Table of Contents
UNITED STATES
SECURITIES AND EXCHANGE COMMISSION
Washington, D.C. 20549
FORM N-CSR
CERTIFIED SHAREHOLDER REPORT OF REGISTERED MANAGEMENT
INVESTMENT COMPANIES
Investment Company Act file number: 811-22375
PIMCO Equity Series
(Exact name of registrant as specified in charter)
840 Newport Center Drive, Newport Beach, CA 92660
(Address of principal executive offices)
Trent W. Walker
Treasurer and Principal Financial Officer
PIMCO Equity Series
840 Newport Center Drive
Newport Beach, CA 92660
(Name and address of agent for service)
Copies to:
Brendan C. Fox
Dechert LLP
1900 K Street, N.W.
Washington, D.C. 20006
Registrant’s telephone number, including area code: (888) 877-4626
Date of fiscal year end: June 30
Date of reporting period: December 31, 2013
Form N-CSR is to be used by management investment companies to file reports with the Commission not later than 10 days after the transmission to stockholders of any report that is required to be transmitted to stockholders under Rule 30e-1 under the Investment Company Act of 1940 (17 CFR 270.30e-1). The Commission may use the information provided on Form N-CSR in its regulatory, disclosure review, inspection, and policymaking roles.
A registrant is required to disclose the information specified by Form N-CSR, and the Commission will make this information public. A registrant is not required to respond to the collection of information contained in Form N-CSR unless the Form displays a currently valid Office of Management and Budget (“OMB”) control number. Please direct comments concerning the accuracy of the information collection burden estimate and any suggestions for reducing the burden to Secretary, Securities and Exchange Commission, 450 Fifth Street, NW, Washington, DC 20549-0609. The OMB has reviewed this collection of information under the clearance requirements of 44 U.S.C. § 3507.
Table of Contents
Item 1. Reports to Stockholders.
The following is a copy of the report transmitted to stockholders pursuant to Rule 30e-1 under the Investment Company Act of 1940, as amended (the “1940 Act”) (17 CFR 270.30e-1).
| • | PIMCO Equity Series—Institutional, P, Administrative, D, A, C and R Classes |
Table of Contents

Your Global Investment Authority
PIMCO Equity Series®
Semiannual Report
December 31, 2013

PIMCO Dividend and Income Builder Fund
PIMCO EqS® Dividend Fund
PIMCO EqS® Emerging Markets Fund
PIMCO EqS® Long/Short Fund
PIMCO Emerging Multi-Asset Fund
PIMCO EqS Pathfinder Fund®
Share Classes
| n | Institutional |
| n | P |
| n | Administrative |
| n | D |
| n | A |
| n | C |
| n | R |

Table of Contents
| Page | ||||||
| 2 | ||||||
| 4 | ||||||
| 26 | ||||||
| 28 | ||||||
| 36 | ||||||
| 38 | ||||||
| 40 | ||||||
| 41 | ||||||
| 42 | ||||||
| 43 | ||||||
| 44 | ||||||
| 87 | ||||||
| 106 | ||||||
| 107 | ||||||
| Fund | Insights from the Portfolio Managers | Fund Summary | Schedule of Investments | |||||||||
PIMCO Dividend and Income Builder Fund | 6 | 9 | 45 | |||||||||
PIMCO EqS® Dividend Fund | 10 | 12 | 54 | |||||||||
PIMCO EqS® Emerging Markets Fund | 13 | 16 | 59 | |||||||||
PIMCO EqS® Long/Short Fund | 17 | 19 | 69 | |||||||||
PIMCO Emerging Multi-Asset Fund | 20 | 22 | 75 | |||||||||
PIMCO EqS Pathfinder Fund® | 23 | 25 | 80 | |||||||||
This material is authorized for use only when preceded or accompanied by the current PIMCO Equity Series prospectus.
Table of Contents
Dear Shareholder,
Please find enclosed the Semiannual Report for the PIMCO Equity Series covering the six-month reporting period ended December 31, 2013. On the following pages are specific details about the investment performance of each fund and a discussion of the factors that influenced performance during the reporting period. In addition, the letters from the portfolio managers provide a further review of such factors as well as an overview of each fund’s investment strategy.
The last six months of 2013 were marked by continued periods of heightened bond market volatility brought on by uncertainty around central bank monetary and fiscal policy, geopolitical concerns, and a slower than hoped for rebound in the global economy. Following a particularly bumpy third quarter, however, all financial markets completed the year along a relatively smoother path. Federal Reserve (“Fed”) Chairman Ben Bernanke laid the groundwork in September, when he clarified the Fed’s commitment to maintain its quantitative easing (“QE”) bond purchase program of U.S. Treasuries and mortgages, while maintaining the Federal Funds Rate within a zero-bound range. The nomination of Janet Yellen to the Chairmanship further helped to reassure investors that the Fed would be committed to the continuation of their accommodative policies.
Towards the latter part of December, the Fed announced that beginning in January 2014 it intends to gradually exit its bond-buying program, by reducing it from $85 billion to $75 billion spread equally across mortgage and U.S. Treasury purchases. As expected, in order to anchor the front-end of the yield curve, the Federal Open Market Committee (“FOMC”) provided even greater assurances that the policy rate would remain near a zero-bound range until signs of sustainable growth are more broadly evident in the U.S. economy. While the markets had months to prepare for the announcement, equities and other risk assets soared in reaction to the news while bond markets saw yields drift higher.
Highlights of the financial markets during our six-month reporting period include:
| n | Developed market equities continued to post strong performance in the last six months of 2013, despite a period marked by considerable volatility and uncertainty around central bank policy and geopolitical risks. U.S. equities, as measured by the S&P 500 Index, returned 16.31%. Global equities, as represented by the MSCI All Country World Index Net USD and MSCI World Index, returned 15.79% and 16.83%, respectively. Emerging market (“EM”) equities, as represented by the MSCI Emerging Markets Index (Net Dividends in USD), returned 7.70%. EM equities underperformed developed market equities due to declining earnings growth and rising interest rates in the U.S. which placed pressure on local EM currencies. |
| n | U.S. Treasuries underperformed most other developed sovereign bond markets on a hedged basis as investors reacted to the various Fed announcements regarding the tapering of their QE bond purchase program. In particular, U.S. Treasury yields rose to their highest level in late December as investors reacted to the Fed’s announcement that it would begin the reduction of its asset purchases starting in January 2014. This decision was made on the back of improving economic data, which included a lower unemployment rate, respectable monthly job reports, and improving housing fundamentals. The benchmark ten-year U.S. Treasury note yielded 3.03% at the end of the reporting period, as compared to 2.49% on June 30, 2013. The Barclays U.S. Aggregate Index, a widely used index of U.S. investment-grade bonds, returned 0.43% for the period. |
All of our active equity strategies are global, high-conviction portfolios that are unconstrained by geography, benchmark or market capitalization and incorporate downside risk management. Each strategy is managed by experienced equity investors who benefit from PIMCO’s global investment resources and macroeconomic insights. We believe the long-term potential of equities to grow earnings and dividends is an important component of an investor’s overall portfolio.
If you have any questions regarding the PIMCO Equity Series, please contact your account manager or financial adviser, or call one of our shareholder associates at 888.87.PIMCO (888.877.4626). We also invite you to visit our website at www.pimco.com/investments to learn more about our views and global thought leadership.
| 2 | PIMCO EQUITY SERIES |
Table of Contents
Thank you again for the trust you have placed in us. We value your commitment and will continue to work diligently to meet your broad investment needs.
 | Sincerely,
Brent R. Harris Chairman of the Board,
January 24, 2014 |

| SEMIANNUAL REPORT | DECEMBER 31, 2013 | 3 |
Table of Contents
Important Information About the Funds
PIMCO Equity Series (the “Trust”) is an open-end management investment company currently consisting of six separate investment portfolios (the “Funds”). Each Fund is an actively managed equity strategy. While we believe that equity funds have an important role to play in a well diversified investment portfolio, they are subject to notable risks. Among other things, equity and equity-related securities may decline in value due to both real and perceived general market, economic, and industry conditions.
As of the date of this report, interest rates in the U.S. are at or near historically low levels. As such, funds that invest in fixed income securities may currently face an increased exposure to the risks associated with a rising interest rate environment. This is especially true since the Federal Reserve Board has begun tapering its quantitative easing program. Further, while the U.S. bond market has steadily grown over the past three decades, dealer inventories of corporate bonds have remained relatively stagnant. As a result, there has been a significant reduction in the ability of dealers to “make markets.” All of the factors mentioned above, individually or collectively, could lead to increased volatility and/or lower liquidity in the fixed income markets, which could result in losses to a Fund. If the performance of a Fund were to be negatively impacted by rising interest rates, the Fund could face increased redemptions by its shareholders, which could further reduce the value of the Fund.
The Funds may be subject to various risks as described in the Funds’ prospectus. Some of these risks may include, but are not limited to, the following: allocation risk, Acquired Fund risk, equity risk, dividend-oriented stocks risk, value investing risk, foreign (non-U.S.) investment risk, emerging markets risk, market risk, issuer risk, interest rate risk, credit risk, high yield and distressed company risk, cash holdings risk, currency risk, real estate risk, liquidity risk, leveraging risk, management risk, small-cap and mid-cap company risk, arbitrage risk, derivatives risk, mortgage-related and other asset-backed risk, short sale risk, commodity risk, convertible securities risk, tax risk, subsidiary risk, operational risk and issuer non-diversification risk. A complete description of these risks and other risks is contained in the Funds’ prospectus. The Funds may use derivative instruments for hedging purposes or as part of an investment strategy. Use of these instruments may involve certain costs and risks such as liquidity risk, interest rate risk, market risk, credit risk, management risk, leverage risk, mispricing or improper valuation risk and the risk that the Funds could not close out a position when it would be most advantageous to do so. Certain derivative transactions may have a leveraging effect on a Fund. For example, a small investment in a derivative instrument may have a significant impact on a Fund’s exposure to interest rates, currency exchange rates or other investments. As a result, a relatively small price
movement in a derivative instrument may cause an immediate and substantial loss or gain. A Fund may engage in such transactions regardless of whether the Fund owns the asset, instrument or components of the index underlying the derivative instrument. A Fund may invest a significant portion of its assets in these types of instruments. If it does, the Fund’s investment exposure could far exceed the value of its portfolio securities and its investment performance could be primarily dependent upon securities it does not own. Investing in non-U.S. securities may entail risk due to non-U.S. economic and political developments; this risk may be increased when investing in emerging markets.
High-yield bonds typically have a lower credit rating than other bonds. Lower-rated bonds generally involve a greater risk to principal than higher-rated bonds. Further, markets for lower-rated bonds are typically less liquid than for higher-rated bonds, and public information is usually less abundant in such markets. Thus, high yield investments increase the chance that the Fund will lose money. The credit quality of a particular security or group of securities does not ensure the stability or safety of the overall portfolio. Mortgage- and Asset-Backed Securities represent ownership interests in “pools” of mortgages or other assets such as consumer loans or receivables. As a general matter, Mortgage- and Asset-Backed Securities are subject to interest rate risk, extension risk, prepayment risk, and credit risk. These risks largely stem from the fact that returns on Mortgage- and Asset-Backed Securities depend on the ability of the underlying assets to generate cash flow.
On each individual Fund Summary page in this Shareholder Report, the Average Annual Total Return table and Cumulative Returns chart measure performance assuming that any dividend and capital gain distributions were reinvested. Class A shares are subject to an initial sales charge. A Contingent Deferred Sales Charge (“CDSC”) may be imposed in certain circumstances on Class A shares that are purchased without an initial sales charge and then redeemed during the first 18 months after purchase. The Cumulative Returns chart reflects only Institutional Class performance. Performance for Class P, Administrative Class, Class D, Class A, Class C and Class R shares is typically lower than Institutional Class performance due to the lower expenses paid by Institutional Class shares. Performance shown is net of fees and expenses. A Fund’s total annual operating expense ratios on each individual Fund summary page are as of the currently effective prospectus, as supplemented to date. The Cumulative Returns chart assumes the initial investment of $1,000,000 was made at the end of the month that the Institutional Class of the relevant Fund commenced operations. The minimum initial investment amount for Institutional Class, Class P or Administrative Class shares is $1,000,000. The
| 4 | PIMCO EQUITY SERIES |
Table of Contents
minimum initial investment amount for Class A, Class C and Class D shares is $1,000. There is no minimum initial investment for Class R shares. Each Fund measures its performance against a broad-based securities market index (benchmark index). The benchmark index does
not take into account fees, expenses, or taxes. A Fund’s past performance, before and after taxes, is not necessarily an indication of how the Fund will perform in the future.
The following table discloses the inception dates of each Fund and its respective share classes:
| Fund Name | Fund Inception | Institutional Class | Class P | Administrative Class | Class D | Class A | Class C | Class R | ||||||||||||||||||||||||||
PIMCO Dividend and Income Builder Fund | 12/14/11 | 12/14/11 | 12/14/11 | — | 12/14/11 | 12/14/11 | 12/14/11 | 12/14/11 | ||||||||||||||||||||||||||
PIMCO EqS® Dividend Fund | 12/14/11 | 12/14/11 | 12/14/11 | — | 12/14/11 | 12/14/11 | 12/14/11 | 12/14/11 | ||||||||||||||||||||||||||
PIMCO EqS® Emerging Markets Fund | 03/22/11 | 03/22/11 | 03/22/11 | 04/19/11 | 03/22/11 | 03/22/11 | 03/22/11 | 03/22/11 | ||||||||||||||||||||||||||
PIMCO EqS® Long/Short Fund | 04/20/12 | 04/20/12 | 04/30/12 | — | 04/30/12 | 04/30/12 | 04/30/12 | — | ||||||||||||||||||||||||||
PIMCO Emerging Multi-Asset Fund | 04/12/11 | 04/12/11 | 04/12/11 | 04/19/11 | 04/12/11 | 04/12/11 | 04/12/11 | 04/12/11 | ||||||||||||||||||||||||||
PIMCO EqS Pathfinder Fund® | 04/14/10 | 04/14/10 | 04/14/10 | — | 04/14/10 | 04/14/10 | 04/14/10 | 04/14/10 | ||||||||||||||||||||||||||
For periods prior to the inception date of the Class P, Administrative Class, Class D, Class A, Class C and Class R shares (if applicable), performance information shown is based on the performance of the Fund’s Institutional Class shares. The prior Institutional Class performance has been adjusted to reflect the distribution and/or service fees and other expenses paid by the Class P, Administrative Class, Class D, Class A, Class C and Class R shares, respectively.
An investment in a Fund is not a bank deposit and is not guaranteed or insured by the Federal Deposit Insurance Corporation (“FDIC”) or any other government agency. It is possible to lose money on investments in a Fund.
PIMCO has adopted written proxy voting policies and procedures (“Proxy Policy”) as required by Rule 206(4)-6 under the Investment Advisers Act of 1940, as amended. The Proxy Policy has been adopted by PIMCO Equity Series as the policies and procedures that PIMCO will use when voting proxies on behalf of a Fund. A description of the
policies and procedures that PIMCO uses to vote proxies relating to portfolio securities of a Fund, and information about how the Fund voted proxies relating to portfolio securities held during the most recent twelve-month period ended June 30th, are available without charge, upon request, by calling the Trust at (888) 87-PIMCO, on the Fund’s website at http://www.pimco.com/investments, and on the Securities and Exchange Commission’s (“SEC”) website at http://www.sec.gov.
PIMCO Equity Series files a complete schedule of each Fund’s portfolio holdings with the SEC for the first and third quarters of each fiscal year on Form N-Q. A copy of a Fund’s Form N-Q is available on the SEC’s website at http://www.sec.gov and may be reviewed and copied at the SEC’s Public Reference Room in Washington, D.C. A Fund’s Form N-Q will also be available without charge, upon request, by calling the Trust at (888) 87-PIMCO and on the Fund’s website at http://www.pimco.com/investments. Information on the operation of the Public Reference Room may be obtained by calling 1-800-SEC-0330.
| SEMIANNUAL REPORT | DECEMBER 31, 2013 | 5 |
Table of Contents
Insights from the Portfolio Managers PIMCO Dividend and Income Builder Fund
Dear Shareholder,
We appreciate your investment in the PIMCO Dividend and Income Builder Fund (the “Fund”). In the following letter, please find a discussion of the recent market environment and a review of portfolio performance.
Market Overview
During the six-month reporting period ended December 31, 2013, the MSCI All Country World Index Net USD (the “Index”), which tracks the performance of stocks in developed and emerging markets countries, returned 15.79%. Performance was strongest in the information technology, industrials, and consumer discretionary sectors. Utilities, consumer staples, and energy were the poorest performing sectors.
Equities rallied early in the period as Federal Reserve (“Fed”) Chairman Ben Bernanke continued to communicate that highly accommodative monetary policy would remain necessary for the foreseeable future, though markets declined in August as headline comments on the Fed’s tapering program created uncertainty. Markets climbed again in September as the situation in Syria continued to play out through diplomatic channels. Stock prices continued to rise until the Fed announced its decision to keep its $85 billion bond-buying program in place. Equities then sold off towards the end of September as investors shifted their macro concerns to the U.S. budget and debt ceiling debates in Washington.
Stocks took off in October as U.S. politicians were finally able to pass legislation that reopened the government and raised the country’s debt ceiling. Also in October, Janet Yellen was nominated to replace Ben Bernanke as the Chairman of the Federal Reserve, allaying investor concerns about rising interest rates. U.S. equities rose even higher in late December after the Fed strengthened its pledge to maintain very low interest rates. While the Fed did announce a December taper (i.e. reduced asset purchases), investors were anticipating this possibility and were heartened by the accompanying positive economic data.
During the reporting period, performance was particularly strong in Europe, as economic reports continued to suggest that the region was exiting its recession, albeit at a slow pace. In November, the European Central Bank (“ECB”) cut interest rates, though the ECB president hinted that other, more aggressive stimulus actions were not under consideration. Given the disinflation facing the region, these comments were viewed by many as far too timid.
Among developed markets, Japan was the worst performing region. While Japanese equities were strong in local terms, especially after the country announced Gross Domestic Product (“GDP”) numbers that were ahead of expectations, the devaluation of the yen caused Japanese equities to be relatively weak in U.S. dollar terms.
Emerging markets continued to underperform developed markets during the reporting period Concerns about a slowdown in China and widening current account deficits in the “fragile five” countries (Turkey, South Africa, India, Indonesia, and Brazil) weighed on returns. Political unrest in Turkey and Vietnam only exacerbated capital outflows from the region.
Fund Review
We seek to provide attractive current yield, growing dividends over time, and capital appreciation. During the six-month reporting period ended December 31, 2013, the Fund paid ordinary quarterly dividends of 18.8 cents per share and a one-time supplemental dividend of 1 cent per share on its Institutional Class shares. The dividend per share was slightly lower for the other share classes, to account for varying class specific expenses. The Fund’s net asset value increased by $1.06 per share (from $11.60 to $12.66) over the reporting period, bringing the six-month total return to 10.88% (net of fees). On a relative basis, the Fund underperformed its benchmark (a blend of 75% MSCI All Country World Index Net USD/25% Barclays Global Aggregate (USD Unhedged) Index), which returned 12.32%. Both security selection and sector allocation decisions within equities detracted from relative performance.
At the security level, the Fund’s position in Walgreens was the largest contributor to relative performance. The U.S. retail drugstore operator outperformed as year-over-year sales, especially in the front end of the store, improved. The company also raised its quarterly dividend.
Marathon Petroleum was another top contributor to performance. The U.S. oil refining and distribution company outperformed as crack spreads continued to widen, and after the company announced a $2 billion increase to its share buyback program. Furthermore, Marathon Petroleum’s stock rallied after the Environmental Protection Agency indicated that it was open to adjusting a renewable fuel mandate that had caused Marathon’s input costs to increase during the first half of 2013.
The largest detractor from performance for the reporting period was the Fund’s holding of Cisco Systems. The U.S. communications equipment company underperformed after stating that it planned to lay off approximately 5% of its workforce in an effort to rationalize headcount gained in recent strategic acquisitions. While the market viewed this news as negative, management indicated that it remained committed to returning capital to shareholders. Cisco’s stock price declined again when the company’s management announced disappointing short-term earnings guidance due to weak revenues from the emerging markets. We continue to think that Cisco is an attractively-valued market leader with a solid balance sheet, and we added to our position.
| 6 | PIMCO EQUITY SERIES |
Table of Contents
The Fund’s holding of ProSafe was another detractor from performance. Following strong performance early in the third quarter, the Norwegian owner and operator of accommodation rigs underperformed after it announced a weakening in forward contracting, though quarterly earnings results hit a record high. We continue to believe that ProSafe’s leading position in a niche market makes it an attractive investment.
The Fund’s fixed income allocation performed positively, driven mainly by security selection, primarily within the securitized sector.
Conclusion
Over the reporting period, we “derisked” the portfolio by decreasing our allocation to “Consistent Earners” (i.e. stable, blue-chip companies) that had appreciated in value during the market rally. At the same time, we increased our allocations to “Basic Value” (i.e. more cyclical) companies and “Emerging Franchises” (i.e. growth companies) as the market volatility provided opportunities to initiate positions in some very compelling investments. We also increased our allocations to European stocks and to financials.
Going forward, we maintain our long-term view that dividend-paying equities have the potential to be an attractive long-term investment solution, especially given a secular outlook for lower returns across asset classes. As always, however, we continue to emphasize valuation in a market that has recently been characterized by overreactions to both positive and negative news.
Thank you for your investment in the Fund.
Sincerely,
 |  | |
 |  | |
| Brad Kinkelaar | Dan Ivascyn | |
| Portfolio Manager | Fixed Income Co-Portfolio Manager | |
 | ||
 | ||
| Alfred Murata | ||
| Fixed Income Co-Portfolio Manager | ||
| SEMIANNUAL REPORT | DECEMBER 31, 2013 | 7 |
Table of Contents
Insights from the Portfolio Managers PIMCO Dividend and Income Builder Fund (Cont.)
Top 10 Holdings1
Cisco Systems, Inc. | 3.6% | |||||
HSBC Holdings PLC | 3.6% | |||||
Roche Holding AG | 3.2% | |||||
Qualcomm, Inc. | 3.1% | |||||
Nippon Telegraph & Telephone Corp. | 3.0% | |||||
Enagas S.A. | 2.9% | |||||
Standard Chartered PLC | 2.7% | |||||
JPMorgan Chase & Co. | 2.7% | |||||
Total S.A. | 2.7% | |||||
Cia de Saneamento Basico do Estado de Sao Paulo SP—ADR | 2.6% |
Geographic Breakdown1
United States | 48.6% | |||||
United Kingdom | 11.6% | |||||
Brazil | 5.3% | |||||
France | 4.0% | |||||
South Africa | 3.7% | |||||
Netherlands | 3.5% | |||||
Spain | 3.2% | |||||
Switzerland | 3.2% | |||||
Japan | 3.1% | |||||
Cyprus | 2.5% | |||||
Other | 8.9% |
Sector Breakdown1
Financials | 26.4% | |||||
Consumer Discretionary | 12.1% | |||||
Information Technology | 11.8% | |||||
Energy | 9.7% | |||||
Health Care | 7.8% | |||||
Industrials | 6.9% | |||||
Utilities | 6.3% | |||||
Consumer Staples | 5.4% | |||||
Telecommunication Services | 4.9% | |||||
Mortgage-Backed Securities | 2.3% | |||||
Materials | 1.8% | |||||
Other | 1.8% |
| 1 | % of Total Investments as of 12/31/2013. Top Holdings, Geographic and Sector Breakdown solely reflect long positions. Securities sold short, financial derivative instruments and short-term instruments are not taken into consideration. |
| 8 | PIMCO EQUITY SERIES |
Table of Contents
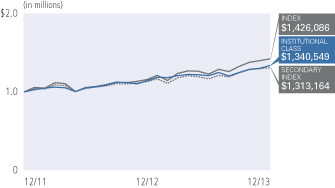
PIMCO Dividend and Income Builder Fund
| Institutional Class - PQIIX | Class A - PQIZX | |
| Class P - PQIPX | Class C - PQICX | |
| Class D - PQIDX | Class R - PQIBX |
Cumulative Returns Through December 31, 2013
Average Annual Total Return for the period ended December 31, 2013 | ||||||||||||||
| 6 Months* | 1 Year | Fund Inception (12/14/11) | ||||||||||||
 | PIMCO Dividend and Income Builder Fund Institutional Class | 10.88% | 17.29% | 16.57% | ||||||||||
| PIMCO Dividend and Income Builder Fund Class P | 10.81% | 17.26% | 16.55% | |||||||||||
| PIMCO Dividend and Income Builder Fund Class D | 10.69% | 17.00% | 16.24% | |||||||||||
| PIMCO Dividend and Income Builder Fund Class A | 10.69% | 17.00% | 16.24% | |||||||||||
| PIMCO Dividend and Income Builder Fund Class A (adjusted) | 4.60% | 10.56% | 13.07% | |||||||||||
| PIMCO Dividend and Income Builder Fund Class C | 10.21% | 16.02% | 15.31% | |||||||||||
| PIMCO Dividend and Income Builder Fund Class C (adjusted) | 9.21% | 15.02% | 15.31% | |||||||||||
| PIMCO Dividend and Income Builder Fund Class R | 10.55% | 16.73% | 15.97% | |||||||||||
 | MSCI All Country World Index Net USD± | 15.79% | 22.80% | 20.96% | ||||||||||
 | 75% MSCI All Country World Index Net USD/25% Barclays Global Aggregate USD Unhedged±± | 12.32% | 15.99% | 15.84% | ||||||||||
All Fund returns are net of fees and expenses.
* Cumulative return.
± The MSCI All Country World Index Net USD is a free float-adjusted market capitalization weighted index that is designed to measure the equity market performance of developed and emerging markets. The Index consists of 45 country indices comprising 24 developed and 21 emerging market country indices. It is not possible to invest directly in an unmanaged index.
±± The benchmark is a blend of 75% MSCI All Country World Index Net USD/25% Barclays Global Aggregate USD Unhedged. The MSCI All Country World Index Net USD is a free float-adjusted market capitalization weighted index that is designed to measure the equity market performance of developed and emerging markets. The Index consists of 45 country indices comprising 24 developed and 21 emerging market country indices. Barclays Global Aggregate (USD Unhedged) Index provides a broad-based measure of the global investment-grade fixed income markets. The three major components of this index are the U.S. Aggregate, the Pan-European Aggregate, and the Asian-Pacific Aggregate Indices. The index also includes Eurodollar and Euro-Yen corporate bonds, Canadian Government securities, and USD investment grade 144A securities. It is not possible to invest directly in an unmanaged index.
Performance quoted represents past performance. Past performance is not a guarantee or a reliable indicator of future results. Current performance may be lower or higher than performance shown. Investment return and the principal value of an investment will fluctuate. Shares may be worth more or less than original cost when redeemed. Returns shown do not reflect the deduction of taxes that a shareholder would pay on fund distributions or the redemption of fund shares. The adjusted returns take into account the maximum sales charge of 5.50% on Class A shares and 1.00% CDSC on Class C shares. The Fund’s total annual operating expense ratio as stated in the Fund’s current prospectus, as supplemented to date, is 1.20% for the Institutional Class shares, 1.30% for the Class P shares, 1.55% for the Class D shares, 1.55% for the Class A shares, 2.30% for the Class C shares and 1.80% for the Class R shares. Details regarding any Fund’s operating expenses can be found in the Fund’s prospectus. For performance current to the most recent month-end, visit www.pimco.com/investments.
Portfolio Insights
| » | The PIMCO Dividend and Income Builder Fund seeks to provide current income that exceeds the average yield on global stocks, and to provide a growing stream of income per share over time, with a secondary objective to seek to provide long-term capital appreciation, by investing under normal circumstances at least 80% of its assets in a diversified portfolio of income-producing investments, and will typically invest at least 50% of its assets in equity and equity-related securities. The Fund’s investments in equity and equity-related securities include common and preferred stock (and securities convertible into, or that PIMCO expects to be exchanged for, common or preferred stock), as well as securities issued by real estate investment trusts, master limited partnerships and other equity trusts and depositary receipts. |
| » | The Fund’s Institutional Class shares returned 10.88% after fees, and the Fund’s benchmark index, a blend of 75% MSCI All Country World Index Net USD/25% Barclays Global Aggregate (USD Unhedged) Index, returned 12.32% during the reporting period. |
| » | During the reporting period, the Fund paid ordinary quarterly dividends of 18.8 cents per share and a one-time supplemental dividend of 1 cent per share on its Institutional Class shares. The dividend per share was slightly lower for the other share classes, to account for varying class specific expenses. The net asset value of the Fund’s Institutional Class shares increased by $1.06 per share (from $11.60 to $12.66) over the reporting period, bringing the six-month total return to 10.88%. |
| » | Security selection detracted from performance. The largest single detractor from relative performance was the Fund’s holding of Cisco Systems, the U.S.-based communications equipment company. |
| » | The largest single contributor to relative performance was the Fund’s holding of Walgreens, the U.S.-based retail drugstore operator. |
| » | The Fund’s weight in cash detracted from relative performance during a period in which the Fund’s blended benchmark index returned 12.32%. |
| » | The Fund’s fixed income allocation performed positively, driven mainly by security selection, primarily within the securitized sector. |
| SEMIANNUAL REPORT | DECEMBER 31, 2013 | 9 |
Table of Contents
Insights from the Portfolio Managers PIMCO EqS® Dividend Fund
Dear Shareholder,
We appreciate your investment in the PIMCO EqS® Dividend Fund (the “Fund”). In the following letter, please find a discussion of the recent market environment and a review of portfolio performance.
Market Overview
During the six-month reporting period ended December 31, 2013, the MSCI All Country World Index Net USD (the “Index”), which tracks the performance of stocks in developed and emerging markets countries, returned 15.79%. Performance was strongest in the information technology, industrials, and consumer discretionary sectors. Utilities, consumer staples, and energy were the poorest performing sectors.
Equities rallied early in the period as Federal Reserve (“Fed”) Chairman Ben Bernanke continued to communicate that highly accommodative monetary policy would remain necessary for the foreseeable future, though markets declined in August as headline comments on the Fed’s tapering program created uncertainty. Markets climbed again in September as the situation in Syria continued to play out through diplomatic channels. Stock prices continued to rise until the Fed announced its decision to keep its $85 billion bond-buying program in place. Equities then sold off towards the end of September as investors shifted their macro concerns to the U.S. budget and debt ceiling debates in Washington.
Stocks took off in October as U.S. politicians were finally able to pass legislation that reopened the government and raised the country’s debt ceiling. Also in October, Janet Yellen was nominated to replace Ben Bernanke as the Chairman of the Federal Reserve, allaying investor concerns about rising interest rates. U.S. equities rose even higher in late December after the Fed strengthened its pledge to maintain very low interest rates. While the Fed did announce a December taper (i.e. reduced asset purchases), investors were anticipating this possibility and were heartened by the accompanying positive economic data.
During the reporting period, performance was particularly strong in Europe, as economic reports continued to suggest that the region was exiting its recession, albeit at a slow pace. In November, the European Central Bank (“ECB”) cut interest rates, though the ECB president hinted that other, more aggressive stimulus actions were not under consideration. Given the disinflation facing the region, these comments were viewed by many as far too timid.
Among developed markets, Japan was the worst performing region. While Japanese equities were strong in local terms, especially after the country announced Gross Domestic Product numbers that were ahead of expectations, the devaluation of the yen caused Japanese equities to be relatively weak in U.S. dollar terms.
Emerging markets continued to underperform developed markets during the period. Concerns about a slowdown in China and widening current account deficits in the “fragile five” countries (Turkey, South Africa, India, Indonesia, and Brazil) weighed on returns. Political unrest in Turkey and Vietnam only exacerbated capital outflows from the region.
Fund Review
We seek to provide attractive current yield, growing dividends over time, and capital appreciation. During the six-month reporting period ended December 31, 2013, the Fund paid ordinary quarterly dividends of 18.9 cents per share and a one-time supplemental dividend of 7 cents per share on its Institutional Class shares. The dividend per share was slightly lower for the other share classes, to account for varying class specific expenses. The Fund’s net asset value increased by $0.42 per share (from $11.87 to $12.29) over the reporting period, bringing the six-month total return to 11.21% (net of fees). On a relative basis, the Fund underperformed the MSCI All Country World Index Net USD, which returned 15.79%. Both security selection and sector allocation decisions detracted from relative performance.
At the security level, the Fund’s position in Walgreens was the largest contributor to relative performance. The U.S. retail drugstore operator outperformed as year-over-year sales, especially in the front end of the store, improved. The company also raised its quarterly dividend.
Marathon Petroleum was another top contributor to performance. The U.S. oil refining and distribution company outperformed as crack spreads continued to widen, and after the company announced a $2 billion increase to its share buyback program. Furthermore, Marathon Petroleum’s stock rallied after the Environmental Protection Agency indicated that it was open to adjusting a renewable fuel mandate that had caused Marathon’s input costs to increase during the first half of 2013.
The largest detractor from performance for the reporting period was the Fund’s holding of Cisco Systems. The U.S. communications equipment company underperformed after stating that it planned to lay off approximately 5% of its workforce in an effort to rationalize headcount gained in recent strategic acquisitions. While the market viewed this news as negative, management indicated that it remained committed to returning capital to shareholders. Cisco’s stock price declined again when the company’s management announced disappointing short-term earnings guidance due to weak revenues from the emerging markets. We continue to think that Cisco is an attractively-valued market leader with a solid balance sheet, and we added to our position.
The Fund’s holding of ProSafe was another detractor from performance. Following strong performance early in the third quarter,
| 10 | PIMCO EQUITY SERIES |
Table of Contents
the Norwegian owner and operator of accommodation rigs underperformed after it announced a weakening in forward contracting, though quarterly earnings results hit a record high. We continue to believe that ProSafe’s leading position in a niche market makes it an attractive investment.
Conclusion
Over the reporting period, we “derisked” the portfolio by decreasing our allocation to “Consistent Earners” (i.e. stable, blue-chip companies) that had appreciated in value during the market rally. At the same time, we increased our allocations to “Basic Value” (i.e. more cyclical) companies and “Emerging Franchises” (i.e. growth companies) as the market volatility provided opportunities to initiate positions in some very compelling investments. We also increased our allocations to European stocks and to financials.
Going forward, we maintain our long-term view that dividend-paying equities have the potential to be an attractive long-term investment solution, especially given a secular outlook for lower returns across asset classes. As always, however, we continue to emphasize valuation in a market that has recently been characterized by overreactions to both positive and negative news.
Thank you for your investment in the Fund.
Sincerely,
| ||
 | ||
Brad Kinkelaar Portfolio Manager | ||
Top 10 Holdings1
HSBC Holdings PLC | 4.3% | |||||
Cisco Systems, Inc. | 4.1% | |||||
Roche Holding AG | 3.9% | |||||
Qualcomm, Inc. | 3.4% | |||||
Nippon Telegraph & Telephone Corp. | 3.3% | |||||
Standard Chartered PLC | 3.3% | |||||
Enagas S.A. | 3.1% | |||||
Total S.A. | 3.0% | |||||
JPMorgan Chase & Co. | 3.0% | |||||
ProSafe SE | 2.8% |
Geographic Breakdown1
United States | 48.0% | |||||
United Kingdom | 12.9% | |||||
Brazil | 5.6% | |||||
France | 4.3% | |||||
South Africa | 4.0% | |||||
Switzerland | 3.9% | |||||
Japan | 3.3% | |||||
Spain | 3.1% | |||||
Cyprus | 2.8% | |||||
Netherlands | 2.6% | |||||
Other | 8.5% |
Sector Breakdown1
Financials | 28.0% | |||||
Consumer Discretionary | 13.1% | |||||
Information Technology | 13.0% | |||||
Energy | 9.9% | |||||
Health Care | 9.3% | |||||
Utilities | 6.2% | |||||
Consumer Staples | 6.1% | |||||
Industrials | 6.0% | |||||
Telecommunication Services | 5.5% | |||||
Materials | 1.9% |
| 1 | % of Total Investments as of 12/31/2013. Top Holdings, Geographic and Sector Breakdown solely reflect long positions. Securities sold short, financial derivative instruments and short-term instruments are not taken into consideration. |
| SEMIANNUAL REPORT | DECEMBER 31, 2013 | 11 |
Table of Contents
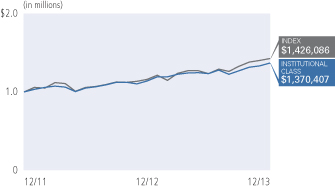
| Institutional Class - PQDIX | Class A - PQDAX | |
| Class P - PQDPX | Class C - PQDCX | |
| Class D - PQDDX | Class R - PQDRX |
Cumulative Returns Through December 31, 2013
| Average Annual Total Return for the period ended December 31, 2013 | ||||||||||||||
| 6 Months* | 1 Year | Fund Inception (12/14/11) | ||||||||||||
| PIMCO EqS® Dividend Fund Institutional Class | 11.21% | 20.33% | 17.68% | ||||||||||
| PIMCO EqS® Dividend Fund Class P | 11.15% | 20.21% | 17.61% | |||||||||||
| PIMCO EqS® Dividend Fund Class D | 11.10% | 19.93% | 17.35% | |||||||||||
| PIMCO EqS® Dividend Fund Class A | 11.01% | 19.93% | 17.35% | |||||||||||
| PIMCO EqS® Dividend Fund Class A (adjusted) | 4.91% | 13.33% | 14.15% | |||||||||||
| PIMCO EqS® Dividend Fund Class C | 10.64% | 19.05% | 16.40% | |||||||||||
| PIMCO EqS® Dividend Fund Class C (adjusted) | 9.64% | 18.05% | 16.40% | |||||||||||
| PIMCO EqS® Dividend Fund Class R | 10.88% | 19.66% | 17.04% | |||||||||||
| MSCI All Country World Index Net USD± | 15.79% | 22.80% | 20.96% | ||||||||||
All Fund returns are net of fees and expenses.
* Cumulative return.
± The MSCI All Country World Index Net USD is a free float-adjusted market capitalization weighted index that is designed to measure the equity market performance of developed and emerging markets. The Index consists of 45 country indices comprising 24 developed and 21 emerging market country indices. It is not possible to invest directly in an unmanaged index.
Performance quoted represents past performance. Past performance is not a guarantee or a reliable indicator of future results. Current performance may be lower or higher than performance shown. Investment return and the principal value of an investment will fluctuate. Shares may be worth more or less than original cost when redeemed. Returns shown do not reflect the deduction of taxes that a shareholder would pay on fund distributions or the redemption of fund shares. The adjusted returns take into account the maximum sales charge of 5.50% on Class A shares and 1.00% CDSC on Class C shares. The Fund’s total annual operating expense ratio as stated in the Fund’s current prospectus, as supplemented to date, is 1.18% for the Institutional Class shares, 1.28% for the Class P shares, 1.53% for the Class D shares, 1.53% for the Class A shares, 2.28% for the Class C shares and 1.78% for the Class R shares. Details regarding any Fund’s operating expenses can be found in the Fund’s prospectus. For performance current to the most recent month-end, visit www.pimco.com/investments.
Portfolio Insights
| » | The PIMCO EqS® Dividend Fund seeks to provide current income that exceeds the average yield on global stocks, and as a secondary objective, seeks to provide long-term capital appreciation, by investing under normal circumstances at least 75% of its assets in equity and equity-related securities, including common and preferred stock (and securities convertible into, or that PIMCO expects to be exchanged for, common or preferred stock), as well as securities issued by real estate investment trusts, master limited partnerships and other equity trusts and depositary receipts. |
| » | The Fund’s Institutional Class shares returned 11.21% after fees, and the Fund’s benchmark index, the MSCI All Country World Index Net USD, returned 15.79% during the reporting period. |
| » | During the reporting period, the Fund paid ordinary quarterly dividends of 18.9 cents per share and a one-time supplemental dividend of 7 cents per share on its Institutional Class shares. The dividend per share was slightly lower for the other share classes to account for varying class specific expenses. The net asset value of the Fund’s Institutional Class shares increased by $0.42 per share (from $11.87 to $12.29) over the reporting period, bringing the six-month total return to 11.21%. |
| » | Security selection detracted from performance. The largest single detractor from relative performance was the Fund’s holding of Cisco Systems, the U.S.-based communications equipment company. |
| » | The largest single contributor to relative performance was the Fund’s holding of Walgreens, the U.S.-based retail drugstore operator. |
| » | The Fund’s holdings in cash detracted from relative performance during a period in which the Fund’s benchmark index returned 15.79%. |
| 12 | PIMCO EQUITY SERIES |
Table of Contents
Insights from the Portfolio Managers PIMCO EqS® Emerging Markets Fund
Dear Shareholder,
We appreciate your investment in the PIMCO EqS® Emerging Markets Fund (the “Fund”). In the following letter, please find a discussion of the recent market environment and a review of portfolio performance.
Market Overview
While emerging market (“EM”) equities rebounded in the second half of the year following May’s “taper tantrum,” developed market (“DM”) equities rallied even stronger. The MSCI Emerging Markets Index delivered 7.70%, underperforming its developed market counterpart, the MSCI World Index, which returned 16.83%.
Second half performance was nevertheless stronger than the first half of the year, in which EM equities underperformed DM equities. Much of the underperformance can be explained by weakening fundamentals in the EM corporate sector. Whereas developed market firms have grown earnings, EM firms have experienced significant earnings deterioration, in part due to on-going structural challenges, such as overcapacity and rising wage costs. Compounding the problem has been the influence of developed market monetary policy. When Federal Reserve (“Fed”) Chairman Ben Bernanke first publicly indicated that scaling back monetary stimulus was a near-term possibility, investors opted to redeploy capital away from the emerging world and into the developed world, driving a market sell-off in May and June 2013.
The strong rebound in the second half of 2013 was driven by both mean reversion from the summer sell-off, and policy influence moving in the opposite direction, as the Fed announced a delay in tapering its stimulus program. In addition, stronger Chinese manufacturing data helped generate more positive sentiment. These factors helped EM equities begin the fourth quarter of 2013 on a strong note. However, by the end of the reporting period concerns over a slowdown in China and widening current account deficits in the “fragile five” countries (Turkey, South Africa, India, Indonesia, and Brazil) weighed on returns. Political unrest, as seen in Turkey and Vietnam, only exacerbated capital outflows.
Looking ahead to 2014, we believe that EM equities remain attractively valued. However, we continue to be mindful of the risks, and will be observing closely how the asset class reacts to reduced Fed purchases and whether the Chinese government can grow its economy back to pre-crisis levels, while simultaneously delivering on its promises of financial and social reform. In addition, upcoming EM political elections may serve as another source of volatility, in our view. While they serve as an opportunity for elected officials to introduce substantial policy shifts, we believe it is likely that unpopular structural reforms may be delayed. In this environment we believe differentiation between both countries and companies will remain critical.
Fund Review
Over the six-month reporting period, the Fund’s Institutional Class shares returned 6.54% net of fees, underperforming its benchmark index, the MSCI Emerging Markets Index, which returned 7.70%. Though the Fund lagged its benchmark index over the six-month reporting period ended December 31, 2013, the Fund outperformed its benchmark index for the full 2013 calendar year.
The Fund’s underperformance over the six-month reporting period was driven by stock-specific events, as well as the general market environment of the third quarter of 2013. As the market re-bounded from its summer lows in September, more cyclical, lower quality sectors rallied. The Fund’s bias towards firms with higher operating margins and returns on equity, which helped it perform well in the first six months of 2013, caused the Fund to lag during the EM equity market rebound in the second half of 2013.
In addition, holdings in KIA Motors, a Korean car manufacturer, and Iluka Resources, an Australian mining company, impacted performance as the stock prices of these companies struggled over the reporting period. Japan’s bond buying program has been successful in weakening the yen, boosting country exports and improved earnings for Japanese industries, particularly carmakers. While this has been positive for our holdings in Japanese industrials, it has come at the expense of competing firms in the Asia-Pacific region, such as KIA Motors. KIA suffered slightly over the reporting period as revenue was challenged by lower-priced Japanese car models. Although we recognize the competition from Japan, we believe that KIA retains a strong market position and is one of the most attractively valued global auto manufacturers.
Concern over whether Chinese growth was cooling also resurfaced in the second half of 2013, and with it concerns of a slowdown among its largest commodity trading partners, such as Australia. This weighed on Australian materials company Iluka Resources as demand for its building materials, which are used heavily in Chinese real estate construction, cooled. Although Chinese growth is likely to slow over the cyclical timeframe, we think that Iluka will benefit from long-term demand for building materials.
Areas that performed well during the reporting period included our holdings in Russian energy companies, a good example of our focus on investing in strong free cash flow generating companies with increasing dividend payouts. From a valuation perspective, Russia is the cheapest market in the developing world, and the energy sector makes up close to 60% of the equity market. We are vigilant of typical investing traps in Russia, such as high cyclicality and poor corporate governance, and we believe investing in businesses with high dividend yields or at low valuations may help mitigate these issues. Over the
| SEMIANNUAL REPORT | DECEMBER 31, 2013 | 13 |
Table of Contents
Insights from the Portfolio Managers PIMCO EqS® Emerging Markets Fund (Cont.)
reporting period, Russian energy companies performed extremely well, helped by news that the government is considering opening up the state-run liquefied natural gas market by granting operating licenses to independent producers as early as 2014.
Other areas that performed well included our long-standing positions in the Asian gaming industry. The Chinese region of Macau offers investors the chance to benefit from rising consumer demand and middle-class consumption on the back of improving infrastructure to access hotels and casinos from the Chinese mainland. Wynn Macau and Melco Crown are businesses that continue to experience double-digit revenue growth from a combination of expanding demand and a constrained supply of table licenses, which is limited by regulation.
Conclusion
Looking ahead, we believe that EM equities remain attractively valued on a historical basis and that real wage growth and an emerging consuming class should drive equity returns over the secular horizon. However, we retain a cautious eye in the near term and believe the asset class remains susceptible to currency volatility and negative shocks. As EM corporate earnings remain highly levered to Gross Domestic Product growth, we believe sustained outperformance likely rests on a turn in the earnings cycle and improving manufacturing data.
To navigate this environment we continue to believe in an active, fundamental approach, investing in both EM equities and DM equities with EM growth drivers, and fully incorporating macroeconomic views. With the near-term headwinds facing EM, we believe that differentiation is critical. We continue to favor companies commanding premium profitability and benefiting from healthy long-run consumer dynamics. From a country perspective we are cautious on countries with large current account deficits, preferring those with strong balance sheets and a high degree of policy flexibility. From a sector perspective, we see value in higher quality cyclicals and may look to add to select consumer staples on any market pull-back.
Again, we thank you for your continued investment in the Fund and look forward to serving your investment needs.
Sincerely,
Maria (Masha) Gordon Portfolio Manager |

Top 10 Holdings1
Samsung Electronics Co. Ltd. | 5.8% | |||||
Kia Motors Corp. | 3.0% | |||||
MegaFon OAO—GDR | 2.6% | |||||
China Shenhua Energy Co. Ltd. ‘H’ | 2.4% | |||||
AIA Group Ltd. | 2.3% | |||||
Industrial & Commercial Bank of China Ltd. ‘H’ | 2.3% | |||||
Credicorp Ltd. | 2.2% | |||||
JPMorgan Chase & Co., Chinese Exchange Basket—Exp. 01/08/2014 | 2.1% | |||||
MediaTek, Inc. | 2.0% | |||||
Prada SpA | 2.0% |
Geographic Breakdown1
Brazil | 10.9% | |||||
China | 10.6% | |||||
South Korea | 10.6% | |||||
India | 5.8% | |||||
Hong Kong | 5.7% | |||||
United Kingdom | 3.9% | |||||
Japan | 3.7% | |||||
Peru | 3.3% | |||||
Taiwan | 3.0% | |||||
Russia | 2.6% | |||||
Cyprus | 2.3% | |||||
Italy | 2.0% | |||||
Israel | 2.0% |
| 14 | PIMCO EQUITY SERIES |
Table of Contents
Geographic Breakdown1 (Cont.)
South Africa | 2.0% | |||||
Mexico | 1.9% | |||||
Cambodia | 1.9% | |||||
Denmark | 1.8% | |||||
Australia | 1.6% | |||||
Other | 11.5% |
Sector Breakdown1
Financials | 21.8% | |||||
Consumer Discretionary | 15.7% | |||||
Consumer Staples | 12.3% | |||||
Information Technology | 9.6% | |||||
Materials | 8.6% | |||||
Industrials | 6.1% | |||||
Energy | 5.4% | |||||
Telecommunication Services | 3.5% | |||||
Utilities | 2.7% | |||||
Other | 1.4% |
| 1 | % of Total Investments as of 12/31/2013. Top Holdings, Geographic and Sector Breakdown solely reflect long positions. Securities sold short, financial derivative instruments and short-term instruments are not taken into consideration. |
| SEMIANNUAL REPORT | DECEMBER 31, 2013 | 15 |
Table of Contents
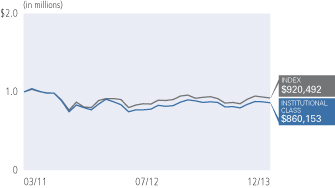
PIMCO EqS® Emerging Markets Fund
| Institutional Class - PEQWX | Class A - PEQAX | |
| Class P - PEQQX | Class C - PEQEX | |
| Administrative Class - PEQTX | Class R - PEQHX | |
| Class D - PEQDX |
Cumulative Returns Through December 31, 2013
| Average Annual Total Return for the period ended December 31, 2013 | ||||||||||||||
| 6 Months* | 1 Year | Fund Inception (03/22/11) | ||||||||||||
| PIMCO EqS® Emerging Markets Fund Institutional Class | 6.54% | -0.79% | -4.03% | ||||||||||
PIMCO EqS® Emerging Markets Fund Class P | 6.67% | -0.79% | -4.06% | |||||||||||
PIMCO EqS® Emerging Markets Fund Administrative Class | 6.44% | -1.02% | -4.30% | |||||||||||
PIMCO EqS® Emerging Markets Fund Class D | 6.46% | -1.02% | -4.35% | |||||||||||
PIMCO EqS® Emerging Markets Fund Class A | 6.46% | -1.13% | -4.41% | |||||||||||
PIMCO EqS® Emerging Markets Fund Class A (adjusted) | 0.58% | -6.53% | -6.33% | |||||||||||
PIMCO EqS® Emerging Markets Fund Class C | 5.92% | -1.94% | -5.08% | |||||||||||
PIMCO EqS® Emerging Markets Fund Class C (adjusted) | 4.92% | -2.92% | -5.08% | |||||||||||
PIMCO EqS® Emerging Markets Fund Class R | 6.23% | -1.36% | -4.60% | |||||||||||
| MSCI Emerging Markets Index (Net Dividends in USD)± | 7.70% | -2.60% | -1.36% | ||||||||||
All Fund returns are net of fees and expenses.
* Cumulative return.
± The MSCI Emerging Markets Index (Net Dividends in USD) is a free float-adjusted market capitalization index that is designed to measure equity market performance of emerging markets. It is not possible to invest directly in an unmanaged index.
Performance quoted represents past performance. Past performance is not a guarantee or a reliable indicator of future results. Current performance may be lower or higher than performance shown. Investment return and the principal value of an investment will fluctuate. Shares may be worth more or less than original cost when redeemed. Returns shown do not reflect the deduction of taxes that a shareholder would pay on fund distributions or the redemption of fund shares. The adjusted returns take into account the maximum sales charge of 5.50% on Class A shares and 1.00% CDSC on Class C shares. The Fund’s total annual operating expense ratio as stated in the Fund’s current prospectus, as supplemented to date, is 1.45% for the Institutional Class shares, 1.55% for the Class P shares, 1.70% for the Administrative Class shares, 1.80% for the Class D shares, 1.80% for the Class A shares, 2.55% for the Class C shares and 2.05% for the Class R shares. Details regarding any Fund’s operating expenses can be found in the Fund’s prospectus. For performance current to the most recent month-end, visit www.pimco.com/investments.
Portfolio Insights
| » | The PIMCO EqS® Emerging Markets Fund seeks capital appreciation by investing under normal circumstances at least 80% of its assets in a diversified portfolio of investments economically tied to emerging market countries. The Fund will invest a substantial portion of its assets in equity and equity-related securities, including common and preferred stock (and securities convertible into, or that PIMCO expects to be exchanged for, common or preferred stock). The Fund may also invest in fixed income securities, including debt securities issued by both corporate and government issuers. The Fund may invest in commodity related instruments, including exchange-traded funds, futures and other investment companies. The Fund may also invest in derivative instruments, such as options, futures contracts or swap agreements. |
| » | The Fund’s Institutional Class shares returned 6.54% after fees, and the Fund’s benchmark index, the MSCI Emerging Markets Index, returned 7.70% during the reporting period. |
| » | From a sector perspective, stock selection in the energy and industrials sectors contributed to relative performance. Positions in Russian energy companies were the top contributors. A focus on Japanese industrials with higher dividend yield and earnings forecasts was also additive to returns. |
| » | On the downside, an overweight to the materials sector detracted from returns. Stock selection in Australian and Israeli materials companies detracted from performance. |
| » | From a country perspective, an overweight to Russia and an underweight to Indonesia were positive for performance. Security selection within Russian energy contributed to performance. An underweight to Indonesia was positive for performance. |
| » | On the downside, stock selection in Korea and off-benchmark allocations to Israel and Australia were negative for relative performance. In Korea, stock selection within the consumer discretionary and information technology sectors, coupled with an underweight to the financials and materials sectors, detracted from returns. An allocation to the Israeli and Australian materials sector was negative on concerns over Chinese demand. |
| » | Currency positioning and cash holdings were negative contributors over the reporting period. |
| 16 | PIMCO EQUITY SERIES |
Table of Contents
Insights from the Portfolio Managers PIMCO EqS® Long/Short Fund
Dear Shareholder,
We appreciate your investment in the PIMCO EqS® Long/Short Fund (the “Fund”). In the following letter, please find a discussion of the recent market environment and a review of recent portfolio performance.
Market Overview
Following the pull back in equity markets during June 2013 as investors began to speculate as to the speed and magnitude of the Federal Reserve’s (“Fed”) eventual exit of its supportive monetary policies, investors began to accept that “tapering” was not necessarily “tightening.” Macroeconomic fears continued to recede as economic results for both the U.S. and Europe indicated stronger than anticipated growth. While the Fed did somewhat surprise the markets with their announcement of a December tapering, their strengthened pledge towards a zero interest rate policy largely offset investor concerns of tightening monetary policy.
Fund Review
Over the six-month reporting period, the Fund’s Institutional Class shares returned 13.78% net of fees, outperforming its benchmark, 3-Month USD LIBOR Index, by 13.65% on an after fees basis. The performance over this time period contributed to a strong 2013. For the 2013 calendar year, the Fund returned 34.52% net of fees, outperforming both its benchmark index by 34.24% and the broader U.S. equity market return of 32.39%, as represented by the S&P 500 Index.
As a reminder, the Fund is a concentrated, long-biased equity fund that integrates bottom-up research and macroeconomic insights. With the flexibility to increase or decrease equity market exposure, the Fund has the potential to participate in market upside while also seeking to mitigate losses during extended market declines. The Fund’s ability to take sizeable positions in its highest conviction stock ideas enhances the potential for returns. In 2013, our performance was driven by strong stock selection, particularly among our long positions.
During the six-month reporting period, the Fund’s position in DST Systems was the top contributor to performance. DST is a conglomerate business, built as the company’s former CEO used DST’s strong free cash flow to make investments in other public companies, private equity, and real estate to amass a substantial portfolio of non-core assets. Last year, the company’s shareholders appointed a new chairman and CEO to improve the company’s overall capital allocation, and this management team is now monetizing these investments and redeploying the capital into share repurchases and debt reduction. We believed that the stock had significant upside with means to unlock shareholder value or the potential to be considered a favorable takeover target for private equity investors.
The Fund’s investment in Genworth Financial was another contributor to returns over the reporting period. Genworth is a combination of two businesses that are a bit of an odd couple: 1) a life insurance operation with a long-term care business, and 2) a U.S. mortgage insurance business that had been driving a sub-par return on equity (“ROE”). As half of the competitors have left the long-term care business over the past two years due to low interest rates and poor ROEs, the industry right now is an oligopoly with just four players. We viewed the company as being in an attractive position to benefit from a rising rate environment along with an improvement in the housing market to improve the headwinds from their mortgage insurance business. Combined with the potential to spin off other businesses and initiate a dividend next year, we viewed that there was substantial upside and the thesis played out favorably over the reporting period.
These positive results were partially offset by the Fund’s position in Penn West Petroleum, which detracted from returns. The company traded sharply lower on announcing that it would be targeting as much as $2 billion Canadian dollars of asset sales before 2015 as a strategic review, which was a sharply negative surprise for investors and extended the timing of the company’s transition plan. Given this new information, we revisited our original investment thesis and decided to exit the position.
In addition, our short positions detracted from performance in aggregate due to the strong equity market rally. Our approach to shorting is primarily to generate alpha as opposed to simply hedging market risk. While detracting from performance over the six-month period, these positions have historically served to reduce the overall volatility of the portfolio in periods when the equity market pulled back, and we believe can still generate alpha over the full market cycle.
Conclusion
We reflect on 2013 as a year in which U.S. equities surged to record highs on signs of economic recovery and continued aggressive monetary policy. In addition, we have observed that equities benefited primarily from expanding valuations rather than strong fundamentals. From here, the outlook for equities is mixed: Valuations today are higher but we think fair, and the global economy is improving but growth is still muted. In this environment, we think equities are investable, but investors should pick their spots. We believe a highly-selective, stock-specific approach to equity investing is the best way to seek attractive returns going forward.
Again, we thank you for your continued investment in the Fund and look forward to serving your investment needs.
| SEMIANNUAL REPORT | DECEMBER 31, 2013 | 17 |
Table of Contents
Insights from the Portfolio Managers PIMCO EqS® Long/Short Fund (Cont.)
Sincerely,


Geoffrey Johnson, CFA
Portfolio Manager
Top 10 Holdings1
Genworth Financial, Inc. ‘A’ | 7.2% | |||||
Lowe’s Cos., Inc. | 5.9% | |||||
DST Systems, Inc. | 5.6% | |||||
Comcast Corp. ‘A’ | 5.5% | |||||
Citigroup, Inc. | 5.0% | |||||
General Motors Co. | 4.4% | |||||
Apple, Inc. | 4.4% | |||||
Walter Investment Management Corp. | 3.8% | |||||
American Realty Capital Properties, Inc. | 3.8% | |||||
DaVita HealthCare Partners, Inc. | 3.7% |
Sector Breakdown2
Financials | 26.6% | |||||
Consumer Discretionary | 17.9% | |||||
Information Technology | 17.1% | |||||
Health Care | 9.2% | |||||
Industrials | 7.9% | |||||
Consumer Staples | 4.8% | |||||
Materials | 3.0% | |||||
Telecommunications | (0.1% | ) | ||||
Energy | (3.6% | ) |
| 1 | % of Total Investments as of 12/31/2013. Top Holdings solely reflect long positions. Securities sold short, financial derivative instruments and short-term instruments are not taken into consideration. |
| 2 | % of net exposure (Total Investments less Securities Sold Short) as of 12/31/2013. Financial derivative instruments and short-term instruments are not taken into consideration. |
| 18 | PIMCO EQUITY SERIES |
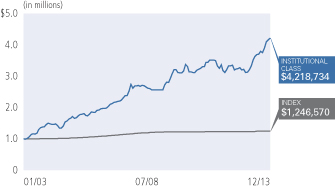
Table of Contents
| Institutional Class - PMHIX | Class A - PMHAX | |
| Class P - PMHBX | Class C - PMHCX | |
| Class D - PMHDX |
Cumulative Returns Through December 31, 2013
| Average Annual Total Return for the period ended December 31, 2013* | ||||||||||||||||||||||
| 6 Months** | 1 Year | 5 Year | 10 Year | Fund Inception (01/01/03) | ||||||||||||||||||
| PIMCO EqS® Long/Short Fund Institutional Class | 13.78% | 34.52% | 10.42% | 11.76% | 14.11% | ||||||||||||||||
PIMCO EqS® Long/Short Fund Class P | 13.69% | 34.44% | 10.32% | 11.65% | 14.01% | |||||||||||||||||
PIMCO EqS® Long/Short Fund Class D | 13.51% | 33.98% | 10.02% | 11.36% | 13.71% | |||||||||||||||||
PIMCO EqS® Long/Short Fund Class A | 13.55% | 34.05% | 10.02% | 11.36% | 13.71% | |||||||||||||||||
PIMCO EqS® Long/Short Fund Class A (adjusted) | 7.33% | 26.74% | 8.78% | 10.73% | 13.12% | |||||||||||||||||
PIMCO EqS® Long/Short Fund Class C | 13.13% | 33.13% | 9.21% | 10.53% | 12.86% | |||||||||||||||||
PIMCO EqS® Long/Short Fund Class C (adjusted) | 12.13% | 32.13% | 9.21% | 10.53% | 12.86% | |||||||||||||||||
| 3 Month USD LIBOR Index± | 0.13% | 0.28% | 0.46% | 2.12% | 2.03% | ||||||||||||||||
All Fund returns are net of fees and expenses.
** Cumulative return.
± The 3 Month USD LIBOR (London Interbank Offered Rate) Index is an average interest rate, determined by the British Bankers Association, that banks charge one another for the use of short-term money (3 months) in England’s Eurodollar market. It is not possible to invest directly in an unmanaged index.
Performance quoted represents past performance. Past performance is not a guarantee or a reliable indicator of future results. Current performance may be lower or higher than performance shown. Investment return and the principal value of an investment will fluctuate. Shares may be worth more or less than original cost when redeemed. Returns shown do not reflect the deduction of taxes that a shareholder would pay on fund distributions or the redemption of fund shares. The adjusted returns take into account the maximum sales charge of 5.50% on Class A shares and 1.00% CDSC on Class C shares. The Fund’s total annual operating expense ratio as stated in the Fund’s current prospectus, as supplemented to date, is 2.74% for the Institutional Class shares, 2.84% for the Class P shares, 3.09% for the Class D shares, 3.09% for the Class A shares, and 3.84% for the Class C shares. Details regarding any Fund’s operating expenses can be found in the Fund’s prospectus. For performance current to the most recent month-end, visit www.pimco.com/investments.
* For periods prior to April 20, 2012, the Fund’s performance reflects the performance when the Fund was a partnership, net of actual fees and expenses charged to individual partnership accounts in the aggregate. If the performance had been restated to reflect the applicable fees and expenses of each share class, the performance may have been higher or lower. The Fund began operations as a partnership on January 1, 2003 and, on April 20, 2012, was reorganized into a newly-formed fund that was registered as an investment company under the Investment Company Act of 1940. Prior to the reorganization, the Fund had an investment objective, investment strategies, investment guidelines, and restrictions that were substantially similar to those currently applicable to the Fund; however, the Fund was not registered as an investment company under the Investment Company Act of 1940 and was not subject to its requirements or requirements imposed by the Internal Revenue Code of 1986 which, if applicable, may have adversely affected its performance. The performance of Class P, D, A and C shares for the period from April 20, 2012 to April 30, 2012 is based on the performance of the Institutional Class shares of the Fund. The performance of each class of shares will differ as a result of the different levels of fees and expenses applicable to each class of shares.
Portfolio Insights
| » | The PIMCO EqS® Long/Short Fund seeks long-term capital appreciation by investing under normal circumstances in long and short positions of equity and equity-related securities, including common and preferred stock (and securities convertible into, or that PIMCO expects to be exchanged for, common or preferred stock), utilizing a fundamental investing style that integrates bottom-up and top-down research. The Fund will normally invest a substantial portion of its assets in equity and equity-related securities. The Fund may also invest in fixed income securities of varying maturities, cash and cash equivalents. |
| » | The Fund’s Institutional Class shares returned 13.78% after fees, and the Fund’s benchmark index, the 3-Month USD LIBOR Index, returned 0.13% during the reporting period. |
| » | The Fund’s long equity positions contributed to absolute returns as equity markets rallied and the stocks held in the Fund outperformed the broad equity market, as represented by the S&P 500 Index. |
| » | The Fund’s short equity positions detracted from performance in aggregate as the overall equity markets rose during the reporting period. |
| » | Within the Fund, two long investments that contributed the most on the long side were DST Systems and Genworth Financial. |
| » | The Fund’s long position in Penn West Petroleum and select equity short positions detracted from performance. |
| SEMIANNUAL REPORT | DECEMBER 31, 2013 | 19 |
Table of Contents
Insights from the Portfolio Managers PIMCO Emerging Multi-Asset Fund
Dear Shareholder,
We appreciate your investment in the PIMCO Emerging Multi-Asset Fund (the “Fund”). Below is our semiannual update that includes a discussion of our investment outlook with a focus on emerging markets (“EM”) as well as an update on the portfolio over the six-month reporting period ended December 31, 2013.
Tapering Speculation Drives EM Volatility
As has been the case since May when the Federal Reserve (“Fed”) hinted that it may begin to unwind its program of bond purchases, speculation regarding the actual start of “Fed tapering” drove volatility across EM classes throughout the second half of 2013. When the Fed finally announced the start of tapering in mid-December, EM responded in mixed, but muted, fashion with dollar assets outperforming as markets had mostly priced-in the event. After years of strong inflows post-financial crisis, outflows from EM accelerated in the second half of 2013 amid higher developed market (“DM”) interest rates and idiosyncratic EM pressures.
EM equities (as represented by the MSCI Emerging Markets Index) returned 7.70% over the six-month reporting period, trailing its DM counterpart (as represented by the MSCI World Index) by over 9 percentage points. Much of the underperformance can be explained by diverging fundamentals in the EM corporate sector. Whereas DM firms have grown earnings, EM firms have experienced significant earnings deterioration, in part due to ongoing structural challenges, such as overcapacity and rising wage costs. Compounding the problem has been the influence of DM monetary policy. When Fed Chairman Bernanke first publicly indicated that scaling back monetary stimulus was a near-term possibility, investors opted to redeploy capital away from the emerging into the developed world, driving an EM sell-off in May and June. The strong rebound in the second half of 2013 was driven by both mean reversion from the summer sell-off and some relief that tapering had been put off by a few months, as the Fed announced a delay in tapering its stimulus program before commencing in December. The Fund is overweight EM equities given depressed valuations post sell-off and an improved global growth outlook.
EM external debt (as represented by the JPMorgan Emerging Markets Bond Index (EMBI) Global) returned 1.79% over the six-month reporting period, recovering from steep declines in May and June. Gains over the period were driven by tightening spreads due to improved market risk sentiment. This offset a rise in U.S. Treasury yields, which weighed on the asset class. Spreads declined 26 basis points over the period, with a larger compression experienced by the high yield subset of the index. The Fund maintains its underweight to EM spread duration, as we believe spreads may be susceptible to further investor outflows, slower EM growth, and limited progress on
structural reforms. Within the more strongly positioned countries, we will substitute higher yielding quasi-sovereign and EM corporate credits for rich sovereign issues and maintain, more broadly, a tactical allocation to the EM corporate debt asset class.
EM local debt markets (as represented by the JPMorgan Government Bond Index-Emerging Markets (GBI-EM) Global Diversified Index (Unhedged)) declined 1.96% over the six-month reporting period. Investor preference for U.S. dollar-denominated assets amid U.S. economic strength, concerns over external vulnerabilities of higher current account deficit countries, and the implications of a slowdown in China generally weakened EM currencies. While higher carry supported the asset class, the combination of rising yields (largely mirroring the rise in U.S. Treasury yields) and depreciating currencies led to losses over the period. We maintain our slight overweight to EM local rates, which offer lower duration than EM dollar-denominated assets. We believe EM local rates are moderately attractive since select yield curves offer attractive carry and roll opportunities, particularly at the front end. The Fund has increased its defensive posturing to EM currencies, given weak technicals and expected volatility and slower EM growth.
EM Likely to Remain Bumpy at the Start of 2014
Investor outflows from EM strategies, which typically follow periods of negative returns, may continue during the first few months of the year. We believe this may lead to further volatility, especially for local bonds and currencies in light of renewed U.S. dollar strength and large levels of foreign ownership of local bond markets. While outflows were driven by tactically-oriented investors, strategically-oriented investors continued to increase allocations to EM.
Growth and inflation across EM are expected to remain steady with continued policy efforts focused on reducing inflation and raising real growth. Our view is that 2014 will be a year where country and corporate differentiation will dominate EM debt and equity investment performance given varying initial conditions relating to balance sheet strength, macro conditions, and the flexibility of fiscal and monetary policies. Politics bear monitoring with key elections in Brazil, Turkey, Indonesia, India and South Africa. The electoral cycle will likely delay needed structural reforms. Country differentiation could be accentuated by changing market reactions to tapering and the withdrawal of quantitative easing liquidity.
We believe that EM equities remain attractively valued on a historical basis and that real wage growth and an emerging consuming class should drive equity returns over the secular horizon. However, we retain a cautious eye in the near term and believe the asset class remains susceptible to currency volatility and negative shocks. As EM
| 20 | PIMCO EQUITY SERIES |
Table of Contents
earnings remain highly levered to Gross Domestic Product growth, sustained outperformance likely rests on a turn in the earnings cycle and improving manufacturing data. From a country perspective, we are cautious on countries with large current account deficits, preferring those with strong balance sheets and a high degree of policy flexibility. From a sector perspective, we see value in higher quality cyclicals and may look to add to select consumer staples on any market pull-back.
In the external EM debt space, we remain underweight both spread and interest rate duration. Spreads remain vulnerable given outflows, low liquidity, and the macro environment. We continue to overweight countries that, in our view, can withstand exogenous shocks and will underweight or avoid countries with weaker fundamentals and are exposed to unique pressures. Our interest rate duration underweight is concentrated in the long-end of EM yield curves and is supported by the view that shorter maturity U.S. Treasury rates are well-tethered. Where relative value dictates, we will substitute a country’s sovereign debt for corporate and quasi-sovereigns, which provide additional yield at generally shorter durations without a proportional drop in credit quality.
In the local EM space, we will continue to favor countries that offer high nominal yields, positive real rates, and steep yield curves that provide attractive carry and roll down. We will focus on the front-end of select EM yield curves which are supported by well anchored short-term U.S. Treasury rates. We remain cautious on EM currencies in aggregate due to the potential negative impact of tapering and a weak technical environment. Our overweights are concentrated in countries we believe have strong, supportive credit fundamentals that offer high carry, while our underweights are in countries we view as having large current account deficits and a reliance on short-term portfolio flows. Amid better valuations across EM, we will look to capitalize on relative value opportunities as dislocations materialize.
Sincerely,
 |  | |
 |  | |
| Curtis Mewbourne | Maria (Masha) Gordon | |
| Portfolio Manager, Generalist | Portfolio Manager, Emerging Markets Equities | |
 |  | |
 |  | |
| Michael Gomez | Ramin Toloui | |
| Portfolio Manager, Emerging Markets Debt | Portfolio Manager, Emerging Markets Debt | |
Top 10 Holdings1
PIMCO EqS® Emerging Markets Fund | 53.7% | |||||
PIMCO Emerging Local Bond Fund | 26.6% | |||||
PIMCO Emerging Markets Bond Fund | 12.4% | |||||
PIMCO Emerging Markets Corporate Bond Fund | 7.1% | |||||
PIMCO Short-Term Floating NAV Portfolio | 0.2% |
| 1 | % of Total Investments as of 12/31/2013. Top Holdings, solely reflect long positions. Securities sold short, financial derivative instruments and short-term instruments are not taken into consideration. |
| SEMIANNUAL REPORT | DECEMBER 31, 2013 | 21 |
Table of Contents
PIMCO Emerging Multi-Asset Fund
| Institutional Class - PEAWX | Class A - PEAAX | |
| Class P - PEAQX | Class C - PEACX | |
| Administrative Class - PEAMX | Class R - PEARX | |
| Class D - PEAEX |
Cumulative Returns Through December 31, 2013
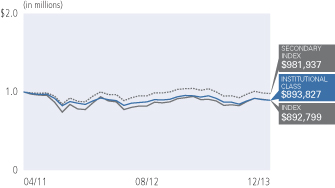
| Average Annual Total Return for the period ended December 31, 2013 | ||||||||||||||
| 6 Months* | 1 Year | Fund Inception (04/12/11) | ||||||||||||
| PIMCO Emerging Multi-Asset Fund Institutional Class | 2.76% | -5.07% | -3.24% | ||||||||||
| PIMCO Emerging Multi-Asset Fund Class P | 2.75% | -5.10% | -3.32% | |||||||||||
| PIMCO Emerging Multi-Asset Fund Administrative Class | 2.67% | -5.30% | -3.48% | |||||||||||
| PIMCO Emerging Multi-Asset Fund Class D | 2.72% | -5.34% | -3.53% | |||||||||||
| PIMCO Emerging Multi-Asset Fund Class A | 2.74% | -5.35% | -3.56% | |||||||||||
| PIMCO Emerging Multi-Asset Fund Class A (adjusted) | -2.91% | -10.56% | -5.54% | |||||||||||
| PIMCO Emerging Multi-Asset Fund Class C | 2.25% | -6.07% | -4.24% | |||||||||||
| PIMCO Emerging Multi-Asset Fund Class C (adjusted) | 1.25% | -7.00% | -4.24% | |||||||||||
| PIMCO Emerging Multi-Asset Fund Class R | 2.64% | -5.47% | -3.75% | |||||||||||
| MSCI Emerging Markets Index (Net Dividends in USD)± | 7.70% | -2.60% | -3.22% | ||||||||||
| 50% MSCI Emerging Markets Index (Net Dividends in USD), 25% JPMorgan Emerging Markets Bond Index (EMBI) Global, 25% JPMorgan Government Bond Index-Emerging Markets Global Diversified Index (Unhedged)±± | 3.76% | -5.17% | 0.09% | ||||||||||
All Fund returns are net of fees and expenses.
* Cumulative return.
± The MSCI Emerging Markets Index (Net Dividends in USD) is a free float-adjusted market capitalization index that is designed to measure equity market performance of emerging markets. It is not possible to invest directly in the index.
±± The benchmark is a blend of 50% MSCI Emerging Markets Index (Net Dividends in USD), 25% JPMorgan Emerging Markets Bond Index (EMBI) Global, 25% JPMorgan Government Bond Index-Emerging Markets Global Diversified Index (Unhedged) . MSCI Emerging Markets Index is a free float-adjusted market capitalization index that is designed to measure equity market performance of emerging markets. JPMorgan Emerging Markets Bond Index (EMBI) Global tracks total returns for United States Dollar denominated debt instruments issued by emerging market sovereign and quasi-sovereign entities: Brady bonds, loans, Eurobonds and local market instruments. JPMorgan Government Bond Index-Emerging Markets Global Diversified Index (Unhedged) is a comprehensive global local emerging markets index, and consists of regularly traded, liquid fixed-rate, domestic currency government bonds to which international investors can gain exposure. It is not possible to invest directly in an unmanaged index.
Performance quoted represents past performance. Past performance is not a guarantee or a reliable indicator of future results. Current performance may be lower or higher than performance shown. Investment return and the principal value of an investment will fluctuate. Shares may be worth more or less than original cost when redeemed. Returns shown do not reflect the deduction of taxes that a shareholder would pay on fund distributions or the redemption of fund shares. The adjusted returns take into account the maximum sales charge of 5.50% on Class A shares and 1.00% CDSC on Class C shares. The Fund’s total annual operating expense ratio as stated in the Fund’s current prospectus, as supplemented to date, is 2.36% for the Institutional Class shares, 2.46% for the Class P shares, 2.61% for the Administrative Class shares, 2.71% for the Class D shares, 2.71% for the Class A shares, 3.46% for the Class C shares and 2.96% for the Class R shares. Details regarding any Fund’s operating expenses can be found in the Fund’s prospectus. For performance current to the most recent month-end, visit www.pimco.com/investments.
Portfolio Insights
| » | The PIMCO Emerging Multi-Asset Fund seeks maximum total return, consistent with prudent investment management, by investing under normal circumstances at least 80% of its assets in investments economically tied to emerging market countries. The Fund will typically invest 20% to 80% of its total assets in equity-related instruments (including investments in common stock, preferred stock, and equity-related Underlying PIMCO Funds or Acquired Funds). The Fund is designed to provide concurrent exposure to a broad spectrum of emerging market asset classes, such as equity, fixed income and currencies, and other investments, including commodities. |
| » | During the reporting period, the Fund’s Institutional Class shares returned 2.76% after fees, while the Fund’s primary benchmark index (MSCI Emerging Markets Index) returned 7.70%, and the Fund’s secondary benchmark index (a blended index consisting of 50% MSCI Emerging Markets Index/25% JPMorgan Government Bond Index-Emerging Markets (GBI-EM) Global Diversified Index (Unhedged)/25% JPMorgan Emerging Markets Bond Index (EMBI) Global) returned 3.76%. |
| » | The relative performance of the PIMCO EqS® Emerging Markets Fund detracted from relative performance as this Underlying PIMCO Fund underperformed its respective primary benchmark, the MSCI Emerging Markets Index, over the reporting period. |
| » | An asset allocation decision to overweight emerging markets (“EM”) local debt throughout the reporting period detracted from relative performance as the JPMorgan Government Bond Index-Emerging Markets (GBI-EM) Global Diversified Index (Unhedged) underperformed the Fund’s secondary benchmark index over the reporting period. |
| » | An asset allocation decision to overweight EM equities throughout the reporting period contributed to relative performance as the MSCI Emerging Markets Index outperformed the Fund’s secondary benchmark index over the reporting period. |
| » | An asset allocation decision to underweight external EM debt positively contributed to relative performance as the asset class, as represented by the JPMorgan Emerging Markets Bond Index (EMBI) Global, lagged the Fund’s secondary benchmark index during the reporting period. |
| 22 | PIMCO EQUITY SERIES |
Table of Contents
Insights from the Portfolio Managers PIMCO EqS Pathfinder Fund®
Dear Shareholder,
It is our pleasure to be speaking with you as we finish the second half of 2013 and we thank you for your investment in the PIMCO EqS Pathfinder Fund® (the “Fund”). Our commitment continues to be to seek an attractive absolute return that beats the market over a full market cycle and to do so with less volatility than the overall market. We have organized our thoughts below to provide you with a review of the equity market over the past six months, the Fund itself, and our outlook for 2014.
The Last Six Months in Review
After the equity market retreat late in the second quarter of 2013 due to concerns about U.S. Federal Reserve (“Fed”) Chairman Bernanke’s comments regarding the potential for Fed “tapering” of its bond buying program, equity markets rebounded strongly in the second half of 2013. Most developed markets posted strong gains for the second half of the year, with the MSCI World Index returning 16.83%.
If earnings for the fourth quarter of 2013 come in close to Analysts’ estimates, we believe the earnings growth for the entire year will be approximately 5.5% to 6.0% for the companies in the index. Very much like the previous six months and the previous calendar year 2012, most of the increase in the price of the index will have been driven by Price/Earnings (“PE”) multiple expansion for the second half of 2013 and indeed for the entire year. Very accommodative developed market central banks increased corporate stock buybacks assisted by corporate cash (which is at elevated levels last seen in the 1960s), relatively benign inflation, and attractive earnings and dividend yields on stocks versus other asset classes, continued to provide support for equity market investors. Although the Fund posted a good absolute return over the reporting period, capturing approximately 86% of the market’s return, it lagged the overall broad equity market index (as represented by the MSCI World Index) during the multiple-expansion led equity market rally.
Pathfinder Fund
After the Bernanke-induced market retreat late in the second quarter of 2013, we opportunistically increased our equity investments as prices became attractive, in our view. We initiated positions in Japanese companies such as leading automotive company Toyota Motor, industrial manufacturer Komatsu, consumer products manufacturer and distributor Kao, and U.S.-based dominant securities services company Brink’s. Later in the year, we also initiated positions in the world’s largest VLGC (very large gas carrier), BW LPG, leading enterprise software provider, Oracle, London-based global bank, Barclays, and IBM. Some of our notable performers in the Fund during the reporting period included Logitech International, ING, and Carrefour.
Logitech sells computer peripheral products such as computer mice, keyboards, audio and gaming devices. With 70% of its sales still coming from PC peripherals, Logitech benefited from less pressure in the near term in the core PC segment. The turnaround implemented by the new management team is starting to materialize with the successful launch of new products such as the iPhone game controller.
ING performed well in the second half of the year, advancing off a low valuation level, as the company continued to progress toward splitting and selling off businesses, and separating them from the bank. Furthermore, the value of the bank and other businesses increased from an improved environment for credit and housing in ING’s home market.
Carrefour’s restructuring plan is starting to bear fruit, for the first time in several years, with a recovery in foot traffic, an expansion of the earnings before interest and tax (“EBIT”) margin in its French operations, and some welcome market share gains. Although the improvement was impressive in 2013, we believe more is expected as Carrefour is beginning to simplify the complex logistics of its supply chain and improve its inventory management. Carrefour’s terms with suppliers should improve materially in 2014, in our view, as the result of the combination of better sales momentum and a new and very competent procurement team.
We also had a few stocks in the Fund which did not perform as we expected. Danone, American Capital Agency Corp., and AngloGold Ashanti were three of those holdings that detracted from performance.
Danone, a long-held position in the Fund, and world leading dairy, yogurt, baby, and nutrition manufacturer, was impacted by a precautionary product recall in its infant milk business in Australasia. After investigation, the product recall proved to be unfounded as no contaminated product was used by Danone. Although we think the long-term brand equity is unlikely to be affected, previous examples of product recalls demonstrates that it often takes between six to twelve months for previous sales growth to return to normal after such an incident.
American Capital Agency Corp., a real estate investment trust which invests in Agency securities and mortgage obligations, suffered in the second half of 2013 due to the recent increase in interest rates and pressure on their book value.
AngloGold Ashanti, a South African gold producer, declined alongside the general retreat in the price of gold, as some investors decreased their exposure to gold and other precious metals ahead of a potential Fed tapering.
| SEMIANNUAL REPORT | DECEMBER 31, 2013 | 23 |
Table of Contents
Insights from the Portfolio Managers PIMCO EqS Pathfinder Fund® (Cont.)
Looking Forward
The equity market advance over the six-month reporting period has largely been driven by PE multiple expansion, and some are now postulating that the market as a whole is fairly valued. Ours is not to quibble with others’ views of the market, as we do not invest in markets per se. We invest in individual businesses, when it is appropriate to do so, and only when these businesses meet our investment criteria. That is our investment discipline. We are continuing to find a number of new attractive investments, as noted in the third paragraph in this letter, and we are fully invested today with a full pipeline of ideas percolating in the background.
We would also be remiss if we didn’t remind our readers that assessing downside risk is equally as important to us as is estimating the upside potential in each and every one of our investments. It is our intent to deliver to you a portfolio which offers less volatility on the downside than the overall equity market. In addition, we know that preserving assets in the short-term leads to the more attractive compounding of returns over the long term.
To close our letter, we repeat our thanks for investing with us in the PIMCO EqS Pathfinder Fund®. We maintain our value-driven discipline, seeking the twin goals of capital appreciation and downside risk mitigation. We are privileged to have the opportunity to manage your capital, and we look forward to the challenges and the opportunities in the months and years ahead.
Sincerely,
 |
 |
Anne Gudefin, CFA Portfolio Manager |
Top 10 Holdings1
Imperial Tobacco Group PLC | 3.1% | |||||
British American Tobacco PLC | 3.0% | |||||
Microsoft Corp. | 2.9% | |||||
Intel Corp. | 2.8% | |||||
Danone | 2.8% | |||||
AIA Group Ltd. | 2.8% | |||||
Marine Harvest ASA | 2.7% | |||||
Berkshire Hathaway, Inc. ‘B’ | 2.5% | |||||
Carrefour S.A. | 2.4% | |||||
Seadrill Ltd. | 2.3% |
Geographic Breakdown1
United States | 34.6% | |||||
United Kingdom | 12.0% | |||||
France | 9.7% | |||||
Switzerland | 5.9% | |||||
Netherlands | 5.3% | |||||
Japan | 4.6% | |||||
Hong Kong | 4.2% | |||||
Norway | 3.5% | |||||
Bermuda | 3.3% | |||||
Germany | 2.4% | |||||
Denmark | 2.1% | |||||
Other | 6.5% |
Sector Breakdown1
Consumer Staples | 28.5% | |||||
Financials | 18.8% | |||||
Information Technology | 11.9% | |||||
Energy | 11.6% | |||||
Industrials | 11.2% | |||||
Health Care | 5.7% | |||||
Consumer Discretionary | 3.8% | |||||
Other | 2.6% |
| 1 | % of Total Investments as of 12/31/2013. Top Holdings, Geographic and Sector Breakdown solely reflect long positions. Securities sold short, financial derivative instruments and short-term instruments are not taken into consideration. |
| 24 | PIMCO EQUITY SERIES |
Table of Contents
| Institutional Class - PTHWX | Class A - PATHX | |
| Class P - PTHPX | Class C - PTHCX | |
| Class D - PTHDX | Class R - PTHRX |
Cumulative Returns Through December 31, 2013
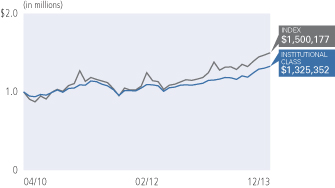
| Average Annual Total Return for the period ended December 31, 2013 | ||||||||||||||
| 6 Months* | 1 Year | Fund Inception (04/14/10) | ||||||||||||
| PIMCO EqS Pathfinder Fund® Institutional Class | 14.48% | 19.45% | 7.38% | ||||||||||
| PIMCO EqS Pathfinder Fund® Class P | 14.35% | 19.32% | 7.26% | |||||||||||
| PIMCO EqS Pathfinder Fund® Class D | 14.19% | 19.07% | 6.97% | |||||||||||
| PIMCO EqS Pathfinder Fund® Class A | 14.25% | 19.11% | 7.00% | |||||||||||
| PIMCO EqS Pathfinder Fund® Class A (adjusted) | 7.97% | 12.56% | 5.38% | |||||||||||
| PIMCO EqS Pathfinder Fund® Class C | 13.90% | 18.25% | 6.24% | |||||||||||
| PIMCO EqS Pathfinder Fund® Class C (adjusted) | 12.90% | 17.25% | 6.24% | |||||||||||
| PIMCO EqS Pathfinder Fund® Class R | 14.12% | 18.69% | 6.65% | |||||||||||
| MSCI World Index± | 16.83% | 26.68% | 10.56% | ||||||||||
All Fund returns are net of fees and expenses.
* Cumulative return.
± The MSCI World Index is a free float-adjusted market capitalization weighted index that is designed to measure the equity market performance of developed markets. The MSCI World Index consists of 24 developed market country indices. It is not possible to invest directly in an unmanaged index.
Performance quoted represents past performance. Past performance is not a guarantee or a reliable indicator of future results. Current performance may be lower or higher than performance shown. Investment return and the principal value of an investment will fluctuate. Shares may be worth more or less than original cost when redeemed. Returns shown do not reflect the deduction of taxes that a shareholder would pay on fund distributions or the redemption of fund shares. The adjusted returns take into account the maximum sales charge of 5.50% on Class A shares and 1.00% CDSC on Class C shares. The Fund’s total annual operating expense ratio as stated in the Fund’s current prospectus, as supplemented to date, is 1.08% for the Institutional Class shares, 1.18% for the Class P shares, 1.43% for the Class D shares, 1.43% for the Class A shares, 2.18% for the Class C shares and 1.68% for the Class R shares. Details regarding any Fund’s operating expenses can be found in the Fund’s prospectus. For performance current to the most recent month-end, visit www.pimco.com/investments.
Portfolio Insights
| » | The PIMCO EqS Pathfinder Fund® seeks capital appreciation by investing under normal circumstances in equity securities, including common and preferred stock (and securities convertible into, or that PIMCO expects to be exchanged for, common or preferred stock), of issuers that PIMCO believes are undervalued. The Fund’s bottom-up value investment style attempts to identify securities that are undervalued by the market in comparison to PIMCO’s own determination of the company’s value, taking into account criteria such as asset value, book value, cash flow and earnings estimates. |
| » | During the reporting period, the Fund’s Institutional Class shares returned 14.48% after fees, and the Fund’s benchmark index, the MSCI World Index, returned 16.83%. |
| » | An overweight to and security selection in the consumer staples sector was a significant detractor from returns, as was an underweight to and security selection in the consumer discretionary sector. In addition, the Fund’s modest cash holding also detracted from returns. However, security selection in the financials and utilities sectors benefited returns relative to the Fund’s benchmark index. |
| » | Holdings in Logitech, ING Groep, and Veolia Environnement benefited performance as prices on these securities appreciated during the reporting period. |
| » | Holdings in Danone, British American Tobacco, and Imperial Tobacco Group detracted from returns as prices on these securities declined or failed to keep pace with the broader equity market during the reporting period. |
| » | At the end of the reporting period, the Fund held approximately 99% in equities we believe are undervalued, approximately 1% (on the long side only) in merger arbitrage investments, and held the balance of the portfolio in cash and currency hedges. |
| SEMIANNUAL REPORT | DECEMBER 31, 2013 | 25 |
Table of Contents
Example
As a shareholder of a Fund, you incur two types of costs: (1) transaction costs, including sales charges (loads) on purchase payments and exchange fees and (2) ongoing costs, including management fees, distribution and/or service (12b-1) fees, and other Fund expenses. The Example is intended to help you understand your ongoing costs (in dollars) of investing in a Fund and to compare these costs with the ongoing costs of investing in other mutual funds.
The Example is based on an investment of $1,000 invested at the beginning of the period and held for the entire period indicated, which for all Funds and share classes is from July 1, 2013 to December 31, 2013 unless noted otherwise in the table and footnotes below.
Actual Expenses
The information in the table under the heading “Actual” provides information about actual account values and actual expenses. You may use the information in these columns, together with the amount you invested, to estimate the expenses that you paid over the period. Simply divide your account value by $1,000 (for example, an $8,600 account value divided by $1,000 = $8.60), then multiply the result by the number in the appropriate column for your share class, in the column entitled “Expenses Paid During Period” to estimate the expenses you paid on your account during this period.
Hypothetical Example for Comparison Purposes
The information in the table under the heading “Hypothetical (5% return before expenses)” provides information about hypothetical account values and hypothetical expenses based on a Fund’s actual expense ratio and an assumed rate of return of 5% per year before expenses, which is not the Fund’s actual return. The hypothetical account values and expenses may not be used to estimate the actual ending account balance or expenses you paid for the period. You may use this information to compare the ongoing costs of investing in a Fund and other funds. To do so, compare this 5% hypothetical example with the 5% hypothetical examples that appear in the shareholder reports of the other funds.
Please note that the expenses shown in the table are meant to highlight your ongoing costs only and do not reflect any transactional costs, such as sales charges (loads) on purchase payments and exchange fees. Therefore, the information under the heading “Hypothetical (5% return before expenses)” is useful in comparing ongoing costs only, and will not help you determine the relative total costs of owning different funds. In addition, if these transactional costs were included, your costs would have been higher.
Expense ratios may vary from period to period because of various factors such as an increase in expenses that are not covered by the management fees, such as fees and expenses of the independent trustees and their counsel, extraordinary expenses and interest expense.
| Actual | Hypothetical (5% return before expenses) | |||||||||||||||||||||||||||||||||
| Beginning Account Value (07/01/13) | Ending Account Value (12/31/13) | Expenses Paid During Period* | Beginning Account Value (07/01/13) | Ending Account Value (12/31/13) | Expenses Paid During Period* | Net Annualized Expense Ratio** | ||||||||||||||||||||||||||||
PIMCO Dividend and Income Builder Fund | ||||||||||||||||||||||||||||||||||
| Institutional Class | $ | 1,000.00 | $ | 1,108.80 | $ | 4.46 | $ | 1,000.00 | $ | 1,020.97 | $ | 4.28 | 0.84 | % | ||||||||||||||||||||
| Class P | 1,000.00 | 1,108.10 | 4.99 | 1,000.00 | 1,020.47 | 4.79 | 0.94 | |||||||||||||||||||||||||||
| Class D | 1,000.00 | 1,106.90 | 6.32 | 1,000.00 | 1,019.21 | 6.06 | 1.19 | |||||||||||||||||||||||||||
| Class A | 1,000.00 | 1,106.90 | 6.32 | 1,000.00 | 1,019.21 | 6.06 | 1.19 | |||||||||||||||||||||||||||
| Class C | 1,000.00 | 1,102.10 | 10.28 | 1,000.00 | 1,015.43 | 9.86 | 1.94 | |||||||||||||||||||||||||||
| Class R | 1,000.00 | 1,105.50 | 7.64 | 1,000.00 | 1,017.95 | 7.32 | 1.44 | |||||||||||||||||||||||||||
PIMCO EqS® Dividend Fund | ||||||||||||||||||||||||||||||||||
| Institutional Class | $ | 1,000.00 | $ | 1,112.10 | $ | 4.47 | $ | 1,000.00 | $ | 1,020.97 | $ | 4.28 | 0.84 | % | ||||||||||||||||||||
| Class P | 1,000.00 | 1,111.50 | 5.00 | 1,000.00 | 1,020.47 | 4.79 | 0.94 | |||||||||||||||||||||||||||
| Class D | 1,000.00 | 1,111.00 | 6.33 | 1,000.00 | 1,019.21 | 6.06 | 1.19 | |||||||||||||||||||||||||||
| Class A | 1,000.00 | 1,110.10 | 6.33 | 1,000.00 | 1,019.21 | 6.06 | 1.19 | |||||||||||||||||||||||||||
| Class C | 1,000.00 | 1,106.40 | 10.30 | 1,000.00 | 1,015.43 | 9.86 | 1.94 | |||||||||||||||||||||||||||
| Class R | 1,000.00 | 1,108.80 | 7.65 | 1,000.00 | 1,017.95 | 7.32 | 1.44 | |||||||||||||||||||||||||||
| 26 | PIMCO EQUITY SERIES |
Table of Contents
(Unaudited)
| Actual | Hypothetical (5% return before expenses) | |||||||||||||||||||||||||||||||||
| Beginning Account Value (07/01/13) | Ending Account Value (12/31/13) | Expenses Paid During Period* | Beginning Account Value (07/01/13) | Ending Account Value (12/31/13) | Expenses Paid During Period* | Net Annualized Expense Ratio** | ||||||||||||||||||||||||||||
PIMCO EqS® Emerging Markets Fund | ||||||||||||||||||||||||||||||||||
| Institutional Class | $ | 1,000.00 | $ | 1,065.40 | $ | 6.56 | $ | 1,000.00 | $ | 1,018.85 | $ | 6.41 | 1.26 | % | ||||||||||||||||||||
| Class P | 1,000.00 | 1,066.70 | 7.08 | 1,000.00 | 1,018.35 | 6.92 | 1.36 | |||||||||||||||||||||||||||
| Administrative Class | 1,000.00 | 1,064.40 | 7.86 | 1,000.00 | 1,017.59 | 7.68 | 1.51 | |||||||||||||||||||||||||||
| Class D | 1,000.00 | 1,064.60 | 8.38 | 1,000.00 | 1,017.09 | 8.19 | 1.61 | |||||||||||||||||||||||||||
| Class A | 1,000.00 | 1,064.60 | 8.38 | 1,000.00 | 1,017.09 | 8.19 | 1.61 | |||||||||||||||||||||||||||
| Class C | 1,000.00 | 1,059.20 | 12.25 | 1,000.00 | 1,013.31 | 11.98 | 2.36 | |||||||||||||||||||||||||||
| Class R | 1,000.00 | 1,062.30 | 9.67 | 1,000.00 | 1,015.83 | 9.45 | 1.86 | |||||||||||||||||||||||||||
PIMCO EqS® Long/Short Fund | ||||||||||||||||||||||||||||||||||
| Institutional Class | $ | 1,000.00 | $ | 1,137.80 | $ | 11.69 | $ | 1,000.00 | $ | 1,014.27 | $ | 11.02 | 2.17 | % | ||||||||||||||||||||
| Class P | 1,000.00 | 1,136.90 | 11.53 | 1,000.00 | 1,014.42 | 10.87 | 2.14 | |||||||||||||||||||||||||||
| Class D | 1,000.00 | 1,135.10 | 12.92 | 1,000.00 | 1,013.11 | 12.18 | 2.40 | |||||||||||||||||||||||||||
| Class A | 1,000.00 | 1,135.50 | 13.03 | 1,000.00 | 1,013.01 | 12.28 | 2.42 | |||||||||||||||||||||||||||
| Class C | 1,000.00 | 1,131.30 | 16.76 | 1,000.00 | 1,009.48 | 15.80 | 3.12 | |||||||||||||||||||||||||||
PIMCO Emerging Multi-Asset Fund | �� | |||||||||||||||||||||||||||||||||
| Institutional Class | $ | 1,000.00 | $ | 1,027.60 | $ | 1.43 | $ | 1,000.00 | $ | 1,023.79 | $ | 1.43 | 0.28 | % | ||||||||||||||||||||
| Class P | 1,000.00 | 1,027.50 | 1.94 | 1,000.00 | 1,023.29 | 1.94 | 0.38 | |||||||||||||||||||||||||||
| Administrative Class | 1,000.00 | 1,026.70 | 2.71 | 1,000.00 | 1,022.53 | 2.70 | 0.53 | |||||||||||||||||||||||||||
| Class D | 1,000.00 | 1,027.20 | 3.22 | 1,000.00 | 1,022.03 | 3.21 | 0.63 | |||||||||||||||||||||||||||
| Class A | 1,000.00 | 1,027.40 | 3.22 | 1,000.00 | 1,022.03 | 3.21 | 0.63 | |||||||||||||||||||||||||||
| Class C | 1,000.00 | 1,022.50 | 7.04 | 1,000.00 | 1,018.25 | 7.02 | 1.38 | |||||||||||||||||||||||||||
| Class R | 1,000.00 | 1,026.40 | 4.49 | 1,000.00 | 1,020.77 | 4.48 | 0.88 | |||||||||||||||||||||||||||
PIMCO EqS Pathfinder Fund® | ||||||||||||||||||||||||||||||||||
| Institutional Class | $ | 1,000.00 | $ | 1,144.80 | $ | 4.87 | $ | 1,000.00 | $ | 1,020.67 | $ | 4.58 | 0.90 | % | ||||||||||||||||||||
| Class P | 1,000.00 | 1,143.50 | 5.40 | 1,000.00 | 1,020.16 | 5.09 | 1.00 | |||||||||||||||||||||||||||
| Class D | 1,000.00 | 1,141.90 | 6.75 | 1,000.00 | 1,018.90 | 6.36 | 1.25 | |||||||||||||||||||||||||||
| Class A | 1,000.00 | 1,142.50 | 6.75 | 1,000.00 | 1,018.90 | 6.36 | 1.25 | |||||||||||||||||||||||||||
| Class C | 1,000.00 | 1,139.00 | 10.78 | 1,000.00 | 1,015.12 | 10.16 | 2.00 | |||||||||||||||||||||||||||
| Class R | 1,000.00 | 1,141.20 | 8.10 | 1,000.00 | 1,017.64 | 7.63 | 1.50 | |||||||||||||||||||||||||||
* Expenses Paid During Period are equal to the net annualized expense ratio for the Fund, multiplied by the average account value over the period, multiplied by 184/365 (to reflect the one-half year period).
** The Net Annualized Expense Ratio is reflective of any applicable waivers related to contractual agreements for contractual fee waivers or voluntary fee waivers. Details regarding fee waivers can be found in note 9 in the Notes to Financial Statements.
| SEMIANNUAL REPORT | DECEMBER 31, 2013 | 27 |
Table of Contents
| Selected Per Share Data for the Year or Period Ended: | Beginning of Year or | Net Investment Income (Loss) (a) | Net Realized/ Unrealized Gain (Loss) | Total Income from Investment Operations | Dividends from Net Investment Income | Distributions from Net Realized Capital Gains | Total Distributions | |||||||||||||||||||||
PIMCO Dividend and Income Builder Fund | ||||||||||||||||||||||||||||
| Institutional Class | ||||||||||||||||||||||||||||
07/01/2013 - 12/31/2013 | $ | 11.60 | $ | 0.16 | $ | 1.10 | $ | 1.26 | $ | (0.20 | ) | $ | 0.00 | $ | (0.20 | ) | ||||||||||||
06/30/2013 | 10.47 | 0.54 | 1.03 | 1.57 | (0.42 | ) | (0.02 | ) | (0.44 | ) | ||||||||||||||||||
12/14/2011 - 06/30/2012 | 10.00 | 0.25 | 0.47 | 0.72 | (0.25 | ) | 0.00 | (0.25 | ) | |||||||||||||||||||
| Class P | ||||||||||||||||||||||||||||
07/01/2013 - 12/31/2013 | 11.62 | 0.15 | 1.10 | 1.25 | (0.19 | ) | 0.00 | (0.19 | ) | |||||||||||||||||||
06/30/2013 | 10.48 | 0.54 | 1.03 | 1.57 | (0.41 | ) | (0.02 | ) | (0.43 | ) | ||||||||||||||||||
12/14/2011 - 06/30/2012 | 10.00 | 0.30 | 0.42 | 0.72 | (0.24 | ) | 0.00 | (0.24 | ) | |||||||||||||||||||
| Class D | ||||||||||||||||||||||||||||
07/01/2013 - 12/31/2013 | 11.61 | 0.14 | 1.10 | 1.24 | (0.18 | ) | 0.00 | (0.18 | ) | |||||||||||||||||||
06/30/2013 | 10.47 | 0.46 | 1.09 | 1.55 | (0.39 | ) | (0.02 | ) | (0.41 | ) | ||||||||||||||||||
12/14/2011 - 06/30/2012 | 10.00 | 0.26 | 0.44 | 0.70 | (0.23 | ) | 0.00 | (0.23 | ) | |||||||||||||||||||
| Class A | ||||||||||||||||||||||||||||
07/01/2013 - 12/31/2013 | 11.61 | 0.14 | 1.10 | 1.24 | (0.18 | ) | 0.00 | (0.18 | ) | |||||||||||||||||||
06/30/2013 | 10.47 | 0.48 | 1.07 | 1.55 | (0.39 | ) | (0.02 | ) | (0.41 | ) | ||||||||||||||||||
12/14/2011 - 06/30/2012 | 10.00 | 0.26 | 0.44 | 0.70 | (0.23 | ) | 0.00 | (0.23 | ) | |||||||||||||||||||
| Class C | ||||||||||||||||||||||||||||
07/01/2013 - 12/31/2013 | 11.59 | 0.09 | 1.09 | 1.18 | (0.13 | ) | 0.00 | (0.13 | ) | |||||||||||||||||||
06/30/2013 | 10.46 | 0.40 | 1.06 | 1.46 | (0.31 | ) | (0.02 | ) | (0.33 | ) | ||||||||||||||||||
12/14/2011 - 06/30/2012 | 10.00 | 0.24 | 0.41 | 0.65 | (0.19 | ) | 0.00 | (0.19 | ) | |||||||||||||||||||
| Class R | ||||||||||||||||||||||||||||
07/01/2013 - 12/31/2013 | 11.61 | 0.12 | 1.10 | 1.22 | (0.16 | ) | 0.00 | (0.16 | ) | |||||||||||||||||||
06/30/2013 | 10.47 | 0.36 | 1.16 | 1.52 | (0.36 | ) | (0.02 | ) | (0.38 | ) | ||||||||||||||||||
12/14/2011 - 06/30/2012 | 10.00 | 0.25 | 0.43 | 0.68 | (0.21 | ) | 0.00 | (0.21 | ) | |||||||||||||||||||
PIMCO EqS® Dividend Fund | ||||||||||||||||||||||||||||
| Institutional Class | ||||||||||||||||||||||||||||
07/01/2013 - 12/31/2013 | $ | 11.87 | $ | 0.16 | $ | 1.14 | $ | 1.30 | $ | (0.26 | ) | $ | (0.62 | ) | $ | (0.88 | ) | |||||||||||
06/30/2013 | 10.47 | 0.43 | 1.37 | 1.80 | (0.37 | ) | (0.03 | ) | (0.40 | ) | ||||||||||||||||||
12/14/2011 - 06/30/2012 | 10.00 | 0.28 | 0.42 | 0.70 | (0.23 | ) | 0.00 | (0.23 | ) | |||||||||||||||||||
| Class P | ||||||||||||||||||||||||||||
07/01/2013 - 12/31/2013 | 11.88 | 0.15 | 1.14 | 1.29 | (0.25 | ) | (0.62 | ) | (0.87 | ) | ||||||||||||||||||
06/30/2013 | 10.48 | 0.47 | 1.32 | 1.79 | (0.36 | ) | (0.03 | ) | (0.39 | ) | ||||||||||||||||||
12/14/2011 - 06/30/2012 | 10.00 | 0.29 | 0.41 | 0.70 | (0.22 | ) | 0.00 | (0.22 | ) | |||||||||||||||||||
| Class D | ||||||||||||||||||||||||||||
07/01/2013 - 12/31/2013 | 11.87 | 0.13 | 1.16 | 1.29 | (0.24 | ) | (0.62 | ) | (0.86 | ) | ||||||||||||||||||
06/30/2013 | 10.48 | 0.40 | 1.36 | 1.76 | (0.34 | ) | (0.03 | ) | (0.37 | ) | ||||||||||||||||||
12/14/2011 - 06/30/2012 | 10.00 | 0.30 | 0.39 | 0.69 | (0.21 | ) | 0.00 | (0.21 | ) | |||||||||||||||||||
| Class A | ||||||||||||||||||||||||||||
07/01/2013 - 12/31/2013 | 11.88 | 0.13 | 1.15 | 1.28 | (0.24 | ) | (0.62 | ) | (0.86 | ) | ||||||||||||||||||
06/30/2013 | 10.48 | 0.42 | 1.35 | 1.77 | (0.34 | ) | (0.03 | ) | (0.37 | ) | ||||||||||||||||||
12/14/2011 - 06/30/2012 | 10.00 | 0.27 | 0.42 | 0.69 | (0.21 | ) | 0.00 | (0.21 | ) | |||||||||||||||||||
| Class C | ||||||||||||||||||||||||||||
07/01/2013 - 12/31/2013 | 11.84 | 0.09 | 1.14 | 1.23 | (0.19 | ) | (0.62 | ) | (0.81 | ) | ||||||||||||||||||
06/30/2013 | 10.45 | 0.36 | 1.32 | 1.68 | (0.26 | ) | (0.03 | ) | (0.29 | ) | ||||||||||||||||||
12/14/2011 - 06/30/2012 | 10.00 | 0.23 | 0.39 | 0.62 | (0.17 | ) | 0.00 | (0.17 | ) | |||||||||||||||||||
| Class R | ||||||||||||||||||||||||||||
07/01/2013 - 12/31/2013 | 11.87 | 0.12 | 1.14 | 1.26 | (0.22 | ) | (0.62 | ) | (0.84 | ) | ||||||||||||||||||
06/30/2013 | 10.47 | 0.36 | 1.38 | 1.74 | (0.31 | ) | (0.03 | ) | (0.34 | ) | ||||||||||||||||||
12/14/2011 - 06/30/2012 | 10.00 | 0.18 | 0.48 | 0.66 | (0.19 | ) | 0.00 | (0.19 | ) | |||||||||||||||||||
PIMCO EqS® Emerging Markets Fund | ||||||||||||||||||||||||||||
| Institutional Class | ||||||||||||||||||||||||||||
07/01/2013 - 12/31/2013 | $ | 8.26 | $ | (0.01 | ) | $ | 0.55 | $ | 0.54 | $ | 0.00 | $ | 0.00 | $ | 0.00 | |||||||||||||
06/30/2013 | 7.97 | 0.13 | 0.25 | 0.38 | (0.09 | ) | 0.00 | (0.09 | ) | |||||||||||||||||||
06/30/2012 | 10.19 | 0.08 | (2.27 | ) | (2.19 | ) | (0.02 | ) | (0.01 | ) | (0.03 | ) | ||||||||||||||||
03/22/2011 - 06/30/2011 | 10.00 | 0.05 | 0.14 | 0.19 | 0.00 | 0.00 | 0.00 | |||||||||||||||||||||
Please see footnotes on page 34.
| 28 | PIMCO EQUITY SERIES | See Accompanying Notes |
Table of Contents
(Unaudited)
| Net Asset Value End of Year or Period | Total Return | Net Assets End of Year or Period (000s) | Ratio of Expenses to Average Net Assets | Ratio of Expenses to Average Net Assets Excluding Waivers | Ratio of Expenses to Average Net Assets Excluding Interest Expense and Dividends on Securities Sold Short | Ratio of Expenses to Average Net Assets Excluding Interest Expense and Dividends on Securities Sold Short and Waivers | Ratio of Net Investment Income (Loss) to Average Net Assets | Portfolio Turnover Rate** | ||||||||||||||||||||||||||
| $ | 12.66 | 10.88 | % | $ | 86,941 | 0.84 | %* | 1.00 | %* | 0.84 | %* | 1.00 | %* | 2.55 | %* | 32 | % | |||||||||||||||||
| 11.60 | 15.17 | 69,203 | 0.83 | 1.00 | 0.83 | 1.00 | 4.66 | 75 | ||||||||||||||||||||||||||
| 10.47 | 7.17 | 11,170 | 0.83 | * | 1.57 | * | 0.83 | * | 1.57 | * | 4.35 | * | 28 | |||||||||||||||||||||
| 12.68 | 10.81 | 134,272 | 0.94 | * | 1.10 | * | 0.94 | * | 1.10 | * | 2.48 | * | 32 | |||||||||||||||||||||
| 11.62 | 15.15 | 85,724 | 0.93 | 1.10 | 0.93 | 1.10 | 4.62 | 75 | ||||||||||||||||||||||||||
| 10.48 | 7.21 | 8,207 | 0.93 | * | 2.47 | * | 0.93 | * | 2.47 | * | 5.28 | * | 28 | |||||||||||||||||||||
| 12.67 | 10.69 | 34,185 | 1.19 | * | 1.35 | * | 1.19 | * | 1.35 | * | 2.22 | * | 32 | |||||||||||||||||||||
| 11.61 | 14.91 | 23,204 | 1.18 | 1.35 | 1.18 | 1.35 | 4.00 | 75 | ||||||||||||||||||||||||||
| 10.47 | 6.98 | 2,306 | 1.18 | * | 2.26 | * | 1.18 | * | 2.26 | * | 4.52 | * | 28 | |||||||||||||||||||||
| 12.67 | 10.69 | 281,654 | 1.19 | * | 1.35 | * | 1.19 | * | 1.35 | * | 2.23 | * | 32 | |||||||||||||||||||||
| 11.61 | 14.91 | 117,579 | 1.18 | 1.35 | 1.18 | 1.35 | 4.18 | 75 | ||||||||||||||||||||||||||
| 10.47 | 6.98 | 13,314 | 1.18 | * | 2.43 | * | 1.18 | * | 2.43 | * | 4.62 | * | 28 | |||||||||||||||||||||
| 12.64 | 10.21 | 291,833 | 1.94 | * | 2.10 | * | 1.94 | * | 2.10 | * | 1.49 | * | 32 | |||||||||||||||||||||
| 11.59 | 14.08 | 86,879 | 1.93 | 2.10 | 1.93 | 2.10 | 3.42 | 75 | ||||||||||||||||||||||||||
| 10.46 | 6.46 | 8,000 | 1.93 | * | 3.46 | * | 1.93 | * | 3.46 | * | 4.27 | * | 28 | |||||||||||||||||||||
| 12.67 | 10.55 | 405 | 1.44 | * | 1.60 | * | 1.44 | * | 1.60 | * | 1.93 | * | 32 | |||||||||||||||||||||
| 11.61 | 14.66 | 217 | 1.43 | 1.60 | 1.43 | 1.60 | 3.24 | 75 | ||||||||||||||||||||||||||
| 10.47 | 6.84 | 415 | 1.43 | * | 2.32 | * | 1.43 | * | 2.32 | * | 4.30 | * | 28 | |||||||||||||||||||||
| $ | 12.29 | 11.21 | % | $ | 495,083 | 0.84 | %* | 1.00 | %* | 0.84 | %* | 1.00 | %* | 2.51 | %* | 48 | % | |||||||||||||||||
| 11.87 | 17.32 | 579,198 | 0.83 | 1.00 | 0.83 | 1.00 | 3.74 | 108 | ||||||||||||||||||||||||||
| 10.47 | 6.95 | 315,513 | 0.83 | * | 1.20 | * | 0.83 | * | 1.20 | * | 4.98 | * | 21 | |||||||||||||||||||||
| 12.30 | 11.15 | 4,200 | 0.94 | * | 1.10 | * | 0.94 | * | 1.10 | * | 2.37 | * | 48 | |||||||||||||||||||||
| 11.88 | 17.21 | 1,435 | 0.93 | 1.10 | 0.93 | 1.10 | 3.98 | 108 | ||||||||||||||||||||||||||
| 10.48 | 7.00 | 71 | 0.93 | * | 1.33 | * | 0.93 | * | 1.33 | * | 5.11 | * | 21 | |||||||||||||||||||||
| 12.30 | 11.10 | 11,177 | 1.19 | * | 1.35 | * | 1.19 | * | 1.35 | * | 2.15 | * | 48 | |||||||||||||||||||||
| 11.87 | 16.85 | 7,801 | 1.18 | 1.35 | 1.18 | 1.35 | 3.41 | 108 | ||||||||||||||||||||||||||
| 10.48 | 6.86 | 1,251 | 1.18 | * | 1.67 | * | 1.18 | * | 1.67 | * | 5.25 | * | 21 | |||||||||||||||||||||
| 12.30 | 11.01 | 59,493 | 1.19 | * | 1.35 | * | 1.19 | * | 1.35 | * | 2.13 | * | 48 | |||||||||||||||||||||
| 11.88 | 16.95 | 27,729 | 1.18 | 1.35 | 1.18 | 1.35 | 3.63 | 108 | ||||||||||||||||||||||||||
| 10.48 | 6.86 | 2,529 | 1.18 | * | 1.51 | * | 1.18 | * | 1.51 | * | 4.74 | * | 21 | |||||||||||||||||||||
| 12.26 | 10.64 | 38,266 | 1.94 | * | 2.10 | * | 1.94 | * | 2.10 | * | 1.39 | * | 48 | |||||||||||||||||||||
| 11.84 | 16.14 | 14,150 | 1.93 | 2.10 | 1.93 | 2.10 | 3.05 | 108 | ||||||||||||||||||||||||||
| 10.45 | 6.19 | 1,275 | 1.93 | * | 2.26 | * | 1.93 | * | 2.26 | * | 4.11 | * | 21 | |||||||||||||||||||||
| 12.29 | 10.88 | 111 | 1.44 | * | 1.60 | * | 1.44 | * | 1.60 | * | 1.89 | * | 48 | |||||||||||||||||||||
| 11.87 | 16.71 | 100 | 1.43 | 1.60 | 1.43 | 1.60 | 3.05 | 108 | ||||||||||||||||||||||||||
| 10.47 | 6.63 | 11 | 1.43 | * | 1.67 | * | 1.43 | * | 1.67 | * | 3.24 | * | 21 | |||||||||||||||||||||
| $ | 8.80 | 6.54 | % | $ | 419,603 | 1.26 | %* | 1.46 | %* | 1.26 | %* | 1.46 | %* | (0.18 | )%* | 31 | % | |||||||||||||||||
| 8.26 | 4.68 | 496,172 | 1.26 | 1.46 | 1.26 | 1.46 | 1.46 | 85 | ||||||||||||||||||||||||||
| 7.97 | (21.51 | ) | 514,884 | 1.25 | 1.46 | 1.25 | 1.45 | 0.94 | 92 | |||||||||||||||||||||||||
| 10.19 | 1.90 | 353,099 | 1.25 | * | 1.62 | * | 1.25 | * | 1.62 | * | 1.77 | * | 41 | |||||||||||||||||||||
Please see footnotes on page 34.
| SEMIANNUAL REPORT | DECEMBER 31, 2013 | 29 |
Table of Contents
Financial Highlights (Cont.)
| Selected Per Share Data for the Year or Period Ended: | Beginning of Year or | Net Investment Income (Loss) (a) | Net Realized/ Unrealized Gain (Loss) | Total Income from Investment Operations | Dividends from Net Investment Income | Distributions from Net Realized Capital Gains | Total Distributions | |||||||||||||||||||||
PIMCO EqS® Emerging Markets Fund (Cont.) | ||||||||||||||||||||||||||||
| Class P | ||||||||||||||||||||||||||||
07/01/2013 - 12/31/2013 | $ | 8.24 | $ | (0.01 | ) | $ | 0.56 | $ | 0.55 | $ | 0.00 | $ | 0.00 | $ | 0.00 | |||||||||||||
06/30/2013 | 7.97 | 0.33 | 0.03 | 0.36 | (0.09 | ) | 0.00 | (0.09 | ) | |||||||||||||||||||
06/30/2012 | 10.19 | 0.06 | (2.25 | ) | (2.19 | ) | (0.02 | ) | (0.01 | ) | (0.03 | ) | ||||||||||||||||
03/22/2011 - 06/30/2011 | 10.00 | 0.04 | 0.15 | 0.19 | 0.00 | 0.00 | 0.00 | |||||||||||||||||||||
| Administrative Class | ||||||||||||||||||||||||||||
07/01/2013 - 12/31/2013 | 8.23 | (0.02 | ) | 0.55 | 0.53 | 0.00 | 0.00 | 0.00 | ||||||||||||||||||||
06/30/2013 | 7.96 | 0.11 | 0.24 | 0.35 | (0.08 | ) | 0.00 | (0.08 | ) | |||||||||||||||||||
06/30/2012 | 10.18 | 0.06 | (2.27 | ) | (2.21 | ) | (0.00 | )^ | (0.01 | ) | (0.01 | ) | ||||||||||||||||
04/19/2011 - 06/30/2011 | 10.51 | 0.04 | (0.37 | ) | (0.33 | ) | 0.00 | 0.00 | 0.00 | |||||||||||||||||||
| Class D | ||||||||||||||||||||||||||||
07/01/2013 - 12/31/2013 | 8.20 | (0.02 | ) | 0.55 | 0.53 | 0.00 | 0.00 | 0.00 | ||||||||||||||||||||
06/30/2013 | 7.93 | 0.09 | 0.26 | 0.35 | (0.08 | ) | 0.00 | (0.08 | ) | |||||||||||||||||||
06/30/2012 | 10.18 | 0.00 | ^ | (2.22 | ) | (2.22 | ) | (0.02 | ) | (0.01 | ) | (0.03 | ) | |||||||||||||||
03/22/2011 - 06/30/2011 | 10.00 | 0.06 | 0.12 | 0.18 | 0.00 | 0.00 | 0.00 | |||||||||||||||||||||
| Class A | ||||||||||||||||||||||||||||
07/01/2013 - 12/31/2013 | 8.20 | (0.02 | ) | 0.55 | 0.53 | 0.00 | 0.00 | 0.00 | ||||||||||||||||||||
06/30/2013 | 7.94 | 0.13 | 0.21 | 0.34 | (0.08 | ) | 0.00 | (0.08 | ) | |||||||||||||||||||
06/30/2012 | 10.18 | 0.08 | (2.31 | ) | (2.23 | ) | (0.00 | )^ | (0.01 | ) | (0.01 | ) | ||||||||||||||||
03/22/2011 - 06/30/2011 | 10.00 | 0.05 | �� | 0.13 | 0.18 | 0.00 | 0.00 | 0.00 | ||||||||||||||||||||
| Class C | ||||||||||||||||||||||||||||
07/01/2013 - 12/31/2013 | 8.11 | (0.06 | ) | 0.54 | 0.48 | 0.00 | 0.00 | 0.00 | ||||||||||||||||||||
06/30/2013 | 7.88 | 0.07 | 0.21 | 0.28 | (0.05 | ) | 0.00 | (0.05 | ) | |||||||||||||||||||
06/30/2012 | 10.17 | 0.01 | (2.29 | ) | (2.28 | ) | (0.00 | )^ | (0.01 | ) | (0.01 | ) | ||||||||||||||||
03/22/2011 - 06/30/2011 | 10.00 | 0.03 | 0.14 | 0.17 | 0.00 | 0.00 | 0.00 | |||||||||||||||||||||
| Class R | ||||||||||||||||||||||||||||
07/01/2013 - 12/31/2013 | 8.19 | (0.03 | ) | 0.54 | 0.51 | 0.00 | 0.00 | 0.00 | ||||||||||||||||||||
06/30/2013 | 7.93 | 0.08 | 0.24 | 0.32 | (0.06 | ) | 0.00 | (0.06 | ) | |||||||||||||||||||
06/30/2012 | 10.18 | 0.01 | (2.25 | ) | (2.24 | ) | (0.00 | )^ | (0.01 | ) | (0.01 | ) | ||||||||||||||||
03/22/2011 - 06/30/2011 | 10.00 | 0.06 | 0.12 | 0.18 | 0.00 | 0.00 | 0.00 | |||||||||||||||||||||
PIMCO EqS® Long/Short Fund | ||||||||||||||||||||||||||||
| Institutional Class | ||||||||||||||||||||||||||||
07/01/2013 - 12/31/2013 | $ | 11.09 | $ | (0.07 | ) | $ | 1.59 | $ | 1.52 | $ | (0.06 | ) | $ | (0.61 | ) | $ | (0.67 | ) | ||||||||||
06/30/2013 | 9.71 | 0.15 | 1.27 | 1.42 | (0.04 | ) | 0.00 | (0.04 | ) | |||||||||||||||||||
04/20/2012 - 06/30/2012 | 10.00 | (0.02 | ) | (0.27 | ) | (0.29 | ) | 0.00 | 0.00 | 0.00 | ||||||||||||||||||
| Class P | ||||||||||||||||||||||||||||
07/01/2013 - 12/31/2013 | 11.08 | (0.07 | ) | 1.58 | 1.51 | (0.07 | ) | (0.61 | ) | (0.68 | ) | |||||||||||||||||
06/30/2013 | 9.70 | (0.05 | ) | 1.47 | 1.42 | (0.04 | ) | 0.00 | (0.04 | ) | ||||||||||||||||||
04/30/2012 - 06/30/2012 | 10.00 | (0.02 | ) | (0.28 | ) | (0.30 | ) | 0.00 | 0.00 | 0.00 | ||||||||||||||||||
| Class D | ||||||||||||||||||||||||||||
07/01/2013 - 12/31/2013 | 11.06 | (0.09 | ) | 1.58 | 1.49 | (0.06 | ) | (0.61 | ) | (0.67 | ) | |||||||||||||||||
06/30/2013 | 9.70 | (0.10 | ) | 1.48 | 1.38 | (0.02 | ) | 0.00 | (0.02 | ) | ||||||||||||||||||
04/30/2012 - 06/30/2012 | 10.00 | (0.03 | ) | (0.27 | ) | (0.30 | ) | 0.00 | 0.00 | 0.00 | ||||||||||||||||||
| Class A | ||||||||||||||||||||||||||||
07/01/2013 - 12/31/2013 | 11.05 | (0.08 | ) | 1.57 | 1.49 | (0.06 | ) | (0.61 | ) | (0.67 | ) | |||||||||||||||||
06/30/2013 | 9.70 | 0.00 | ^ | 1.38 | 1.38 | (0.03 | ) | 0.00 | (0.03 | ) | ||||||||||||||||||
04/30/2012 - 06/30/2012 | 10.00 | (0.03 | ) | (0.27 | ) | (0.30 | ) | 0.00 | 0.00 | 0.00 | ||||||||||||||||||
| Class C | ||||||||||||||||||||||||||||
07/01/2013 - 12/31/2013 | 10.98 | (0.12 | ) | 1.56 | 1.44 | (0.05 | ) | (0.61 | ) | (0.66 | ) | |||||||||||||||||
06/30/2013 | 9.69 | 0.01 | 1.29 | 1.30 | (0.01 | ) | 0.00 | (0.01 | ) | |||||||||||||||||||
04/30/2012 - 06/30/2012 | 10.00 | (0.04 | ) | (0.27 | ) | (0.31 | ) | 0.00 | 0.00 | 0.00 | ||||||||||||||||||
Please see footnotes on page 34.
| 30 | PIMCO EQUITY SERIES | See Accompanying Notes |
Table of Contents
(Unaudited)
| Net Asset Value End of Year or Period | Total Return | Net Assets End of Year or Period (000s) | Ratio of Expenses to Average Net Assets | Ratio of Expenses to Average Net Assets Excluding Waivers | Ratio of Expenses to Average Net Assets Excluding Interest Expense and Dividends on Securities Sold Short | Ratio of Expenses to Average Net Assets Excluding Interest Expense and Dividends on Securities Sold Short and Waivers | Ratio of Net Investment Income (Loss) to Average Net Assets | Portfolio Turnover Rate** | ||||||||||||||||||||||||||
| $ | 8.79 | 6.67 | % | $ | 6,219 | 1.36 | %* | 1.56 | %* | 1.36 | %* | 1.56 | %* | (0.34 | )%* | 31 | % | |||||||||||||||||
| 8.24 | 4.46 | 7,615 | 1.36 | 1.56 | 1.36 | 1.56 | 3.81 | 85 | ||||||||||||||||||||||||||
| 7.97 | (21.52 | ) | 63 | 1.35 | 1.56 | 1.35 | 1.55 | 0.68 | 92 | |||||||||||||||||||||||||
| 10.19 | 1.90 | 37 | 1.35 | * | 1.94 | * | 1.35 | * | 1.94 | * | 1.42 | * | 41 | |||||||||||||||||||||
| 8.76 | 6.44 | 44 | 1.51 | * | 1.71 | * | 1.51 | * | 1.71 | * | (0.43 | )* | 31 | |||||||||||||||||||||
| 8.23 | 4.36 | 42 | 1.51 | 1.71 | 1.51 | 1.71 | 1.32 | 85 | ||||||||||||||||||||||||||
| 7.96 | (21.72 | ) | 34 | 1.50 | 1.72 | 1.50 | 1.72 | 0.74 | 92 | |||||||||||||||||||||||||
| 10.18 | (3.14 | ) | 10 | 1.50 | * | 1.90 | * | 1.50 | * | 1.90 | * | 1.72 | * | 41 | ||||||||||||||||||||
| 8.73 | 6.46 | 1,196 | 1.61 | * | 1.81 | * | 1.61 | * | 1.81 | * | (0.53 | )* | 31 | |||||||||||||||||||||
| 8.20 | 4.31 | 1,097 | 1.61 | 1.81 | 1.61 | 1.81 | 0.99 | 85 | ||||||||||||||||||||||||||
| 7.93 | (21.83 | ) | 989 | 1.60 | 1.82 | 1.60 | 1.81 | (0.02 | ) | 92 | ||||||||||||||||||||||||
| 10.18 | 1.80 | 1,080 | 1.60 | * | 2.11 | * | 1.60 | * | 2.11 | * | 1.98 | * | 41 | |||||||||||||||||||||
| 8.73 | 6.46 | 6,274 | 1.61 | * | 1.81 | * | 1.61 | * | 1.81 | * | (0.56 | )* | 31 | |||||||||||||||||||||
| 8.20 | 4.23 | 4,324 | 1.61 | 1.81 | 1.61 | 1.81 | 1.51 | 85 | ||||||||||||||||||||||||||
| 7.94 | (21.89 | ) | 2,469 | 1.60 | 1.81 | 1.60 | 1.80 | 0.90 | 92 | |||||||||||||||||||||||||
| 10.18 | 1.80 | 764 | 1.60 | * | 2.02 | * | 1.60 | * | 2.02 | * | 1.89 | * | 41 | |||||||||||||||||||||
| 8.59 | 5.92 | 1,886 | 2.36 | * | 2.56 | * | 2.36 | * | 2.56 | * | (1.36 | )* | 31 | |||||||||||||||||||||
| 8.11 | 3.54 | 1,371 | 2.36 | 2.56 | 2.36 | 2.56 | 0.83 | 85 | ||||||||||||||||||||||||||
| 7.88 | (22.43 | ) | 675 | 2.35 | 2.57 | 2.35 | 2.56 | 0.12 | 92 | |||||||||||||||||||||||||
| 10.17 | 1.70 | 98 | 2.35 | * | 2.80 | * | 2.35 | * | 2.80 | * | 0.98 | * | 41 | |||||||||||||||||||||
| 8.70 | 6.23 | 26 | 1.86 | * | 2.06 | * | 1.86 | * | 2.06 | * | (0.79 | )* | 31 | |||||||||||||||||||||
| 8.19 | 4.04 | 25 | 1.86 | 2.06 | 1.86 | 2.06 | 0.92 | 85 | ||||||||||||||||||||||||||
| 7.93 | (22.01 | ) | 24 | 1.85 | 2.07 | 1.85 | 2.06 | 0.06 | 92 | |||||||||||||||||||||||||
| 10.18 | 1.80 | 39 | 1.85 | * | 2.34 | * | 1.85 | * | 2.34 | * | 1.97 | * | 41 | |||||||||||||||||||||
| $ | 11.94 | 13.78 | % | $ | 498,922 | 2.17 | %* | 2.22 | %* | 1.46 | %* | 1.51 | %* | (1.25 | )%* | 250 | % | |||||||||||||||||
| 11.09 | 14.66 | 329,610 | 2.65 | 2.75 | 1.40 | 1.50 | 1.45 | 528 | ||||||||||||||||||||||||||
| 9.71 | (2.90 | ) | 212,229 | 1.52 | * | 2.41 | * | 1.40 | * | 2.29 | * | (1.30 | )* | 113 | ||||||||||||||||||||
| 11.91 | 13.69 | 117,805 | 2.14 | * | 2.19 | * | 1.56 | * | 1.61 | * | (1.14 | )* | 250 | |||||||||||||||||||||
| 11.08 | 14.77 | 15,664 | 3.94 | 4.04 | 1.50 | 1.60 | (0.48 | ) | 528 | |||||||||||||||||||||||||
| 9.70 | (3.00 | ) | 10 | 1.62 | * | 2.40 | * | 1.50 | * | 2.28 | * | (1.34 | )* | 113 | ||||||||||||||||||||
| 11.88 | 13.51 | 64,838 | 2.40 | * | 2.45 | * | 1.81 | * | 1.86 | * | (1.42 | )* | 250 | |||||||||||||||||||||
| 11.06 | 14.31 | 12,421 | 3.95 | 4.05 | 1.75 | 1.85 | (0.97 | ) | 528 | |||||||||||||||||||||||||
| 9.70 | (3.00 | ) | 111 | 1.87 | * | 3.97 | * | 1.77 | * | 3.87 | * | (1.72 | )* | 113 | ||||||||||||||||||||
| 11.87 | 13.55 | 211,793 | 2.42 | * | 2.47 | * | 1.81 | * | 1.86 | * | (1.37 | )* | 250 | |||||||||||||||||||||
| 11.05 | 14.27 | 24,759 | 3.62 | 3.72 | 1.75 | 1.85 | (0.03 | ) | 528 | |||||||||||||||||||||||||
| 9.70 | (3.00 | ) | 1,219 | 1.87 | * | 3.17 | * | 1.74 | * | 3.04 | * | (1.70 | )* | 113 | ||||||||||||||||||||
| 11.76 | 13.13 | 118,302 | 3.12 | * | 3.17 | * | 2.56 | * | 2.61 | * | (2.07 | )* | 250 | |||||||||||||||||||||
| 10.98 | 13.41 | 9,530 | 4.04 | 4.14 | 2.50 | 2.60 | 0.13 | 528 | ||||||||||||||||||||||||||
| 9.69 | (3.10 | ) | 53 | 2.62 | * | 4.50 | * | 2.52 | * | 4.40 | * | (2.46 | )* | 113 | ||||||||||||||||||||
Please see footnotes on page 34.
| SEMIANNUAL REPORT | DECEMBER 31, 2013 | 31 |
Table of Contents
Financial Highlights (Cont.)
| Selected Per Share Data for the Year or Period Ended: | Beginning of Year or | Net Investment Income (Loss) (a) | Net Realized/ Unrealized Gain (Loss) | Total Income from Investment Operations | Dividends from Net Investment Income | Distributions from Net Realized Capital Gains | Total Distributions | |||||||||||||||||||||
PIMCO Emerging Multi-Asset Fund | ||||||||||||||||||||||||||||
| Institutional Class | ||||||||||||||||||||||||||||
07/01/2013 - 12/31/2013 | $ | 8.60 | $ | 0.13 | $ | 0.11 | $ | 0.24 | $ | (0.15 | ) | $ | 0.00 | $ | (0.15 | ) | ||||||||||||
06/30/2013 | 8.71 | 0.24 | (0.08 | ) | 0.16 | (0.27 | ) | 0.00 | (0.27 | ) | ||||||||||||||||||
06/30/2012 | 9.89 | 0.14 | (1.27 | ) | (1.13 | ) | (0.05 | ) | 0.00 | (0.05 | ) | |||||||||||||||||
04/12/2011 - 06/30/2011 | 10.00 | 0.02 | (0.13 | ) | (0.11 | ) | 0.00 | 0.00 | 0.00 | |||||||||||||||||||
| Class P | ||||||||||||||||||||||||||||
07/01/2013 - 12/31/2013 | 8.58 | 0.13 | 0.11 | 0.24 | (0.15 | ) | 0.00 | (0.15 | ) | |||||||||||||||||||
06/30/2013 | 8.69 | 0.24 | (0.09 | ) | 0.15 | (0.26 | ) | 0.00 | (0.26 | ) | ||||||||||||||||||
06/30/2012 | 9.90 | 0.15 | (1.31 | ) | (1.16 | ) | (0.05 | ) | 0.00 | (0.05 | ) | |||||||||||||||||
04/12/2011 - 06/30/2011 | 10.00 | 0.02 | (0.12 | ) | (0.10 | ) | 0.00 | 0.00 | 0.00 | |||||||||||||||||||
| Administrative Class | ||||||||||||||||||||||||||||
07/01/2013 - 12/31/2013 | 8.55 | 0.12 | 0.11 | 0.23 | (0.14 | ) | 0.00 | (0.14 | ) | |||||||||||||||||||
06/30/2013 | 8.69 | 0.15 | (0.01 | ) | 0.14 | (0.28 | ) | 0.00 | (0.28 | ) | ||||||||||||||||||
06/30/2012 | 9.89 | 0.12 | (1.28 | ) | (1.16 | ) | (0.04 | ) | 0.00 | (0.04 | ) | |||||||||||||||||
04/19/2011 - 06/30/2011 | 10.02 | 0.02 | (0.15 | ) | (0.13 | ) | 0.00 | 0.00 | 0.00 | |||||||||||||||||||
| Class D | ||||||||||||||||||||||||||||
07/01/2013 - 12/31/2013 | 8.57 | 0.12 | 0.11 | 0.23 | (0.13 | ) | 0.00 | (0.13 | ) | |||||||||||||||||||
06/30/2013 | 8.70 | 0.20 | (0.08 | ) | 0.12 | (0.25 | ) | 0.00 | (0.25 | ) | ||||||||||||||||||
06/30/2012 | 9.89 | 0.11 | (1.27 | ) | (1.16 | ) | (0.03 | ) | 0.00 | (0.03 | ) | |||||||||||||||||
04/12/2011 - 06/30/2011 | 10.00 | 0.02 | (0.13 | ) | (0.11 | ) | 0.00 | 0.00 | 0.00 | |||||||||||||||||||
| Class A | ||||||||||||||||||||||||||||
07/01/2013 - 12/31/2013 | 8.54 | 0.12 | 0.11 | 0.23 | (0.13 | ) | 0.00 | (0.13 | ) | |||||||||||||||||||
06/30/2013 | 8.68 | 0.23 | (0.12 | ) | 0.11 | (0.25 | ) | 0.00 | (0.25 | ) | ||||||||||||||||||
06/30/2012 | 9.88 | 0.12 | (1.28 | ) | (1.16 | ) | (0.04 | ) | 0.00 | (0.04 | ) | |||||||||||||||||
04/12/2011 - 06/30/2011 | 10.00 | 0.02 | (0.14 | ) | (0.12 | ) | 0.00 | 0.00 | 0.00 | |||||||||||||||||||
| Class C | ||||||||||||||||||||||||||||
07/01/2013 - 12/31/2013 | 8.46 | 0.08 | 0.11 | 0.19 | (0.10 | ) | 0.00 | (0.10 | ) | |||||||||||||||||||
06/30/2013 | 8.62 | 0.15 | (0.09 | ) | 0.06 | (0.22 | ) | 0.00 | (0.22 | ) | ||||||||||||||||||
06/30/2012 | 9.88 | 0.05 | (1.29 | ) | (1.24 | ) | (0.02 | ) | 0.00 | (0.02 | ) | |||||||||||||||||
04/12/2011 - 06/30/2011 | 10.00 | 0.00 | ^ | (0.12 | ) | (0.12 | ) | 0.00 | 0.00 | 0.00 | ||||||||||||||||||
| Class R | ||||||||||||||||||||||||||||
07/01/2013 - 12/31/2013 | 8.51 | 0.11 | 0.11 | 0.22 | (0.12 | ) | 0.00 | (0.12 | ) | |||||||||||||||||||
06/30/2013 | 8.68 | 0.23 | (0.13 | ) | 0.10 | (0.27 | ) | 0.00 | (0.27 | ) | ||||||||||||||||||
06/30/2012 | 9.88 | 0.09 | (1.27 | ) | (1.18 | ) | (0.02 | ) | 0.00 | (0.02 | ) | |||||||||||||||||
04/12/2011 - 06/30/2011 | 10.00 | 0.01 | (0.13 | ) | (0.12 | ) | 0.00 | 0.00 | 0.00 | |||||||||||||||||||
PIMCO EqS Pathfinder Fund® | ||||||||||||||||||||||||||||
| Institutional Class | ||||||||||||||||||||||||||||
07/01/2013 - 12/31/2013 | $ | 10.82 | $ | 0.09 | $ | 1.47 | $ | 1.56 | $ | (0.18 | ) | $ | (0.23 | ) | $ | (0.41 | ) | |||||||||||
06/30/2013 | 10.11 | 0.25 | 0.77 | 1.02 | (0.31 | ) | 0.00 | (0.31 | ) | |||||||||||||||||||
06/30/2012 | 10.65 | 0.18 | (0.62 | ) | (0.44 | ) | (0.07 | ) | (0.03 | ) | (0.10 | ) | ||||||||||||||||
06/30/2011 | 9.23 | 0.19 | 1.34 | 1.53 | (0.09 | ) | (0.02 | ) | (0.11 | ) | ||||||||||||||||||
04/14/2010 - 06/30/2010 | 10.00 | 0.07 | (0.84 | ) | (0.77 | ) | 0.00 | 0.00 | 0.00 | |||||||||||||||||||
| Class P | ||||||||||||||||||||||||||||
07/01/2013 - 12/31/2013 | 10.80 | 0.08 | 1.46 | 1.54 | (0.17 | ) | (0.23 | ) | (0.40 | ) | ||||||||||||||||||
06/30/2013 | 10.09 | 0.25 | 0.76 | 1.01 | (0.30 | ) | 0.00 | (0.30 | ) | |||||||||||||||||||
06/30/2012 | 10.64 | 0.17 | (0.63 | ) | (0.46 | ) | (0.06 | ) | (0.03 | ) | (0.09 | ) | ||||||||||||||||
06/30/2011 | 9.23 | 0.18 | 1.34 | 1.52 | (0.09 | ) | (0.02 | ) | (0.11 | ) | ||||||||||||||||||
04/14/2010 - 06/30/2010 | 10.00 | 0.07 | (0.84 | ) | (0.77 | ) | 0.00 | 0.00 | 0.00 | |||||||||||||||||||
| Class D | ||||||||||||||||||||||||||||
07/01/2013 - 12/31/2013 | 10.74 | 0.07 | 1.44 | 1.51 | (0.15 | ) | (0.23 | ) | (0.38 | ) | ||||||||||||||||||
06/30/2013 | 10.05 | 0.21 | 0.77 | 0.98 | (0.29 | ) | 0.00 | (0.29 | ) | |||||||||||||||||||
06/30/2012 | 10.61 | 0.13 | (0.61 | ) | (0.48 | ) | (0.05 | ) | (0.03 | ) | (0.08 | ) | ||||||||||||||||
06/30/2011 | 9.21 | 0.16 | 1.34 | 1.50 | (0.08 | ) | (0.02 | ) | (0.10 | ) | ||||||||||||||||||
04/14/2010 - 06/30/2010 | 10.00 | 0.06 | (0.85 | ) | (0.79 | ) | 0.00 | 0.00 | 0.00 | |||||||||||||||||||
Please see footnotes on page 34.
| 32 | PIMCO EQUITY SERIES | See Accompanying Notes |
Table of Contents
(Unaudited)
| Net Asset Value End of Year or Period | Total Return | Net Assets End of Year or Period (000s) | Ratio of Expenses to Average Net Assets | Ratio of Expenses to Average Net Assets Excluding Waivers | Ratio of Expenses to Average Net Assets Excluding Interest Expense and Dividends on Securities Sold Short | Ratio of Expenses to Average Net Assets Excluding Interest Expense and Dividends on Securities Sold Short and Waivers | Ratio of Net Investment Income (Loss) to Average Net Assets | Portfolio Turnover Rate** | ||||||||||||||||||||||||||
| $ | 8.69 | 2.76 | % | $ | 27,787 | 0.28 | %* | 1.37 | %* | 0.28 | %* | 1.37 | %* | 2.99 | %* | 15 | % | |||||||||||||||||
| 8.60 | 1.60 | 36,051 | 0.35 | 1.36 | 0.35 | 1.36 | 2.62 | 53 | ||||||||||||||||||||||||||
| 8.71 | (11.45 | ) | 29,987 | 0.53 | 1.38 | 0.53 | 1.38 | 1.62 | 41 | |||||||||||||||||||||||||
| 9.89 | (1.10 | ) | 9,755 | 0.53 | * | 6.96 | * | 0.53 | * | 6.96 | * | 1.13 | * | 0 | ||||||||||||||||||||
| 8.67 | 2.75 | 1,977 | 0.38 | * | 1.47 | * | 0.38 | * | 1.47 | * | 2.89 | * | 15 | |||||||||||||||||||||
| 8.58 | 1.53 | 1,998 | 0.45 | 1.46 | 0.45 | 1.46 | 2.62 | 53 | ||||||||||||||||||||||||||
| 8.69 | (11.69 | ) | 2,019 | 0.63 | 1.48 | 0.63 | 1.48 | 1.71 | 41 | |||||||||||||||||||||||||
| 9.90 | (1.00 | ) | 74 | 0.63 | * | 17.34 | * | 0.63 | * | 17.34 | * | 0.96 | * | 0 | ||||||||||||||||||||
| 8.64 | 2.67 | 1,905 | 0.53 | * | 1.62 | * | 0.53 | * | 1.62 | * | 2.76 | * | 15 | |||||||||||||||||||||
| 8.55 | 1.35 | 2,051 | 0.60 | 1.61 | 0.60 | 1.61 | 1.60 | 53 | ||||||||||||||||||||||||||
| 8.69 | (11.75 | ) | 28 | 0.78 | 1.63 | 0.78 | 1.63 | 1.36 | 41 | |||||||||||||||||||||||||
| 9.89 | (1.30 | ) | 10 | 0.78 | * | 6.47 | * | 0.78 | * | 6.47 | * | 0.88 | * | 0 | ||||||||||||||||||||
| 8.67 | 2.72 | 5,686 | 0.63 | * | 1.72 | * | 0.63 | * | 1.72 | * | 2.69 | * | 15 | |||||||||||||||||||||
| 8.57 | 1.17 | 5,669 | 0.70 | 1.71 | 0.70 | 1.71 | 2.23 | 53 | ||||||||||||||||||||||||||
| 8.70 | (11.77 | ) | 4,912 | 0.88 | 1.73 | 0.88 | 1.73 | 1.20 | 41 | |||||||||||||||||||||||||
| 9.89 | (1.10 | ) | 2,745 | 0.88 | * | 8.20 | * | 0.88 | * | 8.20 | * | 0.81 | * | 0 | ||||||||||||||||||||
| 8.64 | 2.74 | 11,537 | 0.63 | * | 1.72 | * | 0.63 | * | 1.72 | * | 2.63 | * | 15 | |||||||||||||||||||||
| 8.54 | 1.12 | 12,333 | 0.70 | 1.71 | 0.70 | 1.71 | 2.46 | 53 | ||||||||||||||||||||||||||
| 8.68 | (11.72 | ) | 10,147 | 0.88 | 1.73 | 0.88 | 1.73 | 1.32 | 41 | |||||||||||||||||||||||||
| 9.88 | (1.20 | ) | 1,801 | 0.88 | * | 9.28 | * | 0.88 | * | 9.28 | * | 0.82 | * | 0 | ||||||||||||||||||||
| 8.55 | 2.25 | 4,652 | 1.38 | * | 2.47 | * | 1.38 | * | 2.47 | * | 1.91 | * | 15 | |||||||||||||||||||||
| 8.46 | 0.56 | 5,101 | 1.45 | 2.46 | 1.45 | 2.46 | 1.68 | 53 | ||||||||||||||||||||||||||
| 8.62 | (12.51 | ) | 3,868 | 1.63 | 2.48 | 1.63 | 2.48 | 0.57 | 41 | |||||||||||||||||||||||||
| 9.88 | (1.20 | ) | 649 | 1.63 | * | 9.73 | * | 1.63 | * | 9.73 | * | 0.08 | * | 0 | ||||||||||||||||||||
| 8.61 | 2.64 | 31 | 0.88 | * | 1.97 | * | 0.88 | * | 1.97 | * | 2.45 | * | 15 | |||||||||||||||||||||
| 8.51 | 0.96 | 30 | 0.95 | 1.96 | 0.95 | 1.96 | 2.47 | 53 | ||||||||||||||||||||||||||
| 8.68 | (11.98 | ) | 9 | 1.13 | 1.98 | 1.13 | 1.98 | 0.99 | 41 | |||||||||||||||||||||||||
| 9.88 | (1.20 | ) | 10 | 1.13 | * | 6.40 | * | 1.13 | * | 6.40 | * | 0.50 | * | 0 | ||||||||||||||||||||
| $ | 11.97 | 14.48 | % | $ | 2,623,946 | 0.90 | %* | 1.07 | %* | 0.90 | %* | 1.07 | %* | 1.53 | %* | 23 | % | |||||||||||||||||
| 10.82 | 10.19 | 1,691,850 | 0.90 | 1.10 | 0.89 | 1.09 | 2.38 | 29 | ||||||||||||||||||||||||||
| 10.11 | (4.09 | ) | 1,930,637 | 0.92 | 1.09 | 0.90 | 1.07 | 1.80 | 32 | |||||||||||||||||||||||||
| 10.65 | 16.68 | 1,338,509 | 0.92 | 1.10 | 0.89 | 1.07 | 1.87 | 35 | ||||||||||||||||||||||||||
| 9.23 | (7.70 | ) | 542,879 | 0.98 | * | 1.21 | * | 0.89 | * | 1.12 | * | 3.53 | * | 4 | ||||||||||||||||||||
| 11.94 | 14.35 | 79,904 | 1.00 | * | 1.17 | * | 1.00 | * | 1.17 | * | 1.43 | * | 23 | |||||||||||||||||||||
| 10.80 | 10.12 | 62,479 | 1.00 | 1.20 | 0.99 | 1.19 | 2.34 | 29 | ||||||||||||||||||||||||||
| 10.09 | (4.23 | ) | 67,977 | 1.02 | 1.19 | 1.00 | 1.17 | 1.70 | 32 | |||||||||||||||||||||||||
| 10.64 | 16.55 | 45,785 | 1.02 | 1.20 | 0.99 | 1.17 | 1.72 | 35 | ||||||||||||||||||||||||||
| 9.23 | (7.70 | ) | 970 | 1.08 | * | 1.31 | * | 0.99 | * | 1.22 | * | 3.36 | * | 4 | ||||||||||||||||||||
| 11.87 | 14.19 | 18,497 | 1.25 | * | 1.42 | * | 1.25 | * | 1.42 | * | 1.15 | * | 23 | |||||||||||||||||||||
| 10.74 | 9.89 | 17,730 | 1.25 | 1.45 | 1.24 | 1.44 | 2.01 | 29 | ||||||||||||||||||||||||||
| 10.05 | (4.52 | ) | 18,469 | 1.27 | 1.45 | 1.26 | 1.42 | 1.33 | 32 | |||||||||||||||||||||||||
| 10.61 | 16.39 | 24,352 | 1.27 | 1.45 | 1.24 | 1.42 | 1.55 | 35 | ||||||||||||||||||||||||||
| 9.21 | (7.90 | ) | 7,084 | 1.33 | * | 1.56 | * | 1.24 | * | 1.47 | * | 3.13 | * | 4 | ||||||||||||||||||||
Please see footnotes on page 34.
| SEMIANNUAL REPORT | DECEMBER 31, 2013 | 33 |
Table of Contents
Financial Highlights (Cont.)
| Selected Per Share Data for the Year or Period Ended: | Beginning of Year or | Net Investment Income (Loss) (a) | Net Realized/ Unrealized Gain (Loss) | Total Income from Investment Operations | Dividends from Net Investment Income | Distributions from Net Realized Capital Gains | Total Distributions | |||||||||||||||||||||
PIMCO EqS Pathfinder Fund® (Cont.) | ||||||||||||||||||||||||||||
| Class A | ||||||||||||||||||||||||||||
07/01/2013 - 12/31/2013 | $ | 10.78 | $ | 0.07 | $ | 1.46 | $ | 1.53 | $ | (0.16 | ) | $ | (0.23 | ) | $ | (0.39 | ) | |||||||||||
06/30/2013 | 10.08 | 0.22 | 0.76 | 0.98 | (0.28 | ) | 0.00 | (0.28 | ) | |||||||||||||||||||
06/30/2012 | 10.64 | 0.14 | (0.62 | ) | (0.48 | ) | (0.05 | ) | (0.03 | ) | (0.08 | ) | ||||||||||||||||
06/30/2011 | 9.22 | 0.17 | 1.33 | 1.50 | (0.06 | ) | (0.02 | ) | (0.08 | ) | ||||||||||||||||||
04/14/2010 - 06/30/2010 | 10.00 | 0.07 | (0.85 | ) | (0.78 | ) | 0.00 | 0.00 | 0.00 | |||||||||||||||||||
| Class C | ||||||||||||||||||||||||||||
07/01/2013 - 12/31/2013 | 10.60 | 0.03 | 1.43 | 1.46 | (0.12 | ) | (0.23 | ) | (0.35 | ) | ||||||||||||||||||
06/30/2013 | 9.96 | 0.13 | 0.75 | 0.88 | (0.24 | ) | 0.00 | (0.24 | ) | |||||||||||||||||||
06/30/2012 | 10.55 | 0.06 | (0.61 | ) | (0.55 | ) | (0.01 | ) | (0.03 | ) | (0.04 | ) | ||||||||||||||||
06/30/2011 | 9.21 | 0.11 | 1.31 | 1.42 | (0.06 | ) | (0.02 | ) | (0.08 | ) | ||||||||||||||||||
04/14/2010 - 06/30/2010 | 10.00 | 0.05 | (0.84 | ) | (0.79 | ) | 0.00 | 0.00 | 0.00 | |||||||||||||||||||
| Class R | ||||||||||||||||||||||||||||
07/01/2013 - 12/31/2013 | 10.66 | 0.05 | 1.44 | 1.49 | (0.14 | ) | (0.23 | ) | (0.37 | ) | ||||||||||||||||||
06/30/2013 | 10.00 | 0.20 | 0.74 | 0.94 | (0.28 | ) | 0.00 | (0.28 | ) | |||||||||||||||||||
06/30/2012 | 10.59 | 0.07 | (0.59 | ) | (0.52 | ) | (0.04 | ) | (0.03 | ) | (0.07 | ) | ||||||||||||||||
06/30/2011 | 9.21 | 0.12 | 1.35 | 1.47 | (0.07 | ) | (0.02 | ) | (0.09 | ) | ||||||||||||||||||
04/14/2010 - 06/30/2010 | 10.00 | 0.06 | (0.85 | ) | (0.79 | ) | 0.00 | 0.00 | 0.00 | |||||||||||||||||||
| * | Annualized |
| ** | The ratio excludes PIMCO Short-Term Floating NAV Portfolio. |
| ^ | Reflects an amount rounding to less than one cent. |
| (a) | Per share amounts based on average number of shares outstanding during the year or period. |
| 34 | PIMCO EQUITY SERIES | See Accompanying Notes |
Table of Contents
(Unaudited)
| Net Asset Value End of Year or Period | Total Return | Net Assets End of Year or Period (000s) | Ratio of Expenses to Average Net Assets | Ratio of Expenses to Average Net Assets Excluding Waivers | Ratio of Expenses to Average Net Assets Excluding Interest Expense and Dividends on Securities Sold Short | Ratio of Expenses to Average Net Assets Excluding Interest Expense and Dividends on Securities Sold Short and Waivers | Ratio of Net Investment Income (Loss) to Average Net Assets | Portfolio Turnover Rate** | ||||||||||||||||||||||||||
| $ | 11.92 | 14.25 | % | $ | 76,995 | 1.25 | %* | 1.42 | %* | 1.25 | %* | 1.42 | %* | 1.18 | %* | 23 | % | |||||||||||||||||
| 10.78 | 9.88 | 59,746 | 1.25 | 1.45 | 1.24 | 1.44 | 2.04 | 29 | ||||||||||||||||||||||||||
| 10.08 | (4.50 | ) | 69,910 | 1.27 | 1.43 | 1.26 | 1.42 | 1.37 | 32 | |||||||||||||||||||||||||
| 10.64 | 16.30 | 89,571 | 1.27 | 1.45 | 1.24 | 1.42 | 1.64 | 35 | ||||||||||||||||||||||||||
| 9.22 | (7.80 | ) | 15,436 | 1.33 | * | 1.56 | * | 1.24 | * | 1.47 | * | 3.28 | * | 4 | ||||||||||||||||||||
| 11.71 | 13.90 | 52,407 | 2.00 | * | 2.17 | * | 2.00 | * | 2.17 | * | 0.44 | * | 23 | |||||||||||||||||||||
| 10.60 | 8.95 | 35,754 | 2.00 | 2.20 | 1.99 | 2.19 | 1.24 | 29 | ||||||||||||||||||||||||||
| 9.96 | (5.15 | ) | 47,006 | 2.02 | 2.21 | 2.00 | 2.17 | 0.65 | 32 | |||||||||||||||||||||||||
| 10.55 | 15.50 | 50,672 | 2.02 | 2.20 | 1.99 | 2.17 | 1.04 | 35 | ||||||||||||||||||||||||||
| 9.21 | (7.90 | ) | 6,668 | 2.08 | * | 2.31 | * | 1.99 | * | 2.22 | * | 2.43 | * | 4 | ||||||||||||||||||||
| 11.78 | 14.12 | 21 | 1.50 | * | 1.67 | * | 1.50 | * | 1.67 | * | 0.94 | * | 23 | |||||||||||||||||||||
| 10.66 | 9.48 | 15 | 1.50 | 1.70 | 1.49 | 1.69 | 1.92 | 29 | ||||||||||||||||||||||||||
| 10.00 | (4.86 | ) | 11 | 1.52 | 1.67 | 1.51 | 1.66 | 0.71 | 32 | |||||||||||||||||||||||||
| 10.59 | 16.02 | 102 | 1.52 | 1.70 | 1.49 | 1.67 | 1.21 | 35 | ||||||||||||||||||||||||||
| 9.21 | (7.90 | ) | 9 | 1.58 | * | 1.81 | * | 1.49 | * | 1.72 | * | 2.91 | * | 4 | ||||||||||||||||||||
| SEMIANNUAL REPORT | DECEMBER 31, 2013 | 35 |
Table of Contents
Statements of Assets and Liabilities
| (Amounts in thousands, except per share amounts) | PIMCO Dividend and Income Builder Fund | PIMCO EqS® Dividend Fund | PIMCO EqS® Emerging Markets Fund | PIMCO EqS® Long/Short Fund | ||||||||||||
Assets: | ||||||||||||||||
Investments, at value | ||||||||||||||||
Investments in securities* | $ | 811,897 | $ | 600,369 | $ | 379,667 | $ | 875,081 | ||||||||
Investments in Affiliates | 19,470 | 4,290 | 53,254 | 150,648 | ||||||||||||
Financial Derivative Instruments | ||||||||||||||||
Exchange-traded or centrally cleared | 43 | 19 | 5 | 416 | ||||||||||||
Over the counter | 1,928 | 1,931 | 7,141 | 84 | ||||||||||||
Cash | 0 | 0 | 5 | 1 | ||||||||||||
Deposits with counterparty | 1,340 | 751 | 242 | 116,135 | ||||||||||||
Foreign currency, at value | 2,600 | 1,256 | 441 | 0 | ||||||||||||
Receivable for investments sold | 1,564 | 1,281 | 3,719 | 44,409 | ||||||||||||
Receivable for Fund shares sold | 8,275 | 923 | 571 | 8,967 | ||||||||||||
Interest and dividends receivable | 2,490 | 2,082 | 84 | 573 | ||||||||||||
Dividends receivable from Affiliates | 5 | 1 | 14 | 42 | ||||||||||||
| 849,612 | 612,903 | 445,143 | 1,196,356 | |||||||||||||
Liabilities: | ||||||||||||||||
Borrowings & Other Financing Transactions | ||||||||||||||||
Payable for short sales | $ | 0 | $ | 0 | $ | 0 | $ | 136,766 | ||||||||
Financial Derivative Instruments | ||||||||||||||||
Exchange-traded or centrally cleared | 145 | 113 | 7 | 254 | ||||||||||||
Over the counter | 865 | 972 | 5,190 | 355 | ||||||||||||
Payable for investments purchased | 9,801 | 673 | 446 | 44,734 | ||||||||||||
Payable for investments in Affiliates purchased | 5 | 1 | 14 | 42 | ||||||||||||
Deposits from counterparty | 5,025 | 1,765 | 3,370 | 290 | ||||||||||||
Payable for Fund shares redeemed | 2,331 | 513 | 382 | 896 | ||||||||||||
Dividends payable | 1,243 | 36 | 0 | 0 | ||||||||||||
Accrued investment advisory fees | 347 | 274 | 300 | 803 | ||||||||||||
Accrued supervisory and administrative fees | 255 | 164 | 170 | 384 | ||||||||||||
Accrued distribution fees | 178 | 26 | 1 | 76 | ||||||||||||
Accrued servicing fees | 112 | 20 | 2 | 59 | ||||||||||||
Reimbursement to PIMCO | 15 | 16 | 12 | 15 | ||||||||||||
Other liabilities | 0 | 0 | 1 | 22 | ||||||||||||
| 20,322 | 4,573 | 9,895 | 184,696 | |||||||||||||
Net Assets | $ | 829,290 | $ | 608,330 | $ | 435,248 | $ | 1,011,660 | ||||||||
Net Assets Consist of: | ||||||||||||||||
Paid in capital | $ | 769,373 | $ | 531,119 | $ | 471,050 | $ | 947,804 | ||||||||
Undistributed (overdistributed) net investment income | (1,028 | ) | (2,239 | ) | 1,213 | (4,525 | ) | |||||||||
Accumulated undistributed net realized gain (loss) | (566 | ) | 7,788 | (45,168 | ) | 6,716 | ||||||||||
Net unrealized appreciation | 61,511 | 71,662 | 8,153 | 61,665 | ||||||||||||
| $ | 829,290 | $ | 608,330 | $ | 435,248 | $ | 1,011,660 | |||||||||
Cost of Investments in Securities | $ | 751,129 | $ | 529,287 | $ | 373,578 | $ | 809,780 | ||||||||
Cost of Investments in Affiliates | $ | 19,470 | $ | 4,290 | $ | 53,261 | $ | 150,654 | ||||||||
Cost of Foreign Currency Held | $ | 2,602 | $ | 1,258 | $ | 440 | $ | 0 | ||||||||
Proceeds Received on Short Sales | $ | 0 | $ | 0 | $ | 0 | $ | 134,202 | ||||||||
Cost or Premiums of Financial Derivative Instruments, net | $ | 0 | $ | 0 | $ | (25 | ) | $ | 882 | |||||||
* Includes repurchase agreements of: | $ | 3,872 | $ | 1,458 | $ | 117 | $ | 2,085 | ||||||||
| 36 | PIMCO EQUITY SERIES | See Accompanying Notes |
Table of Contents
December 31, 2013 (Unaudited)
| (Amounts in thousands, except per share amounts) | PIMCO Dividend and Income Builder Fund | PIMCO EqS® Dividend Fund | PIMCO EqS® Emerging Markets Fund | PIMCO EqS® Long/Short Fund | ||||||||||||
Net Assets: | ||||||||||||||||
Institutional Class | $ | 86,941 | $ | 495,083 | $ | 419,603 | $ | 498,922 | ||||||||
Class P | 134,272 | 4,200 | 6,219 | 117,805 | ||||||||||||
Administrative Class | NA | NA | 44 | NA | ||||||||||||
Class D | 34,185 | 11,177 | 1,196 | 64,838 | ||||||||||||
Class A | 281,654 | 59,493 | 6,274 | 211,793 | ||||||||||||
Class C | 291,833 | 38,266 | 1,886 | 118,302 | ||||||||||||
Class R | 405 | 111 | 26 | NA | ||||||||||||
Shares Issued and Outstanding: | ||||||||||||||||
Institutional Class | 6,866 | 40,273 | 47,694 | 41,795 | ||||||||||||
Class P | 10,593 | 341 | 708 | 9,894 | ||||||||||||
Administrative Class | NA | NA | 5 | NA | ||||||||||||
Class D | 2,699 | 909 | 137 | 5,459 | ||||||||||||
Class A | 22,237 | 4,836 | 719 | 17,845 | ||||||||||||
Class C | 23,081 | 3,122 | 219 | 10,063 | ||||||||||||
Class R | 32 | 9 | 3 | NA | ||||||||||||
Net Asset Value and Redemption Price^ Per Share Outstanding: | ||||||||||||||||
Institutional Class | $ | 12.66 | $ | 12.29 | $ | 8.80 | $ | 11.94 | ||||||||
Class P | 12.68 | 12.30 | 8.79 | 11.91 | ||||||||||||
Administrative Class | NA | NA | 8.76 | NA | ||||||||||||
Class D | 12.67 | 12.30 | 8.73 | 11.88 | ||||||||||||
Class A | 12.67 | 12.30 | 8.73 | 11.87 | ||||||||||||
Class C | 12.64 | 12.26 | 8.59 | 11.76 | ||||||||||||
Class R | 12.67 | 12.29 | 8.70 | NA | ||||||||||||
| ^ | With respect to the A and C Classes, the redemption price varies by the length of time the shares are held. |
| SEMIANNUAL REPORT | DECEMBER 31, 2013 | 37 |
Table of Contents
Consolidated Statements of Assets and Liabilities
| (Amounts in thousands, except per share amounts) | PIMCO Emerging Multi-Asset Fund | PIMCO EqS Pathfinder Fund® | ||||||
Assets: | ||||||||
Investments, at value | ||||||||
Investments in securities* | $ | 0 | $ | 2,727,641 | ||||
Investments in Affiliates | 52,708 | 152,207 | ||||||
Financial Derivative Instruments | ||||||||
Exchange-traded or centrally cleared | 77 | 0 | ||||||
Over the counter | 167 | 14,274 | ||||||
Cash | 28 | 10 | ||||||
Deposits with counterparty | 32 | 610 | ||||||
Foreign currency, at value | 35 | 785 | ||||||
Receivable for investments sold | 0 | 200 | ||||||
Receivable for investments in Affiliates sold | 675 | 0 | ||||||
Receivable for Fund shares sold | 48 | 2,006 | ||||||
Interest and dividends receivable | 0 | 4,056 | ||||||
Dividends receivable from Affiliates | 103 | 35 | ||||||
Reimbursement receivable from PIMCO | 1 | 0 | ||||||
| 53,874 | 2,901,824 | |||||||
Liabilities: | ||||||||
Financial Derivative Instruments | ||||||||
Exchange-traded or centrally cleared | $ | 26 | $ | 0 | ||||
Over the counter | 105 | 24,047 | ||||||
Payable for investments purchased | 0 | 1,290 | ||||||
Payable for investments in Affiliates purchased | 103 | 35 | ||||||
Deposits from counterparty | 0 | 8,945 | ||||||
Payable for Fund shares redeemed | 42 | 13,460 | ||||||
Accrued investment advisory fees | 0 | 1,399 | ||||||
Accrued supervisory and administrative fees | 14 | 730 | ||||||
Accrued distribution fees | 5 | 36 | ||||||
Accrued servicing fees | 4 | 26 | ||||||
Reimbursement to PIMCO | 0 | 58 | ||||||
Other liabilities | 0 | 28 | ||||||
| 299 | 50,054 | |||||||
Net Assets | $ | 53,575 | $ | 2,851,770 | ||||
Net Assets Consist of: | ||||||||
Paid in capital | $ | 59,208 | $ | 2,454,207 | ||||
Undistributed (overdistributed) net investment income | 390 | (8,075 | ) | |||||
Accumulated undistributed net realized gain (loss) | (2,945 | ) | 1,248 | |||||
Net unrealized appreciation (depreciation) | (3,078 | ) | 404,390 | |||||
| $ | 53,575 | $ | 2,851,770 | |||||
Cost of Investments in Securities | $ | 0 | $ | 2,313,500 | ||||
Cost of Investments in Affiliates | $ | 55,822 | $ | 152,227 | ||||
Cost of Foreign Currency Held | $ | 34 | �� | $ | 783 | |||
Cost or Premiums of Financial Derivative Instruments, net | $ | 79 | $ | 0 | ||||
* Includes repurchase agreements of: | $ | 0 | $ | 1,191 | ||||
| 38 | PIMCO EQUITY SERIES | See Accompanying Notes |
Table of Contents
December 31, 2013 (Unaudited)
| (Amounts in thousands, except per share amounts) | PIMCO Emerging Multi-Asset Fund | PIMCO EqS Pathfinder Fund® | ||||||
Net Assets: | ||||||||
Institutional Class | $ | 27,787 | $ | 2,623,946 | ||||
Class P | 1,977 | 79,904 | ||||||
Administrative Class | 1,905 | NA | ||||||
Class D | 5,686 | 18,497 | ||||||
Class A | 11,537 | 76,995 | ||||||
Class C | 4,652 | 52,407 | ||||||
Class R | 31 | 21 | ||||||
Shares Issued and Outstanding: | ||||||||
Institutional Class | 3,197 | 219,243 | ||||||
Class P | 228 | 6,692 | ||||||
Administrative Class | 220 | NA | ||||||
Class D | 656 | 1,558 | ||||||
Class A | 1,335 | 6,461 | ||||||
Class C | 544 | 4,477 | ||||||
Class R | 4 | 2 | ||||||
Net Asset Value and Redemption Price^ Per Share Outstanding: | ||||||||
Institutional Class | $ | 8.69 | $ | 11.97 | ||||
Class P | 8.67 | 11.94 | ||||||
Administrative Class | 8.64 | NA | ||||||
Class D | 8.67 | 11.87 | ||||||
Class A | 8.64 | 11.92 | ||||||
Class C | 8.55 | 11.71 | ||||||
Class R | 8.61 | 11.78 | ||||||
| ^ | With respect to the A and C Classes, the redemption price varies by the length of time the shares are held. |
| SEMIANNUAL REPORT | DECEMBER 31, 2013 | 39 |
Table of Contents
| Six Months Ended December 31, 2013 (Unaudited) | ||||||||||||||||
| (Amounts in thousands) | PIMCO Dividend and Income Builder Fund | PIMCO EqS® Dividend Fund | PIMCO EqS® Emerging Markets Fund | PIMCO EqS® Long/Short Fund | ||||||||||||
Investment Income: | ||||||||||||||||
Interest | $ | 1,350 | $ | 0 | $ | 8 | $ | 10 | ||||||||
Dividends, net of foreign taxes* | 9,169 | 10,826 | 2,524 | 2,809 | ||||||||||||
Dividends from Investments in Affiliates | 36 | 17 | 57 | 180 | ||||||||||||
Total Income | 10,555 | 10,843 | 2,589 | 2,999 | ||||||||||||
Expenses: | ||||||||||||||||
Investment advisory fees | 2,136 | 2,243 | 2,401 | 3,265 | ||||||||||||
Supervisory and administrative fees | 1,200 | 1,021 | 1,088 | 1,529 | ||||||||||||
Distribution and/or servicing fees - Class D | 36 | 12 | 2 | 44 | ||||||||||||
Distribution fees - Class C | 743 | 114 | 5 | 188 | ||||||||||||
Distribution fees - Class R | 1 | 0 | 0 | 0 | ||||||||||||
Servicing fees - Class A | 259 | 59 | 7 | 125 | ||||||||||||
Servicing fees - Class C | 248 | 38 | 2 | 63 | ||||||||||||
Dividends on short sales | 0 | 0 | 0 | 1,881 | ||||||||||||
Interest expense | 2 | 1 | 4 | 215 | ||||||||||||
Miscellaneous expense | 16 | 18 | 13 | 53 | ||||||||||||
Total Expenses | 4,641 | 3,506 | 3,522 | 7,363 | ||||||||||||
Waiver and/or Reimbursement by PIMCO | (496 | ) | (522 | ) | (482 | ) | (158 | ) | ||||||||
Net Expenses | 4,145 | 2,984 | 3,040 | 7,205 | ||||||||||||
Net Investment Income (Loss) | 6,410 | 7,859 | (451 | ) | (4,206 | ) | ||||||||||
Net Realized Gain (Loss): | ||||||||||||||||
Investments in securities | 3,404 | 22,725 | (512 | ) | 50,780 | |||||||||||
Investments in Affiliates | 1 | (1 | ) | 0 | (27 | ) | ||||||||||
Exchange-traded or centrally cleared financial derivative instruments | (2,563 | ) | (2,944 | ) | (984 | ) | 564 | |||||||||
Over the counter financial derivative instruments | 433 | (50 | ) | (3,655 | ) | (578 | ) | |||||||||
Short sales | 0 | 0 | 0 | (7,042 | ) | |||||||||||
Foreign currency | 149 | 197 | (243 | ) | (185 | ) | ||||||||||
Net Realized Gain (Loss) | 1,424 | 19,927 | (5,394 | ) | 43,512 | |||||||||||
Net Change in Unrealized Appreciation (Depreciation): | ||||||||||||||||
Investments in securities | 53,863 | 38,898 | 27,675 | 50,061 | ||||||||||||
Investments in Affiliates | (2 | ) | 0 | (7 | ) | (7 | ) | |||||||||
Exchange-traded or centrally cleared financial derivative instruments | (231 | ) | (633 | ) | 95 | (3,090 | ) | |||||||||
Over the counter financial derivative instruments | 729 | 791 | 8,935 | (472 | ) | |||||||||||
Short sales | 0 | 0 | 0 | (9,121 | ) | |||||||||||
Foreign currency assets and liabilities | 72 | 147 | (24 | ) | 271 | |||||||||||
Net Change in Unrealized Appreciation | 54,431 | 39,203 | 36,674 | 37,642 | ||||||||||||
Net Gain | 55,855 | 59,130 | 31,280 | 81,154 | ||||||||||||
Net Increase in Net Assets Resulting from Operations | $ | 62,265 | $ | 66,989 | $ | 30,829 | $ | 76,948 | ||||||||
* Foreign tax withholdings - Dividends | $ | 421 | $ | 537 | $ | 214 | $ | 17 | ||||||||
| 40 | PIMCO EQUITY SERIES | See Accompanying Notes |
Table of Contents
Consolidated Statements of Operations
| Six Months Ended December 31, 2013 (Unaudited) | ||||||||
| (Amounts in thousands) | PIMCO Emerging Multi-Asset Fund | PIMCO EqS Pathfinder Fund® | ||||||
Investment Income: | ||||||||
Interest | $ | 0 | $ | 3 | ||||
Dividends, net of foreign taxes* | 0 | 28,532 | ||||||
Dividends from Investments in Affiliates | 995 | 200 | ||||||
Total Income | 995 | 28,735 | ||||||
Expenses: | ||||||||
Investment advisory fees | 275 | 8,932 | ||||||
Supervisory and administrative fees | 150 | 3,675 | ||||||
Distribution and/or servicing fees - Administrative Class | 3 | 0 | ||||||
Distribution and/or servicing fees - Class D | 8 | 22 | ||||||
Distribution fees - Class C | 18 | 166 | ||||||
Servicing fees - Class A | 15 | 86 | ||||||
Servicing fees - Class C | 6 | 55 | ||||||
Dividends on short sales | 0 | 43 | ||||||
Interest expense | 0 | 20 | ||||||
Miscellaneous expense | 2 | 64 | ||||||
Total Expenses | 477 | 13,063 | ||||||
Waiver and/or Reimbursement by PIMCO | (329 | ) | (1,988 | ) | ||||
Net Expenses | 148 | 11,075 | ||||||
Net Investment Income | 847 | 17,660 | ||||||
Net Realized Gain (Loss): | ||||||||
Investments in securities | 153 | 64,770 | ||||||
Investments in Affiliates | (1,022 | ) | 29 | |||||
Exchange-traded or centrally cleared financial derivative instruments | (251 | ) | 90 | |||||
Over the counter financial derivative instruments | (128 | ) | (4,293 | ) | ||||
Short sales | 0 | (1,988 | ) | |||||
Foreign currency | (1 | ) | (288 | ) | ||||
Net Realized Gain (Loss) | (1,249 | ) | 58,320 | |||||
Net Change in Unrealized Appreciation (Depreciation): | ||||||||
Investments in securities | 0 | 242,002 | ||||||
Investments in Affiliates | 1,874 | (19 | ) | |||||
Exchange-traded or centrally cleared financial derivative instruments | 16 | (935 | ) | |||||
Over the counter financial derivative instruments | 162 | (10,287 | ) | |||||
Short sales | 0 | 197 | ||||||
Foreign currency assets and liabilities | 2 | 97 | ||||||
Net Change in Unrealized Appreciation | 2,054 | 231,055 | ||||||
Net Gain | 805 | 289,375 | ||||||
Net Increase in Net Assets Resulting from Operations | $ | 1,652 | $ | 307,035 | ||||
* Foreign tax withholdings - Dividends | $ | 0 | $ | 1,518 | ||||
| SEMIANNUAL REPORT | DECEMBER 31, 2013 | 41 |
Table of Contents
Statements of Changes in Net Assets
| PIMCO Dividend and Income Builder Fund | PIMCO EqS® Dividend Fund | PIMCO EqS® Emerging Markets Fund | PIMCO EqS® Long/Short Fund | |||||||||||||||||||||||||||||
| (Amounts in thousands) | Six Months Ended December 31, 2013 (Unaudited) | Year Ended June 30, 2013 | Six Months Ended December 31, 2013 (Unaudited) | Year Ended June 30, 2013 | Six Months Ended December 31, 2013 (Unaudited) | Year Ended June 30, 2013 | Six Months Ended | Year Ended June 30, 2013 | ||||||||||||||||||||||||
Increase (Decrease) in | ||||||||||||||||||||||||||||||||
Operations: | ||||||||||||||||||||||||||||||||
Net investment income (loss) | $ | 6,410 | $ | 6,920 | $ | 7,859 | $ | 18,361 | $ | (451 | ) | $ | 8,322 | $ | (4,206 | ) | $ | 3,879 | ||||||||||||||
Net realized gain (loss) | 1,424 | (1,730 | ) | 19,927 | 18,234 | (5,394 | ) | 627 | 43,512 | 15,236 | ||||||||||||||||||||||
Net change in unrealized appreciation | 54,431 | 7,508 | 39,203 | 33,325 | 36,674 | 17,587 | 37,642 | 21,700 | ||||||||||||||||||||||||
Net increase resulting from operations | 62,265 | 12,698 | 66,989 | 69,920 | 30,829 | 26,536 | 76,948 | 40,815 | ||||||||||||||||||||||||
Distributions to Shareholders: | ||||||||||||||||||||||||||||||||
From net investment income | ||||||||||||||||||||||||||||||||
Institutional Class | (1,228 | ) | (1,472 | ) | (11,173 | ) | (16,060 | ) | 0 | (5,839 | ) | (2,688 | ) | (1,029 | ) | |||||||||||||||||
Class P | (1,716 | ) | (1,556 | ) | (77 | ) | (30 | ) | 0 | (2 | ) | (663 | ) | (9 | ) | |||||||||||||||||
Administrative Class | 0 | 0 | 0 | 0 | 0 | (0 | )^ | 0 | 0 | |||||||||||||||||||||||
Class D | (413 | ) | (604 | ) | (186 | ) | (149 | ) | 0 | (10 | ) | (316 | ) | (2 | ) | |||||||||||||||||
Class A | (3,038 | ) | (1,667 | ) | (972 | ) | (359 | ) | 0 | (33 | ) | (1,080 | ) | (15 | ) | |||||||||||||||||
Class C | (2,218 | ) | (860 | ) | (515 | ) | (161 | ) | 0 | (6 | ) | (463 | ) | (2 | ) | |||||||||||||||||
Class R | (4 | ) | (8 | ) | (2 | ) | (1 | ) | 0 | (0 | )^ | 0 | 0 | |||||||||||||||||||
From net realized capital gains | ||||||||||||||||||||||||||||||||
Institutional Class | 0 | (52 | ) | (25,541 | ) | (839 | ) | 0 | 0 | (23,512 | ) | 0 | ||||||||||||||||||||
Class P | 0 | (48 | ) | �� | (199 | ) | (2 | ) | 0 | 0 | (4,678 | ) | 0 | |||||||||||||||||||
Administrative Class | 0 | 0 | 0 | 0 | 0 | 0 | 0 | 0 | ||||||||||||||||||||||||
Class D | 0 | (28 | ) | (465 | ) | (9 | ) | 0 | 0 | (2,765 | ) | 0 | ||||||||||||||||||||
Class A | 0 | (60 | ) | (2,702 | ) | (18 | ) | 0 | 0 | (8,208 | ) | 0 | ||||||||||||||||||||
Class C | 0 | (36 | ) | (1,844 | ) | (7 | ) | 0 | 0 | (4,823 | ) | 0 | ||||||||||||||||||||
Class R | 0 | (0 | )^ | (5 | ) | (0 | )^ | 0 | 0 | 0 | 0 | |||||||||||||||||||||
Total Distributions | (8,617 | ) | (6,391 | ) | (43,681 | ) | (17,635 | ) | 0 | (5,890 | ) | (49,196 | ) | (1,057 | ) | |||||||||||||||||
Portfolio Share Transactions: | ||||||||||||||||||||||||||||||||
Net increase (decrease) resulting from Fund share transactions** | 392,836 | 333,087 | (45,391 | ) | 257,478 | (106,227 | ) | (29,138 | ) | 591,924 | 138,604 | |||||||||||||||||||||
Total Increase (Decrease) in Net Assets | 446,484 | 339,394 | (22,083 | ) | 309,763 | (75,398 | ) | (8,492 | ) | 619,676 | 178,362 | |||||||||||||||||||||
Net Assets: | ||||||||||||||||||||||||||||||||
Beginning of period | 382,806 | 43,412 | 630,413 | 320,650 | 510,646 | 519,138 | 391,984 | 213,622 | ||||||||||||||||||||||||
End of period* | $ | 829,290 | $ | 382,806 | $ | 608,330 | $ | 630,413 | $ | 435,248 | $ | 510,646 | $ | 1,011,660 | $ | 391,984 | ||||||||||||||||
* Including undistributed | $ | (1,028 | ) | $ | 1,179 | $ | (2,239 | ) | $ | 2,827 | $ | 1,213 | $ | 1,664 | $ | (4,525 | ) | $ | 4,891 | |||||||||||||
| ** | See note 13 in the Notes to Financial Statements. |
| ^ | Amount is less than $500. |
| 42 | PIMCO EQUITY SERIES | See Accompanying Notes |
Table of Contents
Consolidated Statements of Changes in Net Assets
| PIMCO Emerging Multi-Asset Fund | PIMCO EqS Pathfinder Fund® | |||||||||||||||
| (Amounts in thousands) | Six Months Ended December 31, 2013 (Unaudited) | Year Ended June 30, 2013 | Six Months Ended | Year Ended June 30, 2013 | ||||||||||||
Increase (Decrease) in Net Assets from: | ||||||||||||||||
Operations: | ||||||||||||||||
Net investment income | $ | 847 | $ | 1,478 | $ | 17,660 | $ | 49,210 | ||||||||
Net realized gain (loss) | (1,249 | ) | (886 | ) | 58,320 | (1,580 | ) | |||||||||
Net change in unrealized appreciation (depreciation) | 2,054 | (1,976 | ) | 231,055 | 160,637 | |||||||||||
Net increase (decrease) resulting from operations | 1,652 | (1,384 | ) | 307,035 | 208,267 | |||||||||||
Distributions to Shareholders: | ||||||||||||||||
From net investment income | ||||||||||||||||
Institutional Class | (469 | ) | (773 | ) | (38,137 | ) | (58,239 | ) | ||||||||
Class P | (33 | ) | (47 | ) | (1,112 | ) | (1,444 | ) | ||||||||
Administrative Class | (31 | ) | (2 | ) | 0 | 0 | ||||||||||
Class D | (89 | ) | (84 | ) | (237 | ) | (632 | ) | ||||||||
Class A | (175 | ) | (327 | ) | (976 | ) | (1,599 | ) | ||||||||
Class C | (53 | ) | (104 | ) | (539 | ) | (920 | ) | ||||||||
Class R | (0 | )^ | (1 | ) | (0 | )^ | (0 | )^ | ||||||||
From net realized capital gains | ||||||||||||||||
Institutional Class | 0 | 0 | (49,062 | ) | 0 | |||||||||||
Class P | 0 | 0 | (1,472 | ) | 0 | |||||||||||
Administrative Class | 0 | 0 | 0 | 0 | ||||||||||||
Class D | 0 | 0 | (351 | ) | 0 | |||||||||||
Class A | 0 | 0 | (1,402 | ) | 0 | |||||||||||
Class C | 0 | 0 | (968 | ) | 0 | |||||||||||
Class R | 0 | 0 | (0 | )^ | 0 | |||||||||||
Total Distributions | (850 | ) | (1,338 | ) | (94,256 | ) | (62,834 | ) | ||||||||
Portfolio Share Transactions: | ||||||||||||||||
Net increase (decrease) resulting from Fund share transactions** | (10,460 | ) | 14,985 | 771,417 | (411,869 | ) | ||||||||||
Net Increase (Decrease) in Net Assets | (9,658 | ) | 12,263 | 984,196 | (266,436 | ) | ||||||||||
Net Assets: | ||||||||||||||||
Beginning of period | 63,233 | 50,970 | 1,867,574 | 2,134,010 | ||||||||||||
End of period* | $ | 53,575 | $ | 63,233 | $ | 2,851,770 | $ | 1,867,574 | ||||||||
* Including undistributed (overdistributed) net investment income of: | $ | 390 | $ | 393 | $ | (8,075 | ) | $ | 15,266 | |||||||
| ** | See note 13 in the Notes to Financial Statements. |
| ^ | Amount is less than $500. |
| SEMIANNUAL REPORT | DECEMBER 31, 2013 | 43 |
Table of Contents
| Six Months Ended December 31, 2013 | ||||
| (Amounts in thousands) | PIMCO EqS® Long/Short Fund | |||
Cash flows (used for) operating activities: | ||||
Net increase in net assets resulting from operations | $ | 76,948 | ||
Adjustments to reconcile net increase in net assets from operations to net cash (used for) operating activities: | ||||
Purchases of long-term securities | (1,785,760 | ) | ||
Proceeds from sales of long-term securities | 1,254,649 | |||
Proceeds from sales of short-term portfolio investments, net | 12,005 | |||
(Increase) in deposits with counterparty | (27,915 | ) | ||
Decrease in receivable for investments sold | 8,547 | |||
(Increase) in interest and dividends receivable | (405 | ) | ||
Decrease in exchange-traded or centrally cleared derivatives | 1,034 | |||
(Increase) in over the counter derivatives | (578 | ) | ||
(Decrease) in payable for investments purchased | (18,365 | ) | ||
Increase in deposits from counterparty | 290 | |||
Increase in accrued investment advisory fees | 531 | |||
Increase in accrued supervisory and administrative fees | 251 | |||
Increase in accrued distribution fee | 71 | |||
Increase in accrued servicing fee | 54 | |||
Increase in reimbursement to PIMCO | 1 | |||
Proceeds from short sales transactions, net | 22,608 | |||
Payments on currency transactions | (163 | ) | ||
Net Realized (Gain) Loss | ||||
Investments in securities | (50,780 | ) | ||
Investments in Affiliates | 27 | |||
Exchange-traded or centrally cleared financial derivative instruments | (564 | ) | ||
Over the counter financial derivative instruments | 578 | |||
Short sales | 7,042 | |||
Foreign currency | 185 | |||
Net Change in Unrealized (Appreciation) Depreciation | ||||
Investments in securities | (50,061 | ) | ||
Investments in Affiliates | 7 | |||
Exchange-traded or centrally cleared financial derivative instruments | 3,090 | |||
Over the counter financial derivative instruments | 472 | |||
Short sales | 9,121 | |||
Foreign currency assets and liabilities | (271 | ) | ||
Net amortization (accretion) on investments | (1 | ) | ||
Net cash (used for) operating activities | (537,352 | ) | ||
Cash flows received from financing activities: | ||||
Proceeds from shares sold | 611,569 | |||
Payments on shares redeemed | (73,964 | ) | ||
Cash dividend paid* | (255 | ) | ||
Net cash received from financing activities | 537,350 | |||
Net Decrease in Cash and Foreign Currency | (2 | ) | ||
Cash and Foreign Currency: | ||||
Beginning of period | 3 | |||
End of period | $ | 1 | ||
* Reinvestment of dividends | $ | 48,941 | ||
Supplemental disclosure of cash flow information: | ||||
Interest expense paid during the period | $ | 162 | ||
| 44 | PIMCO EQUITY SERIES | See Accompanying Notes |
Table of Contents
Schedule of Investments PIMCO Dividend and Income Builder Fund
December 31, 2013 (Unaudited)
| PRINCIPAL AMOUNT (000S) | MARKET VALUE (000S) | |||||||||||
| INVESTMENTS IN SECURITIES 98.0% | ||||||||||||
| ASSET-BACKED SECURITIES 1.5% | ||||||||||||
| UNITED STATES 1.5% | ||||||||||||
Credit Suisse First Boston Mortgage Securities Corp. |
| |||||||||||
0.785% due 01/25/2032 | $ | 16 | $ | 15 | ||||||||
EMC Mortgage Loan Trust |
| |||||||||||
0.815% due 02/25/2041 | 74 | 68 | ||||||||||
GSAMP Trust |
| |||||||||||
0.315% due 12/25/2046 | 5,279 | 2,907 | ||||||||||
HSI Asset Securitization Corp. Trust |
| |||||||||||
0.335% due 12/25/2036 | 6,565 | 2,918 | ||||||||||
JPMorgan Mortgage Acquisition Trust |
| |||||||||||
5.338% due 11/25/2036 | 200 | 199 | ||||||||||
Morgan Stanley Home Equity Loan Trust |
| |||||||||||
0.265% due 12/25/2036 | 215 | 120 | ||||||||||
Residential Asset Securities Corp. Trust |
| |||||||||||
1.050% due 01/25/2034 | 3,043 | 2,701 | ||||||||||
Structured Asset Investment Loan Trust |
| |||||||||||
0.315% due 09/25/2036 | 5,335 | 3,951 | ||||||||||
|
| |||||||||||
Total Asset-Backed Securities | 12,879 | |||||||||||
|
| |||||||||||
| SHARES | ||||||||||||
| COMMON STOCKS 86.8% | ||||||||||||
| BERMUDA 0.9% | ||||||||||||
| ENERGY 0.9% | ||||||||||||
Golar LNG Partners LP | 245,184 | 7,417 | ||||||||||
|
| |||||||||||
Total Bermuda | 7,417 | |||||||||||
|
| |||||||||||
| BRAZIL 5.2% | ||||||||||||
| FINANCIALS 1.4% | ||||||||||||
BB Seguridade Participacoes S.A. | 1,093,708 | 11,358 | ||||||||||
|
| |||||||||||
| INDUSTRIALS 0.9% | ||||||||||||
Arteris S.A. | 932,800 | 7,532 | ||||||||||
|
| |||||||||||
| UTILITIES 2.9% | ||||||||||||
Cia de Saneamento Basico do Estado de Sao Paulo | 1,905,148 | 21,604 | ||||||||||
Light S.A. | 279,200 | 2,626 | ||||||||||
|
| |||||||||||
| 24,230 | ||||||||||||
|
| |||||||||||
Total Brazil | 43,120 | |||||||||||
|
| |||||||||||
| CHINA 1.4% | ||||||||||||
| INDUSTRIALS 1.4% | ||||||||||||
Guangshen Railway Co. Ltd. ‘H’ | 8,008,000 | 3,738 | ||||||||||
Zhejiang Expressway Co. Ltd. ‘H’ | 8,006,000 | 7,600 | ||||||||||
|
| |||||||||||
| 11,338 | ||||||||||||
|
| |||||||||||
Total China |
| 11,338 | ||||||||||
|
| |||||||||||
| CYPRUS 2.5% | ||||||||||||
| ENERGY 2.5% | ||||||||||||
ProSafe SE | 2,666,699 | 20,631 | ||||||||||
|
| |||||||||||
Total Cyprus | 20,631 | |||||||||||
|
| |||||||||||
| SHARES | MARKET VALUE (000S) | |||||||||||
| FRANCE 3.9% | ||||||||||||
| ENERGY 2.7% | ||||||||||||
Total S.A. | 362,081 | $ | 22,224 | |||||||||
|
| |||||||||||
| FINANCIALS 1.2% | ||||||||||||
CNP Assurances | 485,490 | 9,956 | ||||||||||
|
| |||||||||||
Total France | 32,180 | |||||||||||
|
| |||||||||||
| HONG KONG 0.5% | ||||||||||||
| INDUSTRIALS 0.5% | ||||||||||||
Yuexiu Transport Infrastructure Ltd. | 7,230,000 | 3,818 | ||||||||||
|
| |||||||||||
Total Hong Kong | 3,818 | |||||||||||
|
| |||||||||||
| ITALY 0.9% | ||||||||||||
| INDUSTRIALS 0.9% | ||||||||||||
Societa Iniziative Autostradali e Servizi SpA | 742,496 | 7,386 | ||||||||||
|
| |||||||||||
Total Italy | 7,386 | |||||||||||
|
| |||||||||||
| JAPAN 3.0% | ||||||||||||
| TELECOMMUNICATION SERVICES 3.0% | ||||||||||||
Nippon Telegraph & Telephone Corp. | 468,200 | 25,217 | ||||||||||
|
| |||||||||||
Total Japan | 25,217 | |||||||||||
|
| |||||||||||
| NETHERLANDS 3.3% | ||||||||||||
| ENERGY 1.4% | ||||||||||||
Royal Dutch Shell PLC ‘A’ | 314,789 | 11,282 | ||||||||||
|
| |||||||||||
| FINANCIALS 1.9% | ||||||||||||
Aegon NV | 1,664,240 | 15,771 | ||||||||||
|
| |||||||||||
Total Netherlands | 27,053 | |||||||||||
|
| |||||||||||
| PANAMA 0.4% | ||||||||||||
| INDUSTRIALS 0.4% | ||||||||||||
Copa Holdings S.A. ‘A’ | 23,588 | 3,777 | ||||||||||
|
| |||||||||||
Total Panama | 3,777 | |||||||||||
|
| |||||||||||
| SOUTH AFRICA 3.6% | ||||||||||||
| CONSUMER DISCRETIONARY 0.9% | ||||||||||||
Imperial Holdings Ltd. | 390,572 | 7,552 | ||||||||||
|
| |||||||||||
| HEALTH CARE 0.9% | ||||||||||||
Life Healthcare Group Holdings Ltd. | 1,857,310 | 7,418 | ||||||||||
|
| |||||||||||
| TELECOMMUNICATION SERVICES 1.8% | ||||||||||||
MTN Group Ltd. | 734,952 | 15,222 | ||||||||||
|
| |||||||||||
Total South Africa | 30,192 | |||||||||||
|
| |||||||||||
| SPAIN 2.9% | ||||||||||||
| UTILITIES 2.9% | ||||||||||||
Enagas S.A. | 929,667 | 24,285 | ||||||||||
|
| |||||||||||
Total Spain | 24,285 | |||||||||||
|
| |||||||||||
| SHARES | MARKET VALUE (000S) | |||||||||||
| SWITZERLAND 3.2% | ||||||||||||
| HEALTH CARE 3.2% | ||||||||||||
Roche Holding AG | 94,192 | $ | 26,386 | |||||||||
|
| |||||||||||
Total Switzerland | 26,386 | |||||||||||
|
| |||||||||||
| TAIWAN 1.4% | ||||||||||||
| INFORMATION TECHNOLOGY 1.4% | ||||||||||||
Radiant Opto-Electronics Corp. | 3,152,590 | 11,564 | ||||||||||
|
| |||||||||||
Total Taiwan | 11,564 | |||||||||||
|
| |||||||||||
| THAILAND 0.2% | ||||||||||||
| INDUSTRIALS 0.2% | ||||||||||||
Bangkok Expressway PCL | 1,675,100 | 1,713 | ||||||||||
|
| |||||||||||
Total Thailand | 1,713 | |||||||||||
|
| |||||||||||
| TURKEY 1.0% | ||||||||||||
| INDUSTRIALS 1.0% | ||||||||||||
TAV Havalimanlari Holding A/S | 1,113,214 | 8,015 | ||||||||||
|
| |||||||||||
Total Turkey | 8,015 | |||||||||||
|
| |||||||||||
| UNITED KINGDOM 10.9% | ||||||||||||
| CONSUMER DISCRETIONARY 1.1% | ||||||||||||
Marks & Spencer Group PLC | 1,263,374 | 9,072 | ||||||||||
|
| |||||||||||
| CONSUMER STAPLES 2.2% | ||||||||||||
Imperial Tobacco Group PLC | 485,639 | 18,827 | ||||||||||
|
| |||||||||||
| FINANCIALS 7.6% | ||||||||||||
HSBC Holdings PLC | 2,730,313 | 29,963 | ||||||||||
Intermediate Capital Group PLC | 1,457,667 | 10,164 | ||||||||||
Standard Chartered PLC | 1,004,501 | 22,688 | ||||||||||
|
| |||||||||||
| 62,815 | ||||||||||||
|
| |||||||||||
Total United Kingdom |
| 90,714 | ||||||||||
|
| |||||||||||
| UNITED STATES 41.6% | ||||||||||||
| CONSUMER DISCRETIONARY 10.2% | ||||||||||||
AMC Entertainment Holdings, Inc. ‘A’ (a) | 198,204 | 4,073 | ||||||||||
Coach, Inc. | 265,649 | 14,911 | ||||||||||
Foot Locker, Inc. | 364,969 | 15,124 | ||||||||||
General Motors Co. (a) | 455,750 | 18,627 | ||||||||||
Kohl’s Corp. | 298,007 | 16,912 | ||||||||||
Staples, Inc. | 932,539 | 14,818 | ||||||||||
|
| |||||||||||
| 84,465 | ||||||||||||
|
| |||||||||||
| CONSUMER STAPLES 2.2% | ||||||||||||
Walgreen Co. | 323,902 | 18,605 | ||||||||||
|
| |||||||||||
| ENERGY 2.3% | ||||||||||||
Marathon Petroleum Corp. | 210,053 | 19,268 | ||||||||||
|
| |||||||||||
| FINANCIALS 10.9% | ||||||||||||
Apollo Investment Corp. | 875,643 | 7,425 | ||||||||||
Blackstone Group LP | 250,396 | 7,888 | ||||||||||
| See Accompanying Notes | SEMIANNUAL REPORT | DECEMBER 31, 2013 | 45 |
Table of Contents
Schedule of Investments PIMCO Dividend and Income Builder Fund (Cont.)
| SHARES | MARKET VALUE (000S) | |||||||||||
JPMorgan Chase & Co. | 383,411 | $ | 22,422 | |||||||||
KeyCorp | 1,388,015 | 18,627 | ||||||||||
Prudential Financial, Inc. | 181,580 | 16,745 | ||||||||||
Solar Capital Ltd. | 574,233 | 12,949 | ||||||||||
Solar Senior Capital Ltd. | 235,130 | 4,284 | ||||||||||
|
| |||||||||||
| 90,340 | ||||||||||||
|
| |||||||||||
| HEALTH CARE 3.8% | ||||||||||||
Medtronic, Inc. | 218,739 | 12,554 | ||||||||||
Merck & Co., Inc. | 376,587 | 18,848 | ||||||||||
|
| |||||||||||
| 31,402 | ||||||||||||
|
| |||||||||||
| INFORMATION TECHNOLOGY 10.4% | ||||||||||||
Cisco Systems, Inc. | 1,345,553 | 30,208 | ||||||||||
Microsoft Corp. | 402,284 | 15,057 | ||||||||||
Qualcomm, Inc. | 349,629 | 25,960 | ||||||||||
Western Digital Corp. | 178,471 | 14,974 | ||||||||||
|
| |||||||||||
| 86,199 | ||||||||||||
|
| |||||||||||
| MATERIALS 1.8% | ||||||||||||
Tronox Ltd. ‘A’ | 647,006 | 14,926 | ||||||||||
|
| |||||||||||
Total United States | 345,205 | |||||||||||
|
| |||||||||||
Total Common Stocks | 720,011 | |||||||||||
|
| |||||||||||
| PRINCIPAL AMOUNT (000S) | ||||||||||||
| CORPORATE BONDS & NOTES 2.9% | ||||||||||||
| AUSTRIA 0.0% | ||||||||||||
| INDUSTRIALS 0.0% | ||||||||||||
OGX Austria GmbH |
| |||||||||||
8.500% due 06/01/2018 ^ | $ | 200 | 17 | |||||||||
8.375% due 04/01/2022 ^ | 200 | 17 | ||||||||||
|
| |||||||||||
| 34 | ||||||||||||
|
| |||||||||||
Total Austria | 34 | |||||||||||
|
| |||||||||||
| BRAZIL 0.1% | ||||||||||||
| BANKING & FINANCE 0.0% | ||||||||||||
Banco Votorantim S.A. |
| |||||||||||
5.250% due 02/11/2016 | 200 | 208 | ||||||||||
BM&FBovespa S.A. |
| |||||||||||
5.500% due 07/16/2020 | 200 | 211 | ||||||||||
|
| |||||||||||
| 419 | ||||||||||||
|
| |||||||||||
| UTILITIES 0.1% | ||||||||||||
Centrais Eletricas Brasileiras S.A. |
| |||||||||||
6.875% due 07/30/2019 | 400 | 430 | ||||||||||
|
| |||||||||||
Total Brazil | 849 | |||||||||||
|
| |||||||||||
| CAYMAN ISLANDS 0.0% | ||||||||||||
| UTILITIES 0.0% | ||||||||||||
Odebrecht Drilling Norbe Ltd. |
| |||||||||||
6.350% due 06/30/2021 | 180 | 185 | ||||||||||
|
| |||||||||||
Total Cayman Islands | 185 | |||||||||||
|
| |||||||||||
| �� | PRINCIPAL AMOUNT (000S) | MARKET VALUE (000S) | ||||||||||
| FRANCE 0.2% | ||||||||||||
| BANKING & FINANCE 0.1% | ||||||||||||
Banque PSA Finance S.A. |
| |||||||||||
2.146% due 04/04/2014 | $ | 250 | $ | 250 | ||||||||
BPCE S.A. | ||||||||||||
12.500% due 09/30/2019 (b) | EUR | 300 | 544 | |||||||||
12.500% due 12/31/2049 | $ | 100 | 131 | |||||||||
RCI Banque S.A. |
| |||||||||||
4.600% due 04/12/2016 | 100 | 106 | ||||||||||
|
| |||||||||||
| 1,031 | ||||||||||||
|
| |||||||||||
| INDUSTRIALS 0.1% | ||||||||||||
Europcar Groupe S.A. |
| |||||||||||
11.500% due 05/15/2017 | EUR | 200 | 322 | |||||||||
|
| |||||||||||
Total France | 1,353 | |||||||||||
|
| |||||||||||
| GERMANY 0.1% | ||||||||||||
| INDUSTRIALS 0.1% | ||||||||||||
KP Germany Erste GmbH |
| |||||||||||
11.625% due 07/15/2017 | 100 | 159 | ||||||||||
Orion Engineered Carbons Bondco GmbH |
| |||||||||||
10.000% due 06/15/2018 | 180 | 275 | ||||||||||
|
| |||||||||||
| 434 | ||||||||||||
|
| |||||||||||
Total Germany | 434 | |||||||||||
|
| |||||||||||
| GUERNSEY, CHANNEL ISLANDS 0.0% | ||||||||||||
| BANKING & FINANCE 0.0% | ||||||||||||
Doric Nimrod Air Finance Alpha Ltd. Pass-Through Trust |
| |||||||||||
5.125% due 11/30/2024 | $ | 375 | 381 | |||||||||
|
| |||||||||||
Total Guernsey, Channel Islands |
| 381 | ||||||||||
|
| |||||||||||
| IRELAND 0.1% | ||||||||||||
| INDUSTRIALS 0.1% | ||||||||||||
Nara Cable Funding Ltd. | ||||||||||||
8.875% due 12/01/2018 | EUR | 300 | 449 | |||||||||
Vimpel Communications Via VIP Finance Ireland Ltd. OJSC |
| |||||||||||
6.493% due 02/02/2016 | $ | 400 | 429 | |||||||||
|
| |||||||||||
| 878 | ||||||||||||
|
| |||||||||||
| UTILITIES 0.0% | ||||||||||||
Novatek OAO via Novatek Finance Ltd. |
| |||||||||||
5.326% due 02/03/2016 | 300 | 320 | ||||||||||
|
| |||||||||||
Total Ireland | 1,198 | |||||||||||
|
| |||||||||||
| ITALY 0.1% | ||||||||||||
| BANKING & FINANCE 0.1% | ||||||||||||
Intesa Sanpaolo SpA |
| |||||||||||
6.500% due 02/24/2021 | 600 | 657 | ||||||||||
3.125% due 01/15/2016 | 100 | 102 | ||||||||||
|
| |||||||||||
| 759 | ||||||||||||
|
| |||||||||||
| UTILITIES 0.0% | ||||||||||||
Telecom Italia SpA |
| |||||||||||
6.375% due 06/24/2019 | GBP | 150 | 261 | |||||||||
|
| |||||||||||
Total Italy | 1,020 | |||||||||||
|
| |||||||||||
| PRINCIPAL AMOUNT (000S) | MARKET VALUE (000S) | |||||||||||
| JAPAN 0.1% | ||||||||||||
| UTILITIES 0.1% | ||||||||||||
Tokyo Electric Power Co., Inc. |
| |||||||||||
4.500% due 03/24/2014 | EUR | 300 | $ | 415 | ||||||||
|
| |||||||||||
Total Japan | 415 | |||||||||||
|
| |||||||||||
| LUXEMBOURG 0.2% | ||||||||||||
| BANKING & FINANCE 0.0% | ||||||||||||
Fiat Finance & Trade S.A. |
| |||||||||||
7.625% due 09/15/2014 | 100 | 143 | ||||||||||
|
| |||||||||||
| INDUSTRIALS 0.1% | ||||||||||||
INEOS Group Holdings S.A. | ||||||||||||
7.875% due 02/15/2016 | 135 | 187 | ||||||||||
Wind Acquisition Finance S.A. |
| |||||||||||
7.250% due 02/15/2018 | $ | 400 | 423 | |||||||||
7.375% due 02/15/2018 | EUR | 100 | 146 | |||||||||
11.750% due 07/15/2017 | 100 | 147 | ||||||||||
|
| |||||||||||
| 903 | ||||||||||||
|
| |||||||||||
| UTILITIES 0.1% | ||||||||||||
Gazprom OAO Via Gaz Capital S.A. |
| |||||||||||
9.250% due 04/23/2019 | $ | 200 | 247 | |||||||||
|
| |||||||||||
Total Luxembourg | 1,293 | |||||||||||
|
| |||||||||||
| MEXICO 0.0% | ||||||||||||
| INDUSTRIALS 0.0% | ||||||||||||
America Movil S.A.B. de C.V. | ||||||||||||
8.460% due 12/18/2036 | MXN | 1,000 | 72 | |||||||||
Corp. GEO S.A.B. de C.V. | ||||||||||||
8.875% due 03/27/2022 ^ | $ | 300 | 45 | |||||||||
9.250% due 06/30/2020 ^ | 100 | 15 | ||||||||||
Desarrolladora Homex S.A.B. de C.V. |
| |||||||||||
7.500% due 09/28/2015 ^ | 300 | 37 | ||||||||||
|
| |||||||||||
| 169 | ||||||||||||
|
| |||||||||||
Total Mexico | 169 | |||||||||||
|
| |||||||||||
| NETHERLANDS 0.2% | ||||||||||||
| BANKING & FINANCE 0.1% | ||||||||||||
GMAC International Finance BV | ||||||||||||
7.500% due 04/21/2015 | EUR | 100 | 148 | |||||||||
Rabobank Group | ||||||||||||
6.875% due 03/19/2020 | 400 | 625 | ||||||||||
|
| |||||||||||
| 773 | ||||||||||||
|
| |||||||||||
| INDUSTRIALS 0.0% | ||||||||||||
Schaeffler Finance BV | ||||||||||||
7.750% due 02/15/2017 | $ | 100 | 114 | |||||||||
Schaeffler Holding Finance BV | ||||||||||||
6.875% due 08/15/2018 | EUR | 100 | 148 | |||||||||
UPC Holding BV | ||||||||||||
9.875% due 04/15/2018 | $ | 100 | 107 | |||||||||
|
| |||||||||||
| 369 | ||||||||||||
|
| |||||||||||
| UTILITIES 0.1% | ||||||||||||
Koninklijke KPN NV | ||||||||||||
6.125% due 09/14/2018 (b) | EUR | 300 | 435 | |||||||||
|
| |||||||||||
Total Netherlands | 1,577 | |||||||||||
|
| |||||||||||
| 46 | PIMCO EQUITY SERIES | See Accompanying Notes |
Table of Contents
December 31, 2013 (Unaudited)
| PRINCIPAL AMOUNT (000S) | MARKET VALUE (000S) | |||||||||||
| NORWAY 0.0% | ||||||||||||
| BANKING & FINANCE 0.0% | ||||||||||||
Eksportfinans ASA | ||||||||||||
1.600% due 03/20/2014 | JPY | 10,000 | $ | 94 | ||||||||
3.000% due 11/17/2014 | $ | 135 | 136 | |||||||||
|
| |||||||||||
| 230 | ||||||||||||
|
| |||||||||||
Total Norway | 230 | |||||||||||
|
| |||||||||||
| SOUTH AFRICA 0.1% | ||||||||||||
| INDUSTRIALS 0.1% | ||||||||||||
AngloGold Ashanti Holdings PLC | ||||||||||||
6.500% due 04/15/2040 | 200 | 156 | ||||||||||
Foodcorp Pty. Ltd. | ||||||||||||
8.750% due 03/01/2018 | EUR | 179 | 271 | |||||||||
|
| |||||||||||
| 427 | ||||||||||||
|
| |||||||||||
Total South Africa | 427 | |||||||||||
|
| |||||||||||
| SPAIN 0.1% | ||||||||||||
| BANKING & FINANCE 0.1% | ||||||||||||
Bankia S.A. | ||||||||||||
0.422% due 01/25/2016 | 400 | 530 | ||||||||||
BBVA U.S. Senior S.A.U. | ||||||||||||
4.664% due 10/09/2015 | $ | 300 | 315 | |||||||||
|
| |||||||||||
| 845 | ||||||||||||
|
| |||||||||||
| INDUSTRIALS 0.0% | ||||||||||||
Obrascon Huarte Lain S.A. | ||||||||||||
8.750% due 03/15/2018 | EUR | 200 | 307 | |||||||||
|
| |||||||||||
Total Spain | 1,152 | |||||||||||
|
| |||||||||||
| UNITED KINGDOM 0.7% | ||||||||||||
| BANKING & FINANCE 0.4% | ||||||||||||
Barclays Bank PLC |
| |||||||||||
14.000% due 06/15/2019 (b) | GBP | 300 | 663 | |||||||||
Co-operative Group Holdings |
| |||||||||||
6.875% due 07/08/2020 | 200 | 342 | ||||||||||
LBG Capital PLC |
| |||||||||||
7.869% due 08/25/2020 | 100 | 177 | ||||||||||
15.000% due 12/21/2019 | 300 | 722 | ||||||||||
Mitchells & Butlers Finance PLC |
| |||||||||||
0.975% due 12/15/2028 | 176 | 264 | ||||||||||
Royal Bank of Scotland PLC |
| |||||||||||
6.934% due 04/09/2018 | EUR | 200 | 313 | |||||||||
9.500% due 03/16/2022 | $ | 200 | 235 | |||||||||
Virgin Media Secured Finance PLC |
| |||||||||||
5.500% due 01/15/2021 | GBP | 200 | 334 | |||||||||
|
| |||||||||||
| 3,050 | ||||||||||||
|
| |||||||||||
| INDUSTRIALS 0.3% | ||||||||||||
Algeco Scotsman Global Finance PLC |
| |||||||||||
8.500% due 10/15/2018 | $ | 400 | 435 | |||||||||
DFS Furniture Holdings PLC |
| |||||||||||
7.625% due 08/15/2018 | GBP | 200 | 355 | |||||||||
Enterprise Inns PLC |
| |||||||||||
6.875% due 02/15/2021 | 200 | 333 | ||||||||||
Marstons Issuer PLC |
| |||||||||||
5.641% due 07/15/2035 | 200 | 297 | ||||||||||
Priory Group PLC |
| |||||||||||
8.875% due 02/15/2019 | 200 | 344 | ||||||||||
| PRINCIPAL AMOUNT (000S) | MARKET VALUE (000S) | |||||||||||
Spirit Issuer PLC |
| |||||||||||
6.582% due 12/28/2027 | $ | 200 | $ | 344 | ||||||||
|
| |||||||||||
| 2,108 | ||||||||||||
|
| |||||||||||
| UTILITIES 0.0% | ||||||||||||
SSE PLC |
| |||||||||||
5.625% due 10/01/2017 (b) | 200 | 211 | ||||||||||
|
| |||||||||||
Total United Kingdom | 5,369 | |||||||||||
|
| |||||||||||
| UNITED STATES 0.8% | ||||||||||||
| BANKING & FINANCE 0.3% | ||||||||||||
American International Group, Inc. |
| |||||||||||
6.765% due 11/15/2017 | GBP | 100 | 192 | |||||||||
Cantor Fitzgerald LP |
| |||||||||||
7.875% due 10/15/2019 | $ | 300 | 316 | |||||||||
Denali Borrower LLC |
| |||||||||||
5.625% due 10/15/2020 | 500 | 497 | ||||||||||
International Lease Finance Corp. |
| |||||||||||
7.125% due 09/01/2018 | 325 | 378 | ||||||||||
SLM Corp. |
| |||||||||||
6.250% due 01/25/2016 | 200 | 217 | ||||||||||
8.450% due 06/15/2018 | 200 | 234 | ||||||||||
Springleaf Finance Corp. |
| |||||||||||
5.400% due 12/01/2015 | 500 | 521 | ||||||||||
6.900% due 12/15/2017 | 200 | 219 | ||||||||||
|
| |||||||||||
| 2,574 | ||||||||||||
|
| |||||||||||
| INDUSTRIALS 0.4% | ||||||||||||
Aleris International, Inc. |
| |||||||||||
7.625% due 02/15/2018 | 300 | 319 | ||||||||||
Altria Group, Inc. |
| |||||||||||
10.200% due 02/06/2039 | 65 | 101 | ||||||||||
Brocade Communications Systems, Inc. |
| |||||||||||
6.875% due 01/15/2020 | 400 | 431 | ||||||||||
CONSOL Energy, Inc. |
| |||||||||||
8.000% due 04/01/2017 | 100 | 106 | ||||||||||
CVS Pass-Through Trust |
| |||||||||||
8.353% due 07/10/2031 | 91 | 115 | ||||||||||
Delta Air Lines Pass-Through Trust |
| |||||||||||
4.750% due 11/07/2021 | 93 | 99 | ||||||||||
First Data Corp. |
| |||||||||||
7.375% due 06/15/2019 | 200 | 214 | ||||||||||
HD Supply, Inc. |
| |||||||||||
8.125% due 04/15/2019 | 100 | 112 | ||||||||||
Hexion U.S. Finance Corp. |
| |||||||||||
8.875% due 02/01/2018 | 300 | 313 | ||||||||||
Midcontinent Express Pipeline LLC |
| |||||||||||
6.700% due 09/15/2019 | 500 | 488 | ||||||||||
Newfield Exploration Co. |
| |||||||||||
6.875% due 02/01/2020 | 200 | 215 | ||||||||||
Reynolds Group Issuer, Inc. |
| |||||||||||
8.500% due 05/15/2018 | 100 | 106 | ||||||||||
Rockies Express Pipeline LLC |
| |||||||||||
5.625% due 04/15/2020 | 400 | 357 | ||||||||||
6.850% due 07/15/2018 | 100 | 98 | ||||||||||
U.S. Airways Pass-Through Trust |
| |||||||||||
5.900% due 04/01/2026 | 96 | 105 | ||||||||||
Vector Group Ltd. |
| |||||||||||
7.750% due 02/15/2021 | 300 | 319 | ||||||||||
Warner Chilcott Co. LLC |
| |||||||||||
7.750% due 09/15/2018 | 100 | 109 | ||||||||||
|
| |||||||||||
| 3,607 | ||||||||||||
|
| |||||||||||
| PRINCIPAL AMOUNT (000S) | MARKET VALUE (000S) | |||||||||||
| UTILITIES 0.1% | ||||||||||||
MetroPCS Wireless, Inc. | $ | 150 | $ | 156 | ||||||||
6.250% due 04/01/2021 | ||||||||||||
NGPL PipeCo LLC |
| |||||||||||
9.625% due 06/01/2019 | 200 | 196 | ||||||||||
NRG Energy, Inc. |
| |||||||||||
7.625% due 01/15/2018 | 100 | 115 | ||||||||||
Penn Virginia Corp. |
| |||||||||||
8.500% due 05/01/2020 | 300 | 324 | ||||||||||
|
| |||||||||||
| 791 | ||||||||||||
|
| |||||||||||
Total United States | 6,972 | |||||||||||
|
| |||||||||||
| VENEZUELA 0.1% | ||||||||||||
| INDUSTRIALS 0.1% | ||||||||||||
Petroleos de Venezuela S.A. |
| |||||||||||
8.500% due 11/02/2017 | 600 | 501 | ||||||||||
|
| |||||||||||
Total Venezuela | 501 | |||||||||||
|
| |||||||||||
| VIRGIN ISLANDS (BRITISH) 0.0% | ||||||||||||
| INDUSTRIALS 0.0% | ||||||||||||
Gold Fields Orogen Holding BVI Ltd. |
| |||||||||||
4.875% due 10/07/2020 | 400 | 326 | ||||||||||
|
| |||||||||||
Total Virgin Islands (British) |
| 326 | ||||||||||
|
| |||||||||||
Total Corporate Bonds & Notes | 23,885 | |||||||||||
|
| |||||||||||
| UNITS | ||||||||||||
| EQUITY-LINKED SECURITIES 1.4% | ||||||||||||
| SAUDI ARABIA 1.4% | ||||||||||||
| CONSUMER STAPLES 0.9% | ||||||||||||
HSBC Bank PLC, |
| |||||||||||
Etihad Etisalat Co. - Exp. 03/30/2015 | 327,257 | 7,461 | ||||||||||
|
| |||||||||||
| INDUSTRIALS 0.5% | ||||||||||||
Merrill Lynch International & Co., |
| |||||||||||
Saudi Airlines Catering Co. - Exp. 04/29/2015 | 99,758 | 3,764 | ||||||||||
|
| |||||||||||
Total Equity-Linked Securities | 11,225 | |||||||||||
|
| |||||||||||
PRINCIPAL AMOUNT | ||||||||||||
| MORTGAGE-BACKED SECURITIES 2.3% | ||||||||||||
| UNITED STATES 2.3% | ||||||||||||
American Home Mortgage Assets Trust |
| |||||||||||
6.250% due 06/25/2037 | $ | 209 | 133 | |||||||||
Banc of America Alternative Loan Trust |
| |||||||||||
6.000% due 04/25/2036 | 114 | 102 | ||||||||||
6.000% due 06/25/2046 | 139 | 110 | ||||||||||
6.000% due 07/25/2046 | 237 | 196 | ||||||||||
Banc of America Funding Corp. | ||||||||||||
5.359% due 05/20/2036 | 59 | 57 | ||||||||||
6.000% due 08/25/2037 ^ | 281 | 243 | ||||||||||
Banc of America Mortgage Trust |
| |||||||||||
5.616% due 11/20/2046 | 38 | 33 | ||||||||||
6.000% due 10/25/2036 ^ | 68 | 60 | ||||||||||
Bear Stearns Alt-A Trust | ||||||||||||
2.931% due 05/25/2036 | 243 | 142 | ||||||||||
5.088% due 09/25/2035 | 166 | 134 | ||||||||||
| See Accompanying Notes | SEMIANNUAL REPORT | DECEMBER 31, 2013 | 47 |
Table of Contents
Schedule of Investments PIMCO Dividend and Income Builder Fund (Cont.)
| PRINCIPAL AMOUNT (000S) | MARKET VALUE (000S) | |||||||||||
Bear Stearns Mortgage Funding Trust |
| |||||||||||
7.000% due 08/25/2036 | $ | 323 | $ | 259 | ||||||||
Chase Mortgage Finance Trust |
| |||||||||||
2.704% due 09/25/2036 | 124 | 104 | ||||||||||
Citigroup Mortgage Loan Trust, Inc. |
| |||||||||||
2.591% due 07/25/2046 ^ | 31 | 24 | ||||||||||
CitiMortgage Alternative Loan Trust |
| |||||||||||
6.000% due 01/25/2037 | 169 | 137 | ||||||||||
Countrywide Alternative Loan Trust |
| |||||||||||
6.000% due 03/25/2036 | 65 | 52 | ||||||||||
6.000% due 05/25/2036 | 3,504 | 2,733 | ||||||||||
6.000% due 05/25/2036 ^ | 280 | 226 | ||||||||||
6.000% due 06/25/2036 | 313 | 244 | ||||||||||
6.000% due 02/25/2037 ^ | 263 | 197 | ||||||||||
6.000% due 03/25/2037 ^ | 83 | 67 | ||||||||||
6.000% due 05/25/2037 ^ | 26 | 20 | ||||||||||
6.000% due 05/25/2037 | 341 | 265 | ||||||||||
6.000% due 06/25/2037 ^ | 887 | 752 | ||||||||||
6.250% due 12/25/2036 ^ | 55 | 45 | ||||||||||
6.500% due 12/25/2036 | 2,440 | 1,913 | ||||||||||
6.500% due 11/25/2037 | 51 | 43 | ||||||||||
Countrywide Home Loan Mortgage Pass-Through Trust |
| |||||||||||
0.665% due 07/25/2037 ^ | 63 | 47 | ||||||||||
5.048% due 09/25/2037 ^ | 160 | 142 | ||||||||||
Credit Suisse First Boston Mortgage Securities Corp. |
| |||||||||||
6.000% due 11/25/2035 ^ | 31 | 21 | ||||||||||
6.000% due 01/25/2036 | 88 | 68 | ||||||||||
Credit Suisse Mortgage Capital Certificates |
| |||||||||||
4.839% due 12/29/2037 | 281 | 158 | ||||||||||
CSMC Mortgage-Backed Trust | ||||||||||||
5.000% due 03/25/2037 | 8 | 7 | ||||||||||
6.500% due 10/25/2021 | 177 | 150 | ||||||||||
6.750% due 08/25/2036 ^ | 36 | 27 | ||||||||||
Deutsche ALT-A Securities, Inc. |
| |||||||||||
0.365% due 02/25/2047 | 34 | 28 | ||||||||||
First Horizon Alternative Mortgage Securities |
| |||||||||||
2.220% due 06/25/2036 | 886 | 687 | ||||||||||
HarborView Mortgage Loan Trust |
| |||||||||||
0.507% due 06/20/2035 | 8 | 8 | ||||||||||
5.329% due 06/19/2036 ^ | 35 | 26 | ||||||||||
HSI Asset Loan Obligation Trust |
| |||||||||||
6.000% due 06/25/2037 | 36 | 31 | ||||||||||
IndyMac Mortgage Loan Trust | ||||||||||||
2.402% due 06/25/2037 | 287 | 156 | ||||||||||
4.596% due 05/25/2037 | 198 | 140 | ||||||||||
4.643% due 08/25/2035 | 138 | 115 | ||||||||||
4.643% due 08/25/2035^ | 275 | 229 | ||||||||||
JPMorgan Alternative Loan Trust |
| |||||||||||
5.723% due 05/26/2037 | 157 | 129 | ||||||||||
JPMorgan Mortgage Trust |
| |||||||||||
6.500% due 07/25/2036 | 149 | 129 | ||||||||||
Merrill Lynch Mortgage Investors Trust |
| |||||||||||
2.480% due 02/25/2036 | 19 | 18 | ||||||||||
2.948% due 03/25/2036 ^ | 28 | 19 | ||||||||||
Morgan Stanley Mortgage Loan Trust |
| |||||||||||
2.491% due 06/25/2037 | 859 | 497 | ||||||||||
6.000% due 10/25/2037 ^ | 104 | 80 | ||||||||||
RBSSP Resecuritization Trust |
| |||||||||||
8.904% due 06/26/2037 | 300 | 177 | ||||||||||
| PRINCIPAL AMOUNT (000S) | MARKET VALUE (000S) | |||||||||||
Residential Accredit Loans, Inc. Trust |
| |||||||||||
0.565% due 10/25/2045 | $ | 211 | $ | 159 | ||||||||
5.500% due 03/25/2037 | 1,079 | 823 | ||||||||||
6.000% due 08/25/2036 | 75 | 57 | ||||||||||
6.000% due 08/25/2036 ^ | 174 | 132 | ||||||||||
6.250% due 03/25/2037 ^ | 90 | 62 | ||||||||||
Residential Funding Mortgage Securities, Inc. Trust |
| |||||||||||
6.000% due 10/25/2036 | 26 | 24 | ||||||||||
Structured Adjustable Rate Mortgage Loan Trust |
| |||||||||||
3.617% due 10/25/2036 | 4,804 | 3,436 | ||||||||||
Wells Fargo Alternative Loan Trust |
| |||||||||||
2.681% due 07/25/2037 | 3,216 | 2,632 | ||||||||||
6.250% due 11/25/2037 ^ | 473 | 429 | ||||||||||
|
| |||||||||||
Total Mortgage-Backed Securities | 19,134 | |||||||||||
|
| |||||||||||
| MUNICIPAL BONDS & NOTES 0.1% | ||||||||||||
| MICHIGAN 0.0% | ||||||||||||
Michigan Tobacco Settlement Finance Authority Revenue Bonds, Series 2006 |
| |||||||||||
7.309% due 06/01/2034 | 95 | 74 | ||||||||||
|
| |||||||||||
Total Michigan | 74 | |||||||||||
|
| |||||||||||
| VIRGINIA 0.0% | ||||||||||||
Tobacco Settlement Financing Corp., Virginia Revenue Bonds, Series 2007 |
| |||||||||||
6.706% due 06/01/2046 | 390 | 264 | ||||||||||
|
| |||||||||||
Total Virginia | 264 | |||||||||||
|
| |||||||||||
| WEST VIRGINIA 0.1% | ||||||||||||
Tobacco Settlement Finance Authority, West Virginia Revenue Bonds, Series 2007 |
| |||||||||||
7.467% due 06/01/2047 | 380 | 296 | ||||||||||
|
| |||||||||||
Total West Virginia | 296 | |||||||||||
|
| |||||||||||
Total Municipal Bonds & Notes | 634 | |||||||||||
|
| |||||||||||
| SHARES | ||||||||||||
| PREFERRED STOCKS 0.1% | ||||||||||||
| UNITED STATES 0.1% | ||||||||||||
| UTILITIES 0.1% | ||||||||||||
Entergy Louisiana LLC | ||||||||||||
4.700% due 06/01/2063 | 25,000 | 484 | ||||||||||
|
| |||||||||||
Total Preferred Stocks (Cost $481) | 484 | |||||||||||
|
| |||||||||||
| REAL ESTATE INVESTMENT TRUSTS 2.2% | ||||||||||||
| UNITED STATES 2.2% | ||||||||||||
| FINANCIALS 2.2% | ||||||||||||
Colony Financial, Inc. | 911,055 | 18,485 | ||||||||||
|
| |||||||||||
Total Real Estate Investment Trusts | 18,485 | |||||||||||
|
| |||||||||||
| PRINCIPAL AMOUNT (000S) | MARKET VALUE (000S) | |||||||||||
| SOVEREIGN ISSUES 0.2% | ||||||||||||
| SPAIN 0.2% | ||||||||||||
Autonomous Community of Catalonia |
| |||||||||||
3.875% due 04/07/2015 | EUR | 100 | $ | 140 | ||||||||
4.750% due 06/04/2018 | 300 | 425 | ||||||||||
Autonomous Community of Madrid |
| |||||||||||
5.750% due 02/01/2018 | 100 | 153 | ||||||||||
Autonomous Community of Valencia |
| |||||||||||
3.250% due 07/06/2015 | 50 | 70 | ||||||||||
4.375% due 07/16/2015 | 200 | 282 | ||||||||||
|
| |||||||||||
Total Spain | 1,070 | |||||||||||
|
| |||||||||||
| VENEZUELA 0.0% | ||||||||||||
Venezuela Government International Bond |
| |||||||||||
7.650% due 04/21/2025 | $ | 100 | 68 | |||||||||
7.750% due 10/13/2019 | 200 | 150 | ||||||||||
|
| |||||||||||
Total Venezuela | 218 | |||||||||||
|
| |||||||||||
Total Sovereign Issues (Cost $1,243) |
| 1,288 | ||||||||||
|
| |||||||||||
| SHORT-TERM INSTRUMENTS 0.5% | ||||||||||||
REPURCHASE AGREEMENTS (c) 0.5% | ||||||||||||
| 3,872 | ||||||||||||
|
| |||||||||||
| Total Short-Term Instruments (Cost $3,872) | 3,872 | |||||||||||
|
| |||||||||||
| Total Investments in Securities (Cost $751,129) | 811,897 | |||||||||||
|
| |||||||||||
| SHARES | ||||||||||||
| INVESTMENTS IN AFFILIATES 2.3% | ||||||||||||
| SHORT-TERM INSTRUMENTS 2.3% | ||||||||||||
| CENTRAL FUNDS USED FOR CASH MANAGEMENT PURPOSES 2.3% | ||||||||||||
PIMCO Short-Term Floating NAV Portfolio | 1,946,013 | 19,470 | ||||||||||
|
| |||||||||||
| Total Short-Term Instruments (Cost $19,470) | 19,470 | |||||||||||
|
| |||||||||||
| Total Investments in Affiliates (Cost $19,470) | 19,470 | |||||||||||
| Total Investments 100.3% (Cost $770,599) | $ | 831,367 | ||||||||||
Financial Derivative Instruments (d)(e) 0.1% (Cost or Premiums, net $0) | 961 | |||||||||||
| Other Assets and Liabilities, net (0.4%) | (3,038 | ) | ||||||||||
|
| |||||||||||
| Net Assets 100.0% | $ | 829,290 | ||||||||||
|
| |||||||||||
NOTES TO SCHEDULE OF INVESTMENTS (AMOUNTS IN THOUSANDS*, EXCEPT NUMBER OF CONTRACTS):
| * | A zero balance may reflect actual amounts rounding to less than one thousand. |
| ^ | Security is in default. |
| (a) | Security did not produce income within the last twelve months. |
| (b) | Perpetual maturity, date shown represents next contractual call date. |
| 48 | PIMCO EQUITY SERIES | See Accompanying Notes |
Table of Contents
December 31, 2013 (Unaudited)
BORROWINGS AND OTHER FINANCING TRANSACTIONS
(c) REPURCHASE AGREEMENTS:
| Counterparty | Lending Rate | Settlement Date | Maturity Date | Principal Amount | Collateralized By | Collateral Received, at Value | Repurchase Agreements, at Value | Repurchase Agreement Proceeds to be Received (1) | ||||||||||||||||||||
BOS | 0.010% | 12/31/2013 | 01/02/2014 | $ | 2,100 | U.S. Treasury Notes 0.375% due 01/15/2016 | $ | (2,146 | ) | $ | 2,100 | $ | 2,100 | |||||||||||||||
SSB | 0.000% | 12/31/2013 | 01/02/2014 | 1,772 | Fannie Mae 2.200% due 10/17/2022 | (1,810 | ) | 1,772 | 1,772 | |||||||||||||||||||
|
|
|
|
|
| |||||||||||||||||||||||
Total Repurchase Agreements |
| $ | (3,956 | ) | $ | 3,872 | $ | 3,872 | ||||||||||||||||||||
|
|
|
|
|
| |||||||||||||||||||||||
| (1) | Includes accrued interest. |
BORROWINGS AND OTHER FINANCING TRANSACTIONS SUMMARY
The following is a summary by counterparty of the market value of Borrowings and Other Financing Transactions and collateral (received) as of December 31, 2013:
| Counterparty | Repurchase Agreement Proceeds to be Received | Payable for Reverse Repurchase Agreements | Payable for Sale-Buyback Transactions | Payable for Short Sales | Total Borrowings and Other Financing Transactions | Collateral (Received) | Net Exposure (2) | |||||||||||||||||||||
Global/Master Repurchase Agreement | ||||||||||||||||||||||||||||
BOS | $ | 2,100 | $ | 0 | $ | 0 | $ | 0 | $ | 2,100 | $ | (2,146 | ) | $ | (46 | ) | ||||||||||||
SSB | 1,772 | 0 | 0 | 0 | 1,772 | (1,810 | ) | (38 | ) | |||||||||||||||||||
|
|
|
|
|
|
|
| |||||||||||||||||||||
Total Borrowings and Other Financing Transactions | $ | 3,872 | $ | 0 | $ | 0 | $ | 0 | ||||||||||||||||||||
|
|
|
|
|
|
|
| |||||||||||||||||||||
| (2) | Net Exposure represents the net receivable/(payable) that would be due from/to the counterparty in the event of default. Exposure from borrowings and other financing transactions can only be netted across transactions governed under the same master agreement with the same legal entity. See Note 7, Principal Risks, in the Notes to Financial Statements for more information regarding master netting arrangements. |
(d) FINANCIAL DERIVATIVE INSTRUMENTS: EXCHANGE-TRADED OR CENTRALLY CLEARED
FUTURES CONTRACTS:
| Description | Type | Expiration Month | # of Contracts | Unrealized Appreciation/ (Depreciation) | Variation Margin | |||||||||||||||||
| Asset | Liability | |||||||||||||||||||||
British pound currency March Futures | Short | 03/2014 | 505 | $ | (524 | ) | $ | 0 | $ | (145 | ) | |||||||||||
E-mini S&P 500 Index March Futures | Long | 03/2014 | 51 | 148 | 16 | 0 | ||||||||||||||||
Euro currency March Futures | Short | 03/2014 | 39 | (1 | ) | 7 | 0 | |||||||||||||||
Mexican peso currency March Futures | Short | 03/2014 | 11 | 1 | 1 | 0 | ||||||||||||||||
Swiss franc currency March Futures | Short | 03/2014 | 75 | 18 | 19 | 0 | ||||||||||||||||
|
|
|
|
|
| |||||||||||||||||
Total Futures Contracts | $ | (358 | ) | $ | 43 | $ | (145 | ) | ||||||||||||||
|
|
|
|
|
| |||||||||||||||||
FINANCIAL DERIVATIVE INSTRUMENTS: EXCHANGE-TRADED OR CENTRALLY CLEARED SUMMARY
The following is a summary of the market value and variation margin of Exchange-Traded or Centrally Cleared Financial Derivative Instruments as of December 31, 2013:
Cash of $1,340 has been pledged as collateral for exchange-traded and centrally cleared financial derivative instruments as of December 31, 2013. See Note 7, Principal Risks, in the Notes to Financial Statements for more information regarding master netting arrangements.
| Financial Derivative Assets | Financial Derivative Liabilities | |||||||||||||||||||||||||||||||||
| Market Value | Variation Margin Asset | Total | Market Value | Variation Margin Liability | Total | |||||||||||||||||||||||||||||
| Purchased Options | Futures | Swap Agreements | Written Options | Futures | Swap Agreements | |||||||||||||||||||||||||||||
Total Exchange-Traded or Centrally Cleared | $ | 0 | $ | 43 | $ | 0 | $ | 43 | $ | 0 | $ | (145 | ) | $ | 0 | $ | (145 | ) | ||||||||||||||||
|
|
|
|
|
|
|
|
|
|
|
|
|
|
|
| |||||||||||||||||||
| See Accompanying Notes | SEMIANNUAL REPORT | DECEMBER 31, 2013 | 49 |
Table of Contents
Schedule of Investments PIMCO Dividend and Income Builder Fund (Cont.)
(e) FINANCIAL DERIVATIVE INSTRUMENTS: OVER THE COUNTER
FORWARD FOREIGN CURRENCY CONTRACTS:
| Counterparty | Settlement Month | Currency to | Currency to | Unrealized Appreciation/ (Depreciation) | ||||||||||||||||||||||||
| Asset | Liability | |||||||||||||||||||||||||||
BOA | 01/2014 | $ | 375 | THB | 12,079 | $ | 0 | $ | (8 | ) | ||||||||||||||||||
| 01/2014 | ZAR | 64,385 | $ | 6,281 | 154 | 0 | ||||||||||||||||||||||
| 02/2014 | BRL | 9,084 | 3,822 | 2 | 0 | |||||||||||||||||||||||
| 02/2014 | EUR | 11,512 | 15,889 | 52 | 0 | |||||||||||||||||||||||
| 04/2014 | THB | 12,079 | 373 | 7 | 0 | |||||||||||||||||||||||
BRC | 02/2014 | EUR | 1,531 | 2,092 | 0 | (14 | ) | |||||||||||||||||||||
| 02/2014 | NOK | 25,627 | 4,215 | 0 | (5 | ) | ||||||||||||||||||||||
CBK | 01/2014 | $ | 1,329 | EUR | 965 | 0 | (1 | ) | ||||||||||||||||||||
| 01/2014 | 31 | HKD | 243 | 0 | 0 | |||||||||||||||||||||||
| 02/2014 | EUR | 965 | $ | 1,328 | 1 | 0 | ||||||||||||||||||||||
| 02/2014 | NOK | 6,226 | 1,009 | 0 | (16 | ) | ||||||||||||||||||||||
DUB | 01/2014 | HKD | 912 | 118 | 0 | 0 | ||||||||||||||||||||||
| 01/2014 | $ | 4,910 | TRY | 10,141 | 0 | (203 | ) | |||||||||||||||||||||
| 01/2014 | ZAR | 146,429 | $ | 14,354 | 419 | 0 | ||||||||||||||||||||||
| 04/2014 | TRY | 10,141 | 4,821 | 206 | 0 | |||||||||||||||||||||||
FBF | 01/2014 | BRL | 30,808 | 13,102 | 44 | 0 | ||||||||||||||||||||||
| 01/2014 | NOK | 73,619 | 12,124 | 0 | (14 | ) | ||||||||||||||||||||||
| 01/2014 | $ | 13,141 | BRL | 30,808 | 0 | (83 | ) | |||||||||||||||||||||
| 02/2014 | BRL | 12,784 | $ | 5,404 | 29 | 0 | ||||||||||||||||||||||
GLM | 01/2014 | 8,611 | 3,721 | 71 | 0 | |||||||||||||||||||||||
| 01/2014 | EUR | 965 | 1,309 | 0 | (19 | ) | ||||||||||||||||||||||
| 01/2014 | NOK | 25,627 | 4,196 | 0 | (30 | ) | ||||||||||||||||||||||
| 01/2014 | $ | 3,676 | BRL | 8,611 | 0 | (26 | ) | |||||||||||||||||||||
HUS | 01/2014 | THB | 12,078 | $ | 373 | 6 | 0 | |||||||||||||||||||||
JPM | 01/2014 | TRY | 10,141 | 4,969 | 262 | 0 | ||||||||||||||||||||||
| 01/2014 | $ | 147 | HKD | 1,139 | 0 | 0 | ||||||||||||||||||||||
| 01/2014 | ZAR | 35,847 | $ | 3,514 | 103 | 0 | ||||||||||||||||||||||
MSC | 01/2014 | BRL | 49,402 | 21,044 | 105 | 0 | ||||||||||||||||||||||
| 01/2014 | $ | 22,271 | BRL | 51,957 | 0 | (248 | ) | |||||||||||||||||||||
| 02/2014 | BRL | 61,678 | $ | 26,186 | 252 | 0 | ||||||||||||||||||||||
| 04/2014 | TRY | 3,521 | 1,623 | 20 | 0 | |||||||||||||||||||||||
UAG | 01/2014 | BRL | 7,384 | 3,147 | 17 | 0 | ||||||||||||||||||||||
| 01/2014 | $ | 3,152 | BRL | 7,384 | 0 | (21 | ) | |||||||||||||||||||||
| 01/2014 | 11,960 | NOK | 73,619 | 178 | 0 | |||||||||||||||||||||||
| 02/2014 | NOK | 73,619 | $ | 11,946 | 0 | (177 | ) | |||||||||||||||||||||
|
|
|
| |||||||||||||||||||||||||
Total Forward Foreign Currency Contracts |
| $ | 1,928 | $ | (865 | ) | ||||||||||||||||||||||
|
|
|
| |||||||||||||||||||||||||
FINANCIAL DERIVATIVE INSTRUMENTS: OVER THE COUNTER SUMMARY
The following is a summary by counterparty of the market value of OTC financial derivative instruments and collateral (received) as of December 31, 2013:
| Financial Derivative Assets | Financial Derivative Liabilities | |||||||||||||||||||||||||||||||||||||||||||||
| Counterparty | Forward Foreign Currency Contracts | Purchased Options | Swap Agreements | Total Over the Counter | Forward Foreign Currency Contracts | Written Options | Swap Agreements | Total Over the Counter | Net Market Value of OTC Derivatives | Collateral (Received) | Net Exposures (1) | |||||||||||||||||||||||||||||||||||
BOA | $ | 215 | $ | 0 | $ | 0 | $ | 215 | $ | (8 | ) | $ | 0 | $ | 0 | $ | (8 | ) | $ | 207 | $ | (870 | ) | $ | (663 | ) | ||||||||||||||||||||
BRC | 0 | 0 | 0 | 0 | (19 | ) | 0 | 0 | (19 | ) | (19 | ) | 0 | (19 | ) | |||||||||||||||||||||||||||||||
CBK | 1 | 0 | 0 | 1 | (17 | ) | 0 | 0 | (17 | ) | (16 | ) | 0 | (16 | ) | |||||||||||||||||||||||||||||||
DUB | 625 | 0 | 0 | 625 | (203 | ) | 0 | 0 | (203 | ) | 422 | (310 | ) | 112 | ||||||||||||||||||||||||||||||||
FBF | 73 | 0 | 0 | 73 | (97 | ) | 0 | 0 | (97 | ) | (24 | ) | (130 | ) | (154 | ) | ||||||||||||||||||||||||||||||
GLM | 71 | 0 | 0 | 71 | (75 | ) | 0 | 0 | (75 | ) | (4 | ) | 0 | (4 | ) | |||||||||||||||||||||||||||||||
HUS | 6 | 0 | 0 | 6 | 0 | 0 | 0 | 0 | 6 | (290 | ) | (284 | ) | |||||||||||||||||||||||||||||||||
JPM | 365 | 0 | 0 | 365 | (0 | ) | 0 | 0 | 0 | 365 | (280 | ) | 85 | |||||||||||||||||||||||||||||||||
MSC | 377 | 0 | 0 | 377 | (248 | ) | 0 | 0 | (248 | ) | 129 | (3,425 | ) | (3,296 | ) | |||||||||||||||||||||||||||||||
UAG | 195 | 0 | 0 | 195 | (198 | ) | 0 | 0 | (198 | ) | (3 | ) | 0 | (3 | ) | |||||||||||||||||||||||||||||||
|
|
|
|
|
|
|
|
|
|
|
|
|
|
|
| |||||||||||||||||||||||||||||||
Total Over the Counter | $ | 1,928 | $ | 0 | $ | 0 | $ | 1,928 | $ | (865 | ) | $ | 0 | $ | 0 | $ | (865 | ) | ||||||||||||||||||||||||||||
|
|
|
|
|
|
|
|
|
|
|
|
|
|
|
| |||||||||||||||||||||||||||||||
| (1) | Net Exposure represents the net receivable/(payable) that would be due from/to the counterparty in the event of default. Exposure from OTC financial derivative instruments can only be netted across transactions governed under the same master agreement with the same legal entity. See note 7, Principal Risks, in the Notes to Financial Statements for more information regarding master netting arrangements. |
| 50 | PIMCO EQUITY SERIES | See Accompanying Notes |
Table of Contents
December 31, 2013 (Unaudited)
FAIR VALUE OF FINANCIAL DERIVATIVE INSTRUMENTS
The following is a summary of the fair valuation of the Fund’s derivative instruments categorized by risk(1) exposure:
Fair Values of Financial Derivative Instruments on the Statements of Assets and Liabilities as of December 31, 2013:
| Derivatives not accounted for as hedging instruments | ||||||||||||||||||||||||
| Commodity Contracts | Credit Contracts | Equity Contracts | Foreign Exchange Contracts | Interest Rate Contracts | Total | |||||||||||||||||||
Financial Derivative Instruments - Assets | ||||||||||||||||||||||||
Exchange-traded or centrally cleared | ||||||||||||||||||||||||
Futures | $ | 0 | $ | 0 | $ | 16 | $ | 27 | $ | 0 | $ | 43 | ||||||||||||
|
|
|
|
|
|
|
|
|
|
|
| |||||||||||||
Over the counter | ||||||||||||||||||||||||
Forward Foreign Currency Contracts | $ | 0 | $ | 0 | $ | 0 | $ | 1,928 | $ | 0 | $ | 1,928 | ||||||||||||
|
|
|
|
|
|
|
|
|
|
|
| |||||||||||||
| $ | 0 | $ | 0 | $ | 16 | $ | 1,955 | $ | 0 | $ | 1,971 | |||||||||||||
|
|
|
|
|
|
|
|
|
|
|
| |||||||||||||
Financial Derivative Instruments - Liabilities | ||||||||||||||||||||||||
Exchange-traded or centrally cleared | ||||||||||||||||||||||||
Futures | $ | 0 | $ | 0 | $ | 0 | $ | 145 | $ | 0 | $ | 145 | ||||||||||||
|
|
|
|
|
|
|
|
|
|
|
| |||||||||||||
Over the counter | ||||||||||||||||||||||||
Forward Foreign Currency Contracts | $ | 0 | $ | 0 | $ | 0 | $ | 865 | $ | 0 | $ | 865 | ||||||||||||
|
|
|
|
|
|
|
|
|
|
|
| |||||||||||||
| $ | 0 | $ | 0 | $ | 0 | $ | 1,010 | $ | 0 | $ | 1,010 | |||||||||||||
|
|
|
|
|
|
|
|
|
|
|
| |||||||||||||
The Effect of Financial Derivative Instruments on the Statements of Operations for the Period Ended December 31, 2013:
| Derivatives not accounted for as hedging instruments | ||||||||||||||||||||||||
| Commodity Contracts | Credit Contracts | Equity Contracts | Foreign Exchange Contracts | Interest Rate Contracts | Total | |||||||||||||||||||
Net Realized Gain on Financial Derivative Instruments | ||||||||||||||||||||||||
Exchange-traded or centrally cleared | ||||||||||||||||||||||||
Futures | $ | 0 | $ | 0 | $ | 239 | $ | (2,802 | ) | $ | 0 | $ | (2,563 | ) | ||||||||||
|
|
|
|
|
|
|
|
|
|
|
| |||||||||||||
Over the counter | ||||||||||||||||||||||||
Forward Foreign Currency Contracts | $ | 0 | $ | 0 | $ | 0 | $ | 433 | $ | 0 | $ | 433 | ||||||||||||
|
|
|
|
|
|
|
|
|
|
|
| |||||||||||||
| $ | 0 | $ | 0 | $ | 239 | $ | (2,369 | ) | $ | 0 | $ | (2,130 | ) | |||||||||||
|
|
|
|
|
|
|
|
|
|
|
| |||||||||||||
Net Change in Unrealized Appreciation (Depreciation) on Financial Derivative Instruments |
| |||||||||||||||||||||||
Exchange-traded or centrally cleared | ||||||||||||||||||||||||
Futures | $ | 0 | $ | 0 | $ | 148 | $ | (379 | ) | $ | 0 | $ | (231 | ) | ||||||||||
|
|
|
|
|
|
|
|
|
|
|
| |||||||||||||
Over the counter | ||||||||||||||||||||||||
Forward Foreign Currency Contracts | $ | 0 | $ | 0 | $ | 0 | $ | 729 | $ | 0 | $ | 729 | ||||||||||||
|
|
|
|
|
|
|
|
|
|
|
| |||||||||||||
| $ | 0 | $ | 0 | $ | 148 | $ | 350 | $ | 0 | $ | 498 | |||||||||||||
|
|
|
|
|
|
|
|
|
|
|
| |||||||||||||
| (1) | See Note 7, Principal Risks, in the Notes to Financial Statements on risks of the Fund. |
FAIR VALUE MEASUREMENTS
The following is a summary of the fair valuations according to the inputs used as of December 31, 2013 in valuing the Fund’s assets and liabilities:
| Category and Subcategory | Level 1 | Level 2 | Level 3 | Fair Value at 12/31/2013 | ||||||||||||
Investments in Securities, at Value | ||||||||||||||||
Asset-Backed Securities | ||||||||||||||||
United States | $ | 0 | $ | 12,879 | $ | 0 | $ | 12,879 | ||||||||
Common Stocks | ||||||||||||||||
Bermuda | ||||||||||||||||
Energy | 7,417 | 0 | 0 | 7,417 | ||||||||||||
Brazil | ||||||||||||||||
Financials | 11,358 | 0 | 0 | 11,358 | ||||||||||||
Industrials | 7,532 | 0 | 0 | 7,532 | ||||||||||||
Utilities | 21,604 | 2,626 | 0 | 24,230 | ||||||||||||
China | ||||||||||||||||
Industrials | 0 | 11,338 | 0 | 11,338 | ||||||||||||
Cyprus | ||||||||||||||||
Energy | 0 | 20,631 | 0 | 20,631 | ||||||||||||
France | ||||||||||||||||
Energy | 0 | 22,224 | 0 | 22,224 | ||||||||||||
| Category and Subcategory | Level 1 | Level 2 | Level 3 | Fair Value at 12/31/2013 | ||||||||||||
Financials | $ | 0 | $ | 9,956 | $ | 0 | $ | 9,956 | ||||||||
Hong Kong | ||||||||||||||||
Industrials | 0 | 3,818 | 0 | 3,818 | ||||||||||||
Italy | ||||||||||||||||
Industrials | 0 | 7,386 | 0 | 7,386 | ||||||||||||
Japan | ||||||||||||||||
Telecommunication Services | 0 | 25,217 | 0 | 25,217 | ||||||||||||
Netherlands | ||||||||||||||||
Energy | 0 | 11,282 | 0 | 11,282 | ||||||||||||
Financials | 0 | 15,771 | 0 | 15,771 | ||||||||||||
Panama | ||||||||||||||||
Industrials | 3,777 | 0 | 0 | 3,777 | ||||||||||||
South Africa | ||||||||||||||||
Consumer Discretionary | 0 | 7,552 | 0 | 7,552 | ||||||||||||
Health Care | 0 | 7,418 | 0 | 7,418 | ||||||||||||
Telecommunication Services | 0 | 15,222 | 0 | 15,222 | ||||||||||||
| See Accompanying Notes | SEMIANNUAL REPORT | DECEMBER 31, 2013 | 51 |
Table of Contents
Schedule of Investments PIMCO Dividend and Income Builder Fund (Cont.)
| Category and Subcategory | Level 1 | Level 2 | Level 3 | Fair Value at 12/31/2013 | ||||||||||||
Spain | ||||||||||||||||
Utilities | $ | 0 | $ | 24,285 | $ | 0 | $ | 24,285 | ||||||||
Switzerland | ||||||||||||||||
Health Care | 0 | 26,386 | 0 | 26,386 | ||||||||||||
Taiwan | ||||||||||||||||
Information Technology | 0 | 11,564 | 0 | 11,564 | ||||||||||||
Thailand | ||||||||||||||||
Industrials | 0 | 1,713 | 0 | 1,713 | ||||||||||||
Turkey | ||||||||||||||||
Industrials | 0 | 8,015 | 0 | 8,015 | ||||||||||||
United Kingdom | ||||||||||||||||
Consumer Discretionary | 0 | 9,072 | 0 | 9,072 | ||||||||||||
Consumer Staples | 0 | 18,827 | 0 | 18,827 | ||||||||||||
Financials | 0 | 62,815 | 0 | 62,815 | ||||||||||||
United States | ||||||||||||||||
Consumer Discretionary | 84,465 | 0 | 0 | 84,465 | ||||||||||||
Consumer Staples | 18,605 | 0 | 0 | 18,605 | ||||||||||||
Energy | 19,268 | 0 | 0 | 19,268 | ||||||||||||
Financials | 90,340 | 0 | 0 | 90,340 | ||||||||||||
Health Care | 31,402 | 0 | 0 | 31,402 | ||||||||||||
Information Technology | 86,199 | 0 | 0 | 86,199 | ||||||||||||
Materials | 14,926 | 0 | 0 | 14,926 | ||||||||||||
Corporate Bonds & Notes | ||||||||||||||||
Austria | ||||||||||||||||
Industrials | 0 | 34 | 0 | 34 | ||||||||||||
Brazil | ||||||||||||||||
Banking & Finance | 0 | 419 | 0 | 419 | ||||||||||||
Utilities | 0 | 430 | 0 | 430 | ||||||||||||
Cayman Islands | ||||||||||||||||
Utilities | 0 | 185 | 0 | 185 | ||||||||||||
France | ||||||||||||||||
Banking & Finance | 0 | 1,031 | 0 | 1,031 | ||||||||||||
Industrials | 0 | 322 | 0 | 322 | ||||||||||||
Germany | ||||||||||||||||
Industrials | 0 | 434 | 0 | 434 | ||||||||||||
Guernsey, Channel Islands | ||||||||||||||||
Banking & Finance | 0 | 0 | 381 | 381 | ||||||||||||
Ireland | ||||||||||||||||
Industrials | 0 | 878 | 0 | 878 | ||||||||||||
Utilities | 0 | 320 | 0 | 320 | ||||||||||||
Italy | ||||||||||||||||
Banking & Finance | 0 | 759 | 0 | 759 | ||||||||||||
Utilities | 0 | 261 | 0 | 261 | ||||||||||||
Japan | ||||||||||||||||
Utilities | 0 | 415 | 0 | 415 | ||||||||||||
Luxembourg | ||||||||||||||||
Banking & Finance | 0 | 143 | 0 | 143 | ||||||||||||
Industrials | 0 | 903 | 0 | 903 | ||||||||||||
Utilities | 0 | 247 | 0 | 247 | ||||||||||||
Mexico | ||||||||||||||||
Industrials | 0 | 169 | 0 | 169 | ||||||||||||
Netherlands | ||||||||||||||||
Banking & Finance | 0 | 773 | 0 | 773 | ||||||||||||
Industrials | 0 | 369 | 0 | 369 | ||||||||||||
Utilities | 0 | 435 | 0 | 435 | ||||||||||||
Norway | ||||||||||||||||
Banking & Finance | 0 | 230 | 0 | 230 | ||||||||||||
South Africa | ||||||||||||||||
Industrials | 0 | 427 | 0 | 427 | ||||||||||||
| Category and Subcategory | Level 1 | Level 2 | Level 3 | Fair Value at 12/31/2013 | ||||||||||||
Spain | ||||||||||||||||
Banking & Finance | $ | 0 | $ | 845 | $ | 0 | $ | 845 | ||||||||
Industrials | 0 | 307 | 0 | 307 | ||||||||||||
United Kingdom | ||||||||||||||||
Banking & Finance | 0 | 3,050 | 0 | 3,050 | ||||||||||||
Industrials | 0 | 2,108 | 0 | 2,108 | ||||||||||||
Utilities | 0 | 211 | 0 | 211 | ||||||||||||
United States | ||||||||||||||||
Banking & Finance | 0 | 2,574 | 0 | 2,574 | ||||||||||||
Industrials | 0 | 3,403 | 204 | 3,607 | ||||||||||||
Utilities | 0 | 791 | 0 | 791 | ||||||||||||
Venezuela | ||||||||||||||||
Industrials | 0 | 501 | 0 | 501 | ||||||||||||
Virgin Islands (British) | ||||||||||||||||
Industrials | 0 | 326 | 0 | 326 | ||||||||||||
Equity-Linked Securities | ||||||||||||||||
Saudi Arabia | ||||||||||||||||
Consumer Staples | 0 | 7,461 | 0 | 7,461 | ||||||||||||
Industrials | 0 | 3,764 | 0 | 3,764 | ||||||||||||
Mortgage-Backed Securities | ||||||||||||||||
United States | 0 | 19,134 | 0 | 19,134 | ||||||||||||
Municipal Bonds & Notes | ||||||||||||||||
Michigan | 0 | 74 | 0 | 74 | ||||||||||||
Virginia | 0 | 264 | 0 | 264 | ||||||||||||
West Virginia | 0 | 296 | 0 | 296 | ||||||||||||
Preferred Stocks | ||||||||||||||||
United States | ||||||||||||||||
Utilities | 484 | 0 | 0 | 484 | ||||||||||||
Real Estate Investment Trusts | ||||||||||||||||
United States | ||||||||||||||||
Financials | 18,485 | 0 | 0 | 18,485 | ||||||||||||
Sovereign Issues | ||||||||||||||||
Spain | 0 | 1,070 | 0 | 1,070 | ||||||||||||
Venezuela | 0 | 218 | 0 | 218 | ||||||||||||
Short-Term Instruments | ||||||||||||||||
Repurchase Agreements | 0 | 3,872 | 0 | 3,872 | ||||||||||||
| $ | 415,862 | $ | 395,450 | $ | 585 | $ | 811,897 | |||||||||
Investments in Affiliates, at Value | ||||||||||||||||
Short-Term Instruments | ||||||||||||||||
Central Funds Used for Cash Management Purposes | $ | 19,470 | $ | 0 | $ | 0 | $ | 19,470 | ||||||||
Total Investments | $ | 435,332 | $ | 395,450 | $ | 585 | $ | 831,367 | ||||||||
Financial Derivative Instruments - Assets |
| |||||||||||||||
Exchange-traded or centrally cleared | 43 | 0 | 0 | 43 | ||||||||||||
Over the counter | 0 | 1,928 | 0 | 1,928 | ||||||||||||
| $ | 43 | $ | 1,928 | $ | 0 | $ | 1,971 | |||||||||
Financial Derivative Instruments - Liabilities |
| |||||||||||||||
Exchange-traded or centrally cleared | (145 | ) | 0 | 0 | (145 | ) | ||||||||||
Over the counter | 0 | (865 | ) | 0 | (865 | ) | ||||||||||
| $ | (145 | ) | $ | (865 | ) | $ | 0 | $ | (1,010 | ) | ||||||
Totals | $ | 435,230 | $ | 396,513 | $ | 585 | $ | 832,328 | ||||||||
There were no transfers between Level 1 and 2 during the period ended December 31, 2013.
| 52 | PIMCO EQUITY SERIES | See Accompanying Notes |
Table of Contents
December 31, 2013 (Unaudited)
The following is a reconciliation of the fair valuations using significant unobservable inputs (Level 3) for the Fund during the period ended December 31, 2013:
| Category and Subcategory | Beginning Balance at 06/30/2013 | Net Purchases | Net Sales | Accrued Discounts/ (Premiums) | Realized Gain/(Loss) | Net Change in Unrealized Appreciation/ (Depreciation) (1) | Transfers into Level 3 | Transfers out of Level 3 | Ending Balance at 12/31/2013 | Net Change in Unrealized Appreciation/ (Depreciation) on Investments Held at 12/31/2013 (1) | ||||||||||||||||||||||||||||||
Investments in Securities, at Value |
| |||||||||||||||||||||||||||||||||||||||
Corporate Bonds & Notes | ||||||||||||||||||||||||||||||||||||||||
Guernsey, Channel Islands | ||||||||||||||||||||||||||||||||||||||||
Banking & Finance | $ | 0 | $ | 388 | $ | (12 | ) | $ | 0 | $ | 0 | $ | 5 | $ | 0 | $ | 0 | $ | 381 | $ | 5 | |||||||||||||||||||
United States | ||||||||||||||||||||||||||||||||||||||||
Industrials | 206 | 0 | (8 | ) | 0 | 0 | 6 | 0 | 0 | 204 | 6 | |||||||||||||||||||||||||||||
|
|
|
|
|
|
|
|
|
|
|
|
|
|
|
|
|
|
|
| |||||||||||||||||||||
Totals | $ | 206 | $ | 388 | $ | (20 | ) | $ | 0 | $ | 0 | $ | 11 | $ | 0 | $ | 0 | $ | 585 | $ | 11 | |||||||||||||||||||
|
|
|
|
|
|
|
|
|
|
|
|
|
|
|
|
|
|
|
| |||||||||||||||||||||
The following is a summary of significant unobservable inputs used in the fair valuations of assets and liabilities categorized within Level 3 of the fair value hierarchy:
| Category and Subcategory | Ending Balance at 12/31/2013 | Valuation Technique | Unobservable Inputs | Input Value(s) (% Unless Noted Otherwise) | ||||||||||||
Investments in Securities, at Value | ||||||||||||||||
Corporate Bonds & Notes | ||||||||||||||||
Guernsey, Channel Islands | ||||||||||||||||
Banking & Finance | $ | 381 | Third Party Vendor | Broker Quote | 101.50 | |||||||||||
United States | ||||||||||||||||
Industrials | 204 | Third Party Vendor | Broker Quote | 107.00-109.00 | ||||||||||||
|
| |||||||||||||||
Total | $ | 585 | ||||||||||||||
|
| |||||||||||||||
| (1) | Any difference between Net Change in Unrealized Appreciation/(Depreciation) and Net Change in Unrealized Appreciation/(Depreciation) on Investments Held at December 31, 2013 may be due to an investment no longer held or categorized as level 3 at period end. |
| See Accompanying Notes | SEMIANNUAL REPORT | DECEMBER 31, 2013 | 53 |
Table of Contents
Schedule of Investments PIMCO EqS® Dividend Fund
| SHARES | MARKET VALUE (000S) | |||||||||||
| INVESTMENTS IN SECURITIES 98.7% | ||||||||||||
| COMMON STOCKS 94.7% | ||||||||||||
| BERMUDA 1.0% | ||||||||||||
| ENERGY 1.0% | ||||||||||||
Golar LNG Partners LP | 194,593 | $ | 5,886 | |||||||||
|
| |||||||||||
Total Bermuda | 5,886 | |||||||||||
|
| |||||||||||
| BRAZIL 5.6% | ||||||||||||
| FINANCIALS 1.5% | ||||||||||||
BB Seguridade Participacoes S.A. | 898,465 | 9,330 | ||||||||||
|
| |||||||||||
| INDUSTRIALS 1.0% | ||||||||||||
Arteris S.A. | 707,900 | 5,716 | ||||||||||
|
| |||||||||||
| UTILITIES 3.1% | ||||||||||||
Cia de Saneamento Basico do Estado de Sao Paulo SP - ADR | 1,468,553 | 16,653 | ||||||||||
Light S.A. | 226,200 | 2,128 | ||||||||||
|
| |||||||||||
| 18,781 | ||||||||||||
|
| |||||||||||
Total Brazil | 33,827 | |||||||||||
|
| |||||||||||
| CHINA 1.5% | ||||||||||||
| INDUSTRIALS 1.5% | ||||||||||||
Guangshen Railway Co. Ltd. ‘H’ | 6,096,000 | 2,845 | ||||||||||
Zhejiang Expressway Co. Ltd. ‘H’ | 6,322,000 | 6,002 | ||||||||||
|
| |||||||||||
Total China | 8,847 | |||||||||||
|
| |||||||||||
| CYPRUS 2.8% | ||||||||||||
| ENERGY 2.8% | ||||||||||||
ProSafe SE | 2,222,820 | 17,197 | ||||||||||
|
| |||||||||||
Total Cyprus | 17,197 | |||||||||||
|
| |||||||||||
| FRANCE 4.3% | ||||||||||||
| ENERGY 3.0% | ||||||||||||
Total S.A. | 294,455 | 18,073 | ||||||||||
|
| |||||||||||
| FINANCIALS 1.3% | ||||||||||||
CNP Assurances | 394,758 | 8,095 | ||||||||||
|
| |||||||||||
Total France | 26,168 | |||||||||||
|
| |||||||||||
| HONG KONG 0.5% | ||||||||||||
| INDUSTRIALS 0.5% | ||||||||||||
Yuexiu Transport Infrastructure Ltd. | 5,618,000 | 2,967 | ||||||||||
|
| |||||||||||
Total Hong Kong | 2,967 | |||||||||||
|
| |||||||||||
| ITALY 1.0% | ||||||||||||
| INDUSTRIALS 1.0% | ||||||||||||
Societa Iniziative Autostradali e Servizi SpA | 586,891 | 5,838 | ||||||||||
|
| |||||||||||
Total Italy | 5,838 | |||||||||||
|
| |||||||||||
| SHARES | MARKET VALUE (000S) | |||||||||||
| JAPAN 3.3% | ||||||||||||
| TELECOMMUNICATION SERVICES 3.3% | ||||||||||||
Nippon Telegraph & Telephone Corp. | 373,800 | $ | 20,133 | |||||||||
|
| |||||||||||
Total Japan | 20,133 | |||||||||||
|
| |||||||||||
| NETHERLANDS 2.6% | ||||||||||||
| ENERGY 0.6% | ||||||||||||
Royal Dutch Shell PLC ‘A’ | 101,750 | 3,646 | ||||||||||
|
| |||||||||||
| FINANCIALS 2.0% | ||||||||||||
Aegon NV | 1,311,101 | 12,425 | ||||||||||
|
| |||||||||||
Total Netherlands | 16,071 | |||||||||||
|
| |||||||||||
| PANAMA 0.5% | ||||||||||||
| INDUSTRIALS 0.5% | ||||||||||||
Copa Holdings S.A. ‘A’ | 18,263 | 2,924 | ||||||||||
|
| |||||||||||
Total Panama | 2,924 | |||||||||||
|
| |||||||||||
| SOUTH AFRICA 4.0% | ||||||||||||
| CONSUMER DISCRETIONARY 0.9% | ||||||||||||
Imperial Holdings Ltd. | 290,276 | 5,613 | ||||||||||
|
| |||||||||||
| HEALTH CARE 0.9% | ||||||||||||
Life Healthcare Group Holdings Ltd. | 1,434,281 | 5,729 | ||||||||||
|
| |||||||||||
| TELECOMMUNICATION SERVICES 2.2% | ||||||||||||
MTN Group Ltd. | 636,079 | 13,174 | ||||||||||
|
| |||||||||||
Total South Africa | 24,516 | |||||||||||
|
| |||||||||||
| SPAIN 3.0% | ||||||||||||
| UTILITIES 3.0% | ||||||||||||
Enagas S.A. | 708,223 | 18,500 | ||||||||||
|
| |||||||||||
Total Spain | 18,500 | |||||||||||
|
| |||||||||||
| SWITZERLAND 3.8% | ||||||||||||
| HEALTH CARE 3.8% | ||||||||||||
Roche Holding AG | 83,469 | 23,382 | ||||||||||
|
| |||||||||||
Total Switzerland | 23,382 | |||||||||||
|
| |||||||||||
| TAIWAN 1.4% | ||||||||||||
| INFORMATION TECHNOLOGY 1.4% | ||||||||||||
Radiant Opto-Electronics Corp. | 2,349,360 | 8,618 | ||||||||||
|
| |||||||||||
Total Taiwan | 8,618 | |||||||||||
|
| |||||||||||
| THAILAND 0.3% | ||||||||||||
| INDUSTRIALS 0.3% | ||||||||||||
Bangkok Expressway PCL | 1,649,400 | 1,687 | ||||||||||
|
| |||||||||||
Total Thailand | 1,687 | |||||||||||
|
| |||||||||||
| SHARES | MARKET VALUE (000S) | |||||||||||
| TURKEY 0.9% | ||||||||||||
| INDUSTRIALS 0.9% | ||||||||||||
TAV Havalimanlari Holding A/S | 769,152 | $ | 5,538 | |||||||||
|
| |||||||||||
Total Turkey | 5,538 | |||||||||||
|
| |||||||||||
| UNITED KINGDOM 12.8% | ||||||||||||
| CONSUMER DISCRETIONARY 1.1% | ||||||||||||
Marks & Spencer Group PLC | 961,283 | 6,903 | ||||||||||
|
| |||||||||||
| CONSUMER STAPLES 2.7% | ||||||||||||
Imperial Tobacco Group PLC | 424,834 | 16,470 | ||||||||||
|
| |||||||||||
| FINANCIALS 9.0% | ||||||||||||
HSBC Holdings PLC | 2,388,349 | 26,210 | ||||||||||
Intermediate Capital Group PLC | 1,185,257 | 8,264 | ||||||||||
Standard Chartered PLC | 890,149 | 20,106 | ||||||||||
|
| |||||||||||
| 54,580 | ||||||||||||
|
| |||||||||||
Total United Kingdom | 77,953 | |||||||||||
|
| |||||||||||
| UNITED STATES 45.4% | ||||||||||||
| CONSUMER DISCRETIONARY 10.9% | ||||||||||||
AMC Entertainment Holdings, Inc. ‘A’ (a) | 175,085 | 3,598 | ||||||||||
Coach, Inc. | 206,614 | 11,597 | ||||||||||
Foot Locker, Inc. | 290,244 | 12,028 | ||||||||||
General Motors Co. (a) | 349,181 | 14,271 | ||||||||||
Kohl’s Corp. | 233,313 | 13,240 | ||||||||||
Staples, Inc. | 741,094 | 11,776 | ||||||||||
|
| |||||||||||
| 66,510 | ||||||||||||
|
| |||||||||||
| CONSUMER STAPLES 2.4% | ||||||||||||
Walgreen Co. | 253,520 | 14,562 | ||||||||||
|
| |||||||||||
| ENERGY 2.5% | ||||||||||||
Marathon Petroleum Corp. | 163,413 | 14,990 | ||||||||||
|
| |||||||||||
| FINANCIALS 11.6% | ||||||||||||
Apollo Investment Corp. | 668,751 | 5,671 | ||||||||||
Blackstone Group LP | 190,817 | 6,011 | ||||||||||
JPMorgan Chase & Co. | 306,833 | 17,944 | ||||||||||
KeyCorp | 1,091,922 | 14,653 | ||||||||||
Prudential Financial, Inc. | 144,353 | 13,312 | ||||||||||
Solar Capital Ltd. | 443,942 | 10,011 | ||||||||||
Solar Senior Capital Ltd. | 168,167 | 3,064 | ||||||||||
|
| |||||||||||
| 70,666 | ||||||||||||
|
| |||||||||||
| HEALTH CARE 4.5% | ||||||||||||
Medtronic, Inc. | 214,888 | 12,333 | ||||||||||
Merck & Co., Inc. | 297,009 | 14,865 | ||||||||||
|
| |||||||||||
| 27,198 | ||||||||||||
|
| |||||||||||
| INFORMATION TECHNOLOGY 11.6% | ||||||||||||
Cisco Systems, Inc. | 1,102,353 | 24,748 | ||||||||||
Microsoft Corp. | 357,000 | 13,362 | ||||||||||
| 54 | PIMCO EQUITY SERIES | See Accompanying Notes |
Table of Contents
December 31, 2013 (Unaudited)
| SHARES | MARKET VALUE (000S) | |||||||||||
Qualcomm, Inc. | 274,399 | $ | 20,374 | |||||||||
Western Digital Corp. | 140,608 | 11,797 | ||||||||||
|
| |||||||||||
| 70,281 | ||||||||||||
|
| |||||||||||
| MATERIALS 1.9% | ||||||||||||
Tronox Ltd. ‘A’ | 513,157 | 11,839 | ||||||||||
|
| |||||||||||
Total United States | 276,046 | |||||||||||
|
| |||||||||||
| Total Common Stocks (Cost $504,952) | 576,098 | |||||||||||
|
| |||||||||||
| UNITS | ||||||||||||
| EQUITY-LINKED SECURITIES 1.4% | ||||||||||||
| SAUDI ARABIA 1.4% | ||||||||||||
| CONSUMER STAPLES 0.9% | ||||||||||||
HSBC Bank PLC, Etihad Etisalat Co. - Exp. 03/30/2015 | 252,593 | 5,759 | ||||||||||
|
| |||||||||||
| INDUSTRIALS 0.5% | ||||||||||||
Merrill Lynch International & Co., Saudi Airlines Catering Co. - Exp. 04/29/2015 | 72,168 | 2,723 | ||||||||||
|
| |||||||||||
Total Equity-Linked Securities | 8,482 | |||||||||||
|
| |||||||||||
| SHARES | MARKET VALUE (000S) | |||||||||||
| REAL ESTATE INVESTMENT TRUSTS 2.4% | ||||||||||||
| UNITED STATES 2.4% | ||||||||||||
| FINANCIALS 2.4% | ||||||||||||
Colony Financial, Inc. | 706,287 | $ | 14,331 | |||||||||
|
| |||||||||||
Total Real Estate Investment Trusts | 14,331 | |||||||||||
|
| |||||||||||
| PRINCIPAL AMOUNT (000S) | ||||||||||||
| SHORT-TERM INSTRUMENTS 0.2% | ||||||||||||
REPURCHASE AGREEMENTS (b) 0.2% |
| |||||||||||
| 1,458 | ||||||||||||
|
| |||||||||||
| Total Short-Term Instruments (Cost $1,458) | 1,458 | |||||||||||
|
| |||||||||||
| Total Investments in Securities (Cost $529,287) | 600,369 | |||||||||||
|
| |||||||||||
| SHARES | MARKET VALUE (000S) | |||||||||||
| INVESTMENTS IN AFFILIATES 0.7% | ||||||||||||
| SHORT-TERM INSTRUMENTS 0.7% | ||||||||||||
| CENTRAL FUNDS USED FOR CASH MANAGEMENT PURPOSES 0.7% | ||||||||||||
PIMCO Short-Term Floating NAV Portfolio | 428,813 | $ | 4,290 | |||||||||
|
| |||||||||||
| Total Short-Term Instruments (Cost $4,290) | 4,290 | |||||||||||
|
| |||||||||||
| Total Investments in Affiliates (Cost $4,290) | 4,290 | |||||||||||
| Total Investments 99.4% (Cost $533,577) | $ | 604,659 | ||||||||||
Financial Derivative Instruments (c)(d) 0.1% (Cost or Premiums, net $0) | 865 | |||||||||||
| Other Assets and Liabilities, net 0.5% | 2,806 | |||||||||||
|
| |||||||||||
| Net Assets 100.0% | $ | 608,330 | ||||||||||
|
| |||||||||||
NOTES TO SCHEDULE OF INVESTMENTS (AMOUNTS IN THOUSANDS*, EXCEPT NUMBER OF CONTRACTS):
| * | A zero balance may reflect actual amounts rounding to less than one thousand. |
| (a) | Security did not produce income within the last twelve months. |
BORROWINGS AND OTHER FINANCING TRANSACTIONS
(b) REPURCHASE AGREEMENTS:
| Counterparty | Lending Rate | Settlement Date | Maturity Date | Principal Amount | Collateralized By | Collateral Received, at Value | Repurchase Agreements, at Value | Repurchase Agreement Proceeds to be Received (1) | ||||||||||||||||||||
BOS | 0.010% | 12/31/2013 | 01/02/2014 | $ | 900 | U.S. Treasury Notes 0.375% due 01/15/2016 | $ | (920 | ) | $ | 900 | $ | 900 | |||||||||||||||
SSB | 0.000% | 12/31/2013 | 01/02/2014 | 558 | Freddie Mac 2.080% due 10/17/2022 | (571 | ) | 558 | 558 | |||||||||||||||||||
|
|
|
|
|
| |||||||||||||||||||||||
Total Repurchase Agreements |
| $ | (1,491 | ) | $ | 1,458 | $ | 1,458 | ||||||||||||||||||||
|
|
|
|
|
| |||||||||||||||||||||||
| (1) | Includes accrued interest. |
BORROWINGS AND OTHER FINANCING TRANSACTIONS SUMMARY
The following is a summary by counterparty of the market value of Borrowings and Other Financing Transactions and collateral (received)/pledged as of December 31, 2013:
| Counterparty | Repurchase Agreement Proceeds to be Received | Payable for Reverse Repurchase Agreements | Payable for Sale-Buyback Transactions | Payable for Short Sales | Total Borrowings and Other Financing Transactions | Collateral (Received) | Net Exposure (2) | |||||||||||||||||||||
Global/Master Repurchase Agreement | ||||||||||||||||||||||||||||
BOS | $ | 900 | $ | 0 | $ | 0 | $ | 0 | $ | 900 | $ | (920 | ) | $ | (20 | ) | ||||||||||||
SSB | 558 | 0 | 0 | 0 | 558 | (570 | ) | (12 | ) | |||||||||||||||||||
|
|
|
|
|
|
|
| |||||||||||||||||||||
Total Borrowings and Other Financing Transactions | $ | 1,458 | $ | 0 | $ | 0 | $ | 0 | ||||||||||||||||||||
|
|
|
|
|
|
|
| |||||||||||||||||||||
| (2) | Net Exposure represents the net receivable/(payable) that would be due from/to the counterparty in the event of default. Exposure from borrowings and other financing transactions can only be netted across transactions governed under the same master agreement with the same legal entity. See Note 7, Principal Risks, in the Notes to Financial Statements for more information regarding master netting arrangements. |
| See Accompanying Notes | SEMIANNUAL REPORT | DECEMBER 31, 2013 | 55 |
Table of Contents
Schedule of Investments PIMCO EqS® Dividend Fund (Cont.)
(c) FINANCIAL DERIVATIVE INSTRUMENTS: EXCHANGE-TRADED OR CENTRALLY CLEARED
FUTURES CONTRACTS:
| Description | Type | Expiration Month | # of Contracts | Unrealized Appreciation/ (Depreciation) | Variation Margin | |||||||||||||||||
| Asset | Liability | |||||||||||||||||||||
British pound currency March Futures | Short | 03/2014 | 393 | $ | (434 | ) | $ | 0 | $ | (113 | ) | |||||||||||
Swiss franc currency March Futures | Short | 03/2014 | 75 | 18 | 19 | 0 | ||||||||||||||||
|
|
|
|
|
| |||||||||||||||||
Total Futures Contracts | $ | (416 | ) | $ | 19 | $ | (113 | ) | ||||||||||||||
|
|
|
|
|
| |||||||||||||||||
FINANCIAL DERIVATIVE INSTRUMENTS: EXCHANGE-TRADED OR CENTRALLY CLEARED SUMMARY
The following is a summary of the market value and variation margin of Exchange-Traded or Centrally Cleared Financial Derivative Instruments as of December 31, 2013:
Cash of $751 has been pledged as collateral for exchange-traded and centrally cleared financial derivative instruments as of December 31, 2013. See Note 7, Principal Risks, in the Notes to Financial Statements for more information regarding master netting arrangements.
| Financial Derivative Assets | Financial Derivative Liabilities | |||||||||||||||||||||||||||||||||
| Market Value | Variation Margin Asset | Total | Market Value | Variation Margin Liability | Total | |||||||||||||||||||||||||||||
| Purchased Options | Futures | Swap Agreements | Written Options | Futures | Swap Agreements | |||||||||||||||||||||||||||||
Total Exchange-Traded or Centrally Cleared | $ | 0 | $ | 19 | $ | 0 | $ | 19 | $ | 0 | $ | (113 | ) | $ | 0 | $ | (113 | ) | ||||||||||||||||
|
|
|
|
|
|
|
|
|
|
|
|
|
|
|
| |||||||||||||||||||
(d) FINANCIAL DERIVATIVE INSTRUMENTS: OVER THE COUNTER
FORWARD FOREIGN CURRENCY CONTRACTS:
| Counterparty | Settlement Month | Currency to be Delivered | Currency to be Received | Unrealized Appreciation/ (Depreciation) | ||||||||||||||||||||||||
| Asset | Liability | |||||||||||||||||||||||||||
BOA | 01/2014 | EUR | 42 | $ | 57 | $ | 0 | $ | (1 | ) | ||||||||||||||||||
| 01/2014 | ZAR | 626 | 60 | 0 | 0 | |||||||||||||||||||||||
| 02/2014 | BRL | 701 | 295 | 0 | 0 | |||||||||||||||||||||||
| 02/2014 | EUR | 5,579 | 7,700 | 25 | 0 | |||||||||||||||||||||||
BRC | 02/2014 | 3,411 | 4,662 | 0 | (31 | ) | ||||||||||||||||||||||
| 02/2014 | $ | 4,647 | NOK | 28,255 | 6 | 0 | ||||||||||||||||||||||
CBK | 01/2014 | HKD | 273 | $ | 35 | 0 | 0 | |||||||||||||||||||||
| 01/2014 | $ | 2,055 | EUR | 1,493 | 0 | (1 | ) | |||||||||||||||||||||
| 02/2014 | EUR | 1,493 | $ | 2,055 | 2 | 0 | ||||||||||||||||||||||
| 02/2014 | NOK | 5,819 | 943 | 0 | (15 | ) | ||||||||||||||||||||||
DUB | 01/2014 | HKD | 1,646 | 212 | 0 | 0 | ||||||||||||||||||||||
| 01/2014 | $ | 5,906 | TRY | 12,198 | 0 | (244 | ) | |||||||||||||||||||||
| 01/2014 | ZAR | 207,781 | $ | 20,368 | 594 | 0 | ||||||||||||||||||||||
| 04/2014 | TRY | 12,198 | 5,799 | 247 | 0 | |||||||||||||||||||||||
FBF | 01/2014 | BRL | 29,321 | 12,469 | 42 | 0 | ||||||||||||||||||||||
| 01/2014 | NOK | 113,568 | 18,703 | 0 | (21 | ) | ||||||||||||||||||||||
| 01/2014 | THB | 21,432 | 654 | 2 | 0 | |||||||||||||||||||||||
| 01/2014 | $ | 12,508 | BRL | 29,321 | 0 | (80 | ) | |||||||||||||||||||||
| 02/2014 | BRL | 13,023 | $ | 5,505 | 30 | 0 | ||||||||||||||||||||||
GLM | 01/2014 | EUR | 1,451 | 1,968 | 0 | (28 | ) | |||||||||||||||||||||
| 01/2014 | $ | 4,627 | NOK | 28,255 | 32 | 0 | ||||||||||||||||||||||
JPM | 01/2014 | HKD | 149 | $ | 19 | 0 | 0 | |||||||||||||||||||||
| 01/2014 | TRY | 12,198 | 5,977 | 315 | 0 | |||||||||||||||||||||||
| 01/2014 | $ | 212 | HKD | 1,646 | 0 | 0 | ||||||||||||||||||||||
MSC | 01/2014 | BRL | 44,476 | $ | 18,944 | 92 | 0 | |||||||||||||||||||||
| 01/2014 | $ | 19,740 | BRL | 46,051 | 0 | (221 | ) | |||||||||||||||||||||
| 02/2014 | BRL | 52,010 | $ | 22,094 | 226 | 0 | ||||||||||||||||||||||
UAG | 01/2014 | 13,800 | 5,880 | 31 | 0 | |||||||||||||||||||||||
| 01/2014 | $ | 5,891 | BRL | 13,800 | 0 | (42 | ) | |||||||||||||||||||||
| 01/2014 | 18,450 | NOK | 113,568 | 274 | 0 | |||||||||||||||||||||||
| 01/2014 | 667 | THB | 21,432 | 0 | (15 | ) | ||||||||||||||||||||||
| 02/2014 | NOK | 113,568 | $ | 18,429 | 0 | (273 | ) | |||||||||||||||||||||
| 04/2014 | THB | 21,432 | 662 | 13 | 0 | |||||||||||||||||||||||
|
|
|
| |||||||||||||||||||||||||
Total Forward Foreign Currency Contracts |
| $ | 1,931 | $ | (972 | ) | ||||||||||||||||||||||
|
|
|
| |||||||||||||||||||||||||
| 56 | PIMCO EQUITY SERIES | See Accompanying Notes |
Table of Contents
December 31, 2013 (Unaudited)
FINANCIAL DERIVATIVE INSTRUMENTS: OVER THE COUNTER SUMMARY
The following is a summary by counterparty of the market value of OTC financial derivative instruments and collateral (received) as of December 31, 2013:
| Financial Derivative Assets | Financial Derivative Liabilities | |||||||||||||||||||||||||||||||||||||||||||||
| Counterparty | Forward Foreign Currency Contracts | Purchased Options | Swap Agreements | Total Over the Counter | Forward Foreign Currency Contracts | Written Options | Swap Agreements | Total Over the Counter | Net Market Value of OTC Derivatives | Collateral (Received)/ Pledged | Net Exposure (1) | |||||||||||||||||||||||||||||||||||
BOA | $ | 25 | $ | 0 | $ | 0 | $ | 25 | $ | (1 | ) | $ | 0 | $ | 0 | $ | (1 | ) | $ | 24 | $ | 0 | $ | 24 | ||||||||||||||||||||||
BRC | 6 | 0 | 0 | 6 | (31 | ) | 0 | 0 | (31 | ) | (25 | ) | 0 | (25 | ) | |||||||||||||||||||||||||||||||
CBK | 2 | 0 | 0 | 2 | (16 | ) | 0 | 0 | (16 | ) | (14 | ) | 0 | (14 | ) | |||||||||||||||||||||||||||||||
DUB | 841 | 0 | 0 | 841 | (244 | ) | 0 | 0 | (244 | ) | 597 | (440 | ) | 157 | ||||||||||||||||||||||||||||||||
FBF | 74 | 0 | 0 | 74 | (101 | ) | 0 | 0 | (101 | ) | (27 | ) | (80 | ) | (107 | ) | ||||||||||||||||||||||||||||||
GLM | 32 | 0 | 0 | 32 | (28 | ) | 0 | 0 | (28 | ) | 4 | 0 | 4 | |||||||||||||||||||||||||||||||||
JPM | 315 | 0 | 0 | 315 | 0 | 0 | 0 | 0 | 315 | (270 | ) | 45 | ||||||||||||||||||||||||||||||||||
MSC | 318 | 0 | 0 | 318 | (221 | ) | 0 | 0 | (221 | ) | 97 | (995 | ) | (898 | ) | |||||||||||||||||||||||||||||||
UAG | 318 | 0 | 0 | 318 | (330 | ) | 0 | 0 | (330 | ) | (12 | ) | 0 | (12 | ) | |||||||||||||||||||||||||||||||
|
|
|
|
|
|
|
|
|
|
|
|
|
|
|
| |||||||||||||||||||||||||||||||
Total Over the Counter | $ | 1,931 | $ | 0 | $ | 0 | $ | 1,931 | $ | (972 | ) | $ | 0 | $ | 0 | $ | (972 | ) | ||||||||||||||||||||||||||||
|
|
|
|
|
|
|
|
|
|
|
|
|
|
|
| |||||||||||||||||||||||||||||||
| (1) | Net Exposure represents the net receivable/(payable) that would be due from/to the counterparty in the event of default. Exposure from OTC financial derivative instruments can only be netted across transactions governed under the same master agreement with the same legal entity. See note 7, Principal Risks, in the Notes to Financial Statements for more information regarding master netting arrangements. |
FAIR VALUE OF FINANCIAL DERIVATIVE INSTRUMENTS
The following is a summary of the fair valuation of the Fund’s derivative instruments categorized by risk (1) exposure:
Fair Values of Financial Derivative Instruments on the Statements of Assets and Liabilities as of December 31, 2013:
| Derivatives not accounted for as hedging instruments | ||||||||||||||||||||||||
| Commodity Contracts | Credit Contracts | Equity Contracts | Foreign Exchange Contracts | Interest Rate Contracts | Total | |||||||||||||||||||
Financial Derivative Instruments - Assets | ||||||||||||||||||||||||
Exchange-traded or centrally cleared | ||||||||||||||||||||||||
Futures | $ | 0 | $ | 0 | $ | 0 | $ | 19 | $ | 0 | $ | 19 | ||||||||||||
|
|
|
|
|
|
|
|
|
|
|
| |||||||||||||
Over the counter | ||||||||||||||||||||||||
Forward Foreign Currency Contracts | $ | 0 | $ | 0 | $ | 0 | $ | 1,931 | $ | 0 | $ | 1,931 | ||||||||||||
|
|
|
|
|
|
|
|
|
|
|
| |||||||||||||
| $ | 0 | $ | 0 | $ | 0 | $ | 1,950 | $ | 0 | $ | 1,950 | |||||||||||||
|
|
|
|
|
|
|
|
|
|
|
| |||||||||||||
Financial Derivative Instruments - Liabilities | ||||||||||||||||||||||||
Exchange-traded or centrally cleared | ||||||||||||||||||||||||
Futures | $ | 0 | $ | 0 | $ | 0 | $ | 113 | $ | 0 | $ | 113 | ||||||||||||
|
|
|
|
|
|
|
|
|
|
|
| |||||||||||||
Over the counter | ||||||||||||||||||||||||
Forward Foreign Currency Contracts | $ | 0 | $ | 0 | $ | 0 | $ | 972 | $ | 0 | $ | 972 | ||||||||||||
|
|
|
|
|
|
|
|
|
|
|
| |||||||||||||
| $ | 0 | $ | 0 | $ | 0 | $ | 1,085 | $ | 0 | $ | 1,085 | |||||||||||||
|
|
|
|
|
|
|
|
|
|
|
| |||||||||||||
The Effect of Financial Derivative Instruments on the Statements of Operations for the Period Ended December 31, 2013:
| Derivatives not accounted for as hedging instruments | ||||||||||||||||||||||||
| Commodity Contracts | Credit Contracts | Equity Contracts | Foreign Exchange Contracts | Interest Rate Contracts | Total | |||||||||||||||||||
Net Realized (Loss) on Financial Derivative Instruments | ||||||||||||||||||||||||
Exchange-traded or centrally cleared | ||||||||||||||||||||||||
Futures | $ | 0 | $ | 0 | $ | 0 | $ | (2,944 | ) | $ | 0 | $ | (2,944 | ) | ||||||||||
|
|
|
|
|
|
|
|
|
|
|
| |||||||||||||
Over the counter | ||||||||||||||||||||||||
Forward Foreign Currency Contracts | $ | 0 | $ | 0 | $ | 0 | $ | (50 | ) | $ | 0 | $ | (50 | ) | ||||||||||
|
|
|
|
|
|
|
|
|
|
|
| |||||||||||||
| $ | 0 | $ | 0 | $ | 0 | $ | (2,994 | ) | $ | 0 | $ | (2,994 | ) | |||||||||||
|
|
|
|
|
|
|
|
|
|
|
| |||||||||||||
Net Change in Unrealized Appreciation (Depreciation) on Financial Derivative Instruments |
| |||||||||||||||||||||||
Exchange-traded or centrally cleared | ||||||||||||||||||||||||
Futures | $ | 0 | $ | 0 | $ | 0 | $ | (633 | ) | $ | 0 | $ | (633 | ) | ||||||||||
|
|
|
|
|
|
|
|
|
|
|
| |||||||||||||
Over the counter | ||||||||||||||||||||||||
Forward Foreign Currency Contracts | $ | 0 | $ | 0 | $ | 0 | $ | 791 | $ | 0 | $ | 791 | ||||||||||||
|
|
|
|
|
|
|
|
|
|
|
| |||||||||||||
| $ | 0 | $ | 0 | $ | 0 | $ | 158 | $ | 0 | $ | 158 | |||||||||||||
|
|
|
|
|
|
|
|
|
|
|
| |||||||||||||
| (1) | See Note 7, Principal Risks, in the Notes to Financial Statements on risks of the Fund. |
| See Accompanying Notes | SEMIANNUAL REPORT | DECEMBER 31, 2013 | 57 |
Table of Contents
Schedule of Investments PIMCO EqS® Dividend Fund (Cont.)
December 31, 2013 (Unaudited)
FAIR VALUE MEASUREMENTS
The following is a summary of the fair valuations according to the inputs used as of December 31, 2013 in valuing the Fund’s assets and liabilities:
| Category and Subcategory | Level 1 | Level 2 | Level 3 | Fair Value at 12/31/2013 | ||||||||||||
Investments in Securities, at Value | ||||||||||||||||
Common Stocks | ||||||||||||||||
Bermuda | ||||||||||||||||
Energy | $ | 5,886 | $ | 0 | $ | 0 | $ | 5,886 | ||||||||
Brazil | ||||||||||||||||
Financials | 9,330 | 0 | 0 | 9,330 | ||||||||||||
Industrials | 5,716 | 0 | 0 | 5,716 | ||||||||||||
Utilities | 16,653 | 2,128 | 0 | 18,781 | ||||||||||||
China | ||||||||||||||||
Industrials | 0 | 8,847 | 0 | 8,847 | ||||||||||||
Cyprus | ||||||||||||||||
Energy | 0 | 17,197 | 0 | 17,197 | ||||||||||||
France | ||||||||||||||||
Energy | 0 | 18,073 | 0 | 18,073 | ||||||||||||
Financials | 0 | 8,095 | 0 | 8,095 | ||||||||||||
Hong Kong | ||||||||||||||||
Industrials | 0 | 2,967 | 0 | 2,967 | ||||||||||||
Italy | ||||||||||||||||
Industrials | 0 | 5,838 | 0 | 5,838 | ||||||||||||
Japan | ||||||||||||||||
Telecommunication Services | 0 | 20,133 | 0 | 20,133 | ||||||||||||
Netherlands | ||||||||||||||||
Energy | 0 | 3,646 | 0 | 3,646 | ||||||||||||
Financials | 0 | 12,425 | 0 | 12,425 | ||||||||||||
Panama | ||||||||||||||||
Industrials | 2,924 | 0 | 0 | 2,924 | ||||||||||||
South Africa | ||||||||||||||||
Consumer Discretionary | 0 | 5,613 | 0 | 5,613 | ||||||||||||
Health Care | 0 | 5,729 | 0 | 5,729 | ||||||||||||
Telecommunication Services | 0 | 13,174 | 0 | 13,174 | ||||||||||||
Spain | ||||||||||||||||
Utilities | 0 | 18,500 | 0 | 18,500 | ||||||||||||
Switzerland | ||||||||||||||||
Health Care | 0 | 23,382 | 0 | 23,382 | ||||||||||||
Taiwan | ||||||||||||||||
Information Technology | 0 | 8,618 | 0 | 8,618 | ||||||||||||
Thailand | ||||||||||||||||
Industrials | 1,687 | 0 | 0 | 1,687 | ||||||||||||
Turkey | ||||||||||||||||
Industrials | 0 | 5,538 | 0 | 5,538 | ||||||||||||
United Kingdom | ||||||||||||||||
Consumer Discretionary | 0 | 6,903 | 0 | 6,903 | ||||||||||||
Consumer Staples | 0 | 16,470 | 0 | 16,470 | ||||||||||||
| Category and Subcategory | Level 1 | Level 2 | Level 3 | Fair Value at 12/31/2013 | ||||||||||||
Financials | $ | 0 | $ | 54,580 | $ | 0 | $ | 54,580 | ||||||||
United States | ||||||||||||||||
Consumer Discretionary | 66,510 | 0 | 0 | 66,510 | ||||||||||||
Consumer Staples | 14,562 | 0 | 0 | 14,562 | ||||||||||||
Energy | 14,990 | 0 | 0 | 14,990 | ||||||||||||
Financials | 70,666 | 0 | 0 | 70,666 | ||||||||||||
Health Care | 27,198 | 0 | 0 | 27,198 | ||||||||||||
Information Technology | 70,281 | 0 | 0 | 70,281 | ||||||||||||
Materials | 11,839 | 0 | 0 | 11,839 | ||||||||||||
Equity-Linked Securities | ||||||||||||||||
Saudi Arabia | ||||||||||||||||
Consumer Staples | 0 | 5,759 | 0 | 5,759 | ||||||||||||
Industrials | 0 | 2,723 | 0 | 2,723 | ||||||||||||
Real Estate Investment Trusts | ||||||||||||||||
United States | ||||||||||||||||
Financials | 14,331 | 0 | 0 | 14,331 | ||||||||||||
Short-Term Instruments | ||||||||||||||||
Repurchase Agreements | 0 | 1,458 | 0 | 1,458 | ||||||||||||
| $ | 332,573 | $ | 267,796 | $ | 0 | $ | 600,369 | |||||||||
Investments in Affiliates, at Value | ||||||||||||||||
Short-Term Instruments | ||||||||||||||||
Central Funds Used for Cash | $ | 4,290 | $ | 0 | $ | 0 | $ | 4,290 | ||||||||
Total Investments | $ | 336,863 | $ | 267,796 | $ | 0 | $ | 604,659 | ||||||||
Financial Derivative Instruments - Assets |
| |||||||||||||||
Exchange-traded or centrally cleared | 19 | 0 | 0 | 19 | ||||||||||||
Over the counter | 0 | 1,931 | 0 | 1,931 | ||||||||||||
| $ | 19 | $ | 1,931 | $ | 0 | $ | 1,950 | |||||||||
Financial Derivative Instruments - Liabilities |
| |||||||||||||||
Exchange-traded or centrally cleared | (113 | ) | 0 | 0 | (113 | ) | ||||||||||
Over the counter | 0 | (972 | ) | 0 | (972 | ) | ||||||||||
| $ | (113 | ) | $ | (972 | ) | $ | 0 | $ | (1,085 | ) | ||||||
Totals | $ | 336,769 | $ | 268,755 | $ | 0 | $ | 605,524 | ||||||||
There were no transfers between Level 1 and 2 during the period ended December 31, 2013.
| 58 | PIMCO EQUITY SERIES | See Accompanying Notes |
Table of Contents
Schedule of Investments PIMCO EqS® Emerging Markets Fund
December 31, 2013 (Unaudited)
| SHARES | MARKET VALUE (000S) | |||||||||||
| INVESTMENTS IN SECURITIES 87.3% | ||||||||||||
| COMMON STOCKS 79.2% | ||||||||||||
| AUSTRALIA 1.6% | ||||||||||||
| MATERIALS 1.6% | ||||||||||||
Iluka Resources Ltd. | 893,418 | $ | 6,923 | |||||||||
|
| |||||||||||
Total Australia | 6,923 | |||||||||||
|
| |||||||||||
| BERMUDA 1.1% | ||||||||||||
| ENERGY 1.1% | ||||||||||||
Seadrill Ltd. | 115,528 | 4,735 | ||||||||||
|
| |||||||||||
Total Bermuda | 4,735 | |||||||||||
|
| |||||||||||
| BRAZIL 9.0% | ||||||||||||
| CONSUMER DISCRETIONARY 1.2% | ||||||||||||
Anhanguera Educacional Participacoes S.A. | 550,800 | 3,479 | ||||||||||
Via Varejo S.A. (a) | 176,398 | 1,880 | ||||||||||
|
| |||||||||||
| 5,359 | ||||||||||||
|
| |||||||||||
| CONSUMER STAPLES 1.9% | ||||||||||||
AMBEV S.A. ADR | 1,108,149 | 8,145 | ||||||||||
|
| |||||||||||
| FINANCIALS 4.1% | ||||||||||||
BB Seguridade Participacoes S.A. | 608,727 | 6,321 | ||||||||||
CETIP S.A. - Mercados Organizados | 302,700 | 3,105 | ||||||||||
Itau Unibanco Holding S.A. SP - ADR | 629,895 | 8,548 | ||||||||||
|
| |||||||||||
| 17,974 | ||||||||||||
|
| |||||||||||
| UTILITIES 1.8% | ||||||||||||
Cia de Saneamento Basico do Estado de Sao Paulo SP - ADR | 691,730 | 7,800 | ||||||||||
|
| |||||||||||
Total Brazil | 39,278 | |||||||||||
|
| |||||||||||
| CAMBODIA 1.8% | ||||||||||||
| CONSUMER DISCRETIONARY 1.8% | ||||||||||||
NagaCorp Ltd. | 7,558,000 | 8,003 | ||||||||||
|
| |||||||||||
Total Cambodia | 8,003 | |||||||||||
|
| |||||||||||
| CANADA 0.2% | ||||||||||||
| MATERIALS 0.2% | ||||||||||||
Turquoise Hill Resources Ltd. (a) | 301,029 | 994 | ||||||||||
|
| |||||||||||
Total Canada | 994 | |||||||||||
|
| |||||||||||
| CHINA 8.5% | ||||||||||||
| CONSUMER STAPLES 1.1% | ||||||||||||
Shenguan Holdings Group Ltd. | 10,710,000 | 4,785 | ||||||||||
|
| |||||||||||
| ENERGY 2.3% | ||||||||||||
China Shenhua Energy Co. Ltd. ‘H’ | 3,235,500 | 10,260 | ||||||||||
|
| |||||||||||
| SHARES | MARKET VALUE (000S) | |||||||||||
| FINANCIALS 2.3% | ||||||||||||
Industrial & Commercial Bank of China Ltd. ‘H’ | 14,503,000 | $ | 9,835 | |||||||||
|
| |||||||||||
| INDUSTRIALS 1.4% | ||||||||||||
First Tractor Co. Ltd. ‘H’ | 3,688,000 | 2,886 | ||||||||||
Shanghai Electric Group Co. Ltd. ‘H’ | 8,512,000 | 3,081 | ||||||||||
|
| |||||||||||
| 5,967 | ||||||||||||
|
| |||||||||||
| INFORMATION TECHNOLOGY 0.7% | ||||||||||||
Baidu, Inc. SP - ADR (a) | 16,543 | 2,943 | ||||||||||
|
| |||||||||||
| MATERIALS 0.7% | ||||||||||||
China Shanshui Cement Group Ltd. | 7,285,000 | 3,139 | ||||||||||
|
| |||||||||||
Total China | 36,929 | |||||||||||
|
| |||||||||||
| COLOMBIA 0.5% | ||||||||||||
| ENERGY 0.5% | ||||||||||||
Ecopetrol S.A. SP - ADR | 57,204 | 2,200 | ||||||||||
|
| |||||||||||
Total Colombia | 2,200 | |||||||||||
|
| |||||||||||
| CYPRUS 2.3% | ||||||||||||
| INDUSTRIALS 2.3% | ||||||||||||
Global Ports Investment PLC SP - GDR | 269,128 | 3,763 | ||||||||||
Globaltrans Investment PLC SP - GDR | 382,725 | 6,085 | ||||||||||
|
| |||||||||||
Total Cyprus | 9,848 | |||||||||||
|
| |||||||||||
| DENMARK 1.8% | ||||||||||||
| CONSUMER STAPLES 1.8% | ||||||||||||
Carlsberg A/S ‘B’ | 69,432 | 7,683 | ||||||||||
|
| |||||||||||
Total Denmark | 7,683 | |||||||||||
|
| |||||||||||
| FINLAND 1.1% | ||||||||||||
| MATERIALS 1.1% | ||||||||||||
Kemira OYJ | 282,904 | 4,736 | ||||||||||
|
| |||||||||||
Total Finland | 4,736 | |||||||||||
|
| |||||||||||
| HONG KONG 5.7% | ||||||||||||
| CONSUMER DISCRETIONARY 1.0% | ||||||||||||
Melco Crown Entertainment Ltd. - ADR (a) | 113,415 | 4,448 | ||||||||||
|
| |||||||||||
| FINANCIALS 4.5% | ||||||||||||
AIA Group Ltd. | 1,981,784 | 9,975 | ||||||||||
China Overseas Land & Investment Ltd. | 2,500,000 | 7,057 | ||||||||||
Glorious Property Holdings Ltd. | 11,934,000 | 2,577 | ||||||||||
|
| |||||||||||
| 19,609 | ||||||||||||
|
| |||||||||||
| INFORMATION TECHNOLOGY 0.2% | ||||||||||||
China High Precision Automation Group Ltd. | 8,446,000 | 665 | ||||||||||
|
| |||||||||||
Total Hong Kong | 24,722 | |||||||||||
|
| |||||||||||
| SHARES | MARKET VALUE (000S) | |||||||||||
| INDIA 5.8% | ||||||||||||
| CONSUMER DISCRETIONARY 2.8% | ||||||||||||
Bajaj Auto Ltd. | 108,611 | $ | 3,349 | |||||||||
Tata Motors Ltd. | 1,109,746 | 6,789 | ||||||||||
Tata Motors Ltd. SP - ADR | 11,011 | 339 | ||||||||||
Zee Entertainment Enterprises Ltd. | 383,786 | 1,719 | ||||||||||
|
| |||||||||||
| 12,196 | ||||||||||||
|
| |||||||||||
| FINANCIALS 3.0% | ||||||||||||
Axis Bank Ltd. | 201,874 | 4,258 | ||||||||||
Housing Development Finance Corp. | 500,894 | 6,477 | ||||||||||
Yes Bank Ltd. | 375,831 | 2,261 | ||||||||||
|
| |||||||||||
| 12,996 | ||||||||||||
|
| |||||||||||
Total India | 25,192 | |||||||||||
|
| |||||||||||
| INDONESIA 1.4% | ||||||||||||
| CONSUMER DISCRETIONARY 1.4% | ||||||||||||
Matahari Department Store Tbk PT (a) | 6,890,000 | 6,235 | ||||||||||
|
| |||||||||||
Total Indonesia | 6,235 | |||||||||||
|
| |||||||||||
| ISRAEL 2.0% | ||||||||||||
| MATERIALS 2.0% | ||||||||||||
Israel Chemicals Ltd. | 1,037,580 | 8,655 | ||||||||||
|
| |||||||||||
Total Israel | 8,655 | |||||||||||
|
| |||||||||||
| ITALY 2.0% | ||||||||||||
| CONSUMER DISCRETIONARY 2.0% | ||||||||||||
Prada SpA | 989,200 | 8,804 | ||||||||||
|
| |||||||||||
Total Italy | 8,804 | |||||||||||
|
| |||||||||||
| JAPAN 3.7% | ||||||||||||
| CONSUMER DISCRETIONARY 1.2% | ||||||||||||
Toyota Motor Corp. | 87,700 | 5,348 | ||||||||||
|
| |||||||||||
| INDUSTRIALS 2.5% | ||||||||||||
Mitsubishi Electric Corp. | 570,000 | 7,167 | ||||||||||
NSK Ltd. | 276,000 | 3,440 | ||||||||||
|
| |||||||||||
| 10,607 | ||||||||||||
|
| |||||||||||
Total Japan | 15,955 | |||||||||||
|
| |||||||||||
| KAZAKHSTAN 0.0% | ||||||||||||
| TELECOMMUNICATION SERVICES 0.0% | ||||||||||||
KCell JSC - GDR | 7,409 | 127 | ||||||||||
|
| |||||||||||
Total Kazakhstan | 127 | |||||||||||
|
| |||||||||||
| MACAU 1.0% | ||||||||||||
| CONSUMER DISCRETIONARY 1.0% | ||||||||||||
Wynn Macau Ltd. | 986,000 | 4,488 | ||||||||||
|
| |||||||||||
Total Macau | 4,488 | |||||||||||
|
| |||||||||||
| See Accompanying Notes | SEMIANNUAL REPORT | DECEMBER 31, 2013 | 59 |
Table of Contents
Schedule of Investments PIMCO EqS® Emerging Markets Fund (Cont.)
| SHARES | MARKET VALUE (000S) | |||||||||||
| MEXICO 1.9% | ||||||||||||
| FINANCIALS 1.9% | ||||||||||||
Bolsa Mexicana de Valores S.A.B. de C.V. | 3,621,700 | $ | 8,305 | |||||||||
|
| |||||||||||
Total Mexico | 8,305 | |||||||||||
|
| |||||||||||
| NORWAY 1.4% | ||||||||||||
| CONSUMER STAPLES 1.4% | ||||||||||||
Marine Harvest ASA | 5,011,401 | 6,113 | ||||||||||
|
| |||||||||||
Total Norway | 6,113 | |||||||||||
|
| |||||||||||
| PERU 3.3% | ||||||||||||
| FINANCIALS 2.2% | ||||||||||||
Credicorp Ltd. | 71,484 | 9,488 | ||||||||||
|
| |||||||||||
| MATERIALS 1.1% | ||||||||||||
Cementos Pacasmayo S.A.A. - ADR | 404,836 | 4,761 | ||||||||||
|
| |||||||||||
Total Peru | 14,249 | |||||||||||
|
| |||||||||||
| PHILIPPINES 0.9% | ||||||||||||
| UTILITIES 0.9% | ||||||||||||
First Gen Corp. | 13,555,000 | 3,999 | ||||||||||
|
| |||||||||||
Total Philippines | 3,999 | |||||||||||
|
| |||||||||||
| RUSSIA 2.6% | ||||||||||||
| TELECOMMUNICATION SERVICES 2.6% | ||||||||||||
MegaFon OAO - GDR | 332,176 | 11,128 | ||||||||||
|
| |||||||||||
Total Russia | 11,128 | |||||||||||
|
| |||||||||||
| SOUTH AFRICA 2.0% | ||||||||||||
| CONSUMER STAPLES 1.1% | ||||||||||||
Tongaat Hulett Ltd. | 436,770 | 4,734 | ||||||||||
|
| |||||||||||
| TELECOMMUNICATION SERVICES 0.9% | ||||||||||||
Vodacom Group Ltd. | 298,439 | 3,784 | ||||||||||
|
| |||||||||||
Total South Africa | 8,518 | |||||||||||
|
| |||||||||||
| SOUTH KOREA 9.3% | ||||||||||||
| CONSUMER DISCRETIONARY 3.0% | ||||||||||||
Kia Motors Corp. | 246,073 | 13,104 | ||||||||||
|
| |||||||||||
| INFORMATION TECHNOLOGY 4.5% | ||||||||||||
Samsung Electronics Co. Ltd. | 15,247 | 19,867 | ||||||||||
|
| |||||||||||
| MATERIALS 1.8% | ||||||||||||
POSCO Processing & Service Co. Ltd. | 24,820 | 7,723 | ||||||||||
|
| |||||||||||
Total South Korea | 40,694 | |||||||||||
|
| |||||||||||
| TAIWAN 3.0% | ||||||||||||
| INFORMATION TECHNOLOGY 3.0% | ||||||||||||
Chicony Electronics Co. Ltd. | 1,735,725 | 4,370 | ||||||||||
MediaTek, Inc. | 592,000 | 8,824 | ||||||||||
|
| |||||||||||
Total Taiwan | 13,194 | |||||||||||
|
| |||||||||||
| SHARES | MARKET VALUE (000S) | |||||||||||
| THAILAND 0.7% | ||||||||||||
| FINANCIALS 0.7% | ||||||||||||
Kasikornbank PCL | 601,700 | $ | 2,876 | |||||||||
|
| |||||||||||
Total Thailand | 2,876 | |||||||||||
|
| |||||||||||
| TURKEY 0.7% | ||||||||||||
| CONSUMER STAPLES 0.7% | ||||||||||||
Ulker Biskuvi Sanayi A/S | 426,969 | 3,020 | ||||||||||
|
| |||||||||||
Total Turkey | 3,020 | |||||||||||
|
| |||||||||||
| UNITED KINGDOM 3.9% | ||||||||||||
| CONSUMER STAPLES 1.5% | ||||||||||||
British American Tobacco PLC | 122,587 | 6,580 | ||||||||||
|
| |||||||||||
| ENERGY 1.4% | ||||||||||||
Afren PLC (a) | 2,162,052 | 6,064 | ||||||||||
|
| |||||||||||
| FINANCIALS 1.0% | ||||||||||||
Standard Chartered PLC | 190,644 | 4,306 | ||||||||||
|
| |||||||||||
Total United Kingdom | 16,950 | |||||||||||
|
| |||||||||||
Total Common Stocks (Cost $337,791) | 344,553 | |||||||||||
|
| |||||||||||
| UNITS | ||||||||||||
| EQUITY-LINKED SECURITIES 3.0% | ||||||||||||
| CHINA 2.0% | ||||||||||||
| FINANCIALS 2.0% | ||||||||||||
JPMorgan Chase & Co., Chinese Exchange Basket - Exp. 01/08/2014 | 117,549 | 8,968 | ||||||||||
|
| |||||||||||
Total China | 8,968 | |||||||||||
|
| |||||||||||
| NIGERIA 1.0% | ||||||||||||
| CONSUMER STAPLES 1.0% | ||||||||||||
HSBC Bank PLC | ||||||||||||
Guinness Nigeria PLC - Exp. 12/09/2014 | 562,117 | 827 | ||||||||||
Nigerian Breweries PLC - Exp. 12/09/2014 | 3,066,979 | 3,208 | ||||||||||
Merrill Lynch International & Co. |
| |||||||||||
Guinness Nigeria PLC - Exp. 11/10/2014 | 10,178 | 15 | ||||||||||
Nigerian Breweries PLC - Exp. 11/10/2014 | 251,197 | 263 | ||||||||||
|
| |||||||||||
Total Nigeria | 4,313 | |||||||||||
|
| |||||||||||
Total Equity-Linked Securities | 13,281 | |||||||||||
|
| |||||||||||
| SHARES | ||||||||||||
| EXCHANGE-TRADED FUNDS 1.4% | ||||||||||||
| LUXEMBOURG 1.4% | ||||||||||||
db x-trackers - CSI300 | 8,424,300 | 6,105 | ||||||||||
|
| |||||||||||
Total Exchange-Traded Funds | 6,105 | |||||||||||
|
| |||||||||||
| SHARES | MARKET VALUE (000S) | |||||||||||
| PREFERRED STOCKS 3.0% | ||||||||||||
| BRAZIL 1.8% | ||||||||||||
| CONSUMER STAPLES 1.8% | ||||||||||||
Cia Brasileira de Distribuicao Grupo Pao de Acucar | 176,642 | $ | 7,863 | |||||||||
|
| |||||||||||
Total Brazil | 7,863 | |||||||||||
|
| |||||||||||
| SOUTH KOREA 1.2% | ||||||||||||
| INFORMATION TECHNOLOGY 1.2% | ||||||||||||
Samsung Electronics Co. Ltd. | 5,248 | 5,047 | ||||||||||
|
| |||||||||||
Total South Korea | 5,047 | |||||||||||
|
| |||||||||||
Total Preferred Stocks (Cost $11,691) |
| 12,910 | ||||||||||
|
| |||||||||||
| RIGHTS 0.1% | ||||||||||||
| CANADA 0.1% | ||||||||||||
| MATERIALS 0.1% | ||||||||||||
Turquoise Hill Resources Ltd. - Exp. 01/07/2014 | 301,029 | 289 | ||||||||||
|
| |||||||||||
Total Rights (Cost $684) | 289 | |||||||||||
|
| |||||||||||
| PRINCIPAL AMOUNT (000S) | ||||||||||||
| SHORT-TERM INSTRUMENTS 0.6% | ||||||||||||
| REPURCHASE AGREEMENTS (c) 0.0% | ||||||||||||
| 117 | ||||||||||||
|
| |||||||||||
| U.S. TREASURY BILLS 0.6% | ||||||||||||
0.104% due 01/02/2014 - 12/11/2014 (b)(f) | $ | 2,414 | 2,412 | |||||||||
|
| |||||||||||
Total Short-Term Instruments | 2,529 | |||||||||||
|
| |||||||||||
Total Investments in Securities | 379,667 | |||||||||||
|
| |||||||||||
| SHARES | ||||||||||||
| INVESTMENTS IN AFFILIATES 12.2% | ||||||||||||
| SHORT-TERM INSTRUMENTS 12.2% | ||||||||||||
| CENTRAL FUNDS USED FOR CASH MANAGEMENT PURPOSES 12.2% | ||||||||||||
PIMCO Short-Term | 5,322,702 | 53,254 | ||||||||||
|
| |||||||||||
| Total Short-Term Instruments (Cost $53,261) | 53,254 | |||||||||||
|
| |||||||||||
| Total Investments in Affiliates (Cost $53,261) | 53,254 | |||||||||||
| Total Investments 99.5% (Cost $426,839) | $ | 432,921 | ||||||||||
Financial Derivative (Cost or Premiums, net $(25)) | 1,949 | |||||||||||
| Other Assets and Liabilities, net 0.1% | 378 | |||||||||||
|
| |||||||||||
| Net Assets 100.0% | $ | 435,248 | ||||||||||
|
| |||||||||||
| 60 | PIMCO EQUITY SERIES | See Accompanying Notes |
Table of Contents
December 31, 2013 (Unaudited)
NOTES TO SCHEDULE OF INVESTMENTS (AMOUNTS IN THOUSANDS*, EXCEPT NUMBER OF CONTRACTS, UNITS, AND SHARES):
| * | A zero balance may reflect actual amounts rounding to less than one thousand. |
| (a) | Security did not produce income within the last twelve months. |
| (b) | Coupon represents a weighted average yield to maturity. |
BORROWINGS AND OTHER FINANCING TRANSACTIONS
(c) REPURCHASE AGREEMENTS:
| Counterparty | Lending Rate | Settlement Date | Maturity Date | Principal Amount | Collateralized By | Collateral Received, at Value | Repurchase Agreements, at Value | Repurchase Agreement Proceeds to be Received (1) | ||||||||||||||||||||
SSB | 0.000% | 12/31/2013 | 01/02/2014 | $ | 117 | Freddie Mac 2.080% due 10/17/2022 | $ | (122 | ) | $ | 117 | $ | 117 | |||||||||||||||
|
|
|
|
|
| |||||||||||||||||||||||
Total Repurchase Agreements |
| $ | (122 | ) | $ | 117 | $ | 117 | ||||||||||||||||||||
|
|
|
|
|
| |||||||||||||||||||||||
| (1) | Includes accrued interest. |
BORROWINGS AND OTHER FINANCING TRANSACTIONS SUMMARY
The following is a summary by counterparty of the market value of Borrowings and Other Financing Transactions and collateral (received)/pledged as of December 31, 2013:
| Counterparty | Repurchase Agreement Proceeds to be Received | Payable for Reverse Repurchase Agreements | Payable for Sale-Buyback Transactions | Payable for Short Sales | Total Borrowings and Other Financing Transactions | Collateral (Received)/Pledged | Net Exposure (2) | |||||||||||||||||||||
Global/Master Repurchase Agreement | ||||||||||||||||||||||||||||
SSB | $ | 117 | $ | 0 | $ | 0 | $ | 0 | $ | 117 | $ | (122 | ) | $ | (5 | ) | ||||||||||||
Prime Brokerage Agreement | ||||||||||||||||||||||||||||
FOB | 0 | 0 | 0 | 0 | 0 | 3 | 3 | |||||||||||||||||||||
|
| |||||||||||||||||||||||||||
Total Borrowings and Other Financing Transactions | $ | 117 | $ | 0 | $ | 0 | $ | 0 | ||||||||||||||||||||
|
| |||||||||||||||||||||||||||
| (2) | Net Exposure represents the net receivable/(payable) that would be due from/to the counterparty in the event of default. Exposure from borrowings and other financing transactions can only be netted across transactions governed under the same master agreement with the same legal entity. See Note 7, Principal Risks, in the Notes to Financial Statements for more information regarding master netting arrangements. |
(d) FINANCIAL DERIVATIVE INSTRUMENTS: EXCHANGE-TRADED OR CENTRALLY CLEARED
FUTURES CONTRACTS:
Description | Type | Expiration | # of | Unrealized | Variation Margin | |||||||||||||||||
| Asset | Liability | |||||||||||||||||||||
Hang Seng China Enterprises Index January Futures | Long | 01/2014 | 11 | $ | (6 | ) | $ | 5 | $ | (7 | ) | |||||||||||
MSCI Taiwan Stock Index January Futures | Long | 01/2014 | 153 | 101 | 0 | 0 | ||||||||||||||||
|
|
|
|
|
| |||||||||||||||||
Total Futures Contracts | $ | 95 | $ | 5 | $ | (7 | ) | |||||||||||||||
|
|
|
|
|
| |||||||||||||||||
FINANCIAL DERIVATIVE INSTRUMENTS: EXCHANGE-TRADED OR CENTRALLY CLEARED SUMMARY
The following is a summary of the market value and variation margin of Exchange-Traded or Centrally Cleared Financial Derivative Instruments as of December 31, 2013:
Cash of $242 has been pledged as collateral for exchange-traded and centrally cleared financial derivative instruments as of December 31, 2013. See Note 7, Principal Risks, in the Notes to Financial Statements for more information regarding master netting arrangements.
| Financial Derivative Assets | Financial Derivative Liabilities | |||||||||||||||||||||||||||||||||
| Market Value | Variation Margin Asset | Total | Market Value | Variation Margin Liability | Total | |||||||||||||||||||||||||||||
| Purchased Options | Futures | Swap Agreements | Written Options | Futures | Swap Agreements | |||||||||||||||||||||||||||||
Total Exchange-Traded or Centrally Cleared | $ | 0 | $ | 5 | $ | 0 | $ | 5 | $ | 0 | $ | (7) | $ | 0 | $ | (7) | ||||||||||||||||||
|
|
|
|
|
|
|
|
|
|
|
|
|
|
|
| |||||||||||||||||||
| See Accompanying Notes | SEMIANNUAL REPORT | DECEMBER 31, 2013 | 61 |
Table of Contents
Schedule of Investments PIMCO EqS® Emerging Markets Fund (Cont.)
(e) FINANCIAL DERIVATIVE INSTRUMENTS: OVER THE COUNTER
FORWARD FOREIGN CURRENCY CONTRACTS:
Counterparty | Settlement | Currency to | Currency to | Unrealized Appreciation/ (Depreciation) | ||||||||||||||||||||||||
| Asset | Liability | |||||||||||||||||||||||||||
BOA | 01/2014 | HKD | 207,480 | $ | 26,761 | $ | 4 | $ | 0 | |||||||||||||||||||
| 01/2014 | INR | 288,256 | 4,608 | 0 | (41 | ) | ||||||||||||||||||||||
| 01/2014 | MYR | 55,445 | 17,267 | 351 | 0 | |||||||||||||||||||||||
| 01/2014 | TWD | 1,091,712 | 36,895 | 278 | 0 | |||||||||||||||||||||||
| 01/2014 | $ | 9,534 | AUD | 10,758 | 69 | 0 | ||||||||||||||||||||||
| 01/2014 | 2,317 | HKD | 17,958 | 0 | (1 | ) | ||||||||||||||||||||||
| 01/2014 | 8,410 | TWD | 245,488 | 0 | (176 | ) | ||||||||||||||||||||||
| 01/2014 | ZAR | 14,500 | $ | 1,439 | 59 | 0 | ||||||||||||||||||||||
| 02/2014 | AUD | 10,758 | 9,516 | 0 | (69 | ) | ||||||||||||||||||||||
| 02/2014 | DKK | 4,806 | 887 | 0 | 0 | |||||||||||||||||||||||
| 02/2014 | $ | 1,507 | DKK | 8,225 | 11 | 0 | ||||||||||||||||||||||
| 04/2014 | PEN | 12,793 | $ | 4,535 | 19 | 0 | ||||||||||||||||||||||
| 04/2014 | $ | 26,764 | HKD | 207,480 | 0 | (5 | ) | |||||||||||||||||||||
| 04/2014 | 4,503 | INR | 288,257 | 51 | 0 | |||||||||||||||||||||||
| 04/2014 | 17,186 | MYR | 55,445 | 0 | (361 | ) | ||||||||||||||||||||||
| 04/2014 | 37,745 | TWD | 1,110,848 | 0 | (404 | ) | ||||||||||||||||||||||
BPS | 01/2014 | COP | 5,088,914 | $ | 2,639 | 3 | (1 | ) | ||||||||||||||||||||
| 01/2014 | $ | 2,902 | COP | 5,543,594 | 0 | (30 | ) | |||||||||||||||||||||
| 01/2014 | 6,585 | HKD | 51,049 | 0 | (2 | ) | ||||||||||||||||||||||
| 01/2014 | 940 | ZAR | 9,744 | 0 | (13 | ) | ||||||||||||||||||||||
| 02/2014 | EUR | 451 | $ | 622 | 1 | 0 | ||||||||||||||||||||||
| 02/2014 | GBP | 10,290 | 16,554 | 0 | (481 | ) | ||||||||||||||||||||||
| 02/2014 | NOK | 70,625 | 11,569 | 0 | (57 | ) | ||||||||||||||||||||||
| 02/2014 | $ | 3,071 | EUR | 2,238 | 8 | 0 | ||||||||||||||||||||||
| 03/2014 | 2,464 | COP | 4,767,672 | 0 | (3 | ) | ||||||||||||||||||||||
| 03/2014 | 7,527 | MXN | 98,637 | 0 | (11 | ) | ||||||||||||||||||||||
BRC | 01/2014 | AUD | 10,758 | $ | 9,825 | 221 | 0 | |||||||||||||||||||||
| 01/2014 | HKD | 2,705 | 349 | 0 | 0 | |||||||||||||||||||||||
| 01/2014 | INR | 56,979 | 900 | 0 | (19 | ) | ||||||||||||||||||||||
| 01/2014 | KRW | 5,066,233 | 4,749 | 0 | (56 | ) | ||||||||||||||||||||||
| 01/2014 | PHP | 45,186 | 1,036 | 16 | 0 | |||||||||||||||||||||||
| 01/2014 | PLN | 1,030 | 336 | 0 | (4 | ) | ||||||||||||||||||||||
| 01/2014 | RUB | 32,647 | 1,007 | 16 | 0 | |||||||||||||||||||||||
| 01/2014 | $ | 41 | HKD | 319 | 0 | 0 | ||||||||||||||||||||||
| 01/2014 | 7,794 | PLN | 24,345 | 251 | 0 | |||||||||||||||||||||||
| 01/2014 | 3,345 | RUB | 108,315 | 0 | (57 | ) | ||||||||||||||||||||||
| 01/2014 | 337 | TWD | 9,971 | 0 | (2 | ) | ||||||||||||||||||||||
| 01/2014 | 1,199 | ZAR | 12,288 | 0 | (29 | ) | ||||||||||||||||||||||
| 02/2014 | JPY | 1,595,238 | $ | 15,952 | 801 | 0 | ||||||||||||||||||||||
| 03/2014 | GBP | 999 | 1,628 | 0 | (26 | ) | ||||||||||||||||||||||
| 04/2014 | HKD | 52,050 | 6,714 | 1 | 0 | |||||||||||||||||||||||
| 04/2014 | $ | 644 | INR | 41,142 | 6 | 0 | ||||||||||||||||||||||
| 04/2014 | 3,218 | KRW | 3,429,744 | 25 | 0 | |||||||||||||||||||||||
| 04/2014 | 423 | THB | 13,885 | 0 | (3 | ) | ||||||||||||||||||||||
CBK | 01/2014 | PLN | 786 | $ | 258 | 0 | (2 | ) | ||||||||||||||||||||
| 01/2014 | TWD | 140,892 | 4,816 | 90 | 0 | |||||||||||||||||||||||
| 01/2014 | $ | 19,070 | HKD | 147,850 | 0 | (3 | ) | |||||||||||||||||||||
| 01/2014 | 3,242 | RUB | 104,473 | 0 | (71 | ) | ||||||||||||||||||||||
| 02/2014 | JPY | 118,339 | $ | 1,152 | 28 | 0 | ||||||||||||||||||||||
| 02/2014 | $ | 1,396 | JPY | 145,100 | 0 | (17 | ) | |||||||||||||||||||||
| 03/2014 | 645 | GBP | 395 | 9 | 0 | |||||||||||||||||||||||
DUB | 01/2014 | BRL | 5,910 | $ | 2,532 | 27 | 0 | |||||||||||||||||||||
| 01/2014 | TRY | 612 | 298 | 14 | 0 | |||||||||||||||||||||||
| 01/2014 | $ | 2,523 | BRL | 5,910 | 0 | (18 | ) | |||||||||||||||||||||
| 01/2014 | 1,294 | CZK | 24,764 | 0 | (47 | ) | ||||||||||||||||||||||
| 01/2014 | 2,063 | KRW | 2,198,539 | 22 | 0 | |||||||||||||||||||||||
| 01/2014 | 1,980 | RUB | 66,152 | 28 | 0 | |||||||||||||||||||||||
| 01/2014 | 96 | THB | 2,997 | 0 | (5 | ) | ||||||||||||||||||||||
| 01/2014 | 862 | TRY | 1,780 | 0 | (36 | ) | ||||||||||||||||||||||
| 01/2014 | 24,127 | ZAR | 245,802 | 0 | (735 | ) | ||||||||||||||||||||||
| 02/2014 | 874 | EUR | 636 | 1 | 0 | |||||||||||||||||||||||
| 02/2014 | 732 | NOK | 4,525 | 13 | 0 | |||||||||||||||||||||||
| 03/2014 | ILS | 30,355 | $ | 8,607 | 0 | (126 | ) | |||||||||||||||||||||
| 04/2014 | TRY | 1,780 | 846 | 36 | 0 | |||||||||||||||||||||||
| 04/2014 | $ | 1,645 | TRY | 3,519 | 0 | (43 | ) | |||||||||||||||||||||
| 62 | PIMCO EQUITY SERIES | See Accompanying Notes |
Table of Contents
December 31, 2013 (Unaudited)
Counterparty | Settlement | Currency to | Currency to | Unrealized Appreciation/ (Depreciation) | ||||||||||||||||||||||||
| Asset | Liability | |||||||||||||||||||||||||||
FBF | 01/2014 | BRL | 837 | $ | 357 | $ | 3 | $ | 0 | |||||||||||||||||||
| 01/2014 | INR | 190,381 | 3,082 | 25 | (14 | ) | ||||||||||||||||||||||
| 01/2014 | KRW | 5,847,914 | 5,394 | 0 | (152 | ) | ||||||||||||||||||||||
| 01/2014 | MYR | 2,102 | 657 | 16 | 0 | |||||||||||||||||||||||
| 01/2014 | RUB | 30,577 | 926 | 0 | (2 | ) | ||||||||||||||||||||||
| 01/2014 | THB | 9,781 | 310 | 13 | 0 | |||||||||||||||||||||||
| 01/2014 | $ | 371 | BRL | 837 | 0 | (16 | ) | |||||||||||||||||||||
| 01/2014 | 5,885 | INR | 381,258 | 265 | 0 | |||||||||||||||||||||||
| 01/2014 | 909 | MYR | 2,907 | 0 | (22 | ) | ||||||||||||||||||||||
| 01/2014 | ZAR | 11,146 | $ | 1,072 | 11 | 0 | ||||||||||||||||||||||
| 04/2014 | INR | 61,627 | 967 | 0 | (6 | ) | ||||||||||||||||||||||
| 04/2014 | MYR | 1,868 | 570 | 3 | 0 | |||||||||||||||||||||||
| 04/2014 | PEN | 19,225 | 6,781 | 1 | (6 | ) | ||||||||||||||||||||||
| 04/2014 | TWD | 50,541 | 1,715 | 16 | 0 | |||||||||||||||||||||||
GLM | 01/2014 | BRL | 1,421 | 607 | 4 | 0 | ||||||||||||||||||||||
| 01/2014 | COP | 454,680 | 240 | 5 | 0 | |||||||||||||||||||||||
| 01/2014 | $ | 599 | BRL | 1,421 | 3 | 0 | ||||||||||||||||||||||
| 01/2014 | 3,136 | RUB | 102,304 | 0 | (30 | ) | ||||||||||||||||||||||
| 01/2014 | ZAR | 7,328 | $ | 723 | 26 | 0 | ||||||||||||||||||||||
| 02/2014 | JPY | 41,395 | 398 | 5 | 0 | |||||||||||||||||||||||
| 04/2014 | $ | 6,819 | CLP | 3,676,081 | 107 | 0 | ||||||||||||||||||||||
HUS | 01/2014 | DKK | 44,860 | $ | 8,146 | 0 | (127 | ) | ||||||||||||||||||||
| 01/2014 | RUB | 170,286 | 5,198 | 29 | 0 | |||||||||||||||||||||||
| 01/2014 | TRY | 846 | 415 | 22 | 0 | |||||||||||||||||||||||
| 01/2014 | $ | 2,616 | HKD | 20,280 | 0 | (1 | ) | |||||||||||||||||||||
| 01/2014 | 1,946 | INR | 123,513 | 46 | 0 | |||||||||||||||||||||||
| 01/2014 | 1,186 | KRW | 1,263,683 | 12 | 0 | |||||||||||||||||||||||
| 01/2014 | 42,636 | TWD | 1,259,671 | 0 | (386 | ) | ||||||||||||||||||||||
| 02/2014 | EUR | 10,775 | $ | 14,857 | 35 | 0 | ||||||||||||||||||||||
| 04/2014 | HKD | 2,322 | 300 | 0 | 0 | |||||||||||||||||||||||
JPM | 01/2014 | IDR | 20,909,028 | 1,794 | 82 | 0 | ||||||||||||||||||||||
| 01/2014 | KRW | 194,412 | 182 | 0 | (2 | ) | ||||||||||||||||||||||
| 01/2014 | MYR | 2,282 | 720 | 24 | 0 | |||||||||||||||||||||||
| 01/2014 | RUB | 185,277 | 5,639 | 27 | (13 | ) | ||||||||||||||||||||||
| 01/2014 | TRY | 322 | 158 | 8 | 0 | |||||||||||||||||||||||
| 01/2014 | TWD | 60,097 | 2,056 | 40 | 0 | |||||||||||||||||||||||
| 01/2014 | $ | 2,272 | CNY | 13,936 | 24 | 0 | ||||||||||||||||||||||
| 01/2014 | 491 | INR | 30,847 | 7 | 0 | |||||||||||||||||||||||
| 01/2014 | 4,408 | KRW | 4,742,928 | 90 | 0 | |||||||||||||||||||||||
| 01/2014 | 209 | MYR | 673 | 0 | (4 | ) | ||||||||||||||||||||||
| 01/2014 | 25,594 | RUB | 843,243 | 16 | (12 | ) | ||||||||||||||||||||||
| 01/2014 | 450 | ZAR | 4,530 | 0 | (19 | ) | ||||||||||||||||||||||
| 01/2014 | ZAR | 10,274 | $ | 1,036 | 58 | 0 | ||||||||||||||||||||||
| 03/2014 | IDR | 332,280 | 27 | 1 | 0 | |||||||||||||||||||||||
| 04/2014 | RUB | 852,816 | 25,495 | 2 | (30 | ) | ||||||||||||||||||||||
| 04/2014 | THB | 7,899 | 242 | 3 | 0 | |||||||||||||||||||||||
| 04/2014 | $ | 322 | RUB | 10,734 | 0 | (1 | ) | |||||||||||||||||||||
| 04/2014 | 1,715 | TWD | 50,970 | 0 | (2 | ) | ||||||||||||||||||||||
MSC | 01/2014 | BRL | 6,436 | $ | 2,739 | 11 | 0 | |||||||||||||||||||||
| 01/2014 | HKD | 29,131 | 3,757 | 1 | 0 | |||||||||||||||||||||||
| 01/2014 | $ | 2,755 | BRL | 6,436 | 0 | (27 | ) | |||||||||||||||||||||
| 01/2014 | 240 | HKD | 1,861 | 0 | 0 | |||||||||||||||||||||||
| 01/2014 | 6,434 | RUB | 208,037 | 0 | (119 | ) | ||||||||||||||||||||||
| 02/2014 | BRL | 6,436 | $ | 2,733 | 28 | 0 | ||||||||||||||||||||||
| 02/2014 | $ | 445 | BRL | 1,054 | 0 | (2 | ) | |||||||||||||||||||||
| 03/2014 | MXN | 10,270 | $ | 786 | 3 | 0 | ||||||||||||||||||||||
| 03/2014 | $ | 6,813 | MXN | 89,996 | 45 | 0 | ||||||||||||||||||||||
| 04/2014 | HKD | 22,596 | $ | 2,915 | 1 | 0 | ||||||||||||||||||||||
| 04/2014 | PEN | 5,117 | 1,814 | 8 | 0 | |||||||||||||||||||||||
RBC | 01/2014 | $ | 1,907 | RUB | 62,750 | 0 | (2 | ) | ||||||||||||||||||||
| 01/2014 | 620 | TWD | 18,296 | 0 | (6 | ) | ||||||||||||||||||||||
| 04/2014 | CLP | 123,839 | $ | 231 | 0 | (2 | ) | |||||||||||||||||||||
| 04/2014 | KRW | 2,523,395 | 2,380 | 0 | (6 | ) | ||||||||||||||||||||||
| 04/2014 | $ | 857 | PEN | 2,413 | 0 | (5 | ) | |||||||||||||||||||||
SCX | 01/2014 | KRW | 11,488,257 | $ | 10,822 | 0 | (73 | ) | ||||||||||||||||||||
| 01/2014 | $ | 3,797 | THB | 124,402 | 0 | (14 | ) | |||||||||||||||||||||
| 02/2014 | IDR | 332,281 | $ | 28 | 1 | 0 | ||||||||||||||||||||||
| 04/2014 | $ | 10,768 | KRW | 11,488,257 | 95 | 0 | ||||||||||||||||||||||
| See Accompanying Notes | SEMIANNUAL REPORT | DECEMBER 31, 2013 | 63 |
Table of Contents
Schedule of Investments PIMCO EqS® Emerging Markets Fund (Cont.)
Counterparty | Settlement | Currency to | Currency to | Unrealized Appreciation/ (Depreciation) | ||||||||||||||||||||||||
| Asset | Liability | |||||||||||||||||||||||||||
UAG | 01/2014 | CNY | 117,019 | $ | 18,972 | $ | 0 | $ | (304 | ) | ||||||||||||||||||
| 01/2014 | IDR | 996,842 | 90 | 9 | 0 | |||||||||||||||||||||||
| 01/2014 | KRW | 18,996,844 | 17,692 | 0 | (324 | ) | ||||||||||||||||||||||
| 01/2014 | PHP | 8,247 | 192 | 6 | 0 | |||||||||||||||||||||||
| 01/2014 | RUB | 1,009,072 | 30,580 | 0 | (52 | ) | ||||||||||||||||||||||
| 01/2014 | THB | 117,618 | 3,658 | 81 | 0 | |||||||||||||||||||||||
| 01/2014 | TWD | 240,726 | 8,171 | 97 | 0 | |||||||||||||||||||||||
| 01/2014 | $ | 16,871 | CNY | 103,082 | 109 | 0 | ||||||||||||||||||||||
| 01/2014 | 1,238 | IDR | 14,512,112 | 0 | (49 | ) | ||||||||||||||||||||||
| 01/2014 | 30,481 | KRW | 33,388,511 | 1,184 | 0 | |||||||||||||||||||||||
| 01/2014 | 16,856 | MYR | 56,250 | 305 | 0 | |||||||||||||||||||||||
| 01/2014 | 1,208 | PHP | 53,433 | 0 | (2 | ) | ||||||||||||||||||||||
| 02/2014 | BRL | 7,294 | $ | 3,106 | 39 | 0 | ||||||||||||||||||||||
| 02/2014 | IDR | 996,841 | 90 | 9 | 0 | |||||||||||||||||||||||
| 04/2014 | CNY | 103,083 | 16,863 | 0 | (4 | ) | ||||||||||||||||||||||
| 04/2014 | PHP | 53,433 | 1,210 | 0 | (2 | ) | ||||||||||||||||||||||
| 04/2014 | $ | 10,769 | KRW | 11,488,256 | 93 | 0 | ||||||||||||||||||||||
| 04/2014 | 3,634 | THB | 117,618 | 0 | (72 | ) | ||||||||||||||||||||||
|
|
|
| |||||||||||||||||||||||||
Total Forward Foreign Currency Contracts |
| $ | 5,613 | $ | (4,864 | ) | ||||||||||||||||||||||
|
|
|
| |||||||||||||||||||||||||
AS OF DECEMBER 31, 2013, THERE WERE NO OPEN WRITTEN OPTIONS. TRANSACTIONS IN WRITTEN CALL AND PUT OPTIONS FOR THE PERIOD ENDED DECEMBER 31, 2013:
| # of Contracts | Notional | Premiums | ||||||||||
Balance at 06/30/2013 | 0 | HKD | 110,062 | $ | (108 | ) | ||||||
Sales | 475,546 | 0 | (524 | ) | ||||||||
Closing Buys | (6,533 | ) | 0 | 179 | ||||||||
Expirations | (469,013 | ) | (110,062 | ) | 453 | |||||||
Exercised | 0 | 0 | 0 | |||||||||
|
|
|
|
|
| |||||||
Balance at 12/31/2013 | 0 | HKD | 0 | $ | 0 | |||||||
|
|
|
|
|
| |||||||
SWAP AGREEMENTS:
CREDIT DEFAULT SWAPS ON CREDIT INDICES - BUY PROTECTION(1)
Counterparty | Index/Tranches | Fixed Deal | Maturity | Notional | Premiums | Unrealized | Swap Agreements, at Value (3) | |||||||||||||||||||||||
| Asset | Liability | |||||||||||||||||||||||||||||
| BPS | CDX.IG-9 10-Year Index 15-30% | (1.000% | ) | 12/20/2017 | $ | 3,100 | $ | (25 | ) | $ | (66 | ) | $ | 0 | $ | (91 | ) | |||||||||||||
|
|
|
|
|
|
|
| |||||||||||||||||||||||
| (1) | If the Fund is a buyer of protection and a credit event occurs, as defined under the terms of that particular swap agreement, the Fund will either (i) receive from the seller of protection an amount equal to the notional amount of the swap and deliver the referenced obligation or underlying securities comprising the referenced index or (ii) receive a net settlement amount in the form of cash or securities equal to the notional amount of the swap less the recovery value of the referenced obligation or underlying securities comprising the referenced index. |
| (2) | The maximum potential amount the Fund could be required to pay as a seller of credit protection or receive as a buyer of credit protection if a credit event occurs as defined under the terms of that particular swap agreement. |
| (3) | The prices and resulting values for credit default swap agreements on credit indices serve as an indicator of the current status of the payment/performance risk and represent the likelihood of an expected liability (or profit) for the credit derivative should the notional amount of the swap agreement be closed/sold as of the period end. Increasing market values, in absolute terms when compared to the notional amount of the swap, represent a deterioration of the referenced indices’ credit soundness and a greater likelihood or risk of default or other credit event occurring as defined under the terms of the agreement. |
TOTAL RETURN SWAPS ON INDICES
Counterparty | Pay/Receive (4) | Underlying Reference | # of Units | Financing Rate | Maturity Date | Notional Amount | Unrealized Appreciation | Swap Agreements, at Value | ||||||||||||||||||||||||||
| Asset | Liability | |||||||||||||||||||||||||||||||||
| JPM | Receive | KOSPI 200 Index | 44,136,399 | 0.000% | 03/13/2014 | KRW | 11,610,845 | $ | 101 | $ | 101 | $ | 0 | |||||||||||||||||||||
|
|
|
|
|
| |||||||||||||||||||||||||||||
| 64 | PIMCO EQUITY SERIES | See Accompanying Notes |
Table of Contents
December 31, 2013 (Unaudited)
TOTAL RETURN SWAPS ON SECURITIES
| Counterparty | Pay/Receive (4) | Underlying Reference | # of Shares | Financing Rate | Maturity Date | Notional Amount | Unrealized Appreciation/ (Depreciation) | Swap Agreements, at Value | ||||||||||||||||||||||||||
| Asset | Liability | |||||||||||||||||||||||||||||||||
| BOA | Receive | Alrosa AO | 1,287,800 | 1-Month USD-LIBOR plus a specified spread | 10/28/2014 | $ | 1,277 | $ | 120 | $ | 120 | $ | 0 | |||||||||||||||||||||
Receive | NovaTek OAO | 591,382 | 1-Month USD-LIBOR plus a specified spread | 10/28/2014 | 7,199 | (27 | ) | 0 | (27 | ) | ||||||||||||||||||||||||
| DUB | Receive | Petroleo Brasileiro S.A. | 722,200 | 1-Month USD-LIBOR plus a specified spread | 04/29/2014 | 5,011 | (106 | ) | 0 | (106 | ) | |||||||||||||||||||||||
Receive | KCell JSC | 20,609 | 3-Month USD-LIBOR plus a specified spread | 08/26/2014 | 355 | (54 | ) | 0 | (54 | ) | ||||||||||||||||||||||||
Receive | Magnitogorsk Iron & Steel Works | 1,175,495 | 3-Month USD-LIBOR plus a specified spread | 08/26/2014 | 3,415 | 115 | 115 | 0 | ||||||||||||||||||||||||||
| ULO | Receive | Bashneft OAO | 420 | 1-Month USD-LIBOR plus a specified spread | 09/23/2014 | 18 | 828 | 828 | 0 | |||||||||||||||||||||||||
Receive | Alrosa AO | 3,916,338 | 1-Month USD-LIBOR plus a specified spread | 10/02/2014 | 3,883 | 364 | 364 | 0 | ||||||||||||||||||||||||||
Receive | Bashneft OAO | 100,850 | 1-Month USD-LIBOR plus a specified spread | 12/18/2014 | 6,176 | (48 | ) | 0 | (48 | ) | ||||||||||||||||||||||||
|
|
|
|
|
| |||||||||||||||||||||||||||||
| $ | 1,192 | $ | 1,427 | $ | (235 | ) | ||||||||||||||||||||||||||||
| �� |
|
|
|
| |||||||||||||||||||||||||||||
Total Swap Agreements | $ | (25 | ) | $ | 1,227 | $ | 1,528 | $ | (326 | ) | ||||||||||||||||||||||||
|
|
|
|
|
|
|
| |||||||||||||||||||||||||||
| (4) | Receive represents that the Fund receives monthly payments for any positive monthly return on the underlying reference. The Fund makes payments for any negative monthly return on such underlying reference. Pay represents that the Fund receives monthly payments for any negative monthly return on the underlying reference. The Fund makes payments for any positive monthly return on such underlying reference. |
FINANCIAL DERIVATIVE INSTRUMENTS: OVER THE COUNTER SUMMARY
The following is a summary by counterparty of the market value of OTC financial derivative instruments and collateral (received)/pledged as of December 31, 2013:
| (f) | Securities with an aggregate market value of $2,282 have been pledged as collateral for financial derivative instruments as governed by International Swaps and Derivatives Association, Inc. master agreements as of December 31, 2013. |
| Financial Derivative Assets | Financial Derivative Liabilities | |||||||||||||||||||||||||||||||||||||||||||||
| Counterparty | Forward Foreign Currency Contracts | Purchased Options | Swap Agreements | Total Over the Counter | Forward Foreign Currency Contracts | Written Options | Swap Agreements | Total Over the Counter | Net Market Value of OTC Derivatives | Collateral (Received)/ Pledged | Net Exposures (5) | |||||||||||||||||||||||||||||||||||
BOA | $ | 842 | $ | 0 | $ | 120 | $ | 962 | $ | (1,057 | ) | $ | 0 | $ | (27 | ) | $ | (1,084 | ) | $ | (122 | ) | $ | 260 | $ | 138 | ||||||||||||||||||||
BPS | 12 | 0 | 0 | 12 | (598 | ) | 0 | (91 | ) | (689 | ) | (677 | ) | 611 | (66 | ) | ||||||||||||||||||||||||||||||
BRC | 1,337 | 0 | 0 | 1,337 | (196 | ) | 0 | 0 | (196 | ) | 1,141 | (1,180 | ) | (39 | ) | |||||||||||||||||||||||||||||||
CBK | 127 | 0 | 0 | 127 | (93 | ) | 0 | 0 | (93 | ) | 34 | 0 | 34 | |||||||||||||||||||||||||||||||||
DUB | 141 | 0 | 115 | 256 | (1,010 | ) | 0 | (160 | ) | (1,170 | ) | (914 | ) | 900 | (14 | ) | ||||||||||||||||||||||||||||||
FBF | 353 | 0 | 0 | 353 | (218 | ) | 0 | 0 | (218 | ) | 135 | 0 | 135 | |||||||||||||||||||||||||||||||||
GLM | 150 | 0 | 0 | 150 | (30 | ) | 0 | 0 | (30 | ) | 120 | 0 | 120 | |||||||||||||||||||||||||||||||||
HUS | 144 | 0 | 0 | 144 | (514 | ) | 0 | 0 | (514 | ) | (370 | ) | 350 | (20 | ) | |||||||||||||||||||||||||||||||
JPM | 382 | 0 | 101 | 483 | (83 | ) | 0 | 0 | (83 | ) | 400 | (356 | ) | 44 | ||||||||||||||||||||||||||||||||
MSC | 97 | 0 | 0 | 97 | (148 | ) | 0 | 0 | (148 | ) | (51 | ) | (289 | ) | (340 | ) | ||||||||||||||||||||||||||||||
RBC | 0 | 0 | 0 | 0 | (21 | ) | 0 | 0 | (21 | ) | (21 | ) | 0 | (21 | ) | |||||||||||||||||||||||||||||||
SCX | 96 | 0 | 0 | 96 | (87 | ) | 0 | 0 | (87 | ) | 9 | 0 | 9 | |||||||||||||||||||||||||||||||||
UAG | 1,932 | 0 | 0 | 1,932 | (809 | ) | 0 | 0 | (809 | ) | 1,123 | (1,740 | ) | (617 | ) | |||||||||||||||||||||||||||||||
ULO | 0 | 0 | 1,192 | 1,192 | 0 | 0 | (48 | ) | (48 | ) | 1,144 | 0 | 1,144 | |||||||||||||||||||||||||||||||||
|
|
|
|
|
|
|
|
|
|
|
|
|
|
|
| |||||||||||||||||||||||||||||||
Total Over the Counter | $ | 5,613 | $ | 0 | $ | 1,528 | $ | 7,141 | $ | (4,864 | ) | $ | 0 | $ | (326 | ) | $ | (5,190 | ) | |||||||||||||||||||||||||||
|
|
|
|
|
|
|
|
|
|
|
|
|
|
|
| |||||||||||||||||||||||||||||||
| (5) | Net Exposure represents the net receivable/(payable) that would be due from/to the counterparty in the event of default. Exposure from OTC financial derivative instruments can only be netted across transactions governed under the same master agreement with the same legal entity. See note 7, Principal Risks, in the Notes to Financial Statements for more information regarding master netting arrangements. |
| See Accompanying Notes | SEMIANNUAL REPORT | DECEMBER 31, 2013 | 65 |
Table of Contents
Schedule of Investments PIMCO EqS® Emerging Markets Fund (Cont.)
FAIR VALUE OF FINANCIAL DERIVATIVE INSTRUMENTS
The following is a summary of the fair valuation of the Fund’s derivative instruments categorized by risk (1) exposure:
Fair Values of Financial Derivative Instruments on the Statements of Assets and Liabilities as of December 31, 2013:
| Derivatives not accounted for as hedging instruments | ||||||||||||||||||||||||
| Commodity Contracts | Credit Contracts | Equity Contracts | Foreign Exchange Contracts | Interest Rate Contracts | Total | |||||||||||||||||||
Financial Derivative Instruments - Assets | ||||||||||||||||||||||||
Exchange-traded or centrally cleared | ||||||||||||||||||||||||
Futures | $ | 0 | $ | 0 | $ | 5 | $ | 0 | $ | 0 | $ | 5 | ||||||||||||
|
|
|
|
|
|
|
|
|
|
|
| |||||||||||||
Over the counter | ||||||||||||||||||||||||
Forward Foreign Currency Contracts | $ | 0 | $ | 0 | $ | 0 | $ | 5,613 | $ | 0 | $ | 5,613 | ||||||||||||
Swap Agreements | 0 | 0 | 1,528 | 0 | 0 | 1,528 | ||||||||||||||||||
|
|
|
|
|
|
|
|
|
|
|
| |||||||||||||
| $ | 0 | $ | 0 | $ | 1,528 | $ | 5,613 | $ | 0 | $ | 7,141 | |||||||||||||
|
|
|
|
|
|
|
|
|
|
|
| |||||||||||||
| $ | 0 | $ | 0 | $ | 1,533 | $ | 5,613 | $ | 0 | $ | 7,146 | |||||||||||||
|
|
|
|
|
|
|
|
|
|
|
| |||||||||||||
Financial Derivative Instruments - Liabilities | ||||||||||||||||||||||||
Exchange-traded or centrally cleared | ||||||||||||||||||||||||
Futures | $ | 0 | $ | 0 | $ | 7 | $ | 0 | $ | 0 | $ | 7 | ||||||||||||
|
|
|
|
|
|
|
|
|
|
|
| |||||||||||||
Over the counter | ||||||||||||||||||||||||
Forward Foreign Currency Contracts | $ | 0 | $ | 0 | $ | 0 | $ | 4,864 | $ | 0 | $ | 4,864 | ||||||||||||
Swap Agreements | 0 | 91 | 235 | 0 | 0 | 326 | ||||||||||||||||||
|
|
|
|
|
|
|
|
|
|
|
| |||||||||||||
| $ | 0 | $ | 91 | $ | 235 | $ | 4,864 | $ | 0 | $ | 5,190 | |||||||||||||
|
|
|
|
|
|
|
|
|
|
|
| |||||||||||||
| $ | 0 | $ | 91 | $ | 242 | $ | 4,864 | $ | 0 | $ | 5,197 | |||||||||||||
|
|
|
|
|
|
|
|
|
|
|
| |||||||||||||
The Effect of Financial Derivative Instruments on the Statements of Operations for the Period Ended December 31, 2013:
| Derivatives not accounted for as hedging instruments | ||||||||||||||||||||||||
| Commodity Contracts | Credit Contracts | Equity Contracts | Foreign Exchange Contracts | Interest Rate Contracts | Total | |||||||||||||||||||
Net Realized Gain (Loss) on Financial Derivative Instruments | ||||||||||||||||||||||||
Exchange-traded or centrally cleared | ||||||||||||||||||||||||
Purchased Options | $ | 0 | $ | 0 | $ | (242 | ) | $ | 0 | $ | 0 | $ | (242 | ) | ||||||||||
Written Options | 0 | 0 | 2 | 0 | 0 | 2 | ||||||||||||||||||
Futures | 0 | 0 | (744 | ) | 0 | 0 | (744 | ) | ||||||||||||||||
|
|
|
|
|
|
|
|
|
|
|
| |||||||||||||
| $ | 0 | $ | 0 | $ | (984 | ) | $ | 0 | $ | 0 | $ | (984 | ) | |||||||||||
|
|
|
|
|
|
|
|
|
|
|
| |||||||||||||
Over the counter | ||||||||||||||||||||||||
Forward Foreign Currency Contracts | $ | 0 | $ | 0 | $ | 0 | $ | (7,028 | ) | $ | 0 | $ | (7,028 | ) | ||||||||||
Purchased Options | 0 | 0 | (209 | ) | 0 | 0 | (209 | ) | ||||||||||||||||
Written Options | 0 | 0 | 591 | 0 | 0 | 591 | ||||||||||||||||||
Swap Agreements | 0 | (16 | ) | 3,007 | 0 | 0 | 2,991 | |||||||||||||||||
|
|
|
|
|
|
|
|
|
|
|
| |||||||||||||
| $ | 0 | $ | (16 | ) | $ | 3,389 | $ | (7,028 | ) | $ | 0 | $ | (3,655 | ) | ||||||||||
|
|
|
|
|
|
|
|
|
|
|
| |||||||||||||
| $ | 0 | $ | (16 | ) | $ | 2,405 | $ | (7,028 | ) | $ | 0 | $ | (4,639 | ) | ||||||||||
|
|
|
|
|
|
|
|
|
|
|
| |||||||||||||
Net Change in Unrealized Appreciation (Depreciation) on Financial Derivative Instruments |
| |||||||||||||||||||||||
Exchange-traded or centrally cleared | ||||||||||||||||||||||||
Futures | $ | 0 | $ | 0 | $ | 95 | $ | 0 | $ | 0 | $ | 95 | ||||||||||||
|
|
|
|
|
|
|
|
|
|
|
| |||||||||||||
Over the counter | ||||||||||||||||||||||||
Forward Foreign Currency Contracts | $ | 0 | $ | 0 | $ | 0 | $ | 4,918 | $ | 0 | $ | 4,918 | ||||||||||||
Written Options | 0 | 0 | 0 | 0 | 423 | 423 | ||||||||||||||||||
Swap Agreements | 0 | (24 | ) | 3,618 | 0 | 0 | 3,594 | |||||||||||||||||
|
|
|
|
|
|
|
|
|
|
|
| |||||||||||||
| $ | 0 | $ | (24 | ) | $ | 3,618 | $ | 4,918 | $ | 423 | $ | 8,935 | ||||||||||||
|
|
|
|
|
|
|
|
|
|
|
| |||||||||||||
| $ | 0 | $ | (24 | ) | $ | 3,713 | $ | 4,918 | $ | 423 | $ | 9,030 | ||||||||||||
|
|
|
|
|
|
|
|
|
|
|
| |||||||||||||
| (1) | See Note 7, Principal Risks, in the Notes to Financial Statements on risks of the Fund. |
| 66 | PIMCO EQUITY SERIES | See Accompanying Notes |
Table of Contents
December 31, 2013 (Unaudited)
FAIR VALUE MEASUREMENTS
The following is a summary of the fair valuations according to the inputs used as of December 31, 2013 in valuing the Fund’s assets and liabilities:
| Category and Subcategory | Level 1 | Level 2 | Level 3 | Fair Value at 12/31/2013 | ||||||||||||
Investments in Securities, at Value | ||||||||||||||||
Common Stocks | ||||||||||||||||
Australia | ||||||||||||||||
Materials | $ | 0 | $ | 6,923 | $ | 0 | $ | 6,923 | ||||||||
Bermuda | ||||||||||||||||
Energy | 0 | 4,735 | 0 | 4,735 | ||||||||||||
Brazil | ||||||||||||||||
Consumer Discretionary | 5,359 | 0 | 0 | 5,359 | ||||||||||||
Consumer Staples | 8,145 | 0 | 0 | 8,145 | ||||||||||||
Financials | 17,974 | 0 | 0 | 17,974 | ||||||||||||
Utilities | 3,656 | 4,144 | 0 | 7,800 | ||||||||||||
Cambodia | ||||||||||||||||
Consumer Discretionary | 0 | 8,003 | 0 | 8,003 | ||||||||||||
Canada | ||||||||||||||||
Materials | 994 | 0 | 0 | 994 | ||||||||||||
China | ||||||||||||||||
Consumer Staples | 0 | 4,785 | 0 | 4,785 | ||||||||||||
Energy | 0 | 10,260 | 0 | 10,260 | ||||||||||||
Financials | 0 | 9,835 | 0 | 9,835 | ||||||||||||
Industrials | 0 | 5,967 | 0 | 5,967 | ||||||||||||
Information Technology | 2,943 | 0 | 0 | 2,943 | ||||||||||||
Materials | 0 | 3,139 | 0 | 3,139 | ||||||||||||
Colombia | ||||||||||||||||
Energy | 2,200 | 0 | 0 | 2,200 | ||||||||||||
Cyprus | ||||||||||||||||
Industrials | 9,848 | 0 | 0 | 9,848 | ||||||||||||
Denmark | ||||||||||||||||
Consumer Staples | 0 | 7,683 | 0 | 7,683 | ||||||||||||
Finland | ||||||||||||||||
Materials | 0 | 4,736 | 0 | 4,736 | ||||||||||||
Hong Kong | ||||||||||||||||
Consumer Discretionary | 4,448 | 0 | 0 | 4,448 | ||||||||||||
Financials | 0 | 19,609 | 0 | 19,609 | ||||||||||||
Information Technology | 0 | 0 | 665 | 665 | ||||||||||||
India | ||||||||||||||||
Consumer Discretionary | 339 | 11,857 | 0 | 12,196 | ||||||||||||
Financials | 0 | 12,996 | 0 | 12,996 | ||||||||||||
Indonesia | ||||||||||||||||
Consumer Discretionary | 0 | 6,235 | 0 | 6,235 | ||||||||||||
Israel | ||||||||||||||||
Materials | 0 | 8,655 | 0 | 8,655 | ||||||||||||
Italy | ||||||||||||||||
Consumer Discretionary | 0 | 8,804 | 0 | 8,804 | ||||||||||||
Japan | ||||||||||||||||
Consumer Discretionary | 0 | 5,348 | 0 | 5,348 | ||||||||||||
Industrials | 0 | 10,607 | 0 | 10,607 | ||||||||||||
Kazakhstan | ||||||||||||||||
Telecommunication Services | 0 | 127 | 0 | 127 | ||||||||||||
Macau | ||||||||||||||||
Consumer Discretionary | 0 | 4,488 | 0 | 4,488 | ||||||||||||
Mexico | ||||||||||||||||
Financials | 8,305 | 0 | 0 | 8,305 | ||||||||||||
Norway | ||||||||||||||||
Consumer Staples | 0 | 6,113 | 0 | 6,113 | ||||||||||||
Peru | ||||||||||||||||
Financials | 9,488 | 0 | 0 | 9,488 | ||||||||||||
Materials | 4,761 | 0 | 0 | 4,761 | ||||||||||||
Philippines | ||||||||||||||||
Utilities | 0 | 3,999 | 0 | 3,999 | ||||||||||||
| Category and Subcategory | Level 1 | Level 2 | Level 3 | Fair Value at 12/31/2013 | ||||||||||||
Russia | ||||||||||||||||
Telecommunication Services | $ | 11,128 | $ | 0 | $ | 0 | $ | 11,128 | ||||||||
South Africa | ||||||||||||||||
Consumer Staples | 4,734 | 0 | 0 | 4,734 | ||||||||||||
Telecommunication Services | 3,784 | 0 | 0 | 3,784 | ||||||||||||
South Korea | ||||||||||||||||
Consumer Discretionary | 0 | 13,104 | 0 | 13,104 | ||||||||||||
Information Technology | 0 | 19,867 | 0 | 19,867 | ||||||||||||
Materials | 0 | 7,723 | 0 | 7,723 | ||||||||||||
Taiwan | ||||||||||||||||
Information Technology | 0 | 13,194 | 0 | 13,194 | ||||||||||||
Thailand | ||||||||||||||||
Financials | 0 | 2,876 | 0 | 2,876 | ||||||||||||
Turkey | ||||||||||||||||
Consumer Staples | 0 | 3,020 | 0 | 3,020 | ||||||||||||
United Kingdom | ||||||||||||||||
Consumer Staples | 0 | 6,580 | 0 | 6,580 | ||||||||||||
Energy | 0 | 6,064 | 0 | 6,064 | ||||||||||||
Financials | 0 | 4,306 | 0 | 4,306 | ||||||||||||
Equity-Linked Securities | ||||||||||||||||
China | ||||||||||||||||
Financials | 0 | 8,968 | 0 | 8,968 | ||||||||||||
Nigeria | ||||||||||||||||
Consumer Staples | 0 | 4,313 | 0 | 4,313 | ||||||||||||
Exchange-Traded Funds | ||||||||||||||||
Luxembourg | 6,105 | 0 | 0 | 6,105 | ||||||||||||
Preferred Stocks | ||||||||||||||||
Brazil | ||||||||||||||||
Consumer Staples | 0 | 7,863 | 0 | 7,863 | ||||||||||||
South Korea | ||||||||||||||||
Information Technology | 0 | 5,047 | 0 | 5,047 | ||||||||||||
Rights | ||||||||||||||||
Canada | ||||||||||||||||
Materials | 289 | 0 | 0 | 289 | ||||||||||||
Short-Term Instruments | ||||||||||||||||
Repurchase Agreements | 0 | 117 | 0 | 117 | ||||||||||||
U.S. Treasury Bills | 0 | 2,412 | 0 | 2,412 | ||||||||||||
| $ | 104,500 | $ | 274,502 | $ | 665 | $ | 379,667 | |||||||||
Investments in Affiliates, at Value | ||||||||||||||||
Short-Term Instruments | ||||||||||||||||
Central Funds Used for Cash Management Purposes | $ | 53,254 | $ | 0 | $ | 0 | $ | 53,254 | ||||||||
Total Investments | $ | 157,754 | $ | 274,502 | $ | 665 | $ | 432,921 | ||||||||
Financial Derivative Instruments - Assets |
| |||||||||||||||
Exchange-traded or centrally cleared | 5 | 0 | 0 | 5 | ||||||||||||
Over the counter | 0 | 7,141 | 0 | 7,141 | ||||||||||||
| $ | 5 | $ | 7,141 | $ | 0 | $ | 7,146 | |||||||||
Financial Derivative Instruments - Liabilities |
| |||||||||||||||
Exchange-traded or centrally cleared | (7 | ) | 0 | 0 | (7 | ) | ||||||||||
Over the counter | 0 | (5,190 | ) | 0 | (5,190 | ) | ||||||||||
| $ | (7 | ) | $ | (5,190 | ) | $ | 0 | $ | (5,197 | ) | ||||||
Totals | $ | 157,752 | $ | 276,453 | $ | 665 | $ | 434,870 | ||||||||
| See Accompanying Notes | SEMIANNUAL REPORT | DECEMBER 31, 2013 | 67 |
Table of Contents
Schedule of Investments PIMCO EqS® Emerging Markets Fund (Cont.)
December 31, 2013 (Unaudited)
There were assets and liabilities valued at $11,814 transferred from Level 2 to Level 1 and assets and liabilities valued at $7,862 transferred from Level 1 to Level 2 during the period ended December 31, 2013.
The following is a reconciliation of the fair valuations using significant unobservable inputs (Level 3) for the Fund during the period ended December 31, 2013:
| Category and Subcategory | Beginning Balance at 06/30/2013 | Net Purchases | Net Sales | Accrued Discounts/ (Premiums) | Realized Gain/(Loss) | Net Change in Unrealized Appreciation/ (Depreciation) (1) | Transfers into Level 3 | Transfers out of Level 3 | Ending Balance at 12/31/2013 | Net Change in Unrealized Appreciation/ (Depreciation) on Investments Held at 12/31/2013 (1) | ||||||||||||||||||||||||||||||
Investments in Securities, at Value |
| |||||||||||||||||||||||||||||||||||||||
Common Stocks | ||||||||||||||||||||||||||||||||||||||||
Hong Kong | $ | 930 | $ | 0 | $ | 0 | $ | 0 | $ | 0 | $ | (265 | ) | $ | 0 | $ | 0 | $ | 665 | $ | (266 | ) | ||||||||||||||||||
|
|
|
|
|
|
|
|
|
|
|
|
|
|
|
|
|
|
|
| |||||||||||||||||||||
The following is a summary of significant unobservable inputs used in the fair valuations of assets and liabilities categorized within Level 3 of the fair value hierarchy:
| Category and Subcategory | Ending Balance at 12/31/2013 | Valuation Technique | Unobservable Inputs | Input Value(s) (% Unless Noted Otherwise) | ||||||||||
Investments in Securities, at Value |
| |||||||||||||
Common Stocks | ||||||||||||||
Hong Kong | ||||||||||||||
Information Technology | $ | 665 | Other Valuation Techniques | (2) | — | |||||||||
|
| |||||||||||||
| (1) | Any difference between Net Change in Unrealized Appreciation/(Depreciation) and Net Change in Unrealized Appreciation/(Depreciation) on Investments Held at December 31, 2013 may be due to an investment no longer held or categorized as level 3 at period end. |
| (2) | Includes valuation techniques not defined in the Notes to Financial Statements as securities valued using such techniques are not considered significant to the Fund. |
| 68 | PIMCO EQUITY SERIES | See Accompanying Notes |
Table of Contents
Schedule of Investments PIMCO EqS® Long/Short Fund
December 31, 2013 (Unaudited)
| SHARES | MARKET VALUE (000S) | |||||||||||
| INVESTMENTS IN SECURITIES 86.5% | ||||||||||||
| COMMON STOCKS 82.5% | ||||||||||||
| CANADA 2.1% | ||||||||||||
| INDUSTRIALS 2.1% | ||||||||||||
Air Canada ‘A’ (a) | 2,100,000 | $ | 14,649 | |||||||||
Air Canada ‘B’ (a) | 1,000,000 | 6,976 | ||||||||||
|
| |||||||||||
Total Canada | 21,625 | |||||||||||
|
| |||||||||||
| CHINA 2.1% | ||||||||||||
| INFORMATION TECHNOLOGY 2.1% | ||||||||||||
Baidu, Inc. SP - ADR (a) | 120,000 | 21,346 | ||||||||||
|
| |||||||||||
Total China | 21,346 | |||||||||||
|
| |||||||||||
| GERMANY 2.6% | ||||||||||||
| MATERIALS 2.6% | ||||||||||||
HeidelbergCement AG | 347,000 | 26,349 | ||||||||||
|
| |||||||||||
Total Germany | 26,349 | |||||||||||
|
| |||||||||||
| GREECE 0.3% | ||||||||||||
| INDUSTRIALS 0.3% | ||||||||||||
Paragon Shipping, Inc. ‘A’ (a) | 163,075 | 1,200 | ||||||||||
Safe Bulkers, Inc. | 123,810 | 1,288 | ||||||||||
|
| |||||||||||
Total Greece | 2,488 | |||||||||||
|
| |||||||||||
| NETHERLANDS 3.3% | ||||||||||||
| INFORMATION TECHNOLOGY 3.3% | ||||||||||||
NXP Semiconductor NV (a) | 720,000 | 33,070 | ||||||||||
|
| |||||||||||
Total Netherlands | 33,070 | |||||||||||
|
| |||||||||||
| UNITED STATES 72.1% | ||||||||||||
| CONSUMER DISCRETIONARY 16.7% | ||||||||||||
Biglari Holdings, Inc. (a) | 14,267 | 7,228 | ||||||||||
Comcast Corp. ‘A’ | 1,080,000 | 56,122 | ||||||||||
General Motors Co. (a) | 1,100,000 | 44,957 | ||||||||||
Lowe’s Cos., Inc. | 1,230,000 | 60,947 | ||||||||||
|
| |||||||||||
| 169,254 | ||||||||||||
|
| |||||||||||
| CONSUMER STAPLES 4.2% | ||||||||||||
Constellation Brands, Inc. ‘A’ (a) | 75,000 | 5,278 | ||||||||||
Walgreen Co. | 650,000 | 37,336 | ||||||||||
|
| |||||||||||
| 42,614 | ||||||||||||
|
| |||||||||||
| SHARES | MARKET VALUE (000S) | |||||||||||
| ENERGY 3.1% | ||||||||||||
Devon Energy Corp. | 510,000 | $ | 31,554 | |||||||||
|
| |||||||||||
| FINANCIALS 22.0% | ||||||||||||
BB&T Corp. | 300,000 | 11,196 | ||||||||||
Citigroup, Inc. | 980,000 | 51,068 | ||||||||||
Genworth Financial, Inc. ‘A’ (a)(d) | 4,750,000 | 73,767 | ||||||||||
JPMorgan Chase & Co. | 200,000 | 11,696 | ||||||||||
Unum Group | 1,000,000 | 35,080 | ||||||||||
Walter Investment Management Corp. (a)(d) | 1,112,900 | 39,352 | ||||||||||
|
| |||||||||||
| 222,159 | ||||||||||||
|
| |||||||||||
| HEALTH CARE 9.5% | ||||||||||||
CareFusion Corp. (a) | 350,000 | 13,937 | ||||||||||
Catamaran Corp. (a) | 290,000 | 13,769 | ||||||||||
DaVita HealthCare Partners, Inc. (a) | 608,000 | 38,529 | ||||||||||
Perrigo Co. PLC | 197,000 | 30,232 | ||||||||||
|
| |||||||||||
| 96,467 | ||||||||||||
|
| |||||||||||
| INDUSTRIALS 5.8% | ||||||||||||
American Airlines Group, Inc. (a) | 520,000 | 13,130 | ||||||||||
Baltic Trading Ltd. | 300,000 | 1,932 | ||||||||||
Iron Mountain, Inc. | 880,000 | 26,708 | ||||||||||
Spirit Airlines, Inc. (a) | 370,000 | 16,802 | ||||||||||
|
| |||||||||||
| 58,572 | ||||||||||||
|
| |||||||||||
| INFORMATION TECHNOLOGY 10.8% | ||||||||||||
Apple, Inc. | 80,000 | 44,889 | ||||||||||
DST Systems, Inc. (d) | 630,000 | 57,166 | ||||||||||
eBay, Inc. (a) | 120,000 | 6,587 | ||||||||||
|
| |||||||||||
| 108,642 | ||||||||||||
|
| |||||||||||
Total United States | 729,262 | |||||||||||
|
| |||||||||||
Total Common Stocks (Cost $769,106) | 834,140 | |||||||||||
|
| |||||||||||
| REAL ESTATE INVESTMENT TRUSTS 3.8% | ||||||||||||
| UNITED STATES 3.8% | ||||||||||||
| FINANCIALS 3.8% | ||||||||||||
American Realty Capital Properties, Inc. (d) | 3,000,000 | 38,580 | ||||||||||
|
| |||||||||||
Total Real Estate Investment Trusts | 38,580 | |||||||||||
|
| |||||||||||
| SHARES | MARKET VALUE (000S) | |||||||||||
| WARRANTS 0.0% | ||||||||||||
| UNITED STATES 0.0% | ||||||||||||
| FINANCIALS 0.0% | ||||||||||||
Citigroup, Inc. - Exp. 01/04/2019 | 10,000 | $ | 6 | |||||||||
|
| |||||||||||
Total Warrants (Cost $7) |
| 6 | ||||||||||
|
| |||||||||||
PRINCIPAL AMOUNT | ||||||||||||
| SHORT-TERM INSTRUMENTS 0.2% | ||||||||||||
| REPURCHASE AGREEMENTS (b) 0.2% | ||||||||||||
| 2,085 | ||||||||||||
|
| |||||||||||
| U.S. TREASURY BILLS 0.0% | ||||||||||||
0.108% due 11/13/2014 (g) | $ | 270 | 270 | |||||||||
|
| |||||||||||
| Total Short-Term Instruments (Cost $2,355) | 2,355 | |||||||||||
|
| |||||||||||
| Total Investments in Securities (Cost $809,780) | 875,081 | |||||||||||
|
| |||||||||||
| SHARES | ||||||||||||
| INVESTMENTS IN AFFILIATES 14.9% | ||||||||||||
| SHORT-TERM INSTRUMENTS 14.9% | ||||||||||||
| CENTRAL FUNDS USED FOR CASH MANAGEMENT PURPOSES 14.9% | ||||||||||||
PIMCO Short-Term | 15,057,241 | 150,648 | ||||||||||
|
| |||||||||||
| Total Short-Term Instruments (Cost $150,654) | 150,648 | |||||||||||
|
| |||||||||||
| Total Investments in Affiliates (Cost $150,654) | 150,648 | |||||||||||
Total Investments 101.4% |
| $ | 1,025,729 | |||||||||
Securities Sold Short (c) (13.5%) (Proceeds $134,202) | (136,766 | ) | ||||||||||
Financial Derivative (Cost or Premiums, net $882) | (109 | ) | ||||||||||
| Other Assets and Liabilities, net 12.1% | 122,806 | |||||||||||
|
| |||||||||||
| Net Assets 100.0% | $ | 1,011,660 | ||||||||||
|
| |||||||||||
NOTES TO SCHEDULE OF INVESTMENTS (AMOUNTS IN THOUSANDS*, EXCEPT NUMBER OF CONTRACTS AND SHARES):
| * | A zero balance may reflect actual amounts rounding to less than one thousand. |
| (a) | Security did not produce income within the last twelve months. |
| See Accompanying Notes | SEMIANNUAL REPORT | DECEMBER 31, 2013 | 69 |
Table of Contents
Schedule of Investments PIMCO EqS® Long/Short Fund (Cont.)
BORROWINGS AND OTHER FINANCING TRANSACTIONS
(b) REPURCHASE AGREEMENTS:
| Counterparty | Lending Rate | Settlement Date | Maturity Date | Principal Amount | Collateralized By | Collateral Received, at Value | Repurchase Agreements, at Value | Repurchase Agreement Proceeds to be Received (1) | ||||||||||||||||||||
SSB | 0.000% | 12/31/2013 | 01/02/2014 | $ | 2,085 | Fannie Mae 2.200% due 10/17/2022 | $ | (2,131 | ) | $ | 2,085 | $ | 2,085 | |||||||||||||||
|
|
|
|
|
| |||||||||||||||||||||||
Total Repurchase Agreements |
| $ | (2,131 | ) | $ | 2,085 | $ | 2,085 | ||||||||||||||||||||
|
|
|
|
|
| |||||||||||||||||||||||
| (1) | Includes accrued interest. |
(c) SHORT SALES:
| Description | Shares | Proceeds | Payable for Short Sales (2) | |||||||||
Common Stocks | ||||||||||||
Argentina | ||||||||||||
Information Technology | ||||||||||||
MercadoLibre, Inc. | 23,000 | $ | (2,523 | ) | $ | (2,482 | ) | |||||
Canada | ||||||||||||
Industrials | ||||||||||||
Ritchie Bros Auctioneers, Inc. | 300,000 | (5,811 | ) | (6,879 | ) | |||||||
Switzerland | ||||||||||||
Energy | ||||||||||||
Transocean Ltd. | 290,000 | (13,963 | ) | (14,331 | ) | |||||||
United States | ||||||||||||
Consumer Discretionary | ||||||||||||
Buckle, Inc. | 50,000 | (2,495 | ) | (2,628 | ) | |||||||
Cablevision Systems Corp. ‘A’ | 100,000 | (1,647 | ) | (1,793 | ) | |||||||
Regis Corp. | 235,000 | (3,432 | ) | (3,410 | ) | |||||||
Weight Watchers International, Inc. | 62,300 | (2,000 | ) | (2,052 | ) | |||||||
Energy | ||||||||||||
Atwood Oceanics, Inc. | 400,000 | (20,648 | ) | (21,356 | ) | |||||||
Diamond Offshore Drilling, Inc. | 440,000 | (25,031 | ) | (25,045 | ) | |||||||
National Oilwell Varco, Inc. | 30,000 | (2,324 | ) | (2,386 | ) | |||||||
Health Care | ||||||||||||
Laboratory Corp. of America Holdings | 90,000 | (8,062 | ) | (8,223 | ) | |||||||
Quest Diagnostics, Inc. | 120,000 | (6,314 | ) | (6,425 | ) | |||||||
Industrials | ||||||||||||
ADT Corp. | 40,000 | (1,652 | ) | (1,619 | ) | |||||||
Joy Global, Inc. | 70,000 | (3,694 | ) | (4,094 | ) | |||||||
Information Technology | ||||||||||||
RealPage, Inc. | 370,000 | (8,610 | ) | (8,651 | ) | |||||||
Telecommunication Services | ||||||||||||
CenturyLink, Inc. | 35,000 | (1,123 | ) | (1,115 | ) | |||||||
Real Estate Investment Trusts | ||||||||||||
United States | ||||||||||||
Financials | ||||||||||||
National Retail Properties, Inc. | 500,000 | (15,864 | ) | (15,165 | ) | |||||||
Post Properties, Inc. | 200,000 | (9,009 | ) | (9,112 | ) | |||||||
|
| |||||||||||
Total Short Sales | $ | (134,202 | ) | $ | (136,766 | ) | ||||||
|
| |||||||||||
| (2) | Market value includes $69 of dividends payable for short sales. |
| 70 | PIMCO EQUITY SERIES | See Accompanying Notes |
Table of Contents
December 31, 2013 (Unaudited)
BORROWINGS AND OTHER FINANCING TRANSACTIONS SUMMARY
The following is a summary by counterparty of the market value of Borrowings and Other Financing Transactions and collateral (received)/pledged as of December 31, 2013:
| (d) | Securities with an aggregate market value of $139,880 and cash of $122,161 have been pledged as collateral as of December 31, 2013 for equity short sales and equity options as governed by prime brokerage agreements and agreements governing listed equity option transactions. |
| Counterparty | Repurchase Agreement Proceeds to be Received | Payable for Reverse Repurchase Agreements | Payable for Sale-Buyback Transactions | Payable for Short Sales | Total Borrowings and Other Financing Transactions | Collateral (Received)/Pledged | Net Exposure (3) | |||||||||||||||||||||
Global/Master Repurchase Agreement | ||||||||||||||||||||||||||||
SSB | $ | 2,085 | $ | 0 | $ | 0 | $ | 0 | $ | 2,085 | $ | (2,131 | ) | $ | (46 | ) | ||||||||||||
FOB | 0 | 0 | 0 | (16,587 | ) | (16,587 | ) | 30,837 | 14,250 | |||||||||||||||||||
GSC | 0 | 0 | 0 | (53,608 | ) | (53,608 | ) | 88,829 | 35,221 | |||||||||||||||||||
MRJ | 0 | 0 | 0 | 0 | 0 | 1 | 1 | |||||||||||||||||||||
UBS | 0 | 0 | 0 | (66,571 | ) | (66,571 | ) | 142,374 | 75,803 | |||||||||||||||||||
|
|
|
|
|
|
|
| |||||||||||||||||||||
Total Borrowings and Other Financing Transactions | $ | 2,085 | $ | 0 | $ | 0 | $ | (136,766 | ) | |||||||||||||||||||
|
|
|
|
|
|
|
| |||||||||||||||||||||
| (3) | Net Exposure represents the net receivable/(payable) that would be due from/to the counterparty in the event of default. Exposure from borrowings and other financing transactions can only be netted across transactions governed under the same master agreement with the same legal entity. See Note 7, Principal Risks, in the Notes to Financial Statements for more information regarding master netting arrangements. |
(e) FINANCIAL DERIVATIVE INSTRUMENTS: EXCHANGE-TRADED OR CENTRALLY CLEARED
PURCHASED OPTIONS:
OPTIONS ON SECURITIES
| Description | Strike Price | Expiration Date | # of Contracts | Cost | Market Value | |||||||||||||
Call - CBOE Iron Mountain, Inc. | $ 32.500 | 01/18/2014 | 3,500 | $ | 460 | $ | 285 | |||||||||||
Put - CBOE Valero Energy Corp. | 40.000 | 01/18/2014 | 11,953 | 473 | 51 | |||||||||||||
|
|
|
| |||||||||||||||
Total Purchased Options | $ | 933 | $ | 336 | ||||||||||||||
|
|
|
| |||||||||||||||
WRITTEN OPTIONS:
OPTIONS ON SECURITIES
| Description | Strike Price | Expiration Date | # of Contracts | Premiums (Received) | Market Value | |||||||||||||
Call - CBOE Iron Mountain, Inc. | $ 40.000 | 01/18/2014 | 3,500 | $ | (51 | ) | $ | (11 | ) | |||||||||
|
|
|
| |||||||||||||||
Total Written Options | $ | (51 | ) | $ | (11 | ) | ||||||||||||
|
|
|
| |||||||||||||||
FUTURES CONTRACTS:
Description | Type | Expiration | # of | Unrealized | Variation Margin | |||||||||||||||||
| Asset | Liability | |||||||||||||||||||||
Brent Crude February Futures | Short | 01/2014 | 160 | $ | (317 | ) | $ | 66 | $ | 0 | ||||||||||||
E-mini S&P 500 Index March Futures | Long | 03/2014 | 1,220 | (90 | ) | 14 | (104 | ) | ||||||||||||||
WTI Crude January Futures | Long | 01/2014 | 160 | 70 | 0 | (139 | ) | |||||||||||||||
|
|
|
|
|
| |||||||||||||||||
Total Futures Contracts | $ | (337 | ) | $ | 80 | $ | (243 | ) | ||||||||||||||
|
|
|
|
|
| |||||||||||||||||
FINANCIAL DERIVATIVE INSTRUMENTS: EXCHANGE-TRADED OR CENTRALLY CLEARED SUMMARY
The following is a summary of the market value and variation margin of Exchange-Traded or Centrally Cleared Financial Derivative Instruments as of December 31, 2013:
Cash of $350 has been pledged as collateral for exchange-traded and centrally cleared financial derivative instruments as of December 31, 2013. See Note 7, Principal Risks, in the Notes to Financial Statements for more information regarding master netting arrangements.
| Financial Derivative Assets | Financial Derivative Liabilities | |||||||||||||||||||||||||||||||||
| Market Value | Variation Margin Asset | Total | Market Value | Variation Margin Liability | Total | |||||||||||||||||||||||||||||
| Purchased Options | Futures | Swap Agreements | Written Options | Futures | Swap Agreements | |||||||||||||||||||||||||||||
Total Exchange-Traded or Centrally Cleared | $ | 336 | $ | 80 | $ | 0 | $ | 416 | $ | (11) | $ | (243) | $ | 0 | $ | (254) | ||||||||||||||||||
|
|
|
|
|
|
|
|
|
|
|
|
|
|
|
| |||||||||||||||||||
| See Accompanying Notes | SEMIANNUAL REPORT | DECEMBER 31, 2013 | 71 |
Table of Contents
Schedule of Investments PIMCO EqS® Long/Short Fund (Cont.)
(f) FINANCIAL DERIVATIVE INSTRUMENTS: OVER THE COUNTER
FORWARD FOREIGN CURRENCY CONTRACTS:
| Counterparty | Settlement Month | Currency to be Delivered | Currency to be Received | Unrealized Appreciation/ (Depreciation) | ||||||||||||||||||||||||
| Asset | Liability | |||||||||||||||||||||||||||
BOA | 01/2014 | EUR | 11,488 | $ | 15,549 | $ | 0 | $ | (255 | ) | ||||||||||||||||||
| 02/2014 | CAD | 5,687 | 5,343 | 0 | (6 | ) | ||||||||||||||||||||||
BPS | 02/2014 | 14,048 | 13,198 | 9 | (25 | ) | ||||||||||||||||||||||
CBK | 01/2014 | 11,471 | 10,852 | 53 | 0 | |||||||||||||||||||||||
| 01/2014 | $ | 19,290 | EUR | 14,012 | 0 | (14 | ) | |||||||||||||||||||||
| 02/2014 | CAD | 1,548 | $ | 1,460 | 4 | 0 | ||||||||||||||||||||||
| 02/2014 | EUR | 14,012 | 19,290 | 14 | 0 | |||||||||||||||||||||||
DUB | 02/2014 | 1,921 | 2,641 | 0 | (2 | ) | ||||||||||||||||||||||
HUS | 01/2014 | 1,102 | 1,511 | 0 | (5 | ) | ||||||||||||||||||||||
RBC | 02/2014 | 2,428 | 3,342 | 2 | 0 | |||||||||||||||||||||||
UAG | 02/2014 | CAD | 1,112 | 1,041 | 0 | (5 | ) | |||||||||||||||||||||
| 02/2014 | EUR | 1,215 | 1,674 | 2 | 0 | |||||||||||||||||||||||
WST | 01/2014 | 1,422 | 1,913 | 0 | (43 | ) | ||||||||||||||||||||||
|
|
|
| |||||||||||||||||||||||||
Total Forward Foreign Currency Contracts |
| $ | 84 | $ | (355 | ) | ||||||||||||||||||||||
|
|
|
| |||||||||||||||||||||||||
TRANSACTIONS IN WRITTEN CALL AND PUT OPTIONS FOR THE PERIOD ENDED DECEMBER 31, 2013:
| # of Contracts | Premiums | |||||||
Balance at 06/30/2013 | 0 | $ | 0 | |||||
Sales | 211,530 | (5,214 | ) | |||||
Closing Buys | (199,600 | ) | 3,900 | |||||
Expirations | (6,430 | ) | 1,085 | |||||
Exercised | (2,000 | ) | 178 | |||||
|
|
|
| |||||
Balance at 12/31/2013 | 3,500 | $ | (51 | ) | ||||
|
|
|
| |||||
FINANCIAL DERIVATIVE INSTRUMENTS: OVER THE COUNTER SUMMARY
The following is a summary by counterparty of the market value of OTC financial derivative instruments and collateral (received)/pledged as of December 31, 2013:
| (g) | Securities with an aggregate market value of $270 have been pledged as collateral for financial derivative instruments as governed by International Swaps and Derivatives Association, Inc. master agreements as of December 31, 2013. |
| Financial Derivative Assets | Financial Derivative Liabilities | |||||||||||||||||||||||||||||||||||||||||||||
| Counterparty | Forward Foreign Currency Contracts | Purchased Options | Swap Agreements | Total Over the Counter | Forward Foreign Currency Contracts | Written Options | Swap Agreements | Total Over the Counter | Net Market Value of OTC Derivatives | Collateral (Received)/ Pledged | Net Exposure (1) | |||||||||||||||||||||||||||||||||||
BOA | $ | 0 | $ | 0 | $ | 0 | $ | 0 | $ | (261 | ) | $ | 0 | $ | 0 | $ | (261 | ) | $ | (261 | ) | $ | 270 | $ | 9 | |||||||||||||||||||||
BPS | 9 | 0 | 0 | 9 | (25 | ) | 0 | 0 | (25 | ) | (16 | ) | 0 | (16 | ) | |||||||||||||||||||||||||||||||
CBK | 71 | 0 | 0 | 71 | (14 | ) | 0 | 0 | (14 | ) | 57 | 0 | 57 | |||||||||||||||||||||||||||||||||
DUB | 0 | 0 | 0 | 0 | (2 | ) | 0 | 0 | (2 | ) | (2 | ) | 0 | (2 | ) | |||||||||||||||||||||||||||||||
HUS | 0 | 0 | 0 | 0 | (5 | ) | 0 | 0 | (5 | ) | (5 | ) | 0 | (5 | ) | |||||||||||||||||||||||||||||||
MSC | 0 | 0 | 0 | 0 | 0 | 0 | 0 | 0 | 0 | (290 | ) | (290 | ) | |||||||||||||||||||||||||||||||||
RBC | $ | 2 | $ | 0 | $ | 0 | $ | 2 | $ | 0 | $ | 0 | $ | 0 | $ | 0 | $ | 2 | $ | 0 | $ | 2 | ||||||||||||||||||||||||
UAG | 2 | 0 | 0 | 2 | (5 | ) | 0 | 0 | (5 | ) | (3 | ) | 0 | (3 | ) | |||||||||||||||||||||||||||||||
WST | 0 | 0 | 0 | 0 | (43 | ) | 0 | 0 | (43 | ) | (43 | ) | 0 | (43 | ) | |||||||||||||||||||||||||||||||
|
|
|
|
|
|
|
|
|
|
|
|
|
|
|
| |||||||||||||||||||||||||||||||
Total Over the Counter | $ | 84 | $ | 0 | $ | 0 | $ | 84 | $ | (355 | ) | $ | 0 | $ | 0 | $ | (355 | ) | ||||||||||||||||||||||||||||
|
|
|
|
|
|
|
|
|
|
|
|
|
|
|
| |||||||||||||||||||||||||||||||
| (1) | Net Exposure represents the net receivable/(payable) that would be due from/to the counterparty in the event of default. Exposure from OTC financial derivative instruments can only be netted across transactions governed under the same master agreement with the same legal entity. See note 7, Principal Risks, in the Notes to Financial Statements for more information regarding master netting arrangements. |
| 72 | PIMCO EQUITY SERIES | See Accompanying Notes |
Table of Contents
December 31, 2013 (Unaudited)
FAIR VALUE OF FINANCIAL DERIVATIVE INSTRUMENTS
The following is a summary of the fair valuation of the Fund’s derivative instruments categorized by risk (1) exposure:
Fair Values of Financial Derivative Instruments on the Statements of Assets and Liabilities as of December 31, 2013:
| Derivatives not accounted for as hedging instruments | ||||||||||||||||||||||||
| Commodity Contracts | Credit Contracts | Equity Contracts | Foreign Exchange Contracts | Interest Rate Contracts | Total | |||||||||||||||||||
Financial Derivative Instruments - Assets | ||||||||||||||||||||||||
Exchange-traded or centrally cleared | ||||||||||||||||||||||||
Purchased Options | $ | 0 | $ | 0 | $ | 336 | $ | 0 | $ | 0 | $ | 336 | ||||||||||||
Futures | 66 | 0 | 14 | 0 | 0 | 80 | ||||||||||||||||||
|
|
|
|
|
|
|
|
|
|
|
| |||||||||||||
| $ | 66 | $ | 0 | $ | 350 | $ | 0 | $ | 0 | $ | 416 | |||||||||||||
|
|
|
|
|
|
|
|
|
|
|
| |||||||||||||
Over the counter | ||||||||||||||||||||||||
Forward Foreign Currency Contracts | $ | 0 | $ | 0 | $ | 0 | $ | 84 | $ | 0 | $ | 84 | ||||||||||||
|
|
|
|
|
|
|
|
|
|
|
| |||||||||||||
| $ | 66 | $ | 0 | $ | 350 | $ | 84 | $ | 0 | $ | 500 | |||||||||||||
|
|
|
|
|
|
|
|
|
|
|
| |||||||||||||
Financial Derivative Instruments - Liabilities | ||||||||||||||||||||||||
Exchange-traded or centrally cleared | ||||||||||||||||||||||||
Written Options | $ | 0 | $ | 0 | $ | 11 | $ | 0 | $ | 0 | $ | 11 | ||||||||||||
Futures | 139 | 0 | 104 | 0 | 0 | 243 | ||||||||||||||||||
|
|
|
|
|
|
|
|
|
|
|
| |||||||||||||
| $ | 139 | $ | 0 | $ | 115 | $ | 0 | $ | 0 | $ | 254 | |||||||||||||
|
|
|
|
|
|
|
|
|
|
|
| |||||||||||||
Over the counter | ||||||||||||||||||||||||
Forward Foreign Currency Contracts | $ | 0 | $ | 0 | $ | 0 | $ | 355 | $ | 0 | $ | 355 | ||||||||||||
|
|
|
|
|
|
|
|
|
|
|
| |||||||||||||
| $ | 139 | $ | 0 | $ | 115 | $ | 355 | $ | 0 | $ | 609 | |||||||||||||
|
|
|
|
|
|
|
|
|
|
|
| |||||||||||||
The Effect of Financial Derivative Instruments on the Statements of Operations for the Period Ended December 31, 2013:
| Derivatives not accounted for as hedging instruments | ||||||||||||||||||||||||
| Commodity Contracts | Credit Contracts | Equity Contracts | Foreign Exchange Contracts | Interest Rate Contracts | Total | |||||||||||||||||||
Net Realized Gain (Loss) on Financial Derivative Instruments | ||||||||||||||||||||||||
Exchange-traded or centrally cleared | ||||||||||||||||||||||||
Purchased Options | $ | 0 | $ | 0 | $ | (1,614 | ) | $ | 0 | $ | 0 | $ | (1,614 | ) | ||||||||||
Written Options | 0 | 0 | 3,424 | 0 | 0 | 3,424 | ||||||||||||||||||
Futures | (79 | ) | 0 | (1,167 | ) | 0 | 0 | (1,246 | ) | |||||||||||||||
|
|
|
|
|
|
|
|
|
|
|
| |||||||||||||
| $ | (79 | ) | $ | 0 | $ | 643 | $ | 0 | $ | 0 | $ | 564 | ||||||||||||
|
|
|
|
|
|
|
|
|
|
|
| |||||||||||||
Over the counter | ||||||||||||||||||||||||
Forward Foreign Currency Contracts | $ | 0 | $ | 0 | $ | 0 | $ | (596 | ) | $ | 0 | $ | (596 | ) | ||||||||||
Purchased Options | 0 | 0 | 6 | 0 | 0 | 6 | ||||||||||||||||||
Written Options | 0 | 0 | 12 | 0 | 0 | 12 | ||||||||||||||||||
|
|
|
|
|
|
|
|
|
|
|
| |||||||||||||
| $ | 0 | $ | 0 | $ | 18 | $ | (596 | ) | $ | 0 | $ | (578 | ) | |||||||||||
|
|
|
|
|
|
|
|
|
|
|
| |||||||||||||
| $ | (79 | ) | $ | 0 | $ | 661 | $ | (596 | ) | $ | 0 | $ | (14 | ) | ||||||||||
|
|
|
|
|
|
|
|
|
|
|
| |||||||||||||
Net Change in Unrealized Appreciation (Depreciation) on Financial Derivative Instruments |
| |||||||||||||||||||||||
Exchange-traded or centrally cleared | ||||||||||||||||||||||||
Purchased Options | $ | 0 | $ | 0 | $ | (2,794 | ) | $ | 0 | $ | 0 | $ | (2,794 | ) | ||||||||||
Written Options | 0 | 0 | 41 | 0 | 0 | 41 | ||||||||||||||||||
Futures | (247 | ) | 0 | (90 | ) | 0 | 0 | (337 | ) | |||||||||||||||
|
|
|
|
|
|
|
|
|
|
|
| |||||||||||||
| $ | (247 | ) | $ | 0 | $ | (2,843 | ) | $ | 0 | $ | 0 | $ | (3,090 | ) | ||||||||||
|
|
|
|
|
|
|
|
|
|
|
| |||||||||||||
Over the counter | ||||||||||||||||||||||||
Forward Foreign Currency Contracts | $ | 0 | $ | 0 | $ | 0 | $ | (472 | ) | $ | 0 | $ | (472 | ) | ||||||||||
|
|
|
|
|
|
|
|
|
|
|
| |||||||||||||
| $ | (247 | ) | $ | 0 | $ | (2,843 | ) | $ | (472 | ) | $ | 0 | $ | (3,562 | ) | |||||||||
|
|
|
|
|
|
|
|
|
|
|
| |||||||||||||
| (1) | See Note 7, Principal Risks, in the Notes to Financial Statements on risks of the Fund. |
| See Accompanying Notes | SEMIANNUAL REPORT | DECEMBER 31, 2013 | 73 |
Table of Contents
Schedule of Investments PIMCO EqS® Long/Short Fund (Cont.)
December 31, 2013 (Unaudited)
FAIR VALUE MEASUREMENTS
The following is a summary of the fair valuations according to the inputs used as of December 31, 2013 in valuing the Fund’s assets and liabilities:
| Category and Subcategory | Level 1 | Level 2 | Level 3 | Fair Value at 12/31/2013 | ||||||||||||
Investments in Securities, at Value | ||||||||||||||||
Common Stocks | ||||||||||||||||
Canada | ||||||||||||||||
Industrials | $ | 21,625 | $ | 0 | $ | 0 | $ | 21,625 | ||||||||
China | ||||||||||||||||
Information Technology | 21,346 | 0 | 0 | 21,346 | ||||||||||||
Germany | ||||||||||||||||
Materials | 0 | 26,349 | 0 | 26,349 | ||||||||||||
Greece | ||||||||||||||||
Industrials | 2,488 | 0 | 0 | 2,488 | ||||||||||||
Netherlands | ||||||||||||||||
Information Technology | 33,070 | 0 | 0 | 33,070 | ||||||||||||
United States | ||||||||||||||||
Consumer Discretionary | 169,254 | 0 | 0 | 169,254 | ||||||||||||
Consumer Staples | 42,614 | 0 | 0 | 42,614 | ||||||||||||
Energy | 31,554 | 0 | 0 | 31,554 | ||||||||||||
Financials | 222,159 | 0 | 0 | 222,159 | ||||||||||||
Health Care | 96,467 | 0 | 0 | 96,467 | ||||||||||||
Industrials | 58,572 | 0 | 0 | 58,572 | ||||||||||||
Information Technology | 108,642 | 0 | 0 | 108,642 | ||||||||||||
Real Estate Investment Trusts | ||||||||||||||||
United States | ||||||||||||||||
Financials | 38,580 | 0 | 0 | 38,580 | ||||||||||||
Warrants | ||||||||||||||||
United States | ||||||||||||||||
Financials | 6 | 0 | 0 | 6 | ||||||||||||
Short-Term Instruments | ||||||||||||||||
Repurchase Agreements | 0 | 2,085 | 0 | 2,085 | ||||||||||||
U.S. Treasury Bills | 0 | 270 | 0 | 270 | ||||||||||||
| $ | 846,377 | $ | 28,704 | $ | 0 | $ | 875,081 | |||||||||
Investments in Affiliates, at Value | ||||||||||||||||
Short-Term Instruments | ||||||||||||||||
Central Funds Used for Cash Management Purposes | $ | 150,648 | $ | 0 | $ | 0 | $ | 150,648 | ||||||||
Total Investments | $ | 997,025 | $ | 28,704 | $ | 0 | $ | 1,025,729 | ||||||||
| Category and Subcategory | Level 1 | Level 2 | Level 3 | Fair Value at 12/31/2013 | ||||||||||||
Short Sales, at Value - Liabilities | ||||||||||||||||
Common Stocks | ||||||||||||||||
Argentina | ||||||||||||||||
Information Technology | $ | (2,482 | ) | $ | 0 | $ | 0 | $ | (2,482 | ) | ||||||
Canada | ||||||||||||||||
Industrials | (6,879 | ) | 0 | 0 | (6,879 | ) | ||||||||||
Switzerland | ||||||||||||||||
Energy | (14,331 | ) | 0 | 0 | (14,331 | ) | ||||||||||
United States | ||||||||||||||||
Consumer Discretionary | (9,883 | ) | 0 | 0 | (9,883 | ) | ||||||||||
Energy | (48,787 | ) | 0 | 0 | (48,787 | ) | ||||||||||
Health Care | (14,648 | ) | 0 | 0 | (14,648 | ) | ||||||||||
Industrials | (5,713 | ) | 0 | 0 | (5,713 | ) | ||||||||||
Information Technology | (8,651 | ) | 0 | 0 | (8,651 | ) | ||||||||||
Telecommunication Services | (1,115 | ) | 0 | 0 | (1,115 | ) | ||||||||||
Real Estate Investment Trusts | ||||||||||||||||
United States | ||||||||||||||||
Financials | (24,277 | ) | 0 | 0 | (24,277 | ) | ||||||||||
| $ | (136,766 | ) | $ | 0 | $ | 0 | $ | (136,766 | ) | |||||||
Financial Derivative Instruments - Assets |
| |||||||||||||||
Exchange-traded or centrally cleared | 80 | 336 | 0 | 416 | ||||||||||||
Over the counter | 0 | 84 | 0 | 84 | ||||||||||||
| $ | 80 | $ | 420 | $ | 0 | $ | 500 | |||||||||
Financial Derivative Instruments - Liabilities |
| |||||||||||||||
Exchange-traded or centrally cleared | (243 | ) | (11 | ) | 0 | (254 | ) | |||||||||
Over the counter | 0 | (355 | ) | 0 | (355 | ) | ||||||||||
| $ | (243 | ) | $ | (366 | ) | $ | 0 | $ | (609 | ) | ||||||
Totals | $ | 860,096 | $ | 28,758 | $ | 0 | $ | 888,854 | ||||||||
There were no transfers between Level 1 and 2 during the period ended December 31, 2013.
| 74 | PIMCO EQUITY SERIES | See Accompanying Notes |
Table of Contents
Consolidated Schedule of Investments PIMCO Emerging Multi-Asset Fund
December 31, 2013 (Unaudited)
| SHARES | MARKET VALUE (000S) | |||||||||||
| INVESTMENTS IN AFFILIATES 98.4% | ||||||||||||
| MUTUAL FUNDS (a) 98.2% | ||||||||||||
| UNITED STATES 98.2% | ||||||||||||
PIMCO Emerging Local Bond Fund | 1,503,303 | $ | 14,026 | |||||||||
PIMCO Emerging Markets Bond Fund | 611,508 | 6,543 | ||||||||||
PIMCO Emerging Markets Corporate Bond Fund | 332,323 | 3,752 | ||||||||||
PIMCO EqS® Emerging Markets Fund | 3,214,229 | 28,285 | ||||||||||
|
| |||||||||||
| Total Mutual Funds (Cost $55,720) | 52,606 | |||||||||||
|
| |||||||||||
| SHARES | MARKET VALUE (000S) | |||||||||||
| SHORT-TERM INSTRUMENTS 0.2% | ||||||||||||
|
| |||||||||||
| CENTRAL FUNDS USED FOR CASH MANAGEMENT PURPOSES 0.2% | ||||||||||||
PIMCO Short-Term | 10,153 | $ | 102 | |||||||||
|
| |||||||||||
| Total Short-Term Instruments (Cost $102) | 102 | |||||||||||
|
| |||||||||||
| Total Investments in Affiliates (Cost $55,822) | 52,708 | |||||||||||
| Total Investments 98.4% (Cost $55,822) | $ | 52,708 | ||||||||||
Financial Derivative (Cost or Premiums, net $79) | 113 | |||||||||||
| Other Assets and Liabilities, net 1.4% | 754 | |||||||||||
|
| |||||||||||
| Net Assets 100.0% | $ | 53,575 | ||||||||||
|
| |||||||||||
NOTES TO CONSOLIDATED SCHEDULE OF INVESTMENTS (AMOUNTS IN THOUSANDS*, EXCEPT NUMBER OF CONTRACTS, UNITS, AND SHARES):
| * | A zero balance may reflect actual amounts rounding to less than one thousand. |
| (a) | Institutional Class Shares of each Fund. |
| (b) | FINANCIAL DERIVATIVE INSTRUMENTS: EXCHANGE-TRADED OR CENTRALLY CLEARED |
PURCHASED OPTIONS:
OPTIONS ON EXCHANGE-TRADED FUNDS
| Description | Strike Price | Expiration Date | # of Contracts | Cost | Market Value | |||||||||||||
Put - CBOE iShares MSCI Emerging Markets Index Fund | $ 36.000 | 06/21/2014 | 1,093 | $ | 133 | $ | 75 | |||||||||||
|
|
|
| |||||||||||||||
Total Purchased Options | $ | 133 | $ | 75 | ||||||||||||||
|
|
|
| |||||||||||||||
WRITTEN OPTIONS:
OPTIONS ON EXCHANGE-TRADED FUNDS
| Description | Strike Price | Expiration Date | # of Contracts | Premiums (Received) | Market Value | |||||||||||||
Put - CBOE iShares MSCI Emerging Markets Index Fund | $ 31.000 | 06/21/2014 | 1,093 | $ | (48 | ) | $ | (26 | ) | |||||||||
|
|
|
| |||||||||||||||
Total Written Options | $ | (48 | ) | $ | (26 | ) | ||||||||||||
|
|
|
| |||||||||||||||
FUTURES CONTRACTS:
| Description | Type | Expiration Month | # of Contracts | Unrealized Appreciation | Variation Margin | |||||||||||||||||
| Asset | Liability | |||||||||||||||||||||
E-mini S&P 500 Index March Futures | Long | 03/2014 | 6 | $ | 4 | $ | 2 | $ | 0 | |||||||||||||
|
|
|
|
|
| |||||||||||||||||
Total Futures Contracts | $ | 4 | $ | 2 | $ | 0 | ||||||||||||||||
|
|
|
|
|
| |||||||||||||||||
FINANCIAL DERIVATIVE INSTRUMENTS: EXCHANGE-TRADED OR CENTRALLY CLEARED SUMMARY
The following is a summary of the market value and variation margin of Exchange-Traded or Centrally Cleared Financial Derivative Instruments as of December 31, 2013:
Cash of $2 has been pledged as collateral as of December 31, 2013 for equity short sales and equity options as governed by prime brokerage agreements and agreements governing listed equity option transactions.
Cash of $30 has been pledged as collateral for exchange-traded and centrally cleared financial derivative instruments as of December 31, 2013. See Note 7, Principal Risks, in the Notes to Financial Statements for more information regarding master netting arrangements.
| See Accompanying Notes | SEMIANNUAL REPORT | DECEMBER 31, 2013 | 75 |
Table of Contents
Consolidated Schedule of Investments PIMCO Emerging Multi-Asset Fund (Cont.)
| Financial Derivative Assets | Financial Derivative Liabilities | |||||||||||||||||||||||||||||||||
| Market Value | Variation Margin Asset | Total | Market Value | Variation Margin Liability | Total | |||||||||||||||||||||||||||||
| Purchased Options | Futures | Swap Agreements | Written Options | Futures | Swap Agreements | |||||||||||||||||||||||||||||
Total Exchange-Traded or Centrally Cleared | $ | 75 | $ | 2 | $ | 0 | $ | 77 | $ | (26) | $ | 0 | $ | 0 | $ | (26) | ||||||||||||||||||
|
|
|
|
|
|
|
|
|
|
|
|
|
|
|
| |||||||||||||||||||
(c) FINANCIAL DERIVATIVE INSTRUMENTS: OVER THE COUNTER
FORWARD FOREIGN CURRENCY CONTRACTS:
| Counterparty | Settlement Month | Currency to | Currency to | Unrealized Appreciation/ (Depreciation) | ||||||||||||||||||||||||
| Asset | Liability | |||||||||||||||||||||||||||
BOA | 01/2014 | HKD | 933 | $ | 120 | $ | 0 | $ | 0 | |||||||||||||||||||
| 01/2014 | MYR | 564 | 176 | 4 | 0 | |||||||||||||||||||||||
| 01/2014 | $ | 144 | INR | 8,980 | 1 | 0 | ||||||||||||||||||||||
| 04/2014 | INR | 8,980 | $ | 140 | 0 | (2 | ) | |||||||||||||||||||||
| 04/2014 | PEN | 520 | 184 | 1 | 0 | |||||||||||||||||||||||
| 04/2014 | $ | 120 | HKD | 933 | 0 | 0 | ||||||||||||||||||||||
| 04/2014 | 175 | MYR | 564 | 0 | (4 | ) | ||||||||||||||||||||||
BPS | 01/2014 | COP | 628,222 | $ | 329 | 3 | 0 | |||||||||||||||||||||
| 01/2014 | $ | 326 | COP | 628,222 | 0 | 0 | ||||||||||||||||||||||
| 03/2014 | COP | 628,222 | $ | 325 | 0 | 0 | ||||||||||||||||||||||
| 03/2014 | $ | 434 | MXN | 5,681 | 0 | (1 | ) | |||||||||||||||||||||
BRC | 01/2014 | BRL | 338 | $ | 153 | 10 | 0 | |||||||||||||||||||||
| 01/2014 | CZK | 14,451 | 757 | 29 | 0 | |||||||||||||||||||||||
| 01/2014 | TWD | 14,024 | 481 | 11 | 0 | |||||||||||||||||||||||
| 01/2014 | $ | 144 | BRL | 338 | 0 | (1 | ) | |||||||||||||||||||||
| 01/2014 | ZAR | 2,548 | $ | 245 | 2 | 0 | ||||||||||||||||||||||
| 03/2014 | $ | 241 | MXN | 3,138 | 0 | (2 | ) | |||||||||||||||||||||
CBK | 01/2014 | HUF | 149,344 | $ | 676 | 0 | (14 | ) | ||||||||||||||||||||
| 01/2014 | $ | 311 | INR | 20,189 | 14 | 0 | ||||||||||||||||||||||
| 03/2014 | EUR | 79 | $ | 109 | 0 | 0 | ||||||||||||||||||||||
DUB | 01/2014 | PHP | 1,393 | 31 | 0 | 0 | ||||||||||||||||||||||
| 01/2014 | $ | 70 | HKD | 543 | 0 | 0 | ||||||||||||||||||||||
| 01/2014 | ZAR | 688 | $ | 70 | 5 | 0 | ||||||||||||||||||||||
| 03/2014 | ILS | 240 | 68 | 0 | (1 | ) | ||||||||||||||||||||||
| 04/2014 | HKD | 3,117 | 402 | 0 | 0 | |||||||||||||||||||||||
| 04/2014 | $ | 31 | PHP | 1,393 | 0 | 0 | ||||||||||||||||||||||
FBF | 01/2014 | BRL | 1,174 | $ | 501 | 4 | 0 | |||||||||||||||||||||
| 01/2014 | IDR | 1,368,711 | 117 | 5 | 0 | |||||||||||||||||||||||
| 01/2014 | $ | 500 | BRL | 1,174 | 0 | (2 | ) | |||||||||||||||||||||
GLM | 01/2014 | 397 | ZAR | 3,906 | 0 | (25 | ) | |||||||||||||||||||||
| 04/2014 | CLP | 38,048 | $ | 71 | 0 | (1 | ) | |||||||||||||||||||||
JPM | 01/2014 | IDR | 608,316 | 51 | 1 | 0 | ||||||||||||||||||||||
| 01/2014 | INR | 29,169 | 460 | 0 | (10 | ) | ||||||||||||||||||||||
| 01/2014 | KRW | 279,126 | 261 | 0 | (4 | ) | ||||||||||||||||||||||
| 01/2014 | RUB | 13,078 | 398 | 1 | 0 | |||||||||||||||||||||||
| 01/2014 | TRY | 220 | 108 | 6 | 0 | |||||||||||||||||||||||
| 01/2014 | TWD | 26,645 | 910 | 16 | 0 | |||||||||||||||||||||||
| 01/2014 | $ | 3 | KRW | 2,942 | 0 | 0 | ||||||||||||||||||||||
| 01/2014 | 32 | PHP | 1,393 | 0 | 0 | |||||||||||||||||||||||
| 01/2014 | 53 | PLN | 166 | 2 | 0 | |||||||||||||||||||||||
| 01/2014 | 549 | RUB | 17,961 | 0 | (4 | ) | ||||||||||||||||||||||
| 03/2014 | IDR | 608,317 | $ | 50 | 1 | 0 | ||||||||||||||||||||||
| 04/2014 | RUB | 7,734 | 231 | 0 | 0 | |||||||||||||||||||||||
RBC | 01/2014 | BRL | 836 | 360 | 6 | 0 | ||||||||||||||||||||||
| 01/2014 | $ | 357 | BRL | 836 | 0 | (3 | ) | |||||||||||||||||||||
| 02/2014 | 357 | 836 | 0 | (6 | ) | |||||||||||||||||||||||
SCX | 01/2014 | CNY | 437 | $ | 71 | 0 | (1 | ) | ||||||||||||||||||||
| 01/2014 | THB | 3,757 | 115 | 0 | 0 | |||||||||||||||||||||||
| 01/2014 | $ | 50 | HKD | 390 | 0 | 0 | ||||||||||||||||||||||
| 01/2014 | 169 | MYR | 564 | 3 | 0 | |||||||||||||||||||||||
| 02/2014 | IDR | 608,316 | $ | 51 | 1 | 0 | ||||||||||||||||||||||
UAG | 01/2014 | 456,237 | 41 | 4 | 0 | |||||||||||||||||||||||
| 01/2014 | RUB | 4,883 | 148 | 0 | 0 | |||||||||||||||||||||||
| 01/2014 | $ | 71 | CNY | 437 | 1 | 0 | ||||||||||||||||||||||
| 01/2014 | 262 | KRW | 276,184 | 0 | 0 | |||||||||||||||||||||||
| 76 | PIMCO EQUITY SERIES | See Accompanying Notes |
Table of Contents
December 31, 2013 (Unaudited)
| Counterparty | Settlement Month | Currency to | Currency to | Unrealized Appreciation/ (Depreciation) | ||||||||||||||||||||||||
| Asset | Liability | |||||||||||||||||||||||||||
| 01/2014 | $ | 117 | THB | 3,757 | 0 | (3 | ) | |||||||||||||||||||||
| 01/2014 | 1,374 | TWD | 40,668 | 0 | (10 | ) | ||||||||||||||||||||||
| 02/2014 | IDR | 456,238 | $ | 41 | 4 | 0 | ||||||||||||||||||||||
| 04/2014 | CNY | 437 | 71 | 0 | 0 | |||||||||||||||||||||||
| 04/2014 | KRW | 276,184 | 261 | 0 | 0 | |||||||||||||||||||||||
| 04/2014 | THB | 3,757 | 116 | 2 | 0 | |||||||||||||||||||||||
| 04/2014 | TWD | 40,668 | 1,382 | 15 | 0 | |||||||||||||||||||||||
|
|
|
| |||||||||||||||||||||||||
Total Forward Foreign Currency Contracts |
| $ | 152 | $ | (94 | ) | ||||||||||||||||||||||
|
|
|
| |||||||||||||||||||||||||
TRANSACTIONS IN WRITTEN CALL AND PUT OPTIONS FOR THE PERIOD ENDED DECEMBER 31, 2013:
| # of Contracts | Premiums | |||||||
Balance at 06/30/2013 | 2,273 | $ | (277 | ) | ||||
Sales | 1,093 | (48 | ) | |||||
Closing Buys | (2,273 | ) | 277 | |||||
Expirations | 0 | 0 | ||||||
Exercised | 0 | 0 | ||||||
|
|
|
| |||||
Balance at 12/31/2013 | 1,093 | $ | (48 | ) | ||||
|
|
|
| |||||
SWAP AGREEMENTS:
CREDIT DEFAULT SWAPS ON CORPORATE AND SOVEREIGN ISSUES - SELL PROTECTION (1)
| Counterparty | Reference Entity | Fixed Deal Receive Rate | Maturity Date | Implied Credit Spread at December 31, 2013 (2) | Notional Amount (3) | Premiums | Unrealized Appreciation | Swap Agreements, at Value | ||||||||||||||||||||||||||
| Asset | Liability | |||||||||||||||||||||||||||||||||
| BOA | South Africa Government International Bond | 1.000% | 09/20/2014 | 0.610% | $600 | $ | 0 | $ | 2 | $ | 2 | $ | 0 | |||||||||||||||||||||
| CBK | Rosneft Oil Co. via Rosneft International Finance Ltd. | 1.000% | 06/20/2014 | 0.990% | 600 | (3 | ) | 3 | 0 | 0 | ||||||||||||||||||||||||
Turkey Government International Bond | 1.000% | 09/20/2014 | 1.216% | 600 | (1 | ) | 0 | 0 | (1 | ) | ||||||||||||||||||||||||
| DUB | Gazprom OAO Via Gaz Capital S.A. | 1.000% | 06/20/2014 | 0.742% | 1,900 | 2 | 1 | 3 | 0 | |||||||||||||||||||||||||
| FBF | Russia Government International Bond | 1.000% | 09/20/2015 | 0.852% | 600 | 0 | 2 | 2 | 0 | |||||||||||||||||||||||||
| RYL | China Government International Bond | 1.000% | 12/20/2016 | 0.391% | 100 | (4 | ) | 6 | 2 | 0 | ||||||||||||||||||||||||
|
|
|
|
|
|
|
| |||||||||||||||||||||||||||
| $ | (6 | ) | $ | 14 | $ | 9 | $ | (1 | ) | |||||||||||||||||||||||||
|
|
|
|
|
|
|
| |||||||||||||||||||||||||||
| (1) | If the Fund is a seller of protection and a credit event occurs, as defined under the terms of that particular swap agreement, the Fund will either (i) pay to the buyer of protection an amount equal to the notional amount of the swap and take delivery of the referenced obligation or underlying securities comprising the referenced index or (ii) pay a net settlement amount in the form of cash or securities equal to the notional amount of the swap less the recovery value of the referenced obligation or underlying securities comprising the referenced index. |
| (2) | Implied credit spreads, represented in absolute terms, utilized in determining the market value of credit default swap agreements on corporate or sovereign issues as of period end serve as an indicator of the current status of the payment/performance risk and represent the likelihood or risk of default for the credit derivative. The implied credit spread of a particular referenced entity reflects the cost of buying/selling protection and may include upfront payments required to be made to enter into the agreement. Wider credit spreads represent a deterioration of the referenced entity’s credit soundness and a greater likelihood or risk of default or other credit event occurring as defined under the terms of the agreement. |
| (3) | The maximum potential amount the Fund could be required to pay as a seller of credit protection or receive as a buyer of credit protection if a credit event occurs as defined under the terms of that particular swap agreement. |
TOTAL RETURN SWAPS ON INDICES
Counterparty | Pay/Receive (4) | Underlying Reference | # of | Financing | Maturity | Notional | Unrealized | Swap Agreements, at Value | ||||||||||||||||||||||||||||
| Asset | Liability | |||||||||||||||||||||||||||||||||||
| BOA | Receive | KOSPI 200 Index | 2,000,000 | 0.000% | 03/13/2014 | KRW | 524,466 | $ | 6 | $ | 6 | $ | 0 | |||||||||||||||||||||||
|
|
|
|
|
| |||||||||||||||||||||||||||||||
TOTAL RETURN SWAPS ON EXCHANGE-TRADED FUNDS
Counterparty | Pay/Receive (4) | Underlying Reference | # of | Financing Rate | Maturity | Notional | Unrealized | Swap Agreements, at Value | ||||||||||||||||||||||||||||
| Asset | Liability | |||||||||||||||||||||||||||||||||||
| BPS | Receive | iShares MSCI Emerging Markets Index Fund | 22,735 | 3-Month USD-LIBOR less a specified spread | 08/15/2014 | $ | 960 | $ | (10 | ) | $ | 0 | $ | (10 | ) | |||||||||||||||||||||
|
|
|
|
|
|
|
|
|
|
| ||||||||||||||||||||||||||
Total Swap Agreements | $ | (6 | ) | $ | 10 | $ | 15 | $ | (11 | ) | ||||||||||||||||||||||||||
|
|
|
|
|
|
|
|
|
|
| ||||||||||||||||||||||||||
| See Accompanying Notes | SEMIANNUAL REPORT | DECEMBER 31, 2013 | 77 |
Table of Contents
Consolidated Schedule of Investments PIMCO Emerging Multi-Asset Fund (Cont.)
| (4) | Receive represents that the Fund receives monthly payments for any positive monthly return on the underlying reference. The Fund makes payments for any negative monthly return on such underlying reference. Pay represents that the Fund receives monthly payments for any negative monthly return on the underlying reference. The Fund makes payments for any positive monthly return on such underlying reference. |
FINANCIAL DERIVATIVE INSTRUMENTS: OVER THE COUNTER SUMMARY
The following is a summary by counterparty of the market value of OTC financial derivative instruments and collateral (received)/pledged as of December 31, 2013:
| Financial Derivative Assets | Financial Derivative Liabilities | |||||||||||||||||||||||||||||||||||||||||||||
| Counterparty | Forward Foreign Currency Contracts | Purchased Options | Swap Agreements | Total Over the Counter | Forward Foreign Currency Contracts | Written Options | Swap Agreements | Total Over the Counter | Net Market Value of OTC Derivatives | Collateral (Received)/ Pledged | Net Exposure (5) | |||||||||||||||||||||||||||||||||||
BOA | $ | 6 | $ | 0 | $ | 8 | $ | 14 | $ | (6 | ) | $ | 0 | $ | 0 | $ | (6 | ) | $ | 8 | $ | 0 | $ | 8 | ||||||||||||||||||||||
BPS | 3 | 0 | 0 | 3 | (1 | ) | 0 | (10 | ) | (11 | ) | (8 | ) | 0 | (8 | ) | ||||||||||||||||||||||||||||||
BRC | 52 | 0 | 0 | 52 | (3 | ) | 0 | 0 | (3 | ) | 49 | 0 | 49 | |||||||||||||||||||||||||||||||||
CBK | 14 | 0 | 0 | 14 | (14 | ) | 0 | (1 | ) | (15 | ) | (1 | ) | 0 | (1 | ) | ||||||||||||||||||||||||||||||
DUB | 5 | 0 | 3 | 8 | (1 | ) | 0 | 0 | (1 | ) | 7 | 0 | 7 | |||||||||||||||||||||||||||||||||
FBF | 9 | 0 | 2 | 11 | (2 | ) | 0 | 0 | (2 | ) | 9 | 0 | 9 | |||||||||||||||||||||||||||||||||
GLM | 0 | 0 | 0 | 0 | (26 | ) | 0 | 0 | (26 | ) | (26 | ) | 0 | (26 | ) | |||||||||||||||||||||||||||||||
JPM | 27 | 0 | 0 | 27 | (18 | ) | 0 | 0 | (18 | ) | 9 | 0 | 9 | |||||||||||||||||||||||||||||||||
RBC | 6 | 0 | 0 | 6 | (9 | ) | 0 | 0 | (9 | ) | (3 | ) | 0 | (3 | ) | |||||||||||||||||||||||||||||||
RYL | 0 | 0 | 2 | 2 | 0 | 0 | 0 | 0 | 2 | 0 | 2 | |||||||||||||||||||||||||||||||||||
SCX | 4 | 0 | 0 | 4 | (1 | ) | 0 | 0 | (1 | ) | 3 | 0 | 3 | |||||||||||||||||||||||||||||||||
UAG | 26 | 0 | 0 | 26 | (13 | ) | 0 | 0 | (13 | ) | 13 | 0 | 13 | |||||||||||||||||||||||||||||||||
|
|
|
|
|
|
|
|
|
|
|
|
|
|
|
| |||||||||||||||||||||||||||||||
Total Over the Counter | $ | 152 | $ | 0 | $ | 15 | $ | 167 | $ | (94 | ) | $ | 0 | $ | (11 | ) | $ | (105 | ) | |||||||||||||||||||||||||||
|
|
|
|
|
|
|
|
|
|
|
|
|
|
|
| |||||||||||||||||||||||||||||||
| (5) | Net Exposure represents the net receivable/(payable) that would be due from/to the counterparty in the event of default. Exposure from OTC financial derivative instruments can only be netted across transactions governed under the same master agreement with the same legal entity. See note 7, Principal Risks, in the Notes to Financial Statements for more information regarding master netting arrangements. |
FAIR VALUE OF FINANCIAL DERIVATIVE INSTRUMENTS
The following is a summary of the fair valuation of the Fund’s derivative instruments categorized by risk(1) exposure:
Fair Values of Financial Derivative Instruments on the Consolidated Statements of Assets and Liabilities as of December 31, 2013:
| Derivatives not accounted for as hedging instruments | ||||||||||||||||||||||||
| Commodity Contracts | Credit Contracts | Equity Contracts | Foreign Exchange Contracts | Interest Rate Contracts | Total | |||||||||||||||||||
Financial Derivative Instruments - Assets | ||||||||||||||||||||||||
Exchange-traded or centrally cleared | ||||||||||||||||||||||||
Purchased Options | $ | 0 | $ | 0 | $ | 75 | $ | 0 | $ | 0 | $ | 75 | ||||||||||||
Futures | 0 | 0 | 2 | 0 | 0 | 2 | ||||||||||||||||||
|
|
|
|
|
|
|
|
|
|
|
| |||||||||||||
| $ | 0 | $ | 0 | $ | 77 | $ | 0 | $ | 0 | $ | 77 | |||||||||||||
|
|
|
|
|
|
|
|
|
|
|
| |||||||||||||
Over the counter | ||||||||||||||||||||||||
Forward Foreign Currency Contracts | $ | 0 | $ | 0 | $ | 0 | $ | 152 | $ | 0 | $ | 152 | ||||||||||||
Swap Agreements | 0 | 9 | 6 | 0 | 0 | 15 | ||||||||||||||||||
|
|
|
|
|
|
|
|
|
|
|
| |||||||||||||
| $ | 0 | $ | 9 | $ | 6 | $ | 152 | $ | 0 | $ | 167 | |||||||||||||
|
|
|
|
|
|
|
|
|
|
|
| |||||||||||||
| $ | 0 | $ | 9 | $ | 83 | $ | 152 | $ | 0 | $ | 244 | |||||||||||||
|
|
|
|
|
|
|
|
|
|
|
| |||||||||||||
Financial Derivative Instruments - Liabilities | ||||||||||||||||||||||||
Exchange-traded or centrally cleared | ||||||||||||||||||||||||
Written Options | $ | 0 | $ | 0 | $ | 26 | $ | 0 | $ | 0 | $ | 26 | ||||||||||||
|
|
|
|
|
|
|
|
|
|
|
| |||||||||||||
Over the counter | ||||||||||||||||||||||||
Forward Foreign Currency Contracts | $ | 0 | $ | 0 | $ | 0 | $ | 94 | $ | 0 | $ | 94 | ||||||||||||
Swap Agreements | 0 | 1 | 10 | 0 | 0 | 11 | ||||||||||||||||||
|
|
|
|
|
|
|
|
|
|
|
| |||||||||||||
| $ | 0 | $ | 1 | $ | 10 | $ | 94 | $ | 0 | $ | 105 | |||||||||||||
|
|
|
|
|
|
|
|
|
|
|
| |||||||||||||
| $ | 0 | $ | 1 | $ | 36 | $ | 94 | $ | 0 | $ | 131 | |||||||||||||
|
|
|
|
|
|
|
|
|
|
|
| |||||||||||||
| 78 | PIMCO EQUITY SERIES | See Accompanying Notes |
Table of Contents
December 31, 2013 (Unaudited)
The Effect of Financial Derivative Instruments on the Consolidated Statements of Operations for the Period Ended December 31, 2013:
| Derivatives not accounted for as hedging instruments | ||||||||||||||||||||||||
| Commodity Contracts | Credit Contracts | Equity Contracts | Foreign Exchange Contracts | Interest Rate Contracts | Total | |||||||||||||||||||
Net Realized Gain (Loss) on Financial Derivative Instruments | ||||||||||||||||||||||||
Exchange-traded or centrally cleared | ||||||||||||||||||||||||
Purchased Options | $ | 0 | $ | 0 | $ | (513 | ) | $ | 0 | $ | 0 | $ | (513 | ) | ||||||||||
Written Options | 0 | 0 | 264 | 0 | 0 | 264 | ||||||||||||||||||
Futures | 0 | 0 | (2 | ) | 0 | 0 | (2 | ) | ||||||||||||||||
|
|
|
|
|
|
|
|
|
|
|
| |||||||||||||
| $ | 0 | $ | 0 | $ | (251 | ) | $ | 0 | $ | 0 | $ | (251 | ) | |||||||||||
|
|
|
|
|
|
|
|
|
|
|
| |||||||||||||
Over the counter | ||||||||||||||||||||||||
Forward Foreign Currency Contracts | $ | 0 | $ | 0 | $ | 0 | $ | (166 | ) | $ | 0 | $ | (166 | ) | ||||||||||
Swap Agreements | 0 | 9 | 29 | 0 | 0 | 38 | ||||||||||||||||||
|
|
|
|
|
|
|
|
|
|
|
| |||||||||||||
| $ | 0 | $ | 9 | $ | 29 | $ | (166 | ) | $ | 0 | $ | (128 | ) | |||||||||||
|
|
|
|
|
|
|
|
|
|
|
| |||||||||||||
| $ | 0 | $ | 9 | $ | (222 | ) | $ | (166 | ) | $ | 0 | $ | (379 | ) | ||||||||||
|
|
|
|
|
|
|
|
|
|
|
| |||||||||||||
Net Change in Unrealized Appreciation (Depreciation) on Financial Derivative Instruments |
| |||||||||||||||||||||||
Exchange-traded or centrally cleared | ||||||||||||||||||||||||
Purchased Options | $ | 0 | $ | 0 | $ | 130 | $ | 0 | $ | 0 | $ | 130 | ||||||||||||
Written Options | 0 | 0 | (118 | ) | 0 | 0 | (118 | ) | ||||||||||||||||
Futures | 0 | 0 | 4 | 0 | 0 | 4 | ||||||||||||||||||
|
|
|
|
|
|
|
|
|
|
|
| |||||||||||||
| $ | 0 | $ | 0 | $ | 16 | $ | 0 | $ | 0 | $ | 16 | |||||||||||||
|
|
|
|
|
|
|
|
|
|
|
| |||||||||||||
Over the counter | ||||||||||||||||||||||||
Forward Foreign Currency Contracts | $ | 0 | $ | 0 | $ | 0 | $ | 157 | $ | 0 | $ | 157 | ||||||||||||
Swap Agreements | 0 | 9 | (4 | ) | 0 | 0 | 5 | |||||||||||||||||
|
|
|
|
|
|
|
|
|
|
|
| |||||||||||||
| $ | 0 | $ | 9 | $ | (4 | ) | $ | 157 | $ | 0 | $ | 162 | ||||||||||||
|
|
|
|
|
|
|
|
|
|
|
| |||||||||||||
| $ | 0 | $ | 9 | $ | 12 | $ | 157 | $ | 0 | $ | 178 | |||||||||||||
|
|
|
|
|
|
|
|
|
|
|
| |||||||||||||
FAIR VALUE MEASUREMENTS
The following is a summary of the fair valuations according to the inputs used as of December 31, 2013 in valuing the Fund’s assets and liabilities:
| Category and Subcategory | Level 1 | Level 2 | Level 3 | Fair Value at 12/31/2013 | ||||||||||||
Investments in Affiliates, at Value | ||||||||||||||||
Mutual Funds | ||||||||||||||||
United States | $ | 52,606 | $ | 0 | $ | 0 | $ | 52,606 | ||||||||
Short-Term Instruments | ||||||||||||||||
Central Funds Used for Cash Management Purposes | 102 | 0 | 0 | 102 | ||||||||||||
Total Investments | $ | 52,708 | $ | 0 | $ | 0 | $ | 52,708 | ||||||||
Financial Derivative Instruments - Assets | ||||||||||||||||
Exchange-traded or centrally cleared | 2 | 75 | 0 | 77 | ||||||||||||
Over the counter | 0 | 167 | 0 | 167 | ||||||||||||
| $ | 2 | $ | 242 | $ | 0 | $ | 244 | |||||||||
| Category and Subcategory | Level 1 | Level 2 | Level 3 | Fair Value at 12/31/2013 | ||||||||||||
Financial Derivative Instruments - Liabilities |
| |||||||||||||||
Exchange-traded or centrally cleared | $ | 0 | $ | (26 | ) | $ | 0 | $ | (26 | ) | ||||||
Over the counter | 0 | (105 | ) | 0 | (105 | ) | ||||||||||
| $ | 0 | $ | (131 | ) | $ | 0 | $ | (131 | ) | |||||||
Totals | $ | 52,710 | $ | 111 | $ | 0 | $ | 52,821 | ||||||||
There were no transfers between Level 1 and 2 during the period ended December 31, 2013.
| See Accompanying Notes | SEMIANNUAL REPORT | DECEMBER 31, 2013 | 79 |
Table of Contents
Consolidated Schedule of Investments PIMCO EqS Pathfinder Fund®
| SHARES | MARKET VALUE (000S) | |||||||||||
| INVESTMENTS IN SECURITIES 95.6% | ||||||||||||
| COMMON STOCKS 93.4% | ||||||||||||
| BELGIUM 1.4% | ||||||||||||
| INDUSTRIALS 1.4% | ||||||||||||
bpost S.A. | 1,991,264 | $ | 39,003 | |||||||||
|
| |||||||||||
Total Belgium | 39,003 | |||||||||||
|
| |||||||||||
| BERMUDA 3.4% | ||||||||||||
| ENERGY 3.4% | ||||||||||||
North Atlantic Drilling Ltd. | 3,240,558 | 30,721 | ||||||||||
Seadrill Ltd. | 1,602,717 | 65,686 | ||||||||||
|
| |||||||||||
Total Bermuda | 96,407 | |||||||||||
|
| |||||||||||
| BRAZIL 0.7% | ||||||||||||
| FINANCIALS 0.7% | ||||||||||||
Itau Unibanco Holding S.A. SP - ADR | 1,466,517 | 19,901 | ||||||||||
|
| |||||||||||
Total Brazil | 19,901 | |||||||||||
|
| |||||||||||
| CANADA 0.8% | ||||||||||||
| ENERGY 0.6% | ||||||||||||
Cameco Corp. | 853,980 | 17,737 | ||||||||||
|
| |||||||||||
| MATERIALS 0.2% | ||||||||||||
Silver Wheaton Corp. | 342,559 | 6,916 | ||||||||||
|
| |||||||||||
Total Canada | 24,653 | |||||||||||
|
| |||||||||||
| DENMARK 2.1% | ||||||||||||
| CONSUMER STAPLES 2.1% | ||||||||||||
Carlsberg A/S ‘B’ | 553,543 | 61,252 | ||||||||||
|
| |||||||||||
Total Denmark | 61,252 | |||||||||||
|
| |||||||||||
| FAROE ISLANDS 0.6% | ||||||||||||
| CONSUMER STAPLES 0.4% | ||||||||||||
Bakkafrost P/F | 732,908 | 11,513 | ||||||||||
|
| |||||||||||
| FINANCIALS 0.2% | ||||||||||||
BankNordik P/F | 236,546 | 5,560 | ||||||||||
|
| |||||||||||
Total Faeroe Islands | 17,073 | |||||||||||
|
| |||||||||||
| FRANCE 9.7% | ||||||||||||
| CONSUMER DISCRETIONARY 2.4% | ||||||||||||
Eutelsat Communications S.A. | 1,353,490 | 42,232 | ||||||||||
JCDecaux S.A. | 630,636 | 26,035 | ||||||||||
|
| |||||||||||
| 68,267 | ||||||||||||
|
| |||||||||||
| CONSUMER STAPLES 5.3% | ||||||||||||
Carrefour S.A. | 1,765,838 | 70,092 | ||||||||||
Danone | 1,115,822 | 80,497 | ||||||||||
|
| |||||||||||
| 150,589 | ||||||||||||
|
| |||||||||||
| SHARES | MARKET VALUE (000S) | |||||||||||
| ENERGY 0.9% | ||||||||||||
Bourbon S.A. | 426,363 | $ | 11,737 | |||||||||
Total S.A. | 249,909 | 15,339 | ||||||||||
|
| |||||||||||
| 27,076 | ||||||||||||
|
| |||||||||||
| UTILITIES 1.1% | ||||||||||||
Suez Environnement Co. | 1,771,625 | 31,771 | ||||||||||
|
| |||||||||||
Total France | 277,703 | |||||||||||
|
| |||||||||||
| GERMANY 2.4% | ||||||||||||
| HEALTH CARE 2.1% | ||||||||||||
Rhoen Klinikum AG | 2,033,102 | 59,449 | ||||||||||
|
| |||||||||||
| INDUSTRIALS 0.1% | ||||||||||||
Kloeckner & Co. SE | 326,294 | 4,477 | ||||||||||
|
| |||||||||||
| UTILITIES 0.2% | ||||||||||||
E.ON SE | 280,492 | 5,186 | ||||||||||
|
| |||||||||||
Total Germany | 69,112 | |||||||||||
|
| |||||||||||
| HONG KONG 4.2% | ||||||||||||
| CONSUMER DISCRETIONARY 0.5% | ||||||||||||
Television Broadcasts Ltd. | 2,276,400 | 15,204 | ||||||||||
|
| |||||||||||
| FINANCIALS 3.4% | ||||||||||||
AIA Group Ltd. | 15,866,100 | 79,862 | ||||||||||
First Pacific Co. Ltd. | 15,112,500 | 17,231 | ||||||||||
|
| |||||||||||
| 97,093 | ||||||||||||
|
| |||||||||||
| INDUSTRIALS 0.3% | ||||||||||||
Jardine Matheson | 79,300 | 4,154 | ||||||||||
Jardine Strategic | 96,500 | 3,092 | ||||||||||
|
| |||||||||||
| 7,246 | ||||||||||||
|
| |||||||||||
Total Hong Kong | 119,543 | |||||||||||
|
| |||||||||||
| JAPAN 4.7% | ||||||||||||
| CONSUMER DISCRETIONARY 0.7% | ||||||||||||
Nissan Motor Co. Ltd. | 1,179,000 | 9,880 | ||||||||||
Toyota Motor Corp. | 180,200 | 10,988 | ||||||||||
|
| |||||||||||
| 20,868 | ||||||||||||
|
| |||||||||||
| CONSUMER STAPLES 0.4% | ||||||||||||
Kao Corp. | 389,700 | 12,268 | ||||||||||
|
| |||||||||||
| INDUSTRIALS 2.3% | ||||||||||||
FANUC Corp. | 291,500 | 53,415 | ||||||||||
Komatsu Ltd. | 529,600 | 10,873 | ||||||||||
|
| |||||||||||
| 64,288 | ||||||||||||
|
| |||||||||||
| INFORMATION TECHNOLOGY 1.3% | ||||||||||||
Nintendo Co. Ltd. | 270,442 | 36,200 | ||||||||||
|
| |||||||||||
Total Japan | 133,624 | |||||||||||
|
| |||||||||||
| SHARES | MARKET VALUE (000S) | |||||||||||
| NETHERLANDS 5.4% | ||||||||||||
| CONSUMER STAPLES 1.6% | ||||||||||||
Corbion NV | 2,137,906 | $ | 45,343 | |||||||||
|
| |||||||||||
| ENERGY 0.8% | ||||||||||||
Royal Dutch Shell PLC ‘A’ | 635,326 | 22,769 | ||||||||||
|
| |||||||||||
| FINANCIALS 2.3% | ||||||||||||
ING Groep NV - | 4,615,818 | 64,476 | ||||||||||
|
| |||||||||||
| INFORMATION TECHNOLOGY 0.7% | ||||||||||||
Gemalto NV | 191,108 | 21,035 | ||||||||||
|
| |||||||||||
Total Netherlands | 153,623 | |||||||||||
|
| |||||||||||
| NORWAY 3.5% | ||||||||||||
| CONSUMER STAPLES 2.8% | ||||||||||||
Marine Harvest ASA | 64,550,970 | 78,741 | ||||||||||
|
| |||||||||||
| ENERGY 0.7% | ||||||||||||
BW LPG Ltd. (a) | 2,199,525 | 20,942 | ||||||||||
|
| |||||||||||
Total Norway | 99,683 | |||||||||||
|
| |||||||||||
| SINGAPORE 1.0% | ||||||||||||
| FINANCIALS 0.1% | ||||||||||||
Great Eastern Holdings Ltd. | 85,220 | 1,205 | ||||||||||
|
| |||||||||||
| INDUSTRIALS 0.9% | ||||||||||||
ComfortDelGro Corp. Ltd. | 3,450,000 | 5,516 | ||||||||||
Keppel Corp. Ltd. | 2,375,300 | 21,099 | ||||||||||
|
| |||||||||||
| 26,615 | ||||||||||||
|
| |||||||||||
Total Singapore | 27,820 | |||||||||||
|
| |||||||||||
| SOUTH AFRICA 0.2% | ||||||||||||
| MATERIALS 0.2% | ||||||||||||
AngloGold Ashanti Ltd. | 606,930 | 7,113 | ||||||||||
|
| |||||||||||
Total South Africa | 7,113 | |||||||||||
|
| |||||||||||
| SOUTH KOREA 0.2% | ||||||||||||
| CONSUMER DISCRETIONARY 0.2% | ||||||||||||
GS Home Shopping, Inc. | 19,542 | 5,687 | ||||||||||
|
| |||||||||||
Total South Korea | 5,687 | |||||||||||
|
| |||||||||||
| SWEDEN 1.3% | ||||||||||||
| INDUSTRIALS 1.3% | ||||||||||||
Loomis AB ‘B’ | 1,555,412 | 36,883 | ||||||||||
|
| |||||||||||
Total Sweden | 36,883 | |||||||||||
|
| |||||||||||
| SWITZERLAND 6.0% | ||||||||||||
| CONSUMER STAPLES 1.5% | ||||||||||||
Nestle S.A. | 592,511 | 43,425 | ||||||||||
|
| |||||||||||
| FINANCIALS 0.8% | ||||||||||||
Swiss Re AG | 249,878 | 23,036 | ||||||||||
|
| |||||||||||
| 80 | PIMCO EQUITY SERIES | See Accompanying Notes |
Table of Contents
December 31, 2013 (Unaudited)
| SHARES | MARKET VALUE (000S) | |||||||||||
| HEALTH CARE 1.4% | ||||||||||||
Roche Holding AG | 142,258 | $ | 39,850 | |||||||||
|
| |||||||||||
| INFORMATION TECHNOLOGY 1.5% | ||||||||||||
Logitech International S.A. | 3,064,335 | 42,081 | ||||||||||
|
| |||||||||||
| MATERIALS 0.8% | ||||||||||||
Sika AG | 6,240 | 22,236 | ||||||||||
|
| |||||||||||
Total Switzerland | 170,628 | |||||||||||
|
| |||||||||||
| UNITED KINGDOM 12.2% | ||||||||||||
| CONSUMER STAPLES 8.4% | ||||||||||||
British American Tobacco PLC | 1,610,612 | 86,448 | ||||||||||
Imperial Tobacco Group PLC | 2,312,762 | 89,662 | ||||||||||
Reckitt Benckiser Group PLC | 788,914 | 62,668 | ||||||||||
|
| |||||||||||
| 238,778 | ||||||||||||
|
| |||||||||||
| ENERGY 2.7% | ||||||||||||
BP PLC | 6,630,637 | 53,735 | ||||||||||
Ensco PLC ‘A’ | 402,299 | 23,004 | ||||||||||
|
| |||||||||||
| 76,739 | ||||||||||||
|
| |||||||||||
| FINANCIALS 1.1% | ||||||||||||
Barclays PLC | 3,408,311 | 15,412 | ||||||||||
Prudential PLC | 721,364 | 16,118 | ||||||||||
|
| |||||||||||
| 31,530 | ||||||||||||
|
| |||||||||||
Total United Kingdom |
| 347,047 | ||||||||||
|
| |||||||||||
| UNITED STATES 33.6% | ||||||||||||
| CONSUMER STAPLES 6.3% | ||||||||||||
Altria Group, Inc. | 1,111,768 | 42,681 | ||||||||||
Lorillard, Inc. | 1,269,354 | 64,331 | ||||||||||
Philip Morris | 315,485 | 27,488 | ||||||||||
Reynolds American, Inc. | 549,972 | 27,493 | ||||||||||
Wal-Mart Stores, Inc. | 220,552 | 17,355 | ||||||||||
|
| |||||||||||
| 179,348 | ||||||||||||
|
| |||||||||||
| ENERGY 2.6% | ||||||||||||
Halliburton Co. | 424,991 | 21,568 | ||||||||||
National Oilwell Varco, Inc. | 377,284 | 30,005 | ||||||||||
Phillips 66 | 213,739 | 16,486 | ||||||||||
Rentech, Inc. (a) | 2,910,142 | 5,093 | ||||||||||
|
| |||||||||||
| 73,152 | ||||||||||||
|
| |||||||||||
| FINANCIALS 8.9% | ||||||||||||
Alleghany Corp. (a) | 70,250 | 28,097 | ||||||||||
Berkshire Hathaway, Inc. ‘B’ (a) | 607,993 | 72,084 | ||||||||||
| SHARES | MARKET VALUE (000S) | |||||||||||
Genworth Financial, Inc. ‘A’ (a)(d) | 3,030,714 | $ | 47,067 | |||||||||
PHH Corp. (a) | 581,722 | 14,165 | ||||||||||
SLM Corp. | 1,507,850 | 39,626 | ||||||||||
ViewPoint Financial | 1,133,161 | 31,105 | ||||||||||
White Mountains Insurance Group Ltd. | 33,870 | 20,427 | ||||||||||
|
| |||||||||||
| 252,571 | ||||||||||||
|
| |||||||||||
| HEALTH CARE 2.2% | ||||||||||||
Life Technologies Corp. (a) | 169,245 | 12,829 | ||||||||||
Merck & Co., Inc. | 365,621 | 18,299 | ||||||||||
Perrigo Co. PLC | 61,618 | 9,456 | ||||||||||
Pfizer, Inc. | 772,120 | 23,650 | ||||||||||
|
| |||||||||||
| 64,234 | ||||||||||||
|
| |||||||||||
| INDUSTRIALS 5.1% | ||||||||||||
3M Co. | 447,065 | 62,701 | ||||||||||
Brink’s Co. | 351,569 | 12,003 | ||||||||||
Deere & Co. | 441,862 | 40,355 | ||||||||||
General Dynamics Corp. | 314,650 | 30,065 | ||||||||||
|
| |||||||||||
| 145,124 | ||||||||||||
|
| |||||||||||
| INFORMATION TECHNOLOGY 8.5% | ||||||||||||
Apple, Inc. | 29,616 | 16,618 | ||||||||||
Intel Corp. (d) | 3,149,013 | 81,748 | ||||||||||
International Business Machines Corp. | 238,596 | 44,753 | ||||||||||
Microsoft Corp. | 2,246,889 | 84,101 | ||||||||||
Oracle Corp. | 409,663 | 15,674 | ||||||||||
|
| |||||||||||
| 242,894 | ||||||||||||
|
| |||||||||||
Total United States | 957,323 | |||||||||||
|
| |||||||||||
Total Common Stocks (Cost $2,242,546) | 2,664,078 | |||||||||||
|
| |||||||||||
| PREFERRED STOCKS 0.2% | ||||||||||||
| BRAZIL 0.2% | ||||||||||||
| FINANCIALS 0.2% | ||||||||||||
Itau Unibanco Holding S.A. | 346,280 | 4,615 | ||||||||||
|
| |||||||||||
Total Preferred Stocks (Cost $4,350) | 4,615 | |||||||||||
|
| |||||||||||
| REAL ESTATE INVESTMENT TRUSTS 1.4% | ||||||||||||
| SINGAPORE 0.0% | ||||||||||||
| FINANCIALS 0.0% | ||||||||||||
Keppel REIT | 478,884 | 450 | ||||||||||
|
| |||||||||||
Total Singapore | 450 | |||||||||||
|
| |||||||||||
| SHARES | MARKET VALUE (000S) | |||||||||||
| UNITED STATES 1.4% | ||||||||||||
| FINANCIALS 1.4% | ||||||||||||
American Capital | 1,176,896 | $ | 22,702 | |||||||||
NorthStar Realty | 1,262,235 | 16,977 | ||||||||||
|
| |||||||||||
Total United States | 39,679 | |||||||||||
|
| |||||||||||
Total Real Estate Investment Trusts |
| 40,129 | ||||||||||
|
| |||||||||||
| RIGHTS 0.0% | ||||||||||||
| FRANCE 0.0% | ||||||||||||
| HEALTH CARE 0.0% | ||||||||||||
Sanofi - Exp. 12/31/2020 | 2,604,991 | 886 | ||||||||||
|
| |||||||||||
Total Rights (Cost $5,401) | 886 | |||||||||||
|
| |||||||||||
| PRINCIPAL AMOUNT (000S) | ||||||||||||
| SHORT-TERM INSTRUMENTS 0.6% | ||||||||||||
| REPURCHASE AGREEMENTS (c) 0.0% | ||||||||||||
| 1,191 | ||||||||||||
|
| |||||||||||
| U.S. TREASURY BILLS 0.6% | ||||||||||||
0.118% due 01/23/2014 - 12/11/2014 (b)(f) | $ | 16,757 | 16,742 | |||||||||
|
| |||||||||||
| Total Short-Term Instruments (Cost $17,931) | 17,933 | |||||||||||
|
| |||||||||||
| Total Investments in Securities (Cost $2,313,500) | 2,727,641 | |||||||||||
|
| |||||||||||
| SHARES | ||||||||||||
| INVESTMENTS IN AFFILIATES 5.4% | ||||||||||||
| SHORT-TERM INSTRUMENTS 5.4% | ||||||||||||
| CENTRAL FUNDS USED FOR CASH MANAGEMENT PURPOSES 5.4% | ||||||||||||
PIMCO Short-Term Floating NAV Portfolio | 15,213,095 | 152,207 | ||||||||||
|
| |||||||||||
| Total Short-Term Instruments (Cost $152,227) | 152,207 | |||||||||||
|
| |||||||||||
| Total Investments in Affiliates (Cost $152,227) | 152,207 | |||||||||||
| Total Investments 101.0% (Cost $2,465,727) | $ | 2,879,848 | ||||||||||
Financial Derivative (Cost or Premiums, net $0) | (9,773 | ) | ||||||||||
Other Assets and Liabilities, net (0.7%) | (18,305 | ) | ||||||||||
|
| |||||||||||
Net Assets 100.0% | $ | 2,851,770 | ||||||||||
|
| |||||||||||
NOTES TO CONSOLIDATED SCHEDULE OF INVESTMENTS (AMOUNTS IN THOUSANDS*):
| * | A zero balance may reflect actual amounts rounding to less than one thousand. |
| (a) | Security did not produce income within the last twelve months. |
| (b) | Coupon represents a weighted average yield to maturity. |
| See Accompanying Notes | SEMIANNUAL REPORT | DECEMBER 31, 2013 | 81 |
Table of Contents
Consolidated Schedule of Investments PIMCO EqS Pathfinder Fund® (Cont.)
BORROWINGS AND OTHER FINANCING TRANSACTIONS
(c) REPURCHASE AGREEMENTS:
| (d) | Securities with an aggregate market value of $103 have been pledged as collateral as of December 31, 2013 for equity short sales and equity options as governed by prime brokerage agreements and agreements governing listed equity option transactions. |
| Counterparty | Lending Rate | Settlement Date | Maturity Date | Principal Amount | Collateralized By | Collateral Received, at Value | Repurchase Agreements, at Value | Repurchase Agreement Proceeds to be Received (1) | ||||||||||||||||||||
SSB | 0.000% | 12/31/2013 | 01/02/2014 | $ | 1,191 | Fannie Mae 2.200% due 10/17/2022 | $ | (1,219 | ) | $ | 1,191 | $ | 1,191 | |||||||||||||||
|
|
|
|
|
| |||||||||||||||||||||||
Total Repurchase Agreements |
| $ | (1,219 | ) | $ | 1,191 | $ | 1,191 | ||||||||||||||||||||
|
|
|
|
|
| |||||||||||||||||||||||
| (1) | Includes accrued interest. |
BORROWINGS AND OTHER FINANCING TRANSACTIONS SUMMARY
The following is a summary by counterparty of the market value of Borrowings and Other Financing Transactions and collateral (received)/pledged as of December 31, 2013:
| Counterparty | Repurchase Agreement Proceeds to be Received | Payable for Reverse Repurchase Agreements | Payable for Sale-Buyback Transactions | Payable for Short Sales | Total Borrowings and Other Financing Transactions | Collateral (Received)/Pledged | Net Exposure (2) | |||||||||||||||||||||
Global/Master Repurchase Agreement | ||||||||||||||||||||||||||||
SSB | $ | 1,191 | $ | 0 | $ | 0 | $ | 0 | $ | 1,191 | $ | (1,219 | ) | $ | (28 | ) | ||||||||||||
Prime Brokerage Agreement | ||||||||||||||||||||||||||||
FOB | 0 | 0 | 0 | 0 | 0 | 101 | 101 | |||||||||||||||||||||
GSC | 0 | 0 | 0 | 0 | 0 | 2 | 2 | |||||||||||||||||||||
|
|
|
|
|
|
|
| |||||||||||||||||||||
Total Borrowings and Other Financing Transactions | $ | 1,191 | $ | 0 | $ | 0 | $ | 0 | ||||||||||||||||||||
|
|
|
|
|
|
|
| |||||||||||||||||||||
| (2) | Net Exposure represents the net receivable/(payable) that would be due from/to the counterparty in the event of default. Exposure from borrowings and other financing transactions can only be netted across transactions governed under the same master agreement with the same legal entity. The Fund and Subsidiary are recognized as two separate legal entities. As such, exposure cannot be netted. See Note 7, Principal Risks, in the Notes to Financial Statements for more information regarding master netting arrangements. |
(e) FINANCIAL DERIVATIVE INSTRUMENTS: OVER THE COUNTER
FORWARD FOREIGN CURRENCY CONTRACTS:
| Counterparty | Settlement Month | Currency to be Delivered | Currency to be Received | Unrealized Appreciation/ (Depreciation) | ||||||||||||||||||||||||
| Asset | Liability | |||||||||||||||||||||||||||
BOA | 01/2014 | AUD | 99,987 | $ | 88,616 | $ | 0 | $ | (645 | ) | ||||||||||||||||||
| 01/2014 | CAD | 41,898 | 39,357 | 0 | (86 | ) | ||||||||||||||||||||||
| 01/2014 | CHF | 5,317 | 5,965 | 5 | 0 | |||||||||||||||||||||||
| 01/2014 | JPY | 12,554,222 | 121,632 | 2,419 | 0 | |||||||||||||||||||||||
| 01/2014 | NOK | 966,103 | 159,063 | 0 | (220 | ) | ||||||||||||||||||||||
| 01/2014 | $ | 71,364 | HKD | 553,296 | 0 | (9 | ) | |||||||||||||||||||||
| 02/2014 | 88,445 | AUD | 99,987 | 647 | 0 | |||||||||||||||||||||||
| 02/2014 | 39,326 | CAD | 41,898 | 86 | 0 | |||||||||||||||||||||||
| 02/2014 | 121,649 | JPY | 12,554,222 | 0 | (2,422 | ) | ||||||||||||||||||||||
| 02/2014 | 571 | NOK | 3,520 | 9 | 0 | |||||||||||||||||||||||
| 04/2014 | HKD | 553,295 | $ | 71,374 | 13 | 0 | ||||||||||||||||||||||
BPS | 01/2014 | NOK | 169,215 | 27,683 | 0 | (214 | ) | |||||||||||||||||||||
| 01/2014 | $ | 164,227 | EUR | 119,438 | 84 | 0 | ||||||||||||||||||||||
| 01/2014 | 10,719 | GBP | 6,556 | 137 | 0 | |||||||||||||||||||||||
| 01/2014 | 1,011 | HKD | 7,840 | 0 | 0 | |||||||||||||||||||||||
| 02/2014 | EUR | 119,438 | $ | 164,224 | 0 | (85 | ) | |||||||||||||||||||||
| 02/2014 | GBP | 219 | 357 | 0 | (6 | ) | ||||||||||||||||||||||
BRC | 01/2014 | HKD | 42,606 | 5,496 | 1 | 0 | ||||||||||||||||||||||
| 01/2014 | $ | 3,934 | EUR | 2,903 | 60 | 0 | ||||||||||||||||||||||
| 01/2014 | 121,826 | JPY | 12,203,522 | 0 | (5,944 | ) | ||||||||||||||||||||||
| 01/2014 | 60,336 | NOK | 368,369 | 398 | 0 | |||||||||||||||||||||||
| 02/2014 | AUD | 6,507 | $ | 5,788 | 0 | (9 | ) | |||||||||||||||||||||
| 02/2014 | NOK | 368,369 | 60,266 | 0 | (396 | ) | ||||||||||||||||||||||
| 02/2014 | SGD | 2,319 | 1,852 | 15 | 0 | |||||||||||||||||||||||
| 04/2014 | HKD | 23,668 | 3,052 | 0 | 0 | |||||||||||||||||||||||
| 82 | PIMCO EQUITY SERIES | See Accompanying Notes |
Table of Contents
December 31, 2013 (Unaudited)
| Counterparty | Settlement Month | Currency to be Delivered | Currency to be Received | Unrealized Appreciation/ (Depreciation) | ||||||||||||||||||||||||
| Asset | Liability | |||||||||||||||||||||||||||
CBK | 01/2014 | CAD | 41,898 | $ | 39,345 | $ | 0 | $ | (98 | ) | ||||||||||||||||||
| 01/2014 | DKK | 290,599 | 52,993 | 0 | (596 | ) | ||||||||||||||||||||||
| 01/2014 | GBP | 3,826 | 6,270 | 0 | (66 | ) | ||||||||||||||||||||||
| 01/2014 | HKD | 343,918 | 44,356 | 4 | 0 | |||||||||||||||||||||||
| 01/2014 | $ | 91,250 | AUD | 99,987 | 0 | (1,989 | ) | |||||||||||||||||||||
| 01/2014 | 118,907 | CAD | 125,694 | 0 | (579 | ) | ||||||||||||||||||||||
| 01/2014 | 17,120 | DKK | 92,866 | 6 | 0 | |||||||||||||||||||||||
| 01/2014 | 1,134 | EUR | 836 | 15 | 0 | |||||||||||||||||||||||
| 01/2014 | 2,878 | HKD | 22,310 | 0 | (1 | ) | ||||||||||||||||||||||
| 01/2014 | 909 | SEK | 5,930 | 13 | 0 | |||||||||||||||||||||||
| 02/2014 | DKK | 92,866 | $ | 17,123 | 0 | (6 | ) | |||||||||||||||||||||
| 02/2014 | SGD | 338 | 268 | 0 | 0 | |||||||||||||||||||||||
| 02/2014 | $ | 39,313 | CAD | 41,898 | 99 | 0 | ||||||||||||||||||||||
| 04/2014 | HKD | 5,556 | $ | 717 | 0 | 0 | ||||||||||||||||||||||
DUB | 01/2014 | SEK | 33,098 | 5,045 | 0 | (101 | ) | |||||||||||||||||||||
| 01/2014 | $ | 85,853 | GBP | 52,411 | 938 | 0 | ||||||||||||||||||||||
| 01/2014 | ZAR | 69,593 | $ | 7,115 | 492 | 0 | ||||||||||||||||||||||
| 02/2014 | GBP | 52,411 | 85,834 | 0 | (938 | ) | ||||||||||||||||||||||
| 02/2014 | JPY | 714,200 | 6,867 | 84 | 0 | |||||||||||||||||||||||
| 02/2014 | SEK | 5,955 | 928 | 3 | 0 | |||||||||||||||||||||||
| 02/2014 | $ | 2,900 | GBP | 1,771 | 32 | 0 | ||||||||||||||||||||||
| 02/2014 | 377 | NOK | 2,310 | 4 | 0 | |||||||||||||||||||||||
| 03/2014 | ILS | 3,101 | $ | 879 | 0 | (13 | ) | |||||||||||||||||||||
FBF | 01/2014 | BRL | 62,937 | 26,866 | 190 | 0 | ||||||||||||||||||||||
| 01/2014 | EUR | 139,570 | 188,764 | 0 | (3,242 | ) | ||||||||||||||||||||||
| 01/2014 | GBP | 55,141 | 89,298 | 0 | (2,013 | ) | ||||||||||||||||||||||
| 01/2014 | HKD | 124,204 | 16,021 | 3 | 0 | |||||||||||||||||||||||
| 01/2014 | $ | 26,816 | BRL | 62,937 | 0 | (139 | ) | |||||||||||||||||||||
| 01/2014 | 57,444 | CHF | 51,422 | 200 | 0 | |||||||||||||||||||||||
| 02/2014 | BRL | 62,937 | $ | 26,606 | 144 | 0 | ||||||||||||||||||||||
| 02/2014 | CHF | 51,422 | 57,460 | 0 | (198 | ) | ||||||||||||||||||||||
| 02/2014 | EUR | 866 | 1,192 | 0 | 0 | |||||||||||||||||||||||
| 02/2014 | SGD | 461 | 367 | 2 | 0 | |||||||||||||||||||||||
GLM | 01/2014 | HKD | 39,410 | 5,083 | 1 | 0 | ||||||||||||||||||||||
| 01/2014 | $ | 5,277 | HKD | 40,911 | 0 | (1 | ) | |||||||||||||||||||||
| 01/2014 | 60,025 | NOK | 368,369 | 709 | 0 | |||||||||||||||||||||||
| 02/2014 | NOK | 368,368 | $ | 59,955 | 0 | (706 | ) | |||||||||||||||||||||
| 04/2014 | HKD | 632 | 82 | 0 | 0 | |||||||||||||||||||||||
HUS | 01/2014 | 23,542 | 3,037 | 1 | 0 | |||||||||||||||||||||||
| 01/2014 | NOK | 26,105 | 4,267 | 0 | (37 | ) | ||||||||||||||||||||||
| 01/2014 | $ | 11,190 | EUR | 8,188 | 74 | 0 | ||||||||||||||||||||||
| 01/2014 | 598 | HKD | 4,634 | 0 | 0 | |||||||||||||||||||||||
| 01/2014 | 3,440 | JPY | 350,700 | 0 | (110 | ) | ||||||||||||||||||||||
| 02/2014 | 468 | NOK | 2,855 | 2 | 0 | |||||||||||||||||||||||
| 04/2014 | HKD | 4,634 | $ | 598 | 0 | 0 | ||||||||||||||||||||||
JPM | 01/2014 | 25,085 | 3,236 | 1 | 0 | |||||||||||||||||||||||
| 01/2014 | PLN | 2,574 | 827 | 0 | (23 | ) | ||||||||||||||||||||||
| 01/2014 | $ | 17,120 | DKK | 92,866 | 5 | 0 | ||||||||||||||||||||||
| 02/2014 | DKK | 92,866 | $ | 17,124 | 0 | (6 | ) | |||||||||||||||||||||
| 02/2014 | NOK | 3,520 | 570 | 0 | (10 | ) | ||||||||||||||||||||||
| 02/2014 | $ | 1,904 | NOK | 11,775 | 35 | 0 | ||||||||||||||||||||||
MSC | 01/2014 | BRL | 62,937 | $ | 26,686 | 10 | 0 | |||||||||||||||||||||
| 01/2014 | HKD | 30,227 | 3,899 | 1 | 0 | |||||||||||||||||||||||
| 01/2014 | $ | 26,866 | BRL | 62,937 | 0 | (190 | ) | |||||||||||||||||||||
| 02/2014 | SGD | 3,026 | $ | 2,417 | 19 | 0 | ||||||||||||||||||||||
RBC | 01/2014 | CAD | 41,898 | 39,357 | 0 | (85 | ) | |||||||||||||||||||||
| 01/2014 | $ | 2,187 | DKK | 12,000 | 26 | 0 | ||||||||||||||||||||||
| 02/2014 | 39,326 | CAD | 41,898 | 86 | 0 | |||||||||||||||||||||||
| 02/2014 | 1,964 | EUR | 1,427 | 0 | (1 | ) | ||||||||||||||||||||||
| 03/2014 | 6,237 | ILS | 21,823 | 41 | 0 | |||||||||||||||||||||||
RYL | 01/2014 | CHF | 49,869 | $ | 54,871 | 0 | (1,033 | ) | ||||||||||||||||||||
| 01/2014 | $ | 4,174 | CHF | 3,764 | 46 | 0 | ||||||||||||||||||||||
| 01/2014 | 11,161 | EUR | 8,205 | 127 | 0 | |||||||||||||||||||||||
| 01/2014 | 5,126 | NOK | 31,730 | 105 | 0 | |||||||||||||||||||||||
UAG | 01/2014 | KRW | 4,966,240 | $ | 4,503 | 0 | (207 | ) | ||||||||||||||||||||
| 01/2014 | NOK | 82,548 | 13,434 | 0 | (176 | ) | ||||||||||||||||||||||
| 01/2014 | $ | 17,120 | DKK | 92,867 | 6 | 0 | ||||||||||||||||||||||
| 01/2014 | 4,712 | KRW | 4,966,241 | 0 | (2 | ) | ||||||||||||||||||||||
| 01/2014 | 60,460 | NOK | 372,128 | 894 | 0 | |||||||||||||||||||||||
| See Accompanying Notes | SEMIANNUAL REPORT | DECEMBER 31, 2013 | 83 |
Table of Contents
Consolidated Schedule of Investments PIMCO EqS Pathfinder Fund® (Cont.)
| Counterparty | Settlement Month | Currency to be Delivered | Currency to be Received | Unrealized Appreciation/ (Depreciation) | ||||||||||||||||||||||||
| Asset | Liability | |||||||||||||||||||||||||||
| 01/2014 | $ | 3,251 | SEK | 21,213 | $ | 47 | $ | 0 | ||||||||||||||||||||
| 02/2014 | DKK | 92,867 | $ | 17,123 | 0 | (7 | ) | |||||||||||||||||||||
| 02/2014 | NOK | 368,367 | 59,775 | 0 | (886 | ) | ||||||||||||||||||||||
| 02/2014 | SGD | 7,797 | 6,258 | 79 | 0 | |||||||||||||||||||||||
| 04/2014 | KRW | 4,966,241 | 4,689 | 0 | (7 | ) | ||||||||||||||||||||||
|
|
|
| |||||||||||||||||||||||||
Total Forward Foreign Currency Contracts |
| $ | 8,418 | $ | (23,502 | ) | ||||||||||||||||||||||
|
|
|
| |||||||||||||||||||||||||
AS OF DECEMBER 31, 2013, THERE WERE NO OPEN WRITTEN OPTIONS. TRANSACTIONS IN WRITTEN CALL AND PUT OPTIONS FOR THE PERIOD ENDED DECEMBER 31, 2013:
| # of Contracts | Premiums | |||||||
Balance at 06/30/2013 | 13,266 | $ | (258 | ) | ||||
Sales | 1,995 | (88 | ) | |||||
Closing Buys | (2,888 | ) | 91 | |||||
Expirations | (12,373 | ) | 255 | |||||
Exercised | 0 | 0 | ||||||
|
|
|
| |||||
Balance at 12/31/2013 | 0 | $ | 0 | |||||
|
|
|
| |||||
SWAP AGREEMENTS:
TOTAL RETURN SWAPS ON SECURITIES
| Counterparty | Pay/Receive(1) | Underlying Reference | # of Shares | Financing Rate | Maturity Date | Notional Amount | Unrealized Appreciation/ (Depreciation) | Swap Agreements, at Value | ||||||||||||||||||||||||||||
| Asset | Liability | |||||||||||||||||||||||||||||||||||
| BOA | Receive | Hiscox Ltd. | 4,889,761 | 1-Month USD-LIBOR plus a specified spread | 09/05/2014 | GBP | 32,835 | $ | 1,967 | $ | 1,967 | $ | 0 | |||||||||||||||||||||||
Receive | Lancashire Holdings Ltd. | 4,571,257 | 1-Month USD-LIBOR plus a specified spread | 09/05/2014 | 35,336 | 2,920 | 2,920 | 0 | ||||||||||||||||||||||||||||
Pay | Rentech Nitrogen Partners LP | 40,539 | 1-Month USD-LIBOR plus a specified spread | 08/15/2014 | $ | 705 | (9 | ) | 0 | (9 | ) | |||||||||||||||||||||||||
| DUB | Receive | GrainCorp Ltd. | 102,109 | 1-Month AUD-BBR-BBSW plus a specified spread | 08/29/2014 | AUD | 832 | 399 | 399 | 0 | ||||||||||||||||||||||||||
Receive | Cermaq ASA | 1,560,943 | 3-Month NOK-NIBOR plus a specified spread | 09/22/2014 | NOK | 171,704 | (536 | ) | 0 | (536 | ) | |||||||||||||||||||||||||
| JPM | Receive | Veolia Environnement S.A. | 939,465 | 1-Month USD-EURIBOR plus a specified spread | 05/07/2014 | EUR | 10,738 | 570 | 570 | 0 | ||||||||||||||||||||||||||
|
|
|
|
|
| |||||||||||||||||||||||||||||||
| $ | 5,311 | $ | 5,856 | $ | (545 | ) | ||||||||||||||||||||||||||||||
|
|
|
|
|
| |||||||||||||||||||||||||||||||
Total Swap Agreements |
| $ | 5,311 | $ | 5,856 | $ | (545 | ) | ||||||||||||||||||||||||||||
|
|
|
|
|
| |||||||||||||||||||||||||||||||
| (1) | Receive represents that the Fund receives monthly payments for any positive monthly return on the underlying reference. The Fund makes payments for any negative monthly return on such underlying reference. Pay represents that the Fund receives monthly payments for any negative monthly return on the underlying reference. The Fund makes payments for any positive monthly return on such underlying reference. |
FINANCIAL DERIVATIVE INSTRUMENTS: OVER THE COUNTER SUMMARY
The following is a summary by counterparty of the market value of OTC financial derivative instruments and collateral (received)/pledged as of December 31, 2013:
| (f) | Securities with an aggregate market value of $16,342 have been pledged as collateral for financial derivative instruments as governed by International Swaps and Derivatives Association, Inc. master agreements as of December 31, 2013. |
| Financial Derivative Assets | Financial Derivative Liabilities | |||||||||||||||||||||||||||||||||||||||||||||
| Counterparty | Forward Foreign | Purchased Options | Swap Agreements | Total Over the Counter | Forward Foreign | Written Options | Swap Agreements | Total Over the Counter | Net Market Value of OTC Derivatives | Collateral Pledged | Net Exposure (2) | |||||||||||||||||||||||||||||||||||
BOA | $ | 3,179 | $ | 0 | $ | 4,887 | $ | 8,066 | $ | (3,382 | ) | $ | 0 | $ | (9 | ) | $ | (3,391 | ) | $ | 4,675 | $ | (4,560 | ) | $ | 115 | ||||||||||||||||||||
BPS | 221 | 0 | 0 | 221 | (305 | ) | 0 | 0 | (305 | ) | (84 | ) | 0 | (84 | ) | |||||||||||||||||||||||||||||||
BRC | 474 | 0 | 0 | 474 | (6,349 | ) | 0 | 0 | (6,349 | ) | (5,875 | ) | 5,468 | (407 | ) | |||||||||||||||||||||||||||||||
CBK | 137 | 0 | 0 | 137 | (3,335 | ) | 0 | 0 | (3,335 | ) | (3,198 | ) | 4,045 | 847 | ||||||||||||||||||||||||||||||||
DUB | 1,553 | 0 | 399 | 1,952 | (1,052 | ) | 0 | (536 | ) | (1,588 | ) | 364 | (640 | ) | (276 | ) | ||||||||||||||||||||||||||||||
FBF | 539 | 0 | 0 | 539 | (5,592 | ) | 0 | 0 | (5,592 | ) | (5,053 | ) | 5,681 | 628 | ||||||||||||||||||||||||||||||||
GLM | 710 | 0 | 0 | 710 | (707 | ) | 0 | 0 | (707 | ) | 3 | 0 | 3 | |||||||||||||||||||||||||||||||||
HUS | 77 | 0 | 0 | 77 | (147 | ) | 0 | 0 | (147 | ) | (70 | ) | 0 | (70 | ) | |||||||||||||||||||||||||||||||
JPM | 41 | 0 | 570 | 611 | (39 | ) | 0 | 0 | (39 | ) | 572 | (400 | ) | 172 | ||||||||||||||||||||||||||||||||
MSC | 30 | 0 | 0 | 30 | (190 | ) | 0 | 0 | (190 | ) | (160 | ) | (1,515 | ) | (1,675 | ) | ||||||||||||||||||||||||||||||
| 84 | PIMCO EQUITY SERIES | See Accompanying Notes |
Table of Contents
December 31, 2013 (Unaudited)
| Financial Derivative Assets | Financial Derivative Liabilities | |||||||||||||||||||||||||||||||||||||||||||||
| Counterparty | Forward Foreign | Purchased Options | Swap Agreements | Total Over the Counter | Forward Foreign | Written Options | Swap Agreements | Total Over the Counter | Net Market Value of OTC Derivatives | Collateral Pledged | Net Exposure (2) | |||||||||||||||||||||||||||||||||||
RBC | $ | 153 | $ | 0 | $ | 0 | $ | 153 | $ | (86 | ) | $ | 0 | $ | 0 | $ | (86 | ) | $ | 67 | $ | 0 | $ | 67 | ||||||||||||||||||||||
RYL | 278 | 0 | 0 | 278 | (1,033 | ) | 0 | 0 | (1,033 | ) | (755 | ) | 1,011 | 256 | ||||||||||||||||||||||||||||||||
UAG | 1,026 | 0 | 0 | 1,026 | (1,285 | ) | 0 | 0 | (1,285 | ) | (259 | ) | 137 | (122 | ) | |||||||||||||||||||||||||||||||
|
|
|
|
|
|
|
|
|
|
|
|
|
|
|
| |||||||||||||||||||||||||||||||
Total Over the Counter | $ | 8,418 | $ | 0 | $ | 5,856 | $ | 14,274 | $ | (23,502 | ) | $ | 0 | $ | (545 | ) | $ | (24,047 | ) | |||||||||||||||||||||||||||
|
|
|
|
|
|
|
|
|
|
|
|
|
|
|
| |||||||||||||||||||||||||||||||
| (2) | Net Exposure represents the net receivable/(payable) that would be due from/to the counterparty in the event of default . Exposure from OTC derivatives can only be netted across transactions governed under the same master agreement with the same legal entity. The Fund and Subsidiary are recognized as two separate legal entities. As such, exposure cannot be netted. See note 7, Principal Risks, in the Notes to Financial Statements for more information regarding master netting agreements. |
FAIR VALUE OF FINANCIAL DERIVATIVE INSTRUMENTS
The following is a summary of the fair valuation of the Fund’s derivative instruments categorized by risk (1) exposure:
Fair Values of Financial Derivative Instruments on the Consolidated Statements of Assets and Liabilities as of December 31, 2013:
| Derivatives not accounted for as hedging instruments | ||||||||||||||||||||||||
| Commodity Contracts | Credit Contracts | Equity Contracts | Foreign Exchange Contracts | Interest Rate Contracts | Total | |||||||||||||||||||
Financial Derivative Instruments - Assets | ||||||||||||||||||||||||
Over the counter | ||||||||||||||||||||||||
Forward Foreign Currency Contracts | $ | 0 | $ | 0 | $ | 0 | $ | 8,418 | $ | 0 | $ | 8,418 | ||||||||||||
Swap Agreements | 0 | 0 | 5,856 | 0 | 0 | 5,856 | ||||||||||||||||||
|
|
|
|
|
|
|
|
|
|
|
| |||||||||||||
| $ | 0 | $ | 0 | $ | 5,856 | $ | 8,418 | $ | 0 | $ | 14,274 | |||||||||||||
|
|
|
|
|
|
|
|
|
|
|
| |||||||||||||
| $ | 0 | $ | 0 | $ | 5,856 | $ | 8,418 | $ | 0 | $ | 14,274 | |||||||||||||
|
|
|
|
|
|
|
|
|
|
|
| |||||||||||||
Financial Derivative Instruments - Liabilities | ||||||||||||||||||||||||
Over the counter | ||||||||||||||||||||||||
Forward Foreign Currency Contracts | $ | 0 | $ | 0 | $ | 0 | $ | 23,502 | $ | 0 | $ | 23,502 | ||||||||||||
Swap Agreements | 0 | 0 | 545 | 0 | 0 | 545 | ||||||||||||||||||
|
|
|
|
|
|
|
|
|
|
|
| |||||||||||||
| $ | 0 | $ | 0 | $ | 545 | $ | 23,502 | $ | 0 | $ | 24,047 | |||||||||||||
|
|
|
|
|
|
|
|
|
|
|
| |||||||||||||
| $ | 0 | $ | 0 | $ | 545 | $ | 23,502 | $ | 0 | $ | 24,047 | |||||||||||||
|
|
|
|
|
|
|
|
|
|
|
| |||||||||||||
The Effect of Financial Derivative Instruments on the Consolidated Statements of Operations for the Period Ended December 31, 2013:
| Derivatives not accounted for as hedging instruments | ||||||||||||||||||||||||
| Commodity Contracts | Credit Contracts | Equity Contracts | Foreign Exchange Contracts | Interest Rate Contracts | Total | |||||||||||||||||||
Net Realized Gain (Loss) on Financial Derivative Instruments | ||||||||||||||||||||||||
Exchange-traded or centrally cleared | ||||||||||||||||||||||||
Purchased Options | $ | 0 | $ | 0 | $ | (256 | ) | $ | 0 | $ | 0 | $ | (256 | ) | ||||||||||
Written Options | 0 | 0 | 346 | 0 | 0 | 346 | ||||||||||||||||||
|
|
|
|
|
|
|
|
|
|
|
| |||||||||||||
| $ | 0 | $ | 0 | $ | 90 | $ | 0 | $ | 0 | $ | 90 | |||||||||||||
|
|
|
|
|
|
|
|
|
|
|
| |||||||||||||
Over the counter | ||||||||||||||||||||||||
Forward Foreign Currency Contracts | $ | 0 | $ | 0 | $ | 0 | $ | (12,090 | ) | $ | 0 | $ | (12,090 | ) | ||||||||||
Swap Agreements | 0 | 0 | 7,797 | 0 | 0 | 7,797 | ||||||||||||||||||
|
|
|
|
|
|
|
|
|
|
|
| |||||||||||||
| $ | 0 | $ | 0 | $ | 7,797 | $ | (12,090 | ) | $ | 0 | $ | (4,293 | ) | |||||||||||
|
|
|
|
|
|
|
|
|
|
|
| |||||||||||||
| $ | 0 | $ | 0 | $ | 7,887 | $ | (12,090 | ) | $ | 0 | $ | (4,203 | ) | |||||||||||
|
|
|
|
|
|
|
|
|
|
|
| |||||||||||||
Net Change in Unrealized Appreciation (Depreciation) on Financial Derivative Instruments |
| |||||||||||||||||||||||
Exchange-traded or centrally cleared | ||||||||||||||||||||||||
Purchased Options | $ | 0 | $ | 0 | $ | (730 | ) | $ | 0 | $ | 0 | $ | (730 | ) | ||||||||||
Written Options | 0 | 0 | (205 | ) | 0 | 0 | (205 | ) | ||||||||||||||||
|
|
|
|
|
|
|
|
|
|
|
| |||||||||||||
| $ | 0 | $ | 0 | $ | (935 | ) | $ | 0 | $ | 0 | $ | (935 | ) | |||||||||||
|
|
|
|
|
|
|
|
|
|
|
| |||||||||||||
Over the counter | ||||||||||||||||||||||||
Forward Foreign Currency Contracts | $ | 0 | $ | 0 | $ | 0 | $ | (17,216 | ) | $ | 0 | $ | (17,216 | ) | ||||||||||
Swap Agreements | 0 | 0 | 6,929 | 0 | 0 | 6,929 | ||||||||||||||||||
|
|
|
|
|
|
|
|
|
|
|
| |||||||||||||
| $ | 0 | $ | 0 | $ | 6,929 | $ | (17,216 | ) | $ | 0 | $ | (10,287 | ) | |||||||||||
|
|
|
|
|
|
|
|
|
|
|
| |||||||||||||
| $ | 0 | $ | 0 | $ | 5,994 | $ | (17,216 | ) | $ | 0 | $ | (11,222 | ) | |||||||||||
|
|
|
|
|
|
|
|
|
|
|
| |||||||||||||
| (1) | See Note 7, Principal Risks, in the Notes to Financial Statements on risks of the Fund. |
| See Accompanying Notes | SEMIANNUAL REPORT | DECEMBER 31, 2013 | 85 |
Table of Contents
Consolidated Schedule of Investments PIMCO EqS Pathfinder Fund® (Cont.)
December 31, 2013 (Unaudited)
FAIR VALUE MEASUREMENTS
The following is a summary of the fair valuations according to the inputs used as of December 31, 2013 in valuing the Fund’s assets and liabilities:
| Category and Subcategory | Level 1 | Level 2 | Level 3 | Fair Value at 12/31/2013 | ||||||||||||
Investments in Securities, at Value | ||||||||||||||||
Common Stocks | ||||||||||||||||
Belgium | ||||||||||||||||
Industrials | $ | 0 | $ | 39,003 | $ | 0 | $ | 39,003 | ||||||||
Bermuda | ||||||||||||||||
Energy | 30,721 | 65,686 | 0 | 96,407 | ||||||||||||
Brazil | ||||||||||||||||
Financials | 19,901 | 0 | 0 | 19,901 | ||||||||||||
Canada | ||||||||||||||||
Energy | 17,737 | 0 | 0 | 17,737 | ||||||||||||
Materials | 6,916 | 0 | 0 | 6,916 | ||||||||||||
Denmark | ||||||||||||||||
Consumer Staples | 0 | 61,252 | 0 | 61,252 | ||||||||||||
Faroe Islands | ||||||||||||||||
Consumer Staples | 0 | 11,513 | 0 | 11,513 | ||||||||||||
Financials | 0 | 5,560 | 0 | 5,560 | ||||||||||||
France | ||||||||||||||||
Consumer Discretionary | 0 | 68,267 | 0 | 68,267 | ||||||||||||
Consumer Staples | 0 | 150,589 | 0 | 150,589 | ||||||||||||
Energy | 0 | 27,076 | 0 | 27,076 | ||||||||||||
Utilities | 0 | 31,771 | 0 | 31,771 | ||||||||||||
Germany | ||||||||||||||||
Health Care | 59,449 | 0 | 0 | 59,449 | ||||||||||||
Industrials | 0 | 4,477 | 0 | 4,477 | ||||||||||||
Utilities | 0 | 5,186 | 0 | 5,186 | ||||||||||||
Hong Kong | ||||||||||||||||
Consumer Discretionary | 0 | 15,204 | 0 | 15,204 | ||||||||||||
Financials | 0 | 97,093 | 0 | 97,093 | ||||||||||||
Industrials | 0 | 7,246 | 0 | 7,246 | ||||||||||||
Japan | ||||||||||||||||
Consumer Discretionary | 0 | 20,868 | 0 | 20,868 | ||||||||||||
Consumer Staples | 0 | 12,268 | 0 | 12,268 | ||||||||||||
Industrials | 0 | 64,288 | 0 | 64,288 | ||||||||||||
Information Technology | 0 | 36,200 | 0 | 36,200 | ||||||||||||
Netherlands | ||||||||||||||||
Consumer Staples | 0 | 45,343 | 0 | 45,343 | ||||||||||||
Energy | 0 | 22,769 | 0 | 22,769 | ||||||||||||
Financials | 0 | 64,476 | 0 | 64,476 | ||||||||||||
Information Technology | 21,035 | 0 | 0 | 21,035 | ||||||||||||
Norway | ||||||||||||||||
Consumer Staples | 0 | 78,741 | 0 | 78,741 | ||||||||||||
Energy | 20,942 | 0 | 0 | 20,942 | ||||||||||||
Singapore | ||||||||||||||||
Financials | 0 | 1,205 | 0 | 1,205 | ||||||||||||
Industrials | 0 | 26,615 | 0 | 26,615 | ||||||||||||
South Africa | ||||||||||||||||
Materials | 7,113 | 0 | 0 | 7,113 | ||||||||||||
South Korea | ||||||||||||||||
Consumer Discretionary | 5,687 | 0 | 0 | 5,687 | ||||||||||||
Sweden | ||||||||||||||||
Industrials | 0 | 36,883 | 0 | 36,883 | ||||||||||||
| Category and Subcategory | Level 1 | Level 2 | Level 3 | Fair Value at 12/31/2013 | ||||||||||||
Switzerland | ||||||||||||||||
Consumer Staples | $ | 0 | $ | 43,425 | $ | 0 | $ | 43,425 | ||||||||
Financials | 0 | 23,036 | 0 | 23,036 | ||||||||||||
Health Care | 0 | 39,850 | 0 | 39,850 | ||||||||||||
Information Technology | 42,081 | 0 | 0 | 42,081 | ||||||||||||
Materials | 0 | 22,236 | 0 | 22,236 | ||||||||||||
United Kingdom | ||||||||||||||||
Consumer Staples | 0 | 238,778 | 0 | 238,778 | ||||||||||||
Energy | 23,004 | 53,735 | 0 | 76,739 | ||||||||||||
Financials | 0 | 31,530 | 0 | 31,530 | ||||||||||||
United States | ||||||||||||||||
Consumer Staples | 179,348 | 0 | 0 | 179,348 | ||||||||||||
Energy | 73,152 | 0 | 0 | 73,152 | ||||||||||||
Financials | 252,571 | 0 | 0 | 252,571 | ||||||||||||
Health Care | 64,234 | 0 | 0 | 64,234 | ||||||||||||
Industrials | 145,124 | 0 | 0 | 145,124 | ||||||||||||
Information Technology | 242,894 | 0 | 0 | 242,894 | ||||||||||||
Preferred Stocks | ||||||||||||||||
Brazil | ||||||||||||||||
Financials | 0 | 4,615 | 0 | 4,615 | ||||||||||||
Real Estate Investment Trusts | ||||||||||||||||
Singapore | ||||||||||||||||
Financials | 0 | 450 | 0 | 450 | ||||||||||||
United States | ||||||||||||||||
Financials | 39,679 | 0 | 0 | 39,679 | ||||||||||||
Rights | ||||||||||||||||
France | ||||||||||||||||
Health Care | 886 | 0 | 0 | 886 | ||||||||||||
Short-Term Instruments | ||||||||||||||||
Repurchase Agreements | 0 | 1,191 | 0 | 1,191 | ||||||||||||
U.S. Treasury Bills | 0 | 16,742 | 0 | 16,742 | ||||||||||||
| $ | 1,252,474 | $ | 1,475,167 | $ | 0 | $ | 2,727,641 | |||||||||
Investments in Affiliates, at Value |
| |||||||||||||||
Short-Term Instruments | ||||||||||||||||
Central Funds Used for Cash Management Purposes | $ | 152,207 | $ | 0 | $ | 0 | $ | 152,207 | ||||||||
Total Investments | $ | 1,404,681 | $ | 1,475,167 | $ | 0 | $ | 2,879,848 | ||||||||
Financial Derivative Instruments - Assets |
| |||||||||||||||
Over the counter | $ | 0 | $ | 14,274 | $ | 0 | $ | 14,274 | ||||||||
Financial Derivative Instruments - Liabilities |
| |||||||||||||||
Over the counter | $ | 0 | $ | (24,047 | ) | $ | 0 | $ | (24,047 | ) | ||||||
Totals | $ | 1,404,681 | $ | 1,465,394 | $ | 0 | $ | 2,870,075 | ||||||||
There were assets and liabilities valued at $60,691 transferred from Level 1 to Level 2 during the period ended December 31, 2013.
| 86 | PIMCO EQUITY SERIES | See Accompanying Notes |
Table of Contents
December 31, 2013 (Unaudited)
1. ORGANIZATION
PIMCO Equity Series (the “Trust”) was established as a Delaware statutory trust on December 28, 2009. The Trust is registered under the Investment Company Act of 1940, as amended (the “Act”), as an open-end management investment company. Information presented in these financial statements pertains to the Institutional Class, Class P, Administrative Class, Class D, Class A, Class C and Class R shares of the six funds (each a “Fund” and collectively the “Funds”) offered by the Trust.
2. SIGNIFICANT ACCOUNTING POLICIES
The following is a summary of significant accounting policies consistently followed by the Trust in the preparation of its financial statements in conformity with accounting principles generally accepted in the United States of America (“U.S. GAAP”). The preparation of financial statements in accordance with U.S. GAAP requires management to make estimates and assumptions that affect the reported amounts of assets and liabilities and disclosure of contingent assets and liabilities at the date of the financial statements and the reported amounts of increases and decreases in net assets from operations during the reporting period. Actual results could differ from those estimates.
(a) Securities Transactions and Investment Income Securities transactions are recorded as of the trade date for financial reporting purposes. Realized gains and losses from securities sold are recorded on the identified cost basis. Dividend income is recorded on the ex-dividend date, except certain dividends from foreign securities where the ex-dividend date may have passed, which are recorded as soon as the Fund is informed of the ex-dividend date. Interest income, adjusted for the accretion of discounts and amortization of premiums, is recorded on the accrual basis from settlement date. For convertible securities, premiums attributable to the conversion feature are not amortized. Estimated tax liabilities on certain foreign securities are recorded on an accrual basis and are reflected as components of interest income or net change in unrealized gain/loss on investments on the Statements of Operations, as appropriate. Tax liabilities realized as a result of such security sales are reflected as a component of net realized gain/loss on investments on the Statements of Operations. Income or short-term capital gain distributions received from underlying funds are recorded as dividend income. Long-term capital gain distributions received from underlying funds are recorded as realized gains.
Debt obligations may be placed on non-accrual status and related interest income may be reduced by ceasing current accruals and writing off interest receivable when the collection of all or a portion of interest has become doubtful based on consistently applied procedures. A debt
obligation is removed from non-accrual status when the issuer resumes interest payments or when collectability of interest is reasonably assured.
(b) Cash and Foreign Currency The functional and reporting currency for the Funds is the U.S. dollar. The market values of foreign securities, currency holdings and other assets and liabilities are translated into U.S. dollars based on the current exchange rates each business day. Purchases and sales of securities and income and expense items denominated in foreign currencies are translated into U.S. dollars at the exchange rate in effect on the transaction date. The Funds do not separately report the effects of changes in foreign exchange rates from changes in market prices on securities held. Such changes are included in net realized and net changes in unrealized gain or loss from investments on the Statements of Operations. Funds may invest in foreign currency-denominated securities and may engage in foreign currency transactions either on a spot (cash) basis at the rate prevailing in the currency exchange market at the time or through a forward foreign currency contract (see financial derivative instruments). Realized foreign exchange gains or losses arising from sales of spot foreign currencies, currency gains or losses realized between the trade and settlement dates on securities transactions and the difference between the recorded amounts of dividends, interest, and foreign withholding taxes and the U.S. dollar equivalent of the amounts actually received or paid and are included in net realized gain or loss on foreign currency transactions on the Statements of Operations. Net unrealized foreign exchange gains and losses arising from changes in foreign exchange rates on foreign denominated assets and liabilities other than investments in securities held at the end of the reporting period and are included in net change in unrealized appreciation or depreciation on translation of assets and liabilities denominated in foreign currencies on the Statements of Operations.
(c) Multiclass Operations Each class offered by the Trust has equal rights as to assets and voting privileges (except that shareholders of a class have exclusive voting rights regarding any matter relating solely to that class of shares). Income and non-class specific expenses are allocated daily to each class on the basis of relative net assets. Realized and unrealized capital gains and losses are allocated daily based on the relative net assets of each class of the respective Fund. Class specific expenses, where applicable, currently include supervisory and administrative and distribution and servicing fees.
(d) Dividends and Distributions to Shareholders Dividends from net investment income, if any, of each Fund, except the PIMCO Dividend and Income Builder Fund and PIMCO EqS® Dividend Fund, are declared and distributed to shareholders annually. Dividends from net investment income, if any, of the PIMCO Dividend and Income Builder Fund and PIMCO EqS® Dividend Fund are declared daily and
| SEMIANNUAL REPORT | DECEMBER 31, 2013 | 87 |
Table of Contents
Notes to Financial Statements (Cont.)
distributed to shareholders quarterly. Net realized capital gains earned by each Fund, if any, will be distributed no less frequently than once each year.
Income dividends and capital gain distributions are determined in accordance with income tax regulations which may differ from U.S. GAAP. Differences between tax regulations and U.S. GAAP may cause timing differences between income and capital gain recognition. Examples of events that give rise to timing differences include wash sales, straddles and capital loss carryforwards. Further, the character of investment income and capital gains may be different for certain transactions under the two methods of accounting. Examples of characterization differences include the treatment of paydowns on mortgage-backed securities, swaps, foreign currency transactions and investments in passive foreign investment companies. As a result, income dividends and capital gain distributions declared during a fiscal period may differ significantly from the net investment income (loss) and realized gains (losses) reported on each Fund’s annual financial statements presented under U.S. GAAP.
Distributions classified as a tax basis return of capital, if any, are reflected on the accompanying Statements of Changes in Net Assets and have been recorded to paid in capital. In addition, other amounts have been reclassified between undistributed net investment income, accumulated undistributed net realized gains or losses and/or paid in capital to more appropriately conform financial accounting to tax characterizations of dividend distributions.
(e) Statement of Cash Flows U.S. GAAP requires entities providing financial statements that report both financial position and results of operations to also provide a statement of cash flows for each period for which results of operations are provided, but exempts investment companies meeting certain conditions. One of the conditions is that substantially all of the enterprise’s investments were carried at fair value during the period and classified as Level 1 or Level 2 in the fair value hierarchy in accordance with the requirements of U.S. GAAP. Another condition is that the enterprise had little or no debt, based on the average debt outstanding during the period, in relation to average total assets. Funds with certain degrees of borrowing activity, typically through the use of reverse repurchase agreements, sale-buyback transactions or short sale transactions, have been determined to be at a level requiring a Statement of Cash Flows. Statements of Cash Flows have been prepared using the indirect method which requires net change in net assets resulting from operations to be adjusted to reconcile to net cash flows from operating activities.
(f) New Accounting Pronouncements In December 2011, the Financial Accounting Standards Board (“FASB”) issued an Accounting Standards Update (“ASU”) to enhance disclosures about financial
instruments and derivative instruments that are subject to offsetting (“netting”) on the Statements of Assets and Liabilities. This information will enable users of the entity’s financial statements to evaluate the effect or potential effect of netting arrangements on the entity’s financial position. The ASU is effective prospectively during interim or annual periods beginning on or after January 1, 2013. The financial statements have been modified to provide enhanced quantitative and qualitative disclosures surrounding counterparty exposure and master netting arrangements. See the Notes to Schedule of Investments and the Principal Risks Note in the Notes to Financial Statements for additional details.
3. INVESTMENT VALUATION AND FAIR VALUE MEASUREMENTS
(a) Investment Valuation Policies The Net Asset Value (“NAV”) of a Fund’s shares is valued as of the close of regular trading (normally 4:00 p.m., Eastern time) (the “NYSE Close”) on each day that the New York Stock Exchange (“NYSE”) is open (each a “Business Day”). Information that becomes known to a Fund or its agents after the NAV has been calculated on a particular day will not generally be used to retroactively adjust the price of a security or the NAV determined earlier that day.
For purposes of calculating the NAV, portfolio securities and other financial derivative instruments are valued on each Business Day using valuation methods as adopted by the Board of Trustees (the “Board”) of the Trust. The Board has formed a Valuation Committee whose function is to monitor the valuation of portfolio securities and other financial derivative instruments and, as required by the Trust’s valuation policies, determine in good faith the fair value of portfolio holdings after consideration of all relevant factors, including recommendations provided by the Adviser. The Board has delegated responsibility for applying the valuation methods to the investment adviser (the “Adviser”). The Adviser monitors the continual appropriateness of methods applied and determines if adjustments should be made in light of market factor changes and events affecting issuers.
Where market quotes are readily available, fair market value is generally determined on the basis of official closing prices or the last reported sales prices, or if no sales are reported, based on quotes obtained from a quotation reporting system, established market makers, or pricing services. Where market quotes are not readily available, portfolio securities and other financial derivative instruments are valued at fair value, as determined in good faith by the Board, its Valuation Committee, or Adviser pursuant to instructions from the Board or its Valuation Committee. Market quotes are considered not readily available in circumstances where there is an absence of current or reliable market-based data (e.g., trade information, bid/ask
| 88 | PIMCO EQUITY SERIES |
Table of Contents
December 31, 2013 (Unaudited)
information, or broker quotes), including where events occur after the close of the relevant market, but prior to the NYSE Close, that materially affect the values of a Fund’s securities or financial derivative instruments. In addition, market quotes are considered not readily available when, due to extraordinary circumstances, the exchanges or markets on which securities trade do not open for trading for the entire day and no other market prices are available. The Board has delegated to the Adviser, Pacific Investment Management Company LLC (“PIMCO”), the responsibility for monitoring significant events that may materially affect the values of a Fund’s securities or financial derivative instruments and for determining whether the value of the applicable securities or financial derivative instruments should be re-evaluated in light of such significant events.
The Board has adopted methods for valuing securities and other financial derivative instruments that may require fair valuation under particular circumstances. The Adviser monitors the continual appropriateness of fair valuation methods applied and determines if adjustments should be made in light of market changes, events affecting the issuer, or other factors. If the Adviser determines that a fair valuation method may no longer be appropriate, another valuation method may be selected, or the Valuation Committee will take any appropriate action in accordance with procedures set forth by the Board. The Board reviews the appropriateness of the valuation methods from time to time and these methods may be amended or supplemented from time to time by the Valuation Committee.
For instances in which daily market quotes are not readily available, investments may be valued, pursuant to guidelines established by the Board, with reference to other securities or indices. In the event that the security or asset cannot be valued pursuant to the established guidelines, the value of the security or other financial derivative instrument will be determined in good faith by the Valuation Committee of the Board, generally based upon recommendations provided by PIMCO. These methods may require subjective determinations about the value of a security. While the Trust’s policy is intended to result in a calculation of a Fund’s NAV that fairly reflects security values as of the time of pricing, the Trust cannot guarantee that values determined by the Board or persons acting at their direction would accurately reflect the price that a Fund could obtain for a security if it were to dispose of that security as of the time of pricing (for instance, in a forced or distressed sale). The prices used by Funds may differ from the value that would be realized if the securities were sold.
(b) Fair Value Hierarchy U.S. GAAP defines fair market value as the price that a Fund would receive to sell an asset or pay to transfer a liability in an orderly transaction between market participants at the measurement date. It establishes a fair value hierarchy that prioritizes inputs to valuation methods and requires disclosure of the fair value hierarchy, separately for each major category of assets and liabilities,
that segregates fair value measurements into levels (Level 1, 2, and 3). The inputs or methodology used for valuing securities are not necessarily an indication of the risk associated with investing in those securities. Levels 1, 2, and 3 of the fair value hierarchy are defined as follows:
| n | Level 1—Inputs using (unadjusted) quoted prices in active markets or exchanges for identical assets and liabilities. |
| n | Level 2—Significant other observable inputs, which may include, but are not limited to, quoted prices for similar assets or liabilities in markets that are active, quoted prices for identical or similar assets or liabilities in markets that are not active, inputs other than quoted prices that are observable for the assets or liabilities (such as interest rates, yield curves, volatilities, prepayment speeds, loss severities, credit risks and default rates) or other market corroborated inputs. |
| n | Level 3—Significant unobservable inputs based on the best information available in the circumstances, to the extent observable inputs are not available, which may include assumptions made by the Board or persons acting at their direction that are used in determining the fair value of investments. |
Assets or liabilities categorized as Level 1 or 2 as of period end have been transferred between Levels 1 and 2 since the prior period due to changes in the valuation method utilized in valuing the investments. Transfers from Level 1 to Level 2 are a result of a change, in the normal course of business, from the use of an exchange traded price or a trade price on the initial purchase date (Level 1) to valuation methods used by third-party pricing services including valuation adjustments applied to certain securities that are solely traded on a foreign exchange to account for the market movement between the close of the foreign market and the close of the NYSE (Level 2). Transfers from Level 2 to Level 1 are a result of exchange traded products for which quoted prices from an active market were not available (Level 2) and have become available (Level 1). In accordance with the requirements of U.S. GAAP, the amounts of transfers between Levels 1 and 2 and transfers in and out of Level 3, if any, are disclosed in the Notes to Schedule of Investments for each respective Fund.
For fair valuations using significant unobservable inputs, U.S. GAAP requires a reconciliation of the beginning to ending balances for reported fair values that presents changes attributable to total realized and unrealized gains or losses, purchases and sales, and transfers in or out of the Level 3 category during the period. The end of period timing recognition is used for the transfers between Levels of the Fund’s assets and liabilities. Additionally, U.S. GAAP requires quantitative information regarding the significant unobservable inputs used in the determination of fair value of assets or liabilities categorized as Level 3 in the fair value hierarchy. In accordance with the requirements of
| SEMIANNUAL REPORT | DECEMBER 31, 2013 | 89 |
Table of Contents
Notes to Financial Statements (Cont.)
U.S. GAAP, a fair value hierarchy, Level 3 reconciliation, and details of significant unobservable inputs, if any, have been included in the Notes to Schedule of Investments for each respective Fund.
(c) Valuation Techniques and the Fair Value Hierarchy Level 1 and Level 2 trading assets and trading liabilities, at fair market value The valuation methods (or “techniques”) and significant inputs used in determining the fair market values of portfolio securities or financial derivative instruments categorized as Level 1 and Level 2 of the fair value hierarchy are as follows:
Fixed income securities including corporate, convertible and municipal bonds and notes, U.S. government agencies, U.S. treasury obligations, sovereign issues, bank loans, convertible preferred securities and non-U.S. bonds are normally valued by pricing service providers that use broker-dealer quotations, reported trades or valuation estimates from their internal pricing models. The service providers’ internal models use inputs that are observable such as issuer details, interest rates, yield curves, prepayment speeds, credit risks/spreads, default rates and quoted prices for similar assets. Securities that use similar valuation techniques and inputs as described above are categorized as Level 2 of the fair value hierarchy.
Fixed income securities purchased on a delayed-delivery basis or as a repurchase commitment in a sale-buyback transaction are marked to market daily until settlement at the forward settlement date and are categorized as Level 2 of the fair value hierarchy.
Mortgage-related and asset-backed securities are usually issued as separate tranches, or classes, of securities within each deal. These securities are also normally valued by pricing service providers that use broker-dealer quotations or valuation estimates from their internal pricing models. The pricing models for these securities usually consider tranche-level attributes, current market data, estimated cash flows and market-based yield spreads for each tranche, and incorporate deal collateral performance, as available. Mortgage-related and asset-backed securities that use similar valuation techniques and inputs as described above are categorized as Level 2 of the fair value hierarchy.
Common stocks, exchange-traded funds, exchange-traded notes and financial derivative instruments, such as futures contracts or options on futures that are traded on a national securities exchange, are stated at the last reported sale or settlement price on the day of valuation. To the extent these securities are actively traded and valuation adjustments are not applied, they are categorized as Level 1 of the fair value hierarchy.
Investments initially valued in currencies other than the U.S. dollar are converted to the U.S. dollar using exchange rates obtained from pricing service providers. As a result, the NAV of a Fund’s shares may be
affected by changes in the value of currencies in relation to the U.S. dollar. The value of securities traded in markets outside the United States or denominated in currencies other than the U.S. dollar may be affected significantly on a day that the NYSE is closed and the NAV may change on days when an investor is not able to purchase, redeem or exchange shares. Valuation adjustments may be applied to certain securities that are solely traded on a foreign exchange to account for the market movement between the close of the foreign market and the NYSE Close. These securities are valued using pricing service providers that consider the correlation of the trading patterns of the foreign security to the intraday trading in the U.S. markets for investments. Securities using these valuation adjustments are categorized as Level 2 of the fair value hierarchy. Preferred securities and other equities traded on inactive markets or valued by reference to similar instruments are also categorized as Level 2 of the fair value hierarchy.
Equity-linked securities are valued by referencing the last reported sale or settlement price of the linked referenced equity on the day of valuation. Foreign exchange adjustments are applied to the last reported price to convert the linked equity’s trading currency to the contract’s settling currency. These investments are categorized as Level 2 of the fair value hierarchy.
Investments in registered open-end investment management companies will be valued based upon the NAVs of such investments and are categorized as Level 1 of the fair value hierarchy. Investments in unregistered open-end management investment companies will be calculated based upon the NAVs of such investments and are considered Level 1 provided that the NAVs are observable, calculated daily and are the value at which both purchases and sales will be conducted. Investments in privately held investment funds with significant restrictions on redemptions where the inputs of NAVs are observable will be valued based upon the NAVs of such investments and are categorized as Level 2 of the fair value hierarchy.
Short-term investments having a maturity of 60 days or less and repurchase agreements are generally valued at amortized cost which approximates fair market value. These investments are categorized as Level 2 of the fair value hierarchy.
Equity exchange-traded options and over-the-counter financial derivative instruments, such as foreign currency contracts, options contracts, or swap agreements, derive their value from underlying asset prices, indices, reference rates, and other inputs or a combination of these factors. These contracts are normally valued by independent pricing service providers. Depending on the product and the terms of the transaction, financial derivative instruments can be valued by a pricing service provider using a series of techniques, including simulation pricing models. The pricing models use inputs that are
| 90 | PIMCO EQUITY SERIES |
Table of Contents
December 31, 2013 (Unaudited)
observed from actively quoted markets such as issuer details, indices, spreads, interest rates, yield curves, dividends and exchange rates. Financial derivative instruments that use similar valuation techniques and inputs as described above are categorized as Level 2 of the fair value hierarchy.
Centrally cleared swaps listed or traded on a multilateral or trade facility platform, such as a registered exchange, are valued at the daily settlement price determined by the respective exchange. For centrally cleared credit default swaps the clearing facility requires its members to provide actionable price levels across complete term structures. These levels along with external third party prices are used to produce daily settlement prices. These securities are categorized as Level 2 of the fair value hierarchy. Centrally cleared interest rate swaps are valued using a pricing model that references the underlying rates including the overnight index swap rate and London Interbank Offered Rate (“LIBOR”) forward rate to produce the daily settlement price. These securities are categorized as Level 2 of the fair value hierarchy.
Level 3 trading assets and trading liabilities, at fair value When a fair valuation method is applied by PIMCO that uses significant unobservable inputs, securities will be priced by a method that the Board or persons acting at their direction believe reflects fair value and are categorized as Level 3 of the fair value hierarchy. The valuation techniques and significant inputs used in determining the fair values of portfolio assets and liabilities categorized as Level 3 of the fair value hierarchy are as follows:
If third party evaluated vendor pricing is neither available nor deemed to be indicative of fair value, the Adviser may elect to obtain indicative market quotations (“broker quotes”) directly from the broker-dealer or passed through from a third party vendor. In the event that the source of fair value is from a single sourced broker quote, these securities are categorized as Level 3 of the fair value hierarchy. Broker quotes are typically received from established market participants. Although independently received, the Adviser does not have the transparency to view the underlying inputs which support the market quotation. Significant changes in the broker quote would have direct and proportional changes in the fair value of the security.
4. SECURITIES AND OTHER INVESTMENTS
(a) Investments in Securities
Equity-Linked Securities A Fund may purchase equity-linked securities, also known as participation notes, equity swaps, and zero strike calls and warrants. Equity-linked securities are primarily used by a Fund as an alternative means to more efficiently and effectively access what is generally an emerging securities market. A Fund deposits cash with its custodian (or broker, if legally permitted) in an amount near or equal to the selling price of the underlying security in exchange for an
equity-linked security. Upon sale, a Fund receives cash from the broker or custodian equal to the value of the underlying security. Aside from market risk of the underlying securities, there is a risk of default by the counterparty to the transaction. In the event of insolvency of the counterparty, a Fund might be unable to obtain its expected benefit. In addition, while a Fund will seek to enter into such transactions only with parties that are capable of entering into closing transactions with the Fund, there can be no assurance that the Fund will be able to close out such a transaction with the counterparty or obtain an offsetting position with any counterparty, at any time prior to the end of the term of the underlying agreement. This may impair a Fund’s ability to enter into other transactions at a time when doing so might be advantageous.
Exchange-Traded Funds The Funds may invest in exchange-traded funds (“ETFs”), which typically are index-based investment companies that hold substantially all of their assets in securities representing their specific index, but may also be actively-managed investment companies. Shares of ETFs trade throughout the day on an exchange and represent an investment in a portfolio of securities and assets. As a shareholder of another investment company, the Funds would bear their pro rata portion of the other investment company’s expenses, including advisory fees, in addition to the expenses the Funds bear directly in connection with their own operations.
Mortgage-Related and Other Asset-Backed Securities Certain Funds may invest in mortgage-related and other asset-backed securities. These securities include mortgage pass-through securities, collateralized mortgage obligations, commercial mortgage-backed securities, asset-backed securities and other securities that directly or indirectly represent a participation in, or are secured by and payable from, mortgage loans on real property. Mortgage-related and other asset-backed securities are interests in pools of loans or other receivables. Mortgage-related securities are created from pools of residential or commercial mortgage loans, including mortgage loans made by savings and loan institutions, mortgage bankers, commercial banks and others. Asset-backed securities are created from many types of assets, including auto loans, credit card receivables, home equity loans, and student loans. These securities provide a monthly payment which consists of both interest and principal. Interest may be determined by fixed or adjustable rates. The rate of prepayments on underlying mortgages will affect the price and volatility of a mortgage-related security, and may have the effect of shortening or extending the effective duration of the security relative to what was anticipated at the time of purchase. The timely payment of principal and interest of certain mortgage-related securities is guaranteed with the full faith and credit of the U.S. Government. Pools created and guaranteed by non-governmental issuers, including government-sponsored corporations,
| SEMIANNUAL REPORT | DECEMBER 31, 2013 | 91 |
Table of Contents
Notes to Financial Statements (Cont.)
may be supported by various forms of insurance or guarantees, but there can be no assurance that private insurers or guarantors can meet their obligations under the insurance policies or guarantee arrangements.
Collateralized Mortgage Obligations (“CMOs”) are debt obligations of a legal entity that are collateralized by mortgages and divided into classes. CMOs are structured into multiple classes, often referred to as “tranches,” with each class bearing a different stated maturity and entitled to a different schedule for payments of principal and interest, including prepayments. Commercial Mortgage-Backed Securities (“CMBS”) include securities that reflect an interest in, and are secured by, mortgage loans on commercial real property. Many of the risks of investing in CMBS reflect the risks of investing in the real estate securing the underlying mortgage loans. These risks reflect the effects of local and other economic conditions on real estate markets, the ability of tenants to make loan payments, and the ability of a property to attract and retain tenants. CMOs and CMBS may be less liquid and may exhibit greater price volatility than other types of mortgage-related or asset-backed securities.
U.S. Government Agencies or Government-Sponsored Enterprises Certain Funds may invest in securities of U.S. Government agencies or government-sponsored enterprises. U.S. Government securities are obligations of and, in certain cases, guaranteed by, the U.S. Government, its agencies or instrumentalities. Some U.S. Government securities, such as Treasury bills, notes and bonds, and securities guaranteed by the Government National Mortgage Association (“GNMA” or “Ginnie Mae”), are supported by the full faith and credit of the U.S. Government; others, such as those of the Federal Home Loan Banks, are supported by the right of the issuer to borrow from the U.S. Department of the Treasury (the “U.S. Treasury”); others, such as those of the Federal National Mortgage Association (“FNMA” or “Fannie Mae”), are supported by the discretionary authority of the U.S. Government to purchase the agency’s obligations. U.S. Government securities may include zero coupon securities, which do not distribute interest on a current basis and tend to be subject to greater risk than interest-paying securities of similar maturities.
(b) Investments in Affiliates
The PIMCO Emerging Multi-Asset Fund may invest assets in Institutional Class shares of the Underlying PIMCO Funds. The Underlying PIMCO Funds are considered to be affiliated with the PIMCO Emerging Multi-Asset Fund. The table below shows the transactions in and earnings from investments in these affiliated Funds for the period ended December 31, 2013 (amounts in thousands):
PIMCO Emerging Multi-Asset Fund
| Underlying PIMCO Funds | Market Value 06/30/2013 | Purchases at Cost | Proceeds from Sales | Net Realized Gain/(Loss) | Change in Unrealized Appreciation/ (Depreciation) | Market Value 12/31/2013 | Dividend Income | Net Capital Gain Distributions | ||||||||||||||||||||||||||
PIMCO Emerging Local Bond Fund | $ | 17,104 | $ | 1,737 | $ | (4,078 | ) | $ | (346 | ) | $ | (391 | ) | $ | 14,026 | $ | 383 | $ | 0 | |||||||||||||||
PIMCO Emerging Markets Bond Fund | 10,024 | 1,125 | (4,269 | ) | (87 | ) | (250 | ) | 6,543 | 482 | 0 | |||||||||||||||||||||||
PIMCO Emerging Markets Corporate Bond Fund | 2,241 | 2,554 | (1,001 | ) | (66 | ) | 24 | 3,752 | 129 | 0 | ||||||||||||||||||||||||
PIMCO EqS® Emerging Markets Fund | 32,271 | 2,744 | (8,698 | ) | (523 | ) | 2,491 | 28,285 | 0 | 0 | ||||||||||||||||||||||||
PIMCO Short-Term Floating NAV Portfolio | 1,723 | 5,401 | (7,022 | ) | 0 | 0 | 102 | 1 | 0 | |||||||||||||||||||||||||
Totals | $ | 63,363 | $ | 13,561 | $ | (25,068 | ) | $ | (1,022 | ) | $ | 1,874 | $ | 52,708 | $ | 995 | $ | 0 | ||||||||||||||||
Each Fund may invest in the PIMCO Short-Term Floating NAV Portfolio and PIMCO Short-Term Floating NAV Portfolio III (“Central Funds”) to the extent permitted by the Act and rules thereunder. The Central Funds are registered investment companies created for use solely by the series of the Trust and series of the PIMCO Funds, PIMCO ETF Trust, PIMCO Variable Insurance Trust, PIMCO Equity Series VIT, and other series of registered investment companies advised by PIMCO, in connection with their cash management activities. The main investments of the Central Funds are money market instruments and short maturity fixed income instruments. The Central Funds may incur expenses related to their investment activities, but do not pay Investment Advisory or Supervisory and Administrative Fees to PIMCO. The Central Funds are considered to be affiliated with the Funds. The table below shows the Fund’s transactions in and earnings from investments in the Central Funds for the period ended December 31, 2013 (amounts in thousands):
Investments in PIMCO Short-Term Floating NAV Portfolio
| Fund Name | Market Value 06/30/2013 | Purchases at Cost | Proceeds from Sales | Net Realized Gain/(Loss) | Change in Unrealized Appreciation/ (Depreciation) | Market Value 12/31/2013 | Dividend Income | Net Capital Gain Distributions | ||||||||||||||||||||||||||
PIMCO Dividend and Income Builder Fund | $ | 28,734 | $ | 217,737 | $ | (227,000 | ) | $ | 1 | $ | (2 | ) | $ | 19,470 | $ | 36 | $ | 0 | ||||||||||||||||
PIMCO EqS® Dividend Fund | 19,574 | 163,917 | (179,200 | ) | (1 | ) | 0 | 4,290 | 17 | 0 | ||||||||||||||||||||||||
PIMCO EqS® Emerging Markets Fund | 9,903 | 224,758 | (181,400 | ) | 0 | (7 | ) | 53,254 | 57 | 0 | ||||||||||||||||||||||||
PIMCO EqS® Long/Short Fund | 136,702 | 883,880 | (869,900 | ) | (27 | ) | (7 | ) | 150,648 | 180 | 0 | |||||||||||||||||||||||
PIMCO EqS Pathfinder Fund® | 52,498 | 1,025,799 | (926,100 | ) | 29 | (19 | ) | 152,207 | 200 | 0 | ||||||||||||||||||||||||
| 92 | PIMCO EQUITY SERIES |
Table of Contents
December 31, 2013 (Unaudited)
5. BORROWINGS AND OTHER FINANCING TRANSACTIONS
The following disclosures contain information on a Fund’s ability to lend or borrow cash or securities to the extent permitted under the Act, which may be viewed as borrowing or financing transactions by a Fund. The location and fair value amounts of these instruments are described below. For a detailed description of credit and counterparty risks that can be associated with borrowings and other financing transactions, please see Note 7, Principal Risks.
(a) Repurchase Agreements Each Fund may engage in repurchase agreements. Under the terms of a typical repurchase agreement, a Fund takes possession of an underlying debt obligation (collateral) subject to an obligation of the seller to repurchase, and a Fund to resell, the obligation at an agreed-upon price and time. The underlying securities for all repurchase agreements are held in safekeeping at the Fund’s custodian or designated subcustodians under tri-party repurchase agreements. The market value of the collateral must be equal to or exceed the total amount of the repurchase obligations, including interest. Securities purchased under repurchase agreements are reflected as an asset on the Statements of Assets and Liabilities. Interest earned is recorded as a component of interest income on the Statements of Operations. In periods of increased demand for collateral, a Fund may pay a fee for receipt of collateral, which may result in interest expense to the Fund.
(b) Short Sales Certain Funds may enter into short sales transactions. Short sales are transactions in which a Fund sells a security that it may not own. A Fund may make short sales of securities to (i) offset potential declines in long positions in similar securities, (ii) to increase the flexibility of the Fund, (iii) for investment return, (iv) as part of a risk arbitrage strategy, and (v) as part of its overall portfolio management strategies involving the use of derivative instruments. When a Fund engages in a short sale, it may borrow the security sold short and deliver it to the counterparty. A Fund will ordinarily have to pay a fee or premium to borrow a security and be obligated to repay the lender of the security any dividend or interest that accrues on the security during the period of the loan. Securities sold in short sale transactions and the dividend or interest payable on such securities, if any, are reflected as payable for short sales on the Statements of Assets and Liabilities. Short sales expose a Fund to the risk that it will be required to cover its short position at a time when the security or other asset has appreciated in value, thus resulting in losses to the Fund. A short sale is “against the box” if a Fund holds in its portfolio or has the right to acquire the security sold short at no additional cost. A Fund will be subject to additional risks to the extent that it engages in short sales that are not “against the box.” A Fund’s loss on a short sale could theoretically be unlimited in cases where the Fund is unable, for whatever reason, to close out its short position.
6. FINANCIAL DERIVATIVE INSTRUMENTS
The following disclosures contain information on how and why the Funds use financial derivative instruments, the credit-risk-related contingent features in certain financial derivative instruments, and how financial derivative instruments affect the Funds’ financial position, results of operations and cash flows. The location and fair value amounts of these instruments on the Statements of Assets and Liabilities and the realized and changes in unrealized gains and losses on the Statements of Operations, each categorized by type of financial derivative contract and related risk exposure, are included in a table in the Notes to Schedules of Investments. The financial derivative instruments outstanding as of period end and the amounts of realized and changes in unrealized gains and losses on financial derivative instruments during the period, as disclosed in the Notes to Schedules of Investments, serve as indicators of the volume of financial derivative activity for the Funds.
(a) Forward Foreign Currency Contracts Certain Funds may enter into forward foreign currency contracts in connection with settling planned purchases or sales of securities, to hedge the currency exposure associated with some or all of a Fund’s securities or as a part of an investment strategy. A forward foreign currency contract is an agreement between two parties to buy and sell a currency at a set price on a future date. The market value of a forward foreign currency contract fluctuates with changes in foreign currency exchange rates. Forward foreign currency contracts are marked to market daily and the change in value is recorded by a Fund as an unrealized gain or loss. Realized gains or losses equal to the difference between the value of the contract at the time it was opened and the value at the time it was closed are recorded upon delivery or receipt of the currency. These contracts may involve market risk in excess of the unrealized gain or loss reflected on the Statements of Assets and Liabilities. In addition, a Fund could be exposed to risk if the counterparties are unable to meet the terms of the contracts or if the value of the currency changes unfavorably to the U.S. dollar. In connection with these contracts, cash or securities may be identified as collateral in accordance with the terms of the respective contracts.
(b) Futures Contracts Certain Funds may enter into futures contracts. A Fund may use futures contracts to manage its exposure to the securities markets or to movements in interest rates and currency values. The primary risks associated with the use of futures contracts are the imperfect correlation between the change in market value of the securities held by a Fund and the prices of futures contracts and the possibility of an illiquid market. Futures contracts are valued based upon their quoted daily settlement prices. Upon entering into a futures contract, a Fund is required to deposit with its futures broker an amount of cash, U.S. Government and Agency Obligations, or select
| SEMIANNUAL REPORT | DECEMBER 31, 2013 | 93 |
Table of Contents
Notes to Financial Statements (Cont.)
sovereign debt, in accordance with the initial margin requirements of the broker or exchange. Futures contracts are marked to market daily and an appropriate payable or receivable for the change in value (“variation margin”) is recorded by the Fund. Gains or losses are recognized but not considered realized until the contracts expire or are closed. Futures contracts involve, to varying degrees, risk of loss in excess of the variation margin disclosed on the Statements of Assets and Liabilities.
(c) Options Contracts Certain Funds may write call and put options on securities and financial derivative instruments they own or in which they may invest. Writing put options tends to increase a Fund’s exposure to the underlying instrument. Writing call options tends to decrease a Fund’s exposure to the underlying instrument. When a Fund writes a call or put, an amount equal to the premium received is recorded as a liability and subsequently marked to market to reflect the current value of the option written. These liabilities are reflected as written options outstanding on the Statements of Assets and Liabilities. Premiums received from writing options which expire are treated as realized gains. Premiums received from writing options which are exercised or closed are added to the proceeds or offset against amounts paid on the underlying futures, swap, security or currency transaction to determine the realized gain or loss. Certain options may be written with premiums to be determined on a future date. The premiums for these options are based upon implied volatility parameters at specified terms. A Fund as a writer of an option has no control over whether the underlying instrument may be sold (call) or purchased (put) and as a result bears the market risk of an unfavorable change in the price of the instrument underlying the written option. There is the risk a Fund may not be able to enter into a closing transaction because of an illiquid market.
Certain Funds may also purchase put and call options. Purchasing call options tends to increase a Fund’s exposure to the underlying instrument. Purchasing put options tends to decrease a Fund’s exposure to the underlying instrument. A Fund pays a premium which is included on the Fund’s Statement of Assets and Liabilities as an investment and subsequently marked to market to reflect the current value of the option. Premiums paid for purchasing options which expire are treated as realized losses. Certain options may be purchased with premiums to be determined on a future date. The premiums for these options are based upon implied volatility parameters at specified terms. The risk associated with purchasing put and call options is limited to the premium paid. Premiums paid for purchasing options which are exercised or closed are added to the amounts paid or offset against the proceeds on the underlying investment transaction to determine the realized gain or loss when the underlying transaction is executed.
Options on Securities Certain Funds may write or purchase options on securities. An option uses a specified security as the underlying instrument for the option contract. A Fund may write or purchase options to enhance returns for a Fund or to hedge an existing position or future investment.
Options on Exchange-Traded Funds Certain Funds may write or purchase options on exchange-traded funds (“ETF Option”). An ETF Option uses a specified exchange-traded fund as the underlying instrument for the option contract. A Fund may write or purchase options to enhance returns or to hedge an existing position or future investment.
(d) Swap Agreements Certain Funds may invest in swap agreements. Swap agreements are bilaterally negotiated agreements between a Fund and a counterparty to exchange or swap investment cash flows, assets, foreign currencies or market-linked returns at specified, future intervals. Swap agreements are privately negotiated in the over-the-counter market (“OTC swaps”) or may be executed in a multilateral or other trade facility platform, such as a registered exchange (“centrally cleared swaps”). A Fund may enter into asset, credit default, cross-currency, interest rate, total return, variance and other forms of swap agreements to manage its exposure to credit, currency, interest rate, commodity, equity and inflation risk. In connection with these agreements, securities or cash may be identified as collateral or margin in accordance with the terms of the respective swap agreements to provide assets of value and recourse in the event of default or bankruptcy/insolvency.
Swaps are marked to market daily based upon values from third party vendors, which may include a registered exchange, or quotations from market makers to the extent available. In the event that market quotes are not readily available and the swap cannot be valued pursuant to one of the valuation methods, the value of the swap will be determined in good faith by the Valuation Committee of the Board of Trustees, generally based upon recommendations provided by PIMCO. Changes in market value, if any, are reflected as a component of net changes in unrealized appreciation/(depreciation) on the Statements of Operations. Daily changes in valuation of centrally cleared swaps, if any, are recorded as a receivable or payable for the change in value as appropriate (“variation margin”) on the Statements of Assets and Liabilities. OTC swap payments received or made at the beginning of the measurement period are reflected as such on the Statements of Assets and Liabilities and represent premiums paid or received upon entering into the swap agreement to compensate for differences between the stated terms of the swap agreement and prevailing market conditions (credit spreads, currency exchange rates, interest rates, and other relevant factors). These upfront premiums are recorded as realized gains or losses on the Statements of Operations upon
| 94 | PIMCO EQUITY SERIES |
Table of Contents
December 31, 2013 (Unaudited)
termination or maturity of the swap. A liquidation payment received or made at the termination of the swap is recorded as realized gain or loss on the Statements of Operations. Net periodic payments received or paid by a Fund are included as part of realized gains or losses on the Statements of Operations.
Entering into these agreements involves, to varying degrees, elements of interest, credit, market and documentation risk in excess of the amounts recognized on the Statements of Assets and Liabilities. Such risks involve the possibility that there will be no liquid market for these agreements, that the counterparty to the agreements may default on its obligation to perform or disagree as to the meaning of contractual terms in the agreements and that there may be unfavorable changes in interest rates.
A Fund’s maximum risk of loss from counterparty credit risk is the discounted net value of the cash flows to be received from the counterparty over the contract’s remaining life, to the extent that amount is positive. The risk is mitigated by having a master netting arrangement between a Fund and the counterparty and by the posting of collateral to a Fund to cover a Fund’s exposure to the counterparty.
Credit Default Swap Agreements Credit default swap agreements involve one party making a stream of payments (referred to as the buyer of protection) to another party (the seller of protection) in exchange for the right to receive a specified return in the event of a default or other credit event for the referenced entity, obligation or index. As a seller of protection on credit default swap agreements, a Fund will generally receive from the buyer of protection a fixed rate of income throughout the term of the swap provided that there is no credit event. As the seller, a Fund would effectively add leverage to its portfolio because, in addition to its total net assets, a Fund would be subject to investment exposure on the notional amount of the swap.
If a Fund is a seller of protection and a credit event occurs, as defined under the terms of that particular swap agreement, a Fund will either (i) pay to the buyer of protection an amount equal to the notional amount of the swap and take delivery of the referenced obligation, other deliverable obligations or underlying securities comprising the referenced index or (ii) pay a net settlement amount in the form of cash or securities equal to the notional amount of the swap less the recovery value of the referenced obligation or underlying securities comprising the referenced index. If a Fund is a buyer of protection and a credit event occurs, as defined under the terms of that particular swap agreement, a Fund will either (i) receive from the seller of protection an amount equal to the notional amount of the swap and deliver the referenced obligation, other deliverable obligations or underlying securities comprising the referenced index or (ii) receive a net settlement amount in the form of cash or securities equal to the
notional amount of the swap less the recovery value of the referenced obligation or underlying securities comprising the referenced index. Recovery values are estimated by market makers considering either industry standard recovery rates or entity specific factors and considerations until a credit event occurs. If a credit event has occurred, the recovery value is determined by a facilitated auction whereby a minimum number of allowable broker bids, together with a specified valuation method, are used to calculate the settlement value.
Credit default swap agreements on corporate or sovereign issues involve one party making a stream of payments to another party in exchange for the right to receive a specified return in the event of a default or other credit event. If a credit event occurs and cash settlement is not elected, a variety of other deliverable obligations may be delivered in lieu of the specific referenced obligation. The ability to deliver other obligations may result in a cheapest-to-deliver option (the buyer of protection’s right to choose the deliverable obligation with the lowest value following a credit event). A Fund may use credit default swaps on corporate or sovereign issues to provide a measure of protection against defaults of the issuers (i.e., to reduce risk where a Fund owns or has exposure to the referenced obligation) or to take an active long or short position with respect to the likelihood of a particular issuer’s default.
Credit default swap agreements on asset-backed securities involve one party making a stream of payments to another party in exchange for the right to receive a specified return in the event of a default or other credit event. Unlike credit default swaps on corporate or sovereign issues, deliverable obligations in most instances would be limited to the specific referenced obligation, as performance for asset-backed securities can vary across deals. Prepayments, principal paydowns, and other writedown or loss events on the underlying mortgage loans will reduce the outstanding principal balance of the referenced obligation. These reductions may be temporary or permanent as defined under the terms of the swap agreement and the notional amount for the swap agreement will be adjusted by corresponding amounts. A Fund may use credit default swaps on asset-backed securities to provide a measure of protection against defaults of the referenced obligation or to take an active long or short position with respect to the likelihood of a particular referenced obligation’s default.
Credit default swap agreements on credit indices involve one party making a stream of payments to another party in exchange for the right to receive a specified return in the event of a write-down, principal shortfall, interest shortfall or default of all or part of the referenced entities comprising the credit index. A credit index is a basket of credit instruments or exposures designed to be representative of some part of the credit market as a whole. These indices are made up of reference credits that are judged by a poll of dealers to be the most liquid entities
| SEMIANNUAL REPORT | DECEMBER 31, 2013 | 95 |
Table of Contents
Notes to Financial Statements (Cont.)
in the credit default swap market based on the sector of the index. Components of the indices may include, but are not limited to, investment grade securities, high yield securities, asset-backed securities, emerging markets, and/or various credit ratings within each sector. Credit indices are traded using credit default swaps with standardized terms including a fixed spread and standard maturity dates. An index credit default swap references all the names in the index, and if there is a default, the credit event is settled based on that name’s weight in the index. The composition of the indices changes periodically, usually every six months, and for most indices, each name has an equal weight in the index. A Fund may use credit default swaps on credit indices to hedge a portfolio of credit default swaps or bonds, which is less expensive than it would be to buy many credit default swaps to achieve a similar effect. Credit default swaps on indices are instruments for protecting investors owning bonds against default, and traders use them to speculate on changes in credit quality.
Implied credit spreads, represented in absolute terms, utilized in determining the market value of credit default swap agreements on corporate or sovereign issues as of period end are disclosed in the Notes to Schedules of Investments. They serve as an indicator of the current status of the payment/performance risk and represent the likelihood or risk of default for the credit derivative. The implied credit spread of a particular referenced entity reflects the cost of buying/selling protection and may include upfront payments required to be made to enter into the agreement. Wider credit spreads represent a deterioration of the referenced entity’s credit soundness and a greater likelihood or risk of default or other credit event occurring as defined under the terms of the agreement. For credit default swap agreements on asset-backed securities and credit indices, the quoted market prices and resulting values serve as the indicator of the current status of the payment/performance risk. Increasing market values, in absolute terms when compared to the notional amount of the swap, represent a deterioration of the referenced entity’s credit soundness and a greater likelihood or risk of default or other credit event occurring as defined under the terms of the agreement.
The maximum potential amount of future payments (undiscounted) that a Fund as a seller of protection could be required to make under a credit default swap agreement equals the notional amount of the agreement. Notional amounts of each individual credit default swap agreement outstanding as of for which a Fund is the seller of protection are disclosed in the Notes to Schedules of Investments. These potential amounts would be partially offset by any recovery values of the respective referenced obligations, upfront payments received upon entering into the agreement, or net amounts received from the settlement of buy protection credit default swap agreements entered into by a Fund for the same referenced entity or entities.
Total Return Swap Agreements Certain Funds may enter into total return swap agreements to gain or mitigate exposure to the underlying reference. Total return swap agreements involve commitments where single or multiple cash flows are exchanged based on the price of an underlying reference and on a fixed or variable interest rate. Total return swap agreements may involve commitments to pay interest in exchange for a market-linked return. One counterparty pays out the total return of a specific reference asset, which may include an underlying equity, index, or bond, and in return receives a fixed or variable rate. At the maturity date, a net cash flow is exchanged where the total return is equivalent to the return of the underlying reference less a financing rate, if any. As a receiver, a Fund would receive payments based on any positive total return and would owe payments in the event of a negative total return. As the payer, a Fund would owe payments on any net positive total return, and would receive payment in the event of a negative total return.
7. PRINCIPAL RISKS
In the normal course of business the Funds (or Underlying PIMCO Funds and/or Acquired Funds in the case of the mutual funds that pursue their investment objective by investing in other mutual funds (“PIMCO Fund of Funds”)) trade financial instruments and enter into financial transactions where risk of potential loss exists due to such things as changes in the market (market risk) or failure or inability of the other party to a transaction to perform (credit and counterparty risk). See below for a detailed description of select principal risks. For a more comprehensive list of potential risks the Funds may be subject to, please see the Important Information About the Funds.
Investments in Mutual Funds To the extent that Certain Funds invest substantially all of their respective assets in certain series of PIMCO Funds and certain series of PIMCO Equity Series, each an affiliated investment company also managed by PIMCO, (“Underlying PIMCO Funds”). The risks associated with investing in these Funds will be closely related to the risks associated with the securities and other investments held by the Underlying PIMCO Funds or Acquired Funds. The ability of the Funds to achieve their respective investment objectives may depend upon the ability of the Underlying PIMCO Funds or Acquired Funds to achieve their respective investment objectives. There can be no assurance that the investment objective of any Underlying PIMCO Fund or Acquired Fund will be achieved. The net asset value of each Fund will fluctuate in response to changes in the respective net asset values of the Underlying PIMCO Funds or Acquired Funds in which it invests. The extent to which the investment performance and risks associated with the Funds correlate to those of a particular Underlying PIMCO Fund will depend upon the extent to
| 96 | PIMCO EQUITY SERIES |
Table of Contents
December 31, 2013 (Unaudited)
which the assets of the Funds are allocated from time to time for investment in the Underlying PIMCO Funds or Acquired Funds, which will vary.
Investing in Underlying PIMCO Funds or Acquired Funds involves certain additional expenses and tax results that would not be present in a direct investment in the Underlying PIMCO Funds or Acquired Funds.
The investment performance depends upon how its assets are allocated and reallocated according to each Fund’s asset allocation targets and ranges. A principal risk of investing in each Fund is that the Funds’ asset allocation sub-adviser will make less than optimal or poor asset allocation decisions. The asset allocation sub-adviser attempts to identify investment allocations for the Underlying PIMCO Funds or Acquired Funds that will provide consistent, quality performance for the Funds, but there is no guarantee that such allocation techniques will produce the desired results.
In the normal course of business the Underlying PIMCO Funds or Acquired Funds trade financial instruments, and enter into financial transactions where risk of potential loss exists due to changes in the market (market risk), or failure or inability of the other party to a transaction to perform (credit and counterparty risk).
Market Risks A Fund’s (or Underlying PIMCO Fund’s and/or Acquired Fund’s in the case of the PIMCO Fund of Funds) investments in financial derivatives and other financial instruments expose the Fund to various risks such as, but not limited to, equity, interest rate, foreign currency and commodity risks.
The market values of equities, such as common stocks and preferred securities or equity related investments such as futures and options, may decline due to general market conditions which are not specifically related to a particular company, such as real or perceived adverse economic conditions, changes in the general outlook for corporate earnings, changes in interest or currency rates or adverse investor sentiment generally. They may also decline due to factors which affect a particular industry or industries, such as labor shortages or increased production costs and competitive conditions within an industry. Equity securities and equity related investments generally have greater market price volatility than fixed income securities.
Interest rate risk is the risk that fixed income securities will decline in value because of changes in interest rates. As nominal interest rates rise, the value of certain fixed income securities held by a Fund (or Underlying PIMCO Fund and/or Acquired Fund in the case of the PIMCO Fund of Funds) is likely to decrease. A nominal interest rate can be described as the sum of a real interest rate and an expected inflation rate. Interest rate changes can be sudden and unpredictable, and the Fund may lose money if these changes are not anticipated by Fund management. Fixed income securities with longer durations tend to be more sensitive to changes in interest rates, usually making them more volatile than securities with shorter durations. Duration is useful
primarily as a measure of the sensitivity of a fixed income’s market price to interest rate (i.e. yield) movements. As mentioned earlier in this report, the U.S. is currently experiencing historically low interest rates. This combined with recent economic recovery and the Federal Reserve Board’s tapering of its quantitative easing program could potentially increase the probability of an upward interest rate environment in the near future. Further, while U.S. bond markets have steadily grown over the past three decades, dealer “market making” ability has remained relatively stagnant. Given the importance of intermediary “market making” in creating a robust and active market, the fixed income securities are currently facing increased volatility and liquidity risks. All of these factors, collectively and/or individually, could cause the Fund to lose value. If the Fund lost enough value, the Fund could face increased redemptions by shareholders, which could further impair the performance of the Fund.
If a Fund (or Underlying PIMCO Fund and/or Acquired Fund in the case of the PIMCO Fund of Funds) invests directly in foreign currencies or in securities that trade in, and receive revenues in, foreign currencies, or in financial derivatives that provide exposure to foreign currencies, it will be subject to the risk that those currencies will decline in value relative to the base currency of the Fund (or Underlying PIMCO Fund and/or Acquired Fund in the case of the PIMCO Fund of Funds), or, in the case of hedging positions, that the Fund’s (or Underlying PIMCO Fund’s and/or Acquired Fund’s in the case of the PIMCO Fund of Funds) base currency will decline in value relative to the currency being hedged. Currency rates in foreign countries may fluctuate significantly over short periods of time for a number of reasons, including changes in interest rates, intervention (or the failure to intervene) by U.S. or foreign governments, central banks or supranational entities such as the International Monetary Fund, or by the imposition of currency controls or other political developments in the United States or abroad. As a result, a Fund’s (or Underlying PIMCO Fund’s and/or Acquired Fund’s in the case of a PIMCO Fund of Funds) investments in foreign currency denominated securities may reduce the returns of the Fund (or Underlying PIMCO Fund and/or Acquired Fund in the case of the PIMCO Fund of Funds).
Credit and Counterparty Risks A Fund (or Underlying PIMCO Fund and/or Acquired Fund in the case of a PIMCO Fund of Funds) will be exposed to credit risk to parties with whom it trades and will also bear the risk of settlement default. A Fund (or Underlying PIMCO Fund and/or Acquired Fund in the case of a PIMCO Fund of Funds) minimizes concentrations of credit risk by undertaking transactions with a large number of customers and counterparties on recognized and reputable exchanges. A Fund (or Underlying PIMCO Fund and/or Acquired Fund in the case of a PIMCO Fund of Funds) could lose money if the issuer or guarantor of a fixed income security, or the counterparty to a financial derivatives contract, repurchase agreement or a loan of portfolio securities, is unable or unwilling to make timely principal and/or interest payments, or to otherwise honor its obligations. Securities are subject to varying degrees of credit risk, which are often reflected in credit ratings.
| SEMIANNUAL REPORT | DECEMBER 31, 2013 | 97 |
Table of Contents
Notes to Financial Statements (Cont.)
Similar to credit risk, a Fund (or Underlying PIMCO Fund and/or Acquired Fund in the case of a PIMCO Fund of Funds) may be exposed to counterparty risk, or the risk that an institution or other entity with which the Fund (or Underlying PIMCO Fund and/or Acquired Fund in the case of the PIMCO Fund of Funds) has unsettled or open transactions will default. Financial assets, which potentially expose a Fund to counterparty risk, consist principally of cash due from counterparties and investments. PIMCO, as the investment adviser, minimizes counterparty risks to the Funds by performing extensive reviews of each counterparty and obtaining approval from the PIMCO Counterparty Risk Committee prior to entering into transactions with a third party. Furthermore, to the extent that unpaid amounts owed to a Fund (or Underlying PIMCO Fund and/or Acquired Fund in the case of a PIMCO Fund of Funds) exceed a predetermined threshold agreed to with the counterparty, such counterparty shall advance collateral to the Fund (or Underlying PIMCO Fund and/or Acquired Fund in the case of the PIMCO Fund of Funds) in the form of cash or cash equivalents equal in value to the unpaid amount owed to the Fund (or Underlying PIMCO Fund and/or Acquired Fund in the case of the PIMCO Fund of Funds). A Fund (or Underlying PIMCO Fund and/or Acquired Fund in the case of a PIMCO Fund of Funds) may invest such collateral in securities or other instruments and will typically pay interest to the counterparty on the collateral received. If the unpaid amount owed to a Fund (or Underlying PIMCO Fund and/or Acquired Fund in the case of a PIMCO Fund of Funds) subsequently decreases, the Fund (or Underlying PIMCO Fund and/or Acquired Fund in the case of the PIMCO Fund of Funds) would be required to return to the counterparty all or a portion of the collateral previously advanced to the Fund (or Underlying PIMCO Fund and/or Acquired Fund in the case of the PIMCO Fund of Funds).
All transactions in listed securities are settled/paid for upon delivery using approved counterparties. The risk of default is considered minimal, as delivery of securities sold is only made once a Fund has received payment. Payment is made on a purchase once the securities have been delivered by the counterparty. The trade will fail if either party fails to meet its obligation.
Master Netting Arrangements A Fund is subject to various netting arrangements with select counterparties (“Master Agreements”). Master Agreements govern the terms of certain transactions, and reduce the counterparty risk associated with relevant transactions by specifying credit protection mechanisms and providing standardization that improves legal certainty. Since different types of transactions have different mechanics and are sometimes traded out of different legal entities of a particular counterparty organization, each type of transaction may be covered by a different Master Agreement, resulting in the need for multiple agreements with a single counterparty. As the Master Agreements are specific to unique operations of different asset types, they allow a Fund to close out and net its total exposure to a
counterparty in the event of a default with respect to all the transactions governed under a single agreement with a counterparty.
Master Agreements can also help limit counterparty risk by specifying collateral posting arrangements at pre-arranged exposure levels. Under the Master Agreements, collateral is routinely transferred if the total net exposure to certain transactions (net of existing collateral already in place) governed under the relevant Master Agreement with a counterparty in a given account exceeds a specified threshold, which typically ranges from zero to $250,000 depending on the counterparty and the type of Master Agreement. United States Treasury Bills and U.S. dollar cash are generally the preferred forms of collateral, although other forms of AAA rated paper or sovereign securities may be used. Securities and cash pledged as collateral are reflected as assets in the Statement of Assets and Liabilities as either a component of Investments at value (securities) or Deposits due from Counterparties (cash). Cash collateral received is not typically held in a segregated account and as such is reflected as a liability in the Statement of Assets and Liabilities as Deposits due to Counterparties. The market value of any securities received as collateral is not reflected as a component of net asset value. A Fund’s overall exposure to counterparty risk can change substantially within a short period, as it is affected by each transaction subject to the relevant Master Agreement.
Master Repurchase Agreements and Global Master Repurchase Agreements (individually and collectively “Master Repo Agreements”) govern repurchase, reverse repurchase, and sale-buyback transactions between a Fund and select counterparties. Master Repo Agreements maintain provisions for, among other things, initiation, income payments, events of default, and maintenance of collateral. The market value of transactions under the Master Repo Agreement, collateral pledged or received, and the net exposure by counterparty as of period end are disclosed in the Notes to Schedule of Investments.
Master Securities Forward Transaction Agreements (“Master Forward Agreements”) govern the considerations and factors surrounding the settlement of certain forward settling transactions, such as To-Be-Announced securities, delayed-delivery or sale-buyback transactions by and between a Fund and select counterparties. The Master Forward Agreements maintain provisions for, among other things, initiation and confirmation, payment and transfer, events of default, termination, and maintenance of collateral. The market value of forward settling transactions, collateral pledged or received, and the net exposure by counterparty as of period end is disclosed in the Notes to Schedule of Investments.
Customer Account Agreements and related addendums govern cleared derivatives transactions such as futures, options on futures, and cleared OTC derivatives. Cleared derivative transactions require posting of initial margin as determined by each relevant clearing agency which is
| 98 | PIMCO EQUITY SERIES |
Table of Contents
December 31, 2013 (Unaudited)
segregated at a broker account registered with the Commodities Futures Trading Commission (CFTC), or the applicable regulator. In the US, counterparty risk is significantly reduced as creditors of the futures broker do not have claim to Fund assets in the segregated account. Additionally, portability of exposure in the event of default further reduces risk to the Funds. Variation margin, or changes in market value, are exchanged daily, but may not be netted between futures and cleared OTC derivatives. The market value or accumulated unrealized appreciation or depreciation, initial margin posted, and any unsettled variation margin as of period end is disclosed in the Notes to Schedule of Investments.
Prime Broker Arrangements may be entered into to facilitate execution and/or clearing of listed equity option transactions or short sales of equity securities between a Fund and selected counterparties. The arrangements provide guidelines surrounding the rights, obligations, and other events, including, but not limited to, margin, execution, and settlement. These agreements maintain provisions for, among other things, payments, maintenance of collateral, events of default, and termination. Margin and other assets delivered as collateral are typically in the possession of the prime broker and would offset any obligations due to the prime broker. The market values of listed options and securities sold short and related collateral are disclosed in the Notes to Schedule of Investments.
International Swaps and Derivatives Association, Inc. Master Agreements and Credit Support Annexes (“ISDA Master Agreements”) govern OTC financial derivative transactions entered into by a Fund and select counterparties. ISDA Master Agreements maintain provisions for general obligations, representations, agreements, collateral and events of default or termination. Events of termination include conditions that may entitle counterparties to elect to terminate early and cause settlement of all outstanding transactions under the applicable ISDA Master Agreement. Any election to terminate early could be material to the financial statements. In limited circumstances, the ISDA Master Agreement may contain additional provisions that add additional
counterparty protection beyond coverage of existing daily exposure if the counterparty has a decline in credit quality below a predefined level. These amounts, if any, may be segregated with a third party custodian. The market value of OTC financial derivative instruments, collateral received or pledged, and net exposure by counterparty as of period end are disclosed in the Notes to Schedule of Investments.
8. BASIS FOR CONSOLIDATION FOR THE PIMCO EMERGING MULTI-ASSET FUND AND PIMCO EqS PATHFINDER FUND® (“Consolidated Funds”)
PIMCO Cayman Commodity Fund V and VI (each a “Commodity Subsidiary”), Cayman Islands exempted companies, were incorporated as wholly owned subsidiaries acting as investment vehicles for the Consolidated Funds in order to effect certain investments for the Consolidated Funds consistent with each Consolidated Fund’s investment objectives and policies as specified in their respective prospectus and statement of additional information. Each Consolidated Fund’s investment portfolio has been consolidated and includes the portfolio holdings of the Consolidated Fund and its respective Commodity Subsidiary. The consolidated financial statements include the accounts of the Consolidated Funds and their respective Commodity Subsidiaries. All inter-company transactions and balances have been eliminated. A subscription agreement was entered into between the Consolidated Funds and their respective Commodity Subsidiary, comprising the entire issued share capital of the Commodity Subsidiary, with the intent that each Consolidated Fund will remain the sole shareholder and retain all rights. Under the Articles of Association of each Commodity Subsidiary, shares issued by each Commodity Subsidiary confer upon a shareholder the right to receive notice of, to attend and to vote at general meetings of each of the Commodity Subsidiaries and shall confer upon the shareholder rights in a winding-up or repayment of capital and the right to participate in the profits or assets of each of the Commodity Subsidiaries. See the table below for details regarding the structure, incorporation and relationship of each Commodity Subsidiary to its respective Consolidated Fund (amounts in thousands).
| PIMCO Emerging Multi Asset Fund | PIMCO EqS Pathfinder Fund® | |||||||||
| PIMCO Cayman Commodity Fund V Ltd. | PIMCO Cayman Commodity Fund VI Ltd. | |||||||||
Date of Incorporation | 06/06/2011 | 06/06/2011 | ||||||||
Subscription Agreement | 07/01/2011 | 06/20/2011 | ||||||||
Fund Net Assets | $ | 53,575 | $ | 2,851,770 | ||||||
Subsidiary % of Fund Net Assets | 0.0% | 0.0% | ||||||||
Subsidiary Financial Statement Information | ||||||||||
Total assets | $ | 10 | $ | 10 | ||||||
Total liabilities | 0 | 0 | ||||||||
Net assets | 10 | 10 | ||||||||
Total income | 0 | 0 | ||||||||
Net investment income (loss) | 0 | (90 | ) | |||||||
Net realized gain (loss) | 0 | (13,202 | ) | |||||||
Net change in unrealized appreciation (depreciation) | 0 | 16,466 | ||||||||
Increase (decrease) in net assets resulting from operations | 0 | 3,174 | ||||||||
| SEMIANNUAL REPORT | DECEMBER 31, 2013 | 99 |
Table of Contents
Notes to Financial Statements (Cont.)
9. FEES AND EXPENSES
(a) Investment Advisory Fee PIMCO is a majority-owned subsidiary of Allianz Asset Management of America L.P. (“Allianz Asset Management”) and serves as the Adviser to the Trust, pursuant to an investment advisory contract. The Adviser receives a monthly fee from each Fund at an annual rate based on average daily net assets (the “Investment Advisory Fee”). The Investment Advisory Fee for all classes is charged at an annual rate as noted in the table below.
(b) Supervisory and Administrative Fee PIMCO serves as administrator (the “Administrator”) and provides supervisory and administrative services to the Trust for which it receives a monthly supervisory and administrative fee based on each share class’s average daily net assets (the “Supervisory and Administrative Fee”). As the Administrator, PIMCO bears the costs of various third-party services, including audit, custodial, portfolio accounting, legal, transfer agency and printing costs.
The Investment Advisory and Supervisory and Administrative Fees for all classes are charged at an annual rate as noted in the following table:
| Investment Advisory Fee | Supervisory and Administrative Fee | |||||||||||||||||||||||||||
| Fund Name | All Classes | Institutional Class | Class P | Administrative Class | Class D | A, C and R Classes | ||||||||||||||||||||||
PIMCO Dividend and Income Builder Fund | 0.69% | 0.30% | 0.40% | N/A | 0.40% | 0.40% | ||||||||||||||||||||||
PIMCO EqS® Dividend Fund | 0.69% | 0.30% | 0.40% | N/A | 0.40% | 0.40% | ||||||||||||||||||||||
PIMCO EqS® Emerging Markets Fund | 1.00% | 0.45% | 0.55% | 0.45% | 0.55% | 0.55% | ||||||||||||||||||||||
PIMCO EqS® Long/Short Fund | 1.04% | 0.45% | 0.55% | N/A | 0.55% | 0.55% | ||||||||||||||||||||||
PIMCO Emerging Multi-Asset Fund | 0.90% | 0.45% | 0.55% | 0.45% | 0.55% | 0.55% | ||||||||||||||||||||||
PIMCO EqS Pathfinder Fund® | 0.75% | 0.30% | 0.40% | N/A | 0.40% | 0.40% | ||||||||||||||||||||||
(c) Distribution and Servicing Fees PIMCO Investments LLC (“PI”), a wholly-owned subsidiary of PIMCO, serves as the distributor (“Distributor”) of the Trust’s shares.
The Trust has adopted separate Distribution and Servicing Plans with respect to the Class A, Class C and Class R shares of the Trust pursuant to Rule 12b-1 under the Act. In connection with the distribution of Class C and Class R shares of the Trust, the Distributor receives distribution fees from the Trust of up to 0.75% for Class C shares and 0.25% for Class R shares, and in connection with personal services rendered to Class A, Class C and Class R shareholders and the maintenance of such shareholder accounts, the Distributor receives servicing fees from the Trust of up to 0.25% for each of Class A, Class C and Class R shares (percentages reflect annual rates of the average daily net assets attributable to the applicable class).
The Trust has adopted a Distribution and Servicing Plan with respect to the Class D shares of each Fund pursuant to Rule 12b-1 under the Act (the “Class D Plan”). Under the terms of the Class D Plan, a Fund is permitted to compensate the Distributor out of the assets attributable to the Class D shares of the Fund, in an amount up to 0.25% on an annual basis of the average daily net assets of the Fund’s Class D shares for providing, or procuring through financial intermediaries, distribution, shareholder services, and/or maintenance of shareholder accounts with respect to Class D shareholders of the Fund, some of which may be deemed to be primarily intended to result in the sale of Class D shares.
The Trust has adopted a Distribution and Servicing Plan with respect to the Administrative Class shares of each Fund pursuant to Rule 12b-1
under the Act (the “Administrative Class Plan”). Under the terms of the Administrative Class Plan, a Fund may compensate the Distributor for providing, or procuring through financial intermediaries, distribution, administrative, recordkeeping, shareholder and/or related services with respect to Administrative Class shares. The Administrative Class Plan permits a Fund to make total payments at an annual rate of up to 0.25% of the average daily net assets attributable to the Administrative Class shares.
The Trust paid distribution and servicing fees at effective rates as set forth in the following table (calculated as a percentage of each Fund’s average daily net assets attributable to each class):
| Distribution Fee | Servicing Fee | |||||||||
Administrative Class | — | 0.25% | ||||||||
Class D | — | 0.25% | ||||||||
Class A | — | 0.25% | ||||||||
Class C | 0.75% | 0.25% | ||||||||
Class R | 0.25% | 0.25% | ||||||||
The Distributor also received the proceeds of the initial sales charges paid by the shareholders upon the purchase of Class A shares and the contingent deferred sales charges paid by the shareholders upon certain redemptions of Class A and Class C Class shares. For the period ended December 31, 2013, the Distributor received $276,443 representing commissions (sales charges) and contingent deferred sales charges from the Trust.
(d) Fund Expenses The Trust is responsible for the following expenses: (i) salaries and other compensation of any of the Trust’s executive
| 100 | PIMCO EQUITY SERIES |
Table of Contents
December 31, 2013 (Unaudited)
officers and employees who are not officers, directors, stockholders or employees of PIMCO or its subsidiaries or affiliates; (ii) taxes and governmental fees; (iii) brokerage fees and commissions and other portfolio transaction expenses; (iv) costs of borrowing money, including interest expense; (v) fees and expenses of the Trustees who are not “interested persons” of PIMCO or the Trust, and any counsel retained exclusively for their benefit; (vi) extraordinary expense, including costs of litigation and indemnification expenses; (vii) organization expenses and (viii) any expenses allocated or allocable to a specific class of shares, which include service fees payable with respect to the Administrative Class Shares, and may include certain other expenses as permitted by the Trust’s Multi-Class Plan adopted pursuant to Rule 18f-3 under the Act and subject to review and approval by the Trustees. The ratio of expenses to average net assets per share class, as disclosed on the Financial Highlights, may differ from the annual fund operating expenses per share class as disclosed in the Prospectus for the reasons set forth above.
Each unaffiliated Trustee receives an annual retainer of $60,000, plus $4,750 for each Board of Trustees meeting attended in person, $375 ($750 in the case of the audit committee chair with respect to audit committee meetings) for each committee meeting attended and $750 for each Board of Trustees meeting attended telephonically, plus reimbursement of related expenses. In addition, the audit committee chair receives an additional annual retainer of $7,500 and each other committee chair receives an additional annual retainer of $750.
These expenses are allocated on a pro-rata basis to each Fund of the Trust according to its respective net assets. The Trust pays no compensation directly to any Trustee or any other officer who is affiliated with the Administrator, all of whom receive remuneration for their services to the Trust from the Administrator or its affiliates.
(e) Expense Limitation PIMCO has agreed to waive a portion of the Funds’ Supervisory and Administrative Fees in each Fund’s first fiscal year, to the extent that the payment of each Fund’s pro rata share of organizational expenses and Trustee Fees cause the actual expense ratio to rise above the rates disclosed in the then-current prospectus plus 0.0049% (calculated as a percentage of each Fund’s average daily net assets attributable to each class).
PIMCO has contractually agreed to waive a portion of the Investment Advisory Fee as set forth in the following table (calculated as a percentage of each Fund’s average daily net assets).
| Fund Name | Fee Waiver | Date | ||||||||
PIMCO Dividend and Income Builder Fund | 0.16% | 10/31/2014 | ||||||||
PIMCO EqS® Dividend Fund | 0.16% | 10/31/2014 | ||||||||
PIMCO EqS® Emerging Markets Fund | 0.20% | 10/31/2014 | ||||||||
PIMCO EqS® Long/Short Fund(1) | 0.09% | 10/31/2013 | ||||||||
PIMCO EqS Pathfinder Fund® | 0.16% | 10/31/2014 | ||||||||
| (1) | The 0.09% advisory fee waiver expired on 10/31/13. |
Under the Fee Limitation Agreement, PIMCO is entitled to reimbursement by each Fund of any portion of the Supervisory and Administrative Fee and/or Investment Advisory Fee waived, reduced or reimbursed pursuant to the Fee Limitation Agreement (the “Reimbursement Amount”) during the previous three years, provided that such amount paid to PIMCO will not: 1) together with any
recoupment of organizational expenses and pro rata Trustees’ fees pursuant to the Expense Limitation Agreement, exceed the Expense Limit; 2) exceed the total Reimbursement Amount; or 3) include any amounts previously reimbursed to PIMCO. The Fee Limitation Agreement will automatically renew for one-year terms unless PIMCO provides written notice to the Trust at least 30 days prior to the end of the then current term.
PIMCO may be reimbursed for these waived amounts in future periods, not to exceed thirty-six months after the waiver. Expenses that have been waived may still be reimbursed by the Administrator, to the extent the Fund’s annualized total portfolio operating expenses plus the amount reimbursed does not exceed the operating expense limitation. The recoverable amounts to PIMCO at , were as follows (amounts in thousands):
| Fund Name | Recoverable Amounts | |||||
PIMCO Dividend and Income Builder Fund | $ | 127 | ||||
PIMCO EqS® Dividend Fund | 174 | |||||
PIMCO EqS® Emerging Markets Fund | 186 | |||||
PIMCO EqS® Long/Short Fund | 264 | |||||
PIMCO Emerging Multi-Asset Fund | 143 | |||||
PIMCO EqS Pathfinder Fund® | 292 | |||||
(f) Acquired Fund Fees and Expenses The Underlying PIMCO Fund expenses for the PIMCO Emerging Multi-Asset Fund are based upon an allocation of the PIMCO Emerging Multi-Asset Fund’s assets among the Underlying PIMCO Funds and upon the total annual operating expenses of the Institutional Class shares of these Underlying PIMCO Funds. Underlying PIMCO Fund expenses will vary with changes in the expenses of the Underlying PIMCO Funds, as well as the allocation of the PIMCO Emerging Multi-Asset Fund’s assets.
PIMCO has contractually agreed, through October 31, 2014, to waive, first, the Investment Advisory Fee and, second, to the extent necessary, the Supervisory and Administrative Fee it receives from the PIMCO
| SEMIANNUAL REPORT | DECEMBER 31, 2013 | 101 |
Table of Contents
Notes to Financial Statements (Cont.)
Emerging Multi-Asset Fund in an amount equal to the expenses attributable to Investment Advisory and Supervisory and Administrative Fees of Underlying PIMCO Funds indirectly incurred by the Fund in connection with the Fund’s investments in Underlying PIMCO Funds, to the extent the Investment Advisory Fee and Supervisory and Administrative Fees taken together are greater than or equal to the Investment Advisory Fees and Supervisory and Administrative Fees of the Underlying PIMCO Funds. This agreement renews annually for a full year unless terminated by PIMCO upon at least 30 days’ notice prior to the end of the contract term. The waivers are reflected in the Statements of Operations as a component of Waiver and/or Reimbursement by PIMCO. For the period ended December 31, 2013, the amount was $328,838.
Each Commodity Subsidiary has entered into a separate contract with PIMCO for the management of each Commodity Subsidiary’s portfolio pursuant to which the Commodity Subsidiary pays PIMCO a management fee and administrative services fee at the annual rates of 0.49% and 0.20%, respectively, of its net assets. PIMCO has contractually agreed to waive the Investment Advisory Fee and Supervisory and Administrative Fees it receives from each Commodity Subsidiary in an amount equal to the management fee and administrative services fee, respectively, paid to PIMCO by each Commodity Subsidiary. This waiver may not be terminated by PIMCO and will remain in effect for as long as PIMCO’s contract with each Commodity Subsidiary is in place. The waiver is reflected in the Consolidated Statements of Operations as a component of Waiver and/or Reimbursement by PIMCO. During the period ended December 31, 2013, the Fund below waived the following fees (amounts in thousands):
| Fund Name | Waived Fees | |||||
PIMCO EqS Pathfinder Fund® | $ | 90 | ||||
PIMCO Emerging Multi-Asset Fund | 0 | * | ||||
| * | Amount is less than $500 |
10. RELATED PARTY TRANSACTIONS
The Adviser, Administrator, and Distributor are related parties. Fees payable to these parties are disclosed in Note 9 and the accrued related party fee amounts are disclosed on the Statements of Assets and Liabilities.
Certain Funds are permitted to purchase or sell securities from or to certain related affiliated funds under specified conditions outlined in procedures adopted by the Board of Trustees of the Trust. The procedures have been designed to ensure that any purchase or sale of securities by the Funds from or to another fund or portfolio that are, or could be, considered an affiliate by virtue of having a common investment adviser (or affiliated investment advisers), common Trustees
and/or common officers complies with Rule 17a-7 of the Act. Further, as defined under the procedures, each transaction is effected at the current market price. During the period ended December 31, 2013, the Funds below engaged in purchases and sales of securities pursuant to Rule 17a-7 of the Act (amounts in thousands):
| Fund Name | Purchases | Sales | ||||||||
PIMCO EqS® Dividend Fund | $ | 179 | $ | 5,917 | ||||||
PIMCO EqS® Long/Short Fund | 2,899 | 0 | ||||||||
PIMCO EqS Pathfinder Fund® | 1,526 | 14,723 | ||||||||
11. GUARANTEES AND INDEMNIFICATIONS
Under the Trust’s organizational documents, each Trustee or officer of the Trust is indemnified and each employee or other agent of the Trust (including the Trust’s investment manager) may be indemnified, to the extent permitted by the Act, against certain liabilities that may arise out of performance of their duties to the Funds. Additionally, in the normal course of business, the Funds enter into contracts that contain a variety of indemnification clauses. The Funds’ maximum exposure under these arrangements is unknown as this would involve future claims that may be made against the Funds that have not yet occurred. However, the Funds have not had prior claims or losses pursuant to these contracts.
12. PURCHASES AND SALES OF SECURITIES
The length of time a Fund has held a particular security is not generally a consideration in investment decisions. A change in the securities held by a Fund is known as “portfolio turnover.” Each Fund may engage in frequent and active trading of portfolio securities to achieve its investment objective, particularly during periods of volatile market movements. High portfolio turnover involves correspondingly greater expenses to a Fund, including brokerage commissions or dealer mark-ups and other transaction costs on the sale of securities and reinvestments in other securities. Such sales may also result in realization of taxable capital gains, including short-term capital gains (which are generally taxed at ordinary income tax rates). The trading costs and tax effects associated with portfolio turnover may adversely affect a Fund’s performance. The portfolio turnover rates are reported in the Financial Highlights.
| 102 | PIMCO EQUITY SERIES |
Table of Contents
December 31, 2013 (Unaudited)
Purchases and sales of securities (excluding short-term investments) for the period ended December 31, 2013 were as follows (amounts in thousands):
| U.S. Government/Agency | All Other | |||||||||||||||||
| Fund Name | Purchases | Sales | Purchases | Sales | ||||||||||||||
PIMCO Dividend and Income Builder Fund | $ | 431 | $ | 319 | $ | 580,463 | $ | 184,863 | ||||||||||
PIMCO EqS® Dividend Fund | 0 | 0 | 294,107 | 344,459 | ||||||||||||||
PIMCO EqS® Emerging Markets Fund | 0 | 4 | 129,517 | 267,870 | ||||||||||||||
PIMCO EqS® Long/Short Fund | 0 | 0 | 2,774,578 | 2,278,996 | ||||||||||||||
PIMCO Emerging Multi-Asset Fund | 0 | 0 | 8,613 | 18,651 | ||||||||||||||
PIMCO EqS Pathfinder Fund® | 500 | 500 | 1,096,246 | 501,779 | ||||||||||||||
13. SHARES OF BENEFICIAL INTEREST
The Trust may issue an unlimited number of shares of beneficial interest with a $0.0001 par value. Changes in shares of beneficial interest were as follows (shares and amounts in thousands):
| PIMCO Dividend and Income Builder Fund | PIMCO EqS® Dividend Fund (1) | PIMCO EqS® Emerging Markets Fund (2) | ||||||||||||||||||||||||||||||||||||||||||||||||
| Six Months Ended 12/31/2013 | Year Ended 06/30/2013 | Six Months Ended 12/31/2013 | Year Ended 06/30/2013 | Six Months Ended 12/31/2013 | Year Ended 06/30/2013 | |||||||||||||||||||||||||||||||||||||||||||||
| Shares | Amount | Shares | Amount | Shares | Amount | Shares | Amount | Shares | Amount | Shares | Amount | |||||||||||||||||||||||||||||||||||||||
Receipts for shares sold | ||||||||||||||||||||||||||||||||||||||||||||||||||
Institutional Class | 2,299 | $ | 27,659 | 6,368 | $ | 72,769 | 2,604 | $ | 31,775 | 33,254 | $ | 387,790 | 9,149 | $ | 76,339 | 7,691 | $ | 66,152 | ||||||||||||||||||||||||||||||||
Class P | 4,019 | 48,657 | 7,038 | 81,313 | 377 | 4,638 | 179 | 2,067 | 268 | 2,384 | 943 | 8,577 | ||||||||||||||||||||||||||||||||||||||
Administrative Class | 0 | 0 | 0 | �� | 0 | 0 | 0 | 0 | 0 | 0 | 2 | 2 | 13 | |||||||||||||||||||||||||||||||||||||
Class D | 1,038 | 12,594 | 2,941 | 33,217 | 264 | 3,239 | 689 | 7,851 | 248 | 2,081 | 814 | 7,357 | ||||||||||||||||||||||||||||||||||||||
Class A | 14,761 | 178,336 | 9,803 | 113,906 | 2,961 | 36,414 | 2,489 | 29,225 | 320 | 2,747 | 413 | 3,589 | ||||||||||||||||||||||||||||||||||||||
Class C | 17,393 | 209,494 | 7,557 | 87,841 | 2,765 | 33,844 | 1,538 | 18,044 | 109 | 935 | 119 | 1,036 | ||||||||||||||||||||||||||||||||||||||
Class R | 14 | 170 | 2 | 23 | (1 | ) | 0 | 8 | 90 | 0 | 0 | 0 | 0 | |||||||||||||||||||||||||||||||||||||
Issued as reinvestment of distributions | ||||||||||||||||||||||||||||||||||||||||||||||||||
Institutional Class | 99 | 1,218 | 131 | 1,511 | 3,048 | 36,460 | 1,442 | 16,798 | 0 | 0 | 668 | 5,839 | ||||||||||||||||||||||||||||||||||||||
Class P | 57 | 702 | 63 | 728 | 23 | 275 | 3 | 32 | 0 | 0 | 0 | 2 | ||||||||||||||||||||||||||||||||||||||
Administrative Class | 0 | 0 | 0 | 0 | 0 | 0 | 0 | 0 | 0 | 0 | 0 | 0 | ||||||||||||||||||||||||||||||||||||||
Class D | 33 | 406 | 54 | 626 | 55 | 652 | 14 | 158 | 0 | 0 | 1 | 10 | ||||||||||||||||||||||||||||||||||||||
Class A | 208 | 2,573 | 129 | 1,493 | 306 | 3,655 | 31 | 365 | 0 | 0 | 4 | 32 | ||||||||||||||||||||||||||||||||||||||
Class C | 129 | 1,605 | 49 | 571 | 197 | 2,337 | 14 | 164 | 0 | 0 | 1 | 6 | ||||||||||||||||||||||||||||||||||||||
Class R | 0 | 4 | 1 | 8 | 1 | 7 | 0 | 1 | 0 | 0 | 0 | 0 | ||||||||||||||||||||||||||||||||||||||
Cost of shares redeemed | ||||||||||||||||||||||||||||||||||||||||||||||||||
Institutional Class | (1,496 | ) | (17,963 | ) | (1,602 | ) | (18,277 | ) | (14,192 | ) | (173,814 | ) | (16,018 | ) | (191,791 | ) | (21,550 | ) | (183,044 | ) | (12,854 | ) | (112,211 | ) | ||||||||||||||||||||||||||
Class P | (863 | ) | (10,435 | ) | (504 | ) | (5,836 | ) | (180 | ) | (2,189 | ) | (68 | ) | (799 | ) | (484 | ) | (3,973 | ) | (27 | ) | (241 | ) | ||||||||||||||||||||||||||
Administrative Class | 0 | 0 | 0 | 0 | 0 | 0 | 0 | 0 | 0 | (3 | ) | (1 | ) | (6 | ) | |||||||||||||||||||||||||||||||||||
Class D | (371 | ) | (4,483 | ) | (1,216 | ) | (14,121 | ) | (67 | ) | (827 | ) | (165 | ) | (1,857 | ) | (245 | ) | (2,104 | ) | (806 | ) | (7,300 | ) | ||||||||||||||||||||||||||
Class A | (2,862 | ) | (34,306 | ) | (1,074 | ) | (12,458 | ) | (766 | ) | (9,464 | ) | (426 | ) | (5,015 | ) | (128 | ) | (1,103 | ) | (201 | ) | (1,683 | ) | ||||||||||||||||||||||||||
Class C | (1,939 | ) | (23,378 | ) | (873 | ) | (9,963 | ) | (1,035 | ) | (12,393 | ) | (479 | ) | (5,645 | ) | (59 | ) | (488 | ) | (37 | ) | (310 | ) | ||||||||||||||||||||||||||
Class R | (1 | ) | (17 | ) | (24 | ) | (264 | ) | 0 | 0 | 0 | 0 | 0 | 0 | 0 | 0 | ||||||||||||||||||||||||||||||||||
Net increase (decrease) resulting from Fund share transactions | 32,518 | $ | 392,836 | 28,843 | $ | 333,087 | (3,640 | ) | $ | (45,391 | ) | 22,505 | $ | 257,478 | (12,372 | ) | $ | (106,227 | ) | (3,270 | ) | $ | (29,138 | ) | ||||||||||||||||||||||||||
| SEMIANNUAL REPORT | DECEMBER 31, 2013 | 103 |
Table of Contents
Notes to Financial Statements (Cont.)
| PIMCO EqS® Long/Short Fund (3) | PIMCO Emerging Multi-Asset Fund | PIMCO EqS Pathfinder Fund® (4) | ||||||||||||||||||||||||||||||||||||||||||||||||
| Six Months Ended 12/31/2013 | Year Ended 06/30/2013 | Six Months Ended 12/31/2013 | Year Ended 06/30/2013 | Six Months Ended 12/31/2013 | Year Ended 06/30/2013 | |||||||||||||||||||||||||||||||||||||||||||||
| Shares | Amount | Shares | Amount | Shares | Amount | Shares | Amount | Shares | Amount | Shares | Amount | |||||||||||||||||||||||||||||||||||||||
| Receipts for shares sold | ||||||||||||||||||||||||||||||||||||||||||||||||||
| Institutional Class | 12,440 | $ | 150,267 | 9,876 | $ | 99,250 | 318 | $ | 2,808 | 2,839 | $ | 26,656 | 74,152 | $ | 870,845 | 7,010 | $ | 73,964 | ||||||||||||||||||||||||||||||||
| Class P | 8,589 | 103,520 | 1,663 | 17,754 | 67 | 588 | 201 | 1,874 | 1,361 | 15,700 | 2,524 | 26,912 | ||||||||||||||||||||||||||||||||||||||
| Administrative Class | 0 | 0 | 0 | 0 | 11 | 101 | 245 | 2,296 | 0 | 0 | 0 | 0 | ||||||||||||||||||||||||||||||||||||||
| Class D | 5,525 | 64,810 | 1,219 | 13,332 | 138 | 1,193 | 579 | 5,376 | 314 | 3,581 | 1,048 | 11,044 | ||||||||||||||||||||||||||||||||||||||
| Class A | 16,117 | 190,568 | 2,511 | 27,131 | 280 | 2,429 | 657 | 6,039 | 1,454 | 16,880 | 1,519 | 16,076 | ||||||||||||||||||||||||||||||||||||||
| Class C | 9,157 | 107,790 | 917 | 9,771 | 102 | 879 | 332 | 3,041 | 1,465 | 16,697 | 601 | 6,376 | ||||||||||||||||||||||||||||||||||||||
| Class R | 0 | 0 | 0 | 0 | 0 | 0 | 5 | 43 | 1 | 3 | 0 | 3 | ||||||||||||||||||||||||||||||||||||||
| Issued as reinvestment of distributions | ||||||||||||||||||||||||||||||||||||||||||||||||||
| Institutional Class | 2,198 | 26,087 | 110 | 1,029 | 54 | 469 | 82 | 758 | 7,387 | 86,726 | 5,607 | 57,868 | ||||||||||||||||||||||||||||||||||||||
| Class P | 449 | 5,314 | 1 | 9 | 4 | 33 | 5 | 47 | 205 | 2,400 | 127 | 1,307 | ||||||||||||||||||||||||||||||||||||||
| Administrative Class | 0 | 0 | 0 | 0 | 4 | 31 | 0 | 2 | 0 | 0 | 0 | 0 | ||||||||||||||||||||||||||||||||||||||
| Class D | 261 | 3,080 | 0 | 2 | 10 | 89 | 9 | 84 | 50 | 587 | 62 | 631 | ||||||||||||||||||||||||||||||||||||||
| Class A | 779 | 9,185 | 2 | 15 | 20 | 175 | 35 | 325 | 189 | 2,209 | 143 | 1,472 | ||||||||||||||||||||||||||||||||||||||
| Class C | 452 | 5,275 | 0 | 2 | 6 | 53 | 11 | 101 | 116 | 1,324 | 81 | 820 | ||||||||||||||||||||||||||||||||||||||
| Class R | 0 | 0 | 0 | 0 | 0 | 0 | 0 | 1 | 0 | 1 | 0 | 0 | ||||||||||||||||||||||||||||||||||||||
| Issued in reorganization Cost of shares redeemed | ||||||||||||||||||||||||||||||||||||||||||||||||||
| Institutional Class | (2,555 | ) | (30,450 | ) | (2,145 | ) | (21,301 | ) | (1,370 | ) | (12,015 | ) | (2,169 | ) | (19,712 | ) | (18,645 | ) | (218,830 | ) | (47,263 | ) | (503,207 | ) | ||||||||||||||||||||||||||
| Class P | (558 | ) | (6,689 | ) | (251 | ) | (2,460 | ) | (76 | ) | (663 | ) | (205 | ) | (1,899 | ) | (661 | ) | (7,688 | ) | (3,603 | ) | (37,955 | ) | ||||||||||||||||||||||||||
| Administrative Class | 0 | 0 | 0 | 0 | (35 | ) | (297 | ) | (8 | ) | (77 | ) | 0 | 0 | 0 | 0 | ||||||||||||||||||||||||||||||||||
| Class D | (1,450 | ) | (16,617 | ) | (107 | ) | (1,098 | ) | (153 | ) | (1,341 | ) | (492 | ) | (4,437 | ) | (457 | ) | (5,192 | ) | (1,296 | ) | (13,691 | ) | ||||||||||||||||||||||||||
| Class A | (1,292 | ) | (15,403 | ) | (398 | ) | (4,244 | ) | (408 | ) | (3,562 | ) | (418 | ) | (3,811 | ) | (726 | ) | (8,449 | ) | (3,052 | ) | (32,290 | ) | ||||||||||||||||||||||||||
| Class C | (414 | ) | (4,813 | ) | (54 | ) | (588 | ) | (167 | ) | (1,430 | ) | (188 | ) | (1,702 | ) | (475 | ) | (5,377 | ) | (2,031 | ) | (21,199 | ) | ||||||||||||||||||||||||||
| Class R | 0 | 0 | 0 | 0 | 0 | 0 | (2 | ) | (20 | ) | 0 | 0 | 0 | 0 | ||||||||||||||||||||||||||||||||||||
| Net increase (decrease) resulting from Fund share transactions | 49,698 | $ | 591,924 | 13,344 | $ | 138,604 | (1,195 | ) | $ | (10,460 | ) | 1,518 | $ | 14,985 | 65,730 | $ | 771,417 | (38,523 | ) | $ | (411,869 | ) | ||||||||||||||||||||||||||||
| (1) | As of December 31, 2013, two shareholders each owned 10% or more of the total Fund’s outstanding shares comprising 47% of the Fund, and each of the two shareholders are related parties of the Fund.* |
| (2) | As of December 31, 2013, three shareholders each owned 10% or more of the total Fund’s outstanding shares comprising 74% of the Fund, and each of the three shareholders are related parties of the Fund.* |
| (3) | As of December 31, 2013, two shareholders each owned 10% or more of the total Fund’s outstanding shares comprising 29% of the Fund, and each of the two shareholders are related parties of the Fund.* |
| (4) | As of December 31, 2013, two shareholders each owned 10% or more of the total Fund’s outstanding shares comprising 76% of the Fund, and each of the two shareholders are related parties of the Fund.* |
| * | Related parties may include, but are not limited to, the investment manager and its affiliates, affiliated broker dealers, fund of funds and directors or employees of the Trust or Adviser. |
14. REGULATORY AND LITIGATION MATTERS
The Trust is not engaged in any material litigation or arbitration proceedings and is not aware of any material litigation or claim pending or threatened by or against it.
15. FEDERAL INCOME TAX MATTERS
Each Fund intends to qualify as a regulated investment company under Subchapter M of the Internal Revenue Code (the “Code”) and distribute all of its taxable income and net realized gains, if applicable, to shareholders. Accordingly, no provision for Federal income taxes has been made.
| 104 | PIMCO EQUITY SERIES |
Table of Contents
December 31, 2013 (Unaudited)
In accordance with provisions set forth under U.S. GAAP, the Adviser has reviewed the Funds’ tax positions for all open tax years. As of , the Funds have recorded no liability for net unrecognized tax benefits relating to uncertain income tax positions they have taken or expect to take in future tax returns.
The Funds file U.S. tax returns. While the statute of limitations remains open to examine the Funds’ U.S. tax returns filed for the fiscal years ending in 2010-2012, no examinations are in progress or anticipated at this time. The Funds are not aware of any tax positions for which it is reasonably possible that the total amounts of unrecognized tax benefits will significantly change in the next twelve months.
The Consolidated Funds may gain exposure to the commodities markets primarily through index-linked notes, and may invest in other commodity-linked derivative investments, including commodity swap agreements, options, futures contracts, options on futures contracts and foreign funds investing in similar commodity-lined derivatives.
One of the requirements for favorable tax treatment as a regulated investment company under the Code is that a Fund must derive at least 90% of its gross income from certain qualifying sources of income. The IRS has issued a revenue ruling which holds that income derived from commodity index-linked swaps is not qualifying income under Subchapter M of the Code. The IRS has also issued private letter rulings in which the IRS specifically concluded that income from certain commodity index-linked notes is qualifying income. The IRS has also
issued private rulings in which the IRS specifically concluded that income derived from investment in a subsidiary, which invests primarily in commodity-linked swaps, will also be qualifying income. Based on the reasoning in such rulings, each Fund will continue to seek to gain exposure to the commodity markets primarily through investments in commodity-linked notes and through any investments in its Subsidiary.
It should be noted, however, that the IRS currently has suspended the issuance of such rulings pending further review. There can be no assurance that the IRS will not change its position that income derived from commodity-linked notes and wholly-owned subsidiaries is qualifying income. Furthermore, the tax treatment of commodity-linked notes, other commodity-linked derivatives, and a Fund’s investments in its Subsidiary may otherwise be adversely affected by future legislation, Treasury Regulations and/or guidance issued by the IRS. Such developments could affect the character, timing and/or amount of the Fund’s taxable income or any distributions made by the Fund or result in the inability of the Fund to operate as described in its Prospectus.
If, during a taxable year, the Subsidiary’s taxable losses (and other deductible items) exceed its income and gains, the net loss will not pass through to the Fund as a deductible amount for income tax purposes. Note that the loss from the Subsidiary’s taxable gains exceed its losses and other deductible items during a taxable year, the net gain will pass through to the Fund as income for Federal income tax purposes.
As of December 31, 2013 the aggregate cost and the net unrealized appreciation/(depreciation) of investments for federal income tax purposes are as follows (amounts in thousands):
| Fund Name | Federal Tax Cost | Unrealized Appreciation | Unrealized (Depreciation) | Net Unrealized Appreciation/ (Depreciation) (1) | ||||||||||||||
PIMCO Dividend and Income Builder Fund | $ | 772,263 | $ | 67,127 | $ | (8,023 | ) | $ | 59,104 | |||||||||
PIMCO EqS® Dividend Fund | 535,604 | 74,727 | (5,672 | ) | 69,055 | |||||||||||||
PIMCO EqS® Emerging Markets Fund | 431,025 | 31,495 | (29,599 | ) | 1,896 | |||||||||||||
PIMCO EqS® Long/Short Fund | 965,464 | 65,425 | (5,160 | ) | 60,265 | |||||||||||||
PIMCO Emerging Multi-Asset Fund | 57,114 | 0 | (4,406 | ) | (4,406 | ) | ||||||||||||
PIMCO EqS Pathfinder Fund® | 2,469,176 | 479,014 | (68,342 | ) | 410,672 | |||||||||||||
| (1) | Primary differences, if any, between book and tax net unrealized appreciation/(depreciation) are attributable to wash sale loss deferrals for federal income tax purposes. |
| SEMIANNUAL REPORT | DECEMBER 31, 2013 | 105 |
Table of Contents
Glossary: (abbreviations that may be used in the preceding statements)
(Unaudited)
| Counterparty Abbreviations: | ||||||||||
| BOA | Bank of America N.A. | FOB | Credit Suisse Securities (USA) LLC | SCX | Standard Chartered Bank | |||||
| BOS | Banc of America Securities LLC | GLM | Goldman Sachs Bank USA | SSB | State Street Bank and Trust Co. | |||||
| BPS | BNP Paribas S.A. | HUS | HSBC Bank USA N.A. | UAG | UBS AG Stamford | |||||
| BRC | Barclays Bank PLC | JPM | JPMorgan Chase Bank N.A. | UBS | UBS Securities LLC | |||||
| CBK | Citibank N.A. | MSC | Morgan Stanley & Co., Inc. | ULO | UBS AG London | |||||
| DUB | Deutsche Bank AG | RBC | Royal Bank of Canada | WST | Westpac Banking Corp. | |||||
| FBF | Credit Suisse International | RYL | Royal Bank of Scotland Group PLC | |||||||
| Currency Abbreviations: | ||||||||||
| AUD | Australian Dollar | HKD | Hong Kong Dollar | PHP | Philippine Peso | |||||
| BRL | Brazilian Real | HUF | Hungarian Forint | PLN | Polish Zloty | |||||
| CAD | Canadian Dollar | IDR | Indonesian Rupiah | RUB | Russian Ruble | |||||
| CHF | Swiss Franc | ILS | Israeli Shekel | SEK | Swedish Krona | |||||
| CLP | Chilean Peso | INR | Indian Rupee | SGD | Singapore Dollar | |||||
| CNY | Chinese Renminbi | JPY | Japanese Yen | THB | Thai Baht | |||||
| COP | Colombian Peso | KRW | South Korean Won | TRY | Turkish New Lira | |||||
| CZK | Czech Koruna | MXN | Mexican Peso | TWD | Taiwanese Dollar | |||||
| DKK | Danish Krone | MYR | Malaysian Ringgit | USD (or $) | United States Dollar | |||||
| EUR | Euro | NOK | Norwegian Krone | ZAR | South African Rand | |||||
| GBP | British Pound | PEN | Peruvian New Sol | |||||||
| Exchange Abbreviations: | ||||||||||
| CBOE | Chicago Board Options Exchange | |||||||||
| Index Abbreviations: | ||||||||||
| CDX.IG | Credit Derivatives Index - Investment Grade | KOSPI | Korea Composite Stock Price Index | |||||||
| Other Abbreviations: | ||||||||||
| ADR | American Depositary Receipt | GDR | Global Depositary Receipt | REIT | Real Estate Investment Trust | |||||
| ALT | Alternate Loan Trust | JSC | Joint Stock Company | SP - ADR | Sponsored American Depositary Receipt | |||||
| BBR | Bank Bill Rate | LIBOR | London Interbank Offered Rate | SP - GDR | Sponsored Global Depositary Receipt | |||||
| BBSW | Bank Bill Swap Reference Rate | MSCI | Morgan Stanley Capital International | WTI | West Texas Intermediate | |||||
| EURIBOR | Euro Interbank Offered Rate | NIBOR | Norway Interbank Offered Rate | |||||||
| 106 | PIMCO EQUITY SERIES |
Table of Contents
Approval of Renewal of the Investment Advisory Contract and Second Amended and Restated Supervision and Administration Agreement
(Unaudited)
On August 14, 2013, the Board of Trustees (the “Board”) of PIMCO Equity Series (the “Trust”), including all of the independent Trustees, approved the Investment Advisory Contract and Second Amended and Restated Supervision and Administration Agreement (the “Supervision and Administration Agreement” and together with the Investment Advisory Contract, the “Agreements”) with Pacific Investment Management Company LLC (“PIMCO”), on behalf of the Trust’s series (the “Funds”), for an additional one-year term through August 31, 2014.
The information, material factors and conclusions that formed the basis for the Board’s approvals are described below.
1. INFORMATION RECEIVED
(a) Materials Reviewed: During the course of each year, the Trustees receive a wide variety of materials relating to the services provided by PIMCO. At each of its quarterly meetings, the Board reviews the Funds’ investment performance and a significant amount of information relating to Fund operations, including the Funds’ compliance program, shareholder services, valuation, custody, distribution, and other information relating to the nature, extent and quality of services provided by PIMCO to the Trust. In considering whether to approve the renewal of the Agreements, the Board also reviewed supplementary information, including, but not limited to, comparative industry data with regard to investment performance, advisory and supervisory and administrative fees and expenses, financial information regarding PIMCO, information about the personnel providing investment management services and supervisory and administrative services to the Funds and, as available, information about the fees charged and services provided by PIMCO to other clients with similar investment mandates as the Funds. The Board also reviewed material provided by counsel to the Trust and the independent Trustees, which included, among other things, a memorandum outlining legal duties of the Board in considering the continuation of the Agreements.
(b) Review Process: In connection with the approval of the renewal of the Agreements, the Board reviewed written materials prepared by PIMCO in response to a request from counsel to the Trust and the independent Trustees. The Board also requested and received assistance and advice regarding applicable legal standards from counsel to the Trust and the independent Trustees, and reviewed comparative fee and performance data prepared at the Board’s request by Lipper, Inc. (“Lipper”), an independent provider of investment company performance and fee and expense data. The Board also heard oral presentations on matters related to the Agreements and met both as a full Board and as the independent Trustees, without management present, at the August 14, 2013 meeting. The independent Trustees also met with counsel to the Trust and independent Trustees on August 5, 2013 to discuss the materials presented.
The approval determinations were made on the basis of each Trustee’s business judgment after consideration of all the information presented. Individual Trustees may have given different weights to certain factors and assigned various degrees of materiality to information received in connection with the approval process. In deciding to approve the renewal of the Agreements, the Board did not identify any single factor or particular information that, in isolation, was controlling. This summary describes the most important, but not all, of the factors considered by the Board.
2. NATURE, EXTENT AND QUALITY OF SERVICES
(a) PIMCO, its Personnel, and Resources: The Board considered the depth and quality of PIMCO’s investment management process, including: the experience, capability and integrity of its senior management and other personnel; the turnover rates of its key personnel; the overall financial strength and stability of its organization; and the ability of its organizational structure to address the recent growth in PIMCO’s assets under management. The Board also considered that PIMCO makes available to its investment professionals a variety of resources and systems relating to investment management, compliance, trading, performance and portfolio accounting. The Board noted that PIMCO has hired many seasoned equity professionals at senior levels and continues to invest in its global infrastructure. The Board considered PIMCO’s commitment to investing in information technology supporting investment management and compliance, as well as PIMCO’s continuing efforts to attract and retain qualified personnel, including personnel with relevant equities experience, and to maintain and enhance its resources and systems. The Board considered PIMCO’s policies, procedures and systems to assure compliance with applicable laws and regulations and its commitment to these programs; its efforts to keep the Trustees informed about matters relevant to the Funds and their shareholders; and its attention to matters that may involve conflicts of interest between the Funds’ investments and those of other accounts.
The Trustees considered the steps that PIMCO has taken in recent years with respect to active management of counterparty risk, such as implementing procedures requiring daily collateral adjustments and frequent communication between credit analysts and the counterparty risk committee. The Trustees considered that, over the last several years, PIMCO has continued to strengthen the process it uses to assess the financial stability of broker-dealers with which the Funds do business, to manage collateral and to protect portfolios from an unforeseen deterioration in the creditworthiness of trading counterparties. The Trustees noted that, consistent with its fiduciary duty, PIMCO executes transactions through a competitive best execution process and uses only the counterparties that meet its stringent and monitored criteria. The Trustees also considered that
| SEMIANNUAL REPORT | DECEMBER 31, 2013 | 107 |
Table of Contents
Approval of Renewal of the Investment Advisory Contract and Second Amended and Restated Supervision and Administration Agreement (Cont.)
PIMCO’s collateral management team utilized the counterparty risk system to analyze portfolio level exposure and any applicable collateral being exchanged with counterparties.
The Trustees also considered new services and service enhancements that PIMCO has implemented since the Agreements were renewed in 2012, including, but not limited to, undertaking significant technology and outsourcing initiatives, expanding the quality management system for processes/activities, implementing a new relationship management model with key intermediaries, enhancing the Funds’ recordkeeping system to comply with Internal Revenue Service cost basis reporting requirements, transitioning to a proprietary platform for shareholder cash flow reporting, continuing to refine the “Pricing Portal” to streamline and automate certain pricing functions, continuing to migrate shareholder confirmation and statement creation and mailing to Broadridge Investor Connection Solutions, Inc., streamlining processes to enable earlier daily net asset value delivery to major intermediary clients and to enhance transparency in the pricing process, working with PricewaterhouseCoopers LLP to analyze the impact of the Foreign Account Tax Compliance Act, and engaging in extensive preparation and testing of business continuity capabilities to respond quickly in the event of a crisis.
Additionally, the Trustees considered the recent decline in assets for some of the Funds and the reasons for the decline. Ultimately, the Board concluded that the nature, extent and quality of services provided by PIMCO under the Agreements are likely to continue to benefit the Funds and their shareholders.
(b) Other Services: The Board considered PIMCO’s policies, procedures and systems to assure compliance with applicable laws and regulations and its commitment to these programs; its efforts to keep the Trustees informed about matters relevant to each Fund and its shareholders; and its attention to matters that may involve conflicts of interest with the Trust. The Board also considered the nature, extent, quality and cost of supervisory and administrative services provided by PIMCO to the Funds under the Agreements.
The Board considered the terms of Trust’s Supervision and Administration Agreement, under which each Fund pays for the supervisory and administrative services it requires under what is essentially an all-in fee structure (the “unified fee”). In return, PIMCO provides or procures supervisory and administrative services and bears the costs of various third party services required by the Funds, including audit, custodial, portfolio accounting, legal, transfer agency and printing costs. The Board noted that the scope and complexity of the supervisory and administrative services provided by PIMCO under the Supervision and Administration Agreement continue to increase. The Board considered PIMCO’s provision of these services and its supervision
of the Trust’s third party service providers to assure that these service providers continue to provide a high level of service relative to alternatives in the market.
Ultimately, the Board concluded that the nature, extent and quality of the services provided by PIMCO has benefited and will likely continue to benefit the Funds and their shareholders.
3. INVESTMENT PERFORMANCE
The Board received and examined information from PIMCO concerning the Funds’ performance, as available, for the one-, two-, three-, five-, and ten-year and since inception periods ended May 31, 2013 and other performance data, as available, for the periods ended June 30, 2013 (the “PIMCO Report”) and from Lipper concerning the Funds’ performance, as available, for the periods ended May 31, 2013 (the “Lipper Report”). The Board noted that, with the exception of the PIMCO Pathfinder Fund® and the PIMCO EqS® Long/Short Fund, long-term performance information was not available due to each Fund’s relatively recent commencement of operations. The Board considered each Fund’s investment performance relative to its peer group and benchmark index as provided to the Board in advance of each of its quarterly meetings throughout the year, including the PIMCO Report and the Lipper Report, which were provided in advance of the August 14, 2013 meeting.
The Board noted that, according to Lipper, certain Funds had underperformed in comparison to their respective peer groups or benchmark indexes, or both, over the one year period ended May 31, 2013. The Board considered the reasons for these Funds’ underperformance in comparison to their peer groups or benchmark indexes, or both.
The Board ultimately determined within the context of all of its considerations in connection with the Agreements, that PIMCO’s performance record and process in managing the Funds indicates that its continued management is likely to benefit the Funds and their shareholders, and merits the approval of the continuation of the Agreements.
4. ADVISORY FEES, SUPERVISORY AND ADMINISTRATIVE FEES AND TOTAL EXPENSES
PIMCO reported to the Board that, in proposing fees for the Funds, it considers a number of factors, including the type and complexity of the services provided, the cost of providing services, the risk assumed by PIMCO in the provision of services, the impact on potential returns from different levels of fees, the competitive marketplace for financial products, and the attractiveness of potential returns to the Funds’ investors.
The Board reviewed the advisory fee, supervisory and administrative fee and total expenses of the Funds (each as a percentage of average net
| 108 | PIMCO EQUITY SERIES |
Table of Contents
(Unaudited)
assets) and compared such amounts with the average and median fees and expenses of other similar funds. With respect to advisory fees, the Board reviewed data from Lipper that compared the average and median advisory fees of other funds in an “Expense Group” of comparable funds, as well as the universe of other similar funds. The Board compared each Fund’s total expenses to other funds in the Expense Group provided by Lipper and found each Fund’s total expenses to be reasonable. The Board noted that PIMCO had contractually agreed, through October 31, 2013, to reduce its advisory fee by 0.16%, 0.16%, 0.20%, 0.09% and 0.16% of the average daily net assets of the PIMCO Dividend and Income Builder, PIMCO EqS® Dividend, PIMCO EqS® Emerging Markets, PIMCO EqS® Long Short and PIMCO EqS Pathfinder® Funds, respectively.
The Board also reviewed data comparing the Funds’ advisory fees to the standard fee rate PIMCO charges to separate accounts and other investment companies with a similar investment strategy and noted that three of the four Funds that have comparable separate account strategies have adviser fees that are lower than the fee charged to the separate account. In cases where the advisory fees for certain separate account clients were lower than those charged to the PIMCO EqS Pathfinder Fund®, the Trustees noted that the differences in fees were attributable to various factors, including differences in the services provided by PIMCO to the Funds, the size of the assets under management with PIMCO, the manner in which similar portfolios may be managed, different requirements with respect to liquidity management and the implementation of other regulatory requirements, and the fact that separate accounts may have other contractual arrangements that justify different levels of fees. At the time that the Board considered the Agreements, PIMCO did not manage any separate accounts with investment strategies similar to those of the PIMCO Emerging Multi-Asset Fund and PIMCO EqS® Long/Short Fund.
The Board considered each Fund’s supervisory and administrative fees, comparing them to similar funds in the report supplied by Lipper. The Board considered that PIMCO has provided a broad array of fund supervisory and administrative functions. The Board considered the Trust’s unified fee structure, under which each Fund pays for the supervisory and administrative services it requires for one set fee, and in return, PIMCO provides or procures supervisory and administrative services and bears the costs of various third party services required by the Fund, including audit, custodial, portfolio accounting, legal, transfer agency and printing costs. The Board considered that many other funds pay for these services separately, and thus it is difficult to directly compare each Fund’s unified supervisory and administrative fees with the fees paid by other funds for administrative services alone. The Board considered that the unified supervisory and administrative fee leads to fund fees that are fixed, rather than variable. The Board concluded that the Funds’ supervisory and administrative fees were
reasonable in relation to the value of the services provided, including the services provided to different classes of shareholders, and that the expenses assumed contractually by PIMCO under the Supervision and Administration Agreement represent, in effect, a cap on overall fund expenses which is beneficial to the Funds and their shareholders. The Board further noted that, although the unified fee structure does not have breakpoints, it implicitly reflects economies of scale by fixing the absolute level of Fund fees at competitive levels, in effect, setting the fees as if a Fund was already at scale.
The Trustees also considered the advisory fees charged to the PIMCO Emerging Multi-Asset Fund, which operates as a fund of funds (the “Fund of Funds”), and the advisory services provided in exchange for such fees. The Trustees determined that such services were in addition to the advisory services provided to the underlying series in which the Fund of Funds may invest and, therefore, such services were not duplicative of the advisory services provided to the underlying series. The Board also considered the various fee waiver agreements in place for the Fund of Funds.
Based on the information presented by PIMCO and Lipper, members of the Board then determined, in the exercise of their business judgment, that the level of the advisory and supervisory and administrative fees charged by PIMCO, as well as the total expenses of the Funds, are reasonable and renewal of the Agreements would likely benefit the Funds and their shareholders.
5. ADVISER COSTS, LEVEL OF PROFITS AND ECONOMIES OF SCALE
The Board reviewed information regarding PIMCO’s costs of providing services to the Funds as a whole and considered that PIMCO continues to invest in the equity asset management platform and does not expect to derive any profit from the Funds during their current fiscal year. The Board noted that it had also received information regarding the structure and manner in which PIMCO’s investment professionals were compensated and PIMCO’s view of the relationship of such compensation to the attraction and retention of quality personnel. The Board considered PIMCO’s need to invest in technology, infrastructure and staff to reinforce and offer new services and to accommodate changing regulatory requirements.
With respect to potential economies of scale, the Board found that because the unified fee protects shareholders against unanticipated increases in expense ratios due to redemptions, declines in asset values, or increases in the costs of services provided or procured by PIMCO, economies of scale are implicitly recognized in the level of the unified fee (which, together with the advisory fee, serves as a proxy for each Fund’s overall expense ratio). The Board noted that PIMCO may share the benefits of economies of scale with the Funds and their shareholders in a number of ways, including through fee reductions or
| SEMIANNUAL REPORT | DECEMBER 31, 2013 | 109 |
Table of Contents
Approval of Renewal of the Investment Advisory Contract and Second Amended and Restated Supervision and Administration Agreement (Cont.)
(Unaudited)
waivers, the pricing of the Funds to scale from inception and the enhancement of services provided to the Funds in return for fees paid. The Trustees also considered that the unified fee has provided inherent economies of scale by maintaining fixed fees even if the Funds’ operating costs rise.
The Board concluded that the Funds’ cost structures were reasonable and that the unified fee structure inherently involves the sharing of economies of scale between PIMCO and the Funds, to the benefit of Fund shareholders.
6. ANCILLARY BENEFITS
The Board considered other benefits received by PIMCO and its affiliates as a result of PIMCO’s relationship with the Trust, including possible ancillary benefits to PIMCO’s institutional investment management business due to the reputation and market penetration of the Funds. The Board also considered that affiliates of PIMCO provide distribution and shareholder services to the Funds and their shareholders, for which the affiliates of PIMCO may be compensated
under the unified supervisory and administrative fee, or through distribution fees paid pursuant to the Funds’ Rule 12b-1 plans. The Board reviewed PIMCO’s soft dollar policies and procedures, noting that while PIMCO has the authority to receive the benefit of research provided by broker-dealers executing portfolio transactions on behalf of the Funds, it has adopted a policy not to enter into contractual soft dollar arrangements.
7. CONCLUSIONS
Based on its review, including its consideration of each of the factors referred to above, the Board concluded that the nature, extent and quality of the services rendered to the Funds by PIMCO supported the renewal of the Agreements. The Board concluded that the Agreements continued to be fair and reasonable to the Funds and their shareholders, that the Funds’ shareholders received reasonable value in return for the fees paid to PIMCO by the Funds under the Agreements and that the renewal of the Agreements was in the best interests of the Funds and their shareholders.
| 110 | PIMCO EQUITY SERIES |
Table of Contents
General Information
Investment Adviser and Administrator
Pacific Investment Management Company LLC
840 Newport Center Drive
Newport Beach, CA 92660
Distributor
PIMCO Investments LLC
1633 Broadway
New York, NY 10019
Custodian
State Street Bank and Trust Company
801 Pennsylvania
Kansas City, MO 64105
Transfer Agent
Boston Financial Data Services
Institutional Class, Class P, Administrative Class, Class D
330 W. 9th Street, 5th Floor
Kansas City, MO 64105
Boston Financial Data Services
Class A, Class C, Class R
P.O. Box 55060
Boston, MA 02205-5060
Legal Counsel
Dechert LLP
1900 K Street, N.W.
Washington, D.C. 20006
Independent Registered Public Accounting Firm
PricewaterhouseCoopers LLP
1100 Walnut Street
Kansas City, MO 64106
This report is submitted for the general information of the shareholders of the PIMCO Equity Series.
Table of Contents

Sign up for e-delivery
To get future shareholder reports online and to eliminate mailings, go to: pimco.com/edelivery
pimco.com/investments

PES4001SAR_123113
Table of Contents
Item 2. | Code of Ethics. | |||||||
The information required by this Item 2 is only required in an annual report on this Form N-CSR. | ||||||||
Item 3. | Audit Committee Financial Expert. | |||||||
| The information required by this Item 3 is only required in an annual report on this Form N-CSR. | ||||||||
Item 4. | Principal Accountant Fees and Services. | |||||||
| The information required by this Item 4 is only required in an annual report on this Form N-CSR. | ||||||||
Item 5. | Audit Committee of Listed Registrants. | |||||||
The information required by this Item 5 is only required in an annual report on this Form N-CSR. | ||||||||
Item 6. | Schedule of Investments. | |||||||
| The Schedule of Investments is included as part of the report to shareholders under Item 1. | ||||||||
Table of Contents
Item 7. | Disclosure of Proxy Voting Policies and Procedures for Closed-End Management Investment Companies. | |||||
| Not applicable. | ||||||
Item 8. | Portfolio Managers of Closed-End Management Investment Companies. | |||||
| Not applicable. | ||||||
Item 9. | Purchases of Equity Securities by Closed-End Management Investment Company and Affiliated Purchases. | |||||
| Not applicable. | ||||||
Item 10. | Submission of Matters to a Vote of Security Holders. | |||||
| Not applicable. | ||||||
Item 11. | Controls and Procedures. | |||||
| (a) | The principal executive officer and principal financial officer have concluded that the Registrant’s disclosure controls and procedures (as defined in Rule 30a-3(c) under the Investment Company Act of 1940, as amended (“1940 Act”)) provide reasonable assurances that material information relating to the Trust is made known to them by the appropriate persons, based on their evaluation of these controls and procedures as of a date within 90 days of the filing of this report. | |||||
| (b) | There were no changes in the Registrant’s internal control over financial reporting (as defined in Rule 30a-3(d) under the 1940 Act) that occurred during the second fiscal quarter of the period covered by this report that have materially affected, or are reasonably likely to materially affect, the Registrant’s internal control over financial reporting. | |||||
Item 12. | Exhibits. | |||||
(a)(1) | Exhibit 99.CODE—Code of Ethics is not applicable for semiannual reports. | |||||
(a)(2) | Exhibit 99.CERT—Certifications pursuant to Section 302 of the Sarbanes-Oxley Act of 2002. | |||||
(b) | Exhibit 99.906CERT—Certifications pursuant to Section 906 of the Sarbanes-Oxley Act of 2002. | |||||
Table of Contents
Signatures
Pursuant to the requirements of the Securities Exchange Act of 1934 and the Investment Company Act of 1940, the registrant has duly caused this report to be signed on its behalf by the undersigned, thereunto duly authorized.
| PIMCO Equity Series | ||
| By: | /s/ PETER G. STRELOW | |
| Peter G. Strelow | ||
| President, Principal Executive Officer | ||
| Date: February 28, 2014 | ||
Pursuant to the requirements of the Securities Exchange Act of 1934 and the Investment Company Act of 1940, this report has been signed below by the following persons on behalf of the registrant and in the capacities and on the dates indicated.
| By: | /S/ PETER G. STRELOW | |
| Peter G. Strelow | ||
| President, Principal Executive Officer | ||
| Date: February 28, 2014 | ||
| By: | /s/ TRENT W. WALKER | |
| Trent W. Walker | ||
| Treasurer, Principal Financial Officer | ||
| Date: February 27, 2014 | ||