
2016 Third Quarter Earnings October 20, 2016
Safe Harbor Statement 2 10/20/2016 Forward-Looking Statements Information in this press release contains forward-looking statements. Any statements about our expectations, beliefs, plans, predictions, forecasts, objectives, assumptions or future events or performance are not historical facts and may be forward- looking. These statements are often, but not always, made through the use of words or phrases such as "anticipate," "believes," "can," "could," "may," "predicts," "potential," "should," "will," "estimate," "plans," "projects," "continuing," "ongoing," "expects," "intends" and similar words or phrases. Accordingly, these statements are only predictions and involve estimates, known and unknown risks, assumptions and uncertainties that could cause actual results to differ materially from those expressed in them. Our actual results could differ materially from those anticipated in such forward-looking statements as a result of several factors more fully described under the caption "Risk Factors" in the annual report on Form 10-K and other periodic reports filed by us with the Securities and Exchange Commission. Any or all of our forward-looking statements in this press release may turn out to be inaccurate. The inclusion of this forward-looking information should not be regarded as a representation by us or any other person that the future plans, estimates or expectations contemplated by us will be achieved. We have based these forward- looking statements largely on our current expectations and projections about future events and financial trends that we believe may affect our financial condition, results of operations, business strategy and financial needs. There are important factors that could cause our actual results, level of activity, performance or achievements to differ materially from the results, level of activity, performance or achievements expressed or implied by the forward looking statements including, but not limited to: (1) changes in general economic and financial market conditions; (2) changes in the regulatory environment; (3) economic conditions generally and in the financial services industry; (4) changes in the economy affecting real estate values; (5) our ability to achieve loan and deposit growth; (6) the completion of future acquisitions or business combinations and our ability to integrate any acquired businesses into our business model; (7) projected population and income growth in our targeted market areas; (8) competitive pressures in our markets and industry; (9) our ability to attract and retain key personnel; (10) changes in accounting policies or judgments and (11) volatility and direction of market interest rates and a weakening of the economy which could materially impact credit quality trends and the ability to generate loans. All forward-looking statements are necessarily only estimates of future results, and actual results may differ materially from expectations. You are, therefore, cautioned not to place undue reliance on such statements, which should be read in conjunction with the other cautionary statements that are included elsewhere in this press release. Further, any forward-looking statement speaks only as of the date on which it is made, and we undertake no obligation to update or revise any forward-looking statement to reflect events or circumstances after the date on which the statement is made or to reflect the occurrence of unanticipated events.

3 A Fully Integrated Regional Bank in SE Growth Markets 10/20/2016
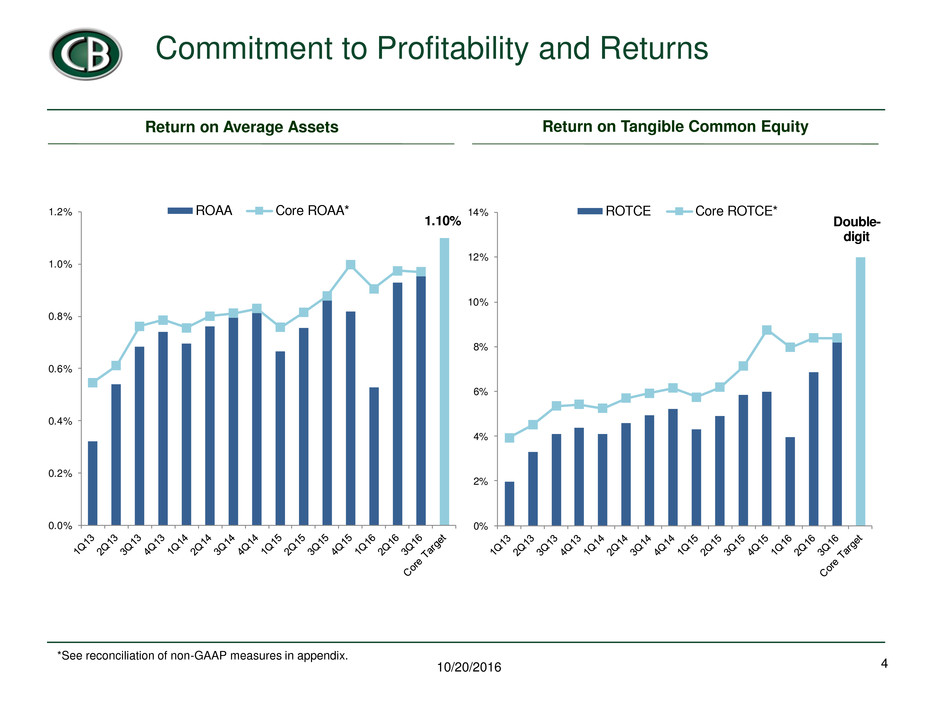
4 Commitment to Profitability and Returns 10/20/2016 *See reconciliation of non-GAAP measures in appendix. Return on Tangible Common Equity Return on Average Assets 1.10% 0.0% 0.2% 0.4% 0.6% 0.8% 1.0% 1.2% ROAA Core ROAA* Double- digit 0% 2% 4% 6% 8% 10% 12% 14% ROTCE Core ROTCE*
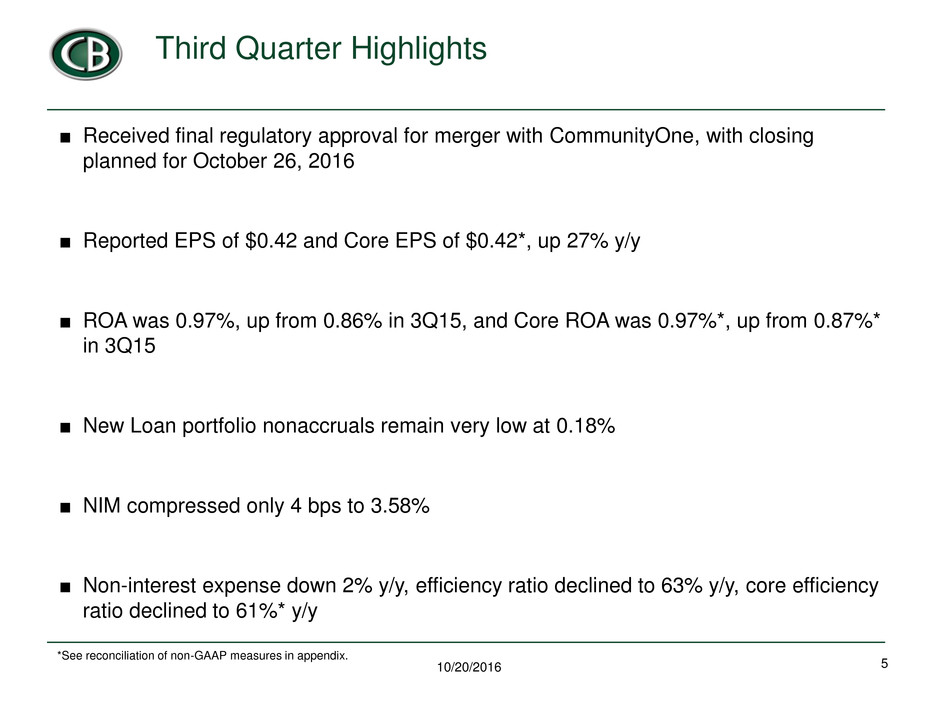
5 Third Quarter Highlights ■ Received final regulatory approval for merger with CommunityOne, with closing planned for October 26, 2016 ■ Reported EPS of $0.42 and Core EPS of $0.42*, up 27% y/y ■ ROA was 0.97%, up from 0.86% in 3Q15, and Core ROA was 0.97%*, up from 0.87%* in 3Q15 ■ New Loan portfolio nonaccruals remain very low at 0.18% ■ NIM compressed only 4 bps to 3.58% ■ Non-interest expense down 2% y/y, efficiency ratio declined to 63% y/y, core efficiency ratio declined to 61%* y/y 10/20/2016 *See reconciliation of non-GAAP measures in appendix.

■ Net interest income increased by $1.1 mm sequentially, thanks to 13% annualized portfolio growth, offset by 4 bps of NIM compression ■ Book value per share sequentially increased by $0.30 to $23.82, and tangible book value sequentially rose by $0.31 to $20.53 Third Quarter Financial Summary 6 10/20/2016 *See reconciliation of non-GAAP measures in appendix. ($ mm's except per share data, growth rates, and metrics) 3Q16 2Q16 3Q15 Net interest income 62.6 2% 2% Provision (reversal) 0.6 -50% -27% Non-interest income 12.4 4% 8% Non-interest expense 47.5 7% -2% Pretax income 26.9 -3% 12% Net income 18.5 6% 21% Per share 0.42$ 5% 27% Adjustments 0.0 NM NM Core Net Income* 18.5 1% 20% Per share 0.42$ 0% 27% Key Metrics 3Q16 2Q16 3Q15 Net interest margin 3.58% 3.62% 3.82% Fee ratio 16.5% 16.2% 15.6% Efficiency ratio 63.4% 60.6% 66.2% ROA 0.97% 0.93% 0.86% ROE 7.2% 6.9% 5.9% Core Metrics Core fee ratio* 16.4% 16.1% 15.7% Core efficiency ratio* 61.1% 59.1% 66.0% Core ROAA* 0.97% 0.97% 0.87% Core ROTCE* 8.4% 8.4% 7.1% % change Non-core adjustments detail $ 000 Conv rsion, merger, and restructuring 218 Legal 61 Legal Settlement 1,500 Tax adjustment (1,067) Securities gains (71) Total pre-tax 641 Tax effect of adjustments (629) Total after-tax 12
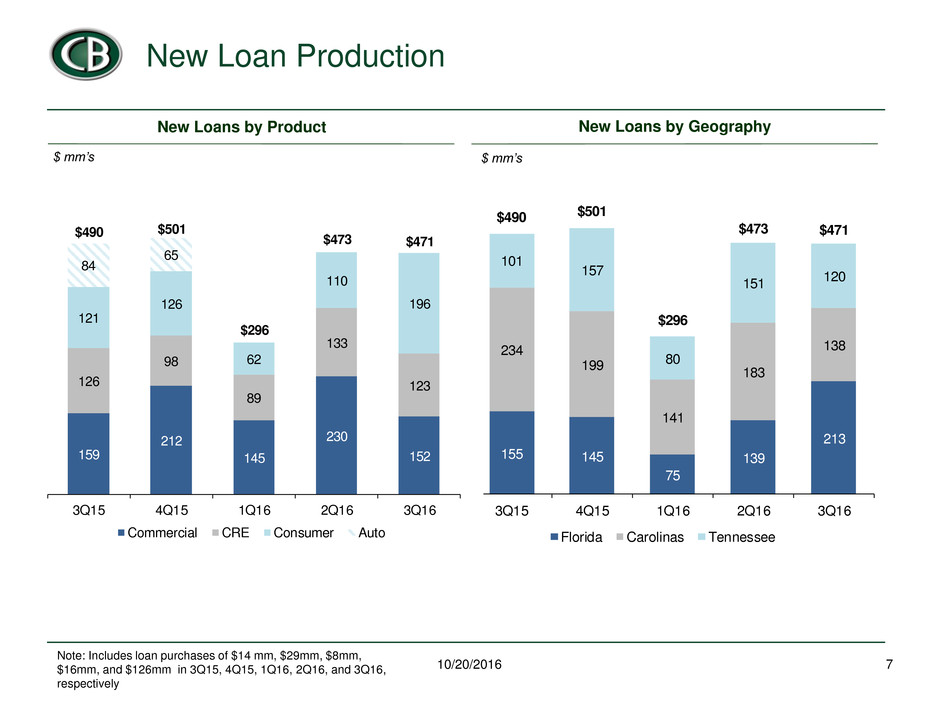
155 145 75 139 213 234 199 141 183 138 101 157 80 151 120 $490 $501 $296 $473 $471 3Q15 4Q15 1Q16 2Q16 3Q16 Florida Carolinas Tennessee New Loan Production 7 10/20/2016 New Loans by Geography New Loans by Product $ mm’s $ mm’s Note: Includes loan purchases of $14 mm, $29mm, $8mm, $16mm, and $126mm in 3Q15, 4Q15, 1Q16, 2Q16, and 3Q16, respectively 159 212 145 230 152 126 98 89 133 123 121 126 62 110 196 84 65 $490 $501 $296 $473 $471 3Q15 4 1Q16 2Q16 3Q16 Commercial CRE Consumer Auto
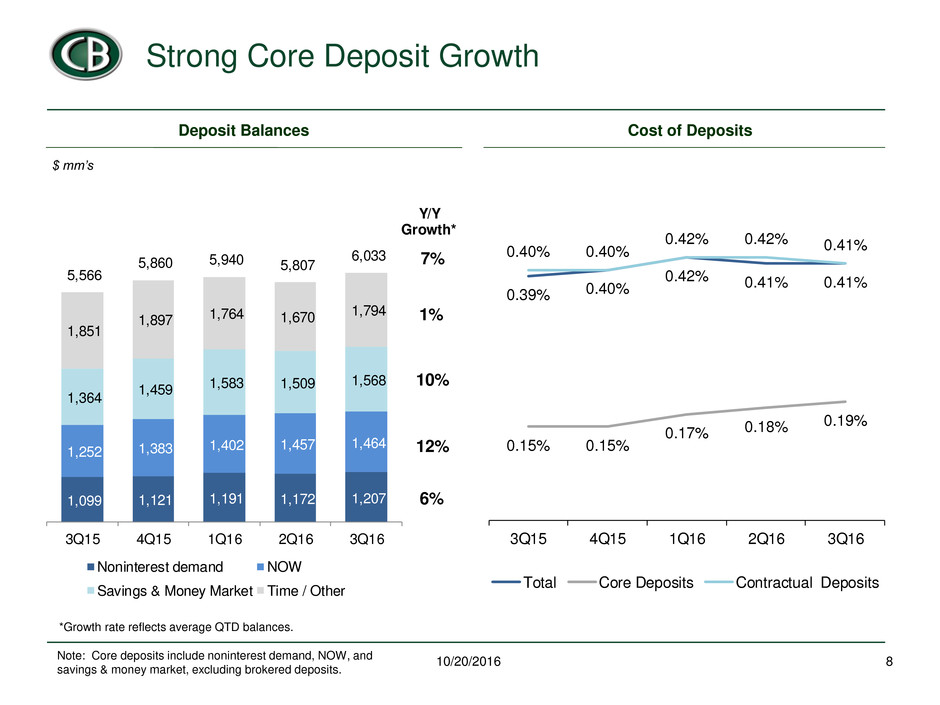
Strong Core Deposit Growth 8 10/20/2016 Cost of Deposits Deposit Balances $ mm’s Note: Core deposits include noninterest demand, NOW, and savings & money market, excluding brokered deposits. *Growth rate reflects average QTD balances. 1,099 1,121 1,191 1,172 1,207 1,252 1,383 1,402 1,457 1,464 1,364 1,459 1,583 1,509 1,568 1,851 1,897 1,764 1,670 1,794 5,566 5,860 5,940 5,807 6,033 3Q15 4Q15 1Q16 2Q16 3Q16 Noninterest demand NOW Savings & Money Market Time / Other Y/Y Growth* 10% 12% 6% 1% 7% 0.39% 0.40% 0.42% 0.41% 0.41% 0.15% 0.15% 0.17% 0.18% 0.19% 0.40% 0.40% 0.42% 0.42% 0.41% 3Q15 4Q15 1Q16 2Q16 3Q16 Total Core Deposits Contractual Deposits
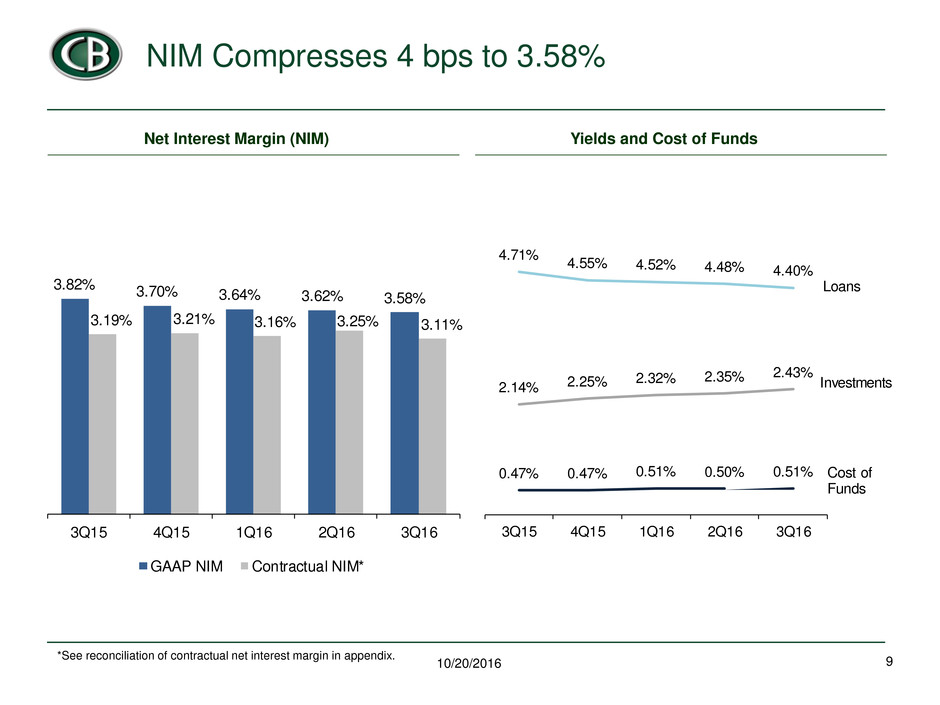
NIM Compresses 4 bps to 3.58% 9 10/20/2016 Net Interest Margin (NIM) *See reconciliation of contractual net interest margin in appendix. Yields and Cost of Funds 3.82% 3.70% 3.64% 3.62% 3.58% 3.19% 3.21% 3.16% 3.25% 3.11% 3Q15 4Q15 1Q16 2Q16 3Q16 GAAP NIM Contractual NIM* 0.47% 0.47% 0.51% 0.50% 0.51% 4.71% 4.55% 4.52% 4.48% 4.40% 2.14% 2.25% 2.32% 2.35% 2.43% 3Q15 4Q15 1Q16 2Q16 3Q16 Loans Investments Cost of Funds
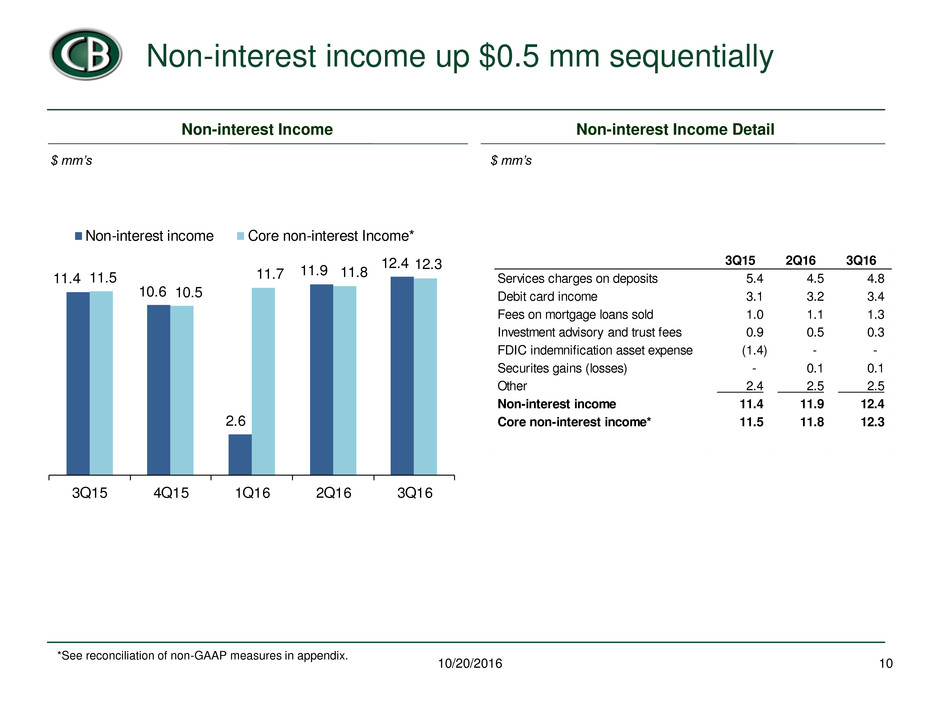
Non-interest income up $0.5 mm sequentially 10 10/20/2016 Non-interest Income $ mm’s *See reconciliation of non-GAAP measures in appendix. Non-interest Income Detail $ mm’s 11.4 10.6 2.6 11.9 12.4 11.5 10.5 11.7 11.8 12.3 3Q15 4Q15 1Q16 2Q16 3Q16 Non-interest income Core non-interest Income* 3Q15 2Q16 3Q16 Services charges on deposits 5.4 4.5 4.8 Debit card income 3.1 3.2 3.4 Fees on mortgage loans sold 1.0 1.1 1.3 Investment advisory and trust fees 0.9 0.5 0.3 FDIC indemnification asset expense (1.4) - - Securites gains (losses) - 0.1 0.1 Other 2.4 2.5 2.5 Non-interest income 11.4 11.9 12.4 Core non-interest income* 11.5 11.8 12.3

Noninterest Expense Down 2% Y/Y 11 10/20/2016 Non-interest Expense $ mm’s *See reconciliation of non-GAAP measures in appendix. Efficiency Ratio 63.4% 61.1% 40% 45% 50% 55% 60% 65% 70% 75% 80% 85% 90% 3Q 12 4Q 12 1Q 13 2Q 13 3Q 13 4Q 13 1Q 14 2Q 14 3Q 14 4Q 14 1Q 15 2Q 15 3Q 15 4Q 15 1Q 16 2Q 16 3Q 16 Efficiency Ratio Core Efficiency Ratio* Target 60% 48.3 42.8 45.0 43.3 45.8 48.3 47.8 46.9 44.5 47.5 3Q15 4Q15 1Q16 2Q16 3Q16 Core non-interest expense* Non-core adjustments

13.6% 12.7% 12.5% 12.6% 12.9% 3Q15 4Q15 1Q16 2Q16 3Q16 1 Liquidity and Capital Ratios Remain Strong 12 10/20/2016 ■ Modified duration of investments was 4.4 years at September 30, 2016, vs. 4.6 years at June 30, 2016 Tier 1 Leverage Ratio1 (1) 3Q16 capital ratio is preliminary. Liquidity Portfolio Cash / Equivalents, 16.4% U.S. Agency Securities, 0.9% Equity Securities and Mutual Funds, 0.3% Corporate bonds, 8.8% Municipal bonds (tax-exempt), 1.3% Industrial Revenue, 0.2% MBS - GSE, 72.1%

0.11% 0.11% 0.09% 0.17% 0.11% 0.17% 0.11% 0.11% 0.12% 0.18% 3Q15 4Q15 1Q16 2Q16 3Q16 Past Due Non-Accruals New Loan Portfolio Performing Strongly 13 10/20/2016 New Loan Portfolio Credit Metrics Past Dues & Nonaccruals Net Charge-offs New Loan Portfolio Reserve Metrics 0.15% 0.22% 0.12% 0.15% 0.12% 3Q15 4Q15 1Q16 2Q16 3Q16 3Q15 2Q16 3Q16 Criticized 0.61% 0.27% 0.25% Classified Performing 0.28% 0.83% 0.71% Classified Nonperforming 0.17% 0.12% 0.18% Total Criticized/Classified 1.06% 1.22% 1.14% 3Q15 Q16 3Q16 Reserves / Loans 0.51% 0.46% 0.43% eserves / NCOs 3. 8x 3.05x 3.39x Reserves / onaccruals 3.04x 3.73x 2.28x

832 577 349 253 225 201 213 195 154 129 78 55 53 49 44 46 986 706 427 308 278 249 257 241 2012 2013 2014 Q315 Q415 1Q16 2Q16 3Q16 Loans REO -76% 3Q15 2Q16 3Q16 Provision (reversal) on legacy loans 492 (778) 48 FDIC indemnification asset expense 1,418 - - OREO valuation expense 2,075 1,119 742 (Gains) losses on sales of OREO (351) (413) (159) Foreclosed asset related expense 872 399 397 Loan workout expense 194 71 206 Salaries and employee benefits 797 519 511 Total legacy credit expense 5,497 917 1,745 Special Assets Down 76% Since 2012 14 10/20/2016 Special Assets Nonperforming Loans / Total Loans $ mm’s Legacy Credit Expenses $000’s 5.8% 2.6% 1.2% 1. % 1.1% 1.0% 2013 2014 2015 1Q16 2Q16 3Q16 Q315 Q415 1Q16 2Q16 3Q16 Criticized 86 74 55 67 62 Classified Performing 85 83 81 81 73 Classified Non-Performing 82 68 65 65 60 Total Special Assets (ex REO) 253 225 201 213 195 Current % (see Note) 62% 61% 65% 68% 71% $ mm’s Note: Percentages represent the portion of criticized loans and classified performing loans that were not past due +30 days since January 1, 2015.

15 Capital Bank Investment Highlights ■ Experienced management team with institutional track record ■ Positioned in Southeastern growth markets ■ Disciplined and sustainable growth story ■ Focused on deploying capital and improving profitability ■ Attractive valuation 10/20/2016
Appendix 16 10/20/2016
GAAP and Non-GAAP Disclosures 17 10/20/2016 Use of Non-GAAP Financial Measures Core net income, core efficiency ratio, core return-on-assets ("core ROA"), tangible book value and tangible book value per share are each non-GAAP measures used in this report. A reconciliation to the most directly comparable GAAP financial measures - net income in the case of core net income and core ROA, total non-interest income and total non-interest expense in the case of core efficiency ratio, and total shareholders' equity in the case of tangible book value and tangible book value per share - appears in tabular form at the end of this release. The Company believes core net income, the core efficiency ratio and core ROA are useful for both investors and management to understand the effects of certain non-interest items and provide an alternative view of the Company's performance over time and in comparison to the Company's competitors. These measures should not be viewed as a substitute for net income. The Company believes that tangible book value and tangible book value per share are useful for both investors and management as these are measures commonly used by financial institutions, regulators and investors to measure the capital adequacy of financial institutions. The Company believes these measures facilitate comparison of the quality and composition of the Company's capital over time and in comparison to its competitors. These measures should not be viewed as a substitute for total shareholders' equity. The Company uses these non-GAAP measures for various purposes, including measuring performance for incentive compensation and as a basis for strategic planning and forecasting. These non-GAAP measures have inherent limitations, are not required to be uniformly applied and are not audited. They should not be considered in isolation or as a substitute for analysis of results reported under GAAP. These non- GAAP measures may not be comparable to similarly titled measures reported by other companies.

Florida 33% North Carolina 33% South Carolina 11% Tennessee 23% Diversified Portfolio by Loan Type and Geography 18 10/20/2016 Portfolio by Loan Type Portfolio by Geography Non-owner Occupied CRE 15% Other C&D 4% Multifamily 1% 1-4 C&D 2% Owner Occupied CRE 18% C&I 25% 1-4 Resi 20% Jr. Lien / HELOC 6% Auto 5% Consumer/ Other 4%
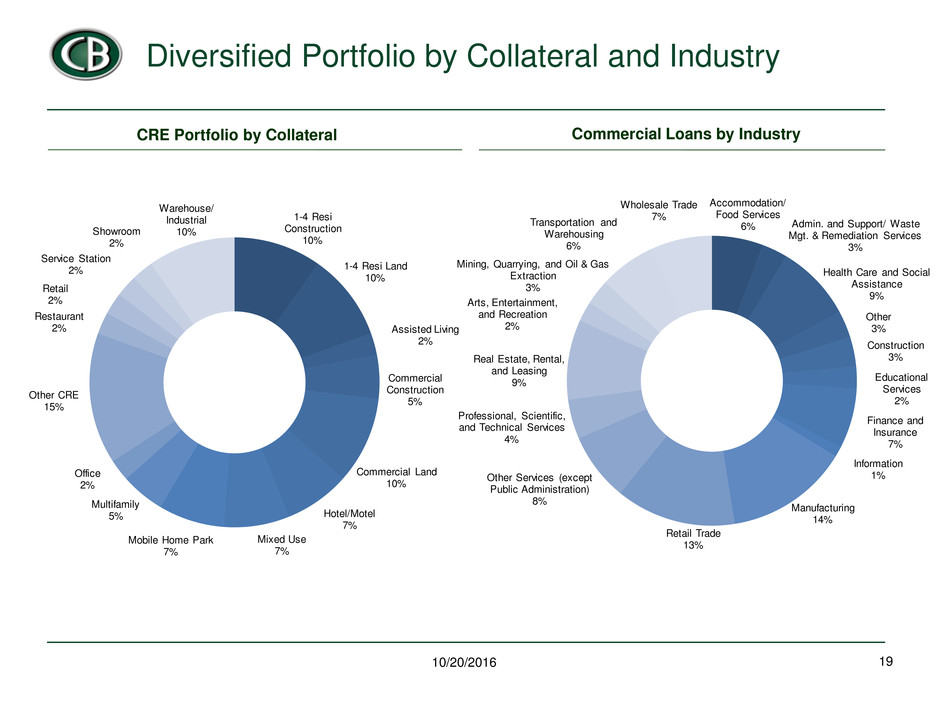
Diversified Portfolio by Collateral and Industry 19 10/20/2016 CRE Portfolio by Collateral Commercial Loans by Industry 1-4 Resi Construction 10% 1-4 Resi Land 10% Assisted Living 2% Commercial Construction 5% Commercial Land 10% Hotel/Motel 7% Mixed Use 7% Mobile Home Park 7% Multifamily 5% Office 2% Other CRE 15% Restaurant 2% Retail 2% Service Station 2% Showroom 2% Warehouse/ Industrial 10% Accommodation/ Food Services 6% Admin. and Support/ Waste Mgt. & Remediation Services 3% Health Care and Social Assistance 9% Other 3% Construction 3% Educational Services 2% Finance and Insurance 7% Information 1% Manufacturing 14% Retail Trade 13% Other Services (except Public Administration) 8% Professional, Scientific, and Technical Services 4% Real Estate, Rental, and Leasing 9% Arts, Entertainment, and Recreation 2% Mining, Quarrying, and Oil & Gas Extraction 3% Transportation and Warehousing 6% Wholesale Trade 7%
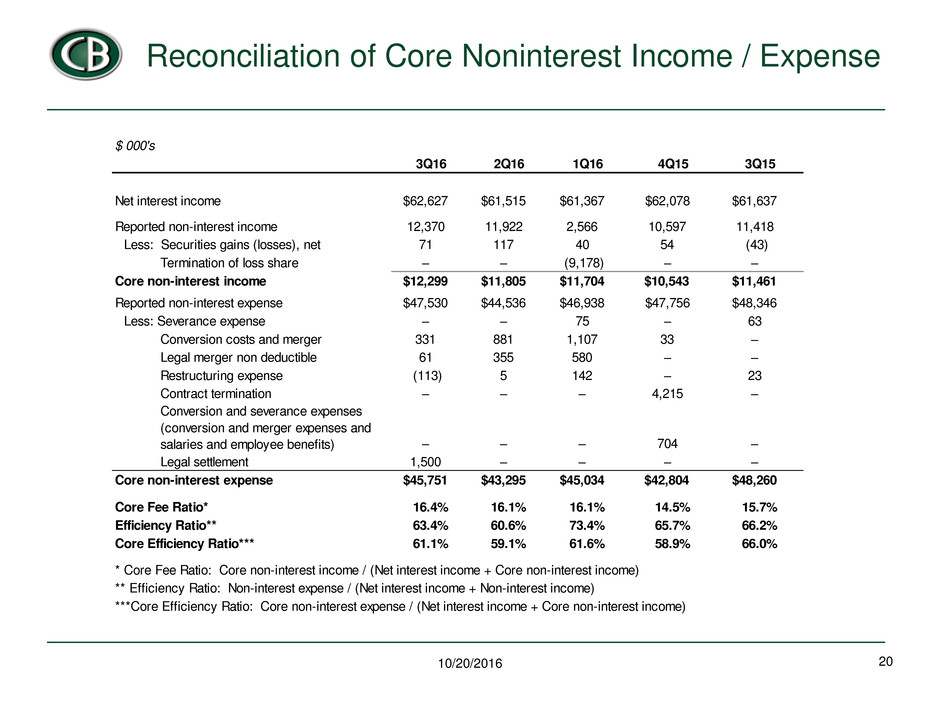
Reconciliation of Core Noninterest Income / Expense 20 10/20/2016 $ 000's 3Q16 2Q16 1Q16 4Q15 3Q15 Net interest income $62,627 $61,515 $61,367 $62,078 $61,637 Reported non-interest income 12,370 11,922 2,566 10,597 11,418 Less: Securities gains (losses), net 71 117 40 54 (43) Termination of loss share – – (9,178) – – Core non-interest income $12,299 $11,805 $11,704 $10,543 $11,461 Reported non-interest expense $47,530 $44,536 $46,938 $47,756 $48,346 Less: Severance expense – – 75 – 63 Conversion costs and merger 331 881 1,107 33 – Legal merger non deductible 61 355 580 – – Restructuring expense (113) 5 142 – 23 Contract termination – – – 4,215 – Conversion and severance expenses (conversion and merger expenses and salaries and employee benefits) – – – 704 – Legal settlement 1,500 – – – – Core non-interest expense $45,751 $43,295 $45,034 $42,804 $48,260 Core Fee Ratio* 16.4% 16.1% 16.1% 14.5% 15.7% Efficiency Ratio** 63.4% 60.6% 73.4% 65.7% 66.2% Core Efficiency Ratio*** 61.1% 59.1% 61.6% 58.9% 66.0% * Core Fee Ratio: Core non-interest income / (Net interest income + Core non-interest income) ** Efficiency Ratio: Non-interest expense / (Net interest income + Non-interest income) ***Core Efficiency Ratio: Core non-interest expense / (Net interest income + Core non-interest income)
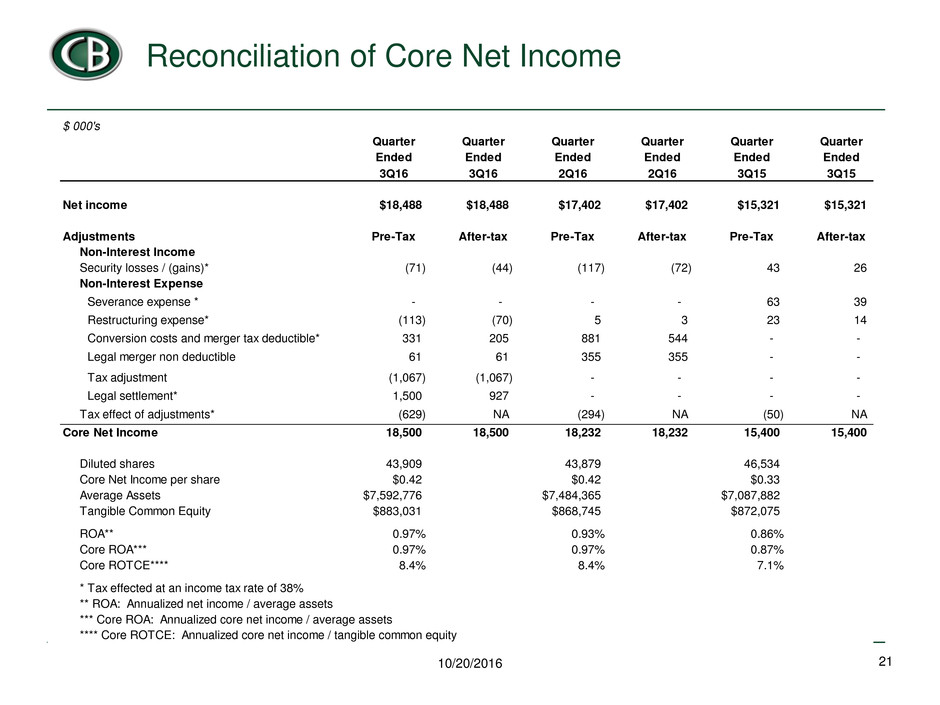
Reconciliation of Core Net Income 21 10/20/2016 $ 000's Quarter Quarter Quarter Quarter Quarter Quarter Ended Ended Ended Ended Ended Ended 3Q16 3Q16 2Q16 2Q16 3Q15 3Q15 $18,488 $18,488 $17,402 $17,402 $15,321 $15,321 Pre-Tax After-tax Pre-Tax After-tax Pre-Tax After-tax Non-Interest Income Security losses / (gains)* (71) (44) (117) (72) 43 26 Non-Interest Expense - - - - 63 39 (113) (70) 5 3 23 14 - 331 205 881 544 - - 61 61 355 355 - - (1,067) (1,067) - - - - 1,500 927 - - - - Tax effect of adjustments* (629) NA (294) NA (50) NA 18,500 18,500 18,232 18,232 15,400 15,400 Diluted shares 43,909 43,879 46,534 Core Net Income per share $0.42 $0.42 $0.33 Average Assets $7,592,776 $7,484,365 $7,087,882 Tangible Common Equity $883,031 $868,745 $872,075 ROA** 0.97% 0.93% 0.86% ore ROA*** 0.97% 0.97% 0.87% Core ROTCE**** 8.4% 8.4% 7.1% * Tax effected at an income tax rate of 38% ** ROA: Annualized net income / average assets *** Core ROA: Annualized core net income / average assets **** Core ROTCE: Annualized core net income / tangible common equity Tax adjustment Legal settlement* Core Net Income Net income Adjustments Severance expense * Restructuring expense* Conversion costs and merger tax deductible* Legal merger non deductible

Tangible Book Value 22 10/20/2016 (In thousands, except per share data) September 30, 2016 Total common shareholders' equity $1,029,841 L ss: Goodwill and core deposit intangibles, net of taxes Intangibles, net of taxes 142,141 Tangible book value* $887,700 Common shares outstanding 43,235 Tangible book value per share $20.53 * Tangible book value is equal to book value less goodwill and core deposit intangibles, net of related deferred tax liabilities.
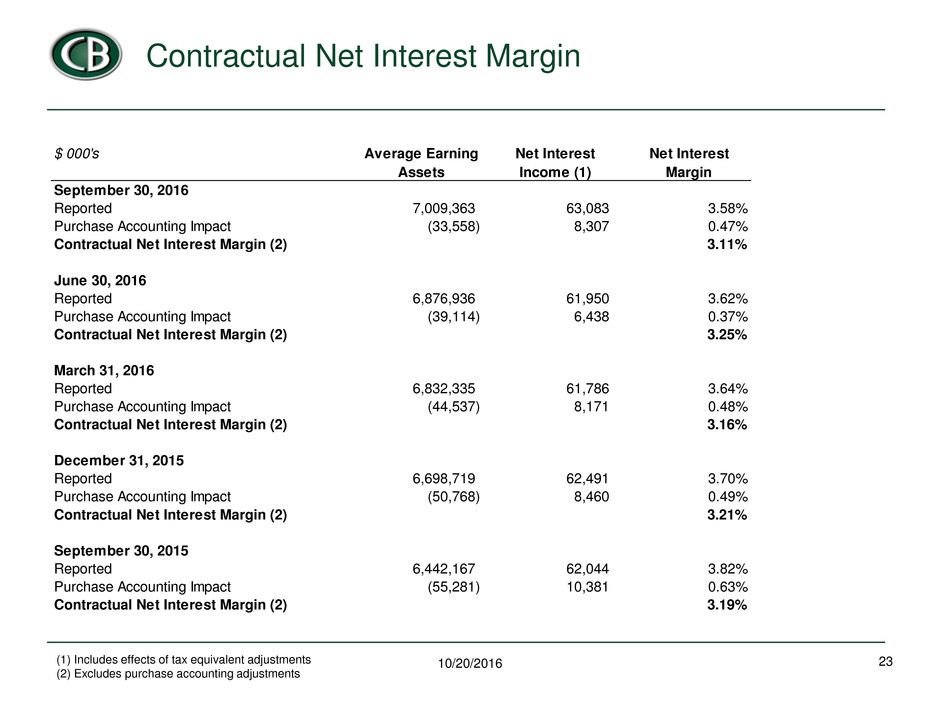
Contractual Net Interest Margin 23 10/20/2016 (1) Includes effects of tax equivalent adjustments (2) Excludes purchase accounting adjustments $ 000's Average Earning Net Interest Net Interest Assets Income (1) Margin September 30, 2016 Reported 7,009,363 63,083 3.58% Purchase Accounting Impact (33,558) 8,307 0.47% Contractual Net Interest Margin (2) 3.11% June 30, 2016 Reported 6,876,936 61,950 3.62% Purchase Accounting Impact (39,114) 6,438 0.37% Contractual Net Interest Margin (2) 3.25% March 31, 2016 Reported 6,832,335 61,786 3.64% Purchase Accounting Impact (44,537) 8,171 0.48% Contractual Net Interest Margin (2) 3.16% December 31, 2015 Reported 6,698,719 62,491 3.70% Purchase Accounting Impact (50,768) 8,460 0.49% Contractual Net Interest Margin (2) 3.21% September 30, 2015 Reported 6,442,167 62,044 3.82% Purchase Accounting Impact (55,281) 10,381 0.63% Contractual Net Interest Margin (2) 3.19%


