As filed with the Securities and Exchange Commission on June 6, 2011
UNITED STATES
SECURITIES AND EXCHANGE COMMISSION
Washington, D.C. 20549
FORM N-CSR
CERTIFIED SHAREHOLDER REPORT OF REGISTERED
MANAGEMENT INVESTMENT COMPANIES
Investment Company Act file number: 811-22378
(Exact name of registrant as specified in charter)
|
| 333 South Grand Avenue, Suite 1800 |
| Los Angeles, CA 90071 |
(Address of principal executive offices) (Zip code)
|
| Ronald R. Redell |
| President |
| DoubleLine Funds Trust |
| 333 South Grand Avenue, Suite 1800 |
| Los Angeles, CA 90071 |
(Name and address of agent for service)
Registrant’s telephone number, including area code: (213) 633-8200
Date of fiscal year end: March 31
Date of reporting period: March 31, 2011
Item 1. Reports to Stockholders.

Annual Report
March 31, 2011

DoubleLine Total Return Bond Fund
DBLTX (I-share)
DLTNX (N-share)
DoubleLine Core Fixed Income Fund
DBLFX (I-share)
DLFNX (N-share)
DoubleLine Emerging Markets Fixed Income Fund
DBLEX (I-share)
DLENX (N-share)
DoubleLine Multi-Asset Growth Fund
DMLIX (I-share)
DMLAX (A-share)
| | |
DoubleLine Capital LP | | 333 S. Grand Avenue 18th Floor Los Angeles, California 90071 doubleline.com |

Table of Contents
| | | | | | |
| | Annual Report | | March 31, 2011 | | 3 |
President’s Letter

May 6, 2011
Dear DoubleLine Funds Shareholder:
The DoubleLine Funds Trust was organized on January 11, 2010. We launched two Funds on April 6, 2010: the DoubleLine Total Return Bond Fund and the DoubleLine Emerging Markets Fixed Income Fund. On June 1, 2010, we launched our third Fund, the DoubleLine Core Fixed Income Fund. On December 20, 2010 we launched our fourth Fund, the DoubleLine Multi-Asset Growth Fund. In the first fiscal year of operations, investors have allocated over $6 billion to the Funds. We strive to deliver superior risk-adjusted returns while working to avoid crossing the double line of risk on the road to successful investing. This motto was inspired by Piet Mondrian (1872-1944), a leading abstract painter of the 20th century, known for his simplicity in balancing brilliant colors and bold black lines. DoubleLine Capital, advisor to the Funds, strives for similar balance by providing investment solutions that integrate risk management with the pursuit of excess returns.
Highlights of Financial Markets through our annual reporting period (April 6, 2010-March 31, 2011)
| | · | | Treasuries: The day before the reporting period began, the 10-year Treasury reached a 4.00% yield, a point that ironically coincided with the conclusion of the Federal Reserve’s Large Scale Asset Program (LSAP), more widely known as quantitative easing. With the start of the first round of quantitative easing, QE1, and amid disappointing reports of economic growth, deflation concerns and flight-to-quality flows from the brewing debt and currency crises in the eurozone, Treasuries rallied to a yield of 2.39% on the 10-year by early October. As a second round of money printing appeared to be in the offing, yields began to rise sharply, anticipating the QE2 program unveiled by the Fed on November 3. The rally in Treasury prices through February alternately was explained by expectations of improved economic growth (according to the Fed), concern over the potential of inflation and currency debasement (according to QE detractors), or both. The 10-year Treasury raced to 3.54% in mid-December and moved sideways thereafter, ending the first quarter of 2011 at 3.47%. |
Markets now are focused on the implications of the approaching end of QE2 in June. DoubleLine does not believe any market disruption or sustained rise in yield is likely at this time. To the contrary, we see a drop in yields as more likely. The case of QE1 is instructive. Foreign central banks easily absorbed the bonds not purchased by the Fed after QE1 ended in March 2010. We believe that central banks, as well as commercial banks and households, have room to add Treasury holdings. Foreign central banks especially appear to have incentive to buy Treasuries as they seek to limit the appreciation of their currencies versus the dollar. Dealers and hedge funds appear to have larger short positions than is normally the case and will likely be forced into the market if yields fail to rise. Finally, as of the date of this letter, the yield curve is very steep, suggesting the Fed’s purchases to date have not pushed Treasury prices above fair value.
| | | | | | | | | | | | | | | | |
| | | | | | U.S. Treasury Yield Curve | |
| Term | | | | | 4/6/2010 | | | 3/31/2011 | | | Change | |
3 MONTH | | | | | | | 0.163 | | | | 0.091 | | | | -0.072 | |
6 MONTH | | | | | | | 0.249 | | | | 0.169 | | | | -0.080 | |
1 YEAR | | | | | | | 0.432 | | | | 0.273 | | | | -0.159 | |
2 YEAR | | | | | | | 1.136 | | | | 0.821 | | | | -0.315 | |
3 YEAR | | | | | | | 1.703 | | | | 1.299 | | | | -0.405 | |
5 YEAR | | | | | | | 2.696 | | | | 2.277 | | | | -0.419 | |
7 YEAR | | | | | | | 3.402 | | | | 2.920 | | | | -0.482 | |
10 YEAR | | | | | | | 3.951 | | | | 3.470 | | | | -0.480 | |
30 YEAR | | | | | | | 4.832 | | | | 4.508 | | | | -0.325 | |
Table by DoubleLine from Bloomberg data | |
| | · | | Agency Mortgage-Backed Securities (Agency MBS): Agency MBS, as represented by the Barclays Capital U.S. MBS Index, returned 4.98% over the period (April 6, 2010-March 31, 2011), underperforming the Treasury market by 25 bps and the Barclays Capital U.S. Aggregate Bond Index return of 5.70%. This underperformance resulted from the shorter duration of the MBS index and the drop in U.S. Treasury yields. Prepayment speeds on lower coupon pass-throughs increased slightly while speeds on higher coupons remained muted relative to these borrowers’ current rate incentive. Prepayment speeds are expected to remain muted going forward given the increase in 10-year U.S. Treasury yields since the beginning of October along with the decreased capability of borrowers to refinance due to a weakening housing market. |
| | · | | Non-Agency MBS: The private label MBS universe delivered outsized returns, with the PrimeX FRM 1 and the PrimeX FRM 2, both baskets of MBS backed by prime fixed-rated residential mortgages, returning 19.2% and 20.7%, respectively. Market prices benefited from the “cheapness” of non-Agency MBS relative to their ultimate expected returns at maturity and shrinking supply, thanks to the lack of new issuance since 2007. |
| | · | | Corporate Bonds: Despite European sovereign debt concerns, a volcanic eruption in Iceland and the Deepwater Horizon oil rig explosion, both investment grade and high yield corporate bonds performed well during the period April 6, 2010 through March 31, 2011. The Barclays Capital US Credit Index returned 7.59% and the Barclays Capital U.S. High Yield Cash Pay Index returned 13.94% versus a return of 5.70% for the Barclays Capital U.S. Aggregate Bond Index. Key drivers of performance in the corporate bond space included: |
| | 1. | Reported corporate earnings, which beat consensus expectations; |
| | 2. | Continued corporate deleveraging and refinancing, which increased corporate cash flows; |
| | 3. | Investor demand for corporate debt, fueled by the low level of absolute Treasury yields due to quantitative easing; and |
| | 4. | Low default rates on non-investment grade issues. |
| | · | | Emerging Markets Fixed Income: All three EM debt sectors—sovereign, corporate and local currency—posted solid returns for the period. |
| | | | | | |
| | Annual Report | | March 31, 2011 | | 5 |
April 6, 2010 through March 31, 2011
| | | | | | | | | | | | | | | | | | |
| | | | | Return | | | Volatility | | | Sharpe | | | YTM | |
US$ Indices | | | | | | | | | | | | | | | | | | |
JP Morgan EMBI GD—Sovereign | | | | | 8.40% | | | | 4.50% | | | | 1.8 | | | | 6.10% | |
JP Morgan CEMBI BD—Corporate | | | | | 9.10% | | | | 2.60% | | | | 3.4 | | | | 6.00% | |
Non US$ Index | | | | | | | | | | | | | | | | | | |
JP Morgan GBI EM—Local Currency | | | | | 9.90% | | | | 10.70% | | | | 0.9 | | | | 6.60% | |
Table by DoubleLine from JP Morgan data | | | | | | | | | | | | | | | | | | |
Government local currency bonds were the best performer: the JP Morgan Global Bond Index Emerging Markets-Local Currency returned 9.9% over the period, with the bulk of returns coming from currency appreciation. Positive returns were broad-based across all regions, led by Brazil and South Africa which saw their currencies appreciate 7.4% and 6.9%, respectively. Both external sovereign and corporate EM debt benefited from a decline in the 10-year U.S. Treasury yield of 48 bps. EM corporate debt outperformed EM sovereign debt as the JP Morgan Corporate Emerging Markets Bond Index-Broad Diversified (CEMBI BD) spread tightened by 36 bps over the period versus the JP Morgan Emerging Markets Bond Index-Global Diversified (EMBI GD), which saw its spread widen by 37 bps. The high yield credits in both the EMBI GD and the CEMBI BD outperformed their investment grade counterparts over the period by 2.5% and 5.0%, respectively. The EMBI GD saw the strongest performance out of lower rated countries with Argentina, Belize, Iraq and Jamaica posting the strongest returns. The CEMBI BD saw similar strong performance out of Argentina, Barbados, Indonesia and Jamaica.
| | · | | Global Equities: Global equity markets posted strong returns for the first quarter of 2011. Favorable economic indicators and corporate earnings provided strong support for equities. Aside from relatively strong quarterly performance, there continue to be concerns regarding the Federal Reserve’s plans for quantitative easing, geopolitical risk surrounding the Middle East/North Africa (MENA) and the ramifications of the Japan earthquake. |
| | · | | Commodities: The broad-based commodities market returned 32.61% over the period April 6, 2010 through March 31, 2011, as measured by the S&P Goldman Sachs Commodity Total Return Index (GSCI). The period began with a sell-off in May 2010 after growing fears that over-indebtedness in Europe would lead to a global economic contraction. However, geopolitical instability in the MENA region led crude oil prices higher. Light, sweet crude futures opened the reporting period at $86.84 per barrel on April 6, 2010, during the May sell-off fell to a low of $68.01 on May 20, then rallied to end March 31, 2011 at $106.72. Reports indicate $15 to $30 of the barrel price reflects a geopolitical risk premium. Food and metals price inflation were further fueled by QE2. |
Fund Highlights
DoubleLine Total Return Bond Fund
Since inception on April 6, 2010 through March 31, 2011 the DoubleLine Total Return Bond Fund (Class I) has outperformed the Barclays Capital U.S. Aggregate Bond Index by 13.58% (19.28% versus 5.70%). This outperformance was primarily driven by investment positions in two subsectors of the MBS market: (1) non-Agency residential mortgage backed securities (RMBS), which have generated higher loss-adjusted yields than other credit sectors, and (2) high cash flowing Agency collateralized mortgage obligations (CMOs).
| | | | | | | | | | | | | | | | |
| | | | | | March 2011 | | | 1Q2011 | | | Since Inception
(4-6-10 to 3-31-11) | |
I-Share | | | | | | | 0.25% | | | | 2.33% | | | | 19.28% | |
N-Share | | | | | | | 0.32% | | | | 2.27% | | | | 19.04% | |
Barclays Capital US Aggregate Index | | | | | | | 0.06% | | | | 0.42% | | | | 5.70% | |
DoubleLine Emerging Markets Fixed Income Fund
From its inception on April 6, 2010 through March 31, 2011, the DoubleLine Emerging Markets Fixed Income Fund (I shares) returned 11.48%, an outperformance of 313 bps over the JP Morgan Emerging Markets Bond Index-Global Diversified, which returned 8.35%. The Fund’s outperformance was driven predominantly by investing in EM corporate debt, which outperformed EM sovereign and quasi-sovereign debt over the period. EM corporate debt spreads tightened by 36 bps over the period on improving credit fundamentals and a positive rating outlook. This compares favorably to EM sovereign and quasi-sovereign debt where the index saw spreads widen by 37 bps during that timeframe. Additionally, the Fund benefited from a slight overweight position to non-investment grade credits relative to its benchmark.
| | | | | | | | | | | | | | | | |
| | | | | | March 2011 | | | 1Q2011 | | | Since Inception
(4-6-10 to 3-31-11) | |
I-Share | | | | | | | 1.14% | | | | 2.30% | | | | 11.48% | |
N-Share | | | | | | | 1.12% | | | | 2.24% | | | | 11.25% | |
JP Morgan Emerging Markets Bond Global Diversified Index | | | | | | | 1.19% | | | | 0.87% | | | | 8.35% | |
DoubleLine Core Fixed Income Fund
From its June 1, 2010 inception through March 31, 2011, the DoubleLine Core Fixed Income Fund (I shares) returned 9.90%, an outperformance of 676 bps over the Barclays Capital U.S. Aggregate Bond Index, which returned 3.14%. The Fund’s outperformance can be attributed mainly to management’s active sector allocation, which included overweighting Treasuries from inception through August 2010, then underweighting Treasuries thereafter; and investments in emerging markets and mortgage-backed securities.
| | | | | | | | | | | | | | | | |
| | | | | | March 2011 | | | 1Q2011 | | | Since Inception
(6-1-10 to 3-31-11) | |
I-Share | | | | | | | 0.10% | | | | 2.23% | | | | 9.90% | |
N-Share | | | | | | | 0.09% | | | | 2.18% | | | | 9.71% | |
Barclays Capital US Aggregate Index | | | | | | | 0.06% | | | | 0.42% | | | | 3.14% | |
DoubleLine Multi-Asset Growth Fund
Since inception on December 20, 2010 through March 31, 2011, the DoubleLine Multi-Asset Growth Fund (I shares) returned 1.24%. The Fund’s positive performance during the first quarter of 2011 was due to allocations to both the global fixed income sectors and real asset sectors. The equity exposure detracted from performance but provided diversification benefits in an attempt to lower overall volatility.
| | | | | | |
| | Annual Report | | March 31, 2011 | | 7 |
| | | | | | | | | | | | | | | | |
| | | | | | March 2011 | | | 1Q2011 | | | Since Inception
(12-20-10 to 3-31-11) | |
I-Share | | | | | | | 0.24 | % | | | 1.04 | % | | | 1.24 | % |
A-Share | | | | | | | | | | | | | | | | |
No Load | | | | | | | 0.12 | % | | | 0.82 | % | | | 1.02 | % |
With Load | | | | | | | -4.13 | % | | | -3.46 | % | | | -3.27 | % |
Blended 60% Barclays Capital US Aggregate Index/25% S&P 500/15% S&P GSCI | | | | | | | 0.69 | % | | | 3.42 | % | | | 4.29 | % |
On behalf of the team at DoubleLine, I thank you for your support of the Funds. On the following pages of this Annual Report, you will find specific information regarding each Fund’s operation and holdings. DoubleLine was founded with the prevailing objective that clients come first, and that our success will be predicated upon being relevant to clients. With that in mind, we will continue to strive to provide investment solutions that integrate risk management with the pursuit of excess return. We value the trust you have placed in us and if you have any questions please do not hesitate to call 877-DLINE11 (354-6311) or visit our website at www.doublelinefunds.com.
Sincerely,

Ronald R. Redell
Past performance is not a guarantee of future results.
Opinions expressed are subject to change at any time, are not guaranteed and should not be considered investment advice.
Fund holdings and sector allocations are subject to change at any time and are not recommendations to buy or sell any security. Please refer to the Schedule of Investments for a complete list of fund holdings.
This report is for the information of shareholders of the Funds. It may also be used as sales literature when preceded or accompanied by the current prospectus.
Investments in debt securities typically decrease when interest rates rise. This risk is usually greater for longer-term debt securities. Investments in Asset-Backed and Mortgage-Backed securities include additional risks that investors should be aware of including credit risk, prepayment risk, possible illiquidity and default, as well as increased susceptibility to adverse economic developments. Investments in lower rated and non-rated securities present a greater risk of loss to principal and interest than higher rated securities. The Emerging Markets Fixed Income Fund and the Multi-Asset Growth Fund are non-diversified meaning each may concentrate its assets in fewer individual holdings than a diversified fund. Therefore, these Funds may be more susceptible to any single economic, political or regulatory event than a more diversified fund, and a decline in the market value of one of the Fund’s investments may affect that Fund’s value more than if the Fund were a diversified fund. The Core Fixed Income Fund, Emerging Markets Fixed Income Fund and Multi-Asset Growth Fund may invest in foreign securities, which involve political, economic, and currency risks, greater volatility, and differences in accounting methods. These risks are greater for investments in emerging markets. The Multi-Asset Growth Fund may invest in securities related to real estate, which may decline in value as a result of factors affecting the real estate industry. Derivatives may involve certain costs and risks such as liquidity, interest rate, market, credit, management and the risk that a position could not be closed when most advantageous. Investing in derivatives could lose more than the amount invested. Commodity-linked derivative instruments may involve additional costs and risks such as changes in commodity index volatility or factors affecting a particular industry or commodity, such as drought, floods, weather, livestock disease, embargoes, tariffs and international economic, political and regulatory developments. Investing in derivatives could lose more than the amount invested. Equities may decline in value due to both real and perceived general market, economic, and industry conditions. For more details regarding the risks of the Funds, please consult the current prospectus.
JP Morgan EMBI Global Diversified Index—This index is an uniquely-weighted version of the EMBI Global. It limits the weights of those index countries with larger debt stocks by only including specified portions of these countries’ eligible current face amounts of debt outstanding. The countries covered in the EMBI Global Diversified are identical to those covered by EMBI Global.
Barclay’s Capital U.S. Aggregate Bond Index—This index represents securities that are SEC-registered, taxable, and dollar denominated. The index covers the US investment grade fixed rate bond market, with index components for government and corporate securities, mortgage pass-through securities, and asset-backed securities. These major sectors are subdivided into more specific indices that are calculated and reported on a regular basis.
Barclay’s Capital U.S. Treasury Index—This index includes public obligations of the U.S. Treasury. Treasury bills are excluded by the maturity constraint but are part of a separate Short Treasury Index. In addition, certain special issues, such as state and local government series bonds (SLGs), as well as U.S. Treasury TIPS are excluded.
Barclays Capital U.S. MBS Index—This index measures the performance of investment grade fixed-rate mortgage-backed pass-through securities of the Government-Sponsored Enterprises (GSEs): Ginnie Mae (GNMA), Fannie Mae (FNMA), and Freddie Mac (FHLMC).
PrimeX—This index is a synthetic credit default swap (CDS) index which references non-Agency Prime residential mortgage-backed securities (RMBS). There are 20 prime RMBS deals referenced in each sub-index from 2005, 2006, and 2007.
Barclays Capital U.S. Credit Index—This index is the U.S. Credit component of the U.S. Government/Credit Index and consists of publicly issued US corporate and specified foreign debentures and secured notes that meet the specified maturity, liquidity, and quality requirements. To qualify, bonds must be SEC-registered. The U.S. Credit Index is the same as the former U.S. Corporate Investment Grade Index.
Barclays Capital U.S. High Yield Cash Pay Index—This index covers the universe of fixed rate, non-investment grade debt. Eurobonds and debt issuer from countries designated as emerging markets (e.g. Argentina, Brazil, Venezuela, etc.) are excluded, but Canadian and global bonds (SEC registered) of issuers in non-EMG countries are included. Original issue zeros, step-up coupon structures, 144As and pay-in-kind (PIK, as of October 1, 2009) are also included.
JP Morgan Corporate Emerging Markets Bond Index—Broad Diversified (CEMBI GD)—This index is a market capitalization weighted index consisting of US-denominated Emerging Market corporate bonds. It is a liquid global corporate benchmark representing Asia, Latin America, Europe and the Middle East/Africa.
JP Morgan Emerging Markets Bond Index—Global Diversified (EMBI GD)—This index tracks total returns for US dollar denominated debt instruments issued by emerging market sovereign entities, including Brady bonds, loans and Eurobonds, and quasi-sovereign entities.
JP Morgan GBI EM—Local Currency—Comprehensive emerging market debt benchmarks that track local currency bonds issued by Emerging Market governments.
Standard & Poor’s/Goldman Sachs Commodity Total Return Index (GSCI)—This is a composite index of commodity sector returns which represents a broadly diversified, unleveraged, long-only position in commodity futures. This index’s components qualify for inclusion in the index based on liquidity measures and are weighted in relation to their global production levels, making the index a valuable economic indicator and commodities market benchmark.
S&P 500 Index—This Index is a broad-based, unmanaged measurement of changes in stock market conditions based on the average of 500 widely held common stocks.
A direct investment cannot be made in an index. The performance of any index mentioned in this commentary has not been adjusted for ongoing management, distribution and operating expenses applicable to mutual fund investments.
A basis point (bps) equals 0.01%.
Duration is a commonly used measure of the potential volatility of the price of a debt security, or the aggregate market value of a portfolio of debt securities, prior to maturity. Securities with a longer duration generally have more volatile prices than securities of comparable quality with a shorter duration.
Volatility—The standard deviation of the index.
Sharpe—A ratio to measure risk-adjusted performance calculated by subtracting the risk-free rate from the rate of return for a portfolio/index and dividing the result by the standard deviation of the portfolio returns.
YTM—Yield to Maturity—The rate of return anticipated on a bond if it is held until the maturity date.
The DoubleLine Funds are distributed by Quasar Distributors, LLC.
This commentary may include statements that constitute “forward-looking statements” under the U.S. securities laws. Forward-looking statements include, among other things, projections, estimates, and information about possible or future results related to a Fund and market or regulatory developments. The views expressed above are not guarantees of future performance or economic results and involve certain risks, uncertainties and assumptions that could cause actual outcomes and results to differ materially from the views expressed herein.
DoubleLine has no obligation to provide revised assessments in the event of changed circumstances. While we have gathered this information from sources believed to be reliable, DoubleLine cannot guarantee the accuracy of the information provided. Securities discussed are not recommendations and are presented as examples of issue selection or portfolio management processes. They have been picked for comparison or illustration purposes only. The views expressed above (including any forward-looking statements) may not be relied upon as investment advice or as an indication of the Funds’ trading intent. Information about the Funds’ holdings, asset allocation or country diversification is historical and is not an indication of future Fund composition, which may vary. No security presented within is either offered for sale or purchase. DoubleLine reserves the right to change its investment perspective and outlook without notice as market conditions dictate or as additional information becomes available.
Investment strategies may not achieve the desired results due to implementation lag, other timing factors, portfolio management decision-making, economic or market conditions or other unanticipated factors. The views and forecasts expressed in this material are as of the date indicated, are subject to change without notice, may not come to pass and do not represent a recommendation or offer of any particular security, strategy, or investment.
| | | | | | |
| | Annual Report | | March 31, 2011 | | 9 |
| | |
| |
| Schedule of Investments DoubleLine Total Return Bond Fund | | |
| | | | | | | | | | | | | | | | |
PRINCIPAL
AMOUNT | | | SECURITY DESCRIPTION | | RATE | | | MATURITY | | | VALUE $ | |
| | COLLATERALIZED MORTGAGE OBLIGATIONS 50.4% | |
| |
| | | | Adjustable Rate Mortgage Trust, | |
| $ | 6,200,000 | | | Series 2005-2 | | | 0.73% | # | | | 06/25/2035 | | | | 3,105,797 | |
| | 7,825,841 | | | Series 2007-3 | | | 3.73% | #^ | | | 11/25/2037 | | | | 4,402,755 | |
| |
| | | | Aegis Asset Backed Securities Trust, | |
| | 738,019 | | | Series 2003-2 | | | 2.80% | # | | | 11/25/2033 | | | | 576,999 | |
| | 8,683,689 | | | Series 2004-1 | | | 2.28% | # | | | 04/25/2034 | | | | 6,251,670 | |
| | 1,512,104 | | | Series 2004-2 | | | 1.55% | # | | | 06/25/2034 | | | | 996,696 | |
| |
| | | | American Home Mortgage Investment Trust, | |
| | 9,270,840 | | | Series 2005-1 | | | 2.46% | # | | | 06/25/2045 | | | | 8,014,571 | |
| | 3,344,389 | | | Series 2006-2 | | | 6.60% | # | | | 06/25/2036 | | | | 2,187,357 | |
| | 15,586,667 | | | Series 2007-A | | | 6.10% | #^ | | | 01/25/2037 | | | | 10,680,639 | |
| |
| | | | Argent Securities, Inc., | |
| | 850,957 | | | Series 2004-W6 | | | 0.80% | # | | | 04/25/2034 | | | | 708,260 | |
| |
| | | | Asset Backed Securities Corporation, | |
| | 9,239,571 | | | Series 2003-HE6-M1 | | | 1.22% | # | | | 11/25/2033 | | | | 7,666,049 | |
| | 2,745,019 | | | Series 2004-HE3-M2 | | | 1.37% | # | | | 06/25/2034 | | | | 1,966,408 | |
| |
| | | | Banc of America Alternative Loan Trust, | |
| | 15,842,779 | | | Series 2005-6-2CB2 | | | 6.00% | | | | 07/25/2035 | | | | 13,901,397 | |
| | 6,187,944 | | | Series 2005-6-4CB1 | | | 6.50% | | | | 07/25/2035 | | | | 5,276,587 | |
| | 5,976,705 | | | Series 2005-8-2CB1 | | | 6.00% | | | | 09/25/2035 | | | | 4,804,294 | |
| | 5,000,000 | | | Series 2006-5-CB14 | | | 6.00% | # | | | 06/25/2046 | | | | 3,497,288 | |
| | 8,203,000 | | | Series 2006-6-CB3 | | | 6.00% | | | | 07/25/2046 | | | | 6,744,831 | |
| | 14,669,286 | | | Series 2006-8-1A1 | | | 6.25% | # I/F I/O | | | 11/25/2036 | | | | 2,476,897 | |
| | 4,987,557 | | | Series 2006-8-1A2 | | | 0.70% | # | | | 11/25/2036 | | | | 3,327,893 | |
| | 3,849,846 | | | Series 2007-2-2A1 | | | 6.00% | | | | 06/25/2037 | | | | 2,708,351 | |
| |
| | | | Banc of America Commercial Mortgage, Inc., | |
| | 5,303,000 | | | Series 2002-2-G | | | 5.85% | ^ | | | 07/11/2043 | | | | 5,417,351 | |
| | 208,613,168 | | | Series 2004-6-XP | | | 0.67% | # I/O | | | 12/10/2042 | | | | 551,782 | |
| | 305,033,137 | | | Series 2005-4-XP | | | 0.35% | # I/O | | | 07/10/2045 | | | | 1,018,079 | |
| | 280,871,687 | | | Series 2006-1-XP | | | 0.34% | # I/O | | | 09/10/2045 | | | | 1,159,747 | |
| |
| | | | Banc of America Funding Corporation, | |
| | 6,107,936 | | | Series 2009-R15A-4A2 | | | 5.75% | #^ | | | 12/26/2036 | | | | 4,572,401 | |
| |
| | | | Banc of America Funding Trust, | |
| | 722,059 | | | Series 2005-6 | | | 5.50% | | | | 10/25/2035 | | | | 725,336 | |
| | 31,364,693 | | | Series 2006-2 | | | 6.00% | | | | 03/25/2036 | | | | 31,984,851 | |
| | 1,088,242 | | | Series 2006-2 | | | 22.10% | # I/F | | | 03/25/2036 | | | | 1,256,494 | |
| | 13,491,804 | | | Series 2006-3 | | | 6.33% | # | | | 03/25/2036 | | | | 13,894,635 | |
| | 5,879,061 | | | Series 2006-7 | | | 6.04% | # | | | 10/25/2036 | | | | 3,889,393 | |
| | 6,020,431 | | | Series 2006-7 | | | 5.91% | # | | | 10/25/2036 | | | | 3,813,810 | |
| | 5,444,750 | | | Series 2006-8T2 | | | 6.10% | # | | | 10/25/2036 | | | | 3,917,574 | |
| | 2,897,696 | | | Series 2006-B | | | 5.63% | # | | | 03/20/2036 | | | | 2,378,883 | |
| | 3,227,161 | | | Series 2006-G | | | 0.47% | # | | | 07/20/2036 | | | | 2,756,990 | |
| | 2,003,296 | | | Series 2006-H | | | 6.02% | # | | | 09/20/2046 | | | | 1,793,294 | |
| | 3,587,642 | | | Series 2007-1 | | | 5.84% | # | | | 01/25/2037 | | | | 2,408,833 | |
| | 5,285,495 | | | Series 2007-3 | | | 5.83% | # | | | 04/25/2037 | | | | 3,763,994 | |
| | 6,383,135 | | | Series 2007-5 | | | 5.50% | | | | 07/25/2037 | | | | 5,229,738 | |
| | 6,658,251 | | | Series 2009-R14 | | | 16.0% | #^ I/F | | | 06/26/2035 | | | | 6,742,335 | |
| | 5,742,588 | | | Series 2010-R1 | | | 13.9% | #^ I/F | | | 07/28/2036 | | | | 4,950,685 | |
| |
| | | | Banc of America Large Loan, | |
| | 3,726,654 | | | Series 2006-BIX1-C | | | 0.44% | #^ | | | 10/15/2019 | | | | 3,558,587 | |
| |
| | | | Banc of America Mortgage Securities, Inc., | |
| | 5,367,079 | | | Series 2004-K-4A1 | | | 5.24% | # | | | 12/25/2034 | | | | 5,010,193 | |
| |
| | | | BCAP LLC Trust, | |
| | 9,679,787 | | | Series 2007-AA2-2A7 | | | 6.00% | | | | 04/25/2037 | | | | 7,189,899 | |
| | 10,660,819 | | | Series 2007-AA2-2A8 | | | 5.75% | | | | 04/25/2037 | | | | 7,660,396 | |
| | 18,000,000 | | | Series 2008-RR3-A1B | | | 6.65% | # | | | 10/25/2036 | | | | 16,376,301 | |
| |
| | | | BCRR Trust, | |
| | 10,500,000 | | | Series 2010-LEAF-32A | | | 4.23% | #^ | | | 12/22/2032 | | | | 10,492,084 | |
| |
| | | | Bear Stearns Adjustable Rate Mortgage Trust, | |
| | 25,890,868 | | | Series 2006-4-4A1 | | | 5.82% | # | | | 10/25/2036 | | | | 22,154,920 | |
| |
| | | | Bear Stearns Asset Backed Securities Trust, | |
| | 17,688,539 | | | Series 2005-AC2-2A1 | | | 5.25% | | | | 04/25/2035 | | | | 16,660,030 | |
| | 54,507,800 | | | Series 2005-AC2-IA | | | 5.25% | | | | 04/25/2035 | | | | 49,741,937 | |
| | 6,869,203 | | | Series 2006-AC1-IA1 | | | 5.75% | # | | | 02/25/2036 | | | | 5,301,561 | |
| | 3,864,712 | | | Series 2007-SD1-IA2A | | | 6.00% | | | | 10/25/2036 | | | | 3,002,624 | |
| | 1,958,912 | | | Series 2007-SD1-IA3A | | | 6.50% | | | | 10/25/2036 | | | | 1,328,476 | |
| | | | | | | | | | | | | | | | |
PRINCIPAL
AMOUNT | | | SECURITY DESCRIPTION | | RATE | | | MATURITY | | | VALUE $ | |
| |
| | | | Bear Stearns Commercial Mortgage Securities, Inc., | |
| $ | 3,441,000 | | | Series 2000-WF1-F | | | 8.18% | # | | | 02/15/2032 | | | | 3,436,738 | |
| | 110,064,196 | | | Series 2004-16-X2 | | | 0.88% | # I/O | | | 02/13/2046 | | | | 1,214,426 | |
| | 42,492,952 | | | Series 2004-PWR5-X2 | | | 0.99% | # I/O | | | 07/11/2042 | | | | 540,455 | |
| | 110,784,572 | | | Series 2004-PWR6 | | | 0.80% | # I/O | | | 11/11/2041 | | | | 1,249,705 | |
| | 750,000 | | | Series 2005-PWR10-AM | | | 5.45% | # | | | 12/15/2015 | | | | 773,390 | |
| | 21,647,397 | | | Series 2005-PWR7-X2 | | | 0.20% | # I/O | | | 02/11/2041 | | | | 105,806 | |
| |
| | | | Capital Trust, | |
| | 11,424,000 | | | Series 2005-3A-A2 | | | 5.16% | ^ | | | 06/25/2035 | | | | 11,445,477 | |
| |
| | | | CD Mortgage Trust, | |
| | 8,983,129 | | | Series 2006-CD2-AAB | | | 5.55% | # | | | 01/15/2046 | | | | 9,412,588 | |
| |
| | | | Centex Home Equity Loan Trust, | |
| | 2,750,000 | | | Series 2004-A | | | 4.93% | # | | | 01/25/2034 | | | | 2,767,846 | |
| |
| | | | Chase Mortgage Financial Trust, | |
| | 12,149,564 | | | Series 2007-S5-1A18 | | | 6.00% | | | | 07/25/2037 | | | | 9,903,924 | |
| |
| | | | Chase Mortgage Loan, | |
| | 4,088,871 | | | Series 2003-4-2M1 | | | 1.15% | # | | | 03/25/2033 | | | | 2,543,413 | |
| |
| | | | Chaseflex Trust, | |
| | 3,037,788 | | | Series 2006-1-2A2 | | | 5.94% | # | | | 06/25/2036 | | | | 3,012,854 | |
| | 17,021,312 | | | Series 2006-2-A2B | | | 0.45% | # | | | 09/25/2036 | | | | 13,101,210 | |
| | 12,267,515 | | | Series 2007-1-1A1 | | | 6.50% | | | | 02/25/2037 | | | | 8,255,069 | |
| |
| | | | Citi Mortgage Alternative Loan Trust, | |
| | 15,655,017 | | | Series 2006-A2-A2 | | | 6.00% | | | | 05/25/2036 | | | | 13,210,815 | |
| | 10,000,000 | | | Series 2006-A5-A3 | | | 6.00% | | | | 10/25/2036 | | | | 8,698,290 | |
| | 7,619,730 | | | Series 2007-A1-1A7 | | | 6.00% | | | | 01/25/2037 | | | | 5,750,523 | |
| | 15,467,589 | | | Series 2007-A1-IA5 | | | 6.00% | | | | 01/25/2037 | | | | 11,791,569 | |
| | 19,619,910 | | | Series 2007-A1-IA9 | | | 5.15% | # I/F I/O | | | 01/25/2037 | | | | 2,620,520 | |
| | 17,845,331 | | | Series 2007-A3-IA1 | | | 6.00% | # | | | 03/25/2037 | | | | 13,335,183 | |
| | 39,039,185 | | | Series 2007-A3-IA3 | | | 5.15% | # I/F I/O | | | 03/25/2037 | | | | 4,763,893 | |
| | 4,200,165 | | | Series 2007-A5-1A11 | | | 6.00% | | | | 05/25/2037 | | | | 3,093,619 | |
| | 2,200,635 | | | Series 2007-A8-A1 | | | 6.00% | | | | 10/25/2037 | | | | 1,728,862 | |
| |
| | | | Citicorp Mortgage Securities, Inc., | |
| | 37,058,120 | | | Series 2005-1-1A4 | | | 5.50% | | | | 02/25/2035 | | | | 37,326,549 | |
| |
| | | | Citicorp Residential Mortgage Securities, Inc., | |
| | 6,594,000 | | | Series 2006-2-A5 | | | 6.04% | # | | | 09/25/2036 | | | | 5,733,312 | |
| |
| | | | Citigroup Commercial Mortgage Securities, Inc., | |
| | 144,013,510 | | | Series 2004-C2 | | | 1.10% | #^ I/O | | | 10/15/2041 | | | | 907,472 | |
| | 5,326,781 | | | Series 2006-C5 | | | 5.68% | #^ | | | 10/15/2049 | | | | 4,688,423 | |
| | 7,000,000 | | | Series 2009-RR1 | | | 5.32% | ^ | | | 12/21/2049 | | | | 6,853,421 | |
| |
| | | | Citigroup Mortgage Loan Trust, Inc., | |
| | 6,841,646 | | | Series 2005-5-2A2 | | | 5.75% | | | | 08/25/2035 | | | | 5,773,597 | |
| | 2,961,316 | | | Series 2005-9-21A1 | | | 5.50% | | | | 10/25/2035 | | | | 2,426,680 | |
| | 7,903,982 | | | Series 2006-FX1-A6 | | | 5.85% | # | | | 10/25/2036 | | | | 5,271,727 | |
| | 3,375,000 | | | Series 2006-WF1-A2D | | | 5.92% | # | | | 03/25/2036 | | | | 2,363,212 | |
| | 21,282,978 | | | Series 2006-WF2-A2D | | | 6.16% | # | | | 05/25/2036 | | | | 13,465,602 | |
| | 2,303,418 | | | Series 2007-12-2A1 | | | 6.50% | ^ | | | 04/25/2037 | | | | 1,607,323 | |
| | 4,495,817 | | | Series 2007-2-2A | | | 6.00% | | | | 11/25/2036 | | | | 4,364,768 | |
| | 3,302,133 | | | Series 2007-9-2A2 | | | 6.50% | ^ | | | 05/25/2037 | | | | 1,774,897 | |
| | 5,185,041 | | | Series 2010-2-5A1 | | | 5.50% | #^ | | | 12/25/2035 | | | | 5,313,789 | |
| | 36,000,000 | | | Series 2010-8-6A4 | | | 10.78% | #^ | | | 12/26/2036 | | | | 27,720,000 | |
| |
| | | | Commercial Mortgage Pass-Through Certificates, | |
| | 3,750,000 | | | Series 2001-J1A-G | | | 6.83% | #^ | | | 02/16/2034 | | | | 3,762,279 | |
| | 1,540,000 | | | Series 2007-C9-A2 | | | 5.81% | # | | | 12/10/2049 | | | | 1,573,361 | |
| |
| | | | Countrywide Alternative Loan Trust, | |
| | 5,814,470 | | | Series 2005-20CB-4A1 | | | 5.25% | | | | 07/25/2020 | | | | 5,373,245 | |
| | 10,687,216 | | | Series 2005-26CB-A11 | | | 12.60% | # I/F | | | 07/25/2035 | | | | 9,901,918 | |
| | 15,739,335 | | | Series 2005-28CB-1A2 | | | 1.00% | # | | | 08/25/2035 | | | | 11,304,714 | |
| | 3,456,662 | | | Series 2005-28CB-3A6 | | | 6.00% | | | | 08/25/2035 | | | | 2,478,378 | |
| | 1,997,666 | | | Series 2005-60T1-1A | | | 34.10% | # I/F | | | 12/25/2035 | | | | 2,813,333 | |
| | 2,828,323 | | | Series 2005-64CB-1A14 | | | 5.50% | | | | 12/25/2035 | | | | 2,345,906 | |
| | 7,528,307 | | | Series 2005-73CB-1A5 | | | 1.05% | # | | | 01/25/2036 | | | | 5,514,511 | |
| | 18,939,662 | | | Series 2005-73CB-1A6 | | | 4.45% | # I/F I/O | | | 01/25/2036 | | | | 2,620,361 | |
| | 4,350,296 | | | Series 2005-79CB-A5 | | | 5.50% | | | | 01/25/2036 | | | | 3,227,837 | |
| | 8,872,235 | | | Series 2005-85CB-2A6 | | | 20.70% | # I/F | | | 02/25/2036 | | | | 8,614,559 | |
| | 5,897,225 | | | Series 2005-86CB-A5 | | | 5.50% | | | | 02/25/2036 | | | | 4,228,995 | |
| | 12,753,872 | | | Series 2005-J10-1A11 | | | 5.50% | | | | 10/25/2035 | | | | 10,702,941 | |
| | 3,211,502 | | | Series 2005-J10-1A13 | | | 0.95% | # | | | 10/25/2035 | | | | 2,420,841 | |
| | 2,264,073 | | | Series 2005-J10-1A15 | | | 5.50% | | | | 10/25/2035 | | | | 2,024,143 | |
| | 6,556,497 | | | Series 2005-J11-1A3 | | | 5.50% | | | | 11/25/2035 | | | | 6,127,026 | |
| | | | | | | | |
| 10 | | DoubleLine Funds | | | | | The accompanying notes are an integral part of these financial statements | |
| | | | | | | | | | | | | | | | |
PRINCIPAL
AMOUNT | | | SECURITY DESCRIPTION | | RATE | | | MATURITY | | | VALUE $ | |
| |
| | | | Countrywide Alternative Loan Trust, (Cont.) | |
| $ | 4,269,929 | | | Series 2005-J11-6A1 | | | 6.50% | | | | 09/25/2032 | | | | 4,117,907 | |
| | 5,735,623 | | | Series 2005-J13-2A5 | | | 0.73% | # | | | 11/25/2035 | | | | 4,245,322 | |
| | 11,471,246 | | | Series 2005-J13-2A6 | | | 4.77% | # I/F I/O | | | 11/25/2035 | | | | 1,233,022 | |
| | 4,907,889 | | | Series 2005-J2-1A5 | | | 0.75% | # | | | 04/25/2035 | | | | 4,067,001 | |
| | 15,101,198 | | | Series 2005-J2-1A6 | | | 4.75% | # I/F I/O | | | 04/25/2035 | | | | 1,648,587 | |
| | 11,853,711 | | | Series 2006-12CB-A3 | | | 5.75% | | | | 05/25/2036 | | | | 7,274,338 | |
| | 5,629,011 | | | Series 2006-15CB-A1 | | | 6.50% | | | | 06/25/2036 | | | | 3,461,355 | |
| | 4,578,253 | | | Series 2006-18CB-A12 | | | 0.85% | # | | | 07/25/2036 | | | | 2,658,910 | |
| | 4,578,253 | | | Series 2006-18CB-A13 | | | 5.25% | # I/F I/O | | | 07/25/2036 | | | | 597,986 | |
| | 4,420,758 | | | Series 2006-19CB-A15 | | | 6.00% | | | | 08/25/2036 | | | | 3,787,601 | |
| | 19,085,837 | | | Series 2006-24CB-A14 | | | 6.90% | # I/F I/O | | | 08/25/2036 | | | | 3,437,958 | |
| | 17,796,700 | | | Series 2006-24CB-A5 | | | 0.85% | # | | | 08/25/2036 | | | | 11,532,226 | |
| | 6,681,009 | | | Series 2006-26CB-A17 | | | 6.25% | | | | 09/25/2036 | | | | 4,597,529 | |
| | 18,926,249 | | | Series 2006-29T1-1A2 | | | 6.25% | | | | 10/25/2036 | | | | 14,301,147 | |
| | 2,493,976 | | | Series 2006-29T1-2A12 | | | 44.50% | # I/F | | | 10/25/2036 | | | | 4,475,785 | |
| | 1,527,613 | | | Series 2006-29T1-2A23 | | | 32.30% | # I/F | | | 10/25/2036 | | | | 1,984,017 | |
| | 6,796,153 | | | Series 2006-36T2-2A1 | | | 6.25% | | | | 12/25/2036 | | | | 4,672,501 | |
| | 6,079,661 | | | Series 2006-39CB-1A10 | | | 6.00% | | | | 01/25/2037 | | | | 4,580,232 | |
| | 29,015,969 | | | Series 2006-39CB-2A2 | | | 6.30% | # I/F I/O | | | 01/25/2037 | | | | 5,733,602 | |
| | 9,731,411 | | | Series 2006-39CB-2A4 | | | 0.70% | # | | | 01/25/2037 | | | | 3,551,279 | |
| | 5,000,000 | | | Series 2006-6CB-1A4 | | | 5.50% | | | | 05/25/2036 | | | | 3,784,623 | |
| | 3,006,974 | | | Series 2007-11T1-A24 | | | 38.40% | # I/F | | | 05/25/2037 | | | | 4,004,625 | |
| | 31,055,194 | | | Series 2007-17CB-1A10 | | | 28.80% | # I/F | | | 08/25/2037 | | | | 40,105,236 | |
| | 5,152,184 | | | Series 2007-18CB-2A25 | | | 6.00% | | | | 08/25/2037 | | | | 3,953,590 | |
| | 2,865,379 | | | Series 2007-19-1A10 | | | 37.50% | # I/F | | | 08/25/2037 | | | | 4,210,921 | |
| | 14,945,136 | | | Series 2007-21CB-2A2 | | | 27.40% | # I/F | | | 09/25/2037 | | | | 20,508,712 | |
| | 25,974,697 | | | Series 2007-4CB-2A1 | | | 7.00% | | | | 03/25/2037 | | | | 12,291,928 | |
| | 1,295,056 | | | Series 2007-8CB-A12 | | | 38.70% | # I/F | | | 05/25/2037 | | | | 1,965,258 | |
| | 1,382,452 | | | Series 2007-8CB-A8 | | | 38.60% | # I/F | | | 05/25/2037 | | | | 2,097,235 | |
| | 1,932,418 | | | Series 2007-9T1-1A4 | | | 0.75% | # | | | 05/25/2037 | | | | 1,118,298 | |
| | 1,932,418 | | | Series 2007-9T1-1A5 | | | 5.25% | # I/F I/O | | | 05/25/2037 | | | | 248,389 | |
| | 5,490,435 | | | Series 2007-9T1-2A1 | | | 6.00% | | | | 05/25/2037 | | | | 3,621,615 | |
| |
| | | | Countrywide Asset-Backed Certificates, | |
| | 4,239,637 | | | Series 2005-13-AF3 | | | 5.43% | | | | 02/25/2033 | | | | 3,445,888 | |
| |
| | | | Countrywide Home Loans Mortgage Pass Through Trust, | |
| | 14,269,771 | | | Series 2002-32-2A6 | | | 5.00% | | | | 01/25/2018 | | | | 14,628,827 | |
| | 4,518,647 | | | Series 2005-27-2A1 | | | 5.50% | | | | 12/25/2035 | | | | 4,132,445 | |
| | 7,713,367 | | | Series 2005-28-A7 | | | 5.25% | | | | 01/25/2019 | | | | 6,652,597 | |
| | 5,730,782 | | | Series 2005-HYB8-1A1 | | | 2.68% | # | | | 12/20/2035 | | | | 4,522,363 | |
| | 9,700,000 | | | Series 2005-J4-A5 | | | 5.50% | | | | 11/25/2035 | | | | 8,211,244 | |
| | 3,000,000 | | | Series 2007-15-1A16 | | | 6.25% | | | | 09/25/2037 | | | | 2,715,681 | |
| | 18,167,073 | | | Series 2007-7-A2 | | | 5.75% | | | | 06/25/2037 | | | | 16,993,779 | |
| | 7,000,000 | | | Series 2007-9-A11 | | | 5.75% | | | | 07/25/2037 | | | | 6,202,298 | |
| | 3,817,011 | | | Series 2007-J3-A1 | | | 0.75% | # | | | 07/25/2037 | | | | 3,163,588 | |
| | 19,085,055 | | | Series 2007-J3-A2 | | | 5.25% | # I/F I/O | | | 07/25/2037 | | | | 2,222,907 | |
| |
| | | | Countrywide Reperforming Trust, | |
| | 3,512,208 | | | Series 2005-R1-1AF1 | | | 0.61% | #^ | | | 03/25/2035 | | | | 3,023,734 | |
| | 3,566,663 | | | Series 2005-R1-1AS | | | 5.68% | #^ I/O | | | 03/25/2035 | | | | 440,111 | |
| |
| | | | Credit Suisse First Boston Commercial Mortgage Pass-Through Certificates, | |
| | 1,235,000 | | | Series 2001-CF2 | | | 6.93% | ^ | | | 02/15/2034 | | | | 1,232,717 | |
| | 7,887,000 | | | Series 2001-CF2 | | | 6.56% | ^ | | | 02/15/2034 | | | | 7,874,025 | |
| | 4,088,000 | | | Series 2001-CK3 | | | 7.29% | ^ | | | 06/15/2034 | | | | 4,081,271 | |
| | 419,546,622 | | | Series 2004-C3 | | | 0.82% | #^ I/O | | | 07/15/2036 | | | | 1,006,954 | |
| | 1,902,892 | | | Series 2004-C3 | | | 4.30% | | | | 07/15/2036 | | | | 1,901,953 | |
| | 336,816,143 | | | Series 2005-C1 | | | 0.49% | #^ I/O | | | 02/15/2038 | | | | 1,215,940 | |
| | 229,026,168 | | | Series 2005-C2 | | | 0.70% | #^ I/O | | | 04/15/2037 | | | | 1,279,363 | |
| | 67,631,820 | | | Series 2005-C4 | | | 0.41% | #^ I/O | | | 08/15/2038 | | | | 239,160 | |
| | 5,963,456 | | | Series 2006-TFL2 | | | 0.49% | #^ | | | 10/15/2021 | | | | 5,838,060 | |
| |
| | | | Credit Suisse First Boston Mortgage Backed Trust, | |
| | 17,774,955 | | | Series 2005-12 | | | 7.00% | | | | 01/25/2036 | | | | 7,289,696 | |
| | 8,083,273 | | | Series 2006-3 | | | 6.11% | # | | | 11/25/2036 | | | | 4,585,451 | |
| | 6,095,595 | | | Series 2006-4 | | | 5.68% | # | | | 12/25/2036 | | | | 3,874,308 | |
| | 18,845,764 | | | Series 2007-1 | | | 5.90% | # | | | 05/25/2037 | | | | 11,511,209 | |
| |
| | | | Credit Suisse First Boston Mortgage Securities Corporation, | |
| | 844,199 | | | Series 2002-34-CB2 | | | 5.87% | # | | | 01/25/2033 | | | | 770,655 | |
| | 650,807 | | | Series 2004-AR8-2A1 | | | 2.84% | # | | | 09/25/2034 | | | | 626,324 | |
| | 2,227,513 | | | Series 2005-10-5A5 | | | 5.50% | | | | 11/25/2035 | | | | 1,905,619 | |
| |
| | | | Credit Suisse Mortgage Capital Certificates, | |
| | 3,055,355 | | | Series 2005-1R | | | 5.75% | ^ | | | 12/26/2035 | | | | 2,513,029 | |
| | 46,607,886 | | | Series 2006-2 | | | 5.05% | # I/F I/O | | | 03/25/2036 | | | | 5,933,561 | |
| | 8,338,411 | | | Series 2006-2 | | | 0.95% | # | | | 03/25/2036 | | | | 4,847,360 | |
| | 7,317,095 | | | Series 2006-2 | | | 6.50% | | | | 03/25/2036 | | | | 5,241,678 | |
| | | | | | | | | | | | | | | | |
PRINCIPAL
AMOUNT | | | SECURITY DESCRIPTION | | RATE | | | MATURITY | | | VALUE $ | |
| $ | 18,840,082 | | | Series 2006-6 | | | 7.00% | | | | 07/25/2036 | | | | 8,276,966 | |
| | 31,593,264 | | | Series 2006-6 | | | 6.00% | | | | 07/25/2036 | | | | 20,292,811 | |
| | 1,395,000 | | | Series 2006-7 | | | 6.00% | | | | 08/25/2036 | | | | 1,185,111 | |
| | 5,969,620 | | | Series 2006-9 | | | 38.40% | # I/F | | | 11/25/2036 | | | | 8,317,569 | |
| | 12,327,207 | | | Series 2006-9 | | | 6.00% | | | | 11/25/2036 | | | | 11,214,615 | |
| | 45,802,635 | | | Series 2007-1-3A1 | | | 6.00% | | | | 02/25/2022 | | | | 36,653,192 | |
| | 11,721,527 | | | Series 2007-5 | | | 5.00% | | | | 08/25/2037 | | | | 10,796,828 | |
| | 5,125,847 | | | Series 2009-1R | | | 4.86% | #^ | | | 07/26/2035 | | | | 3,203,654 | |
| |
| | | | Credit-Based Asset Servicing and Securitization, | |
| | 1,445,893 | | | Series 2005-CB6-A4 | | | 5.16% | # | | | 06/25/2035 | | | | 1,357,562 | |
| | 9,750,000 | | | Series 2007-MX1-A3 | | | 5.83% | #^ | | | 12/25/2036 | | | | 7,929,626 | |
| |
| | | | Deutsche ALT-A Securities Inc. Alternate Loan, | |
| | 40,759,000 | | | Series 2005-4-A5 | | | 5.50% | # | | | 09/25/2035 | | | | 32,847,739 | |
| | 3,626,687 | | | Series 2005-5-1A6 | | | 34.10% | # I/F | | | 11/25/2035 | | | | 4,681,979 | |
| | 3,783,741 | | | Series 2005-5-2A1 | | | 0.45% | # | | | 11/25/2035 | | | | 2,617,174 | |
| | 11,419,740 | | | Series 2005-5-2A2 | | | 5.05% | # I/F I/O | | | 11/25/2035 | | | | 1,477,878 | |
| | 12,955,254 | | | Series 2007-1-A7 | | | 0.41% | # | | | 08/25/2037 | | | | 12,208,085 | |
| | 3,400,361 | | | Series 2006-AF1-A3 | | | 0.43% | # | | | 04/25/2036 | | | | 2,611,273 | |
| |
| | | | Deutsche ALT-B Securities Inc. Mortgage Loan Trust, | |
| | 2,500,000 | | | Series 2006-AB2-A2 | | | 6.16% | # | | | 06/25/2036 | | | | 1,705,916 | |
| | 5,763,601 | | | Series 2006-AB4-A1A | | | 6.01% | # | | | 10/25/2036 | | | | 3,409,913 | |
| | 5,733,509 | | | Series 2006-AB4-A3 | | | 5.90% | # | | | 10/25/2036 | | | | 3,363,924 | |
| | 8,498,665 | | | Series 2006-AB4-A3A1 | | | 5.90% | # | | | 10/25/2036 | | | | 4,986,286 | |
| | 2,677,182 | | | Series 2006-AB4-A6A1 | | | 5.87% | # | | | 10/25/2036 | | | | 1,699,248 | |
| |
| | | | Deutsche Mortgage Securities, Inc., | |
| | 22,927,328 | | | Series 2006-PR1-4A12 | | | 14.10% | #^ I/F | | | 04/15/2036 | | | | 25,334,697 | |
| | 13,965,830 | | | Series 2006-PR1-4AI1 | | | 11.80% | #^ I/F | | | 04/15/2036 | | | | 14,773,236 | |
| | 148,038,686 | | | Series 2006-PR1-5A14 | | | 11.80% | #^ I/F | | | 04/15/2036 | | | | 154,284,141 | |
| | 1,037,181 | | | Series 2006-PR1-5AI1 | | | 18.60% | #^ I/F | | | 04/15/2036 | | | | 1,061,096 | |
| | 8,944,189 | | | Series 2006-PR1-5AI3 | | | 12.20% | #^ I/F | | | 04/15/2036 | | | | 8,692,223 | |
| |
| | | | DLJ Commercial Mortgage Corporation, | |
| | 4,000,000 | | | Series 2000-CKP1-B1 | | | 7.95% | # | | | 11/10/2033 | | | | 3,996,697 | |
| |
| | | | Ellington Loan Acquisition Trust, | |
| | 4,588,613 | | | Series 2007-1-A2A2 | | | 1.05% | #^ | | | 05/25/2037 | | | | 4,257,705 | |
| |
| | | | Extended Stay American Trust, | |
| | 290,115,558 | | | Series 2010-ESH-XA1 | | | 3.33% | #^ I/O | | | 01/05/2013 | | | | 14,953,600 | |
| | 102,500,000 | | | Series 2010-ESH-XB1 | | | 1.37% | #^ I/O | | | 01/05/2016 | | | | 2,069,701 | |
| |
| | | | First Horizon Alternative Mortgage Securities, | |
| | 1,213,964 | | | Series 2006-FA1-1A6 | | | 1.00% | # | | | 09/25/2034 | | | | 1,022,769 | |
| | 7,446,394 | | | Series 2006-FA2-1A5 | | | 6.00% | | | | 05/25/2036 | | | | 6,037,250 | |
| | 2,182,271 | | | Series 2006-FA7-A8 | | | 6.25% | | | | 12/25/2036 | | | | 1,653,035 | |
| | 25,339,823 | | | Series 2006-RE1-A1 | | | 5.50% | | | | 05/25/2035 | | | | 22,535,135 | |
| | 2,970,551 | | | Series 2007-FA3-A4 | | | 6.00% | | | | 06/25/2037 | | | | 2,058,203 | |
| |
| | | | First Horizon Mortgage Trust, | |
| | 166,243 | | | Series 2005-2-1A6 | | | 22.90% | # I/F | | | 06/25/2032 | | | | 167,776 | |
| | 1,235,145 | | | Series 2005-6-1A1 | | | 5.50% | | | | 11/25/2035 | | | | 1,236,224 | |
| |
| | | | First Union Commercial Mortgage Securities, Inc., | |
| | 8,000,000 | | | Series 2000-C2-G | | | 8.65% | # | | | 10/15/2032 | | | | 7,986,002 | |
| | 1,500,000 | | | Series 2001-C1-F | | | 6.84% | | | | 03/15/2033 | | | | 1,503,049 | |
| |
| | | | GE Capital Commercial Mortgage Corporation, | |
| | 1,676,984 | | | Series 2004-C2 | | | 0.76% | #^ I/O | | | 03/10/2040 | | | | 34 | |
| |
| | | | GMAC Commercial Mortgage Securities, Inc., | |
| | 348,783 | | | Series 2003-C3 | | | 4.65% | | | | 04/10/2040 | | | | 360,950 | |
| | 2,388,875 | | | Series 2004-C1 | | | 1.01% | #^ I/O | | | 03/10/2038 | | | | 65 | |
| | 54,153,612 | | | Series 2004-C2 | | | 0.56% | #^ I/O | | | 08/10/2038 | | | | 80,635 | |
| | 9,000,000 | | | Series 2004-C3 | | | 4.55% | | | | 12/10/2041 | | | | 9,116,321 | |
| | 134,194,710 | | | Series 2004-C3 | | | 0.79% | # I/O | | | 12/10/2041 | | | | 494,306 | |
| |
| | | | GMAC Mortgage Corporation Loan Trust, | |
| | 2,836,897 | | | Series 2004-J2-A6 | | | 16.30% | # I/F | | | 06/25/2034 | | | | 2,956,497 | |
| |
| | | | Greenwich Capital Commercial Funding Corporation, | |
| | 6,500,000 | | | Series 2004-FL2 | | | 0.74% | #^ | | | 11/05/2019 | | | | 6,208,497 | |
| | 7,936,000 | | | Series 2004-FL2-F | | | 0.57% | #^ | | | 11/05/2019 | | | | 7,797,618 | |
| |
| | | | GS Mortgage Securities Corporation, | |
| | 3,352,303 | | | Series 2008-2R-1A1 | | | 7.50% | #^ | | | 09/25/2036 | | | | 2,955,264 | |
| |
| | | | GS Mortgage Securities Corporation II, | |
| | 6,750,000 | | | Series 2001-GS3-D | | | 6.74% | #^ | | | 08/05/2018 | | | | 6,853,648 | |
| | 36,698,949 | | | Series 2011-GC3-X | | | 1.35% | #^ I/O | | | 03/10/2021 | | | | 1,909,010 | |
| | | | | | |
| The accompanying notes are an integral part of these financial statements | | Annual Report | | March 31, 2011 | | 11 |
| | |
| |
| Schedule of Investments DoubleLine Total Return Bond Fund (Cont.) | | |
| | | | | | | | | | | | | | | | |
PRINCIPAL
AMOUNT | | | SECURITY DESCRIPTION | | RATE | | | MATURITY | | | VALUE $ | |
| |
| | | | GSAA Home Equity Trust, | |
| $ | 2,445,082 | | | Series 2005-12-AF3 | | | 5.07% | # | | | 09/25/2035 | | | | 2,343,187 | |
| | 45,361,000 | | | Series 2005-7-AF3 | | | 4.75% | # | | | 05/25/2035 | | | | 38,238,347 | |
| | 16,688,832 | | | Series 2006-10-AF3 | | | 5.98% | # | | | 06/25/2036 | | | | 10,171,017 | |
| | 11,944,483 | | | Series 2006-10-AF4 | | | 6.30% | # | | | 06/25/2036 | | | | 7,328,394 | |
| | 9,115,724 | | | Series 2006-15-AF4 | | | 5.96% | # | | | 09/25/2036 | | | | 5,844,706 | |
| | 3,936,728 | | | Series 2006-18-AF3A | | | 5.77% | # | | | 11/25/2036 | | | | 2,454,207 | |
| | 8,083,328 | | | Series 2006-18-AF6 | | | 5.68% | # | | | 11/25/2036 | | | | 4,657,703 | |
| | 7,461,627 | | | Series 2006-4-4A1 | | | 0.35% | # | | | 03/25/2036 | | | | 6,809,626 | |
| | 8,149,448 | | | Series 2007-10-A2A | | | 6.50% | | | | 11/25/2037 | | | | 5,879,085 | |
| |
| | | | GSMPS Mortgage Loan Trust, | |
| | 29,582,470 | | | Series 2005-RP2-1AF | | | 0.60% | #^ | | | 03/25/2035 | | | | 25,575,569 | |
| | 29,582,470 | | | Series 2005-RP2-1AS | | | 5.40% | #^ I/O | | | 03/25/2035 | | | | 4,081,008 | |
| | 16,084,450 | | | Series 2005-RP3-1AF | | | 0.60% | #^ | | | 09/25/2035 | | | | 13,846,243 | |
| | 16,084,450 | | | Series 2005-RP3-1AS | | | 5.27% | #^ I/O | | | 09/25/2035 | | | | 2,299,972 | |
| |
| | | | GSR Mortgage Loan Trust, | |
| | 1,956,545 | | | Series 2005-6F-3A16 | | | 5.50% | | | | 07/25/2035 | | | | 1,957,184 | |
| | 2,789,347 | | | Series 2005-6F-3A16 | | | 6.00% | | | | 07/25/2035 | | | | 2,677,883 | |
| | 35,616,345 | | | Series 2005-6F-3A9 | | | 6.65% | # I/F I/O | | | 07/25/2035 | | | | 6,007,790 | |
| | 3,680,936 | | | Series 2005-6F-4A1 | | | 0.75% | # | | | 06/25/2035 | | | | 3,499,687 | |
| | 4,027,331 | | | Series 2005-7F-3A1 | | | 0.75% | # | | | 09/25/2035 | | | | 3,556,874 | |
| | 4,410,708 | | | Series 2006-2F-2A3 | | | 5.75% | | | | 02/25/2036 | | | | 3,844,009 | |
| | 1,388,876 | | | Series 2006-9F-8A1 | | | 5.50% | | | | 08/25/2021 | | | | 1,341,959 | |
| |
| | | | Gulf Stream Compass Ltd., | |
| | 2,185,700 | | | Series 2002-1A-A | | | 0.89% | #^ | | | 12/19/2014 | | | | 2,147,451 | |
| |
| | | | Harborview Mortgage Loan Trust, | |
| | 7,272,569 | | | Series 2005-14-3A1A | | | 2.94% | # | | | 12/19/2035 | | | | 5,855,869 | |
| |
| | | | Home Equity Asset Trust, | |
| | 6,375,000 | | | Series 2004-7 | | | 0.91% | # | | | 01/25/2035 | | | | 5,576,232 | |
| |
| | | | Home Equity Mortgage Trust, | |
| | 3,142,370 | | | Series 2003-3-M1 | | | 1.54% | # | | | 08/25/2033 | | | | 2,621,186 | |
| |
| | | | Homebanc Mortgage Trust, | |
| | 3,950,570 | | | Series 2005-1 | | | 0.74% | # | | | 03/25/2035 | | | | 2,907,721 | |
| | 8,805,488 | | | Series 2006-1 | | | 5.74% | # | | | 04/25/2037 | | | | 7,369,850 | |
| |
| | | | HSI Asset Loan Obligation, | |
| | 10,061,620 | | | Series 2006-2-2A1 | | | 5.50% | | | | 12/25/2021 | | | | 9,391,214 | |
| |
| | | | IMPAC Trust, | |
| | 2,882,921 | | | Series 2002-9F-A1 | | | 5.22% | # | | | 12/25/2032 | | | | 2,882,405 | |
| |
| | | | Indymac Mortgage Loan Trust, | |
| | 1,616,395 | | | Series 2007-F2-1A2 | | | 6.00% | | | | 07/25/2037 | | | | 1,311,481 | |
| |
| | | | Jefferies & Company Research Trust, | |
| | 3,385,862 | | | Series 2010-R6-1A2 | | | 6.00% | ^ | | | 09/26/2037 | | | | 3,386,190 | |
| |
| | | | JMAC Company, | |
| | 14,429,434 | | | Series 2010-R1-1A1 | | | 6.00% | #^ | | | 03/26/2037 | | | | 14,663,912 | |
| |
| | | | JP Morgan Alternative Loan Trust, | |
| | 11,003,867 | | | Series 2005-S1-2A9 | | | 6.00% | | | | 12/25/2035 | | | | 9,446,672 | |
| | 1,991,656 | | | Series 2006-A6-1A2 | | | 0.32% | # | | | 11/25/2036 | | | | 1,961,732 | |
| | 10,165,776 | | | Series 2006-S1-1A8 | | | 5.75% | | | | 03/25/2036 | | | | 7,749,234 | |
| | 6,500,000 | | | Series 2006-S2-A4 | | | 6.19% | # | | | 05/25/2036 | | | | 3,272,792 | |
| | 14,745,000 | | | Series 2006-S4-A3A | | | 5.78% | # | | | 12/25/2036 | | | | 13,429,193 | |
| |
| | | | JP Morgan Chase, | |
| | 193,752,465 | | | Series 2007-CIBC18-X | | | 0.44% | # I/O | | | 06/12/2047 | | | | 2,624,552 | |
| |
| | | | JP Morgan Chase Commercial Mortgage Securities Trust, | |
| | 6,000,000 | | | Series 2001-C1-F | | | 7.05% | #^ | | | 10/12/2035 | | | | 6,065,935 | |
| | 12,671,000 | | | Series 2001-CBC1-E | | | 7.07% | # | | | 03/15/2033 | | | | 12,656,617 | |
| | 10,000,000 | | | Series 2001-CBC1-F | | | 7.54% | # | | | 03/15/2033 | | | | 9,975,039 | |
| | 5,000,000 | | | Series 2001-CIC2-C | | | 6.74% | # | | | 04/15/2035 | | | | 5,025,850 | |
| |
| | | | JP Morgan Commercial Mortgage Certificates, | |
| | 1,075,594 | | | Series 1997-C5-F | | | 7.56% | | | | 09/15/2029 | | | | 1,119,021 | |
| | 1,153,497 | | | Series 2003-CIBC7-A3 | | | 4.45% | | | | 01/12/2038 | | | | 1,154,933 | |
| | 30,537,572 | | | Series 2004-CBX-X1 | | | 0.54% | #^ I/O | | | 01/12/2037 | | | | 533,641 | |
| | 11,680,000 | | | Series 2004-CIBC10-A5 | | | 4.65% | | | | 01/12/2037 | | | | 12,056,173 | |
| | 322,071,828 | | | Series 2005-LDP3-X2 | | | 0.31% | # I/O | | | 08/15/2042 | | | | 864,119 | |
| | 134,475,570 | | | Series 2005-LDP4-X1 | | | 0.17% | #^ I/O | | | 10/15/2042 | | | | 954,064 | |
| | 337,964,573 | | | Series 2006-CIBC14-X2 | | | 0.16% | # I/O | | | 12/12/2044 | | | | 531,179 | |
| | 106,980,598 | | | Series 2006-CIBC16-X2 | | | 0.71% | # I/O | | | 05/12/2045 | | | | 1,275,305 | |
| | | | | | | | | | | | | | | | |
PRINCIPAL
AMOUNT | | | SECURITY DESCRIPTION | | RATE | | | MATURITY | | | VALUE $ | |
| |
| | | | JP Morgan Mortgage Acquisition Trust, | |
| $ | 16,000,000 | | | Series 2006-CH2-AF3 | | | 5.46% | | | | 10/25/2036 | | | | 9,837,016 | |
| | 25,430,821 | | | Series 2006-S4-A8 | | | 0.63% | # | | | 01/25/2037 | | | | 16,990,319 | |
| | 25,430,821 | | | Series 2006-S4-A9 | | | 6.37% | # I/F I/O | | | 01/25/2037 | | | | 4,179,500 | |
| | 6,841,000 | | | Series 2006-WF1-A5 | | | 6.41% | # | | | 07/25/2036 | | | | 4,180,901 | |
| |
| | | | JP Morgan Mortgage Trust, | |
| | 2,955,902 | | | Series 2003-A1-4A2 | | | 4.50% | # | | | 10/25/2033 | | | | 2,982,542 | |
| | 4,000,000 | | | Series 2007-S3-1A9 | | | 6.00% | | | | 08/25/2037 | | | | 3,347,040 | |
| | 27,530,684 | | | Series 2007-S3-2A2 | | | 5.50% | | | | 08/25/2022 | | | | 26,004,645 | |
| |
| | | | JP Morgan Research Trust, | |
| | 27,546,803 | | | Series 2010-1-1A4 | | | 6.00% | #^ | | | 02/26/2037 | | | | 14,558,485 | |
| | 12,470,275 | | | Series 2010-8-2A3 | | | 4.50% | ^ | | | 11/26/2034 | | | | 12,244,563 | |
| |
| | | | LB-UBS Commercial Mortgage Trust, | |
| | 54,376,003 | | | Series 2005-C1-XCP | | | 0.87% | # I/O | | | 02/15/2040 | | | | 334,086 | |
| | 177,695,140 | | | Series 2005-C2-XCP | | | 0.51% | # I/O | | | 04/15/2040 | | | | 478,195 | |
| | 58,366,115 | | | Series 2005-C5-XCP | | | 0.60% | # I/O | | | 09/15/2040 | | | | 370,502 | |
| | 203,093,794 | | | Series 2006-C7-XCL | | | 0.40% | #^ I/O | | | 11/15/2038 | | | | 3,172,914 | |
| |
| | | | Lehman Mortgage Trust, | |
| | 4,167,382 | | | Series 2005-3-2A3 | | | 5.50% | | | | 01/25/2036 | | | | 3,929,687 | |
| | 5,180,487 | | | Series 2006-1-1A1 | | | 1.01% | # | | | 02/25/2036 | | | | 3,554,521 | |
| | 15,541,460 | | | Series 2006-1-1A2 | | | 4.50% | # I/F I/O | | | 02/25/2036 | | | | 1,660,164 | |
| | 6,773,067 | | | Series 2006-1-3A4 | | | 5.50% | | | | 02/25/2036 | | | | 5,901,715 | |
| | 13,690,414 | | | Series 2006-4-1A3 | | | 5.15% | # I/F I/O | | | 08/25/2036 | | | | 1,640,873 | |
| | 8,701,331 | | | Series 2006-4-1A4 | | | 6.00% | | | | 08/25/2036 | | | | 6,036,387 | |
| | 16,876,017 | | | Series 2006-5-2A1 | | | 0.60% | # | | | 09/25/2036 | | | | 8,017,424 | |
| | 35,152,560 | | | Series 2006-5-2A2 | | | 6.90% | # I/F I/O | | | 09/25/2036 | | | | 6,580,784 | |
| | 8,116,052 | | | Series 2006-7-2A2 | | | 0.70% | # | | | 11/25/2036 | | | | 4,302,790 | |
| | 23,844,403 | | | Series 2006-7-2A5 | | | 6.30% | # I/F I/O | | | 11/25/2036 | | | | 3,903,717 | |
| | 8,872,986 | | | Series 2006-9-1A19 | | | 24.50% | # I/F | | | 01/25/2037 | | | | 12,028,920 | |
| | 9,368,550 | | | Series 2006-9-1A5 | | | 0.85% | # | | | 01/25/2037 | | | | 5,593,277 | |
| | 28,246,864 | | | Series 2006-9-1A6 | | | 4.90% | # I/F I/O | | | 01/25/2037 | | | | 4,101,238 | |
| | 10,365,645 | | | Series 2006-9-2A1 | | | 0.63% | # | | | 01/25/2037 | | | | 5,096,223 | |
| | 24,588,614 | | | Series 2006-9-2A2 | | | 6.37% | # I/F I/O | | | 01/25/2037 | | | | 4,176,774 | |
| | 7,815,812 | | | Series 2007-2-1A1 | | | 5.75% | | | | 03/25/2037 | | | | 5,864,966 | |
| | 6,885,908 | | | Series 2007-4-2A11 | | | 0.58% | # | | | 05/25/2037 | | | | 2,960,941 | |
| | 24,442,818 | | | Series 2007-4-2A8 | | | 6.42% | # I/F I/O | | | 05/25/2037 | | | | 4,223,536 | |
| | 2,982,926 | | | Series 2007-4-2A9 | | | 0.58% | # | | | 05/25/2037 | | | | 1,342,317 | |
| | 36,875,348 | | | Series 2007-5-11A1 | | | 6.09% | # | | | 06/25/2037 | | | | 24,715,222 | |
| | 1,905,261 | | | Series 2007-5-7A3 | | | 7.50% | | | | 10/25/2036 | | | | 1,896,650 | |
| | 1,970,957 | | | Series 2007-6-1A8 | | | 6.00% | | | | 07/25/2037 | | | | 1,619,181 | |
| |
| | | | Lehman XS Trust, | |
| | 4,363,245 | | | Series 2005-10-2A3B | | | 5.55% | # | | | 01/25/2036 | | | | 3,545,649 | |
| | 16,500,000 | | | Series 2005-4-2A3A | | | 5.00% | # | | | 10/25/2035 | | | | 11,433,411 | |
| | 799,114 | | | Series 2006-19-A1 | | | 0.35% | # | | | 12/25/2036 | | | | 768,029 | |
| | 7,153,425 | | | Series 2006-5-2A4A | | | 5.89% | | | | 04/25/2036 | | | | 6,029,683 | |
| |
| | | | Marathon Financing B.V., | |
| | 1,396,908 | | | Series 2006-1-A1 | | | 0.67% | #^ | | | 10/05/2026 | | | | 1,372,462 | |
| |
| | | | MASTR Adjustable Rate Mortgages Trust, | |
| | 8,778,713 | | | Series 2005-2-2A1 | | | 2.49% | # | | | 03/25/2035 | | | | 5,984,690 | |
| |
| | | | MASTR Alternative Loans Trust, | |
| | 4,537,855 | | | Series 2005-2-3A1 | | | 6.00% | | | | 03/25/2035 | | | | 4,562,427 | |
| | 3,748,589 | | | Series 2005-5-2A3 | | | 5.50% | | | | 07/25/2025 | | | | 3,621,102 | |
| | 14,890,148 | | | Series 2007-1-2A7 | | | 6.00% | | | | 10/25/2036 | | | | 13,170,433 | |
| |
| | | | MASTR Asset Backed Securities Trust, | |
| | 4,975,000 | | | Series 2003-OPT1-M3 | | | 4.37% | # | | | 12/25/2032 | | | | 3,717,718 | |
| |
| | | | MASTR Asset Securitization Trust, | |
| | 1,574,161 | | | Series 2003-1-30B2 | | | 5.75% | | | | 02/25/2033 | | | | 1,573,629 | |
| | 1,770,057 | | | Series 2007-1-1A1 | | | 5.50% | | | | 11/25/2037 | | | | 1,672,698 | |
| |
| | | | MASTR Seasoned Securitization Trust, | |
| | 1,382,286 | | | Series 2005-2-1A4 | | | 6.00% | | | | 10/25/2032 | | | | 1,283,483 | |
| | 4,725,776 | | | Series 2005-2-2A1 | | | 0.65% | # | | | 10/25/2032 | | | | 4,149,396 | |
| |
| | | | Merrill Lynch Mortgage Trust, | |
| | 428,125,242 | | | Series 2004-BPC1-XP | | | 0.93% | #^ I/O | | | 10/12/2041 | | | | 3,243,777 | |
| | 369,172,635 | | | Series 2005-MCP1-ASB | | | 0.83% | # I/O | | | 06/12/2043 | | | | 5,041,422 | |
| |
| | | | Morgan Stanley Capital, Inc., | |
| | 1,485,000 | | | Series 1999-LIFE1-G | | | 7.07% | #^ | | | 04/15/2033 | | | | 1,489,973 | |
| | 2,122,335 | | | Series 2003-NC6-M2 | | | 3.17% | # | | | 06/25/2033 | | | | 1,894,726 | |
| | 192,365,029 | | | Series 2004-HQ4-X2 | | | 0.51% | #^ I/O | | | 04/14/2040 | | | | 1,060,393 | |
| | 219,735,831 | | | Series 2005-IQ9-X2 | | | 1.26% | #^ I/O | | | 07/15/2056 | | | | 1,879,840 | |
| | 931,748 | | | Series 2005-RR6-A2 | | | 0.47% | #^ | | | 05/24/2043 | | | | 924,760 | |
| | | | | | | | |
| 12 | | DoubleLine Funds | | | | | The accompanying notes are an integral part of these financial statements | |
| | | | | | | | | | | | | | | | |
PRINCIPAL
AMOUNT | | | SECURITY DESCRIPTION | | RATE | | | MATURITY | | | VALUE $ | |
| |
| | | | Morgan Stanley Capital, Inc., (Cont.) | |
| $ | 9,373,542 | | | Series 2007-HQ12-A2 | | | 0.51% | # | | | 04/12/2049 | | | | 8,853,402 | |
| | 18,747,084 | | | Series 2007-HQ12-A2FX | | | 5.78% | # | | | 06/12/2012 | | | | 19,215,762 | |
| |
| | | | Morgan Stanley Mortgage Loan Trust, | |
| | 5,337,985 | | | Series 2005-10-1A1 | | | 0.95% | # | | | 12/25/2035 | | | | 3,886,745 | |
| | 2,703,007 | | | Series 2005-6AR-1A1 | | | 0.53% | # | | | 11/25/2035 | | | | 2,333,502 | |
| | 8,508,520 | | | Series 2006-11-1A6 | | | 6.23% | # | | | 08/25/2036 | | | | 4,635,088 | |
| | 25,034,811 | | | Series 2006-11-2A1 | | | 6.00% | | | | 08/25/2036 | | | | 19,445,552 | |
| | 12,838,160 | | | Series 2006-17XS-A3A | | | 5.65% | # | | | 10/25/2046 | | | | 8,538,172 | |
| | 3,830,040 | | | Series 2006-17XS-A6 | | | 5.58% | # | | | 10/25/2046 | | | | 2,339,007 | |
| | 1,947,545 | | | Series 2006-2-2A3 | | | 5.75% | | | | 02/25/2036 | | | | 1,724,871 | |
| | 7,491,810 | | | Series 2006-7-4A7 | | | 6.00% | | | | 06/25/2036 | | | | 5,732,261 | |
| | 5,860,598 | | | Series 2007-1XS-2A3 | | | 5.92% | # | | | 09/25/2046 | | | | 3,417,508 | |
| | 4,460,103 | | | Series 2007-1XS-2A4A | | | 6.08% | # | | | 09/25/2046 | | | | 3,017,849 | |
| | 3,990,809 | | | Series 2007-3XS-1A2A | | | 5.62% | # | | | 01/25/2047 | | | | 3,454,790 | |
| | 13,347,125 | | | Series 2007-3XS-2A3S | | | 5.86% | # | | | 01/25/2047 | | | | 8,785,151 | |
| | 7,806,809 | | | Series 2007-3XS-2A4S | | | 5.96% | # | | | 01/25/2047 | | | | 5,169,083 | |
| |
| | | | Morgan Stanley Re-Remic Trust, | |
| | 7,916,879 | | | Series 2010-R9-1A | | | 4.00% | ^ | | | 08/26/2036 | | | | 8,117,623 | |
| | 9,474,955 | | | Series 2010-R9-1B | | | 7.67% | #^ | | | 08/26/2036 | | | | 5,258,600 | |
| |
| | | | Multi Security Asset Trust, | |
| | 7,500,000 | | | Series 2005-RR4-A3 | | | 5.00% | ^ | | | 11/28/2035 | | | | 7,275,000 | |
| |
| | | | New York Mortgage Trust, | |
| | 2,310,755 | | | Series 2005-2-A | | | 0.58% | # | | | 08/25/2035 | | | | 2,076,125 | |
| |
| | | | Nomura Asset Acceptance Corporation, | |
| | 3,191,114 | | | Series 2005-AP1-2A5 | | | 4.86% | # | | | 02/25/2035 | | | | 2,904,311 | |
| |
| | | | Nomura Asset Alternative Loan Trust, | |
| | 23,146,703 | | | Series 2006-AF1-IA2 | | | 6.16% | # | | | 05/25/2036 | | | | 13,218,781 | |
| | 4,703,824 | | | Series 2006-AF1-IA3 | | | 6.41% | | | | 05/25/2036 | | | | 2,633,024 | |
| | 25,553,497 | | | Series 2006-AP1-A2 | | | 5.52% | # | | | 01/25/2036 | | | | 18,203,404 | |
| | 5,000,000 | | | Series 2006-AP1-A3 | | | 5.65% | | | | 01/25/2036 | | | | 3,445,295 | |
| | 2,650,476 | | | Series 2006-WF1-A2 | | | 5.76% | # | | | 06/25/2036 | | | | 1,664,605 | |
| |
| | | | Nomura Home Equity Loan Trust, | |
| | 24,349,412 | | | Series 2006-AF1-A2 | | | 5.80% | # | | | 10/25/2036 | | | | 11,949,291 | |
| | 4,574,651 | | | Series 2007-1-1A1 | | | 6.06% | # | | | 02/25/2037 | | | | 2,422,690 | |
| | 18,735,525 | | | Series 2007-1-1A3 | | | 5.99% | # | | | 02/25/2037 | | | | 10,253,466 | |
| |
| | | | Option One Mortgage Loan Trust, | |
| | 1,598,695 | | | Series 2002-2-A | | | 0.79% | # | | | 06/25/2032 | | | | 1,346,145 | |
| | 8,410,261 | | | Series 2004-3-M3 | | | 0.90% | # | | | 11/25/2034 | | | | 6,910,274 | |
| |
| | | | PHH Alternative Mortgage Trust, | |
| | 2,677,440 | | | Series 2007-2-3A1 | | | 6.00% | | | | 05/25/2037 | | | | 2,296,618 | |
| |
| | | | PNC Mortgage Acceptance Corporation, | |
| | 425,824 | | | Series 1999-CM1-B3 | | | 7.10% | ^ | | | 12/10/2032 | | | | 425,678 | |
| |
| | | | Popular ABS Mortgage Pass-Through Trust, | |
| | 1,594,020 | | | Series 2005-5-AF6 | | | 5.33% | # | | | 11/25/2035 | | | | 1,353,788 | |
| |
| | | | Prime Mortgage Trust, | |
| | 8,092,445 | | | Series 2006-1-2A5 | | | 6.00% | | | | 06/25/2036 | | | | 7,652,378 | |
| | 6,324,223 | | | Series 2006-DR1-2A1 | | | 5.50% | ^ | | | 05/25/2035 | | | | 5,715,981 | |
| |
| | | | Prudential Commercial Mortgage Trust, | |
| | 2,361,363 | | | Series 2003-PWR1-A1 | | | 3.67% | | | | 02/11/2036 | | | | 2,367,147 | |
| |
| | | | Prudential Mortgage Capital Funding, LLC, | |
| | 2,000,000 | | | Series 2001-C1-F | | | 7.40% | #^ | | | 05/10/2034 | | | | 2,000,347 | |
| |
| | | | Renaissance Home Equity Loan Trust, | |
| | 1,994,294 | | | Series 2006-1-AF6 | | | 5.75% | # | | | 05/25/2036 | | | | 1,492,175 | |
| | 11,300,000 | | | Series 2006-4-AF4 | | | 5.47% | # | | | 01/25/2037 | | | | 6,404,343 | |
| | 22,252,000 | | | Series 2006-4-AF5 | | | 5.69% | # | | | 01/25/2037 | | | | 12,973,139 | |
| | 18,490,000 | | | Series 2007-2-AF2 | | | 5.68% | # | | | 06/25/2037 | | | | 10,015,266 | |
| | 10,000,000 | | | Series 2007-2-AF5 | | | 6.20% | # | | | 06/25/2037 | | | | 5,935,100 | |
| |
| | | | Residential Accredit Loans, Inc., | |
| | 1,437,869 | | | Series 2005-QS12-A11 | | | 48.40% | # I/F | | | 08/25/2035 | | | | 2,315,346 | |
| | 7,038,177 | | | Series 2005-QS13-1A6 | | | 5.50% | | | | 09/25/2035 | | | | 6,031,253 | |
| | 11,486,541 | | | Series 2005-QS13-A1 | | | 0.95% | # | | | 09/25/2035 | | | | 7,803,244 | |
| | 47,094,819 | | | Series 2005-QS13-A2 | | | 4.80% | # I/F I/O | | | 09/25/2035 | | | | 6,355,097 | |
| | 21,921,597 | | | Series 2005-QS14-2A1 | | | 6.00% | | | | 09/25/2035 | | | | 17,040,469 | |
| | 11,111,626 | | | Series 2005-QS15-IIA | | | 6.00% | | | | 10/25/2035 | | | | 6,879,247 | |
| | 12,691,503 | | | Series 2005-QS16-A1 | | | 0.95% | # | | | 11/25/2035 | | | | 8,980,285 | |
| | 12,691,503 | | | Series 2005-QS16-A2 | | | 4.55% | # I/F I/O | | | 11/25/2035 | | | | 1,315,487 | |
| | 5,654,468 | | | Series 2005-QS17-A1 | | | 6.00% | | | | 12/25/2035 | | | | 4,393,349 | |
| | 4,241,656 | | | Series 2005-QS17-A10 | | | 6.00% | | | | 12/25/2035 | | | | 3,117,506 | |
| | 12,609,349 | | | Series 2005-QS17-A2 | | | 1.10% | # | | | 12/25/2035 | | | | 8,188,549 | |
| | | | | | | | | | | | | | | | |
PRINCIPAL
AMOUNT | | | SECURITY DESCRIPTION | | RATE | | | MATURITY | | | VALUE $ | |
| $ | 12,609,349 | | | Series 2005-QS17-A4 | | | 4.90% | # I/F I/O | | | 12/25/2035 | | | | 1,497,032 | |
| | 10,145,872 | | | Series 2005-QS17-A6 | | | 6.00% | | | | 12/25/2035 | | | | 7,456,947 | |
| | 7,889,981 | | | Series 2005-QS1-A5 | | | 5.50% | | | | 01/25/2035 | | | | 6,791,289 | |
| | 5,228,124 | | | Series 2005-QS9-A1 | | | 0.75% | # | | | 06/25/2035 | | | | 4,331,697 | |
| | 13,070,310 | | | Series 2005-QS9-A4 | | | 4.75% | # I/F I/O | | | 06/25/2035 | | | | 1,490,891 | |
| | 4,788,247 | | | Series 2006-QS10-A4 | | | 5.75% | | | | 08/25/2036 | | | | 3,180,928 | |
| | 5,448,073 | | | Series 2006-QS12-1A1 | | | 6.50% | | | | 09/25/2036 | | | | 3,703,486 | |
| | 12,465,761 | | | Series 2006-QS12-2A18 | | | 5.75% | | | | 09/25/2036 | | | | 8,340,672 | |
| | 5,245,824 | | | Series 2006-QS1-A6 | | | 40.90% | # I/F | | | 01/25/2036 | | | | 7,431,916 | |
| | 7,619,883 | | | Series 2006-QS4-A8 | | | 1.36% | # I/F | | | 04/25/2036 | | | | 5,721,512 | |
| | 15,329,181 | | | Series 2006-QS5-A3 | | | 6.00% | | | | 05/25/2036 | | | | 11,165,101 | |
| | 29,533,818 | | | Series 2006-QS8-A1 | | | 6.00% | | | | 08/25/2036 | | | | 19,282,940 | |
| | 51,215,952 | | | Series 2006-QS8-A5 | | | 5.30% | # I/F I/O | | | 08/25/2036 | | | | 6,391,141 | |
| | 5,290,550 | | | Series 2007-QS1-1A4 | | | 6.00% | | | | 01/25/2037 | | | | 3,585,792 | |
| | 2,293,965 | | | Series 2007-QS2-A6 | | | 6.25% | | | | 01/25/2037 | | | | 1,574,685 | |
| | 4,392,656 | | | Series 2007-QS5-A5 | | | 0.55% | # | | | 03/25/2037 | | | | 2,212,783 | |
| | 14,589,015 | | | Series 2007-QS5-A8 | | | 6.45% | # I/F I/O | | | 03/25/2037 | | | | 2,253,642 | |
| | 3,910,146 | | | Series 2007-QS6-A13 | | | 52.90% | # I/F | | | 04/25/2037 | | | | 6,655,775 | |
| | 27,752,113 | | | Series 2007-QS6-A6 | | | 6.25% | | | | 04/25/2037 | | | | 18,841,562 | |
| |
| | | | Residential Asset Securities Corporation, | |
| | 3,688,414 | | | Series 06-KS4-A3 | | | 0.40% | # | | | 6/25/2036 | | | | 3,374,978 | |
| | 1,194,955 | | | Series 2002-KS1-AI6 | | | 6.08% | | | | 06/25/2032 | | | | 1,041,972 | |
| | 4,539,611 | | | Series 2003-KS11-MI1 | | | 5.13% | | | | 01/25/2034 | | | | 3,708,483 | |
| |
| | | | Residential Asset Securitization Trust, | |
| | 7,886,095 | | | Series 2004-RS5-AI6 | | | 5.55% | # | | | 05/25/2034 | | | | 6,497,133 | |
| | 2,790,842 | | | Series 2004-RS8-AI4 | | | 5.06% | | | | 06/25/2032 | | | | 2,752,949 | |
| | 2,490,932 | | | Series 2004-RS9-AI4 | | | 4.77% | # | | | 10/25/2032 | | | | 2,219,249 | |
| | 3,185,923 | | | Series 2004-RS9-II6 | | | 4.72% | # | | | 07/25/2034 | | | | 2,644,701 | |
| | 4,832,771 | | | Series 2004-RZ2-AI4 | | | 5.35% | # | | | 02/25/2033 | | | | 3,849,416 | |
| | 11,392,768 | | | Series 2005-A11-2A4 | | | 6.00% | | | | 10/25/2035 | | | | 6,835,661 | |
| | 11,856,050 | | | Series 2005-A12-A7 | | | 4.75% | # I/F I/O | | | 11/25/2035 | | | | 1,346,517 | |
| | 8,959,961 | | | Series 2005-A12-A8 | | | 0.80% | # | | | 11/25/2035 | | | | 6,479,768 | |
| | 8,075,768 | | | Series 2005-A7-A3 | | | 5.50% | | | | 06/25/2035 | | | | 7,368,674 | |
| | 12,760,028 | | | Series 2005-A8CB-A11 | | | 6.00% | | | | 07/25/2035 | | | | 11,490,526 | |
| | 16,793,287 | | | Series 2005-A8CB-A2 | | | 4.75% | # I/F I/O | | | 07/25/2035 | | | | 1,681,267 | |
| | 7,550,000 | | | Series 2005-RS1-AI5 | | | 5.41% | # | | | 12/25/2034 | | | | 5,887,071 | |
| | 2,241,494 | | | Series 2006-A1-1A3 | | | 6.00% | | | | 04/25/2036 | | | | 1,758,380 | |
| | 2,499,984 | | | Series 2006-A4-2A5 | | | 6.00% | | | | 05/25/2036 | | | | 1,746,030 | |
| | 4,519,596 | | | Series 2006-A8-1A1 | | | 6.00% | | | | 08/25/2036 | | | | 3,364,773 | |
| | 13,772,520 | | | Series 2006-R1-A1 | | | 27.40% | # I/F | | | 01/25/2046 | | | | 15,346,498 | |
| | 2,261,802 | | | Series 2007-A3-1A2 | | | 44.50% | # I/F | | | 04/25/2037 | | | | 3,540,667 | |
| | 40,430,875 | | | Series 2007-A5-1A4 | | | 5.85% | # I/F I/O | | | 05/25/2037 | | | | 6,118,704 | |
| | 10,390,237 | | | Series 2007-A5-1A6 | | | 0.65% | # | | | 05/25/2037 | | | | 4,566,467 | |
| |
| | | | Residential Funding Mortgage Securities Trust, | |
| | 2,647,663 | | | Series 2005-S9-A8 | | | 5.50% | | | | 12/25/2035 | | | | 2,528,846 | |
| | 1,039,025 | | | Series 2006-S5-A15 | | | 6.00% | | | | 06/25/2036 | | | | 890,737 | |
| | 18,000,000 | | | Series 2007-S1-A7 | | | 6.00% | | | | 01/25/2037 | | | | 15,763,563 | |
| | 4,500,000 | | | Series 2007-S4-A1 | | | 6.00% | | | | 04/25/2037 | | | | 3,901,322 | |
| | 19,760,548 | | | Series 2007-SA1-4A | | | 5.89% | | | | 02/25/2037 | | | | 15,833,139 | |
| |
| | | | Salomon Brothers Mortgage Securities, | |
| | 3,000,000 | | | Series 2000-C3-F | | | 7.60% | # | | | 12/18/2033 | | | | 2,970,601 | |
| | 4,860,000 | | | Series 2001-C1-C | | | 6.73% | # | | | 12/18/2035 | | | | 4,852,786 | |
| | 3,000,000 | | | Series 2001-C1-E | | | 6.31% | # | | | 12/18/2035 | | | | 2,991,676 | |
| |
| | | | Sequoia Mortgage Trust, | |
| | 685,952 | | | Series 2003-4-2A1 | | | 0.60% | # | | | 07/20/2033 | | | | 660,577 | |
| |
| | | | Soundview Home Loan, | |
| | 7,732,845 | | | Series 2007-1 | | | 0.34% | # | | | 03/25/2037 | | | | 7,531,199 | |
| |
| | | | Structured Asset Securities Corporation, | |
| | 21,217,196 | | | Series 2002-BC7-M1 | | | 1.05% | # | | | 10/25/2032 | | | | 15,503,829 | |
| | 1,382,376 | | | Series 2003-18XS-A6 | | | 4.04% | | | | 06/25/2033 | | | | 1,392,911 | |
| | 10,035,860 | | | Series 2005-14-1A1 | | | 0.55% | # | | | 07/25/2035 | | | | 9,181,487 | |
| | 3,608,083 | | | Series 2005-14-1A4 | | | 23.40% | # I/F | | | 07/25/2035 | | | | 4,313,126 | |
| |
| | | | Suntrust Alternative Loan Trust, | |
| | 2,428,372 | | | Series 2005-1F-2A3 | | | 5.75% | | | | 12/25/2035 | | | | 2,040,071 | |
| | 5,187,847 | | | Series 2006-1F-1A3 | | | 6.00% | | | | 04/25/2036 | | | | 3,319,592 | |
| |
| | | | Thornburg Mortgage Securities Trust, | |
| | 3,128,766 | | | Series 2003-6-A2 | | | 1.25% | # | | | 12/25/2033 | | | | 2,506,348 | |
| |
| | | | TIAA Real Estate CDO, | |
| | 10,000,000 | | | Series 2002-1 | | | 1.56% | #^ | | | 05/22/2037 | | | | 9,500,000 | |
| |
| | | | Wachovia Bank Commercial Mortgage Trust, | |
| | 6,425,084 | | | Series 2006-C23-APB | | | 5.45% | | | | 01/15/2045 | | | | 6,511,382 | |
| | | | | | |
| The accompanying notes are an integral part of these financial statements | | Annual Report | | March 31, 2011 | | 13 |
| | |
| |
| Schedule of Investments DoubleLine Total Return Bond Fund (Cont.) | | |
| | | | | | | | | | | | | | | | |
PRINCIPAL
AMOUNT | | | SECURITY DESCRIPTION | | RATE | | | MATURITY | | | VALUE $ | |
| |
| | | | Washington Mutual Mortgage Pass Through Certificates, | |
| $ | 3,837,331 | | | Series 2002-MS9-CB1 | | | 5.79% | # | | | 12/25/2032 | | | | 3,677,253 | |
| | 14,281,856 | | | Series 2005-1-2A | | | 6.00% | | | | 03/25/2035 | | | | 12,017,103 | |
| | 2,518,702 | | | Series 2005-5-CB12 | | | 47.90% | # I/F | | | 07/25/2035 | | | | 4,122,709 | |
| | 8,156,175 | | | Series 2005-5-CB6 | | | 0.85% | # | | | 07/25/2035 | | | | 5,508,081 | |
| | 9,351,556 | | | Series 2005-9-CX | | | 5.50% | I/O | | | 11/25/2035 | | | | 1,319,095 | |
| | 7,826,246 | | | Series 2006-1-3A2 | | | 5.75% | | | | 02/25/2036 | | | | 6,720,558 | |
| | 6,724,864 | | | Series 2006-1-3A7 | | | 5.75% | | | | 02/25/2036 | | | | 5,090,864 | |
| | 7,107,237 | | | Series 2006-5-1A8 | | | 5.75% | | | | 07/25/2036 | | | | 5,443,678 | |
| | 10,404,012 | | | Series 2006-5-3A5 | | | 6.45% | # | | | 07/25/2036 | | | | 6,202,315 | |
| | 7,791,733 | | | Series 2006-9-A7 | | | 5.93% | # | | | 10/25/2036 | | | | 5,346,154 | |
| | 3,136,450 | | | Series 2007-4-1A4 | | | 6.00% | | | | 06/25/2037 | | | | 442,302 | |
| | 1,317,309 | | | Series 2007-5-A11 | | | 38.00% | # I/F | | | 06/25/2037 | | | | 2,018,686 | |
| |
| | | | Wells Fargo Alternative Loan Trust, | |
| | 24,396,028 | | | Series 2007-PA1-A5 | | | 6.00% | | | | 03/25/2037 | | | | 18,416,647 | |
| | 2,877,557 | | | Series 2007-PA3-1A4 | | | 5.75% | | | | 07/25/2037 | | | | 2,456,195 | |
| |
| | | | Wells Fargo Mortgage Backed Securities Trust, | |
| | 2,265,393 | | | Series 2005-4-A7 | | | 22.90% | # I/F | | | 04/25/2035 | | | | 2,574,743 | |
| | 8,390,367 | | | Series 2005-AR16-6A4 | | | 2.86% | # | | | 10/25/2035 | | | | 4,019,112 | |
| | 385,274 | | | Series 2006-2-1A4 | | | 18.70% | # I/F | | | 03/25/2036 | | | | 457,357 | |
| | 7,295,591 | | | Series 2006-2-3A1 | | | 5.75% | | | | 03/25/2036 | | | | 7,208,934 | |
| | 5,148,012 | | | Series 2006-3-A6 | | | 5.50% | | | | 03/25/2036 | | | | 4,653,340 | |
| | 1,190,795 | | | Series 2006-4-2A2 | | | 5.50% | | | | 04/25/2036 | | | | 1,132,619 | |
| | 7,891,134 | | | Series 2006-9-2A1 | | | 0.00% | P/O | | | 08/25/2036 | | | | 6,159,539 | |
| | 7,891,134 | | | Series 2006-9-2A2 | | | 6.00% | I/O | | | 08/25/2036 | | | | 1,289,269 | |
| | 13,144,588 | | | Series 2007-11-A96 | | | 6.00% | | | | 08/25/2037 | | | | 12,743,704 | |
| | 6,041,553 | | | Series 2007-2-3A2 | | | 5.25% | | | | 03/25/2037 | | | | 5,876,933 | |
| | 10,054,494 | | | Series 2007-5-1A6 | | | 23.50% | # I/F | | | 05/25/2037 | | | | 12,970,297 | |
| | 2,422,000 | | | Series 2007-7-A32 | | | 5.75% | | | | 06/25/2037 | | | | 2,263,997 | |
| | 5,679,547 | | | Series 2007-8-1A14 | | | 38.30% | # I/F | | | 07/25/2037 | | | | 8,327,891 | |
| | | | | | | | | | | | | | | | |
| | | | Total Collateralized Mortgage Obligations
(Cost $2,898,205,448) | | | | 2,929,497,649 | |
| | | | | | | | | | | | | | | | |
| | US GOVERNMENT AGENCY OBLIGATIONS 42.9% | |
| |
| | | | Federal Home Loan Mortgage Corporation, | |
| | 63,685,894 | | | Pool C03490 | | | 4.50% | | | | 08/01/2040 | | | | 64,812,103 | |
| | 1,449,345 | | | Pool U60299 | | | 4.00% | | | | 11/01/2040 | | | | 1,426,060 | |
| | 14,218,028 | | | Series 2519-ZD | | | 5.50% | | | | 11/15/2032 | | | | 15,382,314 | |
| | 4,453,201 | | | Series 2596-ZL | | | 5.00% | | | | 04/15/2033 | | | | 4,687,527 | |
| | 2,407,019 | | | Series 2684-ZN | | | 4.00% | | | | 10/15/2033 | | | | 2,431,720 | |
| | 12,388,317 | | | Series 2750-ZT | | | 5.00% | | | | 02/15/2034 | | | | 13,096,361 | |
| | 2,883,417 | | | Series 2825-PZ | | | 5.50% | | | | 07/15/2034 | | | | 3,065,577 | |
| | 52,176,448 | | | Series 2932-Z | | | 5.00% | | | | 02/15/2035 | | | | 54,324,375 | |
| | 10,183,691 | | | Series 2990-JL | | | 6.40% | # I/F I/O | | | 03/15/2035 | | | | 1,312,124 | |
| | 28,717,175 | | | Series 3002-SN | | | 6.25% | # I/F I/O | | | 07/15/2035 | | | | 4,144,293 | |
| | 1,024,733 | | | Series 3014-SJ | | | 10.90% | # I/F | | | 08/15/2035 | | | | 1,019,324 | |
| | 20,120,936 | | | Series 3030-SL | | | 5.85% | # I/F I/O | | | 09/15/2035 | | | | 2,655,098 | |
| | 5,663,931 | | | Series 3045-DI | | | 6.48% | # I/F I/O | | | 10/15/2035 | | | | 858,377 | |
| | 22,469,479 | | | Series 3116-Z | | | 5.50% | | | | 02/15/2036 | | | | 24,360,007 | |
| | 5,840,129 | | | Series 3117-ZN | | | 4.50% | | | | 02/15/2036 | | | | 5,836,506 | |
| | 6,958,297 | | | Series 3174-PZ | | | 5.00% | | | | 01/15/2036 | | | | 7,088,853 | |
| | 3,786,571 | | | Series 3187-JZ | | | 5.00% | | | | 07/15/2036 | | | | 3,970,655 | |
| | 5,211,559 | | | Series 3188-ZK | | | 5.00% | | | | 07/15/2036 | | | | 5,421,438 | |
| | 23,131,309 | | | Series 3203-SE | | | 6.25% | # I/F I/O | | | 08/15/2036 | | | | 3,117,291 | |
| | 28,281,443 | | | Series 3203-ZC | | | 5.00% | | | | 07/15/2036 | | | | 29,414,771 | |
| | 26,531,622 | | | Series 3261-SA | | | 6.18% | # I/F I/O | | | 01/15/2037 | | | | 3,941,413 | |
| | 53,182,239 | | | Series 3275-SC | | | 5.83% | # I/F I/O | | | 02/15/2037 | | | | 6,039,508 | |
| | 12,578,789 | | | Series 3315-HZ | | | 6.00% | | | | 05/15/2037 | | | | 13,638,996 | |
| | 2,993,905 | | | Series 3351-ZC | | | 5.50% | | | | 07/15/2037 | | | | 3,178,561 | |
| | 38,053,836 | | | Series 3355-BI | | | 5.80% | # I/F I/O | | | 08/15/2037 | | | | 4,635,288 | |
| | 3,061,380 | | | Series 3369-Z | | | 6.00% | | | | 09/15/2037 | | | | 3,321,318 | |
| | 61,646,688 | | | Series 3417-SI | | | 5.93% | # I/F I/O | | | 02/15/2038 | | | | 7,497,735 | |
| | 19,219,720 | | | Series 3423-GS | | | 5.40% | # I/F I/O | | | 03/15/2038 | | | | 1,731,827 | |
| | 16,294,980 | | | Series 3423-SG | | | 5.40% | # I/F I/O | | | 03/15/2038 | | | | 1,468,293 | |
| | 14,946,729 | | | Series 3451-S | | | 5.78% | # I/F I/O | | | 02/15/2037 | | | | 1,863,014 | |
| | 26,472,054 | | | Series 3455-SC | | | 5.81% | # I/F I/O | | | 06/15/2038 | | | | 2,646,607 | |
| | 19,364,130 | | | Series 3473-SM | | | 5.82% | # I/F I/O | | | 07/15/2038 | | | | 2,050,518 | |
| | 52,783,587 | | | Series 3484-SE | | | 5.60% | # I/F I/O | | | 08/15/2038 | | | | 5,928,209 | |
| | 2,719,058 | | | Series 3530-BF | | | 4.50% | | | | 05/15/2039 | | | | 2,452,154 | |
| | 33,518,635 | | | Series 3545-SA | | | 5.40% | # I/F I/O | | | 06/15/2039 | | | | 4,464,622 | |
| | 13,943,684 | | | Series 3549-SA | | | 5.55% | # I/F I/O | | | 07/15/2039 | | | | 1,598,861 | |
| | 23,112,520 | | | Series 3582-SA | | | 5.75% | # I/F I/O | | | 10/15/2049 | | | | 2,771,482 | |
| | 11,140,980 | | | Series 3583-GB | | | 4.50% | | | | 10/15/2039 | | | | 10,914,281 | |
| | 84,199,102 | | | Series 3606-CS | | | 6.10% | # I/F I/O | | | 12/15/2039 | | | | 10,838,748 | |
| | 24,031,030 | | | Series 3616-SG | | | 6.10% | # I/F I/O | | | 03/15/2032 | | | | 3,752,775 | |
| | 34,332,891 | | | Series 3631-SE | | | 6.15% | # I/F I/O | | | 05/15/2039 | | | | 3,764,258 | |
| | | | | | | | | | | | | | | | |
PRINCIPAL
AMOUNT | | | SECURITY DESCRIPTION | | RATE | | | MATURITY | | | VALUE $ | |
| $ | 41,784,334 | | | Series 3641-SB | | | 6.25% | # I/F I/O | | | 10/15/2034 | | | | 4,015,725 | |
| | 23,240,973 | | | Series 3641-Z | | | 5.50% | | | | 02/15/2036 | | | | 25,032,220 | |
| | 18,117,811 | | | Series 3654-ZB | | | 5.50% | | | | 11/15/2037 | | | | 19,371,953 | |
| | 36,295,782 | | | Series 3666-VZ | | | 5.50% | | | | 08/15/2036 | | | | 38,542,911 | |
| | 46,238,888 | | | Series 3667-SB | | | 6.20% | # I/F I/O | | | 05/15/2040 | | | | 6,266,303 | |
| | 16,691,889 | | | Series 3704-EI | | | 5.00% | I/O | | | 12/15/2036 | | | | 2,914,212 | |
| | 14,493,511 | | | Series 3712-SG | | | 23.70% | # I/F | | | 08/15/2040 | | | | 16,980,666 | |
| | 16,646,987 | | | Series 3741-SC | | | 9.49% | # I/F | | | 10/15/2040 | | | | 14,345,536 | |
| | 46,694,821 | | | Series 3748-CS | | | 9.48% | # I/F | | | 10/15/2040 | | | | 39,727,954 | |
| | 51,700,000 | | | Series 3752-BS | | | 9.48% | # I/F | | | 11/15/2040 | | | | 43,769,220 | |
| | 11,808,983 | | | Series 3764-S | | | 9.39% | # I/F | | | 11/15/2040 | | | | 10,277,961 | |
| | 18,761,630 | | | Series 3779-BY | | | 3.50% | | | | 12/15/2030 | | | | 16,628,183 | |
| | 27,801,736 | | | Series 3779-DZ | | | 4.50% | | | | 12/15/2040 | | | | 24,136,775 | |
| | 24,250,000 | | | Series 3779-LB | | | 4.00% | | | | 12/15/2030 | | | | 23,486,222 | |
| | 14,869,541 | | | Series 3779-SH | | | 9.29% | # I/F | | | 12/15/2040 | | | | 12,685,021 | |
| | 3,500,000 | | | Series 3779-YA | | | 3.50% | | | | 12/15/2030 | | | | 3,049,341 | |
| | 16,903,864 | | | Series 3780-BS | | | 9.39% | # I/F | | | 12/15/2040 | | | | 13,824,308 | |
| | 15,000,000 | | | Series 3783-AC | | | 4.00% | | | | 01/15/2031 | | | | 14,448,128 | |
| | 27,325,819 | | | Series 3786-SG | | | 8.99% | # I/F | | | 01/15/2041 | | | | 23,103,947 | |
| | 11,731,674 | | | Series 3788-AY | | | 3.50% | | | | 01/15/2031 | | | | 10,278,303 | |
| | 8,447,713 | | | Series 3796-CS | | | 9.39% | # I/F | | | 01/15/2041 | | | | 6,808,802 | |
| | 11,950,497 | | | Series 3798-SD | | | 9.09% | # I/F | | | 12/15/2040 | | | | 9,824,784 | |
| | 18,000,000 | | | Series 3808-DB | | | 3.50% | | | | 02/15/2031 | | | | 16,149,287 | |
| | 15,277,557 | | | Series 3812-EY | | | 3.50% | | | | 02/15/2031 | | | | 13,714,843 | |
| | 35,500,000 | | | Series 3824-EY | | | 3.50% | | | | 03/15/2031 | | | | 31,095,799 | |
| | 98,806,160 | | | Series R003-ZA | | | 5.50% | | | | 10/15/2035 | | | | 105,660,836 | |
| | 50,000,000 | | | Debt Facility | | | 0.19% | # | | | 05/05/2011 | | | | 50,006,850 | |
| |
| | | | Federal National Mortgage Association, | |
| | 26,667,282 | | | Series 2006-101-SA | | | 6.33% | # I/F I/O | | | 10/25/2036 | | | | 3,985,308 | |
| | 10,268,896 | | | Series 2006-123-LI | | | 6.07% | # I/F I/O | | | 01/25/2037 | | | | 1,526,358 | |
| | 3,174,043 | | | Series 2002-70-QZ | | | 5.50% | | | | 11/25/2032 | | | | 3,442,453 | |
| | 11,259,775 | | | Series 2002-75-ZG | | | 5.50% | | | | 11/25/2032 | | | | 12,194,020 | |
| | 15,820,971 | | | Series 2003-117-KS | | | 6.85% | # I/F I/O | | | 08/25/2033 | | | | 2,085,302 | |
| | 29,772,086 | | | Series 2003-129-ZT | | | 5.50% | | | | 01/25/2034 | | | | 31,716,591 | |
| | 13,974,239 | | | Series 2003-29-ZL | | | 5.00% | | | | 04/25/2033 | | | | 14,552,329 | |
| | 11,475,097 | | | Series 2003-64-ZG | | | 5.50% | | | | 07/25/2033 | | | | 12,620,356 | |
| | 19,500,000 | | | Series 2003-W17-1A7 | | | 5.75% | | | | 08/25/2043 | | | | 22,548,513 | |
| | 18,394,686 | | | Series 2004-51-XP | | | 7.45% | # I/F I/O | | | 07/25/2034 | | | | 3,325,597 | |
| | 5,000,000 | | | Series 2004-W10-AG | | | 5.75% | | | | 08/25/2034 | | | | 5,425,012 | |
| | 7,000,000 | | | Series 2004-W4-A5 | | | 5.50% | | | | 06/25/2034 | | | | 7,730,817 | |
| | 2,900,000 | | | Series 2005-107-EG | | | 4.50% | | | | 01/25/2026 | | | | 3,051,320 | |
| | 1,956,617 | | | Series 2005-37-ZK | | | 4.50% | | | | 05/25/2035 | | | | 1,930,973 | |
| | 52,270,178 | | | Series 2005-87-SE | | | 5.80% | # I/F I/O | | | 10/25/2035 | | | | 6,760,045 | |
| | 42,508,880 | | | Series 2005-87-SG | | | 6.45% | # I/F I/O | | | 10/25/2035 | | | | 6,538,333 | |
| | 53,144,839 | | | Series 2006-56-SM | | | 6.50% | # I/F I/O | | | 07/25/2036 | | | | 7,548,975 | |
| | 15,331,312 | | | Series 2006-93-SN | | | 6.35% | # I/F I/O | | | 10/25/2036 | | | | 1,986,309 | |
| | 12,673,533 | | | Series 2007-116-BI | | | 6.00% | # I/F I/O | | | 05/25/2037 | | | | 1,683,344 | |
| | 19,289,260 | | | Series 2007-30-OI | | | 6.19% | # I/F I/O | | | 04/25/2037 | | | | 2,947,264 | |
| | 11,076,298 | | | Series 2007-30-SI | | | 5.86% | # I/F I/O | | | 04/25/2037 | | | | 1,316,144 | |
| | 28,307,932 | | | Series 2007-32-SG | | | 5.85% | # I/F I/O | | | 04/25/2037 | | | | 3,722,881 | |
| | 21,237,136 | | | Series 2007-75-ID | | | 5.62% | # I/F I/O | | | 08/25/2037 | | | | 2,750,392 | |
| | 11,577,493 | | | Series 2007-7-GZ | | | 6.00% | | | | 07/25/2047 | | | | 12,499,168 | |
| | 17,143,092 | | | Series 2007-93-SB | | | 3.90% | # I/F I/O | | | 01/25/2036 | | | | 846,997 | |
| | 16,707,899 | | | Series 2007-9-SD | | | 6.40% | # I/F I/O | | | 03/25/2037 | | | | 2,436,498 | |
| | 16,477,169 | | | Series 2008-29-ZA | | | 4.50% | | | | 04/25/2038 | | | | 16,426,137 | |
| | 26,038,314 | | | Series 2008-48-SD | | | 5.75% | # I/F I/O | | | 06/25/2037 | | | | 3,289,670 | |
| | 35,328,326 | | | Series 2008-53-LI | | | 5.90% | # I/F I/O | | | 07/25/2038 | | | | 3,709,474 | |
| | 28,478,783 | | | Series 2008-57-SE | | | 5.75% | # I/F I/O | | | 02/25/2037 | | | | 3,592,194 | |
| | 24,306,136 | | | Series 2008-61-SC | | | 5.75% | # I/F I/O | | | 07/25/2038 | | | | 3,057,445 | |
| | 27,177,199 | | | Series 2008-62-SC | | | 5.75% | # I/F I/O | | | 07/25/2038 | | | | 3,285,490 | |
| | 32,035,730 | | | Series 2008-65-SA | | | 5.75% | # I/F I/O | | | 08/25/2038 | | | | 4,018,773 | |
| | 30,019,970 | | | Series 2009-106-EZ | | | 4.50% | | | | 01/25/2040 | | | | 28,715,993 | |
| | 46,030,730 | | | Series 2009-111-SE | | | 6.00% | # I/F I/O | | | 01/25/2040 | | | | 5,602,257 | |
| | 2,893,417 | | | Series 2009-16-MZ | | | 5.00% | | | | 03/25/2029 | | | | 3,000,206 | |
| | 37,319,822 | | | Series 2009-42-SX | | | 5.75% | # I/F I/O | | | 06/25/2039 | | | | 4,730,817 | |
| | 16,748,678 | | | Series 2009-48-WS | | | 5.70% | # I/F I/O | | | 07/25/2039 | | | | 1,957,974 | |
| | 50,303,272 | | | Series 2009-49-S | | | 6.50% | # I/F I/O | | | 07/25/2039 | | | | 6,813,156 | |
| | 7,247,889 | | | Series 2009-51-BZ | | | 4.50% | | | | 07/25/2039 | | | | 7,157,888 | |
| | 4,324,296 | | | Series 2009-54-EZ | | | 5.00% | | | | 07/25/2039 | | | | 4,394,644 | |
| | 38,211,264 | | | Series 2009-70-SA | | | 5.55% | # I/F I/O | | | 09/25/2039 | | | | 4,455,537 | |
| | 36,221,046 | | | Series 2009-85-ES | | | 6.98% | # I/F I/O | | | 01/25/2036 | | | | 10,115,111 | |
| | 5,950,063 | | | Series 2009-94-BC | | | 5.00% | | | | 11/25/2039 | | | | 6,144,878 | |
| | 53,911,424 | | | Series 2010-101-SA | | | 4.23% | # I/F I/O | | | 09/25/2040 | | | | 5,402,210 | |
| | 50,300,811 | | | Series 2010-101-ZH | | | 4.50% | | | | 07/25/2040 | | | | 46,999,821 | |
| | 40,073,725 | | | Series 2010-117-SA | | | 4.25% | # I/F I/O | | | 10/25/2040 | | | | 3,625,598 | |
| | 144,089,760 | | | Series 2010-121-SD | | | 4.25% | # I/F I/O | | | 10/25/2040 | | | | 12,982,963 | |
| | 18,687,591 | | | Series 2010-126-SU | | | 52.10% | # I/F | | | 11/25/2040 | | | | 26,764,707 | |
| | 35,665,874 | | | Series 2010-126-SX | | | 14.20% | # I/F | | | 11/25/2040 | | | | 35,776,428 | |
| | 2,849,464 | | | Series 2010-137-VS | | | 14.20% | # I/F | | | 12/25/2040 | | | | 2,840,073 | |
| | | | | | | | |
| 14 | | DoubleLine Funds | | | | | The accompanying notes are an integral part of these financial statements | |
| | | | | | | | | | | | | | | | |
PRINCIPAL
AMOUNT | | | SECURITY DESCRIPTION | | RATE | | | MATURITY | | | VALUE $ | |
| |
| | | | Federal National Mortgage Association, (Cont.) | |
| $ | 6,470,000 | | | Series 2010-142-AV | | | 4.00% | | | | 11/25/2029 | | | | 6,163,424 | |
| | 27,270,901 | | | Series 2010-150-ZA | | | 4.00% | | | | 01/25/2041 | | | | 22,991,336 | |
| | 4,674,000 | | | Series 2010-153-VB | | | 4.00% | | | | 05/25/2027 | | | | 4,498,103 | |
| | 12,311,058 | | | Series 2010-155-SA | | | 9.48% | # I/F | | | 01/25/2041 | | | | 10,398,423 | |
| | 85,045,392 | | | Series 2010-16-SA | | | 5.20% | # I/F I/O | | | 03/25/2040 | | | | 10,343,663 | |
| | 2,894,932 | | | Series 2010-21-DZ | | | 5.00% | | | | 03/25/2040 | | | | 2,922,353 | |
| | 47,915,389 | | | Series 2010-21-KS | | | 4.70% | # I/F I/O | | | 03/25/2040 | | | | 3,959,114 | |
| | 13,680,412 | | | Series 2010-2-GS | | | 6.20% | # I/F I/O | | | 12/25/2049 | | | | 1,739,362 | |
| | 32,185,300 | | | Series 2010-2-MS | | | 6.00% | # I/F I/O | | | 02/25/2050 | | | | 3,727,701 | |
| | 74,321,850 | | | Series 2010-31-SA | | | 4.75% | # I/F I/O | | | 04/25/2040 | | | | 6,428,632 | |
| | 20,347,929 | | | Series 2010-31-VZ | | | 4.00% | | | | 04/25/2040 | | | | 18,312,241 | |
| | 73,743,355 | | | Series 2010-34-PS | | | 4.68% | # I/F I/O | | | 04/25/2040 | | | | 7,352,825 | |
| | 17,064,965 | | | Series 2010-35-ES | | | 6.20% | # I/F I/O | | | 04/25/2040 | | | | 2,235,783 | |
| | 29,350,865 | | | Series 2010-35-SV | | | 6.20% | # I/F I/O | | | 04/25/2040 | | | | 3,714,334 | |
| | 845,645 | | | Series 2010-39-LS | | | 19.00% | # I/F | | | 05/25/2040 | | | | 884,315 | |
| | 35,427,243 | | | Series 2010-46-MS | | | 4.70% | # I/F I/O | | | 05/25/2040 | | | | 3,039,590 | |
| | 38,721,600 | | | Series 2010-59-MS | | | 5.52% | # I/F I/O | | | 06/25/2040 | | | | 4,603,011 | |
| | 80,586,418 | | | Series 2010-59-PS | | | 6.20% | # I/F I/O | | | 03/25/2039 | | | | 13,082,045 | |
| | 60,171,673 | | | Series 2010-59-SC | | | 4.75% | # I/F I/O | | | 01/25/2040 | | | | 5,592,006 | |
| | 8,162,436 | | | Series 2010-60-VZ | | | 5.00% | | | | 10/25/2039 | | | | 8,478,970 | |
| | 11,348,751 | | | Series 2010-64-EZ | | | 5.00% | | | | 06/25/2040 | | | | 11,571,999 | |
| | 41,215,869 | | | Series 2010-84-ZD | | | 4.50% | | | | 08/25/2040 | | | | 40,383,630 | |
| | 29,230,294 | | | Series 2010-84-ZG | | | 4.50% | | | | 08/25/2040 | | | | 27,087,755 | |
| | 18,336,613 | | | Series 2010-90-SA | | | 5.60% | # I/F I/O | | | 08/25/2040 | | | | 2,200,472 | |
| | 39,021,221 | | | Series 2010-99-SG | | | 23.70% | # I/F | | | 09/25/2040 | | | | 44,631,879 | |
| | 29,688,289 | | | Series 2011-14-US | | | 7.74% | # I/F | | | 03/25/2041 | | | | 22,728,179 | |
| | 29,500,000 | | | Series 2011-16-AL | | | 3.50% | | | | 03/25/2031 | | | | 26,046,388 | |
| | 38,800,000 | | | Series 2011-17-NY | | | 3.50% | | | | 03/25/2031 | | | | 33,906,823 | |
| | 27,500,000 | | | Series 2011-18-S | | | 8.98% | # I/F | | | 03/25/2041 | | | | 23,448,684 | |
| | 12,000,000 | | | Series 2011-23-KS | | | 8.80% | # I/F | | | 02/25/2041 | | | | 9,222,125 | |
| | 56,000,000 | | | Series 2011-29-AL | | | 3.50% | | | | 04/25/2031 | | | | 49,686,454 | |
| | 9,999,404 | | | Series 2011-2-SC | | | 9.08% | # I/F | | | 02/25/2041 | | | | 7,675,144 | |
| | 10,000,000 | | | Series 2011-2-VD | | | 4.00% | | | | 07/25/2027 | | | | 9,628,882 | |
| | 21,787,531 | | | Series 2011-8-AV | | | 4.00% | | | | 01/25/2030 | | | | 20,761,022 | |
| | 7,167,667 | | | Series 2011-8-HS | | | 9.10% | # I/F | | | 02/25/2041 | | | | 7,016,712 | |
| | 74,307,390 | | | Series 400-S4-BZ | | | 5.20% | # I/F I/O | | | 11/25/2039 | | | | 9,147,112 | |
| |
| | | | Federal National Mortgage Association Pass-Through, | |
| | 11,314,769 | | | Pool 745571 | | | 4.00% | | | | 01/01/2019 | | | | 11,848,684 | |
| | 3,886,443 | | | Pool 888695 | | | 5.00% | | | | 08/01/2037 | | | | 4,078,586 | |
| | 11,810,521 | | | Pool 888968 | | | 5.00% | | | | 08/01/2035 | | | | 12,438,715 | |
| | 5,065,366 | | | Pool 931104 | | | 5.00% | | | | 05/01/2039 | | | | 5,317,829 | |
| | 3,831,437 | | | Pool 975116 | | | 5.00% | | | | 05/01/2038 | | | | 4,014,874 | |
| | 3,665,191 | | | Pool AC1032 | | | 5.00% | | | | 06/01/2040 | | | | 3,813,752 | |
| | 4,418,875 | | | Pool AD2177 | | | 4.50% | | | | 06/01/2030 | | | | 4,572,277 | |
| | 8,636,091 | | | Pool AD6438 | | | 5.00% | | | | 06/01/2040 | | | | 9,052,259 | |
| | 3,778,549 | | | Pool AD7018 | | | 5.00% | | | | 04/01/2040 | | | | 3,931,706 | |
| | 4,589,876 | | | Pool AD7859 | | | 5.00% | | | | 06/01/2040 | | | | 4,811,059 | |
| | 23,239,540 | | | Pool AH1140 | | | 4.50% | | | | 12/01/2040 | | | | 23,574,248 | |
| | 48,355,307 | | | Pool AH4437 | | | 4.00% | | | | 01/01/2041 | | | | 47,421,534 | |
| | 65,305,487 | | | Pool AH9323 | | | 4.00% | | | | 04/01/2026 | | | | 67,274,856 | |
| | 2,134,202 | | | Pool MA0315 | | | 4.50% | | | | 01/01/2025 | | | | 2,222,511 | |
| | 17,738,514 | | | Pool MA0406 | | | 4.50% | | | | 05/01/2030 | | | | 18,354,307 | |
| | 2,738,818 | | | Pool MA0445 | | | 5.00% | | | | 06/01/2040 | | | | 2,849,831 | |
| | 6,854,896 | | | Pool MA0459 | | | 4.00% | | | | 07/01/2020 | | | | 7,156,940 | |
| | 9,169,464 | | | Pool MA0468 | | | 5.00% | | | | 07/01/2040 | | | | 9,541,131 | |
| | 21,712,595 | | | Pool MA0502 | | | 4.00% | | | | 08/01/2020 | | | | 22,669,306 | |
| | 9,418,449 | | | Pool MA0517 | | | 4.00% | | | | 09/01/2020 | | | | 9,838,159 | |
| | 23,208,447 | | | Pool MA0534 | | | 4.00% | | | | 10/01/2030 | | | | 23,315,104 | |
| | 49,449,677 | | | Pool MA0536 | | | 4.00% | | | | 10/01/2020 | | | | 51,628,553 | |
| | 55,953,356 | | | Pool MA0580 | | | 4.00% | | | | 11/01/2020 | | | | 58,418,801 | |
| | 3,941,961 | | | Pool MA0587 | | | 4.00% | | | | 12/01/2030 | | | | 3,960,077 | |
| | 50,021,639 | | | Pool MA0616 | | | 4.00% | | | | 01/01/2031 | | | | 50,251,518 | |
| |
| | | | Government National Mortgage Association, | |
| | 14,700,000 | | | Series 2003-67-SP | | | 6.85% | # I/F I/O | | | 08/20/2033 | | | | 4,598,351 | |
| | 13,609,561 | | | Series 2003-86-ZK | | | 5.00% | | | | 10/20/2033 | | | | 14,188,837 | |
| | 5,392,045 | | | Series 2004-49-Z | | | 6.00% | | | | 06/20/2034 | | | | 6,065,991 | |
| | | | | | | | | | | | | | | | |
PRINCIPAL
AMOUNT /
SHARES | | | SECURITY DESCRIPTION | | RATE | | | MATURITY | | | VALUE $ | |
| $ | 6,500,000 | | | Series 2004-80-PH | | | 5.00% | | | | 07/20/2034 | | | | 6,943,249 | |
| | 34,016,097 | | | Series 2004-83-CS | | | 5.83% | # I/F I/O | | | 10/20/2034 | | | | 4,576,485 | |
| | 2,698,035 | | | Series 2005-21-Z | | | 5.00% | | | | 03/20/2035 | | | | 2,780,250 | |
| | 17,659,032 | | | Series 2005-39-ZB | | | 5.00% | | | | 07/20/2034 | | | | 18,207,163 | |
| | 1,933,885 | | | Series 2006-24-CX | | | 38.11% | # | | | 05/20/2036 | | | | 3,201,977 | |
| | 67,159,733 | | | Series 2007-26-SJ | | | 4.44% | # I/F I/O | | | 04/20/2037 | | | | 5,800,553 | |
| | 42,355,289 | | | Series 2008-42-AI | | | 7.44% | # I/F I/O | | | 05/16/2038 | | | | 7,173,533 | |
| | 26,426,114 | | | Series 2008-51-SC | | | 6.00% | # I/F I/O | | | 06/20/2038 | | | | 2,793,684 | |
| | 10,322,358 | | | Series 2008-82-SM | | | 5.80% | # I/F I/O | | | 09/20/2038 | | | | 1,080,166 | |
| | 12,265,859 | | | Series 2008-83-SD | | | 6.31% | # I/F I/O | | | 11/16/2036 | | | | 1,603,911 | |
| | 23,187,620 | | | Series 2009-10-NS | | | 6.40% | # I/F I/O | | | 02/16/2039 | | | | 3,397,909 | |
| | 1,772,076 | | | Series 2009-31-ZM | | | 4.50% | | | | 08/20/2038 | | | | 1,694,666 | |
| | 4,308,148 | | | Series 2009-41-ZQ | | | 4.50% | | | | 06/16/2039 | | | | 4,230,652 | |
| | 13,640,548 | | | Series 2009-48-Z | | | 5.00% | | | | 06/16/2039 | | | | 14,079,889 | |
| | 27,145,949 | | | Series 2009-69-TS | | | 5.95% | # I/F I/O | | | 04/16/2039 | | | | 3,359,336 | |
| | 38,391,583 | | | Series 2009-87-IG | | | 6.49% | # I/F I/O | | | 03/20/2037 | | | | 4,770,577 | |
| | 23,472,879 | | | Series 2010-166-SJ | | | 9.28% | # I/F | | | 12/20/2040 | | | | 19,250,153 | |
| | 9,221,700 | | | Series 2010-25-ZB | | | 4.50% | | | | 02/16/2040 | | | | 8,697,075 | |
| | 37,388,160 | | | Series 2010-42-ES | | | 5.43% | # I/F I/O | | | 04/20/2040 | | | | 5,432,526 | |
| | 6,939,588 | | | Series 2010-62-ZG | | | 5.50% | | | | 05/16/2040 | | | | 7,191,262 | |
| | 15,000,000 | | | Series 2011-12-PO | | | 0.00% | P/O | | | 12/20/2040 | | | | 8,850,251 | |
| | 14,285,021 | | | Series 2011-14-SM | | | 9.19% | # I/F | | | 08/16/2040 | | | | 11,174,640 | |
| | | | | | | | | | | | | | | | |
| | | | Total US Government Agency Obligations
(Cost $2,475,239,061) | | | | 2,494,210,269 | |
| | | | | | | | | | | | | | | | |
| | SHORT TERM INVESTMENTS 7.9% | |
| | 25,000,000 | | | Federal Home Loan Discount Note | | | 0.00% | | | | 05/11/2011 | | | | 24,997,222 | |
| | 45,000,000 | | | Federal Home Loan Discount Note | | | 0.00% | | | | 05/18/2011 | | | | 44,993,831 | |
| | 150,000,000 | | | Federal Home Loan Discount Note | | | 0.00% | | | | 05/20/2011 | | | | 149,978,053 | |
| | 25,000,000 | | | Federal Home Loan Discount Note | | | 0.00% | | | | 05/09/2011 | | | | 24,997,889 | |
| | 50,000,000 | | | Federal Home Loan Discount Note | | | 0.00% | | | | 04/07/2011 | | | | 49,999,083 | |
| | 20,000,000 | | | Federal Home Loan Discount Note | | | 0.00% | | | | 04/15/2011 | | | | 19,999,339 | |
| | 30,000,000 | | | Federal Home Loan Discount Note | | | 0.00% | | | | 04/27/2011 | | | | 29,998,700 | |
| | 25,000,000 | | | Freddie Mac Discount Note | | | 0.00% | | | | 05/24/2011 | | | | 24,996,319 | |
| | 25,000,000 | | | Freddie Mac Discount Note | | | 0.00% | | | | 04/11/2011 | | | | 24,999,375 | |
| | 10,000,000 | | | Freddie Mac Discount Note | | | 0.00% | | | | 04/01/2011 | | | | 10,000,000 | |
| | | | | | | | | | | | | | | | |
| | 51,423,450 | | | Fidelity Institutional Government Portfolio | | | 0.01% | 1 | | | | | | | 51,423,450 | |
| | | | | | | | | | | | | | | | |
| | | | Total Short Term Investments
(Cost $456,383,261) | | | | 456,383,261 | |
| | | | | | | | | | | | | | | | |
| | | | Total Investments 101.2%
(Cost $5,829,827,770) | | | | 5,880,091,179 | |
| | | | Liabilities in Excess of Other Assets (1.2)% | | | | (70,081,972 | ) |
| | | | | | | | | | | | | | | | |
| | | | NET ASSETS 100.0% | | | $ | 5,810,009,207 | |
| | | | | | | | | | | | | | | | |
| | | | | | | | |
| PORTFOLIO HOLDINGS as % of Net Assets |
| Collateralized Mortgage Obligations | | | | | | | | 50.4% |
| US Government Agency Obligations | | | | | | | | 42.9% |
| Short Term Investments | | | | | | | | 7.9% |
| Other Assets and Liabilities | | | | | | | | (1.2)% |
| | | | | | | | |
| | | | | | | | 100.0% |
| | | | | | | | |
| # | Variable rate security. Rate disclosed as of March 31, 2011. |
| ^ | Security exempt from registration under Rule 144A of the Securities Act of 1933. These securities may be resold in transactions exempt from registration, normally to qualified institutional buyers. These securities are determined to be liquid by the Adviser, unless otherwise noted, under procedures established the Fund’s Board of Trustees. At March 31, 2011, the value of these securities amounted to $557,793,113 or 9.6% of net assets. |
| 1 | Seven-day yield as of March 31, 2011 |
| I/O | Interest only security |
| P/O | Principal only security |
| I/F | Inverse floating rate security whose interest rate moves in the opposite direction of prevailing interest rates |
| | | | | | |
| The accompanying notes are an integral part of these financial statements | | Annual Report | | March 31, 2011 | | 15 |
| | |
| |
| Schedule of Investments DoubleLine Core Fixed Income Fund | | |
| | | | | | | | | | | | | | | | |
PRINCIPAL
AMOUNT | | | SECURITY DESCRIPTION | | RATE | | | MATURITY | | | VALUE $ | |
| | COLLATERALIZED MORTGAGE OBLIGATIONS 26.6% | |
| |
| | | | Adjustable Rate Mortgage Trust, | |
| $ | 175,968 | | | Series 2007-3 | | | 3.73% | #^ | | | 11/25/2037 | | | | 98,998 | |
| |
| | | | Bear Stearns Asset Backed Securities Trust, | |
| | 379,144 | | | Series 2007-SD1-IA3A | | | 6.50% | | | | 10/25/2036 | | | | 257,124 | |
| |
| | | | Bear Stearns Commercial Mortgage Securities, Inc., | |
| | 440,000 | | | Series 2005-PWR10-AM | | | 5.45% | # | | | 12/15/2015 | | | | 453,722 | |
| |
| | | | CD Mortgage Trust, | |
| | 400,000 | | | Series 2006-CD3-AM | | | 5.65% | | | | 10/15/2048 | | | | 402,731 | |
| |
| | | | Citi Mortgage Alternative Loan Trust, | |
| | 512,702 | | | Series 2006-A2-A2 | | | 6.00% | | | | 05/25/2036 | | | | 432,654 | |
| | 227,000 | | | Series 2006-A5-A3 | | | 6.00% | | | | 10/25/2036 | | | | 197,451 | |
| | 466,514 | | | Series 2007-A1-1A7 | | | 6.00% | | | | 01/25/2037 | | | | 352,073 | |
| |
| | | | Citicorp Mortgage Securities, Inc., | |
| | 447,712 | | | Series 2005-1-1A4 | | | 5.50% | | | | 02/25/2035 | | | | 450,955 | |
| |
| | | | Citigroup Mortgage Loan Trust Inc., | |
| | 1,147,745 | | | Series 2006-WF2-A2C | | | 5.85% | # | | | 05/25/2036 | | | | 795,205 | |
| |
| | | | Commercial Mortgage Pass-Through Certificates, | |
| | 250,000 | | | Series 2001-J1A-G | | | 6.83% | #^ | | | 02/16/2034 | | | | 250,819 | |
| | 315,000 | | | Series 2006-C7-AM | | | 5.98% | # | | | 06/10/2046 | | | | 327,841 | |
| |
| | | | Commercial Mortgage Trust, | |
| | 150,000 | | | Series 1999-C1 | | | 7.23% | # | | | 01/17/2032 | | | | 164,490 | |
| |
| | | | Countrywide Alternative Loan Trust, | |
| | 454,304 | | | Series 2005-28CB-3A6 | | | 6.00% | | | | 08/25/2035 | | | | 325,730 | |
| | 802,876 | | | Series 2005-J10-1A13 | | | 0.95% | # | | | 10/25/2035 | | | | 605,210 | |
| | 1,113,122 | | | Series 2006-26CB | | | 6.50% | | | | 09/25/2036 | | | | 819,564 | |
| | 352,900 | | | Series 2007-17CB-1A10 | | | 28.80% | # I/F | | | 08/25/2037 | | | | 455,741 | |
| | 1,216,215 | | | Series 2007-4CB-2A1 | | | 7.00% | | | | 03/25/2037 | | | | 575,546 | |
| |
| | | | Countrywide Asset-Backed Certificates, | |
| | 270,615 | | | Series 2005-13-AF3 | | | 5.43% | | | | 02/25/2033 | | | | 219,950 | |
| |
| | | | Countrywide Home Loans Mortgage Pass Through Trust, | |
| | 951,318 | | | Series 2002-32-2A6 | | | 5.00% | | | | 01/25/2018 | | | | 975,255 | |
| | 1,676,819 | | | Series 2005-28-A7 | | | 5.25% | | | | 01/25/2019 | | | | 1,446,217 | |
| | 1,245,000 | | | Series 2007-15-1A16 | | | 6.25% | | | | 09/25/2037 | | | | 1,127,008 | |
| |
| | | | Credit Suisse First Boston Commercial Mortgage Pass-Through Certificates, | |
| | 380,000 | | | Series 2006-C3 | | | 6.02% | # | | | 06/15/2038 | | | | 398,411 | |
| |
| | | | Credit Suisse First Boston Mortgage Securities Corporation, | |
| | 302,460 | | | Series 2005-10-5A5 | | | 5.50% | | | | 11/25/2035 | | | | 258,752 | |
| |
| | | | Credit Suisse Mortgage Capital Certificates, | |
| | 518,716 | | | Series 2007-1-3A1 | | | 6.00% | | | | 02/25/2022 | | | | 415,098 | |
| |
| | | | Deutsche Mortgage Securities, Inc., | |
| | 399,232 | | | Series 2006-PR1-4A12 | | | 14.12% | #^ I/F | | | 04/15/2036 | | | | 441,151 | |
| | 2,412,738 | | | Series 2006-PR1-5A14 | | | 11.80% | #^ I/F | | | 04/15/2036 | | | | 2,514,526 | |
| |
| | | | Federal Home Loan Mortgage Corporation, | |
| | 617,769 | | | Series 2692-SC | | | 12.80% | # | | | 07/15/2033 | | | | 649,869 | |
| | 5,693,386 | | | Series 3562-WS | | | 4.70% | # I/O | | | 08/15/2039 | | | | 479,656 | |
| | 1,089,293 | | | Series 3745-ST | | | 9.49% | # | | | 10/15/2040 | | | | 956,298 | |
| | 1,059,311 | | | Series 3780-YS | | | 9.39% | # | | | 12/15/2040 | | | | 876,055 | |
| | 694,315 | | | Series 3805-KS | | | 8.99% | # | | | 02/15/2041 | | | | 542,871 | |
| |
| | | | Federal National Mortgage Association, | |
| | 1,530,251 | | | Series 2010-112-ZA | | | 4.00% | | | | 10/25/2040 | | | | 1,360,659 | |
| | 3,091,106 | | | Series 2010-90-GS | | | 5.75% | # I/O | | | 08/25/2040 | | | | 411,507 | |
| |
| | | | First Horizon Alternative Mortgage Securities, | |
| | 1,213,762 | | | Series 2006-FA2-1A5 | | | 6.00% | | | | 05/25/2036 | | | | 984,072 | |
| | 324,676 | | | Series 2006-RE1-A1 | | | 5.50% | | | | 05/25/2035 | | | | 288,740 | |
| |
| | | | First Union Commercial Mortgage Securities, Inc., | |
| | 235,000 | | | Series 2000-C2-G | | | 8.65% | # | | | 10/15/2032 | | | | 234,589 | |
| |
| | | | GE Capital Commercial Mortgage Corporation, | |
| | 312,362,970 | | | Series 2005-C3-XP | | | 0.25% | # I/O | | | 07/10/2045 | | | | 634,659 | |
| |
| | | | Greenwich Capital Commercial Funding Corporation, | |
| | 100,000 | | | Series 2004-FL2-P | | | 0.66% | #^ | | | 11/05/2019 | | | | 96,244 | |
| | 230,000 | | | Series 2007-GG9-A4 | | | 5.44% | | | | 03/10/2039 | | | | 243,772 | |
| | 300,000 | | | Series 2004-FL2-F | | | 0.57% | #^ | | | 11/05/2019 | | | | 294,769 | |
| | | | | | | | | | | | | | | | |
PRINCIPAL
AMOUNT | | | SECURITY DESCRIPTION | | RATE | | | MATURITY | | | VALUE $ | |
| |
| | | | GS Mortgage Securities Corporation II, | |
| $ | 250,000 | | | Series 2001-GS3-D | | | 6.74% | #^ | | | 08/05/2018 | | | | 253,839 | |
| |
| | | | GS Mortgage Securities Trust, | |
| | 235,000 | | | Series 2007-GG10-A4 | | | 6.00% | # | | | 08/10/2045 | | | | 249,867 | |
| |
| | | | GSAA Home Equity Trust, | |
| | 288,385 | | | Series 2006-4-4A1 | | | 0.35% | # | | | 03/25/2036 | | | | 263,186 | |
| | 3,060,825 | | | Series 2007-10-A2A | | | 6.50% | | | | 11/25/2037 | | | | 2,208,107 | |
| |
| | | | GSR Mortgage Loan Trust, | |
| | 58,824 | | | Series 2005-6F-3A16 | | | 5.50% | | | | 07/25/2035 | | | | 58,843 | |
| | 897,867 | | | Series 2006-2F-5A1 | | | 4.50% | | | | 01/25/2021 | | | | 839,560 | |
| |
| | | | HSI Asset Loan Obligation, | |
| | 870,962 | | | Series 2006-2-2A1 | | | 5.50% | | | | 12/25/2021 | | | | 812,930 | |
| |
| | | | JP Morgan Alternative Loan Trust, | |
| | 500,000 | | | Series 2006-S2-A4 | | | 6.19% | # | | | 05/25/2036 | | | | 251,753 | |
| |
| | | | JP Morgan Chase, | |
| | 100,000 | | | Series 2007-CIBC19-A4 | | | 5.93% | # | | | 02/12/2049 | | | | 107,240 | |
| |
| | | | JP Morgan Chase Commercial Mortgage Securities Trust, | |
| | 200,000 | | | Series 2001-CBC1-E | | | 7.07% | # | | | 03/15/2033 | | | | 199,773 | |
| | 12,050,000 | | | Series 2009-IWST | | | 0.29% | #^ I/O | | | 12/07/2027 | | | | 282,815 | |
| |
| | | | JP Morgan Commercial Mortgage Certificates, | |
| | 911,971 | | | Series 2006-CIBC16-X2 | | | 0.71% | # I/O | | | 05/12/2045 | | | | 10,872 | |
| | 10,242,193 | | | Series 2006-LDP8 | | | 0.75% | # I/O | | | 05/15/2045 | | | | 231,295 | |
| |
| | | | Lehman Mortgage Trust, | |
| | 134,185 | | | Series 2006-9-1A19 | | | 29.50% | # I/F | | | 01/25/2037 | | | | 181,912 | |
| | 491,684 | | | Series 2007-2-1A1 | | | 5.75% | | | | 03/25/2037 | | | | 368,959 | |
| |
| | | | MASTR Alternative Loans Trust, | |
| | 301,110 | | | Series 2005-2-3A1 | | | 6.00% | | | | 03/25/2035 | | | | 302,741 | |
| | 130,068 | | | Series 2007-1-2A7 | | | 6.00% | | | | 10/25/2036 | | | | 115,046 | |
| |
| | | | MASTR Asset Securitization Trust, | |
| | 950,487 | | | Series 2003-2-30B2 | | | 5.75% | | | | 04/25/2033 | | | | 950,853 | |
| |
| | | | Morgan Stanley Capital, Inc., | |
| | 11,729,039 | | | Series 2004-HQ4-X2 | | | 0.51% | #^ I/O | | | 04/14/2040 | | | | 64,655 | |
| | 34,841,785 | | | Series 2005-IQ9-X2 | | | 1.21% | #^ I/O | | | 07/15/2056 | | | | 298,071 | |
| |
| | | | Nomura Asset Alternative Loan Trust, | |
| | 378,055 | | | Series 2006-AP1-A2 | | | 5.52% | # | | | 01/25/2036 | | | | 269,313 | |
| |
| | | | Nomura Home Equity Loan Trust, | |
| | 822,576 | | | Series 2006-AF1-A2 | | | 5.80% | # | | | 10/25/2036 | | | | 403,673 | |
| | 1,524,884 | | | Series 2007-1-1A1 | | | 6.06% | # | | | 02/25/2037 | | | | 807,563 | |
| |
| | | | N-Star Real Estate CDO II Ltd., | |
| | 1,277,054 | | | Series 2004-2-A1 | | | 0.60% | #^ | | | 06/28/2039 | | | | 1,213,201 | |
| |
| | | | Option One Mortgage Loan Trust, | |
| | 500,000 | | | Series 2004-3-M3 | | | 0.90% | # | | | 11/25/2034 | | | | 410,824 | |
| |
| | | | Residential Accredit Loans, Inc., | |
| | 1,233,208 | | | Series 2005-QS14-3A3 | | | 6.00% | | | | 09/25/2035 | | | | 1,082,544 | |
| | 453,016 | | | Series 2005-QS1-A5 | | | 5.50% | | | | 01/25/2035 | | | | 389,933 | |
| | 1,265,616 | | | Series 2006-QS10-A4 | | | 5.75% | | | | 08/25/2036 | | | | 840,774 | |
| | 1,269,814 | | | Series 2006-QS6-2A1 | | | 6.00% | | | | 06/25/2021 | | | | 1,169,266 | |
| |
| | | | Residential Asset Securitization Trust, | |
| | 918,907 | | | Series 2005-A10-A3 | | | 5.50% | | | | 09/25/2035 | | | | 793,098 | |
| | 569,638 | | | Series 2005-A11-2A4 | | | 6.00% | | | | 10/25/2035 | | | | 341,783 | |
| | 249,766 | | | Series 2005-A7-A3 | | | 5.50% | | | | 06/25/2035 | | | | 227,897 | |
| | 550,000 | | | Series 2005-RS1-AI5 | | | 5.41% | # | | | 12/25/2034 | | | | 428,859 | |
| | 338,669 | | | Series 2006-R1-A1 | | | 27.40% | # I/F | | | 01/25/2046 | | | | 377,373 | |
| |
| | | | RFMSI Series Trust, | |
| | 590,668 | | | Series 2006-S10 | | | 6.00% | | | | 10/25/2036 | | | | 554,857 | |
| |
| | | | Structured Asset Securities Corporation, | |
| | 3,288,017 | | | Series 2005-RF1-A | | | 0.60% | #^ | | | 03/25/2035 | | | | 2,839,792 | |
| | 3,288,017 | | | Series 2005-RF1-AIO | | | 5.50% | #^ I/O | | | 03/25/2035 | | | | 433,717 | |
| |
| | | | Wachovia Bank Commercial Mortgage Trust, | |
| | 128,647,472 | | | Series 2006-C27-XC | | | 0.16% | #^ I/O | | | 07/15/2045 | | | | 1,025,668 | |
| | 21,135,984 | | | Series 2006-C29-IO | | | 0.53% | # I/O | | | 11/15/2048 | | | | 357,188 | |
| |
| | | | Washington Mutual Mortgage Pass Through Certificates, | |
| | 283,556 | | | Series 2005-1-2A | | | 6.00% | | | | 03/25/2035 | | | | 238,591 | |
| | 423,954 | | | Series 2007-5-A11 | | | 38.0% | # I/F | | | 06/25/2037 | | | | 649,680 | |
| | | | | | | | |
| 16 | | DoubleLine Funds | | | | | The accompanying notes are an integral part of these financial statements | |
| | | | | | | | | | | | | | | | |
PRINCIPAL
AMOUNT | | | SECURITY DESCRIPTION | | RATE | | | MATURITY | | | VALUE $ | |
| |
| | | | Wells Fargo Mortgage Backed Securities Trust, | |
| $ | 413,076 | | | Series 2005-AR14-A6 | | | 5.37% | # | | | 08/25/2035 | | | | 282,440 | |
| | 466,131 | | | Series 2005-AR16-6A4 | | | 2.89% | # | | | 10/25/2035 | | | | 223,284 | |
| | 2,354,044 | | | Series 2006-2-3A1 | | | 5.75% | | | | 03/25/2036 | | | | 2,326,083 | |
| | 839,016 | | | Series 2007-11-A96 | | | 6.00% | | | | 08/25/2037 | | | | 813,428 | |
| | 742,756 | | | Series 2007-7-A1 | | | 6.00% | | | | 06/25/2037 | | | | 729,063 | |
| | | | | | | | | | | | | | | | |
| | | | Total Collateralized Mortgage Obligations
(Cost $49,312,716) | | | | 50,098,191 | |
| | | | | | | | | | | | | | | | |
| | DOMESTIC CORPORATE BONDS 15.1% | |
| | 260,000 | | | 3M Company, Series D | | | 5.70% | | | | 03/15/2037 | | | | 284,098 | |
| | 100,000 | | | Alere, Inc. | | | 8.63% | | | | 10/01/2018 | | | | 106,375 | |
| | 425,000 | | | Altria Group, Inc. | | | 9.25% | | | | 08/06/2019 | | | | 555,512 | |
| | 650,000 | | | American Express Credit Corporation | | | 2.75% | | | | 09/15/2015 | | | | 638,917 | |
| | 200,000 | | | American Tower Corporation | | | 4.50% | | | | 01/15/2018 | | | | 196,701 | |
| | 500,000 | | | Anheuser Busch InBev Worldwide | | | 4.13% | | | | 01/15/2015 | | | | 528,590 | |
| | 100,000 | | | Aramark Corporation | | | 8.50% | | | | 02/01/2015 | | | | 104,750 | |
| | 350,000 | | | Arrow Electronics, Inc. | | | 3.38% | | | | 11/01/2015 | | | | 345,032 | |
| | 250,000 | | | AT&T, Inc. | | | 5.35% | ^ | | | 09/01/2040 | | | | 224,718 | |
| | 400,000 | | | Bank of America Funding Corporation | | | 3.70% | | | | 09/01/2015 | | | | 401,046 | |
| | 150,000 | | | Bank of America Funding Corporation | | | 3.63% | | | | 03/17/2016 | | | | 148,054 | |
| | 200,000 | | | BE Aerospace, Inc. | | | 6.88% | | | | 10/01/2020 | | | | 208,000 | |
| | 500,000 | | | Berkshire Hathaway, Inc. | | | 3.20% | | | | 02/11/2015 | | | | 515,146 | |
| | 250,000 | | | Biogen Idec, Inc. | | | 6.88% | | | | 03/01/2018 | | | | 283,604 | |
| | 100,000 | | | Blue Merger Sub, Inc. | | | 7.63% | ^ | | | 02/15/2019 | | | | 101,875 | |
| | 225,000 | | | Boeing Company | | | 6.88% | | | | 03/15/2039 | | | | 274,647 | |
| | 450,000 | | | Boston Properties Ltd. Partnership | | | 4.13% | | | | 05/15/2021 | | | | 428,868 | |
| | 100,000 | | | Calpine Corporation | | | 7.88% | ^ | | | 07/31/2020 | | | | 106,750 | |
| | 500,000 | | | Celgene Corporation | | | 3.95% | | | | 10/15/2020 | | | | 472,745 | |
| | 600,000 | | | Citigroup, Inc. | | | 6.00% | | | | 12/13/2013 | | | | 652,802 | |
| | 425,000 | | | Coca Cola Company | | | 3.15% | | | | 11/15/2020 | | | | 396,236 | |
| | 300,000 | | | Comcast Corporation | | | 5.85% | | | | 11/15/2015 | | | | 334,419 | |
| | 100,000 | | | Community Health Systems, Inc. | | | 8.88% | | | | 07/15/2015 | | | | 105,750 | |
| | 200,000 | | | ConocoPhillips Company | | | 6.50% | | | | 02/01/2039 | | | | 228,463 | |
| | 100,000 | | | Constellation Brands, Inc. | | | 7.25% | | | | 05/15/2017 | | | | 109,000 | |
| | 100,000 | | | Copano Energy LLC | | | 7.13% | | | | 04/01/2021 | | | | 101,500 | |
| | 200,000 | | | Credit Suisse USA, Inc. | | | 4.88% | | | | 01/15/2015 | | | | 215,056 | |
| | 200,000 | | | Credit Suisse USA, Inc. | | | 5.38% | | | | 03/02/2016 | | | | 218,939 | |
| | 100,000 | | | Cricket Communications, Inc. | | | 7.75% | | | | 10/15/2020 | | | | 101,000 | |
| | 200,000 | | | Crown Castle International Corporation | | | 9.00% | | | | 01/15/2015 | | | | 221,500 | |
| | 600,000 | | | Daimler Finance North America LLC | | | 6.50% | | | | 11/15/2013 | | | | 670,471 | |
| | 650,000 | | | Devon Energy Corporation | | | 6.30% | | | | 01/15/2019 | | | | 762,977 | |
| | 100,000 | | | DineEquity, Inc. | | | 9.50% | ^ | | | 10/30/2018 | | | | 109,000 | |
| | 300,000 | | | DIRECTV Holdings LLC | | | 5.00% | | | | 03/01/2021 | | | | 301,640 | |
| | 100,000 | | | EchoStar DBS Corporation | | | 7.75% | | | | 05/31/2015 | | | | 110,000 | |
| | 200,000 | | | El Paso Corporation | | | 7.00% | | | | 06/15/2017 | | | | 224,840 | |
| | 125,000 | | | First Data Corporation | | | 11.25% | | | | 03/31/2016 | | | | 125,156 | |
| | 100,000 | | | Ford Motor Credit Company LLC | | | 7.00% | | | | 04/15/2015 | | | | 108,338 | |
| | 200,000 | | | Forest Oil Corporation | | | 7.25% | | | | 06/15/2019 | | | | 210,000 | |
| | 200,000 | | | Frontier Communications Corporation | | | 8.50% | | | | 04/15/2020 | | | | 217,750 | |
| | 550,000 | | | General Electric Capital Corporation, Series A | | | 3.75% | | | | 11/14/2014 | | | | 573,524 | |
| | 100,000 | | | GMAC, Inc. | | | 7.50% | | | | 12/31/2013 | | | | 108,625 | |
| | 500,000 | | | Goldman Sachs Group, Inc. | | | 6.00% | | | | 06/15/2020 | | | | 529,500 | |
| | | | | | | | | | | | | | | | |
PRINCIPAL
AMOUNT | | | SECURITY DESCRIPTION | | RATE | | | MATURITY | | | VALUE $ | |
| | $200,000 | | | Halliburton Company | | | 6.15% | | | | 09/15/2019 | | | | 230,166 | |
| | 100,000 | | | Hertz Corporation | | | 7.50% | ^ | | | 10/15/2018 | | | | 104,000 | |
| | 200,000 | | | Host Marriott, L.P. | | | 6.38% | | | | 03/15/2015 | | | | 205,250 | |
| | 100,000 | | | Huntsman International LLC | | | 5.50% | | | | 06/30/2016 | | | | 98,750 | |
| | 100,000 | | | International Lease Finance Corporation | | | 8.25% | | | | 12/15/2020 | | | | 109,750 | |
| | 95,000 | | | Interpublic Group of Companies, Inc. | | | 10.00% | | | | 07/15/2017 | | | | 113,525 | |
| | 600,000 | | | JP Morgan Chase & Company | | | 4.95% | | | | 03/25/2020 | | | | 611,089 | |
| | 225,000 | | | Kellogg Company | | | 7.45% | | | | 04/01/2031 | | | | 281,131 | |
| | 250,000 | | | Kinder Morgan Energy Partners, LP | | | 6.95% | | | | 01/15/2038 | | | | 270,349 | |
| | 200,000 | | | Kraft Foods, Inc. | | | 5.38% | | | | 02/10/2020 | | | | 211,522 | |
| | 400,000 | | | Kroger Company | | | 5.50% | | | | 02/01/2013 | | | | 428,195 | |
| | 400,000 | | | Marathon Petroleum Corporation | | | 5.13% | ^ | | | 03/01/2021 | | | | 403,971 | |
| | 300,000 | | | Metlife, Inc. | | | 5.70% | | | | 06/15/2035 | | | | 300,314 | |
| | 100,000 | | | MGM Resorts International | | | 6.75% | | | | 04/01/2013 | | | | 101,250 | |
| | 100,000 | | | Michaels Stores, Inc. | | | 7.75% | ^ | | | 11/01/2018 | | | | 102,500 | |
| | 50,000 | | | Midamerican Energy Holdings Company | | | 6.50% | | | | 09/15/2037 | | | | 55,479 | |
| | 300,000 | | | MidAmerican Energy Holdings Company | | | 5.95% | | | | 05/15/2037 | | | | 310,394 | |
| | 750,000 | | | Morgan Stanley | | | 6.00% | | | | 04/28/2015 | | | | 817,570 | |
| | 300,000 | | | Motorola, Inc. | | | 6.00% | | | | 11/15/2017 | | | | 328,773 | |
| | 283,000 | | | National Rural Utilities Cooperative Finance Corporation | | | 10.38% | | | | 11/01/2018 | | | | 386,946 | |
| | 350,000 | | | News America, Inc. | | | 6.65% | | | | 11/15/2037 | | | | 368,248 | |
| | 400,000 | | | Omnicom Group, Inc. | | | 4.45% | | | | 08/15/2020 | | | | 394,710 | |
| | 300,000 | | | ONEOK Partners LP | | | 6.13% | | | | 02/01/2041 | | | | 300,869 | |
| | 400,000 | | | Oracle Corporation | | | 3.88% | ^ | | | 07/15/2020 | | | | 393,852 | |
| | 600,000 | | | PNC Funding Corporation | | | 4.38% | | | | 08/11/2020 | | | | 598,436 | |
| | 400,000 | | | Pohany Iron and Steel Company | | | 4.25% | ^ | | | 10/28/2020 | | | | 376,559 | |
| | 300,000 | | | Procter and Gamble Company | | | 5.55% | | | | 03/05/2037 | | | | 321,760 | |
| | 250,000 | | | Reliance Holdings USA | | | 6.25% | | | | 10/19/2040 | | | | 237,285 | |
| | 100,000 | | | Safeway, Inc. | | | 5.80% | | | | 08/15/2012 | | | | 106,413 | |
| | 100,000 | | | Safeway, Inc. | | | 6.25% | | | | 03/15/2014 | | | | 110,643 | |
| | 100,000 | | | Sears Holdings Corporation | | | 6.63% | ^ | | | 10/15/2018 | | | | 97,500 | |
| | 100,000 | | | Service Corporation International | | | 6.75% | | | | 04/01/2015 | | | | 107,000 | |
| | 300,000 | | | Simon Property Group L.P. | | | 5.65% | | | | 02/01/2020 | | | | 323,626 | |
| | 300,000 | | | SLM Corporation | | | 6.25% | | | | 01/25/2016 | | | | 313,074 | |
| | 400,000 | | | Southern Power Company, Series D | | | 4.88% | | | | 07/15/2015 | | | | 429,783 | |
| | 200,000 | | | Southwest Airlines Company | | | 5.25% | | | | 10/01/2014 | | | | 213,768 | |
| | 200,000 | | | Southwest Airlines Company | | | 5.75% | | | | 12/15/2016 | | | | 216,589 | |
| | 800,000 | | | Time Warner Cable, Inc. | | | 5.00% | | | | 02/01/2020 | | | | 810,252 | |
| | 500,000 | | | Transocean, Inc. | | | 6.00% | | | | 03/15/2018 | | | | 540,608 | |
| | 500,000 | | | Tyco International Group S.A. | | | 8.50% | | | | 01/15/2019 | | | | 646,010 | |
| | 100,000 | | | United Parcel Service, Inc. | | | 5.13% | | | | 04/01/2019 | | | | 111,424 | |
| | 250,000 | | | United Parcel Service, Inc. | | | 3.13% | | | | 01/15/2021 | | | | 232,128 | |
| | 100,000 | | | United Rentals, Inc. | | | 8.38% | | | | 09/15/2020 | | | | 105,000 | |
| | 500,000 | | | Valero Energy Corporation | | | 6.13% | | | | 02/01/2020 | | | | 541,714 | |
| | 500,000 | | | Wachovia Corporation Global | | | 5.50% | | | | 05/01/2013 | | | | 539,104 | |
| | 500,000 | | | Wal-Mart Stores, Inc. | | | 3.25% | | | | 10/25/2020 | | | | 467,990 | |
| | 530,000 | | | Waste Management, Inc. | | | 6.13% | | | | 11/30/2039 | | | | 551,979 | |
| | 500,000 | | | Wellpoint, Inc. | | | 5.25% | | | | 01/15/2016 | | | | 550,056 | |
| | 200,000 | | | Wynn Las Vegas LLC | | | 7.88% | | | | 11/01/2017 | | | | 215,500 | |
| | 206,000 | | | Xerox Corporation | | | 5.50% | | | | 05/15/2012 | | | | 215,557 | |
| | | | | | | | | | | | | | | | |
| | | | Total Domestic Corporate Bonds
(Cost $28,515,676) | | | | 28,570,275 | |
| | | | | | | | | | | | | | | | |
| | | | | | |
| The accompanying notes are an integral part of these financial statements | | Annual Report | | March 31, 2011 | | 17 |
| | |
| |
| Schedule of Investments DoubleLine Core Fixed Income Fund (Cont.) | | |
| | | | | | | | | | | | | | | | |
PRINCIPAL
AMOUNT | | | SECURITY DESCRIPTION | | RATE | | | MATURITY | | | VALUE $ | |
| | FOREIGN CORPORATE BONDS 12.8% | |
| | $200,000 | | | AES Andres Dominicana Ltd. | | | 9.50% | | | | 11/12/2020 | | | | 214,000 | |
| | 100,000 | | | Alfa Bank | | | 7.88% | ^ | | | 09/25/2017 | | | | 106,250 | |
| | 150,000 | | | Alfa Bank | | | 7.88% | | | | 09/25/2017 | | | | 159,375 | |
| | 200,000 | | | ALROSA Finance S.A. | | | 7.75% | ^ | | | 11/03/2020 | | | | 215,400 | |
| | 200,000 | | | ALROSA Finance S.A. | | | 7.75% | | | | 11/03/2020 | | | | 215,400 | |
| | 527,000 | | | Arcelormittal S.A. Luxembourg | | | 5.38% | | | | 06/01/2013 | | | | 560,758 | |
| | 600,000 | | | Australia and New Zealand Banking Group | | | 4.88% | ^ | | | 01/12/2021 | | | | 606,748 | |
| | 150,000 | | | Banco Bonsucesso S.A. | | | 9.25% | ^ | | | 11/03/2020 | | | | 144,075 | |
| | 200,000 | | | Banco Cruzeiro do Sul S.A. | | | 8.25% | ^ | | | 01/20/2016 | | | | 199,000 | |
| | 200,000 | | | Banco Cruzeiro do Sul S.A. | | | 8.25% | | | | 01/20/2016 | | | | 199,000 | |
| | 100,000 | | | Banco Cruzeiro do Sul S.A. | | | 8.88% | ^ | | | 09/22/2020 | | | | 98,250 | |
| | 350,000 | | | Banco de Credito del Peru | | | 5.38% | | | | 09/16/2020 | | | | 332,500 | |
| | 200,000 | | | Banco Industrial e Comercial S.A. | | | 8.50% | | | | 04/27/2020 | | | | 208,000 | |
| | 100,000 | | | Banco Internacional del Peru | | | 5.75% | | | | 10/07/2020 | | | | 93,500 | |
| | 100,000 | | | Banco International del Peru | | | 5.75% | ^ | | | 10/07/2020 | | | | 93,500 | |
| | 200,000 | | | Banco Internacional del Peru | | | 8.50% | # | | | 04/23/2070 | | | | 211,000 | |
| | 325,000 | | | Bancolombia S.A. | | | 6.13% | | | | 07/26/2020 | | | | 326,625 | |
| | 650,000 | | | BBVA Bancomer S.A. | | | 6.50% | ^ | | | 03/10/2021 | | | | 645,556 | |
| | 300,000 | | | BP Capital Markets P.L.C. | | | 4.75% | | | | 03/10/2019 | | | | 312,693 | |
| | 500,000 | | | British Telecommunications P.L.C. | | | 5.95% | | | | 01/15/2018 | | | | 552,382 | |
| | 150,000 | | | C10 Capital Ltd. | | | 6.72% | # | | | 12/31/2016 | | | | 117,750 | |
| | 575,000 | | | CAP S.A. | | | 7.38% | | | | 09/15/2036 | | | | 595,415 | |
| | 100,000 | | | Cemex Sab de C.V. | | | 9.00% | | | | 01/11/2018 | | | | 105,375 | |
| | 150,000 | | | Cencosud S.A. | | | 5.50% | | | | 01/20/2021 | | | | 148,489 | |
| | 200,000 | | | Cencosud S.A. | | | 5.50% | ^ | | | 01/20/2021 | | | | 197,985 | |
| | 375,000 | | | Continental Banco Trust | | | 7.38% | # | | | 10/07/2040 | | | | 378,750 | |
| | 150,000 | | | Continental Banco Trust | | | 7.38% | #^ | | | 10/07/2040 | | | | 151,500 | |
| | 240,000 | | | Corporacion Pesquera Inca S.A.C. | | | 9.00% | | | | 02/10/2017 | | | | 256,800 | |
| | 350,000 | | | Cosan Overseas Ltd. | | | 8.25% | | | | 02/05/2050 | | | | 358,750 | |
| | 300,000 | | | Covidien International Finance S.A. | | | 2.80% | | | | 06/15/2015 | | | | 300,868 | |
| | 100,000 | | | Credit Suisse AG | | | 3.50% | | | | 03/23/2015 | | | | 102,214 | |
| | 500,000 | | | Deutsche Bank Aktiengesellschaft | | | 3.25% | | | | 01/11/2016 | | | | 502,490 | |
| | 180,000 | | | Development Bank of Kazakhstan | | | 6.50% | | | | 06/03/2020 | | | | 181,980 | |
| | 300,000 | | | Development Bank of Kazakhstan | | | 6.00% | | | | 03/23/2026 | | | | 271,500 | |
| | 200,000 | | | Digicel Group Ltd. | | | 8.25% | | | | 09/01/2017 | | | | 213,000 | |
| | 140,000 | | | Drummond Company, Inc. | | | 7.38% | | | | 02/15/2016 | | | | 144,900 | |
| | 100,000 | | | Dubai Electricity and Water | | | 7.38% | | | | 10/21/2020 | | | | 97,326 | |
| | 100,000 | | | Dubai Electricity and Water | | | 7.38% | ^ | | | 10/21/2020 | | | | 97,326 | |
| | 400,000 | | | Ege Haina Finance Company | | | 9.50% | | | | 04/26/2017 | | | | 423,000 | |
| | 250,000 | | | Fideic Chubut Regal | | | 7.75% | | | | 07/01/2020 | | | | 254,375 | |
| | 200,000 | | | Gaz Capital S.A. | | | 6.51% | | | | 03/07/2022 | | | | 213,500 | |
| | 350,000 | | | Gol Finance | | | 9.25% | | | | 07/20/2020 | | | | 375,813 | |
| | 300,000 | | | Gold Fields Orogen Holdings | | | 4.88% | | | | 10/07/2020 | | | | 288,430 | |
| | 200,000 | | | Gold Fields Orogen Holdings | | | 4.88% | ^ | | | 10/07/2020 | | | | 192,287 | |
| | 300,000 | | | Grupo Famsa S.A. de C.V. | | | 11.00% | | | | 07/20/2015 | | | | 323,250 | |
| | 100,000 | | | Grupo Kuo S.A.B. de C.V. | | | 9.75% | ^ | | | 10/17/2017 | | | | 109,500 | |
| | 250,000 | | | Grupo Kuo S.A.B. de C.V. | | | 9.75% | | | | 10/17/2017 | | | | 273,750 | |
| | 100,000 | | | Grupo Papelero Scribe, S.A. | | | 8.88% | | | | 04/07/2020 | | | | 93,500 | |
| | 300,000 | | | HSBC Holdings P.L.C. | | | 5.10% | | | | 04/05/2021 | | | | 302,126 | |
| | 100,000 | | | Hydro-Quebec | | | 8.00% | | | | 02/01/2013 | | | | 111,773 | |
| | 150,000 | | | Hydro-Quebec | | | 7.50% | | | | 04/01/2016 | | | | 183,426 | |
| | 110,116 | | | Iirsa Norte Finance Ltd. | | | 8.75% | | | | 05/30/2024 | | | | 123,330 | |
| | 200,000 | | | Inkia Energy Ltd. | | | 8.38% | ^ | | | 04/04/2021 | | | | 200,500 | |
| | 270,000 | | | Inversiones CMPC S.A. | | | 4.75% | ^ | | | 01/19/2018 | | | | 266,425 | |
| | 130,000 | | | Inversiones CMPC S.A. | | | 4.75% | | | | 01/19/2018 | | | | 128,279 | |
| | 200,000 | | | Inversiones CMPC S.A. | | | 6.13% | | | | 11/05/2019 | | | | 211,490 | |
| | 200,000 | | | Ixe Banco S.A. | | | 9.25% | | | | 10/14/2020 | | | | 226,000 | |
| | 300,000 | | | JBS Finance II Ltd. | | | 8.25% | | | | 01/29/2018 | | | | 309,750 | |
| | 200,000 | | | KazMunagas National Company | | | 6.38% | | | | 04/09/2021 | | | | 208,000 | |
| | 500,000 | | | Korea Development Bank | | | 8.00% | | | | 01/23/2014 | | | | 571,031 | |
| | 375,000 | | | MCE Finance Limited | | | 10.25% | | | | 05/15/2018 | | | | 436,406 | |
| | 289,000 | | | Mexichem S.A.B. de C.V. | | | 8.75% | | | | 11/06/2019 | | | | 333,073 | |
| | 300,000 | | | Minerva Overseas II Ltd. | | | 10.88% | | | | 11/15/2019 | | | | 332,250 | |
| | 300,000 | | | MMG Fiduc (AES El Salvador) | | | 6.75% | | | | 02/01/2016 | | | | 297,000 | |
| | 200,000 | | | Myriad International Holding B.V. | | | 6.38% | | | | 07/28/2017 | | | | 212,240 | |
| | | | | | | | | | | | | | | | |
PRINCIPAL
AMOUNT | | | SECURITY DESCRIPTION | | RATE | | | MATURITY | | | VALUE $ | |
| | $307,018 | | | Nakilat, Inc. | | | 6.27% | | | | 12/31/2033 | | | | 307,785 | |
| | 30,000 | | | NII Capital Corporation | | | 10.00% | | | | 08/15/2016 | | | | 34,350 | |
| | 85,000 | | | NII Capital Corporation | | | 8.88% | | | | 12/15/2019 | | | | 93,925 | |
| | 300,000 | | | NII Capital Corporation | | | 7.63% | | | | 04/01/2021 | | | | 308,250 | |
| | 200,000 | | | Nova Chemicals Corporation | | | 8.38% | | | | 11/01/2016 | | | | 220,500 | |
| | 300,000 | | | Novartis Capital Corporation | | | 4.40% | | | | 04/24/2020 | | | | 310,902 | |
| | 200,000 | | | Novatek Finance Limited | | | 6.60% | ^ | | | 02/03/2021 | | | | 211,001 | |
| | 200,000 | | | Odebrecht Finance Ltd. | | | 7.50% | | | | 09/14/2015 | | | | 203,500 | |
| | 200,000 | | | Odebrecht Finance Ltd. | | | 6.00% | ^ | | | 04/05/2023 | | | | 199,000 | |
| | 100,000 | | | Odebrecht Finance Ltd. | | | 7.50% | ^ | | | 12/31/2049 | | | | 101,750 | |
| | 400,000 | | | Pan American Energy LLC | | | 7.88% | | | | 05/07/2021 | | | | 432,520 | |
| | 93,800 | | | Panama Canal Railway Company | | | 7.00% | | | | 11/01/2026 | | | | 85,358 | |
| | 500,000 | | | Pemex Project Funding Master Trust | | | 6.63% | | | | 06/15/2035 | | | | 504,057 | |
| | 250,000 | | | Petrobras Energia S.A. | | | 5.88% | | | | 05/15/2017 | | | | 259,375 | |
| | 17,472 | | | Petrolum Export, Ltd. | | | 5.27% | | | | 06/15/2011 | | | | 17,456 | |
| | 200,000 | | | PTTEP Canada International Finance Ltd. | | | 5.69% | ^ | | | 04/05/2021 | | | | 199,540 | |
| | 200,000 | | | Qtel International Finance Ltd. | | | 4.75% | | | | 02/16/2021 | | | | 187,220 | |
| | 225,000 | | | Royal KPN N.V. | | | 8.38% | | | | 10/01/2030 | | | | 291,075 | |
| | 300,000 | | | Sanofi Aventis | | | 2.63% | | | | 03/29/2016 | | | | 297,766 | |
| | 300,000 | | | SCF Capital Ltd. | | | 5.38% | | | | 10/27/2017 | | | | 298,418 | |
| | 400,000 | | | Stats Chippac Ltd. | | | 5.38% | | | | 03/31/2016 | | | | 401,926 | |
| | 200,000 | | | Sydney Airport Finance Company | | | 5.13% | ^ | | | 02/22/2021 | | | | 196,133 | |
| | 100,000 | | | Telemovil Finance Company Ltd. | | | 8.00% | ^ | | | 10/01/2017 | | | | 104,250 | |
| | 350,000 | | | Telemovil Finance Company Ltd. | | | 8.00% | | | | 10/01/2017 | | | | 364,875 | |
| | 100,000 | | | VEB Finance Ltd. | | | 6.80% | ^ | | | 11/22/2025 | | | | 101,900 | |
| | 200,000 | | | Vimpel-Communications | | | 7.75% | | | | 02/02/2021 | | | | 211,000 | |
| | 200,000 | | | VIP Finance Ireland Ltd. | | | 7.75% | ^ | | | 02/02/2021 | | | | 211,000 | |
| | 300,000 | | | Vnesheconombank | | | 6.80% | | | | 11/22/2025 | | | | 305,700 | |
| | 450,000 | | | VTB Capital S.A. | | | 6.55% | | | | 10/13/2020 | | | | 458,415 | |
| | 200,000 | | | WPE International Cooperatief U.A. | | | 10.38% | | | | 09/30/2020 | | | | 208,000 | |
| | 100,000 | | | WPE International Cooperatief U.A. | | | 10.38% | ^ | | | 09/30/2020 | | | | 104,000 | |
| | 190,000 | | | YPF Sociedad Anonima | | | 10.00% | | | | 11/02/2028 | | | | 222,775 | |
| | | | | | | | | | | | | | | | |
| | | | Total Foreign Corporate Bonds
(Cost $24,027,263) | | | | 24,170,656 | |
| | | | | | | | | | | | | | | | |
| | FOREIGN GOVERNMENT BONDS AND NOTES 0.4% | |
| | 200,000 | | | Province of Ontario | | | 4.95% | | | | 11/28/2016 | | | | 221,362 | |
| | 400,000 | | | United Mexican States | | | 5.63% | | | | 01/15/2017 | | | | 443,200 | |
| | | | | | | | | | | | | | | | |
| | | | Total Foreign Government Bonds and Notes
(Cost $669,154) | | | | 664,562 | |
| | | | | | | | | | | | | | | | |
| | US GOVERNMENT AGENCY OBLIGATIONS 23.6% | |
| |
| | | | Federal Home Loan Mortgage Corporation, | |
| | 6,600,000 | | | Debt Facility | | | 0.75% | | | | 12/21/2012 | | | | 6,595,420 | |
| | 1,491,082 | | | Pool U60299 | | | 4.00% | | | | 11/01/2040 | | | | 1,467,126 | |
| | 427,183 | | | Series 2750-ZT | | | 5.00% | | | | 02/15/2034 | | | | 451,599 | |
| | 1,305,326 | | | Series 3002-SN | | | 6.30% | # I/F I/O | | | 07/15/2035 | | | | 188,377 | |
| | 556,481 | | | Series 3045-DI | | | 6.53% | # I/F I/O | | | 10/15/2035 | | | | 84,336 | |
| | 1,011,127 | | | Series 3116-Z | | | 5.50% | | | | 02/15/2036 | | | | 1,096,200 | |
| | 125,649 | | | Series 3117-ZN | | | 4.50% | | | | 02/15/2036 | | | | 125,571 | |
| | 1,256,953 | | | Series 3203-ZC | | | 5.00% | | | | 07/15/2036 | | | | 1,307,323 | |
| | 1,085,352 | | | Series 3275-SC | | | 5.88% | # I/F I/O | | | 02/15/2037 | | | | 123,255 | |
| | 1,671,280 | | | Series 3423-GS | | | 5.45% | # I/O | | | 03/15/2038 | | | | 150,594 | |
| | 1,671,280 | | | Series 3423-SG | | | 5.45% | # I/O | | | 03/15/2038 | | | | 150,594 | |
| | 3,014,676 | | | Series 3582-SA | | | 5.80% | # I/O | | | 10/15/2049 | | | | 361,498 | |
| | 2,405,689 | | | Series 3606-CS | | | 6.15% | # I/O | | | 12/15/2039 | | | | 309,679 | |
| | 1,467,544 | | | Series 3616-SG | | | 6.15% | # I/F I/O | | | 03/15/2032 | | | | 229,177 | |
| | 3,041,824 | | | Series 3666-SC | | | 5.52% | # I/O | | | 05/15/2040 | | | | 312,275 | |
| | 523,395 | | | Series 3666-VZ | | | 5.50% | | | | 08/15/2036 | | | | 555,799 | |
| | 2,498,924 | | | Series 3779-DZ | | | 4.50% | | | | 12/15/2040 | | | | 2,169,504 | |
| | | | | | | | |
| 18 | | DoubleLine Funds | | | | | The accompanying notes are an integral part of these financial statements | |
| | | | | | | | | | | | | | | | |
PRINCIPAL
AMOUNT | | | SECURITY DESCRIPTION | | RATE | | | MATURITY | | | VALUE $ | |
| |
| | | | Federal Home Loan Mortgage Corporation, (Cont.) | |
| | $1,400,000 | | | Series 3779-YA | | | 3.50% | | | | 12/15/2030 | | | | 1,219,736 | |
| | 497,172 | | | Series 3780-BS | | | 9.39% | # | | | 12/15/2040 | | | | 406,597 | |
| | 1,490,499 | | | Series 3786-SG | | | 8.99% | # | | | 01/15/2041 | | | | 1,260,215 | |
| | 1,493,812 | | | Series 3798-SD | | | 9.20% | # | | | 12/15/2040 | | | | 1,228,098 | |
| | 1,156,635 | | | Series 3808-DB | | | 3.50% | | | | 02/15/2031 | | | | 1,037,713 | |
| | 3,736,782 | | | Series 3824-EY | | | 3.50% | | | | 03/15/2031 | | | | 3,273,188 | |
| | 1,346,133 | | | Series R003-ZA | | | 5.50% | | | | 10/15/2035 | | | | 1,439,521 | |
| |
| | | | Federal National Mortgage Association, | |
| | 2,223,741 | | | Series 2006-101-SA | | | 6.33% | # I/O | | | 10/25/2036 | | | | 332,328 | |
| | 1,000,000 | | | Debt Facility | | | 0.80% | | | | 09/27/2012 | | | | 1,000,744 | |
| | 3,030,000 | | | Debt Facility | | | 0.55% | | | | 11/01/2012 | | | | 3,021,195 | |
| | 1,200,000 | | | Pool 099999 | | | 5.25% | | | | 08/01/2012 | | | | 1,269,691 | |
| | 767,570 | | | Series 2003-117-KS | | | 6.89% | # I/F I/O | | | 08/25/2033 | | | | 101,171 | |
| | 500,000 | | | Series 2003-W17-1A7 | | | 5.75% | | | | 08/25/2043 | | | | 578,167 | |
| | 1,134,765 | | | Series 2006-56-SM | | | 6.50% | # I/O | | | 07/25/2036 | | | | 161,188 | |
| | 1,364,785 | | | Series 2007-116-BI | | | 6.04% | # I/F I/O | | | 05/25/2037 | | | | 181,276 | |
| | 3,306,730 | | | Series 2007-30-OI | | | 6.22% | # I/O | | | 04/25/2037 | | | | 505,245 | |
| | 400,487 | | | Series 2008-29-ZA | | | 4.50% | | | | 04/25/2038 | | | | 399,246 | |
| | 1,811,813 | | | Series 2008-62-SC | | | 5.75% | # I/F I/O | | | 07/25/2038 | | | | 219,033 | |
| | 812,307 | | | Series 2009-111-SE | | | 6.00% | # I/O | | | 01/25/2040 | | | | 98,863 | |
| | 332,864 | | | Series 2009-16-MZ | | | 5.00% | | | | 03/25/2029 | | | | 345,149 | |
| | 1,970,433 | | | Series 2009-48-WS | | | 5.70% | # I/O | | | 07/25/2039 | | | | 230,350 | |
| | 272,843 | | | Series 2010-101-ZH | | | 4.50% | | | | 07/25/2040 | | | | 254,938 | |
| | 1,448,896 | | | Series 2010-121-SD | | | 4.25% | # I/O | | | 10/25/2040 | | | | 130,550 | |
| | 949,821 | | | Series 2010-137-VS | | | 14.22% | # I/F | | | 12/25/2040 | | | | 946,691 | |
| | 2,020,067 | | | Series 2010-150-ZA | | | 4.00% | | | | 01/25/2041 | | | | 1,703,062 | |
| | 2,185,937 | | | Series 2010-31-SA | | | 4.75% | # I/F I/O | | | 04/25/2040 | | | | 189,077 | |
| | 1,427,291 | | | Series 2010-34-PS | | | 4.68% | # I/F I/O | | | 04/25/2040 | | | | 142,313 | |
| | 1,845,478 | | | Series 2010-35-SP | | | 6.10% | # I/O | | | 04/25/2050 | | | | 238,113 | |
| | 1,351,951 | | | Series 2010-35-SV | | | 6.20% | # I/O | | | 04/25/2040 | | | | 171,089 | |
| | 1,250,000 | | | Series 2010-59-PS | | | 6.20% | # I/F I/O | | | 03/25/2039 | | | | 202,920 | |
| | 2,019,184 | | | Series 2010-59-SC | | | 4.75% | # I/O | | | 01/25/2040 | | | | 187,651 | |
| | 312,737 | | | Series 2010-64-EZ | | | 5.00% | | | | 06/25/2040 | | | | 318,889 | |
| | 260,141 | | | Series 2010-99-SG | | | 23.70% | # I/F | | | 09/25/2040 | | | | 297,546 | |
| | 2,000,000 | | | Series 2011-18-S | | | 8.78% | # | | | 03/25/2041 | | | | 1,705,359 | |
| | 1,000,000 | | | Series 2011-29-AL | | | 3.50% | | | | 04/25/2031 | | | | 887,258 | |
| | 2,533,206 | | | Series 400-S4-BZ | | | 5.20% | # I/O | | | 11/25/2039 | | | | 311,833 | |
| |
| | | | Federal National Mortgage Association Pass-Through, | |
| | 844,228 | | | Pool #931104 | | | 5.00% | | | | 05/01/2039 | | | | 886,305 | |
| | 193,783 | | | Pool #AC1032 | | | 5.00% | | | | 06/01/2040 | | | | 201,638 | |
| | 124,804 | | | Pool #AD2177 | | | 4.50% | | | | 06/01/2030 | | | | 129,137 | |
| | 445,453 | | | Pool #MA0282 | | | 5.00% | | | | 12/01/2039 | | | | 470,051 | |
| | 586,862 | | | Pool #MA0468 | | | 5.00% | | | | 07/01/2040 | | | | 610,649 | |
| |
| | | | Government National Mortgage Association, | |
| | 271,875 | | | Series 2003-67-SP | | | 6.85% | # I/F I/O | | | 08/20/2033 | | | | 85,046 | |
| | 1,032,236 | | | Series 2008-82-SM | | | 5.80% | # I/F I/O | | | 09/20/2038 | | | | 108,017 | |
| | 318,783 | | | Series 2010-25-ZB | | | 4.50% | | | | 02/16/2040 | | | | 300,648 | |
| | | | | | | | | | | | | | | | |
| | |
| | | | Total US Government Agency Obligations
(Cost $43,974,034) | | | | 44,465,821 | |
| | | | | | | | | | | | | | | | |
| | | | | | | | | | | | | | | | |
PRINCIPAL
AMOUNT /
SHARES | | | SECURITY DESCRIPTION | | RATE | | | MATURITY | | | VALUE $ | |
| | US GOVERNMENT BONDS AND NOTES 15.1% | | | | | |
| | $ 1,650,000 | | | United States Treasury Bonds | | | 8.00% | | | | 11/15/2021 | | | | 2,304,586 | |
| | 850,000 | | | United States Treasury Bonds | | | 5.38% | | | | 02/15/2031 | | | | 972,188 | |
| | 3,300,000 | | | United States Treasury Bonds | | | 4.38% | | | | 11/15/2039 | | | | 3,228,845 | |
| | 4,750,000 | | | United States Treasury Notes | | | 0.63% | | | | 12/31/2012 | | | | 4,746,661 | |
| | 10,050,000 | | | United States Treasury Notes | | | 2.38% | | | | 03/31/2016 | | | | 10,121,455 | |
| | 7,050,000 | | | United States Treasury Notes | | | 3.38% | | | | 11/15/2019 | | | | 7,128,213 | |
| | | | | | | | | | | | | | | | |
| | | | Total US Government Bonds and Notes
(Cost $28,723,381) | | | | 28,501,948 | |
| | | | | | | | | | | | | | | | |
| | SHORT TERM INVESTMENTS 5.2% | | | | | |
| | 9,854,674 | | | Fidelity Institutional Government Portfolio | | | 0.01% | 1 | | | | | | | 9,854,674 | |
| | | | | | | | | | | | | | | | |
| | | | Total Short Term Investments
(Cost $9,854,674) | | | | 9,854,674 | |
| | | | | | | | | | | | | | | | |
| | | | Total Investments 98.8%
(Cost $185,076,898) | | | | 186,326,127 | |
| | | | Other Assets in Excess of Liabilities 1.2% | | | | 2,302,397 | |
| | | | | | | | | | | | | | | | |
| | | | NET ASSETS 100.0% | | | | | | | | | | $ | 188,628,524 | |
| | | | | | | | | | | | | | | | |
| | | | | | | | |
| PORTFOLIO HOLDINGS as % of Net Assets |
| Collateralized Mortgage Obligations | | | | | | | | 26.6% |
| US Government Agency Obligations | | | | | | | | 23.6% |
| Domestic Corporate Bonds | | | | | | | | 15.1% |
| US Government Bonds and Notes | | | | | | | | 15.1% |
| Foreign Corporate Bonds | | | | | | | | 12.8% |
| Short Term Investments | | | | | | | | 5.2% |
| Foreign Government Bonds and Notes | | | | | | | | 0.4% |
| Other Assets and Liabilities | | | | | | | | 1.2% |
| | | | | | | | |
| | | | | | | | 100.0% |
| | | | | | | | |
| # | Variable rate security. Rate disclosed as of March 31, 2011. |
| ^ | Security exempt from registration under Rule 144A of the Securities Act of 1933. These securities may be resold in transactions exempt from registration, normally to qualified institutional buyers. These securities are determined to be liquid by the Adviser, unless otherwise noted, under procedures established by the Fund’s Board of Trustees. At March 31, 2011, the value of these securities amounted to $16,881,866 or 8.9% of net assets. |
| 1 | Seven-day yield as of March 31, 2011 |
| I/O | Interest only security |
| I/F | Inverse floating rate security whose interest rate moves in the opposite direction of prevailing interest rates |
| | | | | | |
| The accompanying notes are an integral part of these financial statements | | Annual Report | | March 31, 2011 | | 19 |
| | |
| |
| Schedule of Investments DoubleLine Emerging Markets Fixed Income Fund | | |
| | | | | | | | | | | | | | | | |
PRINCIPAL
AMOUNT | | | SECURITY DESCRIPTION | | RATE | | | MATURITY | | | VALUE $ | |
| | FOREIGN CORPORATE BONDS 97.3% | | | | | | | | | | | | |
| | |
| | ARGENTINA 8.2% | | | | | | | | | | | | |
| | 1,500,000 | | | Fideic Chubut Regal | | | 7.75% | | | | 07/01/2020 | | | | 1,526,250 | |
| | 2,100,000 | | | Pan American Energy LLC | | | 7.88% | | | | 05/07/2021 | | | | 2,270,730 | |
| | 2,275,000 | | | Petrobras Energia S.A. | | | 5.88% | | | | 05/15/2017 | | | | 2,360,312 | |
| | 1,700,000 | | | WPE International Cooperatief U.A. | | | 10.38% | ^ | | | 09/30/2020 | | | | 1,768,000 | |
| | 800,000 | | | WPE International Cooperatief U.A. | | | 10.38% | | | | 09/30/2020 | | | | 832,000 | |
| | 1,745,000 | | | YPF Sociedad Anonima | | | 10.00% | | | | 11/02/2028 | | | | 2,046,013 | |
| | | | | | | | | | | | | | | | |
| | | | | | | | | | | | | | | 10,803,305 | |
| | | | | | | | | | | | | | | | |
| | BRAZIL 14.8% | | | | | | | | | | | | |
| | 2,350,000 | | | Banco Bonsucesso S.A. | | | 9.25% | ^ | | | 11/03/2020 | | | | 2,257,175 | |
| | 2,000,000 | | | Banco Cruzeiro do Sul S.A. | | | 8.25% | ^ | | | 01/20/2016 | | | | 1,990,000 | |
| | 200,000 | | | Banco Cruzeiro do Sul S.A. | | | 8.25% | | | | 01/20/2016 | | | | 199,000 | |
| | 300,000 | | | Banco Cruzeiro do Sul S.A. | | | 8.88% | | | | 09/22/2020 | | | | 294,750 | |
| | 400,000 | | | Banco Cruzeiro do Sul S.A. | | | 8.88% | ^ | | | 09/22/2020 | | | | 393,000 | |
| | 1,430,000 | | | Banco Industrial e Comercial S.A. | | | 8.50% | | | | 04/27/2020 | | | | 1,487,200 | |
| | 500,000 | | | Cosan Overseas Ltd. | | | 8.25% | | | | 11/05/2015 | | | | 512,500 | |
| | 2,300,000 | | | Cosan Overseas Ltd. | | | 8.25% | | | | 02/05/2050 | | | | 2,357,500 | |
| | 700,000 | | | Fibria Overseas Finance Ltd. | | | 6.75% | ^ | | | 03/03/2021 | | | | 726,250 | |
| | 2,990,000 | | | Gol Finance | | | 9.25% | | | | 07/20/2020 | | | | 3,210,512 | |
| | 1,700,000 | | | JBS Finance II Ltd. | | | 8.25% | | | | 01/29/2018 | | | | 1,755,250 | |
| | 200,000 | | | JBS Finance II Ltd. | | | 8.25% | ^ | | | 01/29/2018 | | | | 206,500 | |
| | 1,800,000 | | | Minerva Overseas II Ltd. | | | 10.88% | | | | 11/15/2019 | | | | 1,993,500 | |
| | 1,400,000 | | | Odebrecht Finance Ltd. | | | 7.50% | | | | 09/14/2015 | | | | 1,424,500 | |
| | 800,000 | | | Odebrecht Finance Ltd. | | | 6.00% | ^ | | | 04/05/2023 | | | | 796,000 | |
| | | | | | | | | | | | | | | | |
| | | | | | | | | | | | | | | 19,603,637 | |
| | | | | | | | | | | | | | | | |
| | CHILE 4.0% | | | | | | | | | | | | |
| | 1,285,000 | | | CAP S.A. | | | 7.38% | | | | 09/15/2036 | | | | 1,330,625 | |
| | 850,000 | | | Cencosud S.A. | | | 5.50% | ^ | | | 01/20/2021 | | | | 841,438 | |
| | 500,000 | | | Colbun S.A. | | | 6.00% | | | | 01/21/2020 | | | | 514,250 | |
| | 1,600,000 | | | Inversiones CMPC S.A. | | | 4.75% | ^ | | | 01/19/2018 | | | | 1,578,816 | |
| | 1,000,000 | | | Inversiones CMPC S.A. | | | 6.13% | | | | 11/05/2019 | | | | 1,057,450 | |
| | | | | | | | | | | | | | | | |
| | | | | | | | | | | | | | | 5,322,579 | |
| | | | | | | | | | | | | | | | |
| | CHINA 1.5% | | | | | | | | | | | | |
| | 1,750,000 | | | MCE Finance Limited | | | 10.25% | | | | 05/15/2018 | | | | 2,036,563 | |
| | | | | | | | | | | | | | | | |
| | | | | | | | | | | | | | | 2,036,563 | |
| | | | | | | | | | | | | | | | |
| | COLOMBIA 2.1% | | | | | | | | | | | | |
| | 1,140,000 | | | Bancolombia S.A. | | | 6.13% | | | | 07/26/2020 | | | | 1,145,700 | |
| | 1,638,000 | | | Drummond Company, Inc. | | | 7.38% | | | | 02/15/2016 | | | | 1,695,330 | |
| | | | | | | | | | | | | | | | |
| | | | | | | | | | | | | | | 2,841,030 | |
| | | | | | | | | | | | | | | | |
| | DOMINICAN REPUBLIC 4.8% | | | | | | | | | | | | |
| | 2,000,000 | | | AES Andres Dominicana Ltd. | | | 9.50% | ^ | | | 11/12/2020 | | | | 2,140,000 | |
| | 300,000 | | | AES Andres Dominicana Ltd. | | | 9.50% | | | | 11/12/2020 | | | | 321,000 | |
| | 3,724,000 | | | Ege Haina Finance Company | | | 9.50% | | | | 04/26/2017 | | | | 3,938,130 | |
| | | | | | | | | | | | | | | | |
| | | | | | | | | | | | | | | 6,399,130 | |
| | | | | | | | | | | | | | | | |
| | EGYPT 0.1% | | | | | | | | | | | | |
| | 96,094 | | | Petroleum Export, Ltd. | | | 5.27% | | | | 06/15/2011 | | | | 96,011 | |
| | | | | | | | | | | | | | | | |
| | | | | | | | | | | | | | | 96,011 | |
| | | | | | | | | | | | | | | | |
| | EL SALVADOR 4.3% | | | | | | | | | | | | |
| | 2,600,000 | | | MMG Fiduc (AES El Salvador) | | | 6.75% | | | | 02/01/2016 | | | | 2,574,000 | |
| | 1,500,000 | | | Telemovil Finance Company Ltd. | | | 8.00% | | | | 10/01/2017 | | | | 1,563,750 | |
| | 1,500,000 | | | Telemovil Finance Company Ltd. | | | 8.00% | ^ | | | 10/01/2017 | | | | 1,563,750 | |
| | | | | | | | | | | | | | | | |
| | | | | | | | | | | | | | | 5,701,500 | |
| | | | | | | | | | | | | | | | |
| | | | | | | | | | | | | | | | |
PRINCIPAL
AMOUNT | | | SECURITY DESCRIPTION | | RATE | | | MATURITY | | | VALUE $ | |
| | INDIA 1.2% | | | | | | | | | | | | |
| | 500,000 | | | Reliance Industries, Ltd. | | | 8.25% | | | | 01/15/2027 | | | | 600,955 | |
| | 1,000,000 | | | Reliance Industries, Ltd. | | | 6.25% | ^ | | | 10/19/2040 | | | | 949,140 | |
| | | | | | | | | | | | | | | | |
| | | | | | | | | | | | | | | 1,550,095 | |
| | | | | | | | | | | | | | | | |
| | ISRAEL 0.6% | | | | | | | | | | | | |
| | 750,000 | | | Israel Electric Corporation Ltd. | | | 7.88% | | | | 12/15/2026 | | | | 794,714 | |
| | | | | | | | | | | | | | | | |
| | | | | | | | | | | | | | | 794,714 | |
| | | | | | | | | | | | | | | | |
| | JAMAICA 1.9% | | | | | | | | | | | | |
| | 2,300,000 | | | Digicel Group Ltd. | | | 8.25% | | | | 09/01/2017 | | | | 2,449,500 | |
| | | | | | | | | | | | | | | | |
| | | | | | | | | | | | | | | 2,449,500 | |
| | | | | | | | | | | | | | | | |
| | KAZAKHSTAN 3.9% | | | | | | | | | | | | |
| | 500,000 | | | Development Bank of Kazakhstan | | | 6.50% | | | | 06/03/2020 | | | | 505,500 | |
| | 2,500,000 | | | Development Bank of Kazakhstan | | | 6.00% | | | | 03/23/2026 | | | | 2,262,500 | |
| | 2,300,000 | | | KazMunagas National Company | | | 6.38% | ^ | | | 04/09/2021 | | | | 2,392,000 | |
| | | | | | | | | | | | | | | | |
| | | | | | | | | | | | | | | 5,160,000 | |
| | | | | | | | | | | | | | | | |
| | MEXICO 14.3% | | | | | | | | | | | | |
| | 3,500,000 | | | BBVA Bancomer S.A. | | | 6.50% | ^ | | | 03/10/2021 | | | | 3,476,067 | |
| | 900,000 | | | C10 Capital Ltd. | | | 6.72% | # | | | 12/31/2016 | | | | 706,500 | |
| | 500,000 | | | Cemex Sab de C.V. | | | 9.00% | ^ | | | 01/11/2018 | | | | 526,875 | |
| | 1,200,000 | | | Grupo Famsa S.A. de C.V. | | | 11.00% | | | | 07/20/2015 | | | | 1,293,000 | |
| | 1,200,000 | | | Grupo Kuo S.A.B. de C.V. | | | 9.75% | ^ | | | 10/17/2017 | | | | 1,314,000 | |
| | 852,000 | | | Grupo Kuo S.A.B. de C.V. | | | 9.75% | | | | 10/17/2017 | | | | 932,940 | |
| | 2,100,000 | | | Grupo Papelero Scribe, S.A. | | | 8.88% | | | | 04/07/2020 | | | | 1,963,500 | |
| | 500,000 | | | Grupo Papelero Scribe, S.A. | | | 8.88% | ^ | | | 04/07/2020 | | | | 467,500 | |
| | 1,530,000 | | | Ixe Banco S.A. | | | 9.25% | | | | 10/14/2020 | | | | 1,728,900 | |
| | 750,000 | | | Ixe Banco S.A. | | | 9.25% | ^ | | | 10/14/2020 | | | | 847,500 | |
| | 2,230,000 | | | Mexichem S.A.B. de C.V. | | | 8.75% | | | | 11/06/2019 | | | | 2,570,074 | |
| | 370,000 | | | NII Capital Corporation | | | 10.00% | | | | 08/15/2016 | | | | 423,650 | |
| | 915,000 | | | NII Capital Corporation | | | 8.88% | | | | 12/15/2019 | | | | 1,011,075 | |
| | 1,600,000 | | | NII Capital Corporation | | | 7.63% | | | | 04/01/2021 | | | | 1,644,000 | |
| | | | | | | | | | | | | | | | |
| | | | | | | | | | | | | | | 18,905,581 | |
| | | | | | | | | | | | | | | | |
| | PANAMA 0.7% | | | | | | | | | | | | |
| | 187,663 | | | Corredor Sur Trust | | | 6.95% | | | | 05/25/2025 | | | | 216,751 | |
| | 844,200 | | | Panama Canal Railway Company | | | 7.00% | | | | 11/01/2026 | | | | 768,222 | |
| | | | | | | | | | | | | | | | |
| | | | | | | | | | | | | | | 984,973 | |
| | | | | | | | | | | | | | | | |
| | PERU 8.1% | | | | | | | | | | | | |
| | 1,550,000 | | | Banco de Credito del Peru | | | 5.38% | | | | 09/16/2020 | | | | 1,472,500 | |
| | 680,000 | | | Banco Internacional del Peru | | | 5.75% | | | | 10/07/2020 | | | | 635,800 | |
| | 400,000 | | | Banco International del Peru | | | 5.75% | ^ | | | 10/07/2020 | | | | 374,000 | |
| | 300,000 | | | Banco International del Peru | | | 8.50% | #^ | | | 04/23/2070 | | | | 316,500 | |
| | 1,350,000 | | | Continental Banco Trust | | | 7.38% | #^ | | | 10/07/2040 | | | | 1,363,500 | |
| | 1,450,000 | | | Continental Banco Trust | | | 7.38% | # | | | 10/07/2040 | | | | 1,464,500 | |
| | 2,340,000 | | | Corporacion Pesquera Inca S.A.C. | | | 9.00% | | | | 02/10/2017 | | | | 2,503,800 | |
| | 1,651,738 | | | Iirsa Norte Finance Ltd. | | | 8.75% | | | | 05/30/2024 | | | | 1,849,946 | |
| | 800,000 | | | Inkia Energy Ltd. | | | 8.38% | ^ | | | 04/04/2021 | | | | 802,000 | |
| | | | | | | | | | | | | | | | |
| | | | | | | | | | | | | | | 10,782,546 | |
| | | | | | | | | | | | | | | | |
| | QATAR 4.0% | | | | | | | | | | | | |
| | 450,000 | | | Nakilat, Inc. | | | 6.07% | ^ | | | 12/31/2033 | | | | 451,125 | |
| | 350,000 | | | Nakilat, Inc. | | | 6.07% | | | | 12/31/2033 | | | | 350,875 | |
| | 2,362,053 | | | Nakilat, Inc. | | | 6.27% | | | | 12/31/2033 | | | | 2,367,958 | |
| | 1,050,000 | | | Qtel International Finance Ltd. | | | 4.75% | | | | 02/16/2021 | | | | 982,903 | |
| | 800,000 | | | Qtel International Finance Ltd. | | | 4.75% | ^ | | | 02/16/2021 | | | | 748,878 | |
| | 400,000 | | | Qtel International Finance Ltd. | | | 5.00% | | | | 10/19/2025 | | | | 354,752 | |
| | | | | | | | | | | | | | | | |
| | | | | | | | | | | | | | | 5,256,491 | |
| | | | | | | | | | | | | | | | |
| | | | | | | | |
| 20 | | DoubleLine Funds | | | | | The accompanying notes are an integral part of these financial statements | |
| | | | | | | | | | | | | | | | |
PRINCIPAL
AMOUNT | | | SECURITY DESCRIPTION | | RATE | | | MATURITY | | | VALUE $ | |
| | RUSSIA 14.5% | | | | | | | | | | | | |
| | 1,600,000 | | | Alfa Bank | | | 7.88% | ^ | | | 09/25/2017 | | | | 1,699,999 | |
| | 700,000 | | | Alfa Bank | | | 7.88% | | | | 09/25/2017 | | | | 743,750 | |
| | 1,500,000 | | | ALROSA Finance S.A. | | | 7.75% | ^ | | | 11/03/2020 | | | | 1,615,500 | |
| | 250,000 | | | ALROSA Finance S.A. | | | 7.75% | | | | 11/03/2020 | | | | 269,250 | |
| | 1,025,000 | | | Gaz Capital S.A. | | | 6.51% | | | | 03/07/2022 | | | | 1,094,188 | |
| | 2,000,000 | | | Lukoil International Finance B.V. | | | 6.13% | ^ | | | 11/09/2020 | | | | 2,049,999 | |
| | 1,600,000 | | | Novatek Finance Limited | | | 6.60% | ^ | | | 02/03/2021 | | | | 1,688,010 | |
| | 1,200,000 | | | SCF Capital Ltd. | | | 5.38% | | | | 10/27/2017 | | | | 1,193,672 | |
| | 800,000 | | | SCF Capital Ltd. | | | 5.38% | ^ | | | 10/27/2017 | | | | 795,782 | |
| | 1,050,000 | | | VEB Finance Ltd. | | | 6.80% | ^ | | | 11/22/2025 | | | | 1,069,950 | |
| | 1,300,000 | | | VIP Finance Ireland Ltd. | | | 7.75% | | | | 02/02/2021 | | | | 1,371,500 | |
| | 1,200,000 | | | VIP Finance Ireland Ltd. | | | 7.75% | ^ | | | 02/02/2021 | | | | 1,266,000 | |
| | 1,450,000 | | | Vnesheconombank | | | 6.80% | | | | 11/22/2025 | | | | 1,477,550 | |
| | 1,650,000 | | | VTB Capital S.A. | | | 6.55% | | | | 10/13/2020 | | | | 1,680,855 | |
| | 1,200,000 | | | VTB Capital S.A. | | | 6.55% | ^ | | | 10/13/2020 | | | | 1,222,440 | |
| | | | | | | | | | | | | | | | |
| | | | | | | | | | | | 19,238,445 | |
| | | | | | | | | | | | | | | | |
| | SINGAPORE 1.2% | | | | | | | | | | | | |
| | 1,600,000 | | | STATS ChipPAC Ltd. | | | 5.38% | | | | 03/31/2016 | | | | 1,607,706 | |
| | | | | | | | | | | | | | | | |
| | | | | | | | | | | | | | | 1,607,706 | |
| | | | | | | | | | | | | | | | |
| | SOUTH AFRICA 2.3% | | | | | | | | | | | | |
| | 1,500,000 | | | Gold Fields Orogen Holdings | | | 4.88% | ^ | | | 10/07/2020 | | | | 1,442,150 | |
| | 900,000 | | | Myriad International Holdings B.V. | | | 6.38% | ^ | | | 07/28/2017 | | | | 955,080 | |
| | 600,000 | | | Myriad International Holdings B.V. | | | 6.38% | | | | 07/28/2017 | | | | 636,720 | |
| | | | | | | | | | | | | | | | |
| | | | | | | | | | | | | | | 3,033,950 | |
| | | | | | | | | | | | | | | | |
| | THAILAND 0.8% | | | | | | | | | | | | |
| | 1,050,000 | | | PTTEP Canada International Finance Ltd. | | | 5.69% | ^ | | | 04/05/2021 | | | | 1,047,585 | |
| | | | | | | | | | | | | | | | |
| | | | | | | | | | | | | | | 1,047,585 | |
| | | | | | | | | | | | | | | | |
| | TRINIDAD AND TOBAGO 0.3% | | | | | | | | | | | | |
| | 400,000 | | | National Gas Company of Trinidad and Tobago | | | 6.05% | | | | 01/15/2036 | | | | 375,842 | |
| | | | | | | | | | | | | | | | |
| | | | | | | | | | | | | | | 375,842 | |
| | | | | | | | | | | | | | | | |
| | UKRAINE 0.4% | | | | | | | | | | | | |
| | 487,500 | | | Alfa Bank (Ukraine ISS) | | | 13.00% | | | | 07/30/2012 | | | | 510,656 | |
| | | | | | | | | | | | | | | | |
| | | | | | | | | | | | | | | 510,656 | |
| | | | | | | | | | | | | | | | |
| | UNITED ARAB EMIRATES 3.3% | | | | | | | | | | | | |
| | 1,700,000 | | | Abu Dhabi National Energy Company PJSC | | | 6.25% | | | | 09/16/2019 | | | | 1,762,050 | |
| | 900,000 | | | Dubai Electricity and Water Authority | | | 7.38% | | | | 10/21/2020 | | | | 875,936 | |
| | 1,800,000 | | | Dubai Electricity and Water Authority | | | 7.38% | ^ | | | 10/21/2020 | | | | 1,751,872 | |
| | | | | | | | | | | | | | | | |
| | | | | | | | | | | | | | | 4,389,858 | |
| | | | | | | | | | | | | | | | |
| | | | Total Corporate Bonds
(Cost $127,581,325) | | | | 128,891,697 | |
| | | | | | | | | | | | | | | | |
| | | | | | | | | | | | | | | | |
SHARES | | | SECURITY DESCRIPTION | | RATE | | | MATURITY | | | VALUE $ | |
| | SHORT TERM INVESTMENTS 7.9% | | | | | | | | | | | | |
| | 10,481,773 | | | Fidelity Institutional Government Portfolio | | | 0.01% | 1 | | | | | | | 10,481,773 | |
| | | | | | | | | | | | | | | | |
| | | | Total Short Term Investments
(Cost $10,481,773) | | | | 10,481,773 | |
| | | | | | | | | | | | | | | | |
| | | | Total Investments 105.2%
(Cost $138,063,098) | | | | 139,373,470 | |
| | | | Liabilities in Excess of Other Assets (5.2)% | | | | (6,869,542 | ) |
| | | | | | | | | | | | | | | | |
| | | | NET ASSETS 100.0% | | | | | | | | | | $ | 132,503,928 | |
| | | | | | | | | | | | | | | | |
| | | | | | | | |
| PORTFOLIO HOLDINGS as % of Net Assets |
| Foreign Corporate Bonds | | | | | | | | |
| Brazil | | | | | | | | 14.8% |
| Russia | | | | | | | | 14.5% |
| Mexico | | | | | | | | 14.3% |
| Argentina | | | | | | | | 8.2% |
| Peru | | | | | | | | 8.1% |
| Dominican Republic | | | | | | | | 4.8% |
| EI Salvador | | | | | | | | 4.3% |
| Chile | | | | | | | | 4.0% |
| Qatar | | | | | | | | 4.0% |
| Kazakhstan | | | | | | | | 3.9% |
| United Arab Emirates | | | | | | | | 3.3% |
| South Africa | | | | | | | | 2.3% |
| Columbia | | | | | | | | 2.1% |
| Jamaica | | | | | | | | 1.9% |
| China | | | | | | | | 1.5% |
| India | | | | | | | | 1.2% |
| Singapore | | | | | | | | 1.2% |
| Thailand | | | | | | | | 0.8% |
| Panama | | | | | | | | 0.7% |
| Israel | | | | | | | | 0.6% |
| Ukraine | | | | | | | | 0.4% |
| Trinidad and Tobago | | | | | | | | 0.3% |
| Egypt | | | | | | | | 0.1% |
| | | | | | | | |
| | | | | | | | 97.3% |
| Short Term Investments | | | | | | | | 7.9% |
| Other Assets and Liabilities | | | | | | | | (5.2)% |
| | | | | | | | |
| | | | | | | | 100.0% |
| | | | | | | | |
| # | Variable rate security. Rate disclosed as of March 31, 2011. |
| ^ | Security exempt from registration under Rule 144A of the Securities Act of 1933. These securities may be resold in transactions exempt from registration, normally to qualified institutional buyers. These securities are determined to be liquid by the Adviser, unless otherwise noted, under procedures established by the Fund’s Board of Trustees. At March 31, 2011, the value of these securities amounted to $44,894,381 or 33.9% of net assets. |
| 1 | Seven-day yield as of March 31, 2011 |
| | | | | | |
| The accompanying notes are an integral part of these financial statements | | Annual Report | | March 31, 2011 | | 21 |
| | |
| |
| Schedule of Investments DoubleLine Multi-Asset Growth Fund | | |
| | | | | | | | | | | | | | | | |
PRINCIPAL
AMOUNT /
SHARES | | | SECURITY DESCRIPTION | | RATE | | | MATURITY | | | VALUE $ | |
| | COLLATERALIZED MORTGAGE OBLIGATIONS 6.4% | |
| |
| | | | Banc of America Commercial Mortgage, Inc., | |
| | 2,737,910 | | | Series 2004-5-XP | | | 0.74% | #I/O | | | 11/10/2041 | | | | 7,330 | |
| |
| | | | BCAP LLC Trust, | |
| | 103,223 | | | Series 2007-AA2-2A5 | | | 6.00% | | | | 04/25/2037 | | | | 75,399 | |
| | 106,000 | | | Series 2010-RR6-1A20 | | | 9.90% | #^ | | | 08/26/2022 | | | | 106,000 | |
| |
| | | | Bear Stearns Commercial Mortgage Securities, Inc., | |
| | 100,000 | | | Series 2005-PWR10-AM | | | 5.45% | # | | | 12/15/2015 | | | | 103,119 | |
| |
| | | | Chaseflex Trust, | |
| | 30,000 | | | Series 2007-M1-2F4 | | | 6.35% | # | | | 08/25/2037 | | | | 22,164 | |
| |
| | | | Citigroup Commercial Mortgage Securities, Inc., | |
| | 597,566 | | | Series 2004-C2 | | | 1.10% | #^IO | | | 10/15/2041 | | | | 3,765 | |
| |
| | | | Commercial Mortgage Trust, | |
| | 100,000 | | | Series 1999-C1 | | | 7.23% | # | | | 01/17/2032 | | | | 109,660 | |
| |
| | | | Countrywide Alternative Loan Trust, | |
| | 225,794 | | | Series 2006-32CB-A16 | | | 5.50% | | | | 11/25/2036 | | | | 178,121 | |
| | 56,464 | | | Series 2007-17CB-1A10 | | | 28.80% | # | | | 08/25/2037 | | | | 72,919 | |
| | 37,363 | | | Series 2007-21CB-2A2 | | | 27.40% | # | | | 09/25/2037 | | | | 51,272 | |
| |
| | | | Countrywide Home Loans Mortgage Pass Through Trust, | |
| | 35,000 | | | Series 2007-4-1A5 | | | 6.50% | | | | 05/25/2037 | | | | 28,788 | |
| |
| | | | Credit Suisse Mortgage Capital Certificates, | |
| | 70,041 | | | Series 2006-9 | | | 6.00% | | | | 11/25/2036 | | | | 63,719 | |
| |
| | | | Deutsche Mortgage Securities, Inc., | |
| | 137,871 | | | Series 2006-PR1-5A14 | | | 11.80% | #^ | | | 04/15/2036 | | | | 143,687 | |
| |
| | | | First Horizon Alternative Mortgage Securities, | |
| | 134,173 | | | Series 2007-FA2-1A3 | | | 6.00% | | | | 04/25/2037 | | | | 100,621 | |
| |
| | | | GMAC Commercial Mortgage Securities, Inc., | |
| | 15,470 | | | Series 2004-C2-A2 | | | 4.76% | | | | 08/10/2038 | | | | 15,515 | |
| |
| | | | JP Morgan Alternative Loan Trust, | |
| | 81,799 | | | Series 2005-S1-2A11 | | | 6.00% | | | | 12/25/2035 | | | | 69,366 | |
| |
| | | | JP Morgan Mortgage Acquisition Trust, | |
| | 200,000 | | | Series 2006-CH2-AF3 | | | 5.46% | | | | 10/25/2036 | | | | 122,963 | |
| |
| | | | LB-UBS Commercial Mortgage Trust, | |
| | 18,000 | | | Series 2005-C2-A3 | | | 4.91% | | | | 04/15/2030 | | | | 18,008 | |
| |
| | | | Lehman Mortgage Trust, | |
| | 258,310 | | | Series 2006-4-1A3 | | | 5.15% | #I/O | | | 08/25/2036 | | | | 30,960 | |
| | 16,143 | | | Series 2006-4-1A4 | | | 6.00% | | | | 08/25/2036 | | | | 11,199 | |
| | 122,918 | | | Series 2007-5-11A1 | | | 6.09% | # | | | 06/25/2037 | | | | 82,384 | |
| |
| | | | Residential Accredit Loans, Inc., | |
| | 10,377 | | | Series 2006-QS13-1A8 | | | 6.00% | | | | 09/25/2036 | | | | 6,629 | |
| | 114,594 | | | Series 2006-QS7-A4 | | | 0.65% | # | | | 06/25/2036 | | | | 66,637 | |
| | 343,781 | | | Series 2006-QS7-A5 | | | 5.35% | #I/O | | | 06/25/2036 | | | | 44,427 | |
| | 211,130 | | | Series 2006-QS8-A4 | | | 0.70% | # | | | 08/25/2036 | | | | 119,576 | |
| | 633,390 | | | Series 2006-QS8-A5 | | | 5.30% | #I/O | | | 08/25/2036 | | | | 79,040 | |
| |
| | | | Residential Asset Securitization Trust, | |
| | 5,523 | | | Series 2004-RS9-AI4 | | | 4.77% | # | | | 10/25/2032 | | | | 4,921 | |
| | 35,000 | | | Series 2005-A12-A12 | | | 5.50% | | | | 11/25/2035 | | | | 29,182 | |
| |
| | | | Salomon Brothers Mortgage Securities, | |
| | 8,773 | | | Series 2000-C2-C | | | 7.73% | | | | 07/18/2033 | | | | 8,760 | |
| |
| | | | Wachovia Bank Commercial Mortgage Trust, | |
| | 6,520 | | | Series 2002-C2-A2 | | | 4.04% | | | | 11/15/2034 | | | | 6,608 | |
| | 24,834 | | | Series 2005-C20-A4 | | | 5.29% | # | | | 07/15/2042 | | | | 24,980 | |
| | | | | | | | | | | | | | | | |
| | | | Total Collateralized Mortgage Obligations
(Cost $1,776,051) | | | | 1,807,719 | |
| | | | | | | | | | | | | | | | |
| | FOREIGN CORPORATE BONDS 4.8% | |
| | 150,000 | | | BBVA Bancomer S.A. | | | 6.50% | ^ | | | 03/10/2021 | | | | 148,974 | |
| | 100,000 | | | C10 Capital Ltd. | | | 6.72% | # | | | 12/31/2016 | | | | 78,500 | |
| | 100,000 | | | Continental Banco Trust | | | 7.38% | # | | | 10/07/2040 | | | | 101,000 | |
| | 100,000 | | | Corporacion Pesquera
Inca S.A.C. | | | 9.00% | | | | 02/10/2017 | | | | 107,000 | |
| | 100,000 | | | Cosan Overseas Ltd. | | | 8.25% | | | | 11/05/2015 | | | | 102,500 | |
| | 100,000 | | | Development Bank of Kazakhstan | | | 6.00% | | | | 03/23/2026 | | | | 90,500 | |
| | | | | | | | | | | | | | | | |
PRINCIPAL
AMOUNT /
SHARES | | | SECURITY DESCRIPTION | | RATE | | | MATURITY | | | VALUE $ | |
| | 100,000 | | | Ege Haina Finance Company | | | 9.50% | | | | 04/26/2017 | | | | 105,750 | |
| | 100,000 | | | Gaz Capital S.A. | | | 6.51% | | | | 03/07/2022 | | | | 106,750 | |
| | 100,000 | | | Minerva Overseas Ltd | | | 10.88% | | | | 11/15/2019 | | | | 110,750 | |
| | 85,000 | | | MCE Finance Limited | | | 10.25% | | | | 05/15/2018 | | | | 98,919 | |
| | 100,000 | | | NII Capital Corporation | | | 7.63% | | | | 04/01/2021 | | | | 102,750 | |
| | 100,000 | | | WPE International Cooperatief U.A. | | | 10.38% | | | | 09/30/2020 | | | | 104,000 | |
| | 80,000 | | | YPF Sociedad Anonima | | | 10.00% | | | | 11/02/2028 | | | | 93,800 | |
| | | | | | | | | | | | | | | | |
| | | | Total Corporate Bonds
(Cost $1,341,723) | | | | 1,351,193 | |
| | | | | | | | | | | | | | | | |
| | FOREIGN GOVERNMENT BONDS AND NOTES 0.4% | |
| | 100,000+ | | | Australia Treasury Bonds | | | 5.75% | | | | 06/15/2011 | | | | 103,641 | |
| | | | | | | | | | | | | | | | |
| | | | Total Foreign Government Bonds and Notes
(Cost $99,461) | | | | 103,641 | |
| | | | | | | | | | | | | | | | |
| | INVESTMENT COMPANIES 48.5% | |
| | 76,000 | | | DoubleLine Core Fixed Income Fund | | | | | | | | | | | 794,960 | |
| | 12,700 | | | DoubleLine Emerging Markets Fixed Income Fund | | | | | | | | | | | 134,239 | |
| | 367,400 | | | DoubleLine Total Return Bond Fund | | | | | | | | | | | 4,026,705 | |
| | 800 | | | E-TRACS Daily Long-Short VIX ETN | | | | | | | | | | | 18,920 | |
| | 6,000 | | | Hugoton Royalty Trust | | | | | | | | | | | 142,680 | |
| | 4,300 | | | iPath Dow Jones-UBS Agriculture Total Return Sub-Index ETN | | | | | | | | | | | 282,166 | |
| | 21,900 | | | iPath Dow Jones-UBS Commodity Index Total Return ETN | | | | | | | | | | | 1,124,565 | |
| | 8,000 | | | iShares Barclays 1-3 Year Credit Bond Fund | | | | | | | | | | | 835,520 | |
| | 3,300 | | | Plum Creek Timber Co, Inc. | | | | | | | | | | | 143,913 | |
| | 3,500 | | | Potlatch Corporation | | | | | | | | | | | 140,700 | |
| | 10,000 | | | Powershares QQQ Trust | | | | | | | | | | | 574,300 | |
| | 5,300 | | | San Juan Basin Royalty Trust | | | | | | | | | | | 146,015 | |
| | 10,100 | | | SPDR Barclays Capital Convertible Securities ETF | | | | | | | | | | | 425,715 | |
| | 9,500 | | | SPDR Dow Jones Industrial Average ETF | | | | | | | | | | | 1,168,690 | |
| | 2,000 | | | SPDR Gold Trust | | | | | | | | | | | 279,640 | |
| | 16,000 | | | SPDR S&P 500 ETF Trust | | | | | | | | | | | 2,120,160 | |
| | 6,900 | | | United States 12 Month Oil Fund LP | | | | | | | | | | | 333,960 | |
| | 26,100 | | | Vanguard MSCI EAFE ETF | | | | | | | | | | | 973,791 | |
| | | | | | | | | | | | | | | | |
| | | | Total Investment Companies
(Cost $13,567,107) | | | | 13,666,639 | |
| | | | | | | | | | | | | | | | |
| | US GOVERNMENT AGENCY OBLIGATIONS 5.6% | |
| |
| | | | Federal Home Loan Mortgage Corporation, | |
| | 265,316 | | | Series 3261-SA | | | 6.18% | #I/O | | | 01/15/2037 | | | | 39,414 | |
| | 528,526 | | | Series 3355-BI | | | 5.80% | #I/O | | | 08/15/2037 | | | | 64,379 | |
| | 569,339 | | | Series 3562-WS | | | 4.70% | #I/O | | | 08/15/2039 | | | | 47,966 | |
| | 145,590 | | | Series 3738-MS | | | 11.30% | # | | | 10/15/2040 | | | | 125,988 | |
| | 228,130 | | | Series 3739-LS | | | 9.49% | # | | | 10/15/2040 | | | | 191,515 | |
| | 78,391 | | | Series 3779-DZ | | | 4.50% | | | | 12/15/2040 | | | | 68,057 | |
| | 49,717 | | | Series 3780-BS | | | 9.39% | # | | | 12/15/2040 | | | | 40,660 | |
| | 99,778 | | | Series 3780-YS | | | 9.39% | # | | | 12/15/2040 | | | | 82,517 | |
| | 166,336 | | | Series 3793-SB | | | 9.86% | # | | | 01/15/2041 | | | | 132,233 | |
| |
| | | | Federal National Mortgage Association, | |
| | 463,279 | | | Series 2006-101-SA | | | 6.33% | #I/O | | | 10/25/2036 | | | | 69,235 | |
| | 225,916 | | | Series 2006-123-LI | | | 6.07% | #I/O | | | 01/25/2037 | | | | 33,580 | |
| | 77,450 | | | Series 2009-49-S | | | 6.50% | #I/O | | | 07/25/2039 | | | | 10,490 | |
| | 103,911 | | | Series 2010-155-SA | | | 9.48% | # | | | 01/25/2041 | | | | 87,768 | |
| | 247,402 | | | Series 2011-14-US | | | 7.74% | # | | | 03/25/2041 | | | | 189,401 | |
| | | | | | | | |
| 22 | | DoubleLine Funds | | | | | The accompanying notes are an integral part of these financial statements | |
| | | | | | | | | | | | | | | | |
PRINCIPAL
AMOUNT /
SHARES | | | SECURITY DESCRIPTION | | RATE | | | MATURITY | | | VALUE $ | |
| |
| | | | Government National Mortgage Association, | |
| | 178,861 | | | Series 2009-6-SM | | | 5.70% | #I/O | | | 02/20/2038 | | | | 19,276 | |
| | 100,000 | | | Series 2011-12-PO | | | 0.00% | P/O | | | 12/20/2040 | | | | 59,002 | |
| | 175,338 | | | Series 2011-14-SM | | | 9.19% | # | | | 08/16/2040 | | | | 137,160 | |
| | 250,000 | | | Series 2011-7-LS | | | 9.37% | # | | | 12/20/2040 | | | | 188,017 | |
| | | | | | | | | | | | | | | | |
| | | | Total US Government Agency Obligations
(Cost $1,573,527) | | | | 1,586,658 | |
| | | | | | | | | | | | | | | | |
| | US GOVERNMENT BONDS AND NOTES 0.8% | |
| | 225,000 | | | United States Treasury Bonds | | | 4.75% | | | | 02/15/2041 | | | | 233,893 | |
| | | | | | | | | | | | | | | | |
| | | | Total US Government Note/Bond
(Cost $233,933) | | | | 233,893 | |
| | | | | | | | | | | | | | | | |
CONTRACTS
(100 SHARES
PER CONTRACT) | | | | | | | | | | | | |
| | PURCHASED OPTIONS 0.3% | |
| |
| | | | SPDR S&P 500 ETF, | |
| | 450 | | | Expiration 4/16/11,
Strike Price $122 | | | | | | | | | | | 7,200 | |
| |
| | | | SPDR S&P 500 ETF, | |
| | 70 | | | Expiration 5/21/11,
Strike Price $122 | | | | | | | | | | | 5,670 | |
| |
| | | | SPDR S&P 500 ETF, | |
| | 520 | | | Expiration 6/18/11,
Strike Price $118 | | | | | | | | | | | 53,040 | |
| |
| | | | SPDR S&P 500 ETF, | |
| | 110 | | | Expiration 4/16/11,
Strike Price $120 | | | | | | | | | | | 1,320 | |
| |
| | | | SPDR S&P 500 ETF, | |
| | 100 | | | Expiration 7/16/11,
Strike Price $119 | | | | | | | | | | | 15,520 | |
| | | | | | | | | | | | | | | | |
| | | | Total Purchased Options
(Cost $184,983) | | | | 82,750 | |
| | | | | | | | | | | | | | | | |
| | | | | | | | | | | | | | | | |
SHARES | | | SECURITY DESCRIPTION | | RATE | | | MATURITY | | | VALUE $ | |
| | SHORT TERM INVESTMENTS 28.8% | |
| | | | |
| | 8,115,442 | | | Fidelity Institutional Government Portfolio | | | 0.01% | 1 | | | | | | | 8,115,442 | |
| | | | | | | | | | | | | | | | |
| | | | Total Short Term Investments
(Cost $8,115,442) | | | | 8,115,442 | |
| | | | | | | | | | | | | | | | |
| | | | Total Investments 95.6%
(Cost $26,892,227) | | | | 26,947,935 | |
| | | | Other Assets in Excess of Liabilities 4.4% | | | | 1,251,755 | |
| | | | | | | | | | | | | | | | |
| | | | NET ASSETS 100.0% | | | $ | 28,199,690 | |
| | | | | | | | | | | | | | | | |
| | | | | | | | | | |
| | PORTFOLIO HOLDINGS as % of Net Assets |
| | Investment Companies | | | | | | | | | 48.5% |
| | Short Term Investments | | | | | | | | | 28.8% |
| | Collateralized Mortgage Obligations | | | | | | | | | 6.4% |
| | US Government Agency Obligations | | | | | | | | | 5.6% |
| | Foreign Corporate Bonds | | | | | | | | | 4.8% |
| | US Government Bonds and Notes | | | | | | | | | 0.8% |
| | Foreign Government Bonds and Notes | | | | | | | | | 0.4% |
| | Purchased Options | | | | | | | | | 0.3% |
| | Other Assets and Liabilities | | | | | | | | | 4.4% |
| | | | | | | | | | |
| | | | | | | | | | 100.0% |
| | | | | | | | | | |
| # | Variable rate security. Rate disclosed as of March 31, 2011. |
| ^ | Security exempt from registration under Rule 144A of the Securities Act of 1933. These securities may be resold in transactions exempt from registration, normally to qualified institutional buyers. These securities are determined to be liquid by the Adviser, unless otherwise noted, under procedures established by the Fund’s Board of Trustees. At March 31, 2011, the value of these securities amounted to $402,426 or 1.4% of net assets. |
| 1 | Seven-day yield as of March 31, 2011 |
| I/O | Interest only security |
| P/O | Principal only security |
| | | | | | | | | | | | | | |
| Futures Contracts | | | | | | | | | |
| Contracts | | Security Description | | Type | | | Expiration
Month | | | Unrealized
Appreciation
(Depreciation) | |
1 | | Japanese Yen Future | | | Sell | | | | 6/2011 | | | $ | 859 | |
4 | | Silver Future | | | Sell | | | | 5/2011 | | | | (14,372 | ) |
2 | | Gasoline Future | | | Buy | | | | 7/2011 | | | | 6,823 | |
| | | | | | | | | | | | | | |
| | | | | | | | | | | | $ | (6,690 | ) |
| | | | | | | | | | | | | | |
| | | | | | | | | | | | | | |
| Credit Default Swaps - Buy Protection | | | | | | | | | |
Reference Entity | | Counterparty | | Notional
Amount | | | Termination
Date | | | Unrealized
Appreciation
(Depreciation) | |
Markit MCDX Index | | Goldman Sachs | | | 10,000,000 | | | | 12/20/2015 | | | $ | (16,964 | ) |
| | | | | | | | | | | | | | |
| | | | | | |
| The accompanying notes are an integral part of these financial statements | | Annual Report | | March 31, 2011 | | 23 |
| | |
| |
| Schedule of Investments DoubleLine Multi-Asset Growth Fund (Cont.) | | March 31, 2011 |
Investment in Affiliates
Affiliated issuers, as defined under the Investment Company Act of 1940, include those in which the Fund’s holdings of an issuer represent 5% or more of the outstanding voting securities of an issuer, or any affiliated mutual fund.
A summary of transactions with investments in affiliates for the period ended March 31, 2011, in DoubleLine Multi-Asset Growth Fund, is as follows:
| | | | | | | | | | | | | | | | | | | | | | |
| Fund | | Value at
Beginning
of Period | | Gross
Purchases | | | Gross
Sales | | | Shares
Held at
March 31,
2011 | | | Value at
March 31,
2011 | | | Dividend
Income Earned
in the Period
Ended March 31,
2011 | |
DoubleLine Total Return Bond Fund | | $— | | $ | 4,055,032 | | | $ | — | | | | 367,400 | | | $ | 4,026,705 | | | $ | 40,548 | |
DoubleLine Core Fixed Income Fund | | — | | | 798,830 | | | | — | | | | 76,000 | | | | 794,960 | | | | 6,035 | |
DoubleLine Emerging Markets Fixed Income Fund | | — | | | 133,869 | | | | — | | | | 12,700 | | | | 134,239 | | | | 1,375 | |
| | | | | | | | | | | | | | | | | | | | | | |
| | $— | | $ | 4,987,731 | | | $ | — | | | | 456,100 | | | $ | 4,955,904 | | | $ | 47,958 | |
| | | | | | | | | | | | | | | | | | | | | | |
| | | | | | | | |
| 24 | | DoubleLine Funds | | | | | The accompanying notes are an integral part of these financial statements | |
| | |
| |
| Statements of Assets and Liabilities | | March 31, 2011 |
| | | | | | | | | | | | | | | | |
| | | DoubleLine
Total Return
Bond Fund | | | DoubleLine
Core Fixed
Income Fund | | | DoubleLine
Emerging
Markets Fixed
Income Fund | | | DoubleLine
Multi-Asset
Growth Fund | |
| | | | |
ASSETS | | | | | | | | | | | | | | | | |
Investments in Unaffiliated Securities, at Value* | | $ | 5,423,707,918 | | | $ | 176,471,453 | | | $ | 128,891,697 | | | $ | 13,876,589 | |
Investments in Affiliated Securities, at Value* | | | — | | | | — | | | | — | | | | 4,955,904 | |
Short-term Securities* | | | 456,383,261 | | | | 9,854,674 | | | | 10,481,773 | | | | 8,115,442 | |
Receivable for Fund Shares Sold | | | 73,842,149 | | | | 2,776,968 | | | | 1,721,186 | | | | 1,028,034 | |
Interest and Dividends Receivable | | | 32,857,948 | | | | 1,948,522 | | | | 4,284,948 | | | | 311,991 | |
Prepaid Expenses and Other Assets | | | 646,311 | | | | 30,216 | | | | 41,469 | | | | 65 | |
Cash | | | 79,754 | | | | 925,349 | | | | 104,026 | | | | 282,540 | |
Receivable for Investments Sold | | | — | | | | 1,023,437 | | | | 408,204 | | | | — | |
Swaps Premiums Paid | | | — | | | | — | | | | — | | | | 205,396 | |
Deposit at Broker for Futures | | | — | | | | — | | | | — | | | | 50,300 | |
Investment Advisory Fees Receivable | | | — | | | | — | | | | — | | | | 15,867 | |
Total Assets | | | 5,987,517,341 | | | | 193,030,619 | | | | 145,933,303 | | | | 28,842,128 | |
| | | | |
LIABILITIES | | | | | | | | | | | | | | | | |
Payable for Investments Purchased | | | 155,173,321 | | | | 3,726,301 | | | | 12,988,036 | | | | 582,429 | |
Distribution Payable | | | 12,003,837 | | | | 182,183 | | | | 193,066 | | | | 6,571 | |
Payable for Fund Shares Redeemed | | | 7,866,327 | | | | 407,818 | | | | 140,144 | | | | 2,578 | |
Investment Advisory Fees Payable | | | 1,037,730 | | | | 11,785 | | | | 35,548 | | | | — | |
Accrued Expenses | | | 991,189 | | | | 54,378 | | | | 50,513 | | | | 24,178 | |
Distribution Fees Payable | | | 229,692 | | | | 2,249 | | | | 1,980 | | | | 888 | |
Administration Fees Payable | | | 206,038 | | | | 17,381 | | | | 20,088 | | | | 4,804 | |
Unrealized Depreciation on Swaps | | | — | | | | — | | | | — | | | | 16,964 | |
Variation Margin Payable | | | — | | | | — | | | | — | | | | 2,915 | |
Other Payables | | | — | | | | — | | | | — | | | | 1,111 | |
Total Liabilities | | | 177,508,134 | | | | 4,402,095 | | | | 13,429,375 | | | | 642,438 | |
Net Assets | | $ | 5,810,009,207 | | | $ | 188,628,524 | | | $ | 132,503,928 | | | $ | 28,199,690 | |
| | | | |
NET ASSETS CONSIST OF: | | | | | | | | | | | | | | | | |
Paid-in Capital | | $ | 5,768,442,688 | | | $ | 187,606,417 | | | $ | 130,648,487 | | | $ | 28,145,560 | |
Undistributed (Accumulated) Net Investment Income (Loss) | | | 13,919,090 | | | | 135,227 | | | | 19,991 | | | | 34,630 | |
Accumulated Net Realized Gain (Loss) on Investments | | | (22,615,980 | ) | | | (362,349 | ) | | | 525,078 | | | | (12,554 | ) |
Net Unrealized Appreciation (Depreciation) on: | | | | | | | | | | | | | | | | |
Investments in Unaffiliated Securities | | | 50,263,409 | | | | 1,249,229 | | | | 1,310,372 | | | | 87,535 | |
Investments in Affiliated Securities | | | — | | | | — | | | | — | | | | (31,827 | ) |
Futures | | | — | | | | — | | | | — | | | | (6,690 | ) |
Swaps | | | — | | | | — | | | | — | | | | (16,964 | ) |
Net Assets | | $ | 5,810,009,207 | | | $ | 188,628,524 | | | $ | 132,503,928 | | | $ | 28,199,690 | |
| | | | |
*Identified Cost: | | | | | | | | | | | | | | | | |
Investment in Unaffiliated Securities | | $ | 5,373,444,509 | | | $ | 175,222,224 | | | $ | 127,581,325 | | | $ | 13,789,054 | |
Investments in Affiliated Securities | | | — | | | | — | | | | — | | | $ | 4,987,731 | |
Short-term Securities | | $ | 456,383,261 | | | $ | 9,854,674 | | | $ | 10,481,773 | | | $ | 8,115,442 | |
| | | | |
Class I (unlimited shares authorized): | | | | | | | | | | | | | | | | |
Net Assets | | $ | 4,330,408,139 | | | $ | 158,042,742 | | | $ | 106,226,716 | | | $ | 22,128,476 | |
Capital Shares Outstanding | | | 395,164,769 | | | | 15,107,569 | | | | 10,052,404 | | | | 2,189,828 | |
Net Asset Value, Offering and Redemption Price per Share | | $ | 10.96 | | | $ | 10.46 | | | $ | 10.57 | | | $ | 10.11 | |
| | | | |
Class N (unlimited shares authorized): | | | | | | | | | | | | | | | | |
Net Assets | | $ | 1,479,601,068 | | | $ | 30,585,782 | | | $ | 26,277,212 | | | | | |
Capital Shares Outstanding | | | 135,028,484 | | | | 2,924,474 | | | | 2,486,189 | | | | | |
Net Asset Value, Offering and Redemption Price per Share | | $ | 10.96 | | | $ | 10.46 | | | $ | 10.57 | | | | | |
| | | | |
Class A (unlimited shares authorized): | | | | | | | | | | | | | | | | |
Net Assets | | | | | | | | | | | | | | $ | 6,071,214 | |
Capital Shares Outstanding | | | | | | | | | | | | | | | 601,490 | |
Net Asset Value, Offering Price per Share | | | | | | | | | | | | | | $ | 10.54 | |
Net Asset Value, Redemption Price per Share | | | | | | | | | | | | | | $ | 10.09 | |
| | | | | | |
| The accompanying notes are an integral part of these financial statements | | Annual Report | | March 31, 2011 | | 25 |
| | |
| |
| Statements of Operations | | Period Ended March 31, 2011 |
| | | | | | | | | | | | | | | | |
| | | DoubleLine
Total Return
Bond Fund1 | | | DoubleLine
Core Fixed
Income Fund2 | | | DoubleLine
Emerging Markets
Fixed Income Fund1 | | | DoubleLine
Multi-Asset
Growth Fund3 | |
| | | | |
INVESTMENT INCOME | | | | | | | | | | | | | | | | |
Income: | | | | | | | | | | | | | | | | |
Interest | | $ | 263,592,695 | | | $ | 4,575,789 | | | $ | 3,899,557 | | | $ | 36,978 | |
Dividends from Unaffiliated Securities | | | — | | | | — | | | | — | | | | 10,391 | |
Dividends from Affiliated Securities | | | — | | | | — | | | | — | | | | 47,958 | |
Total Investment Income | | | 263,592,695 | | | | 4,575,789 | | | | 3,899,557 | | | | 95,327 | |
Expenses: | | | | | | | | | | | | | | | | |
Investment Advisory Fees | | | 10,640,981 | | | | 259,203 | | | | 429,298 | | | | 19,914 | |
Distribution Fees - Class N | | | 1,641,665 | | | | 22,069 | | | | 25,618 | | | | — | |
Distribution Fees - Class A | | | — | | | | — | | | | — | | | | 986 | |
Transfer Agent Expenses | | | 989,778 | | | | 68,887 | | | | 80,955 | | | | 22,536 | |
Registration Fees | | | 793,168 | | | | 67,708 | | | | 76,049 | | | | 17,166 | |
Administration, Fund Accounting, Custodian and Transfer Agent Fees | | | 698,423 | | | | 62,216 | | | | 81,532 | | | | 8,406 | |
Professional Fees | | | 420,033 | | | | 62,736 | | | | 62,035 | | | | 27,127 | |
Insurance Expenses | | | 313,205 | | | | 7,854 | | | | 5,648 | | | | 735 | |
Shareholder Reporting Expenses | | | 194,084 | | | | 5,641 | | | | 5,760 | | | | 5,180 | |
Trustees’ Fees and Expenses | | | 159,987 | | | | 11,093 | | | | 10,021 | | | | 160 | |
Miscellaneous Expenses | | | 8,518 | | | | 3,380 | | | | 3,362 | | | | 2,978 | |
Total Expenses | | | 15,859,842 | | | | 570,787 | | | | 780,278 | | | | 105,188 | |
Less: Fees Waived | | | (1,235,309 | ) | | | (231,152 | ) | | | (210,883 | ) | | | (80,825 | ) |
Net Expenses | | | 14,624,533 | | | | 339,635 | | | | 569,395 | | | | 24,363 | |
| | | | |
Net Investment Income | | | 248,968,162 | | | | 4,236,154 | | | | 3,330,162 | | | | 70,964 | |
| | | | |
REALIZED & UNREALIZED GAIN (LOSS) ON INVESTMENTS | | | | | | | | | | | | | | | | |
Net Realized Gain (Loss) on Investments | | | 161,271 | | | | 133,642 | | | | 776,327 | | | | (11,583 | ) |
Net Change in Unrealized Appreciation (Depreciation) of: | | | | | | | | | | | | | | | | |
Investments in Unaffiliated Securities | | | 50,263,409 | | | | 1,249,229 | | | | 1,310,372 | | | | 87,535 | |
Investments in Affiliated Securities | | | — | | | | — | | | | — | | | | (31,827 | ) |
Futures | | | — | | | | — | | | | — | | | | (6,690 | ) |
Swaps | | | — | | | | — | | | | — | | | | (16,964 | ) |
Net Realized and Unrealized Gain (Loss) on Investments | | | 50,424,680 | | | | 1,382,871 | | | | 2,086,699 | | | | 20,471 | |
| | | | |
NET INCREASE (DECREASE) IN NET ASSETS RESULTING FROM OPERATIONS | | $ | 299,392,842 | | | $ | 5,619,025 | | | $ | 5,416,861 | | | $ | 91,435 | |
| 1 | Commencement of operations on April 6, 2010. |
| 2 | Commencement of operations on June 1, 2010. |
| 3 | Commencement of operations on December 20, 2010. |
| | | | | | | | |
| 26 | | DoubleLine Funds | | | | | The accompanying notes are an integral part of these financial statements | |
| | |
| |
| Statements of Changes in Net Assets | | Period Ended March 31, 2011 |
| | | | | | | | | | | | | | | | |
| | | DoubleLine
Total Return
Bond Fund1 | | | DoubleLine
Core Fixed
Income Fund2 | | | DoubleLine
Emerging
Markets Fixed
Income Fund1 | | | DoubleLine
Multi-Asset
Growth Fund3 | |
| | | | |
OPERATIONS | | | | | | | | | | | | | | | | |
Net Investment Income | | $ | 248,968,162 | | | $ | 4,236,154 | | | $ | 3,330,162 | | | $ | 70,964 | |
Net Change in Unrealized Appreciation (Depreciation) of Investments | | | 50,263,409 | | | | 1,249,229 | | | | 1,310,372 | | | | 32,054 | |
Net Realized Gain (Loss) on Investments | | | 161,271 | | | | 133,642 | | | | 776,327 | | | | (11,583 | ) |
Net Increase (Decrease) in Net Assets Resulting from Operations | | | 299,392,842 | | | | 5,619,025 | | | | 5,416,861 | | | | 91,435 | |
| | | | |
DISTRIBUTIONS TO SHAREHOLDERS | | | | | | | | | | | | | | | | |
From Net Investment Income | | | | | | | | | | | | | | | | |
Class I | | | (194,822,350 | ) | | | (3,671,382 | ) | | | (2,716,962 | ) | | | (30,216 | ) |
Class N | | | (63,003,973 | ) | | | (610,315 | ) | | | (593,209 | ) | | | — | |
Class A | | | — | | | | — | | | | — | | | | (7,225 | ) |
From Net Realized Gain | | | | | | | | | | | | | | | | |
Class I | | | — | | | | (264,504 | ) | | | (206,130 | ) | | | — | |
Class N | | | — | | | | (50,717 | ) | | | (45,119 | ) | | | — | |
| | | | |
Total Distributions to Shareholders | | | (257,826,323 | ) | | | (4,596,918 | ) | | | (3,561,420 | ) | | | (37,441 | ) |
| | | | |
NET SHARE TRANSACTIONS | | | | | | | | | | | | | | | | |
Class I | | | 4,295,933,080 | | | | 157,034,815 | | | | 104,635,717 | | | | 22,086,396 | |
Class N | | | 1,472,509,608 | | | | 30,571,602 | | | | 26,012,770 | | | | — | |
Class A | | | — | | | | — | | | | — | | | | 6,059,300 | |
Increase (Decrease) in Net Assets Resulting from Net Share Transactions | | | 5,768,442,688 | | | | 187,606,417 | | | | 130,648,487 | | | | 28,145,696 | |
| | | | |
Total Increase (Decrease) in Net Assets | | | 5,810,009,207 | | | | 188,628,524 | | | | 132,503,928 | | | | 28,199,690 | |
| | | | |
NET ASSETS | | | | | | | | | | | | | | | | |
Beginning of Period | | | — | | | | — | | | | — | | | | — | |
End of Period | | $ | 5,810,009,207 | | | $ | 188,628,524 | | | $ | 132,503,928 | | | $ | 28,199,690 | |
| | | | |
Undistributed Net Investment Income (Loss) | | $ | 13,919,090 | | | $ | 135,227 | | | $ | 19,991 | | | $ | 34,630 | |
| 1 | Commencement of operations on April 6, 2010. |
| 2 | Commencement of operations on June 1, 2010. |
| 3 | Commencement of operations on December 20, 2010. |
| | | | | | |
| The accompanying notes are an integral part of these financial statements | | Annual Report | | March 31, 2011 | | 27 |
| | |
| |
| Financial Highlights | | Period Ended March 31, 2011 |
| | | | | | | | | | | | | | | | | | | | | | | | | | | | | | | | |
| | | DoubleLine
Total Return
Bond Fund1 | | | DoubleLine
Core Fixed
Income Fund2 | | | DoubleLine
Emerging Markets
Fixed Income Fund1 | | | DoubleLine
Multi-Asset
Growth Fund3 | |
| | | Class I | | | Class N | | | Class I | | | Class N | | | Class I | | | Class N | | | Class I | | | Class A | |
| | | | | | | | |
Net Asset Value, Beginning of Period | | $ | 10.00 | | | $ | 10.00 | | | $ | 10.00 | | | $ | 10.00 | | | $ | 10.00 | | | $ | 10.00 | | | $ | 10.00 | | | $ | 10.00 | |
| | | | | | | | |
Income (Loss) from Investment Operations: | | | | | | | | | | | | | | | | | | | | | | | | | | | | | | | | |
Net Investment Income (Loss)7 | | | 1.02 | | | | 0.99 | | | | 0.57 | | | | 0.55 | | | | 0.60 | | | | 0.58 | | | | 0.10 | | | | 0.10 | |
Net Gain (Loss) on Investments (Realized and Unrealized) | | | 0.87 | | | | 0.87 | | | | 0.41 | | | | 0.41 | | | | 0.52 | | | | 0.52 | | | | 0.02 | | | | — | |
Total from Investment Operations | | | 1.89 | | | | 1.86 | | | | 0.98 | | | | 0.96 | | | | 1.12 | | | | 1.10 | | | | 0.12 | | | | 0.10 | |
| | | | | | | | |
Less Distributions: | | | | | | | | | | | | | | | | | | | | | | | | | | | | | | | | |
Distributions from Net Investment Income | | | (0.93 | ) | | | (0.90 | ) | | | (0.48 | ) | | | (0.46 | ) | | | (0.52 | ) | | | (0.50 | ) | | | (0.01 | ) | | | (0.01 | ) |
Distributions from Net Realized Gain | | | — | | | | — | | | | (0.04 | ) | | | (0.04 | ) | | | (0.03 | ) | | | (0.03 | ) | | | — | | | | — | |
Total Distributions | | | (0.93 | ) | | | (0.90 | ) | | | (0.52 | ) | | | (0.50 | ) | | | (0.55 | ) | | | (0.53 | ) | | | (0.01 | ) | | | (0.01 | ) |
| | | | | | | | |
Net Asset Value, End of Period | | $ | 10.96 | | | $ | 10.96 | | | $ | 10.46 | | | $ | 10.46 | | | $ | 10.57 | | | $ | 10.57 | | | $ | 10.11 | | | $ | 10.09 | |
Total Return4 | | | 19.28% | | | | 19.04% | | | | 9.90% | | | | 9.71% | | | | 11.48% | | | | 11.25% | | | | 1.24% | | | | 1.02% | 6 |
| | | | | | | | |
Supplemental Data: | | | | | | | | | | | | | | | | | | | | | | | | | | | | | | | | |
Net Assets, End of Period (000’s) | �� | $ | 4,330,408 | | | $ | 1,479,601 | | | $ | 158,043 | | | $ | 30,586 | | | $ | 106,227 | | | $ | 26,277 | | | $ | 22,128 | | | $ | 6,071 | |
Ratios to Average Net Assets: | | | | | | | | | | | | | | | | | | | | | | | | | | | | | | | | |
Expenses Before Fees Waived5 | | | 0.53% | | | | 0.78% | | | | 0.85% | | | | 1.09% | | | | 1.32% | | | | 1.57% | | | | 5.11% | | | | 6.05% | |
Expenses After Fees Waived5 | | | 0.49% | | | | 0.74% | | | | 0.49% | | | | 0.74% | | | | 0.95% | | | | 1.20% | | | | 1.18% | | | | 1.43% | |
Net Investment Income (Loss)5 | | | 9.42% | | | | 9.17% | | | | 6.56% | | | | 6.38% | | | | 5.85% | | | | 5.66% | | | | 3.57% | | | | 3.57% | |
Portfolio Turnover Rate4 | | | 17% | | | | 17% | | | | 84% | | | | 84% | | | | 109% | | | | 109% | | | | 19% | | | | 19% | |
| 1 | Commencement of operations on April 6, 2010. |
| 2 | Commencement of operations on June 1, 2010. |
| 3 | Commencement of operations on December 20, 2010. |
| 6 | Total return does not include the effects of sales charges for DoubleLine Multi-Asset Growth Fund, Class A. |
| 7 | Calculated based on average shares outstanding during the period. |
| | | | | | | | |
| 28 | | DoubleLine Funds | | | | | The accompanying notes are an integral part of these financial statements | |
| | |
| |
| Notes to Financial Statements | | March 31, 2011 |
1. Organization
DoubleLine Funds Trust, a Delaware statutory trust (the “Trust”), is an open-end investment management company registered under the Investment Company Act of 1940, as amended (the “1940”). The Trust consists of four funds, DoubleLine Total Return Bond Fund, DoubleLine Core Fixed Income Fund, DoubleLine Emerging Markets Fixed Income Fund and DoubleLine Multi-Asset Growth Fund (each a “Fund” and collectively the “Funds”). The DoubleLine Total Return Bond Fund, DoubleLine Core Fixed Income Fund and the DoubleLine Emerging Markets Fixed Income Fund each have two classes of shares, Class N shares and Class I shares. The DoubleLine Multi-Asset Growth Fund currently offers two classes of shares for sale, Class A shares and Class I shares. Class N shares and Class A shares make payments under a distribution plan adopted pursuant to Rule 12b-1 under the 1940 Act. The Class A shares of DoubleLine Multi-Asset Growth Fund have a maximum sales charge imposed on purchases of 4.25% of the offering price and a contingent deferred sales charge of 0.75% that applies to purchases of $1 million or more of Class A shares if the shares are redeemed within 18 months of purchase.
The DoubleLine Total Return Bond Fund and DoubleLine Emerging Markets Fixed Income Fund commenced operations on April 6, 2010. The DoubleLine Core Fixed Income Fund commenced operations on June 1, 2010. The DoubleLine Multi-Asset Growth Fund commenced operations on December 20, 2010.
The DoubleLine Total Return Bond Fund’s investment objective is to seek to maximize total return. The DoubleLine Core Fixed Income Fund’s investment objective is to seek to maximize current income and total return. The DoubleLine Emerging Markets Fixed Income Fund’s investment objective is to seek high total return from current income and capital appreciation. The DoubleLine Multi-Asset Growth Fund’s investment objective is to seek long-term capital appreciation.
2. Significant Accounting Policies
The following is a summary of the significant accounting policies of the Funds. These policies are in conformity with accounting principles generally accepted in the United States of America.
A. Security Valuation. The Funds have adopted US GAAP fair value accounting standards which establish a definition of fair value and set out a hierarchy for measuring fair value. These standards require additional disclosures about the various inputs and valuation techniques used to develop the measurements of fair value and a discussion in changes in valuation techniques and related inputs during the period. These inputs are summarized in the three broad levels listed below:
| | • | | Level 1—Unadjusted quoted market prices in active markets |
| | • | | Level 2—Quoted prices for similar instruments or inputs derived from observable market data. Directly observable inputs for the life of the financial instrument |
| | • | | Level 3—Unobservable inputs developed using the reporting entity’s estimates and assumptions, which reflect those that market participants would use |
Fixed income securities including corporate, convertible and municipal bonds and notes, U.S. government agencies, U.S. Treasury obligations, sovereign issues, bank loans, convertible referred securities and non-U.S. bonds are normally valued on the basis of quotes obtained from brokers and dealers or independent pricing services or sources. Independent pricing services typically use information provided by market makers or estimates of market values obtained from yield data relating to investments or securities with similar characteristics. The service providers’ internal models use inputs that are observable such as, among other things, issuer details, interest rates, yield curves, prepayment speeds, credit risks/spreads, default rates and quoted prices for similar assets. Securities that use similar valuation techniques and inputs as described above are categorized as Level 2 of the fair value hierarchy.
Fixed income securities purchased on a delayed-delivery basis are typically marked to market daily until settlement at the forward settlement date.
Mortgage and asset-backed securities are usually issued as separate tranches, or classes, of securities within each deal. These securities are also normally valued by pricing service providers that use broker dealer quotations or valuation estimates from their internal pricing models. The pricing models for these securities usually consider tranche-level attributes, estimated cash flows and market-based yield spreads for each tranche, current market data and incorporates deal collateral performance, as available. Mortgage and asset-backed securities that use similar valuation techniques and inputs as described above are categorized as Level 2 of the fair value hierarchy.
| | | | | | |
| | Annual Report | | March 31, 2011 | | 29 |
| | |
| |
| Notes to Financial Statements (Cont.) | | |
Common stocks, exchange-traded funds and financial derivative instruments, such as futures contracts or options contracts that are traded on a national securities or commodities exchange, are valued at the last reported sales price, in the case of common stocks and exchange-traded funds, or, in the case of futures contracts or options contracts, the settlement price determined by the relevant exchange. To the extent these securities are actively traded and valuation adjustments are not applied, they are categorized as Level 1 of the fair value hierarchy.
Valuation adjustments may be applied to certain securities that are solely traded on a foreign exchange to account for the market movement between the close of the foreign market and the close of the NYSE. These securities are generally valued using pricing service providers that consider the correlation of the trading patterns of the foreign security to the intraday trading in the U.S. markets for investments. Securities using these valuation adjustments are categorized as Level 2 of the fair value hierarchy.
Investments in registered open-end management investment companies will be valued based upon the NAVs of such investments and are categorized as Level 1 of the fair value hierarchy. Investments in privately held investment funds will be valued based upon the NAVs of such investments and are categorized as Level 2 of the fair value hierarchy.
Short-term investments having a maturity of 60 days or less are generally valued at amortized cost which approximates fair market value. These investments are categorized as Level 2 of the fair value hierarchy.
Over-the-counter financial derivative instruments, such as foreign currency contracts, options contracts, futures, or swaps agreements, derive their value from underlying asset prices, indices, reference rates, and other inputs or a combination of these factors. These contracts are normally valued on the basis of broker dealer quotations or pricing service providers at the settlement price determined by the relevant exchange. Depending on the product and the terms of the transaction, the value of the derivative contracts can be estimated by a pricing service provider using a series of techniques, including simulation pricing models. The pricing models use inputs that are observed from actively quoted markets such as issuer details, indices, spreads, interest rates, curves, dividends and exchange rates. Derivatives that use similar valuation techniques and inputs as described above are categorized as Level 2 of the fair value hierarchy.
Certain securities may be fair valued in accordance with the fair valuation procedures approved by the Board of Trustees. The Valuation Committee is generally responsible for overseeing the day to day valuation processes and reports periodically to the Board. The Valuation Committee is authorized to make all necessary determinations of the fair value of portfolio securities and other assets for which market quotations are not readily available or if it is deemed that the prices obtained from brokers and dealers or independent pricing services are unreliable. As of March 31, 2011, the Funds did not hold securities fair valued by the Valuation Committee.
The following is a summary of the inputs used to value the Funds’ investments as of March 31, 2011:
| | | | | | | | | | | | | | | | | | | | |
| Valuation Inputs | | | | | DoubleLine
Total Return
Bond Fund | | | DoubleLine
Core Fixed
Income Fund | | | DoubleLine
Emerging
Markets Fixed
Income Fund | | | DoubleLine
Multi-Asset
Growth Fund | |
Investments in Securities | | | | | | | | | | | | | | | | | | | | |
Level 1 | | | | | | | | | | | | | | | | | | | | |
Investment Companies | | | | | | $ | — | | | $ | — | | | $ | — | | | $ | 13,666,639 | |
Money Market Funds | | | | | | | 51,423,450 | | | | 9,854,674 | | | | 10,481,773 | | | | 8,115,442 | |
Total Level 1 | | | | | | | 51,423,450 | | | | 9,854,674 | | | | 10,481,773 | | | | 21,782,081 | |
Level 2 | | | | | | | | | | | | | | | | | | | | |
Collateralized Mortgage Obligations | | | | | | | 2,929,497,649 | | | | 50,098,191 | | | | — | | | | 1,807,719 | |
Domestic Corporate Bonds | | | | | | | — | | | | 28,570,275 | | | | — | | | | 1,351,193 | |
Foreign Corporate Bonds | | | | | | | — | | | | 24,170,656 | | | | 128,891,697 | | | | — | |
Foreign Government Bonds and Notes | | | | | | | — | | | | 664,562 | | | | — | | | | 103,641 | |
Purchased Options | | | | | | | — | | | | — | | | | — | | | | 82,750 | |
Certificates of Deposit | | | | | | | 404,959,811 | | | | — | | | | — | | | | — | |
US Government Agency Obligations | | | | | | | 2,494,210,269 | | | | 44,465,821 | | | | — | | | | 1,586,658 | |
US Government Bonds and Notes | | | | | | | — | | | | 28,501,948 | | | | — | | | | 233,893 | |
Total Level 2 | | | | | | | 5,828,667,729 | | | | 176,471,453 | | | | 128,891,697 | | | | 5,165,854 | |
Level 3 | | | | | | | — | | | | — | | | | — | | | | — | |
Total | | | | | | | 5,880,091,179 | | | | 186,326,127 | | | | 139,373,470 | | | | 26,947,935 | |
Other Financial Instruments | | | | | | | | | | | | | | | | | | | | |
Level 1 | | | | | | | — | | | | — | | | | — | | | | — | |
Level 2 | | | | | | | | | | | | | | | | | | | | |
Futures Contracts | | | | | | | — | | | | — | | | | — | | | | (6,690 | ) |
Credit Default Swaps | | | | | | | — | | | | — | | | | — | | | | (16,964 | ) |
Total Level 2 | | | | | | | — | | | | — | | | | — | | | | (23,654 | ) |
Level 3 | | | | | | | — | | | | — | | | | — | | | | — | |
Total | | | | | | | — | | | | — | | | | — | | | | (23,654 | ) |
| See | the Schedule of Investments for further disaggregation of investment categories. |
B. Federal Income Taxes. Each Fund has elected to be taxed as a “regulated investment company” and intends to distribute substantially all taxable income to its shareholders and otherwise comply with the provisions of the Internal Revenue Code applicable to regulated investment companies. Therefore, no provision for federal income taxes or excise taxes has been made.
The Funds may be subject to a nondeductible 4% excise tax calculated as a percentage of certain undistributed amounts of net investment income and net capital gains. The Funds intend to distribute their net investment income and capital gains as necessary to avoid this excise tax.
The Funds have adopted financial reporting rules that require the Funds to analyze all open tax years, as defined by the applicable statute of limitations, for all major jurisdictions. Open tax years, 2011 for the Funds, are those that are open for exam by taxing authorities. As of March 31, 2011 the Funds have no examinations in progress.
Management has analyzed the Funds’ tax positions, and has concluded that no liability should be recorded related to uncertain tax positions expected to be taken on the tax return for the fiscal year-end March 31, 2011. The Funds identify their major tax jurisdictions as U.S. Federal and the State of California. The Funds are not aware of any tax positions for which it is reasonably possible that the total amounts of unrecognized tax benefits will significantly change in the next twelve months.
C. Security Transactions, Investment Income. Investment securities transactions are accounted for on the trade date. Gains and losses realized on sales of securities are determined on a specific identification basis. Interest income is recorded on an accrual basis. Discounts/premiums on debt securities purchased are accreted/amortized over the life of the respective securities using the effective interest method. Dividend income is recorded on the ex-dividend date. Paydown gains and losses on mortgage-related and other asset-backed securities are recorded as components of interest income on the statements of operations.
D. Dividends and Distributions to Shareholders. Dividends from the net investment income of the DoubleLine Total Return Bond Fund, DoubleLine Core Fixed Income Fund and the DoubleLine Emerging Markets Fixed Income Fund will be declared and paid monthly. Dividends from the net investment income of the DoubleLine Multi-Asset Growth Fund will be declared and paid quarterly. The Funds will distribute any net realized long or short-term capital gains at least annually. Distributions are recorded on the ex-dividend date.
Income and capital gain distributions are determined in accordance with income tax regulations which may differ from accounting principles generally accepted in the United States of America. Permanent book and tax basis differences relating to shareholder distributions will result in reclassifications between paid-in capital, undistributed net investment income (loss), and/or undistributed accumulated realized gain (loss). Undistributed net investment income or loss may include temporary book and tax basis differences which will reverse in a subsequent period. Any taxable income or capital gain remaining at fiscal year end is distributed in the following year.
E. Use of Estimates. The preparation of financial statements in conformity with principles generally accepted in the United States of America requires management to make estimates and assumptions that affect the reported amounts of assets and liabilities and disclosure of contingent assets and liabilities at the date of the financial statements, as well as the reported amounts of revenues and expenses during the period. Actual results could differ from those estimates.
F. Share Valuation. The net asset value (“NAV”) per share of a class of shares of a Fund is calculated by dividing the sum of the value of the securities held by the Fund, plus cash and other assets attributable to that class, minus all liabilities (including estimated accrued expenses) attributable to that class by the total number of shares of that class outstanding, rounded to the nearest cent. The Fund’s shares will not be priced on the days on which the NYSE is closed for trading.
G. Guarantees and Indemnifications. In the normal course of business, the Funds enter into contracts with service providers that contain general indemnification clauses. The Funds’ maximum exposure under these arrangements is unknown as this would involve future claims that may be against the Funds that have not yet been made or may not yet have occurred.
H. Other. Each share class of a Fund is charged for those expenses that are directly attributable to that share class. Expenses that are not directly attributable to a Fund are allocated among all appropriate Funds in proportion to their respective net assets or on another reasonable basis. Net investment income, expenses which are not class-specific, and realized and unrealized gains and losses are allocated directly to each class based upon the relative net assets of the classes.
3. Related Party Transactions
DoubleLine Capital LP (the “Adviser”) provides the Funds with investment management services under an Investment Advisory and Management Agreement (the “Agreement”). Under the Agreement, the Adviser manages the investment of the assets of each Fund, places orders for the purchase and sale of its portfolio securities and is responsible for the day-to-day management of the Trust’s business affairs. As compensation for its services, the Adviser is entitled to a monthly fee at the annual rate of 0.40%, 0.40%, 0.75% and 1.00% of the average daily net assets of the DoubleLine Total Return Bond Fund, DoubleLine Core Fixed Income Fund, DoubleLine Emerging Markets Fixed Income Fund and DoubleLine Multi-Asset Growth Fund, respectively.
The Adviser has contractually agreed to limit the DoubleLine Total Return Bond Fund’s and the DoubleLine Core Fixed Income Fund’s ordinary operating expenses so that their ratio of such expenses to average daily net assets will not exceed 0.49% for the Class I shares and 0.74% for the Class N shares. The Adviser has contractually agreed to limit the DoubleLine Emerging Markets Fixed Income Fund’s ordinary operating expenses so that its ratio of such expenses to average net assets will not exceed 0.95% for the Class I shares and 1.20% for the Class N shares. The Adviser has contractually agreed to limit the DoubleLine Multi-Asset Growth Fund’s ordinary operating expenses so that its ratio of such expenses to average net assets will not exceed 1.20% for the Class I shares and 1.45% for
| | | | | | |
| | Annual Report | | March 31, 2011 | | 31 |
| | |
| |
| Notes to Financial Statements (Cont.) | | |
the Class A shares. For the purposes of the expense limitation agreement between the Adviser and the Funds, “ordinary operating expenses” excludes taxes, commissions, mark-ups, litigation expenses, indemnification expenses, interest expenses, acquired fund fees and expenses, and any extraordinary expenses, except that the Adviser has agreed to bear all legal fees and other related expenses of the Trust and the Trustees related to a claim made by Trust Company of the West, as described in footnote 11 to these Notes to Financial Statements. The contract is renewable annually and may be terminated during its term only by a majority vote of the disinterested Trustees of the Board of Trustees.
The Adviser is permitted to be reimbursed for fee waivers and/or expense reimbursements it made to a Fund in the prior three fiscal years. Each Fund must pay its current ordinary operating expenses before the Adviser is entitled to any reimbursement of fees waived and/or expenses reimbursed. Any such reimbursement requested by the Adviser is subject to review and approval by the Board of Trustees and will be subject to the Fund’s expense limitations in place when the fees were waived or the expenses were reimbursed.
For the period ended March 31, 2011, the Adviser contractually waived a portion of its fees or reimbursed certain operating expenses of the DoubleLine Total Return Bond Fund, DoubleLine Core Fixed Income Fund, DoubleLine Emerging Markets Fixed Income Fund and DoubleLine Multi-Asset Growth Fund in the amounts of $1,235,309, $231,152, $210,883 and $80,825, respectively. The Adviser may recapture a portion of the amounts no later than the dates as stated below:
| | | | | | | | | | | | | | | | | | | | |
| Year of Expiration | | | | | DoubleLine
Total Return
Bond Fund | | | DoubleLine
Core Fixed
Income
Fund | | | DoubleLine
Emerging
Markets Fixed
Income Fund | | | DoubleLine
Multi-Asset
Growth Fund | |
March 31, 2014 | | | | | | $ | 1,235,309 | | | $ | 231,152 | | | $ | 210,883 | | | $ | 79,472 | |
If a Fund invests in an affiliated Fund the Adviser waives its management fee payable to the Fund in an amount equal to the investment advisory fees paid by the affiliated fund; accordingly, the Adviser waived $1,353 in fees from the DoubleLine Multi-Asset Growth Fund for the period ended March 31, 2011. Class N and Class A shares are be subject to fees imposed under a distribution plan (“Distribution Plan”) adopted pursuant to Rule 12b-1 under the 1940 Act. Pursuant to the Distribution Plan, each Fund compensates the Funds’ distributor or other financial intermediaries for distribution and related services at an annual rate equal to 0.25% of the average daily net assets of that Fund attributable to its Class N and Class A shares. The fees may be used to pay the Fund’s distributor for distribution services and sales support services provided in connection with Class N and Class A shares. The fee may also be used to pay financial intermediaries for the sales support services and related expenses and shareholder servicing fees. The shareholder servicing fees will be paid to compensate financial intermediaries for the administration and servicing of shareholder accounts and are not costs which are primarily intended to result in the sale of the Fund’s shares.
4. Purchases and Sales of Securities
Investment transactions (excluding short-term investments) for the period ended March 31, 2011, were as follows:
| | | | | | | | | | | | | | | | | | | | |
| | | | | | All Other | | | U.S. Government/Agency | |
| | | | | | Purchases at
Cost | | | Sales or
Maturity
Proceeds | | | Purchases at
Cost | | | Sales or
Maturity
Proceeds | |
DoubleLine Total Return Bond Fund | | | | | | $ | 5,825,771,253 | | | $ | 450,614,882 | | | $ | — | | | $ | — | |
DoubleLine Core Fixed Income Fund | | | | | | | 187,186,526 | | | | 39,707,570 | | | | 62,213,265 | | | | 32,334,239 | |
DoubleLine Emerging Markets Fixed Income Fund | | | | | | | 194,311,828 | | | | 66,114,020 | | | | — | | | | — | |
DoubleLine Multi-Asset Growth Fund | | | | | | | 19,679,879 | | | | 1,318,246 | | | | — | | | | — | |
5. Income Tax Information
Distributions during the period were all characterized as ordinary income distributions for tax purposes.
As of March 31, 2011, the components of accumulated earnings (losses) and cost basis of investments for income tax purposes were as follows:
| | | | | | | | | | | | | | | | | | | | |
| | | | | | DoubleLine
Total Return
Bond Fund | | | DoubleLine
Core Fixed
Income Fund | | | DoubleLine
Emerging
Markets Fixed
Income Fund | | | DoubleLine
Multi-Asset
Growth Fund | |
Tax Cost of Investments | | | | | | $ | 5,829,827,770 | | | $ | 185,199,434 | | | $ | 138,063,635 | | | $ | 26,892,218 | |
Gross Tax Unrealized Appreciation | | | | | | | 143,538,901 | | | | 3,178,699 | | | | 2,247,695 | | | | 247,670 | |
Gross Tax Unrealized Depreciation | | | | | | | (93,275,492 | ) | | | (2,052,006 | ) | | | (937,860 | ) | | | (191,953 | ) |
Net Tax Unrealized Appreciation | | | | | | | 50,263,409 | | | | 1,126,693 | | | | 1,309,835 | | | | 55,717 | |
Undistributed Ordinary Income | | | | | | | 25,922,927 | | | | 317,420 | | | | 738,671 | | | | 24,162 | |
Total Distributable Earnings | | | | | | | 25,922,927 | | | | 317,420 | | | | 738,671 | | | | 24,162 | |
Other Accumulated Gains/(Losses) | | | | | | | (34,619,817 | ) | | | (422,006 | ) | | | (193,066 | ) | | | (25,749 | ) |
Total Accumulated Earnings | | | | | | $ | 41,566,519 | | | $ | 1,022,107 | | | $ | 1,855,440 | | | $ | 54,130 | |
At March 31, 2011, the following capital loss carryforwards were available:
| | | | | | | | | | | | |
| | | | | | Capital Loss
Carryforward | | | Expires | |
DoubleLine Total Return Bond Fund | | | | | | $ | 3,709,758 | | | | 3/31/2019 | |
At March 31, 2011, the following Funds deferred, on a tax basis, post-October losses of:
| | | | | | | | |
DoubleLine Total Return Bond Fund | | | | | | $ | 18,906,222 | |
DoubleLine Core Fixed Income Fund | | | | | | | 239,823 | |
DoubleLine Multi-Asset Growth Fund | | | | | | | 19,244 | |
Additionally, U.S. generally accepted accounting principles require that certain components of net assets relating to permanent differences be reclassified between financial and tax reporting. These reclassifications have no effect on net assets or net asset value per share. For the year ended March 31, 2011, the following table shows the reclassifications made:
| | | | | | | | | | | | | | | | |
| | | | | | Undistributed
Net
Investment
Income/(Loss) | | | Accumulated
Net Realized
Gain/(Loss) | | | Paid In
Capital | |
DoubleLine Total Return Bond Fund | | | | | | $ | 22,777,251 | | | $ | (22,777,251 | ) | | $ | — | |
DoubleLine Core Fixed Income Fund | | | | | | | 180,771 | | | | (180,771 | ) | | | — | |
DoubleLine Multi-Asset Growth Fund | | | | | | | 1,107 | | | | (971 | ) | | | (136 | ) |
6. Share Transactions
Transactions in each Fund’s shares were as follows:
| | | | | | | | | | | | | | | | | | | | | | | | | | | | | | | | | | | | |
| | | | | | DoubleLine
Total Return
Bond Fund | | | DoubleLine
Core Fixed
Income Fund | | | DoubleLine
Emerging Markets
Fixed Income Fund | | | DoubleLine
Multi-Asset
Growth Fund | |
| | | | | | Class I | | | Class I | | | Class I | | | Class I | |
| | | | | | Shares | | | Amount | | | Shares | | | Amount | | | Shares | | | Amount | | | Shares | | | Amount | |
Shares Sold | | | | | | | 444,676,541 | | | $ | 4,841,923,994 | | | | 17,639,257 | | | $ | 183,543,309 | | | | 11,364,814 | | | $ | 118,392,205 | | | | 2,291,630 | | | $ | 23,102,993 | |
Reinvested Dividends | | | | | | | 11,661,889 | | | | 128,024,193 | | | | 303,045 | | | | 3,171,494 | | | | 185,649 | | | | 1,934,276 | | | | 2,385 | | | | 24,110 | |
Shares Redeemed | | | | | | | (61,173,661 | ) | | | (674,015,107 | ) | | | (2,834,733 | ) | | | (29,679,988 | ) | | | (1,498,059 | ) | | | (15,690,764 | ) | | | (104,187 | ) | | | (1,040,707 | )* |
Net Share Transactions | | | | | | | 395,164,769 | | | $ | 4,295,933,080 | | | | 15,107,569 | | | $ | 157,034,815 | | | | 10,052,404 | | | $ | 104,635,717 | | | | 2,189,828 | | | $ | 22,086,396 | |
Beginning Shares | | | | | | | — | | | | | | | | — | | | | | | | | — | | | | | | | | — | | | | | |
Ending Shares | | | | | | | 395,164,769 | | | | | | | | 15,107,569 | | | | | | | | 10,052,404 | | | | | | | | 2,189,828 | | | | | |
| | | | | |
| | | | | | Class N | | | Class N | | | Class N | | | Class A | |
| | | | | | Shares | | | Amount | | | Shares | | | Amount | | | Shares | | | Amount | | | Shares | | | Amount | |
Shares Sold | | | | | | | 150,729,598 | | | $ | 1,645,617,887 | | | | 3,789,900 | | | $ | 39,591,130 | | | | 3,468,552 | | | $ | 36,304,121 | | | | 601,638 | | | $ | 6,060,718 | |
Reinvested Dividends | | | | | | | 4,616,103 | | | | 50,653,149 | | | | 53,432 | | | | 559,240 | | | | 56,532 | | | | 592,297 | | | | 670 | | | | 6,759 | |
Shares Redeemed | | | | | | | (20,317,217 | ) | | | (223,761,428 | ) | | | (918,858 | ) | | | (9,578,768 | ) | | | (1,038,895 | ) | | | (10,883,648 | ) | | | (818 | ) | | | (8,177 | )* |
Net Share Transactions | | | | | | | 135,028,484 | | | $ | 1,472,509,608 | | | | 2,924,474 | | | $ | 30,571,602 | | | | 2,486,189 | | | $ | 26,012,770 | | | | 601,490 | | | $ | 6,059,300 | |
Beginning Shares | | | | | | | — | | | | | | | | — | | | | | | | | — | | | | | | | | — | | | | | |
Ending Shares | | | | | | | 135,028,484 | | | | | | | | 2,924,474 | | | | | | | | 2,486,189 | | | | | | | | 601,490 | | | | | |
* Net of redemption fees of $10,489 and $80 for Class I and Class A, respectively.
7. Additional Disclosures about Derivative Instruments
The following disclosures provide information on the Funds’ use of derivatives and certain related risks. The location and fair value amounts of these instruments on the Statements of Assets and Liabilities and the realized and changes in unrealized gains and losses on the Statements of Operations, each categorized by type of derivative contract, are included in a table below.
Futures Contracts The Funds may use futures contracts to manage its exposure to the securities markets or to movements in interest rates or currency values. A Fund may also use future contracts to gain long or short market exposures as an alternative to cash investments. The primary risks associated with the use of futures contracts are the imperfect correlation between the change in market value of the securities held by the Funds and the prices of futures
| | | | | | |
| | Annual Report | | March 31, 2011 | | 33 |
| | |
| |
| Notes to Financial Statements (Cont.) | | |
contracts and the possibility of an illiquid market. Futures contracts are valued based upon their quoted daily settlement prices determined by the relevant exchange. Upon entering into a futures contract, the Funds are required to deposit with its futures broker an amount of cash in accordance with the initial margin requirements of the broker or exchange. Futures contracts are marked to market daily and an appropriate payment reflecting the change in value (“variation margin”) is made or received by or for the accounts of the Funds. Gains or losses are recognized but not considered realized until the contracts expire or are closed. Futures contracts involve, to varying degrees, risk of loss in excess of the variation margin disclosed on the Statements of Assets and Liabilities.
Options Contracts When the Funds purchase an option it pays a premium in return for the right to profit from the change in value of an underlying investment or index during the term of the option. The option premium is included on the Funds’ Statements of Assets and Liabilities as an investment and subsequently marked to market to reflect the current value of the option. Premiums paid for purchasing options which expire are treated as realized losses. Certain options may be purchased with premiums to be determined on a future date. The premiums for these options are based upon implied volatility parameters at specified terms. The risk associated with purchasing options is limited to the loss of the premium paid. Premiums paid for purchasing options which are exercised or closed are added to the amounts paid or offset against the proceeds on the underlying investment transaction to determine the realized gain or loss.
Credit Default Swap Agreements Credit default swap agreements involve one party making a stream of payments (generally referred to as the buyer of protection) to another party (the seller of protection) in exchange for the right to receive a specified return in the event of a default or other credit event in respect of the referenced entity, obligation or index. As a seller of protection on credit default swap agreements, the Funds will generally receive from the buyer of protection a fixed rate of income throughout the term of the swap provided that there is no credit event. As the seller, the Funds would effectively add leverage to its portfolio because, in addition to its total net assets, the Funds would be subject to investment exposure on the notional amount of the swap.
If the Funds are a seller of protection and a credit event occurs, as defined under the terms of that particular swap agreement, the Funds will either (i) pay to the buyer of protection an amount equal to the notional amount of the swap and take delivery of the referenced obligation, other deliverable obligations or underlying securities comprising the referenced index or (ii) pay a net settlement amount in the form of cash or securities equal to the notional amount of the swap less the recovery value of the referenced obligation or underlying securities comprising the referenced index. If the Funds are a buyer of protection and a credit event occurs, as defined under the terms of that particular swap agreement, the Funds will either (i) receive from the seller of protection an amount equal to the notional amount of the swap and deliver the referenced obligation, other deliverable obligations or underlying securities comprising the referenced index or (ii) receive a net settlement amount in the form of cash or securities equal to the notional amount of the swap less the recovery value of the referenced obligation or underlying securities comprising the referenced index. Recovery values are typically estimated by market makers considering either industry standard recovery rates or entity specific factors and considerations until a credit event occurs. If a credit event has occurred, the recovery value is typically determined by a facilitated auction whereby a minimum number of allowable broker bids, together with a specified valuation method, are used to calculate the settlement value.
Credit default swap agreements on credit indices involve one party making a stream of payments to another party in exchange for the right to receive a specified return in the event of a write-down, principal shortfall, interest shortfall or default some or all of the referenced entities comprising the credit index. A credit index is a basket of credit instruments or exposures designed to be representative of some part of the credit market as a whole. These indices are made up of reference credits that are judged by a poll of dealers to be the most liquid entities in the credit default swap market based on the sector of the index. Components of the indices may include, but are not limited to, investment grade securities, high yield securities, asset-backed securities, emerging markets, and/or various credit ratings within each sector. Credit indices are traded using credit default swaps with standardized terms including a fixed spread and standard maturity dates. An index credit default swap references all the names in the index, and if there is a default, the credit event is settled based on that name’s weight in the index. The composition of the indices changes periodically, usually every six months, and for most indices, each name has an equal weight in the index. The Funds may use credit default swaps on credit indices to hedge a portfolio of credit default swaps or bonds, which is less expensive than it would be to buy many credit default swaps to achieve a similar effect. Credit default swaps on indices are benchmarks for protecting investors owning bonds against default, and traders use them to speculate on changes in credit quality.
The effect of derivative instruments on the Statements of Assets and Liabilities for the period ended March 31, 2011:
| | | | | | | | | | | | |
| Fund | | | | | Derivatives not accounted
for as hedging instruments | | Statement of Assets
and Liabilities Location | | Unrealized
Appreciation
(Depreciation) | |
DoubleLine Multi-Asset Growth Fund* | | | | | | Purchased Options | | | | | | |
| | | | | | Equity | | Net Unrealized Appreciation (Depreciation) in Unaffiliated Securities | | $ | 102,233 | |
| | | | | | Futures contracts Exchange Rate | | | | $ | 859 | |
| | | | | | Commodity | | | | | (7,549 | ) |
| | | | | | | | Net Unrealized Appreciation (Depreciation) on Futures | | $ | (6,690 | ) |
| | | | | | Credit Default Swap contracts | | Net Unrealized Appreciation (Depreciation) on Swaps | | $ | (16,964 | ) |
| * | See the Schedule of Investments for further details. |
The effect of derivative instruments on the Statements of Operations for the period ended March 31, 2011:
| | | | | | | | | | | | | | | | |
| Fund | | | | | Derivatives not accounted
for as hedging instruments | | Location of Gain (Loss) on
Derivatives in Income | | Realized Gain (Loss)
on Derivatives in
Income | | | Change in Unrealized
Appreciation
(Depreciation)
on Derivatives in
Income | |
DoubleLine Multi-Asset Growth Fund | | | | | | Purchased Options | | | | | | | | | | |
| | | | | | Equity | | Realized and Unrealized Gain/Loss on Investments | | | | | | $ | 102,233 | |
| | | | | | Futures contracts Exchange Rate | | | | $ | (906 | ) | | $ | 859 | |
| | | | | | Commodity | | | | | — | | | | (7,549 | ) |
| | | | | | | | Realized and Unrealized Gain/Loss on Investments | | $ | (906 | ) | | $ | (6,690 | ) |
| | | | | | Credit Default Swap contracts | | Realized and Unrealized Gain/Loss on Investments | | | — | | | $ | (16,964 | ) |
8. Credit Facility
U.S. Bank, N.A. has made available to the DoubleLine Total Return Fund, DoubleLine Core Fixed Income Fund, and DoubleLine Emerging Markets Fixed Income Fund a credit facility for temporary or extraordinary purposes. Borrowings under this credit facility bear interest at the bank’s prime rate less 0.50%. As of March 31, 2011 unused lines of credit were $50,000,000, $5,000,000 and $500,000 for the DoubleLine Total Return Bond Fund, DoubleLine Core Fixed Income Fund, and DoubleLine Emerging Markets Fixed Income Fund, respectively. There were no borrowings under this credit facility for the period ending March 31, 2011.
9. Principal Risks
Below are summaries of the principal risks of investing in one or more of the Funds, each of which could adversely affect a Fund’s net asset value, yield and total return. Each risk listed below does not necessarily apply to each Fund, and you should read a Fund’s prospectus carefully for a description of the principal risks associated with investing in a particular Fund.
| | • | affiliated fund risk: the risk that the Adviser may be subject to a potential conflict of interest in determining whether to invest in an underlying fund managed by the Adviser or in a fund managed by an unaffiliated manager, and may have an economic or other incentive to select the fund managed by it over another fund. |
| | • | asset allocation risk: the risk that a Fund’s investment performance depends, at least in part, on how its assets are allocated and reallocated among asset classes and underlying funds and that such allocation will focus on asset classes, underlying funds, or investments that perform poorly or underperform other asset classes, underlying funds, or available investments. |
| | • | asset-backed securities investment risk: the risk that borrowers may default on the obligations that underlie the asset-backed security and that, during periods of falling interest rates, asset-backed securities may be called or prepaid, which may result in a Fund having to reinvest proceeds in other investments at a lower interest rate, and the risk that the impairment of the value of the collateral underlying a security in which a Fund invests (due, for example, to non-payment of loans) will result in a reduction in the value of the security. |
| | • | commodities risk: the risk that the value of a Fund’s shares may be affected by changes in the values of one or more commodities, which may be extremely volatile and difficult to value, risk of possible illiquidity, and the risks and costs associated with delivery, storage, and maintenance of precious metals or minerals or other commodity-related investments. |
| | ¡ | credit risk: the risk that an issuer will default in the payment of principal and/or interest on a security. |
| | ¡ | interest rate risk: the risk that debt securities will decline in value because of increases in interest rates. The value of a security with a longer duration will be more sensitive to changes in interest rates than a similar security with a shorter duration. |
| | • | defaulted securities risk: the risk of the uncertainty of repayment of defaulted securities and obligations of distressed issuers. |
| | • | derivatives risk: the risk that an investment in derivatives will not perform as anticipated, cannot be closed out at a favorable time or price, or will increase a Fund’s volatility; that derivatives may create investment leverage; that, when a derivative is used as a substitute or alternative to a direct cash investment, the transaction may not provide a return that corresponds precisely with that of the cash investment; that a derivative will not perform in the manner anticipated by the Adviser; or that, when used for hedging purposes, derivatives will not provide the anticipated protection, causing a Fund to lose money on both the derivatives transaction and the exposure the Fund sought to hedge. |
| | | | | | |
| | Annual Report | | March 31, 2011 | | 35 |
| | |
| |
| Notes to Financial Statements (Cont.) | | |
| | • | emerging market country risk: the risk that Fund share prices will decline due to the greater degree of economic, political and social instability of emerging market countries as compared to developed countries. |
| | • | equity issuer risk: the risk that the value of a company’s stock will decline in value in response to factors affecting that company, that company’s industry, or the market generally. |
| | • | exchange-traded note risk: the risk that the level of the particular market benchmark or strategy to which the note’s return is linked will fall in value; exchange-traded notes are subject to credit risk generally to the same extent as debt securities. |
| | • | financial services risk: the risk associated with the financial services industry being subject to extensive government regulation, which may change frequently. In addition, the profitability of businesses in the financial services industry depends heavily on the availability and cost of money and may fluctuate significantly in response to changes in interest rates, as well as changes in general economic conditions. The financial services industry is exposed to risks that may impact the value of investments in the industry more severely than investments outside the industry. Businesses in the financial services industry often operate with substantial financial leverage. |
| | • | foreign currency risk: the risk that fluctuations in exchange rates may adversely affect the value of a Fund’s foreign currency holdings and investments denominated in foreign currencies. |
| | • | foreign investing risk: the risk that a Fund’s investments will be affected by the market conditions, currencies, and the economic and political climates in the foreign countries in which the Fund invests. |
| | • | inflation-indexed bond risk: the risk that such bonds will change in value in response to changes in actual or anticipated changes in inflation rates, in a manner unanticipated by a Fund’s portfolio management team or investors generally. Inflation-indexed bonds are subject to debt securities risk generally to the same extent as other similar debt securities. |
| | • | investment company and exchange traded fund risk: the risk that an investment company, including any exchange-traded fund (“ETF”), in which a Fund invests will not achieve its investment objective or execute its investment strategy effectively or that large purchase or redemption activity by shareholders of such an investment company might negatively affect the value of the investment company’s shares. A Fund must pay its pro rata portion of an investment company’s fees and expenses. |
| | • | junk bond risk: the risk that these bonds have a higher degree of default risk and may be less liquid and subject to greater price volatility than investment grade bonds. |
| | • | leveraging risk: the risk that certain investments by a Fund involving leverage may have the effect of increasing the volatility of the Fund’s portfolio, and the risk of loss in excess of invested capital. |
| | • | limited operating history risk: the risk that a newly formed fund has a limited operating history to evaluate and may not attract sufficient assets to achieve or maximize investment and operational efficiencies. |
| | • | liquidity risk: the risk that low trading volume, lack of a market maker, or contractual or legal restrictions may limit or prevent a Fund from selling securities or closing derivative positions at desirable prices. |
| | • | litigation and investigation risk: the risk that pending litigation against the Trust and the Adviser and four employees of the Adviser (including a portfolio manager) or other proceedings could have a material adverse effect on shareholder returns or may be more expensive than anticipated, or impair the Adviser’s ability to attract or retain talented personnel or otherwise effectively manage the Funds. |
| | • | market capitalization risk: the risk that investing substantially in issuers in one market capitalization category (large, medium or small) may adversely affect a Fund because of unfavorable market conditions particular to that category of issuers, such as larger, more established companies being unable to respond quickly to new competitive challenges or attain the high growth rates of successful smaller companies, or, conversely, stocks of smaller companies being more volatile than those of larger companies due to, among other things, narrower product lines, more limited financial resources, fewer experienced managers and there typically being less publicly available information about small capitalization companies. |
| | • | market risk: the risk that the overall market will perform poorly or that the returns from the securities in which a Fund invests will underperform returns from the general securities markets or other types of investments. |
| | • | mortgage-backed securities risk: the risk that borrowers may default on their mortgage obligations or the guarantees underlying the mortgage-backed securities will default and that, during periods of falling interest rates, mortgage-backed securities will be called or prepaid, which may result in a Fund having to reinvest proceeds in other investments at a lower interest rate. During periods of rising interest rates, the average life of a mortgage-backed security may extend, which may lock in a below-market interest rate, increase the security’s duration, and reduce the value of the security. Enforcing rights against the underlying assets or collateral may be difficult, or the underlying assets or collateral may be insufficient if the issuer defaults. The values of certain types of mortgage-backed securities, such as inverse floaters and interest-only and principal-only securities, may be extremely sensitive to changes in interest rates and prepayment rates. |
| | • | non-diversification risk: the risk that, because a relatively higher percentage of a Fund’s assets may be invested in the securities of a limited number of issuers, the Fund may be more susceptible to any single economic, political or regulatory event than a more diversified fund. A decline in the market value of one of a Fund’s investments may affect the Fund’s value more than if the Fund were a diversified fund. |
| | • | portfolio management risk: the risk that an investment strategy may fail to produce the intended results or that the securities held by a Fund will underperform other comparable funds because of the portfolio managers’ choice of investments. |
| | • | portfolio turnover risk: the risk that frequent purchases and sales of portfolio securities may result in higher Fund expenses and may result in larger distributions of taxable short-term capital gains to investors as compared to a fund that trades less frequently. |
| | • | price volatility risk: the risk that the value of a Fund’s investment portfolio will change as the prices of its investments go up or down. |
| | • | real estate risk: the risk that real estate related investments may decline in value as a result of factors affecting the real estate industry, such as the supply of real property in certain markets, changes in zoning laws, delays in completion of construction, changes in real estate values, changes in property taxes, levels of occupancy, and local and regional market conditions. |
| | • | reliance on the adviser: the risk associated with each Fund’s ability to achieve its investment objective being dependent upon the Adviser’s ability to identify profitable investment opportunities for a Fund. While the portfolio managers of the Funds have considerable experience in managing other portfolios with investment objectives, policies and strategies that are similar and intend to use similar analytical methods to identify potential investments for the Funds, the past experience of the portfolio managers does not guarantee future results for the Adviser. |
| | • | securities or sector selection risk: the risk that the securities held by a Fund will underperform other funds investing in similar asset classes or benchmarks that are representative of the asset class because of the portfolio managers’ choice of securities or sectors for investment. |
| | • | short sales risk: the risk that a security a Fund has sold short increases in value. |
| | • | tax risk: in order to qualify as a regulated investment company under the Internal Revenue Code of 1986, as amended (“Code”), a Fund must meet requirements regarding, among other things, the source of its income. It is possible that certain of a Fund’s investments in commodity-linked derivatives will not give rise to “qualifying income” for this purpose. Any income a Fund derives from investments in instruments that do not generate “qualifying income” must be limited to a maximum of 10% of the Fund’s annual gross income. If a Fund were to earn non-qualifying income in excess of 10% of its annual gross income, it could fail to qualify as a regulated investment company for that year. If a Fund were to fail to qualify as a regulated investment company, the Fund would be subject to tax and shareholders of the Fund would be subject to the risk of diminished returns. |
| | • | U.S. Government securities risk: the risk that debt securities issued or guaranteed by certain U.S. Government agencies, instrumentalities, and sponsored enterprises are not supported by the full faith and credit of the U.S. Government, and so involve credit risk greater than investments in other types of U.S. Government securities. |
10. Recently Issued Accounting Pronouncements
In January 2010, the FASB issued Accounting Standards Update “Improving Disclosures about Fair Value Measurements” (“ASU”). The ASU requires enhanced disclosures about a) transfers into and out of Level 1 and 2, and b) purchases, sales, issuances, and settlements on a gross basis relating to Level 3 measurements. The first disclosure is effective for the first reporting period beginning after December 15, 2009, and for interim periods within those fiscal years. There were no significant transfers into and out of Levels 1 and 2 during the current period presented. The second disclosure will become effective for fiscal years beginning after December 15, 2010, and for interim periods within those fiscal years. Management is currently evaluating the impact this disclosure may have on the Funds’ financial statements.
In May 2011, the FASB issued an update to requirements relating to Fair Value Measurement which represents amendments to achieve common fair value measurement and disclosure requirements in US GAAP and IFRS. The amendments are of two types: (i) those that clarify the Board’s intent about the application of existing fair value measurement and disclosure requirements and (ii) those that change a particular principle or requirement for measuring fair value or for disclosing information about fair value measurements.
The amendments that change a particular principle or requirement for measuring fair value or disclosing information about fair value measurements relate to (i) measuring the fair value of the financial instruments that are managed within a portfolio; (ii) application of premium and discount in a fair value measurement; and (iii) additional disclosures about fair value measurements. The update is effective for annual periods beginning after December 15, 2011. Management is currently evaluating the impact this update will have on the Funds’ financial statements.
11. Legal Proceedings
On January 7, 2010, Trust Company of the West (“TCW”) commenced litigation against the Adviser in the Superior Court of the State of California, County of Los Angeles, Central District (the “Court”). The suit alleges that the Adviser and four employees of the Adviser who are former employees of TCW or its
| | | | | | |
| | Annual Report | | March 31, 2011 | | 37 |
| | |
| |
| Notes to Financial Statements (Cont.) | | |
affiliates, including Jeffrey Gundlach (such four employees, the “Individuals”), misappropriated TCW’s confidential and proprietary information in founding and operating the Adviser and are using such information in competing for assets under management. The lawsuit also includes claims against certain of the Individuals (including Mr. Gundlach), but not the Adviser, for breach of fiduciary duty, misappropriation of trade secrets, breach of confidence, intentional interference with contractual relations and civil conspiracy. The lawsuit seeks, among other things, damages in excess of $200 million and asks that the Court impose a constructive trust on the limited partnership interests of the Adviser in favor of TCW.
On February 10, 2010, the Adviser and the Individuals filed with the Court an answer denying all of TCW’s claims, and the Individuals (but not the Adviser) filed with the Court a cross-complaint against TCW for, among other things, breach of contract in connection with TCW’s termination of Mr. Gundlach’s employment and failure to pay amounts due thereunder. The Adviser has informed the Trust that it believes that it and the Individuals have meritorious defenses to the allegations contained in TCW’s lawsuit.
On December 1, 2010, TCW initiated litigation against the Trust and certain of the Trustees. The litigation against the Trust and the Trustees contained allegations that were substantially similar to the allegations contained in the litigation against the Adviser and the Individuals, and included among other things claims that the Trust aided and abetted, and conspired with, the Adviser and the Individuals to misappropriate TCW’s trade secrets. The litigation against the Trust and the Trustees was designated as “related” to and joined with the case against the Adviser and the Individuals in an action in front of the same judge.
The Trust and the Trustees filed motions seeking to have all of the claims against them dismissed. On January 20, 2011, the Court dismissed all of the claims against the Trust and the Trustees, but allowed leave for TCW to file an amended complaint in respect of certain of its claims against the Trust and the Trustees. The Court also issued an order, effective upon the filing of an amended complaint, that stays any further proceedings against the Trust and the Trustees until the case against the Adviser and the Individuals has been resolved.
On February 9, 2011, TCW filed amended claims against the Trust and a number of unnamed “John Doe” defendants in the Court, but did not reassert any claims against the Trustees. The amended claims contain allegations that are substantially similar to those made in the original litigation against the Trust. In the complaint related to the amended claims, TCW seeks a variety of remedies against the Trust, including compensatory damages for lost profits; disgorgement of certain management fees and any carried interest obtained or retained by the Trust; punitive damages; and certain injunctive relief. There can be no assurance as to the outcome of any litigation. The remedies sought by TCW in its litigation against the Trust, if granted, could have a material adverse effect on shareholder returns for the Funds.
The litigation should not impact the expenses of the Funds, as the Adviser has agreed to bear all legal fees and other related expenses of the Trust and the Trustees in connection with defending against the claim.
TCW raised a fund under the U.S. Treasury’s Legacy Securities Public Private Investment Program (the “PPIP”) in the fall of 2009 to be managed by Mr. Gundlach, as key person, and announced in January 2010, subsequent to the termination of Mr. Gundlach, that it had voluntarily withdrawn the fund from the PPIP and would conduct an orderly liquidation of the fund. The Adviser has advised the Trust that employees and former employees of the Adviser have been interviewed by representatives of the Special Inspector General of the Troubled Asset Relief Program, and by the office of the United States Attorney for the Southern District of New York, in connection with the PPIP and in connection with the same allegations of misappropriation of proprietary information made by TCW in its litigation against the Adviser. The Adviser understands that the inquiry stems at least in part from a federal grand jury inquiry. The Adviser has informed the Trust that it has cooperated with the inquiry and has voluntarily produced documents. The Trust and the Funds are not involved in any of these inquiries.
Litigation and participation in any governmental inquiry or investigation can be expensive and time consuming, and their results can be unpredictable. There can be no assurances as to the outcome of these matters. The litigation and any governmental inquiry or investigation could consume a material amount of the Adviser’s resources thereby potentially impairing the Adviser’s ability to attract or retain talented personnel or otherwise effectively manage the Fund. In the event of an adverse outcome or if expenses of the litigation and related matters are greater than anticipated, the Adviser’s ability to manage the Funds may be materially impaired, and shareholders, or the viability of the Funds, could be adversely affected.
12. Subsequent Events
In preparing these financial statements, the Funds have evaluated events and transactions for potential recognition or disclosure through the date the financial statements were available to be issued. The Funds have determined there are no subsequent events that would need to be disclosed in the Funds’ financial statements.
Report of Independent Registered Public Accounting Firm
To the Board of Trustees and Shareholders of DoubleLine Funds Trust
In our opinion, the accompanying statements of assets and liabilities, including the schedules of investments, and the related statements of operations and of changes in net assets and the financial highlights present fairly, in all material respects, the financial position of DoubleLine Total Return Bond Fund, DoubleLine Core Fixed Income Fund, DoubleLine Emerging Markets Fixed Income Fund, and DoubleLine Multi-Asset Growth Fund (constituting DoubleLine Funds Trust, hereafter referred to as the “Funds”) at March 31, 2011, and the results of its operations, the changes in its net assets and the financial highlights for the period April 6, 2010 (commencement of operations) through March 31, 2011 for the DoubleLine Total Return Bond Fund and DoubleLine Emerging Markets Fixed Income Fund, for the period June 1, 2010 (commencement of operations) through March 31, 2011 for the DoubleLine Core Fixed Income Fund, and for the period December 20, 2010 (commencement of operations) through March 31, 2011 for the DoubleLine Multi-Asset Growth Fund, in conformity with accounting principles generally accepted in the United States of America. These financial statements and financial highlights (hereafter referred to as “financial statements”) are the responsibility of the Funds’ management. Our responsibility is to express an opinion on these financial statements based on our audits. We conducted our audits of these financial statements in accordance with the standards of the Public Company Accounting Oversight Board (United States). Those standards require that we plan and perform the audit to obtain reasonable assurance about whether the financial statements are free of material misstatement. An audit includes examining, on a test basis, evidence supporting the amounts and disclosures in the financial statements, assessing the accounting principles used and significant estimates made by management, and evaluating the overall financial statement presentation. We believe that our audits, which included confirmation of securities at March 31, 2011 by correspondence with the custodian and brokers, provide a reasonable basis for our opinion.
PricewaterhouseCoopers LLP
Los Angeles, California
May 27, 2011
| | | | | | |
| | Annual Report | | March 31, 2011 | | 39 |
| | |
| |
| Shareholder Expenses | | (Unaudited) |
Example
As a shareholder of DoubleLine Total Return Bond Fund, DoubleLine Core Fixed Income Fund, DoubleLine Emerging Markets Fixed Income Fund and DoubleLine Multi-Asset Growth Fund (each a “Fund” and collectively the “Funds”), you incur two types of costs: (1) transaction costs , including sales charges (loads) on purchase payments, reinvested dividends, or other distributions; redemption fees; and exchange fees; and (2) ongoing costs, including management fees; distribution (12b-1) fees and other Fund expenses.
This Example is intended to help you understand your ongoing costs (in dollars) of investing in each Fund and to compare these costs with the ongoing costs of investing in other mutual funds. The Example is based on an investment of $1,000 invested at the beginning of the period and held for the entire period covered by this report.
Actual Expenses
The actual return columns in the following table provide information about account values based on actual returns and actual expenses. You may use the information in these columns, together with the amount you invested, to estimate the expenses that you paid over the period. Simply divide your account value by $1,000 (for example, an $8,600 account value divided by $1,000 = 8.6), then multiply the result by the number in the first line under the heading entitled “Expenses Paid During Period” to estimate the expenses you paid on your account during this period. As a shareholder you will be assessed fees for outgoing wire transfers, returned checks and stop payment orders at prevailing rates charged by U.S. Bancorp Fund Services, LLC, the Fund’s transfer agent. Currently, if you request a redemption be made by wire, a $15.00 fee is charged by the Fund’s transfer agent. You will be charged a redemption fee equal to 1.00% of the net amount of the redemption if you redeem shares that have been held for less than 90 days in the DoubleLine Multi-Asset Growth Fund. An Individual Retirement Account (“IRA”) will be charged a $15.00 annual maintenance fee. The transfer agent charges a transaction fee of $25.00 on returned checks and stop payment orders. If you paid a transaction fee, you would add the fee amount to the expenses paid on your account this period to obtain your total expenses paid.
Hypothetical Example for Comparison Purposes
The hypothetical return columns in the following table provide information about hypothetical account values and hypothetical expenses based on a Fund’s actual expense ratio and an assumed rate of return of 5% per year before expenses, which is not a Fund’s actual return. The hypothetical account values and expenses may not be used to estimate the actual ending account balance or expenses you paid for the period. You may use this information to compare the ongoing costs of investing in the Fund and other funds. To do so, compare this 5% hypothetical example with the 5% hypothetical examples that appear in the shareholder reports of the other funds. Please note that the expenses shown in the table are meant to highlight your ongoing costs only and do not reflect the transaction fees discussed above. Therefore, those columns are useful in comparing ongoing costs only, and will not help you determine the relative total costs of owning different funds. In addition, if these transactional costs were included, your costs would have been higher.
| | | | | | | | | | | | | | | | | | | | | | | | | | | | | | | | | | |
| | | | | | | | | | | | | | Actual | | | | | | Hypothetical
(5% return
before expenses) | |
| | | | | | | | Fund’s
Annualized
Expense Ratio | | | Beginning
Account
Value | | | Ending
Account
Value
3/31/11 | | | Expenses
Paid During
Period * | | | | | | Ending
Account
Value
3/31/11 | | | Expenses
Paid During
Period * | |
DoubleLine Total Return Bond Fund | | | | | | Class I | | | 0.49% | | | $ | 1,000 | | | $ | 1,040 | | | $ | 2.49 | | | | | | | $ | 1,022 | | | $ | 2.47 | |
| | | | | | | Class N | | | 0.74% | | | $ | 1,000 | | | $ | 1,038 | | | $ | 3.76 | | | | | | | $ | 1,021 | | | $ | 3.73 | |
DoubleLine Core Fixed Income Fund | | | | | | Class I | | | 0.49% | | | $ | 1,000 | | | $ | 1,026 | | | $ | 2.47 | | | | | | | $ | 1,022 | | | $ | 2.47 | |
| | | | | | | Class N | | | 0.74% | | | $ | 1,000 | | | $ | 1,025 | | | $ | 3.74 | | | | | | | $ | 1,021 | | | $ | 3.73 | |
DoubleLine Emerging Markets Fixed Income Fund | | | | | | Class I | | | 0.95% | | | $ | 1,000 | | | $ | 1,044 | | | $ | 4.84 | | | | | | | $ | 1,020 | | | $ | 4.78 | |
| | | | | | | Class N | | | 1.20% | | | $ | 1,000 | | | $ | 1,043 | | | $ | 6.11 | | | | | | | $ | 1,018 | | | $ | 6.04 | |
DoubleLine Multi-Asset Growth Fund | | | | | | Class I | | | 1.20% | | | $ | 1,000 | | | $ | 1,012 | | | $ | 3.37 | | | | | | | $ | 1,010 | | | $ | 3.37 | |
| | | | | | | Class A | | | 1.45% | | | $ | 1,000 | | | $ | 1,010 | | | $ | 4.07 | | | | | | | $ | 1,010 | | | $ | 4.07 | |
* Expenses are equal to the Fund’s annualized expense ratio multiplied by the average account value over the period, multiplied by the number of days in the most recent fiscal half-year divided by 365 (to reflect the half-period) for DoubleLine Total Return Fund, DoubleLine Core Fixed Income Fund and DoubleLine Emerging Markets Fixed Income Fund and 102/365 (to reflect the period since inception) for DoubleLine Multi-Asset Growth Fund.
1 Reflects fee waiver and expense limitation arrangements in effect during the period
DoubleLine Total Return Bond Fund
Value of a $100,000 Investment
Class I Shares1
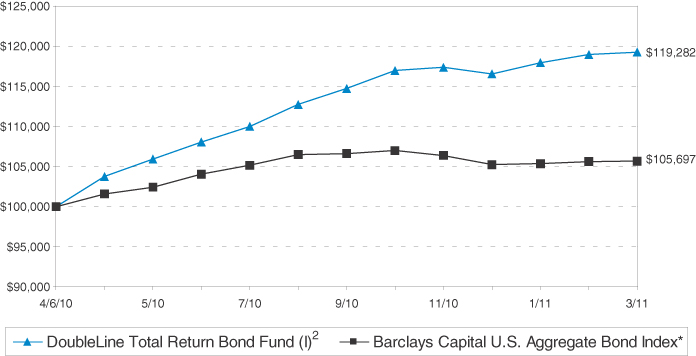
| | | | | | | | |
Since Inception Total Returns1 As of March 31, 2011 | |
| | | | | | Since
Inception
(4/6/2010) | |
DoubleLine Total Return Bond Fund Class I | | | | | | | 19.28% | |
Barclays Capital U.S. Aggregate Bond Index* | | | | | | | 5.70% | |
| | |
DoubleLine Total Return Bond Fund Class N | | | | | | | 19.04% | |
| 1 | Past performance is not an indication of future results. Returns represent past performance and reflect changes in share prices, the reinvestment of all dividends and capital gains, expense limitations and the effects of compounding. The prospectus contains more complete information on the investment objectives, risks, charges and expenses of the investment company, which investors should read and consider carefully before investing. To obtain a prospectus, contact a registered representative or visit www.doubleline.com. The Fund’s adviser waived a portion of its management fee and/or reimbursed Fund expenses during the period shown. Had the adviser not done so, the Fund’s total returns would have been lower. The returns shown do not reflect taxes a shareholder would pay on distributions or redemptions. Total investment return and principal value of your investment will fluctuate, and your shares, when redeemed, may be worth more or less than their original cost. Current performance may be higher or lower than the performance data quoted. Call 877-DLine11 or visit www.doubleline.com for performance results current to the most recent month-end. |
| 2 | Performance of other classes will be greater or less than the line shown based on the differences in loads and fees paid by shareholders investing in the different classes. |
| * | This index represents securities that are SEC-registered, taxable, and dollar denominated. The index covers the US investment grade fixed rate bond market, with index components for government and corporate securities, mortgage pass-through securities, and asset-backed securities. These major sectors are subdivided into more specific indices that are calculated and reported on a regular basis. |
| | | | | | |
| | Annual Report | | March 31, 2011 | | 41 |
| | |
| |
| | | (Unaudited) March 31, 2011 |
DoubleLine Core Fixed Income Fund
Value of a $100,000 Investment
Class I Shares1
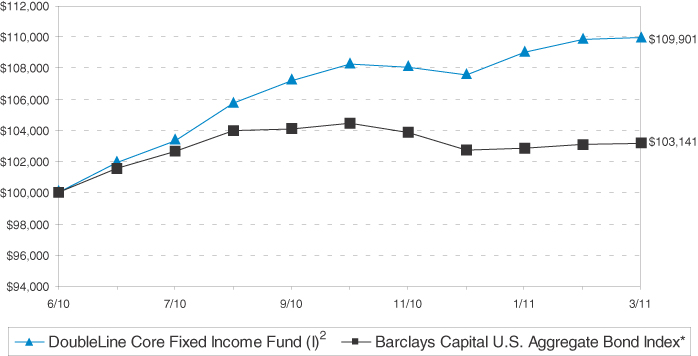
| | | | | | | | |
Since Inception Total Returns1 As of March 31, 2011 | |
| | | | | | Since
Inception
(6/1/2010) | |
DoubleLine Core Fixed Income Fund Class I | | | | | | | 9.90% | |
Barclays Capital U.S. Aggregate Bond Index* | | | | | | | 3.14% | |
| | |
DoubleLine Core Fixed Income Fund Class N | | | | | | | 9.71% | |
| 1 | Past performance is not an indication of future results. Returns represent past performance and reflect changes in share prices, the reinvestment of all dividends and capital gains, expense limitations and the effects of compounding. The prospectus contains more complete information on the investment objectives, risks, charges and expenses of the investment company, which investors should read and consider carefully before investing. To obtain a prospectus, contact a registered representative or visit www.doubleline.com. The Fund’s adviser waived a portion of its management fee and/or reimbursed Fund expenses during the period shown. Had the adviser not done so, the Fund’s total returns would have been lower. The returns shown do not reflect taxes a shareholder would pay on distributions or redemptions. Total investment return and principal value of your investment will fluctuate, and your shares, when redeemed, may be worth more or less than their original cost. Current performance may be higher or lower than the performance data quoted. Call 877-DLine11 or visit www.doubleline.com for performance results current to the most recent month-end. |
| 2 | Performance of other classes will be greater or less than the line shown based on the differences in loads and fees paid by shareholders investing in the different classes. |
| * | This index represents securities that are SEC-registered, taxable, and dollar denominated. The index covers the US investment grade fixed rate bond market, with index components for government and corporate securities, mortgage pass-through securities, and asset-backed securities. These major sectors are subdivided into more specific indices that are calculated and reported on a regular basis. |
DoubleLine Emerging Markets Fixed Income Fund
Value of a $100,000 Investment
Class I Shares1
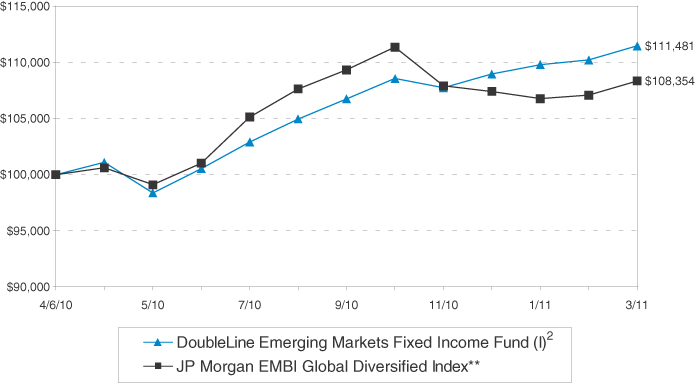
| | | | | | | | |
Since Inception Total Returns1 As of March 31, 2011 | |
| | | | | | Since
Inception
(4/6/2010) | |
DoubleLine Emerging Markets Fixed Income Fund Class I | | | | | | | 11.48% | |
JP Morgan EMBI Global Diversified Index** | | | | | | | 8.35% | |
| | |
DoubleLine Emerging Markets Fixed Income Fund Class N | | | | | | | 11.25% | |
| 1 | Past performance is not an indication of future results. Returns represent past performance and reflect changes in share prices, the reinvestment of all dividends and capital gains, expense limitations and the effects of compounding. The prospectus contains more complete information on the investment objectives, risks, charges and expenses of the investment company, which investors should read and consider carefully before investing. To obtain a prospectus, contact a registered representative or visit www.doubleline.com. The Fund’s adviser waived a portion of its management fee and/or reimbursed Fund expenses during the period shown. Had the adviser not done so, the Fund’s total returns would have been lower. The returns shown do not reflect taxes a shareholder would pay on distributions or redemptions. Total investment return and principal value of your investment will fluctuate, and your shares, when redeemed, may be worth more or less than their original cost. Current performance may be higher or lower than the performance data quoted. Call 877-DLine11 or visit www.doubleline.com for performance results current to the most recent month-end. |
| 2 | Performance of other classes will be greater or less than the line shown based on the differences in loads and fees paid by shareholders investing in the different classes. |
| ** | This index is uniquely-weighted version of the EMBI Global. It limits the weights of those index countries with larger debt stocks by only including specified portions of these countries’ eligible current face amounts of debt outstanding. The countries covered in the EMBI Global Diversified are identical to those covered by EMBI Global. |
| | | | | | |
| | Annual Report | | March 31, 2011 | | 43 |
| | |
| |
| Evaluation of Advisory Agreement by the Board of Trustees | | (Unaudited) |
At the August 25, 2010 meeting of the Board of Trustees of the Trust (the “Meeting”), the Board of Trustees, including the Independent Trustees voting separately, approved an Investment Advisory Agreement (the “Agreement”) between the Trust, on behalf of DoubleLine Multi-Asset Growth Fund (the “Fund”), and DoubleLine Capital LP (the “Adviser”). This summary describes a number, but not necessarily all, of the most important factors considered by the Board and the Independent Trustees. In all of their deliberations, the Board of Trustees and the Independent Trustees were advised by independent counsel to the Independent Trustees and the Fund.
The Board considered a wide range of materials, including information previously provided to the Trustees in connection with the approval of advisory contracts between the Adviser and the three original series of the Trust: DoubleLine Total Return Bond Fund, DoubleLine Core Fixed Income Fund, and DoubleLine Emerging Markets Fixed Income Fund. The Trustees’ determination to approve the Agreement was based on a comprehensive evaluation of all of the information provided to them. The Trustees did not identify any particular information or consideration that was all-important or controlling, and each Trustee attributed different weights to various factors.
In the process of considering the approval of the Agreement, the Trustees considered information regarding, for example, the proposed portfolio management team and the experience of the members of the team, the team’s anticipated investment strategy, and other information relating to the nature, extent, and quality of services to be provided by the Adviser. The Trustees also considered the detailed compliance policies and procedures developed by the Adviser and the Adviser’s commitment to the compliance process.
The Trustees noted that the Fund had not commenced operations at the time of the Board meeting and had no historical investment performance. However, the Trustees considered the expertise of the Fund’s proposed portfolio management team generally, the performance of the other DoubleLine funds to date, and the performance of the funds or accounts managed by the proposed portfolio managers while employed by their previous employer. The Trustees considered the financial position of the Adviser and the commitment that the Adviser has made to the Fund generally. The Board also considered the Adviser’s specific responsibilities in all aspects of day-to-day management of the Fund as well as the qualifications, experience and responsibilities of the other key personnel that would be involved in the day-to-day activities of the Fund. The Board concluded that the Adviser had sufficient quality and depth of personnel, resources, investment methods and compliance policies and procedures essential to performing its duties under the Agreement and that, in the Board’s view, the nature, overall quality, and extent of the investment management services to be provided would be satisfactory and reliable.
The Trustees noted that the Fund’s proposed fee under the Agreement was higher than most other mutual funds against which the Trustees compared the proposed fee. In that regard, the Trustees noted the Adviser’s representation that the proposed fee was set at a level that would continue to make the management of assets in the mutual fund format an attractive option to the Adviser and its personnel in comparison to private funds, where higher fees are generally available. The Trustees noted also the high demand for products managed by Mr. Gundlach and the Adviser as well as the Adviser’s representation that the services to be provided to the Fund were “premium quality” services. The Trustees also considered the Adviser’s representation that, although the Adviser does not currently manage other funds or accounts with a similar investment strategy, investors were expected to welcome the ability to access Mr. Gundlach’s expertise in a product other than a purely fixed income context. In concluding that the proposed advisory fee was not excessive, the Trustees also considered the expense cap proposed by the Adviser.
The Trustees discussed the likely overall profitability of the Adviser from managing the Fund. In assessing profitability, the Trustees reviewed the Adviser’s financial information provided at a previous meeting of the Trustees and took into account both the likely direct and indirect benefits to the Adviser from managing the Fund. The Trustees concluded that the Adviser’s profit from managing the Fund would likely not be excessive in the start-up period and, after review of relevant financial information, the Adviser appeared to have adequate capitalization and/or would maintain adequate profit levels to support the Fund. The Trustees noted that the Fund would be in its start-up phase for some time and that it did not appear appropriate at this time to consider the implementation of breakpoints in the investment advisory fee.
On the basis of these considerations, the Trustees determined to approve the Agreement for the proposed initial term.
| | |
| |
| Federal Tax Information | | (Unaudited) |
For the fiscal year ended March 31, 2011, certain dividends paid by the Funds may be subject to a maximum tax rate of 15%, as provided for by the Jobs and Growth Tax Relief Reconciliation Act of 2003. The percentage of dividends declared from ordinary income designated as qualified dividend income was as follows:
| | | | | | | | |
| Qualified Dividend Income | | | | | | |
DoubleLine Total Return Bond Fund | | | | | | | 0% | |
DoubleLine Core Fixed Income Fund | | | | | | | 0% | |
DoubleLine Emerging Markets Fixed Income Fund | | | | | | | 0% | |
DoubleLine Multi-Asset Growth Fund | | | | | | | 0% | |
For corporate shareholders, the percent of ordinary income distributions qualifying for the corporate dividends received deduction for the fiscal year ended March 31, 2011 was as follows:
| | | | | | | | |
| Dividends Received Deduction | | | | | | |
DoubleLine Total Return Bond Fund | | | | | | | 0% | |
DoubleLine Core Fixed Income Fund | | | | | | | 0% | |
DoubleLine Emerging Markets Fixed Income Fund | | | | | | | 0% | |
DoubleLine Multi-Asset Growth Fund | | | | | | | 0% | |
Non-Resident Alien (“NRA”) shareholders are normally subject to a 30% (or lower tax treaty rate depending on the country) NRA withholding tax on income and short-term capital gain dividends paid by a mutual fund, unless such dividends are designated as exempt from NRA withholding tax. The distributions that have been identified by the Funds as exempt from NRA withholding are disclosed in the table below. The information presented in the table below is applicable to NRA shareholders and their advisors and is not applicable to shareholders filing United States income tax returns.
| | | | | | | | |
| Qualified Interest Income | | | | | | |
DoubleLine Total Return Bond Fund | | | | | | | 89.64% | |
DoubleLine Core Fixed Income Fund | | | | | | | 82.21% | |
DoubleLine Emerging Markets Fixed Income Fund | | | | | | | 29.34% | |
DoubleLine Multi-Asset Growth Fund | | | | | | | 42.40% | |
The Percentage of taxable ordinary income distributions that are designated as short-term capital gain distributions under Internal Revenue Section 871(k)(2)(C) for each Fund were as follows:
| | | | | | | | |
DoubleLine Total Return Bond Fund | | | | | | | 0.00% | |
DoubleLine Core Fixed Income Fund | | | | | | | 6.86% | |
DoubleLine Emerging Markets Fixed Income Fund | | | | | | | 7.05% | |
DoubleLine Multi-Asset Growth Fund | | | | | | | 0.00% | |
| | | | | | |
| | Annual Report | | March 31, 2011 | | 45 |
| | |
| |
| Trustees and Officers | | (Unaudited) |
| | | | | | | | | | |
| Name, Address, and Age(1) | | Position with Trust | | Term of Office and Length of Time Served | | Principal Occupation(s) During Past 5 Years | | Number of
Portfolios
Overseen | | Other Directorships Held by Trustee |
| | | | |
Independent Trustees | | | | | | | | |
| | | | | |
| Joseph J. Ciprari, 46 | | Trustee | | Indefinite/Since Inception | | Consultant with Remo Consultants. Formerly, Managing Director, UBS AG. | | 4 | | None |
| | | | | |
| John C. Salter, 54 | | Trustee | | Indefinite/Since Inception | | Partner at Stark, Salter & Smith, a securities brokerage firm specializing in tax exempt bonds. | | 4 | | None |
| | | | | |
| Robert J. Untracht, 62 | | Trustee | | Indefinite/Since Inception | | Financial Reporting Consultant with International Lease Finance Corporation. | | 4 | | None(2) |
| | | | | |
| Raymond B. Woolson, 52 | | Trustee | | Indefinite/Since Inception | | President of Apogee Group, Inc., a company providing financial consulting services. | | 4 | | None |
(1) The address of each Independent Trustee is c/o DoubleLine Capital LP, 333 South Grand Avenue, Suite 1800, Los Angeles, CA 90071.
(2) Formerly, a member of the Board of Directors of SM&A, Inc. (a publicly traded company).
The following Trustees are an “interested persons” of the Trust as defined in the 1940 Act because they are officers of the Adviser, and indirect shareholders in the Adviser.
| | | | | | | | | | | | | | |
| Name, Address, and Age(1) | | Position
with Trust | | Term of Office and Length of Time Served | | Principal Occupation(s) During Past 5 Years | | Number of
Portfolios Overseen | | | Other Directorships Held by Trustee | |
| | | | |
Interested Trustees | | | | | | | | | | | | |
| | | | | |
| Jeffrey E. Gundlach, 51 | | Trustee | | Indefinite/Since Inception | | Chief Executive Officer at DoubleLine Capital LP (since December 2009); prior thereto, Chief Investment Officer, Group Managing Director and President at TCW. | | | 4 | | | | None | |
| | | | | |
| Philip A. Barach, 58 | | Trustee | | Indefinite/Since Inception | | President at DoubleLine Capital LP (since December 2009); prior thereto, Group Managing Director at TCW. | | | 4 | | | | None | |
(1) The address of each Interested Trustee is DoubleLine Capital LP, 333 South Grand Avenue, Suite 1800, Los Angeles, CA 90071.
Officers
The officers of the Trust who are not also Trustees of the Trust are:
| | | | | | |
| Name, Address, and Age(1) | | Position(s)
Held with
Fund | | Term of Office and Length of Time Served | | Principal Occupation(s) During Past 5 Years |
| | | |
| Ronald R. Redell, 40 | | President | | Indefinite/Since Inception | | President at DoubleLine Funds Trust (since January 2010); prior thereto, President and CEO of TCW Funds, Inc. and TCW Strategic Income Fund, Inc. |
| | | |
| Joseph W. Sullivan III, 54 | | Chief Financial Officer/Treasurer | | Indefinite/Since Inception | | Chief Financial Officer at DoubleLine Funds Trust (since January 2010); prior thereto, Chief Operating Officer and Chief Compliance Officer at Peconic Partners. |
| | | |
| Earl Lariscy, 45 | | Chief Compliance Officer | | Indefinite/Since June 2010 | | General Counsel at DoubleLine Capital LP (since April 2010); prior thereto, Director at Barclay’s Capital and Agency General Manager of Barclay Bank PLC’s California based banking operations beginning in October 2007. Prior to Barclays, Mr. Lariscy served as Associate General Counsel to TCW since January 2006 and worked as an attorney in the New York office of Linklaters prior to joining TCW. |
| | | |
| Louis C. Lucido, 62 | | Secretary | | Indefinite/Since Inception | | Chief Operating Officer at DoubleLine Capital LP (since December 2009); prior thereto, Group Managing Director at TCW. |
| | | |
| Susan Nichols, 48 | | Assistant Treasurer | | Indefinite/Since August 2010 | | Assistant Treasurer at DoubleLine Funds Trust (since January 2010); prior thereto, Senior Vice President at TCW. |
(1) The address of each officer is DoubleLine Capital LP, 333 South Grand Avenue, Suite 1800, Los Angeles, CA 90071
The Statement of Additional Information includes additional information about the Trustees and is available, without charge, upon request, by calling 877-DLine11 (877-354-6311).
| | |
| |
| Information About Proxy Voting | | (Unaudited) |
Information about how a Fund voted proxies relating to portfolio securities held during the most recent twelve month period ended June 30th is available no later than the following August 31st without charge, upon request, by calling 877-DLine11 (877-354-6311) and on the SEC’s website at http://www.sec.gov.
A description of the Funds’ proxy voting policies and procedures is available (i) without charge, upon request, by calling 877-DLine11 (877-354-6311); (ii) on the Fund’s web site at www.doublelinefunds.com; and (iii) on the commission’s web site at http://www.sec.gov.
| | |
| |
| Information About The Portfolio Holdings | | |
It is the policy of the Trust to provide certain unaudited information regarding the portfolio composition of the Funds as of month-end to shareholders and others upon request to the Funds, beginning on the 15th calendar day after the end of the month (or, if not a business day, the next business day thereafter).
Shareholders and others who wish to obtain portfolio holdings for a particular month may make a request by contacting the Funds at no charge at 877-DLine11 (877-354-6311) between the hours of 7:00 a.m. and 5:00 p.m. Pacific time, Monday through Friday, beginning on the 15th day following the end of that month (or, if not a business day, the next business day thereafter). Requests for portfolio holdings may be made on a monthly basis pursuant to this procedure, or standing requests for portfolio holdings may be accepted.
The Trust is required to file its complete schedule of portfolio holdings with the U.S. Securities and Exchange Commission for its first and third fiscal quarters on Form N-Q. The Trust’s Forms N-Q are available on the U.S. Securities and Exchange Commission’s website at www.sec.gov. You can also review and obtain copies of the Forms N-Q at the U.S. Securities and Exchange Commission’s Public Reference Room in Washington, DC (information on the operation of Public Reference Room may be obtained by calling 1-800-SEC-0330).
| | |
| |
| Householding — Important Notice Regarding Delivery of Shareholder Documents | | |
In an effort to conserve resources, the Funds intend to reduce the number of duplicate Prospectuses and Annual and Semi-Annual Reports you receive by sending only one copy of each to addresses where we reasonably believe two or more accounts are from the same family. If you would like to discontinue householding of your accounts, please call toll-free 877-DLine11 (877-354-6311) to request individual copies of these documents. We will begin sending individual copies thirty days after receiving your request to stop householding.
| | | | | | |
| | Annual Report | | March 31, 2011 | | 47 |
| | |
| |
| Privacy Notice | | (Unaudited) |
What Does DoubleLine Do With Your Personal Information
Financial companies choose how they share your personal information. This notice provides information about how we collect, share, and protect your personal information, and how you might choose to limit our ability to share certain information about you. Please read this notice carefully.
All financial companies need to share customers’ personal information to run their everyday businesses. Accordingly, information, confidential and proprietary, plays an important role in the success of our business. However, we recognize that you have entrusted us with your personal and financial data, and we recognize our obligation to keep this information secure. Maintaining your privacy is important to us, and we hold ourselves to a high standard in its safekeeping and use. Most importantly, DoubleLine does not sell its customers’ non-public personal information to any third parties. DoubleLine uses its customers’ non-public personal information primarily to complete financial transactions that its customers request or to make its customers aware of other financial products and services offered by a DoubleLine affiliated company.
DoubleLine may collect non-public information about you from the following sources:
| | • | Information we receive about you on applications or other forms; |
| | • | Information you may give us orally; |
| | • | Information about your transactions with us or others; |
| | • | Information you submit to us in correspondence, including emails or other electronic communications; and |
| | • | Information about any bank account you use for transfers between your bank account and any Fund account, including information provided when effecting wire transfers. |
| | | | |
DoubleLine Capital LP | | 333 South Grand Avenue 18th Floor Los Angeles, CA 90071 doubleline.com | | info@doubleline.com 1. 213. 633. 8200 |

Investment Adviser:
DoubleLine Capital LP
333 South Grand Avenue
18th Floor
Los Angeles, CA 90071
Distributor:
Quasar Distributors, LLC
615 East Michigan Street
Milwaukee, WI 53202
Administrator and
Transfer Agent:
U.S. Bancorp Fund
Services, LLC
P.O. Box 701
Milwaukee, WI 53201
Custodian:
U.S. Bank, N.A.
1555 North River Center
Drive, Suite 302
Milwaukee, WI 53212
Independent Registered
Public Accounting Firm:
PricewaterhouseCoopers LLP
350 South Grand Avenue
Los Angeles, CA 90071
Legal Counsel:
Ropes & Gray LLP
Prudential Tower
800 Boylston Street
Boston, MA 02199
Contact Information:
doublelinefunds.com
fundinfo@doubleline.com
1-877-DLine11 or
1-877-354-6311

Item 2. Code of Ethics.
The registrant has adopted a code of ethics that applies to the registrant’s principal executive officer and principal financial officer. The registrant has not made any amendments to its code of ethics during the period covered by this report. The registrant has not granted any waivers from any provisions of the code of ethics during the period covered by this report. A copy of the registrant’s Code of Ethics is filed herewith.
Item 3. Audit Committee Financial Expert.
The registrant’s board of trustees has determined that there is at least one audit committee financial expert serving on its audit committee. Robert J. Untracht is the “audit committee financial expert” and is considered to be “independent” as each term is defined in Item 3 of Form N-CSR.
Item 4. Principal Accountant Fees and Services.
The registrant has engaged its principal accountant to perform audit services, audit-related services, tax services and other services during the past fiscal year. “Audit services” refer to performing an audit of the registrant’s annual financial statements or services that are normally provided by the accountant in connection with statutory and regulatory filings or engagements for those fiscal years. “Audit-related services” refer to the assurance and related services by the principal accountant that are reasonably related to the performance of the audit. “Tax services” refer to professional services rendered by the principal accountant for tax compliance, tax advice, and tax planning. There were no “Other services” provided by the principal accountant. The following table details the aggregate fees billed or expected to be billed for the last fiscal year for audit fees, audit-related fees and tax fees by the principal accountant.
| | |
| | | FYE 3/31/2011 |
Audit Fees | | $181,000 |
Audit-Related Fees | | N/A |
Tax Fees | | $27,000 |
All Other Fees | | N/A |
The audit committee has adopted pre-approval policies and procedures that require the audit committee to pre-approve all audit and non-audit services of the registrant, including services provided to any entity affiliated with the registrant.
The percentage of fees billed by PricewaterhouseCoopers LLP applicable to non-audit services pursuant to waiver of pre-approval requirement were as follows:
| | |
| | | FYE 3/31/2011 |
Audit-Related Fees | | 0% |
Tax Fees | | 0% |
All Other Fees | | 0% |
All of the principal accountant’s hours spent on auditing the registrant’s financial statements were attributed to work performed by full-time permanent employees of the principal accountant. (If more than 50 percent of the accountant’s hours were spent to audit the registrant’s financial statements for the most recent fiscal year, state how many hours were attributed to work performed by persons other than the principal accountant’s full-time, permanent employees.)
The following table indicates the non-audit fees billed or expected to be billed by the registrant’s accountant for services to the registrant and to the registrant’s investment adviser (and any other controlling entity, etc. — not sub-adviser) for the last year. The audit committee of the board of trustees/directors has considered whether the provision of non-audit services that were rendered to the registrant’s investment adviser is compatible with maintaining the principal accountant’s independence and has concluded that the provision of such non-audit services by the accountant has not compromised the accountant’s independence.
| | |
Non-Audit Related Fees | | FYE 3/31/2011 |
Registrant | | N/A |
Registrant’s Investment Adviser | | N/A |
Item 5. Audit Committee of Listed Registrants.
Not applicable to registrants who are not listed issuers (as defined in Rule 10A-3 under the Securities Exchange Act of 1934).
Item 6. Investments.
| (a) | | Schedule of Investments is included as part of the report to shareholders filed under Item 1 of this Form. |
Item 7. Disclosure of Proxy Voting Policies and Procedures for Closed-End Management Investment Companies.
Not applicable to open-end investment companies.
Item 8. Portfolio Managers of Closed-End Management Investment Companies.
Not applicable to open-end investment companies.
Item 9. Purchases of Equity Securities by Closed-End Management Investment Company and Affiliated Purchasers.
Not applicable to open-end investment companies.
Item 10. Submission of Matters to a Vote of Security Holders.
There have been no material changes to the procedures by which shareholders may recommend nominees to the registrant’s board of trustees.
Item 11. Controls and Procedures.
| (a) | | The Registrant’s President and Treasurer have reviewed the Registrant’s disclosure controls and procedures (as defined in Rule 30a-3(c) under the Investment Company Act of 1940 (the “Act”)) as of a date within 90 days of the filing of this report, as required by Rule 30a-3(b) under the Act and Rules 13a-15(b) or 15d-15(b) under the Securities Exchange Act of 1934. Based on their review, such officers have concluded that the disclosure controls and procedures are effective in ensuring that information required to be disclosed in this report is appropriately recorded, processed, summarized and reported and made known to them by others within the Registrant and by the Registrant’s service provider. |
| (b) | | There were no changes in the Registrant’s internal control over financial reporting (as defined in Rule 30a-3(d) under the Act) that occurred during the second fiscal quarter of the period covered by this report that has materially affected, or is reasonably likely to materially affect, the Registrant’s internal control over financial reporting. |
Item 12. Exhibits.
| (a) | | (1) Any code of ethics or amendment thereto, that is the subject of the disclosure required by Item 2, to the extent that the registrant intends to satisfy Item 2 requirements through filing an exhibit. Filed herewith. |
(2) A separate certification for each principal executive and principal financial officer pursuant to Section 302 of the Sarbanes-Oxley Act of 2002. Filed herewith.
(3) Any written solicitation to purchase securities under Rule 23c-1 under the Act sent or given during the period covered by the report by or on behalf of the registrant to 10 or more persons. Not applicable to open-end investment companies.
| (b) | | Certifications pursuant to Section 906 of the Sarbanes-Oxley Act of 2002. Furnished herewith. |
SIGNATURES
Pursuant to the requirements of the Securities Exchange Act of 1934 and the Investment Company Act of 1940, the registrant has duly caused this report to be signed on its behalf by the undersigned, thereunto duly authorized.
| | | | |
| | (Registrant) DoubleLine Funds Trust |
| |
| | By (Signature and Title)* /s/ Ronald R. Redell, President |
| | Ronald R. Redell, President |
| |
| | Date June 6, 2011 |
Pursuant to the requirements of the Securities Exchange Act of 1934 and the Investment Company Act of 1940, this report has been signed below by the following persons on behalf of the registrant and in the capacities and on the dates indicated.
| | | | |
| |
| | By (Signature and Title)* /s/ Ronald R. Redell, President |
| | Ronald R. Redell, President |
| |
| | Date June 6, 2011 |
| |
| | By (Signature and Title)* /s/ Joseph W. Sullivan, Treasurer |
| | Joseph W. Sullivan, Treasurer |
| |
| | Date June 6, 2011 |
| * | | Print the name and title of each signing officer under his or her signature. |