As filed with the Securities and Exchange Commission on June 7, 2012
UNITED STATES
SECURITIES AND EXCHANGE COMMISSION
Washington, D.C. 20549
FORM N-CSR
CERTIFIED SHAREHOLDER REPORT OF REGISTERED
MANAGEMENT INVESTMENT COMPANIES
Investment Company Act file number 811-22378
DoubleLine Funds Trust
(Exact name of registrant as specified in charter)
333 South Grand Avenue, Suite 1800
Los Angeles, CA 90071
(Address of principal executive offices) (Zip code)
Ronald R. Redell
President
DoubleLine Funds Trust
333 South Grand Avenue, Suite 1800
Los Angeles, CA 90071
(Name and address of agent for service)
(213) 633-8200
Registrant’s telephone number, including area code
Date of fiscal year end: March 31
Date of reporting period: March 31, 2012
Item 1. Reports to Stockholders.

Annual Report
March 31, 2012

DoubleLine Total Return Bond Fund
DBLTX (I-share)
DLTNX (N-share)
DoubleLine Core Fixed Income Fund
DBLFX (I-share)
DLFNX (N-share)
DoubleLine Emerging Markets Fixed Income Fund
DBLEX (I-share)
DLENX (N-share)
DoubleLine Multi-Asset Growth Fund
DMLIX (I-share)
DMLAX (A-share)
DoubleLine Low Duration Bond Fund
DBLSX (I-share)
DLSNX (N-share)
| | |
| DoubleLine Capital LP | | 333 S. Grand Avenue 18th Floor Los Angeles, California 90071 doubleline.com |

Table of Contents
| | | | | | |
| | Annual Report | | March 31, 2012 | | 3 |
President’s Letter
Dear DoubleLine Funds Shareholder:
On behalf of the team at DoubleLine, I am pleased to deliver this Annual Report. On the following pages, you will find specific information regarding each Fund’s operations and holdings. Investor assets in the DoubleLine Funds grew to $25 billion as of March 31, 2012. In this challenging economic and market environment, DoubleLine continues to strive to deliver superior risk-adjusted returns while working to avoid crossing the double line of risk on the road to successful investing.
Highlights of Financial Markets through our Annual reporting period
| | · | | Agency Mortgage-Backed Securities (Agency MBS): Lower-coupon pass-throughs were the best-performing portion of the MBS Index for the one year period ending March 31, 2012, with higher coupons underperforming. Longer-duration Agency Collateralized Mortgage Obligations (Agency CMOs) outperformed over shorter-duration CMOs as Government interest rates fell across the curve. These securities also benefitted from high income streams over the period. |
| | · | | Non-Agency MBS: Overall non-Agency MBS prices were slightly down over the period with prime-backed securities being the best performing collateral. All fixed-rate non-Agency mortgage-backed securities continued to benefit from high income cash flows due to their discounted dollar prices. |
| | · | | Treasuries: Government yields declined sharply over the period. A steady but gradual rally early in the period turned explosive in August and September on a combination of weaker-than-expected economic data, aggressive monetary accommodation by the Federal Reserve and intensified European sovereign debt concerns. The 10-year Treasury note moved from a yield above 3.50% at the start of the period to 3.00% in late July and then fell in dramatic fashion to an all-time low closing yield of 1.71% in late September. Treasury yields found a new equilibrium around 2.00% and traded in a narrow range through the remainder of the period. The 10-year yield moved as high as 2.40% in March as investors expressed their disappointment over a perceived Fed retreat from further monetary stimulus. The period ended with additional Fed action still a possibility and renewed anxiety over eurozone sovereign debt with Spain now the focus. |
| | · | | Corporates: Both investment grade and high yield corporate bond markets experienced tremendous volatility during the second and third quarters of 2011, driven primarily by concerns regarding the European debt crisis, the U.S. debt ceiling debate and the subsequent loss of the vaunted AAA rating of US sovereign debt. The tone of the corporate market changed considerably, however, in the first quarter of 2012 as investors adopted a “yield grab” mentality with higher beta (lower-rated) sectors of each market generally outperforming. Investors became more cautious toward the end of the quarter, perhaps remembering that 2011 started out in much the same way and mindful of the fact that Europe’s issues embed ample potential for further dislocating shocks. |
| | · | | Emerging Markets Debt: Government sovereign bonds outperformed among the EM subsectors. External sovereign bonds (sovereign bonds denominated in US Dollars), represented by the JP Morgan Emerging Markets Bond Index – Global Diversified (EMBI GD), returned 10.94% over the one year period, with comparable returns in the investment grade subindex of 11.15% and in the non-investment grade subindex of 10.60%. Positive returns were broad-based, with the best- and worst-performing regions within the index being Latin |
| | America 15.50% and Europe 5.41%, respectively. Both external sovereign and corporate EM debt benefitted from a decline in the 10-year U.S. Treasury yield of 126 bps. EM corporates underperformed EM sovereign debt as the JP Morgan Corporate Emerging Markets Bond Index-Broad Diversified (CEMBI BD) spread widened by 81 bps over the period versus the EMBI GD, which saw its spread widen by 53 bps. Within the corporate EM space, the high grade credits within the CEMBI BD outperformed their high yield counterparts over the period by 6.78%. Government local currency bonds were the weakest performer: the JP Morgan Global Bond Index Emerging Markets Broad Diversified returned 3.34% over the period, with the bulk of the return coming from carry, offsetting currency depreciation across the index. The weakest-performing regions within the index were Europe and the Middle East with returns of -3.28% and -0.46% respectively. |
| | · | | Commodities: As measured by the Standard & Poor’s Goldman Sachs Commodity Index Excess Return, the broad-based commodities market posted a 6.2% decline for the one year period. Positive returns in 14 of the 24 commodities in the index during the first quarter of 2012 helped reduce the trailing twelve-month loss. By far the worst performing commodity was natural gas as it continued to struggle with a material supply and demand imbalance brought on by an unseasonably warm winter. |
Performance:
DoubleLine Total Return Bond Fund
For the year ended March 31, 2012, the DoubleLine Total Return Bond Fund “I” share has outperformed the Barclays’ Capital U.S. Aggregate Bond Index (“Barclays US Aggregate Index”) by 2.47% (10.18% versus 7.71%). This outperformance was due to both major sectors of the portfolio: the Agency MBS and the non-Agency MBS. The longer duration of the Agency MBS portion of the Fund drove the outperformance of that sector. The non-Agency MBS sector has continued to generate high income streams, which more than offset the slight price decline in that sector over the period.
| | | | | | |
| Period Ended: 3-31-2012 | | | | 1 year
(Annualized) | |
I-Share | | | | | 10.18% | |
N-Share | | | | | 9.83% | |
Barclays US Aggregate Index | | | | | 7.71% | |
DoubleLine Core Fixed Income Fund
The DoubleLine Core Fixed Income Fund “I” share outperformed the Barclays US Aggregate Index by 3.48% (11.19% versus 7.71%) for the one year period ending March 31, 2012. The Fund’s outperformance over the period was due to both the allocation across the various sectors of the fixed income market and security selection. The allocation to Emerging Markets drove a portion of the Fund’s outperformance along with the outperformance of both the MBS and Corporate sectors of the U.S. market.
| | | | | | |
| Period Ended: 3-31-12 | | | | 1 year
(Annualized) | |
I-Share | | | | | 11.19% | |
N-Share | | | | | 10.85% | |
Barclays US Aggregate Index | | | | | 7.71% | |
| | | | | | |
| | Annual Report | | March 31, 2012 | | 5 |
President’s Letter (Cont.)
DoubleLine Emerging Markets Fixed Income Fund
The DoubleLine Emerging Markets Fixed Income Fund “I” share underperformed the JP Morgan EMBI Global Diversified Index by 2.98% (7.96% versus 10.94%) for the one year period ending March 31, 2012. Despite positive performance by both EM corporate and sovereign/quasi sovereign debt for the year, driven by a more than 100 bps decline in the 10-year U.S. Treasury yield, the Fund’s underperformance was driven predominately by corporate debt spread widening of 81 bps versus sovereign and quasi-sovereign debt spread widening of 53 bps. In addition, the Fund’s performance was affected by weaker returns from its high yield corporate positions versus the benchmark’s high yield sovereign and quasi-sovereign positions.
| | | | | | |
| Period Ended: 3-31-12 | | | | 1 year
(Annualized) | |
I-Share | | | | | 7.96% | |
N-Share | | | | | 7.71% | |
JP Morgan Emerging Markets Bond Global Diversified Index | | | | | 10.94% | |
DoubleLine Multi-Asset Growth Fund
The DoubleLine Multi-Asset Growth Fund “I” share underperformed the Blended Benchmark (60% Barclays US Aggregate Index/25% Morgan Stanley Capital International All Country World Index/15% S&P Goldman Sachs Commodity Index Total Return) by 1.23% (2.67% versus 3.90%) for the one year period ending March 31, 2012. The underperformance was largely due to a large cash position held throughout the reporting period, and an underweight in global equities.
| | | | | | |
| Period Ended: 3-31-12 | | | | 1 year
(Annualized) | |
I-Share | | | | | 2.67% | |
A-Share | | | | | | |
No Load | | | | | 2.57% | |
With Load | | | | | -1.79% | |
Blended Benchmark* | | | | | 3.90% | |
| * | Blended Benchmark: 60% Barclays US Aggregate Index/25% Morgan Stanley Capital International All Country World Index/15% S&P Goldman Sachs Commodity Index Total Return. |
DoubleLine Low Duration Bond Fund
The DoubleLine Low Duration Bond Fund “I” share outperformed the BofA Merrill Lynch 1-3 Year US Treasury Index by 2.33% (2.44% versus 0.11%) for the six-month period ending March 31, 2012. The outperformance of the Fund was due to allocations across various fixed income sectors. Specifically, allocations to MBS, Commercial MBS, as well as Emerging Markets, none of which are represented in the BofA Merrill Lynch 1-3 Year US Treasury Index, drove the outperformance of the Fund.
| | | | | | |
| Period Ended: 3-31-12 | | | | From
9-30-2011
(inception)
to 3-31-12
(Annualized) | |
I-Share | | | | | 2.44% | |
N-Share | | | | | 2.25% | |
BofA ML 1-3 Year US Treasury Index | | | | | 0.11% | |
On behalf of the team at DoubleLine, we thank you for your support of the Funds and the trust you have placed in us. If you have any questions please do not hesitate to call 877-DLINE11 (354-6311) or visit our website at www.doublelinefunds.com.
Sincerely,

Ronald R. Redell
President
May 1, 2012
Past Performance is not a guarantee of future results.
Opinions expressed herein are as of March 31, 2012 and are subject to change at any time, are not guaranteed and should not be considered investment advice.
The performance shown assumes the reinvestment of all dividends and distributions and does not reflect any reductions for taxes. Investment performance reflects fee waivers in effect. In the absence of such waivers, total return would be reduced.
Fund holdings and sector allocations are subject to change at any time and are not recommendations to buy or sell any security. Please refer to the Schedule of Investments for a complete list of fund holdings.
This report is for the information of shareholders of the Funds. It may also be used as sales literature when preceded or accompanied by the current prospectus.
Investments in debt securities typically decrease when interest rates rise. This risk is usually greater for longer-term debt securities. Investments in Asset-Backed and Mortgage-Backed securities include additional risks that investors should note, including credit risk, prepayment risk, possible illiquidity and default, as well as increased susceptibility to adverse economic developments. Investments in lower rated and certain non-rated securities present a greater risk of loss to principal and interest than higher rated securities. The Emerging Markets Fixed Income Fund and the Multi-Asset Growth Fund are non-diversified meaning each may concentrate its assets in fewer individual holdings than a diversified fund. Therefore, these Funds may be more susceptible to any single economic, political or regulatory event than a more diversified fund, and a decline in the market value of one of the Fund’s investments may affect that Fund’s value more than if the Fund were a diversified fund. The Core Fixed Income Fund, Emerging Markets Fixed Income Fund and Multi-Asset Growth Fund may invest in foreign securities, which involve political, economic, and currency risks, greater volatility, and differences in accounting methods. These risks are greater for investments in emerging markets. The Funds may invest in securities related to real estate, which may decline in value as a result of factors affecting the real estate industry. Derivatives may involve certain costs and risks such as liquidity, interest rate, market, credit, management and the risk that a position could not be closed when most advantageous. The Funds’ investments in derivatives potentially could lose more than the amount invested. Commodity-linked derivative instruments may involve additional costs and risks such as changes in commodity index volatility or factors affecting a particular industry or commodity, such as drought, floods, weather, livestock disease, embargoes, tariffs and international economic, political and regulatory developments. Equities may decline in value due to both real and perceived general market, economic, and industry conditions. For more details regarding the risks of the Funds, please consult the current prospectus.
| | | | | | |
| | Annual Report | | March 31, 2012 | | 7 |
President’s Letter (Cont.)
JP Morgan Emerging Markets Bond (EMBI) Global Diversified Index—This index is an uniquely-weighted version of the EMBI Global. It limits the weights of those index countries with larger debt supplies by only including specified portions of these countries’ eligible current face amounts of debt outstanding. The countries covered in the EMBI Global Diversified are identical to those covered by EMBI Global.
Morgan Stanley Capital International All Country World Index—This index is designed to provide a broad measure of stock performance throughout the world, with the exception of U.S.-based companies. The MSCI All Country World Index Ex-U.S. includes both developed and emerging markets.
Standard & Poor’s Goldman Sachs Commodity Index (GSCI) Excess Return—This Index measures the returns accrued from investing in uncollateralized nearby commodity futures.
JP Morgan Corporate Emerging Markets Bond Index—Broad Diversified (CEMBI GD)—This index is a market capitalization weighted index consisting of US-denominated Emerging Market corporate bonds. It is a liquid global corporate benchmark representing Asia, Latin America, Europe and the Middle East/Africa.
JP Morgan Emerging Markets Bond Index—Global Diversified (EMBI GD)—This index tracks total returns for US dollar denominated debt instruments issued by emerging market sovereign entities, including Brady bonds, loans and Eurobonds, and quasi-sovereign entities.
Barclays Capital US Aggregate Bond Index—This index represents securities that are SEC-registered, taxable, and dollar denominated. The index covers the US investment grade fixed rate bond market, with index components for government and corporate securities, mortgage pass through securities, and asset-backed securities. These major sectors are subdivided into more specific indices that are calculated and reported on a regular basis.
Standard & Poor’s Goldman Sachs Commodity Index (GSCI) Total Return—This is a composite index of commodity sector returns which represents a broadly diversified, unleveraged, long-only position in commodity futures. This index’s components qualify for inclusion in the index based on liquidity measures and are weighted in relation to their global production levels, making the index a valuable economic indicator and commodities market benchmark.
BofA Merrill Lynch 1-3 Year US Treasury Index—This Index is an unmanaged index that tracks the performance of the direct sovereign debt of the U.S. Government having a maturity of at least one year and less than three years.
JP Morgan Global Bond Index Emerging Markets—JP Morgan Global Bond Index Emerging Markets (GBI-EM) Broad Diversified—The GBI-EM is a benchmark that tracks local currency bonds issued by emerging markets governments. The GBI-EM Broad Diversified is the all-encompassing index containing all eligible countries with eligible instruments.
A direct investment cannot be made in an index. The performance of any index mentioned in this commentary has not been adjusted for ongoing management, distribution and operating expenses applicable to mutual fund investments.
A basis point (bps) equals 0.01%.
Duration is a commonly used measure of the potential volatility of the price of a debt security, or the aggregate market value of a portfolio of debt securities, prior to maturity. Securities with a longer duration generally have more volatile prices than securities of comparable quality with a shorter duration.
Correlation is a statistical measure of how two securities move in relation to each other.
Beta is a measure of the historical price volatility of a security, portfolio or other asset and the asset’s correlation relative to a given market or market index. A higher beta security or portfolio generally has more volatility than the market as a whole. A lower beta security or portfolio generally has less volatility than the market as a whole.
The DoubleLine Funds are distributed by Quasar Distributors, LLC.
DoubleLine® is a registered trademark of DoubleLine Capital LP.
This commentary may include statements that constitute “forward-looking statements” under the U.S. securities laws. Forward-looking statements include, among other things, projections, estimates, and information about possible or future results related to a Fund and market or regulatory developments. The views expressed above are not guarantees of future performance or economic results and involve certain risks, uncertainties and assumptions that could cause actual outcomes and results to differ materially from the views expressed herein.
DoubleLine has no obligation to provide revised assessments in the event of changed circumstances. While we have gathered this information from sources believed to be reliable, DoubleLine cannot guarantee the accuracy of the information provided. Securities or sectors discussed are not recommendations and are presented as examples of issue selection or portfolio management processes. They have been picked for comparison or illustration purposes only. No security or sector mentioned within this material is either offered for sale or purchase. DoubleLine reserves the right to change its investment perspective and outlook without notice as market conditions dictate or as additional information becomes available.
Investment strategies may not achieve the desired results due to implementation lag, other timing factors, portfolio management decision making, economic or market conditions or other unanticipated factors. The views and forecasts expressed in this material are as of the date indicated, are subject to change without notice, may not come to pass and do not represent a recommendation or offer of any particular security, strategy, or investment. Past performance is no guarantee of future results.
| | |
| Schedule of Investments DoubleLine Total Return Bond Fund | | March 31, 2012 |
| | | | | | | | | | | | | | | | |
PRINCIPAL
AMOUNT | | | SECURITY DESCRIPTION | | RATE | | | MATURITY | | | VALUE $ | |
| | COLLATERALIZED LOAN OBLIGATIONS 0.1% | |
| |
| | | | Atrium Corporation, | |
| $ | 3,104,125 | | | Series 3A-A1 | | | 0.82% | #^ | | | 10/27/2016 | | | | 3,057,563 | |
| |
| | | | Avenue Ltd., | |
| | 9,668,357 | | | Series 2004-1A-A1L | | | 0.85% | #^ | | | 02/15/2017 | | | | 9,560,071 | |
| |
| | | | Black Diamond Ltd., | |
| | 2,008,833 | | | Series 2005-1A-A1 | | | 0.74% | #^ | | | 06/20/2017 | | | | 1,943,546 | |
| |
| | | | Galaxy Ltd., | |
| | 6,833,432 | | | Series 2005-5A-A1 | | | 0.82% | #^ | | | 10/20/2017 | | | | 6,696,763 | |
| |
| | | | Gulf Stream Compass Ltd., | |
| | 663,229 | | | Series 2002-1A-A | | | 1.05% | #^ | | | 12/19/2014 | | | | 658,255 | |
| |
| | | | Marathon Financing B.V., | |
| | 206,662 | | | Series 2006-1A-A1 | | | 0.75% | #^ | | | 10/05/2026 | | | | 200,690 | |
| |
| | | | Sargas II Ltd., | |
| | 5,999,718 | | | Series 2006-1A-D | | | 1.81% | #^ | | | 10/20/2018 | | | | 5,924,721 | |
| | 2,142,756 | | | Series 2006-1X-D | | | 1.81% | # | | | 10/20/2018 | | | | 2,115,972 | |
| | | | | | | | | | | | | | | | |
| | | | Total Collateralized Loan Obligations
(Cost $30,152,806) | | | | 30,157,581 | |
| | | | | | | | | | | | | | | | |
| | NON-AGENCY COLLATERALIZED MORTGAGE OBLIGATIONS 37.4% | |
| |
| | | | ACE Securities Corporation, | |
| | 43,345,728 | | | Series 2006-HE1-A2C | | | 0.43% | # | | | 02/25/2036 | | | | 39,899,548 | |
| |
| | | | Adjustable Rate Mortgage Trust, | |
| | 6,200,000 | | | Series 2005-2-6M2 | | | 1.22% | # | | | 06/25/2035 | | | | 2,667,420 | |
| | 9,685,729 | | | Series 2005-7-3A1 | | | 5.12% | # | | | 10/25/2035 | | | | 7,345,429 | |
| | 49,855,496 | | | Series 2006-1-2A1 | | | 3.23% | # | | | 03/25/2036 | | | | 29,343,774 | |
| | 45,037,130 | | | Series 2007-1-3A1 | | | 5.66% | # | | | 03/25/2037 | | | | 28,976,417 | |
| | 6,980,848 | | | Series 2007-3-1A1 | | | 3.56% | #^ | | | 11/25/2037 | | | | 3,549,070 | |
| |
| | | | Aegis Asset Backed Securities Trust, | |
| | 663,255 | | | Series 2003-2-M2 | | | 2.79% | # | | | 11/25/2033 | | | | 456,561 | |
| | 6,291,428 | | | Series 2004-1-M2 | | | 2.27% | # | | | 04/25/2034 | | | | 4,247,724 | |
| | 935,144 | | | Series 2004-2-M2 | | | 1.54% | # | | | 06/25/2034 | | | | 448,131 | |
| |
| | | | American General Mortgage Loan Trust, | |
| | 12,000,000 | | | Series 2010-1-A3 | | | 5.65% | #^ | | | 03/25/2058 | | | | 12,643,656 | |
| | 12,000,000 | | | Series 2010-1-A4 | | | 5.65% | #^ | | | 03/25/2058 | | | | 12,416,064 | |
| |
| | | | American Home Mortgage Investment Trust, | |
| | 7,875,251 | | | Series 2005-1-7A2 | | | 2.74% | # | | | 06/25/2045 | | | | 5,482,065 | |
| | 15,164,258 | | | Series 2005-4-3A1 | | | 0.54% | # | | | 11/25/2045 | | | | 9,344,686 | |
| | 3,073,793 | | | Series 2006-2-3A4 | | | 6.60% | # | | | 06/25/2036 | | | | 1,625,203 | |
| | 14,306,054 | | | Series 2007-A-13A1 | | | 6.10% | #^ | | | 01/25/2037 | | | | 8,338,591 | |
| |
| | | | Amortizing Residential Collateral Trust, | |
| | 20,063,163 | | | Series 2002-BC7-M1 | | | 1.44% | # | | | 10/25/2032 | | | | 12,420,462 | |
| |
| | | | Argent Securities, Inc., | |
| | 707,783 | | | Series 2004-W6-M1 | | | 0.79% | # | | | 05/25/2034 | | | | 531,128 | |
| |
| | | | Asset Backed Securities Corporation Home Equity Loan Trust, | |
| | 8,249,312 | | | Series 2003-HE6-M1 | | | 1.22% | # | | | 11/25/2033 | | | | 6,293,643 | |
| | 1,795,165 | | | Series 2004-HE3-M2 | | | 1.92% | # | | | 06/25/2034 | | | | 1,231,973 | |
| |
| | | | Asset Securitization Corporation, | |
| | 1,941,045 | | | Series 1997-D5-A2 | | | 7.15% | # | | | 02/14/2043 | | | | 1,959,157 | |
| |
| | | | Banc of America Alternative Loan Trust, | |
| | 10,088,435 | | | Series 2005-10-4A1 | | | 5.75% | | | | 11/25/2035 | | | | 8,773,554 | |
| | 8,177,100 | | | Series 2005-5-2CB1 | | | 6.00% | | | | 06/25/2035 | | | | 6,548,381 | |
| | 14,450,914 | | | Series 2005-6-2CB2 | | | 6.00% | | | | 07/25/2035 | | | | 13,043,540 | |
| | 5,757,026 | | | Series 2005-6-4CB1 | | | 6.50% | | | | 07/25/2035 | | | | 4,770,747 | |
| | 5,551,791 | | | Series 2005-8-2CB1 | | | 6.00% | | | | 09/25/2035 | | | | 4,538,875 | |
| | 4,526,961 | | | Series 2006-5-CB14 | | | 6.00% | # | | | 06/25/2046 | | | | 3,172,977 | |
| | 8,019,598 | | | Series 2006-6-CB3 | | | 6.00% | | | | 06/25/2046 | | | | 6,226,572 | |
| | 24,250,000 | | | Series 2006-7-A4 | | | 6.00% | # | | | 10/25/2036 | | | | 16,139,139 | |
| | 13,232,498 | | | Series 2006-8-1A1 | | | 6.26% | #I/F I/O | | | 11/25/2036 | | | | 2,332,548 | |
| | 4,570,516 | | | Series 2006-8-1A2 | | | 0.69% | # | | | 11/25/2036 | | | | 2,542,322 | |
| | 20,595,119 | | | Series 2006-9-1CB1 | | | 6.00% | | | | 01/25/2037 | | | | 13,762,122 | |
| | 3,445,984 | | | Series 2007-2-2A1 | | | 6.00% | | | | 06/25/2037 | | | | 1,950,906 | |
| |
| | | | Banc of America Commercial Mortgage, Inc., | |
| | 5,303,000 | | | Series 2002-2-G | | | 5.85% | ^ | | | 07/11/2043 | | | | 5,370,974 | |
| | 236,917,192 | | | Series 2005-4-XP | | | 0.35% | # I/O | | | 07/10/2045 | | | | 306,097 | |
| | 255,498,198 | | | Series 2006-1-XP | | | 0.35% | # I/O | | | 09/10/2045 | | | | 493,623 | |
| | | | | | | | | | | | | | | | |
PRINCIPAL
AMOUNT | | | SECURITY DESCRIPTION | | RATE | | | MATURITY | | | VALUE $ | |
| |
| | | | Banc of America Commercial Mortgage, Inc., (Cont.) | |
| $ | 108,440,121 | | | Series 2006-4-XP | | | 0.61% | # I/O | | | 07/10/2046 | | | | 658,448 | |
| | 334,442,425 | | | Series 2007-5-XW | | | 0.58% | #^ I/O | | | 02/10/2051 | | | | 5,112,621 | |
| |
| | | | Banc of America Funding Corporation, | |
| | 367,764 | | | Series 2005-6-2A9 | | | 5.50% | | | | 10/25/2035 | | | | 370,232 | |
| | 24,918,339 | | | Series 2006-2-3A1 | | | 6.00% | | | | 03/25/2036 | | | | 23,534,736 | |
| | 925,380 | | | Series 2006-2-4A1 | | | 22.07% | #I/F | | | 03/25/2036 | | | | 1,129,655 | |
| | 4,091,469 | | | Series 2006-2-6A2 | | | 5.50% | | | | 03/25/2036 | | | | 4,056,188 | |
| | 8,053,938 | | | Series 2006-3-6A1 | | | 6.32% | # | | | 03/25/2036 | | | | 8,240,084 | |
| | 5,026,806 | | | Series 2006-7-T2A5 | | | 6.04% | # | | | 10/25/2036 | | | | 3,058,580 | |
| | 5,147,681 | | | Series 2006-7-T2A8 | | | 5.91% | # | | | 10/25/2036 | | | | 3,109,068 | |
| | 4,743,186 | | | Series 2006-8T2-A8 | | | 6.10% | # | | | 10/25/2036 | | | | 3,241,555 | |
| | 2,660,797 | | | Series 2006-B-7A1 | | | 5.59% | # | | | 03/20/2036 | | | | 2,128,841 | |
| | 25,119,237 | | | Series 2006-D-6A1 | | | 5.27% | # | | | 05/20/2036 | | | | 16,087,779 | |
| | 2,684,166 | | | Series 2006-G-2A1 | | | 0.46% | # | | | 07/20/2036 | | | | 2,149,154 | |
| | 1,404,948 | | | Series 2006-H-3A1 | | | 5.98% | # | | | 09/20/2046 | | | | 1,010,384 | |
| | 3,180,485 | | | Series 2007-1-TA10 | | | 5.84% | # | | | 01/25/2037 | | | | 1,983,877 | |
| | 4,436,723 | | | Series 2007-3-TA1B | | | 5.83% | # | | | 04/25/2037 | | | | 3,161,700 | |
| | 6,017,729 | | | Series 2007-5-1A1 | | | 5.50% | | | | 07/25/2037 | | | | 4,280,675 | |
| | 6,657,890 | | | Series 2009-R14-3A | | | 16.00% | #^ I/F | | | 06/26/2035 | | | | 7,426,541 | |
| | 6,107,936 | | | Series 2009-R15A-4A2 | | | 5.75% | ^ | | | 12/26/2036 | | | | 3,703,901 | |
| | 4,849,231 | | | Series 2010-R1-3A | | | 13.91% | #^ I/F | | | 07/26/2036 | | | | 4,201,859 | |
| |
| | | | Banc of America Mortgage Securities, Inc., | |
| | 5,182,677 | | | Series 2004-K-4A1 | | | 5.25% | # | | | 12/25/2034 | | | | 4,825,894 | |
| | 18,693,438 | | | Series 2006-1-A9 | | | 6.00% | | | | 05/25/2036 | | | | 15,491,402 | |
| | 6,458,077 | | | Series 2007-1-2A5 | | | 5.75% | | | | 01/25/2037 | | | | 6,321,847 | |
| |
| | | | BCAP LLC Trust, | |
| | 8,539,798 | | | Series 2007-AA2-2A7 | | | 6.00% | | | | 04/25/2037 | | | | 6,003,162 | |
| | 9,245,501 | | | Series 2007-AA2-2A8 | | | 5.75% | | | | 04/25/2037 | | | | 6,381,503 | |
| | 18,000,000 | | | Series 2008-RR3-A1B | | | 6.62% | # | | | 10/25/2036 | | | | 13,700,817 | |
| | 7,486,436 | | | Series 2010-RR10-5A1 | | | 7.78% | #^ | | | 04/27/2037 | | | | 6,101,445 | |
| | 13,735,685 | | | Series 2010-RR12-3A15 | | | 7.39% | #^ | | | 08/26/2037 | | | | 12,876,813 | |
| | 3,350,000 | | | Series 2010-RR5-2A3 | | | 6.10% | #^ | | | 04/26/2037 | | | | 3,063,240 | |
| |
| | | | BCRR Trust, | |
| | 10,500,000 | | | Series 2010-LEAF-32A | | | 4.23% | ^ | | | 12/22/2032 | | | | 10,458,903 | |
| |
| | | | Bear Stearns Adjustable Rate Mortgage Trust, | |
| | 23,586,515 | | | Series 2006-4-4A1 | | | 5.65% | # | | | 10/25/2046 | | | | 18,416,268 | |
| |
| | | | Bear Stearns Alt-A Trust, | |
| | 7,055,875 | | | Series 2004-11-2A3 | | | 2.74% | # | | | 11/25/2034 | | | | 5,788,615 | |
| | 31,024,482 | | | Series 2006-6-2A1 | | | 4.99% | # | | | 11/25/2036 | | | | 18,791,917 | |
| |
| | | | Bear Stearns Asset Backed Securities Trust, | |
| | 19,075,927 | | | Series 2004-AC4-A2 | | | 5.50% | # | | | 08/25/2034 | | | | 19,535,562 | |
| | 48,179,469 | | | Series 2005-AC2-1A | | | 5.25% | # | | | 04/25/2035 | | | | 44,894,641 | |
| | 15,508,228 | | | Series 2005-AC2-2A1 | | | 5.25% | # | | | 04/25/2035 | | | | 14,400,219 | |
| | 24,363,485 | | | Series 2006-AC1-1A1 | | | 5.75% | # | | | 02/25/2036 | | | | 16,320,611 | |
| | 3,435,926 | | | Series 2007-SD1-1A2A | | | 6.00% | | | | 10/25/2036 | | | | 2,465,258 | |
| | 1,866,649 | | | Series 2007-SD1-1A3A | | | 6.50% | | | | 10/25/2036 | | | | 1,239,133 | |
| | 10,649,887 | | | Series 2007-SD1-23A1 | | | 5.53% | # | | | 10/25/2036 | | | | 7,528,847 | |
| |
| | | | Bear Stearns Commercial Mortgage Securities, Inc., | |
| | 2,041,141 | | | Series 2001-TOP2-C | | | 6.83% | # | | | 02/15/2035 | | | | 2,049,344 | |
| | 4,047,311 | | | Series 2002-TOP8-A2 | | | 4.83% | | | | 08/15/2038 | | | | 4,086,325 | |
| | 10,000,000 | | | Series 2004-BA5A-G | | | 0.94% | #^ | | | 09/15/2019 | | | | 9,982,580 | |
| | 11,000,000 | | | Series 2004-BA5A-H | | | 1.19% | #^ | | | 09/15/2019 | | | | 10,973,545 | |
| | 19,175,000 | | | Series 2004-PWR3-A4 | | | 4.72% | | | | 02/11/2041 | | | | 20,160,461 | |
| | 10,370,000 | | | Series 2004-PWR4-A3 | | | 5.47% | # | | | 06/11/2041 | | | | 11,143,898 | |
| | 38,525,969 | | | Series 2004-PWR5-X2 | | | 1.05% | # I/O | | | 07/11/2042 | | | | 181,727 | |
| | 101,324,329 | | | Series 2004-PWR6-X2 | | | 0.85% | # I/O | | | 11/11/2041 | | | | 507,128 | |
| | 16,500,000 | | | Series 2004-T14-A4 | | | 5.20% | # | | | 01/12/2041 | | | | 17,551,710 | |
| | 92,744,349 | | | Series 2004-T16-X2 | | | 0.95% | # I/O | | | 02/13/2046 | | | | 452,129 | |
| | 19,890,951 | | | Series 2005-PWR7-X2 | | | 0.39% | # I/O | | | 02/11/2041 | | | | 50,304 | |
| | 10,000,000 | | | Series 2007-PW17-AM | | | 5.92% | # | | | 06/11/2050 | | | | 10,511,125 | |
| | 12,815,000 | | | Series 2007-PW17-AMFL | | | 0.93% | #^ | | | 06/11/2050 | | | | 10,832,026 | |
| | 14,958,018 | | | Series 2007-T28-A2 | | | 5.59% | | | | 09/11/2042 | | | | 15,121,464 | |
| |
| | | | Capital Trust, | |
| | 20,553,184 | | | Series 2005-3A-A2 | | | 5.16% | ^ | | | 06/25/2035 | | | | 20,681,641 | |
| |
| | | | CD Commercial Mortgage Trust, | |
| | 4,258,175 | | | Series 2005-CD1-A2FL | | | 0.36% | # | | | 07/15/2044 | | | | 4,246,680 | |
| | 6,931,054 | | | Series 2006-CD2-AAB | | | 5.54% | # | | | 01/15/2046 | | | | 7,134,349 | |
| | 5,149,993 | | | Series 2007-CD4-ASB | | | 5.28% | | | | 12/11/2049 | | | | 5,367,266 | |
| | 560,758,638 | | | Series 2007-CD5-XP | | | 0.32% | #^ I/O | | | 11/15/2044 | | | | 2,830,710 | |
| | | | | | |
| The accompanying notes are an integral part of these financial statements | | Annual Report | | March 31, 2012 | | 9 |
Schedule of Investments DoubleLine Total Return Bond Fund (Cont.)
| | | | | | | | | | | | | | | | |
PRINCIPAL
AMOUNT | | | SECURITY DESCRIPTION | | RATE | | | MATURITY | | | VALUE $ | |
| |
| | | | Centex Home Equity, | |
| $ | 2,750,000 | | | Series 2004-A-AF5 | | | 5.43% | # | | | 01/25/2034 | | | | 2,717,363 | |
| |
| | | | Chase Funding Mortgage Loan Asset-Backed Certificates, | |
| | 4,088,871 | | | Series 2003-4-2M1 | | | 1.14% | # | | | 03/25/2033 | | | | 2,378,093 | |
| |
| | | | Chase Mortgage Finance Corporation, | |
| | 22,000,000 | | | Series 2005-A1-2A4 | | | 2.80% | # | | | 12/25/2035 | | | | 17,875,330 | |
| | 27,787,960 | | | Series 2007-A2-6A4 | | | 4.02% | # | | | 07/25/2037 | | | | 24,310,519 | |
| | 10,000,000 | | | Series 2007-S3-1A5 | | | 6.00% | | | | 05/25/2037 | | | | 8,279,445 | |
| | 4,971,177 | | | Series 2007-S3-2A1 | | | 5.50% | | | | 05/25/2037 | | | | 4,893,379 | |
| | 12,316,072 | | | Series 2007-S5-1A18 | | | 6.00% | | | | 07/25/2037 | | | | 10,315,277 | |
| |
| | | | Chaseflex Trust, | |
| | 1,928,562 | | | Series 2006-1-A2A | | | 5.94% | # | | | 06/25/2036 | | | | 1,885,716 | |
| | 8,378,327 | | | Series 2006-1-A5 | | | 6.16% | # | | | 06/25/2036 | | | | 7,844,820 | |
| | 13,331,898 | | | Series 2006-2-A2B | | | 0.44% | # | | | 09/25/2036 | | | | 8,641,790 | |
| | 10,682,448 | | | Series 2007-1-1A1 | | | 6.50% | | | | 02/25/2037 | | | | 6,541,071 | |
| | 22,354,549 | | | Series 2007-M1-2F4 | | | 6.35% | # | | | 08/25/2037 | | | | 15,408,756 | |
| |
| | | | Citi Mortgage Alternative Loan Trust, | |
| | 13,140,552 | | | Series 2006-A2-A2 | | | 6.00% | | | | 05/25/2036 | | | | 8,324,671 | |
| | 8,968,323 | | | Series 2006-A5-3A3 | | | 6.00% | | | | 10/25/2036 | | | | 6,678,652 | |
| | 13,710,486 | | | Series 2007-A1-1A5 | | | 6.00% | | | | 01/25/2037 | | | | 8,888,940 | |
| | 6,684,769 | | | Series 2007-A1-1A7 | | | 6.00% | | | | 01/25/2037 | | | | 4,333,947 | |
| | 17,103,840 | | | Series 2007-A1-1A9 | | | 5.16% | #I/F I/O | | | 01/25/2037 | | | | 2,933,290 | |
| | 15,375,039 | | | Series 2007-A3-1A1 | | | 6.00% | # | | | 03/25/2037 | | | | 10,865,271 | |
| | 35,382,889 | | | Series 2007-A3-1A3 | | | 5.16% | #I/F I/O | | | 03/25/2037 | | | | 5,996,324 | |
| | 13,865,796 | | | Series 2007-A3-1A4 | | | 5.75% | | | | 03/25/2037 | | | | 9,630,814 | |
| | 3,623,904 | | | Series 2007-A5-1A11 | | | 6.00% | | | | 05/25/2037 | | | | 2,550,690 | |
| | 1,909,884 | | | Series 2007-A8-A1 | | | 6.00% | | | | 10/25/2037 | | | | 1,401,683 | |
| |
| | | | Citicorp Mortgage Securities, Inc., | |
| | 31,719,661 | | | Series 2005-1-1A4 | | | 5.50% | | | | 02/25/2035 | | | | 32,226,780 | |
| | 6,903,552 | | | Series 2006-7-1A1 | | | 6.00% | | | | 12/25/2036 | | | | 6,129,516 | |
| |
| | | | Citicorp Residential Mortgage Securities, Inc., | |
| | 6,594,000 | | | Series 2006-2-A5 | | | 6.04% | # | | | 09/25/2036 | | | | 5,550,829 | |
| |
| | | | Citigroup Commercial Mortgage Trust, | |
| | 8,409,649 | | | Series 2006-C4-ASB | | | 5.92% | # | | | 03/15/2049 | | | | 8,949,409 | |
| | 5,220,575 | | | Series 2006-C5-AMP3 | | | 5.68% | #^ | | | 10/15/2049 | | | | 4,903,898 | |
| | 7,000,000 | | | Series 2009-RR1-CA4B | | | 5.32% | # ^ | | | 12/17/2049 | | | | 7,004,407 | |
| |
| | | | Citigroup Mortgage Loan Trust, Inc., | |
| | 6,263,092 | | | Series 2005-5-2A2 | | | 5.75% | | | | 08/25/2035 | | | | 4,471,732 | |
| | 2,876,026 | | | Series 2005-9-21A1 | | | 5.50% | | | | 11/25/2035 | | | | 2,294,614 | |
| | 7,506,436 | | | Series 2006-FX1-A6 | | | 5.85% | # | | | 10/25/2036 | | | | 4,987,231 | |
| | 3,825,000 | | | Series 2006-WF1-A2D | | | 5.92% | # | | | 03/25/2036 | | | | 2,202,850 | |
| | 21,282,978 | | | Series 2006-WF2-A2D | | | 6.16% | # | | | 05/25/2036 | | | | 12,092,616 | |
| | 2,132,869 | | | Series 2007-12-2A1 | | | 6.50% | ^ | | | 10/25/2036 | | | | 1,434,489 | |
| | 2,222,541 | | | Series 2007-2-2A | | | 6.00% | | | | 11/25/2036 | | | | 2,138,424 | |
| | 2,747,739 | | | Series 2007-9-2A2 | | | 6.50% | ^ | | | 05/25/2037 | | | | 1,417,833 | |
| | 9,179,907 | | | Series 2007-OPX1-A3A | | | 5.97% | # | | | 01/25/2037 | | | | 4,750,409 | |
| | 103,383,695 | | | Series 2007-WFH3-A2 | | | 0.40% | # | | | 06/25/2037 | | | | 76,236,739 | |
| | 20,000,000 | | | Series 2008-AR4-1A1B | | | 3.04% | # ^ | | | 11/25/2038 | | | | 11,188,950 | |
| | 4,562,003 | | | Series 2010-12-3A1 | | | 4.00% | ^ | | | 04/25/2037 | | | | 4,662,824 | |
| | 4,152,827 | | | Series 2010-2-5A1 | | | 5.50% | # ^ | | | 12/25/2035 | | | | 4,287,409 | |
| | 205,000,000 | | | Series 2010-8-5A4 | | | 11.27% | # ^ | | | 11/25/2036 | | | | 146,574,999 | |
| | 35,636,905 | | | Series 2010-8-5A6 | | | 4.00% | ^ | | | 11/25/2036 | | | | 36,671,783 | |
| | 171,000,000 | | | Series 2010-8-6A4 | | | 9.57% | # ^ | | | 12/25/2036 | | | | 113,928,749 | |
| | 161,494,456 | | | Series 2010-8-76I2 | | | 1.00% | ^ I/O | | | 06/25/2037 | | | | 3,718,426 | |
| | 151,506,267 | | | Series 2010-8-7A4 | | | 9.26% | # ^ | | | 06/25/2037 | | | | 107,281,587 | |
| | 10,058,213 | | | Series 2011-12-1A1 | | | 3.50% | # ^ | | | 04/25/2036 | | | | 10,132,710 | |
| | 13,654,060 | | | Series 2011-12-3A1 | | | 5.59% | ^ | | | 09/25/2047 | | | | 13,791,304 | |
| |
| | | | Commercial Mortgage Acceptance Corporation, | |
| | 20,183,738 | | | Series 1998-C2-F | | | 5.44% | # ^ | | | 09/15/2030 | | | | 20,971,045 | |
| |
| | | | Commercial Mortgage Pass-Through Certificates, | |
| | 97,520,000 | | | Series 2002-LC4-XA | | | 2.72% | # ^ I/O | | | 12/10/2044 | | | | 15,512,506 | |
| | 308,623,006 | | | Series 2005-LP5-XC | | | 0.23 | # ^ I/O | | | 05/10/2043 | | | | 2,979,755 | |
| | 2,500,000 | | | Series 2006-CN2A-A2FX | | | 5.45% | ^ | | | 02/05/2019 | | | | 2,432,413 | |
| | 1,346,220 | | | Series 2007-C9-A2 | | | 5.81% | # | | | 12/10/2049 | | | | 1,353,231 | |
| |
| | | | Countrywide Alternative Loan Trust, | |
| | 58,680,472 | | | Series 2004-36CB-1A1 | | | 6.00% | | | | 02/25/2035 | | | | 49,495,599 | |
| | 14,513,108 | | | Series 2005-20CB-2A1 | | | 0.74% | # | | | 07/25/2035 | | | | 10,052,766 | |
| | 29,630,929 | | | Series 2005-20CB-2A2 | | | 4.76% | # I/F I/O | | | 07/25/2035 | | | | 3,753,699 | |
| | | | | | | | | | | | | | | | |
PRINCIPAL
AMOUNT | | | SECURITY DESCRIPTION | | RATE | | | MATURITY | | | VALUE $ | |
| |
| | | | Countrywide Alternative Loan Trust, (Cont.) | |
| $ | 4,730,907 | | | Series 2005-20CB-4A1 | | | 5.25% | | | | 07/25/2020 | | | | 4,575,270 | |
| | 10,687,216 | | | Series 2005-26CB-A11 | | | 12.61% | # I/F | | | 07/25/2035 | | | | 10,837,614 | |
| | 15,131,043 | | | Series 2005-28CB-1A2 | | | 0.99% | # | | | 08/25/2035 | | | | 10,411,875 | |
| | 3,670,488 | | | Series 2005-28CB-3A6 | | | 6.00% | | | | 08/25/2035 | | | | 2,570,791 | |
| | 1,935,854 | | | Series 2005-60T1-A7 | | | 34.16% | # I/F | | | 12/25/2035 | | | | 3,073,819 | |
| | 2,789,314 | | | Series 2005-64CB-1A14 | | | 5.50% | | | | 12/25/2035 | | | | 1,976,236 | |
| | 40,483,404 | | | Series 2005-64CB-1A4 | | | 5.50% | | | | 12/25/2035 | | | | 28,682,593 | |
| | 7,154,321 | | | Series 2005-73CB-1A5 | | | 1.04% | # | | | 01/25/2036 | | | | 4,626,016 | |
| | 17,998,791 | | | Series 2005-73CB-1A6 | | | 4.46% | # I/F I/O | | | 01/25/2036 | | | | 2,305,998 | |
| | 3,895,399 | | | Series 2005-79CB-A5 | | | 5.50% | | | | 01/25/2036 | | | | 2,426,637 | |
| | 8,323,262 | | | Series 2005-85CB-2A6 | | | 20.75% | # I/F | | | 02/25/2036 | | | | 10,519,595 | |
| | 5,188,809 | | | Series 2005-86CB-A5 | | | 5.50% | | | | 02/25/2036 | | | | 3,610,137 | |
| | 11,113,981 | | | Series 2005-J10-1A11 | | | 5.50% | | | | 10/25/2035 | | | | 8,975,006 | |
| | 2,739,158 | | | Series 2005-J10-1A13 | | | 0.94% | # | | | 10/25/2035 | | | | 1,752,909 | |
| | 1,582,908 | | | Series 2005-J10-1A15 | | | 5.50% | | | | 10/25/2035 | | | | 1,452,876 | |
| | 4,128,144 | | | Series 2005-J11-1A3 | | | 5.50% | | | | 11/25/2035 | | | | 3,885,087 | |
| | 3,356,243 | | | Series 2005-J11-6A1 | | | 6.50% | | | | 09/25/2032 | | | | 2,931,126 | |
| | 4,874,521 | | | Series 2005-J13-2A5 | | | 0.72% | # | | | 11/25/2035 | | | | 3,542,648 | |
| | 9,749,041 | | | Series 2005-J13-2A6 | | | 4.78% | # I/F I/O | | | 11/25/2035 | | | | 1,306,048 | |
| | 7,479,655 | | | Series 2005-J1-7A1 | | | 5.50% | | | | 01/25/2020 | | | | 6,876,013 | |
| | 4,241,440 | | | Series 2005-J2-1A5 | | | 0.74% | # | | | 04/25/2035 | | | | 3,093,687 | |
| | 13,050,584 | | | Series 2005-J2-1A6 | | | 4.76% | # I/F I/O | | | 04/25/2035 | | | | 1,955,663 | |
| | 10,583,420 | | | Series 2006-12CB-A3 | | | 5.75% | # | | | 05/25/2036 | | | | 6,226,707 | |
| | 4,962,102 | | | Series 2006-15CB-A1 | | | 6.50% | | | | 06/25/2036 | | | | 3,000,266 | |
| | 3,991,963 | | | Series 2006-18CB-A12 | | | 0.84% | # | | | 07/25/2036 | | | | 1,928,078 | |
| | 3,991,963 | | | Series 2006-18CB-A13 | | | 5.26% | # I/F I/O | | | 07/25/2036 | | | | 688,874 | |
| | 3,882,154 | | | Series 2006-19CB-A15 | | | 6.00% | | | | 08/25/2036 | | | | 2,931,368 | |
| | 6,261,151 | | | Series 2006-24CB-A11 | | | 5.75% | | | | 06/25/2036 | | | | 4,061,399 | |
| | 17,485,393 | | | Series 2006-24CB-A14 | | | 6.91% | # I/F I/O | | | 06/25/2036 | | | | 4,164,064 | |
| | 14,694,760 | | | Series 2006-24CB-A22 | | | 6.00% | | | | 06/25/2036 | | | | 9,695,860 | |
| | 15,771,892 | | | Series 2006-24CB-A5 | | | 0.84% | # | | | 06/25/2036 | | | | 7,917,238 | |
| | 5,940,989 | | | Series 2006-26CB-A17 | | | 6.25% | | | | 09/25/2036 | | | | 3,473,741 | |
| | 7,568,927 | | | Series 2006-26CB-A9 | | | 6.50% | | | | 09/25/2036 | | | | 4,728,089 | |
| | 16,032,052 | | | Series 2006-29T1-1A2 | | | 6.25% | | | | 10/25/2036 | | | | 10,417,699 | |
| | 2,037,886 | | | Series 2006-29T1-2A12 | | | 44.58% | # I/F | | | 10/25/2036 | | | | 3,447,840 | |
| | 1,248,248 | | | Series 2006-29T1-2A23 | | | 32.32% | # I/F | | | 10/25/2036 | | | | 1,823,076 | |
| | 14,448,718 | | | Series 2006-30T1-1A2 | | | 6.25% | | | | 11/25/2036 | | | | 11,377,015 | |
| | 9,173,134 | | | Series 2006-32CB-A1 | | | 0.91% | # | | | 11/25/2036 | | | | 4,485,667 | |
| | 15,300,788 | | | Series 2006-32CB-A2 | | | 5.09% | # I/F I/O | | | 11/25/2036 | | | | 2,487,983 | |
| | 5,965,532 | | | Series 2006-36T2-2A1 | | | 6.25% | | | | 12/25/2036 | | | | 3,960,347 | |
| | 5,369,999 | | | Series 2006-39CB-1A10 | | | 6.00% | | | | 01/25/2037 | | | | 3,614,799 | |
| | 26,634,649 | | | Series 2006-39CB-2A2 | | | 6.31% | # I/F I/O | | | 01/25/2037 | | | | 5,672,664 | |
| | 9,070,355 | | | Series 2006-39CB-2A4 | | | 0.69% | # | | | 01/25/2037 | | | | 1,635,598 | |
| | 9,298,768 | | | Series 2006-40T1-1A11 | | | 6.00% | | | | 01/25/2037 | | | | 6,702,733 | |
| | 14,313,600 | | | Series 2006-40T1-1A4 | | | 5.21% | # I/F I/O | | | 01/25/2037 | | | | 2,254,943 | |
| | 10,387,906 | | | Series 2006-45T1-1A4 | | | 0.84% | # | | | 02/25/2037 | | | | 5,233,126 | |
| | 10,387,906 | | | Series 2006-45T1-1A5 | | | 5.16% | # I/F I/O | | | 02/25/2037 | | | | 1,742,817 | |
| | 4,584,948 | | | Series 2006-6CB-1A4 | | | 5.50% | | | | 05/25/2036 | | | | 3,338,548 | |
| | 28,569,319 | | | Series 2006-J1-1A3 | | | 5.50% | | | | 02/25/2036 | | | | 20,165,768 | |
| | 4,360,828 | | | Series 2006-J4-2A2 | | | 6.00% | | | | 07/25/2036 | | | | 2,836,516 | |
| | 2,721,498 | | | Series 2007-11T1-A24 | | | 38.45% | # I/F | | | 05/25/2037 | | | | 4,550,762 | |
| | 28,645,213 | | | Series 2007-16CB-2A1 | | | 0.69% | # | | | 08/25/2037 | | | | 12,487,365 | |
| | 8,294,938 | | | Series 2007-16CB-2A2 | | | 52.57% | # I/F | | | 08/25/2037 | | | | 18,254,477 | |
| | 27,398,250 | | | Series 2007-17CB-1A10 | | | 28.79% | # I/F | | | 08/25/2037 | | | | 43,722,382 | |
| | 4,518,742 | | | Series 2007-18CB-2A25 | | | 6.00% | | | | 08/25/2037 | | | | 3,263,243 | |
| | 2,506,543 | | | Series 2007-19-1A10 | | | 37.55% | # I/F | | | 08/25/2037 | | | | 3,740,853 | |
| | 61,595,163 | | | Series 2007-19-2A1 | | | 6.50% | | | | 08/25/2037 | | | | 34,250,021 | |
| | 13,231,634 | | | Series 2007-21CB-2A2 | | | 27.43% | # I/F | | | 09/25/2037 | | | | 17,199,097 | |
| | 49,563,590 | | | Series 2007-22-2A16 | | | 6.50% | | | | 09/25/2037 | | | | 34,661,801 | |
| | 23,095,188 | | | Series 2007-4CB-2A1 | | | 7.00% | | | | 03/25/2037 | | | | 8,535,959 | |
| | 16,617,788 | | | Series 2007-5CB-1A18 | | | 5.41% | # I/FI/O | | | 04/25/2037 | | | | 3,040,946 | |
| | 16,617,789 | | | Series 2007-5CB-1A23 | | | 0.79% | # | | | 04/25/2037 | | | | 7,859,583 | |
| | 1,162,015 | | | Series 2007-8CB-A12 | | | 38.75% | # I/F | | | 05/25/2037 | | | | 1,876,257 | |
| | 1,240,433 | | | Series 2007-8CB-A8 | | | 38.63% | # I/F | | | 05/25/2037 | | | | 1,989,929 | |
| | 1,714,928 | | | Series 2007-9T1-1A4 | | | 0.74% | # | | | 05/25/2037 | | | | 786,336 | |
| | 1,714,928 | | | Series 2007-9T1-1A5 | | | 5.26% | # I/F I/O | | | 05/25/2037 | | | | 258,800 | |
| | 46,974,224 | | | Series 2007-9T1-1A6 | | | 6.00% | | | | 05/25/2037 | | | | 30,507,903 | |
| | 4,845,915 | | | Series 2007-9T1-2A1 | | | 6.00% | | | | 05/25/2037 | | | | 3,194,406 | |
| | 5,684,239 | | | Series 2007-9T1-3A1 | | | 5.50% | | | | 05/25/2022 | | | | 5,050,531 | |
| | 27,432,533 | | | Series 2007-HY5R-2A1A | | | 5.54% | # | | | 03/25/2047 | | | | 26,498,771 | |
| |
| | | | Countrywide Asset-Backed Certificates, | |
| | 6,970,439 | | | Series 2003-BC6-M1 | | | 1.07% | # | | | 11/25/2033 | | | | 6,135,864 | |
| | 3,673,360 | | | Series 2005-13-AF3 | | | 5.43% | # | | | 04/25/2036 | | | | 2,759,846 | |
| | 3,153,692 | | | Series 2006-2-2A2 | | | 0.43% | # | | | 06/25/2036 | | | | 2,698,864 | |
| | | | | | |
| 10 | | DoubleLine Funds | | | | The accompanying notes are an integral part of these financial statements |
| | | | | | | | | | | | | | | | |
PRINCIPAL
AMOUNT | | | SECURITY DESCRIPTION | | RATE | | | MATURITY | | | VALUE $ | |
| |
| | | | Countrywide Home Loans, | |
| $ | 9,301,476 | | | Series 2002-32-2A6 | | | 5.00% | | | | 01/25/2018 | | | | 9,575,075 | |
| | 12,708,642 | | | Series 2005-20-A8 | | | 5.25% | | | | 10/25/2035 | | | | 10,858,708 | |
| | 44,812,669 | | | Series 2005-23-A1 | | | 5.50% | | | | 11/25/2035 | | | | 40,486,925 | |
| | 3,722,972 | | | Series 2005-27-2A1 | | | 5.50% | | | | 12/25/2035 | | | | 3,317,275 | |
| | 6,887,824 | | | Series 2005-28-A7 | | | 5.25% | | | | 01/25/2019 | | | | 5,999,453 | |
| | 59,587,093 | | | Series 2005-HYB1-4A1 | | | 2.84% | # | | | 03/25/2035 | | | | 43,249,325 | |
| | 5,617,646 | | | Series 2005-HYB8-1A1 | | | 2.68% | # | | | 12/20/2035 | | | | 3,950,363 | |
| | 14,070,932 | | | Series 2005-J3-2A4 | | | 4.50% | | | | 09/25/2035 | | | | 11,871,505 | |
| | 9,700,000 | | | Series 2005-J4-A5 | | | 5.50% | | | | 11/25/2035 | | | | 8,705,823 | |
| | 3,250,670 | | | Series 2005-R1-1AF1 | | | 0.60% | #^ | | | 03/25/2035 | | | | 2,558,503 | |
| | 3,291,150 | | | Series 2005-R1-1AS | | | 5.69% | #^ I/O | | | 03/25/2035 | | | | 454,804 | |
| | 6,112,333 | | | Series 2006-J3-A4 | | | 5.50% | | | | 05/25/2036 | | | | 5,779,339 | |
| | 2,960,972 | | | Series 2007-15-1A16 | | | 6.25% | | | | 09/25/2037 | | | | 2,565,818 | |
| | 12,855,439 | | | Series 2007-15-1A29 | | | 6.25% | | | | 09/25/2037 | | | | 11,101,089 | |
| | 3,437,941 | | | Series 2007-18-1A1 | | | 6.00% | | | | 11/25/2037 | | | | 3,100,171 | |
| | 41,342,306 | | | Series 2007-7-A1 | | | 6.00% | | | | 06/25/2037 | | | | 36,381,953 | |
| | 13,112,448 | | | Series 2007-7-A2 | | | 5.75% | | | | 06/25/2037 | | | | 11,547,090 | |
| | 25,529,480 | | | Series 2007-8-1A4 | | | 6.00% | | | | 01/25/2038 | | | | 20,837,328 | |
| | 7,000,000 | | | Series 2007-9-A11 | | | 5.75% | | | | 07/25/2037 | | | | 6,107,710 | |
| | 68,095,670 | | | Series 2007-J1-2A1 | | | 6.00% | | | | 02/25/2037 | | | | 47,982,013 | |
| | 3,201,367 | | | Series 2007-J3-A1 | | | 0.74% | # | | | 07/25/2037 | | | | 2,077,492 | |
| | 16,006,834 | | | Series 2007-J3-A2 | | | 5.26% | # I/F I/O | | | 07/25/2037 | | | | 2,746,121 | |
| |
| | | | Credit Suisse First Boston Mortgage Backed Trust, | |
| | 7,319,131 | | | Series 2006-3-A4B | | | 6.11% | # | | | 11/25/2036 | | | | 4,112,558 | |
| | 5,364,929 | | | Series 2006-4-A6A | | | 5.68% | # | | | 12/25/2036 | | | | 3,128,277 | |
| | 17,110,916 | | | Series 2007-1-1A1A | | | 5.90% | # | | | 05/25/2037 | | | | 9,293,691 | |
| |
| | | | Credit Suisse First Boston Mortgage Securities Corporation, | |
| | 3,050,000 | | | Series 1998-C2-F | | | 6.75% | #^ | | | 11/15/2030 | | | | 3,309,980 | |
| | 7,887,000 | | | Series 2001-CF2-F | | | 6.56% | ^ | | | 02/15/2034 | | | | 7,860,618 | |
| | 1,235,000 | | | Series 2001-CF2-G | | | 6.93% | ^ | | | 02/15/2034 | | | | 1,219,411 | |
| | 642,460 | | | Series 2002-34-CB2 | | | 5.87% | # | | | 01/25/2033 | | | | 581,695 | |
| | 209,230 | | | Series 2002-CKN2-A3 | | | 6.13% | | | | 04/15/2037 | | | | 209,060 | |
| | 14,867,607 | | | Series 2002-CKS4-A2 | | | 5.18% | | | | 11/15/2036 | | | | 14,993,737 | |
| | 4,567,977 | | | Series 2003-CPN1-A2 | | | 4.60% | | | | 03/15/2035 | | | | 4,651,865 | |
| | 532,508 | | | Series 2004-AR8-2A1 | | | 2.71% | # | | | 09/25/2034 | | | | 526,321 | |
| | 6,702,959 | | | Series 2005-10-5A4 | | | 5.50% | | | | 11/25/2035 | | | | 5,024,960 | |
| | 1,992,259 | | | Series 2005-10-5A5 | | | 5.50% | | | | 11/25/2035 | | | | 1,545,597 | |
| | 15,761,867 | | | Series 2005-12-7A1 | | | 7.00% | | | | 01/25/2036 | | | | 7,212,788 | |
| | 2,780,304 | | | Series 2005-5-2A11 | | | 5.00% | | | | 07/25/2035 | | | | 2,769,347 | |
| | 188,235,819 | | | Series 2005-C2-ASP | | | 0.74% | #^ I/O | | | 04/15/2037 | | | | 91,106 | |
| | 10,277,652 | | | Series 2005-C4-A3 | | | 5.12% | # | | | 08/15/2038 | | | | 10,304,152 | |
| | 57,164,307 | | | Series 2005-C4-ASP | | | 0.39% | #^ I/O | | | 08/15/2038 | | | | 56,993 | |
| |
| | | | Credit Suisse Mortgage Capital Certificates, | |
| | 8,697,446 | | | Series 2005-1R-2A5 | | | 5.75% | ^ | | | 12/26/2035 | | | | 6,987,380 | |
| | 37,832,328 | | | Series 2006-1-2A1 | | | 6.00% | | | | 02/25/2036 | | | | 26,675,159 | |
| | 6,216,883 | | | Series 2006-2-3A1 | | | 6.50% | | | | 03/25/2036 | | | | 3,861,309 | |
| | 7,516,789 | | | Series 2006-2-5A1 | | | 0.94% | # | | | 03/25/2036 | | | | 4,198,878 | |
| | 42,015,395 | | | Series 2006-2-5A2 | | | 5.06% | # I/F I/O | | | 03/25/2036 | | | | 7,718,568 | |
| | 23,685,731 | | | Series 2006-2-5A4 | | | 6.00% | | | | 03/25/2036 | | | | 17,095,389 | |
| | 7,209,024 | | | Series 2006-3-4A3 | | | 5.50% | | | | 04/25/2036 | | | | 6,419,848 | |
| | 9,708,213 | | | Series 2006-4-1A8 | | | 6.00% | # | | | 05/25/2036 | | | | 6,010,476 | |
| | 33,940,951 | | | Series 2006-4-4A1 | | | 7.00% | | | | 05/25/2036 | | | | 14,896,191 | |
| | 32,132,139 | | | Series 2006-4-6A1 | | | 6.00% | | | | 05/25/2036 | | | | 27,860,958 | |
| | 27,756,748 | | | Series 2006-6-1A4 | | | 6.00% | | | | 07/25/2036 | | | | 19,389,088 | |
| | 16,438,712 | | | Series 2006-6-3A1 | | | 7.00% | | | | 07/25/2036 | | | | 6,221,773 | |
| | 1,140,941 | | | Series 2006-7-3A11 | | | 6.00% | | | | 08/25/2036 | | | | 923,509 | |
| | 3,384,352 | | | Series 2006-9-2A1 | | | 5.50% | | | | 11/25/2036 | | | | 2,931,952 | |
| | 11,349,771 | | | Series 2006-9-4A1 | | | 6.00% | | | | 11/25/2036 | | | | 10,058,831 | |
| | 4,805,246 | | | Series 2006-9-6A15 | | | 38.45% | # I/F | | | 11/25/2036 | | | | 7,348,017 | |
| | 5,963,456 | | | Series 2006-TF2A-SVA1 | | | 0.47% | #^ | | | 10/15/2021 | | | | 5,618,240 | |
| | 15,535,993 | | | Series 2007-1-1A4 | | | 6.13% | # | | | 02/25/2037 | | | | 9,589,739 | |
| | 32,512,710 | | | Series 2007-1-3A1 | | | 6.00% | | | | 02/25/2022 | | | | 25,292,190 | |
| | 18,378,040 | | | Series 2007-1-5A14 | | | 6.00% | | | | 02/25/2037 | | | | 14,324,065 | |
| | 4,180,984 | | | Series 2007-2-2A1 | | | 5.00% | | | | 03/25/2037 | | | | 4,086,626 | |
| | 11,112,517 | | | Series 2007-5-2A5 | | | 5.00% | | | | 08/25/2037 | | | | 9,499,569 | |
| | 1,357,495,400 | | | Series 2007-C1-ASP | | | 0.57% | # I/O | | | 02/15/2040 | | | | 10,194,790 | |
| | 5,125,847 | | | Series 2009-1R-4A2 | | | 4.86% | #^ | | | 07/20/2035 | | | | 3,915,732 | |
| | 7,303,608 | | | Series 2010-1R-5A1 | | | 5.00% | #^ | | | 01/27/2036 | | | | 7,570,536 | |
| | 64,085,130 | | | Series 2010-2R-4A17 | | | 8.01% | #^ | | | 03/26/2037 | | | | 36,989,424 | |
| | 97,400,000 | | | Series 2010-4R-3A17 | | | 9.94% | #^ | | | 06/26/2037 | | | | 67,561,413 | |
| | 48,088,546 | | | Series 2010-4R-8A17 | | | 9.94% | #^ | | | 06/26/2037 | | | | 33,812,331 | |
| | 11,053,210 | | | Series 2010-6R-2A6A | | | 6.25% | ^ | | | 07/26/2037 | | | | 11,132,622 | |
| | 34,804,009 | | | Series 2010-7R-4A17 | | | 8.22% | #^ | | | 04/26/2037 | | | | 22,436,178 | |
| | | | | | | | | | | | | | | | |
PRINCIPAL
AMOUNT | | | SECURITY DESCRIPTION | | RATE | | | MATURITY | | | VALUE $ | |
| |
| | | | Credit-Based Asset Servicing and Securitization LLC, | |
| $ | 1,313,745 | | | Series 2005-CB6-A4 | | | 5.16% | # | | | 07/25/2035 | | | | 1,207,782 | |
| | 9,750,000 | | | Series 2007-MX1-A3 | | | 5.83% | #^ | | | 12/25/2036 | | | | 7,537,540 | |
| |
| | | | Crest Ltd., | |
| | 2,326,995 | | | Series 2003-2A-A1 | | | 0.95% | #^ | | | 12/28/2018 | | | | 2,143,744 | |
| |
| | | | DBUBS Mortgage Trust, | |
| | 205,360,869 | | | Series 2011-LC2A-XA | | | 1.62% | #^ I/O | | | 07/10/2044 | | | | 15,443,035 | |
| |
| | | | Deutsche ALT-A Securities, Inc. Mortgage Loan Trust, | |
| | 40,759,000 | | | Series 2005-4-A5 | | | 5.50% | # | | | 09/25/2035 | | | | 29,982,443 | |
| | 3,626,687 | | | Series 2005-5-1A6 | | | 34.16% | # I/F | | | 11/25/2035 | | | | 4,809,731 | |
| | 3,375,539 | | | Series 2005-5-2A1 | | | 0.44% | # | | | 11/25/2035 | | | | 1,637,226 | |
| | 10,187,743 | | | Series 2005-5-2A2 | | | 5.06% | # I/F I/O | | | 11/25/2035 | | | | 965,725 | |
| | 2,406,393 | | | Series 2006-AB2-A2 | | | 6.16% | # | | | 06/25/2036 | | | | 1,430,669 | |
| | 4,868,230 | | | Series 2006-AB4-A1A | | | 6.01% | # | | | 10/25/2036 | | | | 2,806,634 | |
| | 4,842,813 | | | Series 2006-AB4-A3 | | | 5.90% | # | | | 10/25/2036 | | | | 2,772,832 | |
| | 7,155,086 | | | Series 2006-AB4-A3A1 | | | 5.90% | # | | | 10/25/2036 | | | | 4,096,770 | |
| | 14,290,526 | | | Series 2006-AB4-A6A1 | | | 5.87% | # | | | 10/25/2036 | | | | 8,163,549 | |
| | 26,987,425 | | | Series 2006-AF1-A3 | | | 0.42% | # | | | 04/25/2036 | | | | 23,503,497 | |
| | 5,766,438 | | | Series 2007-1-1A2 | | | 0.40% | # | | | 08/25/2037 | | | | 5,567,516 | |
| | 68,000,000 | | | Series 2007-1-1A3A | | | 0.45% | # | | | 08/25/2037 | | | | 42,981,576 | |
| |
| | | | Deutsche Mortgage Securities, Inc., | |
| | 42,947,546 | | | Series 2006-PR1-3A1 | | | 11.79% | #^ I/F | | | 04/15/2036 | | | | 45,041,702 | |
| | 12,361,153 | | | Series 2006-PR1-4AI1 | | | 11.77% | #^ I/F | | | 04/15/2036 | | | | 13,525,924 | |
| | 20,270,568 | | | Series 2006-PR1-4AI2 | | | 14.14% | #^ I/F | | | 04/15/2036 | | | | 23,009,411 | |
| | 951,114 | | | Series 2006-PR1-5AI1 | | | 18.62% | #^ I/F | | | 04/15/2036 | | | | 1,072,770 | |
| | 8,219,554 | | | Series 2006-PR1-5AI3 | | | 12.23% | #^ I/F | | | 04/15/2036 | | | | 7,934,091 | |
| | 136,058,203 | | | Series 2006-PR1-5AI4 | | | 11.79% | #^ I/F | | | 04/15/2036 | | | | 146,512,029 | |
| |
| | | | DLJ Commercial Mortgage Corporation, | |
| | 1,158,406 | | | Series 1998-CF1-B4 | | | 7.60% | #^ | | | 02/15/2031 | | | | 1,185,606 | |
| | 4,000,000 | | | Series 2000-CKP1-B1 | | | 7.95% | # | | | 11/10/2033 | | | | 4,038,162 | |
| |
| | | | Ellington Loan Acquisition Trust, | |
| | 2,747,160 | | | Series 2007-1-A2A2 | | | 1.04% | #^ | | | 05/27/2037 | | | | 2,515,501 | |
| |
| | | | Extended Stay American Trust, | |
| | 35,675,676 | | | Series 2010-ESHA-A | | | 2.95% | ^ | | | 11/05/2027 | | | | 36,121,836 | |
| | 284,734,527 | | | Series 2010-ESHA-XA1 | | | 3.33% | #^ I/O | | | 01/05/2013 | | | | 6,047,192 | |
| | 102,500,000 | | | Series 2010-ESHA-XB1 | | | 1.37% | #^ I/O | | | 01/05/2016 | | | | 854,235 | |
| |
| | | | First Horizon Alternative Mortgage Securities, | |
| | 21,544,309 | | | Series 2005-AA4-1A1 | | | 2.35% | # | | | 05/25/2035 | | | | 14,386,643 | |
| | 3,998,809 | | | Series 2005-FA8-2A1 | | | 5.00% | | | | 11/25/2020 | | | | 3,861,322 | |
| | 1,063,017 | | | Series 2006-FA1-1A6 | | | 0.99% | # | | | 04/25/2036 | | | | 1,003,944 | |
| | 6,645,469 | | | Series 2006-FA2-1A5 | | | 6.00% | | | | 05/25/2036 | | | | 4,608,433 | |
| | 1,877,033 | | | Series 2006-FA7-A8 | | | 6.25% | | | | 12/25/2036 | | | | 1,374,651 | |
| | 21,834,986 | | | Series 2006-RE1-A1 | | | 5.50% | | | | 05/25/2035 | | | | 18,696,076 | |
| | 2,651,524 | | | Series 2007-FA3-A4 | | | 6.00% | | | | 06/25/2037 | | | | 1,732,736 | |
| | 2,811,692 | | | Series 2007-FA4-1A13 | | | 6.25% | | | | 08/25/2037 | | | | 1,800,070 | |
| | 4,078,310 | | | Series 2007-FA4-1A5 | | | 6.25% | | | | 08/25/2037 | | | | 2,610,970 | |
| |
| | | | First Horizon Asset Securities, Inc., | |
| | 722,757 | | | Series 2005-6-1A1 | | | 5.50% | | | | 11/25/2035 | | | | 731,360 | |
| |
| | | | First Union Commercial Mortgage Securities, Inc., | |
| | 4,636,001 | | | Series 2000-C2-G | | | 8.70% | # | | | 10/15/2032 | | | | 4,638,011 | |
| | 1,500,000 | | | Series 2001-C1-F | | | 6.84% | | | | 03/15/2033 | | | | 1,517,663 | |
| |
| | | | GE Capital Commercial Mortgage Corporation, | |
| | 707,088 | | | Series 2002-2-A3 | | | 5.35% | | | | 08/11/2036 | | | | 711,637 | |
| | 7,000,000 | | | Series 2004-C3-B | | | 5.51% | # | | | 07/10/2039 | | | | 7,434,945 | |
| | 8,273,000 | | | Series 2007-C1-AAB | | | 5.48% | | | | 12/10/2049 | | | | 8,651,763 | |
| |
| | | | GMAC Commercial Mortgage Securities, Inc., | |
| | 4,240,180 | | | Series 2001-C1-D | | | 7.03% | # | | | 04/15/2034 | | | | 4,235,090 | |
| | 102,790 | | | Series 2003-C3-A3 | | | 4.65% | | | | 04/10/2040 | | | | 103,684 | |
| | 4,935,838 | | | Series 2004-C3-A4 | | | 4.55% | | | | 12/10/2041 | | | | 4,991,610 | |
| |
| | | | GMAC Mortgage Corporation Loan Trust, | |
| | 1,449,181 | | | Series 2004-J2-A6 | | | 16.30% | # I/F | | | 06/25/2034 | | | | 1,529,255 | |
| |
| | | | Greenwich Capital Commercial Funding Corporation, | |
| | 6,575,000 | | | Series 2003-C2-B | | | 5.03% | | | | 01/05/2036 | | | | 6,837,681 | |
| | 4,000,000 | | | Series 2003-C2-C | | | 5.07% | # | | | 01/05/2036 | | | | 4,139,286 | |
| | 7,936,000 | | | Series 2004-FL2A-D | | | 0.55% | #^ | | | 11/05/2019 | | | | 7,806,961 | |
| | 6,500,000 | | | Series 2004-FL2A-G | | | 0.72% | #^ | | | 11/05/2019 | | | | 5,874,895 | |
| |
| | | | GS Mortgage Securities Corporation, | |
| | 2,903,855 | | | Series 2008-2R-1A1 | | | 7.50% | #^ | | | 09/25/2036 | | | | 2,590,784 | |
| | | | | | |
| The accompanying notes are an integral part of these financial statements | | Annual Report | | March 31, 2012 | | 11 |
Schedule of Investments DoubleLine Total Return Bond Fund (Cont.)
| | | | | | | | | | | | | | | | |
PRINCIPAL
AMOUNT | | | SECURITY DESCRIPTION | | RATE | | | MATURITY | | | VALUE $ | |
| |
| | | | GS Mortgage Securities Corporation II, | |
| $ | 219,029,179 | | | Series 2006-GG6-XC | | | 0.15% | #^ I/O | | | 04/10/2038 | | | | 339,714 | |
| | 36,295,184 | | | Series 2011-GC3-X | | | 1.32% | #^ I/O | | | 03/10/2044 | | | | 1,976,799 | |
| | 118,552,949 | | | Series 2012-GC6-XA | | | 2.41% | #^ I/O | | | 01/10/2045 | | | | 16,935,111 | |
| |
| | | | GSAA Home Equity Trust, | |
| | 1,746,291 | | | Series 2005-12-AF3 | | | 5.07% | # | | | 09/25/2035 | | | | 1,632,665 | |
| | 47,133,245 | | | Series 2005-7-AF2 | | | 4.48% | # | | | 05/25/2035 | | | | 45,662,711 | |
| | 45,361,000 | | | Series 2005-7-AF3 | | | 4.75% | # | | | 05/25/2035 | | | | 41,703,338 | |
| | 15,791,129 | | | Series 2006-10-AF3 | | | 5.98% | # | | | 06/25/2036 | | | | 8,950,736 | |
| | 11,301,982 | | | Series 2006-10-AF4 | | | 6.30% | # | | | 06/25/2036 | | | | 6,403,839 | |
| | 22,316,110 | | | Series 2006-15-AF4 | | | 5.96% | # | | | 09/25/2036 | | | | 12,137,163 | |
| | 3,634,366 | | | Series 2006-18-AF3A | | | 5.77% | # | | | 11/25/2036 | | | | 2,081,547 | |
| | 7,525,471 | | | Series 2006-18-AF6 | | | 5.68% | # | | | 11/25/2036 | | | | 3,993,075 | |
| | 1,747,712 | | | Series 2006-4-4A1 | | | 0.34% | # | | | 03/25/2036 | | | | 1,687,579 | |
| | 16,074,589 | | | Series 2007-10-A1A | | | 6.00% | | | | 11/25/2037 | | | | 11,727,594 | |
| | 7,171,306 | | | Series 2007-10-A2A | | | 6.50% | | | | 11/25/2037 | | | | 4,609,676 | |
| |
| | | | GSMPS Mortgage Loan Trust, | |
| | 26,805,642 | | | Series 2005-RP2-1AF | | | 0.59% | #^ | | | 03/25/2035 | | | | 22,040,430 | |
| | 26,805,642 | | | Series 2005-RP2-1AS | | | 5.26% | #^ I/O | | | 03/25/2035 | | | | 3,809,334 | |
| | 14,770,971 | | | Series 2005-RP3-1AF | | | 0.59% | #^ | | | 09/25/2035 | | | | 11,640,537 | |
| | 14,770,971 | | | Series 2005-RP3-1AS | | | 5.11% | #^ I/O | | | 09/25/2035 | | | | 2,219,532 | |
| | 56,930,173 | | | Series 2006-RP1-1AS | | | 4.98% | #^ I/O | | | 01/25/2036 | | | | 9,080,852 | |
| | 56,930,173 | | | Series 2006-RP1-AF1 | | | 0.59% | #^ | | | 01/25/2036 | | | | 45,062,424 | |
| |
| | | | GSR Mortgage Loan Trust, | |
| | 12,921,222 | | | Series 2005-1F-3A3 | | | 6.00% | | | | 01/25/2035 | | | | 12,859,161 | |
| | 2,537,711 | | | Series 2005-6F-3A5 | | | 6.00% | | | | 07/25/2035 | | | | 2,570,958 | |
| | 28,578,071 | | | Series 2005-6F-3A9 | | | 6.66% | # I/F I/O | | | 07/25/2035 | | | | 5,796,662 | |
| | 2,959,437 | | | Series 2005-6F-4A1 | | | 0.74% | # | | | 07/25/2035 | | | | 2,555,546 | |
| | 3,091,509 | | | Series 2005-7F-3A1 | | | 0.74% | # | | | 09/25/2035 | | | | 2,622,132 | |
| | 8,958,849 | | | Series 2005-8F-4A1 | | | 6.00% | | | | 11/25/2035 | | | | 7,517,836 | |
| | 13,041,887 | | | Series 2006-1F-1A2 | | | 5.50% | | | | 02/25/2036 | | | | 12,952,857 | |
| | 3,909,021 | | | Series 2006-2F-2A3 | | | 5.75% | | | | 02/25/2036 | | | | 3,584,619 | |
| | 8,459,669 | | | Series 2006-2F-3A3 | | | 6.00% | | | | 02/25/2036 | | | | 6,657,984 | |
| | 44,523,738 | | | Series 2006-6F-2A3 | | | 6.00% | | | | 07/25/2036 | | | | 36,312,648 | |
| | 45,587,171 | | | Series 2006-7F-2A1 | | | 6.00% | | | | 08/25/2036 | | | | 38,851,780 | |
| | 20,629,049 | | | Series 2006-7F-3A4 | | | 6.25% | | | | 08/25/2036 | | | | 16,735,708 | |
| | 21,824,826 | | | Series 2006-9F-2A1 | | | 6.00% | | | | 10/25/2036 | | | | 19,935,113 | |
| | 967,134 | | | Series 2006-9F-8A1 | | | 5.50% | | | | 08/25/2021 | | | | 926,835 | |
| | 20,028,270 | | | Series 2007-1F-2A2 | | | 5.50% | | | | 01/25/2037 | | | | 19,189,106 | |
| | 119,109,502 | | | Series 2007-4F-3A11 | | | 6.00% | | | | 07/25/2037 | | | | 99,351,438 | |
| |
| | | | Harborview Mortgage Loan Trust, | |
| | 6,590,982 | | | Series 2005-14-3A1A | | | 2.90% | # | | | 12/19/2035 | | | | 4,562,983 | |
| |
| | | | Home Equity Asset Trust, | |
| | 2,791,416 | | | Series 2003-3-M1 | | | 1.53% | # | | | 08/25/2033 | | | | 2,114,246 | |
| | 5,094,557 | | | Series 2004-7-M2 | | | 1.23% | # | | | 01/25/2035 | | | | 4,170,692 | |
| |
| | | | Homebanc Mortgage Trust, | |
| | 3,711,372 | | | Series 2005-1-M2 | | | 0.73% | # | | | 03/25/2035 | | | | 2,341,187 | |
| | 7,536,634 | | | Series 2006-1-3A1 | | | 5.56% | # | | | 04/25/2037 | | | | 6,145,835 | |
| |
| | | | HSBC Asset Loan Obligation, | |
| | 5,728,470 | | | Series 2006-2-2A1 | | | 5.50% | | | | 12/25/2021 | | | | 5,313,322 | |
| | 98,829,578 | | | Series 2007-2-3A6 | | | 6.00% | | | | 09/25/2037 | | | | 81,952,203 | |
| | 14,546,308 | | | Series 2007-AR1-3A1 | | | 6.12% | # | | | 01/25/2037 | | | | 10,926,830 | |
| |
| | | | IMPAC Trust, | |
| | 2,621,703 | | | Series 2002-9F-A1 | | | 5.22% | # | | | 12/25/2032 | | | | 2,667,091 | |
| |
| | | | Indymac Mortgage Loan Trust, | |
| | 53,127,504 | | | Series 2006-AR3-1A1 | | | 2.76% | # | | | 12/25/2036 | | | | 35,544,160 | |
| | 18,259,346 | | | Series 2007-A-1 | | | 6.00% | | | | 08/25/2037 | | | | 15,294,658 | |
| | 1,354,706 | | | Series 2007-F2-1A2 | | | 6.00% | | | | 07/25/2037 | | | | 1,043,560 | |
| | 40,168,352 | | | Series 2007-F2-2A1 | | | 6.50% | | | | 07/25/2037 | | | | 21,587,356 | |
| |
| | | | Jefferies & Company, Inc., | |
| | 12,088,599 | | | Series 2010-R1-1A1 | | | 6.00% | #^ | | | 03/26/2037 | | | | 12,754,233 | |
| | 2,674,086 | | | Series 2010-R6-1A2 | | | 6.00% | ^ | | | 09/26/2037 | | | | 2,669,914 | |
| |
| | | | JP Morgan Alternative Loan Trust, | |
| | 30,335,154 | | | Series 2005-S1-2A11 | | | 6.00% | | | | 12/25/2035 | | | | 23,620,983 | |
| | 9,724,803 | | | Series 2005-S1-2A9 | | | 6.00% | | | | 12/25/2035 | | | | 7,572,383 | |
| | 9,666,684 | | | Series 2006-S1-1A8 | | | 5.75% | | | | 03/25/2036 | | | | 6,562,760 | |
| | 6,500,000 | | | Series 2006-S2-A4 | | | 6.19% | # | | | 05/25/2036 | | | | 3,306,612 | |
| | 14,745,000 | | | Series 2006-S4-A3A | | | 5.78% | # | | | 12/25/2036 | | | | 12,706,526 | |
| |
| | | | JP Morgan Chase Commercial Mortgage Securities Corporation, | |
| | 6,000,000 | | | Series 2001-C1-F | | | 7.12% | #^ | | | 10/12/2035 | | | | 6,012,360 | |
| | 4,870,007 | | | Series 2001-CIB2-C | | | 6.74% | # | | | 04/15/2035 | | | | 4,879,810 | |
| | | | | | | | | | | | | | | | |
PRINCIPAL
AMOUNT | | | SECURITY DESCRIPTION | | RATE | | | MATURITY | | | VALUE $ | |
| |
| | | | JP Morgan Chase Commercial Mortgage Securities Corporation, (Cont.) | |
| $ | 683,696 | | | Series 2001-CIBC-E | | | 7.30% | # | | | 03/15/2033 | | | | 683,585 | |
| | 10,000,000 | | | Series 2001-CIBC-F | | | 7.77% | # | | | 03/15/2033 | | | | 9,978,610 | |
| | 4,711,671 | | | Series 2002-CIB5-A2 | | | 5.16% | | | | 10/12/2037 | | | | 4,774,334 | |
| | 2,000,000 | | | Series 2003-LN1-D | | | 5.20% | # | | | 10/15/2037 | | | | 2,007,400 | |
| | 1,125,000 | | | Series 2004-C3-A4 | | | 4.66% | | | | 01/15/2042 | | | | 1,124,861 | |
| | 1,300,238 | | | Series 2004-CB8-A1A | | | 4.16% | ^ | | | 01/12/2039 | | | | 1,353,701 | |
| | 29,447,000 | | | Series 2004-CBX-A5 | | | 4.65% | | | | 01/12/2037 | | | | 29,809,080 | |
| | 24,549,452 | | | Series 2004-CBX-X1 | | | 0.89% | #^ I/O | | | 01/12/2037 | | | | 384,874 | |
| | 256,052,501 | | | Series 2005-LDP3-X2 | | | 0.30% | # I/O | | | 08/15/2042 | | | | 217,901 | |
| | 115,190,026 | | | Series 2005-LDP4-X1 | | | 0.16% | #^ I/O | | | 10/15/2042 | | | | 842,845 | |
| | 306,356,627 | | | Series 2006-CB14-X2 | | | 0.16% | # I/O | | | 12/12/2044 | | | | 217,513 | |
| | 338,005,296 | | | Series 2006-CB16-X2 | | | 0.70% | # I/O | | | 05/12/2045 | | | | 2,461,355 | |
| | 2,885,662 | | | Series 2006-FL1-AG | | | 0.71% | #^ | | | 02/15/2020 | | | | 2,452,831 | |
| | 167,953,486 | | | Series 2006-LDP8-X | | | 0.74% | # I/O | | | 05/15/2045 | | | | 3,377,881 | |
| | 10,000,000 | | | Series 2007-C1-ASB | | | 5.86% | | | | 02/15/2051 | | | | 10,823,015 | |
| | 187,161,488 | | | Series 2007-CB18-X | | | 0.43% | # I/O | | | 06/12/2047 | | | | 2,333,249 | |
| | 2,965,535 | | | Series 2007-CB20-ASB | | | 5.69% | | | | 02/12/2051 | | | | 3,197,717 | |
| | 1,125,488,194 | | | Series 2007-CB20-X1 | | | 0.21% | #^ I/O | | | 02/12/2051 | | | | 11,556,513 | |
| | 15,000,000 | | | Series 2011-CCHP-A | | | 2.60% | #^ | | | 07/15/2028 | | | | 14,980,568 | |
| | 5,000,000 | | | Series 2011-CCHP-B | | | 3.50% | #^ | | | 07/15/2028 | | | | 4,964,548 | |
| | 4,774,171 | | | Series 2011-PLSD-A1 | | | 2.19% | ^ | | | 11/13/2044 | | | | 4,844,418 | |
| |
| | | | JP Morgan Commercial Mortgage Finance Corporation, | |
| | 306,670 | | | Series 1997-C5-F | | | 7.56% | | | | 09/15/2029 | | | | 310,379 | |
| |
| | | | JP Morgan Mortgage Acquisition Corporation, | |
| | 16,000,000 | | | Series 2006-CH2-AF3 | | | 5.46% | # | | | 10/25/2036 | | | | 8,841,936 | |
| | 6,332,368 | | | Series 2006-WF1-A5 | | | 6.41% | # | | | 07/25/2036 | | | | 3,329,866 | |
| | 15,000,000 | | | Series 2007-CH1-AF5 | | | 5.73% | # | | | 11/25/2036 | | | | 10,995,158 | |
| |
| | | | JP Morgan Mortgage Trust, | |
| | 214,761 | | | Series 2003-A1-4A2 | | | 4.50% | # | | | 10/25/2033 | | | | 214,320 | |
| | 6,091,659 | | | Series 2005-S2-2A13 | | | 5.50% | | | | 09/25/2035 | | | | 6,065,903 | |
| | 6,385,011 | | | Series 2006-S2-3A3 | | | 6.00% | | | | 07/25/2036 | | | | 5,115,722 | |
| | 22,126,506 | | | Series 2006-S4-A8 | | | 0.62% | # | | | 01/25/2037 | | | | 14,664,242 | |
| | 22,126,506 | | | Series 2006-S4-A9 | | | 6.38% | # I/F I/O | | | 01/25/2037 | | | | 4,565,481 | |
| | 6,094,560 | | | Series 2007-A2-2A1 | | | 2.88% | # | | | 04/25/2037 | | | | 4,559,389 | |
| | 3,829,464 | | | Series 2007-S3-1A9 | | | 6.00% | | | | 08/25/2037 | | | | 3,028,853 | |
| | 15,765,695 | | | Series 2007-S3-2A2 | | | 5.50% | | | | 08/25/2022 | | | | 15,003,393 | |
| |
| | | | JP Morgan Research Trust, | |
| | 27,546,803 | | | Series 2010-1-1A4 | | | 6.00% | ^ | | | 02/26/2037 | | | | 14,212,663 | |
| | 20,452,000 | | | Series 2010-2-3A9 | | | 6.00% | ^ | | | 07/26/2036 | | | | 9,583,255 | |
| | 9,683,162 | | | Series 2010-8-2A3 | | | 4.50% | #^ | | | 11/26/2034 | | | | 9,848,996 | |
| | 9,228,491 | | | Series 2012-2-3A3 | | | 2.59% | #^ | | | 10/26/2036 | | | | 9,179,580 | |
| |
| | | | LB-UBS Commercial Mortgage Trust, | |
| | 565,000 | | | Series 2004-C2-A4 | | | 4.37% | | | | 03/15/2036 | | | | 595,554 | |
| | 120,192,562 | | | Series 2005-C2-XCP | | | 0.47% | # I/O | | | 04/15/2040 | | | | 17,188 | |
| | 53,494,286 | | | Series 2005-C5-XCP | | | 0.61% | # I/O | | | 09/15/2040 | | | | 102,388 | |
| | 178,101,667 | | | Series 2006-C7-XCL | | | 0.34% | #^ I/O | | | 11/15/2038 | | | | 3,179,471 | |
| | 784,305,145 | | | Series 2007-C7-XCL | | | 0.12% | #^ I/O | | | 09/15/2045 | | | | 6,678,358 | |
| |
| | | | Lehman Mortgage Trust, | |
| | 9,233,471 | | | Series 2005-2-3A5 | | | 5.50% | | | | 12/25/2035 | | | | 7,009,996 | |
| | 16,571,761 | | | Series 2005-3-2A1 | | | 6.00% | | | | 01/25/2036 | | | | 15,529,911 | |
| | 2,573,034 | | | Series 2005-3-2A3 | | | 5.50% | | | | 01/25/2036 | | | | 2,515,669 | |
| | 8,391,878 | | | Series 2005-3-2A7 | | | 6.00% | | | | 01/25/2036 | | | | 7,348,839 | |
| | 4,723,113 | | | Series 2006-1-1A1 | | | 0.99% | # | | | 02/25/2036 | | | | 2,954,810 | |
| | 14,169,338 | | | Series 2006-1-1A2 | | | 4.51% | # I/F I/O | | | 02/25/2036 | | | | 2,264,491 | |
| | 7,155,121 | | | Series 2006-1-3A4 | | | 5.50% | | | | 02/25/2036 | | | | 6,355,136 | |
| | 10,314,981 | | | Series 2006-4-1A3 | | | 5.16% | # I/F I/O | | | 08/25/2036 | | | | 1,433,984 | |
| | 6,555,978 | | | Series 2006-4-1A4 | | | 6.00% | | | | 08/25/2036 | | | | 4,617,825 | |
| | 14,877,443 | | | Series 2006-5-2A1 | | | 0.59% | # | | | 09/25/2036 | | | | 5,139,457 | |
| | 30,989,551 | | | Series 2006-5-2A2 | | | 6.91% | # I/F I/O | | | 09/25/2036 | | | | 8,100,470 | |
| | 28,352,294 | | | Series 2006-6-3A9 | | | 5.50% | | | | 10/25/2036 | | | | 18,526,665 | |
| | 7,269,118 | | | Series 2006-7-2A2 | | | 0.69% | # | | | 11/25/2036 | | | | 3,012,279 | |
| | 21,606,397 | | | Series 2006-7-2A5 | | | 6.31% | # I/F I/O | | | 11/25/2036 | | | | 5,035,025 | |
| | 7,587,871 | | | Series 2006-9-1A19 | | | 29.57% | # I/F | | | 01/25/2037 | | | | 11,225,054 | |
| | 8,429,576 | | | Series 2006-9-1A5 | | | 0.84% | # | | | 01/25/2037 | | | | 4,301,958 | |
| | 25,038,680 | | | Series 2006-9-1A6 | | | 4.91% | # I/F I/O | | | 01/25/2037 | | | | 4,061,449 | |
| | 9,579,941 | | | Series 2006-9-2A1 | | | 0.62% | # | | | 01/25/2037 | | | | 3,983,100 | |
| | 21,236,270 | | | Series 2006-9-2A2 | | | 6.38% | # I/F I/O | | | 01/25/2037 | | | | 4,663,750 | |
| | 23,271,947 | | | Series 2007-10-2A1 | | | 6.50% | | | | 01/25/2038 | | | | 20,869,375 | |
| | 6,783,090 | | | Series 2007-2-1A1 | | | 5.75% | | | | 02/25/2037 | | | | 4,676,737 | |
| | 6,315,096 | | | Series 2007-4-2A11 | | | 0.57% | # | | | 05/25/2037 | | | | 2,135,292 | |
| | 21,580,803 | | | Series 2007-4-2A8 | | | 6.43% | # I/F I/O | | | 05/25/2037 | | | | 6,126,190 | |
| | | | | | |
| 12 | | DoubleLine Funds | | | | The accompanying notes are an integral part of these financial statements |
| | | | | | | | | | | | | | | | |
PRINCIPAL
AMOUNT | | | SECURITY DESCRIPTION | | RATE | | | MATURITY | | | VALUE $ | |
| |
| | | | Lehman Mortgage Trust, (Cont.) | |
| $ | 2,500,317 | | | Series 2007-4-2A9 | | | 0.57% | # | | | 05/25/2037 | | | | 1,222,249 | |
| | 33,824,146 | | | Series 2007-5-11A1 | | | 5.98% | # | | | 06/25/2037 | | | | 22,346,260 | |
| | 5,003,298 | | | Series 2007-5-4A3 | | | 38.63% | # I/F | | | 08/25/2036 | | | | 7,890,914 | |
| | 1,793,746 | | | Series 2007-5-7A3 | | | 7.50% | | | | 10/25/2036 | | | | 1,600,764 | |
| | 1,795,568 | | | Series 2007-6-1A8 | | | 6.00% | | | | 07/25/2037 | | | | 1,406,133 | |
| |
| | | | Lehman XS Trust, | |
| | 3,850,296 | | | Series 2005-10-2A3B | | | 5.55% | # | | | 01/25/2036 | | | | 2,849,592 | |
| | 16,500,000 | | | Series 2005-4-2A3A | | | 5.00% | # | | | 10/25/2035 | | | | 9,052,882 | |
| | 6,831,690 | | | Series 2006-11-2A1 | | | 0.37% | # | | | 06/25/2046 | | | | 6,206,744 | |
| | 6,660,938 | | | Series 2006-5-2A4A | | | 5.89% | # | | | 04/25/2036 | | | | 5,674,679 | |
| |
| | | | MASTR Adjustable Rate Mortgages Trust, | |
| | 8,031,513 | | | Series 2005-2-2A1 | | | 2.59% | # | | | 03/25/2035 | | | | 5,189,755 | |
| |
| | | | MASTR Alternative Loans Trust, | |
| | 3,983,617 | | | Series 2005-2-3A1 | | | 6.00% | | | | 03/25/2035 | | | | 3,775,784 | |
| | 2,758,515 | | | Series 2005-5-2A3 | | | 5.50% | | | | 07/25/2025 | | | | 2,729,820 | |
| | 11,154,327 | | | Series 2005-6-1A5 | | | 5.50% | | | | 12/25/2035 | | | | 8,963,930 | |
| | 5,784,059 | | | Series 2006-3-1A2 | | | 6.25% | | | | 07/25/2036 | | | | 4,407,381 | |
| | 14,378,709 | | | Series 2007-1-1A5 | | | 5.75% | | | | 10/25/2036 | | | | 12,274,946 | |
| | 13,107,285 | | | Series 2007-1-2A7 | | | 6.00% | | | | 10/25/2036 | | | | 10,926,502 | |
| |
| | | | MASTR Asset Backed Securities Trust, | |
| | 4,975,000 | | | Series 2003-OPT1-M3 | | | 4.37% | # | | | 12/25/2032 | | | | 3,389,552 | |
| | 10,359,579 | | | Series 2006-NC1-A3 | | | 0.43% | # | | | 01/25/2036 | | | | 8,778,433 | |
| |
| | | | MASTR Asset Securitization Trust, | |
| | 1,161,420 | | | Series 2003-1-30B2 | | | 5.75% | | | | 02/25/2033 | | | | 1,159,860 | |
| | 1,262,629 | | | Series 2007-1-1A1 | | | 5.50% | | | | 11/25/2037 | | | | 1,080,513 | |
| | 11,853,232 | | | Series 2007-1-1A3 | | | 6.25% | | | | 11/25/2037 | | | | 9,981,660 | |
| |
| | | | MASTR Seasoned Securitization Trust, | |
| | 1,467,394 | | | Series 2005-2-1A4 | | | 6.00% | | | | 10/25/2032 | | | | 1,326,725 | |
| | 4,147,709 | | | Series 2005-2-2A1 | | | 0.64% | # | | | 10/25/2032 | | | | 3,428,907 | |
| |
| | | | Merrill Lynch Mortgage Investors Trust, | |
| | 207,162,991 | | | Series 1998-C1-IO | | | 0.69% | # I/O | | | 11/15/2026 | | | | 5,490,751 | |
| | 7,293,259 | | | Series 2006-F1-1A2 | | | 6.00% | | | | 04/25/2036 | | | | 6,195,838 | |
| |
| | | | Merrill Lynch Mortgage Trust, | |
| | 19,000,000 | | | Series 2003-KEY1-A4 | | | 5.24% | # | | | 11/12/2035 | | | | 20,058,576 | |
| | 326,744,301 | | | Series 2004-BPC1-XP | | | 1.06% | #^ I/O | | | 10/12/2041 | | | | 246,365 | |
| | 10,000,000 | | | Series 2004-KEY2-A4 | | | 4.86% | # | | | 08/12/2039 | | | | 10,751,895 | |
| | 326,291,328 | | | Series 2005-MCP1-XP | | | 0.83% | # I/O | | | 06/12/2043 | | | | 2,645,244 | |
| |
| | | | Merrill Lynch/Countrywide Commercial Mortgage Trust, | |
| | 2,593,761 | | | Series 2006-4-A2FL | | | 0.36% | # | | | 12/12/2049 | | | | 2,592,988 | |
| |
| | | | Morgan Stanley Capital, Inc., | |
| | 1,485,000 | | | Series 1999-LIFE-G | | | 7.05% | #^ | | | 04/15/2033 | | | | 1,489,430 | |
| | 1,907,461 | | | Series 2003-NC6-M2 | | | 3.17% | # | | | 06/25/2033 | | | | 1,367,612 | |
| | 176,337,301 | | | Series 2004-HQ4-X2 | | | 0.51% | #^ I/O | | | 04/14/2040 | | | | 353,380 | |
| | 242,615 | | | Series 2004-IQ8-A4 | | | 4.90% | | | | 06/15/2040 | | | | 242,400 | |
| | 3,692,212 | | | Series 2005-IQ10-AAB | | | 5.18 | # | | | 09/15/2042 | | | | 3,850,519 | |
| | 578,612 | | | Series 2005-RR6-A2FL | | | 0.46 | #^ | | | 05/24/2043 | | | | 529,430 | |
| | 364,649,852 | | | Series 2006-HQ10-X1 | | | 0.18 | #^ I/O | | | 11/12/2041 | | | | 6,754,409 | |
| | 8,945,943 | | | Series 2007-HQ12-A2FL | | | 0.49% | # | | | 04/12/2049 | | | | 8,635,953 | |
| | 17,891,886 | | | Series 2007-HQ12-A2FX | | | 5.60% | # | | | 04/12/2049 | | | | 18,189,786 | |
| | 481,753,484 | | | Series 2007-IQ16-X2 | | | 0.37% | #^ I/O | | | 12/12/2049 | | | | 3,975,912 | |
| | 10,000,000 | | | Series 2008-T29-AAB | | | 6.46% | # | | | 01/11/2043 | | | | 11,136,585 | |
| |
| | | | Morgan Stanley Mortgage Loan Trust, | |
| | 5,286,131 | | | Series 2005-10-1A1 | | | 0.94% | # | | | 12/25/2035 | | | | 3,284,028 | |
| | 2,323,326 | | | Series 2005-6AR-1A1 | | | 0.52% | # | | | 11/25/2035 | | | | 1,951,450 | |
| | 7,928,320 | | | Series 2006-11-1A6 | | | 6.23% | # | | | 08/25/2036 | | | | 3,800,119 | |
| | 23,383,032 | | | Series 2006-11-2A1 | | | 6.00% | | | | 08/25/2036 | | | | 16,031,313 | |
| | 11,883,245 | | | Series 2006-17XS-A3A | | | 5.65% | # | | | 10/25/2046 | | | | 7,519,794 | |
| | 3,574,981 | | | Series 2006-17XS-A6 | | | 5.58% | # | | | 10/25/2046 | | | | 2,086,831 | |
| | 1,763,706 | | | Series 2006-2-2A3 | | | 5.75% | | | | 02/25/2036 | | | | 1,507,860 | |
| | 77,875,776 | | | Series 2006-7-3A | | | 5.67% | # | | | 06/25/2036 | | | | 53,782,218 | |
| | 6,324,989 | | | Series 2006-7-4A4 | | | 6.00% | | | | 06/25/2036 | | | | 4,392,661 | |
| | 6,520,448 | | | Series 2006-7-4A7 | | | 6.00% | | | | 06/25/2036 | | | | 4,389,980 | |
| | 8,690,074 | | | Series 2007-13-6A1 | | | 6.00% | | | | 10/25/2037 | | | | 5,693,197 | |
| | 5,491,563 | | | Series 2007-1XS-2A3 | | | 5.92% | # | | | 09/25/2046 | | | | 2,769,035 | |
| | 4,144,650 | | | Series 2007-1XS-2A4A | | | 6.08% | # | | | 09/25/2046 | | | | 2,368,406 | |
| | 3,257,317 | | | Series 2007-3XS-1A2A | | | 5.62% | # | | | 01/25/2047 | | | | 2,787,365 | |
| | 12,409,023 | | | Series 2007-3XS-2A3S | | | 5.86% | # | | | 01/25/2047 | | | | 6,875,914 | |
| | 7,258,108 | | | Series 2007-3XS-2A4S | | | 5.96% | # | | | 01/25/2047 | | | | 4,050,253 | |
| |
| | | | Morgan Stanley Re-Remic Trust, | |
| | 6,045,795 | | | Series 2010-R9-1A | | | 4.00% | #^ | | | 08/26/2036 | | | | 6,139,260 | |
| | 8,643,376 | | | Series 2010-R9-1B | | | 7.43% | #^ | | | 08/26/2036 | | | | 4,840,291 | |
| | | | | | | | | | | | | | | | |
PRINCIPAL
AMOUNT | | | SECURITY DESCRIPTION | | RATE | | | MATURITY | | | VALUE $ | |
| |
| | | | Morgan Stanley Re-Remic Trust, (Cont.) | |
| $ | 70,000,000 | | | Series 2010-R9-3C | | | 8.51% | #^ | | | 11/26/2036 | | | | 49,000,000 | |
| | 10,550,288 | | | Series 2011-R1-1A | | | 5.94% | #^ | | | 02/26/2037 | | | | 9,811,768 | |
| |
| | | | Multi Security Asset Trust, | |
| | 4,970,022 | | | Series 2005-RR4A-A3 | | | 5.00% | ^ | | | 11/28/2035 | | | | 4,970,022 | |
| |
| | | | New York Mortgage Trust, | |
| | 2,015,296 | | | Series 2005-2-A | | | 0.57% | # | | | 08/25/2035 | | | | 1,782,379 | |
| |
| | | | Newcastle Mortgage Securities Trust, | |
| | 66,165,270 | | | Series 2006-1-A3 | | | 0.42% | # | | | 03/25/2036 | | | | 63,149,821 | |
| |
| | | | Nomura Asset Acceptance Corporation, | |
| | 2,662,274 | | | Series 2005-AP1-2A5 | | | 4.86% | # | | | 02/25/2035 | | | | 2,549,967 | |
| | 22,069,510 | | | Series 2006-AF1-1A2 | | | 6.16% | # | | | 05/25/2036 | | | | 11,233,502 | |
| | 4,484,919 | | | Series 2006-AF1-1A3 | | | 6.41% | # | | | 05/25/2036 | | | | 2,314,424 | |
| | 22,448,570 | | | Series 2006-AP1-A2 | | | 5.52% | # | | | 01/25/2036 | | | | 13,954,806 | |
| | 4,872,299 | | | Series 2006-AP1-A3 | | | 5.65% | # | | | 01/25/2036 | | | | 3,061,791 | |
| | 2,404,943 | | | Series 2006-WF1-A2 | | | 5.76% | # | | | 06/25/2036 | | | | 1,381,738 | |
| |
| | | | Nomura Asset Securities Corporation, | |
| | 20,331,000 | | | Series 1998-D6-A2 | | | 7.32% | # | | | 03/15/2030 | | | | 21,156,489 | |
| | 4,115,000 | | | Series 1998-D6-A3 | | | 7.53% | # | | | 03/15/2030 | | | | 4,311,473 | |
| |
| | | | Nomura Home Equity Loan, Inc., | |
| | 23,248,512 | | | Series 2006-AF1-A2 | | | 5.80% | # | | | 10/25/2036 | | | | 9,826,076 | |
| | 4,315,155 | | | Series 2007-1-1A1 | | | 6.06% | # | | | 02/25/2037 | | | | 2,090,090 | |
| | 21,507,726 | | | Series 2007-1-1A3 | | | 5.99% | # | | | 02/25/2037 | | | | 10,364,692 | |
| |
| | | | Option One Mortgage Loan Trust, | |
| | 1,441,246 | | | Series 2002-2-A | | | 0.78% | # | | | 06/25/2032 | | | | 1,127,147 | |
| | 3,450,487 | | | Series 2004-3-M3 | | | 0.89% | # | | | 11/25/2034 | | | | 2,675,742 | |
| |
| | | | PHH Alternative Mortgage Trust, | |
| | 2,523,556 | | | Series 2007-2-3A1 | | | 6.00% | | | | 05/25/2037 | | | | 1,956,050 | |
| | 52,260,428 | | | Series 2007-3-A2 | | | 0.43% | # | | | 07/25/2037 | | | | 37,557,218 | |
| |
| | | | Popular ABS Mortgage Pass-Thru Trust, | |
| | 1,505,924 | | | Series 2005-5-AF6 | | | 5.33% | # | | | 11/25/2035 | | | | 1,363,929 | |
| |
| | | | Prime Mortgage Trust, | |
| | 5,165,476 | | | Series 2006-1-2A5 | | | 6.00% | | | | 06/25/2036 | | | | 4,776,741 | |
| | 5,789,561 | | | Series 2006-DR1-2A1 | | | 5.50% | ^ | | | 05/25/2035 | | | | 5,013,928 | |
| |
| | | | Prudential Commercial Mortgage Trust, | |
| | 1,705,252 | | | Series 2003-PWR1-A1 | | | 3.67% | | | | 02/11/2036 | | | | 1,720,591 | |
| |
| | | | Prudential Mortgage Capital Funding, LLC, | |
| | 926,285 | | | Series 2001-ROCK-F | | | 8.15% | # ^ | | | 05/10/2034 | | | | 925,836 | |
| |
| | | | RBSGC Structured Trust, | |
| | 71,765,290 | | | Series 2008-B-A1 | | | 6.00% | ^ | | | 06/25/2037 | | | | 60,119,578 | |
| |
| | | | Renaissance Home Equity Loan Trust, | |
| | 1,984,356 | | | Series 2006-1-AF6 | | | 5.75% | # | | | 05/25/2036 | | | | 1,300,124 | |
| | 11,300,000 | | | Series 2006-4-AF4 | | | 5.47% | # | | | 01/25/2037 | | | | 5,118,567 | |
| | 22,252,000 | | | Series 2006-4-AF5 | | | 5.69% | # | | | 01/25/2037 | | | | 10,422,770 | |
| | 18,490,000 | | | Series 2007-2-AF2 | | | 5.68% | # | | | 06/25/2037 | | | | 7,747,051 | |
| | 10,000,000 | | | Series 2007-2-AF5 | | | 6.20% | # | | | 06/25/2037 | | | | 4,563,385 | |
| |
| | | | Residential Accredit Loans, Inc., | |
| | 16,446,178 | | | Series 2004-QS15-A1 | | | 5.25% | | | | 11/25/2034 | | | | 15,447,492 | |
| | 1,437,869 | | | Series 2005-QS12-A11 | | | 48.49% | # I/F | | | 08/25/2035 | | | | 2,623,105 | |
| | 6,615,019 | | | Series 2005-QS13-1A6 | | | 5.50% | | | | 09/25/2035 | | | | 4,863,332 | |
| | 11,484,815 | | | Series 2005-QS13-2A1 | | | 0.94% | # | | | 09/25/2035 | | | | 6,065,802 | |
| | 47,087,740 | | | Series 2005-QS13-2A2 | | | 4.81% | # I/F I/O | | | 09/25/2035 | | | | 7,957,593 | |
| | 20,120,670 | | | Series 2005-QS14-2A1 | | | 6.00% | | | | 09/25/2035 | | | | 13,718,122 | |
| | 10,083,174 | | | Series 2005-QS15-2A | | | 6.00% | | | | 10/25/2035 | | | | 6,069,783 | |
| | 10,473,322 | | | Series 2005-QS15-3A | | | 6.00% | | | | 10/25/2035 | | | | 7,533,670 | |
| | 11,345,470 | | | Series 2005-QS16-A1 | | | 0.94% | # | | | 11/25/2035 | | | | 6,925,292 | |
| | 11,343,509 | | | Series 2005-QS16-A2 | | | 4.56% | # I/F I/O | | | 11/25/2035 | | | | 1,544,631 | |
| | 5,177,457 | | | Series 2005-QS17-A1 | | | 6.00% | | | | 12/25/2035 | | | | 4,063,328 | |
| | 3,727,327 | | | Series 2005-QS17-A10 | | | 6.00% | | | | 12/25/2035 | | | | 2,759,426 | |
| | 15,589,297 | | | Series 2005-QS17-A11 | | | 6.00% | | | | 12/25/2035 | | | | 11,541,115 | |
| | 11,080,381 | | | Series 2005-QS17-A2 | | | 1.09% | # | | | 12/25/2035 | | | | 6,588,948 | |
| | 11,080,381 | | | Series 2005-QS17-A4 | | | 4.91% | # I/F I/O | | | 12/25/2035 | | | | 1,761,393 | |
| | 8,915,617 | | | Series 2005-QS17-A6 | | | 6.00% | | | | 12/25/2035 | | | | 6,600,437 | |
| | 6,846,117 | | | Series 2005-QS1-A5 | | | 5.50% | | | | 01/25/2035 | | | | 6,421,733 | |
| | 5,184,663 | | | Series 2005-QS5-A3 | | | 5.70% | | | | 04/25/2035 | | | | 4,160,856 | |
| | 4,354,756 | | | Series 2005-QS9-A1 | | | 0.74% | # | | | 06/25/2035 | | | | 3,332,739 | |
| | 10,886,891 | | | Series 2005-QS9-A4 | | | 4.76% | # I/F I/O | | | 06/25/2035 | | | | 1,637,902 | |
| | 4,192,037 | | | Series 2006-QS10-A4 | | | 5.75% | | | | 08/25/2036 | | | | 2,745,595 | |
| | 4,615,605 | | | Series 2006-QS12-1A1 | | | 6.50% | | | | 09/25/2036 | | | | 2,540,431 | |
| | | | | | |
| The accompanying notes are an integral part of these financial statements | | Annual Report | | March 31, 2012 | | 13 |
Schedule of Investments DoubleLine Total Return Bond Fund (Cont.)
| | | | | | | | | | | | | | | | |
PRINCIPAL
AMOUNT | | | SECURITY DESCRIPTION | | RATE | | | MATURITY | | | VALUE $ | |
| |
| | | | Residential Accredit Loans, Inc., (Cont.) | |
| $ | 10,768,571 | | | Series 2006-QS12-2A18 | | | 5.75% | | | | 09/25/2036 | | | | 6,340,653 | |
| | 17,095,697 | | | Series 2006-QS14-A18 | | | 6.25% | | | | 11/25/2036 | | | | 10,612,504 | |
| | 9,065,675 | | | Series 2006-QS15-A1 | | | 6.50% | | | | 10/25/2036 | | | | 5,884,235 | |
| | 3,378,487 | | | Series 2006-QS16-A10 | | | 6.00% | | | | 11/25/2036 | | | | 2,242,468 | |
| | 12,013,365 | | | Series 2006-QS16-A11 | | | 6.00% | | | | 11/25/2036 | | | | 7,911,822 | |
| | 3,506,835 | | | Series 2006-QS16-A7 | | | 6.00% | | | | 11/25/2036 | | | | 2,273,252 | |
| | 3,789,549 | | | Series 2006-QS16-A8 | | | 6.00% | | | | 11/25/2036 | | | | 2,495,740 | |
| | 1,499,596 | | | Series 2006-QS16-A9 | | | 6.00% | | | | 11/25/2036 | | | | 987,611 | |
| | 8,403,813 | | | Series 2006-QS17-A4 | | | 6.00% | | | | 12/25/2036 | | | | 5,202,851 | |
| | 46,687,949 | | | Series 2006-QS17-A5 | | | 6.00% | | | | 12/25/2036 | | | | 28,904,790 | |
| | 4,699,070 | | | Series 2006-QS1-A6 | | | 41.00% | # I/F | | | 01/25/2036 | | | | 7,259,889 | |
| | 32,666,443 | | | Series 2006-QS3-1A11 | | | 6.00% | | | | 03/25/2036 | | | | 24,055,389 | |
| | 6,748,165 | | | Series 2006-QS4-A8 | | | 1.34% | # I/F | | | 04/25/2036 | | | | 5,418,784 | |
| | 20,524,586 | | | Series 2006-QS5-A3 | | | 6.00% | | | | 05/25/2036 | | | | 13,889,388 | |
| | 26,005,871 | | | Series 2006-QS8-A1 | | | 6.00% | | | | 08/25/2036 | | | | 16,418,859 | |
| | 45,097,978 | | | Series 2006-QS8-A5 | | | 5.31% | # I/F I/O | | | 08/25/2036 | | | | 7,459,404 | |
| | 15,579,847 | | | Series 2006-QS9-1A6 | | | 5.06% | # I/F I/O | | | 07/25/2036 | | | | 2,568,972 | |
| | 45,823,668 | | | Series 2007-QS1-1A2 | | | 5.21% | # I/F I/O | | | 01/25/2037 | | | | 8,438,470 | |
| | 4,711,610 | | | Series 2007-QS1-1A4 | | | 6.00% | | | | 01/25/2037 | | | | 3,299,283 | |
| | 12,039,172 | | | Series 2007-QS1-2A10 | | | 6.00% | | | | 01/25/2037 | | | | 7,990,013 | |
| | 2,006,723 | | | Series 2007-QS2-A6 | | | 6.25% | | | | 01/25/2037 | | | | 1,298,032 | |
| | 74,997,748 | | | Series 2007-QS3-A1 | | | 6.50% | | | | 02/25/2037 | | | | 48,587,478 | |
| | 11,958,858 | | | Series 2007-QS3-A4 | | | 6.25% | | | | 02/25/2037 | | | | 7,614,893 | |
| | 9,449,964 | | | Series 2007-QS5-A1 | | | 5.50% | | | | 03/25/2037 | | | | 5,707,934 | |
| | 3,898,495 | | | Series 2007-QS5-A5 | | | 0.54% | # | | | 03/25/2037 | | | | 1,756,266 | |
| | 12,947,794 | | | Series 2007-QS5-A8 | | | 6.46% | # I/F I/O | | | 03/25/2037 | | | | 2,924,674 | |
| | 3,368,822 | | | Series 2007-QS6-A13 | | | 52.99% | # I/F | | | 04/25/2037 | | | | 6,728,475 | |
| | 15,002,964 | | | Series 2007-QS6-A45 | | | 5.75% | | | | 04/25/2037 | | | | 9,643,305 | |
| | 23,910,089 | | | Series 2007-QS6-A6 | | | 6.25% | | | | 04/25/2037 | | | | 15,896,706 | |
| | 1,651,394 | | | Series 2007-QS6-A77 | | | 53.82% | # I/F | | | 04/25/2037 | | | | 3,269,960 | |
| | 16,337,115 | | | Series 2007-QS7-2A1 | | | 6.75% | | | | 06/25/2037 | | | | 9,010,319 | |
| | 13,627,193 | | | Series 2007-QS9-A33 | | | 6.50% | | | | 07/25/2037 | | | | 8,479,848 | |
| |
| | | | Residential Asset Mortgage Products, Inc., | |
| | 962,581 | | | Series 2004-RS4-AI6 | | | 5.07% | # | | | 04/25/2034 | | | | 899,434 | |
| | 5,606,949 | | | Series 2004-RS5-AI6 | | | 5.55% | # | | | 05/25/2034 | | | | 4,441,750 | |
| | 11,301,258 | | | Series 2004-RS7-AI6 | | | 5.22% | # | | | 07/25/2034 | | | | 10,109,862 | |
| | 1,756,568 | | | Series 2004-RS8-AI4 | | | 5.06% | # | | | 06/25/2032 | | | | 1,722,359 | |
| | 1,828,850 | | | Series 2004-RS9-AI4 | | | 4.77% | # | | | 10/25/2032 | | | | 1,576,753 | |
| | 2,619,386 | | | Series 2004-RS9-AI6 | | | 4.72% | # | | | 07/25/2034 | | | | 2,235,086 | |
| | 4,213,073 | | | Series 2004-RZ2-AI4 | | | 5.35% | # | | | 02/25/2033 | | | | 3,167,919 | |
| | 7,550,000 | | | Series 2005-RS1-AI5 | | | 5.41% | # | | | 01/25/2035 | | | | 5,546,981 | |
| | 12,709,703 | | | Series 2006-RS5-A3 | | | 0.41% | # | | | 09/25/2036 | | | | 9,122,110 | |
| |
| | | | Residential Asset Securities Corporation, | |
| | 938,124 | | | Series 2002-KS1-AI6 | | | 6.08% | # | | | 06/25/2032 | | | | 780,779 | |
| | 3,894,822 | | | Series 2003-KS11-MI1 | | | 5.13% | # | | | 01/25/2034 | | | | 3,347,771 | |
| | 7,290,856 | | | Series 2005-AHL3-A2 | | | 0.48% | # | | | 11/25/2035 | | | | 6,680,152 | |
| | 2,788,692 | | | Series 2006-KS4-A3 | | | 0.39% | # | | | 06/25/2036 | | | | 2,589,237 | |
| |
| | | | Residential Asset Securitization Trust, | |
| | 10,900,386 | | | Series 2005-A11-2A4 | | | 6.00% | | | | 10/25/2035 | | | | 5,920,120 | |
| | 10,214,699 | | | Series 2005-A12-A7 | | | 4.76% | # I/F I/O | | | 11/25/2035 | | | | 1,200,386 | |
| | 7,790,579 | | | Series 2005-A12-A8 | | | 0.79% | # | | | 11/25/2035 | | | | 5,273,902 | |
| | 8,719,228 | | | Series 2005-A15-5A3 | | | 5.75% | | | | 02/25/2036 | | | | 5,944,299 | |
| | 6,552,718 | | | Series 2005-A7-A3 | | | 5.50% | | | | 06/25/2035 | | | | 5,766,838 | |
| | 11,605,616 | | | Series 2005-A8CB-A11 | | | 6.00% | | | | 07/25/2035 | | | | 9,785,362 | |
| | 12,814,488 | | | Series 2005-A8CB-A2 | | | 4.76% | # I/F I/O | | | 07/25/2035 | | | | 1,694,827 | |
| | 10,776,152 | | | Series 2006-A10-A5 | | | 6.50% | | | | 09/25/2036 | | | | 7,112,282 | |
| | 1,988,999 | | | Series 2006-A1-1A3 | | | 6.00% | | | | 04/25/2036 | | | | 1,398,044 | |
| | 14,910,842 | | | Series 2006-A12-A1 | | | 6.25% | | | | 11/25/2036 | | | | 10,070,239 | |
| | 15,749,485 | | | Series 2006-A13-A1 | | | 6.25% | | | | 12/25/2036 | | | | 10,472,604 | |
| | 29,713,303 | | | Series 2006-A1-3A2 | | | 6.00% | | | | 04/25/2036 | | | | 21,704,498 | |
| | 24,105,805 | | | Series 2006-A14C-2A6 | | | 0.69% | # | | | 12/25/2036 | | | | 7,228,716 | |
| | 53,197,895 | | | Series 2006-A14C-2A7 | | | 6.31% | # I/F I/O | | | 12/25/2036 | | | | 12,383,395 | |
| | 15,185,782 | | | Series 2006-A2-A11 | | | 6.00% | | | | 01/25/2046 | | | | 10,632,287 | |
| | 2,026,156 | | | Series 2006-A4-2A5 | | | 6.00% | | | | 05/25/2036 | | | | 1,359,918 | |
| | 8,912,465 | | | Series 2006-A8-1A1 | | | 6.00% | | | | 08/25/2036 | | | | 6,832,674 | |
| | 12,168,249 | | | Series 2006-R1-A1 | | | 27.43% | # I/F | | | 01/25/2046 | | | | 15,477,141 | |
| | 83,383,515 | | | Series 2007-A2-1A2 | | | 6.00% | | | | 04/25/2037 | | | | 64,021,071 | |
| | 2,036,591 | | | Series 2007-A3-1A2 | | | 44.53% | # I/F | | | 04/25/2037 | | | | 3,674,489 | |
| | 34,051,818 | | | Series 2007-A5-1A4 | | | 5.86% | # I/F I/O | | | 05/25/2037 | | | | 7,257,856 | |
| | 8,794,190 | | | Series 2007-A5-1A6 | | | 0.64% | # | | | 05/25/2037 | | | | 2,129,887 | |
| | 4,486,898 | | | Series 2007-A5-2A3 | | | 6.00% | | | | 05/25/2037 | | | | 3,399,200 | |
| | 8,766,752 | | | Series 2007-A5-2A5 | | | 6.00% | | | | 05/25/2037 | | | | 6,641,547 | |
| | 17,006,364 | | | Series 2007-A7-A1 | | | 6.00% | | | | 07/25/2037 | | | | 12,365,174 | |
| | | | | | | | | | | | | | | | |
PRINCIPAL
AMOUNT | | | SECURITY DESCRIPTION | | RATE | | | MATURITY | | | VALUE $ | |
| |
| | | | Residential Funding Mortgage Securities Trust, | |
| $ | 15,320,610 | | | Series 2003-S16-A1 | | | 4.75% | | | | 09/25/2018 | | | | 15,720,623 | |
| | 28,882,464 | | | Series 2005-S9-A6 | | | 5.75% | | | | 12/25/2035 | | | | 27,769,926 | |
| | 2,233,384 | | | Series 2005-S9-A8 | | | 5.50% | | | | 12/25/2035 | | | | 2,127,753 | |
| | 29,252,029 | | | Series 2006-S11-A1 | | | 6.00% | | | | 11/25/2036 | | | | 25,687,494 | |
| | 802,874 | | | Series 2006-S5-A15 | | | 6.00% | | | | 06/25/2036 | | | | 631,881 | |
| | 16,372,945 | | | Series 2007-S1-A7 | | | 6.00% | | | | 01/25/2037 | | | | 13,314,921 | |
| | 13,475,092 | | | Series 2007-S2-A1 | | | 6.00% | | | | 02/25/2037 | | | | 11,650,275 | |
| | 15,181,175 | | | Series 2007-S2-A4 | | | 6.00% | | | | 02/25/2037 | | | | 13,125,370 | |
| | 4,428,834 | | | Series 2007-S2-A9 | | | 6.00% | | | | 02/25/2037 | | | | 3,829,091 | |
| | 12,236,058 | | | Series 2007-S3-1A4 | | | 6.00% | | | | 03/25/2037 | | | | 9,863,994 | |
| | 3,984,462 | | | Series 2007-S4-A1 | | | 6.00% | | | | 04/25/2037 | | | | 3,371,283 | |
| | 92,885,723 | | | Series 2007-S5-A1 | | | 6.00% | | | | 05/25/2037 | | | | 80,429,096 | |
| | 30,308,445 | | | Series 2007-S8-1A1 | | | 6.00% | | | | 09/25/2037 | | | | 24,503,620 | |
| | 18,558,192 | | | Series 2007-SA1-4A | | | 5.90% | # | | | 02/25/2037 | | | | 15,307,223 | |
| |
| | | | Salomon Brothers Mortgage Securities, | |
| | 3,000,000 | | | Series 2000-C3-F | | | 7.60% | # | | | 12/18/2033 | | | | 2,976,972 | |
| |
| | | | Sequoia Mortgage Trust, | |
| | 684,475 | | | Series 2003-4-2A1 | | | 0.59% | # | | | 07/20/2033 | | | | 640,378 | |
| |
| | | | Soundview Home Equity Loan Trust, | |
| | 3,696,006 | | | Series 2007-1-2A1 | | | 0.33% | # | | | 03/25/2037 | | | | 3,461,875 | |
| |
| | | | Structured Adjustable Rate Mortgage Loan Trust, | |
| | 29,462,913 | | | Series 2004-12-8A | | | 4.29% | # | | | 09/25/2034 | | | | 28,018,729 | |
| |
| | | | Structured Asset Securities Corporation, | |
| | 919,243 | | | Series 2003-18XS-A6 | | | 4.04% | # | | | 06/25/2033 | | | | 928,741 | |
| | 7,630,648 | | | Series 2003-24A-1A3 | | | 2.66% | # | | | 07/25/2033 | | | | 6,958,765 | |
| | 41,061,116 | | | Series 2003-35-1A1 | | | 5.15% | # | | | 12/25/2033 | | | | 41,200,867 | |
| | 9,536,854 | | | Series 20034-15-2A1 | | | 4.75% | | | | 09/25/2019 | | | | 9,608,505 | |
| | 15,589,558 | | | Series 2004-11XS-2A2 | | | 5.40% | # | | | 06/25/2034 | | | | 16,104,255 | |
| | 32,417,758 | | | Series 2004-22-A2 | | | 4.86% | # | | | 01/25/2035 | | | | 32,165,483 | |
| | 53,808,647 | | | Series 2005-10-1A1 | | | 5.75% | | | | 06/25/2035 | | | | 49,741,090 | |
| | 13,547,380 | | | Series 2005-10-6A1 | | | 5.00% | | | | 06/25/2020 | | | | 13,657,229 | |
| | 7,752,332 | | | Series 2005-14-1A1 | | | 0.54% | # | | | 07/25/2035 | | | | 6,603,816 | |
| | 2,549,343 | | | Series 2005-14-1A4 | | | 23.45% | # I/F | | | 07/25/2035 | | | | 3,134,844 | |
| | 84,255,057 | | | Series 2005-14-4A1 | | | 5.75% | | | | 07/25/2035 | | | | 79,405,082 | |
| | 8,655,585 | | | Series 2005-15-1A1 | | | 5.50% | | | | 08/25/2035 | | | | 8,372,656 | |
| | 12,500,000 | | | Series 2005-3-1A6 | | | 5.75% | | | | 03/25/2035 | | | | 10,742,213 | |
| |
| | | | Suntrust Adjustable Rate Mortgage Loan Trust, | |
| | 18,399,186 | | | Series 2007-3-1A1 | | | 5.42% | # | | | 06/25/2037 | | | | 13,221,370 | |
| |
| | | | Suntrust Alternative Loan Trust, | |
| | 2,248,713 | | | Series 2005-1F-2A3 | | | 5.75% | | | | 12/25/2035 | | | | 1,776,870 | |
| | 4,329,593 | | | Series 2006-1F-1A3 | | | 6.00% | | | | 04/25/2036 | | | | 2,632,637 | |
| |
| | | | Thornburg Mortgage Securities Trust, | |
| | 2,676,053 | | | Series 2003-6-A2 | | | 1.24% | # | | | 12/25/2033 | | | | 2,034,211 | |
| | 20,607,456 | | | Series 2004-4-5A | | | 4.82% | # | | | 12/25/2044 | | | | 20,387,935 | |
| | 36,270,095 | | | Series 2007-1-A1 | | | 2.37% | # | | | 03/25/2037 | | | | 26,643,994 | |
| | 12,304,243 | | | Series 2007-1-A2A | | | 5.80% | # | | | 03/25/2037 | | | | 9,548,185 | |
| |
| | | | TIAA Real Estate CDO, | |
| | 6,991,621 | | | Series 2002-1A-IIFL | | | 1.74% | # ^ | | | 05/22/2037 | | | | 6,711,956 | |
| |
| | | | TIAA Seasoned Commercial Mortgage Trust, | |
| | 16,746,000 | | | Series 2007-C4-AJ | | | 5.66% | # | | | 08/15/2039 | | | | 17,680,025 | |
| |
| | | | Wachovia Bank Commercial Mortgage Trust, | |
| | 5,840,000 | | | Series 2005-C22-AM | | | 5.49% | # | | | 12/15/2044 | | | | 6,193,819 | |
| | 2,392,771 | | | Series 2006-C23-APB | | | 5.45% | | | | 01/15/2045 | | | | 2,416,693 | |
| |
| | | | Washington Mutual Mortgage Pass-Through Certificates, | |
| | 13,363,508 | | | Series 2005-1-2A | | | 6.00% | | | | 03/25/2035 | | | | 10,870,439 | |
| | 7,553,567 | | | Series 2005-4-5A1 | | | 5.50% | | | | 06/25/2035 | | | | 6,419,192 | |
| | 2,518,059 | | | Series 2005-5-CB12 | | | 47.94% | # I/F | | | 07/25/2035 | | | | 5,216,355 | |
| | 8,154,092 | | | Series 2005-5-CB6 | | | 0.84% | # | | | 07/25/2035 | | | | 4,948,939 | |
| | 6,150,625 | | | Series 2005-6-2A7 | | | 5.50% | | | | 08/25/2035 | | | | 5,522,465 | |
| | 2,787,842 | | | Series 2005-7-3CB | | | 6.50% | | | | 08/25/2035 | | | | 1,955,063 | |
| | 8,097,222 | | | Series 2005-9-CX | | | 5.50% | I/O | | | 11/25/2035 | | | | 1,484,544 | |
| | 8,652,409 | | | Series 2005-AR14-1A1 | | | 2.46% | # | | | 12/25/2035 | | | | 8,499,344 | |
| | 13,544,003 | | | Series 2006-1-3A1 | | | 5.75% | | | | 02/25/2036 | | | | 10,104,151 | |
| | 6,661,270 | | | Series 2006-1-3A2 | | | 5.75% | | | | 02/25/2036 | | | | 5,043,051 | |
| | 5,754,307 | | | Series 2006-1-3A7 | | | 5.75% | | | | 02/25/2036 | | | | 4,251,898 | |
| | 6,452,180 | | | Series 2006-5-1A8 | | | 5.75% | | | | 07/25/2036 | | | | 4,243,199 | |
| | 11,678,746 | | | Series 2006-5-2CB1 | | | 6.00% | | | | 07/25/2036 | | | | 6,761,363 | |
| | 21,213,517 | | | Series 2006-5-2CB6 | | | 6.00% | | | | 07/25/2036 | | | | 12,281,481 | |
| | 9,905,361 | | | Series 2006-5-3A5 | | | 6.45% | # | | | 07/25/2036 | | | | 4,497,727 | |
| | 6,969,859 | | | Series 2006-9-A7 | | | 5.93% | # | | | 10/25/2036 | | | | 4,229,669 | |
| | | | | | |
| 14 | | DoubleLine Funds | | | | The accompanying notes are an integral part of these financial statements |
| | | | | | | | | | | | | | | | |
PRINCIPAL
AMOUNT | | | SECURITY DESCRIPTION | | RATE | | | MATURITY | | | VALUE $ | |
| |
| | | | Washington Mutual Mortgage Pass-Through Certificates, (Cont.) | |
| $ | 25,231,522 | | | Series 2006-AR10-1A1 | | | 2.52% | # | | | 09/25/2036 | | | | 17,819,750 | |
| | 3,940,000 | | | Series 2006-AR6-2A3 | | | 5.47% | # | | | 08/25/2036 | | | | 3,147,678 | |
| | 28,198,089 | | | Series 2007-4-1A1 | | | 5.50% | | | | 06/25/2037 | | | | 22,825,380 | |
| | 1,187,126 | | | Series 2007-5-A11 | | | 38.03% | # I/F | | | 06/25/2037 | | | | 1,888,197 | |
| | 52,823,104 | | | Series 2007-HY3-4A1 | | | 2.64% | # | | | 03/25/2037 | | | | 42,153,682 | |
| | 52,131,718 | | | Series 2007-HY5-1A1 | | | 4.93% | # | | | 05/25/2037 | | | | 36,688,948 | |
| | 48,338,007 | | | Series 2007-HY6-2A3 | | | 5.35% | # | | | 06/25/2037 | | | | 36,180,055 | |
| |
| | | | Wells Fargo Alternative Loan Trust, | |
| | 5,563,806 | | | Series 2007-PA1-A10 | | | 6.00% | | | | 03/25/2037 | | | | 4,004,691 | |
| | 21,063,523 | | | Series 2007-PA1-A5 | | | 6.00% | | | | 03/25/2037 | | | | 15,161,008 | |
| | 23,129,985 | | | Series 2007-PA2-3A1 | | | 0.59% | # | | | 06/25/2037 | | | | 10,515,319 | |
| | 34,074,049 | | | Series 2007-PA2-3A2 | | | 6.41% | # I/F I/O | | | 06/25/2037 | | | | 6,027,416 | |
| | 2,516,557 | | | Series 2007-PA3-1A4 | | | 5.75% | | | | 07/25/2037 | | | | 2,095,381 | |
| | 24,797,949 | | | Series 2007-PA3-4A3 | | | 6.50% | | | | 07/25/2037 | | | | 16,361,104 | |
| | 292,816,504 | | | Series 2007-PA5-1A1 | | | 6.25% | | | | 11/25/2037 | | | | 268,264,718 | |
| |
| | | | Wells Fargo Mortgage Backed Securities Trust, | |
| | 45,911,061 | | | Series 2004-Y-3A3 | | | 2.63% | # | | | 11/25/2034 | | | | 44,380,570 | |
| | 1,925,739 | | | Series 2005-4-A7 | | | 22.93% | # I/F | | | 04/25/2035 | | | | 2,445,314 | |
| | 10,100,587 | | | Series 2005-8-A1 | | | 5.50% | | | | 10/25/2035 | | | | 9,891,106 | |
| | 7,321,293 | | | Series 2005-AR16-6A4 | | | 2.72% | # | | | 10/25/2035 | | | | 3,015,201 | |
| | 25,000,000 | | | Series 2006-12-A3 | | | 6.00% | | | | 10/25/2036 | | | | 22,914,000 | |
| | 26,130,649 | | | Series 2006-14-A1 | | | 6.00% | | | | 10/25/2036 | | | | 24,060,814 | |
| | 32,946,783 | | | Series 2006-15-A1 | | | 6.00% | | | | 11/25/2036 | | | | 30,684,410 | |
| | 319,928 | | | Series 2006-2-1A4 | | | 18.72% | # I/F | | | 03/25/2036 | | | | 358,129 | |
| | 6,112,800 | | | Series 2006-2-3A1 | | | 5.75% | | | | 03/25/2036 | | | | 6,066,863 | |
| | 5,438,375 | | | Series 2006-3-A6 | | | 5.50% | | | | 03/25/2036 | | | | 4,835,433 | |
| | 3,793,548 | | | Series 2006-4-1A8 | | | 5.75% | | | | 04/25/2036 | | | | 3,838,024 | |
| | 1,020,389 | | | Series 2006-4-2A2 | | | 5.50% | | | | 04/25/2036 | | | | 962,817 | |
| | 14,634,427 | | | Series 2006-6-2A1 | | | 0.64% | # | | | 05/25/2036 | | | | 9,846,401 | |
| | 14,634,427 | | | Series 2006-6-2A2 | | | 6.86% | # I/F I/O | | | 05/25/2036 | | | | 2,857,916 | |
| | 6,359,588 | | | Series 2006-9-2A1 | | | 0.00% | P/O | | | 08/25/2036 | | | | 5,156,990 | |
| | 6,359,588 | | | Series 2006-9-2A2 | | | 6.00% | I/O | | | 08/25/2036 | | | | 1,200,782 | |
| | 31,711,320 | | | Series 2006-AR12-1A1 | | | 2.75% | # | | | 09/25/2036 | | | | 23,441,452 | |
| | 14,839,946 | | | Series 2006-AR13-A2 | | | 2.65% | # | | | 09/25/2036 | | | | 11,255,083 | |
| | 20,761,814 | | | Series 2006-AR4-2A1 | | | 5.61% | # | | | 04/25/2036 | | | | 19,634,136 | |
| | 7,006,712 | | | Series 2007-10-1A18 | | | 6.00% | | | | 07/25/2037 | | | | 6,524,044 | |
| | 11,454,084 | | | Series 2007-10-2A11 | | | 6.00% | | | | 07/25/2037 | | | | 10,475,132 | |
| | 10,618,338 | | | Series 2007-11-A96 | | | 6.00% | | | | 08/25/2037 | | | | 10,319,676 | |
| | 89,554,937 | | | Series 2007-14-1A1 | | | 6.00% | | | | 10/25/2037 | | | | 85,951,066 | |
| | 79,252,030 | | | Series 2007-2-1A1 | | | 6.00% | | | | 03/25/2037 | | | | 71,164,083 | |
| | 4,586,560 | | | Series 2007-2-1A18 | | | 5.75% | | | | 03/25/2037 | | | | 4,083,394 | |
| | 6,041,553 | | | Series 2007-2-3A2 | | | 5.25% | | | | 03/25/2037 | | | | 5,970,894 | |
| | 7,496,395 | | | Series 2007-3-1A3 | | | 6.00% | | | | 04/25/2037 | | | | 6,733,420 | |
| | 8,168,107 | | | Series 2007-4-A11 | | | 6.50% | | | | 04/25/2037 | | | | 7,390,785 | |
| | 19,373,521 | | | Series 2007-4-A15 | | | 6.00% | | | | 04/25/2037 | | | | 17,726,230 | |
| | 7,607,835 | | | Series 2007-5-1A6 | | | 23.50% | # I/F | | | 05/25/2037 | | | | 10,056,710 | |
| | 2,422,000 | | | Series 2007-7-A32 | | | 5.75% | | | | 06/25/2037 | | | | 2,167,645 | |
| | 78,423,000 | | | Series 2007-7-A34 | | | 6.00% | | | | 06/25/2037 | | | | 71,002,028 | |
| | 10,000,000 | | | Series 2007-7-A36 | | | 6.00% | | | | 06/25/2037 | | | | 9,600,045 | |
| | 7,946,354 | | | Series 2007-7-A43 | | | 0.74% | # | | | 06/25/2037 | | | | 5,809,424 | |
| | 20,000,000 | | | Series 2007-7-A49 | | | 6.00% | | | | 06/25/2037 | | | | 18,182,190 | |
| | 9,190,556 | | | Series 2007-7-A8 | | | 0.74% | # | | | 06/25/2037 | | | | 6,719,036 | |
| | 4,146,021 | | | Series 2007-7-A9 | | | 37.55% | # I/F | | | 06/25/2037 | | | | 7,459,471 | |
| | 5,658,871 | | | Series 2007-8-1A13 | | | 0.61% | # | | | 07/25/2037 | | | | 4,375,628 | |
| | 5,658,871 | | | Series 2007-8-1A14 | | | 38.33% | # I/F | | | 07/25/2037 | | | | 10,492,614 | |
| | 4,715,726 | | | Series 2007-8-1A16 | | | 6.00% | | | | 07/25/2037 | | | | 4,389,251 | |
| | 63,662,295 | | | Series 2007-8-1A2 | | | 6.00% | | | | 07/25/2037 | | | | 57,946,026 | |
| | 5,650,000 | | | Series 2007-8-2A2 | | | 6.00% | | | | 07/25/2037 | | | | 5,537,412 | |
| | 144,597,718 | | | Series 2007-AR9-A1 | | | 6.00% | # | | | 12/28/2037 | | | | 144,001,179 | |
| |
| | | | Wells Fargo Mortgage Loan Trust, | |
| | 58,087,055 | | | Series 2012-RR1-A1 | | | 2.85% | #^ | | | 08/27/2037 | | | | 58,182,318 | |
| |
| | | | WF-RBS Commercial Mortgage Trust, | |
| | 90,808,478 | | | Series 2011-C4-XA | | | 1.05% | #^ I/O | | | 06/15/2044 | | | | 3,791,254 | |
| | 120,552,936 | | | Series 2012-C6-XA | | | 2.51% | #^ I/O | | | 04/15/2045 | | | | 17,999,759 | |
| | | | | | | | | | | | | | | | |
| | | | Total Non-Agency Collateralized
Mortgage Obligations
(Cost $8,482,825,177) | | | | 8,354,978,194 | |
| | | | | | | | | | | | | | | | |
| | | | | | | | | | | | | | | | |
PRINCIPAL
AMOUNT | | | SECURITY DESCRIPTION | | RATE | | | MATURITY | | | VALUE $ | |
| | US GOVERNMENT / AGENCY MORTGAGE BACKED SECURITIES 40.5% | |
| |
| | | | Federal Home Loan Mortgage Corporation, | |
| $ | 47,621,017 | | | Pool C03490 | | | 4.50% | | | | 08/01/2040 | | | | 50,538,764 | |
| | 143,612,365 | | | Pool G01840 | | | 5.00% | | | | 07/01/2035 | | | | 155,063,166 | |
| | 45,055,849 | | | Pool G04817 | | | 5.00% | | | | 09/01/2038 | | | | 48,570,896 | |
| | 118,836,293 | | | Pool G06172 | | | 5.50% | | | | 12/01/2038 | | | | 129,363,853 | |
| | 90,752,594 | | | Pool G06871 | | | 6.00% | | | | 06/01/2038 | | | | 100,356,176 | |
| | 53,525,643 | | | Pool T6-0392 | | | 4.00% | | | | 10/01/2041 | | | | 55,409,565 | |
| | 46,186,530 | | | Pool T6-9016 | | | 5.00% | | | | 06/01/2041 | | | | 48,808,324 | |
| | 1,292,779 | | | Pool U60299 | | | 4.00% | | | | 11/01/2040 | | | | 1,367,166 | |
| | 11,234,821 | | | Series 2519-ZD | | | 5.50% | | | | 11/15/2032 | | | | 12,453,690 | |
| | 4,681,036 | | | Series 2596-ZL | | | 5.00% | | | | 04/15/2033 | | | | 5,247,203 | |
| | 2,505,084 | | | Series 2684-ZN | | | 4.00% | | | | 10/15/2033 | | | | 2,670,709 | |
| | 13,022,127 | | | Series 2750-ZT | | | 5.00% | | | | 02/15/2034 | | | | 14,579,206 | |
| | 11,422,742 | | | Series 2825-PZ | | | 5.50% | | | | 07/15/2034 | | | | 13,400,848 | |
| | 20,101,696 | | | Series 2898-JZ | | | 5.00% | | | | 12/15/2034 | | | | 22,528,271 | |
| | 25,649,901 | | | Series 2899-AZ | | | 5.00% | | | | 12/15/2034 | | | | 28,842,401 | |
| | 20,532,447 | | | Series 2909-Z | | | 5.00% | | | | 12/15/2034 | | | | 23,130,032 | |
| | 54,845,893 | | | Series 2932-Z | | | 5.00% | | | | 02/15/2035 | | | | 61,426,370 | |
| | 7,185,334 | | | Series 2990-JL | | | 6.41% | # I/F I/O | | | 03/15/2035 | | | | 906,274 | |
| | 23,057,334 | | | Series 3002-SN | | | 6.26% | # I/F I/O | | | 07/15/2035 | | | | 4,135,363 | |
| | 392,139 | | | Series 3014-SJ | | | 10.90% | # I/F | | | 08/15/2035 | | | | 395,559 | |
| | 16,284,778 | | | Series 3030-SL | | | 5.86% | # I/F I/O | | | 09/15/2035 | | | | 2,067,905 | |
| | 4,588,651 | | | Series 3045-DI | | | 6.49% | # I/F I/O | | | 10/15/2035 | | | | 719,045 | |
| | 23,736,935 | | | Series 3116-Z | | | 5.50% | | | | 02/15/2036 | | | | 27,010,063 | |
| | 6,108,424 | | | Series 3117-ZN | | | 4.50% | | | | 02/15/2036 | | | | 6,635,125 | |
| | 7,314,297 | | | Series 3174-PZ | | | 5.00% | | | | 01/15/2036 | | | | 8,471,847 | |
| | 3,980,299 | | | Series 3187-JZ | | | 5.00% | | | | 07/15/2036 | | | | 4,450,708 | |
| | 5,478,192 | | | Series 3188-ZK | | | 5.00% | | | | 07/15/2036 | | | | 6,201,948 | |
| | 19,027,138 | | | Series 3203-SE | | | 6.26% | # I/F I/O | | | 08/15/2036 | | | | 2,831,198 | |
| | 18,761,908 | | | Series 3203-Z | | | 5.00% | | | | 07/15/2036 | | | | 21,424,425 | |
| | 29,728,375 | | | Series 3203-ZC | | | 5.00% | | | | 07/15/2036 | | | | 33,947,153 | |
| | 21,812,055 | | | Series 3261-SA | | | 6.19% | # I/F I/O | | | 01/15/2037 | | | | 3,154,549 | |
| | 54,778,118 | | | Series 3267-BA | | | 5.80% | | | | 11/15/2036 | | | | 60,576,568 | |
| | 41,233,679 | | | Series 3275-SC | | | 5.84% | # I/F I/O | | | 02/15/2037 | | | | 5,204,585 | |
| | 13,354,621 | | | Series 3315-HZ | | | 6.00% | | | | 05/15/2037 | | | | 15,696,568 | |
| | 3,162,785 | | | Series 3351-ZC | | | 5.50% | | | | 07/15/2037 | | | | 3,625,940 | |
| | 47,520,722 | | | Series 3355-BI | | | 5.81% | # I/F I/O | | | 08/15/2037 | | | | 6,307,012 | |
| | 3,250,199 | | | Series 3369-Z | | | 6.00% | | | | 09/15/2037 | | | | 3,827,766 | |
| | 11,312,040 | | | Series 3405-ZG | | | 5.50% | | | | 01/15/2038 | | | | 12,899,863 | |
| | 43,703,126 | | | Series 3417-SI | | | 5.94% | # I/F I/O | | | 02/15/2038 | | | | 5,908,733 | |
| | 73,671,674 | | | Series 3423-GS | | | 5.41% | # I/F I/O | | | 03/15/2038 | | | | 8,627,675 | |
| | 12,097,664 | | | Series 3423-SG | | | 5.41% | # I/F I/O | | | 03/15/2038 | | | | 1,420,273 | |
| | 11,429,785 | | | Series 3451-S | | | 5.79% | # I/F I/O | | | 02/15/2037 | | | | 1,492,704 | |
| | 19,926,738 | | | Series 3455-SC | | | 5.82% | # I/F I/O | | | 06/15/2038 | | | | 2,515,516 | |
| | 13,815,401 | | | Series 3473-SM | | | 5.83% | # I/F I/O | | | 07/15/2038 | | | | 1,699,412 | |
| | 38,390,541 | | | Series 3484-SE | | | 5.61% | # I/F I/O | | | 08/15/2038 | | | | 4,621,089 | |
| | 20,233,236 | | | Series 3519-SD | | | 5.31% | # I/F I/O | | | 02/15/2038 | | | | 2,609,618 | |
| | 11,804,012 | | | Series 3524-LB | | | 5.70% | # | | | 06/15/2038 | | | | 12,622,538 | |
| | 2,725,849 | | | Series 3530-GZ | | | 4.50% | | | | 05/15/2039 | | | | 2,782,381 | |
| | 52,898,279 | | | Series 3541-EI | | | 6.51% | # I/F I/O | | | 06/15/2039 | | | | 7,644,785 | |
| | 25,157,523 | | | Series 3545-SA | | | 5.91% | # I/F I/O | | | 06/15/2039 | | | | 3,344,698 | |
| | 10,465,479 | | | Series 3549-SA | | | 5.56% | # I/F I/O | | | 07/15/2039 | | | | 1,262,810 | |
| | 41,519,378 | | | Series 3577-LS | | | 6.96% | # I/F I/O | | | 08/15/2035 | | | | 8,607,482 | |
| | 17,920,646 | | | Series 3582-SA | | | 5.76% | # I/F I/O | | | 10/15/2049 | | | | 2,244,186 | |
| | 11,140,980 | | | Series 3583-GB | | | 4.50% | | | | 10/15/2039 | | | | 12,317,646 | |
| | 70,789,096 | | | Series 3606-CS | | | 6.11% | # I/F I/O | | | 12/15/2039 | | | | 11,047,375 | |
| | 19,233,528 | | | Series 3616-SG | | | 6.11% | # I/F I/O | | | 03/15/2032 | | | | 3,379,539 | |
| | 28,156,275 | | | Series 3626-AZ | | | 5.50% | | | | 08/15/2036 | | | | 31,826,442 | |
| | 25,343,830 | | | Series 3631-SE | | | 6.16% | # I/F I/O | | | 05/15/2039 | | | | 2,845,261 | |
| | 26,550,302 | | | Series 3641-SB | | | 6.26% | # I/F I/O | | | 10/15/2034 | | | | 1,443,593 | |
| | 24,551,946 | | | Series 3641-Z | | | 5.50% | | | | 02/15/2036 | | | | 28,293,614 | |
| | 19,139,798 | | | Series 3654-ZB | | | 5.50% | | | | 11/15/2037 | | | | 22,236,755 | |
| | 38,343,149 | | | Series 3666-VZ | | | 5.50% | | | | 08/15/2036 | | | | 44,618,837 | |
| | 33,362,854 | | | Series 3667-SB | | | 6.21% | # I/F I/O | | | 05/15/2040 | | | | 4,677,599 | |
| | 68,044,947 | | | Series 3688-CM | | | 4.00% | | | | 07/15/2029 | | | | 69,933,188 | |
| | 39,831,837 | | | Series 3702-SG | | | 5.81% | # I/F I/O | | | 08/15/2032 | | | | 6,897,958 | |
| | 13,911,718 | | | Series 3704-EI | | | 5.00% | I/O | | | 12/15/2036 | | | | 1,983,844 | |
| | 7,848,032 | | | Series 3712-SG | | | 23.78% | # I/F | | | 08/15/2040 | | | | 10,862,937 | |
| | 41,715,978 | | | Series 3724-CM | | | 5.50% | | | | 06/15/2037 | | | | 46,992,298 | |
| | 143,621,246 | | | Series 3726-SA | | | 5.81% | # I/F I/O | | | 09/15/2040 | | | | 18,386,837 | |
| | 98,000,000 | | | Series 3738-BP | | | 4.00% | | | | 12/15/2038 | | | | 105,019,887 | |
| | 15,607,399 | | | Series 3741-SC | | | 9.52% | # I/F | | | 10/15/2040 | | | | 16,577,475 | |
| | 11,762,380 | | | Series 3745-SY | | | 9.52% | # I/F | | | 10/15/2040 | | | | 11,581,214 | |
| | 11,982,163 | | | Series 3747-KS | | | 14.27% | # I/F | | | 10/15/2040 | | | | 12,855,517 | |
| | | | | | |
| The accompanying notes are an integral part of these financial statements | | Annual Report | | March 31, 2012 | | 15 |
Schedule of Investments DoubleLine Total Return Bond Fund (Cont.)
| | | | | | | | | | | | | | | | |
PRINCIPAL
AMOUNT | | | SECURITY DESCRIPTION | | RATE | | | MATURITY | | | VALUE $ | |
| |
| | | | Federal Home Loan Mortgage Corporation, (Cont.) | |
| $ | 25,521,170 | | | Series 3748-CS | | | 9.51% | # I/F | | | 10/15/2040 | | | | 25,400,830 | |
| | 51,700,000 | | | Series 3752-BS | | | 9.51% | # I/F | | | 11/15/2040 | | | | 53,014,622 | |
| | 18,829,197 | | | Series 3758-SL | | | 5.38% | # I/F | | | 05/15/2039 | | | | 18,608,758 | |
| | 19,758,034 | | | Series 3758-SM | | | 9.51% | # I/F | | | 11/15/2040 | | | | 19,506,688 | |
| | 6,407,834 | | | Series 3764-S | | | 9.42% | # I/F | | | 11/15/2040 | | | | 6,380,129 | |
| | 7,070,092 | | | Series 3768-MS | | | 9.51% | # I/F | | | 12/15/2040 | | | | 7,052,062 | |
| | 12,772,275 | | | Series 3768-ZX | | | 5.00% | | | | 12/15/2040 | | | | 14,554,150 | |
| | 18,900,000 | | | Series 3771-AL | | | 4.00% | | | | 12/15/2030 | | | | 20,288,674 | |
| | 18,761,630 | | | Series 3779-BY | | | 3.50% | | | | 12/15/2030 | | | | 19,441,649 | |
| | 27,207,887 | | | Series 3779-DZ | | | 4.50% | | | | 12/15/2040 | | | | 26,841,291 | |
| | 24,250,000 | | | Series 3779-LB | | | 4.00% | | | | 12/15/2030 | | | | 25,890,532 | |
| | 12,751,614 | | | Series 3779-SH | | | 9.32% | # I/F | | | 12/15/2040 | | | | 12,974,622 | |
| | 3,500,000 | | | Series 3779-YA | | | 3.50% | | | | 12/15/2030 | | | | 3,620,192 | |
| | 10,308,107 | | | Series 3780-BS | | | 9.42% | # I/F | | | 12/15/2040 | | | | 10,320,569 | |
| | 15,000,000 | | | Series 3783-AC | | | 4.00% | | | | 01/15/2031 | | | | 16,052,961 | |
| | 25,451,183 | | | Series 3786-SG | | | 9.02% | # I/F | | | 01/15/2041 | | | | 25,569,867 | |
| | 11,731,674 | | | Series 3788-AY | | | 3.50% | | | | 01/15/2031 | | | | 12,152,289 | |
| | 15,167,493 | | | Series 3793-SA | | | 9.32% | # I/F | | | 01/15/2041 | | | | 15,431,034 | |
| | 10,476,914 | | | Series 3795-VZ | | | 4.00% | | | | 01/15/2041 | | | | 10,774,481 | |
| | 3,328,518 | | | Series 3796-CS | | | 9.42% | # I/F | | | 01/15/2041 | | | | 3,345,193 | |
| | 6,218,437 | | | Series 3796-SK | | | 9.42% | # I/F | | | 01/15/2041 | | | | 6,194,070 | |
| | 9,586,506 | | | Series 3798-SD | | | 9.12% | # I/F | | | 12/15/2040 | | | | 9,687,272 | |
| | 16,306,458 | | | Series 3800-VZ | | | 4.50% | | | | 02/15/2041 | | | | 17,560,514 | |
| | 60,491,233 | | | Series 3806-CZ | | | 5.50% | | | | 07/15/2034 | | | | 71,130,643 | |
| | 18,000,000 | | | Series 3808-DB | | | 3.50% | | | | 02/15/2031 | | | | 18,642,366 | |
| | 15,277,557 | | | Series 3812-EY | | | 3.50% | | | | 02/15/2031 | | | | 15,828,340 | |
| | 11,505,338 | | | Series 3818-CZ | | | 4.50% | | | | 03/15/2041 | | | | 12,428,760 | |
| | 16,902,526 | | | Series 3819-ZU | | | 5.50% | | | | 07/15/2034 | | | | 19,751,296 | |
| | 35,500,000 | | | Series 3824-EY | | | 3.50% | | | | 03/15/2031 | | | | 36,752,380 | |
| | 26,263,676 | | | Series 3828-SW | | | 12.47% | # I/F | | | 02/15/2041 | | | | 26,126,243 | |
| | 17,885,000 | | | Series 3838-TS | | | 8.35% | # I/F | | | 04/15/2041 | | | | 17,926,117 | |
| | 5,234,001 | | | Series 3843-PZ | | | 5.00% | | | | 04/15/2041 | | | | 5,981,729 | |
| | 8,746,781 | | | Series 3843-SC | | | 12.62% | # I/F | | | 04/15/2041 | | | | 8,789,586 | |
| | 11,241,443 | | | Series 3845-LS | | | 12.62% | # I/F | | | 03/15/2041 | | | | 11,233,630 | |
| | 64,900,997 | | | Series 3863-ZA | | | 5.50% | | | | 08/15/2034 | | | | 75,667,410 | |
| | 63,673,206 | | | Series 3871-LZ | | | 5.50% | | | | 06/15/2041 | | | | 75,038,358 | |
| | 172,678,919 | | | Series 3872-BA | | | 4.00% | | | | 06/15/2041 | | | | 183,435,070 | |
| | 30,000,000 | | | Series 3877-EY | | | 4.50% | | | | 06/15/2041 | | | | 32,856,441 | |
| | 12,378,000 | | | Series 3877-GY | | | 4.50% | | | | 06/15/2041 | | | | 13,299,096 | |
| | 47,231,583 | | | Series 3877-ZU | | | 4.50% | | | | 06/15/2041 | | | | 48,836,149 | |
| | 27,214,966 | | | Series 3888-ZG | | | 4.00% | | | | 07/15/2041 | | | | 28,148,361 | |
| | 77,120,554 | | | Series 3900-SB | | | 5.73% | # I/F I/O | | | 07/15/2041 | | | | 10,640,693 | |
| | 36,387,577 | | | Series 3901-VZ | | | 4.00% | | | | 07/15/2041 | | | | 37,721,010 | |
| | 18,531,608 | | | Series 3910-GZ | | | 5.00% | | | | 08/15/2041 | | | | 20,955,543 | |
| | 8,236,270 | | | Series 3910-ZE | | | 5.00% | | | | 10/15/2034 | | | | 9,574,892 | |
| | 12,330,000 | | | Series 3919-KL | | | 4.50% | | | | 09/15/2041 | | | | 13,159,127 | |
| | 24,601,484 | | | Series 3919-ZJ | | | 4.00% | | | | 09/15/2041 | | | | 25,513,857 | |
| | 15,689,727 | | | Series 3924-US | | | 9.07% | # I/F | | | 09/15/2041 | | | | 15,767,565 | |
| | 10,392,252 | | | Series 3942-JZ | | | 4.00% | | | | 10/15/2041 | | | | 10,763,505 | |
| | 57,980,661 | | | Series 3946-SM | | | 13.97% | # I/F | | | 10/15/2041 | | | | 60,242,063 | |
| | 7,082,025 | | | Series 3957-DZ | | | 3.50% | | | | 11/15/2041 | | | | 6,764,508 | |
| | 122,968,522 | | | Series 3969-AB | | | 4.00% | | | | 10/15/2033 | | | | 131,124,077 | |
| | 10,058,418 | | | Series 3982-AZ | | | 3.50% | | | | 01/15/2042 | | | | 9,587,786 | |
| | 42,140,000 | | | Series 3999-ZB | | | 4.00% | | | | 02/15/2042 | | | | 42,809,958 | |
| | 23,893,308 | | | Series 4016-KZ | | | 4.00% | | | | 03/15/2042 | | | | 23,176,509 | |
| | 206,057,284 | | | Series R003-ZA | | | 5.50% | | | | 10/15/2035 | | | | 235,064,399 | |
| |
| | | | Federal National Mortgage Association, | |
| | 3,353,084 | | | Series 2002-70-QZ | | | 5.50% | | | | 11/25/2032 | | | | 3,792,027 | |
| | 7,939,516 | | | Series 2002-75-ZG | | | 5.50% | | | | 11/25/2032 | | | | 8,759,065 | |
| | 11,659,318 | | | Series 2003-117-KS | | | 6.86% | # I/F I/O | | | 08/25/2033 | | | | 1,317,244 | |
| | 31,451,466 | | | Series 2003-129-ZT | | | 5.50% | | | | 01/25/2034 | | | | 35,713,259 | |
| | 14,689,187 | | | Series 2003-29-ZL | | | 5.00% | | | | 04/25/2033 | | | | 16,437,926 | |
| | 12,090,271 | | | Series 2003-64-ZG | | | 5.50% | | | | 07/25/2033 | | | | 13,414,509 | |
| | 19,566,253 | | | Series 2003-84-PZ | | | 5.00% | | | | 09/25/2033 | | | | 22,821,072 | |
| | 53,711,284 | | | Series 2003-92-PZ | | | 5.00% | | | | 09/25/2033 | | | | 61,855,230 | |
| | 19,500,000 | | | Series 2003-W17-1A7 | | | 5.75% | | | | 08/25/2033 | | | | 22,397,406 | |
| | 18,896,867 | | | Series 2004-46-PJ | | | 5.76% | # I/F I/O | | | 03/25/2034 | | | | 2,489,301 | |
| | 14,634,668 | | | Series 2004-51-XP | | | 7.46% | # I/F I/O | | | 07/25/2034 | | | | 2,445,084 | |
| | 5,000,000 | | | Series 2004-W10-A6 | | | 5.75% | | | | 08/25/2034 | | | | 5,522,314 | |
| | 7,000,000 | | | Series 2004-W4-A5 | | | 5.50% | | | | 06/25/2034 | | | | 7,864,334 | |
| | 2,255,193 | | | Series 2005-107-EG | | | 4.50% | | | | 01/25/2026 | | | | 2,436,940 | |
| | 2,046,504 | | | Series 2005-37-ZK | | | 4.50% | | | | 05/25/2035 | | | | 2,214,316 | |
| | 40,234,891 | | | Series 2005-87-SE | | | 5.81% | # I/F I/O | | | 10/25/2035 | | | | 5,387,448 | |
| | 32,721,146 | | | Series 2005-87-SG | | | 6.46% | # I/F I/O | | | 10/25/2035 | | | | 5,366,023 | |
| | | | | | | | | | | | | | | | |
PRINCIPAL
AMOUNT | | | SECURITY DESCRIPTION | | RATE | | | MATURITY | | | VALUE $ | |
| |
| | | | Federal National Mortgage Association, (Cont.) | |
| $ | 22,417,935 | | | Series 2006-101-SA | | | 6.34% | # I/F I/O | | | 10/25/2036 | | | | 3,238,177 | |
| | 8,582,681 | | | Series 2006-123-LI | | | 6.08% | # I/F I/O | | | 01/25/2037 | | | | 1,246,076 | |
| | 10,472,177 | | | Series 2006-16-HZ | | | 5.50% | | | | 03/25/2036 | | | | 11,834,030 | |
| | 41,770,160 | | | Series 2006-56-SM | | | 6.51% | # I/F I/O | | | 07/25/2036 | | | | 7,153,311 | |
| | 11,994,189 | | | Series 2006-93-SN | | | 6.36% | # I/F I/O | | | 10/25/2036 | | | | 1,858,488 | |
| | 10,501,527 | | | Series 2007-116-BI | | | 6.01% | # I/F I/O | | | 05/25/2037 | | | | 1,688,701 | |
| | 53,589,165 | | | Series 2007-14-PS | | | 6.57% | # I/F I/O | | | 03/25/2037 | | | | 8,357,750 | |
| | 6,299,252 | | | Series 2007-2-SH | | | 31.63% | # I/F | | | 08/25/2036 | | | | 9,281,333 | |
| | 16,309,311 | | | Series 2007-30-OI | | | 6.20% | # I/F I/O | | | 04/25/2037 | | | | 2,486,798 | |
| | 8,590,185 | | | Series 2007-30-SI | | | 5.87% | # I/F I/O | | | 04/25/2037 | | | | 1,037,523 | |
| | 23,250,100 | | | Series 2007-32-SG | | | 5.86% | # I/F I/O | | | 04/25/2037 | | | | 3,387,721 | |
| | 24,309,129 | | | Series 2007-57-SX | | | 6.38% | # I/F I/O | | | 10/25/2036 | | | | 3,845,505 | |
| | 13,357,959 | | | Series 2007-60-VZ | | | 6.00% | | | | 07/25/2037 | | | | 15,721,395 | |
| | 12,291,567 | | | Series 2007-71-GZ | | | 6.00% | | | | 07/25/2047 | | | | 14,369,873 | |
| | 18,070,231 | | | Series 2007-75-ID | | | 5.63% | # I/F I/O | | | 08/25/2037 | | | | 2,415,392 | |
| | 12,108,650 | | | Series 2007-93-SB | | | 3.91% | # I/F I/O | | | 01/25/2036 | | | | 678,535 | |
| | 13,542,174 | | | Series 2007-9-SD | | | 6.41% | # I/F I/O | | | 03/25/2037 | | | | 2,174,371 | |
| | 8,500,000 | | | Series 2008-27-B | | | 5.50% | | | | 04/25/2038 | | | | 9,609,710 | |
| | 17,234,127 | | | Series 2008-29-ZA | | | 4.50% | | | | 04/25/2038 | | | | 18,790,748 | |
| | 19,820,563 | | | Series 2008-48-SD | | | 5.76% | # I/F I/O | | | 06/25/2037 | | | | 2,372,611 | |
| | 26,448,719 | | | Series 2008-53-LI | | | 5.91% | # I/F I/O | | | 07/25/2038 | | | | 3,793,720 | |
| | 22,076,366 | | | Series 2008-57-SE | | | 5.76% | # I/F I/O | | | 02/25/2037 | | | | 3,033,935 | |
| | 20,397,108 | | | Series 2008-5-MS | | | 6.01% | # I/F I/O | | | 02/25/2038 | | | | 3,040,540 | |
| | 17,135,043 | | | Series 2008-61-SC | | | 5.76% | # I/F I/O | | | 07/25/2038 | | | | 2,140,453 | |
| | 19,146,629 | | | Series 2008-62-SC | | | 5.76% | # I/F I/O | | | 07/25/2038 | | | | 2,424,712 | |
| | 24,266,938 | | | Series 2008-65-SA | | | 5.76% | # I/F I/O | | | 08/25/2038 | | | | 3,286,962 | |
| | 25,000,000 | | | Series 2008-81-LP | | | 5.50% | | | | 09/25/2038 | | | | 28,330,550 | |
| | 31,399,082 | | | Series 2009-106-EZ | | | 4.50% | | | | 01/25/2040 | | | | 34,151,102 | |
| | 32,785,367 | | | Series 2009-111-SE | | | 6.01% | # I/F I/O | | | 01/25/2040 | | | | 4,263,252 | |
| | 3,041,449 | | | Series 2009-16-MZ | | | 5.00% | | | | 03/25/2029 | | | | 3,387,690 | |
| | 63,061,318 | | | Series 2009-42-SI | | | 5.76% | # I/F I/O | | | 06/25/2039 | | | | 7,782,252 | |
| | 28,939,058 | | | Series 2009-42-SX | | | 5.76% | # I/F I/O | | | 06/25/2039 | | | | 3,938,528 | |
| | 24,533,936 | | | Series 2009-47-SA | | | 5.86% | # I/F I/O | | | 07/25/2039 | | | | 3,191,117 | |
| | 12,392,461 | | | Series 2009-48-WS | | | 5.71% | # I/F I/O | | | 07/25/2039 | | | | 1,394,152 | |
| | 39,350,936 | | | Series 2009-49-S | | | 6.51% | # I/F I/O | | | 07/25/2039 | | | | 5,852,574 | |
| | 7,580,856 | | | Series 2009-51-BZ | | | 4.50% | | | | 07/25/2039 | | | | 8,256,021 | |
| | 4,545,535 | | | Series 2009-54-EZ | | | 5.00% | | | | 07/25/2039 | | | | 5,322,620 | |
| | 28,472,956 | | | Series 2009-70-SA | | | 5.56% | # I/F I/O | | | 09/25/2039 | | | | 3,537,901 | |
| | 10,000,000 | | | Series 2009-80-PM | | | 4.50% | | | | 10/25/2039 | | | | 10,862,353 | |
| | 20,139,063 | | | Series 2009-83-Z | | | 4.50% | | | | 10/25/2039 | | | | 21,919,976 | |
| | 36,221,046 | | | Series 2009-85-ES | | | 6.99% | # I/F I/O | | | 01/25/2036 | | | | 8,188,376 | |
| | 35,736,015 | | | Series 2009-90-IB | | | 5.48% | # I/F I/O | | | 04/25/2037 | | | | 4,726,831 | |
| | 5,950,063 | | | Series 2009-94-BC | | | 5.00% | | | | 11/25/2039 | | | | 6,747,184 | |
| | 48,389,824 | | | Series 2010-101-SA | | | 4.24% | # I/F I/O | | | 09/25/2040 | | | | 4,895,153 | |
| | 18,625,588 | | | Series 2010-101-ZC | | | 4.50% | | | | 09/25/2040 | | | | 19,266,852 | |
| | 52,611,621 | | | Series 2010-101-ZH | | | 4.50% | | | | 07/25/2040 | | | | 54,894,787 | |
| | 51,932,424 | | | Series 2010-10-SA | | | 6.11% | # I/F I/O | | | 02/25/2040 | | | | 7,562,015 | |
| | 12,225,195 | | | Series 2010-10-ZA | | | 4.50% | | | | 02/25/2040 | | | | 13,296,987 | |
| | 18,664,644 | | | Series 2010-111-S | | | 5.71% | # I/F I/O | | | 10/25/2050 | | | | 2,333,864 | |
| | 11,646,123 | | | Series 2010-116-Z | | | 4.00% | | | | 10/25/2040 | | | | 12,030,912 | |
| | 30,442,720 | | | Series 2010-117-SA | | | 4.26% | # I/F I/O | | | 10/25/2040 | | | | 2,599,677 | |
| | 127,014,918 | | | Series 2010-121-SD | | | 4.26% | # I/F I/O | | | 10/25/2040 | | | | 12,956,246 | |
| | 6,923,990 | | | Series 2010-126-SU | | | 52.32% | # I/F | | | 11/25/2040 | | | | 9,305,286 | |
| | 16,847,955 | | | Series 2010-126-SX | | | 14.27% | # I/F | | | 11/25/2040 | | | | 18,703,304 | |
| | 11,619,758 | | | Series 2010-128-HZ | | | 4.00% | | | | 11/25/2040 | | | | 11,861,729 | |
| | 11,829,257 | | | Series 2010-132-Z | | | 4.50% | | | | 11/25/2040 | | | | 12,734,494 | |
| | 619,614 | | | Series 2010-137-VS | | | 14.27% | # I/F | | | 12/25/2040 | | | | 662,657 | |
| | 6,470,000 | | | Series 2010-142-AV | | | 4.00% | | | | 11/25/2029 | | | | 6,813,717 | |
| | 28,381,960 | | | Series 2010-150-ZA | | | 4.00% | | | | 01/25/2041 | | | | 28,874,435 | |
| | 4,674,000 | | | Series 2010-153-VB | | | 4.00% | | | | 05/25/2027 | | | | 5,006,241 | |
| | 9,963,607 | | | Series 2010-155-SA | | | 9.51% | # I/F | | | 01/25/2041 | | | | 9,710,259 | |
| | 68,097,011 | | | Series 2010-16-SA | | | 5.21% | # I/F I/O | | | 03/25/2040 | | | | 7,867,146 | |
| | 3,043,042 | | | Series 2010-21-DZ | | | 5.00% | | | | 03/25/2040 | | | | 3,412,212 | |
| | 31,167,449 | | | Series 2010-21-KS | | | 4.71% | # I/F I/O | | | 03/25/2040 | | | | 2,772,959 | |
| | 10,536,096 | | | Series 2010-2-GS | | | 6.21% | # I/F I/O | | | 12/25/2049 | | | | 1,370,539 | |
| | 24,985,593 | | | Series 2010-2-MS | | | 6.01% | # I/F I/O | | | 02/25/2050 | | | | 3,410,346 | |
| | 48,984,864 | | | Series 2010-31-SA | | | 4.76% | # I/F I/O | | | 04/25/2040 | | | | 4,905,868 | |
| | 21,176,935 | | | Series 2010-31-VZ | | | 4.00% | | | | 04/25/2040 | | | | 21,945,410 | |
| | 59,919,585 | | | Series 2010-34-PS | | | 4.69% | # I/F I/O | | | 04/25/2040 | | | | 5,589,029 | |
| | 12,629,847 | | | Series 2010-35-ES | | | 6.21% | # I/F I/O | | | 04/25/2040 | | | | 1,702,318 | |
| | 22,129,235 | | | Series 2010-35-SV | | | 6.21% | # I/F I/O | | | 04/25/2040 | | | | 2,905,847 | |
| | 23,236,330 | | | Series 2010-46-MS | | | 4.71% | # I/F I/O | | | 05/25/2040 | | | | 2,115,526 | |
| | 21,108,476 | | | Series 2010-49-ZW | | | 4.50% | | | | 05/25/2040 | | | | 22,685,619 | |
| | 12,934,663 | | | Series 2010-4-SK | | | 5.99% | # I/F I/O | | | 02/25/2040 | | | | 2,061,796 | |
| | 8,500,000 | | | Series 2010-58-ES | | | 11.85% | # I/F | | | 06/25/2040 | | | | 10,646,618 | |
| | | | | | |
| 16 | | DoubleLine Funds | | | | The accompanying notes are an integral part of these financial statements |
| | | | | | | | | | | | | | | | |
PRINCIPAL
AMOUNT | | | SECURITY DESCRIPTION | | RATE | | | MATURITY | | | VALUE $ | |
| |
| | | | Federal National Mortgage Association, (Cont.) | |
| $ | 32,820,868 | | | Series 2010-59-MS | | | 5.53% | # I/F I/O | | | 06/25/2040 | | | | 4,260,165 | |
| | 77,781,792 | | | Series 2010-59-PS | | | 6.21% | # I/F I/O | | | 03/25/2039 | | | | 10,576,356 | |
| | 46,927,316 | | | Series 2010-59-SC | | | 4.76% | # I/F I/O | | | 01/25/2040 | | | | 4,744,718 | |
| | 8,580,041 | | | Series 2010-60-VZ | | | 5.00% | | | | 10/25/2039 | | | | 9,375,918 | |
| | 5,000,000 | | | Series 2010-61-EL | | | 4.50% | | | | 06/25/2040 | | | | 5,506,809 | |
| | 11,929,375 | | | Series 2010-64-EZ | | | 5.00% | | | | 06/25/2040 | | | | 13,834,414 | |
| | 35,257,193 | | | Series 2010-76-ZK | | | 4.50% | | | | 07/25/2040 | | | | 38,115,970 | |
| | 31,594,225 | | | Series 2010-79-VZ | | | 4.50% | | | | 07/25/2040 | | | | 34,187,106 | |
| | 21,554,659 | | | Series 2010-84-ZC | | | 4.50% | | | | 08/25/2040 | | | | 23,425,974 | |
| | 43,109,318 | | | Series 2010-84-ZD | | | 4.50% | | | | 08/25/2040 | | | | 46,851,949 | |
| | 39,194,992 | | | Series 2010-84-ZG | | | 4.50% | | | | 08/25/2040 | | | | 41,325,240 | |
| | 13,804,329 | | | Series 2010-90-SA | | | 5.61% | # I/F I/O | | | 08/25/2040 | | | | 1,693,235 | |
| | 5,997,584 | | | Series 2010-94-Z | | | 4.50% | | | | 08/25/2040 | | | | 6,470,421 | |
| | 22,786,607 | | | Series 2010-99-SG | | | 23.78% | # I/F | | | 09/25/2040 | | | | 30,250,601 | |
| | 35,201,604 | | | Series 2010-9-DS | | | 5.06% | # I/F I/O | | | 02/25/2040 | | | | 3,761,964 | |
| | 29,183,019 | | | Series 2011-110-LS | | | 9.61% | # I/F | | | 11/25/2041 | | | | 28,893,935 | |
| | 6,790,328 | | | Series 2011-111-EZ | | | 5.00% | | | | 11/25/2041 | | | | 7,756,739 | |
| | 14,234,894 | | | Series 2011-111-VZ | | | 4.00% | | | | 11/25/2041 | | | | 14,634,523 | |
| | 7,223,064 | | | Series 2011-11-SC | | | 9.02% | # I/F | | | 03/25/2041 | | | | 7,379,886 | |
| | 41,379,753 | | | Series 2011-123-SC | | | 9.31% | # I/F | | | 12/25/2041 | | | | 43,286,114 | |
| | 54,986,257 | | | Series 2011-127-PM | | | 4.00% | | | | 12/25/2041 | | | | 54,570,203 | |
| | 13,968,607 | | | Series 2011-14-US | | | 7.77% | # I/F | | | 03/25/2041 | | | | 13,867,987 | |
| | 29,500,000 | | | Series 2011-16-AL | | | 3.50% | | | | 03/25/2031 | | | | 30,362,831 | |
| | 38,800,000 | | | Series 2011-17-NY | | | 3.50% | | | | 03/25/2031 | | | | 40,147,113 | |
| | 16,679,995 | | | Series 2011-17-SA | | | 6.23% | # I/F I/O | | | 03/25/2041 | | | | 2,412,329 | |
| | 20,438,853 | | | Series 2011-18-S | | | 9.00% | # I/F | | | 03/25/2041 | | | | 20,870,416 | |
| | 3,035,209 | | | Series 2011-23-KS | | | 8.82% | # I/F | | | 02/25/2041 | | | | 3,062,705 | |
| | 11,000,000 | | | Series 2011-25-KY | | | 3.00% | | | | 04/25/2026 | | | | 11,312,486 | |
| | 17,243,974 | | | Series 2011-27-BS | | | 8.51% | # I/F | | | 04/25/2041 | | | | 17,430,712 | |
| | 56,000,000 | | | Series 2011-29-AL | | | 3.50% | | | | 04/25/2031 | | | | 57,657,113 | |
| | 15,715,371 | | | Series 2011-2-GZ | | | 4.00% | | | | 02/25/2041 | | | | 16,090,308 | |
| | 6,592,569 | | | Series 2011-2-SC | | | 9.11% | # I/F | | | 02/25/2041 | | | | 6,607,832 | |
| | 10,000,000 | | | Series 2011-2-VD | | | 4.00% | | | | 07/25/2027 | | | | 10,719,716 | |
| | 8,136,330 | | | Series 2011-35-SE | | | 8.41% | # I/F | | | 04/25/2041 | | | | 8,207,292 | |
| | 17,934,781 | | | Series 2011-36-VZ | | | 4.50% | | | | 05/25/2041 | | | | 19,414,940 | |
| | 25,516,242 | | | Series 2011-37-Z | | | 4.50% | | | | 05/25/2041 | | | | 26,773,540 | |
| | 7,144,785 | | | Series 2011-38-SC | | | 8.42% | # I/F | | | 05/25/2041 | | | | 7,237,867 | |
| | 8,748,233 | | | Series 2011-39-CB | | | 3.00% | | | | 05/25/2026 | | | | 8,969,834 | |
| | 16,531,841 | | | Series 2011-40-LZ | | | 4.50% | | | | 05/25/2041 | | | | 17,902,268 | |
| | 22,764,885 | | | Series 2011-42-MZ | | | 4.50% | | | | 05/25/2041 | | | | 24,490,486 | |
| | 24,605,506 | | | Series 2011-45-ZB | | | 4.50% | | | | 05/25/2041 | | | | 25,846,849 | |
| | 11,000,000 | | | Series 2011-48-SC | | | 8.72% | # I/F | | | 06/25/2041 | | | | 11,320,674 | |
| | 20,062,765 | | | Series 2011-59-MA | | | 4.50% | | | | 07/25/2041 | | | | 21,688,091 | |
| | 13,969,748 | | | Series 2011-60-EL | | | 3.00% | | | | 07/25/2026 | | | | 14,288,960 | |
| | 15,456,047 | | | Series 2011-63-ZE | | | 4.00% | | | | 08/25/2038 | | | | 16,288,666 | |
| | 175,548,021 | | | Series 2011-64-DB | | | 4.00% | | | | 07/25/2041 | | | | 185,699,611 | |
| | 20,745,206 | | | Series 2011-72-LZ | | | 5.50% | | | | 04/25/2037 | | | | 24,314,061 | |
| | 12,000,000 | | | Series 2011-74-KL | | | 5.00% | | | | 06/25/2040 | | | | 13,523,459 | |
| | 14,377,718 | | | Series 2011-77-CZ | | | 4.00% | | | | 08/25/2041 | | | | 14,402,070 | |
| | 21,371,728 | | | Series 2011-77-Z | | | 3.50% | | | | 08/25/2041 | | | | 20,466,261 | |
| | 7,880,089 | | | Series 2011-87-US | | | 13.22% | # I/F | | | 09/25/2041 | | | | 7,934,353 | |
| | 21,787,531 | | | Series 2011-8-AV | | | 4.00% | | | | 01/25/2030 | | | | 23,247,701 | |
| | 4,332,395 | | | Series 2011-8-HS | | | 9.12% | # I/F | | | 02/25/2041 | | | | 4,376,832 | |
| | 92,273,568 | | | Series 2011-99-DZ | | | 5.00% | | | | 10/25/2041 | | | | 106,841,009 | |
| | 8,528,333 | | | Series 2012-14-BZ | | | 4.00% | | | | 03/25/2042 | | | | 8,512,589 | |
| | 18,487,246 | | | Series 2012-15-PZ | | | 4.00% | | | | 03/25/2042 | | | | 18,385,223 | |
| | 45,000,000 | | | Series 2012-30-DZ | | | 4.00% | | | | 04/25/2042 | | | | 43,432,200 | |
| | 37,000,000 | | | Series 2012-31-Z | | | 4.00% | | | | 04/25/2042 | | | | 37,069,375 | |
| | 59,498,946 | | | Series 400-S4 | | | 5.21% | # I/F I/O | | | 11/25/2039 | | | | 6,867,508 | |
| |
| | | | Federal National Mortgage Association Pass-Thru, | |
| | 72,483,168 | | | Pool 555743 | | | 5.00% | | | | 09/01/2033 | | | | 78,491,888 | |
| | 75,319,772 | | | Pool 735141 | | | 5.50% | | | | 01/01/2035 | | | | 82,654,713 | |
| | 26,678,623 | | | Pool 735230 | | | 5.50% | | | | 02/01/2035 | | | | 29,276,695 | |
| | 53,985,924 | | | Pool 735382 | | | 5.00% | | | | 04/01/2035 | | | | 58,435,951 | |
| | 87,557,895 | | | Pool 735402 | | | 5.00% | | | | 04/01/2035 | | | | 94,775,239 | |
| | 65,187,003 | | | Pool 735484 | | | 5.00% | | | | 05/01/2035 | | | | 70,499,215 | |
| | 22,676,805 | | | Pool 735667 | | | 5.00% | | | | 07/01/2035 | | | | 24,546,040 | |
| | 22,262,189 | | | Pool 735893 | | | 5.00% | | | | 10/01/2035 | | | | 24,076,376 | |
| | 55,997,867 | | | Pool 745275 | | | 5.00% | | | | 02/01/2036 | | | | 60,561,239 | |
| | 7,961,827 | | | Pool 745571 | | | 4.00% | | | | 01/01/2019 | | | | 8,500,343 | |
| | 2,942,164 | | | Pool 888695 | | | 5.00% | | | | 08/01/2037 | | | | 3,181,007 | |
| | 8,708,213 | | | Pool 888968 | | | 5.00% | | | | 08/01/2035 | | | | 9,426,026 | |
| | 36,344,867 | | | Pool 889509 | | | 6.00% | | | | 05/01/2038 | | | | 40,086,339 | |
| | 102,892,482 | | | Pool 889662 | | | 6.00% | | | | 06/01/2038 | | | | 113,484,605 | |
| | | | | | | | | | | | | | | | |
PRINCIPAL
AMOUNT | | | SECURITY DESCRIPTION | | RATE | | | MATURITY | | | VALUE $ | |
| |
| | | | Federal National Mortgage Association Pass-Thru, (Cont.) | |
| $ | 119,276,233 | | | Pool 890385 | | | 6.00% | | | | 12/01/2039 | | | | 131,554,957 | |
| | 17,911,568 | | | Pool 929321 | | | 5.50% | | | | 03/01/2038 | | | | 19,535,525 | |
| | 4,459,603 | | | Pool 931104 | | | 5.00% | | | | 05/01/2039 | | | | 4,877,721 | |
| | 10,353,574 | | | Pool 961410 | | | 6.00% | | | | 01/01/2038 | | | | 11,419,408 | |
| | 2,976,640 | | | Pool 975116 | | | 5.00% | | | | 05/01/2038 | | | | 3,218,282 | |
| | 24,999,653 | | | Pool 982036 | | | 6.00% | | | | 05/01/2038 | | | | 27,573,207 | |
| | 11,782,560 | | | Pool 986864 | | | 6.50% | | | | 08/01/2038 | | | | 13,292,973 | |
| | 15,247,027 | | | Pool 987316 | | | 6.50% | | | | 09/01/2038 | | | | 17,201,552 | |
| | 129,338,358 | | | Pool 995023 | | | 5.50% | | | | 08/01/2037 | | | | 141,590,292 | |
| | 46,771,783 | | | Pool 995070 | | | 5.50% | | | | 08/01/2037 | | | | 51,326,607 | |
| | 171,997,136 | | | Pool 995112 | | | 5.50% | | | | 07/01/2036 | | | | 188,746,908 | |
| | 91,254,405 | | | Pool 995203 | | | 5.00% | | | | 07/01/2035 | | | | 98,819,225 | |
| | 12,507,329 | | | Pool 995581 | | | 6.00% | | | | 01/01/2039 | | | | 13,801,376 | |
| | 153,692,944 | | | Pool 995849 | | | 5.00% | | | | 08/01/2036 | | | | 166,433,803 | |
| | 79,754,066 | | | Pool AB2123 | | | 4.00% | | | | 01/01/2031 | | | | 84,658,298 | |
| | 3,810,010 | | | Pool AB2370 | | | 4.50% | | | | 09/01/2035 | | | | 3,976,180 | |
| | 13,780,409 | | | Pool AB3713 | | | 4.00% | | | | 10/01/2031 | | | | 14,627,793 | |
| | 38,052,233 | | | Pool AB3850 | | | 4.00% | | | | 11/01/2041 | | | | 39,428,942 | |
| | 3,159,172 | | | Pool AC1032 | | | 5.00% | | | | 06/01/2040 | | | | 3,334,184 | |
| | 206,726,801 | | | Pool AD0189 | | | 5.50% | | | | 02/01/2039 | | | | 226,309,569 | |
| | 72,994,092 | | | Pool AD0500 | | | 5.50% | | | | 09/01/2036 | | | | 80,228,008 | |
| | 3,916,409 | | | Pool AD2177 | | | 4.50% | | | | 06/01/2030 | | | | 4,171,054 | |
| | 6,950,886 | | | Pool AD6438 | | | 5.00% | | | | 06/01/2040 | | | | 7,512,983 | |
| | 1,691,379 | | | Pool AD7018 | | | 5.00% | | | | 04/01/2040 | | | | 1,785,079 | |
| | 4,015,985 | | | Pool AD7859 | | | 5.00% | | | | 06/01/2040 | | | | 4,374,636 | |
| | 16,629,263 | | | Pool AH1140 | | | 4.50% | | | | 12/01/2040 | | | | 17,354,531 | |
| | 45,159,089 | | | Pool AH4437 | | | 4.00% | | | | 01/01/2041 | | | | 46,792,920 | |
| | 8,597,051 | | | Pool AH7309 | | | 4.00% | | | | 02/01/2031 | | | | 9,125,700 | |
| | 51,691,142 | | | Pool AH9323 | | | 4.00% | | | | 04/01/2026 | | | | 54,928,933 | |
| | 22,073,870 | | | Pool AI8889 | | | 4.00% | | | | 08/01/2041 | | | | 22,872,491 | |
| | 18,757,317 | | | Pool AJ1265 | | | 4.00% | | | | 09/01/2041 | | | | 19,435,947 | |
| | 30,955,816 | | | Pool AJ1399 | | | 4.00% | | | | 09/01/2041 | | | | 32,075,780 | |
| | 40,438,776 | | | Pool AJ3392 | | | 4.00% | | | | 10/01/2041 | | | | 41,901,829 | |
| | 106,766,070 | | | Pool AJ7677 | | | 3.50% | | | | 12/01/2041 | | | | 108,786,231 | |
| | 44,933,398 | | | Pool AK4039 | | | 4.00% | | | | 02/01/2042 | | | | 46,559,063 | |
| | 29,824,709 | | | Pool AK4763 | | | 4.00% | | | | 02/01/2042 | | | | 30,903,751 | |
| | 68,528,819 | | | Pool AL1485 | | | 6.00% | | | | 01/01/2040 | | | | 75,711,914 | |
| | 32,593,635 | | | Pool AL1548 | | | 6.00% | | | | 07/01/2039 | | | | 36,091,538 | |
| | 68,712,633 | | | Pool AL1554 | | | 6.00% | | | | 01/01/2040 | | | | 76,013,350 | |
| | 15,462,723 | | | Pool MA0264 | | | 4.50% | | | | 12/01/2029 | | | | 16,477,776 | |
| | 924,543 | | | Pool MA0315 | | | 4.50% | | | | 01/01/2025 | | | | 984,043 | |
| | 59,114,720 | | | Pool MA0353 | | | 4.50% | | | | 03/01/2030 | | | | 62,958,371 | |
| | 13,746,418 | | | Pool MA0406 | | | 4.50% | | | | 05/01/2030 | | | | 14,640,213 | |
| | 1,753,839 | | | Pool MA0445 | | | 5.00% | | | | 06/01/2040 | | | | 1,850,998 | |
| | 5,019,327 | | | Pool MA0459 | | | 4.00% | | | | 07/01/2020 | | | | 5,321,176 | |
| | 5,691,446 | | | Pool MA0468 | | | 5.00% | | | | 07/01/2040 | | | | 6,006,742 | |
| | 15,767,122 | | | Pool MA0502 | | | 4.00% | | | | 08/01/2020 | | | | 16,715,314 | |
| | 6,969,777 | | | Pool MA0517 | | | 4.00% | | | | 09/01/2020 | | | | 7,395,890 | |
| | 18,133,219 | | | Pool MA0534 | | | 4.00% | | | | 10/01/2030 | | | | 19,248,266 | |
| | 37,572,935 | | | Pool MA0536 | | | 4.00% | | | | 10/01/2020 | | | | 39,832,468 | |
| | 44,971,524 | | | Pool MA0580 | | | 4.00% | | | | 11/01/2020 | | | | 47,675,988 | |
| | 3,301,986 | | | Pool MA0587 | | | 4.00% | | | | 12/01/2030 | | | | 3,505,031 | |
| | 76,493,480 | | | Pool MA0616 | | | 4.00% | | | | 01/01/2031 | | | | 81,197,212 | |
| | 52,765,472 | | | Pool MA0871 | | | 4.00% | | | | 10/01/2041 | | | | 54,674,497 | |
| | 67,391,926 | | | Pool MA0896 | | | 4.00% | | | | 11/01/2041 | | | | 69,830,128 | |
| | 39,731,322 | | | Pool MA3894 | | | 4.00% | | | | 09/01/2031 | | | | 42,174,478 | |
| |
| | | | Government National Mortgage Association, | |
| | 14,700,000 | | | Series 2003-67-SP | | | 6.86% | # I/F I/O | | | 08/20/2033 | | | | 4,491,967 | |
| | 14,305,852 | | | Series 2003-86-ZK | | | 5.00% | | | | 10/20/2033 | | | | 16,255,752 | |
| | 5,724,614 | | | Series 2004-49-Z | | | 6.00% | | | | 06/20/2034 | | | | 6,824,551 | |
| | 6,500,000 | | | Series 2004-80-PH | | | 5.00% | | | | 07/20/2034 | | | | 7,254,033 | |
| | 27,517,766 | | | Series 2004-83-CS | | | 5.84% | # I/F I/O | | | 10/20/2034 | | | | 4,553,422 | |
| | 2,836,072 | | | Series 2005-21-Z | | | 5.00% | | | | 03/20/2035 | | | | 3,215,471 | |
| | 18,562,501 | | | Series 2005-39-ZB | | | 5.00% | | | | 07/20/2034 | | | | 21,197,845 | |
| | 1,751,805 | | | Series 2006-24-CX | | | 38.19% | # | | | 05/20/2036 | | | | 3,101,299 | |
| | 52,379,660 | | | Series 2007-26-SJ | | | 4.45% | # I/F I/O | | | 04/20/2037 | | | | 5,647,564 | |
| | 18,189,041 | | | Series 2008-2-SM | | | 6.26% | # I/F I/O | | | 01/16/2038 | | | | 3,239,970 | |
| | 35,747,315 | | | Series 2008-42-AI | | | 7.45% | # I/F I/O | | | 05/16/2038 | | | | 6,717,818 | |
| | 18,592,662 | | | Series 2008-43-SH | | | 6.09% | # I/F I/O | | | 05/20/2038 | | | | 3,043,868 | |
| | 20,826,409 | | | Series 2008-51-SC | | | 6.01% | # I/FI/O | | | 06/20/2038 | | | | 3,419,844 | |
| | 11,192,601 | | | Series 2008-51-SE | | | 6.01% | # I/F I/O | | | 06/16/2038 | | | | 1,737,048 | |
| | 8,141,621 | | | Series 2008-82-SM | | | 5.81% | # I/F I/O | | | 09/20/2038 | | | | 1,197,944 | |
| | 10,520,432 | | | Series 2008-83-SD | | | 6.32% | # I/F I/O | | | 11/16/2036 | | | | 1,799,974 | |
| | 20,080,817 | | | Series 2009-10-NS | | | 6.41% | # I/F I/O | | | 02/16/2039 | | | | 3,805,279 | |
| | | | | | |
| The accompanying notes are an integral part of these financial statements | | Annual Report | | March 31, 2012 | | 17 |
Schedule of Investments DoubleLine Total Return Bond Fund (Cont.)
| | | | | | | | | | | | | | | | |
PRINCIPAL
AMOUNT | | | SECURITY DESCRIPTION | | RATE | | | MATURITY | | | VALUE $ | |
| |
| | | | Government National Mortgage Association, (Cont.) | |
| $ | 12,500,000 | | | Series 2009-24-SN | | | 5.86% | # I/F I/O | | | 09/20/2038 | | | | 2,197,530 | |
| | 1,853,485 | | | Series 2009-31-ZM | | | 4.50% | | | | 08/20/2038 | | | | 1,783,744 | |
| | 24,985,708 | | | Series 2009-32-ZE | | | 4.50% | | | | 05/16/2039 | | | | 27,583,497 | |
| | 62,464,271 | | | Series 2009-35-DZ | | | 4.50% | | | | 05/20/2039 | | | | 67,594,280 | |
| | 4,506,064 | | | Series 2009-41-ZQ | | | 4.50% | | | | 06/16/2039 | | | | 4,690,105 | |
| | 14,338,425 | | | Series 2009-48-Z | | | 5.00% | | | | 06/16/2039 | | | | 16,296,958 | |
| | 9,607,968 | | | Series 2009-50-KP | | | 4.50% | | | | 06/20/2039 | | | | 10,442,086 | |
| | 20,547,645 | | | Series 2009-69-TS | | | 5.96% | # I/F I/O | | | 04/16/2039 | | | | 2,835,501 | |
| | 8,950,695 | | | Series 2009-75-GZ | | | 4.50% | | | | 09/20/2039 | | | | 9,706,350 | |
| | 31,953,487 | | | Series 2009-87-IG | | | 6.50% | # I/F I/O | | | 03/20/2037 | | | | 4,644,631 | |
| | 19,470,798 | | | Series 2010-166-SJ | | | 9.31% | # I/F | | | 12/20/2040 | | | | 19,623,418 | |
| | 8,491,082 | | | Series 2010-25-ZB | | | 4.50% | | | | 02/16/2040 | | | | 8,702,081 | |
| | 33,130,351 | | | Series 2010-42-ES | | | 5.44% | # I/F I/O | | | 04/20/2040 | | | | 5,361,862 | |
| | 14,500,449 | | | Series 2010-61-AS | | | 6.31% | # I/F I/O | | | 09/20/2039 | | | | 2,226,289 | |
| | 7,331,036 | | | Series 2010-62-ZG | | | 5.50% | | | | 05/16/2040 | | | | 8,605,863 | |
| | 12,959,300 | | | Series 2011-12-PO | | | 0.00% | P/O | | | 12/20/2040 | | | | 9,279,704 | |
| | 9,531,668 | | | Series 2011-14-SM | | | 9.22% | # I/F | | | 08/16/2040 | | | | 9,405,694 | |
| | 7,833,334 | | | Series 2011-18-SN | | | 9.02% | # I/F | | | 12/20/2040 | | | | 7,732,092 | |
| | 8,333,334 | | | Series 2011-18-YS | | | 9.02% | # I/F | | | 12/20/2040 | | | | 8,225,077 | |
| | 10,420,322 | | | Series 2011-51-UZ | | | 4.50% | | | | 04/20/2041 | | | | 11,143,088 | |
| | 16,054,411 | | | Series 2011-69-OC | | | 0.00% | P/O | | | 05/20/2041 | | | | 13,596,447 | |
| | 21,662,847 | | | Series 2011-71-ZA | | | 4.50% | | | | 02/20/2041 | | | | 23,191,648 | |
| | 48,875,383 | | | Series 2011-72-SK | | | 5.91% | # I/F I/O | | | 05/20/2041 | | | | 7,696,959 | |
| | | | | | | | | | | | | | | | |
| | | | Total US Government / Agency Mortgage backed Securities
(Cost $8,600,412,462) | | | | 9,044,932,798 | |
| | | | | | | | | | | | | | | | |
| | SHORT TERM INVESTMENTS 22.8% | |
| | 50,000,000 | | | Fannie Mae Discount Note | | | 0.00% | | | | 05/16/2012 | | | | 49,995,156 | |
| | 50,000,000 | | | Fannie Mae Discount Note | | | 0.00% | | | | 05/21/2012 | | | | 49,995,849 | |
| | 70,000,000 | | | Fannie Mae Discount Note | | | 0.00% | | | | 05/23/2012 | | | | 69,990,575 | |
| | 50,000,000 | | | Fannie Mae Discount Note | | | 0.00% | | | | 07/25/2012 | | | | 49,993,650 | |
| | 25,000,000 | | | Federal Farm Credit Discount Note | | | 0.00% | | | | 08/17/2012 | | | | 24,995,250 | |
| | 50,000,000 | | | Federal Farm Credit Discount Note | | | 0.00% | | | | 09/10/2012 | | | | 49,979,900 | |
| | 25,000,000 | | | Federal Farm Credit Discount Note | | | 0.00% | | | | 09/13/2012 | | | | 24,989,750 | |
| | 30,000,000 | | | Federal Farm Credit Discount Note | | | 0.00% | | | | 11/27/2012 | | | | 29,978,100 | |
| | 50,000,000 | | | Federal Home Loan Banks | | | 1.13% | | | | 05/18/2012 | | | | 50,063,850 | |
| | 100,000,000 | | | Federal Home Loan Banks | | | 1.38% | | | | 06/08/2012 | | | | 100,229,000 | |
| | 50,000,000 | | | Federal Home Loan Banks | | | 1.88% | | | | 06/20/2012 | | | | 50,189,450 | |
| | 50,000,000 | | | Federal Home Loan Banks | | | 0.25% | | | | 07/20/2012 | | | | 50,018,750 | |
| | 88,770,000 | | | Federal Home Loan Banks | | | 0.25% | | | | 07/25/2012 | | | | 88,804,798 | |
| | 100,000,000 | | | Federal Home Loan Banks | | | 0.16% | | | | 08/17/2012 | | | | 100,013,100 | |
| | 100,000,000 | | | Federal Home Loan Banks | | | 0.22% | | | | 08/22/2012 | | | | 100,036,900 | |
| | 100,000,000 | | | Federal Home Loan Banks | | | 1.75% | | | | 08/22/2012 | | | | 100,631,500 | |
| | 100,000,000 | | | Federal Home Loan Banks | | | 0.23% | | | | 08/28/2012 | | | | 100,042,600 | |
| | 100,000,000 | | | Federal Home Loan Banks | | | 0.20% | | | | 09/14/2012 | | | | 100,031,400 | |
| | 70,000,000 | | | Federal Home Loan Banks | | | 1.63% | | | | 09/26/2012 | | | | 70,504,070 | |
| | 12,232,500 | | | Federal Home Loan Banks | | | 0.35% | | | | 10/03/2012 | | | | 12,245,454 | |
| | 25,000,000 | | | Federal Home Loan Banks | | | 0.24% | | | | 10/10/2012 | | | | 25,012,225 | |
| | 50,000,000 | | | Federal Home Loan Banks | | | 0.20% | | | | 10/30/2012 | | | | 50,010,000 | |
| | | | | | | | | | | | | | | | |
PRINCIPAL
AMOUNT | | | SECURITY DESCRIPTION | | RATE | | | MATURITY | | | VALUE $ | |
| $ | 20,000,000 | | | Federal Home Loan Banks | | | 0.23% | | | | 10/30/2012 | | | | 20,010,940 | |
| | 57,165,000 | | | Federal Home Loan Banks | | | 4.50% | | | | 11/15/2012 | | | | 58,667,468 | |
| | 50,000,000 | | | Federal Home Loan Banks | | | 0.21% | | | | 11/16/2012 | | | | 50,012,150 | |
| | 125,000,000 | | | Federal Home Loan Banks | | | 0.20% | | | | 11/19/2012 | | | | 125,022,125 | |
| | 100,000,000 | | | Federal Home Loan Banks | | | 1.63% | | | | 11/21/2012 | | | | 100,923,000 | |
| | 15,000,000 | | | Federal Home Loan Banks | | | 0.32% | | | | 11/23/2012 | | | | 15,004,440 | |
| | 100,000,000 | | | Federal Home Loan Banks | | | 0.18% | | | | 11/28/2012 | | | | 100,003,400 | |
| | 50,000,000 | | | Federal Home Loan Banks | | | 0.19% | | | | 11/28/2012 | | | | 50,004,950 | |
| | 150,000,000 | | | Federal Home Loan Banks | | | 1.75% | | | | 12/14/2012 | | | | 151,593,450 | |
| | 50,000,000 | | | Federal Home Loan Banks | | | 0.18% | | | | 12/27/2012 | | | | 49,989,750 | |
| | 100,000,000 | | | Federal Home Loan Discount Note | | | 0.00% | | | | 04/04/2012 | | | | 99,999,750 | |
| | 50,000,000 | | | Federal Home Loan Discount Note | | | 0.00% | | | | 04/11/2012 | | | | 49,999,028 | |
| | 75,000,000 | | | Federal Home Loan Discount Note | | | 0.00% | | | | 04/18/2012 | | | | 74,997,320 | |
| | 75,000,000 | | | Federal Home Loan Discount Note | | | 0.00% | | | | 04/25/2012 | | | | 74,996,750 | |
| | 50,000,000 | | | Federal Home Loan Discount Note | | | 0.00% | | | | 05/16/2012 | | | | 49,995,156 | |
| | 100,000,000 | | | Federal Home Loan Discount Note | | | 0.00% | | | | 05/23/2012 | | | | 99,987,722 | |
| | 25,000,000 | | | Federal Home Loan Discount Note | | | 0.00% | | | | 06/11/2012 | | | | 24,998,050 | |
| | 25,000,000 | | | Federal Home Loan Discount Note | | | 0.00% | | | | 06/13/2012 | | | | 24,998,000 | |
| | 50,000,000 | | | Federal Home Loan Discount Note | | | 0.00% | | | | 07/18/2012 | | | | 49,994,050 | |
| | 50,000,000 | | | Federal Home Loan Discount Note | | | 0.00% | | | | 07/20/2012 | | | | 49,993,950 | |
| | 50,000,000 | | | Federal Home Loan Discount Note | | | 0.00% | | | | 09/21/2012 | | | | 49,978,500 | |
| | 36,496,000 | | | Federal Home Loan Mortgage Corporation | | | 1.75% | | | | 06/15/2012 | | | | 36,616,911 | |
| | 100,000,000 | | | Federal Home Loan Mortgage Corporation | | | 5.13% | | | | 07/15/2012 | | | | 101,459,000 | |
| | 150,000,000 | | | Federal Home Loan Mortgage Corporation | | | 1.13% | | | | 07/27/2012 | | | | 150,459,600 | |
| | 50,000,000 | | | Federal Home Loan Mortgage Corporation | | | 5.50% | | | | 08/20/2012 | | | | 51,029,550 | |
| | 125,000,000 | | | Federal Home Loan Mortgage Corporation | | | 0.38% | | | | 11/30/2012 | | | | 125,214,250 | |
| | 150,000,000 | | | Federal Home Loan Mortgage Corporation | | | 4.13% | | | | 12/21/2012 | | | | 154,216,500 | |
| | 100,000,000 | | | Federal Home Loan Mortgage Corporation | | | 0.63% | | | | 12/28/2012 | | | | 100,324,900 | |
| | 150,000,000 | | | Federal Home Loan Mortgage Corporation | | | 0.75% | | | | 12/28/2012 | | | | 150,625,800 | |
| | 43,170,000 | | | Federal National Mortgage Association | | | 1.00% | | | | 04/04/2012 | | | | 43,172,115 | |
| | 100,000,000 | | | Federal National Mortgage Association | | | 1.25% | | | | 06/22/2012 | | | | 100,249,800 | |
| | 100,000,000 | | | Federal National Mortgage Association | | | 1.13% | | | | 07/30/2012 | | | | 100,327,600 | |
| | 105,000,000 | | | Federal National Mortgage Association | | | 4.38% | | | | 09/15/2012 | | | | 107,016,525 | |
| | 66,310,000 | | | Federal National Mortgage Association | | | 0.63% | | | | 09/24/2012 | | | | 66,481,478 | |
| | 50,000,000 | | | Federal National Mortgage Association | | | 0.50% | | | | 10/30/2012 | | | | 50,067,700 | |
| | 184,000,000 | | | Federal National Mortgage Association | | | 0.50% | | | | 10/30/2012 | | | | 184,355,488 | |
| | 85,000,000 | | | Federal National Mortgage Association | | | 0.38% | | | | 12/28/2012 | | | | 85,163,370 | |
| | 50,000,000 | | | Freddie Mac Discount Note | | | 0.00% | | | | 05/25/2012 | | | | 49,993,250 | |
| | | | | | |
| 18 | | DoubleLine Funds | | | | The accompanying notes are an integral part of these financial statements |
| | | | | | | | | | | | | | | | |
PRINCIPAL
AMOUNT | | | SECURITY
DESCRIPTION | | RATE | | | MATURITY | | | VALUE $ | |
| $ | 50,000,000 | | | Freddie Mac Discount Note | | | 0.00% | | | | 06/12/2012 | | | | 49,996,050 | |
| | 75,051,000 | | | Freddie Mac Discount Note | | | 0.00% | | | | 06/26/2012 | | | | 75,043,946 | |
| | 50,000,000 | | | Freddie Mac Discount Note | | | 0.00% | | | | 07/06/2012 | | | | 49,994,700 | |
| | 50,000,000 | | | Freddie Mac Discount Note | | | 0.00% | | | | 07/16/2012 | | | | 49,994,150 | |
| | 50,000,000 | | | Freddie Mac Discount Note | | | 0.00% | | | | 12/28/2012 | | | | 49,951,300 | |
| | 449,263,587 | | | Fidelity Institutional Government Portfolio | | | 0.01% | ¨ | | | | | | | 449,263,587 | |
| | | | | | | | | | | | | | | | |
| | | | Total Short Term Investments
(Cost $5,100,051,558) | | | | 5,099,938,846 | |
| | | | | | | | | | | | | | | | |
| | | | Total Investments - 100.8%
(Cost $22,213,442,003) | | | | 22,530,007,419 | |
| | | | Liabilities in Excess of Other Assets - (0.8)% | | | | (187,659,825 | ) |
| | | | | | | | | | | | | | | | |
| | | | NET ASSETS - 100.0% | | | $ | 22,342,347,594 | |
| | | | | | | | | | | | | | | | |
| | | | |
| PORTFOLIO HOLDINGS as % of Net Assets | |
US Government / Agency Mortgage Backed Securities | | | 40.5% | |
Non-Agency Collateralized Mortgage Obligations | | | 37.4% | |
Short Term Investments | | | 22.8% | |
Collateralized Loan Obligations | | | 0.1% | |
Other Assets and Liabilities | | | (0.8)% | |
| | | | |
| | | 100.0% | |
| | | | |
| # | Variable rate security. Rate disclosed as of March 31, 2012. |
| ^ | Security exempt from registration under Rule 144A of the Securities Act of 1933. These securities may be resold in transactions exempt from registration to qualified institutional buyers. These securities are determined to be liquid by the Adviser, unless otherwise noted, under procedures established by the Fund’s Board of Trustees. At March 31, 2012, the value of these securities amounted to $1,693,752,165 or 7.6% of net assets. |
| I/O | Interest only security |
| I/F | Inverse floating rate security whose interest rate moves in the opposite direction of prevailing interest rates |
| P/O | Principal only security |
| ¨ | Seven-day yield as of March 31, 2012 |
| | | | | | |
| The accompanying notes are an integral part of these financial statements | | Annual Report | | March 31, 2012 | | 19 |
Schedule of Investments DoubleLine Core Fixed Income Fund
| | | | | | | | | | | | | | | | |
PRINCIPAL
AMOUNT | | | SECURITY DESCRIPTION | | RATE | | | MATURITY | | | VALUE $ | |
| | NON-AGENCY COLLATERALIZED MORTGAGE OBLIGATIONS 20.6% | |
| |
| | | | Adjustable Rate Mortgage Trust, | |
| $ | 156,968 | | | Series 2007-3-1A1 | | | 3.56% | #^ | | | 11/25/2037 | | | | 79,803 | |
| |
| | | | American General Mortgage Loan Trust, | |
| | 4,000,000 | | | Series 2010-1-A3 | | | 5.65% | #^ | | | 03/25/2058 | | | | 4,214,552 | |
| |
| | | | Banc of America Commercial Mortgage, Inc., | |
| | 250,000 | | | Series 2001-3-H | | | 6.56% | ^ | | | 04/11/2037 | | | | 250,323 | |
| | 400,000 | | | Series 2007-1-A4 | | | 5.45% | | | | 01/15/2049 | | | | 452,537 | |
| |
| | | | Banc of America Funding Corporation, | |
| | 6,468,209 | | | Series 2005-G-A3 | | | 5.21% | # | | | 10/20/2035 | | | | 5,857,025 | |
| | 2,677,663 | | | Series 2006-2-6A2 | | | 5.50% | | | | 03/25/2036 | | | | 2,654,573 | |
| | 2,043,944 | | | Series 2006-6-1A2 | | | 6.25% | | | | 08/25/2036 | | | | 1,950,226 | |
| |
| | | | Banc of America Mortgage Securities, Inc., | |
| | 1,376,039 | | | Series 2004-8-4A1 | | | 5.50% | | | | 09/25/2024 | | | | 1,402,084 | |
| |
| | | | BCAP LLC Trust, | |
| | 3,116,846 | | | Series 2009-RR13-6A5 | | | 6.00% | #^ | | | 04/26/2037 | | | | 3,214,797 | |
| |
| | | | Bear Stearns Asset Backed Securities Trust, | |
| | 361,287 | | | Series 2007-SD1-1A3A | | | 6.50% | | | | 10/25/2036 | | | | 239,832 | |
| |
| | | | Bear Stearns Commercial Mortgage Securities, Inc., | |
| | 510,285 | | | Series 2001-TOP2-C | | | 6.83% | # | | | 02/15/2035 | | | | 512,336 | |
| | 375,000 | | | Series 2006-PW13-AM | | | 5.58% | # | | | 09/11/2041 | | | | 400,700 | |
| |
| | | | CD Commercial Mortgage Trust, | |
| | 400,000 | | | Series 2006-CD3-AM | | | 5.65% | | | | 10/15/2048 | | | | 410,236 | |
| | 1,166,000 | | | Series 2007-CD4-A4 | | | 5.32% | | | | 12/11/2049 | | | | 1,280,231 | |
| | 399,999 | | | Series 2007-CD4-ASB | | | 5.28% | | | | 12/11/2049 | | | | 416,875 | |
| | 119,033,837 | | | Series 2007-CD5-XP | | | 0.32% | #^ I/O | | | 11/15/2044 | | | | 600,883 | |
| |
| | | | Chase Mortgage Finance Corporation, | |
| | 12,375,632 | | | Series 2007-A2-6A4 | | | 4.02% | # | | | 07/25/2037 | | | | 10,826,920 | |
| | 3,678,367 | | | Series 2007-S3-2A1 | | | 5.50% | | | | 05/25/2037 | | | | 3,620,801 | |
| |
| | | | Citi Mortgage Alternative Loan Trust, | |
| | 430,353 | | | Series 2006-A2-A2 | | | 6.00% | | | | 05/25/2036 | | | | 272,633 | |
| | 203,581 | | | Series 2006-A5-3A3 | | | 6.00% | | | | 10/25/2036 | | | | 151,605 | |
| | 409,272 | | | Series 2007-A1-1A7 | | | 6.00% | | | | 01/25/2037 | | | | 265,344 | |
| |
| | | | Citicorp Mortgage Securities, Inc., | |
| | 383,216 | | | Series 2005-1-1A4 | | | 5.50% | | | | 02/25/2035 | | | | 389,343 | |
| |
| | | | Citicorp Residential Mortgage Securities, Inc., | |
| | 1,800,000 | | | Series 2006-2-A5 | | | 6.04% | # | | | 09/25/2036 | | | | 1,515,240 | |
| |
| | | | Citigroup Commercial Mortgage Trust, | |
| | 700,000 | | | Series 2005-C3-AM | | | 4.83% | # | | | 05/15/2043 | | | | 730,181 | |
| |
| | | | Citigroup Mortgage Loan Trust, Inc., | |
| | 527,772 | | | Series 2006-WF2-A2C | | | 5.85% | # | | | 05/25/2036 | | | | 323,684 | |
| | 4,928,000 | | | Series 2008-AR4-2A1B | | | 4.57% | #^ | | | 11/25/2038 | | | | 2,623,110 | |
| | 3,000,000 | | | Series 2010-8-5A4 | | | 11.27% | #^ | | | 11/25/2036 | | | | 2,145,000 | |
| | 16,000,000 | | | Series 2010-8-6A4 | | | 9.57% | #^ | | | 12/25/2036 | | | | 10,659,999 | |
| | 4,551,353 | | | Series 2011-12-3A1 | | | 5.59% | ^ | | | 09/25/2047 | | | | 4,597,101 | |
| |
| | | | Commercial Mortgage Acceptance Corporation, | |
| | 740,063 | | | Series 1998-C2-F | | | 5.44% | #^ | | | 09/15/2030 | | | | 768,931 | |
| |
| | | | Commercial Mortgage Asset Trust, | |
| | 150,000 | | | Series 1999-C1-B | | | 7.23% | # | | | 01/17/2032 | | | | 159,905 | |
| |
| | | | Commercial Mortgage Pass-Through Certificates, | |
| | 5,000,000 | | | Series 2002-LC4-XA | | | 2.72% | #^ I/O | | | 12/10/2044 | | | | 795,350 | |
| | 985,000 | | | Series 2006-C7-AM | | | 5.96% | # | | | 06/10/2046 | | | | 1,031,878 | |
| | 3,670,141 | | | Series 2010-C1-XPA | | | 2.59% | #^ I/O | | | 07/10/2046 | | | | 254,855 | |
| | 400,000 | | | Series 2011-THL-E | | | 5.95% | ^ | | | 06/09/2028 | | | | 407,549 | |
| |
| | | | Countrywide Alternative Loan Trust, | |
| | 563,128 | | | Series 2005-20CB-1A1 | | | 5.50% | | | | 07/25/2035 | | | | 476,355 | |
| | 482,407 | | | Series 2005-28CB-3A6 | | | 6.00% | | | | 08/25/2035 | | | | 337,875 | |
| | 2,824,315 | | | Series 2005-46CB-A22 | | | 5.25% | | | | 10/25/2035 | | | | 2,151,145 | |
| | 684,790 | | | Series 2005-J10-1A13 | | | 0.94% | # | | | 10/25/2035 | | | | 438,227 | |
| | 1,035,934 | | | Series 2006-26CB-A9 | | | 6.50% | | | | 09/25/2036 | | | | 647,118 | |
| | 3,741,972 | | | Series 2007-12T1-A1 | | | 6.00% | | | | 06/25/2037 | | | | 2,451,974 | |
| | 3,997,007 | | | Series 2007-16CB-2A1 | | | 0.69% | # | | | 08/25/2037 | | | | 1,742,423 | |
| | 1,157,433 | | | Series 2007-16CB-2A2 | | | 52.57% | # I/F | | | 08/25/2037 | | | | 2,547,136 | |
| | 311,344 | | | Series 2007-17CB-1A10 | | | 28.79% | # I/F | | | 08/25/2037 | | | | 496,845 | |
| | 1,576,082 | | | Series 2007-18CB-2A17 | | | 6.00% | | | | 08/25/2037 | | | | 1,138,179 | |
| | 6,408,098 | | | Series 2007-23CB-A3 | | | 0.74% | # | | | 09/25/2037 | | | | 3,297,220 | |
| | 6,296,123 | | | Series 2007-23CB-A4 | | | 6.26% | # I/F I/O | | | 09/25/2037 | | | | 1,340,239 | |
| | 1,081,387 | | | Series 2007-4CB-2A1 | | | 7.00% | | | | 03/25/2037 | | | | 399,680 | |
| | | | | | | | | | | | | | | | |
PRINCIPAL
AMOUNT | | | SECURITY DESCRIPTION | | RATE | | | MATURITY | | | VALUE $ | |
| |
| | | | Countrywide Asset-Backed Certificates, | |
| $ | 234,470 | | | Series 2005-13-AF3 | | | 5.43% | # | | | 04/25/2036 | | | | 176,160 | |
| |
| | | | Countrywide Home Loans, | |
| | 620,098 | | | Series 2002-32-2A6 | | | 5.00% | | | | 01/25/2018 | | | | 638,338 | |
| | 1,497,353 | | | Series 2005-28-A7 | | | 5.25% | | | | 01/25/2019 | | | | 1,304,229 | |
| | 2,906,744 | | | Series 2007-10-A5 | | | 6.00% | | | | 07/25/2037 | | | | 2,269,436 | |
| | 1,228,803 | | | Series 2007-15-1A16 | | | 6.25% | | | | 09/25/2037 | | | | 1,064,815 | |
| | 3,084,555 | | | Series 2007-3-A17 | | | 6.00% | | | | 04/25/2037 | | | | 2,565,036 | |
| |
| | | | Credit Suisse First Boston Mortgage Securities Corporation, | |
| | 1,000,000 | | | Series 1998-C2-F | | | 6.75% | #^ | | | 11/15/2030 | | | | 1,085,240 | |
| | 325,000 | | | Series 2001-CF2-G | | | 6.93%^ | | | | 02/15/2034 | | | | 320,898 | |
| | 270,516 | | | Series 2005-10-5A5 | | | 5.50% | | | | 11/25/2035 | | | | 209,867 | |
| | 4,616,831 | | | Series 2005-8-1A3 | | | 5.25% | | | | 09/25/2035 | | | | 4,074,409 | |
| | 4,602,176 | | | Series 2005-8-9A4 | | | 5.50% | | | | 09/25/2035 | | | | 4,003,140 | |
| |
| | | | Credit Suisse Mortgage Capital Certificates, | |
| | 10,710,713 | | | Series 2006-4-6A1 | | | 6.00% | | | | 05/25/2036 | | | | 9,286,986 | |
| | 782,893 | | | Series 2006-4-7A1 | | | 5.50% | | | | 05/25/2021 | | | | 756,482 | |
| | 4,252,553 | | | Series 2006-7-1A3 | | | 5.00% | | | | 08/25/2036 | | | | 3,291,874 | |
| | 880,000 | | | Series 2006-C3-AM | | | 6.01% | # | | | 06/15/2038 | | | | 931,172 | |
| | 368,207 | | | Series 2007-1-3A1 | | | 6.00% | | | | 02/25/2022 | | | | 286,435 | |
| | 1,645,679 | | | Series 2007-2-2A1 | | | 5.00% | | | | 03/25/2037 | | | | 1,608,538 | |
| | 5,948,467 | | | Series 2007-2-2A5 | | | 5.00% | | | | 03/25/2037 | | | | 5,567,718 | |
| | 10,000,000 | | | Series 2010-4R-3A17 | | | 9.94% | #^ | | | 06/26/2037 | | | | 6,936,490 | |
| |
| | | | Crest Ltd., | |
| | 631,820 | | | Series 2003-2A-A1 | | | 0.95% | #^ | | | 12/28/2018 | | | | 582,065 | |
| |
| | | | DBUBS Mortgage Trust, | |
| | 5,947,930 | | | Series 2011-LC2A-XA | | | 1.62% | #^ I/O | | | 07/10/2044 | | | | 447,281 | |
| |
| | | | Deutsche Mortgage Securities, Inc., | |
| | 3,967,980 | | | Series 2006-PR1-3A1 | | | 11.79% | #^ I/F | | | 04/15/2036 | | | | 4,161,462 | |
| | 352,970 | | | Series 2006-PR1-4AI2 | | | 14.14% | #^ I/F | | | 04/15/2036 | | | | 400,661 | |
| | 2,217,479 | | | Series 2006-PR1-5AI4 | | | 11.79% | #^ I/F | | | 04/15/2036 | | | | 2,387,856 | |
| |
| | | | First Horizon Alternative Mortgage Securities, | |
| | 1,083,211 | | | Series 2006-FA2-1A5 | | | 6.00% | | | | 05/25/2036 | | | | 751,175 | |
| | 279,769 | | | Series 2006-RE1-A1 | | | 5.50% | | | | 05/25/2035 | | | | 239,550 | |
| |
| | | | First Union Commercial Mortgage Securities, Inc., | |
| | 136,183 | | | Series 2000-C2-G | | | 8.70% | # | | | 10/15/2032 | | | | 136,242 | |
| |
| | | | GE Capital Commercial Mortgage Corporation, | |
| | 257,520,567 | | | Series 2005-C3-XP | | | 0.25% | # I/O | | | 07/10/2045 | | | | 165,843 | |
| | 630,000 | | | Series 2005-C4-AM | | | 5.44% | # | | | 11/10/2045 | | | | 654,664 | |
| |
| | | | GMAC Commercial Mortgage Securities, Inc., | |
| | 794,000 | | | Series 2006-C1-AM | | | 5.29% | # | | | 11/10/2045 | | | | 812,873 | |
| |
| | | | Greenwich Capital Commercial Funding Corporation, | |
| | 300,000 | | | Series 2004-FL2A-D | | | 0.55% | #^ | | | 11/05/2019 | | | | 295,122 | |
| | 100,000 | | | Series 2004-FL2A-F | | | 0.64% | #^ | | | 11/05/2019 | | | | 93,887 | |
| | 795,000 | | | Series 2007-GG9-A4 | | | 5.44% | | | | 03/10/2039 | | | | 878,204 | |
| |
| | | | GS Mortgage Securities Corporation II, | |
| | 355,000 | | | Series 2006-GG6-AM | | | 5.62% | # | | | 04/10/2038 | | | | 367,266 | |
| | 19,899,572 | | | Series 2006-GG6-XC | | | 0.15% | #^ I/O | | | 04/10/2038 | | | | 30,864 | |
| | 735,000 | | | Series 2007-GG10-A4 | | | 5.98% | # | | | 08/10/2045 | | | | 818,728 | |
| | 800,000 | | | Series 2012-GC6-AS | | | 4.95% | ^ | | | 01/10/2045 | | | | 878,058 | |
| | 5,992,060 | | | Series 2012-GC6-XA | | | 2.41% | #^ I/O | | | 01/10/2045 | | | | 855,957 | |
| |
| | | | GSAA Home Equity Trust, | |
| | 2,221,010 | | | Series 2005-7-AF5 | | | 4.61% | # | | | 05/25/2035 | | | | 2,069,011 | |
| | 75,765 | | | Series 2006-4-4A1 | | | 0.34% | # | | | 03/25/2036 | | | | 73,158 | |
| | 3,843,367 | | | Series 2007-10-A1A | | | 6.00% | | | | 11/25/2037 | | | | 2,804,019 | |
| | 2,693,448 | | | Series 2007-10-A2A | | | 6.50% | | | | 11/25/2037 | | | | 1,731,334 | |
| |
| | | | GSR Mortgage Loan Trust, | |
| | 577,354 | | | Series 2006-2F-5A1 | | | 4.50% | | | | 01/25/2021 | | | | 545,892 | |
| | 17,489,715 | | | Series 2006-3F-4A1 | | | 6.00% | | | | 03/25/2036 | | | | 14,798,703 | |
| | 8,311,732 | | | Series 2007-1F-2A2 | | | 5.50% | | | | 01/25/2037 | | | | 7,963,479 | |
| |
| | | | HSBC Asset Loan Obligation, | |
| | 495,873 | | | Series 2006-2-2A1 | | | 5.50% | | | | 12/25/2021 | | | | 459,936 | |
| | 11,365,401 | | | Series 2007-2-3A6 | | | 6.00% | | | | 09/25/2037 | | | | 9,424,503 | |
| |
| | | | Indymac Mortgage Loan Trust, | |
| | 12,845,762 | | | Series 2006-AR3-1A1 | | | 2.76% | # | | | 12/25/2036 | | | | 8,594,265 | |
| | | | | | |
| 20 | | DoubleLine Funds | | | | The accompanying notes are an integral part of these financial statements |
| | | | | | | | | | | | | | | | |
PRINCIPAL
AMOUNT | | | SECURITY DESCRIPTION | | RATE | | | MATURITY | | | VALUE $ | |
| |
| | | | JP Morgan Alternative Loan Trust, | |
| $ | 500,000 | | | Series 2006-S2-A4 | | | 6.19% | # | | | 05/25/2036 | | | | 254,355 | |
| | 10,000,000 | | | Series 2006-S3-A4 | | | 6.31% | # | | | 08/25/2036 | | | | 5,909,645 | |
| | 3,420,523 | | | Series 2006-S3-A6 | | | 6.12% | # | | | 08/25/2036 | | | | 3,138,048 | |
| | 3,913,283 | | | Series 2006-S4-A6 | | | 5.71% | # | | | 12/25/2036 | | | | 3,466,678 | |
| |
| | | | JP Morgan Chase Commercial Mortgage Securities Corporation, | |
| | 800,000 | | | Series 2001-C5-AS | | | 5.49% | #^ | | | 08/15/2046 | | | | 882,769 | |
| | 10,792 | | | Series 2001-CIBC-E | | | 7.30% | # | | | 03/15/2033 | | | | 10,790 | |
| | 625,987 | | | Series 2003-CB6-A1 | | | 4.39% | | | | 07/12/2037 | | | | 631,711 | |
| | 640,000 | | | Series 2003-LN1-D | | | 5.20% | # | | | 10/15/2037 | | | | 642,368 | |
| | 1,000,000 | | | Series 2004-C3-A4 | | | 4.66% | | | | 01/15/2042 | | | | 999,876 | |
| | 1,065,000 | | | Series 2006-CB16-A4 | | | 5.55% | | | | 05/12/2045 | | | | 1,197,174 | |
| | 835,880 | | | Series 2006-CB16-X2 | | | 0.70% | # I/O | | | 05/12/2045 | | | | 6,087 | |
| | 721,416 | | | Series 2006-FL1-AG | | | 0.71% | #^ | | | 02/15/2020 | | | | 613,208 | |
| | 46,148,872 | | | Series 2006-LDP8-X | | | 0.74% | # I/O | | | 05/15/2045 | | | | 928,146 | |
| | 1,750,000 | | | Series 2007-C1-A4 | | | 5.72% | | | | 02/15/2051 | | | | 1,943,751 | |
| | 750,000 | | | Series 2007-CB18-A4 | | | 5.44% | | | | 06/12/2047 | | | | 837,842 | |
| | 750,000 | | | Series 2007-CB20-A4 | | | 5.79% | # | | | 02/12/2051 | | | | 863,190 | |
| | 400,000 | | | Series 2007-CIBC18-AM | | | 5.47% | # | | | 06/12/2047 | | | | 413,543 | |
| | 1,000,000 | | | Series 2007-CIBC19-A4 | | | 5.93% | # | | | 02/12/2049 | | | | 1,130,216 | |
| | 400,000 | | | Series 2007-CIBC19-AM | | | 5.93% | # | | | 02/12/2049 | | | | 395,837 | |
| | 12,050,000 | | | Series 2009-IWST-XB | | | 0.54% | #^ I/F I/O | | | 12/05/2027 | | | | 271,426 | |
| | 12,868,831 | | | Series 2011-C4-XA | | | 1.79% | #^ I/O | | | 07/15/2046 | | | | 990,276 | |
| | 600,000 | | | Series 2011-PLSD-A2 | | | 3.36% | # | | | 11/13/2044 | | | | 628,840 | |
| |
| | | | JP Morgan Mortgage Trust, | |
| | 933,697 | | | Series 2007-S3-1A7 | | | 6.00% | | | | 08/25/2037 | | | | 738,493 | |
| |
| | | | JP Morgan Research Trust, | |
| | 10,105,458 | | | Series 2011-2-2A3 | | | 3.50% | #^ | | | 07/26/2036 | | | | 10,344,810 | |
| |
| | | | LB-UBS Commercial Mortgage Trust, | |
| | 1,000,000 | | | Series 2004-C2-A4 | | | 4.37% | | | | 03/15/2036 | | | | 1,054,077 | |
| | 175,718 | | | Series 2004-C4-A3 | | | 5.30% | # | | | 06/15/2029 | | | | 180,069 | |
| | 10,673,220 | | | Series 2006-C7-XCL | | | 0.34% | #^ I/O | | | 11/15/2038 | | | | 190,538 | |
| | 8,607,797 | | | Series 2006-C7-XW | | | 0.84% | #^ I/O | | | 11/15/2038 | | | | 211,218 | |
| | 76,194,429 | | | Series 2007-C2-XCP | | | 0.68% | # I/O | | | 02/15/2040 | | | | 724,457 | |
| |
| | | | Leaf II Receivables Funding LLC, | |
| | 2,500,000 | | | Series 2010-4-C | | | 5.00% | ^ | | | 01/20/2019 | | | | 2,434,000 | |
| |
| | | | Lehman Mortgage Trust, | |
| | 5,405,051 | | | Series 2005-1-2A4 | | | 5.50% | | | | 11/25/2035 | | | | 4,664,359 | |
| | 1,632,187 | | | Series 2006-3-1A5 | | | 6.00% | | | | 07/25/2036 | | | | 1,086,264 | |
| | 114,750 | | | Series 2006-9-1A19 | | | 29.57% | # I/F | | | 01/25/2037 | | | | 169,755 | |
| | 2,023,648 | | | Series 2007-10-2A1 | | | 6.50% | | | | 01/25/2038 | | | | 1,814,728 | |
| | 426,717 | | | Series 2007-2-1A1 | | | 5.75% | | | | 02/25/2037 | | | | 294,208 | |
| |
| | | | MASTR Alternative Loans Trust, | |
| | 264,333 | | | Series 2005-2-3A1 | | | 6.00% | | | | 03/25/2035 | | | | 250,543 | |
| | 114,494 | | | Series 2007-1-2A7 | | | 6.00% | | | | 10/25/2036 | | | | 95,445 | |
| |
| | | | MASTR Asset Securitization Trust, | |
| | 675,543 | | | Series 2003-2-30B2 | | | 5.75% | | | | 04/25/2033 | | | | 675,868 | |
| | 591,502 | | | Series 2005-1-2A5 | | | 5.00% | | | | 05/25/2035 | | | | 596,912 | |
| |
| | | | Merrill Lynch Mortgage Trust, | |
| | 780,000 | | | Series 2003-KEY1-A4 | | | 5.24% | # | | | 11/12/2035 | | | | 823,457 | |
| | 81,338,090 | | | Series 2005-CIP1-XP | | | 0.32% | # I/O | | | 07/12/2038 | | | | 292,248 | |
| |
| | | | Merrill Lynch/Countrywide Commercial Mortgage Trust, | |
| | 648,440 | | | Series 2006-4-A2FL | | | 0.36% | # | | | 12/12/2049 | | | | 648,247 | |
| |
| | | | Morgan Stanley Capital, Inc., | |
| | 10,751,783 | | | Series 2004-HQ4-X2 | | | 0.51% | #^ I/O | | | 04/14/2040 | | | | 21,547 | |
| | 325,000 | | | Series 2005-HQ7-AM | | | 5.37% | # | | | 11/14/2042 | | | | 351,121 | |
| | 800,000 | | | Series 2006-HQ9-AM | | | 5.77% | # | | | 07/12/2044 | | | | 875,142 | |
| | 89,459 | | | Series 2007-HQ12-A2FL | | | 0.49% | # | | | 04/12/2049 | | | | 86,360 | |
| | 178,919 | | | Series 2007-HQ12-A2FL | | | 5.78% | # | | | 04/12/2049 | | | | 184,203 | |
| | 36,222,067 | | | Series 2007-IQ16-X2 | | | 0.37% | #^ I/O | | | 12/12/2049 | | | | 298,941 | |
| | 30,043,400 | | | Series 2011-C1-XA | | | 1.15% | #^ I/O | | | 09/15/2047 | | | | 1,166,150 | |
| |
| | | | Morgan Stanley Mortgage Loan Trust, | |
| | 1,786,437 | | | Series 2004-1-1A1 | | | 5.00% | | | | 11/25/2018 | | | | 1,835,532 | |
| | 3,355,488 | | | Series 2005-7-7A4 | | | 5.50% | | | | 11/25/2035 | | | | 3,219,661 | |
| | 8,306,749 | | | Series 2006-7-3A | | | 5.67% | # | | | 06/25/2036 | | | | 5,736,770 | |
| |
| | | | Morgan Stanley Re-Remic Trust, | |
| | 7,683,839 | | | Series 2010-R6-5C | | | 5.90% | #^ | | | 05/26/2037 | | | | 5,974,185 | |
| | | | | | | | | | | | | | | | |
PRINCIPAL
AMOUNT | | | SECURITY DESCRIPTION | | RATE | | | MATURITY | | | VALUE $ | |
| |
| | | | Nomura Asset Acceptance Corporation, | |
| $ | 332,119 | | | Series 2006-AP1-A2 | | | 5.52% | # | | | 01/25/2036 | | | | 206,456 | |
| |
| | | | Nomura Asset Securities Corporation, | |
| | 1,000,000 | | | Series 1998-D6-A4 | | | 7.90% | # | | | 03/15/2030 | | | | 1,047,721 | |
| |
| | | | Nomura Home Equity Loan, Inc., | |
| | 785,385 | | | Series 2006-AF1-A2 | | | 5.80% | # | | | 10/25/2036 | | | | 331,946 | |
| | 1,438,385 | | | Series 2007-1-1A1 | | | 6.06% | # | | | 02/25/2037 | | | | 696,697 | |
| |
| | | | N-Star Real Estate CDO Ltd., | |
| | 619,534 | | | Series 2004-2A-A1 | | | 0.59% | #^ | | | 06/28/2039 | | | | 610,048 | |
| |
| | | | Option One Mortgage Loan Trust, | |
| | 205,136 | | | Series 2004-3-M3 | | | 0.89% | # | | | 11/25/2034 | | | | 159,076 | |
| |
| | | | PHH Alternative Mortgage Trust, | |
| | 3,829,640 | | | Series 2007-2-4A1 | | | 6.00% | | | | 05/25/2022 | | | | 3,493,491 | |
| |
| | | | Residential Accredit Loans, Inc., | |
| | 932,203 | | | Series 2004-QS15-A1 | | | 5.25% | | | | 11/25/2034 | | | | 875,595 | |
| | 1,116,022 | | | Series 2005-QS14-3A3 | | | 6.00% | | | | 09/25/2035 | | | | 862,718 | |
| | 393,081 | | | Series 2005-QS1-A5 | | | 5.50% | | | | 01/25/2035 | | | | 368,715 | |
| | 1,108,027 | | | Series 2006-QS10-A4 | | | 5.75% | | | | 08/25/2036 | | | | 725,708 | |
| | 2,514,384 | | | Series 2006-QS6-1A15 | | | 6.00% | | | | 06/25/2036 | | | | 1,654,598 | |
| | 998,470 | | | Series 2006-QS6-2A1 | | | 6.00% | | | | 06/25/2021 | | | | 868,890 | |
| | 3,559,184 | | | Series 2007-QS3-A4 | | | 6.25% | | | | 02/25/2037 | | | | 2,266,337 | |
| |
| | | | Residential Asset Mortgage Products, Inc., | |
| | 550,000 | | | Series 2005-RS1-AI5 | | | 5.41% | # | | | 01/25/2035 | | | | 404,085 | |
| |
| | | | Residential Asset Securitization Trust, | |
| | 703,307 | | | Series 2005-A10-A3 | | | 5.50% | | | | 09/25/2035 | | | | 595,846 | |
| | 545,019 | | | Series 2005-A11-2A4 | | | 6.00% | | | | 10/25/2035 | | | | 296,006 | |
| | 202,661 | | | Series 2005-A7-A3 | | | 5.50% | | | | 06/25/2035 | | | | 178,356 | |
| | 2,904,374 | | | Series 2006-A6-1A1 | | | 6.50% | | | | 07/25/2036 | | | | 1,567,976 | |
| | 299,219 | | | Series 2006-R1-A1 | | | 27.43% | # I/F | | | 01/25/2046 | | | | 380,585 | |
| |
| | | | Residential Funding Mortgage Securities Trust, | |
| | 408,074 | | | Series 2006-S10-1A2 | | | 6.00% | | | | 10/25/2036 | | | | 341,279 | |
| | 2,125,910 | | | Series 2006-S11-A3 | | | 6.00% | | | | 11/25/2036 | | | | 1,866,875 | |
| | 3,795,294 | | | Series 2007-S2-A4 | | | 6.00% | | | | 02/25/2037 | | | | 3,281,343 | |
| | 2,447,212 | | | Series 2007-S3-1A4 | | | 6.00% | | | | 03/25/2037 | | | | 1,972,799 | |
| |
| | | | Structured Adjustable Rate Mortgage Loan Trust, | |
| | 11,092,447 | | | Series 2005-8XS-A3 | | | 0.80% | # | | | 04/25/2035 | | | | 10,912,648 | |
| | 1,910,422 | | | Series 2006-4-7A1 | | | 5.12% | # | | | 05/25/2036 | | | | 1,804,927 | |
| |
| | | | Structured Asset Securities Corporation, | |
| | 5,723,671 | | | Series 2003-35-1A1 | | | 5.15% | # | | | 12/25/2033 | | | | 5,743,151 | |
| | 4,965,134 | | | Series 2005-10-1A1 | | | 5.75% | | | | 06/25/2035 | | | | 4,589,805 | |
| | 7,132,146 | | | Series 2005-14-1A1 | | | 0.54% | # | | | 07/25/2035 | | | | 6,075,511 | |
| | 4,504,519 | | | Series 2005-16-1A3 | | | 5.50% | | | | 09/25/2035 | | | | 4,012,229 | |
| | 2,990,128 | | | Series 2005-RF1-A | | | 0.59% | #^ | | | 03/25/2035 | | | | 2,373,598 | |
| | 2,990,128 | | | Series 2005-RF1-AIO | | | 5.54% | #^ I/O | | | 03/25/2035 | | | | 418,763 | |
| |
| | | | TIAA Seasoned Commercial Mortgage Trust, | |
| | 1,000,000 | | | Series 2007-C4-AJ | | | 5.66% | # | | | 08/15/2039 | | | | 1,055,776 | |
| |
| | | | Wachovia Bank Commercial Mortgage Trust, | |
| | 500,000 | | | Series 2005-C22-AM | | | 5.49% | # | | | 12/15/2044 | | | | 530,293 | |
| | 250,000 | | | Series 2006-C25-AM | | | 5.92% | # | | | 05/15/2043 | | | | 272,241 | |
| | 110,346,345 | | | Series 2006-C27-XC | | | 0.10% | #^ I/O | | | 07/15/2045 | | | | 813,253 | |
| | 18,993,901 | | | Series 2006-C29-IO | | | 0.55% | # I/O | | | 11/15/2048 | | | | 280,711 | |
| |
| | | | Washington Mutual Mortgage Pass-Through Certificates, | |
| | 265,323 | | | Series 2005-1-2A | | | 6.00% | | | | 03/25/2035 | | | | 215,825 | |
| | 3,483,047 | | | Series 2006-1-3A1 | | | 5.75% | | | | 02/25/2036 | | | | 2,598,437 | |
| | 7,599,684 | | | Series 2006-8-A6 | | | 5.77% | # | | | 10/25/2036 | | | | 4,917,459 | |
| | 6,938,285 | | | Series 2006-AR19-2A | | | 2.47% | # | | | 01/25/2047 | | | | 5,408,625 | |
| | 5,807,884 | | | Series 2007-3-A6 | | | 6.00% | | | | 04/25/2037 | | | | 4,212,206 | |
| | 382,056 | | | Series 2007-5-A11 | | | 38.03% | # I/F | | | 06/25/2037 | | | | 607,684 | |
| |
| | | | Wells Fargo Alternative Loan Trust, | |
| | 18,770,289 | | | Series 2007-PA5-1A1 | | | 6.25% | | | | 11/25/2037 | | | | 17,196,455 | |
| |
| | | | Wells Fargo Mortgage Backed Securities Trust, | |
| | 5,995,851 | | | Series 2005-17-1A1 | | | 5.50% | | | | 01/25/2036 | | | | 5,805,531 | |
| | 332,947 | | | Series 2005-AR14-A6 | | | 5.35% | # | | | 08/25/2035 | | | | 234,380 | |
| | 406,739 | | | Series 2005-AR16-6A4 | | | 2.72% | # | | | 10/25/2035 | | | | 167,511 | |
| | 1,972,397 | | | Series 2006-2-3A1 | | | 5.75% | | | | 03/25/2036 | | | | 1,957,574 | |
| | 4,716,235 | | | Series 2006-7-2A1 | | | 6.00% | | | | 06/25/2036 | | | | 4,256,608 | |
| | 950,234 | | | Series 2007-10-1A36 | | | 6.00% | | | | 07/25/2037 | | | | 865,221 | |
| | 4,469,030 | | | Series 2007-10-1A5 | | | 6.00% | | | | 07/25/2037 | | | | 4,106,294 | |
| | | | | | |
| The accompanying notes are an integral part of these financial statements | | Annual Report | | March 31, 2012 | | 21 |
Schedule of Investments DoubleLine Core Fixed Income Fund (Cont.)
| | | | | | | | | | | | | | | | |
PRINCIPAL
AMOUNT | | | SECURITY DESCRIPTION | | RATE | | | MATURITY | | | VALUE $ | |
| |
| | | | Wells Fargo Mortgage Backed Securities Trust, (Cont.) | |
| $ | 677,766 | | | Series 2007-11-A96 | | | 6.00% | | | | 08/25/2037 | | | | 658,703 | |
| | 9,852,462 | | | Series 2007-14-1A1 | | | 6.00% | | | | 10/25/2037 | | | | 9,455,979 | |
| | 2,313,604 | | | Series 2007-4-A16 | | | 5.50% | | | | 04/25/2037 | | | | 2,007,714 | |
| | 8,492,467 | | | Series 2007-5-1A1 | | | 5.50% | | | | 05/25/2037 | | | | 8,383,407 | |
| | 616,844 | | | Series 2007-7-A1 | | | 6.00% | | | | 06/25/2037 | | | | 564,976 | |
| | 11,315,000 | | | Series 2007-8-2A2 | | | 6.00% | | | | 07/25/2037 | | | | 11,089,525 | |
| |
| | | | Wells Fargo Mortgage Loan Trust, | |
| | 15,005,823 | | | Series 2012-RR1-A1 | | | 2.85% | #^ | | | 08/27/2037 | | | | 15,030,431 | |
| |
| | | | WF-RBS Commercial Mortgage Trust, | |
| | 2,703,043 | | | Series 2011-C2-XA | | | 1.35% | #^ I/O | | | 02/15/2044 | | | | 146,852 | |
| | | | | | | | | | | | | | | | |
| | | | Total Non-Agency Collateralized Mortgage Obligations
(Cost $426,813,039) | | | | 429,758,712 | |
| | | | | | | | | | | | | | | | |
| | US CORPORATE BONDS 17.1% | |
| | 4,167,000 | | | 3M Company, Series D | | | 5.70% | | | | 03/15/2037 | | | | 5,342,232 | |
| | 4,404,000 | | | Alcoa, Inc. | | | 6.15% | | | | 08/15/2020 | | | | 4,748,600 | |
| | 6,255,000 | | | Altria Group, Inc. | | | 9.25% | | | | 08/06/2019 | | | | 8,423,214 | |
| | 9,375,000 | | | American Express Credit Corporation | | | 2.75% | | | | 09/15/2015 | | | | 9,734,822 | |
| | 4,315,000 | | | Amgen, Inc. | | | 3.88% | | | | 11/15/2021 | | | | 4,427,181 | |
| | 3,960,000 | | | Anheuser Busch Inbev Worldwide, Inc. | | | 5.38% | | | | 11/15/2014 | | | | 4,400,079 | |
| | 100,000 | | | Arch Coal, Inc. | | | 7.00% | ^ | | | 06/15/2019 | | | | 92,750 | |
| | 4,450,000 | | | Aristotle Holding, Inc. | | | 2.10% | ^ | | | 02/12/2015 | | | | 4,507,957 | |
| | 4,650,000 | | | Arrow Electronics, Inc. | | | 3.38% | | | | 11/01/2015 | | | | 4,791,318 | |
| | 4,304,000 | | | AT&T, Inc. | | | 5.35% | | | | 09/01/2040 | | | | 4,593,633 | |
| | 200,000 | | | BE Aerospace, Inc. | | | 6.88% | | | | 10/01/2020 | | | | 220,000 | |
| | 7,400,000 | | | Becton Dickinson and Company | | | 3.13% | | | | 11/08/2021 | | | | 7,524,149 | |
| | 5,750,000 | | | Biogen Idec, Inc. | | | 6.88% | | | | 03/01/2018 | | | | 7,018,651 | |
| | 2,500,000 | | | Boeing Company | | | 6.88% | | | | 03/15/2039 | | | | 3,502,033 | |
| | 160,000 | | | Boeing Company | | | 5.88% | | | | 02/15/2040 | | | | 201,661 | |
| | 1,700,000 | | | Boston Properties Ltd. Partnership | | | 5.63% | | | | 11/15/2020 | | | | 1,939,027 | |
| | 2,650,000 | | | Boston Properties Ltd. Partnership | | | 4.13% | | | | 05/15/2021 | | | | 2,730,573 | |
| | 100,000 | | | Calpine Corporation | | | 7.88% | ^ | | | 07/31/2020 | | | | 109,250 | |
| | 100,000 | | | CCO Holdings LLC | | | 6.50% | | | | 04/30/2021 | | | | 104,000 | |
| | 100,000 | | | Cinemark USA, Inc. | | | 7.38% | | | | 06/15/2021 | | | | 107,750 | |
| | 4,300,000 | | | Citigroup, Inc. | | | 6.00% | | | | 12/13/2013 | | | | 4,557,682 | |
| | 8,775,000 | | | Coca-Cola Company | | | 1.80% | | | | 09/01/2016 | | | | 8,971,077 | |
| | 3,570,000 | | | Comcast Corporation | | | 5.85% | | | | 11/15/2015 | | | | 4,119,541 | |
| | 1,875,000 | | | Comcast Corporation | | | 5.90% | | | | 03/15/2016 | | | | 2,166,859 | |
| | 3,250,000 | | | ConocoPhillips Company | | | 6.50% | | | | 02/01/2039 | | | | 4,332,032 | |
| | 100,000 | | | Constellation Brands, Inc. | | | 7.25% | | | | 05/15/2017 | | | | 113,750 | |
| | 100,000 | | | Copano Energy LLC | | | 7.13% | | | | 04/01/2021 | | | | 105,750 | |
| | 200,000 | | | Crown Castle International Corporation | | | 9.00% | | | | 01/15/2015 | | | | 221,000 | |
| | 1,855,000 | | | Daimler Finance North America LLC | | | 1.95% | ^ | | | 03/28/2014 | | | | 1,878,421 | |
| | 4,250,000 | | | Daimler Finance North America LLC | | | 1.88% | ^ | | | 09/15/2014 | | | | 4,313,504 | |
| | 100,000 | | | Delphi Corporation | | | 5.88% | ^ | | | 05/15/2019 | | | | 106,000 | |
| | 4,824,000 | | | Devon Energy Corporation | | | 6.30% | | | | 01/15/2019 | | | | 5,895,565 | |
| | 2,975,000 | | | Devon Energy Corporation | | | 4.00% | | | | 07/15/2021 | | | | 3,178,904 | |
| | 100,000 | | | DineEquity, Inc. | | | 9.50% | | | | 10/30/2018 | | | | 110,000 | |
| | 3,900,000 | | | DIRECTV Holdings LLC | | | 5.00% | | | | 03/01/2021 | | | | 4,234,472 | |
| | 100,000 | | | DISH DBS Corporation | | | 7.75% | | | | 05/31/2015 | | | | 114,125 | |
| | 4,709,000 | | | Duke Energy Corporation | | | 3.55% | | | | 09/15/2021 | | | | 4,872,346 | |
| | 4,170,000 | | | Ecolab, Inc. | | | 2.38% | | | | 12/08/2014 | | | | 4,321,884 | |
| | 200,000 | | | El Paso Corporation | | | 7.00% | | | | 06/15/2017 | | | | 223,709 | |
| | 100,000 | | | Equinix, Inc. | | | 7.00% | | | | 07/15/2021 | | | | 110,000 | |
| | 100,000 | | | Felcor Lodging LP | | | 6.75% | | | | 06/01/2019 | | | | 101,500 | |
| | 200,000 | | | Forest Oil Corporation | | | 7.25% | | | | 06/15/2019 | | | | 196,500 | |
| | 200,000 | | | Frontier Communications Corporation | | | 8.50% | | | | 04/15/2020 | | | | 211,500 | |
| | | | | | | | | | | | | | | | |
PRINCIPAL
AMOUNT | | | SECURITY DESCRIPTION | | RATE | | | MATURITY | | | VALUE $ | |
| $ | 9,925,000 | | | General Electric Capital Corporation | | | 2.90% | | | | 01/09/2017 | | | | 10,307,232 | |
| | 4,900,000 | | | General Mills, Inc. | | | 3.15% | | | | 12/15/2021 | | | | 4,914,666 | |
| | 3,825,000 | | | Goldman Sachs Group, Inc. | | | 5.75% | | | | 01/24/2022 | | | | 3,942,286 | |
| | 2,600,000 | | | Halliburton Company | | | 6.15% | | | | 09/15/2019 | | | | 3,173,378 | |
| | 100,000 | | | Hertz Corporation | | | 7.50% | | | | 10/15/2018 | | | | 106,625 | |
| | 100,000 | | | Huntsman International LLC | | | 5.50% | | | | 06/30/2016 | | | | 100,375 | |
| | 4,100,000 | | | IBM Corporation | | | 1.95% | | | | 07/22/2016 | | | | 4,211,590 | |
| | 3,700,000 | | | Illinois Tool Works, Inc. | | | 3.38% | ^ | | | 09/15/2021 | | | | 3,785,995 | |
| | 4,450,000 | | | Intel Corporation | | | 3.30% | | | | 10/01/2021 | | | | 4,606,871 | |
| | 100,000 | | | International Lease Finance Corporation | | | 8.63% | | | | 01/15/2022 | | | | 111,667 | |
| | 95,000 | | | Interpublic Group of Companies, Inc. | | | 10.00% | | | | 07/15/2017 | | | | 109,250 | |
| | 100,000 | | | Iron Mountain, Inc. | | | 7.75% | | | | 10/01/2019 | | | | 109,750 | |
| | 8,150,000 | | | JP Morgan Chase & Company | | | 4.95% | | | | 03/25/2020 | | | | 8,805,268 | |
| | 3,353,000 | | | Kellogg Company | | | 7.45% | | | | 04/01/2031 | | | | 4,408,045 | |
| | 2,675,000 | | | Kinder Morgan Energy Partners LP | | | 6.95% | | | | 01/15/2038 | | | | 3,064,691 | |
| | 3,800,000 | | | Kraft Foods, Inc. | | | 5.38% | | | | 02/10/2020 | | | | 4,400,126 | |
| | 1,850,000 | | | Kroger Company | | | 5.50% | | | | 02/01/2013 | | | | 1,923,954 | |
| | 3,587,000 | | | Kroger Company | | | 7.50% | | | | 01/15/2014 | | | | 4,000,563 | |
| | 100,000 | | | LINN Energy LLC | | | 6.50% | ^ | | | 05/15/2019 | | | | 98,500 | |
| | 4,350,000 | | | Marathon Petroleum Corporation | | | 5.13% | | | | 03/01/2021 | | | | 4,739,760 | |
| | 4,500,000 | | | Mattel, Inc. | | | 2.50% | | | | 11/01/2016 | | | | 4,608,392 | |
| | 2,000,000 | | | Metlife, Inc. | | | 6.38% | | | | 06/15/2034 | | | | 2,468,582 | |
| | 1,750,000 | | | Metlife, Inc. | | | 5.70% | | | | 06/15/2035 | | | | 2,042,511 | |
| | 100,000 | | | Michaels Stores, Inc. | | | 7.75% | | | | 11/01/2018 | | | | 107,000 | |
| | 2,015,000 | | | MidAmerican Energy Holdings Company | | | 5.95% | | | | 05/15/2037 | | | | 2,361,425 | |
| | 4,254,000 | | | MidAmerican Energy Holdings Company | | | 6.50% | | | | 09/15/2037 | | | | 5,333,278 | |
| | 5,500,000 | | | Motorola, Inc. | | | 6.00% | | | | 11/15/2017 | | | | 6,375,100 | |
| | 8,883,000 | | | National Rural Utilities Cooperative Finance Corporation | | | 10.38% | | | | 11/01/2018 | | | | 12,899,919 | |
| | 5,803,000 | | | News America, Inc. | | | 6.65% | | | | 11/15/2037 | | | | 6,786,550 | |
| | 4,085,000 | | | Novartis Capital Corporation | | | 4.40% | | | | 04/24/2020 | | | | 4,640,732 | |
| | 4,240,000 | | | Omnicom Group, Inc. | | | 4.45% | | | | 08/15/2020 | | | | 4,570,228 | |
| | 4,450,000 | | | ONEOK Partners LP | | | 6.13% | | | | 02/01/2041 | | | | 4,976,128 | |
| | 4,675,000 | | | Phillips 66 | | | 5.88% | ^ | | | 05/01/2042 | | | | 4,806,232 | |
| | 775,000 | | | Plains All American Pipeline LP | | | 5.15% | | | | 06/01/2042 | | | | 759,960 | |
| | 1,950,000 | | | PNC Funding Corporation | | | 6.70% | | | | 06/10/2019 | | | | 2,375,978 | |
| | 4,200,000 | | | PNC Funding Corporation | | | 4.38% | | | | 08/11/2020 | | | | 4,567,735 | |
| | 100,000 | | | Reynolds Group Issuer, Inc. | | | 7.88% | ^ | | | 08/15/2019 | | | | 108,000 | |
| | 100,000 | | | Service Corporation International | | | 6.75% | | | | 04/01/2015 | | | | 109,750 | |
| | 100,000 | | | SESI LLC | | | 6.38% | | | | 05/01/2019 | | | | 106,500 | |
| | 4,427,000 | | | Simon Property Group LP | | | 5.65% | | | | 02/01/2020 | | | | 5,075,640 | |
| | 6,463,000 | | | Southern Power Company, Series D | | | 4.88% | | | | 07/15/2015 | | | | 7,129,923 | |
| | 1,071,000 | | | Southwest Airlines Company | | | 5.25% | | | | 10/01/2014 | | | | 1,152,399 | |
| | 325,000 | | | Southwest Airlines Company | | | 5.75% | | | | 12/15/2016 | | | | 363,916 | |
| | 4,675,000 | | | Southwest Airlines Company | | | 5.13% | | | | 03/01/2017 | | | | 5,092,393 | |
| | 3,100,000 | | | Target Corporation | | | 3.88% | | | | 07/15/2020 | | | | 3,394,351 | |
| | 2,000,000 | | | Target Corporation | | | 2.90% | | | | 01/15/2022 | | | | 1,980,920 | |
| | 9,021,000 | | | Time Warner Cable, Inc. | | | 5.00% | | | | 02/01/2020 | | | | 9,976,884 | |
| | 100,000 | | | Toll Brothers Finance Corporation | | | 5.88% | | | | 02/15/2022 | | | | 102,970 | |
| | 100,000 | | | United Parcel Service, Inc. | | | 5.13% | | | | 04/01/2019 | | | | 118,909 | |
| | | | | | |
| 22 | | DoubleLine Funds | | | | The accompanying notes are an integral part of these financial statements |
| | | | | | | | | | | | | | | | |
PRINCIPAL
AMOUNT | | | SECURITY DESCRIPTION | | RATE | | | MATURITY | | | VALUE $ | |
| $ | 5,259,000 | | | United Parcel Service, Inc. | | | 3.13% | | | | 01/15/2021 | | | | 5,519,531 | |
| | 100,000 | | | United Rentals, Inc. | | | 8.38% | | | | 09/15/2020 | | | | 104,000 | |
| | 100,000 | | | Univision Communications, Inc. | | | 6.88% | ^ | | | 05/15/2019 | | | | 101,875 | |
| | 4,444,000 | | | Valero Energy Corporation | | | 6.13% | | | | 02/01/2020 | | | | 5,113,751 | |
| | 100,000 | | | Vulcan Materials Company | | | 6.50% | | | | 12/01/2016 | | | | 107,750 | |
| | 8,309,000 | | | Wal-Mart Stores, Inc. | | | 3.25% | | | | 10/25/2020 | | | | 8,712,468 | |
| | 5,475,000 | | | Waste Management, Inc. | | | 6.13% | | | | 11/30/2039 | | | | 6,686,924 | |
| | 4,710,000 | | | WellPoint, Inc. | | | 5.25% | | | | 01/15/2016 | | | | 5,283,381 | |
| | 3,485,000 | | | WellPoint, Inc. | | | 5.88% | | | | 06/15/2017 | | | | 4,073,836 | |
| | 8,225,000 | | | Wells Fargo & Company | | | 4.60% | | | | 04/01/2021 | | | | 8,836,964 | |
| | 200,000 | | | Wynn Las Vegas LLC | | | 7.88% | | | | 11/01/2017 | | | | 219,000 | |
| | 3,675,000 | | | Wynn Las Vegas LLC | | | 7.75% | | | | 08/15/2020 | | | | 4,056,281 | |
| | 206,000 | | | Xerox Corporation | | | 5.50% | | | | 05/15/2012 | | | | 207,056 | |
| | 6,560,000 | | | Xerox Corporation | | | 4.25% | | | | 02/15/2015 | | | | 6,972,296 | |
| | | | | | | | | | | | | | | | |
| | | | Total US Corporate Bonds
(Cost $350,103,707) | | | | 356,283,011 | |
| | | | | | | | | | | | | | | | |
| | FOREIGN CORPORATE BONDS 11.5% | |
| | 1,500,000 | | | Abu Dhabi National Energy Company | | | 4.13% | | | | 03/13/2017 | | | | 1,541,250 | |
| | 1,000,000 | | | Abu Dhabi National Energy Company | | | 5.88% | ^ | | | 12/13/2021 | | | | 1,070,000 | |
| | 1,700,000 | | | AES Andres Dominicana Ltd. | | | 9.50% | | | | 11/12/2020 | | | | 1,802,000 | |
| | 2,400,000 | | | AES Gener S.A. | | | 5.25% | | | | 08/15/2021 | | | | 2,538,000 | |
| | 275,000 | | | AES Panama S.A. | | | 6.35% | | | | 12/21/2016 | | | | 299,750 | |
| | 600,000 | | | Alfa Bank | | | 7.88% | | | | 09/25/2017 | | | | 621,900 | |
| | 690,000 | | | AngloGold Holdings PLC | | | 6.50% | | | | 04/15/2040 | | | | 656,934 | |
| | 6,950,000 | | | Australia and New Zealand Banking Group Ltd. | | | 4.88% | ^ | | | 01/12/2021 | | | | 7,587,628 | |
| | 1,300,000 | | | Automotores Gildemeister S.A. | | | 8.25% | ^ | | | 05/24/2021 | | | | 1,399,450 | |
| | 500,000 | | | Automotores Gildemeister S.A. | | | 8.25% | | | | 05/24/2021 | | | | 538,250 | |
| | 1,500,000 | | | Axiata SPV1 Labuan Ltd. | | | 5.38% | | | | 04/28/2020 | | | | 1,589,676 | |
| | 3,400,000 | | | Banco Bradesco S.A. | | | 5.75% | ^ | | | 03/01/2022 | | | | 3,430,600 | |
| | 4,000,000 | | | Banco de Bogota S.A. | | | 5.00% | ^ | | | 01/15/2017 | | | | 4,160,000 | |
| | 2,000,000 | | | Banco de Credito del Peru | | | 5.38% | ^ | | | 09/16/2020 | | | | 2,060,000 | |
| | 1,125,000 | | | Banco de Credito del Peru | | | 5.38% | | | | 09/16/2020 | | | | 1,158,750 | |
| | 503,000 | | | Banco de Credito del Peru | | | 9.75% | #^ | | | 11/06/2069 | | | | 593,540 | |
| | 350,000 | | | Banco de Credito del Peru | | | 9.75% | # | | | 11/06/2069 | | | | 413,000 | |
| | 2,450,000 | | | Banco Internacional del Peru | | | 5.75% | | | | 10/07/2020 | | | | 2,499,000 | |
| | 495,000 | | | Banco Internacional del Peru | | | 8.50% | # | | | 04/23/2070 | | | | 528,413 | |
| | 1,950,000 | | | Banco Latinoamericano de Comercio Exterior S.A. | | | 3.75% | ^ | | | 04/04/2017 | | | | 1,945,125 | |
| | 1,300,000 | | | Banco Mercantil del Norte | | | 4.38% | | | | 07/19/2015 | | | | 1,358,500 | |
| | 1,750,000 | | | Banco Mercantil del Norte | | | 6.86% | # | | | 10/13/2021 | | | | 1,824,375 | |
| | 5,700,000 | | | BanColombia S.A. | | | 5.95% | | | | 06/03/2021 | | | | 6,063,375 | |
| | 100,000 | | | Bombardier, Inc. | | | 5.75% | ^ | | | 03/15/2022 | | | | 97,750 | |
| | 4,237,000 | | | BP Capital Markets PLC | | | 4.75% | | | | 03/10/2019 | | | | 4,804,851 | |
| | 6,788,000 | | | British Telecommunications PLC | | | 5.95% | | | | 01/15/2018 | | | | 7,891,233 | |
| | | | | | | | | | | | | | | | |
PRINCIPAL
AMOUNT | | | SECURITY DESCRIPTION | | RATE | | | MATURITY | | | VALUE $ | |
| $ | 100,000 | | | BTA Bank | | | 10.75% | (a) | | | 07/01/2018 | | | | 22,500 | |
| | 3,500,000 | | | CCL Finance Ltd. | | | 9.50% | | | | 08/15/2014 | | | | 3,970,749 | |
| | 800,000 | | | Celulosa Arauco y Constitution S.A. | | | 4.75% | | | | 01/11/2022 | | | | 822,923 | |
| | 188,000 | | | Cemex Espana | | | 9.88% | ^ | | | 04/30/2019 | | | | 181,420 | |
| | 2,637,000 | | | CNOOC Finance 2011 Ltd. | | | 4.25% | | | | 01/26/2021 | | | | 2,756,599 | |
| | 2,400,000 | | | Controladora Comercial Mexicana S.A.B. de C.V. | | | 7.00% | | | | 06/30/2018 | | | | 2,436,000 | |
| | 4,100,000 | | | Corp Financiera de Desarrolo S.A. | | | 4.75% | ^ | | | 02/08/2022 | | | | 4,243,500 | |
| | 2,000,000 | | | Corporacion Lindley S.A. | | | 6.75% | ^ | | | 11/23/2021 | | | | 2,140,000 | |
| | 700,000 | | | Corporacion Lindley S.A. | | | 6.75% | | | | 11/23/2021 | | | | 749,000 | |
| | 2,344,000 | | | Corporacion Pesquera Inca S.A.C. | | | 9.00% | | | | 02/10/2017 | | | | 2,534,450 | |
| | 1,863,000 | | | Covidien International Finance S.A. | | | 2.80% | | | | 06/15/2015 | | | | 1,942,401 | |
| | 3,950,000 | | | Covidien International Finance S.A. | | | 6.00% | | | | 10/15/2017 | | | | 4,744,207 | |
| | 3,000,000 | | | DBS Bank Ltd. | | | 3.63% | #^ | | | 09/21/2022 | | | | 2,931,594 | |
| | 1,936,000 | | | Deutsche Telekom International Finance B.V. | | | 8.75% | | | | 06/15/2030 | | | | 2,667,909 | |
| | 3,793,050 | | | Dolphin Energy Ltd. | | | 5.89% | | | | 06/15/2019 | | | | 4,120,201 | |
| | 1,600,000 | | | Dolphin Energy Ltd. | | | 5.50% | ^ | | | 12/15/2021 | | | | 1,694,000 | |
| | 4,195,000 | | | EGE Haina Finance Company | | | 9.50% | | | | 04/26/2017 | | | | 4,425,725 | |
| | 2,300,000 | | | Empresa Nacional del Petroleo | | | 4.75% | ^ | | | 12/06/2021 | | | | 2,394,778 | |
| | 300,000 | | | Empresa Nacional del Petroleo | | | 4.75% | | | | 12/06/2021 | | | | 312,362 | |
| | 2,380,000 | | | Empresas ICA S.A.B. de C.V. | | | 8.90% | | | | 02/04/2021 | | | | 2,409,750 | |
| | 3,850,000 | | | France Telecom S.A. | | | 2.75% | | | | 09/14/2016 | | | | 3,964,395 | |
| | 2,200,000 | | | Gaz Capital S.A. | | | 5.09% | | | | 11/29/2015 | | | | 2,315,500 | |
| | 5,325,000 | | | Globo Communicacao e Participacoes S.A. | | | 6.25% | # | | | 07/20/2015 | | | | 5,716,387 | |
| | 1,500,000 | | | GRUMA S.A.B. de C.V. | | | 7.75% | | | | 12/29/2041 | | | | 1,515,000 | |
| | 4,500,000 | | | Grupo Aval Ltd. | | | 5.25% | ^ | | | 02/01/2017 | | | | 4,691,250 | |
| | 700,000 | | | Grupo KUO S.A.B de C.V. | | | 9.75% | | | | 10/17/2017 | | | | 764,750 | |
| | 1,300,000 | | | Grupo Petrotemex S.A. de C.V | | | 9.50% | | | | 08/19/2014 | | | | 1,446,250 | |
| | 200,000 | | | Grupo Televisa S.A.B. | | | 6.63% | | | | 03/18/2025 | | | | 236,321 | |
| | 200,000 | | | Gruposura Finance | | | 5.70% | ^ | | | 05/18/2021 | | | | 210,000 | |
| | 1,900,000 | | | Gruposura Finance | | | 5.70% | | | | 05/18/2021 | | | | 1,995,000 | |
| | 1,700,000 | | | Hongkong Electric Finance Ltd. | | | 4.25% | | | | 12/14/2020 | | | | 1,746,762 | |
| | 2,400,000 | | | Hutchison Whampoa International 11 Ltd. | | | 4.63% | ^ | | | 01/13/2022 | | | | 2,422,534 | |
| | 500,000 | | | Hutchison Whampoa International 11 Ltd. | | | 4.63% | | | | 01/13/2022 | | | | 504,695 | |
| | 3,365,193 | | | IIRSA Norte Finance Ltd. | | | 8.75% | | | | 05/30/2024 | | | | 3,958,477 | |
| | 600,000 | | | Industry & Construction Bank | | | 5.01% | # | | | 09/29/2015 | | | | 594,750 | |
| | 400,000 | | | Inkia Energy Ltd. | | | 8.38% | ^ | | | 04/04/2021 | | | | 416,000 | |
| | 1,100,000 | | | Inkia Energy Ltd. | | | 8.38% | | | | 04/04/2021 | | | | 1,144,000 | |
| | 2,000,000 | | | Instituto Costarricense de Electricidad | | | 6.95% | ^ | | | 11/10/2021 | | | | 2,110,000 | |
| | 2,300,000 | | | Instituto Costarricense de Electricidad | | | 6.95% | | | | 11/10/2021 | | | | 2,426,500 | |
| | 200,000 | | | Interbank Peru | | | 8.50% | #I/F | | | 04/23/2070 | | | | 213,500 | |
| | 500,000 | | | Intercorp Retail Trust | | | 8.88% | ^ | | | 11/14/2018 | | | | 542,500 | |
| | 800,000 | | | Inversiones CMPC S.A. | | | 4.75% | ^ | | | 01/19/2018 | | | | 842,202 | |
| | 250,000 | | | Inversiones CMPC S.A. | | | 4.75% | | | | 01/19/2018 | | | | 263,188 | |
| | 1,600,000 | | | Inversiones CMPC S.A. | | | 6.13% | | | | 11/05/2019 | | | | 1,806,474 | |
| | 575,000 | | | IOI Ventures BHD | | | 5.25% | | | | 03/16/2015 | | | | 607,892 | |
| | 500,000 | | | Ixe Banco S.A. | | | 9.25% | | | | 10/14/2020 | | | | 570,000 | |
| | 200,000 | | | Ixe Banco S.A. | | | 9.75% | | | | 12/29/2041 | | | | 202,750 | |
| | 2,800,000 | | | JBS Finance II Ltd. | | | 8.25% | | | | 01/29/2018 | | | | 2,879,800 | |
| | 900,000 | | | Kuznetski Capital S.A. | | | 5.97% | # | | | 11/25/2015 | | | | 892,261 | |
| | 2,000,000 | | | Lotte Shopping Company Ltd. | | | 3.88% | | | | 04/07/2016 | | | | 2,038,220 | |
| | 2,500,000 | | | Minerva Luxembourg S.A. | | | 12.25% | ^ | | | 02/10/2022 | | | | 2,743,750 | |
| | 200,000 | | | Minerva Overseas II Ltd. | | | 10.88% | | | | 11/15/2019 | | | | 213,000 | |
| | | | | | |
| The accompanying notes are an integral part of these financial statements | | Annual Report | | March 31, 2012 | | 23 |
Schedule of Investments DoubleLine Core Fixed Income Fund (Cont.)
| | | | | | | | | | | | | | | | |
PRINCIPAL
AMOUNT | | | SECURITY DESCRIPTION | | RATE | | | MATURITY | | | VALUE $ | |
| $ | 2,425,595 | | | Nakilat, Inc. | | | 6.27% | | | | 12/31/2033 | | | | 2,648,094 | |
| | 200,000 | | | Nova Chemicals Corporation | | | 8.38% | | | | 11/01/2016 | | | | 223,000 | |
| | 1,000,000 | | | Odebrecht Finance Ltd. | | | 6.00% | ^ | | | 04/05/2023 | | | | 1,044,300 | |
| | 1,000,000 | | | Odebrecht Finance Ltd. | | | 6.00% | | | | 04/05/2023 | | | | 1,044,300 | |
| | 2,500,000 | | | Oversea-Chinese Banking Corporation | | | 4.25% | # | | | 11/18/2019 | | | | 2,571,878 | |
| | 3,800,000 | | | Pacific Rubiales Energy Corporation | | | 7.25% | ^ | | | 12/12/2021 | | | | 4,178,100 | |
| | 1,900,000 | | | Pacific Rubiales Energy Corporation | | | 7.25% | | | | 12/12/2021 | | | | 2,089,050 | |
| | 700,000 | | | PCCW-HKT Capital No 4 Ltd. | | | 4.25% | | | | 02/24/2016 | | | | 723,564 | |
| | 3,000,000 | | | Petrobras International Finance Company | | | 5.38% | | | | 01/27/2021 | | | | 3,245,217 | |
| | 4,026,000 | | | Pohang Iron and Steel Company | | | 4.25% | ^ | | | 10/28/2020 | | | | 3,968,336 | |
| | 1,260,000 | | | Pohang Iron and Steel Company | | | 5.25%^ | | | | 04/14/2021 | | | | 1,329,253 | |
| | 2,750,000 | | | PTTEP Australia International Finance Ltd. | | | 4.15% | | | | 07/19/2015 | | | | 2,868,381 | |
| | 925,260 | | | Ras Laffan Liquefied Natural Gas Company | | | 5.30% | | | | 09/30/2020 | | | | 994,655 | |
| | 1,800,000 | | | Ras Laffan Liquefied Natural Gas Company | | | 5.84% | | | | 09/30/2027 | | | | 1,953,000 | |
| | 2,450,000 | | | Reliance Holdings USA, Inc. | | | 5.40%^ | | | | 02/14/2022 | | | | 2,441,864 | |
| | 8,590,000 | | | Royal Bank of Canada | | | 2.30% | | | | 07/20/2016 | | | | 8,825,151 | |
| | 1,675,000 | | | Royal KPN N.V. | | | 8.38% | | | | 10/01/2030 | | | | 2,156,222 | |
| | 500,000 | | | Russian Agricultural Bank | | | 6.00% | #^ | | | 06/03/2021 | | | | 494,400 | |
| | 1,200,000 | | | Russian Agricultural Bank | | | 6.00% | # | | | 06/03/2021 | | | | 1,186,560 | |
| | 3,100,000 | | | Sigma Alimentos S.A. | | | 5.63% | | | | 04/14/2018 | | | | 3,293,750 | |
| | 800,000 | | | Sigma Alimentos S.A. | | | 6.88% | | | | 12/16/2019 | | | | 904,000 | |
| | 500,000 | | | Sociedad Quimica y Minera S.A. | | | 5.50% | | | | 04/21/2020 | | | | 545,845 | |
| | 4,800,000 | | | Temasek Financial Ltd. | | | 4.30% | | | | 10/25/2019 | | | | 5,237,026 | |
| | 1,373,091 | | | Tengizchevroil Finance Corporation | | | 6.12% | | | | 11/15/2014 | | | | 1,448,817 | |
| | 4,300,000 | | | Transocean, Inc. | | | 6.00% | | | | 03/15/2018 | | | | 4,766,180 | |
| | 1,500,000 | | | VEB Finance Ltd. | | | 5.38%^ | | | | 02/13/2017 | | | | 1,552,500 | |
| | 200,000 | | | Vimpel Communications | | | 7.75%^ | | | | 02/02/2021 | | | | 198,250 | |
| | 1,800,000 | | | Vimpel Communications | | | 7.75% | | | | 02/02/2021 | | | | 1,784,250 | |
| | 300,000 | | | VimpelCom Holdings B.V. | | | 7.50%^ | | | | 03/01/2022 | | | | 292,500 | |
| | 2,700,000 | | | Virgolino De Oliveira Fininance Ltd. | | | 11.75%^ | | | | 02/09/2022 | | | | 2,693,250 | |
| | 4,500,000 | | | Volcan Compania Minera S.A. | | | 5.38%^ | | | | 02/02/2022 | | | | 4,668,750 | |
| | 1,400,000 | | | Votorantim Cimentos S.A. | | | 7.25%^ | | | | 04/05/2041 | | | | 1,435,000 | |
| | 4,000,000 | | | VTB Capital S.A. | | | 6.88% | | | | 05/29/2018 | | | | 4,244,999 | |
| | 100,000 | | | WPE International Cooperatief U.A. | | | 10.38%^ | | | | 09/30/2020 | | | | 95,330 | |
| | 3,100,000 | | | WPE International Cooperatief U.A. | | | 10.38% | | | | 09/30/2020 | | | | 2,955,230 | |
| | 750,000 | | | YPF Sociedad Anonima | | | 10.00% | | | | 11/02/2028 | | | | 791,250 | |
| | | | | | | | | | | | | | | | |
| | | | Total Foreign Corporate Bonds
(Cost $233,291,076) | | | | 238,859,778 | |
| | | | | | | | | | | | | | | | |
| | | | | | | | | | | | | | | | |
PRINCIPAL
AMOUNT | | | SECURITY DESCRIPTION | | RATE | | | MATURITY | | | VALUE $ | |
| FOREIGN GOVERNMENT BONDS AND NOTES, SUPRANATIONALS AND
FOREIGN AGENCIES 3.0% |
|
| $ | 8,640,000 | | | Corporacion Andina de Fomento | | | 3.75% | | | | 01/15/2016 | | | | 8,999,977 | |
| | 100,000 | | | Hydro-Quebec | | | 8.00% | | | | 02/01/2013 | | | | 106,116 | |
| | 150,000 | | | Hydro-Quebec | | | 7.50% | | | | 04/01/2016 | | | | 182,673 | |
| | 2,300,000 | | | Hydro-Quebec | | | 2.00% | | | | 06/30/2016 | | | | 2,368,422 | |
| | 4,500,000 | | | Korea Development Bank | | | 4.38% | | | | 08/10/2015 | | | | 4,765,496 | |
| | 3,800,000 | | | Korea Development Bank | | | 4.00% | | | | 09/09/2016 | | | | 3,979,979 | |
| | 5,800,000 | | | Mexico Government International Bond | | | 3.63% | | | | 03/15/2022 | | | | 5,945,000 | |
| | 8,000,000 | | | Pemex Project Funding Master Trust | | | 6.63% | | | | 06/15/2035 | | | | 9,200,000 | |
| | 500,000 | | | Province of New Brunswick | | | 2.75% | | | | 06/15/2018 | | | | 526,820 | |
| | 1,600,000 | | | Province of Ontario | | | 2.30% | | | | 05/10/2016 | | | | 1,658,594 | |
| | 200,000 | | | Province of Ontario | | | 4.95% | | | | 11/28/2016 | | | | 231,062 | |
| | 1,600,000 | | | Russian Foreign Bond | | | 4.50%^ | | | | 04/04/2022 | | | | 1,609,600 | |
| | 2,000,000 | | | Russian Foreign Bond | | | 5.63%^ | | | | 04/04/2042 | | | | 2,015,000 | |
| | 6,200,000 | | | South Africa Government International Bond | | | 4.67% | | | | 01/17/2024 | | | | 6,370,499 | |
| | 2,000,000 | | | State of Qatar | | | 4.50%^ | | | | 01/20/2022 | | | | 2,097,600 | |
| | 5,700,000 | | | State Of Qatar | | | 4.50% | | | | 01/20/2022 | | | | 5,978,160 | |
| | 4,870,000 | | | United Mexican States | | | 5.63% | | | | 01/15/2017 | | | | 5,656,505 | |
| | 500,000 | | | Wakala Global Sukuk BHD | | | 4.65% | | | | 07/06/2021 | | | | 541,934 | |
| | | | | | | | | | | | | | | | |
| | | | Total Foreign Government Bonds and Notes, Supranationals and Foreign Agencies
(Cost $60,686,273) | | | | 62,233,437 | |
| | | | | | | | | | | | | | | | |
| | US GOVERNMENT/AGENCY MORTGAGE BACKED SECURITIES 25.2% | |
| |
| | | | Federal Home Loan Mortgage Corporation, | |
| | 5,376,621 | | | Pool G01840 | | | 5.00% | | | | 07/01/2035 | | | | 5,805,321 | |
| | 4,463,228 | | | Pool G04817 | | | 5.00% | | | | 09/01/2038 | | | | 4,811,428 | |
| | 16,070,772 | | | Pool G06871 | | | 6.00% | | | | 06/01/2038 | | | | 17,771,406 | |
| | 8,046,138 | | | Pool N70081 | | | 5.50% | | | | 07/01/2038 | | | | 8,774,978 | |
| | 1,330,007 | | | Pool U60299 | | | 4.00% | | | | 11/01/2040 | | | | 1,406,536 | |
| | 451,066 | | | Series 2692-SC | | | 12.80% | # I/F | | | 07/15/2033 | | | | 503,349 | |
| | 5,300,000 | | | Series 2722-PS | | | 9.62% | # I/F | | | 12/15/2033 | | | | 6,149,009 | |
| | 449,039 | | | Series 2750-ZT | | | 5.00% | | | | 02/15/2034 | | | | 502,731 | |
| | 13,697,272 | | | Series 2890-ZA | | | 5.00% | | | | 11/15/2034 | | | | 15,357,333 | |
| | 1,048,061 | | | Series 3002-SN | | | 6.26% | # I/F I/O | | | 07/15/2035 | | | | 187,971 | |
| | 450,835 | | | Series 3045-DI | | | 6.49% | # I/F I/O | | | 10/15/2035 | | | | 70,646 | |
| | 1,068,162 | | | Series 3116-Z | | | 5.50% | | | | 02/15/2036 | | | | 1,215,453 | |
| | 131,421 | | | Series 3117-ZN | | | 4.50% | | | | 02/15/2036 | | | | 142,753 | |
| | 1,321,261 | | | Series 3203-ZC | | | 5.00% | | | | 07/15/2036 | | | | 1,508,762 | |
| | 841,504 | | | Series 3275-SC | | | 5.84% | # I/F I/O | | | 02/15/2037 | | | | 106,216 | |
| | 12,869,003 | | | Series 3382-SB | | | 5.76% | # I/F I/O | | | 11/15/2037 | | | | 1,730,002 | |
| | 8,772,889 | | | Series 3384-S | | | 6.15% | # I/F I/O | | | 11/15/2037 | | | | 1,293,604 | |
| | 9,396,172 | | | Series 3417-SX | | | 5.94% | # I/F I/O | | | 02/15/2038 | | | | 1,270,378 | |
| | 1,240,786 | | | Series 3423-GS | | | 5.41% | # I/F I/O | | | 03/15/2038 | | | | 145,308 | |
| | 1,240,786 | | | Series 3423-SG | | | 5.41% | # I/F I/O | | | 03/15/2038 | | | | 145,669 | |
| | 972,832 | | | Series 3524-LB | | | 5.70% | # | | | 06/15/2038 | | | | 1,040,291 | |
| | 4,307,049 | | | Series 3562-WS | | | 4.71% | # I/F I/O | | | 08/15/2039 | | | | 408,105 | |
| | 2,337,476 | | | Series 3582-SA | | | 5.76% | # I/F I/O | | | 10/15/2049 | | | | 292,720 | |
| | 2,022,546 | | | Series 3606-CS | | | 6.11% | # I/F I/O | | | 12/15/2039 | | | | 315,639 | |
| | 1,174,567 | | | Series 3616-SG | | | 6.11% | # I/F I/O | | | 03/15/2032 | | | | 206,384 | |
| | 5,068,129 | | | Series 3626-AZ | | | 5.50% | | | | 08/15/2036 | | | | 5,728,760 | |
| | 7,000,000 | | | Series 3641-TB | | | 4.50% | | | | 03/15/2040 | | | | 7,699,514 | |
| | 2,484,072 | | | Series 3666-SC | | | 5.53% | # I/F I/O | | | 05/15/2040 | | | | 304,758 | |
| | 552,919 | | | Series 3666-VZ | | | 5.50% | | | | 08/15/2036 | | | | 643,416 | |
| | 1,192,328 | | | Series 3688-CM | | | 4.00% | | | | 07/15/2029 | | | | 1,225,415 | |
| | 12,175,000 | | | Series 3738-BD | | | 4.00% | | | | 10/15/2030 | | | | 12,700,628 | |
| | | | | | |
| 24 | | DoubleLine Funds | | | | The accompanying notes are an integral part of these financial statements |
| | | | | | | | | | | | | | | | |
PRINCIPAL
AMOUNT | | | SECURITY DESCRIPTION | | RATE | | | MATURITY | | | VALUE $ | |
| |
| | | | Federal Home Loan Mortgage Corporation, (Cont.) | |
| $ | 223,072 | | | Series 3745-ST | | | 9.52% | # I/F | | | 10/15/2040 | | | | 224,230 | |
| | 2,469,567 | | | Series 3745-SY | | | 9.52% | # I/F | | | 10/15/2040 | | | | 2,431,530 | |
| | 2,054,094 | | | Series 3758-SL | | | 5.38% | # I/F | | | 05/15/2039 | | | | 2,030,046 | |
| | 2,767,359 | | | Series 3768-MS | | | 9.51% | # I/F | | | 12/15/2040 | | | | 2,760,302 | |
| | 2,445,547 | | | Series 3779-DZ | | | 4.50% | | | | 12/15/2040 | | | | 2,412,596 | |
| | 1,400,000 | | | Series 3779-YA | | | 3.50% | | | | 12/15/2030 | | | | 1,448,077 | |
| | 303,180 | | | Series 3780-BS | | | 9.42% | # I/F | | | 12/15/2040 | | | | 303,546 | |
| | 994,733 | | | Series 3780-YS | | | 9.42% | # I/F | | | 12/15/2040 | | | | 1,051,693 | |
| | 1,388,246 | | | Series 3786-SG | | | 9.02% | # I/F | | | 01/15/2041 | | | | 1,394,720 | |
| | 2,275,124 | | | Series 3793-SA | | | 9.32% | # I/F | | | 01/15/2041 | | | | 2,314,655 | |
| | 2,095,383 | | | Series 3795-VZ | | | 4.00% | | | | 01/15/2041 | | | | 2,154,896 | |
| | 1,198,313 | | | Series 3798-SD | | | 9.12% | # I/F | | | 12/15/2040 | | | | 1,210,909 | |
| | 517,495 | | | Series 3805-KS | | | 9.02% | # I/F | | | 02/15/2041 | | | | 527,839 | |
| | 1,591,875 | | | Series 3806-CZ | | | 5.50% | | | | 07/15/2034 | | | | 1,871,859 | |
| | 1,156,635 | | | Series 3808-DB | | | 3.50% | | | | 02/15/2031 | | | | 1,197,912 | |
| | 4,183,759 | | | Series 3818-CZ | | | 4.50% | | | | 03/15/2041 | | | | 4,519,549 | |
| | 2,096,932 | | | Series 3819-ZU | | | 5.50% | | | | 07/15/2034 | | | | 2,450,351 | |
| | 3,736,782 | | | Series 3824-EY | | | 3.50% | | | | 03/15/2031 | | | | 3,868,609 | |
| | 1,969,776 | | | Series 3828-SW | | | 12.47% | # I/F | | | 02/15/2041 | | | | 1,959,468 | |
| | 4,187,161 | | | Series 3863-ZA | | | 5.50% | | | | 08/15/2034 | | | | 4,881,768 | |
| | 8,000,000 | | | Series 3877-EY | | | 4.50% | | | | 06/15/2041 | | | | 8,761,718 | |
| | 3,080,940 | | | Series 3888-ZG | | | 4.00% | | | | 07/15/2041 | | | | 3,186,607 | |
| | 2,237,772 | | | Series 3910-GZ | | | 5.00% | | | | 08/15/2041 | | | | 2,530,473 | |
| | 5,043,878 | | | Series 3972-AZ | | | 3.50% | | | | 12/15/2041 | | | | 4,692,536 | |
| | 1,422,065 | | | Series R003-ZA | | | 5.50% | | | | 10/15/2035 | | | | 1,622,253 | |
| |
| | | | Federal National Mortgage Association, | |
| | 565,663 | | | Series 2003-117-KS | | | 6.86% | # I/F I/O | | | 08/25/2033 | | | | 63,907 | |
| | 3,069,216 | | | Series 2003-92-PZ | | | 5.00% | | | | 09/25/2033 | | | | 3,534,585 | |
| | 500,000 | | | Series 2003-W17-1A7 | | | 5.75% | | | | 08/25/2033 | | | | 574,292 | |
| | 1,869,395 | | | Series 2006-101-SA | | | 6.34% | # I/F I/O | | | 10/25/2036 | | | | 270,026 | |
| | 891,890 | | | Series 2006-56-SM | | | 6.51% | # I/F I/O | | | 07/25/2036 | | | | 152,740 | |
| | 1,130,886 | | | Series 2007-116-BI | | | 6.01% | # I/F I/O | | | 05/25/2037 | | | | 181,852 | |
| | 2,795,882 | | | Series 2007-30-OI | | | 6.20% | # I/F I/O | | | 04/25/2037 | | | | 426,308 | |
| | 4,879,520 | | | Series 2008-14-ZA | | | 5.50% | | | | 03/25/2038 | | | | 5,559,584 | |
| | 418,885 | | | Series 2008-29-ZA | | | 4.50% | | | | 04/25/2038 | | | | 456,720 | |
| | 1,276,442 | | | Series 2008-62-SC | | | 5.76% | # I/F I/O | | | 07/25/2038 | | | | 161,647 | |
| | 3,897,452 | | | Series 2009-111-EZ | | | 5.00% | | | | 01/25/2040 | | | | 4,376,968 | |
| | 578,565 | | | Series 2009-111-SE | | | 6.01% | # I/F I/O | | | 01/25/2040 | | | | 75,234 | |
| | 349,894 | | | Series 2009-16-MZ | | | 5.00% | | | | 03/25/2029 | | | | 389,726 | |
| | 1,457,937 | | | Series 2009-48-WS | | | 5.71% | # I/F I/O | | | 07/25/2039 | | | | 164,018 | |
| | 6,900,258 | | | Series 2009-62-PS | | | 5.86% | # I/F I/O | | | 08/25/2039 | | | | 877,965 | |
| | 3,356,510 | | | Series 2009-77-ZA | | | 4.50% | | | | 10/25/2039 | | | | 3,657,708 | |
| | 1,790,139 | | | Series 2009-83-Z | | | 4.50% | | | | 10/25/2039 | | | | 1,948,442 | |
| | 285,377 | | | Series 2010-101-ZH | | | 4.50% | | | | 07/25/2040 | | | | 297,762 | |
| | 1,277,896 | | | Series 2010-109-BS | | | 52.32% | # I/F | | | 10/25/2040 | | | | 1,797,905 | |
| | 1,592,596 | | | Series 2010-112-ZA | | | 4.00% | | | | 10/25/2040 | | | | 1,645,599 | |
| | 1,277,200 | | | Series 2010-121-SD | | | 4.26% | # I/F I/O | | | 10/25/2040 | | | | 130,282 | |
| | 206,538 | | | Series 2010-137-VS | | | 14.27% | # I/F | | | 12/25/2040 | | | | 220,886 | |
| | 2,102,367 | | | Series 2010-150-ZA | | | 4.00% | | | | 01/25/2041 | | | | 2,138,847 | |
| | 1,440,731 | | | Series 2010-31-SA | | | 4.76% | # I/F I/O | | | 04/25/2040 | | | | 144,290 | |
| | 1,159,734 | | | Series 2010-34-PS | | | 4.69% | # I/F I/O | | | 04/25/2040 | | | | 108,175 | |
| | 1,400,273 | | | Series 2010-35-SP | | | 6.11% | # I/F I/O | | | 04/25/2050 | | | | 198,214 | |
| | 1,019,311 | | | Series 2010-35-SV | | | 6.21% | # I/F I/O | | | 04/25/2040 | | | | 133,848 | |
| | 10,189,237 | | | Series 2010-37-MY | | | 4.50% | | | | 04/25/2040 | | | | 11,214,121 | |
| | 1,206,497 | | | Series 2010-59-PS | | | 6.21% | # I/F I/O | | | 03/25/2039 | | | | 164,053 | |
| | 1,574,742 | | | Series 2010-59-SC | | | 4.76% | # I/F I/O | | | 01/25/2040 | | | | 159,219 | |
| | 7,670,535 | | | Series 2010-60-VZ | | | 5.00% | | | | 10/25/2039 | | | | 8,382,047 | |
| | 328,737 | | | Series 2010-64-EZ | | | 5.00% | | | | 06/25/2040 | | | | 381,234 | |
| | 1,981,753 | | | Series 2010-7-PE | | | 5.00% | | | | 02/25/2040 | | | | 2,116,783 | |
| | 2,552,288 | | | Series 2010-90-GS | | | 5.76% | # I/F I/O | | | 08/25/2040 | | | | 341,832 | |
| | 151,911 | | | Series 2010-99-SG | | | 23.78% | # I/F | | | 09/25/2040 | | | | 201,671 | |
| | 6,873,282 | | | Series 2011-127-PM | | | 4.00% | | | | 12/25/2041 | | | | 6,821,275 | |
| | 6,154,214 | | | Series 2011-141-PZ | | | 4.00% | | | | 01/25/2042 | | | | 6,208,296 | |
| | 1,486,462 | | | Series 2011-18-S | | | 9.00% | # I/F | | | 03/25/2041 | | | | 1,517,848 | |
| | 13,157,055 | | | Series 2011-18-UZ | | | 4.00% | | | | 03/25/2041 | | | | 13,402,702 | |
| | 1,533,918 | | | Series 2011-25-KY | | | 3.00% | | | | 04/25/2026 | | | | 1,577,493 | |
| | 1,000,000 | | | Series 2011-29-AL | | | 3.50% | | | | 04/25/2031 | | | | 1,029,591 | |
| | 13,914,828 | | | Series 2011-59-MA | | | 4.50% | | | | 07/25/2041 | | | | 15,042,097 | |
| | 9,273,628 | | | Series 2011-63-ZE | | | 4.00% | | | | 08/25/2038 | | | | 9,773,199 | |
| | 2,074,521 | | | Series 2011-72-LZ | | | 5.50% | | | | 04/25/2037 | | | | 2,431,406 | |
| | 2,567,450 | | | Series 2011-77-CZ | | | 4.00% | | | | 08/25/2041 | | | | 2,571,798 | |
| | 1,243,668 | | | Series 2011-87-US | | | 13.22% | # I/F | | | 09/25/2041 | | | | 1,252,233 | |
| | | | | | | | | | | | | | | | |
PRINCIPAL
AMOUNT | | | SECURITY DESCRIPTION | | RATE | | | MATURITY | | | VALUE $ | |
| |
| | | | Federal National Mortgage Association, (Cont.) | |
| $ | 2,121,812 | | | Series 2011-88-SB | | | 8.81% | # I/F | | | 09/25/2041 | | | | 2,172,423 | |
| | 2,028,373 | | | Series 400-S4 | | | 5.21% | # I/FI/O | | | 11/25/2039 | | | | 234,120 | |
| |
| | | | Federal National Mortgage Association Pass-Thru, | |
| | 1,062,803 | | | Pool 555743 | | | 5.00% | | | | 09/01/2033 | | | | 1,150,907 | |
| | 899,765 | | | Pool 735382 | | | 5.00% | | | | 04/01/2035 | | | | 973,933 | |
| | 6,747,873 | | | Pool 735383 | | | 5.00% | | | | 04/01/2035 | | | | 7,304,096 | |
| | 3,648,246 | | | Pool 735402 | | | 5.00% | | | | 04/01/2035 | | | | 3,948,968 | |
| | 5,547,363 | | | Pool 735484 | | | 5.00% | | | | 05/01/2035 | | | | 5,999,428 | |
| | 6,519,224 | | | Pool 889509 | | | 6.00% | | | | 05/01/2038 | | | | 7,190,337 | |
| | 5,648,999 | | | Pool 889662 | | | 6.00% | | | | 06/01/2038 | | | | 6,230,527 | |
| | 7,633,679 | | | Pool 890385 | | | 6.00% | | | | 12/01/2039 | | | | 8,419,517 | |
| | 743,267 | | | Pool 931104 | | | 5.00% | | | | 05/01/2039 | | | | 812,953 | |
| | 12,660,839 | | | Pool 995023 | | | 5.50% | | | | 08/01/2037 | | | | 13,860,172 | |
| | 6,019,900 | | | Pool 995112 | | | 5.50% | | | | 07/01/2036 | | | | 6,606,142 | |
| | 5,856,345 | | | Pool 995203 | | | 5.00% | | | | 07/01/2035 | | | | 6,341,825 | |
| | 3,295,252 | | | Pool AB2123 | | | 4.00% | | | | 01/01/2031 | | | | 3,497,883 | |
| | 735,570 | | | Pool AB2370 | | | 4.50% | | | | 09/01/2035 | | | | 767,651 | |
| | 167,029 | | | Pool AC1032 | | | 5.00% | | | | 06/01/2040 | | | | 176,282 | |
| | 21,094,572 | | | Pool AD0189 | | | 5.50% | | | | 02/01/2039 | | | | 23,092,814 | |
| | 17,727,137 | | | Pool AD0500 | | | 5.50% | | | | 09/01/2036 | | | | 19,483,945 | |
| | 110,613 | | | Pool AD2177 | | | 4.50% | | | | 06/01/2030 | | | | 117,805 | |
| | 5,158,230 | | | Pool AH7309 | | | 4.00% | | | | 02/01/2031 | | | | 5,475,420 | |
| | 7,738,954 | | | Pool AJ1399 | | | 4.00% | | | | 09/01/2041 | | | | 8,018,945 | |
| | 20,061,867 | | | Pool AJ4997 | | | 4.00% | | | | 10/01/2041 | | | | 20,787,694 | |
| | 22,324,642 | | | Pool AJ7677 | | | 3.50% | | | | 12/01/2041 | | | | 22,747,055 | |
| | 15,848,481 | | | Pool AK4039 | | | 4.00% | | | | 02/01/2042 | | | | 16,421,870 | |
| | 3,711,053 | | | Pool MA0264 | | | 4.50% | | | | 12/01/2029 | | | | 3,954,666 | |
| | 402,757 | | | Pool MA0282 | | | 5.00% | | | | 12/01/2039 | | | | 446,717 | |
| | 2,685,457 | | | Pool MA0353 | | | 4.50% | | | | 03/01/2030 | | | | 2,860,066 | |
| | 364,262 | | | Pool MA0468 | | | 5.00% | | | | 07/01/2040 | | | | 384,442 | |
| | 4,471,650 | | | Pool MA0871 | | | 4.00% | | | | 10/01/2041 | | | | 4,633,432 | |
| |
| | | | Government National Mortgage Association, | |
| | 2,895,342 | | | Pool 752494 | | | 5.50% | | | | 09/20/2039 | | | | 3,093,189 | |
| | 271,875 | | | Series 2003-67-SP | | | 6.86% | # I/FI/O | | | 08/20/2033 | | | | 83,078 | |
| | 814,162 | | | Series 2008-82-SM | | | 5.81% | # I/FI/O | | | 09/20/2038 | | | | 119,794 | |
| | 7,949,998 | | | Series 2009-32-ZE | | | 4.50% | | | | 05/16/2039 | | | | 8,776,567 | |
| | 3,974,999 | | | Series 2009-35-DZ | | | 4.50% | | | | 05/20/2039 | | | | 4,301,454 | |
| | 3,915,929 | | | Series 2009-75-GZ | | | 4.50% | | | | 09/20/2039 | | | | 4,246,528 | |
| | 4,531,417 | | | Series 2009-75-HZ | | | 5.00% | | | | 09/20/2039 | | | | 5,143,910 | |
| | 293,527 | | | Series 2010-25-ZB | | | 4.50% | | | | 02/16/2040 | | | | 300,821 | |
| | 6,275,639 | | | Series 2011-45-GZ | | | 4.50% | | | | 03/20/2041 | | | | 6,670,490 | |
| | 10,381,392 | | | Series 2011-71-ZA | | | 4.50% | | | | 02/20/2041 | | | | 11,114,033 | |
| | | | | | | | | | | | | | | | |
| | | | Total US Government/Agency Mortgage backed Securities
(Cost $507,011,199) | | | | 523,510,952 | |
| | | | | | | | | | | | | | | | |
| | US GOVERNMENT BONDS AND NOTES 20.0% | |
| | 2,800,000 | | | United States Treasury Bonds | | | 8.00% | | | | 11/15/2021 | | | | 4,253,595 | |
| | 5,750,000 | | | United States Treasury Bonds | | | 6.13% | | | | 11/15/2027 | | | | 8,126,366 | |
| | 5,500,000 | | | United States Treasury Bonds | | | 4.75% | | | | 02/15/2037 | | | | 6,961,796 | |
| | 27,950,000 | | | United States Treasury Bonds | | | 4.25% | | | | 11/15/2040 | | | | 32,919,873 | |
| | 58,700,000 | | | United States Treasury Notes | | | 0.50% | | | | 05/31/2013 | | | | 58,878,859 | |
| | 105,900,000 | | | United States Treasury Notes | | | 1.88% | | | | 04/30/2014 | | | | 109,192,854 | |
| | 37,700,000 | | | United States Treasury Notes | | | 1.25% | | | | 10/31/2015 | | | | 38,456,941 | |
| | 30,350,000 | | | United States Treasury Notes | | | 2.75% | | | | 11/30/2016 | | | | 32,789,867 | |
| | 13,100,000 | | | United States Treasury Notes | | | 1.88% | | | | 09/30/2017 | | | | 13,567,709 | |
| | 39,600,000 | | | United States Treasury Notes | | | 2.38% | | | | 05/31/2018 | | | | 41,920,322 | |
| | 35,250,000 | | | United States Treasury Notes | | | 3.63% | | | | 08/15/2019 | | | | 40,011,500 | |
| | 27,950,000 | | | United States Treasury Notes | | | 3.13% | | | | 05/15/2021 | | | | 30,426,202 | |
| | | | | | | | | | | | | | | | |
| | | | Total US Government Bonds and Notes
(Cost $422,051,561) | | | | 417,505,884 | |
| | | | | | | | | | | | | | | | |
| | | | | | |
| The accompanying notes are an integral part of these financial statements | | Annual Report | | March 31, 2012 | | 25 |
Schedule of Investments DoubleLine Core Fixed Income Fund (Cont.)
| | | | | | | | | | | | | | |
PRINCIPAL
AMOUNT | | | SECURITY
DESCRIPTION | | RATE | | | MATURITY | | VALUE $ | |
| | SHORT TERM INVESTMENTS 1.6% | |
| $ | 33,587,138 | | | Fidelity Institutional Government Portfolio | | | 0.01% | ¨ | | | | | 33,587,138 | |
| | | | | | | | | | | | | | |
| | | | Total Short Term Investments
(Cost $33,587,138) | | | 33,587,138 | |
| | | | | | | | | | | | | | |
| | | | Total Investments 99.0%
(Cost $2,033,543,993) | | | 2,061,738,912 | |
| | | | Other Assets in Excess of Liabilities 1.0% | | | 21,572,829 | |
| | | | | | | | | | | | | | |
| | | | NET ASSETS 100.0% | | $ | 2,083,311,741 | |
| | | | | | | | | | | | | | |
| | | | |
| PORTFOLIO HOLDINGS as % of Net Assets | |
US Government / Agency Mortgage Backed Securities | | | 25.2% | |
Non-Agency Collateralized Mortgage Obligations | | | 20.6% | |
US Government Bonds and Notes | | | 20.0% | |
US Corporate Bonds | | | 17.1% | |
Foreign Corporate Bonds | | | 11.5% | |
Foreign Government Bonds and Notes, Supranationals and Foreign Agencies | | | 3.0% | |
Short Term Investments | | | 1.6% | |
Other Assets and Liabilities | | | 1.0% | |
| | | | |
| | | 100.0% | |
| | | | |
| # | Variable rate security. Rate disclosed as of March 31, 2012. |
| ^ | Security exempt from registration under Rule 144A of the Securities Act of 1933. These securities may be resold in transactions exempt from registration to qualified institutional buyers. These securities are determined to be liquid by the Adviser, unless otherwise noted, under procedures established by the Fund’s Board of Trustees. At March 31, 2012, the value of these securities amounted to $191,810,243 or 9.2% of net assets. |
| I/O | Interest only security |
| I/F | Inverse floating rate security whose interest rate moves in the opposite direction of prevailing interest rates |
| ¨ | Seven-day yield as of March 31, 2012 |
| (a) | Issuer is in default of interest payments |
| | | | | | |
| 26 | | DoubleLine Funds | | | | The accompanying notes are an integral part of these financial statements |
| | |
| Schedule of Investments DoubleLine Emerging Markets Fixed Income Fund | | March 31, 2012 |
| | | | | | | | | | | | | | | | |
PRINCIPAL
AMOUNT | | | SECURITY DESCRIPTION | | RATE | | | MATURITY | | | VALUE $ | |
| | Foreign Corporate Bonds - 88.2% | | | | | |
| | | | | | |
| | ABU DHABI - 3.6% | | | | | | | | | |
| $ | 2,500,000 | | | Abu Dhabi National Energy Company | | | 4.13% | | | | 03/13/2017 | | | | 2,568,750 | |
| | 2,000,000 | | | Abu Dhabi National Energy Company | | | 5.88% | ^ | | | 12/13/2021 | | | | 2,140,000 | |
| | 3,287,310 | | | Dolphin Energy Ltd. | | | 5.89% | | | | 06/15/2019 | | | | 3,570,840 | |
| | 7,000,000 | | | Dolphin Energy Ltd. | | | 5.50% | ^ | | | 12/15/2021 | | | | 7,411,250 | |
| | | | | | | | | | | | | | | | |
| | | | | | | | | | | | | | | 15,690,840 | |
| | | | | | | | | | | | | | | | |
| | ARGENTINA - 2.2% | | | | | | | | | |
| | 1,700,000 | | | WPE International Cooperatief U.A. | | | 10.38% | ^ | | | 09/30/2020 | | | | 1,620,610 | |
| | 5,173,000 | | | WPE International Cooperatief U.A. | | | 10.38% | | | | 09/30/2020 | | | | 4,931,421 | |
| | 2,800,000 | | | YPF Sociedad Anonima | | | 10.00% | | | | 11/02/2028 | | | | 2,954,000 | |
| | | | | | | | | | | | | | | | |
| | | | | | | | | | | | | | | 9,506,031 | |
| | | | | | | | | | | | | | | | |
| | BRAZIL - 14.0% | | | | | | | | | |
| | 7,900,000 | | | Banco Bradesco S.A. | | | 5.75% | ^ | | | 03/01/2022 | | | | 7,971,100 | |
| | 2,000,000 | | | Braskem Finance Ltd. | | | 5.75% | | | | 04/15/2021 | | | | 2,103,600 | |
| | 5,650,000 | | | CCL Finance Ltd. | | | 9.50% | | | | 08/15/2014 | | | | 6,409,925 | |
| | | | | | | | | | | | | | | | |
| | 8,305,000 | | | Globo Communicacao e Participacoes S.A. | | | 6.25% | # | | | 07/20/2015 | | | | 8,915,417 | |
| | 200,000 | | | JBS Finance II Ltd. | | | 8.25% | ^ | | | 01/29/2018 | | | | 205,700 | |
| | 5,241,000 | | | JBS Finance II Ltd. | | | 8.25% | | | | 01/29/2018 | | | | 5,390,369 | |
| | 6,200,000 | | | Minerva Luxembourg S.A. | | | 12.25% | ^ | | | 02/10/2022 | | | | 6,804,500 | |
| | 170,000 | | | Minerva Overseas II Ltd. | | | 9.50% | | | | 02/01/2017 | | | | 156,706 | |
| | 800,000 | | | Minerva Overseas II Ltd. | | | 10.88% | | | | 11/15/2019 | | | | 852,000 | |
| | 6,300,000 | | | Odebrecht Finance Ltd. | | | 6.00% | | | | 04/05/2023 | | | | 6,579,090 | |
| | 7,000,000 | | | Petrobras International Finance Company | | | 5.38% | | | | 01/27/2021 | | | | 7,572,173 | |
| | 5,100,000 | | | Virgolino De Oliveira Fininance Ltd. | | | 11.75% | ^ | | | 02/09/2022 | | | | 5,087,250 | |
| | 2,800,000 | | | Votorantim Cimentos S.A. | | | 7.25% | ^ | | | 04/05/2041 | | | | 2,870,000 | |
| | | | | | | | | | | | | | | | |
| | | | | | | | | | | | | | | 60,917,830 | |
| | | | | | | | | | | | | | | | |
| | CHILE - 5.3% | | | | | | | | | |
| | 5,155,000 | | | AES Gener S.A. | | | 5.25% | | | | 08/15/2021 | | | | 5,451,413 | |
| | 1,500,000 | | | Automotores Gildemeister S.A. | | | 8.25% | ^ | | | 05/24/2021 | | | | 1,614,750 | |
| | 2,500,000 | | | Automotores Gildemeister S.A. | | | 8.25% | | | | 05/24/2021 | | | | 2,691,250 | |
| | 150,000 | | | Banco del Estado de Chile | | | 3.88% | ^ | | | 02/08/2022 | | | | 149,250 | |
| | 1,605,000 | | | Celulosa Arauco y Constitution S.A. | | | 4.75% | | | | 01/11/2022 | | | | 1,650,990 | |
| | 4,400,000 | | | Empresa Nacional del Petroleo | | | 4.75% | ^ | | | 12/06/2021 | | | | 4,581,315 | |
| | 1,700,000 | | | Inversiones CMPC S.A. | | | 4.75% | ^ | | | 01/19/2018 | | | | 1,789,678 | |
| | 534,000 | | | Inversiones CMPC S.A. | | | 4.75% | | | | 01/19/2018 | | | | 562,170 | |
| | 3,900,000 | | | Inversiones CMPC S.A. | | | 6.13% | | | | 11/05/2019 | | | | 4,403,279 | |
| | 100,000 | | | Sociedad Quimica y Minera S.A. | | | 5.50% | | | | 04/21/2020 | | | | 109,169 | |
| | | | | | | | | | | | | | | | |
| | | | | | | | | | | | | | | 23,003,264 | |
| | | | | | | | | | | | | | | | |
| | CHINA - 4.4% | | | | | | | | | |
| | 4,500,000 | | | CNOOC Finance 2011 Ltd. | | | 4.25% | | | | 01/26/2021 | | | | 4,704,092 | |
| | 2,700,000 | | | Hongkong Electric Finance Ltd. | | | 4.25% | | | | 12/14/2020 | | | | 2,774,269 | |
| | 6,100,000 | | | Hutchison Whampoa International 11 Ltd. | | | 4.63% | ^ | | | 01/13/2022 | | | | 6,157,273 | |
| | 3,400,000 | | | Hutchison Whampoa International 11 Ltd. | | | 4.63% | | | | 01/13/2022 | | | | 3,431,923 | |
| | 2,000,000 | | | PCCW-HKT Capital No 4 Ltd. | | | 4.25% | | | | 02/24/2016 | | | | 2,067,326 | |
| | | | | | | | | | | | | | | | |
| | | | | | | | | | | | | | | 19,134,883 | |
| | | | | | | | | | | | | | | | |
| | | | | | | | | | | | | | | | |
PRINCIPAL
AMOUNT | | | SECURITY DESCRIPTION | | RATE | | | MATURITY | | | VALUE $ | |
| | COLOMBIA - 9.8% | | | | | | | | | |
| $ | 7,500,000 | | | Banco de Bogota S.A. | | | 5.00% | ^ | | | 01/15/2017 | | | | 7,800,000 | |
| | 10,000,000 | | | BanColombia S.A. | | | 5.95% | | | | 06/03/2021 | | | | 10,637,500 | |
| | 7,400,000 | | | Grupo Aval Ltd. | | | 5.25% | ^ | | | 02/01/2017 | | | | 7,714,500 | |
| | 200,000 | | | Gruposura Finance | | | 5.70% | ^ | | | 05/18/2021 | | | | 210,000 | |
| | 3,362,000 | | | Gruposura Finance | | | 5.70% | | | | 05/18/2021 | | | | 3,530,100 | |
| | 6,314,000 | | | Pacific Rubiales Energy Corporation | | | 7.25% | ^ | | | 12/12/2021 | | | | 6,942,243 | |
| | 5,025,000 | | | Pacific Rubiales Energy Corporation | | | 7.25% | | | | 12/12/2021 | | | | 5,524,988 | |
| | | | | | | | | | | | | | | | |
| | | | | | | | | | | | | | | 42,359,331 | |
| | | | | | | | | | | | | | | | |
| | COSTA RICA - 2.0% | | | | | | | | | |
| | 3,500,000 | | | Instituto Costarricense de Electricidad | | | 6.95% | ^ | | | 11/10/2021 | | | | 3,692,500 | |
| | 4,775,000 | | | Instituto Costarricense de Electricidad | | | 6.95% | | | | 11/10/2021 | | | | 5,037,625 | |
| | | | | | | | | | | | | | | | |
| | | | | | | | | | | | | | | 8,730,125 | |
| | | | | | | | | | | | | | | | |
| | DOMINICAN REPUBLIC - 2.6% | | | | | | | | | |
| | 2,420,000 | | | AES Andres Dominicana Ltd. | | | 9.50% | | | | 11/12/2020 | | | | 2,565,200 | |
| | 8,085,000 | | | EGE Haina Finance Company | | | 9.50% | | | | 04/26/2017 | | | | 8,529,675 | |
| | | | | | | | | | | | | | | | |
| | | | | | | | | | | | | | | 11,094,875 | |
| | | | | | | | | | | | | | | | |
| | INDIA - 1.1% | | | | | | | | | |
| | 4,250,000 | | | Reliance Holdings USA, Inc. | | | 5.40% | ^ | | | 02/14/2022 | | | | 4,235,886 | |
| | 500,000 | | | Reliance Industries Ltd. | | | 8.25% | | | | 01/15/2027 | | | | 577,500 | |
| | | | | | | | | | | | | | | | |
| | | | | | | | | | | | | | | 4,813,386 | |
| | | | | | | | | | | | | | | | |
| | KAZAKHSTAN - 0.2% | | | | | | | | | |
| | 700,000 | | | BTA Bank | | | 10.75% | (a) | | | 07/01/2018 | | | | 157,500 | |
| | 100,000 | | | Eurasian Development Bank | | | 7.38% | | | | 09/29/2014 | | | | 109,500 | |
| | 429,091 | | | Tengizchevroil Finance Corporation | | | 6.12% | | | | 11/15/2014 | | | | 452,755 | |
| | | | | | | | | | | | | | | | |
| | | | | | | | | | | | | | | 719,755 | |
| | | | | | | | | | | | | | | | |
| | MALAYSIA - 1.5% | | | | | | | | | |
| | 3,300,000 | | | Axiata SPV1 Labuan Ltd. | | | 5.38% | | | | 04/28/2020 | | | | 3,497,288 | |
| | 1,100,000 | | | IOI Ventures BHD | | | 5.25% | | | | 03/16/2015 | | | | 1,162,923 | |
| | 1,700,000 | | | Penerbangan Malaysia BHD | | | 5.63% | | | | 03/15/2016 | | | | 1,902,099 | |
| | | | | | | | | | | | | | | | |
| | | | | | | | | | | | | | | 6,562,310 | |
| | | | | | | | | | | | | | | | |
| | MEXICO - 11.0% | | | | | | | | | | | | |
| | 2,000,000 | | | Banco Mercantil del Norte | | | 4.38% | | | | 07/19/2015 | | | | 2,090,000 | |
| | 2,900,000 | | | Banco Mercantil del Norte | | | 6.86% | # | | | 10/13/2021 | | | | 3,023,250 | |
| | 1,132,000 | | | Cemex Espana | | | 9.88% | ^ | | | 04/30/2019 | | | | 1,092,380 | |
| | 9,230,400 | | | Controladora Comercial Mexicana S.A.B. de C.V. | | | 7.00% | | | | 06/30/2018 | | | | 9,368,855 | |
| | 5,500,000 | | | Empresas ICA S.A.B. de C.V. | | | 8.90% | | | | 02/04/2021 | | | | 5,568,750 | |
| | 2,859,000 | | | GRUMA S.A.B. de C.V. | | | 7.75% | | | | 12/29/2041 | | | | 2,887,590 | |
| | 1,344,000 | | | Grupo KUO S.A.B de C.V. | | | 9.75% | | | | 10/17/2017 | | | | 1,468,320 | |
| | 3,100,000 | | | Grupo Petrotemex S.A. de C.V | | | 9.50% | | | | 08/19/2014 | | | | 3,448,750 | |
| | 575,000 | | | Grupo Televisa S.A.B | | | 6.00% | | | | 05/15/2018 | | | | 668,729 | |
| | 1,500,000 | | | Grupo Televisa S.A.B. | | | 6.63% | | | | 03/18/2025 | | | | 1,772,409 | |
| | 1,745,000 | | | Ixe Banco S.A. | | | 9.25% | | | | 10/14/2020 | | | | 1,989,300 | |
| | 525,000 | | | Ixe Banco S.A. | | | 9.75% | | | | 12/29/2041 | | | | 532,219 | |
| | 5,100,000 | | | Petroleos Mexicanos | | | 4.88% | ^ | | | 01/24/2022 | | | | 5,367,750 | |
| | 6,395,000 | | | Sigma Alimentos S.A. | | | 5.63% | | | | 04/14/2018 | | | | 6,794,688 | |
| | 1,150,000 | | | Sigma Alimentos S.A. | | | 6.88% | | | | 12/16/2019 | | | | 1,299,500 | |
| | | | | | | | | | | | | | | | |
| | | | | | | | | | | | | | | 47,372,490 | |
| | | | | | | | | | | | | | | | |
| | | | | | |
| The accompanying notes are an integral part of these financial statements | | Annual Report | | March 31, 2012 | | 27 |
Schedule of Investments DoubleLine Emerging Markets Fixed Income Fund (Cont.)
| | | | | | | | | | | | | | | | |
PRINCIPAL
AMOUNT | | | SECURITY DESCRIPTION | | RATE | | | MATURITY | | | VALUE $ | |
| | PANAMA - 0.6% | | | | | | | | | | | | |
| $ | 100,000 | | | AES Panama S.A. | | | 6.35% | | | | 12/21/2016 | | | | 109,000 | |
| | 2,300,000 | | | Banco Latinoamericano de Comercio Exterior S.A. | | | 3.75% | ^ | | | 04/04/2017 | | | | 2,294,250 | |
| | | | | | | | | | | | | | | | |
| | | | | | | | | | | | | | | 2,403,250 | |
| | | | | | | | | | | | | | | | |
| | PERU - 13.4% | | | | | | | | | | | | |
| | 700,000 | | | Banco de Credito del Peru | | | 5.38% | ^ | | | 09/16/2020 | | | | 721,000 | |
| | 2,000,000 | | | Banco de Credito del Peru | | | 5.38% | | | | 09/16/2020 | | | | 2,060,000 | |
| | 3,135,000 | | | Banco de Credito del Peru | | | 9.75% | # | | | 11/06/2069 | | | | 3,699,300 | |
| | 8,860,000 | | | Banco Internacional del Peru | | | 5.75% | | | | 10/07/2020 | | | | 9,037,200 | |
| | 1,566,000 | | | Banco Internacional del Peru | | | 8.50% | # | | | 04/23/2070 | | | | 1,671,705 | |
| | 8,100,000 | | | Corp Financiera de Desarrolo S.A. | | | 4.75% | ^ | | | 02/08/2022 | | | | 8,383,500 | |
| | 1,000,000 | | | Corporacion Lindley S.A. | | | 6.75% | ^ | | | 11/23/2021 | | | | 1,070,000 | |
| | 2,300,000 | | | Corporacion Lindley S.A. | | | 6.75% | | | | 11/23/2021 | | | | 2,461,000 | |
| | 5,755,000 | | | Corporacion Pesquera Inca S.A.C. | | | 9.00% | | | | 02/10/2017 | | | | 6,222,594 | |
| | 6,313,944 | | | IIRSA Norte Finance Ltd. | | | 8.75% | | | | 05/30/2024 | | | | 7,427,092 | |
| | 600,000 | | | Inkia Energy Ltd. | | | 8.38% | ^ | | | 04/04/2021 | | | | 624,000 | |
| | 1,900,000 | | | Inkia Energy Ltd. | | | 8.38% | | | | 04/04/2021 | | | | 1,976,000 | |
| | 1,250,000 | | | Intercorp Retail Trust | | | 8.88% | ^ | | | 11/14/2018 | | | | 1,356,250 | |
| | 9,500,000 | | | Volcan Compania Minera S.A. | | | 5.38% | ^ | | | 02/02/2022 | | | | 9,856,250 | |
| | 1,500,000 | | | Volcan Compania Minera S.A. | | | 5.38% | | | | 02/02/2022 | | | | 1,556,250 | |
| | | | | | | | | | | | | | | | |
| | | | | | | | | | | | | | | 58,122,141 | |
| | | | | | | | | | | | | | | | |
| | QATAR - 3.1% | | | | | | | | | | | | |
| | 5,268,391 | | | Nakilat, Inc. | | | 6.27% | | | | 12/31/2033 | | | | 5,751,661 | |
| | 2,379,240 | | | Ras Laffan Liquefied Natural Gas Company | | | 5.30% | | | | 09/30/2020 | | | | 2,557,683 | |
| | 4,775,000 | | | Ras Laffan Liquefied Natural Gas Company | | | 5.84% | | | | 09/30/2027 | | | | 5,180,875 | |
| | | | | | | | | | | | | | | | |
| | | | | | | | | | | | | | | 13,490,219 | |
| | | | | | | | | | | | | | | | |
| | RUSSIA - 6.2% | | | | | | | | | | | | |
| | 1,200,000 | | | Alfa Bank | | | 7.88% | | | | 09/25/2017 | | | | 1,243,800 | |
| | 750,000 | | | Gaz Capital S.A. | | | 5.09% | | | | 11/29/2015 | | | | 789,375 | |
| | 2,400,000 | | | Industry & Construction Bank | | | 5.01% | # | | | 09/29/2015 | | | | 2,379,000 | |
| | 1,500,000 | | | Kuznetski Capital S.A. | | | 5.97% | # | | | 11/25/2015 | | | | 1,487,102 | |
| | 2,200,000 | | | Russian Agricultural Bank | | | 6.00% | #^ | | | 06/03/2021 | | | | 2,175,360 | |
| | 3,800,000 | | | Russian Agricultural Bank | | | 6.00% | # | | | 06/03/2021 | | | | 3,757,440 | |
| | 2,800,000 | | | VEB Finance Ltd. | | | 5.38% | ^ | | | 02/13/2017 | | | | 2,898,000 | |
| | 1,200,000 | | | Vimpel Communications | | | 7.75% | ^ | | | 02/02/2021 | | | | 1,189,500 | |
| | 1,700,000 | | | Vimpel Communications | | | 7.75% | | | | 02/02/2021 | | | | 1,685,125 | |
| | 2,100,000 | | | VimpelCom Holdings B.V. | | | 7.50% | ^ | | | 03/01/2022 | | | | 2,047,500 | |
| | 6,500,000 | | | VTB Capital S.A. | | | 6.88% | | | | 05/29/2018 | | | | 6,898,125 | |
| | | | | | | | | | | | | | | | |
| | | | | | | | | | | | | | | 26,550,327 | |
| | | | | | | | | | | | | | | | |
| | SINGAPORE - 4.5% | | | | | | | | | | | | |
| | 6,200,000 | | | DBS Bank Ltd. | | | 3.63% | #^ | | | 09/21/2022 | | | | 6,058,628 | |
| | 3,250,000 | | | Oversea-Chinese Banking Corporation | | | 4.25% | # | | | 11/18/2019 | | | | 3,343,441 | |
| | 9,000,000 | | | Temasek Financial Ltd. | | | 4.30% | | | | 10/25/2019 | | | | 9,819,422 | |
| | | | | | | | | | | | | | | | |
| | | | | | | | | | | | | | | 19,221,491 | |
| | | | | | | | | | | | | | | | |
| | SOUTH AFRICA - 1.0% | | | | | | | | | | | | |
| | 4,330,000 | | | AngloGold Holdings PLC | | | 6.50% | | | | 04/15/2040 | | | | 4,122,498 | |
| | | | | | | | | | | | | | | | |
| | | | | | | | | | | | | | | 4,122,498 | |
| | | | | | | | | | | | | | | | |
| | SOUTH KOREA - 0.9% | | | | | | | | | | | | |
| | 3,800,000 | | | Lotte Shopping Company Ltd. | | | 3.88% | | | | 04/07/2016 | | | | 3,872,618 | |
| | | | | | | | | | | | | | | | |
| | | | | | | | | | | | | | | 3,872,618 | |
| | | | | | | | | | | | | | | | |
| | | | | | | | | | | | | | | | |
PRINCIPAL
AMOUNT | | | SECURITY DESCRIPTION | | RATE | | | MATURITY | | | VALUE $ | |
| | THAILAND - 0.8% | | | | | | | | | | | | |
| $ | 3,150,000 | | | PTTEP Australia International Finance Ltd. | | | 4.15% | | | | 07/19/2015 | | | | 3,285,601 | |
| | | | | | | | | | | | | | | | |
| | | | | | | | | | | | | | | 3,285,601 | |
| | | | | | | | | | | | | | | | |
| | | | Total Foreign Corporate Bonds
(Cost $374,479,581) | | | | 380,973,265 | |
| | | | | | | | | | | | | | | | |
| FOREIGN GOVERNMENT BONDS AND NOTES, SUPRANATIONALS AND
FOREIGN AGENCIES - 9.8% |
|
| | |
| | MALAYSIA - 0.8% | |
| | 3,250,000 | | | Wakala Global Sukuk BHD | | | 4.65% | | | | 07/06/2021 | | | | 3,522,571 | |
| | | | | | | | | | | | | | | | |
| | | | | | | | | | | | | | | 3,522,571 | |
| | | | | | | | | | | | | | | | |
| | MEXICO - 1.0% | |
| | 4,100,000 | | | Mexico Government International Bond | | | 3.63% | | | | 03/15/2022 | | | | 4,202,500 | |
| | | | | | | | | | | | | | | | |
| | | | | | | | | | | | | | | 4,202,500 | |
| | | | | | | | | | | | | | | | |
| | QATAR - 3.6% | |
| | 4,000,000 | | | State of Qatar | | | 4.50% | ^ | | | 01/20/2022 | | | | 4,195,200 | |
| | 10,900,000 | | | State Of Qatar | | | 4.50% | | | | 01/20/2022 | | | | 11,431,920 | |
| | | | | | | | | | | | | | | | |
| | | | | | | | | | | | | | | 15,627,120 | |
| | | | | | | | | | | | | | | | |
| | RUSSIA - 1.5% | |
| | 2,800,000 | | | Russian Foreign Bond | | | 4.50% | ^ | | | 04/04/2022 | | | | 2,816,800 | |
| | 3,600,000 | | | Russian Foreign Bond | | | 5.63% | ^ | | | 04/04/2042 | | | | 3,627,000 | |
| | | | | | | | | | | | | | | | |
| | | | | | | | | | | | | | | 6,443,800 | |
| | | | | | | | | | | | | | | | |
| | SOUTH AFRICA - 2.9% | |
| | 12,000,000 | | | South Africa Government International Bond | | | 4.67% | | | | 01/17/2024 | | | | 12,330,000 | |
| | | | | | | | | | | | | | | | |
| | | | | | | | | | | | | | | 12,330,000 | |
| | | | | | | | | | | | | | | | |
| | | | Total Foreign Government Bonds and Notes, Supranationals and Foreign Agencies
(Cost $41,410,275) | | | | 42,125,991 | |
| | | | | | | | | | | | | | | | |
| | SHORT TERM INVESTMENTS - 0.5% | |
| | 2,002,538 | | | Fidelity Institutional Government Portfolio | | | 0.01% | ¨ | | | | | | | 2,002,538 | |
| | | | | | | | | | | | | | | | |
| | | | Total Short Term Investments
(Cost $2,002,538) | | | | 2,002,538 | |
| | | | | | | | | | | | | | | | |
| | | | Total Investments - 98.5%
(Cost $417,892,394) | | | | 425,101,794 | |
| | | | Other Assets in Excess of Liabilities - 1.5% | | | | 6,307,345 | |
| | | | | | | | | | | | | | | | |
| | | | NET ASSETS - 100.0% | | | $ | 431,409,139 | |
| | | | | | | | | | | | | | | | |
| | | | | | |
| 28 | | DoubleLine Funds | | | | The accompanying notes are an integral part of these financial statements |
| | | | |
| PORTFOLIO HOLDINGS as % of Net Assets | | | | |
Abu Dhabi | | | 3.6% | |
Argentina | | | 2.2% | |
Brazil | | | 14.0% | |
Chile | | | 5.3% | |
China | | | 4.4% | |
Colombia | | | 9.8% | |
Costa Rica | | | 2.0% | |
Dominican Republic | | | 2.6% | |
India | | | 1.1% | |
Kazakhstan | | | 0.2% | |
Malaysia | | | 2.3% | |
Mexico | | | 12.0% | |
Panama | | | 0.6% | |
Peru | | | 13.4% | |
Qatar | | | 6.7% | |
Russia | | | 7.7% | |
Singapore | | | 4.5% | |
South Africa | | | 3.9% | |
South Korea | | | 0.9% | |
Thailand | | | 0.8% | |
| | | | |
| | | 98.0% | |
| | | | |
Short Term Investments | | | 0.5% | |
Other Assets and Liabilities | | | 1.5% | |
| | | | |
| | | 100.0% | |
| | | | |
| ^ | Security exempt from registration under Rule 144A of the Securities Act of 1933. These securities may be resold in transactions exempt from registration to qualified institutional buyers. These securities are determined to be liquid by the Adviser, unless otherwise noted, under procedures established by the Fund’s Board of Trustees. At March 31, 2012, the value of these securities amounted to $134,771,173 or 31.2% of net assets. |
| # | Variable rate security. Rate disclosed as of March 31, 2012. |
| ¨ | Seven-day yield as of March 31, 2012 |
| (a) | Issuer is in default of interest payments |
| | | | | | |
| The accompanying notes are an integral part of these financial statements | | Annual Report | | March 31, 2012 | | 29 |
| | |
| Schedule of Investments (Consolidated) DoubleLine Multi-Asset Growth Fund | | |
| | | | | | | | | | | | | | | | |
PRINCIPAL
AMOUNT | | | SECURITY DESCRIPTION | | RATE | | | MATURITY | | | VALUE $ | |
| | NON-AGENCY COLLATERALIZED MORTGAGE OBLIGATIONS 12.8% | |
| |
| | | | Adjustable Rate Mortgage Trust, | |
| $ | 452,565 | | | Series 2006-1-2A1 | | | 3.23% | # | | | 03/25/2036 | | | | 266,369 | |
| |
| | | | Banc of America Alternative Loan Trust, | |
| | 750,000 | | | Series 2006-7-A4 | | | 6.00% | # | | | 10/25/2036 | | | | 499,149 | |
| |
| | | | BCAP LLC Trust, | |
| | 89,520 | | | Series 2007-AA2-2A5 | | | 6.00% | | | | 04/25/2037 | | | | 62,887 | |
| | 106,000 | | | Series 2010-RR6-1A20 | | | 8.77% | #^ | | | 08/26/2022 | | | | 104,146 | |
| |
| | | | Bear Stearns Commercial Mortgage Securities, Inc., | |
| | 273,928 | | | Series 1998-C1-B | | | 6.54% | | | | 06/16/2030 | | | | 283,913 | |
| | 420,500 | | | Series 2002-TOP8-A2 | | | 4.83% | | | | 08/15/2038 | | | | 424,553 | |
| |
| | | | Chaseflex Trust, | |
| | 427,220 | | | Series 2007-M1-2F4 | | | 6.35% | # | | | 08/25/2037 | | | | 294,478 | |
| |
| | | | Citi Mortgage Alternative Loan Trust, | |
| | 574,865 | | | Series 2007-A6-1A11 | | | 6.00% | | | | 06/25/2037 | | | | 419,582 | |
| |
| | | | Citicorp Mortgage Securities, Inc., | |
| | 292,085 | | | Series 2007-2-3A1 | | | 5.50% | | | | 02/25/2037 | | | | 258,788 | |
| |
| | | | Citigroup Mortgage Loan Trust, Inc., | |
| | 357,888 | | | Series 2009-7-2A2 | | | 5.50% | ^ | | | 10/25/2021 | | | | 277,363 | |
| |
| | | | Commercial Mortgage Asset Trust, | |
| | 100,000 | | | Series 1999-C1-B | | | 7.23% | # | | | 01/17/2032 | | | | 106,603 | |
| |
| | | | Commercial Mortgage Pass-Through Certificates, | |
| | 3,000,000 | | | Series 2002-LC4-XA | | | 2.72% | #^ I/O | | | 12/10/2044 | | | | 477,210 | |
| | 52,787,264 | | | Series 2005-LP5-XC | | | 0.23% | #^ I/O | | | 05/10/2043 | | | | 509,661 | |
| |
| | | | Countrywide Alternative Loan Trust, | |
| | 203,602 | | | Series 2006-32CB-A16 | | | 5.50% | | | | 11/25/2036 | | | | 138,844 | |
| | 1,028,109 | | | Series 2006-J1-2A1 | | | 7.00% | | | | 02/25/2036 | | | | 435,770 | |
| | 49,815 | | | Series 2007-17CB-1A10 | | | 28.79% | # I/F | | | 08/25/2037 | | | | 79,495 | |
| | 33,079 | | | Series 2007-21CB-2A2 | | | 27.43% | # I/F | | | 09/25/2037 | | | | 42,998 | |
| |
| | | | Countrywide Asset-Backed Certificates, | |
| | 995,903 | | | Series 2006-2-2A2 | | | 0.43% | # | | | 06/25/2036 | | | | 852,274 | |
| |
| | | | Countrywide Home Loans, | |
| | 693,147 | | | Series 2007-10-A5 | | | 6.00% | | | | 07/25/2037 | | | | 541,173 | |
| | 33,376 | | | Series 2007-4-1A5 | | | 6.50% | | | | 05/25/2037 | | | | 27,500 | |
| |
| | | | Credit Suisse First Boston Mortgage Securities Corporation, | |
| | 362,475 | | | Series 2002-CKS4-A2 | | | 5.18% | | | | 11/15/2036 | | | | 365,550 | |
| | 369,346 | | | Series 2005-8-1A3 | | | 5.25% | | | | 09/25/2035 | | | | 325,953 | |
| |
| | | | Credit Suisse Mortgage Capital Certificates, | |
| | 64,487 | | | Series 2006-9-4A1 | | | 6.00% | | | | 11/25/2036 | | | | 57,152 | |
| | 497,200 | | | Series 2010-7R-4A17 | | | 8.22% | #^ | | | 04/26/2037 | | | | 320,517 | |
| |
| | | | Deutsche Mortgage Securities, Inc., | |
| | 353,038 | | | Series 2006-PR1-3A1 | | | 11.79% | #^ I/F | | | 04/15/2036 | | | | 370,253 | |
| | 126,713 | | | Series 2006-PR1-5AI4 | | | 11.79% | #^ I/F | | | 04/15/2036 | | | | 136,449 | |
| |
| | | | First Horizon Alternative Mortgage Securities, | |
| | 118,918 | | | Series 2007-FA2-1A3 | | | 6.00% | | | | 04/25/2037 | | | | 79,613 | |
| |
| | | | GE Capital Commercial Mortgage Corporation, | |
| | 283,408 | | | Series 2002-2-A3 | | | 5.35% | | | | 08/11/2036 | | | | 285,231 | |
| |
| | | | GMAC Commercial Mortgage Securities, Inc., | |
| | 1,929 | | | Series 2004-C2-A2 | | | 4.76% | | | | 08/10/2038 | | | | 1,928 | |
| |
| | | | GSAA Home Equity Trust, | |
| | 1,000,000 | | | Series 2006-15-AF3B | | | 5.93% | # | | | 09/25/2036 | | | | 174,181 | |
| |
| | | | GSR Mortgage Loan Trust, | |
| | 408,966 | | | Series 2006-2F-2A20 | | | 10.86% | # I/F | | | 02/25/2036 | | | | 420,622 | |
| |
| | | | JP Morgan Alternative Loan Trust, | |
| | 70,004 | | | Series 2005-S1-2A11 | | | 6.00% | | | | 12/25/2035 | | | | 54,510 | |
| |
| | | | JP Morgan Chase Commercial Mortgage Securities Corporation, | |
| | 49,824,556 | | | Series 2005-CB12-X1 | | | 0.15% | #^ I/O | | | 09/12/2037 | | | | 458,087 | |
| | 360,708 | | | Series 2006-FL1-AG | | | 0.71% | #^ | | | 02/15/2020 | | | | 306,604 | |
| |
| | | | JP Morgan Mortgage Acquisition Corporation, | |
| | 200,000 | | | Series 2006-CH2-AF3 | | | 5.46% | # | | | 10/25/2036 | | | | 110,524 | |
| |
| | | | LB-UBS Commercial Mortgage Trust, | |
| | 37,461,045 | | | Series 2006-C6-XCP | | | 0.86% | # I/O | | | 09/15/2039 | | | | 376,877 | |
| | 64,198 | | | Series 2006-C7-A2 | | | 5.30% | | | | 11/15/2038 | | | | 64,273 | |
| | | | | | | | | | | | | | | | |
PRINCIPAL
AMOUNT | | | SECURITY DESCRIPTION | | RATE | | | MATURITY | | | VALUE $ | |
| |
| | | | LB-UBS Commercial Mortgage Trust, (Cont.) | |
| $ | 70,147,698 | | | Series 2007-C2-XCP | | | 0.68% | # I/O | | | 02/15/2040 | | | | 666,964 | |
| | 58,032,637 | | | Series 2007-C7-XCL | | | 0.12% | #^ I/O | | | 09/15/2045 | | | | 494,148 | |
| |
| | | | Lehman Mortgage Trust, | |
| | 194,622 | | | Series 2006-4-1A3 | | | 5.16% | # I/F I/O | | | 08/25/2036 | | | | 27,056 | |
| | 12,163 | | | Series 2006-4-1A4 | | | 6.00% | | | | 08/25/2036 | | | | 8,567 | |
| | 112,747 | | | Series 2007-5-11A1 | | | 5.98% | # | | | 06/25/2037 | | | | 74,488 | |
| |
| | | | Long Beach Mortgage Loan Trust, | |
| | 500,000 | | | Series 2005-WL2-M1 | | | 0.71% | # | | | 08/25/2035 | | | | 426,902 | |
| |
| | | | Morgan Stanley Capital, Inc., | |
| | 269,003 | | | Series 2004-HQ3-A3 | | | 4.49% | | | | 01/13/2041 | | | | 269,969 | |
| | 20,885,888 | | | Series 2005-HQ6-X2 | | | 0.62% | # I/O | | | 08/13/2042 | | | | 139,518 | |
| | 54,333,100 | | | Series 2007-IQ16-X2 | | | 0.37% | #^ I/O | | | 12/12/2049 | | | | 448,411 | |
| |
| | | | Morgan Stanley Mortgage Loan Trust, | |
| | 567,246 | | | Series 2007-13-6A1 | | | 6.00% | | | | 10/25/2037 | | | | 371,624 | |
| |
| | | | Residential Accredit Loans, Inc., | |
| | 477,896 | | | Series 2006-QS10-A9 | | | 6.50% | | | | 08/25/2036 | | | | 327,680 | |
| | 8,751 | | | Series 2006-QS13-1A8 | | | 6.00% | | | | 09/25/2036 | | | | 5,951 | |
| | 482,206 | | | Series 2006-QS2-1A4 | | | 5.50% | | | | 02/25/2036 | | | | 337,609 | |
| | 98,923 | | | Series 2006-QS7-A4 | | | 0.64% | # | | | 06/25/2036 | | | | 49,715 | |
| | 296,769 | | | Series 2006-QS7-A5 | | | 5.36% | # I/F I/O | | | 06/25/2036 | | | | 48,899 | |
| | 185,910 | | | Series 2006-QS8-A4 | | | 0.69% | # | | | 08/25/2036 | | | | 85,323 | |
| | 557,729 | | | Series 2006-QS8-A5 | | | 5.31% | # I/F I/O | | | 08/25/2036 | | | | 92,251 | |
| |
| | | | Residential Asset Mortgage Products, Inc., | |
| | 4,055 | | | Series 2004-RS9-AI4 | | | 4.77% | # | | | 10/25/2032 | | | | 3,496 | |
| |
| | | | Residential Asset Securitization Trust, | |
| | 35,000 | | | Series 2005-A12-A12 | | | 5.50% | | | | 11/25/2035 | | | | 29,411 | |
| | 827,385 | | | Series 2007-A1-A8 | | | 6.00% | | | | 03/25/2037 | | | | 539,626 | |
| | 908,267 | | | Series 2007-A5-2A5 | | | 6.00% | | | | 05/25/2037 | | | | 688,089 | |
| |
| | | | Wachovia Bank Commercial Mortgage Trust, | |
| | 188,407 | | | Series 2006-C23-APB | | | 5.45% | | | | 01/15/2045 | | | | 190,291 | |
| |
| | | | Washington Mutual Mortgage Pass-Through Certificates, | |
| | 56,903 | | | Series 2004-RS1-A1 | | | 4.50% | | | | 11/25/2033 | | | | 56,796 | |
| | 447,040 | | | Series 2006-8-A6 | | | 5.77% | # | | | 10/25/2036 | | | | 289,262 | |
| |
| | | | WF-RBS Commercial Mortgage Trust, | |
| | 6,686,099 | | | Series 2011-C3-XA | | | 1.90% | #^ I/O | | | 03/15/2044 | | | | 589,971 | |
| | | | | | | | | | | | | | | | |
| | - | | | Total Non-Agency Collateralized Mortgage Obligations
(Cost $16,481,932) | | | | 16,273,097 | |
| | | | | | | | | | | | | | | | |
| | FOREIGN CORPORATE BONDS 1.1% | |
| | 200,000 | | | AES Andres Dominicana Ltd. | | | 9.50% | | | | 11/12/2020 | | | | 212,000 | |
| | 100,000 | | | BTA Bank | | | 10.75% | (a) | | | 07/01/2018 | | | | 22,500 | |
| | 100,000 | | | C10 Capital Ltd. | | | 6.72% | # | | | 12/31/2016 | | | | 67,500 | |
| | 100,000 | | | Corporacion Pesquera Inca S.A.C. | | | 9.00% | | | | 02/10/2017 | | | | 108,125 | |
| | 100,000 | | | EGE Haina Finance Company | | | 9.50% | | | | 04/26/2017 | | | | 105,500 | |
| | 100,000 | | | Empresas ICA S.A.B. de C.V. | | | 8.90% | | | | 02/04/2021 | | | | 101,250 | |
| | 150,000 | | | GRUMA S.A.B. de C.V. | | | 7.75% | | | | 12/29/2041 | | | | 151,500 | |
| | 100,000 | | | Minerva Overseas II Ltd. | | | 9.50% | | | | 02/01/2017 | | | | 92,180 | |
| | 100,000 | | | Minerva Overseas II Ltd. | | | 10.88% | | | | 11/15/2019 | | | | 106,500 | |
| | 200,000 | | | VimpelCom Holdings B.V. | | | 7.50% | ^ | | | 03/01/2022 | | | | 195,000 | |
| | 100,000 | | | WPE International Cooperatief U.A. | | | 10.38% | | | | 09/30/2020 | | | | 95,330 | |
| | 80,000 | | | YPF Sociedad Anonima | | | 10.00% | | | | 11/02/2028 | | | | 84,400 | |
| | | | | | | | | | | | | | | | |
| | | | Total Foreign Corporate Bonds
(Cost $1,453,619) | | | | 1,341,785 | |
| | | | | | | | | | | | | | | | |
| | US GOVERNMENT/AGENCY MORTGAGE BACKED SECURITIES 7.8% | |
| |
| | | | Federal Home Loan Mortgage Corporation, | |
| | 905,691 | | | Series 2890-ZA | | | 5.00% | | | | 11/15/2034 | | | | 1,015,459 | |
| | 218,121 | | | Series 3261-SA | | | 6.19% | # I/F I/O | | | 01/15/2037 | | | | 31,545 | |
| | | | | | |
| 30 | | DoubleLine Funds | | | | The accompanying notes are an integral part of these financial statements |
March 31, 2012
| | | | | | | | | | | | | | | | |
PRINCIPAL
AMOUNT | | | SECURITY DESCRIPTION | | RATE | | | MATURITY | | | VALUE $ | |
| |
| | | | Federal Home Loan Mortgage Corporation, (Cont.) | |
| $ | 456,727 | | | Series 3317-DS | | | 14.40% | # I/F | | | 05/15/2037 | | | | 549,048 | |
| | 444,119 | | | Series 3355-BI | | | 5.81% | # I/F I/O | | | 08/15/2037 | | | | 58,944 | |
| | 822,458 | | | Series 3384-S | | | 6.15% | # I/F I/O | | | 11/15/2037 | | | | 121,275 | |
| | 1,411,143 | | | Series 3384-SG | | | 6.07% | # I/F I/O | | | 08/15/2036 | | | | 180,066 | |
| | 874,063 | | | Series 3417-SX | | | 5.94% | # I/F I/O | | | 02/15/2038 | | | | 118,175 | |
| | 1,550,983 | | | Series 3423-GS | | | 5.41% | # I/F I/O | | | 03/15/2038 | | | | 181,635 | |
| | 14,008,931 | | | Series 3423-TG | | | 0.35% | # I/F I/O | | | 03/15/2038 | | | | 128,074 | |
| | 1,675,080 | | | Series 3500-SA | | | 5.28% | # I/F I/O | | | 01/15/2039 | | | | 195,043 | |
| | 1,376,503 | | | Series 3523-SM | | | 5.76% | # I/F I/O | | | 04/15/2039 | | | | 180,957 | |
| | 430,705 | | | Series 3562-WS | | | 4.71% | # I/F I/O | | | 08/15/2039 | | | | 40,811 | |
| | 500,000 | | | Series 3641-TB | | | 4.50% | | | | 03/15/2040 | | | | 549,965 | |
| | 79,141 | | | Series 3738-MS | | | 11.35% | # I/F | | | 10/15/2040 | | | | 79,175 | |
| | 169,635 | | | Series 3739-LS | | | 9.52% | # I/F | | | 10/15/2040 | | | | 167,288 | |
| | 1,322,527 | | | Series 3758-S | | | 5.79% | # I/F I/O | | | 11/15/2040 | | | | 168,388 | |
| | 76,717 | | | Series 3779-DZ | | | 4.50% | | | | 12/15/2040 | | | | 75,683 | |
| | 30,318 | | | Series 3780-BS | | | 9.42% | # I/F | | | 12/15/2040 | | | | 30,355 | |
| | 93,695 | | | Series 3780-YS | | | 9.42% | # I/F | | | 12/15/2040 | | | | 99,061 | |
| | 126,396 | | | Series 3793-SB | | | 9.89% | # I/F | | | 01/15/2041 | | | | 123,183 | |
| | 118,446 | | | Series 3796-SK | | | 9.42% | # I/F | | | 01/15/2041 | | | | 117,982 | |
| | 1,436,352 | | | Series 3815-ST | | | 5.61% | # I/F I/O | | | 02/15/2041 | | | | 168,465 | |
| | 820,431 | | | Series 3900-SB | | | 5.73% | # I/F I/O | | | 07/15/2041 | | | | 113,199 | |
| | 337,311 | | | Series 3923-CZ | | | 5.00% | | | | 09/15/2041 | | | | 357,849 | |
| | 504,388 | | | Series 3972-AZ | | | 3.50% | | | | 12/15/2041 | | | | 469,254 | |
| | 1,006,678 | | | Series 3982-TZ | | | 4.00% | | | | 01/15/2042 | | | | 999,396 | |
| |
| | | | Federal National Mortgage Association, | |
| | 389,457 | | | Series 2006-101-SA | | | 6.34% | # I/F I/O | | | 10/25/2036 | | | | 56,255 | |
| | 188,819 | | | Series 2006-123-LI | | | 6.08% | # I/F I/O | | | 01/25/2037 | | | | 27,414 | |
| | 1,034,431 | | | Series 2007-57-SX | | | 6.38% | # I/F I/O | | | 10/25/2036 | | | | 163,639 | |
| | 60,587 | | | Series 2009-49-S | | | 6.51% | # I/F I/O | | | 07/25/2039 | | | | 9,011 | |
| | 1,326,118 | | | Series 2009-86-CI | | | 5.56% | # I/F I/O | | | 09/25/2036 | | | | 188,707 | |
| | 1,100,384 | | | Series 2009-90-IA | | | 5.51% | # I/F I/O | | | 03/25/2037 | | | | 135,910 | |
| | 1,072,080 | | | Series 2009-90-IB | | | 5.48% | # I/F I/O | | | 04/25/2037 | | | | 141,805 | |
| | 84,098 | | | Series 2010-155-SA | | | 9.51% | # I/F | | | 01/25/2041 | | | | 81,959 | |
| | 1,644,676 | | | Series 2010-39-SL | | | 5.43% | # I/F I/O | | | 05/25/2040 | | | | 198,361 | |
| | 283,552 | | | Series 2011-113-SH | | | 9.32% | # I/F | | | 11/25/2041 | | | | 285,508 | |
| | 350,514 | | | Series 2011-11-SA | | | 6.31% | # I/F | | | 03/25/2031 | | | | 326,493 | |
| | 444,944 | | | Series 2011-123-SC | | | 9.31% | # I/F | | | 12/25/2041 | | | | 465,442 | |
| | 116,405 | | | Series 2011-14-US | | | 7.77% | # I/F | | | 03/25/2041 | | | | 115,567 | |
| | 1,353,527 | | | Series 2011-5-PS | | | 6.16% | # I/F I/O | | | 11/25/2040 | | | | 174,590 | |
| | 299,000 | | | Series 2012-30-DZ | | | 4.00% | | | | 04/25/2042 | | | | 288,583 | |
| |
| | | | Government National Mortgage Association, | |
| | 139,293 | | | Series 2009-6-SM | | | 5.71% | # I/F I/O | | | 02/20/2038 | | | | 21,652 | |
| | 86,395 | | | Series 2011-12-PO | | | 0.00% | P/O | | | 12/20/2040 | | | | 61,865 | |
| | 116,994 | | | Series 2011-14-SM | | | 9.22% | # I/F | | | 08/16/2040 | | | | 115,448 | |
| | 522,970 | | | Series 2011-45-GZ | | | 4.50% | | | | 03/20/2041 | | | | 555,874 | |
| | 250,000 | | | Series 2011-7-LS | | | 9.40% | # I/F | | | 12/20/2040 | | | | 255,189 | |
| | | | | | | | | | | | | | | | |
| | | | Total US Government/Agency Mortgage backed Securities
(Cost $9,272,593) | | | | 9,989,547 | |
| | | | | | | | | | | | | | | | |
| | | | | | | | | | | | | | |
| | INVESTMENT COMPANIES AND EXCHANGE TRADED NOTES 21.5% | |
| | 70,000 | | | First Trust ISE-Revere Natural Gas Index Fund | | | | | | | | | 1,236,900 | |
| | 86,000 | | | Hugoton Royalty Trust | | | | | | | | | 1,262,480 | |
| | 5,700 | | | iPath Dow Jones-UBS Agriculture Total Return ETN | | | * | | | | | | 314,081 | |
| | 53,000 | | | Market Vectors Gold Miners ETF | | | | | | | | | 2,627,210 | |
| | 21,000 | | | Market Vectors Junior Gold Miners ETF | | | | | | | | | 515,550 | |
| | 57,000 | | | Market Vectors Russia ETF | | | | | | | | | 1,760,730 | |
| | 2,000 | | | ProShares UltraShort 20+ Year Treasury | | | * | | | | | | 40,900 | |
| | 73,500 | | | San Juan Basin Royalty Trust | | | | | | | | | 1,425,165 | |
| | 78,500 | | | SPDR Dow Jones Industrial Average ETF Trust | | | * | | | | | | 10,345,515 | |
| | 13,900 | | | Ultra Petroleum Corporation | | | * | | | | | | 314,557 | |
| | 65,000 | | | Vanguard Short-Term Bond ETF | | | | | | | | | 5,261,750 | |
| | | | | | | | | | | | |
PRINCIPAL AMOUNT /
CONTRACTS~/
NOTIONAL/SHARES | | | SECURITY DESCRIPTION | | RATE | | MATURITY | | VALUE $ | |
| | 40,000 | | | WisdomTree Trust Emerging Markets Equity Income Fund | | | | | | | 2,304,400 | |
| | | | | | | | | | | | |
| | | | Total Investment Companies and Exchange Traded Notes
(Cost $28,141,683) | | | 27,409,238 | |
| | | | | | | | | | | | |
| | | | | | | | | | | | |
| | AFFILIATED MUTUAL FUNDS 30.6% | |
| | 349,549 | | | DoubleLine Core Fixed Income Fund | | | | | | | 3,866,013 | |
| | 641,436 | | | DoubleLine Emerging Markets Fixed Income Fund | | | | | | | 6,863,366 | |
| | 394,023 | | | DoubleLine Low Duration Bond Fund | | | | | | | 4,003,271 | |
| | 2,166,865 | | | DoubleLine Total Return Bond Fund | | | | | | | 24,203,882 | |
| | | | | | | | | | | | |
| | | | Total Affiliated Mutual Funds
(Cost $38,559,665) | | | 38,936,532 | |
| | | | | | | | | | | | |
| | PURCHASED OPTIONS 0.5% | |
| |
| | | | Australian Dollar Put, | |
| | 2,440,000 | | | Expiration May 2012, Strike Price $0.98 | | | | | | | 14,250 | |
| |
| | | | Crude Oil European Call, | |
| | 5 | | | Expiration December 2013,
Strike Price $130.00 | | | | | | | 18,150 | |
| |
| | | | COMEX Division Gold Call, | |
| | 10 | | | Expiration December 2014,
Strike Price $100.00 | | | | | | | 150,538 | |
| |
| | | | iShares Barclays 20+ Year Treasury Put, | |
| | 480 | | | Expiration April 2012, Strike Price $105.00 | | | | | | | 9,600 | |
| |
| | | | Japanese Yen Call, | |
| | 15,000,000 | | | Expiration September 2012,
Strike Price $84.00 | | | | | | | 349,950 | |
| |
| | | | ProShares UltraShort 20+ Year Treasury Call, | |
| | 2,010 | | | Expiration June 2012, Strike Price $27.00 | | | | | | | 22,110 | |
| |
| | | | S&P GSCI Crude Oil Call, | |
| | 1,316 | | | Expiration September 2012,
Strike Price $911.58 | | | | | | | 81,927 | |
| |
| | | | SPDR Gold Trust Call, | |
| | 25 | | | Expiration January 2014,
Strike Price $200.00 | | | | | | | 20,000 | |
| | | | | | | | | | | | |
| | | | Total Purchased Options
(Cost $1,030,274) | | | 666,525 | |
| | | | | | | | | | | | |
| | | | | | | | | | | | | | | | |
| | SHORT TERM INVESTMENTS 23.2% | |
| | 20,517,998 | | | Fidelity Institutional Government Portfolio | | | 0.01% | ¨ | | | | | | | 20,517,998 | |
| | 9,000,000 | | | United States Treasury Bills | | | 0.00% | | | | 04/26/2012 | | | | 8,999,770 | |
| | | | | | | | | | | | | | | | |
| | | | Total Short Term Investments
(Cost $29,517,768) | | | | 29,517,768 | |
| | | | | | | | | | | | | | | | |
| | | | Total Investments 97.5%
(Cost $124,457,534) | | | | 124,134,492 | |
| | | | Other Assets in Excess of Liabilities 2.5% | | | | 3,198,811 | |
| | | | | | | | | | | | | | | | |
| | | | NET ASSETS 100.0% | | | $ | 127,333,303 | |
| | | | | | | | | | | | | | | | |
| | | | | | |
| The accompanying notes are an integral part of these financial statements | | Annual Report | | March 31, 2012 | | 31 |
Schedule of Investments (Consolidated) DoubleLine Multi-Asset Growth Fund (Cont.)
| | | | |
| PORTFOLIO HOLDINGS as % of Net Assets | |
Affiliated Mutual Funds | | | 30.6% | |
Short Term Investments | | | 23.2% | |
Investment Companies and Exchange Traded Notes | | | 21.5% | |
Non-Agency Collateralized Mortgage Obligations | | | 12.8% | |
US Government / Agency Mortgage Backed Securities | | | 7.8% | |
Foreign Corporate Bonds | | | 1.1% | |
Purchased Options | | | 0.5% | |
Other Assets and Liabilities | | | 2.5% | |
| | | | |
| | | 100.0% | |
| | | | |
| # | Variable rate security. Rate disclosed as of March 31, 2012. |
| ^ | Security exempt from registration under Rule 144A of the Securities Act of 1933. These securities may be resold in transactions exempt from registration to qualified institutional buyers. These securities are determined to be liquid by the Adviser, unless otherwise noted, under procedures established by the Fund’s Board of Trustees. At March 31, 2012, the value of these securities amounted to $4,687,820 or 3.7% of net assets. |
| I/O | Interest only security |
| I/F | Inverse floating rate security whose interest rate moves in the opposite direction of prevailing interest rates |
| P/O | Principal only security |
| (a) | Issuer is in default of interest payments |
| (b) | Institutional class shares at each Fund |
| ¨ | Seven-day yield as of March 31, 2012 |
| | | | | | | | | | | | | | |
| Written Option | |
| Contracts~/Notional | | Security Description | | | | | | | | Value | |
5 | | Crude Oil Europe Call, Expiration December 2013, Strike Price $180.00 | | | | | | | | | | $ | (3,950 | ) |
15,000,000 | | Japanese Yen Call, Expiration September 2012, Strike Price $90.00 | | | | | | | | | | | (100,950 | ) |
2,075 | | S&P GSCI Crude Oil Call, September 2012, Strike Price $578.36 | | | | | | | | | | | (73,810 | ) |
693 | | Ultra Petroleum Put, Expiration April 2012, Strike Price $24.00 | | | | | | | | | | | (114,345 | ) |
307 | | Ultra Petroleum Put, Expiration April 2012, Strike Price $25.00 | | | | | | | | | | | (77,518 | ) |
| | | | | | | | | | | | | | |
Total Written Options (Premiums Received $340,602) | | | | | | | | | | $ | (370,573 | ) |
| | | | | | | | | | | | |
| ~ 100 shares per contract | |
|
Long Futures Contracts | |
| Contracts | | Security Description | | Type | | | Expiration
Month | | | Unrealized
Appreciation
(Depreciation) | |
19 | | Gold Future | | | Buy | | | | 6/2012 | | | $ | (27,018 | ) |
| | | | | | | | | | | | | | |
| | | | | $ | (27,018 | ) |
| | | | | | | | | | | | | | |
|
| Short Futures Contracts | |
| Contracts | | Security Description | | Type | | | Expiration
Month | | | Unrealized
Appreciation
(Depreciation) | |
32 | | Australian Future | | | Sell | | | | 3/2012 | | | $ | 45,516 | |
| | | | | | | | | | | | | | |
| | | | | | | | | | | | $ | 45,516 | |
| | | | | | | | | | | | | | |
|
| Credit Default Swaps - Buy Protection | |
| Reference Entity | | Counterparty | | Notional
Amount | | | Termination
Date | | | Unrealized
Appreciation
(Depreciation) | |
French Republic | | Morgan Stanley | | | 2,000,000 | | | | 09/20/2016 | | | $ | 38,350 | |
French Republic | | Morgan Stanley | | | 2,000,000 | | | | 12/20/2016 | | | | (9,851 | ) |
Austria | | Morgan Stanley | | | 8,000,000 | | | | 12/20/2016 | | | | (72,943 | ) |
| | | | | | | | | | | | | | |
| | | | | | | | | | | | $ | (44,444 | ) |
| | | | | | | | | | | | | | |
| | | | | | |
| 32 | | DoubleLine Funds | | | | The accompanying notes are an integral part of these financial statements |
March 31, 2012
| | | | | | | | | | | | | | |
| Total Return Swaps - Long | |
| Reference Entity | | Counterparty | | Notional
Amount | | | Termination
Date | | | Unrealized
Appreciation
(Depreciation) | |
S&P GSCI Corn Official Close Index | | Morgan Stanley | | | 515,000 | | | | 4/5/2012 | | | $ | 34,105 | |
S&P GSCI Sugar Official Close Index | | Morgan Stanley | | | 515,000 | | | | 4/5/2012 | | | | 2,303 | |
S&P GSCI Cotton Official Close Index | | Morgan Stanley | | | 515,000 | | | | 4/5/2012 | | | | (110 | ) |
S&P GSCI Brent Crude Official Close Index | | Morgan Stanley | | | 515,000 | | | | 4/5/2012 | | | | 1,906 | |
S&P GSCI Gas Oil Official Close Index | | Morgan Stanley | | | 515,000 | | | | 4/5/2012 | | | | (1,772 | ) |
S&P GSCI Unleaded Gasoline Official Close Index | | Morgan Stanley | | | 515,000 | | | | 4/5/2012 | | | | (4,873 | ) |
| | | | | | | | | | | | | | |
| | | | | | | | | | | | $ | 31,559 | |
| | | | | | | | | | | | | | |
| | | | | | | | | | | | | | |
| Total Return Swaps - Short | | | | | | | | | |
| Reference Entity | | Counterparty | | Notional
Amount | | | Termination
Date | | | Unrealized
Appreciation
(Depreciation) | |
S&P GSCI Cocoa Official Close Index | | Morgan Stanley | | | 515,000 | | | | 4/5/2012 | | | $ | 926 | |
S&P GSCI Coffee Official Close Index | | Morgan Stanley | | | 515,000 | | | | 4/5/2012 | | | | (17,512 | ) |
S&P GSCI Kansas Wheat Official Close Index | | Morgan Stanley | | | 515,000 | | | | 4/5/2012 | | | �� | (34,254 | ) |
S&P GSCI Wheat Official Close Index | | Morgan Stanley | | | 515,000 | | | | 4/5/2012 | | | | (40,570 | ) |
S&P GSCI Aluminum Official Close Index | | Morgan Stanley | | | 515,000 | | | | 4/5/2012 | | | | 1,948 | |
S&P GSCI Natural Gas Official Close Index | | Morgan Stanley | | | 515,000 | | | | 4/5/2012 | | | | 5,512 | |
| | | | | | | | | | | | | | |
| | | | | | | | | | | | $ | (83,950 | ) |
| | | | | | | | | | | | | | |
Investments in Affiliates
Generally, an issuer is an affiliated person of a Fund under the Investment Company Act of 1940 if the Fund holds 5% or more of the outstanding voting securities of the issuer or if the issuer is under common control with the Fund.
A summary of DoubleLine Multi-Asset Growth Fund’s investments in affiliated mutual funds for the period ended March 31, 2012, is as follows:
| | | | | | | | | | | | | | | | | | | | | | | | |
| Fund | | Value at
March 31,
2011 | | | Gross
Purchases | | | Gross
Sales | | | Shares
Held at
March 31,
2012 | | | Value at
March 31,
2012 | | | Dividend
Income Earned
in the Period
Ended March 31,
2012 | |
DoubleLine Total Return Bond Fund | | $ | 4,026,705 | | | $ | 19,991,189 | | | $ | — | | | | 2,166,865 | | | $ | 24,203,882 | | | $ | 1,072,796 | |
DoubleLine Core Fixed Income Fund | | | 794,960 | | | | 2,984,126 | | | | — | | | | 349,549 | | | | 3,866,013 | | | | 106,654 | |
DoubleLine Emerging Markets Fixed Income Fund | | | 134,239 | | | | 6,611,620 | | | | — | | | | 641,436 | | | | 6,863,366 | | | | 109,294 | |
DoubleLine Low Duration Bond Fund | | | — | | | | 3,985,000 | | | | — | | | | 394,023 | | | | 4,003,271 | | | | 16,939 | |
| | | | | | | | | | | | | | | | | | | | | | | | |
| | $ | 4,955,904 | | | $ | 33,571,935 | | | $ | — | | | | 3,551,873 | | | $ | 38,936,532 | | | $ | 1,305,683 | |
| | | | | | | | | | | | | | | | | | | | | | | | |
| | | | | | |
| The accompanying notes are an integral part of these financial statements | | Annual Report | | March 31, 2012 | | 33 |
| | |
| Schedule of Investments DoubleLine Low Duration Bond Fund | | |
| | | | | | | | | | | | | | | | |
PRINCIPAL
AMOUNT | | | SECURITY DESCRIPTION | | RATE | | | MATURITY | | | VALUE $ | |
| | COLLATERALIZED LOAN OBLIGATIONS 3.1% | |
| |
| | | | Atrium Corporation, | |
| $ | 2,069,416 | | | Series 3A-A1 | | | 0.82% | #^ | | | 10/27/2016 | | | | 2,038,375 | |
| |
| | | | Avenue Ltd., | |
| | 568,727 | | | Series 2004-1A-A1L | | | 0.85% | #^ | | | 02/15/2017 | | | | 562,357 | |
| |
| | | | Black Diamond Ltd., | |
| | 1,074,726 | | | Series 2005-1A-A1 | | | 0.74% | #^ | | | 06/20/2017 | | | | 1,039,797 | |
| |
| | | | Galaxy Ltd., | |
| | 976,205 | | | Series 2005-5A-A1 | | | 0.82% | #^ | | | 10/20/2017 | | | | 956,680 | |
| |
| | | | Sargas II Ltd., | |
| | 42,595 | | | Series 2006-1A-C | | | 1.16% | #^ | | | 10/20/2018 | | | | 42,595 | |
| | 857,103 | | | Series 2006-1A-D | | | 1.81% | #^ | | | 10/20/2018 | | | | 846,389 | |
| |
| | | | Venture Ltd., | |
| | 1,282,858 | | | Series 2003-1A-A1 | | | 1.06% | #^ | | | 01/21/2016 | | | | 1,272,441 | |
| | | | | | | | | | | | | | | | |
| | | | Total Collateralized Loan Obligations
(Cost $6,759,406) | | | | 6,758,634 | |
| | | | | | | | | | | | | | | | |
| | NON-AGENCY COLLATERALIZED MORTGAGE OBLIGATIONS 39.4% | |
| |
| | | | Asset Securitization Corporation, | |
| | 9,546,224 | | | Series 1997-D4-PS1 | | | 1.70% | # I/O | | | 04/14/2029 | | | | 444,606 | |
| | 404,384 | | | Series 1997-D5-A2 | | | 7.15% | # | | | 02/14/2043 | | | | 408,158 | |
| |
| | | | Banc of America Merrill Lynch Commercial Mortgage, Inc., | |
| | 1,021,085 | | | Series 2005-5-ASB | | | 5.05% | # | | | 10/10/2045 | | | | 1,075,066 | |
| | 790,954 | | | Series 2006-5-AAB | | | 5.38% | | | | 09/10/2047 | | | | 828,591 | |
| |
| | | | Banc of America Re-Remic Trust, | |
| | 1,775,000 | | | Series 2011-STRP-A2 | | | 2.15% | #^ | | | 08/17/2038 | | | | 1,773,142 | |
| |
| | | | Bank of America Commercial Mortgage, Inc., | |
| | 100,000 | | | Series 2003-2-A4 | | | 5.06% | # | | | 03/11/2041 | | | | 104,429 | |
| |
| | | | BCAP LLC Trust, | |
| | 83,883 | | | Series 2009-RR13-6A5 | | | 6.00% | #^ | | | 04/26/2037 | | | | 86,520 | |
| |
| | | | Bear Stearns Asset Backed Securities Trust, | |
| | 1,100,050 | | | Series 2005-3-A1 | | | 0.69% | # | | | 09/25/2035 | | | | 1,080,798 | |
| |
| | | | Bear Stearns Commercial Mortgage Securities, Inc., | |
| | 700,833 | | | Series 2002-TOP8-A2 | | | 4.83% | | | | 08/15/2038 | | | | 707,589 | |
| | 1,015,000 | | | Series 2004-PWR3-A4 | | | 4.72% | | | | 02/11/2041 | | | | 1,067,164 | |
| | 1,115,000 | | | Series 2004-PWR4-A3 | | | 5.47% | # | | | 06/11/2041 | | | | 1,198,211 | |
| | 825,000 | | | Series 2004-T14-A4 | | | 5.20% | # | | | 01/12/2041 | | | | 877,586 | |
| | 509,766 | | | Series 2005-PWR8-AAB | | | 4.58% | | | | 06/11/2041 | | | | 522,450 | |
| | 860,000 | | | Series 2007-PW17-AAB | | | 5.70% | | | | 06/11/2050 | | | | 904,391 | |
| | 169,099 | | | Series 2007-T28-A2 | | | 5.59% | | | | 09/11/2042 | | | | 170,947 | |
| |
| | | | Capital Trust, | |
| | 1,683,032 | | | Series 2005-3A-A2 | | | 5.16% | ^ | | | 06/25/2035 | | | | 1,693,551 | |
| |
| | | | CD Commercial Mortgage Trust, | |
| | 649,999 | | | Series 2007-CD4-ASB | | | 5.28% | | | | 12/11/2049 | | | | 677,422 | |
| | 15,260,748 | | | Series 2007-CD5-XP | | | 0.32% | #^ I/O | | | 11/15/2044 | | | | 77,036 | |
| |
| | | | Chase Funding Mortgage Loan Asset-Backed Certificates, | |
| | 224,181 | | | Series 2003-5-1A6 | | | 4.60% | | | | 01/25/2015 | | | | 227,420 | |
| | 356,636 | | | Series 2003-6-1A6 | | | 4.59% | | | | 11/25/2034 | | | | 359,592 | |
| |
| | | | Citigroup Mortgage Loan Trust, Inc., | |
| | 1,375,548 | | | Series 2010-12-3A1 | | | 4.00% | ^ | | | 04/25/2037 | | | | 1,405,947 | |
| | 1,781,311 | | | Series 2010-8-5A6 | | | 4.00% | ^ | | | 11/25/2036 | | | | 1,833,038 | |
| | 2,857,447 | | | Series 2011-12-1A1 | | | 3.50% | #^ | | | 04/25/2036 | | | | 2,878,610 | |
| | 1,744,079 | | | Series 2011-12-3A1 | | | 5.59% | ^ | | | 09/25/2047 | | | | 1,761,609 | |
| |
| | | | Commercial Mortgage Acceptance Corporation, | |
| | 93,666 | | | Series 1998-C1-F | | | 6.23% | ^ | | | 07/15/2031 | | | | 96,049 | |
| | 740,063 | | | Series 1998-C2-F | | | 5.44% | #^ | | | 09/15/2030 | | | | 768,931 | |
| |
| | | | Countrywide Alternative Loan Trust, | |
| | 1,490,597 | | | Series 2007-HY5R-2A1A | | | 5.54% | # | | | 03/25/2047 | | | | 1,439,860 | |
| |
| | | | Countrywide Asset-Backed Certificates, | |
| | 1,327,870 | | | Series 2006-2-2A2 | | | 0.43% | # | | | 06/25/2036 | | | | 1,136,364 | |
| | 1,215,791 | | | Series 2007-10-2A1 | | | 0.29% | # | | | 06/25/2047 | | | | 1,195,216 | |
| |
| | | | Countrywide Home Loan Mortgage Pass Through Trust, | |
| | 1,597,370 | | | Series 2004-9-A1 | | | 5.00% | | | | 06/25/2034 | | | | 1,619,210 | |
| | | | | | | | | | | | | | | | |
PRINCIPAL
AMOUNT | | | SECURITY DESCRIPTION | | RATE | | | MATURITY | | | VALUE $ | |
| |
| | | | Credit Suisse First Boston Mortgage Securities Corporation, | |
| $ | 500,000 | | | Series 1998-C2-F | | | 6.75% | #^ | | | 11/15/2030 | | | | 542,620 | |
| | 99,227 | | | Series 2002-CKN2-A3 | | | 6.13% | | | | 04/15/2037 | | | | 99,147 | |
| | 614,364 | | | Series 2002-CKS4-A2 | | | 5.18% | | | | 11/15/2036 | | | | 619,576 | |
| |
| | | | Credit Suisse Mortgage Capital Certificates, | |
| | 105,849 | | | Series 2010-1R-5A1 | | | 5.00% | #^ | | | 01/27/2036 | | | | 109,718 | |
| |
| | | | Crest Ltd., | |
| | 631,820 | | | Series 2003-2A-A1 | | | 0.95% | #^ | | | 12/28/2018 | | | | 582,065 | |
| |
| | | | Deutsche ALT-A Securities Inc Alternate Loan Trust, | |
| | 1,579,967 | | | Series 2007-BAR1-A2 | | | 0.37% | # | | | 03/25/2037 | | | | 1,516,996 | |
| |
| | | | Deutsche Mortgage Securities, Inc., | |
| | 2,434,228 | | | Series 2005-WF1-1A2 | | | 5.25% | #^ | | | 06/26/2035 | | | | 2,450,266 | |
| |
| | | | Extended Stay American Trust, | |
| | 975,118 | | | Series 2010-ESHA-A | | | 2.95% | ^ | | | 11/05/2027 | | | | 987,313 | |
| |
| | | | First Franklin Mortgage Loan Asset Backed Certificates, | |
| | 806,206 | | | Series 2006-FF13-A2B | | | 0.34% | # | | | 10/25/2036 | | | | 796,376 | |
| |
| | | | GE Capital Commercial Mortgage Corporation, | |
| | 858,812 | | | Series 2002-2-A3 | | | 5.35% | | | | 08/11/2036 | | | | 864,337 | |
| | 487,000 | | | Series 2004-C3-B | | | 5.51% | # | | | 07/10/2039 | | | | 517,260 | |
| | 200,000 | | | Series 2007-C1-AAB | | | 5.48% | | | | 12/10/2049 | | | | 209,157 | |
| |
| | | | GMAC Commercial Mortgage Securities, Inc., | |
| | 682,342 | | | Series 2004-C3-AAB | | | 4.70% | | | | 12/10/2041 | | | | 711,904 | |
| |
| | | | Greenpoint Mortgage Funding Trust, | |
| | 138,478 | | | Series 2006-AR8-1A1A | | | 0.32% | # | | | 01/25/2047 | | | | 134,181 | |
| |
| | | | GS Mortgage Securities Corporation II, | |
| | 750,000 | | | Series 2003-C1-A3 | | | 4.61% | | | | 01/10/2040 | | | | 764,216 | |
| | 6,077,956 | | | Series 2005-GG4-XP | | | 0.90% | #^ I/O | | | 07/10/2039 | | | | 8,552 | |
| |
| | | | GSR Mortgage Loan Trust, | |
| | 2,269,403 | | | Series 2006-AR1-2A2 | | | 2.70% | # | | | 01/25/2036 | | | | 2,224,272 | |
| |
| | | | Jefferies & Company, Inc., | |
| | 1,628,531 | | | Series 2010-R7-5A1 | | | 1.24% | #^ | | | 09/26/2035 | | | | 1,490,790 | |
| |
| | | | JP Morgan Alternative Loan Trust, | |
| | 2,608,855 | | | Series 2006-S4-A6 | | | 5.71% | # | | | 12/25/2036 | | | | 2,311,118 | |
| |
| | | | JP Morgan Chase Commercial Mortgage Securities Corporation, | |
| | 1,696,202 | | | Series 2002-CIB5-A2 | | | 5.16% | | | | 10/12/2037 | | | | 1,718,760 | |
| | 529,847 | | | Series 2004-CB8-A1A | | | 4.16% | ^ | | | 01/12/2039 | | | | 551,633 | |
| | 198,037 | | | Series 2006-CB14-ASB | | | 5.51% | # | | | 12/12/2044 | | | | 210,484 | |
| | 111,583 | | | Series 2006-CB15-ASB | | | 5.79% | # | | | 06/12/2043 | | | | 119,951 | |
| | 129,508,320 | | | Series 2006-CB16-X2 | | | 0.70% | # I/O | | | 05/12/2045 | | | | 943,080 | |
| | 230,982 | | | Series 2006-CB17-ASB | | | 5.42% | | | | 12/12/2043 | | | | 248,154 | |
| | 295,059 | | | Series 2006-FL1-AG | | | 0.71% | #^ | | | 02/15/2020 | | | | 250,802 | |
| | 494,256 | | | Series 2007-CB20-ASB | | | 5.69% | | | | 02/12/2051 | | | | 532,953 | |
| | 107,003 | | | Series 2007-LD11-ASB | | | 6.00% | # | | | 06/15/2049 | | | | 114,939 | |
| | 213,380 | | | Series 2007-LDP12-ASB | | | 5.83% | # | | | 02/15/2051 | | | | 231,036 | |
| | 954,834 | | | Series 2011-PLSD-A1 | | | 2.19% | ^ | | | 11/13/2044 | | | | 968,884 | |
| |
| | | | JP Morgan Mortgage Trust, | |
| | 707,036 | | | Series 2007-S1-1A1 | | | 5.00% | | | | 03/25/2022 | | | | 647,758 | |
| |
| | | | JP Morgan Research Trust, | |
| | 1,446,120 | | | Series 2009-7-8A1 | | | 5.48% | #^ | | | 01/27/2047 | | | | 1,484,707 | |
| | 842,121 | | | Series 2011-2-2A3 | | | 3.50% | #^ | | | 07/26/2036 | | | | 862,068 | |
| | 1,682,500 | | | Series 2012-2-3A3 | | | 2.59% | #^ | | | 10/26/2036 | | | | 1,673,582 | |
| |
| | | | LB-UBS Commercial Mortgage Trust, | |
| | 19,463 | | | Series 2003-C5-A3 | | | 4.25% | | | | 07/15/2027 | | | | 19,916 | |
| | 1,299,000 | | | Series 2004-C2-A4 | | | 4.37% | | | | 03/15/2036 | | | | 1,369,246 | |
| | 2,000,000 | | | Series 2004-C6-A6 | | | 5.02% | # | | | 08/15/2029 | | | | 2,148,397 | |
| | 34,658 | | | Series 2005-C3-A3 | | | 4.65% | | | | 07/15/2030 | | | | 34,693 | |
| | 37,461,045 | | | Series 2006-C6-XCP | | | 0.86% | # I/O | | | 09/15/2039 | | | | 376,877 | |
| | 105,221,547 | | | Series 2007-C2-XCP | | | 0.68% | # I/O | | | 02/15/2040 | | | | 1,000,446 | |
| |
| | | | Lehman XS Trust, | |
| | 2,036,684 | | | Series 2006-11-2A1 | | | 0.37% | # | | | 06/25/2046 | | | | 1,850,372 | |
| |
| | | | MASTR Asset Backed Securities Trust, | |
| | 405,424 | | | Series 2006-NC1-A3 | | | 0.43% | # | | | 01/25/2036 | | | | 343,546 | |
| |
| | | | Merrill Lynch Mortgage Trust, | |
| | 138,000 | | | Series 2003-KEY1-A4 | | | 5.24% | # | | | 11/12/2035 | | | | 145,689 | |
| | 1,020,000 | | | Series 2004-KEY2-A4 | | | 4.86% | # | | | 08/12/2039 | | | | 1,096,693 | |
| | | | | | |
| 34 | | DoubleLine Funds | | | | The accompanying notes are an integral part of these financial statements |
March 31, 2012
| | | | | | | | | | | | | | | | |
PRINCIPAL
AMOUNT | | | SECURITY DESCRIPTION | | RATE | | | MATURITY | | | VALUE $ | |
| |
| | | | Merrill Lynch/Countrywide Commercial Mortgage Trust, | |
| $ | 376,744 | | | Series 2006-4-A2FL | | | 0.36% | # | | | 12/12/2049 | | | | 376,632 | |
| |
| | | | Morgan Stanley Capital, Inc., | |
| | 119,013 | | | Series 2003-IQ5-A4 | | | 5.01% | | | | 04/15/2038 | | | | 123,648 | |
| | 464,756 | | | Series 2003-TOP9-A2 | | | 4.74% | | | | 11/13/2036 | | | | 473,008 | |
| | 87,164 | | | Series 2004-T13-A3 | | | 4.39% | | | | 09/13/2045 | | | | 88,768 | |
| | 3,250,000 | | | Series 2005-WMC3-M3 | | | 0.95% | # | | | 03/25/2035 | | | | 2,910,499 | |
| | 26,046,418 | | | Series 2006-HQ10-X1 | | | 0.18% | #^ I/O | | | 11/12/2041 | | | | 482,458 | |
| | 249,931 | | | Series 2006-HQ9-AAB | | | 5.69% | | | | 07/12/2044 | | | | 259,955 | |
| | 1,531,598 | | | Series 2007-T25-AAB | | | 5.51% | | | | 11/12/2049 | | | | 1,625,660 | |
| |
| | | | Morgan Stanley Mortgage Loan Trust, | |
| | 649,614 | | | Series 2004-1-1A1 | | | 5.00% | | | | 11/25/2018 | | | | 667,466 | |
| |
| | | | Nomura Asset Securities Corporation, | |
| | 1,070,000 | | | Series 1998-D6-A2 | | | 7.32% | # | | | 03/15/2030 | | | | 1,113,445 | |
| |
| | | | Park Place Securities, Inc., | |
| | 2,142,644 | | | Series 2004-WHQ2-M1 | | | 0.83% | # | | | 02/25/2035 | | | | 2,130,052 | |
| |
| | | | Residential Funding Mortgage Securities Trust, | |
| | 651,941 | | | Series 2003-S16-A1 | | | 4.75% | | | | 09/25/2018 | | | | 668,963 | |
| |
| | | | Structured Adjustable Rate Mortgage Loan Trust, | |
| | 761,977 | | | Series 2006-5-5A3 | | | 5.23% | # | | | 06/25/2036 | | | | 738,153 | |
| |
| | | | Structured Asset Securities Corporation, | |
| | 901,797 | | | Series 2003-24A-1A3 | | | 2.66% | # | | | 07/25/2033 | | | | 822,394 | |
| | 899,703 | | | Series 20034-15-2A1 | | | 4.75% | | | | 09/25/2019 | | | | 906,463 | |
| | 1,878,815 | | | Series 2005-10-6A1 | | | 5.00% | | | | 06/25/2020 | | | | 1,894,048 | |
| |
| | | | Wachovia Bank Commercial Mortgage Trust, | |
| | 1,502,024 | | | Series 2003-C3-A2 | | | 4.87% | | | | 02/15/2035 | | | | 1,535,396 | |
| | 185,712 | | | Series 2006-C25-APB1 | | | 5.83% | # | | | 05/15/2043 | | | | 188,852 | |
| | 74,859 | | | Series 2006-C26-APB | | | 6.00% | | | | 06/15/2045 | | | | 81,833 | |
| |
| | | | Washington Mutual Mortgage Pass-Through Certificates, | |
| | 131,350 | | | Series 2004-RS1-A1 | | | 4.50% | | | | 11/25/2033 | | | | 131,102 | |
| | 961,379 | | | Series 2005-AR14-1A1 | | | 2.46% | # | | | 12/25/2035 | | | | 944,372 | |
| |
| | | | Wells Fargo Home Equity Trust, | |
| | 165,646 | | | Series 2004-2-AI5 | | | 4.89% | # | | | 05/25/2034 | | | | 166,236 | |
| |
| | | | Wells Fargo Mortgage Backed Securities Trust, | |
| | 767,403 | | | Series 2005-9-1A8 | | | 5.50% | | | | 10/25/2035 | | | | 770,985 | |
| | 584,560 | | | Series 2006-4-1A8 | | | 5.75% | | | | 04/25/2036 | | | | 591,414 | |
| | 5,240 | | | Series 2006-AR4-2A3 | | | 5.61% | # | | | 04/25/2036 | | | | 5,198 | |
| |
| | | | Wells Fargo Mortgage Loan Trust, | |
| | 1,452,176 | | | Series 2012-RR1-A1 | | | 2.85% | #^ | | | 08/27/2037 | | | | 1,454,558 | |
| | | | | | | | | | | | | | | | |
| | | | Total Non-Agency Collateralized Mortgage Obligations
(Cost $85,243,624) | | | | 85,455,591 | |
| | | | | | | | | | | | | | | | |
| | US CORPORATE BONDS 17.9% | |
| | 875,000 | | | Altria Group, Inc. | | | 8.50% | | | | 11/10/2013 | | | | 978,100 | |
| | 911,000 | | | American Express Credit Corporation | | | 5.88% | | | | 05/02/2013 | | | | 958,249 | |
| | 450,000 | | | Amgen, Inc. | | | 1.88% | | | | 11/15/2014 | | | | 460,684 | |
| | 250,000 | | | Amgen, Inc. | | | 4.85% | | | | 11/18/2014 | | | | 273,666 | |
| | 1,000,000 | | | Anheuser Busch Inbev Worldwide, Inc. | | | 5.38% | | | | 11/15/2014 | | | | 1,111,131 | |
| | 900,000 | | | Aristotle Holding, Inc. | | | 2.10% | ^ | | | 02/12/2015 | | | | 911,722 | |
| | 725,000 | | | AT&T, Inc. | | | 4.85% | | | | 02/15/2014 | | | | 779,868 | |
| | 1,019,000 | | | Berkshire Hathaway, Inc. | | | 3.20% | | | | 02/11/2015 | | | | 1,086,313 | |
| | 703,000 | | | Boeing Capital Corporation | | | 3.25% | | | | 10/27/2014 | | | | 749,713 | |
| | 300,000 | | | Boeing Company | | | 5.00% | | | | 03/15/2014 | | | | 326,415 | |
| | 250,000 | | | Caterpillar Financial Services Corporation | | | 6.13% | | | | 02/17/2014 | | | | 274,931 | |
| | 188,000 | | | Caterpillar Financial Services Corporation | | | 1.38% | | | | 05/20/2014 | | | | 190,903 | |
| | 235,000 | | | Caterpillar Financial Services Corporation | | | 1.13% | | | | 12/15/2014 | | | | 237,077 | |
| | 750,000 | | | Citigroup, Inc. | | | 0.81% | # | | | 11/05/2014 | | | | 719,334 | |
| | 750,000 | | | Coca Cola Co. | | | 0.75% | | | | 03/13/2015 | | | | 748,455 | |
| | | | | | | | | | | | | | | | |
PRINCIPAL
AMOUNT | | | SECURITY DESCRIPTION | | RATE | | | MATURITY | | | VALUE $ | |
| $ | 700,000 | | | Comcast Corporation | | | 6.50% | | | | 01/15/2015 | | | | 799,257 | |
| | 1,050,000 | | | ConocoPhillips Company | | | 4.75% | | | | 02/01/2014 | | | | 1,127,907 | |
| | 416,000 | | | Daimler Finance North America LLC | | | 6.50% | | | | 11/15/2013 | | | | 453,216 | |
| | 150,000 | | | Daimler Finance North America LLC | | | 1.95% | ^ | | | 03/28/2014 | | | | 151,894 | |
| | 450,000 | | | Daimler Finance North America LLC | | | 1.88% | ^ | | | 09/15/2014 | | | | 456,724 | |
| | 1,000,000 | | | DIRECTV Holdings LLC | | | 4.75% | | | | 10/01/2014 | | | | 1,087,583 | |
| | 881,000 | | | Dow Chemical Company | | | 7.60% | | | | 05/15/2014 | | | | 998,067 | |
| | 914,000 | | | Duke Energy Corporation | | | 6.30% | | | | 02/01/2014 | | | | 1,002,196 | |
| | 1,050,000 | | | Ecolab, Inc. | | | 2.38% | | | | 12/08/2014 | | | | 1,088,244 | |
| | 986,000 | | | General Electric Capital Corporation | | | 3.75% | | | | 11/14/2014 | | | | 1,049,304 | |
| | 700,000 | | | Gilead Sciences, Inc. | | | 2.40% | | | | 12/01/2014 | | | | 724,650 | |
| | 1,100,000 | | | Hewlett Packard Co. | | | 1.25% | | | | 09/13/2013 | | | | 1,102,619 | |
| | 1,175,000 | | | JP Morgan Chase & Company | | | 4.75% | | | | 05/01/2013 | | | | 1,224,017 | |
| | 120,000 | | | Kinder Morgan Energy Partners LP | | | 5.13% | | | | 11/15/2014 | | | | 131,195 | |
| | 334,000 | | | Kinder Morgan Energy Partners LP | | | 5.63% | | | | 02/15/2015 | | | | 370,972 | |
| | 719,000 | | | Kraft Foods, Inc. | | | 2.63% | | | | 05/08/2013 | | | | 733,005 | |
| | 200,000 | | | Kroger Company | | | 5.50% | | | | 02/01/2013 | | | | 207,995 | |
| | 500,000 | | | Kroger Company | | | 7.50% | | | | 01/15/2014 | | | | 557,647 | |
| | 810,000 | | | Marriott International, Inc. | | | 5.63% | | | | 02/15/2013 | | | | 841,394 | |
| | 300,000 | | | Metlife Institutional Funding II | | | 1.63% | ^ | | | 04/02/2015 | | | | 299,948 | |
| | 525,000 | | | Metropolitan Life Global Funding | | | 5.13% | ^ | | | 04/10/2013 | | | | 548,908 | |
| | 200,000 | | | Metropolitan Life Global Funding | | | 2.00% | ^ | | | 01/09/2015 | | | | 202,256 | |
| | 174,000 | | | Motorola Solutions, Inc. | | | 5.38% | | | | 11/15/2012 | | | | 178,320 | |
| | 212,000 | | | National Rural Utilities Cooperative Finance Corporation | | | 3.88% | | | | 09/16/2015 | | | | 231,251 | |
| | 750,000 | | | National Rural Utilities Cooperative Finance Corporation | | | 1.90% | | | | 11/01/2015 | | | | 768,820 | |
| | 925,000 | | | Phillips 66 | | | 1.95% | ^ | | | 03/05/2015 | | | | 932,058 | |
| | 1,100,000 | | | Procter & Gamble Company | | | 0.70% | | | | 08/15/2014 | | | | 1,104,018 | |
| | 1,050,000 | | | Raytheon Company | | | 1.40% | | | | 12/15/2014 | | | | 1,068,101 | |
| | 775,000 | | | Safeway, Inc. | | | 6.25% | | | | 03/15/2014 | | | | 853,214 | |
| | 483,000 | | | Simon Property Group LP | | | 6.75% | | | | 05/15/2014 | | | | 534,991 | |
| | 500,000 | | | Simon Property Group LP | | | 4.20% | | | | 02/01/2015 | | | | 535,600 | |
| | 600,000 | | | Southern Power Company, Series D | | | 4.88% | | | | 07/15/2015 | | | | 661,915 | |
| | 691,000 | | | Southwest Airlines Company | | | 5.25% | | | | 10/01/2014 | | | | 743,518 | |
| | 999,000 | | | Time Warner Cable, Inc. | | | 6.20% | | | | 07/01/2013 | | | | 1,065,851 | |
| | 1,000,000 | | | Toyota Motor Credit Corporation | | | 1.00% | | | | 02/17/2015 | | | | 1,000,534 | |
| | 900,000 | | | Verizon Wireless Capital LLC | | | 5.55% | | | | 02/01/2014 | | | | 973,807 | |
| | 120,000 | | | Wal-Mart Stores, Inc. | | | 3.00% | | | | 02/03/2014 | | | | 125,480 | |
| | 910,000 | | | Wal-Mart Stores, Inc. | | | 1.63% | | | | 04/15/2014 | | | | 932,465 | |
| | 500,000 | | | Wellpoint, Inc. | | | 5.00% | | | | 12/15/2014 | | | | 548,827 | |
| | 1,032,000 | | | Wells Fargo & Company | | | 4.38% | | | | 01/31/2013 | | | | 1,063,985 | |
| | 725,000 | | | Xerox Corporation | | | 4.25% | | | | 02/15/2015 | | | | 770,566 | |
| | | | | | | | | | | | | | | | |
| | | | Total US Corporate Bonds
(Cost $38,879,308) | | | | 39,058,880 | |
| | | | | | | | | | | | | | | | |
| | | | | | |
| The accompanying notes are an integral part of these financial statements | | Annual Report | | March 31, 2012 | | 35 |
Schedule of Investments DoubleLine Low Duration Bond Fund (Cont.)
| | | | | | | | | | | | | | | | |
PRINCIPAL
AMOUNT | | | SECURITY DESCRIPTION | | RATE | | | MATURITY | | | VALUE $ | |
| | FOREIGN CORPORATE BONDS 14.0% | |
| $ | 400,000 | | | Abu Dhabi National Energy Company | | | 6.60% | | | | 08/01/2013 | | | | 424,000 | |
| | 818,000 | | | AES Gener S.A. | | | 7.50% | | | | 03/25/2014 | | | | 891,620 | |
| | 1,050,000 | | | Australia & New Zealand Banking Group Ltd. | | | 2.13% | ^ | | | 01/10/2014 | | | | 1,063,174 | |
| | 400,000 | | | Banco Bradesco S.A. | | | 2.60% | # | | | 05/16/2014 | | | | 406,368 | |
| | 200,000 | | | Banco de Bogota S.A. | | | 5.00% | ^ | | | 01/15/2017 | | | | 208,000 | |
| | 500,000 | | | Banco de Bogota S.A. | | | 5.00% | | | | 01/15/2017 | | | | 520,000 | |
| | 700,000 | | | Banco de Credito del Peru | | | 4.75% | | | | 03/16/2016 | | | | 724,500 | |
| | 600,000 | | | Banco do Brasil | | | 4.50% | | | | 01/22/2015 | | | | 632,400 | |
| | 500,000 | | | Banco do Nordeste | | | 3.63% | | | | 11/09/2015 | | | | 505,000 | |
| | 603,000 | | | Banco Mercantil del Norte | | | 4.38% | | | | 07/19/2015 | | | | 630,135 | |
| | 600,000 | | | Banco Safra S.A. | | | 3.50% | | | | 05/16/2014 | | | | 607,500 | |
| | 700,000 | | | BanColombia S.A. | | | 4.25% | | | | 01/12/2016 | | | | 726,250 | |
| | 850,000 | | | BP Capital Markets PLC | | | 3.63% | | | | 05/08/2014 | | | | 894,108 | |
| | 400,000 | | | Centrais Eletricas Brasileiras S.A. | | | 7.75% | | | | 11/30/2015 | | | | 466,720 | |
| | 300,000 | | | China Overseas Finance Ltd. | | | 5.75% | | | | 07/13/2012 | | | | 303,941 | |
| | 400,000 | | | CNPC Overseas Capital Ltd. | | | 3.13% | | | | 04/28/2016 | | | | 411,466 | |
| | 200,000 | | | Corporacion Nacional del Cobre de Chile | | | 4.75% | | | | 10/15/2014 | | | | 215,901 | |
| | 894,000 | | | Covidien International Finance S.A. | | | 1.88% | | | | 06/15/2013 | | | | 903,891 | |
| | 450,000 | | | DBS Bank Ltd. | | | 2.38% | | | | 09/14/2015 | | | | 459,914 | |
| | 84,290 | | | Dolphin Energy Ltd. | | | 5.89% | | | | 06/15/2019 | | | | 91,560 | |
| | 200,000 | | | Eurasian Development Bank | | | 7.38% | | | | 09/29/2014 | | | | 219,000 | |
| | 300,000 | | | Gaz Capital S.A. | | | 7.34% | | | | 04/11/2013 | | | | 315,387 | |
| | 300,000 | | | Gaz Capital S.A. | | | 7.51% | | | | 07/31/2013 | | | | 320,580 | |
| | 400,000 | | | Grupo Aval Ltd. | | | 5.25% | ^ | | | 02/01/2017 | | | | 417,000 | |
| | 300,000 | | | Grupo Aval Ltd. | | | 5.25% | | | | 02/01/2017 | | | | 312,750 | |
| | 300,000 | | | Hutchison Whampoa International | | | 6.50% | | | | 02/13/2013 | | | | 312,249 | |
| | 550,000 | | | Hutchison Whampoa International | | | 4.63% | | | | 09/11/2015 | | | | 585,367 | |
| | 700,000 | | | Hyundai Capital America, Inc. | | | 3.75% | | | | 04/06/2016 | | | | 717,116 | |
| | 150,000 | | | Industrial Bank of Korea | | | 7.13% | | | | 04/23/2014 | | | | 164,743 | |
| | 200,000 | | | Industry & Construction Bank | | | 5.01% | # | | | 09/29/2015 | | | | 198,250 | |
| | 68,000 | | | Inversiones CMPC S.A. | | | 4.88% | | | | 06/18/2013 | | | | 70,303 | |
| | 800,000 | | | IOI Ventures BHD | | | 5.25% | | | | 03/16/2015 | | | | 845,761 | |
| | 150,000 | | | KazMunayGas National Company | | | 8.38% | | | | 07/02/2013 | | | | 160,166 | |
| | 700,000 | | | KT Corporation | | | 5.88% | | | | 06/24/2014 | | | | 745,106 | |
| | 800,000 | | | Lotte Shopping Company Ltd. | | | 3.88% | | | | 04/07/2016 | | | | 815,287 | |
| | 400,000 | | | Lukoil International Finance BV | | | 6.38% | | | | 11/05/2014 | | | | 432,748 | |
| | 100,000 | | | MTR Corporation | | | 4.50% | | | | 08/14/2013 | | | | 104,579 | |
| | 400,000 | | | MTR Corporation | | | 4.75% | | | | 01/21/2014 | | | | 428,503 | |
| | 700,000 | | | PCCW-HKT Capital No 4 Ltd. | | | 4.25% | | | | 02/24/2016 | | | | 723,564 | |
| | 300,000 | | | Penerbangan Malaysia BHD | | | 5.63% | | | | 03/15/2016 | | | | 335,665 | |
| | 700,000 | | | Penergangan Mala | | | 5.63% | | | | 03/15/2016 | | | | 783,217 | |
| | 800,000 | | | Petrobras International Finance Company | | | 3.88% | | | | 01/27/2016 | | | | 846,082 | |
| | 200,000 | | | Petroleos Mexicanos | | | 4.88% | | | | 03/15/2015 | | | | 217,500 | |
| | 500,000 | | | Petronas Global Sukuk Ltd. | | | 4.25% | | | | 08/12/2014 | | | | 529,101 | |
| | 700,000 | | | Prime Holdings Labuan Ltd. | | | 5.38% | | | | 09/22/2014 | | | | 742,074 | |
| | 650,000 | | | PTTEP Australia International Finance Ltd. | | | 4.15% | | | | 07/19/2015 | | | | 677,981 | |
| | 400,000 | | | Qtel International Finance Ltd. | | | 6.50% | | | | 06/10/2014 | | | | 438,400 | |
| | 250,000 | | | Ras Laffan Liquefied Natural Gas Company | | | 5.50% | | | | 09/30/2014 | | | | 270,313 | |
| | | | | | | | | | | | | | | | |
PRINCIPAL
AMOUNT | | | SECURITY DESCRIPTION | | RATE | | | MATURITY | | | VALUE $ | |
| $ | 387,900 | | | Ras Laffan Liquefied Natural Gas Company | | | 5.83% | | | | 09/30/2016 | | | | 416,993 | |
| | 915,000 | | | Royal Bank of Cananda | | | 1.25% | # | | | 10/30/2014 | | | | 925,227 | |
| | 300,000 | | | Russian Agricultural Bank | | | 7.18% | | | | 05/16/2013 | | | | 314,850 | |
| | 250,000 | | | Sberbank of Russia | | | 6.47% | | | | 07/02/2013 | | | | 264,125 | |
| | 700,000 | | | Southern Copper Corporation | | | 6.38% | | | | 07/27/2015 | | | | 787,329 | |
| | 800,000 | | | Telefonos de Mexico S.A.B. | | | 5.50% | | | | 01/27/2015 | | | | 882,928 | |
| | 171,636 | | | Tengizchevroil Finance Corporation | | | 6.12% | | | | 11/15/2014 | | | | 181,102 | |
| | 700,000 | | | TM Global, Inc. | | | 5.25% | | | | 09/22/2014 | | | | 739,917 | |
| | 200,000 | | | Transneft | | | 5.67% | | | | 03/05/2014 | | | | 213,550 | |
| | 718,000 | | | United Overseas Bank Ltd. | | | 4.50% | | | | 07/02/2013 | | | | 742,376 | |
| | 400,000 | | | VEB Leasing Investment Ltd. | | | 5.13% | | | | 05/27/2016 | | | | 406,500 | |
| | 700,000 | | | Votorantim Overseas III | | | 7.88% | | | | 01/23/2014 | | | | 765,450 | |
| | | | | | | | | | | | | | | | |
| | | | Total Foreign Corporate Bonds
(Cost $30,229,052) | | | | 30,455,587 | |
| | | | | | | | | | | | | | | | |
| FOREIGN GOVERNMENT BONDS AND NOTES, SUPRANATIONALS AND
FOREIGN AGENCIES 2.8% |
|
| | 300,000 | | | Export-Import Bank of Korea | | | 4.13% | | | | 09/09/2015 | | | | 316,136 | |
| | 925,000 | | | Korea Development Bank | | | 4.38% | | | | 08/10/2015 | | | | 979,574 | |
| | 850,000 | | | Mexico Government International Bond | | | 5.88% | | | | 01/15/2014 | | | | 923,100 | |
| | 660,000 | | | Pemex Project Funding Master Trust | | | 5.75% | | | | 12/15/2015 | | | | 739,200 | |
| | 1,050,000 | | | Republic of Korea | | | 4.88% | | | | 09/22/2014 | | | | 1,126,286 | |
| | 600,000 | | | Republic of South Africa | | | 6.50% | | | | 06/02/2014 | | | | 667,500 | |
| | 1,100,000 | | | State of Qatar | | | 4.00% | | | | 01/20/2015 | | | | 1,160,500 | |
| | 250,000 | | | Wakala Global Sukuk BHD | | | 2.99% | | | | 07/06/2016 | | | | 255,958 | |
| | | | | | | | | | | | | | | | |
| | | | Total Foreign Government Bonds and Notes, Supranationals and Foreign Agencies
(Cost $6,118,154) | | | | 6,168,254 | |
| | | | | | | | | | | | | | | | |
| | US GOVERNMENT / AGENCY MORTGAGE BACKED SECURITIES 2.7% | |
| | 945,340 | | | Federal Home Loan Mortgage Corporation, Pool G06871 | | | 6.00% | | | | 06/01/2038 | | | | 1,045,377 | |
| | 965,537 | | | Federal Home Loan Mortgage Corporation, Pool N70081 | | | 5.50% | | | | 07/01/2038 | | | | 1,052,996 | |
| | 645,845 | | | Federal Home Loan Mortgage Corporation, Series 3267-BA | | | 5.80% | | | | 11/15/2036 | | | | 714,210 | |
| | 402,732 | | | Federal Home Loan Mortgage Corporation, Series 3872-BA | | | 4.00% | | | | 06/15/2041 | | | | 427,818 | |
| | 396,383 | | | Federal National Mortgage Association, Series 2011-64-DB | | | 4.00% | | | | 07/25/2041 | | | | 419,305 | |
| | 214,996 | | | Federal National Mortgage Association Pass-Thru, Pool 995112 | | | 5.50% | | | | 07/01/2036 | | | | 235,934 | |
| | 979,496 | | | Federal National Mortgage Association Pass-Thru, Pool AB3850 | | | 4.00% | | | | 11/01/2041 | | | | 1,014,933 | |
| | | | | | |
| 36 | | DoubleLine Funds | | | | The accompanying notes are an integral part of these financial statements |
March 31, 2012
| | | | | | | | | | | | | | | | |
PRINCIPAL
AMOUNT | | | SECURITY DESCRIPTION | | RATE | | | MATURITY | | | VALUE $ | |
| $ | 866,987 | | | Federal National Mortgage Association Pass-Thru, Pool AD0189 | | | 5.50% | | | | 02/01/2039 | | | | 949,115 | |
| | | | | | | | | | | | | | | | |
| | | | Total US Government / Agency Mortgage backed Securities
(Cost $5,779,688) | | | | 5,859,688 | |
| | | | | | | | | | | | | | | | |
| | US GOVERNMENT BONDS AND NOTES 7.4% | |
| | 3,000,000 | | | United States Treasury Notes | | | 0.50% | | | | 05/31/2013 | | | | 3,009,141 | |
| | 6,000,000 | | | United States Treasury Notes | | | 1.88% | | | | 04/30/2014 | | | | 6,186,564 | |
| | 7,000,000 | | | United States Treasury Notes | | | 0.25% | | | | 02/15/2015 | | | | 6,950,783 | |
| | | | | | | | | | | | | | | | |
| | | | Total US Government Bonds and Notes
(Cost $16,122,979) | | | | 16,146,488 | |
| | | | | | | | | | | | | | | | |
| | SHORT TERM INVESTMENTS 10.9% | |
| | 23,637,921 | | | Fidelity Institutional Government Portfolio | | | 0.01% | ¨ | | | | | | | 23,637,921 | |
| | | | | | | | | | | | | | | | |
| | | | Total Short Term Investments
(Cost $23,637,921) | | | | 23,637,921 | |
| | | | | | | | | | | | | | | | |
| | | | Total Investments 98.2%
(Cost $212,770,132) | | | | 213,541,043 | |
| | | | Other Assets in Excess of Liabilities 1.8% | | | | 3,919,167 | |
| | | | | | | | | | | | | | | | |
| | | | NET ASSETS 100.0% | | | $ | 217,460,210 | |
| | | | | | | | | | | | | | | | |
| | | | |
| PORTFOLIO HOLDINGS as % of Net Assets | |
Non-Agency Collateralized Mortgage Obligations | | | 39.4% | |
US Corporate Bonds | | | 17.9% | |
Foreign Corporate Bonds | | | 14.0% | |
Short Term Investments | | | 10.9% | |
US Government Bonds and Notes | | | 7.4% | |
Collateralized Loan Obligations | | | 3.1% | |
Foreign Government Bonds and Notes, Supranationals and Foreign Agencies | | | 2.8% | |
US Government / Agency Mortgage Backed Securities | | | 2.7% | |
Other Assets and Liabilities | | | 1.8% | |
| | | | |
| | | 100.0% | |
| | | | |
| # | Variable rate security. Rate disclosed as of March 31, 2012. |
| ^ | Security exempt from registration under Rule 144A of the Securities Act of 1933. These securities may be resold in transactions exempt from registration, to qualified institutional buyers. These securities are determined to be liquid by the Adviser, unless otherwise noted, under procedures established by the Fund’s Board of Trustees. At March 31, 2012, the value of these securities amounted to $38,224,767 or 17.6% of net assets. |
| I/O | Interest only security |
| ¨ | Seven-day yield as of March 31, 2012 |
| | | | | | |
| The accompanying notes are an integral part of these financial statements | | Annual Report | | March 31, 2012 | | 37 |
| | |
| Statements of Assets and Liabilities | | March 31, 2012 |
| | | | | | | | | | | | | | | | | | | | |
| | | DoubleLine
Total Return
Bond Fund | | | DoubleLine
Core Fixed
Income Fund | | | DoubleLine
Emerging Markets
Fixed Income Fund | | | DoubleLine
Multi-Asset
Growth Fund
(Consolidated) | | | DoubleLine
Low Duration
Bond Fund | |
| | | | | |
ASSETS | | | | | | | | | | | | | | | | | | | | |
Investments in Unaffiliated Securities, at Value* | | $ | 17,430,068,573 | | | $ | 2,028,151,774 | | | $ | 423,099,256 | | | $ | 55,680,192 | | | $ | 189,903,122 | |
Investments in Affiliated Securities, at Value* | | | — | | | | — | | | | — | | | | 38,936,532 | | | | — | |
Short-term Securities* | | | 5,099,938,846 | | | | 33,587,138 | | | | 2,002,538 | | | | 29,517,768 | | | | 23,637,921 | |
Receivable for Fund Shares Sold | | | 210,114,682 | | | | 25,863,135 | | | | 2,330,281 | | | | 309,545 | | | | 8,718,840 | |
Interest and Dividends Receivable | | | 97,377,480 | | | | 15,303,642 | | | | 6,407,310 | | | | 461,594 | | | | 1,157,628 | |
Cash | | | 1,833,527 | | | | 330,238 | | | | 1,183,674 | | | | 70,850 | | | | — | |
Prepaid Expenses and Other Assets | | | 694,525 | | | | 130,440 | | | | 74,095 | | | | 43,533 | | | | 19,565 | |
Receivable for Investments Sold | | | — | | | | 3,389,213 | | | | 6,461,476 | | | | 6,883,829 | | | | 15,716,688 | |
Deposit at Broker for Futures | | | — | | | | — | | | | — | | | | 954,740 | | | | — | |
Swaps Premiums Paid | | | — | | | | — | | | | — | | | | 436,629 | | | | — | |
Variation Margin Receivable | | | — | | | | — | | | | — | | | | 31,980 | | | | — | |
Total Assets | | | 22,840,027,633 | | | | 2,106,755,580 | | | | 441,558,630 | | | | 133,327,192 | | | | 239,153,764 | |
| | | | | |
LIABILITIES | | | | | | | | | | | | | | | | | | | | |
Payable for Investments Purchased | | | 416,130,834 | | | | 9,049,410 | | | | 8,574,897 | | | | 4,190,000 | | | | 9,198,207 | |
Distribution Payable | | | 37,333,555 | | | | 2,415,833 | | | | 609,100 | | | | 164,692 | | | | 46,615 | |
Payable for Fund Shares Redeemed | | | 31,560,591 | | | | 10,802,310 | | | | 542,558 | | | | 982,694 | | | | 12,338,065 | |
Investment Advisory Fees Payable | | | 7,037,531 | | | | 564,999 | | | | 255,731 | | | | 71,741 | | | | 7,874 | |
Registration Fees Payable | | | 1,857,397 | | | | 234,282 | | | | 32,878 | | | | 11,493 | | | | 25,419 | |
Transfer Agent Expenses Payable | | | 1,361,735 | | | | 127,309 | | | | 39,933 | | | | 23,918 | | | | 18,117 | |
Distribution Fees Payable | | | 1,220,163 | | | | 102,891 | | | | 15,395 | | | | 8,170 | | | | 9,468 | |
Administration Fees Payable | | | 620,575 | | | | 93,972 | | | | 43,923 | | | | 18,386 | | | | 19,287 | |
Accrued Expenses | | | 557,658 | | | | 52,833 | | | | 35,076 | | | | 55,387 | | | | 30,502 | |
Written Option Contracts, at Value
(Premiums received $340,602) | | | — | | | | — | | | | — | | | | 370,573 | | | | — | |
Unrealized Depreciation on Swaps | | | — | | | | — | | | | — | | | | 96,835 | | | | — | |
Total Liabilities | | | 497,680,039 | | | | 23,443,839 | | | | 10,149,491 | | | | 5,993,889 | | | | 21,693,554 | |
Net Assets | | $ | 22,342,347,594 | | | $ | 2,083,311,741 | | | $ | 431,409,139 | | | $ | 127,333,303 | | | $ | 217,460,210 | |
| | | | | |
NET ASSETS CONSIST OF: | | | | | | | | | | | | | | | | | | | | |
Paid-in Capital | | $ | 22,168,251,754 | | | $ | 2,052,364,842 | | | $ | 423,855,326 | | | $ | 128,195,033 | | | $ | 216,525,642 | |
Undistributed (Accumulated) Net Investment Income (Loss) | | | 3,690,569 | | | | 210,819 | | | | 12,770 | | | | 76,940 | | | | — | |
Accumulated Net Realized Gain (Loss) on Investments | | | (146,160,145 | ) | | | 2,541,161 | | | | 331,643 | | | | (507,320 | ) | | | 163,657 | |
Net Unrealized Appreciation (Depreciation) on: | | | | | | | | | | | | | | | | | | | | |
Investments in Unaffiliated Securities | | | 316,678,128 | | | | 28,194,919 | | | | 7,209,400 | | | | (699,909 | ) | | | 770,911 | |
Investments in Affiliated Securities | | | — | | | | — | | | | — | | | | 376,867 | | | | — | |
Short-term Securities | | | (112,712 | ) | | | — | | | | — | | | | — | | | | — | |
Futures | | | — | | | | — | | | | — | | | | 18,498 | | | | — | |
Swaps | | | — | | | | — | | | | — | | | | (96,835 | ) | | | — | |
Written Options | | | — | | | | — | | | | — | | | | (29,971 | ) | | | — | |
Net Assets | | $ | 22,342,347,594 | | | $ | 2,083,311,741 | | | $ | 431,409,139 | | | $ | 127,333,303 | | | $ | 217,460,210 | |
| | | | | |
*Identified Cost: | | | | | | | | | | | | | | | | | | | | |
Investments in Unaffiliated Securities | | $ | 17,113,390,445 | | | $ | 1,999,956,855 | | | $ | 415,889,856 | | | $ | 56,380,101 | | | $ | 189,132,211 | |
Investments in Affiliated Securities | | | — | | | | — | | | | — | | | | 38,559,665 | | | | — | |
Short-term Securities | | | 5,100,051,558 | | | | 33,587,138 | | | | 2,002,538 | | | | 29,517,768 | | | | 23,637,921 | |
| | | | | |
Class I (unlimited shares authorized): | | | | | | | | | | | | | | | | | | | | |
Net Assets | | $ | 16,226,568,668 | | | $ | 1,544,168,770 | | | $ | 349,925,633 | | | $ | 85,072,523 | | | $ | 132,117,124 | |
Shares Outstanding | | | 1,452,955,798 | | | | 139,645,156 | | | | 32,718,477 | | | | 8,483,719 | | | | 13,000,748 | |
Net Asset Value, Offering and Redemption Price per Share | | $ | 11.17 | | | $ | 11.06 | | | $ | 10.70 | | | $ | 10.03 | | | $ | 10.16 | |
| | | | | |
Class N (unlimited shares authorized): | | | | | | | | | | | | | | | | | | | | |
Net Assets | | $ | 6,115,778,926 | | | $ | 539,142,971 | | | $ | 81,483,506 | | | $ | — | | | $ | 85,343,086 | |
Shares Outstanding | | | 547,787,655 | | | | 48,782,225 | | | | 7,618,255 | | | | — | | | | 8,404,228 | |
Net Asset Value, Offering and Redemption Price per Share | | $ | 11.16 | | | $ | 11.05 | | | $ | 10.70 | | | $ | — | | | $ | 10.15 | |
| | | | | |
Class A (unlimited shares authorized): | | | | | | | | | | | | | | | | | | | | |
Net Assets | | $ | — | | | $ | — | | | $ | — | | | $ | 42,260,780 | | | $ | — | |
Shares Outstanding | | | — | | | | — | | | | — | | | | 4,219,050 | | | | — | |
Net Asset Value, Offering and Redemption Price per Share | | $ | — | | | $ | — | | | $ | — | | | $ | 10.02 | | | $ | — | |
| | | | | | | | |
| 38 | | DoubleLine Funds | | | | | The accompanying notes are an integral part of these financial statements | |
| | |
| Statements of Operations | | Period Ended March 31, 2012 |
| | | | | | | | | | | | | | | | | | | | |
| | | DoubleLine
Total Return
Bond Fund | | | DoubleLine
Core Fixed
Income Fund | | | DoubleLine
Emerging Markets
Fixed Income Fund | | | DoubleLine
Multi-Asset
Growth Fund
(Consolidated) | | | DoubleLine
Low Duration
Bond Fund1 | |
| | | | | |
INVESTMENT INCOME | | | | | | | | | | | | | | | | | | | | |
Income: | | | | | | | | | | | | | | | | | | | | |
Interest | | $ | 908,546,421 | | | $ | 45,931,027 | | | $ | 15,005,703 | | | $ | 1,981,106 | | | $ | 1,105,257 | |
Dividends from Unaffiliated Securities | | | — | | | | — | | | | — | | | | 360,350 | | | | — | |
Dividends from Affiliated Securities | | | — | | | | — | | | | — | | | | 1,305,683 | | | | — | |
Total Investment Income | | | 908,546,421 | | | | 45,931,027 | | | | 15,005,703 | | | | 3,647,139 | | | | 1,105,257 | |
Expenses: | | | | | | | | | | | | | | | | | | | | |
Investment Advisory Fees | | | 48,900,892 | | | | 3,671,920 | | | | 1,747,742 | | | | 653,241 | | | | 152,128 | |
Distribution Fees - Class N | | | 8,576,852 | | | | 622,403 | | | | 115,683 | | | | — | | | | 29,299 | |
Distribution Fees - Class A | | | — | | | | — | | | | — | | | | 61,652 | | | | — | |
Transfer Agent Expenses | | | 5,038,155 | | | | 459,885 | | | | 190,132 | | | | 104,632 | | | | 43,224 | |
Administration, Fund Accounting and Custodian Fees | | | 2,531,784 | | | | 326,874 | | | | 76,574 | | | | 71,939 | | | | 39,258 | |
Registration Fees | | | 2,318,377 | | | | 336,733 | | | | 102,532 | | | | 72,425 | | | | 55,479 | |
Professional Fees | | | 880,661 | | | | 65,348 | | | | 53,356 | | | | 147,055 | | | | 105,674 | |
Shareholder Reporting Expenses | | | 872,347 | | | | 55,386 | | | | 19,935 | | | | 18,573 | | | | 11,456 | |
Insurance Expenses | | | 512,627 | | | | 11,800 | | | | 11,716 | | | | 405 | | | | 184 | |
Trustees’ Fees and Expenses | | | 412,213 | | | | 26,731 | | | | 7,439 | | | | 34,396 | | | | 826 | |
Miscellaneous Expenses | | | 24,615 | | | | 4,943 | | | | 5,360 | | | | 22,369 | | | | 2,154 | |
Total Expenses | | | 70,068,523 | | | | 5,582,023 | | | | 2,330,469 | | | | 1,186,687 | | | | 439,682 | |
Less: Fees Waived | | | (1,594,218 | ) | | | (461,517 | ) | | | — | | | | (350,372 | ) | | | (206,049 | ) |
Net Expenses | | | 68,474,305 | | | | 5,120,506 | | | | 2,330,469 | | | | 836,315 | | | | 233,633 | |
| | | | | |
Net Investment Income | | | 840,072,116 | | | | 40,810,521 | | | | 12,675,234 | | | | 2,810,824 | | | | 871,624 | |
| | | | | |
REALIZED & UNREALIZED GAIN (LOSS) ON INVESTMENTS | | | | | | | | | | | | | | | | | | | | |
Net Realized Gain (Loss) on: | | | | | | | | | | | | | | | | | | | | |
Investments in Unaffiliated Securities | | | 1,666,979 | | | | 9,794,979 | | | | 2,118,974 | | | | (85,643 | ) | | | 262,486 | |
Investments in Affiliated Securities | | | — | | | | — | | | | — | | | | — | | | | — | |
Futures | | | — | | | | — | | | | — | | | | (371,293 | ) | | | — | |
Swaps | | | — | | | | — | | | | — | | | | 93,439 | | | | — | |
Written Options | | | | | | | | | | | | | | | 138,106 | | | | | |
Net Change in Unrealized Appreciation (Depreciation) of: | | | | | | | | | | | | | | | | | | | | |
Investments in Unaffiliated Securities | | | 266,302,007 | | | | 26,945,690 | | | | 5,899,028 | | | | (787,444 | ) | | | 770,911 | |
Investments in Affiliated Securities | | | — | | | | — | | | | — | | | | 408,694 | | | | — | |
Futures | | | — | | | | — | | | | — | | | | 25,188 | | | | — | |
Swaps | | | — | | | | — | | | | — | | | | (79,871 | ) | | | — | |
Written Options | | | | | | | | | | | | | | | (29,971 | ) | | | | |
Net Realized and Unrealized Gain (Loss) on Investments | | | 267,968,986 | | | | 36,740,669 | | | | 8,018,002 | | | | (688,795 | ) | | | 1,033,397 | |
| | | | | |
NET INCREASE (DECREASE) IN NET ASSETS RESULTING FROM OPERATIONS | | $ | 1,108,041,102 | | | $ | 77,551,190 | | | $ | 20,693,236 | | | $ | 2,122,029 | | | $ | 1,905,021 | |
| 1 | Commencement of operations on September 30, 2011. |
| | | | | | |
| The accompanying notes are an integral part of these financial statements | | Annual Report | | March 31, 2012 | | 39 |
| | |
| Statements of Changes in Net Assets | | |
| | | | | | | | | | | | | | | | |
| | |
DoubleLine
Total Return Bond Fund | | |
DoubleLine
Core Fixed Income Fund | |
| | | Year Ended
March 31, 2012 | | | Period Ended
March 31, 20111 | | | Year Ended
March 31, 2012 | | | Period Ended
March 31, 20112 | |
| | | | |
OPERATIONS | | | | | | | | | | | | | | | | |
Net Investment Income | | $ | 840,072,116 | | | $ | 248,968,162 | | | $ | 40,810,521 | | | $ | 4,236,154 | |
Net Realized Gain (Loss) on Investments | | | 1,666,979 | | | | 161,271 | | | | 9,794,979 | | | | 133,642 | |
Net Change in Unrealized Appreciation
(Depreciation) of Investments | | | 266,302,007 | | | | 50,263,409 | | | | 26,945,690 | | | | 1,249,229 | |
Net Increase (Decrease) in Net Assets Resulting
from Operations | | | 1,108,041,102 | | | | 299,392,842 | | | | 77,551,190 | | | | 5,619,025 | |
| | | | |
DISTRIBUTIONS TO SHAREHOLDERS | | | | | | | | | | | | | | | | |
From Net Investment Income | | | | | | | | | | | | | | | | |
Class I | | | (707,169,191 | ) | | | (194,822,350 | ) | | | (32,668,808 | ) | | | (3,671,382 | ) |
Class N | | | (268,342,590 | ) | | | (63,003,973 | ) | | | (11,470,441 | ) | | | (610,315 | ) |
From Net Realized Gain | | | | | | | | | | | | | | | | |
Class I | | | — | | | | — | | | | (2,506,764 | ) | | | (264,504 | ) |
Class N | | | — | | | | — | | | | (980,385 | ) | | | (50,717 | ) |
| | | | |
Total Distributions to Shareholders | | | (975,511,781 | ) | | | (257,826,323 | ) | | | (47,626,398 | ) | | | (4,596,918 | ) |
| | | | |
NET SHARE TRANSACTIONS | | | | | | | | | | | | | | | | |
Class I | | | 11,798,073,342 | | | | 4,295,933,080 | | | | 1,363,914,858 | | | | 157,034,815 | |
Class N | | | 4,601,735,724 | | | | 1,472,509,608 | | | | 500,843,567 | | | | 30,571,602 | |
Increase (Decrease) in Net Assets Resulting from Net Share Transactions | | | 16,399,809,066 | | | | 5,768,442,688 | | | | 1,864,758,425 | | | | 187,606,417 | |
| | | | |
Total Increase (Decrease) in Net Assets | | $ | 16,532,338,387 | | | $ | 5,810,009,207 | | | $ | 1,894,683,217 | | | $ | 188,628,524 | |
| | | | |
NET ASSETS | | | | | | | | | | | | | | | | |
Beginning of Period | | $ | 5,810,009,207 | | | | — | | | $ | 188,628,524 | | | | — | |
End of Period | | $ | 22,342,347,594 | | | $ | 5,810,009,207 | | | $ | 2,083,311,741 | | | $ | 188,628,524 | |
| | | | |
Accumulated (Undistributed) Net Investment
Gain (Loss) | | $ | 3,690,569 | | | $ | 13,919,090 | | | $ | 210,819 | | | $ | 135,227 | |
| 1 | Commencement of operations on April 6, 2010. |
| 2 | Commencement of operations on June 1, 2010. |
| | | | | | | | |
| 40 | | DoubleLine Funds | | | | | The accompanying notes are an integral part of these financial statements | |
| | |
| Statements of Changes in Net Assets | | |
| | | | | | | | | | | | | | | | | | | | |
| | | DoubleLine
Emerging Markets
Fixed Income Fund | | | DoubleLine
Multi-Asset
Growth Fund (Consolidated) | | | DoubleLine
Low Duration
Bond Fund | |
| | | Year Ended
March 31, 2012 | | | Period Ended
March 31, 20111 | | | Period Ended
March 31, 2012 | | | Period Ended
March 31, 20112 | | | Period Ended
March 31, 20123 | |
| | | | | |
OPERATIONS | | | | | | | | | | | | | | | | | | | | |
Net Investment Income | | $ | 12,675,234 | | | $ | 3,330,162 | | | $ | 2,810,824 | | | $ | 70,964 | | | $ | 871,624 | |
Net Realized Gain (Loss) on Investments | | | 2,118,974 | | | | 776,327 | | | | (225,391 | ) | | | (11,583 | ) | | | 262,486 | |
Net Change in Unrealized Appreciation
(Depreciation) of Investments | | | 5,899,028 | | | | 1,310,372 | | | | (463,404 | ) | | | 32,054 | | | | 770,911 | |
Net Increase (Decrease) in Net Assets Resulting from Operations | | | 20,693,236 | | | | 5,416,861 | | | | 2,122,029 | | | | 91,435 | | | | 1,905,021 | |
| | | | | |
DISTRIBUTIONS TO SHAREHOLDERS | | | | | | | | | | | | | | | | | | | | |
From Net Investment Income | | | | | | | | | | | | | | | | | | | | |
Class I | | | (10,225,912 | ) | | | (2,716,962 | ) | | | (1,875,262 | ) | | | (30,216 | ) | | | (706,448 | ) |
Class N | | | (2,456,543 | ) | | | (593,209 | ) | | | — | | | | — | | | | (264,005 | ) |
Class A | | | — | | | | — | | | | (956,064 | ) | | | (7,225 | ) | | | — | |
From Net Realized Gain | | | | | | | | | | | | | | | | | | | | |
Class I | | | (1,904,354 | ) | | | (206,130 | ) | | | — | | | | — | | | | — | |
Class N | | | (408,055 | ) | | | (45,119 | ) | | | — | | | | — | | | | — | |
Class A | | | — | | | | — | | | | — | | | | — | | | | | |
| | | | | |
Total Distributions to Shareholders | | | (14,994,864 | ) | | | (3,561,420 | ) | | | (2,831,326 | ) | | | (37,441 | ) | | | (970,453 | ) |
| | | | | |
NET SHARE TRANSACTIONS | | | | | | | | | | | | | | | | | | | | |
Class I | | | 238,564,644 | | | | 104,635,717 | | | | 63,368,833 | | | | 22,086,396 | | | | 131,391,285 | |
Class N | | | 54,642,195 | | | | 26,012,770 | | | | — | | | | — | | | | 85,134,357 | |
Class A | | | — | | | | — | | | | 36,474,077 | | | | 6,059,300 | | | | | |
Increase (Decrease) in Net Assets Resulting from Net Share Transactions | | | 293,206,839 | | | | 130,648,487 | | | | 99,842,910 | | | | 28,145,696 | | | | 216,525,642 | |
| | | | | |
Total Increase (Decrease) in Net Assets | | $ | 298,905,211 | | | $ | 132,503,928 | | | $ | 99,133,613 | | | $ | 28,199,690 | | | $ | 217,460,210 | |
| | | | | |
NET ASSETS | | | | | | | | | | | | | | | | | | | | |
Beginning of Period | | $ | 132,503,928 | | | | — | | | $ | 28,199,690 | | | | — | | | $ | — | |
End of Period | | $ | 431,409,139 | | | $ | 132,503,928 | | | $ | 127,333,303 | | | $ | 28,199,690 | | | $ | 217,460,210 | |
| | | | | |
Accumulated (Undistributed) Net Investment Gain (Loss) | | $ | 12,770 | | | $ | 19,991 | | | $ | 76,940 | | | $ | 34,630 | | | $ | 0 | |
| 1 | Commencement of operations on April 6, 2010. |
| 2 | Commencement of operations on December 20, 2010. |
| 3 | Commencement of operations on September 30, 2011. |
| | | | | | |
| The accompanying notes are an integral part of these financial statements | | Annual Report | | March 31, 2012 | | 41 |
| | | | | | | | | | | | | | | | |
| | | DoubleLine Total Return Bond Fund | |
| | | Year Ended
March 31, 2012 | | | Period Ended
March 31, 20111 | | | Year Ended
March 31, 2012 | | | Period Ended
March 31, 20111 | |
| | | Class I | | | Class I | | | Class N | | | Class N | |
| | | | |
Net Asset Value, Beginning of Period | | $ | 10.96 | | | $ | 10.00 | | | $ | 10.96 | | | $ | 10.00 | |
| | | | |
Income (Loss) from Investment Operations: | | | | | | | | | | | | | | | | |
Net Investment Income (Loss)4 | | | 0.77 | | | | 1.02 | | | | 0.73 | | | | 0.99 | |
Net Gain (Loss) on Investments (Realized and Unrealized) | | | 0.31 | | | | 0.87 | | | | 0.31 | | | | 0.87 | |
Total from Investment Operations | | | 1.08 | | | | 1.89 | | | | 1.04 | | | | 1.86 | |
| | | | |
Less Distributions: | | | | | | | | | | | | | | | | |
Distributions from Net Investment Income | | | (0.87 | ) | | | (0.93 | ) | | | (0.84 | ) | | | (0.90 | ) |
Distributions from Net Realized Gain | | | — | | | | — | | | | — | | | | — | |
Total Distributions | | | (0.87 | ) | | | (0.93 | ) | | | (0.84 | ) | | | (0.90 | ) |
Net Asset Value, End of Period | | $ | 11.17 | | | $ | 10.96 | | | $ | 11.16 | | | $ | 10.96 | |
Total Return | | | 10.18% | | | | 19.28% | 2 | | | 9.83% | | | | 19.04% | 2 |
| | | | |
Supplemental Data: | | | | | | | | | | | | | | | | |
Net Assets, End of Period (000’s) | | $ | 16,226,569 | | | $ | 4,330,408 | | | $ | 6,115,779 | | | $ | 1,479,601 | |
Ratios to Average Net Assets: | | | | | | | | | | | | | | | | |
Expenses Before Fees Waived | | | 0.50% | | | | 0.53% | 3 | | | 0.75% | | | | 0.78% | 3 |
Expenses After Fees Waived | | | 0.49% | | | | 0.49% | 3 | | | 0.74% | | | | 0.74% | 3 |
Net Investment Income (Loss) | | | 6.86% | | | | 9.42% | 3 | | | 6.58% | | | | 9.17% | 3 |
Portfolio Turnover Rate | | | 15% | | | | 17% | 2 | | | 15% | | | | 17% | 2 |
| 1 | Commencement of operations on April 6, 2010. |
| 4 | Calculated based on average shares outstanding during the period. |
| | | | | | | | |
| 42 | | DoubleLine Funds | | | | | The accompanying notes are an integral part of these financial statements | |
| | | | | | | | | | | | | | | | |
| | | DoubleLine Core Fixed Income Fund | |
| | | Year Ended
March 31, 2012 | | | Period Ended
March 31, 20111 | | | Year Ended
March 31, 2012 | | | Period Ended
March 31, 20111 | |
| | | Class I | | | Class I | | | Class N | | | Class N | |
| | | | |
Net Asset Value, Beginning of Period | | $ | 10.46 | | | $ | 10.00 | | | $ | 10.46 | | | $ | 10.00 | |
| | | | |
Income (Loss) from Investment Operations: | | | | | | | | | | | | | | | | |
Net Investment Income (Loss)4 | | | 0.50 | | | | 0.57 | | | | 0.47 | | | | 0.55 | |
Net Gain (Loss) on Investments (Realized and Unrealized) | | | 0.65 | | | | 0.41 | | | | 0.65 | | | | 0.41 | |
Total from Investment Operations | | | 1.15 | | | | 0.98 | | | | 1.12 | | | | 0.96 | |
| | | | |
Less Distributions: | | | | | | | | | | | | | | | | |
Distributions from Net Investment Income | | | (0.52 | ) | | | (0.48 | ) | | | (0.50 | ) | | | (0.46 | ) |
Distributions from Net Realized Gain | | | (0.03 | ) | | | (0.04 | ) | | | (0.03 | ) | | | (0.04 | ) |
Total Distributions | | | (0.55 | ) | | | (0.52 | ) | | | (0.53 | ) | | | (0.50 | ) |
Net Asset Value, End of Period | | $ | 11.06 | | | $ | 10.46 | | | $ | 11.05 | | | $ | 10.46 | |
Total Return | | | 11.19% | | | | 9.90% | 2 | | | 10.85% | | | | 9.71% | 2 |
| | | | |
Supplemental Data: | | | | | | | | | | | | | | | | |
Net Assets, End of Period (000’s) | | $ | 1,544,169 | | | $ | 158,043 | | | $ | 539,143 | | | $ | 30,586 | |
Ratios to Average Net Assets: | | | | | | | | | | | | | | | | |
Expenses Before Fees Waived | | | 0.54% | | | | 0.85% | 3 | | | 0.79% | | | | 1.09% | 3 |
Expenses After Fees Waived | | | 0.49% | | | | 0.49% | 3 | | | 0.74% | | | | 0.74% | 3 |
Net Investment Income (Loss) | | | 4.51% | | | | 6.56% | 3 | | | 4.22% | | | | 6.38% | 3 |
Portfolio Turnover Rate | | | 81% | | | | 84% | 2 | | | 81% | | | | 84% | 2 |
| 1 | Commencement of operations on June 1, 2010. |
| 4 | Calculated based on average shares outstanding during the period. |
| | | | | | |
| The accompanying notes are an integral part of these financial statements | | Annual Report | | March 31, 2012 | | 43 |
| | | | | | | | | | | | | | | | |
| | | DoubleLine Emerging Markets Fixed Income Fund | |
| | | Year Ended
March 31, 2012 | | | Period Ended
March 31, 20111 | | | Year Ended
March 31, 2012 | | | Period Ended
March 31, 20111 | |
| | | Class I | | | Class I | | | Class N | | | Class N | |
| | | | |
Net Asset Value, Beginning of Period | | $ | 10.57 | | | $ | 10.00 | | | $ | 10.57 | | | $ | 10.00 | |
| | | | |
Income (Loss) from Investment Operations: | | | | | | | | | | | | | | | | |
Net Investment Income (Loss)4 | | | 0.58 | | | | 0.60 | | | | 0.55 | | | | 0.58 | |
Net Gain (Loss) on Investments (Realized and Unrealized) | | | 0.23 | | | | 0.52 | | | | 0.23 | | | | 0.52 | |
Total from Investment Operations | | | 0.81 | | | | 1.12 | | | | 0.78 | | | | 1.10 | |
| | | | |
Less Distributions: | | | | | | | | | | | | | | | | |
Distributions from Net Investment Income | | | (0.58 | ) | | | (0.52 | ) | | | (0.55 | ) | | | (0.50 | ) |
Distributions from Net Realized Gain | | | (0.10 | ) | | | (0.03 | ) | | | (0.10 | ) | | | (0.03 | ) |
Total Distributions | | | (0.68 | ) | | | (0.55 | ) | | | (0.65 | ) | | | (0.53 | ) |
Net Asset Value, End of Period | | $ | 10.70 | | | $ | 10.57 | | | $ | 10.70 | | | $ | 10.57 | |
Total Return | | | 7.96% | | | | 11.48% | 2 | | | 7.71% | | | | 11.25% | 2 |
| | | | |
Supplemental Data: | | | | | | | | | | | | | | | | |
Net Assets, End of Period (000’s) | | $ | 349,926 | | | $ | 106,227 | | | $ | 81,484 | | | $ | 26,277 | |
Ratios to Average Net Assets: | | | | | | | | | | | | | | | | |
Expenses Before Fees Waived | | | 0.95% | | | | 1.32% | 3 | | | 1.20% | | | | 1.57% | 3 |
Expenses After Fees Waived | | | 0.95% | | | | 0.95% | 3 | | | 1.20% | | | | 1.20% | 3 |
Net Investment Income (Loss) | | | 5.47% | | | | 5.85% | 3 | | | 5.26% | | | | 5.66% | 3 |
Portfolio Turnover Rate | | | 177% | | | | 109% | 2 | | | 177% | | | | 109% | 2 |
| 1 | Commencement of operations on April 6, 2010. |
| 4 | Calculated based on average shares outstanding during the period. |
| | | | | | | | |
| 44 | | DoubleLine Funds | | | | | The accompanying notes are an integral part of these financial statements | |
| | | | | | | | | | | | | | | | |
| | | DoubleLine Multi-Asset Growth Fund (Consolidated) | |
| | | Period Ended
March 31, 2012 | | | Period Ended
March 31, 20111 | | | Period Ended
March 31, 2012 | | | Period Ended
March 31, 20111 | |
| | | Class I | | | Class I | | | Class A | | | Class A | |
| | | | |
Net Asset Value, Beginning of Period | | $ | 10.11 | | | $ | 10.00 | | | $ | 10.09 | | | $ | 10.00 | |
| | | | |
Income (Loss) from Investment Operations: | | | | | | | | | | | | | | | | |
Net Investment Income (Loss)4 | | | 0.42 | | | | 0.10 | | | | 0.41 | | | | 0.10 | |
Net Gain (Loss) on Investments (Realized and Unrealized) | | | (0.16 | ) | | | 0.02 | | | | (0.16 | ) | | | — | |
Total from Investment Operations | | | 0.26 | | | | 0.12 | | | | 0.25 | | | | 0.10 | |
| | | | |
Less Distributions: | | | | | | | | | | | | | | | | |
Distributions from Net Investment Income | | | (0.34 | ) | | | (0.01 | ) | | | (0.32 | ) | | | (0.01 | ) |
Distributions from Net Realized Gain | | | — | | | | — | | | | — | | | | — | |
Total Distributions | | | (0.34 | ) | | | (0.01 | ) | | | (0.32 | ) | | | (0.01 | ) |
Net Asset Value, End of Period | | $ | 10.03 | | | $ | 10.11 | | | $ | 10.02 | | | $ | 10.09 | |
Total Return5 | | | 2.67% | | | | 1.24% | 2 | | | 2.57% | | | | 1.02% | 2 |
| | | | |
Supplemental Data: | | | | | | | | | | | | | | | | |
Net Assets, End of Period (000’s) | | $ | 85,073 | | | $ | 22,128 | | | $ | 42,261 | | | $ | 6,071 | |
Ratios to Average Net Assets: | | | | | | | | | | | | | | | | |
Expenses Before Fees Waived | | | 1.51% | | | | 5.11% | 3 | | | 1.76% | | | | 6.05% | 3 |
Expenses After Fees Waived | | | 1.09% | | | | 1.18% | 3 | | | 1.34% | | | | 1.43% | 3 |
Net Investment Income (Loss) | | | 4.14% | | | | 3.57% | 3 | | | 3.88% | | | | 3.57% | 3 |
Portfolio Turnover Rate | | | 48% | | | | 19% | 2 | | | 48% | | | | 19% | 2 |
| 1 | Commencement of operations on December 20, 2010. |
| 4 | Calculated based on average shares outstanding during the period. |
| 5 | Total return does not include the effects of sales charges for Class A. |
| | | | | | |
| The accompanying notes are an integral part of these financial statements | | Annual Report | | March 31, 2012 | | 45 |
| | | | | | | | |
| | | DoubleLine Low Duration Bond Fund | |
| | | Period Ended
March 31, 20121 | | | Period Ended
March 31, 20121 | |
| | | Class I | | | Class N | |
| | |
Net Asset Value, Beginning of Period | | $ | 10.00 | | | $ | 10.00 | |
| | |
Income (Loss) from Investment Operations: | | | | | | | | |
Net Investment Income (Loss)4 | | | 0.11 | | | | 0.09 | |
Net Gain (Loss) on Investments (Realized and Unrealized) | | | 0.13 | | | | 0.13 | |
Total from Investment Operations | | | 0.24 | | | | 0.22 | |
| | |
Less Distributions: | | | | | | | | |
Distributions from Net Investment Income | | | (0.08 | ) | | | (0.07 | ) |
Distributions from Net Realized Gain | | | — | | | | — | |
Total Distributions | | | (0.08 | ) | | | (0.07 | ) |
Net Asset Value, End of Period | | $ | 10.16 | | | $ | 10.15 | |
Total Return2 | | | 2.44% | | | | 2.25% | |
| | |
Supplemental Data: | | | | | | | | |
Net Assets, End of Period (000’s) | | $ | 132,117 | | | $ | 85,343 | |
Ratios to Average Net Assets: | | | | | | | | |
Expenses Before Fees Waived3 | | | 0.94% | | | | 1.19% | |
Expenses After Fees Waived3 | | | 0.47% | | | | 0.72% | |
Net Investment Income (Loss)3 | | | 2.10% | | | | 1.74% | |
Portfolio Turnover Rate2 | | | 46% | | | | 46% | |
| 1 | Commencement of operations on September 30, 2011. |
| 4 | Calculated based on average shares outstanding during the period. |
| | | | | | | | |
| 46 | | DoubleLine Funds | | | | | The accompanying notes are an integral part of these financial statements | |
| | |
| Notes to Financial Statements | | March 31, 2012 |
1. Organization
DoubleLine Funds Trust, a Delaware statutory trust (the “Trust”), is an open-end investment management company registered under the Investment Company Act of 1940, as amended (the “1940 Act”). The Trust consists of five funds, DoubleLine Total Return Bond Fund, DoubleLine Core Fixed Income Fund, DoubleLine Emerging Markets Fixed Income Fund, DoubleLine Multi-Asset Growth Fund and DoubleLine Low Duration Bond Fund (each a “Fund” and collectively the “Funds”). The DoubleLine Total Return Bond Fund, DoubleLine Core Fixed Income Fund, DoubleLine Emerging Markets Fixed Income Fund and the DoubleLine Low Duration Bond Fund each offer two classes of shares, Class N shares and Class I shares. The DoubleLine Multi-Asset Growth Fund currently offers two classes of shares, Class A shares and Class I shares.
The DoubleLine Total Return Bond Fund and DoubleLine Emerging Markets Fixed Income Fund commenced operations on April 6, 2010. The DoubleLine Core Fixed Income Fund commenced operations on June 1, 2010. The DoubleLine Multi-Asset Growth Fund commenced operations on December 20, 2010. The DoubleLine Low Duration Bond Fund commenced operations on September 30, 2011.
The DoubleLine Total Return Bond Fund’s investment objective is to seek to maximize total return. The DoubleLine Core Fixed Income Fund’s investment objective is to seek to maximize current income and total return. The DoubleLine Emerging Markets Fixed Income Fund’s investment objective is to seek high total return from current income and capital appreciation. The DoubleLine Multi-Asset Growth Fund’s investment objective is to seek long-term capital appreciation. The DoubleLine Low Duration Bond Fund’s investment objective is to seek current income.
2. Significant Accounting Policies
The following is a summary of the significant accounting policies of the Funds. These policies are in conformity with accounting principles generally accepted in the United States of America (“US GAAP”).
A. Security Valuation. The Funds have adopted US GAAP fair value accounting standards which establish a definition of fair value and set out a hierarchy for measuring fair value. These standards require additional disclosures about the various inputs and valuation techniques used to develop the measurements of fair value and a discussion in changes in valuation techniques and related inputs during the period. These inputs are summarized in the three broad levels listed below:
| | • | | Level 1—Unadjusted quoted market prices in active markets |
| | • | | Level 2—Quoted prices for identical or similar assets in markets that are not active, or inputs derived from observable market data |
| | • | | Level 3—Unobservable inputs developed using the reporting entity’s estimates and assumptions, which reflect those that market participants would use |
Market values for domestic and foreign fixed income securities are normally determined on the basis of valuations provided by independent pricing services. Vendors value such securities based on one or more inputs described in the following table. The table provides examples of inputs that are commonly relevant for valuing particular classes of fixed income securities, in which the fund is authorized to invest. However, these classifications are not exclusive, and any of the inputs may be used to value any other class of fixed-income securities. Securities that use similar valuation techniques and inputs as described in the following table are categorized as Level 2 of the fair value hierarchy.
| | | | |
| Fixed-income class | | | | Examples of Standard Inputs |
All | | | | Benchmark yields, transactions, bids, offers, quotations from dealers and trading systems, new issues, spreads and other relationships observed in the markets among comparable securities; and pricing models such as yield measures calculated using factors such as cash flows, financial or collateral performance and other reference data (collectively referred to as “standard inputs”) |
Corporate bonds and notes; convertible securities | | | | Standard inputs and underlying equity of the issuer |
Bonds and notes of government and government agencies | | | | Standard inputs and interest rate volatilities |
Mortgage-backed; asset-backed obligations (including collateralized loan obligations) | | | | Standard inputs and cash flows, prepayment information, default rates, delinquency and loss assumptions, collateral characteristics, credit enhancements and specific deal information, trustee reports |
Investments in registered open-end management investment companies will be valued based upon the NAVs of such investments and are categorized as Level 1 of the fair value hierarchy. Investments in privately held investment funds typically will be valued based upon the NAVs of such investments and are categorized as Level 2 of the fair value hierarchy.
Short-term investments having a maturity of 60 days or less are generally valued at amortized cost which approximates fair market value. These investments are categorized as Level 2 of the fair value hierarchy.
| | | | | | |
| | Annual Report | | March 31, 2012 | | 47 |
Notes to Financial Statements (Cont.)
Common stocks, exchange-traded funds and financial derivative instruments, such as futures contracts or options contracts that are traded on a national securities or commodities exchange, are valued at the last reported sales price, in the case of common stocks and exchange-traded funds, or, in the case of futures contracts or options contracts, the settlement price determined by the relevant exchange. To the extent these securities are actively traded and valuation adjustments are not applied, they are categorized as Level 1 of the fair value hierarchy.
Over-the-counter financial derivative instruments, such as foreign currency contracts, options contracts, futures, or swaps agreements, derive their values from underlying asset prices, indices, reference rates, other inputs or a combination of these factors. These instruments are normally valued on the basis of broker dealer quotations or pricing service valuations. Depending on the instrument and the terms of the transaction, the value of the derivative instruments can be estimated by a pricing service provider using a series of techniques, such as simulation pricing models. The pricing models use issuer details and other inputs that are observed from actively quoted markets such as indices, spreads, interest rates, curves, dividends and exchange rates. Derivatives that use similar valuation techniques and inputs as described above are normally categorized as Level 2 of the fair value hierarchy.
Certain securities may be fair valued in accordance with the fair valuation procedures approved by the Board of Trustees. The Valuation Committee is generally responsible for overseeing the day to day valuation processes and reports periodically to the Board. The Valuation Committee is authorized to make all necessary determinations of the fair values of portfolio securities and other assets for which market quotations are not readily available or if it is deemed that the prices obtained from brokers and dealers or independent pricing services are deemed to be unreliable indicators of market value. As of March 31, 2012, the Funds did not hold securities fair valued by the Valuation Committee.
The end of period timing recognition is used for the significant transfers between levels of the Funds’ assets and liabilities.
The following is a summary of the inputs used to value the Funds’ investments as of March 31, 20121:
| | | | | | | | | | | | | | | | | | | | | | |
| Valuation Inputs | | | | DoubleLine
Total Return
Bond Fund | | | DoubleLine
Core Fixed
Income
Fund | | | DoubleLine
Emerging
Markets Fixed
Income Fund | | | DoubleLine
Multi-Asset
Growth Fund
(Consolidated) | | |
DoubleLine
Low Duration
Bond Fund | |
Investments in Securities | | | | | | | | | | | | | | | | | | | | | | |
Level 1 | | | | | | | | | | | | | | | | | | | | | | |
Investment Companies and Exchange Traded Notes | | | | $ | — | | | $ | — | | | $ | — | | | $ | 27,409,238 | | | $ | — | |
Affiliated Mutual Funds | | | | | — | | | | — | | | | — | | | | 38,936,532 | | | | — | |
Money Market Funds | | | | | 449,263,587 | | | | 33,587,138 | | | | 2,002,538 | | | | 20,517,998 | | | | 23,637,921 | |
Purchased Options | | | | | — | | | | — | | | | — | | | | 69,860 | | | | — | |
Total Level 1 | | | | | 449,263,587 | | | | 33,587,138 | | | | 2,002,538 | | | | 86,933,628 | | | | 23,637,921 | |
Level 2 | | | | | | | | | | | | | | | | | | | | | | |
US Government / Agency Mortgage Backed Securities | | | | | 9,044,932,798 | | | | 523,510,952 | | | | — | | | | 9,989,547 | | | | 5,859,688 | |
Non-Agency Collateralized Mortgage Obligations | | | | | 8,354,978,194 | | | | 429,758,712 | | | | — | | | | 16,273,097 | | | | 85,455,591 | |
Other Short Term Investments | | | | | 4,650,675,259 | | | | — | | | | — | | | | 8,999,770 | | | | — | |
Collateralized Loan Obligations | | | | | 30,157,581 | | | | — | | | | — | | | | — | | | | 6,758,634 | |
US Government Bonds and Notes | | | | | — | | | | 417,505,884 | | | | — | | | | — | | | | 16,146,488 | |
US Corporate Bonds | | | | | — | | | | 356,283,011 | | | | — | | | | — | | | | 39,058,880 | |
Foreign Corporate Bonds | | | | | — | | | | 238,859,778 | | | | 380,973,265 | | | | 1,341,785 | | | | 30,455,587 | |
Foreign Government Bonds and Notes, Supranationals and Foreign Agencies | | | | | — | | | | 62,233,437 | | | | 42,125,991 | | | | — | | | | 6,168,254 | |
Purchased Options | | | | | — | | | | — | | | | — | | | | 596,665 | | | | — | |
Total Level 2 | | | | | 22,080,743,832 | | | | 2,028,151,774 | | | | 423,099,256 | | | | 37,200,864 | | | | 189,903,122 | |
Level 3 | | | | | — | | | | — | | | | — | | | | — | | | | — | |
Total | | | | | 22,530,007,419 | | | | 2,061,738,912 | | | | 425,101,794 | | | | 124,134,492 | | | | 213,541,043 | |
Other Financial Instruments | | | | | | | | | | | | | | | | | | | | | | |
Level 1 | | | | | | | | | | | | | | | | | | | | | | |
Written Options | | | | | — | | | | — | | | | — | | | | (195,813 | ) | | | — | |
Futures Contracts | | | | | — | | | | — | | | | — | | | | 18,498 | | | | — | |
Total Level 1 | | | | | — | | | | — | | | | — | | | | (177,315 | ) | | | — | |
Level 2 | | | | | | | | | | | | | | | | | | | | | | |
Written Options | | | | | — | | | | — | | | | — | | | | (174,760 | ) | | | — | |
Swaps | | | | | — | | | | — | | | | — | | | | (96,835 | ) | | | — | |
Total Level 2 | | | | | — | | | | — | | | | — | | | | (271,595 | ) | | | — | |
Level 3 | | | | | — | | | | — | | | | — | | | | — | | | | — | |
Total | | | | | — | | | | — | | | | — | | | | (448,910 | ) | | | — | |
| See | the Schedule of Investments for further disaggregation of investment categories. |
| 1 | There were no significant transfers into and out of Level 1, 2, and 3 during the period ended March 31, 2012. |
B. Federal Income Taxes. Each Fund has elected to be taxed as a “regulated investment company” and intends to distribute substantially all of its taxable income to its shareholders and otherwise comply with the provisions of Subchapter M of the Internal Revenue Code applicable to regulated investment companies. Therefore, no provision for federal income taxes or excise taxes has been made.
The Funds may be subject to a nondeductible 4% excise tax calculated as a percentage of certain undistributed amounts of net investment income and net capital gains. The Funds intend to distribute their net investment income and capital gains as necessary to avoid this excise tax.
The Funds have adopted financial reporting rules that require the Funds to analyze all open tax years, as defined by the applicable statute of limitations, for all major jurisdictions. Open tax years, 2012 and 2011 for the Funds, are those that are open for exam by taxing authorities. As of March 31, 2012 the Funds have no examinations in progress.
Management has analyzed the Funds’ tax positions, and has concluded that no liability should be recorded related to uncertain tax positions expected to be taken on the tax return for the fiscal year-end March 31, 2012. The Funds identify their major tax jurisdictions as U.S. Federal and the State of California. The Funds are not aware of any tax positions for which it is reasonably possible that the total amounts of unrecognized tax benefits will significantly change in the next twelve months.
C. Security Transactions, Investment Income. Investment securities transactions are accounted for on trade date. Gains and losses realized on sales of securities are determined on a specific identification basis. Interest income is recorded on an accrual basis. Discounts/premiums on debt securities purchased are accreted/amortized over the life of the respective securities using the effective interest method. Dividend income is recorded on the ex-dividend date. Paydown gains and losses on mortgage-related and other asset-backed securities are recorded as components of interest income on the statements of operations.
D. Dividends and Distributions to Shareholders. Dividends from the net investment income of the DoubleLine Total Return Bond Fund, DoubleLine Core Fixed Income Fund, DoubleLine Emerging Markets Fixed Income Fund and the DoubleLine Low Duration Bond Fund will be declared and paid monthly. Dividends from the net investment income of the DoubleLine Multi-Asset Growth Fund will be declared and paid quarterly. The Funds will distribute any net realized long or short-term capital gains at least annually. Distributions are recorded on the ex-dividend date.
Income and capital gain distributions are determined in accordance with income tax regulations which may differ from accounting principles generally accepted in the United States of America. Permanent book and tax basis differences relating to shareholder distributions will result in reclassifications between paid-in capital, undistributed net investment income (loss), and/or undistributed (accumulated) realized gain (loss). Undistributed net investment income or loss may include temporary book and tax basis differences which will reverse in a subsequent period. Any taxable income or capital gain remaining at fiscal year end is distributed in the following year.
Distributions from investment companies will be classified as investment income or realized gains in the Statements of Operations based on the U.S. income tax characteristics of the distribution if such information is available. In cases where the tax characteristics are not available, such distributions are generally classified as investment income.
E. Use of Estimates. The preparation of financial statements in conformity with principles generally accepted in the United States of America requires management to make estimates and assumptions that affect the reported amounts of assets and liabilities and disclosure of contingent assets and liabilities at the date of the financial statements, as well as the reported amounts of revenues and expenses during the period. Actual results could differ from those estimates.
F. Share Valuation. The net asset value (“NAV”) per share of a class of shares of a Fund is calculated by dividing the sum of the value of the securities held by the Fund, plus cash and other assets, attributable to that class, minus all liabilities (including estimated accrued expenses) attributable to that class by the total number of shares of that class outstanding, rounded to the nearest cent. The Funds’ shares will not be priced on the days on which the NYSE is closed for trading.
G. Guarantees and Indemnifications. Under the Trust’s organizational documents, each Trustee and officer of the Fund is indemnified, to the extent permitted by the Act, against certain liabilities that may arise out of performance of their duties to the Fund. Additionally, in the normal course of business, the Funds enter into contracts that contain a variety of indemnification clauses. Each Fund’s maximum exposure under these arrangements is unknown as this would involve future claims that may be made against the Funds that have not yet occurred. However, the Funds have not had prior claims or losses pursuant to these contracts.
H. Bases for Consolidation for the DoubleLine Multi-Asset Growth Fund. The DoubleLine Multi-Asset Growth Fund may invest up to 25% of its total assets in DoubleLine Cayman Multi-Asset Growth Fund I, Ltd. (the “Subsidiary”). The Subsidiary, which is organized under the laws of the Cayman Islands, is wholly-owned and controlled by the DoubleLine Multi-Asset Growth Fund. The Subsidiary invests in commodity-related investments and other investments. As of March 31, 2012 net assets of the DoubleLine Multi-Asset Growth Fund were $127,333,303 which $8,751,327, or approximately 6.87%, represented the DoubleLine Multi-Asset Growth Fund’s ownership of the Subsidiary. Intercompany balances and transactions have been eliminated in consolidation.
I. Other. Each share class of a Fund is charged for those expenses that are directly attributable to that share class. Expenses that are not directly attributable to a Fund are allocated among all appropriate Funds in proportion to their respective net assets or on another reasonable basis. Net investment income, expenses which are not class-specific, and realized and unrealized gains and losses are allocated directly to each class based upon the relative net assets of the classes.
| | | | | | |
| | Annual Report | | March 31, 2012 | | 49 |
Notes to Financial Statements (Cont.)
3. Related Party Transactions
DoubleLine Capital LP (the “Adviser”) provides the Funds with investment management services under an Investment Advisory and Management Agreement (the “Agreement”). Under the Agreement, the Adviser manages the investment of the assets of each Fund, places orders for the purchase and sale of its portfolio securities and is responsible for the day-to-day management of the Trust’s business affairs. As compensation for its services, the Adviser is entitled to a monthly fee at the annual rate of 0.40%, 0.40%, 0.75%, 1.00% and 0.35% of the average daily net assets of the DoubleLine Total Return Bond Fund, DoubleLine Core Fixed Income Fund, DoubleLine Emerging Markets Fixed Income Fund, DoubleLine Multi-Asset Growth Fund and DoubleLine Low Duration Bond Fund, respectively.
The Adviser has contractually agreed to limit the DoubleLine Total Return Bond Fund’s and the DoubleLine Core Fixed Income Fund’s ordinary operating expenses so that their ratio of such expenses to average daily net assets will not exceed 0.49% for the Class I shares and 0.74% for the Class N shares through July 24, 2012. The Adviser has contractually agreed to limit the DoubleLine Emerging Markets Fixed Income Fund’s ordinary operating expenses so that its ratio of such expenses to average net assets will not exceed 0.95% for the Class I shares and 1.20% for the Class N shares. The Adviser has contractually agreed to limit the DoubleLine Multi-Asset Growth Fund’s ordinary operating expenses so that its ratio of such expenses to average net assets will not exceed 1.20% for the Class I shares and 1.45% for the Class A shares. The Adviser has contractually agreed to limit the DoubleLine Low Duration Bond Fund’s ordinary operating expenses so that its ratio of such expenses to average net assets will not exceed 0.47% for the Class I shares and 0.72% for the Class N shares. For the purposes of the expense limitation agreement between the Adviser and the Funds, “ordinary operating expenses” excludes taxes, commissions, mark-ups, litigation expenses, indemnification expenses, interest expenses, acquired fund fees and expenses, and any extraordinary expenses. Each Fund’s expense limitation may be terminated during its term only by a majority vote of the disinterested Trustees of the Board of Trustees.
The Adviser is permitted to be reimbursed for fee waivers and/or expense reimbursements it made to a Fund in the prior three fiscal years. Each Fund must pay its current ordinary operating expenses before the Adviser is entitled to any reimbursement of fees waived and/or expenses reimbursed. Any such reimbursement requested by the Adviser is subject to review and approval by the Board of Trustees and will be subject to the Fund’s expense limitations in place when the fees were waived or the expenses were reimbursed.
For the period ended March 31, 2012, the Adviser contractually waived a portion of its fees or reimbursed certain operating expenses and may recapture a portion of the amounts no later than the dates as stated below:
| | | | | | | | | | | | | | | | | | | | | | |
| Year of Expiration | | | | DoubleLine
Total Return
Bond Fund | | | DoubleLine
Core Fixed
Income Fund | | | DoubleLine
Emerging
Markets Fixed
Income Fund | | | DoubleLine
Multi-Asset
Growth Fund (Consolidated) | | | DoubleLine Low
Duration Bond
Fund | |
March 31, 2014 | | | | $ | 1,235,309 | | | $ | 231,152 | | | $ | 210,883 | | | $ | 79,472 | | | $ | — | |
March 31, 2015 | | | | | 1,594,218 | | | | 461,517 | | | | — | | | | 270,424 | | | | 206,049 | |
If a Fund invested in an affiliate Fund sponsored by the Adviser during the period covered by this report the Adviser agreed to waive its management fee payable to the Fund in an amount equal to the investment advisory fees paid by the affiliated Fund in respect of the Fund’s investment in the affiliated fund; accordingly, the Adviser waived $79,948 in fees from the DoubleLine Multi-Asset Growth Fund for the period ended March 31, 2012.
4. Distribution, Sales Charge and Redemption Fees
Class N shares and Class A shares of the Funds make payments under a distribution plan (“Distribution Plan”) adopted pursuant to Rule 12b-1 under the 1940 Act. Pursuant to the Distribution Plan, each Fund compensates the Funds’ distributor for distribution and related services at an annual rate equal to 0.25% of the average daily net assets of the Fund attributable to its Class N and Class A shares. The fees may be used to pay the Fund’s distributor for distribution services and sales support services provided in connection with Class N and Class A shares.
The Class A shares of DoubleLine Multi-Asset Growth Fund have a maximum sales charge imposed on purchases of 4.25% of the offering price and a maximum contingent deferred sales charge of 0.75% that applies to purchases of $1 million or more of Class A shares if the shares are redeemed within 18 months of purchase.
The DoubleLine Multi-Asset Growth Fund imposes redemption fees. Redemption fees are paid to and retained by the Fund to limit the opportunity to market time the Fund and to help offset estimated portfolio transaction costs and other related costs incurred by the Fund as a result of short-term trading. The Fund will apply a redemption fee equal to 1% of the value of any shares redeemed within 90 days of purchase.
5. Purchases and Sales of Securities
Investment transactions (excluding short-term investments) for the period ended March 31, 2012, were as follows:
| | | | | | | | | | | | | | | | | | |
| | | | | All Other | | | U.S. Government1 | |
| | | | | Purchases at
Cost | | | Sales or
Maturity
Proceeds | | | Purchases at
Cost | | | Sales or
Maturity
Proceeds | |
DoubleLine Total Return Bond Fund | | | | $ | 13,301,484,442 | | | $ | 1,575,194,945 | | | $ | | | | $ | | |
DoubleLine Core Fixed Income Fund | | | | | 2,051,562,906 | | | | 51,034,772 | | | | 482,275,543 | | | | 671,600,399 | |
DoubleLine Emerging Markets Fixed Income Fund | | | | | 688,876,429 | | | | 402,287,186 | | | | — | | | | — | |
DoubleLine Multi-Asset Growth Fund (Consolidated) | | | | | 111,740,412 | | | | 24,425,264 | | | | — | | | | 127,500 | |
DoubleLine Low Duration Bond Fund | | | | | 189,820,226 | | | | 19,503,872 | | | | 54,490,875 | | | | 22,664,160 | |
| 1 | U.S. Government transactions are defined as those involving U.S. Treasury bills, bonds and notes. |
6. Income Tax Information
The tax character of distributions for the Funds were as follows:
| | | | | | | | | | | | | | | | | | |
| | | | | DoubleLine Total Return Bond Fund | | | DoubleLine Core Fixed Income Fund | |
| | | | | Year Ended
March 31, 2012 | | | Period Ended
March 31, 2011 | | | Year Ended
March 31, 2012 | | | Period Ended
March 31, 2011 | |
Distributions Paid From: | | | | | | | | | | | | | | | | | | |
Ordinary Income | | | | $ | 975,511,781 | | | $ | 257,826,323 | | | $ | 47,531,637 | | | $ | 4,596,918 | |
Long Term Capital Gain | | | | | — | | | | — | | | | 94,761 | | | | — | |
Total Distributions Paid | | | | $ | 975,511,781 | | | $ | 257,826,323 | | | $ | 47,626,398 | | | $ | 4,596,918 | |
| | | | | | | | | | | | | | | | | | | | | | |
| | | | | DoubleLine Emerging Markets Fixed
Income Fund | | | DoubleLine Multi-Asset Growth Fund
(Consolidated) | | | DoubleLine Low
Duration Bond
Fund | |
| | | | | Year Ended
March 31, 2012 | | | Period Ended
March 31, 2011 | | | Year Ended
March 31, 2012 | | | Period Ended
March 31, 2011 | | | Period Ended
March 31, 2012 | |
Distributions Paid From: | | | | | | | | | | | | | | | | | | | | | | |
Ordinary Income | | | | $ | 14,886,871 | | | $ | 3,561,420 | | | $ | 2,831,326 | | | $ | 37,441 | | | $ | 970,453 | |
Long Term Capital Gain | | | | | 107,993 | | | | — | | | | — | | | | — | | | | — | |
Total Distributions Paid | | | | $ | 14,994,864 | | | $ | 3,561,420 | | | $ | 2,831,326 | | | $ | 37,441 | | | $ | 970,453 | |
The Fund designated as long-term capital gain dividend, pursuant to Internal Revenue Code Section 852(b)(3), the amount necessary to reduce the earnings and profits of the Fund related to net capital gain to zero for the period ended March 31, 2012.
The cost basis of investments for federal income tax purposes at March 31, 2012 was as follows:
| | | | | | | | | | | | | | | | | | | | | | |
| | | | | DoubleLine Total
Return Bond Fund | | | DoubleLine Core
Fixed Income Fund | | | DoubleLine
Emerging Markets
Fixed Income Fund | | | DoubleLine Multi-
Asset Growth Fund
(Consolidated) | | | DoubleLine Low
Duration Bond
Fund | |
Tax Cost of Investments | | | | $ | 22,213,442,003 | | | $ | 2,033,828,655 | | | $ | 417,960,200 | | | $ | 124,425,665 | | | $ | 212,780,850 | |
Gross Tax Unrealized Appreciation | | | | | 651,112,367 | | | | 41,861,174 | | | | 9,386,954 | | | | 2,393,913 | | | | 1,271,425 | |
Gross Tax Unrealized Depreciation | | | | | (334,546,951 | ) | | | (13,950,917 | ) | | | (2,245,360 | ) | | | (2,685,086 | ) | | | (511,232 | ) |
Net Tax Unrealized Appreciation (Depreciation) | | | | $ | 316,565,416 | | | $ | 27,910,257 | | | $ | 7,141,594 | | | $ | (291,173 | ) | | $ | 760,193 | |
As of March 31, 2012, the components of accumulated earnings (losses) for income tax purposes were as follows:
| | | | | | | | | | | | | | | | | | | | | | |
| | | | | DoubleLine Total
Return Bond Fund | | | DoubleLine Core
Fixed Income Fund | | | DoubleLine
Emerging Markets
Fixed Income Fund | | | DoubleLine Multi-
Asset Growth Fund
(Consolidated) | | | DoubleLine Low
Duration Bond
Fund | |
Net Tax Unrealized Appreciation (Depreciation) | | | | $ | 316,565,416 | | | $ | 27,910,257 | | | $ | 7,141,594 | | | $ | (291,173 | ) | | $ | 760,193 | |
Undistributed Ordinary Income | | | | | 41,024,124 | | | | 5,503,110 | | | | 1,355,730 | | | | 204,776 | | | | 220,990 | |
Total Distributable Earnings | | | | | 41,024,124 | | | | 5,503,110 | | | | 1,355,730 | | | | 204,776 | | | | 220,990 | |
Other Accumulated Gains / (Losses) | | | | | (183,493,700 | ) | | | (2,466,468 | ) | | | (943,511 | ) | | | (775,333 | ) | | | (46,615 | ) |
Total Accumulated Earnings | | | | $ | 174,095,840 | | | $ | 30,946,899 | | | $ | 7,553,813 | | | $ | (861,730 | ) | | $ | 934,568 | |
| | | | | | |
| | Annual Report | | March 31, 2012 | | 51 |
Notes to Financial Statements (Cont.)
Under the Regulated Investment Company Modernization Act of 2010, capital losses incurred by the Funds after January 1, 2011 will not be subject to expiration. In addition, such losses must be utilized prior to the losses incurred in the years preceding enactment.
At March 31, 2012, the following capital loss carryforwards were available:
| | | | | | | | | | |
| | | | | Capital Loss
Carryforwards | | | Expires | |
DoubleLine Total Return Bond Fund | | | | $ | 3,709,758 | | | | 3/31/2019 | |
DoubleLine Total Return Bond Fund | | | | | 70,828,118 | | | | Indefinite | |
DoubleLine Multi-Asset Growth Fund (Consolidated) | | | | | 261,387 | | | | Indefinite | |
At March 31, 2012, the following Funds deferred, on a tax basis, Qualified Late-year losses of:
| | | | | | |
DoubleLine Total Return Bond Fund | | | | $ | 71,622,269 | |
DoubleLine Core Fixed Income Fund | | | | | 50,635 | |
DoubleLine Emerging Markets Fixed Income Fund | | | | | 334,411 | |
DoubleLine Multi-Asset Growth Fund (Consolidated) | | | | | 199,835 | |
DoubleLine Low Duration Bond Fund | | | | | — | |
Additionally, U.S. generally accepted accounting principles require that certain components of net assets relating to permanent differences be reclassified between financial and tax reporting. These reclassifications have no effect on net assets or net asset value per share. The permanent differences primarily relate to paydown losses and foreign currency gains/losses. For the period ended March 31, 2012, the following table shows the reclassifications made:
| | | | | | | | | | | | | | |
| | | | | Undistributed
Net
Investment
Income/(Loss) | | | Accumulated
Net Realized
Gain/(Loss) | | | Paid In
Capital | |
DoubleLine Total Return Bond Fund | | | | $ | 125,211,144 | | | $ | (125,211,144 | ) | | $ | — | |
DoubleLine Core Fixed Income Fund | | | | | 3,404,320 | | | | (3,404,320 | ) | | | — | |
DoubleLine Emerging Markets Fixed Income Fund | | | | | — | | | | — | | | | — | |
DoubleLine Multi-Asset Growth Fund (Consolidated) | | | | | 62,812 | | | | (269,375 | ) | | | 206,563 | |
DoubleLine Low Duration Bond Fund | | | | | 98,829 | | | | (98,829 | ) | | | — | |
7. Share Transactions
Transactions in each Fund’s shares were as follows:
| | | | | | | | | | | | | | | | | | | | | | | | | | | | | | | | | | | | | | | | | | |
| | | | | DoubleLine
Total Return
Bond Fund | | | DoubleLine
Core Fixed
Income Fund | | | DoubleLine
Emerging Markets
Fixed Income Fund | | | DoubleLine
Multi-Asset
Growth Fund (Consolidated) | | | DoubleLine
Low Duration
Bond Fund | |
| | | | | Class I | | | Class I | | | Class I | | | Class I | | | Class I | |
| | | | | Shares | | | Amount | | | Shares | | | Amount | | | Shares | | | Amount | | | Shares | | | Amount | | | Shares | | | Amount | |
Shares Sold | | | | | 1,196,869,026 | | | $ | 13,349,906,154 | | | | 144,954,636 | | | $ | 1,588,562,387 | | | | 32,395,870 | | | $ | 340,341,359 | | | | 8,922,206 | | | $ | 89,844,524 | | | | 16,645,825 | | | $ | 168,385,785 | |
Reinvested Dividends | | | | | 42,523,124 | | | | 472,648,712 | | | | 2,139,333 | | | | 23,446,409 | | | | 666,030 | | | | 6,980,378 | | | | 149,317 | | | | 1,491,733 | | | | 55,669 | | | | 564,351 | |
Shares Redeemed | | | | | (181,601,121 | ) | | | (2,024,481,524 | ) | | | (22,556,382 | ) | | | (248,093,938 | ) | | | (10,395,827 | ) | | | (108,757,093 | ) | | | (2,777,632 | ) | | | (27,967,424 | )* | | | (3,700,746 | ) | | | (37,558,851 | ) |
| | | | | | 1,057,791,029 | | | $ | 11,798,073,342 | | | | 124,537,587 | | | $ | 1,363,914,858 | | | | 22,666,073 | | | $ | 238,564,644 | | | | 6,293,891 | | | $ | 63,368,833 | | | | 13,000,748 | | | $ | 131,391,285 | |
Beginning Shares | | | | | 395,164,769 | | | | | | | | 15,107,569 | | | | | | | | 10,052,404 | | | | | | | | 2,189,828 | | | | | | | | — | | | | | |
Ending Shares | | | | | 1,452,955,798 | | | | | | | | 139,645,156 | | | | | | | | 32,718,477 | | | | | | | | 8,483,719 | | | | | | | | 13,000,748 | | | | | |
| | | | | Class N | | | Class N | | | Class N | | | Class A | | | Class N | |
| | | | | Shares | | | Amount | | | Shares | | | Amount | | | Shares | | | Amount | | | Shares | | | Amount | | | Shares | | | Amount | |
Shares Sold | | | | | 494,412,639 | | | $ | 5,512,030,649 | | | | 55,840,624 | | | $ | 610,633,684 | | | | 9,479,006 | | | $ | 100,456,674 | | | | 4,600,765 | | | $ | 46,348,389 | | | | 8,666,652 | | | $ | 87,794,991 | |
Reinvested Dividends | | | | | 18,314,285 | | | | 203,475,887 | | | | 982,139 | | | | 10,764,917 | | | | 253,703 | | | | 2,660,646 | | | | 85,668 | | | | 854,747 | | | | 24,470 | | | | 247,871 | |
Shares Redeemed | | | | | (99,967,753 | ) | | | (1,113,770,812 | ) | | | (10,965,012 | ) | | | (120,555,034 | ) | | | (4,600,643 | ) | | | (48,475,125 | ) | | | (1,068,873 | ) | | | (10,729,059 | )* | | | (286,894 | ) | | | (2,908,505 | ) |
| | | | | | 412,759,171 | | | $ | 4,601,735,724 | | | | 45,857,751 | | | $ | 500,843,567 | | | | 5,132,066 | | | $ | 54,642,195 | | | | 3,617,560 | | | $ | 36,474,077 | | | | 8,404,228 | | | $ | 85,134,357 | |
Beginning Shares | | | | | 135,028,484 | | | | | | | | 2,924,474 | | | | | | | | 2,486,189 | | | | | | | | 601,490 | | | | | | | | — | | | | | |
Ending Shares | | | | | 547,787,655 | | | | | | | | 48,782,225 | | | | | | | | 7,618,255 | | | | | | | | 4,219,050 | | | | | | | | 8,404,228 | | | | | |
| * | Net of redemption fees of $ 26,699 and $ 25,331 for Class I and A, respectively |
8. Additional Disclosures about Derivative Instruments
The following disclosures provide information on the Funds’ use of derivatives and certain related risks. The location and fair value amounts of these instruments on the Statements of Assets and Liabilities and the realized and changes in unrealized gains and losses on the Statements of Operations, each categorized by type of derivative contract, are included in a table below. The derivative instruments outstanding as of period end as disclosed in the Notes to Schedules of Investments and the amounts of realized and changes in unrealized gains and losses on derivative instruments during the period as disclosed in the Statements of Operations may serve as indicators of the volume of financial derivative activity for the Funds for the period covered by this report.
Futures Contracts The Funds may use futures contracts for hedging purposes or otherwise to gain, or reduce, long or short exposure to one or more asset classes or issuers. Risks associated with the use of futures contracts include the potential for imperfect correlation between the change in market value of the securities held by the Funds and the prices of futures contracts and the possibility of an illiquid market. Futures contracts are valued based upon their quoted daily settlement prices determined by the relevant exchange. Upon entering into a futures contract, a Fund is required to deposit with its futures broker an amount of cash in accordance with the initial margin requirements of the broker or exchange. Futures contracts are marked to market daily and an appropriate payment reflecting the change in value (“variation margin”) is made or received by or for the accounts of the Funds. Gains or losses are recognized but not considered realized until the contracts expire or are closed. Futures contracts involve, to varying degrees, risk of loss in excess of the variation margin disclosed on the Statements of Assets and Liabilities.
Options Contracts The Funds may purchase or sell put and call options. When a Fund purchases an option it pays a premium in return for the potential to profit from the change in value of an underlying investment or index during the term of the option. The option premium is included on the Funds’ Statements of Assets and Liabilities as an investment and subsequently marked to market to reflect the current value of the option. Premiums paid for purchasing options which expire are treated as realized losses. Certain options may be purchased with premiums to be determined on a future date. The premiums for these options are based upon implied volatility parameters at specified terms. The risk associated with purchasing options is limited to the loss of the premium paid. Premiums paid for purchasing options which are exercised or closed are added to the amounts paid or offset against the proceeds on the underlying investment transaction to determine the realized gain or loss. When a Fund writes or sells an option it receives a premium in return for bearing the risk of the change in value of an underlying instrument during the term off the option. Writing put options tends to increase a Fund’s exposure to the underlying instrument. Writing call options tends to decrease a Fund’s exposure to the underlying instrument. When a Fund writes a call or put, an amount equal to the premium received is recorded as a liability and subsequently marked to market to reflect the current value of the option written. These liabilities are reflected as written options outstanding on the Statements of Assets and Liabilities. Premiums received from writing options which expire are treated as realized gains. Premiums received from writing options which are exercised or closed are added to the proceeds or offset against amounts paid
| | | | | | |
| | Annual Report | | March 31, 2012 | | 53 |
Notes to Financial Statements (Cont.)
on the underlying instrument to determine the realized gain or loss when the underlying instrument is sold. A Fund as a writer of an option has no control over whether the underlying instrument may be sold (call) or purchased (put) and as a result bears the market risk of an unfavorable change in the price of the instrument underlying the written option. There is the risk a Fund may not be able to enter into a closing transaction because of an illiquid market.
The activity in written options during the year ended March 31, 2012, is as follows:
| | | | | | | | | | |
DoubleLine Multi-Asset Growth Fund
(Consolidated) | | | | Number of
Contracts | | | Premium
Amount | |
Outstanding, Beginning of Period | | | | | — | | | $ | — | |
Options Written | | | | | 15,009,028 | | | | 763,198 | |
Options Expired | | | | | (3,890 | ) | | | (135,559 | ) |
Options Exercised | | | | | (808 | ) | | | (47,990 | ) |
Options Closed | | | | | (1,250 | ) | | | (239,047 | ) |
Outstanding, End of Period | | | | | 15,003,080 | | | $ | 340,602 | |
Credit Default Swap Agreements Credit default swap agreements often involve one party making a stream of payments (generally referred to as the buyer of protection) to another party (the seller of protection) in exchange for the right to receive a specified return in the event of a default or other credit event in respect of a referenced entity, obligation or index. As a seller of protection on credit default swap agreements, a Fund generally will receive from the buyer of protection a fixed rate of income throughout the term of the swap. As the seller, a Fund would effectively add leverage to its portfolio because, in addition to its total net assets, the Funds would be subject to investment exposure on the notional amount of the swap.
If a Fund is a seller of protection and a credit event occurs, as defined under the terms of that particular swap agreement, the Fund will either (i) pay to the buyer of protection an amount equal to the notional amount of the swap and take delivery of the referenced obligation, other deliverable obligations or the affected securities in the referenced index or (ii) pay a net settlement amount in the form of cash or securities equal to the notional amount of the swap less the recovery value of the referenced obligation or the affected securities in the referenced index. If a Fund is a buyer of protection and a credit event occurs, as defined under the terms of that particular swap agreement, the Funds typically will either (i) receive from the seller of protection an amount equal to the notional amount of the swap and deliver the referenced obligation, other deliverable obligations or the affected securities in the referenced index or (ii) receive a net settlement amount in the form of cash or securities equal to the notional amount of the swap less the recovery value of the referenced obligation or the affected securities in the referenced index. Recovery values are typically estimated by market makers considering either industry standard recovery rates or entity specific factors and considerations until a credit event occurs. An index credit default swap references all the names in the index, and if there is a default with respect to a single name in the index, the credit event is settled based on that name’s weight in the index.
Credit Default Swaps are considered to have credit risk related contingent features since they require payment by the protection seller to the protection buyer upon occurrence of a defined credit event. A Fund’s maximum risk of loss from counterparty risk, as the protection buyer, is the fair value of the contract, which may be mitigated by the posting of collateral by the counterparty to a Fund to cover a Fund’s exposure to the counterparty.
Total Return Swap Agreements The Funds may enter into total return swaps for investment purposes. Total return swaps are agreements to exchange the return generated by one instrument for the return generated by another instrument. For example, the agreement to pay a predetermined or fixed interest rate in exchange for a market-linked return based on a notional amount. To the extent the total return of a referenced index or instrument exceeds the offsetting interest obligation, a Fund will receive a payment from the counterparty. To the extent it is less, a Fund will make a payment to the counterparty. Payments received or made at the termination of the swap are recorded as realized gain or loss on the Statement of Operations.
The Funds’ derivative instrument holdings and their primary risk exposures are summarized in the following tables.
The effect of derivative instruments on the Statements of Assets and Liabilities for the period ended March 31, 2012 is as follows:
| | | | | | | | | | |
| Fund | | | | Derivatives not accounted
for as hedging instruments | | Statement of Assets and Liabilities Location | | Unrealized
Appreciation
(Depreciation) | |
| DoubleLine Multi-Asset Growth Fund (Consolidated) | | | | Purchase Options | | | | | | |
| | | | Equity | | Net Unrealized Appreciation (Depreciation) in Unaffiliated Securities | | $ | (363,749 | ) |
| | | | |
| | | | Written Options | | | | | | |
| | | | Commodity | | | | $ | (79,021 | ) |
| | | | Exchange Rate | | | | | 49,050 | |
| | | | | | Net Unrealized Appreciation (Depreciation) in Unaffiliated Securities | | $ | (29,971 | ) |
| | | | |
| | | | Futures contracts | | | | | | |
| | | | Commodity | | | | $ | (27,018 | ) |
| | | | Exchange Rate | | | | | 45,516 | |
| | | | | | Net Unrealized Appreciation (Depreciation) on Futures | | $ | 18,498 | |
| | | | | | | | | | |
| Fund | | | | Derivatives not accounted
for as hedging instruments | | Statement of Assets and Liabilities Location | | Unrealized
Appreciation
(Depreciation) | |
| | | | |
| | | | Swap contracts | | | | | | |
| | | | Credit Default | | | | $ | (44,444 | ) |
| | | | Total Return | | | | | (52,391 | ) |
| | | | | | Net Unrealized Appreciation (Depreciation) on Swaps | | $ | (96,835 | ) |
| * | See the Schedule of Investments for further details. |
The effect of derivative instruments on the Statements of Operations for the period ended March 31, 2012:
| | | | | | | | | | | | | | |
| Fund | | | | Derivatives not accounted
for as hedging instruments | | Location of Gain (Loss) on
Derivatives in Income | | Realized Gain (Loss) on
Derivatives | | | Chage in Unrealized
Appreciation
(Depreciation)
on Derivatives | |
| DoubleLine Multi-Asset Growth Fund (Consolidated) | | | | Purchase Options | | | | | | | | | | |
| | | | Equity | | Net Realized and Unrealized Gain (Loss) on Unaffilated Securities | | $ | (272,291 | ) | | $ | (370,267 | ) |
| | | | | |
| | | | Written Options | | | | | | | | | | |
| | | | Commodity | | | | $ | 115,614 | | | $ | (79,021 | ) |
| | | | Equity | | | | | 22,492 | | | | — | |
| | | | Exchange Rate | | | | | — | | | | 49,050 | |
| | | | | | Net Realized and Unrealized Gain (Loss) on Unaffilated Securities | | $ | 138,106 | | | $ | (29,971 | ) |
| | | | | |
| | | | Futures contracts | | | | | | | | | | |
| | | | Commodity | | | | $ | 29,631 | | | $ | (27,877 | ) |
| | | | Exchange Rate | | | | | (400,924 | ) | | $ | 53,065 | |
| | | | | | Net Realized and Unrealized Gain (Loss) on Futures | | $ | (371,293 | ) | | $ | 25,188 | |
| | | | | |
| | | | Swap contracts | | | | | | | | | | |
| | | | Credit Default | | | | $ | (189,519 | ) | | $ | (27,480 | ) |
| | | | Total Return | | | | | 282,958 | | | $ | (52,391 | ) |
| | | | | | Net Realized and Unrealized Gain (Loss) on Swaps | | $ | 93,439 | | | $ | (79,871 | ) |
9. Credit Facility
U.S. Bank, N.A. has made available to the DoubleLine Total Return Fund, DoubleLine Core Fixed Income Fund, DoubleLine Emerging Markets Fixed Income Fund, DoubleLine Multi-Asset Growth Fund and DoubleLine Low Duration Bond Fund an uncommitted credit facility for short term liquidity in connection with shareholder redemptions. Borrowings under this credit facility bear interest at the bank’s prime rate less 0.50%. As of March 31, 2012 the maximum amounts available were $300,000,000, $50,000,000, $5,000,000, $6,000,000, $5,000,000 for the DoubleLine Total Return Bond Fund, DoubleLine Core Fixed Income Fund, DoubleLine Emerging Markets Fixed Income Fund, DoubleLine Multi-Asset Growth Fund and DoubleLine Low Duration Bond Fund respectively. For the period ending March 31, 2012, the average borrowings and interest rate were $6,831 and 2.75%, respectively for the DoubleLine Emerging Markets Fixed Income Fund. The maximum amount outstanding during the period ended March 31, 2012 was $500,000 for the DoubleLine Emerging Markets Fixed Income Fund. Interest expense amounted to $191 for the period ending March 31, 2012 for the DoubleLine Emerging Markets Fixed Income Fund. There were no borrowings under this credit facility for the period ending March 31, 2012 for the DoubleLine Total Return Bond Fund, DoubleLine Core Fixed Income Fund, DoubleLine Multi-Asset Growth Fund and DoubleLine Low Duration Bond Fund, respectively.
10. Principal Risks
Below are summaries of the principal risks of investing in one or more of the Funds, each of which could adversely affect a Fund’s net asset value, yield and total return. Each risk listed below does not necessarily apply to each Fund, and you should read each Fund’s prospectus carefully for a description of the principal risks associated with investing in a particular Fund.
| | | | | | |
| | Annual Report | | March 31, 2012 | | 55 |
Notes to Financial Statements (Cont.)
| | • | affiliated fund risk: the risk that the Adviser may be subject to a potential conflict of interest in determining whether to invest in an underlying fund managed by the Adviser or in a fund managed by an unaffiliated manager, and may have an economic or other incentive to select the fund managed by it over another fund. |
| | • | asset allocation risk: the risk that a Fund’s investment performance depends, at least in part, on how its assets are allocated and reallocated among asset classes and underlying funds and that such allocation will focus on asset classes, underlying funds, or investments that perform poorly or underperform other asset classes, underlying funds, or available investments. |
| | • | asset-backed securities investment risk: the risk that borrowers may default on the obligations that underlie the asset-backed security and that, during periods of falling interest rates, asset-backed securities may be called or prepaid, which may result in a Fund having to reinvest proceeds in other investments at a lower interest rate, and the risk that the impairment of the value of the collateral underlying a security in which a Fund invests (due, for example, to non-payment of loans) will result in a reduction in the value of the security. |
| | • | commodities risk: the risk that the value of a Fund’s shares may be affected by changes in the values of one or more commodities, which may be extremely volatile and difficult to value, risk of possible illiquidity, and the risks and costs associated with delivery, storage, and maintenance of precious metals or minerals or other commodity-related investments. |
| | ( | | credit risk: the risk that an issuer will default in the payment of principal and/or interest on a security. |
| | ( | | interest rate risk: the risk that debt securities will decline in value because of increases in interest rates. The value of a security with a longer duration will be more sensitive to changes in interest rates than a similar security with a shorter duration. |
| | • | defaulted securities risk: the risk of the uncertainty of repayment of defaulted securities and obligations of distressed issuers. |
| | • | derivatives risk: the risk that an investment in derivatives will not perform as anticipated, cannot be closed out at a favorable time or price, or will increase a Fund’s volatility; that derivatives may create investment leverage; that, when a derivative is used as a substitute or alternative to a direct cash investment, the transaction may not provide a return that corresponds precisely with that of the cash investment; that a derivative will not perform in the manner anticipated by the Adviser; or that, when used for hedging purposes, derivatives will not provide the anticipated protection, causing a Fund to lose money on both the derivatives transaction and the exposure the Fund sought to hedge. |
| | • | emerging market country risk: the risk that Fund share prices will decline due to the greater degree of economic, political and social instability of emerging market countries as compared to developed countries. |
| | • | equity issuer risk: the risk that the value of a company’s stock will decline in value in response to factors affecting that company, that company’s industry, or the market generally. |
| | • | exchange-traded note risk: the risk that the level of the particular market benchmark or strategy to which the note’s return is linked will fall in value; exchange-traded notes are subject to credit risk generally to the same extent as debt securities. |
| | • | financial services risk: the risk associated with the financial services industry being subject to extensive government regulation, which may change frequently. In addition, the profitability of businesses in the financial services industry depends heavily on the availability and cost of money and may fluctuate significantly in response to changes in interest rates, as well as changes in general economic conditions. The financial services industry is exposed to risks that may impact the value of investments in the industry more severely than investments outside the industry. Businesses in the financial services industry often operate with substantial financial leverage. |
| | • | foreign currency risk: the risk that fluctuations in exchange rates may adversely affect the value of a Fund’s foreign currency holdings and investments denominated in foreign currencies. |
| | • | foreign investing risk: the risk that a Fund’s investments will be affected by the market conditions, currencies, and the economic and political climates in the foreign countries in which the Fund invests. |
| | • | inflation-indexed bond risk: the risk that such bonds will change in value in response to changes in actual or anticipated changes in inflation rates, in a manner unanticipated by a Fund’s portfolio management team or investors generally. Inflation-indexed bonds are subject to debt securities risk generally to the same extent as other similar debt securities. |
| | • | investment company and exchange traded fund risk: the risk that an investment company, including any exchange-traded fund (“ETF”), in which a Fund invests will not achieve its investment objective or execute its investment strategy effectively or that large purchase or redemption activity by shareholders of such an investment company might negatively affect the value of the investment company’s shares. A Fund must pay its pro rata portion of an investment company’s fees and expenses. |
| | • | junk bond risk: the risk that these bonds have a higher degree of default risk and may be less liquid and subject to greater price volatility than investment grade bonds. |
| | • | leveraging risk: the risk that certain investments by a Fund involving leverage may have the effect of increasing the volatility of the Fund’s portfolio, and the risk of loss in excess of invested capital. |
| | • | limited operating history risk: the risk that a newly formed fund has a limited operating history to evaluate and may not attract sufficient assets to achieve or maximize investment and operational efficiencies. |
| | • | liquidity risk: the risk that low trading volume, lack of a market maker, or contractual or legal restrictions may limit or prevent a Fund from selling securities or closing derivative positions at desirable prices. |
| | • | market capitalization risk: the risk that investing substantially in issuers in one market capitalization category (large, medium or small) may adversely affect a Fund because of unfavorable market conditions particular to that category of issuers, such as larger, more established companies being unable to respond quickly to new competitive challenges or attain the high growth rates of successful smaller companies, or, conversely, stocks of smaller companies being more volatile than those of larger companies due to, among other things, narrower product lines, more limited financial resources, fewer experienced managers and there typically being less publicly available information about small capitalization companies. |
| | • | market risk: the risk that the overall market will perform poorly or that the returns from the securities in which a Fund invests will underperform returns from the general securities markets or other types of investments. |
| | • | mortgage-backed securities risk: the risk that borrowers may default on their mortgage obligations or the guarantees underlying the mortgage-backed securities will default and that, during periods of falling interest rates, mortgage-backed securities will be called or prepaid, which may result in a Fund having to reinvest proceeds in other investments at a lower interest rate. During periods of rising interest rates, the average life of a mortgage-backed security may extend, which may lock in a below-market interest rate, increase the security’s duration, and reduce the value of the security. Enforcing rights against the underlying assets or collateral may be difficult, or the underlying assets or collateral may be insufficient if the issuer defaults. The values of certain types of mortgage-backed securities, such as inverse floaters and interest-only and principal-only securities, may be extremely sensitive to changes in interest rates and prepayment rates. |
| | • | non-diversification risk: the risk that, because a relatively higher percentage of a Fund’s assets may be invested in the securities of a limited number of issuers, the Fund may be more susceptible to any single economic, political or regulatory event than a more diversified fund. A decline in the market value of one of a Fund’s investments may affect the Fund’s value more than if the Fund were a diversified fund. |
| | • | portfolio management risk: the risk that an investment strategy may fail to produce the intended results or that the securities held by a Fund will underperform other comparable funds because of the portfolio managers’ choice of investments. |
| | • | portfolio turnover risk: the risk that frequent purchases and sales of portfolio securities may result in higher Fund expenses and may result in larger distributions of taxable short-term capital gains to investors as compared to a fund that trades less frequently. |
| | • | preferred securities risk: the risk that: (i) certain preferred stocks contain provisions that allow an issuer under certain conditions to skip or defer distributions; (ii) preferred stocks may be subject to redemption, including at the issuer’s call, and, in the event of redemption, the Fund may not be able to reinvest the proceeds at comparable rates of return; (iii) preferred stocks are generally subordinated to bonds and other debt securities in an issuer’s capital structure in terms of priority for corporate income and liquidation payments; and (iv) preferred stocks may trade less frequently and in a more limited volume and may be subject to more abrupt or erratic price movements than many other securities. |
| | • | price volatility risk: the risk that the value of a Fund’s investment portfolio will change as the prices of its investments go up or down. |
| | • | real estate risk: the risk that real estate related investments may decline in value as a result of factors affecting the real estate industry, such as the supply of real property in certain markets, changes in zoning laws, delays in completion of construction, changes in real estate values, changes in property taxes, levels of occupancy, and local and regional market conditions. |
| | • | reliance on the adviser: the risk associated with each Fund’s ability to achieve its investment objective being dependent upon the Adviser’s ability to identify profitable investment opportunities for a Fund. While the portfolio managers of the Funds have considerable experience in managing other portfolios with investment objectives, policies and strategies that are similar and intend to use similar analytical methods to identify potential investments for the Funds, the past experience of the portfolio managers does not guarantee future results for the Adviser. |
| | • | securities or sector selection risk: the risk that the securities held by a Fund will underperform other funds investing in similar asset classes or benchmarks that are representative of the asset class because of the portfolio managers’ choice of securities or sectors for investment. |
| | • | short sales risk: the risk that a security a Fund has sold short increases in value. |
| | • | tax risk: in order to qualify as a regulated investment company under the Internal Revenue Code of 1986, as amended (“Code”), a Fund must meet requirements regarding, among other things, the source of its income. It is possible that certain of a Fund’s investments in commodity-linked derivatives will not give rise to “qualifying income” for this purpose. Any income a Fund derives from investments in instruments that do not generate “qualifying income” must be limited to a maximum of 10% of the Fund’s annual gross income. If a Fund were to earn non-qualifying income in excess of 10% of its annual gross income, it could fail to qualify as a regulated investment company for that year. If a Fund were to fail to qualify as a regulated investment company, the Fund would be subject to tax and shareholders of the Fund would be subject to the risk of diminished returns. |
| | • | U.S. Government securities risk: the risk that debt securities issued or guaranteed by certain U.S. Government agencies, instrumentalities, and sponsored enterprises are not supported by the full faith and credit of the U.S. Government, and so involve credit risk greater than investments in other types of U.S. Government securities. |
11. Recently Issued Accounting Pronouncements
In May 2011, the Financial Accounting Standards Board issued Accounting Standards Update (“ASU”) No. 2011-04 “ Amendments to Achieve Common Fair Value Measurement and Disclosure Requirements in U.S. GAAP and International Financial Reporting Standards (”IFRS“)”. ASU 2011-04 includes common
| | | | | | |
| | Annual Report | | March 31, 2012 | | 57 |
Notes to Financial Statements (Cont.)
requirements for measurement of and disclosure about fair value between U.S. GAAP and IFRS. ASU 2011-04 will require reporting entities to disclose the following information for fair value measurements categorized within Level 3 of the fair value hierarchy: quantitative information about the unobservable inputs used in the fair value measurement, the valuation processes used by the reporting entity, and a narrative description of the sensitivity of the fair value measurement to changes in observable inputs and the interrelationships between those unobservable inputs. In addition, ASU 2011-04 will require reporting entities to make disclosures about amounts and reasons for all transfers in and out of Level 1 and Level 2 fair value measurements. The new and revised disclosures are effective for interim and annual reporting periods beginning after December 15, 2011. At this time, management is evaluating the disclosure implications of ASU 2011-04 on the financial statements.
12. Legal Proceedings
The litigation with Trust Company of the West involving the Trust, the Adviser, and certain key employees of the Adviser described in the Funds’ Prospectuses has been fully settled among the parties. The Trust is not engaged in any material litigation or arbitration proceedings and is not aware of any material litigation or claim pending or threatened by or against it.
13. Subsequent Events
In preparing these financial statements, the Funds have evaluated events and transactions for potential recognition or disclosure through the date the financial statements were available to be issued. The Funds have determined there are no subsequent events that would need to be disclosed in the Funds’ financial statements.
Report of Independent Registered Public Accounting Firm
To the Board of Trustees and Shareholders of DoubleLine Funds Trust
In our opinion, the accompanying statements of assets and liabilities, including the schedules of investments, and the related statements of operations and of changes in net assets and the financial highlights present fairly, in all material respects, the financial position of DoubleLine Total Return Bond Fund, DoubleLine Core Fixed Income Fund, DoubleLine Emerging Markets Fixed Income Fund, DoubleLine Low Duration Bond Fund and DoubleLine Multi-Asset Growth Fund (Consolidated) (constituting DoubleLine Funds Trust, hereafter referred to as the “Funds”) at March 31, 2012, and the results of its operations, the changes in its net assets and the financial highlights for the periods presented for the DoubleLine Total Return Bond Fund, DoubleLine Emerging Markets Fixed Income Fund, DoubleLine Core Fixed Income Fund, DoubleLine Multi-Asset Growth Fund, and from September 30, 2011 (Commencement of Operations) to March 31, 2012 for DoubleLine Low Duration Bond Fund, in conformity with accounting principles generally accepted in the United States of America. These financial statements and financial highlights (hereafter referred to as “financial statements”) are the responsibility of the Funds’ management. Our responsibility is to express an opinion on these financial statements based on our audits. We conducted our audits of these financial statements in accordance with the standards of the Public Company Accounting Oversight Board (United States). Those standards require that we plan and perform the audit to obtain reasonable assurance about whether the financial statements are free of material misstatement. An audit includes examining, on a test basis, evidence supporting the amounts and disclosures in the financial statements, assessing the accounting principles used and significant estimates made by management, and evaluating the overall financial statement presentation. We believe that our audits, which included confirmation of securities at March 31, 2012 by correspondence with the custodian and brokers, provide a reasonable basis for our opinion.
PricewaterhouseCoopers LLP
Los Angeles, California
May 29, 2012
| | | | | | |
| | Annual Report | | March 31, 2012 | | 59 |
| | |
| Shareholder Expenses | | (Unaudited) |
Example
As a shareholder of DoubleLine Total Return Bond Fund, DoubleLine Core Fixed Income Fund, DoubleLine Emerging Markets Fixed Income Fund, DoubleLine Multi-Asset Growth Fund and DoubleLine Low Duration Bond Fund (each a “Fund” and collectively the “Funds”), you incur two basic types of costs: (1) transaction costs , including sales charges (loads) on purchase payments, reinvested dividends, or other distributions; redemption fees; and exchange fees; and (2) ongoing costs, including management fees; distribution (12b-1) fees and other Fund expenses.
This Example is intended to help you understand your ongoing costs (in dollars) of investing in each Fund and to compare these costs with the ongoing costs of investing in other mutual funds. The Example is based on an investment of $1,000 invested at the beginning of the period and held for the entire period covered by this report.
Actual Expenses
The actual return columns in the following table provide information about account values based on actual returns and actual expenses. You may use the information in these columns, together with the amount you invested, to estimate the expenses that you paid over the period. Simply divide your account value by $1,000 (for example, an $8,600 account value divided by $1,000 = 8.6), then multiply the result by the number in the respective line under the heading entitled “Expenses Paid During Period” to estimate the expenses you paid on your account during this period. In addition to the expenses shown below in the table, as a shareholder you will be assessed fees for outgoing wire transfers, returned checks and stop payment orders at prevailing rates charged by U.S. Bancorp Fund Services, LLC, the Fund’s transfer agent. Currently, if you request a redemption be made by wire, a $15.00 fee is charged by the Fund’s transfer agent. You will be charged a redemption fee equal to 1.00% of the net amount of the redemption if you redeem shares that have been held for less than 90 days in the DoubleLine Multi-Asset Growth Fund. An Individual Retirement Account (“IRA”) will be charged a $15.00 annual maintenance fee. The transfer agent charges a transaction fee of $25.00 on returned checks and stop payment orders. If you paid a transaction fee, you would add the fee amount to the expenses paid on your account this period to obtain your total expenses paid.
Hypothetical Example for Comparison Purposes
The hypothetical return columns in the following table provide information about hypothetical account values and hypothetical expenses based on a Fund’s actual expense ratio and an assumed rate of return of 5% per year before expenses, which is not a Fund’s actual return. The hypothetical account values and expenses may not be used to estimate the actual ending account balance or expenses you paid for the period. You may use this information to compare the ongoing costs of investing in the Fund and other funds. To do so, compare this 5% hypothetical example with the 5% hypothetical examples that appear in the shareholder reports of the other funds. Please note that the expenses shown in the table are meant to highlight your ongoing costs only and do not reflect the transaction fees discussed above. Therefore, those columns are useful in comparing ongoing costs only, and will not help you determine the relative total costs of owning different funds. In addition, if these transactional costs were included, your costs would have been higher.
| | | | | | | | | | | | | | | | | | | | | | | | | | | | | | |
| | | | | | | | | | | | | Actual | | | | | Hypothetical
(5% return
before expenses) | |
| | | | | | | Fund’s
Annualized
Expense Ratio | | | Beginning
Account
Value | | | Ending
Account
Value
3/31/12 | | | Expenses
Paid During
Period *1 | | | | | Ending
Account
Value
3/31/12 | | | Expenses
Paid During
Period *1 | |
DoubleLine Total Return Bond Fund | | | | Class I | | | 0.49% | | | $ | 1,000 | | | $ | 1,036 | | | $ | 2.48 | | | | | $ | 1,022 | | | $ | 2.46 | |
| | | | Class N | | | 0.74% | | | $ | 1,000 | | | $ | 1,034 | | | $ | 3.74 | | | | | $ | 1,021 | | | $ | 3.72 | |
DoubleLine Core Fixed Income Fund | | | | Class I | | | 0.49% | | | $ | 1,000 | | | $ | 1,038 | | | $ | 2.48 | | | | | $ | 1,022 | | | $ | 2.46 | |
| | | | Class N | | | 0.74% | | | $ | 1,000 | | | $ | 1,037 | | | $ | 3.75 | | | | | $ | 1,021 | | | $ | 3.72 | |
DoubleLine Emerging Markets Fixed Income Fund | | | | Class I | | | 0.95% | | | $ | 1,000 | | | $ | 1,098 | | | $ | 4.96 | | | | | $ | 1,020 | | | $ | 4.77 | |
| | | | Class N | | | 1.20% | | | $ | 1,000 | | | $ | 1,096 | | | $ | 6.25 | | | | | $ | 1,019 | | | $ | 6.02 | |
DoubleLine Multi-Asset Growth Fund | | | | Class I | | | 1.20% | | | $ | 1,000 | | | $ | 1,021 | | | $ | 6.03 | | | | | $ | 1,019 | | | $ | 6.02 | |
| | | | | Class A | | | 1.45% | | | $ | 1,000 | | | $ | 1,022 | | | $ | 7.29 | | | | | $ | 1,018 | | | $ | 7.27 | |
DoubleLine Low Duration Bond Fund | | | | Class I | | | 0.47% | | | $ | 1,000 | | | $ | 1,024 | | | $ | 2.37 | | | | | $ | 1,023 | | | $ | 2.36 | |
| | | | | Class N | | | 0.72% | | | $ | 1,000 | | | $ | 1,023 | | | $ | 3.62 | | | | | $ | 1,021 | | | $ | 3.62 | |
* The dollar amounts shown as expenses paid during the period are equal to the annualized six-month expense ratio multiplied by the average account value during the period, multiplied by the number of days in the most recent six-month period and divided by the number of days in the most recent twelve month period.
1 Reflects fee waiver and expense limitation arrangements in effect during the period
DoubleLine Total Return Bond Fund
Value of a $100,000 Investment
Class I Shares1
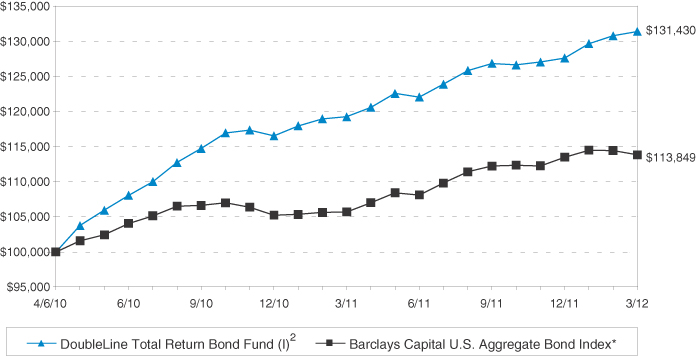
Total Returns1
As of March 31, 2012
| | | | | | | | | | |
| | | | | 1 Year | | | Since
Inception
(4/6/2010) | |
DoubleLine Total Return Bond Fund Class I | | | | | 10.18 | | | | 14.77% | |
Barclays Capital U.S. Aggregate Bond Index* | | | | | 7.71 | | | | 6.76% | |
| | | |
DoubleLine Total Return Bond Fund Class N | | | | | 9.83 | | | | 14.47% | |
| 1 | Past performance is not an indication of future results. Returns represent past performance and reflect changes in share prices, the reinvestment of all dividends and capital gains, expense limitations and the effects of compounding. The prospectus contains more complete information on the investment objectives, risks, charges and expenses of the investment company, which investors should read and consider carefully before investing. To obtain a prospectus, contact a registered representative or visit www.doubleline.com. The Fund’s adviser waived a portion of its management fee and/or reimbursed Fund expenses during the period shown. Had the adviser not done so, the Fund’s total returns would have been lower. The returns shown do not reflect taxes a shareholder would pay on distributions or redemptions. Total investment return and principal value of your investment will fluctuate, and your shares, when redeemed, may be worth more or less than their original cost. Current performance may be higher or lower than the performance data quoted. Call 877-DLine11 or visit www.doubleline.com for performance results current to the most recent month-end. |
| 2 | Performance of other classes will be greater or less than the line shown based on the differences in loads and fees paid by shareholders investing in the different classes. |
| * | This index represents securities that are SEC-registered, taxable, and dollar denominated. The index covers the US investment grade fixed rate bond market, with index components for government and corporate securities, mortgage pass-through securities, and asset-backed securities. These major sectors are subdivided into more specific indices that are calculated and reported on a regular basis. The Fund’s investments likely will diverge widely from the components of the benchmark Index which could lead to performance dispersion between the Fund and the benchmark Index, meaning that the Fund could outperform or underperform the Index at any given time. |
| | | | | | |
| | Annual Report | | March 31, 2012 | | 61 |
| | |
| | | (Unaudited) March 31, 2012 |
DoubleLine Core Fixed Income Fund
Value of a $100,000 Investment
Class I Shares1
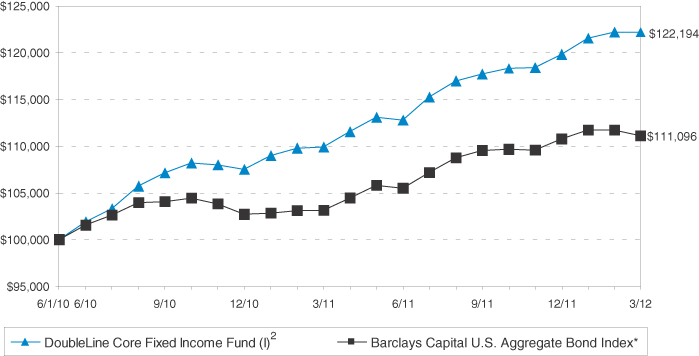
| | | | | | | | | | |
Total Returns1 As of March 31, 2012 | |
| | | | | 1 Year | | | Since
Inception
(6/1/2010) | |
DoubleLine Core Fixed Income Fund Class I | | | | | 11.19 | | | | 11.57% | |
Barclays Capital U.S. Aggregate Bond Index* | | | | | 7.71 | | | | 5.92% | |
| | | |
DoubleLine Core Fixed Income Fund Class N | | | | | 10.85 | | | | 11.28% | |
| 1 | Past performance is not an indication of future results. Returns represent past performance and reflect changes in share prices, the reinvestment of all dividends and capital gains, expense limitations and the effects of compounding. The prospectus contains more complete information on the investment objectives, risks, charges and expenses of the investment company, which investors should read and consider carefully before investing. To obtain a prospectus, contact a registered representative or visit www.doubleline.com. The Fund’s adviser waived a portion of its management fee and/or reimbursed Fund expenses during the period shown. Had the adviser not done so, the Fund’s total returns would have been lower. The returns shown do not reflect taxes a shareholder would pay on distributions or redemptions. Total investment return and principal value of your investment will fluctuate, and your shares, when redeemed, may be worth more or less than their original cost. Current performance may be higher or lower than the performance data quoted. Call 877-DLine11 or visit www.doubleline.com for performance results current to the most recent month-end. |
| 2 | Performance of other classes will be greater or less than the line shown based on the differences in loads and fees paid by shareholders investing in the different classes. |
| * | This index represents securities that are SEC-registered, taxable, and dollar denominated. The index covers the US investment grade fixed rate bond market, with index components for government and corporate securities, mortgage pass-through securities, and asset-backed securities. These major sectors are subdivided into more specific indices that are calculated and reported on a regular basis. The Fund’s investments likely will diverge widely from the components of the benchmark Index which could lead to performance dispersion between the Fund and the benchmark Index, meaning that the Fund could outperform or underperform the Index at any given time. |
DoubleLine Emerging Markets Fixed Income Fund
Value of a $100,000 Investment
Class I Shares1
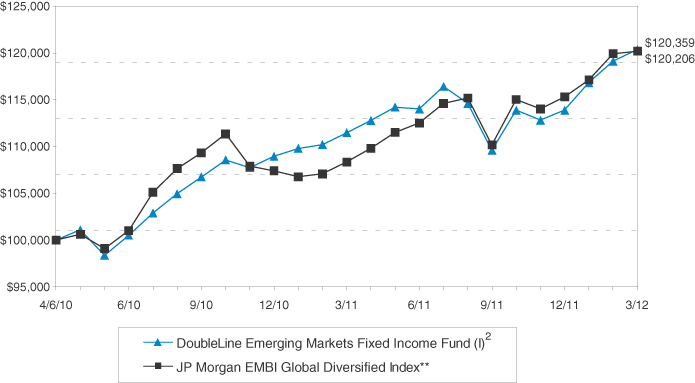
| | | | | | | | | | |
Total Returns1 As of March 31, 2012 | |
| | | | | 1 Year | | | Since
Inception
(4/6/2010) | |
DoubleLine Emerging Markets Fixed Income Fund Class I | | | | | 7.96 | | | | 9.79% | |
JP Morgan EMBI Global Diversified Index** | | | | | 10.94 | | | | 9.72% | |
| | | |
DoubleLine Emerging Markets Fixed Income Fund Class N | | | | | 7.71 | | | | 9.54% | |
| 1 | Past performance is not an indication of future results. Returns represent past performance and reflect changes in share prices, the reinvestment of all dividends and capital gains, expense limitations and the effects of compounding. The prospectus contains more complete information on the investment objectives, risks, charges and expenses of the investment company, which investors should read and consider carefully before investing. To obtain a prospectus, contact a registered representative or visit www.doubleline.com. The Fund’s adviser waived a portion of its management fee and/or reimbursed Fund expenses during the period shown. Had the adviser not done so, the Fund’s total returns would have been lower. The returns shown do not reflect taxes a shareholder would pay on distributions or redemptions. Total investment return and principal value of your investment will fluctuate, and your shares, when redeemed, may be worth more or less than their original cost. Current performance may be higher or lower than the performance data quoted. Call 877-DLine11 or visit www.doubleline.com for performance results current to the most recent month-end. |
| 2 | Performance of other classes will be greater or less than the line shown based on the differences in loads and fees paid by shareholders investing in the different classes. |
| ** | This index is an uniquely-weighted version of the EMBI Global. It limits the weights of those index countries with larger debt supplies by only including specified portions of these countries’ eligible current face amounts of debt outstanding. The countries covered in the EMBI Global Diversified are identical to those covered by EMBI Global. The Fund’s investments likely will diverge widely from the components of the benchmark Index which could lead to performance dispersion between the Fund and the benchmark Index, meaning that the Fund could outperform or underperform the Index at any given time. |
| | | | | | |
| | Annual Report | | March 31, 2012 | | 63 |
| | |
| | | (Unaudited) March 31, 2012 |
DoubleLine Multi-Asset Growth Fund
Value of a $100,000 Investment
Class I Shares1
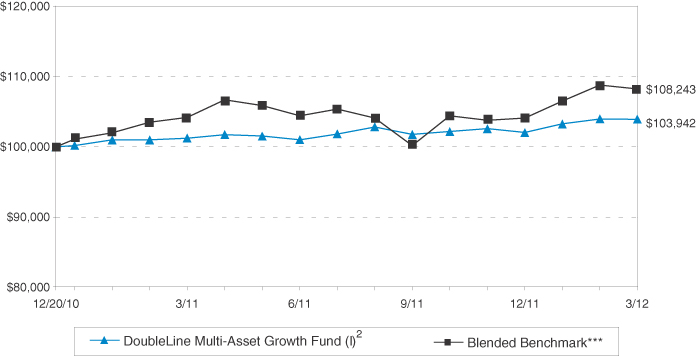
Total Returns1
As of March 31, 2012
| | | | | | | | | | |
| | | | | 1 Year | | | Since
Inception
(12/20/2010) | |
DoubleLine Multi-Asset Growth Fund Class I | | | | | 2.67 | | | | 3.07% | |
Blended Benchmark | | | | | 3.90 | | | | 6.40% | |
| | | |
DoubleLine Multi-Asset Growth Fund (with load) Class A | | | | | -1.79 | | | | -0.62% | |
| 1 | Past performance is not an indication of future results. Returns represent past performance and reflect changes in share prices, the reinvestment of all dividends and capital gains, expense limitations and the effects of compounding. The prospectus contains more complete information on the investment objectives, risks, charges and expenses of the investment company, which investors should read and consider carefully before investing. To obtain a prospectus, contact a registered representative or visit www.doubleline.com. The Fund’s adviser waived a portion of its management fee and/or reimbursed Fund expenses during the period shown. Had the adviser not done so, the Fund’s total returns would have been lower. The returns shown do not reflect taxes a shareholder would pay on distributions or redemptions. Total investment return and principal value of your investment will fluctuate, and your shares, when redeemed, may be worth more or less than their original cost. Current performance may be higher or lower than the performance data quoted. Call 877-DLine11 or visit www.doubleline.com for performance results current to the most recent month-end. |
| 2 | Performance of other classes will be greater or less than the line shown based on the differences in loads and fees paid by shareholders investing in the different classes. |
| *** | Blended Benchmark: 60% Barclays Capital U.S. Aggregate/ 25% Morgan Stanley Capital International All Country World Index/ 15% S&P Goldman Sachs Commodity Total Return Index. The Barclays Capital U.S. Aggregate index covers the US investment grade fixed rate bond market, with index components for government and corporate securities, mortgage pass-through securities, and asset-backed securities. These major sectors are subdivided into more specific indices that are calculated and reported on a regular basis. The Standard & Poor’s/Goldman Sachs Commodity Total Return Index is a composite index of commodity sector returns which represents a broadly diversified, unleveraged, long-only position in commodity futures. This index’s components qualify for inclusion in the index based on liquidity measures and are weighted in relation to their global production levels, making the index a valuable economic indicator and commodities market benchmark. The Morgan Stanley Capital International All Country World Index is designed to provide a broad measure of stock performance throughout the world, with the exception of U.S.-based companies. The MSCI All Country World Index Ex-U.S. includes both developed and emerging markets. The Fund’s investments likely will diverge widely from the components of the benchmark Index which could lead to performance dispersion between the Fund and the benchmark Index, meaning that the Fund could outperform or underperform the Index at any given time. |
DoubleLine Low Duration Bond Fund
Value of a $100,000 Investment
Class I Shares1
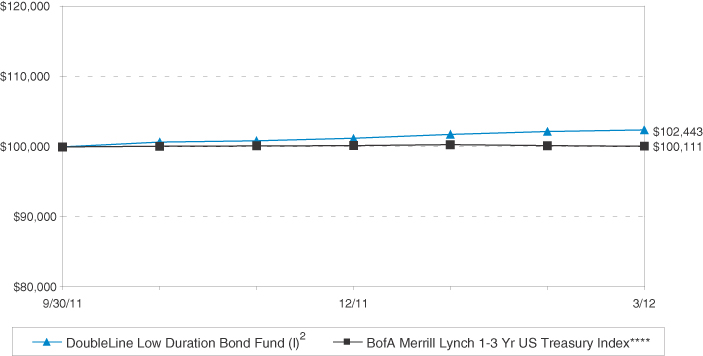
| | | | | | |
Total Returns1 As of March 31, 2012 | |
| | | | | Since
Inception
(9/30/2011) | |
DoubleLine Low Duration Bond Fund Class I | | | | | 2.44% | |
BofA Merrill Lynch 1-3 year Treasury Index | | | | | 0.11% | |
| | |
DoubleLine Low Duration Bond Fund Class N | | | | | 2.25% | |
| 1 | Past performance is not an indication of future results. Returns represent past performance and reflect changes in share prices, the reinvestment of all dividends and capital gains, expense limitations and the effects of compounding. The prospectus contains more complete information on the investment objectives, risks, charges and expenses of the investment company, which investors should read and consider carefully before investing. To obtain a prospectus, contact a registered representative or visit www.doubleline.com. The Fund’s adviser waived a portion of its management fee and/or reimbursed Fund expenses during the period shown. Had the adviser not done so, the Fund’s total returns would have been lower. The returns shown do not reflect taxes a shareholder would pay on distributions or redemptions. Total investment return and principal value of your investment will fluctuate, and your shares, when redeemed, may be worth more or less than their original cost. Current performance may be higher or lower than the performance data quoted. Call 877-DLine11 or visit www.doubleline.com for performance results current to the most recent month-end. |
| 2 | Performance of other classes will be greater or less than the line shown based on the differences in loads and fees paid by shareholders investing in the different classes. |
| **** | The BofA Merrill Lynch 1-3 Year US Treasury Index is an unmanaged index that tracks the performance of the direct sovereign debt of the U.S. Government having a maturity of at least one year and less than three years. The Fund’s investments likely will diverge widely from the components of the benchmark Index which could lead to performance dispersion between the Fund and the benchmark Index, meaning that the Fund could outperform or underperform the Index at any given time. |
| | | | | | |
| | Annual Report | | March 31, 2012 | | 65 |
| | |
| Evaluation of Advisory Agreement by the Board of Trustees | | (Unaudited) |
At the February 29, 2012 meeting (the “Meeting”) of the Board of Trustees of DoubleLine Funds Trust (the “Trust”), the Board of Trustees, including the Trustees who are not “interested persons” (as defined in the Investment Company Act of 1940, as amended) of the Trust (“Independent Trustees”) voting separately, approved the renewal of the Investment Advisory and Management Agreements (the “Advisory Agreements”) between DoubleLine Capital LP (“DoubleLine” or the “Adviser”) and the Trust, in respect of the DoubleLine Total Return Bond Fund, the DoubleLine Core Fixed Income Fund, the DoubleLine Emerging Markets Fixed Income Fund, and the DoubleLine Multi-Asset Growth Fund (each, a “Fund” and, collectively, the “Funds”), for an additional one-year period starting March 25, 2012.
The Trustees meet over the course of the year with investment advisory personnel from DoubleLine and regularly review detailed information, presented both orally and in writing, regarding the investment program and performance of each Fund. The Trustees’ determination to approve the continuance of the Advisory Agreements was made on the basis of each Trustee’s business judgment after a comprehensive evaluation of all of the information provided to the Trustees, both at the February 29, 2012 meeting and at prior meetings. This summary describes a number, but not necessarily all, of the most important factors considered by the Board and the Independent Trustees. Individual Trustees may have given different weights to certain factors and assigned various degrees of materiality to information received in connection with the approval process. No single factor was determined to be decisive. In all of their deliberations, the Board of Trustees and the Independent Trustees were advised by counsel to the Independent Trustees and the Funds, and the Independent Trustees met separately from management in making their assessment of the Advisory Agreement arrangements, including in an executive session with counsel to the Independent Trustees.
The Trustees considered the nature, extent, and quality of the services provided and expected to be provided by DoubleLine. In this regard, the Trustees considered that DoubleLine provides a full investment program for each of the Funds and a variety of other services, including, among others, a number of back-offices services, shareholder services, administration services, valuation services, and compliance services. The Board also considered that DoubleLine makes available to its investment professionals a variety of resources and systems relating to investment management, compliance, trading, performance and portfolio accounting. At their meetings since their initial approval of the Advisory Agreements, the Trustees heard reports from, and reviewed information provided by, DoubleLine’s and the Funds’ officers, including the Funds’ Chief Compliance Officer, regarding, the services described above as well as DoubleLine’s and the Funds’ compliance programs. The Trustees noted the considerable experience and capability of the DoubleLine team and considered a statement by a representative of the Adviser that DoubleLine is aware of the challenges posed by the Funds’ rapid growth and is prepared to devote the resources necessary to continue to provide a high level of expertise and service to the Funds, and that such expertise and service has benefited and reasonably could be expected to benefit the Funds’ shareholders. The Board considered the difficulty of managing bond funds, noting that managing bond funds requires a portfolio management team to balance a number of factors, including (but not limited to) varying maturities, prepayments, collateral management, counter-party management, pay-downs, credit events, workouts and net new issuance in the bond market. Based on these considerations and others, the Trustees concluded that they were satisfied with the nature and the quality of the services provided to the Funds under the Advisory Agreements.
The Trustees considered DoubleLine’s representation that it has attempted to set its management fees at rates that reflect market levels generally, and that reflect the experience and expertise DoubleLine brings to managing the Funds. The Trustees reviewed reports provided by Strategic Insight, which showed that the net management fees paid by the Total Return Bond Fund and the Core Fixed Income Fund were significantly below those Funds’ expense group medians, and that, although there were brief periods of relative underperformance, the performance for each of those Funds had generally been favorable. The Trustees noted that the net management fee paid by the Emerging Markets Fixed Income Fund was relatively high compared to its expense group peers, though not the highest of the peer funds, and that the Fund had achieved second-quartile relative performance for the one-year period ending December 31, 2011. The Trustees also noted that the net management fee for the Multi-Asset Growth Fund compared very favorably to that Fund’s expense group peers, due principally to the substantial fee waivers incurred by DoubleLine. The Trustees concluded that the fees paid by the Funds to DoubleLine were generally reasonable in light of the services provided, the quality of the portfolio management teams, and the Funds’ performance to date. In the course of their discussion, the Trustees met with a representative of the Strategic Insight organization to discuss the performance and expense information provided and the methodology used in assembling and presenting that information.
The Trustees considered information relating to the fees charged by DoubleLine to clients other than the Funds, including institutional separate accounts and mutual funds for which DoubleLine serves as sub-adviser. The Trustees took into account the Adviser’s statement that each of the Funds pays fees at the same rate as the standard rates charged by DoubleLine to clients with comparable investment strategies generally, with the exception of the Emerging Markets Fixed Income Fund, which pays a higher rate. The Trustees considered that DoubleLine’s standard fee schedules for each of the relevant investment strategies incorporate at least one breakpoint, with the exception of the investment strategy used by the Multi-Asset Growth Fund, which is the only account managed by DoubleLine that uses that strategy. The Trustees considered that DoubleLine had also explained that the administrative, compliance, reporting, and other legal burdens of providing investment advice to mutual funds exceed those required to provide advisory services to non-mutual fund clients, including institutional accounts, such as endowments, foundations and retirement or pension plans, noting too, that such arrangements typically entail different contractual obligations. The Trustees also took into account DoubleLine’s representation that there are substantially greater legal and other responsibilities and risks to DoubleLine in managing public mutual funds than in managing private accounts or in sub-advising mutual funds sponsored by others, and that the services and resources required of DoubleLine when it sub-advises mutual funds sponsored by others are less than in the case of the Funds because many of the administrative and compliance responsibilities related to the management function are retained by the primary adviser.
The Trustees reviewed financial information provided to them by DoubleLine, including actual financial information for 2011 and projected information for 2012, regarding the Adviser’s operating costs and profitability. The Trustees also reviewed information regarding the profitability to DoubleLine of its service arrangements with the Funds, both before and after distribution expenses. The Trustees considered DoubleLine’s representation that it continues to invest in its business to maintain high quality services for the Funds and does not engage in contractual soft-dollar arrangements.
| | |
| Evaluation of Advisory Agreement by the Board of Trustees (Cont.) | | (Unaudited) |
The Trustees discussed with DoubleLine whether economies of scale would likely be realized as the Funds grow and whether a reduction in the advisory fees paid by the Funds by means of breakpoints would be appropriate. The Trustees considered DoubleLine’s statement that it did not believe that implementation of breakpoints or fee reductions would be appropriate at this time for a number of reasons. For example, DoubleLine noted that both the Total Return Bond Fund and the Core Fixed Income Fund already pay net management fees that are well below those Funds’ respective peer medians, and the levels of profitability of both Funds to DoubleLine are reasonable and in line with or below what DoubleLine understands to be industry norms. The Trustees also considered that DoubleLine was still heavily subsidizing the expenses of the Multi-Asset Growth Fund. In addition, the Trustees noted that, although DoubleLine’s profitability was higher in respect of the Emerging Markets Fixed Income Fund as compared to the other Funds, DoubleLine believed that the Emerging Markets Fixed Income Fund had not yet achieved economies of scale beyond those that DoubleLine anticipated it would achieve when it proposed the Fund’s current advisory fee schedule, and that DoubleLine was still waiving a portion of its advisory fee as to that Fund. After considering the information provided, the Trustees concluded that the profitability of the Funds to DoubleLine did not appear excessive or such as to preclude renewal of the Advisory Agreements and that, for the reasons noted, it did not appear that implementation of breakpoints for any of the Funds would be appropriate at this time.
On the basis of these considerations, the Trustees determined to approve the Advisory Agreements for an additional one-year period.
| | | | | | |
| | Annual Report | | March 31, 2012 | | 67 |
| | |
| Federal Tax Information | | (Unaudited) |
For the fiscal year ended March 31, 2012, certain dividends paid by the Funds may be subject to a maximum tax rate of 15%, as provided for by the Jobs and Growth Tax Relief Reconciliation Act of 2003. The percentage of dividends declared from ordinary income designated as qualified dividend income was as follows:
| | | | | | |
| Qualified Dividend Income | | | | | |
DoubleLine Total Return Bond Fund | | | | | 0.00% | |
DoubleLine Core Fixed Income Fund | | | | | 0.00% | |
DoubleLine Emerging Markets Fixed Income Fund | | | | | 0.00% | |
DoubleLine Multi-Asset Growth Fund | | | | | 11.29% | |
DoubleLine Low Duration Bond Fund | | | | | 0.00% | |
For corporate shareholders, the percent of ordinary income distributions qualifying for the corporate dividends received deduction for the fiscal year ended March 31, 2012 was as follows:
| | | | | | |
| Dividends Received Deduction | | | | | |
DoubleLine Total Return Bond Fund | | | | | 0.00% | |
DoubleLine Core Fixed Income Fund | | | | | 0.00% | |
DoubleLine Emerging Markets Fixed Income Fund | | | | | 0.00% | |
DoubleLine Multi-Asset Growth Fund | | | | | 11.29% | |
DoubleLine Low Duration Bond Fund | | | | | 0.00% | |
The Percentage of taxable ordinary income distributions that are designated as short-term capital gain distributions under Internal Revenue Section 871(k)(2)(c) for each Fund were as follows:
| | | | | | |
DoubleLine Total Return Bond Fund | | | | | 0.00% | |
DoubleLine Core Fixed Income Fund | | | | | 7.14% | |
DoubleLine Emerging Markets Fixed Income Fund | | | | | 14.81% | |
DoubleLine Multi-Asset Growth Fund | | | | | 0.00% | |
DoubleLine Low Duration Bond Fund | | | | | 0.00% | |
Shareholders are advised to consult their own tax adviser with respect to the tax consequences of their investment in the Funds.
| | |
| Trustees and Officers | | (Unaudited) |
| | | | | | | | | | |
Name, Address, and Year of
Birth(1) | | Position with Trust | | Term of Office and Length of Time Served | | Principal Occupation(s) During Past 5 Years | | Number of
Portfolios
Overseen(3) | | Other Directorships Held by Trustee |
| | | | |
Independent Trustees | | | | | | | | |
| | | | | |
| Joseph J. Ciprari, 1964 | | Trustee | | Indefinite/Since Inception | | Consultant with Remo Consultants. Formerly, Managing Director, UBS AG. Formerly, Managing Director, Ally Securities, LLC. | | 6 | | None |
| | | | | |
| John C. Salter, 1957 | | Trustee | | Indefinite/Since Inception | | California Desk Manager/Broker of ChapDelaine & Co. Formerly, Partner at Stark, Salter & Smith, a securities brokerage firm specializing in tax exempt bonds. | | 6 | | None |
| | | | | |
| Robert J. Untracht, 1949 | | Trustee | | Indefinite/Since Inception | | Financial Reporting Consultant with International Lease Finance Corporation. | | 6 | | None(2) |
| | | | | |
| Raymond B. Woolson, 1958 | | Trustee | | Indefinite/Since Inception | | President of Apogee Group, Inc., a company providing financial consulting services. | | 6 | | None |
(1) The address of each Independent Trustee is c/o DoubleLine Capital LP, 333 South Grand Avenue, Suite 1800, Los Angeles, CA 90071.
(2) Formerly, a member of the Board of Directors of SM&A, Inc. (a publicly traded company).
(3) Includes DoubleLine Opportunistic Credit Fund, a closed-end fund.
The following Trustees are “interested persons” of the Trust as defined in the 1940 Act because they are officers of the Adviser, and indirect shareholders in the Adviser.
| | | | | | | | | | |
| Name, Address, and Age(1) | | Position
with Trust | | Term of Office and Length of Time Served | | Principal Occupation(s) During Past 5 Years | | Number of
Portfolios Overseen | | Other Directorships Held by Trustee |
| | | | |
Interested Trustees | | | | | | | | |
| | | | | |
| Jeffrey E. Gundlach, 1959 | | Trustee | | Indefinite/Since Inception | | Chief Executive Officer at DoubleLine Capital LP (since December 2009); prior thereto, Chief Investment Officer, Group Managing Director and President at TCW Group. | | 5 | | None |
| | | | | |
| Philip A. Barach, 1952 | | Trustee | | Indefinite/Since Inception | | President at DoubleLine Capital LP (since December 2009); prior thereto, Group Managing Director at TCW Group. | | 5 | | None |
(1) The address of each Interested Trustee is DoubleLine Capital LP, 333 South Grand Avenue, Suite 1800, Los Angeles, CA 90071.
Officers
The officers of the Trust who are not also Trustees of the Trust are:
| | | | | | |
| Name, Address, and Age(1) | | Position(s)
Held with
Fund | | Term of Office and Length of Time Served | | Principal Occupation(s) During Past 5 Years |
| | | |
| Ronald R. Redell, 1970 | | President | | Indefinite/Since Inception | | President at DoubleLine Funds Trust (since January 2010); prior thereto, President and CEO of TCW Funds, Inc. and TCW Strategic Income Fund, Inc. |
| | | |
| Earl Lariscy, 1966 | | Chief Compliance Officer | | Indefinite/Since June 2010 | | General Counsel at DoubleLine Capital LP (since April 2010); prior thereto, Director at Barclay’s Capital and Agency General Manager of Barclay Bank PLC’s California based banking operations beginning in October 2007. Prior to Barclays, Mr. Lariscy served as Associate General Counsel to TCW Group since January 2006 and worked as an attorney in the New York office of Linklaters prior to joining TCW Group. |
| | | |
| Louis C. Lucido, 1948 | | Secretary | | Indefinite/Since Inception | | Chief Operating Officer at DoubleLine Capital LP (since December 2009); prior thereto, Group Managing Director at TCW Group. |
| | | |
| Susan Nichols, 1962 | | Treasurer | | Indefinite/Since August 2010 | | Assistant Treasurer at DoubleLine Funds Trust (since January 2010); prior thereto, Senior Vice President at TCW Group. |
(1) The address of each officer is DoubleLine Capital LP, 333 South Grand Avenue, Suite 1800, Los Angeles, CA 90071.
The Statement of Additional Information includes additional information about the Trustees and is available, without charge, upon request, by calling 877-DLine11 (877-354-6311).
| | | | | | |
| | Annual Report | | March 31, 2012 | | 69 |
| | |
| Information About Proxy Voting | | (Unaudited) |
Information about how a Fund voted proxies relating to portfolio securities held during the most recent twelve month period ended June 30th is available no later than the following August 31st without charge, upon request, by calling 877-DLine11 (877-354-6311) and on the SEC’s website at http://www.sec.gov.
A description of the Funds’ proxy voting policies and procedures is available (i) without charge, upon request, by calling 877-DLine11 (877-354-6311); and (ii) on the commission’s web site at http://www.sec.gov.
Information About The Portfolio Holdings
It is the policy of the Trust to provide certain unaudited information regarding the portfolio composition of the Funds as of month-end to shareholders and others upon request to the Funds, beginning on the 15th calendar day after the end of the month (or, if not a business day, the next business day thereafter).
Shareholders and others who wish to obtain portfolio holdings for a particular month may make a request by contacting the Funds at no charge at 877-DLine11 (877-354-6311) between the hours of 7:00 a.m. and 5:00 p.m. Pacific time, Monday through Friday, beginning on the 15th day following the end of that month (or, if not a business day, the next business day thereafter). Requests for portfolio holdings may be made on a monthly basis pursuant to this procedure, or standing requests for portfolio holdings may be accepted.
The Trust is required to file its complete schedule of portfolio holdings with the U.S. Securities and Exchange Commission for its first and third fiscal quarters on Form N-Q. The Trust’s Forms N-Q are available on the U.S. Securities and Exchange Commission’s website at www.sec.gov. You can also review and obtain copies of the Forms N-Q at the U.S. Securities and Exchange Commission’s Public Reference Room in Washington, DC (information on the operation of Public Reference Room may be obtained by calling 1-800-SEC-0330).
Householding — Important Notice Regarding Delivery of Shareholder Documents
In an effort to conserve resources, the Funds intend to reduce the number of duplicate Prospectuses and Annual and Semi-Annual Reports you receive by sending only one copy of each to addresses where we reasonably believe two or more accounts are from the same family. If you would like to discontinue householding of your accounts, please call toll-free 877-DLine11 (877-354-6311) to request individual copies of these documents. We will begin sending individual copies thirty days after receiving your request to stop householding.
| | |
| Privacy Notice | | (Unaudited) |
What Does DoubleLine Do With Your Personal Information
Financial companies choose how they share your personal information. This notice provides information about how we collect, share, and protect your personal information, and how you might choose to limit our ability to share certain information about you. Please read this notice carefully.
All financial companies need to share customers’ personal information to run their everyday businesses. Accordingly, information, confidential and proprietary, plays an important role in the success of our business. However, we recognize that you have entrusted us with your personal and financial data, and we recognize our obligation to keep this information secure. Maintaining your privacy is important to us, and we hold ourselves to a high standard in its safekeeping and use. Most importantly, DoubleLine does not sell its customers’ non-public personal information to any third parties. DoubleLine uses its customers’ non-public personal information primarily to complete financial transactions that its customers request or to make its customers aware of other financial products and services offered by a DoubleLine affiliated company.
DoubleLine may collect non-public information about you from the following sources:
| | • | Information we receive about you on applications or other forms; |
| | • | Information you may give us orally; |
| | • | Information about your transactions with us or others; |
| | • | Information you submit to us in correspondence, including emails or other electronic communications; and |
| | • | Information about any bank account you use for transfers between your bank account and any Fund account, including information provided when effecting wire transfers. |
DoubleLine does not disclose any non-public personal information about our customers or former customers without the customer’s authorization, except that we may disclose the information listed above, as follows:
| | • | It may be necessary for DoubleLine to provide information to nonaffiliated third parties in connection with our performance of the services we have agreed to provide you. For example, it might be necessary to do so in order to process transactions and maintain accounts. |
| | • | DoubleLine will release any of the non-public information listed above about a customer if directed to do so by that customer or if DoubleLine is authorized by law to do so, such as in the case of a court order, legal investigation, or other properly executed governmental request. |
| | • | In order to alert a customer to other financial products and services offered by an affiliate, DoubleLine may share information with an affiliate, including companies using the DoubleLine name. Such products and services may include, for example, other investment products offered by a DoubleLine company. If you prefer that we not disclose non-public personal information about you to our affiliates for this purpose, you may direct us not to make such disclosures (other than disclosures permitted by law) by calling 877-DLine11(877-354-6311). If you limit this sharing and you have a joint account, your decision will be applied to all owners of the account. |
We will limit access to your personal account information to those agents and vendors who need to know that information to provide products and services to you. Your information is not provided by us to nonaffiliated third parties for marketing purposes. We maintain physical, electronic, and procedural safeguards to guard your non-public personal information.
As required by federal law, DoubleLine will notify customers of DoubleLine’s Privacy Policy annually. DoubleLine reserves the right to modify this policy at any time, but in the event that there is a change, DoubleLine will promptly inform its customers of that change.
| | | | | | |
| | Annual Report | | March 31, 2012 | | 71 |
| | | | |
| DoubleLine Capital LP | | 333 South Grand Avenue 18th Floor Los Angeles, CA 90071 doubleline.com | | info@doubleline.com 1. 213. 633. 8200 |

Investment Adviser:
DoubleLine Capital LP
333 South Grand Avenue
18th Floor
Los Angeles, CA 90071
Distributor:
Quasar Distributors, LLC
615 East Michigan Street
Milwaukee, WI 53202
Administrator and Transfer Agent:
U.S. Bancorp Fund
Services, LLC
P.O. Box 701
Milwaukee, WI 53201
Custodian:
U.S. Bank, N.A.
1555 North River Center
Drive, Suite 302
Milwaukee, WI 53212
Independent Registered
Public Accounting Firm:
PricewaterhouseCoopers LLP
350 South Grand Avenue
Los Angeles, CA 90071
Legal Counsel:
Ropes & Gray LLP
Prudential Tower
800 Boylston Street
Boston, MA 02199
Contact Information:
doublelinefunds.com
fundinfo@doubleline.com
1-877-DLine11 or
1-877-354-6311
Item 2. Code of Ethics.
The registrant has adopted a code of ethics that applies to the registrant’s principal executive officer and principal financial officer. The registrant has not made any substantive amendments to its code of ethics during the period covered by this report. The registrant has not granted any waivers from any provisions of the code of ethics during the period covered by this report. A copy of the registrant’s Code of Ethics is filed herewith.
Item 3. Audit Committee Financial Expert.
The registrant’s board of trustees has determined that there is at least one audit committee financial expert serving on its audit committee. Robert J. Untracht is the “audit committee financial expert” and is considered to be “independent” as each term is defined in Item 3 of Form N-CSR.
Item 4. Principal Accountant Fees and Services.
The registrant has engaged its principal accountant to perform audit services, audit-related services, tax services and other services during the past two fiscal years. “Audit services” refer to performing an audit of the registrant’s annual financial statements or services that are normally provided by the accountant in connection with statutory and regulatory filings or engagements for those fiscal years. “Audit-related services” refer to the assurance and related services by the principal accountant that are reasonably related to the performance of the audit. “Tax services” refer to professional services rendered by the principal accountant for tax compliance, tax advice, and tax planning. There were no “Other services” provided by the principal accountant. The following table details the aggregate fees billed or expected to be billed for each of the last two fiscal years for audit fees, audit-related fees, tax fees and other fees by the principal accountant.
| | | | |
| | | FYE 3/31/2012 | | FYE 3/31/2011 |
Audit Fees | | $341,500 | | $215,000 |
Audit-Related Fees | | N/A | | N/A |
Tax Fees | | $20,000 | | $27,000 |
All Other Fees | | N/A | | N/A |
The audit committee has adopted pre-approval policies and procedures that require the audit committee to pre-approve all audit and non-audit services of the registrant, including services provided to any entity affiliated with the registrant.
The percentage of fees billed by PricewaterhouseCoopers LLP applicable to non-audit services pursuant to waiver of pre-approval requirement were as follows:
| | | | |
| | | FYE 3/31/2012 | | FYE 3/31/2011 |
Audit-Related Fees | | 0% | | 0% |
Tax Fees | | 0% | | 0% |
All of the principal accountant’s hours spent on auditing the registrant’s financial statements were attributed to work performed by full-time permanent employees of the principal accountant. (If more than 50 percent of the accountant’s hours were spent to audit the registrant’s financial statements for the most recent fiscal year, state how many hours were attributed to work performed by persons other than the principal accountant’s full-time, permanent employees.)
The following table indicates the non-audit fees billed or expected to be billed by the registrant’s accountant for services to the registrant and to the registrant’s investment adviser (and any other controlling entity, etc.—not sub-adviser) for the last two years. The audit committee of the board of trustees/directors has considered whether the provision of non-audit services that were rendered to the registrant’s investment adviser is compatible with maintaining the principal accountant’s independence and has concluded that the provision of such non-audit services by the accountant has not compromised the accountant’s independence.
| | | | |
Non-Audit Related Fees | | FYE 3/31/2012 | | FYE 3/31/2011 |
Registrant | | N/A | | N/A |
Registrant’s Investment Adviser | | N/A | | N/A |
Item 5. Audit Committee of Listed Registrants.
Not applicable to registrants who are not listed issuers (as defined in Rule 10A-3 under the Securities Exchange Act of 1934).
Item 6. Investments.
| (a) Schedule | of Investments is included as part of the report to shareholders filed under Item 1 of this Form. |
Item 7. Disclosure of Proxy Voting Policies and Procedures for Closed-End Management Investment Companies.
Not applicable to open-end investment companies.
Item 8. Portfolio Managers of Closed-End Management Investment Companies.
Not applicable to open-end investment companies.
Item 9. Purchases of Equity Securities by Closed-End Management Investment Company and Affiliated Purchasers.
Not applicable to open-end investment companies.
Item 10. Submission of Matters to a Vote of Security Holders.
There have been no material changes to the procedures by which shareholders may recommend nominees to the registrant’s board of trustees.
Item 11. Controls and Procedures.
| (a) | The Registrant’s President and Treasurer have reviewed the Registrant’s disclosure controls and procedures (as defined in Rule 30a-3(c) under the Investment Company Act of 1940 (the “Act”)) as of a date within 90 days of the filing of this report, as required by Rule 30a-3(b) under the Act and Rules 13a-15(b) or 15d-15(b) under the Securities Exchange Act of 1934. Based on their review, such officers have concluded that the disclosure controls and procedures are effective in ensuring that information required to be disclosed in this report is appropriately recorded, processed, summarized and reported and made known to them by others within the Registrant and by the Registrant’s service provider. |
| (b) | There were no changes in the Registrant’s internal control over financial reporting (as defined in Rule 30a-3(d) under the Act) that occurred during the second fiscal quarter of the period covered by this report that has materially affected, or is reasonably likely to materially affect, the Registrant’s internal control over financial reporting. |
Item 12. Exhibits.
| (a) | (1) Any code of ethics or amendment thereto, that is the subject of the disclosure required by Item 2, to the extent that the registrant intends to satisfy Item 2 requirements through filing an exhibit. Filed herewith. |
(2) A separate certification for each principal executive and principal financial officer pursuant to Section 302 of the Sarbanes-Oxley Act of 2002. Filed herewith.
(3) Any written solicitation to purchase securities under Rule 23c-1 under the Act sent or given during the period covered by the report by or on behalf of the registrant to 10 or more persons. Not applicable to open-end investment companies.
| (b) | Certifications pursuant to Section 906 of the Sarbanes-Oxley Act of 2002. Furnished herewith. |
SIGNATURES
Pursuant to the requirements of the Securities Exchange Act of 1934 and the Investment Company Act of 1940, the registrant has duly caused this report to be signed on its behalf by the undersigned, thereunto duly authorized.
(Registrant) DoubleLine Funds Trust
By (Signature and Title)*/s/ Ronald R. Redell
Ronald R. Redell, President
Date June 7, 2012
Pursuant to the requirements of the Securities Exchange Act of 1934 and the Investment Company Act of 1940, this report has been signed below by the following persons on behalf of the registrant and in the capacities and on the dates indicated.
By (Signature and Title)* /s/ Ronald R. Redell
Ronald R. Redell, President
Date June 7, 2012
By (Signature and Title)* /s/ Susan Nichols
Susan Nichols, Treasurer
Date June 7, 2012
* Print the name and title of each signing officer under his or her signature.