Not applicable.
| ITEM 3. | Audit Committee Financial Expert. |
Not applicable.
| ITEM 4. | Principal Accountant Fees and Services. |
Not applicable.
| ITEM 5. | Audit Committee of Listed Registrants. |
Not applicable.
| (a) | A copy of Schedule I - Investments in securities of unaffiliated issuers as of the close of the reporting period is included in the financial statements filed under Item 7 of this Form. |
| ITEM 7. | Financial Statements and Financial Highlights for Open-End Management Investment Companies. |

Obra High Grade Structured Products ETF
Obra Opportunistic Structured Products ETF
Semi-Annual Financial Statements
For the semi-annual period ended September 30, 2024
The financial statements and other information contained herein are submitted for the general information of the shareholders of the Obra High Grade Structured Products ETF and Obra Opportunistic Structured Products ETF (each a “Fund”, and collectively the “Funds” or “Orba ETFs”). The Obra ETFs’ shares are not deposits or obligations of, or guaranteed by, any depository institution. The Obra ETFs’ shares are not insured by the FDIC, Federal Reserve Board or any other agency, and are subject to investment risks, including possible loss of principal amount invested. Neither the ETF nor the ETF’s distributor is a bank.
The Obra ETFs are distributed by Capital Investment Group, Inc., Member FINRA/SIPC, 100 E. Six Forks Road, Suite 200, Raleigh, NC 27609. There is no affiliation between the Obra ETFs, including their principals, and Capital Investment Group, Inc.
TABLE OF CONTENTS
Obra High Grade Structured Products ETF
Schedule of Investments (unaudited)
As of September 30, 2024
| | | Principal | | | Interest Rate | | | Maturity Date | | | Value (Note 1) | |
| Asset-Backed Securities - 24.55% | | | | | | | | | | | | | | | | |
| Goodleap Sustainable Home Solutions Trust 2023-4 | | $ | 461,580 | | | | 6.480 | % | | | 3/20/2057 | | | $ | 484,088 | |
| GRACIE POINT INTERNATIONAL FUNDING 2023-2 | | | 630,000 | | | | 9.369 | % | | | 3/1/2027 | | | | 635,751 | |
| Hotwire Funding LLC | | | 750,000 | | | | 5.687 | % | | | 5/20/2053 | | | | 762,366 | |
| Hotwire Funding LLC | | | 125,000 | | | | 7.002 | % | | | 5/20/2053 | | | | 127,402 | |
| Kobalt Music Assets LP | | | 500,000 | | | | 6.625 | % | | | 4/7/2064 | | | | 522,442 | |
| Lendbuzz Securitization Trust 2023-3 | | | 325,008 | | | | 7.500 | % | | | 12/15/2028 | | | | 334,949 | |
| Libra Solutions 2023-1 LLC | | | 482,412 | | | | 7.000 | % | | | 2/15/2035 | | | | 484,451 | |
| Marlette Funding Trust 2023-3 | | | 154,666 | | | | 6.490 | % | | | 9/15/2033 | | | | 154,883 | |
| MCA Fund Holding LLC | | | 630,531 | | | | 3.250 | % | | | 11/15/2035 | | | | 612,552 | |
| MetroNet Infrastructure Issuer LLC | | | 250,000 | | | | 6.560 | % | | | 4/20/2053 | | | | 259,883 | |
| Newtek Small Business Loan Trust 2021-1 | | | 473,301 | | | | 7.750 | % | | | 12/25/2048 | | | | 466,287 | |
| Pagaya AI Debt Trust 2023-3 | | | 73,835 | | | | 7.600 | % | | | 12/16/2030 | | | | 74,319 | |
| Pagaya AI Debt Trust 2024-1 | | | 127,771 | | | | 6.660 | % | | | 7/15/2031 | | | | 130,185 | |
| Pagaya AI Debt Trust 2024-1 | | | 330,051 | | | | 7.109 | % | | | 7/15/2031 | | | | 337,649 | |
| PEAR 2021-1 LLC | | | 345,922 | | | | 2.600 | % | | | 1/15/2034 | | | | 340,066 | |
| Santander Bank Auto Credit-Linked Notes Series 2023-A | | | 255,592 | | | | 6.493 | % | | | 6/15/2033 | | | | 257,751 | |
| Santander Bank Auto Credit-Linked Notes Series 2023-A | | | 102,237 | | | | 6.736 | % | | | 6/15/2033 | | | | 103,003 | |
| Sunnova Helios XIII Issuer LLC | | | 390,861 | | | | 6.000 | % | | | 2/20/2051 | | | | 392,893 | |
| Total Asset-Backed Securities (Cost $6,350,625) | | | | | | | | | | | | | | | 6,480,920 | |
| | | | | | | | | | | | | | | | | |
| Collateralized Loan Obligations - 39.39% | | | | | | | | | | | | | | | | |
| AGL CLO 30 Ltd | | | 750,000 | | | | 7.582 | % | | | 4/21/2037 | | | | 756,356 | |
| Antares CLO 2021-1 Ltd | | | 665,760 | | | | 9.446 | % | | | 7/25/2033 | | | | 666,081 | |
| Antares CLO 2023-1 Ltd | | | 500,000 | | | | 8.785 | % | | | 4/25/2035 | | | | 505,615 | |
| Apidos CLO XLIII Ltd | | | 500,000 | | | | 8.285 | % | | | 4/25/2035 | | | | 504,143 | |
| Ballyrock CLO 23 Ltd | | | 250,000 | | | | 8.485 | % | | | 4/25/2036 | | | | 253,179 | |
| Benefit Street Partners CLO XXXI Ltd | | | 600,000 | | | | 8.285 | % | | | 4/25/2036 | | | | 605,297 | |
| BlackRock Shasta CLO XIII LLC | | | 500,000 | | | | 8.350 | % | | | 7/15/2036 | | | | 505,151 | |
| Cifc Funding 2023-III Ltd | | | 500,000 | | | | 7.932 | % | | | 1/20/2037 | | | | 504,981 | |
| Dryden 105 CLO Ltd | | | 800,000 | | | | 8.379 | % | | | 4/18/2036 | | | | 809,022 | |
| Elmwood CLO 23 Ltd | | | 830,000 | | | | 8.286 | % | | | 4/16/2036 | | | | 837,357 | |
| Golub Capital Partners CLO 71 M | | | 250,000 | | | | 8.354 | % | | | 2/9/2037 | | | | 252,860 | |
| Invesco US CLO 2023-2 Ltd | | | 530,000 | | | | 8.282 | % | | | 4/21/2036 | | | | 535,611 | |
| Ivy Hill Middle Market Credit Fund XXI Ltd | | | 650,000 | | | | 8.729 | % | | | 7/18/2035 | | | | 660,642 | |
| Ivy Hill Middle Market Credit Fund XXII Ltd | | | 250,000 | | | | 8.452 | % | | | 4/20/2036 | | | | 253,137 | |
| Madison Park Funding LXI Ltd | | | 645,000 | | | | 8.182 | % | | | 1/20/2037 | | | | 655,098 | |
| Madison Park Funding XIV Ltd | | | 625,000 | | | | 7.744 | % | | | 10/22/2030 | | | | 626,169 | |
| OCP Aegis CLO 2023-29 Ltd | | | 500,000 | | | | 10.282 | % | | | 1/20/2035 | | | | 503,240 | |
| Octagon 67 Ltd | | | 555,000 | | | | 8.385 | % | | | 4/25/2036 | | | | 561,253 | |
| Symphony CLO 39 Ltd | | | 400,000 | | | | 7.935 | % | | | 4/25/2034 | | | | 400,724 | |
| Total Collateralized Loan Obligations (Cost $10,350,196) | | | | | | | | | | | | | | | 10,395,916 | |
| | | | | | | | | | | | | | | | | |
| Commercial Mortgage-Backed Securities - 2.30% | | | | | | | | | | | | | | | | |
| Independence Plaza Trust 2018-INDP (Cost $597,484) | | | | | | | | | | | 608,145 | | | | 608,145 | |
See Notes to Financial Statements
Obra High Grade Structured Products ETF
Schedule of Investments (unaudited) (continued)
As of September 30, 2024
| | | Principal | | | Interest Rate | | | Maturity Date | | | Value
(Note 1) | |
| Collateralized Mortgage Obligations - 23.22% | | | | | | | | | | | | | | | | |
| AGL CLO 33 Ltd | | $ | 250,000 | | | | 6.559 | % | | | 7/21/2037 | | | $ | 250,051 | |
| Anchorage Capital CLO 2018-10 Ltd | | | 250,000 | | | | 7.001 | % | | | 10/15/2031 | | | | 250,785 | |
| Balboa Bay Loan Funding 2023-1 Ltd | | | 250,000 | | | | 10.432 | % | | | 4/20/2036 | | | | 252,708 | |
| Benefit Street Partners CLO IV Ltd | | | 300,000 | | | | 10.432 | % | | | 4/20/2034 | | | | 302,207 | |
| BX Trust 2024-VLT4 | | | 200,000 | | | | 7.037 | % | | | 7/15/2029 | | | | 200,384 | |
| Cali 2024-Sun | | | 250,000 | | | | 7.886 | % | | | 7/15/2041 | | | | 250,467 | |
| Elmwood CLO 28 Ltd | | | 250,000 | | | | 8.636 | % | | | 4/17/2037 | | | | 252,236 | |
| FS Trust 2024-HULA | | | 100,000 | | | | 8.036 | % | | | 8/15/2039 | | | | 100,187 | |
| GWT 2024-WLF2 | | | 750,000 | | | | 7.537 | % | | | 5/15/2041 | | | | 752,318 | |
| Ivy Hill Middle Market Credit Fund VII Ltd | | | 250,000 | | | | 6.831 | % | | | 10/15/2036 | | | | 250,459 | |
| JP Morgan Mortgage Trust Series 2024-4 | | | 437,079 | | | | 6.500 | % | | | 10/25/2054 | | | | 449,356 | |
| JP Morgan Mortgage Trust Series 2024-4 | | | 421,348 | | | | 6.500 | % | | | 10/25/2054 | | | | 429,530 | |
| NALP Business Loan Trust 2024-1 | | | 462,414 | | | | 6.490 | % | | | 12/27/2049 | | | | 462,689 | |
| NYC Trust 2024-3ELV | | | 250,000 | | | | 7.936 | % | | | 8/15/2029 | | | | 251,112 | |
| OBX 2023-NQM6 Trust | | | 109,060 | | | | 6.975 | % | | | 7/25/2063 | | | | 112,943 | |
| OHA Loan Funding 2013-1 Ltd | | | 250,000 | | | | 9.823 | % | | | 4/23/2037 | | | | 253,314 | |
| Pagaya AI Debt Grantor Trust 2024-5 | | | 149,973 | | | | 6.601 | % | | | 10/15/2031 | | | | 153,142 | |
| Pagaya AI Debt Grantor Trust 2024-5 | | | 99,982 | | | | 7.270 | % | | | 10/15/2031 | | | | 101,744 | |
| Rockford Tower CLO 2022-3 Ltd | | | 250,000 | | | | 0.000 | % | | | 7/20/2037 | | | | 251,086 | |
| Rockford Tower CLO 2023-1 Ltd | | | 281,250 | | | | 10.602 | % | | | 1/20/2036 | | | | 289,637 | |
| Sunrun Artemis Issuer 2024-2 LLC | | | 198,137 | | | | 6.250 | % | | | 7/30/2059 | | | | 202,557 | |
| Verus Securitization Trust 2023-3 | | | 72,069 | | | | 6.438 | % | | | 3/25/2068 | | | | 73,893 | |
| Verus Securitization Trust 2024-3 | | | 229,811 | | | | 6.845 | % | | | 4/25/2069 | | | | 235,840 | |
| Total Collateralized Mortgage Obligations (Cost $6,068,712) | | | | | | | | | | | | | | | 6,128,645 | |
| | | | | | | | | | | | | | | | | |
| Mortgage-Backed Securities - 4.24% | | | | | | | | | | | | | | | | |
| Angel Oak Mortgage Trust 2024-4 | | | 224,883 | | | | 6.398 | % | | | 1/25/2069 | | | | 234,603 | |
| Verus Securitization Trust 2023-5 | | | 489,575 | | | | 6.759 | % | | | 6/25/2068 | | | | 505,849 | |
| Verus Securitization Trust 2023-INV2 | | | 363,342 | | | | 7.079 | % | | | 8/25/2068 | | | | 378,650 | |
| Total Mortgage-Backed Securities (Cost $1,081,580) | | | | | | | | | | | | | | | 1,119,102 | |
| | | | | | | | | | | | | | | | | |
| Short-Term Investment - 4.30% | | | | | | | | | | Shares | | | | | |
| Goldman Sachs Financial Square Government Fund, 5.03% (a) (Cost $1,134,079) | | | | 1,134,079 | | | | 1,134,079 | |
| | | | | | | | | | | | | | | | | |
| Investments, at Value (Cost $25,582,676) - 98.00% | | | | | | | | | | | | | | $ | 25,866,807 | |
| Other Assets Less Liabilities - 2.00% | | | | | | | | | | | | | | | 527,074 | |
| Net Assets - 100.00% | | | | | | | | | | | | | | $ | 26,393,881 | |
See Notes to Financial Statements
Obra Opportunistic Structured Products ETF
Schedule of Investments (unaudited)
As of September 30, 2024
| | | Principal | | | Interest Rate | | | Maturity Date | | | Value
(Note 1) | |
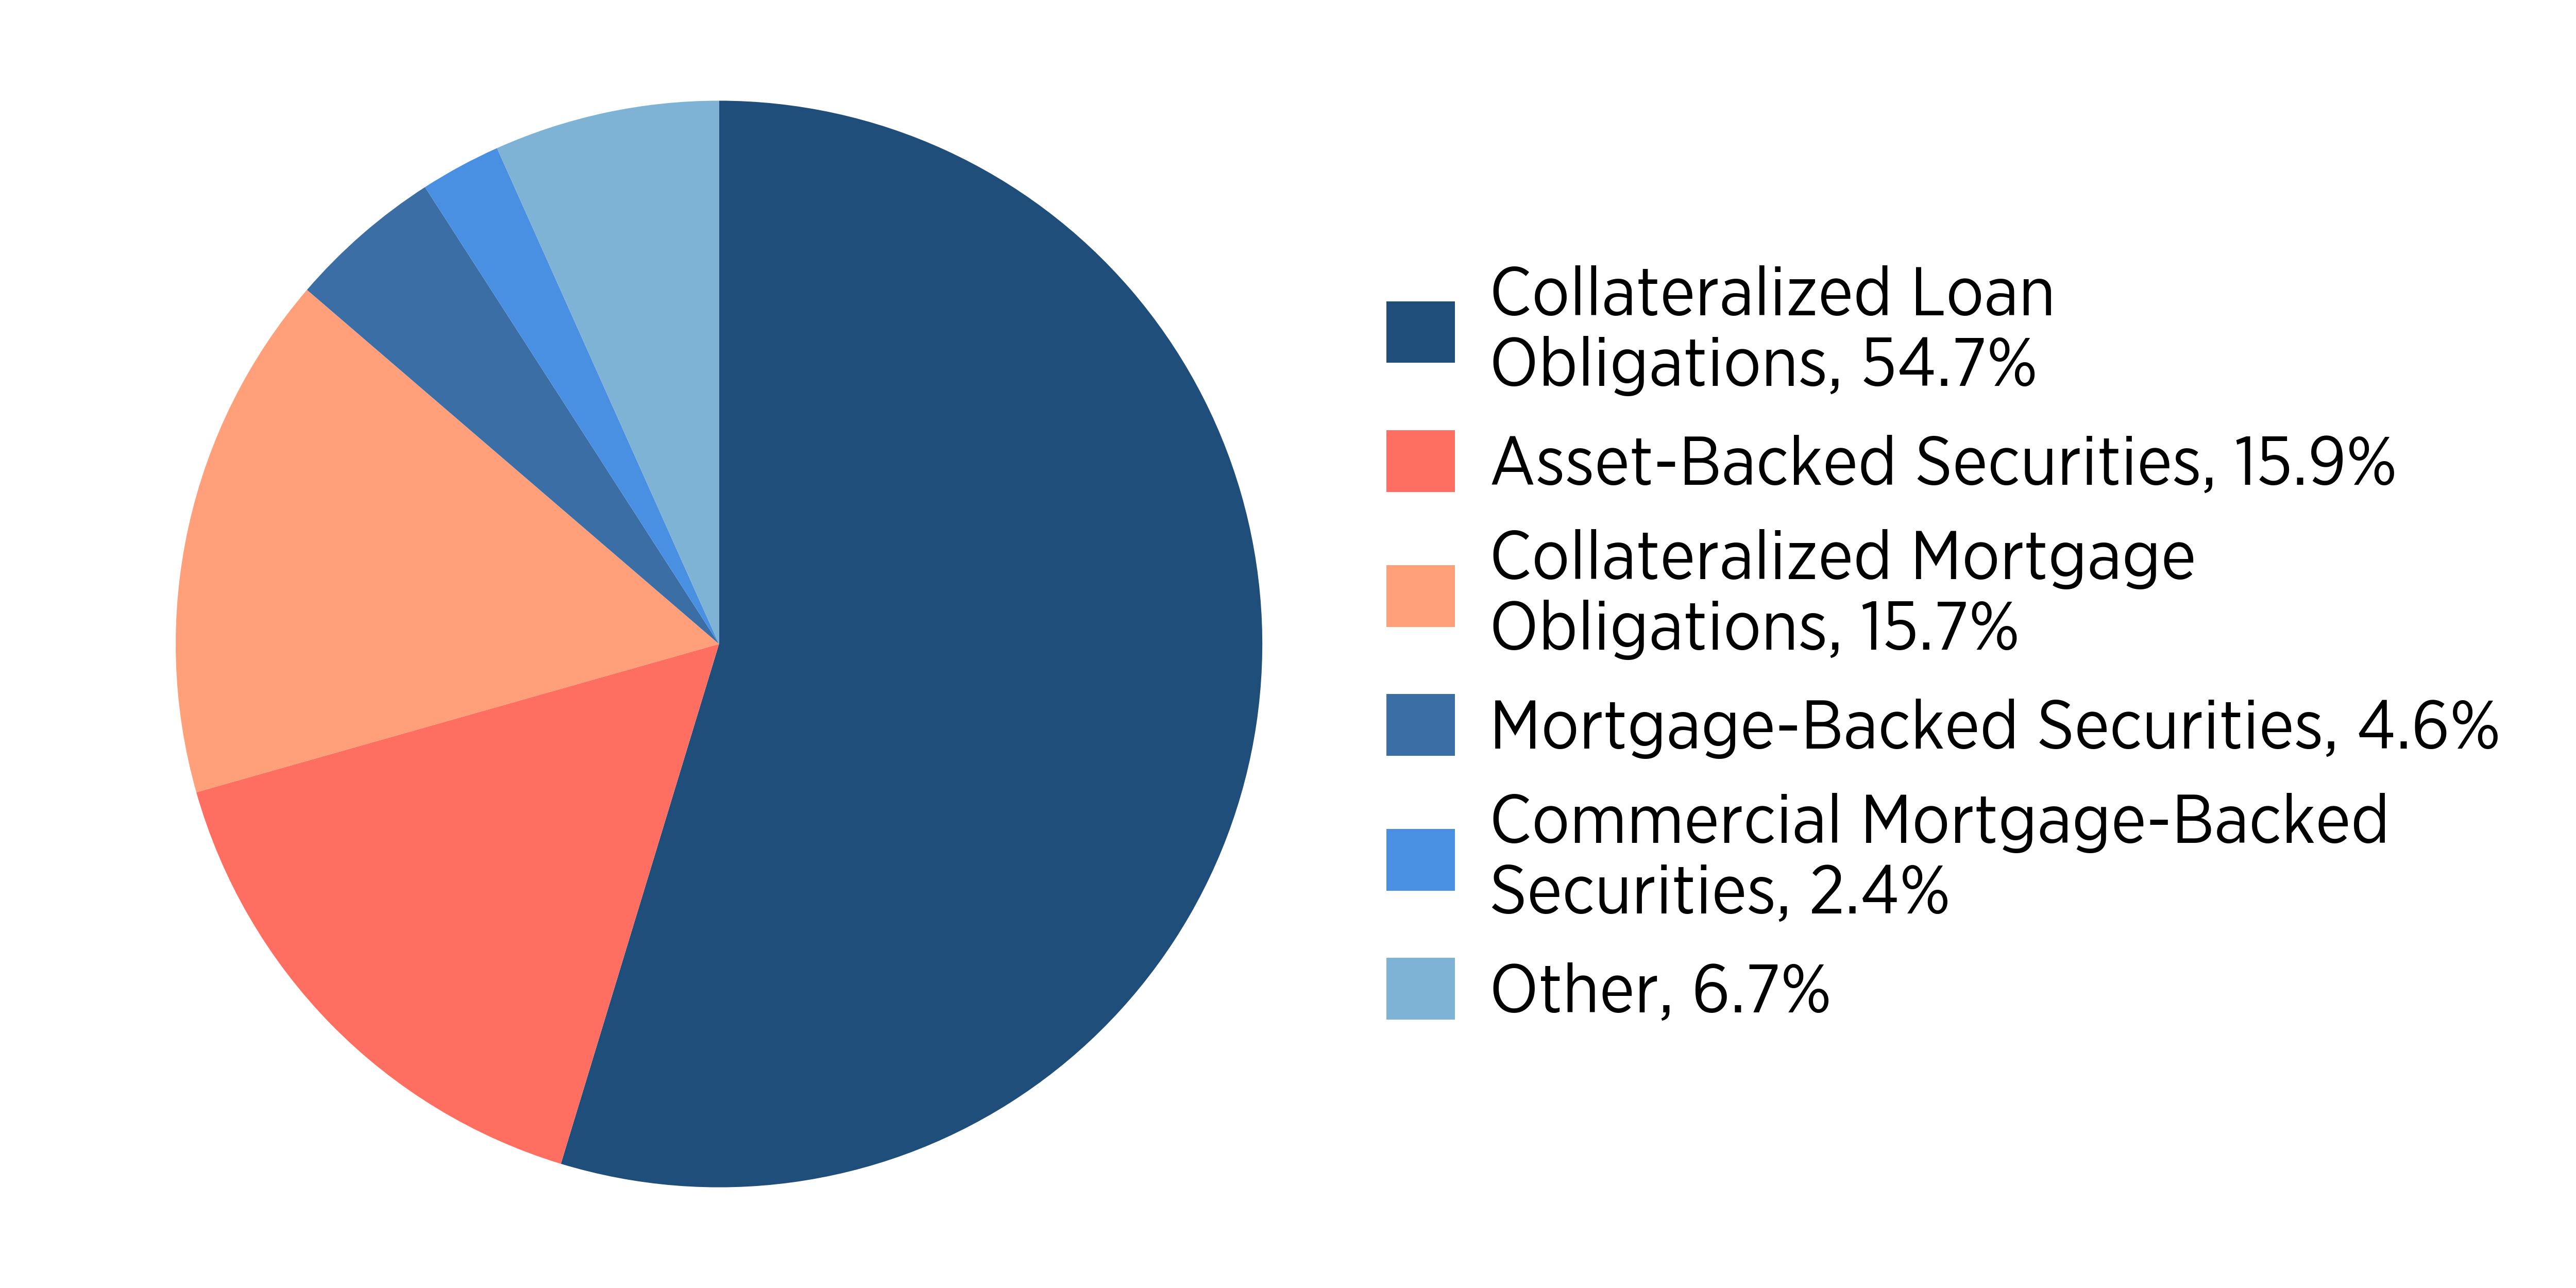
| Asset-Backed Securities - 15.92% | | | | | | | | | | | | | | | | |
| Cartiga Asset Finance Trust 2023-1 LLC | | $ | 125,370 | | | | 7.000 | % | | | 3/15/2035 | | | $ | 125,343 | |
| GRACIE POINT INTERNATIONAL FUNDING 2023-2 | | | 500,000 | | | | 9.369 | % | | | 3/1/2027 | | | | 504,565 | |
| Gracie Point International Funding 2024-1 LLC | | | 148,000 | | | | 8.868 | % | | | 3/1/2028 | | | | 148,533 | |
| Hotwire Funding LLC | | | 625,000 | | | | 7.002 | % | | | 5/20/2053 | | | | 637,009 | |
| Kobalt Music Assets LP | | | 500,000 | | | | 6.625 | % | | | 4/7/2064 | | | | 522,442 | |
| LFS 2023A LLC | | | 342,542 | | | | 7.173 | % | | | 7/15/2035 | | | | 345,820 | |
| Pagaya AI Debt Selection Trust 2021-HG1 | | | 101,394 | | | | 1.220 | % | | | 1/16/2029 | | | | 99,728 | |
| Westgate Resorts 2023-1 LLC | | | 257,871 | | | | 7.490 | % | | | 12/20/2037 | | | | 259,644 | |
| Total Asset-Backed Securities (Cost $2,587,288) | | | | | | | | | | | | | | | 2,643,084 | |
| | | | | | | | | | | | | | | | | |
| Collateralized Loan Obligations - 54.68% | | | | | | | | | | | | | | | | |
| AB BSL CLO 4 Ltd | | | 400,000 | | | | 8.632 | % | | | 4/20/2036 | | | | 404,448 | |
| AGL CLO 23 Ltd | | | 250,000 | | | | 11.212 | % | | | 1/20/2036 | | | | 254,535 | |
| AGL CLO 30 Ltd | | | 350,000 | | | | 8.732 | % | | | 4/21/2037 | | | | 355,050 | |
| Antares CLO 2021-1 Ltd | | | 375,000 | | | | 8.296 | % | | | 7/25/2033 | | | | 376,080 | |
| Antares CLO 2021-1 Ltd | | | 500,000 | | | | 9.446 | % | | | 7/25/2033 | | | | 500,241 | |
| Bain Capital CLO 2024-1 Ltd | | | 500,000 | | | | 9.175 | % | | | 4/16/2037 | | | | 507,711 | |
| Bain Capital Credit CLO 2022-5 Ltd | | | 375,000 | | | | 9.533 | % | | | 1/24/2037 | | | | 382,932 | |
| Balboa Bay Loan Funding 2023-1 Ltd | | | 500,000 | | | | 9.082 | % | | | 4/20/2036 | | | | 504,562 | |
| Ballyrock CLO 22 Ltd | | | 250,000 | | | | 8.823 | % | | | 4/15/2037 | | | | 253,480 | |
| Benefit Street Partners CLO XXXI Ltd | | | 500,000 | | | | 10.285 | % | | | 4/25/2036 | | | | 511,597 | |
| CBAM 2017-1 Ltd | | | 500,000 | | | | 9.294 | % | | | 7/20/2030 | | | | 501,468 | |
| Dryden 50 Senior Loan Fund | | | 500,000 | | | | 8.813 | % | | | 7/15/2030 | | | | 501,961 | |
| Elmwood CLO 23 Ltd | | | 450,000 | | | | 10.286 | % | | | 4/16/2036 | | | | 459,437 | |
| Golub Capital Partners CLO 54M L.P | | | 500,000 | | | | 9.354 | % | | | 8/5/2033 | | | | 500,285 | |
| Oaktree CLO 2023-2 Ltd | | | 500,000 | | | | 10.732 | % | | | 7/20/2036 | | | | 515,937 | |
| OCP CLO Ltd | | | 250,000 | | | | 11.174 | % | | | 7/16/2035 | | | | 251,191 | |
| Octagon 67 Ltd | | | 550,000 | | | | 10.485 | % | | | 4/25/2036 | | | | 558,746 | |
| OHA Credit Funding 17 Ltd | | | 375,000 | | | | 8.613 | % | | | 4/20/2037 | | | | 380,021 | |
| Texas Debt Capital CLO 2023-I Ltd | | | 570,000 | | | | 10.382 | % | | | 4/20/2036 | | | | 581,215 | |
| Texas Debt Capital CLO 2024-I Ltd | | | 375,000 | | | | 8.832 | % | | | 4/22/2037 | | | | 381,384 | |
| Verus Securitization Trust 2023-4 | | | 380,000 | | | | 7.399 | % | | | 5/25/2068 | | | | 393,158 | |
| Total Collateralized Loan Obligations (Cost $9,010,642) | | | | | | | | | | | | | | | 9,075,439 | |
| | | | | | | | | | | | | | | | | |
| Commercial Mortgage-Backed Securities - 2.40% | | | | | | | | | | | | | | | | |
| Independence Plaza Trust 2018-INDP (Cost $390,204) | | | | | | | | | | | 397,685 | | | | 397,685 | |
| | | | | | | | | | | | | | | | | |
| Collateralized Mortgage Obligations - 15.74% | | | | | | | | | | | | | | | | |
| Balboa Bay Loan Funding 2023-1 Ltd | | | 250,000 | | | | 10.432 | % | | | 4/20/2036 | | | | 252,708 | |
| Benefit Street Partners CLO IV Ltd | | | 300,000 | | | | 10.432 | % | | | 4/20/2034 | | | | 302,207 | |
| Cali 2024-Sun | | | 250,000 | | | | 8.723 | % | | | 7/15/2041 | | | | 250,947 | |
| Elmwood CLO 28 Ltd | | | 250,000 | | | | 11.336 | % | | | 4/17/2037 | | | | 251,246 | |
| FS Trust 2024-HULA | | | 100,000 | | | | 8.535 | % | | | 8/15/2039 | | | | 100,182 | |
| GWT 2024-WLF2 | | | 500,000 | | | | 8.036 | % | | | 5/15/2041 | | | | 501,719 | |
| HLTN Commercial Mortgage Trust 2024-DPLO | | | 200,000 | | | | 7.637 | % | | | 6/15/2041 | | | | 200,125 | |
| NYC Trust 2024-3ELV | | | 250,000 | | | | 8.935 | % | | | 8/15/2029 | | | | 251,387 | |
| OHA Loan Funding 2013-1 Ltd | | | 250,000 | | | | 9.823 | % | | | 4/23/2037 | | | | 253,314 | |
| PGA Trust 2024-RSR2 | | | 250,000 | | | | 7.886 | % | | | 6/15/2039 | | | | 248,396 | |
| Total Collateralized Mortgage Obligations (Cost $2,600,930) | | | | | | | | | | | | | | | 2,612,231 | |
See Notes to Financial Statements
Obra Opportunistic Structured Products ETF
Schedule of Investments (unaudited) (continued)
As of September 30, 2024
| | | Principal | | | Interest Rate | | | Maturity Date | | | Value
(Note 1) | |
| Mortgage-Backed Securities - 4.57% | | | | | | | | | | | | | | | | |
| ACHM Trust 2023-HE1 | | $ | 500,000 | | | | 7.000 | % | | | 11/25/2037 | | | $ | 523,203 | |
| Angel Oak Mortgage Trust 2024-4 | | | 224,883 | | | | 6.398 | % | | | 1/25/2069 | | | | 234,603 | |
| Total Mortgage-Backed Securities (Cost $719,162) | | | | | | | | 757,806 | |
| | | | | | | | | | | | | | | | | |
| Short-Term Investment - 5.15% | | | | | | | | | | Shares | | | | | |
| Goldman Sachs Financial Square Government Fund, 5.03% (a) (Cost $854,189) | | | | 854,189 | | | | 854,189 | |
| | | | | | | | | | | | | | | | | |
| Investments, at Value (Cost $16,162,415) - 98.45% | | | | | | | $ | 16,340,434 | |
| Other Assets Less Liabilities - 1.55% | | | | | | | | | | | | | | | 257,804 | |
| Net Assets - 100.00% | | | | | | | | | | | | | | $ | 16,598,238 | |
See Notes to Financial Statements
| Statement of Assets and Liabilities (unaudited) |
| As of September 30, 2024 | | | | | | |
| | | Obra High
Grade
Structured
Products ETF | | | Obra
Opportunistic
Structured
Products ETF | |
| Assets: | | | | | | | | |
| Investments, at value | | $ | 25,866,807 | | | $ | 16,340,434 | |
| Cash | | | 254,151 | | | | 1,111 | |
| Receivables: | | | | | | | | |
| Interest | | | 281,847 | | | | 260,852 | |
| Due from Advisor | | | 2,855 | | | | 10,101 | |
| Prepaid expenses | | | 1,587 | | | | 1,592 | |
| Total assets | | | 26,407,247 | | | | 16,614,090 | |
| Liabilities: | | | | | | | | |
| Accrued expenses: | | | | | | | | |
| Professional fees | | | 10,810 | | | | 13,106 | |
| Trustee fees and meeting expenses | | | 1,471 | | | | 1,471 | |
| Operational expenses | | | 653 | | | | 843 | |
| Other expenses | | | 432 | | | | 432 | |
| Total liabilities | | | 13,366 | | | | 15,852 | |
| Total Net Assets | | $ | 26,393,881 | | | $ | 16,598,238 | |
| Net Assets Consist of: | | | | | | | | |
| Paid in capital | | $ | 26,104,359 | | | $ | 16,410,928 | |
| Accumulated earnings | | | 289,522 | | | | 187,310 | |
| Total Net Assets | | $ | 26,393,881 | | | $ | 16,598,238 | |
| ETF Shares Outstanding, no par value | | | | | | | | |
| (unlimited authorized shares) | | | 2,610,000 | | | | 1,640,000 | |
| Net Asset Value, Per Share | | $ | 10.11 | | | $ | 10.12 | |
| Investments, at cost | | $ | 25,582,676 | | | $ | 16,162,415 | |
See Notes to Financial Statements
| Statement of Operations (unaudited) |
| For the period ended September 30, 2024(a) | | | | | | |
| | | | Obra High
Grade
Structured
Products ETF | | | | Obra
Opportunistic
Structured
Products ETF | |
| Investment Income: | | | | | | | | |
| Interest | | $ | 894,698 | | | $ | 650,214 | |
| Total Investment Income | | | 894,698 | | | | 650,214 | |
| Expenses: | | | | | | | | |
| Advisory fees (note 3) | | | 78,826 | | | | 48,817 | |
| Administration fees | | | 15,225 | | | | 15,225 | |
| Professional fees | | | 19,250 | | | | 19,250 | |
| Custody fees | | | 4,200 | | | | 4,200 | |
| Distribution fees | | | 9,870 | | | | 9,870 | |
| Compliance fees | | | 11,025 | | | | 11,025 | |
| Fund Accounting Fee | | | 17,981 | | | | 17,505 | |
| Transfer agent fees | | | 11,301 | | | | 11,203 | |
| Shareholder fulfillment fees | | | 1,925 | | | | 1,785 | |
| Trustee fees and meeting expenses (note 4) | | | 4,200 | | | | 4,200 | |
| Security pricing fees | | | 12,703 | | | | 12,167 | |
| Insurance fees | | | 1,925 | | | | 1,925 | |
| Registration and filing expenses | | | 525 | | | | 525 | |
| Other expenses | | | 2,099 | | | | 2,099 | |
| Total Expenses | | | 191,055 | | | | 159,796 | |
| Fees waived by Advisor (note 3) | | | (78,447 | ) | | | (48,817 | ) |
| Fees reimbursed by Advisor (note 3) | | | — | | | | (41,241 | ) |
| Net Expenses | | | 112,608 | | | | 69,738 | |
| Net Investment Income | | | 782,090 | | | | 580,476 | |
| Realized and Unrealized Gain (Loss) on Investments: | | | | | | | | |
| Net realized gain (loss) from: | | | | | | | | |
| Investment transactions | | | — | | | | (532 | ) |
| Total realized gain (loss) | | | — | | | | (532 | ) |
| Net change in unrealized appreciation on: | | | | | | | | |
| Investment transactions | | | 284,131 | | | | 178,019 | |
| Total change in unrealized appreciation | | | 284,131 | | | | 178,019 | |
| Net Realized and Unrealized Gain (Loss) on Investments | | | 284,131 | | | | 177,487 | |
| Net Increase in Net Assets Resulting from Operations | | $ | 1,066,221 | | | $ | 757,963 | |
| (a) The fund commenced operations on April 9, 2024. | | | | | | | | |
See Notes to Financial Statements
| Statements of Changes in Net Assets(unaudited) | | | | | | |
| For the period ended September 30, 2024(a) | | | | | | |
| | | High Grade
Structured
Products ETF | | | Opportunistic
Structured
Products | |
| Operations: | | | | | | | | |
| Net investment income | | $ | 782,090 | | | $ | 580,476 | |
| Net realized gain (loss) from investment transactions | | | — | | | | (532 | ) |
| Net change in unrealized appreciation on investments | | | 284,131 | | | | 178,019 | |
| Net Increase (Decrease) in Net Assets Resulting from Operations | | | 1,066,221 | | | | 757,963 | |
| Distributions to Shareholders From: | | | | | | | | |
| Distributable Earnings | | | (776,699 | ) | | | (570,653 | ) |
| Net Decrease in Net Assets Resulting from Distributions | | | (776,699 | ) | | | (570,653 | ) |
| Capital Share Transactions: | | | | | | | | |
| Shares sold | | | 26,102,954 | | | | 16,406,209 | |
| Shares repurchased | | | — | | | | — | |
| Variable fees | | | 1,405 | | | | 4,719 | |
| Net Increase (Decrease) in Net Assets Resulting from Capital Share Transactions | | | 26,104,359 | | | | 16,410,928 | |
| Net Increase (Decrease) in Net Assets | | | 26,393,881 | | | | 16,598,238 | |
| Net Assets: | | | | | | | | |
| Beginning of Period | | | — | | | | — | |
| End of Period | | $ | 26,393,881 | | | $ | 16,598,238 | |
| Share Information: | | | | | | | | |
| Shares sold | | | 2,610,000 | | | | 1,640,000 | |
| Shares repurchased | | | — | | | | — | |
| Net Increase (Decrease) in Capital Shares | | | 2,610,000 | | | | 1,640,000 | |
| (a) The fund commenced operations on April 9, 2024. | | | | | | | | |
See Notes to Financial Statements
| Obra High Grade Structured Products ETF |
| Financial Highlights (unaudited) |
| | | September 30, | |
| For a share outstanding during the period ended | | | 2024(a) | |
| Net Asset Value, Beginning of Period | | $ | 10.00 | |
| Income (Loss) from Investment Operations: | | | | |
| Net investment income (loss) (b) | | | 0.30 | |
| Net realized and unrealized gain (loss) on investments | | | 0.16 | |
| Total from Investment Operations | | | 0.46 | |
| Less Distributions From: | | | | |
| Net investment income | | | (0.35 | ) |
| Total Distributions | | | (0.35 | ) |
| Net Asset Value, End of Period | | $ | 10.11 | |
| Total Return | | | 4.17 | % |
| Net Assets, End of Period (in thousands) | | $ | 26,394 | |
| Ratios of: | | | | |
| Gross Expenses to Average Net Assets | | | 1.53 | %(c) |
| Net Expenses to Average Net Assets | | | 0.90 | %(c) |
| Net Investment Income (Loss) to Average Net Assets | | | 6.27 | %(c) |
| Portfolio turnover rate | | | 35.58 | %(d) |
(a) The fund commenced operations on April 9, 2024.
(b) Calculated using the average shares method.
(c) Annualized
(d) Not annualized
See Notes to Financial Statements
| Obra Opportunistic Structured Products ETF |
| Financial Highlights (unaudited) |
| | | September 30, | |
| For a share outstanding during the period ended | | | 2024(a) | |
| Net Asset Value, Beginning of Period | | $ | 10.00 | |
| Income (Loss) from Investment Operations: | | | | |
| Net investment income (loss) (b) | | | 0.36 | |
| Net realized and unrealized gain (loss) on investments | | | 0.18 | |
| Total from Investment Operations | | | 0.54 | |
| Less Distributions From: | | | | |
| Net investment income | | | (0.42 | ) |
| Total Distributions | | | (0.42 | ) |
| Net Asset Value, End of Period | | $ | 10.12 | |
| Total Return | | | 5.40 | % |
| Net Assets, End of Period (in thousands) | | $ | 16,598 | |
| Ratios of: | | | | |
| Gross Expenses to Average Net Assets | | | 2.07 | %(c) |
| Net Expenses to Average Net Assets | | | 0.90 | %(c) |
| Net Investment Income to Average Net Assets | | | 7.51 | %(c) |
| Portfolio turnover rate | | | 27.48 | %(d) |
(a) The fund commenced operations on April 9, 2024.
(b) Calculated using the average shares method.
(c) Annualized
(d) Not annualized
See Notes to Financial Statements
Notes to Financial Statements (unaudited)
As of September 30, 2024
| 1. | Organization and Significant Accounting Policies |
The Obra High Grade Structured Products ETF and Obra Opportunistic Structured Products ETF, are actively managed exchange-traded funds (the “Obra ETFs”), each is a diversified series of the Spinnaker ETF Series (the “Trust”). The Trust was established as a Delaware statutory trust under an Agreement and Declaration of Trust on December 21, 2016, and is registered under the Investment Company Act of 1940, as amended (the “1940 Act”).
The Obra ETFs commenced operations on April 9, 2024. The investment objective of each Obra ETF is to seek income and capital preservation. The Obra High Grade Structured Products ETF seeks to achieve its investment objective by investing primarily in high grade (investment grade) securitized asset instruments, which are also referred to as “structured products.” The Obra Opportunistic Structured Products ETF seeks to achieve its investment objective by investing primarily in securitized asset instruments, which are also referred to as “structured products.” Structured products are pre-packaged investments that normally include assets linked to interest or one or more derivatives, which may use leverage.
The Trust will issue and redeem shares at Net Asset Value (“NAV”) only in a large specified number of shares called a “Creation Unit” or multiples thereof. A Creation Unit consists of 10,000 shares. Creation Unit transactions are typically conducted in exchange for the deposit or delivery of in-kind securities and/or cash. As a practical matter, only authorized participants may purchase or redeem these Creation Units. Except when aggregated in Creation Units, the shares are not redeemable securities of the Obra ETFs. The prices at which creations and redemptions occur are based on the next calculation of NAV after an order is received in proper form by Capital Investment Group, Inc. (the “Distributor”). Individual shares of each Obra ETF may only be purchased and sold in secondary market transactions through brokers. Shares of the Obra High Grade Structured Products ETF and Obra Opportunistic Structured Products ETF are listed for trading on NYSE Arca under the trading symbols OGSP and OOSP, respectively, and because shares will trade at market prices rather than NAV, shares of the Obra ETFs may trade at a price greater than or less than NAV.
Creation Transaction Fees
A fixed creation transaction fee of $500 per transaction (the “Creation Transaction Fee”) is applicable to each transaction regardless of the number of Creation units purchased in the transactions. An additional variable charge for cash creations or partial cash creations may also be imposed to compensate the Obra ETFs for the costs associated with buying the applicable securities. The price for each Creation Unit will equal each Obra ETF’s daily NAV per share times the number of Shares in a Creation Unit plus the Creation Transaction Fees, and, if applicable, any transfer taxes.
The following is a summary of significant accounting policies consistently followed by the Obra ETFs. The policies are in conformity with accounting principles generally accepted in the United States of America (“GAAP”). The Obra ETFs follow the accounting and reporting guidance in the Financial Accounting Standards Board (“FASB”) Accounting Standards Codification 946 “Financial Services – Investment Companies.”
Investment Valuation
The Obra ETF’s investments in securities are carried at market value. Securities listed on an exchange or quoted on a national market system are valued at the last sales price as of 4:00 p.m. Eastern Time. Securities traded in the NASDAQ over-the-counter market are generally valued at the NASDAQ Official Closing Price. Other securities traded in the over-the-counter market and listed securities for which no sale was reported on that date are valued at the mean of the most recent bid and ask prices. Securities and assets for which representative market quotations are not readily available (e.g., if the exchange on which the security is principally traded closes early or if trading of the particular security is halted during the day and does not resume prior to each Obra ETF’s net asset value calculation) or which cannot be accurately valued using each Obra ETF’s normal pricing procedures are valued at fair value as determined in good faith under policies approved by the Board of Trustees (the “Board” or the “Trustees”). A security’s “fair value” price may differ from the price next available for that security using the Obra ETFs’ normal pricing procedures. Instruments with maturities of 60 days or less are valued at amortized cost, which approximates market value.
With respect to any portion of an Obra ETFs’ assets that may be invested in other mutual funds, the value of the Obra ETFs’ shares is based on the NAV of the shares of the other mutual funds in which the Obra ETFs invest. The valuation methods used by mutual funds in pricing their shares, including the circumstances under which they will use fair value pricing and the effects of using fair value pricing, are included in the prospectuses of such funds. To the extent the Obra ETFs invest a portion of its assets in non-registered investment vehicles, the Obra ETFs’ shares in the non-registered vehicles are fair valued at NAV.
With respect to each Obra ETF's assets invested directly in securities, the Obra ETF's investments are generally valued at current market prices. Equity securities, debt securities, options and futures are generally valued at the official closing price or, if none, the last reported sales price on the primary exchange or market on which they are listed (closing price). Equity securities and debt securities that are not traded primarily on an exchange are generally valued at the quoted bid price obtained from a broker-dealer.
Notes to Financial Statements (unaudited)
As of September 30, 2024
Fair Value Measurement
The Orba ETFs have adopted ASC Topic 820, Fair Value Measurements. ASC Topic 820 defines fair value, establishes a framework for measuring fair value and expands disclosure about fair value measurements.
Various inputs are used in determining the value of the Obra ETFs’ investments. These inputs are summarized in the three broad levels listed below:
| Level 1: | Unadjusted quoted prices in active markets for identical securities assets or liabilities that the Obra ETFs have the ability to access. |
| Level 2: | Observable inputs other than quoted prices included in Level 1 that are observable for the asset or liability, either directly or indirectly. These inputs may include quoted prices for the identical instrument on an inactive market, prices for similar instruments, interest rates, credit spreads, yield curves, and market-collaborated input. |
| Level 3: | Unobservable inputs for the asset or liability to the extent that observable inputs are not available, representing the assumptions that a market participant would use in valuing the asset or liability at the measurement date; they would be based on the best information available, which may include the Obra ETFs’ own data. |
The availability of observable inputs can vary from security to security and is affected by a wide variety of factors, including, for example, the type of security, whether the security is new and not yet established in the marketplace, the liquidity of markets, and other characteristics particular to the security. To the extent that valuation is based on models or inputs that are less observable or unobservable in the market, the determination of fair value requires more judgment. Accordingly, the degree of judgment exercised in determining fair value is greatest for instruments categorized in Level 3.
The inputs used to measure fair value may fall into different levels of the fair value hierarchy. In such cases, for disclosure purposes, the level in the fair value hierarchy within which the fair value measurement falls in its entirety, is determined based on the lowest level input that is significant to the fair value measurement in its entirety.
The inputs or methodology used for valuing securities are not necessarily an indication of the risk associated with investing in those securities. The following table summarizes the inputs as of September 30, 2024 for the Obra ETFs’ assets measured at fair value:
| High Grade Structured Products ETF | | Total | | | Level 1 | | | Level 2 | | | Level 3 | |
| Assets | | | | | | | | | | | | | | | | |
| Asset-Backed Securities | | $ | 6,480,920 | | | $ | — | | | $ | 6,480,920 | | | $ | — | |
| Collateralized Loan Obligations | | | 10,395,916 | | | | — | | | | 10,395,916 | | | | — | |
| Commercial Mortgage-Backed Securities | | | 608,145 | | | | — | | | | 608,145 | | | | — | |
| Collateralized Mortgage Obligations | | | 6,128,645 | | | | — | | | | 6,128,645 | | | | — | |
| Mortgage-Backed Securities | | | 1,119,102 | | | | — | | | | 1,119,102 | | | | — | |
| Short-Term Investment | | | 1,134,079 | | | | 1,134,079 | | | | — | | | | — | |
| Total Assets | | $ | 25,866,807 | | | $ | 1,134,079 | | | $ | 24,732,728 | | | $ | — | |
| | | | | | | | | | | | | | | | | |
| Opportunistic Structured Products ETF | | Total | | | Level 1 | | | Level 2 | | | Level 3 | |
| Assets | | | | | | | | | | | | | | | | |
| Asset-Backed Securities | | $ | 2,643,084 | | | $ | — | | | $ | 2,643,084 | | | $ | — | |
| Collateralized Loan Obligations | | | 9,075,439 | | | | — | | | | — | | | | — | |
| Commercial Mortgage-Backed Securities | | | 397,685 | | | | — | | | | — | | | | — | |
| Collateralized Mortgage Obligations | | | 2,612,231 | | | | — | | | | — | | | | — | |
| Mortgage-Backed Securities | | | 757,806 | | | | — | | | | — | | | | — | |
| Short-Term Investment | | | 854,189 | | | | 854,189 | | | | — | | | | — | |
| Total Assets | | $ | 16,340,434 | | | $ | 854,189 | | | $ | 2,643,084 | | | $ | — | |
| | | | | | | | | | | | | | | | | |
Investment Transactions and Investment Income
Investment transactions are accounted for as of the date purchased or sold (trade date). Dividend income and expenses are recorded on the ex-dividend date. Interest income is recorded on the accrual basis and includes accretion/amortization of discounts and premiums using the effective interest method. Gains and losses are determined on the identified cost basis, which is the same basis used for Federal income tax purposes.
Notes to Financial Statements (unaudited)
As of September 30, 2024
Expenses
The Obra ETFs bear expenses incurred specifically on its behalf as well as a portion of general expenses, which are allocated according to methods reviewed annually by the Trustees.
Distributions
The Obra ETFs may declare and distribute dividends from net investment income, if any, monthly. The Obra ETFs generally declare and distribute capital gains, if any, annually. Dividends and distributions to shareholders are recorded on ex-date.
Estimates
The preparation of financial statements in conformity with GAAP requires management to make estimates and assumptions that affect the reported amounts of assets and liabilities and the disclosure of contingent assets and liabilities at the date of the financial statements and the reported amounts of increases and decreases in the net assets from operations during the reporting period. Actual results could differ from those estimates.
Federal Income Taxes
No provision for income taxes is included in the accompanying financial statements, as the Obra ETFs intend to distribute to shareholders all taxable investment income and realized gains and otherwise comply with Subchapter M of the Internal Revenue Code applicable to regulated investment companies.
| | Obra Opportunistic Structured
Products ETF | Obra High Grade Structured
Products ETF |
| Authorized Participant Risk | X | X |
| Below Investment Grade Securities Risk | X | |
| Cash and Cash Equivalents Risk | X | X |
| Covenant-Lite Risk | X | X |
| Credit/Default Risk | X | X |
| Cybersecurity Risk | X | X |
| Derivatives Risk | X | X |
| Early Close/Trading Halt Risk | X | X |
| ETF Structure Risk | X | X |
| Inflation Risk | X | X |
| Inflation-Indexed Bond Risk | X | X |
| Interest Rate Risk | X | X |
| Investment Risk | X | X |
| Leverage Risk | X | X |
| Limited History of Operations Risk | X | X |
| Liquidity Risk | X | X |
| Management Risk | X | X |
| Market Risk | X | X |
| Mortgage- and Asset-Backed Securities Risk | X | X |
Notes to Financial Statements (unaudited)
As of September 30, 2024
| | Obra Opportunistic Structured
Products ETF | Obra High Grade Structured
Products ETF |
| New Advisor Risk | X | X |
| Small-Cap and Mid-Cap Securities Risk | X | X |
| Structured Products Risk | X | X |
| Transition from LIBOR Risk | X | X |
| U.S. Government Securities Risk | X | X |
Authorized Participant Risk. Only an Authorized Participant may engage in creation or redemption transactions directly with the Fund. The Fund has a limited number of institutions that may act as Authorized Participants on an agency basis (i.e., on behalf of other market participants).
Below Investment Grade Securities Risk. The Fund may invest in securities that are rated below investment grade. Securities in this rating category are speculative and are usually issued by companies without long track records of sales and earnings, or by those companies with questionable credit strength. Credit risk is greater for securities rated below investment grade than for investment grade securities, which is the risk that issuers will not make payments on securities held by the Fund, resulting in losses to the Fund. Changes in economic conditions or other circumstances may have a greater effect on the ability of issuers of these securities to make principal and interest payments than they do on issuers of higher-grade securities. The retail secondary market for below investment grade securities may be less liquid than that of higher-rated securities and adverse conditions could make it difficult at times to sell certain securities or could result in lower prices.
Cash and Cash Equivalents Risk. At any time, the Fund may have significant investments in cash or cash equivalents. When a substantial portion of a portfolio is held in cash or cash equivalents, there is the risk that the value of the cash account, including interest, will not keep pace with inflation, thus reducing purchasing power over time.
Covenant-Lite Risk. Some of the below investment grade loans or debt obligations in which the Fund may invest or get exposure to may be “covenant-lite”, which means the loans or obligations contain fewer financial maintenance covenants than other loans or obligations (in some cases, none) and do not include terms which allow the lender to monitor the borrower’s performance and declare a default if certain criteria are breached. An investment by the Fund in a covenant-lite loan may potentially hinder the ability to reprice credit risk associated with the issuer and reduce the ability to restructure a problematic loan and mitigate potential loss. The Fund may also experience difficulty, expenses or delays in enforcing its rights on its holdings of covenant-lite loans or obligations. As a result of these risks, the Fund’s exposure to losses may be increased, which could result in an adverse impact on the Fund’s net income and NAV.
Credit/Default Risk. Credit risk is the risk that issuers or guarantors of debt instruments or the counterparty to a derivatives contract, repurchase agreement or loan of portfolio securities is unable or unwilling to make timely interest and/or principal payments or otherwise honor its obligations. Changes in the financial condition of an issuer or counterparty, changes in specific economic, social or political conditions that affect a particular type of security or other instrument or an issuer, and changes in economic, social, or political conditions generally can increase the risk of default by an issuer or counterparty, which can affect a security’s or other instrument’s credit quality or value and an issuer’s or counterparty’s ability to pay interest and principal when due. Debt instruments are subject to varying degrees of credit risk, which may be reflected in credit ratings. Securities issued by the U.S. government have limited credit risk. Credit rating downgrades and defaults (failure to make interest or principal payment) may potentially reduce the Fund’s income and Share price.
Cybersecurity Risk. As part of its business, the Advisor processes, stores, and transmits large amounts of electronic information, including information relating to the transactions of the Fund. The Advisor and the Fund are therefore susceptible to cybersecurity risk. Cyber-attacks include, among other behaviors, stealing or corrupting data maintained online or digitally, denial of service attacks on websites, the unauthorized release of confidential information and causing operational disruption. Successful cyber-attacks against, or security breakdowns of, the Fund or its advisor, custodians, fund accountant, fund administrator, transfer agent, pricing vendors and/or other third-party service providers may adversely impact the Fund and its shareholders. For instance, cyber-attacks may interfere with the processing of shareholder transactions, impact the Fund’s ability to calculate its NAV, cause the release of private shareholder information or confidential Fund information, impede trading, cause reputational damage, and subject the Fund to regulatory fines, penalties or financial losses, reimbursement or other compensation costs, and/or additional compliance costs. The Fund also may incur substantial costs for cybersecurity risk management in order to guard against any cyber incidents in the future. The Fund and its shareholders could be negatively impacted as a result.
Notes to Financial Statements (unaudited)
As of September 30, 2024
Derivatives Risk. Structured products may be linked to derivatives. Derivatives involve special risks and costs and may result in losses to the Fund. The successful use of derivatives requires sophisticated management, and, to the extent that derivatives are used, the Fund will depend on the Advisor’s ability to analyze and manage derivatives transactions. The prices of derivatives may move in unexpected ways, especially in abnormal market conditions. Some derivatives are “leveraged” or may create economic leverage for the Fund and, therefore, may magnify or otherwise increase investment losses to the Fund. The Fund's use of derivatives may also increase the amount of taxes payable by shareholders.
Other risks arise from the potential inability to terminate or sell derivatives positions. A liquid secondary market may not always exist for the Fund's derivatives positions. In fact, many over-the-counter derivative instruments will not have liquidity beyond the counterparty to the instrument. Over-the-counter derivative instruments also involve the risk that the other party will not meet its obligations to the Fund. The use of derivatives also exposes the Fund to operational issues, such as documentation and settlement issues, systems failures, inadequate control and human error.
Derivatives may also involve legal risks, such as insufficient documentation, the lack of capacity or authority of a counterparty to execute or settle a transaction, and the legality and enforceability of derivatives contracts. The U.S. Government and foreign governments have adopted (and may adopt further) regulations governing derivatives markets, including mandatory clearing of certain derivatives, margin and reporting requirements and risk exposure limitations. Regulation of derivatives may make derivatives more costly, limit their availability or utility to the Fund, or otherwise adversely affect their performance or disrupt markets.
Early Close/Trading Halt Risk: An exchange or market may close or issue trading halts on specific securities, or the ability to buy or sell certain securities or financial instruments may be restricted, which may prevent the Fund from buying or selling certain securities or financial instruments. In these circumstances, the Fund may be unable to rebalance its portfolio, may be unable to accurately price its investments and may incur substantial trading losses.
ETF Structure Risk. As a result of being structured as an ETF, the ETF is subject to special risks, including:
○ Not Individually Redeemable. Shares are not individually redeemable and may be redeemed by the Fund at NAV only in large blocks known as “Creation Units.” You may incur brokerage costs purchasing enough Shares to constitute a Creation Unit.
○ Trading Issues. Trading in Shares on the Exchange may be halted due to market conditions or for reasons that, in the view of the Exchange, make trading in Shares inadvisable, such as extraordinary market volatility. There can be no assurance that Shares will continue to meet the listing requirements of the Exchange. An active trading market for the Shares may not be developed or maintained. If the Shares are traded outside a collateralized settlement system, the number of financial institutions that can act as authorized participants that can post collateral on an agency basis is limited, which may limit the market for the Shares.
○ Cash Purchases and Redemptions. Although the Funds do not anticipate large cash purchases or redemptions, to the extent Creation Units are purchased or redeemed by Authorized Participants in cash instead of in-kind, the Fund will incur certain costs such as brokerage expenses and taxable gains and losses. These costs could be imposed on the Fund and impact the Fund’s NAV if not fully offset by transaction fees paid by the Authorized Participants.
○ Market Price Variance Risk. Individual Shares of the Fund that are listed for trading on the Exchange can be bought and sold in the secondary market at market prices. The market prices of Shares will fluctuate in response to changes in NAV and supply and demand for Shares. There may be times when the market price and the NAV vary significantly and you may pay more than NAV when buying Shares on the secondary market, and you may receive less than NAV when you sell those Shares. The market price of Shares, like the price of any exchange-traded security, includes a “bid-ask spread” charged by the exchange specialists, market makers or other participants that trade the particular security. In times of severe market disruption, the bid-ask spread often increases significantly. This means that Shares may trade at a discount to NAV and the discount is likely to be greatest when the price of Shares is falling fastest, which may be the time that you most want to sell your Shares. The Fund’s investment results are measured based upon the daily NAV of the Fund over a period of time. Investors purchasing and selling Shares in the secondary market may not experience investment results consistent with those experienced by those creating and redeeming directly with the Fund.
◾ In times of market stress, market makers may step away from their role market making in shares of ETFs and in executing trades, which can lead to differences between the market value of Shares and the Fund’s NAV.
Notes to Financial Statements (unaudited)
As of September 30, 2024
◾ In times of market stress, market makers may step away from their role market making in shares of ETFs and in executing trades, which can lead to differences between the market value of Shares and the Fund’s NAV.
◾ To the extent authorized participants exit the business or are unable to process creations or redemptions and no other A can step in to do so, there may be a significantly reduced trading market in the Shares, which can lead to differences between the market value of Shares and the Fund’s NAV.
◾ The market price for the Shares may deviate from the Fund’s NAV, particularly during times of market stress, with the result that investors may pay significantly more or significantly less for Shares than the Fund’s NAV, which is reflected in the bid and ask price for Shares or in the closing price.
◾ When all or a portion of an ETFs underlying securities trade in a market that is closed when the market for the Shares is open, there may be changes from the last quote of the closed market and the quote from the Fund’s domestic trading day, which could lead to differences between the market value of the Shares and the Fund’s NAV.
◾ In stressed market conditions, the market for the Shares may become less liquid in response to the deteriorating liquidity of the Fund’s portfolio. This adverse effect on the liquidity of the Shares may, in turn, lead to differences between the market value of the Shares and the Fund’s NAV.
Inflation Risk. Fixed income securities held by the Fund and Portfolio Funds are subject to inflation risk. Because inflation reduces the purchasing power of income produced by existing fixed income securities, the prices at which fixed income securities trade will be reduced to compensate for the fact that the income they produce is worth less. This potential decrease in market value of fixed income securities would result in a loss in the value of the Fund’s portfolio.
Inflation-Indexed Bond Risk. Inflation-indexed bonds may change in value in response to actual or anticipated changes in inflation rates in a manner unanticipated by the Fund’s portfolio management team or investors generally. Inflation-indexed bonds are subject to debt securities risks.
Interest Rate Risk. As interest rates rise, the value of fixed income securities held by a Fund are likely to decrease. Securities with longer durations tend to be more sensitive to interest rate changes, making them more volatile than securities with shorter durations. Interest rates in the United States are near historic lows, which may increase a Fund’s exposure to risks associated with rising rates. A wide variety of market factors can cause interest rates to rise, including central bank monetary policy (including the Federal Reserve ending its “quantitative easing” policy of purchasing large quantities of securities issued or guaranteed by the U.S. government), rising inflation, and changes in general economic conditions. Interest rate changes can be sudden and unpredictable. Moreover, rising interest rates may lead to decreased liquidity in the bond markets, making it more difficult for a Fund to value or sell some or all of its bond investments at any given time. Changes in interest rates may also affect the Share price; a sharp rise in interest rates could cause the Share price to fall.
Investment Risk. The value of the Fund’s investments, like other market investments, may move up or down, sometimes rapidly and unpredictably. All investments involve risks, including the risk that the entire amount invested may be lost. No guarantee or representation is made that the Fund’s investment objectives will be achieved.
Various sectors of the global financial markets have been experiencing an extended period of adverse conditions. Market uncertainty has increased dramatically, particularly in the United States and Europe, and adverse market conditions have expanded to other markets. These conditions have resulted in disruption of markets, periods of reduced liquidity, greater volatility, general volatility of spreads, an acute contraction in the availability of credit and a lack of price transparency. These volatile and often difficult global market conditions have episodically adversely affected the market values of many securities, and this volatility may continue and conditions could even deteriorate further. Some of the largest banks and companies across many sectors of the economy in the United States and Europe have declared bankruptcy, entered into insolvency, administration or similar proceedings, been nationalized by government authorities, and/or agreed to merge with or be acquired by other banks or companies that had been considered their peers. The long-term impact of these events is uncertain, but could continue to have a material effect on general economic conditions, consumer and business confidence and market liquidity.
Major public health issues, such as COVID-19, have at times, and may in the future impact the Fund. The COVID-19 pandemic caused substantial market volatility and global business disruption and impacted the global economy in significant and unforeseen ways. Any public health emergency, including the COVID-19 pandemic or any outbreak of other existing or new epidemic diseases or the threat thereof, and the resulting financial and economic market uncertainty, could have a material adverse impact on the Fund or its investments. Moreover, changes in interest rates, travel advisories, quarantines and restrictions, disrupted supply chains and industries, impact on labor markets, reduced liquidity or a slowdown in U.S. or global economic conditions resulting from a future public health crisis may also adversely affect the Fund or its investments. COVID-19, or any other health crisis and the current or any resulting financial, economic and capital markets environment, and future developments in these and other areas present uncertainty and risk with respect to the Fund’s NAV, performance, financial condition, results of operations, ability to pay distributions, make Share repurchases and portfolio liquidity, among other factors.
Notes to Financial Statements (unaudited)
As of September 30, 2024
Leverage Risk. The use of leverage may exaggerate changes in the Share price and the return on its investments. Accordingly, the Fund may be more volatile and all other risks, including the risk of loss of an investment, tend to be compounded or magnified. Borrowing also leads to additional interest expense and other fees that increase the Fund’s expenses.
Limited History of Operations Risk. The Fund has a limited history of operations. Accordingly, investors in the Fund bear the risk that the Fund may not be successful in implementing its investment strategy, may not employ a successful investment strategy, or may fail to attract sufficient assets under management to realize economies of scale, any of which could result in the Fund being liquidated at any time without shareholder approval and at a time that may not be favorable for all shareholders. Such a liquidation could have negative tax consequences for shareholders and will cause shareholders to incur expenses of liquidation.
Liquidity Risk. Liquidity risk exists when particular investments of the Fund would be difficult to purchase or sell, possibly preventing the Fund from selling such illiquid securities at an advantageous time or price, or possibly requiring the Fund to dispose of other investments at unfavorable times or prices in order to satisfy its obligations.
Management Risk. The Fund is subject to management risk because it does not seek to replicate the performance of a specified index. The portfolio managers will utilize proprietary investment processes, techniques, and risk analyses in making investment decisions for the Fund, but there can be no guarantee that these decisions will produce the desired results. In addition, legislative, regulatory, or tax developments may affect the investment techniques available to the portfolio managers in connection with managing the Fund and may also adversely affect the ability of the Fund to achieve its investment objective.
Market Risk. Market risk refers to the possibility that the value of securities held by the Fund may decline due to daily fluctuations in the market. Market prices for securities change daily as a result of many factors, including developments affecting the condition of both individual companies and the market in general. The price of a security may even be affected by factors unrelated to the value or condition of its issuer, including changes in interest rates, economic and political conditions, and general market conditions. The Fund’s performance per Share will change daily in response to such factors.
Mortgage- and Asset-Backed Securities Risks. MBS (residential and commercial) and asset-backed securities represent interests in “pools” of mortgages or other assets, including consumer loans or receivables held in trust. The characteristics of these MBS and asset-backed securities differ from traditional fixed income securities. Like traditional fixed income securities, the value of MBS or asset-backed securities typically increases when interest rates fall and decreases when interest rates rise. However, a main difference is that the principal on MBS or asset-backed securities may normally be prepaid at any time, which will reduce the yield and market value of these securities. Therefore, MBS and asset-backed backed securities are subject to “prepayment risk” and “extension risk.” Because of prepayment risk and extension risk, mortgage-backed securities react differently to changes in interest rates than other fixed income securities.
Prepayment risk is the risk that, when interest rates fall, certain types of obligations will be paid off by the obligor more quickly than originally anticipated and a Fund may have to invest the proceeds in securities with lower yields. In periods of falling interest rates, the rate of prepayments tends to increase (as does price fluctuation) as borrowers are motivated to pay off debt and refinance at new lower rates. During such periods, reinvestment of the prepayment proceeds by the management team will generally be at lower rates of return than the return on the assets which were prepaid. Prepayment reduces the yield to maturity and the average life of the MBS or asset-backed securities. The maturity of certain securities, such as MBS and ABS, is calculated using the security’s weighted-average life. Estimated prepayment rates for these securities are used in this calculation. If actual prepayment rates differ from the estimates used in calculating the weighted-average life, each Fund’s yield and/or Share price could be negatively affected.
Extension risk is the risk that, when interest rates rise, certain obligations will be paid off by the obligor more slowly than anticipated causing the value of these securities to fall. Rising interest rates tend to extend the duration of MBS and asset-backed securities, making them more sensitive to changes in interest rates. The value of longer-term securities generally changes more in response to changes in interest rates than shorter term securities. As a result, in a period of rising interest rates, MBS and asset-backed securities may exhibit additional volatility and may lose value.
Small movements in interest rates (both increases and decreases) may quickly and significantly reduce the value of certain MBS. In addition, because prepayment rates of individual mortgage pools vary widely, the maturity of a particular pool cannot be predicted precisely. A Fund’s investments in asset-backed securities are subject to risks similar to those associated with MBS, as well as additional risks associated with the nature of the assets and the servicing of those assets. These securities also are subject to the risk of default on the underlying mortgage or assets, particularly during periods of economic downturn.
Notes to Financial Statements (unaudited)
As of September 30, 2024
MBS may be either pass-through securities or CMOs. Pass-through securities represent a right to receive principal and interest payments collected on a pool of mortgages, which are passed through to security holders. CMOs are created by dividing the principal and interest payments collected on a pool of mortgages into several revenue streams (tranches) with different priority rights to portions of the underlying mortgage payments. Each Fund will not invest in CMO tranches which represent a right to receive interest only , principal only, or an amount that remains after other floating-rate tranches are paid (an inverse floater). If a Fund invests in CMO tranches (including CMO tranches issued by government agencies) and interest rates move in a manner not anticipated by Fund management, it is possible that such Fund could lose all or substantially all of its investment.
Ongoing developments in the residential mortgage market may have additional consequences to the market for mortgage-backed securities. In past years, delinquencies and losses generally increased with respect to securitizations involving residential mortgage loans and potentially could begin increasing again as a result of a weakening housing market and the seasoning of securitized pools of mortgage loans. Many so-called sub-prime mortgage pools are currently distressed and may be trading at significant discounts to their face value.
Additionally, mortgage lenders have adjusted their loan programs and underwriting standards, which has reduced the availability of mortgage credit to prospective mortgagors. This has resulted in reduced availability of financing alternatives for mortgagors seeking to refinance their mortgage loans. The reduced availability of refinancing options for mortgagors has resulted in higher rates of delinquencies, defaults, and losses on mortgage loans, particularly in the case of, but not limited to, mortgagors with adjustable rate mortgage loans or interest-only mortgage loans that experience significant increases in their monthly payments following the adjustment date or the end of the interest-only period. These events, alone or in combination with each other and with deteriorating economic conditions in the general economy, may continue to contribute to higher delinquency and default rates on mortgage loans. The tighter underwriting guidelines for residential mortgage loans, together with lower levels of home sales and reduced refinance activity, also may have contributed to a reduction in the prepayment rate for mortgage loans generally and this may continue. The values of mortgage-backed securities may be substantially dependent on the servicing of the underlying mortgage pools, and therefore are subject to risks associated with the negligence or malfeasance by their servicers and to the credit risk of their servicers. In certain circumstances, the mishandling of related documentation also may affect the rights of security holders in and to the underlying collateral.
The U.S. Government conservatorship Freddie Mac and Fannie Mae in September 2008 and its ultimate resolution may adversely affect the real estate market, the value of real estate-related assets generally, and markets generally. In addition, there may be proposals from the U.S. Congress or other branches of the U.S. Government regarding the conservatorship, including regarding reforming Fannie Mae and Freddie Mac or winding down their operations, which may or may not come to fruition. There can be no assurance that such proposals, even those that are not adopted, will not adversely affect the values of the Fund’s assets.
The Federal Housing Finance Agent (“FHFA”), as conservator or receiver of Fannie Mae and Freddie Mac, has the power to repudiate any contract entered into by Fannie Mae or Freddie Mac prior to its appointment if it determines that performance of the contract is burdensome, and repudiation of the contract promotes the orderly administration of Fannie Mae’s or Freddie Mac’s affairs. In the event the guaranty obligations of Fannie Mae or Freddie Mac are repudiated, the payments of interest to holders of Fannie Mae or Freddie Mac mortgage-backed securities would be reduced if payments on the mortgage loans represented in the mortgage loan groups related to such mortgage-backed securities are not made by the borrowers or advanced by the servicer. Any actual direct compensatory damages for repudiating these guaranty obligations may not be sufficient to offset any shortfalls experienced by such mortgage-backed security holders.
Further, in its capacity as conservator or receiver, FHFA has the right to transfer or sell any asset or liability of Fannie Mae or Freddie Mac without any approval, assignment or consent. If FHFA were to transfer any such guaranty obligation to another party, holders of Fannie Mae or Freddie Mac mortgage-backed securities would have to rely on that party for satisfaction of the guaranty obligation and would be exposed to the credit risk of that party.
New Advisor Risk. The Advisor has only recently begun serving as an investment advisor to ETFs. As a result, investors do not have a long-term track record of managing an ETF from which to judge the Advisor, and the Advisor may not achieve the intended result in managing the Fund and may have limited resources.
Small-Cap and Mid-Cap Securities Risk. The Fund may invest in securities of small-cap and mid-cap companies, which involve greater volatility than investing in larger and more established companies. Small-cap and mid-cap companies can be subject to more abrupt or erratic share price changes than larger, more established companies. Securities of these types of companies have limited market liquidity, and their prices may be more volatile. You should expect that the value of the Shares will be more volatile than a fund that invests exclusively in large-capitalization companies.
Notes to Financial Statements (unaudited)
As of September 30, 2024
Structured Products Risk. The Fund will primarily invest in structured products. The structured products may include investments in securitizations and other asset-backed securities. Among other risks, the products (i) are subject to the risks associated with the underlying assets; (ii) will often be leveraged, which will generally magnify the opportunities for gain and risk of loss; (iii) are highly complex, which may cause disputes as to their terms and impact the valuation and liquidity of such positions; and (iv) often contain significant obstacles to asserting “putback” or similar claims against the products.
Transition from LIBOR Risk. Although LIBOR is no longer published as of June 30, 2023, holding of certain of the Fund’s underlying investments may still include a LIBOR reference rate. The elimination of LIBOR and transition to other reference rates, or any other changes or reforms to the determination or supervision of reference rates, could have an adverse impact on the market for, or value of, any securities or payments linked to those reference rates, which may adversely affect Fund performance and/or NAV. Uncertainty and risk still remain regarding the willingness and ability of issuers and lenders to include revised provisions in new and existing contracts or instruments. Consequently, the transition away from LIBOR to other reference rates may still lead to increased volatility and illiquidity in markets that have historically been tied to LIBOR, fluctuations in values of LIBOR-related investments or investments in issuers that utilize LIBOR, increased difficulty in borrowing or refinancing and diminished effectiveness of hedging strategies, potentially adversely affecting Fund performance. Furthermore, the risks associated with the discontinuation of LIBOR and transition to alternative rates may be exacerbated if the work necessary to effect an orderly transition to an alternative reference rate is not completed in a timely manner. The ultimate impact of the discontinuance of LIBOR on the Fund remains uncertain and may result in losses to the Fund. The U.S. Federal Reserve, based on the recommendations of the New York Federal Reserve’s Alternative Reference Rate Committee (comprised of major derivative market participants and their regulators), has begun publishing the SOFR, which is their preferred alternative rate for U.S. dollar LIBOR. Proposals for alternative reference rates for other currencies have also been announced or have already begun publication. Markets are in the process of developing in response to these new rates. Although financial regulators and industry working groups have suggested alternative reference rates, such as the European Interbank Offer Rate, the Sterling Overnight Interbank Average Rate and SOFR, there has been no global consensus as to an alternative rate and the process for amending existing contracts or instruments to transition away from LIBOR remains incomplete.
U.S. Government Securities Risk. Debt securities issued or guaranteed by certain U.S. Government agencies, instrumentalities, and sponsored enterprises are not supported by the full faith and credit of the U.S. Government, so investments in their securities or obligations issued by them involve credit risk greater than investments in other types of U.S. Government securities.
3. Transactions with Related Parties and Service Providers
Advisor
Pursuant to the Advisory Agreement, each Obra ETF pays a monthly advisory fee to the Advisor, based upon the average daily net assets and calculated at an annual rate. See the table below for the advisory fee rates and amounts earned by the Advisor from each Obra ETF during period ended September 30, 2024:
| Fund | | Advisory Fee Rate | | | Amount Earned | | | Amount Waived by Advisor | | | Expenses Reimbursed by Advisor | |
| Obra High Grade Structured Products ETF | | | 0.63 | % | | $ | 78,826 | | | $ | 78,447 | | | $ | — | |
| Obra Opportunistic Structured Products ETF | | | 0.63 | % | | $ | 48,817 | | | $ | 48,817 | | | $ | 41,241 | |
The Advisor has entered into a contractual agreement (the “Expense Limitation Agreement”) with the Trust, on behalf of each Obra ETF, under which it has agreed to waive or reduce its management fees and to assume other expenses of each Obra ETF, if necessary, in an amount that limits each Obra ETF’s annual operating expenses (exclusive of (i) any front-end or contingent deferred loads; (ii) brokerage fees and commissions; (iii) acquired fund fees and expenses; (iv) fees and expenses associated with investments in other collective investment vehicles or derivative instruments (including, for example, option and swap fees and expenses); (v) borrowing costs (such as interest and dividend expense on securities sold short); (vi) taxes and (vii) extraordinary expenses, such as litigation expenses (which may include indemnification of each Fund officers and Trustees and contractual indemnification of each Obra ETF service providers (other than the Advisor)) to not more than the amounts set forth in the table below of the average daily net assets of the Obra ETFs. Net annual operating expenses for the Obra ETFs may exceed these limits to the extent that each incurs expenses enumerated above as exclusions. The Expense Limitation Agreement runs through July 31, 2025, and may be terminated by the Board of Trustees at any time for any reason. In consideration of the Advisor’s agreement to limit the Obra ETFs’ expenses, each Obra ETF has agreed to repay the Advisor in the amount of any fees waived and Obra ETF expenses paid or absorbed, such to the limitations that: (i) the reimbursement will be made only for fees and expenses incurred not more than three years from the date in which they were incurred, and (ii) the reimbursement may not be made if it would cause the lesser of the expense limitation in place at the time of waiver or at the time of reimbursement to be exceeded.
Notes to Financial Statements (unaudited)
As of September 30, 2024
| Fund | Expenses Limitation |
| Obra High Grade Structured Products ETF | 0.90% |
| Obra Opportunistic Structured Products ETF | 0.90% |
4. Trustees and Officers
The Board is responsible for the management and supervision of the Obra ETFs. The Trustees approve all significant agreements between the Trust, on behalf of the Obra ETFs, and those companies that furnish services to the Obra ETFs; review performance of the Advisor and the Orba ETFs; and oversee activities of the Obra ETFs. Officers of the Trust and Trustees who are interested persons of the Trust or the Advisor will receive no salary or fees from the Trust. Trustees who are not “interested persons” of the Trust or the Advisor within the meaning of the 1940 Act (the “Independent Trustees”) receive $5,000 per year payable quarterly and $2,000 per series in the Trust. The Trust will reimburse each Trustee and officer of the Trust for his or her travel and other expenses relating to attendance of Board meetings. Additional fees may also be incurred during the year as special meetings are necessary in addition to the regularly scheduled meetings of the Board.
Certain officers of the Trust may also be officers of the Advisor or the Administrator.
5. Purchases and Sales of Investment Securities
For the fiscal period from April 9, 2024 (commencement of operations) through September 30, 2024, the aggregate cost of purchases and proceeds from sales of investment securities (excluding short-term securities) were as follows:
| | | Purchases of Securities | | | Proceeds from Sales of Securities | | | Purchases of U.S. Government Securities | | | Proceeds from Sales of U.S. Government Securities | | | In-Kind Purchases | | | In-Kind Sales | |
| High Grade Structured Products ETF | | $ | 24,076,438 | | | $ | 6,498,237 | | | $ | — | | | $ | 6,229,761 | | | $ | 20,459,651 | | | $ | — | |
| Opportunistic Structured Products ETF | | | 8,578,054 | | | | 9,215,489 | | | | — | | | | 1,688,311 | | | | 10,955,361 | | | | — | |
Distributions are determined in accordance with Federal income tax regulations, which differ from GAAP, and, therefore, may differ significantly in amount or character from net investment income and realized gains for financial reporting purposes. The general ledger is adjusted for permanent book/tax differences to reflect tax character but is not adjusted for temporary differences.
Distributions during the period ended September 30, 2024 were characterized for tax purposes as follows:
| | | Ordinary Income | |
| High Grade Structured Products ETF | | $ | 776,699 | |
| Opportunistic Structured Products ETF | | | 570,653 | |
For the fiscal period from April 9, 2024 (commencement of operations) through September 30, 2024, the tax-basis cost of investments and components of accumulated deficit were as follows:
| | | High Grade Structured Products ETF | | | Opportunistic Structured Products ETF | |
| Cost of Investments | | $ | 25,582,676 | | | $ | 16,162,415 | |
| | | | | | | | | |
| Gross Unrealized Appreciation | | | 293,779 | | | | 182,359 | |
| Gross Unrealized Depreciation | | | (9,648 | ) | | | (4,340 | ) |
| Net Unrealized Appreciation (Depreciation) | | $ | 284,131 | | | $ | 178,019 | |
Notes to Financial Statements (unaudited)
As of September 30, 2024
7. Commitments and Contingencies
Under the Trust’s organizational documents, its officers and Trustees are indemnified against certain liabilities arising out of the performance of their duties to the Obra ETFs. In addition, in the normal course of business, the Trust enters into contracts with its service providers, on behalf of the Obra ETFs, and others that provide for general indemnifications. The Obra ETFs’ maximum exposure under these arrangements is unknown, as this would involve future claims that may be made against the Obra ETFs. The Obra ETFs expect risk of loss to be remote.
8. Subsequent Events
In accordance with GAAP, management has evaluated the need for disclosures and/or adjustments resulting from subsequent events through the date of issuance of the financial statements. This evaluation did not result in any subsequent events that necessitated disclosures and/or adjustments.
Tax Information
We are required to advise you within 60 days of the Obra ETF’s fiscal year-end regarding federal tax status of certain distributions received by shareholders during each fiscal year. The following information is provided for the Obra ETFs’ fiscal period from April 1, 2024 (commencement of operations) through September 30, 2024.
Distributions during the period ended September 30, 2024 were characterized for tax purposes as follows:
| | | Ordinary Income | |
| High Grade Structured Products ETF | | $ | 776,699 | |
| Opportunistic Structured Products ETF | | | 570,653 | |
Dividend and distributions received by retirement plans such as IRAs, Keogh-type plans, and 403(b) plans need not be reported as taxable income. However, many retirement plans may need this information for their annual information meeting.
Individual shareholders should refer to their Form 1099 or other tax information, which will be mailed in early 2025, to determine the calendar year amounts to be included in their 2024 tax returns. Shareholders should consult a tax advisor regarding the tax consequences of investments in the ETF.
Changes In and Disagreements with Accountants
No changes during the period.
Matters Submitted for Shareholder Vote
Not applicable
Remuneration Paid to Directors, Officers and Others
Refer to the information in the financial statements.
Approval of Investment Advisory Agreement
In connection with an organizational Board meeting held on November 16, 2023, the Board, including a majority of the Independent Trustees, discussed the approval of a management agreement between the Trust and the Advisory, with respect to the Obra ETFs (the “Investment Advisory Agreement”).
The Trustees were assisted by legal counsel throughout the process. The Trustees relied upon the advice of legal counsel and their own business judgment in determining the material factors to be considered in evaluating the Investment Advisory Agreement and the weight to be given to each factor considered. The conclusions reached by the Trustees were based on a comprehensive evaluation of all of the information provided and were not the result of any one factor. Moreover, each Trustee may have afforded different weight to the various factors in reaching his conclusions with respect to the approval of the Investment Advisory Agreement. In connection with their deliberations regarding approval of the Investment Advisory Agreement, the Trustees reviewed materials prepared by the Advisor.
In deciding on whether to approve the proposed Investment Advisory Agreement, the Trustees considered numerous factors, including:
| (i) | Nature, Extent, and Quality of Services. The Trustees considered the responsibilities of the Advisor under the proposed Investment Advisory Agreement. The Trustees reviewed the services to be provided by the Advisor to the Obra ETFs including, without limitation, the quality of its investment advisory services; assuring compliance with the Obra ETFs’ investment objectives, policies, and limitations; and its coordination of services for the Obra ETFs among the fund’s service providers. The Trustees evaluated: the Advisor’s staffing, personnel, and methods of operating; the education and experience of the Advisor’s personnel; compliance program; and financial condition. |
After reviewing the foregoing information and further information in the memorandum from the Advisor (e.g., descriptions of Obra Capital’s business and compliance program), the Board concluded that the nature, extent, and quality of the services to be provided by the Advisor were satisfactory and adequate for the Obra ETFs.
| (ii) | Performance. The Board noted that the Advisor was newly formed, and therefore, had no performance to review. As such, the performance information provided was that of Obra Capital Management, LLC, an affiliate of the Advisor entity. It was also noted that the Advisor’s had portfolios that were similar to each respective Obra ETF, which had been presented for comparison. It was noted that all three of the portfolios outperformed their respective benchmark for the periods shown. The Board discussed projections and estimated size of the Obra ETFs over time. After further discussion, the Trustees considered the experience of the personnel of the Advisor and determined that the performance was satisfactory. |
| (iii) | Fees and Expenses. The Trustees compared the proposed advisory fee and expense ratio of the Obra ETFs to other comparable funds. The Board noted that the management fee was above the peer group average but below the category average. The Advisor explained that that higher management fee compared to the peer group average was justifiable due to the more complex nature of the strategy and the expertise required to manage the Obra ETFs. Upon further consideration and discussion of the foregoing, the Board determined that the fee to be paid to the Advisor was fair and reasonable in relation to the nature and quality of the services to be provided by the Advisor and that it reflected charges that were within a range of what could have been negotiated at arm's length. |
| (iv) | Profitability. The Board reviewed the Advisor’s profitability analysis in connection with its management of the Obra ETFs. It was noted that the Advisor expected to be moderately profitable with respect to each Obra ETF over the first 12 months of managing the Obra ETFs and more robustly profitable over the second 12 months of managing the Obra ETFs. The Trustees concluded that the estimated profits were not excessive. |
| (v) | Economies of Scale. The Trustees noted that the Obra ETFs would not immediately realize economies of scale upon launch. The Trustees reviewed the Obra ETFs’ fee arrangements for breakpoints or other provisions that would allow the Fund’s shareholders to benefit from economies of scale in the future as the Obra ETFs grew. The Trustees determined that the maximum management fee would remain the same regardless of the Obra ETFs’ asset levels. It was pointed out that breakpoints in the advisory fee could be reconsidered in the future as the Funds grew. |
Conclusion. Having reviewed and discussed in depth such information from the Advisor as the Trustees believed to be reasonably necessary to evaluate the terms of the Investment Advisory Agreement and as assisted by the advice of legal counsel, the Trustees concluded that approval of the Investment Advisory Agreement was in the best interest of the shareholders of the Obra ETFs.
| ITEM 8. | Changes in and Disagreements with Accountants for Open-End Management Investment Companies. |
No changes during the period.
| ITEM 9. | Proxy Disclosure For Open-End Management Investment Companies. |
Not applicable.
| ITEM 10. | Remuneration Paid to Directors, Officers, and Others of Open-End Management Investment Companies. |
Included under Item 7 of this Form.
| ITEM 11. | Statement Regarding Basis for Approval of Investment Advisory Contract. |
Included under Item 7 of this Form.
| ITEM 12. | Disclosure of Proxy Voting Policies and Procedures for Closed-End Management Investment Companies. |
Not applicable.
| ITEM 13. | Portfolio Managers of Closed-End Management Investment Companies. |
Not applicable.
| ITEM 14. | Purchases of Equity Securities by Closed-End Management Investment Company and Affiliated Purchasers. |
Not applicable.
| ITEM 15. | Submission of Matters to a Vote of Security Holders. |
None.
| Item 16. | Controls and Procedures. |
| (a) | The President and Principal Executive Officer and the Treasurer, Principal Accounting Officer, and Principal Financial Officer have concluded that the registrant’s disclosure controls and procedures (as defined in Rule 30a-3(c) under the Investment Company Act of 1940) are effective based on their evaluation of these disclosure controls and procedures required by Rule 30a-3(b) under the Investment Company Act of 1940 and Rules 13a-15(b) or 15d-15(b) under the Securities Exchange Act of 1934, as of a date within 90 days of the filing of this report. |
| (b) | There were no changes in the registrant’s internal control over financial reporting (as defined in Rule 30a-3(d) under the Investment Company Act of 1940) that occurred during the period covered by this report that have materially affected, or are reasonably likely to materially affect, the registrant’s internal control over financial reporting. |
| ITEM 17. | Disclosure of Securities Lending Activities for Closed-End Management Investment Companies. |
Not applicable.
| ITEM 18. | Recovery of Erroneously Awarded Compensation. |
| (a)(1) | Any code of ethics, or amendment thereto, that is the subject of the disclosure required by Item 2, to the extent that the registrant intends to satisfy the Item 2 requirements through filing of an exhibit. |
Not applicable.
| (a)(2) | Any policy required by the listing standards adopted pursuant to Rule 10D-1 under the Exchange Act by the registered national securities exchange or registered national securities association upon which the registrant’s securities are listed. |
Not applicable.
| (a)(3) | A separate certification for each principal executive and principal financial officer of the registrant as required by Rule 30a-2(a) under the Act. |
| (a)(3) | Any written solicitation to purchase securities under Rule 23c-1 under the Act sent or given during the period covered by the report or on behalf of the registrant to 10 or more persons. |
Not applicable.
| (a)(4) | Change in the registrant’s independent public accountant. |
Not applicable.
| (b) | Certifications pursuant to Section 906 of the Sarbanes-Oxley Act of 2002. |
SIGNATURES
Pursuant to the requirements of the Securities Exchange Act of 1934 and the Investment Company Act of 1940, the registrant has duly caused this report to be signed on its behalf by the undersigned, thereunto duly authorized.
| | Spinnaker ETF Series |
| | |
| |  |
| Date: December 6, 2024 | Katherine M. Honey
|
| | President and Principal Executive Officer |
Pursuant to the requirements of the Securities Exchange Act of 1934 and the Investment Company Act of 1940, this report has been signed below by the following persons on behalf of the registrant and in the capacities and on the dates indicated.
| | |
Date: December 6, 2024
| Katherine M. Honey |
| | President and Principal Executive Officer |
| | |
| |  |
Date: December 6, 2024
| Peter McCabe |
| | Treasurer, Principal Accounting Officer, and Principal Financial Officer |
| | |