UNITED STATES
SECURITIES AND EXCHANGE COMMISSION
Washington, D.C. 20549
FORM N-CSR
CERTIFIED SHAREHOLDER REPORT OF REGISTERED
MANAGEMENT INVESTMENT COMPANIES
Investment Company Act file number 811-22398
Spinnaker ETF Series
(Exact name of registrant as specified in charter)
116 South Franklin Street, Rocky Mount, North Carolina 27802
(Address of principal executive offices) (Zip code)
Paracorp Inc.
2140 South Dupont Hwy, Camden, DE 19934
(Name and address of agent for service)
Registrant’s telephone number, including area code: 252-972-9922
Date of fiscal year end: April 30
Date of reporting period: October 31, 2024
| Item 1. | Report to Stockholders |
(a)
Genter Capital Taxable Quality Intermediate ETF Tailored Shareholder Report
Genter Capital Taxable Quality Intermediate ETF
Genter Capital Taxable Quality Intermediate ETF
Ticker: GENT
Exchange: NYSE Arca
Semi-Annual Shareholder Report October 31, 2024
This semi-annual shareholder report contains important information about Genter Capital Taxable Quality Intermediate ETF for the period May 21, 2024 (commencement of operations) to October 31, 2024. You can find additional information about the Fund at www.genterfunds.com/GENT. You can also request this information by contacting us at (800) 773-3863.
What were the Fund costs for the past year?
(based on a hypothetical $10,000 investment)
Fund Name | Costs of a $10,000 investment | Costs paid as a percentage of a $10,000 investment |
|---|
GENT | $17* | 0.38% |
| * | Based on operations for the period from May 21, 2024 to October 31, 2024. Expenses for the full 6 month period would be higher. |
Key Fund Statistics
(as of October 31, 2024)
| |
|---|
Net Assets | $29,015,359 |
Number of Holdings | 35 |
Annual Portfolio Turnover | 25.61% |
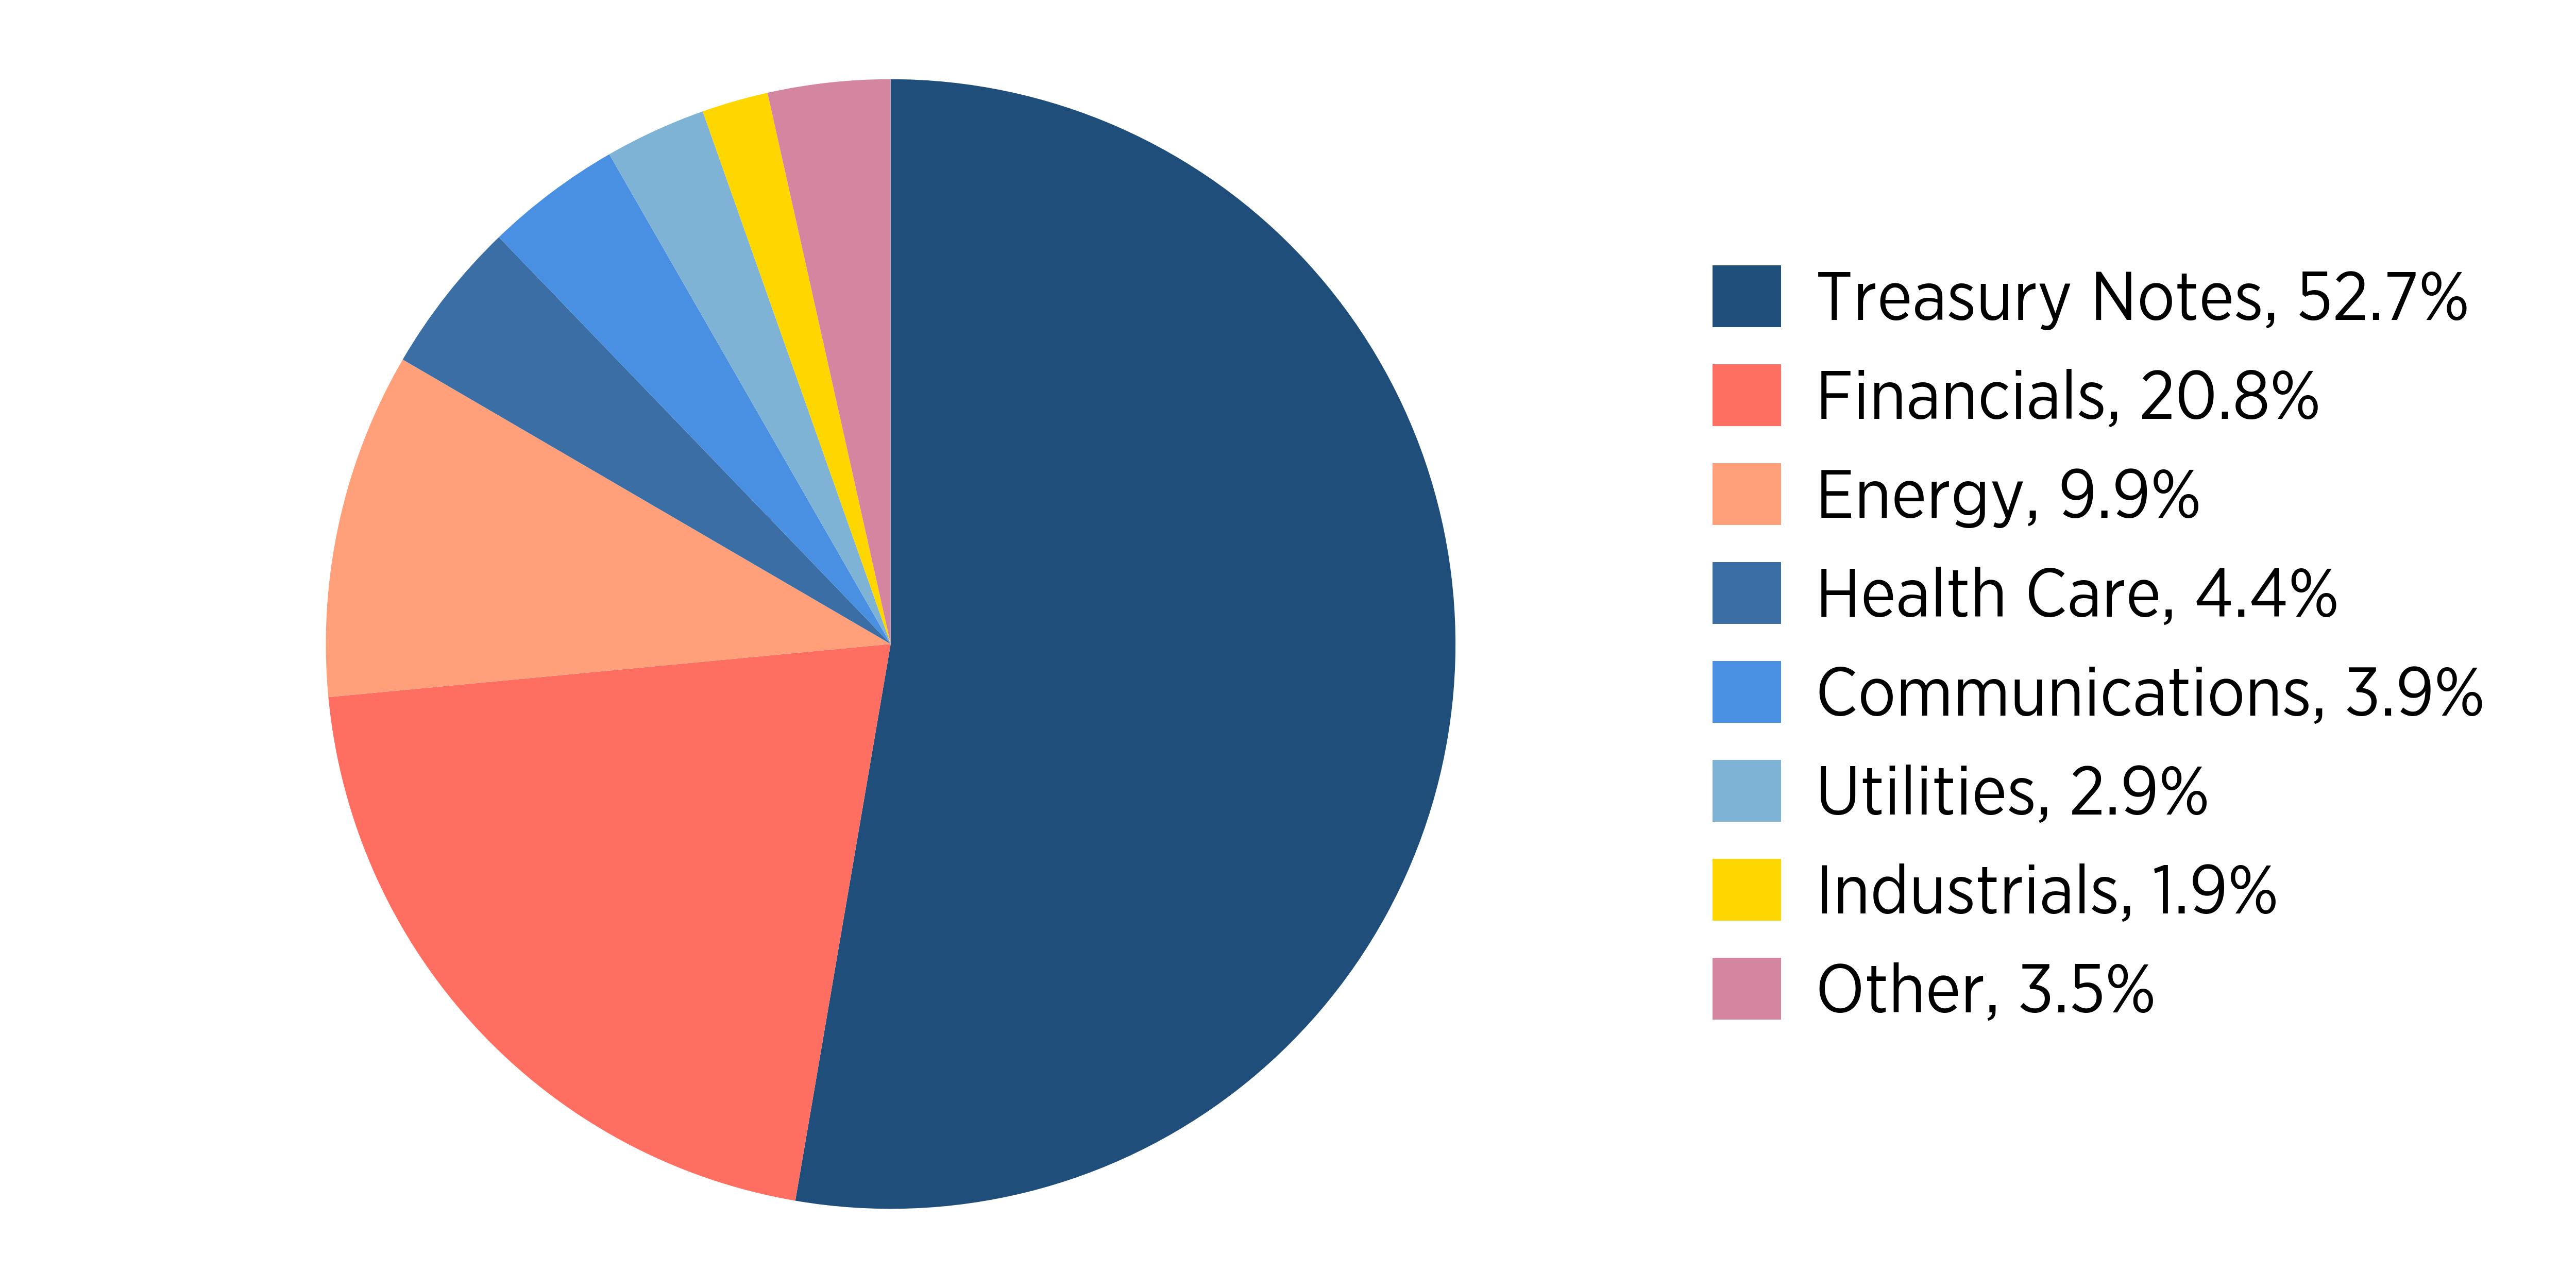
What did the Fund invest in?
(as of October 31, 2024)
Sector Breakdown (% of net assets)
Sector | % |
Treasury Notes | 0.527 |
Financials | 0.208 |
Energy | 0.099 |
Health Care | 0.044 |
Communications | 0.039 |
Utilities | 0.029 |
Industrials | 0.019 |
Other | 0.035 |
Top Ten Holdings | (% of net assets) |
|---|
United States Treasury Note, 2.875%, 05/15/32 | 14.5% |
United States Treasury Note, 3.875%, 09/30/29 | 12.2% |
United States Treasury Note, 1.250%, 03/31/28 | 7.4% |
United States Treasury Note, 3.500%, 02/15/33 | 7.3% |
United States Treasury Note, 4.000%, 01/31/31 | 7.2% |
United States Treasury Note, 4.625%, 11/15/26 | 4.0% |
Mylan N V Gtd Sr Nt, 3.950%, 06/15/26 | 3.4% |
Wells Fargo & Co, 5.574%, 07/25/29 | 2.0% |
Synchrony Financial, 3.950%, 12/01/27 | 2.0% |
Aircastle Ltd, 4.250%, 06/15/26 | 2.0% |
For additional information about the Fund; including its prospectus, financial information, holdings and proxy voting information, visit www.genterfunds.com/GENT.
Genter Capital Taxable Quality Intermediate ETF Tailored Shareholder Report
Genter Capital Municipal Quality Intermediate ETF Tailored Shareholder Report
Genter Capital Municipal Quality Intermediate ETF
Genter Capital Municipal Quality Intermediate ETF
Ticker: GENM
Exchange: NYSE Arca
Semi-Annual Shareholder Report October 31, 2024
This semi-annual shareholder report contains important information about Genter Capital Municipal Quality Intermediate ETF for the period May 21, 2024 (commencement of operations) to October 31, 2024. You can find additional information about the Fund at www.genterfunds.com/GENM. You can also request this information by contacting us at (800) 773-3863.
What were the Fund costs for the past year?
(based on a hypothetical $10,000 investment)
Fund Name | Costs of a $10,000 investment | Costs paid as a percentage of a $10,000 investment |
|---|
GENM | $17* | 0.38% |
| * | Based on operations for the period from May 21, 2024 to October 31, 2024. Expenses for the full 6 month period would be higher. |
Key Fund Statistics
(as of October 31, 2024)
| |
|---|
Net Assets | $1,411,333 |
Number of Holdings | 37 |
Annual Portfolio Turnover | 13.87% |
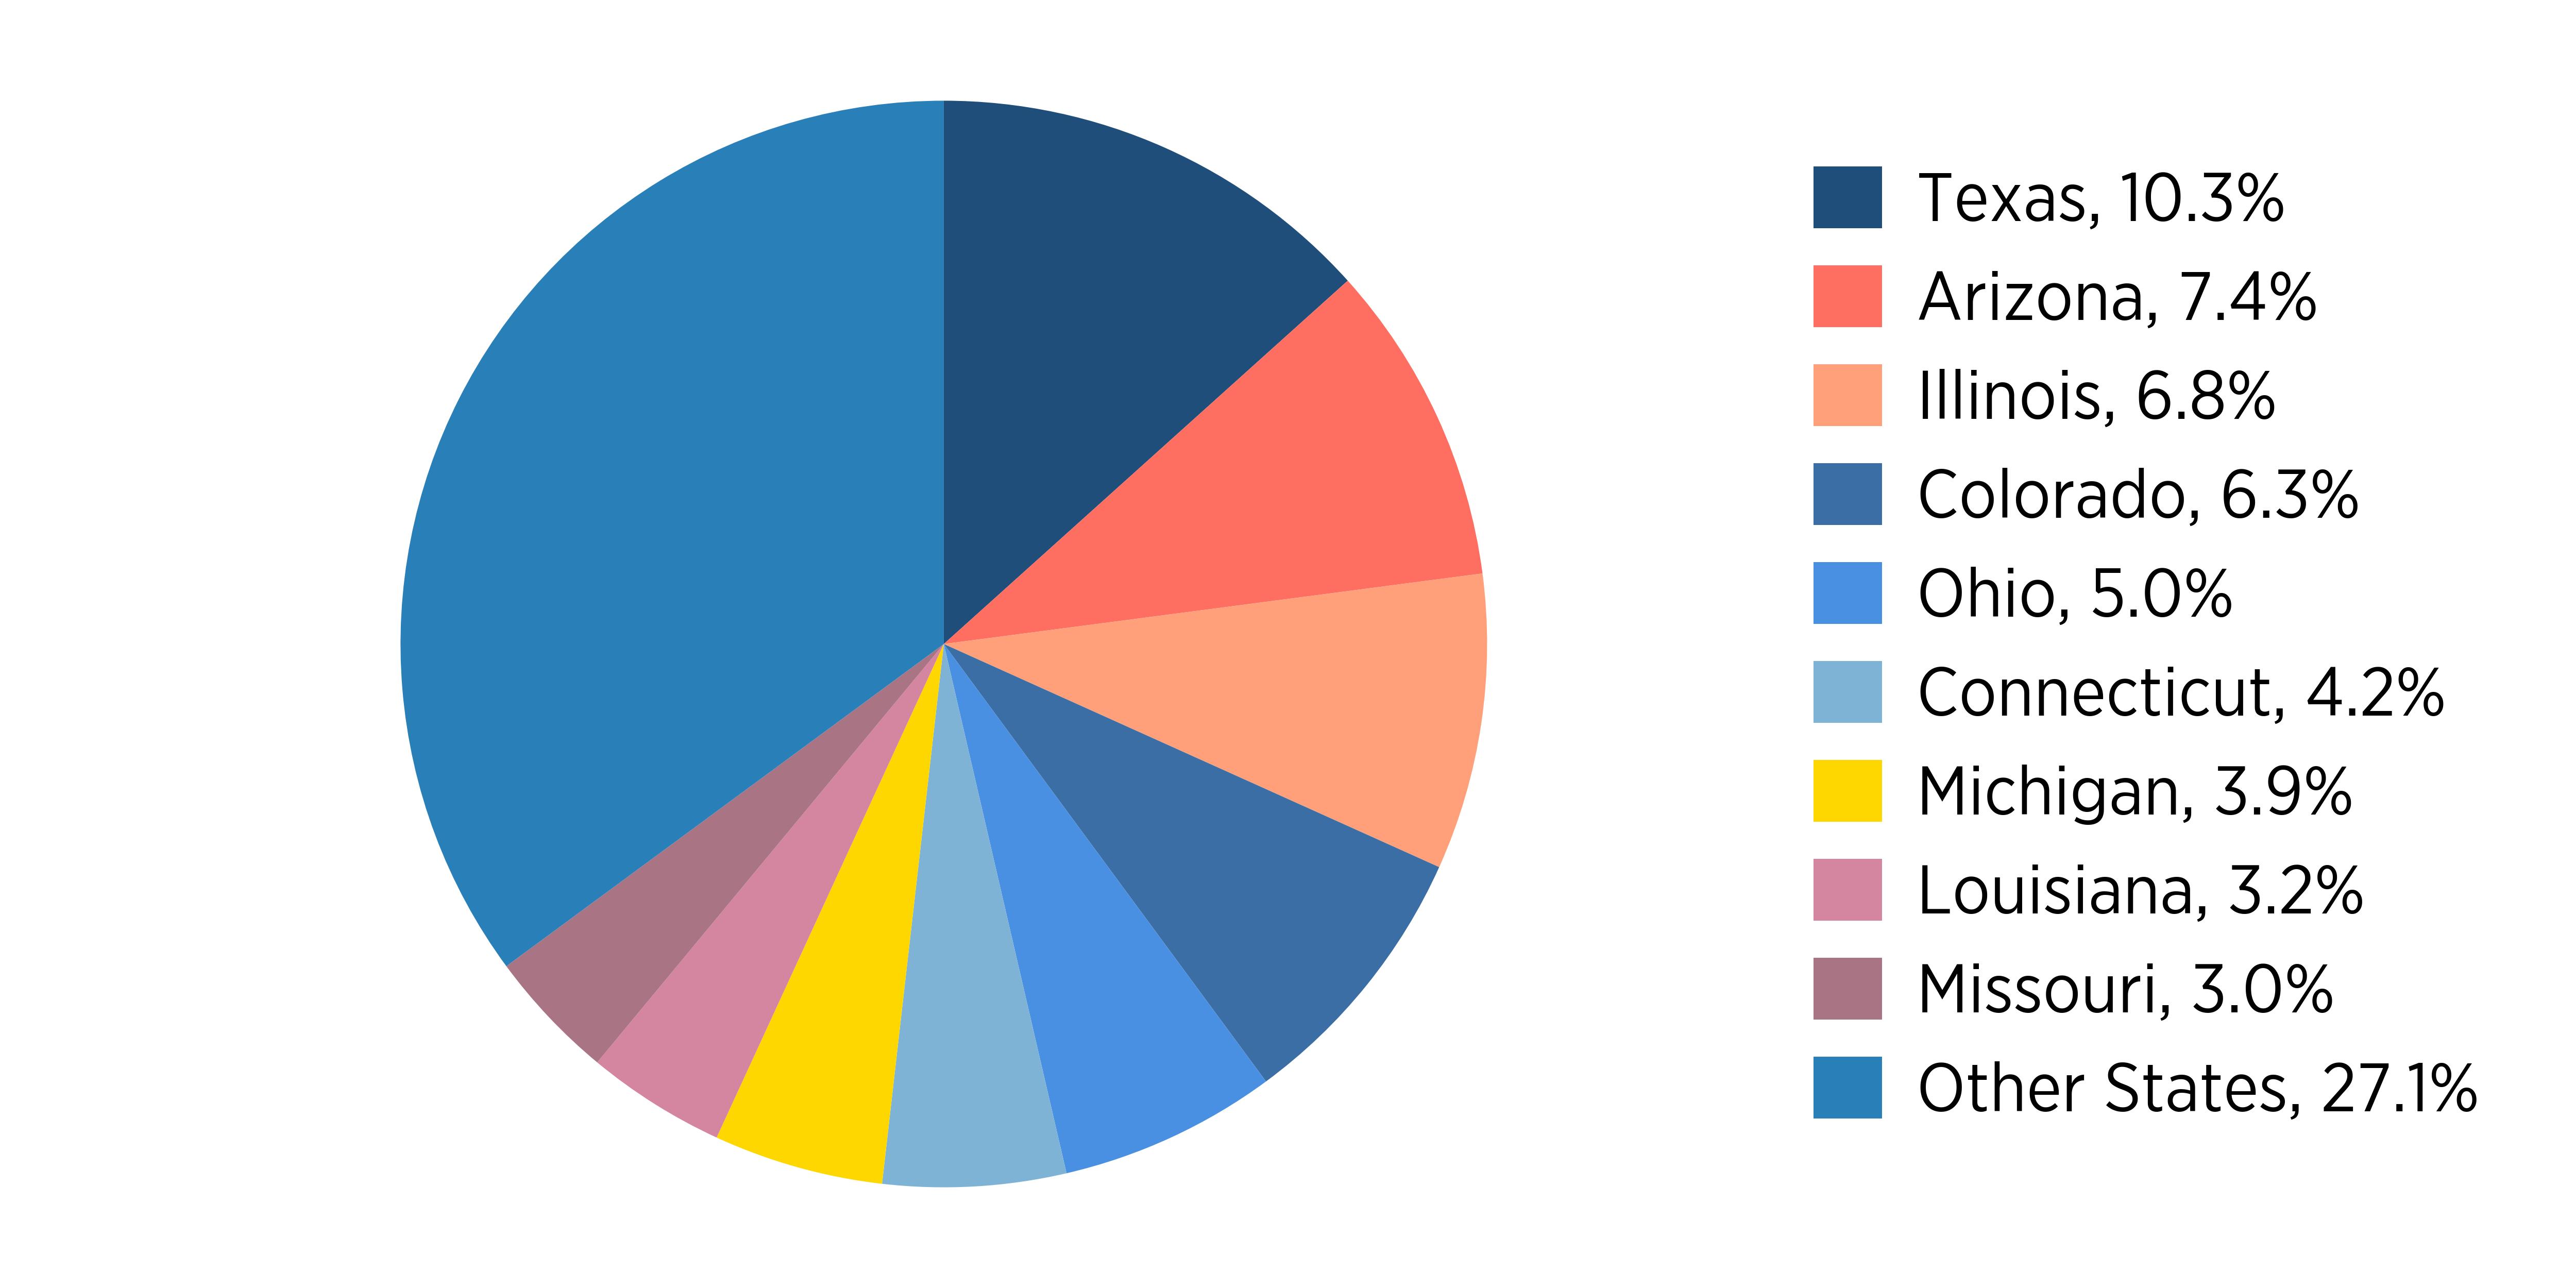
What did the Fund invest in?
(as of October 31, 2024)
State Breakdown (% of net assets)
Sector | % |
Texas | 0.103 |
Arizona | 0.074 |
Illinois | 0.068 |
Colorado | 0.063 |
Ohio | 0.050 |
Connecticut | 0.042 |
Michigan | 0.039 |
Louisiana | 0.032 |
Missouri | 0.030 |
Other States | 0.271 |
Top Ten Holdings | (% of net assets) |
|---|
Waterbury Hsg Auth, 4.250%, 07/01/39 | 4.2% |
Viridian Muni-Ref, 6.250%, 12/01/27 | 3.8% |
Chicago Arpt-Ref-B, 5.000%, 01/01/32 | 3.2% |
Denver Sch Dist #1, 5.000%, 12/01/24 | 3.2% |
Pk Creek Met Dt-A-Re, 5.000%, 12/01/36 | 3.1% |
Az Indl Dev Auth -A, 5.000%, 06/01/30 | 3.0% |
Chandler Indl Dev-2, 5.000%, 09/01/52 | 2.9% |
Lehi -Rev, 4.000%, 02/01/34 | 2.9% |
Benton Washington Wt, 4.000%, 10/01/34 | 2.9% |
Horizon Regl Mud, 4.000%, 02/01/35 | 2.8% |
For additional information about the Fund; including its prospectus, financial information, holdings and proxy voting information, visit www.genterfunds.com/GENM.
Genter Capital Municipal Quality Intermediate ETF Tailored Shareholder Report
Not applicable.
| ITEM 3. | Audit Committee Financial Expert. |
Not applicable.
| ITEM 4. | Principal Accountant Fees and Services. |
Not applicable.
| ITEM 5. | Audit Committee of Listed Registrants. |
Not applicable.
| (a) | A copy of Schedule I - Investments in securities of unaffiliated issuers as of the close of the reporting period is included in the financial statements filed under Item 7 of this Form. |
| ITEM 7. | Financial Statements and Financial Highlights for Open-End Management Investment Companies. |
Semi-Annual Financial Statements
As of October 31, 2024

The financial statements and other information contained herein are submitted for the general information of the shareholders of the Genter Capital Municipal Quality Intermediate ETF and Genter Capital Taxable Quality Intermediate ETF (the “Genter ETFs”). The Genter ETFs’ shares are not deposits or obligations of, or guaranteed by, any depository institution. The Genter ETFs’ shares are not insured by the FDIC, Federal Reserve Board or any other agency, and are subject to investment risks, including possible loss of principal amount invested. Neither the Genter ETFs nor the Genter ETFs’ distributor is a bank.
The Genter ETFs are distributed by Capital Investment Group, Inc., Member FINRA/SIPC, 100 E. Six Forks Road, Suite 200, Raleigh, NC 27609. There is no affiliation between the Genter ETFs, including their principals, and Capital Investment Group, Inc.
TABLE OF CONTENTS
Genter Capital Taxable Quality Intermediate ETF
Schedule of Investments (unaudited)
As of October 31, 2024
| | | Principal | | | Interest
Rate | | | Maturity
Date | | | Value
(Note 1) | |
| Corporate Bonds - 46.23% | | | | | | |
| Communications - 3.87% | | | | | | |
| Charter Communications Operating LLC | | $ | 560,000 | | | | 4.908 | % | | | 7/23/2025 | | | $ | 559,483 | |
| Sprint Capital Corp | | | 525,000 | | | | 6.875 | % | | | 11/15/2028 | | | | 562,406 | |
| | | | | | | | | | | | | | | | 1,121,889 | |
| Consumer Discretionary - 1.35% | | | | | | | | | | | | | | | | |
| Tri Pointe Homes Inc | | | 285,000 | | | | 5.700 | % | | | 6/15/2028 | | | | 283,931 | |
| Ford Motor Co | | | 100,000 | | | | 7.450 | % | | | 7/16/2031 | | | | 108,157 | |
| | | | | | | | | | | | | | | | 392,088 | |
| Energy - 9.91% | | | | | | | | | | | | | | | | |
| Cheniere Energy Inc | | | 575,000 | | | | 4.625 | % | | | 10/15/2028 | | | | 563,500 | |
| Cheniere Energy Partners LP | | | 610,000 | | | | 4.000 | % | | | 3/1/2031 | | | | 564,250 | |
| Enbridge Inc | | | 365,000 | | | | 6.000 | % | | | 1/15/2077 | | | | 361,350 | |
| Energy Transfer LP | | | 565,000 | | | | 5.250 | % | | | 7/1/2029 | | | | 570,249 | |
| HF Sinclair Corp | | | 450,000 | | | | 5.875 | % | | | 4/1/2026 | | | | 454,203 | |
| Transcanada Trust | | | 365,000 | | | | 5.875 | % | | | 8/15/2076 | | | | 362,263 | |
| | | | | | | | | | | | | | | | 2,875,815 | |
| Financials - 20.84% | | | | | | | | | | | | | | | | |
| Aircastle Ltd | | | 580,000 | | | | 4.250 | % | | | 6/15/2026 | | | | 572,238 | |
| Ares Capital Corp | | | 570,000 | | | | 3.875 | % | | | 1/15/2026 | | | | 560,653 | |
| Bank of America Corp | | | 595,000 | | | | 1.658 | % | | | 3/11/2027 | | | | 569,968 | |
| Bank of America Corp | | | 555,000 | | | | 4.827 | % | | | 7/22/2026 | | | | 554,434 | |
| Citigroup Inc | | | 155,000 | | | | 5.174 | % | | | 2/13/2030 | | | | 156,578 | |
| Digital Realty Trust LP | | | 300,000 | | | | 3.600 | % | | | 7/1/2029 | | | | 284,345 | |
| Ally Financial Inc | | | 100,000 | | | | 8.000 | % | | | 11/1/2031 | | | | 111,046 | |
| Goldman Sachs Group Inc/The | | | 550,000 | | | | 3.615 | % | | | 3/15/2028 | | | | 534,325 | |
| M&T Bank Corp | | | 530,000 | | | | 7.413 | % | | | 10/30/2029 | | | | 570,950 | |
| Safehold GL Holdings LLC | | | 496,000 | | | | 2.850 | % | | | 1/15/2032 | | | | 418,805 | |
| Synchrony Financial | | | 600,000 | | | | 3.950 | % | | | 12/1/2027 | | | | 574,234 | |
| Wells Fargo & Co | | | 565,000 | | | | 3.908 | % | | | 4/25/2026 | | | | 561,429 | |
| Wells Fargo & Co | | | 570,000 | | | | 5.574 | % | | | 7/25/2029 | | | | 579,025 | |
| | | | | | | | | | | | | | | | 6,048,030 | |
| Health Care - 4.37% | | | | | | | | | | | | | | | | |
| Mylan N V Gtd Sr Nt | | | 1,000,000 | | | | 3.950 | % | | | 6/15/2026 | | | | 983,842 | |
| Teva Pharmaceutical Finance Netherlands III BV | | | 300,000 | | | | 3.150 | % | | | 10/1/2026 | | | | 284,999 | |
| | | | | | | | | | | | | | | | 1,268,841 | |
| Industrials - 1.93% | | | | | | | | | | | | | | | | |
| RTX Corp | | | 550,000 | | | | 5.750 | % | | | 11/8/2026 | | | | 560,833 | |
| | | | | | | | | | | | | | | | | |
| Technology - 1.09% | | | | | | | | | | | | | | | | |
| VMware LLC | | | 320,000 | | | | 3.900 | % | | | 8/21/2027 | | | | 312,628 | |
| | | | | | | | | | | | | | | | | |
| Utilities - 2.88% | | | | | | | | | | | | | | | | |
| Duke Energy Corp | | | 285,000 | | | | 4.300 | % | | | 3/15/2028 | | | | 280,988 | |
| NextEra Energy Capital Holdings Inc | | | 550,000 | | | | 5.749 | % | | | 9/1/2025 | | | | 553,880 | |
| | | | | | | | | | | | | | | | 834,868 | |
| Total Corporate Bonds (Cost $13,324,437) | | | | | | | | | | | | | | | 13,414,992 | |
See Notes to Financial Statements
Genter Capital Taxable Quality Intermediate ETF
Schedule of Investments (unaudited) (continued)
As of October 31, 2024
| | | Principal | | | Interest
Rate | | | Maturity
Date | | Value
(Note 1) | |
| United States Treasury Bond – 52.66% | | | | | | | | | | | | | | |
| | | $ | 2,380,000 | | | | 1.250 | % | | 3/31/2028 | | $ | 2,161,338 | |
| | | | 4,625,000 | | | | 2.875 | % | | 5/15/2032 | | | 4,217,423 | |
| | | | 3,595,000 | | | | 3.875 | % | | 9/30/2029 | | | 3,546,692 | |
| | | | 2,232,000 | | | | 3.500 | % | | 2/15/2033 | | | 2,114,123 | |
| | | | 1,140,000 | | | | 4.625 | % | | 11/15/2026 | | | 1,149,975 | |
| | | | 2,115,000 | | | | 4.000 | % | | 1/31/2031 | | | 2,089,884 | |
| Total United States Treasury Bond (Cost $15,221,147) | | | | | | | | | | | | | 15,279,435 | |
| Short-Term Investment - 0.10% | | Shares | | | |
| Fidelity Treasury Portfolio, Class I, 4.51%(a) (Cost $29,991) | | 29,991 | | | 29,991 | |
| | | | | | | |
| Investments, at Value (Cost $28,575,575) - 99.00% | | | | $ | 28,724,418 | |
| Other Assets Less Liabilities - 1.00% | | | | | 290,941 | |
| Net Assets - 100.00% | | | | $ | 29,015,359 | |
(a) Represents 7-day effective SEC yield as of October 31, 2024.
See Notes to Financial Statements
Genter Capital Municipal Quality Intermediate ETF
Schedule of Investments (unaudited)
As of October 31, 2024
| | | Principal | | | Interest
Rate | | | Maturity
Date | | | Value
(Note 1) | |
| Municipal Bonds - 77.20% | | | | | | |
| Alabama - 1.78% | | | | | | | | | | | | |
| Black Belt Energy Ga | | $ | 25,000 | | | | 4.000 | % | | | 10/1/2052 | | | $ | 25,091 | |
| | | | | | | | | | | | | | | | | |
| Arkansas - 2.86% | | | | | | | | | | | | | | | | |
| Benton Washington Wt | | | 40,000 | | | | 4.000 | % | | | 10/1/2034 | | | | 40,315 | |
| | | | | | | | | | | | | | | | | |
| Arizona - 7.41% | | | | | | | | | | | | | | | | |
| Az Indl Dev Auth -A | | | 40,000 | | | | 5.000 | % | | | 6/1/2030 | | | | 42,306 | |
| Chandler Indl Dev-2 | | | 40,000 | | | | 5.000 | % | | | 9/1/2052 | | | | 40,797 | |
| Window Rock Unif Sd# | | | 20,000 | | | | 5.000 | % | | | 7/1/2033 | | | | 21,458 | |
| | | | | | | | | | | | | | | | 104,561 | |
| Colorado - 6.25% | | | | | | | | | | | | | | | | |
| Denver Sch Dist #1 | | | 45,000 | | | | 5.000 | % | | | 12/1/2024 | | | | 45,047 | |
| Pk Creek Met Dt-A-Re | | | 40,000 | | | | 5.000 | % | | | 12/1/2036 | | | | 43,217 | |
| | | | | | | | | | | | | | | | 88,264 | |
| Connecticut - 4.19% | | | | | | | | | | | | | | | | |
| Waterbury Hsg Auth | | | 60,000 | | | | 4.250 | % | | | 7/1/2039 | | | | 59,134 | |
| | | | | | | | | | | | | | | | | |
| District Of Columbia - 2.56% | | | | | | | | | | | | | | | | |
| Met Washington Dc Ar | | | 35,000 | | | | 5.000 | % | | | 10/1/2026 | | | | 36,093 | |
| | | | | | | | | | | | | | | | | |
| Florida - 2.86% | | | | | | | | | | | | | | | | |
| Miami Dade Co Hsg Fi | | | 10,000 | | | | 5.000 | % | | | 10/1/2026 | | | | 10,121 | |
| Reedy Creek Imp Dt-A | | | 30,000 | | | | 5.000 | % | | | 6/1/2025 | | | | 30,250 | |
| | | | | | | | | | | | | | | | 40,371 | |
| Iowa - 2.53% | | | | | | | | | | | | | | | | |
| Pefa Inc Gas Proj | | | 35,000 | | | | 5.000 | % | | | 9/1/2049 | | | | 35,649 | |
| | | | | | | | | | | | | | | | | |
| Illinois - 6.83% | | | | | | | | | | | | | | | | |
| Bradley Vlg | | | 10,000 | | | | 5.000 | % | | | 12/15/2035 | | | | 10,910 | |
| Chicago Arpt-Ref-B | | | 45,000 | | | | 5.000 | % | | | 1/1/2032 | | | | 45,122 | |
| Illinois Fin Auth-Re | | | 20,000 | | | | 5.000 | % | | | 3/1/2026 | | | | 20,320 | |
| Madison Cntys Etc -A | | | 20,000 | | | | 4.000 | % | | | 11/1/2025 | | | | 20,128 | |
| | | | | | | | | | | | | | | | 96,480 | |
| Louisiana - 3.19% | | | | | | | | | | | | | | | | |
| Lafayette Pwr Auth | | | 35,000 | | | | 4.000 | % | | | 11/1/2024 | | | | 35,000 | |
| New Orleans Aviation | | | 10,000 | | | | 5.000 | % | | | 1/1/2025 | | | | 10,016 | |
| | | | | | | | | | | | | | | | 45,016 | |
| Maine - 0.75% | | | | | | | | | | | | | | | | |
| Maine Hlth & Hgr Ed- | | | 10,000 | | | | 5.000 | % | | | 7/1/2029 | | | | 10,562 | |
| | | | | | | | | | | | | | | | | |
| Michigan - 3.85% | | | | | | | | | | | | | | | | |
| Grand Traverse Hosp | | | 25,000 | | | | 5.000 | % | | | 7/1/2033 | | | | 27,082 | |
| Jenison Pub Schs-I | | | 25,000 | | | | 5.000 | % | | | 5/1/2038 | | | | 27,226 | |
| | | | | | | | | | | | | | | | 54,308 | |
| Minnesota - 2.66% | | | | | | | | | | | | | | | | |
| Saint Peter Isd#508- | | | 35,000 | | | | 5.000 | % | | | 2/1/2039 | | | | 37,591 | |
| | | | | | | | | | | | | | | | | |
| Missouri - 3.00% | | | | | | | | | | | | | | | | |
| Excelsior Springs-B | | | 20,000 | | | | 4.000 | % | | | 3/1/2031 | | | | 20,627 | |
| Monarch-Chesterfield | | | 20,000 | | | | 5.000 | % | | | 3/1/2031 | | | | 21,749 | |
| | | | | | | | | | | | | | | | 42,376 | |
| Ohio - 5.02% | | | | | | | | | | | | | | | | |
| Lancaster Oh Port Au | | | 20,000 | | | | 5.000 | % | | | 8/1/2049 | | | | 20,059 | |
| Ohio St Univ-A | | | 30,000 | | | | 5.000 | % | | | 12/1/2024 | | | | 30,044 | |
| United Local Sch Dis | | | 20,000 | | | | 4.000 | % | | | 12/1/2032 | | | | 20,736 | |
| | | | | | | | | | | | | | | | 70,839 | |
See Notes to Financial Statements
Genter Capital Municipal Quality Intermediate ETF
Schedule of Investments (unaudited) (continued)
As of October 31, 2024
| | | Principal | | | Interest
Rate | | | Maturity
Date | | | Value
(Note 1) | |
| Oklahoma - 2.56% | | | | | | | | | | | | |
| Ok Cnty Fin Auth | | $ | 35,000 | | | | 5.000 | % | | | 9/1/2026 | | | $ | 36,169 | |
| | | | | | | | | | | | | | | | | |
| South Carolina - 1.52% | | | | | | | | | | | | | | | | |
| Patriots Energy Grou | | | 20,000 | | | | 5.250 | % | | | 10/1/2054 | | | | 21,477 | |
| | | | | | | | | | | | | | | | | |
| Tennessee - 1.42% | | | | | | | | | | | | | | | | |
| Memphis Shelby Co-A | | | 20,000 | | | | 5.000 | % | | | 7/1/2025 | | | | 20,131 | |
| | | | | | | | | | | | | | | | | |
| Texas - 10.27% | | | | | | | | | | | | | | | | |
| Arlington Hgr Edu-A | | | 20,000 | | | | 4.000 | % | | | 12/1/2026 | | | | 20,394 | |
| Horizon Regl Mud | | | 40,000 | | | | 4.000 | % | | | 2/1/2035 | | | | 39,755 | |
| New Hope Hgr Edu -A | | | 10,000 | | | | 4.000 | % | | | 8/15/2027 | | | | 10,162 | |
| Port Corpus Christi- | | | 20,000 | | | | 5.000 | % | | | 12/1/2025 | | | | 20,399 | |
| Viridian Muni-Ref | | | 50,000 | | | | 6.250 | % | | | 12/1/2027 | | | | 54,228 | |
| | | | | | | | | | | | | | | | 144,938 | |
| Utah - 2.88% | | | | | | | | | | | | | | | | |
| Lehi -Rev | | | 40,000 | | | | 4.000 | % | | | 2/1/2034 | | | | 40,633 | |
| | | | | | | | | | | | | | | | | |
| Virginia - 2.81% | | | | | | | | | | | | | | | | |
| Richmond Redev Hsg-F | | | 39,898 | | | | 4.500 | % | | | 5/1/2040 | | | | 39,663 | |
| Total Municipal Bonds (Cost $1,091,897) | | | | | | | | | | | | | | | 1,089,661 | |
| | | | | | | | | | | | | | | | | |
| Short-Term Investment - 21.80% | | | | | | | | | | | Shares | | | | | |
| Fidelity Treasury Portfolio, Class I, 4.51%(a) (Cost $307,614) | | | | | | | | | | | 307,614 | | | | 307,614 | |
| | | | | | | | | | | | | | | | | |
| Investments, at Value (Cost $1,399,512) - 99.00% | | | | | | | | | | | | | | $ | 1,397,275 | |
| Other Assets Less Liabilities - 1.00% | | | | | | | | | | | | | | | 14,058 | |
| Net Assets - 100.00% | | | | | | | | | | | | | | $ | 1,411,333 | |
| | | | | | | | | | | | | | | | | |
(a) Represents 7-day effective SEC yield as of October 31, 2024.
See Notes to Financial Statements
Genter ETFs
Statement of Assets and Liabilities (unaudited)
As of October 31, 2024
| | | Taxable Quality
Intermediate ETF | | | Municipal Quality Intermediate ETF | |
| Assets: | | | | | | |
| Investments, at value | | $ | 28,724,418 | | | $ | 1,397,275 | |
| Receivables: | | | | | | | | |
| Interest | | | 300,369 | | | | 14,419 | |
| Total assets | | | 29,024,787 | | | | 1,411,694 | |
| Liabilities: | | | | | | | | |
| Accrued expenses: | | | | | | | | |
| Advisory fees | | | 4,962 | | | | 190 | |
| Operational expenses | | | 4,466 | | | | 171 | |
| Total liabilities | | | 9,428 | | | | 361 | |
| Total Net Assets | | $ | 29,015,359 | | | $ | 1,411,333 | |
| Net Assets Consist of: | | | | | | | | |
| Paid in capital | | $ | 28,834,574 | | | $ | 1,411,475 | |
| Accumulated earnings (deficit) | | | 180,785 | | | | (142 | ) |
| Total Net Assets | | $ | 29,015,359 | | | $ | 1,411,333 | |
| ETF Shares Outstanding, no par value (unlimited authorized shares) | | | 2,850,000 | | | | 140,000 | |
| Net Asset Value, Per Share | | $ | 10.18 | | | $ | 10.08 | |
| Investments, at cost | | $ | 28,575,575 | | | $ | 1,399,512 | |
See Notes to Financial Statements
Genter ETFs
Statement of Operations (unaudited)
For the period ended October 31, 2024(a)
| | | Taxable Quality
Intermediate ETF | | | Municipal Quality Intermediate ETF | |
| Investment Income: | | | | | | | | |
| Interest | | $ | 498,987 | | | $ | 17,455 | |
| Total Investment Income | | | 498,987 | | | | 17,455 | |
| Expenses: | | | | | | | | |
| Advisory fees (note 3) | | | 20,923 | | | | 884 | |
| Administration fees | | | 18,830 | | | | 796 | |
| Net Expenses | | | 39,753 | | | | 1,680 | |
| Net Investment Income | | | 459,234 | | | | 15,775 | |
| Realized and Unrealized Gain (Loss) on Investments: | | | | | | | | |
| Net realized gain (loss) from: | | | | | | | | |
| Investment transactions | | | 31,353 | | | | 2,096 | |
| Total realized gain | | | 31,353 | | | | 2,096 | |
| Net change in unrealized appreciation (depreciation) on: | | | | | | | | |
| Investment transactions | | | 148,843 | | | | (2,236 | ) |
| Total change in unrealized appreciation (depreciation) | | | 148,843 | | | | (2,236 | ) |
| Net Realized and Unrealized Gain (Loss) on Investments | | | 180,196 | | | | (140 | ) |
| Net Increase in Net Assets Resulting from Operations | | $ | 639,430 | | | $ | 15,635 | |
(a) The fund commenced operations on May 21, 2024.
See Notes to Financial Statements
Genter ETFs
Statements of Changes in Net Assets (unaudited)
For the period ended October 31, 2024(a)
| | | Taxable Quality
Intermediate ETF | | | Municipal Quality Intermediate | |
| Operations: | | | | | | | | |
| Net investment income | | $ | 459,234 | | | $ | 15,775 | |
| Net realized gain from investment transactions | | | 31,353 | | | | 2,096 | |
| Net change in unrealized appreciation (depreciation) on investments | | | 148,843 | | | | (2,236 | ) |
| Net Increase (Decrease) in Net Assets Resulting from Operations | | | 639,430 | | | | 15,635 | |
| Distributions to Shareholders From: | | | | | | | | |
| Distributable Earnings | | | (458,644 | ) | | | (15,776 | ) |
| Net Decrease in Net Assets Resulting from Distributions | | | (458,644 | ) | | | (15,776 | ) |
| Capital Share Transactions: | | | | | | | | |
| Shares sold | | | 28,777,228 | | | | 1,408,954 | |
| Shares repurchased | | | — | | | | — | |
| Variable fees | | | 57,345 | | | | 2,520 | |
| Net Increase (Decrease) in Net Assets Resulting from Capital Share Transactions | | | 28,834,573 | | | | 1,411,474 | |
| Net Increase (Decrease) in Net Assets | | | 29,015,359 | | | | 1,411,333 | |
| Net Assets: | | | | | | | | |
| Beginning of Period | | | — | | | | — | |
| End of Period | | $ | 29,015,359 | | | $ | 1,411,333 | |
| Share Information: | | | | | | | | |
| Shares sold | | | 2,850,000 | | | | 140,000 | |
| Shares repurchased | | | — | | | | — | |
| Net Increase (Decrease) in Capital Shares | | | 2,850,000 | | | | 140,000 | |
(a) The fund commenced operations on May 21, 2024.
See Notes to Financial Statements
Genter Capital Taxable Quality Intermediate ETF
Financial Highlights (unaudited)
| | | October 31, | |
| For a share outstanding during the period ended | | | 2024(a) | |
| Net Asset Value, Beginning of Period | | $ | 10.00 | |
| Income (Loss) from Investment Operations: | | | | |
| Net investment income (loss) (b) | | | 0.20 | |
| Net realized and unrealized gain (loss) on investments | | | 0.15 | |
| Total from Investment Operations | | | 0.35 | |
| Less Distributions From: | | | | |
| Net investment income | | | (0.17 | ) |
| Total Distributions | | | (0.17 | ) |
| Net Asset Value, End of Period | | $ | 10.18 | |
| Total Return | | | 3.49 | % |
| Net Assets, End of Period (in thousands) | | $ | 29,015 | |
| Ratios of: | | | | |
| Net Expenses to Average Net Assets | | | 0.38 | %(c) |
| Net Investment Income (Loss) to Average Net Assets | | | 4.37 | %(c) |
| Portfolio turnover rate | | | 25.61 | %(d) |
| (a) | The fund commenced operations on May 21, 2024. |
| (b) | Calculated using the average shares method. |
See Notes to Financial Statements
Genter Capital Municipal Quality Intermediate ETF
Financial Highlights (unaudited)
| | | October 31, | |
| For a share outstanding during the period ended | | | 2024(a) | |
| Net Asset Value, Beginning of Period | | $ | 10.00 | |
| Income (Loss) from Investment Operations: | | | | |
| Net investment income (loss) (b) | | | 0.16 | |
| Net realized and unrealized gain (loss) on investments | | | 0.07 | |
| Total from Investment Operations | | | 0.23 | |
| Less Distributions From: | | | | |
| Net investment income | | | (0.15 | ) |
| Total Distributions | | | (0.15 | ) |
| Net Asset Value, End of Period | | $ | 10.08 | |
| Total Return | | | 2.30 | % |
| Net Assets, End of Period (in thousands) | | $ | 1,411 | |
| Ratios of: | | | | |
| Net Expenses to Average Net Assets | | | 0.38 | %(c) |
| Net Investment Income to Average Net Assets | | | 3.55 | %(c) |
| Portfolio turnover rate | | | 13.87 | %(d) |
| (a) | The fund commenced operations on May 21, 2024. |
| (b) | Calculated using the average shares method. |
See Notes to Financial Statements
Genter ETFs
Notes to Financial Statements (unaudited)
As of October 31, 2024
| 1. | Organization and Significant Accounting Policies |
The Genter Capital Municipal Quality Intermediate ETF and Genter Capital Taxable Quality Intermediate ETF, are actively managed exchange-traded funds (the “Obra ETFs”), each is a diversified series of the Spinnaker ETF Series (the “Trust”). The Trust was established as a Delaware statutory trust under an Agreement and Declaration of Trust on December 21, 2016, and is registered under the Investment Company Act of 1940, as amended (the “1940 Act”).
The Genter ETFs commenced operations on May 21, 2024. The investment objective of the Genter Capital Municipal Quality Intermediate ETF is to seek current income free from federal income tax with a secondary objective of capital appreciation. The Genter Capital Municipal Quality Intermediate ETF seeks to achieve its investment objective by investing in a diversified portfolio of municipal obligations, the interest on which is exempt from regular federal income tax. The investment objective of the Genter Capital Taxable Quality Intermediate ETF is to seek current income with limited risk to principal with a secondary objective of capital appreciation. The Genter Capital Taxable Quality Intermediate ETF seeks to achieve its investment objective by investing primarily in investment grade, intermediate term securities.
The Trust will issue and redeem shares at Net Asset Value (“NAV”) only in a large specified number of shares called a “Creation Unit” or multiples thereof. A Creation Unit consists of 10,000 shares. Creation Unit transactions are typically conducted in exchange for the deposit or delivery of in-kind securities and/or cash. As a practical matter, only authorized participants may purchase or redeem these Creation Units. Except when aggregated in Creation Units, the shares are not redeemable securities of the Genter ETFs. The prices at which creations and redemptions occur are based on the next calculation of NAV after an order is received in proper form by Capital Investment Group, Inc. (the “Distributor”). Individual shares of each Genter ETF may only be purchased and sold in secondary market transactions through brokers. Shares of the Genter Capital Municipal Quality Intermediate ETF and Genter Capital Taxable Quality Intermediate ETF are listed for trading on NYSE Arca under the trading symbols GENM and GENT, respectively, and because shares will trade at market prices rather than NAV, shares of the Genter ETFs may trade at a price greater than or less than NAV.
Creation Transaction Fees
A fixed creation transaction fee of $500 per transaction (the “Creation Transaction Fee”) is applicable to each transaction regardless of the number of Creation units purchased in the transactions. An additional variable charge for cash creations or partial cash creations may also be imposed to compensate the Genter ETFs for the costs associated with buying the applicable securities. The price for each Creation Unit will equal each Genter ETF’s daily NAV per share times the number of Shares in a Creation Unit plus the Creation Transaction Fees, and, if applicable, any transfer taxes.
The following is a summary of significant accounting policies consistently followed by the Genter ETFs. The policies are in conformity with accounting principles generally accepted in the United States of America (“GAAP”). The Genter ETFs follow the accounting and reporting guidance in the Financial Accounting Standards Board (“FASB”) Accounting Standards Codification 946 “Financial Services – Investment Companies.”
Investment Valuation
The Genter ETF’s investments in securities are carried at market value. Securities listed on an exchange or quoted on a national market system are valued at the last sales price as of 4:00 p.m. Eastern Time. Securities traded in the NASDAQ over-the-counter market are generally valued at the NASDAQ Official Closing Price. Other securities traded in the over-the-counter market and listed securities for which no sale was reported on that date are valued at the mean of the most recent bid and ask prices. Securities and assets for which representative market quotations are not readily available (e.g., if the exchange on which the security is principally traded closes early or if trading of the particular security is halted during the day and does not resume prior to each Genter ETF’s net asset value calculation) or which cannot be accurately valued using each Genter ETF’s normal pricing procedures are valued at fair value as determined in good faith under policies approved by the Board of Trustees (the “Board” or the “Trustees”). A security’s “fair value” price may differ from the price next available for that security using the Genter ETFs’ normal pricing procedures. Instruments with maturities of 60 days or less are valued at amortized cost, which approximates market value.
With respect to any portion of a Genter ETFs’ assets that may be invested in other mutual funds, the value of the Genter ETFs’ shares is based on the NAV of the shares of the other mutual funds in which the Genter ETFs invest. The valuation methods used by mutual funds in pricing their shares, including the circumstances under which they will use fair value pricing and the effects of using fair value pricing, are included in the prospectuses of such funds. To the extent the Genter ETFs invest a portion of its assets in non-registered investment vehicles, the Genter ETFs’ shares in the non-registered vehicles are fair valued at NAV.
With respect to each Genter ETF’s assets invested directly in securities, the Genter ETF’s investments are generally valued at current market prices. Equity securities, debt securities, options and futures are generally valued at the official closing price or, if none, the last reported sales price on the primary exchange or market on which they are listed (closing price).
Genter ETFs
Notes to Financial Statements (unaudited)
As of October 31, 2024
Equity securities and debt securities that are not traded primarily on an exchange are generally valued at the quoted bid price obtained from a broker-dealer.
Fair Value Measurement
The Genter ETFs have adopted ASC Topic 820, Fair Value Measurements. ASC Topic 820 defines fair value, establishes a framework for measuring fair value and expands disclosure about fair value measurements.
Various inputs are used in determining the value of the Genter ETFs’ investments. These inputs are summarized in the three broad levels listed below:
| Level 1: | Unadjusted quoted prices in active markets for identical securities assets or liabilities that the Genter ETFs have the ability to access. |
| Level 2: | Observable inputs other than quoted prices included in Level 1 that are observable for the asset or liability, either directly or indirectly. These inputs may include quoted prices for the identical instrument on an inactive market, prices for similar instruments, interest rates, credit spreads, yield curves, and market-collaborated input. |
| Level 3: | Unobservable inputs for the asset or liability to the extent that observable inputs are not available, representing the assumptions that a market participant would use in valuing the asset or liability at the measurement date; they would be based on the best information available, which may include the Genter ETFs’ own data. |
The availability of observable inputs can vary from security to security and is affected by a wide variety of factors, including, for example, the type of security, whether the security is new and not yet established in the marketplace, the liquidity of markets, and other characteristics particular to the security. To the extent that valuation is based on models or inputs that are less observable or unobservable in the market, the determination of fair value requires more judgment. Accordingly, the degree of judgment exercised in determining fair value is greatest for instruments categorized in Level 3.
The inputs used to measure fair value may fall into different levels of the fair value hierarchy. In such cases, for disclosure purposes, the level in the fair value hierarchy within which the fair value measurement falls in its entirety, is determined based on the lowest level input that is significant to the fair value measurement in its entirety.
The inputs or methodology used for valuing securities are not necessarily an indication of the risk associated with investing in those securities. The following table summarizes the inputs as of October 31, 2024 for the Genter ETFs’ assets measured at fair value:
| Taxable Quality Intermediate ETF | | Total | | | Level 1 | | | Level 2 | | | Level 3 | |
| Assets | | | | | | | | | | | | | | | | |
| Corporate Bonds | | $ | 23,493,082 | | | $ | — | | | $ | 23,493,082 | | | $ | — | |
| United States Treasury Bond | | | 5,120,290 | | | | — | | | | 5,120,290 | | | | — | |
| Short-Term Investment | | | 111,046 | | | | — | | | | 111,046 | | | | — | |
| Total Assets | | $ | 28,724,418 | | | $ | — | | | $ | 28,724,418 | | | $ | — | |
| Municipal Quality Intermediate ETF | | Total | | | Level 1 | | | Level 2 | | | Level 3 | |
| Assets | | | | | | | | | | | | | | | | |
| Municipal Bonds | | $ | 1,089,661 | | | $ | — | | | $ | 1,089,661 | | | $ | — | |
| Short-Term Investment | | | 307,614 | | | | 307,614 | | | | — | | | | — | |
| Total Assets | | $ | 1,397,275 | | | $ | 307,614 | | | $ | 1,089,661 | | | $ | — | |
Investment Transactions and Investment Income
Investment transactions are accounted for as of the date purchased or sold (trade date). Dividend income and expenses are recorded on the ex-dividend date. Interest income is recorded on the accrual basis and includes accretion/amortization of discounts and premiums using the effective interest method. Gains and losses are determined on the identified cost basis, which is the same basis used for Federal income tax purposes.
Expenses
The Genter ETFs bear expenses incurred specifically on its behalf as well as a portion of general expenses, which are allocated according to methods reviewed annually by the Trustees.
Genter ETFs
Notes to Financial Statements (unaudited)
As of October 31, 2024
Distributions
The Getner ETFs may declare and distribute dividends from net investment income, if any, monthly. The Genter ETFs generally declare and distribute capital gains, if any, annually. Dividends and distributions to shareholders are recorded on ex-date.
Estimates
The preparation of financial statements in conformity with GAAP requires management to make estimates and assumptions that affect the reported amounts of assets and liabilities and the disclosure of contingent assets and liabilities at the date of the financial statements and the reported amounts of increases and decreases in the net assets from operations during the reporting period. Actual results could differ from those estimates.
Federal Income Taxes
No provision for income taxes is included in the accompanying financial statements, as the Genter ETFs intend to distribute to shareholders all taxable investment income and realized gains and otherwise comply with Subchapter M of the Internal Revenue Code applicable to regulated investment companies.
| | Genter Capital Taxable Quality Intermediate ETF | Genter Capital Municipal Quality Intermediate ETF |
| Alternative minimum tax risk | | X |
| Authorized participant risk | X | X |
| Call/prepayment risk | X | X |
| Credit/default risk | X | X |
| Cybersecurity risk | X | X |
| Early close/trading halt risk | X | X |
| ETF structure risk | X | X |
| Fixed income risk | X | X |
| Foreign | X | |
| Inflation protected securities risk | X | |
| Interest rate risk | X | X |
| Investment risk | X | X |
| Limited history of operations risk | X | X |
| Management risk | X | X |
| Market risk | X | X |
| Mortgage- and asset-backed securities risk | X | |
| Municipal securities risk | | X |
| Preferred securities risk | X | |
| Tax risk | | X |
| U.S. government securities risk | X | X |
Genter ETFs
Notes to Financial Statements (unaudited)
As of October 31, 2024
Alternative minimum tax risk. Although the fund seeks to distribute tax-exempt income, a portion of the fund’s otherwise tax-exempt dividends may be taxable to those shareholders subject to the federal alternative minimum tax.
Authorized Participant risk. Only an Authorized Participant may engage in creation or redemption transactions directly with the Fund. The Fund has a limited number of institutions that may act as Authorized Participants on an agency basis (i.e., on behalf of other market participants). Authorized Participant concentration risk may be heightened for exchange-traded funds (ETFs), such as the Fund, which invest in securities issued by non-U.S. issuers or other securities or instruments that have lower trading volumes.
Call/prepayment risk. During periods of falling interest rates, an issuer of a callable bond may exercise its right to pay principal on an obligation earlier than expected. This may result in the Fund reinvesting proceeds at lower interest rates, resulting in a decline in the Fund’s income.
Credit/default risk. Credit risk is the risk that issuers or guarantors of debt instruments is unable or unwilling to make timely interest and/or principal payments or otherwise honor its obligations. Changes in the financial condition of an issuer or counterparty, changes in specific economic, social or political conditions that affect a particular type of security or other instrument or an issuer, and changes in economic, social, or political conditions generally can increase the risk of default by an issuer or counterparty, which can affect a security’s or other instrument’s credit quality or value and an issuer’s or counterparty’s ability to pay interest and principal when due. Debt instruments are subject to varying degrees of credit risk, which may be reflected in credit ratings. Securities issued by the U.S. government have limited credit risk. Credit rating downgrades and defaults (failure to make interest or principal payment) may potentially reduce the Fund’s income and Share price.
Cybersecurity risk. As part of its business, the Advisor processes, stores, and transmits large amounts of electronic information, including information relating to the transactions of the Fund. The Advisor and the Fund are therefore susceptible to cybersecurity risk. Cyber-attacks include, among other behaviors, stealing or corrupting data maintained online or digitally, denial of service attacks on websites, the unauthorized release of confidential information and causing operational disruption. Successful cyber-attacks against, or security breakdowns of, the Fund or its advisor, custodians, fund accountant, fund administrator, transfer agent, pricing vendors and/or other third-party service providers may adversely impact the Fund and its shareholders. For instance, cyber-attacks may interfere with the processing of shareholder transactions, impact the Fund’s ability to calculate its NAV, cause the release of private shareholder information or confidential Fund information, impede trading, cause reputational damage, and subject the Fund to regulatory fines, penalties or financial losses, reimbursement or other compensation costs, and/or additional compliance costs. The Fund also may incur substantial costs for cybersecurity risk management in order to guard against any cyber incidents in the future. The Fund and its shareholders could be negatively impacted as a result.
Early close/trading halt risk: An exchange or market may close or issue trading halts on specific securities, or the ability to buy or sell certain securities or financial instruments may be restricted, which may prevent the Fund from buying or selling certain securities or financial instruments. In these circumstances, the Fund may be unable to rebalance its portfolio, may be unable to accurately price its investments and may incur substantial trading losses.
ETF structure risks. The Fund is structured as an ETF and as a result is subject to special risks, including:
| ● | Not individually redeemable. Shares are not individually redeemable and may be redeemed by the Fund at NAV only in large blocks known as “Creation Units” which are only available to APs. Retail investors may only purchase or sell shares on the Exchange. You may incur brokerage costs purchasing enough Shares to constitute a Creation Unit. |
| | | |
| | ● | Trading issues. An active trading market for the Fund’s shares may not be developed or maintained. Trading in Shares on the Exchange may be halted due to market conditions or for reasons that, in the view of the Exchange, make trading in Shares inadvisable, such as extraordinary market volatility. There can be no assurance that Shares will continue to meet the listing requirements of the Exchange. If the Fund’s shares are traded outside a collateralized settlement system, the number of financial institutions that can act as authorized participants that can post collateral on an agency basis is limited, which may limit the market for the Fund’s shares. |
| | | |
| | ● | Cash purchases. To the extent Creation Units are purchased by APs in cash instead of in-kind, the Fund will incur certain costs such as brokerage expenses and taxable gains and losses. These costs could be imposed on the Fund and impact the Fund’s NAV if not fully offset by transaction fees paid by the APs. |
Genter ETFs
Notes to Financial Statements (unaudited)
As of October 31, 2024
| | ● | Market price variance risk. The market prices of Shares will fluctuate in response to changes in NAV and supply and demand for Shares and will include a “bid-ask spread” charged by the exchange specialists, market makers or other participants that trade the particular security. There may be times when the market price and the NAV vary significantly. This means that Shares may trade at a discount to NAV. |
| ■ | In times of market stress, market makers may step away from their role market making in shares of ETFs and in executing trades, which can lead to differences between the market value of Fund shares and the Fund’s net asset value. |
| ■ | To the extent Authorized Participants exit the business or are unable to process creations or redemptions and no other Authorized Participant can step in to do so, there may be a significantly reduced trading market in the Fund’s shares, which can lead to differences between the market value of Fund shares and the Fund’s net asset value. |
| ■ | The market price for the Fund’s shares may deviate from the Fund’s net asset value, particularly during times of market stress, with the result that investors may pay significantly more or receive significantly less for Fund shares than the Fund’s net asset value, which is reflected in the bid and ask price for Fund shares or in the closing price. |
| ■ | When all or a portion of an ETFs underlying securities trade in a market that is closed when the market for the Fund’s shares is open, there may be changes from the last quote of the closed market and the quote from the Fund’s domestic trading day, which could lead to differences between the market value of the Fund’s shares and the Fund’s net asset value. |
| ■ | In stressed market conditions, the market for the Fund’s shares may become less liquid in response to the deteriorating liquidity of the Fund’s portfolio. This adverse effect on the liquidity of the Fund’s shares may, in turn, lead to differences between the market value of the Fund’s shares and the Fund’s net asset value. |
Fixed income risk. Fixed income risk factors include credit risk (the debtor may default) and prepayment risk (the debtor may pay its obligation early or later than expected, potentially reducing the amount of interest payments or extending time to principal repayment). These risks could affect the value of a particular investment, possibly causing the Fund’s share price and total return to be reduced and fluctuate more than other types of investments. When the Fund invests in fixed income securities the value of your investment in the Fund will fluctuate with changes in interest rates. Typically, a rise in interest rates causes a decline in the value of fixed income securities. In general, the market price of debt securities with longer maturities will increase or decrease more in response to changes in interest rates than shorter-term securities. If the U.S. Federal Reserve’s Federal Open Market Committee (“FOMC”) raises the federal funds interest rate target, interest rates across the U.S. financial system may rise. However, the magnitude of rate changes across maturities and borrower sectors is uncertain. Rising rates may decrease liquidity and increase volatility, which may make portfolio management more difficult and costly to the Fund and its shareholders. Default risk increases if issuers must borrow at higher rates. Generally, these changing market conditions may cause the Fund’s share price to fluctuate or decline more than other types of equity investments.
Foreign securities risk. Investments in securities of non-U.S. issuers are subject to risks not usually associated with owning securities of U.S. issuers. There is generally less publicly available information about foreign companies, particularly those not subject to the disclosure and reporting requirements of U.S. securities laws. Foreign issuers are generally not bound by uniform accounting, auditing, and financial reporting requirements and standards of practice comparable to those applicable to domestic issuers. Investments in foreign securities also involve the risk of possible adverse changes in investment or exchange control regulations or currency exchange rates, expropriation or confiscatory taxation, limitation on the removal of cash or other assets of the Fund from foreign markets, political or financial instability, or diplomatic and other developments which could affect such investments. Economies of particular countries or areas of the world may differ favorably or unfavorably from the economy of the United States. Foreign securities often trade with less frequency and volume than domestic securities and therefore may exhibit greater price volatility. Investments in foreign markets also involve currency risk, which is the risk that the values of the Fund’s investments denominated in foreign currencies will decrease due to adverse changes in the value of the U.S. dollar relative to the value of foreign currencies.
Inflation-protected securities risk. Inflation-protected debt securities tend to react to changes in real interest rates. Real interest rates represent nominal (stated) interest rates reduced by the expected impact of inflation. In general, the price of an inflation-protected debt security can fall when real interest rates rise and can rise when real interest rates fall. Interest payments on inflation-protected debt securities can be unpredictable and will vary as the principal and/or interest is adjusted for inflation.
Genter ETFs
Notes to Financial Statements (unaudited)
As of October 31, 2024
Interest rate risk. As interest rates rise, the value of fixed income securities held by a Fund are likely to decrease. Securities with longer durations tend to be more sensitive to interest rate changes, making them more volatile than securities with shorter durations. Interest rates in the United States are near historic lows, which may increase a Fund’s exposure to risks associated with rising rates. A wide variety of market factors can cause interest rates to rise, including central bank monetary policy (including the Federal Reserve ending its “quantitative easing” policy of purchasing large quantities of securities issued or guaranteed by the U.S. government), rising inflation, and changes in general economic conditions. Interest rate changes can be sudden and unpredictable. Rising interest rates may lead to decreased liquidity in the bond markets, making it more difficult for a Fund to value or sell some or all of its bond investments at any given time. Changes in interest rates may also affect a Fund’s share price; a sharp rise in interest rates could cause a Fund’s share price to fall.
The average duration of a Fund’s portfolio of fixed income securities will vary based on the Subadvisor’s assessment of economic and market conditions, as well as current and anticipated changes in interest rates. The Subadvisor intends to manage the Genter Capital Taxable Quality Intermediate ETF portfolio so that it has an average duration of between 2.5 and 6 years under normal circumstances. Duration measures the price sensitivity of a security to interest rate changes and is typically expressed as a period of time. Duration differs from maturity, which is the time until a fixed income security’s issuer is obligated to pay the principal due on such security; however, a fixed income security’s duration increases as its maturity increases and decreases as its maturity decreases, meaning longer-maturity securities have higher durations than those with shorter maturity. The longer the duration of the securities held in a Fund’s portfolio, the more sensitive a Fund’s portfolio will be to a change in interest rates. As the value of a security changes over time, so will its duration, which in turn will affect the Fund’s duration. A 1% change in interest rates is typically estimated to change the price of a fixed income security by 1% for each year of the security’s duration. For example, if a fixed income security has a duration of three years, a 1% rise in interest rates would typically be expected to reduce the price of the security by approximately 3%. Similar estimates would typically apply to a portfolio of fixed income securities, such as the Genter Capital Taxable Quality Intermediate ETF, based on the portfolio’s average duration. Accordingly, securities with longer durations tend to be more sensitive to interest rate changes, making them more volatile than securities with shorter durations. Duration is an estimate of a security’s sensitivity to changes in prevailing interest rates that is based on certain factors that may prove to be incorrect. It is therefore not an exact measurement and may not be able to reliably predict a particular security’s price sensitivity to changes in interest rates.
Investment risk. The value of the Fund’s investments, like other market investments, may move up or down, sometimes rapidly and unpredictably. All investments involve risks, including the risk that the entire amount invested may be lost. No guarantee or representation is made that the Fund’s investment objectives will be achieved.
Various sectors of the global financial markets have been experiencing an extended period of adverse conditions. Market uncertainty has increased dramatically, particularly in the United States and Europe, and adverse market conditions have expanded to other markets. These conditions have resulted in disruption of markets, periods of reduced liquidity, greater volatility, general volatility of spreads, an acute contraction in the availability of credit and a lack of price transparency. These volatile and often difficult global market conditions have episodically adversely affected the market values of many securities, and this volatility may continue, and conditions could even deteriorate further. Some of the largest banks and companies across many sectors of the economy in the United States and Europe have declared bankruptcy, entered into insolvency, administration or similar proceedings, been nationalized by government authorities, and/or agreed to merge with or be acquired by other banks or companies that had been considered their peers. The long-term impact of these events is uncertain but could continue to have a material effect on general economic conditions, consumer and business confidence and market liquidity.
Major public health issues, such as COVID-19, have at times, and may in the future impact the Fund. The COVID-19 pandemic caused substantial market volatility and global business disruption and impacted the global economy in significant and unforeseen ways. Any public health emergency, including the COVID-19 pandemic or any outbreak of other existing or new epidemic diseases or the threat thereof, and the resulting financial and economic market uncertainty, could have a material adverse impact on the Fund or its investments. Changes in interest rates, travel advisories, quarantines and restrictions, disrupted supply chains and industries, impact on labor markets, reduced liquidity or a slowdown in U.S. or global economic conditions resulting from a future public health crisis may also adversely affect the Fund or its investments. COVID-19, or any other health crisis and the current or any resulting financial, economic and capital markets environment, and future developments in these and other areas present uncertainty and risk with respect to the Fund’s NAV, performance, financial condition, results of operations, ability to pay distributions, make share repurchases and portfolio liquidity, among other factors.
Economic problems in a single country are increasingly affecting other markets and economies, and a continuation of this trend could adversely affect global economic conditions and world markets. Uncertainty and volatility in the financial markets and political systems of the U.S. or any other country, including volatility as a result of the ongoing conflicts between Russia and Ukraine and Israel and Hamas and the rapidly evolving measures in response, may have adverse spill-over effects into the global financial markets generally.
Genter ETFs
Notes to Financial Statements (unaudited)
As of October 31, 2024
Limited history of operations risk. The Fund has a limited history of operations. Accordingly, investors in the Fund bear the risk that the Fund may not be successful in implementing its investment strategy, may not employ a successful investment strategy, or may fail to attract sufficient assets under management to realize economies of scale, any of which could result in the Fund being liquidated at any time without shareholder approval and at a time that may not be favorable for all shareholders. Such a liquidation could have negative tax consequences for shareholders and will cause shareholders to incur expenses of liquidation.
Management risk. The Fund is subject to management risk because it does not seek to replicate the performance of a specified index. The portfolio managers will utilize proprietary investment processes, techniques, and risk analyses in making investment decisions for the Fund, but there can be no guarantee that these decisions will produce the desired results. Legislative, regulatory, or tax developments may affect the investment techniques available to the portfolio managers in connection with managing the Fund and may also adversely affect the ability of the Fund to achieve its investment objective.
Market risk. Market risk refers to the possibility that the value of securities held by the Fund may decline due to daily fluctuations in the market. Market prices for securities change daily as a result of many factors, including developments affecting the condition of both individual companies and the market in general. The price of a security may even be affected by factors unrelated to the value or condition of its issuer, including changes in interest rates, economic and political conditions, and general market conditions. The Fund’s performance per share will change daily in response to such factors.
Mortgage and asset backed securities risks. MBS (residential and commercial) and asset-backed securities represent interests in “pools” of mortgages or other assets, including consumer loans or receivables held in trust. The characteristics of these MBS and asset-backed securities differ from traditional fixed income securities. Like traditional fixed income securities, the value of MBS or asset-backed securities typically increases when interest rates fall and decreases when interest rates rise. However, a main difference is that the principal on MBS or asset-backed securities may normally be prepaid at any time, which will reduce the yield and market value of these securities. Therefore, MBS and asset-backed backed securities are subject to “prepayment risk” and “extension risk.” Because of prepayment risk and extension risk, mortgage-backed securities react differently to changes in interest rates than other fixed income securities.
Prepayment risk is the risk that, when interest rates fall, certain types of obligations will be paid off by the obligor more quickly than originally anticipated and a Fund may have to invest the proceeds in securities with lower yields. In periods of falling interest rates, the rate of prepayments tends to increase (as does price fluctuation) as borrowers are motivated to pay off debt and refinance at new lower rates. During such periods, reinvestment of the prepayment proceeds by the management team will generally be at lower rates of return than the return on the assets which were prepaid. Prepayment reduces the yield to maturity and the average life of the MBS or asset-backed securities. The maturity of certain securities, such as MBS and ABS, is calculated using the security’s weighted-average life. Estimated prepayment rates for these securities are used in this calculation. If actual prepayment rates differ from the estimates used in calculating the weighted-average life, each Fund’s yield and/or share price could be negatively affected.
Extension risk is the risk that, when interest rates rise, certain obligations will be paid off by the obligor more slowly than anticipated causing the value of these securities to fall. Rising interest rates tend to extend the duration of MBS and asset-backed securities, making them more sensitive to changes in interest rates. The value of longer-term securities generally changes more in response to changes in interest rates than shorter term securities. As a result, in a period of rising interest rates, MBS and asset-backed securities may exhibit additional volatility and may lose value.
Small movements in interest rates (both increases and decreases) may quickly and significantly reduce the value of certain MBS. Because prepayment rates of individual mortgage pools vary widely, the maturity of a particular pool cannot be predicted precisely. A Fund’s investments in asset-backed securities are subject to risks similar to those associated with MBS, as well as additional risks associated with the nature of the assets and the servicing of those assets. These securities also are subject to the risk of default on the underlying mortgage or assets, particularly during periods of economic downturn.
MBS may be either pass-through securities or CMOs. Pass-through securities represent a right to receive principal and interest payments collected on a pool of mortgages, which are passed through to security holders. CMOs are created by dividing the principal and interest payments collected on a pool of mortgages into several revenue streams (tranches) with different priority rights to portions of the underlying mortgage payments. Each Fund will not invest in CMO tranches which represent a right to receive interest only (“Ios”), principal only (“Pos”), or an amount that remains after other floating-rate tranches are paid (an inverse floater). If a Fund invests in CMO tranches (including CMO tranches issued by government agencies) and interest rates move in a manner not anticipated by Fund management, it is possible that such Fund could lose all or substantially all of its investment.
Genter ETFs
Notes to Financial Statements (unaudited)
As of October 31, 2024
Ongoing developments in the residential mortgage market may have additional consequences to the market for mortgage-backed securities. In past years, delinquencies and losses generally increased with respect to securitizations involving residential mortgage loans and potentially could begin increasing again as a result of a weakening housing market and the seasoning of securitized pools of mortgage loans. Many so-called sub-prime mortgage pools are currently distressed and may be trading at significant discounts to their face value.
Mortgage lenders have adjusted their loan programs and underwriting standards, which has reduced the availability of mortgage credit to prospective mortgagors. This has resulted in reduced availability of financing alternatives for mortgagors seeking to refinance their mortgage loans. The reduced availability of refinancing options for mortgagors has resulted in higher rates of delinquencies, defaults, and losses on mortgage loans, particularly in the case of, but not limited to, mortgagors with adjustable rate mortgage loans or interest-only mortgage loans that experience significant increases in their monthly payments following the adjustment date or the end of the interest-only period. These events, alone or in combination with each other and with deteriorating economic conditions in the general economy, may continue to contribute to higher delinquency and default rates on mortgage loans. The tighter underwriting guidelines for residential mortgage loans, together with lower levels of home sales and reduced refinance activity, also may have contributed to a reduction in the prepayment rate for mortgage loans generally and this may continue. The values of mortgage-backed securities may be substantially dependent on the servicing of the underlying mortgage pools, and therefore are subject to risks associated with the negligence or malfeasance by their servicers and to the credit risk of their servicers. In certain circumstances, the mishandling of related documentation also may affect the rights of security holders in and to the underlying collateral.
The U.S. Government conservatorship of Federal Home Loan Mortgage Corporation (“Freddie Mac”) and the Federal National Mortgage Corporation (“Fannie Mae”) in September 2008 and its ultimate resolution may adversely affect the real estate market, the value of real estate-related assets generally, and markets generally. There may be proposals from the U.S. Congress or other branches of the U.S. Government regarding the conservatorship, including regarding reforming Fannie Mae and Freddie Mac or winding down their operations, which may or may not come to fruition. There can be no assurance that such proposals, even those that are not adopted, will not adversely affect the values of the Fund’s assets.
The Federal Housing Finance Agent (“FHFA”), as conservator or receiver of Fannie Mae and Freddie Mac, has the power to repudiate any contract entered into by Fannie Mae or Freddie Mac prior to its appointment if it determines that performance of the contract is burdensome, and repudiation of the contract promotes the orderly administration of Fannie Mae’s or Freddie Mac’s affairs. In the event the guaranty obligations of Fannie Mae or Freddie Mac are repudiated, the payments of interest to holders of Fannie Mae or Freddie Mac mortgage-backed securities would be reduced if payments on the mortgage loans represented in the mortgage loan groups related to such mortgage-backed securities are not made by the borrowers or advanced by the servicer. Any actual direct compensatory damages for repudiating these guaranty obligations may not be sufficient to offset any shortfalls experienced by such mortgage-backed security holders.
In its capacity as conservator or receiver, FHFA has the right to transfer or sell any asset or liability of Fannie Mae or Freddie Mac without any approval, assignment or consent. If FHFA were to transfer any such guaranty obligation to another party, holders of Fannie Mae or Freddie Mac mortgage-backed securities would have to rely on that party for satisfaction of the guaranty obligation and would be exposed to the credit risk of that party.
Municipal securities risk. Municipal securities are subject to the risk that litigation, legislation or other political events, local business or economic conditions, credit rating downgrades or the bankruptcy of an issuer could have a significant effect on the issuer’s ability to make payments of principal and/or interest or otherwise affect the value of such securities. In addition, there is a risk that, as a result of the recent economic crisis, the ability of any issuer to pay, when due, the principal or interest on its municipal bonds may be materially affected. Certain municipalities may have difficulty meeting their obligations due to, among other reasons, changes in underlying demographics. These actions present heightened risks to debt instruments, and such risks could be even further heightened if these actions are unexpectedly or suddenly reversed or are ineffective in achieving their desired outcomes. Municipal instruments may be susceptible to periods of economic stress, which could affect the market values and marketability of municipal obligations of issuers in a state, U.S. territory, or possession. For example, the COVID-19 pandemic has significantly stressed the financial resources of many municipal issuers, which may impair a municipal issuer’s ability to meet its financial obligations when due and could adversely impact the value of its bonds, which could negatively impact the performance of the Fund. Municipal securities can be significantly affected by political changes as well as uncertainties in the municipal market 54 related to taxation, legislative changes or the rights of municipal security holders. Because many municipal securities are issued to finance similar projects, especially those relating to education, health care, transportation, utilities and water and sewer, conditions in those sectors can affect the overall municipal market. Municipal securities include general obligation bonds, which are backed by the “full faith and credit” of the issuer, which has the power to tax residents to pay bondholders. Timely payments depend on the issuer’s credit quality, ability to raise tax revenues and ability to maintain an adequate tax base. General obligation bonds generally are not backed by revenues from a specific project or source. Municipal securities also include revenue bonds, which are generally backed by revenue from a specific project or tax. Revenue bonds generally are not backed by the full faith and credit and general taxing power of the issuer. Municipal securities also include special tax bonds, which are usually backed and payable through a single tax, or series of special taxes such as incremental property taxes. The failure of the tax levy to generate adequate revenue to pay the debt service on the bonds may cause the value of the bonds to decline. Municipal securities backed by current or anticipated revenues from a specific project or specific assets or a specific tax can be negatively affected by the discontinuance of that taxation or the inability to collect revenues for the project or from the assets or tax. If the Internal Revenue Service determines that an issuer of a municipal security has not complied with applicable tax requirements, interest from the security could become taxable and the security could decline significantly in value. The bond markets may experience reduced liquidity due to events such as limited trading activity, reductions in bond inventory, market volatility, and rapid or unexpected changes in interest rates. Less liquid markets could lead to greater price volatility and limit the Fund’s ability to sell a holding at a suitable price. The market for municipal bonds may be less liquid than for taxable bonds. There may also be less information available on the financial condition of issuers of municipal securities than for public corporations. The reorganization of a municipality’s debts may include extending debt maturities, reducing the amount of principal or interest, refinancing the debt or taking other measures, which may significantly affect the rights of creditors and the value of the securities issued by the municipality and the value of the Fund’s investments. The taxing power of any governmental entity may be limited and an entity’s credit may depend on factors which are beyond the entity’s control.
Genter ETFs
Notes to Financial Statements (unaudited)
As of October 31, 2024
Preferred securities risk. Investing in preferred stock involves the following risks: (i) certain preferred stocks contain provisions that allow an issuer under certain conditions to skip or defer distributions; (ii) preferred stocks may be subject to redemption, including at the issuer’s call, and, in the event of redemption, the Fund may not be able to reinvest the proceeds at comparable or favorable rates of return; (iii) preferred stocks are generally subordinated to bonds and other debt securities in an issuer’s capital structure in terms of priority for corporate income and liquidation payments; and (iv) preferred stocks may trade less frequently and in a more limited volume and may be subject to more abrupt or erratic price movements than many other securities.
Tax risk. There is no guarantee that the Fund’s income will be exempt from U.S. federal or state or local income taxes. Events occurring after the date of issuance of a municipal bond or after the Fund’s acquisition of a municipal bond may result in a determination that interest on that bond is includible in gross income for U.S. federal income tax purposes retroactively to its date of issuance. Such a determination may cause a portion of prior distributions by the Fund to its shareholders to be taxable to those shareholders in the year of receipt. Federal, state or local changes in income or alternative minimum tax rates or in the tax treatment of municipal bonds may make municipal bonds less attractive as investments and cause them to lose value.
U.S. government securities risk. Debt securities issued or guaranteed by certain U.S. Government agencies, instrumentalities, and sponsored enterprises are not supported by the full faith and credit of the U.S. Government, so investments in their securities or obligations issued by them involve credit risk greater than investments in other types of U.S. Government securities.
| 3. | Transactions with Related Parties and Service Providers |
Advisor
Each Genter ETF pays a monthly advisory fee to OBP Capital, LLC (the “Advisor”), based upon the average daily net assets and calculated at an annual rate. See the table below for the advisory fee rates and amounts earned by the Advisor from each Genter ETF during period ended October 31, 2024:
| Fund | | Advisory Fee Rate | | | Amount Earned | |
| Taxable Quality Intermediate ETF | | | 0.20 | % | | $ | 20,923 | |
| Municipal Quality Intermediate ETF | | | 0.20 | % | | $ | 884 | |
Genter ETFs
Notes to Financial Statements (unaudited)
As of October 31, 2024
The Advisor has engaged Genter Fund Management, LLC as the sub-advisor of the Genter ETFs (the “Sub-Advisor”) to provide day to day portfolio management of the Genter ETFs. The Advisor pays a monthly fee to the Sub-Advisor calculated at the annual rate. See the table below for the advisory fee rates and amounts earned by the Sub-Advisor. The Sub-Advisor is paid directly by the Advisor out of the advisory fees disclosed above.
| Fund | | Sub Advisory
Fee Rate | | Amount Earned | |
| Taxable Quality Intermediate ETF | | | 0.15 | % | | $ | 15,692 | |
| Municipal Quality Intermediate ETF | | | 0.15 | % | | $ | 663 | |
The Board is responsible for the management and supervision of the Genter ETFs. The Trustees approve all significant agreements between the Trust, on behalf of the Genter ETFs, and those companies that furnish services to the Genter ETFs; review performance of the Advisor and the Genter ETFs; and oversee activities of the Genter ETFs. Officers of the Trust and Trustees who are interested persons of the Trust or the Advisor will receive no salary or fees from the Trust. Trustees who are not “interested persons” of the Trust or the Advisor within the meaning of the 1940 Act (the “Independent Trustees”) receive $5,000 per year payable quarterly and $2,000 per series in the Trust. The Trust will reimburse each Trustee and officer of the Trust for his or her travel and other expenses relating to attendance of Board meetings. Additional fees may also be incurred during the year as special meetings are necessary in addition to the regularly scheduled meetings of the Board.
Certain officers of the Trust may also be officers of the Advisor or the Administrator.
| 5. | Purchases and Sales of Investment Securities |
For the fiscal period from May 21, 2024 (commencement of operations) through October 31, 2024, the aggregate cost of purchases and proceeds from sales of investment securities (excluding short-term securities) were as follows:
| | | Purchases of Securities | | | Proceeds from Sales of Securities | | | Purchases of U.S. Government Securities | | | Proceeds from Sales of U.S. Government Securities | | | In-Kind Purchases | | | In-Kind Sales | |
| Taxable Quality Intermediate ETF | | $ | 37,601,234 | | | $ | 11,248,776 | | | $ | — | | | $ | (2,116,479 | ) | | $ | — | | | $ | — | |
| Municipal Quality Intermediate ETF | | | 1,400,273 | | | | 1,387,892 | | | | — | | | | 102 | | | | — | | | | — | |
Distributions are determined in accordance with Federal income tax regulations, which differ from GAAP, and, therefore, may differ significantly in amount or character from net investment income and realized gains for financial reporting purposes. The general ledger is adjusted for permanent book/tax differences to reflect tax character but is not adjusted for temporary differences.
Distributions during the period ended October 31, 2024 were characterized for tax purposes as follows:
| | | Ordinary Income | |
| Taxable Quality Intermediate ETF | | $ | 458,644 | |
| Municipal Quality Intermediate ETF | | | 15,776 | |
For the fiscal period from May 21, 2024 (commencement of operations) through October 31, 2024, the tax-basis cost of investments and components of accumulated deficit were as follows:
| | | Taxable Quality Intermediate ETF | | | Municipal Quality Intermediate ETF | |
| Cost of Investments | | $ | 28,575,575 | | | $ | 1,399,512 | |
| | | | | | | | | |
| Gross Unrealized Appreciation | | | 168,493 | | | | 3,252 | |
| Gross Unrealized Depreciation | | | (19,650 | ) | | | (5,488 | ) |
| Net Unrealized Appreciation (Depreciation) | | $ | 148,843 | | | ($ | 2,236 | ) |
| | | | | | | | | |
| 7. | Commitments and Contingencies |
Under the Trust’s organizational documents, its officers and Trustees are indemnified against certain liabilities arising out of the performance of their duties to the Genter ETFs. In addition, in the normal course of business, the Trust enters into contracts with its service providers, on behalf of the Genter ETFs, and others that provide for general indemnifications. The Genter ETFs’ maximum exposure under these arrangements is unknown, as this would involve future claims that may be made against the Genter ETFs. The Genter ETFs expect risk of loss to be remote.
Genter ETFs
Notes to Financial Statements (unaudited)
As of October 31, 2024
In accordance with GAAP, management has evaluated the need for disclosures and/or adjustments resulting from subsequent events through the date of issuance of the financial statements. This evaluation did not result in any subsequent events that necessitated disclosures and/or adjustments.
Effective January 21,2025, the Independent Trustees will receive a flat rate of $7,500 plus an additional $2,500 per Fund each year but may receive up to an additional $1,500 per special meeting in the event that special meetings are held. Prior to January 21,2025, the Independent Trustees received a flat rate of $5,000 plus an additional $2,000 per Fund each year but may receive up to an additional $2,250 per special meeting in the event that special meetings are held.
Genter ETFs
Additional Information (unaudited)
As of October 31, 2024
Tax Information
We are required to advise you within 60 days of the Genter ETF’s fiscal year-end regarding federal tax status of certain distributions received by shareholders during each fiscal year. The following information is provided for the Genter ETFs’ fiscal period from May 21, 2024 (commencement of operations) through October 31, 2024.
Distributions during the period ended October 31, 2024 were characterized for tax purposes as follows:
| | | Ordinary Income | |
| Taxable Quality Intermediate ETF | | $ | 458,644 | |
| Municipal Quality Intermediate ETF | | | 15,776 | |
Dividend and distributions received by retirement plans such as IRAs, Keogh-type plans, and 403(b) plans need not be reported as taxable income. However, many retirement plans may need this information for their annual information meeting.
Individual shareholders should refer to their Form 1099 or other tax information, which will be mailed in early 2025, to determine the calendar year amounts to be included in their 2024 tax returns. Shareholders should consult a tax advisor regarding the tax consequences of investments in the ETF.
Changes In and Disagreements with Accountants
None
Matters Submitted for Shareholder Vote
Not applicable
Remuneration Paid to Directors, Officers and Others
Refer to the information in the financial statements.
Approval of Investment Advisory Agreement
In connection with an organizational Board meeting held on March 14, 2024, the Board, including a majority of the Independent Trustees, discussed the approval of a management agreement between the Trust and the Advisor, with respect to the Genter ETFs (the “Investment Advisory Agreement”).
The Trustees were assisted by legal counsel throughout the process. The Trustees relied upon the advice of legal counsel and their own business judgment in determining the material factors to be considered in evaluating the Investment Advisory Agreement and the weight to be given to each factor considered. The conclusions reached by the Trustees were based on a comprehensive evaluation of all of the information provided and were not the result of any one factor. Moreover, each Trustee may have afforded different weight to the various factors in reaching his conclusions with respect to the approval of the Investment Advisory Agreement. In connection with their deliberations regarding approval of the Investment Advisory Agreement, the Trustees reviewed materials prepared by the Advisor.
In deciding on whether to approve the proposed Investment Advisory Agreement, the Trustees considered numerous factors, including:
| (i) | Nature, Extent, and Quality of Services. The Trustees considered the responsibilities of the Advisor under the proposed Investment Advisory Agreement. The Trustees reviewed the services to be provided by the Advisor to the Genter ETFs including, without limitation, the quality of its investment advisory services; assuring compliance with the Genter ETFs’ investment objectives, policies, and limitations; and its coordination of services for the Genter ETFs among the Genter ETFs’ service providers. The Trustees evaluated: the Advisor’s staffing, personnel, and methods of operating; the education and experience of the Advisor’s personnel; compliance program; and financial condition. |
Genter ETFs
Additional Information (unaudited)
As of October 31, 2024
After reviewing the foregoing information and further information in the memorandum from the Advisor (e.g., descriptions of OBP’s business and compliance program), the Board concluded that the nature, extent, and quality of the services to be provided by the Advisor were satisfactory and adequate for the Genter ETFs.
| (ii) | Performance. The Board noted that the Genter ETFs had not yet launched, and therefore, had no performance to review. It was also noted that the Advisor had provided performance data for another series of the Trust where the Advisor oversees a sub-advisor for comparison. It was noted that the Genter ETF had outperformed its benchmark for the 1-year and 5-year periods shown but had underperformed its benchmark for the since-inception period. It was noted that the underperformance was due to the Genter ETF’s macroeconomic approach to duration during the period and that the ETF held a broader range of securities than the benchmark for the since inception period. The Board discussed projections and estimated size of the Genter ETFs over time. After further discussion, the Trustees considered the experience of the personnel of the Advisor and determined that the performance was satisfactory. |
| (iii) | Fees and Expenses. The Trustees compared the proposed advisory fee of the Genter ETFs to other comparable funds. The Board noted that, for the Genter Capital Taxable Quality Intermediate ETF, the management fee matched the peer group average and was lower than the category average. The Board noted that, for the Genter Capital Municipal Quality Intermediate ETF, the management fee was lower than that of the peer group average and the category average. Upon further consideration and discussion of the foregoing, the Board determined that the fee to be paid to the Advisor was fair and reasonable in relation to the nature and quality of the services to be provided by the Advisor and that it reflected charges that were within a range of what could have been negotiated at arm’s length. |
| (iv) | Profitability. The Board reviewed the Advisor’s profitability analysis in connection with its management of the Genter ETFs. It was noted that the Advisor did not expect to be profitable with respect to each Genter ETF over the first 12 months of managing the Genter ETFs but did expect to be profitable with respect to each Genter ETF over the second 12 months of managing the Genter ETFs. |
| (v) | Economies of Scale. The Trustees noted that the Genter ETFs would not immediately realize economies of scale upon launch. The Trustees reviewed the Genter ETFs’ fee arrangements for breakpoints or other provisions that would allow the Genter ETFs’ shareholders to benefit from economies of scale in the future as the Genter ETFs grew. The Trustees determined that the maximum management fee would remain the same regardless of the Genter ETFs’ asset levels. It was pointed out that breakpoints in the advisory fee could be reconsidered in the future as the Genter ETFs’ grew. |
Conclusion. Having reviewed and discussed in depth such information from the Advisor as the Trustees believed to be reasonably necessary to evaluate the terms of the Investment Advisory Agreement and as assisted by the advice of legal counsel, the Trustees concluded that approval of the Investment Advisory Agreement was in the best interest of the shareholders of the Genter ETFs.
Approval of Investment Sub-Advisory Agreement
In connection with an organizational Board meeting held on March 14, 2024, the Board, including a majority of the Independent Trustees, discussed the approval of a management agreement between the Advisor and Sub-Advisor, with respect to the Genter ETFs (the “Investment Sub-Advisory Agreement”).
The Trustees were assisted by legal counsel throughout the process. The Trustees relied upon the advice of legal counsel and their own business judgment in determining the material factors to be considered in evaluating the Investment Sub-Advisory Agreement and the weight to be given to each factor considered. The conclusions reached by the Trustees were based on a comprehensive evaluation of all of the information provided and were not the result of any one factor. Moreover, each Trustee may have afforded different weight to the various factors in reaching his conclusions with respect to the approval of the Investment Sub-Advisory Agreement. In connection with their deliberations regarding approval of the Investment Sub-Advisory Agreement, the Trustees reviewed materials prepared by the Sub-Advisor.
Genter ETFs
Additional Information (unaudited)
As of October 31, 2024
In deciding on whether to approve the proposed Investment Sub-Advisory Agreement, the Trustees considered numerous factors, including:
| (i) | Nature, Extent, and Quality of Services. The Trustees considered the responsibilities of the Sub-Advisor under the proposed Investment Sub-Advisory Agreement. The Trustees reviewed the services to be provided by the Sub-Advisor to the Genter ETFs including, without limitation, the quality of its investment sub-advisory services; assuring compliance with the Genter ETFs’ investment objectives, policies, and limitations; and its coordination of services for the Genter ETFs among the Genter ETFs’ service providers. The Trustees evaluated: the Sub-Advisor’s staffing, personnel, and methods of operating; the education and experience of the Sub-Advisor’s personnel; compliance program; and financial condition. |
After reviewing the foregoing information and further information in the memorandum from the Sub-Advisor (e.g., descriptions of the Sub-Advisor’s business and compliance program), the Board concluded that the nature, extent, and quality of the services to be provided by the Sub-Advisor were satisfactory and adequate for the Genter ETFs.
| (ii) | Performance. The Board noted that the Genter ETFs had not yet launched, and therefore, had no performance to review. It was also noted that the Sub-Advisor had SMAs that were similar to each respective Genter ETF, which had been presented for comparison. It was noted that each SMA outperformed their respective benchmark for the periods shown. The Board discussed projections and estimated size of the Genter ETFs over time. After further discussion, the Trustees considered the experience of the personnel of the Advisor and determined that the performance was satisfactory. |
| (iii) | Fees and Expenses. The Trustees compared the proposed sub-advisory fee of the Genter ETFs to that of SMAs managed by the Sub-Advisor. The Board noted that the sub-advisory fee was on the lower end of the range provided for the SMAs for each Genter ETF. Upon further consideration and discussion of the foregoing, the Board determined that the fee to be paid to the Sub-Advisor was fair and reasonable in relation to the nature and quality of the services to be provided by the Sub-Advisor and that it reflected charges that were within a range of what could have been negotiated at arm’s length. |
| (iv) | Profitability. The Board reviewed the Sub-Advisor’s profitability analysis in connection with its management of the Genter ETFs. It was noted that the Sub-Advisor did not expect to be profitable with respect to each Genter ETF over the first 12 months of managing the Genter ETFs but did expect to be profitable with respect to each Genter ETF over the second 12 months of managing the Genter ETFs. |
| (v) | Economies of Scale. The Trustees noted that the Genter ETFs would not immediately realize economies of scale upon launch. The Trustees reviewed the Genter ETFs’ fee arrangements for breakpoints or other provisions that would allow the Genter ETFs’ shareholders to benefit from economies of scale in the future as the Genter ETFs grew. The Trustees determined that the maximum management fee would remain the same regardless of the Genter ETF’s asset levels. It was pointed out that breakpoints in the advisory fee could be reconsidered in the future as the Genter ETFs grew. |
Conclusion. Having reviewed and discussed in depth such information from the Sub-Advisor as the Trustees believed to be reasonably necessary to evaluate the terms of the Investment Sub-Advisory Agreement and as assisted by the advice of legal counsel, the Trustees concluded that approval of the Investment Sub-Advisory Agreement was in the best interest of the shareholders of the Genter ETFs.
| ITEM 8. | Changes in and Disagreements with Accountants for Open-End Management Investment Companies. |
No changes during the period.
| ITEM 9. | Proxy Disclosure for Open-End Management Investment Companies. |
Not applicable.
| ITEM 10. | Remuneration Paid to Directors, Officers, and Others of Open-End Management Investment Companies. |
Included under Item 7 of this Form.
| ITEM 11. | Statement Regarding Basis for Approval of Investment Advisory Contract. |
Included under Item 7 of this Form.
| ITEM 12. | Disclosure of Proxy Voting Policies and Procedures for Closed-End Management Investment Companies. |
Not applicable.
| ITEM 13. | Portfolio Managers of Closed-End Management Investment Companies. |
Not applicable.
| ITEM 14. | Purchases of Equity Securities by Closed-End Management Investment Company and Affiliated Purchasers. |
Not applicable.
| ITEM 15. | Submission of Matters to a Vote of Security Holders. |
None.
| Item 16. | Controls and Procedures. |
| (a) | The President and Principal Executive Officer and the Treasurer, Principal Accounting Officer, and Principal Financial Officer have concluded that the registrant’s disclosure controls and procedures (as defined in Rule 30a-3(c) under the Investment Company Act of 1940) are effective based on their evaluation of these disclosure controls and procedures required by Rule 30a-3(b) under the Investment Company Act of 1940 and Rules 13a-15(b) or 15d-15(b) under the Securities Exchange Act of 1934, as of a date within 90 days of the filing of this report. |
| (b) | There were no changes in the registrant's internal control over financial reporting (as defined in Rule 30a-3(d) under the Investment Company Act of 1940) that occurred during the period covered by this report that have materially affected, or are reasonably likely to materially affect, the registrant’s internal control over financial reporting. |
| ITEM 17. | Disclosure of Securities Lending Activities for Closed-End Management Investment Companies. |
Not applicable.
| ITEM 18. | Recovery of Erroneously Awarded Compensation. |
| (a)(1) | Any code of ethics, or amendment thereto, that is the subject of the disclosure required by Item 2, to the extent that the registrant intends to satisfy the Item 2 requirements through filing of an exhibit.
Not applicable. |
| (a)(2) | Any policy required by the listing standards adopted pursuant to Rule 10D-1 under the Exchange Act by the registered national securities exchange or registered national securities association upon which the registrant’s securities are listed. |
Not applicable.
| (a)(3) | A separate certification for each principal executive and principal financial officer of the registrant as required by Rule 30a-2(a) under the Act. |
Filed herewith.
| (a)(4) | Any written solicitation to purchase securities under Rule 23c-1 under the Act sent or given during the period covered by the report or on behalf of the registrant to 10 or more persons. |
Not applicable.
| (a)(5) | Change in the registrant’s independent public accountant. |
Not applicable.
| (b) | Certifications pursuant to Section 906 of the Sarbanes-Oxley Act of 2002. |
Filed herewith.
SIGNATURES
Pursuant to the requirements of the Securities Exchange Act of 1934 and the Investment Company Act of 1940, the registrant has duly caused this report to be signed on its behalf by the undersigned, thereunto duly authorized.
| | | | Spinnaker ETF Series | |
| | | |  | |
| Date: | January 3, 2025 | | Katherine M. Honey
President and Principal Executive Officer | |
Pursuant to the requirements of the Securities Exchange Act of 1934 and the Investment Company Act of 1940, this report has been signed below by the following persons on behalf of the registrant and in the capacities and on the dates indicated.
| | | | | |
| Date: | January 3, 2025 | | Katherine M. Honey President and Principal Executive Officer | |
| | | | | |
| | | |  | |
| Date: | January 3, 2025 | | Peter McCabe
Treasurer, Principal Accounting Officer, and
Principal Financial Officer | |