UNITED STATES
SECURITIES AND EXCHANGE COMMISSION
Washington, D.C. 20549
FORM N-CSR
CERTIFIED SHAREHOLDER REPORT OF REGISTERED
MANAGEMENT INVESTMENT COMPANIES
Investment Company Act file number: 811-22903
J.P. Morgan Exchange-Traded Fund Trust
(Exact name of registrant as specified in charter)
270 Park Avenue
New York, NY 10017
(Address of principal executive offices) (Zip code)
Frank J. Nasta, Esq.
J.P. Morgan Investment Management Inc.
270 Park Avenue
New York, NY 10017
(Name and Address of Agent for Service)
| | |
| With copies to: |
| Elizabeth A. Davin, Esq. | | Jon S. Rand Esq. |
| JPMorgan Chase & Co. | | Dechert LLP |
| 460 Polaris Parkway | | 1095 Avenue of the Americas |
| Westerville, OH 43082 | | New York, NY 10036 |
Registrant’s telephone number, including area code: (844) 457-6383
Date of fiscal year end: October 31
Date of reporting period: June 16, 2014 through October 31, 2014
Form N-CSR is to be used by management investment companies to file reports with the Commission not later than 10 days after the transmission to stockholders of any report that is required to be transmitted to stockholders under Rule 30e-1 under the Investment Company Act of 1940 (17 CFR 270.30e-1). The Commission may use the information provided on Form N-CSR in its regulatory, disclosure review, inspection, and policymaking roles.
A registrant is required to disclose the information specified by Form N-CSR, and the Commission will make this information public. A registrant is not required to respond to the collection of information contained in Form N-CSR unless the Form displays a currently valid Office of Management and Budget (“OMB”) control number. Please direct comments concerning the accuracy of the information collection burden estimate and any suggestions for reducing the burden to Secretary, Securities and Exchange Commission, 450 Fifth Street, NW, Washington, DC 20549-0609. The OMB has reviewed this collection of information under the clearance requirements of 44 U.S.C. Section 3507.
| ITEM 1. | REPORTS TO STOCKHOLDERS. |
The following is a copy of the report transmitted to shareholders pursuant to Rule 30e-1 under the Investment Company Act of 1940 (17 CFR 270.30e-1).
Annual Report
JPMorgan Exchange-Traded Funds
October 31, 2014
JPMorgan Diversified Return Global Equity ETF

CONTENTS
Investments in a Fund are not bank deposits or obligations of, or guaranteed or endorsed by, any bank and are not insured or guaranteed by the FDIC, the Federal Reserve Board or any other government agency. You could lose money if you sell when the Fund’s share price is lower than when you invested.
Past performance is no guarantee of future performance. The general market views expressed in this report are opinions based on market and other conditions through the end of the reporting period and are subject to change without notice. These views are not intended to predict the future performance of a Fund or the securities markets. References to specific securities and their issuers are for illustrative purposes only and are not intended to be, and should not be interpreted as, recommendations to purchase or sell such securities. Such views are not meant as investment advice and may not be relied on as an indication of trading intent on behalf of any Fund.
Prospective investors should refer to the Fund’s prospectus for a discussion of the Fund’s investment objectives, strategies and risks. Call J.P. Morgan Exchange-Traded Funds at (844) 457-6383 for a prospectus containing more complete information about a Fund, including management fees and other expenses. Please read and consider it carefully before investing.
PRESIDENT’S LETTER
NOVEMBER 11, 2014
Dear Shareholder:
While leading central banks continued to provide economic stimulus over the past five months, a clear divergence emerged between the growth trajectories of the U.S. and other developed markets. During the June 16, 2014 to October 31, 2014 reporting period, the U.S. Federal Reserve responded to improving U.S. employment and consumer spending by winding down and closing its $85 billion-a-month program of bond purchases, while also signaling it may start raising interest rates in mid-2015. Meanwhile, the European Central Bank (ECB) took unprecedented steps to prevent a deflationary spiral and the Bank of Japan shocked financial markets at the end of October by unveiling a massive stimulus program.
| | |
 | | “The period was marked by volatility in equity and foreign currency markets, highlighting our belief in investing in diversified global equities with a long-term view.” |
Overall, U.S. markets were supported by a 25% drop in global oil prices from June to October, 3.9% growth in third quarter U.S. gross domestic product (GDP), the strongest employment gains since 1999, and rising corporate earnings. In June, equity prices touched record highs and volatility in U.S. markets remained at lows not consistently seen since 2007. Notably, in mid-October U.S. equities fell to six-month lows only to rebound 8.4%, driving the Standard & Poor’s 500 Index to a new closing high of 2,018.05 points on the final day of the reporting period.
In Europe, the ECB cut the European Union (EU) deposit rate in June to negative 0.1% from 0.0% in a bid to push banks to extend lending by effectively charging them for parking excess cash with the central bank. In August, ECB President Mario Draghi acknowledged the urgent need to spur job creation and signaled his commitment to support growth and head off a deflationary spiral. In October, the EU inflation rate stood at 0.4%, well below the ECB target rate of just below 2%. Growth in GDP across the EU was 0.2% in the third quarter of 2014, and manufacturing activity across the euro zone slowed in the latter part of the reporting period.
Following an April 1, 2014 increase in its national consumption tax, Japan recorded its biggest quarterly economic slowdown since the global financial crisis of 2007-08. While Japan’s GDP improved slightly through the reporting period, it remained negative. On October 31, the Bank of Japan unveiled plans to buy 8 trillion to 12 trillion yen ($72 billion to $107 billion) of Japanese government bonds per month, while also tripling its purchases of exchange-traded funds.
Emerging markets overall weakened during the reporting period amid investor concerns about slowing growth in China, weak global commodities prices and continued conflicts in eastern Ukraine and the Middle East. At 7.3%, China’s third quarter 2014 GDP growth was the slowest in five years, partly due to a slowdown in the property sector. A pro-democracy movement in Hong Kong added to investor concerns in the region. In Brazil, the re-election of President Dilma Rousseff in October was followed by a greater than 5.0% intra-day drop in the Bovespa Index amid investor concern over her administration’s interventionist private-sector policies.
While relatively low global energy prices provided a welcome tailwind for both developed and emerging market economies during the reporting period, investors remained squarely focused on central banks’ policies. Amid this backdrop, a sharp pullback in global equities in mid-October revealed the fragility of gains made during the previous months. However, at the end of the reporting period, select equity and bond markets provided positive returns for investors who maintained a diversified portfolio and a long-term view.
On behalf of everyone at J.P. Morgan Asset Management, thank you for your continued support. We look forward to managing your investment needs for years to come. If you should have any questions, please visit www.jpmorganfunds.com or call J.P. Morgan Exchange-Traded Funds at 1-844-457-6383.
Sincerely yours,

Robert F. Deutsch
President, J.P. Morgan Exchange-Traded Funds
J.P. Morgan Asset Management
| | | | | | | | |
| | | |
| OCTOBER 31, 2014 | | JPMORGAN EXCHANGE-TRADED FUNDS | | | | | 1 | |
JPMorgan Diversified Return Global Equity ETF
FUND COMMENTARY
For the Period June 16, 2014 (Fund Inception Date) Through October 31, 2014 (Unaudited)
| | | | |
| REPORTING PERIOD RETURN: | |
| JPMorgan Diversified Return Global Equity ETF* | | | -0.62% | |
| Market Price** | | | 0.18% | |
| FTSE Developed Diversified Factor Index (net of foreign withholding taxes) | | | -0.94% | |
| MSCI World Index (net of foreign withholding taxes) | | | -0.53% | |
| |
| Net Assets as of 10/31/2014 | | $ | 24,846,767 | |
INVESTMENT OBJECTIVE***
The JPMorgan Diversified Return Global Equity ETF (the “Fund”) seeks investment results that closely correspond, before fees and expenses, to the performance of the FTSE Developed Diversified Factor Index (the “Index”).
INVESTMENT APPROACH
The Fund is passively managed to the Index, which tracks large and mid-cap equity securities in developed global markets, diversified across global industries and regions. The Index uses a proprietary multifactor security selection process that measures the following characteristics: relative valuation, price momentum, low volatility and specific market capitalization. Securities within the Index include common stock, preferred stock and real estate investment trusts.
The Fund may invest up to 20% of its assets in exchange-traded futures and currency forward contracts to seek performance that corresponds to the Index. The Fund’s index methodology includes monthly rebalancing, liquidity screens and turnover constraints.
HOW DID THE MARKET PERFORM?
For the period June 16, 2014 through October 31, 2014, leading central banks maintained accommodative policies to stimulate growth. Notably, while the U.S. Federal Reserve responded to an improving domestic economy by closing out its quantitative easing program of monthly bond purchases, the European Central Bank and the Bank or Japan — independently of each other — took unprecedented steps to counter slowing economic growth.
Overall, the U.S. equities markets performed well during the reporting period, despite a brief sell-off in October, while equities markets in the European Union and Japan posted declines.
HOW DID THE FUND PERFORM?
The Fund posted a negative absolute performance during the period June 16, 2014 to October 31, 2014. On an absolute basis, the Fund’s position in the oil & gas sector, and to a lesser extent its positions in the basic materials and industrials sectors, detracted from performance during the reporting period, while its positions in the financials, health care and utilities sectors made positive contributions to absolute performance.
Because the Fund’s holdings were aligned with those of the Index, variances in relative performance due to security selection and/or sector allocation were not significant. The majority of the Fund’s deviation against the Index was due to specific trading limits, differences in valuations because of the timing of the local market closings and the net asset value calculations, the Fund’s small cash allocation and fees and operating expenses incurred by the Fund.
HOW WAS THE FUND POSITIONED?
At the end of the reporting period, the Fund’s largest allocation of assets was to North American markets, particularly the U.S., with smaller allocations to Asia, Japan and Europe. In terms of sectors, the Fund’s largest positions were in the consumer discretionary, health care and information technology sectors, while the smallest positions were in the consumer staples, energy and material sectors.
| | | | | | |
| | | |
| 2 | | | | JPMORGAN EXCHANGE-TRADED FUNDS | | OCTOBER 31, 2014 |
| | | | | | | | |
| TOP TEN EQUITY HOLDINGS OF THE PORTFOLIO**** | |
| | 1. | | | CSL Ltd. | | | 0.5 | % |
| | 2. | | | Woolworths Ltd. | | | 0.5 | |
| | 3. | | | Samsung Electronics Co., Ltd. | | | 0.5 | |
| | 4. | | | Wesfarmers Ltd. | | | 0.5 | |
| | 5. | | | BHP Billiton Ltd. | | | 0.5 | |
| | 6. | | | Cheung Kong Holdings Ltd. | | | 0.5 | |
| | 7. | | | Toyota Motor Corp. | | | 0.5 | |
| | 8. | | | DBS Group Holdings Ltd. | | | 0.5 | |
| | 9. | | | Hutchison Whampoa Ltd. | | | 0.5 | |
| | 10. | | | Woodside Petroleum Ltd. | | | 0.5 | |
| | | | |
PORTFOLIO COMPOSITION BY COUNTRY**** | |
| United States | | | 27.3 | % |
| Japan | | | 22.5 | |
| Australia | | | 9.8 | |
| South Korea | | | 7.2 | |
| Hong Kong | | | 4.1 | |
| United Kingdom | | | 3.4 | |
| Canada | | | 3.4 | |
| France | | | 3.2 | |
| Germany | | | 3.1 | |
| Singapore | | | 2.6 | |
| Switzerland | | | 2.6 | |
| Sweden | | | 2.4 | |
| Spain | | | 1.9 | |
| Netherlands | | | 1.2 | |
| Belgium | | | 1.0 | |
| Italy | | | 1.0 | |
| Others (each less than 1%) | | | 3.3 | |
| * | | The return shown is based on net asset value calculated for shareholder transactions and may differ from the return shown in the financial highlights, which reflects adjustments made to the net asset value in accordance with accounting principles generally accepted in the United States of America. The net asset value was $49.69 as of October 31, 2014. |
| ** | | Market price cumulative return is calculated assuming an initial investment made at the inception date net asset value, reinvestment of all dividends and distributions at market price during the period, and sale at the market price on the last day of the period. The price used to calculate the market price return is the midpoint of the bid/ask spread at the close of business on the NYSE Arca. The midpoint price was $50.09 as of October 31, 2014. |
| *** | | The adviser seeks to achieve the Fund’s objective. There can be no guarantee it will be achieved. |
| **** | | Percentages indicated are based on total investments as of October 31, 2014. The Fund’s composition is subject to change. |
| | | | | | | | |
| | | |
| OCTOBER 31, 2014 | | JPMORGAN EXCHANGE-TRADED FUNDS | | | | | 3 | |
JPMorgan Diversified Return Global Equity ETF
FUND COMMENTARY
For the Period June 16, 2014 (Fund Inception Date) Through October 31, 2014 (Unaudited) (continued)
LIFE OF FUND PERFORMANCE (6/16/14 TO 10/31/14)
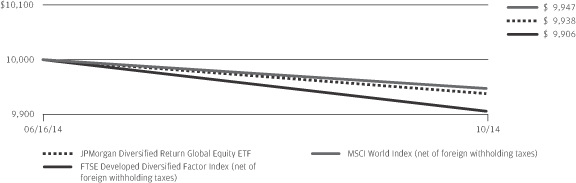
The performance quoted is past performance and is not a guarantee of future results. Mutual funds are subject to certain market risks. Investment returns and principal value of an investment will fluctuate so that an investor’s shares, when redeemed, may be worth more or less than their original cost. Current performance may be higher or lower than the performance data shown. For up-to-date, month-end performance information please call 1-844-457-6383.
Fund commenced operations on June 16, 2014.
The graph illustrates comparative performance for $10,000 invested in shares of the JPMorgan Diversified Return Global Equity ETF, the FTSE Developed Diversified Factor Index (net of foreign withholding taxes), and the MSCI World Index (net of foreign withholding taxes) from June 16, 2014 to October 31, 2014. The performance of the Fund reflects the deduction of Fund expenses and assumes reinvestment of all dividends and capital gain distributions, if any. The performance of the FTSE Developed Diversified Factor Index (net of foreign withholding taxes) and the MSCI World Index (net of foreign withholding taxes) does not reflect the deduction of expenses associated with an exchange-traded fund and has been adjusted to reflect reinvestment of all dividends and capital gain distributions of the securities included in the Index, if applicable. The FTSE Developed Diversified Factor Index (net of foreign withholding taxes) is an index comprised of equity securities from developed global markets selected to
represent a diversified set of factor characteristics, originally developed by the adviser. FTSE International Limited is the Index Provider. The MSCI World Index (net of foreign withholding taxes) is a free float-adjusted market capitalization weighted index that is designed to measure the equity market performance of developed markets. Investors cannot invest directly in an index.
Fund performance reflects the waiver of the Fund’s fees and reimbursement of expenses for certain periods since the inception date. Without these waivers and reimbursements, performance would have been lower. Also, performance shown in this section does not reflect the deduction of taxes that a shareholder may pay on Fund distributions or redemption of Fund shares.
International investing involves a greater degree of risk and increased volatility. Changes in currency exchange rates and differences in accounting and taxation policies outside the United States can raise or lower returns. Also, some overseas markets may not be as politically and economically stable as the United States and other nations.
The returns shown are based on net asset values calculated for shareholder transactions and may differ from the returns shown in the financial highlights, which reflect adjustments made to the net asset values in accordance with accounting principles generally accepted in the United States of America.
| | | | | | |
| | | |
| 4 | | | | JPMORGAN EXCHANGE-TRADED FUNDS | | OCTOBER 31, 2014 |
JPMorgan Diversified Return Global Equity ETF
SCHEDULE OF PORTFOLIO INVESTMENTS
AS OF OCTOBER 31, 2014
| | | | | | | | |
| SHARES | | | SECURITY DESCRIPTION | | VALUE($) | |
| | | | | | | | |
| Common Stocks — 99.7% | |
| | | | Australia — 9.7% | |
| | 5,816 | | | AGL Energy Ltd. | | | 69,720 | |
| | 9,467 | | | Amcor Ltd. | | | 98,333 | |
| | 2,480 | | | Ansell Ltd. | | | 43,501 | |
| | 8,175 | | | APA Group | | | 56,835 | |
| | 24,391 | | | Arrium Ltd. | | | 7,242 | |
| | 9,191 | | | Asciano Ltd. | | | 50,840 | |
| | 1,083 | | | ASX Ltd. | | | 34,361 | |
| | 19,464 | | | Aurizon Holdings Ltd. | | | 80,731 | |
| | 4,157 | | | BHP Billiton Ltd. | | | 124,365 | |
| | 1,757 | | | Caltex Australia Ltd. | | | 48,394 | |
| | 24,330 | | | CFS Retail Property Trust Group REIT | | | 45,254 | |
| | 1,105 | | | Cochlear Ltd. | | | 71,617 | |
| | 4,852 | | | Crown Resorts Ltd. | | | 62,235 | |
| | 1,875 | | | CSL Ltd. | | | 132,381 | |
| | 8,625 | | | CSR Ltd. | | | 26,398 | |
| | 52,342 | | | Dexus Property Group REIT (b) | | | 55,944 | |
| | 1,120 | | | Flight Centre Travel Group Ltd. | | | 41,558 | |
| | 18,681 | | | GPT Group, Class Miscellaneous REIT (b) | | | 67,903 | |
| | 10,050 | | | Harvey Norman Holdings Ltd. | | | 33,796 | |
| | 19,655 | | | Incitec Pivot Ltd. | | | 50,437 | |
| | 7,021 | | | Origin Energy Ltd. | | | 88,203 | |
| | 1,455 | | | Ramsay Health Care Ltd. | | | 67,263 | |
| | 1,045 | | | Rio Tinto Ltd. | | | 55,801 | |
| | 7,726 | | | Santos Ltd. | | | 88,534 | |
| | 19,412 | | | Scentre Group REIT (a) (b) | | | 61,923 | |
| | 4,075 | | | Sonic Healthcare Ltd. | | | 67,436 | |
| | 3,557 | | | Suncorp Group Ltd. | | | 46,285 | |
| | 16,380 | | | Sydney Airport | | | 63,681 | |
| | 18,060 | | | Tabcorp Holdings Ltd. | | | 64,875 | |
| | 18,960 | | | Tatts Group Ltd. | | | 58,038 | |
| | 22,588 | | | Telstra Corp. Ltd. | | | 112,402 | |
| | 10,325 | | | Transurban Group | | | 73,947 | |
| | 3,203 | | | Wesfarmers Ltd. | | | 124,654 | |
| | 3,201 | | | Woodside Petroleum Ltd. | | | 113,701 | |
| | 4,131 | | | Woolworths Ltd. | | | 131,100 | |
| | | | | | | | |
| | | | | | | 2,419,688 | |
| | | | | | | | |
| | | | Austria — 0.1% | |
| | 1,105 | | | OMV AG | | | 34,734 | |
| | | | | | | | |
| | | | Belgium — 1.0% | |
| | 261 | | | Anheuser-Busch InBev NV | | | 28,943 | |
| | 1,560 | | | Belgacom S.A. | | | 58,919 | |
| | 655 | | | Colruyt S.A. | | | 29,832 | |
| | 455 | | | Groupe Bruxelles Lambert S.A. | | | 40,662 | |
| | 255 | | | Solvay S.A. | | | 34,813 | |
| | 606 | | | UCB S.A. | | | 48,872 | |
| | | | | | | | |
| | | | | | | 242,041 | |
| | | | | | | | |
| | | | | | | | |
| SHARES | | | SECURITY DESCRIPTION | | VALUE($) | |
| | | | | | | | |
| | | | | | | | |
| | | | Canada — 3.4% | |
| | 560 | | | Agrium Inc. | | | 54,790 | |
| | 1,474 | | | BCE Inc. (b) | | | 65,457 | |
| | 1,105 | | | Canadian National Railway Co. | | | 77,905 | |
| | 535 | | | Canadian Tire Corp. Ltd., Class A | | | 58,658 | |
| | 1,550 | | | Fortis Inc., Class Common Subscription Receipt | | | 50,500 | |
| | 1,815 | | | Husky Energy Inc. | | | 43,819 | |
| | 987 | | | Imperial Oil Ltd. (b) | | | 47,491 | |
| | 560 | | | Magna International Inc. | | | 55,272 | |
| | 715 | | | Metro Inc., Class A | | | 50,244 | |
| | 1,500 | | | National Bank of Canada | | | 70,112 | |
| | 1,518 | | | RioCan, Class Trust Unit REIT (b) | | | 35,760 | |
| | 1,350 | | | Rogers Communications Inc., Class B | | | 50,764 | |
| | 2,330 | | | Shaw Communications Inc., Class B | | | 59,829 | |
| | 518 | | | Tim Hortons Inc. | | | 41,971 | |
| | 1,432 | | | TransCanada Corp. (b) | | | 70,581 | |
| | | | | | | | |
| | | | | | | 833,153 | |
| | | | | | | | |
| | | | Denmark — 0.8% | |
| | 125 | | | Carlsberg A/S, Class B | | | 11,025 | |
| | 678 | | | Christian Hansen Holdings | | | 27,312 | |
| | 625 | | | Coloplast A/S, Class B | | | 54,476 | |
| | 705 | | | H Lundbeck A/S | | | 14,950 | |
| | 677 | | | Novozymes A/S, Class B | | | 31,350 | |
| | 6,371 | | | TDC A/S | | | 48,655 | |
| | | | | | | | |
| | | | | | | 187,768 | |
| | | | | | | | |
| | | | Finland — 0.7% | |
| | 2,314 | | | Fortum OYJ | | | 53,666 | |
| | 2,545 | | | Neste Oil OYJ | | | 55,015 | |
| | 1,010 | | | Sampo OYJ, Class A | | | 48,397 | |
| | 1,970 | | | Stora Enso OYJ, Class R | | | 16,268 | |
| | | | | | | | |
| | | | | | | 173,346 | |
| | | | | | | | |
| | | | France — 3.2% | |
| | 740 | | | AtoS | | | 51,140 | |
| | 787 | | | Capital Gemini S.A. | | | 51,781 | |
| | 485 | | | Casino Guichard Perrachon S.A. | | | 49,729 | |
| | 1,170 | | | Dassault Systemes | | | 74,191 | |
| | 1,091 | | | Eutelsat Communications S.A. | | | 35,369 | |
| | 1,197 | | | Lagardere SCA | | | 29,131 | |
| | 3,703 | | | Orange S.A. | | | 58,953 | |
| | 290 | | | Pernod Ricard S.A. | | | 33,034 | |
| | 565 | | | Publicis Groupe S.A. (a) | | | 39,187 | |
| | 711 | | | Safran S.A. | | | 45,030 | |
| | 522 | | | Sanofi | | | 47,366 | |
| | 465 | | | Sodexo | | | 44,860 | |
| | 2,743 | | | Suez Environnement Co. | | | 46,212 | |
SEE NOTES TO FINANCIAL STATEMENTS.
| | | | | | | | |
| | | |
| OCTOBER 31, 2014 | | JPMORGAN EXCHANGE-TRADED FUNDS | | | | | 5 | |
JPMorgan Diversified Return Global Equity ETF
SCHEDULE OF PORTFOLIO INVESTMENTS
AS OF OCTOBER 31, 2014 (continued)
| | | | | | | | |
| SHARES | | | SECURITY DESCRIPTION | | VALUE($) | |
| | | | | | | | |
| Common Stocks — continued | |
| | | | France — continued | |
| | 750 | | | Thales S.A. | | | 37,245 | |
| | 905 | | | Total S.A. | | | 54,031 | |
| | 396 | | | Valeo S.A. | | | 44,404 | |
| | 177 | | | Vinci S.A. | | | 10,103 | |
| | 1,719 | | | Vivendi S.A. | | | 41,994 | |
| | | | | | | | |
| | | | | | | 793,760 | |
| | | | | | | | |
| | | | Germany — 3.0% | |
| | 301 | | | BASF SE | | | 26,596 | |
| | 417 | | | Bayerische Motoren Werke AG | | | 44,718 | |
| | 545 | | | Beiersdorf AG | | | 44,188 | |
| | 205 | | | Continental AG | | | 40,378 | |
| | 3,355 | | | Deutsche Telekom AG | | | 50,571 | |
| | 640 | | | Fraport AG Frankfurt Airport Services Worldwide | | | 39,655 | |
| | 800 | | | Fresenius Medical Care AG & Co., KGaA | | | 58,718 | |
| | 1,034 | | | Fresenius SE & Co., KGaA | | | 53,206 | |
| | 627 | | | Hannover Rueck SE | | | 52,334 | |
| | 340 | | | Hugo Boss AG | | | 45,172 | |
| | 4,522 | | | Infineon Technologies AG | | | 44,056 | |
| | 330 | | | Linde AG | | | 60,903 | |
| | 600 | | | Merck KGaA | | | 54,314 | |
| | 636 | | | SAP SE | | | 43,334 | |
| | 1,542 | | | Software AG | | | 38,835 | |
| | 545 | | | Suedzucker AG | | | 7,589 | |
| | 1,296 | | | United Internet AG | | | 50,827 | |
| | | | | | | | |
| | | | | | | 755,394 | |
| | | | | | | | |
| | | | Greece — 0.1% | | | | |
| | 2,945 | | | Hellenic Telecommunications Organization S.A. | | | 33,263 | |
| | | | | | | | |
| | | | Hong Kong — 4.1% | |
| | 10,000 | | | Cathay Pacific Airways Ltd. | | | 18,756 | |
| | 7,000 | | | Cheung Kong Holdings Ltd. | | | 124,266 | |
| | 9,000 | | | Cheung Kong Infrastructure Holdings Ltd. | | | 65,739 | |
| | 9,500 | | | CLP Holdings Ltd. | | | 81,806 | |
| | 3,000 | | | Hang Seng Bank Ltd. | | | 50,833 | |
| | 35,000 | | | Hong Kong & China Gas Co., Ltd. | | | 81,732 | |
| | 9,000 | | | Hutchison Whampoa Ltd. | | | 114,125 | |
| | 3,000 | | | Johnson Electric | | | 10,137 | |
| | 14,500 | | | Link REIT (b) | | | 85,269 | |
| | 15,000 | | | MTR Corp. Ltd. | | | 61,162 | |
| | 70,000 | | | PCCW Ltd. | | | 44,500 | |
| | 8,500 | | | Power Assets Holdings Ltd. | | | 82,070 | |
| | 730,000 | | | Semiconductor Manufacturing International Corp. (a) | | | 75,684 | |
| | 5,500 | | | Swire Pacific Ltd., Class A | | | 72,141 | |
| | | | | | | | |
| SHARES | | | SECURITY DESCRIPTION | | VALUE($) | |
| | | | | | | | |
| | | | | | | | |
| | | | Hong Kong — continued | |
| | 30,000 | | | Xinyi Glass Holdings Ltd. | | | 17,725 | |
| | 118,000 | | | Xinyi Solar Holdings Ltd. | | | 39,935 | |
| | | | | | | | |
| | | | | | | 1,025,880 | |
| | | | | | | | |
| | | | Israel — 0.2% | |
| | 745 | | | Check Point Software Technologies Ltd. (a) | | | 55,316 | |
| | | | | | | | |
| | | | Italy — 1.0% | |
| | 17,010 | | | Enel Green Power SpA | | | 41,815 | |
| | 1,945 | | | Eni SpA | | | 41,438 | |
| | 752 | | | GTECH SpA | | | 17,527 | |
| | 11,945 | | | Parmalat SpA | | | 35,895 | |
| | 3,350 | | | Pirelli & C. SpA | | | 44,923 | |
| | 10,690 | | | Terna Rete Elettrica Nazionale SpA | | | 53,896 | |
| | | | | | | | |
| | | | | | | 235,494 | |
| | | | | | | | |
| | | | Japan — 22.5% | |
| | 4,000 | | | Ajinomoto Co., Inc. | | | 75,523 | |
| | 25,000 | | | ANA Holdings Inc. | | | 57,967 | |
| | 19,000 | | | Aozora Bank Ltd. | | | 66,783 | |
| | 10,000 | | | Asahi Kasei Corp. | | | 82,062 | |
| | 2,000 | | | Bank of Kyoto Ltd. | | | 17,331 | |
| | 14,000 | | | Bank of Yokohama Ltd. (b) | | | 80,910 | |
| | 4,000 | | | Brother Industries Ltd. | | | 71,218 | |
| | 1,800 | | | Canon Inc. | | | 55,225 | |
| | 2,500 | | | Capcom Co., Ltd. | | | 38,843 | |
| | 600 | | | Central Japan Railway Co. | | | 89,489 | |
| | 10,000 | | | Chiba Bank Ltd. | | | 71,030 | |
| | 2,800 | | | Chubu Electric Power Co., Inc. | | | 33,599 | |
| | 200 | | | Chugai Pharmaceutical Co., Ltd. | | | 6,252 | |
| | 3,000 | | | Chugoku Electric Power Co., Inc. | | | 39,563 | |
| | 25,000 | | | Cosmo Oil Co., Ltd. | | | 38,955 | |
| | 3,000 | | | Daicel Corp. | | | 34,583 | |
| | 3,200 | | | Daiichi Sankyo Co., Ltd. | | | 48,134 | |
| | 19,000 | | | DIC Corp. | | | 38,940 | |
| | 3,000 | | | Dowa Holdings Co., Ltd. | | | 25,262 | |
| | 1,000 | | | East Japan Railway Co. | | | 78,103 | |
| | 1,600 | | | Eisai Co., Ltd. | | | 62,575 | |
| | 2,000 | | | Electric Power Development Co., Ltd. | | | 69,942 | |
| | 1,700 | | | FamilyMart Co., Ltd. (b) | | | 68,260 | |
| | 13,000 | | | Fuji Electric Co., Ltd. | | | 57,115 | |
| | 2,600 | | | FUJIFILM Holdings Corp. | | | 87,278 | |
| | 6,000 | | | Fujikura Ltd. (b) | | | 25,204 | |
| | 15,000 | | | Fukuoka Financial Group Inc. | | | 76,756 | |
| | 700 | | | Hikari Tsushin Inc. | | | 46,434 | |
| | 3,000 | | | Hokuriku Electric Power Co. | | | 40,501 | |
| | 2,400 | | | Hoya Corp. | | | 84,929 | |
SEE NOTES TO FINANCIAL STATEMENTS.
| | | | | | |
| | | |
| 6 | | | | JPMORGAN EXCHANGE-TRADED FUNDS | | OCTOBER 31, 2014 |
| | | | | | | | |
| SHARES | | | SECURITY DESCRIPTION | | VALUE($) | |
| | | | | | | | |
| Common Stocks — continued | |
| | | | Japan — continued | |
| | 2,500 | | | Idemitsu Kosan Co., Ltd. | | | 48,349 | |
| | 5,500 | | | Inpex Corp. | | | 70,347 | |
| | 6,500 | | | ITOCHU Corp. | | | 78,576 | |
| | 2,000 | | | Japan Airlines Co., Ltd. | | | 53,704 | |
| | 1,500 | | | Japan Petroleum Exploration Co. | | | 49,039 | |
| | 16,500 | | | JX Holdings Inc. | | | 70,680 | |
| | 9,000 | | | Kaneka Corp. | | | 49,449 | |
| | 28,000 | | | Kawasaki Kisen Kaisha Ltd. | | | 63,795 | |
| | 1,400 | | | KDDI Corp. | | | 91,937 | |
| | 4,000 | | | Keisei Electric Railway Co., Ltd. | | | 47,014 | |
| | 7,200 | | | Konica Minolta Inc. | | | 80,451 | |
| | 4,100 | | | Kuraray Co., Ltd. | | | 47,622 | |
| | 5,000 | | | Kyowa Hakko Kirin Co., Ltd. | | | 58,317 | |
| | 11,600 | | | Marubeni Corp. | | | 74,582 | |
| | 500 | | | MEIJI Holdings Co., Ltd. | | | 41,951 | |
| | 1,600 | | | Mitsubishi Corp. | | | 31,373 | |
| | 5,000 | | | Mitsubishi Tanabe Pharma Corp. | | | 76,036 | |
| | 5,000 | | | Mitsui Mining & Smelting Co., Ltd. | | | 13,263 | |
| | 900 | | | Mochida Pharmaceutical Co., Ltd. | | | 56,280 | |
| | 700 | | | NGK Spark Plug Co., Ltd. | | | 18,256 | |
| | 3,000 | | | NH Foods Ltd. | | | 69,179 | |
| | 5,000 | | | Nippon Kayaku Co., Ltd. | | | 65,745 | |
| | 2,400 | | | Nippon Paper Industries Co., Ltd. | | | 35,321 | |
| | 4,000 | | | Nippon Shokubai Co., Ltd. | | | 47,946 | |
| | 1,300 | | | Nippon Telegraph & Telephone Corp. | | | 80,884 | |
| | 3,500 | | | Nippon Television Holdings Inc. | | | 53,194 | |
| | 4,500 | | | Nipro Corp. | | | 37,075 | |
| | 1,300 | | | Nissin Foods Holdings Co., Ltd. | | | 68,516 | |
| | 700 | | | Nitori Holdings Co., Ltd. | | | 44,363 | |
| | 200 | | | Nomura Research Institute Ltd. | | | 6,597 | |
| | 1,500 | | | NTT Data Corp. | | | 58,637 | |
| | 5,000 | | | NTT DOCOMO Inc. | | | 84,330 | |
| | 400 | | | Oriental Land Co., Ltd. | | | 85,536 | |
| | 19,000 | | | Osaka Gas Co., Ltd. | | | 75,788 | |
| | 1,400 | | | Otsuka Corp. | | | 52,056 | |
| | 2,300 | | | Otsuka Holdings Co., Ltd. | | | 80,679 | |
| | 14,500 | | | Resona Holdings Inc. | | | 82,937 | |
| | 1,000 | | | Rohm Co., Ltd. | | | 60,871 | |
| | 1,100 | | | Sankyo Co., Ltd. | | | 40,030 | |
| | 300 | | | Santen Pharmaceutical Co., Ltd. | | | 17,906 | |
| | 500 | | | Sawai Pharmaceutical Co., Ltd. | | | 29,789 | |
| | 1,100 | | | Seiko Epson Corp. | | | 51,045 | |
| | 2,000 | | | Sekisui Chemical Co., Ltd. | | | 24,927 | |
| | 6,200 | | | Sekisui House Ltd. | | | 77,096 | |
| | 13,000 | | | Seven Bank Ltd. | | | 54,293 | |
| | | | | | | | |
| SHARES | | | SECURITY DESCRIPTION | | VALUE($) | |
| | | | | | | | |
| | | | | | | | |
| | | | Japan — continued | |
| | 600 | | | Shimamura Co., Ltd. | | | 52,772 | |
| | 3,500 | | | Shionogi & Co., Ltd. | | | 91,566 | |
| | 3,000 | | | Shizuoka Bank Ltd. | | | 30,998 | |
| | 7,000 | | | Showa Shell Sekiyu | | | 60,062 | |
| | 1,400 | | | SoftBank Corp. | | | 101,919 | |
| | 6,600 | | | Sumitomo Corp. | | | 70,420 | |
| | 13,000 | | | Sumitomo Osaka Cement Co., Ltd. | | | 40,638 | |
| | 1,400 | | | Suruga Bank Ltd. | | | 29,269 | |
| | 1,000 | | | Suzuken Co.,Ltd. | | | 26,811 | |
| | 500 | | | Taisho Pharmaceutical Holdings Co., Ltd. | | | 35,094 | |
| | 2,000 | | | Takeda Pharmaceutical Co., Ltd. | | | 86,697 | |
| | 4,700 | | | Tohoku Electric Power Co., Inc. | | | 58,742 | |
| | 3,000 | | | Tokyo Broadcasting System Holdings Inc. | | | 33,259 | |
| | 14,000 | | | Tokyo Gas Co., Ltd. | | | 80,700 | |
| | 7,000 | | | TonenGeneral Sekiyu | | | 61,096 | |
| | 7,000 | | | Toppan Printing Co., Ltd. | | | 47,630 | |
| | 10,000 | | | Tosoh Corp. | | | 43,486 | |
| | 2,000 | | | Toyo Suisan Kaisha Ltd. | | | 69,073 | |
| | 1,500 | | | Toyota Industries Corp. | | | 71,425 | |
| | 2,000 | | | Toyota Motor Corp. | | | 120,354 | |
| | 2,000 | | | Tsumura & Co. | | | 44,752 | |
| | 14,000 | | | Ube Industries Ltd. | | | 21,677 | |
| | 1,800 | | | West Japan Railway Co. | | | 85,798 | |
| | 100 | | | Yamato Holdings Co., Ltd. | | | 2,138 | |
| | 4,000 | | | Yokohama Rubber Co., Ltd. | | | 36,310 | |
| | 1,000 | | | Zeon Corp. | | | 9,256 | |
| | | | | | | | |
| | | | | | | 5,586,469 | |
| | | | | | | | |
| | | | Netherlands — 1.1% | | | | |
| | 42 | | | Gemalto NV | | | 3,212 | |
| | 581 | | | Heineken Holding NV | | | 37,658 | |
| | 2,815 | | | Koninklijke Ahold NV | | | 47,147 | |
| | 2,176 | | | Reed Elsevier NV | | | 50,125 | |
| | 1,695 | | | Royal Dutch Shell plc, Class A | | | 60,548 | |
| | 2,860 | | | STMicroelectronics NV | | | 19,104 | |
| | 1,720 | | | Wolters Kluwer NV | | | 45,922 | |
| | 428 | | | Ziggo NV | | | 20,916 | |
| | | | | | | | |
| | | | | | | 284,632 | |
| | | | | | | | |
| | | | New Zealand — 0.3% | | | | |
| | 30,015 | | | Telecom Corp of New Zealand Ltd. | | | 74,071 | |
| | | | | | | | |
| | | | Norway — 0.6% | | | | |
| | 1,441 | | | Marine Harvest ASA | | | 20,408 | |
| | 2,806 | | | Orkla ASA | | | 21,455 | |
| | 1,346 | | | Seadrill Ltd. | | | 30,419 | |
| | 1,735 | | | Statoil ASA | | | 39,706 | |
SEE NOTES TO FINANCIAL STATEMENTS.
| | | | | | | | |
| | | |
| OCTOBER 31, 2014 | | JPMORGAN EXCHANGE-TRADED FUNDS | | | | | 7 | |
JPMorgan Diversified Return Global Equity ETF
SCHEDULE OF PORTFOLIO INVESTMENTS
AS OF OCTOBER 31, 2014 (continued)
| | | | | | | | |
| SHARES | | | SECURITY DESCRIPTION | | VALUE($) | |
| | | | | | | | |
| Common Stocks — continued | |
| | | | Norway — continued | |
| | 1,010 | | | Yara International ASA | | | 46,381 | |
| | | | | | | | |
| | | | | | | 158,369 | |
| | | | | | | | |
| | | | Portugal — 0.4% | | | | |
| | 14,655 | | | EDP — Energias de Portugal S.A. | | | 63,065 | |
| | 23,185 | | | Portugal Telecom SGPS S.A. | | | 37,975 | |
| | | | | | | | |
| | | | | | | 101,040 | |
| | | | | | | | |
| | | | Singapore — 2.6% | | | | |
| | 15,000 | | | CapitaMall Trust REIT (b) | | | 23,007 | |
| | 8,000 | | | DBS Group Holdings Ltd. | | | 115,083 | |
| | 145,000 | | | Golden Agri-Resources Ltd. | | | 58,761 | |
| | 60,000 | | | Hutchison Port Holdings Trust, Class U | | | 40,512 | |
| | 9,000 | | | Keppel Corp. Ltd. | | | 65,999 | |
| | 14,000 | | | Sembcorp Industries Ltd. | | | 52,963 | |
| | 5,000 | | | Singapore Airlines Ltd. | | | 38,533 | |
| | 20,000 | | | Singapore Press Holdings Ltd. | | | 66,663 | |
| | 35,000 | | | Singapore Telecommunications Ltd. | | | 103,015 | |
| | 4,000 | | | Venture Corp. Ltd. | | | 24,094 | |
| | 24,000 | | | Wilmar International, Ltd. | | | 59,825 | |
| | | | | | | | |
| | | | | | | 648,455 | |
| | | | | | | | |
| | | | South Korea — 7.3% | | | | |
| | 1,630 | | | Celltrion Inc. | | | 64,139 | |
| | 131 | | | CJ CheilJedang Corp. | | | 47,832 | |
| | 296 | | | CJ Corp. | | | 48,086 | |
| | 484 | | | Daum Communications Corp. | | | 66,372 | |
| | 816 | | | GS Holdings | | | 31,565 | |
| | 1,075 | | | Halla Visteon Climate Control Corp. | | | 47,907 | |
| | 1,066 | | | Hankook Tire Co., Ltd. | | | 54,924 | |
| | 2,881 | | | Hanwha Chemical Corp. | | | 32,828 | |
| | 145 | | | Hyundai Mobis Co., Ltd. | | | 33,925 | |
| | 19 | | | Hyundai Motor Co. | | | 3,015 | |
| | 1,145 | | | Hyundai Steel Co. | | | 72,975 | |
| | 3,672 | | | Industrial Bank of Korea | | | 53,697 | |
| | 640 | | | Kia Motors Corp. | | | 31,086 | |
| | 2,002 | | | Korea Electric Power Corp. | | | 87,880 | |
| | 1,135 | | | Korea Gas Corp. | | | 53,210 | |
| | 62 | | | Korea Zinc Co., Ltd. | | | 23,349 | |
| | 2,440 | | | KT Corp. | | | 75,175 | |
| | 928 | | | KT&G Corp. | | | 82,168 | |
| | 2,545 | | | LG Display Co., Ltd. (a) | | | 74,922 | |
| | 481 | | | LG Electronics Inc. | | | 29,376 | |
| | 6,592 | | | LG Uplus Corp. | | | 67,792 | |
| | 125 | | | Lotte Shopping Co., Ltd. | | | 34,652 | |
| | 140 | | | NAVER Corp. | | | 99,067 | |
| | 383 | | | Paradise Co., Ltd. | | | 11,789 | |
| | | | | | | | |
| SHARES | | | SECURITY DESCRIPTION | | VALUE($) | |
| | | | | | | | |
| | | | | | | | |
| | | | South Korea — continued | | | | |
| | 343 | | | POSCO | | | 99,071 | |
| | 108 | | | Samsung Electronics Co., Ltd. (b) | | | 125,944 | |
| | 555 | | | Samsung Fine Chemicals Co., Ltd. | | | 15,473 | |
| | 359 | | | SK C&C Co., Ltd. | | | 81,468 | |
| | 176 | | | SK Holdings Co., Ltd. | | | 27,588 | |
| | 2,459 | | | SK Hynix Inc. | | | 109,657 | |
| | 324 | | | SK Telecom Co., Ltd. | | | 81,194 | |
| | 915 | | | SKC Co., Ltd. | | | 23,509 | |
| | | | | | | | |
| | | | | | | 1,791,635 | |
| | | | | | | | |
| | | | Spain — 2.0% | | | | |
| | 25 | | | Acciona S.A. | | | 1,747 | |
| | 1,500 | | | Acerinox S.A. | | | 22,319 | |
| | 929 | | | ACS Actividades de Construccion y Servicios S.A. | | | 34,483 | |
| | 1,688 | | | Enagas S.A. | | | 56,649 | |
| | 1,310 | | | Endesa S.A. | | | 25,555 | |
| | 2,380 | | | Ferrovial S.A. | | | 48,659 | |
| | 1,785 | | | Gas Natural SDG S.A. | | | 51,545 | |
| | 1,060 | | | Grifols S.A. | | | 43,284 | |
| | 7,502 | | | Iberdrola S.A. | | | 53,106 | |
| | 610 | | | Red Electrica Corp. S.A. | | | 53,303 | |
| | 2,007 | | | Repsol S.A. | | | 44,854 | |
| | 3,284 | | | Telefonica S.A. | | | 49,417 | |
| | | | | | | | |
| | | | | | | 484,921 | |
| | | | | | | | |
| | | | Sweden — 2.4% | |
| | 569 | | | Autoliv Inc. | | | 52,200 | |
| | 3,135 | | | Boliden AB | | | 51,813 | |
| | 1,480 | | | Holmen AB, Class B | | | 48,984 | |
| | 1,380 | | | Investor AB, Class B (b) | | | 49,532 | |
| | 5,205 | | | Securitas AB, Class B | | | 57,597 | |
| | 3,000 | | | Skanska AB, Class B | | | 61,153 | |
| | 2,400 | | | Svenska Cellulosa AB SCA, Class B | | | 53,776 | |
| | 1,165 | | | Svenska Handelsbanken AB, Class A | | | 55,693 | |
| | 5,111 | | | Tele2 AB, Class B | | | 64,938 | |
| | 4,026 | | | Telefonaktiebolaget LM Ericsson, Class B (b) | | | 47,573 | |
| | 8,625 | | | TeliaSonera AB | | | 59,726 | |
| | | | | | | | |
| | | | | | | 602,985 | |
| | | | | | | | |
| | | | Switzerland — 2.6% | |
| | 586 | | | Actelion Ltd. | | | 69,790 | |
| | 579 | | | Aryzta AG | | | 49,389 | |
| | 414 | | | Baloise Holding AG | | | 52,116 | |
| | 2,394 | | | Clariant AG | | | 41,759 | |
| | 1,085 | | | Garmin Ltd. | | | 60,196 | |
| | 35 | | | Givaudan S.A. | | | 58,449 | |
| | 460 | | | Lonza Group AG | | | 50,686 | |
SEE NOTES TO FINANCIAL STATEMENTS.
| | | | | | |
| | | |
| 8 | | | | JPMORGAN EXCHANGE-TRADED FUNDS | | OCTOBER 31, 2014 |
| | | | | | | | |
| SHARES | | | SECURITY DESCRIPTION | | VALUE($) | |
| | | | | | | | |
| Common Stocks — continued | |
| | | | Switzerland — continued | |
| | 615 | | | Novartis AG | | | 57,074 | |
| | 139 | | | Roche Holding AG | | | 41,019 | |
| | 321 | | | Sonova Holding AG | | | 50,054 | |
| | 170 | | | Sulzer AG Ltd. | | | 19,376 | |
| | 93 | | | Swiss Life Holding AG | | | 21,338 | |
| | 115 | | | Swisscom AG | | | 67,795 | |
| | | | | | | | |
| | | | | | | 639,041 | |
| | | | | | | | |
| | | | United Kingdom — 3.4% | |
| | 2,700 | | | AMEC plc | | | 45,020 | |
| | 7,015 | | | BP plc (b) | | | 50,472 | |
| | 2,175 | | | British Land Co., plc REIT (b) | | | 25,397 | |
| | 7,356 | | | BT Group plc, Class A | | | 43,366 | |
| | 2,430 | | | Bunzl plc (b) | | | 65,987 | |
| | 576 | | | easyJet plc | | | 13,841 | |
| | 675 | | | Ensco plc, Class A | | | 27,398 | |
| | 2,085 | | | GKN plc | | | 10,654 | |
| | 2,020 | | | GlaxoSmithKline plc | | | 45,680 | |
| | 2,015 | | | Hammerson plc REIT (b) | | | 19,795 | |
| | 9,302 | | | J Sainsbury plc (b) | | | 36,646 | |
| | 195 | | | Johnson Matthey plc | | | 9,309 | |
| | 2,871 | | | Land Securities Group plc REIT (b) | | | 50,943 | |
| | 610 | | | Next plc | | | 62,974 | |
| | 749 | | | Persimmon plc | | | 17,590 | |
| | 6,625 | | | Rexam plc | | | 50,495 | |
| | 1,335 | | | Rowan Co., plc, Class A | | | 32,400 | |
| | 9,361 | | | Sage Group plc | | | 56,685 | |
| | 3,200 | | | Smith & Nephew plc (b) | | | 54,321 | |
| | 2,491 | | | Subsea 7 S.A. | | | 26,807 | |
| | 2,687 | | | Tate & Lyle plc | | | 26,005 | |
| | 1,217 | | | United Utilities Group plc | | | 16,683 | |
| | 5,553 | | | WM Morrison Supermarkets plc | | | 13,787 | |
| | 2,255 | | | WPP plc | | | 44,046 | |
| | | | | | | | |
| | | | | | | 846,301 | |
| | | | | | | | |
| | | | United States — 27.2% | |
| | 370 | | | Airgas Inc. | | | 41,270 | |
| | 100 | | | Alleghany Corp. (a) | | | 44,428 | |
| | 940 | | | Alliant Energy Corp. | | | 58,196 | |
| | 1,414 | | | Amdocs | | | 67,222 | |
| | 980 | | | Ameren Corp. | | | 41,493 | |
| | 1,451 | | | American Water Works Co., Inc. | | | 77,440 | |
| | 920 | | | AmerisourceBergen Corp., Class A | | | 78,577 | |
| | 30 | | | Arthur J Gallagher & Co. | | | 1,431 | |
| | 500 | | | Ashland Inc. | | | 54,035 | |
| | 785 | | | Assurant Inc. | | | 53,553 | |
| | 2,312 | | | AT&T Inc. (b) | | | 80,550 | |
| | | | | | | | |
| SHARES | | | SECURITY DESCRIPTION | | VALUE($) | |
| | | | | | | | |
| | | | | | | | |
| | | | United States — continued | |
| | 990 | | | AutoNation Inc. (a) | | | 56,688 | |
| | 75 | | | AutoZone Inc. (a) | | | 41,514 | |
| | 1,075 | | | Avery Dennison Corp. | | | 50,364 | |
| | 1,130 | | | Axis Capital Holdings Ltd. | | | 54,398 | |
| | 587 | | | Becton Dickinson and Co. (b) | | | 75,547 | |
| | 1,280 | | | Bemis Co., Inc. | | | 49,241 | |
| | 1,806 | | | Broadridge Financial Solutions Inc. | | | 79,338 | |
| | 420 | | | Brown-Forman Corp., Class B | | | 38,921 | |
| | 1,795 | | | CA Technologies Inc. (b) | | | 52,163 | |
| | 1,541 | | | CareFusion Corp. (a) | | | 88,407 | |
| | 1,912 | | | CenturyLink Inc. | | | 79,310 | |
| | 206 | | | CF Industries Holdings Inc. | | | 53,560 | |
| | 630 | | | Chevron Corp. | | | 75,569 | |
| | 196 | | | Chubb Corp. | | | 19,475 | |
| | 735 | | | Church & Dwight Co., Inc. | | | 53,221 | |
| | 678 | | | Cigna Corp. (b) | | | 67,508 | |
| | 1,005 | | | Cincinnati Financial Corp. | | | 50,722 | |
| | 855 | | | Cintas Corp. | | | 62,620 | |
| | 1,755 | | | CMS Energy Corp. (b) | | | 57,336 | |
| | 735 | | | CNA Financial Corp. | | | 28,724 | |
| | 1,260 | | | Coca-Cola Enterprises Inc. | | | 54,621 | |
| | 775 | | | Commerce Bancshares Inc. | | | 35,077 | |
| | 872 | | | Computer Sciences Corp. | | | 52,669 | |
| | 1,035 | | | ConocoPhillips | | | 74,675 | |
| | 603 | | | Constellation Brands Inc., Class A (a) | | | 55,199 | |
| | 255 | | | CR Bard Inc. | | | 41,813 | |
| | 179 | | | DaVita HealthCare Partners Inc. (a) | | | 13,974 | |
| | 1,025 | | | DENTSPLY International Inc. | | | 52,039 | |
| | 595 | | | Diamond Offshore Drilling Inc. | | | 22,437 | |
| | 801 | | | Dr Pepper Snapple Group Inc. | | | 55,469 | |
| | 670 | | | DST Systems Inc. | | | 64,554 | |
| | 892 | | | DTE Energy Co. | | | 73,287 | |
| | 275 | | | Duke Energy Corp. | | | 22,591 | |
| | 350 | | | Eastman Chemical Co. | | | 28,273 | |
| | 183 | | | EI du Pont de Nemours & Co. (b) | | | 12,655 | |
| | 455 | | | Energizer Holdings Inc. | | | 55,806 | |
| | 371 | | | Entergy Corp. (b) | | | 31,171 | |
| | 451 | | | Everest RE Group | | | 76,963 | |
| | 754 | | | Fidelity National Information Services Inc. | | | 44,026 | |
| | 1,417 | | | Foot Locker Inc. | | | 79,366 | |
| | 10,195 | | | Frontier Communications Corp. | | | 66,675 | |
| | 780 | | | GameStop Corp., Class A | | | 33,353 | |
| | 732 | | | Gannett Co., Inc. (b) | | | 23,058 | |
| | 425 | | | Genuine Parts Co. | | | 41,259 | |
| | 760 | | | Harris Corp. | | | 52,896 | |
| | 1,004 | | | Hasbro Inc. | | | 57,760 | |
SEE NOTES TO FINANCIAL STATEMENTS.
| | | | | | | | |
| | | |
| OCTOBER 31, 2014 | | JPMORGAN EXCHANGE-TRADED FUNDS | | | | | 9 | |
JPMorgan Diversified Return Global Equity ETF
SCHEDULE OF PORTFOLIO INVESTMENTS
AS OF OCTOBER 31, 2014 (continued)
| | | | | | | | |
| SHARES | | | SECURITY DESCRIPTION | | VALUE($) | |
| | | | | | | | |
| Common Stocks — continued | |
| | | | United States — continued | |
| | 485 | | | Henry Schein Inc. (a) | | | 58,215 | |
| | 490 | | | Hess Corp. (b) | | | 41,557 | |
| | 1,100 | | | Hormel Foods Corp. | | | 59,301 | |
| | 867 | | | Intel Corp. (b) | | | 29,487 | |
| | 603 | | | InterActiveCorp | | | 40,817 | |
| | 545 | | | International Flavors & Fragrances Inc. (b) | | | 54,037 | |
| | 706 | | | JM Smucker Co. | | | 73,424 | |
| | 815 | | | Johnson & Johnson (b) | | | 87,841 | |
| | 317 | | | KLA-Tencor Corp. | | | 25,090 | |
| | 592 | | | L-3 Communications Holdings Inc., Class 3 | | | 71,904 | |
| | 495 | | | Laboratory Corp of America Holdings (a) | | | 54,099 | |
| | 1,660 | | | Leggett & Platt Inc. | | | 65,371 | |
| | 1,087 | | | Level 3 Communications Inc. (a) | | | 50,991 | |
| | 1,810 | | | Liberty Interactive Corp., Class A (a) | | | 47,313 | |
| | 257 | | | Liberty Ventures, Ser A (a) | | | 9,021 | |
| | 1,752 | | | Marathon Oil Corp. | | | 62,021 | |
| | 255 | | | McCormick & Co., Inc. | | | 18,034 | |
| | 1,485 | | | MDU Resources Group Inc. | | | 41,847 | |
| | 1,201 | | | Medtronic Inc. (b) | | | 81,860 | |
| | 756 | | | Microchip Technology Inc. | | | 32,591 | |
| | 805 | | | Molson Coors Brewing Co., Class B | | | 59,876 | |
| | 825 | | | Motorola Solutions Inc. (b) | | | 53,213 | |
| | 695 | | | Murphy Oil Corp. | | | 37,106 | |
| | 1,720 | | | Newell Rubbermaid Inc. | | | 57,327 | |
| | 1,570 | | | NiSource Inc. | | | 66,034 | |
| | 1,270 | | | Northeast Utilities | | | 62,675 | |
| | 606 | | | Northrop Grumman Corp. | | | 83,604 | |
| | 2,876 | | | NVIDIA Corp. | | | 56,197 | |
| | 19 | | | NVR Inc. (a) | | | 23,324 | |
| | 682 | | | PartnerRe Ltd. | | | 78,900 | |
| | 1,195 | | | Patterson Co., Inc. | | | 51,516 | |
| | 1,225 | | | Patterson-UTI Energy Inc. | | | 28,212 | |
| | 2,962 | | | Pepco Holdings Inc. | | | 80,981 | |
| | 52 | | | PetSmart Inc. | | | 3,762 | |
| | 928 | | | Pfizer Inc. (b) | | | 27,793 | |
| | 910 | | | Pinnacle West Capital Corp. (b) | | | 55,938 | |
| | 370 | | | PPG Industries Inc. (b) | | | 75,365 | |
| | 1,308 | | | PPL Corp. | | | 45,767 | |
| | 945 | | | Quest Diagnostics Inc. | | | 59,970 | |
| | 820 | | | Questar Corp. | | | 19,770 | |
| | 727 | | | Raytheon Co. | | | 75,521 | |
| | 705 | | | RenaissanceRe Holdings Ltd. | | | 72,848 | |
| | 1,242 | | | Republic Services Inc., Class A | | | 47,693 | |
| | 629 | | | Ryder System Inc. (b) | | | 55,648 | |
| | 691 | | | SBA Communications Corp., Class A (a) | | | 77,620 | |
| | 1,224 | | | SCANA Corp. | | | 67,185 | |
| | | | | | | | |
| SHARES | | | SECURITY DESCRIPTION | | VALUE($) | |
| | | | | | | | |
| | | | | | | | |
| | | | United States — continued | |
| | 415 | | | Scripps Networks Interactive Inc., Class A | | | 32,054 | |
| | 396 | | | Sigma-Aldrich Corp. | | | 53,820 | |
| | 1,336 | | | Southwest Airlines Co. | | | 46,065 | |
| | 9,031 | | | Sprint Corp. (a) (b) | | | 53,554 | |
| | 146 | | | SPX Corp. | | | 13,839 | |
| | 1,170 | | | Starz (a) | | | 36,153 | |
| | 1,641 | | | Synopsys Inc. (a) | | | 67,248 | |
| | 2,885 | | | TECO Energy Inc. | | | 56,575 | |
| | 1,990 | | | TELUS Corp. | | | 71,341 | |
| | 330 | | | Thomson Reuters Corp. | | | 12,277 | |
| | 2,000 | | | T-Mobile US Inc. (a) | | | 58,380 | |
| | 990 | | | Torchmark Corp. | | | 52,430 | |
| | 1,064 | | | Total System Services Inc. | | | 35,953 | |
| | 539 | | | TRW Automotive Holdings Corp. (a) | | | 54,628 | |
| | 1,214 | | | Tyson Foods Inc., Class A | | | 48,985 | |
| | 670 | | | Universal Health Services Inc., Class B | | | 69,486 | |
| | 1,616 | | | Verizon Communications Inc. (b) | | | 81,204 | |
| | 894 | | | Walt Disney Co. (The) (b) | | | 81,694 | |
| | 562 | | | WellPoint Inc. | | | 71,200 | |
| | 242 | | | Westlake Chemical Corp. | | | 17,073 | |
| | 5,775 | | | Windstream Holdings Inc. | | | 60,522 | |
| | 779 | | | Wisconsin Energy Corp. | | | 38,685 | |
| | 1,115 | | | WR Berkley Corp. | | | 57,467 | |
| | 920 | | | Wyndham Worldwide Corp. | | | 71,456 | |
| | 2,230 | | | Xcel Energy Inc. | | | 74,638 | |
| | 571 | | | Zimmer Holdings Inc. | | | 63,518 | |
| | | | | | | | |
| | | | | | | 6,763,398 | |
| | | | | | | | |
| | | | Total Common Stock
(Cost $25,144,750) | | | 24,771,154 | |
| | | | | | | | |
| Preferred Stock — 0.1% | | | | |
| | | | Germany — 0.1% | | | | |
| | 210 | | | Porsche Automobil Holding SE | | | 17,244 | |
| | | | | | | | |
| | | | Total Preferred Stock
(Cost $20,876) | | | 17,244 | |
| | | | | | | | |
| | | | Total Investments — 99.8%
(Cost $25,165,626) | | | 24,788,398 | |
| | | | Other Assets in Excess of
Liabilities — 0.2% | | | 58,369 | |
| | | | | | | | |
| | | | NET ASSETS— 100.00% | | $ | 24,846,767 | |
| | | | | | | | |
Percentages indicated are based on net assets.
SEE NOTES TO FINANCIAL STATEMENTS.
| | | | | | |
| | | |
| 10 | | | | JPMORGAN EXCHANGE-TRADED FUNDS | | OCTOBER 31, 2014 |
JPMorgan Diversified Return Global Equity ETF
SCHEDULE OF PORTFOLIO INVESTMENTS
AS OF OCTOBER 31, 2014 (continued)
Summary of Investments by Industry, October 31, 2014
The following table represents the portfolio investments of the Fund by industry classifications as a percentage of total investments:
| | | | |
| INDUSTRY | | PERCENTAGE | |
Oil, Gas & Consumable Fuels | | | 7.2 | % |
Diversified Telecommunication Services | | | 6.6 | |
Chemicals | | | 5.1 | |
Electric Utilities | | | 4.9 | |
Pharmaceuticals | | | 4.8 | |
Commercial Banks | | | 3.6 | |
Food Products | | | 3.4 | |
Health Care Providers & Services | | | 3.4 | |
Media | | | 3.0 | |
Insurance | | | 3.0 | |
Health Care Equipment & Supplies | | | 2.7 | |
Wireless Telecommunication Services | | | 2.7 | |
Semiconductors & Semiconductor Equipment | | | 2.5 | |
Multi-Utilities | | | 2.5 | |
IT Services | | | 2.3 | |
Road & Rail | | | 2.2 | |
Auto Components | | | 2.1 | |
Real Estate Investment Trusts (REITs) | | | 2.1 | |
Metals & Mining | | | 2.1 | |
Hotels, Restaurants & Leisure | | | 2.0 | |
Gas Utilities | | | 1.9 | |
Software | | | 1.7 | |
Specialty Retail | | | 1.6 | |
Food & Staples Retailing | | | 1.5 | |
Beverages | | | 1.5 | |
Trading Companies & Distributors | | | 1.5 | |
Household Durables | | | 1.4 | |
Electronic Equipment & Instruments | | | 1.4 | |
Aerospace & Defense | | | 1.3 | |
Industrial Conglomerates | | | 1.3 | |
Commercial Services & Supplies | | | 1.2 | |
Computers & Peripherals | | | 1.0 | |
Internet Software & Services | | | 1.0 | |
Biotechnology | | | 1.0 | |
Energy Equipment & Services | | | 1.0 | |
Others (each less than 1.0%) | | | 11.5 | |
NOTES TO SCHEDULE OF PORTFOLIO INVESTMENTS
| | |
| REIT | | — Real Estate Investment Trust |
| Ser | | — Series |
| |
| (a) | | — Non-income producing security. |
| |
| (b) | | — All or a portion of this security is reserved and/or pledged with the custodian for current or potential holdings of futures, swaps, options, TBAs, when-issued securities, delayed delivery securities, reverse repurchase agreements, unfunded commitments and/or forward foreign currency contracts. |
The value and percentage, based on total investments, of the investments that apply fair valuation policy for the international investments as described in Note 2.A. of the Notes to Financial Statements are as follows: $16,964,336 and 68.3%, respectively.
SEE NOTES TO FINANCIAL STATEMENTS.
| | | | | | | | |
| | | |
| OCTOBER 31, 2014 | | JPMORGAN EXCHANGE-TRADED FUNDS | | | | | 11 | |
STATEMENT OF ASSETS AND LIABILITIES
AS OF OCTOBER 31, 2014
| | | | |
| | |
JPMorgan
Diversified Return
Global Equity ETF | |
ASSETS: | | | | |
Investments in non-affiliates, at value | | $ | 24,788,398 | |
Cash | | | 109,553 | |
Foreign currency, at value | | | 36,626 | |
Receivables: | | | | |
Due from Adviser | | | 16,228 | |
Dividends from non-affiliates | | | 46,313 | |
Tax reclaims | | | 2,166 | |
Prepaid expenses | | | 31 | |
Deferred offering costs | | | 16,254 | |
| | | | |
Total Assets | | | 25,015,569 | |
| | | | |
| |
LIABILITIES: | | | | |
Accrued Liabilities: | | | | |
Professional fees | | | 138,390 | |
Custodian fees | | | 5,765 | |
Trustees’ and Chief Compliance Officer’s fees | | | 17,596 | |
Accounting fees | | | 357 | |
Other | | | 6,694 | |
| | | | |
Total Liabilities | | | 168,802 | |
| | | | |
Net Assets | | $ | 24,846,767 | |
| | | | |
| |
NET ASSETS: | | | | |
Paid-in-Capital | | $ | 25,173,053 | |
Accumulated undistributed net investment income | | | 152,009 | |
Accumulated net realized gains (losses) | | | (99,673 | ) |
Net unrealized appreciation (depreciation) | | | (378,622 | ) |
| | | | |
Total Net Assets | | $ | 24,846,767 | |
| | | | |
| |
Outstanding number of shares authorized
(unlimited number of shares authorized — no par value) | | | 500,000 | |
| | | | |
Net asset value, per share | | $ | 49.69 | |
| | | | |
| |
Cost of investments in non-affiliates | | $ | 25,165,626 | |
Cost of foreign currency | | | 36,887 | |
SEE NOTES TO FINANCIAL STATEMENTS.
| | | | | | |
| | | |
| 12 | | | | JPMORGAN EXCHANGE-TRADED FUNDS | | OCTOBER 31, 2014 |
STATEMENT OF OPERATIONS
FOR THE PERIOD ENDED OCTOBER 31, 2014
| | | | |
| | |
JPMorgan
Diversified Return
Global Equity ETF (a) | |
INVESTMENT INCOME: | | | | |
Dividend income from non-affiliates | | $ | 191,153 | |
Interest income from non-affiliates | | | 12 | |
Foreign taxes withheld | | | (16,688 | ) |
| | | | |
Total Investment Income | | | 174,477 | |
| | | | |
| |
EXPENSES: | | | | |
Investment advisory fees | | | 17,506 | |
Administration fees | | | 6,200 | |
Custodian fees | | | 12,400 | |
Professional fees | | | 230,774 | |
Trustees’ and Chief Compliance Officer’s fees | | | 70,097 | |
Registration and filing fees | | | 15,787 | |
Printing and mailing costs | | | 10,000 | |
Offering costs | | | 9,653 | |
Other | | | 12,250 | |
| | | | |
Total Expenses | | | 384,667 | |
| | | | |
Less | | | | |
Less fees waived | | | (23,706 | ) |
Less expense reimbursements | | | (333,241 | ) |
| | | | |
Net expenses | | | 27,720 | |
| | | | |
Net Investment income (loss) | | | 146,757 | |
| | | | |
| |
REALIZED/UNREALIZED GAINS (LOSSES): | | | | |
Net realized gain (loss) on transactions from: | | | | |
Investments in non-affiliates | | | (99,543 | ) |
Foreign currency translations | | | 5,122 | |
| | | | |
Net realized gain (loss) | | | (94,421 | ) |
| | | | |
Change in net unrealized appreciation (depreciation) of: | | | | |
Investments in non-affiliates | | | (377,228 | ) |
Foreign currency translations | | | (1,394 | ) |
| | | | |
Change in net unrealized appreciation/depreciation | | | (378,622 | ) |
| | | | |
Net realized/unrealized gains (losses) | | | (473,043 | ) |
| | | | |
Change in net assets resulting from operations | | $ | (326,286 | ) |
| | | | |
| (a) | Commencement of operations was June 16, 2014 |
SEE NOTES TO FINANCIAL STATEMENTS.
| | | | | | | | |
| | | |
| OCTOBER 31, 2014 | | JPMORGAN EXCHANGE-TRADED FUNDS | | | | | 13 | |
STATEMENT OF CHANGES IN NET ASSETS
FOR THE PERIOD INDICATED
| | | | |
| | | JPMorgan
Diversified Return
Global Equity ETF | |
| | | Period Ended
October 31, 2014 (a) | |
CHANGE IN NET ASSETS RESULTING FROM OPERATIONS: | | | | |
Net investment income (loss) | | $ | 146,757 | |
Net realized gain (loss) | | | (94,421 | ) |
Change in net unrealized appreciation/depreciation | | | (378,622 | ) |
| | | | |
Change in net assets resulting from operations | | | (326,286 | ) |
| | | | |
| |
CAPITAL TRANSACTIONS: | | | | |
Change in net assets resulting from capital transactions | | | 25,173,053 | |
| | | | |
| |
NET ASSETS: | | | | |
Change in net assets | | | 24,846,767 | |
Beginning of period | | | — | |
| | | | |
End of period | | $ | 24,846,767 | |
| | | | |
Accumulated undistributed net investment income | | $ | 152,009 | |
| | | | |
| |
CAPITAL TRANSACTIONS: | | | | |
Proceeds from shares issued | | | 25,173,053 | |
| | | | |
Total change in net assets resulting from capital transactions | | $ | 25,173,053 | |
| | | | |
| |
SHARE TRANSACTIONS: | | | | |
Issued | | | 500,000 | |
| | | | |
| (a) | Commencement of operations was June 16, 2014. |
SEE NOTES TO FINANCIAL STATEMENTS.
| | | | | | |
| | | |
| 14 | | | | JPMORGAN EXCHANGE-TRADED FUNDS | | OCTOBER 31, 2014 |
FINANCIAL HIGHLIGHTS
FOR THE PERIOD INDICATED
| | | | |
| | | JPMorgan Diversified
Return Global Equity ETF | |
| | | June 16, 2014 (a) through
October 31, 2014 | |
Net asset value, beginning of period | | $ | 50.00 | |
Net investment income (loss) (b) | | | 0.38 | |
Net realized and unrealized gains (losses) on investments | | | (0.69 | ) |
| | | | |
Total from investment operations | | | (0.31 | ) |
| | | | |
Dividends and distributions: | | | | |
Net investment income | | | — | |
| | | | |
Net asset value, end of period | | $ | 49.69 | |
Market price, end of period (e) | | $ | 50.09 | |
Total return (c)(d) | | | (0.62 | )% |
Market price total return (c)(e) | | | 0.18 | % |
Net assets end of period | | $ | 24,846,767 | |
Ratios to average net assets (f): | | | | |
Net expenses (g) | | | 0.38 | % |
Net investment income (loss) | | | 2.01 | % |
Expenses without waivers and reimbursements (g) | | | 5.19 | % |
Portfolio turnover rate (c)(h) | | | 14 | % |
| (a) | Commencement of operations. |
| (b) | Calculated based upon average shares outstanding. |
| (c) | Not annualized for periods less than one year. |
| (d) | Includes adjustments in accordance with accounting principles generally accepted in the United States of America and as such, the net asset values for financial reporting purposes and the returns based upon those net asset values may differ from the net asset values and returns for shareholder transactions. |
| (e) | Market price total return is calculated assuming an initial investment made at the inception date net asset value, reinvestment of all dividends and distributions at market price during the period, and sale at the market price on the last day of the period. The market price presented to calculate the market price total return is the mid-point of the bid/ask spread at the close of business on the NYSE Arca. |
| (f) | Annualized for periods less than one year, unless otherwise indicated. |
| (g) | Certain non-recurring expenses incurred by the Fund were not annualized for the period ended October 31, 2014. |
| (h) | Portfolio turnover is calculated by dividing the lesser of total purchases or sales of portfolio securities for the reporting period by the monthly average value of portfolio securities owned during the reporting period. Excluded from the numerator are amounts relating to in-kind transactions. |
SEE NOTES TO FINANCIAL STATEMENTS.
| | | | | | | | |
| | | |
| OCTOBER 31, 2014 | | JPMORGAN EXCHANGE-TRADED FUNDS | | | | | 15 | |
NOTES TO FINANCIAL STATEMENTS
AS OF OCTOBER 31, 2014
1. Organization
J.P. Morgan Exchange-Traded Fund Trust (the “Trust”) was formed as a Delaware statutory trust on February 25, 2010, pursuant to a Declaration of Trust and is registered under the Investment Company Act of 1940, as amended (the “1940 Act”), as an open-ended management investment company. Diversified Return Global Equity ETF (the “Fund”) is a separate diversified series of the Trust covered by this report.
The Fund commenced investment operations on June 16, 2014. Prior to June 16, 2014, the Fund had no significant operations other than matters relating to the organization and registration of the Trust and the issuance and redemption of 2,000 shares of the Fund to J.P. Morgan Investment Management Inc. (the “Adviser” or “JPMIM”), an indirect, wholly-owned subsidiary of JPMorgan Chase & Co. (“JPMorgan”).
The investment objective of the Fund is to seek investment results that closely correspond, before fees and expenses, to the performance of the FTSE Developed Diversified Factor Index (the “Index”).
Shares of the Fund are listed and traded on the NYSE Arca, Inc. Market prices for the Fund’s shares may be different from their net asset value (“NAV”). The Fund issues and redeems its shares on a continuous basis, through SEI Investments Distribution Co. (the “Distributor” or “SIDCO”), at NAV in large blocks of shares, typically 100,000 shares, referred to as “Creation Units.” Creation Units are issued and redeemed principally in-kind for a basket of securities and a cash amount. Shares generally trade in the secondary market in amounts less than a Creation Unit at market prices that change throughout the day. Only individuals or institutions that have entered into an authorized participant agreement with the Distributor may do business directly with the Fund.
2. Significant Accounting Policies
The following is a summary of significant accounting policies followed by the Fund in the preparation of its financial statements. The Fund is an investment company and, accordingly, follows the investment company accounting and reporting guidance of the Financial Accounting Standards Board Accounting Standards Codification Topic 946 — Investment Companies, which is part of the U.S. generally accepted accounting principles (“GAAP”). The preparation of financial statements in conformity with GAAP requires management to make estimates and assumptions that affect the reported amounts of assets and liabilities and the disclosure of contingent assets and liabilities at the date of the financial statements and the reported amounts of increases and decreases in net assets from operations during the reporting period. Actual results could differ from those estimates.
A. Valuation of Investments — The valuation of the investments are in accordance with GAAP and the Fund’s valuation policies set forth by and under the supervision and responsibility of the Board of Trustees (the “Board”), which established the following approach to valuation, as described more fully below: (i) investments for which market quotations are readily available shall be valued at such unadjusted quoted prices, and (ii) all other investments for which market quotations are not readily available shall be valued at their fair value as determined in good faith pursuant to procedures approved by the Board.
JPMorgan Funds Management, Inc. (the “Administrator” or “JPMFM”) has established the J.P. Morgan Asset Management Americas Valuation Committee (“AVC”) to assist the Board with the oversight and monitoring of the valuation of the Fund’s investments. The Administrator implements the valuation policies of the Fund’s investments. The AVC oversees and carries out the policies for the valuation of investments held in the Fund. This includes monitoring the appropriateness of fair values based on results of ongoing valuation oversight, including but not limited to consideration of macro or security specific events, market events and pricing vendor and broker due diligence. The Administrator is responsible for discussing and assessing the potential impacts of various events on the fair values on an ongoing basis, and at least on a quarterly basis with the AVC and the Board.
A market-based approach is primarily used to value the Fund’s investments. Investments for which market quotations are not readily available are fair valued by approved pricing vendors or third party broker-dealers (collectively referred to as “Pricing Services”) or may be internally fair valued using methods set forth by the valuation policies approved by the Board. This may include related or comparable assets or liabilities, recent transactions, market multiples, book values, and other relevant information for the investment to determine the fair value of the investment. An income-based valuation approach may be used in which the anticipated future cash flows of the investment are discounted to calculate the fair value. Discounts may also be applied due to the nature or duration of any restrictions on the disposition of the investments. Valuations may be based upon current market prices of securities that are comparable in coupon, rating, maturity and industry. It is possible that the estimated values may differ significantly from the values that would have been used, had a ready market for the investments existed, and such differences could be material.
Equities and other exchange-traded instruments are valued at the last sale price or official market closing price on the primary exchange on which the instrument is traded before the NAV of the Fund is calculated on a valuation date. Certain foreign equity instruments shall be valued by applying an international fair value factor provided by an approved Pricing Service. The factors seek to adjust the local closing price for movements of local markets post closing, but prior to the time the NAVs are calculated.
Valuations reflected in this report are as of the report date. As a result, changes in valuation due to market events and/or issuer related events after the report date and prior to issuance of the report are not reflected herein.
| | | | | | |
| | | |
| 16 | | | | JPMORGAN EXCHANGE-TRADED FUNDS | | OCTOBER 31, 2014 |
The various inputs that are used in determining the valuation of the Fund’s investments are summarized into the three broad levels listed below.
| Ÿ | | Level 1 — Unadjusted inputs using quoted prices in active markets for identical investments. |
| Ÿ | | Level 2— Other significant observable inputs including, but are not limited to, quoted prices for similar investments, inputs other than quoted prices that are observable for investments (such as interest rates, prepayment speeds, credit risk, etc.) or other market corroborated inputs. |
| Ÿ | | Level 3 — Significant inputs based on the best information available in the circumstances, to the extent observable inputs are not available (including the Funds’ assumptions in determining the fair value of investments). |
A financial instrument’s level within the fair value hierarchy is based on the lowest level of any input, both individually and in the aggregate, that is significant to the fair value measurement. The inputs or methodology used for valuing instruments are not necessarily an indication of the risk associated with investing in those instruments.
The following table represents each valuation input as presented on the Schedule of Portfolio Investments:
| | | | | | | | | | | | | | | | |
| | | Level 1
Quoted prices | | | Level 2
Other significant
observable inputs | | | Level 3
Significant
unobservable inputs | | | Total | |
Investments in Securities | | | | | | | | | | | | | | | | |
Common Stock | | | | | | | | | | | | | | | | |
Australia | | $ | — | | | $ | 2,419,688 | | | $ | — | | | $ | 2,419,688 | |
Austria | | | — | | | | 34,734 | | | | — | | | | 34,734 | |
Belgium | | | — | | | | 242,041 | | | | — | | | | 242,041 | |
Canada | | | 833,153 | | | | — | | | | — | | | | 833,153 | |
Denmark | | | — | | | | 187,768 | | | | — | | | | 187,768 | |
Finland | | | 55,015 | | | | 118,331 | | | | — | | | | 173,346 | |
France | | | — | | | | 793,760 | | | | — | | | | 793,760 | |
Germany | | | — | | | | 755,394 | | | | — | | | | 755,394 | |
Greece | | | — | | | | 33,263 | | | | — | | | | 33,263 | |
Hong Kong | | | — | | | | 1,025,880 | | | | — | | | | 1,025,880 | |
Israel | | | 55,316 | | | | — | | | | — | | | | 55,316 | |
Italy | | | 35,895 | | | | 199,599 | | | | — | | | | 235,494 | |
Japan | | | — | | | | 5,586,469 | | | | — | | | | 5,586,469 | |
Netherlands | | | — | | | | 284,632 | | | | — | | | | 284,632 | |
New Zealand | | | — | | | | 74,071 | | | | — | | | | 74,071 | |
Norway | | | — | | | | 158,369 | | | | — | | | | 158,369 | |
Portugal | | | — | | | | 101,040 | | | | — | | | | 101,040 | |
Singapore | | | — | | | | 648,455 | | | | — | | | | 648,455 | |
South Korea | | | — | | | | 1,791,635 | | | | — | | | | 1,791,635 | |
Spain | | | — | | | | 484,921 | | | | — | | | | 484,921 | |
Sweden | | | 52,200 | | | | 550,785 | | | | — | | | | 602,985 | |
Switzerland | | | 60,196 | | | | 578,845 | | | | — | | | | 639,041 | |
United Kingdom | | | 59,798 | | | | 786,503 | | | | — | | | | 846,301 | |
United States | | | 6,763,398 | | | | — | | | | — | | | | 6,763,398 | |
| | | | | | | | | | | | | | | | |
Total Common Stock | | | 7,914,971 | | | | 16,856,183 | | | | — | | | | 24,771,154 | |
| | | | | | | | | | | | | | | | |
Preferred Stock | | | | | | | | | | | | | | | | |
Germany | | | — | | | | 17,244 | | | | — | | | | 17,244 | |
| | | | | | | | | | | | | | | | |
Total Investments in Securities | | $ | 7,914,971 | | | $ | 16,873,427 | | | $ | — | | | $ | 24,788,398 | |
| | | | | | | | | | | | | | | | |
There were no transfers among any levels during the period ended October 31, 2014.
B. Foreign Currency Translation — The books and records of the Fund are maintained in U.S. dollars. Foreign currency amounts are translated into U.S. dollars at the prevailing exchange rates of such currencies against the U.S. dollar. The market value of investment securities and other assets and liabilities are translated at the exchange rate as of the valuation date. Purchases and sales of investment securities, income and expenses are translated at the exchange rate prevailing on the respective dates of such transactions.
Although the net assets of the Fund are presented at the foreign exchange rates and market values at the close of the period, the Fund does not isolate that portion of the results of operations arising as a result of changes in the foreign exchange rates from the fluctuations arising from changes in the market prices of securities held or sold during the period. Accordingly, such foreign currency gains (losses) are included in the reported net realized and unrealized gains (losses) on investment transactions on the Statements of Operations.
| | | | | | | | |
| | | |
| OCTOBER 31, 2014 | | JPMORGAN EXCHANGE-TRADED FUNDS | | | | | 17 | |
NOTES TO FINANCIAL STATEMENTS
AS OF OCTOBER 31, 2014 (continued)
Reported realized foreign currency gains and losses arise from the disposition of foreign currency, purchase of foreign currency in certain countries that impose a tax on such purchases, currency gains or losses realized between the trade and settlement dates on securities transactions, and the difference between the amounts of dividends, interest and foreign withholding taxes recorded on each Fund’s books on the transaction date and the U.S. dollar equivalent of the amounts actually received or paid. Unrealized foreign currency gains and losses arise from changes (due to changes in the exchange rate) in the value of foreign currency and other assets and liabilities denominated in foreign currencies, which are held at period end.
C. Offering and Organizational Costs — Total offering costs of $25,907 incurred in connection with the offering of shares of the Fund are amortized on a straight line basis over 12 months from the date the Fund commenced operations. Costs paid in connection with the organization of the Fund, if any, were recorded as an expense at the time it commenced operations.
D. Security Transactions and Investment Income — Investment transactions are accounted for on the trade date (the date the order to buy or sell is executed). Securities gains and losses are calculated on a specifically identified cost basis. Interest income is determined on the basis of coupon interest accrued using the effective interest method which adjusts for amortization of premiums and accretion of discounts. Dividend income net of foreign taxes withheld, if any, is recorded on the ex-dividend date or when the Fund first learns of the dividend.
E. Allocation of Income and Expenses — Expenses directly attributable to a fund are charged directly to the Fund, while the expenses attributable to more than one fund of the Trust are allocated among the respective funds.
F. Federal Income Taxes — The Fund is treated as a separate entity for Federal income tax purposes. The Fund’s policy is to comply with the provisions of the Internal Revenue Code of 1986, as amended (the “Code”), applicable to regulated investment companies and to distribute to shareholders all of its distributable net investment income and net realized gain on investments. Accordingly, no provision for Federal income tax is necessary. Management has reviewed the Fund’s tax positions for all open tax years and has determined as of October 31, 2014, no liability for income tax is required in the Fund’s financial statements for net unrecognized tax benefits. However, management’s conclusions may be subject to future review based on changes in, or the interpretation of, the accounting standards or tax laws and regulations. The Fund’s Federal tax returns for the prior three fiscal years, or since inception if shorter, remain subject to examination by the Internal Revenue Service.
G. Foreign Taxes — The Fund may be subject to foreign taxes on income, gains on investments or currency purchases/repatriation, a portion of which may be recoverable. The Fund will accrue such taxes and recoveries as applicable, based upon its current interpretation of tax rules and regulations that exist in the markets in which it invests.
H. Distributions to Shareholders — Distribution from net investment income, if any, are generally declared and paid annually. Net realized capital gains, if any, are distributed by the Fund at least annually. The amount of distributions from net investment income and net realized capital gains is determined in accordance with Federal income tax regulations, which may differ from GAAP. To the extent these “book/tax” differences are permanent in nature (i.e., that they result from other than timing of recognition — “temporary differences”), such amounts are reclassified within the capital accounts based on their Federal tax-basis treatment.
The following amounts were reclassified within the capital accounts:
| | | | | | | | | | | | |
| | | Paid-in-Capital | | | Accumulated
Undistributed Net Investment
Income | | | Accumulated
Net Realized
Gains (Losses) | |
| | $ | — | | | $ | 5,252 | | | $ | (5,252 | ) |
The reclassifications for the Fund relate primarily to foreign currency gains.
3. Fees and Other Transactions
A. Investment Advisory Fee — Pursuant to the Investment Advisory Agreement, the Adviser, supervises the investments of the Fund and for such services is paid a fee. The fee is accrued daily and paid monthly at an annual rate of 0.24% based on the Fund’s average daily net assets.
The Adviser waived Investment Advisory fees and/or reimbursed expenses as outlined in Note 3.D.
B. Administration Fee — Pursuant to an Administration Agreement, the Administrator, an indirect, wholly-owned subsidiary of JPMorgan, provides certain administration services to the Fund. In consideration of these services, the Administrator receives a fee accrued daily and paid monthly at an annual rate of 0.085% of the average daily net assets of the Fund in the Trust covered by the Administration Agreement.
The administrator waived administration fees as authorized in Note 3.D.
C. Custodian Fees — JPMorgan Chase Bank, N.A. (“JPMCB”), a wholly-owned subsidiary of JPMorgan, provides portfolio custody and transfer agency services to the Fund. The amounts paid directly to JPMCB by the Fund for custody services are included in the Custodian fees in the Statements of Operations. With respect to the transfer agency services provided by JPMCB for each creation or redemption transaction, the authorized participant will generally be responsible for such associated expenses; during the period, the Fund paid no such fees to JPMCB.
Interest income, earned on cash balances at the custodian, if any, is included as interest income from affiliates in the Statements of Operations.
| | | | | | |
| | | |
| 18 | | | | JPMORGAN EXCHANGE-TRADED FUNDS | | OCTOBER 31, 2014 |
D. Waivers and Reimbursements — The Adviser and Administrator have contractually agreed to waive fees and/or reimburse the Fund to the extent that total annual operating expenses (excluding acquired fund fees and expenses, dividend expenses related to short sales, interest, taxes, expenses related to litigation and potential litigation, and extraordinary expenses) exceed the percentages of the Fund’s respective average daily net assets as shown in the below table:
The expense limitation agreements were in effect for the period ended October 31, 2014. The contractual expense limitation percentages in the table above are in place until at least February 29, 2016.
For the period ended October 31, 2014, the Fund’s service providers waived fees and/or reimbursed expenses for the Fund as follows. None of these parties expect the Fund to repay any such waived fees and/or reimbursed expenses in future years.
| | | | | | | | | | | | | | | | |
| | | Contractual Waivers | | | | |
| | | Investment
Advisory | | | Administration | | | Total | | | Contractual
Reimbursements | |
| | $ | 17,506 | | | $ | 6,200 | | | $ | 23,706 | | | $ | 333,241 | |
E. Other — Certain officers of the Trust are affiliated with the Adviser and the Administrator. Such officers, with the exception of the Chief Compliance Officer, receive no compensation from the Fund for serving in their respective roles.
The Board of Trustees appointed a Chief Compliance Officer to the Fund in accordance with Federal securities regulations. The Fund, along with other affiliated funds, makes reimbursement payments, on a pro-rata basis, to the Administrator for a portion of the fees associated with the Office of the Chief Compliance Officer. Such fees are included in Trustees’ and Chief Compliance Officer’s fees in the Statements of Operations.
During the period ended October 31, 2014, the Fund may have purchased securities from an underwriting syndicate in which the principal underwriter or members of the syndicate are affiliated with the Adviser.
4. Investment Transactions
During the period ended October 31, 2014, purchases and sales of investments (excluding short-term investments) were as follows:
| | | | | | | | |
| | | Purchases (excluding U.S.
Government) | | | Sales (excluding U.S.
Government) | |
| | $ | 5,220,408 | | | $ | 2,738,182 | |
During the period ended October 31, 2014, there were no purchases or sales of U.S. Government securities.
For the period ended October 31, 2014, in-kind transactions associated with creations and redemptions were:
| | | | | | | | |
| | | In-Kind Purchases | | | In-Kind Sales | |
| | $ | 22,782,962 | | | $ | — | |
5. Federal Income Tax Matters
For Federal income tax purposes, the cost and unrealized appreciation (depreciation) in value of investment securities held at October 31, 2014 were as follows:
| | | | | | | | | | | | | | |
| | | Aggregate Cost | | Gross
Unrealized
Appreciation | | | Gross
Unrealized
Depreciation | | | Net Unrealized Appreciation
(Depreciation) | |
| | $25,196,997 | | $ | 785,070 | | | $ | (1,193,669 | ) | | $ | (408,599 | ) |
The difference between book and tax basis appreciation (depreciation) on investments is primarily attributed to passive foreign investment company and wash sales transactions.
There were no taxable distributions for the period ended October 31, 2014.
As of October 31, 2014, the components of net assets (excluding paid-in-capital) on a tax basis were as follows:
| | | | | | | | | | |
| | | Current Distributable Ordinary Income | | Current
Distributable
Short-Term
Capital Gains or
(Tax Basis
Loss Carryover) | | | Unrealized
Appreciation
(Depreciation) | |
| | $161,239 | | $ | (77,532 | ) | | $ | (409,993 | ) |
| | | | | | | | |
| | | |
| OCTOBER 31, 2014 | | JPMORGAN EXCHANGE-TRADED FUNDS | | | | | 19 | |
NOTES TO FINANCIAL STATEMENTS
AS OF OCTOBER 31, 2014 (continued)
The cumulative timing differences primarily consist of passive foreign investment company and wash sales transactions.
At October 31, 2014, the Fund had net capital loss carryforwards, with no expiration dates, as follows:
| | | | | | |
| | | Short-Term | | Long-Term | |
| | $77,532 | | $ | — | |
6. Capital Share Transactions
The Trust issues and redeems shares of the Fund only in Creation Units through the Distributor at NAV. Capital shares transactions detail can be found in the Statement of Changes in Net Assets.
Shares of the Fund may only be purchased or redeemed by certain financial institutions (each an “Authorized Participant”). An Authorized Participant is either (1) a “Participating Party” or other participant in the clearing process through the Continuous Net Settlement System of the National Securities Clearing Corporation (“NSCC”); or (2) a DTC Participant; which, in either case, must have executed an agreement with the Distributor.
Creation Units of the Fund may be created in advance of receipt by the Trust of all or a portion of the applicable basket of equity securities and other instruments (“Deposit Instruments”) and cash as described in the Fund’s registration statement. In these instances, the initial Deposit Instruments and cash must be deposited in an amount equal to the sum of the cash amount, plus at least 105% of the market value of undelivered Deposit Instruments. A transaction fee may be imposed to offset transfer and other transaction costs associated with the purchase or redemption of Creation Units.
For more information about Creation Unit transactions please refer to the Statement of Additional information.
7. Risks, Concentrations and Indemnifications
In the normal course of business, the Fund enters into contracts that contain a variety of representations which provide general indemnifications. The Fund’s maximum exposure under these arrangements is unknown. The amount of exposure would depend on future claims that may be made against the Fund that have not yet occurred. However, based on experience, the Fund expects the risk of loss to be remote.
The Adviser owns a significant portion of the outstanding shares of the Fund.
The Fund may have elements of risk not typically associated with investment in the United States of America due to concentrated investments in a limited number of countries or regions, which may vary throughout the year depending on the Underlying Index of the Fund. Such concentrations may subject the Fund to additional risks resulting from political or economic conditions in such countries or regions and the possible imposition of adverse governmental laws or currency exchange restrictions could cause the securities and their markets to be less liquid and their prices to be more volatile than those of comparable U.S. securities.
As of October 31, 2014, a significant portion of the Fund’s net assets consisted of securities that are denominated in foreign currencies. Changes in currency exchange rates will affect the value of, and investment income from, such securities.
As of October 31, 2014, the Fund had the following country allocation representing greater than 10% of total investments.
| | | | |
Japan | | | 22.5 | % |
United States | | | 27.3 | |
Premium/Discount Risk — Disruptions to creations and redemptions, the existence of extreme markets volatility or potential lack of an active trading market for Shares may result in Shares trading at a significant premium or discount to the NAV. If a shareholder purchases Shares at a time when the market price is at a premium to the NAV or sells Shares at a time when the market price is at a discount to the NAV, the shareholders performance may be negatively impacted.
Index Tracking Risk — The Fund incurs a number of operating expenses not applicable to the Underlying Index, and incurs costs in buying and selling securities, especially when rebalancing the Fund’s securities holdings to reflect changes in the composition of the Underlying Index. Additionally, the Fund calculates its NAV based on fair value prices and the value of the Underlying Index is based on securities’ closing prices on a local foreign market exchange. Because of these issues, the Fund’s return differs from the return of the Underlying Index.
8. Related Party Transactions
SIDCO is the distributor of the Fund’s shares. The Distributor or its agent distributes Creation Units for the Fund on an agency basis. The Distributor does not maintain a secondary market in shares of the Fund. The Distributor has no role in determining the investment policies of the Fund or the securities that are purchased or sold by the Fund. SIDCO receives no fee for its distribution services under the Distribution Agreement.
The Fund may use related party broker-dealers. For the period ended October 31, 2014, The Fund incurred brokerage commissions with related broker-dealers as follows:
| | | | | | | | |
| | | Broker dealer | | | Amount of
Commission | |
| | | SIDCO | | | $ | 4 | |
| | | | | | |
| | | |
| 20 | | | | JPMORGAN EXCHANGE-TRADED FUNDS | | OCTOBER 31, 2014 |
REPORT OF INDEPENDENT REGISTERED PUBLIC ACCOUNTING FIRM
To the Board of Trustees of J.P. Morgan Exchange-Traded Fund Trust and the Shareholders of JPMorgan Diversified Return Global Equity ETF:
In our opinion, the accompanying statement of assets and liabilities, including the schedule of portfolio investments, and the related statements of operations and of changes in net assets and the financial highlights present fairly, in all material respects, the financial position of JPMorgan Diversified Return Global Equity ETF (a separate series of J.P. Morgan Exchange-Traded Fund Trust) (the “Fund”) at October 31, 2014, and the results of its operations, the changes in its net assets and the financial highlights for the period June 16, 2014 (commencement of operations) through October 31, 2014, in conformity with accounting principles generally accepted in the United States of America. These financial statements and financial highlights (hereafter referred to as “financial statements”) are the responsibility of the Fund’s management. Our responsibility is to express an opinion on these financial statements based on our audit. We conducted our audit of these financial statements in accordance with the standards of the Public Company Accounting Oversight Board (United States). Those standards require that we plan and perform the audit to obtain reasonable assurance about whether the financial statements are free of material misstatement. An audit includes examining, on a test basis, evidence supporting the amounts and disclosures in the financial statements, assessing the accounting principles used and significant estimates made by management, and evaluating the overall financial statement presentation. We believe that our audit, which included confirmation of securities at October 31, 2014 by correspondence with the custodian, provides a reasonable basis for our opinion.
PricewaterhouseCoopers LLP
New York, New York
December 23, 2014
| | | | | | | | |
| | | |
| OCTOBER 31, 2014 | | JPMORGAN EXCHANGE-TRADED FUNDS | | | | | 21 | |
SUPPLEMENTAL INFORMATION
For the Period June 16, 2014 (Fund Inception Date) Through October 31, 2014 (Unaudited)
The table below indicates the number of trading days in which the Fund traded within the range of the premium/discount noted. The number of days in each range is also shown as a percentage of the total trading days for the period covered in the table. All information within the table is based on historical performance. Past performance cannot be used to predict future results.
| | | | | | | | |
| Range of Premium/(Discount) | | Day Count | | | Percentage | |
Between 0.00% and 0.50% | | | 95 | | | | 97.94 | % |
Greater than 0.50% | | | 2 | | | | 2.06 | |
| | | | | | | | |
| | | 97 | | | | 100.00 | % |
| | | | | | | | |
| | | | | | |
| | | |
| 22 | | | | JPMORGAN EXCHANGE-TRADED FUNDS | | OCTOBER 31, 2014 |
TRUSTEES
(Unaudited)
The Fund’s Statement of Additional Information includes additional information about the Fund’s Trustees and is available, without charge, upon request by calling 1-844-457-6383 or on the J.P. Morgan Funds’ website at www.jpmorganfunds.com.
| | | | | | |
Name (Year of Birth);
Positions With
the Funds (1) | | Principal Occupations
During the Past 5 Year | | Number of
Funds in Fund
Complex Overseen
by Trustee (2) | | Other Directorships Held
Outside Fund Complex
During the Past 5 Years |
Independent Trustees | | | | | | |
| | | |
Gary L. French (1951);
Trustee of Trust since 2014 | | Real estate investor (2011-present); Senior Consultant for The Regulatory Fundamentals Group LLC (2011-present); Senior Vice President-Fund Administration, State Street Corporation (2002-2010). | | 4 | | Independent Trustee, The China Fund, Inc. (2013-present); Exchange Traded Concepts Trust II (2012-2014); Exchange Traded Concepts Trust I (2011-2014). |
| | | |
| Robert J. Grassi (1957); Trustee of Trust since 2014 | | Sole Proprietor, Academy Hills Advisors LLC (2012-present); Pension Director, Corning Incorporated (2002-2012). | | 4 | | None. |
| | | |
| Thomas P. Lemke (1954); Trustee of Trust since 2014 | | Retired; Executive Vice President and General Counsel, Legg Mason (2005-2013). | | 4 | | Independent Director of AXA Premier VIP Trust (2014-present); SEI family of funds (from February 2014 to present, Independent Trustee of the Advisors’ Inner Circle Fund III (5 portfolios); from May 2014-present, Independent Trustee of O’Connor EQUUS; from December 2014-present, Independent Trustee of Winton Series Trust); Independent Director of The Victory Funds (or their predecessor funds) (2014-present). |
| | | |
| Lawrence R. Maffia (1950); Trustee of Trust since 2014 | | Retired (2013-present); Director and President, ICI Mutual Insurance Company (2006-2013). | | 4 | | Director, ICI Mutual Insurance Company (1999-2013). |
| | | |
| Emily A. Youssouf (1951); Trustee of Trust since 2014 | | Vice Chair (2011-2013) and Board Member (2013-2014) of New York City Housing Authority; Clinical Professor, NYU Schack Institute of Real Estate (2009-present); Board Member, NYC Health and Hospitals Corporation (2005-present). | | 4 | | Trustee, NYC School Construction Authority (2009-present); Board Member, NYS Job Development Authority (2008-present); Board Member, PennyMac Financial Services, Inc. (2013-present). |
Interested Trustee | | Affiliated With the Advisor | | | | |
| | | |
| Robert F. Deutsch (3) (1957); Trustee of Trust since 2014 | | Head of the Global ETF Business for JPMorgan Asset Management (2013-present); Head of the Global Liquidity Business for JPMorgan Asset Management (2003-2013). | | 4 | | None. |
| (1) | The Trustees serve an indefinite term, subject to the Trust’s current retirement policy, which is age 75 for all Trustees. |
| (2) | A Fund complex means two or more registered investment companies that hold themselves out to investors as related companies for purposes of investment and investor services or have a common investment adviser or have an investment adviser that is an affiliated person of the investment adviser of any of the other registered investment companies. Only two series of the Trust have commenced operations, but two additional series have been created and will commence operations in the future. |
| (3) | Mr. Deutsch is an interested trustee because he is an employee of the Adviser. |
The contact address for each of the Trustees is 270 Park Avenue, New York, NY 10017.
| | | | | | | | |
| | | |
| OCTOBER 31, 2014 | | JPMORGAN EXCHANGE-TRADED FUNDS | | | | | 23 | |
OFFICERS
(Unaudited)
| | |
Name (Year of Birth),
Positions Held with
the Trusts (Since) | | Principal Occupations During Past 5 Years |
| |
Robert F. Deutsch (1957),
President and Principal Executive Officer (2014)* | | Managing Director, global head of J.P. Morgan Asset Management’s Exchange Traded Funds and a member of the J.P. Morgan Global Funds Operating Committee. Previously, head of the Global Liquidity Business from 2003 to 2013 and National Sales Manager for J.P. Morgan’s U.S. Mutual Funds Business prior to 2003. |
| |
Paul E. Shield (1960),
Treasurer and Principal Financial Officer (2014) | | Managing Director and head of Business Management for J.P. Morgan Asset Management’s Exchange Traded Fund platform since 2013. Senior Global Product Manager of Alternative Investments for BNY Mellon from 2011 to 2013 and Global Product Head for Exchange Traded Funds at JPMorgan Chase Bank from 2008 to 2011. |
| |
Frank J. Nasta (1964),
Secretary (2014) | | Managing Director and Associate General Counsel, JPMorgan Chase since 2008; Previously, Director, Managing Director, General Counsel and Corporate Secretary, J. & W. Seligman & Co. Incorporated; Secretary of each of the investment companies of the Seligman Group of Funds and Seligman Data Corp.; Director and Corporate Secretary, Seligman Advisors, Inc. and Seligman Services, Inc. |
| |
Stephen M. Ungerman (1953),
Chief Compliance Officer (2014) | | Managing Director, JPMorgan Chase & Co.; Mr. Ungerman has been with JPMorgan Chase & Co. since 2000. |
| |
Valerie-Leila Jaber (1965),
AML Compliance Officer (2014)** | | Managing Director and Global Head of Financial Crime for Asset Management, JPMorgan Chase & Co. since December 2012; Managing Director and Global Head of Financial Crime for Barclays Wealth (2009-2012). |
| |
Elizabeth A. Davin (1964),
Assistant Secretary (2014)*** | | Executive Director and Assistant General Counsel, JPMorgan Chase since February 2012; formerly Vice President and Assistant General Counsel, JPMorgan Chase from 2005 until February 2012; Senior Counsel, JPMorgan Chase (formerly Bank One Corporation) from 2004 to 2005. |
| |
Jessica K. Ditullio (1962),
Assistant Secretary (2014)*** | | Executive Director and Assistant General Counsel, JPMorgan Chase since February 2011; Ms. Ditullio has served as an attorney with various titles for JPMorgan Chase (formerly Bank One Corporation) since 1990. |
| |
John T. Fitzgerald (1975),
Assistant Secretary (2014) | | Executive Director and Assistant General Counsel, JPMorgan Chase since February 2011; formerly, Vice President and Assistant General Counsel, JPMorgan Chase from 2005 until February 2011. |
| |
Carmine Lekstutis (1980),
Assistant Secretary (2014) | | Vice President and Assistant General Counsel, JPMorgan Chase since 2011; Associate, Skadden, Arps, Slate, Meagher & Flom LLP (law firm) from 2006 to 2011. |
| |
| Gregory S. Samuels (1980), Assistant Secretary (2014) | | Executive Director and Assistant General Counsel, JPMorgan Chase since February 2014; formerly Vice President and Assistant General Counsel, JPMorgan Chase from 2010 to February 2014; Associate, Ropes & Gray (law firm) from 2008 to 2010; Associate, Clifford Chance LLP (law firm) from 2005 to 2008. |
| |
Pamela L. Woodley (1971),
Assistant Secretary (2014)**** | | Vice President and Assistant General Counsel, JPMorgan Chase since November 2004. |
| |
| Michael M. D’Ambrosio (1969), Assistant Treasurer (2014) | | Managing Director, JPMorgan Funds Management, Inc. from May 2014; formerly Executive Director, JPMorgan Funds Management, Inc. from 2012 until May 2014; prior to joining JPMorgan Chase, Mr. D’Ambrosio was a Tax Director at PricewaterhouseCoopers LLP since 2006. |
| |
Julie A. Roach (1971),
Assistant Treasurer (2014)*** | | Vice President, JPMorgan Funds Management, Inc. from August 2012; prior to joining JPMorgan Chase, Ms. Roach was a Senior Manager with Deloitte since 2001. |
| |
Jason Ronca (1978),
Assistant Treasurer (2014)***** | | Vice President, Assistant Treasurer and ETF Platform Manager for J.P. Morgan Asset Management since May 2014. ETF Product Manager for Corporate Investment Bank responsible for setting the strategy and control agenda for the ETF servicing business from 2010 to May 2014; Prior to 2010, a Vice President in Fund Accounting within J.P. Morgan Investor Services, supporting a series of U.S. registered mutual funds. |
The contact address for each of the officers, unless otherwise noted, is 270 Park Avenue, New York, NY 10017.
| * | | The contact address for the officer is 500 Stanton Christiana Road, CC Commons North/South, Floor 02, Newark, DE 19173. |
| ** | | The contact address for the officer is 277 Park Avenue, New York, NY 10172. |
| *** | | The contact address for the officer is 460 Polaris Parkway, Westerville, OH 43082. |
| **** | | The contact address for the officer is 4 New York Plaza, 21st Floor, NY, NY 10004. |
| ***** | | The contact address for the officer is One Beacon Street, Floor 18, Boston, MA 02108. |
| | | | | | |
| | | |
| 24 | | | | JPMORGAN EXCHANGE-TRADED FUNDS | | OCTOBER 31, 2014 |
SCHEDULE OF SHAREHOLDER EXPENSES
(Unaudited)
Hypothetical $1,000 Investment
As a shareholder of the Fund, you incur ongoing costs, including investment advisory fees, administration fees, distribution fees and other Fund expenses in addition to brokerage commissions on your purchases and sales of Fund shares. The examples below are intended to help you understand your ongoing costs (in dollars) of investing in the Fund and to compare these ongoing costs with the ongoing costs of investing in other mutual funds. The expenses in the table do not reflect any transactional costs, such as sales charges or brokerage commissions. The examples assume that you had a $1,000 investment at the beginning of the reporting period, June 16, 2014 and continued to hold your shares at the end of the reporting period, October 31, 2014.
Actual Expenses
For the Fund in the table below, the first line provides information about actual account values and actual expenses. You may use the information in this line, together with the amount you invested, to estimate the expenses that you paid
over the period. Simply divide your account value by $1,000 (for example, an $8,600 account value divided by $1,000 = 8.6), then multiply the result by the number under the heading entitled “Expenses Paid During the Period” to estimate the expenses you paid on your account during this period.
Hypothetical Example for Comparison Purposes
The second line in the table below provides information about hypothetical account values and hypothetical expenses based on the Fund’s actual expense ratio and an assumed rate of return of 5% per year before expenses, which is not the Fund’s actual return. The hypothetical account values and expenses may not be used to estimate the actual ending account balance or expenses you paid for the period. You may use this information to compare the ongoing costs of investing in the Fund and other Funds. To do so, compare this 5% hypothetical example with the 5% hypothetical examples that appear in the shareholder reports of other funds. The examples also assume all dividends and distributions have been reinvested.
| | | | | | | | | | | | | | | | |
| | | Beginning
Account Value
6/16/2014 | | | Ending
Account Value
10/31/2014 | | | Annualized
Expense
Ratios | | | Expenses
Paid During
Period | |
JPMorgan Diversified Return Global Equity ETF | | | | | | | | | | | | | | | | |
Actual Fund Return (1) | | $ | 1,000.00 | | | $ | 993.80 | | | | 0.38 | % | | $ | 1.43 | |
Hypothetical 5% Return (2) | | | 1,000.00 | | | | 1,023.29 | | | | 0.38 | | | | 1.94 | |
| (1) | Expenses are equal to the Fund’s annualized expense ratio, multiplied by the average account value over the period, multiplied by 138/365 (to reflect the actual period).The Fund commenced operations on June 16, 2014. |
| (2) | Expenses are equal to the Fund’s annualized expense ratio, multiplied by the average account value over the period, multiplied by 184/365 (to reflect the one-half year period). |
| | | | | | | | |
| | | |
| OCTOBER 31, 2014 | | JPMORGAN EXCHANGE-TRADED FUNDS | | | | | 25 | |
BOARD APPROVAL OF INITIAL INVESTMENT ADVISORY AGREEMENT
(Unaudited)
For the JPMorgan Diversified Return Global Equity ETF
On February 19 - 20, 2014, the Board of the Trust, a statutory Trust organized under the laws of the State of Delaware, held an in-person meeting and approved the initial Investment Advisory Agreement (“Agreement”) for the Fund whose annual report is contained herein. The approval included the approval of a majority of Trustees who are not interested persons of the Trust or the Adviser. Such Trustees are considered Independent Trustees as defined by the 1940 Act. In connection with the approval of the Agreement, the Trustees reviewed written materials prepared by the Adviser and received oral presentations from Adviser personnel. Before voting on the proposed Agreement, the Trustees reviewed the Agreement with representatives of the Adviser and with counsel to the Trust and independent legal counsel and received a memorandum from independent legal counsel to the Trustees discussing the legal standards for their consideration of the proposed Agreement. The Trustees also discussed the proposed Agreement in an executive session with independent legal counsel at which no representatives of the Adviser were present. Set forth below is a summary of the material factors evaluated by the Trustees in determining whether to approve the Agreement.
The Trustees considered information provided with respect to the Fund and the approval of the Agreement. Each Trustee attributed different weights to the various factors and no factor alone was considered determinative. The Trustees determined that the proposed compensation to be received by the Adviser from the Fund under the Agreement was fair and reasonable and that the initial approval of the Agreement was in the best interests of the Fund and its potential shareholders.
The factors summarized below were considered and discussed by the Trustees in reaching their conclusions:
Nature, Extent and Quality of Services Provided by the Adviser
In connection with the approval of the initial Agreement, the Trustees considered the materials furnished specifically in connection with the approval of the Agreement, as well as other relevant information furnished for the Trust. The Trustees considered the background and experience of the Adviser’s senior management and investment personnel, as well as the qualifications, backgrounds and responsibilities of the portfolio management team primarily responsible for the day-to-day management of the Fund. The Trustees also considered the investment strategy and the underlying index for the Fund, and the infrastructure supporting the portfolio management team. In addition, the Trustees considered information about the structure and distribution strategy of the Fund, how it fits within the Trust’s lineup, and how it will be positioned against identified peers.
The Trustees also considered their knowledge of the nature and quality of the services provided by the Adviser gained from experience in the financial industry. In addition, they considered
the overall reputation and capabilities of the Adviser and its affiliates, the commitment of the Adviser to provide high quality service to the Trust, their overall confidence in the Adviser’s integrity and the Adviser’s responsiveness to questions or concerns raised by them.
Based upon these considerations and other factors, the Trustees concluded that they were satisfied with the nature, extent and quality of the investment advisory services to be provided to the Fund by the Adviser.
Fall-Out Benefits
The Trustees reviewed information regarding potential “fallout” or ancillary benefits received by the Adviser and its affiliates as a result of their relationship with the Trust.
The Trustees also considered that the fees that the Administrator, an affiliate of the Adviser, will earn from the Fund for providing administrative services. The Trustees also considered the fees paid to JPMCB, also an affiliate of the Adviser, for custody, transfer agency and other related services. The Trustees also considered that any fall-out or ancillary benefits would be comparable to those related to the other actively managed funds in the complex.
Economies of Scale
The Trustees considered the extent to which the Fund will benefit from economies of scale. The Trustees noted that neither the proposed investment advisory fee schedule nor the proposed administration agreement for the Fund contains breakpoints. The Trustees considered whether it would be appropriate to add advisory fee breakpoints. With respect to the administration agreement, the Trustees also considered the fact that the Fund would benefit from economies of scale for the broader J.P. Morgan mutual fund complex because the administration fee had been set at a level consistent with the lower effective rate of the mutual funds, which includes breakpoints. The Trustees also noted that the Adviser has implemented fee waivers and expense limitations. The Trustees concluded that shareholders of the Fund will generally benefit from the lower expense ratios that resulted from these factors.
Investment Performance
The Trustees considered the Fund’s investment strategy and process, including the fact that the Fund seeks performance that closely corresponds to the Index, the portfolio management team and competitive positioning against identified peer funds, and concluded that the prospects for competitive future performance were acceptable.
Advisory Fees and Expense Ratios
The Trustees considered the contractual advisory fee rate that will be paid by the Fund to the Adviser and compared that rate to the fees charged to similar mutual funds managed by the
| | | | | | |
| | | |
| 26 | | | | JPMORGAN EXCHANGE-TRADED FUNDS | | OCTOBER 31, 2014 |
Adviser, as well as information prepared by Lipper concerning management fee rates paid by other funds in the same Lipper category as the Fund. The Trustees also noted that the Adviser does not currently manage other mutual funds or institutional accounts with the exact same or similar strategies proposed for the Fund. The Trustees also reviewed information about other projected expenses and the expense ratios for the Fund. The Trustees considered the projected fee waiver and/or expense reimbursement arrangements proposed for the Fund and
considered the net advisory fee rate after taking into account any projected waivers and/or reimbursements.
The Trustees noted that the Fund’s estimated net advisory fees and total expenses were in line with identified peer funds. The Trustees also noted that because the Fund was not yet operational, no profitability information was available. After considering the factors identified above, in light of the information, the Trustees concluded that the advisory fees were reasonable.
| | | | | | | | |
| | | |
| OCTOBER 31, 2014 | | JPMORGAN EXCHANGE-TRADED FUNDS | | | | | 27 | |
TAX LETTER
(Unaudited)
Certain tax information for the J.P. Morgan Funds is required to be provided to shareholders based upon the Fund’s income and distributions for the taxable year ended October 31, 2014. The information and distributions reported in this letter may differ from the information and taxable distributions reported to the shareholders for the calendar year ending December 31, 2014. The information necessary to complete your income tax returns for the calendar year ending December 31, 2014 will be provided under separate cover.
Foreign Tax Credit
The fund intends to pass through foreign tax credit to shareholders. For fiscal year ended October 31, 2014, the total amount of foreign tax paid that is eligible for foreign credit tax is $16,688. The amount allocable to each shareholder will be reported on 2014 Form 1099DIV.
| | | | | | |
| | | |
| 28 | | | | JPMORGAN EXCHANGE-TRADED FUNDS | | OCTOBER 31, 2014 |
J.P. Morgan Exchange-Traded Funds are distributed by SEI Investments Distribution Co. (One Freedom Valley Dr., Oaks, PA 19456), which is not affiliated with JPMorgan Chase & Co. or any of its affiliates.
Contact J.P. Morgan Exchange-Traded Funds at 1-844-457-6383 (844-4JPM ETF) for a fund prospectus. You can also visit us at www.jpmorganfunds.com. Investors should carefully consider the investment objectives and risks as well as charges and expenses of the mutual fund before investing. The prospectus contains this and other information about the mutual fund. Read the prospectus carefully before investing.
Investors may obtain information about the Securities Investor Protection Corporation (SIPC), including the SIPC brochure by visiting www.sipc.org or by calling SIPC at 202-371-8300.
The Fund files a complete schedule of its fund holdings for the first and third quarters of its fiscal year with the SEC on Form N-Q. The Fund’s Forms N-Q is available on the SEC’s website at http://www.sec.gov and may be reviewed and copied at the SEC’s Public Reference Room in Washington, DC. Information on the operation of the SEC’s Public Reference Room may be obtained by calling 1-800-SEC-0330. Shareholders may request the Form N-Q without charge by calling 1-844-457-6383 or by visiting the J.P. Morgan Funds’ website at www.jpmorganfunds.com.
A description of each Fund’s policies and procedures with respect to the disclosure of each Fund’s holdings is available in the prospectus and Statement of Additional Information.
A copy of proxy policies and procedures is available without charge upon request by calling 1-844-457-6383 and on the Fund’s website at www.jpmorganfunds.com. A description of such policies and procedures is on the SEC’s website at www.sec.gov. The Trustees have delegated the authority to vote proxies for securities owned by the Fund to the Adviser. A copy of the Fund’s voting record for the most recent 12-month period ended June 30 is available on the SEC’s website at www.sec.gov or at the Fund’s website at www.jpmorganfunds.com no later than August 31 of each year. The Fund’s proxy voting record will include, among other things, a brief description of the matter voted on for each fund security, and will state how each vote was cast, for example, for or against the proposal.


J.P. Morgan Asset Management is the marketing name for the asset management business of JPMorgan Chase & Co. Those businesses include, but are not limited to, J.P. Morgan Investment Management Inc., Security Capital Research & Management Incorporated and J.P. Morgan Alternative Asset Management, Inc.
| | | | |
| | © JPMorgan Chase & Co., 2014. All rights reserved. October 2014. | | AN-ETF-1014 |
Disclose whether, as of the end of the period covered by the report, the registrant has adopted a code of ethics that applies to the registrant’s principal executive officer, principal financial officer, principal accounting officer or controller, or persons performing similar functions, regardless of whether these individuals are employed by the registrant or a third party. If the registrant has not adopted such a code of ethics, explain why it has not done so.
The registrant must briefly describe the nature of any amendment, during the period covered by the report, to a provision of its code of ethics that applies to the registrant’s principal executive officer, principal financial officer, principal accounting officer or controller, or persons performing similar functions, regardless of whether these individuals are employed by the registrant or a third party, and that relates to any element of the code of ethics definition enumerated in paragraph (b) of this Item. The registrant must file a copy of any such amendment as an exhibit pursuant to Item 12(a)(1), unless the registrant has elected to satisfy paragraph (f) of this Item by positing its code of ethics on its website pursuant to paragraph (f)(2) of this Item, or by undertaking to provide its code of ethics to any person without charge, upon request, pursuant to paragraph (f)(3) of this Item.
If the registrant has, during the period covered by the report, granted a waiver, including an implicit waiver, from a provision of the code of ethics that applies to the registrant’s principal executive officer, principal financial officer, principal accounting officer or controller, or persons performing similar functions, regardless of whether these individuals are employed by the registrant or third party, that relates to one or more items set forth in paragraph (b) of this Item, the registrant must briefly describe the nature of the waiver, the name of the person to whom the waiver was granted, and the date of the waiver.
The Registrant has adopted a code of ethics that applies to the Registrant’s principal executive officer and principal financial officer. There were no amendments to the code of ethics or waivers granted with respect to the code of ethics in the period covered by the report.
| ITEM 3. | AUDIT COMMITTEE FINANCIAL EXPERT. |
(a) (1) Disclose that the registrant’s board of directors has determined that the registrant either:
(i) Has at least one audit committee financial expert serving on its audit committee; or
(ii) Does not have an audit committee financial expert serving on its audit committee.
The Registrant’s Board of Trustees has determined that the Registrant has at least one audit committee financial expert serving on its audit committee. The Securities and Exchange Commission has stated that the designation or identification of a person as an audit committee financial expert pursuant to this Item 3 of Form N-CSR does not impose on such person any duties, obligations or liabilities that are greater than the duties, obligations and liabilities imposed on such person as a member of the Audit Committee and the Board of Trustees in the absence of such designation or identification.
(2) If the registrant provides the disclosure required by paragraph (a)(1)(i) of this Item, it must disclose the name of the audit committee financial expert and whether that person is “independent.” In order to be considered “independent” for purposes of this Item, a member of an audit committee may not, other than in his or her capacity as a member of the audit committee, the board of directors, or any other board committee:
(i) Accept directly or indirectly any consulting, advisory, or other compensatory fee from the issuer; or
(ii) Be an “interested person” of the investment company as defined in Section 2(a)(19) of the Act (15 U.S.C. 80a-2(a)(19)).
The audit committee financial experts are Gary L. French, Robert J. Grassi, Thomas P. Lemke, Lawrence R. Maffia, and Emily A. Youssouf, each of which is not an “interested person” of the Registrant and is also “independent” as defined by the U.S. Securities and Exchange Commission for purposes of audit committee financial expert determinations.
(3) If the registrant provides the disclosure required by paragraph (a)(1)(ii) of this Item, it must explain why it does not have an audit committee financial expert.
Not applicable.
| ITEM 4. | PRINCIPAL ACCOUNTANT FEES AND SERVICES. |
(a) Disclose, under the caption Audit Fees, the aggregate fees billed for each of the last two fiscal years for professional services rendered by the principal accountant for the audit of the registrant’s annual financial statements or services that are normally provided by the accountant in connection with statutory and regulatory filings or engagements for those fiscal years.
AUDIT FEES
2014 – $45,000
2013 – Not Applicable
(b) Disclose, under the caption Audit-Related Fees, the aggregate fees billed in each of the last two fiscal years for assurance and related services by the principal accountant that are reasonably related to the performance of the audit of the registrant’s financial statements and are not reported under paragraph (a) of this Item. Registrants shall describe the nature of the services comprising the fees disclosed under this category.
AUDIT-RELATED FEES
2014 – $10,000
2013 – Not applicable
Audit-related fees consist of security count procedures performed as required under Rule 17f-2 of the Investment Company Act of 1940 during the Registrant’s fiscal year.
(c) Disclose, under the caption Tax Fees, the aggregate fees billed in each of the last two fiscal years for professional services rendered by the principal accountant for tax compliance, tax advice, and tax planning. Registrants shall describe the nature of the services comprising the fees disclosed under this category.
TAX FEES
2014 – $9,700
2013 – Not applicable
The tax fees consist of fees billed in connection with preparing the federal regulated investment company income tax returns for the Registrant for the tax years ended October 31, 2014 and 2013, respectively.
For the last fiscal year, no tax fees were required to be approved pursuant to paragraph (c)(7)(ii) of Rule 2-01 of Regulation S-X.
(d) Disclose, under the caption All Other Fees, the aggregate fees billed in each of the last two fiscal years for products and services provided by the principal accountant, other than the services reported in paragraphs (a) through (c) of this Item. Registrants shall describe the nature of the services comprising the fees disclosed under this category.
ALL OTHER FEES
2014 – $0
2013 – Not applicable
(e) (1) Disclose the audit committee’s pre-approval policies and procedures described in paragraph (c)(7) of Rule 2-01 of Regulation S-X.
[Pursuant to the Registrant’s Audit Committee Charter and written policies and procedures for the pre-approval of audit and non-audit services (the “Pre-approval Policy”), the Audit Committee pre-approves all audit and non-audit services performed by the Registrant’s independent public registered accounting firm for the Registrant. In addition, the Audit Committee pre-approves the auditor’s engagement for non-audit services with the Registrant’s investment adviser (not including a sub-adviser whose role is primarily portfolio management and is sub-contracted or overseen by another investment adviser) and any Service Affiliate in accordance with paragraph (c)(7)(ii) of Rule 2-01 of Regulation S-X, if the engagement relates directly to the operations and financial reporting of the Registrant. Proposed services may be pre-approved either 1) without consideration of specific case-by-case services or 2) require the specific pre-approval of the Audit Committee. Therefore, initially the Pre-approval Policy listed a number of audit and non-audit services that have been approved by the Audit Committee, or which were not subject to pre-approval under the transition provisions of Sarbanes-Oxley Act of 2002 (the “Pre-approval List”). The Audit Committee annually reviews and pre-approves the
services included on the Pre-approval List that may be provided by the independent public registered accounting firm without obtaining additional specific pre-approval of individual services from the Audit Committee. The Audit Committee adds to, or subtracts from, the list of general pre-approved services from time to time, based on subsequent determinations. All other audit and non-audit services not on the Pre-approval List must be specifically pre-approved by the Audit Committee.
One or more members of the Audit Committee may be appointed as the Committee’s delegate for the purposes of considering whether to approve such services. Any pre-approvals granted by the delegate will be reported, for informational purposes only, to the Audit Committee at its next scheduled meeting. The Audit Committee’s responsibilities to pre-approve services performed by the independent public registered accounting firm are not delegated to management.
(2) Disclose the percentage of services described in each of paragraphs (b) through (d) of this Item that were approved by the audit committee pursuant to paragraph (c)(7)(i)(C) of Rule 2-01 of Regulation S-X.
2014 – 0.0%
2013 – 0.0%
(f) If greater than 50 percent, disclose the percentage of hours expended on the principal accountant’s engagement to audit the registrant’s financial statements for the most recent fiscal year that were attributed to work performed by persons other than the principal accountant’s full-time, permanent employees.
Not applicable.
(g) Disclose the aggregate non-audit fees billed by the registrant’s accountant for services rendered to the registrant, and rendered to the registrant’s investment adviser (not including any sub-adviser whose role is primarily portfolio management and is subcontracted with or overseen by another investment adviser), and any entity controlling, controlled by, or under common control with the adviser that provides ongoing services to the registrant for each of the last two fiscal years of the registrant.
The aggregate non-audit fees billed by the independent registered public accounting firm for services rendered to the Registrant, and rendered to Service Affiliates, for the last two calendar year ends were:
2013 – $33.7 million
2012 – $33.0 million
(h) Disclose whether the registrant’s audit committee of the board of directors has considered whether the provision of non-audit services that were rendered to the registrant’s investment adviser (not including any subadviser whose role is primarily portfolio management and is subcontracted with or overseen by another investment adviser), and any entity controlling, controlled by, or under common control with the investment adviser that provides ongoing services to the registrant that were not pre-approved pursuant to paragraph (c)(7)(ii) of Rule 2-01 of Regulation S-X is compatible with maintaining the principal accountant’s independence.
[The Registrant’s Audit Committee has considered whether the provision of the non-audit services that were rendered to Service Affiliates that were not pre-approved (not requiring pre-approval) is compatible with maintaining the independent public registered accounting firm’s independence. All services provided by the independent public registered accounting firm to the Registrant or to Service Affiliates that were required to be pre-approved were pre-approved as required.
| ITEM 5. | AUDIT COMMITTEE OF LISTED REGISTRANTS. |
(a) If the registrant is a listed issuer as defined in Rule 10A-3 under the Exchange Act (17CFR 240.10A-3), state whether or not the registrant has a separately-designated standing audit committee established in accordance with Section 3(a)(58)(A) of the Exchange Act (15 U.S.C. 78c(a)(58)(A)). If the registrant has such a committee, however designated, identify each committee member. If the entire board of directors is acting as the registrant’s audit committee as specified in Section 3(a)(58)(B) of the Exchange Act (15 U.S.C. 78c(a)(58)(B)), so state.
The registrant has a separately designated Audit Committee established in accordance with Section 3(a)(58)(A) of the Exchange Act. The members of the Audit Committee are Gary L. French, Robert J. Grassi, Thomas P. Lemke, Lawrence R. Maffia, and Emily A. Youssouf.
(b) If applicable, provide the disclosure required by Rule 10A-3(d) under the Exchange Act (17CFR 240.10A-3(d)) regarding an exemption from the listing standards for all audit committees.
Not applicable.
| ITEM 6. | SCHEDULE OF INVESTMENTS. |
File Schedule I – Investments in securities of unaffiliated issuers as of the close of the reporting period as set forth in Section 210.12-12 of Regulation S-X, unless the schedule is included as part of the report to shareholders filed under Item 1 of this Form.
Included in Item 1.
ITEM 7. DISCLOSURE OF PROXY VOTING POLICIES AND PROCEDURES FOR CLOSED-END MANAGEMENT INVESTMENT COMPANIES.
A closed-end management investment company that is filing an annual report on this Form N-CSR must, unless it invests exclusively in non-voting securities, describe the policies and procedures that it uses to determine how to vote proxies relating to portfolio securities, including the procedures that the company uses when a vote presents a conflict between the interests of its shareholders, on the one hand, and those of the company’s investment adviser; principal underwriter; or any affiliated person (as defined in Section 2(a)(3) of the Investment Company Act of 1940 (15 U.S.C. 80a-2(a)(3)) and the rules thereunder) of the company, its investment adviser, or its principal underwriter, on the other. Include any policies and procedures of the company’s investment adviser, or any other third party, that the company uses, or that are used on the company’s behalf, to determine how to vote proxies relating to portfolio securities.
Not applicable.
| ITEM 8. | PORTFOLIO MANAGERS OF CLOSED-END MANAGEMENT INVESTMENT COMPANIES. |
Not applicable.
ITEM 9. PURCHASE OF EQUITY SECURITIES BY CLOSED-END MANAGEMENT INVESTMENT COMPANY AND AFFILIATED PURCHASERS.
(a) If the registrant is a closed-end management investment company, provide the information specified in paragraph (b) of this Item with respect to any purchase made by or on behalf of the registrant or any “affiliated purchaser,” as defined in Rule 10b-18(a)(3) under the Exchange Act (17 CFR 240.10b-18(a)(3)), of shares or other units of any class of the registrant’s equity securities that is registered by the registrant pursuant to Section 12 of the Exchange Act (15 U.S.C. 781).
Not applicable.
| ITEM 10. | SUBMISSION OF MATTERS TO A VOTE OF SECURITY HOLDERS. |
Describe any material changes to the procedures by which shareholders may recommend nominees to the registrant’s board of directors, where those changes were implemented after the registrant last provided disclosure in response to the requirements of Item 7(d)(2)(ii)(G) of Schedule 14A (17 CFR 240.14a-101), or this Item.
No material changes to report.
| ITEM 11. | CONTROLS AND PROCEDURES. |
(a) Disclose the conclusions of the registrant’s principal executive and principal financial officers, or persons performing similar functions, regarding the effectiveness of the registrant’s disclosure controls and procedures (as defined in Rule 30a-3(c) under the Act (17 CFR 270.30a-3(c))) as of a date within 90 days of the filing date of the report that includes the disclosure required by this paragraph, based on the evaluation of these controls and procedures required by Rule 30a-3(b) under the Act (17 CFR 270.30a-3(b)) and Rules 13a-15(b) or 15d-15(b) under the Exchange Act (17 CFR 240.13a-15(b) or 240.15d-15(b)).
The Registrant’s principal executive and principal financial officers have concluded, based on their evaluation of the Registrant’s disclosure controls and procedures as of a date within 90 days of the filing date of this report, that the Registrant’s disclosure controls and procedures are reasonably designed to ensure that information required to be disclosed by the Registrant on Form N-CSR is recorded, processed, summarized and reported within the required time periods and that information required to be disclosed by the Registrant in the reports that it files or submits on Form N-CSR is accumulated and communicated to the Registrant’s management, including its principal executive and principal financial officers, as appropriate to allow timely decisions regarding required disclosure.
(b) Disclose any change in the registrant’s internal control over financial reporting (as defined in Rule 30a-3(d) under the Act (17 CFR 270.30a-3(d)) that occurred during the registrant’s second fiscal quarter of the period covered by this report that has materially affected, or is reasonably likely to materially affect, the registrant’s internal control over financial reporting.
There were no changes in the Registrant’s internal control over financial reporting that occurred during the last fiscal quarter covered by this report that have materially affected, or are reasonably likely to materially affect, the Registrant’s internal control over financial reporting.
(a) File the exhibits listed below as part of this Form. Letter or number the exhibits in the sequence indicated.
(a)(1) Any code of ethics, or amendment thereto, that is the subject of the disclosure required by Item 2, to the extent that the registrant intends to satisfy the Item 2 requirements through filing of an exhibit.
Code of Ethics applicable to its Principal Executive and Principal Financial Officers pursuant to Section 406 of the Sarbanes-Oxley Act of 2002 attached hereto.
(a)(2) A separate certification for each principal executive officer and principal financial officer of the registrant as required by Rule 30a-2(a) under the Act (17 CFR 270.30a-2).
Certifications pursuant to Rule 30a-2(a) under the Investment Company Act of 1940 are attached hereto.
(a)(3) Any written solicitation to purchase securities under Rule 23c-1 under the Act (17 CFR 270.23c-1) sent or given during the period covered by the report by or on behalf of the registrant to 10 or more persons.
Not applicable.
(b) A separate or combined certification for each principal executive officer and principal officer of the registrant as required by Rule 30a-2(b) under the Act of 1940.
Certifications pursuant to Rule 30a-2(b) under the Investment Company Act of 1940 are attached hereto.
SIGNATURES
Pursuant to the requirements of the Securities Exchange Act of 1934 and the Investment Company Act of 1940, the registrant has duly caused this report to be signed on its behalf by the undersigned, thereunto duly authorized.
J.P. Morgan Exchange-Traded Fund Trust
| | |
| By: | | /s/ Robert F. Deutsch |
| | Robert F. Deutsch |
| | President and Principal Executive Officer |
| | December 29, 2014 |
Pursuant to the requirements of the Securities Exchange Act of 1934 and the Investment Company Act of 1940, this report has been signed below by the following persons on behalf of the registrant and in the capacities and on the dates indicated.
| | |
| By: | | /s/ Robert F. Deutsch |
| | Robert F. Deutsch |
| | President and Principal Executive Officer |
| | December 29, 2014 |
| | |
| By: | | /s/ Paul E. Shield |
| | Paul E. Shield |
| | Treasurer and Principal Financial Officer |
| | December 29, 2014 |