UNITED STATES
SECURITIES AND EXCHANGE COMMISSION
Washington, D.C. 20549
FORM N-CSR
CERTIFIED SHAREHOLDER REPORT OF REGISTERED
MANAGEMENT INVESTMENT COMPANIES
Investment Company Act file number: 811-22903
J.P. Morgan Exchange-Traded Fund Trust
(Exact name of registrant as specified in charter)
270 Park Avenue
New York, NY 10017
(Address of principal executive offices) (Zip code)
Frank J. Nasta, Esq.
J.P. Morgan Investment Management Inc.
270 Park Avenue
New York, NY 10017
(Name and Address of Agent for Service)
With copies to:
| | |
| Elizabeth A. Davin, Esq. | | Jon S. Rand Esq. |
| JPMorgan Chase & Co. | | Dechert LLP |
| 460 Polaris Parkway | | 1095 Avenue of the Americas |
| Westerville, OH 43082 | | New York, NY 10036 |
Registrant’s telephone number, including area code: (844) 457-6383
Date of fiscal year end: October 31
Date of reporting period: November 1, 2014 through October 31, 2015
Form N-CSR is to be used by management investment companies to file reports with the Commission not later than 10 days after the transmission to stockholders of any report that is required to be transmitted to stockholders under Rule 30e-1 under the Investment Company Act of 1940 (17 CFR 270.30e-1). The Commission may use the information provided on Form N-CSR in its regulatory, disclosure review, inspection, and policymaking roles.
A registrant is required to disclose the information specified by Form N-CSR, and the Commission will make this information public. A registrant is not required to respond to the collection of information contained in Form N-CSR unless the Form displays a currently valid Office of Management and Budget (“OMB”) control number. Please direct comments concerning the accuracy of the information collection burden estimate and any suggestions for reducing the burden to Secretary, Securities and Exchange Commission, 450 Fifth Street, NW, Washington, DC 20549-0609. The OMB has reviewed this collection of information under the clearance requirements of 44 U.S.C. Section 3507.
ITEM 1. REPORTS TO STOCKHOLDERS.
The following is a copy of the report transmitted to shareholders pursuant to Rule 30e-1 under the Investment Company Act of 1940 (17 CFR 270.30e-1).
Annual Report
JPMorgan Exchange-Traded Funds
October 31, 2015
JPMorgan Diversified Return Emerging Markets Equity ETF
JPMorgan Diversified Return Global Equity ETF
JPMorgan Diversified Return International Equity ETF

CONTENTS
Investments in a Fund are not bank deposits or obligations of, or guaranteed or endorsed by, any bank and are not insured or guaranteed by the FDIC, the Federal Reserve Board or any other government agency. You could lose money if you sell when the Fund’s share price is lower than when you invested.
Past performance is no guarantee of future performance. The general market views expressed in this report are opinions based on market and other conditions through the end of the reporting period and are subject to change without notice. These views are not intended to predict the future performance of a Fund or the securities markets. References to specific securities and their issuers are for illustrative purposes only and are not intended to be, and should not be interpreted as, recommendations to purchase or sell such securities. Such views are not meant as investment advice and may not be relied on as an indication of trading intent on behalf of any Fund.
Prospective investors should refer to the Funds’ prospectus for a discussion of the Funds’ investment objectives, strategies and risks. Call J.P. Morgan Exchange-Traded Funds at (844) 457-6383 for a prospectus containing more complete information about a Fund, including management fees and other expenses. Please read it carefully before investing.
PRESIDENT’S LETTER
November 30, 2015 (Unaudited)
| | |
 | | “While investors may not be able to avoid global financial market volatility, we believe the basic principles of a well-diversified portfolio, a long term outlook and avoiding excess concentrations provide the most prudent approach toward the current trends in the global financial marketplace.” |
Over the past year, we have been busy building the JPMorgan Exchange-Traded Fund (ETF) business. Recently, we launched our fourth Diversified Return Equity ETF. Our newest ETF targets large cap U.S. equities (JPUS) and complements our funds that invest in global equity (JPGE), developed markets equity (JPIN) and emerging market equity (JPEM). We are seeking to launch several more strategies in our suite of ETFs that uniquely address the risks associated with excess concentrations in sectors of the economy and regions of the world, while selecting stocks with key equity factors. We look forward to telling you more about these new funds as we introduce them.
In recent months, increasing market volatility was punctuated by declining equity markets in late summer followed by rebounding markets in the fall. Following declines in June through September, the Standard & Poor’s 500 Index (S&P 500) finished October with its best one-month performance since October 2011, Japan’s Nikkei Index gained the most since April 2013 and leading European indexes had their best performance since 2009.
Even as leading central banks have extended economic stimulus, financial market volatility has increased over the past year amid slowing growth in China, weakness in commodities prices and uncertainty about the strength of the global economic recovery. Further, financial market apprehension about the pace of future interest rate increases in the U.S. added to investor anxiety. We believe it’s likely that this period of relatively high market volatility will continue into 2016 and beyond.
With this as a backdrop, we thought it would be helpful to share our thoughts on market volatility with you. In recent research developed by JPMorgan and published in “Market Insights: Investing with Composure in Volatile Markets”, we see there have been meaningful declines in equity markets within most calendar years. However, despite average intra-year declines of 14.2%, the S&P 500 posted positive annual returns in 27 of the
past 35 years. This serves to illustrate the importance of keeping market volatility in proper perspective, focusing on longer investment horizons and maintaining portfolio discipline.
Within this volatile market climate, the principles of sound investing provide useful guidelines for investors seeking investment returns over the long-term. Those principles include employing a portfolio that is well diversified across asset classes and adhering to a long-term view of returns. It is also important to remember that attempting to successfully anticipate price swings in financial markets is extremely difficult.
But, what else can an investor do? One thought we want to emphasize is the concept of diversifying within an asset class. In other words, in addition to portfolio diversification across stocks, bonds and real assets, we believe that diversifying the equity portion of a portfolio by deploying complementary strategies has meaningful benefits.
In our opinion, investors should consider strategies that offer lower overall volatility and compensate for the risk of excess sector concentration that is inherent in traditional indexes and well-known market-weighted index mutual funds. The impact of financial market volatility may be mitigated by a properly diversified portfolio that is free of excess concentrations in any particular region, sector or asset class.
While investors may not be able to avoid global financial market volatility, we believe the basic principles of a well-diversified portfolio, a long-term outlook and avoiding excess concentrations provide the most prudent approach toward the current trends in the global financial marketplace. On behalf of everyone at J.P. Morgan Asset Management, thank you for your continued support. We look forward to managing your investment needs for years to come.
If you should have any questions, or would like a copy of “Market Insights: Investing with Composure in Volatile Markets,” please visit www.jpmorganfunds.com or call J.P. Morgan Exchange-Traded Funds at 1-844-457-6383.
Sincerely yours,

Robert F. Deutsch
President, J.P. Morgan Exchange-Traded Funds
J.P. Morgan Asset Management
| | | | | | | | |
| | | |
| OCTOBER 31, 2015 | | JPMORGAN EXCHANGE-TRADED FUNDS | | | | | 1 | |
JPMorgan Diversified Return Emerging Markets Equity ETF
FUND COMMENTARY
FOR THE PERIOD JANUARY 7, 2015 (FUND INCEPTION DATE) THROUGH OCTOBER 31, 2015 (Unaudited)
| | | | |
| REPORTING PERIOD RETURN: | |
| JPMorgan Diversified Return Emerging Markets Equity ETF* | | | -9.54% | |
| Market Price** | | | -9.46% | |
| FTSE Emerging Diversified Factor Index (net of foreign withholding taxes) | | | -8.18% | |
| FTSE Emerging Net Index | | | -9.00% | |
| Morgan Stanley Capital International (“MSCI”) Emerging Markets Index (net of foreign withholding taxes) | | | -8.01% | |
| |
| Net Assets as of 10/31/2015 | | $ | 36,185,674 | |
INVESTMENT OBJECTIVE***
The JPMorgan Diversified Return Emerging Markets Equity ETF (the “Fund”) seeks investment results that closely correspond, before fees and expenses, to the performance of the FTSE Emerging Diversified Factor Index (net of foreign withholding taxes) (the “Underlying Index”).
INVESTMENT APPROACH
The Fund is passively managed to the Underlying Index, which provides emerging markets equity exposure, diversified across emerging market regions and industries. The Underlying Index uses a proprietary multi-factor stock selection process that utilizes the following characteristics: value, momentum and quality. The Underlying Index methodology includes quarterly rebalancing and liquidity screens.
HOW DID THE MARKET PERFORM?
Global financial markets experienced increased volatility through the latter part of the reporting period January 7, 2015 inception through October 31, 2015, punctuated by a sharp sell-off in equities and bonds in August. Weakness in commodities prices, slowing economic growth in China and anxiety over U.S. interest rate policy weighed on financial markets through the summer. In mid-August, Chinese authorities surprised markets by devaluing the yuan by 2%, but when that didn’t halt declines in Shanghai/Shenzhen markets, a global sell-off followed on August 24, 2015. The selling erased year-to-date gains in China’s equity market. The Shanghai Composite Index had its worst one-day performance since 2007.
However, most equity markets rebounded in September and October as China’s central bank undertook further actions to bolster domestic financial markets and the U.S. Federal Reserve held interest rates at historically low levels. Emerging market equities did participate in the October rebound, but persistent weakness in global commodities prices along with
currency devaluations and deterioration in corporate balance sheets pulled investment capital from emerging market nations.
HOW DID THE FUND PERFORM?
The Fund posted a negative absolute performance for the period January 7, 2015 to October 31, 2015 and experienced a deviation of -1.36% relative to the Underlying Index.
On an absolute basis, the Fund’s positions in the financials and defensives (health care, telecommunications and utilities) were leading detractors from performance, while the Fund’s positions in the industry sector (including the industrials and technology subsectors) and commodities sector (basic materials, oil and gas) were the small detractors from performance.
By region, the largest detractors from absolute performance were Latin America (Brazil, Chile, Colombia and Mexico) and ASEAN (Indonesia, Malaysia, Philippines and Thailand), while the smallest detractors from absolute performance were “ChIndia” (China and India) and Taiwan.
Because the Fund’s holdings were closely aligned with those of the Underlying Index, variances in relative performance due to security selection and/or sector allocation were not significant. The majority of the Fund’s deviations from the Underlying Index related to issues around local market access in certain countries, differences in valuations because of the timing of the local market closings and the net asset value calculations.
HOW WAS THE FUND POSITIONED?
At the end of the reporting period, the Fund’s and Underlying Index’s largest allocations of assets were to ChIndia and Taiwan and the smallest allocations were to Latin America and ASEAN. In terms of sectors, the Fund’s and Underlying Index’s largest positions were in financials and industry sectors. The smallest positions were in the commodities and consumer sectors.
| | | | | | |
| | | |
| 2 | | | | JPMORGAN EXCHANGE-TRADED FUNDS | | OCTOBER 31, 2015 |
| | | | | | | | |
| TOP TEN EQUITY HOLDINGS OF THE PORTFOLIO**** | |
| | 1. | | | iShares MSCI India ETF | | | 9.2 | % |
| | 2. | | | Tencent Holdings Ltd. | | | 3.4 | |
| | 3. | | | Taiwan Semiconductor Manufacturing Co., Ltd. | | | 3.2 | |
| | 4. | | | China Mobile Ltd. | | | 2.8 | |
| | 5. | | | Hon Hai Precision Industry Co., Ltd. | | | 2.2 | |
| | 6. | | | America Movil SAB de CV | | | 1.5 | |
| | 7. | | | Ambev S.A. | | | 1.4 | |
| | 8. | | | China Construction Bank Corp. | | | 1.3 | |
| | 9. | | | MTN Group Ltd. | | | 1.1 | |
| | 10. | | | Gazprom OAO | | | 0.9 | |
| | | | | | |
PORTFOLIO COMPOSITION BY COUNTRY**** | |
| China | | | 23.3 | % |
| Taiwan | | | 18.9 | |
India | | | 9.2 | |
| South Africa | | | 8.4 | |
| Brazil | | | 6.8 | |
| Mexico | | | 5.0 | |
| Russia | | | 4.7 | |
| Thailand | | | 4.6 | |
| Indonesia | | | 4.2 | |
| Malaysia | | | 4.2 | |
| Philippines | | | 4.0 | |
| Turkey | | | 1.6 | |
| Chile | | | 1.7 | |
| Poland | | | 1.3 | |
| Other (each less than 1%) | | | 2.1 | |
| * | | The return shown is based on net asset value calculated for shareholder transactions and may differ from the return shown in the financial highlights, which reflects adjustments made to the net asset value in accordance with accounting principles generally accepted in the United States of America. The net asset value was $45.23 as of October 31, 2015. |
| ** | | Market price cumulative return is calculated assuming an initial investment made at the inception date net asset value, reinvestment of all dividends and distributions at market price during the period, and sale at the market price on the last day of the period. The price used to calculate the market price return is the midpoint of the bid/ask spread at the close of business on the NYSE Arca, Inc. The midpoint price was $45.27 as of October 31, 2015. |
| *** | | The adviser seeks to achieve the Fund’s objective. There can be no guarantee it will be achieved. |
| **** | | Percentages indicated are based on total investments as of October 31, 2015. The Fund’s composition is subject to change. |
| | | | | | | | |
| | | |
| OCTOBER 31, 2015 | | JPMORGAN EXCHANGE-TRADED FUNDS | | | | | 3 | |
JPMorgan Diversified Return Emerging Markets Equity ETF
FUND COMMENTARY
FOR THE PERIOD JANUARY 7, 2015 (FUND INCEPTION DATE) THROUGH OCTOBER 31, 2015 (Unaudited) (continued)
| | | | | | | | |
AVERAGE ANNUAL TOTAL RETURNS AS OF OCTOBER 31, 2015 | |
| | |
| | | INCEPTION DATE | | | SINCE INCEPTION | |
JPMorgan Diversified Return Emerging Markets Equity ETF | | | 1/07/2015 | | | | -9.54 | % |
Market Price | | | | | | | -9.46 | |
LIFE OF FUND PERFORMANCE (1/07/15 TO 10/31/15)
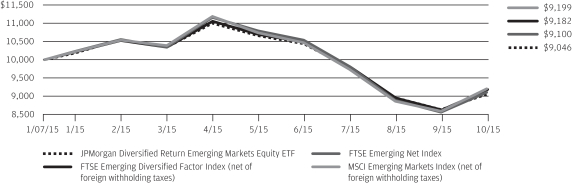
The performance quoted is past performance and is not a guarantee of future results. Exchange-traded funds are subject to certain market risks. Investment returns and principal value of an investment will fluctuate so that an investor’s shares, when sold or redeemed, may be worth more or less than their original cost. Current performance may be higher or lower than the performance data shown. For up-to-date, month-end performance information please call 1-844-457-6383.
Fund commenced operations on January 7, 2015.
The graph illustrates comparative performance for $10,000 invested in shares of the JPMorgan Diversified Return Emerging Markets Equity ETF, the FTSE Emerging Diversified Factor Index , the FTSE Emerging Net Index, and the MSCI Emerging Markets Index from January 7, 2015 to October 31, 2015. The performance of the Fund reflects the deduction of Fund expenses and assumes reinvestment of all dividends and capital gain distributions, if any. The performance of the FTSE Emerging Diversified Factor Index, the FTSE Emerging Net Index and the MSCI Emerging Markets Index does not reflect the deduction of expenses associated with an exchange-traded fund and has been adjusted to reflect reinvestment of all dividends and capital gain distributions of the securities included in the Index, if applicable. The FTSE Emerging Diversified Factor Index is an index comprised of equity securities from emerging markets selected to represent a diversified set of factor characteristics, originally developed by the adviser and its holdings are selected by the index provider primarily from the constituents of the FTSE Emerging Net Index. The FTSE Emerging Net Index is part of the FTSE Global Equity Index Series. The series includes
large and mid cap securities from advanced and secondary emerging markets, classified in accordance with FTSE’s transparent Country Classification Review Process. The FTSE Emerging Index provides investors with a comprehensive means of measuring the performance of the most liquid companies in the emerging markets. FTSE International Limited is the index provider for the two FTSE indexes. The MSCI Emerging Markets Index is a free float-adjusted market capitalization weighted index that is designed to measure the equity market performance of emerging markets. Investors cannot invest directly in an index.
Fund performance reflects the waiver of the Fund’s fees and reimbursement of expenses for certain periods since the inception date. Without these waivers and reimbursements, performance would have been lower. Also, performance shown in this section does not reflect the deduction of taxes that a shareholder may pay on Fund distributions or redemption or sale of Fund shares.
International investing involves a greater degree of risk and increased volatility. Changes in currency exchange rates and differences in accounting and taxation policies outside the United States can raise or lower returns. Also, some overseas markets may not be as politically and economically stable as the United States and other nations.
The returns shown are based on net asset values calculated for shareholder transactions and may differ from the returns shown in the financial highlights, which reflect adjustments made to the net asset values in accordance with accounting principles generally accepted in the United States of America.
| | | | | | |
| | | |
| 4 | | | | JPMORGAN EXCHANGE-TRADED FUNDS | | OCTOBER 31, 2015 |
JPMorgan Diversified Return Global Equity ETF
FUND COMMENTARY
FOR THE YEAR ENDED OCTOBER 31, 2015 (Unaudited)
| | | | |
| REPORTING PERIOD RETURN: | |
| JPMorgan Diversified Return Global Equity ETF * | | | 2.36% | |
| Market Price** | | | 1.82% | |
| FTSE Developed Diversified Factor Index (net of foreign withholding taxes) | | | 3.37% | |
| FTSE Developed Net Index | | | 1.74% | |
| Morgan Stanley Capital International (“MSCI”) World Index (net of foreign withholding taxes) | | | 1.77% | |
| |
| Net Assets as of 10/31/2015 | | $ | 50,530,034 | |
INVESTMENT OBJECTIVE***
The JPMorgan Diversified Return Global Equity ETF (the “Fund”) seeks investment results that closely correspond, before fees and expenses, to the performance of the FTSE Developed Diversified Factor Index (net of foreign withholding taxes) (the “Underlying Index”).
INVESTMENT APPROACH
The Fund is passively managed to the Underlying Index, which provides exposure to large and mid-cap equity securities in developed global markets, diversified across global regions and industries. The Underlying Index uses a proprietary multifactor security selection process that utilizes the following characteristics: relative valuation, price momentum, low volatility and specific market capitalization. The Underlying Index’s methodology includes quarterly rebalancing, and liquidity screens.
HOW DID THE MARKET PERFORM?
Global financial markets experienced increased volatility through the second half of the twelve month period, punctuated by a sharp sell-off in equities and bonds in August. Even as the Greek debt crisis was largely resolved by June, weakness in commodities prices, slowing economic growth in China and anxiety over U.S. interest rate policy weighed on financial markets through the summer. In mid-August, Chinese authorities surprised markets by devaluing the yuan by 2%, but when that didn’t halt declines in Shanghai/Shenzhen markets, a global sell-off followed on August 24, 2015. The selling erased year-to-date gains in China’s equity market. The Shanghai Composite Index had its worst one-day performance since 2007. For the day, the Standard & Poor’s 500 Index (the “S&P 500”) dropped 3.9%, and equity markets in Europe and Japan also fell.
However, most equity markets rebounded in September and October as China’s central bank undertook further actions to
bolster domestic financial markets and the U.S. Federal Reserve held interest rates at historically low levels. October was an especially strong month for global equities: The S&P 500 turned in its best one-month performance since October 2011, Japan’s Nikkei Index posted its biggest monthly gain since April 2013 and leading European indexes had their best performance since 2009.
HOW DID THE FUND PERFORM?
For the twelve months ended October 31, 2015, the Fund posted a positive absolute performance and experienced a deviation of -1.01% relative to the Underlying Index.
On an absolute basis, the Fund’s positions in the health care and consumer goods sectors were leading contributors to performance for the twelve month reporting period, while its positions in the oil & gas sector and the basic materials sector were the sole detractors from performance.
Because the Fund’s holdings were closely aligned with those of the Underlying Index, variances in relative performance due to security selection and/or sector allocation were not significant. The majority of the Fund’s deviation against the Underlying Index was due to specific trading limits, differences in valuations because of the timing of the local market closings and the net asset value calculations, the Fund’s small cash allocation and fees and operating expenses incurred by the Fund.
HOW WAS THE FUND POSITIONED?
At the end of the reporting period, the Fund’s and Underlying Index’s largest allocation of assets was to North American markets – particularly the U.S. – with smaller allocations to Asia, Europe and Japan. In terms of sectors, the Fund’s largest positions were in the consumer goods, consumer services and health care sectors, while the smallest positions were in the basic materials, telecommunications and oil & gas sectors.
| | | | | | | | |
| | | |
| OCTOBER 31, 2015 | | JPMORGAN EXCHANGE-TRADED FUNDS | | | | | 5 | |
JPMorgan Diversified Return Global Equity ETF
FUND COMMENTARY
FOR THE YEAR ENDED OCTOBER 31, 2015 (Unaudited) (continued)
| | | | | | | | |
| TOP TEN EQUITY HOLDINGS OF THE PORTFOLIO**** | |
| | 1. | | | Samsung Electronics Co., Ltd. | | | 0.7 | % |
| | 2. | | | CK Hutchison Holdings Ltd. | | | 0.5 | |
| | 3. | | | Toyota Motor Corp. | | | 0.5 | |
| | 4. | | | SK C&C Co., Ltd. | | | 0.4 | |
| | 5. | | | Wesfarmers Ltd. | | | 0.4 | |
| | 6. | | | CSL Ltd. | | | 0.4 | |
| | 7. | | | Singapore Telecommunications Ltd. | | | 0.4 | |
| | 8. | | | Link REIT (The) | | | 0.4 | |
| | 9. | | | Power Assets Holdings Ltd. | | | 0.4 | |
| | 10. | | | Korea Electric Power Corp. | | | 0.4 | |
| | | | | | |
PORTFOLIO COMPOSITION BY COUNTRY**** | |
| United States | | | 26.7 | % |
| Japan | | | 20.5 | |
| Australia | | | 9.3 | |
| South Korea | | | 9.1 | |
| United Kingdom | | | 4.4 | |
| Hong Kong | | | 4.2 | |
| France | | | 4.0 | |
| Germany | | | 3.3 | |
| Sweden | | | 2.6 | |
| Singapore | | | 2.5 | |
| Canada | | | 2.4 | |
| Spain | | | 2.1 | |
| Switzerland | | | 1.9 | |
| Netherlands | | | 1.1 | |
| Italy | | | 1.1 | |
| Belgium | | | 1.0 | |
| Norway | | | 1.0 | |
| Other (each less than 1%) | | | 2.8 | |
| * | | The return shown is based on net asset value calculated for shareholder transactions and may differ from the return shown in the financial highlights, which reflects adjustments made to the net asset value in accordance with accounting principles generally accepted in the United States of America. The net asset value was $50.53 as of October 31, 2015. |
| ** | | Market price cumulative return is calculated assuming an initial investment made at the inception date net asset value, reinvestment of all dividends and distributions at market price during the period, and sale at the market price on the last day of the period. The price used to calculate the market price return is the midpoint of the bid/ask spread at the close of business on the NYSE Arca. The midpoint price was $50.67 as of October 31, 2015. |
| *** | | The adviser seeks to achieve the Fund’s objective. There can be no guarantee it will be achieved. |
| **** | | Percentages indicated are based on total investments as of October 31, 2015. The Fund’s composition is subject to change. |
| | | | | | |
| | | |
| 6 | | | | JPMORGAN EXCHANGE-TRADED FUNDS | | OCTOBER 31, 2015 |
| | | | | | | | | | | | |
AVERAGE ANNUAL TOTAL RETURNS AS OF OCTOBER 31, 2015 | |
| | | |
| | | INCEPTION DATE | | | 1 YEAR | | | SINCE
INCEPTION | |
JPMorgan Diversified Return Global Equity ETF | | | 6/16/2014 | | | | 2.36 | % | | | 1.25 | % |
Market Price | | | | | | | 1.82 | | | | 1.45 | |
LIFE OF FUND PERFORMANCE (6/16/14 TO 10/31/15)
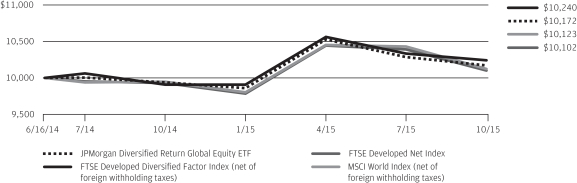
The performance quoted is past performance and is not a guarantee of future results. Exchange-traded funds are subject to certain market risks. Investment returns and principal value of an investment will fluctuate so that an investor’s shares, when sold or redeemed, may be worth more or less than their original cost. Current performance may be higher or lower than the performance data shown. For up-to-date, month-end performance information please call 1-844-457-6383.
Fund commenced operations on June 16, 2014.
The graph illustrates comparative performance for $10,000 invested in shares of the JPMorgan Diversified Return Global Equity ETF, the FTSE Developed Diversified Factor Index, the FTSE Developed Net Index, and the MSCI World Index from June 16, 2014 to October 31, 2015. The performance of the Fund reflects the deduction of Fund expenses and assumes reinvestment of all dividends and capital gain distributions, if any. The performance of the FTSE Developed Diversified Factor Index, the FTSE Developed Net Index and the MSCI World Index does not reflect the deduction of expenses associated with an exchange-traded fund and has been adjusted to reflect reinvestment of all dividends and capital gain distributions of the securities included in the Index, if applicable. The FTSE Developed Diversified Factor Index is an index comprised of equity securities from developed global markets selected to represent a diversified set of factor characteristics, originally developed by the adviser and its holdings are selected by the index provider primarily from the constituents of the FTSE Developed Net Index. The FTSE Developed Net Index is a market-
capitalization weighted index representing the performance of large and mid cap companies in Developed markets. The index is derived from the FTSE Global Equity Index Series (GEIS), which covers 98% of the world’s investable market capitalization. FTSE International Limited is the index provider for the two indexes. The MSCI World Index is a free float-adjusted market capitalization weighted index that is designed to measure the equity market performance of developed markets. Investors cannot invest directly in an index.
Fund performance reflects the waiver of the Fund’s fees and reimbursement of expenses for certain periods since the inception date. Without these waivers and reimbursements, performance would have been lower. Also, performance shown in this section does not reflect the deduction of taxes that a shareholder may pay on Fund distributions or redemption or sale of Fund shares.
International investing involves a greater degree of risk and increased volatility. Changes in currency exchange rates and differences in accounting and taxation policies outside the United States can raise or lower returns. Also, some overseas markets may not be as politically and economically stable as the United States and other nations.
The returns shown are based on net asset values calculated for shareholder transactions and may differ from the returns shown in the financial highlights, which reflect adjustments made to the net asset values in accordance with accounting principles generally accepted in the United States of America.
| | | | | | | | |
| | | |
| OCTOBER 31, 2015 | | JPMORGAN EXCHANGE-TRADED FUNDS | | | | | 7 | |
JPMorgan Diversified Return International Equity ETF
FUND COMMENTARY
FOR THE PERIOD NOVEMBER 5, 2014 (FUND INCEPTION DATE) THROUGH OCTOBER 31, 2015 (Unaudited)
| | | | |
| REPORTING PERIOD RETURN: | |
| JPMorgan Diversified Return International Equity ETF* | | | 2.65% | |
| Market Price** | | | 2.40% | |
| FTSE Developed ex North America Diversified Factor Index (net of foreign withholding taxes) | | | 3.71% | |
| FTSE Developed ex North America Net Index | | | 0.64% | |
| Morgan Stanley Capital International (“MSCI”) Europe, Australia and Far East (“EAFE”) Index (net of foreign withholding taxes) | | | 0.29% | |
| |
| Net Assets as of 10/31/2015 | | $ | 92,113,607 | |
INVESTMENT OBJECTIVE***
The JPMorgan Diversified Return International Equity ETF (the “Fund”) seeks investment results that closely correspond, before fees and expenses, to the performance of the FTSE Developed ex North America Diversified Factor Index (net of foreign withholding taxes) (the “Underlying Index”).
INVESTMENT APPROACH
The Fund is passively managed to the Underlying Index, which tracks large and mid-cap equity securities in developed markets outside North America, diversified across industries and international regions. The Underlying Index uses a proprietary multifactor security selection process that measures the following characteristics: relative valuation, price momentum, low volatility and specific market capitalization. The Underlying Index methodology includes quarterly rebalancing and liquidity screens.
HOW DID THE MARKET PERFORM?
Global financial markets experienced increased volatility through the period November 5, 2014 to October 31, 2015, punctuated by a sharp sell-off in equities and bonds in August. Even as the Greek debt crisis was largely resolved by June, weakness in commodities prices, slowing economic growth in China and anxiety over U.S. interest rate policy weighed on financial markets through the summer. In mid-August, Chinese authorities surprised markets by devaluing the yuan by 2%, but when that didn’t halt declines in Shanghai/Shenzhen markets, a global sell-off followed on August 24, 2015. The selling erased year-to-date gains in China’s equity market. The Shanghai Composite Index had its worst one-day performance since 2007. Equity markets in the Europe and Japan also fell.
However, most equity markets rebounded in September and October as China’s central bank undertook further actions to bolster domestic financial markets and the U.S. Federal Reserve held interest rates at historically low levels. October was an especially strong month for global equities: The Standard and Poor’s 500 turned in its best one-month performance since October 2011, Japan’s Nikkei Index posted its largest
monthly gain since April 2013 and leading European indexes had their best performance since 2009.
HOW DID THE FUND PERFORM?
The Fund posted a positive absolute performance for the period November 5, 2014 to October 31, 2015. During the period, the Fund experienced a deviation of -1.06% relative to the Underlying Index but outperformed the MSCI EAFE Index and the FTSE Developed ex North America Net Index, which are more traditional market capital weighted indexes.
Because the Fund’s holdings were closely aligned with those of the Underlying Index, variances in performance relative to the Underlying Index were not significant. The majority of the Fund’s deviation against the Underlying Index was due to specific trading limits, differences in valuations because of the timing of the local market closings and the net asset value calculations, the Fund’s small cash allocation and fees and operating expenses incurred by the Fund.
Relative to market-cap weighted indexes, the Fund’s and Underlying Index’s multi-factor filter contributed to performance across all regions and in most economic sectors, particularly in basic materials, financials and health care. The Fund’s and Underlying Index’s allocation detracted from performance relative to the market-cap weighted indexes, mostly due to an underweight position in the consumer goods sector, an overweight to the oil & gas sector, an overweight position in the Pacific region (excluding Japan) and an underweight position in Europe (excluding the U.K.)
HOW WAS THE FUND POSITIONED?
By seeking to track the Underlying Index, the Fund seeks to deliver superior risk-adjusted returns by avoiding undue concentrations of risk that tend to characterize more traditional market-cap weighted indexes. The Underlying Index’s weightings are structured to distribute risk evenly across 40 regional sectors. A multi-factor stock screen is then used to identify the most attractive stocks in each regional sector, while avoiding the least attractive stocks.
| | | | | | |
| | | |
| 8 | | | | JPMORGAN EXCHANGE-TRADED FUNDS | | OCTOBER 31, 2015 |
| | | | | | | | |
| TOP TEN EQUITY HOLDINGS OF THE PORTFOLIO**** | |
| | 1. | | | BP plc | | | 0.8 | % |
| | 2. | | | Royal Dutch Shell plc | | | 0.7 | |
| | 3. | | | GlaxoSmithKline plc | | | 0.7 | |
| | 4. | | | Samsung Electronics Co., Ltd. | | | 0.6 | |
| | 5. | | | Vodafone Group plc | | | 0.6 | |
| | 6. | | | AstraZeneca plc | | | 0.6 | |
| | 7. | | | BT Group plc | | | 0.5 | |
| | 8. | | | BG Group plc | | | 0.5 | |
| | 9. | | | Unilever plc | | | 0.5 | |
| | 10. | | | British Land Co., plc | | | 0.5 | |
| | | | | | |
PORTFOLIO COMPOSITION BY COUNTRY**** | |
| Japan | | | 23.7 | % |
| United Kingdom | | | 23.1 | |
| South Korea | | | 9.4 | |
| Australia | | | 8.8 | |
| Hong Kong | | | 5.3 | |
| France | | | 5.2 | |
| Germany | | | 4.2 | |
| Singapore | | | 3.3 | |
| Netherlands | | | 2.6 | |
| Sweden | | | 2.4 | |
| Spain | | | 2.2 | |
| Switzerland | | | 1.9 | |
| Finland | | | 1.5 | |
| Italy | | | 1.4 | |
| Denmark | | | 1.1 | |
| Belgium | | | 1.0 | |
| Norway | | | 1.0 | |
| Other (each less than 1%) | | | 1.9 | |
| * | | The return shown is based on net asset value calculated for shareholder transactions and may differ from the return shown in the financial highlights, which reflects adjustments made to the net asset value in accordance with accounting principles generally accepted in the United States of America. The net asset value was $51.17 as of October 31, 2015. |
| ** | | Market price cumulative return is calculated assuming an initial investment made at the inception date net asset value, reinvestment of all dividends and distributions at market price during the period, and sale at the market price on the last day of the period. The price used to calculate the market price return is the midpoint of the bid/ask spread at the close of business on the NYSE Arca. The midpoint price was $51.05 as of October 31, 2015. |
| *** | | The adviser seeks to achieve the Fund’s objective. There can be no guarantee it will be achieved. |
| **** | | Percentages indicated are based on total investments as of October 31, 2015. The Fund’s composition is subject to change. |
| | | | | | | | |
| | | |
| OCTOBER 31, 2015 | | JPMORGAN EXCHANGE-TRADED FUNDS | | | | | 9 | |
JPMorgan Diversified Return International Equity ETF
FUND COMMENTARY
FOR THE PERIOD NOVEMBER 5, 2014 (FUND INCEPTION DATE) THROUGH OCTOBER 31, 2015 (Unaudited) (continued)
| | | | | | | | |
AVERAGE ANNUAL TOTAL RETURNS AS OF OCTOBER 31, 2015 | |
| | |
| | | INCEPTION DATE | | | SINCE INCEPTION | |
JPMorgan Diversified Return International Equity ETF | | | 11/05/2014 | | | | 2.65 | % |
Market Price | | | | | | | 2.40 | |
LIFE OF FUND PERFORMANCE (11/05/14 TO 10/31/15)
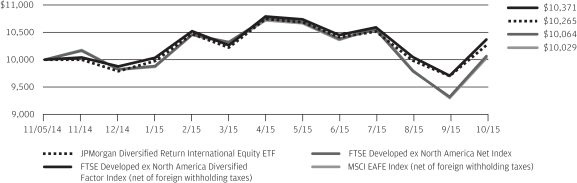
The performance quoted is past performance and is not a guarantee of future results. Exchange-traded funds are subject to certain market risks. Investment returns and principal value of an investment will fluctuate so that an investor’s shares, when sold or redeemed, may be worth more or less than their original cost. Current performance may be higher or lower than the performance data shown. For up-to-date, month-end performance information please call 1-844-457-6383.
Fund commenced operations on November 5, 2014.
The graph illustrates comparative performance for $10,000 invested in shares of the JPMorgan Diversified Return International Equity ETF, the FTSE Developed ex North America Diversified Factor Index, the FTSE Developed ex North America Net Index, and the MSCI EAFE Index from November 5, 2014 to October 31, 2015. The performance of the Fund reflects the deduction of Fund expenses and assumes reinvestment of all dividends and capital gain distributions, if any. The performance of the FTSE Developed ex North America Diversified Factor Index, the FTSE Developed ex North America Net Index and the MSCI EAFE Index does not reflect the deduction of expenses associated with an exchange-traded fund and has been adjusted to reflect reinvestment of all dividends and capital gain distributions of the securities included in the Index, if applicable. The FTSE Developed ex North America Diversified Factor Index is an index comprised of equity securities from developed global markets (excluding North America) selected to represent a diversified set of factor characteristics, originally developed by the adviser and its holdings are selected by the index provider primarily from the constituents of the FTSE Developed ex North
America Net Index. The FTSE Developed ex North America Net Index is part of a range of indices designed to help investors benchmark their international investments. The index comprises Large and Mid cap stocks providing coverage of Developed markets, excluding the U.S. and Canada. The index is derived from the FTSE Global Equity Index Series (GEIS), which covers 98% of the world’s investable market capitalization. FTSE International Limited is the index provider for the two indexes. The MSCI EAFE Index is a free float-adjusted market capitalization weighted index that is designed to measure the equity market performance of developed markets, excluding the U.S. and Canada. Investors cannot invest directly in an index.
Fund performance reflects the waiver of the Fund’s fees and reimbursement of expenses for certain periods since the inception date. Without these waivers and reimbursements, performance would have been lower. Also, performance shown in this section does not reflect the deduction of taxes that a shareholder may pay on Fund distributions or redemption or sale of Fund shares.
International investing involves a greater degree of risk and increased volatility. Changes in currency exchange rates and differences in accounting and taxation policies outside the United States can raise or lower returns. Also, some overseas markets may not be as politically and economically stable as the United States and other nations.
The returns shown are based on net asset values calculated for shareholder transactions and may differ from the returns shown in the financial highlights, which reflect adjustments made to the net asset values in accordance with accounting principles generally accepted in the United States of America.
| | | | | | |
| | | |
| 10 | | | | JPMORGAN EXCHANGE-TRADED FUNDS | | OCTOBER 31, 2015 |
JPMorgan Diversified Return Emerging Markets Equity ETF
SCHEDULE OF PORTFOLIO INVESTMENTS
AS OF OCTOBER 31, 2015
| | | | | | | | |
| SHARES | | | SECURITY DESCRIPTION | | VALUE($) | |
| | | | | | | | |
| Common Stocks — 87.5% | |
| | | | Brazil — 4.7% | | | | |
| | 101,657 | | | Ambev S.A. | | | 503,204 | |
| | 11,585 | | | Banco do Brasil S.A. | | | 47,974 | |
| | 7,737 | | | BB Seguridade Participacoes S.A. | | | 53,365 | |
| | 22,100 | | | Bolsa de Valores Mercadorias e Futuros | | | 65,328 | |
| | 18,869 | | | BRF S.A. | | | 294,052 | |
| | 2,785 | | | CETIP S.A. — Mercados Organizados | | | 24,625 | |
| | 10,820 | | | Cielo S.A. | | | 102,714 | |
| | 5,368 | | | EDP — Energias do Brasil S.A. | | | 15,701 | |
| | 4,305 | | | Equatorial Energia S.A. | | | 38,389 | |
| | 5,865 | | | Estacio Participacoes S.A. | | | 23,511 | |
| | 3,200 | | | Grupo BTG Pactual | | | 23,814 | |
| | 15,210 | | | JBS S.A. | | | 56,201 | |
| | 34,056 | | | Kroton Educacional S.A. | | | 87,071 | |
| | 14,255 | | | Lojas Renner S.A. | | | 68,382 | |
| | 58,349 | | | Petroleo Brasileiro S.A. (a) | | | 141,918 | |
| | 1,224 | | | Porto Seguro S.A. | | | 10,261 | |
| | 5,557 | | | Raia Drogasil S.A. (a) | | | 57,623 | |
| | 1,033 | | | Smiles S.A. | | | 8,062 | |
| | 3,056 | | | Sul America S.A. | | | 15,000 | |
| | 2,096 | | | Transmissora Alianca de Energia Eletrica S.A. | | | 10,815 | |
| | 3,512 | | | Via Varejo S.A. | | | 3,870 | |
| | 9,149 | | | WEG S.A. | | | 34,162 | |
| | | | | | | | |
| | | | | | | 1,686,042 | |
| | | | | | | | |
| | | | Chile — 1.6% | | | | |
| | 53,196 | | | AES Gener S.A. | | | 25,576 | |
| | 64,235 | | | Aguas Andinas S.A., Class A | | | 33,781 | |
| | 306,670 | | | Banco de Chile | | | 32,452 | |
| | 555 | | | Banco de Credito e Inversiones | | | 22,632 | |
| | 782,576 | | | Banco Santander Chile S.A. | | | 37,151 | |
| | 3,283 | | | Cia Cervecerias Unidas S.A. | | | 39,381 | |
| | 158,160 | | | Colbun S.A. | | | 41,951 | |
| | 2,013,064 | | | Corpbanca S.A. | | | 18,333 | |
| | 70,541 | | | Empresa Nacional de Electricidad S.A. | | | 88,374 | |
| | 18,000 | | | Empresas CMPC S.A. | | | 44,431 | |
| | 410,456 | | | Enersis S.A. | | | 108,278 | |
| | 10,255 | | | SACI Falabella | | | 68,758 | |
| | | | | | | | |
| | | | | | | 561,098 | |
| | | | | | | | |
| | | | China — 23.3% | | | | |
| | 8,000 | | | Agile Property Holdings Ltd. | | | 4,355 | |
| | 178,000 | | | Agricultural Bank of China Ltd., Class H | | | 72,786 | |
| | 24,000 | | | Air China Ltd., Class H | | | 23,117 | |
| | 13,000 | | | Anhui Conch Cement Co., Ltd., Class H | | | 39,667 | |
| | 14,000 | | | ANTA Sports Products Ltd. | | | 39,163 | |
| | 35,000 | | | AviChina Industry & Technology Co., Ltd., Class H | | | 28,523 | |
| | | | | | | | |
| SHARES | | | SECURITY DESCRIPTION | | VALUE($) | |
| | | | | | | | |
| | | | | | | | |
| | | | China — (continued) | | | | |
| | 23,500 | | | BAIC Motor Corp. Ltd., Class H | | | 20,714 | |
| | 548,000 | | | Bank of China Ltd., Class H | | | 258,416 | |
| | 58,000 | | | Bank of Communications Co., Ltd., Class H | | | 42,781 | |
| | 16,000 | | | BBMG Corp., Class H | | | 11,212 | |
| | 16,000 | | | Beijing Capital International Airport Co., Ltd., Class H | | | 17,126 | |
| | 6,500 | | | Beijing Enterprises Holdings Ltd. | | | 41,033 | |
| | 56,000 | | | Beijing Enterprises Water Group Ltd. | | | 44,353 | |
| | 32,000 | | | Beijing Jingneng Clean Energy Co., Ltd., Class H | | | 11,072 | |
| | 81,000 | | | Belle International Holdings Ltd. | | | 78,621 | |
| | 14,400 | | | BOE Technology Group Co., Ltd., Class A | | | 4,187 | |
| | 40,000 | | | Brilliance China Automotive Holdings Ltd. | | | 55,466 | |
| | 13,000 | | | CAR, Inc. (a) | | | 22,731 | |
| | 154,000 | | | CGN Power Co., Ltd., Class H | | | 63,577 | |
| | 39,000 | | | China Agri-Industries Holdings (a) | | | 14,318 | |
| | 16,000 | | | China BlueChemical Ltd. | | | 4,772 | |
| | 60,000 | | | China Cinda Asset Management Co., Ltd., Class H | | | 23,328 | |
| | 56,000 | | | China CITIC Bank Corp., Ltd., Class H (a) | | | 36,214 | |
| | 48,000 | | | China Communications Construction Co., Ltd., Class H | | | 66,249 | |
| | 32,000 | | | China Communications Services Corp., Ltd., Class H | | | 12,837 | |
| | 12,500 | | | China Conch Venture Holdings Ltd. | | | 28,493 | |
| | 654,000 | | | China Construction Bank Corp., Class H | | | 473,990 | |
| | 45,000 | | | China Dongxiang Group Co., Ltd. | | | 11,387 | |
| | 28,000 | | | China Eastern Airlines Corp., Ltd., Class H (a) | | | 17,964 | |
| | 24,000 | | | China Everbright Bank Co., Ltd., Class H | | | 11,761 | |
| | 29,000 | | | China Everbright International Ltd. | | | 46,701 | |
| | 6,000 | | | China Everbright Ltd. | | | 14,121 | |
| | 16,000 | | | China Foods Ltd. (a) | | | 7,297 | |
| | 25,500 | | | China Galaxy Securities Co., Ltd., Class H | | | 22,072 | |
| | 16,000 | | | China Gas Holdings Ltd. | | | 25,464 | |
| | 12,000 | | | China Hongqiao Group Ltd. | | | 6,248 | |
| | 87,000 | | | China Huishan Dairy Holdings Co., Ltd. | | | 33,038 | |
| | 7,200 | | | China International Marine Containers Group Co., Ltd., Class H | | | 12,774 | |
| | 52,000 | | | China Life Insurance Co., Ltd., Class H | | | 187,516 | |
| | 39,000 | | | China Longyuan Power Group Corp., Ltd., Class H | | | 35,656 | |
| | 8,000 | | | China Machinery Engineering Corp., Class H | | | 6,943 | |
| | 14,000 | | | China Medical System Holdings | | | 19,230 | |
| | 33,000 | | | China Merchants Bank Co., Ltd., Class H | | | 86,160 | |
| | 12,329 | | | China Merchants Holdings International Co., Ltd. | | | 40,944 | |
SEE NOTES TO FINANCIAL STATEMENTS.
| | | | | | | | |
| | | |
| OCTOBER 31, 2015 | | JPMORGAN EXCHANGE-TRADED FUNDS | | | | | 11 | |
JPMorgan Diversified Return Emerging Markets Equity ETF
SCHEDULE OF PORTFOLIO INVESTMENTS
AS OF OCTOBER 31, 2015 (continued)
| | | | | | | | |
| SHARES | | | SECURITY DESCRIPTION | | VALUE($) | |
| | | | | | | | |
| Common Stocks — continued | |
| | | | China — continued | | | | |
| | 44,500 | | | China Minsheng Banking Corp., Ltd., Class H | | | 44,721 | |
| | 83,000 | | | China Mobile Ltd. | | | 995,161 | |
| | 16,000 | | | China Molybdenum Co., Ltd., Class H (a) | | | 8,870 | |
| | 32,000 | | | China National Building Material Co., Ltd., Class H | | | 19,882 | |
| | 26,000 | | | China Overseas Land & Investment Ltd. | | | 83,976 | |
| | 8,666 | | | China Overseas Property Holdings Ltd. (a) | | | 1,487 | |
| | 17,800 | | | China Pacific Insurance Group Co., Ltd., Class H | | | 70,904 | |
| | 266,000 | | | China Petroleum & Chemical Corp., Class H | | | 191,744 | |
| | 40,000 | | | China Power International Development Ltd. | | | 25,137 | |
| | 20,000 | | | China Railway Construction Corp., Ltd., Class H | | | 29,896 | |
| | 41,000 | | | China Railway Group Ltd., Class H | | | 38,621 | |
| | 16,000 | | | China Resources Cement Holdings Ltd. | | | 6,457 | |
| | 10,000 | | | China Resources Gas Group Ltd. | | | 27,430 | |
| | 20,000 | | | China Resources Land Ltd. | | | 51,972 | |
| | 28,000 | | | China Resources Power Holdings Co., Ltd. | | | 63,341 | |
| | 35,500 | | | China Shenhua Energy Co., Ltd., Class H | | | 59,730 | |
| | 66,000 | | | China Shipping Container Lines Co., Ltd., Class H (a) | | | 24,422 | |
| | 22,000 | | | China Shipping Development Co., Ltd., Class H | | | 14,369 | |
| | 32,000 | | | China South City Holdings Ltd. | | | 7,631 | |
| | 26,000 | | | China Southern Airlines Co., Ltd., Class H | | | 22,107 | |
| | 16,000 | | | China State Construction International Holdings Ltd. | | | 24,278 | |
| | 10,200 | | | China Taiping Insurance Holdings Co., Ltd. (a) | | | 32,025 | |
| | 240,000 | | | China Telecom Corp., Ltd., Class H | | | 125,189 | |
| | 26,000 | | | China Traditional Chinese Medicine Co., Ltd. (a) | | | 19,664 | |
| | 88,000 | | | China Unicom Hong Kong Ltd. | | | 107,245 | |
| | 9,600 | | | China Vanke Co., Ltd., Class H | | | 22,403 | |
| | 16,000 | | | China Zhongwang Holdings Ltd. | | | 7,047 | |
| | 13,100 | | | Chongqing Changan Automobile Co., Ltd., Class B | | | 24,110 | |
| | 24,000 | | | Chongqing Rural Commercial Bank Co., Ltd., Class H | | | 15,073 | |
| | 75,000 | | | CITIC Ltd. | | | 139,836 | |
| | 16,000 | | | CITIC Securities Co., Ltd., Class H | | | 34,477 | |
| | 168,000 | | | CNOOC Ltd. | | | 189,758 | |
| | 22,291 | | | COSCO Pacific Ltd. | | | 27,052 | |
| | 40,000 | | | Country Garden Holdings Co., Ltd. | | | 15,193 | |
| | 7,500 | | | CSG Holding Co., Ltd. | | | 5,942 | |
| | 58,000 | | | CSPC Pharmaceutical Group Ltd. | | | 54,001 | |
| | 4,700 | | | Dalian Wanda Commercial Properties Co., Ltd., Class H | | | 31,369 | |
| | | | | | | | |
| SHARES | | | SECURITY DESCRIPTION | | VALUE($) | |
| | | | | | | | |
| | | | | | | | |
| | | | China — continued | | | | |
| | 48,000 | | | Datang International Power Generation Co., Ltd., Class H | | | 17,665 | |
| | 8,900 | | | Dazhong Transportation Group Co., Ltd., Class B | | | 9,564 | |
| | 44,000 | | | Dongfeng Motor Group Co., Ltd., Class H | | | 63,158 | |
| | 12,000 | | | ENN Energy Holdings Ltd. | | | 68,744 | |
| | 37,000 | | | Evergrande Real Estate Group Ltd. | | | 28,295 | |
| | 19,000 | | | Far East Horizon Ltd. | | | 15,804 | |
| | 25,576 | | | Fosun International Ltd. | | | 46,573 | |
| | 32,000 | | | Franshion Properties China Ltd. | | | 8,814 | |
| | 5,600 | | | Fuyao Glass Industry Group Co., Ltd., Class H (a) | | | 11,972 | |
| | 116,000 | | | GCL-Poly Energy Holdings Ltd. (a) | | | 23,960 | |
| | 80,000 | | | Geely Automobile Holdings Ltd. | | | 42,661 | |
| | 10,000 | | | Golden Eagle Retail Group Ltd. | | | 12,864 | |
| | 174,000 | | | GOME Electrical Appliances Holding Ltd. | | | 31,795 | |
| | 51,000 | | | Great Wall Motor Co., Ltd., Class H | | | 61,933 | |
| | 8,000 | | | Greentown China Holdings Ltd. (a) | | | 6,997 | |
| | 11,700 | | | Guangdong Electric Power Development Co., Ltd., Class B | | | 7,645 | |
| | 44,000 | | | Guangdong Investment Ltd. | | | 61,880 | |
| | 24,000 | | | Guangshen Railway Co., Ltd., Class H | | | 12,402 | |
| | 38,000 | | | Guangzhou Automobile Group Co., Ltd., Class H | | | 33,227 | |
| | 2,000 | | | Guangzhou Baiyunshan Pharmaceutical Holdings Co., Ltd., Class H | | | 5,628 | |
| | 6,400 | | | Guangzhou R&F Properties Co., Ltd. | | | 6,352 | |
| | 19,000 | | | Haier Electronics Group Co., Ltd. | | | 36,720 | |
| | 8,000 | | | Haitian International Holdings Ltd. | | | 13,998 | |
| | 20,400 | | | Haitong Securities Co., Ltd., Class H | | | 35,494 | |
| | 11,000 | | | Hengan International Group Co., Ltd. | | | 118,783 | |
| | 40,000 | | | Huadian Fuxin Energy Corp., Ltd., Class H | | | 12,255 | |
| | 26,000 | | | Huadian Power International Corp., Ltd., Class H | | | 19,010 | |
| | 52,000 | | | Huaneng Power International, Inc., Class H | | | 56,297 | |
| | 32,000 | | | Huaneng Renewables Corp., Ltd., Class H | | | 9,938 | |
| | 8,600 | | | Huatai Securities Co., Ltd., Class H (a) | | | 19,514 | |
| | 518,000 | | | Industrial & Commercial Bank of China Ltd., Class H | | | 328,570 | |
| | 16,000 | | | Jiangsu Expressway Co., Ltd., Class H | | | 21,633 | |
| | 16,000 | | | Jiangxi Copper Co., Ltd., Class H | | | 21,071 | |
| | 8,000 | | | Kingboard Chemical Holdings Ltd. | | | 11,282 | |
| | 30,000 | | | Kunlun Energy Co., Ltd. | | | 24,491 | |
| | 8,718 | | | KWG Property Holding Ltd. | | | 6,286 | |
| | 2,900 | | | Lao Feng Xiang Co., Ltd., Class B | | | 12,479 | |
| | 16,000 | | | Lee & Man Paper Manufacturing Ltd. | | | 9,961 | |
| | 2,900 | | | Legend Holdings Corp., Class H (a) | | | 11,209 | |
SEE NOTES TO FINANCIAL STATEMENTS.
| | | | | | |
| | | |
| 12 | | | | JPMORGAN EXCHANGE-TRADED FUNDS | | OCTOBER 31, 2015 |
| | | | | | | | |
| SHARES | | | SECURITY DESCRIPTION | | VALUE($) | |
| | | | | | | | |
| Common Stocks — continued | |
| | | | China — continued | | | | |
| | 70,000 | | | Lenovo Group Ltd. | | | 65,039 | |
| | 12,000 | | | Longfor Properties Co., Ltd. | | | 16,078 | |
| | 44,000 | | | Metallurgical Corp of China Ltd., Class H | | | 15,867 | |
| | 5,600 | | | New China Life Insurance Co., Ltd., Class H | | | 24,659 | |
| | 16,000 | | | Nine Dragons Paper Holdings Ltd. | | | 10,557 | |
| | 32,000 | | | People’s Insurance Co., Ltd., Class H | | | 17,126 | |
| | 220,000 | | | PetroChina Co., Ltd., Class H | | | 172,239 | |
| | 24,000 | | | PICC Property & Casualty Co., Ltd., Class H | | | 54,458 | |
| | 35,500 | | | Ping An Insurance Group Company of China Ltd., Class H | | | 199,270 | |
| | 16,000 | | | Poly Property Group Co., Ltd. | | | 5,180 | |
| | 108,000 | | | Renhe Commercial Holdings Co., Ltd. (a) | | | 5,627 | |
| | 24,000 | | | Shandong Weigao Group Medical Polymer Co., Ltd., Class H | | | 16,571 | |
| | 3,200 | | | Shanghai Bailian Group Co., Ltd., Class B | | | 6,110 | |
| | 32,000 | | | Shanghai Electric Group Co., Ltd., Class H | | | 19,971 | |
| | 4,000 | | | Shanghai Industrial Holdings Ltd. | | | 10,525 | |
| | 3,400 | | | Shanghai Lujiazui Finance & Trade Zone Development Co., Ltd., Class B | | | 11,071 | |
| | 2,200 | | | Shanghai Mechanical and Electrical Industry Co., Ltd., Class B | | | 5,550 | |
| | 10,400 | | | Shanghai Pharmaceuticals Holding Co., Ltd., Class H | | | 23,988 | |
| | 11,500 | | | Shengjing Bank Co., Ltd., Class H | | | 15,350 | |
| | 10,000 | | | Shenzhen Expressway Co., Ltd., Class H | | | 7,706 | |
| | 12,544 | | | Shenzhen International Holdings Ltd. | | | 19,049 | |
| | 16,000 | | | Shenzhen Investment Ltd. | | | 6,473 | |
| | 9,000 | | | Shenzhou International Group Holdings Ltd. | | | 44,352 | |
| | 8,000 | | | Shimao Property Holdings Ltd. | | | 14,011 | |
| | 16,000 | | | Sichuan Expressway Co., Ltd., Class H | | | 5,569 | |
| | 40,000 | | | Sihuan Pharmaceutical Holdings Group Ltd. | | | 6,683 | |
| | 44,000 | | | Sino Biopharmaceutical Ltd. | | | 54,679 | |
| | 16,000 | | | Sinofert Holdings Ltd. | | | 2,811 | |
| | 28,000 | | | Sino-Ocean Land Holdings Ltd. | | | 16,274 | |
| | 12,000 | | | Sinopec Engineering Group Co., Ltd., Class H | | | 10,331 | |
| | 22,000 | | | Sinopec Oilfield Service Corp., Class H (a) | | | 6,937 | |
| | 32,000 | | | Sinopec Shanghai Petrochemical Co., Ltd., Class H (a) | | | 13,282 | |
| | 16,400 | | | Sinopharm Group Co., Ltd., Class H | | | 67,587 | |
| | 24,000 | | | Sinotrans Ltd., Class H | | | 13,032 | |
| | 14,000 | | | Sunac China Holdings Ltd. | | | 8,586 | |
| | 63,900 | | | Tencent Holdings Ltd. | | | 1,204,475 | |
| | 20,000 | | | Tianhe Chemicals Group Ltd. (a) | | | — | |
| | 8,000 | | | TravelSky Technology Ltd., Class H | | | 11,802 | |
| | 12,000 | | | Weichai Power Co., Ltd., Class H | | | 12,724 | |
| | 4,800 | | | Xinjiang Goldwind Science & Technology Co., Ltd., Class H | | | 9,014 | |
| | | | | | | | |
| SHARES | | | SECURITY DESCRIPTION | | VALUE($) | |
| | | | | | | | |
| | | | | | | | |
| | | | China — continued | | | | |
| | 3,800 | | | Yantai Changyu Pioneer Wine Co., Ltd., Class B | | | 12,074 | |
| | 48,000 | | | Yuexiu Property Co., Ltd. | | | 8,270 | |
| | 12,000 | | | Zhaojin Mining Industry Co., Ltd. | | | 6,763 | |
| | 16,000 | | | Zhejiang Expressway Co., Ltd., Class H | | | 19,670 | |
| | 56,000 | | | Zijin Mining Group Co., Ltd., Class H | | | 14,981 | |
| | 9,600 | | | ZTE Corp., Class H | | | 23,118 | |
| | | | | | | | |
| | | | | | | 8,449,310 | |
| | | | | | | | |
| | | | Colombia — 0.0% (b) | | | | |
| | 2,559 | | | Cemex Latam Holdings S.A. (a) | | | 8,904 | |
| | | | | | | | |
| | | | Czech Republic — 0.3% | | | | |
| | 3,021 | | | CEZ A/S | | | 60,361 | |
| | 176 | | | Komercni banka A/S | | | 36,474 | |
| | | | | | | | |
| | | | | | | 96,835 | |
| | | | | | | | |
| | | | Egypt — 0.2% | | | | |
| | 8,883 | | | Commercial International Bank Egypt SAE GDR | | | 58,504 | |
| | 12,001 | | | Talaat Moustafa Group | | | 10,158 | |
| | 7,240 | | | Telecom Egypt Co. | | | 6,212 | |
| | | | | | | | |
| | | | | | | 74,874 | |
| | | | | | | | |
| | | | Hungary — 0.4% | | | | |
| | 7,826 | | | Magyar Telekom Telecommunications plc ADR (a) | | | 10,841 | |
| | 705 | | | MOL Hungarian Oil & Gas plc | | | 31,815 | |
| | 2,128 | | | OTP Bank plc | | | 41,180 | |
| | 2,584 | | | Richter Gedeon Nyrt | | | 43,104 | |
| | | | | | | | |
| | | | | | | 126,940 | |
| | | | | | | | |
| | | | Indonesia — 4.2% | | | | |
| | 334,400 | | | Adaro Energy | | | 14,456 | |
| | 638,500 | | | Astra International | | | 274,477 | |
| | 279,700 | | | Bank Central Asia | | | 262,758 | |
| | 212,700 | | | Bank Mandiri Persero | | | 134,612 | |
| | 168,800 | | | Bank Negara Indonesia Persero | | | 58,353 | |
| | 240,700 | | | Bank Rakyat Indonesia Persero | | | 184,221 | |
| | 10,400 | | | Indo Tambangraya Megah | | | 6,411 | |
| | 36,000 | | | Indocement Tunggal Prakarsa | | | 47,085 | |
| | 39,100 | | | Indofood CBP Sukses Makmur | | | 37,625 | |
| | 328,600 | | | Perusahaan Gas Negara Persero | | | 71,773 | |
| | 77,500 | | | Semen Indonesia Persero | | | 55,117 | |
| | 20,800 | | | Tambang Batubara Bukit Asam Persero | | | 11,049 | |
| | 1,567,800 | | | Telekomunikasi Indonesia Persero | | | 307,583 | |
| | 40,800 | | | United Tractors | | | 53,680 | |
| | 52,000 | | | Vale Indonesia | | | 8,456 | |
| | | | | | | | |
| | | | | | | 1,527,656 | |
| | | | | | | | |
SEE NOTES TO FINANCIAL STATEMENTS.
| | | | | | | | |
| | | |
| OCTOBER 31, 2015 | | JPMORGAN EXCHANGE-TRADED FUNDS | | | | | 13 | |
JPMorgan Diversified Return Emerging Markets Equity ETF
SCHEDULE OF PORTFOLIO INVESTMENTS
AS OF OCTOBER 31, 2015 (continued)
| | | | | | | | |
| SHARES | | | SECURITY DESCRIPTION | | VALUE($) | |
| | | | | | | | |
| Common Stocks — continued | |
| | | | Malaysia — 4.2% | | | | |
| | 46,400 | | | AirAsia BHD | | | 15,935 | |
| | 24,800 | | | Alliance Financial Group BHD | | | 20,641 | |
| | 40,000 | | | AMMB Holdings BHD | | | 44,338 | |
| | 60,600 | | | Astro Malaysia Holdings BHD | | | 40,291 | |
| | 82,700 | | | Bumi Armada BHD | | | 18,638 | |
| | 17,300 | | | Hong Leong Bank BHD | | | 56,171 | |
| | 119,800 | | | Malayan Banking BHD | | | 229,666 | |
| | 40,000 | | | MISC BHD | | | 84,078 | |
| | 7,800 | | | Petronas Dagangan BHD | | | 40,867 | |
| | 20,000 | | | Petronas Gas BHD | | | 106,872 | |
| | 17,900 | | | PPB Group BHD | | | 64,266 | |
| | 68,600 | | | Public Bank BHD | | | 288,408 | |
| | 16,085 | | | RHB Capital BHD | | | 22,810 | |
| | 100,800 | | | SapuraKencana Petroleum BHD | | | 49,409 | |
| | 108,500 | | | Tenaga Nasional BHD | | | 318,913 | |
| | 28,300 | | | Westports Holdings BHD | | | 28,268 | |
| | 154,500 | | | YTL Corp. BHD | | | 54,257 | |
| | 86,900 | | | YTL Power International BHD | | | 30,544 | |
| | | | | | | | |
| | | | | | | 1,514,372 | |
| | | | | | | | |
| | | | Mexico — 4.9% | | | | |
| | 596,500 | | | America Movil SAB de CV | | | 530,854 | |
| | 5,780 | | | Arca Continental SAB de CV | | | 36,921 | |
| | 14,248 | | | Compartamos SAB de CV | | | 26,171 | |
| | 4,154 | | | El Puerto de Liverpool SAB de CV | | | 57,872 | |
| | 32,616 | | | Fibra Uno Administracion SA de CV REIT | | | 71,520 | |
| | 3,834 | | | Gruma SAB de CV, Class B | | | 58,841 | |
| | 5,800 | | | Grupo Aeroportuario del Pacifico SAB de CV, Class B | | | 52,312 | |
| | 4,115 | | | Grupo Aeroportuario del Sureste SAB de CV, Class B | | | 63,771 | |
| | 28,874 | | | Grupo Financiero Banorte SAB de CV, Class O | | | 154,580 | |
| | 26,048 | | | Grupo Financiero Inbursa SAB de CV, Class O | | | 52,198 | |
| | 18,840 | | | Grupo Financiero Santander Mexico SAB de CV, Class B | | | 34,617 | |
| | 10,575 | | | Grupo Lala SAB de CV, Class B | | | 27,011 | |
| | 62,336 | | | Grupo Mexico SAB de CV | | | 151,936 | |
| | 3,432 | | | Industrias Bachoco SAB de CV | | | 15,620 | |
| | 18,577 | | | Kimberly-Clark de Mexico SAB de CV, Class A | | | 44,458 | |
| | 6,650 | | | Megacable Holdings SAB de CV | | | 25,343 | |
| | 12,872 | | | OHL Mexico SAB de CV (a) | | | 17,012 | |
| | 3,582 | | | Promotora y Operadora de Infraestructura SAB de CV (a) | | | 45,035 | |
| | 121,983 | | | Wal-Mart de Mexico SAB de CV | | | 323,091 | |
| | | | | | | | |
| | | | | | | 1,789,163 | |
| | | | | | | | |
| | | | | | | | |
| SHARES | | | SECURITY DESCRIPTION | | VALUE($) | |
| | | | | | | | |
| | | | | | | | |
| | | | Philippines — 4.0% | | | | |
| | 60,720 | | | Aboitiz Equity Ventures, Inc. | | | 72,477 | |
| | 51,400 | | | Aboitiz Power Corp. | | | 46,108 | |
| | 111,000 | | | Alliance Global Group, Inc. | | | 43,083 | |
| | 6,480 | | | Ayala Corp. | | | 107,809 | |
| | 136,600 | | | Ayala Land, Inc. | | | 104,322 | |
| | 37,100 | | | Bank of the Philippine Islands | | | 66,929 | |
| | 32,400 | | | BDO Unibank, Inc. | | | 70,232 | |
| | 104,000 | | | DMCI Holdings, Inc. | | | 27,557 | |
| | 213,600 | | | Energy Development Corp. | | | 30,185 | |
| | 960 | | | Globe Telecom, Inc. | | | 46,619 | |
| | 1,480 | | | GT Capital Holdings, Inc. | | | 41,491 | |
| | 70,110 | | | JG Summit Holdings, Inc. | | | 106,608 | |
| | 9,440 | | | Manila Electric Co. | | | 65,463 | |
| | 258,000 | | | Megaworld Corp. | | | 25,794 | |
| | 28,816 | | | Metropolitan Bank & Trust Co. | | | 52,271 | |
| | 2,630 | | | Philippine Long Distance Telephone Co. | | | 123,294 | |
| | 8,100 | | | Semirara Mining and Power Corp., Class A | | | 23,155 | |
| | 10,260 | | | SM Investments Corp. | | | 191,353 | |
| | 176,800 | | | SM Prime Holdings, Inc. | | | 81,326 | |
| | 26,380 | | | Universal Robina Corp. | | | 112,923 | |
| | | | | | | | |
| | | | | | | 1,438,999 | |
| | | | | | | | |
| | | | Poland — 1.3% | | | | |
| | 608 | | | Alior Bank S.A. (a) | | | 12,776 | |
| | 1,144 | | | Asseco Poland S.A. | | | 16,886 | |
| | 6,573 | | | Bank Millennium S.A. (a) | | | 10,409 | |
| | 304 | | | Bank Zachodni WBK S.A. (a) | | | 24,504 | |
| | 492 | | | CCC S.A. | | | 21,481 | |
| | 4,504 | | | Cyfrowy Polsat S.A. (a) | | | 29,020 | |
| | 4,592 | | | Enea S.A. | | | 15,229 | |
| | 6,017 | | | Energa S.A. | | | 25,691 | |
| | 1,432 | | | Grupa Lotos S.A. (a) | | | 10,547 | |
| | 2,056 | | | KGHM Polska Miedz S.A. | | | 47,732 | |
| | 13,720 | | | PGE Polska Grupa Energetyczna S.A. | | | 51,069 | |
| | 4,784 | | | Polski Koncern Naftowy Orlen S.A. | | | 77,613 | |
| | 26,384 | | | Polskie Gornictwo Naftowe i Gazownictwo S.A. | | | 46,745 | |
| | 600 | | | Powszechny Zaklad Ubezpieczen S.A. | | | 58,259 | |
| | 22,328 | | | Tauron Polska Energia S.A. | | | 17,506 | |
| | | | | | | | |
| | | | | | | 465,467 | |
| | | | | | | | |
| | | | Russia — 4.3% | | | | |
| | 28,027 | | | Alrosa OAO | | | 22,569 | |
| | 158,214 | | | Gazprom OAO | | | 336,228 | |
| | 6,947 | | | Lukoil PJSC | | | 252,589 | |
| | 23,273 | | | Magnitogorsk Iron & Steel Works | | | 8,771 | |
| | 2,024 | | | MegaFon OAO GDR | | | 26,068 | |
SEE NOTES TO FINANCIAL STATEMENTS.
| | | | | | |
| | | |
| 14 | | | | JPMORGAN EXCHANGE-TRADED FUNDS | | OCTOBER 31, 2015 |
| | | | | | | | |
| SHARES | | | SECURITY DESCRIPTION | | VALUE($) | |
| | | | | | | | |
| Common Stocks — continued | |
| | | | Russia — continued | | | | |
| | 679 | | | MMC Norilsk Nickel OJSC | | | 100,897 | |
| | 18,710 | | | Mobile Telesystems OJSC | | | 60,884 | |
| | 14,849 | | | Moscow Exchange MICEX-RTS | | | 20,895 | |
| | 16,111 | | | Novatek OAO | | | 147,563 | |
| | 14,169 | | | Novolipetsk Steel OAO | | | 17,357 | |
| | 1,160 | | | PhosAgro OAO GDR | | | 15,660 | |
| | 17,609 | | | Rosneft OAO (a) | | | 71,297 | |
| | 21,203 | | | Rostelecom PJSC (a) | | | 31,040 | |
| | 2,560,464 | | | Rushydro PJSC (a) | | | 26,078 | |
| | 115,499 | | | Sberbank of Russia PJSC (a) | | | 163,760 | |
| | 2,636 | | | Severstal PAO | | | 30,639 | |
| | 60,577 | | | Sistema (a) | | | 16,747 | |
| | 112,492 | | | Surgutneftegas OAO (a) | | | 63,011 | |
| | 20,380 | | | Tatneft, Class S (a) | | | 104,982 | |
| | 14,927 | | | Uralkali PJSC (a) | | | 36,271 | |
| | | | | | | | |
| | | | | | | 1,553,306 | |
| | | | | | | | |
| | | | South Africa — 8.4% | | | | |
| | 5,968 | | | AVI Ltd. | | | 37,967 | |
| | 3,664 | | | Barclays Africa Group Ltd. | | | 46,957 | |
| | 3,504 | | | Barloworld Ltd. | | | 19,770 | |
| | 5,134 | | | Bidvest Group Ltd. (The) | | | 131,146 | |
| | 3,746 | | | Brait S.E. (a) | | | 42,893 | |
| | 17,616 | | | Capital Property Fund Ltd. REIT | | | 20,502 | |
| | 584 | | | Capitec Bank Holdings Ltd. | | | 25,228 | |
| | 4,509 | | | Clicks Group Ltd. | | | 32,888 | |
| | 2,928 | | | DataTec Ltd. | | | 12,536 | |
| | 3,657 | | | Discovery Ltd. | | | 39,048 | |
| | 1,664 | | | EOH Holdings Ltd. | | | 18,374 | |
| | 2,089 | | | Exxaro Resources Ltd. | | | 8,646 | |
| | 32,130 | | | FirstRand Ltd. | | | 117,735 | |
| | 4,098 | | | Foschini Group Ltd. (The) | | | 41,808 | |
| | 25,049 | | | Growthpoint Properties Ltd. | | | 45,889 | |
| | 2,779 | | | Hyprop Investments Ltd. | | | 25,202 | |
| | 2,688 | | | Imperial Holdings Ltd. | | | 34,989 | |
| | 1,140 | | | JSE Ltd. | | | 10,982 | |
| | 22,115 | | | KAP Industrial Holdings Ltd. | | | 11,745 | |
| | 864 | | | Kumba Iron Ore Ltd. | | | 3,730 | |
| | 1,168 | | | Liberty Holdings Ltd. | | | 11,420 | |
| | 9,077 | | | Mediclinic International Ltd. | | | 79,673 | |
| | 11,600 | | | MMI Holdings Ltd. | | | 21,050 | |
| | 1,768 | | | Mondi Ltd. | | | 41,080 | |
| | 4,385 | | | Mr Price Group Ltd. | | | 67,332 | |
| | 34,185 | | | MTN Group Ltd. | | | 389,183 | |
| | 2,216 | | | Nedbank Group Ltd. | | | 36,837 | |
| | 27,018 | | | Netcare Ltd. | | | 76,831 | |
| | | | | | | | |
| SHARES | | | SECURITY DESCRIPTION | | VALUE($) | |
| | | | | | | | |
| | | | | | | | |
| | | | South Africa — continued | | | | |
| | 4,291 | | | Pick n Pay Stores Ltd. | | | 20,748 | |
| | 2,385 | | | Pioneer Foods Group Ltd. | | | 34,169 | |
| | 6,894 | | | PPC Ltd. | | | 8,288 | |
| | 752 | | | PSG Group Ltd. | | | 14,500 | |
| | 43,503 | | | Redefine Properties Ltd. | | | 36,297 | |
| | 7,273 | | | Remgro Ltd. | | | 145,511 | |
| | 2,544 | | | Resilient Property Income Fund Ltd. | | | 22,415 | |
| | 7,544 | | | RMB Holdings Ltd. | | | 36,735 | |
| | 18,368 | | | Sanlam Ltd. | | | 82,982 | |
| | 420 | | | Santam Ltd. | | | 6,768 | |
| | 8,024 | | | Sappi Ltd. (a) | | | 31,662 | |
| | 8,025 | | | Sasol Ltd. | | | 257,135 | |
| | 8,203 | | | Shoprite Holdings Ltd. | | | 85,243 | |
| | 6,075 | | | Sibanye Gold Ltd. | | | 10,146 | |
| | 3,288 | | | SPAR Group Ltd. (The) | | | 47,197 | |
| | 12,960 | | | Standard Bank Group Ltd. | | | 134,656 | |
| | 49,724 | | | Steinhoff International Holdings Ltd. | | | 303,985 | |
| | 6,592 | | | Telkom SA SOC Ltd. | | | 34,616 | |
| | 8,073 | | | Truworths International Ltd. | | | 54,621 | |
| | 6,105 | | | Vodacom Group Ltd. | | | 65,941 | |
| | 18,675 | | | Woolworths Holdings Ltd. | | | 138,169 | |
| | | | | | | | |
| | | | | | | 3,023,225 | |
| | | | | | | | |
| | | | Taiwan — 18.7% | | | | |
| | 129,000 | | | Advanced Semiconductor Engineering, Inc. | | | 148,925 | |
| | 48,000 | | | Asia Cement Corp. | | | 49,854 | |
| | 15,000 | | | Asustek Computer, Inc. | | | 134,241 | |
| | 175,000 | | | AU Optronics Corp. | | | 51,477 | |
| | 16,000 | | | Catcher Technology Co., Ltd. | | | 157,024 | |
| | 127,000 | | | Cathay Financial Holding Co., Ltd. | | | 180,898 | |
| | 85,390 | | | Chang Hwa Commercial Bank Ltd. | | | 44,322 | |
| | 45,000 | | | Cheng Shin Rubber Industry Co., Ltd. | | | 81,477 | |
| | 8,000 | | | Cheng Uei Precision Industry Co., Ltd. | | | 11,687 | |
| | 10,065 | | | Chicony Electronics Co., Ltd. | | | 23,956 | |
| | 63,000 | | | China Airlines Ltd. (a) | | | 22,553 | |
| | 228,000 | | | China Development Financial Holding Corp. | | | 61,261 | |
| | 93,000 | | | Chunghwa Telecom Co., Ltd. | | | 284,939 | |
| | 88,000 | | | Compal Electronics, Inc. | | | 54,730 | |
| | 263,811 | | | CTBC Financial Holding Co., Ltd. | | | 144,531 | |
| | 122,388 | | | E.Sun Financial Holding Co., Ltd. | | | 73,559 | |
| | 5,000 | | | Eclat Textile Co., Ltd. | | | 73,540 | |
| | 49,000 | | | Eva Airways Corp. (a) | | | 28,758 | |
| | 33,450 | | | Evergreen Marine Corp. Taiwan Ltd. | | | 14,890 | |
| | 35,000 | | | Far Eastern International Bank | | | 10,874 | |
| | 100,680 | | | Far Eastern New Century Corp. | | | 91,506 | |
| | 40,000 | | | Far EasTone Telecommunications Co., Ltd. | | | 86,787 | |
SEE NOTES TO FINANCIAL STATEMENTS.
| | | | | | | | |
| | | |
| OCTOBER 31, 2015 | | JPMORGAN EXCHANGE-TRADED FUNDS | | | | | 15 | |
JPMorgan Diversified Return Emerging Markets Equity ETF
SCHEDULE OF PORTFOLIO INVESTMENTS
AS OF OCTOBER 31, 2015 (continued)
| | | | | | | | |
| SHARES | | | SECURITY DESCRIPTION | | VALUE($) | |
| | | | | | | | |
| Common Stocks — continued | |
| | | | Taiwan — continued | | | | |
| | 8,000 | | | Feng TAY Enterprise Co., Ltd. | | | 45,842 | |
| | 150,109 | | | First Financial Holding Co., Ltd. | | | 72,698 | |
| | 84,000 | | | Formosa Chemicals & Fibre Corp. | | | 192,036 | |
| | 37,000 | | | Formosa Petrochemical Corp. | | | 89,925 | |
| | 97,000 | | | Formosa Plastics Corp. | | | 225,102 | |
| | 21,300 | | | Foxconn Technology Co., Ltd. | | | 55,791 | |
| | 118,000 | | | Fubon Financial Holding Co., Ltd. | | | 190,726 | |
| | 7,000 | | | Giant Manufacturing Co., Ltd. | | | 52,743 | |
| | 294,900 | | | Hon Hai Precision Industry Co., Ltd. | | | 783,862 | |
| | 11,000 | | | Hotai Motor Co., Ltd. | | | 128,333 | |
| | 120,672 | | | Hua Nan Financial Holdings Co., Ltd. | | | 57,990 | |
| | 192,000 | | | Innolux Corp. | | | 64,411 | |
| | 50,000 | | | Inotera Memories, Inc. (a) | | | 38,374 | |
| | 64,000 | | | Inventec Corp. | | | 36,680 | |
| | 3,000 | | | Largan Precision Co., Ltd. | | | 233,126 | |
| | 42,285 | | | Lite-On Technology Corp. | | | 43,833 | |
| | 163,000 | | | Mega Financial Holding Co., Ltd. | | | 118,770 | |
| | 110,000 | | | Nan Ya Plastics Corp. | | | 218,277 | |
| | 7,000 | | | Nanya Technology Corp. | | | 8,585 | |
| | 13,000 | | | Novatek Microelectronics Corp. | | | 44,249 | |
| | 40,000 | | | Pegatron Corp. | | | 97,746 | |
| | 69,000 | | | Pou Chen Corp. | | | 97,319 | |
| | 54,000 | | | Quanta Computer, Inc. | | | 91,959 | |
| | 115,287 | | | Shin Kong Financial Holding Co., Ltd. | | | 27,587 | |
| | 49,165 | | | Siliconware Precision Industries Co., Ltd. | | | 64,959 | |
| | 155,572 | | | SinoPac Financial Holdings Co., Ltd. | | | 51,344 | |
| | 24,000 | | | Synnex Technology International Corp. | | | 25,294 | |
| | 136,000 | | | Taishin Financial Holding Co., Ltd. | | | 53,259 | |
| | 61,621 | | | Taiwan Business Bank (a) | | | 15,823 | |
| | 41,000 | | | Taiwan Mobile Co., Ltd. | | | 129,071 | |
| | 6,000 | | | Taiwan Secom Co., Ltd. | | | 18,025 | |
| | 270,000 | | | Taiwan Semiconductor Manufacturing Co., Ltd. | | | 1,137,691 | |
| | 48,000 | | | Teco Electric and Machinery Co., Ltd. | | | 41,835 | |
| | 5,000 | | | Transcend Information, Inc. | | | 13,923 | |
| | 122,000 | | | Uni-President Enterprises Corp. | | | 206,273 | |
| | 240,000 | | | United Microelectronics Corp. | | | 87,532 | |
| | 22,000 | | | Wan Hai Lines Ltd. | | | 14,534 | |
| | 30,000 | | | Yang Ming Marine Transport Corp. (a) | | | 9,098 | |
| | 161,665 | | | Yuanta Financial Holding Co., Ltd. | | | 63,521 | |
| | | | | | | | |
| | | | | | | 6,779,935 | |
| | | | | | | | |
| | | | Thailand — 4.6% | | | | |
| | 36,700 | | | Advanced Info Service PCL NVDR | | | 240,111 | |
| | 11,200 | | | Airports of Thailand PCL NVDR | | | 93,602 | |
| | 11,200 | | | Bangkok Bank PCL NVDR | | | 52,627 | |
| | | | | | | | |
| SHARES | | | SECURITY DESCRIPTION | | VALUE($) | |
| | | | | | | | |
| | | | | | | | |
| | | | Thailand — continued | | | | |
| | 11,100 | | | Bumrungrad Hospital PCL NVDR | | | 67,319 | |
| | 31,700 | | | Central Pattana PCL NVDR | | | 40,960 | |
| | 139,200 | | | CP ALL PCL NVDR | | | 195,767 | |
| | 13,600 | | | Delta Electronics Thailand PCL NVDR | | | 32,309 | |
| | 8,000 | | | Electricity Generating PCL NVDR | | | 34,926 | |
| | 13,600 | | | Glow Energy PCL NVDR | | | 32,688 | |
| | 34,800 | | | Indorama Ventures PCL NVDR | | | 22,564 | |
| | 39,900 | | | Intouch Holdings PCL NVDR | | | 84,070 | |
| | 270,500 | | | IRPC PCL NVDR | | | 30,963 | |
| | 26,400 | | | Kasikornbank PCL NVDR | | | 127,677 | |
| | 79,200 | | | Krung Thai Bank PCL NVDR | | | 38,004 | |
| | 72,200 | | | Land & Houses PCL NVDR | | | 17,330 | |
| | 43,200 | | | PTT Global Chemical PCL NVDR | | | 67,675 | |
| | 21,500 | | | PTT PCL NVDR | | | 166,069 | |
| | 8,000 | | | Siam Cement (The) PCL NVDR | | | 102,126 | |
| | 2,100 | | | Siam City Cement PCL NVDR | | | 19,935 | |
| | 35,200 | | | Siam Commercial Bank (The) PCL NVDR | | | 131,847 | |
| | 22,400 | | | Thai Oil PCL NVDR | | | 34,111 | |
| | 492,000 | | | TMB Bank PCL NVDR | | | 36,714 | |
| | | | | | | | |
| | | | | | | 1,669,394 | |
| | | | | | | | |
| | | | Turkey — 1.6% | | | | |
| | 21,455 | | | Akbank TAS | | | 54,983 | |
| | 3,345 | | | Arcelik A/S | | | 18,229 | |
| | 1,248 | | | Aselsan Elektronik Sanayi Ve Ticaret A/S | | | 5,966 | |
| | 22,000 | | | Emlak Konut Gayrimenkul Yatirim Ortakligi A/S REIT | | | 21,312 | |
| | 8,123 | | | Enka Insaat ve Sanayi A/S | | | 14,379 | |
| | 20,352 | | | Eregli Demir ve Celik Fabrikalari | | | 28,843 | |
| | 1,351 | | | Ford Otomotiv Sanayi A/S | | | 15,871 | |
| | 9,264 | | | Haci Omer Sabanci Holding A/S | | | 29,371 | |
| | 9,448 | | | KOC Holding A/S | | | 42,671 | |
| | 680 | | | Koza Altin Isletmeleri A/S | | | 3,817 | |
| | 5,382 | | | Petkim Petrokimya Holding A/S (a) | | | 7,930 | |
| | 2,328 | | | TAV Havalimanlari Holding A/S | | | 18,263 | |
| | 2,311 | | | Tofas Turk Otomobil Fabrikasi A/S | | | 15,246 | |
| | 1,832 | | | Tupras Turkiye Petrol Rafinerileri A/S (a) | | | 48,343 | |
| | 10,347 | | | Turk Hava Yollari AO (a) | | | 30,509 | |
| | 11,152 | | | Turk Telekomunikasyon A/S | | | 24,055 | |
| | 14,599 | | | Turkcell Iletisim Hizmetleri A/S | | | 58,016 | |
| | 21,962 | | | Turkiye Garanti Bankasi A/S | | | 56,869 | |
| | 7,096 | | | Turkiye Halk Bankasi A/S | | | 26,583 | |
| | 15,320 | | | Turkiye Is Bankasi, Class C | | | 26,111 | |
| | 10,469 | | | Turkiye Sise ve Cam Fabrikalari A/S | | | 11,981 | |
| | 11,920 | | | Turkiye Vakiflar Bankasi Tao, Class D | | | 16,968 | |
SEE NOTES TO FINANCIAL STATEMENTS.
| | | | | | |
| | | |
| 16 | | | | JPMORGAN EXCHANGE-TRADED FUNDS | | OCTOBER 31, 2015 |
| | | | | | | | |
| SHARES | | | SECURITY DESCRIPTION | | VALUE($) | |
| | | | | | | | |
| Common Stocks — continued | |
| | | | Turkey — continued | | | | |
| | 9,872 | | | Yapi ve Kredi Bankasi A/S | | | 11,992 | |
| | | | | | | | |
| | | | | | | 588,308 | |
| | | | | | | | |
| | | | United Arab Emirates — 0.8% | | | | |
| | 19,415 | | | Abu Dhabi Commercial Bank PJSC | | | 39,414 | |
| | 43,216 | | | Air Arabia | | | 15,865 | |
| | 33,269 | | | Aldar Properties PJSC | | | 20,667 | |
| | 74,995 | | | Dana Gas PJSC (a) | | | 9,571 | |
| | 2,446 | | | DP World Ltd. | | | 49,431 | |
| | 9,192 | | | Dubai Investments PJSC | | | 5,645 | |
| | 10,381 | | | Dubai Islamic Bank PJSC | | | 18,239 | |
| | 22,028 | | | Emaar Malls Group PJSC (a) | | | 18,796 | |
| | 39,519 | | | Emaar Properties PJSC | | | 69,412 | |
| | 11,706 | | | First Gulf Bank PJSC | | | 39,289 | |
| | 11,391 | | | Union National Bank PJSC | | | 17,367 | |
| | 10,532 | | | Union Properties PJSC | | | 2,473 | |
| | | | | | | | |
| | | | | | | 306,169 | |
| | | | | | | | |
| | | | Total Common Stocks
(Cost $37,012,461) | | | 31,659,997 | |
| | | | | | | | |
| Exchange-Traded Fund — 9.1% | |
| | | | India — 9.1% | | | | |
| | 115,698 | | | iShares MSCI India ETF | | | 3,295,079 | |
| | | | | | | | |
| | | | Total Exchange-Traded Fund
(Cost $3,568,857) | | | 3,295,079 | |
| | | | | | | | |
| Preferred Stocks — 2.7% | |
| | | | Brazil — 2.1% | | | | |
| | 40,228 | | | Banco Bradesco S.A. | | | 219,053 | |
| | 2,416 | | | Braskem S.A. | | | 13,645 | |
| | 784 | | | Cia de Transmissao de Energia Eletrica Paulista S.A. | | | 9,026 | |
| | 16,664 | | | Cia Energetica de Minas Gerais | | | 30,938 | |
| | 2,280 | | | Cia Paranaense de Energia | | | 19,214 | |
| | 38,212 | | | Itau Unibanco Holding S.A. | | | 262,274 | |
| | 43,970 | | | Itausa – Investimentos Itau S.A. | | | 82,090 | |
| | 67,920 | | | Petroleo Brasileiro S.A. (a) | | | 135,785 | |
| | | | | | | | |
| | | | | | | 772,025 | |
| | | | | | | | |
| | | | Chile — 0.1% | | | | |
| | 5,343 | | | Embotelladora Andina S.A. | | | 19,593 | |
| | | | | | | | |
| | | | Colombia — 0.1% | | | | |
| | 5,295 | | | Bancolombia S.A. | | | 45,913 | |
| | | | | | | | |
| | | | Russia — 0.4% | | | | |
| | 24 | | | AK Transneft OAO (a) | | | 55,988 | |
| | | | | | | | |
| SHARES | | | SECURITY DESCRIPTION | | VALUE($) | |
| | | | | | | | |
| | | | Russia — continued | | | | |
| | 108,880 | | | Surgutneftegas OAO (a) | | | 74,219 | |
| | | | | | | | |
| | | | | | | 130,207 | |
| | | | | | | | |
| | | | Total Preferred Stocks
(Cost $1,467,920) | | | 967,738 | |
| | | | | | | | |
| | | | Total Investments — 99.3%
(Cost $42,049,238) | | | 35,922,814 | |
| | | | Other Assets in Excess of
Liabilities — 0.7% | | | 262,860 | |
| | | | | | | | |
| | | | NET ASSETS— 100.0% | | $ | 36,185,674 | |
| | | | | | | | |
Percentages indicated are based on net assets.
Summary of Investments by Industry, October 31, 2015
The following table represents the portfolio investments of the Fund by industry classifications as a percentage of total investments:
| | | | |
| INDUSTRY | | PERCENTAGE | |
Commercial Banks | | | 15.9 | % |
Exchange-Traded Fund | | | 9.2 | |
Wireless Telecommunication Services | | | 7.4 | |
Oil, Gas & Consumable Fuels | | | 6.9 | |
Semiconductors & Semiconductor Equipment | | | 5.1 | |
Electronic Equipment & Instruments | | | 3.8 | |
Internet Software & Services | | | 3.4 | |
Insurance | | | 3.0 | |
Food Products | | | 2.8 | |
Diversified Financial Services | | | 2.7 | |
Diversified Telecommunication Services | | | 2.6 | |
Industrial Conglomerates | | | 2.6 | |
Chemicals | | | 2.3 | |
Electric Utilities | | | 2.3 | |
Real Estate Management & Development | | | 2.2 | |
Computers & Peripherals | | | 2.2 | |
Food & Staples Retailing | | | 2.1 | |
Independent Power Producers & Energy Trader | | | 1.7 | |
Beverages | | | 1.7 | |
Automobiles | | | 1.7 | |
Metals & Mining | | | 1.4 | |
Transportation Infrastructure | | | 1.3 | |
Textiles, Apparel & Luxury Goods | | | 1.2 | |
Construction Materials | | | 1.2 | |
Others (each less than 1.0%) | | | 13.3 | |
SEE NOTES TO FINANCIAL STATEMENTS.
| | | | | | | | |
| | | |
| OCTOBER 31, 2015 | | JPMORGAN EXCHANGE-TRADED FUNDS | | | | | 17 | |
JPMorgan Diversified Return Global Equity ETF
SCHEDULE OF PORTFOLIO INVESTMENTS
AS OF OCTOBER 31, 2015
| | | | | | | | |
| SHARES | | | SECURITY DESCRIPTION | | VALUE($) | |
| | | | | | | | |
| Common Stocks — 99.3% | |
| | | | Australia — 9.3% | | | | |
| | 13,844 | | | AGL Energy Ltd. | | | 164,171 | |
| | 18,932 | | | Amcor Ltd. | | | 182,860 | |
| | 7,094 | | | Ansell Ltd. | | | 100,947 | |
| | 21,800 | | | APA Group | | | 142,031 | |
| | 23,907 | | | Asciano Ltd. | | | 139,223 | |
| | 3,278 | | | ASX Ltd. | | | 95,828 | |
| | 42,193 | | | Aurizon Holdings Ltd. | | | 154,701 | |
| | 1,869 | | | BHP Billiton Ltd. | | | 30,653 | |
| | 16,866 | | | Boral Ltd. | | | 64,516 | |
| | 23,437 | | | Brambles Ltd. | | | 172,589 | |
| | 6,214 | | | Caltex Australia Ltd. | | | 139,108 | |
| | 2,210 | | | Cochlear Ltd. | | | 139,480 | |
| | 4,336 | | | Crown Resorts Ltd. | | | 35,141 | |
| | 3,144 | | | CSL Ltd. | | | 208,982 | |
| | 29,229 | | | CSR Ltd. | | | 57,221 | |
| | 17,443 | | | Dexus Property Group REIT | | | 95,751 | |
| | 19,545 | | | Echo Entertainment Group Ltd. | | | 70,640 | |
| | 2,903 | | | Flight Centre Travel Group Ltd. | | | 78,101 | |
| | 48,905 | | | GPT Group REIT (The) | | | 165,633 | |
| | 20,100 | | | Harvey Norman Holdings Ltd. | | | 56,472 | |
| | 49,075 | | | Incitec Pivot Ltd. | | | 137,044 | |
| | 12,219 | | | Oil Search Ltd. | | | 68,099 | |
| | 7,109 | | | Orica Ltd. | | | 83,164 | |
| | 19,230 | | | Origin Energy Ltd. | | | 74,724 | |
| | 5,690 | | | Qantas Airways Ltd. (a) | | | 16,027 | |
| | 2,910 | | | Ramsay Health Care Ltd. | | | 127,917 | |
| | 4,674 | | | Rio Tinto Ltd. | | | 167,133 | |
| | 61,565 | | | Scentre Group REIT | | | 180,578 | |
| | 8,150 | | | Sonic Healthcare Ltd. | | | 111,464 | |
| | 9,805 | | | South32 Ltd. (a) | | | 10,153 | |
| | 12,666 | | | Suncorp Group Ltd. | | | 117,662 | |
| | 38,721 | | | Sydney Airport | | | 176,959 | |
| | 36,120 | | | Tabcorp Holdings Ltd. | | | 120,716 | |
| | 37,920 | | | Tatts Group Ltd. | | | 106,469 | |
| | 45,173 | | | Telstra Corp. Ltd. | | | 173,087 | |
| | 24,738 | | | Transurban Group | | | 183,309 | |
| | 7,641 | | | Wesfarmers Ltd. | | | 213,675 | |
| | 7,943 | | | Woodside Petroleum Ltd. | | | 166,588 | |
| | 7,157 | | | Woolworths Ltd. | | | 122,608 | |
| | 8,374 | | | WorleyParsons Ltd. | | | 38,633 | |
| | | | | | | | |
| | | | | | | 4,690,057 | |
| | | | | | | | |
| | | | Austria — 0.2% | | | | |
| | 3,600 | | | OMV AG | | | 95,860 | |
| | | | | | | | |
| | | | Belgium — 1.0% | | | | |
| | 521 | | | Anheuser-Busch InBev NV | | | 62,168 | |
| | | | | | | | |
| SHARES | | | SECURITY DESCRIPTION | | VALUE($) | |
| | | | | | | | |
| | | | | | | | |
| | | | Belgium — continued | | | | |
| | 3,120 | | | Belgacom S.A. | | | 107,967 | |
| | 1,310 | | | Colruyt S.A. | | | 64,797 | |
| | 732 | | | Delhaize Group S.A. | | | 67,921 | |
| | 910 | | | Groupe Bruxelles Lambert S.A. | | | 73,864 | |
| | 908 | | | Solvay S.A. | | | 102,578 | |
| | 385 | | | UCB S.A. | | | 33,279 | |
| | | | | | | | |
| | | | | | | 512,574 | |
| | | | | | | | |
| | | | Canada — 2.4% | | | | |
| | 1,120 | | | Agrium, Inc. | | | 104,197 | |
| | 2,944 | | | BCE, Inc. | | | 127,252 | |
| | 1,070 | | | Canadian Tire Corp., Ltd., Class A | | | 94,120 | |
| | 3,664 | | | Fortis, Inc. | | | 106,059 | |
| | 4,592 | | | Husky Energy, Inc. | | | 62,053 | |
| | 2,637 | | | Imperial Oil Ltd. | | | 87,745 | |
| | 662 | | | Magna International, Inc. | | | 34,913 | |
| | 4,290 | | | Metro, Inc., Class A | | | 122,670 | |
| | 1,243 | | | National Bank of Canada | | | 41,170 | |
| | 2,727 | | | Potash Corp of Saskatchewan, Inc. | | | 55,224 | |
| | 3,033 | | | RioCan REIT | | | 59,148 | |
| | 3,181 | | | Rogers Communications, Inc., Class B | | | 126,573 | |
| | 4,660 | | | Shaw Communications, Inc., Class B | | | 96,757 | |
| | 2,862 | | | TransCanada Corp. | | | 96,305 | |
| | | | | | | | |
| | | | | | | 1,214,186 | |
| | | | | | | | |
| | | | Denmark — 0.6% | | | | |
| | 250 | | | Carlsberg A/S, Class B | | | 20,483 | |
| | 1,353 | | | Christian Hansen Holdings | | | 81,292 | |
| | 573 | | | Coloplast A/S, Class B | | | 41,098 | |
| | 1,787 | | | DSV A/S | | | 72,515 | |
| | 1,410 | | | H Lundbeck A/S (a) | | | 41,421 | |
| | 12,741 | | | TDC A/S | | | 66,609 | |
| | | | | | | | |
| | | | | | | 323,418 | |
| | | | | | | | |
| | | | Finland — 0.9% | | | | |
| | 4,624 | | | Fortum OYJ | | | 69,341 | |
| | 5,090 | | | Neste Oil OYJ | | | 124,107 | |
| | 12,822 | | | Nokia OYJ | | | 95,381 | |
| | 2,020 | | | Sampo OYJ, Class A | | | 98,733 | |
| | 3,940 | | | Stora Enso OYJ, Class R | | | 36,548 | |
| | 2,361 | | | UPM-Kymmene OYJ | | | 44,200 | |
| | | | | | | | |
| | | | | | | 468,310 | |
| | | | | | | | |
| | | | France — 4.0% | | | | |
| | 1,480 | | | AtoS | | | 117,818 | |
| | 1,572 | | | Capital Gemini S.A. | | | 139,776 | |
| | 1,201 | | | Casino Guichard Perrachon S.A. | | | 69,003 | |
SEE NOTES TO FINANCIAL STATEMENTS.
| | | | | | |
| | | |
| 18 | | | | JPMORGAN EXCHANGE-TRADED FUNDS | | OCTOBER 31, 2015 |
| | | | | | | | |
| SHARES | | | SECURITY DESCRIPTION | | VALUE($) | |
| | | | | | | | |
| Common Stocks — continued | |
| | | | France — continued | | | | |
| | 292 | | | Christian Dior S.A. | | | 57,390 | |
| | 2,068 | | | Dassault Systemes S.A. | | | 163,141 | |
| | 878 | | | Essilor International S.A. | | | 115,249 | |
| | 3,441 | | | Eutelsat Communications S.A. | | | 113,414 | |
| | 608 | | | Ingenico S.A. | | | 71,654 | |
| | 2,392 | | | Lagardere SCA | | | 69,596 | |
| | 185 | | | L’Oreal S.A. | | | 33,726 | |
| | 4,024 | | | Orange S.A. | | | 70,950 | |
| | 580 | | | Pernod Ricard S.A. | | | 68,248 | |
| | 1,130 | | | Publicis Groupe S.A. | | | 73,196 | |
| | 1,042 | | | Sanofi S.A. | | | 105,113 | |
| | 1,451 | | | SCOR S.A. | | | 53,952 | |
| | 930 | | | Sodexo S.A. | | | 82,669 | |
| | 4,472 | | | STMicroelectronics NV | | | 30,813 | |
| | 2,977 | | | Suez Environnement S.A. | | | 56,527 | |
| | 1,856 | | | Thales S.A. | | | 134,173 | |
| | 1,858 | | | Total S.A. | | | 89,851 | |
| | 791 | | | Valeo S.A. | | | 122,151 | |
| | 2,070 | | | Veolia Environnement S.A. (a) | | | 48,086 | |
| | 352 | | | Vinci S.A. | | | 23,699 | |
| | 4,418 | | | Vivendi S.A. | | | 106,283 | |
| | | | | | | | |
| | | | | | | 2,016,478 | |
| | | | | | | | |
| | | | Germany — 3.2% | | | | |
| | 601 | | | BASF AG | | | 49,236 | |
| | 832 | | | Bayerische Motoren Werke AG | | | 85,220 | |
| | 1,090 | | | Beiersdorf AG | | | 103,524 | |
| | 3,124 | | | Deutsche Telekom AG | | | 58,518 | |
| | 2,710 | | | Evonik Industries AG | | | 98,400 | |
| | 1,280 | | | Fraport AG Frankfurt Airport Services Worldwide | | | 81,155 | |
| | 1,600 | | | Fresenius Medical Care AG & Co., KGaA | | | 144,012 | |
| | 2,064 | | | Fresenius SE & Co., KGaA | | | 151,668 | |
| | 1,252 | | | Hannover Rueck SE | | | 144,744 | |
| | 680 | | | HUGO BOSS AG | | | 69,922 | |
| | 9,042 | | | Infineon Technologies AG | | | 111,379 | |
| | 660 | | | Linde AG | | | 114,481 | |
| | 1,200 | | | Merck KGaA | | | 117,154 | |
| | 1,412 | | | SAP SE | | | 111,315 | |
| | 988 | | | Symrise AG | | | 65,027 | |
| | 2,591 | | | United Internet AG | | | 134,532 | |
| | | | | | | | |
| | | | | | | 1,640,287 | |
| | | | | | | | |
| | | | Greece — 0.1% | | | | |
| | 5,890 | | | Hellenic Telecommunications Organization S.A. | | | 55,138 | |
| | | | | | | | |
| | | | | | | | |
| SHARES | | | SECURITY DESCRIPTION | | VALUE($) | |
| | | | | | | | |
| | | | | | | | |
| | | | Hong Kong — 4.2% | | | | |
| | 29,000 | | | Cathay Pacific Airways Ltd. | | | 57,517 | |
| | 19,000 | | | Cheung Kong Infrastructure Holdings Ltd. | | | 176,263 | |
| | 16,260 | | | Cheung Kong Property Holdings Ltd. | | | 113,774 | |
| | 17,260 | | | CK Hutchison Holdings Ltd. | | | 236,350 | |
| | 21,000 | | | CLP Holdings Ltd. | | | 182,564 | |
| | 8,900 | | | Hang Seng Bank Ltd. | | | 163,278 | |
| | 78,700 | | | Hong Kong & China Gas Co., Ltd. | | | 159,567 | |
| | 5,500 | | | Johnson Electric Holdings Ltd. | | | 20,130 | |
| | 33,500 | | | Link REIT (The) | | | 200,152 | |
| | 30,000 | | | MTR Corp., Ltd. | | | 135,907 | |
| | 30,000 | | | New World Development Co., Ltd. | | | 31,998 | |
| | 140,000 | | | PCCW Ltd. | | | 75,382 | |
| | 20,000 | | | Power Assets Holdings Ltd. | | | 198,928 | |
| | 1,460,000 | | | Semiconductor Manufacturing International Corp. (a) | | | 135,254 | |
| | 10,500 | | | Swire Pacific Ltd., Class A | | | 121,312 | |
| | 60,000 | | | Xinyi Glass Holdings Ltd. | | | 31,084 | |
| | 228,000 | | | Xinyi Solar Holdings Ltd. | | | 90,638 | |
| | | | | | | | |
| | | | | | | 2,130,098 | |
| | | | | | | | |
| | | | Israel — 0.3% | | | | |
| | 1,490 | | | Check Point Software Technologies Ltd. (a) | | | 126,561 | |
| | | | | | | | |
| | | | Italy — 1.0% | | | | |
| | 48,262 | | | Enel Green Power SpA | | | 102,034 | |
| | 6,184 | | | Eni SpA | | | 100,986 | |
| | 23,890 | | | Parmalat SpA | | | 62,156 | |
| | 6,700 | | | Pirelli & C. SpA | | | 110,155 | |
| | 8,934 | | | Snam SpA | | | 46,234 | |
| | 21,380 | | | Terna Rete Elettrica Nazionale SpA | | | 108,745 | |
| | | | | | | | |
| | | | | | | 530,310 | |
| | | | | | | | |
| | | | Japan — 20.4% | | | | |
| | 7,000 | | | Ajinomoto Co., Inc. | | | 155,918 | |
| | 50,000 | | | ANA Holdings Co., Ltd. | | | 149,310 | |
| | 39,000 | | | Aozora Bank Ltd. | | | 142,547 | |
| | 17,000 | | | Asahi Kasei Corp. | | | 104,323 | |
| | 2,000 | | | Bank of Kyoto Ltd. (The) | | | 20,199 | |
| | 25,000 | | | Bank of Yokohama Ltd. (The) | | | 156,028 | |
| | 8,000 | | | Brother Industries Ltd. | | | 102,252 | |
| | 5,000 | | | Canon, Inc. | | | 149,310 | |
| | 3,900 | | | Capcom Co., Ltd. | | | 82,231 | |
| | 300 | | | Central Japan Railway Co. | | | 54,724 | |
| | 20,000 | | | Chiba Bank Ltd. (The) | | | 145,901 | |
| | 7,000 | | | Chubu Electric Power Co., Inc. | | | 107,681 | |
| | 7,300 | | | Chugoku Electric Power Co., Inc. (a) | | | 110,314 | |
SEE NOTES TO FINANCIAL STATEMENTS.
| | | | | | | | |
| | | |
| OCTOBER 31, 2015 | | JPMORGAN EXCHANGE-TRADED FUNDS | | | | | 19 | |
JPMorgan Diversified Return Global Equity ETF
SCHEDULE OF PORTFOLIO INVESTMENTS
AS OF OCTOBER 31, 2015 (continued)
| | | | | | | | |
| SHARES | | | SECURITY DESCRIPTION | | VALUE($) | |
| | | | | | | | |
| Common Stocks — continued | |
| | | | Japan — continued | | | | |
| | 5,000 | | | Cosmo Energy Holdings Co., Ltd. (a) | | | 67,965 | |
| | 8,900 | | | Daicel Corp. | | | 117,608 | |
| | 7,500 | | | Daiichi Sankyo Co., Ltd. | | | 147,293 | |
| | 19,000 | | | DIC Corp. | | | 51,430 | |
| | 4,000 | | | Dowa Holdings Co., Ltd. | | | 34,874 | |
| | 1,800 | | | East Japan Railway Co. | | | 171,136 | |
| | 4,000 | | | Electric Power Development Co., Ltd. | | | 131,864 | |
| | 3,200 | | | FamilyMart Co., Ltd. | | | 130,806 | |
| | 19,000 | | | Fuji Electric Co., Ltd. | | | 84,770 | |
| | 3,800 | | | FUJIFILM Holdings Corp. | | | 151,577 | |
| | 14,000 | | | Fujikura Ltd. | | | 71,959 | |
| | 28,000 | | | Fukuoka Financial Group, Inc. | | | 147,340 | |
| | 1,500 | | | Hikari Tsushin, Inc. | | | 114,148 | |
| | 2,700 | | | Hokkaido Electric Power Co., Inc. (a) | | | 28,843 | |
| | 6,000 | | | Hokuriku Electric Power Co. | | | 89,495 | |
| | 900 | | | Hoya Corp. | | | 37,140 | |
| | 5,000 | | | Idemitsu Kosan Co., Ltd. | | | 81,997 | |
| | 12,500 | | | Inpex Corp. | | | 119,150 | |
| | 12,300 | | | ITOCHU Corp. | | | 153,910 | |
| | 4,200 | | | Japan Airlines Co., Ltd. (a) | | | 158,227 | |
| | 3,000 | | | Japan Petroleum Exploration Co., Ltd. | | | 90,036 | |
| | 37,100 | | | JX Holdings, Inc. | | | 145,679 | |
| | 19,000 | | | Kaneka Corp. | | | 168,478 | |
| | 51,000 | | | Kawasaki Kisen Kaisha Ltd. | | | 114,501 | |
| | 6,900 | | | KDDI Corp. | | | 166,969 | |
| | 9,000 | | | Keisei Electric Railway Co., Ltd. | | | 110,906 | |
| | 12,700 | | | Konica Minolta, Inc. | | | 130,485 | |
| | 9,900 | | | Kuraray Co., Ltd. | | | 122,105 | |
| | 6,000 | | | Kyowa Hakko Kirin Co., Ltd. | | | 98,898 | |
| | 800 | | | Mabuchi Motor Co., Ltd. | | | 39,583 | |
| | 25,700 | | | Marubeni Corp. | | | 148,495 | |
| | 600 | | | MEIJI Holdings Co., Ltd. | | | 47,280 | |
| | 7,100 | | | Mitsubishi Corp. | | | 129,082 | |
| | 9,100 | | | Mitsubishi Tanabe Pharma Corp. | | | 153,874 | |
| | 14,000 | | | Mitsui OSK Lines Ltd. | | | 37,386 | |
| | 1,700 | | | Mochida Pharmaceutical Co., Ltd. | | | 100,378 | |
| | 7,000 | | | NH Foods Ltd. | | | 146,010 | |
| | 8,000 | | | Nippon Kayaku Co., Ltd. | | | 83,462 | |
| | 4,900 | | | Nippon Paper Industries Co., Ltd. | | | 90,820 | |
| | 1,400 | | | Nippon Shokubai Co., Ltd. | | | 109,560 | |
| | 4,100 | | | Nippon Telegraph & Telephone Corp. | | | 150,312 | |
| | 7,000 | | | Nippon Television Holdings, Inc. | | | 121,142 | |
| | 9,000 | | | Nipro Corp. | | | 100,894 | |
| | 2,100 | | | Nissin Foods Holdings Co., Ltd. | | | 97,079 | |
| | 3,300 | | | NTT Data Corp. | | | 164,224 | |
| | | | | | | | |
| SHARES | | | SECURITY DESCRIPTION | | VALUE($) | |
| | | | | | | | |
| | |
| | | | Japan — continued | | | | |
| | 7,700 | | | NTT DOCOMO, Inc. | | | 149,961 | |
| | 39,000 | | | Osaka Gas Co., Ltd. | | | 153,600 | |
| | 1,200 | | | Otsuka Corp. | | | 58,008 | |
| | 4,800 | | | Otsuka Holdings Co., Ltd. | | | 159,746 | |
| | 29,000 | | | Resona Holdings, Inc. | | | 153,449 | |
| | 7,300 | | | Ricoh Co., Ltd. | | | 78,679 | |
| | 2,300 | | | Rohm Co., Ltd. | | | 113,693 | |
| | 1,400 | | | Sankyo Co., Ltd. | | | 53,956 | |
| | 1,100 | | | Sawai Pharmaceutical Co., Ltd. | | | 70,419 | |
| | 4,000 | | | SCREEN Holdings Co., Ltd. | | | 23,633 | |
| | 7,000 | | | Sekisui Chemical Co., Ltd. | | | 82,593 | |
| | 10,000 | | | Sekisui House Ltd. | | | 166,464 | |
| | 26,000 | | | Seven Bank Ltd. | | | 118,470 | |
| | 1,100 | | | Shimamura Co., Ltd. | | | 123,543 | |
| | 1,700 | | | Shionogi & Co., Ltd. | | | 69,728 | |
| | 14,000 | | | Showa Shell Sekiyu | | | 123,571 | |
| | 2,900 | | | SoftBank Group Corp. | | | 162,481 | |
| | 36,300 | | | Sojitz Corp. | | | 79,842 | |
| | 28,000 | | | Sumitomo Osaka Cement Co., Ltd. | | | 107,899 | |
| | 2,100 | | | Suzuken Co., Ltd. | | | 80,375 | |
| | 1,000 | | | Taisho Pharmaceutical Holdings Co., Ltd. | | | 62,395 | |
| | 3,300 | | | Takeda Pharmaceutical Co., Ltd. | | | 161,147 | |
| | 11,000 | | | Tohoku Electric Power Co., Inc. | | | 154,445 | |
| | 6,000 | | | Tokyo Broadcasting System Holdings Inc. | | | 89,143 | |
| | 12,000 | | | TonenGeneral Sekiyu | | | 124,676 | |
| | 15,000 | | | Toppan Printing Co., Ltd. | | | 134,512 | |
| | 12,000 | | | Tosoh Corp. | | | 60,945 | |
| | 4,000 | | | Toyo Suisan Kaisha Ltd. | | | 147,391 | |
| | 2,700 | | | Toyota Industries Corp. | | | 141,884 | |
| | 3,800 | | | Toyota Motor Corp. (a) | | | 232,805 | |
| | 4,000 | | | Tsumura & Co. | | | 96,384 | |
| | 43,000 | | | Ube Industries Ltd. | | | 90,290 | |
| | 2,300 | | | West Japan Railway Co. | | | 161,590 | |
| | 4,400 | | | Yokohama Rubber Co., Ltd. (The) | | | 84,584 | |
| | | | | | | | |
| | | | | | | 10,312,209 | |
| | | | | | | | |
| | | | Netherlands — 1.1% | | | | |
| | 498 | | | Boskalis Westminster NV | | | 24,170 | |
| | 1,161 | | | Heineken Holding NV | | | 92,756 | |
| | 5,630 | | | Koninklijke Ahold NV | | | 114,530 | |
| | 5,450 | | | Reed Elsevier NV | | | 92,959 | |
| | 3,411 | | | Royal Dutch Shell plc, Class A | | | 89,052 | |
| | 3,971 | | | Wolters Kluwer NV | | | 134,209 | |
| | | | | | | | |
| | | | | | | 547,676 | |
| | | | | | | | |
SEE NOTES TO FINANCIAL STATEMENTS.
| | | | | | |
| | | |
| 20 | | | | JPMORGAN EXCHANGE-TRADED FUNDS | | OCTOBER 31, 2015 |
| | | | | | | | |
| SHARES | | | SECURITY DESCRIPTION | | VALUE($) | |
| | | | | | | | |
| Common Stocks — continued | |
| | | | New Zealand — 0.4% | | | | |
| | 13,529 | | | Contact Energy Ltd. | | | 47,486 | |
| | 60,030 | | | Spark New Zealand Ltd. | | | 136,161 | |
| | | | | | | | |
| | | | | | | 183,647 | |
| | | | | | | | |
| | | | Norway — 0.9% | | | | |
| | 8,258 | | | Marine Harvest ASA | | | 110,838 | |
| | 8,788 | | | Orkla ASA | | | 74,787 | |
| | 5,585 | | | Statoil ASA | | | 90,278 | |
| | 4,678 | | | Telenor ASA | | | 88,125 | |
| | 2,494 | | | Yara International ASA | | | 113,292 | |
| | | | | | | | |
| | | | | | | 477,320 | |
| | | | | | | | |
| | | | Portugal — 0.2% | | | | |
| | 29,310 | | | EDP – Energias de Portugal S.A. | | | 108,314 | |
| | | | | | | | |
| | | | Singapore — 2.5% | | | | |
| | 52,400 | | | CapitaMall Trust REIT | | | 73,880 | |
| | 25,200 | | | ComfortDelGro Corp., Ltd. | | | 54,523 | |
| | 15,500 | | | DBS Group Holdings Ltd. | | | 190,573 | |
| | 290,000 | | | Golden Agri-Resources Ltd. | | | 80,482 | |
| | 120,000 | | | Hutchison Port Holdings Trust, Class U | | | 66,463 | |
| | 27,800 | | | Keppel Corp., Ltd. | | | 139,937 | |
| | 40,500 | | | Sembcorp Industries Ltd. | | | 103,200 | |
| | 10,000 | | | Singapore Airlines Ltd. | | | 76,932 | |
| | 40,000 | | | Singapore Press Holdings Ltd. | | | 113,760 | |
| | 72,200 | | | Singapore Telecommunications Ltd. | | | 205,138 | |
| | 8,900 | | | Venture Corp., Ltd. | | | 52,450 | |
| | 48,900 | | | Wilmar International Ltd. | | | 108,967 | |
| | | | | | | | |
| | | | | | | 1,266,305 | |
| | | | | | | | |
| | | | South Korea — 9.1% | | | | |
| | 2,599 | | | Celltrion, Inc. (a) | | | 174,762 | |
| | 341 | | | CJ CheilJedang Corp. | | | 104,433 | |
| | 521 | | | CJ Corp. | | | 109,391 | |
| | 1,288 | | | Daum Kakao Corp. | | | 128,036 | |
| | 1,631 | | | GS Holdings Corp. | | | 71,642 | |
| | 2,150 | | | Halla Visteon Climate Control Corp. | | | 84,545 | |
| | 2,577 | | | Hankook Tire Co., Ltd. | | | 98,516 | |
| | 306 | | | Hanmi Pharm Co., Ltd. (a) | | | 138,008 | |
| | 816 | | | Hanmi Science Co., Ltd. (a) | | | 93,380 | |
| | 5,057 | | | Hanwha Chemical Corp. | | | 97,984 | |
| | 881 | | | Hyundai Mobis Co., Ltd. | | | 185,213 | |
| | 2,290 | | | Hyundai Steel Co. | | | 104,264 | |
| | 7,342 | | | Industrial Bank of Korea | | | 89,872 | |
| | 2,442 | | | Kia Motors Corp. | | | 119,199 | |
| | 4,284 | | | Korea Electric Power Corp. | | | 192,885 | |
| | 2,270 | | | Korea Gas Corp. | | | 84,521 | |
| | 197 | | | Korea Zinc Co., Ltd. | | | 81,867 | |
| | | | | | | | |
| SHARES | | | SECURITY DESCRIPTION | | VALUE($) | |
| | | | | | | | |
| | |
| | | | South Korea — continued | | | | |
| | 2,153 | | | Korean Air Lines Co., Ltd. (a) | | | 58,161 | |
| | 5,272 | | | KT Corp. (a) | | | 136,575 | |
| | 1,853 | | | KT&G Corp. | | | 185,292 | |
| | 7,082 | | | LG Display Co., Ltd. | | | 134,538 | |
| | 2,116 | | | LG Electronics, Inc. | | | 90,844 | |
| | 13,182 | | | LG Uplus Corp. | | | 126,339 | |
| | 364 | | | Lotte Chemical Corp. | | | 76,421 | |
| | 368 | | | Lotte Shopping Co., Ltd. | | | 74,557 | |
| | 333 | | | NAVER Corp. | | | 174,850 | |
| | 1,111 | | | POSCO | | | 178,661 | |
| | 273 | | | Samsung Electronics Co., Ltd. | | | 327,444 | |
| | 1,110 | | | Samsung Fine Chemicals Co., Ltd. | | | 36,477 | |
| | 483 | | | Samsung SDS Co., Ltd. | | | 108,323 | |
| | 120 | | | Shinsegae Co., Ltd. | | | 24,417 | |
| | 920 | | | SK C&C Co., Ltd. | | | 215,051 | |
| | 6,111 | | | SK Hynix, Inc. | | | 163,544 | |
| | 1,389 | | | SK Innovation Co., Ltd. (a) | | | 144,023 | |
| | 714 | | | SK Telecom Co., Ltd. | | | 151,198 | |
| | 1,830 | | | SKC Co., Ltd. | | | 61,421 | |
| | 1,710 | | | S-Oil Corp. | | | 102,270 | |
| | 5,053 | | | Woori Bank | | | 43,832 | |
| | | | | | | | |
| | | | | | | 4,572,756 | |
| | | | | | | | |
| | | | Spain — 2.1% | | | | |
| | 50 | | | Acciona S.A. | | | 4,194 | |
| | 3,000 | | | Acerinox S.A. | | | 32,413 | |
| | 2,363 | | | ACS Actividades de Construccion y Servicios S.A. | | | 80,173 | |
| | 3,373 | | | Enagas S.A. | | | 101,994 | |
| | 5,272 | | | Endesa S.A. | | | 117,224 | |
| | 4,760 | | | Ferrovial S.A. | | | 120,082 | |
| | 4,799 | | | Gas Natural SDG S.A. | | | 103,811 | |
| | 2,120 | | | Grifols S.A. | | | 98,188 | |
| | 15,297 | | | Iberdrola S.A. | | | 109,085 | |
| | 1,220 | | | Red Electrica Corp. S.A. | | | 107,403 | |
| | 5,603 | | | Repsol S.A. | | | 70,533 | |
| | 7,158 | | | Telefonica S.A. | | | 94,438 | |
| | | | | | | | |
| | | | | | | 1,039,538 | |
| | | | | | | | |
| | | | Sweden — 2.6% | | | | |
| | 1,134 | | | Autoliv, Inc. | | | 137,486 | |
| | 6,270 | | | Boliden AB | | | 120,048 | |
| | 1,093 | | | Getinge AB, Class B | | | 27,316 | |
| | 1,190 | | | Hexagon AB, Class B | | | 41,276 | |
| | 2,760 | | | Investor AB, Class B | | | 102,142 | |
| | 10,410 | | | Securitas AB, Class B | | | 135,910 | |
| | 6,000 | | | Skanska AB, Class B | | | 117,078 | |
SEE NOTES TO FINANCIAL STATEMENTS.
| | | | | | | | |
| | | |
| OCTOBER 31, 2015 | | JPMORGAN EXCHANGE-TRADED FUNDS | | | | | 21 | |
JPMorgan Diversified Return Global Equity ETF
SCHEDULE OF PORTFOLIO INVESTMENTS
AS OF OCTOBER 31, 2015 (continued)
| | | | | | | | |
| SHARES | | | SECURITY DESCRIPTION | | VALUE($) | |
| | | | | | | | |
| Common Stocks — continued | |
| | | | Sweden — continued | | | | |
| | 4,800 | | | Svenska Cellulosa AB SCA, Class B | | | 141,379 | |
| | 6,990 | | | Svenska Handelsbanken AB, Class A | | | 94,935 | |
| | 1,528 | | | Swedish Match AB | | | 48,034 | |
| | 10,221 | | | Tele2 AB, Class B | | | 102,073 | |
| | 8,051 | | | Telefonaktiebolaget LM Ericsson, Class B | | | 78,356 | |
| | 17,250 | | | TeliaSonera AB | | | 88,139 | |
| | 5,253 | | | Trelleborg AB, Class B | | | 88,503 | |
| | | | | | | | |
| | | | | | | 1,322,675 | |
| | | | | | | | |
| | | | Switzerland — 1.9% | | | | |
| | 294 | | | Actelion Ltd. | | | 40,811 | |
| | 824 | | | Baloise Holding AG | | | 98,795 | |
| | 4,784 | | | Clariant AG | | | 87,970 | |
| | 2,170 | | | Garmin Ltd. | | | 76,970 | |
| | 70 | | | Givaudan S.A. | | | 125,174 | |
| | 212 | | | Kuehne & Nagel International AG | | | 29,374 | |
| | 920 | | | Lonza Group AG | | | 135,037 | |
| | 1,230 | | | Novartis AG | | | 111,424 | |
| | 357 | | | Sonova Holding AG | | | 48,711 | |
| | 254 | | | Swiss Life Holding AG | | | 60,526 | |
| | 347 | | | Swiss Prime Site AG | | | 26,512 | |
| | 230 | | | Swisscom AG | | | 118,500 | |
| | | | | | | | |
| | | | | | | 959,804 | |
| | | | | | | | |
| | | | United Kingdom — 4.4% | | | | |
| | 6,602 | | | AMEC plc | | | 72,240 | |
| | 6,076 | | | Antofagasta plc | | | 49,119 | |
| | 19,595 | | | BP plc | | | 116,452 | |
| | 6,333 | | | British Land Co., plc REIT | | | 84,828 | |
| | 10,585 | | | BT Group plc, Class A | | | 75,592 | |
| | 4,860 | | | Bunzl plc | | | 138,979 | |
| | 5,867 | | | Direct Line Insurance Group plc | | | 35,588 | |
| | 1,151 | | | easyJet plc | | | 31,006 | |
| | 5,219 | | | GlaxoSmithKline plc | | | 112,551 | |
| | 4,030 | | | Hammerson plc REIT | | | 39,484 | |
| | 4,200 | | | Inmarsat plc | | | 63,659 | |
| | 390 | | | Johnson Matthey plc | | | 15,512 | |
| | 5,741 | | | Land Securities Group plc REIT | | | 118,274 | |
| | 1,425 | | | Mondi plc | | | 32,952 | |
| | 1,220 | | | Next plc | | | 150,248 | |
| | 1,494 | | | Persimmon plc | | | 45,817 | |
| | 13,250 | | | Rexam plc | | | 110,170 | |
| | 4,859 | | | Royal Mail plc | | | 33,289 | |
| | 18,721 | | | Sage Group plc | | | 156,967 | |
| | 1,247 | | | Severn Trent plc | | | 43,006 | |
| | 6,400 | | | Smith & Nephew plc | | | 109,283 | |
| | | | | | | | |
| SHARES | | | SECURITY DESCRIPTION | | VALUE($) | |
| | | | | | | | |
| | |
| | | | United Kingdom — continued | | | | |
| | 10,438 | | | Subsea 7 S.A. (a) | | | 81,869 | |
| | 29,306 | | | Taylor Wimpey plc | | | 89,276 | |
| | 2,435 | | | Travis Perkins plc | | | 71,769 | |
| | 7,036 | | | United Utilities Group plc | | | 107,068 | |
| | 28,168 | | | Vodafone Group plc | | | 92,699 | |
| | 7,970 | | | William Hill plc | | | 38,888 | |
| | 4,510 | | | WPP plc | | | 101,099 | |
| | | | | | | | |
| | | | | | | 2,217,684 | |
| | | | | | | | |
| | | | United States — 26.5% | | | | |
| | 910 | | | Airgas, Inc. | | | 87,506 | |
| | 200 | | | Alleghany Corp. (a) | | | 99,254 | |
| | 1,880 | | | Alliant Energy Corp. | | | 110,957 | |
| | 1,467 | | | Allstate Corp. (The) | | | 90,778 | |
| | 2,561 | | | Amdocs Ltd. | | | 152,559 | |
| | 1,960 | | | Ameren Corp. | | | 85,613 | |
| | 2,901 | | | American Water Works Co., Inc. | | | 166,401 | |
| | 1,421 | | | AmerisourceBergen Corp., Class A | | | 137,141 | |
| | 8,555 | | | Annaly Capital Management, Inc. REIT | | | 85,122 | |
| | 968 | | | Anthem, Inc. | | | 134,697 | |
| | 1,000 | | | Ashland, Inc. | | | 109,720 | |
| | 1,570 | | | Assurant, Inc. | | | 128,002 | |
| | 4,622 | | | AT&T, Inc. | | | 154,883 | |
| | 1,980 | | | AutoNation, Inc. (a) | | | 125,116 | |
| | 150 | | | AutoZone Inc. (a) | | | 117,661 | |
| | 2,150 | | | Avery Dennison Corp. | | | 139,685 | |
| | 2,260 | | | Axis Capital Holdings Ltd. | | | 122,040 | |
| | 1,160 | | | Becton Dickinson & Co. | | | 165,323 | |
| | 2,560 | | | Bemis Co., Inc. | | | 117,197 | |
| | 2,863 | | | Broadridge Financial Solutions Inc. | | | 170,577 | |
| | 3,590 | | | CA Technologies, Inc. | | | 99,479 | |
| | 1,183 | | | Celanese Corp., Class A | | | 84,052 | |
| | 3,822 | | | CenturyLink, Inc. | | | 107,819 | |
| | 2,055 | | | CF Industries Holdings, Inc. | | | 104,332 | |
| | 5,307 | | | Chemours Co. (The) | | | 36,778 | |
| | 1,466 | | | Chevron Corp. | | | 133,230 | |
| | 1,470 | | | Church & Dwight Co., Inc. | | | 126,553 | |
| | 1,094 | | | Cigna Corp. | | | 146,640 | |
| | 2,010 | | | Cincinnati Financial Corp. | | | 121,062 | |
| | 1,710 | | | Cintas Corp. | | | 159,184 | |
| | 771 | | | CMS Energy Corp. | | | 27,810 | |
| | 1,470 | | | CNA Financial Corp. | | | 53,743 | |
| | 292 | | | Columbia Pipeline Group, Inc. | | | 6,065 | |
| | 1,171 | | | Commerce Bancshares Inc. | | | 53,339 | |
| | 1,410 | | | Communications Sales & Leasing, Inc. REIT | | | 28,327 | |
| | 1,742 | | | Computer Sciences Corp. | | | 116,000 | |
SEE NOTES TO FINANCIAL STATEMENTS.
| | | | | | |
| | | |
| 22 | | | | JPMORGAN EXCHANGE-TRADED FUNDS | | OCTOBER 31, 2015 |
| | | | | | | | |
| SHARES | | | SECURITY DESCRIPTION | | VALUE($) | |
| | | | | | | | |
| Common Stocks — continued | |
| | | | United States — continued | | | | |
| | 2,070 | | | ConocoPhillips Co. | | | 110,435 | |
| | 1,203 | | | Constellation Brands, Inc., Class A | | | 162,165 | |
| | 510 | | | C.R. Bard, Inc. | | | 95,039 | |
| | 1,116 | | | Darden Restaurants, Inc. | | | 69,069 | |
| | 354 | | | DaVita HealthCare Partners, Inc. (a) | | | 27,438 | |
| | 2,050 | | | DENTSPLY International Corp. | | | 124,743 | |
| | 1,190 | | | Diamond Offshore Drilling, Inc. | | | 23,657 | |
| | 1,601 | | | Dr Pepper Snapple Group, Inc. | | | 143,081 | |
| | 1,340 | | | DST Systems, Inc. | | | 163,681 | |
| | 1,782 | | | DTE Energy Co. | | | 145,393 | |
| | 700 | | | Eastman Chemical Co. | | | 50,519 | |
| | 910 | | | Edgewell Personal Care Co. | | | 77,086 | |
| | 363 | | | EI du Pont de Nemours & Co. | | | 23,014 | |
| | 910 | | | Energizer Holdings, Inc. | | | 38,975 | |
| | 741 | | | Entergy Corp. | | | 50,506 | |
| | 901 | | | Everest Re Group Ltd. | | | 160,351 | |
| | 2,540 | | | Eversource Energy | | | 129,388 | |
| | 1,504 | | | Fidelity National Information Services, Inc. | | | 109,672 | |
| | 2,061 | | | Foot Locker, Inc. | | | 139,633 | |
| | 20,390 | | | Frontier Communications Corp. | | | 104,805 | |
| | 717 | | | Gannett Co., Inc. | | | 11,343 | |
| | 850 | | | Genuine Parts Co. | | | 77,146 | |
| | 1,520 | | | Harris Corp. | | | 120,278 | |
| | 2,004 | | | Hasbro, Inc. | | | 153,967 | |
| | 1,024 | | | Helmerich & Payne, Inc. | | | 57,621 | |
| | 970 | | | Henry Schein, Inc. (a) | | | 147,159 | |
| | 1,315 | | | Hess Corp. | | | 73,916 | |
| | 2,271 | | | HollyFrontier Corp. | | | 111,211 | |
| | 2,200 | | | Hormel Foods Corp. | | | 148,610 | |
| | 1,203 | | | IAC/Interactive Corp. | | | 80,613 | |
| | 2,391 | | | Intel Corp. | | | 80,959 | |
| | 1,090 | | | International Flavors & Fragrances, Inc. | | | 126,505 | |
| | 2,161 | | | Jabil Circuit, Inc. | | | 49,660 | |
| | 1,254 | | | JM Smucker Co. (The) | | | 147,207 | |
| | 936 | | | Johnson & Johnson | | | 94,564 | |
| | 317 | | | KLA-Tencor Corp. | | | 21,277 | |
| | 1,182 | | | L-3 Communications Holdings Corp., Class 3 | | | 149,405 | |
| | 990 | | | Laboratory Corp of America Holdings (a) | | | 121,513 | |
| | 3,320 | | | Leggett & Platt, Inc. | | | 149,500 | |
| | 2,172 | | | Level 3 Communications, Inc. (a) | | | 110,663 | |
| | 4,320 | | | Liberty Interactive Corp., Class A (a) | | | 118,238 | |
| | 3,502 | | | Marathon Oil Corp. | | | 64,367 | |
| | 1,044 | | | McCormick & Co., Inc. | | | 87,675 | |
| | 1,610 | | | Molson Coors Brewing Co., Class B | | | 141,841 | |
| | 1,228 | | | Motorola Solutions, Inc. | | | 85,923 | |
| | 1,980 | | | Murphy Oil Corp. | | | 56,291 | |
| | | | | | | | |
| SHARES | | | SECURITY DESCRIPTION | | VALUE($) | |
| | | | | | | | |
| | |
| | | | United States — continued | | | | |
| | 3,440 | | | Newell Rubbermaid, Inc. | | | 145,959 | |
| | 2,126 | | | Newfield Exploration Co. (a) | | | 85,444 | |
| | 292 | | | NiSource, Inc. | | | 5,595 | |
| | 922 | | | Northrop Grumman Corp. | | | 173,105 | |
| | 5,751 | | | NVIDIA Corp. | | | 163,156 | |
| | 76 | | | NVR, Inc. (a) | | | 124,470 | |
| | 1,071 | | | PartnerRe, Inc. (a) | | | 148,869 | |
| | 2,390 | | | Patterson Cos., Inc. | | | 113,286 | |
| | 5,356 | | | Pepco Holdings, Inc. | | | 142,630 | |
| | 1,820 | | | Pinnacle West Capital Corp. | | | 115,588 | |
| | 1,302 | | | PPG Industries, Inc. | | | 135,747 | |
| | 340 | | | Quest Diagnostics, Inc. | | | 23,103 | |
| | 1,640 | | | Questar Corp. | | | 33,866 | |
| | 1,452 | | | Raytheon Co. | | | 170,465 | |
| | 1,410 | | | RenaissanceRe Holdings Ltd. | | | 154,578 | |
| | 2,482 | | | Republic Services, Inc., Class A | | | 108,563 | |
| | 1,254 | | | Ryder System, Inc. | | | 90,012 | |
| | 1,230 | | | SBA Communications Corp., Class A (a) | | | 146,395 | |
| | 2,185 | | | SCANA Corp. | | | 129,396 | |
| | 830 | | | Scripps Networks Interactive, Inc., Class A | | | 49,866 | |
| | 2,671 | | | Southwest Airlines Co. | | | 123,641 | |
| | 21,951 | | | Sprint Corp. (a) | | | 103,828 | |
| | 642 | | | Stericycle, Inc. (a) | | | 77,919 | |
| | 3,281 | | | Synopsys, Inc. (a) | | | 163,984 | |
| | 5,770 | | | TECO Energy, Inc. | | | 155,790 | |
| | 1,434 | | | TEGNA, Inc. | | | 38,775 | |
| | 3,980 | | | TELUS Corp. | | | 132,813 | |
| | 823 | | | Tesoro Corp. | | | 88,003 | |
| | 2,533 | | | Thomson Reuters Corp. | | | 103,986 | |
| | 4,000 | | | T-Mobile US, Inc. (a) | | | 151,560 | |
| | 1,980 | | | Torchmark Corp. | | | 114,860 | |
| | 2,575 | | | Total System Services, Inc. | | | 135,059 | |
| | 1,234 | | | Tyson Foods, Inc., Class A | | | 54,740 | |
| | 1,094 | | | Universal Health Services, Inc., Class B | | | 133,566 | |
| | 3,231 | | | Verizon Communications, Inc. | | | 151,469 | |
| | 1,524 | | | Walt Disney Co. (The) | | | 173,340 | |
| | 780 | | | Waters Corp. (a) | | | 99,684 | |
| | 482 | | | Westlake Chemical Corp. | | | 29,050 | |
| | 1,368 | | | WestRock Co. | | | 73,544 | |
| | 2,568 | | | WR Berkley Corp. | | | 143,372 | |
| | 1,840 | | | Wyndham Worldwide Corp. | | | 149,684 | |
| | 4,460 | | | Xcel Energy, Inc. | | | 158,910 | |
| | 1,141 | | | Zimmer Holdings, Inc. | | | 119,314 | |
| | | | | | | | |
| | | | | | | 13,377,731 | |
| | | | | | | | |
| | | | Total Common Stocks
(Cost $50,289,699) | | | 50,188,936 | |
| | | | | | | | |
SEE NOTES TO FINANCIAL STATEMENTS.
| | | | | | | | |
| | | |
| OCTOBER 31, 2015 | | JPMORGAN EXCHANGE-TRADED FUNDS | | | | | 23 | |
JPMorgan Diversified Return Global Equity ETF
SCHEDULE OF PORTFOLIO INVESTMENTS
AS OF OCTOBER 31, 2015 (continued)
| | | | | | | | |
| SHARES | | | SECURITY DESCRIPTION | | VALUE($) | |
| Preferred Stock — 0.1% | |
| | | | Germany — 0.1% | | | | |
| | 420 | | | Porsche Automobil Holding AG | | | 19,632 | |
| | | | | | | | |
| | | | Total Preferred Stock
(Cost $38,523) | | | 19,632 | |
| | | | | | | | |
| | | | Total Investments — 99.4%
(Cost $50,328,222) | | | 50,208,568 | |
| | | | Other Assets in Excess of
Liabilities — 0.6% | | | 321,466 | |
| | | | | | | | |
| | | | NET ASSETS — 100.0% | | $ | 50,530,034 | |
| | | | | | | | |
Percentages indicated are based on net assets.
Summary of Investments by Industry, October 31, 2015
The following table represents the portfolio investments of the Fund by industry classifications as a percentage of total investments:
| | | | |
| INDUSTRY | | PERCENTAGE | |
Oil, Gas & Consumable Fuels | | | 7.1 | % |
Chemicals | | | 6.3 | |
Diversified Telecommunication Services | | | 5.3 | |
Electric Utilities | | | 5.2 | |
Pharmaceuticals | | | 4.3 | |
Insurance | | | 3.9 | |
Health Care Providers & Services | | | 3.3 | |
IT Services | | | 3.1 | |
Food Products | | | 3.1 | |
Commercial Banks | | | 3.1 | |
Media | | | 2.9 | |
Wireless Telecommunication Services | | | 2.7 | |
Semiconductors & Semiconductor Equipment | | | 2.5 | |
Road & Rail | | | 2.3 | |
Real Estate Investment Trusts (REITs) | | | 2.2 | |
Health Care Equipment & Supplies | | | 2.2 | |
Auto Components | | | 2.0 | |
Household Durables | | | 1.9 | |
Multi-Utilities | | | 1.9 | |
Software | | | 1.8 | |
Trading Companies & Distributors | | | 1.7 | |
Metals & Mining | | | 1.7 | |
Gas Utilities | | | 1.6 | |
Commercial Services & Supplies | | | 1.6 | |
Hotels, Restaurants & Leisure | | | 1.5 | |
Specialty Retail | | | 1.4 | |
Beverages | | | 1.4 | |
Electronic Equipment & Instruments | | | 1.3 | |
Airlines | | | 1.3 | |
Aerospace & Defense | | | 1.2 | |
Food & Staples Retailing | | | 1.2 | |
Real Estate Management & Development | | | 1.1 | |
Internet Software & Services | | | 1.0 | |
Transportation Infrastructure | | | 1.0 | |
Others (each less than 1.0%) | | | 13.9 | |
SEE NOTES TO FINANCIAL STATEMENTS.
| | | | | | |
| | | |
| 24 | | | | JPMORGAN EXCHANGE-TRADED FUNDS | | OCTOBER 31, 2015 |
JPMorgan Diversified Return International Equity ETF
SCHEDULE OF PORTFOLIO INVESTMENTS
AS OF OCTOBER 31, 2015
| | | | | | | | |
| SHARES | | | SECURITY DESCRIPTION | | VALUE($) | |
| | | | | | | | |
| Common Stocks — 99.4% | |
| | | | Australia — 8.7% | | | | |
| | 32,274 | | | AGL Energy Ltd. | | | 382,726 | |
| | 18,090 | | | Ansell Ltd. | | | 257,420 | |
| | 53,856 | | | APA Group | | | 350,882 | |
| | 12,247 | | | Asciano Ltd. | | | 71,320 | |
| | 24,206 | | | Bendigo & Adelaide Bank Ltd. | | | 183,630 | |
| | 18,718 | | | BHP Billiton Ltd. | | | 306,989 | |
| | 24,929 | | | Boral Ltd. | | | 95,358 | |
| | 34,495 | | | Brambles Ltd. | | | 254,020 | |
| | 11,890 | | | Caltex Australia Ltd. | | | 266,172 | |
| | 5,400 | | | Cochlear Ltd. | | | 340,811 | |
| | 6,645 | | | CSL Ltd. | | | 441,695 | |
| | 53,157 | | | CSR Ltd. | | | 104,065 | |
| | 51,769 | | | Dexus Property Group REIT | | | 284,179 | |
| | 13,123 | | | Downer EDI Ltd. | | | 32,977 | |
| | 121,845 | | | Federation Centres REIT | | | 251,703 | |
| | 84,923 | | | GPT Group REIT (The) | | | 287,619 | |
| | 13,431 | | | Harvey Norman Holdings Ltd. | | | 37,735 | |
| | 47,310 | | | Healthscope Ltd. | | | 90,573 | |
| | 92,394 | | | Incitec Pivot Ltd. | | | 258,014 | |
| | 8,471 | | | Orica Ltd. | | | 99,097 | |
| | 71,604 | | | Origin Energy Ltd. | | | 278,239 | |
| | 7,686 | | | Ramsay Health Care Ltd. | | | 337,858 | |
| | 22,086 | | | Sonic Healthcare Ltd. | | | 302,061 | |
| | 60,557 | | | South32 Ltd. (a) | | | 62,707 | |
| | 80,473 | | | Sydney Airport | | | 367,770 | |
| | 102,052 | | | Tabcorp Holdings Ltd. | | | 341,065 | |
| | 88,452 | | | Tatts Group Ltd. | | | 248,349 | |
| | 95,038 | | | Telstra Corp. Ltd. | | | 364,152 | |
| | 31,158 | | | TPG Telecom Ltd. | | | 244,213 | |
| | 54,738 | | | Transurban Group | | | 405,610 | |
| | 12,041 | | | Wesfarmers Ltd. | | | 336,718 | |
| | 17,009 | | | Woodside Petroleum Ltd. | | | 356,728 | |
| | | | | | | | |
| | | | | | | 8,042,455 | |
| | | | | | | | |
| | | | Austria — 0.4% | | | | |
| | 7,416 | | | OMV AG | | | 197,472 | |
| | 4,638 | | | Voestalpine AG | | | 167,692 | |
| | | | | | | | |
| | | | | | | 365,164 | |
| | | | | | | | |
| | | | Belgium — 1.0% | | | | |
| | 1,834 | | | Ageas | | | 80,875 | |
| | 9,857 | | | Belgacom S.A. | | | 341,100 | |
| | 4,932 | | | Colruyt S.A. | | | 243,952 | |
| | 1,602 | | | Groupe Bruxelles Lambert S.A. | | | 130,034 | |
| | 2,422 | | | Umicore S.A. | | | 102,834 | |
| | | | | | | | |
| | | | | | | 898,795 | |
| | | | | | | | |
| | | | | | | | |
| SHARES | | | SECURITY DESCRIPTION | | VALUE($) | |
| | | | | | | | |
| | | | | | | | |
| | | | Denmark — 1.1% | | | | |
| | 4,000 | | | Christian Hansen Holdings A/S | | | 240,332 | |
| | 2,006 | | | DSV A/S | | | 81,402 | |
| | 5,238 | | | H Lundbeck A/S (a) | | | 153,876 | |
| | 51,387 | | | TDC A/S | | | 268,645 | |
| | 2,024 | | | Vestas Wind Systems A/S | | | 118,008 | |
| | 1,692 | | | William Demant Holding A/S (a) | | | 146,997 | |
| | | | | | | | |
| | | | | | | 1,009,260 | |
| | | | | | | | |
| | | | Finland — 1.5% | | | | |
| | 1,703 | | | Elisa OYJ | | | 64,163 | |
| | 5,760 | | | Fortum OYJ | | | 86,376 | |
| | 5,166 | | | Kesko OYJ, Class B | | | 164,921 | |
| | 14,238 | | | Neste Oil OYJ | | | 347,158 | |
| | 21,483 | | | Nokia OYJ | | | 159,809 | |
| | 4,115 | | | Orion OYJ, Class B | | | 146,978 | |
| | 6,138 | | | Sampo OYJ, Class A | | | 300,011 | |
| | 6,626 | | | UPM-Kymmene OYJ | | | 124,045 | |
| | | | | | | | |
| | | | | | | 1,393,461 | |
| | | | | | | | |
| | | | France — 5.1% | | | | |
| | 4,392 | | | AtoS | | | 349,632 | |
| | 3,875 | | | Capital Gemini S.A. | | | 344,550 | |
| | 2,085 | | | Casino Guichard Perrachon S.A. | | | 119,793 | |
| | 1,446 | | | Christian Dior S.A. | | | 284,200 | |
| | 5,062 | | | Dassault Systemes S.A. | | | 399,332 | |
| | 2,381 | | | Essilor International S.A. | | | 312,538 | |
| | 5,049 | | | Eutelsat Communications S.A. | | | 166,413 | |
| | 1,945 | | | Ingenico S.A. | | | 229,221 | |
| | 7,875 | | | Lagardere SCA | | | 229,127 | |
| | 542 | | | L’Oreal S.A. | | | 98,809 | |
| | 3,366 | | | Publicis Groupe S.A. | | | 218,033 | |
| | 3,456 | | | Safran S.A. | | | 262,497 | |
| | 7,817 | | | SCOR S.A. | | | 290,657 | |
| | 954 | | | Sodexo S.A. | | | 84,803 | |
| | 5,118 | | | Thales S.A. | | | 369,987 | |
| | 5,422 | | | TOTAL S.A. | | | 262,202 | |
| | 1,224 | | | Valeo S.A. | | | 189,017 | |
| | 10,900 | | | Vivendi S.A. | | | 262,219 | |
| | 10,068 | | | Zodiac Aerospace S.A. | | | 253,983 | |
| | | | | | | | |
| | | | | | | 4,727,013 | |
| | | | | | | | |
| | | | Germany — 4.2% | | | | |
| | 1,398 | | | Axel Springer AG | | | 78,567 | |
| | 3,006 | | | Beiersdorf AG | | | 285,497 | |
| | 3,762 | | | Brenntag AG | | | 227,162 | |
| | 5,697 | | | Evonik Industries AG | | | 206,858 | |
SEE NOTES TO FINANCIAL STATEMENTS.
| | | | | | | | |
| | | |
| OCTOBER 31, 2015 | | JPMORGAN EXCHANGE-TRADED FUNDS | | | | | 25 | |
JPMorgan Diversified Return International Equity ETF
SCHEDULE OF PORTFOLIO INVESTMENTS
AS OF OCTOBER 31, 2015 (continued)
| | | | | | | | |
| SHARES | | | SECURITY DESCRIPTION | | VALUE($) | |
| | | | | | | | |
| Common Stocks — continued | |
| | | | Germany — continued | | | | |
| | 3,960 | | | Fraport AG Frankfurt Airport Services Worldwide | | | 251,075 | |
| | 4,428 | | | Fresenius Medical Care AG & Co., KGaA | | | 398,554 | |
| | 5,724 | | | Fresenius SE & Co., KGaA | | | 420,613 | |
| | 3,240 | | | Hannover Rueck SE | | | 374,577 | |
| | 1,159 | | | HUGO BOSS AG | | | 119,176 | |
| | 21,418 | | | Infineon Technologies AG | | | 263,825 | |
| | 3,620 | | | K+S AG | | | 91,381 | |
| | 1,368 | | | Linde AG | | | 237,287 | |
| | 2,770 | | | Merck KGaA | | | 270,431 | |
| | 2,504 | | | Suedzucker AG | | | 46,731 | |
| | 1,013 | | | Symrise AG | | | 66,672 | |
| | 21,530 | | | Telefonica Deutschland Holding AG | | | 138,603 | |
| | 7,490 | | | United Internet AG | | | 388,902 | |
| | | | | | | | |
| | | | | | | 3,865,911 | |
| | | | | | | | |
| | | | Hong Kong — 5.3% | | | | |
| | 82,000 | | | Cathay Pacific Airways Ltd. | | | 162,634 | |
| | 42,000 | | | Cheung Kong Infrastructure Holdings Ltd. | | | 389,633 | |
| | 29,042 | | | CK Hutchison Holdings Ltd. | | | 397,687 | |
| | 47,000 | | | CLP Holdings Ltd. | | | 408,596 | |
| | 216,000 | | | FIH Mobile Ltd. | | | 103,019 | |
| | 36,000 | | | First Pacific Co., Ltd. | | | 24,634 | |
| | 190,100 | | | Hong Kong & China Gas Co., Ltd. | | | 385,434 | |
| | 68,000 | | | Link REIT (The) | | | 406,279 | |
| | 78,500 | | | MTR Corp., Ltd. | | | 355,625 | |
| | 64,000 | | | New World Development Co., Ltd. | | | 68,263 | |
| | 647,000 | | | PCCW Ltd. | | | 348,372 | |
| | 42,500 | | | Power Assets Holdings Ltd. | | | 422,722 | |
| | 3,417,000 | | | Semiconductor Manufacturing International Corp. (a) | | | 316,550 | |
| | 27,000 | | | Swire Pacific Ltd., Class A | | | 311,945 | |
| | 53,500 | | | Techtronic Industries Co., Ltd. | | | 195,579 | |
| | 26,000 | | | Wheelock & Co., Ltd. | | | 121,189 | |
| | 144,000 | | | Xinyi Solar Holdings Ltd. | | | 57,245 | |
| | 101,000 | | | Yue Yuen Industrial Holdings Ltd. | | | 368,454 | |
| | | | | | | | |
| | | | | | | 4,843,860 | |
| | | | | | | | |
| | | | Ireland — 0.3% | | | | |
| | 2,918 | | | Kerry Group plc, Class A | | | 236,663 | |
| | | | | | | | |
| | | | Italy — 1.4% | | | | |
| | 18,774 | | | Davide Campari-Milano SpA | | | 160,770 | |
| | 39,744 | | | Enel Green Power SpA | | | 84,025 | |
| | 12,691 | | | Eni SpA | | | 207,247 | |
| | 71,604 | | | Parmalat SpA | | | 186,297 | |
| | 21,206 | | | Pirelli & C. SpA | | | 348,648 | |
| | | | | | | | |
| SHARES | | | SECURITY DESCRIPTION | | VALUE($) | |
| | | | | | | | |
| | | | | | | | |
| | | | Italy — continued | | | | |
| | 63,801 | | | Terna Rete Elettrica Nazionale SpA | | | 324,512 | |
| | | | | | | | |
| | | | | | | 1,311,499 | |
| | | | | | | | |
| | | | Japan — 23.6% | | | | |
| | 16,200 | | | Alfresa Holdings Corp. | | | 310,641 | |
| | 40,000 | | | Asahi Kasei Corp. | | | 245,465 | |
| | 58,000 | | | Bank of Yokohama Ltd. (The) | | | 361,984 | |
| | 10,800 | | | Brother Industries Ltd. | | | 138,040 | |
| | 9,000 | | | Canon Marketing Japan, Inc. | | | 136,824 | |
| | 10,100 | | | Canon, Inc. | | | 301,607 | |
| | 13,200 | | | Capcom Co., Ltd. | | | 278,320 | |
| | 1,700 | | | Central Japan Railway Co. | | | 310,103 | |
| | 51,000 | | | Chiba Bank Ltd. (The) | | | 372,047 | |
| | 5,400 | | | Chubu Electric Power Co., Inc. | | | 83,068 | |
| | 16,400 | | | Chugoku Electric Power Co., Inc. (a) | | | 247,828 | |
| | 14,400 | | | COMSYS Holdings Corp. | | | 188,086 | |
| | 30,500 | | | Daicel Corp. | | | 403,039 | |
| | 80,000 | | | DIC Corp. | | | 216,549 | |
| | 8,900 | | | Electric Power Development Co., Ltd. | | | 293,397 | |
| | 7,200 | | | FamilyMart Co., Ltd. | | | 294,313 | |
| | 36,000 | | | Fuji Electric Co., Ltd. | | | 160,616 | |
| | 10,600 | | | FUJIFILM Holdings Corp. | | | 422,821 | |
| | 54,000 | | | Fujikura Ltd. | | | 277,556 | |
| | 46,000 | | | Fukuoka Financial Group, Inc. | | | 242,059 | |
| | 23,000 | | | Gunma Bank Ltd. (The) | | | 144,778 | |
| | 18,000 | | | Hachijuni Bank Ltd. (The) | | | 122,737 | |
| | 47,000 | | | Hankyu Hanshin Holdings, Inc. | | | 306,164 | |
| | 4,800 | | | Hikari Tsushin, Inc. | | | 365,274 | |
| | 12,600 | | | Hitachi Chemical Co., Ltd. | | | 199,176 | |
| | 12,600 | | | Hitachi High-Technologies Corp. | | | 338,853 | |
| | 16,200 | | | Hokuriku Electric Power Co. | | | 241,637 | |
| | 14,300 | | | Idemitsu Kosan Co., Ltd. | | | 234,512 | |
| | 30,300 | | | Inpex Corp. | | | 288,820 | |
| | 8,000 | | | Itochu Techno-Solutions Corp. | | | 175,384 | |
| | 10,200 | | | Japan Airlines Co., Ltd. (a) | | | 384,266 | |
| | 8,000 | | | Japan Petroleum Exploration Co., Ltd. | | | 240,097 | |
| | 84,700 | | | JX Holdings, Inc. | | | 332,588 | |
| | 49,000 | | | Kaneka Corp. | | | 434,496 | |
| | 126,000 | | | Kawasaki Kisen Kaisha Ltd. | | | 282,885 | |
| | 16,500 | | | KDDI Corp. | | | 399,273 | |
| | 32,100 | | | Konica Minolta, Inc. | | | 329,809 | |
| | 15,100 | | | Kuraray Co., Ltd. | | | 186,241 | |
| | 4,000 | | | Kyowa Hakko Kirin Co., Ltd. | | | 65,932 | |
| | 7,200 | | | Lintec Corp. | | | 168,660 | |
| | 6,000 | | | Lion Corp. | | | 57,842 | |
| | 14,400 | | | Medipal Holdings Corp. | | | 251,310 | |
SEE NOTES TO FINANCIAL STATEMENTS.
| | | | | | |
| | | |
| 26 | | | | JPMORGAN EXCHANGE-TRADED FUNDS | | OCTOBER 31, 2015 |
| | | | | | | | |
| SHARES | | | SECURITY DESCRIPTION | | VALUE($) | |
| | | | | | | | |
| Common Stocks — continued | |
| | | | Japan — continued | | | | |
| | 5,400 | | | Miraca Holdings, Inc. | | | 240,329 | |
| | 21,800 | | | Mitsubishi Tanabe Pharma Corp. | | | 368,622 | |
| | 36,700 | | | Mizuho Financial Group, Inc. | | | 75,596 | |
| | 4,800 | | | Mochida Pharmaceutical Co., Ltd. | | | 283,420 | |
| | 17,000 | | | NH Foods Ltd. | | | 354,595 | |
| | 13,000 | | | Nippo Corp. | | | 226,537 | |
| | 54,000 | | | Nippon Express Co., Ltd. | | | 278,191 | |
| | 9,700 | | | Nippon Paper Industries Co., Ltd. | | | 179,786 | |
| | 2,600 | | | Nippon Shokubai Co., Ltd. | | | 203,469 | |
| | 10,500 | | | Nippon Telegraph & Telephone Corp. | | | 384,945 | |
| | 19,800 | | | Nippon Television Holdings, Inc. | | | 342,660 | |
| | 27,100 | | | Nipro Corp. | | | 303,802 | |
| �� | 25,200 | | | Nisshin Seifun Group, Inc. | | | 385,168 | |
| | 4,500 | | | Nissin Foods Holdings Co., Ltd. | | | 208,026 | |
| | 2,300 | | | Nomura Research Institute | | | 94,002 | |
| | 19,600 | | | NTT DOCOMO, Inc. | | | 381,719 | |
| | 90,000 | | | Osaka Gas Co., Ltd. | | | 354,462 | |
| | 4,500 | | | Otsuka Holdings Co., Ltd. | | | 149,762 | |
| | 66,700 | | | Resona Holdings, Inc. | | | 352,932 | |
| | 12,800 | | | Ricoh Co., Ltd. | | | 137,957 | |
| | 500 | | | Sawai Pharmaceutical Co., Ltd. | | | 32,009 | |
| | 23,600 | | | Sekisui House Ltd. | | | 392,855 | |
| | 30,600 | | | Seven Bank Ltd. | | | 139,431 | |
| | 8,900 | | | Shimachu Co., Ltd. | | | 194,400 | |
| | 2,900 | | | Shimamura Co., Ltd. | | | 325,703 | |
| | 1,100 | | | Shionogi & Co., Ltd. | | | 45,118 | |
| | 32,400 | | | Showa Shell Sekiyu | | | 285,977 | |
| | 14,400 | | | SKY Perfect JSAT Holdings, Inc. | | | 75,795 | |
| | 6,600 | | | SoftBank Group Corp. | | | 369,784 | |
| | 117,900 | | | Sojitz Corp. | | | 259,321 | |
| | 53,000 | | | Sumitomo Osaka Cement Co., Ltd. | | | 204,237 | |
| | 5,900 | | | Suzuken Co., Ltd. | | | 225,816 | |
| | 53,000 | | | Taisei Corp. | | | 344,421 | |
| | 1,500 | | | Taisho Pharmaceutical Holdings Co., Ltd. | | | 93,592 | |
| | 4,100 | | | Tohoku Electric Power Co., Inc. | | | 57,566 | |
| | 53,000 | | | Tokyo Gas Co., Ltd. | | | 262,290 | |
| | 36,000 | | | TonenGeneral Sekiyu | | | 374,028 | |
| | 9,300 | | | Toyo Suisan Kaisha Ltd. | | | 342,684 | |
| | 6,600 | | | Toyota Industries Corp. | | | 346,828 | |
| | 10,700 | | | Tsumura & Co. | | | 257,828 | |
| | 88,000 | | | Ube Industries Ltd. | | | 184,779 | |
| | 5,900 | | | West Japan Railway Co. | | | 414,515 | |
| | 5,500 | | | Yamaha Corp. | | | 136,503 | |
| | 12,500 | | | Yokohama Rubber Co., Ltd. (The) | | | 240,296 | |
| | | | | | | | |
| | | | | | | 21,746,853 | |
| | | | | | | | |
| | | | | | | | |
| SHARES | | | SECURITY DESCRIPTION | | VALUE($) | |
| | | | | | | | |
| | | | | | | | |
| | | | Luxembourg — 0.1% | | | | |
| | 16,500 | | | Samsonite International S.A. | | | 48,858 | |
| | | | | | | | |
| | | | Netherlands — 2.6% | | | | |
| | 4,116 | | | Boskalis Westminster NV | | | 199,769 | |
| | 3,797 | | | Heineken Holding NV | | | 303,354 | |
| | 7,720 | | | Koninklijke Ahold NV | | | 157,046 | |
| | 3,475 | | | NN Group NV | | | 108,882 | |
| | 1,734 | | | OCI NV (a) | | | 48,918 | |
| | 7,792 | | | QIAGEN NV (a) | | | 188,906 | |
| | 19,434 | | | Reed Elsevier NV | | | 331,482 | |
| | 25,714 | | | Royal Dutch Shell plc, Class A | | | 671,321 | |
| | 11,346 | | | Wolters Kluwer NV | | | 383,464 | |
| | | | | | | | |
| | | | | | | 2,393,142 | |
| | | | | | | | |
| | | | New Zealand — 0.6% | | | | |
| | 38,482 | | | Fletcher Building Ltd. | | | 193,820 | |
| | 148,230 | | | Spark New Zealand Ltd. | | | 336,218 | |
| | | | | | | | |
| | | | | | | 530,038 | |
| | | | | | | | |
| | | | Norway — 1.0% | | | | |
| | 828 | | | DNB ASA | | | 10,542 | |
| | 9,866 | | | Marine Harvest ASA | | | 132,421 | |
| | 19,872 | | | Norsk Hydro ASA | | | 71,177 | |
| | 14,276 | | | Statoil ASA | | | 230,761 | |
| | 11,443 | | | Telenor ASA | | | 215,566 | |
| | 6,477 | | | Yara International ASA | | | 294,224 | |
| | | | | | | | |
| | | | | | | 954,691 | |
| | | | | | | | |
| | | | Portugal — 0.5% | | | | |
| | 74,394 | | | EDP — Energias de Portugal S.A. | | | 274,922 | |
| | 17,676 | | | Galp Energia SGPS S.A. | | | 190,812 | |
| | | | | | | | |
| | | | | | | 465,734 | |
| | | | | | | | |
| | | | Singapore — 3.3% | | | | |
| | 37,700 | | | Ascendas Real Estate Investment Trust REIT | | | 64,185 | |
| | 162,400 | | | CapitaMall Trust REIT | | | 228,970 | |
| | 81,700 | | | ComfortDelGro Corp., Ltd. | | | 176,767 | |
| | 28,900 | | | DBS Group Holdings Ltd. | | | 355,327 | |
| | 809,200 | | | Golden Agri-Resources Ltd. | | | 224,571 | |
| | 324,000 | | | Hutchison Port Holdings Trust, Class U | | | 179,449 | |
| | 60,200 | | | Keppel Corp., Ltd. | | | 303,029 | |
| | 72,000 | | | Sembcorp Industries Ltd. | | | 183,467 | |
| | 28,800 | | | Sembcorp Marine Ltd. | | | 47,923 | |
| | 90,000 | | | Singapore Press Holdings Ltd. | | | 255,960 | |
| | 133,900 | | | Singapore Telecommunications Ltd. | | | 380,444 | |
| | 44,700 | | | StarHub Ltd. | | | 114,670 | |
| | 77,500 | | | Suntec REIT | | | 91,031 | |
| | 24,900 | | | Venture Corp., Ltd. | | | 146,741 | |
SEE NOTES TO FINANCIAL STATEMENTS.
| | | | | | | | |
| | | |
| OCTOBER 31, 2015 | | JPMORGAN EXCHANGE-TRADED FUNDS | | | | | 27 | |
JPMorgan Diversified Return International Equity ETF
SCHEDULE OF PORTFOLIO INVESTMENTS
AS OF OCTOBER 31, 2015 (continued)
| | | | | | | | |
| SHARES | | | SECURITY DESCRIPTION | | VALUE($) | |
| | | | | | | | |
| Common Stocks — continued | |
| | | | Singapore — continued | | | | |
| | 120,500 | | | Wilmar International Ltd. | | | 268,519 | |
| | | | | | | | |
| | | | | | | 3,021,053 | |
| | | | | | | | |
| | | | South Korea — 9.3% | | | | |
| | 5,520 | | | Celltrion, Inc. (a) | | | 371,177 | |
| | 566 | | | CJ CheilJedang Corp. | | | 173,341 | |
| | 1,402 | | | CJ Corp. | | | 294,369 | |
| | 2,580 | | | Daum Kakao Corp. | | | 256,470 | |
| | 5,512 | | | GS Holdings Corp. | | | 242,115 | |
| | 522 | | | Hanmi Pharm Co., Ltd. (a) | | | 235,424 | |
| | 1,746 | | | Hanmi Science Co., Ltd. (a) | | | 199,806 | |
| | 859 | | | Hyosung Corp. | | | 87,710 | |
| | 940 | | | Hyundai Department Store Co., Ltd. | | | 103,185 | |
| | 6,078 | | | Hyundai Steel Co. | | | 276,731 | |
| | 19,954 | | | Industrial Bank of Korea | | | 244,253 | |
| | 6,190 | | | Kangwon Land, Inc. | | | 229,671 | |
| | 9,483 | | | Korea Electric Power Corp. | | | 426,968 | |
| | 5,992 | | | Korea Gas Corp. | | | 223,106 | |
| | 551 | | | Korea Zinc Co., Ltd. | | | 228,979 | |
| | 3,745 | | | Korean Air Lines Co., Ltd. (a) | | | 101,168 | |
| | 12,562 | | | KT Corp. (a) | | | 325,427 | |
| | 3,827 | | | KT&G Corp. | | | 382,683 | |
| | 4,177 | | | LG Corp. | | | 241,689 | |
| | 12,546 | | | LG Display Co., Ltd. | | | 238,338 | |
| | 34,110 | | | LG Uplus Corp. | | | 326,918 | |
| | 263 | | | Lotte Chemical Corp. | | | 55,216 | |
| | 922 | | | Lotte Shopping Co., Ltd. | | | 186,797 | |
| | 257 | | | NAVER Corp. | | | 134,944 | |
| | 1,988 | | | POSCO | | | 319,692 | |
| | 493 | | | Samsung Electronics Co., Ltd. | | | 591,317 | |
| | 745 | | | Samsung SDS Co., Ltd. | | | 167,082 | |
| | 350 | | | Shinsegae Co., Ltd. | | | 71,216 | |
| | 1,720 | | | SK C&C Co., Ltd. | | | 402,051 | |
| | 11,013 | | | SK Hynix, Inc. | | | 294,733 | |
| | 1,150 | | | SK Innovation Co., Ltd. (a) | | | 119,242 | |
| | 16,488 | | | SK Networks Co., Ltd. | | | 102,277 | |
| | 1,664 | | | SK Telecom Co., Ltd. | | | 352,373 | |
| | 5,076 | | | SKC Co., Ltd. | | | 170,367 | |
| | 3,324 | | | S-Oil Corp. | | | 198,798 | |
| | 13,314 | | | Woori Bank | | | 115,493 | |
| | 336 | | | Yuhan Corp. | | | 83,219 | |
| | | | | | | | |
| | | | | | | 8,574,345 | |
| | | | | | | | |
| | | | Spain — 2.2% | | | | |
| | 16,002 | | | Acerinox S.A. | | | 172,891 | |
| | 738 | | | Corp. Financiera Alba S.A. | | | 32,543 | |
| | | | | | | | |
| SHARES | | | SECURITY DESCRIPTION | | VALUE($) | |
| | | | | | | | |
| | | | | | | | |
| | | | Spain — continued | | | | |
| | 9,486 | | | Enagas S.A. | | | 286,840 | |
| | 14,545 | | | Endesa S.A. | | | 323,411 | |
| | 14,443 | | | Ferrovial S.A. | | | 364,360 | |
| | 8,760 | | | Gas Natural SDG S.A. | | | 189,495 | |
| | 41,666 | | | Iberdrola S.A. | | | 297,126 | |
| | 1,145 | | | Red Electrica Corp. S.A. | | | 100,800 | |
| | 13,120 | | | Repsol S.A. | | | 165,160 | |
| | 8,775 | | | Telefonica S.A. | | | 115,772 | |
| | | | | | | | |
| | | | | | | 2,048,398 | |
| | | | | | | | |
| | | | Sweden — 2.3% | | | | |
| | 16,779 | | | Boliden AB | | | 321,257 | |
| | 8,568 | | | Investor AB, Class B | | | 317,085 | |
| | 19,855 | | | Securitas AB, Class B | | | 259,221 | |
| | 12,451 | | | Skanska AB, Class B | | | 242,956 | |
| | 5,526 | | | Svenska Cellulosa AB SCA, Class B | | | 162,763 | |
| | 31,829 | | | Tele2 AB, Class B | | | 317,864 | |
| | 21,438 | | | Telefonaktiebolaget LM Ericsson, Class B | | | 208,646 | |
| | 54,916 | | | TeliaSonera AB | | | 280,594 | |
| | 3,254 | | | Trelleborg AB, Class B | | | 54,824 | |
| | | | | | | | |
| | | | | | | 2,165,210 | |
| | | | | | | | |
| | | | Switzerland — 1.9% | | | | |
| | 2,277 | | | Baloise Holding AG | | | 273,005 | |
| | 11,255 | | | Clariant AG | | | 206,961 | |
| | 8,858 | | | Coca-Cola HBC AG | | | 211,052 | |
| | 452 | | | Kuehne & Nagel International AG | | | 62,628 | |
| | 1,160 | | | Lonza Group AG | | | 170,264 | |
| | 3,750 | | | Novartis AG | | | 339,708 | |
| | 925 | | | Sonova Holding AG | | | 126,211 | |
| | 630 | | | Swiss Re AG | | | 58,484 | |
| | 630 | | | Swisscom AG | | | 324,585 | |
| | | | | | | | |
| | | | | | | 1,772,898 | |
| | | | | | | | |
| | | | United Kingdom — 23.0% | | | | |
| | 12,205 | | | Admiral Group plc | | | 302,880 | |
| | 26,614 | | | AMEC plc | | | 291,215 | |
| | 33,915 | | | Antofagasta plc | | | 274,172 | |
| | 27,003 | | | ARM Holdings plc | | | 425,259 | |
| | 8,354 | | | AstraZeneca plc | | | 532,419 | |
| | 22,824 | | | Babcock International Group plc | | | 338,343 | |
| | 40,462 | | | Barratt Developments plc | | | 381,170 | |
| | 7,962 | | | Berkeley Group Holdings plc | | | 406,367 | |
| | 30,276 | | | BG Group plc | | | 478,314 | |
| | 119,248 | | | BP plc | | | 708,687 | |
| | 33,588 | | | British Land Co., plc REIT | | | 449,899 | |
| | 69,643 | | | BT Group plc, Class A | | | 497,354 | |
SEE NOTES TO FINANCIAL STATEMENTS.
| | | | | | |
| | | |
| 28 | | | | JPMORGAN EXCHANGE-TRADED FUNDS | | OCTOBER 31, 2015 |
| | | | | | | | |
| SHARES | | | SECURITY DESCRIPTION | | VALUE($) | |
| | | | | | | | |
| Common Stocks — continued | |
| | | | United Kingdom — continued | | | | |
| | 13,176 | | | Bunzl plc | | | 376,786 | |
| | 10,402 | | | Capita plc | | | 204,044 | |
| | 5,229 | | | Carnival plc | | | 291,022 | |
| | 114,684 | | | Centrica plc | | | 399,050 | |
| | 48,798 | | | Cobham plc | | | 208,346 | |
| | 4,238 | | | Croda International plc | | | 189,044 | |
| | 13,663 | | | easyjet plc | | | 368,054 | |
| | 17,044 | | | GKN plc | | | 75,311 | |
| | 29,981 | | | GlaxoSmithKline plc | | | 646,559 | |
| | 39,002 | | | Hammerson plc REIT | | | 382,128 | |
| | 5,520 | | | Hikma Pharmaceuticals plc | | | 183,938 | |
| | 8,138 | | | IMI plc | | | 119,336 | |
| | 5,044 | | | Imperial Tobacco Group plc | | | 271,608 | |
| | 3,953 | | | Inchcape plc | | | 48,616 | |
| | 26,298 | | | Inmarsat plc | | | 398,595 | |
| | 5,442 | | | InterContinental Hotels Group plc | | | 217,458 | |
| | 50,387 | | | Intu Properties plc REIT | | | 268,226 | |
| | 23,472 | | | John Wood Group plc | | | 215,481 | |
| | 8,410 | | | Johnson Matthey plc | | | 334,499 | |
| | 21,401 | | | Land Securities Group plc REIT | | | 440,895 | |
| | 107,696 | | | Legal & General Group plc | | | 433,690 | |
| | 31,739 | | | Meggitt plc | | | 172,904 | |
| | 19,064 | | | Merlin Entertainments plc | | | 121,646 | |
| | 17,969 | | | Mondi plc | | | 415,516 | |
| | 31,319 | | | National Grid plc | | | 446,133 | |
| | 3,557 | | | Next plc | | | 438,060 | |
| | 8,474 | | | Pennon Group plc | | | 105,737 | |
| | 12,624 | | | Persimmon plc | | | 387,145 | |
| | 17,983 | | | Petrofac Ltd. | | | 233,333 | |
| | 4,510 | | | Reckitt Benckiser Group plc | | | 440,131 | |
| | 15,270 | | | Reed Elsevier plc | | | 273,043 | |
| | 42,301 | | | Rexam plc | | | 351,723 | |
| | 11,617 | | | Rio Tinto plc | | | 423,383 | |
| | 48,304 | | | Sage Group plc (The) | | | 405,006 | |
| | 35,939 | | | Segro plc REIT | | | 248,953 | |
| | 11,084 | | | Severn Trent plc | | | 382,261 | |
| | 5,846 | | | Shire plc | | | 442,720 | |
| | 16,400 | | | Sky plc | | | 276,761 | |
| | 22,388 | | | Smith & Nephew plc | | | 382,286 | |
| | 21,064 | | | Smiths Group plc | | | 311,619 | |
| | 17,667 | | | SSE plc | | | 411,014 | |
| | 21,951 | | | Subsea 7 S.A. (a) | | | 172,168 | |
| | 136,444 | | | Taylor Wimpey plc | | | 415,655 | |
| | 11,072 | | | Travis Perkins plc | | | 326,337 | |
| | 24,901 | | | Tullow Oil plc (a) | | | 77,777 | |
| | | | | | | | |
| SHARES | | | SECURITY DESCRIPTION | | VALUE($) | |
| | | | | | | | |
| | |
| | | | United Kingdom — continued | | | | |
| | 10,676 | | | Unilever plc | | | 475,384 | |
| | 29,448 | | | United Utilities Group plc | | | 448,113 | |
| | 176,058 | | | Vodafone Group plc | | | 579,393 | |
| | 5,332 | | | Whitbread plc | | | 407,171 | |
| | 19,931 | | | WPP plc | | | 446,787 | |
| | | | | | | | |
| | | | | | | 21,176,924 | |
| | | | | | | | |
| | | | Total Common Stocks
(Cost $91,900,285) | | | 91,592,225 | |
| | | | | | | | |
| | | | Total Investments — 99.4%
(Cost $91,900,285) | | | 91,592,225 | |
| | | | Other Assets in Excess of
Liabilities — 0.6% | | | 521,382 | |
| | | | | | | | |
| | | | NET ASSETS— 100.0% | | $ | 92,113,607 | |
| | | | | | | | |
Percentages indicated are based on net assets.
SEE NOTES TO FINANCIAL STATEMENTS.
| | | | | | | | |
| | | |
| OCTOBER 31, 2015 | | JPMORGAN EXCHANGE-TRADED FUNDS | | | | | 29 | |
JPMorgan Diversified Return International Equity ETF
SCHEDULE OF PORTFOLIO INVESTMENTS
AS OF OCTOBER 31, 2015 (continued)
Summary of Investments by Industry, October 31, 2015
The following table represents the portfolio investments of the Fund by industry classifications as a percentage of total investments:
| | | | |
| INDUSTRY | | PERCENTAGE | |
Oil, Gas & Consumable Fuels | | | 8.1 | % |
Diversified Telecommunication Services | | | 5.5 | |
Chemicals | | | 5.4 | |
Pharmaceuticals | | | 5.4 | |
Electric Utilities | | | 4.0 | |
Food Products | | | 3.3 | |
Real Estate Investment Trusts (REITs) | | | 3.3 | |
Metals & Mining | | | 3.3 | |
Commercial Banks | | | 3.0 | |
Health Care Providers & Services | | | 2.9 | |
Media | | | 2.9 | |
Wireless Telecommunication Services | | | 2.7 | |
Insurance | | | 2.4 | |
Household Durables | | | 2.4 | |
Semiconductors & Semiconductor Equipment | | | 2.3 | |
Gas Utilities | | | 2.2 | |
Road & Rail | | | 2.2 | |
Hotels, Restaurants & Leisure | | | 2.1 | |
Electronic Equipment & Instruments | | | 2.0 | |
Trading Companies & Distributors | | | 1.8 | |
Health Care Equipment & Supplies | | | 1.8 | |
Construction & Engineering | | | 1.7 | |
IT Services | | | 1.6 | |
Aerospace & Defense | | | 1.5 | |
Industrial Conglomerates | | | 1.5 | |
Energy Equipment & Services | | | 1.4 | |
Multi-Utilities | | | 1.3 | |
Transportation Infrastructure | | | 1.3 | |
Auto Components | | | 1.3 | |
Specialty Retail | | | 1.2 | |
Commercial Services & Supplies | | | 1.2 | |
Software | | | 1.2 | |
Airlines | | | 1.1 | |
Water Utilities | | | 1.0 | |
Others (each less than 1.0%) | | | 13.7 | |
SEE NOTES TO FINANCIAL STATEMENTS.
| | | | | | |
| | | |
| 30 | | | | JPMORGAN EXCHANGE-TRADED FUNDS | | OCTOBER 31, 2015 |
JPMorgan Exchange-Traded Funds
NOTES TO SCHEDULES OF PORTFOLIO INVESTMENTS:
AS OF OCTOBER 31, 2015
| | |
| ADR | | — American Depositary Receipt |
| ETF | | — Exchange Traded Fund |
| GDR | | — Global Depositary Receipt |
| MSCI | | — Morgan Stanley Capital International |
| NVDR | | — Non-Voting Depositary Receipt |
| REIT | | — Real Estate Investment Trust |
| |
| (a) | | — Non-income producing security. |
| (b) | | — Amount rounds to less than 0.1%. |
The value and percentage, based on total investments, of the investments that apply the fair valuation policy for the international investments as described in Note 2.A of the Notes to Financial Statements are as follows:
| | | | | | | | |
| | |
| Fund | | Value | | | Percentage | |
JPMorgan Diversified Return Emerging Markets Equity ETF | | $ | 25,609,147 | | | | 71.3 | % |
JPMorgan Diversified Return Global Equity ETF | | | 35,012,160 | | | | 69.7 | |
JPMorgan Diversified Return International Equity ETF | | | 90,744,715 | | | | 99.1 | |
SEE NOTES TO FINANCIAL STATEMENTS.
| | | | | | | | |
| | | |
| OCTOBER 31, 2015 | | JPMORGAN EXCHANGE-TRADED FUNDS | | | | | 31 | |
STATEMENTS OF ASSETS AND LIABILITIES
AS OF OCTOBER 31, 2015
| | | | | | | | | | | | |
| | | JPMorgan
Diversified
Return Emerging
Markets
Equity ETF | | | JPMorgan
Diversified
Return Global
Equity ETF | | | JPMorgan
Diversified
Return
International
Equity ETF | |
ASSETS: | | | | | | | | | | | | |
Investments in non-affiliates, at value | | $ | 35,922,814 | | | $ | 50,208,568 | | | $ | 91,592,225 | |
Cash | | | 299,347 | | | | 224,898 | | | | 191,472 | |
Foreign currency, at value | | | 44,813 | | | | 39,932 | | | | 154,422 | |
Receivables: | | | | | | | | | | | | |
Due from Adviser | | | 85,936 | | | | 242,962 | | | | 232,558 | |
Dividends from non-affiliates | | | 18,389 | | | | 89,082 | | | | 202,353 | |
Tax reclaims | | | 277 | | | | 19,317 | | | | 48,174 | |
Prepaid insurance | | | 9,082 | | | | 18,412 | | | | 25,658 | |
Deferred offering costs | | | 4,568 | | | | — | | | | 223 | |
| | | | | | | | | | | | |
Total Assets | | | 36,385,226 | | | | 50,843,171 | | | | 92,447,085 | |
| | | | | | | | | | | | |
| | | |
LIABILITIES: | | | | | | | | | | | | |
Accrued Liabilities: | | | | | | | | | | | | |
Professional fees | | | 131,011 | | | | 274,343 | | | | 279,383 | |
Custodian and Transfer Agent fees (Note 3.C) | | | 35,065 | | | | 5,800 | | | | 6,000 | |
Trustees’ and Chief Compliance Officer’s fees | | | 3,576 | | | | 4,628 | | | | 9,016 | |
Accounting fees | | | 1,052 | | | | 3,342 | | | | 2,621 | |
Other | | | 28,848 | | | | 25,024 | | | | 36,458 | |
| | | | | | | | | | | | |
Total Liabilities | | | 199,552 | | | | 313,137 | | | | 333,478 | |
| | | | | | | | | | | | |
Net Assets | | $ | 36,185,674 | | | $ | 50,530,034 | | | $ | 92,113,607 | |
| | | | | | | | | | | | |
| | | |
NET ASSETS: | | | | | | | | | | | | |
Paid-in Capital | | $ | 44,041,497 | | | $ | 50,207,818 | | | $ | 90,782,109 | |
Accumulated undistributed (distributions in excess of)
net investment income | | | 964,675 | | | | 812,361 | | | | 1,836,680 | |
Accumulated net realized gains (losses) | | | (2,692,109 | ) | | | (369,465 | ) | | | (192,684 | ) |
Net unrealized appreciation (depreciation) | | | (6,128,389 | ) | | | (120,680 | ) | | | (312,498 | ) |
| | | | | | | | | | | | |
Total Net Assets | | $ | 36,185,674 | | | $ | 50,530,034 | | | $ | 92,113,607 | |
| | | | | | | | | | | | |
Outstanding number of shares | | | | | | | | | | | | |
(unlimited number of shares authorized — no par value) | | | 800,000 | | | | 1,000,000 | | | | 1,800,000 | |
| | | | | | | | | | | | |
Net asset value, per share | | $ | 45.23 | | | $ | 50.53 | | | $ | 51.17 | |
| | | | | | | | | | | | |
Cost of investments in non-affiliates | | $ | 42,049,238 | | | $ | 50,328,222 | | | $ | 91,900,285 | |
Cost of foreign currency | | | 45,230 | | | | 39,839 | | | | 157,705 | |
SEE NOTES TO FINANCIAL STATEMENTS.
| | | | | | |
| | | |
| 32 | | | | JPMORGAN EXCHANGE-TRADED FUNDS | | OCTOBER 31, 2015 |
STATEMENTS OF OPERATIONS
FOR THE PERIOD ENDED OCTOBER 31, 2015
| | | | | | | | | | | | |
| | | JPMorgan
Diversified
Return Emerging
Markets
Equity ETF (a) | | | JPMorgan
Diversified
Return Global
Equity ETF | | | JPMorgan
Diversified
Return
International
Equity ETF (b) | |
INVESTMENT INCOME: | | | | | | | | | | | | |
Dividend income from non-affiliates | | $ | 1,294,792 | | | $ | 1,232,116 | | | $ | 2,348,425 | |
Interest income from affiliates | | | 171 | | | | 105 | | | | 83 | |
Interest income from non-affiliates | | | 26 | | | | 26 | | | | 13 | |
Foreign taxes withheld | | | (176,213 | ) | | | (97,705 | ) | | | (177,096 | ) |
| | | | | | | | | | | | |
Total Investment Income | | | 1,118,776 | | | | 1,134,542 | | | | 2,171,425 | |
| | | | | | | | | | | | |
| | | |
EXPENSES: | | | | | | | | | | | | |
Investment advisory fees (Note 3.A) | | | 135,156 | | | | 107,159 | | | | 165,087 | |
Administration fees (Note 3.B) | | | 26,110 | | | | 37,952 | | | | 58,468 | |
Custodian and Transfer Agent fees (Note 3.C) | | | 170,466 | | | | 46,977 | | | | 84,677 | |
Trustees’ and Chief Compliance Officer’s fees | | | 36,764 | | | | 79,301 | | | | 103,268 | |
Professional fees | | | 153,552 | | | | 262,160 | | | | 320,955 | |
Printing and mailing costs | | | 11,516 | | | | 17,785 | | | | 28,454 | |
Registration and filing fees | | | 4,527 | | | | 3,095 | | | | 9,142 | |
Offering costs | | | 19,950 | | | | 21,956 | | | | 16,078 | |
Insurance expense | | | 15,028 | | | | 29,731 | | | | 45,185 | |
Accounting fees | | | 5,376 | | | | 12,220 | | | | 12,038 | |
Other | | | 62,286 | | | | 59,399 | | | | 71,057 | |
| | | | | | | | | | | | |
Total expenses | | | 640,731 | | | | 677,735 | | | | 914,409 | |
| | | | | | | | | | | | |
Less fees waived (Note 3.D) | | | (161,266 | ) | | | (145,111 | ) | | | (223,555 | ) |
Less expense reimbursements from affiliates (Note 3.D) | | | (282,442 | ) | | | (339,772 | ) | | | (344,584 | ) |
Less expense reimbursements from non-affiliates (Note 3.C) | | | (58,800 | ) | | | (23,100 | ) | | | (50,400 | ) |
| | | | | | | | | | | | |
Net Expenses | | | 138,223 | | | | 169,752 | | | | 295,870 | |
| | | | | | | | | | | | |
Net investment income (loss) | | | 980,553 | | | | 964,790 | | | | 1,875,555 | |
| | | | | | | | | | | | |
| | | |
REALIZED/UNREALIZED GAINS (LOSSES): | | | | | | | | | | | | |
Net realized gain (loss) on transactions from: | | | | | | | | | | | | |
Investments in non-affiliates | | | (3,605,196 | ) | | | (264,761 | ) | | | (185,642 | ) |
Foreign currency transactions | | | (24,289 | ) | | | (21,458 | ) | | | (1,736 | ) |
| | | | | | | | | | | | |
Net realized gain (loss) | | | (3,629,485 | ) | | | (286,219 | ) | | | (187,378 | ) |
| | | | | | | | | | | | |
Change in net unrealized appreciation/depreciation of: | | | | | | | | | | | | |
Investments in non-affiliates | | | (6,126,424 | ) | | | 257,574 | | | | (308,060 | ) |
Foreign currency translations | | | (1,965 | ) | | | 368 | | | | (4,438 | ) |
| | | | | | | | | | | | |
Change in net unrealized appreciation/depreciation | | | (6,128,389 | ) | | | 257,942 | | | | (312,498 | ) |
| | | | | | | | | | | | |
Net realized/unrealized gains (losses) | | | (9,757,874 | ) | | | (28,277 | ) | | | (499,876 | ) |
| | | | | | | | | | | | |
Change in net assets resulting from operations | | $ | (8,777,321 | ) | | $ | 936,513 | | | $ | 1,375,679 | |
| | | | | | | | | | | | |
| (a) | Commencement of operations was January 7, 2015. |
| (b) | Commencement of operations was November 5, 2014. |
SEE NOTES TO FINANCIAL STATEMENTS.
| | | | | | | | |
| | | |
| OCTOBER 31, 2015 | | JPMORGAN EXCHANGE-TRADED FUNDS | | | | | 33 | |
STATEMENTS OF CHANGES IN NET ASSETS
FOR THE PERIODS INDICATED
| | | | | | | | | | | | | | | | |
| | | JPMorgan
Diversified
Return Emerging
Markets Equity ETF | | | JPMorgan Diversified
Return Global Equity ETF | | | JPMorgan
Diversified Return
International
Equity ETF | |
| | | Period Ended
October 31, 2015 (a) | | | Year ended
October 31, 2015 | | | Period Ended
October 31, 2014 (b) | | | Period Ended
October 31, 2015 (c) | |
CHANGE IN NET ASSETS RESULTING FROM OPERATIONS: | | | | | | | | | | | | | | | | |
Net investment income (loss) | | $ | 980,553 | | | $ | 964,790 | | | $ | 146,757 | | | $ | 1,875,555 | |
Net realized gain (loss) | | | (3,629,485 | ) | | | (286,219 | ) | | | (94,421 | ) | | | (187,378 | ) |
Change in net unrealized appreciation/depreciation | | | (6,128,389 | ) | | | 257,942 | | | | (378,622 | ) | | | (312,498 | ) |
| | | | | | | | | | | | | | | | |
Change in net assets resulting from operations | | | (8,777,321 | ) | | | 936,513 | | | | (326,286 | ) | | | 1,375,679 | |
| | | | | | | | | | | | | | | | |
| | | | |
DISTRIBUTIONS TO SHAREHOLDERS: | | | | | | | | | | | | | | | | |
From net investment income | | | — | | | | (288,042 | ) | | | — | | | | (44,215 | ) |
| | | | | | | | | | | | | | | | |
Total distributions to shareholders | | | — | | | | (288,042 | ) | | | — | | | | (44,215 | ) |
| | | | | | | | | | | | | | | | |
| | | | |
CAPITAL TRANSACTIONS: | | | | | | | | | | | | | | | | |
Change in net assets resulting from capital transactions | | | 44,962,995 | | | | 25,034,796 | | | | 25,173,053 | | | | 90,782,143 | |
| | | | | | | | | | | | | | | | |
| | | | |
NET ASSETS: | | | | | | | | | | | | | | | | |
Change in net assets | | | 36,185,674 | | | | 25,683,267 | | | | 24,846,767 | | | | 92,113,607 | |
Beginning of period | | | — | | | | 24,846,767 | | | | — | | | | — | |
| | | | | | | | | | | | | | | | |
End of period | | $ | 36,185,674 | | | $ | 50,530,034 | | | $ | 24,846,767 | | | $ | 92,113,607 | |
| | | | | | | | | | | | | | | | |
Accumulated undistributed (distributions in excess of) net investment income | | $ | 964,675 | | | $ | 812,361 | | | $ | 152,009 | | | $ | 1,836,680 | |
| | | | | | | | | | | | | | | | |
| | | | |
CAPITAL TRANSACTIONS: | | | | | | | | | | | | | | | | |
Proceeds from shares issued | | $ | 58,386,392 | | | $ | 25,034,796 | | | $ | 25,173,053 | | | $ | 90,782,143 | |
Cost of shares redeemed | | | (13,423,397 | ) | | | — | | | | — | | | | — | |
| | | | | | | | | | | | | | | | |
Total change in net assets resulting from capital transactions | | $ | 44,962,995 | | | $ | 25,034,796 | | | $ | 25,173,053 | | | $ | 90,782,143 | |
| | | | | | | | | | | | | | | | |
SHARE TRANSACTIONS: | | | | | | | | | | | | | | | | |
Issued | | | 1,100,000 | | | | 500,000 | | | | 500,000 | | | | 1,800,000 | |
Redeemed | | | (300,000 | ) | | | — | | | | — | | | | — | |
| | | | | | | | | | | | | | | | |
Net increase in shares from share transactions | | | 800,000 | | | | 500,000 | | | | 500,000 | | | | 1,800,000 | |
| | | | | | | | | | | | | | | | |
| (a) | Commencement of operations was January 7, 2015. |
| (b) | Commencement of operations was June 16, 2014. |
| (c) | Commencement of operations was November 5, 2014. |
SEE NOTES TO FINANCIAL STATEMENTS.
| | | | | | |
| | | |
| 34 | | | | JPMORGAN EXCHANGE-TRADED FUNDS | | OCTOBER 31, 2015 |
THIS PAGE IS INTENTIONALLY LEFT BLANK
| | | | | | | | |
| | | |
| OCTOBER 31, 2015 | | JPMORGAN EXCHANGE-TRADED FUNDS | | | | | 35 | |
FINANCIAL HIGHLIGHTS
FOR THE PERIODS INDICATED
| | | | | | | | | | | | | | | | | | | | | | | | | | | | |
| | | Per share operating performance | |
| | | | | | Investment operations | | | Distributions | | | | | | | |
| | | Net asset
value,
beginning
of period | | | Net
investment
income
(loss) (b) | | | Net realized
and unrealized
gains
(losses) on
investments | | | Total from
investment
operations | | | Net
investment
income | | | Net asset
value,
end of
period | | | Market
price,
end of
period | |
JPMorgan Diversified Return Emerging Markets Equity ETF | | | | | | | | | | | | | | | | | | | | | | | | | | | | |
January 7, 2015 (a) through October 31, 2015 | | $ | 50.00 | | | $ | 1.29 | | | $ | (6.06 | ) | | $ | (4.77 | ) | | $ | — | | | $ | 45.23 | | | $ | 45.27 | |
| | | | | | | |
JPMorgan Diversified Return Global Equity ETF | | | | | | | | | | | | | | | | | | | | | | | | | | | | |
Year ended October 31, 2015 | | | 49.69 | | | | 1.08 | | | | 0.08 | (i) | | | 1.16 | | | | (0.32 | ) | | | 50.53 | | | | 50.67 | |
June 16, 2014 (a) through October 31, 2014 | | | 50.00 | | | | 0.38 | | | | (0.69 | ) | | | (0.31 | ) | | | — | | | | 49.69 | | | | 50.09 | |
| | | | | | | |
JPMorgan Diversified Return International Equity ETF | | | | | | | | | | | | | | | | | | | | | | | | | | | | |
November 5, 2014 (a) through October 31, 2015 | | | 50.00 | | | | 1.39 | | | | (0.07 | ) | | | 1.32 | | | | (0.15 | ) | | | 51.17 | | | | 51.05 | |
| (a) | Commencement of operations. |
| (b) | Calculated based upon average shares outstanding. |
| (c) | Not annualized for periods less than one year. |
| (d) | Includes adjustments in accordance with accounting principles generally accepted in the United States of America and as such, the net asset values for financial reporting purposes and the returns based upon those net asset values may differ from the net asset values and returns for shareholder transactions. |
| (e) | Market price total return is calculated assuming an initial investment made at the beginning of the period market price, reinvestment of all dividends and distributions at market price during the period, and sale at the market price on the last day of the period. The market price presented to calculate the market price total return is the mid-point of the bid/ask spread at the close of business on the NYSE Arca, Inc. |
| (f) | Annualized for periods less than one year, unless otherwise indicated. |
| (g) | Certain non-recurring expenses incurred by the Fund were not annualized for the periods ended October 31, 2014 and October 31, 2015. |
| (h) | Portfolio turnover is calculated by dividing the lesser of total purchases or sales of portfolio securities for the reporting period by the monthly average value of portfolio securities owned during the reporting period. Excluded from the numerator are amounts relating to in-kind transactions. |
| (i) | Calculation of the net realized and unrealized gains (losses) per share do not correlate with the Fund’s net realized and unrealized gains (losses) presented on the Statement of Operations due to the timing of capital transactions in relation to the fluctuating market values of the Fund’s investments. |
SEE NOTES TO FINANCIAL STATEMENTS.
| | | | | | |
| | | |
| 36 | | | | JPMORGAN EXCHANGE-TRADED FUNDS | | OCTOBER 31, 2015 |
| | | | | | | | | | | | | | | | | | | | | | | | | | |
| | | Ratios/Supplemental data | |
| | | | | | | | | | Ratios to average net assets (f) | | | | |
Total return (c)(d) | | | Market
price
total
return (c)(e) | | |
Net assets,
end of
period | | | Net
expenses (g) | | | Net
investment
income
(loss) | | | Expenses
without waivers
and reimbursements | | | Portfolio
turnover rate (c)(h) | |
| | | | | | | | | | | | | | | | | | | | | | | | | | |
| | (9.54 | )% | | | (9.46 | )% | | $ | 36,185,674 | | | | 0.45 | % | | | 3.18 | % | | | 2.07 | %(g) | | | 46 | % |
| | | | | | |
| | | | | | | | | | | | | | | | | | | | | | | | | | |
| | 2.36 | | | | 1.82 | | | | 50,530,034 | | | | 0.38 | | | | 2.16 | | | | 1.52 | | | | 18 | |
| | (0.62 | ) | | | 0.18 | | | | 24,846,767 | | | | 0.38 | | | | 2.01 | | | | 5.19 | (g) | | | 14 | |
| | | | | | |
| | | | | | | | | | | | | | | | | | | | | | | | | | |
| | 2.65 | | | | 2.40 | | | | 92,113,607 | | | | 0.43 | | | | 2.72 | | | | 1.33 | (g) | | | 20 | |
SEE NOTES TO FINANCIAL STATEMENTS.
| | | | | | | | |
| | | |
| OCTOBER 31, 2015 | | JPMORGAN EXCHANGE-TRADED FUNDS | | | | | 37 | |
NOTES TO FINANCIAL STATEMENTS
AS OF OCTOBER 31, 2015
1. Organization
J.P. Morgan Exchange-Traded Fund Trust (the “Trust”) was formed on February 25, 2010 and is governed by a Declaration of Trust as amended and restated February 19, 2014, and is registered under the Investment Company Act of 1940, as amended (the “1940 Act”), as an open-ended management investment company.
The following are 3 separate funds of the Trust (collectively, the “Funds”) covered in this report:
| | |
| | | Diversified/Non-Diversified |
| JPMorgan Diversified Return Emerging Markets Equity ETF | | Diversified |
| JPMorgan Diversified Return Global Equity ETF | | Diversified |
| JPMorgan Diversified Return International Equity ETF | | Diversified |
The JPMorgan Diversified Return Emerging Markets Equity ETF (the “Emerging Markets Equity ETF”) commenced operations on January 7, 2015. The investment objective of the Fund is to seek investment results that closely correspond, before fees and expenses, to the performance of the FTSE Emerging Diversified Factor Index.
The JPMorgan Diversified Return Global Equity ETF (the “Global Equity ETF”) commenced operations as of June 16, 2014. The investment objective of the Fund is to seek investment results that closely correspond, before fees and expenses, to the performance of the FTSE Developed Diversified Factor Index.
The JPMorgan Diversified Return International Return Equity ETF (the “International Equity ETF”) commenced operations as of November 5, 2014. The investment objective of the Fund is to seek investment results that closely correspond, before fees and expenses, to the performance of the FTSE Developed ex-North America Diversified Factor Index.
Shares of each Fund are listed and traded on the NYSE Arca, Inc. Market prices for the Funds’ shares may be different from their net asset value (“NAV”). The Funds issue and redeem their shares on a continuous basis, through SEI Investments Distribution Co. (the “Distributor” or “SIDCO”), at NAV in large blocks of shares, typically 100,000 shares, referred to as “Creation Units.” Creation Units are issued and redeemed principally in-kind for a basket of securities and a cash amount (except for the Emerging Markets Equity ETF, whose shares are created and redeemed partially in cash). Shares are generally traded in the secondary market in amounts less than a Creation Unit at market prices that change throughout the day. Only individuals or institutions that have entered into an authorized participant agreement with the Distributor may do business directly with the Funds (each, an “Authorized Participant”).
2. Significant Accounting Policies
The following is a summary of significant accounting policies followed by the Funds in the preparation of their financial statements. The Funds are investment companies and, accordingly, follow the investment company accounting and reporting guidance of the Financial Accounting Standards Board Accounting Standards Codification Topic 946 — Investment Companies, which is part of the U.S. generally accepted accounting principles (“GAAP”). The preparation of financial statements in conformity with GAAP requires management to make estimates and assumptions that affect the reported amounts of assets and liabilities and the disclosure of contingent assets and liabilities at the date of the financial statements and the reported amounts of increases and decreases in net assets from operations during the reporting period. Actual results could differ from those estimates.
A. Valuation of Investments — The valuation of the investments are in accordance with GAAP and the Funds’ valuation policies set forth by and under the supervision and responsibility of the Board of Trustees (the “Board”), which established the following approach to valuation, as described more fully below: (i) investments for which market quotations are readily available shall be valued at such unadjusted quoted prices, and (ii) all other investments for which market quotations are not readily available shall be valued at their fair value as determined in good faith by the Board.
JPMorgan Funds Management, Inc. (the “Administrator”) has established the J.P. Morgan Asset Management Americas Valuation Committee (“AVC”) to assist the Board with the oversight and monitoring of the valuation of the Funds’ investments. The Administrator implements the valuation policies of the Funds’ investments, as directed by the Board. The AVC oversees and carries out the policies for the valuation of investments held in the Funds. This includes monitoring the appropriateness of fair values based on results of ongoing valuation oversight, including but not limited to consideration of macro or security specific events, market events and pricing vendor and broker due diligence. The Administrator is responsible for discussing and assessing the potential impacts to the fair values on an ongoing basis, and at least on a quarterly basis with the AVC and the Board.
A market-based approach is primarily used to value the Funds’ investments. Investments for which market quotations are not readily available are fair valued by approved pricing vendors or third party broker-dealers (collectively referred to as “Pricing Services”) or may be internally fair valued using methods set forth by the valuation policies approved by the Board. This may include related or comparable assets or liabilities, recent transactions, market multiples, book values, and other relevant information for the investment to determine the fair value of the investment. An income-based valuation approach may be used in which the anticipated future cash flows of the investment are discounted to calculate the fair value. Discounts may also be applied due to the nature or duration of any restrictions on the disposition of the investments. Valuations may be based upon current market prices of securities that are comparable in coupon, rating, maturity and industry. It is possible that the estimated values may differ significantly from the values that would have been used, had a ready market for the investments existed, and such differences could be material.
| | | | | | |
| | | |
| 38 | | | | JPMORGAN EXCHANGE-TRADED FUNDS | | OCTOBER 31, 2015 |
Equities and other exchange-traded instruments are valued at the last sale price or official market closing price on the primary exchange on which the instrument is traded before the NAV of the Funds are calculated on a valuation date. Certain foreign equity instruments are valued by applying an international fair value factor provided by an approved pricing service. The factors seek to adjust the local closing price for movements of local markets post closing, but prior to the time the NAVs are calculated.
Valuations reflected in this report are as of the report date. As a result, changes in valuation due to market events and/or issuer related events after the report date and prior to issuance of the report are not reflected herein.
The various inputs that are used in determining the valuation of the Funds’ investments are summarized into the three broad levels listed below.
| • | | Level 1 — Unadjusted inputs using quoted prices in active markets for identical investments. |
| • | | Level 2 — Other significant observable inputs including, but not limited to, quoted prices for similar investments, inputs other than quoted prices that are observable for investments (such as interest rates, prepayment speeds, credit risk, etc.) or other market corroborated inputs. |
| • | | Level 3 — Significant inputs based on the best information available in the circumstances, to the extent observable inputs are not available (including the Funds’ assumptions in determining the fair value of investments). |
A financial instrument’s level within the fair value hierarchy is based on the lowest level of any input, both individually and in the aggregate, that is significant to the fair value measurement. The inputs or methodology used for valuing instruments are not necessarily an indication of the risk associated with investing in those instruments.
The following tables represent each valuation input as presented on the Schedules of Portfolio Investments:
Emerging Markets Equity ETF
| | | | | | | | | | | | | | | | |
| | | Level 1
Quoted Prices | | | Level 2
Other significant
observable inputs | | | Level 3
Significant
unobservable inputs | | | Total | |
Investments in Securities | | | | | | | | | | | | | | | | |
Common Stocks | | | | | | | | | | | | | | | | |
Brazil | | $ | 1,686,042 | | | $ | — | | | $ | — | | | $ | 1,686,042 | |
Chile | | | 561,098 | | | | — | | | | — | | | | 561,098 | |
China | | | 36,458 | | | | 8,304,488 | | | | 108,364 | | | | 8,449,310 | |
Colombia | | | 8,904 | | | | — | | | | — | | | | 8,904 | |
Czech Republic | | | — | | | | 96,835 | | | | — | | | | 96,835 | |
Egypt | | | 6,212 | | | | 68,662 | | | | — | | | | 74,874 | |
Hungary | | | — | | | | 126,940 | | | | — | | | | 126,940 | |
Indonesia | | | — | | | | 1,527,656 | | | | — | | | | 1,527,656 | |
Malaysia | | | 114,622 | | | | 1,399,750 | | | | — | | | | 1,514,372 | |
Mexico | | | 1,789,163 | | | | — | | | | — | | | | 1,789,163 | |
Philippines | | | 46,108 | | | | 1,392,891 | | | | — | | | | 1,438,999 | |
Poland | | | 25,691 | | | | 439,776 | | | | — | | | | 465,467 | |
Russia | | | 93,901 | | | | 1,459,405 | | | | — | | | | 1,553,306 | |
South Africa | | | 123,583 | | | | 2,899,642 | | | | — | | | | 3,023,225 | |
Taiwan | | | — | | | | 6,779,935 | | | | — | | | | 6,779,935 | |
Thailand | | | — | | | | 1,669,394 | | | | — | | | | 1,669,394 | |
Turkey | | | — | | | | 588,308 | | | | — | | | | 588,308 | |
United Arab Emirates | | | 17,367 | | | | 288,802 | | | | — | | | | 306,169 | |
| | | | | | | | | | | | | | | | |
Total Common Stocks | | | 4,509,149 | | | | 27,042,484 | | | | 108,364 | | | | 31,659,997 | |
| | | | | | | | | | | | | | | | |
Exchange-Traded Fund | | | | | | | | | | | | | | | | |
India | | | 3,295,079 | | | | — | | | | — | | | | 3,295,079 | |
| | | | | | | | | | | | | | | | |
Total Exchange-Traded Fund | | | 3,295,079 | | | | — | | | | — | | | | 3,295,079 | |
| | | | | | | | | | | | | | | | |
Preferred Stocks | | | | | | | | | | | | | | | | |
Brazil | | | 772,025 | | | | — | | | | — | | | | 772,025 | |
Chile | | | 19,593 | | | | — | | | | — | | | | 19,593 | |
Colombia | | | 45,913 | | | | — | | | | — | | | | 45,913 | |
Russia | | | — | | | | 130,207 | | | | — | | | | 130,207 | |
| | | | | | | | | | | | | | | | |
Total Preferred Stocks | | | 837,531 | | | | 130,207 | | | | — | | | | 967,738 | |
| | | | | | | | | | | | | | | | |
Total Investments in Securities | | $ | 8,641,759 | | | $ | 27,172,691 | | | $ | 108,364 | | | $ | 35,922,814 | |
| | | | | | | | | | | | | | | | |
There were no significant transfers among any levels during the period ended October 31, 2015. Transfers between fair value levels are valued utilizing values as of the beginning of the period.
| | | | | | | | |
| | | |
| OCTOBER 31, 2015 | | JPMORGAN EXCHANGE-TRADED FUNDS | | | | | 39 | |
NOTES TO FINANCIAL STATEMENTS
AS OF OCTOBER 31, 2015 (continued)
Global Equity ETF
| | | | | | | | | | | | | | | | |
| | | Level 1
Quoted Prices | | | Level 2
Other significant
observable inputs | | | Level 3
Significant
unobservable inputs | | | Total | |
Investments in Securities | | | | | | | | | | | | | | | | |
Common Stocks | | | | | | | | | | | | | | | | |
Australia | | $ | 16,027 | | | $ | 4,674,030 | | | $ | — | | | $ | 4,690,057 | |
Austria | | | — | | | | 95,860 | | | | — | | | | 95,860 | |
Belgium | | | — | | | | 512,574 | | | | — | | | | 512,574 | |
Canada | | | 1,214,186 | | | | — | | | | — | | | | 1,214,186 | |
Denmark | | | — | | | | 323,418 | | | | — | | | | 323,418 | |
Finland | | | — | | | | 468,310 | | | | — | | | | 468,310 | |
France | | | — | | | | 2,016,478 | | | | — | | | | 2,016,478 | |
Germany | | | — | | | | 1,640,287 | | | | — | | | | 1,640,287 | |
Greece | | | — | | | | 55,138 | | | | — | | | | 55,138 | |
Hong Kong | | | — | | | | 2,130,098 | | | | — | | | | 2,130,098 | |
Israel | | | 126,561 | | | | — | | | | — | | | | 126,561 | |
Italy | | | 62,156 | | | | 468,154 | | | | — | | | | 530,310 | |
Japan | | | — | | | | 10,312,209 | | | | — | | | | 10,312,209 | |
Netherlands | | | — | | | | 547,676 | | | | — | | | | 547,676 | |
New Zealand | | | — | | | | 183,647 | | | | — | | | | 183,647 | |
Norway | | | — | | | | 477,320 | | | | — | | | | 477,320 | |
Portugal | | | — | | | | 108,314 | | | | — | | | | 108,314 | |
Singapore | | | — | | | | 1,266,305 | | | | — | | | | 1,266,305 | |
South Korea | | | 185,292 | | | | 4,387,464 | | | | — | | | | 4,572,756 | |
Spain | | | — | | | | 1,039,538 | | | | — | | | | 1,039,538 | |
Sweden | | | 137,486 | | | | 1,185,189 | | | | — | | | | 1,322,675 | |
Switzerland | | | 76,970 | | | | 882,834 | | | | — | | | | 959,804 | |
United Kingdom | | | — | | | | 2,217,684 | | | | — | | | | 2,217,684 | |
United States | | | 13,377,731 | | | | — | | | | — | | | | 13,377,731 | |
| | | | | | | | | | | | | | | | |
Total Common Stocks | | | 15,196,409 | | | | 34,992,527 | | | | — | | | | 50,188,936 | |
| | | | | | | | | | | | | | | | |
Preferred Stock | | | | | | | | | | | | | | | | |
Germany | | | — | | | | 19,632 | | | | — | | | | 19,632 | |
| | | | | | | | | | | | | | | | |
Total Preferred Stock | | | — | | | | 19,632 | | | | — | | | | 19,632 | |
| | | | | | | | | | | | | | | | |
Total Investments in Securities | | $ | 15,196,409 | | | $ | 35,012,159 | | | $ | — | | | $ | 50,208,568 | |
| | | | | | | | | | | | | | | | |
Transfers from Level 2 to Level 1 in the amount of approximately $82,168 are due to not applying the fair value factors as of October 31, 2015.
Transfers from Level 1 to Level 2 in the amount of $55,015 are due to applying the fair value factors to certain securities as of October 31, 2015.
Transfers between fair value levels are valued utilizing values as of the beginning of the period.
| | | | | | |
| | | |
| 40 | | | | JPMORGAN EXCHANGE-TRADED FUNDS | | OCTOBER 31, 2015 |
International Equity ETF
| | | | | | | | | | | | | | | | |
| | | Level 1
Quoted Prices | | | Level 2
Other significant
observable inputs | | | Level 3
Significant
unobservable inputs | | | Total | |
Investments in Securities | | | | | | | | | | | | | | | | |
Common Stocks | | | | | | | | | | | | | | | | |
Australia | | $ | — | | | $ | 8,042,455 | | | $ | — | | | $ | 8,042,455 | |
Austria | | | — | | | | 365,164 | | | | — | | | | 365,164 | |
Belgium | | | — | | | | 898,795 | | | | — | | | | 898,795 | |
Denmark | | | — | | | | 1,009,260 | | | | ��� | | | | 1,009,260 | |
Finland | | | — | | | | 1,393,461 | | | | — | | | | 1,393,461 | |
France | | | — | | | | 4,727,013 | | | | — | | | | 4,727,013 | |
Germany | | | — | | | | 3,865,911 | | | | — | | | | 3,865,911 | |
Hong Kong | | | — | | | | 4,843,860 | | | | — | | | | 4,843,860 | |
Ireland | | | — | | | | 236,663 | | | | — | | | | 236,663 | |
Italy | | | 186,297 | | | | 1,125,202 | | | | — | | | | 1,311,499 | |
Japan | | | — | | | | 21,746,853 | | | | — | | | | 21,746,853 | |
Luxembourg | | | 48,858 | | | | — | | | | — | | | | 48,858 | |
Netherlands | | | — | | | | 2,393,142 | | | | — | | | | 2,393,142 | |
New Zealand | | | — | | | | 530,038 | | | | — | | | | 530,038 | |
Norway | | | — | | | | 954,691 | | | | — | | | | 954,691 | |
Portugal | | | — | | | | 465,734 | | | | — | | | | 465,734 | |
Singapore | | | — | | | | 3,021,053 | | | | — | | | | 3,021,053 | |
South Korea | | | 612,354 | | | | 7,961,991 | | | | — | | | | 8,574,345 | |
Spain | | | — | | | | 2,048,398 | | | | — | | | | 2,048,398 | |
Sweden | | | — | | | | 2,165,210 | | | | — | | | | 2,165,210 | |
Switzerland | | | — | | | | 1,772,898 | | | | — | | | | 1,772,898 | |
United Kingdom | | | — | | | | 21,176,924 | | | | — | | | | 21,176,924 | |
| | | | | | | | | | | | | | | | |
Total Common Stocks | | | 847,509 | | | | 90,744,716 | | | | — | | | | 91,592,225 | |
| | | | | | | | | | | | | | | | |
Total Investments in Securities | | $ | 847,509 | | | $ | 90,744,716 | | | $ | — | | | $ | 91,592,225 | |
| | | | | | | | | | | | | | | | |
There were no significant transfers among any levels during the period ended October 31, 2015. Transfers between fair value levels are valued utilizing values as of the beginning of the period.
B. Restricted Securities — Certain securities held by the Funds may be subject to legal or contractual restrictions on resale. Restricted securities generally are resold in transactions exempt from registration under the Securities act of 1933 (the “Securities Act”). Disposal of these securities may involve time-consuming negotiations and expense. Prompt sale at the current valuation may be difficult and could adversely affect the net assets of the Funds. As of October 31, 2015, the Funds had no investments in restricted securities other than securities sold to the Funds under rule 144A and/or Regulation S under the Securities Act.
C. Foreign Currency Translation — The books and records of the Funds are maintained in U.S. dollars. Foreign currency amounts are translated into U.S. dollars at the prevailing exchange rates of such currencies against the U.S. dollar. The market value of investment securities and other assets and liabilities are translated at the exchange rate as of the valuation date. Purchases and sales of investment securities, income and expenses are translated at the exchange rate prevailing on the respective dates of such transactions.
The Funds do not isolate the effect of changes in the foreign exchange rates from changes in the market prices of securities held. Accordingly, such changes are included within Change in net unrealized appreciation/deprecation on investments on the Statements of Operations.
Reported realized foreign currency gains and losses arise from the disposition of foreign currency, currency gains or losses realized between the trade and settlement dates on securities transactions, and the difference between the amounts of dividends, interest and withholding taxes recorded on the Funds’ books on the transaction date and the U.S. dollar equivalent of the amounts actually received or paid. The reported realized foreign currency gains and losses are included in Net realized gain (loss) on foreign currency transactions on the Statement of Operations. Unrealized foreign currency gains and losses arise from changes (due to changes in exchange rates) in the value of foreign currency and other assets and liabilities denominated in foreign currencies, which are held at year end and are included in Change in net unrealized appreciation/depreciation on foreign currency translations on the Statement of Operations.
| | | | | | | | |
| | | |
| OCTOBER 31, 2015 | | JPMORGAN EXCHANGE-TRADED FUNDS | | | | | 41 | |
NOTES TO FINANCIAL STATEMENTS
AS OF OCTOBER 31, 2015 (continued)
D. Offering and Organizational Costs — Total offering costs incurred in connection with the offering of shares of each Fund are amortized on a straight line basis over 12 months from the date the Fund commenced operations. Costs paid in connection with the organization of the Trust, if any, were recorded as an expense at the time it commenced operations. Approximate offering costs incurred by the Funds were as follows:
| | | | |
Emerging Markets Equity ETF | | $ | 24,518 | |
Global Equity ETF | | | 31,609 | |
International Equity ETF | | | 16,301 | �� |
E. Security Transactions and Investment Income — Investment transactions are accounted for on the trade date (the date the order to buy or sell is executed). Securities gains and losses are calculated on a specifically identified cost basis. Interest income is determined on the basis of coupon interest accrued using the effective interest method which adjusts for amortization of premiums and accretion of discounts. Dividend income net of foreign taxes withheld, if any, is recorded on the ex-dividend date or when a fund first learns of the dividend.
To the extent such information is publicly available, the Funds record distributions received in excess of income earned from underlying investments as a reduction of cost of investments and/or realized gain. Such amounts are based on estimates if actual amounts are not available and actual amounts of income, realized gain and return of capital may differ from the estimated amounts. The Funds adjust the estimated amounts of the components of distributions (and consequently their net investment income) as necessary once the issuers provide information about the actual composition of the distributions.
F. Allocation of Expenses — Expenses directly attributable to a fund are charged directly to that fund, while the expenses attributable to more than one fund of the Trust are allocated among the respective funds.
G. Federal Income Taxes — Each Fund is treated as a separate taxable entity for Federal income tax purposes. Each Fund’s policy is to comply with the provisions of the Internal Revenue Code of 1986, as amended (the “Code”), applicable to regulated investment companies and to distribute to shareholders all of its distributable net investment income and net realized gain on investments. Accordingly, no provision for Federal income tax is necessary. Management has reviewed the Funds’ tax positions for all open tax years and has determined as of October 31, 2015, no liability for income tax is required in the Funds’ financial statements for net unrecognized tax benefits. However, management’s conclusions may be subject to future review based on changes in, or the interpretation of, the accounting standards or tax laws and regulations. Each of the Funds’ Federal tax returns for the prior three fiscal years, or since inception if shorter, remains subject to examination by the Internal Revenue Service.
H. Foreign Taxes — The Funds may be subject to foreign taxes on income, gains on investments or currency purchases/repatriation, a portion of which may be recoverable. The Funds will accrue such taxes and recoveries as applicable, based upon their current interpretation of tax rules and regulations that exist in the markets in which they invest.
I. Distributions to Shareholders — Distribution from net investment income, if any, are generally declared and paid annually. Net realized capital gains, if any, are distributed by each Fund at least annually. The amount of distributions from net investment income and net realized capital gains is determined in accordance with Federal income tax regulations, which may differ from GAAP. To the extent these “book/tax” differences are permanent in nature (i.e., that they result from other than timing of recognition — “temporary differences”), such amounts are reclassified within the capital accounts based on their Federal tax-basis treatment.
The following amounts were reclassified within the capital accounts:
| | | | | | | | | | | | |
| | | Paid-in-Capital | | | Accumulated
undistributed
(distributions
in excess of)
net investment
Income | | | Accumulated
net realized
gains (losses) | |
Emerging Markets Equity ETF | | $ | (921,498 | ) | | $ | (15,878 | ) | | $ | 937,376 | |
Global Equity ETF | | | (31 | ) | | | (16,396 | ) | | | 16,427 | |
International Equity ETF | | | (34 | ) | | | 5,340 | | | | (5,306 | ) |
The reclassifications for the Funds relate primarily to foreign currency gains or losses, investments in passive foreign investment companies, non-taxable dividends and redemptions in-kind (Emerging Markets Equity ETF).
3. Fees and Other Transactions with Affiliates
A. Investment Advisory Fee — Pursuant to the Investment Advisory Agreement, J.P. Morgan Investment Management Inc. (the “Adviser”), an indirect, wholly-owned subsidiary of JPMorgan Chase & Co. (“JPMorgan”), supervises the investments of each Fund and is paid a fee. The fee is accrued daily and paid monthly based on each Fund’s respective average daily net assets. The annual rate for each Fund is as follows:
| | | | |
Emerging Markets Equity ETF | | | 0.44% | |
Global Equity ETF | | | 0.24% | |
International Equity ETF | | | 0.24% | |
The Adviser waived Investment Advisory fees and/or reimbursed expenses as outlined in Note 3.D.
| | | | | | |
| | | |
| 42 | | | | JPMORGAN EXCHANGE-TRADED FUNDS | | OCTOBER 31, 2015 |
B. Administration Fee — Pursuant to an Administration Agreement, the Administrator, an indirect, wholly-owned subsidiary of JPMorgan, provides certain administration services to the Funds. In consideration of these services, the Administrator receives a fee accrued daily and paid monthly at an annual rate of 0.085% of the average daily net assets of each Fund in the Trust covered by the Administration Agreement.
The Administrator waived administration fees as authorized in Note 3.D.
C. Custodian and Transfer Agent Fees — JPMorgan Chase Bank, N.A. (“JPMCB”), a wholly-owned subsidiary of JPMorgan, provides portfolio custody and transfer agency services to the Funds. The amounts paid directly to JPMCB by the Funds for custody services are included in the Custodian and Transfer Agent fees on the Statements of Operations. With respect to the transfer agency services provided by JPMCB for each creation or redemption transaction, the Authorized Participant will generally be responsible for such associated expenses during the period, the Funds paid no transfer agency fees to JPMCB.
Additionally, Authorized Participants generally pay transaction fees associated with the creation and redemption of Fund shares. These fees are used to offset certain custodian charges incurred by the Funds for these transactions.
For the period ended October 31, 2015, the transaction fees paid by the Authorized Participants that were used to reimburse custodian fees were as follows:
| | | | |
Emerging Markets Equity ETF | | $ | 58,800 | |
Global Equity ETF | | | 23,100 | |
International Equity ETF | | | 50,400 | |
Interest income, earned on cash balances at the custodian, if any, is included as interest income from affiliates in the Statements of Operations. For the period ended October 31, 2015 the interest income earned from affiliates was as follows:
| | | | |
Emerging Markets Equity ETF | | $ | 171 | |
Global Equity ETF | | | 38 | |
International Equity ETF | | | — | |
Interest expense paid to the custodian related to overdrafts, if any, is included in interest expense to affiliates in the Statements of Operations. For the period ended October 31, 2015 the interest expense paid to affiliates was as follows:
| | | | |
Emerging Markets Equity ETF | | $ | — | |
Global Equity ETF | | | — | |
International Equity ETF | | | 5 | |
D. Waivers and Reimbursements — The Adviser and Administrator have contractually agreed to waive fees and/or reimburse the Funds to the extent that total annual operating expenses (excluding acquired fund fees and expenses, dividend expenses related to short sales, interest, taxes, expenses related to litigation and potential litigation, and extraordinary expenses) exceed the percentages of the Funds’ respective average daily net assets as shown in the below table:
| | | | |
| | | Expense Cap | |
Emerging Markets Equity ETF | | | 0.45 | % |
Global Equity ETF | | | 0.38 | % |
International Equity ETF | | | 0.43 | % |
The expense limitation agreements were in effect for the period ended October 31, 2015. The contractual expense limitation percentages in the table above are in place until at least February 29, 2016.
For the period ended October 31, 2015, the Funds’ service providers waived fees and/or reimbursed expenses for each Fund as follows. None of these parties expect the Funds to repay any such waived fees and/or reimbursed expenses in future years.
| | | | | | | | | | | | | | | | |
| | | Contractual Waivers | | | | |
| | | Investment
Advisory | | | Administration | | | Total | | | Contractual
Reimbursements | |
Emerging Markets Equity ETF | | $ | 135,156 | | | $ | 26,110 | | | $ | 161,266 | | | $ | 341,242 | |
Global Equity ETF | | | 107,159 | | | | 37,952 | | | | 145,111 | | | | 362,872 | |
International Equity ETF | | | 165,087 | | | | 58,468 | | | | 223,555 | | | | 394,984 | |
Contractual reimbursements include reimbursements outlined in Note 3.C.
E. Other — Certain officers of the Trust are affiliated with the Adviser and the Administrator. Such officers, with the exception of the Chief Compliance Officer, receive no compensation from the Funds for serving in their respective roles.
The Board of Trustees appointed a Chief Compliance Officer to the Funds in accordance with Federal securities regulations. The Funds, along with other affiliated funds, make reimbursement payments, on a pro-rata basis, to the Administrator for a portion of the fees associated with the Office of the Chief Compliance Officer. Such fees are included in Trustees’ and Chief Compliance Officer’s fees in the Funds’ Statements of Operations.
| | | | | | | | |
| | | |
| OCTOBER 31, 2015 | | JPMORGAN EXCHANGE-TRADED FUNDS | | | | | 43 | |
NOTES TO FINANCIAL STATEMENTS
AS OF OCTOBER 31, 2015 (continued)
During the year ended October 31, 2015, the Funds may have purchased securities from an underwriting syndicate in which the principal underwriter or members of the syndicate are affiliated with the Adviser.
4. Investment Transactions
During the period ended October 31, 2015, purchases and sales of investments (excluding short-term investments) were as follows:
| | | | | | | | |
| | | Purchases (excluding U.S. Government) | | | Sales (excluding U.S. Government) | |
Emerging Markets Equity ETF | | $ | 36,188,459 | | | $ | 17,494,367 | |
Global Equity ETF | | | 10,671,117 | | | | 7,957,513 | |
International Equity ETF | | | 24,838,088 | | | | 14,548,358 | |
During the period ended October 31, 2015, there were no purchases or sales of U.S. Government securities.
For the period ended October 31, 2015, in-kind transactions associated with creations and redemptions were:
| | | | | | | | | | | | |
| | | In-Kind Purchases | | | In-Kind Sales | | | Realized
gain (loss) | |
Emerging Markets Equity ETF | | $ | 35,277,589 | | | $ | 8,336,117 | | | $ | (921,498 | ) |
Global Equity ETF | | | 22,715,800 | | | | — | | | | — | |
International Equity ETF | | | 81,796,467 | | | | — | | | | — | |
5. Federal Income Tax Matters
For Federal income tax purposes, the cost and unrealized appreciation (depreciation) in value of investment securities held at October 31, 2015 were as follows:
| | | | | | | | | | | | | | | | |
| | | Aggregate Cost | | | Gross
Unrealized
Appreciation | | | Gross
Unrealized
Depreciation | | | Net Unrealized Appreciation
(Depreciation) | |
Emerging Markets Equity ETF | | $ | 42,165,145 | | | $ | 291,884 | | | $ | (6,534,215 | ) | | $ | (6,242,331 | ) |
Global Equity ETF | | | 50,432,311 | | | | 3,818,557 | | | | (4,042,300 | ) | | | (223,743 | ) |
International Equity ETF | | | 91,951,835 | | | | 5,638,222 | | | | (5,997,832 | ) | | | (359,610 | ) |
The difference between book and tax basis appreciation (depreciation) on investments is primarily attributed to investments in passive foreign investment companies, wash sale loss deferrals and investments in real estate investment trusts.
The tax character of distributions paid during the period ended October 31, 2015 was as follows:
| | | | | | | | |
| | | Ordinary
Income | | | Total
Distributions
Paid | |
Emerging Markets Equity ETF | | $ | — | | | $ | — | |
Global Equity ETF | | | 288,042 | | | | 288,042 | |
International Equity ETF | | | 44,215 | | | | 44,215 | |
There were no taxable distributions for the period ended October 31, 2014.
As of October 31, 2015, the components of net assets (excluding paid-in-capital) on a tax basis were as follows:
| | | | | | | | | | | | |
| | | Current
Distributable
Ordinary
Income | | | Current
Distributable
Short-Term
Capital Gains or
(Tax Basis Loss
Carryover) | | | Unrealized
Appreciation
(Depreciation) | |
Emerging Markets Equity ETF | | $ | 981,830 | | | $ | (2,593,357 | ) | | $ | (6,244,296 | ) |
Global Equity ETF | | | 862,270 | | | | (315,285 | ) | | | (224,769 | ) |
International Equity ETF | | | 1,869,324 | | | | (173,778 | ) | | | (364,048 | ) |
The cumulative timing differences primarily consist of investments in passive foreign investment companies and wash sale loss deferrals.
As of October 31, 2015, the Funds had net capital loss carryforwards, with no expiration dates, as follows:
| | | | | | | | |
| | | Capital Loss Carryforward Character | |
| | | Short-Term | | | Long-Term | |
Emerging Markets Equity ETF | | $ | (2,593,357 | ) | | $ | — | |
Global Equity ETF | �� | | (315,285 | ) | | | — | |
International Equity ETF | | | (173,778 | ) | | | — | |
| | | | | | |
| | | |
| 44 | | | | JPMORGAN EXCHANGE-TRADED FUNDS | | OCTOBER 31, 2015 |
6. Capital Share Transactions
The Trust issues and redeems shares of the Funds only in Creation Units through the Distributor at NAV. Capital shares transactions detail can be found in the Statement of Changes in Net Assets.
Shares of the Funds may only be purchased or redeemed by Authorized Participants. An Authorized Participant is either (1) a “Participating Party” or other participant in the clearing process through the Continuous Net Settlement System of the National Securities Clearing Corporation (“NSCC”); or (2) a DTC Participant; which, in either case, must have executed an agreement with the Distributor.
Creation Units of a Fund may be created in advance of receipt by the Trust of all or a portion of the applicable basket of equity securities and other instruments (“Deposit Instruments”) and cash as described in the Funds’ registration statement. In these instances, the initial Deposit Instruments and cash must be deposited in an amount equal to the sum of the cash amount, plus at least 105% of the market value of undelivered Deposit Instruments. A transaction fee may be imposed to offset transfer and other transaction costs associated with the purchase or redemption of Creation Units.
For more information about Creation Unit transactions please refer to the Funds’ Statement of Additional information.
7. Risks, Concentrations and Indemnifications
In the normal course of business, the Funds enter into contracts that contain a variety of representations which provide general indemnifications. The Funds’ maximum exposure under these arrangements is unknown. The amount of exposure would depend on future claims that may be made against the Funds that have not yet occurred. However, based on experience, the Funds expect the risk of loss to be remote.
As of October 31, 2015, the Adviser owned 60%, 49%, and 27% of the outstanding shares of Emerging Markets Equity ETF, Global Equity ETF, and International Equity ETF, respectively.
Each Fund may have elements of risk not typically associated with investment in the United States of America due to concentrated investments in a limited number of countries or regions, which may vary throughout the year depending on a Fund’s benchmark index (each an “underlying index”). Such concentrations may subject the Funds to additional risks resulting from political or economic conditions in such countries or regions and the possible imposition of adverse governmental laws or currency exchange restrictions could cause the securities and their markets to be less liquid and their prices to be more volatile than those of comparable U.S. securities.
As of October 31, 2015, a significant portion of the Funds’ net assets consisted of securities that are denominated in foreign currencies. Changes in currency exchange rates will affect the value of, and investment income from, such securities.
As of October 31, 2015, the Funds had the following country allocation representing greater than 10% of total investments:
| | | | | | | | | | | | | | | | | | | | |
| | | China | | | Japan | | | Taiwan | | | United Kingdom | | | United States | |
Emerging Markets Equity ETF | | | 23.3 | % | | | — | % | | | 18.9 | % | | | — | % | | | — | % |
Global Equity ETF | | | — | | | | 20.5 | | | | — | | | | — | | | | 26.7 | |
International Equity ETF | | | — | | | | 23.7 | | | | — | | | | 23.1 | | | | — | |
Premium/Discount Risk — Disruptions to creations and redemptions, the existence of extreme market volatility or potential lack of an active trading market for Shares may result in Shares trading at a significant premium or discount to the NAV. If a shareholder purchases Shares at a time when the market price is at a premium to the NAV or sells Shares at a time when the market price is at a discount to the NAV, the shareholders performance may be negatively impacted.
Index Tracking Risk — The Funds incur a number of operating expenses not applicable to the underlying index, and incur costs in buying and selling securities, especially when rebalancing a Fund’s securities holdings to reflect changes in the composition of the underlying index. Additionally, the Funds calculate their NAV based on fair value prices and the value of the underlying index is based on securities’ closing prices on a local foreign market exchange. To the extent of the previously outlined items, each Fund’s return differs from the return of the underlying index.
8. Related Party Transactions
The Distributor or its agent distributes Creation Units for each Fund on an agency basis. The Distributor does not maintain a secondary market in shares of each Fund. The Distributor has no role in determining the investment policies of the Funds or the securities that are purchased or sold by the Funds. SIDCO receives no fee for its distribution services under the Distribution Agreement.
The Funds may use related party broker-dealers. For the period ended October 31, 2015, the Funds incurred no brokerage commissions with broker-dealers affiliated with the Adviser or Trust.
| | | | | | | | |
| | | |
| OCTOBER 31, 2015 | | JPMORGAN EXCHANGE-TRADED FUNDS | | | | | 45 | |
REPORT OF INDEPENDENT REGISTERED PUBLIC ACCOUNTING FIRM
To the Board of Trustees of J.P. Morgan Exchange-Traded Fund Trust and the Shareholders of JPMorgan Diversified Return Emerging Markets Equity ETF, JPMorgan Diversified Return Global Equity ETF and JPMorgan Diversified Return International Equity ETF:
In our opinion, the accompanying statements of assets and liabilities, including the schedules of portfolio investments, and the related statements of operations and of changes in net assets and the financial highlights present fairly, in all material respects, the financial position of JPMorgan Diversified Return Emerging Markets Equity ETF, JPMorgan Diversified Return Global Equity ETF and JPMorgan Diversified Return International Equity ETF (each a separate fund of J.P. Morgan Exchange-Traded Fund Trust) (the “Funds”) at October 31, 2015, and the results of each of their operations, and the changes in each of their net assets and the financial highlights for each of the periods presented, in conformity with accounting principles generally accepted in the United States of America. These financial statements and financial highlights (hereafter referred to as “financial statements”) are the responsibility of the Funds’ management. Our responsibility is to express an opinion on these financial statements based on our audits. We conducted our audits of these financial statements in accordance with the standards of the Public Company Accounting Oversight Board (United States). Those standards require that we plan and perform the audit to obtain reasonable assurance about whether the financial statements are free of material misstatement. An audit includes examining, on a test basis, evidence supporting the amounts and disclosures in the financial statements, assessing the accounting principles used and significant estimates made by management, and evaluating the overall financial statement presentation. We believe that our audits, which included confirmation of securities at October 31, 2015 by correspondence with the custodian, provide a reasonable basis for our opinion.
PricewaterhouseCoopers LLP
New York, New York
December 22, 2015
| | | | | | |
| | | |
| 46 | | | | JPMORGAN EXCHANGE-TRADED FUNDS | | OCTOBER 31, 2015 |
SUPPLEMENTAL INFORMATION
FOR THE PERIOD ENDED OCTOBER 31, 2015 (Unaudited)
The table below indicates the number of trading days in which the Funds traded within the range of the premium/discount noted. The number of days in each range is also shown as a percentage of the total trading days for the period covered in the table. All information within the table is based on historical performance. Past performance cannot be used to predict future results. Shareholders may pay more than NAV when they buy fund shares and receive less than NAV when they sell those shares because shares are bought and sold at current market prices.
| | | | | | | | | | | | | | | | | | | | | | | | |
| | | Emerging Markets Equity ETF (a) | | | Global Equity ETF | | | International Equity ETF (b) | |
| Range of Premium/(Discount) | | Day Count | | | Percentage | | | Day Count | | | Percentage | | | Day Count | | | Percentage | |
Greater than 1.5% and Less than or equal to 2.0% | | | 2 | | | | 0.97 | % | | | — | | | | — | | | | — | | | | — | |
Greater than 1.0% and Less than or equal to 1.5% | | | 20 | | | | 9.71 | % | | | — | | | | — | | | | — | | | | — | |
Greater than 0.5% and Less than or equal to 1.0% | | | 94 | | | | 45.64 | % | | | 7 | | | | 2.79 | % | | | 72 | | | | 29.15 | % |
Between 0.5% and –0.5% | | | 62 | | | | 30.09 | % | | | 241 | | | | 96.01 | % | | | 172 | | | | 69.64 | % |
Less than –0.5% and greater than or equal to –1.0% | | | 21 | | | | 10.19 | % | | | 2 | | | | 0.80 | % | | | 3 | | | | 1.21 | % |
Less than –1.0% and greater than or equal to –1.5% | | | 6 | | | | 2.91 | % | | | 1 | | | | 0.40 | % | | | — | | | | — | |
Less than –1.5% and greater than or equal to –2.0% | | | 1 | | | | 0.49 | % | | | — | | | | — | | | | — | | | | — | |
| | | | | | | | | | | | | | | | | | | | | | | | |
| | | 206 | | | | 100.00 | % | | | 251 | | | | 100.00 | % | | | 247 | | | | 100.00 | % |
| | | | | | | | | | | | | | | | | | | | | | | | |
| (a) | Commencement of operations was January 7, 2015. |
| (b) | Commencement of operations was November 5, 2014. |
| | | | | | | | |
| | | |
| OCTOBER 31, 2015 | | JPMORGAN EXCHANGE-TRADED FUNDS | | | | | 47 | |
TRUSTEES
(Unaudited)
The Fund’s Statement of Additional Information includes additional information about the Funds Trustees and is available, without charge, upon request by calling 1-844-457-6383 or on the J.P. Morgan Funds’ website at www.jpmorganfunds.com.
| | | | | | |
Name (Year of Birth;
Positions With
the Funds since) | | Principal Occupation
During the Past 5 Year | | Number of
Funds in Fund
Complex Overseen
by Trustee (1) | | Other Directorships Held
During the Past 5 Years |
Independent Trustees | | |
| | | |
| Gary L. French (1951); Trustee of the Trust since 2014 | | Senior Consultant for the Regulatory Fundamentals Group LLC (2011-present); Senior Vice President-Fund Administration, State Street Corporation (2002-2010). | | 10 | | Independent Trustee, The China Fund, Inc. (2013-present); Exchange Traded Concepts Trust II (2012-2014); Exchange Traded Concepts Trust I (2011-2014). |
| | | |
| Robert J. Grassi (1957); Trustee of the Trust since 2014 | | Sole Proprietor, Academy Hills Advisors LLC (2012-present); Pension Director, Coming Incorporated (2002-2012). | | 10 | | None |
| | | |
| Thomas P. Lemke (1954); Trustee of the Trust since 2014 | | Retired; Executive Vice President and General Counsel, Legg Mason (2005-2013). | | 10 | | Independent Director of AXA Premier VIP Trust (2014-present); Independent Director of The Advisors’ Inner Circle III Funds (2014-present); Independent Director of The Munder Funds (2014-present); Independent Director of ICI Mutual Insurance Company (2008-2013). |
| | | |
| Lawrence R. Maffia (1950); Trustee of the Trust since 2014 | | Retired; Director and President, ICI Mutual Insurance Company (2006-2013). | | 10 | | Director, ICI Mutual Insurance Company (1999-2013). |
| | | |
| Emily A. Youssouf (1951); Trustee of the Trust since 2014 | | Vice Chair (2011-2013) and Board Member (2013-present) of New York City Housing Authority; Clinical Professor, NYU Schack Institute of Real Estate (2009-present); Board Member, NYC Health and Hospitals Corporation (2005-present). | | 10 | | Trustee, NYC School Construction Authority (2009-present); Board Member, NYS Job Development Authority (2008-present); Board Member, PennyMac Financial Services, Inc. (2013-present). |
| | | |
| Interested Trustee | | | | | | |
| | | |
| Robert Deutsch (2) (1957); Trustee of the Trust since 2014 | | Head of the Global ETF Business for JPMorgan Asset Management (2013-present); Head of the Global Liquidity Business for JPMorgan Asset Management (2003-2013). | | 10 | | None |
| (1) | A Fund complex means two or more registered investment companies that hold themselves out to investors as related companies for purposes of investment and investor services or have a common investment adviser or have an investment adviser that is an affiliated person of the investment adviser of any of the other registered investment companies. Four Funds are currently operating, but three additional series are in registration and three additional series have been created and will be registered in the future. |
| (2) | Mr. Deutsch is an interested trustee because he is an employee of the Adviser. |
| | | | | | |
| | | |
| 48 | | | | JPMORGAN EXCHANGE-TRADED FUNDS | | OCTOBER 31, 2015 |
OFFICERS
(Unaudited)
| | |
Name (Year of Birth),
Positions Held with
the Trusts (Since) | | Principal Occupations During Past 5 Years |
| |
Robert Deutsch (1957),
President and Principal Executive Officer (2014) | | Managing Director, global head of J.P. Morgan Asset Management’s Exchange-Traded Funds and a member of the J.P. Morgan Global Funds Operating Committee. Previously, head of the Global Liquidity Business from 2003 to 2013 and National Sales Manager for J.P. Morgan’s U.S. Mutual Funds Business prior to 2003. |
| |
Paul Shield (1960),
Treasurer and Principal Financial Officer (2014) | | Managing Director and head of Business Management for JPMorgan Asset Management’s Exchange-Traded Fund platform since 2013. Senior Global Product Manager of Alternative Investments for BNY Mellon from 2011 to 2013 and Global Product Head for Exchange Traded Funds at JPMorgan Chase Bank from 2008 to 2011. |
| |
Frank J. Nasta (1964),
Secretary (2014) | | Managing Director and Associate General Counsel, JPMorgan Chase since 2008; |
| |
Stephen M. Ungerman (1953),
Chief Compliance Officer (2014) | | Managing Director, JPMorgan Chase & Co.; Mr. Ungerman has been with JPMorgan Chase & Co. since 2000. |
| |
Elizabeth A. Davin (1964),
Assistant Secretary (2014)** | | Executive Director and Assistant General Counsel, JPMorgan Chase since February 2012; formerly Vice President and Assistant General Counsel, JPMorgan Chase from 2005 until February 2012; Senior Counsel, JPMorgan Chase (formerly Bank One Corporation) from 2004 to 2005. |
| |
Jessica K. Ditullio (1962),
Assistant Secretary (2014)** | | Executive Director and Assistant General Counsel, JPMorgan Chase since February 2011; Ms. Ditullio has served as an attorney with various titles for JPMorgan Chase (formerly Bank One Corporation) since 1990. |
| |
John T. Fitzgerald (1975),
Assistant Secretary (2014) | | Executive Director and Assistant General Counsel, JPMorgan Chase since February 2011; formerly, Vice President and Assistant General Counsel, JPMorgan Chase from 2005 until February 2011. |
| |
Carmine Lekstutis (1980),
Assistant Secretary (2011) | | Executive Director and Assistant General Counsel, JPMorgan Chase since February 2015; formerly Vice President and Assistant General Counsel, JPMorgan Chase from 2011 to February 2015; Associate, Skadden, Arps, Slate, Meagher & Flom LLP (law firm) from 2006 to 2011. |
| |
Gregory S. Samuels (1980),
Assistant Secretary (2014) | | Executive Director and Assistant General Counsel, JPMorgan Chase since February 2014; formerly Vice President and Assistant General Counsel, JPMorgan Chase from 2010 to February 2014 |
| |
Pamela L. Woodley (1971),
Assistant Secretary (2014)*** | | Vice President and Assistant General Counsel, JPMorgan Chase since November 2004. |
| |
Frederick J. Cavaliere (1978),
Assistant Treasurer (2015) | | Vice President, JPMorgan Funds Management, Inc. since September 2011; formerly Vice President of J.P. Morgan Investment Management Inc. (2010-2011). Mr. Cavaliere has been with JPMorgan since May 2006. |
| |
Michael M. D’Ambrosio (1969),
Assistant Treasurer (2014) | | Managing Director, JPMorgan Funds Management, Inc. from May 2014; formerly Executive Director, JPMorgan Funds Management, Inc. from 2012 until May 2014; prior to joining JPMorgan Chase, Mr. D’Ambrosio was a Tax Director at PricewaterhouseCoopers LLP since 2006. |
| |
Lauren A. Paino (1973),
Assistant Treasurer (2015) | | Executive Director, JPMorgan Funds Management, Inc. since August 2013; Director, Credit Suisse Asset Management (2000-2013); Manager, PricewaterhouseCoopers LLP (1995-2000). |
| |
Julie A. Roach (1971),
Assistant Treasurer (2014)** | | Vice President, JPMorgan Funds Management, Inc. from August 2012; prior to joining JPMorgan Chase, Ms. Roach was a Senior Manager with Deloitte since 2001. |
| |
Jason Ronca (1978),
Assistant Treasurer (2014)**** | | Vice President, Assistant Treasurer and ETF Platform Manager for J.P. Morgan Asset Management since May 2014. ETF Product Manager for Corporate Investment Bank responsible for setting the strategy and control agenda for the ETF servicing business from 2010 to May 2014; Prior to 2010, a Vice President in Fund Accounting within J.P. Morgan Investor Services, supporting a series of U.S. registered mutual funds. |
| * | The contact address for the officer is 500 Stanton Christiana Road, Ops 1, Floor 02, Newark, DE 19173. |
| ** | The contact address for the officer is 460 Polaris Parkway, Westerville, OH 43082. |
| *** | The contact address for the officer is 4 New York Plaza, 21st Floor, NY, NY 10004. |
| **** | The contact address for the officer is One Beacon Street, Floor 18, Boston, MA 02108. |
| | | | | | | | |
| | | |
| OCTOBER 31, 2015 | | JPMORGAN EXCHANGE-TRADED FUNDS | | | | | 49 | |
SCHEDULE OF SHAREHOLDER EXPENSES
(Unaudited)
Hypothetical $1,000 Investment
As a shareholder of the Funds, you incur ongoing costs, including investment advisory fees, administration fees, distribution fees and other Fund expenses, in addition to brokerage commissions on your purchases and sales of Fund shares. The examples below are intended to help you understand your ongoing costs (in dollars) of investing in the Fund and to compare these ongoing costs with the ongoing costs of investing in other funds. The examples assume that you had a $1,000 investment at the beginning of the reporting period, May 1, 2015 and continued to hold your shares at the end of the reporting period, October 31, 2015.
Actual Expenses
For the Fund in the table below, the first line provides information about actual account values and actual expenses. You may use the information in this line, together with the amount you invested, to estimate the expenses that you paid over the period. Simply divide your account value by $1,000 (for example, an $8,600 account value divided by $1,000 = 8.6), then multiply the result by the number under the heading entitled “Expenses Paid During the Period” to estimate the expenses you paid on your account during this period.
Hypothetical Example for Comparison Purposes
The second line in the table below provides information about hypothetical account values and hypothetical expenses based on the Fund’s actual expense ratio and an assumed rate of return of 5% per year before expenses, which is not the Fund’s actual return. The hypothetical account values and expenses may not be used to estimate the actual ending account balance or expenses you paid for the period. You may use this information to compare the ongoing costs of investing in the Fund and other Funds. To do so, compare this 5% hypothetical example with the 5% hypothetical examples that appear in the shareholder reports of other funds. The examples also assume all dividends and distributions have been reinvested.
| | | | | | | | | | | | | | | | |
| | | Beginning
Account Value
5/01/2015 | | | Ending
Account Value
10/31/2015 | | | Annualized
Expense
Ratios | | | Expenses
Paid During
Period(1) | |
Emerging Markets Equity ETF | | | | | | | | | | | | | | | | |
Actual Fund Return | | $ | 1,000.00 | | | $ | 822.40 | | | | 0.45 | % | | $ | 2.07 | |
Hypothetical 5% Return | | | 1,000.00 | | | | 1,022.94 | | | | 0.45 | | | | 2.29 | |
Global Equity ETF | | | | | | | | | | | | | | | | |
Actual Fund Return | | $ | 1,000.00 | | | $ | 966.50 | | | | 0.38 | % | | $ | 1.88 | |
Hypothetical 5% Return | | | 1,000.00 | | | | 1,023.29 | | | | 0.38 | | | | 1.94 | |
International Equity ETF | | | | | | | | | | | | | | | | |
Actual Fund Return | | $ | 1,000.00 | | | $ | 955.60 | | | | 0.43 | % | | $ | 2.12 | |
Hypothetical 5% Return | | | 1,000.00 | | | | 1,023.04 | | | | 0.43 | | | | 2.19 | |
| (1) | Expenses are equal to the Fund’s annualized expense ratio, multiplied by the average account value over the period, multiplied by 184/365 (to reflect the one-half year period). |
| | | | | | |
| | | |
| 50 | | | | JPMORGAN EXCHANGE-TRADED FUNDS | | OCTOBER 31, 2015 |
TAX LETTER
(Unaudited)
Certain tax information for the JPMorgan ETFs is required to be provided to shareholders based upon the Funds’ income and distributions for the taxable year ended October 31, 2015. The information and distributions reported in this letter may differ from the information and taxable distributions reported to the shareholders for the calendar year ending December 31, 2015. The information necessary to complete your income tax returns for the calendar year ending December 31, 2015 will be provided under separate cover.
Dividends Received deductions
Each Fund listed below had the following percentage, or maximum allowable percentage, of ordinary income distributions eligible for the 70% dividends received deductions for corporate shareholders for the fiscal year ended October 31, 2015.
| | | | |
| | | Dividends
Received
Deduction | |
Global Equity ETF | | | 24.37 | % |
Foreign Source Income and Foreign Tax Credit Pass Through
For the fiscal year ended October 31, 2015, the following Funds intend to elect to pass through to shareholders taxes paid to foreign countries. Gross income and foreign tax expenses are as follows or amounts as finally determined:
| | | | | | | | |
| | | Gross
Income | | | Foreign Tax
Pass Through | |
Emerging Markets Equity ETF | | $ | 1,155,987 | | | $ | 175,441 | |
Global Equity ETF | | | 837,881 | | | | 96,951 | |
International Equity ETF | | | 2,042,680 | | | | 167,104 | |
Qualified Dividend Income (QDI)
Each fund listed below had the following amount, or maximum allowable amount, of ordinary income distributions treated as qualified dividends for the fiscal year ended October 31, 2015:
| | | | |
| | | Qualified
Dividend
Income | |
Global Equity ETF | | $ | 345,478 | |
International Equity ETF | | | 211,319 | |
| | | | | | | | |
| | | |
| OCTOBER 31, 2015 | | JPMORGAN EXCHANGE-TRADED FUNDS | | | | | 51 | |
J.P. Morgan Exchange-Traded Funds are distributed by SEI Investments Distribution Co. (One Freedom Valley Dr., Oaks, PA 19456), which is not affiliated with JPMorgan Chase & Co. or any of its affiliates.
Contact J.P. Morgan Exchange-Traded Funds at 1-844-457-6383 (844-4JPM ETF) for a fund prospectus. You can also visit us at www.jpmorganfunds.com. Investors should carefully consider the investment objectives and risks as well as charges and expenses of the fund before investing. The prospectus contains this and other information about the fund. Read the prospectus carefully before investing.
Investors may obtain information about the Securities Investor Protection Corporation (SIPC), including the SIPC brochure by visiting www.sipc.org or by calling SIPC at 202-371-8300.
The Fund files a complete schedule of its fund holdings for the first and third quarters of its fiscal year with the SEC on Form N-Q. The Fund’s Forms N-Q is available on the SEC’s website at http://www.sec.gov and may be reviewed and copied at the SEC’s Public Reference Room in Washington, DC. Information on the operation of the SEC’s Public Reference Room may be obtained by calling 1-800-SEC-0330. Shareholders may request the Form N-Q without charge by calling 1-844-457-6383 or by visiting the J.P. Morgan Funds’ website at www.jpmorganfunds.com.
A description of each Fund’s policies and procedures with respect to the disclosure of each Fund’s holdings is available in the prospectus and Statement of Additional Information.
A copy of proxy policies and procedures is available without charge upon request by calling 1-844-457-6383 and on the Fund’s website at www.jpmorganfunds.com. A description of such policies and procedures is on the SEC’s website at www.sec.gov. The Trustees have delegated the authority to vote proxies for securities owned by the Fund to the Adviser. A copy of the Fund’s voting record for the most recent 12-month period ended June 30 is available on the SEC’s website at www.sec.gov or at the Fund’s website at www.jpmorganfunds.com no later than August 31 of each year. The Fund’s proxy voting record will include, among other things, a brief description of the matter voted on for each fund security, and will state how each vote was cast, for example, for or against the proposal.


J.P. Morgan Asset Management is the marketing name for the asset management business of JPMorgan Chase & Co. Those businesses include, but are not limited to, J.P. Morgan Investment Management Inc., Security Capital Research & Management Incorporated and J.P. Morgan Alternative Asset Management, Inc.
| | | | |
| | © JPMorgan Chase & Co., 2015. All rights reserved. October 2015. | | AN-ETF-1015 |
Annual Report
JPMorgan Exchange-Traded Funds
October 31, 2015
JPMorgan Diversified Return U.S. Equity ETF

CONTENTS
Investments in the Fund are not bank deposits or obligations of, or guaranteed or endorsed by, any bank and are not insured or guaranteed by the FDIC, the Federal Reserve Board or any other government agency. You could lose money if you sell when the Fund’s share price is lower than when you invested.
Past performance is no guarantee of future performance. The general market views expressed in this report are opinions based on market and other conditions through the end of the reporting period and are subject to change without notice. These views are not intended to predict the future performance of a Fund or the securities markets. References to specific securities and their issuers are for illustrative purposes only and are not intended to be, and should not be interpreted as, recommendations to purchase or sell such securities. Such views are not meant as investment advice and may not be relied on as an indication of trading intent on behalf of the Fund.
Prospective investors should refer to the Fund’s prospectus for a discussion of the Fund’s investment objectives, strategies and risks. Call J.P. Morgan Exchange-Traded Funds at (844) 457-6383 for a prospectus containing more complete information about the Fund, including management fees and other expenses. Please read it carefully before investing.
PRESIDENT’S LETTER
NOVEMBER 30, 2015 (Unaudited)
Dear Shareholder,
Over the past year, we have been busy building the JPMorgan Exchange-Traded Fund (ETF) business. Recently, we launched our fourth Diversified Return Equity ETF. Our newest ETF targets large cap U.S. equities (JPUS) and complements our funds that invest in global equity (JPGE), developed markets equity (JPIN) and emerging market equity (JPEM). We are seeking to launch several more strategies in our suite of ETFs that uniquely address the risks associated with excess concentration in sectors of the economy and regions of the world, while selecting stocks with key equity factors. We look forward to telling you more about these new funds as we introduce them.
| | |
 | | “While investors may not be able to avoid global financial market volatility, we believe the basic principles of a well-diversified portfolio, a long term outlook and avoiding excess concentrations provide the most prudent approach toward the current trends in the global financial marketplace.” |
In recent months, increasing market volatility was punctuated by declining equity markets in late summer followed by rebounding markets in the fall. Following declines in June through September, the Standard & Poor’s 500 Index (S&P 500) finished October with its best one-month performance since October 2011, Japan’s Nikkei Index gained the most since April 2013 and leading European indexes had their best performance since 2009.
Even as leading central banks have extended economic stimulus, financial market volatility has increased over the past year amid slowing growth in China, weakness in commodities prices and uncertainty about the strength of the global economic recovery. Further, financial market apprehension about the pace of future interest rate increases in the U.S. added to investor anxiety. We believe it’s likely that this period of relatively high market volatility will continue into 2016 and beyond.
With this as a backdrop, we thought it would be helpful to share our thoughts on market volatility with you. In recent research developed by JPMorgan and published in “Market Insights: Investing with Composure in Volatile Markets”, we see there have been meaningful declines in equity markets within most calendar years. However, despite average intra-year declines of 14.2%, the S&P 500 posted positive annual returns in 27 of the past 35 years. This serves to illustrate the importance of keeping market volatility in proper perspective, focusing on longer investment horizons and maintaining portfolio discipline.
Within this volatile market climate, the principles of sound investing provide useful guidelines for investors seeking investment returns over the long-term. Those principles include employing a portfolio that is well diversified across asset classes and adhering to a long-term view of returns. It is also important to remember that attempting to successfully anticipate price swings in financial markets is extremely difficult.
But, what else can an investor do? One thought we want to emphasize is the concept of diversifying within an asset class. In other words, in addition to portfolio diversification across stocks, bonds and real assets, we believe that diversifying the equity portion of a portfolio by deploying complementary strategies has meaningful benefits.
In our opinion, investors should consider strategies that offer lower overall volatility and compensate for the risk of excess sector concentration that is inherent in traditional indexes and well-known market-weighted index mutual funds. The impact of financial market volatility may be mitigated by a properly diversified portfolio that is free of excess concentrations in any particular region, sector or asset class.
While investors may not be able to avoid global financial market volatility, we believe the basic principles of a well-diversified portfolio, a long-term outlook and avoiding excess concentrations provide the most prudent approach toward the current trends in the global financial marketplace. On behalf of everyone at J.P. Morgan Asset Management, thank you for your continued support. We look forward to managing your investment needs for years to come.
If you should have any questions, or would like a copy of “Market Insights: Investing with Composure in Volatile Markets,” please visit www.jpmorganfunds.com or call J.P. Morgan Exchange-Traded Funds at 1-844-457-6383.
Sincerely yours,

Robert F. Deutsch
President, J.P. Morgan Exchange-Traded Funds
J.P. Morgan Asset Management
| | | | | | | | |
| | | |
| OCTOBER 31, 2015 | | JPMORGAN EXCHANGE-TRADED FUNDS | | | | | 1 | |
JPMorgan Diversified Return U.S. Equity ETF
FUND COMMENTARY
FOR THE PERIOD SEPTEMBER 29, 2015 (FUND INCEPTION DATE) THROUGH OCTOBER 31, 2015 (Unaudited)
| | | | |
| REPORTING PERIOD RETURN: | |
| JPMorgan Diversified Return U.S. Equity ETF* | | | 8.26% | |
| Market Price** | | | 8.32% | |
| Russell 1000 Diversified Factor Index | | | 8.31% | |
| Russell 1000 Index | | | 10.13% | |
| |
| Net Assets as of 10/31/2015 | | $ | 10,826,623 | |
INVESTMENT OBJECTIVE***
The JPMorgan Diversified Return U.S. Equity ETF (the “Fund”) seeks investment results that closely correspond, before fees and expenses, to the performance of the Russell 1000 Diversified Factor Index (the “Underlying Index”).
INVESTMENT APPROACH
The Fund is passively managed to the Underlying Index, which tracks large and mid cap equity securities in the U.S. The Underlying Index seeks to diversify risk across sectors and securities, and avoid the most unattractive stocks by building a portfolio that excludes expensive, low quality stocks with weak momentum characteristics. The Underlying Index’s methodology includes quarterly rebalancing, liquidity screens and turnover controls.
HOW DID THE MARKET PERFORM?
In October 2015, U.S. financial markets rebounded from an August-September sell-off as China’s central bank undertook further actions to bolster domestic financial markets and the U.S. Federal Reserve held interest rates at historically low levels. The Standard & Poor’s 500 Index turned in its best one-month performance since October 2011 and returned 8.30% in October 2015.
HOW DID THE FUND PERFORM?
The Fund posted a positive absolute performance but experienced a deviation of -0.05% relative to the Underlying Index for the period September 29, 2015 to October 31, 2015.
On an absolute basis, the Fund’s positions in the information technology, health care and consumer discretionary sectors were leading contributors to performance for the one month period, while the Fund’s positions in the telecom services, utilities, and energy made the smallest contribution to performance.
Because the Fund’s holdings were closely aligned with those of the Underlying Index, variances in relative performance due to security selection and/or sector allocation were not significant. The majority of the Fund’s deviation against the Underlying Index was due to the Fund’s small cash allocation and fees and operating expenses incurred by the Fund.
HOW WAS THE FUND POSITIONED?
At the end of the reporting period, the Fund’s largest positions were in the consumer discretionary and health care sectors and the smallest positions were in the telecommunications services and energy sectors.
| | | | | | |
| | | |
| 2 | | | | JPMORGAN EXCHANGE-TRADED FUNDS | | OCTOBER 31, 2015 |
| | | | | | | | |
| TOP TEN EQUITY HOLDINGS OF THE PORTFOLIO**** | |
| | 1. | | | Xcel Energy, Inc. | | | 0.6 | % |
| | 2. | | | Henry Schein, Inc. | | | 0.6 | |
| | 3. | | | TECO Energy, Inc. | | | 0.6 | |
| | 4. | | | DaVita HealthCare Partners, Inc. | | | 0.6 | |
| | 5. | | | CMS Energy Corp. | | | 0.6 | |
| | 6. | | | Sigma-Aldrich Corp. | | | 0.6 | |
| | 7. | | | SCANA Corp. | | | 0.6 | |
| | 8. | | | DTE Energy Co. | | | 0.6 | |
| | 9. | | | Molson Coors Brewing Co. | | | 0.6 | |
| | 10. | | | Consolidated Edison, Inc. | | | 0.6 | |
| | | | | | |
PORTFOLIO COMPOSITION BY SECTOR**** | |
| Consumer Discretionary | | | 16.8 | % |
| Health Care | | | 16.0 | |
| Information Technology | | | 12.5 | |
| Utilities | | | 12.5 | |
| Consumer Staples | | | 12.5 | |
| Financials | | | 10.1 | |
| Industrials | | | 7.8 | |
| Materials | | | 5.9 | |
| Energy | | | 4.4 | |
| Telecommunication Services | | | 1.5 | |
| * | | The return shown is based on net asset value calculated for shareholder transactions and may differ from the return shown in the financial highlights, which reflects adjustments made to the net asset value in accordance with accounting principles generally accepted in the United States of America. The net asset value was $54.13 as of October 31, 2015. |
| ** | | Market price cumulative return is calculated assuming an initial investment made at the inception date net asset value, reinvestment of all dividends and distributions at market price during the period, and sale at the market price on the last day of the period. The price used to calculate the market price return is the midpoint of the bid/ask spread at the close of business on the NYSE Arca, Inc. The midpoint price was $54.16 as of October 31, 2015. |
| *** | | The adviser seeks to achieve the Fund’s objective. There can be no guarantee it will be achieved. |
| **** | | Percentages indicated are based on total investments as of October 31, 2015. The Fund’s composition is subject to change. |
| | | | | | | | |
| | | |
| OCTOBER 31, 2015 | | JPMORGAN EXCHANGE-TRADED FUNDS | | | | | 3 | |
JPMorgan Diversified Return U.S. Equity ETF
FUND COMMENTARY
FOR THE PERIOD SEPTEMBER 29, 2015 (FUND INCEPTION DATE) THROUGH OCTOBER 31, 2015 (Unaudited) (continued)
| | | | | | | | |
AVERAGE ANNUAL TOTAL RETURNS AS OF OCTOBER 31, 2015 | |
| | |
| | | INCEPTION DATE | | | CUMULATIVE
SINCE
INCEPTION | |
JPMorgan Diversified Return U.S. Equity ETF | | | 9/29/2015 | | | | 8.26 | % |
Market Price | | | | | | | 8.32 | |
LIFE OF FUND PERFORMANCE (9/29/15 TO 10/31/15)
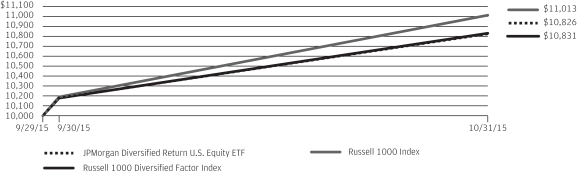
The performance quoted is past performance and is not a guarantee of future results. Exchange-traded funds are subject to certain market risks. Investment returns and principal value of an investment will fluctuate so that an investor’s shares, when sold or redeemed, may be worth more or less than their original cost. Current performance may be higher or lower than the performance data shown. For up-to-date, month-end performance information please call 1-844-457-6383.
Fund commenced operations on September 29, 2015.
The graph illustrates comparative performance for $10,000 invested in shares of the JPMorgan Diversified Return U.S. Equity ETF, the Russell 1000 Diversified Factor Index, and the Russell 1000 Index from September 29, 2015 to October 31, 2015. The performance of the Fund reflects the deduction of Fund expenses and assumes reinvestment of all dividends and capital gain distributions, if any. The performance of the Russell 1000 Diversified Factor Index and Russell 1000 Index does not reflect the deduction of expenses associated with an exchange-traded fund and has been adjusted to reflect reinvestment of all dividends and capital gain distributions of the securities included in the Index,
if applicable. The Russell 1000 Diversified Factor Index is an index comprised of U.S. equity securities selected to represent a diversified set of factor characteristics, originally developed by the adviser and its holdings are selected by the index provider primarily from the constituents of the Russell 1000 Index. Frank Russell Company is the index provider. The Russell 1000 Index is an unmanaged index, which measures the performance of the 1,000 largest companies in the Russell 3000 Index. Investors cannot invest directly in an index.
Fund performance reflects the waiver of the Fund’s fees and reimbursement of expenses for certain periods since the inception date. Without these waivers and reimbursements, performance would have been lower. Also, performance shown in this section does not reflect the deduction of taxes that a shareholder may pay on Fund distributions, redemption or sale of Fund shares.
The returns shown are based on net asset values calculated for shareholder transactions and may differ from the returns shown in the financial highlights, which reflect adjustments made to the net asset values in accordance with accounting principles generally accepted in the United States of America.
| | | | | | |
| | | |
| 4 | | | | JPMORGAN EXCHANGE-TRADED FUNDS | | OCTOBER 31, 2015 |
JPMorgan Diversified Return U.S. Equity ETF
SCHEDULE OF PORTFOLIO INVESTMENTS
AS OF OCTOBER 31, 2015
| | | | | | | | |
| SHARES | | | SECURITY DESCRIPTION | | VALUE($) | |
| | | | | | | | |
| Common Stocks — 99.7% | |
| | | | Consumer Discretionary — 16.8% | |
| | | | Auto Components — 1.2% | |
| | 353 | | | Delphi Automotive plc (United Kingdom) | | | 29,366 | |
| | 1,219 | | | Gentex Corp. | | | 19,979 | |
| | 661 | | | Goodyear Tire & Rubber Co. (The) | | | 21,707 | |
| | 390 | | | Johnson Controls, Inc. | | | 17,620 | |
| | 328 | | | Lear Corp. | | | 41,020 | |
| | | | | | | | |
| | | | | | | 129,692 | |
| | | | | | | | |
| | | | Automobiles — 0.6% | |
| | 1,488 | | | Ford Motor Co. | | | 22,037 | |
| | 811 | | | General Motors Co. | | | 28,312 | |
| | 341 | | | Harley-Davidson, Inc. | | | 16,863 | |
| | | | | | | | |
| | | | | | | 67,212 | |
| | | | | | | | |
| | | | Distributors — 0.6% | |
| | 636 | | | Genuine Parts Co. | | | 57,723 | |
| | | | | | | | |
| | | | Diversified Consumer Services — 0.2% | |
| | 2 | | | Graham Holdings Co., Class B | | | 1,105 | |
| | 546 | | | H&R Block, Inc. | | | 20,344 | |
| | | | | | | | |
| | | | | | | 21,449 | |
| | | | | | | | |
| | | | Hotels, Restaurants & Leisure — 2.3% | |
| | 271 | | | Brinker International, Inc. | | | 12,333 | |
| | 464 | | | Carnival Corp. | | | 25,093 | |
| | 18 | | | Chipotle Mexican Grill, Inc., Class A (a) | | | 11,524 | |
| | 232 | | | Darden Restaurants, Inc. | | | 14,359 | |
| | 585 | | | International Game Technology plc | | | 9,489 | |
| | 230 | | | Las Vegas Sands Corp. | | | 11,387 | |
| | 158 | | | Marriott International, Inc., Class A | | | 12,131 | |
| | 289 | | | McDonald’s Corp. | | | 32,440 | |
| | 39 | | | Panera Bread Co., Class A (a) | | | 6,918 | |
| | 166 | | | Royal Caribbean Cruises Ltd. | | | 16,326 | |
| | 300 | | | Speedway Motorsports, Inc. | | | 5,541 | |
| | 550 | | | Starbucks Corp. | | | 34,414 | |
| | 189 | | | Starwood Hotels & Resorts Worldwide, Inc. | | | 15,095 | |
| | 244 | | | Wyndham Worldwide Corp. | | | 19,849 | |
| | 64 | | | Wynn Resorts Ltd. | | | 4,477 | |
| | 267 | | | Yum! Brands, Inc. | | | 18,933 | |
| | | | | | | | |
| | | | | | | 250,309 | |
| | | | | | | | |
| | | | Household Durables — 1.9% | |
| | 347 | | | Garmin Ltd. (Switzerland) | | | 12,308 | |
| | 195 | | | GoPro, Inc., Class A (a) | | | 4,875 | |
| | 129 | | | Harman International Industries, Inc. | | | 14,185 | |
| | 919 | | | Leggett & Platt, Inc. | | | 41,383 | |
| | 458 | | | Lennar Corp., Class A | | | 22,932 | |
| | 55 | | | Mohawk Industries, Inc. (a) | | | 10,752 | |
| | 878 | | | Newell Rubbermaid, Inc. | | | 37,254 | |
| | | | | | | | |
| SHARES | | | SECURITY DESCRIPTION | | VALUE($) | |
| | | | | | | | |
| | | | | | | | |
| | | | Household Durables — continued | | | | |
| | 16 | | | NVR, Inc. (a) | | | 26,204 | |
| | 985 | | | PulteGroup, Inc. | | | 18,055 | |
| | 33 | | | TopBuild Corp. (a) | | | 928 | |
| | 113 | | | Whirlpool Corp. | | | 18,096 | |
| | | | | | | | |
| | | | | | | 206,972 | |
| | | | | | | | |
| | | | Internet & Catalog Retail — 0.6% | |
| | 142 | | | Expedia, Inc. | | | 19,355 | |
| | 698 | | | Liberty Interactive Corp., Class A (a) | | | 19,104 | |
| | 80 | | | Netflix, Inc. (a) | | | 8,670 | |
| | 12 | | | Priceline Group, Inc. (The) (a) | | | 17,451 | |
| | | | | | | | |
| | | | | | | 64,580 | |
| | | | | | | | |
| | | | Leisure Equipment & Products — 0.7% | |
| | 593 | | | Hasbro, Inc. | | | 45,560 | |
| | 363 | | | Mattel, Inc. | | | 8,923 | |
| | 146 | | | Polaris Industries, Inc. | | | 16,402 | |
| | | | | | | | |
| | | | | | | 70,885 | |
| | | | | | | | |
| | | | Media — 2.7% | |
| | 2 | | | Cable One, Inc. (a) | | | 867 | |
| | 267 | | | CBS Corp. (Non-Voting), Class B | | | 12,421 | |
| | 628 | | | Comcast Corp., Class A | | | 39,341 | |
| | 185 | | | DISH Network Corp., Class A (a) | | | 11,649 | |
| | 470 | | | EW Scripps Co. (The), Class A (a) | | | 10,368 | |
| | 905 | | | Interpublic Group of Cos., Inc. (The) | | | 20,752 | |
| | 51 | | | John Wiley & Sons, Inc., Class A | | | 2,669 | |
| | 176 | | | Liberty Media Corp. (a) | | | 7,174 | |
| | 287 | | | Omnicom Group, Inc. | | | 21,502 | |
| | 181 | | | Scripps Networks Interactive, Inc., Class A | | | 10,874 | |
| | 2,152 | | | Sirius XM Holdings, Inc. (a) | | | 8,780 | |
| | 1,042 | | | Starz (a) | | | 34,917 | |
| | 525 | | | TEGNA, Inc. | | | 14,196 | |
| | 90 | | | Time Warner Cable, Inc. | | | 17,046 | |
| | 197 | | | Time Warner, Inc. | | | 14,842 | |
| | 267 | | | Twenty-First Century Fox, Inc. | | | 8,245 | |
| | 638 | | | Twenty-First Century Fox, Inc., Class A | | | 19,580 | |
| | 209 | | | Viacom, Inc., Class B | | | 10,306 | |
| | 236 | | | Walt Disney Co. (The) | | | 26,843 | |
| | | | | | | | |
| | | | | | | 292,372 | |
| | | | | | | | |
| | | | Multiline Retail — 1.0% | |
| | 150 | | | Dillard’s, Inc., Class A | | | 13,422 | |
| | 275 | | | Dollar General Corp. | | | 18,637 | |
| | 269 | | | Dollar Tree, Inc. (a) | | | 17,617 | |
| | 256 | | | Kohl’s Corp. | | | 11,807 | |
| | 312 | | | Macy’s, Inc. | | | 15,906 | |
SEE NOTES TO FINANCIAL STATEMENTS.
| | | | | | | | |
| | | |
| OCTOBER 31, 2015 | | JPMORGAN EXCHANGE-TRADED FUNDS | | | | | 5 | |
JPMorgan Diversified Return U.S. Equity ETF
SCHEDULE OF PORTFOLIO INVESTMENTS
AS OF OCTOBER 31, 2015 (continued)
| | | | | | | | |
| SHARES | | | SECURITY DESCRIPTION | | VALUE($) | |
| | | | | | | | |
| Common Stocks — continued | |
| | | | Multiline Retail — continued | | | | |
| | 222 | | | Nordstrom, Inc. | | | 14,476 | |
| | 250 | | | Target Corp. | | | 19,295 | |
| | | | | | | | |
| | | | | | | 111,160 | |
| | | | | | | | |
| | | | Specialty Retail — 3.5% | |
| | 96 | | | Advance Auto Parts, Inc. | | | 19,049 | |
| | 289 | | | AutoNation, Inc. (a) | | | 18,262 | |
| | 199 | | | Bed Bath & Beyond, Inc. (a) | | | 11,866 | |
| | 228 | | | Best Buy Co., Inc. | | | 7,987 | |
| | 213 | | | CarMax, Inc. (a) | | | 12,569 | |
| | 240 | | | Dick’s Sporting Goods, Inc. | | | 10,692 | |
| | 482 | | | Foot Locker, Inc. | | | 32,656 | |
| | 191 | | | GameStop Corp., Class A | | | 8,799 | |
| | 326 | | | Gap, Inc. | | | 8,874 | |
| | 289 | | | GNC Holdings, Inc., Class A | | | 8,598 | |
| | 316 | | | Home Depot, Inc. (The) | | | 39,070 | |
| | 246 | | | L Brands, Inc. | | | 23,611 | |
| | 314 | | | Lowe’s Cos., Inc. | | | 23,183 | |
| | 94 | | | O’Reilly Automotive, Inc. (a) | | | 25,969 | |
| | 400 | | | Ross Stores, Inc. | | | 20,232 | |
| | 60 | | | Signet Jewelers Ltd. (Bermuda) | | | 9,056 | |
| | 640 | | | Staples, Inc. | | | 8,314 | |
| | 164 | | | Tiffany & Co. | | | 13,520 | |
| | 396 | | | TJX Co., Inc. (The) | | | 28,983 | |
| | 179 | | | Tractor Supply Co. | | | 16,538 | |
| | 66 | | | Ulta Salon Cosmetics & Fragrance, Inc. (a) | | | 11,481 | |
| | 127 | | | Urban Outfitters, Inc. (a) | | | 3,632 | |
| | 252 | | | Williams-Sonoma, Inc. | | | 18,585 | |
| | | | | | | | |
| | | | | | | 381,526 | |
| | | | | | | | |
| | | | Textiles, Apparel & Luxury Goods — 1.5% | |
| | 817 | | | Coach, Inc. | | | 25,490 | |
| | 185 | | | Deckers Outdoor Corp. (a) | | | 10,297 | |
| | 519 | | | Hanesbrands, Inc. | | | 16,577 | |
| | 187 | | | lululemon athletica, Inc. (a) | | | 9,195 | |
| | 341 | | | NIKE, Inc., Class B | | | 44,681 | |
| | 165 | | | Skechers U.S.A., Inc., Class A (a) | | | 5,148 | |
| | 195 | | | Under Armour, Inc., Class A (a) | | | 18,541 | |
| | 497 | | | V.F. Corp. | | | 33,557 | |
| | | | | | | | |
| | | | | | | 163,486 | |
| | | | | | | | |
| | | | Total Consumer Discretionary | | | 1,817,366 | |
| | | | | | | | |
| | | | Consumer Staples — 12.4% | |
| | | | Beverages — 3.1% | |
| | 388 | | | Brown-Forman Corp., Class B | | | 41,198 | |
| | 570 | | | Coca-Cola Enterprises, Inc. | | | 29,264 | |
| | 878 | | | Coca-Cola Co. (The) | | | 37,183 | |
| | | | | | | | |
| SHARES | | | SECURITY DESCRIPTION | | VALUE($) | |
| | | | | | | | |
| | | | | | | | |
| | | | Beverages — continued | | | | |
| | 291 | | | Constellation Brands, Inc., Class A | | | 39,227 | |
| | 552 | | | Dr. Pepper Snapple Group, Inc. | | | 49,332 | |
| | 677 | | | Molson Coors Brewing Co., Class B | | | 59,644 | |
| | 170 | | | Monster Beverage Corp. (a) | | | 23,174 | |
| | 572 | | | PepsiCo, Inc. | | | 58,453 | |
| | | | | | | | |
| | | | | | | 337,475 | |
| | | | | | | | |
| | | | Food & Staples Retailing — 1.5% | |
| | 174 | | | Costco Wholesale Corp. | | | 27,513 | |
| | 314 | | | CVS Health Corp. | | | 31,017 | |
| | 714 | | | Kroger Co. (The) | | | 26,989 | |
| | 718 | | | Sysco Corp. | | | 29,617 | |
| | 185 | | | Walgreens Boots Alliance, Inc. | | | 15,666 | |
| | 501 | | | Wal-Mart Stores, Inc. | | | 28,677 | |
| | 144 | | | Weis Markets, Inc. | | | 5,924 | |
| | | | | | | | |
| | | | | | | 165,403 | |
| | | | | | | | |
| | | | Food Products — 4.5% | |
| | 495 | | | Archer-Daniels-Midland Co. | | | 22,602 | |
| | 35 | | | Bunge Ltd. | | | 2,553 | |
| | 1,005 | | | Campbell Soup Co. | | | 51,044 | |
| | 745 | | | ConAgra Foods, Inc. | | | 30,210 | |
| | 833 | | | General Mills, Inc. | | | 48,406 | |
| | 575 | | | Hershey Co. (The) | | | 50,997 | |
| | 749 | | | Hormel Foods Corp. | | | 50,595 | |
| | 314 | | | JM Smucker Co. (The) | | | 36,860 | |
| | 628 | | | Kellogg Co. | | | 44,286 | |
| | 531 | | | Kraft Heinz Co. (The) | | | 41,402 | |
| | 616 | | | McCormick & Co., Inc. (Non-Voting) | | | 51,732 | |
| | 398 | | | Mead Johnson Nutrition Co., Class A | | | 32,636 | |
| | 511 | | | Tyson Foods, Inc., Class A | | | 22,668 | |
| | | | | | | | |
| | | | | | | 485,991 | |
| | | | | | | | |
| | | | Household Products — 1.8% | |
| | 484 | | | Clorox Co. (The) | | | 59,019 | |
| | 628 | | | Colgate-Palmolive Co. | | | 41,668 | |
| | 140 | | | Energizer Holdings, Inc. | | | 5,996 | |
| | 326 | | | Kimberly-Clark Corp. | | | 39,026 | |
| | 667 | | | Procter & Gamble Co. (The) | | | 50,945 | |
| | | | | | | | |
| | | | | | | 196,654 | |
| | | | | | | | |
| | | | Personal Products — 0.6% | |
| | 339 | | | Edgewell Personal Care Co. | | | 28,717 | |
| | 396 | | | Estee Lauder Cos., Inc. (The), Class A | | | 31,862 | |
| | 96 | | | Nu Skin Enterprises, Inc., Class A | | | 3,668 | |
| | | | | | | | |
| | | | | | | 64,247 | |
| | | | | | | | |
SEE NOTES TO FINANCIAL STATEMENTS.
| | | | | | |
| | | |
| 6 | | | | JPMORGAN EXCHANGE-TRADED FUNDS | | OCTOBER 31, 2015 |
| | | | | | | | |
| SHARES | | | SECURITY DESCRIPTION | | VALUE($) | |
| | | | | | | | |
| Common Stocks — continued | |
| | | | Tobacco — 0.9% | |
| | 819 | | | Altria Group, Inc. | | | 49,525 | |
| | 29 | | | Philip Morris International, Inc. | | | 2,564 | |
| | 882 | | | Reynolds American, Inc. | | | 42,618 | |
| | | | | | | | |
| | | | | | | 94,707 | |
| | | | | | | | |
| | | | Total Consumer Staples | | | 1,344,477 | |
| | | | | | | | |
| | | | Energy — 4.4% | |
| | | | Energy Equipment & Services — 1.0% | |
| | 207 | | | Baker Hughes, Inc. | | | 10,905 | |
| | 289 | | | Diamond Offshore Drilling, Inc. | | | 5,745 | |
| | 345 | | | FMC Technologies, Inc. (a) | | | 11,671 | |
| | 234 | | | Halliburton Co. | | | 8,981 | |
| | 174 | | | Helmerich & Payne, Inc. | | | 9,791 | |
| | 271 | | | Nabors Industries Ltd. (Bermuda) | | | 2,721 | |
| | 211 | | | National Oilwell Varco, Inc. | | | 7,942 | |
| | 634 | | | Noble Corp. plc (United Kingdom) | | | 8,540 | |
| | 279 | | | Oceaneering International, Inc. | | | 11,724 | |
| | 334 | | | Patterson-UTI Energy, Inc. | | | 4,973 | |
| | 240 | | | Schlumberger Ltd. | | | 18,758 | |
| | 376 | | | Seadrill Ltd. (a) | | | 2,433 | |
| | 80 | | | Superior Energy Services, Inc. | | | 1,133 | |
| | | | | | | | |
| | | | | | | 105,317 | |
| | | | | | | | |
| | | | Oil, Gas & Consumable Fuels — 3.4% | |
| | 638 | | | Chesapeake Energy Corp. (a) | | | 4,549 | |
| | 209 | | | Chevron Corp. | | | 18,994 | |
| | 86 | | | Cimarex Energy Co. | | | 10,153 | |
| | 230 | | | Columbia Pipeline Group, Inc. | | | 4,777 | |
| | 267 | | | ConocoPhillips | | | 14,244 | |
| | 172 | | | Continental Resources, Inc. (a) | | | 5,833 | |
| | 211 | | | Devon Energy Corp. | | | 8,847 | |
| | 174 | | | EOG Resources, Inc. | | | 14,938 | |
| | 363 | | | Exxon Mobil Corp. | | | 30,035 | |
| | 96 | | | Gulfport Energy Corp. (a) | | | 2,925 | |
| | 273 | | | Hess Corp. | | | 15,345 | |
| | 170 | | | HollyFrontier Corp. | | | 8,325 | |
| | 542 | | | Kinder Morgan, Inc. | | | 14,824 | |
| | 435 | | | Marathon Oil Corp. | | | 7,995 | |
| | 345 | | | Marathon Petroleum Corp. | | | 17,871 | |
| | 337 | | | Murphy Oil Corp. | | | 9,581 | |
| | 179 | | | Newfield Exploration Co. (a) | | | 7,194 | |
| | 263 | | | Noble Energy, Inc. | | | 9,426 | |
| | 314 | | | Occidental Petroleum Corp. | | | 23,406 | |
| | 845 | | | ONEOK, Inc. | | | 28,662 | |
| | 156 | | | Phillips 66 | | | 13,892 | |
| | 234 | | | Range Resources Corp. | | | 7,123 | |
| | | | | | | | |
| SHARES | | | SECURITY DESCRIPTION | | VALUE($) | |
| | | | | | | | |
| | | | | | | | |
| | | | Oil, Gas & Consumable Fuels — continued | | | | |
| | 1,570 | | | Spectra Energy Corp. | | | 44,855 | |
| | 181 | | | Tesoro Corp. | | | 19,354 | |
| | 213 | | | Valero Energy Corp. | | | 14,041 | |
| | 244 | | | Williams Cos., Inc. (The) | | | 9,623 | |
| | | | | | | | |
| | | | | | | 366,812 | |
| | | | | | | | |
| | | | Total Energy | | | 472,129 | |
| | | | | | | | |
| | | | Financials — 10.1% | | | | |
| | | | Banks — 1.2% | | | | |
| | 148 | | | Bank of Hawaii Corp. | | | 9,691 | |
| | 322 | | | BB&T Corp. | | | 11,962 | |
| | 2 | | | Comerica, Inc. | | | 87 | |
| | 64 | | | Cullen/Frost Bankers, Inc. | | | 4,380 | |
| | 1,075 | | | Huntington Bancshares, Inc. | | | 11,793 | |
| | 944 | | | KeyCorp | | | 11,724 | |
| | 115 | | | M&T Bank Corp. | | | 13,783 | |
| | 369 | | | People’s United Financial, Inc. | | | 5,886 | |
| | 185 | | | PNC Financial Services Group, Inc. (The) | | | 16,698 | |
| | 27 | | | Popular, Inc. | | | 798 | |
| | 244 | | | SunTrust Banks, Inc. | | | 10,131 | |
| | 70 | | | Synovus Financial Corp. | | | 2,214 | |
| | 458 | | | U.S. Bancorp | | | 19,318 | |
| | 271 | | | Wells Fargo & Co. | | | 14,672 | |
| | 23 | | | Zions Bancorporation | | | 662 | |
| | | | | | | | |
| | | | | | | 133,799 | |
| | | | | | | | |
| | | | Capital Markets — 1.5% | | | | |
| | 78 | | | Ameriprise Financial, Inc. | | | 8,998 | |
| | 293 | | | Bank of New York Mellon Corp. (The) | | | 12,203 | |
| | 39 | | | BlackRock, Inc., Class A | | | 13,727 | |
| | 105 | | | Eaton Vance Corp. | | | 3,792 | |
| | 131 | | | Federated Investors, Inc., Class B | | | 4,026 | |
| | 215 | | | Franklin Resources, Inc. | | | 8,763 | |
| | 62 | | | Goldman Sachs Group, Inc. | | | 11,625 | |
| | 310 | | | Invesco Ltd. | | | 10,283 | |
| | 271 | | | Morgan Stanley | | | 8,935 | |
| | 201 | | | Northern Trust Corp. | | | 14,148 | |
| | 131 | | | Raymond James Financial, Inc. | | | 7,219 | |
| | 472 | | | SEI Investments Co. | | | 24,459 | |
| | 156 | | | State Street Corp. | | | 10,764 | |
| | 212 | | | T. Rowe Price Group, Inc. | | | 16,031 | |
| | 295 | | | TD Ameritrade Holding Corp. | | | 10,169 | |
| | | | | | | | |
| | | | | | | 165,142 | |
| | | | | | | | |
| | | | Consumer Finance — 0.4% | | | | |
| | 146 | | | American Express Co. | | | 10,696 | |
| | 158 | | | Capital One Financial Corp. | | | 12,466 | |
SEE NOTES TO FINANCIAL STATEMENTS.
| | | | | | | | |
| | | |
| OCTOBER 31, 2015 | | JPMORGAN EXCHANGE-TRADED FUNDS | | | | | 7 | |
JPMorgan Diversified Return U.S. Equity ETF
SCHEDULE OF PORTFOLIO INVESTMENTS
AS OF OCTOBER 31, 2015 (continued)
| | | | | | | | |
| SHARES | | | SECURITY DESCRIPTION | | VALUE($) | |
| | | | | | | | |
| Common Stocks — continued | |
| | | | Consumer Finance — continued | | | | |
| | 246 | | | Discover Financial Services | | | 13,830 | |
| | 1,168 | | | SLM Corp. (a) | | | 8,246 | |
| | | | | | | | |
| | | | | | | 45,238 | |
| | | | | | | | |
| | | | Diversified Financial Services — 0.8% | | | | |
| | 129 | | | Berkshire Hathaway, Inc., Class B (a) | | | 17,547 | |
| | 115 | | | CME Group, Inc., Class A | | | 10,864 | |
| | 207 | | | FactSet Research Systems, Inc. | | | 36,250 | |
| | 113 | | | Moody’s Corp. | | | 10,866 | |
| | 150 | | | Voya Financial, Inc. | | | 6,085 | |
| | | | | | | | |
| | | | | | | 81,612 | |
| | | | | | | | |
| | | | Insurance — 3.1% | | | | |
| | 146 | | | ACE Ltd. (Switzerland) | | | 16,577 | |
| | 312 | | | Aflac, Inc. | | | 19,890 | |
| | 238 | | | Allstate Corp. (The) | | | 14,727 | |
| | 88 | | | American Financial Group, Inc. | | | 6,353 | |
| | 277 | | | American International Group, Inc. | | | 17,468 | |
| | 183 | | | Aon plc (United Kingdom) | | | 17,076 | |
| | 181 | | | Assurant, Inc. | | | 14,757 | |
| | 84 | | | Chubb Corp. (The) | | | 10,865 | |
| | 289 | | | Cincinnati Financial Corp. | | | 17,406 | |
| | 35 | | | Erie Indemnity Co., Class A | | | 3,061 | |
| | 86 | | | Everest Re Group Ltd. | | | 15,305 | |
| | 314 | | | FNF Group | | | 11,078 | |
| | 345 | | | Genworth Financial, Inc., Class A (a) | | | 1,615 | |
| | 295 | | | Hartford Financial Services Group, Inc. (The) | | | 13,647 | |
| | 78 | | | Kemper Corp. | | | 2,786 | |
| | 224 | | | Lincoln National Corp. | | | 11,986 | |
| | 269 | | | Marsh & McLennan Cos., Inc. | | | 14,994 | |
| | 10 | | | Mercury General Corp. | | | 540 | |
| | 181 | | | MetLife, Inc. | | | 9,119 | |
| | 105 | | | PartnerRe, Inc. (Bermuda) (a) | | | 14,595 | |
| | 228 | | | Principal Financial Group, Inc. | | | 11,437 | |
| | 570 | | | Progressive Corp. (The) | | | 18,884 | |
| | 70 | | | Reinsurance Group of America, Inc., Class A | | | 6,317 | |
| | 345 | | | Torchmark Corp. | | | 20,013 | |
| | 131 | | | Travelers Cos., Inc. (The) | | | 14,789 | |
| | 248 | | | W.R. Berkley Corp. (Ireland) | | | 13,846 | |
| | 562 | | | XL Group plc, Class A | | | 21,401 | |
| | | | | | | | |
| | | | | | | 340,532 | |
| | | | | | | | |
| | | | Real Estate Investment Trusts (REITs) — 2.8% | |
| | 55 | | | Alexandria Real Estate Equities, Inc. | | | 4,936 | |
| | 776 | | | American Capital Agency Corp. | | | 13,836 | |
| | 133 | | | American Tower Corp. | | | 13,597 | |
| | 538 | | | Annaly Capital Management, Inc. | | | 5,353 | |
| | | | | | | | |
| SHARES | | | SECURITY DESCRIPTION | | VALUE($) | |
| | | | | | | | |
| | | | | | | | |
| | | | Real Estate Investment Trusts (REITs) — continued | |
| | 107 | | | AvalonBay Communities, Inc. | | | 18,707 | |
| | 127 | | | Boston Properties, Inc. | | | 15,983 | |
| | 25 | | | Camden Property Trust | | | 1,845 | |
| | 37 | | | Care Capital Properties, Inc. | | | 1,219 | |
| | 478 | | | Chimera Investment Corp. | | | 6,730 | |
| | 94 | | | Corporate Office Properties Trust | | | 2,162 | |
| | 226 | | | Digital Realty Trust, Inc. | | | 16,715 | |
| | 66 | | | Duke Realty Corp. | | | 1,366 | |
| | 129 | | | Equity Residential | | | 9,974 | |
| | 76 | | | Essex Property Trust, Inc. | | | 16,753 | |
| | 129 | | | Federal Realty Investment Trust | | | 18,510 | |
| | 308 | | | General Growth Properties, Inc. | | | 8,917 | |
| | 185 | | | HCP, Inc. | | | 6,882 | |
| | 113 | | | Iron Mountain, Inc. | | | 3,462 | |
| | 406 | | | Kimco Realty Corp. | | | 10,869 | |
| | 21 | | | Liberty Property Trust | | | 714 | |
| | 105 | | | Macerich Co. (The) | | | 8,898 | |
| | 435 | | | NorthStar Realty Finance Corp. | | | 5,224 | |
| | 240 | | | Plum Creek Timber Co., Inc. | | | 9,778 | |
| | 78 | | | Public Storage | | | 17,898 | |
| | 222 | | | Rayonier, Inc. | | | 5,028 | |
| | 142 | | | Realty Income Corp. | | | 7,023 | |
| | 172 | | | Senior Housing Properties Trust | | | 2,613 | |
| | 80 | | | Simon Property Group, Inc. | | | 16,117 | |
| | 25 | | | Taubman Centers, Inc. | | | 1,925 | |
| | 154 | | | Ventas, Inc. | | | 8,273 | |
| | 148 | | | Vornado Realty Trust | | | 14,881 | |
| | 164 | | | Weingarten Realty Investors | | | 5,865 | |
| | 152 | | | Welltower, Inc. | | | 9,860 | |
| | 300 | | | Weyerhaeuser Co. | | | 8,799 | |
| | | | | | | | |
| | | | | | | 300,712 | |
| | | | | | | | |
| | | | Real Estate Management & Development — 0.1% | |
| | 142 | | | CBRE Group, Inc., Class A (a) | | | 5,294 | |
| | 10 | | | Jones Lang LaSalle, Inc. | | | 1,667 | |
| | | | | | | | |
| | | | | | | 6,961 | |
| | | | | | | | |
| | | | Thrifts & Mortgage Finance — 0.2% | | | | |
| | 1,075 | | | New York Community Bancorp, Inc. | | | 17,759 | |
| | | | | | | | |
| | | | Total Financials | | | 1,091,755 | |
| | | | | | | | |
| | | | Health Care — 16.0% | | | | |
| | | | Biotechnology — 1.8% | | | | |
| | 88 | | | Alexion Pharmaceuticals, Inc. (a) | | | 15,488 | |
| | 164 | | | Amgen, Inc. | | | 25,941 | |
| | 164 | | | Baxalta, Inc. | | | 5,651 | |
| | 49 | | | Biogen, Inc. (a) | | | 14,235 | |
| | 207 | | | Celgene Corp. (a) | | | 25,401 | |
SEE NOTES TO FINANCIAL STATEMENTS.
| | | | | | |
| | | |
| 8 | | | | JPMORGAN EXCHANGE-TRADED FUNDS | | OCTOBER 31, 2015 |
| | | | | | | | |
| SHARES | | | SECURITY DESCRIPTION | | VALUE($) | |
| | | | | | | | |
| Common Stocks — continued | |
| | | | Biotechnology — continued | | | | |
| | 197 | | | Gilead Sciences, Inc. | | | 21,302 | |
| | 107 | | | Incyte Corp. (a) | | | 12,576 | |
| | 359 | | | Medivation, Inc. (a) | | | 15,100 | |
| | 222 | | | Myriad Genetics, Inc. (a) | | | 8,962 | |
| | 57 | | | Regeneron Pharmaceuticals, Inc. (a) | | | 31,771 | |
| | 119 | | | United Therapeutics Corp. (a) | | | 17,449 | |
| | | | | | | | |
| | | | | | | 193,876 | |
| | | | | | | | |
| | | | Health Care Equipment & Supplies — 4.5% | | | | |
| | 884 | | | Abbott Laboratories | | | 39,603 | |
| | 1,036 | | | Baxter International, Inc. | | | 38,736 | |
| | 380 | | | Becton, Dickinson & Co. | | | 54,158 | |
| | 265 | | | Boston Scientific Corp. (a) | | | 4,844 | |
| | 318 | | | C.R. Bard, Inc. | | | 59,259 | |
| | 821 | | | DENTSPLY International, Inc. | | | 49,958 | |
| | 197 | | | Edwards Lifesciences Corp. (a) | | | 30,959 | |
| | 318 | | | Hill-Rom Holdings, Inc. | | | 16,756 | |
| | 458 | | | Medtronic plc (Ireland) | | | 33,855 | |
| | 425 | | | St. Jude Medical, Inc. | | | 27,119 | |
| | 503 | | | Stryker Corp. | | | 48,097 | |
| | 4 | | | Teleflex, Inc. | | | 532 | |
| | 396 | | | Varian Medical Systems, Inc. (a) | | | 31,098 | |
| | 513 | | | Zimmer Holdings, Inc. | | | 53,644 | |
| | | | | | | | |
| | | | | | | 488,618 | |
| | | | | | | | |
| | | | Health Care Providers & Services — 5.4% | | | | |
| | 308 | | | Aetna, Inc. | | | 35,352 | |
| | 240 | | | AmerisourceBergen Corp., Class A | | | 23,162 | |
| | 199 | | | Anthem, Inc. | | | 27,691 | |
| | 505 | | | Cardinal Health, Inc. | | | 41,511 | |
| | 265 | | | Centene Corp. (a) | | | 15,762 | |
| | 211 | | | Cigna Corp. | | | 28,282 | |
| | 808 | | | DaVita HealthCare Partners, Inc. (a) | | | 62,628 | |
| | 291 | | | Express Scripts Holding Co. (a) | | | 25,137 | |
| | 334 | | | HCA Holdings, Inc. (a) | | | 22,976 | |
| | 435 | | | Henry Schein, Inc. (a) | | | 65,994 | |
| | 142 | | | Humana, Inc. | | | 25,365 | |
| | 451 | | | Laboratory Corp. of America Holdings (a) | | | 55,356 | |
| | 121 | | | McKesson Corp. | | | 21,635 | |
| | 628 | | | Quest Diagnostics, Inc. | | | 42,673 | |
| | 35 | | | Tenet Healthcare Corp. (a) | | | 1,098 | |
| | 310 | | | UnitedHealth Group, Inc. | | | 36,512 | |
| | 449 | | | Universal Health Services, Inc., Class B | | | 54,818 | |
| | | | | | | | |
| | | | | | | 585,952 | |
| | | | | | | | |
| | | | | | | | |
| SHARES | | | SECURITY DESCRIPTION | | VALUE($) | |
| | | | | | | | |
| | | | | | | | |
| | | | Health Care Technology — 0.4% | | | | |
| | 726 | | | Cerner Corp. (a) | | | 48,127 | |
| | | | | | | | |
| | | | | | | | |
| | | | Life Sciences Tools & Services — 1.1% | | | | |
| | 90 | | | Illumina, Inc. (a) | | | 12,895 | |
| | 37 | | | Mettler-Toledo International, Inc. (a) | | | 11,507 | |
| | 304 | | | Thermo Fisher Scientific, Inc. | | | 39,757 | |
| | 404 | | | Waters Corp. (a) | | | 51,631 | |
| | | | | | | | |
| | | | | | | 115,790 | |
| | | | | | | | |
| | | | Pharmaceuticals — 2.8% | | | | |
| | 388 | | | AbbVie, Inc. | | | 23,105 | |
| | 84 | | | Allergan plc (a) | | | 25,911 | |
| | 484 | | | Bristol-Myers Squibb Co. | | | 31,920 | |
| | 536 | | | Eli Lilly & Co. | | | 43,721 | |
| | 29 | | | Jazz Pharmaceuticals plc (Ireland) (a) | | | 3,981 | |
| | 421 | | | Johnson & Johnson | | | 42,534 | |
| | 716 | | | Merck & Co., Inc. | | | 39,137 | |
| | 345 | | | Mylan N.V. (a) | | | 15,211 | |
| | 1,252 | | | Pfizer, Inc. | | | 42,343 | |
| | 698 | | | Zoetis, Inc., Class A | | | 30,021 | |
| | | | | | | | |
| | | | | | | 297,884 | |
| | | | | | | | |
| | | | Total Health Care | | | 1,730,247 | |
| | | | | | | | |
| | | | Industrials — 7.8% | | | | |
| | | | Aerospace & Defense — 1.7% | | | | |
| | 113 | | | Boeing Co. (The) | | | 16,732 | |
| | 117 | | | General Dynamics Corp. | | | 17,384 | |
| | 183 | | | Honeywell International, Inc. | | | 18,900 | |
| | 133 | | | L-3 Communications Holdings, Inc., Class 3 | | | 16,811 | |
| | 88 | | | Lockheed Martin Corp. | | | 19,345 | |
| | 131 | | | Northrop Grumman Corp. | | | 24,595 | |
| | 154 | | | Raytheon Co. | | | 18,080 | |
| | 185 | | | Rockwell Collins, Inc. | | | 16,043 | |
| | 234 | | | Textron, Inc. | | | 9,868 | |
| | 80 | | | TransDigm Group, Inc. (a) | | | 17,588 | |
| | 133 | | | United Technologies Corp. | | | 13,089 | |
| | | | | | | | |
| | | | | | | 188,435 | |
| | | | | | | | |
| | | | Air Freight & Logistics — 0.4% | | | | |
| | 222 | | | C.H. Robinson Worldwide, Inc. | | | 15,402 | |
| | 101 | | | FedEx Corp. | | | 15,761 | |
| | 131 | | | United Parcel Service, Inc., Class B | | | 13,496 | |
| | | | | | | | |
| | | | | | | 44,659 | |
| | | | | | | | |
| | | | Airlines — 0.7% | | | | |
| | 103 | | | Alaska Air Group, Inc. | | | 7,853 | |
| | 236 | | | American Airlines Group, Inc. | | | 10,908 | |
SEE NOTES TO FINANCIAL STATEMENTS.
| | | | | | | | |
| | | |
| OCTOBER 31, 2015 | | JPMORGAN EXCHANGE-TRADED FUNDS | | | | | 9 | |
JPMorgan Diversified Return U.S. Equity ETF
SCHEDULE OF PORTFOLIO INVESTMENTS
AS OF OCTOBER 31, 2015 (continued)
| | | | | | | | |
| SHARES | | | SECURITY DESCRIPTION | | VALUE($) | |
| | | | | | | | |
| Common Stocks — continued | |
| | | | Airlines —continued | | | | |
| | 345 | | | Delta Air Lines, Inc. | | | 17,540 | |
| | 587 | | | JetBlue Airways Corp. (a) | | | 14,581 | |
| | 365 | | | Southwest Airlines Co. | | | 16,896 | |
| | 197 | | | United Continental Holdings, Inc. (a) | | | 11,881 | |
| | | | | | | | |
| | | | | | | 79,659 | |
| | | | | | | | |
| | | | Building Products — 0.1% | | | | |
| | 295 | | | Masco Corp. | | | 8,555 | |
| | | | | | | | |
| | | | | | | | |
| | | | Commercial Services & Supplies — 1.1% | | | | |
| | 279 | | | Cintas Corp. | | | 25,972 | |
| | 318 | | | Herman Miller, Inc. | | | 10,090 | |
| | 648 | | | Pitney Bowes, Inc. | | | 13,381 | |
| | 577 | | | Republic Services, Inc., Class A | | | 25,238 | |
| | 43 | | | Stericycle, Inc. (a) | | | 5,219 | |
| | 417 | | | Tyco International plc | | | 15,196 | |
| | 497 | | | Waste Management, Inc. | | | 26,719 | |
| | | | | | | | |
| | | | | | | 121,815 | |
| | | | | | | | |
| | | | Construction & Engineering — 0.2% | | | | |
| | 101 | | | Chicago Bridge & Iron Co., N.V. | | | 4,532 | |
| | 236 | | | Fluor Corp. | | | 11,283 | |
| | 18 | | | KBR, Inc. | | | 332 | |
| | | | | | | | |
| | | | | | | 16,147 | |
| | | | | | | | |
| | | | Electrical Equipment — 0.4% | | | | |
| | 150 | | | Eaton Corp. plc | | | 8,387 | |
| | 193 | | | Emerson Electric Co. | | | 9,115 | |
| | 117 | | | Hubbell, Inc., Class B | | | 11,332 | |
| | 127 | | | Rockwell Automation, Inc. | | | 13,863 | |
| | | | | | | | |
| | | | | | | 42,697 | |
| | | | | | | | |
| | | | Industrial Conglomerates — 0.5% | | | | |
| | 129 | | | 3M Co. | | | 20,280 | |
| | 189 | | | Danaher Corp. | | | 17,636 | |
| | 595 | | | General Electric Co. | | | 17,207 | |
| | | | | | | | |
| | | | | | | 55,123 | |
| | | | | | | | |
| | | | Machinery — 1.7% | | | | |
| | 105 | | | AGCO Corp. | | | 5,081 | |
| | 168 | | | Caterpillar, Inc. | | | 12,262 | |
| | 37 | | | Crane Co. | | | 1,948 | |
| | 78 | | | Cummins, Inc. | | | 8,074 | |
| | 195 | | | Deere & Co. | | | 15,210 | |
| | 215 | | | Dover Corp. | | | 13,852 | |
| | 158 | | | Flowserve Corp. | | | 7,325 | |
| | | | | | | | |
| SHARES | | | SECURITY DESCRIPTION | | VALUE($) | |
| | | | | | | | |
| | | | | | | | |
| | | | Machinery — continued | | | | |
| | 183 | | | Illinois Tool Works, Inc. | | | 16,825 | |
| | 209 | | | Ingersoll-Rand plc | | | 12,385 | |
| | 579 | | | ITT Corp. | | | 22,917 | |
| | 127 | | | Manitowoc Co., Inc. | | | 1,943 | |
| | 193 | | | PACCAR, Inc. | | | 10,161 | |
| | 98 | | | Parker-Hannifin Corp. | | | 10,261 | |
| | 31 | | | SPX Corp. (a) | | | 380 | |
| | 31 | | | SPX FLOW, Inc. (a) | | | 1,051 | |
| | 351 | | | Stanley Black & Decker, Inc. | | | 37,199 | |
| | 94 | | | Terex Corp. | | | 1,886 | |
| | 211 | | | Trinity Industries, Inc. | | | 5,712 | |
| | | | | | | | |
| | | | | | | 184,472 | |
| | | | | | | | |
| | | | Professional Services — 0.1% | | | | |
| | 18 | | | Dun & Bradstreet Corp. | | | 2,049 | |
| | 101 | | | Robert Half International, Inc. | | | 5,319 | |
| | | | | | | | |
| | | | | | | 7,368 | |
| | | | | | | | |
| | | | Road & Rail — 0.6% | | | | |
| | 127 | | | Avis Budget Group, Inc. (a) | | | 6,342 | |
| | 347 | | | CSX Corp. | | | 9,365 | |
| | 183 | | | J.B. Hunt Transport Services, Inc. | | | 13,976 | |
| | 131 | | | Norfolk Southern Corp. | | | 10,484 | |
| | 109 | | | Ryder System, Inc. | | | 7,824 | |
| | 168 | | | Union Pacific Corp. | | | 15,011 | |
| | | | | | | | |
| | | | | | | 63,002 | |
| | | | | | | | |
| | | | Trading Companies & Distributors — 0.3% | | | | |
| | 304 | | | Fastenal Co. | | | 11,904 | |
| | 101 | | | United Rentals, Inc. (a) | | | 7,561 | |
| | 51 | | | W.W. Grainger, Inc. | | | 10,710 | |
| | | | | | | | |
| | | | | | | 30,175 | |
| | | | | | | | |
| | | | Total Industrials | | | 842,107 | |
| | | | | | | | |
| | | | Information Technology — 12.5% | | | | |
| | | | Communications Equipment — 1.2% | | | | |
| | 730 | | | Cisco Systems, Inc. | | | 21,060 | |
| | 170 | | | F5 Networks, Inc. (a) | | | 18,734 | |
| | 560 | | | Harris Corp. | | | 44,313 | |
| | 492 | | | Juniper Networks, Inc. | | | 15,444 | |
| | 246 | | | Motorola Solutions, Inc. | | | 17,213 | |
| | 265 | | | QUALCOMM, Inc. | | | 15,746 | |
| | | | | | | | |
| | | | | | | 132,510 | |
| | | | | | | | |
| | | | Computers & Peripherals — 1.2% | | | | |
| | 146 | | | 3D Systems Corp. (a) | | | 1,469 | |
| | 179 | | | Apple, Inc. | | | 21,390 | |
| | 419 | | | Diebold, Inc. | | | 15,449 | |
SEE NOTES TO FINANCIAL STATEMENTS.
| | | | | | |
| | | |
| 10 | | | | JPMORGAN EXCHANGE-TRADED FUNDS | | OCTOBER 31, 2015 |
| | | | | | | | |
| SHARES | | | SECURITY DESCRIPTION | | VALUE($) | |
| | | | | | | | |
| Common Stocks — continued | |
| | | | Computers & Peripherals — continued | | | | |
| | 1,092 | | | EMC Corp. | | | 28,632 | |
| | 382 | | | Hewlett-Packard, Inc. | | | 10,299 | |
| | 199 | | | Lexmark International, Inc., Class A | | | 6,466 | |
| | 419 | | | NetApp, Inc. | | | 14,246 | |
| | 183 | | | SanDisk Corp. (a) | | | 14,091 | |
| | 199 | | | Western Digital Corp. | | | 13,297 | |
| | | | | | | | |
| | | | | | | 125,339 | |
| | | | | | | | |
| | | | Electronic Equipment & Instruments — 0.7% | | | | |
| | 406 | | | Amphenol Corp., Class A | | | 22,013 | |
| | 314 | | | AVX Corp. | | | 4,239 | |
| | 798 | | | Corning, Inc. | | | 14,843 | |
| | 125 | | | Ingram Micro, Inc., Class A | | | 3,722 | |
| | 624 | | | Leidos Holdings, Inc. | | | 32,804 | |
| | | | | | | | |
| | | | | | | 77,621 | |
| | | | | | | | |
| | | | Internet Software & Services — 1.5% | | | | |
| | 222 | | | Akamai Technologies, Inc. (a) | | | 13,502 | |
| | 53 | | | Alphabet, Inc., Class A (a) | | | 39,082 | |
| | 33 | | | Alphabet, Inc., Class C (a) | | | 23,457 | |
| | 158 | | | Facebook, Inc., Class A (a) | | | 16,111 | |
| | 468 | | | IAC/Interactive Corp. | | | 31,361 | |
| | 291 | | | VeriSign, Inc. (a) | | | 23,455 | |
| | 312 | | | Yahoo!, Inc. (a) | | | 11,113 | |
| | | | | | | | |
| | | | | | | 158,081 | |
| | | | | | | | |
| | | | IT Services — 2.9% | | | | |
| | 222 | | | Accenture plc (Ireland), Class A | | | 23,798 | |
| | 39 | | | Alliance Data Systems Corp. (a) | | | 11,595 | |
| | 209 | | | Automatic Data Processing, Inc. | | | 18,181 | |
| | 398 | | | Cognizant Technology Solutions Corp., Class A (a) | | | 27,108 | |
| | 256 | | | Computer Sciences Corp. | | | 17,047 | |
| | 215 | | | DST Systems, Inc. | | | 26,262 | |
| | 314 | | | Fidelity National Information Services, Inc. | | | 22,897 | |
| | 240 | | | Fiserv, Inc. (a) | | | 23,162 | |
| | 53 | | | FleetCor Technologies, Inc. (a) | | | 7,678 | |
| | 135 | | | Gartner, Inc. (a) | | | 12,240 | |
| | 287 | | | International Business Machines Corp. | | | 40,203 | |
| | 168 | | | MasterCard, Inc., Class A | | | 16,630 | |
| | 449 | | | Paychex, Inc. | | | 23,159 | |
| | 359 | | | Teradata Corp. (a) | | | 10,092 | |
| | 53 | | | Total System Services, Inc. | | | 2,780 | |
| | 121 | | | VeriFone Systems, Inc. (a) | | | 3,647 | |
| | 156 | | | Visa, Inc., Class A | | | 12,102 | |
| | 322 | | | Western Union Co. (The) | | | 6,199 | |
| | 1,012 | | | Xerox Corp. | | | 9,503 | |
| | | | | | | | |
| | | | | | | 314,283 | |
| | | | | | | | |
| | | | | | | | |
| SHARES | | | SECURITY DESCRIPTION | | VALUE($) | |
| | | | | | | | |
| | | | | | | | |
| | | | Semiconductors & Semiconductor Equipment — 3.4% | |
| | 369 | | | Altera Corp. | | | 19,391 | |
| | 423 | | | Analog Devices, Inc. | | | 25,431 | |
| | 923 | | | Applied Materials, Inc. | | | 15,479 | |
| | 113 | | | Avago Technologies Ltd.,Class A (Singapore) | | | 13,914 | |
| | 277 | | | Broadcom Corp., Class A | | | 14,238 | |
| | 164 | | | Freescale Semiconductor Ltd. (a) | | | 5,492 | |
| | 663 | | | Intel Corp. | | | 22,449 | |
| | 228 | | | KLA-Tencor Corp. | | | 15,303 | |
| | 267 | | | Lam Research Corp. | | | 20,450 | |
| | 948 | | | Linear Technology Corp. | | | 42,110 | |
| | 1,046 | | | Marvell Technology Group Ltd. (Bermuda) | | | 8,588 | |
| | 480 | | | Maxim Integrated Products, Inc. | | | 19,670 | |
| | 412 | | | Microchip Technology, Inc. | | | 19,895 | |
| | 437 | | | Micron Technology, Inc. (a) | | | 7,237 | |
| | 1,016 | | | NVIDIA Corp. | | | 28,824 | |
| | 156 | | | Qorvo, Inc. (a) | | | 6,853 | |
| | 174 | | | Skyworks Solutions, Inc. | | | 13,440 | |
| | 197 | | | SunPower Corp., Class A (a) | | | 5,287 | |
| | 419 | | | Teradyne, Inc. | | | 8,179 | |
| | 525 | | | Texas Instruments, Inc. | | | 29,778 | |
| | 480 | | | Xilinx, Inc. | | | 22,858 | |
| | | | | | | | |
| | | | | | | 364,866 | |
| | | | | | | | |
| | | | Software — 1.6% | | | | |
| | 429 | | | Adobe Systems, Inc. (a) | | | 38,035 | |
| | 133 | | | Autodesk, Inc. (a) | | | 7,340 | |
| | 558 | | | CA, Inc. | | | 15,462 | |
| | 254 | | | Cadence Design Systems, Inc. (a) | | | 5,644 | |
| | 246 | | | Electronic Arts, Inc. (a) | | | 17,729 | |
| | 326 | | | Intuit, Inc. | | | 31,762 | |
| | 470 | | | Microsoft Corp. | | | 24,741 | |
| | 417 | | | Oracle Corp. | | | 16,196 | |
| | 107 | | | Red Hat, Inc. (a) | | | 8,465 | |
| | 616 | | | Symantec Corp. | | | 12,690 | |
| | | | | | | | |
| | | | | | | 178,064 | |
| | | | | | | | |
| | | | Total Information Technology | | | 1,350,764 | |
| | | | | | | | |
| | | | Materials — 5.8% | | | | |
| | | | Chemicals — 4.6% | | | | |
| | 115 | | | Air Products & Chemicals, Inc. | | | 15,983 | |
| | 330 | | | Airgas, Inc. | | | 31,733 | |
| | 250 | | | Albemarle Corp. | | | 13,380 | |
| | 295 | | | Ashland, Inc. | | | 32,367 | |
| | 207 | | | Cabot Corp. | | | 7,440 | |
| | 314 | | | Celanese Corp., Class A | | | 22,310 | |
| | 259 | | | CF Industries Holdings, Inc. | | | 13,149 | |
| | 76 | | | Chemours Co. (The) | | | 527 | |
SEE NOTES TO FINANCIAL STATEMENTS.
| | | | | | | | |
| | | |
| OCTOBER 31, 2015 | | JPMORGAN EXCHANGE-TRADED FUNDS | | | | | 11 | |
JPMorgan Diversified Return U.S. Equity ETF
SCHEDULE OF PORTFOLIO INVESTMENTS
AS OF OCTOBER 31, 2015 (continued)
| | | | | | | | |
| SHARES | | | SECURITY DESCRIPTION | | VALUE($) | |
| | | | | | | | |
| Common Stocks — continued | |
| | | | Chemicals — continued | | | | |
| | 402 | | | Dow Chemical Co. (The) | | | 20,771 | |
| | 148 | | | Eastman Chemical Co. | | | 10,681 | |
| | 238 | | | Ecolab, Inc. | | | 28,643 | |
| | 376 | | | E.I. du Pont de Nemours & Co. | | | 23,838 | |
| | 246 | | | FMC Corp. | | | 10,015 | |
| | 659 | | | Huntsman Corp. | | | 8,679 | |
| | 359 | | | International Flavors & Fragrances, Inc. | | | 41,666 | |
| | 156 | | | LyondellBasell Industries N.V., Class A | | | 14,494 | |
| | 384 | | | Monsanto Co. | | | 35,796 | |
| | 509 | | | Mosaic Co. (The) | | | 17,199 | |
| | 246 | | | PPG Industries, Inc. | | | 25,648 | |
| | 417 | | | Praxair, Inc. | | | 46,325 | |
| | 8 | | | RPM International, Inc. | | | 366 | |
| | 62 | | | Sherwin-Williams Co. (The) | | | 16,543 | |
| | 443 | | | Sigma-Aldrich Corp. | | | 61,896 | |
| | 33 | | | Valspar Corp. (The) | | | 2,671 | |
| | | | | | | | |
| | | | | | | 502,120 | |
| | | | | | | | |
| | | | Construction Materials — 0.1% | | | | |
| | 80 | | | Vulcan Materials Co. | | | 7,727 | |
| | | | | | | | |
| | | | | | | | |
| | | | Containers & Packaging — 0.4% | | | | |
| | 355 | | | Ball Corp. | | | 24,318 | |
| | 222 | | | Bemis Co., Inc. | | | 10,163 | |
| | 84 | | | Crown Holdings, Inc. (a) | | | 4,455 | |
| | 140 | | | Sealed Air Corp. | | | 6,877 | |
| | | | | | | | |
| | | | | | | 45,813 | |
| | | | | | | | |
| | | | Metals & Mining — 0.5% | | | | |
| | 1,077 | | | Alcoa, Inc. | | | 9,617 | |
| | 62 | | | Compass Minerals International, Inc. | | | 5,037 | |
| | 445 | | | Freeport-McMoRan, Inc. | | | 5,238 | |
| | 503 | | | Nucor Corp. | | | 21,277 | |
| | 80 | | | Reliance Steel & Aluminum Co. | | | 4,797 | |
| | 57 | | | Royal Gold, Inc. | | | 2,727 | |
| | 224 | | | Southern Copper Corp. | | | 6,218 | |
| | 287 | | | United States Steel Corp. | | | 3,352 | |
| | | | | | | | |
| | | | | | | 58,263 | |
| | | | | | | | |
| | | | Paper & Forest Products — 0.2% | | | | |
| | 125 | | | Domtar Corp. | | | 5,155 | |
| | 351 | | | International Paper Co. | | | 14,984 | |
| | | | | | | | |
| | | | | | | 20,139 | |
| | | | | | | | |
| | | | Total Materials | | | 634,062 | |
| | | | | | | | |
| | | | | | | | |
| SHARES | | | SECURITY DESCRIPTION | | VALUE($) | |
| | | | | | | | |
| | | | | | | | |
| | | | Telecommunication Services — 1.5% | | | | |
| | | | Diversified Telecommunication Services — 1.4% | |
| | 1,527 | | | AT&T, Inc. | | | 51,170 | |
| | 1,360 | | | CenturyLink, Inc. | | | 38,365 | |
| | 92 | | | Frontier Communications Corp. | | | 473 | |
| | 1,053 | | | Verizon Communications, Inc. | | | 49,365 | |
| | 2,782 | | | Windstream Holdings, Inc. | | | 18,111 | |
| | | | | | | | |
| | | | | | | 157,484 | |
| | | | | | | | |
| | | | Wireless Telecommunication Services — 0.1% | |
| | 275 | | | Telephone & Data Systems, Inc. | | | 7,876 | |
| | 2 | | | T-Mobile US, Inc. (a) | | | 76 | |
| | 78 | | | United States Cellular Corp. (a) | | | 3,177 | |
| | | | | | | | |
| | | | | | | 11,129 | |
| | | | | | | | |
| | | | Total Telecommunication Services | | | 168,613 | |
| | | | | | | | |
| | | | Utilities — 12.4% | | | | |
| | | | Electric Utilities — 5.6% | | | | |
| | 829 | | | American Electric Power Co., Inc. | | | 46,963 | |
| | 642 | | | Duke Energy Corp. | | | 45,884 | |
| | 868 | | | Edison International | | | 52,531 | |
| | 767 | | | Entergy Corp. | | | 52,279 | |
| | 1,079 | | | Eversource Energy | | | 54,964 | |
| | 1,687 | | | Exelon Corp. | | | 47,101 | |
| | 140 | | | FirstEnergy Corp. | | | 4,368 | |
| | 427 | | | NextEra Energy, Inc. | | | 43,836 | |
| | 1,586 | | | Pepco Holdings, Inc. | | | 42,235 | |
| | 811 | | | Pinnacle West Capital Corp. | | | 51,507 | |
| | 1,311 | | | PPL Corp. | | | 45,098 | |
| | 1,243 | | | Southern Co. (The) | | | 56,059 | |
| | 1,919 | | | Xcel Energy, Inc. | | | 68,374 | |
| | | | | | | | |
| | | | | | | 611,199 | |
| | | | | | | | |
| | | | Gas Utilities — 0.2% | |
| | 1,001 | | | Questar Corp. | | | 20,671 | |
| | | | | | | | |
| | | | Independent Power Producers & Energy Trader — 0.2% | |
| | 1,502 | | | NRG Energy, Inc. | | | 19,361 | |
| | | | | | | | |
| | | | Multi-Utilities — 6.4% | |
| | 127 | | | Alliant Energy Corp. | | | 7,495 | |
| | 1,209 | | | Ameren Corp. | | | 52,809 | |
| | 1,978 | | | CenterPoint Energy, Inc. | | | 36,692 | |
| | 1,717 | | | CMS Energy Corp. | | | 61,932 | |
| | 905 | | | Consolidated Edison, Inc. | | | 59,504 | |
| | 628 | | | Dominion Resources, Inc. | | | 44,858 | |
| | 733 | | | DTE Energy Co. | | | 59,805 | |
| | 2,194 | | | NiSource, Inc. | | | 42,037 | |
| | 839 | | | PG&E Corp. | | | 44,803 | |
| | 1,071 | | | Public Service Enterprise Group, Inc. | | | 44,222 | |
SEE NOTES TO FINANCIAL STATEMENTS.
| | | | | | |
| | | |
| 12 | | | | JPMORGAN EXCHANGE-TRADED FUNDS | | OCTOBER 31, 2015 |
| | | | | | | | |
| SHARES | | | SECURITY DESCRIPTION | | VALUE($) | |
| | | | | | | | |
| Common Stocks — continued | |
| | | | Multi-Utilities — continued | |
| | 1,042 | | | SCANA Corp. | | | 61,707 | |
| | 560 | | | Sempra Energy | | | 57,350 | |
| | 2,425 | | | TECO Energy, Inc. | | | 65,475 | |
| | 1,057 | | | WEC Energy Group, Inc. | | | 54,499 | |
| | | | | | | | |
| | | | | | | 693,188 | |
| | | | | | | | |
| | | | Total Utilities | | | 1,344,419 | |
| | | | | | | | |
| | | | Total Common Stocks
(Cost $9,979,613) | | | 10,795,939 | |
| | | | | | | | |
| | | | Total Investments — 99.7%
(Cost $9,979,613) | | | 10,795,939 | |
| | | | Other Assets in Excess of
Liabilities — 0.3% | | | 30,684 | |
| | | | | | | | |
| | | | NET ASSETS — 100.0% | | $ | 10,826,623 | |
| | | | | | | | |
Percentages indicated are based on net assets.
NOTES TO SCHEDULE OF PORTFOLIO INVESTMENTS:
| | |
| REIT | | — Real Estate Investment Trust |
| (a) | | — Non-income producing security. |
SEE NOTES TO FINANCIAL STATEMENTS.
| | | | | | | | |
| | | |
| OCTOBER 31, 2015 | | JPMORGAN EXCHANGE-TRADED FUNDS | | | | | 13 | |
STATEMENT OF ASSETS AND LIABILITIES
AS OF OCTOBER 31, 2015
| | | | |
| | | JPMorgan Diversified Return U.S. Equity ETF | |
ASSETS: | | | | |
Investments in non-affiliates, at value | | $ | 10,795,939 | |
Cash | | | 23,232 | |
Receivables: | | | | |
Investment securities sold | | | 1,427 | |
Due from Adviser | | | 22,993 | |
Dividends from non-affiliates | | | 9,760 | |
Deferred offering costs | | | 21,770 | |
| | | | |
Total Assets | | | 10,875,121 | |
| | | | |
| |
LIABILITIES: | | | | |
Accrued Liabilities: | | | | |
Professional fees | | | 41,086 | |
Custodian and Transfer Agent fees (Note 3.C) | | | 2,950 | |
Trustees’ and Chief Compliance Officer’s fees | | | 994 | |
Accounting fees | | | 158 | |
Other | | | 3,310 | |
| | | | |
Total Liabilities | | | 48,498 | |
| | | | |
Net Assets | | $ | 10,826,623 | |
| | | | |
| |
NET ASSETS: | | | | |
Paid-in Capital | | $ | 10,000,000 | |
Accumulated undistributed (distributions in excess of) net investment income | | | 10,819 | |
Accumulated net realized gains (losses) | | | (522 | ) |
Net unrealized appreciation (depreciation) | | | 816,326 | |
| | | | |
Total Net Assets | | $ | 10,826,623 | |
| | | | |
Outstanding number of shares | | | | |
(unlimited number of shares authorized — no par value) | | | 200,000 | |
| | | | |
Net asset value, per share | | $ | 54.13 | |
| | | | |
Cost of investments in non-affiliates | | $ | 9,979,613 | |
SEE NOTES TO FINANCIAL STATEMENTS.
| | | | | | |
| | | |
| 14 | | | | JPMORGAN EXCHANGE-TRADED FUNDS | | OCTOBER 31, 2015 |
STATEMENT OF OPERATIONS
FOR THE PERIOD ENDED OCTOBER 31, 2015
| | | | |
| | | JPMorgan Diversified Return U.S. Equity ETF (a) | |
INVESTMENT INCOME: | | | | |
Dividend income from non-affiliates | | $ | 13,435 | |
| | | | |
Total Investment Income | | | 13,435 | |
| | | | |
| |
EXPENSES: | | | | |
Investment advisory fees (Note 3.A) | | | 2,075 | |
Administration fees (Note 3.B) | | | 767 | |
Custodian and Transfer Agent fees (Note 3.C) | | | 2,950 | |
Professional fees | | | 41,086 | |
Trustees’ and Chief Compliance Officer’s fees | | | 995 | |
Registration and filing fees | | | 65 | |
Printing and mailing costs | | | 939 | |
Offering costs | | | 2,092 | |
Accounting fees | | | 158 | |
Other | | | 2,635 | |
| | | | |
Total expenses | | | 53,762 | |
| | | | |
Less fees waived (Note 3.D) | | | (2,842 | ) |
Less expense reimbursements from affiliates (Note 3.D) | | | (46,854 | ) |
Less expense reimbursements from non-affiliates (Note 3.C) | | | (1,450 | ) |
| | | | |
Net expenses | | | 2,616 | |
| | | | |
Net investment income (loss) | | | 10,819 | |
| | | | |
| |
REALIZED/UNREALIZED GAINS (LOSSES): | | | | |
Net realized gain (loss) on transactions from: | | | | |
Investments in non-affiliates | | | (522 | ) |
| | | | |
Net realized gain (loss) | | | (522 | ) |
| | | | |
Change in net unrealized appreciation/depreciation of: | | | | |
Investments in non-affiliates | | | 816,326 | |
| | | | |
Change in net unrealized appreciation/depreciation | | | 816,326 | |
| | | | |
Net realized/unrealized gains (losses) | | | 815,804 | |
| | | | |
Change in net assets resulting from operations | | $ | 826,623 | |
| | | | |
| (a) | Commencement of operations was September 29, 2015. |
SEE NOTES TO FINANCIAL STATEMENTS.
| | | | | | | | |
| | | |
| OCTOBER 31, 2015 | | JPMORGAN EXCHANGE-TRADED FUNDS | | | | | 15 | |
STATEMENT OF CHANGES IN NET ASSETS
FOR THE PERIOD ENDED OCTOBER 31, 2015
| | | | |
| | | JPMorgan Diversified Return U.S.
Equity ETF (a) | |
CHANGE IN NET ASSETS RESULTING FROM OPERATIONS: | | | | |
Net investment income (loss) | | $ | 10,819 | |
Net realized gain (loss) | | | (522 | ) |
Change in net unrealized appreciation/depreciation | | | 816,326 | |
| | | | |
Change in net assets resulting from operations | | | 826,623 | |
| | | | |
| |
CAPITAL TRANSACTIONS: | | | | |
Change in net assets resulting from capital transactions | | | 10,000,000 | |
| | | | |
| |
NET ASSETS: | | | | |
Change in net assets | | | 10,826,623 | |
| | | | |
Beginning of period | | | — | |
| | | | |
End of period | | $ | 10,826,623 | |
| | | | |
Accumulated undistributed (distributions in excess of) net investment income | | $ | 10,819 | |
| | | | |
| |
CAPITAL TRANSACTIONS: | | | | |
Proceeds from shares issued | | | 10,000,000 | |
| | | | |
Total change in net assets resulting from capital transactions | | $ | 10,000,000 | |
| | | | |
| |
SHARE TRANSACTIONS: | | | | |
Issued | | | 200,000 | |
| | | | |
Net increase in shares from share transactions | | | 200,000 | |
| | | | |
| (a) | Commencement of operations was September 29, 2015. |
SEE NOTES TO FINANCIAL STATEMENTS.
| | | | | | |
| | | |
| 16 | | | | JPMORGAN EXCHANGE-TRADED FUNDS | | OCTOBER 31, 2015 |
THIS PAGE IS INTENTIONALLY LEFT BLANK
| | | | | | | | |
| | | |
| OCTOBER 31, 2015 | | JPMORGAN EXCHANGE-TRADED FUNDS | | | | | 17 | |
FINANCIAL HIGHLIGHTS
FOR THE PERIOD INDICATED
| | | | | | | | | | | | | | | | | | | | | | | | |
| | | Per share operating performance | |
| | | | | | Investment operations | | | | | | | |
| | | Net asset
value,
beginning
of period | | | Net
investment
income
(loss) (b) | | | Net realized
and unrealized
gains
(losses) on
investments | | | Total from
investment
operations | | | Net asset
value,
end of
period | | | Market
price,
end of
period | |
| | | | | | |
JPMorgan Diversified Return U.S. Equity ETF | | | | | | | | | | | | | | | | | | | | | | | | |
September 29, 2015 (a) through October 31, 2015 | | $ | 50.00 | | | $ | 0.06 | | | $ | 4.07 | | | $ | 4.13 | | | $ | 54.13 | | | $ | 54.16 | |
| (a) | Commencement of operations. |
| (b) | Calculated based upon average shares outstanding. |
| (c) | Not annualized for periods less than one year. |
| (d) | Includes adjustments in accordance with accounting principles generally accepted in the United States of America and as such, the net asset values for financial reporting purposes and the returns based upon those net asset values may differ from the net asset values and returns for shareholder transactions. |
| (e) | Market price total return is calculated assuming an initial investment made at the inception date net asset value, reinvestment of all dividends and distributions at market price during the period, and sale at the market price on the last day of the period. The market price presented to calculate the market price total return is the mid-point of the bid/ask spread at the close of business on the NYSE Arca, Inc. |
| (f) | Annualized for periods less than one year, unless otherwise indicated. |
| (g) | Certain non-recurring expenses incurred by the Fund (including offering costs) were not annualized for the period ended October 31, 2015. |
| (h) | Portfolio turnover is calculated by dividing the lesser of total purchases or sales of portfolio securities for the reporting period by the monthly average value of portfolio securities owned during the reporting period. Excluded from the numerator are amounts relating to in-kind transactions. |
| (i) | Amount rounds to less than 0.1%. |
SEE NOTES TO FINANCIAL STATEMENTS.
| | | | | | |
| | | |
| 18 | | | | JPMORGAN EXCHANGE-TRADED FUNDS | | OCTOBER 31, 2015 |
| | | | | | | | | | | | | | | | | | | | | | | | | | |
| | | Ratios/Supplemental data | |
| | | | | | | | | | Ratios to average net assets (f) | | | | |
Total
return (c)(d) | | | Market
price
total
return (c)(e) | | | Net assets,
end of
period | | | Net
expenses (g) | | |
Net
investment
income
(loss) | | |
Expenses
without waivers
and reimbursements (g) | | | Portfolio
turnover
rate (c)(h) | |
| | | | | | |
| | | | | | | | | | | | | | | | | | | | | | | | | | |
| | 8.26 | % | | | 8.32 | % | | $ | 10,826,623 | | | | 0.29 | % | | | 1.20 | % | | | 5.75 | % | | | — | %(i) |
SEE NOTES TO FINANCIAL STATEMENTS.
| | | | | | | | |
| | | |
| OCTOBER 31, 2015 | | JPMORGAN EXCHANGE-TRADED FUNDS | | | | | 19 | |
NOTES TO FINANCIAL STATEMENTS
AS OF OCTOBER 31, 2015
1. Organization
J.P. Morgan Exchange-Traded Fund Trust (the “Trust”) was formed on February 25, 2010 and is governed by a Declaration of Trust as amended and restated February 19, 2014, and is registered under the Investment Company Act of 1940, as amended (the “1940 Act”), as an open-ended management investment company. JPMorgan Diversified Return U.S. Equity ETF (the “Fund” or the “U.S. Equity ETF”) is a separate diversified series of the Trust covered in this report.
The Fund commenced operations on September 29, 2015. The investment objective of the Fund is to seek investment results that closely correspond, before fees and expenses, to the performance of the Russell 1000 Diversified Factor Index.
Shares of the Fund are listed and traded on the NYSE Arca, Inc. Market price for the Fund’s shares may be different from its net asset value (“NAV”). The Fund issues and redeems its shares on a continuous basis, through SEI Investments Distribution Co. (the “Distributor” or “SIDCO”), at NAV in large blocks of shares, typically 100,000 shares, referred to as “Creation Units.” Creation Units are issued and redeemed principally in-kind for a basket of securities and a cash amount. Shares are generally traded in the secondary market in amounts less than a Creation Unit at market prices that change throughout the day. Only individuals or institutions that have entered into an authorized participant agreement with the Distributor may do business directly with the Fund (each an “Authorized Participant”).
2. Significant Accounting Policies
The following is a summary of significant accounting policies followed by the Fund in the preparation of its financial statements. The Fund is an investment company and, accordingly, follows the investment company accounting and reporting guidance of the Financial Accounting Standards Board Accounting Standards Codification Topic 946 — Investment Companies, which is part of the U.S. generally accepted accounting principles (“GAAP”). The preparation of financial statements in conformity with GAAP requires management to make estimates and assumptions that affect the reported amounts of assets and liabilities and the disclosure of contingent assets and liabilities at the date of the financial statements and the reported amounts of increases and decreases in net assets from operations during the reporting period. Actual results could differ from those estimates.
A. Valuation of Investments — The valuation of the investments is in accordance with GAAP and the Fund’s valuation policies set forth by and under the supervision and responsibility of the Board of Trustees (the “Board”), which established the following approach to valuation, as described more fully below: (i) investments for which market quotations are readily available shall be valued at such unadjusted quoted prices, and (ii) all other investments for which market quotations are not readily available shall be valued at their fair value as determined in good faith by the Board.
JPMorgan Funds Management, Inc. (the “Administrator”) has established the J.P. Morgan Asset Management Americas Valuation Committee (“AVC”) to assist the Board with the oversight and monitoring of the valuation of the Fund’s investments. The Administrator implements the valuation policies of the Fund’s investments, as directed by the Board. The AVC oversees and carries out the policies for the valuation of investments held in the Fund. This includes monitoring the appropriateness of fair values based on results of ongoing valuation oversight, including but not limited to consideration of macro or security specific events, market events and pricing vendor and broker due diligence. The Administrator is responsible for discussing and assessing the potential impacts to the fair values on an ongoing basis, and at least on a quarterly basis with the AVC and the Board.
Equities and other exchange-traded instruments are valued at the last sale price or official market closing price on the primary exchange on which the instruments are traded before the net asset value (“NAV”) of the Fund is calculated on a valuation date.
Valuations reflected in this report are as of the report date. As a result, changes in valuation due to market events and/or issuer related events after the report date and prior to issuance of the report are not reflected herein.
The various inputs that are used in determining the valuation of the Fund’s investments are summarized into the three broad levels listed below.
| • | | Level 1 — Unadjusted inputs using quoted prices in active markets for identical investments. |
| • | | Level 2 — Other significant observable inputs including, but not limited to, quoted prices for similar investments, inputs other than quoted prices that are observable for investments (such as interest rates, prepayment speeds, credit risk, etc.) or other market corroborated inputs. |
| • | | Level 3 — Significant inputs based on the best information available in the circumstances, to the extent observable inputs are not available (including the Fund’s assumptions in determining the fair value of investments). |
A financial instrument’s level within the fair value hierarchy is based on the lowest level of any input, both individually and in the aggregate, that is significant to the fair value measurement. The inputs or methodology used for valuing instruments are not necessarily an indication of the risk associated with investing in those instruments.
| | | | | | |
| | | |
| 20 | | | | JPMORGAN EXCHANGE-TRADED FUNDS | | OCTOBER 31, 2015 |
The following table represents each valuation input as presented on the Schedule of Portfolio Investments :
| | | | | | | | | | | | | | | | |
| | | Level 1 Quoted Prices | | | Level 2 Other significant observable inputs | | | Level 3 Significant unobservable inputs | | | Total | |
Investments in Securities | | | | | | | | | | | | | | | | |
Common Stocks | | | | | | | | | | | | | | | | |
Consumer Discretionary | | $ | 1,817,366 | | | $ | — | | | $ | — | | | $ | 1,817,366 | |
Consumer Staples | | | 1,344,477 | | | | — | | | | — | | | | 1,344,477 | |
Energy | | | 472,129 | | | | — | | | | — | | | | 472,129 | |
Financials | | | 1,091,755 | | | | — | | | | — | | | | 1,091,755 | |
Health Care | | | 1,730,247 | | | | — | | | | — | | | | 1,730,247 | |
Industrials | | | 842,107 | | | | — | | | | — | | | | 842,107 | |
Information Technology | | | 1,350,764 | | | | — | | | | — | | | | 1,350,764 | |
Materials | | | 634,062 | | | | — | | | | — | | | | 634,062 | |
Telecommunication Services | | | 168,613 | | | | — | | | | — | | | | 168,613 | |
Utilities | | | 1,344,419 | | | | — | | | | — | | | | 1,344,419 | |
| | | | | | | | | | | | | | | | |
Total Common Stocks | | | 10,795,939 | | | | — | | | | — | | | | 10,795,939 | |
| | | | | | | | | | | | | | | | |
Total Investments in Securities | | $ | 10,795,939 | | | $ | — | | | $ | — | | | $ | 10,795,939 | |
| | | | | | | | | | | | | | | | |
There were no transfers among any levels during the period ended October 31, 2015. Transfers between fair value levels are valued utilizing values as of the beginning of the period.
B. Restricted Securities — Certain securities held by the Fund may be subject to legal or contractual restrictions on resale. Restricted securities generally are resold in transactions exempt from registration under the Securities act of 1933 (the “Securities Act”). Disposal of these securities may involve time-consuming negotiations and expense. Prompt sale at the current valuation may be difficult and could adversely affect the net assets of the Fund. As of October 31, 2015, the Fund had no investments in restricted securities.
C. Offering and Organizational Costs — Total offering costs of $23,862 incurred in connection with the offering of shares of the Fund are amortized on a straight line basis over 12 months from the date the Fund commenced operations. Costs paid in connection with the organization of the Trust, if any, were recorded as an expense at the time it commenced operations.
D. Security Transactions and Investment Income — Investment transactions are accounted for on the trade date (the date the order to buy or sell is executed). Securities gains and losses are calculated on a specifically identified cost basis. Interest income is determined on the basis of coupon interest accrued using the effective interest method which adjusts for amortization of premiums and accretion of discounts. Dividend income net of foreign taxes withheld, if any, is recorded on the ex-dividend date or when a fund first learns of the dividend.
To the extent such information is publicly available, the Fund records distributions received in excess of income earned from underlying investments as a reduction of cost of investments and/or realized gain. Such amounts are based on estimates if actual amounts are not available and actual amounts of income, realized gain and return of capital may differ from the estimated amounts. The Fund adjusts the estimated amounts of the components of distributions (and consequently their net investment income) as necessary once the issuers provide information about the actual composition of the distributions.
E. Allocation of Expenses — Expenses directly attributable to a fund are charged directly to that fund, while the expenses attributable to more than one fund of the Trust are allocated among the respective funds.
F. Federal Income Taxes — The Fund is treated as a separate taxable entity for Federal income tax purposes. The Fund’s policy is to comply with the provisions of the Internal Revenue Code of 1986, as amended (the “Code”), applicable to regulated investment companies and to distribute to shareholders all of its distributable net investment income and net realized gain on investments. Accordingly, no provision for Federal income tax is necessary. Management has reviewed the Fund’s tax positions for all open tax years and has determined as of October 31, 2015, no liability for income tax is required in the Fund’s financial statements for net unrecognized tax benefits. However, management’s conclusions may be subject to future review based on changes in, or the interpretation of, the accounting standards or tax laws and regulations. The Fund’s Federal tax returns for the prior three fiscal years, or since inception if shorter, remain subject to examination by the Internal Revenue Service.
G. Distributions to Shareholders — Distribution from net investment income, if any, are generally declared and paid annually. Net realized capital gains, if any, are distributed by the Fund at least annually. The amount of distributions from net investment income and net realized capital gains is determined in accordance with Federal income tax regulations, which may differ from GAAP. To the extent these “book/tax” differences are permanent in nature (i.e., that they result from other than timing of recognition — “temporary differences”), such amounts are reclassified within the capital accounts based on their Federal tax-basis treatment.
| | | | | | | | |
| | | |
| OCTOBER 31, 2015 | | JPMORGAN EXCHANGE-TRADED FUNDS | | | | | 21 | |
NOTES TO FINANCIAL STATEMENTS
AS OF OCTOBER 31, 2015 (continued)
3. Fees and Other Transactions with Affiliates
A. Investment Advisory Fee — Pursuant to the Investment Advisory Agreement, the J.P. Morgan Investment Management Inc. (the “Adviser” or “JPMIM”), an indirect, wholly-owned subsidiary of JPMorgan Chase & Co. (“JPMorgan”), supervises the investments of the Fund and is paid a fee for such services. The fee is accrued daily and paid monthly at an annual rate of 0.23% of the Fund’s average daily net assets.
The Adviser waived Investment Advisory fees and/or reimbursed expenses as outlined in Note 3.D.
B. Administration Fee — Pursuant to an Administration Agreement, the Administrator, an indirect, wholly-owned subsidiary of JPMorgan, provides certain administration services to the Fund. In consideration of these services, the Administrator receives a fee accrued daily and paid monthly at an annual rate of 0.085% of the Fund’s average daily net assets in the Trust covered by the Administration Agreement.
The administrator waived administration fees as authorized in Note 3.D.
C. Custodian and Transfer Agent Fees — JPMorgan Chase Bank, N.A. (“JPMCB”), a wholly-owned subsidiary of JPMorgan, provides portfolio custody and transfer agency services to the Fund. The amounts paid directly to JPMCB by the Fund for custody services are included in the Custodian fees on the Statements of Operations. With respect to the transfer agency services provided by JPMCB for each creation or redemption transaction, the “Authorized Participant” will generally be responsible for such associated expenses; during the period, the Fund paid no such fees to JPMCB.
Additionally, Authorized Participants generally pay transaction fees associated with the creation and redemption of Fund shares. These fees are used to offset certain custodian charges incurred by the Fund for these transactions.
For the period ended October 31, 2015, the transaction fees paid by the Authorized Participants that were used to reimburse custodian fees of the Fund were $1,450.
Interest income, earned on cash balances at the custodian, if any, is included as interest income from affiliates in the Statements of Operations.
Interest expense paid to the custodian related to overdrafts, if any, is included in interest expense to affiliates in the Statement of Operations.
D. Waivers and Reimbursements — The Adviser and Administrator have contractually agreed to waive fees and/or reimburse the Fund to the extent that total annual operating expenses (excluding acquired fund fees and expenses, dividend expenses related to short sales, interest, taxes, expenses related to litigation and potential litigation, and extraordinary expenses) exceed the percentages of the Fund’s average daily net assets of 0.29%.
The expense limitation agreements were in effect for the period ended October 31, 2015. The contractual expense limitation percentage is in place until at least February 28, 2017.
For the period ended October 31, 2015, the Fund’s service providers waived fees and/or reimbursed expenses for the Fund as follows. None of these parties expect the Fund to repay any such waived fees and/or reimbursed expenses in future years.
| | | | | | | | | | | | | | | | |
| | | Contractual Waivers | | | | |
| | | Investment
Advisory | | | Administration | | | Total | | | Contractual
Reimbursements | |
| | $ | 2,075 | | | $ | 767 | | | $ | 2,842 | | | $ | 48,304 | |
Contractual Reimbursements include reimbursements outlined in Note 3.C.
E. Other — Certain officers of the Trust are affiliated with the Adviser and the Administrator. Such officers, with the exception of the Chief Compliance Officer, receive no compensation from the Fund for serving in their respective roles.
The Board of Trustees appointed a Chief Compliance Officer to the Fund in accordance with Federal securities regulations. The Fund, along with other affiliated funds, makes reimbursement payments, on a pro-rata basis, to the Administrator for a portion of the fees associated with the Office of the Chief Compliance Officer. Such fees are included in Trustees’ and Chief Compliance Officer’s fees in the Fund’s Statements of Operations.
During the period ended October 31, 2015, the Fund may have purchased securities from an underwriting syndicate in which the principal underwriter or members of the syndicate are affiliated with the Adviser.
4. Investment Transactions
During the period ended October 31, 2015, purchases and sales of investments (excluding short-term investments) were as follows:
| | | | | | | | |
| | | Purchases (excluding U.S. Government) | | | Sales (excluding U.S. Government) | |
| | $ | 365,081 | | | $ | 1,427 | |
During the period ended October 31, 2015, there were no purchases or sales of U.S. Government securities.
For the period ended October 31, 2015, in-kind transactions associated with creations and redemptions were $9,616,482 and $0, respectively.
| | | | | | |
| | | |
| 22 | | | | JPMORGAN EXCHANGE-TRADED FUNDS | | OCTOBER 31, 2015 |
5. Federal Income Tax Matters
For Federal income tax purposes, the cost and unrealized appreciation (depreciation) in value of investment securities held at October 31, 2015 were as follows:
| | | | | | | | | | | | | | | | |
| | | Aggregate Cost | | | Gross Unrealized Appreciation | | | Gross Unrealized Depreciation | | | Net Unrealized Appreciation (Depreciation) | |
| | $ | 9,979,613 | | | $ | 871,337 | | | $ | (55,011 | ) | | $ | 816,326 | |
There is no difference between book and tax basis appreciation (depreciation) on investments.
As of October 31, 2015, the components of net assets (excluding paid-in-capital) on a tax basis were as follows:
| | | | | | | | | | | | |
| | | Current Distributable Ordinary Income | | | Current Distributable Short-Term Capital Gains or (Tax Basis Loss Carryover) | | | Unrealized Appreciation (Depreciation) | |
| | $ | 10,819 | | | $ | (522 | ) | | $ | 816,326 | |
There were no cumulative timing differences.
As of October 31, 2015, the Fund had net capital loss carryforwards, with no expiration dates, as follows:
| | | | | | | | |
| | | Capital Loss Carryforward Character | |
| | | Short-Term | | | Long-Term | |
| | $ | (522 | ) | | $ | 0 | |
6. Capital Share Transactions
The Trust issues and redeems shares of the Fund only in Creation Units through the Distributor at NAV. Capital shares transactions detail can be found in the Statement of Changes in Net Assets.
Shares of the Fund may only be purchased or redeemed by Authorized Participants. An Authorized Participant is either (1) a “Participating Party” or other participant in the clearing process through the Continuous Net Settlement System of the National Securities Clearing Corporation (“NSCC”); or (2) a “DTC Participant”; which, in either case, must have executed an agreement with the Distributor.
Creation Units of the Fund may be created in advance of receipt by the Trust of all or a portion of the applicable basket of equity securities and other instruments (“Deposit Instruments”) and cash as described in the Fund’s registration statement. In these instances, the initial Deposit Instruments and cash must be deposited in an amount equal to the sum of the cash amount, plus at least 105% of the market value of undelivered Deposit Instruments. A transaction fee may be imposed to offset transfer and other transaction costs associated with the purchase or redemption of Creation Units.
For more information about Creation Unit transactions please refer to the Fund’s Statement of Additional information.
7. Risks, Concentrations and Indemnifications
In the normal course of business, the Fund enters into contracts that contain a variety of representations which provide general indemnifications. The Fund’s maximum exposure under these arrangements is unknown. The amount of exposure would depend on future claims that may be made against the Fund that have not yet occurred. However, based on experience, the Fund expects the risk of loss to be remote.
As of October 31, 2015, the Adviser owned 93% of the outstanding shares of the Fund.
Premium/Discount Risk — Disruptions to creations and redemptions, the existence of extreme markets volatility or potential lack of an active trading market for Shares may result in Shares trading at a significant premium or discount to the NAV. If a shareholder purchases Shares at a time when the market price is at a premium to the NAV or sells Shares at a time when the market price is at a discount to the NAV, the shareholders performance may be negatively impacted.
Index Tracking Risk — The Fund incurs a number of operating expenses not applicable to the underlying index, and incurs costs in buying and selling securities, especially when rebalancing a Fund’s securities holdings to reflect changes in the composition of the underlying index. To the extent of the previously outlined items, the Fund’s return differs from the return of the underlying index.
8. Related Party Transactions
The Distributor or its agent distributes Creation Units for the Fund on an agency basis. The Distributor does not maintain a secondary market in shares of the Fund. The Distributor has no role in determining the investment policies of the Fund or the securities that are purchased or sold by the Fund. SIDCO receives no fee for its distribution services under the Distribution Agreement.
The Fund may use related party broker-dealers. For the period ended October 31, 2015, The Fund incurred no brokerage commissions with broker-dealers affiliated with the Adviser or Trust.
| | | | | | | | |
| | | |
| OCTOBER 31, 2015 | | JPMORGAN EXCHANGE-TRADED FUNDS | | | | | 23 | |
REPORT OF INDEPENDENT REGISTERED PUBLIC ACCOUNTING FIRM
To the Board of Trustees of J.P. Morgan Exchange-Traded Fund Trust and the Shareholders of JPMorgan Diversified Return U.S. Equity ETF:
In our opinion, the accompanying statement of assets and liabilities, including the schedule of portfolio investments, and the related statements of operations and of changes in net assets and the financial highlights present fairly, in all material respects, the financial position of JPMorgan Diversified Return U.S. Equity ETF (a separate series of J.P. Morgan Exchange-Traded Fund Trust) (the “Fund”) at October 31, 2015, and the results of its operations, the changes in its net assets and the financial highlights for the period September 29, 2015 (commencement of operations) through October 31, 2015, in conformity with accounting principles generally accepted in the United States of America. These financial statements and financial highlights (hereafter referred to as “financial statements”) are the responsibility of the Fund’s management. Our responsibility is to express an opinion on these financial statements based on our audit. We conducted our audit of these financial statements in accordance with the standards of the Public Company Accounting Oversight Board (United States). Those standards require that we plan and perform the audit to obtain reasonable assurance about whether the financial statements are free of material misstatement. An audit includes examining, on a test basis, evidence supporting the amounts and disclosures in the financial statements, assessing the accounting principles used and significant estimates made by management, and evaluating the overall financial statement presentation. We believe that our audit, which included confirmation of securities at October 31, 2015 by correspondence with the custodian, provides a reasonable basis for our opinion.
PricewaterhouseCoopers LLP
New York, New York
December 22, 2015
| | | | | | |
| | | |
| 24 | | | | JPMORGAN EXCHANGE-TRADED FUNDS | | OCTOBER 31, 2015 |
SUPPLEMENTAL INFORMATION
FOR THE PERIOD ENDED OCTOBER 31, 2015 (Unaudited)
The table below indicates the number of trading days in which the Fund traded within the range of the premium/discount noted. The number of days in each range is also shown as a percentage of the total trading days for the period covered in the table. All information within the table is based on historical performance. Past performance cannot be used to predict future results. Shareholders may pay more than NAV when they buy fund shares and receive less than NAV when they sell those shares because shares are bought and sold at current market prices.
| | | | | | | | |
| | | U.S. Equity ETF (a) | |
| Range of Premium/(Discount) | | Day Count | | | Percentage | |
Between 0.5% and -0.5% | | | 23 | | | | 100 | % |
| | | | | | | | |
| | | 23 | | | | 100 | % |
| | | | | | | | |
| (a) | Commencement of operations was September 29, 2015. |
| | | | | | | | |
| | | |
| OCTOBER 31, 2015 | | JPMORGAN EXCHANGE-TRADED FUNDS | | | | | 25 | |
TRUSTEES
(Unaudited)
The Fund’s Statement of Additional Information includes additional information about the Fund’s Trustees and is available, without charge, upon request by calling 1-844-457-6383 or on the J.P. Morgan Funds’ website at www.jpmorganfunds.com.
| | | | | | |
Name (Year of Birth; Positions With
the Funds since) | | Principal Occupation
During the Past 5 Year | | Number of
Funds in Fund
Complex Overseen
by Trustee (1) | | Other Directorships Held
During the Past 5 Years |
Independent Trustees | | | | | | |
| | | |
Gary L. French (1951); Trustee of the Trust since 2014 | | Senior Consultant for the Regulatory Fundamentals Group LLC (2011-present); Senior Vice President-Fund Administration, State Street Corporation (2002-2010). | | 10 | | Independent Trustee, The China Fund, Inc. (2013-present); Exchange Traded Concepts Trust II (2012-2014); Exchange Traded Concepts Trust I (2011-2014). |
| | | |
| Robert J. Grassi (1957); Trustee of the Trust since 2014 | | Sole Proprietor, Academy Hills Advisors LLC (2012-present); Pension Director, Coming Incorporated (2002-2012). | | 10 | | None |
| | | |
| Thomas P. Lemke (1954); Trustee of the Trust since 2014 | | Retired; Executive Vice President and General Counsel, Legg Mason (2005-2013). | | 10 | | Independent Director of AXA Premier VIP Trust (2014-present); Independent Director of The Advisors’ Inner Circle III Funds (2014-present); Independent Director of The Munder Funds (2014-present); Independent Director of ICI Mutual Insurance Company (2008-2013). |
| | | |
| Lawrence R. Maffia (1950); Trustee of the Trust since 2014 | | Retired; Director and President, ICI Mutual Insurance Company (2006-2013). | | 10 | | Director, ICI Mutual Insurance Company (1999-2013). |
| | | |
| Emily A. Youssouf (1951); Trustee of the Trust since 2014 | | Vice Chair (2011-2013) and Board Member (2013-present) of New York City Housing Authority; Clinical Professor, NYU Schack Institute of Real Estate (2009-present); Board Member, NYC Health and Hospitals Corporation (2005-present). | | 10 | | Trustee, NYC School Construction Authority (2009-present); Board Member, NYS Job Development Authority (2008-present); Board Member, PennyMac Financial Services, Inc. (2013-present). |
| | | |
| Interested Trustee | | | | | | |
| | | |
| Robert Deutsch (2) (1957); Trustee of the Trust since 2014 | | Head of the Global ETF Business for JPMorgan Asset Management (2013-present); Head of the Global Liquidity Business for JPMorgan Asset Management (2003-2013). | | 10 | | None |
| (1) | A Fund complex means two or more registered investment companies that hold themselves out to investors as related companies for purposes of investment and investor services or have a common investment adviser or have an investment adviser that is an affiliated person of the investment adviser of any of the other registered investment companies. Four Funds are currently operating, but three additional series are in registration, and three additional series have been created and will be registered in the future. |
| (2) | Mr. Deutsch is an interested trustee because he is an employee of the Adviser. |
| | | | | | |
| | | |
| 26 | | | | JPMORGAN EXCHANGE-TRADED FUNDS | | OCTOBER 31, 2015 |
OFFICERS
(Unaudited)
| | |
Name (Year of Birth),
Positions Held with
the Trusts (Since) | | Principal Occupations During Past 5 Years |
| |
Robert Deutsch (1957),
President and Principal Executive Officer (2014) | | Managing Director, global head of J.P. Morgan Asset Management’s Exchange-Traded Funds and a member of the J.P. Morgan Global Funds Operating Committee. Previously, head of the Global Liquidity Business from 2003 to 2013 and National Sales Manager for J.P. Morgan’s U.S. Mutual Funds Business prior to 2003. |
| |
Paul Shield (1960),
Treasurer and Principal Financial Officer (2014) | | Managing Director and head of Business Management for JPMorgan Asset Management’s Exchange-Traded Fund platform since 2013. Senior Global Product Manager of Alternative Investments for BNY Mellon from 2011 to 2013 and Global Product Head for Exchange Traded Funds at JPMorgan Chase Bank from 2008 to 2011. |
| |
Frank J. Nasta (1964),
Secretary (2014) | | Managing Director and Associate General Counsel, JPMorgan Chase since 2008; Previously, Director, Managing Director, General Counsel and Corporate Secretary, J. & W. Seligman & Co. Incorporated; Secretary of each of the investment companies of the Seligman Group of Funds and Seligman Data Corp.; Director and Corporate Secretary, Seligman Advisors, Inc. and Seligman Services, Inc. |
| |
Stephen M. Ungerman (1953),
Chief Compliance Officer (2014) | | Managing Director, JPMorgan Chase & Co.; Mr. Ungerman has been with JPMorgan Chase & Co. since 2000. |
| |
Elizabeth A. Davin (1964),
Assistant Secretary (2014)** | | Executive Director and Assistant General Counsel, JPMorgan Chase since February 2012; formerly Vice President and Assistant General Counsel, JPMorgan Chase from 2005 until February 2012; Senior Counsel, JPMorgan Chase (formerly Bank One Corporation) from 2004 to 2005. |
| |
Jessica K. Ditullio (1962),
Assistant Secretary (2014)** | | Executive Director and Assistant General Counsel, JPMorgan Chase since February 2011; Ms. Ditullio has served as an attorney with various titles for JPMorgan Chase (formerly Bank One Corporation) since 1990. |
| |
John T. Fitzgerald (1975),
Assistant Secretary (2014) | | Executive Director and Assistant General Counsel, JPMorgan Chase since February 2011; formerly, Vice President and Assistant General Counsel, JPMorgan Chase from 2005 until February 2011. |
| |
Carmine Lekstutis (1980),
Assistant Secretary (2014) | | Executive Director and Assistant General Counsel, JPMorgan Chase since 2011; Associate, Skadden, Arps, Slate, Meagher & Flom LLP (law firm) from 2006 to 2011. |
| |
Gregory S. Samuels (1980),
Assistant Secretary (2014) | | Executive Director and Assistant General Counsel, JPMorgan Chase since February 2014; formerly Vice President and Assistant General Counsel, JPMorgan Chase from 2010 to February 2014 |
| |
Pamela L. Woodley (1971),
Assistant Secretary (2014)*** | | Vice President and Assistant General Counsel, JPMorgan Chase since November 2004. |
| |
| Frederick J. Cavaliere (1978), Assistant Treasurer (2015) | | Vice President, JPMorgan Funds Management, Inc. since September 2011; formerly, Vice President of J.P. Morgan Investment Management Inc. (2010-2011). Mr. Cavaliere has been with JPMorgan since May 2006. |
| |
Michael M. D’Ambrosio (1969),
Assistant Treasurer (2014) | | Managing Director, JPMorgan Funds Management, Inc. from May 2014; formerly Executive Director, JPMorgan Funds Management, Inc. from 2012 until May 2014; prior to joining JPMorgan Chase, Mr. D’Ambrosio was a Tax Director at PricewaterhouseCoopers LLP since 2006. |
| |
Lauren A. Paino (1973),
Assistant Treasurer (2015) | | Executive Director, JPMorgan Funds Management, Inc. since August 2013; formerly Director, Credit Suisse Asset Management from 2000-2013. |
| |
Julie A. Roach (1971),
Assistant Treasurer (2014)** | | Vice President, JPMorgan Funds Management, Inc. from August 2012; prior to joining JPMorgan Chase, Ms. Roach was a Senior Manager with Deloitte since 2001. |
| |
Jason Ronca (1978), Assistant Treasurer (2014)**** | | Vice President, Assistant Treasurer and ETF Platform Manager for J.P. Morgan Asset Management since May 2014. ETF Product Manager for Corporate Investment Bank responsible for setting the strategy and control agenda for the ETF servicing business from 2010 to May 2014; Prior to 2010, a Vice President in Fund Accounting within J.P. Morgan Investor Services, supporting a series of U.S. registered mutual funds. |
| * | | The contact address for the officer is 500 Stanton Christiana Road, Ops 1, Floor 02, Newark, DE 19173. |
| ** | | The contact address for the officer is 460 Polaris Parkway, Westerville, OH 43082. |
| *** | | The contact address for the officer is 4 New York Plaza, 21st Floor, NY, NY 10004. |
| **** | | The contact address for the officer is One Beacon Street, Floor 18, Boston, MA 02108 . |
| | | | | | | | |
| | | |
| OCTOBER 31, 2015 | | JPMORGAN EXCHANGE-TRADED FUNDS | | | | | 27 | |
SCHEDULE OF SHAREHOLDER EXPENSES
(Unaudited)
Hypothetical $1,000 Investment
As a shareholder of the Fund, you incur ongoing costs, including investment advisory fees, administration fees, distribution fees and other Fund expenses. The examples below are intended to help you understand your ongoing costs (in dollars) of investing in the Fund and to compare these ongoing costs with the ongoing costs of investing in other funds. The examples assume that you had a $1,000 investment at the beginning of the reporting period, September 29, 2015 and continued to hold your shares at the end of the reporting period, October 31, 2015.
Actual Expenses
For the Fund in the table below, the first line provides information about actual account values and actual expenses. You may use the information in this line, together with the amount you invested, to estimate the expenses that you paid over the period. Simply divide your account value by $1,000 (for example, an $8,600 account value divided by $1,000 = 8.6), then
multiply the result by the number under the heading entitled “Expenses Paid During the Period” to estimate the expenses you paid on your account during this period.
Hypothetical Example for Comparison Purposes
The second line in the table below provides information about hypothetical account values and hypothetical expenses based on the Fund’s actual expense ratio and an assumed rate of return of 5% per year before expenses, which is not the Fund’s actual return. The hypothetical account values and expenses may not be used to estimate the actual ending account balance or expenses you paid for the period. You may use this information to compare the ongoing costs of investing in the Fund and other Funds. To do so, compare this 5% hypothetical example with the 5% hypothetical examples that appear in the shareholder reports of other funds. The examples also assume all dividends and distributions have been reinvested.
| | | | | | | | | | | | | | | | |
| | | Beginning
Account Value
9/29/2015 | | | Ending Account Value 10/31/2015 | | | Annualized Expense Ratios | | | Expenses
Paid During Period | |
JPMorgan Diversified Return U.S. Equity ETF | |
Actual Fund Return (1) | | $ | 1,000.00 | | | $ | 1,000.00 | | | | 0.29 | % | | $ | 0.27 | |
Hypothetical 5% Return (2) | | | 1,000.00 | | | | 1,000.00 | | | | 0.29 | % | | | 1.48 | |
| (1) | Expenses are equal to the Fund’s annualized expense ratio, multiplied by the average account value over the period, multiplied by 33/365 (to reflect the actual period). The Fund commenced operations on September 29, 2015. |
| (2) | Expenses are equal to the Fund’s annualized expense ratio, multiplied by the average account value over the period, multiplied by 184/365 (to reflect the one-half year period). |
| | | | | | |
| | | |
| 28 | | | | JPMORGAN EXCHANGE-TRADED FUNDS | | OCTOBER 31, 2015 |
BOARD APPROVAL OF INITIAL INVESTMENT ADVISORY AGREEMENT
(Unaudited)
Board Approval of Initial Investment Advisory Agreement
For the JPMorgan Diversified Return U.S. Equity ETF
On May 6 - 7, 2014, the Board of the Trust, a statutory Trust organized under the laws of the State of Delaware, held an in-person meeting and approved the initial Investment Advisory Agreement (“Agreement”) for the Fund. The approval included the approval of a majority of Trustees who are not interested persons of the Trust or the Adviser. Such Trustees are considered Independent Trustees as defined by the 1940 Act. In connection with the approval of the Agreement, the Trustees reviewed written materials prepared by the Adviser and received oral presentations from Adviser personnel. Before voting on the proposed Agreement, the Trustees reviewed the Agreement with representatives of the Adviser and with counsel to the Trust and independent legal counsel and received a memorandum from independent legal counsel to the Trustees discussing the legal standards for their consideration of the proposed Agreement. The Trustees also discussed the proposed Agreement in an executive session with independent legal counsel at which no representatives of the Adviser were present. Set forth below is a summary of the material factors evaluated by the Trustees in determining whether to approve the Agreement.
The Trustees considered information provided with respect to the Fund and the approval of the Agreement. Each Trustee attributed different weights to the various factors and no factor alone was considered determinative. The Trustees determined that the proposed compensation to be received by the Adviser from the Fund under the Agreement was fair and reasonable and that the initial approval of the Agreement was in the best interests of the Fund and its potential shareholders.
The factors summarized below were considered and discussed by the Trustees in reaching their conclusions:
Nature, Extent and Quality of Services Provided by the Adviser
In connection with the approval of the initial Agreement, the Trustees considered the materials furnished specifically in connection with the approval of the Agreement, as well as other relevant information furnished for the Trust. The Trustees considered the background and experience of the Adviser’s senior management and investment personnel, as well as the qualifications, backgrounds and responsibilities of the portfolio management team primarily responsible for the day-to-day management of the Fund. The Trustees also considered the investment strategy and the underlying index for the Fund, and the infrastructure supporting the portfolio management team. In addition, the Trustees considered information about the structure and distribution strategy of the Fund, how it fits within the Trust’s lineup, and how it will be positioned against identified peers.
The Trustees also considered their knowledge of the nature and quality of the services provided by the Adviser gained from experience in the financial industry. In addition, they considered the overall reputation and capabilities of the Adviser and its affiliates, the commitment of the Adviser to provide high quality service to the Trust, their overall confidence in the Adviser’s integrity and the Adviser’s responsiveness to questions or concerns raised by them.
Based upon these considerations and other factors, the Trustees concluded that they were satisfied with the nature, extent and quality of the investment advisory services to be provided to the Fund by the Adviser.
Fall-Out Benefits
The Trustees reviewed information regarding potential “fallout” or ancillary benefits received by the Adviser and its affiliates as a result of their relationship with the Trust.
The Trustees also considered that the fees that the Administrator, an affiliate of the Adviser, will earn from the Fund for providing administrative services. The Trustees also considered the fees paid to JPMCB, also an affiliate of the Adviser, for custody, transfer agency and other related services. The Trustees also considered that any fall-out or ancillary benefits would be comparable to those related to the other funds in the complex.
Economies of Scale
The Trustees considered the extent to which the Fund will benefit from economies of scale. The Trustees noted that neither the proposed investment advisory fee schedule nor the proposed administration agreement for the Fund contains breakpoints. The Trustees considered whether it would be appropriate to add advisory fee breakpoints. With respect to the administration agreement, the Trustees also considered the fact that the Fund would benefit from economies of scale for the broader J.P. Morgan mutual fund complex because the administration fee had been set at a level consistent with the lower effective rate of the mutual funds, which includes breakpoints. The Trustees also noted that the Adviser has implemented fee waivers and expense limitations. The Trustees concluded that shareholders of the Fund will generally benefit from the lower expense ratios that resulted from these factors.
Investment Performance
The Trustees considered the Fund’s investment strategy and process, including the fact that the Fund seeks performance that closely corresponds to the Index, the portfolio management team and competitive positioning against identified peer funds, and concluded that the prospects for competitive future performance were acceptable.
| | | | | | | | |
| | | |
| OCTOBER 31, 2015 | | JPMORGAN EXCHANGE-TRADED FUNDS | | | | | 29 | |
BOARD APPROVAL OF INITIAL INVESTMENT ADVISORY AGREEMENT
(Unaudited) (continued)
Advisory Fees and Expense Ratios
The Trustees considered the contractual advisory fee rate that will be paid by the Fund to the Adviser and compared that rate to the fees charged to similar mutual funds managed by the Adviser, as well as information prepared by Lipper concerning management fee rates paid by other funds in the same Lipper category as the Fund. The Trustees also noted that the Adviser does not currently manage other mutual funds or institutional accounts with the exact same or similar strategies proposed for the Fund. The Trustees also reviewed information about other projected expenses and the expense ratios for the Fund. The Trustees considered the projected fee waiver and/or expense reimbursement arrangements proposed for the Fund and considered the net advisory fee rate after taking into account any projected waivers and/or reimbursements.
The Trustees noted that the Fund’s estimated net advisory fees and total expenses were in line with identified peer funds. The Trustees also noted that because the Fund was not yet operational, no profitability information was available. After considering the factors identified above, in light of the information, the Trustees concluded that the advisory fees were reasonable.
| | | | | | |
| | | |
| 30 | | | | JPMORGAN EXCHANGE-TRADED FUNDS | | OCTOBER 31, 2015 |
J.P. Morgan Exchange-Traded Funds are distributed by SEI Investments Distribution Co. (One Freedom Valley Dr., Oaks, PA 19456), which is not affiliated with JPMorgan Chase & Co. or any of its affiliates.
Contact J.P. Morgan Exchange-Traded Funds at 1-844-457-6383 (844-4JPM ETF) for a fund prospectus. You can also visit us at www.jpmorganfunds.com. Investors should carefully consider the investment objectives and risks as well as charges and expenses of the fund before investing. The prospectus contains this and other information about the fund. Read the prospectus carefully before investing.
Investors may obtain information about the Securities Investor Protection Corporation (SIPC), including the SIPC brochure by visiting www.sipc.org or by calling SIPC at 202-371-8300.
The Fund files a complete schedule of its fund holdings for the first and third quarters of its fiscal year with the SEC on Form N-Q. The Fund’s Forms N-Q is available on the SEC’s website at http://www.sec.gov and may be reviewed and copied at the SEC’s Public Reference Room in Washington, DC. Information on the operation of the SEC’s Public Reference Room may be obtained by calling 1-800-SEC-0330. Shareholders may request the Form N-Q without charge by calling 1-844-457-6383 or by visiting the J.P. Morgan Funds’ website at www.jpmorganfunds.com.
A description of each Fund’s policies and procedures with respect to the disclosure of each Fund’s holdings is available in the prospectus and Statement of Additional Information.
A copy of proxy policies and procedures is available without charge upon request by calling 1-844-457-6383 and on the Fund’s website at www.jpmorganfunds.com. A description of such policies and procedures is on the SEC’s website at www.sec.gov. The Trustees have delegated the authority to vote proxies for securities owned by the Fund to the Adviser. A copy of the Fund’s voting record for the most recent 12-month period ended June 30 is available on the SEC’s website at www.sec.gov or at the Fund’s website at www.jpmorganfunds.com no later than August 31 of each year. The Fund’s proxy voting record will include, among other things, a brief description of the matter voted on for each fund security, and will state how each vote was cast, for example, for or against the proposal.


J.P. Morgan Asset Management is the marketing name for the asset management business of JPMorgan Chase & Co. Those businesses include, but are not limited to, J.P. Morgan Investment Management Inc., Security Capital Research & Management Incorporated and J.P. Morgan Alternative Asset Management, Inc.
| | | | |
| | © JPMorgan Chase & Co., 2015. All rights reserved. October 2015. | | AN-USEETF-1015 |
ITEM 2. CODE OF ETHICS.
Disclose whether, as of the end of the period covered by the report, the registrant has adopted a code of ethics that applies to the registrant’s principal executive officer, principal financial officer, principal accounting officer or controller, or persons performing similar functions, regardless of whether these individuals are employed by the registrant or a third party. If the registrant has not adopted such a code of ethics, explain why it has not done so.
The registrant must briefly describe the nature of any amendment, during the period covered by the report, to a provision of its code of ethics that applies to the registrant’s principal executive officer, principal financial officer, principal accounting officer or controller, or persons performing similar functions, regardless of whether these individuals are employed by the registrant or a third party, and that relates to any element of the code of ethics definition enumerated in paragraph (b) of this Item. The registrant must file a copy of any such amendment as an exhibit pursuant to Item 12(a)(1), unless the registrant has elected to satisfy paragraph (f) of this Item by positing its code of ethics on its website pursuant to paragraph (f)(2) of this Item, or by undertaking to provide its code of ethics to any person without charge, upon request, pursuant to paragraph (f)(3) of this Item.
If the registrant has, during the period covered by the report, granted a waiver, including an implicit waiver, from a provision of the code of ethics that applies to the registrant’s principal executive officer, principal financial officer, principal accounting officer or controller, or persons performing similar functions, regardless of whether these individuals are employed by the registrant or third party, that relates to one or more items set forth in paragraph (b) of this Item, the registrant must briefly describe the nature of the waiver, the name of the person to whom the waiver was granted, and the date of the waiver.
The Registrant has adopted a code of ethics that applies to the Registrant’s principal executive officer and principal financial officer. There were no amendments to the code of ethics or waivers granted with respect to the code of ethics in the period covered by the report.
ITEM 3. AUDIT COMMITTEE FINANCIAL EXPERT.
(a) (1) Disclose that the registrant’s board of directors has determined that the registrant either:
(i) Has at least one audit committee financial expert serving on its audit committee; or
(ii) Does not have an audit committee financial expert serving on its audit committee.
The Registrant’s Board of Trustees has determined that the Registrant has at least one audit committee financial expert serving on its audit committee. The Securities and Exchange Commission has stated that the designation or identification of a person as an audit committee financial expert pursuant to this Item 3 of Form N-CSR does not impose on such person any duties, obligations or liabilities that are greater than the duties, obligations and liabilities imposed on such person as a member of the Audit Committee and the Board of Trustees in the absence of such designation or identification.
(2) If the registrant provides the disclosure required by paragraph (a)(1)(i) of this Item, it must disclose the name of the audit committee financial expert and whether that person is “independent.” In order to be considered “independent” for purposes of this Item, a member of an audit committee may not, other than in his or her capacity as a member of the audit committee, the board of directors, or any other board committee:
(i) Accept directly or indirectly any consulting, advisory, or other compensatory fee from the issuer; or
(ii) Be an “interested person” of the investment company as defined in Section 2(a)(19) of the Act (15 U.S.C. 80a-2(a)(19)).
The audit committee financial experts are Gary L. French, Robert J. Grassi, Thomas P. Lemke, Lawrence R. Maffia, and Emily A. Youssouf, each of which is not an “interested person” of the Registrant and is also “independent” as defined by the U.S. Securities and Exchange Commission for purposes of audit committee financial expert determinations.
(3) If the registrant provides the disclosure required by paragraph (a)(1)(ii) of this Item, it must explain why it does not have an audit committee financial expert.
Not applicable.
ITEM 4. PRINCIPAL ACCOUNTANT FEES AND SERVICES.
(a) Disclose, under the caption Audit Fees, the aggregate fees billed for each of the last two fiscal years for professional services rendered by the principal accountant for the audit of the registrant’s annual financial statements or services that are normally provided by the accountant in connection with statutory and regulatory filings or engagements for those fiscal years.
AUDIT FEES
2015 – $133,900
2014 – $45,000
(b) Disclose, under the caption Audit-Related Fees, the aggregate fees billed in each of the last two fiscal years for assurance and related services by the principal accountant that are reasonably related to the performance of the audit of the registrant’s financial statements and are not reported under paragraph (a) of this Item. Registrants shall describe the nature of the services comprising the fees disclosed under this category.
AUDIT-RELATED FEES
2015 – $33,333
2014 – $10,000
Audit-related fees consist of security count procedures performed as required under Rule 17f-2 of the Investment Company Act of 1940 during the Registrant’s fiscal year.
(c) Disclose, under the caption Tax Fees, the aggregate fees billed in each of the last two fiscal years for professional services rendered by the principal accountant for tax compliance, tax advice, and tax planning. Registrants shall describe the nature of the services comprising the fees disclosed under this category.
TAX FEES
2015 – $38,800
2014 – $9,700
The tax fees consist of fees billed in connection with preparing the federal regulated investment company income tax returns for the Registrant for the tax years ended October 31, 2015 and 2014, respectively.
For the last fiscal year, no tax fees were required to be approved pursuant to paragraph (c)(7)(ii) of Rule 2-01 of Regulation S-X.
(d) Disclose, under the caption All Other Fees, the aggregate fees billed in each of the last two fiscal years for products and services provided by the principal accountant, other than the services reported in paragraphs (a) through (c) of this Item. Registrants shall describe the nature of the services comprising the fees disclosed under this category.
ALL OTHER FEES
2015 – $0
2014 – $0
(e) (1) Disclose the audit committee’s pre-approval policies and procedures described in paragraph (c)(7) of Rule 2-01 of Regulation S-X.
Pursuant to the Registrant’s Audit Committee Charter and written policies and procedures for the pre-approval of audit and non-audit services (the “Pre-approval Policy”), the Audit Committee pre-approves all audit and non-audit services performed by the Registrant’s independent public registered accounting firm for the Registrant. In addition, the Audit Committee pre-approves the auditor’s engagement for non-audit services with the Registrant’s investment adviser (not including a sub-adviser whose role is primarily portfolio management and is sub-contracted or overseen by another investment adviser) and any Service Affiliate in accordance with paragraph (c)(7)(ii) of Rule 2-01 of Regulation S-X, if the engagement relates directly to the operations and financial reporting of the Registrant. Proposed services may be pre-approved either 1) without consideration of specific case-by-case services or 2) require the specific pre-approval of the Audit Committee. Therefore, initially the Pre-approval Policy listed a number of audit and non-audit services that have been approved by the Audit Committee, or which were not subject to pre-approval under the transition provisions of Sarbanes-Oxley Act of 2002 (the “Pre-approval List”). The Audit Committee annually reviews and pre-approves the
services included on the Pre-approval List that may be provided by the independent public registered accounting firm without obtaining additional specific pre-approval of individual services from the Audit Committee. The Audit Committee adds to, or subtracts from, the list of general pre-approved services from time to time, based on subsequent determinations. All other audit and non-audit services not on the Pre-approval List must be specifically pre-approved by the Audit Committee.
One or more members of the Audit Committee may be appointed as the Committee’s delegate for the purposes of considering whether to approve such services. Any pre-approvals granted by the delegate will be reported, for informational purposes only, to the Audit Committee at its next scheduled meeting. The Audit Committee’s responsibilities to pre-approve services performed by the independent public registered accounting firm are not delegated to management.
(2) Disclose the percentage of services described in each of paragraphs (b) through (d) of this Item that were approved by the audit committee pursuant to paragraph (c)(7)(i)(C) of Rule 2-01 of Regulation S-X.
2015 – 0.0%
2014 – 0.0%
(f) If greater than 50 percent, disclose the percentage of hours expended on the principal accountant’s engagement to audit the registrant’s financial statements for the most recent fiscal year that were attributed to work performed by persons other than the principal accountant’s full-time, permanent employees.
Not applicable.
(g) Disclose the aggregate non-audit fees billed by the registrant’s accountant for services rendered to the registrant, and rendered to the registrant’s investment adviser (not including any sub-adviser whose role is primarily portfolio management and is subcontracted with or overseen by another investment adviser), and any entity controlling, controlled by, or under common control with the adviser that provides ongoing services to the registrant for each of the last two fiscal years of the registrant.
The aggregate non-audit fees billed by the independent registered public accounting firm for services rendered to the Registrant, and rendered to Service Affiliates, for the last two calendar year ends were:
2015 - $30.7 million
2014 - $33.7 million
(h) Disclose whether the registrant’s audit committee of the board of directors has considered whether the provision of non-audit services that were rendered to the registrant’s investment adviser (not including any subadviser whose role is primarily portfolio management and is subcontracted with or overseen by another investment adviser), and any entity controlling, controlled by, or under common control with the investment adviser that provides ongoing services to the registrant that were not pre-approved pursuant to paragraph (c)(7)(ii) of Rule 2-01 of Regulation S-X is compatible with maintaining the principal accountant’s independence.
The Registrant’s Audit Committee has considered whether the provision of the non-audit services that were rendered to Service Affiliates that were not pre-approved (not requiring pre-approval) is compatible with maintaining the independent public registered accounting firm’s independence. All services provided by the independent public registered accounting firm to the Registrant or to Service Affiliates that were required to be pre-approved were pre-approved as required.
ITEM 5. AUDIT COMMITTEE OF LISTED REGISTRANTS.
(a) If the registrant is a listed issuer as defined in Rule 10A-3 under the Exchange Act (17CFR 240.10A-3), state whether or not the registrant has a separately-designated standing audit committee established in accordance with Section 3(a)(58)(A) of the Exchange Act (15 U.S.C. 78c(a)(58)(A)). If the registrant has such a committee, however designated, identify each committee member. If the entire board of directors is acting as the registrant’s audit committee as specified in Section 3(a)(58)(B) of the Exchange Act (15 U.S.C. 78c(a)(58)(B)), so state.
The registrant has a separately designated Audit Committee established in accordance with Section 3(a)(58)(A) of the Exchange Act. The members of the Audit Committee are Gary L. French, Robert J. Grassi, Thomas P. Lemke, Lawrence R. Maffia, and Emily A. Youssouf.
(b) If applicable, provide the disclosure required by Rule 10A-3(d) under the Exchange Act (17CFR 240.10A-3(d)) regarding an exemption from the listing standards for all audit committees.
Not applicable.
ITEM 6. SCHEDULE OF INVESTMENTS.
File Schedule I – Investments in securities of unaffiliated issuers as of the close of the reporting period as set forth in Section 210.12-12 of Regulation S-X, unless the schedule is included as part of the report to shareholders filed under Item 1 of this Form.
Included in Item 1.
ITEM 7. DISCLOSURE OF PROXY VOTING POLICIES AND PROCEDURES FOR CLOSED-END MANAGEMENT INVESTMENT COMPANIES.
A closed-end management investment company that is filing an annual report on this Form N-CSR must, unless it invests exclusively in non-voting securities, describe the policies and procedures that it uses to determine how to vote proxies relating to portfolio securities, including the procedures that the company uses when a vote presents a conflict between the interests of its shareholders, on the one hand, and those of the company’s investment adviser; principal underwriter; or any affiliated person (as defined in Section 2(a)(3) of the Investment Company Act of 1940 (15 U.S.C. 80a-2(a)(3)) and the rules thereunder) of the company, its investment adviser, or its principal underwriter, on the other. Include any policies and procedures of the company’s investment adviser, or any other third party, that the company uses, or that are used on the company’s behalf, to determine how to vote proxies relating to portfolio securities.
Not applicable.
ITEM 8. PORTFOLIO MANAGERS OF CLOSED-END MANAGEMENT INVESTMENT COMPANIES.
Not applicable.
ITEM 9. PURCHASE OF EQUITY SECURITIES BY CLOSED-END MANAGEMENT INVESTMENT COMPANY AND AFFILIATED PURCHASERS.
(a) If the registrant is a closed-end management investment company, provide the information specified in paragraph (b) of this Item with respect to any purchase made by or on behalf of the registrant or any “affiliated purchaser,” as defined in Rule 10b-18(a)(3) under the Exchange Act (17 CFR 240.10b-18(a)(3)), of shares or other units of any class of the registrant’s equity securities that is registered by the registrant pursuant to Section 12 of the Exchange Act (15 U.S.C. 781).
Not applicable.
ITEM 10. SUBMISSION OF MATTERS TO A VOTE OF SECURITY HOLDERS.
Describe any material changes to the procedures by which shareholders may recommend nominees to the registrant’s board of directors, where those changes were implemented after the registrant last provided disclosure in response to the requirements of Item 7(d)(2)(ii)(G) of Schedule 14A (17 CFR 240.14a-101), or this Item.
No material changes to report.
ITEM 11. CONTROLS AND PROCEDURES.
(a) Disclose the conclusions of the registrant’s principal executive and principal financial officers, or persons performing similar functions, regarding the effectiveness of the registrant’s disclosure controls and procedures (as defined in Rule 30a-3(c) under the Act (17 CFR 270.30a-3(c))) as of a date within 90 days of the filing date of the report that includes the disclosure required by this paragraph, based on the evaluation of these controls and procedures required by Rule 30a-3(b) under the Act (17 CFR 270.30a-3(b)) and Rules 13a-15(b) or 15d-15(b) under the Exchange Act (17 CFR 240.13a-15(b) or 240.15d-15(b)).
The Registrant’s principal executive and principal financial officers have concluded, based on their evaluation of the Registrant’s disclosure controls and procedures as of a date within 90 days of the filing date of this report, that the Registrant’s disclosure controls and procedures are reasonably designed to ensure that information required to be disclosed by the Registrant on Form N-CSR is recorded, processed, summarized and reported within the required time periods and that information required to be disclosed by the Registrant in the reports that it files or submits on Form N-CSR is accumulated and communicated to the Registrant’s management, including its principal executive and principal financial officers, as appropriate to allow timely decisions regarding required disclosure.
(b) Disclose any change in the registrant’s internal control over financial reporting (as defined in Rule 30a-3(d) under the Act (17 CFR 270.30a-3(d)) that occurred during the registrant’s second fiscal quarter of the period covered by this report that has materially affected, or is reasonably likely to materially affect, the registrant’s internal control over financial reporting.
There were no changes in the Registrant’s internal control over financial reporting that occurred during the last fiscal quarter covered by this report that have materially affected, or are reasonably likely to materially affect, the Registrant’s internal control over financial reporting.
ITEM 12. EXHIBITS.
(a) File the exhibits listed below as part of this Form. Letter or number the exhibits in the sequence indicated.
(a)(1) Any code of ethics, or amendment thereto, that is the subject of the disclosure required by Item 2, to the extent that the registrant intends to satisfy the Item 2 requirements through filing of an exhibit.
Code of Ethics applicable to its Principal Executive and Principal Financial Officers pursuant to Section 406 of the Sarbanes-Oxley Act of 2002 attached hereto.
(a)(2) A separate certification for each principal executive officer and principal financial officer of the registrant as required by Rule 30a-2(a) under the Act (17 CFR 270.30a-2).
Certifications pursuant to Rule 30a-2(a) under the Investment Company Act of 1940 are attached hereto.
(a)(3) Any written solicitation to purchase securities under Rule 23c-1 under the Act (17 CFR 270.23c-1) sent or given during the period covered by the report by or on behalf of the registrant to 10 or more persons.
Not applicable.
(b) A separate or combined certification for each principal executive officer and principal officer of the registrant as required by Rule 30a-2(b) under the Act of 1940.
Certifications pursuant to Rule 30a-2(b) under the Investment Company Act of 1940 are attached hereto.
SIGNATURES
Pursuant to the requirements of the Securities Exchange Act of 1934 and the Investment Company Act of 1940, the registrant has duly caused this report to be signed on its behalf by the undersigned, thereunto duly authorized.
| | |
| J.P. Morgan Exchange-Traded Fund Trust |
| |
| By: | | /s/ Robert F. Deutsch |
| | Robert F. Deutsch |
| | President and Principal Executive Officer |
| | January 6, 2016 |
Pursuant to the requirements of the Securities Exchange Act of 1934 and the Investment Company Act of 1940, this report has been signed below by the following persons on behalf of the registrant and in the capacities and on the dates indicated.
| | |
| By: | | /s/ Robert F. Deutsch |
| | Robert F. Deutsch |
| | President and Principal Executive Officer |
| | January 6, 2016 |
| |
| By: | | /s/ Paul E. Shield |
| | Paul E. Shield |
| | Treasurer and Principal Financial Officer |
| | January 6, 2016 |