UNITED STATES
SECURITIES AND EXCHANGE COMMISSION
Washington, D.C. 20549
FORMN-CSR
CERTIFIED SHAREHOLDER REPORT OF REGISTERED
MANAGEMENT INVESTMENT COMPANIES
Investment Company Act file number:811-22903
J.P. Morgan Exchange-Traded Fund Trust
(Exact name of registrant as specified in charter)
277 Park Avenue
New York, NY 10172
(Address of principal executive offices) (Zip code)
Gregory S. Samuels
J.P. Morgan Investment Management Inc.
277 Park Avenue
New York, NY 10172
(Name and Address of Agent for Service)
With copies to:
| | |
| Elizabeth A. Davin, Esq. | | Jon S. Rand, Esq. |
| JPMorgan Chase & Co. | | Dechert LLP |
| 1111 Polaris Parkway | | 1095 Avenue of the Americas |
| Columbus, OH 43240 | | New York, NY 10036 |
Registrant’s telephone number, including area code:1-844-457-6383
Date of fiscal year end: October 31
Date of reporting period: November 1, 2018 through October 31, 2019
FormN-CSR is to be used by management investment companies to file reports with the Commission not later than 10 days after the transmission to stockholders of any report that is required to be transmitted to stockholders under Rule30e-1 under the Investment Company Act of 1940 (17 CFR270.30e-1). The Commission may use the information provided on FormN-CSR in its regulatory, disclosure review, inspection, and policymaking roles.
A registrant is required to disclose the information specified by FormN-CSR, and the Commission will make this information public. A registrant is not required to respond to the collection of information contained in FormN-CSR unless the Form displays a currently valid Office of Management and Budget (“OMB”) control number. Please direct comments concerning the accuracy of the information collection burden estimate and any suggestions for reducing the burden to Secretary, Securities and Exchange Commission, 450 Fifth Street, NW, Washington, DC 20549-0609. The OMB has reviewed this collection of information under the clearance requirements of 44 U.S.C. Section 3507.
ITEM 1. REPORTS TO STOCKHOLDERS.
The following is a copy of the report transmitted to shareholders pursuant to Rule30e-1 under the Investment Company Act of 1940 (17 CFR270.30e-1).
Annual Report
J.P. Morgan Exchange-Traded Funds
October 31, 2019
JPMorgan BetaBuilders Canada ETF
JPMorgan BetaBuilders Developed Asia ex-Japan ETF
JPMorgan BetaBuilders Europe ETF
JPMorgan BetaBuilders Japan ETF
JPMorgan BetaBuilders U.S. Equity ETF
JPMorgan Diversified Return Emerging Markets Equity ETF
JPMorgan Diversified Return Europe Equity ETF
JPMorgan Diversified Return Global Equity ETF
JPMorgan Diversified Return International Equity ETF
JPMorgan Diversified Return U.S. Equity ETF
JPMorgan Diversified Return U.S. Mid Cap Equity ETF
JPMorgan Diversified Return U.S. Small Cap Equity ETF
JPMorgan U.S. Dividend ETF
JPMorgan U.S. Minimum Volatility ETF
JPMorgan U.S. Momentum Factor ETF
JPMorgan U.S. Quality Factor ETF
JPMorgan U.S. Value Factor ETF
Beginning on January 1, 2021, as permitted by regulations adopted by the Securities and Exchange Commission, paper copies of the Funds’ annual and semi-annual shareholder reports will no longer be sent by mail, unless you specifically request paper copies of the reports. Instead, the reports will be made available on the Funds’ website www.jpmorganfunds.com and you will be notified by mail each time a report is posted and provided with a website to access the report. If you already elected to receive shareholder reports electronically, you will not be affected by this change and you need not take any action.
You may elect to receive shareholder reports and other communications from the Funds electronically anytime by contacting your financial intermediary (such as a broker dealer, bank, or retirement plan).
Alternatively, you may elect to receive paper copies of all future reports free of charge by contacting your financial intermediary. Your election to receive paper reports will apply to all funds held within your account(s).
CONTENTS
Investments in a Fund are not bank deposits or obligations of, or guaranteed or endorsed by, any bank and are not insured or guaranteed by the FDIC, the Federal Reserve Board or any other government agency. You could lose money if you sell when the Fund’s share price is lower than when you invested.
Past performance is no guarantee of future performance. The general market views expressed in this report are opinions based on market and other conditions through the end of the reporting period and are subject to change without notice. These views are not intended to predict the future performance of a Fund or the securities markets. References to specific securities and their issuers are for illustrative purposes only and are not intended to be, and should not be interpreted as, recommendations to purchase or sell such securities. Such views are not meant as investment advice and may not be relied on as an indication of trading intent on behalf of any Fund.
Prospective investors should refer to the Funds’ prospectuses for a discussion of the Funds’ investment objectives, strategies and risks. Call J.P. Morgan Exchange-Traded Funds at (844) 457-6383 for a prospectus containing more complete information about a Fund, including management fees and other expenses. Please read it carefully before investing.
Shares are bought and sold throughout the day on an exchange at market price (not at net asset value) through a brokerage account, and are not individually subscribed and redeemed from a Fund. Shares may only be subscribed and redeemed directly from a Fund by Authorized Participants, in very large creation/redemption units. Brokerage commissions will reduce returns.
PRESIDENT’S LETTER
DECEMBER 17, 2019 (Unaudited)
Dear Shareholder,
JPMorgan Exchange-Traded Funds has continued to grow in 2019. Our assets under management have surpassed $30 billion1 and in September we became one of the top five providers in ETF flows.2 Our expanding suite of liquid and transparent solutions provides well-diversified, well-priced portfolios that may help each investor to achieve their goals.
| | |
 | | “It is our belief that diversification across regions and asset classes is a key element of building robust portfolio.” —Joanna M. Gallegos |
For the twelve months ended October 31, 2109, financial markets largely provided positive returns despite slowing global economic growth, U.S.-China trade tensions and geo-political uncertainties. Corporate profits remained buoyant, particularly in the U.S., and leading central banks maintained accommodative policies, which further supported financial markets. In July, the U.S. Federal Reserve responded to slowing economic growth by cutting interest rates for the first time in more than a decade and then followed with two more rate cuts by the end of the twelve month reporting period. Meanwhile, the European Central Bank resumed its monthly purchases of assets in an attempt to bolster flagging economic growth and inflation, which was below the bank’s target levels. China also moved to ease lending as the toll of reciprocal trade tariffs with the U.S. appeared to become a drag on exports. For the twelve months ended October 31, 2019, the MSCI World Index returned 12.69% (net of foreign withholding taxes, while the S&P 500 returned 14.33% and the Bloomberg Barclays U.S. Aggregate Index returned 11.51%.
It is our belief that diversification across regions and asset classes is a key element of building robust portfolio. For investors looking to diversify geographically, our BetaBuilders and Diversified Return ETFs can provide efficient and transparent exposures to regions and countries that continue to benefit from global economic growth. For investors looking to diversify geographically, developed economies outside the U.S. may provide attractive yields and diversification benefits. Our JPMorgan BetaBuilders Developed Asia ex-Japan ETF (BBAX), for example, returned 16.18% for twelve months ended October 31, 2019.
We are proud to bring a range of investment solutions to help you navigate a changing market landscape. We are committed to building solutions that address your needs and help you build stronger portfolios. Thank you for your belief in our Firm and our process.
Sincerely,

Joanna M. Gallegos
President, J.P. Morgan Exchange-Traded Funds
J.P Morgan Asset Management
1-844-4JPM-ETF or jpmorgan.com/etfs for more information
| 1 | J.P. Morgan Asset Management, December 16, 2019. |
| 2 | Bloomberg L.P., September 30, 2019. |
| | | | | | | | |
| | | |
| OCTOBER 31, 2019 | | J.P. MORGAN EXCHANGE-TRADED FUNDS | | | | | 1 | |
J.P. Morgan Exchange-Traded Funds
MARKET OVERVIEW
TWELVE MONTHS ENDED OCTOBER 31, 2019 (Unaudited)
Global equity markets generally provided positive returns for the reporting period amid slowing but continued growth in both the global economy and corporate profits. Investor optimism over U.S.-China trade negotiations and an extension of the deadline for Britain’s exit from the European Union (“Brexit”) also bolstered investor sentiment. Bond markets also provided positive returns for the period but generally underperformed equity markets. Emerging markets debt and U.S. investment grade bonds largely outperformed U.S. Treasury bonds.
In the final months of 2018, global equity markets generally slumped as investors faced both slowing global economic growth — particularly in China and Europe — and the prospect of rising U.S. interest rates. Equity prices largely rebounded in the first months of 2019, and markets remained buoyant through April 2019. Global equity markets were hit with a selloff in May 2019 and leading indexes in the U.S. and Asian
developed markets, as well as in emerging markets, dropped by more than 6%. Equity prices rebounded again in June and received further support at the end of July 2019, when the U.S. Federal Reserve (the “Fed”) responded to slowing economic growth by raising interest rates for the first time in more than a decade.
Investor concerns about increased U.S.-China trade tensions and uncertainty over the U.K.’s Brexit strategy led to increased market volatility in the final months of the reporting period. However, the Fed cut interest rates again in mid-September 2019 and, by the end of October 2019, leading U.S. equity indexes had returned to record highs.
For the twelve months ended October 31, 2019, the S&P 500 returned 14.33%, the MSCI EAFE Index returned 11.63% and the MSCI Emerging Markets Index returned 12.29%.
| | | | | | |
| | | |
| 2 | | | | J.P. MORGAN EXCHANGE-TRADED FUNDS | | OCTOBER 31, 2019 |
JPMorgan BetaBuilders Canada ETF
FUND COMMENTARY
TWELVE MONTHS ENDED OCTOBER 31, 2019 (Unaudited)
| | | | |
| REPORTING PERIOD RETURN: | |
| JPMorgan BetaBuilders Canada ETF | | | | |
| Net Asset Value* | | | 13.08% | |
| Market Price** | | | 12.97% | |
| Morningstar® Canada Target Market Exposure Indexsm | | | 12.72% | |
| |
| Net Assets as of 10/31/2019 | | $ | 3,800,754,020 | |
INVESTMENT OBJECTIVE***
The JPMorgan BetaBuilders Canada ETF (the “Fund”) seeks investment results that closely correspond, before fees and expenses, to the performance of the Morningstar® Canada Target Market Exposure Indexsm (the “Underlying Index”).
INVESTMENT APPROACH
The Underlying Index is a free-float adjusted market-capitalization weighted index consisting of stocks traded primarily on the Toronto Stock Exchange. Using a “passive” investment approach, the Fund attempts to replicate the Underlying Index as closely as possible, before considering fees and expenses, and invests in substantially all of the securities in the Underlying Index in approximately the same proportions as the Underlying Index.
HOW DID THE FUND PERFORM?
For the twelve months ended October 31, 2019, the Fund performed in line with the Underlying Index, before considering the effects of operating expenses, fees and tax management of the Fund’s portfolio.
The Fund’s and the Underlying Index’s allocations to the financials and information technology sectors were leading contributors to absolute performance, while their allocations to the health care sector was the sole sector detractor from absolute performance.
HOW WAS THE FUND POSITIONED?
During the reporting period, the Fund’s and the Underlying Index’s largest allocations were in the financials and energy sectors and their smallest allocations were in the real estate and health care sectors.
| | | | | | | | |
| | | |
| OCTOBER 31, 2019 | | J.P. MORGAN EXCHANGE-TRADED FUNDS | | | | | 3 | |
JPMorgan BetaBuilders Canada ETF
FUND COMMENTARY
TWELVE MONTHS ENDED OCTOBER 31, 2019 (Unaudited) (continued)
| | | | | | | | |
| TOP TEN EQUITY HOLDINGS OF THE PORTFOLIO**** | |
| | 1. | | | Royal Bank of Canada | | | 7.4 | % |
| | 2. | | | Toronto-Dominion Bank (The) | | | 6.6 | |
| | 3. | | | Enbridge, Inc. | | | 4.7 | |
| | 4. | | | Bank of Nova Scotia (The) | | | 4.5 | |
| | 5. | | | Canadian National Railway Co. | | | 4.1 | |
| | 6. | | | Brookfield Asset Management, Inc., Class A | | | 3.2 | |
| | 7. | | | Bank of Montreal | | | 3.0 | |
| | 8. | | | TC Energy Corp. | | | 3.0 | |
| | 9. | | | Suncor Energy, Inc. | | | 2.9 | |
| | 10. | | | Canadian Imperial Bank of Commerce | | | 2.4 | |
| | | | |
PORTFOLIO COMPOSITION BY SECTOR**** | |
| Financials | | | 36.5 | % |
| Energy | | | 16.8 | |
| Industrials | | | 10.5 | |
| Materials | | | 9.3 | |
| Information Technology | | | 5.3 | |
| Consumer Staples | | | 4.0 | |
| Consumer Discretionary | | | 3.9 | |
| Communication Services | | | 3.3 | |
| Utilities | | | 3.2 | |
| Health Care | | | 1.0 | |
| Real Estate | | | 0.5 | |
| Short-Term Investments | | | 5.7 | |
| * | | The return shown is based on net asset value calculated for shareholder transactions and may differ from the return shown in the financial highlights, which reflects adjustments made to the net asset value in accordance with accounting principles generally accepted in the United States of America. The net asset value was $24.89 as of October 31, 2019. |
| ** | | Market price return is calculated assuming an initial investment made at the market price at the beginning of the period, reinvestment of all dividends and distributions at market price during the period, and sale at the market price on the last day of the period. The price used to calculate the market price return is the midpoint of the bid/ask spread at the close of business on the Cboe BZX Exchange, Inc. The midpoint price was $24.90 as of October 31, 2019. |
| *** | | The adviser seeks to achieve the Fund’s objective. There can be no guarantee it will be achieved. |
| **** | | Percentages indicated are based on total investments as of October 31, 2019. The Fund’s portfolio composition is subject to change. |
| | | | | | |
| | | |
| 4 | | | | J.P. MORGAN EXCHANGE-TRADED FUNDS | | OCTOBER 31, 2019 |
| | | | | | | | | | | | |
AVERAGE ANNUAL TOTAL RETURNSAS OF OCTOBER 31, 2019 (Unaudited) | |
| | | INCEPTION DATE | | | 1 YEAR | | | SINCE
INCEPTION | |
JPMorgan BetaBuilders Canada ETF | | | | | | | | | | | | |
Net Asset Value | | | August 7, 2018 | | | | 13.08% | | | | 3.10% | |
Market Price | | | | | | | 12.97% | | | | 3.13% | |
LIFE OF FUND PERFORMANCE(8/7/18 TO 10/31/19)
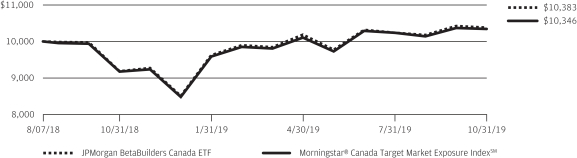
The performance quoted is past performance and is not a guarantee of future results. Exchange-traded funds are subject to certain market risks. Investment returns and principal value of an investment will fluctuate so that an investor’s shares, when sold or redeemed, may be worth more or less than their original cost. Current performance may be higher or lower than the performance data shown. For up-to-date, month-end performance information please call 1-844-457-6383.
Fund commenced operations on August 7, 2018.
The graph illustrates comparative performance for $10,000 invested in shares of the JPMorgan BetaBuilders Canada ETF and Morningstar® Canada Target Market Exposure IndexSM from August 7, 2018 to October 31, 2019. The performance of the Fund reflects the deduction of Fund expenses and assumes reinvestment of all dividends and capital gain distributions, if any. The performance of the Morningstar® Canada Target Market Exposure IndexSM does not reflect the deduction of expenses associated with an exchange-traded fund and has been adjusted to reflect reinvestment of all dividends and capital gain distributions of the securities included in the Index, if applicable. The Morningstar® Canada Target Market Exposure IndexSM is a free float adjusted market
capitalization weighted index which consists of stocks traded primarily on the Toronto Stock Exchange. Investors cannot invest directly in an index.
Fund performance reflects the waiver of the Fund’s fees and reimbursement of expenses for certain periods since the inception date. Without these waivers and reimbursements, performance would have been lower. Also, performance shown in this section does not reflect the deduction of taxes that a shareholder may pay on Fund distributions or redemption or sale of Fund shares.
International investing involves a greater degree of risk and increased volatility. Changes in currency exchange rates and differences in accounting and taxation policies outside the United States can raise or lower returns. Also, some foreign markets may not be as politically and economically stable as the United States and other nations.
The returns shown are based on net asset values calculated for shareholder transactions and may differ from the returns shown in the financial highlights, which reflect adjustments made to the net asset values in accordance with accounting principles generally accepted in the United States of America.
| | | | | | | | |
| | | |
| OCTOBER 31, 2019 | | J.P. MORGAN EXCHANGE-TRADED FUNDS | | | | | 5 | |
JPMorgan BetaBuilders Developed Asia ex-Japan ETF
FUND COMMENTARY
TWELVE MONTHS ENDED OCTOBER 31, 2019 (Unaudited)
| | | | |
| REPORTING PERIOD RETURN: | |
| JPMorgan BetaBuilders Developed Asia ex-Japan ETF | | | | |
| Net Asset Value* | | | 16.18% | |
| Market Price** | | | 15.94% | |
| Morningstar® Developed Asia Pacific ex-Japan Target Market Exposure Indexsm | | | 16.77% | |
| |
| Net Assets as of 10/31/2019 | | $ | 1,442,853,830 | |
INVESTMENT OBJECTIVE***
The JPMorgan BetaBuilders Developed Asia ex-Japan ETF (the “Fund”) seeks investment results that closely correspond, before fees and expenses, to the performance of the Morningstar® Developed Asia Pacific ex-Japan Target Market Exposure Indexsm (the “Underlying Index”).
INVESTMENT APPROACH
The Underlying Index is a free-float adjusted market-cap weighted index consisting of stocks from developed Asia Pacific countries other than Japan, including: Australia, Hong Kong, New Zealand and Singapore. Using a “passive” investment approach, the Fund attempts to replicate the Underlying Index as closely as possible, before considering fees and expenses, and invests in substantially all of the securities in the Underlying Index in approximately the same proportions as the Underlying Index.
HOW DID THE FUND PERFORM?
For the twelve months ended October 31, 2019, the Fund performed in line with the Underlying Index, before considering
the effects of operating expenses, fees and tax management of the Fund’s portfolio.
The Fund’s and the Underlying Index’s exposures to the financials and real estate sectors were leading contributors to absolute performance, while their exposures to the information technology and energy sectors were the smallest sector contributors to absolute performance. By country, the Fund’s and the Underlying Index’s exposures to Australia and Hong Kong were leading contributors to absolute performance, while their exposures to New Zealand and Singapore were the smallest contributors to absolute performance.
HOW WAS THE FUND POSITIONED?
During the reporting period, the Fund’s and the Underlying Index’s largest allocations were in the financials and real estate sectors and their smallest allocations were in the information technology and energy sectors. The Fund and the Underlying Index were mainly invested in four equity markets during the reporting period, with the largest allocations to Australia, followed by Hong Kong, Singapore and New Zealand.
| | | | | | |
| | | |
| 6 | | | | J.P. MORGAN EXCHANGE-TRADED FUNDS | | OCTOBER 31, 2019 |
| | | | | | | | |
| TOP TEN EQUITY HOLDINGS OF THE PORTFOLIO**** | |
| | 1. | | | AIA Group Ltd. (Hong Kong) | | | 6.9 | % |
| | 2. | | | Commonwealth Bank of Australia (Australia) | | | 5.5 | |
| | 3. | | | CSL Ltd. (Australia) | | | 4.6 | |
| | 4. | | | BHP Group Ltd. (Australia) | | | 4.2 | |
| | 5. | | | Westpac Banking Corp. (Australia) | | | 3.8 | |
| | 6. | | | National Australia Bank Ltd. (Australia) | | | 3.3 | |
| | 7. | | | Australia & New Zealand Banking Group Ltd. (Australia) | | | 3.1 | |
| | 8. | | | Hong Kong Exchanges & Clearing Ltd. (Hong Kong) | | | 2.1 | |
| | 9. | | | DBS Group Holdings Ltd. (Singapore) | | | 2.0 | |
| | 10. | | | Woolworths Group Ltd. (Australia) | | | 2.0 | |
| | | | |
PORTFOLIO COMPOSITION BY COUNTRY**** | |
| Australia | | | 57.0 | % |
| Hong Kong | | | 24.7 | |
| Singapore | | | 11.8 | |
| New Zealand | | | 2.3 | |
| Macau | | | 2.1 | |
| United Kingdom | | | 1.4 | |
| Others (each less than 1.0%) | | | 0.7 | |
| * | | The return shown is based on net asset value calculated for shareholder transactions and may differ from the return shown in the financial highlights, which reflects adjustments made to the net asset value in accordance with accounting principles generally accepted in the United States of America. The net asset value was $25.31 as of October 31, 2019. |
| ** | | Market price return is calculated assuming an initial investment made at the market price at the beginning of the period, reinvestment of all dividends and distributions at market price during the period, and sale at the market price on the last day of the period. The price used to calculate the market price return is the midpoint of the bid/ask spread at the close of business on the Cboe BZX Exchange, Inc. The midpoint price was $25.27 as of October 31, 2019. |
| *** | | The adviser seeks to achieve the Fund’s objective. There can be no guarantee it will be achieved. |
| **** | | Percentages indicated are based on total investments as of October 31, 2019. The Fund’s portfolio composition is subject to change. |
| | | | | | | | |
| | | |
| OCTOBER 31, 2019 | | J.P. MORGAN EXCHANGE-TRADED FUNDS | | | | | 7 | |
JPMorgan BetaBuilders Developed Asia ex-Japan ETF
FUND COMMENTARY
TWELVE MONTHS ENDED OCTOBER 31, 2019 (Unaudited) (continued)
| | | | | | | | | | | | |
AVERAGE ANNUAL TOTAL RETURNSAS OF OCTOBER 31, 2019 (Unaudited) | |
| | | INCEPTION DATE | | | 1 YEAR | | | SINCE
INCEPTION | |
JPMorgan BetaBuilders Developed Asiaex-Japan ETF | | | | | | | | | | | | |
Net Asset Value | | | August 7, 2018 | | | | 16.18% | | | | 3.71% | |
Market Price | | | | | | | 15.94% | | | | 3.57% | |
LIFE OF FUND PERFORMANCE(8/7/18 TO 10/31/19)
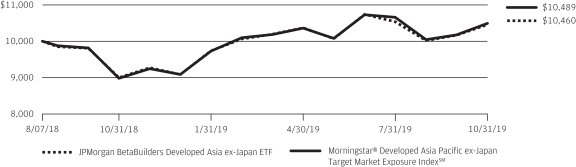
The performance quoted is past performance and is not a guarantee of future results. Exchange-traded funds are subject to certain market risks. Investment returns and principal value of an investment will fluctuate so that an investor’s shares, when sold or redeemed, may be worth more or less than their original cost. Current performance may be higher or lower than the performance data shown. For up-to-date, month-end performance information pleasecall 1-844-457-6383.
Fund commenced operations on August 7, 2018.
The graph illustrates comparative performance for $10,000 invested in shares of the JPMorgan BetaBuilders Developed Asia ex-Japan ETF and Morningstar® Developed Asia Pacific ex-Japan Target Market Exposure IndexSM from August 7, 2018 to October 31, 2019. The performance of the Fund reflects the deduction of Fund expenses and assumes reinvestment of all dividends and capital gain distributions, if any. The performance of the Morningstar® Developed Asia Pacific ex-Japan Target Market Exposure IndexSM does not reflect the deduction of expenses associated with an exchange-traded fund and has been adjusted to reflect reinvestment of all dividends and capital gain distributions of the securities included in the Index, if applicable. The Morningstar® Developed Asia Pacific ex-Japan Target Market Exposure IndexSM is a free float adjusted
market capitalization-weighted index that consists of equity securities from developed Asia-Pacific countries or regions other than Japan, including Australia, Hong Kong, New Zealand, and Singapore. Investors cannot invest directly in an index.
Fund performance reflects the waiver of the Fund’s fees and reimbursement of expenses for certain periods since the inception date. Without these waivers and reimbursements, performance would have been lower. Also, performance shown in this section does not reflect the deduction of taxes that a shareholder may pay on Fund distributions or redemption or sale of Fund shares.
International investing involves a greater degree of risk and increased volatility. Changes in currency exchange rates and differences in accounting and taxation policies outside the United States can raise or lower returns. Also, some over- seas markets may not be as politically and economically stable as the United States and other nations.
The returns shown are based on net asset values calculated for shareholder transactions and may differ from the returns shown in the financial highlights, which reflect adjustments made to the net asset values in accordance with accounting principles generally accepted in the United States of America.
| | | | | | |
| | | |
| 8 | | | | J.P. MORGAN EXCHANGE-TRADED FUNDS | | OCTOBER 31, 2019 |
JPMorgan BetaBuilders Europe ETF
FUND COMMENTARY
TWELVE MONTHS ENDED OCTOBER 31, 2019 (Unaudited)
| | | | |
| REPORTING PERIOD RETURN: | |
| JPMorgan BetaBuilders Europe ETF | | | | |
| Net Asset Value* | | | 11.43% | |
| Market Price** | | | 11.32% | |
| Morningstar® Developed Europe Target Market Exposure Indexsm | | | 10.93% | |
| |
| Net Assets as of 10/31/2019 | | $ | 3,853,145,624 | |
INVESTMENT OBJECTIVE***
The JPMorgan BetaBuilders Europe ETF (the “Fund”) seeks investment results that closely correspond, before fees and expenses, to the performance of the Morningstar® Developed Europe Target Market Exposure Indexsm (the “Underlying Index”).
INVESTMENT APPROACH
The Underlying Index is a free-float adjusted market-cap weighted index consisting of stocks traded on the primary exchanges in developed countries or regions across Europe. Using a “passive” investment approach, the Fund attempts to replicate the Underlying Index as closely as possible, before considering fees and expenses, and invests in substantially all of the securities in the Underlying Index in approximately the same proportions as the Underlying Index.
HOW DID THE FUND PERFORM?
For the twelve months ended October 31, 2019, the Fund performed in line with the Underlying Index, before considering the effects of operating expenses, fees and tax management of the Fund’s portfolio.
The Fund’s and the Underlying Index’s exposures to the industrials and health care sectors were the leading contributors to absolute performance, while their exposure to the energy sector was the sole sector detractor from absolute performance during the reporting period.
By country, the Fund’s and the Underlying Index’s exposures to Switzerland and France were leading contributors to absolute performance, while their exposures to Norway and Austria were the largest detractors from absolute performance.
HOW WAS THE FUND POSITIONED?
During the reporting period, the Fund’s and the Underlying Index’s largest allocations were in the financials and consumer staples sectors and their smallest allocations were in the real estate and utilities sectors. The Fund’s and the Underlying Index’s largest country allocations were in the U.K. and France and their smallest country allocations were in Portugal and Austria.
| | | | | | | | |
| | | |
| OCTOBER 31, 2019 | | J.P. MORGAN EXCHANGE-TRADED FUNDS | | | | | 9 | |
JPMorgan BetaBuilders Europe ETF
FUND COMMENTARY
TWELVE MONTHS ENDED OCTOBER 31, 2019 (Unaudited) (continued)
| | | | | | | | |
| TOP TEN EQUITY HOLDINGS OF THE PORTFOLIO**** | |
| | 1. | | | Nestle SA (Registered) (Switzerland) | | | 3.4 | % |
| | 2. | | | Novartis AG (Registered) (Switzerland) | | | 2.4 | |
| | 3. | | | Roche Holding AG (Switzerland) | | | 2.3 | |
| | 4. | | | HSBC Holdings plc (United Kingdom) | | | 1.6 | |
| | 5. | | | SAP SE (Germany) | | | 1.5 | |
| | 6. | | | TOTAL SA (France) | | | 1.4 | |
| | 7. | | | BP plc (United Kingdom) | | | 1.4 | |
| | 8. | | | AstraZeneca plc (United Kingdom) | | | 1.4 | |
| | 9. | | | Royal Dutch Shell plc, Class A (Netherlands) | | | 1.3 | |
| | 10. | | | LVMH Moet Hennessy Louis Vuitton SE (France) | | | 1.2 | |
| | | | |
PORTFOLIO COMPOSITION BY COUNTRY**** | |
| United Kingdom | | | 22.1 | % |
| France | | | 16.7 | |
| Switzerland | | | 14.8 | |
| Germany | | | 13.1 | |
| Netherlands | | | 6.9 | |
| Sweden | | | 4.4 | |
| Spain | | | 4.3 | |
| Italy | | | 3.5 | |
| Denmark | | | 2.7 | |
| Finland | | | 1.9 | |
| Belgium | | | 1.7 | |
| Norway | | | 1.1 | |
| Australia | | | 1.0 | |
| Others (each less than 1.0%) | | | 2.9 | |
| Short-Term Investments | | | 2.9 | |
| * | | The return shown is based on net asset value calculated for shareholder transactions and may differ from the return shown in the financial highlights, which reflects adjustments made to the net asset value in accordance with accounting principles generally accepted in the United States of America. The net asset value was $24.36 as of October 31, 2019. |
| ** | | Market price return is calculated assuming an initial investment made at the market price at the beginning of the period, reinvestment of all dividends and distributions at market price during the period, and sale at the market price on the last day of the period. The price used to calculate the market price return is the midpoint of the bid/ask spread at the close of business on the Cboe BZX Exchange, Inc. The midpoint price was $24.39 as of October 31, 2019. |
| *** | | The adviser seeks to achieve the Fund’s objective. There can be no guarantee it will be achieved. |
| **** | | Percentages indicated are based on total investments as of October 31, 2019. The Fund’s portfolio composition is subject to change. |
| | | | | | |
| | | |
| 10 | | | | J.P. MORGAN EXCHANGE-TRADED FUNDS | | OCTOBER 31, 2019 |
| | | | | | | | | | | | |
AVERAGE ANNUAL TOTAL RETURNSAS OF OCTOBER 31, 2019 (Unaudited) | |
| | | INCEPTION DATE | | | 1 YEAR | | | SINCE
INCEPTION | |
JPMorgan BetaBuilders Europe ETF | | | | | | | | | | | | |
Net Asset Value | | | June 15, 2018 | | | | 11.43% | | | | 1.21% | |
Market Price | | | | | | | 11.32% | | | | 1.31% | |
LIFE OF FUND PERFORMANCE(6/15/18 TO 10/31/19)
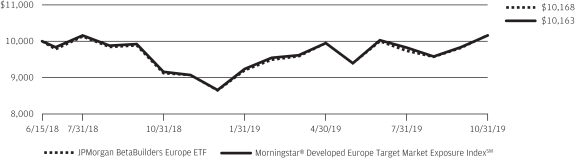
The performance quoted is past performance and is not a guarantee of future results. Exchange-traded funds are subject to certain market risks. Investment returns and principal value of an investment will fluctuate so that an investor’s shares, when sold or redeemed, may be worth more or less than their original cost. Current performance may be higher or lower than the performance data shown. For up-to-date, month-end performance information please call 1-844-457-6383.
Fund commenced operations on June 15, 2018.
The graph illustrates comparative performance for $10,000 invested in shares of the JPMorgan BetaBuilders Europe ETF and Morningstar® Developed Europe Target Market Exposure IndexSM from June 15, 2018 to October 31, 2019. The performance of the Fund reflects the deduction of Fund expenses and assumes reinvestment of all dividends and capital gain distributions, if any. The performance of the Morningstar® Developed Europe Target Market Exposure IndexSM does not reflect the deduction of expenses associated with an exchange-traded fund and has been adjusted to reflect reinvestment of all dividends and capital gain distributions of the securities included in the Index, if applicable. Morningstar® Developed Europe Target Market Exposure IndexSM is a
free float adjusted market capitalization-weighted index which consists of equity securities from developed European countries or regions. Investors cannot invest directly in an index.
Fund performance reflects the waiver of the Fund’s fees and reimbursement of expenses for certain periods since the inception date. Without these waivers and reimbursements, performance would have been lower. Also, performance shown in this section does not reflect the deduction of taxes that a shareholder may pay on Fund distributions or redemption or sale of Fund shares.
International investing involves a greater degree of risk and increased volatility. Changes in currency exchange rates and differences in accounting and taxation policies outside the United States can raise or lower returns. Also, some over- seas markets may not be as politically and economically stable as the United States and other nations.
The returns shown are based on net asset values calculated for shareholder transactions and may differ from the returns shown in the financial highlights, which reflect adjustments made to the net asset values in accordance with accounting principles generally accepted in the United States of America.
| | | | | | | | |
| | | |
| OCTOBER 31, 2019 | | J.P. MORGAN EXCHANGE-TRADED FUNDS | | | | | 11 | |
JPMorgan BetaBuilders Japan ETF
FUND COMMENTARY
TWELVE MONTHS ENDED OCTOBER 31, 2019 (Unaudited)
| | | | |
| REPORTING PERIOD RETURN: | |
| JPMorgan BetaBuilders Japan ETF | | | | |
| Net Asset Value* | | | 8.74% | |
| Market Price** | | | 9.07% | |
| Morningstar® Japan Target Market Exposure Indexsm | | | 9.05% | |
| |
| Net Assets as of 10/31/2019 | | $ | 4,318,521,919 | |
INVESTMENT OBJECTIVE***
The JPMorgan BetaBuilders Japan ETF (the “Fund”) seeks investment results that closely correspond, before fees and expenses, to the performance of the Morningstar® Japan Target Market Exposure Indexsm (the “Underlying Index”).
INVESTMENT APPROACH
The Underlying Index is a free-float adjusted market-cap weighted index consisting of stocks traded primarily on the Tokyo or Nagoya stock exchanges. Using a “passive” investment approach, the Fund attempts to replicate the Underlying Index as closely as possible, before considering fees and expenses, and invests in substantially all of the securities in the Underlying Index in approximately the same proportions as the Underlying Index.
HOW DID THE FUND PERFORM?
For the twelve months ended October 31, 2019, the Fund performed in line with the Underlying Index, before considering
the effects of operating expenses, fees and tax management of the Fund’s portfolio.
The Fund’s and the Underlying Index’s exposures to the industrials and information technology sectors were leading contributors to absolute performance, while their exposures to the financials and energy sectors were leading detractors from absolute performance.
HOW WAS THE FUND POSITIONED?
During the reporting period, the Fund’s and the Underlying Index’s largest allocations were in the industrials and consumer discretionary sectors and their smallest allocations were in the energy and utilities sectors.
| | | | | | |
| | | |
| 12 | | | | J.P. MORGAN EXCHANGE-TRADED FUNDS | | OCTOBER 31, 2019 |
| | | | | | | | |
| TOP TEN EQUITY HOLDINGS OF THE PORTFOLIO**** | |
| | 1. | | | Toyota Motor Corp. | | | 4.5 | % |
| | 2. | | | Sony Corp. | | | 1.9 | |
| | 3. | | | Mitsubishi UFJ Financial Group, Inc. | | | 1.7 | |
| | 4. | | | SoftBank Group Corp. | | | 1.6 | |
| | 5. | | | Keyence Corp. | | | 1.5 | |
| | 6. | | | Takeda Pharmaceutical Co. Ltd. | | | 1.4 | |
| | 7. | | | Recruit Holdings Co. Ltd. | | | 1.3 | |
| | 8. | | | Honda Motor Co. Ltd. | | | 1.2 | |
| | 9. | | | Sumitomo Mitsui Financial Group, Inc. | | | 1.2 | |
| | 10. | | | KDDI Corp. | | | 1.1 | |
| | | | |
PORTFOLIO COMPOSITION BY SECTOR**** | |
| Industrials | | | 21.9 | % |
| Consumer Discretionary | | | 18.9 | |
| Information Technology | | | 10.9 | |
| Financials | | | 10.1 | |
| Health Care | | | 9.3 | |
| Consumer Staples | | | 8.3 | |
| Communication Services | | | 7.3 | |
| Materials | | | 5.7 | |
| Real Estate | | | 4.8 | |
| Utilities | | | 1.6 | |
| Others (each less than 1.0%) | | | 1.2 | |
| * | | The return shown is based on net asset value calculated for shareholder transactions and may differ from the return shown in the financial highlights, which reflects adjustments made to the net asset value in accordance with accounting principles generally accepted in the United States of America. The net asset value was $24.54 as of October 31, 2019. |
| ** | | Market price return is calculated assuming an initial investment made at the market price at the beginning of the period, reinvestment of all dividends and distributions at market price during the period, and sale at the market price on the last day of the period. The price used to calculate the market price return is the midpoint of the bid/ask spread at the close of business on the Cboe BZX Exchange, Inc. The midpoint price was $24.57 as of October 31, 2019. |
| *** | | The adviser seeks to achieve the Fund’s objective. There can be no guarantee it will be achieved. |
| **** | | Percentages indicated are based on total investments as of October 31, 2019. The Fund’s portfolio composition is subject to change. |
| | | | | | | | |
| | | |
| OCTOBER 31, 2019 | | J.P. MORGAN EXCHANGE-TRADED FUNDS | | | | | 13 | |
JPMorgan BetaBuilders Japan ETF
FUND COMMENTARY
TWELVE MONTHS ENDED OCTOBER 31, 2019 (Unaudited) (continued)
| | | | | | | | | | | | |
AVERAGE ANNUAL TOTAL RETURNSAS OF OCTOBER 31, 2019 (Unaudited) | |
| | | INCEPTION DATE | | | 1 YEAR | | | SINCE
INCEPTION | |
JPMorgan BetaBuilders Japan ETF | | | | | | | | | | | | |
Net Asset Value | | | June 15, 2018 | | | | 8.74% | | | | (0.24 | )% |
Market Price | | | | | | | 9.07% | | | | (0.16 | )% |
LIFE OF FUND PERFORMANCE(6/15/18 TO 10/31/19)
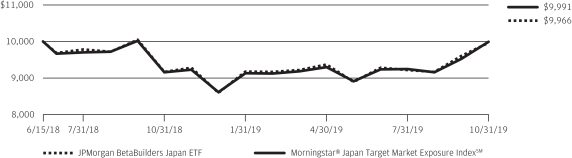
The performance quoted is past performance and is not a guarantee of future results. Exchange-traded funds are subject to certain market risks. Investment returns and principal value of an investment will fluctuate so that an investor’s shares, when sold or redeemed, may be worth more or less than their original cost. Current performance may be higher or lower than the performance data shown. For up-to-date, month-end performance information please call 1-844-457-6383.
Fund commenced operations on June 15, 2018.
The graph illustrates comparative performance for $10,000 invested in shares of the JPMorgan BetaBuilders Japan ETF and Morningstar® Japan Target Market Exposure IndexSM from June 15, 2018 to October 31, 2019. The performance of the Fund reflects the deduction of Fund expenses and assumes reinvestment of all dividends and capital gain distributions, if any. The performance of the Morningstar® Japan Target Market Exposure IndexSM does not reflect the deduction of expenses associated with an exchange-traded fund and has been adjusted to reflect reinvestment of all dividends and capital gain distributions of the securities included in the Index, if applicable. Morningstar® Japan Target Market Exposure IndexSM is a free float adjusted market capitalization weighted index
which consists of stocks traded primarily on the Tokyo Stock Exchange or the Nagoya Stock Exchange. Investors cannot invest directly in an index.
Fund performance reflects the waiver of the Fund’s fees and reimbursement of expenses for certain periods since the inception date. Without these waivers and reimbursements, performance would have been lower. Also, performance shown in this section does not reflect the deduction of taxes that a shareholder may pay on Fund distributions or redemption or sale of Fund shares.
International investing involves a greater degree of risk and increased volatility. Changes in currency exchange rates and differences in accounting and taxation policies outside the United States can raise or lower returns. Also, some over- seas markets may not be as politically and economically stable as the United States and other nations.
The returns shown are based on net asset values calculated for shareholder transactions and may differ from the returns shown in the financial highlights, which reflect adjustments made to the net asset values in accordance with accounting principles generally accepted in the United States of America.
| | | | | | |
| | | |
| 14 | | | | J.P. MORGAN EXCHANGE-TRADED FUNDS | | OCTOBER 31, 2019 |
JPMorgan BetaBuilders U.S. Equity ETF
FUND COMMENTARY
FOR THE PERIOD MARCH 12, 2019 (INCEPTION DATE) THROUGH OCTOBER 31, 2019 (Unaudited)
| | | | |
| REPORTING PERIOD RETURN: | |
| JPMorgan BetaBuilders U.S. Equity ETF | | | | |
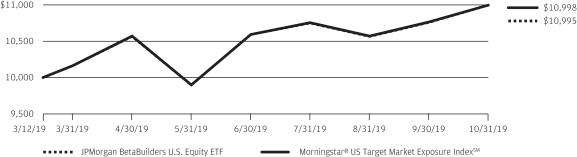
| Net Asset Value* | | | 9.95% | |
| Market Price** | | | 9.97% | |
| Morningstar® US Target Market Exposure Indexsm | | | 9.98% | |
| |
| Net Assets as of 10/31/2019 | | $ | 46,409,125 | |
INVESTMENT OBJECTIVE***
The JPMorgan BetaBuilders U.S. Equity ETF (the “Fund”) seeks investment results that closely correspond, before fees and expenses, to the performance of the Morningstar® US Target Market Exposure Indexsm (the “Underlying Index”).
INVESTMENT APPROACH
The Underlying Index is a free-float adjusted market-cap weighted index consisting of equity securities traded primarily in the U.S. Using a “passive” investment approach, the Fund attempts to replicate the Underlying Index as closely as possible, before considering fees and expenses, and invests in substantially all of the securities in the Underlying Index in approximately the same proportions as the Underlying Index.
HOW DID THE FUND PERFORM?
For the period from inception on March 12, 2019 to October 31, 2019, the Fund performed in line with the Underlying Index, before considering the effects of operating expenses, fees and tax management of the Fund’s portfolio.
The Fund’s and the Underlying Index’s exposures to the information technology and financials sectors were leading contributors to absolute performance, while their exposure to the energy sector was the sole sector detractor from absolute performance.
HOW WAS THE FUND POSITIONED?
During the reporting period, the Fund’s and the Underlying Index’s largest allocations were in the information technology and health care sectors and their smallest allocations were in the materials and real estate sectors.
| | | | | | | | |
| TOP TEN EQUITY HOLDINGS OF THE PORTFOLIO**** | |
| | 1. | | | Microsoft Corp. | | | 4.1 | % |
| | 2. | | | Apple, Inc. | | | 4.0 | |
| | 3. | | | Amazon.com, Inc. | | | 2.8 | |
| | 4. | | | Facebook, Inc., Class A | | | 1.8 | |
| | 5. | | | Berkshire Hathaway, Inc., Class B | | | 1.6 | |
| | 6. | | | JPMorgan Chase & Co. | | | 1.5 | |
| | 7. | | | Alphabet, Inc., Class C | | | 1.4 | |
| | 8. | | | Alphabet, Inc., Class A | | | 1.4 | |
| | 9. | | | Johnson & Johnson | | | 1.3 | |
| | 10. | | | Procter & Gamble Co. (The) | | | 1.2 | |
| | | | |
PORTFOLIO COMPOSITION BY SECTOR**** | |
| Information Technology | | | 22.3 | % |
| Health Care | | | 13.9 | |
| Financials | | | 13.0 | |
| Communication Services | | | 10.3 | |
| Consumer Discretionary | | | 10.2 | |
| Industrials | | | 9.3 | |
| Consumer Staples | | | 7.2 | |
| Energy | | | 4.2 | |
| Utilities | | | 3.5 | |
| Real Estate | | | 3.2 | |
| Materials | | | 2.6 | |
| Short-Term Investments | | | 0.3 | |
| * | | The return shown is based on net asset value calculated for shareholder transactions and may differ from the return shown in the financial highlights, which reflects adjustments made to the net asset value in accordance with accounting principles generally accepted in the United States of America. The net asset value was $54.60 as of October 31, 2019. |
| ** | | Market price return is calculated assuming an initial investment made at the inception date net asset value, reinvestment of all dividends and distributions at market price during the period, and sale at the market price on the last day of the period. The price used to calculate the market price return is the midpoint of the bid/ask spread at the close of business on the Cboe BZX Exchange, Inc. The midpoint price was $54.61 as of October 31, 2019. |
| *** | | The adviser seeks to achieve the Fund’s objective. There can be no guarantee it will be achieved. |
| **** | | Percentages indicated are based on total investments as of October 31, 2019. The Fund’s portfolio composition is subject to change. |
| | | | | | | | |
| | | |
| OCTOBER 31, 2019 | | J.P. MORGAN EXCHANGE-TRADED FUNDS | | | | | 15 | |
JPMorgan BetaBuilders U.S. Equity ETF
FUND COMMENTARY
FOR THE PERIOD MARCH 12, 2019 (INCEPTION DATE) THROUGH OCTOBER 31, 2019 (Unaudited) (continued)
| | | | | | | | |
TOTAL RETURNSAS OF OCTOBER 31, 2019 (Unaudited) | |
| | | INCEPTION DATE | | | CUMULATIVE
SINCE
INCEPTION | |
| JPMorgan BetaBuilders U.S. Equity ETF | | | | | | | | |
Net Asset Value | | | March 12, 2019 | | | | 9.95% | |
Market Price | | | | | | | 9.97% | |
LIFE OF FUND PERFORMANCE(3/12/19 TO 10/31/19)
The performance quoted is past performance and is not a guarantee of future results. Exchange-traded funds are subject to certain market risks. Investment returns and principal value of an investment will fluctuate so that an investor’s shares, when sold or redeemed, may be worth more or less than their original cost. Current performance may be higher or lower than the performance data shown. For up-to-date, month-end performance information please call 1-844-457-6383.
Fund commenced operations on March 12, 2019.
The graph illustrates comparative performance for $10,000 invested in shares of the JPMorgan BetaBuilders U.S. Equity ETF and the Morningstar® US Target Market Exposure IndexSM from March 12, 2019 to October 31, 2019. The performance of the Fund reflects the deduction of Fund expenses and assumes
reinvestment of all dividends and capital gain distributions, if any. The performance of the Morningstar® US Target Market Exposure IndexSM does not reflect the deduction of expenses associated with an exchange-traded fund and has been adjusted to reflect reinvestment of all dividends and capital gain distributions of the securities included in the Index, if applicable. Morningstar® US Target Market Exposure IndexSM is a free float adjusted market capitalization weighted index which consists of stocks traded primarily on the US Stock Exchange. Investors cannot invest directly in an index.
The returns shown are based on net asset values calculated for shareholder transactions and may differ from the returns shown in the financial highlights, which reflect adjustments made to the net asset values in accordance with accounting principles generally accepted in the United States of America.
| | | | | | |
| | | |
| 16 | | | | J.P. MORGAN EXCHANGE-TRADED FUNDS | | OCTOBER 31, 2019 |
JPMorgan Diversified Return Emerging Markets Equity ETF
FUND COMMENTARY
TWELVE MONTHS ENDED OCTOBER 31, 2019 (Unaudited)
| | | | |
| REPORTING PERIOD RETURN: | |
| JPMorgan Diversified Return Emerging Markets Equity ETF | | | | |
| Net Asset Value* | | | 10.00% | |
| Market Price** | | | 10.31% | |
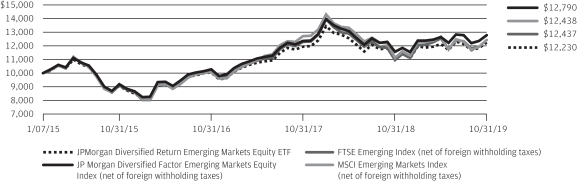
| JP Morgan Diversified Factor Emerging Markets Equity Index (net of foreign withholding taxes) | | | 10.66% | |
| FTSE Emerging Index (net of foreign withholding taxes) | | | 13.61% | |
| MSCI Emerging Markets Index (net of foreign withholding taxes) | | | 11.86% | |
| |
| Net Assets as of 10/31/2019 | | $ | 353,795,416 | |
INVESTMENT OBJECTIVE***
The JPMorgan Diversified Return Emerging Markets Equity ETF (the “Fund”) seeks investment results that closely correspond, before fees and expenses, to the performance of the JP Morgan Diversified Factor Emerging Markets Equity Index (the “Underlying Index”).
INVESTMENT APPROACH
The Fund is passively managed to the Underlying Index, which provides emerging markets equity exposure, diversified across emerging market regions and super-sectors, and beginning June 21, 2019, individual securities. The Underlying Index uses a proprietary multi-factor stock selection process that utilizes the following characteristics: value, momentum and quality. The Underlying Index methodology includes quarterly rebalancing.
HOW DID THE FUND PERFORM?
The Fund posted a positive absolute return for the twelve months ended October 31, 2019 and performed in line with the Underlying Index, before considering differences in the net asset value calculations and foreign exchange pricing between the Underlying Index and the Fund and fees and operating expenses incurred by the Fund. The Fund and the Underlying Index underperformed both the FTSE Emerging Index and the MSCI Emerging Markets Index, which are more traditional market capitalization weighted indexes.
By sector, the Fund’s and the Underlying Index’s positions in the financials and consumer goods sectors were leading contributors to absolute performance, while their positions in the basic materials and health care sectors were leading detractors from absolute performance. By country, the Fund’s and the Underlying Index’s positions in Brazil and Russia were leading contributors to absolute performance, while their positions in Malaysia and South Africa were leading detractors from absolute performance.
Relative to the FTSE Emerging Index, The Fund’s and the Underlying Index’s security selection and underweight positions in the technology sector and consumer services sectors were leading detractors from performance. The Fund’s and the Underlying Index’s security selection and underweight positions in the financials sector and their security selection and overweight positions in the consumer goods sector were leading contributors to relative performance.
HOW WAS THE FUND POSITIONED?
During the reporting period, the Fund’s and the Underlying Index’s largest sector allocations were in the financials and consumer goods sectors, while their smallest allocations were in the health care and consumer services sectors. The Fund’s and the Underlying Index’s largest country allocations were in China and Taiwan and their smallest allocations were in Pakistan and Hong Kong.
| | | | | | | | |
| | | |
| OCTOBER 31, 2019 | | J.P. MORGAN EXCHANGE-TRADED FUNDS | | | | | 17 | |
JPMorgan Diversified Return Emerging Markets Equity ETF
FUND COMMENTARY
TWELVE MONTHS ENDED OCTOBER 31, 2019 (Unaudited) (continued)
| | | | | | | | |
| TOP TEN EQUITY HOLDINGS OF THE PORTFOLIO**** | |
| | 1. | | | China Mobile Ltd. (China) | | | 1.7 | % |
| | 2. | | | LUKOIL PJSC (Russia) | | | 1.6 | |
| | 3. | | | Naspers Ltd., Class N (South Africa) | | | 1.6 | |
| | 4. | | | Gazprom PJSC (Russia) | | | 1.5 | |
| | 5. | | | Vale SA (Brazil) | | | 1.4 | |
| | 6. | | | Petroleo Brasileiro SA (Preference) (Brazil) | | | 1.3 | |
| | 7. | | | Taiwan Semiconductor Manufacturing Co. Ltd. (Taiwan) | | | 1.2 | |
| | 8. | | | Reliance Industries Ltd. (India) | | | 1.2 | |
| | 9. | | | Sberbank of Russia PJSC (Russia) | | | 1.1 | |
| | 10. | | | Itau Unibanco Holding SA (Preference) (Brazil) | | | 1.0 | |
| | | | |
PORTFOLIO COMPOSITION BY COUNTRY**** | |
China | | | 20.6 | % |
Brazil | | | 14.6 | |
Taiwan | | | 11.1 | |
India | | | 9.0 | |
Russia | | | 7.6 | |
| South Africa | | | 6.8 | |
| Mexico | | | 4.4 | |
| Thailand | | | 4.4 | |
| Indonesia | | | 4.2 | |
Malaysia | | | 3.1 | |
Saudi Arabia | | | 1.9 | |
Qatar | | | 1.7 | |
Turkey | | | 1.6 | |
Philippines | | | 1.3 | |
Kuwait | | | 1.3 | |
Chile | | | 1.2 | |
United Arab Emirates | | | 1.1 | |
Others (each less than 1.0%) | | | 3.6 | |
Short-Term Investments | | | 0.5 | |
| * | | The return shown is based on net asset value calculated for shareholder transactions and may differ from the return shown in the financial highlights, which reflects adjustments made to the net asset value in accordance with accounting principles generally accepted in the United States of America. The net asset value was $54.43 as of October 31, 2019. |
| ** | | Market price return is calculated assuming an initial investment made at the market price at the beginning of the period, reinvestment of all dividends and distributions at market price during the period, and sale at the market price on the last day of the period. The price used to calculate the market price return is the midpoint of the bid/ask spread at the close of business on the NYSE Arca. The midpoint price was $54.50 as of October 31, 2019. |
| *** | | The adviser seeks to achieve the Fund’s objective. There can be no guarantee it will be achieved. |
| **** | | Percentages indicated are based on total investments as of October 31, 2019. The Fund’s composition is subject to change. |
| | | | | | |
| | | |
| 18 | | | | J.P. MORGAN EXCHANGE-TRADED FUNDS | | OCTOBER 31, 2019 |
| | | | | | | | | | | | |
AVERAGE ANNUAL TOTAL RETURNSAS OFOCTOBER 31, 2019 (Unaudited) | |
| | | INCEPTION DATE | | | 1 YEAR | | | SINCE
INCEPTION | |
JPMorgan Diversified Return Emerging Markets Equity ETF | | | | | | | | | | | | |
Net Asset Value | | | January 7, 2015 | | | | 10.00% | | | | 4.27% | |
Market Price | | | | | | | 10.31% | | | | 4.30% | |
LIFE OF FUND PERFORMANCE(1/07/15 TO 10/31/19)
The performance quoted is past performance and is not a guarantee of future results. Exchange-traded funds are subject to certain market risks. Investment returns and principal value of an investment will fluctuate so that an investor’s shares, when sold or redeemed, may be worth more or less than their original cost. Current performance may be higher or lower than the performance data shown. For up-to-date, month-end performance information pleasecall 1-844-457-6383.
Fund commenced operations on January 7, 2015.
The graph illustrates comparative performance for $10,000 invested in shares of the JPMorgan Diversified Return Emerging Markets Equity ETF, the JP Morgan Diversified Factor Emerging Markets Equity Index, the FTSE Emerging Index and the MSCI Emerging Markets Index from January 7, 2015 to October 31, 2019. The performance of the Fund reflects the deduction of Fund expenses and assumes reinvestment of all dividends and capital gain distributions, if any. The performance of the JP Morgan Diversified Factor Emerging Markets Equity Index, the FTSE Emerging Index and the MSCI Emerging Markets Index does not reflect the deduction of expenses associated with an exchange-traded fund and has been adjusted to reflect reinvestment of all dividends and capital gain distributions of the securities included in the Index, if applicable. The Fund’s adviser is a sponsor of the JP Morgan Diversified Factor Emerging Markets Equity Index and developed the proprietary factors on which the index is based. FTSE Russell, the benchmark administrator, administers, calculates and governs the JP Morgan Diversified Factor Emerging Markets Equity Index. JP Morgan Diversified Factor Emerging Markets Equity Index is comprised of large- and mid-cap equity securities from emerging markets.
Holdings in this index are selected from the constituents of the FTSE Emerging Index. The FTSE Emerging Index is a market-capitalization weighted index and is part of the FTSE Global Equity Index Series. The series includes large- and mid-cap securities from advanced and secondary emerging markets, classified in accordance with FTSE’s transparent Country Classification Review Process. The FTSE Emerging Index provides investors with a comprehensive means of measuring the performance of the most liquid companies in the emerging markets. The MSCI Emerging Markets Index is a free float-adjusted market capitalization weighted index that is designed to measure the equity market performance of emerging markets. Investors cannot invest directly in an index.
Fund performance reflects the waiver of the Fund’s fees and reimbursement of expenses for certain periods since the inception date. Without these waivers and reimbursements, performance would have been lower. Also, performance shown in this section does not reflect the deduction of taxes that a shareholder may pay on Fund distributions or redemption or sale of Fund shares.
International investing involves a greater degree of risk and increased volatility. Changes in currency exchange rates and differences in accounting and taxation policies outside the United States can raise or lower returns. Also, some overseas markets may not be as politically and economically stable as the United States and other nations.
The returns shown are based on net asset values calculated for shareholder transactions and may differ from the returns shown in the financial highlights, which reflect adjustments made to the net asset values in accordance with accounting principles generally accepted in the United States of America.
| | | | | | | | |
| | | |
| OCTOBER 31, 2019 | | J.P. MORGAN EXCHANGE-TRADED FUNDS | | | | | 19 | |
JPMorgan Diversified Return Europe Equity ETF
FUND COMMENTARY
TWELVE MONTHS ENDED OCTOBER 31, 2019 (Unaudited)
| | | | |
| REPORTING PERIOD RETURN: | |
| JPMorgan Diversified Return Europe Equity ETF | | | | |
| Net Asset Value* | | | 11.09% | |
| Market Price** | | | 10.81% | |
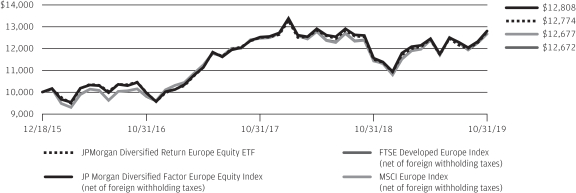
| JP Morgan Diversified Factor Europe Equity Index (net of foreign withholding taxes) | | | 10.70% | |
| FTSE Developed Europe Index (net of foreign withholding taxes) | | | 10.81% | |
| MSCI Europe Index (net of foreign withholding taxes) | | | 10.90% | |
| |
| Net Assets as of 10/31/2019 | | $ | 17,280,937 | |
INVESTMENT OBJECTIVE***
The JPMorgan Diversified Return Europe Equity ETF (the “Fund”) seeks investment results that closely correspond, before fees and expenses, to the performance of the JP Morgan Diversified Factor Europe Equity Index (the “Underlying Index”).
INVESTMENT APPROACH
The Fund is passively managed to the Underlying Index, which is composed of large cap and mid cap equity securities of companies in developed Europe and is diversified across sectors and individual securities. The Underlying Index uses a proprietary multi-factor security selection process that measures the following characteristics: value, momentum and quality. The Underlying Index methodology includes quarterly rebalancing.
HOW DID THE FUND PERFORM?
The Fund posted a positive absolute performance for the twelve months ended October 31, 2019, and performed in line with the Underlying Index, before considering the Fund’s small cash allocation and fees and operating expenses incurred by the Fund. The Fund also performed in line with the FTSE Developed Europe Index and the MSCI Europe Index, both of which are more traditional market capitalization weighted indexes.
By sector, the Fund’s and the Underlying Index’s positions in the utilities and industrials sectors were leading contributors to absolute performance, while their positions in the oil & gas sector were the sole sector detractors from absolute performance. By country, the Fund’s and the Underlying Index’s positions in the U.K. and France were leading contributors to absolute performance, while their positions in Norway and Austria were leading detractors from absolute performance.
Relative to the FTSE Developed Europe Index, the Fund’s and the Underlying Index’s security selection and underweight positions in the financials sector and their security selection and underweight positions in the oil & gas sector were leading contributors to performance, while the Fund’s and the Underlying Index’s security selection in the health care and consumer goods sectors were leading detractors from relative performance.
HOW WAS THE FUND POSITIONED?
During the reporting period, the Fund’s and the Underlying Index’s largest sector allocations were in the consumer goods and health care sectors, while their smallest allocations were in the telecommunications and technology sectors. The Fund’s and the Underlying Index’s largest country allocations were in the U.K. and France and their smallest allocations were in Ireland and Poland.
| | | | | | |
| | | |
| 20 | | | | J.P. MORGAN EXCHANGE-TRADED FUNDS | | OCTOBER 31, 2019 |
| | | | | | | | |
| TOP TEN EQUITY HOLDINGS OF THE PORTFOLIO**** | |
| | 1. | | | ASML Holding NV (Netherlands) | | | 0.5 | % |
| | 2. | | | UPM-Kymmene OYJ (Finland) | | | 0.5 | |
| | 3. | | | ConvaTec Group plc (United Kingdom) | | | 0.4 | |
| | 4. | | | Porsche Automobil Holding SE (Preference) (Germany) | | | 0.4 | |
| | 5. | | | Orion OYJ, Class B (Finland) | | | 0.4 | |
| | 6. | | | Next plc (United Kingdom) | | | 0.4 | |
| | 7. | | | OMV AG (Austria) | | | 0.4 | |
| | 8. | | | Peugeot SA (France) | | | 0.4 | |
| | 9. | | | Geberit AG (Registered) (Switzerland) | | | 0.4 | |
| | 10. | | | Neste OYJ (Finland) | | | 0.4 | |
| | | | |
PORTFOLIO COMPOSITION BY COUNTRY**** | |
United Kingdom | | | 19.6 | % |
France | | | 15.2 | |
Germany | | | 12.6 | |
Switzerland | | | 9.0 | |
Sweden | | | 7.7 | |
Italy | | | 6.1 | |
Spain | | | 5.4 | |
Netherlands | | | 4.6 | |
Finland | | | 3.8 | |
Denmark | | | 3.7 | |
Norway | | | 2.4 | |
Belgium | | | 1.9 | |
United States | | | 0.7 | |
Others (each less than 1.0%) | | | 6.5 | |
Short-Term Investments | | | 0.8 | |
| * | | The return shown is based on net asset value calculated for shareholder transactions and may differ from the return shown in the financial highlights, which reflects adjustments made to the net asset value in accordance with accounting principles generally accepted in the United States of America. The net asset value was $57.60 as of October 31, 2019. |
| ** | | Market price return is calculated assuming an initial investment made at the market price at the beginning of the period, reinvestment of all dividends and distributions at market price during the period, and sale at the market price on the last day of the period. The price used to calculate the market price return is the midpoint of the bid/ask spread at the close of business on the NYSE Arca. The midpoint price was $57.58 as of October 31, 2019. |
| *** | | The adviser seeks to achieve the Fund’s objective. There can be no guarantee it will be achieved. |
| **** | | Percentages indicated are based on total investments as of October 31, 2019. The Fund’s composition is subject to change. |
| | | | | | | | |
| | | |
| OCTOBER 31, 2019 | | J.P. MORGAN EXCHANGE-TRADED FUNDS | | | | | 21 | |
JPMorgan Diversified Return Europe Equity ETF
FUND COMMENTARY
TWELVE MONTHS ENDED OCTOBER 31, 2019 (Unaudited) (continued)
| | | | | | | | | | | | |
AVERAGE ANNUAL TOTAL RETURNSAS OF OCTOBER 31, 2019 (Unaudited) | |
| | | INCEPTION DATE | | | 1 YEAR | | | SINCE
INCEPTION | |
JPMorgan Diversified Return Europe Equity ETF | | | | | | | | | | | | |
Net Asset Value | | | December 18, 2015 | | | | 11.09% | | | | 6.53% | |
Market Price | | | | | | | 10.81% | | | | 6.51% | |
LIFE OF FUND PERFORMANCE(12/18/15 TO 10/31/19)
The performance quoted is past performance and is not a guarantee of future results. Exchange-traded funds are subject to certain market risks. Investment returns and principal value of an investment will fluctuate so that an investor’s shares, when sold or redeemed, may be worth more or less than their original cost. Current performance may be higher or lower than the performance data shown. For up-to-date, month-end performance information please call 1-844-457-6383.
Fund commenced operations on December 18, 2015.
The graph illustrates comparative performance for $10,000 invested in shares of the JPMorgan Diversified Return Europe Equity ETF, the JP Morgan Diversified Factor Europe Equity Index, the FTSE Developed Europe Index, and the MSCI Europe Index from December 18, 2015 to October 31, 2019. The performance of the Fund reflects the deduction of Fund expenses and assumes reinvestment of all dividends and capital gain distributions, if any. The performance of the JP Morgan Diversified Factor Europe Equity Index, the FTSE Developed Europe Index, and the MSCI Europe Index does not reflect the deduction of expenses associated with an exchange-traded fund and has been adjusted to reflect reinvestment of all dividends and capital gain distributions of the securities included in the Index, if applicable. The Fund’s adviser is a sponsor of the JP Morgan Diversified Factor Europe Equity Index and developed the proprietary factors on which the index is based. FTSE Russell, the benchmark administrator, administers, calculates and governs the JP Morgan Diversified Factor Europe Equity Index. The JP Morgan Diversified Factor Europe Equity
Index includes large and mid-cap stocks providing coverage of developed European markets. Holdings in this index are selected from the constituents of the FTSE Developed Europe Index. The FTSE Developed Europe Index is a market-capitalization weighted index representing the performance of large- and mid-cap companies in developed European markets. The MSCI Europe Index is a free float-adjusted market capitalization weighted index that is designed to measure the equity market performance of the developed markets in Europe. Investors cannot invest directly in an index.
Fund performance reflects the waiver of the Fund’s fees and reimbursement of expenses for certain periods since the inception date. Without these waivers and reimbursements, performance would have been lower. Also, performance shown in this section does not reflect the deduction of taxes that a shareholder may pay on Fund distributions or redemption or sale of Fund shares.
International investing involves a greater degree of risk and increased volatility. Changes in currency exchange rates and differences in accounting and taxation policies outside the United States can raise or lower returns. Also, some over-seas markets may not be as politically and economically stable as the United States and other nations.
The returns shown are based on net asset values calculated for shareholder transactions and may differ from the returns shown in the financial highlights, which reflect adjustments made to the net asset values in accordance with accounting principles generally accepted in the United States of America.
| | | | | | |
| | | |
| 22 | | | | J.P. MORGAN EXCHANGE-TRADED FUNDS | | OCTOBER 31, 2019 |
JPMorgan Diversified Return Global Equity ETF
FUND COMMENTARY
TWELVE MONTHS ENDED OCTOBER 31, 2019 (Unaudited)
| | | | |
| REPORTING PERIOD RETURN: | |
| JPMorgan Diversified Return Global Equity ETF | | | | |
| Net Asset Value* | | | 10.49% | |
| Market Price** | | | 10.30% | |
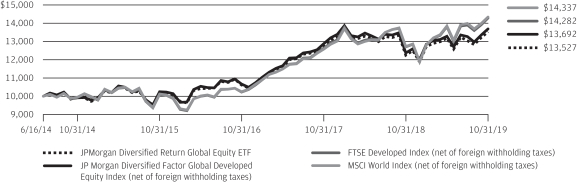
| JP Morgan Diversified Factor Global Developed Equity Index (net of foreign withholding taxes) | | | 10.70% | |
| FTSE Developed Index (net of foreign withholding taxes) | | | 12.47% | |
| MSCI World Index (net of foreign withholding taxes) | | | 12.69% | |
| |
| Net Assets as of 10/31/2019 | | $ | 145,749,540 | |
INVESTMENT OBJECTIVE***
The JPMorgan Diversified Return Global Equity ETF (the “Fund”) seeks investment results that closely correspond, before fees and expenses, to the performance of the JPMorgan Diversified Factor Global Developed Equity Index (the “Underlying Index”).
INVESTMENT APPROACH
The Fund is passively managed to the Underlying Index, which provides exposure to large and mid cap equity securities in developed global markets, diversified across global regions, sectors and individual securities. The Underlying Index’s proprietary multi-factor selection process utilizes the following characteristics: value, quality and momentum. The Underlying Index’s methodology includes quarterly rebalancing.
HOW DID THE FUND PERFORM?
The Fund posted a positive absolute performance for the twelve months ended October 31, 2019, and performed in line with the Underlying Index, before consideration of specific trading limits, differences in valuations because of the timing of the local market closings and the net asset value calculations, the Fund’s small cash allocation and fees and operating expenses incurred by the Fund. The Fund and the Underlying Index underperformed the FTSE Developed Index (net of foreign withholding taxes) and the MSCI World Index (net of foreign
withholding taxes), both of which are more traditional market capitalization weighted indexes.
By sector, the Fund’s and the Underlying Index’s positions in the technology and consumer goods sectors were leading contributors to absolute performance, while their positions in the oil & gas sector were the sole sector detractors from absolute performance. By region, the Fund’s and the Underlying Index’s allocations to the U.S. and Australia were leading contributors to absolute performance, while their allocations to Norway and South Korea detracted from absolute performance.
Relative to the FTSE Developed Index, the Underlying Index’s security selection in the industrials and consumer services sectors was a leading detractor from performance. The Fund’s and the Underlying Index’s security selection in the consumer goods and their underweight allocation to the financials sector were leading contributors to relative performance.
HOW WAS THE FUND POSITIONED?
During the reporting period, the Fund’s and the Underlying Index’s largest sector allocations were in the consumer goods and consumer services sectors, while their smallest allocations were in the oil & gas and telecommunications sectors. The Fund’s and the Underlying Index’s largest country allocations were in the U.S. and Japan and their smallest allocations were in Austria and New Zealand.
| | | | | | | | |
| | | |
| OCTOBER 31, 2019 | | J.P. MORGAN EXCHANGE-TRADED FUNDS | | | | | 23 | |
JPMorgan Diversified Return Global Equity ETF
FUND COMMENTARY
TWELVE MONTHS ENDED OCTOBER 31, 2019 (Unaudited) (continued)
| | | | | | | | |
| TOP TEN EQUITY HOLDINGS OF THE PORTFOLIO**** | |
| | 1. | | | Samsung Electronics Co. Ltd. (South Korea) | | | 0.4 | % |
| | 2. | | | Lam Research Corp. (United States) | | | 0.4 | |
| | 3. | | | Sekisui House Ltd. (Japan) | | | 0.3 | |
| | 4. | | | CSL Ltd. (Australia) | | | 0.3 | |
| | 5. | | | NAVER Corp. (South Korea) | | | 0.3 | |
| | 6. | | | SK Hynix, Inc. (South Korea) | | | 0.3 | |
| | 7. | | | Garmin Ltd. (United States) | | | 0.3 | |
| | 8. | | | Fortescue Metals Group Ltd. (Australia) | | | 0.3 | |
| | 9. | | | Hannover Rueck SE (Germany) | | | 0.3 | |
| | 10. | | | Advantest Corp. (Japan) | | | 0.3 | |
| | | | |
PORTFOLIO COMPOSITION BY COUNTRY**** | |
Japan | | | 22.7 | % |
United States | | | 21.7 | |
Australia | | | 9.9 | |
South Korea | | | 7.6 | |
United Kingdom | | | 4.4 | |
France | | | 4.1 | |
Hong Kong | | | 3.6 | |
Canada | | | 3.4 | |
Sweden | | | 2.5 | |
Spain | | | 2.4 | |
Switzerland | | | 2.2 | |
Germany | | | 2.1 | |
Netherlands | | | 2.0 | |
Singapore | | | 2.0 | |
Italy | | | 1.5 | |
Finland | | | 1.1 | |
Norway | | | 1.0 | |
Others (each less than 1.0%) | | | 5.1 | |
Short-Term Investments | | | 0.7 | |
| * | | The return shown is based on net asset value calculated for shareholder transactions and may differ from the return shown in the financial highlights, which reflects adjustments made to the net asset value in accordance with accounting principles generally accepted in the United States of America. The net asset value was $60.73 as of October 31, 2019. |
| ** | | Market price return is calculated assuming an initial investment made at the market price at the beginning of the period, reinvestment of all dividends and distributions at market price during the period, and sale at the market price on the last day of the period. The price used to calculate the market price return is the midpoint of the bid/ask spread at the close of business on the NYSE Arca. The midpoint price was $60.57 as of October 31, 2019. |
| *** | | The adviser seeks to achieve the Fund’s objective. There can be no guarantee it will be achieved. |
| **** | | Percentages indicated are based on total investments as of October 31, 2019. The Fund’s composition is subject to change. |
| | | | | | |
| | | |
| 24 | | | | J.P. MORGAN EXCHANGE-TRADED FUNDS | | OCTOBER 31, 2019 |
| | | | | | | | | | | | | | | | |
AVERAGE ANNUAL TOTAL RETURNSAS OF OCTOBER 31, 2019 (Unaudited) | |
| | | INCEPTION DATE | | | 1 YEAR | | | 5 YEAR | | | SINCE
INCEPTION | |
JPMorgan Diversified Return Global Equity ETF | | | | | | | | | | | | | | | | |
Net Asset Value | | | June 16, 2014 | | | | 10.49% | | | | 6.36% | | | | 5.78% | |
Market Price | | | | | | | 10.30% | | | | 6.13% | | | | 5.73% | |
LIFE OF FUND PERFORMANCE(6/16/14 TO 10/31/19)
The performance quoted is past performance and is not a guarantee of future results. Exchange-traded funds are subject to certain market risks. Investment returns and principal value of an investment will fluctuate so that an investor’s shares, when sold or redeemed, may be worth more or less than their original cost. Current performance may be higher or lower than the performance data shown. For up-to-date, month-end performance information please call 1-844-457-6383.
Fund commenced operations on June 16, 2014.
The graph illustrates comparative performance for $10,000 invested in shares of the JPMorgan Diversified Return Global Equity ETF, the JP Morgan Diversified Factor Global Developed Equity Index, the FTSE Developed Index, and the MSCI World Index from June 16, 2014 to October 31, 2019. The performance of the Fund reflects the deduction of Fund expenses and assumes reinvestment of all dividends and capital gain distributions, if any. The performance of the JP Morgan Diversified Factor Global Developed Equity Index, the FTSE Developed Index and the MSCI World Index does not reflect the deduction of expenses associated with an exchange-traded fund and has been adjusted to reflect reinvestment of all dividends and capital gain distributions of the securities included in the Index, if applicable. The Fund’s adviser is a sponsor of the JP Morgan Diversified Factor Global Developed Equity Index and developed the proprietary factors on which the index is based. FTSE Russell, the benchmark administrator, administers, calculates and governs the JP Morgan Diversified Factor Global Developed Equity Index. JP Morgan Diversified Factor Global Developed Equity Index is comprised of large- and mid-cap equity securities
from developed global markets. Holdings in this index are selected from the constituents of the FTSE Developed Index. The FTSE Developed Index is a market-capitalization weighted index representing the performance of large- and mid-cap companies in developed markets. The index is derived from the FTSE Global Equity Index Series, which covers 98% of the world’s investable market capitalization. The MSCI World Index is a free float-adjusted market capitalization weighted index that is designed to measure the equity market performance of developed markets. Investors cannot invest directly in an index.
Fund performance reflects the waiver of the Fund’s fees and reimbursement of expenses for certain periods since the inception date. Without these waivers and reimbursements, performance would have been lower. Also, performance shown in this section does not reflect the deduction of taxes that a shareholder may pay on Fund distributions or redemption or sale of Fund shares.
International investing involves a greater degree of risk and increased volatility. Changes in currency exchange rates and differences in accounting and taxation policies outside the United States can raise or lower returns. Also, some over-seas markets may not be as politically and economically stable as the United States and other nations.
The returns shown are based on net asset values calculated for shareholder transactions and may differ from the returns shown in the financial highlights, which reflect adjustments made to the net asset values in accordance with accounting principles generally accepted in the United States of America.
| | | | | | | | |
| | | |
| OCTOBER 31, 2019 | | J.P. MORGAN EXCHANGE-TRADED FUNDS | | | | | 25 | |
JPMorgan Diversified Return International Equity ETF
FUND COMMENTARY
TWELVE MONTHS ENDED OCTOBER 31, 2019 (Unaudited)
| | | | |
| REPORTING PERIOD RETURN: | |
| JPMorgan Diversified Return International Equity ETF | | | | |
| Net Asset Value* | | | 7.05% | |
| Market Price** | | | 7.23% | |
| JP Morgan Diversified Factor International Equity Index (net of foreign withholding taxes) | | | 7.30% | |
| FTSE Developed ex North America Index (net of foreign withholding taxes) | | | 10.54% | |
| MSCI EAFE Index (net of foreign withholding taxes) | | | 11.04% | |
| |
| Net Assets as of 10/31/2019 | | $ | 1,282,867,303 | |
INVESTMENT OBJECTIVE***
The JPMorgan Diversified Return International Equity ETF (the “Fund”) seeks investment results that closely correspond, before fees and expenses, to the performance of the JP Morgan Diversified Factor International Equity Index (the “Underlying Index”).
INVESTMENT APPROACH
The Fund is passively managed to the Underlying Index, which is composed of large cap and mid cap equity securities in developed markets outside North America, diversified across sectors, international regions and individual securities. The Underlying Index uses a proprietary multi-factor selection process that utilizes the following characteristics: value, quality and momentum. The Underlying Index methodology includes quarterly rebalancing.
HOW DID THE FUND PERFORM?
The Fund posted a positive absolute performance for the twelve months ended October 31, 2019, and performed in line with the Underlying Index, before considering differences due to specific trading limits, the Fund’s small cash allocation and fees and operating expenses incurred by the Fund. The Fund and the Underlying Index underperformed both the FTSE Developed ex North America Index and the MSCI EAFE Index, which are more traditional market capitalization weighted indexes.
By sector, the Fund’s and the Underlying Index’s positions in the technology and consumer goods sectors were leading contributors to absolute performance, while their positions in the oil & gas sector were the sole sector detractors from absolute performance.
By country, the Fund’s and the Underlying Index’s positions in the U.K. and Hong Kong were leading contributors to absolute performance, while their positions in Denmark and Norway were leading detractors from absolute performance.
Relative to FTSE Developed ex North America Index, the Fund’s and the Underlying Index’s security selection in the industrials and utilities sectors was the leading detractor from performance, while the Fund’s and the Underlying Index’s security selection in the technology sector and their underweight position in the financials sector were leading contributors to relative performance.
HOW WAS THE FUND POSITIONED?
During the reporting period, the Fund’s and the Underlying Index’s largest allocations were in the consumer services and consumer goods sectors, while their smallest allocations were in the oil & gas and telecommunications sectors. By region, the Fund’s and the Underlying Index’s largest allocations were in Japan and the U.K. and their smallest allocations were in Ireland and Poland.
| | | | | | |
| | | |
| 26 | | | | J.P. MORGAN EXCHANGE-TRADED FUNDS | | OCTOBER 31, 2019 |
| | | | | | | | |
| TOP TEN EQUITY HOLDINGS OF THE PORTFOLIO**** | |
| | 1. | | | Samsung Electronics Co. Ltd. (South Korea) | | | 0.5 | % |
| | 2. | | | Sekisui House Ltd. (Japan) | | | 0.4 | |
| | 3. | | | Berkeley Group Holdings plc (United Kingdom) | | | 0.4 | |
| | 4. | | | UPM-Kymmene OYJ (Finland) | | | 0.4 | |
| | 5. | | | CSL Ltd. (Australia) | | | 0.4 | |
| | 6. | | | Segro plc, REIT (United Kingdom) | | | 0.4 | |
| | 7. | | | Techtronic Industries Co. Ltd. (Hong Kong) | | | 0.4 | |
| | 8. | | | United Utilities Group plc (United Kingdom) | | | 0.4 | |
| | 9. | | | National Grid plc (United Kingdom) | | | 0.4 | |
| | 10. | | | GlaxoSmithKline plc (United Kingdom) | | | 0.4 | |
| | | | |
PORTFOLIO COMPOSITION BY COUNTRY**** | |
Japan | | | 23.8 | % |
United Kingdom | | | 19.8 | |
Australia | | | 10.3 | |
South Korea | | | 7.0 | |
France | | | 5.3 | |
Hong Kong | | | 5.0 | |
Sweden | | | 3.5 | |
Netherlands | | | 3.0 | |
Germany | | | 2.9 | |
Singapore | | | 2.4 | |
Switzerland | | | 2.4 | |
Finland | | | 2.1 | |
Italy | | | 2.0 | |
Spain | | | 1.9 | |
United States | | | 0.5 | |
Norway | | | 1.4 | |
Others (each less than 1.0%) | | | 5.5 | |
Short-Term Investments | | | 1.2 | |
| * | | The return shown is based on net asset value calculated for shareholder transactions and may differ from the return shown in the financial highlights, which reflects adjustments made to the net asset value in accordance with accounting principles generally accepted in the United States of America. The net asset value was $55.06 as of October 31, 2019. |
| ** | | Market price return is calculated assuming an initial investment made at the market price at the beginning of the period, reinvestment of all dividends and distributions at market price during the period, and sale at the market price on the last day of the period. The price used to calculate the market price return is the midpoint of the bid/ask spread at the close of business on the NYSE Arca. The midpoint price was $55.02 as of October 31, 2019. |
| *** | | The adviser seeks to achieve the Fund’s objective. There can be no guarantee it will be achieved. |
| **** | | Percentages indicated are based on total investments as of October 31, 2019. The Fund’s composition is subject to change. |
| | | | | | | | |
| | | |
| OCTOBER 31, 2019 | | J.P. MORGAN EXCHANGE-TRADED FUNDS | | | | | 27 | |
JPMorgan Diversified Return International Equity ETF
FUND COMMENTARY
TWELVE MONTHS ENDED OCTOBER 31, 2019 (Unaudited) (continued)
| | | | | | | | | | | | |
AVERAGE ANNUAL TOTAL RETURNSAS OF OCTOBER 31, 2019 (Unaudited) | |
| | | INCEPTION DATE | | | 1 YEAR | | | SINCE
INCEPTION | |
JPMorgan Diversified Return International Equity ETF | | | | | | | | | | | | |
Net Asset Value | | | November 5, 2014 | | | | 7.05% | | | | 4.27% | |
Market Price | | | | | | | 7.23% | | | | 4.25% | |
LIFE OF FUND PERFORMANCE(11/5/14 TO 10/31/19)
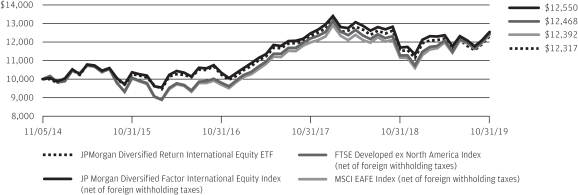
The performance quoted is past performance and is not a guarantee of future results. Exchange-traded funds are subject to certain market risks. Investment returns and principal value of an investment will fluctuate so that an investor’s shares, when sold or redeemed, may be worth more or less than their original cost. Current performance may be higher or lower than the performance data shown. For up-to-date, month-end performance information please call 1-844-457-6383.
Fund commenced operations on November 5, 2014.
The graph illustrates comparative performance for $10,000 invested in shares of the JPMorgan Diversified Return International Equity ETF, the JP Morgan Diversified Factor International Equity Index, the FTSE Developed ex North America Index, and the MSCI EAFE Index from November 5, 2014 to October 31, 2019. The performance of the Fund reflects the deduction of Fund expenses and assumes reinvestment of all dividends and capital gain distributions, if any. The performance of the JP Morgan Diversified Factor International Equity Index, the FTSE Developed ex North America Index and the MSCI EAFE Index does not reflect the deduction of expenses associated with an exchange-traded fund and has been adjusted to reflect reinvestment of all dividends and capital gain distributions of the securities included in the Index, if applicable. The Fund’s adviser is a sponsor of the JP Morgan Diversified Factor International Equity Index and developed the proprietary factors on which the index is based. FTSE Russell, the benchmark administrator, administers, calculates and governs the JP Morgan Diversified Factor International Equity Index. JP Morgan Diversified Factor International Equity Index is comprised of large- and mid-cap equity securities from developed global markets (excluding North America). Holdings in this index are selected
from the constituents of the FTSE Developed ex North America Index. The FTSE Developed ex North America Index is a market-capitalization weighted index representing the performance of large- and mid-cap stocks in developed markets, excluding the U.S. and Canada. The index is derived from the FTSE Global Equity Index Series, which covers 98% of the world’s investable market capitalization. The MSCI EAFE Index is a free float-adjusted market capitalization weighted index that is designed to measure the equity market performance of developed markets, excluding the U.S. and Canada. Investors cannot invest directly in an index.
Fund performance reflects the waiver of the Fund’s fees and reimbursement of expenses for certain periods since the inception date. Without these waivers and reimbursements, performance would have been lower. Also, performance shown in this section does not reflect the deduction of taxes that a shareholder may pay on Fund distributions or redemption or sale of Fund shares.
International investing involves a greater degree of risk and increased volatility. Changes in currency exchange rates and differences in accounting and taxation policies outside the United States can raise or lower returns. Also, some overseas markets may not be as politically and economically stable as the United States and other nations.
The returns shown are based on net asset values calculated for shareholder transactions and may differ from the returns shown in the financial highlights, which reflect adjustments made to the net asset values in accordance with accounting principles generally accepted in the United States of America.
| | | | | | |
| | | |
| 28 | | | | J.P. MORGAN EXCHANGE-TRADED FUNDS | | OCTOBER 31, 2019 |
JPMorgan Diversified Return U.S. Equity ETF
FUND COMMENTARY
TWELVE MONTHS ENDED OCTOBER 31, 2019 (Unaudited)
| | | | |
| REPORTING PERIOD RETURN: | |
| JPMorgan Diversified Return U.S. Equity ETF | | | | |
| Net Asset Value* | | | 11.65% | |
| Market Price** | | | 11.65% | |
| JP Morgan Diversified Factor US Equity Index | | | 11.86% | |
| Russell 1000 Index | | | 14.15% | |
| |
| Net Assets as of 10/31/2019 | | $ | 802,625,997 | |
INVESTMENT OBJECTIVE***
The JPMorgan Diversified Return U.S. Equity ETF (the “Fund”) seeks investment results that closely correspond, before fees and expenses, to the performance of the JP Morgan Diversified Factor US Equity Index (the “Underlying Index”).
INVESTMENT APPROACH
The Fund is passively managed to the Underlying Index, which is composed of large cap and mid cap equity securities of U.S. companies. The Underlying Index uses a rules based proprietary multi-factor selection process that utilizes the following characteristics: value, momentum and quality. The Underlying Index’s methodology includes quarterly rebalancing.
HOW DID THE FUND PERFORM?
The Fund posted a positive absolute performance for the twelve months ended October 31, 2019 and performed in line with the Underlying Index, before considering operating expenses, fees and tax management of the Fund’s portfolio. Both the Fund and the Underlying Index underperformed the Russell 1000 Index, which is a more traditional market capitalization weighted index.
During the reporting period, the Fund’s and the Underlying Index’s positions in the industrials and utilities sectors were leading contributors to absolute performance, while the Fund’s and the Underlying Index’s positions in the oil & gas sector and the telecommunications sector were the leading detractors from absolute performance.
Relative to the Russell 1000 Index, the Fund’s and the Underlying Index’s overweight positions in the oil & gas sector and their security selection in the technology sector were leading detractors from performance, while their security selection and overweight positions in the utilities sector and their security selection in the basic materials sector were leading contributors to relative performance.
HOW WAS THE FUND POSITIONED?
During the reporting period, the Fund’s and the Underlying Index’s largest allocations were in the consumer goods and financials sectors, while the smallest allocations were in the telecommunications and oil & gas sectors.
| | | | | | | | |
| | | |
| OCTOBER 31, 2019 | | J.P. MORGAN EXCHANGE-TRADED FUNDS | | | | | 29 | |
JPMorgan Diversified Return U.S. Equity ETF
FUND COMMENTARY
TWELVE MONTHS ENDED OCTOBER 31, 2019 (Unaudited) (continued)
| | | | | | | | |
| TOP TEN EQUITY HOLDINGS OF THE PORTFOLIO**** | |
| | 1. | | | Global Payments, Inc. | | | 0.5 | % |
| | 2. | | | Reliance Steel & Aluminum Co. | | | 0.5 | |
| | 3. | | | PulteGroup, Inc. | | | 0.4 | |
| | 4. | | | Cummins, Inc. | | | 0.4 | |
| | 5. | | | Garmin Ltd. | | | 0.4 | |
| | 6. | | | PPG Industries, Inc. | | | 0.4 | |
| | 7. | | | International Paper Co. | | | 0.4 | |
| | 8. | | | AES Corp. | | | 0.4 | |
| | 9. | | | Medical Properties Trust, Inc. | | | 0.4 | |
| | 10. | | | Lululemon Athletica, Inc. | | | 0.4 | |
| | | | |
PORTFOLIO COMPOSITION BY SECTOR**** | |
Consumer Goods | | | 14.0 | % |
Financials | | | 12.8 | |
Consumer Services | | | 11.9 | |
Industrials | | | 10.6 | |
Health Care | | | 10.5 | |
Utilities | | | 10.5 | |
Technology | | | 9.0 | |
Basic Materials | | | 8.9 | |
Oil & Gas | | | 6.6 | |
Telecommunications | | | 2.2 | |
Short-Term Investments | | | 3.0 | |
| * | | The return shown is based on net asset value calculated for shareholder transactions and may differ from the return shown in the financial highlights, which reflects adjustments made to the net asset value in accordance with accounting principles generally accepted in the United States of America. The net asset value was $76.44 as of October 31, 2019. |
| ** | | Market price return is calculated assuming an initial investment made at the market price at the beginning of the period, reinvestment of all dividends and distributions at market price during the period, and sale at the market price on the last day of the period. The price used to calculate the market price return is the midpoint of the bid/ask spread at the close of business on the NYSE Arca. The midpoint price was $76.45 as of October 31, 2019. |
| *** | | The adviser seeks to achieve the Fund’s objective. There can be no guarantee it will be achieved. |
| **** | | Percentages indicated are based on total investments as of October 31, 2019. The Fund’s composition is subject to change. |
| | | | | | |
| | | |
| 30 | | | | J.P. MORGAN EXCHANGE-TRADED FUNDS | | OCTOBER 31, 2019 |
| | | | | | | | | | | | |
AVERAGE ANNUAL TOTAL RETURNSAS OF OCTOBER 31, 2019 (Unaudited) | |
| | | INCEPTION DATE | | | 1 YEAR | | | SINCE
INCEPTION | |
JPMorgan Diversified Return U.S. Equity ETF | | | | | | | | | | | | |
Net Asset Value | | | September 29, 2015 | | | | 11.65% | | | | 12.57% | |
Market Price | | | | | | | 11.65% | | | | 12.57% | |
LIFE OF FUND PERFORMANCE(9/29/15 TO 10/31/19)
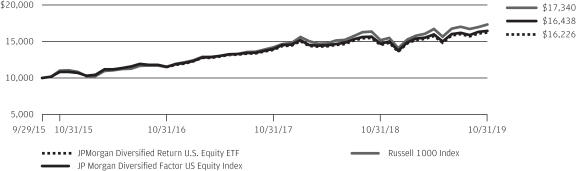
The performance quoted is past performance and is not a guarantee of future results. Exchange-traded funds are subject to certain market risks. Investment returns and principal value of an investment will fluctuate so that an investor’s shares, when sold or redeemed, may be worth more or less than their original cost. Current performance may be higher or lower than the performance data shown. For up-to-date, month-end performance information please call 1-844-457-6383.
Fund commenced operations on September 29, 2015.
The graph illustrates comparative performance for $10,000 invested in shares of the JPMorgan Diversified Return U.S. Equity ETF, the JP Morgan Diversified Factor US Equity Index, and the Russell 1000 Index from September 29, 2015 to October 31, 2019. The performance of the Fund reflects the deduction of Fund expenses and assumes reinvestment of all dividends and capital gain distributions, if any. The performance of the JP Morgan Diversified Factor US Equity Index and Russell 1000 Index does not reflect the deduction of expenses associated with an exchange-traded fund and has been adjusted to reflect reinvestment of all dividends and capital gain distributions of the securities included in the Index, if applicable. The Fund’s adviser is a sponsor of the
JP Morgan Diversified Factor US Equity Index and developed the proprietary factors on which the index is based. JP Morgan Diversified Factor US Equity Index is comprised of U.S. large- and mid-cap equity securities. Holdings in this index are selected from the constituents of the Russell 1000 Index. FTSE Russell, the benchmark administrator, administers, calculates and governs the JP Morgan Diversified Factor US Equity Index. The Russell 1000 Index is a market-capitalization weighted index, which measures the performance of the 1,000 largest companies in the Russell 3000 Index. Investors cannot invest directly in an index.
Fund performance reflects the waiver of the Fund’s fees and reimbursement of expenses for certain periods since the inception date. Without these waivers and reimbursements, performance would have been lower. Also, performance shown in this section does not reflect the deduction of taxes that a shareholder may pay on Fund distributions or redemption or sale of Fund shares.
The returns shown are based on net asset values calculated for shareholder transactions and may differ from the returns shown in the financial highlights, which reflect adjustments made to the net asset values in accordance with accounting principles generally accepted in the United States of America.
| | | | | | | | |
| | | |
| OCTOBER 31, 2019 | | J.P. MORGAN EXCHANGE-TRADED FUNDS | | | | | 31 | |
JPMorgan Diversified Return U.S. Mid Cap Equity ETF
FUND COMMENTARY
TWELVE MONTHS ENDED OCTOBER 31, 2019 (Unaudited)
| | | | |
| REPORTING PERIOD RETURN: | |
| JPMorgan Diversified Return U.S. Mid Cap Equity ETF | | | | |
| Net Asset Value* | | | 9.73% | |
| Market Price** | | | 9.78% | |
| JP Morgan Diversified Factor US Mid Cap Equity Index | | | 10.02% | |
| Russell Midcap Index | | | 13.72% | |
| |
| Net Assets as of 10/31/2019 | | $ | 187,973,791 | |
INVESTMENT OBJECTIVE***
The JPMorgan Diversified Return U.S. Mid Cap Equity ETF (the “Fund”) seeks investment results that closely correspond, before fees and expenses, to the performance of the JP Morgan Diversified Factor US Mid Cap Equity Index (the “Underlying Index”).
INVESTMENT APPROACH
The Fund is passively managed to the Underlying Index, which tracks mid cap equity securities of U.S. companies. The Underlying Index uses a proprietary multi-factor selection process that utilizes the following characteristics: value, momentum and quality. The Underlying Index’s methodology includes quarterly rebalancing.
HOW DID THE FUND PERFORM?
The Fund posted a positive absolute performance for the twelve months ended October 31, 2019 and performed in line with the Underlying Index, before considering operating expenses, fees and tax management of the Fund’s portfolio. The Fund and the Underlying Index underperformed the Russell Midcap Index, which is a more traditional market capitalization weighted index.
During the reporting period, the Fund’s and the Underlying Index’s positions in the financials and industrials sectors were leading contributors to absolute performance, while the Fund’s and the Underlying Index’s positions in the oil & gas sector and the telecommunications sector were leading detractors from absolute performance.
Relative to the Russell Midcap Index, the Fund and the Underlying Index’s security selection and overweight positions in the oil & gas sector and their security selection in the consumer services sector were leading detractors from performance, while the Fund’s and Underlying Index’s overweight positions in the utilities sector and their underweight positions in the health care sector were leading contributors to relative performance.
HOW WAS THE FUND POSITIONED?
During the reporting period, the Fund’s and the Underlying Index’s largest allocations were in the financials and consumer goods sectors and their smallest allocations were in the telecommunications and oil & gas sectors.
| | | | | | |
| | | |
| 32 | | | | J.P. MORGAN EXCHANGE-TRADED FUNDS | | OCTOBER 31, 2019 |
| | | | | | | | |
| TOP TEN EQUITY HOLDINGS OF THE PORTFOLIO**** | |
| | 1. | | | Lam Research Corp. | | | 0.5 | % |
| | 2. | | | Reliance Steel & Aluminum Co. | | | 0.5 | |
| | 3. | | | Teradyne, Inc. | | | 0.5 | |
| | 4. | | | HollyFrontier Corp. | | | 0.5 | |
| | 5. | | | Leggett & Platt, Inc. | | | 0.4 | |
| | 6. | | | Cummins, Inc. | | | 0.4 | |
| | 7. | | | International Paper Co. | | | 0.4 | |
| | 8. | | | Nucor Corp. | | | 0.4 | |
| | 9. | | | CDW Corp. | | | 0.4 | |
| | 10. | | | Medical Properties Trust, Inc. | | | 0.4 | |
| | | | |
PORTFOLIO COMPOSITION BY SECTOR**** | |
| Financials | | | 14.3 | % |
| Consumer Goods | | | 13.6 | |
| Consumer Services | | | 11.7 | |
| Industrials | | | 11.2 | |
| Health Care | | | 10.4 | |
| Technology | | | 9.3 | |
| Utilities | | | 9.0 | |
| Basic Materials | | | 8.6 | |
| Oil & Gas | | | 6.1 | |
| Telecommunications | | | 1.0 | |
| Short-Term Investments | | | 4.8 | |
| * | | The return shown is based on net asset value calculated for shareholder transactions and may differ from the return shown in the financial highlights, which reflects adjustments made to the net asset value in accordance with accounting principles generally accepted in the United States of America. The net asset value was $67.13 as of October 31, 2019. |
| ** | | Market price return is calculated assuming an initial investment made at the market price at the beginning of the period, reinvestment of all dividends and distributions at market price during the period, and sale at the market price on the last day of the period. The price used to calculate the market price return is the midpoint of the bid/ask spread at the close of business on the NYSE Arca. The midpoint price was $67.17 as of October 31, 2019. |
| *** | | The adviser seeks to achieve the Fund’s objective. There can be no guarantee it will be achieved. |
| **** | | Percentages indicated are based on total investments as of October 31, 2019. The Fund’s composition is subject to change. |
| | | | | | | | |
| | | |
| OCTOBER 31, 2019 | | J.P. MORGAN EXCHANGE-TRADED FUNDS | | | | | 33 | |
JPMorgan Diversified Return U.S. Mid Cap Equity ETF
FUND COMMENTARY
TWELVE MONTHS ENDED OCTOBER 31, 2019 (Unaudited) (continued)
| | | | | | | | | | | | |
AVERAGE ANNUAL TOTAL RETURNSAS OF OCTOBER 31, 2019 (Unaudited) | |
| | | INCEPTION DATE | | | 1 YEAR | | | SINCE
INCEPTION | |
JPMorgan Diversified Return U.S. Mid Cap Equity ETF | |
Net Asset Value | | | May 11, 2016 | | | | 9.73% | | | | 10.39% | |
Market Price | | | | | | | 9.78% | | | | 10.41% | |
LIFE OF FUND PERFORMANCE(5/11/16 TO 10/31/19)
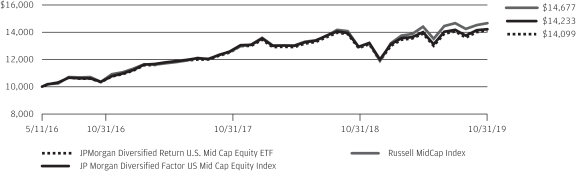
The performance quoted is past performance and is not a guarantee of future results. Exchange-traded funds are subject to certain market risks. Investment returns and principal value of an investment will fluctuate so that an investor’s shares, when sold or redeemed, may be worth more or less than their original cost. Current performance may be higher or lower than the performance data shown. For up-to-date, month-end performance information please call 1-844-457-6383.
Fund commenced operations on May 11, 2016.
The graph illustrates comparative performance for $10,000 invested in shares of the JPMorgan Diversified Return U.S. Mid Cap Equity ETF, JP Morgan Diversified Factor US Mid Cap Equity Index, and the Russell Midcap Index from May 11, 2016 to October 31, 2019. The performance of the Fund reflects the deduction of Fund expenses and assumes reinvestment of all dividends and capital gain distributions, if any. The performance of the JP Morgan Diversified Factor US Mid Cap Equity Index and Russell Midcap Index does not reflect the deduction of expenses associated with an exchange-traded fund and has been adjusted to reflect reinvestment of all dividends and capital gain distributions of the securities included in the Index, if applicable. The Fund’s adviser is a sponsor of
the JP Morgan Diversified Factor US Mid Cap Equity Index and developed the proprietary factors on which the index is based. FTSE Russell, the benchmark administrator, administers, calculates and governs the JP Morgan Diversified Factor US Mid Cap Equity Index. The JP Morgan Diversified Factor US Mid Cap Equity Index is comprised of U.S. mid-cap equity securities. Holdings in this index are selected from the Russell Midcap Index. The Russell Midcap Index is a market-capitalization weighted index which measures the performance of the 800 smallest companies in the Russell 1000 Index. Investors cannot invest directly in an index.
Fund performance reflects the waiver of the Fund’s fees and reimbursement of expenses for certain periods since the inception date. Without these waivers and reimbursements, performance would have been lower. Also, performance shown in this section does not reflect the deduction of taxes that a shareholder may pay on Fund distributions or redemption or sale of Fund shares.
The returns shown are based on net asset values calculated for shareholder transactions and may differ from the returns shown in the financial highlights, which reflect adjustments made to the net asset values in accordance with accounting principles generally accepted in the United States of America.
| | | | | | |
| | | |
| 34 | | | | J.P. MORGAN EXCHANGE-TRADED FUNDS | | OCTOBER 31, 2019 |
JPMorgan Diversified Return U.S. Small Cap Equity ETF
FUND COMMENTARY
TWELVE MONTHS ENDED OCTOBER 31, 2019 (Unaudited)
| | | | |
| REPORTING PERIOD RETURN: | | | |
| JPMorgan Diversified Return U.S. Small Cap Equity ETF | | | | |
| Net Asset Value* | | | 5.64% | |
| Market Price** | | | 5.75% | |
| JP Morgan Diversified Factor US Small Cap Equity Index | | | 5.90% | |
| Russell 2000 Index | | | 4.90% | |
| |
| Net Assets as of 10/31/2019 | | $ | 140,343,327 | |
INVESTMENT OBJECTIVE***
The JPMorgan Diversified Return U.S. Small Cap Equity ETF (the “Fund”) seeks investment results that closely correspond, before fees and expenses, to the performance of the JP Morgan Diversified Factor US Small Cap Equity Index (the “Underlying Index”).
INVESTMENT APPROACH
The Fund is passively managed to the Underlying Index, which tracks small cap equity securities of U.S. companies. The Underlying Index uses a proprietary multi-factor selection process that utilizes the following characteristics: value, momentum and quality. Prior to June 28, 2019, the Underlying Index security selection process sought to exclude the least attractive stocks based on these characteristics. As of June 28, 2019, the Underlying Index was revised so that each of the individual characteristics is given equal input in security selection. The Underlying Index’s methodology includes quarterly rebalancing.
HOW DID THE FUND PERFORM?
The Fund posted a positive absolute performance for the twelve months ended October 31, 2019 and performed in line with the Underlying Index, before considering operating expenses, fees and tax management of the Fund’s portfolio.
Both the Fund and the Underlying Index outperformed the Russell 2000 Index, which is a more traditional market capitalization weighted index.
During the reporting period, the Fund’s and the Underlying Index’s positions in the utilities and technology sectors were leading contributors to absolute performance, while the Fund’s and the Underlying Index’s positions in the oil & gas and health care sectors were leading detractors from absolute performance.
Relative to the Russell 2000 Index, the Fund’s and the Underlying Index’s overweight positions and security selection in the utilities sector and their underweight positions in the health care sector were leading contributors to performance, while the Fund’s and the Underlying Index’s security selection and overweight positions in the basic materials sector and their overweight positions in the oil & gas sector were leading detractors from relative performance.
HOW WAS THE FUND POSITIONED?
During the reporting period, the Fund’s and the Underlying Index’s largest allocations were in the consumer goods and consumer services sectors and their smallest allocations were in the telecommunications and oil & gas sectors.
| | | | | | | | |
| | | |
| OCTOBER 31, 2019 | | J.P. MORGAN EXCHANGE-TRADED FUNDS | | | | | 35 | |
JPMorgan Diversified Return U.S. Small Cap Equity ETF
FUND COMMENTARY
TWELVE MONTHS ENDED OCTOBER 31, 2019 (Unaudited) (continued)
| | | | | | | | |
| TOP TEN EQUITY HOLDINGS OF THE PORTFOLIO**** | |
| | 1. | | | El Paso Electric Co. | | | 0.7 | % |
| | 2. | | | Ormat Technologies, Inc. | | | 0.6 | |
| | 3. | | | American States Water Co. | | | 0.5 | |
| | 4. | | | California Water Service Group | | | 0.4 | |
| | 5. | | | Avista Corp. | | | 0.4 | |
| | 6. | | | Winnebago Industries, Inc. | | | 0.4 | |
| | 7. | | | ALLETE, Inc. | | | 0.3 | |
| | 8. | | | ONE Gas, Inc. | | | 0.3 | |
| | 9. | | | Fox Factory Holding Corp. | | | 0.3 | |
| | 10. | | | PNM Resources, Inc. | | | 0.3 | |
| | | | |
PORTFOLIO COMPOSITION BY SECTOR**** | |
| Financials | | | 12.6 | % |
| Consumer Goods | | | 11.9 | |
| Consumer Services | | | 11.2 | |
| Industrials | | | 11.0 | |
| Technology | | | 9.8 | |
| Health Care | | | 7.9 | |
| Basic Materials | | | 6.8 | |
| Utilities | | | 5.9 | |
| Oil & Gas | | | 5.5 | |
| Telecommunications | | | 1.2 | |
| Short-Term Investments | | | 16.2 | |
| * | | The return shown is based on net asset value calculated for shareholder transactions and may differ from the return shown in the financial highlights, which reflects adjustments made to the net asset value in accordance with accounting principles generally accepted in the United States of America. The net asset value was $30.84 as of October 31, 2019. |
| ** | | Market price return is calculated assuming an initial investment made at the market price at the beginning of the period, reinvestment of all dividends and distributions at market price during the period, and sale at the market price on the last day of the period. The price used to calculate the market price return is the midpoint of the bid/ask spread at the close of business on the NYSE Arca. The midpoint price was $30.87 as of October 31, 2019. |
| *** | | The adviser seeks to achieve the Fund’s objective. There can be no guarantee it will be achieved. |
| **** | | Percentages indicated are based on total investments as of October 31, 2019. The Fund’s composition is subject to change. |
| | | | | | |
| | | |
| 36 | | | | J.P. MORGAN EXCHANGE-TRADED FUNDS | | OCTOBER 31, 2019 |
| | | | | | | | | | | | |
AVERAGE ANNUAL TOTAL RETURNSAS OF OCTOBER 31, 2019 (Unaudited) | |
| | | INCEPTION DATE | | | 1 YEAR | | | SINCE
INCEPTION | |
JPMorgan Diversified Return U.S. Small Cap Equity ETF | |
Net Asset Value | | | November 15, 2016 | | | | 5.64% | | | | 8.39% | |
Market Price | | | | | | | 5.75% | | | | 8.43% | |
LIFE OF FUND PERFORMANCE(11/15/16 TO 10/31/19)
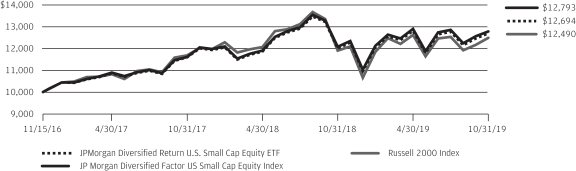
The performance quoted is past performance and is not a guarantee of future results. Exchange-traded funds are subject to certain market risks. Investment returns and principal value of an investment will fluctuate so that an investor’s shares, when sold or redeemed, may be worth more or less than their original cost. Current performance may be higher or lower than the performance data shown. For up-to-date, month-end performance information please call 1-844-457-6383.
Fund commenced operations on November 15, 2016.
The graph illustrates comparative performance for $10,000 invested in shares of the JPMorgan Diversified Return U.S. Small Cap Equity ETF, the JP Morgan Diversified Factor US Small Cap Equity Index, and the Russell 2000 Index from November 15, 2016 to October 31, 2019. The performance of the Fund reflects the deduction of Fund expenses and assumes reinvestment of all dividends and capital gain distributions, if any. The performance of the JP Morgan Diversified Factor US Small Cap Equity Index and Russell 2000 Index does not reflect the deduction of expenses associated with an exchange-traded fund and has been adjusted to reflect reinvestment of all dividends and capital gain distributions of the securities included in the Index, if applicable. The Fund’s adviser is a sponsor of the
JP Morgan Diversified Factor US Small Cap Equity Index and developed the proprietary factors on which the index is based. FTSE Russell, the benchmark administrator, administers, calculates and governs the JP Morgan Diversified Factor US Small Cap Equity Index. The JP Morgan Diversified Factor US Small Cap Equity Index is comprised of U.S. large- and mid-cap equity securities. Holdings in this index are selected from the Russell 2000 Index. The Russell 2000 Index is an unmanaged index, measuring performance of the 2000 smallest stocks (on the basis of capitalization) in the Russell 3000 Index. Investors cannot invest directly in an index.
Fund performance reflects the waiver of the Fund’s fees and reimbursement of expenses for certain periods since the inception date. Without these waivers and reimbursements, performance would have been lower. Also, performance shown in this section does not reflect the deduction of taxes that a shareholder may pay on Fund distributions or redemption or sale of Fund shares.
The returns shown are based on net asset values calculated for shareholder transactions and may differ from the returns shown in the financial highlights, which reflect adjustments made to the net asset values in accordance with accounting principles generally accepted in the United States of America.
| | | | | | | | |
| | | |
| OCTOBER 31, 2019 | | J.P. MORGAN EXCHANGE-TRADED FUNDS | | | | | 37 | |
JPMorgan U.S. Dividend ETF
FUND COMMENTARY
TWELVE MONTHS ENDED OCTOBER 31, 2019 (Unaudited)
| | | | |
| REPORTING PERIOD RETURN: | | | |
| JPMorgan U.S. Dividend ETF | | | | |
| Net Asset Value* | | | 12.57% | |
| Market Price** | | | 12.69% | |
| JP Morgan US Dividend Index | | | 12.83% | |
| Russell 1000 Index | | | 14.15% | |
| |
| Net Assets as of 10/31/2019 | | $ | 40,631,525 | |
INVESTMENT OBJECTIVE***
The JPMorgan U.S. Dividend ETF (the “Fund”) seeks investment results that closely correspond, before fees and expenses, to the performance of the JP Morgan US Dividend Index (the “Underlying Index”).
INVESTMENT APPROACH
The Fund is passively managed to the Underlying Index, which consists of large and mid cap U.S. equity securities selected to provide exposure to the highest dividend yielding sectors on a risk adjusted basis. The Underlying Index uses a proprietary selection process that seeks to identify companies within each sector that have higher dividend yields over a rolling twelve month period. Within each sector, individual equity securities are also weighted to diversify risk. The Underlying Index’s methodology includes quarterly rebalancing.
HOW DID THE FUND PERFORM?
The Fund posted a positive absolute performance for the twelve months ended October 31, 2019 and performed in line with the Underlying Index, before considering operating expenses, fees and tax management of the Fund’s portfolio. The Fund and the Underlying Index underperformed the Russell 1000 Index, which is a more traditional market capitalization weighted index.
On an absolute basis, the Fund’s and the Underlying Index’s allocations to the utilities and financials sectors were leading contributors to performance, while the Fund’s and the Underlying Index’s allocations to the oil & gas and consumer services sectors were leading detractors from performance.
Relative to the Russell 1000 Index, the Fund’s and the Underlying Index’s security selection in the consumer services and consumer goods sectors were leading detractors from performance, while the Fund’s and the Underlying Index’s overweight positions and security selection in the utilities sector and their underweight positions and security selection the health care sector were leading contributors to relative performance.
HOW WAS THE FUND POSITIONED?
During the reporting period, the Fund’s and the Underlying Index’s largest allocations were in the financials and utilities sectors and their smallest allocations were in the telecommunications and technology sectors.
| | | | | | |
| | | |
| 38 | | | | J.P. MORGAN EXCHANGE-TRADED FUNDS | | OCTOBER 31, 2019 |
| | | | | | | | |
| TOP TEN EQUITY HOLDINGS OF THE PORTFOLIO**** | |
| | 1. | | | Reliance Steel & Aluminum Co. | | | 0.7 | % |
| | 2. | | | Intel Corp. | | | 0.7 | |
| | 3. | | | LyondellBasell Industries NV, Class A | | | 0.7 | |
| | 4. | | | Eastman Chemical Co. | | | 0.7 | |
| | 5. | | | KLA Corp. | | | 0.6 | |
| | 6. | | | AGNC Investment Corp. | | | 0.6 | |
| | 7. | | | CenturyLink, Inc. | | | 0.6 | |
| | 8. | | | PBF Energy, Inc., Class A | | | 0.6 | |
| | 9. | | | Liberty Property Trust | | | 0.6 | |
| | 10. | | | PPL Corp. | | | 0.6 | |
| | | | |
PORTFOLIO COMPOSITION BY SECTOR**** | |
| Financials | | | 17.7 | % |
| Utilities | | | 16.0 | |
| Consumer Goods | | | 14.1 | |
| Basic Materials | | | 9.7 | |
| Consumer Services | | | 9.3 | |
| Industrials | | | 8.9 | |
| Oil & Gas | | | 7.4 | |
| Health Care | | | 6.2 | |
| Technology | | | 5.3 | |
| Telecommunications | | | 3.4 | |
| Short-Term Investments | | | 2.0 | |
| * | | The return shown is based on net asset value calculated for shareholder transactions and may differ from the return shown in the financial highlights, which reflects adjustments made to the net asset value in accordance with accounting principles generally accepted in the United States of America. The net asset value was $27.09 as of October 31, 2019. |
| ** | | Market price return is calculated assuming an initial investment made at the market price at the beginning of the period, reinvestment of all dividends and distributions at market price during the period, and sale at the market price on the last day of the period. The price used to calculate the market price return is the midpoint of the bid/ask spread at the close of business on the NYSE Arca. The midpoint price was $27.10 as of October 31, 2019. |
| *** | | The adviser seeks to achieve the Fund’s objective. There can be no guarantee it will be achieved. |
| **** | | Percentages indicated are based on total investments as of October 31, 2019. The Fund’s composition is subject to change. |
| | | | | | | | |
| | | |
| OCTOBER 31, 2019 | | J.P. MORGAN EXCHANGE-TRADED FUNDS | | | | | 39 | |
JPMorgan U.S. Dividend ETF
FUND COMMENTARY
TWELVE MONTHS ENDED OCTOBER 31, 2019 (Unaudited) (continued)
| | | | | | | | | | | | |
AVERAGE ANNUAL TOTAL RETURNSAS OF OCTOBER 31, 2019 (Unaudited) | |
| | | INCEPTION DATE | | | 1 YEAR | | | SINCE
INCEPTION | |
JPMorgan U.S. Dividend ETF | |
Net Asset Value | | | November 8, 2017 | | | | 12.57% | | | | 7.80% | |
Market Price | | | | | | | 12.69% | | | | 7.82% | |
LIFE OF FUND PERFORMANCE(11/8/17 TO 10/31/19)
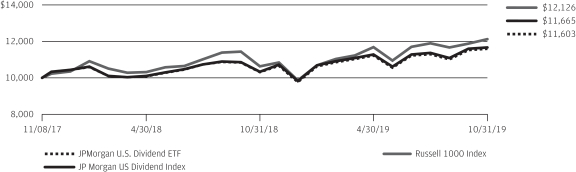
The performance quoted is past performance and is not a guarantee of future results. Exchange-traded funds are subject to certain market risks. Investment returns and principal value of an investment will fluctuate so that an investor’s shares, when sold or redeemed, may be worth more or less than their original cost. Current performance may be higher or lower than the performance data shown. For up-to-date, month-end performance information please call 1-844-457-6383.
Fund commenced operations on November 8, 2017.
The graph illustrates comparative performance for $10,000 invested in shares of the JPMorgan U.S. Dividend ETF, the JP Morgan US Dividend Index, and the Russell 1000 Index from November 8, 2017 to October 31, 2019. The performance of the Fund reflects the deduction of Fund expenses and assumes reinvestment of all dividends and capital gain distributions, if any. The performance of the JP Morgan US Dividend Index and Russell 1000 Index does not reflect the deduction of expenses associated with an exchange-traded fund and has been adjusted to reflect reinvestment of all dividends and capital gain distributions of the securities included in the Index, if applicable. The Fund’s adviser is a sponsor of the JP Morgan US Dividend Index and developed the proprietary factors on which the index is based. FTSE International Limited, the benchmark
administrator, administers, calculates and governs the JP Morgan US Dividend Index. The JP Morgan US Dividend Index contains U.S. large- and mid-cap equity securities from the Russell 1000 Index using a rules-based factor selection process. The Underlying Index is designed to provide exposure to the highest dividend yielding sectors on a risk adjusted basis, meaning that the index will establish sector weights by considering both the yield of the sector and the relative volatility of sector returns. The Russell 1000 Index is a market-capitalization weighted index, which measures the performance of the 1,000 largest companies in the Russell 3000 Index. Investors cannot invest directly in an index.
Fund performance reflects the waiver of the Fund’s fees and reimbursement of expenses for certain periods since the inception date. Without these waivers and reimbursements, performance would have been lower. Also, performance shown in this section does not reflect the deduction of taxes that a shareholder may pay on Fund distributions or redemption or sale of Fund shares.
The returns shown are based on net asset values calculated for shareholder transactions and may differ from the returns shown in the financial highlights, which reflect adjustments made to the net asset values in accordance with accounting principles generally accepted in the United States of America.
| | | | | | |
| | | |
| 40 | | | | J.P. MORGAN EXCHANGE-TRADED FUNDS | | OCTOBER 31, 2019 |
JPMorgan U.S. Minimum Volatility ETF
FUND COMMENTARY
TWELVE MONTHS ENDED OCTOBER 31, 2019 (Unaudited)
| | | | |
| REPORTING PERIOD RETURN: | |
| JPMorgan U.S. Minimum Volatility ETF | | | | |
| Net Asset Value* | | | 17.82% | |
| Market Price** | | | 17.90% | |
| JP Morgan US Minimum Volatility Index | | | 18.02% | |
| Russell 1000 Index | | | 14.15% | |
| |
| Net Assets as of 10/31/2019 | | $ | 107,244,658 | |
INVESTMENT OBJECTIVE***
The JPMorgan U.S. Minimum Volatility ETF (the “Fund”) seeks investment results that closely correspond, before fees and expenses, to the performance of the JP Morgan US Minimum Volatility Index (the “Underlying Index”).
INVESTMENT APPROACH
The Fund is passively managed to the Underlying Index, which consists of large and mid cap U.S. equity securities and is designed so that it targets lower volatility than the Russell 1000 Index. The Underlying Index is designed to distribute risk among sectors and stocks in order to seek to minimize the overall portfolio volatility based upon the parameters of the rule-based process. The Underlying Index’s methodology includes quarterly rebalancing.
HOW DID THE FUND PERFORM?
The Fund posted a positive absolute return for the twelve months ended October 31, 2019 and performed in line with the Underlying Index, before considering operating expenses, fees and tax management of the Fund’s portfolio. The Fund and the Underlying Index outperformed the Russell 1000 Index, which
is a more traditional market capitalization weighted equity index.
In terms of absolute performance, the Fund’s and the Underlying Index’s positions in the utilities and financials sectors were leading contributors to performance, while their positions in the oil & gas sector were the sole sector detractors from performance.
Relative to the Russell 1000 Index, the Fund’s and the Underlying Index’s overweight positions and security selection in the utilities sector and their security selection in the health care sector were leading contributors to performance. The Fund’s and the Underlying Index’s underweight positions in the technology sector and their security selection in the telecommunications sector were leading detractors from relative performance.
HOW WAS THE FUND POSITIONED?
During the reporting period, among the Fund’s and the Underlying Index’s largest allocations were in the health care and consumer goods sectors, while among their smallest allocations were in the telecommunications and oil & gas sectors.
| | | | | | | | |
| | | |
| OCTOBER 31, 2019 | | J.P. MORGAN EXCHANGE-TRADED FUNDS | | | | | 41 | |
JPMorgan U.S. Minimum Volatility ETF
FUND COMMENTARY
TWELVE MONTHS ENDED OCTOBER 31, 2019 (Unaudited) (continued)
| | | | | | | | |
| TOP TEN EQUITY HOLDINGS OF THE PORTFOLIO**** | |
| | 1. | | | Archer-Daniels-Midland Co. | | | 0.7 | % |
| | 2. | | | AT&T, Inc. | | | 0.6 | |
| | 3. | | | NextEra Energy, Inc. | | | 0.6 | |
| | 4. | | | Entergy Corp. | | | 0.6 | |
| | 5. | | | Southern Co. (The) | | | 0.6 | |
| | 6. | | | Microsoft Corp. | | | 0.6 | |
| | 7. | | | Sysco Corp. | | | 0.6 | |
| | 8. | | | ANSYS, Inc. | | | 0.6 | |
| | 9. | | | Dominion Energy, Inc. | | | 0.6 | |
| | 10. | | | ResMed, Inc. | | | 0.6 | |
| | | | |
PORTFOLIO COMPOSITION BY SECTOR**** | |
| Consumer Goods | | | 18.7 | % |
| Utilities | | | 16.8 | |
| Health Care | | | 16.8 | |
| Financials | | | 14.0 | |
| Consumer Services | | | 9.7 | |
| Basic Materials | | | 5.1 | |
| Industrials | | | 5.0 | |
| Oil & Gas | | | 5.0 | |
| Technology | | | 4.9 | |
| Telecommunications | | | 3.5 | |
| Short-Term Investments | | | 0.5 | |
| * | | The return shown is based on net asset value calculated for shareholder transactions and may differ from the return shown in the financial highlights, which reflects adjustments made to the net asset value in accordance with accounting principles generally accepted in the United States of America. The net asset value was $30.21 as of October 31, 2019. |
| ** | | Market price return is calculated assuming an initial investment made at the market price at the beginning of the period, reinvestment of all dividends and distributions at market price during the period, and sale at the market price on the last day of the period. The price used to calculate the market price return is the midpoint of the bid/ask spread at the close of business on the NYSE Arca. The midpoint price was $30.23 as of October 31, 2019. |
| *** | | The adviser seeks to achieve the Fund’s objective. There can be no guarantee it will be achieved. |
| **** | | Percentages indicated are based on total investments as of October 31, 2019. The Fund’s composition is subject to change. |
| | | | | | |
| | | |
| 42 | | | | J.P. MORGAN EXCHANGE-TRADED FUNDS | | OCTOBER 31, 2019 |
| | | | | | | | | | | | |
AVERAGE ANNUAL TOTAL RETURNSAS OF OCTOBER 31, 2019 (Unaudited) | |
| | | INCEPTION DATE | | | 1 YEAR | | | SINCE
INCEPTION | |
JPMorgan U.S. Minimum Volatility ETF | |
Net Asset Value | | | November 8, 2017 | | | | 17.82% | | | | 12.26% | |
Market Price | | | | | | | 17.90% | | | | 12.30% | |
LIFE OF FUND PERFORMANCE(11/8/17 TO 10/31/19)
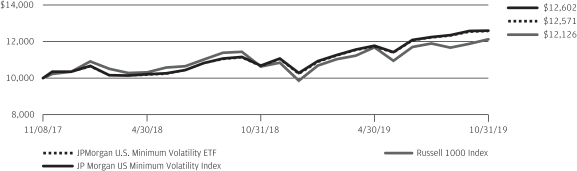
The performance quoted is past performance and is not a guarantee of future results. Exchange-traded funds are subject to certain market risks. Investment returns and principal value of an investment will fluctuate so that an investor’s shares, when sold or redeemed, may be worth more or less than their original cost. Current performance may be higher or lower than the performance data shown. For up-to-date, month-end performance information please call 1-844-457-6383.
Fund commenced operations on November 8, 2017.
The graph illustrates comparative performance for $10,000 invested in shares of the JPMorgan U.S. Minimum Volatility ETF, the JP Morgan US Minimum Volatility Index, and the Russell 1000 Index from November 8, 2017 to October 31, 2019. The performance of the Fund reflects the deduction of Fund expenses and assumes reinvestment of all dividends and capital gain distributions, if any. The performance of the JP Morgan US Minimum Volatility Index and Russell 1000 Index does not reflect the deduction of expenses associated with an exchange-traded fund and has been adjusted to reflect reinvestment of all dividends and capital gain distributions of the securities included in the Index, if applicable. The Fund’s adviser is a sponsor of the JP Morgan US Minimum Volatility Index and developed the proprietary factors on which the index is based.
FTSE International Limited, the benchmark administrator, administers, calculates and governs the JP Morgan US Minimum Volatility Index. The JP Morgan US Minimum Volatility Index contains U.S. large- and mid-cap equity securities selected from the Russell 1000 Index, using a rules-based factor selection process. The Underlying Index is designed to distribute risk among sectors and stocks in order to seek to minimize the overall portfolio volatility based upon the parameters of the rules-based process. The Russell 1000 Index is a market-capitalization weighted index, which measures the performance of the 1,000 largest companies in the Russell 3000 Index. Investors cannot invest directly in an index.
Fund performance reflects the waiver of the Fund’s fees and reimbursement of expenses for certain periods since the inception date. Without these waivers and reimbursements, performance would have been lower. Also, performance shown in this section does not reflect the deduction of taxes that a shareholder may pay on Fund distributions or redemption or sale of Fund shares.
The returns shown are based on net asset values calculated for shareholder transactions and may differ from the returns shown in the financial highlights, which reflect adjustments made to the net asset values in accordance with accounting principles generally accepted in the United States of America.
| | | | | | | | |
| | | |
| OCTOBER 31, 2019 | | J.P. MORGAN EXCHANGE-TRADED FUNDS | | | | | 43 | |
JPMorgan U.S. Momentum Factor ETF
FUND COMMENTARY
TWELVE MONTHS ENDED OCTOBER 31, 2019 (Unaudited)
| | | | |
| REPORTING PERIOD RETURN: | |
| JPMorgan U.S. Momentum Factor ETF | | | | |
| Net Asset Value* | | | 13.06% | |
| Market Price** | | | 13.06% | |
| JP Morgan US Momentum Factor Index | | | 13.18% | |
| Russell 1000 Index | | | 14.15% | |
| |
| Net Assets as of 10/31/2019 | | $ | 56,620,589 | |
INVESTMENT OBJECTIVE***
The JPMorgan U.S. Momentum Factor ETF (the “Fund”) seeks investment results that closely correspond, before fees and expenses, to the performance of the JP Morgan US Momentum Factor Index (the “Underlying Index”).
INVESTMENT APPROACH
The Fund is passively managed to the Underlying Index, which is composed of U.S. large and mid cap securities selected to represent positive momentum factor characteristics. The Underlying Index uses a proprietary selection process that utilizes a momentum factor to identify the companies that have had better recent performance compared with other companies. The Underlying Index’s methodology includes quarterly rebalancing.
HOW DID THE FUND PERFORM?
The Fund posted a positive absolute performance for the twelve months ended October 31, 2019 and performed in line with the Underlying Index, before considering operating expenses, fees and tax management of the Fund’s portfolio.
The Fund underperformed the Russell 1000 Index, which is a more traditional market capitalization weighted index.
On an absolute basis, the Fund’s and the Underlying Index’s positions in the financials and technology sectors were leading contributors to performance, while the Fund’s and the Underlying Index’s positions in the oil & gas sector were the sole sector detractors from performance.
Relative to the Russell 1000 Index, the Fund’s and the Underlying Index’s security selection in the technology and health care sectors was a leading detractor from relative performance, while the Fund’s and Underlying Index’s security selection in the financials and basic materials sectors was a leading contributor to performance.
HOW WAS THE FUND POSITIONED?
During the reporting period, among the Fund’s and Underlying Index’s largest allocations were in the technology and financials sectors and among their smallest allocations were in the telecommunications and basic materials sectors.
| | | | | | |
| | | |
| 44 | | | | J.P. MORGAN EXCHANGE-TRADED FUNDS | | OCTOBER 31, 2019 |
| | | | | | | | |
| TOP TEN EQUITY HOLDINGS OF THE PORTFOLIO**** | |
| | 1. | | | Microsoft Corp. | | | 2.2 | % |
| | 2. | | | Berkshire Hathaway, Inc., Class B | | | 2.0 | |
| | 3. | | | Visa, Inc., Class A | | | 2.0 | |
| | 4. | | | Mastercard, Inc., Class A | | | 1.9 | |
| | 5. | | | Home Depot, Inc. (The) | | | 1.8 | |
| | 6. | | | Verizon Communications, Inc. | | | 1.8 | |
| | 7. | | | Amazon.com, Inc. | | | 1.7 | |
| | 8. | | | Merck & Co., Inc. | | | 1.7 | |
| | 9. | | | Procter & Gamble Co. (The) | | | 1.7 | |
| | 10. | | | Cisco Systems, Inc. | | | 1.6 | |
| | | | |
PORTFOLIO COMPOSITION BY SECTOR**** | |
Technology | | | 21.3 | % |
Financials | | | 19.0 | |
Consumer Services | | | 13.6 | |
Health Care | | | 12.5 | |
Industrials | | | 12.2 | |
Consumer Goods | | | 8.3 | |
Oil & Gas | | | 4.1 | |
Utilities | | | 3.5 | |
Telecommunications | | | 2.2 | |
Basic Materials | | | 2.1 | |
Short-Term Investments | | | 1.2 | |
| * | | The return shown is based on net asset value calculated for shareholder transactions and may differ from the return shown in the financial highlights, which reflects adjustments made to the net asset value in accordance with accounting principles generally accepted in the United States of America. The net asset value was $29.04 as of October 31, 2019. |
| ** | | Market price return is calculated assuming an initial investment made at the market price at the beginning of the period, reinvestment of all dividends and distributions at market price during the period, and sale at the market price on the last day of the period. The price used to calculate the market price return is the midpoint of the bid/ask spread at the close of business on the NYSE Arca. The midpoint price was $29.05 as of October 31, 2019. |
| *** | | The adviser seeks to achieve the Fund’s objective. There can be no guarantee it will be achieved. |
| **** | | Percentages indicated are based on total investments as of October 31, 2019. The Fund’s composition is subject to change. |
| | | | | | | | |
| | | |
| OCTOBER 31, 2019 | | J.P. MORGAN EXCHANGE-TRADED FUNDS | | | | | 45 | |
JPMorgan U.S. Momentum Factor ETF
FUND COMMENTARY
TWELVE MONTHS ENDED OCTOBER 31, 2019 (Unaudited) (continued)
| | | | | | | | | | | | |
AVERAGE ANNUAL TOTAL RETURNSAS OF OCTOBER 31, 2019 (Unaudited) | |
| | | INCEPTION DATE | | | 1 YEAR | | | SINCE
INCEPTION | |
JPMorgan U.S. Momentum Factor ETF | | | | | | | | | | | | |
Net Asset Value | | | November 8, 2017 | | | | 13.06% | | | | 9.15% | |
Market Price | | | | | | | 13.06% | | | | 9.17% | |
LIFE OF FUND PERFORMANCE(11/8/17 TO 10/31/19)
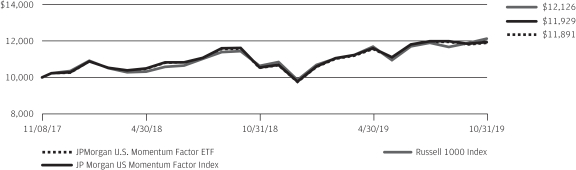
The performance quoted is past performance and is not a guarantee of future results. Exchange-traded funds are subject to certain market risks. Investment returns and principal value of an investment will fluctuate so that an investor’s shares, when sold or redeemed, may be worth more or less than their original cost. Current performance may be higher or lower than the performance data shown. For up-to-date, month-end performance information pleasecall 1-844-457-6383.
Fund commenced operations on November 8, 2017.
The graph illustrates comparative performance for $10,000 invested in shares of the JPMorgan U.S. Momentum Factor ETF, the JP Morgan US Momentum Factor Index, and the Russell 1000 Index from November 8, 2017 to October 31, 2019. The performance of the Fund reflects the deduction of Fund expenses and assumes reinvestment of all dividends and capital gain distributions, if any. The performance of the JP Morgan US Momentum Factor Index and Russell 1000 Index does not reflect the deduction of expenses associated with an exchange-traded fund and has been adjusted to reflect reinvestment of all dividends and capital gain distributions of the securities included in the Index, if applicable. The Fund’s adviser is a sponsor of the JP Morgan US Momentum Factor Index and developed the proprietary factors on which the index is based. FTSE
International Limited, the benchmark administrator, administers, calculates and governs the JP Morgan US Momentum Factor Index. The JP Morgan US Momentum Factor Index contains U.S. large- and mid-cap equity securities selected from the Russell 1000 Index, using a rules-based risk allocation and factor selection process. It is designed to reflect a sub-set of U.S. securities selected utilizing a momentum factor to identify companies that have had better recent performance compared to other securities without undue concentration in individual securities. The Russell 1000 Index is a market-capitalization weighted index, which measures the performance of the 1,000 largest companies in the Russell 3000 Index. Investors cannot invest directly in an index.
Fund performance reflects the waiver of the Fund’s fees and reimbursement of expenses for certain periods since the inception date. Without these waivers and reimbursements, performance would have been lower. Also, performance shown in this section does not reflect the deduction of taxes that a shareholder may pay on Fund distributions or redemption or sale of Fund shares.
The returns shown are based on net asset values calculated for shareholder transactions and may differ from the returns shown in the financial highlights, which reflect adjustments made to the net asset values in accordance with accounting principles generally accepted in the United States of America.
| | | | | | |
| | | |
| 46 | | | | J.P. MORGAN EXCHANGE-TRADED FUNDS | | OCTOBER 31, 2019 |
JPMorgan U.S. Quality Factor ETF
FUND COMMENTARY
TWELVE MONTHS ENDED OCTOBER 31, 2019 (Unaudited)
| | | | |
| REPORTING PERIOD RETURN: | |
| JPMorgan U.S. Quality Factor ETF | | | | |
| Net Asset Value* | | | 14.10% | |
| Market Price** | | | 14.18% | |
| JP Morgan US Quality Factor Index | | | 14.36% | |
| Russell 1000 Index | | | 14.15% | |
| |
| Net Assets as of 10/31/2019 | | $ | 107,067,872 | |
INVESTMENT OBJECTIVE***
The JPMorgan U.S. Quality Factor ETF (the “Fund”) seeks investment results that closely correspond, before fees and expenses, to the performance of the JP Morgan US Quality Factor Index (the “Underlying Index”).
INVESTMENT APPROACH
The Fund is passively managed to the Underlying Index, which consists of large and mid cap U.S. equity securities selected to represent quality factor characteristics. The Underlying Index uses a proprietary selection process that utilizes a quality factor to identify higher quality companies relative to their sector peers as measured by profitability, quality of earnings and solvency. The Underlying Index’s methodology includes quarterly rebalancing.
HOW DID THE FUND PERFORM?
The Fund posted a positive absolute performance for the twelve months ended October 31, 2019 and performed in line with the Underlying Index, before considering operating expenses, fees and tax management of the Fund’s portfolio.
Both the Fund and the Underlying Index performed in line with the Russell 1000 Index, which is a more traditional market capitalization weighted index.
On an absolute basis, the Fund’s and the Underlying Index’s positions in the technology and financials sectors were leading contributors to performance, while the Fund’s and the Underlying Index’s positions in the oil & gas sector were the sole sector detractors from performance.
Relative to the Russell 1000 Index, the Fund’s and the Underlying Index’s security selection in the financials and consumer services sectors was a leading contributor to performance. The Fund’s and the Underlying Index’s security selection in the industrials and utilities sectors was a leading detractor from performance.
HOW WAS THE FUND POSITIONED?
During the reporting period, among the Fund’s and the Underlying Index’s largest allocations were in the technology and financials sectors and among their smallest allocations were in the telecommunications and basic materials energy sectors.
| | | | | | | | |
| | | |
| OCTOBER 31, 2019 | | J.P. MORGAN EXCHANGE-TRADED FUNDS | | | | | 47 | |
JPMorgan U.S. Quality Factor ETF
FUND COMMENTARY
TWELVE MONTHS ENDED OCTOBER 31, 2019 (Unaudited) (continued)
| | | | | | | | |
| TOP TEN EQUITY HOLDINGS OF THE PORTFOLIO**** | |
| | 1. | | | Apple, Inc. | | | 2.3 | % |
| | 2. | | | Microsoft Corp. | | | 2.0 | |
| | 3. | | | Johnson & Johnson | | | 2.0 | |
| | 4. | | | Visa, Inc., Class A | | | 1.9 | |
| | 5. | | | Alphabet, Inc., Class A | | | 1.9 | |
| | 6. | | | Home Depot, Inc. (The) | | | 1.9 | |
| | 7. | | | Facebook, Inc., Class A | | | 1.8 | |
| | 8. | | | Verizon Communications, Inc. | | | 1.8 | |
| | 9. | | | Mastercard, Inc., Class A | | | 1.8 | |
| | 10. | | | Merck & Co., Inc. | | | 1.6 | |
| | | | |
PORTFOLIO COMPOSITION BY SECTOR**** | |
Technology | | | 22.2 | % |
Financials | | | 18.2 | |
Consumer Services | | | 13.8 | |
Health Care | | | 12.8 | |
Industrials | | | 12.5 | |
Consumer Goods | | | 7.8 | |
Oil & Gas | | | 4.2 | |
Utilities | | | 3.3 | �� |
Basic Materials | | | 2.1 | |
Telecommunications | | | 2.0 | |
Short-Term Investments | | | 1.1 | |
| * | | The return shown is based on net asset value calculated for shareholder transactions and may differ from the return shown in the financial highlights, which reflects adjustments made to the net asset value in accordance with accounting principles generally accepted in the United States of America. The net asset value was $29.74 as of October 31, 2019. |
| ** | | Market price return is calculated assuming an initial investment made at the market price at the beginning of the period, reinvestment of all dividends and distributions at market price during the period, and sale at the market price on the last day of the period. The price used to calculate the market price return is the midpoint of the bid/ask spread at the close of business on the NYSE Arca. The midpoint price was $29.76 as of October 31, 2019. |
| *** | | The adviser seeks to achieve the Fund’s objective. There can be no guarantee it will be achieved. |
| **** | | Percentages indicated are based on total investments as of October 31, 2019. The Fund’s composition is subject to change. |
| | | | | | |
| | | |
| 48 | | | | J.P. MORGAN EXCHANGE-TRADED FUNDS | | OCTOBER 31, 2019 |
| | | | | | | | | | | | |
AVERAGE ANNUAL TOTAL RETURNSAS OF OCTOBER 31, 2019 (Unaudited) | |
| | | INCEPTION DATE | | | 1 YEAR | | | SINCE
INCEPTION | |
JPMorgan U.S. Quality Factor ETF | |
Net Asset Value | | | November 8, 2017 | | | | 14.10% | | | | 11.22% | |
Market Price | | | | | | | 14.18% | | | | 11.25% | |
LIFE OF FUND PERFORMANCE(11/8/17 TO 10/31/19)
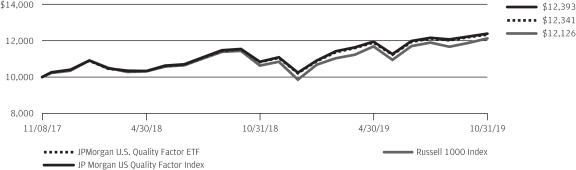
The performance quoted is past performance and is not a guarantee of future results. Exchange-traded funds are subject to certain market risks. Investment returns and principal value of an investment will fluctuate so that an investor’s shares, when sold or redeemed, may be worth more or less than their original cost. Current performance may be higher or lower than the performance data shown. For up-to-date, month-end performance information please call 1-844-457-6383.
Fund commenced operations on November 8, 2017.
The graph illustrates comparative performance for $10,000 invested in shares of the JPMorgan U.S. Quality Factor ETF, the JP Morgan US Quality Factor Index, and the Russell 1000 Index from November 8, 2017 to October 31, 2019. The performance of the Fund reflects the deduction of Fund expenses and assumes reinvestment of all dividends and capital gain distributions, if any. The performance of the JP Morgan US Quality Factor Index and Russell 1000 Index does not reflect the deduction of expenses associated with an exchange-traded fund and has been adjusted to reflect reinvestment of all dividends and capital gain distributions of the securities included in the Index, if applicable. The Fund’s adviser is a sponsor of the JP Morgan US Quality Factor Index and developed the proprietary factors on which the index is based. FTSE
International Limited, the benchmark administrator, administers, calculates and governs the JP Morgan US Quality Factor Index. The JP Morgan US Quality Factor Index contains U.S. large- and mid-cap equity securities selected from the Russell 1000 Index, using a rules-based risk allocation and factor selection process. It is designed to reflect a sub-set of U.S. securities selected utilizing a quality factor to identifying higher quality companies as measured by profitability, solvency, and earnings quality without undue concentration in individual securities. The Russell 1000 Index is a market-capitalization weighted index, which measures the performance of the 1,000 largest companies in the Russell 3000 Index. Investors cannot invest directly in an index.
Fund performance reflects the waiver of the Fund’s fees and reimbursement of expenses for certain periods since the inception date. Without these waivers and reimbursements, performance would have been lower. Also, performance shown in this section does not reflect the deduction of taxes that a shareholder may pay on Fund distributions or redemption or sale of Fund shares.
The returns shown are based on net asset values calculated for shareholder transactions and may differ from the returns shown in the financial highlights, which reflect adjustments made to the net asset values in accordance with accounting principles generally accepted in the United States of America.
| | | | | | | | |
| | | |
| OCTOBER 31, 2019 | | J.P. MORGAN EXCHANGE-TRADED FUNDS | | | | | 49 | |
JPMorgan U.S. Value Factor ETF
FUND COMMENTARY
TWELVE MONTHS ENDED OCTOBER 31, 2019 (Unaudited)
| | | | |
| REPORTING PERIOD RETURN: | |
| JPMorgan U.S. Value Factor ETF | | | | |
| Net Asset Value* | | | 11.01% | |
| Market Price** | | | 11.05% | |
| JP Morgan US Value Factor Index | | | 11.56% | |
| Russell 1000 Index | | | 14.15% | |
| |
| Net Assets as of 10/31/2019 | | $ | 66,849,642 | |
INVESTMENT OBJECTIVE***
The JPMorgan U.S. Value Factor ETF (the “Fund”) seeks investment results that closely correspond, before fees and expenses, to the performance of the JP Morgan US Value Factor Index (the “Underlying Index”).
INVESTMENT APPROACH
The Fund is passively managed to the Underlying Index, which consists of large and mid cap U.S. equity securities selected to represent value factor characteristics. The Underlying Index uses a proprietary selection process that utilizes a value factor to identify companies of attractive prices relative to their sector peers based on fundamental characteristics of book yield, earnings yield, dividend yield and cash flow yield. The Underlying Index’s methodology includes quarterly rebalancing.
HOW DID THE FUND PERFORM?
The Fund posted a positive absolute return for the twelve months ended October 31, 2019 and performed in line with the Underlying Index, before considering operating expenses, fees and tax management of the Fund’s portfolio. The Fund and the
Underlying Index underperformed the Russell 1000 Index, which is a more traditional market capitalization weighted index.
On an absolute basis, the Fund’s and the Underlying Index’s positions in the technology and industrials sectors were leading contributors to performance, while the Fund’s and the Underlying Index’s positions in the oil & gas and consumer services sectors were leading detractors from performance.
Relative to the Russell 1000 Index, the Fund’s and the Underlying Index’s security selection in the consumer services and financials sectors was a leading detractor from performance. The Fund’s and the Underlying Index’s security selection in the oil & gas and consumer goods sectors was a leading contributor to relative performance.
HOW WAS THE FUND POSITIONED?
During the reporting period, among the Fund’s and the Underlying Index’s largest allocations were in the technology and financials sectors and among their smallest allocations were in the telecommunications and basic materials.
| | | | | | |
| | | |
| 50 | | | | J.P. MORGAN EXCHANGE-TRADED FUNDS | | OCTOBER 31, 2019 |
| | | | | | | | |
| TOP TEN EQUITY HOLDINGS OF THE PORTFOLIO**** | |
| | 1. | | | Apple, Inc. | | | 2.2 | % |
| | 2. | | | Microsoft Corp. | | | 1.9 | |
| | 3. | | | Intel Corp. | | | 1.8 | |
| | 4. | | | Wells Fargo & Co. | | | 1.7 | |
| | 5. | | | Johnson & Johnson | | | 1.5 | |
| | 6. | | | Pfizer, Inc. | | | 1.5 | |
| | 7. | | | Walt Disney Co. (The) | | | 1.5 | |
| | 8. | | | Cisco Systems, Inc. | | | 1.5 | |
| | 9. | | | Comcast Corp., Class A | | | 1.5 | |
| | 10. | | | UnitedHealth Group, Inc. | | | 1.4 | |
| | | | |
PORTFOLIO COMPOSITION BY SECTOR**** | |
Technology | | | 21.8 | % |
Financials | | | 19.0 | |
Consumer Services | | | 13.4 | |
Industrials | | | 12.8 | |
Health Care | | | 12.1 | |
Consumer Goods | | | 8.6 | |
Oil & Gas | | | 4.2 | |
Utilities | | | 3.2 | |
Basic Materials | | | 2.2 | |
Telecommunications | | | 2.0 | |
Short-Term Investments | | | 0.7 | |
| * | | The return shown is based on net asset value calculated for shareholder transactions and may differ from the return shown in the financial highlights, which reflects adjustments made to the net asset value in accordance with accounting principles generally accepted in the United States of America. The net asset value was $27.29 as of October 31, 2019. |
| ** | | Market price return is calculated assuming an initial investment made at the market price at the beginning of the period, reinvestment of all dividends and distributions at market price during the period, and sale at the market price on the last day of the period. The price used to calculate the market price return is the midpoint of the bid/ask spread at the close of business on the NYSE Arca. The midpoint price was $27.30 as of October 31, 2019. |
| *** | | The adviser seeks to achieve the Fund’s objective. There can be no guarantee it will be achieved. |
| **** | | Percentages indicated are based on total investments as of October 31, 2019. The Fund’s composition is subject to change. |
| | | | | | | | |
| | | |
| OCTOBER 31, 2019 | | J.P. MORGAN EXCHANGE-TRADED FUNDS | | | | | 51 | |
JPMorgan U.S. Value Factor ETF
FUND COMMENTARY
TWELVE MONTHS ENDED OCTOBER 31, 2019 (Unaudited) (continued)
| | | | | | | | | | | | |
AVERAGE ANNUAL TOTAL RETURNSAS OF OCTOBER 31, 2019 (Unaudited) | |
| | | INCEPTION DATE | | | 1 YEAR | | | SINCE
INCEPTION | |
JPMorgan U.S. Value Factor ETF | |
Net Asset Value | | | November 8, 2017 | | | | 11.01% | | | | 7.07% | |
Market Price | | | | | | | 11.05% | | | | 7.09% | |
LIFE OF FUND PERFORMANCE(11/8/17 TO 10/31/19)
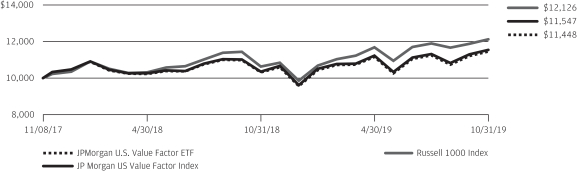
The performance quoted is past performance and is not a guarantee of future results. Exchange-traded funds are subject to certain market risks. Investment returns and principal value of an investment will fluctuate so that an investor’s shares, when sold or redeemed, may be worth more or less than their original cost. Current performance may be higher or lower than the performance data shown. For up-to-date, month-end performance information please call 1-844-457-6383.
Fund commenced operations on November 8, 2017.
The graph illustrates comparative performance for $10,000 invested in shares of the JPMorgan U.S. Value Factor ETF, the JP Morgan US Value Factor Index, and the Russell 1000 Index from November 8, 2017 to October 31, 2019. The performance of the Fund reflects the deduction of Fund expenses and assumes reinvestment of all dividends and capital gain distributions, if any. The performance of the JP Morgan US Value Factor Index and Russell 1000 Index does not reflect the deduction of expenses associated with an exchange-traded fund and has been adjusted to reflect reinvestment of all dividends and capital gain distributions of the securities included in the Index, if applicable. The Fund’s adviser is a sponsor of the JP Morgan US Value Factor Index and developed the proprietary factors on which the index is based. FTSE International
Limited, the benchmark administrator, administers, calculates and governs the JP Morgan US Value Factor Index. The JP Morgan US Value Factor Index contains U.S. large- and mid-cap equity securities selected from the Russell 1000 Index, using a rules-based risk allocation and factor selection process. It is designed to reflect a sub-set of U.S. securities selected utilizing a value factor to identify companies with attractive valuations without undue concentration in individual securities. The Russell 1000 Index is a market-capitalization weighted index, which measures the performance of the 1,000 largest companies in the Russell 3000 Index. Investors cannot invest directly in an index.
Fund performance reflects the waiver of the Fund’s fees and reimbursement of expenses for certain periods since the inception date. Without these waivers and reimbursements, performance would have been lower. Also, performance shown in this section does not reflect the deduction of taxes that a shareholder may pay on Fund distributions or redemption or sale of Fund shares.
The returns shown are based on net asset values calculated for shareholder transactions and may differ from the returns shown in the financial highlights, which reflect adjustments made to the net asset values in accordance with accounting principles generally accepted in the United States of America.
| | | | | | |
| | | |
| 52 | | | | J.P. MORGAN EXCHANGE-TRADED FUNDS | | OCTOBER 31, 2019 |
JPMorgan BetaBuilders Canada ETF
SCHEDULE OF PORTFOLIO INVESTMENTS
AS OF OCTOBER 31, 2019
| | | | | | | | |
| INVESTMENTS | | SHARES | | | VALUE($) | |
Common Stocks — 99.4% | |
|
Aerospace & Defense — 0.6% | |
| | |
Bombardier, Inc., Class B* | | | 5,418,770 | | | | 6,829,518 | |
| | |
CAE, Inc. | | | 678,374 | | | | 17,012,143 | |
| | | | | | | | |
| | |
| | | | | | | 23,841,661 | |
| | | | | | | | |
|
Airlines — 0.6% | |
| | |
Air Canada* | | | 678,048 | | | | 24,144,295 | |
| | | | | | | | |
|
Auto Components — 1.0% | |
| | |
Magna International, Inc. | | | 744,561 | | | | 40,034,781 | |
| | | | | | | | |
|
Banks — 26.3% | |
| | |
Bank of Montreal (a) | | | 1,628,132 | | | | 120,524,539 | |
| | |
Bank of Nova Scotia (The) | | | 3,109,857 | | | | 178,360,487 | |
| | |
Canadian Imperial Bank of Commerce | | | 1,133,676 | | | | 96,669,313 | |
| | |
National Bank of Canada (a) | | | 855,115 | | | | 44,161,356 | |
| | |
Royal Bank of Canada | | | 3,655,520 | | | | 294,861,776 | |
| | |
Toronto-Dominion Bank (The) | | | 4,637,304 | | | | 264,802,698 | |
| | | | | | | | |
| | |
| | | | | | | 999,380,169 | |
| | | | | | | | |
|
Capital Markets — 4.1% | |
| | |
Brookfield Asset Management, Inc., Class A | | | 2,347,413 | | | | 129,801,905 | |
| | |
CI Financial Corp. | | | 555,225 | | | | 8,081,135 | |
| | |
IGM Financial, Inc. | | | 206,428 | | | | 5,825,624 | |
| | |
TMX Group Ltd. | | | 128,562 | | | | 11,232,947 | |
| | | | | | | | |
| | |
| | | | | | | 154,941,611 | |
| | | | | | | | |
|
Chemicals — 2.0% | |
| | |
Methanex Corp. | | | 194,262 | | | | 7,361,337 | |
| | |
Nutrien Ltd. | | | 1,459,775 | | | | 69,835,565 | |
| | | | | | | | |
| | |
| | | | | | | 77,196,902 | |
| | | | | | | | |
|
Commercial Services & Supplies — 1.9% | |
| | |
Ritchie Bros Auctioneers, Inc. | | | 274,790 | | | | 11,305,801 | |
| | |
Waste Connections, Inc. | | | 671,930 | | | | 62,065,905 | |
| | | | | | | | |
| | |
| | | | | | | 73,371,706 | |
| | | | | | | | |
|
Construction & Engineering — 0.5% | |
| | |
SNC-Lavalin Group, Inc. | | | 447,346 | | | | 8,086,940 | |
| | |
WSP Global, Inc. | | | 163,738 | | | | 10,216,376 | |
| | | | | | | | |
| | |
| | | | | | | 18,303,316 | |
| | | | | | | | |
|
Containers & Packaging — 0.4% | |
| | |
CCL Industries, Inc., Class B | | | 369,022 | | | | 15,188,431 | |
| | | | | | | | |
|
Diversified Financial Services — 0.3% | |
| | |
Onex Corp. (a) | | | 216,129 | | | | 12,705,845 | |
| | | | | | | | |
|
Diversified Telecommunication Services — 1.4% | |
| | |
BCE, Inc. | | | 756,886 | | | | 35,904,819 | |
| | |
TELUS Corp. | | | 506,089 | | | | 18,001,875 | |
| | | | | | | | |
| | |
| | | | | | | 53,906,694 | |
| | | | | | | | |
| | | | | | | | |
| INVESTMENTS | | SHARES | | | VALUE($) | |
| | | | | | | | |
|
Electric Utilities — 2.3% | |
| | |
Emera, Inc. (a) | | | 608,015 | | | | 25,172,772 | |
| | |
Fortis, Inc. | | | 1,110,618 | | | | 46,141,536 | |
| | |
Hydro One Ltd. (a) (b) | | | 775,337 | | | | 14,416,523 | |
| | | | | | | | |
| | |
| | | | | | | 85,730,831 | |
| | | | | | | | |
|
Equity Real Estate Investment Trusts (REITs) — 0.6% | |
| | |
Canadian Apartment Properties | | | 199,543 | | | | 8,308,358 | |
| | |
H&R | | | 357,168 | | | | 6,041,836 | |
| | |
RioCan (a) | | | 380,113 | | | | 7,627,657 | |
| | | | | | | | |
| | |
| | | | | | | 21,977,851 | |
| | | | | | | | |
|
Food & Staples Retailing — 3.8% | |
| | |
Alimentation Couche-Tard, Inc., Class B | | | 2,228,510 | | | | 66,833,304 | |
| | |
Empire Co. Ltd., Class A | | | 441,789 | | | | 11,729,832 | |
| | |
George Weston Ltd. | | | 180,010 | | | | 14,412,007 | |
| | |
Loblaw Cos. Ltd. | | | 447,802 | | | | 23,880,960 | |
| | |
Metro, Inc. | | | 648,759 | | | | 27,435,940 | |
| | | | | | | | |
| | |
| | | | | | | 144,292,043 | |
| | | | | | | | |
|
Food Products — 0.5% | |
| | |
Saputo, Inc. | | | 602,555 | | | | 17,475,971 | |
| | | | | | | | |
|
Gas Utilities — 0.3% | |
| | |
AltaGas Ltd. (a) | | | 706,399 | | | | 10,276,065 | |
| | | | | | | | |
|
Hotels, Restaurants & Leisure — 1.6% | |
| | |
Restaurant Brands International, Inc. | | | 759,085 | | | | 49,662,405 | |
| | |
Stars Group, Inc. (The)* | | | 593,871 | | | | 12,922,590 | |
| | | | | | | | |
| | |
| | | | | | | 62,584,995 | |
| | | | | | | | |
|
Insurance — 7.6% | |
| | |
Fairfax Financial Holdings Ltd. | | | 69,996 | | | | 29,654,368 | |
| | |
Great-West Lifeco, Inc. | | | 685,804 | | | | 16,677,778 | |
| | |
iA Financial Corp., Inc. | | | 270,894 | | | | 13,045,939 | |
| | |
Intact Financial Corp. | | | 354,677 | | | | 36,596,010 | |
| | |
Manulife Financial Corp. | | | 4,987,801 | | | | 92,894,054 | |
| | |
Power Corp. of Canada | | | 834,948 | | | | 19,322,159 | |
| | |
Power Financial Corp. | | | 609,209 | | | | 14,246,175 | |
| | |
Sun Life Financial, Inc. | | | 1,506,080 | | | | 67,568,345 | |
| | | | | | | | |
| | |
| | | | | | | 290,004,828 | |
| | | | | | | | |
|
IT Services — 3.4% | |
| | |
CGI, Inc.* | | | 612,826 | | | | 47,635,810 | |
| | |
Shopify, Inc., Class A* | | | 255,537 | | | | 80,128,146 | |
| | | | | | | | |
| | |
| | | | | | | 127,763,956 | |
| | | | | | | | |
|
Media — 0.9% | |
| | |
Quebecor, Inc., Class B | | | 455,284 | | | | 10,584,463 | |
| | |
Shaw Communications, Inc., Class B | | | 1,157,171 | | | | 23,616,093 | |
| | | | | | | | |
| | |
| | | | | | | 34,200,556 | |
| | | | | | | | |
SEE NOTES TO FINANCIAL STATEMENTS.
| | | | | | | | |
| | | |
| OCTOBER 31, 2019 | | J.P. MORGAN EXCHANGE-TRADED FUNDS | | | | | 53 | |
JPMorgan BetaBuilders Canada ETF
SCHEDULE OF PORTFOLIO INVESTMENTS
AS OF OCTOBER 31, 2019 (continued)
| | | | | | | | |
| INVESTMENTS | | SHARES | | | VALUE($) | |
Common Stocks — continued | |
|
Metals & Mining — 7.2% | |
| | |
Agnico Eagle Mines Ltd. | | | 607,197 | | | | 37,318,804 | |
| | |
Barrick Gold Corp. | | | 4,527,587 | | | | 78,650,969 | |
| | |
First Quantum Minerals Ltd. | | | 1,756,696 | | | | 14,844,755 | |
| | |
Franco-Nevada Corp. | | | 477,068 | | | | 46,290,555 | |
| | |
Kinross Gold Corp.* | | | 3,191,528 | | | | 15,508,146 | |
| | |
Kirkland Lake Gold Ltd. | | | 487,393 | | | | 22,887,599 | |
| | |
Lundin Mining Corp. | | | 1,630,746 | | | | 8,233,590 | |
| | |
Teck Resources Ltd., Class B | | | 1,247,083 | | | | 19,713,210 | |
| | |
Wheaton Precious Metals Corp. | | | 1,137,190 | | | | 31,876,892 | |
| | | | | | | | |
| | |
| | | | | | | 275,324,520 | |
| | | | | | | | |
|
Multiline Retail — 1.1% | |
| | |
Canadian Tire Corp. Ltd., Class A (a) | | | 148,395 | | | | 15,997,727 | |
| | |
Dollarama, Inc. | | | 745,966 | | | | 25,095,857 | |
| | | | | | | | |
| | |
| | | | | | | 41,093,584 | |
| | | | | | | | |
|
Multi-Utilities — 0.9% | |
| | |
Algonquin Power & Utilities Corp. | | | 1,262,861 | | | | 17,345,042 | |
| | |
Atco Ltd., Class I | | | 188,746 | | | | 6,634,986 | |
| | |
Canadian Utilities Ltd., Class A | | | 304,912 | | | | 8,892,013 | |
| | | | | | | | |
| | |
| | | | | | | 32,872,041 | |
| | | | | | | | |
|
Oil, Gas & Consumable Fuels — 17.7% | |
| | |
ARC Resources Ltd. (a) | | | 902,452 | | | | 3,823,311 | |
| | |
Cameco Corp. | | | 1,008,564 | | | | 9,005,173 | |
| | |
Canadian Natural Resources Ltd. | | | 3,028,571 | | | | 76,363,862 | |
| | |
Cenovus Energy, Inc. | | | 2,598,700 | | | | 22,137,586 | |
| | |
Crescent Point Energy Corp. | | | 1,394,362 | | | | 5,092,158 | |
| | |
Enbridge, Inc. | | | 5,157,153 | | | | 187,828,281 | |
| | |
Encana Corp. | | | 3,310,158 | | | | 12,968,199 | |
| | |
Husky Energy, Inc. | | | 768,370 | | | | 5,367,097 | |
| | |
Imperial Oil Ltd. | | | 602,550 | | | | 15,005,421 | |
| | |
Inter Pipeline Ltd. (a) | | | 1,050,953 | | | | 17,642,222 | |
| | |
Keyera Corp. | | | 545,633 | | | | 12,647,616 | |
| | |
Pembina Pipeline Corp. | | | 1,302,321 | | | | 45,849,689 | |
| | |
PrairieSky Royalty Ltd. (a) | | | 529,282 | | | | 5,167,843 | |
| | |
Seven Generations Energy Ltd., Class A* | | | 742,730 | | | | 4,161,679 | |
| | |
Suncor Energy, Inc. | | | 3,964,012 | | | | 117,857,953 | |
| | |
TC Energy Corp. | | | 2,376,925 | | | | 119,811,746 | |
| | |
Tourmaline Oil Corp. | | | 637,781 | | | | 5,471,813 | |
| | |
Vermilion Energy, Inc. (a) | | | 395,381 | | | | 5,223,316 | |
| | | | | | | | |
| | |
| | | | | | | 671,424,965 | |
| | | | | | | | |
|
Paper & Forest Products — 0.2% | |
| | |
West Fraser Timber Co. Ltd. | | | 128,542 | | | | 5,943,518 | |
| | | | | | | | |
|
Pharmaceuticals — 1.1% | |
| | |
Aurora Cannabis, Inc.* (a) | | | 2,599,279 | | | | 9,314,856 | |
| | | | | | | | |
| INVESTMENTS | | SHARES | | | VALUE($) | |
| | | | | | | | |
|
Pharmaceuticals — continued | |
| | |
Bausch Health Cos., Inc.* | | | 793,206 | | | | 19,717,231 | |
| | |
Canopy Growth Corp.* (a) | | | 565,344 | | | | 11,301,729 | |
| | | | | | | | |
| | |
| | | | | | | 40,333,816 | |
| | | | | | | | |
|
Professional Services — 0.8% | |
| | |
Thomson Reuters Corp. | | | 434,191 | | | | 29,177,925 | |
| | | | | | | | |
|
Road & Rail — 6.4% | |
| | |
Canadian National Railway Co. | | | 1,836,483 | | | | 164,253,054 | |
| | |
Canadian Pacific Railway Ltd. | | | 354,371 | | | | 80,584,358 | |
| | | | | | | | |
| | |
| | | | | | | 244,837,412 | |
| | | | | | | | |
|
Software — 2.2% | |
| | |
BlackBerry Ltd.* (a) | | | 1,257,367 | | | | 6,606,165 | |
| | |
Constellation Software, Inc. (a) | | | 50,222 | | | | 49,601,613 | |
| | |
Open Text Corp. | | | 687,586 | | | | 27,783,256 | |
| | | | | | | | |
| | |
| | | | | | | 83,991,034 | |
| | | | | | | | |
|
Textiles, Apparel & Luxury Goods — 0.3% | |
| | |
Gildan Activewear, Inc. | | | 519,025 | | | | 13,260,338 | |
| | | | | | | | |
|
Thrifts & Mortgage Finance — 0.1% | |
| | |
Genworth MI Canada, Inc. (a) | | | 99,162 | | | | 4,005,329 | |
| | | | | | | | |
|
Trading Companies & Distributors — 0.2% | |
| | |
Finning International, Inc. | | | 416,139 | | | | 7,086,780 | |
| | | | | | | | |
|
Wireless Telecommunication Services — 1.1% | |
| | |
Rogers Communications, Inc., Class B | | | 908,876 | | | | 42,790,525 | |
| | | | | | | | |
| | |
Total Common Stocks
(Cost $3,653,743,505) | | | | | | | 3,779,464,294 | |
| | | | | | | | |
Short-Term Investments — 6.0% | |
|
Investment of Cash Collateral from Securities Loaned — 6.0% | |
| | |
JPMorgan Securities Lending Money Market Fund Class Agency SL Shares, 1.98% (c) (d) | | | 173,986,803 | | | | 174,004,202 | |
| | |
JPMorgan U.S. Government Money Market Fund Class IM Shares, 1.70% (c) (d) | | | 52,671,952 | | | | 52,671,952 | |
| | | | | | | | |
| | |
Total Investment of Cash Collateral from Securities Loaned
(Cost $226,676,154) | | | | | | | 226,676,154 | |
| | | | | | | | |
Total Investments — 105.4%
(Cost $3,880,419,659) | | | | | | | 4,006,140,448 | |
| | |
Liabilities in Excess of
Other Assets — (5.4)% | | | | | | | (205,386,428 | ) |
| | | | | | | | |
NET ASSETS — 100.0% | | | | | | | 3,800,754,020 | |
| | | | | | | | |
Percentages indicated are based on net assets.
SEE NOTES TO FINANCIAL STATEMENTS.
| | | | | | |
| | | |
| 54 | | | | J.P. MORGAN EXCHANGE-TRADED FUNDS | | OCTOBER 31, 2019 |
| | |
| (a) | | Thesecurity or a portion of this security is on loan at October 31, 2019. The total value of securities on loan at October 31, 2019 is $213,748,097. |
| (b) | | Security exempt from registration pursuant to Regulation S under the Securities Act of 1933, as amended. Regulation S applies to securities offerings that are made outside of the United States and do not involve direct selling efforts in the United States and as such may have restrictions on resale. |
| | |
| (c) | | Investment in an affiliated fund, which is registered under the Investment Company Act of 1940, as amended, and is advised by J.P. Morgan Investment Management Inc. |
| (d) | | Therate shown is the current yield as of October 31, 2019. |
| * | | Non-incomeproducing security. |
| | | | | | | | | | | | | | | | | | | | |
| Futures contracts outstanding as of October 31, 2019: | |
| DESCRIPTION | | NUMBER OF
CONTRACTS | | | EXPIRATION
DATE | | | TRADING
CURRENCY | | | NOTIONAL
AMOUNT($) | | | VALUE AND
UNREALIZED
APPRECIATION
(DEPRECIATION)($) | |
|
Long Contracts | |
| | | | | |
| S&P/TSX 60 Index | | | 136 | | | | 12/2019 | | | | CAD | | | | 20,318,943 | | | | (100,766 | ) |
| | | | | | | | | | | | | | | | | | | | |
Abbreviations
| | |
| CAD | | CanadianDollar |
| TSX | | TorontoStock Exchange |
SEE NOTES TO FINANCIAL STATEMENTS.
| | | | | | | | |
| | | |
| OCTOBER 31, 2019 | | J.P. MORGAN EXCHANGE-TRADED FUNDS | | | | | 55 | |
JPMorgan BetaBuilders Developed Asia ex-Japan ETF
SCHEDULE OF PORTFOLIO INVESTMENTS
AS OF OCTOBER 31, 2019
| | | | | | | | |
| INVESTMENTS | | SHARES | | | VALUE($) | |
Common Stocks — 99.1% | |
|
Australia — 56.6% | |
| | |
AGL Energy Ltd. | | | 542,934 | | | | 7,411,383 | |
| | |
Alumina Ltd. | | | 1,922,831 | | | | 3,001,755 | |
| | |
AMP Ltd. | | | 2,423,233 | | | | 3,061,853 | |
| | |
APA Group | | | 974,848 | | | | 7,830,230 | |
| | |
Aristocrat Leisure Ltd. | | | 525,731 | | | | 11,463,585 | |
| | |
ASX Ltd. | | | 159,727 | | | | 9,066,402 | |
| | |
Aurizon Holdings Ltd. | | | 1,644,292 | | | | 6,689,373 | |
| | |
AusNet Services | | | 1,425,512 | | | | 1,820,904 | |
| | |
Australia & New Zealand Banking Group Ltd. | | | 2,388,284 | | | | 43,889,777 | |
| | |
Bendigo & Adelaide Bank Ltd. | | | 397,829 | | | | 2,919,711 | |
| | |
BHP Group Ltd. | | | 2,428,745 | | | | 59,534,508 | |
| | |
BlueScope Steel Ltd. | | | 431,004 | | | | 3,945,491 | |
| | |
Boral Ltd. | | | 968,589 | | | | 3,362,861 | |
| | |
Brambles Ltd. | | | 1,310,516 | | | | 10,834,102 | |
| | |
Caltex Australia Ltd. | | | 215,488 | | | | 4,050,876 | |
| | |
Challenger Ltd. | | | 420,592 | | | | 2,306,826 | |
| | |
CIMIC Group Ltd. | | | 80,978 | | | | 1,845,399 | |
| | |
Coca-Cola Amatil Ltd. | | | 414,200 | | | | 2,906,710 | |
| | |
Cochlear Ltd. | | | 47,270 | | | | 6,896,226 | |
| | |
Coles Group Ltd. | | | 936,807 | | | | 9,694,896 | |
| | |
Commonwealth Bank of Australia | | | 1,452,160 | | | | 78,736,275 | |
| | |
Computershare Ltd. | | | 414,744 | | | | 4,527,125 | |
| | |
Crown Resorts Ltd. | | | 290,201 | | | | 2,493,004 | |
| | |
CSL Ltd. | | | 373,375 | | | | 65,847,036 | |
| | |
Dexus, REIT | | | 894,118 | | | | 7,373,318 | |
| | |
Domino’s Pizza Enterprises Ltd. | | | 51,491 | | | | 1,811,543 | |
| | |
Flight Centre Travel Group Ltd. | | | 47,590 | | | | 1,398,038 | |
| | |
Fortescue Metals Group Ltd. | | | 1,412,374 | | | | 8,644,613 | |
| | |
Goodman Group, REIT | | | 1,322,475 | | | | 13,131,205 | |
| | |
GPT Group (The), REIT | | | 1,591,815 | | | | 6,533,973 | |
| | |
Harvey Norman Holdings Ltd. | | | 552,149 | | | | 1,557,899 | |
| | |
Iluka Resources Ltd. | | | 345,316 | | | | 2,235,179 | |
| | |
Incitec Pivot Ltd. | | | 1,381,986 | | | | 3,288,352 | |
| | |
Insurance Australia Group Ltd. | | | 1,906,711 | | | | 10,447,006 | |
| | |
Lendlease Group | | | 482,076 | | | | 6,231,177 | |
| | |
Macquarie Group Ltd. | | | 261,137 | | | | 24,112,720 | |
| | |
Magellan Financial Group Ltd. | | | 121,692 | | | | 4,036,273 | |
| | |
Medibank Pvt Ltd. | | | 2,272,510 | | | | 5,296,594 | |
| | |
Mirvac Group, REIT | | | 3,265,709 | | | | 7,236,416 | |
| | |
National Australia Bank Ltd. | | | 2,378,957 | | | | 46,696,904 | |
| | |
Newcrest Mining Ltd. | | | 629,880 | | | | 13,749,230 | |
| | |
Orica Ltd. | | | 309,378 | | | | 4,889,319 | |
| | |
Origin Energy Ltd. | | | 1,450,463 | | | | 7,863,627 | |
| | |
Qantas Airways Ltd. | | | 636,474 | | | | 2,815,210 | |
| | |
QBE Insurance Group Ltd. | | | 1,126,306 | | | | 9,799,298 | |
| | | | | | | | |
| INVESTMENTS | | SHARES | | | VALUE($) | |
| | | | | | | | |
|
Australia — continued | |
| | |
Ramsay Health Care Ltd. | | | 131,870 | | | | 6,230,943 | |
| | |
REA Group Ltd. | | | 40,213 | | | | 3,017,961 | |
| | |
Reece Ltd. | | | 147,003 | | | | 1,052,885 | |
| | |
Rio Tinto Ltd. | | | 306,316 | | | | 19,154,867 | |
| | |
Santos Ltd. | | | 1,453,722 | | | | 8,131,417 | |
| | |
Scentre Group, REIT | | | 4,399,067 | | | | 11,622,978 | |
| | |
SEEK Ltd. | | | 289,349 | | | | 4,528,320 | |
| | |
Seven Group Holdings Ltd. | | | 109,352 | | | | 1,413,404 | |
| | |
Sonic Healthcare Ltd. | | | 375,743 | | | | 7,400,257 | |
| | |
South32 Ltd. | | | 4,240,199 | | | | 7,420,058 | |
| | |
Stockland, REIT | | | 2,011,421 | | | | 6,790,499 | |
| | |
Suncorp Group Ltd. | | | 1,038,417 | | | | 9,641,187 | |
| | |
Sydney Airport | | | 911,508 | | | | 5,520,499 | |
| | |
Tabcorp Holdings Ltd. | | | 1,658,652 | | | | 5,496,188 | |
| | |
Telstra Corp. Ltd. | | | 3,434,878 | | | | 8,272,719 | |
| | |
TPG Telecom Ltd. | | | 283,758 | | | | 1,278,947 | |
| | |
Transurban Group | | | 2,151,970 | | | | 22,040,362 | |
| | |
Treasury Wine Estates Ltd. | | | 593,017 | | | | 7,189,232 | |
| | |
Vicinity Centres, REIT | | | 2,651,616 | | | | 4,880,892 | |
| | |
Washington H Soul Pattinson & Co. Ltd. | | | 96,144 | | | | 1,437,183 | |
| | |
Wesfarmers Ltd. | | | 935,606 | | | | 25,705,697 | |
| | |
Westpac Banking Corp. | | | 2,834,277 | | | | 55,028,901 | |
| | |
WiseTech Global Ltd. | | | 120,444 | | | | 2,163,023 | |
| | |
Woodside Petroleum Ltd. | | | 772,396 | | | | 17,118,971 | |
| | |
Woolworths Group Ltd. | | | 1,083,480 | | | | 27,938,774 | |
| | |
Worley Ltd. | | | 264,347 | | | | 2,481,222 | |
| | | | | | | | |
| | |
| | | | | | | 816,241,588 | |
| | | | | | | | |
|
China — 0.2% | |
| | |
Evergrande Health Industry Group Ltd.* (a) | | | 1,770,000 | | | | 1,578,169 | |
| | |
Yangzijiang Shipbuilding Holdings Ltd. | | | 2,021,300 | | | | 1,415,090 | |
| | | | | | | | |
| | |
| | | | | | | 2,993,259 | |
| | | | | | | | |
|
Hong Kong — 24.5% | |
| | |
AIA Group Ltd. | | | 9,975,200 | | | | 99,335,285 | |
| | |
ASM Pacific Technology Ltd. | | | 225,200 | | | | 3,144,430 | |
| | |
Bank of East Asia Ltd. (The) | | | 1,167,000 | | | | 2,811,188 | |
| | |
Cathay Pacific Airways Ltd. | | | 813,000 | | | | 1,038,649 | |
| | |
Chow Tai Fook Jewellery Group Ltd. | | | 885,400 | | | | 796,074 | |
| | |
CK Asset Holdings Ltd. | | | 2,103,500 | | | | 14,635,541 | |
| | |
CK Infrastructure Holdings Ltd. | | | 612,000 | | | | 4,404,398 | |
| | |
CLP Holdings Ltd. | | | 1,428,500 | | | | 14,835,578 | |
| | |
Dairy Farm International Holdings Ltd. | | | 190,100 | | | | 1,146,303 | |
| | |
Guoco Group Ltd. | | | 64,000 | | | | 1,059,841 | |
| | |
Hang Lung Group Ltd. | | | 705,000 | | | | 1,765,768 | |
| | |
Hang Lung Properties Ltd. | | | 1,559,000 | | | | 3,426,999 | |
SEE NOTES TO FINANCIAL STATEMENTS.
| | | | | | |
| | | |
| 56 | | | | J.P. MORGAN EXCHANGE-TRADED FUNDS | | OCTOBER 31, 2019 |
| | | | | | | | |
| INVESTMENTS | | SHARES | | | VALUE($) | |
Common Stocks — continued | |
|
Hong Kong — continued | |
| | |
Hang Seng Bank Ltd. | | | 599,500 | | | | 12,508,629 | |
| | |
Henderson Land Development Co. Ltd. | | | 1,360,700 | | | | 6,796,129 | |
| | |
HK Electric Investments & HK Electric Investments Ltd. (b) | | | 1,901,000 | | | | 1,897,131 | |
| | |
HKT Trust & HKT Ltd. | | | 2,993,000 | | | | 4,656,090 | |
| | |
Hong Kong & China Gas Co. Ltd. | | | 8,098,600 | | | | 15,718,590 | |
| | |
Hong Kong Exchanges & Clearing Ltd. (a) | | | 975,700 | | | | 30,396,994 | |
| | |
Hutchison Port Holdings Trust | | | 4,492,900 | | | | 695,955 | |
| | |
Hysan Development Co. Ltd. | | | 511,000 | | | | 2,013,977 | |
| | |
Jardine Matheson Holdings Ltd. | | | 255,300 | | | | 14,554,912 | |
| | |
Jardine Strategic Holdings Ltd. | | | 146,400 | | | | 4,727,524 | |
| | |
Kerry Properties Ltd. | | | 493,000 | | | | 1,594,196 | |
| | |
Kingston Financial Group Ltd. (a) | | | 2,812,000 | | | | 426,108 | |
| | |
Link, REIT | | | 1,737,500 | | | | 18,923,812 | |
| | |
MTR Corp. Ltd. | | | 1,271,500 | | | | 7,290,508 | |
| | |
New World Development Co. Ltd. | | | 4,733,000 | | | | 6,770,257 | |
| | |
NWS Holdings Ltd. | | | 1,195,000 | | | | 1,778,495 | |
| | |
PCCW Ltd. | | | 3,637,000 | | | | 2,160,068 | |
| | |
Power Assets Holdings Ltd. | | | 1,127,500 | | | | 8,045,998 | |
| | |
Shangri-La Asia Ltd. (a) | | | 1,096,000 | | | | 1,124,948 | |
| | |
Sino Land Co. Ltd. | | | 2,476,000 | | | | 3,701,291 | |
| | |
Sun Hung Kai Properties Ltd. | | | 1,211,000 | | | | 18,350,669 | |
| | |
Swire Pacific Ltd., Class A (a) | | | 404,000 | | | | 3,851,044 | |
| | |
Swire Pacific Ltd., Class B | | | 692,500 | | | | 1,022,636 | |
| | |
Swire Properties Ltd. | | | 869,800 | | | | 2,735,565 | |
| | |
Techtronic Industries Co. Ltd. | | | 1,419,000 | | | | 11,089,506 | |
| | |
WH Group Ltd. (b) | | | 7,767,500 | | | | 8,198,933 | |
| | |
Wharf Holdings Ltd. (The) | | | 906,000 | | | | 2,055,944 | |
| | |
Wharf Real Estate Investment Co. Ltd. | | | 952,000 | | | | 5,599,402 | |
| | |
Wheelock & Co. Ltd. | | | 642,000 | | | | 3,970,516 | |
| | |
Yue Yuen Industrial Holdings Ltd. | | | 653,500 | | | | 1,841,687 | |
| | | | | | | | |
| | |
| | | | | | | 352,897,568 | |
| | | | | | | | |
|
Macau — 2.1% | |
| | |
Galaxy Entertainment Group Ltd. | | | 2,143,000 | | | | 14,755,927 | |
| | |
MGM China Holdings Ltd. | | | 689,428 | | | | 1,091,698 | |
| | |
Sands China Ltd. | | | 2,004,979 | | | | 9,875,764 | |
| | |
SJM Holdings Ltd. | | | 1,780,000 | | | | 1,901,470 | |
| | |
Wynn Macau Ltd. | | | 1,201,516 | | | | 2,607,387 | |
| | | | | | | | |
| | |
| | | | | | | 30,232,246 | |
| | | | | | | | |
|
New Zealand — 2.2% | |
| | |
a2 Milk Co. Ltd.* | | | 606,561 | | | | 5,035,886 | |
| | |
Auckland International Airport Ltd. | | | 780,640 | | | | 4,652,476 | |
| | |
Contact Energy Ltd. | | | 587,298 | | | | 2,777,688 | |
| | |
Fisher & Paykel Healthcare Corp. Ltd. | | | 474,196 | | | | 5,816,109 | |
| | | | | | | | |
| INVESTMENTS | | SHARES | | | VALUE($) | |
| | | | | | | | |
|
New Zealand — continued | |
| | |
Fletcher Building Ltd. | | | 707,074 | | | | 2,077,478 | |
| | |
Mercury NZ Ltd. | | | 517,762 | | | | 1,646,476 | |
| | |
Meridian Energy Ltd. | | | 1,037,632 | | | | 3,058,616 | |
| | |
Ryman Healthcare Ltd. | | | 341,006 | | | | 2,818,398 | |
| | |
Spark New Zealand Ltd. | | | 1,517,107 | | | | 4,352,072 | |
| | | | | | | | |
| | |
| | | | | | | 32,235,199 | |
| | | | | | | | |
|
Singapore — 11.7% | |
| | |
Ascendas, REIT | | | 2,133,200 | | | | 4,968,336 | |
| | |
CapitaLand Commercial Trust, REIT | | | 2,357,300 | | | | 3,550,058 | |
| | |
CapitaLand Ltd. | | | 2,081,000 | | | | 5,500,547 | |
| | |
CapitaLand Mall Trust, REIT | | | 2,345,500 | | | | 4,376,340 | |
| | |
City Developments Ltd. | | | 509,600 | | | | 4,035,622 | |
| | |
ComfortDelGro Corp. Ltd. | | | 1,789,300 | | | | 3,021,559 | |
| | |
DBS Group Holdings Ltd. | | | 1,477,700 | | | | 28,166,264 | |
| | |
Frasers Property Ltd. | | | 313,300 | | | | 423,736 | |
| | |
Genting Singapore Ltd. | | | 4,695,400 | | | | 3,239,424 | |
| | |
Golden Agri-Resources Ltd. | | | 5,464,500 | | | | 820,227 | |
| | |
Great Eastern Holdings Ltd. | | | 47,100 | | | | 756,163 | |
| | |
Jardine Cycle & Carriage Ltd. | | | 82,100 | | | | 1,973,861 | |
| | |
Keppel, REIT | | | 1,582,400 | | | | 1,406,620 | |
| | |
Keppel Corp. Ltd. | | | 1,198,000 | | | | 6,032,393 | |
| | |
Mapletree North Asia Commercial Trust, REIT (b) | | | 1,691,600 | | | | 1,590,215 | |
| | |
Olam International Ltd. | | | 578,300 | | | | 776,630 | |
| | |
Oversea-Chinese Banking Corp. Ltd. | | | 3,170,900 | | | | 25,491,526 | |
| | |
SATS Ltd. | | | 553,400 | | | | 2,052,267 | |
| | |
Sembcorp Industries Ltd. | | | 726,600 | | | | 1,219,882 | |
| | |
Sembcorp Marine Ltd.* | | | 668,100 | | | | 671,349 | |
| | |
SIA Engineering Co. Ltd. | | | 181,300 | | | | 355,472 | |
| | |
Singapore Airlines Ltd. | | | 431,400 | | | | 2,981,737 | |
| | |
Singapore Exchange Ltd. | | | 680,900 | | | | 4,470,477 | |
| | |
Singapore Press Holdings Ltd. | | | 1,322,800 | | | | 2,152,718 | |
| | |
Singapore Technologies Engineering Ltd. | | | 1,287,900 | | | | 3,772,704 | |
| | |
Singapore Telecommunications Ltd. | | | 6,736,800 | | | | 16,313,539 | |
| | |
StarHub Ltd. | | | 489,900 | | | | 468,125 | |
| | |
Suntec, REIT | | | 1,918,500 | | | | 2,620,879 | |
| | |
United Overseas Bank Ltd. | | | 1,154,300 | | | | 22,725,216 | |
| | |
UOL Group Ltd. | | | 447,500 | | | | 2,562,333 | |
| | |
Venture Corp. Ltd. | | | 221,200 | | | | 2,565,838 | |
| | |
Wilmar International Ltd. | | | 2,509,200 | | | | 6,898,997 | |
| | |
Yanlord Land Group Ltd. | | | 546,900 | | | | 485,409 | |
| | | | | | | | |
| | |
| | | | | | | 168,446,463 | |
| | | | | | | | |
|
Taiwan — 0.0%(c) | |
| | |
FIT Hon Teng Ltd. (b) | | | 1,265,000 | | | | 513,648 | |
| | | | | | | | |
SEE NOTES TO FINANCIAL STATEMENTS.
| | | | | | | | |
| | | |
| OCTOBER 31, 2019 | | J.P. MORGAN EXCHANGE-TRADED FUNDS | | | | | 57 | |
JPMorgan BetaBuilders Developed Asia ex-Japan ETF
SCHEDULE OF PORTFOLIO INVESTMENTS
AS OF OCTOBER 31, 2019 (continued)
| | | | | | | | |
| INVESTMENTS | | SHARES | | | VALUE($) | |
Common Stocks — continued | |
|
United Kingdom — 1.4% | |
| | |
CK Hutchison Holdings Ltd. | | | 2,212,500 | | | | 20,428,198 | |
| | | | | | | | |
|
United States — 0.4% | |
| | |
James Hardie Industries plc, CHDI | | | 365,788 | | | | 6,282,120 | |
| | | | | | | | |
| | |
Total Common Stocks
(Cost $1,372,523,032) | | | | | | | 1,430,270,289 | |
| | | | | | | | |
Short-Term Investments — 0.1% | |
|
Investment of Cash Collateral from Securities Loaned — 0.1% | |
| | |
JPMorgan Securities Lending Money Market Fund Class Agency SL Shares, 1.98% (d) (e) | | | 1,000,000 | | | | 1,000,100 | |
| | |
JPMorgan U.S. Government Money Market Fund Class IM Shares, 1.70% (d) (e) | | | 546,282 | | | | 546,282 | |
| | | | | | | | |
| | |
Total Investment of Cash Collateral from Securities Loaned
(Cost $1,546,382) | | | | | | | 1,546,382 | |
| | | | | | | | |
Total Investments — 99.2%
(Cost $1,374,069,414) | | | | | | | 1,431,816,671 | |
| | |
Other Assets Less Liabilities — 0.8% | | | | | | | 11,037,159 | |
| | | | | | | | |
NET ASSETS — 100.0% | | | | | | | 1,442,853,830 | |
| | | | | | | | |
Percentages indicated are based on net assets.
Summary of Investments by Industry, October 31, 2019
The following table represents the portfolio investments of the Fund by industry classifications as a percentage of total investments:
| | | | |
| INDUSTRY | | PERCENTAGE | |
| |
Banks | | | 22.3 | % |
| |
Insurance | | | 9.4 | |
| |
Metals & Mining | | | 8.2 | |
| |
Real Estate Management & Development | | | 6.8 | |
| |
Equity Real Estate Investment Trusts (REITs) | | | 6.6 | |
| |
Capital Markets | | | 5.1 | |
| |
Biotechnology | | | 4.6 | |
| |
Hotels, Restaurants & Leisure | | | 4.0 | |
| |
Industrial Conglomerates | | | 3.5 | |
| |
Food & Staples Retailing | | | 2.8 | |
| |
Oil, Gas & Consumable Fuels | | | 2.7 | |
| |
Diversified Telecommunication Services | | | 2.6 | |
| |
Electric Utilities | | | 2.5 | |
| |
Transportation Infrastructure | | | 2.5 | |
| |
Multiline Retail | | | 1.9 | |
| |
Gas Utilities | | | 1.6 | |
| |
Food Products | | | 1.5 | |
| |
Health Care Providers & Services | | | 1.3 | |
| |
Road & Rail | | | 1.2 | |
| |
Others (each less than 1.0%) | | | 8.9 | |
Abbreviations
| | |
| CHDI | | Clearing House Electronic Subregister System (CHESS) Depository Interest |
| REIT | | RealEstate Investment Trust |
| |
| (a) | | The security or a portion of this security is on loan at October 31, 2019. The total value of securities on loan at October 31, 2019 is $1,455,691. |
| (b) | | Security exempt from registration pursuant to Regulation S under the Securities Act of 1933, as amended. Regulation S applies to securities offerings that are made outside of the United States and do not involve direct selling efforts in the United States and as such may have restrictions on resale. |
| (c) | | Amountrounds to less than 0.1% of net assets. |
| (d) | | Investment in an affiliated fund, which is registered under the Investment Company Act of 1940, as amended, and is advised by J.P. Morgan Investment Management Inc. |
| (e) | | Therate shown is the current yield as of October 31, 2019. |
| * | | Non-incomeproducing security. |
SEE NOTES TO FINANCIAL STATEMENTS.
| | | | | | |
| | | |
| 58 | | | | J.P. MORGAN EXCHANGE-TRADED FUNDS | | OCTOBER 31, 2019 |
| | | | | | | | | | | | | | | | | | | | |
| Futures contracts outstanding as of October 31, 2019: | |
| DESCRIPTION | | NUMBER OF
CONTRACTS | | | EXPIRATION
DATE | | | TRADING
CURRENCY | | | NOTIONAL
AMOUNT($) | | | VALUE AND
UNREALIZED
APPRECIATION
(DEPRECIATION)($) | |
Long Contracts | | | | | | | | | | | | | | | | | | | | |
Hang Seng Index | | | 22 | | | | 11/2019 | | | | HKD | | | | 3,776,926 | | | | 29,856 | |
MSCI Singapore Index | | | 44 | | | | 11/2019 | | | | SGD | | | | 1,197,957 | | | | 13,511 | |
SPI 200 Index | | | 66 | | | | 12/2019 | | | | AUD | | | | 7,544,418 | | | | (26,387 | ) |
| | | | | | | | | | | | | | | | | | | | |
| | | | | |
| | | | | | | | | | | | | | | | | | | 16,980 | |
| | | | | | | | | | | | | | | | | | | | |
Abbreviations
| | |
| AUD | | AustralianDollar |
| HKD | | HongKong Dollar |
| MSCI | | MorganStanley Capital International |
| SGD | | SingaporeDollar |
| SPI | | AustralianSecurities Exchange |
SEE NOTES TO FINANCIAL STATEMENTS.
| | | | | | | | |
| | | |
| OCTOBER 31, 2019 | | J.P. MORGAN EXCHANGE-TRADED FUNDS | | | | | 59 | |
JPMorgan BetaBuilders Europe ETF
SCHEDULE OF PORTFOLIO INVESTMENTS
AS OF OCTOBER 31, 2019
| | | | | | | | |
| INVESTMENTS | | SHARES | | | VALUE($) | |
Common Stocks — 99.3% | |
|
Australia — 1.1% | |
| | |
BHP Group plc | | | 879,927 | | | | 18,663,725 | |
| | |
Rio Tinto plc | | | 414,751 | | | | 21,592,691 | |
| | | | | | | | |
| | |
| | | | | | | 40,256,416 | |
| | | | | | | | |
|
Austria — 0.5% | |
| | |
ANDRITZ AG | | | 29,733 | | | | 1,336,982 | |
| | |
BAWAG Group AG (a) | | | 20,413 | | | | 843,678 | |
| | |
Erste Group Bank AG | | | 124,783 | | | | 4,413,308 | |
| | |
EVN AG | | | 14,175 | | | | 258,958 | |
| | |
IMMOFINANZ AG* | | | 38,449 | | | | 1,105,434 | |
| | |
Lenzing AG (b) | | | 5,510 | | | | 580,384 | |
| | |
Oesterreichische Post AG | | | 13,226 | | | | 487,441 | |
| | |
OMV AG | | | 59,753 | | | | 3,493,258 | |
| | |
Raiffeisen Bank International AG | | | 55,871 | | | | 1,376,622 | |
| | |
Strabag SE | | | 6,330 | | | | 210,384 | |
| | |
Telekom Austria AG* | | | 57,109 | | | | 442,034 | |
| | |
UNIQA Insurance Group AG | | | 48,268 | | | | 464,182 | |
| | |
Verbund AG | | | 28,368 | | | | 1,536,838 | |
| | |
Vienna Insurance Group AG Wiener Versicherung Gruppe | | | 15,808 | | | | 428,425 | |
| | |
voestalpine AG (b) | | | 46,626 | | | | 1,169,971 | |
| | | | | | | | |
| | |
| | | | | | | 18,147,899 | |
| | | | | | | | |
| | |
Belgium — 1.7% | | | | | | | | |
| | |
Ackermans & van Haaren NV | | | 9,349 | | | | 1,433,163 | |
| | |
Ageas | | | 78,098 | | | | 4,503,969 | |
| | |
Anheuser-Busch InBev SA/NV | | | 352,716 | | | | 28,470,336 | |
| | |
bpost SA | | | 40,331 | | | | 460,913 | |
| | |
Colruyt SA | | | 20,070 | | | | 1,115,622 | |
| | |
Elia System Operator SA/NV | | | 13,731 | | | | 1,183,786 | |
| | |
Groupe Bruxelles Lambert SA | | | 33,480 | | | | 3,363,265 | |
| | |
KBC Group NV (b) | | | 142,225 | | | | 10,000,455 | |
| | |
Proximus SADP | | | 64,513 | | | | 1,982,534 | |
| | |
Sofina SA | | | 6,562 | | | | 1,452,118 | |
| | |
Solvay SA | | | 30,320 | | | | 3,296,572 | |
| | |
Telenet Group Holding NV* | | | 18,462 | | | | 907,057 | |
| | |
UCB SA | | | 52,670 | | | | 4,245,143 | |
| | |
Umicore SA (b) | | | 83,151 | | | | 3,432,475 | |
| | | | | | | | |
| | |
| | | | | | | 65,847,408 | |
| | | | | | | | |
|
Chile — 0.0%(c) | |
| | |
Antofagasta plc | | | 143,024 | | | | 1,610,839 | |
| | | | | | | | |
|
Colombia — 0.0%(c) | |
| | |
Millicom International Cellular SA, SDR (b) | | | 24,989 | | | | 1,139,202 | |
| | | | | | | | |
|
Denmark — 2.8% | |
| | |
Ambu A/S, Class B (b) | | | 71,825 | | | | 1,129,064 | |
| | |
AP Moller — Maersk A/S, Class A | | | 1,343 | | | | 1,613,273 | |
| | | | | | | | |
| INVESTMENTS | | SHARES | | | VALUE($) | |
| | | | | | | | |
|
Denmark — continued | |
| | |
AP Moller — Maersk A/S, Class B (b) | | | 2,727 | | | | 3,478,568 | |
| | |
Carlsberg A/S, Class B | | | 44,154 | | | | 6,217,952 | |
| | |
Chr Hansen Holding A/S | | | 42,848 | | | | 3,289,687 | |
| | |
Coloplast A/S, Class B | | | 48,685 | | | | 5,861,477 | |
| | |
Danske Bank A/S | | | 283,767 | | | | 4,055,183 | |
| | |
Demant A/S* (b) | | | 41,898 | | | | 1,106,745 | |
| | |
DSV Panalpina A/S | | | 87,726 | | | | 8,526,018 | |
| | |
Genmab A/S* | | | 27,086 | | | | 5,918,148 | |
| | |
GN Store Nord A/S | | | 59,040 | | | | 2,597,345 | |
| | |
H Lundbeck A/S | | | 25,534 | | | | 872,512 | |
| | |
ISS A/S | | | 66,954 | | | | 1,752,938 | |
| | |
Jyske Bank A/S (Registered)* (b) | | | 26,855 | | | | 893,335 | |
| | |
Novo Nordisk A/S, Class B | | | 690,619 | | | | 37,976,249 | |
| | |
Novozymes A/S, Class B | | | 88,510 | | | | 4,172,326 | |
| | |
Orsted A/S (a) | | | 69,591 | | | | 6,108,120 | |
| | |
Pandora A/S | | | 41,505 | | | | 2,042,296 | |
| | |
Rockwool International A/S, Class A | | | 2,489 | | | | 468,469 | |
| | |
Rockwool International A/S, Class B | | | 2,905 | | | | 570,944 | |
| | |
Tryg A/S | | | 50,144 | | | | 1,401,578 | |
| | |
Vestas Wind Systems A/S | | | 82,806 | | | | 6,746,024 | |
| | | | | | | | |
| | |
| | | | | | | 106,798,251 | |
| | | | | | | | |
|
Finland — 2.0% | |
| | |
Elisa OYJ | | | 62,103 | | | | 3,391,832 | |
| | |
Fortum OYJ | | | 180,474 | | | | 4,410,356 | |
| | |
Huhtamaki OYJ | | | 39,555 | | | | 1,831,615 | |
| | |
Kesko OYJ, Class A | | | 10,314 | | | | 634,977 | |
| | |
Kesko OYJ, Class B | | | 28,179 | | | | 1,877,512 | |
| | |
Kone OYJ, Class B | | | 168,361 | | | | 10,720,533 | |
| | |
Konecranes OYJ | | | 27,502 | | | | 849,328 | |
| | |
Metso OYJ | | | 53,244 | | | | 2,015,648 | |
| | |
Neste OYJ | | | 179,461 | | | | 6,484,369 | |
| | |
Nokia OYJ | | | 2,342,643 | | | | 8,599,874 | |
| | |
Nokian Renkaat OYJ | | | 54,635 | | | | 1,561,422 | |
| | |
Nordea Bank Abp (b) | | | 1,345,482 | | | | 9,848,036 | |
| | |
Orion OYJ, Class A | | | 13,443 | | | | 591,345 | |
| | |
Orion OYJ, Class B | | | 43,203 | | | | 1,916,685 | |
| | |
Sampo OYJ, Class A | | | 205,472 | | | | 8,420,212 | |
| | |
Stora Enso OYJ, Class A (b) | | | 21,403 | | | | 310,320 | |
| | |
Stora Enso OYJ, Class R | | | 255,134 | | | | 3,314,630 | |
| | |
UPM-Kymmene OYJ | | | 221,667 | | | | 7,219,580 | |
| | |
Wartsila OYJ Abp | | | 202,146 | | | | 2,135,625 | |
| | | | | | | | |
| | |
| | | | | | | 76,133,899 | |
| | | | | | | | |
|
France — 17.1% | |
| | |
Accor SA | | | 75,381 | | | | 3,242,411 | |
SEE NOTES TO FINANCIAL STATEMENTS.
| | | | | | |
| | | |
| 60 | | | | J.P. MORGAN EXCHANGE-TRADED FUNDS | | OCTOBER 31, 2019 |
| | | | | | | | |
| INVESTMENTS | | SHARES | | | VALUE($) | |
Common Stocks — continued | |
|
France — continued | |
| | |
Aeroports de Paris | | | 13,552 | | | | 2,577,445 | |
| | |
Air Liquide SA | | | 196,243 | | | | 26,092,688 | |
| | |
Airbus SE | | | 251,093 | | | | 36,021,402 | |
| | |
Alstom SA | | | 79,434 | | | | 3,436,571 | |
| | |
Amundi SA (a) | | | 24,948 | | | | 1,782,967 | |
| | |
Arkema SA | | | 29,951 | | | | 3,065,124 | |
| | |
Atos SE | | | 40,067 | | | | 3,109,467 | |
| | |
AXA SA | | | 808,725 | | | | 21,407,948 | |
| | |
BioMerieux | | | 17,704 | | | | 1,449,693 | |
| | |
BNP Paribas SA | | | 476,987 | | | | 24,927,129 | |
| | |
Bollore SA | | | 375,038 | | | | 1,624,804 | |
| | |
Bouygues SA | | | 103,701 | | | | 4,398,797 | |
| | |
Bureau Veritas SA | | | 117,889 | | | | 3,014,019 | |
| | |
Capgemini SE | | | 65,515 | | | | 7,385,522 | |
| | |
Carrefour SA | | | 238,787 | | | | 4,065,484 | |
| | |
Casino Guichard Perrachon SA (b) | | | 22,137 | | | | 1,194,226 | |
| | |
Cie de Saint-Gobain | | | 227,266 | | | | 9,256,081 | |
| | |
Cie Generale des Etablissements Michelin SCA | | | 74,972 | | | | 9,128,387 | |
| | |
CNP Assurances | | | 65,440 | | | | 1,298,935 | |
| | |
Covivio, REIT | | | 18,518 | | | | 2,097,151 | |
| | |
Credit Agricole SA | | | 528,800 | | | | 6,899,968 | |
| | |
Danone SA | | | 268,282 | | | | 22,224,830 | |
| | |
Dassault Aviation SA | | | 966 | | | | 1,341,920 | |
| | |
Dassault Systemes SE | | | 56,944 | | | | 8,648,472 | |
| | |
Edenred | | | 101,324 | | | | 5,340,560 | |
| | |
Eiffage SA | | | 33,481 | | | | 3,596,067 | |
| | |
Electricite de France SA | | | 190,663 | | | | 1,969,705 | |
| | |
Engie SA | | | 763,607 | | | | 12,786,435 | |
| | |
EssilorLuxottica SA | | | 120,970 | | | | 18,471,437 | |
| | |
Eutelsat Communications SA (b) | | | 71,442 | | | | 1,355,250 | |
| | |
Faurecia SE | | | 30,869 | | | | 1,440,600 | |
| | |
Gecina SA, REIT | | | 22,702 | | | | 3,897,230 | |
| | |
Getlink SE | | | 181,019 | | | | 3,032,230 | |
| | |
Hermes International | | | 14,516 | | | | 10,456,646 | |
| | |
ICADE, REIT | | | 11,701 | | | | 1,145,801 | |
| | |
Iliad SA | | | 10,755 | | | | 1,114,600 | |
| | |
Imerys SA | | | 15,062 | | | | 581,825 | |
| | |
Ipsen SA | | | 15,290 | | | | 1,629,726 | |
| | |
JCDecaux SA | | | 31,563 | | | | 862,791 | |
| | |
Kering SA | | | 30,956 | | | | 17,613,860 | |
| | |
Klepierre SA, REIT | | | 87,094 | | | | 3,246,450 | |
| | |
Legrand SA | | | 110,153 | | | | 8,605,601 | |
| | |
L’Oreal SA | | | 102,399 | | | | 29,906,843 | |
| | |
LVMH Moet Hennessy Louis Vuitton SE | | | 112,219 | | | | 47,923,800 | |
| | |
Natixis SA | | | 378,824 | | | | 1,740,441 | |
| | | | | | | | |
| INVESTMENTS | | SHARES | | | VALUE($) | |
| | | | | | | | |
|
France — continued | |
| | |
Orange SA | | | 794,510 | | | | 12,787,248 | |
| | |
Pernod Ricard SA (b) | | | 90,635 | | | | 16,743,303 | |
| | |
Peugeot SA | | | 237,490 | | | | 6,014,701 | |
| | |
Publicis Groupe SA | | | 93,130 | | | | 4,008,182 | |
| | |
Renault SA | | | 85,869 | | | | 4,384,381 | |
| | |
Rexel SA | | | 103,120 | | | | 1,278,432 | |
| | |
Safran SA | | | 139,763 | | | | 22,137,065 | |
| | |
Sanofi | | | 477,632 | | | | 44,031,535 | |
| | |
Sartorius Stedim Biotech | | | 9,966 | | | | 1,493,021 | |
| | |
Schneider Electric SE | | | 230,342 | | | | 21,408,092 | |
| | |
SEB SA (b) | | | 11,449 | | | | 1,739,712 | |
| | |
Societe Generale SA | | | 331,969 | | | | 9,440,842 | |
| | |
Sodexo SA | | | 35,631 | | | | 3,918,290 | |
| | |
Suez | | | 175,745 | | | | 2,741,190 | |
| | |
Teleperformance | | | 24,378 | | | | 5,530,965 | |
| | |
Thales SA | | | 43,216 | | | | 4,224,784 | |
| | |
TOTAL SA | | | 1,052,204 | | | | 55,628,179 | |
| | |
Ubisoft Entertainment SA* | | | 30,046 | | | | 1,775,697 | |
| | |
Unibail-Rodamco-Westfield, REIT | | | 57,390 | | | | 8,874,580 | |
| | |
Valeo SA | | | 99,589 | | | | 3,708,764 | |
| | |
Veolia Environnement SA | | | 234,359 | | | | 6,169,215 | |
| | |
Vinci SA (b) | | | 208,312 | | | | 23,371,844 | |
| | |
Vivendi SA | | | 345,593 | | | | 9,623,940 | |
| | |
Worldline SA* (a) | | | 34,987 | | | | 2,128,866 | |
| | | | | | | | |
| | |
| | | | | | | 659,572,167 | |
| | | | | | | | |
|
Germany — 13.4% | |
| | |
1&1 Drillisch AG (b) | | | 19,725 | | | | 528,291 | |
| | |
adidas AG | | | 76,818 | | | | 23,719,156 | |
| | |
Allianz SE (Registered) | | | 176,835 | | | | 43,187,123 | |
| | |
Aroundtown SA | | | 370,586 | | | | 3,132,411 | |
| | |
BASF SE | | | 382,652 | | | | 29,088,914 | |
| | |
Bayer AG (Registered) | | | 388,518 | | | | 30,139,749 | |
| | |
Bayerische Motoren Werke AG (b) | | | 132,887 | | | | 10,175,792 | |
| | |
Bayerische Motoren Werke AG (Preference) | | | 23,069 | | | | 1,419,970 | |
| | |
Beiersdorf AG | | | 40,798 | | | | 4,830,038 | |
| | |
Brenntag AG | | | 64,046 | | | | 3,210,001 | |
| | |
Commerzbank AG | | | 412,186 | | | | 2,466,416 | |
| | |
Continental AG (b) | | | 44,966 | | | | 6,022,784 | |
| | |
Covestro AG (a) | | | 70,577 | | | | 3,389,244 | |
| | |
Daimler AG (Registered) | | | 369,939 | | | | 21,623,997 | |
| | |
Delivery Hero SE* (a) (b) | | | 55,050 | | | | 2,583,095 | |
| | |
Deutsche Bank AG (Registered) (b) | | | 861,050 | | | | 6,244,109 | |
| | |
Deutsche Boerse AG | | | 79,035 | | | | 12,239,336 | |
| | |
Deutsche Lufthansa AG (Registered) | | | 98,193 | | | | 1,701,018 | |
SEE NOTES TO FINANCIAL STATEMENTS.
| | | | | | | | |
| | | |
| OCTOBER 31, 2019 | | J.P. MORGAN EXCHANGE-TRADED FUNDS | | | | | 61 | |
JPMorgan BetaBuilders Europe ETF
SCHEDULE OF PORTFOLIO INVESTMENTS
AS OF OCTOBER 31, 2019 (continued)
| | | | | | | | |
| INVESTMENTS | | SHARES | | | VALUE($) | |
Common Stocks — continued | |
|
Germany — continued | |
| | |
Deutsche Post AG (Registered) | | | 403,962 | | | | 14,310,382 | |
| | |
Deutsche Telekom AG (Registered) | | | 1,348,773 | | | | 23,732,444 | |
| | |
Deutsche Wohnen SE | | | 149,862 | | | | 5,650,162 | |
| | |
E.ON SE | | | 916,881 | | | | 9,246,265 | |
| | |
Evonik Industries AG | | | 69,894 | | | | 1,841,983 | |
| | |
Fraport AG Frankfurt Airport Services Worldwide | | | 15,356 | | | | 1,283,496 | |
| | |
Fresenius Medical Care AG & Co. KGaA | | | 88,342 | | | | 6,376,496 | |
| | |
Fresenius SE & Co. KGaA | | | 170,380 | | | | 8,971,409 | |
| | |
GEA Group AG | | | 68,100 | | | | 2,081,842 | |
| | |
Hannover Rueck SE | | | 25,270 | | | | 4,477,945 | |
| | |
HeidelbergCement AG | | | 60,863 | | | | 4,512,267 | |
| | |
Henkel AG & Co. KGaA | | | 42,015 | | | | 4,042,600 | |
| | |
Henkel AG & Co. KGaA (Preference) | | | 74,179 | | | | 7,705,178 | |
| | |
HOCHTIEF AG | | | 9,418 | | | | 1,176,713 | |
| | |
HUGO BOSS AG | | | 26,705 | | | | 1,125,951 | |
| | |
Infineon Technologies AG | | | 520,063 | | | | 10,072,983 | |
| | |
KION Group AG | | | 27,060 | | | | 1,800,513 | |
| | |
LANXESS AG | | | 34,609 | | | | 2,248,866 | |
| | |
Merck KGaA | | | 53,837 | | | | 6,420,954 | |
| | |
MTU Aero Engines AG | | | 21,710 | | | | 5,805,929 | |
| | |
Muenchener Rueckversicherungs-Gesellschaft AG (Registered) | | | 60,107 | | | | 16,700,117 | |
| | |
Porsche Automobil Holding SE (Preference) | | | 63,509 | | | | 4,676,208 | |
| | |
RWE AG | | | 240,328 | | | | 7,323,875 | |
| | |
SAP SE | | | 450,400 | | | | 59,678,667 | |
| | |
Sartorius AG (Preference) (b) | | | 14,107 | | | | 2,741,301 | |
| | |
Siemens AG (Registered) | | | 336,420 | | | | 38,822,892 | |
| | |
Siemens Healthineers AG (a) | | | 62,493 | | | | 2,655,162 | |
| | |
Symrise AG (b) | | | 53,025 | | | | 5,096,069 | |
| | |
Talanx AG | | | 22,117 | | | | 1,019,338 | |
| | |
Telefonica Deutschland Holding AG | | | 384,165 | | | | 1,218,966 | |
| | |
thyssenkrupp AG (b) | | | 167,758 | | | | 2,392,328 | |
| | |
TUI AG | | | 184,890 | | | | 2,418,780 | |
| | |
Uniper SE | | | 76,235 | | | | 2,375,983 | |
| | |
United Internet AG (Registered) | | | 51,899 | | | | 1,566,746 | |
| | |
Volkswagen AG | | | 13,458 | | | | 2,544,103 | |
| | |
Volkswagen AG (Preference) | | | 76,353 | | | | 14,515,118 | |
| | |
Vonovia SE | | | 225,918 | | | | 12,031,235 | |
| | |
Wacker Chemie AG (b) | | | 6,301 | | | | 493,630 | |
| | |
Wirecard AG (b) | | | 47,783 | | | | 6,045,311 | |
| | |
Zalando SE* (a) (b) | | | 55,309 | | | | 2,398,035 | |
| | | | | | | | |
| | |
| | | | | | | 515,299,686 | |
| | | | | | | | |
|
Ghana — 0.0%(c) | |
| | |
Tullow Oil plc | | | 583,031 | | | | 1,558,048 | |
| | | | | | | | |
| | | | | | | | |
| INVESTMENTS | | SHARES | | | VALUE($) | |
| | | | | | | | |
|
Ireland — 1.0% | |
| | |
AIB Group plc | | | 326,388 | | | | 1,045,467 | |
| | |
Bank of Ireland Group plc | | | 384,927 | | | | 1,855,363 | |
| | |
CRH plc | | | 335,023 | | | | 12,198,115 | |
| | |
Flutter Entertainment plc | | | 32,383 | | | | 3,345,134 | |
| | |
Glanbia plc | | | 83,461 | | | | 929,910 | |
| | |
Kerry Group plc, Class A | | | 62,977 | | | | 7,613,826 | |
| | |
Kingspan Group plc | | | 63,234 | | | | 3,276,586 | |
| | |
Ryanair Holdings plc, ADR* | | | 40,576 | | | | 3,028,593 | |
| | |
Smurfit Kappa Group plc | | | 97,952 | | | | 3,271,354 | |
| | | | | | | | |
| | |
| | | | | | | 36,564,348 | |
| | | | | | | | |
|
Italy — 3.6% | |
| | |
A2A SpA | | | 648,763 | | | | 1,302,378 | |
| | |
Assicurazioni Generali SpA | | | 505,917 | | | | 10,258,732 | |
| | |
Atlantia SpA | | | 195,020 | | | | 4,818,150 | |
| | |
Banca Mediolanum SpA | | | 102,999 | | | | 883,198 | |
| | |
Banco BPM SpA* (b) | | | 628,257 | | | | 1,430,141 | |
| | |
Buzzi Unicem SpA | | | 16,659 | | | | 255,390 | |
| | |
Buzzi Unicem SpA | | | 29,260 | | | | 706,004 | |
| | |
Davide Campari-Milano SpA (b) | | | 174,221 | | | | 1,598,009 | |
| | |
DiaSorin SpA | | | 6,280 | | | | 708,076 | |
| | |
Enel SpA | | | 3,215,888 | | | | 24,924,305 | |
| | |
Eni SpA | | | 1,059,733 | | | | 16,077,201 | |
| | |
Ferrari NV | | | 53,325 | | | | 8,540,378 | |
| | |
FinecoBank Banca Fineco SpA (b) | | | 207,127 | | | | 2,335,013 | |
| | |
Freni Brembo SpA (b) | | | 63,246 | | | | 672,900 | |
| | |
Hera SpA | | | 328,899 | | | | 1,408,907 | |
| | |
Intesa Sanpaolo SpA | | | 6,563,522 | | | | 16,447,043 | |
| | |
Leonardo SpA | | | 168,608 | | | | 1,958,824 | |
| | |
Mediaset SpA* (b) | | | 145,623 | | | | 435,524 | |
| | |
Mediobanca Banca di Credito Finanziario SpA | | | 290,037 | | | | 3,448,927 | |
| | |
Moncler SpA | | | 78,451 | | | | 3,027,327 | |
| | |
Nexi SpA* (a) (b) | | | 104,619 | | | | 1,083,159 | |
| | |
Pirelli & C SpA (a) (b) | | | 179,148 | | | | 1,035,635 | |
| | |
Poste Italiane SpA (a) | | | 189,573 | | | | 2,302,634 | |
| | |
Prysmian SpA (b) | | | 111,219 | | | | 2,572,752 | |
| | |
Recordati SpA | | | 42,414 | | | | 1,782,412 | |
| | |
Saipem SpA* (b) | | | 238,891 | | | | 1,084,336 | |
| | |
Salvatore Ferragamo SpA | | | 28,068 | | | | 524,955 | |
| | |
Snam SpA | | | 900,902 | | | | 4,625,146 | |
| | |
Telecom Italia SpA | | | 2,495,822 | | | | 1,444,594 | |
| | |
Telecom Italia SpA* | | | 4,497,055 | | | | 2,632,098 | |
| | |
Terna Rete Elettrica Nazionale SpA | | | 583,527 | | | | 3,856,767 | |
| | |
UniCredit SpA (b) | | | 880,174 | | | | 11,166,807 | |
| | |
Unione di Banche Italiane SpA (b) | | | 421,849 | | | | 1,285,067 | |
SEE NOTES TO FINANCIAL STATEMENTS.
| | | | | | |
| | | |
| 62 | | | | J.P. MORGAN EXCHANGE-TRADED FUNDS | | OCTOBER 31, 2019 |
| | | | | | | | |
| INVESTMENTS | | SHARES | | | VALUE($) | |
Common Stocks — continued | |
|
Italy — continued | |
| | |
UnipolSai Assicurazioni SpA | | | 247,570 | | | | 690,958 | |
| | | | | | | | |
| | |
| | | | | | | 137,323,747 | |
| | | | | | | | |
|
Jordan — 0.0%(c) | |
| | |
Hikma Pharmaceuticals plc | | | 56,519 | | | | 1,471,912 | |
| | | | | | | | |
|
Luxembourg — 0.3% | |
| | |
ArcelorMittal | | | 267,975 | | | | 3,984,516 | |
| | |
Eurofins Scientific SE (b) | | | 4,740 | | | | 2,403,155 | |
| | |
RTL Group SA | | | 15,996 | | | | 812,806 | |
| | |
SES SA, FDR | | | 158,962 | | | | 3,081,466 | |
| | |
Tenaris SA | | | 195,813 | | | | 1,986,503 | |
| | | | | | | | |
| | |
| | | | | | | 12,268,446 | |
| | | | | | | | |
|
Mexico — 0.0%(c) | |
| | |
Fresnillo plc | | | 76,256 | | | | 704,512 | |
| | | | | | | | |
|
Netherlands — 7.0% | |
| | |
ABN AMRO Bank NV, CVA (a) | | | 171,516 | | | | 3,197,071 | |
| | |
Adyen NV* (a) | | | 9,934 | | | | 6,993,695 | |
| | |
Aegon NV (b) | | | 582,173 | | | | 2,525,663 | |
| | |
Akzo Nobel NV | | | 94,847 | | | | 8,744,273 | |
| | |
Altice Europe NV* | | | 296,951 | | | | 1,699,097 | |
| | |
Argenx SE* | | | 14,217 | | | | 1,731,192 | |
| | |
ASML Holding NV | | | 177,063 | | | | 46,410,798 | |
| | |
EXOR NV | | | 40,020 | | | | 3,068,095 | |
| | |
GrandVision NV (a) | | | 23,850 | | | | 729,097 | |
| | |
HAL Trust | | | 34,766 | | | | 5,278,018 | |
| | |
Heineken Holding NV | | | 42,000 | | | | 4,007,452 | |
| | |
Heineken NV | | | 98,243 | | | | 10,032,533 | |
| | |
ING Groep NV | | | 1,623,331 | | | | 18,381,780 | |
| | |
Koninklijke Ahold Delhaize NV | | | 492,417 | | | | 12,271,063 | |
| | |
Koninklijke DSM NV | | | 75,478 | | | | 8,958,337 | |
| | |
Koninklijke KPN NV | | | 1,470,822 | | | | 4,565,978 | |
| | |
Koninklijke Philips NV | | | 377,152 | | | | 16,547,211 | |
| | |
Koninklijke Vopak NV | | | 27,564 | | | | 1,514,247 | |
| | |
NN Group NV | | | 126,366 | | | | 4,821,738 | |
| | |
OCI NV* | | | 26,068 | | | | 586,123 | |
| | |
Randstad NV | | | 51,601 | | | | 2,863,696 | |
| | |
Royal Dutch Shell plc, Class A | | | 1,782,543 | | | | 51,672,529 | |
| | |
Royal Dutch Shell plc, Class B | | | 1,560,432 | | | | 44,940,100 | |
| | |
Wolters Kluwer NV | | | 116,359 | | | | 8,570,194 | |
| | | | | | | | |
| | |
| | | | | | | 270,109,980 | |
| | | | | | | | |
| | |
Norway — 1.1% | | | | | | | | |
| | |
Aker ASA, Class A | | | 10,215 | | | | 542,792 | |
| | |
Aker BP ASA (b) | | | 45,579 | | | | 1,264,242 | |
| | |
DNB ASA | | | 375,279 | | | | 6,832,816 | |
| | | | | | | | |
| INVESTMENTS | | SHARES | | | VALUE($) | |
| | | | | | | | |
|
Norway — continued | |
| | |
Equinor ASA (b) | | | 459,013 | | | | 8,521,890 | |
| | |
Gjensidige Forsikring ASA | | | 78,829 | | | | 1,473,719 | |
| | |
Kongsberg Gruppen ASA | | | 37,225 | | | | 549,704 | |
| | |
Leroy Seafood Group ASA | | | 114,866 | | | | 771,612 | |
| | |
Mowi ASA | | | 187,045 | | | | 4,566,134 | |
| | |
Norsk Hydro ASA | | | 566,170 | | | | 2,000,596 | |
| | |
Orkla ASA | | | 337,944 | | | | 3,248,263 | |
| | |
Salmar ASA | | | 22,600 | | | | 1,054,690 | |
| | |
Schibsted ASA, Class A | | | 33,130 | | | | 972,977 | |
| | |
Schibsted ASA, Class B | | | 42,178 | | | | 1,176,807 | |
| | |
Storebrand ASA | | | 193,958 | | | | 1,371,185 | |
| | |
Telenor ASA | | | 270,428 | | | | 5,061,266 | |
| | |
TGS NOPEC Geophysical Co. ASA | | | 49,466 | | | | 1,284,697 | |
| | |
Yara International ASA | | | 73,016 | | | | 2,844,427 | |
| | | | | | | | |
| | |
| | | | | | | 43,537,817 | |
| | | | | | | | |
|
Portugal — 0.3% | |
| | |
Banco Comercial Portugues SA, Class R | | | 3,337,273 | | | | 756,806 | |
| | |
EDP — Energias de Portugal SA | | | 900,486 | | | | 3,709,310 | |
| | |
Galp Energia SGPS SA | | | 188,675 | | | | 3,017,817 | |
| | |
Jeronimo Martins SGPS SA | | | 101,812 | | | | 1,710,814 | |
| | |
Navigator Co. SA (The) | | | 91,150 | | | | 328,935 | |
| | |
NOS SGPS SA | | | 103,021 | | | | 612,486 | |
| | |
Sonae SGPS SA | | | 385,719 | | | | 389,167 | |
| | | | | | | | |
| | |
| | | | | | | 10,525,335 | |
| | | | | | | | |
|
Russia — 0.1% | |
| | |
Evraz plc | | | 225,950 | | | | 1,078,224 | |
| | |
Polymetal International plc | | | 87,997 | | | | 1,447,331 | |
| | | | | | | | |
| | |
| | | | | | | 2,525,555 | |
| | | | | | | | |
|
South Africa — 0.4% | |
| | |
Anglo American plc | | | 576,445 | | | | 14,836,024 | |
| | | | | | | | |
|
Spain — 4.3% | |
| | |
Acciona SA | | | 8,915 | | | | 928,750 | |
| | |
ACS Actividades de Construccion y Servicios SA | | | 113,546 | | | | 4,607,487 | |
| | |
Aena SME SA (a) | | | 30,527 | | | | 5,603,601 | |
| | |
Amadeus IT Group SA | | | 179,674 | | | | 13,291,974 | |
| | |
Banco Bilbao Vizcaya Argentaria SA | | | 2,773,771 | | | | 14,608,987 | |
| | |
Banco de Sabadell SA | | | 2,328,604 | | | | 2,559,673 | |
| | |
Banco Santander SA | | | 6,923,386 | | | | 27,799,462 | |
| | |
Bankia SA | | | 488,397 | | | | 931,774 | |
| | |
CaixaBank SA | | | 1,488,009 | | | | 4,267,015 | |
| | |
EDP Renovaveis SA | | | 61,782 | | | | 704,214 | |
| | |
Enagas SA | | | 94,004 | | | | 2,326,092 | |
| | |
Endesa SA | | | 131,730 | | | | 3,587,649 | |
SEE NOTES TO FINANCIAL STATEMENTS.
| | | | | | | | |
| | | |
| OCTOBER 31, 2019 | | J.P. MORGAN EXCHANGE-TRADED FUNDS | | | | | 63 | |
JPMorgan BetaBuilders Europe ETF
SCHEDULE OF PORTFOLIO INVESTMENTS
AS OF OCTOBER 31, 2019 (continued)
| | | | | | | | |
| INVESTMENTS | | SHARES | | | VALUE($) | |
Common Stocks — continued | |
|
Spain — continued | |
| | |
Ferrovial SA | | | 200,237 | | | | 5,907,633 | |
| | |
Grifols SA | | | 122,439 | | | | 3,949,954 | |
| | |
Grifols SA (Preference), Class B | | | 107,652 | | | | 2,349,503 | |
| | |
Iberdrola SA | | | 2,491,513 | | | | 25,610,258 | |
| | |
Industria de Diseno Textil SA | | | 440,803 | | | | 13,735,783 | |
| | |
Mapfre SA | | | 408,104 | | | | 1,139,018 | |
| | |
Naturgy Energy Group SA | | | 139,402 | | | | 3,798,020 | |
| | |
Red Electrica Corp. SA | | | 179,431 | | | | 3,606,121 | |
| | |
Repsol SA | | | 612,795 | | | | 10,098,690 | |
| | |
Siemens Gamesa Renewable Energy SA | | | 93,160 | | | | 1,282,521 | |
| | |
Telefonica SA | | | 1,900,684 | | | | 14,595,893 | |
| | | | | | | | |
| | |
| | | | | | | 167,290,072 | |
| | | | | | | | |
|
Sweden — 4.5% | |
| | |
Alfa Laval AB (b) | | | 124,227 | | | | 2,875,267 | |
| | |
Assa Abloy AB, Class B | | | 413,088 | | | | 9,810,171 | |
| | |
Atlas Copco AB, Class A | | | 268,875 | | | | 9,490,354 | |
| | |
Atlas Copco AB, Class B | | | 161,824 | | | | 5,021,126 | |
| | |
Axfood AB | | | 43,720 | | | | 941,678 | |
| | |
Boliden AB | | | 113,428 | | | | 3,058,866 | |
| | |
Castellum AB | | | 106,993 | | | | 2,186,471 | |
| | |
Electrolux AB, Series B | | | 106,923 | | | | 2,811,149 | |
| | |
Elekta AB, Class B | | | 152,157 | | | | 2,119,674 | |
| | |
Epiroc AB, Class A | | | 259,553 | | | | 2,924,449 | |
| | |
Epiroc AB, Class B | | | 161,824 | | | | 1,762,492 | |
| | |
Essity AB, Class A | | | 11,864 | | | | 371,517 | |
| | |
Essity AB, Class B | | | 252,762 | | | | 7,896,473 | |
| | |
Fabege AB | | | 114,380 | | | | 1,708,204 | |
| | |
Fastighets AB Balder, Class B* (b) | | | 40,616 | | | | 1,575,268 | |
| | |
Getinge AB, Class B | | | 90,670 | | | | 1,550,145 | |
| | |
Hennes & Mauritz AB, Class B (b) | | | 322,525 | | | | 6,759,966 | |
| | |
Hexagon AB, Class B | | | 116,690 | | | | 5,974,288 | |
| | |
Hexpol AB (b) | | | 106,568 | | | | 950,818 | |
| | |
Holmen AB, Class B | | | 41,176 | | | | 1,215,132 | |
| | |
Husqvarna AB, Class A | | | 10,758 | | | | 81,869 | |
| | |
Husqvarna AB, Class B (b) | | | 170,704 | | | | 1,307,748 | |
| | |
ICA Gruppen AB | | | 38,547 | | | | 1,705,771 | |
| | |
Industrivarden AB, Class A | | | 67,128 | | | | 1,485,937 | |
| | |
Industrivarden AB, Class C | | | 69,300 | | | | 1,501,500 | |
| | |
Intrum AB | | | 30,521 | | | | 822,818 | |
| | |
Investment AB Latour, Class B (b) | | | 51,753 | | | | 700,195 | |
| | |
Investor AB, Class A | | | 54,539 | | | | 2,749,218 | |
| | |
Investor AB, Class B | | | 189,762 | | | | 9,735,638 | |
| | |
Kinnevik AB, Class A | | | 283 | | | | 7,924 | |
| | |
Kinnevik AB, Class B (b) | | | 100,260 | | | | 2,743,878 | |
| | |
L E Lundbergforetagen AB, Class B | | | 26,595 | | | | 1,002,361 | |
| |
| | | | | | | | |
| INVESTMENTS | | SHARES | | | VALUE($) | |
| | | | | | | | |
|
Sweden — continued | |
| | |
Lundin Petroleum AB | | | 78,221 | | | | 2,590,528 | |
| | |
NCC AB, Class B | | | 35,700 | | | | 573,768 | |
| | |
Nibe Industrier AB, Class B | | | 151,985 | | | | 2,081,045 | |
| | |
Saab AB, Class B (b) | | | 34,347 | | | | 1,060,703 | |
| | |
Sandvik AB | | | 460,223 | | | | 8,130,911 | |
| | |
Securitas AB, Class B | | | 132,694 | | | | 2,124,714 | |
| | |
Skandinaviska Enskilda Banken AB, Class A | | | 669,008 | | | | 6,416,679 | |
| | |
Skanska AB, Class B | | | 149,987 | | | | 3,195,749 | |
| | |
SKF AB, Class A | | | 7,030 | | | | 127,359 | |
| | |
SKF AB, Class B | | | 157,636 | | | | 2,854,182 | |
| | |
SSAB AB, Class A | | | 97,400 | | | | 272,618 | |
| | |
SSAB AB, Class B | | | 263,020 | | | | 662,604 | |
| | |
Svenska Cellulosa AB SCA, Class A | | | 12,008 | | | | 126,968 | |
| | |
Svenska Cellulosa AB SCA, Class B | | | 251,183 | | | | 2,563,104 | |
| | |
Svenska Handelsbanken AB, Class A | | | 622,178 | | | | 6,244,062 | |
| | |
Svenska Handelsbanken AB, Class B (b) | | | 14,330 | | | | 144,005 | |
| | |
Swedbank AB, Class A | | | 386,722 | | | | 5,419,246 | |
| | |
Swedish Match AB (b) | | | 70,463 | | | | 3,310,235 | |
| | |
Swedish Orphan Biovitrum AB* | | | 79,330 | | | | 1,258,041 | |
| | |
Tele2 AB, Class B | | | 207,087 | | | | 2,964,483 | |
| | |
Telefonaktiebolaget LM Ericsson, Class A | | | 24,606 | | | | 214,756 | |
| | |
Telefonaktiebolaget LM Ericsson, Class B | | | 1,090,387 | | | | 9,528,664 | |
| | |
Telia Co. AB | | | 1,087,332 | | | | 4,783,076 | |
| | |
Trelleborg AB, Class B | | | 101,058 | | | | 1,634,174 | |
| | |
Volvo AB, Class A | | | 99,435 | | | | 1,490,137 | |
| | |
Volvo AB, Class B | | | 683,417 | | | | 10,241,535 | |
| | | | | | | | |
| | |
| | | | | | | 174,861,711 | |
| | | | | | | | |
|
Switzerland — 15.1% | |
| | |
ABB Ltd. (Registered) | | | 802,722 | | | | 16,857,153 | |
| | |
Adecco Group AG (Registered) | | | 68,052 | | | | 4,045,429 | |
| | |
Alcon, Inc.* | | | 203,587 | | | | 12,039,753 | |
| | |
Baloise Holding AG (Registered) | | | 20,263 | | | | 3,747,712 | |
| | |
Barry Callebaut AG (Registered) | | | 939 | | | | 1,984,389 | |
| | |
Chocoladefabriken Lindt & Spruengli AG | | | 445 | | | | 3,306,488 | |
| | |
Chocoladefabriken Lindt & Spruengli AG (Registered) | | | 46 | | | | 3,767,664 | |
| | |
Cie Financiere Richemont SA (Registered) | | | 217,153 | | | | 17,064,139 | |
| | |
Coca-Cola HBC AG* | | | 80,570 | | | | 2,453,249 | |
| | |
Credit Suisse Group AG (Registered)* | | | 1,010,116 | | | | 12,503,089 | |
| | |
EMS-Chemie Holding AG (Registered) | | | 2,921 | | | | 1,830,003 | |
| | |
Geberit AG (Registered) | | | 15,405 | | | | 7,827,128 | |
| | |
Givaudan SA (Registered) | | | 3,308 | | | | 9,718,693 | |
| | |
Glencore plc* | | | 4,557,642 | | | | 13,756,697 | |
| | |
Julius Baer Group Ltd.* | | | 92,817 | | | | 4,110,274 | |
SEE NOTES TO FINANCIAL STATEMENTS.
| | | | | | |
| | | |
| 64 | | | | J.P. MORGAN EXCHANGE-TRADED FUNDS | | OCTOBER 31, 2019 |
| | | | | | | | |
| INVESTMENTS | | SHARES | | | VALUE($) | |
Common Stocks — continued | |
|
Switzerland — continued | |
| | |
Kuehne + Nagel International AG (Registered) | | | 20,943 | | | | 3,383,493 | |
| | |
LafargeHolcim Ltd. (Registered)* | | | 202,721 | | | | 10,464,151 | |
| | |
Lonza Group AG (Registered)* | | | 30,981 | | | | 11,166,561 | |
| | |
Mediclinic International plc | | | 199,649 | | | | 946,772 | |
| | |
Nestle SA (Registered) | | | 1,239,855 | | | | 132,641,354 | |
| | |
Novartis AG (Registered) | | | 1,062,636 | | | | 92,848,114 | |
| | |
Pargesa Holding SA | | | 14,096 | | | | 1,114,270 | |
| | |
Partners Group Holding AG | | | 7,786 | | | | 6,084,458 | |
| | |
Roche Holding AG | | | 11,307 | | | | 3,370,919 | |
| | |
Roche Holding AG | | | 292,700 | | | | 88,089,816 | |
| | |
Schindler Holding AG | | | 16,920 | | | | 4,145,342 | |
| | |
Schindler Holding AG (Registered) | | | 8,088 | | | | 1,915,350 | |
| | |
SGS SA (Registered) | | | 2,161 | | | | 5,636,116 | |
| | |
Sika AG (Registered) (b) | | | 52,574 | | | | 9,037,813 | |
| | |
Sonova Holding AG (Registered) (b) | | | 22,895 | | | | 5,253,907 | |
| | |
STMicroelectronics NV | | | 273,064 | | | | 6,197,549 | |
| | |
Straumann Holding AG (Registered) | | | 4,697 | | | | 4,196,684 | |
| | |
Swatch Group AG (The) | | | 12,805 | | | | 3,550,548 | |
| | |
Swatch Group AG (The) (Registered) | | | 25,838 | | | | 1,387,150 | |
| | |
Swiss Life Holding AG (Registered) | | | 13,994 | | | | 7,008,435 | |
| | |
Swiss Re AG | | | 121,401 | | | | 12,733,597 | |
| | |
Swisscom AG (Registered) | | | 10,567 | | | | 5,404,965 | |
| | |
Temenos AG (Registered)* | | | 26,859 | | | | 3,842,742 | |
| | |
UBS Group AG (Registered)* | | | 1,595,970 | | | | 18,888,578 | |
| | |
Vifor Pharma AG | | | 17,870 | | | | 2,814,155 | |
| | |
Zurich Insurance Group AG | | | 62,716 | | | | 24,565,875 | |
| | | | | | | | |
| | |
| | | | | | | 581,700,574 | |
| | | | | | | | |
|
United Arab Emirates — 0.0%(c) | |
| | |
NMC Health plc | | | 38,989 | | | | 1,105,209 | |
| | | | | | | | |
|
United Kingdom — 22.6% | |
| | |
3i Group plc | | | 404,571 | | | | 5,911,948 | |
| | |
Admiral Group plc | | | 104,082 | | | | 2,724,009 | |
| | |
Aggreko plc | | | 106,203 | | | | 1,088,798 | |
| | |
Ashtead Group plc | | | 209,638 | | | | 6,382,599 | |
| | |
ASOS plc* (b) | | | 23,632 | | | | 1,086,339 | |
| | |
Associated British Foods plc | | | 147,751 | | | | 4,264,802 | |
| | |
AstraZeneca plc | | | 546,508 | | | | 53,293,966 | |
| | |
Auto Trader Group plc (a) | | | 389,328 | | | | 2,836,758 | |
| | |
AVEVA Group plc | | | 26,707 | | | | 1,447,111 | |
| | |
Aviva plc | | | 1,639,865 | | | | 8,838,945 | |
| | |
Babcock International Group plc | | | 207,915 | | | | 1,493,287 | |
| | |
BAE Systems plc | | | 1,329,394 | | | | 9,930,197 | |
| | |
Barclays plc | | | 6,709,409 | | | | 14,553,204 | |
| | |
Barratt Developments plc | | | 424,087 | | | | 3,468,103 | |
| | | | | | | | |
| INVESTMENTS | | SHARES | | | VALUE($) | |
| | | | | | | | |
|
United Kingdom — continued | |
| | |
Berkeley Group Holdings plc | | | 53,607 | | | | 3,055,570 | |
| | |
BP plc | | | 8,428,767 | | | | 53,449,888 | |
| | |
British American Tobacco plc | | | 953,828 | | | | 33,360,970 | |
| | |
British Land Co. plc (The), REIT | | | 392,276 | | | | 3,153,953 | |
| | |
BT Group plc | | | 3,649,045 | | | | 9,684,045 | |
| | |
Bunzl plc | | | 139,116 | | | | 3,619,067 | |
| | |
Burberry Group plc | | | 170,604 | | | | 4,523,900 | |
| | |
Centrica plc | | | 2,428,711 | | | | 2,285,582 | |
| | |
CNH Industrial NV (b) | | | 411,992 | | | | 4,485,628 | |
| | |
Coca-Cola European Partners plc | | | 89,435 | | | | 4,785,667 | |
| | |
Compass Group plc | | | 663,694 | | | | 17,670,247 | |
| | |
ConvaTec Group plc (a) | | | 650,800 | | | | 1,662,614 | |
| | |
Croda International plc | | | 54,699 | | | | 3,412,764 | |
| | |
DCC plc | | | 42,022 | | | | 3,940,802 | |
| | |
Derwent London plc, REIT | | | 43,862 | | | | 2,016,991 | |
| | |
Diageo plc | | | 987,105 | | | | 40,403,172 | |
| | |
Direct Line Insurance Group plc | | | 570,087 | | | | 2,009,985 | |
| | |
DS Smith plc | | | 569,789 | | | | 2,641,667 | |
| | |
easyJet plc | | | 110,423 | | | | 1,771,407 | |
| | |
Experian plc | | | 384,039 | | | | 12,105,414 | |
| | |
Fiat Chrysler Automobiles NV | | | 458,297 | | | | 7,112,208 | |
| | |
G4S plc | | | 643,362 | | | | 1,725,458 | |
| | |
GlaxoSmithKline plc | | | 2,079,719 | | | | 47,635,842 | |
| | |
GVC Holdings plc | | | 239,699 | | | | 2,765,346 | |
| | |
Halma plc | | | 157,200 | | | | 3,814,526 | |
| | |
Hammerson plc, REIT | | | 319,059 | | | | 1,198,588 | |
| | |
Hargreaves Lansdown plc | | | 114,613 | | | | 2,631,891 | |
| | |
Hiscox Ltd. | | | 121,577 | | | | 2,347,762 | |
| | |
HSBC Holdings plc | | | 8,566,608 | | | | 64,721,681 | |
| | |
Imperial Brands plc | | | 400,797 | | | | 8,791,669 | |
| | |
Informa plc | | | 520,660 | | | | 5,233,284 | |
| | |
InterContinental Hotels Group plc | | | 78,206 | | | | 4,732,616 | |
| | |
International Consolidated Airlines Group SA | | | 414,955 | | | | 2,856,387 | |
| | |
Intertek Group plc | | | 66,951 | | | | 4,642,101 | |
| | |
ITV plc | | | 1,502,085 | | | | 2,605,763 | |
| | |
J Sainsbury plc | | | 715,993 | | | | 1,886,840 | |
| | |
JD Sports Fashion plc | | | 173,525 | | | | 1,726,143 | |
| | |
John Wood Group plc | | | 280,963 | | | | 1,233,601 | |
| | |
Johnson Matthey plc | | | 82,504 | | | | 3,277,628 | |
| | |
Just Eat plc* | | | 246,439 | | | | 2,346,631 | |
| | |
Kingfisher plc | | | 883,655 | | | | 2,370,500 | |
| | |
Land Securities Group plc, REIT | | | 311,531 | | | | 3,794,611 | |
| | |
Legal & General Group plc | | | 2,461,017 | | | | 8,412,591 | |
| | |
Lloyds Banking Group plc | | | 29,235,247 | | | | 21,505,659 | |
| | |
London Stock Exchange Group plc | | | 131,144 | | | | 11,818,544 | |
SEE NOTES TO FINANCIAL STATEMENTS.
| | | | | | | | |
| | | |
| OCTOBER 31, 2019 | | J.P. MORGAN EXCHANGE-TRADED FUNDS | | | | | 65 | |
JPMorgan BetaBuilders Europe ETF
SCHEDULE OF PORTFOLIO INVESTMENTS
AS OF OCTOBER 31, 2019 (continued)
| | | | | | | | |
| INVESTMENTS | | SHARES | | | VALUE($) | |
Common Stocks — continued | |
|
United Kingdom — continued | |
| | |
Marks & Spencer Group plc | | | 808,515 | | | | 1,904,693 | |
| | |
Melrose Industries plc | | | 2,014,387 | | | | 5,567,136 | |
| | |
Merlin Entertainments plc (a) | | | 273,054 | | | | 1,608,686 | |
| | |
Micro Focus International plc | | | 151,116 | | | | 2,074,100 | |
| | |
Mondi plc | | | 201,319 | | | | 4,174,128 | |
| | |
National Grid plc | | | 1,563,527 | | | | 18,281,203 | |
| | |
Next plc | | | 55,506 | | | | 4,733,908 | |
| | |
Ocado Group plc* | | | 244,371 | | | | 4,212,049 | |
| | |
Pearson plc | | | 323,641 | | | | 2,858,267 | |
| | |
Persimmon plc | | | 131,709 | | | | 3,884,927 | |
| | |
Phoenix Group Holdings plc | | | 219,328 | | | | 2,003,372 | |
| | |
Prudential plc | | | 1,077,306 | | | | 18,817,128 | |
| | |
Reckitt Benckiser Group plc | | | 306,853 | | | | 23,744,781 | |
| | |
RELX plc | | | 838,089 | | | | 20,177,293 | |
| | |
Rentokil Initial plc | | | 761,788 | | | | 4,483,272 | |
| | |
Rightmove plc | | | 379,739 | | | | 2,947,604 | |
| | |
Rolls-Royce Holdings plc* | | | 793,339 | | | | 7,300,105 | |
| | |
Royal Bank of Scotland Group plc | | | 1,905,098 | | | | 5,266,147 | |
| | |
Royal Mail plc | | | 416,615 | | | | 1,140,047 | |
| | |
RSA Insurance Group plc | | | 425,639 | | | | 2,879,574 | |
| | |
Sage Group plc (The) | | | 464,334 | | | | 4,327,639 | |
| | |
Schroders plc | | | 53,673 | | | | 2,151,720 | |
| | |
Schroders plc(Non-Voting) | | | 18,961 | | | | 569,200 | |
| | |
Segro plc, REIT | | | 452,416 | | | | 4,949,116 | |
| | |
Severn Trent plc | | | 99,552 | | | | 2,907,928 | |
| | |
Smith & Nephew plc | | | 371,255 | | | | 7,969,512 | |
| | |
Smiths Group plc | | | 162,787 | | | | 3,402,840 | |
| | |
Spirax-Sarco Engineering plc | | | 30,523 | | | | 3,132,387 | |
| | |
SSE plc | | | 430,916 | | | | 7,168,742 | |
| | |
St James’s Place plc | | | 219,362 | | | | 2,958,768 | |
| | |
Standard Chartered plc | | | 1,123,106 | | | | 10,190,987 | |
| | |
Standard Life Aberdeen plc | | | 1,007,071 | | | | 3,959,466 | |
| | |
Subsea 7 SA | | | 98,737 | | | | 927,606 | |
| | |
Tate & Lyle plc | | | 193,258 | | | | 1,685,653 | |
| | |
Taylor Wimpey plc | | | 1,356,332 | | | | 2,908,929 | |
| | |
TechnipFMC plc | | | 174,852 | | | | 3,481,000 | |
| | |
Tesco plc | | | 4,046,223 | | | | 12,351,316 | |
| | |
Travis Perkins plc | | | 103,581 | | | | 1,923,928 | |
| | |
Unilever NV (b) | | | 643,557 | | | | 38,038,547 | |
| | |
Unilever plc | | | 486,415 | | | | 29,126,032 | |
| | |
United Utilities Group plc | | | 282,726 | | | | 3,192,434 | |
| | |
Vodafone Group plc | | | 11,163,263 | | | | 22,781,111 | |
| | |
Weir Group plc (The) | | | 107,633 | | | | 1,880,029 | |
| | |
Whitbread plc | | | 55,658 | | | | 2,929,651 | |
| | |
Wm Morrison Supermarkets plc | | | 988,207 | | | | 2,552,888 | |
| | | | | | | | |
| INVESTMENTS | | SHARES | | | VALUE($) | |
| | | | | | | | |
|
United Kingdom — continued | |
| | |
WPP plc | | | 519,673 | | | | 6,485,289 | |
| | | | | | | | |
| | |
| | | | | | | 870,558,407 | |
| | | | | | | | |
|
United States — 0.4% | |
| | |
Carnival plc | | | 77,555 | | | | 3,103,501 | |
| | |
Ferguson plc | | | 96,504 | | | | 8,240,798 | |
| | |
QIAGEN NV* | | | 94,561 | | | | 2,844,307 | |
| | | | | | | | |
| | |
| | | | | | | 14,188,606 | |
| | | | | | | | |
| | |
Total Common Stocks
(Cost $3,680,810,963) | | | | | | | 3,825,936,070 | |
| | | | | | | | |
Preferred Stocks — 0.0%(c) | |
|
United Kingdom — 0.0%(c) | |
| | |
Rolls-Royce Holdings plc*
(Cost $46,881) | | | 36,493,594 | | | | 47,272 | |
| | | | | | | | |
| | |
| | | NO. OF
RIGHTS | | | | |
Rights — 0.0%(c) | |
|
Italy — 0.0%(c) | |
| | |
Mediaset SpA, expiring 11/7/2019* (Cost $—) | | | 146,727 | | | | 6 | |
| | | | | | | | |
| | |
| | | SHARES | | | | |
Short-Term Investments — 3.0% | |
|
Investment of Cash Collateral from Securities Loaned — 3.0% | |
| | |
JPMorgan Securities Lending Money Market Fund Class Agency SL Shares, 1.98% (d) (e) | | | 84,000,399 | | | | 84,008,799 | |
| | |
JPMorgan U.S. Government Money Market Fund Class IM Shares, 1.70% (d) (e) | | | 30,866,797 | | | | 30,866,797 | |
| | | | | | | | |
| | |
Total Investment of Cash Collateral from Securities Loaned
(Cost $114,870,696) | | | | | | | 114,875,596 | |
| | | | | | | | |
Total Investments — 102.3%
(Cost $3,795,728,540) | | | | | | | 3,940,858,944 | |
| | |
Liabilities in Excess of Other Assets — (2.3)% | | | | | | | (87,713,320 | ) |
| | | | | | | | |
NET ASSETS — 100.0% | | | | | | | 3,853,145,624 | |
| | | | | | | | |
Percentages indicated are based on net assets.
SEE NOTES TO FINANCIAL STATEMENTS.
| | | | | | |
| | | |
| 66 | | | | J.P. MORGAN EXCHANGE-TRADED FUNDS | | OCTOBER 31, 2019 |
Summary of Investments by Industry, October 31, 2019
The following table represents the portfolio investments of the Fund by industry classifications as a percentage of total investments:
| | | | |
| INDUSTRY | | PERCENTAGE | |
| |
Pharmaceuticals | | | 10.6 | % |
| |
Banks | | | 8.3 | |
| |
Oil, Gas & Consumable Fuels | | | 6.6 | |
| |
Insurance | | | 5.7 | |
| |
Food Products | | | 4.8 | |
| |
Textiles, Apparel & Luxury Goods | | | 3.8 | |
| |
Chemicals | | | 3.4 | |
| |
Short-Term Investments | | | 2.9 | |
| |
Beverages | | | 2.9 | |
| |
Personal Products | | | 2.6 | |
| |
Diversified Telecommunication Services | | | 2.4 | |
| |
Capital Markets | | | 2.4 | |
| |
Aerospace & Defense | | | 2.3 | |
| |
Electric Utilities | | | 2.3 | |
| |
Metals & Mining | | | 2.2 | |
| |
Machinery | | | 2.2 | |
| |
Automobiles | | | 2.1 | |
| |
Software | | | 2.0 | |
| |
Health Care Equipment & Supplies | | | 1.8 | |
| |
Professional Services | | | 1.7 | |
| |
Electrical Equipment | | | 1.6 | |
| |
Semiconductors & Semiconductor Equipment | | | 1.6 | |
| |
Multi-Utilities | | | 1.6 | |
| |
Construction & Engineering | | | 1.2 | |
| |
Industrial Conglomerates | | | 1.2 | |
| |
Hotels, Restaurants & Leisure | | | 1.2 | |
| |
Tobacco | | | 1.2 | |
| |
Household Products | | | 1.1 | |
| |
Food & Staples Retailing | | | 1.1 | |
| |
IT Services | | | 1.0 | |
| |
Others (each less than 1.0%) | | | 14.2 | |
Abbreviations
| | |
| ADR | | AmericanDepositary Receipt |
| CVA | | DutchCertification |
| FDR | | FiduciaryDepository Receipt |
| OYJ | | PublicLimited Company |
| Preference | | A special type of equity investment that shares in the earnings of the company, has limited voting rights, and may have a dividend preference. Preference shares may also have liquidation preference. |
| REIT | | RealEstate Investment Trust |
| SCA | | Limitedpartnership with share capital |
| SDR | | SwedishDepositary Receipt |
| SGPS | | Holdingcompany |
| |
| (a) | | Security exempt from registration pursuant to Regulation S under the Securities Act of 1933, as amended. Regulation S applies to securities offerings that are made outside of the United States and do not involve direct selling efforts in the United States and as such may have restrictions on resale. |
| (b) | | The security or a portion of this security is on loan at October 31, 2019. The total value of securities on loan at October 31, 2019 is $107,191,515 |
| (c) | | Amountrounds to less than 0.1% of net assets. |
| (d) | | Investment in an affiliated fund, which is registered under the Investment Company Act of 1940, as amended, and is advised by J.P. Morgan Investment Management Inc. |
| (e) | | Therate shown is the current yield as of October 31, 2019. |
| * | | Non-incomeproducing security. |
| | | | | | | | | | | | | | | | | | | | |
| Futures contracts outstanding as of October 31, 2019: | |
| DESCRIPTION | | NUMBER OF
CONTRACTS | | | EXPIRATION
DATE | | | TRADING
CURRENCY | | | NOTIONAL
AMOUNT($) | | | VALUE AND
UNREALIZED
APPRECIATION
(DEPRECIATION)($) | |
|
Long Contracts | |
EURO STOXX 50 Index | | | 324 | | | | 12/2019 | | | | EUR | | | | 13,026,927 | | | | 286,062 | |
FTSE 100 Index | | | 81 | | | | 12/2019 | | | | GBP | | | | 7,599,073 | | | | (14,075 | ) |
| | | | | | | | | | | | | | | | | | | | |
| | | | | |
| | | | | | | | | | | | | | | | | | | 271,987 | |
| | | | | | | | | | | | | | | | | | | | |
Abbreviations
| | |
| EUR | | Euro |
| FTSE | | FinancialTimes and the London Stock Exchange |
| GBP | | BritishPound |
SEE NOTES TO FINANCIAL STATEMENTS.
| | | | | | | | |
| | | |
| OCTOBER 31, 2019 | | J.P. MORGAN EXCHANGE-TRADED FUNDS | | | | | 67 | |
JPMorgan BetaBuilders Japan ETF
SCHEDULE OF PORTFOLIO INVESTMENTS
AS OF OCTOBER 31, 2019
| | | | | | | | |
| INVESTMENTS | | SHARES | | | VALUE($) | |
Common Stocks — 98.9% | |
|
Air Freight & Logistics — 0.3% | |
| | |
SG Holdings Co. Ltd. | | | 260,500 | | | | 6,450,987 | |
| | |
Yamato Holdings Co. Ltd. | | | 440,300 | | | | 7,384,986 | |
| | | | | | | | |
| | |
| | | | | | | 13,835,973 | |
| | | | | | | | |
|
Airlines — 0.2% | |
| | |
ANA Holdings, Inc. | | | 123,200 | | | | 4,230,499 | |
| | |
Japan Airlines Co. Ltd. | | | 123,300 | | | | 3,842,286 | |
| | | | | | | | |
| | |
| | | | | | | 8,072,785 | |
| | | | | | | | |
|
Auto Components — 2.7% | |
| | |
Aisin Seiki Co. Ltd. | | | 195,400 | | | | 7,798,379 | |
| | |
Bridgestone Corp. | | | 709,100 | | | | 29,463,047 | |
| | |
Denso Corp. | | | 556,700 | | | | 25,847,537 | |
| | |
Koito Manufacturing Co. Ltd. | | | 137,600 | | | | 7,198,301 | |
| | |
NGK Spark Plug Co. Ltd. | | | 187,800 | | | | 3,807,419 | |
| | |
NHK Spring Co. Ltd. | | | 240,200 | | | | 1,962,243 | |
| | |
NOK Corp. | | | 129,700 | | | | 2,031,499 | |
| | |
Stanley Electric Co. Ltd. | | | 164,700 | | | | 4,557,789 | |
| | |
Sumitomo Electric Industries Ltd. | | | 849,700 | | | | 11,652,581 | |
| | |
Sumitomo Rubber Industries Ltd. | | | 199,700 | | | | 2,646,776 | |
| | |
Toyoda Gosei Co. Ltd. | | | 79,400 | | | | 1,857,540 | |
| | |
Toyota Boshoku Corp. | | | 92,400 | | | | 1,357,615 | |
| | |
Toyota Industries Corp. | | | 219,700 | | | | 13,182,546 | |
| | |
Yokohama Rubber Co. Ltd. (The) | | | 143,300 | | | | 3,200,639 | |
| | | | | | | | |
| | |
| | | | | | | 116,563,911 | |
| | | | | | | | |
|
Automobiles — 7.6% | |
| | |
Honda Motor Co. Ltd. | | | 1,938,900 | | | | 52,454,988 | |
| | |
Isuzu Motors Ltd. | | | 662,900 | | | | 7,702,838 | |
| | |
Mazda Motor Corp. | | | 642,600 | | | | 5,899,272 | |
| | |
Mitsubishi Motors Corp. | | | 733,900 | | | | 3,350,841 | |
| | |
Nissan Motor Co. Ltd. | | | 2,574,900 | | | | 16,249,114 | |
| | |
Subaru Corp. | | | 683,200 | | | | 19,578,814 | |
| | |
Suzuki Motor Corp. | | | 494,000 | | | | 23,323,773 | |
| | |
Toyota Motor Corp. | | | 2,793,900 | | | | 193,843,248 | |
| | |
Yamaha Motor Co. Ltd. | | | 337,300 | | | | 6,601,952 | |
| | | | | | | | |
| | |
| | | | | | | 329,004,840 | |
| | | | | | | | |
|
Banks — 5.5% | |
| | |
Aozora Bank Ltd. | | | 126,600 | | | | 3,248,350 | |
| | |
Bank of Kyoto Ltd. (The) | | | 81,200 | | | | 3,213,940 | |
| | |
Chiba Bank Ltd. (The) | | | 818,800 | | | | 4,450,465 | |
| | |
Chugoku Bank Ltd. (The) | | | 209,100 | | | | 2,043,300 | |
| | |
Concordia Financial Group Ltd. | | | 1,333,200 | | | | 5,436,701 | |
| | |
Fukuoka Financial Group, Inc. | | | 204,700 | | | | 3,946,071 | |
| | |
Gunma Bank Ltd. (The) | | | 456,600 | | | | 1,536,526 | |
| | |
Hachijuni Bank Ltd. (The) | | | 546,900 | | | | 2,352,576 | |
| | | | | | | | |
| INVESTMENTS | | SHARES | | | VALUE($) | |
| | | | | | | | |
|
Banks — continued | |
| | |
Iyo Bank Ltd. (The) | | | 346,600 | | | | 1,831,347 | |
| | |
Kansai Mirai Financial Group, Inc. | | | 139,600 | | | | 908,234 | |
| | |
Kyushu Financial Group, Inc. | | | 495,900 | | | | 2,001,640 | |
| | |
Mebuki Financial Group, Inc. | | | 1,135,900 | | | | 2,885,882 | |
| | |
Mitsubishi UFJ Financial Group, Inc. | | | 13,898,000 | | | | 72,051,239 | |
| | |
Mizuho Financial Group, Inc. | | | 27,179,100 | | | | 42,194,915 | |
| | |
Resona Holdings, Inc. | | | 2,363,300 | | | | 10,276,961 | |
| | |
Seven Bank Ltd. | | | 782,600 | | | | 2,268,886 | |
| | |
Shinsei Bank Ltd. | | | 213,500 | | | | 3,328,412 | |
| | |
Shizuoka Bank Ltd. (The) | | | 615,300 | | | | 4,675,528 | |
| | |
Sumitomo Mitsui Financial Group, Inc. | | | 1,469,700 | | | | 52,179,048 | |
| | |
Sumitomo Mitsui Trust Holdings, Inc. | | | 417,700 | | | | 15,223,245 | |
| | |
Yamaguchi Financial Group, Inc. | | | 282,800 | | | | 1,984,210 | |
| | | | | | | | |
| | |
| | | | | | | 238,037,476 | |
| | | | | | | | |
|
Beverages — 1.3% | |
| | |
Asahi Group Holdings Ltd. | | | 491,700 | | | | 24,623,088 | |
| | |
Coca-Cola Bottlers Japan Holdings, Inc. (a) | | | 165,700 | | | | 3,762,065 | |
| | |
Kirin Holdings Co. Ltd. | | | 978,200 | | | | 20,751,892 | |
| | |
Suntory Beverage & Food Ltd. | | | 135,600 | | | | 5,797,012 | |
| | | | | | | | |
| | |
| | | | | | | 54,934,057 | |
| | | | | | | | |
|
Biotechnology — 0.1% | |
| | |
PeptiDream, Inc.* | | | 104,500 | | | | 5,245,241 | |
| | | | | | | | |
|
Building Products — 1.5% | |
| | |
AGC, Inc. | | | 243,300 | | | | 8,554,452 | |
| | |
Daikin Industries Ltd. | | | 313,700 | | | | 43,905,339 | |
| | |
LIXIL Group Corp. | | | 311,900 | | | | 5,800,689 | |
| | |
TOTO Ltd. | | | 170,500 | | | | 6,960,805 | |
| | | | | | | | |
| | |
| | | | | | | 65,221,285 | |
| | | | | | | | |
|
Capital Markets — 0.9% | |
| | |
Daiwa Securities Group, Inc. | | | 1,673,400 | | | | 7,521,607 | |
| | |
Japan Exchange Group, Inc. | | | 574,100 | | | | 9,477,534 | |
| | |
Matsui Securities Co. Ltd. | | | 119,400 | | | | 983,398 | |
| | |
Nomura Holdings, Inc. | | | 3,552,500 | | | | 16,146,056 | |
| | |
SBI Holdings, Inc. | | | 240,400 | | | | 5,228,301 | |
| | | | | | | | |
| | |
| | | | | | | 39,356,896 | |
| | | | | | | | |
|
Chemicals — 4.3% | |
| | |
Air Water, Inc. | | | 202,200 | | | | 3,785,382 | |
| | |
Asahi Kasei Corp. | | | 1,501,300 | | | | 16,666,448 | |
| | |
Daicel Corp. | | | 337,600 | | | | 3,017,955 | |
| | |
DIC Corp. | | | 88,600 | | | | 2,537,958 | |
| | |
Hitachi Chemical Co. Ltd. | | | 109,100 | | | | 3,591,550 | |
| | |
JSR Corp. | | | 213,000 | | | | 3,998,806 | |
SEE NOTES TO FINANCIAL STATEMENTS.
| | | | | | |
| | | |
| 68 | | | | J.P. MORGAN EXCHANGE-TRADED FUNDS | | OCTOBER 31, 2019 |
| | | | | | | | |
| INVESTMENTS | | SHARES | | | VALUE($) | |
Common Stocks — continued | |
|
Chemicals — continued | |
| | |
Kaneka Corp. | | | 72,900 | | | | 2,426,737 | |
| | |
Kansai Paint Co. Ltd. | | | 277,100 | | | | 6,673,909 | |
| | |
Kuraray Co. Ltd. | | | 379,900 | | | | 4,519,789 | |
| | |
Mitsubishi Chemical Holdings Corp. | | | 1,515,400 | | | | 11,549,203 | |
| | |
Mitsubishi Gas Chemical Co., Inc. | | | 225,500 | | | | 3,181,111 | |
| | |
Mitsui Chemicals, Inc. | | | 208,100 | | | | 4,948,919 | |
| | |
Nippon Paint Holdings Co. Ltd. | | | 212,500 | | | | 11,572,861 | |
| | |
Nippon Shokubai Co. Ltd. | | | 37,600 | | | | 2,318,526 | |
| | |
Nissan Chemical Corp. | | | 158,500 | | | | 6,507,674 | |
| | |
Nitto Denko Corp. | | | 170,000 | | | | 9,405,372 | |
| | |
Shin-Etsu Chemical Co. Ltd. | | | 421,200 | | | | 46,964,319 | |
| | |
Showa Denko KK | | | 160,400 | | | | 4,500,333 | |
| | |
Sumitomo Chemical Co. Ltd. | | | 1,771,800 | | | | 8,104,888 | |
| | |
Taiyo Nippon Sanso Corp. | | | 227,100 | | | | 5,316,347 | |
| | |
Teijin Ltd. | | | 211,900 | | | | 4,246,125 | |
| | |
Toray Industries, Inc. | | | 1,746,400 | | | | 12,342,062 | |
| | |
Tosoh Corp. | | | 348,000 | | | | 4,764,994 | |
| | |
Ube Industries Ltd. | | | 107,900 | | | | 2,310,266 | |
| | | | | | | | |
| | |
| | | | | | | 185,251,534 | |
| | | | | | | | |
|
Commercial Services & Supplies — 1.0% | |
| | |
Dai Nippon Printing Co. Ltd. | | | 322,700 | | | | 8,618,837 | |
| | |
Park24 Co. Ltd. (a) | | | 121,200 | | | | 2,862,315 | |
| | |
Secom Co. Ltd. | | | 229,700 | | | | 21,284,792 | |
| | |
Sohgo Security Services Co. Ltd. | | | 92,800 | | | | 5,040,695 | |
| | |
Toppan Printing Co. Ltd. | | | 382,600 | | | | 7,076,313 | |
| | | | | | | | |
| | |
| | | | | | | 44,882,952 | |
| | | | | | | | |
|
Construction & Engineering — 0.9% | |
| | |
JGC Holdings Corp. | | | 277,300 | | | | 4,010,711 | |
| | |
Kajima Corp. | | | 537,500 | | | | 7,386,633 | |
| | |
Kinden Corp. | | | 154,000 | | | | 2,316,599 | |
| | |
Obayashi Corp. | | | 772,400 | | | | 7,949,076 | |
| | |
Shimizu Corp. | | | 776,600 | | | | 7,239,471 | |
| | |
Taisei Corp. | | | 240,200 | | | | 9,471,909 | |
| | | | | | | | |
| | |
| | | | | | | 38,374,399 | |
| | | | | | | | |
|
Construction Materials — 0.1% | |
| | |
Taiheiyo Cement Corp. | | | 136,100 | | | | 3,850,132 | |
| | | | | | | | |
|
Consumer Finance — 0.2% | |
| | |
Acom Co. Ltd. | | | 495,400 | | | | 1,990,341 | |
| | |
AEON Financial Service Co. Ltd. | | | 120,800 | | | | 1,841,040 | |
| | |
Credit Saison Co. Ltd. | | | 174,700 | | | | 2,529,786 | |
| | |
Hitachi Capital Corp. | | | 54,700 | | | | 1,225,730 | |
| | |
Orient Corp. | | | 643,900 | | | | 940,689 | |
| | | | | | | | |
| | |
| | | | | | | 8,527,586 | |
| | | | | | | | |
| | | | | | | | |
| INVESTMENTS | | SHARES | | | VALUE($) | |
| | | | | | | | |
|
Containers & Packaging — 0.1% | |
| | |
Toyo Seikan Group Holdings Ltd. | | | 175,900 | | | | 2,779,815 | |
| | | | | | | | |
|
Diversified Consumer Services — 0.0%(b) | |
| | |
Benesse Holdings, Inc. | | | 87,800 | | | | 2,350,386 | |
| | | | | | | | |
|
Diversified Financial Services — 0.7% | |
| | |
Mitsubishi UFJ Lease & Finance Co. Ltd. | | | 575,300 | | | | 3,531,758 | |
| | |
ORIX Corp. | | | 1,417,800 | | | | 22,280,578 | |
| | |
Tokyo Century Corp. | | | 58,100 | | | | 2,682,813 | |
| | | | | | | | |
| | |
| | | | | | | 28,495,149 | |
| | | | | | | | |
|
Diversified Telecommunication Services — 0.8% | |
| | |
Nippon Telegraph & Telephone Corp. | | | 689,000 | | | | 34,203,966 | |
| | | | | | | | |
|
Electric Utilities — 1.0% | |
| | |
Chubu Electric Power Co., Inc. | | | 770,600 | | | | 11,560,731 | |
| | |
Chugoku Electric Power Co., Inc. (The) (a) | | | 333,700 | | | | 4,445,474 | |
| | |
Kansai Electric Power Co., Inc. (The) | | | 884,200 | | | | 10,315,192 | |
| | |
Kyushu Electric Power Co., Inc. | | | 507,400 | | | | 5,070,688 | |
| | |
Shikoku Electric Power Co., Inc. | | | 222,100 | | | | 2,201,769 | |
| | |
Tohoku Electric Power Co., Inc. | | | 538,200 | | | | 5,531,501 | |
| | |
Tokyo Electric Power Co. Holdings, Inc.* | | | 860,200 | | | | 3,983,712 | |
| | | | | | | | |
| | |
| | | | | | | 43,109,067 | |
| | | | | | | | |
|
Electrical Equipment — 2.0% | |
| | |
Fuji Electric Co. Ltd. | | | 159,900 | | | | 5,081,885 | |
| | |
Furukawa Electric Co. Ltd. | | | 75,700 | | | | 2,115,917 | |
| | |
Mabuchi Motor Co. Ltd. | | | 63,700 | | | | 2,580,936 | |
| | |
Mitsubishi Electric Corp. | | | 2,298,200 | | | | 32,835,419 | |
| | |
Nidec Corp. | | | 293,700 | | | | 43,240,213 | |
| | | | | | | | |
| | |
| | | | | | | 85,854,370 | |
| | | | | | | | |
|
Electronic Equipment, Instruments & Components — 5.6% | |
| | |
Alps Alpine Co. Ltd. | | | 234,600 | | | | 5,029,497 | |
| | |
Canon Marketing Japan, Inc. | | | 58,100 | | | | 1,229,264 | |
| | |
Citizen Watch Co. Ltd. | | | 343,000 | | | | 1,823,579 | |
| | |
Hamamatsu Photonics KK | | | 157,300 | | | | 6,107,845 | |
| | |
Hirose Electric Co. Ltd. | | | 35,800 | | | | 4,509,728 | |
| | |
Hitachi High-Technologies Corp. | | | 70,900 | | | | 4,411,098 | |
| | |
Hitachi Ltd. | | | 1,035,200 | | | | 38,636,213 | |
| | |
Ibiden Co. Ltd. | | | 143,200 | | | | 3,306,596 | |
| | |
Keyence Corp. | | | 100,100 | | | | 63,292,871 | |
| | |
Kyocera Corp. | | | 375,700 | | | | 24,648,502 | |
| | |
Murata Manufacturing Co. Ltd. | | | 687,300 | | | | 37,422,238 | |
| | |
Nippon Electric Glass Co. Ltd. | | | 89,500 | | | | 2,016,127 | |
| | |
Omron Corp. | | | 229,000 | | | | 13,396,911 | |
| | |
Shimadzu Corp. | | | 294,800 | | | | 7,872,960 | |
| | |
TDK Corp. | | | 138,700 | | | | 13,686,054 | |
| | |
Yaskawa Electric Corp. | | | 285,300 | | | | 10,852,172 | |
SEE NOTES TO FINANCIAL STATEMENTS.
| | | | | | | | |
| | | |
| OCTOBER 31, 2019 | | J.P. MORGAN EXCHANGE-TRADED FUNDS | | | | | 69 | |
JPMorgan BetaBuilders Japan ETF
SCHEDULE OF PORTFOLIO INVESTMENTS
AS OF OCTOBER 31, 2019 (continued)
| | | | | | | | |
| INVESTMENTS | | SHARES | | | VALUE($) | |
Common Stocks — continued | |
|
Electronic Equipment, Instruments & Components — continued | |
| | |
Yokogawa Electric Corp. | | | 256,000 | | | | 4,690,668 | |
| | | | | | | | |
| | |
| | | | | | | 242,932,323 | |
| | | | | | | | |
|
Entertainment — 1.6% | |
| | |
DeNA Co. Ltd. | | | 114,700 | | | | 1,955,154 | |
| | |
GungHo Online Entertainment, Inc. | | | 49,850 | | | | 1,079,671 | |
| | |
Konami Holdings Corp. | | | 108,900 | | | | 4,780,579 | |
| | |
Nexon Co. Ltd.* | | | 498,800 | | | | 5,780,217 | |
| | |
Nintendo Co. Ltd. | | | 126,900 | | | | 46,545,335 | |
| | |
Square Enix Holdings Co. Ltd. | | | 94,400 | | | | 4,492,330 | |
| | |
Toho Co. Ltd. | | | 151,600 | | | | 6,122,437 | |
| | | | | | | | |
| | |
| | | | | | | 70,755,723 | |
| | | | | | | | |
|
Equity Real Estate Investment Trusts (REITs) — 1.8% | |
| | |
Advance Residence Investment Corp. | | | 1,444 | | | | 4,798,522 | |
| | |
Daiwa House REIT Investment Corp. | | | 1,997 | | | | 5,814,871 | |
| | |
GLP J | | | 4,102 | | | | 5,348,288 | |
| | |
Japan Prime Realty Investment Corp. | | | 987 | | | | 4,743,523 | |
| | |
Japan Real Estate Investment Corp. | | | 1,481 | | | | 10,109,022 | |
| | |
Japan Retail Fund Investment Corp. | | | 2,801 | | | | 6,536,272 | |
| | |
Nippon Building Fund, Inc. | | | 1,510 | | | | 11,455,783 | |
| | |
Nippon Prologis REIT, Inc. | | | 2,515 | | | | 7,025,111 | |
| | |
Nomura Real Estate Master Fund, Inc. | | | 4,867 | | | | 9,303,559 | |
| | |
Orix JREIT, Inc. | | | 2,955 | | | | 6,681,607 | |
| | |
United Urban Investment Corp. | | | 3,339 | | | | 6,736,203 | |
| | | | | | | | |
| | |
| | | | | | | 78,552,761 | |
| | | | | | | | |
|
Food & Staples Retailing — 1.8% | |
| | |
Aeon Co. Ltd. | | | 933,200 | | | | 18,776,325 | |
| | |
Cosmos Pharmaceutical Corp. | | | 11,600 | | | | 2,395,526 | |
| | |
FamilyMart Co. Ltd. | | | 271,200 | | | | 6,727,441 | |
| | |
Lawson, Inc. | | | 53,600 | | | | 2,956,921 | |
| | |
Matsumotokiyoshi Holdings Co. Ltd. | | | 98,200 | | | | 3,459,019 | |
| | |
Seven & i Holdings Co. Ltd. | | | 853,800 | | | | 32,256,825 | |
| | |
Sundrug Co. Ltd. | | | 72,900 | | | | 2,412,314 | |
| | |
Tsuruha Holdings, Inc. | | | 38,500 | | | | 4,330,810 | |
| | |
Welcia Holdings Co. Ltd. | | | 54,900 | | | | 3,154,570 | |
| | | | | | | | |
| | |
| | | | | | | 76,469,751 | |
| | | | | | | | |
|
Food Products — 1.8% | |
| | |
Ajinomoto Co., Inc. | | | 587,700 | | | | 11,173,464 | |
| | |
Calbee, Inc. | | | 120,500 | | | | 4,027,801 | |
| | |
Ezaki Glico Co. Ltd. | | | 62,300 | | | | 2,890,936 | |
| | |
Kewpie Corp. | | | 128,500 | | | | 2,916,588 | |
| | |
Kikkoman Corp. | | | 207,600 | | | | 9,986,115 | |
| | |
MEIJI Holdings Co. Ltd. | | | 155,100 | | | | 11,179,280 | |
| | |
NH Foods Ltd. | | | 110,100 | | | | 4,625,949 | |
| | |
Nisshin Seifun Group, Inc. | | | 280,100 | | | | 5,552,762 | |
| | | | | | | | |
| INVESTMENTS | | SHARES | | | VALUE($) | |
| | | | | | | | |
|
Food Products — continued | |
| | |
Nissin Foods Holdings Co. Ltd. | | | 90,500 | | | | 6,836,041 | |
| | |
Toyo Suisan Kaisha Ltd. | | | 109,000 | | | | 4,589,443 | |
| | |
Yakult Honsha Co. Ltd. | | | 172,100 | | | | 9,863,000 | |
| | |
Yamazaki Baking Co. Ltd. | | | 193,200 | | | | 3,293,808 | |
| | | | | | | | |
| | |
| | | | | | | 76,935,187 | |
| | | | | | | | |
| | | | | | | | |
|
Gas Utilities — 0.5% | |
| | |
Osaka Gas Co. Ltd. | | | 446,000 | | | | 8,721,387 | |
| | |
Toho Gas Co. Ltd. | | | 106,900 | | | | 4,163,603 | |
| | |
Tokyo Gas Co. Ltd. | | | 416,600 | | | | 10,169,636 | |
| | | | | | | | |
| | |
| | | | | | | 23,054,626 | |
| | | | | | | | |
|
Health Care Equipment & Supplies — 2.3% | |
| | |
Asahi Intecc Co. Ltd. | | | 278,500 | | | | 7,663,037 | |
| | |
Hoya Corp. | | | 408,200 | | | | 36,075,585 | |
| | |
Olympus Corp. | | | 1,394,100 | | | | 18,968,670 | |
| | |
Sysmex Corp. | | | 176,900 | | | | 11,542,383 | |
| | |
Terumo Corp. | | | 747,900 | | | | 24,409,007 | |
| | | | | | | | |
| | |
| | | | | | | 98,658,682 | |
| | | | | | | | |
|
Health Care Providers & Services — 0.3% | |
| | |
Alfresa Holdings Corp. | | | 226,400 | | | | 5,055,250 | |
| | |
Medipal Holdings Corp. | | | 238,000 | | | | 5,437,715 | |
| | |
Suzuken Co. Ltd. | | | 87,400 | | | | 4,666,626 | |
| | | | | | | | |
| | |
| | | | | | | 15,159,591 | |
| | | | | | | | |
|
Health Care Technology — 0.2% | |
| | |
M3, Inc. | | | 457,400 | | | | 10,960,843 | |
| | | | | | | | |
|
Hotels, Restaurants & Leisure — 0.9% | |
| | |
McDonald’s Holdings Co. Japan Ltd. | | | 71,300 | | | | 3,578,733 | |
| | |
Oriental Land Co. Ltd. | | | 241,200 | | | | 35,360,151 | |
| | | | | | | | |
| | |
| | | | | | | 38,938,884 | |
| | | | | | | | |
|
Household Durables — 3.5% | |
| | |
Casio Computer Co. Ltd. | | | 249,600 | | | | 4,051,900 | |
| | |
Haseko Corp. | | | 286,400 | | | | 3,695,817 | |
| | |
Iida Group Holdings Co. Ltd. | | | 192,100 | | | | 3,199,831 | |
| | |
Nikon Corp. | | | 429,200 | | | | 5,472,433 | |
| | |
Panasonic Corp. | | | 2,494,500 | | | | 20,964,725 | |
| | |
Rinnai Corp. | | | 41,500 | | | | 3,050,390 | |
| | |
Sekisui Chemical Co. Ltd. | | | 487,500 | | | | 8,499,926 | |
| | |
Sekisui House Ltd. | | | 695,000 | | | | 14,987,243 | |
| | |
Sharp Corp. (a) | | | 222,200 | | | | 2,548,892 | |
| | |
Sony Corp. | | | 1,361,200 | | | | 82,855,086 | |
| | | | | | | | |
| | |
| | | | | | | 149,326,243 | |
| | | | | | | | |
SEE NOTES TO FINANCIAL STATEMENTS.
| | | | | | |
| | | |
| 70 | | | | J.P. MORGAN EXCHANGE-TRADED FUNDS | | OCTOBER 31, 2019 |
| | | | | | | | |
| INVESTMENTS | | SHARES | | | VALUE($) | |
Common Stocks — continued | |
|
Household Products — 0.7% | |
| | |
Lion Corp. | | | 320,100 | | | | 6,698,881 | |
| | |
Pigeon Corp. | | | 130,200 | | | | 6,356,146 | |
| | |
Unicharm Corp. | | | 471,900 | | | | 15,993,103 | |
| | | | | | | | |
| | |
| | | | | | | 29,048,130 | |
| | | | | | | | |
|
Independent Power and Renewable Electricity Producers — 0.1% | |
| | |
Electric Power Development Co. Ltd. | | | 186,100 | | | | 4,518,588 | |
| | | | | | | | |
|
Industrial Conglomerates — 0.5% | |
| | |
Keihan Holdings Co. Ltd. | | | 115,200 | | | | 5,439,386 | |
| | |
Toshiba Corp. | | | 484,000 | | | | 16,550,951 | |
| | | | | | | | |
| | |
| | | | | | | 21,990,337 | |
| | | | | | | | |
|
Insurance — 2.8% | |
| | |
Dai-ichi Life Holdings, Inc. | | | 1,282,700 | | | | 20,907,259 | |
| | |
Japan Post Holdings Co. Ltd. | | | 1,589,400 | | | | 14,589,472 | |
| | |
Japan Post Insurance Co. Ltd. | | | 30,200 | | | | 476,430 | |
| | |
MS&AD Insurance Group Holdings, Inc. | | | 527,100 | | | | 17,020,712 | |
| | |
Sompo Holdings, Inc. | | | 399,600 | | | | 15,706,710 | |
| | |
Sony Financial Holdings, Inc. | | | 163,100 | | | | 3,508,843 | |
| | |
T&D Holdings, Inc. | | | 659,000 | | | | 7,339,771 | |
| | |
Tokio Marine Holdings, Inc. | | | 759,900 | | | | 41,084,463 | |
| | | | | | | | |
| | |
| | | | | | | 120,633,660 | |
| | | | | | | | |
|
Interactive Media & Services — 0.3% | |
| | |
Kakaku.com, Inc. | | | 141,200 | | | | 3,278,649 | |
| | |
LINE Corp.* | | | 59,200 | | | | 2,177,786 | |
| | |
Z Holdings Corp. | | | 2,838,800 | | | | 8,739,865 | |
| | | | | | | | |
| | |
| | | | | | | 14,196,300 | |
| | | | | | | | |
|
Internet & Direct Marketing Retail — 0.4% | |
| | |
Mercari, Inc.* | | | 99,200 | | | | 2,236,619 | |
| | |
Rakuten, Inc. | | | 875,300 | | | | 8,344,606 | |
| | |
ZOZO, Inc. (a) | | | 210,200 | | | | 4,896,178 | |
| | | | | | | | |
| | |
| | | | | | | 15,477,403 | |
| | | | | | | | |
|
IT Services — 1.3% | |
| | |
Fujitsu Ltd. | | | 204,000 | | | | 18,080,324 | |
| | |
GMO Payment Gateway, Inc. | | | 44,500 | | | | 3,279,611 | |
| | |
Itochu Techno-Solutions Corp. | | | 102,700 | | | | 2,765,795 | |
| | |
Nomura Research Institute Ltd. | | | 411,800 | | | | 8,742,808 | |
| | |
NTT Data Corp. | | | 690,600 | | | | 9,068,166 | |
| | |
Obic Co. Ltd. | | | 71,500 | | | | 8,952,173 | |
| | |
Otsuka Corp. | | | 118,100 | | | | 4,761,551 | |
| | |
SCSK Corp. | | | 54,600 | | | | 2,779,379 | |
| | | | | | | | |
| | |
| | | | | | | 58,429,807 | |
| | | | | | | | |
| | | | | | | | |
| INVESTMENTS | | SHARES | | | VALUE($) | |
| | | | | | | | |
|
Leisure Products — 1.0% | |
| | |
Bandai Namco Holdings, Inc. | | | 237,500 | | | | 14,603,681 | |
| | |
Sankyo Co. Ltd. | | | 48,900 | | | | 1,711,385 | |
| | |
Sega Sammy Holdings, Inc. | | | 190,800 | | | | 2,685,147 | |
| | |
Shimano, Inc. | | | 91,300 | | | | 15,196,955 | |
| | |
Yamaha Corp. | | | 180,400 | | | | 8,401,095 | |
| | | | | | | | |
| | |
| | | | | | | 42,598,263 | |
| | | | | | | | |
|
Machinery — 5.1% | |
| | |
Amada Holdings Co. Ltd. | | | 394,000 | | | | 4,486,915 | |
| | |
Daifuku Co. Ltd. | | | 135,500 | | | | 7,189,867 | |
| | |
FANUC Corp. | | | 207,600 | | | | 40,948,955 | |
| | |
Harmonic Drive Systems, Inc. (a) | | | 44,300 | | | | 2,054,489 | |
| | |
Hino Motors Ltd. | | | 307,500 | | | | 2,907,202 | |
| | |
Hitachi Construction Machinery Co. Ltd. | | | 113,000 | | | | 2,916,779 | |
| | |
Hoshizaki Corp. | | | 58,800 | | | | 4,998,137 | |
| | |
IHI Corp. | | | 165,600 | | | | 4,080,905 | |
| | |
JTEKT Corp. | | | 264,600 | | | | 3,374,811 | |
| | |
Kawasaki Heavy Industries Ltd. | | | 178,800 | | | | 4,290,901 | |
| | |
Komatsu Ltd. | | | 1,040,800 | | | | 24,370,243 | |
| | |
Kubota Corp. | | | 1,253,200 | | | | 19,904,899 | |
| | |
Kurita Water Industries Ltd. | | | 114,500 | | | | 3,296,182 | |
| | |
Makita Corp. | | | 299,800 | | | | 10,082,531 | |
| | |
MINEBEA MITSUMI, Inc. | | | 457,000 | | | | 8,679,138 | |
| | |
MISUMI Group, Inc. | | | 303,800 | | | | 7,637,156 | |
| | |
Mitsubishi Heavy Industries Ltd. | | | 361,000 | | | | 14,609,442 | |
| | |
Nabtesco Corp. | | | 133,900 | | | | 4,262,680 | |
| | |
NGK Insulators Ltd. | | | 298,100 | | | | 4,579,640 | |
| | |
NSK Ltd. | | | 519,300 | | | | 4,828,664 | |
| | |
SMC Corp. | | | 72,200 | | | | 31,193,375 | |
| | |
Sumitomo Heavy Industries Ltd. | | | 131,600 | | | | 4,087,764 | |
| | |
THK Co. Ltd. | | | 131,800 | | | | 3,789,948 | |
| | | | | | | | |
| | |
| | | | | | | 218,570,623 | |
| | | | | | | | |
|
Marine — 0.2% | |
| | |
Mitsui OSK Lines Ltd. | | | 129,100 | | | | 3,516,493 | |
| | |
Nippon Yusen KK | | | 182,000 | | | | 3,269,645 | |
| | | | | | | | |
| | |
| | | | | | | 6,786,138 | |
| | | | | | | | |
|
Media — 0.5% | |
| | |
CyberAgent, Inc. | | | 108,100 | | | | 3,513,421 | |
| | |
Dentsu, Inc. | | | 265,500 | | | | 9,491,564 | |
| | |
Fuji Media Holdings, Inc. | | | 50,100 | | | | 676,981 | |
| | |
Hakuhodo DY Holdings, Inc. | | | 324,800 | | | | 4,846,897 | |
| | |
Nippon Television Holdings, Inc. | | | 56,400 | | | | 737,641 | |
| | |
Tokyo Broadcasting System Holdings, Inc. | | | 37,400 | | | | 596,359 | |
| | | | | | | | |
| | |
| | | | | | | 19,862,863 | |
| | | | | | | | |
SEE NOTES TO FINANCIAL STATEMENTS.
| | | | | | | | |
| | | |
| OCTOBER 31, 2019 | | J.P. MORGAN EXCHANGE-TRADED FUNDS | | | | | 71 | |
JPMorgan BetaBuilders Japan ETF
SCHEDULE OF PORTFOLIO INVESTMENTS
AS OF OCTOBER 31, 2019 (continued)
| | | | | | | | |
| INVESTMENTS | | SHARES | | | VALUE($) | |
Common Stocks — continued | |
|
Metals & Mining — 1.1% | |
| | |
Daido Steel Co. Ltd. | | | 42,300 | | | | 1,845,889 | |
| | |
Hitachi Metals Ltd. | | | 215,800 | | | | 2,708,359 | |
| | |
JFE Holdings, Inc. | | | 618,200 | | | | 7,732,227 | |
| | |
Kobe Steel Ltd. | | | 390,000 | | | | 2,096,844 | |
| | |
Maruichi Steel Tube Ltd. (a) | | | 85,500 | | | | 2,334,863 | |
| | |
Mitsubishi Materials Corp. | | | 140,700 | | | | 4,045,834 | |
| | |
Nippon Steel Corp. | | | 1,017,100 | | | | 14,845,121 | |
| | |
Sumitomo Metal Mining Co. Ltd. | | | 292,700 | | | | 9,790,727 | |
| | |
Yamato Kogyo Co. Ltd. | | | 51,400 | | | | 1,333,402 | |
| | | | | | | | |
| | |
| | | | | | | 46,733,266 | |
| | | | | | | | |
|
Multiline Retail — 0.8% | |
| | |
Isetan Mitsukoshi Holdings Ltd. | | | 423,700 | | | | 3,379,079 | |
| | |
Izumi Co. Ltd. | | | 48,300 | | | | 1,816,967 | |
| | |
J Front Retailing Co. Ltd. | | | 289,700 | | | | 3,683,796 | |
| | |
Marui Group Co. Ltd. (a) | | | 239,300 | | | | 5,319,726 | |
| | |
Pan Pacific International Holdings Corp. | | | 644,100 | | | | 10,139,002 | |
| | |
Ryohin Keikaku Co. Ltd. (a) | | | 282,400 | | | | 6,286,866 | |
| | |
Seria Co. Ltd. | | | 48,700 | | | | 1,224,116 | |
| | |
Takashimaya Co. Ltd. (a) | | | 190,200 | | | | 2,207,846 | |
| | | | | | | | |
| | |
| | | | | | | 34,057,398 | |
| | | | | | | | |
|
Oil, Gas & Consumable Fuels — 0.8% | |
| | |
Idemitsu Kosan Co. Ltd. | | | 268,152 | | | | 7,882,402 | |
| | |
Inpex Corp. | | | 1,158,200 | | | | 10,706,963 | |
| | |
JXTG Holdings, Inc. | | | 3,564,600 | | | | 16,661,798 | |
| | | | | | | | |
| | |
| | | | | | | 35,251,163 | |
| | | | | | | | |
|
Paper & Forest Products — 0.1% | |
| | |
Oji Holdings Corp. | | | 1,085,800 | | | | 5,613,848 | |
| | | | | | | | |
|
Personal Products — 2.1% | |
| | |
Kao Corp. | | | 516,000 | | | | 41,485,723 | |
| | |
Kobayashi Pharmaceutical Co. Ltd. | | | 59,600 | | | | 4,765,617 | |
| | |
Kose Corp. | | | 36,400 | | | | 6,453,503 | |
| | |
Pola Orbis Holdings, Inc. | | | 90,700 | | | | 2,046,718 | |
| | |
Shiseido Co. Ltd. | | | 428,200 | | | | 35,304,212 | |
| | | | | | | | |
| | |
| | | | | | | 90,055,773 | |
| | | | | | | | |
|
Pharmaceuticals — 6.2% | |
| | |
Astellas Pharma, Inc. | | | 1,920,700 | | | | 32,964,387 | |
| | |
Chugai Pharmaceutical Co. Ltd. | | | 227,600 | | | | 19,153,862 | |
| | |
Daiichi Sankyo Co. Ltd. | | | 652,700 | | | | 42,917,501 | |
| | |
Eisai Co. Ltd. | | | 317,400 | | | | 22,976,272 | |
| | |
Hisamitsu Pharmaceutical Co., Inc. | | | 88,600 | | | | 4,123,379 | |
| | |
Kyowa Kirin Co. Ltd. | | | 271,600 | | | | 4,997,446 | |
| | |
Mitsubishi Tanabe Pharma Corp. | | | 264,400 | | | | 3,164,417 | |
| | |
Nippon Shinyaku Co. Ltd. | | | 65,300 | | | | 5,891,148 | |
| | |
Ono Pharmaceutical Co. Ltd. | | | 552,600 | | | | 10,409,246 | |
| | |
Otsuka Holdings Co. Ltd. | | | 597,200 | | | | 24,897,423 | |
| | | | | | | | |
| INVESTMENTS | | SHARES | | | VALUE($) | |
| | | | | | | | |
|
Pharmaceuticals — continued | |
| | |
Santen Pharmaceutical Co. Ltd. | | | 428,100 | | | | 7,583,080 | |
| | |
Shionogi & Co. Ltd. | | | 311,900 | | | | 18,721,142 | |
| | |
Sumitomo Dainippon Pharma Co. Ltd. | | | 183,100 | | | | 3,195,672 | |
| | |
Taisho Pharmaceutical Holdings Co. Ltd. | | | 58,200 | | | | 4,142,355 | |
| | |
Takeda Pharmaceutical Co. Ltd. | | | 1,687,200 | | | | 60,963,730 | |
| | |
Tsumura & Co. | | | 74,000 | | | | 2,037,921 | |
| | | | | | | | |
| | |
| | | | | | | 268,138,981 | |
| | | | | | | | |
|
Professional Services — 1.5% | |
| | |
Nihon M&A Center, Inc. | | | 150,800 | | | | 4,585,089 | |
| | |
Persol Holdings Co. Ltd. | | | 202,800 | | | | 3,895,387 | |
| | |
Recruit Holdings Co. Ltd. | | | 1,706,400 | | | | 56,710,572 | |
| | | | | | | | |
| | |
| | | | | | | 65,191,048 | |
| | | | | | | | |
|
Real Estate Management & Development — 3.0% | |
| | |
Aeon Mall Co. Ltd. | | | 109,400 | | | | 1,750,294 | |
| | |
Daito Trust Construction Co. Ltd. | | | 81,000 | | | | 10,734,157 | |
| | |
Daiwa House Industry Co. Ltd. | | | 713,100 | | | | 24,548,546 | |
| | |
Hulic Co. Ltd. | | | 537,200 | | | | 5,832,248 | |
| | |
Mitsubishi Estate Co. Ltd. | | | 1,489,100 | | | | 28,911,447 | |
| | |
Mitsui Fudosan Co. Ltd. | | | 1,061,100 | | | | 27,145,950 | |
| | |
Nomura Real Estate Holdings, Inc. | | | 129,800 | | | | 3,076,181 | |
| | |
Sumitomo Realty & Development Co. Ltd. | | | 509,700 | | | | 18,501,227 | |
| | |
Tokyo Tatemono Co. Ltd. | | | 232,100 | | | | 3,302,200 | |
| | |
Tokyu Fudosan Holdings Corp. | | | 647,300 | | | | 4,293,479 | |
| | | | | | | | |
| | |
| | | | | | | 128,095,729 | |
| | | | | | | | |
|
Road & Rail — 4.6% | |
| | |
Central Japan Railway Co. | | | 220,500 | | | | 45,232,053 | |
| | |
East Japan Railway Co. | | | 404,500 | | | | 36,720,927 | |
| | |
Hankyu Hanshin Holdings, Inc. | | | 272,100 | | | | 10,888,628 | |
| | |
Keikyu Corp. | | | 295,300 | | | | 5,878,133 | |
| | |
Keio Corp. | | | 130,700 | | | | 8,085,555 | |
| | |
Keisei Electric Railway Co. Ltd. | | | 184,500 | | | | 7,543,368 | |
| | |
Kintetsu Group Holdings Co. Ltd. | | | 204,200 | | | | 11,130,116 | |
| | |
Kyushu Railway Co. | | | 171,300 | | | | 5,659,334 | |
| | |
Nagoya Railroad Co. Ltd. | | | 210,500 | | | | 6,691,350 | |
| | |
Nankai Electric Railway Co. Ltd. | | | 121,500 | | | | 3,157,412 | |
| | |
Nippon Express Co. Ltd. | | | 95,400 | | | | 5,443,103 | |
| | |
Odakyu Electric Railway Co. Ltd. | | | 362,800 | | | | 8,831,343 | |
| | |
Seibu Holdings, Inc. | | | 302,500 | | | | 5,339,125 | |
| | |
Tobu Railway Co. Ltd. | | | 227,200 | | | | 7,581,643 | |
| | |
Tokyu Corp. | | | 608,700 | | | | 11,512,717 | |
| | |
West Japan Railway Co. | | | 204,900 | | | | 17,803,840 | |
| | | | | | | | |
| | |
| | | | | | | 197,498,647 | |
| | | | | | | | |
SEE NOTES TO FINANCIAL STATEMENTS.
| | | | | | |
| | | |
| 72 | | | | J.P. MORGAN EXCHANGE-TRADED FUNDS | | OCTOBER 31, 2019 |
| | | | | | | | |
| INVESTMENTS | | SHARES | | | VALUE($) | |
Common Stocks — continued | |
|
Semiconductors & Semiconductor Equipment — 1.7% | |
| | |
Advantest Corp. | | | 213,700 | | | | 9,725,164 | |
| | |
Disco Corp. | | | 30,900 | | | | 6,743,539 | |
| | |
Renesas Electronics Corp.* | | | 1,111,700 | | | | 7,525,850 | |
| | |
Rohm Co. Ltd. | | | 101,200 | | | | 8,017,957 | |
| | |
SUMCO Corp. | | | 273,000 | | | | 4,534,768 | |
| | |
Tokyo Electron Ltd. | | | 176,800 | | | | 35,819,429 | |
| | | | | | | | |
| | |
| | | | | | | 72,366,707 | |
| | | | | | | | |
|
Software — 0.2% | |
| | |
Oracle Corp. | | | 35,700 | | | | 3,137,894 | |
| | |
Trend Micro, Inc. | | | 130,800 | | | | 6,602,032 | |
| | | | | | | | |
| | |
| | | | | | | 9,739,926 | |
| | | | | | | | |
|
Specialty Retail — 1.8% | |
| | |
ABC-Mart, Inc. | | | 33,600 | | | | 2,303,798 | |
| | |
Fast Retailing Co. Ltd. | | | 69,400 | | | | 42,798,433 | |
| | |
Hikari Tsushin, Inc. | | | 21,900 | | | | 4,800,409 | |
| | |
K’s Holdings Corp. | | | 224,300 | | | | 2,562,700 | |
| | |
Nitori Holdings Co. Ltd. | | | 90,600 | | | | 13,790,329 | |
| | |
Shimamura Co. Ltd. | | | 26,600 | | | | 2,253,102 | |
| | |
USS Co. Ltd. | | | 234,600 | | | | 4,543,778 | |
| | |
Yamada Denki Co. Ltd. | | | 765,400 | | | | 3,699,547 | |
| | | | | | | | |
| | |
| | | | | | | 76,752,096 | |
| | | | | | | | |
|
Technology Hardware, Storage & Peripherals — 1.9% | |
| | |
Brother Industries Ltd. | | | 280,600 | | | | 5,273,607 | |
| | |
Canon, Inc. | | | 1,156,300 | | | | 31,728,551 | |
| | |
FUJIFILM Holdings Corp. | | | 440,700 | | | | 19,347,721 | |
| | |
Konica Minolta, Inc. | | | 538,000 | | | | 3,948,812 | |
| | |
NEC Corp. | | | 278,700 | | | | 11,045,053 | |
| | |
Ricoh Co. Ltd. | | | 797,300 | | | | 7,100,445 | |
| | |
Seiko Epson Corp. | | | 342,300 | | | | 4,840,481 | |
| | | | | | | | |
| | |
| | | | | | | 83,284,670 | |
| | | | | | | | |
|
Textiles, Apparel & Luxury Goods — 0.1% | |
| | |
Asics Corp. | | | 203,300 | | | | 3,490,322 | |
| | | | | | | | |
|
Tobacco — 0.6% | |
| | |
Japan Tobacco, Inc. | | | 1,198,700 | | | | 27,093,871 | |
| | | | | | | | |
|
Trading Companies & Distributors — 3.8% | |
| | |
ITOCHU Corp. | | | 1,696,500 | | | | 35,470,223 | |
| | |
Marubeni Corp. | | | 1,860,100 | | | | 13,091,529 | |
| | |
Mitsubishi Corp. | | | 1,702,000 | | | | 43,289,375 | |
| | |
Mitsui & Co. Ltd. | | | 1,865,200 | | | | 32,032,873 | |
| | |
MonotaRO Co. Ltd. | | | 147,400 | | | | 4,453,045 | |
| | |
Sojitz Corp. | | | 1,205,500 | | | | 3,794,363 | |
| | |
Sumitomo Corp. | | | 1,338,900 | | | | 21,746,950 | |
| | |
Toyota Tsusho Corp. | | | 254,000 | | | | 8,762,630 | |
| | | | | | | | |
| | |
| | | | | | | 162,640,988 | |
| | | | | | | | |
| | | | | | | | |
| INVESTMENTS | | SHARES | | | VALUE($) | |
| | | | | | | | |
|
Transportation Infrastructure — 0.2% | |
| | |
Japan Airport Terminal Co. Ltd. | | | 77,800 | | | | 3,843,054 | |
| | |
Kamigumi Co. Ltd. | | | 128,000 | | | | 2,894,228 | |
| | |
Mitsubishi Logistics Corp. | | | 88,500 | | | | 2,246,547 | |
| | | | | | | | |
| | |
| | | | | | | 8,983,829 | |
| | | | | | | | |
|
Wireless Telecommunication Services — 4.0% | |
| | |
KDDI Corp. | | | 1,714,400 | | | | 47,439,410 | |
| | |
NTT DOCOMO, Inc. | | | 1,285,100 | | | | 35,231,170 | |
| | |
Softbank Corp. | | | 1,742,300 | | | | 23,899,679 | |
| | |
SoftBank Group Corp. | | | 1,767,100 | | | | 67,974,003 | |
| | | | | | | | |
| | |
| | | | | | | 174,544,262 | |
| | | | | | | | |
| | |
Total Common Stocks
(Cost $4,121,630,584) | | | | | | | 4,271,341,070 | |
| | | | | | | | |
Short-Term Investments — 0.4% | |
|
Investment of Cash Collateral from Securities Loaned — 0.4% | |
| | |
JPMorgan Securities Lending Money Market Fund Class Agency SL Shares, 1.98% (c) (d) | | | 12,000,400 | | | | 12,001,600 | |
| | |
JPMorgan U.S. Government Money Market Fund Class IM Shares, 1.70% (c) (d) | | | 6,340,122 | | | | 6,340,122 | |
| | | | | | | | |
| | |
Total Investment of Cash Collateral from Securities Loaned
(Cost $18,340,323) | | | | | | | 18,341,722 | |
| | | | | | | | |
Total Investments — 99.3%
(Cost $4,139,970,907) | | | | | | | 4,289,682,792 | |
| | |
Other Assets Less Liabilities — 0.7% | | | | | | | 28,839,127 | |
| | | | | | | | |
NET ASSETS — 100.0% | | | | | | | 4,318,521,919 | |
| | | | | | | | |
Percentages indicated are based on net assets.
Abbreviations
| | |
| REIT | | Real Estate Investment Trust |
| |
| (a) | | The security or a portion of this security is on loan at October 31, 2019. The total value of securities on loan at October 31, 2019 is $17,484,369. |
| (b) | | Amount rounds to less than 0.1% of net assets. |
| (c) | | Investment in an affiliated fund, which is registered under the Investment Company Act of 1940, as amended, and is advised by J.P. Morgan Investment Management Inc. |
| (d) | | The rate shown is the current yield as of October 31, 2019. |
| * | | Non-income producing security. |
SEE NOTES TO FINANCIAL STATEMENTS.
| | | | | | | | |
| | | |
| OCTOBER 31, 2019 | | J.P. MORGAN EXCHANGE-TRADED FUNDS | | | | | 73 | |
JPMorgan BetaBuilders Japan ETF
SCHEDULE OF PORTFOLIO INVESTMENTS
AS OF OCTOBER 31, 2019 (continued)
| | | | | | | | | | | | | | | | | | | | |
| Futures contracts outstanding as of October 31, 2019: | |
| DESCRIPTION | | NUMBER OF
CONTRACTS | | | EXPIRATION
DATE | | | TRADING
CURRENCY | | | NOTIONAL
AMOUNT($) | | | VALUE AND
UNREALIZED
APPRECIATION
(DEPRECIATION)($) | |
| | | | | |
Long Contracts | | | | | | | | | | | | | | | | | | | | |
TOPIX Index | | | 308 | | | | 12/2019 | | | | JPY | | | | 47,216,779 | | | | 1,459,579 | |
| | | | | | | | | | | | | | | | | | | | |
Abbreviations
| | |
| JPY | | Japanese Yen |
| TOPIX | | Tokyo Stock Price Index |
SEE NOTES TO FINANCIAL STATEMENTS.
| | | | | | |
| | | |
| 74 | | | | J.P. MORGAN EXCHANGE-TRADED FUNDS | | OCTOBER 31, 2019 |
JPMorgan BetaBuilders U.S. Equity ETF
SCHEDULE OF PORTFOLIO INVESTMENTS
AS OF OCTOBER 31, 2019
| | | | | | | | |
| INVESTMENTS | | SHARES | | | VALUE($) | |
Common Stocks — 99.6% | |
|
Aerospace & Defense — 2.5% | |
| | |
Arconic, Inc. | | | 681 | | | | 18,707 | |
| | |
Boeing Co. (The) | | | 939 | | | | 319,175 | |
| | |
General Dynamics Corp. | | | 411 | | | | 72,665 | |
| | |
HEICO Corp. | | | 70 | | | | 8,634 | |
| | |
HEICO Corp., Class A | | | 125 | | | | 11,909 | |
| | |
Huntington Ingalls Industries, Inc. | | | 72 | | | | 16,248 | |
| | |
L3Harris Technologies, Inc. | | | 392 | | | | 80,874 | |
| | |
Lockheed Martin Corp. | | | 438 | | | | 164,986 | |
| | |
Northrop Grumman Corp. | | | 276 | | | | 97,284 | |
| | |
Raytheon Co. | | | 490 | | | | 103,983 | |
| | |
Spirit AeroSystems Holdings, Inc., Class A | | | 183 | | | | 14,973 | |
| | |
Textron, Inc. | | | 405 | | | | 18,666 | |
| | |
TransDigm Group, Inc. | | | 87 | | | | 45,786 | |
| | |
United Technologies Corp. | | | 1,427 | | | | 204,889 | |
| | | | | | | | |
| | |
| | | | | | | 1,178,779 | |
| | | | | | | | |
|
Air Freight & Logistics — 0.6% | |
| | |
CH Robinson Worldwide, Inc. | | | 238 | | | | 18,002 | |
| | |
Expeditors International of Washington, Inc. | | | 302 | | | | 22,028 | |
| | |
FedEx Corp. | | | 423 | | | | 64,575 | |
| | |
United Parcel Service, Inc., Class B | | | 1,227 | | | | 141,314 | |
| | |
XPO Logistics, Inc.* | | | 160 | | | | 12,224 | |
| | | | | | | | |
| | |
| | | | | | | 258,143 | |
| | | | | | | | |
|
Airlines — 0.4% | |
| | |
Alaska Air Group, Inc. | | | 218 | | | | 15,136 | |
| | |
American Airlines Group, Inc. | | | 697 | | | | 20,952 | |
| | |
Delta Air Lines, Inc. | | | 1,018 | | | | 56,071 | |
| | |
Southwest Airlines Co. | | | 850 | | | | 47,710 | |
| | |
United Airlines Holdings, Inc.* | | | 389 | | | | 35,337 | |
| | | | | | | | |
| | |
| | | | | | | 175,206 | |
| | | | | | | | |
|
Auto Components — 0.2% | |
| | |
Aptiv plc | | | 448 | | | | 40,118 | |
| | |
Autoliv, Inc. (Sweden) | | | 138 | | | | 10,742 | |
| | |
BorgWarner, Inc. | | | 362 | | | | 15,088 | |
| | |
Goodyear Tire & Rubber Co. (The) | | | 409 | | | | 6,491 | |
| | |
Lear Corp. | | | 99 | | | | 11,659 | |
| | | | | | | | |
| | |
| | | | | | | 84,098 | |
| | | | | | | | |
|
Automobiles — 0.5% | |
| | |
Ford Motor Co. | | | 6,890 | | | | 59,185 | |
| | |
General Motors Co. | | | 2,209 | | | | 82,087 | |
| | |
Harley-Davidson, Inc. | | | 275 | | | | 10,700 | |
| | |
Tesla, Inc.* | | | 250 | | | | 78,730 | |
| | | | | | | | |
| | |
| | | | | | | 230,702 | |
| | | | | | | | |
| | | | | | | | |
| INVESTMENTS | | SHARES | | | VALUE($) | |
| | | | | | | | |
|
Banks — 5.4% | |
| | |
Bank of America Corp. | | | 14,729 | | | | 460,576 | |
| | |
BB&T Corp. | | | 1,346 | | | | 71,405 | |
| | |
CIT Group, Inc. | | | 167 | | | | 7,163 | |
| | |
Citigroup, Inc. | | | 3,974 | | | | 285,572 | |
| | |
Citizens Financial Group, Inc. | | | 785 | | | | 27,601 | |
| | |
Comerica, Inc. | | | 261 | | | | 17,075 | |
| | |
East West Bancorp, Inc. | | | 256 | | | | 10,987 | |
| | |
Fifth Third Bancorp | | | 1,282 | | | | 37,281 | |
| | |
First Republic Bank | | | 294 | | | | 31,270 | |
| | |
Huntington Bancshares, Inc. | | | 1,824 | | | | 25,773 | |
| | |
JPMorgan Chase & Co. (a) | | | 5,623 | | | | 702,425 | |
| | |
KeyCorp | | | 1,765 | | | | 31,717 | |
| | |
M&T Bank Corp. | | | 236 | | | | 36,941 | |
| | |
PNC Financial Services Group, Inc. (The) | | | 783 | | | | 114,866 | |
| | |
Regions Financial Corp. | | | 1,754 | | | | 28,239 | |
| | |
SunTrust Banks, Inc. | | | 781 | | | | 53,373 | |
| | |
SVB Financial Group* | | | 89 | | | | 19,712 | |
| | |
US Bancorp | | | 2,520 | | | | 143,690 | |
| | |
Wells Fargo & Co. | | | 7,051 | | | | 364,043 | |
| | |
Zions Bancorp NA | | | 310 | | | | 15,026 | |
| | | | | | | | |
| | |
| | | | | | | 2,484,735 | |
| | | | | | | | |
|
Beverages — 1.8% | |
| | |
Brown-Forman Corp., Class A | | | 99 | | | | 6,153 | |
| | |
Brown-Forman Corp., Class B | | | 321 | | | | 21,032 | |
| | |
Coca-Cola Co. (The) | | | 6,767 | | | | 368,328 | |
| | |
Constellation Brands, Inc., Class A | | | 293 | | | | 55,767 | |
| | |
Keurig Dr Pepper, Inc. | | | 471 | | | | 13,263 | |
| | |
Molson Coors Brewing Co., Class B | | | 329 | | | | 17,345 | |
| | |
Monster Beverage Corp.* | | | 680 | | | | 38,168 | |
| | |
PepsiCo, Inc. | | | 2,460 | | | | 337,438 | |
| | | | | | | | |
| | |
| | | | | | | 857,494 | |
| | | | | | | | |
|
Biotechnology — 2.4% | |
| | |
AbbVie, Inc. | | | 2,600 | | | | 206,830 | |
| | |
Alexion Pharmaceuticals, Inc.* | | | 394 | | | | 41,528 | |
| | |
Alkermes plc* | | | 276 | | | | 5,390 | |
| | |
Alnylam Pharmaceuticals, Inc.* | | | 194 | | | | 16,828 | |
| | |
Amgen, Inc. | | | 1,054 | | | | 224,765 | |
| | |
Biogen, Inc.* | | | 324 | | | | 96,782 | |
| | |
BioMarin Pharmaceutical, Inc.* | | | 313 | | | | 22,915 | |
| | |
Celgene Corp.* | | | 1,245 | | | | 134,497 | |
| | |
Exact Sciences Corp.* | | | 226 | | | | 19,662 | |
| | |
Gilead Sciences, Inc. | | | 2,227 | | | | 141,882 | |
| | |
Incyte Corp.* | | | 312 | | | | 26,183 | |
| | |
Neurocrine Biosciences, Inc.* | | | 159 | | | | 15,819 | |
SEE NOTES TO FINANCIAL STATEMENTS.
| | | | | | | | |
| | | |
| OCTOBER 31, 2019 | | J.P. MORGAN EXCHANGE-TRADED FUNDS | | | | | 75 | |
JPMorgan BetaBuilders U.S. Equity ETF
SCHEDULE OF PORTFOLIO INVESTMENTS
AS OF OCTOBER 31, 2019 (continued)
| | | | | | | | |
| INVESTMENTS | | SHARES | | | VALUE($) | |
Common Stocks — continued | |
|
Biotechnology — continued | |
| | |
Regeneron Pharmaceuticals, Inc.* | | | 139 | | | | 42,573 | |
| | |
Seattle Genetics, Inc.* | | | 200 | | | | 21,480 | |
| | |
Vertex Pharmaceuticals, Inc.* | | | 454 | | | | 88,748 | |
| | | | | | | | |
| | |
| | | | | | | 1,105,882 | |
| | | | | | | | |
|
Building Products — 0.3% | |
| | |
Fortune Brands Home & Security, Inc. | | | 244 | | | | 14,652 | |
| | |
Johnson Controls International plc | | | 1,398 | | | | 60,576 | |
| | |
Lennox International, Inc. | | | 63 | | | | 15,584 | |
| | |
Masco Corp. | | | 509 | | | | 23,541 | |
| | |
Owens Corning | | | 190 | | | | 11,643 | |
| | | | | | | | |
| | |
| | | | | | | 125,996 | |
| | | | | | | | |
|
Capital Markets — 2.6% | |
| | |
Affiliated Managers Group, Inc. | | | 88 | | | | 7,029 | |
| | |
Ameriprise Financial, Inc. | | | 228 | | | | 34,403 | |
| | |
Bank of New York Mellon Corp. (The) | | | 1,509 | | | | 70,546 | |
| | |
BlackRock, Inc. | | | 206 | | | | 95,110 | |
| | |
Charles Schwab Corp. (The) | | | 2,044 | | | | 83,211 | |
| | |
CME Group, Inc. | | | 630 | | | | 129,623 | |
| | |
E*TRADE Financial Corp. | | | 422 | | | | 17,635 | |
| | |
Franklin Resources, Inc. | | | 495 | | | | 13,637 | |
| | |
Goldman Sachs Group, Inc. (The) | | | 567 | | | | 120,987 | |
| | |
Intercontinental Exchange, Inc. | | | 986 | | | | 93,000 | |
| | |
Invesco Ltd. | | | 678 | | | | 11,404 | |
| | |
KKR & Co., Inc., Class A | | | 958 | | | | 27,619 | |
| | |
Moody’s Corp. | | | 287 | | | | 63,338 | |
| | |
Morgan Stanley | | | 2,209 | | | | 101,724 | |
| | |
MSCI, Inc. | | | 150 | | | | 35,184 | |
| | |
Nasdaq, Inc. | | | 203 | | | | 20,253 | |
| | |
Northern Trust Corp. | | | 377 | | | | 37,579 | |
| | |
Raymond James Financial, Inc. | | | 218 | | | | 18,201 | |
| | |
S&P Global, Inc. | | | 431 | | | | 111,194 | |
| | |
SEI Investments Co. | | | 223 | | | | 13,362 | |
| | |
State Street Corp. | | | 653 | | | | 43,144 | |
| | |
T. Rowe Price Group, Inc. | | | 413 | | | | 47,825 | |
| | |
TD Ameritrade Holding Corp. | | | 473 | | | | 18,154 | |
| | | | | | | | |
| | |
| | | | | | | 1,214,162 | |
| | | | | | | | |
|
Chemicals — 1.8% | |
| | |
Air Products & Chemicals, Inc. | | | 388 | | | | 82,745 | |
| | |
Albemarle Corp. | | | 187 | | | | 11,358 | |
| | |
Ashland Global Holdings, Inc. | | | 105 | | | | 8,124 | |
| | |
Axalta Coating Systems Ltd.* | | | 363 | | | | 10,705 | |
| | |
Celanese Corp. | | | 218 | | | | 26,411 | |
| | |
CF Industries Holdings, Inc. | | | 386 | | | | 17,505 | |
| | |
Chemours Co. (The) | | | 287 | | | | 4,710 | |
| | | | | | | | |
| INVESTMENTS | | SHARES | | | VALUE($) | |
| | | | | | | | |
|
Chemicals — continued | |
| | |
Dow, Inc. | | | 1,307 | | | | 65,990 | |
| | |
DuPont de Nemours, Inc. | | | 1,310 | | | | 86,342 | |
| | |
Eastman Chemical Co. | | | 240 | | | | 18,250 | |
| | |
Ecolab, Inc. | | | 441 | | | | 84,703 | |
| | |
FMC Corp. | | | 227 | | | | 20,770 | |
| | |
International Flavors & Fragrances, Inc. | | | 188 | | | | 22,938 | |
| | |
Linde plc (United Kingdom) | | | 951 | | | | 188,631 | |
| | |
LyondellBasell Industries NV, Class A | | | 455 | | | | 40,813 | |
| | |
Mosaic Co. (The) | | | 625 | | | | 12,425 | |
| | |
PPG Industries, Inc. | | | 414 | | | | 51,800 | |
| | |
Sherwin-Williams Co. (The) | | | 142 | | | | 81,269 | |
| | |
Westlake Chemical Corp. | | | 63 | | | | 3,981 | |
| | |
WR Grace & Co. | | | 99 | | | | 6,579 | |
| | | | | | | | |
| | |
| | | | | | | 846,049 | |
| | | | | | | | |
|
Commercial Services & Supplies — 0.4% | |
| | |
Cintas Corp. | | | 148 | | | | 39,763 | |
| | |
Copart, Inc.* | | | 355 | | | | 29,337 | |
| | |
Republic Services, Inc. | | | 373 | | | | 32,641 | |
| | |
Rollins, Inc. | | | 245 | | | | 9,337 | |
| | |
Stericycle, Inc.* | | | 159 | | | | 9,159 | |
| | |
Waste Management, Inc. | | | 685 | | | | 76,864 | |
| | | | | | | | |
| | |
| | | | | | | 197,101 | |
| | | | | | | | |
|
Communications Equipment — 1.0% | |
| | |
Arista Networks, Inc.* | | | 97 | | | | 23,723 | |
| | |
Cisco Systems, Inc. | | | 7,464 | | | | 354,615 | |
| | |
F5 Networks, Inc.* | | | 105 | | | | 15,129 | |
| | |
Juniper Networks, Inc. | | | 609 | | | | 15,115 | |
| | |
Motorola Solutions, Inc. | | | 291 | | | | 48,399 | |
| | |
Ubiquiti, Inc. | | | 22 | | | | 2,785 | |
| | | | | | | | |
| | |
| | | | | | | 459,766 | |
| | | | | | | | |
|
Construction & Engineering — 0.1% | |
| | |
Fluor Corp. | | | 246 | | | | 3,963 | |
| | |
Jacobs Engineering Group, Inc. | | | 238 | | | | 22,272 | |
| | |
Quanta Services, Inc. | | | 251 | | | | 10,555 | |
| | | | | | | | |
| | |
| | | | | | | 36,790 | |
| | | | | | | | |
|
Construction Materials — 0.1% | |
| | |
Martin Marietta Materials, Inc. | | | 108 | | | | 28,286 | |
| | |
Vulcan Materials Co. | | | 234 | | | | 33,432 | |
| | | | | | | | |
| | |
| | | | | | | 61,718 | |
| | | | | | | | |
|
Consumer Finance — 0.7% | |
| | |
Ally Financial, Inc. | | | 685 | | | | 20,981 | |
| | |
American Express Co. | | | 1,195 | | | | 140,149 | |
| | |
Capital One Financial Corp. | | | 828 | | | | 77,211 | |
SEE NOTES TO FINANCIAL STATEMENTS.
| | | | | | |
| | | |
| 76 | | | | J.P. MORGAN EXCHANGE-TRADED FUNDS | | OCTOBER 31, 2019 |
| | | | | | | | |
| INVESTMENTS | | SHARES | | | VALUE($) | |
Common Stocks — continued | |
|
Consumer Finance — continued | |
| | |
Discover Financial Services | | | 560 | | | | 44,946 | |
| | |
Santander Consumer USA Holdings, Inc. | | | 184 | | | | 4,615 | |
| | |
Synchrony Financial | | | 1,073 | | | | 37,952 | |
| | | | | | | | |
| | |
| | | | | | | 325,854 | |
| | | | | | | | |
|
Containers & Packaging — 0.3% | |
| | |
Avery Dennison Corp. | | | 149 | | | | 19,051 | |
| | |
Ball Corp. | | | 582 | | | | 40,722 | |
| | |
Crown Holdings, Inc.* | | | 238 | | | | 17,336 | |
| | |
International Paper Co. | | | 692 | | | | 30,227 | |
| | |
Packaging Corp. of America | | | 167 | | | | 18,280 | |
| | |
Sealed Air Corp. | | | 272 | | | | 11,361 | |
| | |
Westrock Co. | | | 454 | | | | 16,966 | |
| | | | | | | | |
| | |
| | | | | | | 153,943 | |
| | | | | | | | |
|
Distributors — 0.1% | |
| | |
Genuine Parts Co. | | | 256 | | | | 26,260 | |
| | |
LKQ Corp.* | | | 542 | | | | 18,423 | |
| | | | | | | | |
| | |
| | | | | | | 44,683 | |
| | | | | | | | |
|
Diversified Consumer Services — 0.0% (b) | |
| | |
H&R Block, Inc. | | | 354 | | | | 8,846 | |
| | | | | | | | |
|
Diversified Financial Services — 1.6% | |
| | |
AXA Equitable Holdings, Inc. | | | 527 | | | | 11,383 | |
| | |
Berkshire Hathaway, Inc., Class B* | | | 3,449 | | | | 733,189 | |
| | |
Jefferies Financial Group, Inc. | | | 443 | | | | 8,271 | |
| | |
Voya Financial, Inc. | | | 245 | | | | 13,220 | |
| | | | | | | | |
| | |
| | | | | | | 766,063 | |
| | | | | | | | |
|
Diversified Telecommunication Services — 2.1% | |
| | |
AT&T, Inc. | | | 12,849 | | | | 494,558 | |
| | |
CenturyLink, Inc. | | | 1,724 | | | | 22,309 | |
| | |
Verizon Communications, Inc. | | | 7,273 | | | | 439,798 | |
| | |
Zayo Group Holdings, Inc.* | | | 414 | | | | 14,134 | |
| | | | | | | | |
| | |
| | | | | | | 970,799 | |
| | | | | | | | |
|
Electric Utilities — 2.1% | |
| | |
Alliant Energy Corp. | | | 415 | | | | 22,136 | |
| | |
American Electric Power Co., Inc. | | | 868 | | | | 81,930 | |
| | |
Avangrid, Inc. | | | 99 | | | | 4,955 | |
| | |
Duke Energy Corp. | | | 1,280 | | | | 120,653 | |
| | |
Edison International | | | 630 | | | | 39,627 | |
| | |
Entergy Corp. | | | 347 | | | | 42,154 | |
| | |
Evergy, Inc. | | | 413 | | | | 26,395 | |
| | |
Eversource Energy | | | 567 | | | | 47,481 | |
| | |
Exelon Corp. | | | 1,706 | | | | 77,606 | |
| | |
FirstEnergy Corp. | | | 950 | | | | 45,904 | |
| | |
NextEra Energy, Inc. | | | 857 | | | | 204,257 | |
| | | | | | | | |
| INVESTMENTS | | SHARES | | | VALUE($) | |
| | | | | | | | |
|
Electric Utilities — continued | |
| | |
OGE Energy Corp. | | | 353 | | | | 15,200 | |
| | |
Pinnacle West Capital Corp. | | | 199 | | | | 18,730 | |
| | |
PPL Corp. | | | 1,271 | | | | 42,566 | |
| | |
Southern Co. (The) | | | 1,837 | | | | 115,106 | |
| | |
Xcel Energy, Inc. | | | 921 | | | | 58,493 | |
| | | | | | | | |
| | |
| | | | | | | 963,193 | |
| | | | | | | | |
|
Electrical Equipment — 0.5% | |
| | |
Acuity Brands, Inc. | | | 70 | | | | 8,735 | |
| | |
AMETEK, Inc. | | | 403 | | | | 36,935 | |
| | |
Eaton Corp. plc | | | 737 | | | | 64,200 | |
| | |
Emerson Electric Co. | | | 1,083 | | | | 75,973 | |
| | |
Hubbell, Inc. | | | 97 | | | | 13,745 | |
| | |
Rockwell Automation, Inc. | | | 205 | | | | 35,258 | |
| | |
Sensata Technologies Holding plc* | | | 285 | | | | 14,589 | |
| | | | | | | | |
| | |
| | | | | | | 249,435 | |
| | | | | | | | |
|
Electronic Equipment, Instruments & Components — 0.6% | |
| | |
Amphenol Corp., Class A | | | 524 | | | | 52,573 | |
| | |
CDW Corp. | | | 255 | | | | 32,617 | |
| | |
Cognex Corp. | | | 301 | | | | 15,499 | |
| | |
Corning, Inc. | | | 1,374 | | | | 40,712 | |
| | |
Flex Ltd.* | | | 904 | | | | 10,622 | |
| | |
IPG Photonics Corp.* | | | 64 | | | | 8,594 | |
| | |
Keysight Technologies, Inc.* | | | 328 | | | | 33,098 | |
| | |
TE Connectivity Ltd. | | | 592 | | | | 52,984 | |
| | |
Trimble, Inc.* | | | 443 | | | | 17,649 | |
| | |
Zebra Technologies Corp., Class A* | | | 97 | | | | 23,073 | |
| | | | | | | | |
| | |
| | | | | | | 287,421 | |
| | | | | | | | |
|
Energy Equipment & Services — 0.3% | |
| | |
Baker Hughes Co. | | | 1,140 | | | | 24,396 | |
| | |
Halliburton Co. | | | 1,542 | | | | 29,683 | |
| | |
Helmerich & Payne, Inc. | | | 191 | | | | 7,163 | |
| | |
National Oilwell Varco, Inc. | | | 679 | | | | 15,359 | |
| | |
Schlumberger Ltd. | | | 2,432 | | | | 79,502 | |
| | |
Transocean Ltd.* | | | 385 | | | | 1,829 | |
| | | | | | | | |
| | |
| | | | | | | 157,932 | |
| | | | | | | | |
|
Entertainment — 1.8% | |
| | |
Activision Blizzard, Inc. | | | 1,347 | | | | 75,472 | |
| | |
Electronic Arts, Inc.* | | | 516 | | | | 49,742 | |
| | |
Live Nation Entertainment, Inc.* | | | 243 | | | | 17,132 | |
| | |
Netflix, Inc.* | | | 769 | | | | 221,018 | |
| | |
Take-Two Interactive Software, Inc.* | | | 200 | | | | 24,070 | |
| | |
Viacom, Inc., Class A | | | 17 | | | | 406 | |
| | |
Viacom, Inc., Class B | | | 624 | | | | 13,454 | |
| | |
Walt Disney Co. (The) | | | 3,166 | | | | 411,327 | |
| | | | | | | | |
| | |
| | | | | | | 812,621 | |
| | | | | | | | |
SEE NOTES TO FINANCIAL STATEMENTS.
| | | | | | | | |
| | | |
| OCTOBER 31, 2019 | | J.P. MORGAN EXCHANGE-TRADED FUNDS | | | | | 77 | |
JPMorgan BetaBuilders U.S. Equity ETF
SCHEDULE OF PORTFOLIO INVESTMENTS
AS OF OCTOBER 31, 2019 (continued)
| | | | | | | | |
| INVESTMENTS | | SHARES | | | VALUE($) | |
Common Stocks — continued | |
|
Equity Real Estate Investment Trusts (REITs) — 3.2% | |
| | |
Alexandria Real Estate Equities, Inc. | | | 201 | | | | 31,909 | |
| | |
American Tower Corp. | | | 779 | | | | 169,884 | |
| | |
AvalonBay Communities, Inc. | | | 244 | | | | 53,109 | |
| | |
Boston Properties, Inc. | | | 253 | | | | 34,712 | |
| | |
Crown Castle International Corp. | | | 731 | | | | 101,455 | |
| | |
Digital Realty Trust, Inc. | | | 364 | | | | 46,242 | |
| | |
Duke Realty Corp. | | | 634 | | | | 22,279 | |
| | |
Equinix, Inc. | | | 150 | | | | 85,017 | |
| | |
Equity Residential | | | 613 | | | | 54,349 | |
| | |
Essex Property Trust, Inc. | | | 116 | | | | 37,947 | |
| | |
Extra Space Storage, Inc. | | | 225 | | | | 25,261 | |
| | |
Federal Realty Investment Trust | | | 122 | | | | 16,593 | |
| | |
HCP, Inc. | | | 864 | | | | 32,504 | |
| | |
Host Hotels & Resorts, Inc. | | | 1,281 | | | | 20,996 | |
| | |
Invitation Homes, Inc. | | | 839 | | | | 25,833 | |
| | |
Iron Mountain, Inc. | | | 506 | | | | 16,597 | |
| | |
Kimco Realty Corp. | | | 744 | | | | 16,041 | |
| | |
Macerich Co. (The) | | | 192 | | | | 5,280 | |
| | |
Mid-America Apartment Communities, Inc. | | | 201 | | | | 27,937 | |
| | |
Prologis, Inc. | | | 1,109 | | | | 97,326 | |
| | |
Public Storage | | | 262 | | | | 58,389 | |
| | |
Realty Income Corp. | | | 560 | | | | 45,802 | |
| | |
Regency Centers Corp. | | | 293 | | | | 19,701 | |
| | |
SBA Communications Corp. | | | 200 | | | | 48,130 | |
| | |
Simon Property Group, Inc. | | | 542 | | | | 81,669 | |
| | |
SL Green Realty Corp. | | | 143 | | | | 11,955 | |
| | |
Sun Communities, Inc. | | | 158 | | | | 25,699 | |
| | |
UDR, Inc. | | | 514 | | | | 25,828 | |
| | |
Ventas, Inc. | | | 653 | | | | 42,510 | |
| | |
VEREIT, Inc. | | | 1,713 | | | | 16,856 | |
| | |
VICI Properties, Inc. | | | 812 | | | | 19,123 | |
| | |
Vornado Realty Trust | | | 277 | | | | 18,179 | |
| | |
Welltower, Inc. | | | 713 | | | | 64,662 | |
| | |
Weyerhaeuser Co. | | | 1,310 | | | | 38,265 | |
| | |
WP Carey, Inc. | | | 302 | | | | 27,802 | |
| | | | | | | | |
| | |
| | | | | | | 1,465,841 | |
| | | | | | | | |
|
Food & Staples Retailing — 1.5% | |
| | |
Costco Wholesale Corp. | | | 771 | | | | 229,072 | |
| | |
Kroger Co. (The) | | | 1,406 | | | | 34,644 | |
| | |
Sysco Corp. | | | 902 | | | | 72,042 | |
| | |
Walgreens Boots Alliance, Inc. | | | 1,332 | | | | 72,967 | |
| | |
Walmart, Inc. | | | 2,500 | | | | 293,150 | |
| | | | | | | | |
| | |
| | | | | | | 701,875 | |
| | | | | | | | |
| | | | | | | | |
| INVESTMENTS | | SHARES | | | VALUE($) | |
| | | | | | | | |
|
Food Products — 1.1% | |
| | |
Archer-Daniels-Midland Co. | | | 981 | | | | 41,241 | |
| | |
Bunge Ltd. | | | 250 | | | | 13,500 | |
| | |
Campbell Soup Co. | | | 295 | | | | 13,661 | |
| | |
Conagra Brands, Inc. | | | 854 | | | | 23,101 | |
| | |
General Mills, Inc. | | | 1,059 | | | | 53,861 | |
| | |
Hershey Co. (The) | | | 260 | | | | 38,186 | |
| | |
Hormel Foods Corp. | | | 489 | | | | 19,995 | |
| | |
Ingredion, Inc. | | | 118 | | | | 9,322 | |
| | |
JM Smucker Co. (The) | | | 201 | | | | 21,242 | |
| | |
Kellogg Co. | | | 438 | | | | 27,826 | |
| | |
Kraft Heinz Co. (The) | | | 1,093 | | | | 35,337 | |
| | |
Lamb Weston Holdings, Inc. | | | 256 | | | | 19,978 | |
| | |
McCormick & Co., Inc.(Non-Voting) | | | 217 | | | | 34,870 | |
| | |
Mondelez International, Inc., Class A | | | 2,535 | | | | 132,961 | |
| | |
Tyson Foods, Inc., Class A | | | 516 | | | | 42,719 | |
| | | | | | | | |
| | |
| | | | | | | 527,800 | |
| | | | | | | | |
|
Gas Utilities — 0.1% | |
| | |
Atmos Energy Corp. | | | 207 | | | | 23,284 | |
| | |
National Fuel Gas Co. | | | 152 | | | | 6,887 | |
| | |
UGI Corp. | | | 369 | | | | 17,590 | |
| | | | | | | | |
| | |
| | | | | | | 47,761 | |
| | | | | | | | |
|
Health Care Equipment & Supplies — 3.5% | |
| | |
Abbott Laboratories | | | 3,109 | | | | 259,943 | |
| | |
ABIOMED, Inc.* | | | 80 | | | | 16,606 | |
| | |
Align Technology, Inc.* | | | 126 | | | | 31,789 | |
| | |
Baxter International, Inc. | | | 899 | | | | 68,953 | |
| | |
Becton Dickinson and Co. | | | 475 | | | | 121,600 | |
| | |
Boston Scientific Corp.* | | | 2,449 | | | | 102,123 | |
| | |
Cooper Cos., Inc. (The) | | | 87 | | | | 25,317 | |
| | |
Danaher Corp. | | | 1,122 | | | | 154,634 | |
| | |
Dentsply Sirona, Inc. | | | 393 | | | | 21,529 | |
| | |
DexCom, Inc.* | | | 159 | | | | 24,524 | |
| | |
Edwards Lifesciences Corp.* | | | 364 | | | | 86,770 | |
| | |
Hologic, Inc.* | | | 471 | | | | 22,754 | |
| | |
IDEXX Laboratories, Inc.* | | | 152 | | | | 43,322 | |
| | |
Intuitive Surgical, Inc.* | | | 203 | | | | 112,249 | |
| | |
Medtronic plc | | | 2,360 | | | | 257,004 | |
| | |
ResMed, Inc. | | | 253 | | | | 37,424 | |
| | |
STERIS plc | | | 150 | | | | 21,235 | |
| | |
Stryker Corp. | | | 563 | | | | 121,760 | |
| | |
Teleflex, Inc. | | | 82 | | | | 28,488 | |
| | |
Varian Medical Systems, Inc.* | | | 158 | | | | 19,088 | |
| | |
Zimmer Biomet Holdings, Inc. | | | 360 | | | | 49,763 | |
| | | | | | | | |
| | |
| | | | | | | 1,626,875 | |
| | | | | | | | |
SEE NOTES TO FINANCIAL STATEMENTS.
| | | | | | |
| | | |
| 78 | | | | J.P. MORGAN EXCHANGE-TRADED FUNDS | | OCTOBER 31, 2019 |
| | | | | | | | |
| INVESTMENTS | | SHARES | | | VALUE($) | |
Common Stocks — continued | |
|
Health Care Providers & Services — 2.6% | |
| | |
AmerisourceBergen Corp. | | | 268 | | | | 22,882 | |
| | |
Anthem, Inc. | | | 448 | | | | 120,548 | |
| | |
Cardinal Health, Inc. | | | 525 | | | | 25,961 | |
| | |
Centene Corp.* | | | 728 | | | | 38,642 | |
| | |
Cigna Corp. | | | 664 | | | | 118,497 | |
| | |
CVS Health Corp. | | | 2,285 | | | | 151,701 | |
| | |
DaVita, Inc.* | | | 170 | | | | 9,962 | |
| | |
HCA Healthcare, Inc. | | | 466 | | | | 62,230 | |
| | |
Henry Schein, Inc.* | | | 259 | | | | 16,209 | |
| | |
Humana, Inc. | | | 238 | | | | 70,020 | |
| | |
Laboratory Corp. of America Holdings* | | | 171 | | | | 28,176 | |
| | |
McKesson Corp. | | | 325 | | | | 43,225 | |
| | |
Quest Diagnostics, Inc. | | | 237 | | | | 23,996 | |
| | |
UnitedHealth Group, Inc. | | | 1,666 | | | | 420,998 | |
| | |
Universal Health Services, Inc., Class B | | | 141 | | | | 19,382 | |
| | |
WellCare Health Plans, Inc.* | | | 88 | | | | 26,101 | |
| | | | | | | | |
| | |
| | | | | | | 1,198,530 | |
| | | | | | | | |
|
Health Care Technology — 0.1% | |
| | |
Cerner Corp. | | | 560 | | | | 37,587 | |
| | |
Veeva Systems, Inc., Class A* | | | 227 | | | | 32,196 | |
| | | | | | | | |
| | |
| | | | | | | 69,783 | |
| | | | | | | | |
|
Hotels, Restaurants & Leisure — 1.9% | |
| | |
Aramark | | | 432 | | | | 18,904 | |
| | |
Carnival Corp. | | | 702 | | | | 30,109 | |
| | |
Chipotle Mexican Grill, Inc.* | | | 46 | | | | 35,795 | |
| | |
Darden Restaurants, Inc. | | | 217 | | | | 24,363 | |
| | |
Domino’s Pizza, Inc. | | | 71 | | | | 19,285 | |
| | |
Hilton Worldwide Holdings, Inc. | | | 506 | | | | 49,062 | |
| | |
Las Vegas Sands Corp. | | | 595 | | | | 36,795 | |
| | |
Marriott International, Inc., Class A | | | 480 | | | | 60,744 | |
| | |
McDonald’s Corp. | | | 1,333 | | | | 262,201 | |
| | |
MGM Resorts International | | | 917 | | | | 26,135 | |
| | |
Norwegian Cruise Line Holdings Ltd.* | | | 378 | | | | 19,187 | |
| | |
Royal Caribbean Cruises Ltd. | | | 303 | | | | 32,975 | |
| | |
Starbucks Corp. | | | 2,106 | | | | 178,083 | |
| | |
Vail Resorts, Inc. | | | 70 | | | | 16,266 | |
| | |
Wyndham Destinations, Inc. | | | 160 | | | | 7,426 | |
| | |
Wynn Resorts Ltd. | | | 170 | | | | 20,628 | |
| | |
Yum! Brands, Inc. | | | 533 | | | | 54,211 | |
| | | | | | | | |
| | |
| | | | | | | 892,169 | |
| | | | | | | | |
|
Household Durables — 0.4% | |
| | |
DR Horton, Inc. | | | 593 | | | | 31,055 | |
| | |
Garmin Ltd. | | | 254 | | | | 23,812 | |
| | |
Lennar Corp., Class A | | | 498 | | | | 29,681 | |
| | | | | | | | |
| INVESTMENTS | | SHARES | | | VALUE($) | |
| | | | | | | | |
|
Household Durables — continued | |
| | |
Lennar Corp., Class B | | | 29 | | | | 1,364 | |
| | |
Mohawk Industries, Inc.* | | | 105 | | | | 15,055 | |
| | |
Newell Brands, Inc. | | | 668 | | | | 12,672 | |
| | |
NVR, Inc.* | | | 6 | | | | 21,820 | |
| | |
PulteGroup, Inc. | | | 455 | | | | 17,854 | |
| | |
Whirlpool Corp. | | | 109 | | | | 16,581 | |
| | | | | | | | |
| | |
| | | | | | | 169,894 | |
| | | | | | | | |
|
Household Products — 1.7% | |
| | |
Church & Dwight Co., Inc. | | | 432 | | | | 30,214 | |
| | |
Clorox Co. (The) | | | 221 | | | | 32,639 | |
| | |
Colgate-Palmolive Co. | | | 1,510 | | | | 103,586 | |
| | |
Kimberly-Clark Corp. | | | 607 | | | | 80,658 | |
| | |
Procter & Gamble Co. (The) | | | 4,401 | | | | 547,969 | |
| | | | | | | | |
| | |
| | | | | | | 795,066 | |
| | | | | | | | |
|
Independent Power and Renewable Electricity Producers — 0.1% | |
| | |
AES Corp. | | | 1,169 | | | | 19,932 | |
| | |
NRG Energy, Inc. | | | 444 | | | | 17,813 | |
| | |
Vistra Energy Corp. | | | 796 | | | | 21,516 | |
| | | | | | | | |
| | |
| | | | | | | 59,261 | |
| | | | | | | | |
|
Industrial Conglomerates — 1.3% | |
| | |
3M Co. | | | 1,010 | | | | 166,640 | |
| | |
General Electric Co. | | | 15,347 | | | | 153,163 | |
| | |
Honeywell International, Inc. | | | 1,263 | | | | 218,158 | |
| | |
Roper Technologies, Inc. | | | 184 | | | | 62,001 | |
| | | | | | | | |
| | |
| | | | | | | 599,962 | |
| | | | | | | | |
|
Insurance — 2.5% | |
| | |
Aflac, Inc. | | | 1,304 | | | | 69,321 | |
| | |
Alleghany Corp.* | | | 23 | | | | 17,901 | |
| | |
Allstate Corp. (The) | | | 579 | | | | 61,617 | |
| | |
American Financial Group, Inc. | | | 132 | | | | 13,733 | |
| | |
American International Group, Inc. | | | 1,530 | | | | 81,029 | |
| | |
Aon plc | | | 413 | | | | 79,775 | |
| | |
Arch Capital Group Ltd.* | | | 713 | | | | 29,775 | |
| | |
Arthur J Gallagher & Co. | | | 326 | | | | 29,738 | |
| | |
Brighthouse Financial, Inc.* | | | 194 | | | | 7,325 | |
| | |
Chubb Ltd. | | | 801 | | | | 122,088 | |
| | |
Cincinnati Financial Corp. | | | 268 | | | | 30,340 | |
| | |
Everest Re Group Ltd. | | | 71 | | | | 18,253 | |
| | |
Fidelity National Financial, Inc. | | | 481 | | | | 22,049 | |
| | |
Globe Life, Inc. | | | 175 | | | | 17,033 | |
| | |
Hartford Financial Services Group, Inc. (The) | | | 634 | | | | 36,189 | |
| | |
Lincoln National Corp. | | | 353 | | | | 19,937 | |
| | |
Loews Corp. | | | 458 | | | | 22,442 | |
SEE NOTES TO FINANCIAL STATEMENTS.
| | | | | | | | |
| | | |
| OCTOBER 31, 2019 | | J.P. MORGAN EXCHANGE-TRADED FUNDS | | | | | 79 | |
JPMorgan BetaBuilders U.S. Equity ETF
SCHEDULE OF PORTFOLIO INVESTMENTS
AS OF OCTOBER 31, 2019 (continued)
| | | | | | | | |
| INVESTMENTS | | SHARES | | | VALUE($) | |
Common Stocks — continued | |
|
Insurance — continued | |
| | |
Markel Corp.* | | | 23 | | | | 26,933 | |
| | |
Marsh & McLennan Cos., Inc. | | | 889 | | | | 92,118 | |
| | |
MetLife, Inc. | | | 1,398 | | | | 65,412 | |
| | |
Principal Financial Group, Inc. | | | 457 | | | | 24,395 | |
| | |
Progressive Corp. (The) | | | 1,026 | | | | 71,512 | |
| | |
Prudential Financial, Inc. | | | 709 | | | | 64,618 | |
| | |
Reinsurance Group of America, Inc. | | | 108 | | | | 17,547 | |
| | |
Travelers Cos., Inc. (The) | | | 458 | | | | 60,026 | |
| | |
Unum Group | | | 369 | | | | 10,162 | |
| | |
Willis Towers Watson plc | | | 225 | | | | 42,053 | |
| | |
WR Berkley Corp. | | | 255 | | | | 17,825 | |
| | | | | | | | |
| | |
| | | | | | | 1,171,146 | |
| | | | | | | | |
|
Interactive Media & Services — 4.8% | |
| | |
Alphabet, Inc., Class A* | | | 527 | | | | 663,388 | |
| | |
Alphabet, Inc., Class C* | | | 530 | | | | 667,858 | |
| | |
Facebook, Inc., Class A* | | | 4,231 | | | | 810,871 | |
| | |
IAC/InterActiveCorp* | | | 125 | | | | 28,406 | |
| | |
Snap, Inc., Class A* | | | 1,340 | | | | 20,181 | |
| | |
TripAdvisor, Inc.* | | | 185 | | | | 7,474 | |
| | |
Twitter, Inc.* | | | 1,359 | | | | 40,729 | |
| | | | | | | �� | |
| | |
| | | | | | | 2,238,907 | |
| | | | | | | | |
|
Internet & Direct Marketing Retail — 3.4% | |
| | |
Amazon.com, Inc.* | | | 729 | | | | 1,295,185 | |
| | |
Booking Holdings, Inc.* | | | 75 | | | | 153,658 | |
| | |
eBay, Inc. | | | 1,384 | | | | 48,786 | |
| | |
Expedia Group, Inc. | | | 244 | | | | 33,345 | |
| | |
MercadoLibre, Inc. (Argentina)* | | | 80 | | | | 41,722 | |
| | |
Qurate Retail, Inc., Series A* | | | 682 | | | | 6,506 | |
| | | | | | | | |
| | |
| | | | | | | 1,579,202 | |
| | | | | | | | |
|
IT Services — 5.4% | |
| | |
Accenture plc, Class A | | | 1,121 | | | | 207,856 | |
| | |
Akamai Technologies, Inc.* | | | 290 | | | | 25,085 | |
| | |
Alliance Data Systems Corp. | | | 71 | | | | 7,100 | |
| | |
Automatic Data Processing, Inc. | | | 763 | | | | 123,781 | |
| | |
Broadridge Financial Solutions, Inc. | | | 202 | | | | 25,294 | |
| | |
Cognizant Technology Solutions Corp., Class A | | | 971 | | | | 59,173 | |
| | |
DXC Technology Co. | | | 460 | | | | 12,728 | |
| | |
Fidelity National Information Services, Inc. | | | 1,077 | | | | 141,906 | |
| | |
Fiserv, Inc.* | | | 1,004 | | | | 106,565 | |
| | |
FleetCor Technologies, Inc.* | | | 152 | | | | 44,721 | |
| | |
Gartner, Inc.* | | | 157 | | | | 24,191 | |
| | |
Global Payments, Inc. | | | 527 | | | | 89,158 | |
| | |
GoDaddy, Inc., Class A* | | | 310 | | | | 20,159 | |
| | |
International Business Machines Corp. | | | 1,559 | | | | 208,485 | |
| | | | | | | | |
| INVESTMENTS | | SHARES | | | VALUE($) | |
| | | | | | | | |
|
IT Services — continued | |
| | |
Jack Henry & Associates, Inc. | | | 136 | | | | 19,252 | |
| | |
Leidos Holdings, Inc. | | | 238 | | | | 20,523 | |
| | |
Mastercard, Inc., Class A | | | 1,568 | | | | 434,038 | |
| | |
Paychex, Inc. | | | 562 | | | | 47,006 | |
| | |
PayPal Holdings, Inc.* | | | 2,070 | | | | 215,487 | |
| | |
Sabre Corp. | | | 480 | | | | 11,270 | |
| | |
Square, Inc., Class A* | | | 601 | | | | 36,919 | |
| | |
Twilio, Inc., Class A* | | | 211 | | | | 20,374 | |
| | |
VeriSign, Inc.* | | | 184 | | | | 34,964 | |
| | |
Visa, Inc., Class A | | | 3,038 | | | | 543,377 | |
| | |
Western Union Co. (The) | | | 746 | | | | 18,695 | |
| | | | | | | | |
| | |
| | | | | | | 2,498,107 | |
| | | | | | | | |
|
Leisure Products — 0.1% | |
| | |
Hasbro, Inc. | | | 206 | | | | 20,046 | |
| | |
Mattel, Inc.* | | | 609 | | | | 7,271 | |
| | |
Polaris, Inc. | | | 101 | | | | 9,964 | |
| | | | | | | | |
| | |
| | | | | | | 37,281 | |
| | | | | | | | |
|
Life Sciences Tools & Services — 1.0% | |
| | |
Agilent Technologies, Inc. | | | 544 | | | | 41,208 | |
| | |
Bio-Rad Laboratories, Inc., Class A* | | | 37 | | | | 12,270 | |
| | |
Illumina, Inc.* | | | 258 | | | | 76,244 | |
| | |
IQVIA Holdings, Inc.* | | | 321 | | | | 46,359 | |
| | |
Mettler-Toledo International, Inc.* | | | 41 | | | | 28,903 | |
| | |
PerkinElmer, Inc. | | | 193 | | | | 16,590 | |
| | |
Thermo Fisher Scientific, Inc. | | | 702 | | | | 211,990 | |
| | |
Waters Corp.* | | | 118 | | | | 24,971 | |
| | | | | | | | |
| | |
| | | | | | | 458,535 | |
| | | | | | | | |
|
Machinery — 1.6% | |
| | |
Caterpillar, Inc. | | | 988 | | | | 136,146 | |
| | |
Cummins, Inc. | | | 276 | | | | 47,605 | |
| | |
Deere & Co. | | | 551 | | | | 95,951 | |
| | |
Donaldson Co., Inc. | | | 223 | | | | 11,761 | |
| | |
Dover Corp. | | | 256 | | | | 26,596 | |
| | |
Flowserve Corp. | | | 228 | | | | 11,136 | |
| | |
Fortive Corp. | | | 517 | | | | 35,673 | |
| | |
IDEX Corp. | | | 134 | | | | 20,841 | |
| | |
Illinois Tool Works, Inc. | | | 516 | | | | 86,987 | |
| | |
Ingersoll-Rand plc | | | 425 | | | | 53,928 | |
| | |
PACCAR, Inc. | | | 610 | | | | 46,397 | |
| | |
Parker-Hannifin Corp. | | | 225 | | | | 41,285 | |
| | |
Pentair plc | | | 294 | | | | 12,192 | |
| | |
Snap-on, Inc. | | | 98 | | | | 15,942 | |
| | |
Stanley Black & Decker, Inc. | | | 268 | | | | 40,556 | |
| | |
Wabtec Corp. | | | 321 | | | | 22,268 | |
| | |
Xylem, Inc. | | | 318 | | | | 24,387 | |
| | | | | | | | |
| | |
| | | | | | | 729,651 | |
| | | | | | | | |
SEE NOTES TO FINANCIAL STATEMENTS.
| | | | | | |
| | | |
| 80 | | | | J.P. MORGAN EXCHANGE-TRADED FUNDS | | OCTOBER 31, 2019 |
| | | | | | | | |
| INVESTMENTS | | SHARES | | | VALUE($) | |
Common Stocks — continued | |
|
Media — 1.6% | |
| | |
Altice USA, Inc., Class A* | | | 543 | | | | 16,806 | |
| | |
CBS Corp.(Non-Voting), Class B | | | 576 | | | | 20,759 | |
| | |
Charter Communications, Inc., Class A* | | | 285 | | | | 133,340 | |
| | |
Comcast Corp., Class A | | | 7,975 | | | | 357,439 | |
| | |
Discovery, Inc., Class A* | | | 277 | | | | 7,466 | |
| | |
Discovery, Inc., Class C* | | | 611 | | | | 15,422 | |
| | |
DISH Network Corp., Class A* | | | 424 | | | | 14,577 | |
| | |
Fox Corp., Class A | | | 625 | | | | 20,025 | |
| | |
Fox Corp., Class B | | | 286 | | | | 8,935 | |
| | |
Interpublic Group of Cos., Inc. (The) | | | 681 | | | | 14,812 | |
| | |
Liberty Broadband Corp., Class A* | | | 41 | | | | 4,838 | |
| | |
Liberty Broadband Corp., Class C* | | | 269 | | | | 31,761 | |
| | |
Liberty Media Corp.-Liberty SiriusXM, Class A* | | | 148 | | | | 6,647 | |
| | |
Liberty Media Corp.-Liberty SiriusXM, Class C* | | | 268 | | | | 12,111 | |
| | |
News Corp., Class A | | | 679 | | | | 9,309 | |
| | |
News Corp., Class B | | | 216 | | | | 3,050 | |
| | |
Omnicom Group, Inc. | | | 380 | | | | 29,332 | |
| | |
Sirius XM Holdings, Inc. | | | 2,427 | | | | 16,309 | |
| | | | | | | | |
| | |
| | | | | | | 722,938 | |
| | | | | | | | |
|
Metals & Mining — 0.3% | |
| | |
Freeport-McMoRan, Inc. | | | 2,551 | | | | 25,051 | |
| | |
Newmont Goldcorp Corp. | | | 1,442 | | | | 57,291 | |
| | |
Nucor Corp. | | | 532 | | | | 28,648 | |
| | |
Southern Copper Corp. (Peru) | | | 150 | | | | 5,337 | |
| | |
Steel Dynamics, Inc. | | | 387 | | | | 11,749 | |
| | | | | | | | |
| | |
| | | | | | | 128,076 | |
| | | | | | | | |
|
Mortgage Real Estate Investment Trusts (REITs) — 0.1% | |
| | |
AGNC Investment Corp. | | | 965 | | | | 16,453 | |
| | |
Annaly Capital Management, Inc. | | | 2,562 | | | | 23,007 | |
| | | | | | | | |
| | |
| | | | | | | 39,460 | |
| | | | | | | | |
|
Multiline Retail — 0.5% | |
| | |
Dollar General Corp. | | | 454 | | | | 72,794 | |
| | |
Dollar Tree, Inc.* | | | 414 | | | | 45,706 | |
| | |
Kohl’s Corp. | | | 278 | | | | 14,250 | |
| | |
Macy’s, Inc. | | | 543 | | | | 8,232 | |
| | |
Nordstrom, Inc. | | | 188 | | | | 6,749 | |
| | |
Target Corp. | | | 899 | | | | 96,112 | |
| | | | | | | | |
| | |
| | | | | | | 243,843 | |
| | | | | | | | |
|
Multi-Utilities — 1.1% | |
| | |
Ameren Corp. | | | 431 | | | | 33,489 | |
| | |
CenterPoint Energy, Inc. | | | 883 | | | | 25,669 | |
| | |
CMS Energy Corp. | | | 498 | | | | 31,832 | |
| | |
Consolidated Edison, Inc. | | | 583 | | | | 53,764 | |
| | | | | | | | |
| INVESTMENTS | | SHARES | | | VALUE($) | |
| | | | | | | | |
|
Multi-Utilities — continued | |
| | |
Dominion Energy, Inc. | | | 1,445 | | | | 119,285 | |
| | |
DTE Energy Co. | | | 322 | | | | 40,997 | |
| | |
NiSource, Inc. | | | 658 | | | | 18,450 | |
| | |
Public Service Enterprise Group, Inc. | | | 888 | | | | 56,219 | |
| | |
Sempra Energy | | | 481 | | | | 69,509 | |
| | |
WEC Energy Group, Inc. | | | 556 | | | | 52,487 | |
| | | | | | | | |
| | |
| | | | | | | 501,701 | |
| | | | | | | | |
|
Oil, Gas & Consumable Fuels — 3.8% | |
| | |
Apache Corp. | | | 662 | | | | 14,339 | |
| | |
Cabot Oil & Gas Corp. | | | 735 | | | | 13,700 | |
| | |
Cheniere Energy, Inc.* | | | 410 | | | | 25,236 | |
| | |
Chevron Corp. | | | 3,337 | | | | 387,559 | |
| | |
Cimarex Energy Co. | | | 176 | | | | 7,431 | |
| | |
Concho Resources, Inc. | | | 107 | | | | 7,225 | |
| | |
ConocoPhillips | | | 1,953 | | | | 107,806 | |
| | |
Continental Resources, Inc.* | | | 152 | | | | 4,479 | |
| | |
Devon Energy Corp. | | | 712 | | | | 14,439 | |
| | |
Diamondback Energy, Inc. | | | 287 | | | | 24,613 | |
| | |
EOG Resources, Inc. | | | 1,020 | | | | 70,696 | |
| | |
EQT Corp. | | | 448 | | | | 4,812 | |
| | |
Exxon Mobil Corp. | | | 7,441 | | | | 502,788 | |
| | |
Hess Corp. | | | 456 | | | | 29,982 | |
| | |
HollyFrontier Corp. | | | 268 | | | | 14,724 | |
| | |
Kinder Morgan, Inc. | | | 3,422 | | | | 68,372 | |
| | |
Marathon Oil Corp. | | | 1,413 | | | | 16,292 | |
| | |
Marathon Petroleum Corp. | | | 1,157 | | | | 73,990 | |
| | |
Murphy Oil Corp. | | | 271 | | | | 5,591 | |
| | |
Noble Energy, Inc. | | | 839 | | | | 16,159 | |
| | |
Occidental Petroleum Corp. | | | 1,571 | | | | 63,626 | |
| | |
ONEOK, Inc. | | | 727 | | | | 50,766 | |
| | |
Phillips 66 | | | 787 | | | | 91,937 | |
| | |
Pioneer Natural Resources Co. | | | 293 | | | | 36,045 | |
| | |
Targa Resources Corp. | | | 409 | | | | 15,902 | |
| | |
Valero Energy Corp. | | | 729 | | | | 70,698 | |
| | |
Williams Cos., Inc. (The) | | | 2,130 | | | | 47,520 | |
| | | | | | | | |
| | |
| | | | | | | 1,786,727 | |
| | | | | | | | |
|
Personal Products — 0.2% | |
| | |
Coty, Inc., Class A | | | 516 | | | | 6,032 | |
| | |
Estee Lauder Cos., Inc. (The), Class A | | | 389 | | | | 72,459 | |
| | |
Herbalife Nutrition Ltd.* | | | 168 | | | | 7,505 | |
| | | | | | | | |
| | |
| | | | | | | 85,996 | |
| | | | | | | | |
|
Pharmaceuticals — 4.3% | |
| | |
Allergan plc | | | 577 | | | | 101,615 | |
| | |
Bristol-Myers Squibb Co. | | | 2,876 | | | | 164,996 | |
SEE NOTES TO FINANCIAL STATEMENTS.
| | | | | | | | |
| | | |
| OCTOBER 31, 2019 | | J.P. MORGAN EXCHANGE-TRADED FUNDS | | | | | 81 | |
JPMorgan BetaBuilders U.S. Equity ETF
SCHEDULE OF PORTFOLIO INVESTMENTS
AS OF OCTOBER 31, 2019 (continued)
| | | | | | | | |
| INVESTMENTS | | SHARES | | | VALUE($) | |
Common Stocks — continued | |
|
Pharmaceuticals — continued | |
| | |
Elanco Animal Health, Inc.* | | | 658 | | | | 17,779 | |
| | |
Eli Lilly & Co. | | | 1,494 | | | | 170,241 | |
| | |
Jazz Pharmaceuticals plc* | | | 100 | | | | 12,563 | |
| | |
Johnson & Johnson | | | 4,641 | | | | 612,798 | |
| | |
Merck & Co., Inc. | | | 4,503 | | | | 390,230 | |
| | |
Mylan NV* | | | 906 | | | | 17,350 | |
| | |
Nektar Therapeutics* | | | 308 | | | | 5,275 | |
| | |
Perrigo Co. plc | | | 239 | | | | 12,672 | |
| | |
Pfizer, Inc. | | | 9,725 | | | | 373,148 | |
| | |
Zoetis, Inc. | | | 838 | | | | 107,197 | |
| | | | | | | | |
| | |
| | | | | | | 1,985,864 | |
| | | | | | | | |
|
Professional Services — 0.4% | |
| | |
CoStar Group, Inc.* | | | 65 | | | | 35,719 | |
| | |
Equifax, Inc. | | | 211 | | | | 28,846 | |
| | |
IHS Markit Ltd.* | | | 703 | | | | 49,224 | |
| | |
ManpowerGroup, Inc. | | | 104 | | | | 9,456 | |
| | |
Nielsen Holdings plc | | | 626 | | | | 12,620 | |
| | |
TransUnion | | | 329 | | | | 27,182 | |
| | |
Verisk Analytics, Inc. | | | 288 | | | | 41,673 | |
| | | | | | | | |
| | |
| | | | | | | 204,720 | |
| | | | | | | | |
|
Real Estate Management & Development — 0.1% | |
| | |
CBRE Group, Inc., Class A* | | | 592 | | | | 31,702 | |
| | | | | | | | |
|
Road & Rail — 1.0% | |
| | |
CSX Corp. | | | 1,401 | | | | 98,448 | |
| | |
JB Hunt Transport Services, Inc. | | | 151 | | | | 17,752 | |
| | |
Kansas City Southern | | | 175 | | | | 24,636 | |
| | |
Lyft, Inc., Class A* | | | 347 | | | | 14,380 | |
| | |
Norfolk Southern Corp. | | | 462 | | | | 84,084 | |
| | |
Old Dominion Freight Line, Inc. | | | 114 | | | | 20,757 | |
| | |
Union Pacific Corp. | | | 1,239 | | | | 205,005 | |
| | | | | | | | |
| | |
| | | | | | | 465,062 | |
| | | | | | | | |
|
Semiconductors & Semiconductor Equipment — 4.0% | |
| | |
Advanced Micro Devices, Inc.* | | | 1,908 | | | | 64,738 | |
| | |
Analog Devices, Inc. | | | 649 | | | | 69,203 | |
| | |
Applied Materials, Inc. | | | 1,622 | | | | 88,010 | |
| | |
Broadcom, Inc. | | | 699 | | | | 204,702 | |
| | |
Intel Corp. | | | 7,789 | | | | 440,312 | |
| | |
KLA Corp. | | | 278 | | | | 46,993 | |
| | |
Lam Research Corp. | | | 254 | | | | 68,844 | |
| | |
Marvell Technology Group Ltd. | | | 1,161 | | | | 28,317 | |
| | |
Maxim Integrated Products, Inc. | | | 477 | | | | 27,981 | |
| | |
Microchip Technology, Inc. | | | 420 | | | | 39,602 | |
| | |
Micron Technology, Inc.* | | | 1,940 | | | | 92,247 | |
| | |
NVIDIA Corp. | | | 1,071 | | | | 215,292 | |
| | | | | | | | |
| INVESTMENTS | | SHARES | | | VALUE($) | |
| | | | | | | | |
|
Semiconductors & Semiconductor Equipment — continued | |
| | |
Qorvo, Inc.* | | | 206 | | | | 16,657 | |
| | |
QUALCOMM, Inc. | | | 2,139 | | | | 172,061 | |
| | |
Skyworks Solutions, Inc. | | | 303 | | | | 27,591 | |
| | |
Texas Instruments, Inc. | | | 1,639 | | | | 193,386 | |
| | |
Xilinx, Inc. | | | 444 | | | | 40,289 | |
| | | | | | | | |
| | |
| | | | | | | 1,836,225 | |
| | | | | | | | |
|
Software — 7.0% | |
| | |
Adobe, Inc.* | | | 853 | | | | 237,074 | |
| | |
ANSYS, Inc.* | | | 149 | | | | 32,802 | |
| | |
Autodesk, Inc.* | | | 387 | | | | 57,028 | |
| | |
Cadence Design Systems, Inc.* | | | 493 | | | | 32,218 | |
| | |
CDK Global, Inc. | | | 211 | | | | 10,664 | |
| | |
Citrix Systems, Inc. | | | 217 | | | | 23,623 | |
| | |
Fortinet, Inc.* | | | 251 | | | | 20,472 | |
| | |
Intuit, Inc. | | | 458 | | | | 117,935 | |
| | |
Microsoft Corp. | | | 13,399 | | | | 1,921,015 | |
| | |
Oracle Corp. | | | 3,872 | | | | 210,985 | |
| | |
Palo Alto Networks, Inc.* | | | 169 | | | | 38,429 | |
| | |
Paycom Software, Inc.* | | | 86 | | | | 18,192 | |
| | |
PTC, Inc.* | | | 183 | | | | 12,244 | |
| | |
salesforce.com, Inc.* | | | 1,543 | | | | 241,464 | |
| | |
ServiceNow, Inc.* | | | 328 | | | | 81,101 | |
| | |
Splunk, Inc.* | | | 262 | | | | 31,429 | |
| | |
SS&C Technologies Holdings, Inc. | | | 389 | | | | 20,232 | |
| | |
Symantec Corp. | | | 1,001 | | | | 22,903 | |
| | |
Synopsys, Inc.* | | | 262 | | | | 35,566 | |
| | |
Teradata Corp.* | | | 61 | | | | 1,826 | |
| | |
VMware, Inc., Class A | | | 138 | | | | 21,841 | |
| | |
Workday, Inc., Class A* | | | 286 | | | | 46,378 | |
| | | | | | | | |
| | |
| | | | | | | 3,235,421 | |
| | | | | | | | |
|
Specialty Retail — 2.3% | |
| | |
Advance Auto Parts, Inc. | | | 124 | | | | 20,148 | |
| | |
AutoZone, Inc.* | | | 41 | | | | 46,920 | |
| | |
Best Buy Co., Inc. | | | 408 | | | | 29,307 | |
| | |
Burlington Stores, Inc.* | | | 117 | | | | 22,484 | |
| | |
CarMax, Inc.* | | | 291 | | | | 27,112 | |
| | |
Foot Locker, Inc. | | | 192 | | | | 8,354 | |
| | |
Gap, Inc. (The) | | | 376 | | | | 6,114 | |
| | |
Home Depot, Inc. (The) | | | 1,925 | | | | 451,566 | |
| | |
L Brands, Inc. | | | 408 | | | | 6,952 | |
| | |
Lowe’s Cos., Inc. | | | 1,358 | | | | 151,566 | |
| | |
O’Reilly Automotive, Inc.* | | | 135 | | | | 58,794 | |
| | |
Ross Stores, Inc. | | | 642 | | | | 70,408 | |
| | |
Tiffany & Co. | | | 190 | | | | 23,657 | |
SEE NOTES TO FINANCIAL STATEMENTS.
| | | | | | |
| | | |
| 82 | | | | J.P. MORGAN EXCHANGE-TRADED FUNDS | | OCTOBER 31, 2019 |
| | | | | | | | |
| INVESTMENTS | | SHARES | | | VALUE($) | |
Common Stocks — continued | |
|
Specialty Retail — continued | |
| | |
TJX Cos., Inc. (The) | | | 2,126 | | | | 122,564 | |
| | |
Tractor Supply Co. | | | 208 | | | | 19,764 | |
| | |
Ulta Beauty, Inc.* | | | 103 | | | | 24,014 | |
| | | | | | | | |
| | |
| | | | | | | 1,089,724 | |
| | | | | | | | |
|
Technology Hardware, Storage & Peripherals — 4.4% | |
| | |
Apple, Inc. | | | 7,455 | | | | 1,854,506 | |
| | |
Dell Technologies, Inc., Class C* | | | 269 | | | | 14,227 | |
| | |
Hewlett Packard Enterprise Co. | | | 2,296 | | | | 37,677 | |
| | |
HP, Inc. | | | 2,605 | | | | 45,249 | |
| | |
NetApp, Inc. | | | 420 | | | | 23,470 | |
| | |
Seagate Technology plc | | | 414 | | | | 24,024 | |
| | |
Western Digital Corp. | | | 522 | | | | 26,961 | |
| | |
Xerox Holdings Corp. | | | 336 | | | | 11,401 | |
| | | | | | | | |
| | |
| | | | | | | 2,037,515 | |
| | | | | | | | |
|
Textiles, Apparel & Luxury Goods — 0.8% | |
| | |
Capri Holdings Ltd.* | | | 268 | | | | 8,327 | |
| | |
Hanesbrands, Inc. | | | 634 | | | | 9,643 | |
| | |
Lululemon Athletica, Inc.* | | | 200 | | | | 40,854 | |
| | |
NIKE, Inc., Class B | | | 2,199 | | | | 196,920 | |
| | |
PVH Corp. | | | 132 | | | | 11,505 | |
| | |
Ralph Lauren Corp. | | | 90 | | | | 8,645 | |
| | |
Tapestry, Inc. | | | 506 | | | | 13,085 | |
| | |
Under Armour, Inc., Class A* | | | 329 | | | | 6,794 | |
| | |
Under Armour, Inc., Class C* | | | 341 | | | | 6,309 | |
| | |
VF Corp. | | | 575 | | | | 47,317 | |
| | | | | | | | |
| | |
| | | | | | | 349,399 | |
| | | | | | | | |
|
Thrifts & Mortgage Finance — 0.0% (b) | |
| | |
New York Community Bancorp, Inc. | | | 820 | | | | 9,553 | |
| | | | | | | | |
|
Tobacco — 0.8% | |
| | |
Altria Group, Inc. | | | 3,284 | | | | 147,090 | |
| | |
Philip Morris International, Inc. | | | 2,736 | | | | 222,820 | |
| | | | | | | | |
| | |
| | | | | | | 369,910 | |
| | | | | | | | |
|
Trading Companies & Distributors — 0.2% | |
| | |
Fastenal Co. | | | 1,007 | | | | 36,192 | |
| | |
United Rentals, Inc.* | | | 136 | | | | 18,165 | |
| | |
Watsco, Inc. | | | 56 | | | | 9,873 | |
| | |
WW Grainger, Inc. | | | 75 | | | | 23,163 | |
| | | | | | | | |
| | |
| | | | | | | 87,393 | |
| | | | | | | | |
|
Water Utilities — 0.1% | |
| | |
American Water Works Co., Inc. | | | 319 | | | | 39,323 | |
| | | | | | | | |
| | | | | | | | |
| INVESTMENTS | | SHARES | | | VALUE($) | |
| | | | | | | | |
|
Wireless Telecommunication Services — 0.1% | |
| | |
Sprint Corp.* | | | 1,078 | | | | 6,694 | |
| | |
T-Mobile US, Inc.* | | | 557 | | | | 46,042 | |
| | | | | | | | |
| | |
| | | | | | | 52,736 | |
| | | | | | | | |
| | |
Total Common Stocks
(Cost $43,108,289) | | | | | | | 46,228,345 | |
| | | | | | | | |
Short-Term Investments — 0.3% | |
|
Investment Companies — 0.3% | |
| | |
JPMorgan U.S. Government Money Market Fund Class Institutional Shares, 1.64% (c) (d)
(Cost $123,432) | | | 123,432 | | | | 123,432 | |
| | | | | | | | |
Total Investments — 99.9%
(Cost $43,231,721) | | | | | | | 46,351,777 | |
| | |
Other Assets Less Liabilities — 0.1% | | | | | | | 57,348 | |
| | | | | | | | |
NET ASSETS — 100.0% | | | | | | | 46,409,125 | |
| | | | | | | | |
Percentages indicated are based on net assets.
| | |
| (a) | | Investment in affiliate. This security is included in an index in which the Fund, as an index fund, tracks. |
| (b) | | Amount rounds to less than 0.1% of net assets. |
| (c) | | Investment in an affiliated fund, which is registered under the Investment Company Act of 1940, as amended, and is advised by J.P. Morgan Investment Management Inc. |
| (d) | | The rate shown is the current yield as of October 31, 2019. |
| * | | Non-income producing security. |
SEE NOTES TO FINANCIAL STATEMENTS.
| | | | | | | | |
| | | |
| OCTOBER 31, 2019 | | J.P. MORGAN EXCHANGE-TRADED FUNDS | | | | | 83 | |
JPMorgan BetaBuilders U.S. Equity ETF
SCHEDULE OF PORTFOLIO INVESTMENTS
AS OF OCTOBER 31, 2019 (continued)
| | | | | | | | | | | | | | | | | | | | |
| Futures contracts outstanding as of October 31, 2019: | |
| DESCRIPTION | | NUMBER OF
CONTRACTS | | | EXPIRATION
DATE | | | TRADING
CURRENCY | | | NOTIONAL
AMOUNT($) | | | VALUE AND
UNREALIZED
APPRECIATION
(DEPRECIATION)($) | |
| | | | | |
Long Contracts | | | | | | | | | | | | | | | | | | | | |
S&P 500 MicE-Mini Index | | | 11 | | | | 12/2019 | | | | USD | | | | 166,966 | | | | 5,139 | |
| | | | | | | | | | | | | | | | | | | | |
Abbreviations
SEE NOTES TO FINANCIAL STATEMENTS.
| | | | | | |
| | | |
| 84 | | | | J.P. MORGAN EXCHANGE-TRADED FUNDS | | OCTOBER 31, 2019 |
JPMorgan Diversified Return Emerging Markets Equity ETF
SCHEDULE OF PORTFOLIO INVESTMENTS
AS OF OCTOBER 31, 2019
| | | | | | | | |
| INVESTMENTS | | SHARES | | | VALUE($) | |
Common Stocks — 99.7% | |
|
Bahrain — 0.1% | |
| | |
Ahli United Bank BSC | | | 463,342 | | | | 409,625 | |
| | | | | | | | |
|
Brazil — 14.7% | |
| | |
Ambev SA* | | | 206,668 | | | | 894,591 | |
| | |
Atacadao SA* | | | 60,586 | | | | 289,900 | |
| | |
Azul SA (Preference)* | | | 35,175 | | | | 459,060 | |
| | |
B3 SA — Brasil Bolsa Balcao | | | 170,296 | | | | 2,055,611 | |
| | |
Banco Bradesco SA (Preference) | | | 342,906 | | | | 3,015,658 | |
| | |
Banco BTG Pactual SA* | | | 47,107 | | | | 765,834 | |
| | |
Banco do Brasil SA* | | | 157,555 | | | | 1,886,103 | |
| | |
Banco do Estado do Rio Grande do Sul SA (Preference), Class B | | | 76,073 | | | | 424,893 | |
| | |
Banco Santander Brasil SA | | | 33,594 | | | | 397,214 | |
| | |
BB Seguridade Participacoes SA | | | 57,652 | | | | 488,040 | |
| | |
BR Malls Participacoes SA | | | 66,065 | | | | 251,708 | |
| | |
BRF SA* | | | 104,505 | | | | 920,103 | |
| | |
CCR SA | | | 311,514 | | | | 1,289,398 | |
| | |
Centrais Eletricas Brasileiras SA | | | 78,757 | | | | 779,617 | |
| | |
Cia Brasileira de Distribuicao (Preference)* | | | 34,942 | | | | 721,754 | |
| | |
Cia de Saneamento Basico do Estado de Sao Paulo* | | | 72,863 | | | | 993,611 | |
| | |
Cia de Transmissao de Energia Eletrica Paulista (Preference) | | | 134,895 | | | | 792,115 | |
| | |
Cia Energetica de Minas Gerais (Preference) | | | 206,981 | | | | 702,409 | |
| | |
Cia Paranaense de Energia (Preference) | | | 42,028 | | | | 582,869 | |
| | |
Cia Siderurgica Nacional SA | | | 166,551 | | | | 492,115 | |
| | |
Cosan SA | | | 50,207 | | | | 719,836 | |
| | |
CPFL Energia SA | | | 64,335 | | | | 526,968 | |
| | |
CVC Brasil Operadora e Agencia de Viagens SA | | | 21,554 | | | | 274,739 | |
| | |
EDP — Energias do Brasil SA | | | 104,424 | | | | 492,372 | |
| | |
Energisa SA | | | 54,831 | | | | 653,378 | |
| | |
Engie Brasil Energia SA | | | 52,349 | | | | 587,384 | |
| | |
Equatorial Energia SA | | | 37,539 | | | | 951,275 | |
| | |
Gerdau SA (Preference) | | | 110,865 | | | | 371,255 | |
| | |
Grendene SA | | | 96,030 | | | | 236,573 | |
| | |
Hapvida Participacoes e Investimentos SA (a) | | | 52,748 | | | | 739,432 | |
| | |
Hypera SA* | | | 95,972 | | | | 823,677 | |
| | |
IRB Brasil Resseguros S/A | | | 50,001 | | | | 469,776 | |
| | |
Itau Unibanco Holding SA (Preference) | | | 400,930 | | | | 3,624,915 | |
| | |
Itausa — Investimentos Itau SA (Preference) | | | 378,860 | | | | 1,294,198 | |
| | |
Localiza Rent a Car SA | | | 6,721 | | | | 72,062 | |
| | |
Lojas Renner SA | | | 146,020 | | | | 1,852,876 | |
| | | | | | | | |
| INVESTMENTS | | SHARES | | | VALUE($) | |
| | | | | | | | |
|
Brazil — continued | |
| | |
M Dias Branco SA* | | | 15,462 | | | | 145,772 | |
| | |
Magazine Luiza SA | | | 110,597 | | | | 1,224,413 | |
| | |
Natura Cosmeticos SA | | | 69,433 | | | | 542,410 | |
| | |
Notre Dame Intermedica Participacoes SA | | | 73,909 | | | | 1,102,968 | |
| | |
Odontoprev SA | | | 115,600 | | | | 429,771 | |
| | |
Petrobras Distribuidora SA | | | 96,136 | | | | 680,779 | |
| | |
Petroleo Brasileiro SA (Preference) | | | 590,598 | | | | 4,473,848 | |
| | |
Porto Seguro SA | | | 7,810 | | | | 111,663 | |
| | |
Rumo SA* | | | 212,042 | | | | 1,209,705 | |
| | |
Sao Martinho SA | | | 54,150 | | | | 234,936 | |
| | |
Sul America SA | | | 18,841 | | | | 229,493 | |
| | |
Telefonica Brasil SA (Preference) | | | 88,947 | | | | 1,177,015 | |
| | |
TIM Participacoes SA* | | | 229,036 | | | | 648,188 | |
| | |
Transmissora Alianca de Energia Eletrica SA | | | 77,810 | | | | 557,019 | |
| | |
Ultrapar Participacoes SA | | | 91,434 | | | | 428,843 | |
| | |
Usinas Siderurgicas de Minas Gerais SA Usiminas (Preference), Class A | | | 40,085 | | | | 72,764 | |
| | |
Vale SA* | | | 423,357 | | | | 4,986,756 | |
| | |
WEG SA | | | 145,746 | | | | 934,693 | |
| | |
YDUQS Part | | | 78,786 | | | | 768,706 | |
| | | | | | | | |
| | |
| | | | | | | 51,853,061 | |
| | | | | | | | |
|
Chile — 1.2% | |
| | |
AES Gener SA | | | 1,167,311 | | | | 250,273 | |
| | |
Aguas Andinas SA, Class A | | | 923,072 | | | | 423,199 | |
| | |
Banco de Chile | | | 2,413,127 | | | | 310,752 | |
| | |
Banco Santander Chile | | | 294,111 | | | | 18,247 | |
| | |
Cencosud SA | | | 16,129 | | | | 21,901 | |
| | |
Cia Cervecerias Unidas SA | | | 40,189 | | | | 401,018 | |
| | |
Colbun SA | | | 2,681,837 | | | | 462,704 | |
| | |
Empresas CMPC SA | | | 119,894 | | | | 273,221 | |
| | |
Enel Americas SA | | | 6,320,286 | | | | 1,180,366 | |
| | |
Enel Chile SA | | | 7,295,752 | | | | 600,011 | |
| | |
Engie Energia Chile SA | | | 202,360 | | | | 300,156 | |
| | |
Parque Arauco SA | | | 49,213 | | | | 129,403 | |
| | | | | | | | |
| | |
| | | | | | | 4,371,251 | |
| | | | | | | | |
|
China — 20.7% | |
| | |
Air China Ltd., Class H | | | 282,000 | | | | 248,979 | |
| | |
Angang Steel Co. Ltd., Class H | | | 99,800 | | | | 33,385 | |
| | |
Anhui Conch Cement Co. Ltd., Class H | | | 197,500 | | | | 1,180,404 | |
| | |
Anhui Gujing Distillery Co. Ltd., Class A | | | 25,300 | | | | 396,036 | |
| | |
ANTA Sports Products Ltd. | | | 189,000 | | | | 1,848,821 | |
| | |
Autohome, Inc., ADR* (b) | | | 5,086 | | | | 430,072 | |
| | |
AviChina Industry & Technology Co. Ltd., Class H | | | 228,000 | | | | 107,696 | |
SEE NOTES TO FINANCIAL STATEMENTS.
| | | | | | | | |
| | | |
| OCTOBER 31, 2019 | | J.P. MORGAN EXCHANGE-TRADED FUNDS | | | | | 85 | |
JPMorgan Diversified Return Emerging Markets Equity ETF
SCHEDULE OF PORTFOLIO INVESTMENTS
AS OF OCTOBER 31, 2019 (continued)
| | | | | | | | |
| INVESTMENTS | | SHARES | | | VALUE($) | |
Common Stocks — continued | |
|
China — continued | |
| | |
BAIC Motor Corp. Ltd., Class H (a) | | | 225,000 | | | | 139,569 | |
| | |
Bank of China Ltd., Class H | | | 4,366,000 | | | | 1,780,390 | |
| | |
Bank of Communications Co. Ltd., Class H | | | 438,000 | | | | 299,131 | |
| | |
Baoshan Iron & Steel Co. Ltd., Class A | | | 531,700 | | | | 437,880 | |
| | |
BBMG Corp., Class H | | | 212,000 | | | | 60,673 | |
| | |
Beijing Capital International Airport Co. Ltd., Class H | | | 154,000 | | | | 145,857 | |
| | |
Beijing Enterprises Holdings Ltd. | | | 47,000 | | | | 221,295 | |
| | |
Beijing Enterprises Water Group Ltd.* | | | 934,000 | | | | 486,827 | |
| | |
Bengang Steel Plates Co. Ltd., Class A | | | 525,398 | | | | 268,655 | |
| | |
BYD Electronic International Co. Ltd. | | | 71,000 | | | | 121,919 | |
| | |
CGN Power Co. Ltd., Class H (a) | | | 2,537,000 | | | | 658,915 | |
| | |
China Agri-Industries Holdings Ltd. | | | 34,000 | | | | 11,202 | |
| | |
China CITIC Bank Corp. Ltd., Class H | | | 468,000 | | | | 271,281 | |
| | |
China Coal Energy Co. Ltd., Class H | | | 163,000 | | | | 65,001 | |
| | |
China Communications Construction Co. Ltd., Class H | | | 410,000 | | | | 312,109 | |
| | |
China Communications Services Corp. Ltd., Class H | | | 736,000 | | | | 454,501 | |
| | |
China Conch Venture Holdings Ltd. | | | 128,000 | | | | 500,849 | |
| | |
China Everbright Bank Co. Ltd., Class H | | | 176,000 | | | | 80,990 | |
| | |
China Everbright International Ltd. | | | 331,000 | | | | 250,172 | |
| | |
China Longyuan Power Group Corp. Ltd., Class H | | | 266,000 | | | | 143,702 | |
| | |
China Medical System Holdings Ltd. | | | 226,000 | | | | 306,484 | |
| | |
China Merchants Bank Co. Ltd., Class H | | | 219,000 | | | | 1,044,462 | |
| | |
China Merchants Port Holdings Co. Ltd. | | | 114,000 | | | | 178,243 | |
| | |
China Minsheng Banking Corp. Ltd., Class H | | | 361,300 | | | | 252,719 | |
| | |
China Mobile Ltd. | | | 727,500 | | | | 5,912,175 | |
| | |
China Molybdenum Co. Ltd., Class H | | | 300,000 | | | | 94,541 | |
| | |
China National Building Material Co. Ltd., Class H | | | 352,250 | | | | 296,885 | |
| | |
China Overseas Land & Investment Ltd. | | | 82,000 | | | | 258,750 | |
| | |
China Petroleum & Chemical Corp., Class H | | | 2,048,000 | | | | 1,164,852 | |
| | |
China Power International Development Ltd. | | | 800,000 | | | | 167,068 | |
| | |
China Railway Construction Corp. Ltd., Class H | | | 173,000 | | | | 189,225 | |
| | |
China Railway Group Ltd., Class H | | | 350,000 | | | | 210,950 | |
| | |
China Resources Cement Holdings Ltd. | | | 368,000 | | | | 402,993 | |
| | |
China Resources Gas Group Ltd. (b) | | | 148,000 | | | | 892,338 | |
| | |
China Resources Land Ltd. | | | 152,000 | | | | 646,437 | |
| | |
China Resources Pharmaceutical Group Ltd. (a) | | | 298,500 | | | | 275,667 | |
| | |
China Resources Power Holdings Co. Ltd. | | | 342,000 | | | | 429,803 | |
| | |
China Shenhua Energy Co. Ltd., Class H | | | 560,500 | | | | 1,138,342 | |
| | | | | | | | |
| INVESTMENTS | | SHARES | | | VALUE($) | |
| | | | | | | | |
|
China — continued | |
| | |
China South Publishing & Media Group Co. Ltd., Class A | | | 196,600 | | | | 322,891 | |
| | |
China State Construction International Holdings Ltd. | | | 164,000 | | | | 151,036 | |
| | |
China Telecom Corp. Ltd., Class H | | | 2,570,000 | | | | 1,093,300 | |
| | |
China Traditional Chinese Medicine Holdings Co. Ltd. | | | 440,000 | | | | 196,472 | |
| | |
China Unicom Hong Kong Ltd. | | | 1,096,000 | | | | 1,079,011 | |
| | |
China Vanke Co. Ltd., Class H (b) | | | 74,000 | | | | 269,845 | |
| | |
China Yangtze Power Co. Ltd., Class A | | | 248,900 | | | | 631,505 | |
| | |
Chinese Universe Publishing and Media Group Co. Ltd., Class A | | | 186,900 | | | | 315,569 | |
| | |
Chongqing Changan Automobile Co. Ltd., Class B | | | 45,600 | | | | 18,777 | |
| | |
Chongqing Dima Industry Co. Ltd., Class A | | | 612,000 | | | | 278,095 | |
| | |
Chongqing Rural Commercial Bank Co. Ltd., Class H | | | 157,000 | | | | 83,798 | |
| | |
CIMC Enric Holdings Ltd. | | | 48,000 | | | | 25,981 | |
| | |
CITIC Ltd. | | | 451,000 | | | | 593,284 | |
| | |
CNOOC Ltd. | | | 2,042,000 | | | | 3,039,008 | |
| | |
Contemporary Amperex Technology Co. Ltd., Class A | | | 40,700 | | | | 397,230 | |
| | |
COSCO SHIPPING Energy Transportation Co. Ltd., Class H | | | 120,000 | | | | 51,622 | |
| | |
COSCO SHIPPING Ports Ltd. | | | 162,000 | | | | 127,363 | |
| | |
Country Garden Services Holdings Co. Ltd. | | | 69,000 | | | | 233,798 | |
| | |
CRRC Corp. Ltd., Class H | | | 372,000 | | | | 248,807 | |
| | |
Dali Foods Group Co. Ltd. (a) | | | 753,000 | | | | 514,811 | |
| | |
Daqin Railway Co. Ltd., Class A | | | 406,400 | | | | 440,463 | |
| | |
Datang International Power Generation Co. Ltd., Class H | | | 516,000 | | | | 101,779 | |
| | |
Dongguan Development Holdings Co. Ltd., Class A | | | 180,300 | | | | 205,956 | |
| | |
ENN Energy Holdings Ltd. | | | 139,600 | | | | 1,592,633 | |
| | |
Foshan Haitian Flavouring & Food Co. Ltd., Class A | | | 31,600 | | | | 501,456 | |
| | |
Fosun International Ltd. | | | 179,076 | | | | 234,156 | |
| | |
Fujian Funeng Co. Ltd., Class A | | | 210,500 | | | | 264,949 | |
| | |
Fujian Sunner Development Co. Ltd., Class A | | | 95,600 | | | | 391,043 | |
| | |
Future Land Development Holdings Ltd. (b) | | | 90,000 | | | | 94,844 | |
| | |
Fuyao Glass Industry Group Co. Ltd., Class H (a) | | | 5,200 | | | | 14,693 | |
| | |
G-bits Network Technology Xiamen Co. Ltd., Class A | | | 12,100 | | | | 462,354 | |
| | |
Geely Automobile Holdings Ltd. | | | 224,000 | | | | 423,856 | |
| | |
Great Wall Motor Co. Ltd., Class H | | | 483,500 | | | | 391,757 | |
SEE NOTES TO FINANCIAL STATEMENTS.
| | | | | | |
| | | |
| 86 | | | | J.P. MORGAN EXCHANGE-TRADED FUNDS | | OCTOBER 31, 2019 |
| | | | | | | | |
| INVESTMENTS | | SHARES | | | VALUE($) | |
Common Stocks — continued | |
|
China — continued | |
| | |
Greattown Holdings Ltd., Class A | | | 369,200 | | | | 348,857 | |
| | |
Gree Electric Appliances, Inc. of Zhuhai, Class A | | | 94,000 | | | | 784,176 | |
| | |
Guangdong Investment Ltd. | | | 540,000 | | | | 1,168,721 | |
| | |
Guangzhou Baiyunshan Pharmaceutical Holdings Co. Ltd., Class H | | | 40,000 | | | | 126,512 | |
| | |
Guangzhou Shiyuan Electronic Technology Co. Ltd., Class A | | | 33,100 | | | | 402,205 | |
| | |
Haitian International Holdings Ltd. (b) | | | 51,000 | | | | 120,345 | |
| | |
Heilongjiang Agriculture Co. Ltd., Class A | | | 233,900 | | | | 317,661 | |
| | |
Henan Zhongyuan Expressway Co. Ltd., Class A | | | 410,500 | | | | 243,528 | |
| | |
Huadian Power International Corp. Ltd., Class H | | | 292,000 | | | | 109,415 | |
| | |
Huaneng Renewables Corp. Ltd., Class H | | | 916,000 | | | | 349,707 | |
| | |
Huaxin Cement Co. Ltd., Class B | | | 249,600 | | | | 454,075 | |
| | |
Industrial & Commercial Bank of China Ltd., Class H | | | 4,460,000 | | | | 3,195,114 | |
| | |
Inner Mongolia Yitai Coal Co. Ltd., Class B | | | 80,600 | | | | 70,302 | |
| | |
Jiangsu Expressway Co. Ltd., Class A | | | 235,500 | | | | 349,414 | |
| | |
Jiangsu Expressway Co. Ltd., Class H | | | 110,000 | | | | 146,140 | |
| | |
Jiangsu Zhongnan Construction Group Co. Ltd., Class A | | | 295,200 | | | | 341,330 | |
| | |
Jiangxi Copper Co. Ltd., Class H | | | 92,000 | | | | 107,707 | |
| | |
Joyoung Co. Ltd., Class A | | | 123,371 | | | | 389,244 | |
| | |
Kingboard Holdings Ltd. | | | 55,000 | | | | 146,570 | |
| | |
Kunlun Energy Co. Ltd. | | | 694,000 | | | | 645,931 | |
| | |
Kweichow Moutai Co. Ltd., Class A | | | 12,800 | | | | 2,143,579 | |
| | |
Legend Holdings Corp., Class H (a) | | | 35,600 | | | | 78,256 | |
| | |
Li Ning Co. Ltd. | | | 249,000 | | | | 844,315 | |
| | |
Liuzhou Iron & Steel Co. Ltd., Class A | | | 410,400 | | | | 293,103 | |
| | |
Lomon Billions Group Co. Ltd., Class A | | | 169,000 | | | | 292,148 | |
| | |
Longfor Group Holdings Ltd. (a) | | | 92,000 | | | | 381,814 | |
| | |
Luye Pharma Group Ltd. (a) (b) | | | 296,500 | | | | 219,158 | |
| | |
Maanshan Iron & Steel Co. Ltd., Class H (b) | | | 1,008,000 | | | | 381,249 | |
| | |
Momo, Inc., ADR | | | 9,076 | | | | 304,228 | |
| | |
Nanjing Iron & Steel Co. Ltd., Class A | | | 725,500 | | | | 314,169 | |
| | |
New China Life Insurance Co. Ltd., Class H | | | 49,600 | | | | 192,506 | |
| | |
PetroChina Co. Ltd., Class H | | | 1,642,000 | | | | 800,740 | |
| | |
Ping An Insurance Group Co. of China Ltd., Class H | | | 285,000 | | | | 3,289,410 | |
| | |
Sansteel Minguang Co. Ltd. Fujian, Class A | | | 284,800 | | | | 306,862 | |
| | |
Sany Heavy Industry Co. Ltd., Class A | | | 266,000 | | | | 508,613 | |
| | |
SDIC Power Holdings Co. Ltd., Class A | | | 450,700 | | | | 533,819 | |
| | |
Shaanxi Coal Industry Co. Ltd., Class A | | | 363,000 | | | | 431,873 | |
| | |
Shandong Weigao Group Medical Polymer Co. Ltd., Class H | | | 304,000 | | | | 349,004 | |
| | | | | | | | |
| INVESTMENTS | | SHARES | | | VALUE($) | |
| | | | | | | | |
|
China — continued | |
| | |
Shanghai Electric Group Co. Ltd., Class H | | | 260,000 | | | | 79,528 | |
| | |
Shanghai Industrial Holdings Ltd. | | | 44,000 | | | | 81,905 | |
| | |
Shanghai Pharmaceuticals Holding Co. Ltd., Class H | | | 32,600 | | | | 58,906 | |
| | |
Shanxi Lanhua Sci-Tech Venture Co. Ltd., Class A | | | 334,700 | | | | 295,101 | |
| | |
Shanxi Lu’an Environmental Energy Development Co. Ltd., Class A | | | 348,500 | | | | 346,872 | |
| | |
Shenzhen Expressway Co. Ltd., Class H | | | 320,000 | | | | 428,320 | |
| | |
Shenzhen International Holdings Ltd. | | | 80,044 | | | | 162,732 | |
| | |
Shenzhen Jinjia Group Co. Ltd., Class A | | | 214,300 | | | | 328,601 | |
| | |
Shenzhou International Group Holdings Ltd. | | | 113,300 | | | | 1,565,653 | |
| | |
Sichuan Expressway Co. Ltd., Class A | | | 412,100 | | | | 214,859 | |
| | |
Sihuan Pharmaceutical Holdings Group Ltd. | | | 738,000 | | | | 96,693 | |
| | |
Sinopec Engineering Group Co. Ltd., Class H | | | 134,000 | | | | 76,548 | |
| | |
Sinopec Shanghai Petrochemical Co. Ltd., Class H | | | 274,000 | | | | 75,676 | |
| | |
Sinotrans Ltd., Class H | | | 189,000 | | | | 55,571 | |
| | |
Sinotruk Hong Kong Ltd. | | | 257,500 | | | | 389,100 | |
| | |
Sunac China Holdings Ltd. (b) | | | 126,000 | | | | 571,509 | |
| | |
Tangshan Jidong Cement Co. Ltd., Class A | | | 151,900 | | | | 301,150 | |
| | |
Tianhe Chemicals Group Ltd.*‡ (a) | | | 20,000 | | | | — | |
| | |
Weichai Power Co. Ltd., Class A | | | 290,956 | | | | 477,327 | |
| | |
Weichai Power Co. Ltd., Class H | | | 451,000 | | | | 709,883 | |
| | |
Weifu High-Technology Group Co. Ltd., Class A | | | 127,900 | | | | 304,740 | |
| | |
Wuhu Sanqi Interactive Entertainment Network Technology Group Co. Ltd., Class A | | | 173,800 | | | | 450,530 | |
| | |
Wuliangye Yibin Co. Ltd., Class A | | | 55,600 | | | | 1,040,711 | |
| | |
Xiamen ITG Group Corp. Ltd., Class A | | | 299,600 | | | | 308,319 | |
| | |
Xinhua Winshare Publishing and Media Co. Ltd., Class A | | | 174,700 | | | | 298,656 | |
| | |
Xinjiang Goldwind Science & Technology Co. Ltd., Class H | | | 45,040 | | | | 53,715 | |
| | |
Xinxing Ductile Iron Pipes Co. Ltd., Class A | | | 567,700 | | | | 311,996 | |
| | |
Xinyangfeng Agricultural Technology Co. Ltd., Class A | | | 132,900 | | | | 159,502 | |
| | |
Yangzijiang Shipbuilding Holdings Ltd. | | | 589,800 | | | | 412,912 | |
| | |
Yanzhou Coal Mining Co. Ltd., Class H | | | 152,000 | | | | 154,215 | |
| | |
Yuexiu Property Co. Ltd. | | | 682,000 | | | | 150,219 | |
| | |
YY, Inc., ADR* | | | 3,837 | | | | 218,095 | |
| | |
Zhaojin Mining Industry Co. Ltd., Class H | | | 73,500 | | | | 82,201 | |
| | |
Zhejiang Expressway Co. Ltd., Class H | | | 408,000 | | | | 334,099 | |
| | |
Zhongsheng Group Holdings Ltd. | | | 96,000 | | | | 319,144 | |
SEE NOTES TO FINANCIAL STATEMENTS.
| | | | | | | | |
| | | |
| OCTOBER 31, 2019 | | J.P. MORGAN EXCHANGE-TRADED FUNDS | | | | | 87 | |
JPMorgan Diversified Return Emerging Markets Equity ETF
SCHEDULE OF PORTFOLIO INVESTMENTS
AS OF OCTOBER 31, 2019 (continued)
| | | | | | | | |
| INVESTMENTS | | SHARES | | | VALUE($) | |
Common Stocks — continued | |
|
China — continued | |
| | |
Zhuzhou CRRC Times Electric Co. Ltd., Class H | | | 46,400 | | | | 172,170 | |
| | |
Zijin Mining Group Co. Ltd., Class H | | | 448,000 | | | | 155,183 | |
| | |
Zoomlion Heavy Industry Science and Technology Co. Ltd., Class H | | | 741,400 | | | | 544,259 | |
| | |
ZTE Corp., Class H* | | | 69,000 | | | | 192,503 | |
| | | | | | | | |
| | |
| | | | | | | 73,071,290 | |
| | | | | | | | |
|
Colombia — 0.4% | |
| | |
Bancolombia SA (Preference) | | | 38,322 | | | | 500,227 | |
| | |
Ecopetrol SA | | | 1,009,530 | | | | 907,980 | |
| | |
Grupo Aval Acciones y Valores SA (Preference) | | | 336,104 | | | | 137,723 | |
| | | | | | | | |
| | |
| | | | | | | 1,545,930 | |
| | | | | | | | |
|
Czech Republic — 0.3% | |
| | |
CEZ A/S | | | 20,439 | | | | 466,223 | |
| | |
Komercni banka A/S | | | 7,497 | | | | 253,376 | |
| | |
Moneta Money Bank A/S (a) | | | 51,223 | | | | 170,066 | |
| | |
O2 Czech Republic A/S | | | 13,530 | | | | 127,714 | |
| | | | | | | | |
| | |
| | | | | | | 1,017,379 | |
| | | | | | | | |
|
Egypt — 0.2% | |
| | |
Commercial International Bank Egypt SAE | | | 132,285 | | | | 663,884 | |
| | |
ElSewedy Electric Co. | | | 266,482 | | | | 222,068 | |
| | | | | | | | |
| | |
| | | | | | | 885,952 | |
| | | | | | | | |
|
Greece — 0.8% | |
| | |
Hellenic Telecommunications Organization SA | | | 56,511 | | | | 857,069 | |
| | |
JUMBO SA | | | 39,452 | | | | 768,620 | |
| | |
Mytilineos SA | | | 43,621 | | | | 478,057 | |
| | |
OPAP SA | | | 66,803 | | | | 726,510 | |
| | | | | | | | |
| | |
| | | | | | | 2,830,256 | |
| | | | | | | | |
|
Hong Kong — 0.6% | |
| | |
Bosideng International Holdings Ltd. | | | 1,462,000 | | | | 756,015 | |
| | |
China Gas Holdings Ltd. (b) | | | 126,600 | | | | 539,308 | |
| | |
Haier Electronics Group Co. Ltd. | | | 190,000 | | | | 542,467 | |
| | |
Kingboard Laminates Holdings Ltd. | | | 80,000 | | | | 73,239 | |
| | |
Lee & Man Paper Manufacturing Ltd. | | | 107,000 | | | | 59,499 | |
| | |
Nine Dragons Paper Holdings Ltd. | | | 119,000 | | | | 103,228 | |
| | | | | | | | |
| | |
| | | | | | | 2,073,756 | |
| | | | | | | | |
|
Hungary — 0.6% | |
| | |
Magyar Telekom Telecommunications plc | | | 114,451 | | | | 170,619 | |
| | |
MOL Hungarian Oil & Gas plc | | | 26,697 | | | | 264,014 | |
| | |
OTP Bank Nyrt. | | | 23,344 | | | | 1,076,554 | |
| | |
Richter Gedeon Nyrt. | | | 36,619 | | | | 678,666 | |
| | | | | | | | |
| | |
| | | | | | | 2,189,853 | |
| | | | | | | | |
| | | | | | | | |
| INVESTMENTS | | SHARES | | | VALUE($) | |
| | | | | | | | |
|
India — 9.0% | |
| | |
Asian Paints Ltd. | | | 19,947 | | | | 508,461 | |
| | |
Aurobindo Pharma Ltd. | | | 43,430 | | | | 287,691 | |
| | |
Bajaj Auto Ltd. | | | 13,597 | | | | 621,914 | |
| | |
Bajaj Finance Ltd. | | | 4,480 | | | | 254,051 | |
| | |
Bajaj Holdings & Investment Ltd. | | | 1,406 | | | | 72,667 | |
| | |
Bharat Petroleum Corp. Ltd. | | | 78,563 | | | | 581,839 | |
| | |
Bharti Infratel Ltd. | | | 157,285 | | | | 420,360 | |
| | |
Castrol India Ltd. | | | 34,035 | | | | 73,009 | |
| | |
Coal India Ltd. | | | 115,531 | | | | 337,502 | |
| | |
Colgate-Palmolive India Ltd. | | | 8,916 | | | | 194,476 | |
| | |
Cummins India Ltd. | | | 3,974 | | | | 30,445 | |
| | |
Dabur India Ltd. | | | 75,922 | | | | 493,944 | |
| | |
Divi’s Laboratories Ltd. | | | 14,506 | | | | 358,657 | |
| | |
Dr Reddy’s Laboratories Ltd. | | | 14,878 | | | | 584,136 | |
| | |
Federal Bank Ltd. | | | 19,703 | | | | 23,245 | |
| | |
GAIL India Ltd. | | | 85,585 | | | | 165,527 | |
| | |
GlaxoSmithKline Consumer Healthcare Ltd. | | | 1,571 | | | | 204,059 | |
| | |
Glenmark Pharmaceuticals Ltd. | | | 22,669 | | | | 100,740 | |
| | |
Havells India Ltd. | | | 15,946 | | | | 155,366 | |
| | |
HCL Technologies Ltd. | | | 49,877 | | | | 817,644 | |
| | |
Hindalco Industries Ltd. | | | 44,490 | | | | 117,608 | |
| | |
Hindustan Petroleum Corp. Ltd. | | | 65,497 | | | | 299,409 | |
| | |
Hindustan Unilever Ltd. | | | 105,797 | | | | 3,242,701 | |
| | |
Hindustan Zinc Ltd. | | | 16,563 | | | | 49,601 | |
| | |
Housing Development Finance Corp. Ltd. | | | 91,626 | | | | 2,749,886 | |
| | |
ICICI Lombard General Insurance Co. Ltd. (a) | | | 9,082 | | | | 171,937 | |
| | |
Indian Oil Corp. Ltd. | | | 173,638 | | | | 358,656 | |
| | |
Infosys Ltd. | | | 351,539 | | | | 3,380,352 | |
| | |
ITC Ltd. | | | 461,223 | | | | 1,673,867 | |
| | |
JSW Steel Ltd. | | | 56,724 | | | | 182,010 | |
| | |
Larsen & Toubro Infotech Ltd. (a) | | | 1,262 | | | | 30,636 | |
| | |
Larsen & Toubro Ltd. | | | 6,925 | | | | 143,680 | |
| | |
LIC Housing Finance Ltd. | | | 8,920 | | | | 51,811 | |
| | |
Mphasis Ltd. | | | 5,957 | | | | 79,807 | |
| | |
Muthoot Finance Ltd. | | | 3,192 | | | | 31,790 | |
| | |
Nestle India Ltd. | | | 3,621 | | | | 762,068 | |
| | |
NHPC Ltd. | | | 439,167 | | | | 145,504 | |
| | |
NMDC Ltd. | | | 60,042 | | | | 95,120 | |
| | |
NTPC Ltd. | | | 410,126 | | | | 707,744 | |
| | |
Oil & Natural Gas Corp. Ltd. | | | 244,748 | | | | 488,485 | |
| | |
Oil India Ltd. | | | 21,533 | | | | 52,073 | |
| | |
Petronet LNG Ltd. | | | 95,635 | | | | 385,905 | |
| | |
Piramal Enterprises Ltd. | | | 11,993 | | | | 284,257 | |
| | |
Power Finance Corp. Ltd.* | | | 15,299 | | | | 23,514 | |
SEE NOTES TO FINANCIAL STATEMENTS.
| | | | | | |
| | | |
| 88 | | | | J.P. MORGAN EXCHANGE-TRADED FUNDS | | OCTOBER 31, 2019 |
| | | | | | | | |
| INVESTMENTS | | SHARES | | | VALUE($) | |
Common Stocks — continued | |
|
India — continued | |
| | |
Power Grid Corp. of India Ltd. | | | 139,192 | | | | 389,246 | |
| | |
REC Ltd. | | | 119,447 | | | | 234,982 | |
| | |
Reliance Industries Ltd. | | | 197,208 | | | | 4,064,714 | |
| | |
Shriram Transport Finance Co. Ltd. | | | 6,476 | | | | 103,807 | |
| | |
Sun Pharmaceutical Industries Ltd. | | | 12,594 | | | | 76,933 | |
| | |
Tata Consultancy Services Ltd. | | | 83,441 | | | | 2,670,030 | |
| | |
Tata Power Co. Ltd. (The) | | | 148,300 | | | | 123,869 | |
| | |
Tech Mahindra Ltd. | | | 32,017 | | | | 333,383 | |
| | |
Titan Co. Ltd. | | | 41,729 | | | | 782,890 | |
| | |
Torrent Power Ltd. | | | 21,010 | | | | 82,888 | |
| | |
United Breweries Ltd. | | | 8,457 | | | | 152,158 | |
| | |
UPL Ltd. | | | 31,133 | | | | 261,612 | |
| | |
Vedanta Ltd. | | | 145,400 | | | | 303,469 | |
| | |
Wipro Ltd. | | | 133,980 | | | | 490,631 | |
| | | | | | | | |
| | |
| | | | | | | 31,864,766 | |
| | | | | | | | |
|
Indonesia — 4.2% | |
| | |
Adaro Energy Tbk. PT | | | 3,499,000 | | | | 326,224 | |
| | |
Astra International Tbk. PT | | | 3,885,600 | | | | 1,921,821 | |
| | |
Bank Central Asia Tbk. PT | | | 1,491,800 | | | | 3,339,137 | |
| | |
Bank Mandiri Persero Tbk. PT | | | 497,100 | | | | 248,485 | |
| | |
Bank Rakyat Indonesia Persero Tbk. PT | | | 8,700,100 | | | | 2,606,857 | |
| | |
Bukit Asam Tbk. PT | | | 1,966,800 | | | | 314,937 | |
| | |
Bumi Serpong Damai Tbk. PT* | | | 486,100 | | | | 48,950 | |
| | |
Charoen Pokphand Indonesia Tbk. PT | | | 1,922,000 | | | | 861,977 | |
| | |
Gudang Garam Tbk. PT | | | 122,000 | | | | 487,234 | |
| | |
Hanjaya Mandala Sampoerna Tbk. PT | | | 2,156,500 | | | | 326,973 | |
| | |
Indofood CBP Sukses Makmur Tbk. PT | | | 261,500 | | | | 216,503 | |
| | |
Indofood Sukses Makmur Tbk. PT | | | 597,500 | | | | 327,432 | |
| | |
Kalbe Farma Tbk. PT | | | 5,670,900 | | | | 643,980 | |
| | |
Matahari Department Store Tbk. PT | | | 609,500 | | | | 157,996 | |
| | |
Media Nusantara Citra Tbk. PT | | | 4,059,400 | | | | 380,102 | |
| | |
Perusahaan Gas Negara Tbk. PT | | | 3,597,000 | | | | 539,798 | |
| | |
Telekomunikasi Indonesia Persero Tbk. PT | | | 7,834,800 | | | | 2,286,358 | |
| | | | | | | | |
| | |
| | | | | | | 15,034,764 | |
| | | | | | | | |
|
Kuwait — 1.3% | |
| | |
Agility Public Warehousing Co. KSC | | | 243,772 | | | | 602,617 | |
| | |
Gulf Bank KSCP | | | 175,000 | | | | 151,697 | |
| | |
Humansoft Holding Co. KSC | | | 15,955 | | | | 162,495 | |
| | |
Kuwait Finance House KSCP | | | 368,250 | | | | 830,867 | |
| | |
Mobile Telecommunications Co. KSC | | | 506,022 | | | | 943,024 | |
| | |
National Bank of Kuwait SAKP | | | 571,103 | | | | 1,771,285 | |
| | | | | | | | |
| | |
| | | | | | | 4,461,985 | |
| | | | | | | | |
| | | | | | | | |
| INVESTMENTS | | SHARES | | | VALUE($) | |
| | | | | | | | |
|
Malaysia — 3.1% | |
| | |
AirAsia Group Bhd. | | | 395,100 | | | | 180,388 | |
| | |
AMMB Holdings Bhd. | | | 310,200 | | | | 295,889 | |
| | |
Astro Malaysia Holdings Bhd. | | | 404,400 | | | | 130,690 | |
| | |
Axiata Group Bhd. | | | 358,400 | | | | 368,386 | |
| | |
CIMB Group Holdings Bhd. | | | 460,755 | | | | 578,257 | |
| | |
DiGi.Com Bhd. | | | 350,500 | | | | 393,629 | |
| | |
Gamuda Bhd. | | | 101,700 | | | | 90,940 | |
| | |
Hong Leong Bank Bhd. | | | 16,668 | | | | 68,632 | |
| | |
Hong Leong Financial Group Bhd. | | | 20,200 | | | | 84,213 | |
| | |
IJM Corp. Bhd. | | | 77,900 | | | | 40,052 | |
| | |
Malayan Banking Bhd. | | | 530,408 | | | | 1,090,748 | |
| | |
Maxis Bhd. | | | 595,800 | | | | 767,174 | |
| | |
MISC Bhd. | | | 286,800 | | | | 571,248 | |
| | |
Nestle Malaysia Bhd. | | | 16,000 | | | | 553,727 | |
| | |
Petronas Chemicals Group Bhd. | | | 526,800 | | | | 941,188 | |
| | |
Petronas Dagangan Bhd. | | | 76,100 | | | | 429,081 | |
| | |
Petronas Gas Bhd. | | | 223,500 | | | | 890,042 | |
| | |
PPB Group Bhd. | | | 176,260 | | | | 762,517 | |
| | |
RHB Bank Bhd. | | | 182,600 | | | | 251,274 | |
| | |
Telekom Malaysia Bhd. | | | 203,700 | | | | 183,053 | |
| | |
Tenaga Nasional Bhd. | | | 645,700 | | | | 2,138,396 | |
| | |
Top Glove Corp. Bhd. | | | 81,600 | | | | 84,894 | |
| | | | | | | | |
| | |
| | | | | | | 10,894,418 | |
| | | | | | | | |
|
Mexico — 4.4% | |
| | |
Alfa SAB de CV, Class A | | | 774,009 | | | | 673,559 | |
| | |
Alpek SAB de CV | | | 39,744 | | | | 42,954 | |
| | |
Banco del Bajio SA (a) | | | 53,695 | | | | 86,754 | |
| | |
Coca-Cola Femsa SAB de CV | | | 47,839 | | | | 263,212 | |
| | |
El Puerto de Liverpool SAB de CV, Class C1 | | | 35,876 | | | | 182,788 | |
| | |
Fibra Uno Administracion SA de CV, REIT | | | 257,394 | | | | 391,246 | |
| | |
Fomento Economico Mexicano SAB de CV | | | 200,426 | | | | 1,781,553 | |
| | |
Gruma SAB de CV, Class B | | | 37,170 | | | | 388,945 | |
| | |
Grupo Aeroportuario del Centro Norte SAB de CV | | | 156,741 | | | | 1,087,690 | |
| | |
Grupo Aeroportuario del Pacifico SAB de CV, Class B | | | 115,545 | | | | 1,211,101 | |
| | |
Grupo Aeroportuario del Sureste SAB de CV, Class B | | | 53,147 | | | | 870,289 | |
| | |
Grupo Carso SAB de CV, Series A1 | | | 114,281 | | | | 381,402 | |
| | |
Grupo Elektra SAB de CV | | | 5,517 | | | | 400,801 | |
| | |
Grupo Financiero Banorte SAB de CV, Class O | | | 243,554 | | | | 1,331,688 | |
| | |
Grupo Financiero Inbursa SAB de CV, Class O | | | 891 | | | | 1,108 | |
| | |
Grupo Mexico SAB de CV, Series B | | | 732,587 | | | | 1,934,244 | |
SEE NOTES TO FINANCIAL STATEMENTS.
| | | | | | | | |
| | | |
| OCTOBER 31, 2019 | | J.P. MORGAN EXCHANGE-TRADED FUNDS | | | | | 89 | |
JPMorgan Diversified Return Emerging Markets Equity ETF
SCHEDULE OF PORTFOLIO INVESTMENTS
AS OF OCTOBER 31, 2019 (continued)
| | | | | | | | |
| INVESTMENTS | | SHARES | | | VALUE($) | |
Common Stocks — continued | |
|
Mexico — continued | |
| | |
Infraestructura Energetica Nova SAB de CV* | | | 29,641 | | | | 130,974 | |
| | |
Kimberly-Clark de Mexico SAB de CV, Class A* | | | 294,028 | | | | 590,761 | |
| | |
Megacable Holdings SAB de CV | | | 120,655 | | | | 495,315 | |
| | |
Orbia Advance Corp. SAB de CV | | | 110,973 | | | | 240,216 | |
| | |
Promotora y Operadora de Infraestructura SAB de CV | | | 64,649 | | | | 597,642 | |
| | |
Wal-Mart de Mexico SAB de CV | | | 884,145 | | | | 2,649,700 | |
| | | | | | | | |
| | |
| | | | | | | 15,733,942 | |
| | | | | | | | |
|
Pakistan — 0.1% | |
| | |
Oil & Gas Development Co. Ltd. | | | 228,600 | | | | 189,092 | |
| | | | | | | | |
|
Peru — 0.1% | |
| | |
Cia de Minas Buenaventura SAA, ADR | | | 27,372 | | | | 419,886 | |
| | | | | | | | |
|
Philippines — 1.3% | |
| | |
Ayala Corp. | | | 10,725 | | | | 181,588 | |
| | |
Ayala Land, Inc. | | | 321,050 | | | | 306,804 | |
| | |
BDO Unibank, Inc. | | | 153,890 | | | | 469,443 | |
| | |
Bloomberry Resorts Corp. | | | 506,900 | | | | 99,737 | |
| | |
Globe Telecom, Inc. | | | 11,675 | | | | 419,651 | |
| | |
GT Capital Holdings, Inc. | | | 9,316 | | | | 163,983 | |
| | |
International Container Terminal Services, Inc. | | | 215,600 | | | | 504,024 | |
| | |
JG Summit Holdings, Inc. | | | 476,580 | | | | 715,314 | |
| | |
Manila Electric Co. | | | 76,100 | | | | 507,483 | |
| | |
Megaworld Corp. | | | 187,400 | | | | 17,825 | |
| | |
Metro Pacific Investments Corp. | | | 5,640,200 | | | | 532,884 | |
| | |
Metropolitan Bank & Trust Co. | | | 109,338 | | | | 145,552 | |
| | |
PLDT, Inc. | | | 9,430 | | | | 202,929 | |
| | |
San Miguel Corp. | | | 94,570 | | | | 311,227 | |
| | | | | | | | |
| | |
| | | | | | | 4,578,444 | |
| | | | | | | | |
|
Qatar — 1.7% | |
| | |
Barwa Real Estate Co. | | | 191,016 | | | | 179,355 | |
| | |
Commercial Bank PSQC (The) | | | 164,270 | | | | 193,789 | |
| | |
Industries Qatar QSC | | | 346,873 | | | | 1,000,381 | |
| | |
Masraf Al Rayan QSC | | | 368,167 | | | | 379,058 | |
| | |
Qatar Electricity & Water Co. QSC | | | 102,819 | | | | 446,180 | |
| | |
Qatar Fuel QSC | | | 120,741 | | | | 733,556 | |
| | |
Qatar Gas Transport Co. Ltd. | | | 594,859 | | | | 403,543 | |
| | |
Qatar International Islamic Bank QSC | | | 43,826 | | | | 114,470 | |
| | |
Qatar Islamic Bank SAQ | | | 13,658 | | | | 57,093 | |
| | |
Qatar National Bank QPSC | | | 448,580 | | | | 2,364,840 | |
| | |
United Development Co. QSC | | | 173,819 | | | | 66,835 | |
| | | | | | | | |
| | |
| | | | | | | 5,939,100 | |
| | | | | | | | |
| | | | | | | | |
| INVESTMENTS | | SHARES | | | VALUE($) | |
| | | | | | | | |
|
Russia — 7.6% | |
| | |
Aeroflot PJSC | | | 103,307 | | | | 172,225 | |
| | |
Federal Grid Co. Unified Energy System PJSC | | | 157,739,437 | | | | 454,132 | |
| | |
Gazprom PJSC | | | 1,295,254 | | | | 5,254,401 | |
| | |
Inter RAO UES PJSC | | | 10,172,558 | | | | 685,620 | |
| | |
LUKOIL PJSC | | | 59,986 | | | | 5,541,674 | |
| | |
Magnit PJSC | | | 14,346 | | | | 723,950 | |
| | |
Magnitogorsk Iron & Steel Works PJSC | | | 214,839 | | | | 122,469 | |
| | |
MMC Norilsk Nickel PJSC | | | 5,799 | | | | 1,617,889 | |
| | |
Mobile TeleSystems PJSC | | | 220,129 | | | | 979,759 | |
| | |
Novatek PJSC | | | 112,418 | | | | 2,385,698 | |
| | |
Novolipetsk Steel PJSC | | | 107,269 | | | | 209,367 | |
| | |
ROSSETI PJSC | | | 22,582,681 | | | | 420,354 | |
| | |
Rostelecom PJSC | | | 313,831 | | | | 384,180 | |
| | |
RusHydro PJSC | | | 54,360,980 | | | | 432,387 | |
| | |
Sberbank of Russia PJSC | | | 1,035,153 | | | | 3,793,744 | |
| | |
Severstal PJSC | | | 22,847 | | | | 314,519 | |
| | |
Sistema PJSFC | | | 1,565,311 | | | | 355,620 | |
| | |
Surgutneftegas PJSC (Preference) | | | 941,188 | | | | 553,772 | |
| | |
Tatneft PJSC | | | 184,807 | | | | 2,160,007 | |
| | |
Transneft PJSC (Preference) | | | 106 | | | | 275,239 | |
| | | | | | | | |
| | |
| | | | | | | 26,837,006 | |
| | | | | | | | |
|
Saudi Arabia — 1.9% | |
| | |
Almarai Co. JSC | | | 44,646 | | | | 593,849 | |
| | |
Etihad Etisalat Co.* | | | 107,798 | | | | 646,564 | |
| | |
Jarir Marketing Co. | | | 15,383 | | | | 649,836 | |
| | |
Mobile Telecommunications Co. Saudi Arabia* | | | 250,059 | | | | 805,938 | |
| | |
Saudi Airlines Catering Co. | | | 15,761 | | | | 363,805 | |
| | |
Saudi Cement Co. | | | 24,336 | | | | 445,151 | |
| | |
Saudi Electricity Co. | | | 167,631 | | | | 928,825 | |
| | |
Saudi Telecom Co. | | | 84,502 | | | | 2,160,012 | |
| | |
Seera Group Holding* | | | 34,525 | | | | 167,732 | |
| | | | | | | | |
| | |
| | | | | | | 6,761,712 | |
| | | | | | | | |
|
South Africa — 6.8% | |
| | |
Absa Group Ltd. | | | 71,058 | | | | 728,777 | |
| | |
African Rainbow Minerals Ltd. | | | 12,676 | | | | 126,997 | |
| | |
Anglo American Platinum Ltd. | | | 7,390 | | | | 551,508 | |
| | |
AVI Ltd. | | | 61,390 | | | | 351,914 | |
| | |
Barloworld Ltd. | | | 104,014 | | | | 828,470 | |
| | |
Bid Corp. Ltd. | | | 66,901 | | | | 1,560,747 | |
| | |
Bidvest Group Ltd. (The) | | | 45,488 | | | | 620,949 | |
| | |
Capitec Bank Holdings Ltd. | | | 5,314 | | | | 483,042 | |
| | |
Clicks Group Ltd. | | | 59,127 | | | | 961,162 | |
| | |
Foschini Group Ltd. (The) | | | 61,147 | | | | 705,199 | |
SEE NOTES TO FINANCIAL STATEMENTS.
| | | | | | |
| | | |
| 90 | | | | J.P. MORGAN EXCHANGE-TRADED FUNDS | | OCTOBER 31, 2019 |
| | | | | | | | |
| INVESTMENTS | | SHARES | | | VALUE($) | |
Common Stocks — continued | |
|
South Africa — continued | |
| | |
Impala Platinum Holdings Ltd.* | | | 82,755 | | | | 569,766 | |
| | |
KAP Industrial Holdings Ltd. | | | 736,681 | | | | 226,701 | |
| | |
Kumba Iron Ore Ltd. | | | 6,302 | | | | 153,555 | |
| | |
Motus Holdings Ltd. | | | 79,361 | | | | 375,970 | |
| | |
Mr Price Group Ltd. | | | 58,001 | | | | 613,293 | |
| | |
MTN Group Ltd. | | | 286,832 | | | | 1,775,371 | |
| | |
MultiChoice Group* | | | 96,648 | | | | 804,926 | |
| | |
Naspers Ltd., Class N | | | 39,146 | | | | 5,539,496 | |
| | |
Nedbank Group Ltd. | | | 39,601 | | | | 600,759 | |
| | |
Pioneer Foods Group Ltd. | | | 30,533 | | | | 217,644 | |
| | |
Remgro Ltd. | | | 28,917 | | | | 331,562 | |
| | |
RMB Holdings Ltd. | | | 74,999 | | | | 394,806 | |
| | |
Sanlam Ltd. | | | 173,670 | | | | 913,998 | |
| | |
SPAR Group Ltd. (The) | | | 51,239 | | | | 689,381 | |
| | |
Super Group Ltd.* | | | 50,185 | | | | 93,791 | |
| | |
Telkom SA SOC Ltd. | | | 98,962 | | | | 452,400 | |
| | |
Tiger Brands Ltd. | | | 30,853 | | | | 438,107 | |
| | |
Truworths International Ltd. | | | 147,572 | | | | 523,035 | |
| | |
Tsogo Sun Gaming Ltd. | | | 188,558 | | | | 155,109 | |
| | |
Vodacom Group Ltd. | | | 144,715 | | | | 1,264,277 | |
| | |
Vukile Property Fund Ltd., REIT | | | 79,580 | | | | 101,855 | |
| | |
Woolworths Holdings Ltd. | | | 210,740 | | | | 801,219 | |
| | | | | | | | |
| | |
| | | | | | | 23,955,786 | |
| | | | | | | | |
|
Taiwan — 11.1% | |
| | |
Advantech Co. Ltd. | | | 56,000 | | | | 553,272 | |
| | |
Asia Cement Corp. | | | 352,000 | | | | 496,892 | |
| | |
Chang Hwa Commercial Bank Ltd. | | | 721,912 | | | | 563,298 | |
| | |
Chicony Electronics Co. Ltd. | | | 88,551 | | | | 275,105 | |
| | |
China Steel Corp. | | | 1,855,000 | | | | 1,428,323 | |
| | |
Chunghwa Telecom Co. Ltd. | | | 431,000 | | | | 1,587,143 | |
| | |
CTBC Financial Holding Co. Ltd. | | | 2,132,395 | | | | 1,482,469 | |
| | |
Delta Electronics, Inc. | | | 331,000 | | | | 1,453,251 | |
| | |
E.Sun Financial Holding Co. Ltd. | | | 1,298,679 | | | | 1,173,435 | |
| | |
Eclat Textile Co. Ltd. | | | 50,000 | | | | 670,432 | |
| | |
Eva Airways Corp. | | | 491,077 | | | | 230,103 | |
| | |
Far Eastern New Century Corp. | | | 847,000 | | | | 823,747 | |
| | |
Far EasTone Telecommunications Co. Ltd. | | | 159,000 | | | | 381,509 | |
| | |
Feng TAY Enterprise Co. Ltd. | | | 81,900 | | | | 553,262 | |
| | |
First Financial Holding Co. Ltd. | | | 1,141,806 | | | | 837,227 | |
| | |
Formosa Chemicals & Fibre Corp. | | | 481,000 | | | | 1,398,112 | |
| | |
Formosa Petrochemical Corp. | | | 244,000 | | | | 777,166 | |
| | |
Formosa Plastics Corp. | | | 679,000 | | | | 2,179,520 | |
| | |
Formosa Taffeta Co. Ltd. | | | 303,000 | | | | 344,667 | |
| | |
Giant Manufacturing Co. Ltd. | | | 64,000 | | | | 473,244 | |
| | |
Globalwafers Co. Ltd. | | | 32,000 | | | | 381,801 | |
| | | | | | | | |
| INVESTMENTS | | SHARES | | | VALUE($) | |
| | | | | | | | |
|
Taiwan — continued | |
| | |
Hotai Motor Co. Ltd. | | | 70,000 | | | | 1,238,318 | |
| | |
Hua Nan Financial Holdings Co. Ltd. | | | 1,054,448 | | | | 757,753 | |
| | |
Lite-On Technology Corp. | | | 322,000 | | | | 530,599 | |
| | |
Mega Financial Holding Co. Ltd. | | | 1,283,233 | | | | 1,259,463 | |
| | |
Nan Ya Plastics Corp. | | | 790,000 | | | | 1,866,828 | |
| | |
Novatek Microelectronics Corp. | | | 86,000 | | | | 550,885 | |
| | |
Pou Chen Corp. | | | 711,000 | | | | 950,560 | |
| | |
President Chain Store Corp. | | | 121,000 | | | | 1,207,110 | |
| | |
Realtek Semiconductor Corp. | | | 71,000 | | | | 526,675 | |
| | |
SinoPac Financial Holdings Co. Ltd. | | | 1,212,580 | | | | 497,648 | |
| | |
Synnex Technology International Corp. | | | 28,200 | | | | 33,635 | |
| | |
Taishin Financial Holding Co. Ltd. | | | 32,489 | | | | 15,088 | |
| | |
Taiwan Business Bank | | | 1,418,304 | | | | 597,898 | |
| | |
Taiwan Cement Corp. | | | 744,884 | | | | 988,940 | |
| | |
Taiwan Cooperative Financial Holding Co. Ltd. | | | 1,085,562 | | | | 746,862 | |
| | |
Taiwan Fertilizer Co. Ltd. | | | 264,000 | | | | 420,206 | |
| | |
Taiwan High Speed Rail Corp. | | | 316,000 | | | | 373,950 | |
| | |
Taiwan Mobile Co. Ltd. | | | 269,000 | | | | 1,002,989 | |
| | |
Taiwan Semiconductor Manufacturing Co. Ltd. | | | 446,000 | | | | 4,370,713 | |
| | |
Unimicron Technology Corp. | | | 194,000 | | | | 298,098 | |
| | |
Uni-President Enterprises Corp. | | | 867,000 | | | | 2,141,821 | |
| | |
Yuanta Financial Holding Co. Ltd. | | | 1,304,665 | | | | 815,377 | |
| | | | | | | | |
| | |
| | | | | | | 39,255,394 | |
| | | | | | | | |
|
Thailand — 4.4% | |
| | |
Advanced Info Service PCL | | | 224,600 | | | | 1,703,823 | |
| | |
Bangkok Bank PCL, NVDR | | | 31,300 | | | | 180,316 | |
| | |
Bangkok Bank PCL | | | 47,400 | | | | 273,907 | |
| | |
Bangkok Dusit Medical Services PCL, Class F | | | 1,958,100 | | | | 1,556,607 | |
| | |
Bumrungrad Hospital PCL | | | 102,300 | | | | 408,296 | |
| | |
Digital Telecommunications Infrastructure Fund, Class F | | | 959,700 | | | | 565,720 | |
| | |
Electricity Generating PCL | | | 78,700 | | | | 904,472 | |
| | |
Energy Absolute PCL | | | 206,800 | | | | 280,804 | |
| | |
Home Product Center PCL | | | 1,500,800 | | | | 850,857 | |
| | |
Intouch Holdings PCL, NVDR | | | 377,700 | | | | 825,574 | |
| | |
Krung Thai Bank PCL | | | 1,008,100 | | | | 554,213 | |
| | |
PTT Exploration & Production PCL | | | 274,900 | | | | 1,096,714 | |
| | |
PTT PCL | | | 2,208,300 | | | | 3,310,563 | |
| | |
Ratch Group PCL | | | 262,800 | | | | 640,161 | |
| | |
Siam Commercial Bank PCL (The) | | | 397,100 | | | | 1,482,011 | |
| | |
Thai Union Group PCL, Class F | | | 743,300 | | | | 359,432 | |
| | |
Total Access Communication PCL | | | 298,500 | | | | 612,703 | |
| | | | | | | | |
| | |
| | | | | | | 15,606,173 | |
| | | | | | | | |
SEE NOTES TO FINANCIAL STATEMENTS.
| | | | | | | | |
| | | |
| OCTOBER 31, 2019 | | J.P. MORGAN EXCHANGE-TRADED FUNDS | | | | | 91 | |
JPMorgan Diversified Return Emerging Markets Equity ETF
SCHEDULE OF PORTFOLIO INVESTMENTS
AS OF OCTOBER 31, 2019 (continued)
| | | | | | | | |
| INVESTMENTS | | SHARES | | | VALUE($) | |
Common Stocks — continued | |
|
Turkey — 1.6% | |
| | |
Arcelik A/S* | | | 136,854 | | | | 423,980 | |
| | |
BIM Birlesik Magazalar A/S | | | 110,152 | | | | 911,696 | |
| | |
Ford Otomotiv Sanayi A/S | | | 40,839 | | | | 460,544 | |
| | |
Haci Omer Sabanci Holding A/S | | | 89,093 | | | | 128,880 | |
| | |
TAV Havalimanlari Holding A/S | | | 178,023 | | | | 811,580 | |
| | |
Tekfen Holding A/S | | | 211,028 | | | | 624,803 | |
| | |
Tofas Turk Otomobil Fabrikasi A/S | | | 140,413 | | | | 549,057 | |
| | |
Turk Telekomunikasyon A/S* | | | 499,634 | | | | 507,465 | |
| | |
Turkcell Iletisim Hizmetleri A/S | | | 312,377 | | | | 686,858 | |
| | |
Turkiye Sise ve Cam Fabrikalari A/S | | | 524,678 | | | | 398,283 | |
| | | | | | | | |
| | |
| | | | | | | 5,503,146 | |
| | | | | | | | |
|
United Arab Emirates — 1.1% | |
| | |
Abu Dhabi Commercial Bank PJSC | | | 206,590 | | | | 438,240 | |
| | |
Abu Dhabi Islamic Bank PJSC | | | 74,904 | | | | 109,034 | |
| | |
Aldar Properties PJSC | | | 117,962 | | | | 75,438 | |
| | |
DP World plc | | | 9,734 | | | | 129,208 | |
| | |
Dubai Islamic Bank PJSC | | | 164,698 | | | | 237,088 | |
| | |
Emaar Malls PJSC | | | 200,788 | | | | 106,464 | |
| | |
Emirates Telecommunications Group Co. PJSC | | | 361,676 | | | | 1,630,755 | |
| | |
First Abu Dhabi Bank PJSC | | | 303,722 | | | | 1,257,037 | |
| | | | | | | | |
| | |
| | | | | | | 3,983,264 | |
| | | | | | | | |
|
United States — 0.4% | |
| | |
JBS SA | | | 185,124 | | | | 1,305,862 | |
| | | | | | | | |
| | |
Total Common Stocks
(Cost $332,926,205) | | | | | | | 352,573,093 | |
| | | | | | | | |
| | |
| | | NO. OF
RIGHTS | | | | |
Rights — 0.0% | |
|
China — 0.0% | |
| | |
Legend Holdings Corp.,
expiring 12/31/2019*
(Cost $—) | | | 2,638 | | | | — | |
| | | | | | | | |
| | |
| | | SHARES | | | | |
Short-Term Investments — 0.5% | |
|
Investment Companies — 0.2% | |
| | |
JPMorgan U.S. Government Money Market Fund Class Institutional Shares, 1.64% (c) (d)
(Cost $670,911) | | | 670,911 | | | | 670,911 | |
| | | | | | | | |
| | | | | | | | |
| INVESTMENTS | | SHARES | | | VALUE($) | |
|
Investment of Cash Collateral from Securities Loaned — 0.3% | |
| | |
JPMorgan U.S. Government Money Market Fund Class IM Shares, 1.70% (c) (d)
(Cost $1,212,618) | | | 1,212,618 | | | | 1,212,618 | |
| | | | | | | | |
| | |
TotalShort-Term Investments
(Cost $1,883,529) | | | | | | | 1,883,529 | |
| | | | | | | | |
Total Investments — 100.2%
(Cost $334,809,734) | | | | | | | 354,456,622 | |
| | |
Liabilities in Excess of
Other Assets — (0.2)% | | | | | | | (661,206 | ) |
| | | | | | | | |
NET ASSETS — 100.0% | | | | | | | 353,795,416 | |
| | | | | | | | |
Percentages indicated are based on net assets.
Summary of Investments by Industry, October 31, 2019
The following table represents the portfolio investments of the Fund by industry classifications as a percentage of total investments:
| | | | |
| INDUSTRY | | PERCENTAGE | |
| |
Banks | | | 15.8 | % |
| |
Oil, Gas & Consumable Fuels | | | 12.6 | |
| |
Wireless Telecommunication Services | | | 5.8 | |
| |
Metals & Mining | | | 4.8 | |
| |
Electric Utilities | | | 4.2 | |
| |
Diversified Telecommunication Services | | | 4.0 | |
| |
Food Products | | | 3.5 | |
| |
Food & Staples Retailing | | | 2.7 | |
| |
Transportation Infrastructure | | | 2.7 | |
| |
Textiles, Apparel & Luxury Goods | | | 2.4 | |
| |
Chemicals | | | 2.4 | |
| |
IT Services | | | 2.2 | |
| |
Independent Power and Renewable Electricity Producers | | | 2.1 | |
| |
Beverages | | | 2.0 | |
| |
Industrial Conglomerates | | | 1.9 | |
| |
Specialty Retail | | | 1.9 | |
| |
Insurance | | | 1.7 | |
| |
Semiconductors & Semiconductor Equipment | | | 1.6 | |
| |
Gas Utilities | | | 1.6 | |
| |
Internet & Direct Marketing Retail | | | 1.6 | |
| |
Pharmaceuticals | | | 1.3 | |
| |
Construction Materials | | | 1.3 | |
| |
Automobiles | | | 1.3 | |
| |
Real Estate Management & Development | | | 1.3 | |
| |
Health Care Providers & Services | | | 1.2 | |
| |
Multiline Retail | | | 1.2 | |
| |
Machinery | | | 1.1 | |
| |
Household Products | | | 1.1 | |
| |
Capital Markets | | | 1.0 | |
| |
Others (each less than 1.0%) | | | 11.2 | |
| |
Short-Term Investments | | | 0.5 | |
SEE NOTES TO FINANCIAL STATEMENTS.
| | | | | | |
| | | |
| 92 | | | | J.P. MORGAN EXCHANGE-TRADED FUNDS | | OCTOBER 31, 2019 |
Abbreviations
| | |
| ADR | | American Depositary Receipt |
| JSC | | Joint Stock Company |
| NVDR | | Non-voting depository receipt |
| PJSC | | Public Joint Stock Company |
| Preference | | A special type of equity investment that shares in the earnings of the company, has limited voting rights, and may have a dividend preference. Preference shares may also have liquidation preference. |
| PT | | Limited liability company |
| REIT | | Real Estate Investment Trust |
| |
| (a) | | Security exempt from registration pursuant to Regulation S under the Securities Act of 1933, as amended. Regulation S applies to securities offerings that are made outside of the United States and do not involve direct selling efforts in the United States and as such may have restrictions on resale. |
| | |
| (b) | | The security or a portion of this security is on loan at October 31, 2019. The total value of securities on loan at October 31, 2019 is $1,106,394. |
| (c) | | Investment in an affiliated fund, which is registered under the Investment Company Act of 1940, as amended, and is advised by J.P. Morgan Investment Management Inc. |
| (d) | | The rate shown is the current yield as of October 31, 2019. |
| * | | Non-income producing security. |
| ‡ | | Value determined using significant unobservable inputs. |
| | | | | | | | | | | | | | | | | | | | |
| Futures contracts outstanding as of October 31, 2019: | |
| DESCRIPTION | | NUMBER OF
CONTRACTS | | | EXPIRATION
DATE | | | TRADING
CURRENCY | | | NOTIONAL
AMOUNT($) | | | VALUE AND
UNREALIZED
APPRECIATION
(DEPRECIATION)($) | |
Long Contracts | | | | | | | | | | | | | | | | | | | | |
MSCI Emerging MarketsE-Mini Index | | | 21 | | | | 12/2019 | | | | USD | | | | 1,093,680 | | | | 22,206 | |
| | | | | | | | | | | | | | | | | | | | |
Abbreviations
| | |
| MSCI | | Morgan Stanley Capital International |
| USD | | United States Dollar |
SEE NOTES TO FINANCIAL STATEMENTS.
| | | | | | | | |
| | | |
| OCTOBER 31, 2019 | | J.P. MORGAN EXCHANGE-TRADED FUNDS | | | | | 93 | |
JPMorgan Diversified Return Europe Equity ETF
SCHEDULE OF PORTFOLIO INVESTMENTS
AS OF OCTOBER 31, 2019
| | | | | | | | |
| INVESTMENTS | | SHARES | | | VALUE($) | |
Common Stocks — 97.9% | |
|
Australia — 0.7% | |
| | |
BHP Group plc | | | 2,817 | | | | 59,750 | |
| | |
Rio Tinto plc | | | 1,112 | | | | 57,893 | |
| | | | | | | | |
| | |
| | | | | | | 117,643 | |
| | | | | | | | |
|
Austria — 0.7% | |
| | |
OMV AG | | | 1,252 | | | | 73,194 | |
| | |
Verbund AG | | | 1,068 | | | | 57,859 | |
| | | | | | | | |
| | |
| | | | | | | 131,053 | |
| | | | | | | | |
|
Belgium — 1.9% | |
| | |
Ageas | | | 1,076 | | | | 62,054 | |
| | |
Colruyt SA | | | 932 | | | | 51,807 | |
| | |
Groupe Bruxelles Lambert SA | | | 26 | | | | 2,612 | |
| | |
Proximus SADP | | | 2,163 | | | | 66,470 | |
| | |
Solvay SA | | | 588 | | | | 63,931 | |
| | |
Telenet Group Holding NV* | | | 306 | | | | 15,034 | |
| | |
UCB SA | | | 819 | | | | 66,010 | |
| | | | | | | | |
| | |
| | | | | | | 327,918 | |
| | | | | | | | |
|
Chile — 0.3% | |
| | |
Antofagasta plc | | | 5,287 | | | | 59,546 | |
| | | | | | | | |
|
Denmark — 3.7% | |
| | |
Carlsberg A/S, Class B | | | 432 | | | | 60,836 | |
| | |
Chr Hansen Holding A/S | | | 601 | | | | 46,142 | |
| | |
Coloplast A/S, Class B | | | 535 | | | | 64,412 | |
| | |
Drilling Co. of 1972 A/S (The)* | | | 278 | | | | 15,693 | |
| | |
DSV Panalpina A/S | | | 643 | | | | 62,493 | |
| | |
GN Store Nord A/S | | | 1,019 | | | | 44,829 | |
| | |
H Lundbeck A/S | | | 1,561 | | | | 53,340 | |
| | |
Novo Nordisk A/S, Class B | | | 1,240 | | | | 68,186 | |
| | |
Novozymes A/S, Class B | | | 1,088 | | | | 51,288 | |
| | |
Orsted A/S (a) | | | 667 | | | | 58,544 | |
| | |
Rockwool International A/S, Class B | | | 38 | | | | 7,468 | |
| | |
Tryg A/S | | | 1,639 | | | | 45,812 | |
| | |
Vestas Wind Systems A/S | | | 727 | | | | 59,227 | |
| | | | | | | | |
| | |
| | | | | | | 638,270 | |
| | | | | | | | |
| | |
Finland — 3.8% | | | | | | | | |
| | |
Elisa OYJ | | | 1,265 | | | | 69,090 | |
| | |
Fortum OYJ | | | 2,812 | | | | 68,719 | |
| | |
Kesko OYJ, Class B | | | 916 | | | | 61,031 | |
| | |
Kone OYJ, Class B | | | 1,103 | | | | 70,234 | |
| | |
Neste OYJ | | | 2,020 | | | | 72,988 | |
| | |
Nokia OYJ | | | 9,319 | | | | 34,210 | |
| | |
Orion OYJ, Class B | | | 1,714 | | | | 76,041 | |
| | |
Sampo OYJ, Class A | | | 1,371 | | | | 56,183 | |
| | |
Stora Enso OYJ, Class R | | | 3,696 | | | | 48,017 | |
| | | | | | | | |
| INVESTMENTS | | SHARES | | | VALUE($) | |
| | | | | | | | |
|
Finland — continued | |
| | |
UPM-Kymmene OYJ | | | 2,364 | | | | 76,994 | |
| | |
Wartsila OYJ Abp | | | 2,170 | | | | 22,926 | |
| | | | | | | | |
| | |
| | | | | | | 656,433 | |
| | | | | | | | |
|
France — 15.0% | |
| | |
Air France-KLM* | | | 5,441 | | | | 64,859 | |
| | |
Air Liquide SA | | | 507 | | | | 67,411 | |
| | |
Arkema SA | | | 509 | | | | 52,090 | |
| | |
Atos SE | | | 580 | | | | 45,012 | |
| | |
AXA SA | | | 1,061 | | | | 28,086 | |
| | |
BioMerieux | | | 212 | | | | 17,360 | |
| | |
Bouygues SA | | | 708 | | | | 30,032 | |
| | |
Bureau Veritas SA | | | 682 | | | | 17,436 | |
| | |
Capgemini SE | | | 531 | | | | 59,860 | |
| | |
Casino Guichard Perrachon SA (b) | | | 1,199 | | | | 64,683 | |
| | |
Cie Generale des Etablissements Michelin SCA | | | 462 | | | | 56,252 | |
| | |
Cie Plastic Omnium SA | | | 512 | | | | 13,986 | |
| | |
CNP Assurances | | | 1,170 | | | | 23,224 | |
| | |
Covivio, REIT | | | 515 | | | | 58,323 | |
| | |
Danone SA | | | 716 | | | | 59,314 | |
| | |
Dassault Aviation SA | | | 22 | | | | 30,561 | |
| | |
Dassault Systemes SE | | | 396 | | | | 60,143 | |
| | |
Edenred | | | 1,079 | | | | 56,872 | |
| | |
Eiffage SA | | | 482 | | | | 51,770 | |
| | |
Electricite de France SA | | | 1,087 | | | | 11,230 | |
| | |
Engie SA | | | 4,184 | | | | 70,060 | |
| | |
EssilorLuxottica SA | | | 418 | | | | 63,826 | |
| | |
Eurazeo SE | | | 162 | | | | 11,304 | |
| | |
Eutelsat Communications SA | | | 3,557 | | | | 67,476 | |
| | |
Faurecia SE | | | 636 | | | | 29,681 | |
| | |
Gecina SA, REIT | | | 314 | | | | 53,904 | |
| | |
Hermes International | | | 79 | | | | 56,908 | |
| | |
Imerys SA | | | 448 | | | | 17,306 | |
| | |
Ingenico Group SA | | | 642 | | | | 68,650 | |
| | |
Ipsen SA | | | 137 | | | | 14,603 | |
| | |
Kering SA | | | 122 | | | | 69,418 | |
| | |
Klepierre SA, REIT | | | 526 | | | | 19,607 | |
| | |
Lagardere SCA | | | 1,557 | | | | 34,792 | |
| | |
Legrand SA | | | 671 | | | | 52,421 | |
| | |
L’Oreal SA | | | 235 | | | | 68,635 | |
| | |
LVMH Moet Hennessy Louis Vuitton SE | | | 162 | | | | 69,183 | |
| | |
Natixis SA | | | 1,570 | | | | 7,213 | |
| | |
Orange SA | | | 3,729 | | | | 60,016 | |
| | |
Pernod Ricard SA | | | 335 | | | | 61,886 | |
| | |
Peugeot SA | | | 2,890 | | | | 73,192 | |
| | |
Publicis Groupe SA | | | 997 | | | | 42,909 | |
SEE NOTES TO FINANCIAL STATEMENTS.
| | | | | | |
| | | |
| 94 | | | | J.P. MORGAN EXCHANGE-TRADED FUNDS | | OCTOBER 31, 2019 |
| | | | | | | | |
| INVESTMENTS | | SHARES | | | VALUE($) | |
Common Stocks — continued | |
|
France — continued | |
| | |
Safran SA | | | 441 | | | | 69,850 | |
| | |
Sanofi | | | 751 | | | | 69,233 | |
| | |
Sartorius Stedim Biotech | | | 411 | | | | 61,573 | |
| | |
Schneider Electric SE | | | 679 | | | | 63,107 | |
| | |
SCOR SE | | | 615 | | | | 25,940 | |
| | |
SEB SA | | | 47 | | | | 7,142 | |
| | |
Societe BIC SA | | | 293 | | | | 20,342 | |
| | |
Sodexo SA | | | 563 | | | | 61,912 | |
| | |
Suez | | | 1,667 | | | | 26,001 | |
| | |
Thales SA | | | 32 | | | | 3,128 | |
| | |
TOTAL SA | | | 1,211 | | | | 64,023 | |
| | |
Ubisoft Entertainment SA* | | | 503 | | | | 29,727 | |
| | |
Valeo SA | | | 1,086 | | | | 40,443 | |
| | |
Veolia Environnement SA | | | 2,664 | | | | 70,127 | |
| | |
Vinci SA (b) | | | 470 | | | | 52,732 | |
| | |
Vivendi SA | | | 1,714 | | | | 47,731 | |
| | | | | | | | |
| | |
| | | | | | | 2,594,505 | |
| | | | | | | | |
|
Germany — 12.5% | |
| | |
adidas AG | | | 217 | | | | 67,003 | |
| | |
Allianz SE (Registered) | | | 220 | | | | 53,729 | |
| | |
Aroundtown SA | | | 4,312 | | | | 36,448 | |
| | |
Axel Springer SE* | | | 740 | | | | 51,583 | |
| | |
BASF SE | | | 824 | | | | 62,640 | |
| | |
Bayer AG (Registered) | | | 717 | | | | 55,622 | |
| | |
Carl Zeiss Meditec AG | | | 552 | | | | 60,170 | |
| | |
Covestro AG (a) | | | 868 | | | | 41,683 | |
| | |
Deutsche Boerse AG | | | 270 | | | | 41,812 | |
| | |
Deutsche Lufthansa AG (Registered) | | | 2,579 | | | | 44,677 | |
| | |
Deutsche Post AG (Registered) | | | 992 | | | | 35,142 | |
| | |
Deutsche Telekom AG (Registered) | | | 3,690 | | | | 64,928 | |
| | |
Deutsche Wohnen SE | | | 1,178 | | | | 44,413 | |
| | |
E.ON SE | | | 6,208 | | | | 62,604 | |
| | |
Evonik Industries AG | | | 1,611 | | | | 42,456 | |
| | |
Fielmann AG | | | 429 | | | | 33,085 | |
| | |
Fraport AG Frankfurt Airport Services Worldwide | | | 245 | | | | 20,478 | |
| | |
Fresenius Medical Care AG & Co. KGaA | | | 707 | | | | 51,031 | |
| | |
Fresenius SE & Co. KGaA | | | 881 | | | | 46,389 | |
| | |
FUCHS PETROLUB SE (Preference) | | | 315 | | | | 13,420 | |
| | |
Hannover Rueck SE | | | 300 | | | | 53,161 | |
| | |
Hella GmbH & Co. KGaA | | | 380 | | | | 18,485 | |
| | |
Henkel AG & Co. KGaA (Preference) | | | 551 | | | | 57,234 | |
| | |
HOCHTIEF AG | | | 128 | | | | 15,993 | |
| | |
HUGO BOSS AG | | | 600 | | | | 25,297 | |
| | |
Infineon Technologies AG | | | 2,822 | | | | 54,659 | |
| | |
LEG Immobilien AG | | | 494 | | | | 56,743 | |
| | | | | | | | |
| INVESTMENTS | | SHARES | | | VALUE($) | |
| | |
| | | | | | | | |
|
Germany — continued | |
| | |
Merck KGaA | | | 596 | | | | 71,083 | |
| | |
METRO AG | | | 2,884 | | | | 47,094 | |
| | |
MTU Aero Engines AG | | | 234 | | | | 62,579 | |
| | |
Muenchener Rueckversicherungs-Gesellschaft AG (Registered) | | | 200 | | | | 55,568 | |
| | |
Porsche Automobil Holding SE (Preference) | | | 1,036 | | | | 76,281 | |
| | |
ProSiebenSat.1 Media SE | | | 3,625 | | | | 53,529 | |
| | |
Puma SE | | | 250 | | | | 18,807 | |
| | |
RWE AG | | | 2,238 | | | | 68,202 | |
| | |
SAP SE | | | 524 | | | | 69,431 | |
| | |
Scout24 AG (a) | | | 807 | | | | 50,023 | |
| | |
Siemens AG (Registered) | | | 346 | | | | 39,928 | |
| | |
Siemens Healthineers AG (a) | | | 1,610 | | | | 68,405 | |
| | |
Symrise AG | | | 581 | | | | 55,838 | |
| | |
Talanx AG | | | 708 | | | | 32,631 | |
| | |
Telefonica Deutschland Holding AG | | | 18,738 | | | | 59,456 | |
| | |
Uniper SE | | | 328 | | | | 10,223 | |
| | |
Volkswagen AG (Preference) | | | 202 | | | | 38,401 | |
| | |
Vonovia SE | | | 1,225 | | | | 65,237 | |
| | | | | | | | |
| | |
| | | | | | | 2,153,601 | |
| | | | | | | | |
|
Ireland — 0.5% | |
| | |
Flutter Entertainment plc | | | 581 | | | | 59,921 | |
| | |
Smurfit Kappa Group plc | | | 952 | | | | 31,795 | |
| | | | | | | | |
| | |
| | | | | | | 91,716 | |
| | | | | | | | |
| | |
Italy — 6.0% | | | | | | | | |
| | |
A2A SpA | | | 36,189 | | | | 72,649 | |
| | |
Assicurazioni Generali SpA | | | 3,301 | | | | 66,936 | |
| | |
Atlantia SpA | | | 1,901 | | | | 46,966 | |
| | |
DiaSorin SpA | | | 537 | | | | 60,547 | |
| | |
Enel SpA | | | 8,848 | | | | 68,575 | |
| | |
Eni SpA | | | 3,865 | | | | 58,636 | |
| | |
Hera SpA | | | 9,522 | | | | 40,790 | |
| | |
Infrastrutture Wireless Italiane SpA (a) | | | 863 | | | | 8,855 | |
| | |
Intesa Sanpaolo SpA | | | 21,911 | | | | 54,905 | |
| | |
Italgas SpA | | | 9,808 | | | | 63,141 | |
| | |
Mediaset SpA* | | | 3,504 | | | | 10,480 | |
| | |
Mediobanca Banca di Credito Finanziario SpA | | | 4,822 | | | | 57,340 | |
| | |
Moncler SpA | | | 1,444 | | | | 55,722 | |
| | |
Poste Italiane SpA (a) | | | 5,924 | | | | 71,955 | |
| | |
Recordati SpA | | | 1,452 | | | | 61,019 | |
| | |
Saipem SpA* | | | 10,983 | | | | 49,852 | |
| | |
Snam SpA | | | 12,577 | | | | 64,569 | |
| | |
Terna Rete Elettrica Nazionale SpA | | | 10,144 | | | | 67,046 | |
| | |
UnipolSai Assicurazioni SpA | | | 18,835 | | | | 52,568 | |
| | | | | | | | |
| | |
| | | | | | | 1,032,551 | |
| | | | | | | | |
SEE NOTES TO FINANCIAL STATEMENTS.
| | | | | | | | |
| | | |
| OCTOBER 31, 2019 | | J.P. MORGAN EXCHANGE-TRADED FUNDS | | | | | 95 | |
JPMorgan Diversified Return Europe Equity ETF
SCHEDULE OF PORTFOLIO INVESTMENTS
AS OF OCTOBER 31, 2019 (continued)
| | | | | | | | |
| INVESTMENTS | | SHARES | | | VALUE($) | |
Common Stocks — continued | |
|
Jordan — 0.4% | |
| | |
Hikma Pharmaceuticals plc | | | 2,595 | | | | 67,581 | |
| | | | | | | | |
|
Kazakhstan — 0.2% | |
| | |
KAZ Minerals plc | | | 6,688 | | | | 40,872 | |
| | | | | | | | |
|
Luxembourg — 0.8% | |
| | |
RTL Group SA | | | 784 | | | | 39,837 | |
| | |
SES SA, FDR | | | 3,275 | | | | 63,486 | |
| | |
Tenaris SA | | | 3,021 | | | | 30,648 | |
| | | | | | | | |
| | |
| | | | | | | 133,971 | |
| | | | | | | | |
| | |
Netherlands — 4.6% | | | | | | | | |
| | |
Aalberts NV | | | 488 | | | | 19,665 | |
| | |
ABN AMRO Bank NV, CVA (a) | | | 728 | | | | 13,570 | |
| | |
Aegon NV | | | 8,784 | | | | 38,108 | |
| | |
Akzo Nobel NV | | | 712 | | | | 65,642 | |
| | |
ASML Holding NV | | | 300 | | | | 78,634 | |
| | |
ASR Nederland NV | | | 1,182 | | | | 43,330 | |
| | |
Heineken Holding NV | | | 549 | | | | 52,383 | |
| | |
Heineken NV | | | 417 | | | | 42,584 | |
| | |
Koninklijke Ahold Delhaize NV | | | 2,632 | | | | 65,590 | |
| | |
Koninklijke DSM NV | | | 513 | | | | 60,887 | |
| | |
Koninklijke KPN NV | | | 20,117 | | | | 62,451 | |
| | |
Koninklijke Philips NV | | | 1,358 | | | | 59,581 | |
| | |
NN Group NV | | | 1,280 | | | | 48,841 | |
| | |
Randstad NV | | | 62 | | | | 3,441 | |
| | |
Royal Dutch Shell plc, Class B | | | 2,365 | | | | 68,111 | |
| | |
Wolters Kluwer NV | | | 885 | | | | 65,183 | |
| | | | | | | | |
| | |
| | | | | | | 788,001 | |
| | | | | | | | |
| | |
Norway — 2.4% | | | | | | | | |
| | |
Aker BP ASA | | | 2,399 | | | | 66,542 | |
| | |
DNB ASA | | | 2,592 | | | | 47,193 | |
| | |
Equinor ASA | | | 2,927 | | | | 54,342 | |
| | |
Gjensidige Forsikring ASA | | | 1,951 | | | | 36,474 | |
| | |
Mowi ASA | | | 2,665 | | | | 65,058 | |
| | |
Orkla ASA | | | 3,482 | | | | 33,468 | |
| | |
Salmar ASA | | | 783 | | | | 36,541 | |
| | |
Schibsted ASA, Class A | | | 496 | | | | 14,567 | |
| | |
Telenor ASA | | | 3,145 | | | | 58,861 | |
| | | | | | | | |
| | |
| | | | | | | 413,046 | |
| | | | | | | | |
| | |
Poland — 0.9% | | | | | | | | |
| | |
Grupa Lotos SA | | | 2,041 | | | | 50,970 | |
| | |
Polski Koncern Naftowy ORLEN SA | | | 2,311 | | | | 63,190 | |
| | |
Polskie Gornictwo Naftowe i Gazownictwo SA | | | 30,072 | | | | 37,049 | |
| | | | | | | | |
| | |
| | | | | | | 151,209 | |
| | | | | | | | |
| | | | | | | | |
| INVESTMENTS | | SHARES | | | VALUE($) | |
| | | | | | | | |
|
Portugal — 0.7% | |
| | |
EDP — Energias de Portugal SA | | | 16,847 | | | | 69,397 | |
| | |
Galp Energia SGPS SA | | | 1,307 | | | | 20,905 | |
| | |
Jeronimo Martins SGPS SA | | | 2,056 | | | | 34,548 | |
| | | | | | | | |
| | |
| | | | | | | 124,850 | |
| | | | | | | | |
|
Russia — 0.6% | |
| | |
Evraz plc | | | 8,441 | | | | 40,280 | |
| | |
Polymetal International plc | | | 4,424 | | | | 72,764 | |
| | | | | | | | |
| | |
| | | | | | | 113,044 | |
| | | | | | | | |
|
South Africa — 0.4% | |
| | |
Anglo American plc | | | 2,640 | | | | 67,946 | |
| | | | | | | | |
|
Spain — 5.3% | |
| | |
Acciona SA | | | 305 | | | | 31,774 | |
| | |
ACS Actividades de Construccion y Servicios SA | | | 1,395 | | | | 56,606 | |
| | |
Aena SME SA (a) | | | 173 | | | | 31,756 | |
| | |
Amadeus IT Group SA | | | 789 | | | | 58,369 | |
| | |
Cellnex Telecom SA* (a) | | | 1,180 | | | | 50,916 | |
| | |
Enagas SA | | | 2,913 | | | | 72,081 | |
| | |
Endesa SA | | | 2,478 | | | | 67,488 | |
| | |
Grifols SA | | | 2,012 | | | | 64,908 | |
| | |
Iberdrola SA | | | 6,243 | | | | 64,172 | |
| | |
Industria de Diseno Textil SA | | | 1,660 | | | | 51,727 | |
| | |
Inmobiliaria Colonial Socimi SA, REIT | | | 1,004 | | | | 12,974 | |
| | |
Merlin Properties Socimi SA, REIT | | | 3,887 | | | | 57,220 | |
| | |
Naturgy Energy Group SA | | | 2,430 | | | | 66,206 | |
| | |
Red Electrica Corp. SA | | | 3,191 | | | | 64,131 | |
| | |
Repsol SA | | | 4,086 | | | | 67,336 | |
| | |
Siemens Gamesa Renewable Energy SA | | | 3,334 | | | | 45,899 | |
| | |
Telefonica SA | | | 7,123 | | | | 54,700 | |
| | | | | | | | |
| | |
| | | | | | | 918,263 | |
| | | | | | | | |
| | |
Sweden — 7.6% | | | | | | | | |
| | |
Alfa Laval AB | | | 1,154 | | | | 26,710 | |
| | |
Atlas Copco AB, Class A | | | 1,617 | | | | 57,075 | |
| | |
Boliden AB | | | 2,639 | | | | 71,167 | |
| | |
Castellum AB | | | 2,239 | | | | 45,755 | |
| | |
Elekta AB, Class B | | | 4,822 | | | | 67,175 | |
| | |
Essity AB, Class B | | | 2,047 | | | | 63,950 | |
| | |
Fastighets AB Balder, Class B* | | | 966 | | | | 37,466 | |
| | |
Hennes & Mauritz AB, Class B | | | 3,332 | | | | 69,837 | |
| | |
Hexagon AB, Class B | | | 1,203 | | | | 61,591 | |
| | |
ICA Gruppen AB | | | 1,299 | | | | 57,483 | |
| | |
Industrivarden AB, Class C | | | 1,866 | | | | 40,430 | |
| | |
Investor AB, Class B | | | 691 | | | | 35,451 | |
| | |
Lundin Petroleum AB | | | 2,095 | | | | 69,382 | |
| | |
Sandvik AB | | | 3,200 | | | | 56,535 | |
SEE NOTES TO FINANCIAL STATEMENTS.
| | | | | | |
| | | |
| 96 | | | | J.P. MORGAN EXCHANGE-TRADED FUNDS | | OCTOBER 31, 2019 |
| | | | | | | | |
| INVESTMENTS | | SHARES | | | VALUE($) | |
Common Stocks — continued | |
|
Sweden — continued | |
| | |
Securitas AB, Class B | | | 2,346 | | | | 37,565 | |
| | |
Skandinaviska Enskilda Banken AB, Class A | | | 7,280 | | | | 69,825 | |
| | |
Skanska AB, Class B | | | 1,835 | | | | 39,098 | |
| | |
SKF AB, Class B | | | 1,298 | | | | 23,502 | |
| | |
Svenska Cellulosa AB SCA, Class B | | | 5,360 | | | | 54,694 | |
| | |
Swedbank AB, Class A | | | 2,851 | | | | 39,952 | |
| | |
Swedish Match AB | | | 676 | | | | 31,757 | |
| | |
Swedish Orphan Biovitrum AB* | | | 1,589 | | | | 25,199 | |
| | |
Tele2 AB, Class B | | | 4,647 | | | | 66,523 | |
| | |
Telefonaktiebolaget LM Ericsson, Class B | | | 6,678 | | | | 58,358 | |
| | |
Telia Co. AB | | | 13,658 | | | | 60,080 | |
| | |
Trelleborg AB, Class B | | | 1,484 | | | | 23,997 | |
| | |
Volvo AB, Class B | | | 1,812 | | | | 27,154 | |
| | | | | | | | |
| | |
| | | | | | | 1,317,711 | |
| | | | | | | | |
|
Switzerland — 8.9% | |
| | |
ABB Ltd. (Registered) | | | 1,516 | | | | 31,836 | |
| | |
Adecco Group AG (Registered) | | | 374 | | | | 22,233 | |
| | |
Alcon, Inc.* | | | 404 | | | | 23,892 | |
| | |
Baloise Holding AG (Registered) | | | 198 | | | | 36,621 | |
| | |
Banque Cantonale Vaudoise (Registered) | | | 20 | | | | 15,682 | |
| | |
Barry Callebaut AG (Registered) | | | 1 | | | | 2,113 | |
| | |
Clariant AG (Registered)* | | | 547 | | | | 11,220 | |
| | |
EMS-Chemie Holding AG (Registered) | | | 94 | | | | 58,891 | |
| | |
Flughafen Zurich AG (Registered) | | | 68 | | | | 12,253 | |
| | |
Geberit AG (Registered) | | | 144 | | | | 73,165 | |
| | |
Georg Fischer AG (Registered) | | | 28 | | | | 26,742 | |
| | |
Givaudan SA (Registered) | | | 24 | | | | 70,511 | |
| | |
Glencore plc* | | | 16,451 | | | | 49,655 | |
| | |
Helvetia Holding AG (Registered) | | | 172 | | | | 24,160 | |
| | |
Logitech International SA (Registered) | | | 1,400 | | | | 57,466 | |
| | |
Lonza Group AG (Registered)* | | | 181 | | | | 65,238 | |
| | |
Nestle SA (Registered) | | | 596 | | | | 63,761 | |
| | |
Novartis AG (Registered) | | | 729 | | | | 63,697 | |
| | |
OC Oerlikon Corp. AG (Registered) | | | 1,502 | | | | 15,414 | |
| | |
Pargesa Holding SA | | | 293 | | | | 23,161 | |
| | |
Partners Group Holding AG | | | 49 | | | | 38,292 | |
| | |
PSP Swiss Property AG (Registered) | | | 360 | | | | 47,651 | |
| | |
Roche Holding AG | | | 240 | | | | 72,229 | |
| | |
Schindler Holding AG | | | 237 | | | | 58,064 | |
| | |
SGS SA (Registered) | | | 22 | | | | 57,378 | |
| | |
Sika AG (Registered) | | | 353 | | | | 60,683 | |
| | |
Sonova Holding AG (Registered) | | | 275 | | | | 63,107 | |
| | |
STMicroelectronics NV | | | 2,100 | | | | 47,662 | |
| | |
Swiss Life Holding AG (Registered) | | | 135 | | | | 67,610 | |
| | |
Swiss Prime Site AG (Registered)* | | | 481 | | | | 49,578 | |
| | | | | | | | |
| INVESTMENTS | | SHARES | | | VALUE($) | |
| | | | | | | | |
|
Switzerland — continued | |
| | |
Swiss Re AG | | | 261 | | | | 27,376 | |
| | |
Swisscom AG (Registered) | | | 128 | | | | 65,471 | |
| | |
Temenos AG (Registered)* | | | 361 | | | | 51,649 | |
| | |
Vifor Pharma AG | | | 45 | | | | 7,087 | |
| | |
Zurich Insurance Group AG | | | 181 | | | | 70,898 | |
| | | | | | | | |
| | |
| | | | | | | 1,532,446 | |
| | | | | | | | |
| | |
United Kingdom — 19.3% | | | | | | | | |
| | |
3i Group plc | | | 3,587 | | | | 52,416 | |
| | |
Admiral Group plc | | | 525 | | | | 13,740 | |
| | |
AstraZeneca plc | | | 728 | | | | 70,993 | |
| | |
Auto Trader Group plc (a) | | | 8,276 | | | | 60,301 | |
| | |
AVEVA Group plc | | | 1,061 | | | | 57,490 | |
| | |
Barratt Developments plc | | | 8,281 | | | | 67,720 | |
| | |
Bellway plc | | | 1,705 | | | | 69,785 | |
| | |
Berkeley Group Holdings plc | | | 1,254 | | | | 71,477 | |
| | |
BP plc | | | 9,510 | | | | 60,306 | |
| | |
British American Tobacco plc | | | 1,618 | | | | 56,591 | |
| | |
BT Group plc | | | 23,768 | | | | 63,077 | |
| | |
Bunzl plc | | | 1,957 | | | | 50,911 | |
| | |
Burberry Group plc | | | 2,421 | | | | 64,198 | |
| | |
Compass Group plc | | | 2,526 | | | | 67,252 | |
| | |
ConvaTec Group plc (a) | | | 30,000 | | | | 76,642 | |
| | |
Croda International plc | | | 979 | | | | 61,082 | |
| | |
Diageo plc | | | 1,521 | | | | 62,256 | |
| | |
Experian plc | | | 2,148 | | | | 67,708 | |
| | |
Fiat Chrysler Automobiles NV | | | 2,464 | | | | 38,238 | |
| | |
GlaxoSmithKline plc | | | 3,104 | | | | 71,097 | |
| | |
IMI plc | | | 1,538 | | | | 20,000 | |
| | |
Imperial Brands plc | | | 1,082 | | | | 23,734 | |
| | |
Inchcape plc | | | 3,662 | | | | 30,616 | |
| | |
Informa plc | | | 5,210 | | | | 52,367 | |
| | |
InterContinental Hotels Group plc | | | 303 | | | | 18,336 | |
| | |
International Consolidated Airlines Group SA | | | 6,406 | | | | 44,096 | |
| | |
Intertek Group plc | | | 654 | | | | 45,346 | |
| | |
ITV plc | | | 22,625 | | | | 39,249 | |
| | |
J Sainsbury plc | | | 16,106 | | | | 42,444 | |
| | |
JD Sports Fashion plc | | | 2,348 | | | | 23,357 | |
| | |
Johnson Matthey plc | | | 1,154 | | | | 45,845 | |
| | |
Kingfisher plc | | | 12,584 | | | | 33,758 | |
| | |
Legal & General Group plc | | | 15,504 | | | | 52,998 | |
| | |
Marks & Spencer Group plc | | | 12,387 | | | | 29,181 | |
| | |
Meggitt plc | | | 7,305 | | | | 59,107 | |
| | |
Merlin Entertainments plc (a) | | | 3,482 | | | | 20,514 | |
| | |
Micro Focus International plc | | | 3,149 | | | | 43,221 | |
| | |
Mondi plc | | | 2,444 | | | | 50,674 | |
SEE NOTES TO FINANCIAL STATEMENTS.
| | | | | | | | |
| | | |
| OCTOBER 31, 2019 | | J.P. MORGAN EXCHANGE-TRADED FUNDS | | | | | 97 | |
JPMorgan Diversified Return Europe Equity ETF
SCHEDULE OF PORTFOLIO INVESTMENTS
AS OF OCTOBER 31, 2019 (continued)
| | | | | | | | |
| INVESTMENTS | | SHARES | | | VALUE($) | |
Common Stocks — continued | |
|
United Kingdom — continued | |
| | |
National Grid plc | | | 5,915 | | | | 69,160 | |
| | |
Next plc | | | 887 | | | | 75,649 | |
| | |
Pearson plc | | | 5,855 | | | | 51,709 | |
| | |
Pennon Group plc | | | 2,534 | | | | 29,483 | |
| | |
Persimmon plc | | | 2,036 | | | | 60,054 | |
| | |
Phoenix Group Holdings plc | | | 1,488 | | | | 13,592 | |
| | |
Reckitt Benckiser Group plc | | | 812 | | | | 62,834 | |
| | |
RELX plc | | | 2,678 | | | | 64,474 | |
| | |
Rentokil Initial plc | | | 11,636 | | | | 68,480 | |
| | |
Rightmove plc | | | 8,580 | | | | 66,600 | |
| | |
Sage Group plc (The) | | | 6,649 | | | | 61,969 | |
| | |
Segro plc, REIT | | | 6,215 | | | | 67,988 | |
| | |
Severn Trent plc | | | 29 | | | | 847 | |
| | |
Smith & Nephew plc | | | 2,670 | | | | 57,315 | |
| | |
Smiths Group plc | | | 1,674 | | | | 34,993 | |
| | |
SSE plc | | | 4,014 | | | | 66,777 | |
| | |
Subsea 7 SA | | | 2,261 | | | | 21,241 | |
| | |
Tate & Lyle plc | | | 6,872 | | | | 59,940 | |
| | |
Taylor Wimpey plc | | | 30,022 | | | | 64,388 | |
| | |
Tesco plc | | | 17,492 | | | | 53,395 | |
| | |
Unilever NV (b) | | | 1,049 | | | | 62,003 | |
| | |
Unilever plc | | | 1,017 | | | | 60,897 | |
| | |
United Utilities Group plc | | | 6,426 | | | | 72,560 | |
| | |
Vodafone Group plc | | | 29,823 | | | | 60,860 | |
| | |
Whitbread plc | | | 1,022 | | | | 53,794 | |
| | |
Wm Morrison Supermarkets plc | | | 17,219 | | | | 44,483 | |
| | |
WPP plc | | | 4,290 | | | | 53,537 | |
| | | | | | | | |
| | |
| | | | | | | 3,337,145 | |
| | | | | | | | |
|
United States — 0.7% | |
| | |
Carnival plc | | | 862 | | | | 34,494 | |
| | |
Ferguson plc | | | 732 | | | | 62,508 | |
| | |
QIAGEN NV* | | | 670 | | | | 20,153 | |
| | | | | | | | |
| | |
| | | | | | | 117,155 | |
| | | | | | | | |
| | |
Total Common Stocks
(Cost $17,166,650) | | | | | | | 16,926,476 | |
| | | | | | | | |
| | |
| | | NO. OF RIGHTS | | | | |
Rights — 0.0% | |
|
Italy — 0.0% | |
| | |
Mediaset SpA, expiring 11/7/2019*
(Cost $—) | | | 3,504 | | | | — | |
| | | | | | | | |
| | | | | | | | |
| INVESTMENTS | | SHARES | | | VALUE($) | |
Short-Term Investments — 0.8% | |
|
Investment Companies — 0.0%(e) | |
| | |
JPMorgan U.S. Government Money Market Fund Class Institutional Shares, 1.64%(c) (d)
(Cost $119) | | | 119 | | | | 119 | |
| | | | | | | | |
|
Investment of Cash Collateral from Securities Loaned — 0.8% | |
| | |
JPMorgan U.S. Government Money Market Fund Class IM Shares, 1.70% (c) (d)
(Cost $133,278) | | | 133,278 | | | | 133,278 | |
| | | | | | | | |
| | |
TotalShort-Term Investments
(Cost $133,397) | | | | | | | 133,397 | |
| | | | | | | | |
Total Investments — 98.7%
(Cost $17,300,047) | | | | | | | 17,059,873 | |
| | |
Other Assets Less Liabilities — 1.3% | | | | | | | 221,064 | |
| | | | | | | | |
NET ASSETS — 100.0% | | | | | | | 17,280,937 | |
| | | | | | | | |
Percentages indicated are based on net assets.
Summary of Investments by Industry, October 31, 2019
The following table represents the portfolio investments of the Fund by industry classifications as a percentage of total investments:
| | | | |
| INDUSTRY | | PERCENTAGE | |
| |
Insurance | | | 6.5 | % |
| |
Chemicals | | | 5.5 | |
| |
Pharmaceuticals | | | 5.2 | |
| |
Oil, Gas & Consumable Fuels | | | 4.8 | |
| |
Diversified Telecommunication Services | | | 4.4 | |
| |
Electric Utilities | | | 4.1 | |
| |
Health Care Equipment & Supplies | | | 3.9 | |
| |
Media | | | 3.5 | |
| |
Food & Staples Retailing | | | 3.1 | |
| |
Metals & Mining | | | 3.0 | |
| |
Textiles, Apparel & Luxury Goods | | | 2.9 | |
| |
Multi-Utilities | | | 2.8 | |
| |
Machinery | | | 2.6 | |
| |
Real Estate Management & Development | | | 2.2 | |
| |
Software | | | 2.0 | |
| |
Professional Services | | | 2.0 | |
| |
Household Durables | | | 2.0 | |
| |
Food Products | | | 1.9 | |
| |
Hotels, Restaurants & Leisure | | | 1.8 | |
| |
Banks | | | 1.7 | |
| |
Beverages | | | 1.6 | |
| |
Equity Real Estate Investment Trusts (REITs) | | | 1.6 | |
| |
Gas Utilities | | | 1.6 | |
| |
Electrical Equipment | | | 1.5 | |
| |
Construction & Engineering | | | 1.4 | |
SEE NOTES TO FINANCIAL STATEMENTS.
| | | | | | |
| | | |
| 98 | | | | J.P. MORGAN EXCHANGE-TRADED FUNDS | | OCTOBER 31, 2019 |
| | | | |
| INDUSTRY | | PERCENTAGE | |
| |
Paper & Forest Products | | | 1.3 | % |
| |
Automobiles | | | 1.3 | |
| |
Aerospace & Defense | | | 1.3 | |
| |
Specialty Retail | | | 1.2 | |
| |
Personal Products | | | 1.1 | |
| |
Household Products | | | 1.1 | |
| |
Commercial Services & Supplies | | | 1.1 | |
| |
Semiconductors & Semiconductor Equipment | | | 1.1 | |
| |
Interactive Media & Services | | | 1.0 | |
| |
IT Services | | | 1.0 | |
| |
Others (each less than 1.0%) | | | 14.1 | |
| |
Short-Term Investments | | | 0.8 | |
Abbreviations
| | |
| CVA | | Dutch Certification |
| FDR | | Fiduciary Depository Receipt |
| OYJ | | Public Limited Company |
| | |
| Preference | | A special type of equity investment that shares in the earnings of the company, has limited voting rights, and may have a dividend preference. Preference shares may also have liquidation preference. |
| REIT | | Real Estate Investment Trust |
| SCA | | Limited partnership with share capital |
| SGPS | | Holding company |
| |
| (a) | | Security exempt from registration pursuant to Regulation S under the Securities Act of 1933, as amended. Regulation S applies to securities offerings that are made outside of the United States and do not involve direct selling efforts in the United States and as such may have restrictions on resale. |
| (b) | | The security or a portion of this security is on loan at October 31, 2019. The total value of securities on loan at October 31, 2019 is $125,559. |
| (c) | | Investment in an affiliated fund, which is registered under the Investment Company Act of 1940, as amended, and is advised by J.P. Morgan Investment Management Inc. |
| (d) | | The rate shown is the current yield as of October 31, 2019. |
| (e) | | Amount rounds to less than 0.1%. |
| * | | Non-income producing security. |
| | | | | | | | | | | | | | | | | | | | |
| Futures contracts outstanding as of October 31, 2019: | |
| DESCRIPTION | | NUMBER OF
CONTRACTS | | | EXPIRATION
DATE | | | TRADING
CURRENCY | | | NOTIONAL
AMOUNT($) | | | VALUE AND
UNREALIZED
APPRECIATION
(DEPRECIATION)($) | |
| |
Long Contracts | | | | | |
| | | | | |
| EURO STOXX 50 Index | | | 6 | | | | 12/2019 | | | | EUR | | | | 241,239 | | | | 6,694 | |
| | | | | |
| FTSE 100 Index | | | 1 | | | | 12/2019 | | | | GBP | | | | 93,816 | | | | (865 | ) |
| | | | | | | | | | | | | | | | | | | | |
| | | | | |
| | | | | | | | | | | | | | | | | | | 5,829 | |
| | | | | | | | | | | | | | | | | | | | |
Abbreviations
| | |
| EUR | | Euro |
| FTSE | | Financial Times and the London Stock Exchange |
| GBP | | British Pound |
SEE NOTES TO FINANCIAL STATEMENTS.
| | | | | | | | |
| | | |
| OCTOBER 31, 2019 | | J.P. MORGAN EXCHANGE-TRADED FUNDS | | | | | 99 | |
JPMorgan Diversified Return Global Equity ETF
SCHEDULE OF PORTFOLIO INVESTMENTS
AS OF OCTOBER 31, 2019
| | | | | | | | |
| INVESTMENTS | | SHARES | | | VALUE($) | |
Common Stocks — 99.3% | |
|
Australia — 9.9% | |
| | |
AGL Energy Ltd. | | | 27,068 | | | | 369,495 | |
| | |
Alumina Ltd. | | | 179,026 | | | | 279,480 | |
| | |
Ansell Ltd. | | | 15,887 | | | | 302,120 | |
| | |
APA Group | | | 37,736 | | | | 303,105 | |
| | |
Aristocrat Leisure Ltd. | | | 10,865 | | | | 236,912 | |
| | |
ASX Ltd. | | | 7,237 | | | | 410,786 | |
| | |
Aurizon Holdings Ltd. | | | 89,462 | | | | 363,953 | |
| | |
BHP Group Ltd. | | | 17,083 | | | | 418,746 | |
| | |
BlueScope Steel Ltd. | | | 3,328 | | | | 30,465 | |
| | |
Boral Ltd. | | | 18,499 | | | | 64,227 | |
| | |
Brambles Ltd. | | | 39,301 | | | | 324,903 | |
| | |
Caltex Australia Ltd. | | | 13,351 | | | | 250,980 | |
| | |
CIMIC Group Ltd. | | | 5,995 | | | | 136,619 | |
| | |
Cochlear Ltd. | | | 2,816 | | | | 410,827 | |
| | |
Coles Group Ltd. | | | 3,323 | | | | 34,389 | |
| | |
Commonwealth Bank of Australia | | | 7,765 | | | | 421,019 | |
| | |
Computershare Ltd. | | | 221 | | | | 2,412 | |
| | |
Crown Resorts Ltd. | | | 20,099 | | | | 172,663 | |
| | |
CSL Ltd. | | | 2,776 | | | | 489,565 | |
| | |
CSR Ltd. | | | 54,096 | | | | 154,629 | |
| | |
Dexus, REIT | | | 45,663 | | | | 376,559 | |
| | |
Evolution Mining Ltd. | | | 37,475 | | | | 106,893 | |
| | |
Flight Centre Travel Group Ltd. | | | 5,747 | | | | 168,828 | |
| | |
Fortescue Metals Group Ltd. | | | 76,729 | | | | 469,630 | |
| | |
Goodman Group, REIT | | | 7,932 | | | | 78,759 | |
| | |
GPT Group (The), REIT | | | 96,062 | | | | 394,309 | |
| | |
Harvey Norman Holdings Ltd. | | | 67,492 | | | | 190,430 | |
| | |
Incitec Pivot Ltd. | | | 53,032 | | | | 126,186 | |
| | |
Insurance Australia Group Ltd. | | | 11,875 | | | | 65,064 | |
| | |
Macquarie Group Ltd. | | | 3,841 | | | | 354,668 | |
| | |
Mirvac Group, REIT | | | 192,425 | | | | 426,390 | |
| | |
Newcrest Mining Ltd. | | | 11,447 | | | | 249,869 | |
| | |
Oil Search Ltd. | | | 43,884 | | | | 216,580 | |
| | |
Origin Energy Ltd. | | | 36,594 | | | | 198,393 | |
| | |
Qantas Airways Ltd. | | | 92,147 | | | | 407,579 | |
| | |
Ramsay Health Care Ltd. | | | 6,765 | | | | 319,651 | |
| | |
Rio Tinto Ltd. | | | 6,216 | | | | 388,705 | |
| | |
Rio Tinto plc | | | 5,456 | | | | 284,049 | |
| | |
Santos Ltd. | | | 62,813 | | | | 351,346 | |
| | |
Scentre Group, REIT | | | 107,885 | | | | 285,048 | |
| | |
SEEK Ltd. | | | 7,587 | | | | 118,737 | |
| | |
Sonic Healthcare Ltd. | | | 20,843 | | | | 410,503 | |
| | |
South32 Ltd. | | | 143,805 | | | | 251,649 | |
| | |
Star Entertainment Grp Ltd. (The) | | | 54,263 | | | | 175,947 | |
| | |
Suncorp Group Ltd. | | | 11,565 | | | | 107,375 | |
| | | | | | | | |
| INVESTMENTS | | SHARES | | | VALUE($) | |
| | | | | | | | |
|
Australia — continued | |
| | |
Sydney Airport | | | 55,780 | | | | 337,829 | |
| | |
Telstra Corp. Ltd. | | | 129,354 | | | | 311,542 | |
| | |
Transurban Group | | | 38,933 | | | | 398,750 | |
| | |
Treasury Wine Estates Ltd. | | | 15,643 | | | | 189,642 | |
| | |
Wesfarmers Ltd. | | | 16,269 | | | | 446,989 | |
| | |
WiseTech Global Ltd. | | | 3,491 | | | | 62,694 | |
| | |
Woodside Petroleum Ltd. | | | 19,105 | | | | 423,433 | |
| | |
Woolworths Group Ltd. | | | 16,886 | | | | 435,425 | |
| | |
Worley Ltd. | | | 15,679 | | | | 147,167 | |
| | | | | | | | |
| | |
| | | | | | | 14,453,913 | |
| | | | | | | | |
|
Austria — 0.2% | |
| | |
OMV AG | | | 5,837 | | | | 341,241 | |
| | | | | | | | |
|
Belgium — 0.9% | |
| | |
Ageas | | | 4,827 | | | | 278,377 | |
| | |
Colruyt SA | | | 4,312 | | | | 239,689 | |
| | |
Groupe Bruxelles Lambert SA | | | 2,612 | | | | 262,391 | |
| | |
Proximus SADP | | | 9,259 | | | | 284,536 | |
| | |
Solvay SA | | | 1,286 | | | | 139,822 | |
| | |
UCB SA | | | 1,939 | | | | 156,281 | |
| | | | | | | | |
| | |
| | | | | | | 1,361,096 | |
| | | | | | | | |
|
Bermuda — 0.3% | |
| | |
RenaissanceRe Holdings Ltd. | | | 2,241 | | | | 419,470 | |
| | | | | | | | |
|
Canada — 3.4% | |
| | |
Alimentation Couche-Tard, Inc., Class B | | | 2,904 | | | | 87,091 | |
| | |
BCE, Inc. | | | 8,308 | | | | 394,111 | |
| | |
Canadian Imperial Bank of Commerce | | | 633 | | | | 53,976 | |
| | |
Canadian Tire Corp. Ltd., Class A | | | 455 | | | | 49,051 | |
| | |
CGI, Inc.* | | | 2,821 | | | | 219,280 | |
| | |
Fortis, Inc. | | | 9,821 | | | | 408,022 | |
| | |
Husky Energy, Inc. | | | 15,847 | | | | 110,692 | |
| | |
Hydro One Ltd. (a) | | | 12,121 | | | | 225,376 | |
| | |
Imperial Oil Ltd. | | | 7,872 | | | | 196,038 | |
| | |
Inter Pipeline Ltd. | | | 11,367 | | | | 190,817 | |
| | |
Loblaw Cos. Ltd. | | | 5,824 | | | | 310,590 | |
| | |
Metro, Inc. | | | 9,728 | | | | 411,396 | |
| | |
National Bank of Canada | | | 4,845 | | | | 250,214 | |
| | |
Pembina Pipeline Corp. | | | 4,829 | | | | 170,010 | |
| | |
RioCan, REIT | | | 9,081 | | | | 182,227 | |
| | |
Rogers Communications, Inc., Class B | | | 5,133 | | | | 241,665 | |
| | |
Shaw Communications, Inc., Class B | | | 10,544 | | | | 215,187 | |
| | |
Suncor Energy, Inc. | | | 7,168 | | | | 213,119 | |
| | |
Teck Resources Ltd., Class B | | | 11,317 | | | | 178,893 | |
| | |
TELUS Corp. | | | 10,326 | | | | 367,302 | |
| | |
Thomson Reuters Corp. | | | 6,007 | | | | 403,674 | |
SEE NOTES TO FINANCIAL STATEMENTS.
| | | | | | |
| | | |
| 100 | | | | J.P. MORGAN EXCHANGE-TRADED FUNDS | | OCTOBER 31, 2019 |
| | | | | | | | |
| INVESTMENTS | | SHARES | | | VALUE($) | |
Common Stocks — continued | |
|
Canada — continued | |
| | |
Toronto-Dominion Bank (The) | | | 1,962 | | | | 112,036 | |
| | | | | | | | |
| | |
| | | | | | | 4,990,767 | |
| | | | | | | | |
|
Chile — 0.0% (b) | |
| | |
Antofagasta plc | | | 817 | | | | 9,202 | |
| | | | | | | | |
|
China — 0.9% | |
| | |
China Mengniu Dairy Co. Ltd.* | | | 104,000 | | | | 414,622 | |
| | |
Lenovo Group Ltd. | | | 422,000 | | | | 294,194 | |
| | |
Semiconductor Manufacturing International Corp.* | | | 294,700 | | | | 374,342 | |
| | |
Xinyi Solar Holdings Ltd. | | | 376,000 | | | | 212,454 | |
| | | | | | | | |
| | |
| | | | | | | 1,295,612 | |
| | | | | | | | |
|
Denmark — 0.7% | |
| | |
Carlsberg A/S, Class B | | | 2,522 | | | | 355,159 | |
| | |
Chr Hansen Holding A/S | | | 3,913 | | | | 300,423 | |
| | |
H Lundbeck A/S | | | 2,466 | | | | 84,265 | |
| | |
Orsted A/S (a) | | | 3,655 | | | | 320,805 | |
| | | | | | | | |
| | |
| | | | | | | 1,060,652 | |
| | | | | | | | |
|
Finland — 1.1% | |
| | |
Elisa OYJ | | | 6,918 | | | | 377,835 | |
| | |
Fortum OYJ | | | 7,848 | | | | 191,786 | |
| | |
Kesko OYJ, Class B | | | 1,385 | | | | 92,280 | |
| | |
Kone OYJ, Class B | | | 1,700 | | | | 108,249 | |
| | |
Neste OYJ | | | 12,084 | | | | 436,625 | |
| | |
Sampo OYJ, Class A | | | 2,108 | | | | 86,386 | |
| | |
Stora Enso OYJ, Class R | | | 13,881 | | | | 180,338 | |
| | |
UPM-Kymmene OYJ | | | 5,366 | | | | 174,768 | |
| | | | | | | | |
| | |
| | | | | | | 1,648,267 | |
| | | | | | | | |
|
France — 4.1% | |
| | |
Air France-KLM* | | | 7,571 | | | | 90,250 | |
| | |
Alstom SA | | | 4,223 | | | | 182,701 | |
| | |
Arkema SA | | | 2,698 | | | | 276,108 | |
| | |
Atos SE | | | 2,669 | | | | 207,132 | |
| | |
Bouygues SA | | | 3,544 | | | | 150,330 | |
| | |
Capgemini SE | | | 3,364 | | | | 379,224 | |
| | |
Casino Guichard Perrachon SA (c) | | | 4,860 | | | | 262,183 | |
| | |
Danone SA | | | 3,346 | | | | 277,187 | |
| | |
Dassault Systemes SE | | | 2,712 | | | | 411,890 | |
| | |
Eiffage SA | | | 2,802 | | | | 300,952 | |
| | |
Eutelsat Communications SA | | | 10,921 | | | | 207,171 | |
| | |
Faurecia SE | | | 2,726 | | | | 127,217 | |
| | |
Ingenico Group SA | | | 818 | | | | 87,470 | |
| | |
Lagardere SCA | | | 7,311 | | | | 163,369 | |
| | |
Orange SA | | | 18,142 | | | | 291,986 | |
| | | | | | | | |
| INVESTMENTS | | SHARES | | | VALUE($) | |
| | | | | | | | |
|
France — continued | |
| | |
Pernod Ricard SA | | | 1,915 | | | | 353,764 | |
| | |
Peugeot SA | | | 15,301 | | | | 387,515 | |
| | |
Sanofi | | | 3,360 | | | | 309,749 | |
| | |
SCOR SE | | | 3,637 | | | | 153,405 | |
| | |
Sodexo SA | | | 2,490 | | | | 273,822 | |
| | |
Thales SA | | | 2,408 | | | | 235,405 | |
| | |
TOTAL SA | | | 5,484 | | | | 289,929 | |
| | |
Vinci SA | | | 1,715 | | | | 192,417 | |
| | |
Vivendi SA | | | 10,082 | | | | 280,760 | |
| | | | | | | | |
| | |
| | | | | | | 5,891,936 | |
| | | | | | | | |
|
Germany — 2.1% | |
| | |
Covestro AG (a) | | | 2,605 | | | | 125,097 | |
| | |
Deutsche Lufthansa AG (Registered) | | | 11,399 | | | | 197,467 | |
| | |
Deutsche Telekom AG (Registered) | | | 18,146 | | | | 319,289 | |
| | |
Evonik Industries AG | | | 6,179 | | | | 162,841 | |
| | |
Fraport AG Frankfurt Airport Services Worldwide | | | 3,297 | | | | 275,572 | |
| | |
Fresenius Medical Care AG & Co. KGaA | | | 3,728 | | | | 269,086 | |
| | |
Fresenius SE & Co. KGaA | | | 4,673 | | | | 246,058 | |
| | |
Hannover Rueck SE | | | 2,594 | | | | 459,667 | |
| | |
Merck KGaA | | | 983 | | | | 117,239 | |
| | |
Muenchener Rueckversicherungs-Gesellschaft AG (Registered) | | | 745 | | | | 206,991 | |
| | |
SAP SE | | | 3,312 | | | | 438,845 | |
| | |
Telefonica Deutschland Holding AG | | | 55,019 | | | | 174,577 | |
| | |
Uniper SE (c) | | | 3,840 | | | | 119,680 | |
| | | | | | | | |
| | |
| | | | | | | 3,112,409 | |
| | | | | | | | |
|
Hong Kong — 3.6% | |
| | |
ASM Pacific Technology Ltd. | | | 25,800 | | | | 360,241 | |
| | |
Cathay Pacific Airways Ltd. | | | 74,000 | | | | 94,539 | |
| | |
CK Infrastructure Holdings Ltd. | | | 27,000 | | | | 194,312 | |
| | |
CLP Holdings Ltd. | | | 37,000 | | | | 384,261 | |
| | |
Hang Seng Bank Ltd. | | | 8,500 | | | | 177,353 | |
| | |
Henderson Land Development Co. Ltd. | | | 17,300 | | | | 86,406 | |
| | |
Hong Kong & China Gas Co. Ltd. | | | 197,531 | | | | 383,388 | |
| | |
Hutchison Port Holdings Trust | | | 476,900 | | | | 73,872 | |
| | |
Jardine Matheson Holdings Ltd. | | | 4,700 | | | | 267,952 | |
| | |
Jardine Strategic Holdings Ltd. | | | 5,200 | | | | 167,918 | |
| | |
Johnson Electric Holdings Ltd. | | | 12,500 | | | | 22,826 | |
| | |
Link, REIT | | | 35,000 | | | | 381,199 | |
| | |
MTR Corp. Ltd. | | | 67,000 | | | | 384,164 | |
| | |
New World Development Co. Ltd. | | | 253,000 | | | | 361,900 | |
| | |
PCCW Ltd. | | | 207,000 | | | | 122,940 | |
| | |
Power Assets Holdings Ltd. | | | 35,500 | | | | 253,333 | |
| | |
Sun Hung Kai Properties Ltd. | | | 15,000 | | | | 227,300 | |
SEE NOTES TO FINANCIAL STATEMENTS.
| | | | | | | | |
| | | |
| OCTOBER 31, 2019 | | J.P. MORGAN EXCHANGE-TRADED FUNDS | | | | | 101 | |
JPMorgan Diversified Return Global Equity ETF
SCHEDULE OF PORTFOLIO INVESTMENTS
AS OF OCTOBER 31, 2019 (continued)
| | | | | | | | |
| INVESTMENTS | | SHARES | | | VALUE($) | |
Common Stocks — continued | |
|
Hong Kong — continued | |
| | |
Swire Pacific Ltd., Class A | | | 30,000 | | | | 285,969 | |
| | |
Techtronic Industries Co. Ltd. | | | 43,500 | | | | 339,953 | |
| | |
WH Group Ltd. (a) | | | 409,000 | | | | 431,717 | |
| | |
Xinyi Glass Holdings Ltd. | | | 248,000 | | | | 278,836 | |
| | | | | | | | |
| | |
| | | | | | | 5,280,379 | |
| | | | | | | | |
|
Israel — 0.3% | |
| | |
Check Point Software Technologies Ltd.* | | | 3,461 | | | | 389,051 | |
| | | | | | | | |
|
Italy — 1.5% | |
| | |
Assicurazioni Generali SpA | | | 14,073 | | | | 285,365 | |
| | |
Buzzi Unicem SpA | | | 3,102 | | | | 74,847 | |
| | |
Enel SpA | | | 51,228 | | | | 397,036 | |
| | |
Eni SpA | | | 16,315 | | | | 247,515 | |
| | |
Italgas SpA | | | 47,052 | | | | 302,907 | |
| | |
Poste Italiane SpA (a) | | | 8,147 | | | | 98,957 | |
| | |
Recordati SpA | | | 5,897 | | | | 247,816 | |
| | |
Snam SpA | | | 32,658 | | | | 167,663 | |
| | |
Terna Rete Elettrica Nazionale SpA | | | 56,730 | | | | 374,952 | |
| | | | | | | | |
| | |
| | | | | | | 2,197,058 | |
| | | | | | | | |
|
Japan — 22.7% | |
| | |
Advantest Corp. | | | 10,100 | | | | 459,636 | |
| | |
Aisin Seiki Co. Ltd. | | | 2,300 | | | | 91,793 | |
| | |
ANA Holdings, Inc. | | | 8,000 | | | | 274,708 | |
| | |
Aozora Bank Ltd. | | | 6,200 | | | | 159,082 | |
| | |
Asahi Kasei Corp. | | | 7,700 | | | | 85,480 | |
| | |
Astellas Pharma, Inc. | | | 23,300 | | | | 399,891 | |
| | |
Bandai Namco Holdings, Inc. | | | 5,100 | | | | 313,595 | |
| | |
Bridgestone Corp. | | | 5,500 | | | | 228,525 | |
| | |
Brother Industries Ltd. | | | 17,800 | | | | 334,534 | |
| | |
Canon, Inc. | | | 11,600 | | | | 318,301 | |
| | |
Capcom Co. Ltd. | | | 15,800 | | | | 372,937 | |
| | |
Central Japan Railway Co. | | | 1,900 | | | | 389,755 | |
| | |
Chubu Electric Power Co., Inc. | | | 24,500 | | | | 367,555 | |
| | |
Chugai Pharmaceutical Co. Ltd. | | | 1,800 | | | | 151,480 | |
| | |
Chugoku Electric Power Co., Inc. (The) | | | 15,100 | | | | 201,159 | |
| | |
COMSYS Holdings Corp. | | | 6,300 | | | | 185,857 | |
| | |
Cosmo Energy Holdings Co. Ltd. | | | 8,400 | | | | 179,629 | |
| | |
Credit Saison Co. Ltd. | | | 8,400 | | | | 121,638 | |
| | |
Dai Nippon Printing Co. Ltd. | | | 3,900 | | | | 104,163 | |
| | |
Daiichi Sankyo Co. Ltd. | | | 6,300 | | | | 414,249 | |
| | |
Daito Trust Construction Co. Ltd. | | | 100 | | | | 13,252 | |
| | |
Daiwa Securities Group, Inc. | | | 19,800 | | | | 88,997 | |
| | |
DIC Corp. | | | 7,800 | | | | 223,432 | |
| | |
Dowa Holdings Co. Ltd. | | | 4,200 | | | | 145,002 | |
| | |
Ebara Corp. | | | 2,200 | | | | 65,090 | |
| | | | | | | | |
| INVESTMENTS | | SHARES | | | VALUE($) | |
| | | | | | | | |
|
Japan — continued | |
| | |
Electric Power Development Co. Ltd. | | | 7,200 | | | | 174,819 | |
| | |
FamilyMart Co. Ltd. | | | 13,000 | | | | 322,481 | |
| | |
Fast Retailing Co. Ltd. | | | 400 | | | | 246,677 | |
| | |
Fuji Electric Co. Ltd. | | | 5,500 | | | | 174,799 | |
| | |
FUJIFILM Holdings Corp. | | | 8,600 | | | | 377,559 | |
| | |
Fujikura Ltd. | | | 7,100 | | | | 32,944 | |
| | |
Goldwin, Inc. | | | 1,200 | | | | 91,884 | |
| | |
GungHo Online Entertainment, Inc. | | | 5,680 | | | | 123,020 | |
| | |
Hankyu Hanshin Holdings, Inc. | | | 5,900 | | | | 236,100 | |
| | |
Hikari Tsushin, Inc. | | | 1,800 | | | | 394,554 | |
| | |
Hitachi Chemical Co. Ltd. | | | 3,600 | | | | 118,511 | |
| | |
Hitachi High-Technologies Corp. | | | 5,400 | | | | 335,965 | |
| | |
Hokuriku Electric Power Co.* | | | 6,700 | | | | 47,753 | |
| | |
Honda Motor Co. Ltd. | | | 9,600 | | | | 259,718 | |
| | |
Hoya Corp. | | | 3,400 | | | | 300,483 | |
| | |
Idemitsu Kosan Co. Ltd. | | | 14,492 | | | | 425,996 | |
| | |
ITOCHU Corp. | | | 20,800 | | | | 434,884 | |
| | |
Japan Airlines Co. Ltd. | | | 11,600 | | | | 361,480 | |
| | |
Japan Petroleum Exploration Co. Ltd. | | | 4,400 | | | | 112,498 | |
| | |
Japan Post Holdings Co. Ltd. | | | 17,900 | | | | 164,308 | |
| | |
Japan Tobacco, Inc. | | | 3,300 | | | | 74,589 | |
| | |
JXTG Holdings, Inc. | | | 78,700 | | | | 367,863 | |
| | |
Kaneka Corp. | | | 4,800 | | | | 159,785 | |
| | |
Kansai Electric Power Co., Inc. (The) | | | 23,400 | | | | 272,987 | |
| | |
KDDI Corp. | | | 15,200 | | | | 420,601 | |
| | |
Keisei Electric Railway Co. Ltd. | | | 8,800 | | | | 359,792 | |
| | |
Kirin Holdings Co. Ltd. | | | 11,800 | | | | 250,329 | |
| | |
K’s Holdings Corp. | | | 13,700 | | | | 156,527 | |
| | |
Kuraray Co. Ltd. | | | 18,000 | | | | 214,152 | |
| | |
Kyowa Kirin Co. Ltd. | | | 3,900 | | | | 71,760 | |
| | |
Kyushu Electric Power Co., Inc. | | | 16,500 | | | | 164,892 | |
| | |
Lawson, Inc. | | | 1,300 | | | | 71,716 | |
| | |
Marubeni Corp. | | | 55,400 | | | | 389,910 | |
| | |
Mitsubishi Corp. | | | 15,700 | | | | 399,320 | |
| | |
Mitsubishi Gas Chemical Co., Inc. | | | 7,200 | | | | 101,570 | |
| | |
Mitsubishi Heavy Industries Ltd. | | | 8,900 | | | | 360,177 | |
| | |
Mitsubishi Tanabe Pharma Corp. | | | 13,600 | | | | 162,769 | |
| | |
Mitsui & Co. Ltd. | | | 21,700 | | | | 372,675 | |
| | |
Mitsui Chemicals, Inc. | | | 5,800 | | | | 137,932 | |
| | |
Mochida Pharmaceutical Co. Ltd. | | | 7,900 | | | | 315,272 | |
| | |
MS&AD Insurance Group Holdings, Inc. | | | 13,000 | | | | 419,786 | |
| | |
NEC Corp. | | | 4,200 | | | | 166,449 | |
| | |
NH Foods Ltd. | | | 2,100 | | | | 88,233 | |
| | |
Nihon M&A Center, Inc. | | | 7,900 | | | | 240,200 | |
| | |
Nikon Corp. | | | 18,600 | | | | 237,156 | |
SEE NOTES TO FINANCIAL STATEMENTS.
| | | | | | |
| | | |
| 102 | | | | J.P. MORGAN EXCHANGE-TRADED FUNDS | | OCTOBER 31, 2019 |
| | | | | | | | |
| INVESTMENTS | | SHARES | | | VALUE($) | |
Common Stocks — continued | |
|
Japan — continued | |
| | |
Nippon Express Co. Ltd. | | | 500 | | | | 28,528 | |
| | |
Nippon Kayaku Co. Ltd. | | | 16,400 | | | | 199,314 | |
| | |
Nippon Paper Industries Co. Ltd. | | | 14,100 | | | | 243,050 | |
| | |
Nippon Shokubai Co. Ltd. | | | 4,100 | | | | 252,818 | |
| | |
Nippon Telegraph & Telephone Corp. | | | 7,400 | | | | 367,358 | |
| | |
Nipro Corp. | | | 13,400 | | | | 157,123 | |
| | |
Nissan Chemical Corp. | | | 3,900 | | | | 160,126 | |
| | |
Nissin Foods Holdings Co. Ltd. | | | 2,200 | | | | 166,180 | |
| | |
Nomura Real Estate Holdings, Inc. | | | 15,300 | | | | 362,601 | |
| | |
Nomura Research Institute Ltd. | | | 18,600 | | | | 394,891 | |
| | |
NTT Data Corp. | | | 23,800 | | | | 312,514 | |
| | |
NTT DOCOMO, Inc. | | | 16,400 | | | | 449,608 | |
| | |
Oji Holdings Corp. | | | 40,900 | | | | 211,463 | |
| | |
Oriental Land Co. Ltd. | | | 1,700 | | | | 249,222 | |
| | |
ORIX Corp. | | | 13,800 | | | | 216,866 | |
| | |
Osaka Gas Co. Ltd. | | | 12,600 | | | | 246,389 | |
| | |
Otsuka Corp. | | | 9,300 | | | | 374,957 | |
| | |
Rakuten, Inc. | | | 29,300 | | | | 279,329 | |
| | |
Resona Holdings, Inc. | | | 66,700 | | | | 290,049 | |
| | |
Sankyo Co. Ltd. | | | 7,100 | | | | 248,483 | |
| | |
Sawai Pharmaceutical Co. Ltd. | | | 4,400 | | | | 248,278 | |
| | |
SBI Holdings, Inc. | | | 9,000 | | | | 195,735 | |
| | |
SCSK Corp. | | | 5,200 | | | | 264,703 | |
| | |
Secom Co. Ltd. | | | 2,300 | | | | 213,126 | |
| | |
Sekisui Chemical Co. Ltd. | | | 20,500 | | | | 357,433 | |
| | |
Sekisui House Ltd. | | | 23,300 | | | | 502,450 | |
| | |
Shimamura Co. Ltd. | | | 1,700 | | | | 143,995 | |
| | |
Shimizu Corp. | | | 13,000 | | | | 121,186 | |
| | |
Shin-Etsu Chemical Co. Ltd. | | | 1,100 | | | | 122,651 | |
| | |
Shionogi & Co. Ltd. | | | 7,500 | | | | 450,172 | |
| | |
Showa Denko KK | | | 11,400 | | | | 319,849 | |
| | |
Skylark Holdings Co. Ltd. (c) | | | 15,500 | | | | 281,327 | |
| | |
SoftBank Group Corp. | | | 1,600 | | | | 61,546 | |
| | |
Sojitz Corp. | | | 115,200 | | | | 362,597 | |
| | |
Sony Corp. | | | 7,400 | | | | 450,432 | |
| | |
Sumitomo Chemical Co. Ltd. | | | 38,300 | | | | 175,199 | |
| | |
Sumitomo Corp. | | | 12,700 | | | | 206,278 | |
| | |
Sumitomo Dainippon Pharma Co. Ltd. | | | 14,300 | | | | 249,580 | |
| | |
Sumitomo Mitsui Financial Group, Inc. | | | 10,300 | | | | 365,683 | |
| | |
Sumitomo Mitsui Trust Holdings, Inc. | | | 7,400 | | | | 269,696 | |
| | |
Sumitomo Osaka Cement Co. Ltd. | | | 6,400 | | | | 279,373 | |
| | |
Suzuken Co. Ltd. | | | 6,600 | | | | 352,400 | |
| | |
Taisho Pharmaceutical Holdings Co. Ltd. | | | 2,400 | | | | 170,819 | |
| | |
Teijin Ltd. | | | 14,900 | | | | 298,571 | |
| | |
Terumo Corp. | | | 14,000 | | | | 456,914 | |
| | | | | | | | |
| INVESTMENTS | | SHARES | | | VALUE($) | |
| | | | | | | | |
|
Japan — continued | |
| | |
Toho Co. Ltd. | | | 2,000 | | | | 80,771 | |
| | |
Tohoku Electric Power Co., Inc. | | | 14,000 | | | | 143,889 | |
| | |
Tokio Marine Holdings, Inc. | | | 8,100 | | | | 437,931 | |
| | |
Tokyo Broadcasting System Holdings, Inc. | | | 14,100 | | | | 224,831 | |
| | |
Tokyo Electric Power Co. Holdings, Inc.* | | | 69,800 | | | | 323,254 | |
| | |
Tokyo Gas Co. Ltd. | | | 8,500 | | | | 207,494 | |
| | |
Tokyo Tatemono Co. Ltd. | | | 14,500 | | | | 206,299 | |
| | |
Tokyu Corp. | | | 7,900 | | | | 149,418 | |
| | |
Tokyu Fudosan Holdings Corp. | | | 4,500 | | | | 29,848 | |
| | |
Toppan Printing Co. Ltd. | | | 15,800 | | | | 292,226 | |
| | |
Toyo Suisan Kaisha Ltd. | | | 8,200 | | | | 345,261 | |
| | |
Toyota Industries Corp. | | | 6,100 | | | | 366,015 | |
| | |
Toyota Motor Corp. | | | 6,500 | | | | 450,976 | |
| | |
Trend Micro, Inc. | | | 1,200 | | | | 60,569 | |
| | |
Tsumura & Co. | | | 7,100 | | | | 195,530 | |
| | |
Ube Industries Ltd. | | | 14,100 | | | | 301,898 | |
| | |
West Japan Railway Co. | | | 2,800 | | | | 243,293 | |
| | |
Yamada Denki Co. Ltd. | | | 56,400 | | | | 272,608 | |
| | |
Yokohama Rubber Co. Ltd. (The) | | | 11,900 | | | | 265,789 | |
| | | | | | | | |
| | |
| | | | | | | 33,131,377 | |
| | | | | | | | |
|
Macau — 0.7% | |
| | |
Galaxy Entertainment Group Ltd. | | | 38,000 | | | | 261,654 | |
| | |
Sands China Ltd. | | | 79,452 | | | | 391,351 | |
| | |
SJM Holdings Ltd. | | | 91,000 | | | | 97,210 | |
| | |
Wynn Macau Ltd. | | | 93,097 | | | | 202,028 | |
| | | | | | | | |
| | |
| | | | | | | 952,243 | |
| | | | | | | | |
|
Netherlands — 2.0% | |
| | |
Aegon NV | | | 34,683 | | | | 150,467 | |
| | |
Heineken Holding NV | | | 2,560 | | | | 244,264 | |
| | |
Koninklijke Ahold Delhaize NV | | | 16,180 | | | | 403,207 | |
| | |
Koninklijke DSM NV | | | 2,994 | | | | 355,352 | |
| | |
Koninklijke KPN NV | | | 108,569 | | | | 337,038 | |
| | |
Koninklijke Philips NV | | | 7,765 | | | | 340,682 | |
| | |
NN Group NV | | | 6,984 | | | | 266,488 | |
| | |
Royal Dutch Shell plc, Class A | | | 13,052 | | | | 378,353 | |
| | |
Wolters Kluwer NV | | | 5,732 | | | | 422,179 | |
| | | | | | | | |
| | |
| | | | | | | 2,898,030 | |
| | | | | | | | |
|
New Zealand — 0.4% | |
| | |
Contact Energy Ltd. | | | 36,756 | | | | 173,842 | |
| | |
Spark New Zealand Ltd. | | | 118,130 | | | | 338,875 | |
| | | | | | | | |
| | |
| | | | | | | 512,717 | |
| | | | | | | | |
|
Norway — 1.0% | |
| | |
Aker BP ASA | | | 3,365 | | | | 93,336 | |
| | |
Equinor ASA | | | 11,786 | | | | 218,815 | |
SEE NOTES TO FINANCIAL STATEMENTS.
| | | | | | | | |
| | | |
| OCTOBER 31, 2019 | | J.P. MORGAN EXCHANGE-TRADED FUNDS | | | | | 103 | |
JPMorgan Diversified Return Global Equity ETF
SCHEDULE OF PORTFOLIO INVESTMENTS
AS OF OCTOBER 31, 2019 (continued)
| | | | | | | | |
| INVESTMENTS | | SHARES | | | VALUE($) | |
Common Stocks — continued | |
|
Norway — continued | |
| | |
Mowi ASA | | | 17,276 | | | | 421,741 | |
| | |
Orkla ASA | | | 23,641 | | | | 227,234 | |
| | |
Telenor ASA | | | 16,595 | | | | 310,588 | |
| | |
Yara International ASA | | | 3,418 | | | | 133,152 | |
| | | | | | | | |
| | |
| | | | | | | 1,404,866 | |
| | | | | | | | |
|
Portugal — 0.3% | |
| | |
EDP — Energias de Portugal SA | | | 88,928 | | | | 366,315 | |
| | |
Galp Energia SGPS SA | | | 7,491 | | | | 119,817 | |
| | | | | | | | |
| | |
| | | | | | | 486,132 | |
| | | | | | | | |
|
Russia — 0.1% | |
| | |
Evraz plc | | | 14,439 | | | | 68,902 | |
| | | | | | | | |
|
Singapore — 2.0% | |
| | |
Ascendas, REIT | | | 36,000 | | | | 83,846 | |
| | |
CapitaLand Mall Trust, REIT | | | 191,900 | | | | 358,056 | |
| | |
ComfortDelGro Corp. Ltd. | | | 177,000 | | | | 298,897 | |
| | |
DBS Group Holdings Ltd. | | | 7,500 | | | | 142,957 | |
| | |
Genting Singapore Ltd. | | | 102,500 | | | | 70,716 | |
| | |
Golden Agri-Resources Ltd. | | | 513,700 | | | | 77,107 | |
| | |
Keppel Corp. Ltd. | | | 76,700 | | | | 386,214 | |
| | |
Sembcorp Industries Ltd. | | | 69,400 | | | | 116,515 | |
| | |
Singapore Airlines Ltd. | | | 28,800 | | | | 199,059 | |
| | |
Singapore Press Holdings Ltd. | | | 103,900 | | | | 169,086 | |
| | |
Singapore Telecommunications Ltd. | | | 55,100 | | | | 133,428 | |
| | |
United Overseas Bank Ltd. | | | 10,000 | | | | 196,874 | |
| | |
Venture Corp. Ltd. | | | 18,300 | | | | 212,273 | |
| | |
Wilmar International Ltd. | | | 150,100 | | | | 412,697 | |
| | | | | | | | |
| | |
| | | | | | | 2,857,725 | |
| | | | | | | | |
|
South Africa — 0.3% | |
| | |
Anglo American plc | | | 15,885 | | | | 408,834 | |
| | | | | | | | |
|
South Korea — 7.6% | |
| | |
Celltrion Healthcare Co. Ltd.* | | | 5,027 | | | | 236,659 | |
| | |
Celltrion, Inc.* | | | 2,603 | | | | 445,504 | |
| | |
CJ CheilJedang Corp. | | | 597 | | | | 117,339 | |
| | |
Doosan Infracore Co. Ltd.* | | | 16,843 | | | | 81,679 | |
| | |
Fila Korea Ltd. | | | 1,274 | | | | 62,863 | |
| | |
GS Engineering & Construction Corp. | | | 7,744 | | | | 205,028 | |
| | |
GS Holdings Corp. | | | 4,991 | | | | 212,702 | |
| | |
Hankook Tire & Technology Co. Ltd. | | | 6,594 | | | | 175,830 | |
| | |
Hanmi Pharm Co. Ltd. | | | 223 | | | | 63,787 | |
| | |
Hanmi Science Co. Ltd. | | | 2,358 | | | | 88,193 | |
| | |
Hanon Systems | | | 13,075 | | | | 130,128 | |
| | |
Hanwha Aerospace Co. Ltd.* | | | 5,125 | | | | 166,476 | |
| | |
Hanwha Chemical Corp. | | | 10,037 | | | | 140,440 | |
| | | | | | | | |
| INVESTMENTS | | SHARES | | | VALUE($) | |
| | | | | | | | |
|
South Korea — continued | |
| | |
Hyundai Construction Equipment Co. Ltd. | | | 139 | | | | 3,324 | |
| | |
Hyundai Engineering & Construction Co. Ltd. | | | 7,479 | | | | 275,549 | |
| | |
Hyundai Mobis Co. Ltd. | | | 1,912 | | | | 389,921 | |
| | |
Hyundai Motor Co. | | | 3,027 | | | | 317,061 | |
| | |
Hyundai Steel Co. | | | 2,926 | | | | 79,689 | |
| | |
Industrial Bank of Korea | | | 19,017 | | | | 192,592 | |
| | |
Kakao Corp. | | | 3,750 | | | | 455,071 | |
| | |
Kia Motors Corp. | | | 11,592 | | | | 423,657 | |
| | |
Korea Gas Corp. | | | 2,997 | | | | 101,255 | |
| | |
Korea Zinc Co. Ltd. | | | 402 | | | | 149,798 | |
| | |
Korean Air Lines Co. Ltd. | | | 9,443 | | | | 202,114 | |
| | |
KT&G Corp. | | | 4,439 | | | | 381,051 | |
| | |
LG Corp. | | | 3,810 | | | | 227,139 | |
| | |
LG Display Co. Ltd.* | | | 1,869 | | | | 21,908 | |
| | |
LG Electronics, Inc. | | | 1,201 | | | | 68,828 | |
| | |
LG Household & Health Care Ltd. | | | 275 | | | | 297,577 | |
| | |
LG Uplus Corp. | | | 26,128 | | | | 301,848 | |
| | |
Lotte Chemical Corp. | | | 705 | | | | 137,161 | |
| | |
LOTTE Fine Chemical Co. Ltd. | | | 2,224 | | | | 84,326 | |
| | |
NAVER Corp. | | | 3,419 | | | | 482,067 | |
| | |
NCSoft Corp. | | | 747 | | | | 331,516 | |
| | |
Netmarble Corp.* (a) | | | 150 | | | | 11,576 | |
| | |
POSCO | | | 1,274 | | | | 231,162 | |
| | |
Samsung Biologics Co. Ltd.* (a) | | | 1,248 | | | | 426,340 | |
| | |
Samsung Electro-Mechanics Co. Ltd. | | | 2,628 | | | | 254,428 | |
| | |
Samsung Electronics Co. Ltd. | | | 13,752 | | | | 594,359 | |
| | |
Samsung Engineering Co. Ltd.* | | | 13,650 | | | | 208,382 | |
| | |
Samsung SDS Co. Ltd. | | | 1,407 | | | | 243,012 | |
| | |
Shinsegae, Inc. | | | 430 | | | | 87,145 | |
| | |
SK Holdings Co. Ltd. | | | 1,686 | | | | 374,047 | |
| | |
SK Hynix, Inc. | | | 6,732 | | | | 473,367 | |
| | |
SK Innovation Co. Ltd. | | | 2,106 | | | | 288,176 | |
| | |
SK Telecom Co. Ltd. | | | 1,129 | | | | 230,764 | |
| | |
SKC Co. Ltd. | | | 4,315 | | | | 164,580 | |
| | |
S-Oil Corp. | | | 951 | | | | 81,245 | |
| | |
Woori Financial Group, Inc. | | | 28,745 | | | | 289,802 | |
| | |
Yuhan Corp. | | | 607 | | | | 117,009 | |
| | | | | | | | |
| | |
| | | | | | | 11,125,474 | |
| | | | | | | | |
|
Spain — 2.4% | |
| | |
Acciona SA | | | 1,654 | | | | 172,311 | |
| | |
ACS Actividades de Construccion y Servicios SA | | | 5,379 | | | | 218,270 | |
| | |
Aena SME SA (a) | | | 2,290 | | | | 420,357 | |
| | |
Amadeus IT Group SA | | | 5,281 | | | | 390,679 | |
| | |
Enagas SA | | | 12,144 | | | | 300,498 | |
| | |
Endesa SA | | | 2,878 | | | | 78,382 | |
SEE NOTES TO FINANCIAL STATEMENTS.
| | | | | | |
| | | |
| 104 | | | | J.P. MORGAN EXCHANGE-TRADED FUNDS | | OCTOBER 31, 2019 |
| | | | | | | | |
| INVESTMENTS | | SHARES | | | VALUE($) | |
Common Stocks — continued | |
|
Spain — continued | |
| | |
Grifols SA | | | 8,024 | | | | 258,859 | |
| | |
Iberdrola SA | | | 40,157 | | | | 412,774 | |
| | |
Naturgy Energy Group SA | | | 13,498 | | | | 367,754 | |
| | |
Red Electrica Corp. SA | | | 12,965 | | | | 260,565 | |
| | |
Repsol SA | | | 20,097 | | | | 331,193 | |
| | |
Telefonica SA | | | 39,734 | | | | 305,129 | |
| | | | | | | | |
| | |
| | | | | | | 3,516,771 | |
| | | | | | | | |
|
Sweden — 2.5% | |
| | |
Boliden AB | | | 9,599 | | | | 258,861 | |
| | |
Hennes & Mauritz AB, Class B | | | 14,384 | | | | 301,481 | |
| | |
Hexagon AB, Class B | | | 6,915 | | | | 354,034 | |
| | |
Investor AB, Class B | | | 7,314 | | | | 375,241 | |
| | |
Lundin Petroleum AB | | | 8,021 | | | | 265,640 | |
| | |
Securitas AB, Class B | | | 21,830 | | | | 349,545 | |
| | |
Skanska AB, Class B | | | 15,158 | | | | 322,969 | |
| | |
Svenska Cellulosa AB SCA, Class B | | | 5,393 | | | | 55,031 | |
| | |
Swedish Match AB | | | 9,024 | | | | 423,932 | |
| | |
Tele2 AB, Class B | | | 29,294 | | | | 419,348 | |
| | |
Telia Co. AB | | | 85,741 | | | | 377,167 | |
| | |
Trelleborg AB, Class B (c) | | | 9,884 | | | | 159,831 | |
| | | | | | | | |
| | |
| | | | | | | 3,663,080 | |
| | | | | | | | |
|
Switzerland — 2.2% | |
| | |
Alcon, Inc.* | | | 191 | | | | 11,295 | |
| | |
Baloise Holding AG (Registered) | | | 2,074 | | | | 383,593 | |
| | |
Barry Callebaut AG (Registered) | | | 83 | | | | 175,404 | |
| | |
Clariant AG (Registered)* | | | 7,458 | | | | 152,983 | |
| | |
Kuehne + Nagel International AG (Registered) | | | 231 | | | | 37,320 | |
| | |
LafargeHolcim Ltd. (Registered)* | | | 2,591 | | | | 133,743 | |
| | |
Logitech International SA (Registered) | | | 4,176 | | | | 171,413 | |
| | |
Lonza Group AG (Registered)* | | | 187 | | | | 67,401 | |
| | |
Novartis AG (Registered) | | | 3,396 | | | | 296,726 | |
| | |
Roche Holding AG | | | 274 | | | | 82,462 | |
| | |
Sonova Holding AG (Registered) | | | 1,781 | | | | 408,701 | |
| | |
Swiss Life Holding AG (Registered) | | | 872 | | | | 436,713 | |
| | |
Swiss Prime Site AG (Registered)* | | | 1,332 | | | | 137,292 | |
| | |
Swisscom AG (Registered) | | | 660 | | | | 337,586 | |
| | |
Vifor Pharma AG | | | 497 | | | | 78,267 | |
| | |
Zurich Insurance Group AG | | | 775 | | | | 303,568 | |
| | | | | | | | |
| | |
| | | | | | | 3,214,467 | |
| | | | | | | | |
|
United Kingdom — 4.4% | |
| | |
Auto Trader Group plc (a) | | | 21,463 | | | | 156,386 | |
| | |
Barratt Developments plc | | | 27,815 | | | | 227,466 | |
| | |
Bellway plc | | | 2,659 | | | | 108,831 | |
| | |
Berkeley Group Holdings plc | | | 1,460 | | | | 83,219 | |
| | | | | | | | |
| INVESTMENTS | | SHARES | | | VALUE($) | |
| | | | | | | | |
|
United Kingdom — continued | |
| | |
BP plc | | | 47,317 | | | | 300,054 | |
| | |
BT Group plc | | | 60,589 | | | | 160,795 | |
| | |
Bunzl plc | | | 2,080 | | | | 54,111 | |
| | |
Burberry Group plc | | | 4,809 | | | | 127,520 | |
| | |
CK Hutchison Holdings Ltd. | | | 41,260 | | | | 380,957 | |
| | |
Coca-Cola European Partners plc | | | 7,355 | | | | 393,566 | |
| | |
Compass Group plc | | | 7,351 | | | | 195,714 | |
| | |
Informa plc | | | 7,602 | | | | 76,410 | |
| | |
International Consolidated Airlines Group SA | | | 23,547 | | | | 162,088 | |
| | |
Land Securities Group plc, REIT | | | 7,031 | | | | 85,641 | |
| | |
Linde plc | | | 2,189 | | | | 434,188 | |
| | |
Micro Focus International plc | | | 7,304 | | | | 100,249 | |
| | |
Mondi plc | | | 6,660 | | | | 138,088 | |
| | |
Pearson plc | | | 24,251 | | | | 214,175 | |
| | |
Persimmon plc | | | 2,599 | | | | 76,661 | |
| | |
RELX plc | | | 10,489 | | | | 252,526 | |
| | |
Rentokil Initial plc | | | 42,362 | | | | 249,309 | |
| | |
Sage Group plc (The) | | | 31,639 | | | | 294,879 | |
| | |
Segro plc, REIT | | | 34,184 | | | | 373,949 | |
| | |
Smith & Nephew plc | | | 17,282 | | | | 370,982 | |
| | |
Tate & Lyle plc | | | 29,610 | | | | 258,267 | |
| | |
Taylor Wimpey plc | | | 75,209 | | | | 161,301 | |
| | |
Unilever plc | | | 1,326 | | | | 79,400 | |
| | |
United Utilities Group plc | | | 26,003 | | | | 293,616 | |
| | |
Vodafone Group plc | | | 157,717 | | | | 321,856 | |
| | |
Wm Morrison Supermarkets plc | | | 101,729 | | | | 262,802 | |
| | | | | | | | |
| | |
| | | | | | | 6,395,006 | |
| | | | | | | | |
|
United States — 21.7% | |
| | |
AbbVie, Inc. | | | 1,376 | | | | 109,461 | |
| | |
AES Corp. | | | 13,420 | | | | 228,811 | |
| | |
Air Products & Chemicals, Inc. | | | 1,831 | | | | 390,479 | |
| | |
Alaska Air Group, Inc. | | | 3,829 | | | | 265,847 | |
| | |
Alleghany Corp.* | | | 552 | | | | 429,616 | |
| | |
Allstate Corp. (The) | | | 1,379 | | | | 146,753 | |
| | |
Amcor plc | | | 29,116 | | | | 278,797 | |
| | |
Amdocs Ltd. | | | 979 | | | | 63,831 | |
| | |
Ameren Corp. | | | 5,361 | | | | 416,550 | |
| | |
American Electric Power Co., Inc. | | | 4,039 | | | | 381,241 | |
| | |
American Water Works Co., Inc. | | | 198 | | | | 24,407 | |
| | |
ANSYS, Inc.* | | | 1,146 | | | | 252,292 | |
| | |
Anthem, Inc. | | | 1,408 | | | | 378,865 | |
| | |
Ashland Global Holdings, Inc. | | | 2,630 | | | | 203,483 | |
| | |
Assurant, Inc. | | | 1,388 | | | | 174,985 | |
| | |
AT&T, Inc. | | | 11,729 | | | | 451,449 | |
| | |
Avangrid, Inc. (c) | | | 3,280 | | | | 164,164 | |
SEE NOTES TO FINANCIAL STATEMENTS.
| | | | | | | | |
| | | |
| OCTOBER 31, 2019 | | J.P. MORGAN EXCHANGE-TRADED FUNDS | | | | | 105 | |
JPMorgan Diversified Return Global Equity ETF
SCHEDULE OF PORTFOLIO INVESTMENTS
AS OF OCTOBER 31, 2019 (continued)
| | | | | | | | |
| INVESTMENTS | | SHARES | | | VALUE($) | |
Common Stocks — continued | |
|
United States — continued | |
| | |
Avery Dennison Corp. | | | 3,579 | | | | 457,611 | |
| | |
Avnet, Inc. | | | 5,906 | | | | 233,641 | |
| | |
Axis Capital Holdings Ltd. | | | 4,423 | | | | 262,859 | |
| | |
Baxter International, Inc. | | | 4,702 | | | | 360,643 | |
| | |
Becton Dickinson and Co. | | | 803 | | | | 205,568 | |
| | |
Broadridge Financial Solutions, Inc. | | | 3,195 | | | | 400,078 | |
| | |
Brown & Brown, Inc. | | | 5,044 | | | | 190,058 | |
| | |
Carnival Corp. | | | 1,198 | | | | 51,382 | |
| | |
Celanese Corp. | | | 3,648 | | | | 441,955 | |
| | |
CenturyLink, Inc. | | | 21,992 | | | | 284,576 | |
| | |
CF Industries Holdings, Inc. | | | 8,582 | | | | 389,194 | |
| | |
Chevron Corp. | | | 3,462 | | | | 402,077 | |
| | |
Church & Dwight Co., Inc. | | | 5,184 | | | | 362,569 | |
| | |
Cigna Corp. | | | 57 | | | | 10,172 | |
| | |
Cincinnati Financial Corp. | | | 3,677 | | | | 416,273 | |
| | |
Cintas Corp. | | | 1,568 | | | | 421,275 | |
| | |
Cisco Systems, Inc. | | | 4,089 | | | | 194,268 | |
| | |
CMS Energy Corp. | | | 6,203 | | | | 396,496 | |
| | |
CNA Financial Corp. | | | 4,130 | | | | 185,189 | |
| | |
Commerce Bancshares, Inc. (c) | | | 3,871 | | | | 249,138 | |
| | |
ConocoPhillips | | | 4,608 | | | | 254,362 | |
| | |
Consolidated Edison, Inc. | | | 2,344 | | | | 216,164 | |
| | |
Constellation Brands, Inc., Class A | | | 723 | | | | 137,609 | |
| | |
CSX Corp. | | | 2,047 | | | | 143,843 | |
| | |
Cummins, Inc. | | | 1,449 | | | | 249,924 | |
| | |
Darden Restaurants, Inc. | | | 3,419 | | | | 383,851 | |
| | |
DTE Energy Co. | | | 3,190 | | | | 406,151 | |
| | |
Eastman Chemical Co. | | | 3,959 | | | | 301,042 | |
| | |
Everest Re Group Ltd. | | | 872 | | | | 224,182 | |
| | |
Eversource Energy | | | 5,161 | | | | 432,182 | |
| | |
Exelon Corp. | | | 3,232 | | | | 147,024 | |
| | |
Fidelity National Information Services, Inc. | | | 3,036 | | | | 400,023 | |
| | |
Foot Locker, Inc. | | | 6,422 | | | | 279,421 | |
| | |
Garmin Ltd. | | | 5,041 | | | | 472,594 | |
| | |
Gentex Corp. | | | 13,984 | | | | 392,251 | |
| | |
Genuine Parts Co. | | | 328 | | | | 33,646 | |
| | |
Globe Life, Inc. | | | 4,633 | | | | 450,930 | |
| | |
Hasbro, Inc. | | | 3,744 | | | | 364,329 | |
| | |
HCP, Inc., REIT | | | 5,444 | | | | 204,803 | |
| | |
Henry Schein, Inc.* | | | 748 | | | | 46,814 | |
| | |
HollyFrontier Corp. | | | 5,733 | | | | 314,971 | |
| | |
Hormel Foods Corp. | | | 9,133 | | | | 373,448 | |
| | |
IAC/InterActiveCorp* | | | 1,624 | | | | 369,054 | |
| | |
Intel Corp. | | | 7,992 | | | | 451,788 | |
| | |
International Paper Co. | | | 4,975 | | | | 217,308 | |
| | | | | | | | |
| INVESTMENTS | | SHARES | | | VALUE($) | |
| | | | | | | | |
|
United States — continued | |
| | |
Interpublic Group of Cos., Inc. (The) | | | 6,682 | | | | 145,333 | |
| | |
Intuit, Inc. | | | 570 | | | | 146,775 | |
| | |
IQVIA Holdings, Inc.* | | | 2,666 | | | | 385,024 | |
| | |
JM Smucker Co. (The) | | | 2,872 | | | | 303,513 | |
| | |
Johnson & Johnson | | | 2,802 | | | | 369,976 | |
| | |
Kinder Morgan, Inc. | | | 14,703 | | | | 293,766 | |
| | |
Kohl’s Corp. | | | 1,643 | | | | 84,220 | |
| | |
L3Harris Technologies, Inc. | | | 1,956 | | | | 403,542 | |
| | |
Laboratory Corp. of America Holdings* | | | 63 | | | | 10,381 | |
| | |
Lam Research Corp. | | | 1,965 | | | | 532,594 | |
| | |
Leggett & Platt, Inc. | | | 986 | | | | 50,582 | |
| | |
LyondellBasell Industries NV, Class A | | | 1,397 | | | | 125,311 | |
| | |
ManpowerGroup, Inc. | | | 1,319 | | | | 119,923 | |
| | |
Marathon Petroleum Corp. | | | 1,075 | | | | 68,746 | |
| | |
McCormick & Co., Inc.(Non-Voting) | | | 2,539 | | | | 407,992 | |
| | |
MDU Resources Group, Inc. | | | 8,225 | | | | 237,620 | |
| | |
Merck & Co., Inc. | | | 2,869 | | | | 248,628 | |
| | |
Molson Coors Brewing Co., Class B | | | 4,014 | | | | 211,618 | |
| | |
NextEra Energy, Inc. | | | 731 | | | | 174,227 | |
| | |
NVR, Inc.* | | | 115 | | | | 418,208 | |
| | |
Old Republic International Corp. | | | 15,066 | | | | 336,574 | |
| | |
Pfizer, Inc. | | | 8,908 | | | | 341,800 | |
| | |
Phillips 66 | | | 2,058 | | | | 240,416 | |
| | |
Pinnacle West Capital Corp. | | | 4,339 | | | | 408,387 | |
| | |
PPG Industries, Inc. | | | 1,050 | | | | 131,376 | |
| | |
Procter & Gamble Co. (The) | | | 3,000 | | | | 373,530 | |
| | |
Public Service Enterprise Group, Inc. | | | 2,938 | | | | 186,005 | |
| | |
PulteGroup, Inc. | | | 11,259 | | | | 441,803 | |
| | |
Quest Diagnostics, Inc. | | | 2,940 | | | | 297,675 | |
| | |
Raytheon Co. | | | 1,869 | | | | 396,620 | |
| | |
Republic Services, Inc. | | | 4,634 | | | | 405,521 | |
| | |
Southwest Airlines Co. | | | 7,028 | | | | 394,482 | |
| | |
Starbucks Corp. | | | 4,283 | | | | 362,170 | |
| | |
TJX Cos., Inc. (The) | | | 2,773 | | | | 159,863 | |
| | |
T-Mobile US, Inc.* | | | 1,563 | | | | 129,198 | |
| | |
Toll Brothers, Inc. | | | 5,561 | | | | 221,161 | |
| | |
Tyson Foods, Inc., Class A | | | 561 | | | | 46,445 | |
| | |
United Airlines Holdings, Inc.* | | | 516 | | | | 46,873 | |
| | |
UnitedHealth Group, Inc. | | | 1,342 | | | | 339,123 | |
| | |
Universal Health Services, Inc., Class B | | | 2,847 | | | | 391,349 | |
| | |
Valero Energy Corp. | | | 2,691 | | | | 260,973 | |
| | |
Verizon Communications, Inc. | | | 6,829 | | | | 412,950 | |
| | |
VMware, Inc., Class A | | | 2,296 | | | | 363,388 | |
| | |
Walmart, Inc. | | | 3,620 | | | | 424,481 | |
| | |
Walt Disney Co. (The) | | | 2,699 | | | | 350,654 | |
SEE NOTES TO FINANCIAL STATEMENTS.
| | | | | | |
| | | |
| 106 | | | | J.P. MORGAN EXCHANGE-TRADED FUNDS | | OCTOBER 31, 2019 |
| | | | | | | | |
| INVESTMENTS | | SHARES | | | VALUE($) | |
Common Stocks — continued | |
|
United States — continued | |
| | |
Waters Corp.* | | | 1,748 | | | | 369,912 | |
| | |
Westlake Chemical Corp. | | | 675 | | | | 42,653 | |
| | |
WR Berkley Corp. | | | 5,805 | | | | 405,770 | |
| | |
Xcel Energy, Inc. | | | 6,440 | | | | 409,004 | |
| | |
Xylem, Inc. | | | 5,398 | | | | 413,973 | |
| | |
Zimmer Biomet Holdings, Inc. | | | 1,403 | | | | 193,937 | |
| | | | | | | | |
| | |
| | | | | | | 31,579,812 | |
| | | | | | | | |
| | |
Total Common Stocks
(Cost $139,427,730) | | | | | | | 144,666,489 | |
| | | | | | | | |
Short-Term Investments — 0.7% | |
|
Investment Companies — 0.2% | |
| | |
JPMorgan U.S. Government Money Market Fund Class Institutional Shares,
1.64% (d) (e)
(Cost $287,721) | | | 287,721 | | | | 287,721 | |
| | | | | | | | |
|
Investment of Cash Collateral from Securities Loaned — 0.5% | |
| | |
JPMorgan Securities Lending Money Market Fund Class Agency SL Shares, 1.98% (d) (e) | | | 499,900 | | | | 499,950 | |
| | |
JPMorgan U.S. Government Money Market Fund Class IM Shares, 1.70% (d) (e) | | | 287,546 | | | | 287,546 | |
| | | | | | | | |
| | |
Total Investment of Cash Collateral from Securities Loaned
(Cost $787,496) | | | | | | | 787,496 | |
| | | | | | | | |
| | |
TotalShort-Term Investments
(Cost $1,075,217) | | | | | | | 1,075,217 | |
| | | | | | | | |
Total Investments — 100.0%
(Cost $140,502,947) | | | | | | | 145,741,706 | |
| | |
Other Assets Less Liabilities — 0.0% (b) | | | | | | | 7,834 | |
| | | | | | | | |
NET ASSETS — 100.0% | | | | | | | 145,749,540 | |
| | | | | | | | |
Percentages indicated are based on net assets.
Summary of Investments by Industry, October 31, 2019
The following table represents the portfolio investments of the Fund by industry classifications as a percentage of total investments:
| | | | |
| INDUSTRY | | PERCENTAGE | |
| |
Oil, Gas & Consumable Fuels | | | 6.1 | % |
| |
Insurance | | | 5.5 | |
| |
Electric Utilities | | | 5.4 | |
| |
Chemicals | | | 5.2 | |
| |
Diversified Telecommunication Services | | | 4.5 | |
| |
Pharmaceuticals | | | 3.6 | |
| |
Food Products | | | 3.0 | |
| |
Metals & Mining | | | 2.8 | |
| |
Household Durables | | | 2.7 | |
| | | | |
| INDUSTRY | | PERCENTAGE | |
| |
IT Services | | | 2.5 | % |
| |
Hotels, Restaurants & Leisure | | | 2.5 | |
| |
Health Care Equipment & Supplies | | | 2.4 | |
| |
Food & Staples Retailing | | | 2.3 | |
| |
Health Care Providers & Services | | | 2.3 | |
| |
Equity Real Estate Investment Trusts (REITs) | | | 2.2 | |
| |
Banks | | | 2.2 | |
| |
Semiconductors & Semiconductor Equipment | | | 2.0 | |
| |
Airlines | | | 1.9 | |
| |
Road & Rail | | | 1.8 | |
| |
Software | | | 1.7 | |
| |
Auto Components | | | 1.7 | |
| |
Gas Utilities | | | 1.6 | |
| |
Commercial Services & Supplies | | | 1.6 | |
| |
Construction & Engineering | | | 1.6 | |
| |
Wireless Telecommunication Services | | | 1.6 | |
| |
Technology Hardware, Storage & Peripherals | | | 1.5 | |
| |
Multi-Utilities | | | 1.5 | |
| |
Trading Companies & Distributors | | | 1.5 | |
| |
Beverages | | | 1.5 | |
| |
Machinery | | | 1.3 | |
| |
Specialty Retail | | | 1.3 | |
| |
Industrial Conglomerates | | | 1.3 | |
| |
Automobiles | | | 1.3 | |
| |
Real Estate Management & Development | | | 1.2 | |
| |
Professional Services | | | 1.1 | |
| |
Entertainment | | | 1.1 | |
| |
Transportation Infrastructure | | | 1.0 | |
| |
Electronic Equipment, Instruments & Components | | | 1.0 | |
| |
Interactive Media & Services | | | 1.0 | |
| |
Media | | | 1.0 | |
| |
Others (each less than 1.0%) | | | 10.0 | |
| |
Short-Term Investments | | | 0.7 | |
Abbreviations
| | |
| OYJ | | Public Limited Company |
| REIT | | Real Estate Investment Trust |
| SCA | | Limited partnership with share capital |
| SGPS | | Holding company |
| |
| (a) | | Security exempt from registration pursuant to Regulation S under the Securities Act of 1933, as amended. Regulation S applies to securities offerings that are made outside of the United States and do not involve direct selling efforts in the United States and as such may have restrictions on resale. |
| (b) | | Amount rounds to less than 0.1% of net assets. |
| (c) | | The security or a portion of this security is on loan at October 31, 2019. The total value of securities on loan at October 31, 2019 is $750,135. |
| (d) | | Investment in an affiliated fund, which is registered under the Investment Company Act of 1940, as amended, and is advised by J.P. Morgan Investment Management Inc. |
SEE NOTES TO FINANCIAL STATEMENTS.
| | | | | | | | |
| | | |
| OCTOBER 31, 2019 | | J.P. MORGAN EXCHANGE-TRADED FUNDS | | | | | 107 | |
JPMorgan Diversified Return Global Equity ETF
SCHEDULE OF PORTFOLIO INVESTMENTS
AS OF OCTOBER 31, 2019 (continued)
| | |
| (e) | | The rate shown is the current yield as of October 31, 2019. |
| * | | Non-income producing security. |
| | | | | | | | | | | | | | | | | | | | |
| Futures contracts outstanding as of October 31, 2019: | |
| DESCRIPTION | | NUMBER OF
CONTRACTS | | | EXPIRATION
DATE | | | TRADING
CURRENCY | | | NOTIONAL
AMOUNT($) | | | VALUE AND
UNREALIZED
APPRECIATION
(DEPRECIATION)($) | |
| | | | | |
Long Contracts | | | | | | | | | | | | | | | | | | | | |
| | | | | |
MSCI EAFEE-Mini Index | | | 7 | | | | 12/2019 | | | | USD | | | | 685,370 | | | | 19,886 | |
| | | | | |
S&P 500E-Mini Index | | | 2 | | | | 12/2019 | | | | USD | | | | 303,500 | | | | 7,321 | |
| | | | | | | | | | | | | | | | | | | | |
| | | | | | | | | | | | | | | | | | | 27,207 | |
| | | | | | | | | | | | | | | | | | | | |
Abbreviations
| | |
| EAFE | | Europe,Australasia, and Far East |
| MSCI | | MorganStanley Capital International |
| USD | | UnitedStates Dollar |
SEE NOTES TO FINANCIAL STATEMENTS.
| | | | | | |
| | | |
| 108 | | | | J.P. MORGAN EXCHANGE-TRADED FUNDS | | OCTOBER 31, 2019 |
JPMorgan Diversified Return International Equity ETF
SCHEDULE OF PORTFOLIO INVESTMENTS
AS OF OCTOBER 31, 2019
| | | | | | | | |
| INVESTMENTS | | SHARES | | | VALUE($) | |
Common Stocks — 99.3% | |
|
Australia — 10.3% | |
| | |
AGL Energy Ltd. | | | 343,105 | | | | 4,683,594 | |
| | |
Alumina Ltd. | | | 2,929,412 | | | | 4,573,141 | |
| | |
Ansell Ltd. | | | 242,773 | | | | 4,616,761 | |
| | |
APA Group | | | 505,756 | | | | 4,062,362 | |
| | |
Atlas Arteria Ltd. | | | 201,879 | | | | 1,116,485 | |
| | |
Aurizon Holdings Ltd. | | | 224,947 | | | | 915,138 | |
| | |
AusNet Services | | | 539,024 | | | | 688,532 | |
| | |
BHP Group Ltd. | | | 128,036 | | | | 3,138,477 | |
| | |
BHP Group plc | | | 181,572 | | | | 3,851,240 | |
| | |
Brambles Ltd. | | | 209,821 | | | | 1,734,601 | |
| | |
Caltex Australia Ltd. | | | 144,068 | | | | 2,708,279 | |
| | |
CIMIC Group Ltd. | | | 41,892 | | | | 954,672 | |
| | |
Coca-Cola Amatil Ltd. | | | 337,557 | | | | 2,368,856 | |
| | |
Cochlear Ltd. | | | 32,970 | | | | 4,809,997 | |
| | |
Coles Group Ltd. | | | 93,998 | | | | 972,773 | |
| | |
Computershare Ltd. | | | 28,978 | | | | 316,308 | |
| | |
Crown Resorts Ltd. | | | 126,639 | | | | 1,087,907 | |
| | |
CSL Ltd. | | | 31,370 | | | | 5,532,297 | |
| | |
CSR Ltd. | | | 542,471 | | | | 1,550,614 | |
| | |
Dexus, REIT | | | 547,684 | | | | 4,516,460 | |
| | |
Downer EDI Ltd. | | | 575,163 | | | | 3,199,088 | |
| | |
Fortescue Metals Group Ltd. | | | 158,038 | | | | 967,291 | |
| | |
GPT Group (The), REIT | | | 1,124,487 | | | | 4,615,717 | |
| | |
Harvey Norman Holdings Ltd. (a) | | | 709,903 | | | | 2,003,005 | |
| | |
Incitec Pivot Ltd. | | | 278,889 | | | | 663,600 | |
| | |
Macquarie Group Ltd. | | | 30,104 | | | | 2,779,726 | |
| | |
Metcash Ltd. | | | 609,970 | | | | 1,185,726 | |
| | |
Mirvac Group, REIT | | | 1,203,239 | | | | 2,666,232 | |
| | |
Oil Search Ltd. | | | 599,117 | | | | 2,956,816 | |
| | |
Origin Energy Ltd. | | | 738,261 | | | | 4,002,452 | |
| | |
Orora Ltd. | | | 294,459 | | | | 627,628 | |
| | |
Qantas Airways Ltd. | | | 944,055 | | | | 4,175,683 | |
| | |
Ramsay Health Care Ltd. | | | 69,553 | | | | 3,286,425 | |
| | |
Rio Tinto Ltd. | | | 71,458 | | | | 4,468,485 | |
| | |
Rio Tinto plc | | | 79,209 | | | | 4,123,765 | |
| | |
Santos Ltd. | | | 949,563 | | | | 5,311,396 | |
| | |
Sonic Healthcare Ltd. | | | 244,195 | | | | 4,809,420 | |
| | |
Tabcorp Holdings Ltd. | | | 1,350,038 | | | | 4,473,550 | |
| | |
Telstra Corp. Ltd. | | | 1,476,090 | | | | 3,555,083 | |
| | |
TPG Telecom Ltd. | | | 226,511 | | | | 1,020,925 | |
| | |
Vicinity Centres, REIT | | | 2,205,868 | | | | 4,060,393 | |
| | |
Vocus Group Ltd.* | | | 384,804 | | | | 882,226 | |
| | |
Wesfarmers Ltd. | | | 167,667 | | | | 4,606,637 | |
| | |
Whitehaven Coal Ltd. | | | 1,322,647 | | | | 3,008,215 | |
| | | | | | | | |
| INVESTMENTS | | SHARES | | | VALUE($) | |
| | | | | | | | |
|
Australia — continued | |
| | |
Woodside Petroleum Ltd. | | | 200,799 | | | | 4,450,402 | |
| | | | | | | | |
| | |
| | | | | | | 132,098,380 | |
| | | | | | | | |
|
Austria — 0.3% | |
| | |
OMV AG | | | 43,911 | | | | 2,567,109 | |
| | |
voestalpine AG (a) | | | 41,134 | | | | 1,032,162 | |
| | | | | | | | |
| | |
| | | | | | | 3,599,271 | |
| | | | | | | | |
|
Belgium — 0.6% | |
| | |
Colruyt SA | | | 65,267 | | | | 3,627,968 | |
| | |
Groupe Bruxelles Lambert SA | | | 20,245 | | | | 2,033,730 | |
| | |
Proximus SADP | | | 81,441 | | | | 2,502,744 | |
| | | | | | | | |
| | |
| | | | | | | 8,164,442 | |
| | | | | | | | |
|
Cambodia — 0.1% | |
| | |
NagaCorp Ltd. | | | 704,000 | | | | 1,279,228 | |
| | | | | | | | |
|
Chile — 0.4% | |
| | |
Antofagasta plc | | | 393,799 | | | | 4,435,246 | |
| | | | | | | | |
|
China — 0.8% | |
| | |
China Mengniu Dairy Co. Ltd.* | | | 327,000 | | | | 1,303,666 | |
| | |
Lenovo Group Ltd. | | | 3,542,000 | | | | 2,469,281 | |
| | |
Nexteer Automotive Group Ltd. | | | 356,760 | | | | 332,508 | |
| | |
Tingyi Cayman Islands Holding Corp. | | | 112,000 | | | | 148,993 | |
| | |
Uni-President China Holdings Ltd. | | | 1,371,000 | | | | 1,416,149 | |
| | |
Want Want China Holdings Ltd. | | | 1,898,000 | | | | 1,598,893 | |
| | |
Xinyi Solar Holdings Ltd. | | | 5,896,400 | | | | 3,331,680 | |
| | | | | | | | |
| | |
| | | | | | | 10,601,170 | |
| | | | | | | | |
|
Denmark — 0.4% | |
| | |
Chr Hansen Holding A/S | | | 46,487 | | | | 3,569,074 | |
| | |
Demant A/S* | | | 7,064 | | | | 186,597 | |
| | |
DSV Panalpina A/S | | | 5,974 | | | | 580,608 | |
| | |
H Lundbeck A/S | | | 21,782 | | | | 744,304 | |
| | | | | | | | |
| | |
| | | | | | | 5,080,583 | |
| | | | | | | | |
|
Finland — 2.1% | |
| | |
Elisa OYJ | | | 95,419 | | | | 5,211,427 | |
| | |
Fortum OYJ | | | 192,806 | | | | 4,711,721 | |
| | |
Kesko OYJ, Class B | | | 74,060 | | | | 4,934,474 | |
| | |
Neste OYJ | | | 143,516 | | | | 5,185,587 | |
| | |
Nokian Renkaat OYJ | | | 27,169 | | | | 776,467 | |
| | |
Orion OYJ, Class B | | | 16,180 | | | | 717,820 | |
| | |
UPM-Kymmene OYJ | | | 170,450 | | | | 5,551,469 | |
| | | | | | | | |
| | |
| | | | | | | 27,088,965 | |
| | | | | | | | |
|
France — 5.3% | |
| | |
Air Liquide SA | | | 29,578 | | | | 3,932,724 | |
| | |
Arkema SA | | | 30,185 | | | | 3,089,071 | |
SEE NOTES TO FINANCIAL STATEMENTS.
| | | | | | | | |
| | | |
| OCTOBER 31, 2019 | | J.P. MORGAN EXCHANGE-TRADED FUNDS | | | | | 109 | |
JPMorgan Diversified Return International Equity ETF
SCHEDULE OF PORTFOLIO INVESTMENTS
AS OF OCTOBER 31, 2019 (continued)
| | | | | | | | |
| INVESTMENTS | | SHARES | | | VALUE($) | |
Common Stocks — continued | |
|
France — continued | |
| | |
Atos SE | | | 27,992 | | | | 2,172,366 | |
| | |
Capgemini SE | | | 40,000 | | | | 4,509,210 | |
| | |
Casino Guichard Perrachon SA (a) | | | 25,184 | | | | 1,358,603 | |
| | |
Covivio, REIT | | | 11,360 | | | | 1,286,512 | |
| | |
Dassault Aviation SA | | | 585 | | | | 812,654 | |
| | |
Dassault Systemes SE | | | 32,698 | | | | 4,966,068 | |
| | |
Eiffage SA | | | 43,560 | | | | 4,678,615 | |
| | |
Eutelsat Communications SA (a) | | | 40,699 | | | | 772,057 | |
| | |
Faurecia SE | | | 16,197 | | | | 755,885 | |
| | |
Gecina SA, REIT | | | 13,529 | | | | 2,322,510 | |
| | |
Lagardere SCA | | | 130,605 | | | | 2,918,445 | |
| | |
Orange SA | | | 197,822 | | | | 3,183,848 | |
| | |
Pernod Ricard SA | | | 24,406 | | | | 4,508,601 | |
| | |
Peugeot SA | | | 202,166 | | | | 5,120,081 | |
| | |
Safran SA | | | 25,554 | | | | 4,047,499 | |
| | |
SCOR SE | | | 87,941 | | | | 3,709,276 | |
| | |
Sodexo SA | | | 5,953 | | | | 654,643 | |
| | |
Thales SA | | | 8,897 | | | | 869,768 | |
| | |
TOTAL SA | | | 76,572 | | | | 4,048,227 | |
| | |
Vinci SA (a) | | | 37,630 | | | | 4,221,948 | |
| | |
Vivendi SA | | | 155,679 | | | | 4,335,288 | |
| | | | | | | | |
| | |
| | | | | | | 68,273,899 | |
| | | | | | | | |
|
Germany — 3.0% | |
| | |
Axel Springer SE* (a) | | | 45,795 | | | | 3,192,198 | |
| | |
Beiersdorf AG | | | 3,250 | | | | 384,765 | |
| | |
Deutsche Lufthansa AG (Registered) | | | 38,234 | | | | 662,335 | |
| | |
Deutsche Telekom AG (Registered) | | | 234,056 | | | | 4,118,351 | |
| | |
Evonik Industries AG | | | 115,357 | | | | 3,040,113 | |
| | |
Fraport AG Frankfurt Airport Services Worldwide | | | 51,030 | | | | 4,265,224 | |
| | |
Fresenius Medical Care AG & Co. KGaA | | | 48,252 | | | | 3,482,813 | |
| | |
Hannover Rueck SE | | | 30,169 | | | | 5,346,068 | |
| | |
Hella GmbH & Co. KGaA | | | 11,382 | | | | 553,665 | |
| | |
Infineon Technologies AG | | | 152,438 | | | | 2,952,537 | |
| | |
Merck KGaA | | | 11,214 | | | | 1,337,455 | |
| | |
SAP SE | | | 39,325 | | | | 5,210,621 | |
| | |
Telefonica Deutschland Holding AG | | | 549,822 | | | | 1,744,601 | |
| | |
Uniper SE (a) | | | 51,845 | | | | 1,615,830 | |
| | | | | | | | |
| | |
| | | | | | | 37,906,576 | |
| | | | | | | | |
|
Hong Kong — 5.0% | |
| | |
ASM Pacific Technology Ltd. | | | 317,100 | | | | 4,427,614 | |
| | |
Cathay Pacific Airways Ltd. | | | 947,000 | | | | 1,209,841 | |
| | |
CK Infrastructure Holdings Ltd. | | | 547,500 | | | | 3,940,209 | |
| | |
CLP Holdings Ltd. | | | 432,500 | | | | 4,491,696 | |
| | |
Hong Kong & China Gas Co. Ltd. | | | 2,229,103 | | | | 4,326,471 | |
| | | | | | | | |
| INVESTMENTS | | SHARES | | | VALUE($) | |
| | | | | | | | |
|
Hong Kong — continued | |
| | |
Hutchison Port Holdings Trust | | | 4,216,100 | | | | 653,078 | |
| | |
Jardine Matheson Holdings Ltd. | | | 38,500 | | | | 2,194,924 | |
| | |
Jardine Strategic Holdings Ltd. | | | 62,200 | | | | 2,008,552 | |
| | |
Link, REIT | | | 409,500 | | | | 4,460,029 | |
| | |
Melco International Development Ltd. | | | 237,000 | | | | 628,132 | |
| | |
MTR Corp. Ltd. | | | 796,500 | | | | 4,566,960 | |
| | |
New World Development Co. Ltd. | | | 1,183,000 | | | | 1,692,207 | |
| | |
PCCW Ltd. | | | 5,720,000 | | | | 3,397,193 | |
| | |
Power Assets Holdings Ltd. | | | 706,000 | | | | 5,038,114 | |
| | |
Swire Pacific Ltd., Class A | | | 417,500 | | | | 3,979,730 | |
| | |
Swire Properties Ltd. | | | 189,800 | | | | 596,931 | |
| | |
Techtronic Industries Co. Ltd. | | | 700,000 | | | | 5,470,510 | |
| | |
WH Group Ltd. (b) | | | 2,672,000 | | | | 2,820,412 | |
| | |
Wheelock & Co. Ltd. | | | 236,000 | | | | 1,459,567 | |
| | |
Xinyi Glass Holdings Ltd. | | | 3,540,000 | | | | 3,980,162 | |
| | |
Yue Yuen Industrial Holdings Ltd. | | | 1,081,000 | | | | 3,046,462 | |
| | | | | | | | |
| | |
| | | | | | | 64,388,794 | |
| | | | | | | | |
|
Indonesia — 0.0% (c) | |
| | |
First Pacific Co. Ltd. | | | 766,000 | | | | 293,043 | |
| | | | | | | | |
|
Ireland — 0.2% | |
| | |
CRH plc | | | 32,525 | | | | 1,184,228 | |
| | |
Flutter Entertainment plc | | | 8,907 | | | | 918,621 | |
| | | | | | | | |
| | |
| | | | | | | 2,102,849 | |
| | | | | | | | |
|
Italy — 2.0% | |
| | |
Assicurazioni Generali SpA | | | 103,385 | | | | 2,096,389 | |
| | |
Davide Campari-Milano SpA | | | 496,617 | | | | 4,555,125 | |
| | |
Enel SpA | | | 123,379 | | | | 956,232 | |
| | |
Eni SpA | | | 199,482 | | | | 3,026,340 | |
| | |
Italgas SpA | | | 517,829 | | | | 3,333,631 | |
| | |
Poste Italiane SpA (b) | | | 199,725 | | | | 2,425,944 | |
| | |
Recordati SpA | | | 41,701 | | | | 1,752,449 | |
| | |
Snam SpA | | | 543,258 | | | | 2,789,035 | |
| | |
Terna Rete Elettrica Nazionale SpA | | | 749,748 | | | | 4,955,389 | |
| | | | | | | | |
| | |
| | | | | | | 25,890,534 | |
| | | | | | | | |
|
Japan — 23.9% | |
| | |
Advantest Corp. | | | 117,000 | | | | 5,324,493 | |
| | |
Alfresa Holdings Corp. | | | 159,200 | | | | 3,554,751 | |
| | |
ANA Holdings, Inc. | | | 115,300 | | | | 3,959,225 | |
| | |
Aozora Bank Ltd. | | | 109,300 | | | | 2,804,460 | |
| | |
Asahi Kasei Corp. | | | 104,600 | | | | 1,161,201 | |
| | |
Astellas Pharma, Inc. | | | 53,500 | | | | 918,204 | |
| | |
Bandai Namco Holdings, Inc. | | | 50,800 | | | | 3,123,651 | |
| | |
Brother Industries Ltd. | | | 70,300 | | | | 1,321,221 | |
| | |
Canon Marketing Japan, Inc. | | | 119,600 | | | | 2,530,463 | |
SEE NOTES TO FINANCIAL STATEMENTS.
| | | | | | |
| | | |
| 110 | | | | J.P. MORGAN EXCHANGE-TRADED FUNDS | | OCTOBER 31, 2019 |
| | | | | | | | |
| INVESTMENTS | | SHARES | | | VALUE($) | |
Common Stocks — continued | |
|
Japan — continued | |
| | |
Canon, Inc. | | | 24,200 | | | | 664,041 | |
| | |
Capcom Co. Ltd. | | | 184,300 | | | | 4,350,147 | |
| | |
Central Japan Railway Co. | | | 23,200 | | | | 4,759,109 | |
| | |
Chubu Electric Power Co., Inc. | | | 325,800 | | | | 4,887,732 | |
| | |
Chugoku Electric Power Co., Inc. (The) | | | 343,500 | | | | 4,576,027 | |
| | |
COMSYS Holdings Corp. | | | 170,600 | | | | 5,032,899 | |
| | |
Cosmo Energy Holdings Co. Ltd. | | | 186,500 | | | | 3,988,188 | |
| | |
Dai Nippon Printing Co. Ltd. | | | 58,900 | | | | 1,573,131 | |
| | |
Daicel Corp. | | | 108,300 | | | | 968,142 | |
| | |
Daiwa Securities Group, Inc. | | | 485,000 | | | | 2,179,981 | |
| | |
Denka Co. Ltd. | | | 47,300 | | | | 1,365,015 | |
| | |
DIC Corp. | | | 105,900 | | | | 3,033,518 | |
| | |
Electric Power Development Co. Ltd. | | | 149,800 | | | | 3,637,209 | |
| | |
FamilyMart Co. Ltd. | | | 55,300 | | | | 1,371,783 | |
| | |
Fuji Media Holdings, Inc. | | | 76,100 | | | | 1,028,309 | |
| | |
FUJIFILM Holdings Corp. | | | 99,200 | | | | 4,355,103 | |
| | |
Gunma Bank Ltd. (The) | | | 243,900 | | | | 820,759 | |
| | |
Hachijuni Bank Ltd. (The) | | | 221,900 | | | | 954,538 | |
| | |
Hankyu Hanshin Holdings, Inc. | | | 128,000 | | | | 5,122,177 | |
| | |
Hikari Tsushin, Inc. | | | 19,500 | | | | 4,274,337 | |
| | |
Hitachi Capital Corp. | | | 18,100 | | | | 405,589 | |
| | |
Hitachi High-Technologies Corp. | | | 23,600 | | | | 1,468,292 | |
| | |
Hoya Corp. | | | 9,800 | | | | 866,097 | |
| | |
Idemitsu Kosan Co. Ltd. | | | 171,937 | | | | 5,054,135 | |
| | |
Iida Group Holdings Co. Ltd. | | | 52,300 | | | | 871,167 | |
| | |
Inpex Corp. | | | 167,600 | | | | 1,549,376 | |
| | |
ITOCHU Corp. | | | 60,500 | | | | 1,264,927 | |
| | |
Itochu Techno-Solutions Corp. | | | 175,600 | | | | 4,729,051 | |
| | |
Japan Airlines Co. Ltd. | | | 141,200 | | | | 4,400,087 | |
| | |
Japan Petroleum Exploration Co. Ltd. | | | 91,400 | | | | 2,336,882 | |
| | |
Japan Post Holdings Co. Ltd. | | | 436,000 | | | | 4,002,145 | |
| | |
JXTG Holdings, Inc. | | | 1,014,000 | | | | 4,739,680 | |
| | |
Kajima Corp. | | | 32,200 | | | | 442,511 | |
| | |
Kaneka Corp. | | | 58,200 | | | | 1,937,395 | |
| | |
Kansai Electric Power Co., Inc. (The) | | | 187,200 | | | | 2,183,900 | |
| | |
KDDI Corp. | | | 176,000 | | | | 4,870,121 | |
| | |
Keisei Electric Railway Co. Ltd. | | | 34,900 | | | | 1,426,903 | |
| | |
Kirin Holdings Co. Ltd. | | | 85,200 | | | | 1,807,464 | |
| | |
K’s Holdings Corp. | | | 321,700 | | | | 3,675,526 | |
| | |
Kuraray Co. Ltd. | | | 114,700 | | | | 1,364,622 | |
| | |
Kyushu Electric Power Co., Inc. | | | 25,500 | | | | 254,834 | |
| | |
Lintec Corp. | | | 91,300 | | | | 1,917,557 | |
| | |
Mani, Inc. | | | 31,800 | | | | 839,537 | |
| | |
Marubeni Corp. | | | 664,600 | | | | 4,677,507 | |
| | |
Matsui Securities Co. Ltd. | | | 227,900 | | | | 1,877,022 | |
| | | | | | | | |
| INVESTMENTS | | SHARES | | | VALUE($) | |
| | | | | | | | |
|
Japan — continued | |
| | |
Mebuki Financial Group, Inc. | | | 274,600 | | | | 697,652 | |
| | |
Medipal Holdings Corp. | | | 170,100 | | | | 3,886,367 | |
| | |
Mitsubishi Corp. | | | 40,600 | | | | 1,032,637 | |
| | |
Mitsubishi Gas Chemical Co., Inc. | | | 198,000 | | | | 2,793,170 | |
| | |
Mitsubishi Heavy Industries Ltd. | | | 109,600 | | | | 4,435,443 | |
| | |
Mitsubishi Tanabe Pharma Corp. | | | 135,800 | | | | 1,625,294 | |
| | |
Mitsubishi UFJ Lease & Finance Co. Ltd. | | | 206,400 | | | | 1,267,087 | |
| | |
Mitsui & Co. Ltd. | | | 152,400 | | | | 2,617,312 | |
| | |
Mochida Pharmaceutical Co. Ltd. | | | 107,800 | | | | 4,302,070 | |
| | |
MS&AD Insurance Group Holdings, Inc. | | | 46,800 | | | | 1,511,230 | |
| | |
Nagoya Railroad Co. Ltd. | | | 22,800 | | | | 724,764 | |
| | |
Nifco, Inc. | | | 35,500 | | | | 937,054 | |
| | |
Nippo Corp. | | | 165,000 | | | | 3,390,325 | |
| | |
Nippon Express Co. Ltd. | | | 3,200 | | | | 182,578 | |
| | |
Nippon Paper Industries Co. Ltd. | | | 175,900 | | | | 3,032,096 | |
| | |
Nippon Shokubai Co. Ltd. | | | 42,200 | | | | 2,602,175 | |
| | |
Nippon Telegraph & Telephone Corp. | | | 100,200 | | | | 4,974,220 | |
| | |
Nipro Corp. | | | 122,800 | | | | 1,439,900 | |
| | |
Nissan Motor Co. Ltd. | | | 1,800 | | | | 11,359 | |
| | |
Nisshin Seifun Group, Inc. | | | 207,800 | | | | 4,119,471 | |
| | |
Nissin Foods Holdings Co. Ltd. | | | 58,600 | | | | 4,426,431 | |
| | |
Nomura Real Estate Holdings, Inc. | | | 84,500 | | | | 2,002,598 | |
| | |
Nomura Research Institute Ltd. | | | 128,900 | | | | 2,736,639 | |
| | |
NTT DOCOMO, Inc. | | | 190,800 | | | | 5,230,805 | |
| | |
Oracle Corp. | | | 800 | | | | 70,317 | |
| | |
ORIX Corp. | | | 155,400 | | | | 2,442,095 | |
| | |
Osaka Gas Co. Ltd. | | | 193,200 | | | | 3,777,964 | |
| | |
Rakuten, Inc. | | | 271,400 | | | | 2,587,371 | |
| | |
Resona Holdings, Inc. | | | 797,500 | | | | 3,467,980 | |
| | |
Sankyo Co. Ltd. | | | 66,300 | | | | 2,320,344 | |
| | |
Sawai Pharmaceutical Co. Ltd. | | | 49,300 | | | | 2,781,846 | |
| | |
SBI Holdings, Inc. | | | 104,500 | | | | 2,272,702 | |
| | |
SCSK Corp. | | | 38,900 | | | | 1,980,180 | |
| | |
Sekisui Chemical Co. Ltd. | | | 173,000 | | | | 3,016,384 | |
| | |
Sekisui House Ltd. | | | 269,700 | | | | 5,815,913 | |
| | |
Shionogi & Co. Ltd. | | | 66,900 | | | | 4,015,532 | |
| | |
Showa Denko KK | | | 111,900 | | | | 3,139,572 | |
| | |
SKY Perfect JSAT Holdings, Inc. | | | 215,800 | | | | 891,254 | |
| | |
Skylark Holdings Co. Ltd. | | | 176,300 | | | | 3,199,867 | |
| | |
SoftBank Group Corp. | | | 59,700 | | | | 2,296,445 | |
| | |
Sojitz Corp. | | | 1,401,400 | | | | 4,410,966 | |
| | |
Sony Corp. | | | 45,200 | | | | 2,751,286 | |
| | |
Sumitomo Dainippon Pharma Co. Ltd. | | | 78,300 | | | | 1,366,582 | |
| | |
Sumitomo Mitsui Financial Group, Inc. | | | 79,400 | | | | 2,818,954 | |
| | |
Sumitomo Osaka Cement Co. Ltd. | | | 89,300 | | | | 3,898,124 | |
SEE NOTES TO FINANCIAL STATEMENTS.
| | | | | | | | |
| | | |
| OCTOBER 31, 2019 | | J.P. MORGAN EXCHANGE-TRADED FUNDS | | | | | 111 | |
JPMorgan Diversified Return International Equity ETF
SCHEDULE OF PORTFOLIO INVESTMENTS
AS OF OCTOBER 31, 2019 (continued)
| | | | | | | | |
| INVESTMENTS | | SHARES | | | VALUE($) | |
Common Stocks — continued | |
|
Japan — continued | |
| | |
Suzuken Co. Ltd. | | | 79,500 | | | | 4,244,814 | |
| | |
Taisho Pharmaceutical Holdings Co. Ltd. | | | 27,800 | | | | 1,978,651 | |
| | |
Teijin Ltd. | | | 125,000 | | | | 2,504,793 | |
| | |
TIS, Inc. | | | 37,400 | | | | 2,267,694 | |
| | |
Tobu Railway Co. Ltd. | | | 59,600 | | | | 1,988,847 | |
| | |
Toho Co. Ltd. | | | 2,800 | | | | 113,079 | |
| | |
Toho Gas Co. Ltd. | | | 29,000 | | | | 1,129,509 | |
| | |
Tohoku Electric Power Co., Inc. | | | 292,300 | | | | 3,004,195 | |
| | |
Tokuyama Corp. | | | 68,300 | | | | 1,824,565 | |
| | |
Tokyo Century Corp. | | | 12,500 | | | | 577,197 | |
| | |
Tokyo Electric Power Co. Holdings, Inc.* | | | 736,300 | | | | 3,409,913 | |
| | |
Toyo Suisan Kaisha Ltd. | | | 89,800 | | | | 3,781,027 | |
| | |
Toyota Industries Corp. | | | 86,800 | | | | 5,208,216 | |
| | |
Tsumura & Co. | | | 100,300 | | | | 2,762,209 | |
| | |
Ube Industries Ltd. | | | 147,400 | | | | 3,156,007 | |
| | |
Yamada Denki Co. Ltd. | | | 316,800 | | | | 1,531,247 | |
| | |
Yamaguchi Financial Group, Inc. | | | 66,000 | | | | 463,076 | |
| | |
Yokohama Rubber Co. Ltd. (The) | | | 175,300 | | | | 3,915,367 | |
| | |
Zeon Corp. | | | 118,600 | | | | 1,351,056 | |
| | | | | | | | |
| | |
| | | | | | | 307,113,958 | |
| | | | | | | | |
|
Jordan — 0.4% | |
| | |
Hikma Pharmaceuticals plc | | | 195,780 | | | | 5,098,658 | |
| | | | | | | | |
|
Luxembourg — 0.2% | |
| | |
RTL Group SA | | | 39,202 | | | | 1,991,974 | |
| | | | | | | | |
|
Macau — 0.2% | |
| | |
Sands China Ltd. | | | 533,112 | | | | 2,625,907 | |
| | | | | | | | |
|
Netherlands — 3.0% | |
| | |
Aegon NV | | | 664,889 | | | | 2,884,513 | |
| | |
Akzo Nobel NV | | | 41,300 | | | | 3,807,590 | |
| | |
ASR Nederland NV | | | 40,818 | | | | 1,496,331 | |
| | |
Heineken Holding NV | | | 48,557 | | | | 4,633,091 | |
| | |
Koninklijke Ahold Delhaize NV | | | 149,516 | | | | 3,725,948 | |
| | |
Koninklijke DSM NV | | | 11,265 | | | | 1,337,021 | |
| | |
Koninklijke KPN NV | | | 963,043 | | | | 2,989,643 | |
| | |
Koninklijke Philips NV | | | 83,474 | | | | 3,662,348 | |
| | |
NN Group NV | | | 108,827 | | | | 4,152,504 | |
| | |
Royal Dutch Shell plc, Class A | | | 161,832 | | | | 4,691,202 | |
| | |
Wolters Kluwer NV | | | 66,651 | | | | 4,909,049 | |
| | | | | | | | |
| | |
| | | | | | | 38,289,240 | |
| | | | | | | | |
|
New Zealand — 0.8% | |
| | |
Fisher & Paykel Healthcare Corp. Ltd. | | | 174,869 | | | | 2,144,803 | |
| | |
Spark New Zealand Ltd. | | | 1,725,083 | | | | 4,948,685 | |
| | | | | | | | |
| INVESTMENTS | | SHARES | | | VALUE($) | |
| | | | | | | | |
|
New Zealand — continued | |
| | |
Xero Ltd.* | | | 72,769 | | | | 3,451,739 | |
| | | | | | | | |
| | |
| | | | | | | 10,545,227 | |
| | | | | | | | |
|
Norway — 1.4% | |
| | |
Aker BP ASA (a) | | | 62,706 | | | | 1,739,300 | |
| | |
Equinor ASA | | | 159,248 | | | | 2,956,548 | |
| | |
Mowi ASA | | | 200,885 | | | | 4,903,996 | |
| | |
Norsk Hydro ASA | | | 270,199 | | | | 954,765 | |
| | |
Orkla ASA | | | 270,913 | | | | 2,603,972 | |
| | |
Salmar ASA | | | 16,147 | | | | 753,543 | |
| | |
Telenor ASA | | | 234,071 | | | | 4,380,817 | |
| | | | | | | | |
| | |
| | | | | | | 18,292,941 | |
| | | | | | | | |
|
Poland — 0.1% | |
| | |
Grupa Lotos SA | | | 51,323 | | | | 1,281,693 | |
| | | | | | | | |
|
Portugal — 0.5% | |
| | |
EDP — Energias de Portugal SA | | | 1,089,462 | | | | 4,487,746 | |
| | |
Galp Energia SGPS SA | | | 74,527 | | | | 1,192,043 | |
| | | | | | | | |
| | |
| | | | | | | 5,679,789 | |
| | | | | | | | |
|
Russia — 0.3% | |
| | |
Evraz plc | | | 511,961 | | | | 2,443,057 | |
| | |
Polymetal International plc | | | 59,565 | | | | 979,696 | |
| | | | | | | | |
| | |
| | | | | | | 3,422,753 | |
| | | | | | | | |
|
Singapore — 2.5% | |
| | |
Ascendas, REIT | | | 905,700 | | | | 2,109,423 | |
| | |
CapitaLand Commercial Trust, REIT | | | 595,700 | | | | 897,115 | |
| | |
CapitaLand Mall Trust, REIT | | | 2,476,800 | | | | 4,621,325 | |
| | |
ComfortDelGro Corp. Ltd. | | | 1,192,000 | | | | 2,012,909 | |
| | |
Golden Agri-Resources Ltd. | | | 7,992,900 | | | | 1,199,743 | |
| | |
Keppel Corp. Ltd. | | | 947,200 | | | | 4,769,518 | |
| | |
Mapletree North Asia Commercial Trust, REIT (b) | | | 734,400 | | | | 690,384 | |
| | |
Sembcorp Industries Ltd. | | | 922,100 | | | | 1,548,105 | |
| | |
Singapore Press Holdings Ltd. | | | 685,900 | | | | 1,116,230 | |
| | |
Singapore Telecommunications Ltd. | | | 1,099,300 | | | | 2,662,017 | |
| | |
Suntec, REIT | | | 991,400 | | | | 1,354,360 | |
| | |
Venture Corp. Ltd. | | | 305,000 | | | | 3,537,887 | |
| | |
Wilmar International Ltd. | | | 1,759,600 | | | | 4,837,986 | |
| | | | | | | | |
| | |
| | | | | | | 31,357,002 | |
| | | | | | | | |
|
South Africa — 0.4% | |
| | |
Anglo American plc | | | 175,584 | | | | 4,519,023 | |
| | | | | | | | |
|
South Korea — 7.0% | |
| | |
Celltrion, Inc.* | | | 4,822 | | | | 825,286 | |
SEE NOTES TO FINANCIAL STATEMENTS.
| | | | | | |
| | | |
| 112 | | | | J.P. MORGAN EXCHANGE-TRADED FUNDS | | OCTOBER 31, 2019 |
| | | | | | | | |
| INVESTMENTS | | SHARES | | | VALUE($) | |
Common Stocks — continued | |
|
South Korea — continued | |
| | |
Daelim Industrial Co. Ltd. | | | 40,782 | | | | 3,169,964 | |
| | |
GS Engineering & Construction Corp. | | | 86,234 | | | | 2,283,108 | |
| | |
GS Holdings Corp. | | | 75,612 | | | | 3,222,371 | |
| | |
Hanwha Chemical Corp. | | | 102,933 | | | | 1,440,267 | |
| | |
Hanwha Corp. | | | 41,052 | | | | 836,907 | |
| | |
Hyundai Department Store Co. Ltd. | | | 25,149 | | | | 1,596,729 | |
| | |
Hyundai Mipo Dockyard Co. Ltd. | | | 18,986 | | | | 708,019 | |
| | |
Hyundai Mobis Co. Ltd. | | | 2,780 | | | | 566,936 | |
| | |
Hyundai Steel Co. | | | 39,508 | | | | 1,075,997 | |
| | |
Industrial Bank of Korea | | | 258,546 | | | | 2,618,394 | |
| | |
Kakao Corp. | | | 43,457 | | | | 5,273,605 | |
| | |
Kangwon Land, Inc. | | | 91,439 | | | | 2,461,916 | |
| | |
KCC Corp. | | | 3,592 | | | | 697,201 | |
| | |
Korea Electric Power Corp.* | | | 61,404 | | | | 1,342,331 | |
| | |
Korea Gas Corp. | | | 80,830 | | | | 2,730,880 | |
| | |
Korea Zinc Co. Ltd. | | | 3,638 | | | | 1,355,638 | |
| | |
Korean Air Lines Co. Ltd. | | | 31,767 | | | | 679,928 | |
| | |
KT&G Corp. | | | 47,541 | | | | 4,080,996 | |
| | |
LG Corp. | | | 66,720 | | | | 3,977,618 | |
| | |
LG Uplus Corp. | | | 315,252 | | | | 3,641,997 | |
| | |
NAVER Corp. | | | 19,779 | | | | 2,788,769 | |
| | |
NCSoft Corp. | | | 10,907 | | | | 4,840,482 | |
| | |
POSCO | | | 18,169 | | | | 3,296,687 | |
| | |
Samsung Electronics Co. Ltd. | | | 150,510 | | | | 6,505,020 | |
| | |
Samsung SDS Co. Ltd. | | | 17,261 | | | | 2,981,255 | |
| | |
SK Holdings Co. Ltd. | | | 8,928 | | | | 1,980,716 | |
| | |
SK Hynix, Inc. | | | 76,445 | | | | 5,375,307 | |
| | |
SK Innovation Co. Ltd. | | | 28,528 | | | | 3,903,644 | |
| | |
SK Networks Co. Ltd. | | | 121,891 | | | | 607,983 | |
| | |
SK Telecom Co. Ltd. | | | 19,273 | | | | 3,939,331 | |
| | |
SKC Co. Ltd. | | | 73,641 | | | | 2,808,764 | |
| | |
Woori Financial Group, Inc. | | | 282,073 | | | | 2,843,811 | |
| | |
Yuhan Corp. | | | 19,206 | | | | 3,702,254 | |
| | | | | | | | |
| | |
| | | | | | | 90,160,111 | |
| | | | | | | | |
|
Spain — 1.9% | |
| | |
Acciona SA | | | 14,698 | | | | 1,531,214 | |
| | |
Amadeus IT Group SA | | | 34,052 | | | | 2,519,108 | |
| | |
Corp. Financiera Alba SA | | | 8,612 | | | | 429,822 | |
| | |
Enagas SA | | | 151,321 | | | | 3,744,379 | |
| | |
Endesa SA | | | 186,857 | | | | 5,089,026 | |
| | |
Ferrovial SA | | | 39,335 | | | | 1,160,509 | |
| | |
Iberdrola SA | | | 71,541 | | | | 735,370 | |
| | |
Naturgy Energy Group SA | | | 170,109 | | | | 4,634,635 | |
| | | | | | | | |
| INVESTMENTS | | SHARES | | | VALUE($) | |
| | | | | | | | |
|
Spain — continued | |
| | |
Repsol SA | | | 261,742 | | | | 4,313,435 | |
| | | | | | | | |
| | |
| | | | | | | 24,157,498 | |
| | | | | | | | |
|
Sweden — 3.5% | |
| | |
Boliden AB | | | 187,993 | | | | 5,069,696 | |
| | |
Castellum AB | | | 102,966 | | | | 2,104,177 | |
| | |
Hennes & Mauritz AB, Class B | | | 35,277 | | | | 739,389 | |
| | |
Hexagon AB, Class B | | | 90,448 | | | | 4,630,751 | |
| | |
ICA Gruppen AB | | | 84,342 | | | | 3,732,279 | |
| | |
Investor AB, Class B | | | 102,475 | | | | 5,257,425 | |
| | |
Securitas AB, Class B | | | 273,801 | | | | 4,384,138 | |
| | |
Skanska AB, Class B | | | 173,771 | | | | 3,702,511 | |
| | |
Svenska Cellulosa AB SCA, Class B | | | 79,841 | | | | 814,708 | |
| | |
Swedish Match AB | | | 95,350 | | | | 4,479,385 | |
| | |
Tele2 AB, Class B | | | 320,036 | | | | 4,581,365 | |
| | |
Telia Co. AB | | | 946,612 | | | | 4,164,062 | |
| | |
Trelleborg AB, Class B (a) | | | 81,891 | | | | 1,324,231 | |
| | | | | | | | |
| | |
| | | | | | | 44,984,117 | |
| | | | | | | | |
|
Switzerland — 2.4% | |
| | |
Alcon, Inc.* | | | 9,021 | | | | 533,485 | |
| | |
Baloise Holding AG (Registered) | | | 22,092 | | | | 4,085,992 | |
| | |
Coca-Cola HBC AG* | | | 108,657 | | | | 3,308,461 | |
| | |
EMS-Chemie Holding AG (Registered) | | | 534 | | | | 334,550 | |
| | |
Flughafen Zurich AG (Registered) | | | 3,435 | | | | 618,960 | |
| | |
Kuehne + Nagel International AG (Registered) | | | 6,592 | | | | 1,064,985 | |
| | |
Lonza Group AG (Registered)* | | | 11,995 | | | | 4,323,389 | |
| | |
Novartis AG (Registered) | | | 45,693 | | | | 3,992,439 | |
| | |
Roche Holding AG | | | 11,935 | | | | 3,591,910 | |
| | |
Sonova Holding AG (Registered) (a) | | | 20,712 | | | | 4,752,955 | |
| | |
Swisscom AG (Registered) | | | 9,241 | | | | 4,726,723 | |
| | | | | | | | |
| | |
| | | | | | | 31,333,849 | |
| | | | | | | | |
|
United Kingdom — 19.9% | |
| | |
3i Group plc | | | 270,901 | | | | 3,958,644 | |
| | |
Admiral Group plc | | | 185,981 | | | | 4,867,451 | |
| | |
Ashmore Group plc | | | 160,670 | | | | 969,109 | |
| | |
Ashtead Group plc | | | 121,755 | | | | 3,706,930 | |
| | |
Associated British Foods plc | | | 84,175 | | | | 2,429,694 | |
| | |
AstraZeneca plc | | | 27,451 | | | | 2,676,946 | |
| | |
Auto Trader Group plc (b) | | | 718,700 | | | | 5,236,660 | |
| | |
AVEVA Group plc | | | 34,410 | | | | 1,864,496 | |
| | |
Babcock International Group plc | | | 454,106 | | | | 3,261,480 | |
| | |
Barratt Developments plc | | | 625,262 | | | | 5,113,274 | |
| | |
Bellway plc | | | 94,826 | | | | 3,881,175 | |
| | |
Berkeley Group Holdings plc | | | 97,865 | | | | 5,578,251 | |
SEE NOTES TO FINANCIAL STATEMENTS.
| | | | | | | | |
| | | |
| OCTOBER 31, 2019 | | J.P. MORGAN EXCHANGE-TRADED FUNDS | | | | | 113 | |
JPMorgan Diversified Return International Equity ETF
SCHEDULE OF PORTFOLIO INVESTMENTS
AS OF OCTOBER 31, 2019 (continued)
| | | | | | | | |
| INVESTMENTS | | SHARES | | | VALUE($) | |
Common Stocks — continued | |
|
United Kingdom — continued | |
| | |
BP plc | | | 614,608 | | | | 3,897,454 | |
| | |
British American Tobacco plc | | | 104,778 | | | | 3,664,702 | |
| | |
British Land Co. plc (The), REIT | | | 283,359 | | | | 2,278,245 | |
| | |
BT Group plc | | | 1,485,771 | | | | 3,943,024 | |
| | |
Bunzl plc | | | 100,785 | | | | 2,621,896 | |
| | |
Burberry Group plc | | | 49,445 | | | | 1,311,131 | |
| | |
Centrica plc | | | 4,254,002 | | | | 4,003,305 | |
| | |
CK Hutchison Holdings Ltd. | | | 481,542 | | | | 4,446,118 | |
| | |
Compass Group plc | | | 180,226 | | | | 4,798,353 | |
| | |
ConvaTec Group plc (b) | | | 1,453,556 | | | | 3,713,435 | |
| | |
Croda International plc | | | 65,378 | | | | 4,079,045 | |
| | |
Derwent London plc, REIT | | | 93,089 | | | | 4,280,691 | |
| | |
Diageo plc | | | 114,715 | | | | 4,695,397 | |
| | |
Direct Line Insurance Group plc | | | 1,160,515 | | | | 4,091,687 | |
| | |
Experian plc | | | 157,608 | | | | 4,968,011 | |
| | |
GlaxoSmithKline plc | | | 234,903 | | | | 5,380,439 | |
| | |
Halma plc | | | 201,478 | | | | 4,888,951 | |
| | |
HSBC Holdings plc | | | 518,084 | | | | 3,914,183 | |
| | |
IMI plc | | | 131,107 | | | | 1,704,937 | |
| | |
Inchcape plc | | | 194,217 | | | | 1,623,761 | |
| | |
Informa plc | | | 341,466 | | | | 3,432,161 | |
| | |
InterContinental Hotels Group plc | | | 63,460 | | | | 3,840,265 | |
| | |
International Consolidated Airlines Group SA | | | 301,010 | | | | 2,072,035 | |
| | |
Intertek Group plc | | | 29,493 | | | | 2,044,921 | |
| | |
J Sainsbury plc | | | 46,718 | | | | 123,115 | |
| | |
John Wood Group plc | | | 610,026 | | | | 2,678,391 | |
| | |
Land Securities Group plc, REIT | | | 212,927 | | | | 2,593,563 | |
| | |
Legal & General Group plc | | | 1,502,803 | | | | 5,137,090 | |
| | |
London Stock Exchange Group plc | | | 42,854 | | | | 3,861,952 | |
| | |
Meggitt plc | | | 638,584 | | | | 5,166,994 | |
| | |
Merlin Entertainments plc (b) | | | 66,456 | | | | 391,523 | |
| | |
Micro Focus International plc | | | 240,421 | | | | 3,299,830 | |
| | |
Mondi plc | | | 169,629 | | | | 3,517,071 | |
| | |
National Grid plc | | | 462,933 | | | | 5,412,744 | |
| | |
Next plc | | | 37,540 | | | | 3,201,652 | |
| | |
Pearson plc | | | 475,629 | | | | 4,200,563 | |
| | |
Pennon Group plc | | | 438,155 | | | | 5,097,860 | |
| | |
Persimmon plc | | | 155,946 | | | | 4,599,828 | |
| | |
Phoenix Group Holdings plc | | | 244,374 | | | | 2,232,146 | |
| | |
Reckitt Benckiser Group plc | | | 9,926 | | | | 768,090 | |
| | |
RELX plc | | | 202,403 | | | | 4,872,925 | |
| | |
Rentokil Initial plc | | | 878,705 | | | | 5,171,351 | |
| | |
Rightmove plc | | | 179,845 | | | | 1,395,990 | |
| | |
Rolls-Royce Holdings plc* | | | 58,267 | | | | 536,158 | |
| | |
Sage Group plc (The) | | | 515,748 | | | | 4,806,823 | |
| | |
Segro plc, REIT | | | 503,959 | | | | 5,512,961 | |
| | | | | | | | |
| INVESTMENTS | | SHARES | | | VALUE($) | |
| | | | | | | | |
|
United Kingdom — continued | |
| | |
Severn Trent plc | | | 66,271 | | | | 1,935,785 | |
| | |
Smith & Nephew plc | | | 201,696 | | | | 4,329,689 | |
| | |
Smiths Group plc | | | 236,178 | | | | 4,936,978 | |
| | |
Spirax-Sarco Engineering plc | | | 11,165 | | | | 1,145,795 | |
| | |
SSE plc | | | 119,274 | | | | 1,984,249 | |
| | |
Standard Chartered plc | | | 451,579 | | | | 4,097,597 | |
| | |
Tate & Lyle plc | | | 502,703 | | | | 4,384,724 | |
| | |
Taylor Wimpey plc | | | 2,031,952 | | | | 4,357,934 | |
| | |
Unilever NV (a) | | | 43,314 | | | | 2,560,149 | |
| | |
Unilever plc | | | 76,933 | | | | 4,606,669 | |
| | |
United Utilities Group plc | | | 481,752 | | | | 5,439,759 | |
| | |
Vodafone Group plc | | | 2,261,111 | | | | 4,614,298 | |
| | |
Whitbread plc | | | 67,842 | | | | 3,570,976 | |
| | |
Wm Morrison Supermarkets plc | | | 1,335,989 | | | | 3,451,333 | |
| | | | | | | | |
| | |
| | | | | | | 255,232,812 | |
| | | | | | | | |
|
United States — 0.4% | |
| | |
Carnival plc | | | 85,567 | | | | 3,424,115 | |
| | |
Ferguson plc | | | 26,107 | | | | 2,229,364 | |
| | | | | | | | |
| | |
| | | | | | | 5,653,479 | |
| | | | | | | | |
| | |
Total Common Stocks
(Cost $1,265,203,883) | | | | | | | 1,272,943,011 | |
| | | | | | | | |
Preferred Stocks — 0.0%(c) | |
|
United Kingdom — 0.0%(c) | |
| | |
Rolls-Royce Holdings plc*
(Cost $3,443) | | | 2,680,282 | | | | 3,472 | |
| | | | | | | | |
Short-Term Investments — 1.2% | |
|
Investment Companies — 0.2% | |
| | |
JPMorgan U.S. Government Money Market Fund Class Institutional Shares, 1.64% (d) (e)
(Cost $2,710,919) | | | 2,710,919 | | | | 2,710,919 | |
| | | | | | | | |
|
Investment of Cash Collateral From Securities Loaned — 1.0% | |
| | |
JPMorgan Securities Lending Money Market Fund Class Agency SL Shares, 1.98% (d) (e) | | | 4,000,200 | | | | 4,000,600 | |
| | |
JPMorgan U.S. Government Money Market Fund Class IM Shares, 1.70% (d) (e) | | | 9,041,799 | | | | 9,041,799 | |
| | | | | | | | |
| | |
Total Investment of Cash Collateral From Securities Loaned
(Cost $13,042,399) | | | | | | | 13,042,399 | |
| | | | | | | | |
| | |
TotalShort-Term Investments
(Cost $15,753,318) | | | | | | | 15,753,318 | |
| | | | | | | | |
Total Investments — 100.5%
(Cost $1,280,960,644) | | | | | | | 1,288,699,801 | |
| | |
Liabilities in Excess of
Other Assets — (0.5)% | | | | | | | (5,832,498 | ) |
| | | | | | | | |
NET ASSETS — 100.0% | | | | | | | 1,282,867,303 | |
| | | | | | | | |
Percentages indicated are based on net assets.
SEE NOTES TO FINANCIAL STATEMENTS.
| | | | | | |
| | | |
| 114 | | | | J.P. MORGAN EXCHANGE-TRADED FUNDS | | OCTOBER 31, 2019 |
Summary of Investments by Industry, October 31, 2019
The following table represents the portfolio investments of the Fund by industry classifications as a percentage of total investments:
| | | | |
| INDUSTRY | | PERCENTAGE | |
| |
Oil, Gas & Consumable Fuels | | | 6.4 | % |
| |
Diversified Telecommunication Services | | | 4.8 | |
| |
Electric Utilities | | | 4.5 | |
| |
Chemicals | | | 4.4 | |
| |
Pharmaceuticals | | | 3.8 | |
| |
Equity Real Estate Investment Trusts (REITs) | | | 3.7 | |
| |
Insurance | | | 3.7 | |
| |
Metals & Mining | | | 3.6 | |
| |
Food Products | | | 3.2 | |
| |
Household Durables | | | 2.8 | |
| |
Hotels, Restaurants & Leisure | | | 2.6 | |
| |
Health Care Equipment & Supplies | | | 2.5 | |
| |
Gas Utilities | | | 2.4 | |
| |
Construction & Engineering | | | 2.3 | |
| |
Industrial Conglomerates | | | 2.1 | |
| |
Beverages | | | 2.0 | |
| |
Wireless Telecommunication Services | | | 2.0 | |
| |
Banks | | | 2.0 | |
| |
Food & Staples Retailing | | | 1.9 | |
| |
IT Services | | | 1.9 | |
| |
Software | | | 1.8 | |
| |
Health Care Providers & Services | | | 1.8 | |
| |
Trading Companies & Distributors | | | 1.8 | |
| |
Road & Rail | | | 1.7 | |
| |
Semiconductors & Semiconductor Equipment | | | 1.7 | |
| |
Media | | | 1.5 | |
| |
Commercial Services & Supplies | | | 1.5 | |
| |
Capital Markets | | | 1.4 | |
| | | | |
| INDUSTRY | | PERCENTAGE | |
| |
Airlines | | | 1.3 | % |
| |
Electronic Equipment, Instruments & Components | | | 1.3 | |
| |
Auto Components | | | 1.3 | |
| |
Professional Services | | | 1.3 | |
| |
Technology Hardware, Storage & Peripherals | | | 1.2 | |
| |
Machinery | | | 1.1 | |
| |
Interactive Media & Services | | | 1.1 | |
| |
Multi-Utilities | | | 1.1 | |
| |
Entertainment | | | 1.1 | |
| |
Paper & Forest Products | | | 1.0 | |
| |
Water Utilities | | | 1.0 | |
| |
Diversified Financial Services | | | 1.0 | |
| |
Others (each less than 1.0%) | | | 9.2 | |
| |
Short-Term Investments | | | 1.2 | |
Abbreviations
| | |
| OYJ | | Public Limited Company |
| REIT | | Real Estate Investment Trust |
| SCA | | Limited partnership with share capital |
| SGPS | | Holding company |
| |
| (a) | | The security or a portion of this security is on loan at October 31, 2019. The total value of securities on loan at October 31, 2019 is $12,277,449. |
| (b) | | Security exempt from registration pursuant to Regulation S under the Securities Act of 1933, as amended. Regulation S applies to securities offerings that are made outside of the United States and do not involve direct selling efforts in the United States and as such may have restrictions on resale. |
| (c) | | Amount rounds to less than 0.1% of net assets. |
| (d) | | Investment in an affiliated fund, which is registered under the Investment Company Act of 1940, as amended, and is advised by J.P. Morgan Investment Management Inc. |
| (e) | | The rate shown is the current yield as of October 31, 2019. |
| * | | Non-income producing security. |
| | | | | | | | | | | | | | | | | | | | |
| Futures contracts outstanding as of October 31, 2019: | |
| DESCRIPTION | | NUMBER OF
CONTRACTS | | | EXPIRATION
DATE | | | TRADING
CURRENCY | | | NOTIONAL
AMOUNT($) | | | VALUE AND
UNREALIZED
APPRECIATION
(DEPRECIATION)($) | |
| | | | | |
Long Contracts | | | | | | | | | | | | | | | | | | | | |
| | | | | |
MSCI EAFE E-Mini Index | | | 86 | | | | 12/2019 | | | | USD | | | | 8,420,260 | | | | 266,142 | |
| | | | | | | | | | | | | | | | | | | | |
Abbreviations
| | |
| EAFE | | Europe, Australasia, and Far East |
| MSCI | | Morgan Stanley Capital International |
| USD | | United States Dollar |
SEE NOTES TO FINANCIAL STATEMENTS.
| | | | | | | | |
| | | |
| OCTOBER 31, 2019 | | J.P. MORGAN EXCHANGE-TRADED FUNDS | | | | | 115 | |
JPMorgan Diversified Return U.S. Equity ETF
SCHEDULE OF PORTFOLIO INVESTMENTS
AS OF OCTOBER 31, 2019
| | | | | | | | |
| INVESTMENTS | | SHARES | | | VALUE($) | |
Common Stocks — 99.8% | |
|
Aerospace & Defense — 1.0% | |
| | |
Boeing Co. (The) | | | 7,067 | | | | 2,402,144 | |
| | |
Curtiss-Wright Corp. | | | 9,959 | | | | 1,346,955 | |
| | |
FLIR Systems, Inc. (a) | | | 2,979 | | | | 153,597 | |
| | |
Northrop Grumman Corp. | | | 125 | | | | 44,060 | |
| | |
Raytheon Co. | | | 11,042 | | | | 2,343,223 | |
| | |
United Technologies Corp. | | | 11,879 | | | | 1,705,587 | |
| | | | | | | | |
| | |
| | | | | | | 7,995,566 | |
| | | | | | | | |
|
Automobiles & Parts — 1.6% | |
| | |
Delphi Technologies plc (a) | | | 49 | | | | 599 | |
| | |
Ford Motor Co. | | | 210,599 | | | | 1,809,045 | |
| | |
General Motors Co. | | | 33,573 | | | | 1,247,573 | |
| | |
Gentex Corp. | | | 118,361 | | | | 3,320,026 | |
| | |
Genuine Parts Co. | | | 30,351 | | | | 3,113,406 | |
| | |
Harley-Davidson, Inc. (a) | | | 53,917 | | | | 2,097,911 | |
| | |
Lear Corp. | | | 11,164 | | | | 1,314,784 | |
| | | | | | | | |
| | |
| | | | | | | 12,903,344 | |
| | | | | | | | |
|
Banks — 2.4% | |
| | |
Bank of America Corp. | | | 26,116 | | | | 816,647 | |
| | |
Bank of Hawaii Corp. | | | 8,733 | | | | 762,478 | |
| | |
BB&T Corp. | | | 43,994 | | | | 2,333,882 | |
| | |
Citizens Financial Group, Inc. | | | 13,852 | | | | 487,036 | |
| | |
Fifth Third Bancorp | | | 75,558 | | | | 2,197,227 | |
| | |
Huntington Bancshares, Inc. | | | 198,760 | | | | 2,808,479 | |
| | |
KeyCorp | | | 30,211 | | | | 542,892 | |
| | |
M&T Bank Corp. | | | 4,195 | | | | 656,643 | |
| | |
People’s United Financial, Inc. | | | 51,130 | | | | 826,772 | |
| | |
Popular, Inc. (Puerto Rico) | | | 15,222 | | | | 828,990 | |
| | |
Regions Financial Corp. | | | 34,114 | | | | 549,235 | |
| | |
SunTrust Banks, Inc. | | | 43,770 | | | | 2,991,242 | |
| | |
TCF Financial Corp. | | | 14,119 | | | | 558,962 | |
| | |
Umpqua Holdings Corp. | | | 39,656 | | | | 627,358 | |
| | |
US Bancorp | | | 17,730 | | | | 1,010,965 | |
| | |
Wells Fargo & Co. | | | 16,448 | | | | 849,210 | |
| | |
Zions Bancorp NA | | | 11,746 | | | | 569,329 | |
| | | | | | | | |
| | |
| | | | | | | 19,417,347 | |
| | | | | | | | |
|
Beverages — 2.0% | |
| | |
Brown-Forman Corp., Class B (a) | | | 42,429 | | | | 2,779,948 | |
| | |
Coca-Cola Co. (The) | | | 57,211 | | | | 3,113,995 | |
| | |
Constellation Brands, Inc., Class A | | | 13,771 | | | | 2,621,035 | |
| | |
Keurig Dr Pepper, Inc. (a) | | | 59,927 | | | | 1,687,544 | |
| | |
Molson Coors Brewing Co., Class B | | | 34,657 | | | | 1,827,117 | |
| | |
Monster Beverage Corp.* | | | 8,526 | | | | 478,564 | |
| | |
PepsiCo, Inc. | | | 23,024 | | | | 3,158,202 | |
| | | | | | | | |
| | |
| | | | | | | 15,666,405 | |
| | | | | | | | |
| | | | | | | | |
| INVESTMENTS | | SHARES | | | VALUE($) | |
| | | | | | | | |
|
Chemicals — 6.0% | |
| | |
Air Products & Chemicals, Inc. | | | 13,939 | | | | 2,972,631 | |
| | |
Ashland Global Holdings, Inc. | | | 35,396 | | | | 2,738,588 | |
| | |
Avery Dennison Corp. | | | 21,684 | | | | 2,772,516 | |
| | |
Cabot Corp. | | | 15,780 | | | | 687,850 | |
| | |
Celanese Corp. | | | 27,757 | | | | 3,362,761 | |
| | |
CF Industries Holdings, Inc. | | | 65,319 | | | | 2,962,217 | |
| | |
Eastman Chemical Co. | | | 34,744 | | | | 2,641,934 | |
| | |
Ecolab, Inc. | | | 15,265 | | | | 2,931,949 | |
| | |
Huntsman Corp. | | | 119,744 | | | | 2,649,935 | |
| | |
International Flavors & Fragrances, Inc. (a) | | | 16,700 | | | | 2,037,567 | |
| | |
Linde plc (United Kingdom) | | | 16,613 | | | | 3,295,189 | |
| | |
LyondellBasell Industries NV, Class A | | | 30,370 | | | | 2,724,189 | |
| | |
NewMarket Corp. | | | 3,849 | | | | 1,868,651 | |
| | |
Olin Corp. (a) | | | 120,409 | | | | 2,208,301 | |
| | |
PPG Industries, Inc. | | | 28,403 | | | | 3,553,783 | |
| | |
RPM International, Inc. | | | 44,787 | | | | 3,243,922 | |
| | |
Scotts Miracle-Gro Co. (The) | | | 29,619 | | | | 2,973,451 | |
| | |
Westlake Chemical Corp. | | | 8,003 | | | | 505,710 | |
| | |
WR Grace & Co. (a) | | | 23,821 | | | | 1,582,905 | |
| | | | | | | | |
| | |
| | | | | | | 47,714,049 | |
| | | | | | | | |
|
Construction & Materials — 0.3% | |
| | |
Sherwin-Williams Co. (The) | | | 3,595 | | | | 2,057,490 | |
| | | | | | | | |
|
Electricity — 8.2% | |
| | |
AES Corp. | | | 205,320 | | | | 3,500,706 | |
| | |
American Electric Power Co., Inc. | | | 34,536 | | | | 3,259,853 | |
| | |
Avangrid, Inc. (a) | | | 36,020 | | | | 1,802,801 | |
| | |
CMS Energy Corp. | | | 49,930 | | | | 3,191,525 | |
| | |
Consolidated Edison, Inc. | | | 35,406 | | | | 3,265,141 | |
| | |
Dominion Energy, Inc. | | | 39,908 | | | | 3,294,405 | |
| | |
DTE Energy Co. | | | 24,281 | | | | 3,091,457 | |
| | |
Entergy Corp. (a) | | | 27,894 | | | | 3,388,563 | |
| | |
Evergy, Inc. | | | 48,438 | | | | 3,095,672 | |
| | |
Eversource Energy | | | 39,274 | | | | 3,288,805 | |
| | |
Exelon Corp. | | | 66,616 | | | | 3,030,362 | |
| | |
FirstEnergy Corp. | | | 68,425 | | | | 3,306,296 | |
| | |
Hawaiian Electric Industries, Inc. | | | 19,243 | | | | 868,821 | |
| | |
IDACORP, Inc. | | | 16,829 | | | | 1,811,137 | |
| | |
NextEra Energy, Inc. | | | 14,366 | | | | 3,423,992 | |
| | |
NRG Energy, Inc. | | | 74,530 | | | | 2,990,144 | |
| | |
Pinnacle West Capital Corp. | | | 33,031 | | | | 3,108,878 | |
| | |
PPL Corp. | | | 100,820 | | | | 3,376,462 | |
| | |
Public Service Enterprise Group, Inc. | | | 52,054 | | | | 3,295,539 | |
| | |
Southern Co. (The) | | | 54,021 | | | | 3,384,956 | |
| | |
Vistra Energy Corp. | | | 126,119 | | | | 3,408,996 | |
| | |
Xcel Energy, Inc. | | | 49,027 | | | | 3,113,705 | |
| | | | | | | | |
| | |
| | | | | | | 66,298,216 | |
| | | | | | | | |
SEE NOTES TO FINANCIAL STATEMENTS.
| | | | | | |
| | | |
| 116 | | | | J.P. MORGAN EXCHANGE-TRADED FUNDS | | OCTOBER 31, 2019 |
| | | | | | | | |
| INVESTMENTS | | SHARES | | | VALUE($) | |
Common Stocks — continued | |
|
Electronic & Electrical Equipment — 1.4% | |
| | |
Agilent Technologies, Inc. | | | 19,979 | | | | 1,513,409 | |
| | |
AMETEK, Inc. | | | 14,729 | | | | 1,349,913 | |
| | |
Amphenol Corp., Class A | | | 17,748 | | | | 1,780,657 | |
| | |
Emerson Electric Co. | | | 11,517 | | | | 807,917 | |
| | |
Hubbell, Inc. | | | 7,030 | | | | 996,151 | |
| | |
Roper Technologies, Inc. | | | 5,629 | | | | 1,896,748 | |
| | |
Waters Corp.* | | | 12,827 | | | | 2,714,450 | |
| | | | | | | | |
| | |
| | | | | | | 11,059,245 | |
| | | | | | | | |
|
Financial Services — 2.9% | |
| | |
Ally Financial, Inc. | | | 89,627 | | | | 2,745,275 | |
| | |
American Express Co. | | | 10,735 | | | | 1,259,001 | |
| | |
Ameriprise Financial, Inc. | | | 4,588 | | | | 692,283 | |
| | |
Capital One Financial Corp. | | | 9,435 | | | | 879,814 | |
| | |
CME Group, Inc. | | | 14,143 | | | | 2,909,922 | |
| | |
Discover Financial Services | | | 14,783 | | | | 1,186,483 | |
| | |
Fidelity National Financial, Inc. | | | 18,613 | | | | 853,220 | |
| | |
Intercontinental Exchange, Inc. | | | 14,412 | | | | 1,359,340 | |
| | |
Mastercard, Inc., Class A | | | 7,364 | | | | 2,038,429 | |
| | |
Moody’s Corp. | | | 3,398 | | | | 749,905 | |
| | |
Morgan Stanley | | | 10,401 | | | | 478,966 | |
| | |
Nasdaq, Inc. | | | 5,983 | | | | 596,924 | |
| | |
Raymond James Financial, Inc. | | | 7,097 | | | | 592,529 | |
| | |
S&P Global, Inc. | | | 5,900 | | | | 1,522,141 | |
| | |
Santander Consumer USA Holdings, Inc. | | | 91,562 | | | | 2,296,375 | |
| | |
Synchrony Financial | | | 16,380 | | | | 579,361 | |
| | |
Visa, Inc., Class A | | | 9,417 | | | | 1,684,325 | |
| | |
Western Union Co. (The) (a) | | | 43,327 | | | | 1,085,775 | |
| | | | | | | | |
| | |
| | | | | | | 23,510,068 | |
| | | | | | | | |
|
Fixed Line Telecommunications — 1.2% | |
| | |
AT&T, Inc. | | | 89,251 | | | | 3,435,271 | |
| | |
CenturyLink, Inc. | | | 206,155 | | | | 2,667,646 | |
| | |
Verizon Communications, Inc. | | | 54,122 | | | | 3,272,757 | |
| | | | | | | | |
| | |
| | | | | | | 9,375,674 | |
| | | | | | | | |
|
Food & Drug Retailers — 0.9% | |
| | |
AmerisourceBergen Corp. | | | 16,210 | | | | 1,384,010 | |
| | |
Kroger Co. (The) | | | 27,029 | | | | 665,995 | |
| | |
McKesson Corp. | | | 7,294 | | | | 970,102 | |
| | |
Sysco Corp. | | | 36,818 | | | | 2,940,654 | |
| | |
Walgreens Boots Alliance, Inc. | | | 26,535 | | | | 1,453,587 | |
| | | | | | | | |
| | |
| | | | | | | 7,414,348 | |
| | | | | | | | |
|
Food Producers — 3.0% | |
| | |
Flowers Foods, Inc. | | | 85,875 | | | | 1,865,205 | |
| | |
General Mills, Inc. | | | 58,513 | | | | 2,975,971 | |
| | | | | | | | |
| INVESTMENTS | | SHARES | | | VALUE($) | |
| | | | | | | | |
|
Food Producers — continued | |
| | |
Hershey Co. (The) | | | 19,867 | | | | 2,917,866 | |
| | |
Hormel Foods Corp. (a) | | | 71,569 | | | | 2,926,457 | |
| | |
JM Smucker Co. (The) | | | 8,799 | | | | 929,878 | |
| | |
Kellogg Co. | | | 36,132 | | | | 2,295,466 | |
| | |
Lamb Weston Holdings, Inc. | | | 4,505 | | | | 351,570 | |
| | |
McCormick & Co., Inc.(Non-Voting) | | | 19,230 | | | | 3,090,069 | |
| | |
Mondelez International, Inc., Class A | | | 57,016 | | | | 2,990,489 | |
| | |
TreeHouse Foods, Inc.* (a) | | | 18,462 | | | | 997,317 | |
| | |
Tyson Foods, Inc., Class A | | | 33,863 | | | | 2,803,518 | |
| | | | | | | | |
| | |
| | | | | | | 24,143,806 | |
| | | | | | | | |
|
Forestry & Paper — 0.7% | |
| | |
Domtar Corp. | | | 64,051 | | | | 2,330,816 | |
| | |
International Paper Co. | | | 80,495 | | | | 3,516,022 | |
| | | | | | | | |
| | |
| | | | | | | 5,846,838 | |
| | | | | | | | |
|
Gas, Water & Multiutilities — 2.6% | |
| | |
Ameren Corp. | | | 40,651 | | | | 3,158,583 | |
| | |
American Water Works Co., Inc. | | | 24,732 | | | | 3,048,714 | |
| | |
Atmos Energy Corp. | | | 2,007 | | | | 225,747 | |
| | |
CenterPoint Energy, Inc. | | | 2,227 | | | | 64,739 | |
| | |
Duke Energy Corp. | | | 33,941 | | | | 3,199,279 | |
| | |
National Fuel Gas Co. (a) | | | 42,022 | | | | 1,904,017 | |
| | |
Sempra Energy | | | 22,225 | | | | 3,211,735 | |
| | |
UGI Corp. | | | 52,400 | | | | 2,497,908 | |
| | |
WEC Energy Group, Inc. | | | 32,878 | | | | 3,103,683 | |
| | | | | | | | |
| | |
| | | | | | | 20,414,405 | |
| | | | | | | | |
|
General Industrials — 1.3% | |
| | |
3M Co. | | | 5,277 | | | | 870,652 | |
| | |
Ball Corp. | | | 1,603 | | | | 112,162 | |
| | |
Danaher Corp. | | | 15,573 | | | | 2,146,271 | |
| | |
Eaton Corp. plc | | | 15,496 | | | | 1,349,857 | |
| | |
Honeywell International, Inc. | | | 10,977 | | | | 1,896,057 | |
| | |
ITT, Inc. | | | 34,859 | | | | 2,072,368 | |
| | |
Parker-Hannifin Corp. | | | 5,889 | | | | 1,080,573 | |
| | |
Sonoco Products Co. | | | 13,850 | | | | 799,145 | |
| | | | | | | | |
| | |
| | | | | | | 10,327,085 | |
| | | | | | | | |
|
General Retailers — 5.7% | |
| | |
AutoZone, Inc.* | | | 2,167 | | | | 2,479,871 | |
| | |
Best Buy Co., Inc. | | | 13,769 | | | | 989,027 | |
| | |
Burlington Stores, Inc.* | | | 2,391 | | | | 459,478 | |
| | |
Costco Wholesale Corp. | | | 9,925 | | | | 2,948,817 | |
| | |
Dick’s Sporting Goods, Inc. | | | 64,404 | | | | 2,507,248 | |
| | |
Dollar General Corp. | | | 20,165 | | | | 3,233,256 | |
| | |
Dollar Tree, Inc.* | | | 10,357 | | | | 1,143,413 | |
SEE NOTES TO FINANCIAL STATEMENTS.
| | | | | | | | |
| | | |
| OCTOBER 31, 2019 | | J.P. MORGAN EXCHANGE-TRADED FUNDS | | | | | 117 | |
JPMorgan Diversified Return U.S. Equity ETF
SCHEDULE OF PORTFOLIO INVESTMENTS
AS OF OCTOBER 31, 2019 (continued)
| | | | | | | | |
| INVESTMENTS | | SHARES | | | VALUE($) | |
Common Stocks — continued | |
|
General Retailers — continued | |
| | |
eBay, Inc. | | | 49,076 | | | | 1,729,929 | |
| | |
Foot Locker, Inc. (a) | | | 46,117 | | | | 2,006,551 | |
| | |
Gap, Inc. (The) | | | 19,502 | | | | 317,102 | |
| | |
H&R Block, Inc. (a) | | | 98,346 | | | | 2,457,666 | |
| | |
Home Depot, Inc. (The) | | | 13,810 | | | | 3,239,550 | |
| | |
KAR Auction Services, Inc. (a) | | | 53,754 | | | | 1,336,324 | |
| | |
Kohl’s Corp. | | | 46,088 | | | | 2,362,471 | |
| | |
Lowe’s Cos., Inc. | | | 22,634 | | | | 2,526,181 | |
| | |
Macy’s, Inc. | | | 72,979 | | | | 1,106,361 | |
| | |
Nordstrom, Inc. (a) | | | 13,149 | | | | 472,049 | |
| | |
Ross Stores, Inc. | | | 16,907 | | | | 1,854,191 | |
| | |
Target Corp. | | | 29,404 | | | | 3,143,582 | |
| | |
TJX Cos., Inc. (The) | | | 57,252 | | | | 3,300,578 | |
| | |
Tractor Supply Co. | | | 29,794 | | | | 2,831,026 | |
| | |
Walmart, Inc. | | | 26,417 | | | | 3,097,657 | |
| | |
Williams-Sonoma, Inc. | | | 14,985 | | | | 1,000,848 | |
| | | | | | | | |
| | |
| | | | | | | 46,543,176 | |
| | | | | | | | |
|
Health Care Equipment & Services — 6.8% | |
| | |
Anthem, Inc. | | | 10,336 | | | | 2,781,211 | |
| | |
Baxter International, Inc. | | | 35,796 | | | | 2,745,553 | |
| | |
Becton Dickinson and Co. | | | 8,344 | | | | 2,136,064 | |
| | |
Centene Corp.* | | | 4,173 | | | | 221,503 | |
| | |
Cigna Corp. | | | 17,794 | | | | 3,175,517 | |
| | |
Edwards Lifesciences Corp.* | | | 10,974 | | | | 2,615,982 | |
| | |
HCA Healthcare, Inc. | | | 19,549 | | | | 2,610,573 | |
| | |
Hill-Rom Holdings, Inc. | | | 29,070 | | | | 3,043,338 | |
| | |
Humana, Inc. | | | 8,469 | | | | 2,491,580 | |
| | |
IDEXX Laboratories, Inc.* | | | 10,073 | | | | 2,870,906 | |
| | |
Intuitive Surgical, Inc.* | | | 4,836 | | | | 2,674,066 | |
| | |
Laboratory Corp. of America Holdings* | | | 16,991 | | | | 2,799,607 | |
| | |
Medtronic plc | | | 29,181 | | | | 3,177,811 | |
| | |
Quest Diagnostics, Inc. | | | 28,774 | | | | 2,913,367 | |
| | |
STERIS plc | | | 11,696 | | | | 1,655,803 | |
| | |
Stryker Corp. | | | 14,270 | | | | 3,086,173 | |
| | |
Thermo Fisher Scientific, Inc. | | | 10,966 | | | | 3,311,513 | |
| | |
UnitedHealth Group, Inc. | | | 10,877 | | | | 2,748,618 | |
| | |
Universal Health Services, Inc., Class B | | | 21,774 | | | | 2,993,054 | |
| | |
Varian Medical Systems, Inc.* | | | 23,135 | | | | 2,794,939 | |
| | |
Zimmer Biomet Holdings, Inc. | | | 18,960 | | | | 2,620,841 | |
| | | | | | | | |
| | |
| | | | | | | 55,468,019 | |
| | | | | | | | |
|
Household Goods & Home Construction — 3.1% | |
| | |
Church & Dwight Co., Inc. | | | 39,482 | | | | 2,761,371 | |
| | |
Clorox Co. (The) | | | 18,446 | | | | 2,724,290 | |
| | |
DR Horton, Inc. | | | 40,751 | | | | 2,134,130 | |
| | | | | | | | |
| INVESTMENTS | | SHARES | | | VALUE($) | |
| | | | | | | | |
|
Household Goods & Home Construction — continued | |
| | |
Fortune Brands Home & Security, Inc. | | | 15,020 | | | | 901,951 | |
| | |
Leggett & Platt, Inc. (a) | | | 55,244 | | | | 2,834,017 | |
| | |
Lennar Corp., Class A | | | 37,859 | | | | 2,256,396 | |
| | |
NVR, Inc.* | | | 875 | | | | 3,182,016 | |
| | |
Procter & Gamble Co. (The) | | | 26,184 | | | | 3,260,170 | |
| | |
PulteGroup, Inc. | | | 93,094 | | | | 3,653,009 | |
| | |
Toll Brothers, Inc. | | | 13,853 | | | | 550,934 | |
| | | | | | | | |
| | |
| | | | | | | 24,258,284 | |
| | | | | | | | |
|
Industrial Engineering — 1.5% | |
| | |
Caterpillar, Inc. | | | 7,069 | | | | 974,108 | |
| | |
Crane Co. | | | 2,297 | | | | 175,766 | |
| | |
Cummins, Inc. | | | 21,080 | | | | 3,635,878 | |
| | |
Dover Corp. | | | 12,813 | | | | 1,331,143 | |
| | |
IDEX Corp. | | | 7,107 | | | | 1,105,352 | |
| | |
Illinois Tool Works, Inc. | | | 10,737 | | | | 1,810,043 | |
| | |
Ingersoll-Rand plc | | | 12,400 | | | | 1,573,436 | |
| | |
PACCAR, Inc. | | | 11,484 | | | | 873,473 | |
| | |
Rockwell Automation, Inc. | | | 7,493 | | | | 1,288,721 | |
| | | | | | | | |
| | |
| | | | | | | 12,767,920 | |
| | | | | | | | |
|
Industrial Metals & Mining — 1.7% | |
| | |
Freeport-McMoRan, Inc. | | | 141,170 | | | | 1,386,289 | |
| | |
Nucor Corp. | | | 64,254 | | | | 3,460,078 | |
| | |
Reliance Steel & Aluminum Co. | | | 32,373 | | | | 3,756,563 | |
| | |
Southern Copper Corp. (Peru) | | | 82,364 | | | | 2,930,511 | |
| | |
Steel Dynamics, Inc. | | | 64,731 | | | | 1,965,233 | |
| | | | | | | | |
| | |
| | | | | | | 13,498,674 | |
| | | | | | | | |
|
Industrial Transportation — 0.7% | |
| | |
CH Robinson Worldwide, Inc. (a) | | | 13,138 | | | | 993,758 | |
| | |
CSX Corp. | | | 12,080 | | | | 848,862 | |
| | |
Kansas City Southern | | | 4,537 | | | | 638,719 | |
| | |
Norfolk Southern Corp. | | | 7,832 | | | | 1,425,424 | |
| | |
Union Pacific Corp. | | | 10,479 | | | | 1,733,855 | |
| | | | | | | | |
| | |
| | | | | | | 5,640,618 | |
| | | | | | | | |
|
Leisure Goods — 1.3% | |
| | |
Activision Blizzard, Inc. | | | 24,163 | | | | 1,353,853 | |
| | |
Electronic Arts, Inc.* | | | 14,771 | | | | 1,423,924 | |
| | |
Garmin Ltd. | | | 38,581 | | | | 3,616,969 | |
| | |
Hasbro, Inc. | | | 28,482 | | | | 2,771,583 | |
| | |
Take-Two Interactive Software, Inc.* (a) | | | 11,641 | | | | 1,400,994 | |
| | | | | | | | |
| | |
| | | | | | | 10,567,323 | |
| | | | | | | | |
|
Life Insurance — 1.0% | |
| | |
Aflac, Inc. | | | 51,136 | | | | 2,718,390 | |
| | |
Assurant, Inc. | | | 10,939 | | | | 1,379,080 | |
SEE NOTES TO FINANCIAL STATEMENTS.
| | | | | | |
| | | |
| 118 | | | | J.P. MORGAN EXCHANGE-TRADED FUNDS | | OCTOBER 31, 2019 |
| | | | | | | | |
| INVESTMENTS | | SHARES | | | VALUE($) | |
Common Stocks — continued | |
|
Life Insurance — continued | |
| | |
Globe Life, Inc. | | | 20,532 | | | | 1,998,380 | |
| | |
Lincoln National Corp. | | | 6,737 | | | | 380,506 | |
| | |
MetLife, Inc. | | | 10,799 | | | | 505,285 | |
| | |
Principal Financial Group, Inc. | | | 13,447 | | | | 717,801 | |
| | |
Prudential Financial, Inc. | | | 5,840 | | | | 532,258 | |
| | | | | | | | |
| | |
| | | | | | | 8,231,700 | |
| | | | | | | | |
|
Media — 2.1% | |
| | |
Cable One, Inc. | | | 98 | | | | 129,886 | |
| | |
Comcast Corp., Class A | | | 50,616 | | | | 2,268,609 | |
| | |
DISH Network Corp., Class A* | | | 4,228 | | | | 145,359 | |
| | |
FactSet Research Systems, Inc. | | | 10,789 | | | | 2,735,227 | |
| | |
Fox Corp., Class A | | | 20,264 | | | | 649,259 | |
| | |
Graham Holdings Co., Class B | | | 98 | | | | 61,707 | |
| | |
Interpublic Group of Cos., Inc. (The) (a) | | | 61,705 | | | | 1,342,084 | |
| | |
John Wiley & Sons, Inc., Class A | | | 7,941 | | | | 365,842 | |
| | |
Liberty Media Corp.-Liberty SiriusXM, Class A* | | | 10,496 | | | | 471,375 | |
| | |
Nexstar Media Group, Inc., Class A | | | 12,567 | | | | 1,222,643 | |
| | |
Nielsen Holdings plc | | | 4,218 | | | | 85,035 | |
| | |
Omnicom Group, Inc. | | | 26,057 | | | | 2,011,340 | |
| | |
Sinclair Broadcast Group, Inc., Class A | | | 63,739 | | | | 2,539,362 | |
| | |
Viacom, Inc., Class B | | | 40,085 | | | | 864,233 | |
| | |
Walt Disney Co. (The) | | | 22,725 | | | | 2,952,432 | |
| | | | | | | | |
| | |
| | | | | | | 17,844,393 | |
| | | | | | | | |
|
Mining — 0.7% | |
| | |
Newmont Goldcorp Corp. | | | 78,953 | | | | 3,136,803 | |
| | |
Royal Gold, Inc. (a) | | | 23,614 | | | | 2,726,000 | |
| | | | | | | | |
| | |
| | | | | | | 5,862,803 | |
| | | | | | | | |
|
Mobile Telecommunications — 1.1% | |
| | |
Sprint Corp.* | | | 345,513 | | | | 2,145,636 | |
| | |
Telephone & Data Systems, Inc. | | | 88,198 | | | | 2,301,086 | |
| | |
T-Mobile US, Inc.* | | | 40,332 | | | | 3,333,843 | |
| | |
United States Cellular Corp.* (a) | | | 25,580 | | | | 952,087 | |
| | | | | | | | |
| | |
| | | | | | | 8,732,652 | |
| | | | | | | | |
|
Nonlife Insurance — 2.1% | |
| | |
Allstate Corp. (The) | | | 10,248 | | | | 1,090,592 | |
| | |
American Financial Group, Inc. | | | 5,302 | | | | 551,620 | |
| | |
Aon plc | | | 11,065 | | | | 2,137,315 | |
| | |
Chubb Ltd. | | | 8,371 | | | | 1,275,908 | |
| | |
Cincinnati Financial Corp. | | | 20,731 | | | | 2,346,956 | |
| | |
Hanover Insurance Group, Inc. (The) | | | 5,762 | | | | 758,913 | |
| | |
Marsh & McLennan Cos., Inc. | | | 16,068 | | | | 1,664,966 | |
| | |
Mercury General Corp. | | | 636 | | | | 30,566 | |
| | |
Old Republic International Corp. | | | 36,269 | | | | 810,249 | |
| | | | | | | | |
| INVESTMENTS | | SHARES | | | VALUE($) | |
| | | | | | | | |
|
Nonlife Insurance — continued | |
| | |
Progressive Corp. (The) | | | 37,081 | | | | 2,584,546 | |
| | |
Reinsurance Group of America, Inc. | | | 4,090 | | | | 664,502 | |
| | |
Travelers Cos., Inc. (The) | | | 7,929 | | | | 1,039,175 | |
| | |
WR Berkley Corp. | | | 22,753 | | | | 1,590,435 | |
| | | | | | | | |
| | |
| | | | | | | 16,545,743 | |
| | | | | | | | |
|
Oil & Gas Producers — 4.8% | |
| | |
Cabot Oil & Gas Corp. | | | 137,035 | | | | 2,554,332 | |
| | |
Chesapeake Energy Corp.* (a) | | | 37,783 | | | | 50,629 | |
| | |
Chevron Corp. | | | 26,747 | | | | 3,106,397 | |
| | |
ConocoPhillips | | | 60,308 | | | | 3,329,002 | |
| | |
Devon Energy Corp. (a) | | | 71,470 | | | | 1,449,412 | |
| | |
Diamondback Energy, Inc. | | | 5,218 | | | | 447,496 | |
| | |
EOG Resources, Inc. | | | 26,378 | | | | 1,828,259 | |
| | |
EQT Corp. | | | 84,327 | | | | 905,672 | |
| | |
Exxon Mobil Corp. | | | 34,827 | | | | 2,353,260 | |
| | |
Hess Corp. | | | 32,508 | | | | 2,137,401 | |
| | |
HollyFrontier Corp. | | | 53,264 | | | | 2,926,324 | |
| | |
Marathon Oil Corp. | | | 171,987 | | | | 1,983,010 | |
| | |
Marathon Petroleum Corp. | | | 46,905 | | | | 2,999,575 | |
| | |
Murphy Oil Corp. (a) | | | 90,141 | | | | 1,859,609 | |
| | |
Noble Energy, Inc. (a) | | | 103,899 | | | | 2,001,095 | |
| | |
Occidental Petroleum Corp. | | | 44,395 | | | | 1,797,998 | |
| | |
PBF Energy, Inc., Class A | | | 16,811 | | | | 542,659 | |
| | |
Phillips 66 | | | 29,138 | | | | 3,403,901 | |
| | |
Valero Energy Corp. | | | 31,394 | | | | 3,044,590 | |
| | | | | | | | |
| | |
| | | | | | | 38,720,621 | |
| | | | | | | | |
|
Oil Equipment, Services & Distribution — 2.0% | |
| | |
Apergy Corp.* | | | 6,338 | | | | 159,527 | |
| | |
Helmerich & Payne, Inc. | | | 62,412 | | | | 2,340,450 | |
| | |
Kinder Morgan, Inc. | | | 155,327 | | | | 3,103,433 | |
| | |
OGE Energy Corp. | | | 55,197 | | | | 2,376,783 | |
| | |
ONEOK, Inc. | | | 37,361 | | | | 2,608,919 | |
| | |
Patterson-UTI Energy, Inc. | | | 134,034 | | | | 1,115,163 | |
| | |
Schlumberger Ltd. | | | 26,679 | | | | 872,137 | |
| | |
Targa Resources Corp. | | | 20,833 | | | | 809,987 | |
| | |
Williams Cos., Inc. (The) | | | 99,408 | | | | 2,217,792 | |
| | | | | | | | |
| | |
| | | | | | | 15,604,191 | |
| | | | | | | | |
|
Personal Goods — 3.0% | |
| | |
Carter’s, Inc. | | | 16,912 | | | | 1,695,259 | |
| | |
Colgate-Palmolive Co. | | | 15,637 | | | | 1,072,698 | |
| | |
Columbia Sportswear Co. | | | 8,134 | | | | 735,720 | |
| | |
Estee Lauder Cos., Inc. (The), Class A | | | 15,904 | | | | 2,962,438 | |
| | |
Hanesbrands, Inc. | | | 51,985 | | | | 790,692 | |
SEE NOTES TO FINANCIAL STATEMENTS.
| | | | | | | | |
| | | |
| OCTOBER 31, 2019 | | J.P. MORGAN EXCHANGE-TRADED FUNDS | | | | | 119 | |
JPMorgan Diversified Return U.S. Equity ETF
SCHEDULE OF PORTFOLIO INVESTMENTS
AS OF OCTOBER 31, 2019 (continued)
| | | | | | | | |
| INVESTMENTS | | SHARES | | | VALUE($) | |
Common Stocks — continued | |
|
Personal Goods — continued | |
| | |
Kimberly-Clark Corp. | | | 22,316 | | | | 2,965,350 | |
| | |
Lululemon Athletica, Inc.* | | | 17,038 | | | | 3,480,352 | |
| | |
NIKE, Inc., Class B | | | 36,180 | | | | 3,239,919 | |
| | |
Nu Skin Enterprises, Inc., Class A | | | 7,166 | | | | 319,460 | |
| | |
PVH Corp. | | | 10,762 | | | | 938,016 | |
| | |
Ralph Lauren Corp. | | | 20,861 | | | | 2,003,908 | |
| | |
Tapestry, Inc. | | | 58,617 | | | | 1,515,836 | |
| | |
VF Corp. | | | 26,295 | | | | 2,163,815 | |
| | | | | | | | |
| | |
| | | | | | | 23,883,463 | |
| | | | | | | | |
|
Pharmaceuticals & Biotechnology — 4.0% | |
| | |
Abbott Laboratories | | | 36,917 | | | | 3,086,630 | |
| | |
AbbVie, Inc. | | | 17,211 | | | | 1,369,135 | |
| | |
Amgen, Inc. | | | 13,584 | | | | 2,896,788 | |
| | |
Biogen, Inc.* | | | 4,989 | | | | 1,490,264 | |
| | |
Bristol-Myers Squibb Co. | | | 43,065 | | | | 2,470,639 | |
| | |
Eli Lilly & Co. | | | 24,611 | | | | 2,804,423 | |
| | |
Gilead Sciences, Inc. | | | 28,499 | | | | 1,815,671 | |
| | |
Illumina, Inc.* | | | 5,458 | | | | 1,612,948 | |
| | |
IQVIA Holdings, Inc.* | | | 20,299 | | | | 2,931,581 | |
| | |
Johnson & Johnson | | | 20,814 | | | | 2,748,281 | |
| | |
Merck & Co., Inc. | | | 28,712 | | | | 2,488,182 | |
| | |
Pfizer, Inc. | | | 66,206 | | | | 2,540,324 | |
| | |
Vertex Pharmaceuticals, Inc.* | | | 759 | | | | 148,370 | |
| | |
Zoetis, Inc. | | | 24,900 | | | | 3,185,208 | |
| | | | | | | | |
| | |
| | | | | | | 31,588,444 | |
| | | | | | | | |
|
Real Estate Investment & Services — 0.1% | |
| | |
CBRE Group, Inc., Class A* | | | 8,280 | | | | 443,394 | |
| | | | | | | | |
|
Real Estate Investment Trusts — 4.8% | |
| | |
Alexandria Real Estate Equities, Inc. | | | 7,449 | | | | 1,182,529 | |
| | |
American Tower Corp. | | | 7,412 | | | | 1,616,409 | |
| | |
Apartment Investment & Management Co., Class A | | | 25,992 | | | | 1,426,441 | |
| | |
AvalonBay Communities, Inc. | | | 6,373 | | | | 1,387,147 | |
| | |
Boston Properties, Inc. | | | 885 | | | | 121,422 | |
| | |
Camden Property Trust | | | 1,546 | | | | 176,816 | |
| | |
Chimera Investment Corp. (a) | | | 127,936 | | | | 2,591,983 | |
| | |
Crown Castle International Corp. | | | 7,755 | | | | 1,076,316 | |
| | |
Digital Realty Trust, Inc. | | | 5,993 | | | | 761,351 | |
| | |
Duke Realty Corp. | | | 3,911 | | | | 137,433 | |
| | |
EPR Properties | | | 24,903 | | | | 1,937,204 | |
| | |
Equity Residential | | | 16,151 | | | | 1,431,948 | |
| | |
Federal Realty Investment Trust | | | 1,057 | | | | 143,763 | |
| | |
HCP, Inc. | | | 90,676 | | | | 3,411,231 | |
| | |
Iron Mountain, Inc. | | | 6,729 | | | | 220,711 | |
| | | | | | | | |
| INVESTMENTS | | SHARES | | | VALUE($) | |
| | | | | | | | |
|
Real Estate Investment Trusts — continued | |
| | |
Liberty Property Trust | | | 1,202 | | | | 71,002 | |
| | |
Medical Properties Trust, Inc. | | | 168,752 | | | | 3,498,229 | |
| | |
MFA Financial, Inc. | | | 60,807 | | | | 461,525 | |
| | |
New Residential Investment Corp. | | | 187,746 | | | | 2,973,897 | |
| | |
Park Hotels & Resorts, Inc. | | | 51,943 | | | | 1,207,675 | |
| | |
Prologis, Inc. | | | 12,742 | | | | 1,118,238 | |
| | |
Starwood Property Trust, Inc. | | | 113,151 | | | | 2,783,515 | |
| | |
STORE Capital Corp. | | | 54,068 | | | | 2,189,754 | |
| | |
VEREIT, Inc. | | | 279,723 | | | | 2,752,474 | |
| | |
Vornado Realty Trust | | | 2,958 | | | | 194,134 | |
| | |
Weingarten Realty Investors | | | 9,681 | | | | 307,178 | |
| | |
WP Carey, Inc. | | | 35,057 | | | | 3,227,347 | |
| | | | | | | | |
| | |
| | | | | | | 38,407,672 | |
| | | | | | | | |
|
Software & Computer Services — 4.2% | |
| | |
Adobe, Inc.* | | | 8,252 | | | | 2,293,478 | |
| | |
Alphabet, Inc., Class A* | | | 1,615 | | | | 2,032,962 | |
| | |
Cadence Design Systems, Inc.* | | | 35,996 | | | | 2,352,339 | |
| | |
Citrix Systems, Inc. | | | 24,999 | | | | 2,721,391 | |
| | |
Cognizant Technology Solutions Corp., Class A | | | 27,104 | | | | 1,651,718 | |
| | |
DXC Technology Co. | | | 15,986 | | | | 442,333 | |
| | |
Facebook, Inc., Class A* | | | 9,163 | | | | 1,756,089 | |
| | |
Hewlett Packard Enterprise Co. | | | 19,873 | | | | 326,116 | |
| | |
IAC/InterActiveCorp* (a) | | | 12,373 | | | | 2,811,764 | |
| | |
International Business Machines Corp. | | | 11,579 | | | | 1,548,460 | |
| | |
Intuit, Inc. | | | 10,922 | | | | 2,812,415 | |
| | |
Leidos Holdings, Inc. | | | 36,049 | | | | 3,108,505 | |
| | |
Microsoft Corp. | | | 22,834 | | | | 3,273,711 | |
| | |
Oracle Corp. | | | 31,479 | | | | 1,715,291 | |
| | |
VeriSign, Inc.* | | | 15,393 | | | | 2,924,978 | |
| | |
VMware, Inc., Class A | | | 12,097 | | | | 1,914,592 | |
| | | | | | | | |
| | |
| | | | | | | 33,686,142 | |
| | | | | | | | |
|
Support Services — 4.7% | |
| | |
Accenture plc, Class A | | | 14,825 | | | | 2,748,851 | |
| | |
Automatic Data Processing, Inc. | | | 8,467 | | | | 1,373,601 | |
| | |
Booz Allen Hamilton Holding Corp. | | | 24,980 | | | | 1,757,843 | |
| | |
Broadridge Financial Solutions, Inc. | | | 19,957 | | | | 2,499,016 | |
| | |
Cintas Corp. | | | 11,933 | | | | 3,206,039 | |
| | |
Fastenal Co. | | | 36,259 | | | | 1,303,149 | |
| | |
Fidelity National Information Services, Inc. | | | 23,116 | | | | 3,045,764 | |
| | |
Fiserv, Inc.* | | | 18,644 | | | | 1,978,874 | |
| | |
Global Payments, Inc. | | | 25,469 | | | | 4,308,845 | |
| | |
Paychex, Inc. | | | 20,552 | | | | 1,718,969 | |
| | |
PayPal Holdings, Inc.* | | | 10,845 | | | | 1,128,964 | |
SEE NOTES TO FINANCIAL STATEMENTS.
| | | | | | |
| | | |
| 120 | | | | J.P. MORGAN EXCHANGE-TRADED FUNDS | | OCTOBER 31, 2019 |
| | | | | | | | |
| INVESTMENTS | | SHARES | | | VALUE($) | |
Common Stocks — continued | |
|
Support Services — continued | |
| | |
Republic Services, Inc. | | | 34,503 | | | | 3,019,358 | |
| | |
Robert Half International, Inc. | | | 35,909 | | | | 2,056,508 | |
| | |
Verisk Analytics, Inc. | | | 2,624 | | | | 379,693 | |
| | |
Waste Management, Inc. | | | 26,381 | | | | 2,960,212 | |
| | |
WW Grainger, Inc. | | | 7,468 | | | | 2,306,417 | |
| | |
Xerox Holdings Corp. | | | 60,812 | | | | 2,063,351 | |
| | | | | | | | |
| | |
| | | | | | | 37,855,454 | |
| | | | | | | | |
|
Technology Hardware & Equipment — 5.0% | |
| | |
Analog Devices, Inc. | | | 20,328 | | | | 2,167,575 | |
| | |
Apple, Inc. | | | 9,996 | | | | 2,486,605 | |
| | |
Applied Materials, Inc. | | | 23,815 | | | | 1,292,202 | |
| | |
Broadcom, Inc. | | | 5,752 | | | | 1,684,473 | |
| | |
Cisco Systems, Inc. | | | 50,787 | | | | 2,412,891 | |
| | |
Cypress Semiconductor Corp. | | | 28,082 | | | | 653,468 | |
| | |
F5 Networks, Inc.* | | | 9,627 | | | | 1,387,058 | |
| | |
HP, Inc. | | | 85,194 | | | | 1,479,820 | |
| | |
Intel Corp. | | | 32,417 | | | | 1,832,533 | |
| | |
Juniper Networks, Inc. | | | 50,112 | | | | 1,243,780 | |
| | |
KLA Corp. | | | 13,540 | | | | 2,288,802 | |
| | |
L3Harris Technologies, Inc. | | | 14,892 | | | | 3,072,368 | |
| | |
Lam Research Corp. | | | 11,676 | | | | 3,164,663 | |
| | |
Maxim Integrated Products, Inc. | | | 28,242 | | | | 1,656,676 | |
| | |
Micron Technology, Inc.* | | | 26,259 | | | | 1,248,615 | |
| | |
Motorola Solutions, Inc. | | | 16,354 | | | | 2,719,997 | |
| | |
NetApp, Inc. | | | 16,809 | | | | 939,287 | |
| | |
ON Semiconductor Corp.* | | | 51,295 | | | | 1,046,418 | |
| | |
Skyworks Solutions, Inc. | | | 10,323 | | | | 940,012 | |
| | |
Teradyne, Inc. | | | 24,936 | | | | 1,526,582 | |
| | |
Texas Instruments, Inc. | | | 15,746 | | | | 1,857,871 | |
| | |
Western Digital Corp. | | | 9,968 | | | | 514,847 | |
| | |
Xilinx, Inc. | | | 20,688 | | | | 1,877,229 | |
| | | | | | | | |
| | |
| | | | | | | 39,493,772 | |
| | | | | | | | |
|
Tobacco — 0.5% | |
| | |
Altria Group, Inc. | | | 39,155 | | | | 1,753,753 | |
| | |
Philip Morris International, Inc. | | | 28,594 | | | | 2,328,695 | |
| | | | | | | | |
| | |
| | | | | | | 4,082,448 | |
| | | | | | | | |
|
Travel & Leisure — 3.4% | |
| | |
Alaska Air Group, Inc. | | | 3,388 | | | | 235,229 | |
| | |
Booking Holdings, Inc.* | | | 700 | | | | 1,434,139 | |
| | |
Carnival Corp. | | | 37,940 | | | | 1,627,246 | |
| | |
Darden Restaurants, Inc. | | | 25,790 | | | | 2,895,443 | |
| | |
Delta Air Lines, Inc. | | | 17,433 | | | | 960,209 | |
| | |
Dunkin’ Brands Group, Inc. | | | 18,792 | | | | 1,477,427 | |
| | |
Hilton Worldwide Holdings, Inc. | | | 25,433 | | | | 2,465,984 | |
| | | | | | | | |
| INVESTMENTS | | SHARES | | | VALUE($) | |
| | | | | | | | |
|
Travel & Leisure — continued | |
| | |
Las Vegas Sands Corp. | | | 28,440 | | | | 1,758,730 | |
| | |
Marriott International, Inc., Class A | | | 16,045 | | | | 2,030,495 | |
| | |
McDonald’s Corp. | | | 14,447 | | | | 2,841,725 | |
| | |
Royal Caribbean Cruises Ltd. | | | 9,861 | | | | 1,073,173 | |
| | |
Southwest Airlines Co. | | | 5,659 | | | | 317,640 | |
| | |
Starbucks Corp. | | | 32,628 | | | | 2,759,024 | |
| | |
United Airlines Holdings, Inc.* | | | 3,293 | | | | 299,136 | |
| | |
Wyndham Destinations, Inc. | | | 32,491 | | | | 1,507,907 | |
| | |
Yum China Holdings, Inc. (China) | | | 18,083 | | | | 768,527 | |
| | |
Yum! Brands, Inc. | | | 26,964 | | | | 2,742,508 | |
| | | | | | | | |
| | |
| | | | | | | 27,194,542 | |
| | | | | | | | |
| | |
Total Common Stocks
(cost $719,012,710) | | | | | | | 801,065,334 | |
| | | | | | | | |
Short-Term Investments — 3.1% | |
|
Investment Companies — 0.1% | |
| | |
JPMorgan U.S. Government Money Market Fund Class Institutional Shares, 1.64% (b) (c)
(Cost $894,552) | | | 894,552 | | | | 894,552 | |
| | | | | | | | |
|
Investment of Cash Collateral From Securities Loaned — 3.0% | |
| | |
JPMorgan Securities Lending Money Market Fund Class Agency SL Shares,
1.98% (b) (c) | | | 17,002,300 | | | | 17,004,001 | |
| | |
JPMorgan U.S. Government Money Market Fund Class IM Shares, 1.70% (b) (c) | | | 6,625,093 | | | | 6,625,093 | |
| | | | | | | | |
| | |
Total Investment of Cash Collateral From Securities Loaned
(Cost $23,628,694) | | | | | | | 23,629,094 | |
| | | | | | | | |
| | |
Total Short-Term Investments
(Cost $24,523,246) | | | | | | | 24,523,646 | |
| | | | | | | | |
Total Investments — 102.9%
(Cost $743,535,956) | | | | | | | 825,588,980 | |
| | |
Liabilities in Excess of
Other Assets — (2.9%) | | | | | | | (22,962,983 | ) |
| | | | | | | | |
NET ASSETS — 100.0% | | | | | | | 802,625,997 | |
| | | | | | | | |
Percentages indicated are based on net assets.
| | |
| (a) | | The security or a portion of this security is on loan at October 31, 2019. The total value of securities on loan at October 31, 2019 is $23,110,059. |
| (b) | | Investment in an affiliated fund, which is registered under the Investment Company Act of 1940, as amended, and is advised by J.P. Morgan Investment Management Inc. |
| (c) | | Therate shown is the current yield as of October 31, 2019. |
| * | | Non-incomeproducing security. |
SEE NOTES TO FINANCIAL STATEMENTS.
| | | | | | | | |
| | | |
| OCTOBER 31, 2019 | | J.P. MORGAN EXCHANGE-TRADED FUNDS | | | | | 121 | |
JPMorgan Diversified Return U.S. Equity ETF
SCHEDULE OF PORTFOLIO INVESTMENTS
AS OF OCTOBER 31, 2019 (continued)
| | | | | | | | | | | | | | | | | | | | |
| Futures contracts outstanding as of October 31, 2019: | |
| DESCRIPTION | | NUMBER OF
CONTRACTS | | | EXPIRATION
DATE | | | TRADING
CURRENCY | | | NOTIONAL
AMOUNT($) | | | VALUE AND
UNREALIZED
APPRECIATION
(DEPRECIATION)($) | |
| | | | | |
Long Contracts | | | | | | | | | | | | | | | | | | | | |
| | | | | |
S&P 500E-Mini Index | | | 11 | | | | 12/2019 | | | | USD | | | | 1,669,250 | | | | 44,378 | |
| | | | | | | | | | | | | | | | | | | | |
Abbreviations
SEE NOTES TO FINANCIAL STATEMENTS.
| | | | | | |
| | | |
| 122 | | | | J.P. MORGAN EXCHANGE-TRADED FUNDS | | OCTOBER 31, 2019 |
JPMorgan Diversified Return U.S. Mid Cap Equity ETF
SCHEDULE OF PORTFOLIO INVESTMENTS
AS OF OCTOBER 31, 2019
| | | | | | | | |
| INVESTMENTS | | SHARES | | | VALUE($) | |
Common Stocks — 99.8% | |
|
Aerospace & Defense — 0.9% | |
| | |
Hexcel Corp. | | | 5,940 | | | | 443,243 | |
| | |
Huntington Ingalls Industries, Inc. | | | 987 | | | | 222,726 | |
| | |
L3Harris Technologies, Inc. | | | 3,692 | | | | 761,697 | |
| | |
Spirit AeroSystems Holdings, Inc., Class A | | | 2,790 | | | | 228,278 | |
| | | | | | | | |
| | |
| | | | | | | 1,655,944 | |
| | | | | | | | |
|
Air Freight & Logistics — 0.3% | |
| | |
CH Robinson Worldwide, Inc. | | | 3,878 | | | | 293,332 | |
| | |
Expeditors International of Washington, Inc. | | | 4,343 | | | | 316,778 | |
| | | | | | | | |
| | |
| | | | | | | 610,110 | |
| | | | | | | | |
|
Airlines — 0.3% | |
| | |
Alaska Air Group, Inc. | | | 1,040 | | | | 72,207 | |
| | |
Copa Holdings SA, Class A (Panama) (a) | | | 4,056 | | | | 412,658 | |
| | |
United Airlines Holdings, Inc.* | | | 1,011 | | | | 91,839 | |
| | | | | | | | |
| | |
| | | | | | | 576,704 | |
| | | | | | | | |
|
Auto Components — 1.0% | |
| | |
Aptiv plc | | | 4,706 | | | | 421,422 | |
| | |
BorgWarner, Inc. | | | 6,713 | | | | 279,798 | |
| | |
Gentex Corp. | | | 29,210 | | | | 819,341 | |
| | |
Lear Corp. | | | 3,839 | | | | 452,119 | |
| | | | | | | | |
| | |
| | | | | | | 1,972,680 | |
| | | | | | | | |
|
Automobiles — 0.5% | |
| | |
Harley-Davidson, Inc. (a) | | | 16,892 | | | | 657,268 | |
| | |
Thor Industries, Inc. | | | 3,184 | | | | 201,420 | |
| | | | | | | | |
| | |
| | | | | | | 858,688 | |
| | | | | | | | |
|
Banks — 2.7% | |
| | |
Associated Banc-Corp. | | | 2,960 | | | | 59,526 | |
| | |
Bank of Hawaii Corp. | | | 2,064 | | | | 180,208 | |
| | |
BankUnited, Inc. | | | 3,367 | | | | 115,488 | |
| | |
CIT Group, Inc. | | | 4,196 | | | | 179,966 | |
| | |
Citizens Financial Group, Inc. | | | 4,211 | | | | 148,059 | |
| | |
Comerica, Inc. | | | 2,260 | | | | 147,849 | |
| | |
Commerce Bancshares, Inc. (a) | | | 707 | | | | 45,503 | |
| | |
Cullen/Frost Bankers, Inc. (a) | | | 1,537 | | | | 138,453 | |
| | |
Fifth Third Bancorp | | | 7,514 | | | | 218,507 | |
| | |
First Horizon National Corp. | | | 7,887 | | | | 125,955 | |
| | |
First Republic Bank | | | 2,235 | | | | 237,715 | |
| | |
FNB Corp. | | | 9,674 | | | | 116,668 | |
| | |
Huntington Bancshares, Inc. | | | 51,788 | | | | 731,764 | |
| | |
KeyCorp | | | 9,123 | | | | 163,940 | |
| | |
M&T Bank Corp. | | | 1,299 | | | | 203,332 | |
| | |
PacWest Bancorp | | | 2,723 | | | | 100,724 | |
| | |
People’s United Financial, Inc. | | | 13,040 | | | | 210,857 | |
| | |
Popular, Inc. (Puerto Rico) | | | 7,429 | | | | 404,583 | |
| | | | | | | | |
| INVESTMENTS | | SHARES | | | VALUE($) | |
| | | | | | | | |
|
Banks — continued | |
| | |
Prosperity Bancshares, Inc. | | | 1,657 | | | | 114,366 | |
| | |
Regions Financial Corp. | | | 11,499 | | | | 185,134 | |
| | |
SunTrust Banks, Inc. | | | 11,484 | | | | 784,817 | |
| | |
TCF Financial Corp. | | | 8,154 | | | | 322,812 | |
| | |
Zions Bancorp NA | | | 3,274 | | | | 158,691 | |
| | | | | | | | |
| | |
| | | | | | | 5,094,917 | |
| | | | | | | | |
|
Beverages — 0.7% | |
| | |
Brown-Forman Corp., Class B (a) | | | 10,871 | | | | 712,268 | |
| | |
Molson Coors Brewing Co., Class B | | | 11,099 | | | | 585,139 | |
| | | | | | | | |
| | |
| | | | | | | 1,297,407 | |
| | | | | | | | |
|
Biotechnology — 0.1% | |
| | |
Ionis Pharmaceuticals, Inc.* | | | 4,947 | | | | 275,647 | |
| | | | | | | | |
|
Building Products — 0.5% | |
| | |
AO Smith Corp. | | | 5,716 | | | | 283,971 | |
| | |
Armstrong World Industries, Inc. | | | 1,411 | | | | 131,971 | |
| | |
Fortune Brands Home & Security, Inc. | | | 4,160 | | | | 249,808 | |
| | |
Lennox International, Inc. | | | 1,318 | | | | 326,020 | |
| | | | | | | | |
| | |
| | | | | | | 991,770 | |
| | | | | | | | |
|
Capital Markets — 1.3% | |
| | |
Ameriprise Financial, Inc. | | | 1,707 | | | | 257,569 | |
| | |
FactSet Research Systems, Inc. | | | 2,662 | | | | 674,870 | |
| | |
Invesco Ltd. | | | 2,909 | | | | 48,929 | |
| | |
LPL Financial Holdings, Inc. | | | 3,026 | | | | 244,622 | |
| | |
Morningstar, Inc. | | | 794 | | | | 128,501 | |
| | |
MSCI, Inc. | | | 1,861 | | | | 436,516 | |
| | |
Nasdaq, Inc. | | | 2,214 | | | | 220,891 | |
| | |
Raymond James Financial, Inc. | | | 2,432 | | | | 203,048 | |
| | |
T. Rowe Price Group, Inc. | | | 2,060 | | | | 238,548 | |
| | | | | | | | |
| | |
| | | | | | | 2,453,494 | |
| | | | | | | | |
|
Chemicals — 5.3% | |
| | |
Ashland Global Holdings, Inc. | | | 7,828 | | | | 605,652 | |
| | |
Axalta Coating Systems Ltd.* | | | 13,794 | | | | 406,785 | |
| | |
Cabot Corp. | | | 14,224 | | | | 620,024 | |
| | |
Celanese Corp. | | | 6,827 | | | | 827,091 | |
| | |
CF Industries Holdings, Inc. | | | 16,185 | | | | 733,990 | |
| | |
Eastman Chemical Co. | | | 9,904 | | | | 753,100 | |
| | |
Element Solutions, Inc.* (a) | | | 23,299 | | | | 253,027 | |
| | |
FMC Corp. | | | 7,561 | | | | 691,831 | |
| | |
Huntsman Corp. | | | 31,135 | | | | 689,018 | |
| | |
International Flavors & Fragrances, Inc. (a) | | | 5,261 | | | | 641,895 | |
| | |
NewMarket Corp. | | | 991 | | | | 481,121 | |
| | |
Olin Corp. | | | 45,577 | | | | 835,882 | |
| | |
RPM International, Inc. | | | 11,368 | | | | 823,384 | |
SEE NOTES TO FINANCIAL STATEMENTS.
| | | | | | | | |
| | | |
| OCTOBER 31, 2019 | | J.P. MORGAN EXCHANGE-TRADED FUNDS | | | | | 123 | |
JPMorgan Diversified Return U.S. Mid Cap Equity ETF
SCHEDULE OF PORTFOLIO INVESTMENTS
AS OF OCTOBER 31, 2019 (continued)
| | | | | | | | |
| INVESTMENTS | | SHARES | | | VALUE($) | |
Common Stocks — continued | |
|
Chemicals — continued | |
| | |
Scotts Miracle-Gro Co. (The) | | | 5,149 | | | | 516,908 | |
| | |
Valvoline, Inc. | | | 17,493 | | | | 373,301 | |
| | |
Westlake Chemical Corp. (a) | | | 2,702 | | | | 170,739 | |
| | |
WR Grace & Co. | | | 8,468 | | | | 562,699 | |
| | | | | | | | |
| | |
| | | | | | | 9,986,447 | |
| | | | | | | | |
|
Commercial Services & Supplies — 1.2% | |
| | |
Cintas Corp. | | | 1,518 | | | | 407,841 | |
| | |
Copart, Inc.* | | | 8,982 | | | | 742,272 | |
| | |
IAA, Inc.* | | | 12,344 | | | | 470,924 | |
| | |
KAR Auction Services, Inc. | | | 12,299 | | | | 305,753 | |
| | |
Republic Services, Inc. | | | 4,504 | | | | 394,145 | |
| | | | | | | | |
| | |
| | | | | | | 2,320,935 | |
| | | | | | | | |
|
Communications Equipment — 0.9% | |
| | |
F5 Networks, Inc.* | | | 3,404 | | | | 490,448 | |
| | |
Juniper Networks, Inc. | | | 19,325 | | | | 479,647 | |
| | |
Motorola Solutions, Inc. | | | 4,323 | | | | 719,001 | |
| | | | | | | | |
| | |
| | | | | | | 1,689,096 | |
| | | | | | | | |
|
Construction & Engineering — 0.0%(b) | |
| | |
Jacobs Engineering Group, Inc. | | | 908 | | | | 84,971 | |
| | | | | | | | |
|
Construction Materials — 0.1% | |
| | |
Eagle Materials, Inc. | | | 1,655 | | | | 151,168 | |
| | | | | | | | |
|
Consumer Finance — 0.5% | |
| | |
Ally Financial, Inc. | | | 7,150 | | | | 219,004 | |
| | |
Credit Acceptance Corp.* | | | 283 | | | | 123,900 | |
| | |
Discover Financial Services | | | 3,824 | | | | 306,914 | |
| | |
Navient Corp. | | | 6,832 | | | | 94,077 | |
| | |
Santander Consumer USA Holdings, Inc. | | | 5,501 | | | | 137,965 | |
| | |
Synchrony Financial | | | 4,283 | | | | 151,490 | |
| | | | | | | | |
| | |
| | | | | | | 1,033,350 | |
| | | | | | | | |
|
Containers & Packaging — 1.6% | |
| | |
AptarGroup, Inc. | | | 3,155 | | | | 372,763 | |
| | |
Avery Dennison Corp. | | | 6,419 | | �� | | 820,733 | |
| | |
International Paper Co. | | | 19,852 | | | | 867,135 | |
| | |
Packaging Corp. of America | | | 2,786 | | | | 304,956 | |
| | |
Silgan Holdings, Inc. | | | 2,247 | | | | 69,140 | |
| | |
Sonoco Products Co. | | | 6,577 | | | | 379,493 | |
| | |
Westrock Co. | | | 3,134 | | | | 117,118 | |
| | | | | | | | |
| | |
| | | | | | | 2,931,338 | |
| | | | | | | | |
|
Distributors — 0.8% | |
| | |
Genuine Parts Co. | | | 6,958 | | | | 713,752 | |
| | |
Pool Corp. | | | 3,853 | | | | 799,112 | |
| | | | | | | | |
| | |
| | | | | | | 1,512,864 | |
| | | | | | | | |
| | | | | | | | |
| INVESTMENTS | | SHARES | | | VALUE($) | |
| | | | | | | | |
|
Diversified Consumer Services — 1.5% | |
| | |
frontdoor, Inc.* | | | 5,250 | | | | 253,208 | |
| | |
Graham Holdings Co., Class B | | | 558 | | | | 351,350 | |
| | |
Grand Canyon Education, Inc.* | | | 2,757 | | | | 253,534 | |
| | |
H&R Block, Inc. | | | 28,786 | | | | 719,362 | |
| | |
Service Corp. International (a) | | | 16,087 | | | | 731,637 | |
| | |
ServiceMaster Global Holdings, Inc.* | | | 10,490 | | | | 423,586 | |
| | | | | | | | |
| | |
| | | | | | | 2,732,677 | |
| | | | | | | | |
|
Diversified Financial Services — 0.1% | |
| | |
Jefferies Financial Group, Inc. | | | 10,864 | | | | 202,831 | |
| | | | | | | | |
|
Diversified Telecommunication Services — 0.6% | |
| | |
CenturyLink, Inc. | | | 43,897 | | | | 568,027 | |
| | |
Zayo Group Holdings, Inc.* | | | 17,206 | | | | 587,413 | |
| | | | | | | | |
| | |
| | | | | | | 1,155,440 | |
| | | | | | | | |
|
Electric Utilities — 4.2% | |
| | |
Alliant Energy Corp. | | | 2,963 | | | | 158,047 | |
| | |
Edison International | | | 9,968 | | | | 626,987 | |
| | |
Entergy Corp. | | | 6,921 | | | | 840,763 | |
| | |
Evergy, Inc. | | | 12,010 | | | | 767,559 | |
| | |
Eversource Energy | | | 9,702 | | | | 812,446 | |
| | |
FirstEnergy Corp. | | | 13,541 | | | | 654,301 | |
| | |
Hawaiian Electric Industries, Inc. | | | 13,292 | | | | 600,134 | |
| | |
IDACORP, Inc. | | | 2,811 | | | | 302,520 | |
| | |
OGE Energy Corp. | | | 18,066 | | | | 777,922 | |
| | |
Pinnacle West Capital Corp. | | | 8,186 | | | | 770,466 | |
| | |
PPL Corp. | | | 24,472 | | | | 819,567 | |
| | |
Xcel Energy, Inc. | | | 12,177 | | | | 773,361 | |
| | | | | | | | |
| | |
| | | | | | | 7,904,073 | |
| | | | | | | | |
|
Electrical Equipment — 0.7% | |
| | |
AMETEK, Inc. | | | 5,514 | | | | 505,358 | |
| | |
nVent Electric plc | | | 3,240 | | | | 74,714 | |
| | |
Regal Beloit Corp. | | | 1,333 | | | | 98,709 | |
| | |
Rockwell Automation, Inc. | | | 2,204 | | | | 379,066 | |
| | |
Sensata Technologies Holding plc* | | | 4,244 | | | | 217,250 | |
| | | | | | | | |
| | |
| | | | | | | 1,275,097 | |
| | | | | | | | |
|
Electronic Equipment, Instruments & Components — 1.5% | |
| | |
Amphenol Corp., Class A | | | 5,425 | | | | 544,290 | |
| | |
CDW Corp. | | | 6,670 | | | | 853,160 | |
| | |
Dolby Laboratories, Inc., Class A | | | 4,434 | | | | 285,239 | |
| | |
FLIR Systems, Inc. | | | 5,992 | | | | 308,947 | |
| | |
Keysight Technologies, Inc.* | | | 6,313 | | | | 637,045 | |
| | |
National Instruments Corp. | | | 6,543 | | | | 270,815 | |
| | | | | | | | |
| | |
| | | | | | | 2,899,496 | |
| | | | | | | | |
SEE NOTES TO FINANCIAL STATEMENTS.
| | | | | | |
| | | |
| 124 | | | | J.P. MORGAN EXCHANGE-TRADED FUNDS | | OCTOBER 31, 2019 |
| | | | | | | | |
| INVESTMENTS | | SHARES | | | VALUE($) | |
Common Stocks — continued | |
|
Energy Equipment & Services — 0.9% | |
| | |
Apergy Corp.* | | | 11,317 | | | | 284,849 | |
| | |
Baker Hughes Co. | | | 16,905 | | | | 361,767 | |
| | |
Helmerich & Payne, Inc. | | | 14,950 | | | | 560,625 | |
| | |
Patterson-UTI Energy, Inc. | | | 65,522 | | | | 545,143 | |
| | | | | | | | |
| | |
| | | | | | | 1,752,384 | |
| | | | | | | | |
|
Entertainment — 0.6% | |
| | |
Cinemark Holdings, Inc. | | | 10,988 | | | | 402,161 | |
| | |
Take-Two Interactive Software, Inc.* | | | 3,646 | | | | 438,796 | |
| | |
Viacom, Inc., Class B | | | 10,854 | | | | 234,012 | |
| | | | | | | | |
| | |
| | | | | | | 1,074,969 | |
| | | | | | | | |
|
Equity Real Estate Investment Trusts (REITs) — 5.1% | |
| | |
Alexandria Real Estate Equities, Inc. | | | 1,696 | | | | 269,240 | |
| | |
American Campus Communities, Inc. | | | 1,066 | | | | 53,279 | |
| | |
AvalonBay Communities, Inc. | | | 1,840 | | | | 400,494 | |
| | |
Brandywine Realty Trust | | | 7,488 | | | | 114,417 | |
| | |
Brixmor Property Group, Inc. | | | 4,785 | | | | 105,366 | |
| | |
Camden Property Trust | | | 2,177 | | | | 248,984 | |
| | |
CoreSite Realty Corp. | | | 1,579 | | | | 185,533 | |
| | |
CubeSmart | | | 607 | | | | 19,242 | |
| | |
Digital Realty Trust, Inc. | | | 2,220 | | | | 282,029 | |
| | |
Douglas Emmett, Inc. | | | 6,082 | | | | 263,472 | |
| | |
Duke Realty Corp. | | | 9,332 | | | | 327,926 | |
| | |
EPR Properties | | | 1,722 | | | | 133,954 | |
| | |
Equity Commonwealth | | | 4,765 | | | | 153,338 | |
| | |
Equity LifeStyle Properties, Inc. | | | 4,526 | | | | 316,548 | |
| | |
Essex Property Trust, Inc. | | | 524 | | | | 171,416 | |
| | |
Extra Space Storage, Inc. | | | 2,389 | | | | 268,213 | |
| | |
Federal Realty Investment Trust | | | 312 | | | | 42,435 | |
| | |
Gaming and Leisure Properties, Inc. | | | 5,016 | | | | 202,446 | |
| | |
HCP, Inc. | | | 22,527 | | | | 847,466 | |
| | |
Highwoods Properties, Inc. | | | 2,980 | | | | 139,464 | |
| | |
Host Hotels & Resorts, Inc. | | | 10,635 | | | | 174,308 | |
| | |
Hudson Pacific Properties, Inc. | | | 4,028 | | | | 144,686 | |
| | |
Iron Mountain, Inc. | | | 3,884 | | | | 127,395 | |
| | |
Kilroy Realty Corp. (a) | | | 2,462 | | | | 206,636 | |
| | |
Lamar Advertising Co., Class A | | | 3,111 | | | | 248,911 | |
| | |
Liberty Property Trust | | | 5,478 | | | | 323,585 | |
| | |
Medical Properties Trust, Inc. | | | 41,133 | | | | 852,687 | |
| | |
Mid-America Apartment Communities, Inc. | | | 1,559 | | | | 216,685 | |
| | |
National Retail Properties, Inc. | | | 2,010 | | | | 118,409 | |
| | |
Omega Healthcare Investors, Inc. (a) | | | 4,051 | | | | 178,406 | |
| | |
Outfront Media, Inc. | | | 5,949 | | | | 156,518 | |
| | |
Park Hotels & Resorts, Inc. | | | 24,613 | | | | 572,252 | |
| | |
Service Properties Trust | | | 6,728 | | | | 170,218 | |
| | | | | | | | |
| INVESTMENTS | | SHARES | | | VALUE($) | |
| | | | | | | | |
|
Equity Real Estate Investment Trusts (REITs) — continued | |
| | |
SITE Centers Corp. | | | 1,299 | | | | 20,173 | |
| | |
Sun Communities, Inc. | | | 1,687 | | | | 274,391 | |
| | |
Vornado Realty Trust | | | 701 | | | | 46,007 | |
| | |
Weingarten Realty Investors | | | 3,692 | | | | 117,147 | |
| | |
Welltower, Inc. | | | 3,610 | | | | 327,391 | |
| | |
WP Carey, Inc. | | | 8,120 | | | | 747,527 | |
| | | | | | | | |
| | |
| | | | | | | 9,568,594 | |
| | | | | | | | |
|
Food & Staples Retailing — 0.2% | |
| | |
Casey’s General Stores, Inc. | | | 2,770 | | | | 473,144 | |
| | | | | | | | |
|
Food Products — 3.7% | |
| | |
Campbell Soup Co. (a) | | | 9,496 | | | | 439,760 | |
| | |
Flowers Foods, Inc. | | | 31,606 | | | | 686,482 | |
| | |
Hershey Co. (The) | | | 4,810 | | | | 706,445 | |
| | |
Hormel Foods Corp. (a) | | | 9,365 | | | | 382,935 | |
| | |
Ingredion, Inc. | | | 4,502 | | | | 355,658 | |
| | |
JM Smucker Co. (The) | | | 7,176 | | | | 758,360 | |
| | |
Kellogg Co. | | | 7,930 | | | | 503,793 | |
| | |
Lamb Weston Holdings, Inc. | | | 9,313 | | | | 726,786 | |
| | |
McCormick & Co., Inc.(Non-Voting) | | | 4,808 | | | | 772,598 | |
| | |
Post Holdings, Inc.* | | | 5,826 | | | | 599,495 | |
| | |
TreeHouse Foods, Inc.* | | | 6,898 | | | | 372,630 | |
| | |
Tyson Foods, Inc., Class A | | | 8,217 | | | | 680,285 | |
| | | | | | | | |
| | |
| | | | | | | 6,985,227 | |
| | | | | | | | |
|
Gas Utilities — 1.0% | |
| | |
Atmos Energy Corp. | | | 7,009 | | | | 788,373 | |
| | |
National Fuel Gas Co. | | | 10,355 | | | | 469,185 | |
| | |
UGI Corp. | | | 14,266 | | | | 680,060 | |
| | | | | | | | |
| | |
| | | | | | | 1,937,618 | |
| | | | | | | | |
|
Health Care Equipment & Supplies — 4.6% | |
| | |
ABIOMED, Inc.* | | | 2,010 | | | | 417,236 | |
| | |
Cooper Cos., Inc. (The) | | | 2,468 | | | | 718,188 | |
| | |
Dentsply Sirona, Inc. | | | 12,946 | | | | 709,182 | |
| | |
Hill-Rom Holdings, Inc. | | | 7,174 | | | | 751,046 | |
| | |
Hologic, Inc.* | | | 13,494 | | | | 651,895 | |
| | |
ICU Medical, Inc.* | | | 1,264 | | | | 204,275 | |
| | |
IDEXX Laboratories, Inc.* | | | 2,668 | | | | 760,407 | |
| | |
ResMed, Inc. | | | 5,562 | | | | 822,731 | |
| | |
STERIS plc | | | 5,022 | | | | 710,965 | |
| | |
Teleflex, Inc. | | | 2,152 | | | | 747,626 | |
| | |
Varian Medical Systems, Inc.* | | | 5,850 | | | | 706,738 | |
| | |
West Pharmaceutical Services, Inc. | | | 5,349 | | | | 769,400 | |
| | |
Zimmer Biomet Holdings, Inc. | | | 5,601 | | | | 774,226 | |
| | | | | | | | |
| | |
| | | | | | | 8,743,915 | |
| | | | | | | | |
SEE NOTES TO FINANCIAL STATEMENTS.
| | | | | | | | |
| | | |
| OCTOBER 31, 2019 | | J.P. MORGAN EXCHANGE-TRADED FUNDS | | | | | 125 | |
JPMorgan Diversified Return U.S. Mid Cap Equity ETF
SCHEDULE OF PORTFOLIO INVESTMENTS
AS OF OCTOBER 31, 2019 (continued)
| | | | | | | | |
| INVESTMENTS | | SHARES | | | VALUE($) | |
Common Stocks — continued | |
|
Health Care Providers & Services — 3.9% | |
| | |
Acadia Healthcare Co., Inc.* | | | 4,074 | | | | 122,179 | |
| | |
AmerisourceBergen Corp. | | | 3,017 | | | | 257,591 | |
| | |
Cardinal Health, Inc. | | | 6,373 | | | | 315,145 | |
| | |
Centene Corp.* | | | 10,730 | | | | 569,548 | |
| | |
Chemed Corp. | | | 1,776 | | | | 699,584 | |
| | |
Covetrus, Inc.* | | | 2,954 | | | | 29,289 | |
| | |
DaVita, Inc.* | | | 6,961 | | | | 407,915 | |
| | |
Encompass Health Corp. (a) | | | 9,071 | | | | 580,725 | |
| | |
Henry Schein, Inc.* | | | 8,578 | | | | 536,854 | |
| | |
Laboratory Corp. of America Holdings* | | | 4,510 | | | | 743,113 | |
| | |
MEDNAX, Inc.* | | | 10,511 | | | | 230,822 | |
| | |
Molina Healthcare, Inc.* | | | 5,187 | | | | 610,199 | |
| | |
Quest Diagnostics, Inc. | | | 7,314 | | | | 740,542 | |
| | |
Universal Health Services, Inc., Class B | | | 5,128 | | | | 704,895 | |
| | |
WellCare Health Plans, Inc.* | | | 2,723 | | | | 807,642 | |
| | | | | | | | |
| | |
| | | | | | | 7,356,043 | |
| | | | | | | | |
|
Health Care Technology — 0.6% | |
| | |
Cerner Corp. | | | 6,586 | | | | 442,052 | |
| | |
Veeva Systems, Inc., Class A* | | | 4,390 | | | | 622,634 | |
| | | | | | | | |
| | |
| | | | | | | 1,064,686 | |
| | | | | | | | |
|
Hotels, Restaurants & Leisure — 3.2% | |
| | |
Choice Hotels International, Inc. | | | 4,227 | | | | 374,005 | |
| | |
Darden Restaurants, Inc. | | | 5,408 | | | | 607,156 | |
| | |
Dunkin’ Brands Group, Inc. | | | 7,430 | | | | 584,146 | |
| | |
Extended Stay America, Inc. (a) | | | 27,454 | | | | 390,121 | |
| | |
Hilton Worldwide Holdings, Inc. | | | 7,172 | | | | 695,397 | |
| | |
Hyatt Hotels Corp., Class A | | | 7,213 | | | | 539,100 | |
| | |
Norwegian Cruise Line Holdings Ltd.* | | | 5,683 | | | | 288,469 | |
| | |
Royal Caribbean Cruises Ltd. | | | 2,376 | | | | 258,580 | |
| | |
Six Flags Entertainment Corp. | | | 8,704 | | | | 367,222 | |
| | |
Vail Resorts, Inc. | | | 2,310 | | | | 536,775 | |
| | |
Wendy’s Co. (The) | | | 21,920 | | | | 464,266 | |
| | |
Wyndham Destinations, Inc. | | | 9,264 | | | | 429,942 | |
| | |
Yum China Holdings, Inc. (China) | | | 9,318 | | | | 396,015 | |
| | | | | | | | |
| | |
| | | | | | | 5,931,194 | |
| | | | | | | | |
|
Household Durables — 2.9% | |
| | |
DR Horton, Inc. | | | 10,712 | | | | 560,987 | |
| | |
Garmin Ltd. | | | 7,206 | | | | 675,563 | |
| | |
Leggett & Platt, Inc. (a) | | | 17,225 | | | | 883,642 | |
| | |
Lennar Corp., Class A | | | 7,893 | | | | 470,423 | |
| | |
NVR, Inc.* | | | 190 | | | | 690,952 | |
| | |
PulteGroup, Inc. | | | 21,486 | | | | 843,111 | |
| | |
Toll Brothers, Inc. | | | 19,905 | | | | 791,622 | |
| | |
Whirlpool Corp. | | | 3,750 | | | | 570,450 | |
| | | | | | | | |
| | |
| | | | | | | 5,486,750 | |
| | | | | | | | |
| | | | | | | | |
| INVESTMENTS | | SHARES | | | VALUE($) | |
| | | | | | | | |
|
Household Products — 0.8% | |
| | |
Church & Dwight Co., Inc. | | | 9,802 | | | | 685,552 | |
| | |
Clorox Co. (The) | | | 4,954 | | | | 731,656 | |
| | |
Energizer Holdings, Inc. (a) | | | 1,549 | | | | 65,817 | |
| | | | | | | | |
| | |
| | | | | | | 1,483,025 | |
| | | | | | | | |
|
Independent Power and Renewable Electricity Producers — 1.0% | |
| | |
AES Corp. | | | 45,521 | | | | 776,133 | |
| | |
NRG Energy, Inc. | | | 18,764 | | | | 752,812 | |
| | |
Vistra Energy Corp. | | | 9,868 | | | | 266,732 | |
| | | | | | | | |
| | |
| | | | | | | 1,795,677 | |
| | | | | | | | |
|
Insurance — 3.5% | |
| | |
Alleghany Corp.* | | | 499 | | | | 388,367 | |
| | |
American Financial Group, Inc. | | | 3,828 | | | | 398,265 | |
| | |
Arch Capital Group Ltd.* | | | 518 | | | | 21,632 | |
| | |
Arthur J Gallagher & Co. | | | 6,458 | | | | 589,099 | |
| | |
Assurant, Inc. | | | 3,043 | | | | 383,631 | |
| | |
Assured Guaranty Ltd. | | | 3,952 | | | | 185,428 | |
| | |
Axis Capital Holdings Ltd. | | | 5,146 | | | | 305,827 | |
| | |
Brown & Brown, Inc. | | | 11,921 | | | | 449,183 | |
| | |
Cincinnati Financial Corp. | | | 4,591 | | | | 519,747 | |
| | |
CNA Financial Corp. | | | 92 | | | | 4,125 | |
| | |
Everest Re Group Ltd. | | | 1,005 | | | | 258,375 | |
| | |
Fidelity National Financial, Inc. | | | 5,922 | | | | 271,464 | |
| | |
First American Financial Corp. | | | 3,023 | | | | 186,761 | |
| | |
Globe Life, Inc. | | | 5,184 | | | | 504,559 | |
| | |
Hanover Insurance Group, Inc. (The) | | | 1,513 | | | | 199,277 | |
| | |
Lincoln National Corp. | | | 2,040 | | | | 115,219 | |
| | |
Loews Corp. | | | 5,665 | | | | 277,585 | |
| | |
Mercury General Corp. | | | 1,192 | | | | 57,288 | |
| | |
Old Republic International Corp. | | | 21,727 | | | | 485,381 | |
| | |
Principal Financial Group, Inc. | | | 4,281 | | | | 228,520 | |
| | |
Reinsurance Group of America, Inc. | | | 2,053 | | | | 333,551 | |
| | |
WR Berkley Corp. | | | 6,069 | | | | 424,223 | |
| | | | | | | | |
| | |
| | | | | | | 6,587,507 | |
| | | | | | | | |
|
Interactive Media & Services — 0.3% | |
| | |
IAC/InterActiveCorp* | | | 2,616 | | | | 594,486 | |
| | | | | | | | |
|
IT Services — 3.1% | |
| | |
Akamai Technologies, Inc.* | | | 716 | | | | 61,934 | |
| | |
Amdocs Ltd. | | | 11,848 | | | | 772,490 | |
| | |
Booz Allen Hamilton Holding Corp. | | | 8,841 | | | | 622,141 | |
| | |
Broadridge Financial Solutions, Inc. | | | 6,012 | | | | 752,823 | |
| | |
DXC Technology Co. | | | 4,422 | | | | 122,357 | |
| | |
Fiserv, Inc.* | | | 7,285 | | | | 773,230 | |
| | |
Jack Henry & Associates, Inc. | | | 3,622 | | | | 512,730 | |
SEE NOTES TO FINANCIAL STATEMENTS.
| | | | | | |
| | | |
| 126 | | | | J.P. MORGAN EXCHANGE-TRADED FUNDS | | OCTOBER 31, 2019 |
| | | | | | | | |
| INVESTMENTS | | SHARES | | | VALUE($) | |
Common Stocks — continued | |
|
IT Services — continued | |
| | |
Leidos Holdings, Inc. | | | 8,457 | | | | 729,247 | |
| | |
Paychex, Inc. | | | 3,994 | | | | 334,058 | |
| | |
Sabre Corp. | | | 17,710 | | | | 415,831 | |
| | |
VeriSign, Inc.* | | | 3,329 | | | | 632,576 | |
| | |
Western Union Co. (The) | | | 6,758 | | | | 169,355 | |
| | | | | | | | |
| | |
| | | | | | | 5,898,772 | |
| | | | | | | | |
|
Leisure Products — 0.5% | |
| | |
Hasbro, Inc. | | | 6,520 | | | | 634,461 | |
| | |
Polaris, Inc. | | | 2,804 | | | | 276,615 | |
| | | | | | | | |
| | |
| | | | | | | 911,076 | |
| | | | | | | | |
|
Life Sciences Tools & Services — 2.2% | |
| | |
Agilent Technologies, Inc. | | | 5,051 | | | | 382,613 | |
| | |
Bio-Rad Laboratories, Inc., Class A* | | | 1,783 | | | | 591,278 | |
| | |
Bio-Techne Corp. | | | 3,765 | | | | 783,760 | |
| | |
Bruker Corp. (a) | | | 5,799 | | | | 258,056 | |
| | |
Charles River Laboratories International, Inc.* | | | 5,447 | | | | 708,001 | |
| | |
IQVIA Holdings, Inc.* | | | 4,599 | | | | 664,188 | |
| | |
Waters Corp.* | | | 3,218 | | | | 680,993 | |
| | | | | | | | |
| | |
| | | | | | | 4,068,889 | |
| | | | | | | | |
|
Machinery — 4.0% | |
| | |
Allison Transmission Holdings, Inc. | | | 5,803 | | | | 253,069 | |
| | |
Crane Co. | | | 1,883 | | | | 144,087 | |
| | |
Cummins, Inc. | | | 5,110 | | | | 881,373 | |
| | |
Dover Corp. | | | 3,433 | | | | 356,654 | |
| | |
Graco, Inc. | | | 11,021 | | | | 498,149 | |
| | |
IDEX Corp. | | | 3,496 | | | | 543,733 | |
| | |
Ingersoll-Rand plc | | | 3,760 | | | | 477,106 | |
| | |
ITT, Inc. | | | 2,464 | | | | 146,485 | |
| | |
Lincoln Electric Holdings, Inc. | | | 3,369 | | | | 301,761 | |
| | |
Middleby Corp. (The)* | | | 2,032 | | | | 245,771 | |
| | |
Nordson Corp. | | | 1,599 | | | | 250,739 | |
| | |
Oshkosh Corp. | | | 2,970 | | | | 253,579 | |
| | |
PACCAR, Inc. | | | 3,657 | | | | 278,152 | |
| | |
Parker-Hannifin Corp. | | | 1,702 | | | | 312,300 | |
| | |
Pentair plc | | | 3,732 | | | | 154,766 | |
| | |
Snap-on, Inc. | | | 4,372 | | | | 711,193 | |
| | |
Toro Co. (The) | | | 10,806 | | | | 833,467 | |
| | |
WABCO Holdings, Inc.* | | | 4,237 | | | | 570,385 | |
| | |
Xylem, Inc. | | | 3,051 | | | | 233,981 | |
| | | | | | | | |
| | |
| | | | | | | 7,446,750 | |
| | | | | | | | |
|
Media — 1.4% | |
| | |
Discovery, Inc., Class A* (a) | | | 16,107 | | | | 434,164 | |
| | |
Interpublic Group of Cos., Inc. (The) | | | 16,060 | | | | 349,305 | |
| | | | | | | | |
| INVESTMENTS | | SHARES | | | VALUE($) | |
| | | | | | | | |
|
Media — continued | |
| | |
John Wiley & Sons, Inc., Class A | | | 1,756 | | | | 80,899 | |
| | |
Liberty Media Corp.-Liberty SiriusXM, Class A* | | | 3,223 | | | | 144,745 | |
| | |
Nexstar Media Group, Inc., Class A | | | 4,289 | | | | 417,277 | |
| | |
Omnicom Group, Inc. | | | 6,505 | | | | 502,121 | |
| | |
Sinclair Broadcast Group, Inc., Class A | | | 12,049 | | | | 480,032 | |
| | |
Sirius XM Holdings, Inc. (a) | | | 27,846 | | | | 187,125 | |
| | | | | | | | |
| | |
| | | | | | | 2,595,668 | |
| | | | | | | | |
|
Metals & Mining — 2.8% | |
| | |
Alcoa Corp.* | | | 26,300 | | | | 546,777 | |
| | |
Freeport-McMoRan, Inc. | | | 62,724 | | | | 615,950 | |
| | |
Newmont Goldcorp Corp. | | | 19,573 | | | | 777,635 | |
| | |
Nucor Corp. | | | 15,850 | | | | 853,523 | |
| | |
Reliance Steel & Aluminum Co. | | | 7,778 | | | | 902,559 | |
| | |
Royal Gold, Inc. | | | 5,842 | | | | 674,400 | |
| | |
Steel Dynamics, Inc. | | | 27,457 | | | | 833,595 | |
| | | | | | | | |
| | |
| | | | | | | 5,204,439 | |
| | | | | | | | |
|
Mortgage Real Estate Investment Trusts (REITs) — 1.7% | |
| | |
Annaly Capital Management, Inc. | | | 23,519 | | | | 211,201 | |
| | |
Chimera Investment Corp. (a) | | | 40,482 | | | | 820,165 | |
| | |
MFA Financial, Inc. | | | 49,622 | | | | 376,631 | |
| | |
New Residential Investment Corp. | | | 47,305 | | | | 749,311 | |
| | |
Starwood Property Trust, Inc. (a) | | | 32,384 | | | | 796,647 | |
| | |
Two Harbors Investment Corp. | | | 14,251 | | | | 197,661 | |
| | | | | | | | |
| | |
| | | | | | | 3,151,616 | |
| | | | | | | | |
|
Multiline Retail — 1.3% | |
| | |
Dollar General Corp. | | | 4,983 | | | | 798,974 | |
| | |
Dollar Tree, Inc.* | | | 4,537 | | | | 500,885 | |
| | |
Kohl’s Corp. | | | 11,392 | | | | 583,954 | |
| | |
Macy’s, Inc. (a) | | | 17,381 | | | | 263,496 | |
| | |
Nordstrom, Inc. (a) | | | 8,473 | | | | 304,181 | |
| | | | | | | | |
| | |
| | | | | | | 2,451,490 | |
| | | | | | | | |
|
Multi-Utilities — 3.4% | |
| | |
Ameren Corp. | | | 9,993 | | | | 776,456 | |
| | |
CenterPoint Energy, Inc. | | | 26,056 | | | | 757,448 | |
| | |
CMS Energy Corp. | | | 12,360 | | | | 790,051 | |
| | |
Consolidated Edison, Inc. | | | 8,725 | | | | 804,620 | |
| | |
DTE Energy Co. | | | 6,003 | | | | 764,302 | |
| | |
MDU Resources Group, Inc. | | | 7,354 | | | | 212,457 | |
| | |
Public Service Enterprise Group, Inc. | | | 12,828 | | | | 812,141 | |
| | |
Sempra Energy | | | 4,661 | | | | 673,561 | |
| | |
WEC Energy Group, Inc. | | | 8,168 | | | | 771,059 | |
| | | | | | | | |
| | |
| | | | | | | 6,362,095 | |
| | | | | | | | |
SEE NOTES TO FINANCIAL STATEMENTS.
| | | | | | | | |
| | | |
| OCTOBER 31, 2019 | | J.P. MORGAN EXCHANGE-TRADED FUNDS | | | | | 127 | |
JPMorgan Diversified Return U.S. Mid Cap Equity ETF
SCHEDULE OF PORTFOLIO INVESTMENTS
AS OF OCTOBER 31, 2019 (continued)
| | | | | | | | |
| INVESTMENTS | | SHARES | | | VALUE($) | |
Common Stocks — continued | |
|
Oil, Gas & Consumable Fuels — 5.1% | |
| | |
Antero Midstream Corp. (a) | | | 4,814 | | | | 31,002 | |
| | |
Apache Corp. (a) | | | 21,345 | | | | 462,333 | |
| | |
Cabot Oil & Gas Corp. | | | 44,934 | | | | 837,570 | |
| | |
Cheniere Energy, Inc.* | | | 6,621 | | | | 407,522 | |
| | |
Concho Resources, Inc. | | | 5,658 | | | | 382,028 | |
| | |
Continental Resources, Inc.* | | | 2,880 | | | | 84,873 | |
| | |
Devon Energy Corp. | | | 22,063 | | | | 447,438 | |
| | |
Diamondback Energy, Inc. | | | 5,872 | | | | 503,583 | |
| | |
EQT Corp. | | | 30,440 | | | | 326,926 | |
| | |
Hess Corp. | | | 9,470 | | | | 622,652 | |
| | |
HollyFrontier Corp. | | | 16,181 | | | | 888,984 | |
| | |
Marathon Oil Corp. | | | 48,622 | | | | 560,612 | |
| | |
Murphy Oil Corp. (a) | | | 21,241 | | | | 438,202 | |
| | |
Noble Energy, Inc. | | | 25,319 | | | | 487,644 | |
| | |
ONEOK, Inc. | | | 10,804 | | | | 754,443 | |
| | |
PBF Energy, Inc., Class A | | | 20,937 | | | | 675,846 | |
| | |
Pioneer Natural Resources Co. | | | 4,650 | | | | 572,043 | |
| | |
Targa Resources Corp. | | | 12,761 | | | | 496,148 | |
| | |
Williams Cos., Inc. (The) | | | 24,502 | | | | 546,640 | |
| | | | | | | | |
| | |
| | | | | | | 9,526,489 | |
| | | | | | | | |
|
Paper & Forest Products — 0.4% | |
| | |
Domtar Corp. | | | 23,172 | | | | 843,229 | |
| | | | | | | | |
|
Personal Products — 0.2% | |
| | |
Nu Skin Enterprises, Inc., Class A | | | 7,748 | | | | 345,406 | |
| | | | | | | | |
|
Pharmaceuticals — 0.6% | |
| | |
Jazz Pharmaceuticals plc* | | | 3,479 | | | | 437,067 | |
| | |
Mylan NV* | | | 15,836 | | | | 303,259 | |
| | |
Perrigo Co. plc | | | 7,595 | | | | 402,687 | |
| | | | | | | | |
| | |
| | | | | | | 1,143,013 | |
| | | | | | | | |
|
Professional Services — 0.4% | |
| | |
Robert Half International, Inc. | | | 4,754 | | | | 272,261 | |
| | |
TransUnion | | | 4,851 | | | | 400,790 | |
| | | | | | | | |
| | |
| | | | | | | 673,051 | |
| | | | | | | | |
|
Real Estate Management & Development — 0.2% | |
| | |
CBRE Group, Inc., Class A* | | | 4,283 | | | | 229,355 | |
| | |
Jones Lang LaSalle, Inc. | | | 987 | | | | 144,615 | |
| | | | | | | | |
| | |
| | | | | | | 373,970 | |
| | | | | | | | |
|
Road & Rail — 0.6% | |
| | |
Kansas City Southern | | | 2,193 | | | | 308,730 | |
| | |
Landstar System, Inc. | | | 4,318 | | | | 488,582 | |
| | |
Old Dominion Freight Line, Inc. | | | 1,535 | | | | 279,493 | |
| | | | | | | | |
| | |
| | | | | | | 1,076,805 | |
| | | | | | | | |
| | | | | | | | |
| INVESTMENTS | | SHARES | | | VALUE($) | |
| | | | | | | | |
|
Semiconductors & Semiconductor Equipment — 3.4% | |
| | |
Cypress Semiconductor Corp. | | | 33,865 | | | | 788,039 | |
| | |
Entegris, Inc. | | | 7,656 | | | | 367,488 | |
| | |
KLA Corp. | | | 4,533 | | | | 766,258 | |
| | |
Lam Research Corp. | | | 3,684 | | | | 998,511 | |
| | |
Marvell Technology Group Ltd. | | | 12,518 | | | | 305,314 | |
| | |
Maxim Integrated Products, Inc. | | | 9,106 | | | | 534,158 | |
| | |
ON Semiconductor Corp.* | | | 15,831 | | | | 322,952 | |
| | |
Qorvo, Inc.* | | | 5,410 | | | | 437,453 | |
| | |
Skyworks Solutions, Inc. | | | 3,789 | | | | 345,026 | |
| | |
Teradyne, Inc. | | | 14,594 | | | | 893,445 | |
| | |
Xilinx, Inc. | | | 6,193 | | | | 561,953 | |
| | | | | | | | |
| | |
| | | | | | | 6,320,597 | |
| | | | | | | | |
|
Software — 2.3% | |
| | |
ANSYS, Inc.* | | | 3,672 | | | | 808,391 | |
| | |
Cadence Design Systems, Inc.* | | | 11,304 | | | | 738,716 | |
| | |
Citrix Systems, Inc. | | | 7,096 | | | | 772,471 | |
| | |
LogMeIn, Inc. | | | 3,290 | | | | 216,087 | |
| | |
Manhattan Associates, Inc.* | | | 5,870 | | | | 439,956 | |
| | |
Paycom Software, Inc.* | | | 476 | | | | 100,688 | |
| | |
SS&C Technologies Holdings, Inc. | | | 10,967 | | | | 570,394 | |
| | |
Synopsys, Inc.* | | | 5,490 | | | | 745,268 | |
| | | | | | | | |
| | |
| | | | | | | 4,391,971 | |
| | | | | | | | |
|
Specialty Retail — 2.4% | |
| | |
AutoZone, Inc.* | | | 582 | | | | 666,029 | |
| | |
Best Buy Co., Inc. | | | 7,566 | | | | 543,466 | |
| | |
Burlington Stores, Inc.* | | | 382 | | | | 73,409 | |
| | |
Dick’s Sporting Goods, Inc. (a) | | | 19,372 | | | | 754,152 | |
| | |
Foot Locker, Inc. | | | 4,801 | | | | 208,892 | |
| | |
Gap, Inc. (The) | | | 5,313 | | | | 86,389 | |
| | |
Penske Automotive Group, Inc. | | | 1,960 | | | | 95,491 | |
| | |
Tiffany & Co. (a) | | | 4,604 | | | | 573,244 | |
| | |
Tractor Supply Co. | | | 7,486 | | | | 711,320 | |
| | |
Williams-Sonoma, Inc. (a) | | | 10,885 | | | | 727,009 | |
| | | | | | | | |
| | |
| | | | | | | 4,439,401 | |
| | | | | | | | |
|
Technology Hardware, Storage & Peripherals — 0.7% | |
| | |
NetApp, Inc. | | | 5,799 | | | | 324,048 | |
| | |
Western Digital Corp. | | | 3,316 | | | | 171,271 | |
| | |
Xerox Holdings Corp. | | | 21,986 | | | | 745,985 | |
| | | | | | | | |
| | |
| | | | | | | 1,241,304 | |
| | | | | | | | |
|
Textiles, Apparel & Luxury Goods — 2.3% | |
| | |
Capri Holdings Ltd.* | | | 9,844 | | | | 305,853 | |
| | |
Carter’s, Inc. | | | 5,834 | | | | 584,800 | |
| | |
Columbia Sportswear Co. (a) | | | 2,752 | | | | 248,918 | |
SEE NOTES TO FINANCIAL STATEMENTS.
| | | | | | |
| | | |
| 128 | | | | J.P. MORGAN EXCHANGE-TRADED FUNDS | | OCTOBER 31, 2019 |
| | | | | | | | |
| INVESTMENTS | | SHARES | | | VALUE($) | |
Common Stocks — continued | |
|
Textiles, Apparel & Luxury Goods — continued | |
| | |
Hanesbrands, Inc. (a) | | | 37,222 | | | | 566,147 | |
| | |
Lululemon Athletica, Inc.* | | | 4,062 | | | | 829,745 | |
| | |
PVH Corp. | | | 3,214 | | | | 280,132 | |
| | |
Ralph Lauren Corp. | | | 6,094 | | | | 585,390 | |
| | |
Skechers U.S.A., Inc., Class A* | | | 15,274 | | | | 570,789 | |
| | |
Tapestry, Inc. | | | 14,808 | | | | 382,935 | |
| | |
Under Armour, Inc., Class C* | | | 2,818 | | | | 52,133 | |
| | | | | | | | |
| | |
| | | | | | | 4,406,842 | |
| | | | | | | | |
|
Trading Companies & Distributors — 0.3% | |
| | |
Fastenal Co. | | | 6,500 | | | | 233,610 | |
| | |
MSC Industrial Direct Co., Inc., Class A | | | 2,083 | | | | 152,497 | |
| | |
WW Grainger, Inc. | | | 617 | | | | 190,554 | |
| | | | | | | | |
| | |
| | | | | | | 576,661 | |
| | | | | | | | |
|
Transportation Infrastructure — 0.1% | |
| | |
Macquarie Infrastructure Corp. | | | 2,953 | | | | 127,392 | |
| | | | | | | | |
|
Water Utilities — 0.4% | |
| | |
American Water Works Co., Inc. | | | 6,146 | | | | 757,617 | |
| | | | | | | | |
|
Wireless Telecommunication Services — 0.4% | |
| | |
Sprint Corp.* | | | 12,638 | | | | 78,482 | |
| | |
Telephone & Data Systems, Inc. | | | 21,465 | | | | 560,022 | |
| | |
United States Cellular Corp.* | | | 2,831 | | | | 105,370 | |
| | | | | | | | |
| | |
| | | | | | | 743,874 | |
| | | | | | | | |
| | |
Total Common Stocks
(Cost $173,151,458) | | | | | | | 187,580,780 | |
| | | | | | | | |
| | | | | | | | |
| INVESTMENTS | | SHARES | | | VALUE($) | |
Short-Term Investments — 5.0% | |
|
Investment Companies — 0.2% | |
| | |
JPMorgan U.S. Government Money Market Fund Class Institutional Shares,
1.64% (c) (d)
(Cost $329,265) | | | 329,265 | | | | 329,265 | |
| | | | | | | | |
|
Investment of Cash Collateral From Securities Loaned — 4.8% | |
| | |
JPMorgan Securities Lending Money Market Fund Class Agency SL Shares,
1.98% (c) (d) | | | 6,000,300 | | | | 6,000,900 | |
| | |
JPMorgan U.S. Government Money Market Fund Class IM Shares, 1.70%) (c) (d) | | | 3,100,057 | | | | 3,100,057 | |
| | | | | | | | |
| | |
Total Investment of Cash Collateral From Securities Loaned
(cost $9,100,957) | | | | | | | 9,100,957 | |
| | | | | | | | |
| | |
Total Short-Term Investments
(Cost $9,430,222) | | | | | | | 9,430,222 | |
| | | | | | | | |
Total Investments — 104.8%
(Cost $182,581,680) | | | | | | | 197,011,002 | |
| | |
Liabilities in Excess of
Other Assets — (4.8)% | | | | | | | (9,037,211 | ) |
| | | | | | | | |
NET ASSETS — 100.0% | | | | | | | 187,973,791 | |
| | | | | | | | |
Percentages indicated are based on net assets.
| | |
| (a) | | Thesecurity or a portion of this security is on loan at October 31, 2019. The total value of securities on loan at October 31, 2019 is $8,836,243. |
| (b) | | Amountrounds to less than 0.1% of net assets. |
| (c) | | Investment in an affiliated fund, which is registered under the Investment Company Act of 1940, as amended, and is advised by J.P. Morgan Investment Management Inc. |
| (d) | | Therate shown is the current yield as of October 31, 2019. |
| * | | Non-incomeproducing security. |
| | | | | | | | | | | | | | | | | | | | |
| Futures contracts outstanding as of October 31, 2019: | |
| DESCRIPTION | | NUMBER OF
CONTRACTS | | | EXPIRATION
DATE | | | TRADING
CURRENCY | | | NOTIONAL
AMOUNT($) | | | VALUE AND
UNREALIZED
APPRECIATION
(DEPRECIATION)($) | |
| | | | | |
Long Contracts | | | | | | | | | | | | | | | | | | | | |
| | | | | |
S&P Midcap 400E-Mini Index | | | 2 | | | | 12/2019 | | | | USD | | | | 390,920 | | | | 10,026 | |
| | | | | | | | | | | | | | | | | | | | |
Abbreviations
SEE NOTES TO FINANCIAL STATEMENTS.
| | | | | | | | |
| | | |
| OCTOBER 31, 2019 | | J.P. MORGAN EXCHANGE-TRADED FUNDS | | | | | 129 | |
JPMorgan Diversified Return U.S. Small Cap Equity ETF
SCHEDULE OF PORTFOLIO INVESTMENTS
AS OF OCTOBER 31, 2019
| | | | | | | | |
| INVESTMENTS | | SHARES | | | VALUE($) | |
Common Stocks — 99.9% | |
|
Aerospace & Defense — 1.0% | |
| | |
AAR Corp. | | | 2,589 | | | | 108,091 | |
| | |
Aerojet Rocketdyne Holdings, Inc.* (a) | | | 3,552 | | | | 153,553 | |
| | |
AeroVironment, Inc.* (a) | | | 1,771 | | | | 102,683 | |
| | |
Allegheny Technologies, Inc.* (a) | | | 4,101 | | | | 86,162 | |
| | |
Cubic Corp. | | | 1,723 | | | | 127,054 | |
| | |
ManTech International Corp., Class A | | | 1,139 | | | | 90,186 | |
| | |
Moog, Inc., Class A | | | 3,233 | | | | 270,634 | |
| | |
RBC Bearings, Inc.* | | | 1,873 | | | | 300,504 | |
| | | | | | | | |
| | |
| | | | | | | 1,238,867 | |
| | | | | | | | |
|
Alternative Energy — 1.4% | |
| | |
Arcosa, Inc. | | | 8,241 | | | | 316,537 | |
| | |
Enphase Energy, Inc.* (a) | | | 13,850 | | | | 269,106 | |
| | |
Green Plains, Inc. (a) | | | 17,997 | | | | 221,903 | |
| | |
Plug Power, Inc.* | | | 54,447 | | | | 144,284 | |
| | |
Renewable Energy Group, Inc.* | | | 16,743 | | | | 273,581 | |
| | |
REX American Resources Corp.* (a) | | | 2,738 | | | | 221,559 | |
| | |
SunPower Corp.* (a) | | | 24,843 | | | | 217,625 | |
| | |
TPI Composites, Inc.* (a) | | | 6,794 | | | | 139,481 | |
| | | | | | | | |
| | |
| | | | | | | 1,804,076 | |
| | | | | | | | |
|
Automobiles & Parts — 1.1% | |
| | |
Cooper Tire & Rubber Co. (a) | | | 14,453 | | | | 408,153 | |
| | |
Cooper-Standard Holdings, Inc.* (a) | | | 835 | | | | 26,603 | |
| | |
Dorman Products, Inc.* (a) | | | 5,367 | | | | 386,156 | |
| | |
Gentherm, Inc.* | | | 8,023 | | | | 335,121 | |
| | |
Meritor, Inc.* | | | 14,148 | | | | 311,680 | |
| | |
Modine Manufacturing Co.* | | | 900 | | | | 10,287 | |
| | |
Stoneridge, Inc.* | | | 2,649 | | | | 81,801 | |
| | |
Titan International, Inc. | | | 8,504 | | | | 22,706 | |
| | | | | | | | |
| | |
| | | | | | | 1,582,507 | |
| | | | | | | | |
|
Banks — 4.4% | |
| | |
1st Source Corp. | | | 695 | | | | 35,570 | |
| | |
Ameris Bancorp | | | 1,976 | | | | 84,672 | |
| | |
Atlantic Union Bankshares Corp. | | | 2,589 | | | | 95,430 | |
| | |
Axos Financial, Inc.* (a) | | | 2,893 | | | | 84,042 | |
| | |
BancFirst Corp. | | | 1,435 | | | | 83,072 | |
| | |
BancorpSouth Bank (a) | | | 2,438 | | | | 74,773 | |
| | |
Bank of NT Butterfield & Son Ltd. (The) (Bermuda) | | | 2,395 | | | | 78,915 | |
| | |
Banner Corp. | | | 1,637 | | | | 88,365 | |
| | |
Brookline Bancorp, Inc. | | | 4,733 | | | | 74,308 | |
| | |
Cadence BanCorp | | | 4,714 | | | | 72,501 | |
| | |
Capital City Bank Group, Inc. (a) | | | 520 | | | | 14,794 | |
| | |
Capitol Federal Financial, Inc. | | | 11,580 | | | | 165,246 | |
| | |
Cathay General Bancorp | | | 2,031 | | | | 72,243 | |
| | | | | | | | |
| INVESTMENTS | | SHARES | | | VALUE($) | |
| | | | | | | | |
|
Banks — continued | |
| | |
CenterState Bank Corp. | | | 3,291 | | | | 83,460 | |
| | |
Columbia Banking System, Inc. (a) | | | 2,477 | | | | 97,346 | |
| | |
Community Bank System, Inc. (a) | | | 4,383 | | | | 297,080 | |
| | |
Community Trust Bancorp, Inc. | | | 1,606 | | | | 70,359 | |
| | |
CVB Financial Corp. | | | 2,195 | | | | 45,612 | |
| | |
Dime Community Bancshares, Inc. | | | 5,711 | | | | 110,165 | |
| | |
First BanCorp (Puerto Rico) | | | 26,498 | | | | 278,759 | |
| | |
First Busey Corp. | | | 184 | | | | 4,852 | |
| | |
First Financial Bancorp (a) | | | 1,838 | | | | 43,083 | |
| | |
First Financial Bankshares, Inc. (a) | | | 3,211 | | | | 106,862 | |
| | |
First Financial Corp. | | | 449 | | | | 19,698 | |
| | |
First Merchants Corp. | | | 641 | | | | 25,351 | |
| | |
First Midwest Bancorp, Inc. (a) | | | 2,128 | | | | 43,709 | |
| | |
Fulton Financial Corp. | | | 5,171 | | | | 88,217 | |
| | |
Glacier Bancorp, Inc. (a) | | | 5,127 | | | | 216,975 | |
| | |
Great Western Bancorp, Inc. | | | 2,809 | | | | 97,950 | |
| | |
Hancock Whitney Corp. | | | 1,935 | | | | 75,465 | |
| | |
Home BancShares, Inc. (a) | | | 4,260 | | | | 78,725 | |
| | |
Hope Bancorp, Inc. | | | 6,408 | | | | 91,442 | |
| | |
Houlihan Lokey, Inc. | | | 2,262 | | | | 106,902 | |
| | |
IBERIABANK Corp. | | | 1,225 | | | | 89,903 | |
| | |
Independent Bank Corp. (a) | | | 2,165 | | | | 177,703 | |
| | |
Investors Bancorp, Inc. | | | 12,450 | | | | 150,022 | |
| | |
Kearny Financial Corp. | | | 6,917 | | | | 97,045 | |
| | |
NBT Bancorp, Inc. | | | 825 | | | | 32,794 | |
| | |
Northwest Bancshares, Inc. | | | 10,124 | | | | 170,792 | |
| | |
OceanFirst Financial Corp. | | | 5,378 | | | | 128,695 | |
| | |
OFG Bancorp (Puerto Rico) | | | 4,577 | | | | 92,959 | |
| | |
Old National Bancorp (a) | | | 15,050 | | | | 270,825 | |
| | |
Oritani Financial Corp. | | | 6,860 | | | | 128,008 | |
| | |
Renasant Corp. | | | 978 | | | | 33,937 | |
| | |
Republic Bancorp, Inc., Class A | | | 1,253 | | | | 55,721 | |
| | |
S&T Bancorp, Inc. | | | 1,474 | | | | 55,503 | |
| | |
Sandy Spring Bancorp, Inc. | | | 577 | | | | 19,906 | |
| | |
Simmons First National Corp., Class A | | | 3,336 | | | | 79,797 | |
| | |
TrustCo Bank Corp. | | | 5,660 | | | | 48,902 | |
| | |
Trustmark Corp. (a) | | | 6,902 | | | | 236,877 | |
| | |
UMB Financial Corp. | | | 1,397 | | | | 91,168 | |
| | |
United Bankshares, Inc. (a) | | | 7,542 | | | | 298,211 | |
| | |
United Community Banks, Inc. | | | 4,290 | | | | 129,601 | |
| | |
Valley National Bancorp | | | 12,332 | | | | 142,805 | |
| | |
Washington Federal, Inc. | | | 8,482 | | | | 309,254 | |
| | |
WesBanco, Inc. | | | 3,880 | | | | 145,849 | |
| | |
Westamerica Bancorp | | | 2,432 | | | | 160,561 | |
| | | | | | | | |
| | |
| | | | | | | 6,152,781 | |
| | | | | | | | |
SEE NOTES TO FINANCIAL STATEMENTS.
| | | | | | |
| | | |
| 130 | | | | J.P. MORGAN EXCHANGE-TRADED FUNDS | | OCTOBER 31, 2019 |
| | | | | | | | |
| INVESTMENTS | | SHARES | | | VALUE($) | |
Common Stocks — continued | |
|
Beverages — 0.5% | |
| | |
Boston Beer Co., Inc. (The), Class A* | | | 946 | | | | 354,239 | |
| | |
Coca-Cola Consolidated, Inc. | | | 1,220 | | | | 334,719 | |
| | | | | | | | |
| | |
| | | | | | | 688,958 | |
| | | | | | | | |
|
Chemicals — 4.2% | |
| | |
AdvanSix, Inc.* (a) | | | 7,298 | | | | 166,102 | |
| | |
American Vanguard Corp. | | | 2,623 | | | | 36,670 | |
| | |
Balchem Corp. (a) | | | 3,865 | | | | 391,177 | |
| | |
Codexis, Inc.* (a) | | | 11,967 | | | | 161,794 | |
| | |
CSW Industrials, Inc. | | | 1,039 | | | | 71,919 | |
| | |
Ferro Corp.* | | | 19,264 | | | | 214,408 | |
| | |
GCP Applied Technologies, Inc.* | | | 6,565 | | | | 135,633 | |
| | |
HB Fuller Co. | | | 8,234 | | | | 401,819 | |
| | |
Ingevity Corp.* | | | 3,635 | | | | 306,103 | |
| | |
Innophos Holdings, Inc. (a) | | | 4,198 | | | | 136,939 | |
| | |
Innospec, Inc. | | | 4,000 | | | | 365,440 | |
| | |
Koppers Holdings, Inc.* | | | 2,907 | | | | 93,315 | |
| | |
Kraton Corp.* | | | 9,086 | | | | 203,708 | |
| | |
Kronos Worldwide, Inc. | | | 7,339 | | | | 93,059 | |
| | |
LSB Industries, Inc.* | | | 3,736 | | | | 15,803 | |
| | |
Materion Corp. | | | 4,647 | | | | 264,136 | |
| | |
Minerals Technologies, Inc. (a) | | | 8,496 | | | | 420,127 | |
| | |
Orion Engineered Carbons SA (Luxembourg) | | | 12,435 | | | | 205,924 | |
| | |
PolyOne Corp. | | | 8,618 | | | | 276,207 | |
| | |
Quaker Chemical Corp. | | | 1,748 | | | | 267,234 | |
| | |
Rayonier Advanced Materials, Inc. | | | 39,059 | | | | 162,876 | |
| | |
Sensient Technologies Corp. | | | 7,873 | | | | 492,535 | |
| | |
Stepan Co. | | | 3,166 | | | | 309,382 | |
| | |
Tredegar Corp. (a) | | | 4,190 | | | | 83,297 | |
| | |
Trinseo SA | | | 7,838 | | | | 333,115 | |
| | |
Tronox Holdings plc, Class A (a) | | | 36,669 | | | | 311,320 | |
| | | | | | | | |
| | |
| | | | | | | 5,920,042 | |
| | | | | | | | |
|
Construction & Materials — 2.8% | |
| | |
Advanced Drainage Systems, Inc. | | | 3,281 | | | | 121,463 | |
| | |
Aegion Corp.* | | | 2,952 | | | | 63,970 | |
| | |
Apogee Enterprises, Inc. | | | 3,635 | | | | 136,458 | |
| | |
Argan, Inc. (a) | | | 1,465 | | | | 55,450 | |
| | |
Boise Cascade Co. | | | 3,286 | | | | 117,540 | |
| | |
Builders FirstSource, Inc.* | | | 5,293 | | | | 119,675 | |
| | |
EMCOR Group, Inc. | | | 2,231 | | | | 195,681 | |
| | |
Generac Holdings, Inc.* | | | 1,762 | | | | 170,174 | |
| | |
Gibraltar Industries, Inc.* | | | 1,984 | | | | 105,608 | |
| | |
GMS, Inc.* | | | 2,989 | | | | 89,550 | |
| | |
Granite Construction, Inc. | | | 1,157 | | | | 27,236 | |
| | |
Great Lakes Dredge & Dock Corp.* | | | 6,532 | | | | 70,219 | |
| | |
Griffon Corp. | | | 4,820 | | | | 102,714 | |
| | | | | | | | |
| INVESTMENTS | | SHARES | | | VALUE($) | |
| | | | | | | | |
|
Construction & Materials — continued | |
| | |
Installed Building Products, Inc.* | | | 1,710 | | | | 111,526 | |
| | |
JELD-WEN Holding, Inc.* | | | 3,371 | | | | 57,610 | |
| | |
KBR, Inc. | | | 5,613 | | | | 158,062 | |
| | |
LB Foster Co., Class A* | | | 731 | | | | 13,304 | |
| | |
Louisiana-Pacific Corp. | | | 5,152 | | | | 150,593 | |
| | |
Masonite International Corp.* | | | 1,714 | | | | 105,257 | |
| | |
MasTec, Inc.* | | | 2,891 | | | | 181,959 | |
| | |
Mueller Water Products, Inc., Class A | | | 9,801 | | | | 114,672 | |
| | |
Patrick Industries, Inc.* | | | 2,036 | | | | 100,599 | |
| | |
PGT Innovations, Inc.* | | | 5,136 | | | | 90,702 | |
| | |
Quanex Building Products Corp. | | | 3,889 | | | | 75,019 | |
| | |
Simpson Manufacturing Co., Inc. | | | 2,922 | | | | 241,474 | |
| | |
TopBuild Corp.* | | | 3,293 | | | | 342,242 | |
| | |
Trex Co., Inc.* | | | 1,127 | | | | 99,052 | |
| | |
Universal Forest Products, Inc. | | | 6,869 | | | | 345,923 | |
| | |
US Concrete, Inc.* | | | 1,472 | | | | 76,927 | |
| | |
Watts Water Technologies, Inc., Class A | | | 2,304 | | | | 214,848 | |
| | | | | | | | |
| | |
| | | | | | | 3,855,507 | |
| | | | | | | | |
|
Electricity — 3.5% | |
| | |
ALLETE, Inc. | | | 6,759 | | | | 581,679 | |
| | |
Black Hills Corp. | | | 3,743 | | | | 295,061 | |
| | |
El Paso Electric Co. | | | 17,211 | | | | 1,148,146 | |
| | |
MGE Energy, Inc. | | | 3,249 | | | | 250,303 | |
| | |
NorthWestern Corp. | | | 4,808 | | | | 348,676 | |
| | |
Ormat Technologies, Inc. | | | 12,236 | | | | 936,788 | |
| | |
Pattern Energy Group, Inc., Class A | | | 2,118 | | | | 59,368 | |
| | |
PNM Resources, Inc. | | | 10,767 | | | | 561,499 | |
| | |
Portland General Electric Co. | | | 6,951 | | | | 395,373 | |
| | |
TerraForm Power, Inc., Class A | | | 16,332 | | | | 277,317 | |
| | | | | | | | |
| | |
| | | | | | | 4,854,210 | |
| | | | | | | | |
|
Electronic & Electrical Equipment — 1.9% | |
| | |
Anixter International, Inc.* (a) | | | 1,583 | | | | 130,993 | |
| | |
Atkore International Group, Inc.* | | | 4,339 | | | | 150,563 | |
| | |
AZZ, Inc. | | | 3,254 | | | | 126,223 | |
| | |
Badger Meter, Inc. (a) | | | 3,374 | | | | 195,017 | |
| | |
Belden, Inc. | | | 1,555 | | | | 79,741 | |
| | |
Benchmark Electronics, Inc. | | | 2,206 | | | | 74,783 | |
| | |
Brady Corp., Class A (a) | | | 2,699 | | | | 152,062 | |
| | |
CTS Corp. (a) | | | 940 | | | | 25,079 | |
| | |
Daktronics, Inc. | | | 5,091 | | | | 34,924 | |
| | |
Encore Wire Corp. | | | 2,428 | | | | 136,454 | |
| | |
EnerSys | | | 1,852 | | | | 123,825 | |
| | |
ESCO Technologies, Inc. | | | 1,473 | | | | 124,454 | |
| | |
Fabrinet (Thailand)* | | | 2,728 | | | | 153,396 | |
| | |
II-VI, Inc.* | | | 2,765 | | | | 91,660 | |
SEE NOTES TO FINANCIAL STATEMENTS.
| | | | | | | | |
| | | |
| OCTOBER 31, 2019 | | J.P. MORGAN EXCHANGE-TRADED FUNDS | | | | | 131 | |
JPMorgan Diversified Return U.S. Small Cap Equity ETF
SCHEDULE OF PORTFOLIO INVESTMENTS
AS OF OCTOBER 31, 2019 (continued)
| | | | | | | | |
| INVESTMENTS | | SHARES | | | VALUE($) | |
Common Stocks — continued | |
|
Electronic & Electrical Equipment — continued | |
| | |
Integer Holdings Corp.* | | | 3,796 | | | | 293,962 | |
| | |
Methode Electronics, Inc. | | | 2,258 | | | | 77,675 | |
| | |
MTS Systems Corp. | | | 4,013 | | | | 226,654 | |
| | |
Novanta, Inc.* | | | 1,746 | | | | 155,481 | |
| | |
Park Aerospace Corp. | | | 2,811 | | | | 47,759 | |
| | |
Plexus Corp.* | | | 2,603 | | | | 192,466 | |
| | |
TTM Technologies, Inc.* (a) | | | 4,019 | | | | 47,063 | |
| | |
Veeco Instruments, Inc.* | | | 1,617 | | | | 22,056 | |
| | |
Vishay Intertechnology, Inc. | | | 5,322 | | | | 107,238 | |
| | | | | | | | |
| | |
| | | | | | | 2,769,528 | |
| | | | | | | | |
|
Financial Services — 1.4% | |
| | |
Ares Management Corp. | | | 10,268 | | | | 303,625 | |
| | |
Clearway Energy, Inc., Class A | | | 3,588 | | | | 61,606 | |
| | |
Clearway Energy, Inc., Class C | | | 5,244 | | | | 95,074 | |
| | |
Cohen & Steers, Inc. (a) | | | 2,642 | | | | 172,892 | |
| | |
Encore Capital Group, Inc.* (a) | | | 2,164 | | | | 71,823 | |
| | |
Essent Group Ltd. | | | 5,788 | | | | 301,497 | |
| | |
EZCORP, Inc., Class A* (a) | | | 1,579 | | | | 8,306 | |
| | |
Federated Investors, Inc., Class B | | | 8,880 | | | | 283,627 | |
| | |
FirstCash, Inc. | | | 1,512 | | | | 127,598 | |
| | |
NMI Holdings, Inc., Class A* | | | 4,979 | | | | 145,636 | |
| | |
PRA Group, Inc.* (a) | | | 1,433 | | | | 48,622 | |
| | |
Radian Group, Inc. | | | 12,116 | | | | 304,112 | |
| | |
Stewart Information Services Corp. | | | 1,936 | | | | 79,221 | |
| | |
World Acceptance Corp.* | | | 629 | | | | 65,296 | |
| | | | | | | | |
| | |
| | | | | | | 2,068,935 | |
| | | | | | | | |
|
Fixed Line Telecommunications — 0.7% | |
| | |
8x8, Inc.* (a) | | | 16,348 | | | | 315,843 | |
| | |
Consolidated Communications Holdings, Inc. (a) | | | 32,330 | | | | 129,320 | |
| | |
Frontier Communications Corp.* (a) | | | 65,682 | | | | 59,771 | |
| | |
IDT Corp., Class B* (a) | | | 15,413 | | | | 104,962 | |
| | |
Pareteum Corp.* | | | 55,097 | | | | 20,386 | |
| | |
Vonage Holdings Corp.* | | | 31,300 | | | | 305,801 | |
| | | | | | | | |
| | |
| | | | | | | 936,083 | |
| | | | | | | | |
|
Food & Drug Retailers — 0.8% | |
| | |
Core-Mark Holding Co., Inc. | | | 6,461 | | | | 197,190 | |
| | |
Diplomat Pharmacy, Inc.* (a) | | | 2,605 | | | | 14,171 | |
| | |
GNC Holdings, Inc., Class A* (a) | | | 4,223 | | | | 11,149 | |
| | |
Ingles Markets, Inc., Class A | | | 4,047 | | | | 159,573 | |
| | |
Performance Food Group Co.* | | | 6,878 | | | | 293,072 | |
| | |
PetMed Express, Inc. (a) | | | 7,494 | | | | 175,472 | |
| | |
Simply Good Foods Co. (The)* | | | 9,125 | | | | 223,927 | |
| | |
SpartanNash Co. | | | 7,894 | | | | 103,372 | |
| | |
United Natural Foods, Inc.* | | | 2,069 | | | | 15,517 | |
| | | | | | | | |
| | |
| | | | | | | 1,193,443 | |
| | | | | | | | |
| | | | | | | | |
| INVESTMENTS | | SHARES | | | VALUE($) | |
| | | | | | | | |
|
Food Producers — 2.7% | |
| | |
Andersons, Inc. (The) | | | 6,769 | | | | 124,685 | |
| | |
B&G Foods, Inc. (a) | | | 9,137 | | | | 142,080 | |
| | |
Calavo Growers, Inc. | | | 2,526 | | | | 219,080 | |
| | |
Cal-Maine Foods, Inc. | | | 2,868 | | | | 114,404 | |
| | |
Darling Ingredients, Inc.* | | | 5,110 | | | | 98,623 | |
| | |
Fresh Del Monte Produce, Inc. | | | 13,532 | | | | 431,671 | |
| | |
Hostess Brands, Inc.* (a) | | | 21,883 | | | | 279,665 | |
| | |
J&J Snack Foods Corp. | | | 2,135 | | | | 407,273 | |
| | |
John B Sanfilippo & Son, Inc. | | | 982 | | | | 104,210 | |
| | |
Lancaster Colony Corp. (a) | | | 3,631 | | | | 505,363 | |
| | |
Medifast, Inc. (a) | | | 3,098 | | | | 343,692 | |
| | |
MGP Ingredients, Inc. (a) | | | 1,647 | | | | 70,640 | |
| | |
Nature’s Sunshine Products, Inc.* | | | 915 | | | | 8,638 | |
| | |
Sanderson Farms, Inc. | | | 2,305 | | | | 356,837 | |
| | |
Tootsie Roll Industries, Inc. (a) | | | 8,344 | | | | 286,032 | |
| | |
USANA Health Sciences, Inc.* | | | 5,949 | | | | 440,881 | |
| | | | | | | | |
| | |
| | | | | | | 3,933,774 | |
| | | | | | | | |
|
Forestry & Paper — 0.7% | |
| | |
Clearwater Paper Corp.* | | | 5,035 | | | | 93,349 | |
| | |
Neenah, Inc. (a) | | | 1,258 | | | | 81,141 | |
| | |
PH Glatfelter Co. | | | 10,528 | | | | 189,504 | |
| | |
Schweitzer-Mauduit International, Inc. | | | 9,797 | | | | 396,680 | |
| | |
Verso Corp., Class A* | | | 13,395 | | | | 196,103 | |
| | | | | | | | |
| | |
| | | | | | | 956,777 | |
| | | | | | | | |
|
Gas, Water & Multiutilities — 3.5% | |
| | |
American States Water Co. | | | 8,195 | | | | 779,590 | |
| | |
Avista Corp. | | | 12,434 | | | | 597,205 | |
| | |
California Water Service Group (a) | | | 11,395 | | | | 637,778 | |
| | |
New Jersey Resources Corp. | | | 8,542 | | | | 372,431 | |
| | |
Northwest Natural Holding Co. | | | 5,374 | | | | 372,741 | |
| | |
ONE Gas, Inc. | | | 6,214 | | | | 576,908 | |
| | |
SJW Group | | | 4,107 | | | | 297,142 | |
| | |
South Jersey Industries, Inc. (a) | | | 14,210 | | | | 456,994 | |
| | |
Southwest Gas Holdings, Inc. | | | 3,064 | | | | 267,487 | |
| | |
Spark Energy, Inc., Class A (a) | | | 12,412 | | | | 118,783 | |
| | |
Spire, Inc. | | | 6,185 | | | | 519,911 | |
| | | | | | | | |
| | |
| | | | | | | 4,996,970 | |
| | | | | | | | |
|
General Industrials — 0.5% | |
| | |
Actuant Corp., Class A | | | 2,586 | | | | 64,055 | |
| | |
Greif, Inc., Class A | | | 2,742 | | | | 107,404 | |
| | |
Harsco Corp.* (a) | | | 3,485 | | | | 70,641 | |
| | |
Myers Industries, Inc. | | | 2,701 | | | | 45,728 | |
| | |
NACCO Industries, Inc., Class A | | | 1,843 | | | | 93,071 | |
| | |
Otter Tail Corp. | | | 6,390 | | | | 362,185 | |
SEE NOTES TO FINANCIAL STATEMENTS.
| | | | | | |
| | | |
| 132 | | | | J.P. MORGAN EXCHANGE-TRADED FUNDS | | OCTOBER 31, 2019 |
| | | | | | | | |
| INVESTMENTS | | SHARES | | | VALUE($) | |
Common Stocks — continued | |
|
General Industrials — continued | |
| | |
TriMas Corp.* | | | 2,959 | | | | 95,635 | |
| | | | | | | | |
| | |
| | | | | | | 838,719 | |
| | | | | | | | |
|
General Retailers — 7.0% | |
| | |
1-800-Flowers.com, Inc., Class A* (a) | | | 7,860 | | | | 112,084 | |
| | |
Aaron’s, Inc. | | | 5,057 | | | | 378,921 | |
| | |
Abercrombie & Fitch Co., Class A | | | 18,679 | | | | 302,413 | |
| | |
Adtalem Global Education, Inc.* | | | 4,514 | | | | 134,427 | |
| | |
American Eagle Outfitters, Inc. | | | 9,315 | | | | 143,265 | |
| | |
American Public Education, Inc.* | | | 3,613 | | | | 78,474 | |
| | |
America’s Car-Mart, Inc.* | | | 1,563 | | | | 142,217 | |
| | |
Asbury Automotive Group, Inc.* | | | 2,246 | | | | 231,630 | |
| | |
At Home Group, Inc.* (a) | | | 3,061 | | | | 26,080 | |
| | |
Bed Bath & Beyond, Inc. (a) | | | 21,122 | | | | 289,371 | |
| | |
Big Lots, Inc. | | | 3,610 | | | | 78,228 | |
| | |
BJ’s Wholesale Club Holdings, Inc.* (a) | | | 10,847 | | | | 289,615 | |
| | |
Boot Barn Holdings, Inc.* | | | 4,656 | | | | 163,193 | |
| | |
Buckle, Inc. (The) (a) | | | 13,896 | | | | 290,704 | |
| | |
Caleres, Inc. | | | 5,309 | | | | 114,250 | |
| | |
Career Education Corp.* | | | 13,122 | | | | 185,808 | |
| | |
Cargurus, Inc.* (a) | | | 3,821 | | | | 128,347 | |
| | |
Carriage Services, Inc. | | | 2,305 | | | | 59,377 | |
| | |
Cars.com, Inc.* | | | 6,795 | | | | 76,852 | |
| | |
Cato Corp. (The), Class A | | | 6,710 | | | | 117,358 | |
| | |
Chegg, Inc.* (a) | | | 4,428 | | | | 135,763 | |
| | |
Chico’s FAS, Inc. | | | 10,841 | | | | 37,293 | |
| | |
Children’s Place, Inc. (The) (a) | | | 1,258 | | | | 103,043 | |
| | |
Citi Trends, Inc. | | | 3,676 | | | | 65,617 | |
| | |
Conn’s, Inc.* | | | 1,796 | | | | 43,445 | |
| | |
Designer Brands, Inc., Class A | | | 5,297 | | | | 87,400 | |
| | |
Dillard’s, Inc., Class A (a) | | | 4,614 | | | | 318,274 | |
| | |
Express, Inc.* (a) | | | 21,723 | | | | 69,948 | |
| | |
GameStop Corp., Class A (a) | | | 14,082 | | | | 76,606 | |
| | |
Genesco, Inc.* | | | 5,807 | | | | 225,602 | |
| | |
Group 1 Automotive, Inc. | | | 3,694 | | | | 367,331 | |
| | |
Guess?, Inc. (a) | | | 7,018 | | | | 117,552 | |
| | |
Haverty Furniture Cos., Inc. (a) | | | 6,717 | | | | 121,846 | |
| | |
Hibbett Sports, Inc.* (a) | | | 3,614 | | | | 86,230 | |
| | |
Hillenbrand, Inc. | | | 7,759 | | | | 238,900 | |
| | |
Houghton Mifflin Harcourt Co.* (a) | | | 917 | | | | 5,924 | |
| | |
K12, Inc.* | | | 7,124 | | | | 140,984 | |
| | |
Lands’ End, Inc.* (a) | | | 2,765 | | | | 33,374 | |
| | |
Laureate Education, Inc., Class A* (a) | | | 14,757 | | | | 228,069 | |
| | |
Liquidity Services, Inc.* | | | 1,556 | | | | 10,098 | |
| | |
Lithia Motors, Inc., Class A | | | 2,346 | | | | 369,448 | |
| | |
Lumber Liquidators Holdings, Inc.* | | | 1,331 | | | | 12,285 | |
| | | | | | | | |
| INVESTMENTS | | SHARES | | | VALUE($) | |
| | | | | | | | |
|
General Retailers — continued | |
| | |
Matthews International Corp., Class A (a) | | | 3,450 | | | | 127,581 | |
| | |
Monro, Inc. | | | 5,023 | | | | 352,163 | |
| | |
Murphy USA, Inc.* | | | 3,337 | | | | 393,532 | |
| | |
Office Depot, Inc. (a) | | | 97,823 | | | | 201,515 | |
| | |
Party City Holdco, Inc.* (a) | | | 7,341 | | | | 41,256 | |
| | |
PriceSmart, Inc. | | | 1,831 | | | | 135,677 | |
| | |
Regis Corp.* (a) | | | 5,982 | | | | 123,229 | |
| | |
Rent-A-Center, Inc. | | | 11,201 | | | | 289,770 | |
| | |
RH* (a) | | | 755 | | | | 137,184 | |
| | |
Sally Beauty Holdings, Inc.* | | | 17,370 | | | | 269,235 | |
| | |
Shoe Carnival, Inc. (a) | | | 10,168 | | | | 337,476 | |
| | |
Signet Jewelers Ltd. | | | 3,007 | | | | 48,232 | |
| | |
Sonic Automotive, Inc., Class A | | | 3,748 | | | | 120,798 | |
| | |
Stamps.com, Inc.* (a) | | | 673 | | | | 56,821 | |
| | |
Strategic Education, Inc. | | | 1,512 | | | | 186,021 | |
| | |
Tailored Brands, Inc. (a) | | | 2,979 | | | | 13,823 | |
| | |
Tile Shop Holdings, Inc. | | | 4,389 | | | | 7,374 | |
| | |
Titan Machinery, Inc.* | | | 4,400 | | | | 73,040 | |
| | |
WW International, Inc.* | | | 2,058 | | | | 71,762 | |
| | |
Zumiez, Inc.* | | | 15,656 | | | | 499,583 | |
| | | | | | | | |
| | |
| | | | | | | 9,723,718 | |
| | | | | | | | |
|
Health Care Equipment & Services — 5.8% | |
| | |
Accuray, Inc.* (a) | | | 9,320 | | | | 24,232 | |
| | |
Amedisys, Inc.* | | | 2,401 | | | | 308,577 | |
| | |
Anika Therapeutics, Inc.* (a) | | | 2,400 | | | | 168,936 | |
| | |
Atrion Corp. | | | 86 | | | | 72,535 | |
| | |
Avanos Medical, Inc.* (a) | | | 3,070 | | | | 135,203 | |
| | |
Axogen, Inc.* | | | 2,423 | | | | 30,130 | |
| | |
BioTelemetry, Inc.* (a) | | | 2,440 | | | | 96,039 | |
| | |
Brookdale Senior Living, Inc.* | | | 15,752 | | | | 115,777 | |
| | |
CONMED Corp. | | | 4,093 | | | | 450,312 | |
| | |
CorVel Corp.* | | | 1,024 | | | | 81,019 | |
| | |
Ensign Group, Inc. (The) | | | 5,424 | | | | 229,164 | |
| | |
Fluidigm Corp.* | | | 1,753 | | | | 8,625 | |
| | |
Genesis Healthcare, Inc.* (a) | | | 5,390 | | | | 6,899 | |
| | |
Globus Medical, Inc., Class A* | | | 3,219 | | | | 168,579 | |
| | |
Haemonetics Corp.* | | | 2,405 | | | | 290,356 | |
| | |
Healthcare Services Group, Inc. (a) | | | 4,125 | | | | 100,485 | |
| | |
HealthEquity, Inc.* | | | 1,739 | | | | 98,758 | |
| | |
HMS Holdings Corp.* | | | 8,812 | | | | 288,064 | |
| | |
Inogen, Inc.* | | | 514 | | | | 27,980 | |
| | |
Intersect ENT, Inc.* | | | 2,449 | | | | 43,641 | |
| | |
Invacare Corp. (a) | | | 10,094 | | | | 77,926 | |
| | |
iRhythm Technologies, Inc.* (a) | | | 1,045 | | | | 69,827 | |
| | |
Lantheus Holdings, Inc.* | | | 5,535 | | | | 115,405 | |
SEE NOTES TO FINANCIAL STATEMENTS.
| | | | | | | | |
| | | |
| OCTOBER 31, 2019 | | J.P. MORGAN EXCHANGE-TRADED FUNDS | | | | | 133 | |
JPMorgan Diversified Return U.S. Small Cap Equity ETF
SCHEDULE OF PORTFOLIO INVESTMENTS
AS OF OCTOBER 31, 2019 (continued)
| | | | | | | | |
| INVESTMENTS | | SHARES | | | VALUE($) | |
Common Stocks — continued | |
|
Health Care Equipment & Services — continued | |
| | |
LHC Group, Inc.* | | | 3,492 | | | | 387,507 | |
| | |
LivaNova plc* | | | 1,637 | | | | 115,785 | |
| | |
Magellan Health, Inc.* | | | 3,674 | | | | 238,443 | |
| | |
Meridian Bioscience, Inc. | | | 6,683 | | | | 65,427 | |
| | |
Merit Medical Systems, Inc.* | | | 6,637 | | | | 137,087 | |
| | |
Natus Medical, Inc.* (a) | | | 8,289 | | | | 279,173 | |
| | |
Neogen Corp.* (a) | | | 4,555 | | | | 296,348 | |
| | |
NeoGenomics, Inc.* | | | 12,401 | | | | 284,355 | |
| | |
NuVasive, Inc.* | | | 4,639 | | | | 327,235 | |
| | |
Omnicell, Inc.* | | | 5,744 | | | | 404,320 | |
| | |
Option Care Health, Inc.* (a) | | | 2,193 | | | | 7,763 | |
| | |
OraSure Technologies, Inc.* (a) | | | 6,775 | | | | 57,858 | |
| | |
Orthofix Medical, Inc.* | | | 2,133 | | | | 89,650 | |
| | |
Owens & Minor, Inc. | | | 7,078 | | | | 47,635 | |
| | |
Patterson Cos., Inc. (a) | | | 12,548 | | | | 214,947 | |
| | |
Pennant Group, Inc. (The)* (a) | | | 2,679 | | | | 48,195 | |
| | |
Quidel Corp.* | | | 6,275 | | | | 357,047 | |
| | |
Repligen Corp.* | | | 3,884 | | | | 308,739 | |
| | |
Select Medical Holdings Corp.* | | | 7,051 | | | | 128,469 | |
| | |
STAAR Surgical Co.* (a) | | | 2,186 | | | | 71,657 | |
| | |
Surmodics, Inc.* | | | 3,022 | | | | 143,575 | |
| | |
Tactile Systems Technology, Inc.* | | | 2,045 | | | | 92,884 | |
| | |
Teladoc Health, Inc.* (a) | | | 1,587 | | | | 121,564 | |
| | |
Tenet Healthcare Corp.* (a) | | | 3,274 | | | | 82,963 | |
| | |
Tivity Health, Inc.* | | | 22,421 | | | | 363,445 | |
| | |
US Physical Therapy, Inc. (a) | | | 1,177 | | | | 166,510 | |
| | |
Varex Imaging Corp.* | | | 4,264 | | | | 127,963 | |
| | |
Wright Medical Group NV* | | | 4,835 | | | | 100,568 | |
| | | | | | | | |
| | |
| | | | | | | 8,075,581 | |
| | | | | | | | |
|
Household Goods & Home Construction — 5.4% | |
| | |
ACCO Brands Corp. | | | 20,481 | | | | 187,401 | |
| | |
American Woodmark Corp.* | | | 3,126 | | | | 309,974 | |
| | |
Bassett Furniture Industries, Inc. | | | 3,032 | | | | 46,238 | |
| | |
Beazer Homes USA, Inc.* | | | 7,806 | | | | 117,168 | |
| | |
Central Garden & Pet Co., Class A* | | | 7,648 | | | | 216,285 | |
| | |
CompX International, Inc. | | | 1,217 | | | | 17,841 | |
| | |
Ethan Allen Interiors, Inc. | | | 16,003 | | | | 315,419 | |
| | |
Hamilton Beach Brands Holding Co., Class A | | | 3,252 | | | | 60,650 | |
| | |
Herman Miller, Inc. | | | 9,722 | | | | 452,073 | |
| | |
HNI Corp. | | | 9,210 | | | | 349,980 | |
| | |
Interface, Inc. | | | 24,460 | | | | 406,770 | |
| | |
iRobot Corp.* (a) | | | 2,040 | | | | 98,042 | |
| | |
KB Home | | | 12,482 | | | | 445,483 | |
| | |
Kimball International, Inc., Class B | | | 4,195 | | | | 85,410 | |
| | |
Knoll, Inc. | | | 12,738 | | | | 340,614 | |
| | | | | | | | |
| INVESTMENTS | | SHARES | | | VALUE($) | |
| | | | | | | | |
|
Household Goods & Home Construction — continued | |
| | |
La-Z-Boy, Inc. | | | 12,851 | | | | 456,339 | |
| | |
LGI Homes, Inc.* (a) | | | 3,567 | | | | 279,938 | |
| | |
M/I Homes, Inc.* | | | 10,685 | | | | 472,063 | |
| | |
MDC Holdings, Inc. | | | 10,598 | | | | 410,249 | |
| | |
Meritage Homes Corp.* | | | 6,289 | | | | 453,374 | |
| | |
National Presto Industries, Inc. | | | 1,298 | | | | 111,745 | |
| | |
Sleep Number Corp.* (a) | | | 6,532 | | | | 314,320 | |
| | |
Steelcase, Inc., Class A | | | 18,222 | | | | 318,338 | |
| | |
Taylor Morrison Home Corp.* | | | 11,552 | | | | 289,378 | |
| | |
TRI Pointe Group, Inc.* | | | 19,624 | | | | 308,882 | |
| | |
WD-40 Co. (a) | | | 2,412 | | | | 452,009 | |
| | |
William Lyon Homes, Class A* | | | 6,185 | | | | 119,680 | |
| | | | | | | | |
| | |
| | | | | | | 7,435,663 | |
| | | | | | | | |
|
Industrial Engineering — 1.8% | |
| | |
Albany International Corp., Class A | | | 3,196 | | | | 268,400 | |
| | |
Astec Industries, Inc. | | | 975 | | | | 34,213 | |
| | |
Briggs & Stratton Corp. | | | 13,780 | | | | 101,559 | |
| | |
CIRCOR International, Inc.* (a) | | | 1,340 | | | | 51,309 | |
| | |
Columbus McKinnon Corp. | | | 6,292 | | | | 236,076 | |
| | |
EnPro Industries, Inc. | | | 2,110 | | | | 146,750 | |
| | |
Federal Signal Corp. | | | 3,049 | | | | 98,910 | |
| | |
Franklin Electric Co., Inc. | | | 2,831 | | | | 152,449 | |
| | |
GATX Corp. | | | 1,698 | | | | 135,076 | |
| | |
John Bean Technologies Corp. | | | 891 | | | | 91,568 | |
| | |
Kennametal, Inc. | | | 2,595 | | | | 80,315 | |
| | |
Lindsay Corp. | | | 635 | | | | 59,950 | |
| | |
MSA Safety, Inc. | | | 2,014 | | | | 241,821 | |
| | |
Mueller Industries, Inc. | | | 4,446 | | | | 136,803 | |
| | |
Proto Labs, Inc.* (a) | | | 1,182 | | | | 114,619 | |
| | |
Rexnord Corp.* | | | 4,685 | | | | 132,539 | |
| | |
Standex International Corp. | | | 1,078 | | | | 81,691 | |
| | |
Tennant Co. (a) | | | 1,863 | | | | 144,252 | |
| | |
Wabash National Corp. | | | 5,982 | | | | 85,303 | |
| | | | | | | | |
| | |
| | | | | | | 2,393,603 | |
| | | | | | | | |
|
Industrial Metals & Mining — 1.4% | |
| | |
AK Steel Holding Corp.* (a) | | | 126,016 | | | | 297,398 | |
| | |
Carpenter Technology Corp. | | | 6,611 | | | | 324,071 | |
| | |
Century Aluminum Co.* | | | 6,405 | | | | 37,341 | |
| | |
Cleveland-Cliffs, Inc. (a) | | | 35,015 | | | | 253,158 | |
| | |
Commercial Metals Co. | | | 17,480 | | | | 337,888 | |
| | |
Haynes International, Inc. | | | 3,226 | | | | 111,168 | |
| | |
Kaiser Aluminum Corp. | | | 3,933 | | | | 421,146 | |
| | |
Olympic Steel, Inc. (a) | | | 2,575 | | | | 38,574 | |
| | |
Worthington Industries, Inc. | | | 7,891 | | | | 290,468 | |
| | | | | | | | |
| | |
| | | | | | | 2,111,212 | |
| | | | | | | | |
SEE NOTES TO FINANCIAL STATEMENTS.
| | | | | | |
| | | |
| 134 | | | | J.P. MORGAN EXCHANGE-TRADED FUNDS | | OCTOBER 31, 2019 |
| | | | | | | | |
| INVESTMENTS | | SHARES | | | VALUE($) | |
Common Stocks — continued | |
|
Industrial Transportation — 1.4% | |
| | |
Aircastle Ltd. | | | 6,122 | | | | 166,641 | |
| | |
ArcBest Corp. | | | 2,900 | | | | 83,781 | |
| | |
Atlas Air Worldwide Holdings, Inc.* | | | 1,530 | | | | 33,553 | |
| | |
Covenant Transportation Group, Inc., Class A* | | | 2,368 | | | | 36,396 | |
| | |
DHT Holdings, Inc. | | | 11,899 | | | | 91,979 | |
| | |
Echo Global Logistics, Inc.* | | | 3,484 | | | | 69,367 | |
| | |
Forward Air Corp. | | | 2,317 | | | | 160,267 | |
| | |
GasLog Ltd. (Monaco) | | | 3,649 | | | | 50,028 | |
| | |
Heartland Express, Inc. (a) | | | 4,997 | | | | 104,437 | |
| | |
Hub Group, Inc., Class A* | | | 2,608 | | | | 119,446 | |
| | |
Matson, Inc. | | | 2,272 | | | | 86,745 | |
| | |
Nordic American Tankers Ltd. (a) | | | 1,791 | | | | 6,412 | |
| | |
Saia, Inc.* | | | 1,833 | | | | 163,504 | |
| | |
Scorpio Tankers, Inc. (Monaco) | | | 975 | | | | 31,015 | |
| | |
SEACOR Holdings, Inc.* | | | 4,863 | | | | 208,671 | |
| | |
Ship Finance International Ltd. (Norway) (a) | | | 10,615 | | | | 153,599 | |
| | |
Triton International Ltd. (Bermuda) | | | 2,649 | | | | 97,218 | |
| | |
Werner Enterprises, Inc. | | | 4,919 | | | | 179,544 | |
| | |
World Fuel Services Corp. | | | 3,370 | | | | 140,765 | |
| | | | | | | | |
| | |
| | | | | | | 1,983,368 | |
| | | | | | | | |
|
Leisure Goods — 2.1% | |
| | |
American Outdoor Brands Corp.* (a) | | | 6,897 | | | | 48,831 | |
| | |
Callaway Golf Co. | | | 13,934 | | | | 281,745 | |
| | |
Fox Factory Holding Corp.* (a) | | | 9,214 | | | | 561,501 | |
| | |
Funko, Inc., Class A* | | | 4,118 | | | | 74,124 | |
| | |
LCI Industries | | | 4,812 | | | | 467,341 | |
| | |
Sturm Ruger & Co., Inc. (a) | | | 4,524 | | | | 207,018 | |
| | |
Universal Electronics, Inc.* | | | 4,911 | | | | 255,961 | |
| | |
Winnebago Industries, Inc. | | | 12,330 | | | | 592,703 | |
| | |
YETI Holdings, Inc.* (a) | | | 9,645 | | | | 321,275 | |
| | |
ZAGG, Inc.* (a) | | | 15,866 | | | | 116,932 | |
| | | | | | | | |
| | |
| | | | | | | 2,927,431 | |
| | | | | | | | |
|
Life Insurance — 0.2% | |
| | |
Employers Holdings, Inc. | | | 4,314 | | | | 182,655 | |
| | |
FBL Financial Group, Inc., Class A | | | 1,346 | | | | 77,233 | |
| | |
National Western Life Group, Inc., Class A | | | 190 | | | | 51,794 | |
| | | | | | | | |
| | |
| | | | | | | 311,682 | |
| | | | | | | | |
|
Media — 1.3% | |
| | |
Entercom Communications Corp., Class A (a) | | | 9,162 | | | | 31,884 | |
| | |
EW Scripps Co. (The), Class A (a) | | | 10,870 | | | | 146,038 | |
| | |
Gannett Co., Inc. | | | 11,579 | | | | 125,632 | |
| | |
Gray Television, Inc.* | | | 15,270 | | | | 250,581 | |
| | |
LiveRamp Holdings, Inc.* | | | 5,162 | | | | 201,783 | |
| | |
MDC Partners, Inc., Class A* (a) | | | 4,109 | | | | 12,861 | |
| | | | | | | | |
| INVESTMENTS | | SHARES | | | VALUE($) | |
| | | | | | | | |
|
Media — continued | |
| | |
Meredith Corp. | | | 5,109 | | | | 192,609 | |
| | |
MSG Networks, Inc., Class A* (a) | | | 12,651 | | | | 205,073 | |
| | |
QuinStreet, Inc.* | | | 5,812 | | | | 74,568 | |
| | |
Scholastic Corp. | | | 3,944 | | | | 151,844 | |
| | |
TEGNA, Inc. | | | 19,351 | | | | 290,846 | |
| | |
Viad Corp. | | | 3,341 | | | | 203,868 | |
| | |
Yelp, Inc.* | | | 3,757 | | | | 129,654 | |
| | | | | | | | |
| | |
| | | | | | | 2,017,241 | |
| | | | | | | | |
|
Mining — 1.7% | |
| | |
Arch Coal, Inc., Class A (a) | | | 3,598 | | | | 283,846 | |
| | |
Coeur Mining, Inc.* | | | 50,480 | | | | 278,650 | |
| | |
Compass Minerals International, Inc. (a) | | | 5,511 | | | | 311,261 | |
| | |
CONSOL Energy, Inc.* | | | 11,195 | | | | 148,110 | |
| | |
Contura Energy, Inc.* | | | 2,119 | | | | 48,610 | |
| | |
Hecla Mining Co. (a) | | | 153,916 | | | | 354,007 | |
| | |
Novagold Resources, Inc. (Canada)* | | | 37,280 | | | | 271,398 | |
| | |
Peabody Energy Corp. | | | 14,588 | | | | 153,612 | |
| | |
SunCoke Energy, Inc.* | | | 19,953 | | | | 105,551 | |
| | |
US Silica Holdings, Inc. (a) | | | 26,345 | | | | 117,499 | |
| | |
Warrior Met Coal, Inc. | | | 13,076 | | | | 254,720 | |
| | | | | | | | |
| | |
| | | | | | | 2,327,264 | |
| | | | | | | | |
|
Mobile Telecommunications — 0.7% | |
| | |
Intelsat SA* | | | 17,298 | | | | 439,196 | |
| | |
Iridium Communications, Inc.* | | | 17,396 | | | | 425,680 | |
| | |
Shenandoah Telecommunications Co. | | | 4,209 | | | | 135,361 | |
| | | | | | | | |
| | |
| | | | | | | 1,000,237 | |
| | | | | | | | |
|
Nonlife Insurance — 1.1% | |
| | |
Argo Group International Holdings Ltd. | | | 2,344 | | | | 145,023 | |
| | |
Horace Mann Educators Corp. | | | 2,269 | | | | 98,838 | |
| | |
James River Group Holdings Ltd. | | | 2,153 | | | | 77,099 | |
| | |
Kinsale Capital Group, Inc. | | | 1,194 | | | | 126,230 | |
| | |
ProAssurance Corp. (a) | | | 4,122 | | | | 161,665 | |
| | |
Protective Insurance Corp., Class B | | | 457 | | | | 7,271 | |
| | |
RLI Corp. (a) | | | 3,143 | | | | 305,877 | |
| | |
Safety Insurance Group, Inc. (a) | | | 1,663 | | | | 161,643 | |
| | |
Selective Insurance Group, Inc. | | | 5,223 | | | | 361,014 | |
| | |
State Auto Financial Corp. | | | 2,394 | | | | 79,217 | |
| | | | | | | | |
| | |
| | | | | | | 1,523,877 | |
| | | | | | | | |
|
Oil & Gas Producers — 2.7% | |
| | |
Abraxas Petroleum Corp.* | | | 17,498 | | | | 5,074 | |
| | |
Berry Petroleum Corp. | | | 16,179 | | | | 151,921 | |
| | |
Bonanza Creek Energy, Inc.* | | | 3,071 | | | | 54,725 | |
| | |
California Resources Corp.* (a) | | | 2,265 | | | | 12,661 | |
| | |
Callon Petroleum Co.* | | | 42,019 | | | | 159,672 | |
SEE NOTES TO FINANCIAL STATEMENTS.
| | | | | | | | |
| | | |
| OCTOBER 31, 2019 | | J.P. MORGAN EXCHANGE-TRADED FUNDS | | | | | 135 | |
JPMorgan Diversified Return U.S. Small Cap Equity ETF
SCHEDULE OF PORTFOLIO INVESTMENTS
AS OF OCTOBER 31, 2019 (continued)
| | | | | | | | |
| INVESTMENTS | | SHARES | | | VALUE($) | |
Common Stocks — continued | |
|
Oil & Gas Producers — continued | |
| | |
Carrizo Oil & Gas, Inc.* | | | 4,590 | | | | 33,782 | |
| | |
CVR Energy, Inc. (a) | | | 6,868 | | | | 325,681 | |
| | |
Delek US Holdings, Inc. | | | 8,741 | | | | 349,203 | |
| | |
Denbury Resources, Inc.* (a) | | | 254,121 | | | | 253,638 | |
| | |
Gulfport Energy Corp.* | | | 47,212 | | | | 131,485 | |
| | |
Jagged Peak Energy, Inc.* (a) | | | 14,806 | | | | 104,975 | |
| | |
Laredo Petroleum, Inc.* | | | 14,941 | | | | 35,261 | |
| | |
Magnolia Oil & Gas Corp., Class A* | | | 26,957 | | | | 264,718 | |
| | |
Matador Resources Co.* | | | 7,084 | | | | 98,538 | |
| | |
Northern Oil and Gas, Inc.* (a) | | | 148,021 | | | | 290,121 | |
| | |
Oasis Petroleum, Inc.* (a) | | | 19,657 | | | | 51,305 | |
| | |
Par Pacific Holdings, Inc.* (a) | | | 9,094 | | | | 205,979 | |
| | |
PDC Energy, Inc.* | | | 6,463 | | | | 128,937 | |
| | |
Penn Virginia Corp.* | | | 1,562 | | | | 37,176 | |
| | |
ProPetro Holding Corp.* | | | 25,179 | | | | 195,137 | |
| | |
QEP Resources, Inc. | | | 38,114 | | | | 126,920 | |
| | |
SM Energy Co. | | | 13,360 | | | | 104,742 | |
| | |
Southwestern Energy Co.* | | | 73,484 | | | | 150,642 | |
| | |
SRC Energy, Inc.* | | | 53,543 | | | | 167,054 | |
| | |
Talos Energy, Inc.* | | | 3,454 | | | | 74,365 | |
| | |
W&T Offshore, Inc.* | | | 62,645 | | | | 252,459 | |
| | |
Whiting Petroleum Corp.* (a) | | | 14,417 | | | | 91,404 | |
| | | | | | | | |
| | |
| | | | | | | 3,857,575 | |
| | | | | | | | |
|
Oil Equipment, Services & Distribution — 2.6% | |
| | |
Archrock, Inc. (a) | | | 28,382 | | | | 273,603 | |
| | |
Cactus, Inc., Class A* | | | 10,729 | | | | 318,866 | |
| | |
Chart Industries, Inc.* | | | 3,561 | | | | 208,781 | |
| | |
Covia Holdings Corp.* (a) | | | 4,610 | | | | 6,362 | |
| | |
Diamond Offshore Drilling, Inc.* (a) | | | 10,493 | | | | 55,508 | |
| | |
Dril-Quip, Inc.* | | | 5,980 | | | | 245,300 | |
| | |
Flotek Industries, Inc.* | | | 5,062 | | | | 9,668 | |
| | |
Forum Energy Technologies, Inc.* | | | 4,946 | | | | 5,737 | |
| | |
Geospace Technologies Corp.* | | | 1,213 | | | | 17,698 | |
| | |
Golar LNG Ltd. (Bermuda) | | | 14,538 | | | | 200,188 | |
| | |
Helix Energy Solutions Group, Inc.* | | | 37,672 | | | | 323,602 | |
| | |
KLX Energy Services Holdings, Inc.* | | | 820 | | | | 6,511 | |
| | |
Liberty Oilfield Services, Inc., Class A (a) | | | 21,360 | | | | 196,726 | |
| | |
Matrix Service Co.* | | | 6,445 | | | | 120,908 | |
| | |
McDermott International, Inc.* (a) | | | 6,834 | | | | 11,139 | |
| | |
MRC Global, Inc.* | | | 17,628 | | | | 200,254 | |
| | |
Nabors Industries Ltd. (a) | | | 110,450 | | | | 204,333 | |
| | |
Newpark Resources, Inc.* (a) | | | 14,704 | | | | 88,224 | |
| | |
NexTier Oilfield Solutions, Inc.* (a) | | | 19,078 | | | | 82,415 | |
| | |
Noble Corp. plc* | | | 29,754 | | | | 36,597 | |
| | |
NOW, Inc.* | | | 23,257 | | | | 245,129 | |
| | | | | | | | |
| INVESTMENTS | | SHARES | | | VALUE($) | |
| | | | | | | | |
|
Oil Equipment, Services & Distribution — continued | |
| | |
Oceaneering International, Inc.* | | | 16,304 | | | | 230,865 | |
| | |
Oil States International, Inc.* (a) | | | 13,795 | | | | 196,855 | |
| | |
RPC, Inc. (a) | | | 19,181 | | | | 79,409 | |
| | |
SemGroup Corp., Class A | | | 7,252 | | | | 116,757 | |
| | |
Solaris Oilfield Infrastructure, Inc., Class A (a) | | | 13,482 | | | | 143,448 | |
| | |
Teekay Tankers Ltd., Class A (Bermuda)* | | | 48,806 | | | | 99,564 | |
| | |
TETRA Technologies, Inc.* | | | 6,807 | | | | 11,572 | |
| | |
Tidewater, Inc.* | | | 3,036 | | | | 49,274 | |
| | |
Unit Corp.* | | | 5,615 | | | | 11,455 | |
| | | | | | | | |
| | |
| | | | | | | 3,796,748 | |
| | | | | | | | |
|
Personal Goods — 1.9% | |
| | |
Crocs, Inc.* | | | 12,328 | | | | 431,357 | |
| | |
Deckers Outdoor Corp.* | | | 2,656 | | | | 406,102 | |
| | |
elf Beauty, Inc.* | | | 8,929 | | | | 150,007 | |
| | |
Helen of Troy Ltd.* | | | 2,698 | | | | 404,052 | |
| | |
Inter Parfums, Inc. | | | 1,259 | | | | 97,484 | |
| | |
Movado Group, Inc. | | | 1,816 | | | | 47,307 | |
| | |
Oxford Industries, Inc. | | | 4,374 | | | | 301,194 | |
| | |
Steven Madden Ltd. | | | 12,392 | | | | 510,302 | |
| | |
Vera Bradley, Inc.* | | | 27,607 | | | | 297,051 | |
| | | | | | | | |
| | |
| | | | | | | 2,644,856 | |
| | | | | | | | |
|
Pharmaceuticals & Biotechnology — 3.7% | |
| | |
Acceleron Pharma, Inc.* | | | 2,652 | | | | 118,995 | |
| | |
Achillion Pharmaceuticals, Inc.* | | | 9,683 | | | | 62,068 | |
| | |
Acorda Therapeutics, Inc.* | | | 3,799 | | | | 6,268 | |
| | |
AMAG Pharmaceuticals, Inc.* (a) | | | 1,191 | | | | 11,559 | |
| | |
Amneal Pharmaceuticals, Inc.* | | | 3,033 | | | | 9,342 | |
| | |
ANI Pharmaceuticals, Inc.* | | | 3,335 | | | | 260,497 | |
| | |
Arena Pharmaceuticals, Inc.* | | | 4,977 | | | | 242,455 | |
| | |
Arrowhead Pharmaceuticals, Inc.* | | | 11,236 | | | | 450,002 | |
| | |
Assertio Therapeutics, Inc.* (a) | | | 2,581 | | | | 2,039 | |
| | |
Blueprint Medicines Corp.* | | | 1,488 | | | | 102,434 | |
| | |
Cambrex Corp.* | | | 2,474 | | | | 147,772 | |
| | |
Chimerix, Inc.* | | | 2,022 | | | | 2,891 | |
| | |
Corcept Therapeutics, Inc.* (a) | | | 5,886 | | | | 85,877 | |
| | |
Cyclerion Therapeutics, Inc.* | | | 566 | | | | 1,353 | |
| | |
Dynavax Technologies Corp.* (a) | | | 1,834 | | | | 9,335 | |
| | |
Eagle Pharmaceuticals, Inc.* | | | 1,546 | | | | 96,934 | |
| | |
Emergent BioSolutions, Inc.* (a) | | | 2,121 | | | | 121,236 | |
| | |
Enanta Pharmaceuticals, Inc.* (a) | | | 1,533 | | | | 93,329 | |
| | |
FibroGen, Inc.* | | | 2,239 | | | | 87,657 | |
| | |
Five Prime Therapeutics, Inc.* | | | 1,655 | | | | 6,537 | |
| | |
Genomic Health, Inc.* | | | 5,112 | | | | 340,868 | |
| | |
Halozyme Therapeutics, Inc.* | | | 4,786 | | | | 73,322 | |
| | |
Heron Therapeutics, Inc.* (a) | | | 3,384 | | | | 71,910 | |
SEE NOTES TO FINANCIAL STATEMENTS.
| | | | | | |
| | | |
| 136 | | | | J.P. MORGAN EXCHANGE-TRADED FUNDS | | OCTOBER 31, 2019 |
| | | | | | | | |
| INVESTMENTS | | SHARES | | | VALUE($) | |
Common Stocks — continued | |
|
Pharmaceuticals & Biotechnology — continued | |
| | |
ImmunoGen, Inc.* | | | 2,701 | | | | 6,428 | |
| | |
Innoviva, Inc.* | | | 8,440 | | | | 98,073 | |
| | |
Inovio Pharmaceuticals, Inc.* (a) | | | 9,596 | | | | 20,440 | |
| | |
Ironwood Pharmaceuticals, Inc.* (a) | | | 7,053 | | | | 70,812 | |
| | |
Lannett Co., Inc.* | | | 2,219 | | | | 26,384 | |
| | |
Lexicon Pharmaceuticals, Inc.* | | | 6,028 | | | | 22,364 | |
| | |
Ligand Pharmaceuticals, Inc.* (a) | | | 866 | | | | 94,229 | |
| | |
Luminex Corp. | | | 8,001 | | | | 163,980 | |
| | |
Mallinckrodt plc* (a) | | | 2,527 | | | | 7,985 | |
| | |
Medpace Holdings, Inc.* (a) | | | 4,933 | | | | 363,217 | |
| | |
Momenta Pharmaceuticals, Inc.* | | | 4,154 | | | | 64,304 | |
| | |
MyoKardia, Inc.* (a) | | | 1,821 | | | | 104,398 | |
| | |
Myriad Genetics, Inc.* (a) | | | 3,999 | | | | 134,646 | |
| | |
Novavax, Inc.* | | | 305 | | | | 1,272 | |
| | |
Novocure Ltd.* (a) | | | 4,655 | | | | 333,484 | |
| | |
Pacira BioSciences, Inc.* (a) | | | 6,035 | | | | 244,357 | |
| | |
Paratek Pharmaceuticals, Inc.* | | | 2,853 | | | | 8,801 | |
| | |
PDL BioPharma, Inc.* (a) | | | 20,457 | | | | 57,689 | |
| | |
PetIQ, Inc.* (a) | | | 2,936 | | | | 72,578 | |
| | |
Prestige Consumer Healthcare, Inc.* | | | 3,022 | | | | 107,160 | |
| | |
PTC Therapeutics, Inc.* | | | 2,927 | | | | 119,685 | |
| | |
Retrophin, Inc.* (a) | | | 4,849 | | | | 58,188 | |
| | |
Sangamo Therapeutics, Inc.* (a) | | | 2,436 | | | | 22,046 | |
| | |
Spark Therapeutics, Inc.* | | | 486 | | | | 53,057 | |
| | |
Spectrum Pharmaceuticals, Inc.* | | | 4,470 | | | | 34,687 | |
| | |
Supernus Pharmaceuticals, Inc.* (a) | | | 2,277 | | | | 63,278 | |
| | |
Syneos Health, Inc.* | | | 2,300 | | | | 115,345 | |
| | |
Theravance Biopharma, Inc.* (a) | | | 2,967 | | | | 47,828 | |
| | |
Vanda Pharmaceuticals, Inc.* | | | 6,182 | | | | 83,519 | |
| | |
Xencor, Inc.* | | | 2,368 | | | | 81,009 | |
| | |
Zogenix, Inc.* (a) | | | 2,407 | | | | 107,473 | |
| | | | | | | | |
| | |
| | | | | | | 5,193,396 | |
| | | | | | | | |
|
Real Estate Investment & Services — 0.2% | |
| | |
Kennedy-Wilson Holdings, Inc. | | | 8,551 | | | | 196,758 | |
| | |
Rafael Holdings, Inc., Class B* | | | 4,161 | | | | 72,277 | |
| | | | | | | | |
| | |
| | | | | | | 269,035 | |
| | | | | | | | |
|
Real Estate Investment Trusts — 7.6% | |
| | |
Acadia Realty Trust | | | 8,410 | | | | 235,312 | |
| | |
AG Mortgage Investment Trust, Inc. | | | 2,766 | | | | 43,260 | |
| | |
Agree Realty Corp. (a) | | �� | 4,008 | | | | 315,710 | |
| | |
American Assets Trust, Inc. | | | 5,813 | | | | 284,605 | |
| | |
Anworth Mortgage Asset Corp. | | | 15,677 | | | | 53,615 | |
| | |
Apollo Commercial Real Estate Finance, Inc. (a) | | | 14,755 | | | | 270,017 | |
| | |
ARMOUR Residential REIT, Inc. | | | 5,021 | | | | 84,001 | |
| | |
Blackstone Mortgage Trust, Inc., Class A (a) | | | 7,709 | | | | 279,837 | |
| | | | | | | | |
| INVESTMENTS | | SHARES | | | VALUE($) | |
| | | | | | | | |
|
Real Estate Investment Trusts — continued | |
| | |
Capstead Mortgage Corp. | | | 17,473 | | | | 135,066 | |
| | |
CareTrust REIT, Inc. | | | 10,841 | | | | 262,786 | |
| | |
Community Healthcare Trust, Inc. | | | 1,764 | | | | 85,413 | |
| | |
CoreCivic, Inc. | | | 5,952 | | | | 90,828 | |
| | |
CorePoint Lodging, Inc. | | | 1,890 | | | | 18,617 | |
| | |
DiamondRock Hospitality Co. | | | 4,567 | | | | 45,579 | |
| | |
EastGroup Properties, Inc. | | | 2,438 | | | | 326,570 | |
| | |
Essential Properties Realty Trust, Inc. | | | 6,735 | | | | 172,820 | |
| | |
Exantas Capital Corp. | | | 4,620 | | | | 54,331 | |
| | |
First Industrial Realty Trust, Inc. | | | 7,811 | | | | 328,921 | |
| | |
Four Corners Property Trust, Inc. | | | 8,356 | | | | 239,399 | |
| | |
Franklin Street Properties Corp. | | | 4,986 | | | | 42,880 | |
| | |
GEO Group, Inc. (The) | | | 3,375 | | | | 51,368 | |
| | |
Global Net Lease, Inc. | | | 12,991 | | | | 253,065 | |
| | |
Granite Point Mortgage Trust, Inc. (a) | | | 6,209 | | | | 115,487 | |
| | |
Hannon Armstrong Sustainable Infrastructure Capital,
Inc. (a) | | | 5,104 | | | | 152,405 | |
| | |
Healthcare Realty Trust, Inc. | | | 8,469 | | | | 294,467 | |
| | |
Innovative Industrial Properties, Inc. | | | 3,124 | | | | 237,424 | |
| | |
Invesco Mortgage Capital, Inc. | | | 17,133 | | | | 269,674 | |
| | |
Kite Realty Group Trust | | | 6,972 | | | | 124,241 | |
| | |
Ladder Capital Corp. | | | 15,730 | | | | 271,657 | |
| | |
Lexington Realty Trust (a) | | | 25,655 | | | | 279,126 | |
| | |
LTC Properties, Inc. | | | 5,888 | | | | 305,293 | |
| | |
Mack-Cali Realty Corp. | | | 5,372 | | | | 115,068 | |
| | |
National Health Investors, Inc. | | | 3,432 | | | | 294,431 | |
| | |
National Storage Affiliates Trust | | | 3,678 | | | | 125,677 | |
| | |
New York Mortgage Trust, Inc. (a) | | | 44,901 | | | | 281,080 | |
| | |
Office Properties Income Trust (a) | | | 1,576 | | | | 50,243 | |
| | |
Pebblebrook Hotel Trust | | | 2,819 | | | | 72,477 | |
| | |
Pennsylvania REIT (a) | | | 2,244 | | | | 12,387 | |
| | |
PennyMac Mortgage Investment Trust | | | 12,653 | | | | 289,627 | |
| | |
Physicians Realty Trust (a) | | | 14,860 | | | | 277,436 | |
| | |
Piedmont Office Realty Trust, Inc., Class A | | | 13,294 | | | | 298,317 | |
| | |
PotlatchDeltic Corp. | | | 2,009 | | | | 85,322 | |
| | |
PS Business Parks, Inc. | | | 1,673 | | | | 302,060 | |
| | |
QTS Realty Trust, Inc., Class A (a) | | | 2,835 | | | | 151,928 | |
| | |
Redwood Trust, Inc. | | | 12,211 | | | | 199,528 | |
| | |
Retail Opportunity Investments Corp. | | | 6,845 | | | | 127,762 | |
| | |
Rexford Industrial Realty, Inc. | | | 7,155 | | | | 344,084 | |
| | |
RLJ Lodging Trust | | | 4,801 | | | | 78,784 | |
| | |
RPT Realty (a) | | | 10,381 | | | | 150,525 | |
| | |
Ryman Hospitality Properties, Inc. (a) | | | 1,332 | | | | 112,114 | |
| | |
Sabra Health Care REIT, Inc. | | | 13,978 | | | | 343,859 | |
| | |
Saul Centers, Inc. | | | 1,821 | | | | 97,496 | |
| | |
STAG Industrial, Inc. | | | 9,333 | | | | 289,696 | |
SEE NOTES TO FINANCIAL STATEMENTS.
| | | | | | | | |
| | | |
| OCTOBER 31, 2019 | | J.P. MORGAN EXCHANGE-TRADED FUNDS | | | | | 137 | |
JPMorgan Diversified Return U.S. Small Cap Equity ETF
SCHEDULE OF PORTFOLIO INVESTMENTS
AS OF OCTOBER 31, 2019 (continued)
| | | | | | | | |
| INVESTMENTS | | SHARES | | | VALUE($) | |
Common Stocks — continued | |
|
Real Estate Investment Trusts — continued | |
| | |
Summit Hotel Properties, Inc. | | | 5,109 | | | | 62,636 | |
| | |
Sunstone Hotel Investors, Inc. | | | 3,092 | | | | 41,773 | |
| | |
Tanger Factory Outlet Centers, Inc. (a) | | | 4,424 | | | | 71,315 | |
| | |
Terreno Realty Corp. | | | 5,874 | | | | 331,352 | |
| | |
Urban Edge Properties | | | 618 | | | | 13,046 | |
| | |
Washington | | | 3,210 | | | | 99,574 | |
| | |
Western Asset Mortgage Capital Corp. | | | 11,461 | | | | 115,069 | |
| | |
Xenia Hotels & Resorts, Inc. (a) | | | 4,311 | | | | 90,747 | |
| | | | | | | | |
| | |
| | | | | | | 10,649,187 | |
| | | | | | | | |
|
Software & Computer Services — 5.8% | |
| | |
ACI Worldwide, Inc.* | | | 12,785 | | | | 401,321 | |
| | |
Alarm.com Holdings, Inc.* (a) | | | 4,530 | | | | 223,782 | |
| | |
Appfolio, Inc., Class A* (a) | | | 2,789 | | | | 271,175 | |
| | |
Avaya Holdings Corp.* | | | 9,656 | | | | 116,741 | |
| | |
Blackbaud, Inc. | | | 2,060 | | | | 172,937 | |
| | |
Blackline, Inc.* (a) | | | 2,906 | | | | 135,826 | |
| | |
Blucora, Inc.* (a) | | | 6,493 | | | | 140,444 | |
| | |
Bottomline Technologies DE, Inc.* (a) | | | 2,847 | | | | 116,585 | |
| | |
Carbonite, Inc.* (a) | | | 3,452 | | | | 59,271 | |
| | |
Cogent Communications Holdings, Inc. (a) | | | 4,906 | | | | 287,688 | |
| | |
CommVault Systems, Inc.* | | | 3,822 | | | | 189,839 | |
| | |
Computer Programs & Systems, Inc. | | | 1,851 | | | | 42,703 | |
| | |
CSG Systems International, Inc. (a) | | | 5,863 | | | | 337,943 | |
| | |
Diebold Nixdorf, Inc.* | | | 4,681 | | | | 32,767 | |
| | |
Ebix, Inc. (a) | | | 3,449 | | | | 147,031 | |
| | |
Envestnet, Inc.* (a) | | | 4,070 | | | | 254,334 | |
| | |
Everbridge, Inc.* | | | 2,379 | | | | 165,364 | |
| | |
Five9, Inc.* (a) | | | 3,355 | | | | 186,236 | |
| | |
Forrester Research, Inc. | | | 3,302 | | | | 113,853 | |
| | |
Gogo, Inc.* (a) | | | 8,763 | | | | 53,893 | |
| | |
Intelligent Systems Corp.* | | | 2,425 | | | | 109,537 | |
| | |
j2 Global, Inc. (a) | | | 3,210 | | | | 304,822 | |
| | |
LivePerson, Inc.* (a) | | | 6,700 | | | | 275,035 | |
| | |
Meet Group, Inc. (The)* | | | 38,687 | | | | 164,807 | |
| | |
MicroStrategy, Inc., Class A* (a) | | | 1,139 | | | | 174,552 | |
| | |
NetScout Systems, Inc.* | | | 3,229 | | | | 78,206 | |
| | |
NextGen Healthcare, Inc.* | | | 5,868 | | | | 99,198 | |
| | |
NIC, Inc. | | | 4,262 | | | | 100,242 | |
| | |
OneSpan, Inc.* | | | 4,455 | | | | 83,353 | |
| | |
Perficient, Inc.* | | | 8,514 | | | | 333,749 | |
| | |
Perspecta, Inc. | | | 9,602 | | | | 254,837 | |
| | |
Progress Software Corp. | | | 7,362 | | | | 293,597 | |
| | |
PROS Holdings, Inc.* | | | 4,709 | | | | 241,289 | |
| | |
Q2 Holdings, Inc.* (a) | | | 2,462 | | | | 176,008 | |
| | |
Qualys, Inc.* (a) | | | 4,513 | | | | 385,094 | |
| | | | | | | | |
| INVESTMENTS | | SHARES | | | VALUE($) | |
| | | | | | | | |
|
Software & Computer Services — continued | |
| | |
Rosetta Stone, Inc.* | | | 4,865 | | | | 93,213 | |
| | |
SailPoint Technologies Holding, Inc.* | | | 4,077 | | | | 78,931 | |
| | |
Science Applications International Corp. | | | 2,835 | | | | 234,228 | |
| | |
Shutterstock, Inc.* (a) | | | 3,969 | | | | 161,062 | |
| | |
SPS Commerce, Inc.* | | | 5,215 | | | | 275,196 | |
| | |
Tabula Rasa HealthCare, Inc.* | | | 490 | | | | 24,961 | |
| | |
TiVo Corp. | | | 5,573 | | | | 45,364 | |
| | |
Unisys Corp.* | | | 10,626 | | | | 109,023 | |
| | |
Varonis Systems, Inc.* | | | 2,204 | | | | 157,696 | |
| | |
Verint Systems, Inc.* (a) | | | 4,680 | | | | 212,425 | |
| | |
Virtusa Corp.* | | | 2,937 | | | | 109,491 | |
| | |
Workiva, Inc.* (a) | | | 4,747 | | | | 197,808 | |
| | | | | | | | |
| | |
| | | | | | | 8,223,457 | |
| | | | | | | | |
|
Support Services — 3.4% | |
| | |
ABM Industries, Inc. | | | 3,951 | | | | 144,053 | |
| | |
AMN Healthcare Services, Inc.* | | | 1,632 | | | | 95,896 | |
| | |
Applied Industrial Technologies, Inc. | | | 7,348 | | | | 439,704 | |
| | |
ASGN, Inc.* | | | 2,368 | | | | 150,581 | |
| | |
Barnes Group, Inc. (a) | | | 2,264 | | | | 132,331 | |
| | |
Cimpress NV (Netherlands)* (a) | | | 864 | | | | 114,152 | |
| | |
Comfort Systems USA, Inc. | | | 4,319 | | | | 217,721 | |
| | |
Covanta Holding Corp. (a) | | | 8,665 | | | | 125,123 | |
| | |
CRA International, Inc. | | | 2,068 | | | | 101,849 | |
| | |
Deluxe Corp. | | | 1,902 | | | | 98,581 | |
| | |
DXP Enterprises, Inc.* | | | 878 | | | | 30,308 | |
| | |
EVERTEC, Inc. (Puerto Rico) (a) | | | 4,354 | | | | 133,189 | |
| | |
ExlService Holdings, Inc.* | | | 1,762 | | | | 122,688 | |
| | |
Exponent, Inc. | | | 1,775 | | | | 112,766 | |
| | |
FTI Consulting, Inc.* | | | 2,365 | | | | 257,477 | |
| | |
Heidrick & Struggles International, Inc. | | | 1,060 | | | | 30,168 | |
| | |
Huron Consulting Group, Inc.* | | | 1,292 | | | | 85,453 | |
| | |
Insperity, Inc. | | | 1,213 | | | | 128,129 | |
| | |
Kaman Corp. | | | 3,461 | | | | 203,057 | |
| | |
Kelly Services, Inc., Class A | | | 1,658 | | | | 39,808 | |
| | |
Korn Ferry | | | 1,556 | | | | 57,090 | |
| | |
Lawson Products, Inc.* | | | 1,247 | | | | 57,300 | |
| | |
MAXIMUS, Inc. | | | 5,415 | | | | 415,547 | |
| | |
McGrath RentCorp | | | 2,249 | | | | 171,621 | |
| | |
Mobile Mini, Inc. | | | 648 | | | | 24,378 | |
| | |
Resources Connection, Inc. | | | 2,497 | | | | 36,581 | |
| | |
SiteOne Landscape Supply, Inc.* (a) | | | 2,283 | | | | 201,041 | |
| | |
Sykes Enterprises, Inc.* | | | 1,425 | | | | 44,025 | |
| | |
Team, Inc.* (a) | | | 1,695 | | | | 30,781 | |
| | |
Tetra Tech, Inc. | | | 3,969 | | | | 347,168 | |
| | |
TriNet Group, Inc.* | | | 2,409 | | | | 127,653 | |
SEE NOTES TO FINANCIAL STATEMENTS.
| | | | | | |
| | | |
| 138 | | | | J.P. MORGAN EXCHANGE-TRADED FUNDS | | OCTOBER 31, 2019 |
| | | | | | | | |
| INVESTMENTS | | SHARES | | | VALUE($) | |
Common Stocks — continued | |
|
Support Services — continued | |
| | |
TrueBlue, Inc.* | | | 911 | | | | 20,862 | |
| | |
TTEC Holdings, Inc. | | | 3,535 | | | | 167,453 | |
| | |
UniFirst Corp. | | | 1,822 | | | | 365,931 | |
| | | | | | | | |
| | |
| | | | | | | 4,830,465 | |
| | | | | | | | |
|
Technology Hardware & Equipment — 5.9% | |
| | |
Acacia Communications, Inc.* | | | 5,715 | | | | 375,247 | |
| | |
ADTRAN, Inc. | | | 13,820 | | | | 121,754 | |
| | |
Advanced Energy Industries, Inc.* (a) | | | 2,419 | | | | 142,963 | |
| | |
Agilysys, Inc.* (a) | | | 4,007 | | | | 100,936 | |
| | |
Amkor Technology, Inc.* (a) | | | 11,431 | | | | 142,087 | |
| | |
Axcelis Technologies, Inc.* | | | 3,426 | | | | 65,676 | |
| | |
Brooks Automation, Inc. | | | 4,318 | | | | 183,386 | |
| | |
Cabot Microelectronics Corp. | | | 3,311 | | | | 500,358 | |
| | |
Casa Systems, Inc.* | | | 2,462 | | | | 16,545 | |
| | |
CEVA, Inc.* | | | 2,670 | | | | 72,677 | |
| | |
Cirrus Logic, Inc.* | | | 7,171 | | | | 487,341 | |
| | |
Cohu, Inc. | | | 4,197 | | | | 69,754 | |
| | |
Comtech Telecommunications Corp. | | | 4,470 | | | | 156,227 | |
| | |
Diodes, Inc.* | | | 8,622 | | | | 402,216 | |
| | |
DSP Group, Inc.* | | | 2,265 | | | | 33,771 | |
| | |
FormFactor, Inc.* | | | 4,682 | | | | 102,208 | |
| | |
Harmonic, Inc.* | | | 12,171 | | | | 94,690 | |
| | |
Ichor Holdings Ltd.* (a) | | | 7,583 | | | | 220,741 | |
| | |
Inphi Corp.* | | | 6,102 | | | | 438,612 | |
| | |
Inseego Corp.* (a) | | | 33,471 | | | | 191,789 | |
| | |
Insight Enterprises, Inc.* | | | 5,694 | | | | 349,498 | |
| | |
InterDigital, Inc. | | | 2,190 | | | | 117,450 | |
| | |
Lattice Semiconductor Corp.* | | | 20,853 | | | | 408,510 | |
| | |
Loral Space & Communications, Inc.* | | | 2,465 | | | | 98,575 | |
| | |
Lumentum Holdings, Inc.* (a) | | | 1,641 | | | | 102,825 | |
| | |
MaxLinear, Inc.* | | | 7,468 | | | | 141,593 | |
| | |
NeoPhotonics Corp.* | | | 6,799 | | | | 44,737 | |
| | |
NETGEAR, Inc.* | | | 2,208 | | | | 59,991 | |
| | |
Onto Innovation, Inc.* | | | 5,880 | | | | 189,336 | |
| | |
PC Connection, Inc. | | | 2,706 | | | | 132,161 | |
| | |
Photronics, Inc.* | | | 6,491 | | | | 76,594 | |
| | |
Pitney Bowes, Inc. | | | 16,630 | | | | 73,172 | |
| | |
Plantronics, Inc. | | | 2,847 | | | | 112,229 | |
| | |
Power Integrations, Inc. | | | 2,372 | | | | 216,113 | |
| | |
Rambus, Inc.* | | | 9,119 | | | | 126,253 | |
| | |
Ribbon Communications, Inc.* | | | 1,005 | | | | 4,311 | |
| | |
ScanSource, Inc.* | | | 2,621 | | | | 84,658 | |
| | |
Semtech Corp.* | | | 3,181 | | | | 160,513 | |
| | |
Silicon Laboratories, Inc.* | | | 2,016 | | | | 214,180 | |
| | |
SMART Global Holdings, Inc.* | | | 2,815 | | | | 83,606 | |
| | | | | | | | |
| INVESTMENTS | | SHARES | | | VALUE($) | |
| | | | | | | | |
|
Technology Hardware & Equipment — continued | |
| | |
Stratasys Ltd.* (a) | | | 10,708 | | | | 221,441 | |
| | |
Synaptics, Inc.* | | | 3,626 | | | | 152,691 | |
| | |
Systemax, Inc. | | | 1,526 | | | | 33,023 | |
| | |
Tech Data Corp.* | | | 2,966 | | | | 360,369 | |
| | |
Ultra Clean Holdings, Inc.* | | | 3,805 | | | | 81,313 | |
| | |
Viavi Solutions, Inc.* | | | 22,247 | | | | 355,062 | |
| | |
Vocera Communications, Inc.* | | | 2,654 | | | | 52,868 | |
| | |
Xperi Corp. | | | 12,127 | | | | 246,239 | |
| | | | | | | | |
| | |
| | | | | | | 8,218,289 | |
| | | | | | | | |
|
Tobacco — 0.6% | |
| | |
Universal Corp. | | | 7,054 | | | | 386,559 | |
| | |
Vector Group Ltd. (a) | | | 36,757 | | | | 448,436 | |
| | | | | | | | |
| | |
| | | | | | | 834,995 | |
| | | | | | | | |
|
Travel & Leisure — 4.5% | |
| | |
Allegiant Travel Co. | | | 789 | | | | 132,023 | |
| | |
AMC Entertainment Holdings, Inc., Class A (a) | | | 12,204 | | | | 114,352 | |
| | |
Avis Budget Group, Inc.* | | | 2,990 | | | | 88,833 | |
| | |
Biglari Holdings, Inc., Class B* | | | 124 | | | | 10,351 | |
| | |
BJ’s Restaurants, Inc. (a) | | | 2,849 | | | | 112,792 | |
| | |
Bloomin’ Brands, Inc. | | | 15,285 | | | | 302,796 | |
| | |
Boyd Gaming Corp. | | | 6,315 | | | | 172,084 | |
| | |
Brinker International, Inc. (a) | | | 4,722 | | | | 209,893 | |
| | |
Cheesecake Factory, Inc. (The) (a) | | | 6,089 | | | | 254,459 | |
| | |
Churchill Downs, Inc. | | | 3,021 | | | | 392,700 | |
| | |
Chuy’s Holdings, Inc.* | | | 2,582 | | | | 62,923 | |
| | |
Cracker Barrel Old Country Store, Inc. (a) | | | 1,713 | | | | 266,371 | |
| | |
Dave & Buster’s Entertainment, Inc. (a) | | | 5,390 | | | | 214,414 | |
| | |
Denny’s Corp.* | | | 10,741 | | | | 216,109 | |
| | |
Dine Brands Global, Inc. | | | 2,832 | | | | 207,161 | |
| | |
El Pollo Loco Holdings, Inc.* | | | 7,040 | | | | 81,805 | |
| | |
Eldorado Resorts, Inc.* (a) | | | 3,167 | | | | 141,787 | |
| | |
Fiesta Restaurant Group, Inc.* | | | 2,044 | | | | 17,568 | |
| | |
Hawaiian Holdings, Inc. | | | 2,858 | | | | 81,768 | |
| | |
Hertz Global Holdings, Inc.* | | | 6,814 | | | | 92,057 | |
| | |
IMAX Corp.* | | | 5,298 | | | | 113,112 | |
| | |
Jack in the Box, Inc. | | | 3,256 | | | | 273,569 | |
| | |
Marcus Corp. (The) | | | 4,031 | | | | 145,519 | |
| | |
Marriott Vacations Worldwide Corp. | | | 2,252 | | | | 247,562 | |
| | |
Noodles & Co.* (a) | | | 2,736 | | | | 14,583 | |
| | |
Penn National Gaming, Inc.* | | | 8,335 | | | | 177,661 | |
| | |
Red Robin Gourmet Burgers, Inc.* (a) | | | 6,200 | | | | 189,100 | |
| | |
Red Rock Resorts, Inc., Class A | | | 5,413 | | | | 117,895 | |
| | |
Ruth’s Hospitality Group, Inc. | | | 7,077 | | | | 145,645 | |
| | |
SeaWorld Entertainment, Inc.* (a) | | | 8,235 | | | | 217,569 | |
| | |
Shake Shack, Inc., Class A* (a) | | | 3,268 | | | | 268,891 | |
SEE NOTES TO FINANCIAL STATEMENTS.
| | | | | | | | |
| | | |
| OCTOBER 31, 2019 | | J.P. MORGAN EXCHANGE-TRADED FUNDS | | | | | 139 | |
JPMorgan Diversified Return U.S. Small Cap Equity ETF
SCHEDULE OF PORTFOLIO INVESTMENTS
AS OF OCTOBER 31, 2019 (continued)
| | | | | | | | |
| INVESTMENTS | | SHARES | | | VALUE($) | |
Common Stocks — continued | |
|
Travel & Leisure — continued | |
| | |
SkyWest, Inc. | | | 4,057 | | | | 241,594 | |
| | |
Spirit Airlines, Inc.* | | | 5,743 | | | | 215,707 | |
| | |
Texas Roadhouse, Inc. | | | 4,830 | | | | 272,895 | |
| | |
Travelzoo* | | | 585 | | | | 5,920 | |
| | |
Wingstop, Inc. | | | 3,475 | | | | 289,920 | |
| | | | | | | | |
| | |
| | | | | | | 6,109,388 | |
| | | | | | | | |
| | |
Total Common Stocks
(Cost $144,735,504) | | | | | | | 140,249,445 | |
| | | | | | | | |
| | | NO. OF
RIGHTS | | | | |
Rights — 0.0% | |
|
Chemicals — 0.0% | |
| | |
Schulman, Inc., CVR*‡ | | | 5,865 | | | | — | |
| | | | | | | | |
|
Media — 0.0% | |
| | |
Media General, Inc., CVR*‡ | | | 1,533 | | | | — | |
| | | | | | | | |
| | |
Total Rights
(Cost $—) | | | | | | | — | |
| | | | | | | | |
| | | SHARES | | | | |
Short-Term Investments — 19.3% | |
|
Investment Companies — 0.3% | |
| | |
JPMorgan U.S. Government Money Market Fund Class Institutional Shares, 1.64% (b) (c)
(Cost $440,610) | | | 440,610 | | | | 440,610 | |
| | | | | | | | |
| | | | | | | | |
| INVESTMENTS | | SHARES | | | VALUE($) | |
|
Investment of Cash Collateral From Securities Loaned — 19.0% | |
| | |
JPMorgan Securities Lending Money Market Fund Class Agency SL Shares, 1.98% (b) (c) | | | 18,999,800 | | | | 19,001,700 | |
| | |
JPMorgan U.S. Government Money Market Fund Class IM Shares, 1.70% (b) (c) | | | 7,634,136 | | | | 7,634,136 | |
| | | | | | | | |
| | |
Total Investment Of Cash Collateral From Securities Loaned
(Cost $26,635,336) | | | | | | | 26,635,836 | |
| | | | | | | | |
| | |
Total Short-Term Investments
(Cost $27,075,946) | | | | | | | 27,076,446 | |
| | | | | | | | |
Total Investments — 119.2%
(Cost $171,811,450) | | | | | | | 167,325,891 | |
| | |
Liabilities in Excess of
Other Assets — (19.2%) | | | | | | | (26,982,564 | ) |
| | | | | | | | |
NET ASSETS — 100.0% | | | | | | | 140,343,327 | |
| | | | | | | | |
Percentages indicated are based on net assets.
Abbreviations
| | |
| CVR | | ContingentValue Rights |
| REIT | | RealEstate Investment Trust |
| |
| (a) | | The security or a portion of this security is on loan at October 31, 2019. The total value of securities on loan at October 31, 2019 is $25,431,992. |
| (b) | | Investment in an affiliated fund, which is registered under the Investment Company Act of 1940, as amended, and is advised by J.P. Morgan Investment Management Inc. |
| (c) | | Therate shown is the current yield as of October 31, 2019. |
| * | | Non-incomeproducing security. |
| ‡ | | Valuedetermined using significant unobservable inputs. |
| | | | | | | | | | | | | | | | | | | | |
| Futures contracts outstanding as of October 31, 2019: | |
| DESCRIPTION | | NUMBER OF
CONTRACTS | | | EXPIRATION
DATE | | | TRADING
CURRENCY | | | NOTIONAL
AMOUNT($) | | | VALUE AND
UNREALIZED
APPRECIATION
(DEPRECIATION)($) | |
| | | | | |
Long Contracts | | | | | | | | | | | | | | | | | | | | |
| | | | | |
Russell 2000E-Mini Index | | | 2 | | | | 12/2019 | | | | USD | | | | 156,290 | | | | 8,156 | |
| | | | | | | | | | | | | | | | | | | | |
Abbreviations
SEE NOTES TO FINANCIAL STATEMENTS.
| | | | | | |
| | | |
| 140 | | | | J.P. MORGAN EXCHANGE-TRADED FUNDS | | OCTOBER 31, 2019 |
JPMorgan U.S. Dividend ETF
SCHEDULE OF PORTFOLIO INVESTMENTS
AS OF OCTOBER 31, 2019
| | | | | | | | |
| INVESTMENTS | | SHARES | | | VALUE($) | |
Common Stocks — 99.8% | |
|
Aerospace & Defense — 0.6% | |
| | |
Lockheed Martin Corp. | | | 616 | | | | 232,035 | |
| | | | | | | | |
|
Automobiles & Parts — 2.0% | |
| | |
Ford Motor Co. | | | 23,668 | | | | 203,308 | |
| | |
General Motors Co. | | | 5,741 | | | | 213,336 | |
| | |
Genuine Parts Co. | | | 2,151 | | | | 220,650 | |
| | |
Harley-Davidson, Inc. (a) | | | 4,747 | | | | 184,706 | |
| | | | | | | | |
| | |
| | | | | | | 822,000 | |
| | | | | | | | |
|
Banks — 1.0% | |
| | |
New York Community Bancorp, Inc. | | | 18,742 | | | | 218,344 | |
| | |
PacWest Bancorp | | | 1,850 | | | | 68,431 | |
| | |
People’s United Financial, Inc. | | | 8,870 | | | | 143,428 | |
| | | | | | | | |
| | |
| | | | | | | 430,203 | |
| | | | | | | | |
|
Beverages — 1.6% | |
| | |
Coca-Cola Co. (The) | | | 4,356 | | | | 237,097 | |
| | |
Keurig Dr Pepper, Inc. | | | 4,120 | | | | 116,019 | |
| | |
Molson Coors Brewing Co., Class B | | | 1,044 | | | | 55,040 | |
| | |
PepsiCo, Inc. | | | 1,734 | | | | 237,853 | |
| | | | | | | | |
| | |
| | | | | | | 646,009 | |
| | | | | | | | |
|
Chemicals — 6.7% | |
| | |
Air Products & Chemicals, Inc. | | | 1,043 | | | | 222,430 | |
| | |
Albemarle Corp. (a) | | | 353 | | | | 21,441 | |
| | |
Cabot Corp. | | | 1,650 | | | | 71,923 | |
| | |
Celanese Corp. | | | 631 | | | | 76,446 | |
| | |
CF Industries Holdings, Inc. | | | 4,803 | | | | 217,816 | |
| | |
Chemours Co. (The) | | | 12,419 | | | | 203,796 | |
| | |
DuPont de Nemours, Inc. | | | 3,425 | | | | 225,742 | |
| | |
Eastman Chemical Co. | | | 3,566 | | | | 271,159 | |
| | |
Huntsman Corp. | | | 11,705 | | | | 259,032 | |
| | |
International Flavors & Fragrances, Inc. | | | 1,529 | | | | 186,553 | |
| | |
LyondellBasell Industries NV, Class A | | | 3,029 | | | | 271,701 | |
| | |
Olin Corp. | | | 13,732 | | | | 251,845 | |
| | |
RPM International, Inc. | | | 3,120 | | | | 225,982 | |
| | |
Scotts Miracle-Gro Co. (The) | | | 2,205 | | | | 221,360 | |
| | | | | | | | |
| | |
| | | | | | | 2,727,226 | |
| | | | | | | | |
|
Construction & Materials — 0.6% | |
| | |
MDU Resources Group, Inc. | | | 8,329 | | | | 240,625 | |
| | | | | | | | |
|
Electricity — 12.0% | |
| | |
AES Corp. | | | 15,255 | | | | 260,098 | |
| | |
Alliant Energy Corp. | | | 4,414 | | | | 235,443 | |
| | |
American Electric Power Co., Inc. | | | 2,551 | | | | 240,789 | |
| | |
Avangrid, Inc. | | | 3,110 | | | | 155,655 | |
| | |
CMS Energy Corp. | | | 3,721 | | | | 237,846 | |
| | |
Consolidated Edison, Inc. | | | 2,605 | | | | 240,233 | |
| | | | | | | | |
| INVESTMENTS | | SHARES | | | VALUE($) | |
| | | | | | | | |
|
Electricity — continued | |
| | |
Dominion Energy, Inc. | | | 3,002 | | | | 247,815 | |
| | |
DTE Energy Co. | | | 1,789 | | | | 227,775 | |
| | |
Edison International | | | 3,209 | | | | 201,846 | |
| | |
Entergy Corp. | | | 2,078 | | | | 252,435 | |
| | |
Evergy, Inc. | | | 3,564 | | | | 227,775 | |
| | |
Eversource Energy | | | 2,930 | | | | 245,358 | |
| | |
Exelon Corp. | | | 4,891 | | | | 222,492 | |
| | |
FirstEnergy Corp. | | | 5,041 | | | | 243,581 | |
| | |
Hawaiian Electric Industries, Inc. | | | 4,061 | | | | 183,354 | |
| | |
IDACORP, Inc. | | | 834 | | | | 89,755 | |
| | |
NextEra Energy, Inc. | | | 775 | | | | 184,714 | |
| | |
Pinnacle West Capital Corp. | | | 2,426 | | | | 228,335 | |
| | |
PPL Corp. | | | 7,885 | | | | 264,069 | |
| | |
Public Service Enterprise Group, Inc. | | | 3,828 | | | | 242,351 | |
| | |
Southern Co. (The) | | | 4,047 | | | | 253,585 | |
| | |
Xcel Energy, Inc. | | | 3,650 | | | | 231,812 | |
| | | | | | | | |
| | |
| | | | | | | 4,917,116 | |
| | | | | | | | |
|
Electronic & Electrical Equipment — 1.2% | |
| | |
Emerson Electric Co. | | | 3,228 | | | | 226,444 | |
| | |
Hubbell, Inc. | | | 1,763 | | | | 249,817 | |
| | | | | | | | |
| | |
| | | | | | | 476,261 | |
| | | | | | | | |
|
Financial Services — 0.7% | |
| | |
BGC Partners, Inc., Class A | | | 13,016 | | | | 67,683 | |
| | |
Invesco Ltd. | | | 5,905 | | | | 99,322 | |
| | |
Lazard Ltd., Class A | | | 2,639 | | | | 98,514 | |
| | | | | | | | |
| | |
| | | | | | | 265,519 | |
| | | | | | | | |
|
Fixed Line Telecommunications — 2.2% | |
| | |
AT&T, Inc. | | | 6,836 | | | | 263,118 | |
| | |
CenturyLink, Inc. | | | 20,566 | | | | 266,124 | |
| | |
Verizon Communications, Inc. | | | 4,101 | | | | 247,987 | |
| | |
Zayo Group Holdings, Inc.* | | | 3,758 | | | | 128,298 | |
| | | | | | | | |
| | |
| | | | | | | 905,527 | |
| | | | | | | | |
|
Food & Drug Retailers — 0.6% | |
| | |
Sysco Corp. | | | 3,162 | | | | 252,549 | |
| | | | | | | | |
|
Food Producers — 3.3% | |
| | |
Archer-Daniels-Midland Co. | | | 1,613 | | | | 67,811 | |
| | |
Campbell Soup Co. | | | 5,189 | | | | 240,303 | |
| | |
Conagra Brands, Inc. | | | 5,880 | | | | 159,054 | |
| | |
Flowers Foods, Inc. | | | 9,967 | | | | 216,483 | |
| | |
General Mills, Inc. | | | 4,315 | | | | 219,461 | |
| | |
JM Smucker Co. (The) | | | 134 | | | | 14,161 | |
| | |
Kellogg Co. | | | 3,097 | | | | 196,752 | |
| | |
Kraft Heinz Co. (The) | | | 6,759 | | | | 218,518 | |
| | | | | | | | |
| | |
| | | | | | | 1,332,543 | |
| | | | | | | | |
SEE NOTES TO FINANCIAL STATEMENTS.
| | | | | | | | |
| | | |
| OCTOBER 31, 2019 | | J.P. MORGAN EXCHANGE-TRADED FUNDS | | | | | 141 | |
JPMorgan U.S. Dividend ETF
SCHEDULE OF PORTFOLIO INVESTMENTS
AS OF OCTOBER 31, 2019 (continued)
| | | | | | | | |
| INVESTMENTS | | SHARES | | | VALUE($) | |
Common Stocks — continued | |
|
Forestry & Paper — 1.1% | |
| | |
Domtar Corp. | | | 4,567 | | | | 166,193 | |
| | |
International Paper Co. | | | 5,965 | | | | 260,552 | |
| | | | | | | | |
| | |
| | | | | | | 426,745 | |
| | | | | | | | |
|
Gas, Water & Multiutilities — 4.2% | |
| | |
Ameren Corp. | | | 3,042 | | | | 236,363 | |
| | |
CenterPoint Energy, Inc. | | | 8,451 | | | | 245,671 | |
| | |
Duke Energy Corp. | | | 2,515 | | | | 237,064 | |
| | |
National Fuel Gas Co. | | | 3,472 | | | | 157,316 | |
| | |
NiSource, Inc. | | | 7,729 | | | | 216,721 | |
| | |
Sempra Energy | | | 1,655 | | | | 239,164 | |
| | |
UGI Corp. | | | 2,677 | | | | 127,613 | |
| | |
WEC Energy Group, Inc. | | | 2,424 | | | | 228,826 | |
| | | | | | | | |
| | |
| | | | | | | 1,688,738 | |
| | | | | | | | |
|
General Industrials — 2.8% | |
| | |
3M Co. | | | 1,142 | | | | 188,419 | |
| | |
Eaton Corp. plc | | | 2,877 | | | | 250,615 | |
| | |
General Electric Co. | | | 16,499 | | | | 164,660 | |
| | |
Packaging Corp. of America | | | 1,959 | | | | 214,432 | |
| | |
Sonoco Products Co. | | | 3,606 | | | | 208,066 | |
| | |
Westrock Co. | | | 3,560 | | | | 133,037 | |
| | | | | | | | |
| | |
| | | | | | | 1,159,229 | |
| | | | | | | | |
|
General Retailers — 4.0% | |
| | |
Foot Locker, Inc. | | | 3,918 | | | | 170,472 | |
| | |
Gap, Inc. (The) | | | 7,648 | | | | 124,356 | |
| | |
H&R Block, Inc. | | | 8,041 | | | | 200,945 | |
| | |
Home Depot, Inc. (The) | | | 1,048 | | | | 245,840 | |
| | |
Kohl’s Corp. | | | 3,085 | | | | 158,137 | |
| | |
L Brands, Inc. | | | 11,673 | | | | 198,908 | |
| | |
Macy’s, Inc. | | | 13,058 | | | | 197,959 | |
| | |
Nordstrom, Inc. (a) | | | 3,054 | | | | 109,639 | |
| | |
Target Corp. | | | 2,201 | | | | 235,309 | |
| | | | | | | | |
| | |
| | | | | | | 1,641,565 | |
| | | | | | | | |
|
Health Care Equipment & Services — 1.5% | |
| | |
Medtronic plc | | | 2,184 | | | | 237,838 | |
| | |
Quest Diagnostics, Inc. | | | 2,148 | | | | 217,485 | |
| | |
ResMed, Inc. | | | 1,074 | | | | 158,866 | |
| | | | | | | | |
| | |
| | | | | | | 614,189 | |
| | | | | | | | |
|
Household Goods & Home Construction — 3.2% | |
| | |
Clorox Co. (The) | | | 1,431 | | | | 211,344 | |
| | |
Leggett & Platt, Inc. | | | 5,126 | | | | 262,964 | |
| | |
Newell Brands, Inc. | | | 12,859 | | | | 243,935 | |
| | |
Procter & Gamble Co. (The) | | | 1,999 | | | | 248,896 | |
| | |
Stanley Black & Decker, Inc. | | | 649 | | | | 98,213 | |
| | | | | | | | |
| INVESTMENTS | | SHARES | | | VALUE($) | |
| | | | | | | | |
|
Household Goods & Home Construction — continued | |
| | |
Whirlpool Corp. | | | 1,571 | | | | 238,981 | |
| | | | | | | | |
| | |
| | | | | | | 1,304,333 | |
| | | | | | | | |
|
Industrial Engineering — 1.5% | |
| | |
Caterpillar, Inc. | | | 1,656 | | | | 228,197 | |
| | |
Cummins, Inc. | | | 1,432 | | | | 246,991 | |
| | |
Rockwell Automation, Inc. | | | 252 | | | | 43,342 | |
| | |
Timken Co. (The) | | | 1,719 | | | | 84,231 | |
| | | | | | | | |
| | |
| | | | | | | 602,761 | |
| | | | | | | | |
|
Industrial Metals & Mining — 2.1% | |
| | |
Nucor Corp. | | | 4,763 | | | | 256,488 | |
| | |
Reliance Steel & Aluminum Co. | | | 2,401 | | | | 278,612 | |
| | |
Southern Copper Corp. (Peru) | | | 5,383 | | | | 191,527 | |
| | |
Steel Dynamics, Inc. | | | 4,229 | | | | 128,392 | |
| | | | | | | | |
| | |
| | | | | | | 855,019 | |
| | | | | | | | |
|
Industrial Transportation — 1.0% | |
| | |
Macquarie Infrastructure Corp. | | | 4,698 | | | | 202,672 | |
| | |
United Parcel Service, Inc., Class B | | | 1,585 | | | | 182,544 | |
| | | | | | | | |
| | |
| | | | | | | 385,216 | |
| | | | | | | | |
|
Leisure Goods — 1.0% | |
| | |
Garmin Ltd. | | | 2,782 | | | | 260,812 | |
| | |
Hasbro, Inc. | | | 1,680 | | | | 163,481 | |
| | | | | | | | |
| | |
| | | | | | | 424,293 | |
| | | | | | | | |
|
Media — 0.7% | |
| | |
Nielsen Holdings plc | | | 9,290 | | | | 187,286 | |
| | |
Viacom, Inc., Class B | | | 3,853 | | | | 83,071 | |
| | | | | | | | |
| | |
| | | | | | | 270,357 | |
| �� | | | | | | | |
|
Mobile Telecommunications — 1.2% | |
| | |
Sprint Corp.* | | | 13,740 | | | | 85,325 | |
| | |
Telephone & Data Systems, Inc. | | | 6,577 | | | | 171,594 | |
| | |
T-Mobile US, Inc.* | | | 2,971 | | | | 245,583 | |
| | | | | | | | |
| | |
| | | | | | | 502,502 | |
| | | | | | | | |
|
Nonlife Insurance — 0.6% | |
| | |
Old Republic International Corp. | | | 10,422 | | | | 232,828 | |
| | | | | | | | |
|
Oil & Gas Producers — 3.7% | |
| | |
Apache Corp. | | | 7,424 | | | | 160,804 | |
| | |
Chevron Corp. | | | 2,040 | | | | 236,926 | |
| | |
Exxon Mobil Corp. | | | 2,941 | | | | 198,723 | |
| | |
Marathon Petroleum Corp. | | | 751 | | | | 48,026 | |
| | |
Murphy Oil Corp. (a) | | | 7,778 | | | | 160,460 | |
| | |
Occidental Petroleum Corp. | | | 4,458 | | | | 180,549 | |
| | |
PBF Energy, Inc., Class A | | | 8,222 | | | | 265,406 | |
| | |
Valero Energy Corp. | | | 2,697 | | | | 261,555 | |
| | | | | | | | |
| | |
| | | | | | | 1,512,449 | |
| | | | | | | | |
SEE NOTES TO FINANCIAL STATEMENTS.
| | | | | | |
| | | |
| 142 | | | | J.P. MORGAN EXCHANGE-TRADED FUNDS | | OCTOBER 31, 2019 |
| | | | | | | | |
| INVESTMENTS | | SHARES | | | VALUE($) | |
Common Stocks — continued | |
|
Oil Equipment, Services & Distribution — 3.9% | |
| | |
Antero Midstream Corp. (a) | | | 12,955 | | | | 83,430 | |
| | |
Equitrans Midstream Corp. (a) | | | 3,961 | | | | 55,137 | |
| | |
Helmerich & Payne, Inc. | | | 5,128 | | | | 192,300 | |
| | |
Kinder Morgan, Inc. | | | 9,563 | | | | 191,069 | |
| | |
OGE Energy Corp. | | | 4,808 | | | | 207,032 | |
| | |
ONEOK, Inc. | | | 3,297 | | | | 230,230 | |
| | |
Schlumberger Ltd. | | | 5,980 | | | | 195,486 | |
| | |
Targa Resources Corp. | | | 5,340 | | | | 207,619 | |
| | |
Williams Cos., Inc. (The) | | | 8,271 | | | | 184,526 | |
| | | | | | | | |
| | |
| | | | | | | 1,546,829 | |
| | | | | | | | |
|
Personal Goods — 2.4% | |
| | |
Coty, Inc., Class A | | | 14,338 | | | | 167,611 | |
| | |
Hanesbrands, Inc. | | | 12,340 | | | | 187,691 | |
| | |
Kimberly-Clark Corp. | | | 1,649 | | | | 219,119 | |
| | |
Nu Skin Enterprises, Inc., Class A | | | 1,060 | | | | 47,255 | |
| | |
Tapestry, Inc. | | | 5,054 | | | | 130,697 | |
| | |
VF Corp. | | | 2,667 | | | | 219,467 | |
| | | | | | | | |
| | |
| | | | | | | 971,840 | |
| | | | | | | | |
|
Pharmaceuticals & Biotechnology — 4.9% | |
| | |
Abbott Laboratories | | | 510 | | | | 42,641 | |
| | |
AbbVie, Inc. | | | 2,508 | | | | 199,512 | |
| | |
Amgen, Inc. | | | 1,128 | | | | 240,546 | |
| | |
Bristol-Myers Squibb Co. | | | 3,918 | | | | 224,776 | |
| | |
Cardinal Health, Inc. | | | 2,914 | | | | 144,097 | |
| | |
Eli Lilly & Co. | | | 1,933 | | | | 220,266 | |
| | |
Gilead Sciences, Inc. | | | 3,154 | | | | 200,941 | |
| | |
Johnson & Johnson | | | 1,831 | | | | 241,765 | |
| | |
Merck & Co., Inc. | | | 2,752 | | | | 238,488 | |
| | |
Pfizer, Inc. | | | 5,622 | | | | 215,716 | |
| | | | | | | | |
| | |
| | | | | | | 1,968,748 | |
| | | | | | | | |
|
Real Estate Investment Trusts — 15.7% | |
| | |
AGNC Investment Corp. | | | 15,683 | | | | 267,395 | |
| | |
Annaly Capital Management, Inc. | | | 23,696 | | | | 212,790 | |
| | |
Apple Hospitality REIT, Inc. | | | 7,638 | | | | 125,874 | |
| | |
Brandywine Realty Trust | | | 12,265 | | | | 187,409 | |
| | |
Brixmor Property Group, Inc. | | | 11,259 | | | | 247,923 | |
| | |
Chimera Investment Corp. | | | 9,654 | | | | 195,590 | |
| | |
Colony Capital, Inc. | | | 9,131 | | | | 51,134 | |
| | |
Corporate Office Properties Trust | | | 1,415 | | | | 41,941 | |
| | |
Digital Realty Trust, Inc. | | | 1,893 | | | | 240,487 | |
| | |
Duke Realty Corp. | | | 2,630 | | | | 92,418 | |
| | |
EPR Properties | | | 1,891 | | | | 147,101 | |
| | |
Gaming and Leisure Properties, Inc. | | | 5,646 | | | | 227,873 | |
| | |
HCP, Inc. | | | 6,126 | | | | 230,460 | |
| | | | | | | | |
| INVESTMENTS | | SHARES | | | VALUE($) | |
| | | | | | | | |
|
Real Estate Investment Trusts — continued | |
| | |
Healthcare Trust of America, Inc., Class A | | | 1,143 | | | | 35,433 | |
| | |
Iron Mountain, Inc. | | | 6,082 | | | | 199,490 | |
| | |
Kimco Realty Corp. | | | 12,152 | | | | 261,997 | |
| | |
Liberty Property Trust | | | 4,486 | | | | 264,988 | |
| | |
Macerich Co. (The) (a) | | | 6,130 | | | | 168,575 | |
| | |
Medical Properties Trust, Inc. | | | 5,480 | | | | 113,600 | |
| | |
MFA Financial, Inc. | | | 24,444 | | | | 185,530 | |
| | |
National Retail Properties, Inc. | | | 3,462 | | | | 203,946 | |
| | |
New Residential Investment Corp. | | | 16,569 | | | | 262,453 | |
| | |
Omega Healthcare Investors, Inc. | | | 5,740 | | | | 252,790 | |
| | |
Outfront Media, Inc. | | | 5,767 | | | | 151,730 | |
| | |
Park Hotels & Resorts, Inc. | | | 6,741 | | | | 156,728 | |
| | |
Rayonier, Inc. | | | 4,368 | | | | 117,849 | |
| | |
Service Properties Trust | | | 6,385 | | | | 161,540 | |
| | |
SITE Centers Corp. | | | 8,402 | | | | 130,483 | |
| | |
Spirit Realty Capital, Inc. | | | 4,825 | | | | 240,478 | |
| | |
Starwood Property Trust, Inc. | | | 9,969 | | | | 245,238 | |
| | |
Two Harbors Investment Corp. | | | 15,215 | | | | 211,032 | |
| | |
Ventas, Inc. | | | 1,088 | | | | 70,829 | |
| | |
VEREIT, Inc. | | | 23,735 | | | | 233,552 | |
| | |
Welltower, Inc. | | | 2,431 | | | | 220,467 | |
| | |
WP Carey, Inc. | | | 2,579 | | | | 237,423 | |
| | | | | | | | |
| | |
| | | | | | | 6,394,546 | |
| | | | | | | | |
|
Software & Computer Services — 1.0% | |
| | |
International Business Machines Corp. | | | 1,490 | | | | 199,258 | |
| | |
Microsoft Corp. | | | 1,378 | | | | 197,564 | |
| | | | | | | | |
| | |
| | | | | | | 396,822 | |
| | | | | | | | |
|
Support Services — 1.5% | |
| | |
Paychex, Inc. | | | 2,654 | | | | 221,980 | |
| | |
Waste Management, Inc. | | | 1,472 | | | | 165,173 | |
| | |
Xerox Holdings Corp. | | | 6,517 | | | | 221,122 | |
| | | | | | | | |
| | |
| | | | | | | 608,275 | |
| | | | | | | | |
|
Technology Hardware & Equipment — 4.3% | |
| | |
Analog Devices, Inc. | | | 2,143 | | | | 228,508 | |
| | |
Cypress Semiconductor Corp. | | | 10,056 | | | | 234,003 | |
| | |
HP, Inc. | | | 2,700 | | | | 46,899 | |
| | |
Intel Corp. | | | 4,807 | | | | 271,740 | |
| | |
KLA Corp. | | | 1,586 | | | | 268,097 | |
| | |
Maxim Integrated Products, Inc. | | | 3,862 | | | | 226,545 | |
| | |
Microchip Technology, Inc. | | | 2,040 | | | | 192,352 | |
| | |
QUALCOMM, Inc. | | | 3,046 | | | | 245,020 | |
| | |
Xilinx, Inc. | | | 659 | | | | 59,798 | |
| | | | | | | | |
| | |
| | | | | | | 1,772,962 | |
| | | | | | | | |
SEE NOTES TO FINANCIAL STATEMENTS.
| | | | | | | | |
| | | |
| OCTOBER 31, 2019 | | J.P. MORGAN EXCHANGE-TRADED FUNDS | | | | | 143 | |
JPMorgan U.S. Dividend ETF
SCHEDULE OF PORTFOLIO INVESTMENTS
AS OF OCTOBER 31, 2019 (continued)
| | | | | | | | |
| INVESTMENTS | | SHARES | | | VALUE($) | |
Common Stocks — continued | |
|
Tobacco — 1.1% | |
| | |
Altria Group, Inc. | | | 4,380 | | | | 196,180 | |
| | |
Philip Morris International, Inc. | | | 2,840 | | | | 231,290 | |
| | | | | | | | |
| | |
| | | | | | | 427,470 | |
| | | | | | | | |
|
Travel & Leisure — 3.9% | |
| | |
Cinemark Holdings, Inc. | | | 4,812 | | | | 176,119 | |
| | |
Copa Holdings SA, Class A (Panama) | | | 2,054 | | | | 208,974 | |
| | |
Darden Restaurants, Inc. | | | 1,915 | | | | 214,997 | |
| | |
Extended Stay America, Inc. | | | 10,318 | | | | 146,619 | |
| | |
International Game Technology plc (a) | | | 9,139 | | | | 121,000 | |
| | |
Las Vegas Sands Corp. | | | 3,183 | | | | 196,837 | |
| | |
McDonald’s Corp. | | | 995 | | | | 195,716 | |
| | |
Six Flags Entertainment Corp. | | | 3,485 | | | | 147,032 | |
| | |
Wendy’s Co. (The) | | | 3,078 | | | | 65,192 | |
| | |
Wyndham Destinations, Inc. | | | 2,624 | | | | 121,780 | |
| | | | | | | | |
| | |
| | | | | | | 1,594,266 | |
| | | | | | | | |
| | |
Total Common Stocks
(Cost $38,603,633) | | | | | | | 40,549,595 | |
| | | | | | | | |
Short-Term Investments — 2.0% | |
|
Investment Companies — 0.4% | |
| | |
JPMorgan U.S. Government Money Market Fund Class Institutional Shares, 1.64% (b) (c)
(Cost $149,529) | | | 149,529 | | | | 149,529 | |
| | | | | | | | |
| | | | | | | | |
| INVESTMENTS | | SHARES | | | VALUE($) | |
|
Investment of Cash Collateral From Securities Loaned — 1.6% | |
| | |
JPMorgan U.S. Government Money Market Fund Class IM Shares, 1.70% (b) (c)
(Cost $654,469) | | | 654,469 | | | | 654,469 | |
| | | | | | | | |
| | |
Total Short-Term Investments
(Cost $803,998) | | | | | | | 803,998 | |
| | | | | | | | |
Total Investments — 101.8%
(Cost $39,407,631) | | | | | | | 41,353,593 | |
| | |
Liabilities in Excess of Other Assets — (1.8%) | | | | | | | (722,068 | ) |
| | | | | | | | |
NET ASSETS — 100.0% | | | | | | | 40,631,525 | |
| | | | | | | | |
Percentages indicated are based on net assets.
Abbreviations
| | |
| REIT | | RealEstate Investment Trust |
| |
| (a) | | The security or a portion of this security is on loan at October 31, 2019. The total value of securities on loan at October 31, 2019 is $628,762. |
| (b) | | Investment in an affiliated fund, which is registered under the Investment Company Act of 1940, as amended, and is advised by J.P. Morgan Investment Management Inc. |
| (c) | | Therate shown is the current yield as of October 31, 2019. |
| * | | Non-incomeproducing security. |
| | | | | | | | | | | | | | | | | | | | |
| Futures contracts outstanding as of October 31, 2019: | |
| DESCRIPTION | | NUMBER OF
CONTRACTS | | | EXPIRATION
DATE | | | TRADING
CURRENCY | | | NOTIONAL
AMOUNT($) | | | VALUE AND
UNREALIZED
APPRECIATION
(DEPRECIATION)($) | |
| | | | | |
Long Contracts | | | | | | | | | | | | | | | | | | | | |
| | | | | |
S&P 500 MicE-Mini Index | | | 8 | | | | 12/2019 | | | | USD | | | | 121,430 | | | | 1,695 | |
| | | | | | | | | | | | | | | | | | | | |
Abbreviations
SEE NOTES TO FINANCIAL STATEMENTS.
| | | | | | |
| | | |
| 144 | | | | J.P. MORGAN EXCHANGE-TRADED FUNDS | | OCTOBER 31, 2019 |
JPMorgan U.S. Minimum Volatility ETF
SCHEDULE OF PORTFOLIO INVESTMENTS
AS OF OCTOBER 31, 2019
| | | | | | | | |
| INVESTMENTS | | SHARES | | | VALUE($) | |
Common Stocks — 99.8% | |
|
Aerospace & Defense — 1.0% | |
| | |
Lockheed Martin Corp. | | | 1,598 | | | | 601,934 | |
| | |
Raytheon Co. | | | 2,561 | | | | 543,470 | |
| | | | | | | | |
| | |
| | | | | | | 1,145,404 | |
| | | | | | | | |
|
Automobiles & Parts — 0.7% | |
| | |
Genuine Parts Co. | | | 5,881 | | | | 603,273 | |
| | |
WABCO Holdings, Inc.* | | | 1,086 | | | | 146,197 | |
| | | | | | | | |
| | |
| | | | | | | 749,470 | |
| | | | | | | | |
|
Banks — 0.7% | |
| | |
TFS Financial Corp. | | | 9,539 | | | | 183,721 | |
| | |
US Bancorp | | | 9,290 | | | | 529,716 | |
| | | | | | | | |
| | |
| | | | | | | 713,437 | |
| | | | | | | | |
|
Beverages — 2.5% | |
| | |
Brown-Forman Corp., Class B | | | 9,892 | | | | 648,124 | |
| | |
Coca-Cola Co. (The) | | | 11,651 | | | | 634,164 | |
| | |
Constellation Brands, Inc., Class A | | | 2,079 | | | | 395,696 | |
| | |
Molson Coors Brewing Co., Class B | | | 6,035 | | | | 318,165 | |
| | |
PepsiCo, Inc. | | | 4,686 | | | | 642,779 | |
| | | | | | | | |
| | |
| | | | | | | 2,638,928 | |
| | | | | | | | |
|
Chemicals — 5.1% | |
| | |
Air Products & Chemicals, Inc. | | | 2,799 | | | | 596,915 | |
| | |
Ashland Global Holdings, Inc. | | | 7,027 | | | | 543,679 | |
| | |
Avery Dennison Corp. | | | 4,397 | | | | 562,200 | |
| | |
Ecolab, Inc. | | | 3,094 | | | | 594,265 | |
| | |
International Flavors & Fragrances, Inc. | | | 3,778 | | | | 460,954 | |
| | |
Linde plc (United Kingdom) | | | 3,313 | | | | 657,133 | |
| | |
NewMarket Corp. | | | 558 | | | | 270,903 | |
| | |
PPG Industries, Inc. | | | 4,785 | | | | 598,699 | |
| | |
RPM International, Inc. | | | 8,834 | | | | 639,847 | |
| | |
Scotts Miracle-Gro Co. (The) | | | 3,861 | | | | 387,606 | |
| | |
WR Grace & Co. | | | 3,547 | | | | 235,698 | |
| | | | | | | | |
| | |
| | | | | | | 5,547,899 | |
| | | | | | | | |
|
Electricity — 11.3% | |
| | |
Alliant Energy Corp. | | | 12,141 | | | | 647,601 | |
| | |
American Electric Power Co., Inc. | | | 6,975 | | | | 658,370 | |
| | |
Avangrid, Inc. | | | 7,237 | | | | 362,212 | |
| | |
CMS Energy Corp. | | | 10,102 | | | | 645,720 | |
| | |
Consolidated Edison, Inc. | | | 7,158 | | | | 660,111 | |
| | |
Dominion Energy, Inc. | | | 8,196 | | | | 676,580 | |
| | |
DTE Energy Co. | | | 4,910 | | | | 625,141 | |
| | |
Entergy Corp. | | | 5,643 | | | | 685,512 | |
| | |
Evergy, Inc. | | | 9,800 | | | | 626,318 | |
| | |
Eversource Energy | | | 7,947 | | | | 665,482 | |
| | |
Exelon Corp. | | | 13,473 | | | | 612,887 | |
| | | | | | | | |
| INVESTMENTS | | SHARES | | | VALUE($) | |
| | | | | | | | |
|
Electricity — continued | |
| | |
FirstEnergy Corp. | | | 13,008 | | | | 628,547 | |
| | |
Hawaiian Electric Industries, Inc. | | | 7,981 | | | | 360,342 | |
| | |
IDACORP, Inc. | | | 2,235 | | | | 240,531 | |
| | |
NextEra Energy, Inc. | | | 2,915 | | | | 694,761 | |
| | |
Pinnacle West Capital Corp. | | | 6,276 | | | | 590,697 | |
| | |
PPL Corp. | | | 17,976 | | | | 602,016 | |
| | |
Public Service Enterprise Group, Inc. | | | 10,523 | | | | 666,211 | |
| | |
Southern Co. (The) | | | 10,940 | | | | 685,500 | |
| | |
Vistra Energy Corp. | | | 2,569 | | | | 69,440 | |
| | |
Xcel Energy, Inc. | | | 9,925 | | | | 630,337 | |
| | | | | | | | |
| | |
| | | | | | | 12,034,316 | |
| | | | | | | | |
|
Electronic & Electrical Equipment — 0.5% | |
| | |
Hubbell, Inc. | | | 2,532 | | | | 358,784 | |
| | |
Waters Corp.* | | | 1,206 | | | | 255,214 | |
| | | | | | | | |
| | |
| | | | | | | 613,998 | |
| | | | | | | | |
|
Fixed Line Telecommunications — 2.2% | |
| | |
AT&T, Inc. | | | 18,199 | | | | 700,480 | |
| | |
CenturyLink, Inc. | | | 31,678 | | | | 409,913 | |
| | |
Verizon Communications, Inc. | | | 10,941 | | | | 661,602 | |
| | |
Zayo Group Holdings, Inc.* | | | 18,260 | | | | 623,397 | |
| | | | | | | | |
| | |
| | | | | | | 2,395,392 | |
| | | | | | | | |
|
Food & Drug Retailers — 1.5% | |
| | |
AmerisourceBergen Corp. | | | 5,800 | | | | 495,204 | |
| | |
CVS Health Corp. | | | 7,117 | | | | 472,498 | |
| | |
Sysco Corp. | | | 8,571 | | | | 684,566 | |
| | | | | | | | |
| | |
| | | | | | | 1,652,268 | |
| | | | | | | | |
|
Food Producers — 7.6% | |
| | |
Archer-Daniels-Midland Co. | | | 16,717 | | | | 702,783 | |
| | |
Campbell Soup Co. | | | 8,806 | | | | 407,806 | |
| | |
Conagra Brands, Inc. | | | 18,086 | | | | 489,226 | |
| | |
Flowers Foods, Inc. | | | 4,497 | | | | 97,675 | |
| | |
General Mills, Inc. | | | 10,943 | | | | 556,561 | |
| | |
Hershey Co. (The) | | | 3,987 | | | | 585,571 | |
| | |
Hormel Foods Corp. | | | 14,791 | | | | 604,804 | |
| | |
Ingredion, Inc. | | | 6,811 | | | | 538,069 | |
| | |
JM Smucker Co. (The) | | | 4,136 | | | | 437,092 | |
| | |
Kellogg Co. | | | 9,327 | | | | 592,544 | |
| | |
Kraft Heinz Co. (The) | | | 6,464 | | | | 208,981 | |
| | |
Lamb Weston Holdings, Inc. | | | 8,338 | | | | 650,698 | |
| | |
McCormick & Co., Inc.(Non-Voting) | | | 3,805 | | | | 611,425 | |
| | |
Mondelez International, Inc., Class A | | | 11,563 | | | | 606,479 | |
| | |
Post Holdings, Inc.* | | | 2,634 | | | | 271,039 | |
| | |
Tyson Foods, Inc., Class A | | | 6,467 | | | | 535,403 | |
| | |
US Foods Holding Corp.* | | | 5,029 | | | | 199,500 | |
| | | | | | | | |
| | |
| | | | | | | 8,095,656 | |
| | | | | | | | |
SEE NOTES TO FINANCIAL STATEMENTS.
| | | | | | | | |
| | | |
| OCTOBER 31, 2019 | | J.P. MORGAN EXCHANGE-TRADED FUNDS | | | | | 145 | |
JPMorgan U.S. Minimum Volatility ETF
SCHEDULE OF PORTFOLIO INVESTMENTS
AS OF OCTOBER 31, 2019 (continued)
| | | | | | | | |
| INVESTMENTS | | SHARES | | | VALUE($) | |
Common Stocks — continued | |
|
Gas, Water & Multiutilities — 5.7% | |
| | |
Ameren Corp. | | | 8,251 | | | | 641,103 | |
| | |
American Water Works Co., Inc. | | | 5,005 | | | | 616,966 | |
| | |
Aqua America, Inc. | | | 12,391 | | | | 561,684 | |
| | |
Atmos Energy Corp. | | | 5,776 | | | | 649,684 | |
| | |
CenterPoint Energy, Inc. | | | 19,013 | | | | 552,708 | |
| | |
Duke Energy Corp. | | | 6,863 | | | | 646,906 | |
| | |
National Fuel Gas Co. | | | 4,192 | | | | 189,940 | |
| | |
NiSource, Inc. | | | 19,867 | | | | 557,070 | |
| | |
Sempra Energy | | | 3,821 | | | | 552,173 | |
| | |
UGI Corp. | | | 10,814 | | | | 515,503 | |
| | |
WEC Energy Group, Inc. | | | 6,656 | | | | 628,326 | |
| | | | | | | | |
| | |
| | | | | | | 6,112,063 | |
| | | | | | | | |
|
General Industrials — 0.7% | |
| | |
3M Co. | | | 2,393 | | | | 394,821 | |
| | |
Honeywell International, Inc. | | | 1,385 | | | | 239,231 | |
| | |
Sonoco Products Co. | | | 1,644 | | | | 94,859 | |
| | | | | | | | |
| | |
| | | | | | | 728,911 | |
| | | | | | | | |
|
General Retailers — 5.9% | |
| | |
AutoZone, Inc.* | | | 578 | | | | 661,452 | |
| | |
Bright Horizons Family Solutions, Inc.* | | | 3,189 | | | | 473,631 | |
| | |
Copart, Inc.* | | | 6,524 | | | | 539,143 | |
| | |
Costco Wholesale Corp. | | | 2,170 | | | | 644,729 | |
| | |
Dollar Tree, Inc.* | | | 2,615 | | | | 288,696 | |
| | |
Home Depot, Inc. (The) | | | 2,818 | | | | 661,046 | |
| | |
O’Reilly Automotive, Inc.* | | | 843 | | | | 367,135 | |
| | |
Rollins, Inc. | | | 4,548 | | | | 173,324 | |
| | |
Service Corp. International | | | 11,367 | | | | 516,971 | |
| | |
Target Corp. | | | 5,957 | | | | 636,863 | |
| | |
TJX Cos., Inc. (The) | | | 10,953 | | | | 631,440 | |
| | |
Walmart, Inc. | | | 5,600 | | | | 656,656 | |
| | | | | | | | |
| | |
| | | | | | | 6,251,086 | |
| | | | | | | | |
|
Health Care Equipment & Services — 11.2% | |
| | |
Anthem, Inc. | | | 1,971 | | | | 530,357 | |
| | |
Baxter International, Inc. | | | 7,189 | | | | 551,396 | |
| | |
Becton Dickinson and Co. | | | 2,282 | | | | 584,192 | |
| | |
Bio-Rad Laboratories, Inc., Class A* | | | 317 | | | | 105,124 | |
| | |
Cigna Corp. | | | 2,682 | | | | 478,630 | |
| | |
Cooper Cos., Inc. (The) (a) | | | 1,976 | | | | 575,016 | |
| | |
Dentsply Sirona, Inc. | | | 2,000 | | | | 109,560 | |
| | |
Henry Schein, Inc.* | | | 5,954 | | | | 372,631 | |
| | |
Hill-Rom Holdings, Inc. | | | 5,498 | | | | 575,586 | |
| | |
Humana, Inc. | | | 1,261 | | | | 370,986 | |
| | |
IDEXX Laboratories, Inc.* | | | 2,182 | | | | 621,892 | |
| | |
Laboratory Corp. of America Holdings* | | | 3,347 | | | | 551,485 | |
| | | | | | | | |
| INVESTMENTS | | SHARES | | | VALUE($) | |
| | | | | | | | |
|
Health Care Equipment & Services — continued | |
| | |
MEDNAX, Inc.* | | | 971 | | | | 21,323 | |
| | |
Medtronic plc | | | 5,928 | | | | 645,559 | |
| | |
Quest Diagnostics, Inc. | | | 5,670 | | | | 574,087 | |
| | |
ResMed, Inc. | | | 4,571 | | | | 676,142 | |
| | |
STERIS plc | | | 4,092 | | | | 579,305 | |
| | |
Stryker Corp. | | | 2,894 | | | | 625,885 | |
| | |
Teleflex, Inc. | | | 1,735 | | | | 602,756 | |
| | |
Thermo Fisher Scientific, Inc. | | | 2,225 | | | | 671,905 | |
| | |
UnitedHealth Group, Inc. | | | 2,163 | | | | 546,590 | |
| | |
Varian Medical Systems, Inc.* | | | 4,342 | | | | 524,557 | |
| | |
West Pharmaceutical Services, Inc. | | | 4,031 | | | | 579,819 | |
| | |
Zimmer Biomet Holdings, Inc. | | | 4,144 | | | | 572,825 | |
| | | | | | | | |
| | |
| | | | | | | 12,047,608 | |
| | | | | | | | |
|
Household Goods & Home Construction — 2.8% | |
| | |
Church & Dwight Co., Inc. | | | 7,908 | | | | 553,086 | |
| | |
Clorox Co. (The) | | | 3,535 | | | | 522,084 | |
| | |
Leggett & Platt, Inc. | | | 11,155 | | | | 572,251 | |
| | |
NVR, Inc.* | | | 162 | | | | 589,128 | |
| | |
Procter & Gamble Co. (The) | | | 5,347 | | | | 665,755 | |
| | |
Stanley Black & Decker, Inc. | | | 1,527 | | | | 231,081 | |
| | | | | | | | |
| | |
| | | | | | | 3,133,385 | |
| | | | | | | | |
|
Industrial Engineering — 0.1% | |
| | |
Snap-on, Inc. | | | 400 | | | | 65,068 | |
| | | | | | | | |
|
Industrial Transportation — 0.4% | |
| | |
United Parcel Service, Inc., Class B | | | 4,190 | | | | 482,562 | |
| | | | | | | | |
|
Leisure Goods — 1.5% | |
| | |
Garmin Ltd. | | | 6,454 | | | | 605,063 | |
| | |
Hasbro, Inc. | | | 3,203 | | | | 311,684 | |
| | |
Pool Corp. | | | 3,081 | | | | 638,999 | |
| | | | | | | | |
| | |
| | | | | | | 1,555,746 | |
| | | | | | | | |
|
Life Insurance — 0.4% | |
| | |
Aflac, Inc. | | | 7,630 | | | | 405,611 | |
| | | | | | | | |
|
Media — 1.1% | |
| | |
Graham Holdings Co., Class B | | | 364 | | | | 229,196 | |
| | |
Omnicom Group, Inc. | | | 3,619 | | | | 279,351 | |
| | |
Walt Disney Co. (The) | | | 4,595 | | | | 596,982 | |
| | | | | | | | |
| | |
| | | | | | | 1,105,529 | |
| | | | | | | | |
|
Mobile Telecommunications — 1.3% | |
| | |
Telephone & Data Systems, Inc. | | | 15,893 | | | | 414,649 | |
| | |
T-Mobile US, Inc.* | | | 8,150 | | | | 673,679 | |
| | |
United States Cellular Corp.* | | | 8,765 | | | | 326,233 | |
| | | | | | | | |
| | |
| | | | | | | 1,414,561 | |
| | | | | | | | |
SEE NOTES TO FINANCIAL STATEMENTS.
| | | | | | |
| | | |
| 146 | | | | J.P. MORGAN EXCHANGE-TRADED FUNDS | | OCTOBER 31, 2019 |
| | | | | | | | |
| INVESTMENTS | | SHARES | | | VALUE($) | |
Common Stocks — continued | |
|
Nonlife Insurance — 6.9% | |
| | |
Allstate Corp. (The) | | | 5,574 | | | | 593,185 | |
| | |
American Financial Group, Inc. | | | 4,835 | | | | 503,033 | |
| | |
Aon plc | | | 742 | | | | 143,325 | |
| | |
Arch Capital Group Ltd.* | | | 16,119 | | | | 673,130 | |
| | |
Arthur J Gallagher & Co. | | | 3,033 | | | | 276,670 | |
| | |
Berkshire Hathaway, Inc., Class B* | | | 2,994 | | | | 636,465 | |
| | |
Brown & Brown, Inc. | | | 13,184 | | | | 496,773 | |
| | |
Chubb Ltd. | | | 3,416 | | | | 520,667 | |
| | |
Cincinnati Financial Corp. | | | 5,663 | | | | 641,108 | |
| | |
Everest Re Group Ltd. | | | 1,428 | | | | 367,125 | |
| | |
Markel Corp.* | | | 490 | | | | 573,790 | |
| | |
Marsh & McLennan Cos., Inc. | | | 6,227 | | | | 645,242 | |
| | |
RenaissanceRe Holdings Ltd. (Bermuda) | | | 3,369 | | | | 630,609 | |
| | |
White Mountains Insurance Group Ltd. | | | 280 | | | | 299,880 | |
| | |
WR Berkley Corp. | | | 6,187 | | | | 432,471 | |
| | | | | | | | |
| | |
| | | | | | | 7,433,473 | |
| | | | | | | | |
|
Oil & Gas Producers — 2.5% | |
| | |
Chevron Corp. | | | 4,642 | | | | 539,122 | |
| | |
ConocoPhillips | | | 6,001 | | | | 331,255 | |
| | |
EOG Resources, Inc. | | | 939 | | | | 65,082 | |
| | |
Exxon Mobil Corp. | | | 7,775 | | | | 525,357 | |
| | |
Occidental Petroleum Corp. | | | 4,348 | | | | 176,094 | |
| | |
Phillips 66 | | | 5,275 | | | | 616,225 | |
| | |
Valero Energy Corp. | | | 4,642 | | | | 450,181 | |
| | | | | | | | |
| | |
| | | | | | | 2,703,316 | |
| | | | | | | | |
|
Oil Equipment, Services & Distribution — 2.5% | |
| | |
Halliburton Co. | | | 8,825 | | | | 169,881 | |
| | |
Kinder Morgan, Inc. | | | 28,915 | | | | 577,722 | |
| | |
OGE Energy Corp. | | | 13,831 | | | | 595,563 | |
| | |
ONEOK, Inc. | | | 7,390 | | | | 516,044 | |
| | |
Schlumberger Ltd. | | | 8,140 | | | | 266,097 | |
| | |
Williams Cos., Inc. (The) | | | 22,320 | | | | 497,959 | |
| | | | | | | | |
| | |
| | | | | | | 2,623,266 | |
| | | | | | | | |
|
Personal Goods — 2.8% | |
| | |
Colgate-Palmolive Co. | | | 8,515 | | | | 584,129 | |
| | |
Estee Lauder Cos., Inc. (The), Class A | | | 3,194 | | | | 594,946 | |
| | |
Kimberly-Clark Corp. | | | 4,482 | | | | 595,568 | |
| | |
NIKE, Inc., Class B | | | 6,930 | | | | 620,582 | |
| | |
VF Corp. | | | 6,446 | | | | 530,441 | |
| | | | | | | | |
| | |
| | | | | | | 2,925,666 | |
| | | | | | | | |
|
Pharmaceuticals & Biotechnology — 5.7% | |
| | |
Abbott Laboratories | | | 7,501 | | | | 627,159 | |
| | |
Amgen, Inc. | | | 2,616 | | | | 557,862 | |
| | | | | | | | |
| INVESTMENTS | | SHARES | | | VALUE($) | |
| | | | | | | | |
|
Pharmaceuticals & Biotechnology — continued | |
| | |
Bio-Techne Corp. | | | 2,991 | | | | 622,636 | |
| | |
Bristol-Myers Squibb Co. | | | 7,313 | | | | 419,547 | |
| | |
Eli Lilly & Co. | | | 4,711 | | | | 536,819 | |
| | |
IQVIA Holdings, Inc.* | | | 4,073 | | | | 588,223 | |
| | |
Johnson & Johnson | | | 4,222 | | | | 557,473 | |
| | |
Merck & Co., Inc. | | | 7,388 | | | | 640,244 | |
| | |
Pfizer, Inc. | | | 13,187 | | | | 505,985 | |
| | |
QIAGEN NV* | | | 10,011 | | | | 298,428 | |
| | |
Zoetis, Inc. | | | 5,047 | | | | 645,612 | |
| | | | | | | | |
| | |
| | | | | | | 5,999,988 | |
| | | | | | | | |
|
Real Estate Investment Trusts — 6.1% | |
| | |
AGNC Investment Corp. | | | 35,706 | | | | 608,787 | |
| | |
American Tower Corp. | | | 2,753 | | | | 600,374 | |
| | |
Annaly Capital Management, Inc. | | | 63,422 | | | | 569,530 | |
| | |
Apple Hospitality REIT, Inc. | | | 18,593 | | | | 306,413 | |
| | |
Camden Property Trust | | | 360 | | | | 41,173 | |
| | |
Chimera Investment Corp. | | | 13,085 | | | | 265,102 | |
| | |
Crown Castle International Corp. | | | 4,395 | | | | 609,982 | |
| | |
Equity Commonwealth | | | 7,462 | | | | 240,127 | |
| | |
Equity LifeStyle Properties, Inc. | | | 4,998 | | | | 349,560 | |
| | |
Federal Realty Investment Trust | | | 2,958 | | | | 402,318 | |
| | |
Gaming and Leisure Properties, Inc. | | | 13,304 | | | | 536,950 | |
| | |
MFA Financial, Inc. | | | 30,889 | | | | 234,447 | |
| | |
National Retail Properties, Inc. | | | 3,274 | | | | 192,871 | |
| | |
Regency Centers Corp. | | | 1,797 | | | | 120,830 | |
| | |
Starwood Property Trust, Inc. | | | 25,638 | | | | 630,695 | |
| | |
Two Harbors Investment Corp. | | | 40,063 | | | | 555,674 | |
| | |
WP Carey, Inc. | | | 2,318 | | | | 213,395 | |
| | | | | | | | |
| | |
| | | | | | | 6,478,228 | |
| | | | | | | | |
|
Software & Computer Services — 3.5% | |
| | |
Amdocs Ltd. | | | 8,277 | | | | 539,660 | |
| | |
ANSYS, Inc.* | | | 3,080 | | | | 678,062 | |
| | |
CDK Global, Inc. | | | 8,077 | | | | 408,212 | |
| | |
Cognizant Technology Solutions Corp., Class A | | | 888 | | | | 54,115 | |
| | |
International Business Machines Corp. | | | 2,257 | | | | 301,829 | |
| | |
Intuit, Inc. | | | 2,195 | | | | 565,212 | |
| | |
Microsoft Corp. | | | 4,779 | | | | 685,165 | |
| | |
Synopsys, Inc.* | | | 4,493 | | | | 609,925 | |
| | | | | | | | |
| | |
| | | | | | | 3,842,180 | |
| | | | | | | | |
|
Support Services — 2.1% | |
| | |
Automatic Data Processing, Inc. | | | 3,695 | | | | 599,440 | |
| | |
Jack Henry & Associates, Inc. | | | 1,627 | | | | 230,318 | |
| | |
Paychex, Inc. | | | 2,305 | | | | 192,790 | |
| | |
Republic Services, Inc. | | | 7,134 | | | | 624,296 | |
SEE NOTES TO FINANCIAL STATEMENTS.
| | | | | | | | |
| | | |
| OCTOBER 31, 2019 | | J.P. MORGAN EXCHANGE-TRADED FUNDS | | | | | 147 | |
JPMorgan U.S. Minimum Volatility ETF
SCHEDULE OF PORTFOLIO INVESTMENTS
AS OF OCTOBER 31, 2019 (continued)
| | | | | | | | |
| INVESTMENTS | | SHARES | | | VALUE($) | |
Common Stocks — continued | |
|
Support Services — continued | |
| | |
Verisk Analytics, Inc. | | | 398 | | | | 57,591 | |
| | |
Waste Management, Inc. | | | 5,345 | | | | 599,763 | |
| | | | | | | | |
| | |
| | | | | | | 2,304,198 | |
| | | | | | | | |
|
Technology Hardware & Equipment — 1.4% | |
| | |
L3Harris Technologies, Inc. | | | 3,016 | | | | 622,231 | |
| | |
Motorola Solutions, Inc. | | | 3,493 | | | | 580,956 | |
| | |
Texas Instruments, Inc. | | | 2,651 | | | | 312,792 | |
| | | | | | | | |
| | |
| | | | | | | 1,515,979 | |
| | | | | | | | |
|
Tobacco — 0.8% | |
| | |
Altria Group, Inc. | | | 8,918 | | | | 399,437 | |
| | |
Philip Morris International, Inc. | | | 5,484 | | | | 446,617 | |
| | | | | | | | |
| | |
| | | | | | | 846,054 | |
| | | | | | | | |
|
Travel & Leisure — 1.3% | |
| | |
Choice Hotels International, Inc. | | | 3,631 | | | | 321,271 | |
| | |
McDonald’s Corp. | | | 2,939 | | | | 578,101 | |
| | |
Yum! Brands, Inc. | | | 5,413 | | | | 550,556 | |
| | | | | | | | |
| | |
| | | | | | | 1,449,928 | |
| | | | | | | | |
| | |
Total Common Stocks
(Cost $102,224,158) | | | | | | | 107,011,174 | |
| | | | | | | | |
Short-Term Investments — 0.5% | |
|
Investment Companies — 0.1% | |
| | |
JPMorgan U.S. Government Money Market Fund Class Institutional Shares, 1.64% (b) (c)
(Cost $138,939) | | | 138,939 | | | | 138,939 | |
| | | | | | | | |
| | | | | | | | |
| INVESTMENTS | | SHARES | | | VALUE($) | |
|
Investment of Cash Collateral From Securities Loaned — 0.4% | |
| | |
JPMorgan U.S. Government Money Market Fund Class IM Shares, 1.70% (b) (c)
(Cost $387,400) | | | 387,400 | | | | 387,400 | |
| | | | | | | | |
| | |
Total Short-Term Investments
(Cost $526,339) | | | | | | | 526,339 | |
| | | | | | | | |
Total Investments — 100.3%
(Cost $102,750,497) | | | | | | | 107,537,513 | |
| | |
Liabilities in Excess of
Other Assets — (0.3%) | | | | | | | (292,855 | ) |
| | | | | | | | |
NET ASSETS — 100.0% | | | | | | | 107,244,658 | |
| | | | | | | | |
Percentages indicated are based on net assets.
Abbreviations
| | |
| REIT | | RealEstate Investment Trust |
| |
| (a) | | The security or a portion of this security is on loan at October 31, 2019. The total value of securities on loan at October 31, 2019 is $378,300. |
| (b) | | Investment in an affiliated fund, which is registered under the Investment Company Act of 1940, as amended, and is advised by J.P. Morgan Investment Management Inc. |
| (c) | | Therate shown is the current yield as of October 31, 2019. |
| * | | Non-incomeproducing security. |
| | | | | | | | | | | | | | | | | | | | |
| Futures contracts outstanding as of October 31, 2019: | |
| DESCRIPTION | | NUMBER OF
CONTRACTS | | | EXPIRATION
DATE | | | TRADING
CURRENCY | | | NOTIONAL
AMOUNT($) | | | VALUE AND
UNREALIZED
APPRECIATION
(DEPRECIATION)($) | |
| | | | | |
Long Contracts | | | | | | | | | | | | | | | | | | | | |
| | | | | |
S&P 500 MicE-Mini Index | | | 9 | | | | 12/2019 | | | | USD | | | | 136,609 | | | | 2,500 | |
| | | | | | | | | | | | | | | | | | | | |
Abbreviations
SEE NOTES TO FINANCIAL STATEMENTS.
| | | | | | |
| | | |
| 148 | | | | J.P. MORGAN EXCHANGE-TRADED FUNDS | | OCTOBER 31, 2019 |
JPMorgan U.S. Momentum Factor ETF
SCHEDULE OF PORTFOLIO INVESTMENTS
AS OF OCTOBER 31, 2019
| | | | | | | | |
| INVESTMENTS | | SHARES | | | VALUE($) | |
Common Stocks — 99.8% | |
|
Aerospace & Defense — 2.2% | |
| | |
Boeing Co. (The) | | | 2,249 | | | | 764,457 | |
| | |
HEICO Corp. | | | 940 | | | | 115,940 | |
| | |
Teledyne Technologies, Inc.* | | | 507 | | | | 167,107 | |
| | |
TransDigm Group, Inc. | | | 407 | | | | 214,196 | |
| | | | | | | | |
| | |
| | | | | | | 1,261,700 | |
| | | | | | | | |
|
Alternative Energy — 0.1% | |
| | |
First Solar, Inc.* | | | 1,208 | | | | 62,562 | |
| | | | | | | | |
|
Automobiles & Parts — 0.3% | |
| | |
Gentex Corp. | | | 5,278 | | | | 148,048 | |
| | | | | | | | |
|
Banks — 0.8% | |
| | |
Popular, Inc. (Puerto Rico) | | | 1,454 | | | | 79,185 | |
| | |
TCF Financial Corp. | | | 1,449 | | | | 57,375 | |
| | |
US Bancorp | | | 5,717 | | | | 325,983 | |
| | | | | | | | |
| | |
| | | | | | | 462,543 | |
| | | | | | | | |
|
Beverages — 0.7% | |
| | |
Coca-Cola Co. (The) | | | 3,971 | | | | 216,142 | |
| | |
Monster Beverage Corp.* | | | 3,093 | | | | 173,610 | |
| | | | | | | | |
| | |
| | | | | | | 389,752 | |
| | | | | | | | |
|
Chemicals — 2.2% | |
| | |
Air Products & Chemicals, Inc. | | | 690 | | | | 147,149 | |
| | |
Ashland Global Holdings, Inc. | | | 1,222 | | | | 94,546 | |
| | |
Avery Dennison Corp. | | | 1,183 | | | | 151,258 | |
| | |
CF Industries Holdings, Inc. | | | 3,206 | | | | 145,392 | |
| | |
Ecolab, Inc. | | | 1,539 | | | | 295,596 | |
| | |
FMC Corp. | | | 1,734 | | | | 158,661 | |
| | |
RPM International, Inc. | | | 1,787 | | | | 129,433 | |
| | |
WR Grace & Co. | | | 1,269 | | | | 84,325 | |
| | | | | | | | |
| | |
| | | | | | | 1,206,360 | |
| | | | | | | | |
|
Construction & Materials — 0.2% | |
| | |
Armstrong World Industries, Inc. | | | 731 | | | | 68,371 | |
| | |
Lennox International, Inc. (a) | | | 176 | | | | 43,535 | |
| | | | | | | | |
| | |
| | | | | | | 111,906 | |
| | | | | | | | |
|
Electricity — 2.4% | |
| | |
American Electric Power Co., Inc. | | | 1,572 | | | | 148,381 | |
| | |
DTE Energy Co. | | | 1,158 | | | | 147,436 | |
| | |
Entergy Corp. | | | 1,782 | | | | 216,477 | |
| | |
Eversource Energy | | | 2,511 | | | | 210,271 | |
| | |
NextEra Energy, Inc. | | | 2,333 | | | | 556,047 | |
| | |
Southern Co. (The) | | | 1,322 | | | | 82,837 | |
| | | | | | | | |
| | |
| | | | | | | 1,361,449 | |
| | | | | | | | |
| | | | | | | | |
| INVESTMENTS | | SHARES | | | VALUE($) | |
| | | | | | | | |
|
Electronic & Electrical Equipment — 0.6% | |
| | |
Keysight Technologies, Inc.* | | | 1,884 | | | | 190,115 | |
| | |
Zebra Technologies Corp., Class A* | | | 730 | | | | 173,645 | |
| | | | | | | | |
| | |
| | | | | | | 363,760 | |
| | | | | | | | |
|
Financial Services — 7.2% | |
| | |
American Express Co. | | | 2,892 | | | | 339,173 | |
| | |
CME Group, Inc. | | | 1,858 | | | | 382,283 | |
| | |
Credit Acceptance Corp.* | | | 238 | | | | 104,199 | |
| | |
Element Solutions, Inc.* | | | 1,300 | | | | 14,118 | |
| | |
LPL Financial Holdings, Inc. | | | 1,666 | | | | 134,679 | |
| | |
MarketAxess Holdings, Inc. | | | 296 | | | | 109,103 | |
| | |
Mastercard, Inc., Class A | | | 3,834 | | | | 1,061,289 | |
| | |
Moody’s Corp. | | | 1,172 | | | | 258,649 | |
| | |
MSCI, Inc. | | | 814 | | | | 190,932 | |
| | |
S&P Global, Inc. | | | 1,380 | | | | 356,026 | |
| | |
Visa, Inc., Class A | | | 6,335 | | | | 1,133,078 | |
| | | | | | | | |
| | |
| | | | | | | 4,083,529 | |
| | | | | | | | |
|
Fixed Line Telecommunications — 2.0% | |
| | |
AT&T, Inc. | | | 2,642 | | | | 101,690 | |
| | |
Verizon Communications, Inc. | | | 16,738 | | | | 1,012,147 | |
| | | | | | | | |
| | |
| | | | | | | 1,113,837 | |
| | | | | | | | |
|
Food & Drug Retailers — 0.7% | |
| | |
Casey’s General Stores, Inc. | | | 622 | | | | 106,244 | |
| | |
Sysco Corp. | | | 3,291 | | | | 262,852 | |
| | | | | | | | |
| | |
| | | | | | | 369,096 | |
| | | | | | | | |
|
Food Producers — 1.3% | |
| | |
Hershey Co. (The) | | | 1,261 | | | | 185,203 | |
| | |
Hormel Foods Corp. | | | 3,502 | | | | 143,197 | |
| | |
Lamb Weston Holdings, Inc. | | | 1,891 | | | | 147,573 | |
| | |
McCormick & Co., Inc.(Non-Voting) | | | 1,142 | | | | 183,508 | |
| | |
TreeHouse Foods, Inc.* | | | 1,287 | | | | 69,524 | |
| | | | | | | | |
| | |
| | | | | | | 729,005 | |
| | | | | | | | |
|
Gas, Water & Multiutilities — 1.1% | |
| | |
Ameren Corp. | | | 577 | | | | 44,833 | |
| | |
American Water Works Co., Inc. | | | 1,578 | | | | 194,520 | |
| | |
Atmos Energy Corp. | | | 1,391 | | | | 156,460 | |
| | |
WEC Energy Group, Inc. | | | 2,409 | | | | 227,410 | |
| | | | | | | | |
| | |
| | | | | | | 623,223 | |
| | | | | | | | |
|
General Industrials — 1.1% | |
| | |
AptarGroup, Inc. | | | 534 | | | | 63,092 | |
| | |
Ball Corp. | | | 2,674 | | | | 187,100 | |
| | |
Crown Holdings, Inc.* | | | 2,238 | | | | 163,016 | |
| | |
Danaher Corp. | | | 1,533 | | | | 211,278 | |
| | | | | | | | |
| | |
| | | | | | | 624,486 | |
| | | | | | | | |
SEE NOTES TO FINANCIAL STATEMENTS.
| | | | | | | | |
| | | |
| OCTOBER 31, 2019 | | J.P. MORGAN EXCHANGE-TRADED FUNDS | | | | | 149 | |
JPMorgan U.S. Momentum Factor ETF
SCHEDULE OF PORTFOLIO INVESTMENTS
AS OF OCTOBER 31, 2019 (continued)
| | | | | | | | |
| INVESTMENTS | | SHARES | | | VALUE($) | |
Common Stocks — continued | |
|
General Retailers — 7.4% | |
| | |
Amazon.com, Inc.* | | | 561 | | | | 996,706 | |
| | |
AutoZone, Inc.* | | | 198 | | | | 226,587 | |
| | |
Bright Horizons Family Solutions, Inc.* | | | 922 | | | | 136,936 | |
| | |
Burlington Stores, Inc.* | | | 810 | | | | 155,658 | |
| | |
Copart, Inc.* | | | 2,242 | | | | 185,279 | |
| | |
Costco Wholesale Corp. | | | 1,628 | | | | 483,695 | |
| | |
Dollar General Corp. | | | 1,688 | | | | 270,654 | |
| | |
frontdoor, Inc.* | | | 658 | | | | 31,735 | |
| | |
Home Depot, Inc. (The) | | | 4,504 | | | | 1,056,548 | |
| | |
O’Reilly Automotive, Inc.* | | | 252 | | | | 109,748 | |
| | |
Rollins, Inc. | | | 340 | | | | 12,958 | |
| | |
Ross Stores, Inc. | | | 430 | | | | 47,158 | |
| | |
Service Corp. International | | | 1,200 | | | | 54,576 | |
| | |
ServiceMaster Global Holdings, Inc.* | | | 1,612 | | | | 65,093 | |
| | |
TJX Cos., Inc. (The) | | | 6,658 | | | | 383,834 | |
| | | | | | | | |
| | |
| | | | | | | 4,217,165 | |
| | | | | | | | |
|
Health Care Equipment & Services — 8.5% | |
| | |
Anthem, Inc. | | | 1,281 | | | | 344,691 | |
| | |
Becton Dickinson and Co. | | | 1,399 | | | | 358,144 | |
| | |
Boston Scientific Corp.* | | | 7,947 | | | | 331,390 | |
| | |
Bruker Corp. (a) | | | 862 | | | | 38,359 | |
| | |
Chemed Corp. | | | 335 | | | | 131,960 | |
| | |
Cooper Cos., Inc. (The) | | | 472 | | | | 137,352 | |
| | |
DexCom, Inc.* | | | 1,009 | | | | 155,628 | |
| | |
Edwards Lifesciences Corp.* | | | 1,317 | | | | 313,947 | |
| | |
HCA Healthcare, Inc. | | | 1,804 | | | | 240,906 | |
| | |
Hill-Rom Holdings, Inc. | | | 772 | | | | 80,821 | |
| | |
IDEXX Laboratories, Inc.* | | | 730 | | | | 208,057 | |
| | |
Insulet Corp.* (a) | | | 734 | | | | 106,665 | |
| | |
Intuitive Surgical, Inc.* | | | 600 | | | | 331,770 | |
| | |
Masimo Corp.* | | | 698 | | | | 101,761 | |
| | |
Molina Healthcare, Inc.* | | | 1,003 | | | | 117,993 | |
| | |
ResMed, Inc. | | | 1,359 | | | | 201,023 | |
| | |
STERIS plc | | | 1,064 | | | | 150,631 | |
| | |
Stryker Corp. | | | 1,163 | | | | 251,522 | |
| | |
Teleflex, Inc. | | | 478 | | | | 166,062 | |
| | |
Thermo Fisher Scientific, Inc. | | | 1,197 | | | | 361,470 | |
| | |
UnitedHealth Group, Inc. | | | 1,980 | | | | 500,346 | |
| | |
WellCare Health Plans, Inc.* | | | 562 | | | | 166,689 | |
| | |
West Pharmaceutical Services, Inc. | | | 580 | | | | 83,427 | |
| | | | | | | | |
| | |
| | | | | | | 4,880,614 | |
| | | | | | | | |
|
Household Goods & Home Construction — 2.3% | |
| | |
Church & Dwight Co., Inc. | | | 2,361 | | | | 165,128 | |
| | |
Procter & Gamble Co. (The) | | | 7,715 | | | | 960,595 | |
| | | | | | | | |
| INVESTMENTS | | SHARES | | | VALUE($) | |
| | | | | | | | |
|
Household Goods & Home Construction — continued | |
| | |
PulteGroup, Inc. | | | 3,880 | | | | 152,251 | |
| | |
Wayfair, Inc., Class A* | | | 877 | | | | 72,116 | |
| | | | | | | | |
| | |
| | | | | | | 1,350,090 | |
| | | | | | | | |
|
Industrial Engineering — 0.3% | |
| | |
Ingersoll-Rand plc | | | 578 | | | | 73,343 | |
| | |
Xylem, Inc. | | | 1,499 | | | | 114,958 | |
| | | | | | | | |
| | |
| | | | | | | 188,301 | |
| | | | | | | | |
|
Industrial Transportation — 1.1% | |
| | |
CSX Corp. | | | 4,389 | | | | 308,415 | |
| | |
Norfolk Southern Corp. | | | 1,567 | | | | 285,194 | |
| | | | | | | | |
| | |
| | | | | | | 593,609 | |
| | | | | | | | |
|
Leisure Goods — 1.1% | |
| | |
Garmin Ltd. | | | 1,708 | | | | 160,125 | |
| | |
Hasbro, Inc. | | | 1,183 | | | | 115,118 | |
| | |
Pool Corp. | | | 720 | | | | 149,328 | |
| | |
Take-Two Interactive Software, Inc.* | | | 1,267 | | | | 152,483 | |
| | | | | | | | |
| | |
| | | | | | | 577,054 | |
| | | | | | | | |
|
Life Insurance — 0.0%(b) | |
| | |
Globe Life, Inc. | | | 159 | | | | 15,475 | |
| | | | | | | | |
|
Media — 1.0% | |
| | |
Cable One, Inc. | | | 101 | | | | 133,862 | |
| | |
Dolby Laboratories, Inc., Class A | | | 186 | | | | 11,965 | |
| | |
FactSet Research Systems, Inc. | | | 214 | | | | 54,253 | |
| | |
Fox Corp., Class A | | | 2,013 | | | | 64,497 | |
| | |
Graham Holdings Co., Class B | | | 58 | | | | 36,520 | |
| | |
Roku, Inc.* | | | 1,072 | | | | 157,799 | |
| | |
Sinclair Broadcast Group, Inc., Class A | | | 2,235 | | | | 89,042 | |
| | | | | | | | |
| | |
| | | | | | | 547,938 | |
| | | | | | | | |
|
Mobile Telecommunications — 0.2% | |
| | |
Telephone & Data Systems, Inc. | | | 314 | | | | 8,192 | |
| | |
T-Mobile US, Inc.* | | | 1,235 | | | | 102,085 | |
| | | | | | | | |
| | |
| | | | | | | 110,277 | |
| | | | | | | | |
|
Nonlife Insurance — 5.1% | |
| | |
Aon plc | | | 1,504 | | | | 290,513 | |
| | |
Arthur J Gallagher & Co. | | | 1,968 | | | | 179,521 | |
| | |
Berkshire Hathaway, Inc., Class B* | | | 5,370 | | | | 1,141,555 | |
| | |
Brown & Brown, Inc. | | | 4,010 | | | | 151,097 | |
| | |
CNA Financial Corp. | | | 432 | | | | 19,371 | |
| | |
Erie Indemnity Co., Class A | | | 413 | | | | 76,104 | |
| | |
First American Financial Corp. | | | 1,041 | | | | 64,313 | |
| | |
Hanover Insurance Group, Inc. (The) | | | 231 | | | | 30,425 | |
| | |
Marsh & McLennan Cos., Inc. | | | 2,802 | | | | 290,343 | |
SEE NOTES TO FINANCIAL STATEMENTS.
| | | | | | |
| | | |
| 150 | | | | J.P. MORGAN EXCHANGE-TRADED FUNDS | | OCTOBER 31, 2019 |
| | | | | | | | |
| INVESTMENTS | | SHARES | | | VALUE($) | |
Common Stocks — continued | |
|
Nonlife Insurance — continued | |
| | |
Old Republic International Corp. | | | 2,476 | | | | 55,314 | |
| | |
Progressive Corp. (The) | | | 3,585 | | | | 249,874 | |
| | |
Reinsurance Group of America, Inc. | | | 805 | | | | 130,788 | |
| | |
Travelers Cos., Inc. (The) | | | 1,628 | | | | 213,366 | |
| | | | | | | | |
| | |
| | | | | | | 2,892,584 | |
| | | | | | | | |
|
Oil & Gas Producers — 2.5% | |
| | |
Cabot Oil & Gas Corp. | | | 5,865 | | | | 109,324 | |
| | |
Chevron Corp. | | | 5,702 | | | | 662,230 | |
| | |
ConocoPhillips | | | 1,901 | | | | 104,935 | |
| | |
Diamondback Energy, Inc. | | | 1,158 | | | | 99,310 | |
| | |
EOG Resources, Inc. | | | 2,433 | | | | 168,631 | |
| | |
Hess Corp. | | | 2,836 | | | | 186,467 | |
| | |
WPX Energy, Inc.* | | | 6,915 | | | | 69,012 | |
| | | | | | | | |
| | |
| | | | | | | 1,399,909 | |
| | | | | | | | |
|
Oil Equipment, Services & Distribution — 1.5% | |
| | |
Kinder Morgan, Inc. | | | 12,944 | | | | 258,621 | |
| | |
OGE Energy Corp. | | | 3,335 | | | | 143,605 | |
| | |
ONEOK, Inc. | | | 3,221 | | | | 224,923 | |
| | |
Targa Resources Corp. | | | 2,530 | | | | 98,366 | |
| | |
Williams Cos., Inc. (The) | | | 8,696 | | | | 194,008 | |
| | | | | | | | |
| | |
| | | | | | | 919,523 | |
| | | | | | | | |
|
Personal Goods — 2.6% | |
| | |
Columbia Sportswear Co. | | | 1,159 | | | | 104,832 | |
| | |
Estee Lauder Cos., Inc. (The), Class A | | | 1,418 | | | | 264,131 | |
| | |
Lululemon Athletica, Inc.* | | | 1,080 | | | | 220,612 | |
| | |
NIKE, Inc., Class B | | | 5,904 | | | | 528,703 | |
| | |
Under Armour, Inc., Class A* | | | 5,003 | | | | 103,312 | |
| | |
Under Armour, Inc., Class C* | | | 5,322 | | | | 98,457 | |
| | |
VF Corp. | | | 1,670 | | | | 137,424 | |
| | | | | | | | |
| | |
| | | | | | | 1,457,471 | |
| | | | | | | | |
|
Pharmaceuticals & Biotechnology — 4.1% | |
| | |
Bio-Techne Corp. | | | 416 | | | | 86,599 | |
| | |
Eli Lilly & Co. | | | 4,218 | | | | 480,641 | |
| | |
Exact Sciences Corp.* | | | 1,270 | | | | 110,490 | |
| | |
Guardant Health, Inc.* | | | 1,447 | | | | 100,567 | |
| | |
IQVIA Holdings, Inc.* | | | 1,433 | | | | 206,954 | |
| | |
Merck & Co., Inc. | | | 11,194 | | | | 970,072 | |
| | |
Zoetis, Inc. | | | 2,747 | | | | 351,396 | |
| | | | | | | | |
| | |
| | | | | | | 2,306,719 | |
| | | | | | | | |
|
Real Estate Investment Trusts — 6.1% | |
| | |
Alexandria Real Estate Equities, Inc. | | | 1,104 | | | | 175,260 | |
| | |
American Tower Corp. | | | 964 | | | | 210,229 | |
| | | | | | | | |
| INVESTMENTS | | SHARES | | | VALUE($) | |
| | | | | | | | |
|
Real Estate Investment Trusts — continued | |
| | |
Apartment Investment & Management Co., Class A | | | 2,222 | | | | 121,943 | |
| | |
Chimera Investment Corp. | | | 4,860 | | | | 98,464 | |
| | |
CoreSite Realty Corp. | | | 487 | | | | 57,223 | |
| | |
CyrusOne, Inc. | | | 1,402 | | | | 99,935 | |
| | |
EPR Properties | | | 914 | | | | 71,100 | |
| | |
Equity LifeStyle Properties, Inc. | | | 2,370 | | | | 165,758 | |
| | |
Equity Residential | | | 2,784 | | | | 246,829 | |
| | |
HCP, Inc. | | | 5,181 | | | | 194,909 | |
| | |
Life Storage, Inc. | | | 715 | | | | 77,878 | |
| | |
Medical Properties Trust, Inc. | | | 7,299 | | | | 151,308 | |
| | |
National Retail Properties, Inc. | | | 2,628 | | | | 154,816 | |
| | |
Omega Healthcare Investors, Inc. | | | 3,622 | | | | 159,513 | |
| | |
Prologis, Inc. | | | 3,807 | | | | 334,102 | |
| | |
Realty Income Corp. | | | 2,676 | | | | 218,870 | |
| | |
STORE Capital Corp. | | | 3,836 | | | | 155,358 | |
| | |
Sun Communities, Inc. | | | 879 | | | | 142,969 | |
| | |
UDR, Inc. | | | 3,135 | | | | 157,534 | |
| | |
Welltower, Inc. | | | 2,860 | | | | 259,373 | |
| | |
WP Carey, Inc. | | | 1,846 | | | | 169,943 | |
| | | | | | | | |
| | |
| | | | | | | 3,423,314 | |
| | | | | | | | |
|
Software & Computer Services — 14.2% | |
| | |
Adobe, Inc.* | | | 2,205 | | | | 612,836 | |
| | |
Akamai Technologies, Inc.* | | | 1,884 | | | | 162,966 | |
| | |
Alteryx, Inc., Class A* | | | 976 | | | | 89,304 | |
| | |
Anaplan, Inc.* | | | 2,427 | | | | 114,554 | |
| | |
ANSYS, Inc.* | | | 882 | | | | 194,172 | |
| | |
Aspen Technology, Inc.* | | | 1,114 | | | | 128,233 | |
| | |
Atlassian Corp. plc, Class A* | | | 1,259 | | | | 152,075 | |
| | |
Avalara, Inc.* | | | 1,537 | | | | 109,127 | |
| | |
Black Knight, Inc.* | | | 1,261 | | | | 80,956 | |
| | |
CACI International, Inc., Class A* | | | 597 | | | | 133,579 | |
| | |
Cadence Design Systems, Inc.* | | | 2,729 | | | | 178,340 | |
| | |
CDW Corp. | | | 1,556 | | | | 199,028 | |
| | |
Cerence, Inc.* | | | 455 | | | | 7,052 | |
| | |
Ceridian HCM Holding, Inc.* | | | 2,279 | | | | 109,962 | |
| | |
Coupa Software, Inc.* | | | 1,058 | | | | 145,464 | |
| | |
Elastic NV* | | | 1,461 | | | | 105,207 | |
| | |
EPAM Systems, Inc.* | | | 806 | | | | 141,824 | |
| | |
Fortinet, Inc.* | | | 1,782 | | | | 145,340 | |
| | |
HubSpot, Inc.* (a) | | | 712 | | | | 110,431 | |
| | |
IAC/InterActiveCorp* | | | 726 | | | | 164,984 | |
| | |
Intuit, Inc. | | | 1,352 | | | | 348,140 | |
| | |
Leidos Holdings, Inc. | | | 1,823 | | | | 157,197 | |
| | |
Manhattan Associates, Inc.* | | | 1,622 | | | | 121,569 | |
SEE NOTES TO FINANCIAL STATEMENTS.
| | | | | | | | |
| | | |
| OCTOBER 31, 2019 | | J.P. MORGAN EXCHANGE-TRADED FUNDS | | | | | 151 | |
JPMorgan U.S. Momentum Factor ETF
SCHEDULE OF PORTFOLIO INVESTMENTS
AS OF OCTOBER 31, 2019 (continued)
| | | | | | | | |
| INVESTMENTS | | SHARES | | | VALUE($) | |
Common Stocks — continued | |
|
Software & Computer Services — continued | |
| | |
Match Group, Inc. (a) | | | 1,554 | | | | 113,426 | |
| | |
Microsoft Corp. | | | 8,331 | | | | 1,194,415 | |
| | |
MongoDB, Inc.* | | | 919 | | | | 117,421 | |
| | |
Nuance Communications, Inc.* | | | 3,699 | | | | 60,368 | |
| | |
Okta, Inc.* | | | 1,297 | | | | 141,464 | |
| | |
Paycom Software, Inc.* | | | 659 | | | | 139,398 | |
| | |
RealPage, Inc.* (a) | | | 1,556 | | | | 94,216 | |
| | |
RingCentral, Inc., Class A* | | | 1,075 | | | | 173,634 | |
| | |
salesforce.com, Inc.* | | | 3,895 | | | | 609,529 | |
| | |
ServiceNow, Inc.* | | | 1,152 | | | | 284,844 | |
| | |
Smartsheet, Inc., Class A* | | | 2,680 | | | | 105,592 | |
| | |
Switch, Inc., Class A | | | 2,647 | | | | 39,096 | |
| | |
Synopsys, Inc.* | | | 1,381 | | | | 187,471 | |
| | |
Twilio, Inc., Class A* | | | 1,336 | | | | 129,004 | |
| | |
Veeva Systems, Inc., Class A* | | | 1,205 | | | | 170,905 | |
| | |
VeriSign, Inc.* | | | 952 | | | | 180,899 | |
| | |
VMware, Inc., Class A | | | 905 | | | | 143,234 | |
| | |
Workday, Inc., Class A* | | | 1,134 | | | | 183,889 | |
| | |
Zendesk, Inc.* | | | 1,691 | | | | 119,469 | |
| | |
Zscaler, Inc.* | | | 1,892 | | | | 83,210 | |
| | | | | | | | |
| | |
| | | | | | | 7,983,824 | |
| | | | | | | | |
|
Support Services — 6.8% | |
| | |
Automatic Data Processing, Inc. | | | 2,340 | | | | 379,618 | |
| | |
Booz Allen Hamilton Holding Corp. | | | 2,037 | | | | 143,344 | |
| | |
Broadridge Financial Solutions, Inc. | | | 1,268 | | | | 158,779 | |
| | |
Cintas Corp. | | | 760 | | | | 204,189 | |
| | |
CoStar Group, Inc.* | | | 331 | | | | 181,891 | |
| | |
Euronet Worldwide, Inc.* | | | 937 | | | | 131,245 | |
| | |
Fair Isaac Corp.* | | | 434 | | | | 131,953 | |
| | |
Fidelity National Information Services, Inc. | | | 2,346 | | | | 309,109 | |
| | |
Fiserv, Inc.* | | | 2,752 | | | | 292,097 | |
| | |
Jack Henry & Associates, Inc. | | | 173 | | | | 24,490 | |
| | |
Paychex, Inc. | | | 2,506 | | | | 209,602 | |
| | |
PayPal Holdings, Inc.* | | | 5,379 | | | | 559,954 | |
| | |
Republic Services, Inc. | | | 2,084 | | | | 182,371 | |
| | |
TransUnion | | | 1,325 | | | | 109,472 | |
| | |
Verisk Analytics, Inc. | | | 1,309 | | | | 189,412 | |
| | |
Waste Management, Inc. | | | 2,587 | | | | 290,287 | |
| | |
WEX, Inc.* | | | 737 | | | | 139,426 | |
| | |
Willis Towers Watson plc | | | 1,080 | | | | 201,852 | |
| | | | | | | | |
| | |
| | | | | | | 3,839,091 | |
| | | | | | | | |
|
Technology Hardware & Equipment — 7.3% | |
| | |
Advanced Micro Devices, Inc.* | | | 7,460 | | | | 253,118 | |
| | |
Broadcom, Inc. | | | 1,903 | | | | 557,294 | |
| | |
Ciena Corp.* | | | 3,376 | | | | 125,317 | |
| | | | | | | | |
| INVESTMENTS | | SHARES | | | VALUE($) | |
| | | | | | | | |
|
Technology Hardware & Equipment — continued | |
| | |
Cisco Systems, Inc. | | | 18,844 | | | | 895,279 | |
| | |
Cypress Semiconductor Corp. | | | 6,383 | | | | 148,532 | |
| | |
Entegris, Inc. | | | 1,594 | | | | 76,512 | |
| | |
KLA Corp. | | | 1,391 | | | | 235,135 | |
| | |
L3Harris Technologies, Inc. | | | 1,393 | | | | 287,390 | |
| | |
Lam Research Corp. | | | 1,116 | | | | 302,481 | |
| | |
Motorola Solutions, Inc. | | | 1,268 | | | | 210,894 | |
| | |
Teradyne, Inc. | | | 2,810 | | | | 172,028 | |
| | |
Texas Instruments, Inc. | | | 3,951 | | | | 466,178 | |
| | |
Ubiquiti, Inc. (a) | | | 1,092 | | | | 138,236 | |
| | |
ViaSat, Inc.* | | | 1,668 | | | | 114,825 | |
| | |
Xilinx, Inc. | | | 2,068 | | | | 187,650 | |
| | | | | | | | |
| | |
| | | | | | | 4,170,869 | |
| | | | | | | | |
|
Travel & Leisure — 4.8% | |
| | |
Chipotle Mexican Grill, Inc.* | | | 234 | | | | 182,089 | |
| | |
Choice Hotels International, Inc. | | | 739 | | | | 65,387 | |
| | |
Darden Restaurants, Inc. | | | 1,377 | | | | 154,596 | |
| | |
Hilton Worldwide Holdings, Inc. | | | 2,035 | | | | 197,313 | |
| | |
Hyatt Hotels Corp., Class A | | | 324 | | | | 24,216 | |
| | |
Live Nation Entertainment, Inc.* | | | 2,130 | | | | 150,165 | |
| | |
McDonald’s Corp. | | | 3,466 | | | | 681,762 | |
| | |
Planet Fitness, Inc., Class A* | | | 1,738 | | | | 110,641 | |
| | |
Starbucks Corp. | | | 5,794 | | | | 489,941 | |
| | |
United Airlines Holdings, Inc.* | | | 1,549 | | | | 140,711 | |
| | |
Vail Resorts, Inc. | | | 156 | | | | 36,250 | |
| | |
Wendy’s Co. (The) | | | 5,860 | | | | 124,115 | |
| | |
Yum China Holdings, Inc. (China) | | | 3,958 | | | | 168,215 | |
| | |
Yum! Brands, Inc. | | | 2,148 | | | | 218,473 | |
| | | | | | | | |
| | |
| | | | | | | 2,743,874 | |
| | | | | | | | |
| | |
Total Common Stocks
(Cost $57,669,701) | | | | | | | 56,528,957 | |
| | | | | | | | |
Short-Term Investments — 1.2% | |
|
Investment Companies — 0.2% | |
| | |
JPMorgan U.S. Government Money Market Fund Class Institutional Shares, 1.64% (c) (d)
(Cost $87,612) | | | 87,612 | | | | 87,612 | |
| | | | | | | | |
|
Investment of Cash Collateral From Securities Loaned — 1.0% | |
| | |
JPMorgan U.S. Government Money Market Fund Class IM Shares, 1.70% (c) (d)
(Cost $561,328) | | | 561,328 | | | | 561,328 | |
| | | | | | | | |
| | |
Total Short-Term Investments
(Cost $648,940) | | | | | | | 648,940 | |
| | | | | | | | |
Total Investments — 101.0%
(Cost $58,318,641) | | | | | | | 57,177,897 | |
| | |
Liabilities in Excess of
Other Assets — (1.0%) | | | | | | | (557,308 | ) |
| | | | | | | | |
NET ASSETS — 100.0% | | | | | | | 56,620,589 | |
| | | | | | | | |
Percentages indicated are based on net assets.
SEE NOTES TO FINANCIAL STATEMENTS.
| | | | | | |
| | | |
| 152 | | | | J.P. MORGAN EXCHANGE-TRADED FUNDS | | OCTOBER 31, 2019 |
| | |
| (a) | | The security or a portion of this security is on loan at October 31, 2019. The total value of securities on loan at October 31, 2019 is $541,227. |
| (b) | | Amountrounds to less than 0.1% of net assets. |
| | |
| (c) | | Investment in an affiliated fund, which is registered under the Investment Company Act of 1940, as amended, and is advised by J.P. Morgan Investment Management Inc. |
| (d) | | Therate shown is the current yield as of October 31, 2019. |
| * | | Non-incomeproducing security. |
| | | | | | | | | | | | | | | | | | | | |
| Futures contracts outstanding as of October 31, 2019: | |
| DESCRIPTION | | NUMBER OF
CONTRACTS | | | EXPIRATION
DATE | | | TRADING
CURRENCY | | | NOTIONAL
AMOUNT($) | | | VALUE AND
UNREALIZED
APPRECIATION
(DEPRECIATION)($) | |
| | | | | |
Long Contracts | | | | | | | | | | | | | | | | | | | | |
| | | | | |
S&P 500 MicE-Mini Index | | | 4 | | | | 12/2019 | | | | USD | | | | 60,715 | | | | 1,316 | |
| | | | | | | | | | | | | | | | | | | | |
Abbreviations
SEE NOTES TO FINANCIAL STATEMENTS.
| | | | | | | | |
| | | |
| OCTOBER 31, 2019 | | J.P. MORGAN EXCHANGE-TRADED FUNDS | | | | | 153 | |
JPMorgan U.S. Quality Factor ETF
SCHEDULE OF PORTFOLIO INVESTMENTS
AS OF OCTOBER 31, 2019
| | | | | | | | |
| INVESTMENTS | | SHARES | | | VALUE($) | |
Common Stocks — 99.7% | |
|
Aerospace & Defense — 1.3% | |
| | |
Boeing Co. (The) | | | 4,062 | | | | 1,380,715 | |
| | |
Spirit AeroSystems Holdings, Inc., Class A | | | 116 | | | | 9,491 | |
| | | | | | | | |
| | |
| | | | | | | 1,390,206 | |
| | | | | | | | |
|
Banks — 1.2% | |
| | |
Bank of Hawaii Corp. | | | 2,726 | | | | 238,007 | |
| | |
Commerce Bancshares, Inc. | | | 3,882 | | | | 249,845 | |
| | |
US Bancorp | | | 13,935 | | | | 794,574 | |
| | | | | | | | |
| | |
| | | | | | | 1,282,426 | |
| | | | | | | | |
|
Beverages — 2.8% | |
| | |
Brown-Forman Corp., Class B | | | 3,702 | | | | 242,555 | |
| | |
Coca-Cola Co. (The) | | | 20,920 | | | | 1,138,676 | |
| | |
Monster Beverage Corp.* | | | 5,857 | | | | 328,753 | |
| | |
PepsiCo, Inc. | | | 9,443 | | | | 1,295,296 | |
| | | | | | | | |
| | |
| | | | | | | 3,005,280 | |
| | | | | | | | |
|
Chemicals — 1.8% | |
| | |
Air Products & Chemicals, Inc. | | | 2,301 | | | | 490,711 | |
| | |
Celanese Corp. | | | 2,700 | | | | 327,105 | |
| | |
CF Industries Holdings, Inc. | | | 4,004 | | | | 181,581 | |
| | |
LyondellBasell Industries NV, Class A | | | 3,730 | | | | 334,581 | |
| | |
NewMarket Corp. | | | 487 | | | | 236,434 | |
| | |
PPG Industries, Inc. | | | 2,906 | | | | 363,599 | |
| | | | | | | | |
| | |
| | | | | | | 1,934,011 | |
| | | | | | | | |
|
Construction & Materials — 0.3% | |
| | |
AO Smith Corp. | | | 2,044 | | | | 101,546 | |
| | |
Watsco, Inc. | | | 1,210 | | | | 213,323 | |
| | | | | | | | |
| | |
| | | | | | | 314,869 | |
| | | | | | | | |
|
Electricity — 2.2% | |
| | |
AES Corp. | | | 4,824 | | | | 82,249 | |
| | |
Exelon Corp. | | | 10,817 | | | | 492,065 | |
| | |
Hawaiian Electric Industries, Inc. | | | 1,341 | | | | 60,546 | |
| | |
IDACORP, Inc. | | | 1,271 | | | | 136,785 | |
| | |
NextEra Energy, Inc. | | | 3,348 | | | | 797,962 | |
| | |
NRG Energy, Inc. | | | 6,832 | | | | 274,100 | |
| | |
PG&E Corp.* | | | 7,292 | | | | 44,992 | |
| | |
Pinnacle West Capital Corp. | | | 2,871 | | | | 270,219 | |
| | |
Vistra Energy Corp. | | | 6,650 | | | | 179,750 | |
| | | | | | | | |
| | |
| | | | | | | 2,338,668 | |
| | | | | | | | |
|
Electronic & Electrical Equipment — 0.6% | |
| | |
Allegion plc | | | 1,078 | | | | 125,091 | |
| | |
Mettler-Toledo International, Inc.* | | | 422 | | | | 297,485 | |
| | |
Waters Corp.* | | | 1,353 | | | | 286,322 | |
| | | | | | | | |
| | |
| | | | | | | 708,898 | |
| | | | | | | | |
| | | | | | | | |
| INVESTMENTS | | SHARES | | | VALUE($) | |
| | | | | | | | |
|
Financial Services — 7.3% | |
| | |
American Express Co. | | | 6,400 | | | | 750,592 | |
| | |
Cboe Global Markets, Inc. | | | 2,104 | | | | 242,275 | |
| | |
Eaton Vance Corp. | | | 5,575 | | | | 254,220 | |
| | |
Mastercard, Inc., Class A | | | 6,968 | | | | 1,928,812 | |
| | |
Moody’s Corp. | | | 2,113 | | | | 466,318 | |
| | |
MSCI, Inc. | | | 1,250 | | | | 293,200 | |
| | |
Nasdaq, Inc. | | | 2,897 | | | | 289,034 | |
| | |
S&P Global, Inc. | | | 2,517 | | | | 649,361 | |
| | |
SEI Investments Co. | | | 4,528 | | | | 271,318 | |
| | |
T. Rowe Price Group, Inc. | | | 2,587 | | | | 299,574 | |
| | |
Visa, Inc., Class A | | | 11,545 | | | | 2,064,939 | |
| | |
Western Union Co. (The) | | | 12,385 | | | | 310,368 | |
| | | | | | | | |
| | |
| | | | | | | 7,820,011 | |
| | | | | | | | |
|
Fixed Line Telecommunications — 2.0% | |
| | |
AT&T, Inc. | | | 2,468 | | | | 94,993 | |
| | |
CenturyLink, Inc. | | | 9,104 | | | | 117,806 | |
| | |
Verizon Communications, Inc. | | | 32,336 | | | | 1,955,358 | |
| | | | | | | | |
| | |
| | | | | | | 2,168,157 | |
| | | | | | | | |
|
Food Producers — 0.5% | |
| | |
Hershey Co. (The) | | | 2,061 | | | | 302,699 | |
| | |
Hormel Foods Corp. | | | 4,969 | | | | 203,182 | |
| | | | | | | | |
| | |
| | | | | | | 505,881 | |
| | | | | | | | |
|
Gas, Water & Multiutilities — 1.1% | |
| | |
Ameren Corp. | | | 4,379 | | | | 340,248 | |
| | |
National Fuel Gas Co. | | | 4,256 | | | | 192,839 | |
| | |
UGI Corp. | | | 5,014 | | | | 239,018 | |
| | |
WEC Energy Group, Inc. | | | 4,376 | | | | 413,095 | |
| | | | | | | | |
| | |
| | | | | | | 1,185,200 | |
| | | | | | | | |
|
General Industrials — 1.8% | |
| | |
3M Co. | | | 5,191 | | | | 856,463 | |
| | |
Honeywell International, Inc. | | | 6,281 | | | | 1,084,917 | |
| | | | | | | | |
| | |
| | | | | | | 1,941,380 | |
| | | | | | | | |
|
General Retailers — 7.2% | |
| | |
Copart, Inc.* | | | 4,120 | | | | 340,477 | |
| | |
Costco Wholesale Corp. | | | 3,443 | | | | 1,022,950 | |
| | |
eBay, Inc. | | | 10,713 | | | | 377,633 | |
| | |
Foot Locker, Inc. | | | 3,891 | | | | 169,297 | |
| | |
frontdoor, Inc.* | | | 2,682 | | | | 129,353 | |
| | |
H&R Block, Inc. | | | 8,903 | | | | 222,486 | |
| | |
Home Depot, Inc. (The) | | | 8,599 | | | | 2,017,154 | |
| | |
Kohl’s Corp. | | | 982 | | | | 50,337 | |
| | |
Lowe’s Cos., Inc. | | | 7,323 | | | | 817,320 | |
| | |
Nordstrom, Inc. (a) | | | 3,927 | | | | 140,979 | |
SEE NOTES TO FINANCIAL STATEMENTS.
| | | | | | |
| | | |
| 154 | | | | J.P. MORGAN EXCHANGE-TRADED FUNDS | | OCTOBER 31, 2019 |
| | | | | | | | |
| INVESTMENTS | | SHARES | | | VALUE($) | |
Common Stocks — continued | |
|
General Retailers — continued | |
| | |
O’Reilly Automotive, Inc.* | | | 1,064 | | | | 463,383 | |
| | |
Ross Stores, Inc. | | | 4,475 | | | | 490,773 | |
| | |
Target Corp. | | | 5,424 | | | | 579,880 | |
| | |
TJX Cos., Inc. (The) | | | 12,260 | | | | 706,789 | |
| | |
Tractor Supply Co. | | | 766 | | | | 72,785 | |
| | |
Williams-Sonoma, Inc. | | | 2,935 | | | | 196,029 | |
| | | | | | | | |
| | |
| | | | | | | 7,797,625 | |
| | | | | | | | |
|
Health Care Equipment & Services — 1.6% | |
| | |
Chemed Corp. | | | 377 | | | | 148,504 | |
| | |
Edwards Lifesciences Corp.* | | | 2,387 | | | | 569,013 | |
| | |
IDEXX Laboratories, Inc.* | | | 1,312 | | | | 373,933 | |
| | |
ResMed, Inc. | | | 2,487 | | | | 367,877 | |
| | |
Varian Medical Systems, Inc.* | | | 2,103 | | | | 254,064 | |
| | | | | | | | |
| | |
| | | | | | | 1,713,391 | |
| | | | | | | | |
|
Household Goods & Home Construction — 0.9% | |
| | |
Church & Dwight Co., Inc. | | | 2,594 | | | | 181,424 | |
| | |
Clorox Co. (The) | | | 1,818 | | | | 268,501 | |
| | |
Procter & Gamble Co. (The) | | | 4,261 | | | | 530,537 | |
| | | | | | | | |
| | |
| | | | | | | 980,462 | |
| | | | | | | | |
|
Industrial Engineering — 2.2% | |
| | |
Allison Transmission Holdings, Inc. | | | 5,467 | | | | 238,416 | |
| | |
Donaldson Co., Inc. | | | 3,482 | | | | 183,641 | |
| | |
Graco, Inc. | | | 5,307 | | | | 239,876 | |
| | |
IDEX Corp. | | | 1,793 | | | | 278,865 | |
| | |
Illinois Tool Works, Inc. | | | 3,654 | | | | 615,991 | |
| | |
Lincoln Electric Holdings, Inc. | | | 2,251 | | | | 201,622 | |
| | |
Rockwell Automation, Inc. | | | 1,908 | | | | 328,157 | |
| | |
Toro Co. (The) | | | 3,522 | | | | 271,652 | |
| | | | | | | | |
| | |
| | | | | | | 2,358,220 | |
| | | | | | | | |
|
Industrial Metals & Mining — 0.1% | |
| | |
Southern Copper Corp. (Peru) | | | 2,945 | | | | 104,783 | |
| | | | | | | | |
|
Industrial Transportation — 1.7% | |
| | |
CH Robinson Worldwide, Inc. | | | 3,408 | | | | 257,781 | |
| | |
Landstar System, Inc. | | | 2,146 | | | | 242,820 | |
| | |
Union Pacific Corp. | | | 6,092 | | | | 1,007,982 | |
| | |
United Parcel Service, Inc., Class B | | | 2,787 | | | | 320,979 | |
| | | | | | | | |
| | |
| | | | | | | 1,829,562 | |
| | | | | | | | |
|
Leisure Goods — 0.1% | |
| | |
Electronic Arts, Inc.* | | | 783 | | | | 75,481 | |
| | | | | | | | |
|
Life Insurance — 0.7% | |
| | |
Aflac, Inc. | | | 8,949 | | | | 475,729 | |
| | |
Globe Life, Inc. | | | 3,050 | | | | 296,856 | |
| | | | | | | | |
| | |
| | | | | | | 772,585 | |
| | | | | | | | |
| | | | | | | | |
| INVESTMENTS | | SHARES | | | VALUE($) | |
| | | | | | | | |
|
Media — 1.1% | |
| | |
Cable One, Inc. | | | 110 | | | | 145,791 | |
| | |
Dolby Laboratories, Inc., Class A | | | 3,182 | | | | 204,698 | |
| | |
FactSet Research Systems, Inc. (a) | | | 967 | | | | 245,154 | |
| | |
Omnicom Group, Inc. | | | 4,054 | | | | 312,928 | |
| | |
Sirius XM Holdings, Inc. (a) | | | 43,358 | | | | 291,366 | |
| | | | | | | | |
| | |
| | | | | | | 1,199,937 | |
| | | | | | | | |
|
Mining — 0.2% | |
| | |
Royal Gold, Inc. | | | 2,019 | | | | 233,073 | |
| | | | | | | | |
|
Mobile Telecommunications — 0.1% | |
| | |
Telephone & Data Systems, Inc. | | | 2,283 | | | | 59,563 | |
| | | | | | | | |
|
Nonlife Insurance — 4.7% | |
| | |
Allstate Corp. (The) | | | 4,256 | | | | 452,924 | |
| | |
American Financial Group, Inc. | | | 2,513 | | | | 261,453 | |
| | |
Aon plc | | | 2,702 | | | | 521,918 | |
| | |
Arch Capital Group Ltd.* | | | 7,032 | | | | 293,656 | |
| | |
Arthur J Gallagher & Co. | | | 3,581 | | | | 326,659 | |
| | |
Brown & Brown, Inc. | | | 7,299 | | | | 275,026 | |
| | |
Chubb Ltd. | | | 3,142 | | | | 478,904 | |
| | |
Cincinnati Financial Corp. | | | 106 | | | | 12,000 | |
| | |
Erie Indemnity Co., Class A | | | 1,044 | | | | 192,378 | |
| | |
Hartford Financial Services Group, Inc. (The) | | | 3,594 | | | | 205,146 | |
| | |
Marsh & McLennan Cos., Inc. | | | 5,573 | | | | 577,474 | |
| | |
Old Republic International Corp. | | | 5,982 | | | | 133,638 | |
| | |
Progressive Corp. (The) | | | 6,523 | | | | 454,653 | |
| | |
Reinsurance Group of America, Inc. | | | 881 | | | | 143,136 | |
| | |
Travelers Cos., Inc. (The) | | | 2,890 | | | | 378,763 | |
| | |
WR Berkley Corp. | | | 3,930 | | | | 274,707 | |
| | | | | | | | |
| | |
| | | | | | | 4,982,435 | |
| | | | | | | | |
|
Oil & Gas Producers — 3.9% | |
| | |
Cabot Oil & Gas Corp. | | | 10,681 | | | | 199,094 | |
| | |
Chevron Corp. | | | 11,975 | | | | 1,390,777 | |
| | |
ConocoPhillips | | | 11,746 | | | | 648,379 | |
| | |
Exxon Mobil Corp. | | | 17,934 | | | | 1,211,800 | |
| | |
Occidental Petroleum Corp. | | | 7,087 | | | | 287,024 | |
| | |
Phillips 66 | | | 3,470 | | | | 405,365 | |
| | | | | | | | |
| | |
| | | | | | | 4,142,439 | |
| | | | | | | | |
|
Oil Equipment, Services & Distribution — 0.3% | |
| | |
Schlumberger Ltd. | | | 10,211 | | | | 333,798 | |
| | | | | | | | |
|
Personal Goods — 2.5% | |
| | |
Carter’s, Inc. | | | 1,152 | | | | 115,476 | |
| | |
Colgate-Palmolive Co. | | | 7,457 | | | | 511,550 | |
| | |
Estee Lauder Cos., Inc. (The), Class A | | | 1,899 | | | | 353,727 | |
| | |
Kimberly-Clark Corp. | | | 3,407 | | | | 452,722 | |
SEE NOTES TO FINANCIAL STATEMENTS.
| | | | | | | | |
| | | |
| OCTOBER 31, 2019 | | J.P. MORGAN EXCHANGE-TRADED FUNDS | | | | | 155 | |
JPMorgan U.S. Quality Factor ETF
SCHEDULE OF PORTFOLIO INVESTMENTS
AS OF OCTOBER 31, 2019 (continued)
| | | | | | | | |
| INVESTMENTS | | SHARES | | | VALUE($) | |
Common Stocks — continued | |
|
Personal Goods — continued | |
| | |
NIKE, Inc., Class B | | | 11,069 | | | | 991,229 | |
| | |
VF Corp. | | | 3,133 | | | | 257,815 | |
| | | | | | | | |
| | |
| | | | | | | 2,682,519 | |
| | | | | | | | |
|
Pharmaceuticals & Biotechnology — 11.4% | |
| | |
AbbVie, Inc. | | | 12,824 | | | | 1,020,149 | |
| | |
Amgen, Inc. | | | 5,180 | | | | 1,104,635 | |
| | |
Biogen, Inc.* | | | 1,953 | | | | 583,381 | |
| | |
Bio-Techne Corp. | | | 909 | | | | 189,226 | |
| | |
Bristol-Myers Squibb Co. | | | 15,745 | | | | 903,291 | |
| | |
Celgene Corp.* | | | 4,368 | | | | 471,875 | |
| | |
Eli Lilly & Co. | | | 7,664 | | | | 873,313 | |
| | |
Gilead Sciences, Inc. | | | 11,073 | | | | 705,461 | |
| | |
Incyte Corp.* | | | 1,197 | | | | 100,452 | |
| | |
Johnson & Johnson | | | 16,264 | | | | 2,147,498 | |
| | |
Merck & Co., Inc. | | | 20,356 | | | | 1,764,051 | |
| | |
Pfizer, Inc. | | | 40,122 | | | | 1,539,481 | |
| | |
Regeneron Pharmaceuticals, Inc.* | | | 731 | | | | 223,891 | |
| | |
Vertex Pharmaceuticals, Inc.* | | | 2,811 | | | | 549,494 | |
| | |
Zoetis, Inc. | | | 480 | | | | 61,402 | |
| | | | | | | | |
| | |
| | | | | | | 12,237,600 | |
| | | | | | | | |
|
Real Estate Investment Trusts — 4.5% | |
| | |
AGNC Investment Corp. | | | 12,399 | | | | 211,403 | |
| | |
American Tower Corp. | | | 3,969 | | | | 865,560 | |
| | |
Brookfield Property REIT, Inc., Class A | | | 5,775 | | | | 109,147 | |
| | |
Camden Property Trust | | | 1,437 | | | | 164,350 | |
| | |
Chimera Investment Corp. | | | 12,072 | | | | 244,578 | |
| | |
Equity LifeStyle Properties, Inc. | | | 4,306 | | | | 301,162 | |
| | |
Equity Residential (a) | | | 3,037 | | | | 269,260 | |
| | |
Federal Realty Investment Trust | | | 1,395 | | | | 189,734 | |
| | |
Gaming and Leisure Properties, Inc. | | | 6,381 | | | | 257,537 | |
| | |
Lamar Advertising Co., Class A | | | 2,594 | | | | 207,546 | |
| | |
Medical Properties Trust, Inc. | | | 13,281 | | | | 275,315 | |
| | |
MFA Financial, Inc. | | | 18,471 | | | | 140,195 | |
| | |
New Residential Investment Corp. | | | 9,633 | | | | 152,587 | |
| | |
Public Storage | | | 1,820 | | | | 405,605 | |
| | |
Simon Property Group, Inc. | | | 3,259 | | | | 491,066 | |
| | |
Starwood Property Trust, Inc. | | | 10,805 | | | | 265,803 | |
| | |
Vornado Realty Trust | | | 2,258 | | | | 148,193 | |
| | |
Weingarten Realty Investors | | | 2,982 | | | | 94,619 | |
| | | | | | | | |
| | |
| | | | | | | 4,793,660 | |
| | | | | | | | |
|
Software & Computer Services — 13.3% | |
| | |
Adobe, Inc.* | | | 3,990 | | | | 1,108,941 | |
| | |
Akamai Technologies, Inc.* | | | 3,461 | | | | 299,376 | |
| | |
Alphabet, Inc., Class A* | | | 1,618 | | | | 2,036,738 | |
| | | | | | | | |
| INVESTMENTS | | SHARES | | | VALUE($) | |
| | | | | | | | |
|
Software & Computer Services — continued | |
| | |
Aspen Technology, Inc.* | | | 2,047 | | | | 235,630 | |
| | |
Cadence Design Systems, Inc.* | | | 4,985 | | | | 325,770 | |
| | |
Cerner Corp. | | | 4,481 | | | | 300,765 | |
| | |
Citrix Systems, Inc. | | | 3,119 | | | | 339,534 | |
| | |
Cognizant Technology Solutions Corp., Class A | | | 5,853 | | | | 356,682 | |
| | |
EPAM Systems, Inc.* | | | 899 | | | | 158,188 | |
| | |
Facebook, Inc., Class A* | | | 10,386 | | | | 1,990,477 | |
| | |
International Business Machines Corp. | | | 7,723 | | | | 1,032,797 | |
| | |
Intuit, Inc. | | | 2,459 | | | | 633,193 | |
| | |
Manhattan Associates, Inc.* | | | 2,974 | | | | 222,901 | |
| | |
Match Group, Inc. (a) | | | 1,620 | | | | 118,244 | |
| | |
Microsoft Corp. | | | 15,143 | | | | 2,171,052 | |
| | |
Oracle Corp. | | | 19,639 | | | | 1,070,129 | |
| | |
Palo Alto Networks, Inc.* | | | 1,449 | | | | 329,488 | |
| | |
Paycom Software, Inc.* | | | 776 | | | | 164,147 | |
| | |
Premier, Inc., Class A* | | | 4,699 | | | | 153,093 | |
| | |
Proofpoint, Inc.* (a) | | | 2,219 | | | | 256,006 | |
| | |
Veeva Systems, Inc., Class A* | | | 2,203 | | | | 312,451 | |
| | |
VeriSign, Inc.* | | | 1,756 | | | | 333,675 | |
| | |
VMware, Inc., Class A | | | 1,650 | | | | 261,146 | |
| | | | | | | | |
| | |
| | | | | | | 14,210,423 | |
| | | | | | | | |
|
Support Services — 4.7% | |
| | |
Accenture plc, Class A | | | 5,497 | | | | 1,019,254 | |
| | |
Automatic Data Processing, Inc. | | | 4,224 | | | | 685,259 | |
| | |
Broadridge Financial Solutions, Inc. | | | 2,236 | | | | 279,992 | |
| | |
Fiserv, Inc.* | | | 5,006 | | | | 531,337 | |
| | |
Jack Henry & Associates, Inc. | | | 1,764 | | | | 249,712 | |
| | |
MSC Industrial Direct Co., Inc., Class A | | | 2,231 | | | | 163,332 | |
| | |
Paychex, Inc. | | | 4,518 | | | | 377,886 | |
| | |
PayPal Holdings, Inc.* | | | 7,383 | | | | 768,570 | |
| | |
Robert Half International, Inc. | | | 4,467 | | | | 255,825 | |
| | |
Verisk Analytics, Inc. | | | 2,403 | | | | 347,714 | |
| | |
WW Grainger, Inc. | | | 862 | | | | 266,220 | |
| | | | | | | | |
| | |
| | | | | | | 4,945,101 | |
| | | | | | | | |
|
Technology Hardware & Equipment — 9.0% | |
| | |
Apple, Inc. | | | 10,001 | | | | 2,487,849 | |
| | |
Cisco Systems, Inc. | | | 34,326 | | | | 1,630,828 | |
| | |
Intel Corp. | | | 28,480 | | | | 1,609,974 | |
| | |
Juniper Networks, Inc. | | | 8,661 | | | | 214,966 | |
| | |
Lam Research Corp. | | | 1,997 | | | | 541,267 | |
| | |
Maxim Integrated Products, Inc. | | | 5,717 | | | | 335,359 | |
| | |
NetApp, Inc. | | | 1,627 | | | | 90,917 | |
| | |
NVIDIA Corp. | | | 4,539 | | | | 912,430 | |
| | |
Qorvo, Inc.* | | | 2,212 | | | | 178,862 | |
SEE NOTES TO FINANCIAL STATEMENTS.
| | | | | | |
| | | |
| 156 | | | | J.P. MORGAN EXCHANGE-TRADED FUNDS | | OCTOBER 31, 2019 |
| | | | | | | | |
| INVESTMENTS | | SHARES | | | VALUE($) | |
Common Stocks — continued | |
|
Technology Hardware & Equipment — continued | |
| | |
Teradyne, Inc. | | | 5,130 | | | | 314,059 | |
| | |
Texas Instruments, Inc. | | | 8,223 | | | | 970,232 | |
| | |
Ubiquiti, Inc. | | | 913 | | | | 115,577 | |
| | |
Xilinx, Inc. | | | 3,378 | | | | 306,520 | |
| | | | | | | | |
| | |
| | | | | | | 9,708,840 | |
| | | | | | | | |
|
Tobacco — 1.1% | |
| | |
Altria Group, Inc. | | | 13,673 | | | | 612,413 | |
| | |
Philip Morris International, Inc. | | | 6,413 | | | | 522,275 | |
| | | | | | | | |
| | |
| | | | | | | 1,134,688 | |
| | | | | | | | |
|
Travel & Leisure — 5.5% | |
| | |
Booking Holdings, Inc.* | | | 402 | | | | 823,606 | |
| | |
Choice Hotels International, Inc. | | | 767 | | | | 67,864 | |
| | |
Darden Restaurants, Inc. | | | 2,544 | | | | 285,615 | |
| | |
Expedia Group, Inc. | | | 2,408 | | | | 329,077 | |
| | |
Hilton Worldwide Holdings, Inc. | | | 4,190 | | | | 406,263 | |
| | |
Las Vegas Sands Corp. | | | 5,937 | | | | 367,144 | |
| | |
Marriott International, Inc., Class A | | | 3,499 | | | | 442,799 | |
| | |
McDonald’s Corp. | | | 5,366 | | | | 1,055,492 | |
| | |
Six Flags Entertainment Corp. | | | 3,206 | | | | 135,261 | |
| | |
Southwest Airlines Co. | | | 7,354 | | | | 412,780 | |
| | |
Starbucks Corp. | | | 10,504 | | | | 888,218 | |
| | |
TripAdvisor, Inc.* | | | 4,498 | | | | 181,719 | |
| | |
Vail Resorts, Inc. | | | 595 | | | | 138,260 | |
| | |
Yum! Brands, Inc. | | | 3,061 | | | | 311,334 | |
| | | | | | | | |
| | |
| | | | | | | 5,845,432 | |
| | | | | | | | |
| | |
Total Common Stocks
(Cost $99,180,085) | | | | | | | 106,736,604 | |
| | | | | | | | |
| | | | | | | | |
| INVESTMENTS | | SHARES | | | VALUE($) | |
Short-Term Investments – 1.1% | |
|
Investment Companies — 0.2% | |
| | |
JPMorgan U.S. Government Money Market Fund Class Institutional Shares, 1.64% (b) (c)
(Cost $260,405) | | | 260,405 | | | | 260,405 | |
| | | | | | | | |
|
Investment of Cash Collateral From Securities Loaned — 0.9% | |
| | |
JPMorgan U.S. Government Money Market Fund Class IM Shares, 1.70% (b) (c)
(Cost $946,322) | | | 946,322 | | | | 946,322 | |
| | | | | | | | |
| | |
Total Short-Term Investments
(Cost $1,206,727) | | | | | | | 1,206,727 | |
| | | | | | | | |
Total Investments — 100.8%
(Cost $100,386,812) | | | | | | | 107,943,331 | |
| | |
Liabilities in Excess of
Other Assets — (0.8%) | | | | | | | (875,459 | ) |
| | | | | | | | |
NET ASSETS — 100.0% | | | | | | | 107,067,872 | |
| | | | | | | | |
Percentages indicated are based on net assets.
Abbreviations
| | |
| REIT | | RealEstate Investment Trust |
| |
| (a) | | The security or a portion of this security is on loan at October 31, 2019. The total value of securities on loan at October 31, 2019 is $928,985. |
| (b) | | Investment in an affiliated fund, which is registered under the Investment Company Act of 1940, as amended, and is advised by J.P. Morgan Investment Management Inc. |
| (c) | | Therate shown is the current yield as of October 31, 2019. |
| * | | Non-incomeproducing security. |
| | | | | | | | | | | | | | | | | | | | |
| Futures contracts outstanding as of October 31, 2019: | |
| DESCRIPTION | | NUMBER OF
CONTRACTS | | | EXPIRATION
DATE | | | TRADING
CURRENCY | | | NOTIONAL
AMOUNT($) | | | VALUE AND
UNREALIZED
APPRECIATION
(DEPRECIATION)($) | |
| | | | | |
Long Contracts | | | | | | | | | | | | | | | | | | | | |
| | | | | |
S&P 500 MicE-Mini Index | | | 17 | | | | 12/2019 | | | | USD | | | | 258,039 | | | | 3,452 | |
| | | | | | | | | | | | | | | | | | | | |
Abbreviations
SEE NOTES TO FINANCIAL STATEMENTS.
| | | | | | | | |
| | | |
| OCTOBER 31, 2019 | | J.P. MORGAN EXCHANGE-TRADED FUNDS | | | | | 157 | |
JPMorgan U.S. Value Factor ETF
SCHEDULE OF PORTFOLIO INVESTMENTS
AS OF OCTOBER 31, 2019
| | | | | | | | |
| INVESTMENTS | | SHARES | | | VALUE($) | |
Common Stocks — 99.7% | |
|
Aerospace & Defense — 1.3% | |
| | |
General Dynamics Corp. | | | 1,175 | | | | 207,740 | |
| | |
Textron, Inc. | | | 2,158 | | | | 99,462 | |
| | |
United Technologies Corp. | | | 4,064 | | | | 583,509 | |
| | | | | | | | |
| | |
| | | | | | | 890,711 | |
| | | | | | | | |
|
Automobiles & Parts — 1.9% | |
| | |
BorgWarner, Inc. | | | 3,641 | | | | 151,757 | |
| | |
Ford Motor Co. | | | 30,050 | | | | 258,130 | |
| | |
Gentex Corp. | | | 5,785 | | | | 162,269 | |
| | |
Genuine Parts Co. | | | 1,802 | | | | 184,849 | |
| | |
Goodyear Tire & Rubber Co. (The) | | | 11,908 | | | | 188,980 | |
| | |
Harley-Davidson, Inc. (a) | | | 4,585 | | | | 178,402 | |
| | |
Lear Corp. | | | 1,372 | | | | 161,580 | |
| | | | | | | | |
| | |
| | | | | | | 1,285,967 | |
| | | | | | | | |
|
Banks — 8.2% | |
| | |
Associated Banc-Corp. | | | 4,992 | | | | 100,389 | |
| | |
Bank of America Corp. | | | 4,251 | | | | 132,929 | |
| | |
Bank OZK | | | 3,240 | | | | 90,914 | |
| | |
BB&T Corp. | | | 6,529 | | | | 346,364 | |
| | |
BOK Financial Corp. | | | 605 | | | | 46,676 | |
| | |
Citigroup, Inc. | | | 8,890 | | | | 638,835 | |
| | |
Citizens Financial Group, Inc. | | | 6,253 | | | | 219,856 | |
| | |
Comerica, Inc. | | | 1,776 | | | | 116,186 | |
| | |
Fifth Third Bancorp | | | 7,937 | | | | 230,808 | |
| | |
First Horizon National Corp. | | | 6,085 | | | | 97,178 | |
| | |
FNB Corp. | | | 13,825 | | | | 166,730 | |
| | |
Huntington Bancshares, Inc. | | | 12,411 | | | | 175,367 | |
| | |
KeyCorp | | | 13,154 | | | | 236,377 | |
| | |
New York Community Bancorp, Inc. | | | 14,287 | | | | 166,444 | |
| | |
PacWest Bancorp | | | 4,278 | | | | 158,243 | |
| | |
People’s United Financial, Inc. | | | 8,506 | | | | 137,542 | |
| | |
PNC Financial Services Group, Inc. (The) | | | 3,174 | | | | 465,626 | |
| | |
Popular, Inc. (Puerto Rico) | | | 3,012 | | | | 164,034 | |
| | |
Regions Financial Corp. | | | 14,273 | | | | 229,795 | |
| | |
SunTrust Banks, Inc. | | | 4,354 | | | | 297,552 | |
| | |
Umpqua Holdings Corp. | | | 9,509 | | | | 150,432 | |
| | |
Wells Fargo & Co. | | | 21,627 | | | | 1,116,602 | |
| | | | | | | | |
| | |
| | | | | | | 5,484,879 | |
| | | | | | | | |
|
Beverages — 0.5% | |
| | |
Keurig Dr Pepper, Inc. | | | 5,030 | | | | 141,645 | |
| | |
Molson Coors Brewing Co., Class B | | | 3,171 | | | | 167,175 | |
| | | | | | | | |
| | |
| | | | | | | 308,820 | |
| | | | | | | | |
|
Chemicals — 1.2% | |
| | |
Cabot Corp. | | | 893 | | | | 38,926 | |
| | |
Chemours Co. (The) | | | 5,052 | | | | 82,903 | |
| | | | | | | | |
| INVESTMENTS | | SHARES | | | VALUE($) | |
| | | | | | | | |
|
Chemicals — continued | |
| | |
DuPont de Nemours, Inc. | | | 1,297 | | | | 85,485 | |
| | |
Eastman Chemical Co. | | | 1,977 | | | | 150,331 | |
| | |
Huntsman Corp. | | | 5,380 | | | | 119,060 | |
| | |
LyondellBasell Industries NV, Class A | | | 2,617 | | | | 234,745 | |
| | |
Olin Corp. | | | 4,324 | | | | 79,302 | |
| | | | | | | | |
| | |
| | | | | | | 790,752 | |
| | | | | | | | |
|
Construction & Materials — 0.5% | |
| | |
AECOM* | | | 4,186 | | | | 167,482 | |
| | |
Owens Corning | | | 2,636 | | | | 161,534 | |
| | | | | | | | |
| | |
| | | | | | | 329,016 | |
| | | | | | | | |
|
Electricity — 2.3% | |
| | |
Avangrid, Inc. | | | 2,375 | | | | 118,869 | |
| | |
Consolidated Edison, Inc. | | | 2,794 | | | | 257,662 | |
| | |
Exelon Corp. | | | 6,644 | | | | 302,236 | |
| | |
Hawaiian Electric Industries, Inc. | | | 2,515 | | | | 113,552 | |
| | |
Pinnacle West Capital Corp. | | | 1,087 | | | | 102,308 | |
| | |
PPL Corp. | | | 7,136 | | | | 238,985 | |
| | |
Public Service Enterprise Group, Inc. | | | 2,581 | | | | 163,403 | |
| | |
Southern Co. (The) | | | 3,606 | | | | 225,952 | |
| | | | | | | | |
| | |
| | | | | | | 1,522,967 | |
| | | | | | | | |
|
Electronic & Electrical Equipment — 1.6% | |
| | |
Arrow Electronics, Inc.* | | | 930 | | | | 73,730 | |
| | |
Avnet, Inc. | | | 1,892 | | | | 74,848 | |
| | |
Emerson Electric Co. | | | 4,540 | | | | 318,481 | |
| | |
Hubbell, Inc. | | | 1,183 | | | | 167,631 | |
| | |
nVent Electric plc | | | 6,324 | | | | 145,831 | |
| | |
Regal Beloit Corp. | | | 1,843 | | | | 136,474 | |
| | |
WESCO International, Inc.* | | | 2,767 | | | | 138,765 | |
| | | | | | | | |
| | |
| | | | | | | 1,055,760 | |
| | | | | | | | |
|
Financial Services — 4.0% | |
| | |
Ally Financial, Inc. | | | 4,882 | | | | 149,536 | |
| | |
Bank of New York Mellon Corp. (The) | | | 7,116 | | | | 332,673 | |
| | |
Capital One Financial Corp. | | | 3,803 | | | | 354,630 | |
| | |
Goldman Sachs Group, Inc. (The) | | | 2,205 | | | | 470,503 | |
| | |
Invesco Ltd. | | | 8,793 | | | | 147,898 | |
| | |
Janus Henderson Group plc (United Kingdom) | | | 4,363 | | | | 100,916 | |
| | |
Jefferies Financial Group, Inc. | | | 5,951 | | | | 111,105 | |
| | |
Legg Mason, Inc. | | | 4,197 | | | | 156,380 | |
| | |
Morgan Stanley | | | 8,954 | | | | 412,332 | |
| | |
Navient Corp. | | | 11,364 | | | | 156,482 | |
| | |
State Street Corp. | | | 4,219 | | | | 278,750 | |
| | | | | | | | |
| | |
| | | | | | | 2,671,205 | |
| | | | | | | | |
SEE NOTES TO FINANCIAL STATEMENTS.
| | | | | | |
| | | |
| 158 | | | | J.P. MORGAN EXCHANGE-TRADED FUNDS | | OCTOBER 31, 2019 |
| | | | | | | | |
| INVESTMENTS | | SHARES | | | VALUE($) | |
Common Stocks — continued | |
|
Fixed Line Telecommunications — 2.1% | |
| | |
AT&T, Inc. | | | 19,492 | | | | 750,247 | |
| | |
CenturyLink, Inc. | | | 6,274 | | | | 81,186 | |
| | |
Verizon Communications, Inc. | | | 9,041 | | | | 546,709 | |
| | | | | | | | |
| | |
| | | | | | | 1,378,142 | |
| | | | | | | | |
|
Food & Drug Retailers — 1.9% | |
| | |
AmerisourceBergen Corp. | | | 1,386 | | | | 118,337 | |
| | |
CVS Health Corp. | | | 7,547 | | | | 501,045 | |
| | |
Kroger Co. (The) | | | 7,847 | | | | 193,350 | |
| | |
McKesson Corp. | | | 1,298 | | | | 172,634 | |
| | |
Walgreens Boots Alliance, Inc. | | | 5,375 | | | | 294,443 | |
| | | | | | | | |
| | |
| | | | | | | 1,279,809 | |
| | | | | | | | |
|
Food Producers — 2.2% | |
| | |
Archer-Daniels-Midland Co. | | | 5,147 | | | | 216,380 | |
| | |
Bunge Ltd. | | | 2,239 | | | | 120,906 | |
| | |
Flowers Foods, Inc. | | | 6,226 | | | | 135,229 | |
| | |
General Mills, Inc. | | | 4,840 | | | | 246,162 | |
| | |
Ingredion, Inc. | | | 1,876 | | | | 148,204 | |
| | |
JM Smucker Co. (The) | | | 1,461 | | | | 154,399 | |
| | |
Kraft Heinz Co. (The) | | | 7,528 | | | | 243,380 | |
| | |
Tyson Foods, Inc., Class A | | | 2,552 | | | | 211,280 | |
| | | | | | | | |
| | |
| | | | | | | 1,475,940 | |
| | | | | | | | |
|
Forestry & Paper — 0.3% | |
| | |
Domtar Corp. | | | 2,775 | | | | 100,982 | |
| | |
International Paper Co. | | | 3,109 | | | | 135,801 | |
| | | | | | | | |
| | |
| | | | | | | 236,783 | |
| | | | | | | | |
|
Gas, Water & Multiutilities — 0.9% | |
| | |
CenterPoint Energy, Inc. | | | 6,382 | | | | 185,525 | |
| | |
Duke Energy Corp. | | | 4,412 | | | | 415,875 | |
| | |
National Fuel Gas Co. | | | 728 | | | | 32,986 | |
| | | | | | | | |
| | |
| | | | | | | 634,386 | |
| | | | | | | | |
|
General Industrials — 2.2% | |
| | |
Carlisle Cos., Inc. | | | 1,099 | | | | 167,345 | |
| | |
Eaton Corp. plc | | | 3,323 | | | | 289,467 | |
| | |
Graphic Packaging Holding Co. | | | 9,870 | | | | 154,564 | |
| | |
Packaging Corp. of America | | | 1,638 | | | | 179,295 | |
| | |
Parker-Hannifin Corp. | | | 1,291 | | | | 236,886 | |
| | |
Silgan Holdings, Inc. | | | 4,048 | | | | 124,557 | |
| | |
Sonoco Products Co. | | | 2,374 | | | | 136,980 | |
| | |
Westrock Co. | | | 4,735 | | | | 176,947 | |
| | | | | | | | |
| | |
| | | | | | | 1,466,041 | |
| | | | | | | | |
|
General Retailers — 3.1% | |
| | |
AutoNation, Inc.* | | | 2,025 | | | | 102,971 | |
| | |
Best Buy Co., Inc. | | | 2,763 | | | | 198,466 | |
| | | | | | | | |
| INVESTMENTS | | SHARES | | | VALUE($) | |
| | | | | | | | |
|
General Retailers — continued | |
| | |
Dick’s Sporting Goods, Inc. | | | 3,572 | | | | 139,058 | |
| | |
Foot Locker, Inc. | | | 2,557 | | | | 111,255 | |
| | |
Gap, Inc. (The) | | | 5,962 | | | | 96,942 | |
| | |
H&R Block, Inc. | | | 5,467 | | | | 136,620 | |
| | |
KAR Auction Services, Inc. | | | 2,871 | | | | 71,373 | |
| | |
Kohl’s Corp. | | | 3,091 | | | | 158,445 | |
| | |
L Brands, Inc. | | | 4,672 | | | | 79,611 | |
| | |
Macy’s, Inc. | | | 9,791 | | | | 148,431 | |
| | |
Nordstrom, Inc. (a) | | | 2,662 | | | | 95,566 | |
| | |
Penske Automotive Group, Inc. | | | 2,975 | | | | 144,942 | |
| | |
Target Corp. | | | 3,258 | | | | 348,313 | |
| | |
Urban Outfitters, Inc.* | | | 2,972 | | | | 85,297 | |
| | |
Williams-Sonoma, Inc. | | | 2,234 | | | | 149,209 | |
| | | | | | | | |
| | |
| | | | | | | 2,066,499 | |
| | | | | | | | |
|
Health Care Equipment & Services — 5.4% | |
| | |
Anthem, Inc. | | | 1,543 | | | | 415,191 | |
| | |
Baxter International, Inc. | | | 1,478 | | | | 113,362 | |
| | |
Becton Dickinson and Co. | | | 1,421 | | | | 363,776 | |
| | |
Cigna Corp. | | | 2,290 | | | | 408,673 | |
| | |
Hill-Rom Holdings, Inc. | | | 1,270 | | | | 132,956 | |
| | |
MEDNAX, Inc.* | | | 2,391 | | | | 52,506 | |
| | |
Medtronic plc | | | 6,473 | | | | 704,910 | |
| | |
Quest Diagnostics, Inc. | | | 1,700 | | | | 172,125 | |
| | |
UnitedHealth Group, Inc. | | | 3,742 | | | | 945,603 | |
| | |
Universal Health Services, Inc., Class B | | | 1,198 | | | | 164,677 | |
| | |
Zimmer Biomet Holdings, Inc. | | | 1,412 | | | | 195,181 | |
| | | | | | | | |
| | |
| | | | | | | 3,668,960 | |
| | | | | | | | |
|
Household Goods & Home Construction — 1.5% | |
| | |
Leggett & Platt, Inc. | | | 1,955 | | | | 100,291 | |
| | |
Lennar Corp., Class A | | | 3,680 | | | | 219,328 | |
| | |
Newell Brands, Inc. | | | 7,416 | | | | 140,682 | |
| | |
PulteGroup, Inc. | | | 4,776 | | | | 187,410 | |
| | |
Stanley Black & Decker, Inc. | | | 1,425 | | | | 215,645 | |
| | |
Toll Brothers, Inc. | | | 4,021 | | | | 159,915 | |
| | | | | | | | |
| | |
| | | | | | | 1,023,271 | |
| | | | | | | | |
|
Industrial Engineering — 3.6% | |
| | |
AGCO Corp. | | | 1,973 | | | | 151,309 | |
| | |
Allison Transmission Holdings, Inc. | | | 3,066 | | | | 133,708 | |
| | |
Caterpillar, Inc. | | | 2,621 | | | | 361,174 | |
| | |
Crane Co. | | | 1,630 | | | | 124,728 | |
| | |
Cummins, Inc. | | | 1,456 | | | | 251,131 | |
| | |
Dover Corp. | | | 1,945 | | | | 202,066 | |
| | |
Ingersoll-Rand plc | | | 1,148 | | | | 145,670 | |
| | |
Oshkosh Corp. | | | 1,992 | | | | 170,077 | |
SEE NOTES TO FINANCIAL STATEMENTS.
| | | | | | | | |
| | | |
| OCTOBER 31, 2019 | | J.P. MORGAN EXCHANGE-TRADED FUNDS | | | | | 159 | |
JPMorgan U.S. Value Factor ETF
SCHEDULE OF PORTFOLIO INVESTMENTS
AS OF OCTOBER 31, 2019 (continued)
| | | | | | | | |
| INVESTMENTS | | SHARES | | | VALUE($) | |
Common Stocks — continued | |
|
Industrial Engineering — continued | |
| | |
PACCAR, Inc. | | | 3,278 | | | | 249,325 | |
| | |
Pentair plc | | | 3,682 | | | | 152,692 | |
| | |
Snap-on, Inc. | | | 1,009 | | | | 164,134 | |
| | |
Timken Co. (The) | | | 3,402 | | | | 166,698 | |
| | |
Trinity Industries, Inc. | | | 6,025 | | | | 119,174 | |
| | | | | | | | |
| | |
| | | | | | | 2,391,886 | |
| | | | | | | | |
|
Industrial Metals & Mining — 0.7% | |
| | |
Nucor Corp. | | | 3,421 | | | | 184,221 | |
| | |
Reliance Steel & Aluminum Co. | | | 1,563 | | | | 181,370 | |
| | |
Steel Dynamics, Inc. | | | 3,600 | | | | 109,296 | |
| | | | | | | | |
| | |
| | | | | | | 474,887 | |
| | | | | | | | |
|
Industrial Transportation — 1.8% | |
| | |
Kansas City Southern | | | 1,417 | | | | 199,485 | |
| | |
Macquarie Infrastructure Corp. | | | 3,340 | | | | 144,088 | |
| | |
Norfolk Southern Corp. | | | 1,752 | | | | 318,864 | |
| | |
Ryder System, Inc. | | | 2,275 | | | | 110,633 | |
| | |
Schneider National, Inc., Class B | | | 3,289 | | | | 75,220 | |
| | |
Union Pacific Corp. | | | 2,053 | | | | 339,689 | |
| | | | | | | | |
| | |
| | | | | | | 1,187,979 | |
| | | | | | | | |
|
Leisure Goods — 0.6% | |
| | |
Garmin Ltd. | | | 2,018 | | | | 189,188 | |
| | |
Thor Industries, Inc. | | | 2,953 | | | | 186,807 | |
| | | | | | | | |
| | |
| | | | | | | 375,995 | |
| | | | | | | | |
|
Life Insurance — 1.6% | |
| | |
Lincoln National Corp. | | | 3,202 | | | | 180,849 | |
| | |
MetLife, Inc. | | | 6,756 | | | | 316,113 | |
| | |
Principal Financial Group, Inc. | | | 3,931 | | | | 209,837 | |
| | |
Prudential Financial, Inc. | | | 3,396 | | | | 309,511 | |
| | |
Unum Group | | | 3,657 | | | | 100,714 | |
| | | | | | | | |
| | |
| | | | | | | 1,117,024 | |
| | | | | | | | |
|
Media — 5.6% | |
| | |
AMC Networks, Inc., Class A* | | | 997 | | | | 43,419 | |
| | |
CBS Corp.(Non-Voting), Class B | | | 2,541 | | | | 91,578 | |
| | |
Comcast Corp., Class A | | | 21,771 | | | | 975,776 | |
| | |
Discovery, Inc., Class A* (a) | | | 4,095 | | | | 110,381 | |
| | |
DISH Network Corp., Class A* | | | 4,294 | | | | 147,628 | |
| | |
Fox Corp., Class A | | | 3,236 | | | | 103,681 | |
| | |
Fox Corp., Class B | | | 2,537 | | | | 79,256 | |
| | |
Graham Holdings Co., Class B | | | 137 | | | | 86,264 | |
| | |
Interpublic Group of Cos., Inc. (The) | | | 6,487 | | | | 141,092 | |
| | |
John Wiley & Sons, Inc., Class A | | | 2,119 | | | | 97,622 | |
| | |
Liberty Media Corp.-Liberty SiriusXM, Class C* | | | 3,719 | | | | 168,062 | |
| | |
Lions Gate Entertainment Corp., Class A* | | | 5,092 | | | | 40,685 | |
| | | | | | | | |
| INVESTMENTS | | SHARES | | | VALUE($) | |
| | | | | | | | |
|
Media — continued | |
| | |
Nexstar Media Group, Inc., Class A | | | 816 | | | | 79,389 | |
| | |
Nielsen Holdings plc | | | 6,431 | | | | 129,649 | |
| | |
Omnicom Group, Inc. | | | 2,490 | | | | 192,203 | |
| | |
Qurate Retail, Inc., Series A* | | | 8,897 | | | | 84,877 | |
| | |
Sinclair Broadcast Group, Inc., Class A | | | 1,641 | | | | 65,377 | |
| | |
Viacom, Inc., Class B | | | 6,502 | | | | 140,183 | |
| | |
Walt Disney Co. (The) | | | 7,759 | | | | 1,008,049 | |
| | | | | | | | |
| | |
| | | | | | | 3,785,171 | |
| | | | | | | | |
|
Nonlife Insurance — 1.2% | |
| | |
Assured Guaranty Ltd. | | | 3,749 | | | | 175,903 | |
| | |
First American Financial Corp. | | | 2,912 | | | | 179,903 | |
| | |
Mercury General Corp. | | | 1,288 | | | | 61,901 | |
| | |
Old Republic International Corp. | | | 7,593 | | | | 169,628 | |
| | |
Reinsurance Group of America, Inc. | | | 1,204 | | | | 195,614 | |
| | | | | | | | |
| | |
| | | | | | | 782,949 | |
| | | | | | | | |
|
Oil & Gas Producers — 3.9% | |
| | |
Chevron Corp. | | | 8,043 | | | | 934,114 | |
| | |
ConocoPhillips | | | 975 | | | | 53,820 | |
| | |
Exxon Mobil Corp. | | | 13,368 | | | | 903,276 | |
| | |
HollyFrontier Corp. | | | 2,384 | | | | 130,977 | |
| | |
Marathon Petroleum Corp. | | | 4,978 | | | | 318,343 | |
| | |
Valero Energy Corp. | | | 2,990 | | | | 289,970 | |
| | | | | | | | |
| | |
| | | | | | | 2,630,500 | |
| | | | | | | | |
|
Oil Equipment, Services & Distribution — 0.3% | |
| | |
Helmerich & Payne, Inc. | | | 1,550 | | | | 58,125 | |
| | |
Kinder Morgan, Inc. | | | 5,508 | | | | 110,050 | |
| | | | | | | | |
| | |
| | | | | | | 168,175 | |
| | | | | | | | |
|
Personal Goods — 1.2% | |
| | |
Capri Holdings Ltd.* | | | 2,152 | | | | 66,863 | |
| | |
Hanesbrands, Inc. | | | 10,686 | | | | 162,534 | |
| | |
Nu Skin Enterprises, Inc., Class A | | | 1,139 | | | | 50,777 | |
| | |
PVH Corp. | | | 1,966 | | | | 171,357 | |
| | |
Ralph Lauren Corp. | | | 1,633 | | | | 156,866 | |
| | |
Tapestry, Inc. | | | 7,275 | | | | 188,131 | |
| | | | | | | | |
| | |
| | | | | | | 796,528 | |
| | | | | | | | |
|
Pharmaceuticals & Biotechnology — 6.8% | |
| | |
Abbott Laboratories | | | 1,513 | | | | 126,502 | |
| | |
Allergan plc | | | 2,159 | | | | 380,222 | |
| | |
Amgen, Inc. | | | 2,115 | | | | 451,024 | |
| | |
Cardinal Health, Inc. | | | 2,830 | | | | 139,944 | |
| | |
Gilead Sciences, Inc. | | | 6,285 | | | | 400,417 | |
| | |
Johnson & Johnson | | | 7,823 | | | | 1,032,949 | |
| | |
Merck & Co., Inc. | | | 10,094 | | | | 874,746 | |
SEE NOTES TO FINANCIAL STATEMENTS.
| | | | | | |
| | | |
| 160 | | | | J.P. MORGAN EXCHANGE-TRADED FUNDS | | OCTOBER 31, 2019 |
| | | | | | | | |
| INVESTMENTS | | SHARES | | | VALUE($) | |
Common Stocks — continued | |
|
Pharmaceuticals & Biotechnology — continued | |
| | |
Perrigo Co. plc (a) | | | 1,242 | | | | 65,851 | |
| | |
Pfizer, Inc. | | | 26,709 | | | | 1,024,824 | |
| | | | | | | | |
| | |
| | | | | | | 4,496,479 | |
| | | | | | | | |
|
Real Estate Investment Trusts — 4.0% | |
| | |
AGNC Investment Corp. | | | 10,692 | | | | 182,299 | |
| | |
Annaly Capital Management, Inc. | | | 20,845 | | | | 187,188 | |
| | |
Apple Hospitality REIT, Inc. | | | 5,510 | | | | 90,805 | |
| | |
Brandywine Realty Trust | | | 6,399 | | | | 97,777 | |
| | |
Brixmor Property Group, Inc. | | | 5,348 | | | | 117,763 | |
| | |
Chimera Investment Corp. | | | 8,233 | | | | 166,801 | |
| | |
Colony Capital, Inc. | | | 835 | | | | 4,676 | |
| | |
Columbia Property Trust, Inc. | | | 2,652 | | | | 54,419 | |
| | |
EPR Properties | | | 1,552 | | | | 120,730 | |
| | |
Kimco Realty Corp. | | | 9,526 | | | | 205,381 | |
| | |
Medical Properties Trust, Inc. | | | 9,462 | | | | 196,147 | |
| | |
MFA Financial, Inc. | | | 21,328 | | | | 161,879 | |
| | |
New Residential Investment Corp. | | | 10,834 | | | | 171,610 | |
| | |
Omega Healthcare Investors, Inc. | | | 4,451 | | | | 196,022 | |
| | |
Park Hotels & Resorts, Inc. | | | 5,550 | | | | 129,037 | |
| | |
Retail Properties of America, Inc., Class A | | | 7,087 | | | | 97,517 | |
| | |
Service Properties Trust | | | 5,167 | | | | 130,725 | |
| | |
Starwood Property Trust, Inc. | | | 7,266 | | | | 178,744 | |
| | |
Two Harbors Investment Corp. | | | 11,195 | | | | 155,275 | |
| | |
Weingarten Realty Investors | | | 1,396 | | | | 44,295 | |
| | | | | | | | |
| | |
| | | | | | | 2,689,090 | |
| | | | | | | | |
|
Software & Computer Services — 7.3% | |
| | |
Akamai Technologies, Inc.* | | | 1,971 | | | | 170,491 | |
| | |
Amdocs Ltd. | | | 2,492 | | | | 162,478 | |
| | |
CACI International, Inc., Class A* | | | 376 | | | | 84,130 | |
| | |
CDK Global, Inc. | | | 1,721 | | | | 86,979 | |
| | |
CDW Corp. | | | 1,371 | | | | 175,365 | |
| | |
Cerence, Inc.* | | | 497 | | | | 7,704 | |
| | |
Cerner Corp. | | | 2,322 | | | | 155,853 | |
| | |
Cognizant Technology Solutions Corp., Class A | | | 3,233 | | | | 197,019 | |
| | |
Covetrus, Inc.* | | | 5,091 | | | | 50,477 | |
| | |
DXC Technology Co. | | | 4,616 | | | | 127,725 | |
| | |
Hewlett Packard Enterprise Co. | | | 13,955 | | | | 229,002 | |
| | |
International Business Machines Corp. | | | 4,663 | | | | 623,583 | |
| | |
Leidos Holdings, Inc. | | | 2,005 | | | | 172,891 | |
| | |
LogMeIn, Inc. | | | 1,824 | | | | 119,800 | |
| | |
Microsoft Corp. | | | 9,123 | | | | 1,307,965 | |
| | |
Nuance Communications, Inc.* | | | 3,982 | | | | 64,986 | |
| | |
Oracle Corp. | | | 11,859 | | | | 646,197 | |
| | |
SS&C Technologies Holdings, Inc. | | | 2,194 | | | | 114,110 | |
| | |
Symantec Corp. | | | 7,816 | | | | 178,830 | |
| | | | | | | | |
| INVESTMENTS | | SHARES | | | VALUE($) | |
| | | | | | | | |
|
Software & Computer Services — continued | |
| | |
Twitter, Inc.* | | | 4,596 | | | | 137,742 | |
| | | | | | | | |
| | |
| | | | | | | 4,813,327 | |
| | | | | | | | |
|
Support Services — 2.0% | |
| | |
ADT, Inc. (a) | | | 13,421 | | | | 103,879 | |
| | |
Alliance Data Systems Corp. | | | 1,068 | | | | 106,800 | |
| | |
Johnson Controls International plc | | | 6,270 | | | | 271,679 | |
| | |
ManpowerGroup, Inc. | | | 1,783 | | | | 162,110 | |
| | |
MSC Industrial Direct Co., Inc., Class A | | | 1,895 | | | | 138,733 | |
| | |
Republic Services, Inc. | | | 2,297 | | | | 201,010 | |
| | |
Resideo Technologies, Inc.* | | | 1,770 | | | | 16,868 | |
| | |
Robert Half International, Inc. | | | 1,617 | | | | 92,606 | |
| | |
Xerox Holdings Corp. | | | 5,094 | | | | 172,839 | |
| | | | | | | | |
| | |
| | | | | | | 1,266,524 | |
| | | | | | | | |
|
Technology Hardware & Equipment — 14.7% | |
| | |
Analog Devices, Inc. | | | 2,547 | | | | 271,587 | |
| | |
Apple, Inc. | | | 6,024 | | | | 1,498,530 | |
| | |
Applied Materials, Inc. | | | 6,525 | | | | 354,046 | |
| | |
Broadcom, Inc. | | | 2,074 | | | | 607,371 | |
| | |
Cisco Systems, Inc. | | | 20,693 | | | | 983,124 | |
| | |
Corning, Inc. | | | 7,143 | | | | 211,647 | |
| | |
Cypress Semiconductor Corp. | | | 6,993 | | | | 162,727 | |
| | |
Entegris, Inc. | | | 2,284 | | | | 109,632 | |
| | |
F5 Networks, Inc.* | | | 723 | | | | 104,170 | |
| | |
HP, Inc. | | | 12,613 | | | | 219,088 | |
| | |
Intel Corp. | | | 21,281 | | | | 1,203,015 | |
| | |
Juniper Networks, Inc. | | | 6,206 | | | | 154,033 | |
| | |
KLA Corp. | | | 1,515 | | | | 256,096 | |
| | |
L3Harris Technologies, Inc. | | | 1,510 | | | | 311,528 | |
| | |
Lam Research Corp. | | | 1,199 | | | | 324,977 | |
| | |
Marvell Technology Group Ltd. | | | 5,475 | | | | 133,535 | |
| | |
Maxim Integrated Products, Inc. | | | 3,410 | | | | 200,031 | |
| | |
Microchip Technology, Inc. | | | 1,717 | | | | 161,896 | |
| | |
Micron Technology, Inc.* | | | 7,402 | | | | 351,965 | |
| | |
MKS Instruments, Inc. | | | 1,770 | | | | 191,549 | |
| | |
NetApp, Inc. | | | 2,712 | | | | 151,547 | |
| | |
ON Semiconductor Corp.* | | | 5,146 | | | | 104,978 | |
| | |
Qorvo, Inc.* | | | 1,465 | | | | 118,460 | |
| | |
QUALCOMM, Inc. | | | 2,505 | | | | 201,502 | |
| | |
Skyworks Solutions, Inc. | | | 2,325 | | | | 211,715 | |
| | |
SYNNEX Corp. | | | 906 | | | | 106,672 | |
| | |
Teradyne, Inc. | | | 3,083 | | | | 188,741 | |
| | |
Texas Instruments, Inc. | | | 4,965 | | | | 585,820 | |
| | |
Western Digital Corp. | | | 3,417 | | | | 176,488 | |
| | |
Xilinx, Inc. | | | 1,582 | | | | 143,551 | |
| | | | | | | | |
| | |
| | | | | | | 9,800,021 | |
| | | | | | | | |
SEE NOTES TO FINANCIAL STATEMENTS.
| | | | | | | | |
| | | |
| OCTOBER 31, 2019 | | J.P. MORGAN EXCHANGE-TRADED FUNDS | | | | | 161 | |
JPMorgan U.S. Value Factor ETF
SCHEDULE OF PORTFOLIO INVESTMENTS
AS OF OCTOBER 31, 2019 (continued)
| | | | | | | | |
| INVESTMENTS | | SHARES | | | VALUE($) | |
Common Stocks — continued | |
|
Tobacco — 0.7% | |
| | |
Altria Group, Inc. | | | 10,781 | | | | 482,881 | |
| | | | | | | | |
|
Travel & Leisure — 2.6% | |
| | |
Alaska Air Group, Inc. | | | 1,789 | | | | 124,210 | |
| | |
Aramark | | | 4,092 | | | | 179,066 | |
| | |
Carnival Corp. | | | 3,972 | | | | 170,359 | |
| | |
Cinemark Holdings, Inc. | | | 2,333 | | | | 85,388 | |
| | |
Copa Holdings SA, Class A (Panama) | | | 1,346 | | | | 136,942 | |
| | |
Delta Air Lines, Inc. | | | 4,607 | | | | 253,754 | |
| | |
Extended Stay America, Inc. | | | 5,184 | | | | 73,664 | |
| | |
Las Vegas Sands Corp. | | | 3,644 | | | | 225,345 | |
| | |
Royal Caribbean Cruises Ltd. | | | 1,378 | | | | 149,968 | |
| | |
Sabre Corp. | | | 4,049 | | | | 95,071 | |
| | |
Southwest Airlines Co. | | | 3,218 | | | | 180,626 | |
| | |
Wyndham Destinations, Inc. | | | 3,209 | | | | 148,930 | |
| | | | | | | | |
| | |
| | | | | | | 1,823,323 | |
| | | | | | | | |
| | |
Total Common Stocks
(Cost $62,504,900) | | | | | | | 66,652,647 | |
| | | | | | | | |
Short-Term Investments — 0.8% | |
|
Investment Companies — 0.2% | |
| | |
JPMorgan U.S. Government Money Market Fund Class Institutional Shares, 1.64% (b) (c)
(Cost $154,371) | | | 154,371 | | | | 154,371 | |
| | | | | | | | |
| | | | | | | | |
| INVESTMENTS | | SHARES | | | VALUE($) | |
|
Investment of Cash Collateral From Securities Loaned — 0.6% | |
| | |
JPMorgan U.S. Government Money Market Fund Class IM Shares, 1.70% (b) (c)
(Cost $368,753) | | | 368,753 | | | | 368,753 | |
| | | | | | | | |
| | |
Total Short-Term Investments
(Cost $523,124) | | | | | | | 523,124 | |
| | | | | | | | |
Total Investments — 100.5%
(Cost $63,028,024) | | | | | | | 67,175,771 | |
| | |
Liabilities in Excess of
Other Assets — (0.5%) | | | | | | | (326,129 | ) |
| | | | | | | | |
NET ASSETS — 100.0% | | | | | | | 66,849,642 | |
| | | | | | | | |
Percentages indicated are based on net assets.
Abbreviations
| | |
| REIT | | RealEstate Investment Trust |
| |
| (a) | | The security or a portion of this security is on loan at October 31, 2019. The total value of securities on loan at October 31, 2019 is $354,482. |
| (b) | | Investment in an affiliated fund, which is registered under the Investment Company Act of 1940, as amended, and is advised by J.P. Morgan Investment Management Inc. |
| (c) | | Therate shown is the current yield as of October 31, 2019. |
| * | | Non-incomeproducing security. |
| | | | | | | | | | | | | | | | | | | | |
| Futures contracts outstanding as of October 31, 2019: | |
| DESCRIPTION | | NUMBER OF
CONTRACTS | | | EXPIRATION
DATE | | | TRADING
CURRENCY | | | NOTIONAL
AMOUNT($) | | | VALUE AND
UNREALIZED
APPRECIATION
(DEPRECIATION)($) | |
| | | | | |
Long Contracts | | | | | | | | | | | | | | | | | | | | |
| | | | | |
S&P 500 MicE-Mini Index | | | 14 | | | | 12/2019 | | | | USD | | | | 212,503 | | | | 2,897 | |
| | | | | | | | | | | | | | | | | | | | |
Abbreviations
SEE NOTES TO FINANCIAL STATEMENTS.
| | | | | | |
| | | |
| 162 | | | | J.P. MORGAN EXCHANGE-TRADED FUNDS | | OCTOBER 31, 2019 |
STATEMENTS OF ASSETS AND LIABILITIES
AS OF OCTOBER 31, 2019
| | | | | | | | | | | | | | | | |
| | | | |
| | | JPMorgan
BetaBuilders
Canada ETF | | | JPMorgan
BetaBuilders
Developed Asia
ex-Japan ETF | | | JPMorgan
BetaBuilders
Europe ETF | | | JPMorgan
BetaBuilders
Japan ETF | |
ASSETS: | |
Investments innon-affiliates, at value | | $ | 3,779,464,294 | | | $ | 1,430,270,289 | | | $ | 3,825,983,348 | | | $ | 4,271,341,070 | |
Investments of cash collateral received from securities loaned, at value (See Note 2.D.) | | | 226,676,154 | | | | 1,546,382 | | | | 114,875,596 | | | | 18,341,722 | |
Restricted cash | | | 4,500 | | | | 17,220 | | | | 11,147 | | | | 9,300 | |
Cash | | | 688,534 | | | | 57,635 | | | | 380,089 | | | | 817,695 | |
Foreign currency, at value | | | 9,922,541 | | | | 11,786,909 | | | | 15,039,731 | | | | 8,335,920 | |
Deposits at broker for futures contracts | | | 756,966 | | | | 687,282 | | | | 1,317,169 | | | | 1,487,276 | |
Receivables: | | | | | | | | | | | | | | | | |
Dividends fromnon-affiliates | | | 9,218,728 | | | | 315,786 | | | | 4,219,677 | | | | 37,514,990 | |
Tax reclaims | | | 694,561 | | | | 22,108 | | | | 6,632,037 | | | | 645 | |
Securities lending income (See Note 2.D.) | | | 515,069 | | | | 33,276 | | | | 68,176 | | | | 31,759 | |
Variation margin on futures contracts | | | 48,784 | | | | — | | | | — | | | | — | |
Due from Adviser | | | 98,935 | | | | 118,286 | | | | 364,584 | | | | — | |
| | | | | | | | | | | | | | | | |
Total Assets | | | 4,028,089,066 | | | | 1,444,855,173 | | | | 3,968,891,554 | | | | 4,337,880,377 | |
| | | | | | | | | | | | | | | | |
|
LIABILITIES: | |
Payables: | | | | | | | | | | | | | | | | |
Investment securities purchased | | | — | | | | — | | | | 440 | | | | — | |
Collateral received on securities loaned (See Note 2.D.) | | | 226,676,154 | | | | 1,546,382 | | | | 114,875,596 | | | | 18,341,722 | |
Variation margin on futures contracts | | | — | | | | 74,601 | | | | 56,033 | | | | 213,908 | |
Accrued liabilities: | | | | | | | | | | | | | | | | |
Investment advisory fees | | | — | | | | — | | | | — | | | | 123,775 | |
Administration fees | | | 240,220 | | | | 89,601 | | | | 239,563 | | | | 267,566 | |
Custodian, Accounting and Transfer Agent fees | | | 76,071 | | | | 61,326 | | | | 180,305 | | | | 112,933 | |
Trustees’ and Chief Compliance Officer’s fees | | | 7,800 | | | | 2,831 | | | | 9,847 | | | | 15,684 | |
Professional fees | | | 45,945 | | | | 44,298 | | | | 42,169 | | | | 60,849 | |
Other | | | 288,856 | | | | 182,304 | | | | 341,977 | | | | 222,021 | |
| | | | | | | | | | | | | | | | |
Total Liabilities | | | 227,335,046 | | | | 2,001,343 | | | | 115,745,930 | | | | 19,358,458 | |
| | | | | | | | | | | | | | | | |
Net Assets | | $ | 3,800,754,020 | | | $ | 1,442,853,830 | | | $ | 3,853,145,624 | | | $ | 4,318,521,919 | |
| | | | | | | | | | | | | | | | |
|
NET ASSETS: | |
Paid-in-Capital | | $ | 3,685,593,539 | | | $ | 1,387,489,779 | | | $ | 3,709,961,736 | | | $ | 4,117,194,333 | |
Total distributable earnings (loss) | | | 115,160,481 | | | | 55,364,051 | | | | 143,183,888 | | | | 201,327,586 | |
| | | | | | | | | | | | | | | | |
Total Net Assets | | $ | 3,800,754,020 | | | $ | 1,442,853,830 | | | $ | 3,853,145,624 | | | $ | 4,318,521,919 | |
| | | | | | | | | | | | | | | | |
|
Outstanding number of shares | |
(unlimited number of shares authorized — par value $0.0001) | | | 152,700,000 | | | | 57,000,000 | | | | 158,200,000 | | | | 176,000,000 | |
| | | | | | | | | | | | | | | | |
Net asset value, per share | | $ | 24.89 | | | $ | 25.31 | | | $ | 24.36 | | | $ | 24.54 | |
| | | | | | | | | | | | | | | | |
| | | | |
Cost of investments innon-affiliates | | $ | 3,653,743,505 | | | $ | 1,372,523,032 | | | $ | 3,680,857,844 | | | $ | 4,121,630,584 | |
Cost of foreign currency | | | 9,877,248 | | | | 11,609,125 | | | | 14,745,628 | | | | 8,328,503 | |
Investment securities on loan, at value (See Note 2.D.) | | | 213,748,097 | | | | 1,455,691 | | | | 107,191,515 | | | | 17,484,369 | |
Cost of investment of cash collateral (See Note 2.D.) | | | 226,676,154 | | | | 1,546,382 | | | | 114,870,696 | | | | 18,340,323 | |
SEE NOTES TO FINANCIAL STATEMENTS.
| | | | | | | | |
| | | |
| OCTOBER 31, 2019 | | J.P. MORGAN EXCHANGE-TRADED FUNDS | | | | | 163 | |
STATEMENTS OF ASSETS AND LIABILITIES
AS OF OCTOBER 31, 2019 (continued)
| | | | | | | | | | | | | | | | |
| | | | |
| | | JPMorgan
BetaBuilders
U.S. Equity
ETF | | | JPMorgan
Diversified
Return Emerging
Markets
Equity ETF | | | JPMorgan
Diversified
Return Europe
Equity ETF | | | JPMorgan
Diversified
Return Global
Equity ETF | |
ASSETS: | |
Investments innon-affiliates, at value | | $ | 45,525,920 | | | $ | 352,573,093 | | | $ | 16,926,476 | | | $ | 144,666,489 | |
Investments in affiliates, at value | | | 825,857 | | | | 670,911 | | | | 119 | | | | 287,721 | |
Investments of cash collateral received from securities loaned, at value (See Note 2.D.) | | | — | | | | 1,212,618 | | | | 133,278 | | | | 787,496 | |
Restricted cash | | | 1,550 | | | | — | | | | — | | | | — | |
Cash | | | 204 | | | | 442,836 | | | | 25,099 | | | | 107,402 | |
Foreign currency, at value | | | — | | | | 161,711 | | | | 41,507 | | | | 184,619 | |
Deposits at broker for futures contracts | | | 18,000 | | | | 61,000 | | | | 46,000 | | | | 117,580 | |
Receivables: | | | | | | | | | | | | | | | | |
Investment securities sold | | | — | | | | 5,669 | | | | 9 | | | | — | |
Dividends fromnon-affiliates | | | 40,344 | | | | 278,512 | | | | 15,285 | | | | 409,951 | |
Dividends from affiliates | | | 167 | | | | 290 | | | | — | | | | 105 | |
Tax reclaims | | | — | | | | 11,146 | | | | 319,547 | | | | 129,605 | |
Securities lending income (See Note 2.D.) | | | — | | | | 325 | | | | 657 | | | | 3,892 | |
Due from Adviser | | | 38 | | | | 22,291 | | | | — | | | | — | |
| | | | | | | | | | | | | | | | |
Total Assets | | | 46,412,080 | | | | 355,440,402 | | | | 17,507,977 | | | | 146,694,860 | |
| | | | | | | | | | | | | | | | |
|
LIABILITIES: | |
Payables: | | | | | | | | | | | | | | | | |
Investment securities purchased | | | — | | | | — | | | | 11,161 | | | | — | |
Collateral received on securities loaned (See Note 2.D.) | | | — | | | | 1,212,618 | | | | 133,278 | | | | 787,496 | |
Variation margin on futures contracts | | | 653 | | | | 8,085 | | | | 842 | | | | 2,995 | |
Accrued liabilities: | | | | | | | | | | | | | | | | |
Investment advisory fees | | | — | | | | — | | | | 6,304 | | | | 4,260 | |
Management fees (See Note 3.G.) | | | 2,302 | | | | — | | | | — | | | | — | |
Administration fees | | | — | | | | 22,122 | | | | 1,069 | | | | 9,119 | |
Custodian, Accounting and Transfer Agent fees | | | — | | | | 102,799 | | | | 12,159 | | | | 36,811 | |
Trustees’ and Chief Compliance Officer’s fees | | | — | | | | 712 | | | | 255 | | | | 1,763 | |
Deferred foreign capital gains tax | | | — | | | | 188,085 | | | | — | | | | — | |
Professional fees | | | — | | | | 72,689 | | | | 50,898 | | | | 74,937 | |
Other | | | — | | | | 37,876 | | | | 11,074 | | | | 27,939 | |
| | | | | | | | | | | | | | | | |
Total Liabilities | | | 2,955 | | | | 1,644,986 | | | | 227,040 | | | | 945,320 | |
| | | | | | | | | | | | | | | | |
Net Assets | | $ | 46,409,125 | | | $ | 353,795,416 | | | $ | 17,280,937 | | | $ | 145,749,540 | |
| | | | | | | | | | | | | | | | |
|
NET ASSETS: | |
Paid-in-Capital | | $ | 43,212,268 | | | $ | 350,340,333 | | | $ | 18,428,965 | | | $ | 147,005,773 | |
Total distributable earnings (loss) | | | 3,196,857 | | | | 3,455,083 | | | | (1,148,028 | ) | | | (1,256,233 | ) |
| | | | | | | | | | | | | | | | |
Total Net Assets | | $ | 46,409,125 | | | $ | 353,795,416 | | | $ | 17,280,937 | | | $ | 145,749,540 | |
| | | | | | | | | | | | | | | | |
|
Outstanding number of shares | |
(unlimited number of shares authorized — par value $0.0001) | | | 850,000 | | | | 6,500,000 | | | | 300,000 | | | | 2,400,000 | |
| | | | | | | | | | | | | | | | |
Net asset value, per share | | $ | 54.60 | | | $ | 54.43 | | | $ | 57.60 | | | $ | 60.73 | |
| | | | | | | | | | | | | | | | |
| | | | |
Cost of investments innon-affiliates | | $ | 42,508,805 | | | $ | 332,926,205 | | | $ | 17,166,650 | | | $ | 139,427,730 | |
Cost of investments in affiliates | | | 722,916 | | | | 670,911 | | | | 119 | | | | 287,721 | |
Cost of foreign currency | | | — | | | | 176,162 | | | | 41,397 | | | | 182,547 | |
Investment securities on loan, at value (See Note 2.D.) | | | — | | | | 1,106,394 | | | | 125,559 | | | | 750,135 | |
Cost of investment of cash collateral (See Note 2.D.) | | | — | | | | 1,212,618 | | | | 133,278 | | | | 787,496 | |
SEE NOTES TO FINANCIAL STATEMENTS.
| | | | | | |
| | | |
| 164 | | | | J.P. MORGAN EXCHANGE-TRADED FUNDS | | OCTOBER 31, 2019 |
| | | | | | | | | | | | | | | | |
| | | | |
| | | JPMorgan
Diversified Return
International
Equity ETF | | | JPMorgan
Diversified
Return U.S.
Equity ETF | | | JPMorgan
Diversified
Return U.S.
Mid Cap
Equity ETF | | | JPMorgan
Diversified
Return U.S.
Small Cap
Equity ETF | |
ASSETS: | |
Investments innon-affiliates, at value | | $ | 1,272,946,483 | | | $ | 801,065,334 | | | $ | 187,580,780 | | | $ | 140,249,445 | |
Investments in affiliates, at value | | | 2,710,919 | | | | 894,552 | | | | 329,265 | | | | 440,610 | |
Investments of cash collateral received from securities loaned, at value (See Note 2.D.) | | | 13,042,399 | | | | 23,629,094 | | | | 9,100,957 | | | | 26,635,836 | |
Restricted cash | | | 57,600 | | | | 7,250 | | | | 3,225 | | | | 8,400 | |
Cash | | | 363,435 | | | | — | | | | — | | | | — | |
Foreign currency, at value | | | 514,154 | | | | — | | | | — | | | | — | |
Deposits at broker for futures contracts | | | 703,000 | | | | 236,000 | | | | 60,000 | | | | 36,000 | |
Receivables: | | | | | | | | | | | | | | | | |
Investment securities sold | | | — | | | | — | | | | — | | | | 1,534,580 | |
Dividends fromnon-affiliates | | | 4,866,597 | | | | 698,208 | | | | 101,092 | | | | 46,818 | |
Dividends from affiliates | | | 3,343 | | | | 2,025 | | | | 689 | | | | 594 | |
Tax reclaims | | | 1,512,144 | | | | — | | | | — | | | | — | |
Securities lending income (See Note 2.D.) | | | 30,086 | | | | 4,519 | | | | 1,754 | | | | 20,594 | |
| | | | | | | | | | | | | | | | |
Total Assets | | | 1,296,750,160 | | | | 826,536,982 | | | | 197,177,762 | | | | 168,972,877 | |
| | | | | | | | | | | | | | | | |
LIABILITIES: | |
Payables: | | | | | | | | | | | | | | | | |
Due to custodian | | | — | | | | 204 | | | | — | | | | 3 | |
Investment securities purchased | | | — | | | | — | | | | — | | | | 343,643 | |
Collateral received on securities loaned (See Note 2.D.) | | | 13,042,399 | | | | 23,629,094 | | | | 9,100,957 | | | | 26,635,836 | |
Fund shares redeemed | | | — | | | | — | | | | — | | | | 1,554,078 | |
Variation margin on futures contracts | | | 21,070 | | | | 7,040 | | | | 2,946 | | | | 1,150 | |
Accrued liabilities: | | | | | | | | | | | | | | | | |
Investment advisory fees | | | 192,658 | | | | 51,147 | | | | 17,055 | | | | 14,745 | |
Administration fees | | | 85,069 | | | | 50,646 | | | | 11,693 | | | | 8,729 | |
Custodian, Accounting and Transfer Agent fees | | | 163,634 | | | | 14,015 | | | | 10,425 | | | | 12,589 | |
Trustees’ and Chief Compliance Officer’s fees | | | 6,363 | | | | 2,027 | | | | 432 | | | | 405 | |
Professional fees | | | 190,331 | | | | 73,833 | | | | 41,974 | | | | 41,570 | |
Other | | | 181,333 | | | | 82,979 | | | | 18,489 | | | | 16,802 | |
| | | | | | | | | | | | | | | | |
Total Liabilities | | | 13,882,857 | | | | 23,910,985 | | | | 9,203,971 | | | | 28,629,550 | |
| | | | | | | | | | | | | | | | |
Net Assets | | $ | 1,282,867,303 | | | $ | 802,625,997 | | | $ | 187,973,791 | | | $ | 140,343,327 | |
| | | | | | | | | | | | | | | | |
NET ASSETS: | |
Paid-in-Capital | | $ | 1,341,910,659 | | | $ | 729,098,729 | | | $ | 176,261,127 | | | $ | 146,810,731 | |
Total distributable earnings (loss) | | | (59,043,356 | ) | | | 73,527,268 | | | | 11,712,664 | | | | (6,467,404 | ) |
| | | | | | | | | | | | | | | | |
Total Net Assets | | $ | 1,282,867,303 | | | $ | 802,625,997 | | | $ | 187,973,791 | | | $ | 140,343,327 | |
| | | | | | | | | | | | | | | | |
|
Outstanding number of shares | |
(unlimited number of shares authorized — par value $0.0001) | | | 23,300,000 | | | | 10,500,000 | | | | 2,800,000 | | | | 4,550,000 | |
| | | | | | | | | | | | | | | | |
Net asset value, per share | | $ | 55.06 | | | $ | 76.44 | | | $ | 67.13 | | | $ | 30.84 | |
| | | | | | | | | | | | | | | | |
| | | | |
Cost of investments innon-affiliates | | $ | 1,265,207,326 | | | $ | 719,012,710 | | | $ | 173,151,458 | | | $ | 144,735,504 | |
Cost of investments in affiliates | | | 2,710,919 | | | | 894,552 | | | | 329,265 | | | | 440,610 | |
Cost of foreign currency | | | 510,047 | | | | — | | | | — | | | | — | |
Investment securities on loan, at value (See Note 2.D.) | | | 12,277,449 | | | | 23,110,059 | | | | 8,836,243 | | | | 25,431,992 | |
Cost of investment of cash collateral (See Note 2.D.) | | | 13,042,399 | | | | 23,628,694 | | | | 9,100,957 | | | | 26,635,336 | |
SEE NOTES TO FINANCIAL STATEMENTS.
| | | | | | | | |
| | | |
| OCTOBER 31, 2019 | | J.P. MORGAN EXCHANGE-TRADED FUNDS | | | | | 165 | |
STATEMENTS OF ASSETS AND LIABILITIES
AS OF OCTOBER 31, 2019 (continued)
| | | | | | | | | | | | | | | | | | | | |
| | | | | |
| | | JPMorgan U.S.
Dividend ETF | | | JPMorgan
U.S. Minimum
Volatility ETF | | | JPMorgan
U.S. Momentum
Factor ETF | | | JPMorgan
U.S. Quality
Factor ETF | | | JPMorgan
U.S. Value
Factor ETF | |
ASSETS: | |
Investments innon-affiliates, at value | | $ | 40,549,595 | | | $ | 107,011,174 | | | $ | 56,528,957 | | | $ | 106,736,604 | | | $ | 66,652,647 | |
Investments in affiliates, at value | | | 149,529 | | | | 138,939 | | | | 87,612 | | | | 260,405 | | | | 154,371 | |
Investments of cash collateral received from securities loaned, at value (See Note 2.D.) | | | 654,469 | | | | 387,400 | | | | 561,328 | | | | 946,322 | | | | 368,753 | |
Restricted cash | | | 1,963 | | | | 2,523 | | | | 4,000 | | | | 733 | | | | 2,573 | |
Deposits at broker for futures contracts | | | 16,000 | | | | 33,000 | | | | 12,000 | | | | 30,000 | | | | 25,000 | |
Receivables: | | | | | | | | | | | | | | | | | | | | |
Fund shares sold | | | — | | | | 3,020,977 | | | | — | | | | — | | | | — | |
Dividends fromnon-affiliates | | | 64,744 | | | | 94,828 | | | | 47,483 | | | | 101,604 | | | | 75,448 | |
Dividends from affiliates | | | 119 | | | | 349 | | | | 87 | | | | 286 | | | | 144 | |
Securities lending income (See Note 2.D.) | | | 270 | | | | 128 | | | | 220 | | | | 281 | | | | 663 | |
Due from Adviser | | | 8,537 | | | | 9,534 | | | | 10,229 | | | | 11,899 | | | | 4,599 | |
| | | | | | | | | | | | | | | | | | | | |
Total Assets | | | 41,445,226 | | | | 110,698,852 | | | | 57,251,916 | | | | 108,088,134 | | | | 67,284,198 | |
| | | | | | | | | | | | | | | | | | | | |
|
LIABILITIES: | |
Payables: | | | | | | | | | | | | | | | | | | | | |
Investment securities purchased | | | 93,875 | | | | 2,990,229 | | | | — | | | | — | | | | — | |
Collateral received on securities loaned
(See Note 2.D.) | | | 654,469 | | | | 387,400 | | | | 561,328 | | | | 946,322 | | | | 368,753 | |
Variation margin on futures contracts | | | 546 | | | | 528 | | | | 227 | | | | 1,004 | | | | 825 | |
Accrued liabilities: | | | | | | | | | | | | | | | | | | | | |
Administration fees | | | 2,399 | | | | 6,573 | | | | 4,154 | | | | 6,723 | | | | 4,137 | |
Custodian, Accounting and Transfer Agent fees | | | 6,005 | | | | 7,414 | | | | 8,736 | | | | 4,951 | | | | 6,499 | |
Trustees’ and Chief Compliance Officer’s fees | | | 93 | | | | 43 | | | | 84 | | | | 63 | | | | 184 | |
Professional fees | | | 40,992 | | | | 40,640 | | | | 40,732 | | | | 40,321 | | | | 37,833 | |
Other | | | 15,322 | | | | 21,367 | | | | 16,066 | | | | 20,878 | | | | 16,325 | |
| | | | | | | | | | | | | | | | | | | | |
Total Liabilities | | | 813,701 | | | | 3,454,194 | | | | 631,327 | | | | 1,020,262 | | | | 434,556 | |
| | | | | | | | | | | | | | | | | | | | |
Net Assets | | $ | 40,631,525 | | | $ | 107,244,658 | | | $ | 56,620,589 | | | $ | 107,067,872 | | | $ | 66,849,642 | |
| | | | | | | | | | | | | | | | | | | | |
|
NET ASSETS: | |
Paid-in-Capital | | $ | 39,032,668 | | | $ | 102,635,078 | | | $ | 59,159,289 | | | $ | 99,793,876 | | | $ | 63,048,616 | |
Total distributable earnings (loss) | | | 1,598,857 | | | | 4,609,580 | | | | (2,538,700 | ) | | | 7,273,996 | | | | 3,801,026 | |
| | | | | | | | | | | | | | | | | | | | |
Total Net Assets | | $ | 40,631,525 | | | $ | 107,244,658 | | | $ | 56,620,589 | | | $ | 107,067,872 | | | $ | 66,849,642 | |
| | | | | | | | | | | | | | | | | | | | |
|
Outstanding number of shares | |
(unlimited number of shares authorized — par value $0.0001) | | | 1,500,000 | | | | 3,550,000 | | | | 1,950,000 | | | | 3,600,000 | | | | 2,450,000 | |
| | | | | | | | | | | | | | | | | | | | |
Net asset value, per share | | $ | 27.09 | | | $ | 30.21 | | | $ | 29.04 | | | $ | 29.74 | | | $ | 27.29 | |
| | | | | | | | | | | | | | | | | | | | |
| | | | | |
Cost of investments innon-affiliates | | $ | 38,603,633 | | | $ | 102,224,158 | | | $ | 57,669,701 | | | $ | 99,180,085 | | | $ | 62,504,900 | |
Cost of investments in affiliates | | | 149,529 | | | | 138,939 | | | | 87,612 | | | | 260,405 | | | | 154,371 | |
Investment securities on loan, at value (See Note 2.D.) | | | 628,762 | | | | 378,300 | | | | 541,227 | | | | 928,985 | | | | 354,482 | |
Cost of investment of cash collateral (See Note 2.D.) | | | 654,469 | | | | 387,400 | | | | 561,328 | | | | 946,322 | | | | 368,753 | |
SEE NOTES TO FINANCIAL STATEMENTS.
| | | | | | |
| | | |
| 166 | | | | J.P. MORGAN EXCHANGE-TRADED FUNDS | | OCTOBER 31, 2019 |
STATEMENTS OF OPERATIONS
FOR THE YEAR ENDED OCTOBER 31, 2019
| | | | | | | | | | | | | | | | |
| | | | |
| | | JPMorgan
BetaBuilders
Canada ETF | | | JPMorgan
BetaBuilders
Developed Asia
ex-Japan ETF | | | JPMorgan
BetaBuilders
Europe ETF | | | JPMorgan
BetaBuilders
Japan ETF | |
INVESTMENT INCOME: | |
Interest income fromnon-affiliates | | $ | 11,201 | | | $ | 20,495 | | | $ | — | | | $ | — | |
Interest income from affiliates | | | 42,023 | | | | 19,698 | | | | 5,224 | | | | 3,155 | |
Dividend income fromnon-affiliates | | | 98,641,762 | | | | 53,159,992 | | | | 146,195,414 | | | | 92,482,579 | |
Dividend income from affiliates | | | 3,731 | | | | 5,141 | | | | 4,568 | | | | 3,955 | |
Income from securities lending (net) (See Note 2.D.) | | | 4,223,782 | | | | 354,900 | | | | 1,370,079 | | | | 411,998 | |
Foreign taxes withheld (net) | | | (13,378,572 | ) | | | (584,703 | ) | | | (13,388,066 | ) | | | (9,242,516 | ) |
| | | | | | | | | | | | | | | | |
Total investment income | | | 89,543,927 | | | | 52,975,523 | | | | 134,187,219 | | | | 83,659,171 | |
| | | | | | | | | | | | | | | | |
|
EXPENSES: | |
Investment advisory fees (See Note 3.A.) | | | 5,824,551 | | | | 2,280,500 | | | | 3,073,512 | | | | 6,821,856 | |
Administration fees (See Note 3.B.) | | | 2,334,999 | | | | 911,832 | | | | 2,587,534 | | | | 2,738,751 | |
Interest expense to affiliates | | | 330 | | | | 471 | | | | 65,339 | | | | 12,926 | |
Professional fees | | | 164,331 | | | | 97,496 | | | | 159,111 | | | | 205,228 | |
Trustees’ and Chief Compliance Officer’s fees | | | 94,450 | | | | 37,811 | | | | 108,629 | | | | 118,745 | |
Shareholder communication costs | | | 902,941 | | | | 623,482 | | | | 806,320 | | | | 896,821 | |
Registration and filing fees | | | 278,893 | | | | 104,098 | | | | 280,343 | | | | 213,901 | |
Custodian, Accounting and Transfer Agent fees (See Note 3.C.) | | | 755,071 | | | | 613,500 | | | | 1,311,792 | | | | 846,186 | |
Insurance expense | | | 46,296 | | | | 16,154 | | | | 54,554 | | | | 46,040 | |
Offering costs (See Note 2.G.) | | | 12,978 | | | | 11,976 | | | | 8,638 | | | | 8,260 | |
Other | | | 4,417 | | | | 10,207 | | | | 55,557 | | | | 9,788 | |
| | | | | | | | | | | | | | | | |
Total expenses | | | 10,419,257 | | | | 4,707,527 | | | | 8,511,329 | | | | 11,918,502 | |
| | | | | | | | | | | | | | | | |
Less fee waived (See Note 3.D.) | | | (4,518,121 | ) | | | (2,209,679 | ) | | | (4,742,995 | ) | | | (4,859,892 | ) |
Less expense reimbursements from affiliates (See Note 3.D.) | | | — | | | | (6,420 | ) | | | (447 | ) | | | — | |
Less expense reimbursements fromnon-affiliates
(See Note 3.C.) | | | (67,500 | ) | | | (205,200 | ) | | | (609,900 | ) | | | (210,800 | ) |
| | | | | | | | | | | | | | | | |
Net expenses | | | 5,833,636 | | | | 2,286,228 | | | | 3,157,987 | | | | 6,847,810 | |
| | | | | | | | | | | | | | | | |
Net investment income (loss) | | | 83,710,291 | | | | 50,689,295 | | | | 131,029,232 | | | | 76,811,361 | |
| | | | | | | | | | | | | | | | |
| | | | |
REALIZED/UNREALIZED GAINS (LOSSES): | | | | | | | | | | | | | | | | |
Net realized gain (loss) on transactions from: | |
Investments innon-affiliates | | | (24,337,257 | ) | | | (4,287,279 | ) | | | (13,066,068 | ) | | | (17,864,136 | ) |
In-kind redemptions of investments innon-affiliates | | | (1,687,309 | ) | | | 5,875,432 | | | | 69,200,691 | | | | 50,491,360 | |
Futures contracts | | | 836,464 | | | | 996,082 | | | | 3,417,139 | | | | (4,361,834 | ) |
Foreign currency transactions | | | (164,595 | ) | | | (105,256 | ) | | | (884,426 | ) | | | 1,830,426 | |
| | | | | | | | | | | | | | | | |
Net realized gain (loss) | | | (25,352,697 | ) | | | 2,478,979 | | | | 58,667,336 | | | | 30,095,816 | |
| | | | | | | | | | | | | | | | |
Change in net unrealized appreciation/depreciation on: | |
Investments innon-affiliates | | | 258,673,035 | | | | 117,489,299 | | | | 236,312,466 | | | | 266,950,329 | |
Investments in affiliates | | | 199 | | | | — | | | | 5,700 | | | | 1,599 | |
Futures contracts | | | 281,723 | | | | 110,709 | | | | 291,373 | | | | 2,035,656 | |
Foreign currency translations | | | 123,813 | | | | 202,303 | | | | 497,048 | | | | (18,265 | ) |
| | | | | | | | | | | | | | | | |
Change in net unrealized appreciation/depreciation | | | 259,078,770 | | | | 117,802,311 | | | | 237,106,587 | | | | 268,969,319 | |
| | | | | | | | | | | | | | | | |
Net realized/unrealized gains (losses) | | | 233,726,073 | | | | 120,281,290 | | | | 295,773,923 | | | | 299,065,135 | |
| | | | | | | | | | | | | | | | |
Change in net assets resulting from operations | | $ | 317,436,364 | | | $ | 170,970,585 | | | $ | 426,803,155 | | | $ | 375,876,496 | |
| | | | | | | | | | | | | | | | |
SEE NOTES TO FINANCIAL STATEMENTS.
| | | | | | | | |
| | | |
| OCTOBER 31, 2019 | | J.P. MORGAN EXCHANGE-TRADED FUNDS | | | | | 167 | |
STATEMENTS OF OPERATIONS
FOR THE YEAR ENDED OCTOBER 31, 2019 (continued)
| | | | | | | | | | | | | | | | |
| | | | |
| | | JPMorgan
BetaBuilders
U.S. Equity
ETF(a) | | | JPMorgan
Diversified
Return Emerging
Markets
Equity ETF | | | JPMorgan
Diversified
Return Europe
Equity ETF | | | JPMorgan
Diversified
Return Global
Equity ETF | |
INVESTMENT INCOME: | |
Interest income fromnon-affiliates | | $ | 101 | | | $ | 2,730 | | | $ | 526 | | | $ | 2,038 | |
Interest income from affiliates | | | — | | | | 5,291 | | | | 1,108 | | | | 1,829 | |
Dividend income fromnon-affiliates | | | 421,475 | | | | 11,643,864 | | | | 831,988 | | | | 5,902,641 | |
Dividend income from affiliates | | | 13,154 | | | | 4,285 | | | | 93 | | | | 4,610 | |
Non-cash dividend income fromnon-affiliates | | | — | | | | 2,468,188 | | | | — | | | | — | |
Income from securities lending (net) (See Note 2.D.) | | | — | | | | 5,246 | | | | 6,768 | | | | 40,966 | |
Foreign taxes withheld (net) | | | — | | | | (1,077,800 | ) | | | (67,411 | ) | | | (424,818 | ) |
| | | | | | | | | | | | | | | | |
Total investment income | | | 434,730 | | | | 13,051,804 | | | | 773,072 | | | | 5,527,266 | |
| | | | | | | | | | | | | | | | |
|
EXPENSES: | |
Investment advisory fees (See Note 3.A.) | | | — | | | | 1,325,844 | | | | 78,723 | | | | 426,675 | |
Management fees (See Note 3.G.) | | | 4,259 | | | | — | | | | — | | | | — | |
Administration fees (See Note 3.B.) | | | — | | | | 229,763 | | | | 20,722 | | | | 136,758 | |
Interest expense to affiliates | | | — | | | | 3,865 | | | | 117 | | | | 323 | |
Professional fees | | | — | | | | 123,245 | | | | 31,201 | | | | 61,687 | |
Trustees’ and Chief Compliance Officer’s fees | | | — | | | | 6,322 | | | | 275 | | | | 3,813 | |
Shareholder communication costs | | | — | | | | 79,238 | | | | 7,205 | | | | 54,907 | |
Registration and filing fees | | | — | | | | 20,703 | | | | 5,500 | | | | 11,594 | |
Custodian, Accounting and Transfer Agent fees (See Note 3.C.) | | | — | | | | 790,936 | | | | 112,425 | | | | 161,211 | |
Insurance expense | | | — | | | | 16,335 | | | | 992 | | | | 17,971 | |
Other | | | 6 | | | | 15,693 | | | | 6,379 | | | | 13,648 | |
| | | | | | | | | | | | | | | | |
Total expenses | | | 4,265 | | | | 2,611,944 | | | | 263,539 | | | | 888,587 | |
| | | | | | | | | | | | | | | | |
Less fee waived (See Note 3.D.) | | | (172 | ) | | | (1,088,584 | ) | | | (99,445 | ) | | | (190,690 | ) |
Less expense reimbursements from affiliates (See Note 3.D.) | | | — | | | | (686 | ) | | | (30,660 | ) | | | — | |
Less expense reimbursements fromnon-affiliates
(See Note 3.C.) | | | — | | | | (161,700 | ) | | | (34,200 | ) | | | (23,100 | ) |
| | | | | | | | | | | | | | | | |
Net expenses | | | 4,093 | | | | 1,360,974 | | | | 99,234 | | | | 674,797 | |
| | | | | | | | | | | | | | | | |
Net investment income (loss) | | | 430,637 | | | | 11,690,830 | | | | 673,838 | | | | 4,852,469 | |
| | | | | | | | | | | | | | | | |
| | | | |
REALIZED/UNREALIZED GAINS (LOSSES): | | | | | | | | | | | | | | | | |
Net realized gain (loss) on transactions from: | |
Investments innon-affiliates | | | (43,498 | ) | | | (9,356,480 | )(b) | | | (831,658 | ) | | | (6,226,049 | ) |
Investments in affiliates | | | 554 | | | | — | | | | — | | | | — | |
In-kind redemptions of investments innon-affiliates | | | — | | | | — | | | | 819,336 | | | | 10,134,091 | |
Futures contracts | | | 1,850 | | | | (90,896 | ) | | | 45,846 | | | | 15,033 | |
Foreign currency transactions | | | — | | | | 158,981 | | | | (1,550 | ) | | | (7,303 | ) |
| | | | | | | | | | | | | | | | |
Net realized gain (loss) | | | (41,094 | ) | | | (9,288,395 | ) | | | 31,974 | | | | 3,915,772 | |
| | | | | | | | | | | | | | | | |
Distributions of capital gains received from investment company affiliates | | | — | | | | — | | | | — | | | | 834 | |
| | | | | | | | | | | | | | | | |
Change in net unrealized appreciation/depreciation on: | |
Investments innon-affiliates | | | 3,017,115 | | | | 22,882,602 | (c) | | | (559,850 | ) | | | 8,635,700 | |
Investments in affiliates | | | 102,941 | | | | — | | | | — | | | | — | |
Futures contracts | | | 5,139 | | | | 8,009 | | | | (777 | ) | | | 45,083 | |
Foreign currency translations | | | — | | | | (17,902 | ) | | | (240 | ) | | | 6,324 | |
| | | | | | | | | | | | | | | | |
Change in net unrealized appreciation/depreciation | | | 3,125,195 | | | | 22,872,709 | | | | (560,867 | ) | | | 8,687,107 | |
| | | | | | | | | | | | | | | | |
Net realized/unrealized gains (losses) | | | 3,084,101 | | | | 13,584,314 | | | | (528,893 | ) | | | 12,603,713 | |
| | | | | | | | | | | | | | | | |
Change in net assets resulting from operations | | $ | 3,514,738 | | | $ | 25,275,144 | | | $ | 144,945 | | | $ | 17,456,182 | |
| | | | | | | | | | | | | | | | |
| (a) | Commencement of operations was March 12, 2019. |
| (b) | Net of foreign capital gains tax of $15,344. |
| (c) | Net change in foreign capital gains tax of $(188,085). |
SEE NOTES TO FINANCIAL STATEMENTS.
| | | | | | |
| | | |
| 168 | | | | J.P. MORGAN EXCHANGE-TRADED FUNDS | | OCTOBER 31, 2019 |
| | | | | | | | | | | | | | | | |
| | | | |
| | | JPMorgan
Diversified Return
International
Equity ETF | | | JPMorgan
Diversified
Return U.S.
Equity ETF | | | JPMorgan
Diversified
Return U.S.
Mid Cap
Equity ETF | | | JPMorgan
Diversified
Return U.S.
Small Cap
Equity ETF | |
INVESTMENT INCOME: | |
Interest income fromnon-affiliates | | $ | 6,127 | | | $ | 3,221 | | | $ | 1,090 | | | $ | 1,397 | |
Interest income from affiliates | | | 5,995 | | | | 115 | | | | 7 | | | | 21 | |
Dividend income fromnon-affiliates | | | 59,330,080 | | | | 16,608,279 | | | | 3,229,418 | | | | 2,113,151 | |
Dividend income from affiliates | | | 56,690 | | | | 36,454 | | | | 12,832 | | | | 8,972 | |
Income from securities lending (net) (See Note 2.D.) | | | 408,051 | | | | 75,753 | | | | 20,077 | | | | 136,269 | |
Foreign taxes withheld (net) | | | (4,420,190 | ) | | | — | | | | — | | | | — | |
| | | | | | | | | | | | | | | | |
Total investment income | | | 55,386,753 | | | | 16,723,822 | | | | 3,263,424 | | | | 2,259,810 | |
| | | | | | | | | | | | | | | | |
|
EXPENSES: | |
Investment advisory fees (See Note 3.A.) | | | 3,638,389 | | | | 1,560,277 | | | | 379,929 | | | | 387,748 | |
Administration fees (See Note 3.B.) | | | 1,160,440 | | | | 518,199 | | | | 120,876 | | | | 101,917 | |
Interest expense to affiliates | | | 1,506 | | | | — | | | | — | | | | — | |
Professional fees | | | 190,826 | | | | 80,717 | | | | 46,549 | | | | 39,675 | |
Trustees’ and Chief Compliance Officer’s fees | | | 32,036 | | | | 16,634 | | | | 3,974 | | | | 3,891 | |
Shareholder communication costs | | | 294,746 | | | | 120,704 | | | | 50,816 | | | | 47,862 | |
Registration and filing fees | | | 37,572 | | | | 30,545 | | | | 10,815 | | | | 17,398 | |
Custodian, Accounting and Transfer Agent fees (See Note 3.C.) | | | 693,857 | | | | 92,910 | | | | 52,133 | | | | 105,743 | |
Insurance expense | | | 110,158 | | | | 36,850 | | | | 7,018 | | | | 5,116 | |
Other | | | 83,687 | | | | 28,937 | | | | 8,319 | | | | 6,647 | |
| | | | | | | | | | | | | | | | |
Total expenses | | | 6,243,217 | | | | 2,485,773 | | | | 680,429 | | | | 715,997 | |
| | | | | | | | | | | | | | | | |
Less fee waived (See Note 3.D.) | | | (287,592 | ) | | | (1,150,239 | ) | | | (281,669 | ) | | | (257,522 | ) |
Less expense reimbursements from affiliates (See Note 3.D.) | | | — | | | | — | | | | (1,725 | ) | | | (4,200 | ) |
Less expense reimbursements fromnon-affiliates (See Note 3.C.) | | | (201,600 | ) | | | (49,300 | ) | | | (18,000 | ) | | | (67,200 | ) |
| | | | | | | | | | | | | | | | |
Net expenses | | | 5,754,025 | | | | 1,286,234 | | | | 379,035 | | | | 387,075 | |
| | | | | | | | | | | | | | | | |
Net investment income (loss) | | | 49,632,728 | | | | 15,437,588 | | | | 2,884,389 | | | | 1,872,735 | |
| | | | | | | | | | | | | | | | |
| | | | |
REALIZED/UNREALIZED GAINS (LOSSES): | | | | | | | | | | | | | | | | |
Net realized gain (loss) on transactions from: | |
Investments innon-affiliates | | | (65,313,824 | ) | | | (8,777,884 | ) | | | (2,388,322 | ) | | | (1,977,879 | ) |
In-kind redemptions of investments innon-affiliates | | | 58,273,499 | | | | 19,996,137 | | | | 4,074,921 | | | | 13,589,703 | |
Futures contracts | | | 583,092 | | | | (61,970 | ) | | | (154,627 | ) | | | (80,716 | ) |
Foreign currency transactions | | | 133,712 | | | | — | | | | — | | | | — | |
| | | | | | | | | | | | | | | | |
Net realized gain (loss) | | | (6,323,521 | ) | | | 11,156,283 | | | | 1,531,972 | | | | 11,531,108 | |
| | | | | | | | | | | | | | | | |
Change in net unrealized appreciation/depreciation on: | |
Investments innon-affiliates | | | 47,013,018 | | | | 48,812,160 | | | | 9,421,577 | | | | (6,040,252 | ) |
Investments in affiliates | | | — | | | | 400 | | | | — | | | | 500 | |
Futures contracts | | | 352,221 | | | | 63,826 | | | | 29,856 | | | | 36,742 | |
Foreign currency translations | | | 83,304 | | | | — | | | | — | | | | — | |
| | | | | | | | | | | | | | | | |
Change in net unrealized appreciation/depreciation | | | 47,448,543 | | | | 48,876,386 | | | | 9,451,433 | | | | (6,003,010 | ) |
| | | | | | | | | | | | | | | | |
Net realized/unrealized gains (losses) | | | 41,125,022 | | | | 60,032,669 | | | | 10,983,405 | | | | 5,528,098 | |
| | | | | | | | | | | | | | | | |
Change in net assets resulting from operations | | $ | 90,757,750 | | | $ | 75,470,257 | | | $ | 13,867,794 | | | $ | 7,400,833 | |
| | | | | | | | | | | | | | | | |
SEE NOTES TO FINANCIAL STATEMENTS.
| | | | | | | | |
| | | |
| OCTOBER 31, 2019 | | J.P. MORGAN EXCHANGE-TRADED FUNDS | | | | | 169 | |
STATEMENTS OF OPERATIONS
FOR THE YEAR ENDED OCTOBER 31, 2019 (continued)
| | | | | | | | | | | | | | | | | | | | |
| | | | | |
| | | JPMorgan U.S.
Dividend ETF | | | JPMorgan
U.S. Minimum
Volatility ETF | | | JPMorgan U.S. Momentum
Factor ETF | | | JPMorgan
U.S. Quality
Factor ETF | | | JPMorgan
U.S. Value
Factor ETF | |
INVESTMENT INCOME: | |
Interest income fromnon-affiliates | | $ | — | | | $ | — | | | $ | — | | | $ | 20 | | | $ | 53 | |
Interest income from affiliates | | | — | | | | 4 | | | | 3 | | | | — | | | | 2 | |
Dividend income fromnon-affiliates | | | 1,159,165 | | | | 1,181,450 | | | | 647,758 | | | | 1,292,699 | | | | 1,585,145 | |
Dividend income from affiliates | | | 3,427 | | | | 4,014 | | | | 1,512 | | | | 3,375 | | | | 3,546 | |
Income from securities lending (net) (See Note 2.D.) | | | 971 | | | | 585 | | | | 1,011 | | | | 2,574 | | | | 1,367 | |
| | | | | | | | | | | | | | | | | | | | |
Total investment income | | | 1,163,563 | | | | 1,186,053 | | | | 650,284 | | | | 1,298,668 | | | | 1,590,113 | |
| | | | | | | | | | | | | | | | | | | | |
|
EXPENSES: | |
Investment advisory fees (See Note 3.A.) | | | 72,160 | | | | 115,989 | | | | 101,601 | | | | 137,273 | | | | 120,947 | |
Administration fees (See Note 3.B.) | | | 23,984 | | | | 38,317 | | | | 33,626 | | | | 45,323 | | | | 39,958 | |
Professional fees | | | 39,977 | | | | 39,943 | | | | 40,079 | | | | 40,009 | | | | 37,551 | |
Trustees’ and Chief Compliance Officer’s fees | | | 664 | | | | 818 | | | | 896 | | | | 1,101 | | | | 1,319 | |
Shareholder communication costs | | | 6,506 | | | | 8,073 | | | | 7,113 | | | | 10,077 | | | | 8,625 | |
Registration and filing fees | | | 12,328 | | | | 18,412 | | | | 12,747 | | | | 18,210 | | | | 13,991 | |
Custodian, Accounting and Transfer Agent fees (See Note 3.C.) | | | 36,228 | | | | 48,751 | | | | 40,114 | | | | 39,774 | | | | 45,501 | |
Insurance expense | | | 1,990 | | | | 1,995 | | | | 2,091 | | | | 2,065 | | | | 2,050 | |
Offering costs (See Note 2.G.) | | | 90 | | | | 126 | | | | 90 | | | | 90 | | | | 89 | |
Other | | | 2,980 | | | | 2,950 | | | | 2,993 | | | | 2,945 | | | | 3,000 | |
| | | | | | | | | | | | | | | | | | | | |
Total expenses | | | 196,907 | | | | 275,374 | | | | 241,350 | | | | 296,867 | | | | 273,031 | |
| | | | | | | | | | | | | | | | | | | | |
Less fee waived (See Note 3.D.) | | | (96,144 | ) | | | (154,306 | ) | | | (135,227 | ) | | | (182,596 | ) | | | (160,905 | ) |
Less expense reimbursements from affiliates (See Note 3.D.) | | | (58,680 | ) | | | (42,702 | ) | | | (43,571 | ) | | | (33,752 | ) | | | (38,093 | ) |
Less expense reimbursements fromnon-affiliates (See Note 3.C.) | | | (4,800 | ) | | | (18,000 | ) | | | (9,600 | ) | | | (9,000 | ) | | | (11,200 | ) |
| | | | | | | | | | | | | | | | | | | | |
Net expenses | | | 37,283 | | | | 60,366 | | | | 52,952 | | | | 71,519 | | | | 62,833 | |
| | | | | | | | | | | | | | | | | | | | |
Net investment income (loss) | | | 1,126,280 | | | | 1,125,687 | | | | 597,332 | | | | 1,227,149 | | | | 1,527,280 | |
| | | | | | | | | | | | | | | | | | | | |
| | | | | |
REALIZED/UNREALIZED GAINS (LOSSES): | | | | | | | | | | | | | | | | | | | | |
Net realized gain (loss) on transactions from: | |
Investments innon-affiliates | | | (214,448 | ) | | | (364,303 | ) | | | (1,257,413 | ) | | | (359,008 | ) | | | (514,012 | ) |
In-kind redemptions of investments innon-affiliates | | | 938,136 | | | | 3,552,278 | | | | 7,058,324 | | | | 930,493 | | | | 2,842,858 | |
Futures contracts | | | (42,299 | ) | | | 13,724 | | | | 976 | | | | (21,899 | ) | | | (4,342 | ) |
| | | | | | | | | | | | | | | | | | | | |
Net realized gain (loss) | | | 681,389 | | | | 3,201,699 | | | | 5,801,887 | | | | 549,586 | | | | 2,324,504 | |
| | | | | | | | | | | | | | | | | | | | |
Change in net unrealized appreciation/depreciation on: | | | | | | | | | | | | | | | | | | | | |
Investments innon-affiliates | | | 1,912,160 | | | | 3,579,816 | | | | (2,462,802 | ) | | | 5,927,268 | | | | 3,852,460 | |
Futures contracts | | | 19,736 | | | | 6,748 | | | | 1,316 | | | | 14,134 | | | | 10,487 | |
| | | | | | | | | | | | | | | | | | | | |
Change in net unrealized appreciation/depreciation | | | 1,931,896 | | | | 3,586,564 | | | | (2,461,486 | ) | | | 5,941,402 | | | | 3,862,947 | |
| | | | | | | | | | | | | | | | | | | | |
Net realized/unrealized gains (losses) | | | 2,613,285 | | | | 6,788,263 | | | | 3,340,401 | | | | 6,490,988 | | | | 6,187,451 | |
| | | | | | | | | | | | | | | | | | | | |
Change in net assets resulting from operations | | $ | 3,739,565 | | | $ | 7,913,950 | | | $ | 3,937,733 | | | $ | 7,718,137 | | | $ | 7,714,731 | |
| | | | | | | | | | | | | | | | | | | | |
SEE NOTES TO FINANCIAL STATEMENTS.
| | | | | | |
| | | |
| 170 | | | | J.P. MORGAN EXCHANGE-TRADED FUNDS | | OCTOBER 31, 2019 |
STATEMENTS OF CHANGES IN NET ASSETS
FOR THE PERIODS INDICATED
| | | | | | | | | | | | | | | | |
| | |
JPMorgan BetaBuilders
Canada ETF | | |
JPMorgan BetaBuilders Developed
Asiaex-Japan ETF | |
| | | Year Ended
October 31, 2019 | | | Period Ended
October 31, 2018 (a) | | | Year Ended
October 31, 2019 | | | Period Ended
October 31, 2018 (a) | |
CHANGE IN NET ASSETS RESULTING FROM OPERATIONS: | | | | | | | | | | | | | | | | |
Net investment income (loss) | | $ | 83,710,291 | | | $ | 8,081,911 | | | $ | 50,689,295 | | | $ | 4,897,239 | |
Net realized gain (loss) | | | (25,352,697 | ) | | | (1,239,799 | ) | | | 2,478,979 | | | | (457,627 | ) |
Change in net unrealized appreciation/depreciation | | | 259,078,770 | | | | (133,423,165 | ) | | | 117,802,311 | | | | (59,845,937 | ) |
| | | | | | | | | | | | | | | | |
Change in net assets resulting from operations | | | 317,436,364 | | | | (126,581,053 | ) | | | 170,970,585 | | | | (55,406,325 | ) |
| | | | | | | | | | | | | | | | |
|
DISTRIBUTIONS TO SHAREHOLDERS: | |
Total distributions to shareholders | | | (75,222,486 | ) | | | (2,945,124 | ) | | | (50,248,812 | ) | | | (4,159,764 | ) |
| | | | | | | | | | | | | | | | |
|
CAPITAL TRANSACTIONS: | |
Change in net assets resulting from capital transactions | | | 1,513,841,316 | | | | 2,174,225,003 | | | | 718,818,123 | | | | 662,880,023 | |
| | | | | | | | | | | | | | | | |
|
NET ASSETS: | |
Change in net assets | | | 1,756,055,194 | | | | 2,044,698,826 | | | | 839,539,896 | | | | 603,313,934 | |
Beginning of period | | | 2,044,698,826 | | | | — | | | | 603,313,934 | | | | — | |
| | | | | | | | | | | | | | | | |
End of period | | $ | 3,800,754,020 | | | $ | 2,044,698,826 | | | $ | 1,442,853,830 | | | $ | 603,313,934 | |
| | | | | | | | | | | | | | | | |
| | | | |
CAPITAL TRANSACTIONS: | | | | | | | | | | | | | | | | |
Proceeds from shares issued | | $ | 1,594,807,117 | | | $ | 2,219,440,596 | | | $ | 759,011,170 | | | $ | 662,880,023 | |
Cost of shares redeemed | | | (80,965,801 | ) | | | (45,215,593 | ) | | | (40,193,047 | ) | | | — | |
| | | | | | | | | | | | | | | | |
Total change in net assets resulting from capital transactions | | $ | 1,513,841,316 | | | $ | 2,174,225,003 | | | $ | 718,818,123 | | | $ | 662,880,023 | |
| | | | | | | | | | | | | | | | |
|
SHARE TRANSACTIONS: | |
Issued | | | 66,000,000 | | | | 92,400,000 | | | | 32,000,000 | | | | 26,600,000 | |
Redeemed | | | (3,800,000 | ) | | | (1,900,000 | ) | | | (1,600,000 | ) | | | — | |
| | | | | | | | | | | | | | | | |
Net increase in shares from share transactions | | | 62,200,000 | | | | 90,500,000 | | | | 30,400,000 | | | | 26,600,000 | |
| | | | | | | | | | | | | | | | |
| (a) | Commencement of operations was August 7, 2018. |
SEE NOTES TO FINANCIAL STATEMENTS.
| | | | | | | | |
| | | |
| OCTOBER 31, 2019 | | J.P. MORGAN EXCHANGE-TRADED FUNDS | | | | | 171 | |
STATEMENTS OF CHANGES IN NET ASSETS
FOR THE PERIODS INDICATED (continued)
| | | | | | | | | | | | | | | | |
| | |
JPMorgan BetaBuilders
Europe ETF | | |
JPMorgan BetaBuilders
Japan ETF | |
| | | Year Ended
October 31, 2019 | | | Period Ended
October 31, 2018 (a) | | | Year Ended
October 31, 2019 | | | Period Ended
October 31, 2018 (a) | |
CHANGE IN NET ASSETS RESULTING FROM OPERATIONS: | | | | | | | | | | | | | | | | |
Net investment income (loss) | | $ | 131,029,232 | | | $ | 4,429,007 | | | $ | 76,811,361 | | | $ | 14,466,776 | |
Net realized gain (loss) | | | 58,667,336 | | | | (5,318 | ) | | | 30,095,816 | | | | (2,096,213 | ) |
Change in net unrealized appreciation/depreciation | | | 237,106,587 | | | | (91,293,111 | ) | | | 268,969,319 | | | | (117,813,749 | ) |
| | | | | | | | | | | | | | | | |
Change in net assets resulting from operations | | | 426,803,155 | | | | (86,869,422 | ) | | | 375,876,496 | | | | (105,443,186 | ) |
| | | | | | | | | | | | | | | | |
|
DISTRIBUTIONS TO SHAREHOLDERS: | |
Total distributions to shareholders | | | (126,316,866 | ) | | | (1,891,512 | ) | | | (20,089,888 | ) | | | — | |
| | | | | | | | | | | | | | | | |
|
CAPITAL TRANSACTIONS: | |
Change in net assets resulting from capital transactions | | | 2,237,729,043 | | | | 1,403,691,226 | | | | 1,626,647,644 | | | | 2,441,530,853 | |
| | | | | | | | | | | | | | | | |
|
NET ASSETS: | |
Change in net assets | | | 2,538,215,332 | | | | 1,314,930,292 | | | | 1,982,434,252 | | | | 2,336,087,667 | |
Beginning of period | | | 1,314,930,292 | | | | — | | | | 2,336,087,667 | | | | — | |
| | | | | | | | | | | | | | | | |
End of period | | $ | 3,853,145,624 | | | $ | 1,314,930,292 | | | $ | 4,318,521,919 | | | $ | 2,336,087,667 | |
| | | | | | | | | | | | | | | | |
| | | | |
CAPITAL TRANSACTIONS: | | | | | | | | | | | | | | | | |
Proceeds from shares issued | | $ | 2,927,537,309 | | | $ | 1,403,691,226 | | | $ | 2,238,563,149 | | | $ | 2,441,530,853 | |
Cost of shares redeemed | | | (689,808,266 | ) | | | — | | | | (611,915,505 | ) | | | — | |
| | | | | | | | | | | | | | | | |
Total change in net assets resulting from capital transactions | | $ | 2,237,729,043 | | | $ | 1,403,691,226 | | | $ | 1,626,647,644 | | | $ | 2,441,530,853 | |
| | | | | | | | | | | | | | | | |
|
SHARE TRANSACTIONS: | |
Issued | | | 130,000,000 | | | | 58,200,000 | | | | 100,400,000 | | | | 102,800,000 | |
Redeemed | | | (30,000,000 | ) | | | — | | | | (27,200,000 | ) | | | — | |
| | | | | | | | | | | | | | | | |
Net increase in shares from share transactions | | | 100,000,000 | | | | 58,200,000 | | | | 73,200,000 | | | | 102,800,000 | |
| | | | | | | | | | | | | | | | |
| (a) | Commencement of operations was June 15, 2018. |
SEE NOTES TO FINANCIAL STATEMENTS.
| | | | | | |
| | | |
| 172 | | | | J.P. MORGAN EXCHANGE-TRADED FUNDS | | OCTOBER 31, 2019 |
| | | | | | | | | | | | |
| | | JPMorgan
BetaBuilders
U.S. Equity ETF | | |
JPMorgan Diversified Return Emerging
Markets Equity ETF | |
| | | Period Ended
October 31, 2019 (a) | | | Year Ended
October 31, 2019 | | | Year Ended
October 31, 2018 | |
CHANGE IN NET ASSETS RESULTING FROM OPERATIONS: | |
Net investment income (loss) | | $ | 430,637 | | | $ | 11,690,830 | | | $ | 5,819,759 | |
Net realized gain (loss) | | | (41,094 | ) | | | (9,288,395 | ) | | | (4,278,249 | ) |
Change in net unrealized appreciation/depreciation | | | 3,125,195 | | | | 22,872,709 | | | | (22,751,387 | ) |
| | | | | | | | | | | | |
Change in net assets resulting from operations | | | 3,514,738 | | | | 25,275,144 | | | | (21,209,877 | ) |
| | | | | | | | | | | | |
|
DISTRIBUTIONS TO SHAREHOLDERS: | |
Total distributions to shareholders | | | (317,882 | ) | | | (9,059,080 | ) | | | (8,601,176 | ) |
| | | | | | | | | | | | |
|
CAPITAL TRANSACTIONS: | |
Change in net assets resulting from capital transactions | | | 43,212,269 | | | | 123,775,100 | | | | 77,874,259 | |
| | | | | | | | | | | | |
|
NET ASSETS: | |
Change in net assets | | | 46,409,125 | | | | 139,991,164 | | | | 48,063,206 | |
Beginning of period | | | — | | | | 213,804,252 | | | | 165,741,046 | |
| | | | | | | | | | | | |
End of period | | $ | 46,409,125 | | | $ | 353,795,416 | | | $ | 213,804,252 | |
| | | | | | | | | | | | |
| | | |
CAPITAL TRANSACTIONS: | | | | | | | | | | | | |
Proceeds from shares issued | | $ | 43,212,269 | | | $ | 123,775,100 | | | $ | 77,874,259 | |
| | | | | | | | | | | | |
Total change in net assets resulting from capital transactions | | $ | 43,212,269 | | | $ | 123,775,100 | | | $ | 77,874,259 | |
| | | | | | | | | | | | |
|
SHARE TRANSACTIONS: | |
Issued | | | 850,000 | | | | 2,300,000 | | | | 1,300,000 | |
| | | | | | | | | | | | |
Net increase in shares from share transactions | | | 850,000 | | | | 2,300,000 | | | | 1,300,000 | |
| | | | | | | | | | | | |
| (a) | Commencement of operations was March 12, 2019. |
SEE NOTES TO FINANCIAL STATEMENTS.
| | | | | | | | |
| | | |
| OCTOBER 31, 2019 | | J.P. MORGAN EXCHANGE-TRADED FUNDS | | | | | 173 | |
STATEMENTS OF CHANGES IN NET ASSETS
FOR THE PERIODS INDICATED (continued)
| | | | | | | | | | | | | | | | |
| | | JPMorgan Diversified Return
Europe Equity ETF | | |
JPMorgan Diversified Return
Global Equity ETF | |
| | | Year Ended
October 31, 2019 | | | Year Ended
October 31, 2018 | | | Year Ended
October 31, 2019 | | | Year Ended
October 31, 2018 | |
CHANGE IN NET ASSETS RESULTING FROM OPERATIONS: | | | | | | | | | | | | | | | | |
Net investment income (loss) | | $ | 673,838 | | | $ | 2,214,736 | | | $ | 4,852,469 | | | $ | 4,574,724 | |
Net realized gain (loss) | | | 31,974 | | | | 2,599,003 | | | | 3,915,772 | | | | 1,039,948 | |
Distributions of capital gains received from investment company affiliates | | | — | | | | — | | | | 834 | | | | — | |
Change in net unrealized appreciation/depreciation | | | (560,867 | ) | | | (11,434,565 | ) | | | 8,687,107 | | | | (17,420,873 | ) |
| | | | | | | | | | | | | | | | |
Change in net assets resulting from operations | | | 144,945 | | | | (6,620,826 | ) | | | 17,456,182 | | | | (11,806,201 | ) |
| | | | | | | | | | | | | | | | |
|
DISTRIBUTIONS TO SHAREHOLDERS: | |
Total distributions to shareholders | | | (661,542 | ) | | | (4,014,806 | ) | | | (4,502,466 | ) | | | (5,818,989 | ) |
| | | | | | | | | | | | | | | | |
|
CAPITAL TRANSACTIONS: | |
Change in net assets resulting from capital transactions | | | (57,023,254 | ) | | | 5,964,063 | | | | (70,661,440 | ) | | | 117,387,384 | |
| | | | | | | | | | | | | | | | |
|
NET ASSETS: | |
Change in net assets | | | (57,539,851 | ) | | | (4,671,569 | ) | | | (57,707,724 | ) | | | 99,762,194 | |
Beginning of period | | | 74,820,788 | | | | 79,492,357 | | | | 203,457,264 | | | | 103,695,070 | |
| | | | | | | | | | | | | | | | |
End of period | | $ | 17,280,937 | | | $ | 74,820,788 | | | $ | 145,749,540 | | | $ | 203,457,264 | |
| | | | | | | | | | | | | | | | |
| | | | |
CAPITAL TRANSACTIONS: | | | | | | | | | | | | | | | | |
Proceeds from shares issued | | $ | 10,124,234 | | | $ | 17,683,797 | | | $ | 5,664,966 | | | $ | 154,127,556 | |
Cost of shares redeemed | | | (67,147,488 | ) | | | (11,719,734 | ) | | | (76,326,406 | ) | | | (36,740,172 | ) |
| | | | | | | | | | | | | | | | |
Total change in net assets resulting from capital transactions | | $ | (57,023,254 | ) | | $ | 5,964,063 | | | $ | (70,661,440 | ) | | $ | 117,387,384 | |
| | | | | | | | | | | | | | | | |
|
SHARE TRANSACTIONS: | |
Issued | | | 200,000 | | | | 300,000 | | | | 100,000 | | | | 2,500,000 | |
Redeemed | | | (1,300,000 | ) | | | (200,000 | ) | | | (1,300,000 | ) | | | (600,000 | ) |
| | | | | | | | | | | | | | | | |
Net increase (decrease) in shares from share transactions | | | (1,100,000 | ) | | | 100,000 | | | | (1,200,000 | ) | | | 1,900,000 | |
| | | | | | | | | | | | | | | | |
SEE NOTES TO FINANCIAL STATEMENTS.
| | | | | | |
| | | |
| 174 | | | | J.P. MORGAN EXCHANGE-TRADED FUNDS | | OCTOBER 31, 2019 |
| | | | | | | | | | | | | | | | |
| | | JPMorgan Diversified Return
International Equity ETF | | |
JPMorgan Diversified Return
U.S. Equity ETF | |
| | | Year Ended
October 31, 2019 | | | Year Ended
October 31, 2018 | | | Year Ended
October 31, 2019 | | | Year Ended
October 31, 2018 | |
CHANGE IN NET ASSETS RESULTING FROM OPERATIONS: | | | | | | | | | | | | | | | | |
Net investment income (loss) | | $ | 49,632,728 | | | $ | 37,201,171 | | | $ | 15,437,588 | | | $ | 9,698,233 | |
Net realized gain (loss) | | | (6,323,521 | ) | | | 11,476,505 | | | | 11,156,283 | | | | 937,055 | |
Change in net unrealized appreciation/depreciation | | | 47,448,543 | | | | (167,979,171 | ) | | | 48,876,386 | | | | 5,530,137 | |
| | | | | | | | | | | | | | | | |
Change in net assets resulting from operations | | | 90,757,750 | | | | (119,301,495 | ) | | | 75,470,257 | | | | 16,165,425 | |
| | | | | | | | | | | | | | | | |
| | | | |
DISTRIBUTIONS TO SHAREHOLDERS: | | | | | | | | | | | | | | | | |
Total distributions to shareholders | | | (47,722,104 | ) | | | (54,092,274 | ) | | | (13,823,828 | ) | | | (12,462,949 | ) |
| | | | | | | | | | | | | | | | |
| | | | |
CAPITAL TRANSACTIONS: | | | | | | | | | | | | | | | | |
Change in net assets resulting from capital transactions | | | (204,500,604 | ) | | | 457,839,024 | | | | 181,617,239 | | | | 199,361,082 | |
| | | | | | | | | | | | | | | | |
| | | | |
NET ASSETS: | | | | | | | | | | | | | | | | |
Change in net assets | | | (161,464,958 | ) | | | 284,445,255 | | | | 243,263,668 | | | | 203,063,558 | |
Beginning of period | | | 1,444,332,261 | | | | 1,159,887,006 | | | | 559,362,329 | | | | 356,298,771 | |
| | | | | | | | | | | | | | | | |
End of period | | $ | 1,282,867,303 | | | $ | 1,444,332,261 | | | $ | 802,625,997 | | | $ | 559,362,329 | |
| | | | | | | | | | | | | | | | |
| | | | |
CAPITAL TRANSACTIONS: | | | | | | | | | | | | | | | | |
Proceeds from shares issued | | $ | 298,833,792 | | | $ | 530,366,203 | | | $ | 261,868,954 | | | $ | 206,369,804 | |
Cost of shares redeemed | | | (503,334,396 | ) | | | (72,527,179 | ) | | | (80,251,715 | ) | | | (7,008,722 | ) |
| | | | | | | | | | | | | | | | |
Total change in net assets resulting from capital transactions | | $ | (204,500,604 | ) | | $ | 457,839,024 | | | $ | 181,617,239 | | | $ | 199,361,082 | |
| | | | | | | | | | | | | | | | |
| | | | |
SHARE TRANSACTIONS: | | | | | | | | | | | | | | | | |
Issued | | | 5,500,000 | | | | 8,900,000 | | | | 3,600,000 | | | | 2,900,000 | |
Redeemed | | | (9,400,000 | ) | | | (1,300,000 | ) | | | (1,100,000 | ) | | | (100,000 | ) |
| | | | | | | | | | | | | | | | |
Net increase (decrease) in shares from share transactions | | | (3,900,000 | ) | | | 7,600,000 | | | | 2,500,000 | | | | 2,800,000 | |
| | | | | | | | | | | | | | | | |
SEE NOTES TO FINANCIAL STATEMENTS.
| | | | | | | | |
| | | |
| OCTOBER 31, 2019 | | J.P. MORGAN EXCHANGE-TRADED FUNDS | | | | | 175 | |
STATEMENTS OF CHANGES IN NET ASSETS
FOR THE PERIODS INDICATED (continued)
| | | | | | | | | | | | | | | | |
| | | JPMorgan Diversified Return U.S.
Mid Cap Equity ETF | | |
JPMorgan Diversified Return U.S.
Small Cap Equity ETF | |
| | | Year Ended
October 31, 2019 | | | Year Ended
October 31, 2018 | | | Year Ended
October 31, 2019 | | | Year Ended
October 31, 2018 | |
CHANGE IN NET ASSETS RESULTING FROM OPERATIONS: | | | | | | | | | | | | | | | | |
Net investment income (loss) | | $ | 2,884,389 | | | $ | 1,609,625 | | | $ | 1,872,735 | | | $ | 845,794 | |
Net realized gain (loss) | | | 1,531,972 | | | | 1,365,158 | | | | 11,531,108 | | | | 3,032,826 | |
Change in net unrealized appreciation/depreciation | | | 9,451,433 | | | | (1,296,856 | ) | | | (6,003,010 | ) | | | (3,177,766 | ) |
| | | | | | | | | | | | | | | | |
Change in net assets resulting from operations | | | 13,867,794 | | | | 1,677,927 | | | | 7,400,833 | | | | 700,854 | |
| | | | | | | | | | | | | | | | |
| | | | |
DISTRIBUTIONS TO SHAREHOLDERS: | | | | | | | | | | | | | | | | |
Total distributions to shareholders | | | (2,653,452 | ) | | | (2,149,261 | ) | | | (1,663,026 | ) | | | (1,058,143 | ) |
| | | | | | | | | | | | | | | | |
| | | | |
CAPITAL TRANSACTIONS: | | | | | | | | | | | | | | | | |
Change in net assets resulting from capital transactions | | | 64,731,269 | | | | 50,436,264 | | | | 38,470,266 | | | | 41,481,438 | |
| | | | | | | | | | | | | | | | |
| | | | |
NET ASSETS: | | | | | | | | | | | | | | | | |
Change in net assets | | | 75,945,611 | | | | 49,964,930 | | | | 44,208,073 | | | | 41,124,149 | |
Beginning of period | | | 112,028,180 | | | | 62,063,250 | | | | 96,135,254 | | | | 55,011,105 | |
| | | | | | | | | | | | | | | | |
End of period | | $ | 187,973,791 | | | $ | 112,028,180 | | | $ | 140,343,327 | | | $ | 96,135,254 | |
| | | | | | | | | | | | | | | | |
| | | | |
CAPITAL TRANSACTIONS: | | | | | | | | | | | | | | | | |
Proceeds from shares issued | | $ | 83,490,606 | | | $ | 57,240,549 | | | $ | 125,026,689 | | | $ | 51,393,702 | |
Cost of shares redeemed | | | (18,759,337 | ) | | | (6,804,285 | ) | | | (86,556,423 | ) | | | (9,912,264 | ) |
| | | | | | | | | | | | | | | | |
Total change in net assets resulting from capital transactions | | $ | 64,731,269 | | | $ | 50,436,264 | | | $ | 38,470,266 | | | $ | 41,481,438 | |
| | | | | | | | | | | | | | | | |
| | | | |
SHARE TRANSACTIONS: | | | | | | | | | | | | | | | | |
Issued | | | 1,300,000 | | | | 900,000 | | | | 4,150,000 | | | | 1,650,000 | |
Redeemed | | | (300,000 | ) | | | (100,000 | ) | | | (2,850,000 | ) | | | (300,000 | ) |
| | | | | | | | | | | | | | | | |
Net increase in shares from share transactions | | | 1,000,000 | | | | 800,000 | | | | 1,300,000 | | | | 1,350,000 | |
| | | | | | | | | | | | | | | | |
SEE NOTES TO FINANCIAL STATEMENTS.
| | | | | | |
| | | |
| 176 | | | | J.P. MORGAN EXCHANGE-TRADED FUNDS | | OCTOBER 31, 2019 |
| | | | | | | | | | | | | | | | |
| | | JPMorgan U.S. Dividend ETF | | |
JPMorgan U.S. Minimum
Volatility ETF | |
| | | Year Ended
October 31, 2019 | | | Period Ended
October 31, 2018 (a) | | | Year Ended
October 31, 2019 | | | Period Ended
October 31, 2018 (a) | |
CHANGE IN NET ASSETS RESULTING FROM OPERATIONS: | | | | | | | | | | | | | | | | |
Net investment income (loss) | | $ | 1,126,280 | | | $ | 1,000,159 | | | $ | 1,125,687 | | | $ | 612,463 | |
Net realized gain (loss) | | | 681,389 | | | | (262,149 | ) | | | 3,201,699 | | | | (98,636 | ) |
Change in net unrealized appreciation/depreciation | | | 1,931,896 | | | | 15,761 | | | | 3,586,564 | | | | 1,202,952 | |
| | | | | | | | | | | | | | | | |
Change in net assets resulting from operations | | | 3,739,565 | | | | 753,771 | | | | 7,913,950 | | | | 1,716,779 | |
| | | | | | | | | | | | | | | | |
| | | | |
DISTRIBUTIONS TO SHAREHOLDERS: | | | | | | | | | | | | | | | | |
Total distributions to shareholders | | | (1,057,550 | ) | | | (908,996 | ) | | | (948,027 | ) | | | (549,553 | ) |
| | | | | | | | | | | | | | | | |
| | | | |
CAPITAL TRANSACTIONS: | | | | | | | | | | | | | | | | |
Change in net assets resulting from capital transactions | | | 10,538,384 | | | | 27,566,351 | | | | 72,832,965 | | | | 26,278,544 | |
| | | | | | | | | | | | | | | | |
| | | | |
NET ASSETS: | | | | | | | | | | | | | | | | |
Change in net assets | | | 13,220,399 | | | | 27,411,126 | | | | 79,798,888 | | | | 27,445,770 | |
Beginning of period | | | 27,411,126 | | | | — | | | | 27,445,770 | | | | — | |
| | | | | | | | | | | | | | | | |
End of period | | $ | 40,631,525 | | | $ | 27,411,126 | | | $ | 107,244,658 | | | $ | 27,445,770 | |
| | | | | | | | | | | | | | | | |
| | | | |
CAPITAL TRANSACTIONS: | | | | | | | | | | | | | | | | |
Proceeds from shares issued | | $ | 15,758,539 | | | $ | 27,566,351 | | | $ | 93,087,661 | | | $ | 26,278,544 | |
Cost of shares redeemed | | | (5,220,155 | ) | | | — | | | | (20,254,696 | ) | | | — | |
| | �� | | | | | | | | | | | | | | |
Total change in net assets resulting from capital transactions | | $ | 10,538,384 | | | $ | 27,566,351 | | | $ | 72,832,965 | | | $ | 26,278,544 | |
| | | | | | | | | | | | | | | | |
| | | | |
SHARE TRANSACTIONS: | | | | | | | | | | | | | | | | |
Issued | | | 600,000 | | | | 1,100,000 | | | | 3,200,000 | | | | 1,050,000 | |
Redeemed | | | (200,000 | ) | | | — | | | | (700,000 | ) | | | — | |
| | | | | | | | | | | | | | | | |
Net increase in shares from share transactions | | | 400,000 | | | | 1,100,000 | | | | 2,500,000 | | | | 1,050,000 | |
| | | | | | | | | | | | | | | | |
| (a) | Commencement of operations was November 8, 2017. |
SEE NOTES TO FINANCIAL STATEMENTS.
| | | | | | | | |
| | | |
| OCTOBER 31, 2019 | | J.P. MORGAN EXCHANGE-TRADED FUNDS | | | | | 177 | |
STATEMENTS OF CHANGES IN NET ASSETS
FOR THE PERIODS INDICATED (continued)
| | | | | | | | | | | | | | | | |
| | |
JPMorgan
U.S. Momentum Factor ETF | | |
JPMorgan
U.S. Quality Factor ETF | |
| | | Year Ended
October 31, 2019 | | | Period Ended
October 31, 2018 (a) | | | Year Ended
October 31, 2019 | | | Period Ended
October 31, 2018 (a) | |
CHANGE IN NET ASSETS RESULTING FROM OPERATIONS: | | | | | | | | | | | | | | | | |
Net investment income (loss) | | $ | 597,332 | | | $ | 363,689 | | | $ | 1,227,149 | | | $ | 543,151 | |
Net realized gain (loss) | | | 5,801,887 | | | | (304,570 | ) | | | 549,586 | | | | (97,686 | ) |
Change in net unrealized appreciation/depreciation | | | (2,461,486 | ) | | | 1,322,058 | | | | 5,941,402 | | | | 1,618,569 | |
| | | | | | | | | | | | | | | | |
Change in net assets resulting from operations | | | 3,937,733 | | | | 1,381,177 | | | | 7,718,137 | | | | 2,064,034 | |
| | | | | | | | | | | | | | | | |
| | | | |
DISTRIBUTIONS TO SHAREHOLDERS: | | | | | | | | | | | | | | | | |
Total distributions to shareholders | | | (515,149 | ) | | | (338,121 | ) | | | (1,098,039 | ) | | | (496,228 | ) |
| | | | | | | | | | | | | | | | |
| | | | |
CAPITAL TRANSACTIONS: | | | | | | | | | | | | | | | | |
Change in net assets resulting from capital transactions | | | 24,622,635 | | | | 27,532,314 | | | | 71,232,507 | | | | 27,647,461 | |
| | | | | | | | | | | | | | | | |
| | | | |
NET ASSETS: | | | | | | | | | | | | | | | | |
Change in net assets | | | 28,045,219 | | | | 28,575,370 | | | | 77,852,605 | | | | 29,215,267 | |
Beginning of period | | | 28,575,370 | | | | — | | | | 29,215,267 | | | | — | |
| | | | | | | | | | | | | | | | |
End of period | | $ | 56,620,589 | | | $ | 28,575,370 | | | $ | 107,067,872 | | | $ | 29,215,267 | |
| | | | | | | | | | | | | | | | |
| | | | |
CAPITAL TRANSACTIONS: | | | | | | | | | | | | | | | | |
Proceeds from shares issued | | $ | 66,439,247 | | | $ | 27,532,314 | | | $ | 77,043,167 | | | $ | 27,647,461 | |
Cost of shares redeemed | | | (41,816,612 | ) | | | — | | | | (5,810,660 | ) | | | — | |
| | | | | | | | | | | | | | | | |
Total change in net assets resulting from capital transactions | | $ | 24,622,635 | | | $ | 27,532,314 | | | $ | 71,232,507 | | | $ | 27,647,461 | |
| | | | | | | | | | | | | | | | |
| | | | |
SHARE TRANSACTIONS: | | | | | | | | | | | | | | | | |
Issued | | | 2,300,000 | | | | 1,100,000 | | | | 2,700,000 | | | | 1,100,000 | |
Redeemed | | | (1,450,000 | ) | | | — | | | | (200,000 | ) | | | — | |
| | | | | | | | | | | | | | | | |
Net increase in shares from share transactions | | | 850,000 | | | | 1,100,000 | | | | 2,500,000 | | | | 1,100,000 | |
| | | | | | | | | | | | | | | | |
| (a) | Commencement of operations was November 8, 2017. |
SEE NOTES TO FINANCIAL STATEMENTS.
| | | | | | |
| | | |
| 178 | | | | J.P. MORGAN EXCHANGE-TRADED FUNDS | | OCTOBER 31, 2019 |
| | | | | | | | |
| | |
JPMorgan U.S. Value
Factor ETF | |
| | | Year Ended
October 31, 2019 | | | Period Ended
October 31, 2018 (a) | |
CHANGE IN NET ASSETS RESULTING FROM OPERATIONS: | |
Net investment income (loss) | | $ | 1,527,280 | | | $ | 674,149 | |
Net realized gain (loss) | | | 2,324,504 | | | | (145,490 | ) |
Change in net unrealized appreciation/depreciation | | | 3,862,947 | | | | 287,697 | |
| | | | | | | | |
Change in net assets resulting from operations | | | 7,714,731 | | | | 816,356 | |
| | | | | | | | |
| | |
DISTRIBUTIONS TO SHAREHOLDERS: | | | | | | | | |
Total distributions to shareholders | | | (1,321,813 | ) | | | (616,329 | ) |
| | | | | | | | |
| | |
CAPITAL TRANSACTIONS: | | | | | | | | |
Change in net assets resulting from capital transactions | | | 31,470,215 | | | | 28,786,482 | |
| | | | | | | | |
| | |
NET ASSETS: | | | | | | | | |
Change in net assets | | | 37,863,133 | | | | 28,986,509 | |
Beginning of period | | | 28,986,509 | | | | — | |
| | | | | | | | |
End of period | | $ | 66,849,642 | | | $ | 28,986,509 | |
| | | | | | | | |
| | |
CAPITAL TRANSACTIONS: | | | | | | | | |
Proceeds from shares issued | | $ | 46,088,396 | | | $ | 28,786,482 | |
Cost of shares redeemed | | | (14,618,181 | ) | | | — | |
| | | | | | | | |
Total change in net assets resulting from capital transactions | | $ | 31,470,215 | | | $ | 28,786,482 | |
| | | | | | | | |
| | |
SHARE TRANSACTIONS: | | | | | | | | |
Issued | | | 1,850,000 | | | | 1,150,000 | |
Redeemed | | | (550,000 | ) | | | — | |
| | | | | | | | |
Net increase in shares from share transactions | | | 1,300,000 | | | | 1,150,000 | |
| | | | | | | | |
| (a) | Commencement of operations was November 8, 2017. |
SEE NOTES TO FINANCIAL STATEMENTS.
| | | | | | | | |
| | | |
| OCTOBER 31, 2019 | | J.P. MORGAN EXCHANGE-TRADED FUNDS | | | | | 179 | |
FINANCIAL HIGHLIGHTS
FOR THE PERIODS INDICATED
| | | | | | | | | | | | | | | | | | | | |
| | | Per share operating performance | |
| | | | | | Investment Operations | | | Distributions | |
| | | Net asset
value,
beginning
of period | | | Net
investment
income
(loss) (b) | | | Net realized
and unrealized
gains
(losses) on
investments | | | Total from
investment
operations | | | Net
investment
income | |
| | | | | |
JPMorgan BetaBuilders Canada ETF | | | | | | | | | | | | | | | | | | | | |
Year Ended October 31, 2019 | | $ | 22.59 | | | $ | 0.66 | | | $ | 2.24 | | | $ | 2.90 | | | $ | (0.60 | ) |
August 7, 2018 (g) through October 31, 2018 | | | 24.65 | | | | 0.14 | | | | (2.15 | ) | | | (2.01 | ) | | | (0.05 | ) |
| | | | | |
JPMorgan BetaBuilders Developed Asiaex-Japan ETF | | | | | | | | | | | | | | | | | | | | |
Year Ended October 31, 2019 | | | 22.68 | | | | 1.05 | | | | 2.58 | | | | 3.63 | | | | (1.00 | ) |
August 7, 2018 (g) through October 31, 2018 | | | 25.36 | | | | 0.22 | | | | (2.73 | ) | | | (2.51 | ) | | | (0.17 | ) |
| | | | | |
JPMorgan BetaBuilders Europe ETF | | | | | | | | | | | | | | | | | | | | |
Year Ended October 31, 2019 | | | 22.59 | | | | 0.90 | | | | 1.65 | | | | 2.55 | | | | (0.78 | ) |
June 15, 2018 (g) through October 31, 2018 | | | 24.79 | | | | 0.13 | | | | (2.30 | ) | | | (2.17 | ) | | | (0.03 | ) |
| | | | | |
JPMorgan BetaBuilders Japan ETF | | | | | | | | | | | | | | | | | | | | |
Year Ended October 31, 2019 | | | 22.72 | | | | 0.48 | | | | 1.48 | | | | 1.96 | | | | (0.14 | ) |
June 15, 2018 (g) through October 31, 2018 | | | 24.79 | | | | 0.24 | | | | (2.31 | ) | | | (2.07 | ) | | | — | |
| | | | | |
JPMorgan BetaBuilders U.S. Equity ETF | | | | | | | | | | | | | | | | | | | | |
March 12, 2019 (g) through October 31, 2019 | | | 50.14 | | | | 0.68 | | | | 4.29 | | | | 4.97 | | | | (0.51 | ) |
| (a) | Annualized for periods less than one year, unless otherwise indicated. |
| (b) | Calculated based upon average shares outstanding. |
| (c) | Not annualized for periods less than one year. |
| (d) | Includes adjustments in accordance with accounting principles generally accepted in the United States of America and as such, the net asset values for financial reporting purposes and the returns based upon those net asset values may differ from the net asset values and returns for shareholder transactions. |
| (e) | Market price total return is calculated assuming an initial investment made at the beginning of the period market price, reinvestment of all dividends and distributions at market price during the period, and sale at the market price on the last day of the period. The market price presented to calculate the market price total return is themid-point of the bid/ask spread at the close of business on the Cboe BZX Exchange, Inc. |
| (f) | Certainnon-recurring expenses incurred by the Fund were not annualized for the periods indicated. |
| (g) | Commencement of operations. |
| (h) | Since the Shares of the Fund did not trade in the secondary market until the day after the Fund’s inception, for the period from the inception to the first day of secondary market trading, the NAV is used as a proxy for the secondary market trading price to calculate the market returns. |
SEE NOTES TO FINANCIAL STATEMENTS.
| | | | | | |
| | | |
| 180 | | | | J.P. MORGAN EXCHANGE-TRADED FUNDS | | OCTOBER 31, 2019 |
| | | | | | | | | | | | | | | | | | | | | | | | | | | | | | | | | | |
| | | Ratios/Supplemental data | |
| | | | | | | | | | | | | | | | Ratios to average net assets(a) | | | | |
Net asset
value,
end of
period | | |
Market
price,
end of
period | | | Total
return (c)(d) | | | Market
price
total
return (c)(e) | | | Net assets,
end of
period | | | Net
expenses | | | Net
investment
income
(loss) | | | Expenses
without waivers
and reimbursements | | | Portfolio
turnover
rate (c) | |
| | | | | | | | |
| | | | | | | | | | | | | | | | | | | | | | | | | | | | | | | | | | |
| $ | 24.89 | | | $ | 24.90 | | | | 13.08 | % | | | 12.97 | % | | $ | 3,800,754,020 | | | | 0.19 | % | | | 2.73 | % | | | 0.34 | % | | | 7 | % |
| | 22.59 | | | | 22.62 | | | | (8.18 | ) | | | (8.05 | )(h) | | | 2,044,698,826 | | | | 0.19 | (f) | | | 2.55 | | | | 0.37 | (f) | | | 1 | |
| | | | | | | | |
| | | | | | | | | | | | | | | | | | | | | | | | | | | | | | | | | | |
| | 25.31 | | | | 25.27 | | | | 16.18 | | | | 15.94 | | | | 1,442,853,830 | | | | 0.19 | | | | 4.22 | | | | 0.39 | | | | 7 | |
| | 22.68 | | | | 22.69 | | | | (9.97 | ) | | | (9.93 | )(h) | | | 603,313,934 | | | | 0.19 | (f) | | | 3.94 | | | | 0.45 | (f) | | | 2 | |
| | | | | | | | |
| | | | | | | | | | | | | | | | | | | | | | | | | | | | | | | | | | |
| | 24.36 | | | | 24.39 | | | | 11.43 | | | | 11.32 | | | | 3,853,145,624 | | | | 0.09 | | | | 3.83 | | | | 0.25 | | | | 7 | |
| | 22.59 | | | | 22.64 | | | | (8.75 | ) | | | (8.55 | )(h) | | | 1,314,930,292 | | | | 0.09 | (f) | | | 1.45 | | | | 0.34 | (f) | | | 2 | |
| | | | | | | | |
| | | | | | | | | | | | | | | | | | | | | | | | | | | | | | | | | | |
| | 24.54 | | | | 24.57 | | | | 8.74 | | | | 9.07 | | | | 4,318,521,919 | | | | 0.19 | | | | 2.14 | | | | 0.33 | | | | 4 | |
| | 22.72 | | | | 22.68 | | | | (8.35 | ) | | | (8.51 | )(h) | | | 2,336,087,667 | | | | 0.19 | (f) | | | 2.63 | | | | 0.37 | (f) | | | 5 | |
| | | | | | | | |
| | | | | | | | | | | | | | | | | | | | | | | | | | | | | | | | | | |
| | 54.60 | | | | 54.61 | | | | 9.95 | | | | 9.97 | (h) | | | 46,409,125 | | | | 0.02 | | | | 2.01 | | | | 0.02 | | | | 3 | |
SEE NOTES TO FINANCIAL STATEMENTS.
| | | | | | | | |
| | | |
| OCTOBER 31, 2019 | | J.P. MORGAN EXCHANGE-TRADED FUNDS | | | | | 181 | |
FINANCIAL HIGHLIGHTS
FOR THE PERIODS INDICATED (continued)
| | | | | | | | | | | | | | | | | | | | |
| | | Per share operating performance | |
| | | | | | Investment Operations | | | Distributions | |
| | | Net asset
value,
beginning
of period | | | Net
investment
income
(loss) (b) | | | Net realized
and unrealized
gains
(losses) on
investments | | | Total from
investment
operations | | | Net
investment
income | |
|
JPMorgan Diversified Return Emerging Markets Equity ETF | |
Year Ended October 31, 2019 | | $ | 50.91 | | | $ | 2.07 | | | $ | 2.97 | | | $ | 5.04 | | | $ | (1.52 | ) |
Year Ended October 31, 2018 | | | 57.15 | | | | 1.59 | | | | (5.37 | ) | | | (3.78 | ) | | | (2.46 | ) |
Year Ended October 31, 2017 | | | 48.68 | | | | 1.50 | | | | 7.56 | | | | 9.06 | | | | (0.59 | ) |
Year Ended October 31, 2016 | | | 45.23 | | | | 1.04 | | | | 3.72 | | | | 4.76 | | | | (1.31 | ) |
January 7, 2015 (f) through October 31, 2015 | | | 50.00 | | | | 1.29 | | | | (6.06 | ) | | | (4.77 | ) | | | — | |
| | | | | |
JPMorgan Diversified Return Europe Equity ETF | | | | | | | | | | | | | | | | | | | | |
Year Ended October 31, 2019 | | | 53.44 | | | | 1.40 | | | | 4.46 | (j) | | | 5.86 | | | | (1.70 | ) |
Year Ended October 31, 2018 | | | 61.15 | | | | 1.65 | | | | (6.36 | ) | | | (4.71 | ) | | | (3.00 | ) |
Year Ended October 31, 2017 | | | 49.88 | | | | 1.57 | | | | 10.82 | | | | 12.39 | | | | (1.12 | ) |
December 18, 2015 (f) through October 31, 2016 | | | 50.00 | | | | 1.39 | | | | (1.51 | ) | | | (0.12 | ) | | | — | (i) |
| | | | | |
JPMorgan Diversified Return Global Equity ETF | | | | | | | | | | | | | | | | | | | | |
Year Ended October 31, 2019 | | | 56.52 | | | | 1.59 | | | | 4.25 | | | | 5.84 | | | | (1.63 | ) |
Year Ended October 31, 2018 | | | 61.00 | | | | 1.42 | | | | (3.93 | ) | | | (2.51 | ) | | | (1.97 | ) |
Year Ended October 31, 2017 | | | 51.70 | | | | 1.15 | | | | 9.28 | | | | 10.43 | | | | (1.13 | ) |
Year Ended October 31, 2016 | | | 50.53 | | | | 1.14 | | | | 0.99 | | | | 2.13 | | | | (0.96 | ) |
Year Ended October 31, 2015 | | | 49.69 | | | | 1.08 | | | | 0.08 | | | | 1.16 | | | | (0.32 | ) |
| | | | | |
JPMorgan Diversified Return International Equity ETF | | | | | | | | | | | | | | | | | | | | |
Year Ended October 31, 2019 | | | 53.10 | | | | 1.77 | | | | 1.90 | | | | 3.67 | | | | (1.71 | ) |
Year Ended October 31, 2018 | | | 59.18 | | | | 1.51 | | | | (5.29 | ) | | | (3.78 | ) | | | (2.30 | ) |
Year Ended October 31, 2017 | | | 50.00 | | | | 1.43 | | | | 8.57 | | | | 10.00 | | | | (0.82 | ) |
Year Ended October 31, 2016 | | | 51.17 | | | | 1.28 | | | | (1.37 | )(j) | | | (0.09 | ) | | | (1.08 | ) |
November 5, 2014 (f) through October 31, 2015 | | | 50.00 | | | | 1.39 | | | | (0.07 | ) | | | 1.32 | | | | (0.15 | ) |
| | | | | |
JPMorgan Diversified Return U.S. Equity ETF | | | | | | | | | | | | | | | | | | | | |
Year Ended October 31, 2019 | | | 69.92 | | | | 1.66 | | | | 6.34 | | | | 8.00 | | | | (1.48 | ) |
Year Ended October 31, 2018 | | | 68.52 | | | | 1.39 | | | | 1.88 | | | | 3.27 | | | | (1.87 | ) |
Year Ended October 31, 2017 | | | 57.06 | | | | 1.17 | | | | 10.75 | | | | 11.92 | | | | (0.46 | ) |
Year Ended October 31, 2016 | | | 54.13 | | | | 1.10 | | | | 2.09 | (j) | | | 3.19 | | | | (0.26 | ) |
September 29, 2015 (f) through October 31, 2015 | | | 50.00 | | | | 0.06 | | | | 4.07 | | | | 4.13 | | | | — | |
| | | | | |
JPMorgan Diversified Return U.S. Mid Cap Equity ETF | | | | | | | | | | | | | | | | | | | | |
Year Ended October 31, 2019 | | | 62.24 | | | | 1.18 | | | | 4.78 | | | | 5.96 | | | | (1.07 | ) |
Year Ended October 31, 2018 | | | 62.06 | | | | 1.06 | | | | 0.59 | | | | 1.65 | | | | (1.47 | ) |
Year Ended October 31, 2017 | | | 51.65 | | | | 0.89 | | | | 10.02 | | | | 10.91 | | | | (0.50 | ) |
May 11, 2016 (f) through October 31, 2016 | | | 50.00 | | | | 0.42 | | | | 1.23 | | | | 1.65 | | | | — | |
| | | | | |
JPMorgan Diversified Return U.S. Small Cap Equity ETF | | | | | | | | | | | | | | | | | | | | |
Year Ended October 31, 2019 | | | 29.58 | | | | 0.42 | | | | 1.22 | | | | 1.64 | | | | (0.38 | ) |
Year Ended October 31, 2018 | | | 28.95 | | | | 0.33 | | | | 0.73 | | | | 1.06 | | | | (0.43 | ) |
November 15, 2016 (f) through October 31, 2017 | | | 25.00 | | | | 0.28 | | | | 3.71 | | | | 3.99 | | | | (0.04 | ) |
| (a) | Annualized for periods less than one year, unless otherwise indicated. |
| (b) | Calculated based upon average shares outstanding. |
| (c) | Not annualized for periods less than one year. |
| (d) | Includes adjustments in accordance with accounting principles generally accepted in the United States of America and as such, the net asset values for financial reporting purposes and the returns based upon those net asset values may differ from the net asset values and returns for shareholder transactions. |
| (e) | Market price total return is calculated assuming an initial investment made at the beginning of the period market price, reinvestment of all dividends and distributions at market price during the period, and sale at the market price on the last day of the period. The market price presented to calculate the market price total return is themid-point of the bid/ask spread at the close of business on the NYSE Arca, Inc. |
| (f) | Commencement of operations. |
| (g) | Since the Shares of the Fund did not trade in the secondary market until the day after the Fund’s inception, for the period from the inception to the first day of secondary market trading, the NAV is used as a proxy for the secondary market trading price to calculate the market returns. |
| (h) | Certainnon-recurring expenses incurred by the Fund were not annualized for the periods indicated. |
| (i) | Amount rounds to less than $0.005. |
| (j) | Calculation of the net realized and unrealized gains (losses) per share do not correlate with the Fund’s net realized and unrealized gains (losses) presented in the Statement of Operations due to the timing of capital transactions in relation to the fluctuating market values of the Fund’s investments. |
| (k) | Amount rounds to less than 0.5%. |
SEE NOTES TO FINANCIAL STATEMENTS.
| | | | | | |
| | | |
| 182 | | | | J.P. MORGAN EXCHANGE-TRADED FUNDS | | OCTOBER 31, 2019 |
| | | | | | | | | | | | | | | | | | | | | | | | | | | | | | | | | | |
| | | Ratios/Supplemental data | |
| | | | | | | | | | | | | | | | Ratios to average net assets(a) | | | | |
Net asset
value,
end of
period | | |
Market
price,
end of
period | | | Total
return (c)(d) | | | Market
price
total
return (c)(e) | | | Net assets,
end of
period | | | Net
expenses | | | Net
investment
income
(loss) | | | Expenses
without waivers
and reimbursements | | | Portfolio
turnover
rate (c) | |
| | | | | | | | |
| | | | | | | | | | | | | | | | | | | | | | | | | | | | | | | | | | |
| $ | 54.43 | | | $ | 54.50 | | | | 10.00 | % | | | 10.31 | % | | $ | 353,795,416 | | | | 0.45 | % | | | 3.87 | % | | | 0.87 | % | | | 51 | % |
| | 50.91 | | | | 50.83 | | | | (6.93 | ) | | | (7.43 | ) | | | 213,804,252 | | | | 0.45 | | | | 2.80 | | | | 0.96 | | | | 53 | |
| | 57.15 | | | | 57.36 | | | | 18.95 | | | | 18.65 | | | | 165,741,046 | | | | 0.45 | | | | 2.85 | | | | 1.06 | | | | 60 | |
| | 48.68 | | | | 48.98 | | | | 11.02 | | | | 11.63 | | | | 43,809,461 | | | | 0.45 | | | | 2.33 | | | | 1.91 | | | | 44 | |
| | 45.23 | | | | 45.27 | | | | (9.54 | ) | | | (9.46 | )(g) | | | 36,185,674 | | | | 0.45 | (h) | | | 3.18 | | | | 2.07 | (h) | | | 46 | |
| | | | | | | | |
| | | | | | | | | | | | | | | | | | | | | | | | | | | | | | | | | | |
| | 57.60 | | | | 57.58 | | | | 11.09 | | | | 10.81 | | | | 17,280,937 | | | | 0.38 | | | | 2.58 | | | | 1.01 | | | | 20 | |
| | 53.44 | | | | 53.56 | | | | (8.11 | ) | | | (8.33 | ) | | | 74,820,788 | | | | 0.40 | | | | 2.77 | | | | 0.70 | | | | 51 | |
| | 61.15 | | | | 61.42 | | | | 25.42 | | | | 25.80 | | | | 79,492,357 | | | | 0.43 | | | | 2.89 | | | | 0.80 | | | | 18 | |
| | 49.88 | | | | 49.95 | | | | (0.23 | ) | | | (0.09 | )(g) | | | 59,859,633 | | | | 0.43 | (h) | | | 3.14 | | | | 1.14 | (h) | | | 15 | |
| | | | | | | | |
| | | | | | | | | | | | | | | | | | | | | | | | | | | | | | | | | | |
| | 60.73 | | | | 60.57 | | | | 10.49 | | | | 10.30 | | | | 145,749,540 | | | | 0.38 | | | | 2.73 | | | | 0.50 | | | | 23 | |
| | 56.52 | | | | 56.47 | | | | (4.34 | ) | | | (4.65 | ) | | | 203,457,264 | | | | 0.38 | | | | 2.30 | | | | 0.56 | | | | 29 | |
| | 61.00 | | | | 61.14 | | | | 20.61 | | | | 20.40 | | | | 103,695,070 | | | | 0.38 | | | | 2.06 | | | | 0.80 | | | | 26 | |
| | 51.70 | | | | 51.91 | | | | 4.31 | | | | 4.44 | | | | 77,556,933 | | | | 0.38 | | | | 2.26 | | | | 0.93 | | | | 22 | |
| | 50.53 | | | | 50.67 | | | | 2.36 | | | | 1.82 | | | | 50,530,034 | | | | 0.38 | | | | 2.16 | | | | 1.52 | | | | 18 | |
| | | | | | | | |
| | | | | | | | | | | | | | | | | | | | | | | | | | | | | | | | | | |
| | 55.06 | | | | 55.02 | | | | 7.05 | | | | 7.23 | | | | 1,282,867,303 | | | | 0.38 | | | | 3.27 | | | | 0.41 | | | | 25 | |
| | 53.10 | | | | 52.98 | | | | (6.72 | ) | | | (7.22 | ) | | | 1,444,332,261 | | | | 0.40 | | | | 2.57 | | | | 0.44 | | | | 28 | |
| | 59.18 | | | | 59.36 | | | | 20.35 | | | | 20.30 | | | | 1,159,887,006 | | | | 0.43 | | | | 2.63 | | | | 0.51 | | | | 29 | |
| | 50.00 | | | | 50.17 | | | | (0.15 | ) | | | 0.41 | | | | 470,042,716 | | | | 0.43 | | | | 2.56 | | | | 0.75 | | | | 27 | |
| | 51.17 | | | | 51.05 | | | | 2.65 | | | | 2.40 | (g) | | | 92,113,607 | | | | 0.43 | (h) | | | 2.72 | | | | 1.33 | (h) | | | 20 | |
| | | | | | | | |
| | | | | | | | | | | | | | | | | | | | | | | | | | | | | | | | | | |
| | 76.44 | | | | 76.45 | | | | 11.65 | | | | 11.65 | | | | 802,625,997 | | | | 0.19 | | | | 2.27 | | | | 0.37 | | | | 24 | |
| | 69.92 | | | | 69.93 | | | | 4.74 | | | | 4.70 | | | | 559,362,329 | | | | 0.19 | | | | 1.95 | | | | 0.41 | | | | 32 | |
| | 68.52 | | | | 68.55 | | | | 20.99 | | | | 21.02 | | | | 356,298,771 | | | | 0.21 | | | | 1.83 | | | | 0.47 | | | | 27 | |
| | 57.06 | | | | 57.08 | | | | 5.92 | | | | 5.90 | | | | 125,538,258 | | | | 0.29 | | | | 1.95 | | | | 0.90 | | | | 22 | |
| | 54.13 | | | | 54.16 | | | | 8.26 | | | | 8.32 | (g) | | | 10,826,623 | | | | 0.29 | (h) | | | 1.20 | | | | 5.75 | (h) | | | — | (k) |
| | | | | | | | |
| | | | | | | | | | | | | | | | | | | | | | | | | | | | | | | | | | |
| | 67.13 | | | | 67.17 | | | | 9.73 | | | | 9.78 | | | | 187,973,791 | | | | 0.24 | | | | 1.82 | | | | 0.43 | | | | 25 | |
| | 62.24 | | | | 62.25 | | | | 2.59 | | | | 2.57 | | | | 112,028,180 | | | | 0.24 | | | | 1.64 | | | | 0.50 | | | | 35 | |
| | 62.06 | | | | 62.08 | | | | 21.25 | | | | 21.31 | | | | 62,063,250 | | | | 0.26 | | | | 1.54 | | | | 0.62 | | | | 31 | |
| | 51.65 | | | | 51.64 | | | | 3.30 | | | | 3.28 | (g) | | | 36,153,888 | | | | 0.34 | (h) | | | 1.69 | | | | 1.02 | (h) | | | 15 | |
| | | | | | | | |
| | | | | | | | | | | | | | | | | | | | | | | | | | | | | | | | | | |
| | 30.84 | | | | 30.87 | | | | 5.64 | | | | 5.75 | | | | 140,343,327 | | | | 0.29 | | | | 1.40 | | | | 0.54 | | | | 43 | |
| | 29.58 | | | | 29.58 | | | | 3.61 | | | | 3.43 | | | | 96,135,254 | | | | 0.29 | | | | 1.08 | | | | 0.61 | | | | 30 | |
| | 28.95 | | | | 29.00 | | | | 15.96 | | | | 16.16 | (g) | | | 55,011,105 | | | | 0.31 | (h) | | | 1.08 | | | | 0.97 | (h) | | | 24 | |
SEE NOTES TO FINANCIAL STATEMENTS.
| | | | | | | | |
| | | |
| OCTOBER 31, 2019 | | J.P. MORGAN EXCHANGE-TRADED FUNDS | | | | | 183 | |
FINANCIAL HIGHLIGHTS
FOR THE PERIODS INDICATED (continued)
| | | | | | | | | | | | | | | | | | | | |
| | | Per share operating performance | |
| | | | | | Investment Operations | | | Distributions | |
| | | Net asset
value,
beginning
of period | | | Net
investment
income
(loss) (b) | | | Net realized
and unrealized
gains
(losses) on
investments | | | Total from
investment
operations | | | Net
investment
income | |
|
JPMorgan U.S. Dividend ETF | |
Year Ended October 31, 2019 | | $ | 24.92 | | | $ | 0.93 | | | $ | 2.11 | | | $ | 3.04 | | | $ | (0.87 | ) |
November 8, 2017 (g) through October 31, 2018 | | | 25.00 | | | | 0.96 | | | | (0.17 | ) | | | 0.79 | | | | (0.87 | ) |
| | | | | |
JPMorgan U.S. Minimum Volatility ETF | | | | | | | | | | | | | | | | | | | | |
Year Ended October 31, 2019 | | | 26.14 | | | | 0.64 | | | | 3.95 | | | | 4.59 | | | | (0.52 | ) |
November 8, 2017 (g) through October 31, 2018 | | | 25.00 | | | | 0.59 | | | | 1.08 | | | | 1.67 | | | | (0.53 | ) |
| | | | | |
JPMorgan U.S. Momentum Factor ETF | | | | | | | | | | | | | | | | | | | | |
Year Ended October 31, 2019 | | | 25.98 | | | | 0.37 | | | | 2.99 | | | | 3.36 | | | | (0.30 | ) |
November 8, 2017 (g) through October 31, 2018 | | | 25.00 | | | | 0.35 | | | | 0.95 | | | | 1.30 | | | | (0.32 | ) |
| | | | | |
JPMorgan U.S. Quality Factor ETF | | | | | | | | | | | | | | | | | | | | |
Year Ended October 31, 2019 | | | 26.56 | | | | 0.58 | | | | 3.11 | | | | 3.69 | | | | (0.51 | ) |
November 8, 2017 (g) through October 31, 2018 | | | 25.00 | | | | 0.52 | | | | 1.52 | | | | 2.04 | | | | (0.48 | ) |
| | | | | |
JPMorgan U.S. Value Factor ETF | | | | | | | | | | | | | | | | | | | | |
Year Ended October 31, 2019 | | | 25.21 | | | | 0.75 | | | | 1.97 | | | | 2.72 | | | | (0.64 | ) |
November 8, 2017 (g) through October 31, 2018 | | | 25.00 | | | | 0.64 | | | | 0.16 | | | | 0.80 | | | | (0.59 | ) |
| (a) | Annualized for periods less than one year, unless otherwise indicated. |
| (b) | Calculated based upon average shares outstanding. |
| (c) | Not annualized for periods less than one year. |
| (d) | Includes adjustments in accordance with accounting principles generally accepted in the United States of America and as such, the net asset values for financial reporting purposes and the returns based upon those net asset values may differ from the net asset values and returns for shareholder transactions. |
| (e) | Market price total return is calculated assuming an initial investment made at the beginning of the period market price, reinvestment of all dividends and distributions at market price during the period, and sale at the market price on the last day of the period. The market price presented to calculate the market price total return is themid-point of the bid/ask spread at the close of business on the NYSE Arca, Inc. |
| (f) | Certainnon-recurring expenses incurred by the Fund were not annualized for the periods indicated. |
| (g) | Commencement of operations. |
| (h) | Since the Shares of the Fund did not trade in the secondary market until the day after the Fund’s inception, for the period from the inception to the first day of secondary market trading, the NAV is used as a proxy for the secondary market trading price to calculate the market returns. |
SEE NOTES TO FINANCIAL STATEMENTS.
| | | | | | |
| | | |
| 184 | | | | J.P. MORGAN EXCHANGE-TRADED FUNDS | | OCTOBER 31, 2019 |
| | | | | | | | | | | | | | | | | | | | | | | | | | | | | | | | | | |
| | | Ratios/Supplemental data | |
| | | | | | | | | | | | | | | | Ratios to average net assets(a) | | | | |
Net asset
value,
end of
period | | |
Market
price,
end of
period | | | Total
return (c)(d) | | | Market
price
total
return (c)(e) | | | Net assets,
end of
period | | | Net
expenses | | | Net
investment
income
(loss) | | | Expenses
without waivers
and reimbursements | | | Portfolio
turnover
rate (c) | |
| | | | | | | | |
| | | | | | | | | | | | | | | | | | | | | | | | | | | | | | | | | | |
| $ | 27.09 | | | $ | 27.10 | | | | 12.57 | % | | | 12.69 | % | | $ | 40,631,525 | | | | 0.12 | % | | | 3.59 | % | | | 0.63 | % | | | 20 | % |
| | 24.92 | | | | 24.90 | | | | 3.08 | | | | 2.99 | (h) | | | 27,411,126 | | | | 0.12 | (f) | | | 3.81 | | | | 0.76 | (f) | | | 24 | |
| | | | | | | | |
| | | | | | | | | | | | | | | | | | | | | | | | | | | | | | | | | | |
| | 30.21 | | | | 30.23 | | | | 17.82 | | | | 17.90 | | | | 107,244,658 | | | | 0.12 | | | | 2.22 | | | | 0.54 | | | | 15 | |
| | 26.14 | | | | 26.14 | | | | 6.69 | | | | 6.69 | (h) | | | 27,445,770 | | | | 0.12 | (f) | | | 2.33 | | | | 0.76 | (f) | | | 17 | |
| | | | | | | | |
| | | | | | | | | | | | | | | | | | | | | | | | | | | | | | | | | | |
| | 29.04 | | | | 29.05 | | | | 13.06 | | | | 13.06 | | | | 56,620,589 | | | | 0.12 | | | | 1.35 | | | | 0.55 | | | | 52 | |
| | 25.98 | | | | 25.99 | | | | 5.17 | | | | 5.21 | (h) | | | 28,575,370 | | | | 0.12 | (f) | | | 1.32 | | | | 0.74 | (f) | | | 44 | |
| | | | | | | | |
| | | | | | | | | | | | | | | | | | | | | | | | | | | | | | | | | | |
| | 29.74 | | | | 29.76 | | | | 14.10 | | | | 14.18 | | | | 107,067,872 | | | | 0.12 | | | | 2.05 | | | | 0.50 | | | | 21 | |
| | 26.56 | | | | 26.56 | | | | 8.15 | | | | 8.15 | (h) | | | 29,215,267 | | | | 0.12 | (f) | | | 2.01 | | | | 0.74 | (f) | | | 22 | |
| | | | | | | | |
| | | | | | | | | | | | | | | | | | | | | | | | | | | | | | | | | | |
| | 27.29 | | | | 27.30 | | | | 11.01 | | | | 11.05 | | | | 66,849,642 | | | | 0.12 | | | | 2.90 | | | | 0.52 | | | | 22 | |
| | 25.21 | | | | 25.21 | | | | 3.12 | | | | 3.12 | (h) | | | 28,986,509 | | | | 0.12 | (f) | | | 2.52 | | | | 0.75 | (f) | | | 26 | |
SEE NOTES TO FINANCIAL STATEMENTS.
| | | | | | | | |
| | | |
| OCTOBER 31, 2019 | | J.P. MORGAN EXCHANGE-TRADED FUNDS | | | | | 185 | |
NOTES TO FINANCIAL STATEMENTS
AS OF OCTOBER 31, 2019
1. Organization
J.P. Morgan Exchange-Traded Fund Trust (the “Trust”) was formed on February 25, 2010, and is governed by a Declaration of Trust as amended and restated February 19, 2014, and is registered under the Investment Company Act of 1940, as amended (the “1940 Act”), as anopen-end management investment company.
The following are 17 separate funds of the Trust (each, a “Fund” and collectively, the “Funds”) covered by this report:
| | |
| | | Diversification Classification |
| JPMorgan BetaBuilders Canada ETF | | Diversified |
| JPMorgan BetaBuilders Developed Asiaex-Japan ETF | | Diversified |
| JPMorgan BetaBuilders Europe ETF | | Diversified |
| JPMorgan BetaBuilders Japan ETF | | Diversified |
| JPMorgan BetaBuilders U.S. Equity ETF | | Diversified |
| JPMorgan Diversified Return Emerging Markets Equity ETF | | Diversified |
| JPMorgan Diversified Return Europe Equity ETF | | Diversified |
| JPMorgan Diversified Return Global Equity ETF | | Diversified |
| JPMorgan Diversified Return International Equity ETF | | Diversified |
| JPMorgan Diversified Return U.S. Equity ETF | | Diversified |
| JPMorgan Diversified Return U.S. Mid Cap Equity ETF | | Diversified |
| JPMorgan Diversified Return U.S. Small Cap Equity ETF | | Diversified |
| JPMorgan U.S. Dividend ETF | | Diversified |
| JPMorgan U.S. Minimum Volatility ETF | | Diversified |
| JPMorgan U.S. Momentum Factor ETF | | Diversified |
| JPMorgan U.S. Quality Factor ETF | | Diversified |
| JPMorgan U.S. Value Factor ETF | | Diversified |
JPMorgan BetaBuilders Canada ETF (the “BetaBuilders Canada ETF”) commenced operations on August 7, 2018. The investment objective of the Fund is to seek investment results that closely correspond, before fees and expenses, to the performance of the Morningstar® Canada Target Market Exposure IndexSM.
JPMorgan BetaBuilders Developed Asiaex-Japan ETF (the “BetaBuilders Developed Asiaex-Japan ETF”) commenced operations on August 7, 2018. The investment objective of the Fund is to seek investment results that closely correspond, before fees and expenses, to the performance of the Morningstar® Developed Asiaex-Japan Target Market Exposure IndexSM.
JPMorgan BetaBuilders Europe ETF (the “BetaBuilders Europe ETF”) commenced operations on June 15, 2018. The investment objective of the Fund is to seek investment results that closely correspond, before fees and expenses, to the performance of the Morningstar® Developed Europe Target Market Exposure IndexSM.
JPMorgan BetaBuilders Japan ETF (the “BetaBuilders Japan ETF”) commenced operations on June 15, 2018. The investment objective of the Fund is to seek investment results that closely correspond, before fees and expenses, to the performance of the Morningstar® Japan Target Market Exposure IndexSM.
JPMorgan BetaBuilders U.S. Equity ETF (the “BetaBuilders U.S. Equity ETF”) commenced operations on March 12, 2019. The investment objective of the Fund is to seek investment results that closely correspond, before fees and expenses, to the performance of the Morningstar® US Target Market Exposure IndexSM.
The investment objective of JPMorgan Diversified Return Emerging Markets Equity ETF (the “Emerging Markets Equity ETF”) is to seek investment results that closely correspond, before fees and expenses, to the performance of the JP Morgan Diversified Factor Emerging Markets Equity Index.
The investment objective of JPMorgan Diversified Return Europe Equity ETF (the “Europe Equity ETF”) is to seek investment results that closely correspond, before fees and expenses, to the performance of the JP Morgan Diversified Factor Europe Equity Index.
The investment objective of JPMorgan Diversified Return Global Equity ETF (the “Global Equity ETF”) is to seek investment results that closely correspond, before fees and expenses, to the performance of the JP Morgan Diversified Factor Global Developed Equity Index.
The investment objective of JPMorgan Diversified Return International Equity ETF (the “International Equity ETF”) is to seek investment results that closely correspond, before fees and expenses, to the performance of the JP Morgan Diversified Factor International Equity Index.
The investment objective of JPMorgan Diversified Return U.S. Equity ETF (the “U.S. Equity ETF”) is to seek investment results that closely correspond, before fees and expenses, to the performance of the JP Morgan Diversified Factor US Equity Index.
The investment objective of JPMorgan Diversified Return U.S. Mid Cap Equity ETF (the “U.S. Mid Cap Equity ETF”) is to seek investment results that closely correspond, before fees and expenses, to the performance of the JP Morgan Diversified Factor US Mid Cap Equity Index.
| | | | | | |
| | | |
| 186 | | | | J.P. MORGAN EXCHANGE-TRADED FUNDS | | OCTOBER 31, 2019 |
The investment objective of JPMorgan Diversified Return U.S. Small Cap Equity ETF (the “U.S. Small Cap Equity ETF”) is to seek investment results that closely correspond, before fees and expenses, to the performance of the JP Morgan Diversified Factor US Small Cap Equity Index.
JPMorgan U.S. Dividend ETF (the “U.S. Dividend ETF”) commenced operations on November 8, 2017. The investment objective of the Fund is to seek investment results that closely correspond, before fees and expenses, to the performance of the JP Morgan US Dividend Index.
JPMorgan U.S. Minimum Volatility ETF (the “U.S. Minimum Volatility ETF”) commenced operations on November 8, 2017. The investment objective of the Fund is to seek investment results that closely correspond, before fees and expenses, to the performance of the JP Morgan US Minimum Volatility Index.
JPMorgan U.S. Momentum Factor ETF (the “U.S. Momentum Factor ETF”) commenced operations on November 8, 2017. The investment objective of the Fund is to seek investment results that closely correspond, before fees and expenses, to the performance of the JP Morgan US Momentum Factor Index.
JPMorgan U.S. Quality Factor ETF (the “U.S. Quality Factor ETF”) commenced operations on November 8, 2017. The investment objective of the Fund is to seek investment results that closely correspond, before fees and expenses, to the performance of the JP Morgan US Quality Factor Index.
JPMorgan U.S. Value Factor ETF (the “U.S. Value Factor ETF”) commenced operations on November 8, 2017. The investment objective of the Fund is to seek investment results that closely correspond, before fees and expenses, to the performance of the JP Morgan US Value Factor Index.
J.P. Morgan Investment Management Inc. (“JPMIM”), an indirect, wholly-owned subsidiary of JPMorgan Chase & Co. (“JPMorgan”), acts as the Adviser (the “Adviser”) and Administrator (the “Administrator”) to the Funds.
Shares of each Fund are listed and traded at market price on an exchange as follows:
| | | | |
| | | Listing Exchange | |
BetaBuilders Canada ETF | | | Cboe BZX Exchange, Inc. | |
BetaBuilders Developed Asia ex-Japan ETF | | | Cboe BZX Exchange, Inc. | |
BetaBuilders Europe ETF | | | Cboe BZX Exchange, Inc. | |
BetaBuilders Japan ETF | | | Cboe BZX Exchange, Inc. | |
BetaBuilders U.S. Equity ETF | | | Cboe BZX Exchange, Inc. | |
Emerging Markets Equity ETF | | | NYSE Arca, Inc. | |
Europe Equity ETF | | | NYSE Arca, Inc. | |
Global Equity ETF | | | NYSE Arca, Inc. | |
International Equity ETF | | | NYSE Arca, Inc. | |
U.S. Equity ETF | | | NYSE Arca, Inc. | |
U.S. Mid Cap Equity ETF | | | NYSE Arca, Inc. | |
U.S. Small Cap Equity ETF | | | NYSE Arca, Inc. | |
U.S. Dividend ETF | | | NYSE Arca, Inc. | |
U.S. Minimum Volatility ETF | | | NYSE Arca, Inc. | |
U.S. Momentum Factor ETF | | | NYSE Arca, Inc. | |
U.S. Quality Factor ETF | | | NYSE Arca, Inc. | |
U.S. Value Factor ETF | | | NYSE Arca, Inc. | |
Market prices for the Funds’ shares may be different from their net asset value (“NAV”).
The Funds issue and redeem their shares on a continuous basis, through JPMorgan Distribution Services, Inc. (the “Distributor” or “JPMDS”), an indirect, wholly-owned subsidiary of JPMorgan, at NAV in large blocks of shares, referred to as “Creation Units” as shown in the table below:
| | | | |
| | | Shares per
Creation Unit | |
| BetaBuilders Canada ETF | | | 100,000 | |
| BetaBuilders Developed Asiaex-Japan ETF | | | 200,000 | |
| BetaBuilders Europe ETF | | | 200,000 | |
| BetaBuilders Japan ETF | | | 400,000 | |
| BetaBuilders U.S. Equity ETF | | | 50,000 | |
| Emerging Markets Equity ETF | | | 100,000 | |
| Europe Equity ETF | | | 100,000 | |
| Global Equity ETF | | | 100,000 | |
| International Equity ETF | | | 100,000 | |
| U.S. Equity ETF | | | 100,000 | |
| U.S. Mid Cap Equity ETF | | | 100,000 | |
| U.S. Small Cap Equity ETF | | | 50,000 | |
| | | | | | | | |
| | | |
| OCTOBER 31, 2019 | | J.P. MORGAN EXCHANGE-TRADED FUNDS | | | | | 187 | |
NOTES TO FINANCIAL STATEMENTS
AS OF OCTOBER 31, 2019 (continued)
| | | | |
| | | Shares per
Creation Unit | |
| U.S. Dividend ETF | | | 50,000 | |
| U.S. Minimum Volatility ETF | | | 50,000 | |
| U.S. Momentum Factor ETF | | | 50,000 | |
| U.S. Quality Factor ETF | | | 50,000 | |
| U.S. Value Factor ETF | | | 50,000 | |
Creation Units are issued and redeemed principallyin-kind for a basket of securities. A cash amount may be substituted if a Fund has sizeable exposure to market or sponsor restricted securities. Shares are generally traded in the secondary market in amounts less than a Creation Unit at market prices that change throughout the day. Only individuals or institutions that have entered into an authorized participant agreement with the Distributor may do business directly with the Funds (each, an “Authorized Participant”).
2. Significant Accounting Policies
The following is a summary of significant accounting policies followed by the Funds in the preparation of their financial statements. The Funds are investment companies and, thus, follow the investment company accounting and reporting guidance of the Financial Accounting Standards Board (“FASB”) Accounting Standards Codification Topic 946 — Investment Companies, which is part of U.S. generally accepted accounting principles (“GAAP”). The preparation of financial statements in conformity with GAAP requires management to make estimates and assumptions that affect (i) the reported amounts of assets and liabilities, (ii) disclosure of contingent assets and liabilities at the date of the financial statements, and (iii) the reported amounts of increases and decreases in net assets from operations during the reporting period. Actual results could differ from those estimates.
A. Valuation of Investments — Investments are valued in accordance with GAAP and the Funds’ valuation policies set forth by, and under the supervision and responsibility of, the Board of Trustees of the Trust (the “Board”), which established the following approach to valuation, as described more fully below: (i) investments for which market quotations are readily available shall be valued at their market value, and (ii) all other investments for which market quotations are not readily available shall be valued at their fair value as determined in good faith by the Board.
The Administrator has established the J.P. Morgan Asset Management Americas Valuation Committee (“AVC”) to assist the Board with the oversight and monitoring of the valuation of the Funds’ investments. The Administrator implements the valuation policies of the Funds’ investments, as directed by the Board. The AVC oversees and carries out the policies for the valuation of investments held in the Funds. This includes monitoring the appropriateness of fair values based on results of ongoing valuation oversight including, but not limited to, consideration of macro or security specific events, market events, and pricing vendor and broker due diligence. The Administrator is responsible for discussing and assessing the potential impacts to the fair values on an ongoing basis, and at least on a quarterly basis, with the AVC and the Board.
A market-based approach is primarily used to value the Funds’ investments. Investments for which market quotations are not readily available are fair valued by approved affiliated and/or unaffiliated pricing vendors or third party broker-dealers (collectively referred to as “Pricing Services”) or may be internally fair valued using methods set forth by the valuation policies approved by the Board. This may include the use of related or comparable assets or liabilities, recent transactions, market multiples, book values and other relevant information for the investment. An income-based valuation approach may be used in which the anticipated future cash flows of the investment are discounted to calculate the fair value. Discounts may also be applied due to the nature or duration of any restrictions on the disposition of the investments. Valuations may be based upon current market prices of securities that are comparable in coupon, rating, maturity and industry. It is possible that the estimated values may differ significantly from the values that would have been used had a ready market for the investments existed, and such differences could be material.
Equities and other exchange-traded instruments are valued at the last sale price or official market closing price on the primary exchange on which the instrument is traded before the NAVs of the Funds are calculated on a valuation date. Certain foreign equity instruments, as well as certain derivatives with equity reference obligations, are valued by applying international fair value factors provided by approved Pricing Services. The factors seek to adjust the local closing price for movements of local markets post closing, but prior to the time the NAVs are calculated.
Investments inopen-end investment companies, excluding Exchange-Traded Funds (“ETFs”), (“Underlying Funds”) are valued at each Underlying Fund’s NAV per share as of the report date.
Futures contracts are generally valued on the basis of available market quotations.
Valuations reflected in this report are as of the report date. As a result, changes in valuation due to market events and/or issuer related events after the report date and prior to issuance of the report are not reflected herein.
The various inputs that are used in determining the valuation of the Funds’ investments are summarized into the three broad levels listed below.
| • | | Level 1 — Unadjusted inputs using quoted prices in active markets for identical investments. |
| • | | Level 2 — Other significant observable inputs including, but not limited to, quoted prices for similar investments, inputs other than quoted prices that are observable for investments (such as interest rates, prepayment speeds, credit risk, etc.) or other market corroborated inputs. |
| • | | Level 3 — Significant inputs based on the best information available in the circumstances, to the extent observable inputs are not available (including the Funds’ assumptions in determining the fair value of investments). |
| | | | | | |
| | | |
| 188 | | | | J.P. MORGAN EXCHANGE-TRADED FUNDS | | OCTOBER 31, 2019 |
A financial instrument’s level within the fair value hierarchy is based on the lowest level of any input, both individually and in the aggregate, that is significant to the fair value measurement. The inputs or methodology used for valuing instruments are not necessarily an indication of the risk associated with investing in those instruments.
The following tables represent each valuation input as presented on the Schedules of Portfolio Investments (“SOIs”):
BetaBuilders Canada ETF
| | | | | | | | | | | | | | | | |
| | | Level 1
Quoted prices | | | Level 2
Other significant
observable inputs | | | Level 3
Significant
unobservable inputs | | | Total | |
Total Investments in Securities (a) | | $ | 4,006,140,448 | | | $ | — | | | $ | — | | | $ | 4,006,140,448 | |
| | | | | | | | | | | | | | | | |
Depreciation in Other Financial Instruments; | |
Futures Contracts (a) | | $ | (100,766 | ) | | $ | — | | | $ | — | | | $ | (100,766 | ) |
| | | | | | | | | | | | | | | | |
BetaBuilders Developed Asiaex-Japan ETF
| | | | | | | | | | | | | | | | |
| | | Level 1
Quoted prices | | | Level 2
Other significant
observable inputs | | | Level 3
Significant
unobservable inputs | | | Total | |
Investments in Securities | |
Common Stocks | |
Australia | | $ | — | | | $ | 816,241,588 | | | $ | — | | | $ | 816,241,588 | |
China | | | — | | | | 2,993,259 | | | | — | | | | 2,993,259 | |
Hong Kong | | | 3,043,434 | | | | 349,854,134 | | | | — | | | | 352,897,568 | |
Macau | | | — | | | | 30,232,246 | | | | — | | | | 30,232,246 | |
New Zealand | | | — | | | | 32,235,199 | | | | — | | | | 32,235,199 | |
Singapore | | | 423,736 | | | | 168,022,727 | | | | — | | | | 168,446,463 | |
Taiwan | | | — | | | | 513,648 | | | | — | | | | 513,648 | |
United Kingdom | | | — | | | | 20,428,198 | | | | — | | | | 20,428,198 | |
United States | | | — | | | | 6,282,120 | | | | — | | | | 6,282,120 | |
| | | | | | | | | | | | | | | | |
Total Common Stocks | | | 3,467,170 | | | | 1,426,803,119 | | | | — | | | | 1,430,270,289 | |
| | | | | | | | | | | | | | | | |
Short-Term Investments | | | 1,546,382 | | | | — | | | | — | | | | 1,546,382 | |
| | | | | | | | | | | | | | | | |
Total Investments in Securities | | $ | 5,013,552 | | | $ | 1,426,803,119 | | | $ | — | | | $ | 1,431,816,671 | |
| | | | | | | | | | | | | | | | |
Appreciation in Other Financial Instruments | |
Futures Contracts | | $ | 13,511 | | | $ | 29,856 | | | $ | — | | | $ | 43,367 | |
| | | | | | | | | | | | | | | | |
Depreciation in Other Financial Instruments | |
Futures Contracts | | $ | — | | | $ | (26,387 | ) | | $ | — | | | $ | (26,387 | ) |
| | | | | | | | | | | | | | | | |
| | | | | | | | |
| | | |
| OCTOBER 31, 2019 | | J.P. MORGAN EXCHANGE-TRADED FUNDS | | | | | 189 | |
NOTES TO FINANCIAL STATEMENTS
AS OF OCTOBER 31, 2019 (continued)
BetaBuilders Europe ETF
| | | | | | | | | | | | | | | | |
| | | Level 1
Quoted prices | | | Level 2
Other significant
observable inputs | | | Level 3
Significant
unobservable inputs | | | Total | |
Investments in Securities | | | | | | | | | | | | | | | | |
Common Stocks | | | | | | | | | | | | | | | | |
Australia | | $ | — | | | $ | 40,256,416 | | | $ | — | | | $ | 40,256,416 | |
Austria | | | 1,339,801 | | | | 16,808,098 | | | | — | | | | 18,147,899 | |
Belgium | | | 2,299,408 | | | | 63,548,000 | | | | — | | | | 65,847,408 | |
Chile | | | — | | | | 1,610,839 | | | | — | | | | 1,610,839 | |
Colombia | | | — | | | | 1,139,202 | | | | — | | | | 1,139,202 | |
Denmark | | | — | | | | 106,798,251 | | | | — | | | | 106,798,251 | |
Finland | | | 4,337,129 | | | | 71,796,770 | | | | — | | | | 76,133,899 | |
France | | | 15,132,897 | | | | 644,439,270 | | | | — | | | | 659,572,167 | |
Germany | | | 56,129,161 | | | | 459,170,525 | | | | — | | | | 515,299,686 | |
Ghana | | | — | | | | 1,558,048 | | | | — | | | | 1,558,048 | |
Ireland | | | 19,239,516 | | | | 17,324,832 | | | | — | | | | 36,564,348 | |
Italy | | | — | | | | 137,323,747 | | | | — | | | | 137,323,747 | |
Jordan | | | — | | | | 1,471,912 | | | | — | | | | 1,471,912 | |
Luxembourg | | | 812,806 | | | | 11,455,640 | | | | — | | | | 12,268,446 | |
Mexico | | | — | | | | 704,512 | | | | — | | | | 704,512 | |
Netherlands | | | — | | | | 270,109,980 | | | | — | | | | 270,109,980 | |
Norway | | | 549,704 | | | | 42,988,113 | | | | — | | | | 43,537,817 | |
Portugal | | | — | | | | 10,525,335 | | | | — | | | | 10,525,335 | |
Russia | | | — | | | | 2,525,555 | | | | — | | | | 2,525,555 | |
South Africa | | | — | | | | 14,836,024 | | | | — | | | | 14,836,024 | |
Spain | | | 704,214 | | | | 166,585,858 | | | | — | | | | 167,290,072 | |
Sweden | | | — | | | | 174,861,711 | | | | — | | | | 174,861,711 | |
Switzerland | | | 7,074,152 | | | | 574,626,422 | | | | — | | | | 581,700,574 | |
United Arab Emirates | | | — | | | | 1,105,209 | | | | — | | | | 1,105,209 | |
United Kingdom | | | 9,710,586 | | | | 860,847,821 | | | | — | | | | 870,558,407 | |
United States | | | — | | | | 14,188,606 | | | | — | | | | 14,188,606 | |
| | | | | | | | | | | | | | | | |
Total Common Stocks | | | 117,329,374 | | | | 3,708,606,696 | | | | — | | | | 3,825,936,070 | |
| | | | | | | | | | | | | | | | |
Preferred Stocks | | | 47,272 | | | | — | | | | — | | | | 47,272 | |
Rights | | | — | | | | 6 | | | | — | | | | 6 | |
Short-Term Investments | | | 114,875,596 | | | | — | | | | — | | | | 114,875,596 | |
| | | | | | | | | | | | | | | | |
Total Investments in Securities | | $ | 232,252,242 | | | $ | 3,708,606,702 | | | $ | — | | | $ | 3,940,858,944 | |
| | | | | | | | | | | | | | | | |
Appreciation in Other Financial Instruments | | | | | | | | | | | | | | | | |
| |
Futures Contracts | | $ | 286,062 | | | $ | — | | | $ | — | | | $ | 286,062 | |
| | | | | | | | | | | | | | | | |
Depreciation in Other Financial Instruments | | | | | | | | | | | | | | | | |
Futures Contracts | | $ | (14,075 | ) | | $ | — | | | $ | — | | | $ | (14,075 | ) |
| | | | | | | | | | | | | | | | |
| | | | | | |
| | | |
| 190 | | | | J.P. MORGAN EXCHANGE-TRADED FUNDS | | OCTOBER 31, 2019 |
BetaBuilders Japan ETF
| | | | | | | | | | | | | | | | |
| | | Level 1
Quoted prices | | | Level 2
Other significant
observable inputs | | | Level 3
Significant
unobservable inputs | | | Total | |
Investments in Securities | | | | | | | | | | | | | | | | |
Common Stocks | | $ | 16,628,083 | | | $ | 4,254,712,987 | | | $ | — | | | $ | 4,271,341,070 | |
Short-Term Investments | | | 18,341,722 | | | | — | | | | — | | | | 18,341,722 | |
| | | | | | | | | | | | | | | | |
Total Investments in Securities | | $ | 34,969,805 | | | $ | 4,254,712,987 | | | $ | — | | | $ | 4,289,682,792 | |
| | | | | | | | | | | | | | | | |
Appreciation in Other Financial Instruments | | | | | | | | | | | | | | | | |
Futures Contracts | | $ | 1,459,579 | | | $ | — | | | $ | — | | | $ | 1,459,579 | |
| | | | | | | | | | | | | | | | |
BetaBuilders U.S. Equity ETF
| | | | | | | | | | | | | | | | |
| | | Level 1
Quoted prices | | | Level 2
Other significant
observable inputs | | | Level 3
Significant
unobservable inputs | | | Total | |
Total Investments in Securities (a) | | $ | 46,351,777 | | | $ | — | | | $ | — | | | $ | 46,351,777 | |
| | | | | | | | | | | | | | | | |
Appreciation in Other Financial Instruments | | | | | | | | | | | | | | | | |
Futures Contracts (a) | | $ | 5,139 | | | $ | — | | | $ | — | | | $ | 5,139 | |
| | | | | | | | | | | | | | | | |
Emerging Markets Equity ETF
| | | | | | | | | | | | | | | | |
| | | Level 1
Quoted prices | | | Level 2
Other significant
observable inputs | | | Level 3
Significant
unobservable inputs | | | Total | |
Investments in Securities | | | | | | | | | | | | | | | | |
Common Stocks | | | | | | | | | | | | | | | | |
Bahrain | | $ | — | | | $ | 409,625 | | | $ | — | | | $ | 409,625 | |
China | | | 952,395 | | | | 72,118,895 | | | | — | (b) | | | 73,071,290 | |
Czech Republic | | | 127,714 | | | | 889,665 | | | | — | | | | 1,017,379 | |
Greece | | | — | | | | 2,830,256 | | | | — | | | | 2,830,256 | |
Hong Kong | | | — | | | | 2,073,756 | | | | — | | | | 2,073,756 | |
Hungary | | | 678,666 | | | | 1,511,187 | | | | — | | | | 2,189,853 | |
India | | | 5,525,406 | | | | 26,339,360 | | | | — | | | | 31,864,766 | |
Indonesia | | | — | | | | 15,034,764 | | | | — | | | | 15,034,764 | |
Kuwait | | | 2,085,477 | | | | 2,376,508 | | | | — | | | | 4,461,985 | |
Malaysia | | | 1,654,610 | | | | 9,239,808 | | | | — | | | | 10,894,418 | |
Pakistan | | | — | | | | 189,092 | | | | — | | | | 189,092 | |
Philippines | | | 1,238,361 | | | | 3,340,083 | | | | — | | | | 4,578,444 | |
Qatar | | | 1,088,121 | | | | 4,850,979 | | | | — | | | | 5,939,100 | |
Saudi Arabia | | | 1,541,708 | | | | 5,220,004 | | | | — | | | | 6,761,712 | |
South Africa | | | 1,698,522 | | | | 22,257,264 | | | | — | | | | 23,955,786 | |
Taiwan | | | — | | | | 39,255,394 | | | | — | | | | 39,255,394 | |
Thailand | | | 5,882,408 | | | | 9,723,765 | | | | — | | | | 15,606,173 | |
Turkey | | | 911,696 | | | | 4,591,450 | | | | — | | | | 5,503,146 | |
United Arab Emirates | | | 1,630,755 | | | | 2,352,509 | | | | — | | | | 3,983,264 | |
Other Common Stocks | | | 102,952,890 | | | | — | | | | — | | | | 102,952,890 | |
| | | | | | | | | | | | | | | | |
Total Common Stocks | �� | | 127,968,729 | | | | 224,604,364 | | | | — | (b) | | | 352,573,093 | |
| | | | | | | | | | | | | | | | |
Rights | | | — | | | | — | (b) | | | — | | | | — | (b) |
Short-Term Investments | | | 1,883,529 | | | | — | | | | — | | | | 1,883,529 | |
| | | | | | | | | | | | | | | | |
Total Investments in Securities | | $ | 129,852,258 | | | $ | 224,604,364 | | | $ | — | (b) | | $ | 354,456,622 | |
| | | | | | | | | | | | | | | | |
Appreciation in Other Financial Instruments | | | | | | | | | | | | | | | | |
Futures Contracts | | $ | 22,206 | | | $ | — | | | $ | — | | | $ | 22,206 | |
| | | | | | | | | | | | | | | | |
| | | | | | | | |
| | | |
| OCTOBER 31, 2019 | | J.P. MORGAN EXCHANGE-TRADED FUNDS | | | | | 191 | |
NOTES TO FINANCIAL STATEMENTS
AS OF OCTOBER 31, 2019 (continued)
Europe Equity ETF
| | | | | | | | | | | | | | | | |
| | | Level 1
Quoted prices | | | Level 2
Other significant
observable inputs | | | Level 3
Significant
unobservable inputs | | | Total | |
Investments in Securities | |
Common Stocks | |
Australia | | $ | — | | | $ | 117,643 | | | $ | — | | | $ | 117,643 | |
Austria | | | — | | | | 131,053 | | | | — | | | | 131,053 | |
Belgium | | | 51,807 | | | | 276,111 | | | | — | | | | 327,918 | |
Chile | | | — | | | | 59,546 | | | | — | | | | 59,546 | |
Denmark | | | — | | | | 638,270 | | | | — | | | | 638,270 | |
Finland | | | 69,090 | | | | 587,343 | | | | — | | | | 656,433 | |
France | | | 146,937 | | | | 2,447,568 | | | | — | | | | 2,594,505 | |
Germany | | | 318,783 | | | | 1,834,818 | | | | — | | | | 2,153,601 | |
Ireland | | | — | | | | 91,716 | | | | — | | | | 91,716 | |
Italy | | | 8,855 | | | | 1,023,696 | | | | — | | | | 1,032,551 | |
Jordan | | | — | | | | 67,581 | | | | — | | | | 67,581 | |
Kazakhstan | | | — | | | | 40,872 | | | | — | | | | 40,872 | |
Luxembourg | | | 39,837 | | | | 94,134 | | | | — | | | | 133,971 | |
Netherlands | | | — | | | | 788,001 | | | | — | | | | 788,001 | |
Norway | | | — | | | | 413,046 | | | | — | | | | 413,046 | |
Poland | | | — | | | | 151,209 | | | | — | | | | 151,209 | |
Portugal | | | — | | | | 124,850 | | | | — | | | | 124,850 | |
Russia | | | — | | | | 113,044 | | | | — | | | | 113,044 | |
South Africa | | | — | | | | 67,946 | | | | — | | | | 67,946 | |
Spain | | | — | | | | 918,263 | | | | — | | | | 918,263 | |
Sweden | | | — | | | | 1,317,711 | | | | — | | | | 1,317,711 | |
Switzerland | | | — | | | | 1,532,446 | | | | — | | | | 1,532,446 | |
United Kingdom | | | 30,330 | | | | 3,306,815 | | | | — | | | | 3,337,145 | |
United States | | | — | | | | 117,155 | | | | — | | | | 117,155 | |
| | | | | | | | | | | | | | | | |
Total Common Stocks | | | 665,639 | | | | 16,260,837 | | | | — | | | | 16,926,476 | |
| | | | | | | | | | | | | | | | |
Rights | | | — | | | | — | (b) | | | — | | | | — | (b) |
Short-Term Investments | | | 133,397 | | | | — | | | | — | | | | 133,397 | |
| | | | | | | | | | | | | | | | |
Total Investments in Securities | | $ | 799,036 | | | $ | 16,260,837 | | | $ | — | | | $ | 17,059,873 | |
| | | | | | | | | | | | | | | | |
Appreciation in Other Financial Instruments | | | | | | | | | | | | | | | | |
Futures Contracts | | $ | 6,694 | | | $ | — | | | $ | — | | | $ | 6,694 | |
| | | | | | | | | | | | | | | | |
Depreciation in Other Financial Instruments | | | | | | | | | | | | | | | | |
Futures Contracts | | $ | (865 | ) | | $ | — | | | $ | — | | | $ | (865 | ) |
| | | | | | | | | | | | | | | | |
Global Equity ETF
| | | | | | | | | | | | | | | | |
| | | Level 1
Quoted prices | | | Level 2
Other significant
observable inputs | | | Level 3
Significant
unobservable inputs | | | Total | |
Investments in Securities | | | | | | | | | | | | | | | | |
Common Stocks | | | | | | | | | | | | | | | | |
Australia | | $ | — | | | $ | 14,453,913 | | | $ | — | | | $ | 14,453,913 | |
Austria | | | — | | | | 341,241 | | | | — | | | | 341,241 | |
Belgium | | | 239,689 | | | | 1,121,407 | | | | — | | | | 1,361,096 | |
Chile | | | — | | | | 9,202 | | | | — | | | | 9,202 | |
China | | | — | | | | 1,295,612 | | | | — | | | | 1,295,612 | |
Denmark | | | — | | | | 1,060,652 | | | | — | | | | 1,060,652 | |
Finland | | | 377,835 | | | | 1,270,432 | | | | — | | | | 1,648,267 | |
France | | | 536,005 | | | | 5,355,931 | | | | — | | | | 5,891,936 | |
Germany | | | 174,577 | �� | | | 2,937,832 | | | | — | | | | 3,112,409 | |
Hong Kong | | | — | | | | 5,280,379 | | | | — | | | | 5,280,379 | |
| | | | | | |
| | | |
| 192 | | | | J.P. MORGAN EXCHANGE-TRADED FUNDS | | OCTOBER 31, 2019 |
Global Equity ETF(continued)
| | | | | | | | | | | | | | | | |
| | | Level 1
Quoted prices | | | Level 2
Other significant
observable inputs | | | Level 3
Significant
unobservable inputs | | | Total | |
Italy | | $ | — | | | $ | 2,197,058 | | | $ | — | | | $ | 2,197,058 | |
Japan | | | — | | | | 33,131,377 | | | | — | | | | 33,131,377 | |
Macau | | | — | | | | 952,243 | | | | — | | | | 952,243 | |
Netherlands | | | — | | | | 2,898,030 | | | | — | | | | 2,898,030 | |
New Zealand | | | — | | | | 512,717 | | | | — | | | | 512,717 | |
Norway | | | — | | | | 1,404,866 | | | | — | | | | 1,404,866 | |
Portugal | | | — | | | | 486,132 | | | | — | | | | 486,132 | |
Russia | | | — | | | | 68,902 | | | | — | | | | 68,902 | |
Singapore | | | — | | | | 2,857,725 | | | | — | | | | 2,857,725 | |
South Africa | | | — | | | | 408,834 | | | | — | | | | 408,834 | |
South Korea | | | — | | | | 11,125,474 | | | | — | | | | 11,125,474 | |
Spain | | | — | | | | 3,516,771 | | | | — | | | | 3,516,771 | |
Sweden | | | — | | | | 3,663,080 | | | | — | | | | 3,663,080 | |
Switzerland | | | — | | | | 3,214,467 | | | | — | | | | 3,214,467 | |
United Kingdom | | | 827,754 | | | | 5,567,252 | | | | — | | | | 6,395,006 | |
United States | | | 31,301,015 | | | | 278,797 | | | | — | | | | 31,579,812 | |
Other Common Stocks | | | 5,799,288 | | | | — | | | | — | | | | 5,799,288 | |
| | | | | | | | | | | | | | | | |
Total Common Stocks | | | 39,256,163 | | | | 105,410,326 | | | | — | | | | 144,666,489 | |
| | | | | | | | | | | | | | | | |
Short-Term Investments | | | 1,075,217 | | | | — | | | | — | | | | 1,075,217 | |
| | | | | | | | | | | | | | | | |
Total Investments in Securities | | $ | 40,331,380 | | | $ | 105,410,326 | | | $ | — | | | $ | 145,741,706 | |
| | | | | | | | | | | | | | | | |
Appreciation in Other Financial Instruments | | | | | | | | | | | | | | | | |
Futures Contracts | | $ | 27,207 | | | $ | — | | | $ | — | | | $ | 27,207 | |
| | | | | | | | | | | | | �� | | | |
International Equity ETF
| | | | | | | | | | | | | | | | |
| | | Level 1
Quoted prices | | | Level 2
Other significant
observable inputs | | | Level 3
Significant
unobservable inputs | | | Total | |
Investments in Securities | | | | | | | | | | | | | | | | |
Common Stocks | | | | | | | | | | | | | | | | |
Australia | | $ | — | | | $ | 132,098,380 | | | $ | — | | | $ | 132,098,380 | |
Austria | | | — | | | | 3,599,271 | | | | — | | | | 3,599,271 | |
Belgium | | | 3,627,968 | | | | 4,536,474 | | | | — | | | | 8,164,442 | |
Cambodia | | | — | | | | 1,279,228 | | | | — | | | | 1,279,228 | |
Chile | | | — | | | | 4,435,246 | | | | — | | | | 4,435,246 | |
China | | | — | | | | 10,601,170 | | | | — | | | | 10,601,170 | |
Denmark | | | — | | | | 5,080,583 | | | | — | | | | 5,080,583 | |
Finland | | | 5,211,427 | | | | 21,877,538 | | | | — | | | | 27,088,965 | |
France | | | 2,013,246 | | | | 66,260,653 | | | | — | | | | 68,273,899 | |
Germany | | | 5,321,564 | | | | 32,585,012 | | | | — | | | | 37,906,576 | |
Hong Kong | | | — | | | | 64,388,794 | | | | — | | | | 64,388,794 | |
Indonesia | | | — | | | | 293,043 | | | | — | | | | 293,043 | |
Ireland | | | — | | | | 2,102,849 | | | | — | | | | 2,102,849 | |
Italy | | | — | | | | 25,890,534 | | | | — | | | | 25,890,534 | |
Japan | | | — | | | | 307,113,958 | | | | — | | | | 307,113,958 | |
Jordan | | | — | | | | 5,098,658 | | | | — | | | | 5,098,658 | |
Macau | | | — | | | | 2,625,907 | | | | — | | | | 2,625,907 | |
Netherlands | | | — | | | | 38,289,240 | | | | — | | | | 38,289,240 | |
New Zealand | | | — | | | | 10,545,227 | | | | — | | | | 10,545,227 | |
Norway | | | — | | | | 18,292,941 | | | | — | | | | 18,292,941 | |
Poland | | | — | | | | 1,281,693 | | | | — | | | | 1,281,693 | |
Portugal | | | — | | | | 5,679,789 | | | | — | | | | 5,679,789 | |
Russia | | | — | | | | 3,422,753 | | | | — | | | | 3,422,753 | |
| | | | | | | | |
| | | |
| OCTOBER 31, 2019 | | J.P. MORGAN EXCHANGE-TRADED FUNDS | | | | | 193 | |
NOTES TO FINANCIAL STATEMENTS
AS OF OCTOBER 31, 2019 (continued)
International Equity ETF(continued)
| | | | | | | | | | | | | | | | |
| | | Level 1
Quoted prices | | | Level 2
Other significant
observable inputs | | | Level 3
Significant
unobservable inputs | | | Total | |
Singapore | | $ | — | | | $ | 31,357,002 | | | $ | — | | | $ | 31,357,002 | |
South Africa | | | — | | | | 4,519,023 | | | | — | | | | 4,519,023 | |
South Korea | | | — | | | | 90,160,111 | | | | — | | | | 90,160,111 | |
Spain | | | 429,822 | | | | 23,727,676 | | | | — | | | | 24,157,498 | |
Sweden | | | — | | | | 44,984,117 | | | | — | | | | 44,984,117 | |
Switzerland | | | — | | | | 31,333,849 | | | | — | | | | 31,333,849 | |
United Kingdom | | | 11,314,336 | | | | 243,918,476 | | | | — | | | | 255,232,812 | |
United States | | | — | | | | 5,653,479 | | | | — | | | | 5,653,479 | |
Other Common Stocks | | | 1,991,974 | | | | — | | | | — | | | | 1,991,974 | |
| | | | | | | | | | | | | | | | |
Total Common Stocks | | | 29,910,337 | | | | 1,243,032,674 | | | | — | | | | 1,272,943,011 | |
| | | | | | | | | | | | | | | | |
Preferred Stocks | | | 3,472 | | | | — | | | | — | | | | 3,472 | |
Short-Term Investments | | | 15,753,318 | | | | — | | | | — | | | | 15,753,318 | |
| | | | | | | | | | | | | | | | |
Total Investments in Securities | | $ | 45,667,127 | | | $ | 1,243,032,674 | | | $ | — | | | $ | 1,288,699,801 | |
| | | | | | | | | | | | | | | | |
Appreciation in Other Financial Instruments | | | | | | | | | | | | | | | | |
Futures Contracts | | $ | 266,142 | | | $ | — | | | $ | — | | | $ | 266,142 | |
| | | | | | | | | | | | | | | | |
U.S. Equity ETF
| | | | | | | | | | | | | | | | |
| | | Level 1
Quoted prices | | | Level 2
Other significant
observable inputs | | | Level 3
Significant
unobservable inputs | | | Total | |
Total Investments in Securities (a) | | $ | 825,588,980 | | | $ | — | | | $ | — | | | $ | 825,588,980 | |
| | | | | | | | | | | | | | | | |
Appreciation in Other Financial Instruments | | | | | | | | | | | | | | | | |
Futures Contracts (a) | | $ | 44,378 | | | $ | — | | | $ | — | | | $ | 44,378 | |
| | | | | | | | | | | | | | | | |
U.S. Mid Cap Equity ETF
| | | | | | | | | | | | | | | | |
| | | Level 1
Quoted prices | | | Level 2
Other significant
observable inputs | | | Level 3
Significant
unobservable inputs | | | Total | |
Total Investments in Securities (a) | | $ | 197,011,002 | | | $ | — | | | $ | — | | | $ | 197,011,002 | |
| | | | | | | | | | | | | | | | |
Appreciation in Other Financial Instruments | | | | | | | | | | | | | | | | |
Futures Contracts (a) | | $ | 10,026 | | | $ | — | | | $ | — | | | $ | 10,026 | |
| | | | | | | | | | | | | | | | |
U.S. Small Cap Equity ETF
| | | | | | | | | | | | | | | | |
| | | Level 1
Quoted prices | | | Level 2
Other significant
observable inputs | | | Level 3
Significant
unobservable inputs | | | Total | |
Investments in Securities | | | | | | | | | | | | | | | | |
Common Stocks | | $ | 140,249,445 | | | $ | — | | | $ | — | | | $ | 140,249,445 | |
Rights | | | — | | | | — | | | | — | (b) | | | — | (b) |
Short-Term Investments | | | 27,076,446 | | | | — | | | | — | | | | 27,076,446 | |
| | | | | | | | | | | | | | | | |
Total Investments in Securities | | $ | 167,325,891 | | | $ | — | | | $ | — | (b) | | $ | 167,325,891 | |
| | | | | | | | | | | | | | | | |
Appreciation in Other Financial Instruments | | | | | | | | | | | | | | | | |
Futures Contracts | | $ | 8,156 | | | $ | — | | | $ | — | | | $ | 8,156 | |
| | | | | | | | | | | | | | | | |
| | | | | | |
| | | |
| 194 | | | | J.P. MORGAN EXCHANGE-TRADED FUNDS | | OCTOBER 31, 2019 |
U.S. Dividend ETF
| | | | | | | | | | | | | | | | |
| | | Level 1
Quoted prices | | | Level 2
Other significant
observable inputs | | | Level 3
Significant
unobservable inputs | | | Total | |
Total Investments in Securities (a) | | $ | 41,353,593 | | | $ | — | | | $ | — | | | $ | 41,353,593 | |
| | | | | | | | | | | | | | | | |
Appreciation in Other Financial Instruments | | | | | | | | | | | | | | | | |
Futures Contracts (a) | | $ | 1,695 | | | $ | — | | | $ | — | | | $ | 1,695 | |
| | | | | | | | | | | | | | | | |
U.S. Minimum Volatility ETF
| | | | | | | | | | | | | | | | |
| | | Level 1
Quoted prices | | | Level 2
Other significant
observable inputs | | | Level 3
Significant
unobservable inputs | | | Total | |
Total Investments in Securities (a) | | $ | 107,537,513 | | | $ | — | | | $ | — | | | $ | 107,537,513 | |
| | | | | | | | | | | | | | | | |
Appreciation in Other Financial Instruments | | | | | | | | | | | | | | | | |
Futures Contracts (a) | | $ | 2,500 | | | $ | — | | | $ | — | | | $ | 2,500 | |
| | | | | | | | | | | | | | | | |
U.S. Momentum Factor ETF
| | | | | | | | | | | | | | | | |
| | | Level 1
Quoted prices | | | Level 2
Other significant
observable inputs | | | Level 3
Significant
unobservable inputs | | | Total | |
Total Investments in Securities (a) | | $ | 57,177,897 | | | $ | — | | | $ | — | | | $ | 57,177,897 | |
| | | | | | | | | | | | | | | | |
Appreciation in Other Financial Instruments | | | | | | | | | | | | | | | | |
Futures Contracts (a) | | $ | 1,316 | | | $ | — | | | $ | — | | | $ | 1,316 | |
| | | | | | | | | | | | | | | | |
U.S. Quality Factor ETF
| | | | | | | | | | | | | | | | |
| | | Level 1
Quoted prices | | | Level 2
Other significant
observable inputs | | | Level 3
Significant
unobservable inputs | | | Total | |
Total Investments in Securities (a) | | $ | 107,943,331 | | | $ | — | | | $ | — | | | $ | 107,943,331 | |
| | | | | | | | | | | | | | | | |
Appreciation in Other Financial Instruments | | | | | | | | | | | | | | | | |
Futures Contracts (a) | | $ | 3,452 | | | $ | — | | | $ | — | | | $ | 3,452 | |
| | | | | | | | | | | | | | | | |
U.S. Value Factor ETF
| | | | | | | | | | | | | | | | |
| | | Level 1
Quoted prices | | | Level 2
Other significant
observable inputs | | | Level 3
Significant
unobservable inputs | | | Total | |
Total Investments in Securities (a) | | $ | 67,175,771 | | | $ | — | | | $ | — | | | $ | 67,175,771 | |
| | | | | | | | | | | | | | | | |
Appreciation in Other Financial Instruments | | | | | | | | | | | | | | | | |
Futures Contracts (a) | | $ | 2,897 | | | $ | — | | | $ | — | | | $ | 2,897 | |
| | | | | | | | | | | | | | | | |
| (a) | All portfolio holdings designated as level 1 are disclosed individually on the SOIs. |
There were no transfers into or out of level 3 for the year ended October 31, 2019.
B. Restricted Securities — Certain securities held by the Funds may be subject to legal or contractual restrictions on resale. Restricted securities generally are resold in transactions exempt from registration under the Securities Act of 1933, as amended (the “Securities Act”). Disposal of these securities may involve time-consuming negotiations and expense. Prompt sale at the current valuation may be difficult and could adversely affect the NAVs of the Funds.
As of October 31, 2019, the Funds had no investments in restricted securities other than securities sold to the Funds under Rule 144A and /or Regulation S under the Securities Act.
| | | | | | | | |
| | | |
| OCTOBER 31, 2019 | | J.P. MORGAN EXCHANGE-TRADED FUNDS | | | | | 195 | |
NOTES TO FINANCIAL STATEMENTS
AS OF OCTOBER 31, 2019 (continued)
C. Futures Contracts — The Funds used index futures contracts to obtain long exposure to the underlying commodities markets, to gain or reduce exposure to the stock market, to gain or reduce exposure to particular countries or regions, maintain liquidity, minimize transaction costs or to manage and hedge interest rate risk associated with portfolio investments.
Futures contracts provide for the delayed delivery of the underlying instrument at a fixed price or are settled for a cash amount based on the change in the value of the underlying instrument at a specific date in the future. Upon entering into a futures contract, the Funds are required to deposit with the broker, cash or securities in an amount equal to a certain percentage of the contract amount, which is referred to as the initial margin deposit. Subsequent payments, referred to as variation margin, are made or received by the Funds periodically and are based on changes in the market value of open futures contracts. Changes in the market value of open futures contracts are recorded as Change in net unrealized appreciation/depreciation on the Statements of Operations (“SOP”). Realized gains or losses, representing the difference between the value of the contract at the time it was opened and the value at the time it was closed, are reported on the SOP at the closing or expiration of the futures contract. Securities deposited as initial margin are designated in the SOIs, while cash deposited, which is considered restricted, is recorded on the SAL. A receivable from and/or a payable to brokers for the daily variation margin is also recorded on the SAL.
The use of futures contracts exposes the Funds to equity price risk. The Funds may be subject to the risk that the change in the value of the futures contract may not correlate perfectly with the underlying instrument. Use of long futures contracts subjects the Funds to risk of loss in excess of the amounts shown on the SAL, up to the notional amount of the futures contracts. Use of short futures contracts subjects the Funds to unlimited risk of loss. The Funds may enter into futures contracts only on exchanges or boards of trade. The exchange or board of trade acts as the counterparty to each futures transaction; therefore, the Funds’ credit risk is limited to failure of the exchange or board of trade. Under some circumstances, futures exchanges may establish daily limits on the amount that the price of a futures contract can vary from the previous day’s settlement price, which could effectively prevent liquidation of positions.
The Funds’ futures contracts are not subject to master netting arrangements (the right to close out all transactions traded with a counterparty and net amounts owed or due across transactions).
The table below discloses the volume of the Funds’ futures contracts activity during the year ended October 31, 2019:
| | | | | | | | | | | | | | | | | | | | | | | | | | | | | | | | |
| | | BetaBuilders
Canada ETF | | | BetaBuilders
Developed Asia
ex-Japan ETF | | | BetaBuilders
Europe ETF | | | BetaBuilders
Japan ETF | | | BetaBuilders
U.S.
Equity ETF | | | Emerging
Markets
Equity ETF | | | Europe
Equity ETF | | | Global
Equity ETF | |
Futures Contracts — Equity: | | | | | | | | | | | | | | | | | | | | | | | | | | | | | | | | |
Average Notional Balance Long | | $ | 15,151,614 | | | $ | 9,090,538 | | | $ | 19,762,694 | | | $ | 24,412,142 | | | $ | 163,841 | (a) | | $ | 1,051,703 | | | $ | 289,129 | | | $ | 873,211 | |
Ending Notional Balance Long | | | 20,318,943 | | | | 12,519,301 | | | | 20,626,000 | | | | 47,216,779 | | | | 166,966 | | | | 1,093,680 | | | | 335,055 | | | | 988,870 | |
| | | | | | | | | | | | | | | | | | | | | | | | | | | | | | | | | | | | |
| | | International
Equity ETF | | | U.S.
Equity ETF | | | U.S. Mid Cap
Equity ETF | | | U.S. Small Cap
Equity ETF | | | U.S.
Dividend ETF | | | U.S. Minimum
Volatility ETF | | | U.S. Momentum
Factor ETF | | | U.S. Quality
Factor ETF | | | U.S. Value
Factor ETF | |
Futures Contracts — Equity: | | | | | | | | | | | | | | | | | | | | | | | | | | | | | | | | | | | | |
Average Notional Balance Long | | $ | 8,179,085 | | | $ | 1,894,502 | | | $ | 547,477 | | | $ | 395,090 | | | $ | 172,027 | | | $ | 164,977 | | | $ | 38,779 | | | $ | 194,020 | | | $ | 202,168 | |
Ending Notional Balance Long | | | 8,420,260 | | | | 1,669,250 | | | | 390,920 | | | | 156,290 | | | | 121,430 | | | | 136,609 | | | | 60,715 | | | | 258,039 | | | | 212,503 | |
| (a) | For the period May 1, 2019 through October 31, 2019. |
D. Securities Lending —The Funds are authorized to engage in securities lending in order to generate additional income. The Funds are able to lend to approved borrowers. Citibank N.A. (“Citibank”) serves as lending agent for the Funds, pursuant to a Securities Lending Agency Agreement (the “Securities Lending Agency Agreement”). Securities loaned are collateralized by cash equal to at least 100% of the market value plus accrued interest on the securities lent, which is invested in the IM Shares of JPMorgan U.S. Government Money Market Fund and the Agency SL Shares of the JPMorgan Securities Lending Money Market Fund. The Funds retain loan fees and the interest on cash collateral investments but are required to pay the borrower a rebate for the use of cash collateral. In cases where the lent security is of high value to borrowers, there may be a negative rebate (i.e., a net payment from the borrower to the Funds). Upon termination of a loan, the Funds are required to return to the borrower an amount equal to the cash collateral, plus any rebate owed to the borrowers. The remaining maturities of the securities lending transactions are considered overnight and continuous. Loans are subject to termination by the Funds or the borrower at any time.
The net income earned on the securities lending (after payment of rebates and Citibank’s fee) is included on the SOP as Income from securities lending (net). The Funds also receive payments from the borrower during the period of the loan, equivalent to dividends and interest earned on the securities loaned, which are recorded as Dividend or Interest income, respectively, on the SOP.
Under the Securities Lending Agency Agreement, Citibank marks to market the loaned securities on a daily basis. In the event the cash received from the borrower is less than 102% of the value of the loaned securities (105% for loans ofnon-U.S. securities), Citibank requests additional cash from the borrower so as to maintain a collateralization level of at least 102% of the value of the loaned securities plus accrued interest (105% for loans ofnon-U.S. securities), subject to certaindeminimis amounts.
| | | | | | |
| | | |
| 196 | | | | J.P. MORGAN EXCHANGE-TRADED FUNDS | | OCTOBER 31, 2019 |
The value of securities out on loan is recorded as an asset on the SAL. The value of the cash collateral received is recorded as a liability on the SAL and details of collateral investments are disclosed in the SOIs.
The Funds bear the risk of loss associated with the collateral investments and are not entitled to additional collateral from the borrower to cover any such losses. To the extent that the value of the collateral investments declines below the amount owed to a borrower, the Fund may incur losses that exceed the amount it earned on lending the security. Upon termination of a loan, the Funds may use leverage (borrow money) to repay the borrower for cash collateral posted if the Adviser does not believe that it is prudent to sell the collateral investments to fund the payment of this liability.
The following table presents, for each lending fund, the value of the securities on loan with Citibank, net of amounts available for offset under the master netting arrangements and any related collateral received or posted by the Funds as of October 31, 2019.
| | | | | | | | | | | | |
| | | Investment Securities
on Loan, at value,
Presented on the
Statements of Assets
and Liabilities | | | Cash Collateral
Posted by Borrower* | | | Net Amount Due
to Counterparty
(not less than zero) | |
BetaBuilders Canada ETF | | $ | 213,748,097 | | | $ | (213,748,097 | ) | | $ | — | |
BetaBuilders Developed Asiaex-Japan ETF | | | 1,455,691 | | | | (1,455,691 | ) | | | — | |
BetaBuilders Europe ETF | | | 107,191,515 | | | | (107,191,515 | ) | | | — | |
BetaBuilders Japan ETF | | | 17,484,369 | | | | (17,484,369 | ) | | | — | |
Emerging Markets Equity ETF | | | 1,106,394 | | | | (1,106,394 | ) | | | — | |
Europe Equity ETF | | | 125,559 | | | | (125,559 | ) | | | — | |
Global Equity ETF | | | 750,135 | | | | (750,135 | ) | | | — | |
International Equity ETF | | | 12,277,449 | | | | (12,277,449 | ) | | | — | |
U.S. Equity ETF | | | 23,110,059 | | | | (23,110,059 | ) | | | — | |
U.S. Mid Cap Equity ETF | | | 8,836,243 | | | | (8,836,243 | ) | | | — | |
U.S. Small Cap Equity ETF | | | 25,431,992 | | | | (25,431,992 | ) | | | — | |
U.S. Dividend ETF | | | 628,762 | | | | (628,762 | ) | | | — | |
U.S. Minimum Volatility ETF | | | 378,300 | | | | (378,300 | ) | | | — | |
U.S. Momentum Factor ETF | | | 541,227 | | | | (541,227 | ) | | | — | |
U.S. Quality Factor ETF | | | 928,985 | | | | (928,985 | ) | | | — | |
U.S. Value Factor ETF | | | 354,482 | | | | (354,482 | ) | | | — | |
| * | Collateral posted reflects the value of securities on loan and does not include any additional amounts received from the borrower. |
Securities lending also involves counterparty risks, including the risk that the loaned securities may not be returned in a timely manner or at all. Subject to certain conditions, Citibank has agreed to indemnify the Funds from losses resulting from a borrower’s failure to return a loaned security.
JPMIM voluntarily waived investment advisory fees charged to the Funds to reduce the impact of the cash collateral investment in the JPMorgan U.S. Government Money Market Fund from 0.16% to 0.06%. JPMIM waived fees associated with the Funds’ investment in JPMorgan U.S. Government Money Market Fund as follows:
| | | | |
BetaBuilders Canada ETF | | $ | 24,154 | |
BetaBuilders Developed Asiaex-Japan ETF | | | 2,777 | |
BetaBuilders Europe ETF | | | 15,109 | |
BetaBuilders Japan ETF | | | 8,676 | |
Emerging Markets Equity ETF | | | 261 | |
Europe Equity ETF | | | 159 | |
Global Equity ETF | | | 1,283 | |
International Equity ETF | | | 5,242 | |
U.S. Equity ETF | | | 6,650 | |
U.S. Mid Cap Equity ETF | | | 2,457 | |
U.S. Small Cap Equity ETF | | | 4,457 | |
U.S. Dividend ETF | | | 185 | |
U.S. Minimum Volatility ETF | | | 123 | |
U.S. Momentum Factor ETF | | | 175 | |
U.S. Quality Factor ETF | | | 199 | |
U.S. Value Factor ETF | | | 147 | |
The above waiver is included in the determination of earnings on cash collateral investment and in the calculation of Citibank’s compensation and is included in the SOP as Income from securities lending (net).
BetaBuilders U.S. Equity ETF did not lend out any securities during the period ended October 31, 2019.
| | | | | | | | |
| | | |
| OCTOBER 31, 2019 | | J.P. MORGAN EXCHANGE-TRADED FUNDS | | | | | 197 | |
NOTES TO FINANCIAL STATEMENTS
AS OF OCTOBER 31, 2019 (continued)
E. Investment Transactions with Affiliates — The Funds invested in Underlying Funds which are advised by the Adviser. An issuer who is under common control with the Funds may be considered an affiliate. For the purposes of the financial statements, the Funds assume the issuers listed in the table below to be affiliated issuers. Underlying Funds’ distributions may be reinvested into the Underlying Funds. Reinvestment amounts are included in the purchase cost amounts in the tables below.
BetaBuilders Canada ETF
| | | | | | | | | | | | | | | | | | | | | | | | | | | | | | | | | | | | |
| | | For the year ended October 31, 2019 | |
| Security Description | | Value at
October 31,
2018 | | | Purchases
at Cost | | | Proceeds
from
Sales | | | Net Realized
Gain (Loss) | | | Change in
Unrealized
Appreciation/
(Depreciation) | | | Value at
October 31,
2019 | | | Shares at
October 31,
2019 | | | Dividend
Income | | | Capital Gain
Distributions | |
JPMorgan Prime Money Market Fund Class IM Shares (a) | | $ | 1,992,902 | | | $ | — | | | $ | 1,992,902 | | | $ | (199 | )* | | $ | 199 | | | $ | — | | | | — | | | $ | — | | | $ | — | |
JPMorgan Securities Lending Money Market Fund Class Agency SL Shares, 1.98% (a)(b) | | | 49,999,700 | | | | 3,002,000,000 | | | | 2,878,000,000 | | | | 4,502 | * | | | — | | | | 174,004,202 | | | | 173,986,803 | | | | 2,166,507 | * | | | — | |
JPMorgan U.S. Government Money Market Fund Class IM Shares, 1.70% (a)(b) | | | 19,883,026 | | | | 2,254,627,489 | | | | 2,221,838,563 | | | | — | | | | — | | | | 52,671,952 | | | | 52,671,952 | | | | 701,724 | * | | | — | |
JPMorgan U.S. Government Money Market Fund Class Institutional Shares (a) | | | 190,063 | | | | 8,147,244 | | | | 8,337,307 | | | | — | | | | — | | | | — | | | | — | | | | 3,731 | | | | — | |
| | | | | | | | | | | | | | | | | | | | | | | | | | | | | | | | | | | | |
Total | | $ | 72,065,691 | | | $ | 5,264,774,733 | | | $ | 5,110,168,772 | | | $ | 4,303 | | | $ | 199 | | | $ | 226,676,154 | | | | | | | $ | 2,871,962 | | | $ | — | |
| | | | | | | | | | | | | | | | | | | | | | | | | | | | | | | | | | | | |
BetaBuilders Developed Asiaex-Japan ETF
| | | | | | | | | | | | | | | | | | | | | | | | | | | | | | | | | | | | |
| | | For the year ended October 31, 2019 | |
| Security Description | | Value at
October 31,
2018 | | | Purchases
at Cost | | | Proceeds
from Sales | | | Net Realized
Gain (Loss) | | | Change in
Unrealized
Appreciation/
(Depreciation) | | | Value at
October 31,
2019 | | | Shares at
October 31,
2019 | | | Dividend
Income | | | Capital Gain
Distributions | |
JPMorgan Securities Lending Money Market Fund Class Agency SL Shares, 1.98% (a)(b) | | $ | — | | | $ | 59,000,000 | | | $ | 58,000,000 | | | $ | 100 | * | | $ | — | | | $ | 1,000,100 | | | | 1,000,000 | | | $ | 51,950 | * | | $ | — | |
JPMorgan U.S. Government Money Market Fund Class IM Shares, 1.70% (a)(b) | | | — | | | | 36,337,168 | | | | 35,790,886 | | | | — | | | | — | | | | 546,282 | | | | 546,282 | | | | 74,817 | * | | | — | |
JPMorgan U.S. Government Money Market Fund Class Institutional Shares (a) | | | 254,772 | | | | 48,388,688 | | | | 48,643,460 | | | | — | | | | — | | | | — | | | | — | | | | 5,141 | | | | — | |
| | | | | | | | | | | | | | | | | | | | | | | | | | | | | | | | | | | | |
Total | | $ | 254,772 | | | $ | 143,725,856 | | | $ | 142,434,346 | | | $ | 100 | | | $ | — | | | $ | 1,546,382 | | | | | | | $ | 131,908 | | | $ | — | |
| | | | | | | | | | | | | | | | | | | | | | | | | | | | | | | | | | | | |
| | | | | | |
| | | |
| 198 | | | | J.P. MORGAN EXCHANGE-TRADED FUNDS | | OCTOBER 31, 2019 |
BetaBuilders Europe ETF
| | | | | | | | | | | | | | | | | | | | | | | | | | | | | | | | | | | | |
| | | For the year ended October 31, 2019 | |
| Security Description | | Value at
October 31,
2018 | | | Purchases
at Cost | | | Proceeds
from
Sales | | | Net Realized
Gain (Loss) | | | Change in
Unrealized
Appreciation/
(Depreciation) | | | Value at
October 31,
2019 | | | Shares at
October 31,
2019 | | | Dividend
Income | | | Capital Gain
Distributions | |
JPMorgan Prime Money Market Fund Class IM Shares (a) | | $ | 2,999,300 | | | $ | — | | | $ | 2,999,300 | | | $ | (300 | )* | | $ | 300 | | | $ | — | | | | — | | | $ | — | | | $ | — | |
JPMorgan Securities Lending Money Market Fund Class Agency SL Shares, 1.98% (a)(b) | | | 17,999,500 | | | | 713,000,000 | | | | 647,000,000 | | | | 3,899 | * | | | 5,400 | | | | 84,008,799 | | | | 84,000,399 | | | | 1,516,777 | * | | | — | |
JPMorgan U.S. Government Money Market Fund Class IM Shares, 1.70% (a)(b) | | | 5,502,935 | | | | 557,988,564 | | | | 532,624,702 | | | | — | | | | — | | | | 30,866,797 | | | | 30,866,797 | | | | 438,994 | * | | | — | |
JPMorgan U.S. Government Money Market Fund Class Institutional Shares (a) | | | 296,502 | | | | 17,282,282 | | | | 17,578,784 | | | | — | | | | — | | | | — | | | | — | | | | 4,568 | | | | — | |
| | | | | | | | | | | | | | | | | | | | | | | | | | | | | | | | | | | | |
Total | | $ | 26,798,237 | | | $ | 1,288,270,846 | | | $ | 1,200,202,786 | | | $ | 3,599 | | | $ | 5,700 | | | $ | 114,875,596 | | | | | | | $ | 1,960,339 | | | $ | — | |
| | | | | | | | | | | | | | | | | | | | | | | | | | | | | | | | | | | | |
BetaBuilders Japan ETF
| | | | | | | | | | | | | | | | | | | | | | | | | | | | | | | | | | | | |
| | | For the year ended October 31, 2019 | |
| Security Description | | Value at
October 31,
2018 | | | Purchases
at Cost | | | Proceeds
from
Sales | | | Net Realized
Gain (Loss) | | | Change in
Unrealized
Appreciation/
(Depreciation) | | | Value at
October 31,
2019 | | | Shares at
October 31,
2019 | | | Dividend
Income | | | Capital Gain
Distributions | |
JPMorgan Securities Lending Money Market Fund Class Agency SL Shares, 1.98% (a)(b) | | $ | 12,999,800 | | | $ | 506,000,000 | | | $ | 507,000,000 | | | $ | 201 | * | | $ | 1,599 | | | $ | 12,001,600 | | | | 12,000,400 | | | $ | 811,621 | * | | $ | — | |
JPMorgan U.S. Government Money Market Fund Class IM Shares, 1.70% (a)(b) | | | 6,499,769 | | | | 282,946,013 | | | | 283,105,660 | | | | — | | | | — | | | | 6,340,122 | | | | 6,340,122 | | | | 238,804 | * | | | — | |
JPMorgan U.S. Government Money Market Fund Class Institutional Shares (a) | | | 288,800 | | | | 16,223,341 | | | | 16,512,141 | | | | — | | | | — | | | | — | | | | — | | | | 3,955 | | | | — | |
| | | | | | | | | | | | | | | | | | | | | | | | | | | | | | | | | | | | |
Total | | $ | 19,788,369 | | | $ | 805,169,354 | | | $ | 806,617,801 | | | $ | 201 | | | $ | 1,599 | | | $ | 18,341,722 | | | | | | | $ | 1,054,380 | | | $ | — | |
| | | | | | | | | | | | | | | | | | | | | | | | | | | | | | | | | | | | |
BetaBuilders U.S. Equity ETF
| | | | | | | | | | | | | | | | | | | | | | | | | | | | | | | | | | | | |
| | | For the period ended October 31, 2019 | |
| Security Description | | Value at
March 12,
2019 (c) | | | Purchases
at Cost | | | Proceeds
from
Sales | | | Net Realized
Gain (Loss) | | | Change in
Unrealized
Appreciation/
(Depreciation) | | | Value at
October 31,
2019 | | | Shares at
October 31,
2019 | | | Dividend
Income | | | Capital Gain
Distributions | |
JPMorgan Chase & Co. (d) | | $ | — | | | $ | 613,167 | | | $ | 14,237 | | | $ | 554 | | | $ | 102,941 | | | $ | 702,425 | | | | 5,623 | | | $ | 11,214 | | | $ | — | |
JPMorgan U.S. Government Money Market Fund Class Institutional Shares, 1.64% (a)(b) | | | — | | | | 820,366 | | | | 696,934 | | | | — | | | | — | | | | 123,432 | | | | 123,432 | | | | 1,940 | | | | — | |
| | | | | | | | | | | | | | | | | | | | | | | | | | | | | | | | | | | | |
Total | | $ | — | | | $ | 1,433,533 | | | $ | 711,171 | | | $ | 554 | | | $ | 102,941 | | | $ | 825,857 | | | | | | | $ | 13,154 | | | $ | — | |
| | | | | | | | | | | | | | | | | | | | | | | | | | | | | | | | | | | | |
| | | | | | | | |
| | | |
| OCTOBER 31, 2019 | | J.P. MORGAN EXCHANGE-TRADED FUNDS | | | | | 199 | |
NOTES TO FINANCIAL STATEMENTS
AS OF OCTOBER 31, 2019 (continued)
Emerging Markets Equity ETF
| | | | | | | | | | | | | | | | | | | | | | | | | | | | | | | | | | | | |
| | | For the year ended October 31, 2019 | |
| Security Description | | Value at
October 31,
2018 | | | Purchases
at Cost | | | Proceeds
from
Sales | | | Net Realized
Gain (Loss) | | | Change in
Unrealized
Appreciation/
(Depreciation) | | | Value at
October 31,
2019 | | | Shares at
October 31,
2019 | | | Dividend
Income | | | Capital Gain
Distributions | |
JPMorgan U.S. Government Money Market Fund Class IM Shares, 1.70% (a)(b) | | $ | — | | | $ | 4,593,959 | | | $ | 3,381,341 | | | $ | — | | | $ | — | | | $ | 1,212,618 | | | | 1,212,618 | | | $ | 8,601 | * | | $ | — | |
JPMorgan U.S. Government Money Market Fund Class Institutional Shares, 1.64% (a)(b) | | | 753,648 | | | | 8,015,188 | | | | 8,097,925 | | | | — | | | | — | | | | 670,911 | | | | 670,911 | | | | 4,285 | | | | — | |
| | | | | | | | | | | | | | | | | | | | | | | | | | | | | | | | | | | | |
Total | | $ | 753,648 | | | $ | 12,609,147 | | | $ | 11,479,266 | | | $ | — | | | $ | — | | | $ | 1,883,529 | | | | | | | $ | 12,886 | | | $ | — | |
| | | | | | | | | | | | | | | | | | | | | | | | | | | | | | | | | | | | |
Europe Equity ETF
| | | | | | | | | | | | | | | | | | | | | | | | | | | | | | | | | | | | |
| | | For the year ended October 31, 2019 | |
| Security Description | | Value at
October 31,
2018 | | | Purchases
at Cost | | | Proceeds
from
Sales | | | Net Realized
Gain (Loss) | | | Change in
Unrealized
Appreciation/
(Depreciation) | | | Value at
October 31,
2019 | | | Shares at
October 31,
2019 | | | Dividend
Income | | | Capital Gain
Distributions | |
JPMorgan U.S. Government Money Market Fund Class IM Shares, 1.70% (a)(b) | | $ | — | | | $ | 3,145,894 | | | $ | 3,012,616 | | | $ | — | | | $ | — | | | $ | 133,278 | | | | 133,278 | | | $ | 4,421 | * | | $ | — | |
JPMorgan U.S. Government Money Market Fund Class Institutional Shares, 1.64% (a)(b) | | | — | | | | 468,851 | | | | 468,732 | | | | — | | | | — | | | | 119 | | | | 119 | | | | 93 | | | | — | |
| | | | | | | | | | | | | | | | | | | | | | | | | | | | | | | | | | | | |
Total | | $ | — | | | $ | 3,614,745 | | | $ | 3,481,348 | | | $ | — | | | $ | — | | | $ | 133,397 | | | | | | | $ | 4,514 | | | $ | — | |
| | | | | | | | | | | | | | | | | | | | | | | | | | | | | | | | | | | | |
Global Equity ETF
| | | | | | | | | | | | | | | | | | | | | | | | | | | | | | | | | | | | |
| | | For the year ended October 31, 2019 | |
| Security Description | | Value at
October 31,
2018 | | | Purchases
at Cost | | | Proceeds
from
Sales | | | Net Realized
Gain (Loss) | | | Change in
Unrealized
Appreciation/
(Depreciation) | | | Value at
October 31,
2019 | | | Shares at
October 31,
2019 | | | Dividend
Income | | | Capital Gain
Distributions | |
JPMorgan Securities Lending Money Market Fund Class Agency SL Shares, 1.98% (a)(b) | | $ | — | | | $ | 3,000,000 | | | $ | 2,500,000 | | | $ | (50 | )* | | $ | — | | | $ | 499,950 | | | | 499,900 | | | $ | 25,513 | * | | $ | — | |
JPMorgan U.S. Government Money Market Fund Class IM Shares, 1.70% (a)(b) | | | 924,151 | | | | 39,639,537 | | | | 40,276,142 | | | | — | | | | — | | | | 287,546 | | | | 287,546 | | | | 35,094 | * | | | — | |
JPMorgan U.S. Government Money Market Fund Class Institutional Shares, 1.64% (a)(b) | | | 627,017 | | | | 3,660,510 | | | | 3,999,806 | | | | — | | | | — | | | | 287,721 | | | | 287,721 | | | | 4,610 | | | | 834 | |
| | | | | | | | | | | | | | | | | | | | | | | | | | | | | | | | | | | | |
Total | | $ | 1,551,168 | | | $ | 46,300,047 | | | $ | 46,775,948 | | | $ | (50 | ) | | $ | — | | | $ | 1,075,217 | | | | | | | $ | 65,217 | | | $ | 834 | |
| | | | | | | | | | | | | | | | | | | | | | | | | | | | | | | | | | | | |
| | | | | | |
| | | |
| 200 | | | | J.P. MORGAN EXCHANGE-TRADED FUNDS | | OCTOBER 31, 2019 |
International Equity ETF
| | | | | | | | | | | | | | | | | | | | | | | | | | | | | | | | | | | | |
| | | For the year ended October 31, 2019 | |
| Security Description | | Value at
October 31,
2018 | | | Purchases
at Cost | | | Proceeds
from
Sales | | | Net Realized
Gain (Loss) | | | Change in
Unrealized
Appreciation/
(Depreciation) | | | Value at
October 31,
2019 | | | Shares at
October 31,
2019 | | | Dividend
Income | | | Capital Gain
Distributions | |
JPMorgan Securities Lending Money Market Fund Class Agency SL Shares, 1.98% (a)(b) | | $ | — | | | $ | 119,000,000 | | | $ | 115,000,000 | | | $ | 600 | * | | $ | — | | | $ | 4,000,600 | | | | 4,000,200 | | | $ | 268,942 | * | | $ | — | |
JPMorgan U.S. Government Money Market Fund Class IM Shares, 1.70% (a)(b) | | | — | | | | 175,712,354 | | | | 166,670,555 | | | | — | | | | — | | | | 9,041,799 | | | | 9,041,799 | | | | 153,253 | * | | | — | |
JPMorgan U.S. Government Money Market Fund Class Institutional Shares, 1.64% (a)(b) | | | 6,618,219 | | | | 82,653,193 | | | | 86,560,493 | | | | — | | | | — | | | | 2,710,919 | | | | 2,710,919 | | | | 56,690 | | | | — | |
| | | | | | | | | | | | | | | | | | | | | | | | | | | | | | | | | | | | |
Total | | $ | 6,618,219 | | | $ | 377,365,547 | | | $ | 368,231,048 | | | $ | 600 | | | $ | — | | | $ | 15,753,318 | | | | | | | $ | 478,885 | | | $ | — | |
| | | | | | | | | | | | | | | | | | | | | | | | | | | | | | | | | | | | |
U.S. Equity ETF
| | | | | | | | | | | | | | | | | | | | | | | | | | | | | | | | | | | | |
| | | For the year ended October 31, 2019 | |
| Security Description | | Value at
October 31,
2018 | | | Purchases
at Cost | | | Proceeds
from
Sales | | | Net Realized
Gain (Loss) | | | Change in
Unrealized
Appreciation/
(Depreciation) | | | Value at
October 31,
2019 | | | Shares at
October 31,
2019 | | | Dividend
Income | | | Capital Gain
Distributions | |
JPMorgan Securities Lending Money Market Fund Class Agency SL Shares, 1.98% (a)(b) | | $ | — | | | $ | 156,000,000 | | | $ | 139,000,000 | | | $ | 3,601 | * | | $ | 400 | | | $ | 17,004,001 | | | | 17,002,300 | | | $ | 542,323 | * | | $ | — | |
JPMorgan U.S. Government Money Market Fund Class IM Shares, 1.70% (a)(b) | | | 4,709,887 | | | | 266,113,079 | | | | 264,197,873 | | | | — | | | | — | | | | 6,625,093 | | | | 6,625,093 | | | | 184,014 | * | | | — | |
JPMorgan U.S. Government Money Market Fund Class Institutional Shares, 1.64% (a)(b) | | | 6,889,863 | | | | 34,644,771 | | | | 40,640,082 | | | | — | | | | — | | | | 894,552 | | | | 894,552 | | | | 36,454 | | | | — | |
| | | | | | | | | | | | | | | | | | | | | | | | | | | | | | | | | | | | |
Total | | $ | 11,599,750 | | | $ | 456,757,850 | | | $ | 443,837,955 | | | $ | 3,601 | | | $ | 400 | | | $ | 24,523,646 | | | | | | | $ | 762,791 | | | $ | — | |
| | | | | | | | | | | | | | | | | | | | | | | | | | | | | | | | | | | | |
U.S. Mid Cap Equity ETF
| | | | | | | | | | | | | | | | | | | | | | | | | | | | | | | | | | | | |
| | | For the year ended October 31, 2019 | |
| Security Description | | Value at
October 31,
2018 | | | Purchases
at Cost | | | Proceeds
from
Sales | | | Net Realized
Gain (Loss) | | | Change in
Unrealized
Appreciation/
(Depreciation) | | | Value at
October 31,
2019 | | | Shares at
October 31,
2019 | | | Dividend
Income | | | Capital Gain
Distributions | |
JPMorgan Securities Lending Money Market Fund Class Agency SL Shares, 1.98% (a)(b) | | $ | — | | | $ | 23,000,000 | | | $ | 17,000,000 | | | $ | 900 | * | | $ | — | | | $ | 6,000,900 | | | | 6,000,300 | | | $ | 114,968 | * | | $ | — | |
JPMorgan U.S. Government Money Market Fund Class IM Shares, 1.70% (a)(b) | | | 643,332 | | | | 91,865,224 | | | | 89,408,499 | | | | — | | | | — | | | | 3,100,057 | | | | 3,100,057 | | | | 71,116 | * | | | — | |
JPMorgan U.S. Government Money Market Fund Class Institutional Shares, 1.64% (a)(b) | | | 3,620,915 | | | | 9,102,309 | | | | 12,393,959 | | | | — | | | | — | | | | 329,265 | | | | 329,265 | | | | 12,832 | | | | — | |
| | | | | | | | | | | | | | | | | | | | | | | | | | | | | | | | | | | | |
Total | | $ | 4,264,247 | | | $ | 123,967,533 | | | $ | 118,802,458 | | | $ | 900 | | | $ | — | | | $ | 9,430,222 | | | | | | | $ | 198,916 | | | $ | — | |
| | | | | | | | | | | | | | | | | | | | | | | | | | | | | | | | | | | | |
| | | | | | | | |
| | | |
| OCTOBER 31, 2019 | | J.P. MORGAN EXCHANGE-TRADED FUNDS | | | | | 201 | |
NOTES TO FINANCIAL STATEMENTS
AS OF OCTOBER 31, 2019 (continued)
U.S. Small Cap Equity ETF
| | | | | | | | | | | | | | | | | | | | | | | | | | | | | | | | | | | | |
| | | For the year ended October 31, 2019 | |
| Security Description | | Value at
October 31,
2018 | | | Purchases
at Cost | | | Proceeds
from
Sales | | | Net Realized
Gain (Loss) | | | Change in
Unrealized
Appreciation/
(Depreciation) | | | Value at
October 31,
2019 | | | Shares at
October 31,
2019 | | | Dividend
Income | | | Capital Gain
Distributions | |
JPMorgan Securities Lending Money Market Fund Class Agency SL Shares, 1.98% (a)(b) | | $ | — | | | $ | 57,000,000 | | | $ | 38,000,000 | | | $ | 1,200 | * | | $ | 500 | | | $ | 19,001,700 | | | | 18,999,800 | | | $ | 209,571 | * | | $ | — | |
JPMorgan U.S. Government Money Market Fund Class IM Shares, 1.70% (a)(b) | | | 2,431,125 | | | | 102,119,015 | | | | 96,916,004 | | | | — | | | | — | | | | 7,634,136 | | | | 7,634,136 | | | | 127,611 | * | | | — | |
JPMorgan U.S. Government Money Market Fund Class Institutional Shares, 1.64% (a)(b) | | | 1,505,075 | | | | 8,797,846 | | | | 9,862,311 | | | | — | | | | — | | | | 440,610 | | | | 440,610 | | | | 8,972 | | | | — | |
| | | | | | | | | | | | | | | | | | | | | | | | | | | | | | | | | | | | |
Total | | $ | 3,936,200 | | | $ | 167,916,861 | | | $ | 144,778,315 | | | $ | 1,200 | | | $ | 500 | | | $ | 27,076,446 | | | | | | | $ | 346,154 | | | $ | — | |
| | | | | | | | | | | | | | | | | | | | | | | | | | | | | | | | | | | | |
U.S. Dividend ETF
| | | | | | | | | | | | | | | | | | | | | | | | | | | | | | | | | | | | |
| | | For the year ended October 31, 2019 | |
| Security Description | | Value at
October 31,
2018 | | | Purchases
at Cost | | | Proceeds
from
Sales | | | Net Realized
Gain (Loss) | | | Change in
Unrealized
Appreciation/
(Depreciation) | | | Value at
October 31,
2019 | | | Shares at
October 31,
2019 | | | Dividend
Income | | | Capital Gain
Distributions | |
JPMorgan U.S. Government Money Market Fund Class IM Shares, 1.70% (a)(b) | | $ | 148,580 | | | $ | 8,147,797 | | | $ | 7,641,908 | | | $ | — | | | $ | — | | | $ | 654,469 | | | | 654,469 | | | $ | 6,282 | * | | $ | — | |
JPMorgan U.S. Government Money Market Fund Class Institutional Shares, 1.64% (a)(b) | | | 1,248,859 | | | | 2,295,663 | | | | 3,394,993 | | | | — | | | | — | | | | 149,529 | | | | 149,529 | | | | 3,427 | | | | — | |
| | | | | | | | | | | | | | | | | | | | | | | | | | | | | | | | | | | | |
Total | | $ | 1,397,439 | | | $ | 10,443,460 | | | $ | 11,036,901 | | | $ | — | | | $ | — | | | $ | 803,998 | | | | | | | $ | 9,709 | | | $ | — | |
| | | | | | | | | | | | | | | | | | | | | | | | | | | | | | | | | | | | |
U.S. Minimum Volatility ETF
| | | | | | | | | | | | | | | | | | | | | | | | | | | | | | | | | | | | |
| | | For the year ended October 31, 2019 | |
| Security Description | | Value at
October 31,
2018 | | | Purchases
at Cost | | | Proceeds
from
Sales | | | Net Realized
Gain (Loss) | | | Change in
Unrealized
Appreciation/
(Depreciation) | | | Value at
October 31,
2019 | | | Shares at
October 31,
2019 | | | Dividend
Income | | | Capital Gain
Distributions | |
JPMorgan U.S. Government Money Market Fund Class IM Shares, 1.70% (a)(b) | | $ | 93,840 | | | $ | 7,973,815 | | | $ | 7,680,255 | | | $ | — | | | $ | — | | | $ | 387,400 | | | | 387,400 | | | $ | 4,320 | * | | $ | — | |
JPMorgan U.S. Government Money Market Fund Class Institutional Shares, 1.64% (a)(b) | | | 760,666 | | | | 2,812,509 | | | | 3,434,236 | | | | — | | | | — | | | | 138,939 | | | | 138,939 | | | | 4,014 | | | | — | |
| | | | | | | | | | | | | | | | | | | | | | | | | | | | | | | | | | | | |
Total | | $ | 854,506 | | | $ | 10,786,324 | | | $ | 11,114,491 | | | $ | — | | | $ | — | | | $ | 526,339 | | | | | | | $ | 8,334 | | | $ | — | |
| | | | | | | | | | | | | | | | | | | | | | | | | | | | | | | | | | | | |
U.S. Momentum Factor ETF
| | | | | | | | | | | | | | | | | | | | | | | | | | | | | | | | | | | | |
| | | For the year ended October 31, 2019 | |
| Security Description | | Value at
October 31,
2018 | | | Purchases
at Cost | | | Proceeds
from
Sales | | | Net Realized
Gain (Loss) | | | Change in
Unrealized
Appreciation/
(Depreciation) | | | Value at
October 31,
2019 | | | Shares at
October 31,
2019 | | | Dividend
Income | | | Capital Gain
Distributions | |
JPMorgan U.S. Government Money Market Fund Class IM Shares, 1.70% (a)(b) | | $ | 66,300 | | | $ | 7,923,766 | | | $ | 7,428,738 | | | $ | — | | | $ | — | | | $ | 561,328 | | | | 561,328 | | | $ | 5,083 | * | | $ | — | |
JPMorgan U.S. Government Money Market Fund Class Institutional Shares, 1.64% (a)(b) | | | 63,323 | | | | 1,690,751 | | | | 1,666,462 | | | | — | | | | — | | | | 87,612 | | | | 87,612 | | | | 1,512 | | | | — | |
| | | | | | | | | | | | | | | | | | | | | | | | | | | | | | | | | | | | |
Total | | $ | 129,623 | | | $ | 9,614,517 | | | $ | 9,095,200 | | | $ | — | | | $ | — | | | $ | 648,940 | | | | | | | $ | 6,595 | | | $ | — | |
| | | | | | | | | | | | | | | | | | | | | | | | | | | | | | | | | | | | |
| | | | | | |
| | | |
| 202 | | | | J.P. MORGAN EXCHANGE-TRADED FUNDS | | OCTOBER 31, 2019 |
U.S. Quality Factor ETF
| | | | | | | | | | | | | | | | | | | | | | | | | | | | | | | | | | | | |
| | | For the year ended October 31, 2019 | |
| Security Description | | Value at
October 31,
2018 | | | Purchases
at Cost | | | Proceeds
from
Sales | | | Net Realized
Gain (Loss) | | | Change in
Unrealized
Appreciation/
(Depreciation) | | | Value at
October 31,
2019 | | | Shares at
October 31,
2019 | | | Dividend
Income | | | Capital Gain
Distributions | |
JPMorgan U.S. Government Money Market Fund Class IM Shares, 1.70% (a)(b) | | $ | 58,800 | | | $ | 7,198,303 | | | $ | 6,310,781 | | | $ | — | | | $ | — | | | $ | 946,322 | | | | 946,322 | | | $ | 6,416 | * | | $ | — | |
JPMorgan U.S. Government Money Market Fund Class Institutional Shares, 1.64% (a)(b) | | | 836,372 | | | | 3,145,724 | | | | 3,721,691 | | | | — | | | | — | | | | 260,405 | | | | 260,405 | | | | 3,375 | | | | — | |
| | | | | | | | | | | | | | | | | | | | | | | | | | | | | | | | | | | | |
Total | | $ | 895,172 | | | $ | 10,344,027 | | | $ | 10,032,472 | | | $ | — | | | $ | — | | | $ | 1,206,727 | | | | | | | $ | 9,791 | | | $ | — | |
| | | | | | | | | | | | | | | | | | | | | | | | | | | | | | | | | | | | |
U.S. Value Factor ETF
| | | | | | | | | | | | | | | | | | | | | | | | | | | | | | | | | | | | |
| | | For the year ended October 31, 2019 | |
| Security Description | | Value at
October 31,
2018 | | | Purchases
at Cost | | | Proceeds
from
Sales | | | Net Realized
Gain (Loss) | | | Change in
Unrealized
Appreciation/
(Depreciation) | | | Value at
October 31,
2019 | | | Shares at
October 31,
2019 | | | Dividend
Income | | | Capital Gain
Distributions | |
JPMorgan U.S. Government Money Market Fund Class IM Shares, 1.70% (a)(b) | | $ | 57,600 | | | $ | 5,285,951 | | | $ | 4,974,798 | | | $ | — | | | $ | — | | | $ | 368,753 | | | | 368,753 | | | $ | 4,550 | * | | $ | — | |
JPMorgan U.S. Government Money Market Fund Class Institutional Shares, 1.64% (a)(b) | | | 692,762 | | | | 3,199,498 | | | | 3,737,889 | | | | — | | | | — | | | | 154,371 | | | | 154,371 | | | | 3,546 | | | | — | |
| | | | | | | | | | | | | | | | | | | | | | | | | | | | | | | | | | | | |
Total | | $ | 750,362 | | | $ | 8,485,449 | | | $ | 8,712,687 | | | $ | — | | | $ | — | | | $ | 523,124 | | | | | | | $ | 8,096 | | | $ | — | |
| | | | | | | | | | | | | | | | | | | | | | | | | | | | | | | | | | | | |
| (a) | Investment in an affiliated fund, which is registered under the Investment Company Act of 1940, as amended, and is advised by J.P. Morgan Investment Management Inc. |
| (b) | The rate shown is the current yield as of October 31, 2019. |
| (c) | Commencement of operations. |
| (d) | Investment in affiliate. This security is included in an index in which the Fund, as an index fund, tracks. |
| * | Amount is included on the SOP as Income from securities lending (net) (after payments of rebates and Citibank’s fee). |
F. Foreign Currency Translation — The books and records of the Funds are maintained in U.S. dollars. Foreign currency amounts are translated into U.S. dollars at the prevailing exchange rates of such currencies against the U.S. dollar. The market value of investment securities and other assets and liabilities are translated at the exchange rate as of the valuation date. Purchases and sales of investment securities, income and expenses are translated at the exchange rate prevailing on the respective dates of such transactions.
The Funds do not isolate the effect of changes in foreign exchange rates from changes in market prices of securities held. Accordingly, such changes are included within Change in net unrealized appreciation/depreciation on investments on the SOP.
Reported realized foreign currency gains and losses arise from the disposition of foreign currency, currency gains or losses realized between the trade and settlement dates on securities transactions, and the difference between the amounts of dividends, interest and foreign withholding taxes recorded on each Fund’s books on the transaction date and the U.S. dollar equivalent of the amounts actually received or paid. These reported realized foreign currency gains and losses are included in Net realized gain (loss) on foreign currency transactions on the SOP. Unrealized foreign currency gains and losses arise from changes (due to changes in exchange rates) in the value of foreign currency and other assets and liabilities denominated in foreign currencies, which are held at year end are included in Change in net unrealized appreciation/ depreciation on foreign currency translations on the SOP.
| | | | | | | | |
| | | |
| OCTOBER 31, 2019 | | J.P. MORGAN EXCHANGE-TRADED FUNDS | | | | | 203 | |
NOTES TO FINANCIAL STATEMENTS
AS OF OCTOBER 31, 2019 (continued)
G. Offering and Organizational Costs — Total offering costs incurred in connection with the offering of shares of the Funds are amortized on a straight line basis over 12 months from the date the Funds commenced operations. Total offering costs incurred were as follows:
| | | | |
BetaBuilders Canada ETF | | $ | 16,918 | |
BetaBuilders Developed Asiaex-Japan ETF | | | 15,611 | |
BetaBuilders Europe ETF | | | 13,889 | |
BetaBuilders Japan ETF | | | 13,250 | |
U.S. Dividend ETF | | | 4,068 | |
U.S. Minimum Volatility ETF | | | 5,756 | |
U.S. Momentum Factor ETF | | | 4,071 | |
U.S. Quality Factor ETF | | | 4,061 | |
U.S. Value Factor ETF | | | 4,073 | |
Costs paid in connection with the organization of the Funds, if any, were recorded as an expense at the time the Funds commenced operations and are included as part of Offering costs on the SOP. For the year ended October 31, 2019, total offering costs amortized were as follows:
| | | | |
BetaBuilders Canada ETF | | $ | 12,978 | |
BetaBuilders Developed Asiaex-Japan ETF | | | 11,976 | |
BetaBuilders Europe ETF | | | 8,638 | |
BetaBuilders Japan ETF | | | 8,260 | |
U.S. Dividend ETF | | | 90 | |
U.S. Minimum Volatility ETF | | | 126 | |
U.S. Momentum Factor ETF | | | 90 | |
U.S. Quality Factor ETF | | | 90 | |
U.S. Value Factor ETF | | | 89 | |
H. Security Transactions and Investment Income — Investment transactions are accounted for on the trade date (the date the order to buy or sell is executed). Securities gains and losses are calculated on a specifically identified cost basis. Interest income is determined on the basis of coupon interest accrued using the effective interest method, which adjusts for amortization of premiums and accretion of discounts. Dividend income net of foreign taxes withheld, if any, and distributions of net investment income and realized capital gains from the Underlying Funds and ETFs, if any, are recorded on theex-dividend date or when a Fund first learns of the dividend.
To the extent such information is publicly available, the Funds record distributions received in excess of income earned from underlying investments as a reduction of cost of investments and/or realized gain. Such amounts are based on estimates if actual amounts are not available and actual amounts of income, realized gain and return of capital may differ from the estimated amounts. The Funds adjust the estimated amounts of the components of distributions (and consequently their net investment income) as necessary once the issuers provide information about the actual composition of the distributions.
I. Allocation of Expenses — Expenses directly attributable to a Fund are charged directly to that Fund, while the expenses attributable to more than one fund of the Trust are allocated among the applicable funds.
J. Federal Income Taxes — Each Fund is treated as a separate taxable entity for Federal income tax purposes. Each Fund’s policy is to comply with the provisions of the Internal Revenue Code (the “Code”) applicable to regulated investment companies and to distribute to shareholders all of its distributable net investment income and net realized capital gains on investments. Accordingly, no provision for Federal income tax is necessary. Management has reviewed the Funds’ tax positions for all open tax years and has determined that as of October 31, 2019, no liability for Federal income tax is required in the Funds’ financial statements for net unrecognized tax benefits. However, management’s conclusions may be subject to future review based on changes in, or the interpretation of, the accounting standards or tax laws and regulations. Each of the Funds’ Federal tax returns for the prior three fiscal years, or since inception if shorter, remains subject to examination by the Internal Revenue Service.
K. Foreign Taxes — The Funds may be subject to foreign taxes on income, gains on investments or currency purchases/repatriation, a portion of which may be recoverable. The Funds will accrue such taxes and recoveries as applicable, based upon their current interpretation of tax rules and regulations that exist in the markets in which they invest. When a capital gain tax is determined to apply, the Funds record an estimated deferred tax liability in an amount that would be payable if the securities were disposed of on the valuation date.
L. Distributions to Shareholders — Distributions from net investment income, if any, are generally declared and paid quarterly for all Funds, except the BetaBuilders Japan ETF, which generally declares and pays any net investment income annually. Prior to March 1, 2019, the BetaBuilders Japan ETF distributed quarterly. Net realized capital gains, if any, are distributed by each Fund at least annually. The amount of distributions from net investment income and net realized capital gains is determined in accordance with Federal income tax regulations, which may differ from GAAP. To the extent these “book/tax” differences are permanent in nature (i.e., that they result from other than timing of recognition — “temporary differences”), such amounts are reclassified within the capital accounts based on their Federal tax basis treatment.
| | | | | | |
| | | |
| 204 | | | | J.P. MORGAN EXCHANGE-TRADED FUNDS | | OCTOBER 31, 2019 |
The following amounts were reclassified within the capital accounts:
| | | | | | | | | | | | |
| | | Paid-in-Capital | | | Accumulated
undistributed
(distributions
in excess of)
net investment
income | | | Accumulated
net realized
gains (losses) | |
BetaBuilders Canada ETF | | $ | (2,111,022 | ) | | $ | (162,042 | ) | | $ | 2,273,064 | |
BetaBuilders Developed Asia ex-Japan ETF | | | 5,791,633 | | | | (62,604 | ) | | | (5,729,029 | ) |
BetaBuilders Europe ETF | | | 68,541,468 | | | | (792,169 | ) | | | (67,749,299 | ) |
BetaBuilders Japan ETF | | | 49,015,836 | | | | 1,904,769 | | | | (50,920,605 | ) |
BetaBuilders U.S. Equity ETF | | | (1 | ) | | | — | | | | 1 | |
Emerging Markets Equity ETF | | | (686 | ) | | | 221,602 | | | | (220,916 | ) |
Europe Equity ETF | | | 486,007 | | | | 80,785 | | | | (566,792 | ) |
Global Equity ETF | | | 9,771,580 | | | | 102,790 | | | | (9,874,370 | ) |
International Equity ETF | | | 53,732,903 | | | | 1,257,546 | | | | (54,990,449 | ) |
U.S. Equity ETF | | | 19,691,157 | | | | 5,568 | | | | (19,696,725 | ) |
U.S. Mid Cap Equity ETF | | | 4,076,154 | | | | (6,913 | ) | | | (4,069,241 | ) |
U.S. Small Cap Equity ETF | | | 13,123,858 | | | | (61,394 | ) | | | (13,062,464 | ) |
U.S. Dividend ETF | | | 927,934 | | | | (24,420 | ) | | | (903,514 | ) |
U.S. Minimum Volatility ETF | | | 3,523,569 | | | | (2,630 | ) | | | (3,520,939 | ) |
U.S. Momentum Factor ETF | | | 7,004,340 | | | | (7,202 | ) | | | (6,997,138 | ) |
U.S. Quality Factor ETF | | | 913,908 | | | | 4,976 | | | | (918,884 | ) |
U.S. Value Factor ETF | | | 2,791,919 | | | | (11,074 | ) | | | (2,780,845 | ) |
The reclassifications for the Funds relate primarily to foreign currency gains or losses, investments in real estate investment trusts (“REITs”), investments in passive foreign investment companies (“PFICs”),non-taxable dividends and redemptionsin-kind.
3. Fees and Other Transactions with Affiliates
A. Investment Advisory Fee — Pursuant to Investment Advisory Agreement for all Funds, except the BetaBuilders U.S. Equity ETF, the Adviser manages the investments of each Fund. For such services, the Adviser is paid a fee which is accrued daily and paid monthly based on each Fund’s respective average daily net assets. The annual rate for each Fund is as follows:
| | | | |
BetaBuilders Canada ETF | | | 0.19 | % |
BetaBuilders Developed Asiaex-Japan ETF | | | 0.19 | % |
BetaBuilders Europe ETF | | | 0.09 | % |
BetaBuilders Japan ETF | | | 0.19 | % |
Emerging Markets Equity ETF | | | 0.44 | % |
Europe Equity ETF | | | 0.30 | % |
Global Equity ETF | | | 0.24 | % |
International Equity ETF | | | 0.24 | % |
U.S. Equity ETF | | | 0.23 | % |
U.S. Mid Cap Equity ETF | | | 0.24 | % |
U.S. Small Cap Equity ETF | | | 0.29 | % |
U.S. Dividend ETF | | | 0.23 | % |
U.S. Minimum Volatility ETF | | | 0.23 | % |
U.S. Momentum Factor ETF | | | 0.23 | % |
U.S. Quality Factor ETF | | | 0.23 | % |
U.S. Value Factor ETF | | | 0.23 | % |
The Adviser waived investment advisory fees and/or reimbursed expenses as outlined in Note 3.D.
B. Administration Fee — Pursuant to an Administration Agreement for all Funds, except the BetaBuilders U.S. Equity ETF, the Administrator provides certain administration services to the Funds. In consideration of these services, effective January 1, 2019, the Administrator receives a fee accrued daily and paid monthly at an annual rate of 0.075% of each Fund’s respective average daily net assets. Prior to January 1, 2019, the Administrator received a fee accrued daily and paid monthly at an annual rate of 0.085% each Fund’s respective average daily net assets. The Administrator also provides administration services to the BetaBuilders U.S. Equity ETF pursuant to the Management Agreement for that Fund; the Administrator is compensated as described in Note 3.G.
The Administrator waived administration fees as outlined in Note 3.D.
| | | | | | | | |
| | | |
| OCTOBER 31, 2019 | | J.P. MORGAN EXCHANGE-TRADED FUNDS | | | | | 205 | |
NOTES TO FINANCIAL STATEMENTS
AS OF OCTOBER 31, 2019 (continued)
JPMorgan Chase Bank, N.A. (“JPMCB”), a wholly-owned subsidiary of JPMorgan, serves as the Funds’sub-administrator (the“Sub-administrator”). For its services asSub-administrator, JPMCB receives a portion of the fees payable to the Administrator.
C. Custodian, Accounting and Transfer Agent Fees — JPMCB provides custody, accounting and transfer agency services to the Funds. The amounts paid directly to JPMCB by the Funds, except the BetaBuilders U.S. Equity ETF, which is paid as described in Note 3.G, for custody services are included in the Custodian, Accounting and Transfer Agent fees on the SOP. Interest income earned on cash balances at the custodian, if any, is included in Interest income from affiliates on the SOP. With respect to the transfer agency services provided by JPMCB for each creation or redemption transaction, the Authorized Participant will generally be responsible for such associated expenses; during the period, the Funds paid no transfer agency fees to JPMCB.
Additionally, Authorized Participants generally pay transaction fees associated with the creation and redemption of fund shares. These fees are used to offset certain custodian charges incurred by the Fund for these transactions.
For the year ended October 31, 2019, the amount of transaction fees paid by the Authorized Participants to the Funds that were used to reimburse Custodian and Transfer Agent fees were as follows:
| | | | |
BetaBuilders Canada ETF | | $ | 67,500 | |
BetaBuilders Developed Asiaex-Japan ETF | | | 205,200 | |
BetaBuilders Europe ETF | | | 609,900 | |
BetaBuilders Japan ETF | | | 210,800 | |
Emerging Markets Equity ETF | | | 161,700 | |
Europe Equity ETF | | | 34,200 | |
Global Equity ETF | | | 23,100 | |
International Equity ETF | | | 201,600 | |
U.S. Equity ETF | | | 49,300 | |
U.S. Mid Cap Equity ETF | | | 18,000 | |
U.S. Small Cap Equity ETF | | | 67,200 | |
U.S. Dividend ETF | | | 4,800 | |
U.S. Minimum Volatility ETF | | | 18,000 | |
U.S. Momentum Factor ETF | | | 9,600 | |
U.S. Quality Factor ETF | | | 9,000 | |
U.S. Value Factor ETF | | | 11,200 | |
Such amounts are included in expense reimbursements fromnon-affiliates in the SOP.
Restricted cash on the SAL is cash received from Authorized Participants for the reimbursement of creation and/or redemption of Fund shares.
Interest expense paid to the custodian related to cash overdrafts, if any, is included in Interest expense to affiliates on the SOP.
D. Waivers and Reimbursements — The Adviser has contractually agreed to waive fees and/or reimburse the Funds to the extent that total annual operating expenses, (excluding acquired fund fees and expenses, dividend expenses related to short sales, interest, taxes, expenses related to litigation and potential litigation, and extraordinary expenses), exceed the percentages of the Funds’ respective average daily net assets as shown in the below table:
| | | | |
| | | Expense Cap | |
BetaBuilders Canada ETF | | | 0.19 | % |
BetaBuilders Developed Asiaex-Japan ETF | | | 0.19 | % |
BetaBuilders Europe ETF | | | 0.09 | % |
BetaBuilders Japan ETF | | | 0.19 | % |
Emerging Markets Equity ETF | | | 0.45 | % |
Europe Equity ETF | | | 0.38 | % |
Global Equity ETF | | | 0.38 | % |
International Equity ETF | | | 0.38 | % |
U.S. Equity ETF | | | 0.19 | % |
U.S. Mid Cap Equity ETF | | | 0.24 | % |
U.S. Small Cap Equity ETF | | | 0.29 | % |
U.S. Dividend ETF | | | 0.12 | % |
U.S. Minimum Volatility ETF | | | 0.12 | % |
U.S. Momentum Factor ETF | | | 0.12 | % |
U.S. Quality Factor ETF | | | 0.12 | % |
U.S. Value Factor ETF | | | 0.12 | % |
The expense limitation agreements were in effect for the year ended October 31, 2019.
| | | | | | |
| | | |
| 206 | | | | J.P. MORGAN EXCHANGE-TRADED FUNDS | | OCTOBER 31, 2019 |
For the year ended October 31, 2019, the Funds’ service providers waived fees and/or reimbursed expenses for each of the Funds as follows. None of these parties expect the Funds to repay any such waived fees and/or reimbursed expenses in future years.
| | | | | | | | | | | | | | | | |
| | | Contractual Waivers | | | | |
| | | Investment
Advisory
Fees | | | Administration
Fees | | | Total | | | Contractual
Reimbursements | |
BetaBuilders Canada ETF | | $ | 2,710,628 | | | $ | 1,807,086 | | | $ | 4,517,714 | | | $ | — | |
BetaBuilders Developed Asiaex-Japan ETF | | | 1,325,505 | | | | 883,670 | | | | 2,209,175 | | | | 6,420 | |
BetaBuilders Europe ETF | | | 2,845,520 | | | | 1,897,013 | | | | 4,742,533 | | | | 447 | |
BetaBuilders Japan ETF | | | 2,915,570 | | | | 1,943,713 | | | | 4,859,283 | | | | — | |
Emerging Markets Equity ETF | | | 858,203 | | | | 229,763 | | | | 1,087,966 | | | | 686 | |
Europe Equity ETF | | | 78,722 | | | | 20,722 | | | | 99,444 | | | | 30,660 | |
Global Equity ETF | | | 114,111 | | | | 76,074 | | | | 190,185 | | | | — | |
International Equity ETF | | | 168,560 | | | | 112,373 | | | | 280,933 | | | | — | |
U.S. Equity ETF | | | 687,761 | | | | 458,508 | | | | 1,146,269 | | | | — | |
U.S. Mid Cap Equity ETF | | | 168,160 | | | | 112,106 | | | | 280,266 | | | | 1,725 | |
U.S. Small Cap Equity ETF | | | 154,571 | | | | 101,917 | | | | 256,488 | | | | 4,200 | |
U.S. Dividend ETF | | | 71,749 | | | | 23,984 | | | | 95,733 | | | | 58,680 | |
U.S. Minimum Volatility ETF | | | 115,576 | | | | 38,317 | | | | 153,893 | | | | 42,702 | |
U.S. Momentum Factor ETF | | | 101,450 | | | | 33,626 | | | | 135,076 | | | | 43,571 | |
U.S. Quality Factor ETF | | | 136,914 | | | | 45,323 | | | | 182,237 | | | | 33,752 | |
U.S. Value Factor ETF | | | 120,553 | | | | 39,958 | | | | 160,511 | | | | 38,093 | |
Additionally, the Funds may invest in one or more money market funds advised by the Adviser (affiliated money market funds). For each Fund, except the BetaBuilders U.S. Equity ETF, the Adviser has contractually agreed to waive fees and/or reimburse expenses in an amount sufficient to offset the respective fees and expenses incurred by each Fund from the applicable Fund’s investment in such affiliated money market funds, except for investments of securities lending collateral. For BetaBuilders U.S. Equity ETF, these waivers are covered under the Management Agreement as described in Note 3.G.
The amounts of these waivers resulting from investments in these money market funds for the year ended October 31, 2019 were as follows:
| | | | |
BetaBuilders Canada ETF | | $ | 407 | |
BetaBuilders Developed Asiaex-Japan ETF | | | 504 | |
BetaBuilders Europe ETF | | | 462 | |
BetaBuilders Japan ETF | | | 609 | |
BetaBuilders U.S. Equity ETF | | | 172 | |
Emerging Markets Equity ETF | | | 618 | |
Europe Equity ETF | | | 1 | |
Global Equity ETF | | | 505 | |
International Equity ETF | | | 6,659 | |
U.S. Equity ETF | | | 3,970 | |
U.S. Mid Cap Equity ETF | | | 1,403 | |
U.S. Small Cap Equity ETF | | | 1,034 | |
U.S. Dividend ETF | | | 411 | |
U.S. Minimum Volatility ETF | | | 413 | |
U.S. Momentum Factor ETF | | | 151 | |
U.S. Quality Factor ETF | | | 359 | |
U.S. Value Factor ETF | | | 394 | |
E. Distribution Services — The Distributor or its agent distributes Creation Units for each Fund on an agency basis. The Distributor does not maintain a secondary market in shares of each Fund. JPMDS receives no fees for their distribution services under the distribution agreement with the Trust (the “Distribution Agreement”). Although the Trust does not pay any fees under the Distribution Agreement, JPMIM pays JPMDS for certain distribution related services.
F. Other — Certain officers of the Trust are affiliated with the Adviser, the Administrator and the JPMDS. Such officers, with the exception of the Chief Compliance Officer, receive no compensation from the Funds for serving in their respective roles.
The Board designated and appointed a Chief Compliance Officer to the Funds pursuant to Rule38a-1 under the 1940 Act. Each Fund, excluding the BetaBuilders U.S. Equity ETF, along with affiliated funds, makes reimbursement payments, on apro-rata basis, to the Administrator for a portion of the fees associated with the office of the Chief Compliance Officer. Such fees are included in Trustees’ and Chief Compliance Officer’s fees on the SOP.
| | | | | | | | |
| | | |
| OCTOBER 31, 2019 | | J.P. MORGAN EXCHANGE-TRADED FUNDS | | | | | 207 | |
NOTES TO FINANCIAL STATEMENTS
AS OF OCTOBER 31, 2019 (continued)
The Securities and Exchange Commission (“SEC”) has granted an exemptive order permitting the Funds to engage in principal transactions with J.P. Morgan Securities, Inc., an affiliated broker, involving taxable money market instruments, subject to certain conditions.
G. Management Fee — Pursuant to a Management Agreement for BetaBuilders U.S. Equity ETF, the Adviser manages the investments of BetaBuilders U.S. Equity ETF. For such services, the Adviser is paid a fee of 0.02%, which is accrued daily and paid monthly, based on BetaBuilders U.S. Equity ETF’s average daily net assets. Under the Management Agreement, JPMIM is responsible for substantially all expenses of the BetaBuilders U.S. Equity ETF, (including expenses of the Trust relating to BetaBuilders U.S. Equity ETF), except for the management fees, payments under the BetaBuilders U.S. Equity ETF’s12b-1 plan (if any), interest expenses, dividend and interest expenses related to short sales, taxes, acquired fund fees and expenses (other than fees for funds advised by the adviser and/or its affiliates), costs of holding shareholder meetings, litigation and potential litigation and other extraordinary expenses not incurred in the ordinary course of the BetaBuilders U.S. Equity ETF’s business. Additionally, the BetaBuilders U.S. Equity ETF shall be responsible for itsnon-operating expenses, including brokerage commissions and fees and expenses associated with the Fund’s securities lending program, if applicable.
Effective November 1, 2019, the Investment Advisory Agreement, Administration Agreement and Expense Limitation Agreement for each Fund except Betabuilders U.S. Equity ETF were replaced by a Management Agreement. Under the Management Agreement, JPMIM is responsible for substantially all expenses of each Fund (including expenses of the Trust relating to each Fund), except for the management fees, payments under a Fund’s12b-1 plan (if any), interest expenses, dividend and interest expenses related to short sales, taxes, acquired fund fees and expenses (other than fees for funds advised by the adviser and/or its affiliates), costs of holding shareholder meetings, the costs of any securities lending program, and litigation and potential litigation and other extraordinary expenses not incurred in the ordinary course of each Fund’s business. Additionally, each Fund shall be responsible for itsnon-operating expenses, including brokerage commissions and fees and expense associated with a Fund’s securities lending program, if applicable. For the avoidance of doubt, the Adviser’s payment of such expenses may be accomplished through a Fund’s payment of such expenses and a corresponding reduction in the fee payable to the Adviser, provided, however, that if the amount of expenses paid by a Fund exceeds the fee payable to the Adviser, the Adviser will reimburse that Fund for such amount. The management fee is accrued daily and paid no more frequently than monthly based on each Fund’s respective average daily net assets at following rate:
| | | | |
BetaBuilders Canada ETF | | | 0.19 | % |
BetaBuilders Developed Asiaex-Japan ETF | | | 0.19 | % |
BetaBuilders Europe ETF | | | 0.09 | % |
BetaBuilders Japan ETF | | | 0.19 | % |
Emerging Markets Equity ETF | | | 0.44 | % |
Europe Equity ETF | | | 0.37 | % |
Global Equity ETF | | | 0.29 | % |
International Equity ETF | | | 0.37 | % |
U.S. Equity ETF | | | 0.18 | % |
U.S. Mid Cap Equity ETF | | | 0.24 | % |
U.S. Small Cap Equity ETF | | | 0.29 | % |
U.S. Dividend ETF | | | 0.12 | % |
U.S. Minimum Volatility ETF | | | 0.12 | % |
U.S. Momentum Factor ETF | | | 0.12 | % |
U.S. Quality Factor ETF | | | 0.12 | % |
U.S. Value Factor ETF | | | 0.12 | % |
4. Investment Transactions
During the year ended October 31, 2019, purchases and sales of investments (excluding short-term investments) were as follows:
| | | | | | | | |
| | | Purchases
(excluding U.S. Government) | | | Sales
(excluding U.S. Government) | |
BetaBuilders Canada ETF | | $ | 273,368,678 | | | $ | 196,062,854 | |
BetaBuilders Developed Asiaex-Japan ETF | | | 233,034,243 | | | | 86,750,204 | |
BetaBuilders Europe ETF | | | 231,637,118 | | | | 214,975,077 | |
BetaBuilders Japan ETF | | | 186,361,167 | | | | 130,388,044 | |
BetaBuilders U.S. Equity ETF | | | 1,115,861 | | | | 1,041,463 | |
Emerging Markets Equity ETF | | | 236,465,459 | | | | 153,124,709 | |
Europe Equity ETF | | | 5,293,020 | | | | 5,536,386 | |
Global Equity ETF | | | 41,043,728 | | | | 45,891,683 | |
International Equity ETF | | | 383,700,533 | | | | 376,315,766 | |
U.S. Equity ETF | | | 171,404,743 | | | | 161,059,176 | |
U.S. Mid Cap Equity ETF | | | 44,425,506 | | | | 38,795,109 | |
U.S. Small Cap Equity ETF | | | 59,155,897 | | | | 56,745,546 | |
U.S. Dividend ETF | | | 7,372,778 | | | | 6,362,958 | |
| | | | | | |
| | | |
| 208 | | | | J.P. MORGAN EXCHANGE-TRADED FUNDS | | OCTOBER 31, 2019 |
| | | | | | | | |
| | | Purchases
(excluding U.S. Government) | | | Sales
(excluding U.S. Government) | |
U.S. Minimum Volatility ETF | | $ | 9,518,496 | | | $ | 7,691,521 | |
U.S. Momentum Factor ETF | | | 23,024,620 | | | | 22,735,162 | |
U.S. Quality Factor ETF | | | 14,391,911 | | | | 12,837,428 | |
U.S. Value Factor ETF | | | 12,850,631 | | | | 11,689,281 | |
During the year ended October 31, 2019, there were no purchases or sales of U.S. Government securities.
For the year ended October 31, 2019,in-kind transactions associated with creations and redemptions were:
| | | | | | | | |
| | | In-Kind
Creations | | | In-Kind
Redemptions | |
BetaBuilders Canada ETF | | $ | 1,516,229,435 | | | $ | 73,579,797 | |
BetaBuilders Developed Asiaex-Japan ETF | | | 604,598,597 | | | | 39,546,861 | |
BetaBuilders Europe ETF | | | 2,893,686,981 | | | | 682,469,119 | |
BetaBuilders Japan ETF | | | 2,206,423,026 | | | | 606,864,991 | |
BetaBuilders U.S. Equity ETF | | | 43,037,961 | | | | — | |
Emerging Markets Equity ETF | | | 42,955,716 | | | | — | |
Europe Equity ETF | | | 10,046,848 | | | | 66,469,954 | |
Global Equity ETF | | | 4,795,720 | | | | 68,935,978 | |
International Equity ETF | | | 252,209,756 | | | | 457,321,859 | |
U.S. Equity ETF | | | 257,924,624 | | | | 79,145,467 | |
U.S. Mid Cap Equity ETF | | | 80,954,781 | | | | 18,121,044 | |
U.S. Small Cap Equity ETF | | | 122,670,547 | | | | 84,781,849 | |
U.S. Dividend ETF | | | 15,518,675 | | | | 4,582,355 | |
U.S. Minimum Volatility ETF | | | 91,833,080 | | | | 20,043,193 | |
U.S. Momentum Factor ETF | | | 66,065,497 | | | | 41,684,460 | |
U.S. Quality Factor ETF | | | 75,849,084 | | | | 5,357,886 | |
U.S. Value Factor ETF | | | 45,219,167 | | | | 14,142,705 | |
5. Federal Income Tax Matters
For Federal income tax purposes, the estimated cost and unrealized appreciation (depreciation) in value of investments held at October 31, 2019 were as follows:
| | | | | | | | | | | | | | | | |
| | | Aggregate
Cost | | | Gross
Unrealized
Appreciation | | | Gross
Unrealized
Depreciation | | | Net Unrealized
Appreciation
(Depreciation) | |
BetaBuilders Canada ETF | | $ | 3,884,821,827 | | | $ | 312,598,789 | | | $ | 191,380,934 | | | $ | 121,217,855 | |
BetaBuilders Developed Asiaex-Japan ETF | | | 1,379,543,905 | | | | 96,171,463 | | | | 43,881,717 | | | | 52,289,746 | |
BetaBuilders Europe ETF | | | 3,804,672,350 | | | | 314,060,609 | | | | 177,602,028 | | | | 136,458,581 | |
BetaBuilders Japan ETF | | | 4,177,153,208 | | | | 323,120,620 | | | | 209,131,457 | | | | 113,989,163 | |
BetaBuilders U.S. Equity ETF | | | 43,248,645 | | | | 3,903,048 | | | | 794,777 | | | | 3,108,271 | |
Emerging Markets Equity ETF | | | 337,222,823 | | | | 39,282,138 | | | | 22,026,133 | | | | 17,256,005 | |
Europe Equity ETF | | | 17,378,017 | | | | 1,177,990 | | | | 1,490,305 | | | | (312,315 | ) |
Global Equity ETF | | | 141,134,477 | | | | 14,377,354 | | | | 9,742,918 | | | | 4,634,436 | |
International Equity ETF | | | 1,292,081,876 | | | | 98,266,168 | | | | 101,382,101 | | | | (3,115,933 | ) |
U.S. Equity ETF | | | 745,491,670 | | | | 111,109,838 | | | | 30,968,150 | | | | 80,141,688 | |
U.S. Mid Cap Equity ETF | | | 183,015,890 | | | | 22,354,541 | | | | 8,349,403 | | | | 14,005,138 | |
U.S. Small Cap Equity ETF | | | 172,402,839 | | | | 10,064,960 | | | | 15,133,752 | | | | (5,068,792 | ) |
U.S. Dividend ETF | | | 39,533,473 | | | | 3,675,670 | | | | 1,853,855 | | | | 1,821,815 | |
U.S. Minimum Volatility ETF | | | 102,883,317 | | | | 5,907,508 | | | | 1,250,812 | | | | 4,656,696 | |
U.S. Momentum Factor ETF | | | 58,412,985 | | | | 1,150,396 | | | | 2,384,168 | | | | (1,233,772 | ) |
U.S. Quality Factor ETF | | | 100,572,462 | | | | 9,401,231 | | | | 2,026,910 | | | | 7,374,321 | |
U.S. Value Factor ETF | | | 63,309,967 | | | | 6,064,202 | | | | 2,195,501 | | | | 3,868,701 | |
The difference between book and tax basis appreciation (depreciation) on investments is primarily attributed to wash sale loss deferrals, investments in passive foreign investment companies (“PFICs”) and non-taxable dividends.
| | | | | | | | |
| | | |
| OCTOBER 31, 2019 | | J.P. MORGAN EXCHANGE-TRADED FUNDS | | | | | 209 | |
NOTES TO FINANCIAL STATEMENTS
AS OF OCTOBER 31, 2019 (continued)
The tax character of distributions paid during the year ended October 31, 2019 was as follows:
| | | | | | | | |
| | | Ordinary
Income* | | | Total
Distributions
Paid | |
BetaBuilders Canada ETF | | $ | 75,222,486 | | | $ | 75,222,486 | |
BetaBuilders Developed Asiaex-Japan ETF | | | 50,248,812 | | | | 50,248,812 | |
BetaBuilders Europe ETF | | | 126,316,866 | | | | 126,316,866 | |
BetaBuilders Japan ETF | | | 20,089,888 | | | | 20,089,888 | |
BetaBuilders U.S. Equity ETF | | | 317,882 | | | | 317,882 | |
Emerging Markets Equity ETF | | | 9,059,080 | | | | 9,059,080 | |
Europe Equity ETF | | | 661,542 | | | | 661,542 | |
Global Equity ETF | | | 4,502,466 | | | | 4,502,466 | |
International Equity ETF | | | 47,722,104 | | | | 47,722,104 | |
U.S. Equity ETF | | | 13,823,828 | | | | 13,823,828 | |
U.S. Mid Cap Equity ETF | | | 2,653,452 | | | | 2,653,452 | |
U.S. Small Cap Equity ETF | | | 1,663,026 | | | | 1,663,026 | |
U.S. Dividend ETF | | | 1,057,550 | | | | 1,057,550 | |
U.S. Minimum Volatility ETF | | | 948,027 | | | | 948,027 | |
U.S. Momentum Factor ETF | | | 515,149 | | | | 515,149 | |
U.S. Quality Factor ETF | | | 1,098,039 | | | | 1,098,039 | |
U.S. Value Factor ETF | | | 1,321,813 | | | | 1,321,813 | |
| * | Short-term gain distributions are treated as ordinary income for income tax purposes. |
The tax character of distributions paid during the year ended October 31, 2018 was as follows:
| | | | | | | | |
| | | Ordinary
Income* | | | Total
Distributions
Paid | |
BetaBuilders Canada ETF | | $ | 2,945,124 | | | $ | 2,945,124 | |
BetaBuilders Developed Asiaex-Japan ETF | | | 4,159,764 | | | | 4,159,764 | |
BetaBuilders Europe ETF | | | 1,891,512 | | | | 1,891,512 | |
Emerging Markets Equity ETF | | | 8,601,176 | | | | 8,601,176 | |
Europe Equity ETF | | | 4,014,806 | | | | 4,014,806 | |
Global Equity ETF | | | 5,818,989 | | | | 5,818,989 | |
International Equity ETF | | | 54,092,274 | | | | 54,092,274 | |
U.S. Equity ETF | | | 12,462,949 | | | | 12,462,949 | |
U.S. Mid Cap Equity ETF | | | 2,149,261 | | | | 2,149,261 | |
U.S. Small Cap Equity ETF | | | 1,058,143 | | | | 1,058,143 | |
U.S. Dividend ETF | | | 908,996 | | | | 908,996 | |
U.S. Minimum Volatility ETF | | | 549,553 | | | | 549,553 | |
U.S. Momentum Factor ETF | | | 338,121 | | | | 338,121 | |
U.S. Quality Factor ETF | | | 496,228 | | | | 496,228 | |
U.S. Value Factor ETF | | | 616,329 | | | | 616,329 | |
| * | Short-term gain distributions are treated as ordinary income for income tax purposes. |
As of October 31, 2019, the estimated components of net assets (excludingpaid-in-capital) on a tax basis were as follows:
| | | | | | | | | | | | |
| | | Current
Distributable
Ordinary
Income | | | Current
Distributable
Long-Term
Capital Gain or
(Tax Basis Capital
Loss Carryover) | | | Unrealized
Appreciation
(Depreciation) | |
BetaBuilders Canada ETF | | $ | 13,446,205 | | | $ | (19,539,163 | ) | | $ | 121,253,437 | |
BetaBuilders Developed Asiaex-Japan ETF | | | 3,106,728 | | | | (224,560 | ) | | | 52,481,883 | |
BetaBuilders Europe ETF | | | 10,045,797 | | | | (3,824,375 | ) | | | 136,869,667 | |
BetaBuilders Japan ETF | | | 96,506,970 | | | | (9,152,650 | ) | | | 113,973,270 | |
BetaBuilders U.S. Equity ETF | | | 112,754 | | | | (24,168 | ) | | | 3,108,272 | |
Emerging Markets Equity ETF | | | 3,585,880 | | | | (17,191,447 | ) | | | 17,049,352 | |
| | | | | | |
| | | |
| 210 | | | | J.P. MORGAN EXCHANGE-TRADED FUNDS | | OCTOBER 31, 2019 |
| | | | | | | | | | | | |
| | | Current
Distributable
Ordinary
Income | | | Current
Distributable
Long-Term
Capital Gain or
(Tax Basis Capital
Loss Carryover) | | | Unrealized
Appreciation
(Depreciation) | |
Europe Equity ETF | | $ | 39,207 | | | $ | (890,210 | ) | | $ | (319,215 | ) |
Global Equity ETF | | | 616,634 | | | | (6,508,104 | ) | | | 4,635,230 | |
International Equity ETF | | | 7,866,907 | | | | (63,817,842 | ) | | | (3,103,905 | ) |
U.S. Equity ETF | | | 2,479,665 | | | | (9,094,088 | ) | | | 80,141,689 | |
U.S. Mid Cap Equity ETF | | | 365,107 | | | | (2,657,584 | ) | | | 14,005,138 | |
U.S. Small Cap Equity ETF | | | 226,391 | | | | (1,625,003 | ) | | | (5,068,792 | ) |
U.S. Dividend ETF | | | 129,349 | | | | (352,308 | ) | | | 1,821,815 | |
U.S. Minimum Volatility ETF | | | 237,938 | | | | (285,053 | ) | | | 4,656,696 | |
U.S. Momentum Factor ETF | | | 100,547 | | | | (1,405,473 | ) | | | (1,233,772 | ) |
U.S. Quality Factor ETF | | | 180,839 | | | | (281,172 | ) | | | 7,374,321 | |
U.S. Value Factor ETF | | | 251,138 | | | | (318,815 | ) | | | 3,868,701 | |
For the Funds, the cumulative timing differences primarily consist of wash sale loss deferrals,non-taxable dividends, foreign taxes and investments in passive foreign investment companies (“PFICs”).
As of October 31, 2019, the following Funds had net capital loss carryforwards as follows:
| | | | | | | | |
| | | Capital Loss Carryforward Character | |
| | | Short-Term | | | Long-Term | |
BetaBuilders Canada ETF | | $ | 19,539,163 | | | $ | — | |
BetaBuilders Developed Asiaex-Japan ETF | | | — | | | | 224,560 | |
BetaBuilders Europe ETF | | | 3,010,441 | | | | 813,934 | |
BetaBuilders Japan ETF | | | 9,152,650 | | | | — | |
BetaBuilders U.S. Equity ETF | | | 24,168 | | | | — | |
Emerging Markets Equity ETF | | | 13,649,613 | | | | 3,541,834 | |
Europe Equity ETF | | | 545,128 | | | | 345,082 | |
Global Equity ETF | | | 3,204,966 | | | | 3,303,138 | |
International Equity ETF | | | 27,029,344 | | | | 36,788,498 | |
U.S. Equity ETF | | | 8,505,408 | | | | 588,680 | |
U.S. Mid Cap Equity ETF | | | 2,657,584 | | | | — | |
U.S. Small Cap Equity ETF | | | 1,432,885 | | | | 192,118 | |
U.S. Dividend ETF | | | 281,701 | | | | 70,607 | |
U.S. Minimum Volatility ETF | | | 124,150 | | | | 160,903 | |
U.S. Momentum Factor ETF | | | 947,749 | | | | 457,724 | |
U.S. Quality Factor ETF | | | 281,172 | | | | — | |
U.S. Value Factor ETF | | | 293,810 | | | | 25,005 | |
During the year ended October 31, 2019, the following Funds utilized capital loss carryforwards as follows:
| | | | | | | | |
| | | Capital Loss Carryforward Utilized | |
| | | Short-Term | | | Long-Term | |
BetaBuilders Developed Asiaex-Japan ETF | | $ | 149,273 | | | $ | — | |
U.S. Quality Factor ETF | | | — | | | | 1,033 | |
6. Capital Share Transactions
The Trust issues and redeems shares of the Funds only in Creation Units through the Distributor at NAV. Capital shares transactions detail can be found in the Statements of Changes in Net Assets.
Shares of the Funds may only be purchased or redeemed by Authorized Participants. Such Authorized Participants may from time to time hold, of record or beneficially, a substantial percentage of the Funds’ shares outstanding and act as executing or clearing broker for investment transactions on behalf of the Funds. An Authorized Participant is either (1) a “Participating Party” or other participant in the clearing process through the Continuous Net Settlement System of the National Securities Clearing Corporation (“NSCC”); or (2) a DTC Participant; which, in either case, must have executed an agreement with the Distributor.
Creation Units of a Fund may be created in advance of receipt by the Trust of all or a portion of the applicable basket of equity securities and other instruments (“Deposit Instruments”) and cash as described in the Funds’ registration statement. In these instances, the initial Deposit Instruments
and cash must be deposited in an amount equal to the sum of the cash amount, plus at least 105%, for BetaBuilders Canada ETF, BetaBuilders
| | | | | | | | |
| | | |
| OCTOBER 31, 2019 | | J.P. MORGAN EXCHANGE-TRADED FUNDS | | | | | 211 | |
NOTES TO FINANCIAL STATEMENTS
AS OF OCTOBER 31, 2019 (continued)
Developed Asiaex-Japan ETF, BetaBuilders Europe ETF, BetaBuilders Japan ETF, Europe Equity ETF, Global Equity ETF and International Equity ETF, and plus at least 110% for Emerging Markets Equity ETF of the market value of undelivered Deposit Instruments. A transaction fee may be imposed to offset transfer and other transaction costs associated with the purchase or redemption of Creation Units.
7. Risks, Concentrations and Indemnifications
In the normal course of business, the Funds enter into contracts that contain a variety of representations which provide general indemnifications. Each Fund’s maximum exposure under these arrangements is unknown. The amount of exposure would depend on future claims that may be brought against each Fund. However, based on experience, the Funds expect the risk of loss to be remote.
As of October 31, 2019, the Adviser owns shares representing more than 10% of net assets of the following Funds:
| | | | |
| | | %
of Ownership | |
U.S. Dividend ETF | | | 66 | % |
U.S. Minimum Volatility ETF | | | 26 | |
U.S. Momentum Factor ETF | | | 51 | |
U.S. Quality Factor ETF | | | 28 | |
U.S. Value Factor ETF | | | 39 | |
Significant shareholder transactions by the Adviser may impact the Funds’ performance.
Derivatives may be riskier than other types of investments because they may be more sensitive to changes in economic and market conditions and could result in losses that significantly exceed the Funds’ original investment. Derivatives also expose the Funds to counterparty risk (the risk that the derivative counterparty will not fulfill its contractual obligations), including credit risk of the derivative counterparty. The possible lack of a liquid secondary market for derivatives and the resulting inability of the Funds to sell or otherwise close a derivatives position could expose the Funds to losses.
The BetaBuilders Canada ETF, BetaBuilders Developed Asiaex-Japan ETF, BetaBuilders Europe ETF, BetaBuilders Japan ETF, Emerging Markets Equity ETF, Europe Equity ETF, Global Equity ETF and International Equity ETF may have elements of risk not typically associated with investments in the United States of America due to concentrated investments in a limited number of foreign countries or regions, which may vary throughout the period depending on the Funds. Such concentrations may subject each Fund to additional risks resulting from political or economic conditions in such countries or regions and the possible imposition of adverse governmental laws or currency exchange restrictions could cause the securities and their markets to be less liquid and their prices to be more volatile than those of comparable U.S. securities.
Investing in securities of foreign countries may include certain risks and considerations not typically associated with investing in U.S. securities. These risks include revaluation of currencies, high rates of inflation, repatriation restrictions on income and currencies, and future and adverse political, social and economic developments.
As of October 31, 2019, the following Funds hadnon-U.S. country allocations representing greater than 10% of total investments (excluding investment of cash collateral from securities loaned) as follows:
| | | | | | | | | | | | | | | | | | | | | | | | | | | | | | | | | | | | | | | | | | | | | | | | |
| Fund Name | | Australia | | | Brazil | | | Canada | | | China | | | France | | | Germany | | | Hong Kong | | | Japan | | | Singapore | | | Switzerland | | | Taiwan | | | United
Kingdom | |
BetaBuilders Canada ETF | | | — | % | | | — | % | | | 97.2 | % | | | — | % | | | — | % | | | — | % | | | — | % | | | — | % | | | — | % | | | — | % | | | — | % | | | — | % |
BetaBuilders Developed Asiaex-Japan ETF | | | 57.1 | | | | — | | | | — | | | | — | | | | — | | | | — | | | | 24.7 | | | | — | | | | 11.8 | | | | — | | | | — | | | | — | |
BetaBuilders Europe ETF | | | — | | | | — | | | | — | | | | — | | | | 17.2 | | | | 13.5 | | | | — | | | | — | | | | — | | | | 15.2 | | | | — | | | | 22.8 | |
BetaBuilders Japan ETF | | | — | | | | — | | | | — | | | | — | | | | — | | | | — | | | | — | | | | 100.0 | | | | — | | | | — | | | | — | | | | — | |
Emerging Markets Equity ETF | | | — | | | | 14.7 | | | | — | | | | 20.7 | | | | — | | | | — | | | | — | | | | — | | | | — | | | | — | | | | 11.1 | | | | — | |
Europe Equity ETF | | | — | | | | — | | | | — | | | | — | | | | 15.3 | | | | 12.7 | | | | — | | | | — | | | | — | | | | — | | | | — | | | | 19.7 | |
Global Equity ETF | | | 10.0 | | | | — | | | | — | | | | — | | | | — | | | | — | | | | — | | | | 22.9 | | | | — | | | | — | | | | — | | | | — | |
International Equity ETF | | | 10.4 | | | | — | | | | — | | | | — | | | | — | | | | — | | | | — | | | | 24.1 | | | | — | | | | — | | | | — | | | | 20.0 | |
As of October 31, 2019, a significant portion of each Fund’s net assets noted in the table above consisted of securities that were denominated in foreign currencies. Changes in currency exchange rates will affect the value of, and investment income from, such securities.
Disruptions to creations and redemptions, the existence of significant market volatility or potential lack of an active trading market for the Shares (including through a trading halt), as well as other factors, may result in Shares trading significantly above (at a premium) or below (at a discount) to the NAV or to the intraday value of the Fund’s holdings. During such periods, investors may incur significant losses if shares are sold.
The Funds may not track the return of the underlying index for a number of reasons and therefore may not achieve its investment objective. For example, each Fund incurs a number of operating expenses not applicable to its underlying index, and incurs costs in buying and selling securities, especially when rebalancing the Fund’s securities holdings to reflect changes in the composition of the underlying index. In addition, a Fund’s return may differ from the return of its underlying index as a result of, among other things, pricing differences and the inability to purchase certain securities included in the underlying index due to regulatory or other restrictions. To the extent of the previously outlined items, each Fund’s return differs from the return of the underlying index.
| | | | | | |
| | | |
| 212 | | | | J.P. MORGAN EXCHANGE-TRADED FUNDS | | OCTOBER 31, 2019 |
REPORT OF INDEPENDENT REGISTERED PUBLIC ACCOUNTING FIRM
TotheBoard of Trustees of J.P. Morgan Exchange-Traded Fund Trust and Shareholders of each of the seventeen funds listed in the table below
Opinions on the Financial Statements
We have audited the accompanying statements of assets and liabilities, including the schedules of portfolio investments, of each of the funds listed in the table below (seventeen of the funds constituting J.P. Morgan Exchange-Traded Fund Trust, hereafter collectively referred to as the “Funds”) as of October 31, 2019, the related statements of operations and of changes in net assets for each of the periods indicated in the table below, including the related notes,and the financial highlights for each of the periods indicated therein (collectively referred to as the “financial statements”). In our opinion, the financial statements present fairly, in all material respects, the financial position of each of the Funds as of October 31, 2019, the results of each of their operations and the changes in each of their net assets for the periods indicated in the table below, and each of the financial highlights for each of the periods indicated therein, in conformity with accounting principles generally accepted in the United States of America.
| | | | |
| JPMorgan BetaBuilders Canada ETF (1) | | JPMorgan Diversified Return Europe Equity ETF (4) | | JPMorgan U.S. Dividend ETF (5) |
| JPMorgan BetaBuilders Developed Asia Ex-Japan ETF (1) | | JPMorgan Diversified Return Global Equity ETF (4) | | JPMorgan U.S. Minimum Volatility ETF (5) |
| JPMorgan BetaBuilders Europe ETF (2) | | JPMorgan Diversified Return International Equity ETF (4) | | JPMorgan U.S. Momentum Factor ETF (5) |
| JPMorgan BetaBuilders Japan ETF (2) | | JPMorgan Diversified Return U.S. Equity ETF (4) | | JPMorgan U.S. Quality Factor ETF (5) |
| JPMorgan BetaBuilders U.S. Equity ETF (3) | | JPMorgan Diversified Return U.S. Mid Cap Equity ETF (4) | | JPMorgan U.S. Value Factor ETF (5) |
| JPMorgan Diversified Return Emerging Markets Equity ETF (4) | | JPMorgan Diversified Return U.S. Small Cap Equity ETF (4) | | |
| (1) | Statement of operations for the year ended October 31, 2019, and statement of changes in net assets for the year ended October 31, 2019 and the period August 7, 2018 (commencement of operations) through October 31, 2018 |
| (2) | Statement of operations for the year ended October 31, 2019, and statement of changes in net assets for the year ended October 31, 2019 and the period June 15, 2018 (commencement of operations) through October 31, 2018 |
| (3) | Statement of operations and statement of changes in net assets for the period March 12, 2019 (commencement of operations) through October 31, 2019 |
| (4) | Statement of operations for the year ended October 31, 2019 and statement of changes in net assets for the years ended October 31, 2019 and 2018 |
| (5) | Statement of operations for the year ended October 31, 2019, and statement of changes in net assets for the year ended October 31, 2019 and the period November 8, 2017 (commencement of operations) through October 31, 2018 |
Basis for Opinions
These financial statements are the responsibility of the Funds’ management. Our responsibility is to express an opinion on the Funds’ financial statements based on our audits. We are a public accounting firm registered with the Public Company Accounting Oversight Board (United States) (PCAOB) and are required to be independent with respect to the Funds in accordance with the U.S. federal securities laws and the applicable rules and regulations of the Securities and Exchange Commission and the PCAOB.
We conducted our audits of these financial statements in accordance with the standards of the PCAOB. Those standards require that we plan and perform the audit to obtain reasonable assurance about whether the financial statements are free of material misstatement, whether due to error or fraud.
Our audits included performing procedures to assess the risks of material misstatement of the financial statements, whether due to error or fraud, and performing procedures that respond to those risks. Such procedures included examining, on a test basis, evidence regarding the amounts and disclosures in the financial statements. Our audits also included evaluating the accounting principles used and significant estimates made by management, as well as evaluating the overall presentation of the financial statements. Our procedures included confirmation of securities owned as of October 31, 2019 by correspondence with the custodian, transfer agent and brokers; when replies were not received from brokers, we performed other auditing procedures. We believe that our audits provide a reasonable basis for our opinions.
/s/PricewaterhouseCoopers LLP
New York, New York
December 20, 2019
We have served as the auditor of one or more investment companies in the JPMorgan Funds complex since 1993.
| | | | | | | | |
| | | |
| OCTOBER 31, 2019 | | J.P. MORGAN EXCHANGE-TRADED FUNDS | | | | | 213 | |
TRUSTEES
(Unaudited)
The Funds’ Statements of Additional Information includes additional information about the Funds’ Trustees and is available, without charge, upon request by calling1-844-457-6383 or on the J.P. Morgan Funds’ website at www.jpmorganfunds.com.
| | | | | | | | |
Name (Year of Birth;
Positions With
the Funds since) | | Principal Occupation
During Past 5 Years | | Number of
Funds in Fund
Complex Overseen
by Trustee (1) | | | Other Directorships Held
During the Past 5 Years |
Independent Trustees | | | | | | | | |
| | | |
Gary L. French (1951);
Trustee of the Trust since 2014 | | Real Estate Investor (2011–present); Consultant to the Mutual Fund Industry (2011-present); Senior Consultant for The Regulatory Fundamentals Group LLC (2011–2017); Senior Vice President–Fund Administration, State Street Corporation (2002–2010). | | | 35 | | | Independent Trustee, The China Fund, Inc. (2013-2019); Exchange Traded Concepts Trust II (2012-2014); Exchange Traded Concepts Trust I (2011-2014). |
| | | |
| Robert J. Grassi (1957); Trustee of the Trust since 2014 | | Sole Proprietor, Academy Hills Advisors LLC (2012-present); Pension Director, Corning Incorporated (2002-2012). | | | 35 | | | None. |
| | | |
| Thomas P. Lemke (1954); Trustee of the Trust since 2014 | | Retired; Executive Vice President and General Counsel, Legg Mason (2005-2013). | | | 35 | | | SEI family of funds (Independent Trustee of Advisors’ Inner Circle Fund III (20 portfolios) (from February 2014 to present); Independent Trustee of Winton Diversified Opportunities Fund (from December 2014 to 2018); Independent Trustee of Gallery Trust (from August 2015 to present); Independent Trustee of Schroder Series Trust (from 2017 to present) Independent Trustee of Schroder Global Series Trust (from February 2017 to present); Independent Trustee of O’Connor EQUUS (May 2014-April 2016), Independent Trustee of Winton Series Trust (December 2014-March 2017); Independent Trustee of AXA Premier VIP Trust (2014-June 2017); Independent Director of The Victory Funds (or their predecessor funds) (35 portfolios) (2014-March 2015); Symmetry Panoramic Trust (16 portfolios) (2018-present). |
| | | |
| Lawrence R. Maffia (1950); Trustee of the Trust since 2014 | | Retired; Director and President, ICI Mutual Insurance Company (2006-2013). | | | 35 | | | Director, ICI Mutual Insurance Company (1999-2013). |
| | | |
| Emily A. Youssouf (1951); Trustee of the Trust since 2014 | | Clinical Professor, NYU Schack Institute of Real Estate (2009-present); Board Member(2005-present), Chair of Capital Committee (2006-2016), Chair of Audit Committee(2005-present), and Chair of IT Committee (2016-present), NYC Health and Hospitals Corporation; Board Member and Member of the Audit Committee and Related Parties Committee (2013-2018) and Member of the Risk Management Committee (2017-2018), PennyMac Financial Services, Inc. | | | 35 | | | Trustee, NYC School Construction Authority (2009-present); Board Member, NYS Job Development Authority (2008-present); Trustee (2015-present) and Chair of the Audit and Finance Committee (2015-present) of the Transit Center Foundation; Vice Chair (2011-2013) and Board Member (2013-2014) of New York City Housing Authority. |
Interested Trustee | | | | | | | | |
| | | |
| Robert Deutsch (2) (1957); Chairman and Trustee of the Trust since 2014 | | Retired; Head of the Global ETF Business for JPMorgan Asset Management (2013-2017); Head of the Global Liquidity Business for JPMorgan Asset Management (2003-2013). | | | 35 | | | Board of Directors of the JUST Capital Foundation (2017–present). |
| (1) | A Fund Complex means two or more registered investment companies that hold themselves out to investors as related companies for purposes of investment and investor services or have a common investment adviser or have an investment adviser that is an affiliated person of the investment adviser of any of the other registered investment companies. Thirty three series of the Trust have commenced operations. |
| (2) | Mr. Deutsch is an interested trustee because he was an employee of the Adviser until August 2017. |
The contact address for each of the Trustees is 277 Park Avenue, New York, NY 10172.
| | | | | | |
| | | |
| 214 | | | | J.P. MORGAN EXCHANGE-TRADED FUNDS | | OCTOBER 31, 2019 |
OFFICERS
(Unaudited)
| | |
Name (Year of Birth),
Positions Held with
the Trusts (Since) | | Principal Occupations During Past 5 Years |
| |
Joanna Gallegos (1975), President and Principal Executive Officer (2017) | | Managing Director, Head of J.P. Morgan Asset Management’s U.S. Exchange Traded Funds business. Previously, Head of J.P. Morgan Asset Management’s ETF Product Development team from August 2013 to July 2017. |
| |
Lauren A. Paino (1973), Treasurer and Principal Financial Officer (2016)* | | Executive Director, J.P. Morgan Investment Management Inc. (formerly JPMorgan Funds Management, Inc.) since August 2013. |
| |
Brian S. Shlissel (1964), Vice President (2016) | | Managing Director and Chief Administrative Officer for J.P. Morgan pooled vehicles, J.P. Morgan Investment Management Inc. (formerly JPMorgan Funds Management, Inc.) (from 2014 to present); Managing Director and Head of Mutual Fund Services, Allianz Global Investors; President and Chief Executive Officer, Allianz Global Investors Mutual Funds and PIMCO Closed-End Funds (from 1999 to 2014). |
| |
Paul Shield (1960), Vice President and Assistant Treasurer (2016) | | Managing Director and head of Business Management for JPMorgan Asset Management’s Exchange Traded Fund platform since 2013. |
| |
| Elizabeth A. Davin (1964), Secretary (2018)** | | Executive Director and Assistant General Counsel, JPMorgan Chase. Ms. Davin has been with JPMorgan Chase (formerly Bank One Corporation) since 2004. |
| |
Stephen M. Ungerman (1953), Chief Compliance Officer (2014) | | Managing Director, JPMorgan Chase & Co.; Mr. Ungerman has been with JPMorgan Chase & Co. since 2000. |
| |
Jessica K. Ditullio (1962), Assistant Secretary (2014)** | | Executive Director and Assistant General Counsel, JPMorgan Chase. Ms. Ditullio has been with JPMorgan Chase (formerly Bank One Corporation) since 1990. |
| |
Anthony Geron (1971), Assistant Secretary (2019)* | | Vice President and Assistant General Counsel, JPMorgan Chase since September 2018; Lead Director and Counsel, AXA Equitable Life Insurance Company from 2015 to 2018 and Senior Director and Counsel, AXA Equitable Life Insurance Company from 2014 to 2015; Associate, Willkie Farr & Gallagher (law firm) from 2007 to 2014. |
| |
Carmine Lekstutis (1980), Assistant Secretary (2014)* | | Executive Director and Assistant General Counsel, JPMorgan Chase since February 2015; formerly Vice President and Assistant General Counsel, JPMorgan Chase from 2011 to February 2015. |
| |
Keri E. Riemer (1976), Assistant Secretary (2019)* | | Executive Director and Assistant General Counsel, JPMorgan Chase since February 2019; Counsel, Seward & Kissel LLP (2016-2019); Associate, Seward & Kissel LLP (2011-2016). |
| |
Gregory S. Samuels (1980), Assistant Secretary (2014)* | | Executive Director and Assistant General Counsel, JPMorgan Chase since February 2014; formerly Vice President and Assistant General Counsel, JPMorgan Chase from 2010. |
| |
| Zachary E. Vonnegut-Gabovitch (1986), Assistant Secretary (2017)* | | Vice President and Assistant General Counsel, JPMorgan Chase since September 2016; Associate, Morgan Lewis & Bockius (law firm) from 2012 to 2016. |
| |
| Frederick J. Cavaliere (1978), Assistant Treasurer (2015)* | | Executive Director, J.P. Morgan Investment Management Inc. since February 2016; formerly, Vice President, J.P. Morgan Investment Management Inc. (formerly JPMorgan Funds Management, Inc.) since September 2010 to February 2016. Mr. Cavaliere has been with JPMorgan since May 2006. |
| |
Timothy J. Clemens (1975), Assistant Treasurer (2019)* | | Executive Director, J.P. Morgan Investment Management Inc. (formerly JPMorgan Funds Management, Inc.) since February 2016; Vice President, JPMorgan Funds Management, Inc. from October 2013 to January 2016. |
| |
Michael M. D’Ambrosio (1969), Assistant Treasurer (2014) | | Managing Director, J.P. Morgan Investment Management Inc. (formerly JPMorgan Funds Management, Inc.) since May 2014; formerly Executive Director, J.P. Morgan Investment Management Inc. (formerly JPMorgan Funds Management, Inc.) from 2012 to May 2014. |
| |
Shannon Gaines (1977), Assistant Treasurer (2019)** | | Vice President, J.P. Morgan Investment Management Inc. (formerly JPMorgan Funds Management, Inc.) since January 2014. |
| |
Jason Ronca (1978), Assistant Treasurer (2014)*** | | Executive Director, Assistant Treasurer and ETF Platform Manager for J.P. Morgan Asset Management since February 2017; formerly Vice President, Assistant Treasurer and ETF Platform Manager for J.P. Morgan Asset Management from May 2014 to February 2017. ETF Product Manager for Corporate Investment Bank responsible for setting the strategy and control agenda for the ETF servicing business from 2010 to May 2014; Prior to 2010, a Vice President in Fund Accounting within J.P. Morgan Investor Services, supporting a series of U.S. registered mutual funds. |
The contact address for each of the officers, unless otherwise noted, is 277 Park Avenue, New York, NY 10172.
| * | The contact address for the officer is 4 New York Plaza, New York, NY 10004. |
| ** | The contact address for the officer is 1111 Polaris Parkway, Columbus, OH 43240. |
| *** | The contact address for the officer is 50 Rowes Wharf, Floor 3, Boston, MA 02110. |
| | | | | | | | |
| | | |
| OCTOBER 31, 2019 | | J.P. MORGAN EXCHANGE-TRADED FUNDS | | | | | 215 | |
SCHEDULE OF SHAREHOLDER EXPENSES
(Unaudited)
Hypothetical $1,000 Investment
As a shareholder of the Funds, excluding BetaBuilders U.S. Equity ETF, you incur two types of ongoing costs: (1) transaction costs, including brokerage commissions on your purchases and sales of Fund shares and (2) ongoing costs, including investment advisory fees, administration fees and other Fund expenses. As a shareholder of BetaBuilders U.S. Equity ETF, you incur two types of costs: (1) transaction costs, including brokerage commissions on your purchase and sales of Fund Shares and (2) ongoing costs, primarily management fees. The examples assume that you had a $1,000 investment at the beginning of the reporting period May 1, 2019 and continued to hold your shares at the end of the reporting period, October 31, 2019.
Actual Expenses
For the Fund in the table below, the first line provides information about actual account values and actual expenses. You may use the information in this line, together with the amount you invested, to estimate the expenses that you paid over the period. Simply divide your account value by $1,000 (for
example, an $8,600 account value divided by $1,000 = 8.6), then multiply the result by the number under the heading “Expenses Paid During the Period” to estimate the expenses you paid on your account during this period.
Hypothetical Example for Comparison Purposes
The second line in the table below provides information about hypothetical account values and hypothetical expenses based on the Fund’s actual expense ratio and an assumed rate of return of 5% per year before expenses, which is not the Fund’s actual return. The hypothetical account values and expenses may not be used to estimate the actual ending account balance or expenses you paid for the period. You may use this information to compare the ongoing costs of investing in the Fund and other Funds. To do so, compare this 5% hypothetical example with the 5% hypothetical examples that appear in the shareholder reports of other funds. The examples also assume all dividends and distributions have been reinvested.
| | | | | | | | | | | | | | | | |
| | | Beginning
Account Value
May 1, 2019 | | | Ending
Account Value
October 31, 2019 | | | Annualized
Expense
Ratio(1) | | | Expenses
Paid During
the Period | |
JPMorgan BetaBuilders Canada ETF | | | | | | | | | | | | | | | | |
Actual | | $ | 1,000.00 | | | $ | 1,019.30 | | | | 0.19 | % | | $ | 0.97 | |
Hypothetical | | | 1,000.00 | | | | 1,024.25 | | | | 0.19 | | | | 0.97 | |
| | | | |
JPMorgan BetaBuilders Developed Asia ex-Japan ETF | | | | | | | | | | | | | | | | |
Actual | | | 1,000.00 | | | | 1,008.30 | | | | 0.19 | | | | 0.96 | |
Hypothetical | | | 1,000.00 | | �� | | 1,024.25 | | | | 0.19 | | | | 0.97 | |
| | | | |
JPMorgan BetaBuilders Europe ETF | | | | | | | | | | | | | | | | |
Actual | | | 1,000.00 | | | | 1,022.00 | | | | 0.09 | | | | 0.46 | |
Hypothetical | | | 1,000.00 | | | | 1,024.75 | | | | 0.09 | | | | 0.46 | |
| | | | |
JPMorgan BetaBuilders Japan ETF | | | | | | | | | | | | | | | | |
Actual | | | 1,000.00 | | | | 1,063.70 | | | | 0.19 | | | | 0.99 | |
Hypothetical | | | 1,000.00 | | | | 1,024.25 | | | | 0.19 | | | | 0.97 | |
| | | | |
JPMorgan BetaBuilders U.S. Equity ETF | | | | | | | | | | | | | | | | |
Actual | | | 1,000.00 | | | | 1,040.40 | | | | 0.02 | | | | 0.10 | |
Hypothetical | | | 1,000.00 | | | | 1,025.10 | | | | 0.02 | | | | 0.10 | |
| | | | |
JPMorgan Diversified Return Emerging Markets Equity ETF | | | | | | | | | | | | | | | | |
Actual | | | 1,000.00 | | | | 1,008.20 | | | | 0.45 | | | | 2.28 | |
Hypothetical | | | 1,000.00 | | | | 1,022.94 | | | | 0.45 | | | | 2.29 | |
| | | | |
JPMorgan Diversified Return Europe Equity ETF | | | | | | | | | | | | | | | | |
Actual | | | 1,000.00 | | | | 1,027.90 | | | | 0.38 | | | | 1.94 | |
Hypothetical | | | 1,000.00 | | | | 1,023.29 | | | | 0.38 | | | | 1.94 | |
| | | | |
JPMorgan Diversified Return Global Equity ETF | | | | | | | | | | | | | | | | |
Actual | | | 1,000.00 | | | | 1,027.20 | | | | 0.38 | | | | 1.94 | |
Hypothetical | | | 1,000.00 | | | | 1,023.29 | | | | 0.38 | | | | 1.94 | |
| | | | |
JPMorgan Diversified Return International Equity ETF | | | | | | | | | | | | | | | | |
Actual | | | 1,000.00 | | | | 1,009.60 | | | | 0.38 | | | | 1.92 | |
Hypothetical | | | 1,000.00 | | | | 1,023.29 | | | | 0.38 | | | | 1.94 | |
| | | | | | |
| | | |
| 216 | | | | J.P. MORGAN EXCHANGE-TRADED FUNDS | | OCTOBER 31, 2019 |
| | | | | | | | | | | | | | | | |
| | | Beginning
Account Value
May 1, 2019 | | | Ending
Account Value
October 31, 2019 | | | Annualized
Expense
Ratio(1) | | | Expenses
Paid During
the Period | |
| | | | |
JPMorgan Diversified Return U.S. Equity ETF | | | | | | | | | | | | | | | | |
Actual | | $ | 1,000.00 | | | $ | 1,029.50 | | | | 0.19 | % | | $ | 0.97 | |
Hypothetical | | | 1,000.00 | | | | 1,024.25 | | | | 0.19 | | | | 0.97 | |
| | | | |
JPMorgan Diversified Return U.S. Mid Cap Equity ETF | | | | | | | | | | | | | | | | |
Actual | | | 1,000.00 | | | | 1,014.00 | | | | 0.24 | | | | 1.22 | |
Hypothetical | | | 1,000.00 | | | | 1,024.00 | | | | 0.24 | | | | 1.22 | |
| | | | |
JPMorgan Diversified Return U.S. Small Cap Equity ETF | | | | | | | | | | | | | | | | |
Actual | | | 1,000.00 | | | | 990.60 | | | | 0.29 | | | | 1.46 | |
Hypothetical | | | 1,000.00 | | | | 1,023.74 | | | | 0.29 | | | | 1.48 | |
| | | | |
JPMorgan U.S. Dividend ETF | | | | | | | | | | | | | | | | |
Actual | | | 1,000.00 | | | | 1,034.00 | | | | 0.12 | | | | 0.62 | |
Hypothetical | | | 1,000.00 | | | | 1,024.60 | | | | 0.12 | | | | 0.61 | |
| | | | |
JPMorgan U.S. Minimum Volatility ETF | | | | | | | | | | | | | | | | |
Actual | | | 1,000.00 | | | | 1,070.40 | | | | 0.12 | | | | 0.63 | |
Hypothetical | | | 1,000.00 | | | | 1,024.60 | | | | 0.12 | | | | 0.61 | |
| | | | |
JPMorgan U.S. Momentum Factor ETF | | | | | | | | | | | | | | | | |
Actual | | | 1,000.00 | | | | 1,028.30 | | | | 0.12 | | | | 0.61 | |
Hypothetical | | | 1,000.00 | | | | 1,024.60 | | | | 0.12 | | | | 0.61 | |
| | | | |
JPMorgan U.S. Quality Factor ETF | | | | | | | | | | | | | | | | |
Actual | | | 1,000.00 | | | | 1,036.90 | | | | 0.12 | | | | 0.62 | |
Hypothetical | | | 1,000.00 | | | | 1,024.60 | | | | 0.12 | | | | 0.61 | |
| | | | |
JPMorgan U.S. Value Factor ETF | | | | | | | | | | | | | | | | |
Actual | | | 1,000.00 | | | | 1,026.30 | | | | 0.12 | | | | 0.61 | |
Hypothetical | | | 1,000.00 | | | | 1,024.60 | | | | 0.12 | | | | 0.61 | |
| (1) | Expenses are equal to the Fund’s annualized expense ratio, multiplied by the average account value over the period, multiplied by 184/365 (to reflect the one-half year period). |
| | | | | | | | |
| | | |
| OCTOBER 31, 2019 | | J.P. MORGAN EXCHANGE-TRADED FUNDS | | | | | 217 | |
SPECIAL SHAREHOLDER MEETING RESULTS
(Unaudited)
J.P. Morgan Exchange-Traded Trust (the “Trust”) held a special meeting of shareholders on August 22, 2019, for the purpose of considering and voting upon the approval of a new Management Agreement with J.P. Morgan Investment Management Inc. which will implement a unitary fee structure for each of the Funds covered by this report, except for BetaBuilders U.S. Equity ETF.
The new Management Agreement was approved by shareholders of JPMorgan BetaBuilders Europe ETF, JPMorgan BetaBuilders Japan ETF, JPMorgan BetaBuilders Developed Asia ex-Japan ETF, JPMorgan BetaBuilders Canada ETF, JPMorgan U.S. Dividend ETF, JPMorgan U.S. Minimum Volatility ETF, JPMorgan U.S. Momentum Factor ETF, JPMorgan U.S. Quality Factor ETF and JPMorgan U.S. Value Factor ETF.
The results of the voting for these Funds were as follows:
| | | | | | | | | | | | |
| | | Voting Results | |
| Fund | | For | | | Against | | | Abstain | |
JPMorgan BetaBuilders Canada ETF | | | 3,665,895,757 | | | | 230,335 | | | | 1,382,810 | |
JPMorgan BetaBuilders Developed Asia ex-Japan ETF | | | 1,390,269,356 | | | | 67,397 | | | | 91,387 | |
JPMorgan Beta Builders Europe ETF | | | 4,323,674,981 | | | | 245,541 | | | | 42,084 | |
JPMorgan BetaBuilders Japan ETF | | | 3,550,439,799 | | | | 186,505 | | | | 209,983 | |
JPMorgan U.S. Dividend ETF | | | 26,993,677 | | | | 21,184 | | | | 113,283 | |
JPMorgan U.S. Minimum Volatility ETF | | | 35,314,936 | | | | 30,389 | | | | 138,515 | |
JPMorgan U.S. Momentum Factor ETF | | | 32,057,359 | | | | 87 | | | | 10,947 | |
JPMorgan U.S. Quality Factor ETF | | | 37,357,328 | | | | 21,075 | | | | 54,161 | |
JPMorgan U.S. Value Factor ETF | | | 39,251,793 | | | | — | | | | 91,963 | |
For JPMorgan Diversified Return Emerging Markets Equity ETF, JPMorgan Diversified Return Europe Equity ETF, JPMorgan Diversified Return Global Equity ETF, JPMorgan Diversified Return International Equity ETF, JPMorgan Diversified Return U.S. Equity ETF, JPMorgan Diversified Return U.S. Mid Cap Equity ETF and JPMorgan Diversified Return U.S. Small Cap Equity ETF, the August 22, 2019 meeting was adjourned to September 17, 2019 to allow shareholders of these Funds additional time to vote on the proposal.
The results of the voting for these Funds as of August 22, 2019, were as follows:
| | | | | | | | | | | | |
| | | Voting Results | |
| Fund | | For | | | Against | | | Abstain | |
JPMorgan Diversified Return Emerging Markets Equity ETF | | | 140,345,100 | | | | 415,039 | | | | 18,303,360 | |
JPMorgan Diversified Return Europe Equity ETF | | | 3,530,213 | | | | 86,193 | | | | 279,220 | |
JPMorgan Diversified Return Global Equity ETF | | | 37,176,891 | | | | 464,552 | | | | 8,745,685 | |
JPMorgan Diversified Return International Equity ETF | | | 646,276,425 | | | | 4,926,269 | | | | 34,749,049 | |
JPMorgan Diversified Return U.S. Equity ETF | | | 287,139,444 | | | | 2,636,059 | | | | 24,094,740 | |
JPMorgan Diversified Return U.S. Mid Cap Equity ETF | | | 52,512,997 | | | | 410,251 | | | | 4,333,007 | |
JPMorgan Diversified Return U.S. Small Cap Equity ETF | | | 53,241,061 | | | | 1,425,207 | | | | 7,586,563 | |
The new Management Agreement was approved by shareholders of JPMorgan Diversified Return Emerging Markets Equity ETF, JPMorgan Diversified Return International Equity ETF, JPMorgan Diversified Return U.S. Equity ETF and JPMorgan Diversified Return U.S. Small Cap Equity ETF when the special meeting reconvened on September 17, 2019.
The results of the voting for these Funds as of September 17, 2019, were as follows:
| | | | | | | | | | | | |
| | | Voting Results | |
| Fund | | For | | | Against | | | Abstain | |
JPMorgan Diversified Return Emerging Markets Equity ETF | | | 159,462,532 | | | | 603,821 | | | | 22,502,300 | |
JPMorgan Diversified Return International Equity ETF | | | 733,689,059 | | | | 6,725,493 | | | | 87,654,484 | |
JPMorgan Diversified Return U.S. Equity ETF | | | 330,786,630 | | | | 3,673,221 | | | | 48,341,008 | |
JPMorgan Diversified Return U.S. Small Cap Equity ETF | | | 62,338,330 | | | | 1,631,537 | | | | 18,969,024 | |
For JPMorgan Diversified Return Europe Equity ETF, JPMorgan Diversified Return Global Equity ETF and JPMorgan Diversified Return U.S. Mid Cap Equity ETF, the September 17, 2019 meeting was adjourned to October 10, 2019 to allow shareholders of these Funds additional time to vote on the proposal.
The results of the voting of these Funds as of September 17, 2019, were as follows:
| | | | | | | | | | | | |
| | | Voting Results | |
| Fund | | For | | | Against | | | Abstain | |
JPMorgan Diversified Return Europe Equity ETF | | | 5,875,925 | | | | 86,193 | | | | 1,435,660 | |
JPMorgan Diversified Return Global Equity ETF | | | 51,161,006 | | | | 652,527 | | | | 18,515,912 | |
JPMorgan Diversified Return U.S. Mid Cap Equity ETF | | | 65,957,084 | | | | 632,039 | | | | 14,335,167 | |
| | | | | | |
| | | |
| 218 | | | | J.P. MORGAN EXCHANGE-TRADED FUNDS | | OCTOBER 31, 2019 |
The new Management Agreement was approved by shareholders of JPMorgan Diversified Return Europe Equity ETF, JPMorgan Diversified Return Global Equity ETF and JPMorgan Diversified Return U.S. Mid Cap Equity ETF when the special meeting reconvened on October 10, 2019.
The results of the voting for these Funds as of October 10, 2019, were as follows:
| | | | | | | | | | | | |
| | | Voting Results | |
| Fund | | For | | | Against | | | Abstain | |
JPMorgan Diversified Return Europe Equity ETF | | | 6,273,653 | | | | 100,108 | | | | 2,378,430 | |
JPMorgan Diversified Return Global Equity ETF | | | 52,828,574 | | | | 748,935 | | | | 20,778,634 | |
JPMorgan Diversified Return U.S. Mid Cap Equity ETF | | | 73,100,493 | | | | 686,562 | | | | 19,307,564 | |
| | | | | | | | |
| | | |
| OCTOBER 31, 2019 | | J.P. MORGAN EXCHANGE-TRADED FUNDS | | | | | 219 | |
TAX LETTER
(Unaudited)
Certain tax information for the J.P. Morgan Funds is required to be provided to shareholders based upon the Funds’ income and distributions for the taxable year ended October 31, 2019. The information and distributions reported in this letter may differ from the information and taxable distributions reported to the shareholders for the calendar year ending December 31, 2019. The information necessary to complete your income tax returns for the calendar year ending December 31, 2019 will be provided under separate cover.
Dividends Received Deductions (DRD)
Each Fund listed below had the following percentage, or maximum allowable percentage, of ordinary income distributions eligible for the dividends received deductions for corporate shareholders for the fiscal year ended October 31, 2019:
| | | | |
| | | Dividends Received Deduction | |
BetaBuilders U.S. Equity ETF | | | 100.00 | % |
Global Equity ETF | | | 18.01 | |
U.S. Equity ETF | | | 99.97 | |
U.S. Mid Cap Equity ETF | | | 92.10 | |
U.S. Small Cap Equity ETF | | | 87.57 | |
U.S. Dividend ETF | | | 81.65 | |
U.S. Minimum Volatility ETF | | | 98.03 | |
U.S. Momentum Factor ETF | | | 100.00 | |
U.S. Quality Factor ETF | | | 98.76 | |
U.S. Value Factor ETF | | | 100.00 | |
Qualified Dividend Income (QDI)
Each Fund listed below had the following amount, or maximum allowable amount, of ordinary income distributions treated as qualified dividends for the fiscal year ended October 31, 2019:
| | | | |
| | | Qualified
Dividend
Income | |
BetaBuilders Canada ETF | | $ | 87,790,470 | |
BetaBuilders Developed Asiaex-Japan ETF | | | 33,465,270 | |
BetaBuilders Europe ETF | | | 120,888,663 | |
BetaBuilders Japan ETF | | | 28,745,390 | |
BetaBuilders U.S. Equity ETF | | | 317,882 | |
Emerging Markets Equity ETF | | | 7,452,046 | |
Europe Equity ETF | | | 737,968 | |
Global Equity ETF | | | 4,800,288 | |
International Equity ETF | | | 47,907,942 | |
U.S. Equity ETF | | | 13,823,828 | |
U.S. Mid Cap Equity ETF | | | 2,533,064 | |
U.S. Small Cap Equity ETF | | | 1,504,458 | |
U.S. Dividend ETF | | | 911,621 | |
U.S. Minimum Volatility ETF | | | 948,027 | |
U.S. Momentum Factor ETF | | | 495,619 | |
U.S. Quality Factor ETF | | | 1,098,039 | |
U.S. Value Factor ETF | | | 1,321,813 | |
Foreign Source Income and Foreign Tax Credit Pass Through
For the fiscal year ended October 31, 2019, the following Funds intend to elect to pass through to shareholders taxes paid to foreign countries. Gross income and foreign tax expenses are
as follows or amounts as finally determined:
| | | | | | | | |
| | | Gross Income | | | Foreign Tax Pass Through | |
BetaBuilders Canada ETF | | $ | 99,488,154 | | | $ | 12,924,031 | |
BetaBuilders Developed Asiaex-Japan ETF | | | 53,225,783 | | | | 630,051 | |
BetaBuilders Europe ETF | | | 146,607,404 | | | | 10,257,310 | |
BetaBuilders Japan ETF | | | 92,467,523 | | | | 8,655,502 | |
Emerging Markets Equity ETF | | | 14,121,955 | | | | 1,097,794 | |
Europe Equity ETF | | | 833,179 | | | | 81,971 | |
Global Equity ETF | | | 4,883,537 | | | | 383,444 | |
International Equity ETF | | | 59,410,568 | | | | 3,744,238 | |
| | | | | | |
| | | |
| 220 | | | | J.P. MORGAN EXCHANGE-TRADED FUNDS | | OCTOBER 31, 2019 |
BOARD APPROVAL OF MANAGEMENT AGREEMENT
(Unaudited)
JPMorgan BetaBuilders Canada ETF, JPMorgan BetaBuilders Developed Asiaex-Japan ETF, JPMorgan BetaBuilders Europe ETF, JPMorgan BetaBuilders Japan ETF, JPMorgan Diversified Emerging Markets Equity ETF, JPMorgan Diversified Return Europe Equity ETF, JPMorgan Diversified Return Global Equity ETF, JPMorgan Diversified Return International Equity ETF, JPMorgan Diversified Return U.S. Equity ETF, JPMorgan Diversified Return U.S. Mid Cap Equity ETF, JPMorgan Diversified Return U.S. Small Cap Equity ETF, JPMorgan U.S. Dividend ETF, JPMorgan U.S. Minimum Volatility ETF, JPMorgan U.S. Momentum Factor ETF, JPMorgan U.S. Quality Factor ETF, JPMorgan U.S. Value Factor ETF
The Board meets regularly throughout the year and considers factors that are relevant to its consideration of investment advisory agreements at each meeting. The Board also meets for the specific purpose of considering approvals of amendments to and new investment advisory agreements for the Funds. At the June11-12, 2019 quarterly Board meeting, the Trustees, including a majority of the Trustees who are not “interested persons” (as defined in the 1940 Act) of the Trust, Adviser or any of its affiliates (“Independent Trustees”), approved a new Management Agreement (the “New Management Agreement”) on behalf of each Fund. The Board also recommended that the Fund’s shareholders approve the New Management Agreement. Such approval was recently obtained, and the agreement went into effect November 1, 2019.
As part of their review of the New Management Agreement, the Trustees considered and reviewed information received from the Adviser about the proposed changes to the previously existing advisory agreements to convert them to a “unitary fee” structure. They also considered information received in connection with the December 2018 board meeting when the Trustees last approved the Investment Advisory Agreement for certain Funds. This included comprehensive information concerning the nature and quality of services provided by the Adviser,“fall-out” benefits received by the Adviser, and information on profitability and performance of the Funds. The Board noted that the possibility of proposing a unitary fee had been raised by the Adviser at an earlier meeting, and that prior to the June11-12, 2019 meeting, the Adviser and the Board had several discussions about unitary fees generally, industry practice, the potential impact on the Funds, and related matters. Before voting on the New Management Agreement, the Trustees reviewed the agreement with representatives of the Adviser, counsel to the Trust and independent legal counsel and received a memorandum from independent legal counsel to the Trustees discussing the legal standards for their consideration of the New Management Agreement. The Trustees also discussed the New Management Agreement in executive sessions with independent legal counsel at which no representatives of the Adviser were present. A summary of the material factors evaluated by the Trustees in determining whether to approve New Management Agreement is provided below.
The Trustees considered information provided with respect to the Funds over the course of the year, as well as the materials furnished specifically in connection with this approval process. Each Trustee attributed his or her own evaluation of the significance of the various factors and no factor alone was considered determinative. The Trustees determined that the proposed compensation to be received by the Adviser from each Fund under the New Management Agreement was fair and reasonable and that the approval of the New Management Agreement was in the best interests of each Fund and its shareholders.
The factors summarized below were considered and discussed by the Trustees in reaching their conclusions:
Nature, Extent and Quality of Services Provided by the Adviser
In connection with the approval of the New Management Agreement on behalf of each Fund, the Trustees received and considered information regarding the nature, extent and quality of the services provided to each Fund under its then-existing separate Investment Advisory and Administration Agreements, as well as the services that will be provided under the New Management Agreement. They also considered management’s representation that the services provided to the Funds will not change as a result of the transition to the unitary fee structure. The Trustees also took into account information furnished throughout the year at Trustee meetings, including consideration of the background and experience of the Adviser’s senior management and the qualifications, backgrounds and responsibilities of the portfolio management team primarily responsible for theday-to-day management of each Fund. The Trustees also considered each Fund’s investment strategy, and the infrastructure supporting the portfolio management teams. In addition, the Trustees considered information about the structure and distribution strategies of the Funds, how they fit within the Trust’s fund offerings, and how each Fund is positioned against peer funds, as identified by management and/or Broadridge Investor Communication Solutions Inc. (“Broadridge”), an independent provider of investment company data. The Trustees reviewed information relating to the Adviser’s risk governance model and reports showing the Adviser’s compliance structure and ongoing compliance processes.
The Trustees also considered their knowledge of the nature and quality of services provided by the Adviser and its affiliates gained from their experience as Trustees of the Trust and in the financial industry in general. In addition, they considered the overall reputation and capabilities of the Adviser and its affiliates, the commitment of the Adviser to continue to provide high quality service to the Funds, their overall confidence in the Adviser’s integrity and the Adviser’s responsiveness to requests for additional information, questions or concerns raised by them.
Based upon these considerations and other factors, the Trustees concluded that they were satisfied with the nature, extent and quality of services provided to each Fund by the Adviser.
| | | | | | | | |
| | | |
| OCTOBER 31, 2019 | | J.P. MORGAN EXCHANGE-TRADED FUNDS | | | | | 221 | |
Fall-Out Benefits
The Trustees reviewed information regarding potential“fall-out” or ancillary benefits received by the Adviser and its affiliates as a result of their relationships with the Funds, particularly those benefits potentially impacted by the implementation of the unitary fee structure. The Trustees also considered the benefits the Adviser receives as the result of JPMorgan Chase Bank, N.A.’s (“JPMCB”) roles as custodian, fund accountant and transfer agent for the Funds.
The Trustees also considered that adopting the New Management Agreement would benefit the Adviser by bringing the Funds in line with industry practice, which could potentially improve their marketability and ultimately increase the Adviser’s assets under management.
Costs of Services Provided and Profitability to the Adviser and its Affiliates
While information concerning the actual profitability to the Adviser and its affiliates with respect to the New Management Agreement was not available (because the New Management Agreement was not yet in effect), the Trustees received and considered information regarding the profitability to the Adviser in providing services to each Fund when renewing the then-existing Investment Advisory Agreement for each applicable Fund. In conjunction with the consideration of the New Management Agreement, the Trustees also considered that the Adviser’s profitability was not expected to increase in the near term as a result of the transition to the unitary fee structure. The Trustees reviewed and discussed the profitability information. The Trustees recognized that this information is not audited and represents the Adviser’s determination of its and its affiliates’ revenues from the contractual services provided to the Funds, less expenses of providing such services. Expenses include direct and indirect costs and are calculated using allocation methodologies developed by the Adviser. The Trustees also recognized that it is difficult to make direct comparisons of profitability from fund investment advisory contracts because comparative information is not generally publicly available and is affected by numerous factors, including the structure of the particular adviser, the types of funds it manages, its business mix, numerous assumptions regarding allocations and the fact that publicly-traded fund managers’ operating profits and net income are net of distribution and marketing expenses. Based upon their review, the Trustees concluded that the profitability to the Adviser under the then-existing Investment Advisory Agreement was not unreasonable in light of the services and benefits provided to each Fund.
The Trustees also considered the fees that the Adviser earned from the Funds for providing administrative services. The Trustees also considered the fees paid to JPMCB, also an affiliate of the Adviser, for custody, transfer agency and other related services for each Fund. It was noted that under the new
fee structure, the Adviser will be responsible for providing the administrative services under the Management Agreement and for paying JPMCB for the services that it provides.
The Trustees also considered the fact that because each Fund’s total expense ratio would decrease, or stay the same, the Adviser’s profitability was not expected to increase in the near term as a result of the transition to the unitary fee structure under the New Management Agreement. They also noted, however, that if Fund assets increase, Fund fees will not necessarily decrease even if the Fund and the Adviser achieve economies of scale. In this regard, the Trustees noted that after the New Management Agreement’s initialtwo-year term, the Trustees would have the opportunity to review the fee each year as part of the annual contract review process.
Based on these considerations and other factors, the Trustees concluded that the projected profitability to the Adviser under the New Management Agreement would not be unreasonable in light of the anticipated services and benefits provided to each Fund under the new fee structure.
Economies of Scale
In connection with its review of the then-existing Investment Advisory Agreement, the Board discussed potential economies of scale or other efficiencies that may result from increases in the Funds’ asset levels. The Trustees noted that the management fees and other expenses paid by the Funds under the New Management Agreement would be the same as or less than the amounts the Funds would have paid under the prior structure, which involved the then-existing Investment Advisory and Administration Agreements operating in conjunction with a terminable expense limitation agreement. The Trustees further considered that shareholders would benefit because expenses would be limited even when Funds are new or if assets decreased. The Trustees also considered the fact that increases in assets would not lead to fee decreases even if economies of scale were achieved, but that they will have the opportunity to further review the appropriateness of the fee payable to the Adviser under the New Management Agreement in the future. In this regard, the Trustees noted that after the New Management Agreement’s initialtwo-year term, the Trustees would have the opportunity to review the fee each year as part of the annual contract renewal process.
Investment Performance
The Trustees considered each Fund’s investment strategy and process, portfolio management team and a comparison of Fund performance against the index the Fund seeks to track. Performance for each Fund was considered by the Board in approving the continuation of the Fund’s Investment Advisory Agreement in December 2018 and is also reviewed by the Trustees at regular Board Meetings. After considering such information, the Trustees concluded that the prospects for competitive future performance were acceptable.
| | | | | | |
| | | |
| 222 | | | | J.P. MORGAN EXCHANGE-TRADED FUNDS | | OCTOBER 31, 2019 |
BOARD APPROVAL OF MANAGEMENT AGREEMENT
(Unaudited) (continued)
Management Fees and Expense Ratios
The Trustees considered the contractual unitary management fee rate that will be paid by each Fund to the Adviser and compared that rate to the information prepared by Broadridge concerning management fee rates paid by other funds in the same Broadridge category as each Fund. The Trustees also considered additional fund comparisons proposed by the Adviser. The Trustees also considered information comparing the management fee for the Fund to the expense ratios of mutual funds with similar investment objectives or in similar asset classes managed by the Adviser.
The Trustees noted that each Fund’s estimated unitary management fees were in line with fees for identified peer funds. After considering the factors identified above, the Trustees concluded that the proposed management fees were reasonable.
Based on the foregoing, the Board, including all of the Independent Trustees, unanimously: (a) concluded that the terms of the New Management Agreement are fair and reasonable; (b) concluded that the proposed fees were reasonable in light of the services that the Adviser will provide to each Fund; and (c) approved the New Management Agreement.
| | | | | | | | |
| | | |
| OCTOBER 31, 2019 | | J.P. MORGAN EXCHANGE-TRADED FUNDS | | | | | 223 | |
J.P. Morgan Exchange-Traded Funds are distributed by JPMorgan Distribution Services, Inc., an indirect, wholly-owned subsidiary of JPMorgan Chase & Co.
Contact J.P. Morgan Exchange-Traded Funds at 1-844-457-6383 (844-4JPM ETF) for a fund prospectus. You can also visit us at www.jpmorganfunds.com. Investors should carefully consider the investment objectives and risks as well as charges and expenses of the fund before investing. The prospectus contains this and other information about the fund. Read the prospectus carefully before investing.
Investors may obtain information about the Securities Investor Protection Corporation (SIPC), including the SIPC brochure by visiting www.sipc.org or by calling SIPC at 202-371-8300.
Each Fund files a complete schedule of its fund holdings for the first and third quarters of its fiscal year with the SEC on FormN-PORT. Prior to March 31, 2019, each Fund filed a complete schedule of its fund holdings for the first and third quarters of its fiscal year with the SEC on Form N-Q. The Funds’ Form N-PORT and Form N-Q are available on the SEC’s website at http://www.sec.gov. Each Fund’s quarterly holdings can be found by visiting the J.P. Morgan Funds’ website at www.jpmorganfunds.com.
A description of each Fund’s policies and procedures with respect to the disclosure of each Fund’s holdings is available in the prospectus and Statement of Additional Information.
A copy of proxy policies and procedures is available without charge upon request by calling 1-844-457-6383 and on the Fund’s website at www.jpmorganfunds.com. A description of such policies and procedures is on the SEC’s website at www.sec.gov. The Trustees have delegated the authority to vote proxies for securities owned by the Fund to the Adviser. A copy of the Fund’s voting record for the most recent 12-month period ended June 30 is available on the SEC’s website at www.sec.gov or at the Fund’s website at www.jpmorganfunds.com no later than August 31 of each year. The Fund’s proxy voting record will include, among other things, a brief description of the matter voted on for each fund security, and will state how each vote was cast, for example, for or against the proposal.


J.P. Morgan Asset Management is the brand name for the asset management business of JPMorgan Chase & Co. and its affiliates worldwide.
| | | | |
| | © JPMorgan Chase & Co., 2019. All rights reserved. October 2019. | | AN-ETF-1019 |
Annual Report
J.P. Morgan Exchange-Traded Funds
October 31, 2019
JPMorgan Diversified Alternatives ETF
JPMorgan Event Driven ETF
JPMorgan Long/Short ETF
JPMorgan Managed Futures Strategy ETF
Beginning on January 1, 2021, as permitted by regulations adopted by the Securities and Exchange Commission, paper copies of the Funds’ annual and semi-annual shareholder reports will no longer be sent by mail, unless you specifically request paper copies of the reports. Instead, the reports will be made available on the Funds’ website www.jpmorganfunds.com and you will be notified by mail each time a report is posted and provided with a website to access the report. If you already elected to receive shareholder reports electronically, you will not be affected by this change and you need not take any action.
You may elect to receive shareholder reports and other communications from the Funds electronically anytime by contacting your financial intermediary (such as a broker dealer, bank, or retirement plan).
Alternatively, you may elect to receive paper copies of all future reports free of charge by contacting your financial intermediary. Your election to receive paper reports will apply to all funds held within your account(s).
CONTENTS
Investments in a Fund are not bank deposits or obligations of, or guaranteed or endorsed by, any bank and are not insured or guaranteed by the FDIC, the Federal Reserve Board or any other government agency. You could lose money if you sell when a Fund’s share price is lower than when you invested.
Past performance is no guarantee of future performance. The general market views expressed in this report are opinions based on market and other conditions through the end of the reporting period and are subject to change without notice. These views are not intended to predict the future performance of a Fund or the securities markets. References to specific securities and their issuers are for illustrative purposes only and are not intended to be, and should not be interpreted as, recommendations to purchase or sell such securities. Such views are not meant as investment advice and may not be relied on as an indication of trading intent on behalf of a Fund.
Prospective investors should refer to the Funds’ prospectuses for a discussion of the Funds’ investment objectives, strategies and risks. Call J.P. Morgan Exchange-Traded Funds at (844) 457-6383 for a prospectus containing more complete information about a Fund, including management fees and other expenses. Please read it carefully before investing.
Shares are bought and sold throughout the day on an exchange at market price (not at net asset value) through a brokerage account, and are not individually subscribed and redeemed from a Fund. Shares may only be subscribed and redeemed directly from a Fund by Authorized Participants, in very large creation/redemption units. Brokerage commissions will reduce returns.
PRESIDENT’S LETTER
DECEMBER 17, 2019 (Unaudited)
Dear Shareholder,
JPMorgan Exchange-Traded Funds has continued to grow in 2019. Our assets under management have surpassed $30 billion1 and in September we became one of the top five providers in ETF flows as of the end of September 2019.2 Our expanding suite of liquid and transparent solutions provides well-diversified, well-priced portfolios that may help each investor to achieve their goals.
| | |
 | | “Against the current market backdrop, we believe diversification remains a key pillar in a well-constructed portfolio.” – Joanna M. Gallegos |
For the twelve months ended October 31, 2109, financial markets largely provided positive returns despite slowing global economic growth, U.S.-China trade tensions and geo-political uncertainties. Corporate profits remained buoyant, particularly in the U.S., and leading central banks maintained accommodative policies, which further supported financial markets. In July, the U.S. Federal Reserve responded to slowing economic growth by cutting interest rates for the first time in more than a decade and then followed with two more rate cuts by the end of the twelve month reporting period. Meanwhile, the European Central Bank resumed its monthly purchases of assets in an attempt to bolster flagging economic growth and inflation,
which was below the bank’s target levels. China also moved to ease lending as the toll of reciprocal trade tariffs with the U.S. appeared to become a drag on exports. For the twelve months ended October 31, 2019, the MSCI World Index returned 12.69% (net of foreign withholding taxes, while the S&P 500 returned 14.33% and the Bloomberg Barclays U.S. Aggregate Index returned 11.51%.
Against the current market backdrop, we believe diversification remains a key pillar in a well-constructed portfolio. As such, our alternative investment strategy ETFs can provide investors with exposures to asset classes that may have a low correlation to the performance of traditional equity or fixed-income markets.
We are proud to bring a range of investment solutions to help you navigate a changing market landscape. We are committed to building solutions that address your needs and help you build stronger portfolios. Thank you for your belief in our Firm and our process.
Sincerely,

Joanna M. Gallegos
President, J.P. Morgan Exchange-Traded Funds
J.P Morgan Asset Management
1-844-4JPM-ETF or jpmorgan.com/etfs for more information
| 1 | J.P. Morgan Asset Management, December 16, 2019. |
| 2 | Bloomberg L.P., September 30, 2019. |
| | | | | | | | |
| | | |
| OCTOBER 31, 2019 | | J.P. MORGAN EXCHANGE-TRADED FUNDS | | | | | 1 | |
J.P. Morgan Exchange-Traded Funds
MARKET OVERVIEW
TWELVE MONTHS ENDED OCTOBER 31, 2019 (Unaudited)
Global equity markets generally provided positive returns for the reporting period amid slowing but continued growth in both the global economy and corporate profits. Investor optimism over U.S.-China trade negotiations and an extension of the deadline for Britain’s exit from the European Union (“Brexit”) also bolstered investor sentiment. Bond markets also provided positive returns for the period but generally underperformed equity markets. Emerging markets debt and U.S. investment grade bonds largely outperformed U.S. Treasury bonds.
In the final months of 2018, global equity markets generally slumped as investors faced both slowing global economic growth — particularly in China and Europe — and the prospect of rising U.S. interest rates. Equity prices largely rebounded in the first months of 2019, and markets remained buoyant through April 2019. Global equity markets were hit with a sell-off in May 2019 and leading indexes in the U.S. and Asian
developed markets, as well as in emerging markets, dropped by more than 6%. Equity prices rebounded again in June and received further support at the end of July 2019, when the U.S. Federal Reserve (the “Fed”) responded to slowing economic growth by raising interest rates for the first time in more than a decade.
Investor concerns about increased U.S.-China trade tensions and uncertainty over the U.K.’s Brexit strategy led to increased market volatility in the final months of the reporting period. However, the Fed cut interest rates again inmid-September 2019 and, by the end of October 2019, leading U.S. equity indexes had returned to record highs.
For the twelve months ended October 31, 2019, the S&P 500 returned 14.33%, the MSCI EAFE Index returned 11.63% and the MSCI Emerging Markets Index returned 12.29%.
| | | | | | |
| | | |
| 2 | | | | J.P. MORGAN EXCHANGE-TRADED FUNDS | | OCTOBER 31, 2019 |
JPMorgan Diversified Alternatives ETF
FUND COMMENTARY
TWELVE MONTHS ENDED OCTOBER 31, 2019 (Unaudited)
| | | | |
REPORTING PERIOD RETURN: | |
| JPMorgan Diversified Alternatives ETF | | | | |
| Net Asset Value* | | | 2.76% | |
| Market Price** | | | 2.55% | |
| ICE BofAML3-Month US Treasury Bill Index | | | 2.40% | |
| |
| Net Assets as of 10/31/2019 | | $ | 104,798,391 | |
INVESTMENT OBJECTIVE***
The JPMorgan Diversified Alternatives ETF (the “Fund”) seeks to provide long-term total return.
INVESTMENT APPROACH
The Fund seeks to achieve its investment objective by allocating assets across a variety of strategies commonly employed by hedge funds, including equity long/short, event driven and macro/managed futures strategies. The Fund seeks to achieve the efficiency of rules-based investing with the diversification benefits of alternative strategies without replicating an index.
The Fund uses derivatives, including swaps, futures and forward contracts, in implementing its strategies, and under normal market conditions, the Fund’s managers seek to obtain a significant portion of the Fund’s exposure through the use of derivatives, in addition to its exposure through direct investments. Derivatives, which are instruments that have a value based on another instrument, exchange rate or index, are primarily used as an efficient means of implementing a particular strategy in order to gain exposure to a desired strategy.
HOW DID THE FUND PERFORM?
For the twelve months ended October 31, 2019, the Fund posted a positive absolute performance and outperformed the ICE BofAML3-Month US Treasury Bill Index (the “Index”).
The Fund’s allocation to alternative investment strategies, which are not represented in the Index, contributed to
performance relative to the Index. References to the Index are for informational purposes and are not an indication of how the Fund is managed. The use of the Index does not imply the Fund is being managed like the Index and does not imply low risk or low volatility, but rather is disclosed to allow for comparison of the Fund’s performance to that of a well-known and widely recognized index.
On an absolute basis, the Fund’s time series fixed income-based factors, which are part of the Fund’s macro/managed futures strategy and seek to benefit from positive or negative exposure to an asset primarily through the use of futures contracts, and relative value fixed income-based factors within the macro/managed futures strategy, which seek to balance long and short positions so that exposure to the asset(s) is neutral, were leading contributors to performance.
The Fund’s allocations to the value and size factors, which are part of the Fund’s equity long/short strategy and were implemented primarily through the use of equity securities and total return swaps contracts, detracted from absolute performance during the reporting period.
HOW WAS THE FUND POSITIONED?
At the end of the reporting period, the Fund’s largest allocation was to the event driven strategy, while the smallest allocation was to the macro/managed futures strategy.
| | | | | | | | |
| | | |
| OCTOBER 31, 2019 | | J.P. MORGAN EXCHANGE-TRADED FUNDS | | | | | 3 | |
JPMorgan Diversified Alternatives ETF
FUND COMMENTARY
TWELVE MONTHS ENDED OCTOBER 31, 2019 (Unaudited) (continued)
| | | | |
RISK ALLOCATION AS OF OCTOBER 31, 2019 | |
| Strategy | | % of Risk
Allocation**** | |
| Equity Long/Short (1) | | | 28 | % |
| Event Driven (2) | | | 42 | |
| Macro/Managed Futures (3) | | | 30 | |
| | | | | | | | |
| TOP TEN LONG HOLDINGS OF THE PORTFOLIO(a) | |
| | 1. | | | WellCare Health Plans, Inc. | | | 1.7 | % |
| | 2. | | | WABCO Holdings, Inc. | | | 1.6 | |
| | 3. | | | Zayo Group Holdings, Inc. | | | 1.6 | |
| | 4. | | | Cypress Semiconductor Corp. | | | 1.6 | |
| | 5. | | | Caesars Entertainment Corp. | | | 1.5 | |
| | 6. | | | Allergan plc. | | | 1.5 | |
| | 7. | | | Cambrex Corp. | | | 1.3 | |
| | 8. | | | Genomic Health, Inc. | | | 1.3 | |
| | 9. | | | Spark Therapeutics, Inc. | | | 1.2 | |
| | 10. | | | Acacia Communications, Inc. | | | 1.2 | |
| | | | | | | | |
| TOP TEN SHORT HOLDINGS OF THE PORTFOLIO(a) | |
| | 1. | | | Centene Corp. | | | 1.0 | % |
| | 2. | | | Prosperity Bancshares, Inc. | | | 1.0 | |
| | 3. | | | BB&T Corp. | | | 0.9 | |
| | 4. | | | Exact Sciences Corp. | | | 0.7 | |
| | 5. | | | AbbVie, Inc. | | | 0.6 | |
| | 6. | | | Eldorado Resorts, Inc. | | | 0.5 | |
| | 7. | | | Callon Petroleum Co. | | | 0.4 | |
| | 8. | | | New Media Investment Group, Inc. | | | 0.4 | |
| | 9. | | | Bristol-Myers Squibb Co. | | | 0.3 | |
| | 10. | | | Pembina Pipeline Corp. | | | 0.2 | |
| * | | The return shown is based on net asset value calculated for shareholder transactions and may differ from the return shown in the financial highlights, which reflects adjustments made to the net asset value in accordance with accounting principles generally accepted in the United States of America. The net asset value was $24.95 as of October 31, 2019. |
| ** | | Market price return is calculated assuming an initial investment made at the market price at the beginning of the period, reinvestment of all dividends and distributions at market price during the period, and sale at the market price on the last day of the period. The price used to calculate the market price return is the midpoint of the bid/ask spread at the close of business on the NYSE Arca. The midpoint price was $24.95 as of October 31, 2019. |
| *** | | The adviser seeks to achieve the Fund’s objective. There can be no guarantee it will be achieved. |
| **** | | Risk allocations are calculated as the standard deviation (volatility of an asset class) divided by the overall volatility of the Fund. Risk, as measured by standard deviation, shows how widely a set of values varies from the mean. It is a historical measure of the volatility of returns earned by the Fund. The percentages above represent the current risk allocation based on the Fund’s holdings as of October 31, 2019 and may not be representative of the targeted equal risk allocation across asset classes over the long term. Holdings and allocations may vary over time. |
| (1) | | Equity Long/Short strategies involve simultaneously investing in equities (i.e., investing long) that the adviser believes are attractive based on relevant return factors and take short positions in equity securities that the adviser believes are unattractive based on the relevant return factors. |
| (2) | | Event Driven strategies seek to profit from investing in securities of companies that the Fund’s adviser believes will be impacted by pending or anticipated corporate or special situation events. In executing this investment strategy, the Fund seeks to capture the price difference between a security’s market price and the anticipated value post-event, based on the assumption that an event or catalyst will affect future pricing. For example, merger arbitrage strategies seek to capitalize on price discrepancies and returns generated by a corporate transaction. |
| (3) | | Macro/Managed Futures strategies aim to exploit macro-economic imbalances across the globe. The macro based strategies may be implemented through a broad range of asset classes including, but not limited to, equities, fixed income, currency and commodities based on a systematic assessment of their attractiveness. |
| (a) | | Percentages indicated are based upon total investments plus the current value of the total net long and short positions within each Total Return Basket Swap as of October 31, 2019. The Fund’s portfolio composition is subject to change. |
| | | | | | |
| | | |
| 4 | | | | J.P. MORGAN EXCHANGE-TRADED FUNDS | | OCTOBER 31, 2019 |
| | | | | | | | | | | | |
AVERAGE ANNUAL TOTAL RETURNSAS OF OCTOBER 31, 2019 (Unaudited) | |
| | | INCEPTION DATE | | | 1 YEAR | | | SINCE
INCEPTION | |
| JPMorgan Diversified Alternatives ETF | | | | | | | | | | | | |
| Net Asset Value | | | September 12, 2016 | | | | 2.76% | | | | 0.22% | |
| Market Price | | | | | | | 2.55% | | | | 0.21% | |
LIFE OF FUND PERFORMANCE(09/12/16 TO 10/31/19)
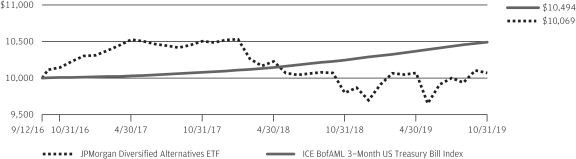
The performance quoted is past performance and is not a guarantee of future results. Exchange-traded funds are subject to certain market risks. Investment returns and principal value of an investment will fluctuate so that an investor’s shares, when sold or redeemed, may be worth more or less than their original cost. Current performance may be higher or lower than the performance data shown. For up-to-date, month-end performance information please call 1-844-457-6383.
Fund commenced operations on September 12, 2016.
The graph illustrates comparative performance for $10,000 invested in shares of the JPMorgan Diversified Alternatives ETF and the ICE BofAML 3-Month US Treasury Bill Index from September 12, 2016 to October 31, 2019. The performance of the Fund assumes reinvestment of all dividends and capital gain distributions, if any. The performance of the ICE BofAML 3-Month US Treasury Bill Index does not reflect the deduction of expenses and has been adjusted to reflect reinvestment of all dividends and capital gain distributions of the securities included in the benchmark, if applicable. The ICE BofAML 3-Month US Treasury Bill Index is comprised of a single issue purchased at the beginning of
the month and held for a full month. Each month the index is rebalanced and the issue selected is the outstanding Treasury Bill that matures closest to, but not beyond, 3 months from the rebalancing date. Investors cannot invest directly in an index. The Fund is not an index fund. The Fund is actively managed and does not seek to replicate the performance of a specified index.
The performance of the Fund reflects the deduction of Fund expenses and assumes reinvestment of all dividends and capital gain distributions, if any. Fund performance reflects the waiver of the Fund’s fees and reimbursement of expenses since the inception date. Without these waivers and reimbursements, performance would have been lower. Also, performance shown in this section does not reflect the deduction of taxes that a shareholder may pay on Fund distributions or redemption or sale of Fund shares.
The returns shown are based on net asset values calculated for shareholder transactions and may differ from the returns shown in the financial highlights, which reflect adjustments made to the net asset values in accordance with accounting principles generally accepted in the United States of America.
| | | | | | | | |
| | | |
| OCTOBER 31, 2019 | | J.P. MORGAN EXCHANGE-TRADED FUNDS | | | | | 5 | |
JPMorgan Event Driven ETF
FUND COMMENTARY
TWELVE MONTHS ENDED OCTOBER 31, 2019 (Unaudited)
| | | | |
| REPORTING PERIOD RETURN: | | | |
| JPMorgan Event Driven ETF | | | | |
| Net Asset Value* | | | 6.17% | |
| Market Price** | | | 6.07% | |
| ICE BofAML3-Month US Treasury Bill Index | | | 2.40% | |
| |
| Net Assets as of 10/31/2019 | | $ | 29,475,685 | |
INVESTMENT OBJECTIVE***
The JPMorgan Event Driven ETF (the “Fund”) seeks to provide long-term total return.
INVESTMENT APPROACH
The Fund employs a rules-based,bottom-up approach to building a diversified portfolio that seeks to capture returns by primarily investing in companies that the Fund’s adviser believes will be positively impacted by corporate or special situation events. The Fund seeks to profit by exploiting pricing inefficiencies associated with corporate change, through long and short equity positions across developed markets, achieved through the use of both equities and derivative instruments.
The Fund uses derivatives, including swaps, futures and forward contracts, in implementing its strategies, and under normal market conditions, the Fund’s managers seek to obtain a significant portion of the Fund’s exposure through the use of derivatives, in addition to its exposure through direct investments. Derivatives, which are instruments that have a value based on another instrument, exchange rate or index, are primarily used as an efficient means of implementing a particular strategy in order to gain exposure to a desired strategy.
HOW DID THE FUND PERFORM?
The Fund posted a positive absolute performance for the twelve months ended October 31, 2019 and outperformed the ICE BofAML3-Month US Treasury Bill Index (the “Index”).
Relative to the Index, the Fund’s allocation to alternative investment strategies, which are not represented in the Index, contributed to performance. References to the Index are for informational purposes and are not an indication of how the Fund is managed. The use of the Index does not imply the Fund is being managed like the Index and does not imply low risk or low volatility, but rather is disclosed to allow for comparison of the Fund’s performance to that of a well-known and widely recognized index.
In absolute terms, the Fund’s exposure to the merger arbitrage factor made a positive contribution to absolute performance. Merger arbitrage involves exploiting the differences between the share price of a target company in a merger relative to the share price announced in the merger agreement. The share buybacks factor detracted from absolute performance. Share buybacks factor seeks to benefit from the relative outperformance by companies that repurchased a significant portion of their outstanding shares.
HOW WAS THE FUND POSITIONED?
At the end of the reporting period, the Fund’s largest allocation in notional exposure terms was to the merger arbitrage factor. From a sector perspective, the Fund’s largest positions were in the consumer discretionary and industrials sectors and its smallest positions were the consumer staples and real estate sectors.
| | | | | | |
| | | |
| 6 | | | | J.P. MORGAN EXCHANGE-TRADED FUNDS | | OCTOBER 31, 2019 |
| | | | | | | | |
| TOP TEN LONG HOLDINGS OF THE PORTFOLIO(a) | |
| | 1. | | | U.S. Treasury Bills, 2.52%, 1/30/2020 | | | 4.1 | % |
| | 2. | | | Japan Treasury, (0.27)%, 3/10/2020 | | | 2.8 | |
| | 3. | | | U.S. Treasury Bills, 2.39%, 3/26/2020 | | | 2.7 | |
| | 4. | | | U.S. Treasury Bills, 2.07%, 4/23/2020 | | | 2.7 | |
| | 5. | | | U.S. Treasury Bills, 1.94%, 5/21/2020 | | | 2.7 | |
| | 6. | | | WellCare Health Plans, Inc. | | | 1.3 | |
| | 7. | | | Zayo Group Holdings, Inc. | | | 1.3 | |
| | 8. | | | Allergan plc | | | 1.3 | |
| | 9. | | | WABCO Holdings, Inc. | | | 1.2 | |
| | 10. | | | Acacia Communications, Inc. | | | 1.2 | |
| | | | | | | | |
| TOP TEN SHORT HOLDINGS OF THE PORTFOLIO(a) | |
| | 1. | | | Centene Corp. | | | 0.7 | % |
| | 2. | | | Prosperity Bancshares, Inc. | | | 0.7 | |
| | 3. | | | Exact Sciences Corp. | | | 0.6 | |
| | 4. | | | BB&T Corp. | | | 0.6 | |
| | 5. | | | AbbVie, Inc. | | | 0.4 | |
| | 6. | | | Eldorado Resorts, Inc. | | | 0.4 | |
| | 7. | | | Callon Petroleum Co. | | | 0.3 | |
| | 8. | | | Bristol-Myers Squibb Co. | | | 0.3 | |
| | 9. | | | New Media Investment Group, Inc. | | | 0.3 | |
| | 10. | | | Pembina Pipeline Corp. | | | 0.2 | |
| * | | The return shown is based on net asset value calculated for shareholder transactions and may differ from the return shown in the financial highlights, which reflects adjustments made to the net asset value in accordance with accounting principles generally accepted in the United States of America. The net asset value was $25.63 as of October 31, 2019. |
| ** | | Market price return is calculated assuming an initial investment made at the market price at the beginning of the period, reinvestment of all dividends and distributions at market price during the period, and sale at the market price on the last day of the period. The price used to calculate the market price return is the midpoint of the bid/ask spread at the close of business on the NYSE Arca. The midpoint price was $25.72 as of October 31, 2019. |
| *** | | The adviser seeks to achieve the Fund’s objective. There can be no guarantee it will be achieved. |
| (a) | | Percentages indicated are based upon total investments plus the current value of the total net long and short positions within each Total Return Basket Swap as of October 31, 2019. The Fund’s portfolio composition is subject to change. |
| | | | | | | | |
| | | |
| OCTOBER 31, 2019 | | J.P. MORGAN EXCHANGE-TRADED FUNDS | | | | | 7 | |
JPMorgan Event Driven ETF
FUND COMMENTARY
TWELVE MONTHS ENDED OCTOBER 31, 2019 (Unaudited) (continued)
| | | | | | | | | | | | |
AVERAGE ANNUAL TOTAL RETURNSAS OF OCTOBER 31, 2019 (Unaudited) | |
| | | INCEPTION DATE | | | 1 YEAR | | | SINCE
INCEPTION | |
| JPMorgan Event Driven ETF | | | | | | | | | | | | |
| Net Asset Value | | | November 29, 2017 | | | | 6.17% | | | | 3.26% | |
| Market Price | | | | | | | 6.07% | | | | 3.45% | |
LIFE OF FUND PERFORMANCE(11/29/17 TO 10/31/19)
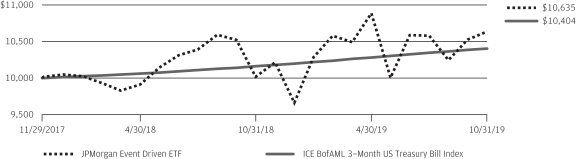
The performance quoted is past performance and is not a guarantee of future results. Exchange-traded funds are subject to certain market risks. Investment returns and principal value of an investment will fluctuate so that an investor’s shares, when sold or redeemed, may be worth more or less than their original cost. Current performance may be higher or lower than the performance data shown. Forup-to-date,month-end performance information please call1-844-457-6383.
Fund commenced operations on November 29, 2017.
The graph illustrates comparative performance for $10,000 invested in shares of the JPMorgan Event Driven ETF and the ICE BofAML3-Month US Treasury Bill Index from November 29, 2017 to October 31, 2019. The performance of the Fund assumes reinvestment of all dividends and capital gain distributions, if any. The performance of the ICE BofAML3-Month US Treasury Bill Index does not reflect the deduction of expenses and has been adjusted to reflect reinvestment of all dividends and capital gain distributions of the securities included in the benchmark, if applicable. The ICE BofAML3-Month US Treasury
Bill Index is comprised of a single issue purchased at the beginning of the month and held for a full month. Each month the index is rebalanced and the issue selected is the outstanding Treasury Bill that matures closest to, but not beyond, 3 months from the rebalancing date. Investors cannot invest directly in an index. The Fund is not an index fund. The Fund is actively managed and does not seek to replicate the performance of a specified index.
The performance of the Fund reflects the deduction of Fund expenses and assumes reinvestment of all dividends and capital gain distributions, if any. Fund performance reflects the waiver of the Fund’s fees and reimbursement of expenses since the inception date. Without these waivers and reimbursements, performance would have been lower. Also, performance shown in this section does not reflect the deduction of taxes that a shareholder may pay on Fund distributions or redemption or sale of Fund shares.
The returns shown are based on net asset values calculated for shareholder transactions and may differ from the returns shown in the financial highlights, which reflect adjustments made to the net asset values in accordance with accounting principles generally accepted in the United States of America.
| | | | | | |
| | | |
| 8 | | | | J.P. MORGAN EXCHANGE-TRADED FUNDS | | OCTOBER 31, 2019 |
JPMorgan Long/Short ETF
FUND COMMENTARY
TWELVE MONTHS ENDED OCTOBER 31, 2019 (Unaudited)
| | | | |
| REPORTING PERIOD RETURN: | |
| JPMorgan Long/Short ETF | | | | |
| Net Asset Value* | | | -1.84% | |
| Market Price** | | | -2.04% | |
| ICE BofAML3-Month US Treasury Bill Index | | | 2.40% | |
| |
| Net Assets as of 10/31/2019 | | $ | 28,498,988 | |
INVESTMENT OBJECTIVE***
The JPMorgan Long/Short ETF (the “Fund”) seeks to provide long-term total return.
INVESTMENT APPROACH
The Fund seeks to achieve its investment objective by taking advantage of pricing inefficiencies between equity securities by maintaining long and short exposures to equity factors such as value, quality, momentum and size. The Fund utilizes an equity long/short strategy, which involves simultaneously investing in equities (investing long) that the portfolio managers believe are attractive and holding short positions in equities that they believe are unattractive.
The Fund uses derivatives, including swaps, futures and forward contracts, in implementing its strategies, and under normal market conditions, the Fund’s managers seek to obtain a significant portion of the Fund’s exposure through the use of derivatives, in addition to its exposure through direct investments. Derivatives, which are instruments that have a value based on another instrument, exchange rate or index, are primarily used as an efficient means of implementing a particular strategy in order to gain exposure to a desired strategy.
HOW DID THE FUND PERFORM?
The Fund posted a negative absolute performance for the twelve months ended October 31, 2019 and underperformed its broad-based market benchmark, the ICE BofAML3-Month US Treasury Bill Index (the “Index”).
Relative to the Index, the Fund’s allocation to alternative investment strategies, which are not represented in the Index,
detracted from performance. References to the Index are for informational purposes and are not an indication of how the Fund is managed. The use of the Index does not imply the Fund is being managed like the Index and does not imply low risk or low volatility, but rather is disclosed to allow for comparison of the Fund’s performance to that of a well-known and widely recognized index.
In terms of absolute performance, the Fund’s allocations to the value and size factors, which were implemented primarily through the use of equity securities and total return swaps contracts, were leading detractors from performance. From a return perspective, the size factor, which seeks to purchase small cap stocks long and take short positions in large cap stocks, was the worst performing factor over the period and suffered as larger cap stocks led the market. Also, the Fund’s allocation to the time-series momentum factor, which relies on a security’s recent past performance as an indicator of near future performance and which was implemented through the use of futures contracts, detracted from absolute performance during the reporting period.
The Fund’s single stock momentum factor, which seeks to hold securities that have outperformed their peers, was a positive contributor to absolute performance.
HOW WAS THE FUND POSITIONED?
At the end of the reporting period, the Fund’s exposures were balanced across equity value, momentum and quality factors. In addition, the Fund had a slightly long overall exposure to developed market equities on an aggregate basis.
| | | | | | | | |
| | | |
| OCTOBER 31, 2019 | | J.P. MORGAN EXCHANGE-TRADED FUNDS | | | | | 9 | |
JPMorgan Long/Short ETF
FUND COMMENTARY
TWELVE MONTHS ENDED OCTOBER 31, 2019 (Unaudited) (continued)
| | | | | | | | |
| TOP TEN LONG HOLDINGS OF THE PORTFOLIO(a) | |
| | 1. | | | U.S. Treasury Bills, 1.94%, 5/21/2020 | | | 9.8 | % |
| | 2. | | | U.S. Treasury Bills, 1.94%, 6/18/2020 | | | 1.2 | |
| | 3. | | | Cirrus Logic, Inc. | | | 0.6 | |
| | 4. | | | Zebra Technologies Corp., Class A | | | 0.6 | |
| | 5. | | | nVent Electric plc | | | 0.6 | |
| | 6. | | | Xerox Holdings Corp. | | | 0.6 | |
| | 7. | | | Atkore International Group, Inc. | | | 0.5 | |
| | 8. | | | UCB SA | | | 0.5 | |
| | 9. | | | ManTech International Corp., Class A | | | 0.5 | |
| | 10. | | | UnitedHealth Group, Inc. | | | 0.5 | |
| | | | | | | | |
| TOP TEN SHORT HOLDINGS OF THE PORTFOLIO(a) | |
| | 1. | | | ABIOMED, Inc. | | | 0.4 | % |
| | 2. | | | Green Dot Corp., Class A | | | 0.4 | |
| | 3. | | | 3D Systems Corp. | | | 0.4 | |
| | 4. | | | SMC Corp. | | | 0.4 | |
| | 5. | | | SiteOne Landscape Supply, Inc. | | | 0.4 | |
| | 6. | | | Advanced Micro Devices, Inc. | | | 0.4 | |
| | 7. | | | Cosmos Pharmaceutical Corp. | | | 0.4 | |
| | 8. | | | Varonis Systems, Inc. | | | 0.4 | |
| | 9. | | | Makita Corp. | | | 0.4 | |
| | 10. | | | PostNL NV | | | 0.4 | |
| * | | The return shown is based on net asset value calculated for shareholder transactions and may differ from the return shown in the financial highlights, which reflects adjustments made to the net asset value in accordance with accounting principles generally accepted in the United States of America. The net asset value was $21.92 as of October 31, 2019. |
| ** | | Market price return is calculated assuming an initial investment made at the market price at the beginning of the period, reinvestment of all dividends and distributions at market price during the period, and sale at the market price on the last day of the period. The price used to calculate the market price return is the midpoint of the bid/ask spread at the close of business on the NYSE Arca. The midpoint price was $22.04 as of October 31, 2019. |
| *** | | The adviser seeks to achieve the Fund’s objective. There can be no guarantee it will be achieved. |
| (a) | | Percentages indicated are based upon total investments plus the current value of the total net long and short positions within each Total Return Basket Swap as of October 31, 2019. The Fund’s portfolio composition is subject to change. |
| | | | | | |
| | | |
| 10 | | | | J.P. MORGAN EXCHANGE-TRADED FUNDS | | OCTOBER 31, 2019 |
| | | | | | | | | | | | |
AVERAGE ANNUAL TOTAL RETURNSAS OF OCTOBER 31, 2019 (Unaudited) | |
| | | INCEPTION DATE | | | 1 YEAR | | | SINCE
INCEPTION | |
| JPMorgan Long/Short ETF | | | | | | | | | | | | |
| Net Asset Value | | | January 23, 2018 | | | | (1.84 | )% | | | (7.14 | )% |
| Market Price | | | | | | | (2.04 | )% | | | (6.87 | )% |
LIFE OF FUND PERFORMANCE(1/23/18 TO 10/31/19)
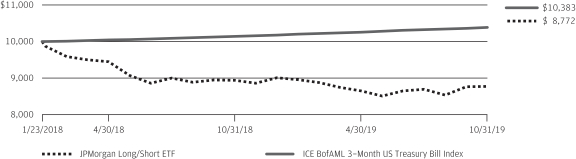
The performance quoted is past performance and is not a guarantee of future results. Exchange-traded funds are subject to certain market risks. Investment returns and principal value of an investment will fluctuate so that an investor’s shares, when sold or redeemed, may be worth more or less than their original cost. Current performance may be higher or lower than the performance data shown. Forup-to-date,month-end performance information please call1-844-457-6383.
Fund commenced operations on January 23, 2018.
The graph illustrates comparative performance for $10,000 invested in shares of the JPMorgan Long/Short ETF and the ICE BofAML3-Month US Treasury Bill Index from January 23, 2018 to October 31, 2019. The performance of the Fund assumes reinvestment of all dividends and capital gain distributions, if any. The performance of the ICE BofAML3-Month US Treasury Bill Index does not reflect the deduction of expenses and has been adjusted to reflect reinvestment of all dividends and capital gain distributions of the securities included in the benchmark, if applicable. The ICE BofAML3-Month US Treasury Bill Index is comprised of a single issue purchased at the beginning of the month and held for a
full month. Each month the index is rebalanced and the issue selected is the outstanding Treasury Bill that matures closest to, but not beyond, 3 months from the rebalancing date. Investors cannot invest directly in an index. The Fund is not an index fund. The Fund is actively managed and does not seek to replicate the performance of a specified index.
The performance of the Fund reflects the deduction of Fund expenses and assumes reinvestment of all dividends and capital gain distributions, if any. Fund performance reflects the waiver of the Fund’s fees and reimbursement of expenses since the inception date. Without these waivers and reimbursements, performance would have been lower. Also, performance shown in this section does not reflect the deduction of taxes that a shareholder may pay on Fund distributions or redemption or sale of Fund shares.
The returns shown are based on net asset values calculated for shareholder transactions and may differ from the returns shown in the financial highlights, which reflect adjustments made to the net asset values in accordance with accounting principles generally accepted in the United States of America.
| | | | | | | | |
| | | |
| OCTOBER 31, 2019 | | J.P. MORGAN EXCHANGE-TRADED FUNDS | | | | | 11 | |
JPMorgan Managed Futures Strategy ETF
FUND COMMENTARY
TWELVE MONTHS ENDED OCTOBER 31, 2019 (Unaudited)
| | | | |
REPORTING PERIOD RETURN: | | | |
| JPMorgan Managed Futures Strategy ETF | | | | |
| Net Asset Value* | | | 7.05% | |
| Market Price** | | | 6.38% | |
| ICE BofAML3-Month US Treasury Bill Index | | | 2.40% | |
| |
| Net Assets as of 10/31/2019 | | $ | 51,499,845 | |
INVESTMENT OBJECTIVE***
The JPMorgan Managed Futures Strategy ETF (the “Fund”) seeks to provide long-term total return.
INVESTMENT APPROACH
The Fund seeks to achieve its investment objective by investing globally to take advantage of opportunities across a broad range of asset classes, including equities, fixed income, currency and commodities based on the portfolio managers’ assessment of their relative attractiveness. The Fund’s portfolio managers seek to identify a set of investment return sources with distinct risk and return profiles that have a low correlation to one another and to traditional markets (each a “return factor”).
The Fund uses derivatives, including swaps, futures, options and forward contracts, in implementing its strategies, and under normal market conditions, the Fund’s managers seek to obtain a significant portion of the Fund’s exposure through the use of derivatives, in addition to its exposure through direct investments. Derivatives, which are instruments that have a value based on another instrument, exchange rate or index, are primarily used as an efficient means of implementing a particular strategy in order to gain exposure to a desired return factor.
HOW DID THE FUND PERFORM?
The Fund posted a positive absolute performance for the twelve months ended October 31, 2019 and outperformed its broad-based market benchmark, the ICE BofAML3-Month US Treasury Bill Index (the “Index”).
The Fund’s allocation to alternative investment strategies, which are not represented in the Index, contributed to performance relative to the Index. References to the Index are for informational purposes and are not an indication of how the
Fund is managed. The use of the Index does not imply the Fund is being managed like the Index and does not imply low risk or low volatility, but rather is disclosed to allow for comparison of the Fund’s performance to that of a well-known and widely recognized index.
On an absolute basis, leading contributors to Fund performance included the Fund’s interest rate directional fixed income-based return factors, which seek to benefit from positive or negative exposure to fixed income assets, primarily through the use of futures contracts. In addition, the Fund’s allocation to relative value fixed income return factors, which seek to balance out long and short positions so that exposure to the asset(s) is neutral, contributed to performance. The Fund’s leading detractor was directional commodity return factors, which seek to benefit from price trends in commodities through the use of futures contracts.
HOW WAS THE FUND POSITIONED?
At the end of the reporting period, the Fund’s largest allocation was to directional fixed income-based return factors.
| * | | The return shown is based on net asset value calculated for shareholder transactions and may differ from the return shown in the financial highlights, which reflects adjustments made to the net asset value in accordance with accounting principles generally accepted in the United States of America. The net asset value was $25.12 as of October 31, 2019. |
| ** | | Market price return is calculated assuming an initial investment made at the market price at the beginning of the period, reinvestment of all dividends and distributions at market price during the period, and sale at the market price on the last day of the period. The price used to calculate the market price return is the midpoint of the bid/ask spread at the close of business on the NYSE Arca. The midpoint price was $25.06 as of October 31, 2019. |
| *** | | The adviser seeks to achieve the Fund’s objective. There can be no guarantee it will be achieved. |
| | | | | | |
| | | |
| 12 | | | | J.P. MORGAN EXCHANGE-TRADED FUNDS | | OCTOBER 31, 2019 |
| | | | | | | | | | | | |
AVERAGE ANNUAL TOTAL RETURNSAS OF OCTOBER 31, 2019 (Unaudited) | |
| | | INCEPTION DATE | | | 1 YEAR | | | SINCE
INCEPTION | |
| JPMorgan Managed Futures Strategy ETF | | | | | | | | | | | | |
| Net Asset Value | | | December 5, 2017 | | | | 7.05% | | | | 0.63% | |
| Market Price | | | | | | | 6.38% | | | | 0.51% | |
LIFE OF FUND PERFORMANCE(12/5/17 TO 10/31/19)
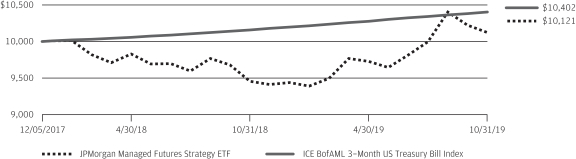
The performance quoted is past performance and is not a guarantee of future results. Exchange-traded funds are subject to certain market risks. Investment returns and principal value of an investment will fluctuate so that an investor’s shares, when sold or redeemed, may be worth more or less than their original cost. Current performance may be higher or lower than the performance data shown. Forup-to-date,month-end performance information please call1-844-457-6383.
Fund commenced operations on December 5, 2017.
The graph illustrates comparative performance for $10,000 invested in shares of the JPMorgan Managed Futures Strategy ETF and the ICE BofAML3-Month US Treasury Bill Index from December 5, 2017 to October 31, 2019. The performance of the Fund assumes reinvestment of all dividends and capital gain distributions, if any. The performance of the ICE BofAML3-Month US Treasury Bill Index does not reflect the deduction of expenses and has been adjusted to reflect reinvestment of all dividends and capital gain distributions of the securities included in the benchmark, if applicable. The ICE BofAML3-Month US Treasury Bill Index is comprised of a single issue purchased at the beginning
of the month and held for a full month. Each month the index is rebalanced and the issue selected is the outstanding Treasury Bill that matures closest to, but not beyond, 3 months from the rebalancing date. Investors cannot invest directly in an index. The Fund is not an index fund. The Fund is actively managed and does not seek to replicate the performance of a specified index.
The performance of the Fund reflects the deduction of Fund expenses and assumes reinvestment of all dividends and capital gain distributions, if any. Fund performance reflects the waiver of the Fund’s fees and reimbursement of expenses since the inception date. Without these waivers and reimbursements, performance would have been lower. Also, performance shown in this section does not reflect the deduction of taxes that a shareholder may pay on Fund distributions or redemption or sale of Fund shares.
The returns shown are based on net asset values calculated for shareholder transactions and may differ from the returns shown in the financial highlights, which reflect adjustments made to the net asset values in accordance with accounting principles generally accepted in the United States of America.
| | | | | | | | |
| | | |
| OCTOBER 31, 2019 | | J.P. MORGAN EXCHANGE-TRADED FUNDS | | | | | 13 | |
JPMorgan Diversified Alternatives ETF
CONSOLIDATED SCHEDULE OF PORTFOLIO INVESTMENTS
AS OF OCTOBER 31, 2019
(Amounts in U.S. Dollars, unless otherwise noted)
| | | | | | | | |
| INVESTMENTS | | SHARES | | | VALUE | |
Common Stocks — 51.0% | |
|
Airlines — 0.3% | |
| | |
Alaska Air Group, Inc. | | | 2,582 | | | | 179,268 | |
| | |
United Airlines Holdings, Inc.* | | | 1,846 | | | | 167,691 | |
| | | | | | | | |
| | |
| | | | | | | 346,959 | |
| | | | | | | | |
|
Auto Components — 0.1% | |
| | |
Gentex Corp. | | | 4,779 | | | | 134,051 | |
| | | | | | | | |
|
Banks — 1.7% | |
| | |
OFG Bancorp (Puerto Rico) | | | 7,446 | | | | 151,228 | |
| | |
Pacific Premier Bancorp, Inc. | | | 7,450 | | | | 251,475 | |
| | |
Popular, Inc. (Puerto Rico) | | | 2,957 | | | | 161,038 | |
| | |
SunTrust Banks, Inc. | | | 14,433 | | | | 986,351 | |
| | |
Synovus Financial Corp. | | | 6,658 | | | | 225,507 | |
| | | | | | | | |
| | |
| | | | | | | 1,775,599 | |
| | | | | | | | |
|
Beverages — 0.3% | |
| | |
Coca-Cola European Partners plc (United Kingdom) | | | 2,839 | | | | 151,915 | |
| | |
Molson Coors Brewing Co., Class B | | | 2,980 | | | | 157,105 | |
| | | | | | | | |
| | |
| | | | | | | 309,020 | |
| | | | | | | | |
|
Biotechnology — 2.8% | |
| | |
Ligand Pharmaceuticals, Inc.* | | | 2,112 | | | | 229,806 | |
| | |
Ra Pharmaceuticals, Inc.* | | | 27,826 | | | | 1,309,770 | |
| | |
Spark Therapeutics, Inc.* | | | 12,669 | | | | 1,383,075 | |
| | | | | | | | |
| | |
| | | | | | | 2,922,651 | |
| | | | | | | | |
|
Building Products — 0.2% | |
| | |
Johnson Controls International plc | | | 5,353 | | | | 231,945 | |
| | | | | | | | |
|
Capital Markets — 0.7% | |
| | |
Cohen & Steers, Inc. | | | 2,487 | | | | 162,749 | |
| | |
Lazard Ltd., Class A | | | 6,634 | | | | 247,647 | |
| | |
Legg Mason, Inc. | | | 4,244 | | | | 158,132 | |
| | |
Virtus Investment Partners, Inc. | | | 1,537 | | | | 166,734 | |
| | | | | | | | |
| | |
| | | | | | | 735,262 | |
| | | | | | | | |
|
Chemicals — 1.2% | |
| | |
CF Industries Holdings, Inc. | | | 2,888 | | | | 130,971 | |
| | |
Eastman Chemical Co. | | | 1,725 | | | | 131,169 | |
| | |
Ecolab, Inc. | | | 2,725 | | | | 523,390 | |
| | |
Huntsman Corp. | | | 5,915 | | | | 130,899 | |
| | |
Kraton Corp.* | | | 5,571 | | | | 124,902 | |
| | |
LyondellBasell Industries NV, Class A | | | 2,667 | | | | 239,230 | |
| | | | | | | | |
| | |
| | | | | | | 1,280,561 | |
| | | | | | | | |
|
Commercial Services & Supplies — 1.0% | |
| | |
ABM Industries, Inc. | | | 4,273 | | | | 155,794 | |
| | |
Brady Corp., Class A | | | 2,726 | | | | 153,583 | |
| | |
Deluxe Corp. | | | 2,981 | | | | 154,505 | |
| | | | | | | | |
| INVESTMENTS | | SHARES | | | VALUE | |
| | | | | | | | |
|
Commercial Services & Supplies — continued | |
| | |
Herman Miller, Inc. | | | 3,925 | | | | 182,512 | |
| | |
Pitney Bowes, Inc. | | | 54,472 | | | | 239,677 | |
| | |
Tetra Tech, Inc. | | | 1,935 | | | | 169,254 | |
| | | | | | | | |
| | |
| | | | | | | 1,055,325 | |
| | | | | | | | |
|
Communications Equipment — 0.9% | |
| | |
Acacia Communications, Inc.* | | | 4,956 | | | | 325,411 | |
| | |
Cisco Systems, Inc. | | | 3,226 | | | | 153,268 | |
| | |
CommScope Holding Co., Inc.* | | | 14,521 | | | | 162,635 | |
| | |
Juniper Networks, Inc. | | | 6,510 | | | | 161,578 | |
| | |
NetScout Systems, Inc.* | | | 7,092 | | | | 171,768 | |
| | | | | | | | |
| | |
| | | | | | | 974,660 | |
| | | | | | | | |
|
Construction Materials — 0.1% | |
| | |
Eagle Materials, Inc. | | | 1,500 | | | | 137,010 | |
| | | | | | | | |
|
Consumer Finance — 0.7% | |
| | |
Ally Financial, Inc. | | | 5,050 | | | | 154,681 | |
| | |
Navient Corp. | | | 11,600 | | | | 159,732 | |
| | |
Santander Consumer USA Holdings, Inc. | | | 5,899 | | | | 147,947 | |
| | |
SLM Corp. | | | 14,000 | | | | 118,160 | |
| | |
World Acceptance Corp.* | | | 1,505 | | | | 156,234 | |
| | | | | | | | |
| | |
| | | | | | | 736,754 | |
| | | | | | | | |
|
Containers & Packaging — 0.3% | |
| | |
Owens-Illinois, Inc. | | | 8,800 | | | | 74,800 | |
| | |
Silgan Holdings, Inc. | | | 4,332 | | | | 133,296 | |
| | |
Sonoco Products Co. | | | 2,327 | | | | 134,268 | |
| | | | | | | | |
| | |
| | | | | | | 342,364 | |
| | | | | | | | |
|
Distributors — 0.2% | |
| | |
Core-Mark Holding Co., Inc. | | | 4,503 | | | | 137,432 | |
| | |
LKQ Corp.* | | | 2,300 | | | | 78,177 | |
| | | | | | | | |
| | |
| | | | | | | 215,609 | |
| | | | | | | | |
|
Diversified Consumer Services — 0.3% | |
| | |
H&R Block, Inc. | | | 5,578 | | | | 139,394 | |
| | |
K12, Inc.* | | | 6,033 | | | | 119,393 | |
| | | | | | | | |
| | |
| | | | | | | 258,787 | |
| | | | | | | | |
|
Diversified Financial Services — 0.2% | |
| | |
AXA Equitable Holdings, Inc. | | | 11,590 | | | | 250,344 | |
| | | | | | | | |
|
Diversified Telecommunication Services — 0.3% | |
| | |
CenturyLink, Inc. | | | 12,499 | | | | 161,737 | |
| | |
Verizon Communications, Inc. | | | 2,745 | | | | 165,990 | |
| | | | | | | | |
| | |
| | | | | | | 327,727 | |
| | | | | | | | |
|
Electric Utilities — 0.7% | |
| | |
Evergy, Inc. | | | 4,021 | | | | 256,982 | |
| | |
Exelon Corp. | | | 3,455 | | | | 157,168 | |
SEE NOTES TO CONSOLIDATED FINANCIAL STATEMENTS.
| | | | | | |
| | | |
| 14 | | | | J.P. MORGAN EXCHANGE-TRADED FUNDS | | OCTOBER 31, 2019 |
| | | | | | | | |
| INVESTMENTS | | SHARES | | | VALUE | |
Common Stocks — continued | |
|
Electric Utilities — continued | |
| | |
OGE Energy Corp. | | | 3,625 | | | | 156,092 | |
| | |
Pinnacle West Capital Corp. | | | 1,648 | | | | 155,110 | |
| | | | | | | | |
| | |
| | | | | | | 725,352 | |
| | | | | | | | |
|
Electrical Equipment — 2.2% | |
| | |
Atkore International Group, Inc.* | | | 4,561 | | | | 158,267 | |
| | |
Eaton Corp. plc | | | 7,719 | | | | 672,402 | |
| | |
Generac Holdings, Inc.* | | | 1,753 | | | | 169,305 | |
| | |
nVent Electric plc | | | 7,411 | | | | 170,898 | |
| | |
OSRAM Licht AG (Germany) | | | 21,724 | | | | 969,151 | |
| | |
Regal Beloit Corp. | | | 2,190 | | | | 162,169 | |
| | | | | | | | |
| | |
| | | | | | | 2,302,192 | |
| | | | | | | | |
|
Electronic Equipment, Instruments & Components — 1.2% | |
| | |
Benchmark Electronics, Inc. | | | 7,765 | | | | 263,233 | |
| | |
CDW Corp. | | | 1,369 | | | | 175,109 | |
| | |
Dolby Laboratories, Inc., Class A | | | 2,597 | | | | 167,065 | |
| | |
Fabrinet (Thailand)* | | | 2,771 | | | | 155,813 | |
| | |
Insight Enterprises, Inc.* | | | 2,603 | | | | 159,772 | |
| | |
Tech Data Corp.* | | | 1,301 | | | | 158,072 | |
| | |
Zebra Technologies Corp., Class A* | | | 763 | | | | 181,495 | |
| | | | | | | | |
| | |
| | | | | | | 1,260,559 | |
| | | | | | | | |
|
Energy Equipment & Services — 0.3% | |
| | |
Patterson-UTI Energy, Inc. | | | 27,955 | | | | 232,586 | |
| | |
ProPetro Holding Corp.* | | | 16,759 | | | | 129,882 | |
| | | | | | | | |
| | |
| | | | | | | 362,468 | |
| | | | | | | | |
|
Entertainment — 0.8% | |
| | |
IMAX Corp.* | | | 7,401 | | | | 158,011 | |
| | |
Madison Square Garden Co. (The), Class A* | | | 1,843 | | | | 491,934 | |
| | |
Marcus Corp. (The) | | | 4,378 | | | | 158,046 | |
| | | | | | | | |
| | |
| | | | | | | 807,991 | |
| | | | | | | | |
|
Food & Staples Retailing — 0.2% | |
| | |
Walmart, Inc. | | | 1,375 | | | | 161,232 | |
| | | | | | | | |
|
Food Products — 1.2% | |
| | |
B&G Foods, Inc. | | | 10,123 | | | | 157,413 | |
| | |
General Mills, Inc. | | | 2,834 | | | | 144,137 | |
| | |
Hershey Co. (The) | | | 992 | | | | 145,695 | |
| | |
Hostess Brands, Inc.* | | | 11,609 | | | | 148,363 | |
| | |
Ingredion, Inc. | | | 2,041 | | | | 161,239 | |
| | |
Mondelez International, Inc., Class A | | | 3,416 | | | | 179,169 | |
| | |
TreeHouse Foods, Inc.* | | | 2,924 | | | | 157,955 | |
| | |
Tyson Foods, Inc., Class A | | | 1,789 | | | | 148,111 | |
| | | | | | | | |
| | |
| | | | | | | 1,242,082 | |
| | | | | | | | |
| | | | | | | | |
| INVESTMENTS | | SHARES | | | VALUE | |
| | | | | | | | |
|
Health Care Equipment & Supplies — 1.8% | |
| | |
Atrion Corp. | | | 209 | | | | 176,277 | |
| | |
Baxter International, Inc. | | | 1,780 | | | | 136,526 | |
| | |
Danaher Corp. | | | 6,374 | | | | 878,465 | |
| | |
Dentsply Sirona, Inc. | | | 3,308 | | | | 181,212 | |
| | |
Hill-Rom Holdings, Inc. | | | 1,482 | | | | 155,151 | |
| | |
Integer Holdings Corp.* | | | 2,353 | | | | 182,216 | |
| | |
STERIS plc | | | 1,021 | | | | 144,543 | |
| | | | | | | | |
| | |
| | | | | | | 1,854,390 | |
| | | | | �� | | | |
|
Health Care Providers & Services — 1.2% | |
| | |
Acadia Healthcare Co., Inc.* | | | 2,300 | | | | 68,977 | |
| | |
Chemed Corp. | | | 361 | | | | 142,202 | |
| | |
Encompass Health Corp. | | | 2,513 | | | | 160,882 | |
| | |
Ensign Group, Inc. (The) | | | 3,808 | | | | 160,888 | |
| | |
Magellan Health, Inc.* | | | 2,000 | | | | 129,800 | |
| | |
Premier, Inc., Class A* | | | 4,067 | | | | 132,503 | |
| | |
Sigma Healthcare Ltd. (Australia) | | | 767,437 | | | | 307,488 | |
| | |
UnitedHealth Group, Inc. | | | 639 | | | | 161,475 | |
| | | | | | | | |
| | |
| | | | | | | 1,264,215 | |
| | | | | | | | |
|
Hotels, Restaurants & Leisure — 1.2% | |
| | |
Aramark | | | 2,100 | | | | 91,896 | |
| | |
Bloomin’ Brands, Inc. | | | 4,100 | | | | 81,221 | |
| | |
Cracker Barrel Old Country Store, Inc. | | | 800 | | | | 124,400 | |
| | |
Dave & Buster’s Entertainment, Inc. | | | 6,368 | | | | 253,319 | |
| | |
Dine Brands Global, Inc. | | | 1,625 | | | | 118,869 | |
| | |
Koshidaka Holdings Co. Ltd. (Japan) | | | 8,600 | | | | 124,881 | |
| | |
SeaWorld Entertainment, Inc.* | | | 8,858 | | | | 234,028 | |
| | |
Starbucks Corp. | | | 1,536 | | | | 129,884 | |
| | |
Wyndham Destinations, Inc. | | | 3,081 | | | | 142,989 | |
| | | | | | | | |
| | |
| | | | | | | 1,301,487 | |
| | | | | | | | |
|
Household Durables — 1.3% | |
| | |
Electrolux AB, Series B (Sweden) | | | 18,494 | | | | 486,232 | |
| | |
Garmin Ltd. | | | 1,545 | | | | 144,844 | |
| | |
Helen of Troy Ltd.* | | | 822 | | | | 123,103 | |
| | |
KB Home | | | 3,580 | | | | 127,770 | |
| | |
La-Z-Boy, Inc. | | | 3,919 | | | | 139,164 | |
| | |
Meritage Homes Corp.* | | | 1,765 | | | | 127,239 | |
| | |
NVR, Inc.* | | | 36 | | | | 130,917 | |
| | |
PulteGroup, Inc. | | | 3,246 | | | | 127,373 | |
| | | | | | | | |
| | |
| | | | | | | 1,406,642 | |
| | | | | | | | |
|
Household Products — 0.4% | |
| | |
Church & Dwight Co., Inc. | | | 1,963 | | | | 137,292 | |
| | |
Kimberly-Clark Corp. | | | 1,096 | | | | 145,636 | |
| | |
Procter & Gamble Co. (The) | | | 1,301 | | | | 161,988 | |
| | | | | | | | |
| | |
| | | | | | | 444,916 | |
| | | | | | | | |
SEE NOTES TO CONSOLIDATED FINANCIAL STATEMENTS.
| | | | | | | | |
| | | |
| OCTOBER 31, 2019 | | J.P. MORGAN EXCHANGE-TRADED FUNDS | | | | | 15 | |
JPMorgan Diversified Alternatives ETF
CONSOLIDATED SCHEDULE OF PORTFOLIO INVESTMENTS
AS OF OCTOBER 31, 2019 (continued)
(Amounts in U.S. Dollars, unless otherwise noted)
| | | | | | | | |
| INVESTMENTS | | SHARES | | | VALUE | |
Common Stocks — continued | |
|
Independent Power and Renewable Electricity Producers — 0.5% | |
| | |
AES Corp. | | | 9,349 | | | | 159,401 | |
| | |
Atlantica Yield plc (Spain) | | | 6,624 | | | | 159,042 | |
| | |
Clearway Energy, Inc., Class C | | | 8,930 | | | | 161,901 | |
| | | | | | | | |
| | |
| | | | | | | 480,344 | |
| | | | | | | | |
|
Insurance — 0.5% | |
| | |
First American Financial Corp. | | | 2,826 | | | | 174,590 | |
| | |
MBIA, Inc.* | | | 24,157 | | | | 224,419 | |
| | |
MetLife, Inc. | | | 3,449 | | | | 161,379 | |
| | | | | | | | |
| | |
| | | | | | | 560,388 | |
| | | | | | | | |
|
Interactive Media & Services — 0.5% | |
| | |
IAC/InterActiveCorp* | | | 1,400 | | | | 318,150 | |
| | |
Yelp, Inc.* | | | 7,140 | | | | 246,401 | |
| | | | | | | | |
| | |
| | | | | | | 564,551 | |
| | | | | | | | |
|
Internet & Direct Marketing Retail — 0.5% | |
| | |
Booking Holdings, Inc.* | | | 129 | | | | 264,291 | |
| | |
Quotient Technology, Inc.* | | | 29,593 | | | | 254,796 | |
| | | | | | | | |
| | |
| | | | | | | 519,087 | |
| | | | | | | | |
|
IT Services — 2.1% | |
| | |
Accenture plc, Class A | | | 802 | | | | 148,707 | |
| | |
Akamai Technologies, Inc.* | | | 1,797 | | | | 155,441 | |
| | |
Automatic Data Processing, Inc. | | | 926 | | | | 150,225 | |
| | |
Broadridge Financial Solutions, Inc. | | | 1,220 | | | | 152,768 | |
| | |
CACI International, Inc., Class A* | | | 747 | | | | 167,141 | |
| | |
Cardtronics plc, Class A* | | | 4,425 | | | | 151,601 | |
| | |
CSG Systems International, Inc. | | | 2,983 | | | | 171,940 | |
| | |
Euronet Worldwide, Inc.* | | | 1,025 | | | | 143,572 | |
| | |
EVERTEC, Inc. (Puerto Rico) | | | 5,272 | | | | 161,270 | |
| | |
ManTech International Corp., Class A | | | 2,271 | | | | 179,818 | |
| | |
Mastercard, Inc., Class A | | | 563 | | | | 155,844 | |
| | |
MAXIMUS, Inc. | | | 2,008 | | | | 154,094 | |
| | |
Perficient, Inc.* | | | 4,331 | | | | 169,775 | |
| | |
Visa, Inc., Class A | | | 870 | | | | 155,608 | |
| | | | | | | | |
| | |
| | | | | | | 2,217,804 | |
| | | | | | | | |
|
Life Sciences Tools & Services — 0.6% | |
| | |
Agilent Technologies, Inc. | | | 2,180 | | | | 165,135 | |
| | |
Charles River Laboratories International, Inc.* | | | 1,197 | | | | 155,586 | |
| | |
ICON plc (Ireland)* | | | 994 | | | | 146,019 | |
| | |
Medpace Holdings, Inc.* | | | 1,932 | | | | 142,253 | |
| | | | | | | | |
| | |
| | | | | | | 608,993 | |
| | | | | | | | |
|
Machinery — 2.3% | |
| | |
AGCO Corp. | | | 2,142 | | | | 164,270 | |
| | |
Allison Transmission Holdings, Inc. | | | 3,586 | | | | 156,385 | |
| | |
CNH Industrial NV (United Kingdom) | | | 24,700 | | | | 269,477 | |
| | | | | | | | |
| INVESTMENTS | | SHARES | | | VALUE | |
| | | | | | | | |
|
Machinery — continued | |
| | |
Cummins, Inc. | | | 1,019 | | | | 175,757 | |
| | |
Fortive Corp. | | | 4,800 | | | | 331,200 | |
| | |
Ingersoll-Rand plc | | | 3,527 | | | | 447,541 | |
| | |
ITT, Inc. | | | 2,733 | | | | 162,477 | |
| | |
Meritor, Inc.* | | | 10,336 | | | | 227,702 | |
| | |
Oshkosh Corp. | | | 1,877 | | | | 160,258 | |
| | |
Snap-on, Inc. | | | 957 | | | | 155,675 | |
| | |
Watts Water Technologies, Inc., Class A | | | 1,818 | | | | 169,529 | |
| | | | | | | | |
| | |
| | | | | | | 2,420,271 | |
| | | | | | | | |
|
Media — 1.4% | |
| | |
AMC Networks, Inc., Class A* | | | 3,102 | | | | 135,092 | |
| | |
Comcast Corp., Class A | | | 3,556 | | | | 159,380 | |
| | |
Gray Television, Inc.* | | | 10,022 | | | | 164,461 | |
| | |
iHeartMedia, Inc., Class A* | | | 5,000 | | | | 71,700 | |
| | |
Nexstar Media Group, Inc., Class A | | | 1,620 | | | | 157,610 | |
| | |
Omnicom Group, Inc. | | | 2,004 | | | | 154,689 | |
| | |
Sinclair Broadcast Group, Inc., Class A | | | 3,997 | | | | 159,240 | |
| | |
Sirius XM Holdings, Inc. | | | 35,875 | | | | 241,080 | |
| | |
TEGNA, Inc. | | | 14,964 | | | | 224,909 | |
| | | | | | | | |
| | |
| | | | | | | 1,468,161 | |
| | | | | | | | |
|
Metals & Mining — 0.5% | |
| | |
Sandstorm Gold Ltd. (Canada)* | | | 18,700 | | | | 133,460 | |
| | |
Schnitzer Steel Industries, Inc., Class A | | | 6,653 | | | | 141,975 | |
| | |
Steel Dynamics, Inc. | | | 4,362 | | | | 132,430 | |
| | |
Warrior Met Coal, Inc. | | | 5,920 | | | | 115,322 | |
| | | | | | | | |
| | |
| | | | | | | 523,187 | |
| | | | | | | | |
|
Multiline Retail — 0.5% | |
| | |
Dillard’s, Inc., Class A | | | 3,365 | | | | 232,118 | |
| | |
Kohl’s Corp. | | | 2,592 | | | | 132,866 | |
| | |
Nordstrom, Inc. | | | 3,407 | | | | 122,311 | |
| | | | | | | | |
| | |
| | | | | | | 487,295 | |
| | | | | | | | |
|
Multi-Utilities — 0.2% | |
| | |
NorthWestern Corp. | | | 2,180 | | | | 158,094 | |
| | | | | | | | |
|
Oil, Gas & Consumable Fuels — 2.3% | |
| | |
Arch Coal, Inc., Class A | | | 2,007 | | | | 158,332 | |
| | |
Chevron Corp. | | | 1,335 | | | | 155,047 | |
| | |
ConocoPhillips | | | 2,900 | | | | 160,080 | |
| | |
CVR Energy, Inc. | | | 3,889 | | | | 184,417 | |
| | |
Delek US Holdings, Inc. | | | 3,923 | | | | 156,724 | |
| | |
Devon Energy Corp. | | | 9,018 | | | | 182,885 | |
| | |
HollyFrontier Corp. | | | 2,721 | | | | 149,492 | |
| | |
Murphy Oil Corp. | | | 10,424 | | | | 215,047 | |
| | |
PDC Energy, Inc.* | | | 8,673 | | | | 173,026 | |
SEE NOTES TO CONSOLIDATED FINANCIAL STATEMENTS.
| | | | | | |
| | | |
| 16 | | | | J.P. MORGAN EXCHANGE-TRADED FUNDS | | OCTOBER 31, 2019 |
| | | | | | | | |
| INVESTMENTS | | SHARES | | | VALUE | |
Common Stocks — continued | |
|
Oil, Gas & Consumable Fuels — continued | |
| | |
Peabody Energy Corp. | | | 16,155 | | | | 170,112 | |
| | |
Phillips 66 | | | 1,336 | | | | 156,072 | |
| | |
Renewable Energy Group, Inc.* | | | 9,657 | | | | 157,795 | |
| | |
Tallgrass Energy LP, Class A | | | 20,665 | | | | 385,609 | |
| | | | | | | | |
| | |
| | | | | | | 2,404,638 | |
| | | | | | | | |
|
Paper & Forest Products — 0.8% | |
| | |
Canfor Corp. (Canada)* | | | 34,476 | | | | 416,717 | |
| | |
Domtar Corp. | | | 3,661 | | | | 133,224 | |
| | |
Louisiana-Pacific Corp. | | | 4,680 | | | | 136,796 | |
| | |
Schweitzer-Mauduit International, Inc. | | | 3,380 | | | | 136,856 | |
| | | | | | | | |
| | |
| | | | | | | 823,593 | |
| | | | | | | | |
|
Personal Products — 0.2% | |
| | |
Medifast, Inc. | | | 1,687 | | | | 187,156 | |
| | | | | | | | |
|
Pharmaceuticals — 1.2% | |
| | |
Eli Lilly & Co. | | | 2,336 | | | | 266,187 | |
| | |
Horizon Therapeutics plc* | | | 5,689 | | | | 164,469 | |
| | |
Jazz Pharmaceuticals plc* | | | 1,152 | | | | 144,726 | |
| | |
Johnson & Johnson | | | 1,183 | | | | 156,203 | |
| | |
Merck & Co., Inc. | | | 2,165 | | | | 187,619 | |
| | |
Pfizer, Inc. | | | 4,855 | | | | 186,287 | |
| | |
Taro Pharmaceutical Industries Ltd. | | | 1,900 | | | | 153,596 | |
| | | | | | | | |
| | |
| | | | | | | 1,259,087 | |
| | | | | | | | |
|
Professional Services — 0.6% | |
| | |
FTI Consulting, Inc.* | | | 1,623 | | | | 176,696 | |
| | |
Korn Ferry | | | 4,391 | | | | 161,106 | |
| | |
Nielsen Holdings plc | | | 6,100 | | | | 122,976 | |
| | |
Robert Half International, Inc. | | | 3,016 | | | | 172,726 | |
| | | | | | | | |
| | |
| | | | | | | 633,504 | |
| | | | | | | | |
|
Real Estate Management & Development — 1.0% | |
| | |
Unizo Holdings Co. Ltd. (Japan) | | | 21,500 | | | | 991,634 | |
| | | | | | | | |
|
Road & Rail — 0.8% | |
| | |
ArcBest Corp. | | | 5,183 | | | | 149,737 | |
| | |
CSX Corp. | | | 2,244 | | | | 157,686 | |
| | |
Genesee & Wyoming, Inc., Class A* | | | 4,500 | | | | 499,635 | |
| | | | | | | | |
| | |
| | | | | | | 807,058 | |
| | | | | | | | |
|
Semiconductors & Semiconductor Equipment — 2.4% | |
| | |
Cabot Microelectronics Corp. | | | 1,010 | | | | 152,631 | |
| | |
Cirrus Logic, Inc.* | | | 2,752 | | | | 187,026 | |
| | |
Diodes, Inc.* | | | 3,967 | | | | 185,060 | |
| | |
Intel Corp. | | | 2,822 | | | | 159,528 | |
| | |
KLA Corp. | | | 930 | | | | 157,207 | |
| | |
Kulicke & Soffa Industries, Inc. (Singapore) | | | 7,507 | | | | 178,254 | |
| | | | | | | | |
| INVESTMENTS | | SHARES | | | VALUE | |
| | | | | | | | |
|
Semiconductors & Semiconductor Equipment — continued | |
| | |
Lam Research Corp. | | | 572 | | | | 155,035 | |
| | |
Mellanox Technologies Ltd.* | | | 4,050 | | | | 456,435 | |
| | |
MKS Instruments, Inc. | | | 1,413 | | | | 152,915 | |
| | |
NXP Semiconductors NV (Netherlands) | | | 2,120 | | | | 241,002 | |
| | |
Qorvo, Inc.* | | | 2,172 | | | | 175,628 | |
| | |
Rambus, Inc.* | | | 11,586 | | | | 160,408 | |
| | |
Teradyne, Inc. | | | 2,810 | | | | 172,028 | |
| | |
Xperi Corp. | | | 1,453 | | | | 29,503 | |
| | | | | | | | |
| | |
| | | | | | | 2,562,660 | |
| | | | | | | | |
|
Software — 2.6% | |
| | |
Check Point Software Technologies Ltd. (Israel)* | | | 1,438 | | | | 161,646 | |
| | |
Cision Ltd.* | | | 79,853 | | | | 804,120 | |
| | |
Citrix Systems, Inc. | | | 1,691 | | | | 184,082 | |
| | |
ForeScout Technologies, Inc.* | | | 2,600 | | | | 79,976 | |
| | |
Intuit, Inc. | | | 571 | | | | 147,033 | |
| | |
LogMeIn, Inc. | | | 2,258 | | | | 148,305 | |
| | |
Microsoft Corp. | | | 1,130 | | | | 162,008 | |
| | |
Oracle Corp. | | | 2,904 | | | | 158,239 | |
| | |
Pivotal Software, Inc., Class A* | | | 28,924 | | | | 432,992 | |
| | |
Progress Software Corp. | | | 4,042 | | | | 161,195 | |
| | |
TiVo Corp. | | | 28,599 | | | | 232,796 | |
| | | | | | | | |
| | |
| | | | | | | 2,672,392 | |
| | | | | | | | |
|
Specialty Retail — 2.9% | |
| | |
Aaron’s, Inc. | | | 1,630 | | | | 122,136 | |
| | |
Abercrombie & Fitch Co., Class A | | | 7,392 | | | | 119,677 | |
| | |
American Eagle Outfitters, Inc. | | | 7,858 | | | | 120,856 | |
| | |
Best Buy Co., Inc. | | | 1,712 | | | | 122,973 | |
| | |
Designer Brands, Inc., Class A | | | 13,444 | | | | 221,826 | |
| | |
Dick’s Sporting Goods, Inc. | | | 8,935 | | | | 347,840 | |
| | |
Foot Locker, Inc. | | | 5,482 | | | | 238,522 | |
| | |
Gap, Inc. (The) | | | 18,755 | | | | 304,956 | |
| | |
Genesco, Inc.* | | | 9,135 | | | | 354,895 | |
| | |
Guess?, Inc. | | | 12,795 | | | | 214,316 | |
| | |
Office Depot, Inc. | | | 61,956 | | | | 127,629 | |
| | |
Rent-A-Center, Inc. | | | 5,484 | | | | 141,871 | |
| | |
Signet Jewelers Ltd. | | | 7,106 | | | | 113,980 | |
| | |
Urban Outfitters, Inc.* | | | 8,150 | | | | 233,905 | |
| | |
Williams-Sonoma, Inc. | | | 1,919 | | | | 128,170 | |
| | |
Zumiez, Inc.* | | | 4,224 | | | | 134,788 | |
| | | | | | | | |
| | |
| | | | | | | 3,048,340 | |
| | | | | | | | |
|
Technology Hardware, Storage & Peripherals — 0.7% | |
| | |
Apple, Inc. | | | 655 | | | | 162,938 | |
| | |
NetApp, Inc. | | | 2,870 | | | | 160,375 | |
| | |
Seagate Technology plc | | | 4,302 | | | | 249,645 | |
SEE NOTES TO CONSOLIDATED FINANCIAL STATEMENTS.
| | | | | | | | |
| | | |
| OCTOBER 31, 2019 | | J.P. MORGAN EXCHANGE-TRADED FUNDS | | | | | 17 | |
JPMorgan Diversified Alternatives ETF
CONSOLIDATED SCHEDULE OF PORTFOLIO INVESTMENTS
AS OF OCTOBER 31, 2019 (continued)
(Amounts in U.S. Dollars, unless otherwise noted)
| | | | | | | | |
| INVESTMENTS | | SHARES | | | VALUE | |
Common Stocks — continued | |
|
Technology Hardware, Storage & Peripherals — continued | |
| | |
Xerox Holdings Corp. | | | 4,632 | | | | 157,164 | |
| | | | | | | | |
| | |
| | | | | | | 730,122 | |
| | | | | | | | |
|
Textiles, Apparel & Luxury Goods — 0.8% | |
| | |
Carter’s, Inc. | | | 1,408 | | | | 141,138 | |
| | |
Columbia Sportswear Co. | | | 1,540 | | | | 139,293 | |
| | |
Deckers Outdoor Corp.* | | | 969 | | | | 148,160 | |
| | |
Ralph Lauren Corp. | | | 1,318 | | | | 126,607 | |
| | |
Wolverine World Wide, Inc. | | | 8,425 | | | | 250,054 | |
| | | | | | | | |
| | |
| | | | | | | 805,252 | |
| | | | | | | | |
|
Thrifts & Mortgage Finance — 0.2% | |
| | |
Radian Group, Inc. | | | 6,823 | | | | 171,257 | |
| | | | | | | | |
|
Trading Companies & Distributors — 1.1% | |
| | |
BMC Stock Holdings, Inc.* | | | 6,176 | | | | 166,690 | |
| | |
HD Supply Holdings, Inc.* | | | 8,700 | | | | 343,998 | |
| | |
Triton International Ltd. (Bermuda) | | | 6,733 | | | | 247,101 | |
| | |
WESCO International, Inc.* | | | 7,527 | | | | 377,479 | |
| | | | | | | | |
| | |
| | | | | | | 1,135,268 | |
| | | | | | | | |
| |
Total Common Stocks
(Cost $50,866,511) | | | | 53,408,290 | |
| | | | | | | | |
| | |
| INVESTMENTS | | PRINCIPAL
AMOUNT | | | | |
Short-Term Investments — 31.9% | |
|
Foreign Government Treasury Bills — 2.0% | |
| | |
Japan Treasury Bills (Japan) (0.27)%, 3/10/2020 (c)
(Cost $2,112,709) | | | JPY 228,200,000 | | | | 2,114,733 | |
| | | | | | | | |
| INVESTMENTS | | SHARES | | | VALUE | |
| | | | | | | | |
| | |
Investment Companies — 29.9% | | | | | | | | |
| | |
JPMorgan Prime Money Market Fund Class Institutional Shares, 1.88% (a)(b) | | | 18,903,424 | | | | 18,910,985 | |
| | | | | | | | |
| | |
JPMorgan U.S. Government Money Market Fund Class Institutional Shares, 1.64% (a)(b) | | | 12,410,484 | | | | 12,410,484 | |
| | | | | | | | |
| | |
Total Investment Companies
(Cost $31,317,626) | | | | | | | 31,321,469 | |
| | | | | | | | |
Total Short-Term Investments
(Cost $33,430,335) | | | | | | | 33,436,202 | |
| | | | | | | | |
Total Investments — 82.9%
(Cost $84,296,846) | | | | | | | 86,844,492 | |
Other Assets Less Liabilities — 17.1% | | | | | | | 17,953,899 | |
| | | | | | | | |
NET ASSETS — 100.0% | | | | | | | 104,798,391 | |
| | | | | | | | |
Percentages indicated are based on net assets.
| | |
Abbreviations |
| JPY | | Japanese Yen |
| |
| (a) | | Investment in an affiliated fund, which is registered under the Investment Company Act of 1940, as amended, and is advised by J.P. Morgan Investment Management Inc. |
| (b) | | The rate shown is the current yield as of October 31, 2019. |
| (c) | | The rate shown is the effective yield as of October 31, 2019. |
| * | | Non-income producing security. |
| | | | | | | | | | | | | | | | | | | | |
| Futures contracts outstanding as of October 31, 2019: | |
| DESCRIPTION | | NUMBER OF
CONTRACTS | | | EXPIRATION
DATE | | | TRADING
CURRENCY | | | NOTIONAL
AMOUNT ($) | | | VALUE AND
UNREALIZED
APPRECIATION
(DEPRECIATION) ($) | |
|
Long Contracts | |
CAC 40 10 Euro Index | | | 10 | | | | 11/2019 | | | | EUR | | | | 639,848 | | | | 3,737 | |
Feeder Cattle | | | 14 | | | | 11/2019 | | | | USD | | | | 1,033,200 | | | | 102,146 | |
IBEX 35 Index | | | 2 | | | | 11/2019 | | | | EUR | | | | 207,155 | | | | (712 | ) |
LME Aluminum Base Metal | | | 19 | | | | 11/2019 | | | | USD | | | | 836,713 | | | | (8,181 | ) |
LME Nickel Base Metal | | | 13 | | | | 11/2019 | | | | USD | | | | 1,301,898 | | | | (63,368 | ) |
LME Zinc Base Metal | | | 16 | | | | 11/2019 | | | | USD | | | | 1,010,000 | | | | 113,090 | |
Natural Gas | | | 3 | | | | 11/2019 | | | | USD | | | | 79,050 | | | | 6,110 | |
100 oz Gold | | | 18 | | | | 12/2019 | | | | USD | | | | 2,724,660 | | | | 121,912 | |
Australia 10 Year Bond | | | 63 | | | | 12/2019 | | | | AUD | | | | 6,332,345 | | | | (18,013 | ) |
Australia 3 Year Bond | | | 115 | | | | 12/2019 | | | | AUD | | | | 9,145,808 | | | | (2,220 | ) |
Canada 10 Year Bond | | | 22 | | | | 12/2019 | | | | CAD | | | | 2,372,880 | | | | (38,842 | ) |
Cocoa | | | 8 | | | | 12/2019 | | | | USD | | | | 192,240 | | | | (4,944 | ) |
DAX Index | | | 1 | | | | 12/2019 | | | | EUR | | | | 359,322 | | | | 14,241 | |
EURO STOXX 50 Index | | | 27 | | | | 12/2019 | | | | EUR | | | | 1,085,577 | | | | 24,423 | |
Euro-Bobl | | | 54 | | | | 12/2019 | | | | EUR | | | | 8,110,060 | | | | (106,753 | ) |
SEE NOTES TO CONSOLIDATED FINANCIAL STATEMENTS.
| | | | | | |
| | | |
| 18 | | | | J.P. MORGAN EXCHANGE-TRADED FUNDS | | OCTOBER 31, 2019 |
| | | | | | | | | | | | | | | | | | | | |
| DESCRIPTION | | NUMBER OF
CONTRACTS | | | EXPIRATION
DATE | | | TRADING
CURRENCY | | | NOTIONAL
AMOUNT ($) | | | VALUE AND
UNREALIZED
APPRECIATION
(DEPRECIATION) ($) | |
|
Long Contracts — continued | |
Euro-Bund | | | 17 | | | | 12/2019 | | | | EUR | | | | 3,259,052 | | | | (74,485 | ) |
Euro-Buxl | | | 4 | | | | 12/2019 | | | | EUR | | | | 937,744 | | | | (49,118 | ) |
Euro-Schatz | | | 61 | | | | 12/2019 | | | | EUR | | | | 7,624,832 | | | | (39,594 | ) |
FTSE 100 Index | | | 3 | | | | 12/2019 | | | | GBP | | | | 281,447 | | | | (2,333 | ) |
FTSE/MIB Index | | | 8 | | | | 12/2019 | | | | EUR | | | | 1,011,983 | | | | 27,020 | |
Japan 10 Year Bond | | | 11 | | | | 12/2019 | | | | JPY | | | | 15,709,047 | | | | (84,382 | ) |
Live Cattle | | | 7 | | | | 12/2019 | | | | USD | | | | 328,230 | | | | 10,249 | |
LME Aluminum Base Metal | | | 27 | | | | 12/2019 | | | | USD | | | | 1,192,050 | | | | 25,819 | |
LME Nickel Base Metal | | | 9 | | | | 12/2019 | | | | USD | | | | 901,206 | | | | (21,249 | ) |
LME Zinc Base Metal | | | 17 | | | | 12/2019 | | | | USD | | | | 1,065,475 | | | | 35,699 | |
S&P 500E-Mini Index | | | 4 | | | | 12/2019 | | | | USD | | | | 607,000 | | | | 5,232 | |
Silver | | | 9 | | | | 12/2019 | | | | USD | | | | 814,500 | | | | 68,751 | |
SPI 200 Index | | | 7 | | | | 12/2019 | | | | AUD | | | | 800,166 | | | | (528 | ) |
TOPIX Index | | | 2 | | | | 12/2019 | | | | JPY | | | | 306,602 | | | | 3,000 | |
U.S. Treasury 2 Year Note | | | 31 | | | | 12/2019 | | | | USD | | | | 6,684,375 | | | | (11,204 | ) |
U.S. Treasury 5 Year Note | | | 36 | | | | 12/2019 | | | | USD | | | | 4,292,156 | | | | (14,763 | ) |
U.S. Treasury 10 Year Note | | | 40 | | | | 12/2019 | | | | USD | | | | 5,213,125 | | | | (33,658 | ) |
U.S. Treasury Long Bond | | | 14 | | | | 12/2019 | | | | USD | | | | 2,257,938 | | | | (24,938 | ) |
WTI Crude Oil | | | 3 | | | | 12/2019 | | | | USD | | | | 162,450 | | | | (1,788 | ) |
Feeder Cattle | | | 11 | | | | 01/2020 | | | | USD | | | | 795,713 | | | | 34,130 | |
Cocoa | | | 23 | | | | 03/2020 | | | | USD | | | | 562,580 | | | | 30,221 | |
Copper | | | 9 | | | | 03/2020 | | | | USD | | | | 595,912 | | | | 9,589 | |
Silver | | | 9 | | | | 03/2020 | | | | USD | | | | 821,700 | | | | 42,001 | |
Cocoa | | | 10 | | | | 05/2020 | | | | USD | | | | 245,500 | | | | (1,510 | ) |
Copper | | | 5 | | | | 05/2020 | | | | USD | | | | 331,563 | | | | 5,024 | |
| | | | | | | | | | | | | | | | | | | | |
| | |
| | | | | | | | 79,811 | |
| | | | | | | | | | | | | | | | | | | | |
| |
Short Contracts | | | | | |
Hang Seng Index | | | (4 | ) | | | 11/2019 | | | | HKD | | | | (686,714 | ) | | | 592 | |
LME Aluminum Base Metal | | | (47 | ) | | | 11/2019 | | | | USD | | | | (2,069,763 | ) | | | (20,292 | ) |
LME Nickel Base Metal | | | (3 | ) | | | 11/2019 | | | | USD | | | | (300,438 | ) | | | 8,073 | |
Natural Gas | | | (44 | ) | | | 11/2019 | | | | USD | | | | (1,159,400 | ) | | | (55,601 | ) |
WTI Crude Oil | | | (6 | ) | | | 11/2019 | | | | USD | | | | (324,540 | ) | | | 1,694 | |
Canada 10 Year Bond | | | (7 | ) | | | 12/2019 | | | | CAD | | | | (755,007 | ) | | | 17,330 | |
Coffee ‘C’ | | | (12 | ) | | | 12/2019 | | | | USD | | | | (458,775 | ) | | | 15,883 | |
Copper | | | (18 | ) | | | 12/2019 | | | | USD | | | | (1,187,775 | ) | | | (30,060 | ) |
Corn | | | (17 | ) | | | 12/2019 | | | | USD | | | | (331,500 | ) | | | 29,500 | |
Cotton No. 2 | | | (42 | ) | | | 12/2019 | | | | USD | | | | (1,353,240 | ) | | | (24,506 | ) |
Euro-Bund | | | (12 | ) | | | 12/2019 | | | | EUR | | | | (2,300,507 | ) | | | 56,874 | |
Lean Hogs | | | (40 | ) | | | 12/2019 | | | | USD | | | | (1,056,000 | ) | | | 25,962 | |
Live Cattle | | | (13 | ) | | | 12/2019 | | | | USD | | | | (609,570 | ) | | | (37,598 | ) |
LME Aluminum Base Metal | | | (27 | ) | | | 12/2019 | | | | USD | | | | (1,192,050 | ) | | | 1,828 | |
LME Zinc Base Metal | | | (8 | ) | | | 12/2019 | | | | USD | | | | (501,400 | ) | | | (47,462 | ) |
Long Gilt | | | (27 | ) | | | 12/2019 | | | | GBP | | | | (4,646,006 | ) | | | 58,547 | |
Natural Gas | | | (17 | ) | | | 12/2019 | | | | USD | | | | (464,780 | ) | | | (18,070 | ) |
Russell 2000E-Mini Index | | | (56 | ) | | | 12/2019 | | | | USD | | | | (4,376,120 | ) | | | 11,294 | |
S&P 500E-Mini Index | | | (85 | ) | | | 12/2019 | | | | USD | | | | (12,898,750 | ) | | | (103,778 | ) |
Wheat | | | (5 | ) | | | 12/2019 | | | | USD | | | | (127,188 | ) | | | (5,502 | ) |
LME Aluminum Base Metal | | | (33 | ) | | | 01/2020 | | | | USD | | | | (1,445,400 | ) | | | (28,875 | ) |
LME Zinc Base Metal | | | (6 | ) | | | 01/2020 | | | | USD | | | | (374,025 | ) | | | (1,406 | ) |
Soybean | | | (10 | ) | | | 01/2020 | | | | USD | | | | (466,125 | ) | | | 8,946 | |
Lean Hogs | | | (12 | ) | | | 02/2020 | | | | USD | | | | (351,960 | ) | | | 445 | |
Live Cattle | | | (8 | ) | | | 02/2020 | | | | USD | | | | (391,520 | ) | | | (40,884 | ) |
SEE NOTES TO CONSOLIDATED FINANCIAL STATEMENTS.
| | | | | | | | |
| | | |
| OCTOBER 31, 2019 | | J.P. MORGAN EXCHANGE-TRADED FUNDS | | | | | 19 | |
JPMorgan Diversified Alternatives ETF
CONSOLIDATED SCHEDULE OF PORTFOLIO INVESTMENTS
AS OF OCTOBER 31, 2019 (continued)
| | | | | | | | | | | | | | | | | | | | |
| DESCRIPTION | | NUMBER OF
CONTRACTS | | | EXPIRATION
DATE | | | TRADING
CURRENCY | | | NOTIONAL
AMOUNT ($) | | | VALUE AND
UNREALIZED
APPRECIATION
(DEPRECIATION) ($) | |
| |
Short Contracts — continued | | | | | |
Sugar No. 11 | | | (127 | ) | | | 02/2020 | | | | USD | | | | (1,775,155 | ) | | | 34,047 | |
Coffee ‘C’ | | | (12 | ) | | | 03/2020 | | | | USD | | | | (474,525 | ) | | | (4,761 | ) |
Coffee ‘C’ | | | (15 | ) | | | 05/2020 | | | | USD | | | | (604,969 | ) | | | (4,114 | ) |
Corn | | | (15 | ) | | | 05/2020 | | | | USD | | | | (303,563 | ) | | | (8,594 | ) |
| | | | | | | | | | | | | | | | | | | | |
| | | | | |
| | | | | | | | | | | | | | | | | | | (160,488 | ) |
| | | | | | | | | | | | | | | | | | | | |
| | | | | |
| | | | | | | | | | | | | | | | | | | (80,677 | ) |
| | | | | | | | | | | | | | | | | | | | |
Abbreviations
| | |
| AUD | | Australian Dollar |
| CAC | | Continuous Assisted Quotation |
| CAD | | Canadian Dollar |
| DAX | | Deutscher Aktien Index |
| EUR | | Euro |
| FTSE | | Financial Times and the London Stock Exchange |
| GBP | | British Pound |
| HKD | | Hong Kong Dollar |
| | |
| IBEX | | International Business Exchange |
| JPY | | Japanese Yen |
| LME | | London Metal Exchange |
| MIB | | Milan, Italian Stock Exchange |
| SPI | | Australian Securities Exchange |
| TOPIX | | Tokyo Stock Price Index |
| USD | | United States Dollar |
| WTI | | West Texas Intermediate |
| | | | | | | | | | | | | | | | | | | | |
| Forward foreign currency exchange contracts outstanding as of October 31, 2019: | |
| CURRENCY PURCHASED | | | CURRENCY SOLD | | | COUNTERPARTY | | SETTLEMENT
DATE | | | UNREALIZED
APPRECIATION
(DEPRECIATION) ($) | |
| | | | | | |
| AUD | | | 1,333,502 | | | USD | | | 907,872 | | | Merrill Lynch International | | | 11/12/2019 | | | | 11,608 | |
| | | | | | |
| AUD | | | 206,544 | | | USD | | | 139,000 | | | Standard Chartered Bank | | | 11/12/2019 | | | | 3,416 | |
| | | | | | |
| EUR | | | 106,749 | | | USD | | | 117,947 | | | Barclays Bank plc | | | 11/12/2019 | | | | 1,179 | |
| | | | | | |
| EUR | | | 744,906 | | | USD | | | 814,763 | | | HSBC Bank, NA | | | 11/12/2019 | | | | 16,511 | |
| | | | | | |
| GBP | | | 175,432 | | | USD | | | 217,159 | | | Barclays Bank plc | | | 11/12/2019 | | | | 10,150 | |
| | | | | | |
| GBP | | | 41,763 | | | USD | | | 51,396 | | | BNP Paribas | | | 11/12/2019 | | | | 2,716 | |
| | | | | | |
| USD | | | 140,159 | | | JPY | | | 15,017,830 | | | BNP Paribas | | | 11/12/2019 | | | | 1,028 | |
| | | | | | |
| USD | | | 1,092,959 | | | JPY | | | 116,495,499 | | | Merrill Lynch International | | | 11/12/2019 | | | | 13,698 | |
| | | | | | |
| AUD | | | 112,163 | | | USD | | | 76,759 | | | Citibank, NA | | | 11/18/2019 | | | | 592 | |
| | | | | | |
| AUD | | | 989,466 | | | USD | | | 667,619 | | | Merrill Lynch International | | | 11/18/2019 | | | | 14,746 | |
| | | | | | |
| CAD | | | 11,280,566 | | | USD | | | 8,467,867 | | | Citibank, NA | | | 11/18/2019 | | | | 97,049 | |
| | | | | | |
| EUR | | | 105,727 | | | CAD | | | 153,287 | | | Barclays Bank plc | | | 11/18/2019 | | | | 1,644 | |
| | | | | | |
| EUR | | | 55,077 | | | USD | | | 60,556 | | | Citibank, NA | | | 11/18/2019 | | | | 929 | |
| | | | | | |
| EUR | | | 318,862 | | | USD | | | 355,316 | | | Merrill Lynch International | | | 11/18/2019 | | | | 647 | |
| | | | | | |
| GBP | | | 66,653 | | | CAD | | | 110,670 | | | Barclays Bank plc | | | 11/18/2019 | | | | 2,351 | |
| | | | | | |
| GBP | | | 829,991 | | | CAD | | | 1,405,514 | | | Citibank, NA | | | 11/18/2019 | | | | 8,461 | |
| | | | | | |
| GBP | | | 454,465 | | | NOK | | | 5,383,695 | | | HSBC Bank, NA | | | 11/18/2019 | | | | 3,478 | |
| | | | | | |
| GBP | | | 175,332 | | | SEK | | | 2,188,167 | | | Merrill Lynch International | | | 11/18/2019 | | | | 422 | |
| | | | | | |
| GBP | | | 67,622 | | | USD | | | 84,997 | | | Citibank, NA | | | 11/18/2019 | | | | 2,636 | |
| | | | | | |
| GBP | | | 424,002 | | | USD | | | 546,535 | | | State Street Corp. | | | 11/18/2019 | | | | 2,945 | |
| | | | | | |
| IDR | | | 14,077,381,883 | | | USD | | | 989,289 | | | Merrill Lynch International** | | | 11/18/2019 | | | | 8,544 | |
| | | | | | |
| INR | | | 70,281,590 | | | USD | | | 984,708 | | | Merrill Lynch International** | | | 11/18/2019 | | | | 2,547 | |
| | | | | | |
| NZD | | | 237,809 | | | USD | | | 151,549 | | | Citibank, NA | | | 11/18/2019 | | | | 960 | |
| | | | | | |
| RUB | | | 64,344,892 | | | USD | | | 987,160 | | | Goldman Sachs International** | | | 11/18/2019 | | | | 14,314 | |
| | | | | | |
| SEK | | | 2,959,436 | | | USD | | | 305,998 | | | Barclays Bank plc | | | 11/18/2019 | | | | 739 | |
| | | | | | |
| SEK | | | 611,852 | | | USD | | | 62,400 | | | State Street Corp. | | | 11/18/2019 | | | | 1,017 | |
| | | | | | |
| USD | | | 988,412 | | | ILS | | | 3,447,000 | | | Merrill Lynch International | | | 11/18/2019 | | | | 9,687 | |
SEE NOTES TO CONSOLIDATED FINANCIAL STATEMENTS.
| | | | | | |
| | | |
| 20 | | | | J.P. MORGAN EXCHANGE-TRADED FUNDS | | OCTOBER 31, 2019 |
| | | | | | | | | | | | | | | | | | | | |
| CURRENCY PURCHASED | | | CURRENCY SOLD | | | COUNTERPARTY | | SETTLEMENT
DATE | | | UNREALIZED
APPRECIATION
(DEPRECIATION) ($) | |
| | | | | | |
| ZAR | | | 15,036,865 | | | USD | | | 987,419 | | | BNP Paribas | | | 11/18/2019 | | | | 5,749 | |
| | | | | | |
| MXN | | | 19,580,404 | | | USD | | | 993,503 | | | Merrill Lynch International | | | 11/19/2019 | | | | 21,897 | |
| | | | | | |
| USD | | | 2,136,926 | | | JPY | | | 228,200,000 | | | Standard Chartered Bank | | | 3/10/2020 | | | | 6,093 | |
| | | | | | | | | | | | | | | | | | | | |
| |
| Total unrealized appreciation | | | | 267,753 | |
| | | | | | | | | | | | | | | | | | | | |
| | | | | | |
| JPY | | | 21,897,941 | | | USD | | | 205,516 | | | Barclays Bank plc | | | 11/12/2019 | | | | (2,645 | ) |
| | | | | | |
| JPY | | | 20,817,312 | | | USD | | | 193,183 | | | Merrill Lynch International | | | 11/12/2019 | | | | (324 | ) |
| | | | | | |
| USD | | | 53,635 | | | AUD | | | 78,276 | | | HSBC Bank, NA | | | 11/12/2019 | | | | (338 | ) |
| | | | | | |
| USD | | | 1,846,255 | | | AUD | | | 2,735,152 | | | Merrill Lynch International | | | 11/12/2019 | | | | (39,695 | ) |
| | | | | | |
| USD | | | 498,816 | | | CAD | | | 664,508 | | | Goldman Sachs International | | | 11/12/2019 | | | | (5,714 | ) |
| | | | | | |
| USD | | | 1,334,954 | | | EUR | | | 1,212,647 | | | BNP Paribas | | | 11/12/2019 | | | | (18,292 | ) |
| | | | | | |
| USD | | | 500,947 | | | EUR | | | 451,370 | | | Merrill Lynch International | | | 11/12/2019 | | | | (2,757 | ) |
| | | | | | |
| USD | | | 145,162 | | | GBP | | | 112,950 | | | Barclays Bank plc | | | 11/12/2019 | | | | (1,188 | ) |
| | | | | | |
| USD | | | 97,381 | | | GBP | | | 78,939 | | | Citibank, NA | | | 11/12/2019 | | | | (4,901 | ) |
| | | | | | |
| USD | | | 146,396 | | | GBP | | | 113,964 | | | TD Bank Financial Group | | | 11/12/2019 | | | | (1,267 | ) |
| | | | | | |
| USD | | | 118,716 | | | JPY | | | 12,838,608 | | | Goldman Sachs International | | | 11/12/2019 | | | | (226 | ) |
| | | | | | |
| USD | | | 138,216 | | | JPY | | | 14,987,078 | | | HSBC Bank, NA | | | 11/12/2019 | | | | (630 | ) |
| | | | | | |
| USD | | | 283,497 | | | JPY | | | 30,787,730 | | | Merrill Lynch International | | | 11/12/2019 | | | | (1,733 | ) |
| | | | | | |
| USD | | | 443,642 | | | SEK | | | 4,378,565 | | | Merrill Lynch International | | | 11/12/2019 | | | | (10,043 | ) |
| | | | | | |
| JPY | | | 45,142,792 | | | USD | | | 423,700 | | | Citibank, NA | | | 11/18/2019 | | | | (5,336 | ) |
| | | | | | |
| NOK | | | 12,433,207 | | | USD | | | 1,363,163 | | | Merrill Lynch International | | | 11/18/2019 | | | | (11,045 | ) |
| | | | | | |
| SEK | | | 1,690,081 | | | USD | | | 176,227 | | | Goldman Sachs International | | | 11/18/2019 | | | | (1,055 | ) |
| | | | | | |
| USD | | | 32,189 | | | CHF | | | 31,900 | | | BNP Paribas | | | 11/18/2019 | | | | (182 | ) |
| | | | | | |
| USD | | | 4,786,096 | | | EUR | | | 4,352,686 | | | Citibank, NA | | | 11/18/2019 | | | | (73,058 | ) |
| | | | | | |
| USD | | | 4,760,885 | | | GBP | | | 3,866,995 | | | Citibank, NA | | | 11/18/2019 | | | | (250,498 | ) |
| | | | | | |
| USD | | | 1,005,286 | | | HUF | | | 304,705,106 | | | Merrill Lynch International | | | 11/18/2019 | | | | (29,694 | ) |
| | | | | | |
| USD | | | 990,952 | | | KRW | | | 1,186,238,847 | | | Goldman Sachs International** | | | 11/18/2019 | | | | (22,901 | ) |
| | | | | | |
| USD | | | 128,560 | | | NZD | | | 204,072 | | | Merrill Lynch International | | | 11/18/2019 | | | | (2,313 | ) |
| | | | | | |
| USD | | | 1,007,946 | | | PLN | | | 3,975,931 | | | Merrill Lynch International | | | 11/18/2019 | | | | (32,777 | ) |
| | | | | | |
| USD | | | 8,009,558 | | | SEK | | | 79,033,796 | | | Citibank, NA | | | 11/18/2019 | | | | (182,066 | ) |
| | | | | | |
| USD | | | 189,629 | | | SEK | | | 1,831,258 | | | State Street Corp. | | | 11/18/2019 | | | | (176 | ) |
| | | | | | |
| USD | | | 999,365 | | | TWD | | | 30,767,435 | | | Merrill Lynch International** | | | 11/18/2019 | | | | (11,641 | ) |
| | | | | | |
| USD | | | 177,814 | | | EUR | | | 159,053 | | | HSBC Bank, NA | | | 12/11/2019 | | | | (29 | ) |
| | | | | | | | | | | | | | | | | | | | |
| |
| Total unrealized depreciation | | | | (712,524 | ) |
| | | | | | | | | | | | | | | | | | | | |
| |
| Net unrealized depreciation | | | | (444,771 | ) |
| | | | | | | | | | | | | | | | | | | | |
| ** | Non-deliverable forward. |
| | |
Abbreviations |
| |
| AUD | | Australian Dollar |
| CAD | | Canadian Dollar |
| CHF | | Swiss Franc |
| EUR | | Euro |
| GBP | | British Pound |
| HUF | | Hungarian Forint |
| IDR | | Indonesian Rupiah |
| ILS | | Israeli Shekel |
| INR | | Indian Rupee |
| | |
| | |
| |
| JPY | | Japanese Yen |
| KRW | | Korean Republic Won |
| MXN | | Mexican Peso |
| NOK | | Norwegian Krone |
| NZD | | New Zealand Dollar |
| PLN | | Polish Zloty |
| RUB | | Russian Ruble |
| SEK | | Swedish Krona |
| TWD | | Taiwan Dollar |
| USD | | United States Dollar |
| ZAR | | South African Rand |
SEE NOTES TO CONSOLIDATED FINANCIAL STATEMENTS.
| | | | | | | | |
| | | |
| OCTOBER 31, 2019 | | J.P. MORGAN EXCHANGE-TRADED FUNDS | | | | | 21 | |
JPMorgan Diversified Alternatives ETF
CONSOLIDATED SCHEDULE OF PORTFOLIO INVESTMENTS
AS OF OCTOBER 31, 2019 (continued)
| | | | | | | | | | | | | | | | | | | | |
| Over-the-Counter (“OTC”) Total Return Basket Swaps Outstanding at October 31, 2019 | |
| COUNTERPARTY | | DESCRIPTION | | TERMINATION
DATE | | NOTIONAL
VALUE (1) | | | NET UNREALIZED
APPRECIATION
(DEPRECIATION) (2) | | | NET CASH
AND OTHER
RECEIVABLES
(PAYABLES) | | | VALUE | |
| Bank of America | | The Fund receives the total return on a portfolio of long and short equity positions and pays or receives the net of one month LIBOR on long positions and short positions respectively, plus or minus a specified spread (rates range from 0.00% to 0.20%), which is denominated in GBP based on the local currencies of the positions within the swaps. | | 10/30/2020 | | $ | 2,662,013 | | | $ | (26,172 | ) | | $ | (588 | ) | | $ | (26,760 | ) |
| | | | | | | | | | | | | | | | | | | | |
| | | | | | | | | | | | | | | | |
| REFERENCE ENTITY | | SHARES | | | NOTIONAL
VALUE($) (1) | | | NET UNREALIZED
APPRECIATION
(DEPRECIATION)($) (2) | | | PERCENTAGE
OF NET
ASSETS (%) | |
Long Positions | | | | | | | | | | | | | | | | |
| | | | |
Common Stocks | | | | | | | | | | | | | | | | |
Aerospace & Defense | | | | | | | | | | | | | |
Meggitt plc | | | 2,371 | | | | 19,185 | | | | 1,064 | | | | 0.0 | (a) |
| | | | | | | | | | | | | | | | |
Airlines | | | | | | | | | | | | | |
Wizz Air Holdings plc* (b) | | | 3,291 | | | | 162,972 | | | | (2,676 | ) | | | (0.0 | )(a) |
| | | | | | | | | | | | | | | | |
Capital Markets | | | | | | | | | | | | | |
3i Group plc | | | 11,711 | | | | 171,131 | | | | 7,003 | | | | 0.0 | (a) |
| | | | | | | | | | | | | | | | |
Commercial Services & Supplies | | | | | | | | | | | | | |
Aggreko plc | | | 16,450 | | | | 168,646 | | | | 1,492 | | | | 0.0 | (a) |
| | | | | | | | | | | | | | | | |
Construction Materials | | | | | | | | | | | | | |
Rhi Magnesita NV | | | 2,699 | | | | 121,640 | | | | (3,114 | ) | | | (0.0 | )(a) |
| | | | | | | | | | | | | | | | |
Distributors | | | | | | | | | | | | | |
Inchcape plc | | | 16,421 | | | | 137,289 | | | | (1,314 | ) | | | (0.0 | )(a) |
| | | | | | | | | | | | | | | | |
Energy Equipment & Services | | | | | | | | | | | | | |
Petrofac Ltd. | | | 33,288 | | | | 166,136 | | | | (8,591 | ) | | | (0.0 | )(a) |
| | | | | | | | | | | | | | | | |
Food Products | | | | | | | | | | | | | |
Greencore Group plc | | | 58,279 | | | | 175,216 | | | | (4,819 | ) | | | (0.0 | )(a) |
Tate & Lyle plc | | | 2,295 | | | | 20,018 | | | | 12 | | | | 0.0 | (a) |
| | | | | | | | | | | | | | | | |
| | | 60,574 | | | | 195,234 | | | | (4,807 | ) | | | (0.0 | )(a) |
| | | | | | | | | | | | | | | | |
Hotels, Restaurants & Leisure | | | | | | | | | | | | | |
Greggs plc | | | 5,147 | | | | 118,387 | | | | (6,246 | ) | | | (0.0 | )(a) |
Playtech plc | | | 24,387 | | | | 124,126 | | | | (1,966 | ) | | | (0.0 | )(a) |
| | | | | | | | | | | | | | | | |
| | | 29,534 | | | | 242,513 | | | | (8,212 | ) | | | (0.0 | )(a) |
| | | | | | | | | | | | | | | | |
Household Durables | | | | | | | | | | | | | |
Barratt Developments plc | | | 16,380 | | | | 133,953 | | | | (9,068 | ) | | | (0.0 | )(a) |
Berkeley Group Holdings plc | | | 1,899 | | | | 108,242 | | | | (3,139 | ) | | | (0.0 | )(a) |
Bovis Homes Group plc | | | 9,463 | | | | 143,417 | | | | (6,854 | ) | | | (0.0 | )(a) |
Redrow plc | | | 9,088 | | | | 70,848 | | | | (5,530 | ) | | | (0.0 | )(a) |
Taylor Wimpey plc | | | 11,977 | | | | 25,687 | | | | 12 | | | | 0.0 | (a) |
| | | | | | | | | | | | | | | | |
| | | 48,807 | | | | 482,147 | | | | (24,579 | ) | | | (0.0 | )(a) |
| | | | | | | | | | | | | | | | |
Independent Power and Renewable Electricity Producers | | | | | | | | | | | | | |
Drax Group plc | | | 45,736 | | | | 175,828 | | | | (4,211 | ) | | | (0.0 | )(a) |
| | | | | | | | | | | | | | | | |
Media | | | | | | | | | | | | | |
WPP plc | | | 12,547 | | | | 156,581 | | | | (1,850 | ) | | | (0.0 | )(a) |
| | | | | | | | | | | | | | | | |
SEE NOTES TO CONSOLIDATED FINANCIAL STATEMENTS.
| | | | | | |
| | | |
| 22 | | | | J.P. MORGAN EXCHANGE-TRADED FUNDS | | OCTOBER 31, 2019 |
| | | | | | | | | | | | | | | | |
| REFERENCE ENTITY | | SHARES | | | NOTIONAL
VALUE($) (1) | | | NET UNREALIZED
APPRECIATION
(DEPRECIATION)($) (2) | | | PERCENTAGE
OF NET
ASSETS (%) | |
Long Positions — continued | | | | | | | | | | | | | | | | |
| | | | |
Common Stocks — continued | | | | | | | | | | | | | | | | |
Metals & Mining | | | | | | | | | | | | | |
Anglo American plc | | | 5,159 | | | | 132,778 | | | | 5,786 | | | | 0.0 | (a) |
BHP Group plc | | | 6,300 | | | | 133,626 | | | | 3,027 | | | | 0.0 | (a) |
Rio Tinto plc | | | 2,543 | | | | 132,393 | | | | 1,871 | | | | 0.0 | (a) |
| | | | | | | | | | | | | | | | |
| | | 14,002 | | | | 398,797 | | | | 10,684 | | | | 0.0 | (a) |
| | | | | | | | | | | | | | | | |
Multi-Utilities | | | | | | | | | | | | | |
Centrica plc | | | 131,797 | | | | 124,030 | | | | 4,551 | | | | 0.0 | (a) |
| | | | | | | | | | | | | | | | |
Oil, Gas & Consumable Fuels | | | | | | | | | | | | | |
Royal Dutch Shell plc | | | 584 | | | | 16,819 | | | | (27 | ) | | | (0.0 | )(a) |
Tullow Oil plc | | | 61,477 | | | | 164,287 | | | | 1,909 | | | | 0.0 | (a) |
| | | | | | | | | | | | | | | | |
| | | 62,061 | | | | 181,106 | | | | 1,882 | | | | 0.0 | (a) |
| | | | | | | | | | | | | | | | |
Personal Products | | | | | | | | | | | | | |
Unilever plc | | | 2,507 | | | | 150,117 | | | | (130 | ) | | | (0.0 | )(a) |
| | | | | | | | | | | | | | | | |
Pharmaceuticals | | | | | | | | | | | | | |
GlaxoSmithKline plc | | | 7,905 | | | | 181,064 | | | | 12,422 | | | | 0.0 | (a) |
Hikma Pharmaceuticals plc | | | 6,290 | | | | 163,809 | | | | 1,394 | | | | 0.0 | (a) |
| | | | | | | | | | | | | | | | |
| | | 14,195 | | | | 344,873 | | | | 13,816 | | | | 0.0 | (a) |
| | | | | | | | | | | | | | | | |
Software | | | | | | | | | | | | | |
Avast plc (b) | | | 29,434 | | | | 158,043 | | | | 5,046 | | | | 0.0 | (a) |
AVEVA Group plc | | | 3,372 | | | | 182,711 | | | | 11,222 | | | | 0.0 | (a) |
Sage Group plc (The) | | | 18,496 | | | | 172,385 | | | | 7,024 | | | | 0.0 | (a) |
| | | | | | | | | | | | | | | | |
| | | 51,302 | | | | 513,139 | | | | 23,292 | | | | 0.0 | (a) |
| | | | | | | | | | | | | | | | |
Tobacco | | | | | | | | | | | | | |
Imperial Brands plc | | | 6,083 | | | | 133,433 | | | | (13,295 | ) | | | (0.0 | )(a) |
| | | | | | | | | | | | | | | | |
Total Long Positions of Total Return Basket Swap | | | 565,376 | | | | 4,044,797 | | | | (8,995 | ) | | | 0.0 | (a) |
| | | | | | | | | | | | | | | | |
|
Short Positions | |
| | |
Common Stocks | | | | | | | | | |
Capital Markets | | | | | | | | | | | | | |
St James’s Place plc | | | (8,818 | ) | | | (118,938 | ) | | | (4,189 | ) | | | (0.0 | )(a) |
Standard Life Aberdeen plc | | | (32,350 | ) | | | (127,189 | ) | | | (8,232 | ) | | | (0.0 | )(a) |
| | | | | | | | | | | | | | | | |
| | | (41,168 | ) | | | (246,127 | ) | | | (12,421 | ) | | | (0.0 | )(a) |
| | | | | | | | | | | | | | | | |
Chemicals | | | | | | | | | | | | | |
Johnson Matthey plc | | | (2,526 | ) | | | (100,350 | ) | | | (2,625 | ) | | | (0.0 | )(a) |
| | | | | | | | | | | | | | | | |
Containers & Packaging | | | | | | | | | | | | | |
DS Smith plc | | | (21,493 | ) | | | (99,646 | ) | | | (5,298 | ) | | | (0.0 | )(a) |
| | | | | | | | | | | | | | | | |
Electrical Equipment | | | | | | | | | | | | | |
Melrose Industries plc | | | (21,668 | ) | | | (59,884 | ) | | | (2,064 | ) | | | (0.0 | )(a) |
| | | | | | | | | | | | | | | | |
Health Care Providers & Services | | | | | | | | | | | | | |
NMC Health plc | | | (1,766 | ) | | | (50,060 | ) | | | 6,427 | | | | 0.0 | (a) |
| | | | | | | | | | | | | | | | |
Hotels, Restaurants & Leisure | | | | | | | | | | | | | |
Domino’s Pizza Group plc | | | (23,924 | ) | | | (88,654 | ) | | | (3,728 | ) | | | (0.0 | )(a) |
TUI AG | | | (6,750 | ) | | | (88,305 | ) | | | 3,396 | | | | 0.0 | (a) |
| | | | | | | | | | | | | | | | |
| | | (30,674 | ) | | | (176,959 | ) | | | (332 | ) | | | (0.0 | )(a) |
| | | | | | | | | | | | | | | | |
Insurance | | | | | | | | | | | | | |
Beazley plc | | | (13,326 | ) | | | (101,282 | ) | | | 4,369 | | | | 0.0 | (a) |
| | | | | | | | | | | | | | | | |
SEE NOTES TO CONSOLIDATED FINANCIAL STATEMENTS.
| | | | | | | | |
| | | |
| OCTOBER 31, 2019 | | J.P. MORGAN EXCHANGE-TRADED FUNDS | | | | | 23 | |
JPMorgan Diversified Alternatives ETF
CONSOLIDATED SCHEDULE OF PORTFOLIO INVESTMENTS
AS OF OCTOBER 31, 2019 (continued)
| | | | | | | | | | | | | | | | |
| REFERENCE ENTITY | | SHARES | | | NOTIONAL
VALUE($) (1) | | | NET UNREALIZED
APPRECIATION
(DEPRECIATION)($) (2) | | | PERCENTAGE
OF NET
ASSETS (%) | |
|
Short Positions — continued | |
| | |
Common Stocks — continued | | | | | | | | | |
Machinery | | | | | | | | | | | | | |
Weir Group plc (The) | | | (5,731 | ) | | | (100,103 | ) | | | 1,156 | | | | 0.0 | (a) |
| | | | | | | | | | | | | | | | |
Media | | | | | | | | | | | | | |
ITV plc | | | (71,579 | ) | | | (124,173 | ) | | | 3,190 | | | | 0.0 | (a) |
| | | | | | | | | | | | | | | | |
Metals & Mining | | | | | | | | | | | | | |
Fresnillo plc | | | (9,296 | ) | | | (85,884 | ) | | | (11,652 | ) | | | (0.0 | )(a) |
| | | | | | | | | | | | | | | | |
Multiline Retail | | | | | | | | | | | | | |
B&M European Value Retail SA | | | (17,850 | ) | | | (85,633 | ) | | | 2,763 | | | | 0.0 | (a) |
| | | | | | | | | | | | | | | | |
Paper & Forest Products | | | | | | | | | | | | | |
Mondi plc | | | (4,383 | ) | | | (90,877 | ) | | | (3,516 | ) | | | (0.0 | )(a) |
| | | | | | | | | | | | | | | | |
Professional Services | | | | | | | | | | | | | |
Capita plc* | | | (18,074 | ) | | | (36,561 | ) | | | 3,367 | | | | 0.0 | (a) |
| | | | | | | | | | | | | | | | |
Real Estate Management & Development | | | | | | | | | | | | | |
Capital & Counties Properties plc | | | (7,638 | ) | | | (25,245 | ) | | | (541 | ) | | | (0.0 | )(a) |
| | | | | | | | | | | | | | | | |
Total Short Positions of Total Return Basket Swap | | | (267,172 | ) | | | (1,382,784 | ) | | | (17,177 | ) | | | 0.0 | (a) |
| | | | | | | | | | | | | | | | |
Total of Long and Short Positions of Total Return Basket Swap | | | 298,204 | | | | 2,662,013 | | | | (26,172 | ) | | | 0.0 | (a) |
| | | | | | | | | | | | | | | | |
| | | | | | | | | | | | | | | | | | | | |
| COUNTERPARTY | | DESCRIPTION | | TERMINATION
DATE | | NOTIONAL
VALUE (1) | | | NET UNREALIZED
APPRECIATION
(DEPRECIATION) (2) | | | NET CASH
AND OTHER
RECEIVABLES
(PAYABLES) | | | VALUE | |
Bank of America | | The Fund receives the total return on a portfolio of long and short equity positions and pays or receives the net of one month BA on long positions and short positions respectively, plus or minus a specified spread (rates range from 0.00% to 0.50%), which is denominated in CAD based on the local currencies of the positions within the swaps. | | 11/18/2019 –
4/20/2020 | | $ | (1,254,485 | ) | | $ | (26,064 | ) | | $ | 1,090 | | | $ | (24,974 | ) |
| | | | | | | | | | | | | | | | | | | | |
| | | | | | | | | | | | | | | | |
| REFERENCE ENTITY | | SHARES | | | NOTIONAL
VALUE($) (1) | | | NET UNREALIZED
APPRECIATION
(DEPRECIATION)($) (2) | | | PERCENTAGE
OF NET
ASSETS (%) | |
Long Positions | | | | | |
| | | |
Common Stocks | | | | | | | | | | | | | |
Trading Companies & Distributors | | | | | | | | | | | | | |
Toromont Industries Ltd. | | | 3,095 | | | | 159,814 | | | | 7,067 | | | | 0.0 | (a) |
| | | | | | | | | | | | | | | | |
Short Positions | | | | | |
| | | |
Common Stocks | | | | | | | | | | | | | |
Aerospace & Defense | | | | | | | | | | | | | |
Bombardier, Inc.* | | | (91,500 | ) | | | (115,321 | ) | | | (3,978 | ) | | | (0.0 | )(a) |
| | | | | | | | | | | | | | | | |
Construction & Engineering | | | | | | | | | | | | | |
SNC-Lavalin Group, Inc. | | | (2,999 | ) | | | (54,215 | ) | | | (14,398 | ) | | | (0.0 | )(a) |
| | | | | | | | | | | | | | | | |
Diversified Financial Services | | | | | | | | | | | | | |
Onex Corp. | | | (293 | ) | | | (17,225 | ) | | | 200 | | | | 0.0 | (a) |
| | | | | | | | | | | | | | | | |
SEE NOTES TO CONSOLIDATED FINANCIAL STATEMENTS.
| | | | | | |
| | | |
| 24 | | | | J.P. MORGAN EXCHANGE-TRADED FUNDS | | OCTOBER 31, 2019 |
| | | | | | | | | | | | | | | | |
| REFERENCE ENTITY | | SHARES | | | NOTIONAL
VALUE($) (1) | | | NET UNREALIZED
APPRECIATION
(DEPRECIATION)($) (2) | | | PERCENTAGE
OF NET
ASSETS (%) | |
|
Short Positions — continued | |
| | |
Common Stocks — continued | | | | | | | | | |
Food Products | | | | | | | | | | | | | |
Premium Brands Holdings Corp. | | | (1,633 | ) | | | (107,730 | ) | | | 5,593 | | | | 0.0 | (a) |
| | | | | | | | | | | | | | | | |
Metals & Mining | | | | | | | | | | | | | |
Agnico Eagle Mines Ltd. | | | (1,590 | ) | | | (97,723 | ) | | | (11,914 | ) | | | (0.0 | )(a) |
First Quantum Minerals Ltd. | | | (10,289 | ) | | | (86,946 | ) | | | (424 | ) | | | (0.0 | )(a) |
Franco-Nevada Corp. | | | (986 | ) | | | (95,673 | ) | | | (4,009 | ) | | | (0.0 | )(a) |
Kinross Gold Corp.* | | | (17,230 | ) | | | (83,723 | ) | | | (3,541 | ) | | | (0.0 | )(a) |
Pan American Silver Corp. | | | (6,411 | ) | | | (108,886 | ) | | | (4,133 | ) | | | (0.0 | )(a) |
Yamana Gold, Inc. | | | (17,212 | ) | | | (62,858 | ) | | | (4,989 | ) | | | (0.0 | )(a) |
| | | | | | | | | | | | | | | | |
| | | (53,718 | ) | | | (535,809 | ) | | | (29,010 | ) | | | (0.0 | )(a) |
| | | | | | | | | | | | | | | | |
Multiline Retail | | | | | | | | | | | | | |
Dollarama, Inc. | | | (2,384 | ) | | | (80,203 | ) | | | 3,679 | | | | 0.0 | (a) |
| | | | | | | | | | | | | | | | |
Multi-Utilities | | | | | | | | | | | | | |
Atco Ltd. | | | (3,145 | ) | | | (110,556 | ) | | | (38 | ) | | | (0.0 | )(a) |
| | | | | | | | | | | | | | | | |
Oil, Gas & Consumable Fuels | | | | | | | | | | | | | |
MEG Energy Corp.* | | | (27,191 | ) | | | (104,462 | ) | | | 2,131 | | | | 0.0 | (a) |
Vermilion Energy, Inc. | | | (5,775 | ) | | | (76,292 | ) | | | 8,664 | | | | 0.0 | (a) |
| | | | | | | | | | | | | | | | |
| | | (32,966 | ) | | | (180,754 | ) | | | 10,795 | | | | 0.0 | (a) |
| | | | | | | | | | | | | | | | |
Software | | | | | | | | | | | | | |
BlackBerry Ltd.* | | | (20,947 | ) | | | (110,055 | ) | | | (3,032 | ) | | | (0.0 | )(a) |
Kinaxis, Inc.* | | | (1,604 | ) | | | (102,431 | ) | | | (2,942 | ) | | | (0.0 | )(a) |
| | | | | | | | | | | | | | | | |
| | | (22,551 | ) | | | (212,486 | ) | | | (5,974 | ) | | | (0.0 | )(a) |
| | | | | | | | | | | | | | | | |
Total Short Positions of Total Return Basket Swap | | | (211,189 | ) | | | (1,414,299 | ) | | | (33,131 | ) | | | 0.0 | (a) |
| | | | | | | | | | | | | | | | |
Total of Long and Short Positions of Total Return Basket Swap | | | (208,094 | ) | | | (1,254,485 | ) | | | (26,064 | ) | | | 0.0 | (a) |
| | | | | | | | | | | | | | | | |
| | | | | | | | | | | | | | | | | | | | |
| COUNTERPARTY | | DESCRIPTION | | TERMINATION
DATE | | NOTIONAL
VALUE (1) | | | NET UNREALIZED
APPRECIATION
(DEPRECIATION) (2) | | | NET CASH
AND OTHER
RECEIVABLES
(PAYABLES) | | | VALUE | |
Bank of America | | The Fund receives the total return on a portfolio of long and short equity positions and pays or receives the net of one month LIBOR on long positions and short positions respectively, plus or minus a specified spread (rates range from 0.00% to 0.20%), which is denominated in USD based on the local currencies of the positions within the swaps. | | 11/18/2019 –
9/18/2020 | | $ | (7,850,867 | ) | | $ | (193,567 | ) | | $ | (78 | ) | | $ | (193,645 | ) |
| | | | | | | | | | | | | | | | | | | | |
| | | | | | | | | | | | | | | | |
| REFERENCE ENTITY | | SHARES | | | NOTIONAL
VALUE($) (1) | | | NET UNREALIZED
APPRECIATION
(DEPRECIATION)($) (2) | | | PERCENTAGE
OF NET
ASSETS (%) | |
Long Positions | | | | | |
| | | |
Common Stocks | | | | | | | | | | | | | |
Specialty Retail | | | | | | | | | | | | | |
Foot Locker, Inc. | | | 3,158 | | | | 137,405 | | | | (2,811 | ) | | | (0.0 | )(a) |
| | | | | | | | | | | | | | | | |
SEE NOTES TO CONSOLIDATED FINANCIAL STATEMENTS.
| | | | | | | | |
| | | |
| OCTOBER 31, 2019 | | J.P. MORGAN EXCHANGE-TRADED FUNDS | | | | | 25 | |
JPMorgan Diversified Alternatives ETF
CONSOLIDATED SCHEDULE OF PORTFOLIO INVESTMENTS
AS OF OCTOBER 31, 2019 (continued)
| | | | | | | | | | | | | | | | |
| REFERENCE ENTITY | | SHARES | | | NOTIONAL
VALUE($) (1) | | | NET UNREALIZED
APPRECIATION
(DEPRECIATION)($) (2) | | | PERCENTAGE
OF NET
ASSETS (%) | |
Short Positions | | | | | |
| | | |
Common Stocks | | | | | | | | | | | | | |
Aerospace & Defense | | | | | | | | | | | | | |
BWX Technologies, Inc. | | | (1,853 | ) | | | (107,659 | ) | | | (3,280 | ) | | | (0.0 | )(a) |
| | | | | | | | | | | | | | | | |
Air Freight & Logistics | | | | | | | | | | | | | |
FedEx Corp. | | | (654 | ) | | | (99,840 | ) | | | (1,798 | ) | | | (0.0 | )(a) |
| | | | | | | | | | | | | | | | |
Auto Components | | | | | | | | | | | | | |
Cooper-Standard Holdings, Inc.* | | | (1,933 | ) | | | (61,586 | ) | | | 3,190 | | | | 0.0 | (a) |
Veoneer, Inc.* | | | (899 | ) | | | (14,312 | ) | | | 584 | | | | 0.0 | (a) |
| | | | | | | | | | | | | | | | |
| | | (2,832 | ) | | | (75,898 | ) | | | 3,774 | | | | 0.0 | (a) |
| | | | | | | | | | | | | | | | |
Beverages | | | | | | | | | | | | | |
National Beverage Corp. | | | (2,179 | ) | | | (95,789 | ) | | | 9,283 | | | | 0.0 | (a) |
| | | | | | | | | | | | | | | | |
Capital Markets | | | | | | | | | | | | | |
Charles Schwab Corp. (The) | | | (2,499 | ) | | | (101,735 | ) | | | (1,924 | ) | | | (0.0 | )(a) |
Northern Trust Corp. | | | (1,068 | ) | | | (106,458 | ) | | | (5,340 | ) | | | (0.0 | )(a) |
| | | | | | | | | | | | | | | | |
| | | (3,567 | ) | | | (208,193 | ) | | | (7,264 | ) | | | (0.0 | )(a) |
| | | | | | | | | | | | | | | | |
Chemicals | | | | | | | | | | | | | |
Dow, Inc. | | | (1,817 | ) | | | (91,740 | ) | | | (4,597 | ) | | | (0.0 | )(a) |
DuPont de Nemours, Inc. | | | (214 | ) | | | (14,105 | ) | | | (81 | ) | | | (0.0 | )(a) |
Orion Engineered Carbons SA | | | (5,250 | ) | | | (86,940 | ) | | | (840 | ) | | | (0.0 | )(a) |
Sensient Technologies Corp. | | | (1,523 | ) | | | (95,279 | ) | | | (3,823 | ) | | | (0.0 | )(a) |
| | | | | | | | | | | | | | | | |
| | | (8,804 | ) | | | (288,064 | ) | | | (9,341 | ) | | | (0.0 | )(a) |
| | | | | | | | | | | | | | | | |
Commercial Services & Supplies | | | | | | | | | | | | | |
Stericycle, Inc.* | | | (2,062 | ) | | | (118,771 | ) | | | (7,145 | ) | | | (0.0 | )(a) |
| | | | | | | | | | | | | | | | |
Communications Equipment | | | | | | | | | | | | | |
Infinera Corp.* | | | (19,444 | ) | | | (108,692 | ) | | | (1,555 | ) | | | (0.0 | )(a) |
NETGEAR, Inc.* | | | (2,768 | ) | | | (75,206 | ) | | | 12,899 | | | | 0.0 | (a) |
ViaSat, Inc.* | | | (1,214 | ) | | | (83,572 | ) | | | 3,241 | | | | 0.0 | (a) |
| | | | | | | | | | | | | | | | |
| | | (23,426 | ) | | | (267,470 | ) | | | 14,585 | | | | 0.0 | (a) |
| | | | | | | | | | | | | | | | |
Construction & Engineering | | | | | | | | | | | | | |
Dycom Industries, Inc.* | | | (2,125 | ) | | | (96,879 | ) | | | 10,816 | | | | 0.0 | (a) |
| | | | | | | | | | | | | | | | |
Consumer Finance | | | | | | | | | | | | | |
LendingClub Corp.* | | | (8,158 | ) | | | (103,117 | ) | | | (3,100 | ) | | | (0.0 | )(a) |
PRA Group, Inc.* | | | (2,791 | ) | | | (94,699 | ) | | | 837 | | | | 0.0 | (a) |
| | | | | | | | | | | | | | | | |
| | | (10,949 | ) | | | (197,816 | ) | | | (2,263 | ) | | | (0.0 | )(a) |
| | | | | | | | | | | | | | | | |
Containers & Packaging | | | | | | | | | | | | | |
AptarGroup, Inc. | | | (790 | ) | | | (93,339 | ) | | | (292 | ) | | | (0.0 | )(a) |
Crown Holdings, Inc.* | | | (1,267 | ) | | | (92,288 | ) | | | (3,763 | ) | | | (0.0 | )(a) |
| | | | | | | | | | | | | | | | |
| | | (2,057 | ) | | | (185,627 | ) | | | (4,055 | ) | | | (0.0 | )(a) |
| | | | | | | | | | | | | | | | |
Electric Utilities | | | | | | | | | | | | | |
Alliant Energy Corp. | | | (1,818 | ) | | | (96,972 | ) | | | (654 | ) | | | (0.0 | )(a) |
| | | | | | | | | | | | | | | | |
Electrical Equipment | | | | | | | | | | | | | |
GrafTech International Ltd. | | | (7,986 | ) | | | (96,471 | ) | | | (5,271 | ) | | | (0.0 | )(a) |
| | | | | | | | | | | | | | | | |
Electronic Equipment, Instruments & Components | | | | | | | | | | | | | |
Flex Ltd.* | | | (9,317 | ) | | | (109,475 | ) | | | (16,584 | ) | | | (0.0 | )(a) |
Itron, Inc.* | | | (1,350 | ) | | | (102,951 | ) | | | 1,377 | | | | 0.0 | (a) |
Rogers Corp.* | | | (761 | ) | | | (103,100 | ) | | | 10,836 | | | | 0.0 | (a) |
| | | | | | | | | | | | | | | | |
| | | (11,428 | ) | | | (315,526 | ) | | | (4,371 | ) | | | (0.0 | )(a) |
| | | | | | | | | | | | | | | | |
SEE NOTES TO CONSOLIDATED FINANCIAL STATEMENTS.
| | | | | | |
| | | |
| 26 | | | | J.P. MORGAN EXCHANGE-TRADED FUNDS | | OCTOBER 31, 2019 |
| | | | | | | | | | | | | | | | |
| REFERENCE ENTITY | | SHARES | | | NOTIONAL
VALUE($) (1) | | | NET UNREALIZED
APPRECIATION
(DEPRECIATION)($) (2) | | | PERCENTAGE
OF NET
ASSETS (%) | |
Short Positions — continued | | | | | |
| | | |
Common Stocks — continued | | | | | | | | | | | | | |
Energy Equipment & Services | | | | | | | | | | | | | |
Core Laboratories NV | | | (2,283 | ) | | | (100,543 | ) | | | (8,333 | ) | | | (0.0 | )(a) |
Diamond Offshore Drilling, Inc.* | | | (2,692 | ) | | | (14,241 | ) | | | 1,076 | | | | 0.0 | (a) |
Oceaneering International, Inc.* | | | (5,700 | ) | | | (80,712 | ) | | | (4,959 | ) | | | (0.0 | )(a) |
Oil States International, Inc.* | | | (5,556 | ) | | | (79,284 | ) | | | (10,723 | ) | | | (0.0 | )(a) |
| | | | | | | | | | | | | | | | |
| | | (16,231 | ) | | | (274,780 | ) | | | (22,939 | ) | | | (0.0 | )(a) |
| | | | | | | | | | | | | | | | |
Entertainment | | | | | | | | | | | | | |
Netflix, Inc.* | | | (337 | ) | | | (96,857 | ) | | | (4,081 | ) | | | (0.0 | )(a) |
| | | | | | | | | | | | | | | | |
Food Products | | | | | | | | | | | | | |
Kraft Heinz Co. (The) | | | (1,128 | ) | | | (36,468 | ) | | | (5,324 | ) | | | (0.0 | )(a) |
| | | | | | | | | | | | | | | | |
Gas Utilities | | | | | | | | | | | | | |
Northwest Natural Holding Co. | | | (1,321 | ) | | | (91,625 | ) | | | 806 | | | | 0.0 | (a) |
| | | | | | | | | | | | | | | | |
Health Care Equipment & Supplies | | | | | | | | | | | | | |
Insulet Corp.* | | | (620 | ) | | | (90,098 | ) | | | 5,221 | | | | 0.0 | (a) |
Nevro Corp.* | | | (1,169 | ) | | | (100,768 | ) | | | (1,403 | ) | | | (0.0 | )(a) |
Wright Medical Group NV* | | | (3,097 | ) | | | (64,418 | ) | | | 31 | | | | 0.0 | (a) |
| | | | | | | | | | | | | | | | |
| | | (4,886 | ) | | | (255,284 | ) | | | 3,849 | | | | 0.0 | (a) |
| | | | | | | | | | | | | | | | |
Health Care Providers & Services | | | | | | | | | | | | | |
Guardant Health, Inc.* | | | (951 | ) | | | (66,094 | ) | | | (4,023 | ) | | | (0.0 | )(a) |
R1 RCM, Inc.* | | | (7,752 | ) | | | (82,404 | ) | | | (4,341 | ) | | | (0.0 | )(a) |
| | | | | | | | | | | | | | | | |
| | | (8,703 | ) | | | (148,498 | ) | | | (8,364 | ) | | | (0.0 | )(a) |
| | | | | | | | | | | | | | | | |
Health Care Technology | | | | | | | | | | | | | |
Evolent Health, Inc.* | | | (4,224 | ) | | | (32,187 | ) | | | (676 | ) | | | (0.0 | )(a) |
Tabula Rasa HealthCare, Inc.* | | | (1,487 | ) | | | (75,748 | ) | | | (3,004 | ) | | | (0.0 | )(a) |
Teladoc Health, Inc.* | | | (540 | ) | | | (41,364 | ) | | | (3,985 | ) | | | (0.0 | )(a) |
| | | | | | | | | | | | | | | | |
| | | (6,251 | ) | | | (149,299 | ) | | | (7,665 | ) | | | (0.0 | )(a) |
| | | | | | | | | | | | | | | | |
Hotels, Restaurants & Leisure | | | | | | | | | | | | | |
MGM Resorts International | | | (2,628 | ) | | | (74,898 | ) | | | (1,656 | ) | | | (0.0 | )(a) |
Red Rock Resorts, Inc. | | | (4,454 | ) | | | (97,008 | ) | | | (4,276 | ) | | | (0.0 | )(a) |
Scientific Games Corp.* | | | (3,732 | ) | | | (89,531 | ) | | | (5,001 | ) | | | (0.0 | )(a) |
Shake Shack, Inc.* | | | (788 | ) | | | (64,836 | ) | | | 8,298 | | | | 0.0 | (a) |
Wynn Resorts Ltd. | | | (673 | ) | | | (81,662 | ) | | | (5,263 | ) | | | (0.0 | )(a) |
| | | | | | | | | | | | | | | | |
| | | (12,275 | ) | | | (407,935 | ) | | | (7,898 | ) | | | (0.0 | )(a) |
| | | | | | | | | | | | | | | | |
Household Durables | | | | | | | | | | | | | |
iRobot Corp.* | | | (1,262 | ) | | | (60,652 | ) | | | 12,153 | | | | 0.0 | (a) |
| | | | | | | | | | | | | | | | |
Interactive Media & Services | | | | | | | | | | | | | |
Snap, Inc.* | | | (6,800 | ) | | | (102,408 | ) | | | (10,472 | ) | | | (0.0 | )(a) |
Zillow Group, Inc.* | | | (2,545 | ) | | | (82,433 | ) | | | (1,629 | ) | | | (0.0 | )(a) |
| | | | | | | | | | | | | | | | |
| | | (9,345 | ) | | | (184,841 | ) | | | (12,101 | ) | | | (0.0 | )(a) |
| | | | | | | | | | | | | | | | |
Internet & Direct Marketing Retail | | | | | | | | | | | | | |
Farfetch Ltd.* | | | (4,576 | ) | | | (40,863 | ) | | | (4,073 | ) | | | (0.0 | )(a) |
GrubHub, Inc.* | | | (634 | ) | | | (21,594 | ) | | | 13,714 | | | | 0.0 | (a) |
Wayfair, Inc.* | | | (890 | ) | | | (73,185 | ) | | | 22,426 | | | | 0.0 | (a) |
| | | | | | | | | | | | | | | | |
| | | (6,100 | ) | | | (135,642 | ) | | | 32,067 | | | | 0.0 | (a) |
| | | | | | | | | | | | | | | | |
Leisure Products | | | | | | | | | | | | | |
Polaris, Inc. | | | (385 | ) | | | (37,980 | ) | | | (3,107 | ) | | | (0.0 | )(a) |
| | | | | | | | | | | | | | | | |
SEE NOTES TO CONSOLIDATED FINANCIAL STATEMENTS.
| | | | | | | | |
| | | |
| OCTOBER 31, 2019 | | J.P. MORGAN EXCHANGE-TRADED FUNDS | | | | | 27 | |
JPMorgan Diversified Alternatives ETF
CONSOLIDATED SCHEDULE OF PORTFOLIO INVESTMENTS
AS OF OCTOBER 31, 2019 (continued)
| | | | | | | | | | | | | | | | |
| REFERENCE ENTITY | | SHARES | | | NOTIONAL
VALUE($) (1) | | | NET UNREALIZED
APPRECIATION
(DEPRECIATION)($) (2) | | | PERCENTAGE
OF NET
ASSETS (%) | |
Short Positions — continued | | | | | |
| | | |
Common Stocks — continued | | | | | | | | | | | | | |
Machinery | | | | | | | | | | | | | |
Welbilt, Inc.* | | | (5,989 | ) | | | (113,551 | ) | | | (5,630 | ) | | | (0.0 | )(a) |
| | | | | | | | | | | | | | | | |
Marine | | | | | | | | | | | | | |
Kirby Corp.* | | | (1,414 | ) | | | (111,932 | ) | | | 2,757 | | | | 0.0 | (a) |
| | | | | | | | | | | | | | | | |
Media | | | | | | | | | | | | | |
Liberty Broadband Corp.* | | | (933 | ) | | | (110,159 | ) | | | (6,578 | ) | | | (0.0 | )(a) |
| | | | | | | | | | | | | | | | |
Metals & Mining | | | | | | | | | | | | | |
Alcoa Corp.* | | | (4,218 | ) | | | (87,692 | ) | | | 3,163 | | | | 0.0 | (a) |
Coeur Mining, Inc.* | | | (20,343 | ) | | | (112,293 | ) | | | (13,223 | ) | | | (0.0 | )(a) |
Hecla Mining Co. | | | (24,767 | ) | | | (56,964 | ) | | | (7,678 | ) | | | (0.0 | )(a) |
United States Steel Corp. | | | (6,536 | ) | | | (75,230 | ) | | | (5,163 | ) | | | (0.0 | )(a) |
| | | | | | | | | | | | | | | | |
| | | (55,864 | ) | | | (332,179 | ) | | | (22,901 | ) | | | (0.0 | )(a) |
| | | | | | | | | | | | | | | | |
Multi-Utilities | | | | | | | | | | | | | |
NiSource, Inc. | | | (3,189 | ) | | | (89,420 | ) | | | (191 | ) | | | (0.0 | )(a) |
Sempra Energy | | | (677 | ) | | | (97,833 | ) | | | 1,164 | | | | 0.0 | (a) |
| | | | | | | | | | | | | | | | |
| | | (3,866 | ) | | | (187,253 | ) | | | 973 | | | | 0.0 | (a) |
| | | | | | | | | | | | | | | | |
Oil, Gas & Consumable Fuels | | | | | | | | | | | | | |
Centennial Resource Development, Inc.* | | | (5,579 | ) | | | (18,969 | ) | | | (1,172 | ) | | | (0.0 | )(a) |
Cheniere Energy, Inc.* | | | (1,592 | ) | | | (97,987 | ) | | | 1,592 | | | | 0.0 | (a) |
Oasis Petroleum, Inc.* | | | (22,634 | ) | | | (59,075 | ) | | | 6,564 | | | | 0.0 | (a) |
Parsley Energy, Inc. | | | (5,242 | ) | | | (82,876 | ) | | | (2,097 | ) | | | (0.0 | )(a) |
Penn Virginia Corp.* | | | (1,211 | ) | | | (28,822 | ) | | | 3,028 | | | | 0.0 | (a) |
Targa Resources Corp. | | | (2,563 | ) | | | (99,649 | ) | | | 1,256 | | | | 0.0 | (a) |
| | | | | | | | | | | | | | | | |
| | | (38,821 | ) | | | (387,378 | ) | | | 9,171 | | | | 0.0 | (a) |
| | | | | | | | | | | | | | | | |
Pharmaceuticals | | | | | | | | | | | | | |
Aerie Pharmaceuticals, Inc.* | | | (2,955 | ) | | | (65,571 | ) | | | (4,965 | ) | | | (0.0 | )(a) |
Intersect ENT, Inc.* | | | (5,196 | ) | | | (92,593 | ) | | | (5,248 | ) | | | (0.0 | )(a) |
MyoKardia, Inc.* | | | (1,719 | ) | | | (98,550 | ) | | | 791 | | | | 0.0 | (a) |
WaVe Life Sciences Ltd.* | | | (2,061 | ) | | | (52,123 | ) | | | (9,728 | ) | | | (0.0 | )(a) |
| | | | | | | | | | | | | | | | |
| | | (11,931 | ) | | | (308,837 | ) | | | (19,150 | ) | | | (0.0 | )(a) |
| | | | | | | | | | | | | | | | |
Road & Rail | | | | | | | | | | | | | |
AMERCO | | | (269 | ) | | | (108,956 | ) | | | (1,926 | ) | | | (0.0 | )(a) |
Avis Budget Group, Inc.* | | | (3,378 | ) | | | (100,360 | ) | | | (3,310 | ) | | | (0.0 | )(a) |
JB Hunt Transport Services, Inc. | | | (1,026 | ) | | | (120,617 | ) | | | (2,032 | ) | | | (0.0 | )(a) |
| | | | | | | | | | | | | | | | |
| | | (4,673 | ) | | | (329,933 | ) | | | (7,268 | ) | | | (0.0 | )(a) |
| | | | | | | | | | | | | | | | |
Semiconductors & Semiconductor Equipment | | | | | | | | | | | | | |
Advanced Micro Devices, Inc.* | | | (3,002 | ) | | | (101,858 | ) | | | (8,886 | ) | | | (0.1 | ) |
Impinj, Inc.* | | | (3,205 | ) | | | (105,428 | ) | | | (4,247 | ) | | | (0.0 | )(a) |
MACOM Technology Solutions Holdings, Inc.* | | | (4,766 | ) | | | (108,379 | ) | | | (8,102 | ) | | | (0.0 | )(a) |
NVIDIA Corp. | | | (553 | ) | | | (111,164 | ) | | | (5,823 | ) | | | (0.0 | )(a) |
| | | | | | | | | | | | | | | | |
| | | (11,526 | ) | | | (426,829 | ) | | | (27,058 | ) | | | (0.1 | ) |
| | | | | | | | | | | | | | | | |
Software | | | | | | | | | | | | | |
Appian Corp.* | | | (1,578 | ) | | | (70,442 | ) | | | (4,986 | ) | | | (0.0 | )(a) |
Autodesk, Inc.* | | | (711 | ) | | | (104,773 | ) | | | (5,468 | ) | | | (0.0 | )(a) |
Avalara, Inc.* | | | (1,111 | ) | | | (78,881 | ) | | | (5,166 | ) | | | (0.0 | )(a) |
Benefitfocus, Inc.* | | | (381 | ) | | | (8,662 | ) | | | (88 | ) | | | (0.0 | )(a) |
HubSpot, Inc.* | | | (500 | ) | | | (77,550 | ) | | | (495 | ) | | | (0.0 | )(a) |
Nutanix, Inc.* | | | (3,784 | ) | | | (110,568 | ) | | | (11,636 | ) | | | (0.0 | )(a) |
SEE NOTES TO CONSOLIDATED FINANCIAL STATEMENTS.
| | | | | | |
| | | |
| 28 | | | | J.P. MORGAN EXCHANGE-TRADED FUNDS | | OCTOBER 31, 2019 |
| | | | | | | | | | | | | | | | |
| REFERENCE ENTITY | | SHARES | | | NOTIONAL
VALUE($) (1) | | | NET UNREALIZED
APPRECIATION
(DEPRECIATION)($) (2) | | | PERCENTAGE
OF NET
ASSETS (%) | |
Short Positions — continued | | | | | |
| | | |
Common Stocks — continued | | | | | | | | | | | | | |
Software — continued | | | | | | | | | | | | | |
PROS Holdings, Inc.* | | | (1,301 | ) | | | (66,663 | ) | | | 7,351 | | | | 0.0 | (a) |
Q2 Holdings, Inc.* | | | (1,033 | ) | | | (73,849 | ) | | | 1,043 | | | | 0.0 | (a) |
Varonis Systems, Inc.* | | | (1,623 | ) | | | (116,126 | ) | | | (14,948 | ) | | | (0.1 | ) |
Zuora, Inc.* | | | (5,991 | ) | | | (85,372 | ) | | | (3,774 | ) | | | (0.0 | )(a) |
| | | | | | | | | | | | | | | | |
| | | (18,013 | ) | | | (792,886 | ) | | | (38,167 | ) | | | (0.1 | ) |
| | | | | | | | | | | | | | | | |
Specialty Retail | | | | | | | | | | | | | |
CarMax, Inc.* | | | (879 | ) | | | (81,896 | ) | | | 976 | | | | 0.0 | (a) |
Carvana Co.* | | | (1,130 | ) | | | (91,620 | ) | | | (8,170 | ) | | | (0.0 | )(a) |
National Vision Holdings, Inc.* | | | (1,352 | ) | | | (32,178 | ) | | | (1,095 | ) | | | (0.0 | )(a) |
| | | | | | | | | | | | | | | | |
| | | (3,361 | ) | | | (205,694 | ) | | | (8,289 | ) | | | (0.0 | )(a) |
| | | | | | | | | | | | | | | | |
Technology Hardware, Storage & Peripherals | | | | | | | | | | | | | |
3D Systems Corp.* | | | (13,638 | ) | | | (129,425 | ) | | | (16,638 | ) | | | (0.0 | )(a) |
Pure Storage, Inc.* | | | (5,718 | ) | | | (111,272 | ) | | | (7,033 | ) | | | (0.0 | )(a) |
| | | | | | | | | | | | | | | | |
| | | (19,356 | ) | | | (240,697 | ) | | | (23,671 | ) | | | (0.0 | )(a) |
| | | | | | | | | | | | | | | | |
Trading Companies & Distributors | | | | | | | | | | | | | |
SiteOne Landscape Supply, Inc.* | | | (1,375 | ) | | | (121,083 | ) | | | (12,952 | ) | | | (0.0 | )(a) |
| | | | | | | | | | | | | | | | |
Water Utilities | | | | | | | | | | | | | |
American Water Works Co., Inc. | | | (762 | ) | | | (93,932 | ) | | | (655 | ) | | | (0.0 | )(a) |
California Water Service Group | | | (1,699 | ) | | | (95,093 | ) | | | (1,750 | ) | | | (0.0 | )(a) |
| | | | | | | | | | | | | | | | |
| | | (2,461 | ) | | | (189,025 | ) | | | (2,405 | ) | | | (0.0 | )(a) |
| | | | | | | | | | | | | | | | |
Total Short Positions of Total Return Basket Swap | | | (329,547 | ) | | | (7,988,272 | ) | | | (190,756 | ) | | | (0.2 | ) |
| | | | | | | | | | | | | | | | |
Total of Long and Short Positions of Total Return Basket Swap | | | (326,389 | ) | | | (7,850,867 | ) | | | (193,567 | ) | | | (0.2 | ) |
| | | | | | | | | | | | | | | | |
| | | | | | | | | | | | | | | | | | | | |
| COUNTERPARTY | | DESCRIPTION | | TERMINATION
DATE | | NOTIONAL
VALUE (1) | | | NET UNREALIZED
APPRECIATION
(DEPRECIATION) (2) | | | NET CASH
AND OTHER
RECEIVABLES
(PAYABLES) | | | VALUE | |
Bank of America | | The Fund receives the total return on a portfolio of long and short equity positions and pays or receives the net of one month EURIBOR on long positions and short positions respectively, plus or minus a specified spread (rates range from 0.00% to 0.20%), which is denominated in EUR based on the local currencies of the positions within the swaps. | | 5/29/2020 –
10/30/2020 | | $ | (1,198,437 | ) | | $ | 25,845 | | | $ | (8,511 | ) | | $ | 17,334 | |
| | | | | | | | | | | | | | | | | | | | |
| | | | | | | | | | | | | | | | |
| REFERENCE ENTITY | | SHARES | | | NOTIONAL
VALUE($) (1) | | | NET UNREALIZED
APPRECIATION
(DEPRECIATION)($) (2) | | | PERCENTAGE
OF NET
ASSETS (%) | |
Long Positions | | | | | |
| | | |
Common Stocks | | | | | | | | | | | | | |
Automobiles | | | | | | | | | | | | | |
Peugeot SA | | | 3,716 | | | | 94,112 | | | | (3,958 | ) | | | (0.0 | )(a) |
| | | | | | | | | | | | | | | | |
SEE NOTES TO CONSOLIDATED FINANCIAL STATEMENTS.
| | | | | | | | |
| | | |
| OCTOBER 31, 2019 | | J.P. MORGAN EXCHANGE-TRADED FUNDS | | | | | 29 | |
JPMorgan Diversified Alternatives ETF
CONSOLIDATED SCHEDULE OF PORTFOLIO INVESTMENTS
AS OF OCTOBER 31, 2019 (continued)
| | | | | | | | | | | | | | | | |
| REFERENCE ENTITY | | SHARES | | | NOTIONAL
VALUE($) (1) | | | NET UNREALIZED
APPRECIATION
(DEPRECIATION)($) (2) | | | PERCENTAGE
OF NET
ASSETS (%) | |
Long Positions — continued | | | | | |
| | | |
Common Stocks — continued | | | | | | | | | | | | | |
Chemicals | | | | | | | | | | | | | |
Covestro AG (b) | | | 1,071 | | | | 51,431 | | | | (3,193 | ) | | | (0.0 | )(a) |
Koninklijke DSM NV | | | 1,139 | | | | 135,186 | | | | (2,210 | ) | | | (0.0 | )(a) |
| | | | | | | | | | | | | | | | |
| | | 2,210 | | | | 186,617 | | | | (5,403 | ) | | | (0.0 | )(a) |
| | | | | | | | | | | | | | | | |
Commercial Services & Supplies | | | | | | | | | | | | | |
Edenred | | | 3,414 | | | | 179,944 | | | | 11,053 | | | | 0.0 | (a) |
SPIE SA | | | 8,695 | | | | 183,512 | | | | 5,453 | | | | 0.0 | (a) |
| | | | | | | | | | | | | | | | |
| | | 12,109 | | | | 363,456 | | | | 16,506 | | | | 0.0 | (a) |
| | | | | | | | | | | | | | | | |
Construction & Engineering | | | | | | | | | | | | | |
Eiffage SA | | | 1,538 | | | | 165,191 | | | | 1,940 | | | | 0.0 | (a) |
Koninklijke BAM Groep NV | | | 54,345 | | | | 137,974 | | | | (4,214 | ) | | | (0.0 | )(a) |
| | | | | | | | | | | | | | | | |
| | | 55,883 | | | | 303,165 | | | | (2,274 | ) | | | (0.0 | )(a) |
| | | | | | | | | | | | | | | | |
Diversified Telecommunication Services | | | | | | | | | | | | | |
Koninklijke KPN NV | | | 50,906 | | | | 158,031 | | | | (10,218 | ) | | | (0.0 | )(a) |
Telefonica SA | | | 20,755 | | | | 159,384 | | | | (4,202 | ) | | | (0.0 | )(a) |
| | | | | | | | | | | | | | | | |
| | | 71,661 | | | | 317,415 | | | | (14,420 | ) | | | (0.0 | )(a) |
| | | | | | | | | | | | | | | | |
Electric Utilities | | | | | | | | | | | | | |
Iberdrola SA | | | 15,187 | | | | 156,107 | | | | 1,595 | | | | 0.0 | (a) |
| | | | | | | | | | | | | | | | |
Energy Equipment & Services | | | | | | | | | | | | | |
SBM Offshore NV | | | 9,528 | | | | 164,315 | | | | 540 | | | | 0.0 | (a) |
| | | | | | | | | | | | | | | | |
Food Products | | | | | | | | | | | | | |
Danone SA | | | 1,753 | | | | 145,221 | | | | 4,518 | | | | 0.0 | (a) |
| | | | | | | | | | | | | | | | |
Gas Utilities | | | | | | | | | | | | | |
Snam SpA | | | 34,799 | | | | 178,655 | | | | 2,198 | | | | 0.0 | (a) |
| | | | | | | | | | | | | | | | |
Insurance | | | | | | | | | | | | | |
AXA SA | | | 6,518 | | | | 172,539 | | | | (1,418 | ) | | | (0.0 | )(a) |
Unipol Gruppo SpA | | | 31,627 | | | | 176,513 | | | | (72 | ) | | | (0.0 | )(a) |
| | | | | | | | | | | | | | | | |
| | | 38,145 | | | | 349,052 | | | | (1,490 | ) | | | (0.0 | )(a) |
| | | | | | | | | | | | | | | | |
Media | | | | | | | | | | | | | |
ProSiebenSat.1 Media SE | | | 2,664 | | | | 39,338 | | | | 866 | | | | 0.0 | (a) |
| | | | | | | | | | | | | | | | |
Oil, Gas & Consumable Fuels | | | | | | | | | | | | | |
Eni SpA | | | 3,542 | | | | 53,736 | | | | (697 | ) | | | (0.0 | )(a) |
| | | | | | | | | | | | | | | | |
Pharmaceuticals | | | | | | | | | | | | | |
Ipsen SA | | | 1,486 | | | | 158,389 | | | | (1,048 | ) | | | (0.0 | )(a) |
| | | | | | | | | | | | | | | | |
Semiconductors & Semiconductor Equipment | | | | | | | | | | | | | |
Dialog Semiconductor plc* | | | 3,296 | | | | 148,255 | | | | (2,473 | ) | | | (0.0 | )(a) |
| | | | | | | | | | | | | | | | |
Textiles, Apparel & Luxury Goods | | | | | | | | | | | | | |
adidas AG | | | 431 | | | | 133,080 | | | | (2,165 | ) | | | (0.0 | )(a) |
| | | | | | | | | | | | | | | | |
Total Long Positions of Total Return Basket Swap | | | 256,410 | | | | 2,790,913 | | | | (7,705 | ) | | | 0.0 | (a) |
| | | | | | | | | | | | | | | | |
Short Positions | |
| | |
Common Stocks | | | | | | | | | |
Air Freight & Logistics | | | | | | | | | | | | | |
PostNL NV | | | (54,008 | ) | | | (124,090 | ) | | | 648 | | | | 0.0 | (a) |
| | | | | | | | | | | | | | | | |
SEE NOTES TO CONSOLIDATED FINANCIAL STATEMENTS.
| | | | | | |
| | | |
| 30 | | | | J.P. MORGAN EXCHANGE-TRADED FUNDS | | OCTOBER 31, 2019 |
| | | | | | | | | | | | | | | | |
| REFERENCE ENTITY | | SHARES | | | NOTIONAL
VALUE($) (1) | | | NET UNREALIZED
APPRECIATION
(DEPRECIATION)($) (2) | | | PERCENTAGE
OF NET
ASSETS (%) | |
Short Positions — continued | |
| | |
Common Stocks — continued | | | | | | | | | |
Automobiles | | | | | | | | | | | | | |
Bayerische Motoren Werke AG | | | (1,295 | ) | | | (99,164 | ) | | | (1,793 | ) | | | (0.0 | )(a) |
Daimler AG (Registered) | | | (1,496 | ) | | | (87,446 | ) | | | (6,619 | ) | | | (0.0 | )(a) |
| | | | | | | | | | | | | | | | |
| | | (2,791 | ) | | | (186,610 | ) | | | (8,412 | ) | | | (0.0 | )(a) |
| | | | | | | | | | | | | | | | |
Banks | | | | | | | | | | | | | |
Bankia SA | | | (59,950 | ) | | | (114,374 | ) | | | 6,471 | | | | 0.0 | (a) |
| | | | | | | | | | | | | | | | |
Chemicals | | | | | | | | | | | | | |
BASF SE | | | (1,209 | ) | | | (91,907 | ) | | | (2,480 | ) | | | (0.0 | )(a) |
K+S AG (Registered) | | | (2,910 | ) | | | (41,322 | ) | | | (553 | ) | | | (0.0 | )(a) |
Umicore SA | | | (864 | ) | | | (35,666 | ) | | | (588 | ) | | | (0.0 | )(a) |
Wacker Chemie AG | | | (1,179 | ) | | | (92,365 | ) | | | (6,888 | ) | | | (0.0 | )(a) |
| | | | | | | | | | | | | | | | |
| | | (6,162 | ) | | | (261,260 | ) | | | (10,509 | ) | | | (0.0 | )(a) |
| | | | | | | | | | | | | | | | |
Communications Equipment | | | | | | | | | | | | | |
Nokia OYJ | | | (18,195 | ) | | | (66,794 | ) | | | 28,724 | | | | 0.0 | (a) |
| | | | | | | | | | | | | | | | |
Construction & Engineering | | | | | | | | | | | | | |
Bouygues SA | | | (2,625 | ) | | | (111,347 | ) | | | 2,093 | | | | 0.0 | (a) |
Ferrovial SA | | | (3,662 | ) | | | (108,041 | ) | | | (1,844 | ) | | | (0.0 | )(a) |
| | | | | | | | | | | | | | | | |
| | | (6,287 | ) | | | (219,388 | ) | | | 249 | | | | 0.0 | (a) |
| | | | | | | | | | | | | | | | |
Containers & Packaging | | | | | | | | | | | | | |
Huhtamaki OYJ | | | (2,015 | ) | | | (93,306 | ) | | | (8,999 | ) | | | (0.0 | )(a) |
| | | | | | | | | | | | | | | | |
Diversified Financial Services | | | | | | | | | | | | | |
Groupe Bruxelles Lambert SA | | | (1,044 | ) | | | (104,876 | ) | | | (1,937 | ) | | | (0.0 | )(a) |
Wendel SA | | | (97 | ) | | | (13,754 | ) | | | (543 | ) | | | (0.0 | )(a) |
| | | | | | | | | | | | | | | | |
| | | (1,141 | ) | | | (118,630 | ) | | | (2,480 | ) | | | (0.0 | )(a) |
| | | | | | | | | | | | | | | | |
Diversified Telecommunication Services | | | | | | | | | | | | | |
Cellnex Telecom SA* (b) | | | (508 | ) | | | (21,919 | ) | | | 1,291 | | | | 0.0 | (a) |
Iliad SA | | | (899 | ) | | | (93,168 | ) | | | (866 | ) | | | (0.0 | )(a) |
Masmovil Ibercom SA* | | | (4,626 | ) | | | (107,109 | ) | | | 9,265 | | | | 0.0 | (a) |
United Internet AG (Registered) | | | (3,020 | ) | | | (91,169 | ) | | | 28,297 | | | | 0.0 | (a) |
| | | | | | | | | | | | | | | | |
| | | (9,053 | ) | | | (313,365 | ) | | | 37,987 | | | | 0.0 | (a) |
| | | | | | | | | | | | | | | | |
Electric Utilities | | | | | | | | | | | | | |
Fortum OYJ | | | (4,171 | ) | | | (101,929 | ) | | | (755 | ) | | | (0.0 | )(a) |
| | | | | | | | | | | | | | | | |
Electrical Equipment | | | | | | | | | | | | | |
Prysmian SpA | | | (5,142 | ) | | | (118,946 | ) | | | (3,086 | ) | | | (0.0 | )(a) |
| | | | | | | | | | | | | | | | |
Energy Equipment & Services | | | | | | | | | | | | | |
Tenaris SA | | | (7,672 | ) | | | (77,832 | ) | | | 1,753 | | | | 0.0 | (a) |
| | | | | | | | | | | | | | | | |
Food & Staples Retailing | | | | | | | | | | | | | |
Jeronimo Martins SGPS SA | | | (5,765 | ) | | | (96,873 | ) | | | (648 | ) | | | (0.0 | )(a) |
| | | | | | | | | | | | | | | | |
Gas Utilities | | | | | | | | | | | | | |
Rubis SCA | | | (1,640 | ) | | | (95,100 | ) | | | (1,812 | ) | | | (0.0 | )(a) |
| | | | | | | | | | | | | | | | |
Health Care Providers & Services | | | | | | | | | | | | | |
Orpea | | | (320 | ) | | | (38,542 | ) | | | 323 | | | | 0.0 | (a) |
| | | | | | | | | | | | | | | | |
Hotels, Restaurants & Leisure | | | | | | | | | | | | | |
Accor SA | | | (1,772 | ) | | | (76,220 | ) | | | (1,196 | ) | | | (0.0 | )(a) |
Autogrill SpA | | | (9,135 | ) | | | (90,315 | ) | | | (299 | ) | | | (0.0 | )(a) |
Elior Group SA (b) | | | (6,023 | ) | | | (78,002 | ) | | | (1,089 | ) | | | (0.0 | )(a) |
Flutter Entertainment plc | | | (912 | ) | | | (94,209 | ) | | | (5,788 | ) | | | (0.0 | )(a) |
| | | | | | | | | | | | | | | | |
| | | (17,842 | ) | | | (338,746 | ) | | | (8,372 | ) | | | (0.0 | )(a) |
| | | | | | | | | | | | | | | | |
SEE NOTES TO CONSOLIDATED FINANCIAL STATEMENTS.
| | | | | | | | |
| | | |
| OCTOBER 31, 2019 | | J.P. MORGAN EXCHANGE-TRADED FUNDS | | | | | 31 | |
JPMorgan Diversified Alternatives ETF
CONSOLIDATED SCHEDULE OF PORTFOLIO INVESTMENTS
AS OF OCTOBER 31, 2019 (continued)
| | | | | | | | | | | | | | | | |
| REFERENCE ENTITY | | SHARES | | | NOTIONAL
VALUE($) (1) | | | NET UNREALIZED
APPRECIATION
(DEPRECIATION)($) (2) | | | PERCENTAGE
OF NET
ASSETS (%) | |
Short Positions — continued | |
| | |
Common Stocks — continued | | | | | | | | | |
Industrial Conglomerates | | | | | | | | | | | | | |
Rheinmetall AG | | | (905 | ) | | | (109,149 | ) | | | (3,103 | ) | | | (0.0 | )(a) |
| | | | | | | | | | | | | | | | |
Internet & Direct Marketing Retail | | | | | | | | | | | | | |
Delivery Hero SE* (b) | | | (591 | ) | | | (27,731 | ) | | | 319 | | | | 0.0 | (a) |
Zalando SE* (b) | | | (1,646 | ) | | | (71,366 | ) | | | 4,875 | | | | 0.0 | (a) |
| | | | | | | | | | | | | | | | |
| | | (2,237 | ) | | | (99,097 | ) | | | 5,194 | | | | 0.0 | (a) |
| | | | | | | | | | | | | | | | |
Life Sciences Tools & Services | | | | | | | | | | | | | |
Eurofins Scientific SE | | | (221 | ) | | | (112,046 | ) | | | (7,594 | ) | | | (0.0 | )(a) |
| | | | | | | | | | | | | | | | |
Machinery | | | | | | | | | | | | | |
ANDRITZ AG | | | (2,666 | ) | | | (119,880 | ) | | | (6,920 | ) | | | (0.0 | )(a) |
Fincantieri SpA | | | (109,120 | ) | | | (115,148 | ) | | | (2,018 | ) | | | (0.0 | )(a) |
GEA Group AG | | | (3,469 | ) | | | (106,049 | ) | | | (2,870 | ) | | | (0.0 | )(a) |
| | | | | | | | | | | | | | | | |
| | | (115,255 | ) | | | (341,077 | ) | | | (11,808 | ) | | | (0.0 | )(a) |
| | | | | | | | | | | | | | | | |
Media | | | | | | | | | | | | | |
Altice Europe NV* | | | (20,819 | ) | | | (119,122 | ) | | | 3,800 | | | | 0.0 | (a) |
| | | | | | | | | | | | | | | | |
Metals & Mining | | | | | | | | | | | | | |
AMG Advanced Metallurgical Group NV | | | (3,205 | ) | | | (78,855 | ) | | | 6,920 | | | | 0.0 | (a) |
ArcelorMittal | | | (5,881 | ) | | | (87,444 | ) | | | (882 | ) | | | (0.0 | )(a) |
thyssenkrupp AG | | | (6,309 | ) | | | (89,970 | ) | | | 1,467 | | | | 0.0 | (a) |
| | | | | | | | | | | | | | | | |
| | | (15,395 | ) | | | (256,269 | ) | | | 7,505 | | | | 0.0 | (a) |
| | | | | | | | | | | | | | | | |
Semiconductors & Semiconductor Equipment | | | | | | | | | | | | | |
AIXTRON SE* | | | (2,739 | ) | | | (25,041 | ) | | | 665 | | | | 0.0 | (a) |
Infineon Technologies AG | | | (5,388 | ) | | | (104,359 | ) | | | (6,419 | ) | | | (0.0 | )(a) |
SOITEC* | | | (962 | ) | | | (106,109 | ) | | | 195 | | | | 0.0 | (a) |
| | | | | | | | | | | | | | | | |
| | | (9,089 | ) | | | (235,509 | ) | | | (5,559 | ) | | | (0.0 | )(a) |
| | | | | | | | | | | | | | | | |
Technology Hardware, Storage & Peripherals | | | | | | | | | | | | | |
S&T AG | | | (5,597 | ) | | | (119,362 | ) | | | (9,513 | ) | | | (0.0 | )(a) |
| | | | | | | | | | | | | | | | |
Transportation Infrastructure | | | | | | | | | | | | | |
Aeroports de Paris | | | (55 | ) | | | (10,461 | ) | | | (319 | ) | | | (0.0 | )(a) |
Getlink SE | | | (6,527 | ) | | | (109,333 | ) | | | (1,734 | ) | | | (0.0 | )(a) |
| | | | | | | | | | | | | | | | |
| | | (6,582 | ) | | | (119,794 | ) | | | (2,053 | ) | | | (0.0 | )(a) |
| | | | | | | | | | | | | | | | |
Wireless Telecommunication Services | | | | | | | | | | | | | |
1&1 Drillisch AG | | | (4,187 | ) | | | (112,140 | ) | | | 25,599 | | | | 0.0 | (a) |
| | | | | | | | | | | | | | | | |
Total Short Positions of Total Return Basket Swap | | | (382,441 | ) | | | (3,989,350 | ) | | | 33,550 | | | | 0.0 | (a) |
| | | | | | | | | | | | | | | | |
Total of Long and Short Positions of Total Return Basket Swap | | | (126,031 | ) | | | (1,198,437 | ) | | | 25,845 | | | | 0.0 | (a) |
| | | | | | | | | | | | | | | | |
SEE NOTES TO CONSOLIDATED FINANCIAL STATEMENTS.
| | | | | | |
| | | |
| 32 | | | | J.P. MORGAN EXCHANGE-TRADED FUNDS | | OCTOBER 31, 2019 |
| | | | | | | | | | | | | | | | | | | | |
| COUNTERPARTY | | DESCRIPTION | | TERMINATION
DATE | | NOTIONAL
VALUE (1) | | | NET UNREALIZED
APPRECIATION
(DEPRECIATION) (2) | | | NET CASH
AND OTHER
RECEIVABLES
(PAYABLES) | | | VALUE | |
Bank of America | | The Fund receives the total return on a portfolio of long and short equity positions and pays or receives the net of one month LIBOR on long positions and short positions respectively, plus or minus a specified spread (rates range from 0.00% to 0.20%), which is denominated in CHF based on the local currencies of the positions within the swaps. | | 10/30/2020 | | $ | 713,604 | | | $ | (16,456 | ) | | $ | (3,246 | ) | | $ | (19,702 | ) |
| | | | | | | | | | | | | | | | | | | | |
| | | | | | | | | | | | | | | | |
| REFERENCE ENTITY | | SHARES | | | NOTIONAL
VALUE($) (1) | | | NET UNREALIZED
APPRECIATION
(DEPRECIATION)($) (2) | | | PERCENTAGE
OF NET
ASSETS (%) | |
Long Positions | | | | | |
| | | |
Common Stocks | | | | | | | | | | | | | |
Diversified Telecommunication Services | | | | | | | | | | | | | |
Sunrise Communications Group AG* (b) | | | 2,085 | | | | 162,224 | | | | 1,638 | | | | 0.0 | (a) |
| | | | | | | | | | | | | | | | |
Electronic Equipment, Instruments & Components | | | | | | | | | | | | | |
Landis+Gyr Group AG* | | | 1,826 | | | | 169,550 | | | | (1,609 | ) | | | (0.0 | )(a) |
| | | | | | | | | | | | | | | | |
Health Care Equipment & Supplies | | | | | | | | | | | | | |
Sonova Holding AG (Registered) | | | 344 | | | | 78,941 | | | | (580 | ) | | | (0.0 | )(a) |
| | | | | | | | | | | | | | | | |
Health Care Providers & Services | | | | | | | | | | | | | |
Galenica AG (b) | | | 2,857 | | | | 171,041 | | | | 3,023 | | | | 0.0 | (a) |
| | | | | | | | | | | | | | | | |
Insurance | | | | | | | | | | | | | |
Zurich Insurance Group AG | | | 433 | | | | 169,606 | | | | (298 | ) | | | (0.0 | )(a) |
| | | | | | | | | | | | | | | | |
Machinery | | | | | | | | | | | | | |
OC Oerlikon Corp. AG (Registered) | | | 15,952 | | | | 163,702 | | | | 3,359 | | | | 0.0 | (a) |
| | | | | | | | | | | | | | | | |
Pharmaceuticals | | | | | | | | | | | | | |
Roche Holding AG | | | 92 | | | | 27,428 | | | | 640 | | | | 0.0 | (a) |
| | | | | | | | | | | | | | | | |
Professional Services | | | | | | | | | | | | | |
Adecco Group AG (Registered) | | | 2,688 | | | | 159,791 | | | | 73 | | | | 0.0 | (a) |
| | | | | | | | | | | | | | | | |
Real Estate Management & Development | | | | | | | | | | | | | |
PSP Swiss Property AG (Registered) | | | 184 | | | | 24,355 | | | | 52 | | | | 0.0 | (a) |
| | | | | | | | | | | | | | | | |
Total Long Positions of Total Return Basket Swap | | | 26,461 | | | | 1,126,638 | | | | 6,298 | | | | 0.0 | (a) |
| | | | | | | | | | | | | | | | |
| |
Short Positions | | | | | |
| | | |
Common Stocks | | | | | | | | | | | | | |
Chemicals | | | | | | | | | | | | | |
Givaudan SA (Registered) | | | (32 | ) | | | (94,014 | ) | | | (2,844 | ) | | | (0.0 | )(a) |
Sika AG (Registered) | | | (551 | ) | | | (94,721 | ) | | | (5,209 | ) | | | (0.0 | )(a) |
| | | | | | | | | | | | | | | | |
| | | (583 | ) | | | (188,735 | ) | | | (8,053 | ) | | | (0.0 | )(a) |
| | | | | | | | | | | | | | | | |
Electrical Equipment | | | | | | | | | | | | | |
ABB Ltd. (Registered) | | | (5,061 | ) | | | (106,281 | ) | | | (9,786 | ) | | | (0.0 | )(a) |
| | | | | | | | | | | | | | | | |
Marine | | | | | | | | | | | | | |
Kuehne + Nagel International AG (Registered) | | | (100 | ) | | | (16,156 | ) | | | (1,292 | ) | | | (0.0 | )(a) |
| | | | | | | | | | | | | | | | |
Semiconductors & Semiconductor Equipment | | | | | | | | | | | | | |
ams AG* | | | (2,267 | ) | | | (101,862 | ) | | | (3,623 | ) | | | (0.0 | )(a) |
| | | | | | | | | | | | | | | | |
Total Short Positions of Total Return Basket Swap | | | (8,011 | ) | | | (413,034 | ) | | | (22,754 | ) | | | 0.0 | (a) |
| | | | | | | | | | | | | | | | |
Total of Long and Short Positions of Total Return Basket Swap | | | 18,450 | | | | 713,604 | | | | (16,456 | ) | | | 0.0 | (a) |
| | | | | | | | | | | | | | | | |
SEE NOTES TO CONSOLIDATED FINANCIAL STATEMENTS.
| | | | | | | | |
| | | |
| OCTOBER 31, 2019 | | J.P. MORGAN EXCHANGE-TRADED FUNDS | | | | | 33 | |
JPMorgan Diversified Alternatives ETF
CONSOLIDATED SCHEDULE OF PORTFOLIO INVESTMENTS
AS OF OCTOBER 31, 2019 (continued)
| | | | | | | | | | | | | | | | | | | | |
| COUNTERPARTY | | DESCRIPTION | | TERMINATION
DATE | | NOTIONAL
VALUE (1) | | | NET UNREALIZED
APPRECIATION
(DEPRECIATION) (2) | | | NET CASH
AND OTHER
RECEIVABLES
(PAYABLES) | | | VALUE | |
Bank of America | | The Fund receives the total return on a portfolio of long and short equity positions and pays or receives the net of one month LIBOR on long positions and short positions respectively, plus or minus a specified spread (rates range from (3.75)% to 0.35%), which is denominated in JPY based on the local currencies of the positions within the swaps. | | 11/19/2019 | | $ | (3,917,529 | ) | | $ | (67,167 | ) | | $ | (52,652 | ) | | $ | (119,819 | ) |
| | | | | | | | | | | | | | | | | | | | |
| | | | | | | | | | | | | | | | |
| REFERENCE ENTITY | | SHARES | | | NOTIONAL
VALUE($) (1) | | | NET UNREALIZED
APPRECIATION
(DEPRECIATION)($) (2) | | | PERCENTAGE
OF NET
ASSETS (%) | |
Long Positions | | | | | |
| | | |
Common Stocks | | | | | | | | | | | | | |
Diversified Telecommunication Services | | | | | | | | | | | | | |
Nippon Telegraph & Telephone Corp. | | | 600 | | | | 29,786 | | | | 462 | | | | 0.0 | (a) |
| | | | | | | | | | | | | | | | |
Pharmaceuticals | | | | | | | | | | | | | |
Astellas Pharma, Inc. | | | 8,800 | | | | 151,031 | | | | 11,159 | | | | 0.0 | (a) |
Shionogi & Co. Ltd. | | | 2,700 | | | | 162,062 | | | | 10,067 | | | | 0.0 | (a) |
| | | | | | | | | | | | | | | | |
| | | 11,500 | | | | 313,093 | | | | 21,226 | | | | 0.0 | (a) |
| | | | | | | | | | | | | | | | |
Wireless Telecommunication Services | | | | | | | | | | | | | |
NTT DOCOMO, Inc. | | | 5,200 | | | | 142,559 | | | | 6,636 | | | | 0.0 | (a) |
| | | | | | | | | | | | | | | | |
Total Long Positions of Total Return Basket Swap | | | 17,300 | | | | 485,438 | | | | 28,324 | | | | 0.0 | (a) |
| | | | | | | | | | | | | | | | |
| |
Short Positions | | | | | |
| | | |
Common Stocks | | | | | | | | | | | | | |
Auto Components | | | | | | | | | | | | | |
Toyo Tire Corp. | | | (6,900 | ) | | | (96,243 | ) | | | (6,921 | ) | | | (0.0 | )(a) |
| | | | | | | | | | | | | | | | |
Automobiles | | | | | | | | | | | | | |
Nissan Motor Co. Ltd. | | | (13,600 | ) | | | (85,824 | ) | | | 982 | | | | 0.0 | (a) |
| | | | | | | | | | | | | | | | |
Banks | | | | | | | | | | | | | |
Bank of Kyoto Ltd. (The) | | | (2,700 | ) | | | (106,867 | ) | | | (3,823 | ) | | | (0.0 | )(a) |
| | | | | | | | | | | | | | | | |
Building Products | | | | | | | | | | | | | |
TOTO Ltd. | | | (1,000 | ) | | | (40,826 | ) | | | (1,919 | ) | | | (0.0 | )(a) |
| | | | | | | | | | | | | | | | |
Chemicals | | | | | | | | | | | | | |
Air Water, Inc. | | | (5,100 | ) | | | (95,477 | ) | | | (678 | ) | | | (0.0 | )(a) |
JSR Corp. | | | (5,000 | ) | | | (93,869 | ) | | | (8,991 | ) | | | (0.0 | )(a) |
Toray Industries, Inc. | | | (11,800 | ) | | | (83,392 | ) | | | 8,707 | | | | 0.0 | (a) |
| | | | | | | | | | | | | | | | |
| | | (21,900 | ) | | | (272,738 | ) | | | (962 | ) | | | (0.0 | )(a) |
| | | | | | | | | | | | | | | | |
Construction & Engineering | | | | | | | | | | | | | |
JGC Holdings Corp. | | | (8,300 | ) | | | (120,046 | ) | | | (4,111 | ) | | | (0.0 | )(a) |
| | | | | | | | | | | | | | | | |
Consumer Finance | | | | | | | | | | | | | |
Aiful Corp.* | | | (46,300 | ) | | | (107,803 | ) | | | 1,069 | | | | 0.0 | (a) |
| | | | | | | | | | | | | | | | |
Electrical Equipment | | | | | | | | | | | | | |
Fujikura Ltd. | | | (23,800 | ) | | | (110,434 | ) | | | (10,640 | ) | | | (0.0 | )(a) |
Nidec Corp. | | | (800 | ) | | | (117,780 | ) | | | (6,056 | ) | | | (0.0 | )(a) |
| | | | | | | | | | | | | | | | |
| | | (24,600 | ) | | | (228,214 | ) | | | (16,696 | ) | | | (0.0 | )(a) |
| | | | | | | | | | | | | | | | |
SEE NOTES TO CONSOLIDATED FINANCIAL STATEMENTS.
| | | | | | |
| | | |
| 34 | | | | J.P. MORGAN EXCHANGE-TRADED FUNDS | | OCTOBER 31, 2019 |
| | | | | | | | | | | | | | | | |
| REFERENCE ENTITY | | SHARES | | | NOTIONAL
VALUE($) (1) | | | NET UNREALIZED
APPRECIATION
(DEPRECIATION)($) (2) | | | PERCENTAGE
OF NET
ASSETS (%) | |
Short Positions — continued | | | | | |
| | | |
Common Stocks — continued | | | | | | | | | | | | | |
Electronic Equipment, Instruments & Components | | | | | | | | | | | | | |
Murata Manufacturing Co. Ltd. | | | (2,200 | ) | | | (119,786 | ) | | | 268 | | | | 0.0 | (a) |
TDK Corp. | | | (1,200 | ) | | | (118,409 | ) | | | (482 | ) | | | (0.0 | )(a) |
Yaskawa Electric Corp. | | | (2,900 | ) | | | (110,309 | ) | | | (1,927 | ) | | | (0.0 | )(a) |
| | | | | | | | | | | | | | | | |
| | | (6,300 | ) | | | (348,504 | ) | | | (2,141 | ) | | | (0.0 | )(a) |
| | | | | | | | | | | | | | | | |
Food & Staples Retailing | | | | | | | | | | | | | |
Aeon Co. Ltd. | | | (5,200 | ) | | | (104,626 | ) | | | 114 | | | | 0.0 | (a) |
Cosmos Pharmaceutical Corp. | | | (100 | ) | | | (20,651 | ) | | | (444 | ) | | | (0.0 | )(a) |
| | | | | | | | | | | | | | | | |
| | | (5,300 | ) | | | (125,277 | ) | | | (330 | ) | | | (0.0 | )(a) |
| | | | | | | | | | | | | | | | |
Food Products | | | | | | | | | | | | | |
Nissin Foods Holdings Co. Ltd. | | | (1,400 | ) | | | (105,751 | ) | | | (582 | ) | | | (0.0 | )(a) |
Yamazaki Baking Co. Ltd.* | | | (6,300 | ) | | | (107,407 | ) | | | 4,108 | | | | 0.0 | (a) |
| | | | | | | | | | | | | | | | |
| | | (7,700 | ) | | | (213,158 | ) | | | 3,526 | | | | 0.0 | (a) |
| | | | | | | | | | | | | | | | |
Hotels, Restaurants & Leisure | | | | | | | | | | | | | |
HIS Co. Ltd. | | | (3,100 | ) | | | (80,447 | ) | | | (1,894 | ) | | | (0.0 | )(a) |
Kyoritsu Maintenance Co. Ltd. | | | (1,800 | ) | | | (79,625 | ) | | | (2,607 | ) | | | (0.0 | )(a) |
| | | | | | | | | | | | | | | | |
| | | (4,900 | ) | | | (160,072 | ) | | | (4,501 | ) | | | (0.0 | )(a) |
| | | | | | | | | | | | | | | | |
Household Durables | | | | | | | | | | | | | |
Panasonic Corp. | | | (6,100 | ) | | | (51,267 | ) | | | (1,084 | ) | | | (0.0 | )(a) |
Sharp Corp.* | | | (7,500 | ) | | | (86,033 | ) | | | 1,609 | | | | 0.0 | (a) |
| | | | | | | | | | | | | | | | |
| | | (13,600 | ) | | | (137,300 | ) | | | 525 | | | | 0.0 | (a) |
| | | | | | | | | | | | | | | | |
Industrial Conglomerates | | | | | | | | | | | | | |
Toshiba Corp. | | | (3,200 | ) | | | (109,428 | ) | | | (450 | ) | | | (0.0 | )(a) |
| | | | | | | | | | | | | | | | |
Interactive Media & Services | | | | | | | | | | | | | |
LINE Corp.* | | | (2,800 | ) | | | (103,003 | ) | | | (3,790 | ) | | | (0.0 | )(a) |
| | | | | | | | | | | | | | | | |
IT Services | | | | | | | | | | | | | |
GMO Payment Gateway, Inc. | | | (400 | ) | | | (29,480 | ) | | | (1,724 | ) | | | (0.0 | )(a) |
| | | | | | | | | | | | | | | | |
Leisure Products | | | | | | | | | | | | | |
Sega Sammy Holdings, Inc. | | | (5,900 | ) | | | (83,031 | ) | | | 1,594 | | | | 0.0 | (a) |
| | | | | | | | | | | | | | | | |
Machinery | | | | | | | | | | | | | |
CKD Corp. | | | (7,300 | ) | | | (102,485 | ) | | | (1,960 | ) | | | (0.0 | )(a) |
Daifuku Co. Ltd. | | | (800 | ) | | | (42,449 | ) | | | 1,106 | | | | 0.0 | (a) |
FANUC Corp. | | | (600 | ) | | | (118,350 | ) | | | (1,238 | ) | | | (0.0 | )(a) |
IHI Corp. | | | (4,500 | ) | | | (110,894 | ) | | | (3,387 | ) | | | (0.0 | )(a) |
Komatsu Ltd. | | | (4,700 | ) | | | (110,050 | ) | | | (1,740 | ) | | | (0.0 | )(a) |
Makita Corp. | | | (3,400 | ) | | | (114,345 | ) | | | (6,627 | ) | | | (0.1 | ) |
MISUMI Group, Inc. | | | (2,300 | ) | | | (57,819 | ) | | | (4,653 | ) | | | (0.0 | )(a) |
Nabtesco Corp. | | | (3,300 | ) | | | (105,055 | ) | | | (2,174 | ) | | | (0.0 | )(a) |
NGK Insulators Ltd. | | | (2,400 | ) | | | (36,871 | ) | | | (2,295 | ) | | | (0.0 | )(a) |
| | | | | | | | | | | | | | | | |
| | | (29,300 | ) | | | (798,318 | ) | | | (22,968 | ) | | | (0.1 | ) |
| | | | | | | | | | | | | | | | |
Marine | | | | | | | | | | | | | |
Kawasaki Kisen Kaisha Ltd.* | | | (7,400 | ) | | | (110,111 | ) | | | (6,304 | ) | | | (0.0 | )(a) |
Nippon Yusen KK | | | (6,200 | ) | | | (111,384 | ) | | | (603 | ) | | | (0.0 | )(a) |
| | | | | | | | | | | | | | | | |
| | | (13,600 | ) | | | (221,495 | ) | | | (6,907 | ) | | | (0.0 | )(a) |
| | | | | | | | | | | | | | | | |
Metals & Mining | | | | | | | | | | | | | |
Hitachi Metals Ltd. | | | (1,300 | ) | | | (16,315 | ) | | | (1,430 | ) | | | (0.0 | )(a) |
JFE Holdings, Inc. | | | (7,700 | ) | | | (96,309 | ) | | | (3,096 | ) | | | (0.0 | )(a) |
SEE NOTES TO CONSOLIDATED FINANCIAL STATEMENTS.
| | | | | | | | |
| | | |
| OCTOBER 31, 2019 | | J.P. MORGAN EXCHANGE-TRADED FUNDS | | | | | 35 | |
JPMorgan Diversified Alternatives ETF
CONSOLIDATED SCHEDULE OF PORTFOLIO INVESTMENTS
AS OF OCTOBER 31, 2019 (continued)
| | | | | | | | | | | | | | | | |
| REFERENCE ENTITY | | SHARES | | | NOTIONAL
VALUE($) (1) | | | NET UNREALIZED
APPRECIATION
(DEPRECIATION)($) (2) | | | PERCENTAGE
OF NET
ASSETS (%) | |
Short Positions — continued | | | | | |
| | | |
Common Stocks — continued | | | | | | | | | | | | | |
Metals & Mining — continued | | | | | | | | | | | | | |
Kobe Steel Ltd. | | | (16,800 | ) | | | (90,326 | ) | | | (2,975 | ) | | | (0.0 | )(a) |
| | | | | | | | | | | | | | | | |
| | | (25,800 | ) | | | (202,950 | ) | | | (7,501 | ) | | | (0.0 | )(a) |
| | | | | | | | | | | | | | | | |
Multiline Retail | | | | | | | | | | | | | |
Marui Group Co. Ltd. | | | (4,500 | ) | | | (100,037 | ) | | | (1,229 | ) | | | (0.0 | )(a) |
Pan Pacific International Holdings Corp. | | | (2,400 | ) | | | (37,779 | ) | | | (105 | ) | | | (0.0 | )(a) |
Takashimaya Co. Ltd. | | | (2,800 | ) | | | (32,502 | ) | | | (555 | ) | | | (0.0 | )(a) |
| | | | | | | | | | | | | | | | |
| | | (9,700 | ) | | | (170,318 | ) | | | (1,889 | ) | | | (0.0 | )(a) |
| | | | | | | | | | | | | | | | |
Personal Products | | | | | | | | | | | | | |
Shiseido Co. Ltd. | | | (1,200 | ) | | | (98,938 | ) | | | (3,451 | ) | | | (0.0 | )(a) |
| | | | | | | | | | | | | | | | |
Pharmaceuticals | | | | | | | | | | | | | |
Takeda Pharmaceutical Co. Ltd. | | | (2,800 | ) | | | (101,173 | ) | | | (3,136 | ) | | | (0.0 | )(a) |
| | | | | | | | | | | | | | | | |
Road & Rail | | | | | | | | | | | | | |
Nippon Express Co. Ltd. | | | (1,900 | ) | | | (108,406 | ) | | | (8,959 | ) | | | (0.0 | )(a) |
Tokyu Corp. | | | (5,300 | ) | | | (100,242 | ) | | | 227 | | | | 0.0 | (a) |
| | | | | | | | | | | | | | | | |
| | | (7,200 | ) | | | (208,648 | ) | | | (8,732 | ) | | | (0.0 | )(a) |
| | | | | | | | | | | | | | | | |
Semiconductors & Semiconductor Equipment | | | | | | | | | | | | | |
Rohm Co. Ltd. | | | (300 | ) | | | (23,769 | ) | | | 760 | | | | 0.0 | (a) |
| | | | | | | | | | | | | | | | |
Textiles, Apparel & Luxury Goods | | | | | | | | | | | | | |
Asics Corp. | | | (5,300 | ) | | | (90,992 | ) | | | 1,188 | | | | 0.0 | (a) |
| | | | | | | | | | | | | | | | |
Transportation Infrastructure | | | | | | | | | | | | | |
Japan Airport Terminal Co. Ltd. | | | (2,400 | ) | | | (118,552 | ) | | | (3,183 | ) | | | (0.0 | )(a) |
| | | | | | | | | | | | | | | | |
Total Short Positions of Total Return Basket Swap | | | (273,000 | ) | | | (4,402,967 | ) | | | (95,491 | ) | | | (0.1 | ) |
| | | | | | | | | | | | | | | | |
Total of Long and Short Positions of Total Return Basket Swap | | | (255,700 | ) | | | (3,917,529 | ) | | | (67,167 | ) | | | (0.1 | ) |
| | | | | | | | | | | | | | | | |
| | | | | | | | | | | | | | | | | | | | |
| COUNTERPARTY | | DESCRIPTION | | TERMINATION
DATE | | NOTIONAL
VALUE (1) | | | NET UNREALIZED
APPRECIATION
(DEPRECIATION) (2) | | | NET CASH
AND OTHER
RECEIVABLES
(PAYABLES) | | | VALUE | |
Bank of America | | The Fund receives the total return on a portfolio of long and short equity positions and pays or receives the net of one month BBR on long positions and short positions respectively, plus or minus a specified spread (rates range from (0.35)% to 0.35%), which is denominated in AUD based on the local currencies of the positions within the swaps. | | 11/18/2019 | | $ | 605,580 | | | $ | 25,687 | | | $ | 2,423 | | | $ | 28,110 | |
| | | | | | | | | | | | | | | | | | | | |
| | | | | | | | | | | | | | | | |
| REFERENCE ENTITY | | SHARES | | | NOTIONAL
VALUE($) (1) | | | NET UNREALIZED
APPRECIATION
(DEPRECIATION)($) (2) | | | PERCENTAGE
OF NET
ASSETS (%) | |
Long Positions | | | | | |
| | | |
Common Stocks | | | | | | | | | | | | | |
Airlines | | | | | | | | | | | | | |
Qantas Airways Ltd. | | | 14,050 | | | | 62,145 | | | | (1,090 | ) | | | (0.0 | )(a) |
| | | | | | | | | | | | | | | | |
SEE NOTES TO CONSOLIDATED FINANCIAL STATEMENTS.
| | | | | | |
| | | |
| 36 | | | | J.P. MORGAN EXCHANGE-TRADED FUNDS | | OCTOBER 31, 2019 |
| | | | | | | | | | | | | | | | |
| REFERENCE ENTITY | | SHARES | | | NOTIONAL
VALUE($) (1) | | | NET UNREALIZED
APPRECIATION
(DEPRECIATION)($) (2) | | | PERCENTAGE
OF NET
ASSETS (%) | |
Long Positions — continued | | | | | |
| | | |
Common Stocks — continued | | | | | | | | | | | | | |
Construction & Engineering | | | | | | | | | | | | | |
CIMIC Group Ltd. | | | 7,825 | | | | 178,323 | | | | 2,834 | | | | 0.0 | (a) |
| | | | | | | | | | | | | | | | |
Food & Staples Retailing | | | | | | | | | | | | | |
Metcash Ltd. | | | 57,993 | | | | 112,733 | | | | (1,602 | ) | | | (0.0 | )(a) |
| | | | | | | | | | | | | | | | |
Metals & Mining | | | | | | | | | | | | | |
Alumina Ltd. | | | 45,948 | | | | 71,730 | | | | 151 | | | | 0.0 | (a) |
BHP Group Ltd. | | | 5,408 | | | | 132,564 | | | | 2,660 | | | | 0.0 | (a) |
Iluka Resources Ltd. | | | 9,031 | | | | 58,456 | | | | 6,463 | | | | 0.0 | (a) |
Rio Tinto Ltd. | | | 2,148 | | | | 134,321 | | | | 4,022 | | | | 0.0 | (a) |
| | | | | | | | | | | | | | | | |
| | | 62,535 | | | | 397,071 | | | | 13,296 | | | | 0.0 | (a) |
| | | | | | | | | | | | | | | | |
Oil, Gas & Consumable Fuels | | | | | | | | | | | | | |
Beach Energy Ltd. | | | 105,850 | | | | 166,500 | | | | (4,981 | ) | | | (0.0 | )(a) |
Santos Ltd. | | | 28,396 | | | | 158,833 | | | | 6,227 | | | | 0.0 | (a) |
Whitehaven Coal Ltd. | | | 55,185 | | | | 125,512 | | | | 4,852 | | | | 0.0 | (a) |
Woodside Petroleum Ltd. | | | 2,171 | | | | 48,117 | | | | 320 | | | | 0.0 | (a) |
| | | | | | | | | | | | | | | | |
| | | 191,602 | | | | 498,962 | | | | 6,418 | | | | 0.0 | (a) |
| | | | | | | | | | | | | | | | |
Total Long Positions of Total Return Basket Swap | | | 334,005 | | | | 1,249,234 | | | | 19,856 | | | | 0.0 | (a) |
| | | | | | | | | | | | | | | | |
Short Positions | | | | | |
Common Stocks | | | | | | | | | | | | | |
Beverages | | | | | | | | | | | | | |
Treasury Wine Estates Ltd. | | | (7,654 | ) | | | (92,791 | ) | | | 5,360 | | | | 0.0 | (a) |
| | | | | | | | | | | | | | | | |
Building Products | | | | | | | | | | | | | |
Reliance Worldwide Corp. Ltd. | | | (38,499 | ) | | | (112,027 | ) | | | (749 | ) | | | (0.0 | )(a) |
| | | | | | | | | | | | | | | | |
Chemicals | | | | | | | | | | | | | |
Nufarm Ltd.* | | | (21,741 | ) | | | (88,721 | ) | | | 4,751 | | | | 0.0 | (a) |
| | | | | | | | | | | | | | | | |
Hotels, Restaurants & Leisure | | | | | | | | | | | | | |
Domino’s Pizza Enterprises Ltd. | | | (2,511 | ) | | | (88,341 | ) | | | (1,948 | ) | | | (0.0 | )(a) |
Star Entertainment Grp Ltd. (The) | | | (21,060 | ) | | | (68,287 | ) | | | (3,638 | ) | | | (0.0 | )(a) |
| | | | | | | | | | | | | | | | |
| | | (23,571 | ) | | | (156,628 | ) | | | (5,586 | ) | | | (0.0 | )(a) |
| | | | | | | | | | | | | | | | |
IT Services | | | | | | | | | | | | | |
NEXTDC Ltd.* | | | (21,443 | ) | | | (94,762 | ) | | | 1,619 | | | | 0.0 | (a) |
| | | | | | | | | | | | | | | | |
Oil, Gas & Consumable Fuels | | | | | | | | | | | | | |
Oil Search Ltd. | | | (20,004 | ) | | | (98,725 | ) | | | 436 | | | | 0.0 | (a) |
| | | | | | | | | | | | | | | | |
Total Short Positions of Total Return Basket Swap | | | (132,912 | ) | | | (643,654 | ) | | | 5,831 | | | | 0.0 | (a) |
| | | | | | | | | | | | | | | | |
Total of Long and Short Positions of Total Return Basket Swap | | | 201,093 | | | | 605,580 | | | | 25,687 | | | | 0.0 | (a) |
| | | | | | | | | | | | | | | | |
| | | | | | | | | | | | | | | | | | | | |
| COUNTERPARTY | | DESCRIPTION | | TERMINATION
DATE | | NOTIONAL
VALUE (1) | | | NET UNREALIZED
APPRECIATION
(DEPRECIATION) (2) | | | NET CASH
AND OTHER
RECEIVABLES
(PAYABLES) | | | VALUE | |
Bank of America | | The Fund receives the total return on a portfolio of long equity positions and pays or receives the net of one month LIBOR on long positions, plus or minus a specified spread (rates range from 0.00% to 0.20%), which is denominated in GBP based on the local currencies of the positions within the swaps. | | 10/30/2020 | | $ | 2,871,184 | | | $ | (4,576 | ) | | $ | 1,454 | | | $ | (3,122 | ) |
| | | | | | | | | | | | | | | | | | | | |
SEE NOTES TO CONSOLIDATED FINANCIAL STATEMENTS.
| | | | | | | | |
| | | |
| OCTOBER 31, 2019 | | J.P. MORGAN EXCHANGE-TRADED FUNDS | | | | | 37 | |
JPMorgan Diversified Alternatives ETF
CONSOLIDATED SCHEDULE OF PORTFOLIO INVESTMENTS
AS OF OCTOBER 31, 2019 (continued)
| | | | | | | | | | | | | | | | |
| REFERENCE ENTITY | | SHARES | | | NOTIONAL
VALUE($) (1) | | | NET UNREALIZED
APPRECIATION
(DEPRECIATION)($) (2) | | | PERCENTAGE
OF NET
ASSETS (%) | |
Long Positions | | | | | |
| | | |
Common Stocks | | | | | | | | | | | | | |
Aerospace & Defense | | | | | | | | | | | | | |
Cobham plc | | | 274,065 | | | | 560,595 | | | | 5,687 | | | | 0.0 | (a) |
| | | | | | | | | | | | | | | | |
Capital Markets | | | | | | | | | | | | | |
Sole Realisation Co. plc*‡ | | | 153 | | | | — | | | | — | | | | 0.0 | (a) |
| | | | | | | | | | | | | | | | |
Entertainment | | | | | | | | | | | | | |
Entertainment One Ltd. | | | 67,602 | | | | 488,221 | | | | (834 | ) | | | (0.0 | )(a) |
| | | | | | | | | | | | | | | | |
Hotels, Restaurants & Leisure | | | | | | | | | | | | | |
EI Group plc* | | | 62,759 | | | | 228,926 | | | | (326 | ) | | | (0.0 | )(a) |
Merlin Entertainments plc (b) | | | 146,381 | | | | 862,398 | | | | 418 | | | | 0.0 | (a) |
| | | | | | | | | | | | | �� | | | |
| | | 209,140 | | | | 1,091,324 | | | | 92 | | | | 0.0 | (a) |
| | | | | | | | | | | | | | | | |
Internet & Direct Marketing Retail | | | | | | | | | | | | | |
Just Eat plc* | | | 41,837 | | | | 398,378 | | | | (9,238 | ) | | | (0.0 | )(a) |
| | | | | | | | | | | | | | | | |
Specialty Retail | | | | | | | | | | | | | |
BCA Marketplace plc | | | 108,820 | | | | 332,666 | | | | (283 | ) | | | (0.0 | )(a) |
| | | | | | | | | | | | | | | | |
Total Long Positions of Total Return Basket Swap | | | 701,617 | | | | 2,871,184 | | | | (4,576 | ) | | | 0.0 | (a) |
| | | | | | | | | | | | | | | | |
| | | | | | | | | | | | | | | | | | | | |
| COUNTERPARTY | | DESCRIPTION | | TERMINATION
DATE | | NOTIONAL
VALUE (1) | | | NET UNREALIZED
APPRECIATION
(DEPRECIATION) (2) | | | NET CASH
AND OTHER
RECEIVABLES
(PAYABLES) | | | VALUE | |
Bank of America | | The Fund receives the total return on a portfolio of long and short equity positions and pays or receives the net of one month LIBOR on long positions and short positions respectively, plus or minus a specified spread (rates range from 0.00% to 0.20%), which is denominated in USD based on the local currencies of the positions within the swaps. | | 11/18/2019 –
4/20/2020 | | $ | (406,176 | ) | | $ | 3,290 | | | $ | (17,723 | ) | | $ | (14,433 | ) |
| | | | | | | | | | | | | | | | | | | | |
| | | | | | | | | | | | | | | | |
| REFERENCE ENTITY | | SHARES | | | NOTIONAL
VALUE($) (1) | | | NET UNREALIZED
APPRECIATION
(DEPRECIATION)($) (2) | | | PERCENTAGE
OF NET
ASSETS (%) | |
Long Positions | | | | | |
| | | |
Rights | | | | | | | | | | | | | |
Media | | | | | | | | | | | | | |
Media General, Inc. CVR*‡ | | | 1,329 | | | | — | | | | (399 | ) | | | (0.0 | )(a) |
| | | | | | | | | | | | | | | | |
| |
Short Positions | | | | | |
| | | |
Common Stocks | | | | | | | | | | | | | |
Media | | | | | | | | | | | | | |
New Media Investment Group, Inc. | | | (46,104 | ) | | | (406,176 | ) | | | 3,689 | | | | 0.0 | (a) |
| | | | | | | | | | | | | | | | |
Total of Long and Short Positions of Total Return Basket Swap | | | (44,775 | ) | | | (406,176 | ) | | | 3,290 | | | | 0.0 | (a) |
| | | | | | | | | | | | | | | | |
SEE NOTES TO CONSOLIDATED FINANCIAL STATEMENTS.
| | | | | | |
| | | |
| 38 | | | | J.P. MORGAN EXCHANGE-TRADED FUNDS | | OCTOBER 31, 2019 |
| | | | | | | | | | | | | | | | | | | | |
| COUNTERPARTY | | DESCRIPTION | | TERMINATION
DATE | | NOTIONAL
VALUE (1) | | | NET UNREALIZED
APPRECIATION
(DEPRECIATION) (2) | | | NET CASH
AND OTHER
RECEIVABLES
(PAYABLES) | | | VALUE | |
Bank of America | | The Fund receives the total return on a portfolio of long equity positions and pays or receives the net of one month EURIBOR on long positions, plus or minus a specified spread (rates range from 0.00% to 0.20%), which is denominated in EUR based on the local currencies of the positions within the swaps. | | 12/31/2020 | | $ | 1,309,850 | | | $ | 18 | | | $ | 95 | | | $ | 113 | |
| | | | | | | | | | | | | | | | | | | | |
| | | | | | | | | | | | | | | | |
| REFERENCE ENTITY | | SHARES | | | NOTIONAL
VALUE($) (1) | | | NET UNREALIZED
APPRECIATION
(DEPRECIATION)($) (2) | | | PERCENTAGE
OF NET
ASSETS (%) | |
Long Positions | | | | | |
| | | |
Common Stocks | | | | | | | | | | | | | |
Media | | | | | | | | | | | | | |
Axel Springer SE* | | | 18,791 | | | | 1,309,850 | | | | 18 | | | | 0.0 | (a) |
| | | | | | | | | | | | | | | | |
| | | | | | | | | | | | | | | | | | | | |
| COUNTERPARTY | | DESCRIPTION | | TERMINATION
DATE | | NOTIONAL
VALUE (1) | | | NET UNREALIZED
APPRECIATION
(DEPRECIATION) (2) | | | NET CASH
AND OTHER
RECEIVABLES
(PAYABLES) | | | VALUE | |
UBS | | The Fund receives the total return on a portfolio of long and short equity positions and pays or receives the net of one month LIBOR on long positions and short positions respectively, plus or minus a specified spread (rates range from 0.00% to 0.23%), which is denominated in GBP based on the local currencies of the positions within the swaps. | | 8/26/2022 | | $ | (874,057 | ) | | $ | 33,495 | | | $ | (1,229 | ) | | $ | 32,266 | |
| | | | | | | | | | | | | | | | | | | | |
| | | | | | | | | | | | | | | | |
| REFERENCE ENTITY | | SHARES | | | NOTIONAL
VALUE($) (1) | | | NET UNREALIZED
APPRECIATION
(DEPRECIATION)($) (2) | | | PERCENTAGE
OF NET
ASSETS (%) | |
Long Positions | | | | | |
| | | |
Common Stocks | | | | | | | | | | | | | |
Aerospace & Defense | | | | | | | | | | | | | |
Meggitt plc | | | 20,473 | | | | 165,654 | | | | 9,187 | | | | 0.0 | (a) |
| | | | | | | | | | | | | | | | |
Food Products | | | | | | | | | | | | | |
Tate & Lyle plc | | | 15,930 | | | | 138,946 | | | | 82 | | | | 0.0 | (a) |
| | | | | | | | | | | | | | | | |
Household Durables | | | | | | | | | | | | | |
Berkeley Group Holdings plc | | | 329 | | | | 18,753 | | | | (544 | ) | | | (0.0 | )(a) |
Redrow plc | | | 6,924 | | | | 53,978 | | | | (4,213 | ) | | | (0.0 | )(a) |
Taylor Wimpey plc | | | 52,351 | | | | 112,277 | | | | 54 | | | | 0.0 | (a) |
| | | | | | | | | | | | | | | | |
| | | 59,604 | | | | 185,008 | | | | (4,703 | ) | | | (0.0 | )(a) |
| | | | | | | | | | | | | | | | |
Multi-Utilities | | | | | | | | | | | | | |
Centrica plc | | | 66,557 | | | | 62,635 | | | | 2,298 | | | | 0.0 | (a) |
| | | | | | | | | | | | | | | | |
Oil, Gas & Consumable Fuels | | | | | | | | | | | | | |
Royal Dutch Shell plc | | | 4,962 | | | | 142,904 | | | | (229 | ) | | | (0.0 | )(a) |
| | | | | | | | | | | | | | | | |
Total Long Positions of Total Return Basket Swap | | | 167,526 | | | | 695,147 | | | | 6,635 | | | | 0.0 | (a) |
| | | | | | | | | | | | | | | | |
SEE NOTES TO CONSOLIDATED FINANCIAL STATEMENTS.
| | | | | | | | |
| | | |
| OCTOBER 31, 2019 | | J.P. MORGAN EXCHANGE-TRADED FUNDS | | | | | 39 | |
JPMorgan Diversified Alternatives ETF
CONSOLIDATED SCHEDULE OF PORTFOLIO INVESTMENTS
AS OF OCTOBER 31, 2019 (continued)
| | | | | | | | | | | | | | | | |
| REFERENCE ENTITY | | SHARES | | | NOTIONAL
VALUE($) (1) | | | NET UNREALIZED
APPRECIATION
(DEPRECIATION)($) (2) | | | PERCENTAGE
OF NET
ASSETS (%) | |
Short Positions | | | | | |
| | | |
Common Stocks | | | | | | | | | | | | | |
Banks | | | | | | | | | | | | | |
Royal Bank of Scotland Group plc | | | (39,081 | ) | | | (108,029 | ) | | | (568 | ) | | | (0.0 | )(a) |
| | | | | | | | | | | | | | | | |
Capital Markets | | | | | | | | | | | | | |
Hargreaves Lansdown plc | | | (4,898 | ) | | | (112,474 | ) | | | (1,734 | ) | | | (0.0 | )(a) |
| | | | | | | | | | | | | | | | |
Commercial Services & Supplies | | | | | | | | | | | | | |
IWG plc | | | (22,361 | ) | | | (111,386 | ) | | | 540 | | | | 0.0 | (a) |
| | | | | | | | | | | | | | | | |
Construction & Engineering | | | | | | | | | | | | | |
Balfour Beatty plc | | | (37,672 | ) | | | (109,777 | ) | | | (597 | ) | | | (0.0 | )(a) |
| | | | | | | | | | | | | | | | |
Diversified Telecommunication Services | | | | | | | | | | | | | |
BT Group plc | | | (42,588 | ) | | | (113,023 | ) | | | 723 | | | | 0.0 | (a) |
| | | | | | | | | | | | | | | | |
Electrical Equipment | | | | | | | | | | | | | |
Melrose Industries plc | | | (19,977 | ) | | | (55,210 | ) | | | (1,903 | ) | | | (0.0 | )(a) |
| | | | | | | | | | | | | | | | |
Electronic Equipment, Instruments & Components | | | | | | | | | | | | | |
Spectris plc | | | (3,524 | ) | | | (109,250 | ) | | | 1,186 | | | | 0.0 | (a) |
| | | | | | | | | | | | | | | | |
Food & Staples Retailing | | | | | | | | | | | | | |
J Sainsbury plc | | | (39,140 | ) | | | (103,145 | ) | | | 6,439 | | | | 0.0 | (a) |
| | | | | | | | | | | | | | | | |
Health Care Providers & Services | | | | | | | | | | | | | |
NMC Health plc | | | (1,847 | ) | | | (52,356 | ) | | | 10,978 | | | | 0.0 | (a) |
| | | | | | | | | | | | | | | | |
Hotels, Restaurants & Leisure | | | | | | | | | | | | | |
SSP Group plc | | | (10,117 | ) | | | (83,426 | ) | | | 3,447 | | | | 0.0 | (a) |
| | | | | | | | | | | | | | | | |
Insurance | | | | | | | | | | | | | |
Hiscox Ltd. | | | (5,673 | ) | | | (109,551 | ) | | | 3,906 | | | | 0.0 | (a) |
| | | | | | | | | | | | | | | | |
Metals & Mining | | | | | | | | | | | | | |
Fresnillo plc | | | (1,428 | ) | | | (13,193 | ) | | | (1,790 | ) | | | (0.0 | )(a) |
| | | | | | | | | | | | | | | | |
Multi-Utilities | | | | | | | | | | | | | |
National Grid plc | | | (9,077 | ) | | | (106,131 | ) | | | (325 | ) | | | (0.0 | )(a) |
| | | | | | | | | | | | | | | | |
Paper & Forest Products | | | | | | | | | | | | | |
Mondi plc | | | (169 | ) | | | (3,504 | ) | | | (136 | ) | | | (0.0 | )(a) |
| | | | | | | | | | | | | | | | |
Professional Services | | | | | | | | | | | | | |
Capita plc* | | | (35,500 | ) | | | (71,810 | ) | | | 6,614 | | | | 0.0 | (a) |
Pagegroup plc | | | (19,225 | ) | | | (110,770 | ) | | | 1,130 | | | | 0.0 | (a) |
| | | | | | | | | | | | | | | | |
| | | (54,725 | ) | | | (182,580 | ) | | | 7,744 | | | | 0.0 | (a) |
| | | | | | | | | | | | | | | | |
Real Estate Management & Development | | | | | | | | | | | | | |
Capital & Counties Properties plc | | | (25,071 | ) | | | (82,863 | ) | | | (1,775 | ) | | | (0.0 | )(a) |
| | | | | | | | | | | | | | | | |
Water Utilities | | | | | | | | | | | | | |
Severn Trent plc | | | (3,879 | ) | | | (113,306 | ) | | | 725 | | | | 0.0 | (a) |
| | | | | | | | | | | | | | | | |
Total Short Positions of Total Return Basket Swap | | | (321,227 | ) | | | (1,569,204 | ) | | | 26,860 | | | | 0.0 | (a) |
| | | | | | | | | | | | | | | | |
Total of Long and Short Positions of Total Return Basket Swap | | | (153,701 | ) | | | (874,057 | ) | | | 33,495 | | | | 0.0 | (a) |
| | | | | | | | | | | | | | | | |
SEE NOTES TO CONSOLIDATED FINANCIAL STATEMENTS.
| | | | | | |
| | | |
| 40 | | | | J.P. MORGAN EXCHANGE-TRADED FUNDS | | OCTOBER 31, 2019 |
| | | | | | | | | | | | | | | | | | | | |
| COUNTERPARTY | | DESCRIPTION | | TERMINATION
DATE | | NOTIONAL
VALUE (1) | | | NET UNREALIZED
APPRECIATION
(DEPRECIATION) (2) | | | NET CASH
AND OTHER
RECEIVABLES
(PAYABLES) | | | VALUE | |
UBS | | The Fund receives the total return on a portfolio of short equity positions and pays or receives the net of one month LIBOR on short positions, plus or minus a specified spread (rates range from 0.00% to 0.23%), which is denominated in USD based on the local currencies of the positions within the swaps. | | 8/26/2022 | | $ | (11,726,646 | ) | | $ | (228,420 | ) | | $ | (24,514 | ) | | $ | (252,934 | ) |
| | | | | | | | | | | | | | | | | | | | |
| | | | | | | | | | | | | | | | |
| REFERENCE ENTITY | | SHARES | | | NOTIONAL
VALUE($) (1) | | | NET UNREALIZED
APPRECIATION
(DEPRECIATION)($) (2) | | | PERCENTAGE
OF NET
ASSETS (%) | |
Short Positions | | | | | |
| | | |
Common Stocks | | | | | | | | | | | | | |
Aerospace & Defense | | | | | | | | | | | | | |
Cubic Corp. | | | (1,533 | ) | | | (113,044 | ) | | | (6,071 | ) | | | (0.0 | )(a) |
Kratos Defense & Security Solutions, Inc.* | | | (5,815 | ) | | | (109,787 | ) | | | 1,599 | | | | 0.0 | (a) |
| | | | | | | | | | | | | | | | |
| | | (7,348 | ) | | | (222,831 | ) | | | (4,472 | ) | | | (0.0 | )(a) |
| | | | | | | | | | | | | | | | |
Air Freight & Logistics | | | | | | | | | | | | | |
Air Transport Services Group, Inc.* | | | (5,244 | ) | | | (109,652 | ) | | | (2,360 | ) | | | (0.0 | )(a) |
| | | | | | | | | | | | | | | | |
Airlines | | | | | | | | | | | | | |
American Airlines Group, Inc. | | | (3,670 | ) | | | (110,320 | ) | | | (6,753 | ) | | | (0.0 | )(a) |
Spirit Airlines, Inc.* | | | (2,936 | ) | | | (110,276 | ) | | | (244 | ) | | | (0.0 | )(a) |
| | | | | | | | | | | | | | | | |
| | | (6,606 | ) | | | (220,596 | ) | | | (6,997 | ) | | | (0.0 | )(a) |
| | | | | | | | | | | | | | | | |
Auto Components | | | | | | | | | | | | | |
Cooper-Standard Holdings, Inc.* | | | (701 | ) | | | (22,334 | ) | | | 949 | | | | 0.0 | (a) |
Veoneer, Inc.* | | | (3,877 | ) | | | (61,722 | ) | | | 2,520 | | | | 0.0 | (a) |
| | | | | | | | | | | | | | | | |
| | | (4,578 | ) | | | (84,056 | ) | | | 3,469 | | | | 0.0 | (a) |
| | | | | | | | | | | | | | | | |
Banks | | | | | | | | | | | | | |
SVB Financial Group* | | | (496 | ) | | | (109,854 | ) | | | (8,313 | ) | | | (0.0 | )(a) |
| | | | | | | | | | | | | | | | |
Beverages | | | | | | | | | | | | | |
Coca-Cola Consolidated, Inc. | | | (356 | ) | | | (97,672 | ) | | | 4,607 | | | | 0.0 | (a) |
Constellation Brands, Inc. | | | (568 | ) | | | (108,107 | ) | | | 3,240 | | | | 0.0 | (a) |
MGP Ingredients, Inc. | | | (2,256 | ) | | | (96,760 | ) | | | 7,693 | | | | 0.0 | (a) |
| | | | | | | | | | | | | | | | |
| | | (3,180 | ) | | | (302,539 | ) | | | 15,540 | | | | 0.0 | (a) |
| | | | | | | | | | | | | | | | |
Capital Markets | | | | | | | | | | | | | |
Cboe Global Markets, Inc. | | | (966 | ) | | | (111,235 | ) | | | 1,515 | | | | 0.0 | (a) |
Interactive Brokers Group, Inc. | | | (1,984 | ) | | | (94,379 | ) | | | (5,099 | ) | | | (0.0 | )(a) |
WisdomTree Investments, Inc. | | | (20,135 | ) | | | (102,890 | ) | | | (4,027 | ) | | | (0.0 | )(a) |
| | | | | | | | | | | | | | | | |
| | | (23,085 | ) | | | (308,504 | ) | | | (7,611 | ) | | | (0.0 | )(a) |
| | | | | | | | | | | | | | | | |
Chemicals | | | | | | | | | | | | | |
Albemarle Corp. | | | (1,344 | ) | | | (81,635 | ) | | | 8,588 | | | | 0.0 | (a) |
DuPont de Nemours, Inc. | | | (1,151 | ) | | | (75,862 | ) | | | (438 | ) | | | (0.0 | )(a) |
GCP Applied Technologies, Inc.* | | | (4,765 | ) | | | (98,445 | ) | | | (95 | ) | | | (0.0 | )(a) |
International Flavors & Fragrances, Inc. | | | (764 | ) | | | (93,216 | ) | | | (3,186 | ) | | | (0.0 | )(a) |
Mosaic Co. (The) | | | (5,109 | ) | | | (101,567 | ) | | | (1,686 | ) | | | (0.0 | )(a) |
SEE NOTES TO CONSOLIDATED FINANCIAL STATEMENTS.
| | | | | | | | |
| | | |
| OCTOBER 31, 2019 | | J.P. MORGAN EXCHANGE-TRADED FUNDS | | | | | 41 | |
JPMorgan Diversified Alternatives ETF
CONSOLIDATED SCHEDULE OF PORTFOLIO INVESTMENTS
AS OF OCTOBER 31, 2019 (continued)
| | | | | | | | | | | | | | | | |
| REFERENCE ENTITY | | SHARES | | | NOTIONAL
VALUE($) (1) | | | NET UNREALIZED
APPRECIATION
(DEPRECIATION)($) (2) | | | PERCENTAGE
OF NET
ASSETS (%) | |
Short Positions — continued | | | | | |
| | | |
Common Stocks — continued | | | | | | | | | | | | | |
Chemicals — continued | | | | | | | | | | | | | |
Orion Engineered Carbons SA | | | (227 | ) | | | (3,759 | ) | | | (36 | ) | | | (0.0 | )(a) |
RPM International, Inc. | | | (1,285 | ) | | | (93,072 | ) | | | (3,868 | ) | | | (0.0 | )(a) |
| | | | | | | | | | | | | | | | |
| | | (14,645 | ) | | | (547,556 | ) | | | (721 | ) | | | (0.0 | )(a) |
| | | | | | | | | | | | | | | | |
Commercial Services & Supplies | | | | | | | | | | | | | |
Brink’s Co. (The) | | | (1,270 | ) | | | (107,899 | ) | | | 1,334 | | | | 0.0 | (a) |
US Ecology, Inc. | | | (1,749 | ) | | | (108,840 | ) | | | 4,547 | | | | 0.0 | (a) |
| | | | | | | | | | | | | | | | |
| | | (3,019 | ) | | | (216,739 | ) | | | 5,881 | | | | 0.0 | (a) |
| | | | | | | | | | | | | | | | |
Communications Equipment | | | | | | | | | | | | | |
NETGEAR, Inc.* | | | (806 | ) | | | (21,899 | ) | | | 3,756 | | | | 0.0 | (a) |
ViaSat, Inc.* | | | (360 | ) | | | (24,782 | ) | | | 405 | | | | 0.0 | (a) |
| | | | | | | | | | | | | | | | |
| | | (1,166 | ) | | | (46,681 | ) | | | 4,161 | | | | 0.0 | (a) |
| | | | | | | | | | | | | | | | |
Construction & Engineering | | | | | | | | | | | | | |
Fluor Corp. | | | (5,792 | ) | | | (93,309 | ) | | | 17,086 | | | | 0.0 | (a) |
WillScot Corp.* | | | (6,508 | ) | | | (102,566 | ) | | | (130 | ) | | | (0.0 | )(a) |
| | | | | | | | | | | | | | | | |
| | | (12,300 | ) | | | (195,875 | ) | | | 16,956 | | | | 0.0 | (a) |
| | | | | | | | | | | | | | | | |
Construction Materials | | | | | | | | | | | | | |
Martin Marietta Materials, Inc. | | | (399 | ) | | | (104,502 | ) | | | 1,544 | | | | 0.0 | (a) |
Summit Materials, Inc.* | | | (4,017 | ) | | | (92,110 | ) | | | (2,209 | ) | | | (0.0 | )(a) |
| | | | | | | | | | | | | | | | |
| | | (4,416 | ) | | | (196,612 | ) | | | (665 | ) | | | (0.0 | )(a) |
| | | | | | | | | | | | | | | | |
Consumer Finance | | | | | | | | | | | | | |
Green Dot Corp.* | | | (3,944 | ) | | | (113,745 | ) | | | (17,945 | ) | | | (0.0 | )(a) |
| | | | | | | | | | | | | | | | |
Containers & Packaging | | | | | | | | | | | | | |
Crown Holdings, Inc.* | | | (15 | ) | | | (1,093 | ) | | | (44 | ) | | | (0.0 | )(a) |
Graphic Packaging Holding Co. | | | (6,537 | ) | | | (102,369 | ) | | | (6,472 | ) | | | (0.0 | )(a) |
| | | | | | | | | | | | | | | | |
| | | (6,552 | ) | | | (103,462 | ) | | | (6,516 | ) | | | (0.0 | )(a) |
| | | | | | | | | | | | | | | | |
Diversified Telecommunication Services | | | | | | | | | | | | | |
GCI Liberty, Inc.* | | | (1,577 | ) | | | (110,359 | ) | | | (5,630 | ) | | | (0.0 | )(a) |
Iridium Communications, Inc.* | | | (4,103 | ) | | | (100,400 | ) | | | (862 | ) | | | (0.0 | )(a) |
| | | | | | | | | | | | | | | | |
| | | (5,680 | ) | | | (210,759 | ) | | | (6,492 | ) | | | (0.0 | )(a) |
| | | | | | | | | | | | | | | | |
Electrical Equipment | | | | | | | | | | | | | |
Vicor Corp.* | | | (3,364 | ) | | | (122,281 | ) | | | (18,098 | ) | | | (0.0 | )(a) |
| | | | | | | | | | | | | | | | |
Electronic Equipment, Instruments & Components | | | | | | | | | | | | | |
nLight, Inc.* | | | (8,350 | ) | | | (111,556 | ) | | | 1,000 | | | | 0.0 | (a) |
Trimble, Inc.* | | | (2,776 | ) | | | (110,596 | ) | | | (305 | ) | | | (0.0 | )(a) |
| | | | | | | | | | | | | | | | |
| | | (11,126 | ) | | | (222,152 | ) | | | 695 | | | | 0.0 | (a) |
| | | | | | | | | | | | | | | | |
Energy Equipment & Services | | | | | | | | | | | | | |
Diamond Offshore Drilling, Inc.* | | | (15,392 | ) | | | (81,423 | ) | | | 1,539 | | | | 0.0 | (a) |
Nabors Industries Ltd. | | | (59,052 | ) | | | (109,246 | ) | | | (10,120 | ) | | | (0.0 | )(a) |
Oceaneering International, Inc.* | | | (1,948 | ) | | | (27,584 | ) | | | (1,695 | ) | | | (0.0 | )(a) |
Oil States International, Inc.* | | | (2,099 | ) | | | (29,953 | ) | | | (4,051 | ) | | | (0.0 | )(a) |
US Silica Holdings, Inc. | | | (22,200 | ) | | | (99,012 | ) | | | 14,738 | | | | 0.0 | (a) |
Valaris plc | | | (22,026 | ) | | | (90,527 | ) | | | 22,123 | | | | 0.0 | (a) |
| | | | | | | | | | | | | | | | |
| | | (122,717 | ) | | | (437,745 | ) | | | 22,534 | | | | 0.0 | (a) |
| | | | | | | | | | | | | | | | |
Entertainment | | | | | | | | | | | | | |
Spotify Technology SA* | | | (862 | ) | | | (124,387 | ) | | | (24,972 | ) | | | (0.0 | )(a) |
| | | | | | | | | | | | | | | | |
SEE NOTES TO CONSOLIDATED FINANCIAL STATEMENTS.
| | | | | | |
| | | |
| 42 | | | | J.P. MORGAN EXCHANGE-TRADED FUNDS | | OCTOBER 31, 2019 |
| | | | | | | | | | | | | | | | |
| REFERENCE ENTITY | | SHARES | | | NOTIONAL
VALUE($) (1) | | | NET UNREALIZED
APPRECIATION
(DEPRECIATION)($) (2) | | | PERCENTAGE
OF NET
ASSETS (%) | |
Short Positions — continued | | | | | |
| | | |
Common Stocks — continued | | | | | | | | | | | | | |
Equity Real Estate Investment Trusts (REITs) | | | | | | | | | | | | | |
Alexander & Baldwin, Inc. | | | (4,063 | ) | | | (95,521 | ) | | | 5,688 | | | | 0.0 | (a) |
| | | | | | | | | | | | | | | | |
Food & Staples Retailing | | | | | | | | | | | | | |
PriceSmart, Inc. | | | (1,620 | ) | | | (120,042 | ) | | | (10,789 | ) | | | (0.0 | )(a) |
| | | | | | | | | | | | | | | | |
Food Products | | | | | | | | | | | | | |
Archer-Daniels-Midland Co. | | | (2,641 | ) | | | (111,028 | ) | | | (3,877 | ) | | | (0.0 | )(a) |
Hain Celestial Group, Inc. (The)* | | | (4,315 | ) | | | (102,007 | ) | | | (6,386 | ) | | | (0.0 | )(a) |
Kraft Heinz Co. (The) | | | (3,029 | ) | | | (97,927 | ) | | | (14,297 | ) | | | (0.0 | )(a) |
| | | | | | | | | | | | | | | | |
| | | (9,985 | ) | | | (310,962 | ) | | | (24,560 | ) | | | (0.0 | )(a) |
| | | | | | | | | | | | | | | | |
Gas Utilities | | | | | | | | | | | | | |
Northwest Natural Holding Co. | | | (263 | ) | | | (18,242 | ) | | | 11 | | | | 0.0 | (a) |
South Jersey Industries, Inc. | | | (2,983 | ) | | | (95,933 | ) | | | (209 | ) | | | (0.0 | )(a) |
Southwest Gas Holdings, Inc. | | | (1,271 | ) | | | (110,958 | ) | | | 1,947 | | | | 0.0 | (a) |
| | | | | | | | | | | | | | | | |
| | | (4,517 | ) | | | (225,133 | ) | | | 1,749 | | | | 0.0 | (a) |
| | | | | | | | | | | | | | | | |
Health Care Equipment & Supplies | | | | | | | | | | | | | |
ABIOMED, Inc.* | | | (580 | ) | | | (120,396 | ) | | | (18,722 | ) | | | (0.1 | ) |
AtriCure, Inc.* | | | (4,125 | ) | | | (109,684 | ) | | | 2,764 | | | | 0.0 | (a) |
Avanos Medical, Inc.* | | | (2,606 | ) | | | (114,768 | ) | | | (9,069 | ) | | | (0.0 | )(a) |
Axogen, Inc.* | | | (1,258 | ) | | | (15,643 | ) | | | (57 | ) | | | (0.0 | )(a) |
Glaukos Corp.* | | | (1,694 | ) | | | (108,128 | ) | | | 976 | | | | 0.0 | (a) |
Heska Corp.* | | | (1,520 | ) | | | (123,150 | ) | | | (7,737 | ) | | | (0.0 | )(a) |
Insulet Corp.* | | | (128 | ) | | | (18,601 | ) | | | 225 | | | | 0.0 | (a) |
iRhythm Technologies, Inc.* | | | (1,569 | ) | | | (104,841 | ) | | | 3,191 | | | | 0.0 | (a) |
Penumbra, Inc.* | | | (701 | ) | | | (109,335 | ) | | | (6,141 | ) | | | (0.0 | )(a) |
Tactile Systems Technology, Inc.* | | | (2,409 | ) | | | (109,417 | ) | | | (311 | ) | | | (0.0 | )(a) |
ViewRay, Inc.* | | | (28,044 | ) | | | (72,914 | ) | | | (2,244 | ) | | | (0.0 | )(a) |
Wright Medical Group NV* | | | (2,256 | ) | | | (46,925 | ) | | | (89 | ) | | | (0.0 | )(a) |
| | | | | | | | | | | | | | | | |
| | | (46,890 | ) | | | (1,053,802 | ) | | | (37,214 | ) | | | (0.1 | ) |
| | | | | | | | | | | | | | | | |
Health Care Providers & Services | | | | | | | | | | | | | |
Guardant Health, Inc.* | | | (526 | ) | | | (36,557 | ) | | | (2,225 | ) | | | (0.0 | )(a) |
R1 RCM, Inc.* | | | (2,540 | ) | | | (27,000 | ) | | | (1,422 | ) | | | (0.0 | )(a) |
| | | | | | | | | | | | | | | | |
| | | (3,066 | ) | | | (63,557 | ) | | | (3,647 | ) | | | (0.0 | )(a) |
| | | | | | | | | | | | | | | | |
Health Care Technology | | | | | | | | | | | | | |
Evolent Health, Inc.* | | | (8,529 | ) | | | (64,991 | ) | | | (1,365 | ) | | | (0.0 | )(a) |
Inspire Medical Systems, Inc.* | | | (1,826 | ) | | | (111,350 | ) | | | (9,346 | ) | | | (0.0 | )(a) |
Tabula Rasa HealthCare, Inc.* | | | (479 | ) | | | (24,400 | ) | | | (967 | ) | | | (0.0 | )(a) |
Teladoc Health, Inc.* | | | (1,243 | ) | | | (95,214 | ) | | | (9,173 | ) | | | (0.0 | )(a) |
Vocera Communications, Inc.* | | | (5,362 | ) | | | (106,811 | ) | | | 18,642 | | | | 0.0 | (a) |
| | | | | | | | | | | | | | | | |
| | | (17,439 | ) | | | (402,766 | ) | | | (2,209 | ) | | | (0.0 | )(a) |
| | | | | | | | | | | | | | | | |
Hotels, Restaurants & Leisure | | | | | | | | | | | | | |
Domino’s Pizza, Inc. | | | (347 | ) | | | (94,252 | ) | | | (5,524 | ) | | | (0.0 | )(a) |
Shake Shack, Inc.* | | | (263 | ) | | | (21,640 | ) | | | 12 | | | | 0.0 | (a) |
| | | | | | | | | | | | | | | | |
| | | (610 | ) | | | (115,892 | ) | | | (5,512 | ) | | | (0.0 | )(a) |
| | | | | | | | | | | | | | | | |
Household Durables | | | | | | | | | | | | | |
Cavco Industries, Inc.* | | | (411 | ) | | | (78,768 | ) | | | 2,898 | | | | 0.0 | (a) |
iRobot Corp.* | | | (543 | ) | | | (26,097 | ) | | | 271 | | | | 0.0 | (a) |
LGI Homes, Inc.* | | | (962 | ) | | | (75,498 | ) | | | 8,696 | | | | 0.0 | (a) |
Mohawk Industries, Inc.* | | | (663 | ) | | | (95,061 | ) | | | (12,073 | ) | | | (0.0 | )(a) |
SEE NOTES TO CONSOLIDATED FINANCIAL STATEMENTS.
| | | | | | | | |
| | | |
| OCTOBER 31, 2019 | | J.P. MORGAN EXCHANGE-TRADED FUNDS | | | | | 43 | |
JPMorgan Diversified Alternatives ETF
CONSOLIDATED SCHEDULE OF PORTFOLIO INVESTMENTS
AS OF OCTOBER 31, 2019 (continued)
| | | | | | | | | | | | | | | | |
| REFERENCE ENTITY | | SHARES | | | NOTIONAL
VALUE($) (1) | | | NET UNREALIZED
APPRECIATION
(DEPRECIATION)($) (2) | | | PERCENTAGE
OF NET
ASSETS (%) | |
Short Positions — continued | | | | | |
| | | |
Common Stocks — continued | | | | | | | | | | | | | |
Household Durables — continued | | | | | | | | | | | | | |
Roku, Inc.* | | | (560 | ) | | | (82,432 | ) | | | (9,666 | ) | | | (0.0 | )(a) |
Sonos, Inc.* | | | (6,591 | ) | | | (86,210 | ) | | | 902 | | | | 0.0 | (a) |
| | | | | | | | | | | | | | | | |
| | | (9,730 | ) | | | (444,066 | ) | | | (8,972 | ) | | | (0.0 | )(a) |
| | | | | | | | | | | | | | | | |
Independent Power and Renewable Electricity Producers | | | | | | | | | | | | | |
Ormat Technologies, Inc. | | | (1,287 | ) | | | (98,533 | ) | | | (1,145 | ) | | | (0.0 | )(a) |
| | | | | | | | | | | | | | | | |
Insurance | | | | | | | | | | | | | |
Markel Corp.* | | | (99 | ) | | | (115,929 | ) | | | (3,433 | ) | | | (0.0 | )(a) |
| | | | | | | | | | | | | | | | |
Interactive Media & Services | | | | | | | | | | | | | |
Cargurus, Inc.* | | | (2,943 | ) | | | (98,855 | ) | | | (7,299 | ) | | | (0.0 | )(a) |
Eventbrite, Inc.* | | | (5,754 | ) | | | (103,457 | ) | | | (2,474 | ) | | | (0.0 | )(a) |
TrueCar, Inc.* | | | (24,327 | ) | | | (79,793 | ) | | | 2,798 | | | | 0.0 | (a) |
Zillow Group, Inc.* | | | (962 | ) | | | (31,159 | ) | | | (616 | ) | | | (0.0 | )(a) |
| | | | | | | | | | | | | | | | |
| | | (33,986 | ) | | | (313,264 | ) | | | (7,591 | ) | | | (0.0 | )(a) |
| | | | | | | | | | | | | | | | |
Internet & Direct Marketing Retail | | | | | | | | | | | | | |
Farfetch Ltd.* | | | (5,122 | ) | | | (45,739 | ) | | | (4,559 | ) | | | (0.0 | )(a) |
GrubHub, Inc.* | | | (660 | ) | | | (22,480 | ) | | | 14,276 | | | | 0.0 | (a) |
| | | | | | | | | | | | | | | | |
| | | (5,782 | ) | | | (68,219 | ) | | | 9,717 | | | | 0.0 | (a) |
| | | | | | | | | | | | | | | | |
Leisure Products | | | | | | | | | | | | | |
Polaris, Inc. | | | (536 | ) | | | (52,876 | ) | | | (4,326 | ) | | | (0.0 | )(a) |
| | | | | | | | | | | | | | | | |
Machinery | | | | | | | | | | | | | |
Deere & Co. | | | (620 | ) | | | (107,967 | ) | | | (136 | ) | | | (0.0 | )(a) |
Evoqua Water Technologies Corp.* | | | (6,989 | ) | | | (121,399 | ) | | | (3,145 | ) | | | (0.0 | )(a) |
Trinity Industries, Inc. | | | (5,545 | ) | | | (109,680 | ) | | | 299 | | | | 0.0 | (a) |
Wabtec Corp. | | | (1,388 | ) | | | (96,285 | ) | | | 69 | | | | 0.0 | (a) |
| | | | | | | | | | | | | | | | |
| | | (14,542 | ) | | | (435,331 | ) | | | (2,913 | ) | | | (0.0 | )(a) |
| | | | | | | | | | | | | | | | |
Media | | | | | | | | | | | | | |
Altice USA, Inc.* | | | (3,541 | ) | | | (109,594 | ) | | | (5,701 | ) | | | (0.0 | )(a) |
| | | | | | | | | | | | | | | | |
Metals & Mining | | | | | | | | | | | | | |
Alcoa Corp.* | | | (447 | ) | | | (9,293 | ) | | | 335 | | | | 0.0 | (a) |
Century Aluminum Co.* | | | (13,910 | ) | | | (81,095 | ) | | | 7,512 | | | | 0.0 | (a) |
Constellium SE* | | | (7,269 | ) | | | (96,896 | ) | | | 6,615 | | | | 0.0 | (a) |
Hecla Mining Co. | | | (19,206 | ) | | | (44,174 | ) | | | (5,954 | ) | | | (0.0 | )(a) |
United States Steel Corp. | | | (1,005 | ) | | | (11,568 | ) | | | (794 | ) | | | (0.0 | )(a) |
| | | | | | | | | | | | | | | | |
| | | (41,837 | ) | | | (243,026 | ) | | | 7,714 | | | | 0.0 | (a) |
| | | | | | | | | | | | | | | | |
Multi-Utilities | | | | | | | | | | | | | |
NiSource, Inc. | | | (836 | ) | | | (23,441 | ) | | | (653 | ) | | | (0.0 | )(a) |
| | | | | | | | | | | | | | | | |
Oil, Gas & Consumable Fuels | | | | | | | | | | | | | |
Antero Resources Corp.* | | | (38,240 | ) | | | (95,600 | ) | | | 12,252 | | | | 0.0 | (a) |
Callon Petroleum Co.* | | | (21,516 | ) | | | (81,761 | ) | | | 430 | | | | 0.0 | (a) |
Centennial Resource Development, Inc.* | | | (23,711 | ) | | | (80,617 | ) | | | (2,317 | ) | | | (0.0 | )(a) |
Concho Resources, Inc. | | | (1,663 | ) | | | (112,286 | ) | | | (6,724 | ) | | | (0.0 | )(a) |
Golar LNG Ltd. | | | (7,313 | ) | | | (100,700 | ) | | | 3,876 | | | | 0.0 | (a) |
Matador Resources Co.* | | | (7,389 | ) | | | (102,781 | ) | | | (8,848 | ) | | | (0.0 | )(a) |
Noble Energy, Inc. | | | (5,368 | ) | | | (103,388 | ) | | | (550 | ) | | | (0.0 | )(a) |
Oasis Petroleum, Inc.* | | | (16,213 | ) | | | (42,316 | ) | | | 2,034 | | | | 0.0 | (a) |
Parsley Energy, Inc. | | | (513 | ) | | | (8,110 | ) | | | (205 | ) | | | (0.0 | )(a) |
Penn Virginia Corp.* | | | (338 | ) | | | (8,044 | ) | | | 845 | | | | 0.0 | (a) |
SEE NOTES TO CONSOLIDATED FINANCIAL STATEMENTS.
| | | | | | |
| | | |
| 44 | | | | J.P. MORGAN EXCHANGE-TRADED FUNDS | | OCTOBER 31, 2019 |
| | | | | | | | | | | | | | | | |
| REFERENCE ENTITY | | SHARES | | | NOTIONAL
VALUE($) (1) | | | NET UNREALIZED
APPRECIATION
(DEPRECIATION)($) (2) | | | PERCENTAGE
OF NET
ASSETS (%) | |
Short Positions — continued | | | | | |
| | | |
Common Stocks — continued | | | | | | | | | | | | | |
Oil, Gas & Consumable Fuels — continued | | | | | | | | | | | | | |
SM Energy Co. | | | (13,033 | ) | | | (102,179 | ) | | | (5,342 | ) | | | (0.0 | )(a) |
Targa Resources Corp. | | | (61 | ) | | | (2,372 | ) | | | 30 | | | | 0.0 | (a) |
WPX Energy, Inc.* | | | (10,395 | ) | | | (103,742 | ) | | | (4,574 | ) | | | (0.0 | )(a) |
| | | | | | | | | | | | | | | | |
| | | (145,753 | ) | | | (943,896 | ) | | | (9,093 | ) | | | (0.0 | )(a) |
| | | | | | | | | | | | | | | | |
Pharmaceuticals | | | | | | | | | | | | | |
Aerie Pharmaceuticals, Inc.* | | | (1,726 | ) | | | (38,300 | ) | | | (2,900 | ) | | | (0.0 | )(a) |
Intersect ENT, Inc.* | | | (700 | ) | | | (12,474 | ) | | | (707 | ) | | | (0.0 | )(a) |
Revance Therapeutics, Inc.* | | | (8,289 | ) | | | (129,806 | ) | | | (4,062 | ) | | | (0.0 | )(a) |
Theravance Biopharma, Inc.* | | | (6,677 | ) | | | (107,633 | ) | | | 3,441 | | | | 0.0 | (a) |
WaVe Life Sciences Ltd.* | | | (2,552 | ) | | | (64,540 | ) | | | (12,045 | ) | | | (0.0 | )(a) |
Zogenix, Inc.* | | | (2,593 | ) | | | (115,777 | ) | | | (5,342 | ) | | | (0.0 | )(a) |
| | | | | | | | | | | | | | | | |
| | | (22,537 | ) | | | (468,530 | ) | | | (21,615 | ) | | | (0.0 | )(a) |
| | | | | | | | | | | | | | | | |
Professional Services | | | | | | | | | | | | | |
TransUnion | | | (1,273 | ) | | | (105,175 | ) | | | (1,540 | ) | | | (0.0 | )(a) |
| | | | | | | | | | | | | | | | |
Road & Rail | | | | | | | | | | | | | |
Hertz Global Holdings, Inc.* | | | (8,704 | ) | | | (117,591 | ) | | | 1,828 | | | | 0.0 | (a) |
| | | | | | | | | | | | | | | | |
Semiconductors & Semiconductor Equipment | | | | | | | | | | | | | |
Advanced Micro Devices, Inc.* | | | (539 | ) | | | (18,288 | ) | | | (1,595 | ) | | | (0.0 | )(a) |
Brooks Automation, Inc. | | | (2,716 | ) | | | (115,349 | ) | | | (7,360 | ) | | | (0.0 | )(a) |
Cohu, Inc. | | | (6,626 | ) | | | (110,124 | ) | | | (10,502 | ) | | | (0.0 | )(a) |
Cree, Inc.* | | | (2,109 | ) | | | (100,663 | ) | | | (7,118 | ) | | | (0.0 | )(a) |
Silicon Laboratories, Inc.* | | | (867 | ) | | | (92,110 | ) | | | 2,089 | | | | 0.0 | (a) |
| | | | | | | | | | | | | | | | |
| | | (12,857 | ) | | | (436,534 | ) | | | (24,486 | ) | | | (0.0 | )(a) |
| | | | | | | | | | | | | | | | |
Software | | | | | | | | | | | | | |
2U, Inc.* | | | (5,415 | ) | | | (97,064 | ) | | | (7,608 | ) | | | (0.0 | )(a) |
8x8, Inc.* | | | (5,614 | ) | | | (108,462 | ) | | | (896 | ) | | | (0.0 | )(a) |
Appian Corp.* | | | (676 | ) | | | (30,177 | ) | | | (2,136 | ) | | | (0.0 | )(a) |
Avalara, Inc.* | | | (245 | ) | | | (17,395 | ) | | | (1,139 | ) | | | (0.0 | )(a) |
Benefitfocus, Inc.* | | | (3,905 | ) | | | (88,780 | ) | | | (898 | ) | | | (0.0 | )(a) |
FireEye, Inc.* | | | (7,033 | ) | | | (111,403 | ) | | | (4,255 | ) | | | (0.0 | )(a) |
HubSpot, Inc.* | | | (163 | ) | | | (25,281 | ) | | | (162 | ) | | | (0.0 | )(a) |
Instructure, Inc.* | | | (2,734 | ) | | | (127,760 | ) | | | (10,389 | ) | | | (0.0 | )(a) |
Nutanix, Inc.* | | | (271 | ) | | | (7,919 | ) | | | (833 | ) | | | (0.0 | )(a) |
PROS Holdings, Inc.* | | | (827 | ) | | | (42,375 | ) | | | 3,011 | | | | 0.0 | (a) |
Q2 Holdings, Inc.* | | | (296 | ) | | | (21,161 | ) | | | 299 | | | | 0.0 | (a) |
RingCentral, Inc.* | | | (694 | ) | | | (112,095 | ) | | | 104 | | | | 0.0 | (a) |
Yext, Inc.* | | | (6,066 | ) | | | (99,846 | ) | | | (12,496 | ) | | | (0.1 | ) |
Zuora, Inc.* | | | (922 | ) | | | (13,139 | ) | | | (581 | ) | | | (0.0 | )(a) |
| | | | | | | | | | | | | | | | |
| | | (34,861 | ) | | | (902,857 | ) | | | (37,979 | ) | | | (0.1 | ) |
| | | | | | | | | | | | | | | | |
Specialty Retail | | | | | | | | | | | | | |
Floor & Decor Holdings, Inc.* | | | (1,674 | ) | | | (76,720 | ) | | | (2,544 | ) | | | (0.0 | )(a) |
National Vision Holdings, Inc.* | | | (1,758 | ) | | | (41,840 | ) | | | (1,424 | ) | | | (0.0 | )(a) |
| | | | | | | | | | | | | | | | |
| | | (3,432 | ) | | | (118,560 | ) | | | (3,968 | ) | | | (0.0 | )(a) |
| | | | | | | | | | | | | | | | |
Tobacco | | | | | | | | | | | | | |
Vector Group Ltd. | | | (8,338 | ) | | | (101,724 | ) | | | (5,086 | ) | | | (0.0 | )(a) |
| | | | | | | | | | | | | | | | |
Trading Companies & Distributors | | | | | | | | | | | | | |
MRC Global, Inc.* | | | (9,274 | ) | | | (105,353 | ) | | | 658 | | | | 0.0 | (a) |
| | | | | | | | | | | | | | | | |
SEE NOTES TO CONSOLIDATED FINANCIAL STATEMENTS.
| | | | | | | | |
| | | |
| OCTOBER 31, 2019 | | J.P. MORGAN EXCHANGE-TRADED FUNDS | | | | | 45 | |
JPMorgan Diversified Alternatives ETF
CONSOLIDATED SCHEDULE OF PORTFOLIO INVESTMENTS
AS OF OCTOBER 31, 2019 (continued)
| | | | | | | | | | | | | | | | |
| REFERENCE ENTITY | | SHARES | | | NOTIONAL
VALUE($) (1) | | | NET UNREALIZED
APPRECIATION
(DEPRECIATION)($) (2) | | | PERCENTAGE
OF NET
ASSETS (%) | |
Short Positions — continued | | | | | |
| | | |
Common Stocks — continued | | | | | | | | | | | | | |
Water Utilities | | | | | | | | | | | | | |
American Water Works Co., Inc. | | | (162 | ) | | | (19,970 | ) | | | (415 | ) | | | (0.0 | )(a) |
Aqua America, Inc. | | | (2,132 | ) | | | (96,644 | ) | | | 2,665 | | | | 0.0 | (a) |
California Water Service Group | | | (336 | ) | | | (18,806 | ) | | | (463 | ) | | | (0.0 | )(a) |
SJW Group | | | (1,424 | ) | | | (103,026 | ) | | | 797 | | | | 0.0 | (a) |
| | | | | | | | | | | | | | | | |
| | | (4,054 | ) | | | (238,446 | ) | | | 2,584 | | | | 0.0 | (a) |
| | | | | | | | | | | | | | | | |
Total Short Positions of Total Return Basket Swap | | | (691,777 | ) | | | (11,726,646 | ) | | | (228,420 | ) | | | (0.2 | ) |
| | | | | | | | | | | | | | | | |
| | | | | | | | | | | | | | | | | | | | |
| COUNTERPARTY | | DESCRIPTION | | TERMINATION
DATE | | NOTIONAL
VALUE (1) | | | NET UNREALIZED
APPRECIATION
(DEPRECIATION) (2) | | | NET CASH
AND OTHER
RECEIVABLES
(PAYABLES) | | | VALUE | |
UBS | | The Fund receives the total return on a portfolio of long and short equity positions and pays or receives the net of one month CDOR on long positions and short positions respectively, plus or minus a specified spread (rates range from 0.00% to 0.23%), which is denominated in CAD based on the local currencies of the positions within the swaps. | | 8/26/2022 | | $ | 1,852,612 | | | $ | (11,547 | ) | | $ | 440 | | | $ | (11,107 | ) |
| | | | | | | | | | | | | | | | | | | | |
| | | | | | | | | | | | | | | | |
| REFERENCE ENTITY | | SHARES | | | NOTIONAL
VALUE($) (1) | | | NET UNREALIZED
APPRECIATION
(DEPRECIATION)($) (2) | | | PERCENTAGE
OF NET
ASSETS (%) | |
Long Positions | | | | | |
| | | |
Common Stocks | | | | | | | | | | | | | |
Airlines | | | | | | | | | | | | | |
Air Canada* | | | 4,393 | | | | 156,428 | | | | 262 | | | | 0.0 | (a) |
| | | | | | | | | | | | | | | | |
Banks | | | | | | | | | | | | | |
Laurentian Bank of Canada | | | 4,853 | | | | 166,913 | | | | (1,253 | ) | | | (0.0 | )(a) |
| | | | | | | | | | | | | | | | |
Chemicals | | | | | | | | | | | | | |
Methanex Corp. | | | 3,556 | | | | 134,751 | | | | 9,180 | | | | 0.0 | (a) |
| | | | | | | | | | | | | | | | |
Construction & Engineering | | | | | | | | | | | | | |
Aecon Group, Inc. | | | 11,167 | | | | 154,308 | | | | 1,953 | | | | 0.0 | (a) |
| | | | | | | | | | | | | | | | |
Food & Staples Retailing | | | | | | | | | | | | | |
Empire Co. Ltd. | | | 5,679 | | | | 150,782 | | | | 554 | | | | 0.0 | (a) |
| | | | | | | | | | | | | | | | |
Insurance | | | | | | | | | | | | | |
iA Financial Corp., Inc. | | | 3,728 | | | | 179,536 | | | | 6,095 | | | | 0.0 | (a) |
| | | | | | | | | | | | | | | | |
IT Services | | | | | | | | | | | | | |
CGI, Inc.* | | | 1,989 | | | | 154,608 | | | | 710 | | | | 0.0 | (a) |
| | | | | | | | | | | | | | | | |
Media | | | | | | | | | | | | | |
Quebecor, Inc. | | | 6,921 | | | | 160,900 | | | | 290 | | | | 0.0 | (a) |
| | | | | | | | | | | | | | | | |
Metals & Mining | | | | | | | | | | | | | |
Teck Resources Ltd. | | | 8,083 | | | | 127,772 | | | | (4,876 | ) | | | (0.0 | )(a) |
| | | | | | | | | | | | | | | | |
Oil, Gas & Consumable Fuels | | | | | | | | | | | | | |
Imperial Oil Ltd. | | | 6,434 | | | | 160,227 | | | | 1,682 | | | | 0.0 | (a) |
Parex Resources, Inc.* | | | 10,057 | | | | 136,298 | | | | (4,750 | ) | | | (0.0 | )(a) |
SEE NOTES TO CONSOLIDATED FINANCIAL STATEMENTS.
| | | | | | |
| | | |
| 46 | | | | J.P. MORGAN EXCHANGE-TRADED FUNDS | | OCTOBER 31, 2019 |
| | | | | | | | | | | | | | | | |
| REFERENCE ENTITY | | SHARES | | | NOTIONAL
VALUE($) (1) | | | NET UNREALIZED
APPRECIATION
(DEPRECIATION)($) (2) | | | PERCENTAGE
OF NET
ASSETS (%) | |
Long Positions — continued | | | | | |
| | | |
Common Stocks — continued | | | | | | | | | | | | | |
Oil, Gas & Consumable Fuels — continued | | | | | | | | | | | | | |
Suncor Energy, Inc. | | | 5,584 | | | | 166,023 | | | | (1,780 | ) | | | (0.0 | )(a) |
| | | | | | | | | | | | | | | | |
| | | 22,075 | | | | 462,548 | | | | (4,848 | ) | | | (0.0 | )(a) |
| | | | | | | | | | | | | | | | |
Real Estate Management & Development | | | | | | | | | | | | | |
First Capital Realty, Inc. | | | 9,576 | | | | 158,497 | | | | (60 | ) | | | (0.0 | )(a) |
| | | | | | | | | | | | | | | | |
Textiles, Apparel & Luxury Goods | | | | | | | | | | | | | |
Gildan Activewear, Inc. | | | 4,912 | | | | 125,494 | | | | (2,879 | ) | | | (0.0 | )(a) |
| | | | | | | | | | | | | | | | |
Total Long Positions of Total Return Basket Swap | | | 86,932 | | | | 2,132,537 | | | | 5,128 | | | | 0.0 | (a) |
| | | | | | | | | | | | | | | | |
| |
Short Positions | | | | | |
| | | |
Common Stocks | | | | | | | | | | | | | |
Construction & Engineering | | | | | | | | | | | | | |
SNC-Lavalin Group, Inc. | | | (3,206 | ) | | | (57,957 | ) | | | (15,392 | ) | | | (0.0 | )(a) |
| | | | | | | | | | | | | | | | |
Diversified Financial Services | | | | | | | | | | | | | |
Onex Corp. | | | (1,348 | ) | | | (79,246 | ) | | | 922 | | | | 0.0 | (a) |
| | | | | | | | | | | | | | | | |
Metals & Mining | | | | | | | | | | | | | |
First Quantum Minerals Ltd. | | | (227 | ) | | | (1,918 | ) | | | (9 | ) | | | (0.0 | )(a) |
Kinross Gold Corp.* | | | (953 | ) | | | (4,631 | ) | | | (196 | ) | | | (0.0 | )(a) |
Yamana Gold, Inc. | | | (9,432 | ) | | | (34,445 | ) | | | (2,734 | ) | | | (0.0 | )(a) |
| | | | | | | | | | | | | | | | |
| | | (10,612 | ) | | | (40,994 | ) | | | (2,939 | ) | | | (0.0 | )(a) |
| | | | | | | | | | | | | | | | |
Multi-Utilities | | | | | | | | | | | | | |
Canadian Utilities Ltd. | | | (3,308 | ) | | | (96,470 | ) | | | 137 | | | | 0.0 | (a) |
| | | | | | | | | | | | | | | | |
Oil, Gas & Consumable Fuels | | | | | | | | | | | | | |
Vermilion Energy, Inc. | | | (398 | ) | | | (5,258 | ) | | | 597 | | | | 0.0 | (a) |
| | | | | | | | | | | | | | | | |
Total Short Positions of Total Return Basket Swap | | | (18,872 | ) | | | (279,925 | ) | | | (16,675 | ) | | | 0.0 | (a) |
| | | | | | | | | | | | | | | | |
Total of Long and Short Positions of Total Return Basket Swap | | | 68,060 | | | | 1,852,612 | | | | (11,547 | ) | | | 0.0 | (a) |
| | | | | | | | | | | | | | | | |
| | | | | | | | | | | | | | | | | | | | |
| COUNTERPARTY | | DESCRIPTION | | TERMINATION
DATE | | NOTIONAL
VALUE (1) | | | NET UNREALIZED
APPRECIATION
(DEPRECIATION) (2) | | | NET CASH
AND OTHER
RECEIVABLES
(PAYABLES) | | | VALUE | |
UBS | | The Fund receives the total return on a portfolio of long and short equity positions and pays or receives the net of one month LIBOR on long positions and short positions respectively, plus or minus a specified spread (rates range from 0.00% to 0.23%), which is denominated in EUR based on the local currencies of the positions within the swaps. | | 8/26/2022 | | $ | 5,116,748 | | | $ | 182,221 | | | $ | 27,283 | | | $ | 209,504 | |
| | | | | | | | | | | | | | | | | | | | |
SEE NOTES TO CONSOLIDATED FINANCIAL STATEMENTS.
| | | | | | | | |
| | | |
| OCTOBER 31, 2019 | | J.P. MORGAN EXCHANGE-TRADED FUNDS | | | | | 47 | |
JPMorgan Diversified Alternatives ETF
CONSOLIDATED SCHEDULE OF PORTFOLIO INVESTMENTS
AS OF OCTOBER 31, 2019 (continued)
| | | | | | | | | | | | | | | | |
| REFERENCE ENTITY | | SHARES | | | NOTIONAL
VALUE($) (1) | | | NET UNREALIZED
APPRECIATION
(DEPRECIATION)($) (2) | | | PERCENTAGE
OF NET
ASSETS (%) | |
Long Positions | | | | | |
| | | |
Common Stocks | | | | | | | | | | | | | |
Air Freight & Logistics | | | | | | | | | | | | | |
Bollore SA | | | 39,835 | | | | 172,580 | | | | 6,137 | | | | 0.0 | (a) |
| | | | | | | | | | | | | | | | |
Automobiles | | | | | | | | | | | | | |
Peugeot SA | | | 1,264 | | | | 32,012 | | | | (1,346 | ) | | | (0.0 | )(a) |
| | | | | | | | | | | | | | | | |
Chemicals | | | | | | | | | | | | | |
Covestro AG (b) | | | 1,658 | | | | 79,620 | | | | (4,944 | ) | | | (0.0 | )(a) |
| | | | | | | | | | | | | | | | |
Construction & Engineering | | | | | | | | | | | | | |
ACS Actividades de Construccion y Servicios SA | | | 4,734 | | | | 192,097 | | | | 3,373 | | | | 0.0 | (a) |
HOCHTIEF AG | | | 1,288 | | | | 160,927 | | | | 8,631 | | | | 0.0 | (a) |
Vinci SA | | | 1,444 | | | | 162,011 | | | | 6,506 | | | | 0.0 | (a) |
| | | | | | | | | | | | | | | | |
| | | 7,466 | | | | 515,035 | | | | 18,510 | | | | 0.0 | (a) |
| | | | | | | | | | | | | | | | |
Construction Materials | | | | | | | | | | | | | |
HeidelbergCement AG | | | 1,832 | | | | 135,821 | | | | 3,649 | | | | 0.0 | (a) |
| | | | | | | | | | | | | | | | |
Diversified Financial Services | | | | | | | | | | | | | |
Banca IFIS SpA | | | 9,084 | | | | 154,113 | | | | 5,632 | | | | 0.0 | (a) |
| | | | | | | | | | | | | | | | |
Diversified Telecommunication Services | | | | | | | | | | | | | |
Deutsche Telekom AG (Registered) | | | 9,404 | | | | 165,469 | | | | (1,609 | ) | | | (0.0 | )(a) |
Elisa OYJ | | | 2,986 | | | | 163,084 | | | | 786 | | | | 0.0 | (a) |
| | | | | | | | | | | | | | | | |
| | | 12,390 | | | | 328,553 | | | | (823 | ) | | | (0.0 | )(a) |
| | | | | | | | | | | | | | | | |
Electric Utilities | | | | | | | | | | | | | |
EDP — Energias de Portugal SA | | | 42,760 | | | | 176,138 | | | | 8,266 | | | | 0.0 | (a) |
Endesa SA | | | 6,035 | | | | 164,362 | | | | 4,972 | | | | 0.0 | (a) |
Enel SpA | | | 22,504 | | | | 174,414 | | | | 4,533 | | | | 0.0 | (a) |
Verbund AG | | | 2,613 | | | | 141,560 | | | | (832 | ) | | | (0.0 | )(a) |
| | | | | | | | | | | | | | | | |
| | | 73,912 | | | | 656,474 | | | | 16,939 | | | | 0.0 | (a) |
| | | | | | | | | | | | | | | | |
Electrical Equipment | | | | | | | | | | | | | |
Signify NV (b) | | | 5,444 | | | | 159,510 | | | | 7,199 | | | | 0.0 | (a) |
| | | | | | | | | | | | | | | | |
Food & Staples Retailing | | | | | | | | | | | | | |
Koninklijke Ahold Delhaize NV | | | 6,783 | | | | 169,033 | | | | (4,803 | ) | | | (0.0 | )(a) |
| | | | | | | | | | | | | | | | |
Gas Utilities | | | | | | | | | | | | | |
Enagas SA | | | 7,022 | | | | 173,757 | | | | 14,374 | | | | 0.0 | (a) |
Italgas SpA | | | 24,440 | | | | 157,337 | | | | 2,560 | | | | 0.0 | (a) |
| | | | | | | | | | | | | | | | |
| | | 31,462 | | | | 331,094 | | | | 16,934 | | | | 0.0 | (a) |
| | | | | | | | | | | | | | | | |
Health Care Equipment & Supplies | | | | | | | | | | | | | |
Koninklijke Philips NV | | | 3,344 | | | | 146,715 | | | | 1,008 | | | | 0.0 | (a) |
| | | | | | | | | | | | | | | | |
Insurance | | | | | | | | | | | | | |
Ageas | | | 2,924 | | | | 168,629 | | | | (54 | ) | | | (0.0 | )(a) |
ASR Nederland NV | | | 4,414 | | | | 161,811 | | | | (793 | ) | | | (0.0 | )(a) |
Assicurazioni Generali SpA | | | 8,682 | | | | 176,050 | | | | (133 | ) | | | (0.0 | )(a) |
UnipolSai Assicurazioni SpA | | | 62,208 | | | | 173,620 | | | | (1,014 | ) | | | (0.0 | )(a) |
| | | | | | | | | | | | | | | | |
| | | 78,228 | | | | 680,110 | | | | (1,994 | ) | | | (0.0 | )(a) |
| | | | | | | | | | | | | | | | |
Machinery | | | | | | | | | | | | | |
Kone OYJ | | | 2,715 | | | | 172,880 | | | | 13,246 | | | | 0.0 | (a) |
Valmet OYJ | | | 7,969 | | | | 178,350 | | | | 20,567 | | | | 0.1 | |
| | | | | | | | | | | | | | | | |
| | | 10,684 | | | | 351,230 | | | | 33,813 | | | | 0.1 | |
| | | | | | | | | | | | | | | | |
SEE NOTES TO CONSOLIDATED FINANCIAL STATEMENTS.
| | | | | | |
| | | |
| 48 | | | | J.P. MORGAN EXCHANGE-TRADED FUNDS | | OCTOBER 31, 2019 |
| | | | | | | | | | | | | | | | |
| REFERENCE ENTITY | | SHARES | | | NOTIONAL
VALUE($) (1) | | | NET UNREALIZED
APPRECIATION
(DEPRECIATION)($) (2) | | | PERCENTAGE
OF NET
ASSETS (%) | |
Long Positions — continued | | | | | |
| | | |
Common Stocks — continued | | | | | | | | | | | | | |
Media | | | | | | | | | | | | | |
ProSiebenSat.1 Media SE | | | 8,209 | | | | 121,219 | | | | 2,669 | | | | 0.0 | (a) |
Publicis Groupe SA | | | 3,208 | | | | 138,068 | | | | 2,963 | | | | 0.0 | (a) |
| | | | | | | | | | | | | | | | |
| | | 11,417 | | | | 259,287 | | | | 5,632 | | | | 0.0 | (a) |
| | | | | | | | | | | | | | | | |
Multi-Utilities | | | | | | | | | | | | | |
A2A SpA | | | 89,375 | | | | 179,418 | | | | 12,431 | | | | 0.0 | (a) |
Engie SA | | | 10,429 | | | | 174,631 | | | | 750 | | | | 0.0 | (a) |
Hera SpA | | | 40,555 | | | | 173,726 | | | | 2,112 | | | | 0.0 | (a) |
Iren SpA | | | 53,391 | | | | 165,660 | | | | 3,109 | | | | 0.0 | (a) |
RWE AG | | | 5,342 | | | | 162,795 | | | | (71 | ) | | | (0.0 | )(a) |
Veolia Environnement SA | | | 6,609 | | | | 173,974 | | | | 3,849 | | | | 0.0 | (a) |
| | | | | | | | | | | | | | | | |
| | | 205,701 | | | | 1,030,204 | | | | 22,180 | | | | 0.0 | (a) |
| | | | | | | | | | | | | | | | |
Oil, Gas & Consumable Fuels | | | | | | | | | | | | | |
Eni SpA | | | 7,576 | | | | 114,935 | | | | (1,491 | ) | | | (0.0 | )(a) |
Neste OYJ | | | 4,398 | | | | 158,911 | | | | 16,318 | | | | 0.1 | |
OMV AG | | | 3,088 | | | | 180,530 | | | | 9,231 | | | | 0.0 | (a) |
Repsol SA | | | 9,543 | | | | 157,266 | | | | 2,921 | | | | 0.0 | (a) |
| | | | | | | | | | | | | | | | |
| | | 24,605 | | | | 611,642 | | | | 26,979 | | | | 0.1 | |
| | | | | | | | | | | | | | | | |
Pharmaceuticals | | | | | | | | | | | | | |
Merck KGaA | | | 1,464 | | | | 174,606 | | | | 1,509 | | | | 0.0 | (a) |
UCB SA | | | 2,048 | | | | 165,067 | | | | 3,419 | | | | 0.0 | (a) |
| | | | | | | | | | | | | | | | |
| | | 3,512 | | | | 339,673 | | | | 4,928 | | | | 0.0 | (a) |
| | | | | | | | | | | | | | | | |
Semiconductors & Semiconductor Equipment | | | | | | | | | | | | | |
Siltronic AG | | | 1,655 | | | | 157,621 | | | | 16,096 | | | | 0.0 | (a) |
| | | | | | | | | | | | | | | | |
Textiles, Apparel & Luxury Goods | | | | | | | | | | | | | |
Christian Dior SE | | | 253 | | | | 124,971 | | | | 1,647 | | | | 0.0 | (a) |
Kering SA | | | 288 | | | | 163,871 | | | | 12,958 | | | | 0.0 | (a) |
| | | | | | | | | | | | | | | | |
| | | 541 | | | | 288,842 | | | | 14,605 | | | | 0.0 | (a) |
| | | | | | | | | | | | | | | | |
Transportation Infrastructure | | | | | | | | | | | | | |
Aena SME SA (b) | | | 930 | | | | 170,713 | | | | (3,497 | ) | | | (0.0 | )(a) |
| | | | | | | | | | | | | | | | |
Total Long Positions of Total Return Basket Swap | | | 531,747 | | | | 6,769,882 | | | | 182,834 | | | | 0.2 | |
| | | | | | | | | | | | | | | | |
| |
Short Positions | | | | | |
| | | |
Common Stocks | | | | | | | | | | | | | |
Aerospace & Defense | | | | | | | | | | | | | |
Thales SA | | | (1,140 | ) | | | (111,446 | ) | | | 2,053 | | | | 0.0 | (a) |
| | | | | | | | | | | | | | | | |
Banks | | | | | | | | | | | | | |
FinecoBank Banca Fineco SpA | | | (9,533 | ) | | | (107,469 | ) | | | (555 | ) | | | (0.0 | )(a) |
| | | | | | | | | | | | | | | | |
Chemicals | | | | | | | | | | | | | |
K+S AG (Registered) | | | (4,058 | ) | | | (57,624 | ) | | | (771 | ) | | | (0.0 | )(a) |
Umicore SA | | | (1,411 | ) | | | (58,246 | ) | | | (960 | ) | | | (0.0 | )(a) |
| | | | | | | | | | | | | | | | |
| | | (5,469 | ) | | | (115,870 | ) | | | (1,731 | ) | | | (0.0 | )(a) |
| | | | | | | | | | | | | | | | |
Communications Equipment | | | | | | | | | | | | | |
Nokia OYJ | | | (12,644 | ) | | | (46,416 | ) | | | 75 | | | | 0.0 | (a) |
| | | | | | | | | | | | | | | | |
Diversified Financial Services | | | | | | | | | | | | | |
Wendel SA | | | (595 | ) | | | (84,369 | ) | | | (3,332 | ) | | | (0.0 | )(a) |
| | | | | | | | | | | | | | | | |
SEE NOTES TO CONSOLIDATED FINANCIAL STATEMENTS.
| | | | | | | | |
| | | |
| OCTOBER 31, 2019 | | J.P. MORGAN EXCHANGE-TRADED FUNDS | | | | | 49 | |
JPMorgan Diversified Alternatives ETF
CONSOLIDATED SCHEDULE OF PORTFOLIO INVESTMENTS
AS OF OCTOBER 31, 2019 (continued)
| | | | | | | | | | | | | | | | |
| REFERENCE ENTITY | | SHARES | | | NOTIONAL
VALUE($) (1) | | | NET UNREALIZED
APPRECIATION
(DEPRECIATION)($) (2) | | | PERCENTAGE
OF NET
ASSETS (%) | |
| |
Short Positions — continued | | | | | |
| | | |
Common Stocks — continued | | | | | | | | | | | | | |
Diversified Telecommunication Services | | | | | | | | | | | | | |
Cellnex Telecom SA* (b) | | | (1,864 | ) | | | (80,430 | ) | | | 4,739 | | | | 0.0 | (a) |
Iliad SA | | | (288 | ) | | | (29,847 | ) | | | (278 | ) | | | (0.0 | )(a) |
| | | | | | | | | | | | | | | | |
| | | (2,152 | ) | | | (110,277 | ) | | | 4,461 | | | | 0.0 | (a) |
| | | | | | | | | | | | | | | | |
Energy Equipment & Services | | | | | | | | | | | | | |
Tenaris SA | | | (1,860 | ) | | | (18,869 | ) | | | 425 | | | | 0.0 | (a) |
| | | | | | | | | | | | | | | | |
Food Products | | | | | | | | | | | | | |
Kerry Group plc | | | (937 | ) | | | (113,282 | ) | | | (4,582 | ) | | | (0.0 | )(a) |
| | | | | | | | | | | | | | | | |
Gas Utilities | | | | | | | | | | | | | |
Rubis SCA | | | (302 | ) | | | (17,512 | ) | | | (331 | ) | | | (0.0 | )(a) |
| | | | | | | | | | | | | | | | |
Health Care Providers & Services | | | | | | | | | | | | | |
Orpea | | | (615 | ) | | | (74,073 | ) | | | 318 | | | | 0.0 | (a) |
| | | | | | | | | | | | | | | | |
Internet & Direct Marketing Retail | | | | | | | | | | | | | |
Delivery Hero SE* (b) | | | (1,274 | ) | | | (59,779 | ) | | | 688 | | | | 0.0 | (a) |
Rocket Internet SE* (b) | | | (3,424 | ) | | | (90,926 | ) | | | 2,617 | | | | 0.0 | (a) |
| | | | | | | | | | | | | | | | |
| | | (4,698 | ) | | | (150,705 | ) | | | 3,305 | | | | 0.0 | (a) |
| | | | | | | | | | | | | | | | |
Machinery | | | | | | | | | | | | | |
Konecranes OYJ | | | (3,222 | ) | | | (99,503 | ) | | | (1,382 | ) | | | (0.0 | )(a) |
Metso OYJ | | | (2,714 | ) | | | (102,743 | ) | | | (4,336 | ) | | | (0.0 | )(a) |
| | | | | | | | | | | | | | | | |
| | | (5,936 | ) | | | (202,246 | ) | | | (5,718 | ) | | | (0.0 | )(a) |
| | | | | | | | | | | | | | | | |
Media | | | | | | | | | | | | | |
JCDecaux SA | | | (4,043 | ) | | | (110,518 | ) | | | (5,993 | ) | | | (0.0 | )(a) |
| | | | | | | | | | | | | | | | |
Metals & Mining | | | | | | | | | | | | | |
ArcelorMittal | | | (470 | ) | | | (6,988 | ) | | | (70 | ) | | | (0.0 | )(a) |
Outokumpu OYJ | | | (32,618 | ) | | | (92,681 | ) | | | 2,329 | | | | 0.0 | (a) |
| | | | | | | | | | | | | | | | |
| | | (33,088 | ) | | | (99,669 | ) | | | 2,259 | | | | 0.0 | (a) |
| | | | | | | | | | | | | | | | |
Semiconductors & Semiconductor Equipment | | | | | | | | | | | | | |
AIXTRON SE* | | | (8,841 | ) | | | (80,827 | ) | | | 11,535 | | | | 0.0 | (a) |
| | | | | | | | | | | | | | | | |
Trading Companies & Distributors | | | | | | | | | | | | | |
Rexel SA | | | (9,235 | ) | | | (114,491 | ) | | | 99 | | | | 0.0 | (a) |
| | | | | | | | | | | | | | | | |
Transportation Infrastructure | | | | | | | | | | | | | |
Aeroports de Paris | | | (500 | ) | | | (95,095 | ) | | | (2,901 | ) | | | (0.0 | )(a) |
| | | | | | | | | | | | | | | | |
Total Short Positions of Total Return Basket Swap | | | (101,588 | ) | | | (1,653,134 | ) | | | (613 | ) | | | 0.0 | (a) |
| | | | | | | | | | | | | | | | |
Total of Long and Short Positions of Total Return Basket Swap | | | 430,159 | | | | 5,116,748 | | | | 182,221 | | | | 0.2 | |
| | | | | | | | | | | | | | | | |
| | | | | | | | | | | | | | | | | | | | |
| COUNTERPARTY | | DESCRIPTION | | TERMINATION
DATE | | NOTIONAL
VALUE (1) | | | NET UNREALIZED
APPRECIATION
(DEPRECIATION) (2) | | | NET CASH
AND OTHER
RECEIVABLES
(PAYABLES) | | | VALUE | |
UBS | | The Fund receives the total return on a portfolio of long and short equity positions and pays or receives the net of one month BBSW on long positions and short positions respectively, plus or minus a specified spread (rates range from 0.00% to 0.23%), which is denominated in AUD based on the local currencies of the positions within the swaps. | | 8/26/2022 | | $ | 37,703 | | | $ | 18,393 | | | $ | 2,395 | | | $ | 20,788 | |
| | | | | | | | | | | | | | | | | | | | |
SEE NOTES TO CONSOLIDATED FINANCIAL STATEMENTS.
| | | | | | |
| | | |
| 50 | | | | J.P. MORGAN EXCHANGE-TRADED FUNDS | | OCTOBER 31, 2019 |
| | | | | | | | | | | | | | | | |
| REFERENCE ENTITY | | SHARES | | | NOTIONAL
VALUE($) (1) | | | NET UNREALIZED
APPRECIATION
(DEPRECIATION)($) (2) | | | PERCENTAGE
OF NET
ASSETS (%) | |
Long Positions | | | | | |
| | | |
Common Stocks | | | | | | | | | | | | | |
Airlines | | | | | | | | | | | | | |
Qantas Airways Ltd. | | | 21,619 | | | | 95,624 | | | | (1,846 | ) | | | (0.0 | )(a) |
| | | | | | | | | | | | | | | | |
Food & Staples Retailing | | | | | | | | | | | | | |
Metcash Ltd. | | | 21,577 | | | | 41,944 | | | | (596 | ) | | | (0.0 | )(a) |
| | | | | | | | | | | | | | | | |
Metals & Mining | | | | | | | | | | | | | |
Alumina Ltd. | | | 41,299 | | | | 64,472 | | | | (66 | ) | | | (0.0 | )(a) |
Iluka Resources Ltd. | | | 13,655 | | | | 88,387 | | | | 9,561 | | | | 0.0 | (a) |
Regis Resources Ltd. | | | 41,175 | | | | 139,544 | | | | 3,128 | | | | 0.0 | (a) |
| | | | | | | | | | | | | | | | |
| | | 96,129 | | | | 292,403 | | | | 12,623 | | | | 0.0 | (a) |
| | | | | | | | | | | | | | | | |
Oil, Gas & Consumable Fuels | | | | | | | | | | | | | |
Whitehaven Coal Ltd. | | | 14,740 | | | | 33,524 | | | | 1,296 | | | | 0.0 | (a) |
Woodside Petroleum Ltd. | | | 4,918 | | | | 109,000 | | | | 725 | | | | 0.0 | (a) |
| | | | | | | | | | | | | | | | |
| | | 19,658 | | | | 142,524 | | | | 2,021 | | | | 0.0 | (a) |
| | | | | | | | | | | | | | | | |
Road & Rail | | | | | | | | | | | | | |
Aurizon Holdings Ltd. | | | 38,658 | | | | 157,270 | | | | 2,948 | | | | 0.0 | (a) |
| | | | | | | | | | | | | | | | |
Total Long Positions of Total Return Basket Swap | | | 197,641 | | | | 729,765 | | | | 15,150 | | | | 0.0 | (a) |
| | | | | | | | | | | | | | | | |
| |
Short Positions | | | | | |
| | | |
Common Stocks | | | | | | | | | | | | | |
Beverages | | | | | | | | | | | | | |
Treasury Wine Estates Ltd. | | | (1,447 | ) | | | (17,550 | ) | | | (9 | ) | | | (0.0 | )(a) |
| | | | | | | | | | | | | | | | |
Capital Markets | | | | | | | | | | | | | |
Platinum Asset Management Ltd. | | | (38,315 | ) | | | (109,396 | ) | | | (113 | ) | | | (0.0 | )(a) |
| | | | | | | | | | | | | | | | |
Construction Materials | | | | | | | | | | | | | |
Adelaide Brighton Ltd. | | | (46,829 | ) | | | (99,462 | ) | | | (1,343 | ) | | | (0.0 | )(a) |
| | | | | | | | | | | | | | | | |
Food Products | | | | | | | | | | | | | |
GrainCorp., Ltd. | | | (21,783 | ) | | | (108,614 | ) | | | 2,239 | | | | 0.0 | (a) |
| | | | | | | | | | | | | | | | |
Hotels, Restaurants & Leisure | | | | | | | | | | | | | |
Star Entertainment Grp Ltd. (The) | | | (6,162 | ) | | | (19,980 | ) | | | (936 | ) | | | (0.0 | )(a) |
| | | | | | | | | | | | | | | | |
IT Services | | | | | | | | | | | | | |
Afterpay Touch Group Ltd.* | | | (4,778 | ) | | | (94,853 | ) | | | 2,783 | | | | 0.0 | (a) |
NEXTDC Ltd.* | | | (3,943 | ) | | | (17,425 | ) | | | 298 | | | | 0.0 | (a) |
| | | | | | | | | | | | | | | | |
| | | (8,721 | ) | | | (112,278 | ) | | | 3,081 | | | | 0.0 | (a) |
| | | | | | | | | | | | | | | | |
Oil, Gas & Consumable Fuels | | | | | | | | | | | | | |
Oil Search Ltd. | | | (1,211 | ) | | | (5,977 | ) | | | 26 | | | | 0.0 | (a) |
| | | | | | | | | | | | | | | | |
Professional Services | | | | | | | | | | | | | |
ALS Ltd. | | | (19,425 | ) | | | (108,034 | ) | | | 32 | | | | 0.0 | (a) |
| | | | | | | | | | | | | | | | |
Transportation Infrastructure | | | | | | | | | | | | | |
Qube Holdings Ltd. | | | (49,405 | ) | | | (110,771 | ) | | | 266 | | | | 0.0 | (a) |
| | | | | | | | | | | | | | | | |
Total Short Positions of Total Return Basket Swap | | | (193,298 | ) | | | (692,062 | ) | | | 3,243 | | | | 0.0 | (a) |
| | | | | | | | | | | | | | | | |
Total of Long and Short Positions of Total Return Basket Swap | | | 4,343 | | | | 37,703 | | | | 18,393 | | | | 0.0 | (a) |
| | | | | | | | | | | | | | | | |
SEE NOTES TO CONSOLIDATED FINANCIAL STATEMENTS.
| | | | | | | | |
| | | |
| OCTOBER 31, 2019 | | J.P. MORGAN EXCHANGE-TRADED FUNDS | | | | | 51 | |
JPMorgan Diversified Alternatives ETF
CONSOLIDATED SCHEDULE OF PORTFOLIO INVESTMENTS
AS OF OCTOBER 31, 2019 (continued)
| | | | | | | | | | | | | | | | | | | | |
| COUNTERPARTY | | DESCRIPTION | | TERMINATION
DATE | | NOTIONAL
VALUE (1) | | | NET UNREALIZED
APPRECIATION
(DEPRECIATION) (2) | | | NET CASH
AND OTHER
RECEIVABLES
(PAYABLES) | | | VALUE | |
UBS | | The Fund receives the total return on a portfolio of long and short equity positions and pays or receives the net of one month LIBOR on long positions and short positions respectively, plus or minus a specified spread (rates range from 0.00% to 0.23%), which is denominated in JPY based on the local currencies of the positions within the swaps. | | 11/22/2019 –
8/26/2022 | | $ | 6,974,441 | | | $ | 44,683 | | | $ | 42,539 | | | $ | 87,222 | |
| | | | | | | | | | | | | | | | | | | | |
| | | | | | | | | | | | | | | | |
| REFERENCE ENTITY | | SHARES | | | NOTIONAL
VALUE($) (1) | | | NET UNREALIZED
APPRECIATION
(DEPRECIATION)($) (2) | | | PERCENTAGE
OF NET
ASSETS (%) | |
Long Positions | | | | | |
| | | |
Common Stocks | | | | | | | | | | | | | |
Airlines | | | | | | | | | | | | | |
Japan Airlines Co. Ltd. | | | 5,400 | | | | 168,275 | | | | (494 | ) | | | (0.0 | )(a) |
| | | | | | | | | | | | | | | | |
Auto Components | | | | | | | | | | | | | |
TS Tech Co. Ltd. | | | 3,900 | | | | 124,907 | | | | 3,580 | | | | 0.0 | (a) |
Yokohama Rubber Co. Ltd. (The) | | | 5,700 | | | | 127,311 | | | | 6,011 | | | | 0.0 | (a) |
| | | | | | | | | | | | | | | | |
| | | 9,600 | | | | 252,218 | | | | 9,591 | | | | 0.0 | (a) |
| | | | | | | | | | | | | | | | |
Beverages | | | | | | | | | | | | | |
Asahi Group Holdings Ltd. | | | 3,400 | | | | 170,263 | | | | 3,681 | | | | 0.0 | (a) |
Suntory Beverage & Food Ltd. | | | 3,600 | | | | 153,903 | | | | 870 | | | | 0.0 | (a) |
| | | | | | | | | | | | | | | | |
| | | 7,000 | | | | 324,166 | | | | 4,551 | | | | 0.0 | (a) |
| | | | | | | | | | | | | | | | |
Chemicals | | | | | | | | | | | | | |
DIC Corp.* | | | 4,700 | | | | 134,632 | | | | (1,044 | ) | | | (0.0 | )(a) |
Kureha Corp. | | | 2,100 | | | | 134,219 | | | | 4,509 | | | | 0.0 | (a) |
Mitsui Chemicals, Inc. | | | 5,600 | | | | 133,176 | | | | (822 | ) | | | (0.0 | )(a) |
Showa Denko KK | | | 4,800 | | | | 134,673 | | | | 2,262 | | | | 0.0 | (a) |
Teijin Ltd. | | | 6,700 | | | | 134,257 | | | | 913 | | | | 0.0 | (a) |
Tokuyama Corp. | | | 5,000 | | | | 133,570 | | | | 3,405 | | | | 0.0 | (a) |
Zeon Corp. | | | 10,600 | | | | 120,752 | | | | (14,792 | ) | | | (0.0 | )(a) |
| | | | | | | | | | | | | | | | |
| | | 39,500 | | | | 925,279 | | | | (5,569 | ) | | | (0.0 | )(a) |
| | | | | | | | | | | | | | | | |
Commercial Services & Supplies | | | | | | | | | | | | | |
Dai Nippon Printing Co. Ltd. | | | 6,000 | | | | 160,251 | | | | 4,826 | | | | 0.0 | (a) |
Sohgo Security Services Co. Ltd. | | | 3,200 | | | | 173,817 | | | | 9,898 | | | | 0.0 | (a) |
| | | | | | | | | | | | | | | | |
| | | 9,200 | | | | 334,068 | | | | 14,724 | | | | 0.0 | (a) |
| | | | | | | | | | | | | | | | |
Construction & Engineering | | | | | | | | | | | | | |
Hazama Ando Corp. | | | 20,800 | | | | 161,161 | | | | 3,860 | | | | 0.0 | (a) |
Kyowa Exeo Corp. | | | 7,000 | | | | 178,094 | | | | 3,495 | | | | 0.0 | (a) |
Kyudenko Corp. | | | 5,200 | | | | 169,918 | | | | (1,511 | ) | | | (0.0 | )(a) |
| | | | | | | | | | | | | | | | |
| | | 33,000 | | | | 509,173 | | | | 5,844 | | | | 0.0 | (a) |
| | | | | | | | | | | | | | | | |
Construction Materials | | | | | | | | | | | | | |
Sumitomo Osaka Cement Co. Ltd. | | | 3,300 | | | | 144,052 | | | | (5,381 | ) | | | (0.0 | )(a) |
Taiheiyo Cement Corp. | | | 4,700 | | | | 132,958 | | | | (3,869 | ) | | | (0.0 | )(a) |
| | | | | | | | | | | | | | | | |
| | | 8,000 | | | | 277,010 | | | | (9,250 | ) | | | (0.0 | )(a) |
| | | | | | | | | | | | | | | | |
SEE NOTES TO CONSOLIDATED FINANCIAL STATEMENTS.
| | | | | | |
| | | |
| 52 | | | | J.P. MORGAN EXCHANGE-TRADED FUNDS | | OCTOBER 31, 2019 |
| | | | | | | | | | | | | | | | |
| REFERENCE ENTITY | | SHARES | | | NOTIONAL
VALUE($) (1) | | | NET UNREALIZED
APPRECIATION
(DEPRECIATION)($) (2) | | | PERCENTAGE
OF NET
ASSETS (%) | |
Long Positions — continued | | | | | | | | | | | | | | | | |
| | | | |
Common Stocks — continued | | | | | | | | | | | | | | | | |
Containers & Packaging | | | | | | | | | | | | | |
Rengo Co. Ltd. | | | 19,300 | | | | 139,945 | | | | 889 | | | | 0.0 | (a) |
| | | | | | | | | | | | | | | | |
Diversified Financial Services | | | | | | | | | | | | | |
Mitsubishi UFJ Lease & Finance Co. Ltd. | | | 28,600 | | | | 175,575 | | | | 2,077 | | | | 0.0 | (a) |
| | | | | | | | | | | | | | | | |
Diversified Telecommunication Services | | | | | | | | | | | | | |
Nippon Telegraph & Telephone Corp. | | | 2,700 | | | | 134,036 | | | | 2,080 | | | | 0.0 | (a) |
| | | | | | | | | | | | | | | | |
Electronic Equipment, Instruments & Components | | | | | | | | | | | | | |
Hitachi Ltd. | | | 4,500 | | | | 167,951 | | | | (4,408 | ) | | | (0.0 | )(a) |
Japan Aviation Electronics Industry Ltd. | | | 9,100 | | | | 169,522 | | | | 24,349 | | | | 0.0 | (a) |
| | | | | | | | | | | | | | | | |
| | | 13,600 | | | | 337,473 | | | | 19,941 | | | | 0.0 | (a) |
| | | | | | | | | | | | | | | | |
Entertainment | | | | | | | | | | | | | |
Akatsuki, Inc.* | | | 2,800 | | | | 156,041 | | | | (5,894 | ) | | | (0.0 | )(a) |
Capcom Co. Ltd. | | | 5,700 | | | | 134,540 | | | | (12,611 | ) | | | (0.0 | )(a) |
GungHo Online Entertainment, Inc.* | | | 7,170 | | | | 155,291 | | | | 3,411 | | | | 0.0 | (a) |
| | | | | | | | | | | | | | | | |
| | | 15,670 | | | | 445,872 | | | | (15,094 | ) | | | (0.0 | )(a) |
| | | | | | | | | | | | | | | | |
Food & Staples Retailing | | | | | | | | | | | | | |
Lawson, Inc. | | | 3,100 | | | | 171,016 | | | | (1,213 | ) | | | (0.0 | )(a) |
| | | | | | | | | | | | | | | | |
Food Products | | | | | | | | | | | | | |
Morinaga & Co. Ltd.* | | | 3,200 | | | | 158,078 | | | | (476 | ) | | | (0.0 | )(a) |
| | | | | | | | | | | | | | | | |
Health Care Providers & Services | | | | | | | | | | | | | |
Alfresa Holdings Corp. | | | 6,700 | | | | 149,603 | | | | 729 | | | | 0.0 | (a) |
Medipal Holdings Corp. | | | 7,300 | | | | 166,787 | | | | 4,233 | | | | 0.0 | (a) |
Suzuken Co. Ltd. | | | 2,900 | | | | 154,843 | | | | (406 | ) | | | (0.0 | )(a) |
| | | | | | | | | | | | | | | | |
| | | 16,900 | | | | 471,233 | | | | 4,556 | | | | 0.0 | (a) |
| | | | | | | | | | | | | | | | |
Hotels, Restaurants & Leisure | | | | | | | | | | | | | |
Round One Corp. | | | 9,600 | | | | 123,788 | | | | (1,119 | ) | | | (0.0 | )(a) |
Sushiro Global Holdings Ltd. | | | 2,100 | | | | 144,381 | | | | (694 | ) | | | (0.0 | )(a) |
| | | | | | | | | | | | | | | | |
| | | 11,700 | | | | 268,169 | | | | (1,813 | ) | | | (0.0 | )(a) |
| | | | | | | | | | | | | | | | |
Household Durables | | | | | | | | | | | | | |
Sekisui House Ltd. | | | 5,900 | | | | 127,230 | | | | (722 | ) | | | (0.0 | )(a) |
| | | | | | | | | | | | | | | | |
Insurance | | | | | | | | | | | | | |
MS&AD Insurance Group Holdings, Inc. | | | 5,000 | | | | 161,456 | | | | (1,223 | ) | | | (0.0 | )(a) |
| | | | | | | | | | | | | | | | |
IT Services | | | | | | | | | | | | | |
Nihon Unisys Ltd. | | | 4,900 | | | | 161,746 | | | | 3,576 | | | | 0.0 | (a) |
Otsuka Corp.* | | | 4,300 | | | | 173,367 | | | | 13,014 | | | | 0.0 | (a) |
TIS, Inc. | | | 2,700 | | | | 163,711 | | | | 185 | | | | 0.0 | (a) |
| | | | | | | | | | | | | | | | |
| | | 11,900 | | | | 498,824 | | | | 16,775 | | | | 0.0 | (a) |
| | | | | | | | | | | | | | | | |
Leisure Products | | | | | | | | | | | | | |
Bandai Namco Holdings, Inc. | | | 2,100 | | | | 129,128 | | | | (4,443 | ) | | | (0.0 | )(a) |
Tomy Co. Ltd. | | | 11,500 | | | | 124,709 | | | | 311 | | | | 0.0 | (a) |
| | | | | | | | | | | | | | | | |
| | | 13,600 | | | | 253,837 | | | | (4,132 | ) | | | (0.0 | )(a) |
| | | | | | | | | | | | | | | | |
Machinery | | | | | | | | | | | | | |
Amada Holdings Co. Ltd. | | | 14,000 | | | | 159,433 | | | | 5,094 | | | | 0.0 | (a) |
DMG Mori Co. Ltd. | | | 9,500 | | | | 153,807 | | | | 11,405 | | | | 0.1 | |
Ebara Corp.* | | | 5,200 | | | | 153,849 | | | | 4,078 | | | | 0.0 | (a) |
Glory Ltd. | | | 5,400 | | | | 158,990 | | | | (859 | ) | | | (0.0 | )(a) |
SEE NOTES TO CONSOLIDATED FINANCIAL STATEMENTS.
| | | | | | | | |
| | | |
| OCTOBER 31, 2019 | | J.P. MORGAN EXCHANGE-TRADED FUNDS | | | | | 53 | |
JPMorgan Diversified Alternatives ETF
CONSOLIDATED SCHEDULE OF PORTFOLIO INVESTMENTS
AS OF OCTOBER 31, 2019 (continued)
| | | | | | | | | | | | | | | | |
| REFERENCE ENTITY | | SHARES | | | NOTIONAL
VALUE($) (1) | | | NET UNREALIZED
APPRECIATION
(DEPRECIATION)($) (2) | | | PERCENTAGE
OF NET
ASSETS (%) | |
Long Positions — continued | | | | | | | | | | | | | | | | |
| | | | |
Common Stocks — continued | | | | | | | | | | | | | | | | |
Machinery — continued | | | | | | | | | | | | | |
MINEBEA MITSUMI, Inc. | | | 8,400 | | | | 159,529 | | | | 11,223 | | | | 0.0 | (a) |
Mitsubishi Heavy Industries Ltd. | | | 3,900 | | | | 157,830 | | | | (1,146 | ) | | | (0.0 | )(a) |
Shinmaywa Industries Ltd. | | | 13,200 | | | | 162,612 | | | | 670 | | | | 0.0 | (a) |
Takeuchi Manufacturing Co. Ltd. | | | 10,600 | | | | 165,639 | | | | (1,959 | ) | | | (0.0 | )(a) |
THK Co. Ltd. | | | 5,300 | | | | 152,403 | | | | 10,168 | | | | 0.0 | (a) |
| | | | | | | | | | | | | | | | |
| | | 75,500 | | | | 1,424,092 | | | | 38,674 | | | | 0.1 | |
| | | | | | | | | | | | | | | | |
Media | | | | | | | | | | | | | |
Hakuhodo DY Holdings, Inc. | | | 10,700 | | | | 159,673 | | | | 4,135 | | | | 0.0 | (a) |
| | | | | | | | | | | | | | | | |
Metals & Mining | | | | | | | | | | | | | |
Mitsubishi Materials Corp. | | | 4,700 | | | | 135,149 | | | | 5,983 | | | | 0.0 | (a) |
Tokyo Steel Manufacturing Co. Ltd. | | | 18,600 | | | | 149,743 | | | | 913 | | | | 0.0 | (a) |
| | | | | | | | | | | | | | | | |
| | | 23,300 | | | | 284,892 | | | | 6,896 | | | | 0.0 | (a) |
| | | | | | | | | | | | | | | | |
Oil, Gas & Consumable Fuels | | | | | | | | | | | | | |
Cosmo Energy Holdings Co. Ltd. | | | 7,400 | | | | 158,244 | | | | 2,920 | | | | 0.0 | (a) |
| | | | | | | | | | | | | | | | |
Paper & Forest Products | | | | | | | | | | | | | |
Oji Holdings Corp. | | | 25,900 | | | | 133,909 | | | | 3,488 | | | | 0.0 | (a) |
| | | | | | | | | | | | | | | | |
Pharmaceuticals | | | | | | | | | | | | | |
Astellas Pharma, Inc. | | | 900 | | | | 15,446 | | | | 1,020 | | | | 0.0 | (a) |
Kaken Pharmaceutical Co. Ltd. | | | 3,400 | | | | 166,698 | | | | 6,386 | | | | 0.0 | (a) |
Kyowa Hakko Kirin Co. Ltd. | | | 8,900 | | | | 163,760 | | | | (3,090 | ) | | | (0.0 | )(a) |
Sawai Pharmaceutical Co. Ltd. | | | 2,900 | | | | 163,638 | | | | 11,557 | | | | 0.0 | (a) |
Shionogi & Co. Ltd. | | | 200 | | | | 12,005 | | | | 746 | | | | 0.0 | (a) |
Sumitomo Dainippon Pharma Co. Ltd. | | | 8,600 | | | | 150,097 | | | | 7,852 | | | | 0.0 | (a) |
| | | | | | | | | | | | | | | | |
| | | 24,900 | | | | 671,644 | | | | 24,471 | | | | 0.0 | (a) |
| | | | | | | | | | | | | | | | |
Professional Services | | | | | | | | | | | | | |
Meitec Corp. | | | 3,200 | | | | 166,817 | | | | 4,684 | | | | 0.0 | (a) |
TechnoPro Holdings, Inc.* | | | 2,700 | | | | 166,066 | | | | 2,262 | | | | 0.0 | (a) |
UT Group Co. Ltd. | | | 6,200 | | | | 154,006 | | | | 12,496 | | | | 0.0 | (a) |
| | | | | | | | | | | | | | | | |
| | | 12,100 | | | | 486,889 | | | | 19,442 | | | | 0.0 | (a) |
| | | | | | | | | | | | | | | | |
Real Estate Management & Development | | | | | | | | | | | | | |
SAMTY Co. Ltd.* | | | 9,000 | | | | 169,573 | | | | 5,099 | | | | 0.0 | (a) |
| | | | | | | | | | | | | | | | |
Road & Rail | | | | | | | | | | | | | |
Sankyu, Inc. | | | 3,000 | | | | 152,523 | | | | (9,440 | ) | | | (0.0 | )(a) |
Seino Holdings Co. Ltd. | | | 13,100 | | | | 168,440 | | | | 3,430 | | | | 0.0 | (a) |
| | | | | | | | | | | | | | | | |
| | | 16,100 | | | | 320,963 | | | | (6,010 | ) | | | (0.0 | )(a) |
| | | | | | | | | | | | | | | | |
Semiconductors & Semiconductor Equipment | | | | | | | | | | | | | |
Optorun Co. Ltd.* | | | 5,800 | | | | 174,934 | | | | (2,342 | ) | | | (0.0 | )(a) |
| | | | | | | | | | | | | | | | |
Specialty Retail | | | | | | | | | | | | | |
ABC-Mart, Inc. | | | 2,000 | | | | 137,131 | | | | (1,209 | ) | | | (0.0 | )(a) |
| | | | | | | | | | | | | | | | |
Technology Hardware, Storage & Peripherals | | | | | | | | | | | | | |
Brother Industries Ltd. | | | 9,000 | | | | 169,146 | | | | 1,915 | | | | 0.0 | (a) |
FUJIFILM Holdings Corp. | | | 3,600 | | | | 158,048 | | | | 4,072 | | | | 0.0 | (a) |
| | | | | | | | | | | | | | | | |
| | | 12,600 | | | | 327,194 | | | | 5,987 | | | | 0.0 | (a) |
| | | | | | | | | | | | | | | | |
Trading Companies & Distributors | | | | | | | | | | | | | |
ITOCHU Corp. | | | 7,600 | | | | 158,900 | | | | (96 | ) | | | (0.0 | )(a) |
Kanamoto Co. Ltd. | | | 6,500 | | | | 173,772 | | | | 1,138 | | | | 0.0 | (a) |
| | | | | | | | | | | | | | | | |
| | | 14,100 | | | | 332,672 | | | | 1,042 | | | | 0.0 | (a) |
| | | | | | | | | | | | | | | | |
SEE NOTES TO CONSOLIDATED FINANCIAL STATEMENTS.
| | | | | | |
| | | |
| 54 | | | | J.P. MORGAN EXCHANGE-TRADED FUNDS | | OCTOBER 31, 2019 |
| | | | | | | | | | | | | | | | |
| REFERENCE ENTITY | | SHARES | | | NOTIONAL
VALUE($) (1) | | | NET UNREALIZED
APPRECIATION
(DEPRECIATION)($) (2) | | | PERCENTAGE
OF NET
ASSETS (%) | |
Long Positions — continued | | | | | | | | | | | | | | | | |
| | | | |
Common Stocks — continued | | | | | | | | | | | | | | | | |
Transportation Infrastructure | | | | | | | | | | | | | |
Kamigumi Co. Ltd. | | | 6,700 | | | | 151,495 | | | | 893 | | | | 0.0 | (a) |
| | | | | | | | | | | | | | | | |
Wireless Telecommunication Services | | | | | | | | | | | | | |
KDDI Corp. | | | 6,000 | | | | 166,027 | | | | 2,997 | | | | 0.0 | (a) |
NTT DOCOMO, Inc. | | | 1,100 | | | | 30,157 | | | | 1,404 | | | | 0.0 | (a) |
| | | | | | | | | | | | | | | | |
| | | 7,100 | | | | 196,184 | | | | 4,401 | | | | 0.0 | (a) |
| | | | | | | | | | | | | | | | |
Total Long Positions of Total Return Basket Swap | | | 516,070 | | | | 11,262,422 | | | | 148,929 | | | | 0.1 | |
| | | | | | | | | | | | | | | | |
| |
Short Positions | | | | | |
| | | |
Common Stocks | | | | | | | | | | | | | |
Auto Components | | | | | | | | | | | | | |
NGK Spark Plug Co. Ltd. | | | (4,500 | ) | | | (91,232 | ) | | | (4,059 | ) | | | (0.0 | )(a) |
Toyo Tire Corp. | | | (200 | ) | | | (2,790 | ) | | | (201 | ) | | | (0.0 | )(a) |
| | | | | | | | | | | | | | | | |
| | | (4,700 | ) | | | (94,022 | ) | | | (4,260 | ) | | | (0.0 | )(a) |
| | | | | | | | | | | | | | | | |
Automobiles | | | | | | | | | | | | | |
Mitsubishi Motors Corp. | | | (18,700 | ) | | | (85,380 | ) | | | (521 | ) | | | (0.0 | )(a) |
| | | | | | | | | | | | | | | | |
Beverages | | | | | | | | | | | | | |
Coca-Cola Bottlers Japan Holdings, Inc. | | | (4,900 | ) | | | (111,250 | ) | | | 1,595 | | | | 0.0 | (a) |
| | | | | | | | | | | | | | | | |
Building Products | | | | | | | | | | | | | |
TOTO Ltd. | | | (1,700 | ) | | | (69,404 | ) | | | (3,262 | ) | | | (0.0 | )(a) |
| | | | | | | | | | | | | | | | |
Capital Markets | | | | | | | | | | | | | |
Nomura Holdings, Inc. | | | (25,100 | ) | | | (114,079 | ) | | | (1,654 | ) | | | (0.0 | )(a) |
| | | | | | | | | | | | | | | | |
Chemicals | | | | | | | | | | | | | |
Kuraray Co. Ltd. | | | (7,300 | ) | | | (86,850 | ) | | | 4,726 | | | | 0.0 | (a) |
Taiyo Nippon Sanso Corp. | | | (4,000 | ) | | | (93,639 | ) | | | (1,776 | ) | | | (0.0 | )(a) |
Toray Industries, Inc. | | | (2,300 | ) | | | (16,255 | ) | | | 1,697 | | | | 0.0 | (a) |
| | | | | | | | | | | | | | | | |
| | | (13,600 | ) | | | (196,744 | ) | | | 4,647 | | | | 0.0 | (a) |
| | | | | | | | | | | | | | | | |
Construction & Engineering | | | | | | | | | | | | | |
Maeda Corp. | | | (11,700 | ) | | | (108,586 | ) | | | 999 | | | | 0.0 | (a) |
SHO-BOND Holdings Co. Ltd.* | | | (3,000 | ) | | | (116,431 | ) | | | (3,759 | ) | | | (0.0 | )(a) |
| | | | | | | | | | | | | | | | |
| | | (14,700 | ) | | | (225,017 | ) | | | (2,760 | ) | | | (0.0 | )(a) |
| | | | | | | | | | | | | | | | |
Electrical Equipment | | | | | | | | | | | | | |
Mabuchi Motor Co. Ltd. | | | (3,000 | ) | | | (121,551 | ) | | | (9,562 | ) | | | (0.0 | )(a) |
| | | | | | | | | | | | | | | | |
Electronic Equipment, Instruments & Components | | | | | | | | | | | | | |
Keyence Corp. | | | (200 | ) | | | (126,459 | ) | | | (2,235 | ) | | | (0.0 | )(a) |
Shimadzu Corp. | | | (4,000 | ) | | | (106,825 | ) | | | (6,561 | ) | | | (0.0 | )(a) |
| | | | | | | | | | | | | | | | |
| | | (4,200 | ) | | | (233,284 | ) | | | (8,796 | ) | | | (0.0 | )(a) |
| | | | | | | | | | | | | | | | |
Entertainment | | | | | | | | | | | | | |
Square Enix Holdings Co. Ltd. | | | (2,400 | ) | | | (114,212 | ) | | | (4,069 | ) | | | (0.0 | )(a) |
| | | | | | | | | | | | | | | | |
Food & Staples Retailing | | | | | | | | | | | | | |
Cosmos Pharmaceutical Corp. | | | (400 | ) | | | (82,605 | ) | | | (1,775 | ) | | | (0.0 | )(a) |
Kusuri no Aoki Holdings Co. Ltd.* | | | (1,400 | ) | | | (104,408 | ) | | | (6,605 | ) | | | (0.0 | )(a) |
| | | | | | | | | | | | | | | | |
| | | (1,800 | ) | | | (187,013 | ) | | | (8,380 | ) | | | (0.0 | )(a) |
| | | | | | | | | | | | | | | | |
SEE NOTES TO CONSOLIDATED FINANCIAL STATEMENTS.
| | | | | | | | |
| | | |
| OCTOBER 31, 2019 | | J.P. MORGAN EXCHANGE-TRADED FUNDS | | | | | 55 | |
JPMorgan Diversified Alternatives ETF
CONSOLIDATED SCHEDULE OF PORTFOLIO INVESTMENTS
AS OF OCTOBER 31, 2019 (continued)
| | | | | | | | | | | | | | | | |
| REFERENCE ENTITY | | SHARES | | | NOTIONAL
VALUE($) (1) | | | NET UNREALIZED
APPRECIATION
(DEPRECIATION)($) (2) | | | PERCENTAGE
OF NET
ASSETS (%) | |
Short Positions — continued | |
| | |
Common Stocks — continued | | | | | | | | | |
Food Products | | | | | | | | | | | | | |
Kikkoman Corp. | | | (2,400 | ) | | | (115,446 | ) | | | 878 | | | | 0.0 | (a) |
| | | | | | | | | | | | | | | | |
Gas Utilities | | | | | | | | | | | | | |
Nippon Gas Co. Ltd. | | | (3,400 | ) | | | (96,239 | ) | | | 5,569 | | | | 0.0 | (a) |
| | | | | | | | | | | | | | | | |
Health Care Equipment & Supplies | | | | | | | | | | | | | |
Asahi Intecc Co., Ltd. | | | (4,100 | ) | | | (112,813 | ) | | | (1,456 | ) | | | (0.0 | )(a) |
| | | | | | | | | | | | | | | | |
Hotels, Restaurants & Leisure | | | | | | | | | | | | | |
Toridoll Holdings Corp. | | | (4,000 | ) | | | (91,352 | ) | | | (6,848 | ) | | | (0.0 | )(a) |
| | | | | | | | | | | | | | | | |
Household Durables | | | | | | | | | | | | | |
Panasonic Corp. | | | (5,200 | ) | | | (43,703 | ) | | | (924 | ) | | | (0.0 | )(a) |
| | | | | | | | | | | | | | | | |
Household Products | | | | | | | | | | | | | |
Pigeon Corp. | | | (2,600 | ) | | | (126,928 | ) | | | (15,358 | ) | | | (0.0 | )(a) |
| | | | | | | | | | | | | | | | |
Industrial Conglomerates | | | | | | | | | | | | | |
Keihan Holdings Co. Ltd. | | | (2,300 | ) | | | (108,599 | ) | | | 766 | | | | 0.0 | (a) |
| | | | | | | | | | | | | | | | |
IT Services | | | | | | | | | | | | | |
GMO Payment Gateway, Inc. | | | (1,200 | ) | | | (88,439 | ) | | | (5,172 | ) | | | (0.0 | )(a) |
| | | | | | | | | | | | | | | | |
Machinery | | | | | | | | | | | | | |
Daifuku Co. Ltd. | | | (1,200 | ) | | | (63,674 | ) | | | 1,659 | | | | 0.0 | (a) |
Hino Motors Ltd. | | | (13,600 | ) | | | (128,579 | ) | | | (10,138 | ) | | | (0.1 | ) |
Hitachi Construction Machinery Co. Ltd. | | | (4,300 | ) | | | (110,993 | ) | | | (7,786 | ) | | | (0.0 | )(a) |
MISUMI Group, Inc. | | | (2,400 | ) | | | (60,333 | ) | | | (4,855 | ) | | | (0.0 | )(a) |
NGK Insulators Ltd. | | | (4,400 | ) | | | (67,596 | ) | | | (4,207 | ) | | | (0.0 | )(a) |
NTN Corp. | | | (34,700 | ) | | | (107,589 | ) | | | (959 | ) | | | (0.0 | )(a) |
SMC Corp. | | | (300 | ) | | | (129,612 | ) | | | (282 | ) | | | (0.0 | )(a) |
| | | | | | | | | | | | | | | | |
| | | (60,900 | ) | | | (668,376 | ) | | | (26,568 | ) | | | (0.1 | ) |
| | | | | | | | | | | | | | | | |
Metals & Mining | | | | | | | | | | | | | |
Hitachi Metals Ltd. | | | (6,800 | ) | | | (85,342 | ) | | | (7,404 | ) | | | (0.0 | )(a) |
| | | | | | | | | | | | | | | | |
Multiline Retail | | | | | | | | | | | | | |
Isetan Mitsukoshi Holdings Ltd. | | | (11,700 | ) | | | (93,309 | ) | | | 1,158 | | | | 0.0 | (a) |
Pan Pacific International Holdings Corp. | | | (2,400 | ) | | | (37,779 | ) | | | (104 | ) | | | (0.0 | )(a) |
Ryohin Keikaku Co. Ltd. | | | (4,000 | ) | | | (89,049 | ) | | | (3,841 | ) | | | (0.0 | )(a) |
Takashimaya Co. Ltd. | | | (3,700 | ) | | | (42,950 | ) | | | (733 | ) | | | (0.0 | )(a) |
| | | | | | | | | | | | | | | | |
| | | (21,800 | ) | | | (263,087 | ) | | | (3,520 | ) | | | (0.0 | )(a) |
| | | | | | | | | | | | | | | | |
Personal Products | | | | | | | | | | | | | |
Kose Corp. | | | (600 | ) | | | (106,376 | ) | | | (1,248 | ) | | | (0.0 | )(a) |
| | | | | | | | | | | | | | | | |
Road & Rail | | | | | | | | | | | | | |
Keisei Electric Railway Co. Ltd. | | | (2,400 | ) | | | (98,125 | ) | | | 1,125 | | | | 0.0 | (a) |
Kyushu Railway Co. | | | (3,400 | ) | | | (112,328 | ) | | | 34 | | | | 0.0 | (a) |
Nankai Electric Railway Co. Ltd. | | | (3,700 | ) | | | (96,152 | ) | | | (1,473 | ) | | | (0.0 | )(a) |
Odakyu Electric Railway Co. Ltd. | | | (4,700 | ) | | | (114,408 | ) | | | 384 | | | | 0.0 | (a) |
| | | | | | | | | | | | | | | | |
| | | (14,200 | ) | | | (421,013 | ) | | | 70 | | | | 0.0 | (a) |
| | | | | | | | | | | | | | | | |
Semiconductors & Semiconductor Equipment | | | | | | | | | | | | | |
Disco Corp. | | | (500 | ) | | | (109,119 | ) | | | (8,970 | ) | | | (0.0 | )(a) |
Rohm Co. Ltd. | | | (1,000 | ) | | | (79,229 | ) | | | 2,532 | | | | 0.0 | (a) |
SCREEN Holdings Co. Ltd.* | | | (1,600 | ) | | | (111,078 | ) | | | 2,437 | | | | 0.0 | (a) |
| | | | | | | | | | | | | | | | |
| | | (3,100 | ) | | | (299,426 | ) | | | (4,001 | ) | | | (0.0 | )(a) |
| | | | | | | | | | | | | | | | |
SEE NOTES TO CONSOLIDATED FINANCIAL STATEMENTS.
| | | | | | |
| | | |
| 56 | | | | J.P. MORGAN EXCHANGE-TRADED FUNDS | | OCTOBER 31, 2019 |
| | | | | | | | | | | | | | | | |
| REFERENCE ENTITY | | SHARES | | | NOTIONAL
VALUE($) (1) | | | NET UNREALIZED
APPRECIATION
(DEPRECIATION)($) (2) | | | PERCENTAGE
OF NET
ASSETS (%) | |
Short Positions — continued | |
| | |
Common Stocks — continued | | | | | | | | | |
Technology Hardware, Storage & Peripherals | | | | | | | | | | | | | |
Seiko Epson Corp. | | | (7,700 | ) | | | (108,886 | ) | | | (2,008 | ) | | | (0.0 | )(a) |
| | | | | | | | | | | | | | | | |
Total Short Positions of Total Return Basket Swap | | | (235,100 | ) | | | (4,287,981 | ) | | | (104,246 | ) | | | (0.1 | ) |
| | | | | | | | | | | | | | | | |
Total of Long and Short Positions of Total Return Basket Swap | | | 280,970 | | | | 6,974,441 | | | | 44,683 | | | | 0.0 | (a) |
| | | | | | | | | | | | | | | | |
| | | | | | | | | | | | | | | | | | | | |
| COUNTERPARTY | | DESCRIPTION | | TERMINATION
DATE | | NOTIONAL
VALUE (1) | | | NET UNREALIZED
APPRECIATION
(DEPRECIATION) (2) | | | NET CASH
AND OTHER
RECEIVABLES
(PAYABLES) | | | VALUE | |
UBS | | The Fund receives the total return on a portfolio of long and short equity positions and pays or receives the net of one month LIBOR on long positions and short positions respectively, plus or minus a specified spread (rates range from 0.00% to 0.23%), which is denominated in CHF based on the local currencies of the positions within the swaps. | | 8/26/2022 | | $ | 168,930 | | | $ | (5,289 | ) | | $ | 262 | | | $ | (5,027 | ) |
| | | | | | | | | | | | | | | | | | | | |
| | | | | | | | | | | | | | | | |
| REFERENCE ENTITY | | SHARES | | | NOTIONAL
VALUE($) (1) | | | NET UNREALIZED
APPRECIATION
(DEPRECIATION)($) (2) | | | PERCENTAGE
OF NET
ASSETS (%) | |
Long Positions | | | | | |
| | | |
Common Stocks | | | | | | | | | | | | | |
Health Care Equipment & Supplies | | | | | | | | | | | | | |
Sonova Holding AG (Registered) | | | 459 | | | | 105,331 | | | | (774 | ) | | | (0.0 | )(a) |
| | | | | | | | | | | | | | | | |
Pharmaceuticals | | | | | | | | | | | | | |
Roche Holding AG | | | 451 | | | | 134,455 | | | | 3,136 | | | | 0.0 | (a) |
| | | | | | | | | | | | | | | | |
Real Estate Management & Development | | | | | | | | | | | | | |
PSP Swiss Property AG (Registered) | | | 993 | | | | 131,438 | | | | 280 | | | | 0.0 | (a) |
| | | | | | | | | | | | | | | | |
Total Long Positions of Total Return Basket Swap | | | 1,903 | | | | 371,224 | | | | 2,642 | | | | 0.0 | (a) |
| | | | | | | | | | | | | | | | |
| |
Short Positions | | | | | |
| | | |
Common Stocks | | | | | | | | | | | | | |
Marine | | | | | | | | | | | | | |
Kuehne + Nagel International AG (Registered) | | | (563 | ) | | | (90,956 | ) | | | (7,275 | ) | | | (0.0 | )(a) |
| | | | | | | | | | | | | | | | |
Pharmaceuticals | | | | | | | | | | | | | |
Vifor Pharma AG | | | (707 | ) | | | (111,338 | ) | | | (656 | ) | | | (0.0 | )(a) |
| | | | | | | | | | | | | | | | |
Total Short Positions of Total Return Basket Swap | | | (1,270 | ) | | | (202,294 | ) | | | (7,931 | ) | | | 0.0 | (a) |
| | | | | | | | | | | | | | | | |
Total of Long and Short Positions of Total Return Basket Swap | | | 633 | | | | 168,930 | | | | (5,289 | ) | | | 0.0 | (a) |
| | | | | | | | | | | | | | | | |
SEE NOTES TO CONSOLIDATED FINANCIAL STATEMENTS.
| | | | | | | | |
| | | |
| OCTOBER 31, 2019 | | J.P. MORGAN EXCHANGE-TRADED FUNDS | | | | | 57 | |
JPMorgan Diversified Alternatives ETF
CONSOLIDATED SCHEDULE OF PORTFOLIO INVESTMENTS
AS OF OCTOBER 31, 2019 (continued)
| | | | | | | | | | | | | | | | | | | | |
| COUNTERPARTY | | DESCRIPTION | | TERMINATION
DATE | | NOTIONAL
VALUE (1) | | | NET UNREALIZED
APPRECIATION
(DEPRECIATION) (2) | | | NET CASH
AND OTHER
RECEIVABLES
(PAYABLES) | | | VALUE | |
UBS | | The Fund receives the total return on a portfolio of long equity positions and pays or receives the net of One month LIBOR on long positions, plus or minus a specified spread (rates range from 0.00% to 0.23%), which is denominated in GBP based on the local currencies of the positions within the swaps. | | 11/15/2021 –
8/26/2022 | | $ | 592,325 | | | $ | 12,762 | | | $ | 40,123 | | | $ | 52,885 | |
| | | | | | | | | | | | | | | | | | | | |
| | | | | | | | | | | | | | | | |
| REFERENCE ENTITY | | SHARES | | | NOTIONAL
VALUE($) (1) | | | NET UNREALIZED
APPRECIATION
(DEPRECIATION)($) (2) | | | PERCENTAGE
OF NET
ASSETS (%) | |
Long Positions | | | | | |
| | | |
Common Stocks | | | | | | | | | | | | | |
Capital Markets | | | | | | | | | | | | | |
Sole Realisation Co. plc*‡ | | | 698 | | | | — | | | | (634 | ) | | | (0.0 | )(a) |
| | | | | | | | | | | | | | | | |
Industrial Conglomerates | | | | | | | | | | | | | |
Smiths Group plc | | | 28,336 | | | | 592,325 | | | | 13,396 | | | | 0.0 | (a) |
| | | | | | | | | | | | | | | | |
Total Long Positions of Total Return Basket Swap | | | 29,034 | | | | 592,325 | | | | 12,762 | | | | 0.0 | (a) |
| | | | | | | | | | | | | | | | |
| | | | | | | | | | | | | | | | | | | | |
| COUNTERPARTY | | DESCRIPTION | | TERMINATION
DATE | | NOTIONAL
VALUE (1) | | | NET UNREALIZED
APPRECIATION
(DEPRECIATION) (2) | | | NET CASH
AND OTHER
RECEIVABLES
(PAYABLES) | | | VALUE | |
UBS | | The Fund receives the total return on a portfolio of long and short equity positions and pays or receives the net of one month LIBOR on long positions and short positions respectively, plus or minus a specified spread (rates range from 0.00% to 0.25%), which is denominated in USD based on the local currencies of the positions within the swaps. | | 11/16/2021 –
8/26/2022 | | $ | 25,935,742 | | | $ | 55,612 | | | $ | 23 | | | $ | 55,635 | |
| | | | | | | | | | | | | | | | | | | | |
| | | | | | | | | | | | | | | | |
| REFERENCE ENTITY | | SHARES | | | NOTIONAL
VALUE($) (1) | | | NET UNREALIZED
APPRECIATION
(DEPRECIATION)($) (2) | | �� | PERCENTAGE
OF NET
ASSETS (%) | |
Long Positions | | | | | |
| | | |
Common Stocks | | | | | | | | | | | | | |
Air Freight & Logistics | | | | | | | | | | | | | |
XPO Logistics, Inc.* | | | 3,305 | | | | 252,502 | | | | (1,124 | ) | | | (0.0 | )(a) |
| | | | | | | | | | | | | | | | |
Banks | | | | | | | | | | | | | |
LegacyTexas Financial Group, Inc. | | | 29,954 | | | | 1,274,243 | | | | (32,350 | ) | | | (0.0 | )(a) |
| | | | | | | | | | | | | | | | |
Biotechnology | | | | | | | | | | | | | |
Biogen, Inc.* | | | 1,006 | | | | 300,502 | | | | 79,122 | | | | 0.1 | |
Celgene Corp.* | | | 5,848 | | | | 631,760 | | | | 29,708 | | | | 0.1 | |
Genomic Health, Inc.* | | | 22,449 | | | | 1,496,899 | | | | (78,123 | ) | | | (0.1 | ) |
SEE NOTES TO CONSOLIDATED FINANCIAL STATEMENTS.
| | | | | | |
| | | |
| 58 | | | | J.P. MORGAN EXCHANGE-TRADED FUNDS | | OCTOBER 31, 2019 |
| | | | | | | | | | | | | | | | |
| REFERENCE ENTITY | | SHARES | | | NOTIONAL
VALUE($) (1) | | | NET UNREALIZED
APPRECIATION
(DEPRECIATION)($) (2) | | | PERCENTAGE
OF NET
ASSETS (%) | |
Long Positions — continued | | | | | |
| | | |
Common Stocks — continued | | | | | | | | | | | | | |
Biotechnology — continued | | | | | | | | | | | | | |
Ironwood Pharmaceuticals, Inc.* | | | 9,600 | | | | 96,384 | | | | 12,480 | | | | 0.0 | (a) |
Spark Therapeutics, Inc.* | | | 2,977 | | | | 324,999 | | | | 27,180 | | | | 0.0 | (a) |
| | | | | | | | | | | | | | | | |
| | | 41,880 | | | | 2,850,544 | | | | 70,367 | | | | 0.1 | |
| | | | | | | | | | | | | | | | |
Building Products | | | | | | | | | | | | | |
Apogee Enterprises, Inc. | | | 3,500 | | | | 131,390 | | | | 1,015 | | | | 0.0 | (a) |
| | | | | | | | | | | | | | | | |
Commercial Services & Supplies | | | | | | | | | | | | | |
Advanced Disposal Services, Inc.* | | | 36,559 | | | | 1,198,404 | | | | 3,656 | | | | 0.0 | (a) |
| | | | | | | | | | | | | | | | |
Communications Equipment | | | | | | | | | | | | | |
Acacia Communications, Inc.* | | | 20,140 | | | | 1,322,392 | | | | 15,709 | | | | 0.0 | (a) |
| | | | | | | | | | | | | | | | |
Construction & Engineering | | | | | | | | | | | | | |
AECOM* | | | 10,580 | | | | 423,306 | | | | (11,109 | ) | | | (0.0 | )(a) |
Arcosa, Inc. | | | 4,700 | | | | 180,527 | | | | 23,876 | | | | 0.0 | (a) |
| | | | | | | | | | | | | | | | |
| | | 15,280 | | | | 603,833 | | | | 12,767 | | | | 0.0 | (a) |
| | | | | | | | | | | | | | | | |
Construction Materials | | | | | | | | | | | | | |
Eagle Materials, Inc. | | | 4,168 | | | | 380,705 | | | | (4,501 | ) | | | (0.0 | )(a) |
| | | | | | | | | | | | | | | | |
Diversified Consumer Services | | | | | | | | | | | | | |
Regis Corp.* | | | 8,500 | | | | 175,100 | | | | (2,930 | ) | | | (0.0 | )(a) |
| | | | | | | | | | | | | | | | |
Diversified Financial Services | | | | | | | | | | | | | |
Voya Financial, Inc. | | | 4,397 | | | | 237,262 | | | | 4,309 | | | | 0.0 | (a) |
| | | | | | | | | | | | | | | | |
Diversified Telecommunication Services | | | | | | | | | | | | | |
Zayo Group Holdings, Inc.* | | | 53,344 | | | | 1,821,164 | | | | (10,135 | ) | | | (0.0 | )(a) |
| | | | | | | | | | | | | | | | |
Electronic Equipment, Instruments & Components | | | | | | | | | | | | | |
Anixter International, Inc.* | | | 14,790 | | | | 1,223,873 | | | | (2,139 | ) | | | (0.0 | )(a) |
Avnet, Inc. | | | 5,181 | | | | 204,960 | | | | (9,222 | ) | | | (0.0 | )(a) |
| | | | | | | | | | | | | | | | |
| | | 19,971 | | | | 1,428,833 | | | | (11,361 | ) | | | (0.0 | )(a) |
| | | | | | | | | | | | | | | | |
Energy Equipment & Services | | | | | | | | | | | | | |
TechnipFMC plc | | | 13,400 | | | | 264,382 | | | | (42,478 | ) | | | (0.0 | )(a) |
| | | | | | | | | | | | | | | | |
Health Care Providers & Services | | | | | | | | | | | | | |
Tenet Healthcare Corp.* | | | 15,678 | | | | 397,280 | | | | 23,987 | | | | 0.0 | (a) |
WellCare Health Plans, Inc.* | | | 6,526 | | | | 1,935,612 | | | | 144,551 | | | | 0.2 | |
| | | | | | | | | | | | | | | | |
| | | 22,204 | | | | 2,332,892 | | | | 168,538 | | | | 0.2 | |
| | | | | | | | | | | | | | | | |
Hotels, Restaurants & Leisure | | | | | | | | | | | | | |
Bloomin’ Brands, Inc. | | | 12,036 | | | | 238,433 | | | | 19,378 | | | | 0.0 | (a) |
Caesars Entertainment Corp.* | | | 141,659 | | | | 1,739,573 | | | | 33,290 | | | | 0.0 | (a) |
Hilton Grand Vacations, Inc.* | | | 7,002 | | | | 243,179 | | | | 2,731 | | | | 0.0 | (a) |
| | | | | | | | | | | | | | | | |
| | | 160,697 | | | | 2,221,185 | | | | 55,399 | | | | 0.0 | (a) |
| | | | | | | | | | | | | | | | |
Independent Power and Renewable Electricity Producers | | | | | | | | | | | | | |
NRG Energy, Inc. | | | 5,851 | | | | 234,742 | | | | (176 | ) | | | (0.0 | )(a) |
| | | | | | | | | | | | | | | | |
Insurance | | | | | | | | | | | | | |
Athene Holding Ltd.* | | | 5,670 | | | | 245,794 | | | | 13,381 | | | | 0.0 | (a) |
| | | | | | | | | | | | | | | | |
IT Services | | | | | | | | | | | | | |
Presidio, Inc. | | | 27,575 | | | | 457,745 | | | | (3,171 | ) | | | (0.0 | )(a) |
| | | | | | | | | | | | | | | | |
Leisure Products | | | | | | | | | | | | | |
Brunswick Corp. | | | 9,778 | | | | 569,471 | | | | 33,832 | | | | 0.0 | (a) |
Callaway Golf Co. | | | 5,800 | | | | 117,276 | | | | (3,248 | ) | | | (0.0 | )(a) |
| | | | | | | | | | | | | | | | |
| | | 15,578 | | | | 686,747 | | | | 30,584 | | | | 0.0 | (a) |
| | | | | | | | | | | | | | | | |
SEE NOTES TO CONSOLIDATED FINANCIAL STATEMENTS.
| | | | | | | | |
| | | |
| OCTOBER 31, 2019 | | J.P. MORGAN EXCHANGE-TRADED FUNDS | | | | | 59 | |
JPMorgan Diversified Alternatives ETF
CONSOLIDATED SCHEDULE OF PORTFOLIO INVESTMENTS
AS OF OCTOBER 31, 2019 (continued)
| | | | | | | | | | | | | | | | |
| REFERENCE ENTITY | | SHARES | | | NOTIONAL
VALUE($) (1) | | | NET UNREALIZED
APPRECIATION
(DEPRECIATION)($) (2) | | | PERCENTAGE
OF NET
ASSETS (%) | |
Long Positions — continued | | | | | |
| | | |
Common Stocks — continued | | | | | | | | | | | | | |
Life Sciences Tools & Services | | | | | | | | | | | | | |
Cambrex Corp.* | | | 25,202 | | | | 1,505,315 | | | | 5,544 | | | | 0.0 | (a) |
Pacific Biosciences of California, Inc.* | | | 61,244 | | | | 296,421 | | | | (37,971 | ) | | | (0.0 | )(a) |
Waters Corp.* | | | 1,127 | | | | 238,496 | | | | (4,654 | ) | | | (0.0 | )(a) |
| | | | | | | | | | | | | | | | |
| | | 87,573 | | | | 2,040,232 | | | | (37,081 | ) | | | (0.0 | )(a) |
| | | | | | | | | | | | | | | | |
Machinery | | | | | | | | | | | | | |
Milacron Holdings Corp.* | | | 39,947 | | | | 667,914 | | | | 7,590 | | | | 0.0 | (a) |
WABCO Holdings, Inc.* | | | 13,606 | | | | 1,831,640 | | | | (5,715 | ) | | | (0.0 | )(a) |
| | | | | | | | | | | | | | | | |
| | | 53,553 | | | | 2,499,554 | | | | 1,875 | | | | 0.0 | (a) |
| | | | | | | | | | | | | | | | |
Media | | | | | | | | | | | | | |
Altice USA, Inc.* | | | 7,906 | | | | 244,691 | | | | 12,729 | | | | 0.0 | (a) |
Gannett Co., Inc. | | | 85,812 | | | | 931,060 | | | | (5,149 | ) | | | (0.0 | )(a) |
| | | | | | | | | | | | | | | | |
| | | 93,718 | | | | 1,175,751 | | | | 7,580 | | | | 0.0 | (a) |
| | | | | | | | | | | | | | | | |
Metals & Mining | | | | | | | | | | | | | |
Cleveland-Cliffs, Inc. | | | 31,659 | | | | 228,895 | | | | 9,814 | | | | 0.0 | (a) |
| | | | | | | | | | | | | | | | |
Oil, Gas & Consumable Fuels | | | | | | | | | | | | | |
Arch Coal, Inc. | | | 3,000 | | | | 236,670 | | | | (270 | ) | | | (0.0 | )(a) |
Carrizo Oil & Gas, Inc.* | | | 66,102 | | | | 486,511 | | | | (7,271 | ) | | | (0.0 | )(a) |
CNX Resources Corp.* | | | 32,492 | | | | 273,908 | | | | 32,492 | | | | 0.0 | (a) |
Ship Finance International Ltd. | | | 7,856 | | | | 113,676 | | | | (2,593 | ) | | | (0.0 | )(a) |
| | | | | | | | | | | | | | | | |
| | | 109,450 | | | | 1,110,765 | | | | 22,358 | | | | 0.0 | (a) |
| | | | | | | | | | | | | | | | |
Pharmaceuticals | | | | | | | | | | | | | |
Allergan plc | | | 9,864 | | | | 1,737,149 | | | | 24,759 | | | | 0.0 | (a) |
| | | | | | | | | | | | | | | | |
Road & Rail | | | | | | | | | | | | | |
Genesee & Wyoming, Inc.* | | | 10,371 | | | | 1,151,492 | | | | (726 | ) | | | (0.0 | )(a) |
| | | | | | | | | | | | | | | | |
Semiconductors & Semiconductor Equipment | | | | | | | | | | | | | |
Cypress Semiconductor Corp. | | | 75,530 | | | | 1,757,583 | | | | (12,840 | ) | | | (0.0 | )(a) |
| | | | | | | | | | | | | | | | |
Software | | | | | | | | | | | | | |
Pivotal Software, Inc.* | | | 44,475 | | | | 665,791 | | | | 1,779 | | | | 0.0 | (a) |
| | | | | | | | | | | | | | | | |
Specialty Retail | | | | | | | | | | | | | |
Abercrombie & Fitch Co. | | | 15,585 | | | | 252,321 | | | | 4,208 | | | | 0.0 | (a) |
Asbury Automotive Group, Inc.* | | | 1,800 | | | | 185,634 | | | | (342 | ) | | | (0.0 | )(a) |
Conn’s, Inc.* | | | 9,135 | | | | 220,976 | | | | (9,500 | ) | | | (0.0 | )(a) |
RH* | | | 1,367 | | | | 248,384 | | | | 1,066 | | | | 0.0 | (a) |
Tiffany & Co. | | | 3,020 | | | | 376,020 | | | | (13,782 | ) | | | (0.0 | )(a) |
| | | | | | | | | | | | | | | | |
| | | 30,907 | | | | 1,283,335 | | | | (18,350 | ) | | | (0.0 | )(a) |
| | | | | | | | | | | | | | | | |
Technology Hardware, Storage & Peripherals | | | | | | | | | | | | | |
Stratasys Ltd.* | | | 20,118 | | | | 416,040 | | | | 2,817 | | | | 0.0 | (a) |
| | | | | | | | | | | | | | | | |
Total Long Positions of Total Return Basket Swap | | | 1,059,191 | | | | 32,186,446 | | | | 269,484 | | | | 0.3 | |
| | | | | | | | | | | | | | | | |
| |
Short Positions | | | | | |
| | | |
Common Stocks | | | | | | | | | | | | | |
Banks | | | | | | | | | | | | | |
BB&T Corp. | | | (18,503 | ) | | | (981,584 | ) | | | (7,031 | ) | | | (0.0 | )(a) |
Prosperity Bancshares, Inc. | | | (15,657 | ) | | | (1,080,646 | ) | | | 27,869 | | | | 0.0 | (a) |
| | | | | | | | | | | | | | | | |
| | | (34,160 | ) | | | (2,062,230 | ) | | | 20,838 | | | | 0.0 | (a) |
| | | | | | | | | | | | | | | | |
SEE NOTES TO CONSOLIDATED FINANCIAL STATEMENTS.
| | | | | | |
| | | |
| 60 | | | | J.P. MORGAN EXCHANGE-TRADED FUNDS | | OCTOBER 31, 2019 |
| | | | | | | | | | | | | | | | |
| REFERENCE ENTITY | | SHARES | | | NOTIONAL
VALUE($) (1) | | | NET UNREALIZED
APPRECIATION
(DEPRECIATION)($) (2) | | | PERCENTAGE
OF NET
ASSETS (%) | |
| |
Short Positions — continued | | | | | |
| | | |
Common Stocks — continued | | | | | | | | | | | | | |
Biotechnology | | | | | | | | | | | | | |
AbbVie, Inc. | | | (8,457 | ) | | | (672,754 | ) | | | (26,132 | ) | | | (0.1 | ) |
Exact Sciences Corp.* | | | (9,606 | ) | | | (835,722 | ) | | | (22,769 | ) | | | (0.0 | )(a) |
| | | | | | | | | | | | | | | | |
| | | (18,063 | ) | | | (1,508,476 | ) | | | (48,901 | ) | | | (0.1 | ) |
| | | | | | | | | | | | | | | | |
Health Care Providers & Services | | | | | | | | | | | | | |
Centene Corp.* | | | (21,836 | ) | | | (1,159,055 | ) | | | (135,383 | ) | | | (0.1 | ) |
| | | | | | | | | | | | | | | | |
Hotels, Restaurants & Leisure | | | | | | | | | | | | | |
Eldorado Resorts, Inc.* | | | (12,608 | ) | | | (564,460 | ) | | | (21,812 | ) | | | (0.0 | )(a) |
| | | | | | | | | | | | | | | | |
Machinery | | | | | | | | | | | | | |
Hillenbrand, Inc. | | | (6,375 | ) | | | (196,286 | ) | | | (5,738 | ) | | | (0.0 | )(a) |
| | | | | | | | | | | | | | | | |
Oil, Gas & Consumable Fuels | | | | | | | | | | | | | |
Callon Petroleum Co.* | | | (112,638 | ) | | | (428,025 | ) | | | 2,253 | | | | 0.0 | (a) |
| | | | | | | | | | | | | | | | |
Pharmaceuticals | | | | | | | | | | | | | |
Bristol-Myers Squibb Co. | | | (5,790 | ) | | | (332,172 | ) | | | (25,129 | ) | | | (0.0 | )(a) |
| | | | | | | | | | | | | | | | |
Total Short Positions of Total Return Basket Swap | | | (211,470 | ) | | | (6,250,704 | ) | | | (213,872 | ) | | | (0.2 | ) |
| | | | | | | | | | | | | | | | |
Total of Long and Short Positions of Total Return Basket Swap | | | 847,721 | | | | 25,935,742 | | | | 55,612 | | | | 0.1 | |
| | | | | | | | | | | | | | | | |
| | | | | | | | | | | | | | | | | | | | |
| COUNTERPARTY | | DESCRIPTION | | TERMINATION
DATE | | NOTIONAL
VALUE (1) | | | NET UNREALIZED
APPRECIATION
(DEPRECIATION) (2) | | | NET CASH
AND OTHER
RECEIVABLES
(PAYABLES) | | | VALUE | |
UBS | | The Fund receives the total return on a portfolio of long and short equity positions and pays or receives the net of one month BBSW on long positions and short positions respectively, plus or minus a specified spread (rates range from 0.00% to 0.25%), which is denominated in AUD based on the local currencies of the positions within the swaps. | | 4/6/2021 –
8/26/2022 | | $ | 968,966 | | | $ | 18,214 | | | $ | (145 | ) | | $ | 18,069 | |
| | | | | | | | | | | | | | | | | | | | |
| | | | | | | | | | | | | | | | |
| REFERENCE ENTITY | | SHARES | | | NOTIONAL
VALUE($) (1) | | | NET UNREALIZED
APPRECIATION
(DEPRECIATION)($) (2) | | | PERCENTAGE
OF NET
ASSETS (%) | |
Long Positions | | | | | |
| | | |
Common Stocks | | | | | | | | | | | | | |
Food Products | | | | | | | | | | | | | |
Bellamy’s Australia Ltd.* | | | 95,461 | | | | 841,732 | | | | (9,085 | ) | | | (0.0 | )(a) |
| | | | | | | | | | | | | | | | |
Metals & Mining | | | | | | | | | | | | | |
South32 Ltd. | | | 195,686 | | | | 342,437 | | | | 10,483 | | | | 0.0 | (a) |
| | | | | | | | | | | | | | | | |
Total Long Positions of Total Return Basket Swap | | | 291,147 | | | | 1,184,169 | | | | 1,398 | | | | 0.0 | (a) |
| | | | | | | | | | | | | | | | |
| |
Short Positions | | | | | |
Common Stocks | | | | | | | | | | | | | |
Health Care Providers & Services | | | | | | | | | | | | | |
Australian Pharmaceutical Industries Ltd. | | | (235,526 | ) | | | (215,203 | ) | | | 16,816 | | | | 0.0 | (a) |
| | | | | | | | | | | | | | | | |
Total of Long and Short Positions of Total Return Basket Swap | | | 55,621 | | | | 968,966 | | | | 18,214 | | | | 0.0 | (a) |
| | | | | | | | | | | | | | | | |
SEE NOTES TO CONSOLIDATED FINANCIAL STATEMENTS.
| | | | | | | | |
| | | |
| OCTOBER 31, 2019 | | J.P. MORGAN EXCHANGE-TRADED FUNDS | | | | | 61 | |
JPMorgan Diversified Alternatives ETF
CONSOLIDATED SCHEDULE OF PORTFOLIO INVESTMENTS
AS OF OCTOBER 31, 2019 (continued)
| | | | | | | | | | | | | | | | | | | | |
| COUNTERPARTY | | DESCRIPTION | | TERMINATION
DATE | | NOTIONAL
VALUE (1) | | | NET UNREALIZED
APPRECIATION
(DEPRECIATION) (2) | | | NET CASH
AND OTHER
RECEIVABLES
(PAYABLES) | | | VALUE | |
UBS | | The Fund receives the total return on a portfolio of long equity positions and pays or receives the net of one month LIBOR on long positions, plus or minus a specified spread (rates range from 0.00% to 0.23%), which is denominated in EUR based on the local currencies of the positions within the swaps. | | 8/26/2022 | | $ | 1,252,666 | | | $ | (3,503 | ) | | $ | (5,072 | ) | | $ | (8,575 | ) |
| | | | | | | | | | | | | | | | | | | | |
| | | | | | | | | | | | | | | | |
| REFERENCE ENTITY | | SHARES | | | NOTIONAL
VALUE($) (1) | | | NET UNREALIZED
APPRECIATION
(DEPRECIATION)($) (2) | | | PERCENTAGE
OF NET
ASSETS (%) | |
Long Positions | | | | | |
| | | |
Common Stocks | | | | | | | | | | | | | |
IT Services | | | | | | | | | | | | | |
Altran Technologies SA | | | 78,789 | | | | 1,252,666 | | | | (3,503 | ) | | | (0.0 | )(a) |
| | | | | | | | | | | | | | | | |
| | | | | | | | | | | | | | | | | | | | |
| COUNTERPARTY | | DESCRIPTION | | TERMINATION
DATE | | NOTIONAL
VALUE (1) | | | NET UNREALIZED
APPRECIATION
(DEPRECIATION) (2) | | | NET CASH
AND OTHER
RECEIVABLES
(PAYABLES) | | | VALUE | |
UBS | | The Fund receives the total return on a portfolio of long and short equity positions and pays or receives the net of one month CDOR on long positions and short positions respectively, plus or minus a specified spread (rates range from 0.00% to 0.23%), which is denominated in CAD based on the local currencies of the positions within the swaps. | | 8/26/2022 | | $ | 2,134,107 | | | $ | 15,406 | | | $ | 594 | | | $ | 16,000 | |
| | | | | | | | | | | | | | | | | | | | |
| | | | | | | | | | | | | | | | |
| REFERENCE ENTITY | | SHARES | | | NOTIONAL
VALUE($) (1) | | | NET UNREALIZED
APPRECIATION
(DEPRECIATION)($) (2) | | | PERCENTAGE
OF NET
ASSETS (%) | |
Long Positions | | | | | |
| | | |
Common Stocks | | | | | | | | | | | | | |
Airlines | | | | | | | | | | | | | |
WestJet Airlines Ltd. | | | 49,923 | | | | 1,160,991 | | | | 757 | | | | 0.0 | (a) |
| | | | | | | | | | | | | | | | |
| | | |
Multiline Retail | | | | | | | | | | | | | |
Hudson’s Bay Co. | | | 37,717 | | | | 285,792 | | | | 15,281 | | | | 0.0 | (a) |
| | | | | | | | | | | | | | | | |
| | | |
Oil, Gas & Consumable Fuels | | | | | | | | | | | | | |
Kinder Morgan Canada Ltd. (b) | | | 25,584 | | | | 271,943 | | | | (4,301 | ) | | | (0.0 | )(a) |
| | | | | | | | | | | | | | | | |
| | | |
Paper & Forest Products | | | | | | | | | | | | | |
Canfor Corp.* | | | 57,000 | | | | 688,968 | | | | 95 | | | | 0.0 | (a) |
| | | | | | | | | | | | | | | | |
Total Long Positions of Total Return Basket Swap | | | 170,224 | | | | 2,407,694 | | | | 11,832 | | | | 0.0 | (a) |
| | | | | | | | | | | | | | | | |
| |
Short Positions | | | | | |
Common Stocks | | | | | | | | | | | | | |
Oil, Gas & Consumable Fuels | | | | | | | | | | | | | |
Pembina Pipeline Corp. | | | (7,771 | ) | | | (273,587 | ) | | | 3,574 | | | | 0.0 | (a) |
| | | | | | | | | | | | | | | | |
Total of Long and Short Positions of Total Return Basket Swap | | | 162,453 | | | | 2,134,107 | | | | 15,406 | | | | 0.0 | (a) |
| | | | | | | | | | | | | | | | |
SEE NOTES TO CONSOLIDATED FINANCIAL STATEMENTS.
| | | | | | |
| | | |
| 62 | | | | J.P. MORGAN EXCHANGE-TRADED FUNDS | | OCTOBER 31, 2019 |
The following reference rates, and their values as ofperiod-end, are used for security descriptions:
| | | | | | |
| | | | | VALUE | |
BA | | | | | 1.83 | % |
BBR | | | | | 0.75 | |
BBSW | | | | | 0.92 | |
CDOR | | | | | 1.96 | |
CHF LIBOR | | | | | (0.79 | ) |
EURIBOR | | | | | (0.44 | ) |
EUR LIBOR | | | | | (0.51 | ) |
GBP LIBOR | | | | | 0.71 | |
JPY LIBOR | | | | | (0.11 | ) |
USD LIBOR | | | | | 1.78 | |
Summary of total swap contracts outstanding as of October 31, 2019:
| | | | | | | | |
| | | NET UPFRONT
PAYMENTS
(RECEIPTS)($) | | | VALUE($) | |
Assets | |
OTC Total return basket swaps contracts outstanding | | | — | | | | 537,926 | |
| | | | | | | | |
|
Liabilities | |
OTC Total return basket swaps contracts outstanding | | | — | | | | (680,098 | ) |
| | | | | | | | |
Abbreviations
| | |
| AUD | | Australian Dollar |
| BA | | Banker’s Acceptance Rate |
| BBR | | Bank Base Rate |
| BBSW | | ASX Australia Bank Bill Short Term Rates |
| CAD | | Canadian Dollar |
| CDOR | | Canadian Dollar Offered Rate |
| CHF | | Swiss Franc |
| CVR | | Contingent Value Rights |
| EUR | | Euro |
| EURIBOR | | Euro Interbank Offered Rate |
| GBP | | British Pound |
| JPY | | Japanese Yen |
| LIBOR | | London Interbank Offered Rate |
| OYJ | | Public Limited Company |
| SCA | | Limited partnership with share capital |
| SGPS | | Holding company |
| USD | | United States Dollar |
| | |
| (a) | | Amount rounds to less than 0.1% of net assets. |
| (b) | | Security exempt from registration pursuant to Regulation S under the Securities Act of 1933, as amended. Regulation S applies to securities offerings that are made outside of the United States and do not involve direct selling efforts in the United States and as such may have restrictions on resale. |
| * | | Non-income producing security. |
| ‡ | | Value determined using significant unobservable inputs. |
| (1) | | Notional value represents market value as of October 31, 2019, of these positions based on the securities’ last sale or closing price on the principal exchange on which the securities are traded. |
| (2) | | Unrealized appreciation (depreciation) represents the unrealized gain(loss) of the positions subsequent to the swap reset. |
SEE NOTES TO CONSOLIDATED FINANCIAL STATEMENTS.
| | | | | | | | |
| | | |
| OCTOBER 31, 2019 | | J.P. MORGAN EXCHANGE-TRADED FUNDS | | | | | 63 | |
JPMorgan Event Driven ETF
SCHEDULE OF PORTFOLIO INVESTMENTS
AS OF OCTOBER 31, 2019
(Amounts in U.S. Dollars, unless otherwise noted)
| | | | | | | | |
| INVESTMENTS | | SHARES | | | VALUE | |
Common Stocks — 70.2% | |
|
Airlines — 0.9% | |
| | |
WestJet Airlines Ltd. (Canada) | | | 11,268 | | | | 262,045 | |
| | | | | | | | |
|
Banks — 2.6% | |
| | |
Commonwealth Bank of Australia (Australia) | | | 3,404 | | | | 184,565 | |
| | |
Pacific Premier Bancorp, Inc. | | | 5,771 | | | | 194,800 | |
| | |
SunTrust Banks, Inc. | | | 3,074 | | | | 210,077 | |
| | |
Synovus Financial Corp. | | | 5,157 | | | | 174,668 | |
| | | | | | | | |
| | |
| | | | | | | 764,110 | |
| | | | | | | | |
|
Biotechnology — 5.0% | |
| | |
Genomic Health, Inc.* | | | 6,056 | | | | 403,814 | |
| | |
Ironwood Pharmaceuticals, Inc.* | | | 16,410 | | | | 164,756 | |
| | |
Ligand Pharmaceuticals, Inc.* | | | 1,544 | | | | 168,003 | |
| | |
Ra Pharmaceuticals, Inc.* | | | 7,460 | | | | 351,142 | |
| | |
Spark Therapeutics, Inc.* | | | 3,517 | | | | 383,951 | |
| | | | | | | | |
| | |
| | | | | | | 1,471,666 | |
| | | | | | | | |
|
Building Products — 1.1% | |
| | |
Apogee Enterprises, Inc. | | | 3,972 | | | | 149,109 | |
| | |
Johnson Controls International plc | | | 4,146 | | | | 179,646 | |
| | | | | | | | |
| | |
| | | | | | | 328,755 | |
| | | | | | | | |
|
Capital Markets — 0.6% | |
| | |
Lazard Ltd., Class A | | | 5,138 | | | | 191,802 | |
| | | | | | | | |
|
Chemicals — 1.8% | |
| | |
Ashland Global Holdings, Inc. | | | 2,221 | | | | 171,839 | |
| | |
Ecolab, Inc. | | | 941 | | | | 180,738 | |
| | |
LyondellBasell Industries NV, Class A | | | 2,066 | | | | 185,320 | |
| | | | | | | | |
| | |
| | | | | | | 537,897 | |
| | | | | | | | |
|
Commercial Services & Supplies — 0.7% | |
| | |
Advanced Disposal Services, Inc.* | | | 787 | | | | 25,798 | |
| | |
Pitney Bowes, Inc. | | | 42,191 | | | | 185,640 | |
| | | | | | | | |
| | |
| | | | | | | 211,438 | |
| | | | | | | | |
|
Communications Equipment — 1.5% | |
| | |
Acacia Communications, Inc.* | | | 6,778 | | | | 445,043 | |
| | | | | | | | |
|
Construction & Engineering — 0.7% | |
| | |
Arcosa, Inc. | | | 5,435 | | �� | | 208,758 | |
| | | | | | | | |
|
Construction Materials — 0.7% | |
| | |
Eagle Materials, Inc. | | | 2,221 | | | | 202,866 | |
| | | | | | | | |
|
Consumer Finance — 1.5% | |
| | |
Navient Corp. | | | 13,274 | | | | 182,783 | |
| | |
SLM Corp. | | | 15,992 | | | | 134,972 | |
| | |
World Acceptance Corp.* | | | 1,074 | | | | 111,492 | |
| | | | | | | | |
| | |
| | | | | | | 429,247 | |
| | | | | | | | |
|
Containers & Packaging — 0.3% | |
| | |
Owens-Illinois, Inc. | | | 10,139 | | | | 86,182 | |
| | | | | | | | |
| | | | | | | | |
| INVESTMENTS | | SHARES | | | VALUE | |
| | | | | | | | |
|
Distributors — 0.6% | |
| | |
LKQ Corp.* | | | 5,500 | | | | 186,945 | |
| | | | | | | | |
|
Diversified Consumer Services — 0.6% | |
| | |
Regis Corp.* | | | 8,505 | | | | 175,203 | |
| | | | | | | | |
|
Diversified Financial Services — 0.6% | |
| | |
AXA Equitable Holdings, Inc. | | | 8,428 | | | | 182,045 | |
| | | | | | | | |
|
Diversified Telecommunication Services — 1.6% | |
| | |
Zayo Group Holdings, Inc.* | | | 13,564 | | | | 463,075 | |
| | | | | | | | |
|
Electric Utilities — 0.6% | |
| | |
Evergy, Inc. | | | 2,623 | | | | 167,636 | |
| | | | | | | | |
|
Electrical Equipment — 1.5% | |
| | |
Eaton Corp. plc | | | 2,090 | | | | 182,060 | |
| | |
OSRAM Licht AG (Germany) | | | 5,921 | | | | 264,148 | |
| | | | | | | | |
| | |
| | | | | | | 446,208 | |
| | | | | | | | |
|
Electronic Equipment, Instruments & Components — 1.3% | |
| | |
Anixter International, Inc.* | | | 4,258 | | | | 352,349 | |
| | |
Benchmark Electronics, Inc. | | | 571 | | | | 19,357 | |
| | | | | | | | |
| | |
| | | | | | | 371,706 | |
| | | | | | | | |
|
Energy Equipment & Services — 1.1% | |
| | |
Patterson-UTI Energy, Inc. | | | 21,652 | | | | 180,145 | |
| | |
TechnipFMC plc (United Kingdom) | | | 6,800 | | | | 134,164 | |
| | | | | | | | |
| | |
| | | | | | | 314,309 | |
| | | | | | | | |
|
Entertainment — 0.5% | |
| | |
Madison Square Garden Co. (The), Class A* | | | 523 | | | | 139,599 | |
| | | | | | | | |
|
Health Care Equipment & Supplies — 0.8% | |
| | |
Danaher Corp. | | | 1,672 | | | | 230,435 | |
| | | | | | | | |
|
Health Care Providers & Services — 2.0% | |
| | |
Acadia Healthcare Co., Inc.* | | | 5,400 | | | | 161,946 | |
| | |
Magellan Health, Inc.* | | | 2,564 | | | | 166,404 | |
| | |
Sigma Healthcare Ltd. (Australia) | | | 133,180 | | | | 53,361 | |
| | |
Tenet Healthcare Corp.* | | | 8,000 | | | | 202,720 | |
| | | | | | | | |
| | |
| | | | | | | 584,431 | |
| | | | | | | | |
|
Hotels, Restaurants & Leisure — 5.3% | |
| | |
Aramark | | | 4,100 | | | | 179,416 | |
| | |
Bloomin’ Brands, Inc. | | | 9,300 | | | | 184,233 | |
| | |
Caesars Entertainment Corp.* | | | 17,900 | | | | 219,812 | |
| | |
Cracker Barrel Old Country Store, Inc. | | | 1,150 | | | | 178,825 | |
| | |
Dave & Buster’s Entertainment, Inc. | | | 4,491 | | | | 178,652 | |
| | |
Hilton Grand Vacations, Inc.* | | | 5,575 | | | | 193,620 | |
| | |
Koshidaka Holdings Co. Ltd. (Japan) | | | 4,600 | | | | 66,797 | |
| | |
Papa John’s International, Inc. (a) | | | 3,031 | | | | 177,465 | |
| | |
SeaWorld Entertainment, Inc.* | | | 6,861 | | | | 181,267 | |
| | | | | | | | |
| | |
| | | | | | | 1,560,087 | |
| | | | | | | | |
SEE NOTES TO FINANCIAL STATEMENTS.
| | | | | | |
| | | |
| 64 | | | | J.P. MORGAN EXCHANGE-TRADED FUNDS | | OCTOBER 31, 2019 |
| | | | | | | | |
| INVESTMENTS | | SHARES | | | VALUE | |
Common Stocks — continued | |
|
Household Durables — 0.6% | |
| | |
Electrolux AB, Series B (Sweden) | | | 6,519 | | | | 171,393 | |
| | | | | | | | |
|
Independent Power and Renewable Electricity Producers — 0.6% | |
| | |
NRG Energy, Inc. | | | 4,532 | | | | 181,824 | |
| | | | | | | | |
|
Industrial Conglomerates — 0.6% | |
| | |
Smiths Group plc (United Kingdom) | | | 9,159 | | | | 191,456 | |
| | | | | | | | |
|
Insurance — 0.6% | |
| | |
MBIA, Inc.* | | | 18,711 | | | | 173,825 | |
| | | | | | | | |
|
Interactive Media & Services — 1.2% | |
| | |
IAC/InterActiveCorp* | | | 800 | | | | 181,800 | |
| | |
Yelp, Inc.* | | | 5,140 | | | | 177,381 | |
| | | | | | | | |
| | |
| | | | | | | 359,181 | |
| | | | | | | | |
|
Internet & Direct Marketing Retail — 0.7% | |
| | |
Quotient Technology, Inc.* | | | 22,921 | | | | 197,350 | |
| | | | | | | | |
|
IT Services — 0.4% | |
| | |
Presidio, Inc. | | | 7,539 | | | | 125,147 | |
| | | | | | | | |
|
Leisure Products — 0.7% | |
| | |
Callaway Golf Co. | | | 9,930 | | | | 200,785 | |
| | | | | | | | |
|
Life Sciences Tools & Services — 1.6% | |
| | |
Cambrex Corp.* | | | 6,759 | | | | 403,715 | |
| | |
Pacific Biosciences of California, Inc.* | | | 11,156 | | | | 53,995 | |
| | |
Waters Corp.* | | | 78 | | | | 16,506 | |
| | | | | | | | |
| | |
| | | | | | | 474,216 | |
| | | | | | | | |
|
Machinery — 3.8% | |
| | |
CNH Industrial NV (United Kingdom) | | | 12,700 | | | | 138,557 | |
| | |
Fortive Corp. | | | 2,500 | | | | 172,500 | |
| | |
Ingersoll-Rand plc | | | 1,463 | | | | 185,640 | |
| | |
Meritor, Inc.* | | | 7,900 | | | | 174,037 | |
| | |
WABCO Holdings, Inc.* | | | 3,348 | | | | 450,708 | |
| | | | | | | | |
| | |
| | | | | | | 1,121,442 | |
| | | | | | | | |
|
Media — 1.9% | |
| | |
Gannett Co., Inc. | | | 12,180 | | | | 132,153 | |
| | |
iHeartMedia, Inc., Class A* | | | 4,000 | | | | 57,360 | |
| | |
Sirius XM Holdings, Inc. | | | 27,786 | | | | 186,722 | |
| | |
TEGNA, Inc. | | | 12,000 | | | | 180,360 | |
| | | | | | | | |
| | |
| | | | | | | 556,595 | |
| | | | | | | | |
|
Multiline Retail — 0.6% | |
| | |
Dillard’s, Inc., Class A(a) | | | 2,607 | | | | 179,831 | |
| | | | | | | | |
|
Oil, Gas & Consumable Fuels — 2.6% | |
| | |
Arch Coal, Inc., Class A | | | 1,954 | | | | 154,151 | |
| | |
Carrizo Oil & Gas, Inc.* | | | 13,000 | | | | 95,680 | |
| | |
Devon Energy Corp. | | | 1,034 | | | | 20,969 | |
| | |
Gulfport Energy Corp.* | | | 18,200 | | | | 50,687 | |
| | | | | | | | |
| INVESTMENTS | | SHARES | | | VALUE | |
| | | | | | | | |
| | |
Oil, Gas & Consumable Fuels — continued | | | | | | | | |
| | |
Murphy Oil Corp. | | | 8,074 | | | | 166,567 | |
| | |
PDC Energy, Inc.* | | | 6,718 | | | | 134,024 | |
| | |
Peabody Energy Corp. | | | 3,800 | | | | 40,014 | |
| | |
Tallgrass Energy LP, Class A | | | 5,418 | | | | 101,100 | |
| | | | | | | | |
| | |
| | | | | | | 763,192 | |
| | | | | | | | |
|
Paper & Forest Products — 1.2% | |
| | |
Canfor Corp. (Canada)* | | | 28,522 | | | | 344,750 | |
| | | | | | | | |
|
Pharmaceuticals — 1.1% | |
| | |
Eli Lilly & Co. | | | 1,546 | | | | 176,167 | |
| | |
Pacira BioSciences, Inc.* | | | 3,833 | | | | 155,198 | |
| | | | | | | | |
| | |
| | | | | | | 331,365 | |
| | | | | | | | |
|
Professional Services — 0.5% | |
| | |
Nielsen Holdings plc | | | 6,898 | | | | 139,064 | |
| | | | | | | | |
|
Real Estate Management & Development — 0.9% | |
| | |
Unizo Holdings Co. Ltd. (Japan) | | | 5,800 | | | | 267,511 | |
| | | | | | | | |
|
Road & Rail — 0.8% | |
| | |
Genesee & Wyoming, Inc., Class A* | | | 2,063 | | | | 229,055 | |
| | | | | | | | |
|
Semiconductors & Semiconductor Equipment — 2.4% | |
| | |
Cypress Semiconductor Corp. | | | 18,949 | | | | 440,943 | |
| | |
Mellanox Technologies Ltd.* | | | 840 | | | | 94,668 | |
| | |
NXP Semiconductors NV (Netherlands) | | | 1,642 | | | | 186,663 | |
| | | | | | | | |
| | |
| | | | | | | 722,274 | |
| | | | | | | | |
|
Software — 4.1% | |
| | |
Cision Ltd.* | | | 21,991 | | | | 221,449 | |
| | |
Cloudera, Inc.* | | | 26,100 | | | | 221,328 | |
| | |
ForeScout Technologies, Inc.* | | | 6,100 | | | | 187,636 | |
| | |
Instructure, Inc.* | | | 4,181 | | | | 195,378 | |
| | |
Pivotal Software, Inc., Class A* | | | 19,439 | | | | 291,002 | |
| | |
TiVo Corp. | | | 10,200 | | | | 83,028 | |
| | | | | | | | |
| | |
| | | | | | | 1,199,821 | |
| | | | | | | | |
|
Specialty Retail — 5.7% | |
| | |
Asbury Automotive Group, Inc.* | | | 2,404 | | | | 247,925 | |
| | |
Designer Brands, Inc., Class A | | | 9,596 | | | | 158,334 | |
| | |
Dick’s Sporting Goods, Inc. | | | 4,447 | | | | 173,122 | |
| | |
Foot Locker, Inc. | | | 4,246 | | | | 184,743 | |
| | |
Gap, Inc. (The) | | | 6,585 | | | | 107,072 | |
| | |
Genesco, Inc.* | | | 4,255 | | | | 165,307 | |
| | |
Guess?, Inc. | | | 9,910 | | | | 165,992 | |
| | |
RH* | | | 1,058 | | | | 192,239 | |
| | |
Tiffany & Co. | | | 870 | | | | 108,324 | |
| | |
Urban Outfitters, Inc.* | | | 6,312 | | | | 181,154 | |
| | | | | | | | |
| | |
| | | | | | | 1,684,212 | |
| | | | | | | | |
SEE NOTES TO FINANCIAL STATEMENTS.
| | | | | | | | |
| | | |
| OCTOBER 31, 2019 | | J.P. MORGAN EXCHANGE-TRADED FUNDS | | | | | 65 | |
JPMorgan Event Driven ETF
SCHEDULE OF PORTFOLIO INVESTMENTS
AS OF OCTOBER 31, 2019 (continued)
(Amounts in U.S. Dollars, unless otherwise noted)
| | | | | | | | |
| INVESTMENTS | | SHARES | | | VALUE | |
Common Stocks — continued | |
|
Technology Hardware, Storage & Peripherals — 0.6% | |
| | |
Seagate Technology plc | | | 3,332 | | | | 193,356 | |
| | | | | | | | |
|
Textiles, Apparel & Luxury Goods — 0.7% | |
| | |
Wolverine World Wide, Inc. | | | 6,525 | | | | 193,662 | |
| | | | | | | | |
|
Trading Companies & Distributors — 2.4% | |
| | |
HD Supply Holdings, Inc.* | | | 4,600 | | | | 181,884 | |
| | |
Triton International Ltd. (Bermuda) | | | 5,215 | | | | 191,391 | |
| | |
WESCO International, Inc.* | | | 6,821 | | | | 342,073 | |
| | | | | | | | |
| | |
| | | | | | | 715,348 | |
| | | | | | | | |
| |
Total Common Stocks
(Cost $20,303,318) | | | | 20,678,143 | |
| | | | | | | | |
| | |
| | | PRINCIPAL
AMOUNT | | | | |
Short-Term Investments — 32.4% | |
|
Foreign Government Treasury Bills — 3.5% | |
| | |
Japan Treasury Bills (Japan) (0.27)%, 3/10/2020 (b)
(Cost $1,021,173) | | | JPY 110,000,000 | | | | 1,019,372 | |
| | | | | | | | |
| | |
| | | SHARES | | | | |
|
Investment Companies — 11.6% | |
| | |
JPMorgan Prime Money Market Fund Class IM Shares, 1.94% (c)(d)
(Cost $3,426,549) | | | 3,425,522 | | | | 3,426,892 | |
| | | | | | | | |
|
Investment of Cash Collateral From Securities Loaned — 1.2% | |
JPMorgan U.S. Government Money Market Fund Class IM Shares, 1.70% (c)(d) (Cost $357,950) | | | 357,950 | | | | 357,950 | |
| | | | | | | | |
| | | | | | | | |
| INVESTMENTS | | PRINCIPAL
AMOUNT | | | VALUE | |
|
U.S. Treasury Obligations — 16.1% | |
U.S. Treasury Bills | | | | | | | | |
2.52%, 1/30/2020 (b) | | | 1,500,000 | | | | 1,494,319 | |
2.39%, 3/26/2020 (b) | | | 1,000,000 | | | | 993,791 | |
2.07%, 4/23/2020 (b) | | | 1,000,000 | | | | 992,693 | |
1.94%, 5/21/2020 (b) | | | 1,000,000 | | | | 991,449 | |
1.94%, 6/18/2020 (b) | | | 291,000 | | | | 288,170 | |
| | | | | | | | |
| |
Total U.S. Treasury Obligations
(Cost $4,748,194) | | | | 4,760,422 | |
| | | | | | | | |
| | |
Total Short-Term Investments
(Cost $9,553,866) | | | | | | | 9,564,636 | |
| | | | | | | | |
Total Investments — 102.6%
(Cost $29,857,184) | | | | 30,242,779 | |
Liabilities in Excess of
Other Assets — (2.6)% | | | | (767,094 | ) |
| | | | | | | | |
NET ASSETS — 100.0% | | | | 29,475,685 | |
| | | | | | | | |
Percentages indicated are based on net assets.
| | |
Abbreviations |
| JPY | | Japanese Yen |
| |
| (a) | | The security or a portion of this security is on loan at October 31, 2019. The total value of securities on loan at October 31, 2019 is $342,245. |
| (b) | | The rate shown is the effective yield as of October 31, 2019. |
| (c) | | Investment in an affiliated fund, which is registered under the Investment Company Act of 1940, as amended, and is advised by J.P. Morgan Investment Management Inc. |
| (d) | | The rate shown is the current yield as of October 31, 2019. |
| * | | Non-income producing security. |
| | | | | | | | | | | | | | | | | | | | | | |
| Forward foreign currency exchange contracts outstanding as of October 31, 2019: | |
| CURRENCY PURCHASED | | | CURRENCY SOLD | | | COUNTERPARTY | | SETTLEMENT
DATE | | | UNREALIZED
APPRECIATION
(DEPRECIATION) ($) | |
| | EUR | | | | 203,939 | | | USD | | | 225,882 | | | Australia & New Zealand Banking Group Ltd. | | | 11/12/2019 | | | | 1,702 | |
| | USD | | | | 260,779 | | | CAD | | | 342,389 | | | Citibank, NA | | | 11/12/2019 | | | | 818 | |
| | USD | | | | 229,549 | | | JPY | | | 24,467,027 | | | Merrill Lynch International | | | 11/12/2019 | | | | 2,877 | |
| | USD | | | | 1,034,079 | | | JPY | | | 110,000,000 | | | Standard Chartered Bank | | | 3/10/2020 | | | | 6,946 | |
| | | | | | | | | | | | | | | | | | | | | | |
| | Total unrealized appreciation | | | | | | | 12,343 | |
| | | | | | | | | | | | | | | | | | | | | | |
| | USD | | | | 309,054 | | | AUD | | | 458,126 | | | Merrill Lynch International | | | 11/12/2019 | | | | (6,835 | ) |
| | USD | | | | 237,317 | | | CAD | | | 316,146 | | | Goldman Sachs International | | | 11/12/2019 | | | | (2,718 | ) |
| | USD | | | | 121,312 | | | EUR | | | 110,368 | | | BNP Paribas | | | 11/12/2019 | | | | (1,853 | ) |
| | USD | | | | 145,174 | | | EUR | | | 131,830 | | | Goldman Sachs International | | | 11/12/2019 | | | | (1,941 | ) |
| | USD | | | | 172,364 | | | GBP | | | 140,058 | | | BNP Paribas | | | 11/12/2019 | | | | (9,109 | ) |
| | USD | | | | 124,420 | | | SEK | | | 1,227,975 | | | Merrill Lynch International | | | 11/12/2019 | | | | (2,817 | ) |
| | USD | | | | 180,094 | | | EUR | | | 161,094 | | | Merrill Lynch International | | | 12/11/2019 | | | | (33 | ) |
| | | | | | | | | | | | | | | | | | | | | | |
| | Total unrealized depreciation | | | | | | | (25,306 | ) |
| | | | | | | | | | | | | | | | | | | | | | |
| | Net unrealized depreciation | | | | | | | (12,963 | ) |
| | | | | | | | | | | | | | | | | | | | | | |
SEE NOTES TO FINANCIAL STATEMENTS.
| | | | | | |
| | | |
| 66 | | | | J.P. MORGAN EXCHANGE-TRADED FUNDS | | OCTOBER 31, 2019 |
Abbreviations
| | |
| AUD | | Australian Dollar |
| CAD | | Canadian Dollar |
| EUR | | Euro |
| GBP | | British Pound |
| JPY | | Japanese Yen |
| SEK | | Swedish Krona |
| USD | | United States Dollar |
| | | | | | | | | | | | | | | | | | | | | | |
| Over-the-Counter (“OTC”) Total Return Basket Swaps Outstanding at October 31, 2019 | |
| COUNTERPARTY | | DESCRIPTION | | TERMINATION
DATE | | | NOTIONAL
VALUE (1) | | | NET UNREALIZED
APPRECIATION
(DEPRECIATION) (2) | | | NET CASH
AND OTHER
RECEIVABLES
(PAYABLES) | | | VALUE | |
| Bank of America | | The Fund receives the total return on a portfolio of long and short equity positions and pays or receives the net of one month LIBOR on long positions and short positions respectively, plus or minus a specified spread (rates range from 0.00% to 0.20%), which is denominated in USD based on the local currencies of the positions within the swaps. | | | 2/10/2020 | | | $ | 675,900 | | | $ | 6,824 | | | $ | 3,262 | | | $ | 10,086 | |
| | | | | | | | | | | | | | | | | | | | | | |
| | | | | | | | | | | | | | | | |
| REFERENCE ENTITY | | SHARES | | | NOTIONAL
VALUE($) (1) | | | NET UNREALIZED
APPRECIATION
(DEPRECIATION)($) (2) | | | PERCENTAGE
OF NET
ASSETS (%) | |
Long Positions | | | | | |
| | | | |
Common Stocks | | | | | | | | | | | | | | | | |
Air Freight & Logistics | | | | | | | | | | | | | | | | |
XPO Logistics, Inc.* | | | 2,560 | | | | 195,584 | | | | 13,722 | | | | 0.1 | |
| | | | | | | | | | | | | | | | |
Construction & Engineering | | | | | | | | | | | | | | | | |
AECOM* | | | 4,599 | | | | 184,006 | | | | 14,671 | | | | 0.1 | |
| | | | | | | | | | | | | | | | |
Electronic Equipment, Instruments & Components | | | | | | | | | | | | | |
Benchmark Electronics, Inc. | | | 6,480 | | | | 219,672 | | | | 29,354 | | | | 0.1 | |
| | | | | | | | | | | | | | | | |
Hotels, Restaurants & Leisure | | | | | | | | | | | | | |
Caesars Entertainment Corp.* | | | 16,177 | | | | 198,653 | | | | 8,574 | | | | 0.0 | (a) |
| | | | | | | | | | | | | | | | |
Internet & Direct Marketing Retail | | | | | | | | | | | | | |
Booking Holdings, Inc.* | | | 93 | | | | 190,536 | | | | 7,985 | | | | 0.0 | (a) |
| | | | | | | | | | | | | | | | |
Leisure Products | | | | | | | | | | | | | |
Brunswick Corp. | | | 2,613 | | | | 152,181 | | | | 16,828 | | | | 0.1 | |
| | | | | | | | | | | | | | | | |
Life Sciences Tools & Services | | | | | | | | | | | | | |
Waters Corp.* | | | 732 | | | | 154,906 | | | | 234 | | | | 0.0 | (a) |
| | | | | | | | | | | | | | | | |
Oil, Gas & Consumable Fuels | | | | | | | | | | | | | |
Devon Energy Corp. | | | 5,331 | | | | 108,113 | | | | (2,932 | ) | | | (0.0 | )(a) |
| | | | | | | | | | | | | | | | |
Technology Hardware, Storage & Peripherals | | | | | | | | | | | | | |
Stratasys Ltd.* | | | 6,898 | | | | 142,651 | | | | 5,794 | | | | 0.0 | (a) |
| | | | | | | | | | | | | | | | |
Total Long Positions of Total Return Basket Swap | | | 45,483 | | | | 1,546,302 | | | | 94,230 | | | | 0.4 | |
| | | | | | | | | | | | | | | | |
| |
Short Positions | | | | | |
| | | |
Common Stocks | | | | | | | | | | | | | |
Banks | | | | | | | | | | | | | |
BB&T Corp. | | | (3,940 | ) | | | (209,017 | ) | | | (6,777 | ) | | | (0.0 | )(a) |
| | | | | | | | | | | | | | | | |
SEE NOTES TO FINANCIAL STATEMENTS.
| | | | | | | | |
| | | |
| OCTOBER 31, 2019 | | J.P. MORGAN EXCHANGE-TRADED FUNDS | | | | | 67 | |
JPMorgan Event Driven ETF
SCHEDULE OF PORTFOLIO INVESTMENTS
AS OF OCTOBER 31, 2019 (continued)
| | | | | | | | | | | | | | | | |
| REFERENCE ENTITY | | SHARES | | | NOTIONAL
VALUE($) (1) | | | NET UNREALIZED
APPRECIATION
(DEPRECIATION)($) (2) | | | PERCENTAGE
OF NET
ASSETS (%) | |
| | | | |
Short Positions — continued | | | | | | | | | | | | | | | | |
| | | | |
Common Stocks — continued | | | | | | | | | | | | | | | | |
Biotechnology | | | | | | | | | | | | | |
AbbVie, Inc. | | | (2,043 | ) | | | (162,521 | ) | | | (10,419 | ) | | | (0.0 | )(a) |
| | | | | | | | | | | | | | | | |
Health Care Providers & Services | | | | | | | | | | | | | |
Centene Corp.* | | | (4,915 | ) | | | (260,888 | ) | | | (44,186 | ) | | | (0.2 | ) |
| | | | | | | | | | | | | | | | |
Hotels, Restaurants & Leisure | | | | | | | | | | | | | |
Eldorado Resorts, Inc.* | | | (3,032 | ) | | | (135,743 | ) | | | (14,281 | ) | | | (0.1 | ) |
| | | | | | | | | | | | | | | | |
Pharmaceuticals | | | | | | | | | | | | | |
Bristol-Myers Squibb Co. | | | (1,782 | ) | | | (102,233 | ) | | | (11,743 | ) | | | (0.0 | )(a) |
| | | | | | | | | | | | | | | | |
Total Short Positions of Total Return Basket Swap | | | (15,712 | ) | | | (870,402 | ) | | | (87,406 | ) | | | (0.3 | ) |
| | | | | | | | | | | | | | | | |
Total of Long and Short Positions of Total Return Basket Swap | | | 29,771 | | | | 675,900 | | | | 6,824 | | | | 0.1 | |
| | | | | | | | | | | | | | | | |
| | | | | | | | | | | | | | | | | | | | | | |
| COUNTERPARTY | | DESCRIPTION | | TERMINATION
DATE | | | NOTIONAL
VALUE (1) | | | NET UNREALIZED
APPRECIATION
(DEPRECIATION) (2) | | | NET CASH
AND OTHER
RECEIVABLES
(PAYABLES) | | | VALUE | |
Bank of America | | The Fund receives the total return on a portfolio of long equity positions and pays or receives the net of one month EURIBOR on long positions, plus or minus a specified spread (rates range from 0.00% to 0.20%), which is denominated in EUR based on the local currencies of the positions within the swaps. | | | 12/31/2020 | | | $ | 559,394 | | | $ | (3,027 | ) | | $ | 41 | | | $ | (2,986 | ) |
| | | | | | | | | | | | | | | | | | | | | | |
| | | | | | | | | | | | | | | | |
| REFERENCE ENTITY | | SHARES | | | NOTIONAL
VALUE($) (1) | | | NET UNREALIZED
APPRECIATION
(DEPRECIATION)($) (2) | | | PERCENTAGE
OF NET
ASSETS (%) | |
Long Positions | | | | | |
| | | |
Common Stocks | | | | | | | | | | | | | |
IT Services | | | | | | | | | | | | | |
Altran Technologies SA | | | 20,203 | | | | 321,208 | | | | (3,020 | ) | | | (0.0 | )(a) |
| | | | | | | | | | | | | | | | |
Media | | | | | | | | | | | | | |
Axel Springer SE* | | | 3,417 | | | | 238,186 | | | | (7 | ) | | | (0.0 | )(a) |
| | | | | | | | | | | | | | | | |
Total Long Positions of Total Return Basket Swap | | | 23,620 | | | | 559,394 | | | | (3,027 | ) | | | 0.0 | (a) |
| | | | | | | | | | | | | | | | |
| | | | | | | | | | | | | | | | | | | | | | |
| COUNTERPARTY | | DESCRIPTION | | TERMINATION
DATE | | | NOTIONAL
VALUE (1) | | | NET UNREALIZED
APPRECIATION
(DEPRECIATION) (2) | | | NET CASH
AND OTHER
RECEIVABLES
(PAYABLES) | | | VALUE | |
Bank of America | | The Fund receives the total return on a portfolio of long equity positions and pays or receives the net of one month LIBOR on long positions, plus or minus a specified spread (rates range from 0.00% to 0.20%), which is denominated in GBP based on the local currencies of the positions within the swaps. | | | 12/31/2020 | | | $ | 474,626 | | | $ | 3,137 | | | $ | 14,943 | | | $ | 18,080 | |
| | | | | | | | | | | | | | | | | | | | | | |
SEE NOTES TO FINANCIAL STATEMENTS.
| | | | | | |
| | | |
| 68 | | | | J.P. MORGAN EXCHANGE-TRADED FUNDS | | OCTOBER 31, 2019 |
| | | | | | | | | | | | | | | | |
| REFERENCE ENTITY | | SHARES | | | NOTIONAL
VALUE($) (1) | | | NET UNREALIZED
APPRECIATION
(DEPRECIATION)($) (2) | | | PERCENTAGE
OF NET
ASSETS (%) | |
Long Positions | | | | | |
| | | |
Common Stocks | | | | | | | | | | | | | |
Aerospace & Defense | | | | | | | | | | | | | |
Cobham plc | | | 71,349 | | | | 145,943 | | | | 2,159 | | | | 0.0 | (a) |
| | | | | | | | | | | | | | | | |
Hotels, Restaurants & Leisure | | | | | | | | | | | | | |
EI Group plc* | | | 13,389 | | | | 48,839 | | | | 34 | | | | 0.0 | (a) |
Merlin Entertainments plc(b) | | | 35,651 | | | | 210,037 | | | | 828 | | | | 0.0 | (a) |
| | | | | | | | | | | | | | | | |
| | | 49,040 | | | | 258,876 | | | | 862 | | | | 0.0 | (a) |
| | | | | | | | | | | | | | | | |
Specialty Retail | | | | | | | | | | | | | |
BCA Marketplace plc | | | 22,835 | | | | 69,807 | | | | 116 | | | | 0.0 | (a) |
| | | | | | | | | | | | | | | | |
Total Long Positions of Total Return Basket Swap | | | 143,224 | | | | 474,626 | | | | 3,137 | | | | 0.0 | (a) |
| | | | | | | | | | | | | | | | |
| | | | | | | | | | | | | | | | | | | | | | |
| COUNTERPARTY | | DESCRIPTION | | TERMINATION
DATE | | | NOTIONAL
VALUE (1) | | | NET UNREALIZED
APPRECIATION
(DEPRECIATION) (2) | | | NET CASH
AND OTHER
RECEIVABLES
(PAYABLES) | | | VALUE | |
Bank of America | | The Fund receives the total return on a portfolio of long equity positions and pays or receives the net of one month BA on long positions, plus or minus a specified spread of 0.50%, which is denominated in CAD based on the local currencies of the positions within the swaps. | | | 11/26/2019 | | | $ | 38,539 | | | $ | 6,369 | | | $ | (58 | ) | | $ | 6,311 | |
| | | | | | | | | | | | | | | | | | | | | | |
| | | | | | | | | | | | | | | | |
| REFERENCE ENTITY | | SHARES | | | NOTIONAL
VALUE($) (1) | | | NET UNREALIZED
APPRECIATION
(DEPRECIATION)($) (2) | | | PERCENTAGE
OF NET
ASSETS (%) | |
Long Positions | | | | | |
| | | |
Common Stocks | | | | | | | | | | | | | |
Metals & Mining | | | | | | | | | | | | | |
Sandstorm Gold Ltd.* | | | 5,400 | | | | 38,539 | | | | 6,369 | | | | 0.0 | (a) |
| | | | | | | | | | | | | | | | |
| | | | | | | | | | | | | | | | | | | | | | |
| COUNTERPARTY | | DESCRIPTION | | TERMINATION
DATE | | | NOTIONAL
VALUE (1) | | | NET UNREALIZED
APPRECIATION
(DEPRECIATION) (2) | | | NET CASH
AND OTHER
RECEIVABLES
(PAYABLES) | | | VALUE | |
Bank of America | | The Fund receives the total return on a portfolio of long equity positions and pays or receives the net of one month BBR on long positions, plus or minus a specified spread of 0.35%, which is denominated in AUD based on the local currencies of the positions within the swaps. | | | 2/10/2020 | | | $ | 110,226 | | | $ | 5,085 | | | $ | (14 | ) | | $ | 5,071 | |
| | | | | | | | | | | | | | | | | | | | | | |
| | | | | | | | | | | | | | | | |
| REFERENCE ENTITY | | SHARES | | | NOTIONAL
VALUE($) (1) | | | NET UNREALIZED
APPRECIATION
(DEPRECIATION)($) (2) | | | PERCENTAGE
OF NET
ASSETS (%) | |
Long Positions | | | | | |
| | | |
Common Stocks | | | | | | | | | | | | | |
Metals & Mining | | | | | | | | | | | | | |
South32 Ltd. | | | 62,989 | | | | 110,226 | | | | 5,085 | | | | 0.0 | (a) |
| | | | | | | | | | | | | | | | |
SEE NOTES TO FINANCIAL STATEMENTS.
| | | | | | | | |
| | | |
| OCTOBER 31, 2019 | | J.P. MORGAN EXCHANGE-TRADED FUNDS | | | | | 69 | |
JPMorgan Event Driven ETF
SCHEDULE OF PORTFOLIO INVESTMENTS
AS OF OCTOBER 31, 2019 (continued)
| | | | | | | | | | | | | | | | | | | | |
| COUNTERPARTY | | DESCRIPTION | | TERMINATION
DATE | | NOTIONAL
VALUE (1) | | | NET UNREALIZED
APPRECIATION
(DEPRECIATION) (2) | | | NET CASH
AND OTHER
RECEIVABLES
(PAYABLES) | | | VALUE | |
Goldman Sachs | | The Fund receives the total return on a portfolio of long and short equity positions and pays or receives the net of one day FEDEF and one month LIBOR on long positions and short positions respectively, plus or minus a specified spread (rates range from (5.69)% to 0.18%), which is denominated in USD based on the local currencies of the positions within the swaps. | | 6/1/2028 –
11/1/2029 | | $ | 3,889,890 | | | $ | 262,106 | | | $ | (7,523 | ) | | $ | 254,583 | |
| | | | | | | | | | | | | | | | | | | | |
| | | | | | | | | | | | | | | | |
| REFERENCE ENTITY | | SHARES | | | NOTIONAL
VALUE($) (1) | | | NET UNREALIZED
APPRECIATION
(DEPRECIATION)($) (2) | | | PERCENTAGE
OF NET
ASSETS (%) | |
Long Positions | | | | | |
| | | |
Common Stocks | | | | | | | | | | | | | |
Banks | | | | | | | | | | | | | |
LegacyTexas Financial Group, Inc. | | | 7,055 | | | | 300,120 | | | | 353 | | | | 0.0 | (a) |
| | | | | | | | | | | | | | | | |
Biotechnology | |
Biogen, Inc.* | | | 780 | | | | 232,994 | | | | 59,054 | | | | 0.2 | |
Celgene Corp.* | | | 1,800 | | | | 194,454 | | | | 14,796 | | | | 0.1 | |
Ligand Pharmaceuticals, Inc.* | | | 236 | | | | 25,679 | | | | 1,418 | | | | 0.0 | (a) |
| | | | | | | | | | | | | | | | |
| | | 2,816 | | | | 453,127 | | | | 75,268 | | | | 0.3 | |
| | | | | | | | | | | | | | | | |
Commercial Services & Supplies | | | | | | | | | | | | | | | | |
Advanced Disposal Services, Inc.* | | | 8,168 | | | | 267,747 | | | | 1,388 | | | | 0.0 | (a) |
| | | | | | | | | | | | | | | | |
Construction Materials | |
Eagle Materials, Inc. | | | 1,978 | | | | 180,670 | | | | 2,097 | | | | 0.0 | (a) |
| | | | | | | | | | | | | | | | |
Consumer Finance | |
World Acceptance Corp.* | | | 380 | | | | 39,448 | | | | (5,772 | ) | | | (0.0 | )(a) |
| | | | | | | | | | | | | | | | |
Diversified Financial Services | |
Voya Financial, Inc. | | | 3,393 | | | | 183,086 | | | | 7,159 | | | | 0.0 | (a) |
| | | | | | | | | | | | | | | | |
Electronic Equipment, Instruments & Components | | | | | | | | | | | | | |
Avnet, Inc. | | | 4,013 | | | | 158,754 | | | | (1,083 | ) | | | (0.0 | )(a) |
Benchmark Electronics, Inc. | | | 5,444 | | | | 184,552 | | | | 24,661 | | | | 0.1 | |
| | | | | | | | | | | | | | | | |
| | | 9,457 | | | | 343,306 | | | | 23,578 | | | | 0.1 | |
| | | | | | | | | | | | | | | | |
Health Care Providers & Services | | | | | | | | | | | | | |
WellCare Health Plans, Inc.* | | | 1,610 | | | | 477,526 | | | | 52,792 | | | | 0.2 | |
| | | | | | | | | | | | | | | | |
Hotels, Restaurants & Leisure | | | | | | | | | | | | | |
Bloomin’ Brands, Inc. | | | 9,322 | | | | 184,669 | | | | 10,721 | | | | 0.0 | (a) |
Caesars Entertainment Corp.* | | | 2,693 | | | | 33,070 | | | | 1,427 | | | | 0.0 | (a) |
| | | | | | | | | | | | | | | | |
| | | 12,015 | | | | 217,739 | | | | 12,148 | | | | 0.0 | (a) |
| | | | | | | | | | | | | | | | |
Insurance | | | | | | | | | | | | | |
Athene Holding Ltd.* | | | 4,391 | | | | 190,350 | | | | 22,789 | | | | 0.1 | |
| | | | | | | | | | | | | | | | |
Life Sciences Tools & Services | | | | | | | | | | | | | |
Waters Corp.* | | | 47 | | | | 9,946 | | | | 15 | | | | 0.0 | (a) |
| | | | | | | | | | | | | | | | |
Machinery | | | | | | | | | | | | | |
Milacron Holdings Corp.* | | | 10,339 | | | | 172,868 | | | | 4,963 | | | | 0.0 | (a) |
| | | | | | | | | | | | | | | | |
Media | | | | | | | | | | | | | |
Altice USA, Inc.* | | | 6,124 | | | | 189,538 | | | | 16,535 | | | | 0.1 | |
SEE NOTES TO FINANCIAL STATEMENTS.
| | | | | | |
| | | |
| 70 | | | | J.P. MORGAN EXCHANGE-TRADED FUNDS | | OCTOBER 31, 2019 |
| | | | | | | | | | | | | | | | |
| REFERENCE ENTITY | | SHARES | | | NOTIONAL
VALUE($) (1) | | | NET UNREALIZED
APPRECIATION
(DEPRECIATION)($) (2) | | | PERCENTAGE
OF NET
ASSETS (%) | |
| | | | |
Long Positions — continued | | | | | | | | | | | | | | | | |
| | | | |
Common Stocks — continued | | | | | | | | | | | | | | | | |
| | | | |
Media — continued | | | | | | | | | | | | | | | | |
Gannett Co., Inc. | | | 8,506 | | | | 92,290 | | | | 5,188 | | | | 0.0 | (a) |
| | | | | | | | | | | | | | | | |
| | | 14,630 | | | | 281,828 | | | | 21,723 | | | | 0.1 | |
| | | | | | | | | | | | | | | | |
Metals & Mining | | | | | | | | | | | | | |
Cleveland-Cliffs, Inc. | | | 24,521 | | | | 177,287 | | | | (1,471 | ) | | | (0.0 | )(a) |
| | | | | | | | | | | | | | | | |
Oil, Gas & Consumable Fuels | | | | | | | | | | | | | |
Arch Coal, Inc. | | | 370 | | | | 29,189 | | | | 547 | | | | 0.0 | (a) |
Carrizo Oil & Gas, Inc.* | | | 3,149 | | | | 23,177 | | | | (1,417 | ) | | | (0.0 | )(a) |
CNX Resources Corp.* | | | 25,166 | | | | 212,149 | | | | 33,219 | | | | 0.1 | |
Devon Energy Corp. | | | 2,675 | | | | 54,249 | | | | (1,471 | ) | | | (0.0 | )(a) |
| | | | | | | | | | | | | | | | |
| | | 31,360 | | | | 318,764 | | | | 30,878 | | | | 0.1 | |
| | | | | | | | | | | | | | | | |
Pharmaceuticals | | | | | | | | | | | | | |
Allergan plc | | | 2,613 | | | | 460,175 | | | | 21,636 | | | | 0.1 | |
Eli Lilly & Co. | | | 65 | | | | 7,407 | | | | 457 | | | | 0.0 | (a) |
| | | | | | | | | | | | | | | | |
| | | 2,678 | | | | 467,582 | | | | 22,093 | | | | 0.1 | |
| | | | | | | | | | | | | | | | |
Road & Rail | | | | | | | | | | | | | |
Genesee & Wyoming, Inc.* | | | 1,796 | | | | 199,410 | | | | 431 | | | | 0.0 | (a) |
| | | | | | | | | | | | | | | | |
Specialty Retail | | | | | | | | | | | | | |
Abercrombie & Fitch Co. | | | 12,071 | | | | 195,430 | | | | 19,072 | | | | 0.0 | (a) |
Conn’s, Inc.* | | | 7,075 | | | | 171,144 | | | | (4,882 | ) | | | (0.0 | )(a) |
Designer Brands, Inc. | | | 1,198 | | | | 19,767 | | | | (371 | ) | | | (0.0 | )(a) |
Genesco, Inc.* | | | 384 | | | | 14,918 | | | | 637 | | | | 0.0 | (a) |
| | | | | | | | | | | | | | | | |
| | | 20,728 | | | | 401,259 | | | | 14,456 | | | | 0.0 | (a) |
| | | | | | | | | | | | | | | | |
Technology Hardware, Storage & Peripherals | | | | | | | | | | | | | |
Stratasys Ltd.* | | | 600 | | | | 12,408 | | | | 504 | | | | 0.0 | (a) |
| | | | | | | | | | | | | | | | |
Total Long Positions of Total Return Basket Swap | | | 157,962 | | | | 4,694,471 | | | | 285,392 | | | | 1.0 | |
| | | | | | | | | | | | | | | | |
| |
Short Positions | | | | | |
| | | |
Common Stocks | | | | | | | | | | | | | |
Banks | | | | | | | | | | | | | |
Prosperity Bancshares, Inc. | | | (3,688 | ) | | | (254,546 | ) | | | (1,291 | ) | | | (0.0 | )(a) |
| | | | | | | | | | | | | | | | |
Biotechnology | | | | | | | | | | | | | |
AbbVie, Inc. | | | (196 | ) | | | (15,592 | ) | | | (1,000 | ) | | | (0.0 | )(a) |
Exact Sciences Corp.* | | | (2,591 | ) | | | (225,417 | ) | | | (6,305 | ) | | | (0.0 | )(a) |
| | | | | | | | | | | | | | | | |
| | | (2,787 | ) | | | (241,009 | ) | | | (7,305 | ) | | | (0.0 | )(a) |
| | | | | | | | | | | | | | | | |
Health Care Providers & Services | | | | | | | | | | | | | |
Centene Corp.* | | | (472 | ) | | | (25,054 | ) | | | (4,243 | ) | | | (0.0 | )(a) |
| | | | | | | | | | | | | | | | |
Hotels, Restaurants & Leisure | | | | | | | | | | | | | |
Eldorado Resorts, Inc.* | | | (240 | ) | | | (10,745 | ) | | | (1,130 | ) | | | (0.0 | )(a) |
| | | | | | | | | | | | | | | | |
Machinery | | | | | | | | | | | | | |
Hillenbrand, Inc. | | | (1,649 | ) | | | (50,772 | ) | | | (3,974 | ) | | | (0.0 | )(a) |
| | | | | | | | | | | | | | | | |
Media | | | | | | | | | | | | | |
New Media Investment Group, Inc. | | | (11,114 | ) | | | (97,914 | ) | | | (12,225 | ) | | | (0.1 | ) |
| | | | | | | | | | | | | | | | |
Oil, Gas & Consumable Fuels | | | | | | | | | | | | | |
Callon Petroleum Co.* | | | (32,774 | ) | | | (124,541 | ) | | | 6,882 | | | | 0.0 | (a) |
| | | | | | | | | | | | | | | | |
Total Short Positions of Total Return Basket Swap | | | (52,724 | ) | | | (804,581 | ) | | | (23,286 | ) | | | (0.1 | ) |
| | | | | | | | | | | | | | | | |
Total of Long and Short Positions of Total Return Basket Swap | | | 105,238 | | | | 3,889,890 | | | | 262,106 | | | | 0.9 | |
| | | | | | | | | | | | | | | | |
SEE NOTES TO FINANCIAL STATEMENTS.
| | | | | | | | |
| | | |
| OCTOBER 31, 2019 | | J.P. MORGAN EXCHANGE-TRADED FUNDS | | | | | 71 | |
JPMorgan Event Driven ETF
SCHEDULE OF PORTFOLIO INVESTMENTS
AS OF OCTOBER 31, 2019 (continued)
| | | | | | | | | | | | | | | | | | | | |
| COUNTERPARTY | | DESCRIPTION | | TERMINATION
DATE | | NOTIONAL
VALUE (1) | | | NET UNREALIZED
APPRECIATION
(DEPRECIATION) (2) | | | NET CASH
AND OTHER
RECEIVABLES
(PAYABLES) | | | VALUE | |
Goldman Sachs | | The Fund receives the total return on a portfolio of long and short equity positions and pays or receives the net of one dayOIS-RBA on long positions and short positions respectively, plus or minus a specified spread (rates range from (0.28)% to 0.28%), which is denominated in AUD based on the local currencies of the positions within the swaps. | | 12/21/2028 –
9/19/2029 | | $ | 197,933 | | | $ | (173 | ) | | $ | (134 | ) | | $ | (307 | ) |
| | | | | | | | | | | | | | | | | | | | |
| | | | | | | | | | | | | | | | |
| REFERENCE ENTITY | | SHARES | | | NOTIONAL
VALUE($) (1) | | | NET UNREALIZED
APPRECIATION
(DEPRECIATION)($) (2) | | | PERCENTAGE
OF NET
ASSETS (%) | |
Long Positions | | | | | |
| | | |
Common Stocks | | | | | | | | | | | | | |
Food Products | | | | | | | | | |
Bellamy’s Australia Ltd.* | | | 26,683 | | | | 235,278 | | | | (1,992 | ) | | | (0.0 | )(a) |
| | | | | | | | | | | | | | | | |
| |
Short Positions | | | | | |
Common Stocks | | | | | | | | | | | | | |
Health Care Providers & Services | | | | | | | | | | | | | |
Australian Pharmaceutical Industries Ltd. | | | (40,872 | ) | | | (37,345 | ) | | | 1,819 | | | | 0.0 | (a) |
| | | | | | | | | | | | | | | | |
Total of Long and Short Positions of Total Return Basket Swap | | | (14,189 | ) | | | 197,933 | | | | (173 | ) | | | 0.0 | (a) |
| | | | | | | | | | | | | | | | |
| | | | | | | | | | | | | | | | | | | | |
| COUNTERPARTY | | DESCRIPTION | | TERMINATION
DATE | | NOTIONAL
VALUE (1) | | | NET UNREALIZED
APPRECIATION
(DEPRECIATION) (2) | | | NET CASH
AND OTHER
RECEIVABLES
(PAYABLES) | | | VALUE | |
Goldman Sachs | | The Fund receives the total return on a portfolio of long equity positions and pays or receives the net of one day SONIA and one month LIBOR on long positions, plus or minus a specified spread of 0.18%, which is denominated in GBP based on the local currencies of the positions within the swaps. | | 8/22/2029 –
10/26/2029 | | $ | 239,666 | | | $ | (3,694 | ) | | $ | (895 | ) | | $ | (4,589 | ) |
| | | | | | | | | | | | | | | | | | | | |
| | | | | | | | | | | | | | | | |
| REFERENCE ENTITY | | SHARES | | | NOTIONAL
VALUE($) (1) | | | NET UNREALIZED
APPRECIATION
(DEPRECIATION)($) (2) | | | PERCENTAGE
OF NET
ASSETS (%) | |
Long Positions | | | | | |
| | | |
Common Stocks | | | | | | | | | | | | | |
Entertainment | | | | | | | | | |
Entertainment One Ltd. | | | 17,866 | | | | 129,028 | | | | (1,128 | ) | | | (0.0 | )(a) |
| | | | | | | | | | | | | | | | |
Internet & Direct Marketing Retail | | | | | | | | | | | | | |
Just Eat plc* | | | 11,619 | | | | 110,638 | | | | (2,566 | ) | | | (0.0 | )(a) |
| | | | | | | | | | | | | | | | |
Total Long Positions of Total Return Basket Swap | | | 29,485 | | | | 239,666 | | | | (3,694 | ) | | | 0.0 | (a) |
| | | | | | | | | | | | | | | | |
SEE NOTES TO FINANCIAL STATEMENTS.
| | | | | | |
| | | |
| 72 | | | | J.P. MORGAN EXCHANGE-TRADED FUNDS | | OCTOBER 31, 2019 |
| | | | | | | | | | | | | | | | | | | | |
| COUNTERPARTY | | DESCRIPTION | | TERMINATION
DATE | | NOTIONAL
VALUE (1) | | | NET UNREALIZED
APPRECIATION
(DEPRECIATION) (2) | | | NET CASH
AND OTHER
RECEIVABLES
(PAYABLES) | | | VALUE | |
Goldman Sachs | | The Fund receives the total return on a portfolio of long and short equity positions and pays or receives the net of one day CORRA and one month BA on long positions and short positions respectively, plus or minus a specified spread (rates range from (0.25)% to 0.18%), which is denominated in CAD based on the local currencies of the positions within the swaps. | | 8/23/2029 | | $ | (400 | ) | | $ | (708 | ) | | $ | 254 | | | $ | (454 | ) |
| | | | | | | | | | | | | | | | | | | | |
| | | | | | | | | | | | | | | | |
| REFERENCE ENTITY | | SHARES | | | NOTIONAL
VALUE($) (1) | | | NET UNREALIZED
APPRECIATION
(DEPRECIATION)($) (2) | | | PERCENTAGE
OF NET
ASSETS (%) | |
Long Positions | | | | | |
| | | |
Common Stocks | | | | | | | | | | | | | |
Oil, Gas & Consumable Fuels | | | | | | | | | |
Kinder Morgan Canada Ltd.(b) | | | 6,792 | | | | 72,195 | | | | (2,017 | ) | | | (0.0 | )(a) |
| | | | | | | | | | | | | | | | |
| |
Short Positions | | | | | |
| | | |
Common Stocks | | | | | | | | | | | | | |
Oil, Gas & Consumable Fuels | | | | | | | | | | | | | |
Pembina Pipeline Corp. | | | (2,062 | ) | | | (72,595 | ) | | | 1,309 | | | | 0.0 | (a) |
| | | | | | | | | | | | | | | | |
Total of Long and Short Positions of Total Return Basket Swap | | | 4,730 | | | | (400 | ) | | | (708 | ) | | | 0.0 | (a) |
| | | | | | | | | | | | | | | | |
| | | | | | | | | | | | | | | | | | | | |
| COUNTERPARTY | | DESCRIPTION | | TERMINATION
DATE | | NOTIONAL
VALUE (1) | | | NET UNREALIZED
APPRECIATION
(DEPRECIATION) (2) | | | NET CASH
AND OTHER
RECEIVABLES
(PAYABLES) | | | VALUE | |
Goldman Sachs | | The Fund receives the total return on a portfolio of long equity positions and pays or receives the net of one month EURIBOR on long positions, plus or minus a specified spread of 0.18%, which is denominated in EUR based on the local currencies of the positions within the swaps. | | 7/9/2029 | | $ | — | | | $ | — | | | $ | 9,839 | | | $ | 9,839 | |
| | | | | | | | | | | | | | | | | | | | |
The following reference rates, and their values as ofperiod-end, are used for security descriptions:
| | | | | | |
| | | | | VALUE | |
BA | | | | | 1.83 | % |
BBR | | | | | 0.75 | |
CORRA | | | | | 1.76 | |
EURIBOR | | | | | (0.44 | ) |
FEDEF | | | | | 1.58 | |
GBP LIBOR | | | | | 0.71 | |
OIS-RBA | | | | | 0.75 | |
SONIA | | | | | 0.71 | |
USD LIBOR | | | | | 1.78 | |
SEE NOTES TO FINANCIAL STATEMENTS.
| | | | | | | | |
| | | |
| OCTOBER 31, 2019 | | J.P. MORGAN EXCHANGE-TRADED FUNDS | | | | | 73 | |
JPMorgan Event Driven ETF
SCHEDULE OF PORTFOLIO INVESTMENTS
AS OF OCTOBER 31, 2019 (continued)
Summary of total swap contracts outstanding as of October 31, 2019:
| | | | | | | | |
| | | NET UPFRONT
PAYMENTS
(RECEIPTS) ($) | | | VALUE ($) | |
Assets | |
OTC Total return basket swaps contracts outstanding | | | — | | | | 303,970 | |
| | | | | | | | |
|
Liabilities | |
OTC Total return basket swaps contracts outstanding | | | — | | | | (8,336 | ) |
| | | | | | | | |
Abbreviations
| | |
| AUD | | Australian Dollar |
| BA | | Banker’s Acceptance Rate |
| BBR | | Bank Base Rate |
| CAD | | Canadian Dollar |
| CORRA | | Canadian Overnight Repo Rate Average |
| EUR | | Euro |
| EURIBOR | | Euro Interbank Offered Rate |
| FEDEF | | US Federal Fund Effective Rate (Continuous Series) |
| GBP | | British Pound |
| LIBOR | | London Interbank Offered Rate |
| OIS-RBA | | Overnight Indexed Swap-Reserve Bank Of Australia |
| SONIA | | Sterling Overnight Index Average |
| USD | | United States Dollar |
| | |
| (1) | | Notional value represents market value as of October 31, 2019 of these positions based on the securities’ last sale or closing price on the principal exchange on which the securities are traded. |
| (2) | | Unrealized appreciation (depreciation) represents the unrealized gain (loss) of the positions subsequent to the swap reset. |
| (a) | | Amount rounds to less than 0.1% of net assets. |
| (b) | | Security exempt from registration pursuant to Regulation S under the Securities Act of 1933, as amended. Regulation S applies to securities offerings that are made outside of the United States and do not involve direct selling efforts in the United States and as such may have restrictions on resale. |
| * | | Non-income producing security. |
SEE NOTES TO FINANCIAL STATEMENTS.
| | | | | | |
| | | |
| 74 | | | | J.P. MORGAN EXCHANGE-TRADED FUNDS | | OCTOBER 31, 2019 |
JPMorgan Long/Short ETF
SCHEDULE OF PORTFOLIO INVESTMENTS
AS OF OCTOBER 31, 2019
| | | | | | | | |
INVESTMENTS | |
SHARES | | | VALUE($) | |
Common Stocks — 62.8% | |
|
Airlines — 0.7% | |
| | |
Alaska Air Group, Inc. | | | 1,446 | | | | 100,396 | |
| | |
United Airlines Holdings, Inc.* | | | 1,107 | | | | 100,560 | |
| | | | | | | | |
| | |
| | | | | | | 200,956 | |
| | | | | | | | |
|
Auto Components — 0.3% | |
| | |
Gentex Corp. | | | 2,940 | | | | 82,467 | |
| | | | | | | | |
|
Banks — 0.6% | |
| | |
OFG Bancorp (Puerto Rico) | | | 4,292 | | | | 87,170 | |
| | |
Popular, Inc. (Puerto Rico) | | | 1,778 | | | | 96,830 | |
| | | | | | | | |
| | |
| | | | | | | 184,000 | |
| | | | | | | | |
|
Beverages — 0.6% | |
| | |
Coca-Cola European Partners plc (United Kingdom) | | | 1,703 | | | | 91,128 | |
| | |
Molson Coors Brewing Co., Class B | | | 1,681 | | | | 88,622 | |
| | | | | | | | |
| | |
| | | | | | | 179,750 | |
| | | | | | | | |
|
Capital Markets — 1.1% | |
| | |
Cohen & Steers, Inc. | | | 1,531 | | | | 100,189 | |
| | |
Legg Mason, Inc. | | | 2,644 | | | | 98,515 | |
| | |
Virtus Investment Partners, Inc. | | | 995 | | | | 107,938 | |
| | | | | | | | |
| | |
| | | | | | | 306,642 | |
| | | | | | | | |
|
Chemicals — 1.2% | |
| | |
CF Industries Holdings, Inc. | | | 1,938 | | | | 87,888 | |
| | |
Eastman Chemical Co. | | | 1,061 | | | | 80,678 | |
| | |
Huntsman Corp. | | | 3,628 | | | | 80,288 | |
| | |
Kraton Corp.* | | | 3,571 | | | | 80,062 | |
| | | | | | | | |
| | |
| | | | | | | 328,916 | |
| | | | | | | | |
|
Commercial Services & Supplies — 1.7% | |
| | |
ABM Industries, Inc. | | | 2,762 | | | | 100,703 | |
| | |
Brady Corp., Class A | | | 1,747 | | | | 98,426 | |
| | |
Deluxe Corp. | | | 2,093 | | | | 108,480 | |
| | |
Herman Miller, Inc. | | | 2,043 | | | | 94,999 | |
| | |
Tetra Tech, Inc. | | | 1,056 | | | | 92,368 | |
| | | | | | | | |
| | |
| | | | | | | 494,976 | |
| | | | | | | | |
|
Communications Equipment — 1.3% | |
| | |
Cisco Systems, Inc. | | | 1,845 | | | | 87,656 | |
| | |
CommScope Holding Co., Inc.* | | | 8,603 | | | | 96,353 | |
| | |
Juniper Networks, Inc. | | | 3,729 | | | | 92,554 | |
| | |
NetScout Systems, Inc.* | | | 4,326 | | | | 104,776 | |
| | | | | | | | |
| | |
| | | | | | | 381,339 | |
| | | | | | | | |
|
Consumer Finance — 0.6% | |
| | |
Ally Financial, Inc. | | | 3,097 | | | | 94,861 | |
| | |
Santander Consumer USA Holdings, Inc. | | | 3,544 | | | | 88,884 | |
| | | | | | | | |
| | |
| | | | | | | 183,745 | |
| | | | | | | | |
| | | | | | | | |
INVESTMENTS | |
SHARES | | | VALUE($) | |
| | | | | | | | |
|
Containers & Packaging — 0.6% | |
| | |
Silgan Holdings, Inc. | | | 2,655 | | | | 81,695 | |
| | |
Sonoco Products Co. | | | 1,426 | | | | 82,280 | |
| | | | | | | | |
| | |
| | | | | | | 163,975 | |
| | | | | | | | |
|
Distributors — 0.3% | |
| | |
Core-Mark Holding Co., Inc. | | | 3,008 | | | | 91,804 | |
| | | | | | | | |
|
Diversified Consumer Services — 0.6% | |
| | |
H&R Block, Inc. | | | 3,211 | | | | 80,243 | |
| | |
K12, Inc.* | | | 4,167 | | | | 82,465 | |
| | | | | | | | |
| | |
| | | | | | | 162,708 | |
| | | | | | | | |
|
Diversified Telecommunication Services — 0.7% | |
| | |
CenturyLink, Inc. | | | 7,684 | | | | 99,431 | |
| | |
Verizon Communications, Inc. | | | 1,591 | | | | 96,208 | |
| | | | | | | | |
| | |
| | | | | | | 195,639 | |
| | | | | | | | |
|
Electric Utilities — 1.0% | |
| | |
Exelon Corp. | | | 2,140 | | | | 97,349 | |
| | |
OGE Energy Corp. | | | 2,153 | | | | 92,708 | |
| | |
Pinnacle West Capital Corp. | | | 986 | | | | 92,802 | |
| | | | | | | | |
| | |
| | | | | | | 282,859 | |
| | | | | | | | |
|
Electrical Equipment — 1.9% | |
| | |
Atkore International Group, Inc.* | | | 3,196 | | | | 110,901 | |
| | |
Eaton Corp. plc | | | 1,229 | | | | 107,058 | |
| | |
Generac Holdings, Inc.* | | | 1,077 | | | | 104,017 | |
| | |
nVent Electric plc | | | 4,913 | | | | 113,294 | |
| | |
Regal Beloit Corp. | | | 1,378 | | | | 102,041 | |
| | | | | | | | |
| | |
| | | | | | | 537,311 | |
| | | | | | | | |
|
Electronic Equipment, Instruments & Components — 2.1% | |
| | |
CDW Corp. | | | 767 | | | | 98,107 | |
| | |
Dolby Laboratories, Inc., Class A | | | 1,542 | | | | 99,197 | |
| | |
Fabrinet (Thailand)* | | | 1,918 | | | | 107,849 | |
| | |
Insight Enterprises, Inc.* | | | 1,559 | | | | 95,691 | |
| | |
Tech Data Corp.* | | | 800 | | | | 97,200 | |
| | |
Zebra Technologies Corp., Class A* | | | 479 | | | | 113,940 | |
| | | | | | | | |
| | |
| | | | | | | 611,984 | |
| | | | | | | | |
|
Energy Equipment & Services — 0.3% | |
| | |
ProPetro Holding Corp.* | | | 11,467 | | | | 88,869 | |
| | | | | | | | |
|
Entertainment — 0.7% | |
| | |
IMAX Corp.* | | | 4,517 | | | | 96,438 | |
| | |
Marcus Corp. (The) | | | 2,735 | | | | 98,733 | |
| | | | | | | | |
| | |
| | | | | | | 195,171 | |
| | | | | | | | |
|
Food & Staples Retailing — 0.3% | |
| | |
Walmart, Inc. | | | 803 | | | | 94,160 | |
| | | | | | | | |
SEE NOTES TO FINANCIAL STATEMENTS.
| | | | | | | | |
| | | |
| OCTOBER 31, 2019 | | J.P. MORGAN EXCHANGE-TRADED FUNDS | | | | | 75 | |
JPMorgan Long/Short ETF
SCHEDULE OF PORTFOLIO INVESTMENTS
AS OF OCTOBER 31, 2019 (continued)
| | | | | | | | |
INVESTMENTS | |
SHARES | | | VALUE($) | |
Common Stocks — continued | |
|
Food Products — 2.6% | |
| | |
B&G Foods, Inc. (a) | | | 5,631 | | | | 87,562 | |
| | |
General Mills, Inc. | | | 1,938 | | | | 98,567 | |
| | |
Hershey Co. (The) | | | 685 | | | | 100,606 | |
| | |
Hostess Brands, Inc.* | | | 6,952 | | | | 88,847 | |
| | |
Ingredion, Inc. | | | 1,118 | | | | 88,322 | |
| | |
Mondelez International, Inc., Class A | | | 1,703 | | | | 89,322 | |
| | |
TreeHouse Foods, Inc.* | | | 1,830 | | | | 98,857 | |
| | |
Tyson Foods, Inc., Class A | | | 1,184 | | | | 98,023 | |
| | | | | | | | |
| | |
| | | | | | | 750,106 | |
| | | | | | | | |
|
Health Care Equipment & Supplies — 2.4% | |
| | |
Atrion Corp. | | | 125 | | | | 105,429 | |
| | |
Baxter International, Inc. | | | 1,258 | | | | 96,489 | |
| | |
Danaher Corp. | | | 697 | | | | 96,060 | |
| | |
Dentsply Sirona, Inc. | | | 1,662 | | | | 91,044 | |
| | |
Hill-Rom Holdings, Inc. | | | 943 | | | | 98,723 | |
| | |
Integer Holdings Corp.* | | | 1,283 | | | | 99,355 | |
| | |
STERIS plc | | | 682 | | | | 96,551 | |
| | | | | | | | |
| | |
| | | | | | | 683,651 | |
| | | | | | | | |
|
Health Care Providers & Services — 1.7% | |
| | |
Chemed Corp. | | | 235 | | | | 92,569 | |
| | |
Encompass Health Corp. | | | 1,515 | | | | 96,990 | |
| | |
Ensign Group, Inc. (The) | | | 2,425 | | | | 102,456 | |
| | |
Premier, Inc., Class A* | | | 2,827 | | | | 92,104 | |
| | |
UnitedHealth Group, Inc. | | | 432 | | | | 109,166 | |
| | | | | | | | |
| | |
| | | | | | | 493,285 | |
| | | | | | | | |
|
Hotels, Restaurants & Leisure — 0.9% | |
| | |
Dine Brands Global, Inc. | | | 1,057 | | | | 77,320 | |
| | |
Starbucks Corp. | | | 1,049 | | | | 88,703 | |
| | |
Wyndham Destinations, Inc. | | | 1,698 | | | | 78,804 | |
| | | | | | | | |
| | |
| | | | | | | 244,827 | |
| | | | | | | | |
|
Household Durables — 2.1% | |
| | |
Garmin Ltd. | | | 903 | | | | 84,656 | |
| | |
Helen of Troy Ltd.* | | | 573 | | | | 85,813 | |
| | |
KB Home | | | 2,471 | | | | 88,190 | |
| | |
La-Z-Boy, Inc. | | | 2,314 | | | | 82,170 | |
| | |
Meritage Homes Corp.* | | | 1,220 | | | | 87,950 | |
| | |
NVR, Inc.* | | | 21 | | | | 76,368 | |
| | |
PulteGroup, Inc. | | | 2,059 | | | | 80,795 | |
| | | | | | | | |
| | |
| | | | | | | 585,942 | |
| | | | | | | | |
|
Household Products — 1.0% | |
| | |
Church & Dwight Co., Inc. | | | 1,247 | | | | 87,215 | |
| | |
Kimberly-Clark Corp. | | | 737 | | | | 97,933 | |
| | |
Procter & Gamble Co. (The) | | | 763 | | | | 95,001 | |
| | | | | | | | |
| | |
| | | | | | | 280,149 | |
| | | | | | | | |
| | | | | | | | |
INVESTMENTS | |
SHARES | | | VALUE($) | |
| | | | | | | | |
|
Independent Power and Renewable Electricity Producers — 0.9% | |
| | |
AES Corp. | | | 5,633 | | | | 96,043 | |
| | |
Atlantica Yield plc (Spain) | | | 3,750 | | | | 90,038 | |
| | |
Clearway Energy, Inc., Class C | | | 4,650 | | | | 84,304 | |
| | | | | | | | |
| | |
| | | | | | | 270,385 | |
| | | | | | | | |
|
Insurance — 0.7% | |
| | |
First American Financial Corp. | | | 1,481 | | | | 91,496 | |
| | |
MetLife, Inc. | | | 2,142 | | | | 100,224 | |
| | | | | | | | |
| | |
| | | | | | | 191,720 | |
| | | | | | | | |
|
IT Services — 4.7% | |
| | |
Accenture plc, Class A | | | 515 | | | | 95,491 | |
| | |
Akamai Technologies, Inc.* | | | 1,066 | | | | 92,209 | |
| | |
Automatic Data Processing, Inc. | | | 603 | | | | 97,825 | |
| | |
Broadridge Financial Solutions, Inc. | | | 788 | | | | 98,673 | |
| | |
CACI International, Inc., Class A* | | | 415 | | | | 92,856 | |
| | |
Cardtronics plc, Class A* | | | 2,721 | | | | 93,222 | |
| | |
CSG Systems International, Inc. | | | 1,874 | | | | 108,017 | |
| | |
Euronet Worldwide, Inc.* | | | 645 | | | | 90,345 | |
| | |
EVERTEC, Inc. (Puerto Rico) | | | 3,015 | | | | 92,229 | |
| | |
ManTech International Corp., Class A | | | 1,388 | | | | 109,902 | |
| | |
Mastercard, Inc., Class A | | | 337 | | | | 93,285 | |
| | |
MAXIMUS, Inc. | | | 1,274 | | | | 97,767 | |
| | |
Perficient, Inc.* | | | 2,423 | | | | 94,982 | |
| | |
Visa, Inc., Class A | | | 506 | | | | 90,503 | |
| | | | | | | | |
| | |
| | | | | | | 1,347,306 | |
| | | | | | | | |
|
Life Sciences Tools & Services — 1.3% | |
| | |
Agilent Technologies, Inc. | | | 1,214 | | | | 91,960 | |
| | |
Charles River Laboratories International, Inc.* | | | 729 | | | | 94,755 | |
| | |
ICON plc (Ireland)* | | | 653 | | | | 95,926 | |
| | |
Medpace Holdings, Inc.* | | | 1,231 | | | | 90,639 | |
| | | | | | | | |
| | |
| | | | | | | 373,280 | |
| | | | | | | | |
|
Machinery — 2.8% | |
| | |
AGCO Corp. | | | 1,347 | | | | 103,301 | |
| | |
Allison Transmission Holdings, Inc. | | | 2,197 | | | | 95,811 | |
| | |
Cummins, Inc. | | | 579 | | | | 99,866 | |
| | |
ITT, Inc. | | | 1,700 | | | | 101,065 | |
| | |
Meritor, Inc.* | | | 4,291 | | | | 94,531 | |
| | |
Oshkosh Corp. | | | 1,229 | | | | 104,932 | |
| | |
Snap-on, Inc. | | | 581 | | | | 94,511 | |
| | |
Watts Water Technologies, Inc., Class A | | | 1,084 | | | | 101,083 | |
| | | | | | | | |
| | |
| | | | | | | 795,100 | |
| | | | | | | | |
|
Media — 2.3% | |
| | |
AMC Networks, Inc., Class A* | | | 2,012 | | | | 87,623 | |
| | |
Comcast Corp., Class A | | | 1,967 | | | | 88,161 | |
SEE NOTES TO FINANCIAL STATEMENTS.
| | | | | | |
| | | |
| 76 | | | | J.P. MORGAN EXCHANGE-TRADED FUNDS | | OCTOBER 31, 2019 |
| | | | | | | | |
INVESTMENTS | |
SHARES | | | VALUE($) | |
Common Stocks — continued | |
|
Media — continued | |
| | |
Gray Television, Inc.* | | | 6,374 | | | | 104,597 | |
| | |
Nexstar Media Group, Inc., Class A | | | 995 | | | | 96,804 | |
| | |
Omnicom Group, Inc. | | | 1,259 | | | | 97,182 | |
| | |
Sinclair Broadcast Group, Inc., Class A | | | 2,441 | | | | 97,249 | |
| | |
TEGNA, Inc. | | | 6,582 | | | | 98,927 | |
| | | | | | | | |
| | |
| | | | | | | 670,543 | |
| | | | | | | | |
|
Metals & Mining — 0.8% | |
| | |
Schnitzer Steel Industries, Inc., Class A | | | 3,883 | | | | 82,863 | |
| | |
Steel Dynamics, Inc. | | | 2,697 | | | | 81,881 | |
| | |
Warrior Met Coal, Inc. | | | 3,662 | | | | 71,336 | |
| | | | | | | | |
| | |
| | | | | | | 236,080 | |
| | | | | | | | |
|
Multiline Retail — 0.6% | |
| | |
Kohl’s Corp. | | | 1,561 | | | | 80,017 | |
| | |
Nordstrom, Inc. (a) | | | 2,323 | | | | 83,396 | |
| | | | | | | | |
| | |
| | | | | | | 163,413 | |
| | | | | | | | |
|
Multi-Utilities — 0.3% | |
| | |
NorthWestern Corp. | | | 1,268 | | | | 91,955 | |
| | | | | | | | |
|
Oil, Gas & Consumable Fuels — 3.1% | |
| | |
Arch Coal, Inc., Class A | | | 1,287 | | | | 101,531 | |
| | |
Chevron Corp. | | | 845 | | | | 98,138 | |
| | |
ConocoPhillips | | | 1,740 | | | | 96,048 | |
| | |
CVR Energy, Inc. | | | 2,214 | | | | 104,988 | |
| | |
Delek US Holdings, Inc. | | | 2,421 | | | | 96,719 | |
| | |
HollyFrontier Corp. | | | 1,807 | | | | 99,277 | |
| | |
Peabody Energy Corp. | | | 6,703 | | | | 70,583 | |
| | |
Phillips 66 | | | 909 | | | | 106,189 | |
| | |
Renewable Energy Group, Inc.* | | | 6,232 | | | | 101,831 | |
| | | | | | | | |
| | |
| | | | | | | 875,304 | |
| | | | | | | | |
|
Paper & Forest Products — 0.9% | |
| | |
Domtar Corp. | | | 2,244 | | | | 81,659 | |
| | |
Louisiana-Pacific Corp. | | | 2,875 | | | | 84,036 | |
| | |
Schweitzer-Mauduit International, Inc. | | | 2,059 | | | | 83,369 | |
| | | | | | | | |
| | |
| | | | | | | 249,064 | |
| | | | | | | | |
|
Personal Products — 0.4% | |
| | |
Medifast, Inc. | | | 938 | | | | 104,062 | |
| | | | | | | | |
|
Pharmaceuticals — 2.1% | |
| | |
Horizon Therapeutics plc* | | | 3,601 | | | | 104,105 | |
| | |
Jazz Pharmaceuticals plc* | | | 791 | | | | 99,373 | |
| | |
Johnson & Johnson | | | 715 | | | | 94,409 | |
| | |
Merck & Co., Inc. | | | 1,129 | | | | 97,839 | |
| | |
Pfizer, Inc. | | | 2,659 | | | | 102,026 | |
| | |
Taro Pharmaceutical Industries Ltd. | | | 1,251 | | | | 101,131 | |
| | | | | | | | |
| | |
| | | | | | | 598,883 | |
| | | | | | | | |
| | | | | | | | |
INVESTMENTS | |
SHARES | | | VALUE($) | |
| | | | | | | | |
|
Professional Services — 1.0% | |
| | |
FTI Consulting, Inc.* | | | 884 | | | | 96,241 | |
| | |
Korn Ferry | | | 2,644 | | | | 97,008 | |
| | |
Robert Half International, Inc. | | | 1,615 | | | | 92,491 | |
| | | | | | | | |
| | |
| | | | | | | 285,740 | |
| | | | | | | | |
|
Road & Rail — 0.7% | |
| | |
ArcBest Corp. | | | 3,396 | | | | 98,111 | |
| | |
CSX Corp. | | | 1,423 | | | | 99,994 | |
| | | | | | | | |
| | |
| | | | | | | 198,105 | |
| | | | | | | | |
|
Semiconductors & Semiconductor Equipment — 4.0% | |
| | |
Cabot Microelectronics Corp. | | | 659 | | | | 99,588 | |
| | |
Cirrus Logic, Inc.* | | | 1,696 | | | | 115,260 | |
| | |
Diodes, Inc.* | | | 2,237 | | | | 104,356 | |
| | |
Intel Corp. | | | 1,891 | | | | 106,898 | |
| | |
KLA Corp. | | | 602 | | | | 101,762 | |
| | |
Kulicke & Soffa Industries, Inc. (Singapore) | | | 4,156 | | | | 98,684 | |
| | |
Lam Research Corp. | | | 352 | | | | 95,406 | |
| | |
MKS Instruments, Inc. | | | 867 | | | | 93,827 | |
| | |
Qorvo, Inc.* | | | 1,299 | | | | 105,037 | |
| | |
Rambus, Inc.* | | | 7,000 | | | | 96,915 | |
| | |
Teradyne, Inc. | | | 1,534 | | | | 93,912 | |
| | |
Xperi Corp. | | | 929 | | | | 18,864 | |
| | | | | | | | |
| | |
| | | | | | | 1,130,509 | |
| | | | | | | | |
|
Software — 2.4% | |
| | |
Check Point Software Technologies Ltd. (Israel)* | | | 802 | | | | 90,153 | |
| | |
Citrix Systems, Inc. | | | 987 | | | | 107,445 | |
| | |
Intuit, Inc. | | | 359 | | | | 92,442 | |
| | |
LogMeIn, Inc. | | | 1,417 | | | | 93,069 | |
| | |
Microsoft Corp. | | | 667 | | | | 95,628 | |
| | |
Oracle Corp. | | | 1,746 | | | | 95,140 | |
| | |
Progress Software Corp. | | | 2,504 | | | | 99,859 | |
| | | | | | | | |
| | |
| | | | | | | 673,736 | |
| | | | | | | | |
|
Specialty Retail — 3.5% | |
| | |
Aaron’s, Inc. | | | 1,233 | | | | 92,389 | |
| | |
Abercrombie & Fitch Co., Class A | | | 5,411 | | | | 87,604 | |
| | |
American Eagle Outfitters, Inc. | | | 5,329 | | | | 81,960 | |
| | |
Best Buy Co., Inc. | | | 1,100 | | | | 79,013 | |
| | |
Dick’s Sporting Goods, Inc. | | | 1,963 | | | | 76,420 | |
| | |
Foot Locker, Inc. | | | 1,850 | | | | 80,494 | |
| | |
Genesco, Inc.* | | | 2,079 | | | | 80,769 | |
| | |
Office Depot, Inc. | | | 44,835 | | | | 92,360 | |
| | |
Rent-A-Center, Inc. | | | 3,312 | | | | 85,681 | |
| | |
Signet Jewelers Ltd. | | | 4,985 | | | | 79,959 | |
SEE NOTES TO FINANCIAL STATEMENTS.
| | | | | | | | |
| | | |
| OCTOBER 31, 2019 | | J.P. MORGAN EXCHANGE-TRADED FUNDS | | | | | 77 | |
JPMorgan Long/Short ETF
SCHEDULE OF PORTFOLIO INVESTMENTS
AS OF OCTOBER 31, 2019 (continued)
| | | | | | | | |
INVESTMENTS | |
SHARES | | | VALUE($) | |
Common Stocks — continued | |
|
Specialty Retail — continued | |
| | |
Williams-Sonoma, Inc. | | | 1,171 | | | | 78,211 | |
| | |
Zumiez, Inc.* | | | 2,559 | | | | 81,658 | |
| | | | | | | | |
| | |
| | | | | | | 996,518 | |
| | | | | | | | |
|
Technology Hardware, Storage & Peripherals — 1.1% | |
| | |
Apple, Inc. | | | 418 | | | | 103,982 | |
| | |
NetApp, Inc. | | | 1,852 | | | | 103,490 | |
| | |
Xerox Holdings Corp. | | | 3,308 | | | | 112,240 | |
| | | | | | | | |
| | |
| | | | | | | 319,712 | |
| | | | | | | | |
|
Textiles, Apparel & Luxury Goods — 1.2% | |
| | |
Carter’s, Inc. | | | 841 | | | | 84,302 | |
| | |
Columbia Sportswear Co. | | | 927 | | | | 83,847 | |
| | |
Deckers Outdoor Corp.* | | | 532 | | | | 81,343 | |
| | |
Ralph Lauren Corp. | | | 837 | | | | 80,402 | |
| | | | | | | | |
| | |
| | | | | | | 329,894 | |
| | | | | | | | |
|
Thrifts & Mortgage Finance — 0.3% | |
| | |
Radian Group, Inc. | | | 3,834 | | | | 96,233 | |
| | | | | | | | |
|
Trading Companies & Distributors — 0.4% | |
| | |
BMC Stock Holdings, Inc.* | | | 3,772 | | | | 101,806 | |
| | | | | | | | |
| | |
Total Common Stocks
(Cost $16,779,883) | | | | | | | 17,904,579 | |
| | | | | | | | |
| |
Short-Term Investments — 36.9% | | | | |
| |
Investment Companies — 28.6% | | | | |
| | |
JPMorgan Prime Money Market Fund Class IM Shares, 1.94% (b)(c)
(Cost $8,132,758) | | | 8,130,318 | | | | 8,133,570 | |
| | | | | | | | |
|
Investment of Cash Collateral From Securities Loaned — 0.5% | |
| | |
JPMorgan U.S. Government Money Market Fund Class IM Shares, 1.70% (b)(c)
(Cost $143,604) | | | 143,604 | | | | 143,604 | |
| | | | | | | | |
| | | | | | | | |
| INVESTMENTS | | PRINCIPAL
AMOUNT ($) | | | VALUE($) | |
| | | | | | | | |
| |
U.S. Treasury Obligations — 7.8% | | | | |
| | |
U.S. Treasury Bills | | | | | | | | |
| | |
1.94%, 5/21/2020 (d) | | | 2,000,000 | | | | 1,982,897 | |
| | |
1.94%, 6/18/2020 (d) | | | 247,000 | | | | 244,599 | |
| | | | | | | | |
| | |
Total U.S. Treasury Obligations
(Cost $2,222,550) | | | | | | | 2,227,496 | |
| | | | | | | | |
| | |
Total Short-Term Investments
(Cost $10,498,912) | | | | | | | 10,504,670 | |
| | | | | | | | |
Total Investments — 99.7%
(Cost $27,278,795) | | | | | | | 28,409,249 | |
Other Assets Less Liabilities — 0.3% | | | | | | | 89,739 | |
| | | | | | | | |
NET ASSETS — 100.0% | | | | | | | 28,498,988 | |
| | | | | | | | |
Percentages indicated are based on net assets.
| | |
| (a) | | The security or a portion of this security is on loan at October 31, 2019. The total value of securities on loan at October 31, 2019 is $142,631. |
| (b) | | Investment in an affiliated fund, which is registered under the Investment Company Act of 1940, as amended, and is advised by J.P. Morgan Investment Management Inc. |
| (c) | | The rate shown is the current yield as of October 31, 2019. |
| (d) | | The rate shown is the effective yield as of October 31, 2019. |
| * | | Non-income producing security. |
| | | | | | | | | | | | | | | | | | | | |
| Futures contracts outstanding as of October 31, 2019: | |
| DESCRIPTION | | NUMBER OF
CONTRACTS | | | EXPIRATION
DATE | | | TRADING
CURRENCY | | | NOTIONAL
AMOUNT ($) | | | VALUE AND UNREALIZED
APPRECIATION
(DEPRECIATION) ($) | |
| | | | | |
Long Contracts | | | | | | | | | | | | | | | | | | | | |
| | | | | |
| CAC 40 10 Euro Index | | | 7 | | | | 11/2019 | | | | EUR | | | | 447,893 | | | | 2,616 | |
| | | | | |
| IBEX 35 Index | | | 1 | | | | 11/2019 | | | | EUR | | | | 103,577 | | | | (239 | ) |
| | | | | |
| DAX Index | | | 1 | | | | 12/2019 | | | | EUR | | | | 359,322 | | | | 14,241 | |
| | | | | |
| EURO STOXX 50 Index | | | 15 | | | | 12/2019 | | | | EUR | | | | 603,098 | | | | 14,418 | |
| | | | | |
| FTSE 100 Index | | | 3 | | | | 12/2019 | | | | GBP | | | | 281,447 | | | | (2,334 | ) |
| | | | | |
| FTSE/MIB Index | | | 4 | | | | 12/2019 | | | | EUR | | | | 505,992 | | | | 14,713 | |
| | | | | |
| S&P 500E-Mini Index | | | 3 | | | | 12/2019 | | | | USD | | | | 455,250 | | | | 3,924 | |
| | | | | |
| SPI 200 Index | | | 5 | | | | 12/2019 | | | | AUD | | | | 571,547 | | | | 519 | |
| | | | | | | | | | | | | | | | | | | | |
| | | | | |
| | | | | | | | | | | | | | | | | | | 47,858 | |
| | | | | | | | | | | | | | | | | | | | |
SEE NOTES TO FINANCIAL STATEMENTS.
| | | | | | |
| | | |
| 78 | | | | J.P. MORGAN EXCHANGE-TRADED FUNDS | | OCTOBER 31, 2019 |
| | | | | | | | | | | | | | | | | | | | |
| DESCRIPTION | | NUMBER OF
CONTRACTS | | | EXPIRATION
DATE | | | TRADING
CURRENCY | | | NOTIONAL
AMOUNT ($) | | | VALUE AND UNREALIZED
APPRECIATION
(DEPRECIATION) ($) | |
| | | | | |
Short Contracts | | | | | | | | | | | | | | | | | | | | |
| | | | | |
| Hang Seng Index | | | (2) | | | | 11/2019 | | | | HKD | | | | (343,357 | ) | | | 360 | |
| | | | | | | | | | | | | | | | | | | | |
| | | | | |
| | | | | | | | | | | | | | | | | | | 360 | |
| | | | | | | | | | | | | | | | | | | | |
| | | | | |
| | | | | | | | | | | | | | | | | | | 48,218 | |
| | | | | | | | | | | | | | | | | | | | |
Abbreviations
| | |
| AUD | | Australian Dollar |
| CAC | | Continuous Assisted Quotation |
| DAX | | Deutscher Aktien Index |
| EUR | | Euro |
| FTSE | | Financial Times and the London Stock Exchange |
| GBP | | British Pound |
| | |
| HKD | | Hong Kong Dollar |
| IBEX | | International Business Exchange |
| MIB | | Milan, Italian Stock Exchange |
| SPI | | Australian Securities Exchange |
| USD | | United States Dollar |
| | | | | | | | | | | | | | | | | | | | |
| Forward foreign currency exchange contracts outstanding as of October 31, 2019: | |
| CURRENCY PURCHASED | | | CURRENCY SOLD | | | COUNTERPARTY | | SETTLEMENT
DATE | | | UNREALIZED
APPRECIATION
(DEPRECIATION)($) | |
| | | | | | |
| EUR | | | 49,990 | | | USD | | | 54,947 | | | BNP Paribas | | | 11/12/2019 | | | | 839 | |
| | | | | | |
| EUR | | | 146,120 | | | USD | | | 162,655 | | | Standard Chartered Bank | | | 11/12/2019 | | | | 406 | |
| | | | | | |
| USD | | | 48,001 | | | JPY | | | 5,116,319 | | | Merrill Lynch International | | | 11/12/2019 | | | | 602 | |
| | | | | | | | | | | | | | | | | | | | |
| Total unrealized appreciation | | | | 1,847 | |
| | | | | | | | | | | | | | | | | | | | |
| | | | | | |
| USD | | | 290,870 | | | EUR | | | 265,461 | | | Citibank, NA | | | 11/12/2019 | | | | (5,370 | ) |
| | | | | | |
| USD | | | 169,978 | | | EUR | | | 152,046 | | | Merrill Lynch International | | | 12/11/2019 | | | | (31 | ) |
| | | | | | | | | | | | | | | | | | | | |
| |
| Total unrealized depreciation | | | | (5,401 | ) |
| | | | | | | | | | | | | | | | | | | | |
| |
| Net unrealized depreciation | | | | (3,554 | ) |
| | | | | | | | | | | | | | | | | | | | |
Abbreviations
| | |
| EUR | | Euro |
| JPY | | Japanese Yen |
| USD | | United States Dollar |
| | | | | | | | | | | | | | | | | | | | |
| Over-the-Counter (“OTC”) Total Return Basket Swaps Outstanding at October 31, 2019 | |
| COUNTERPARTY | | DESCRIPTION | | TERMINATION
DATE | | NOTIONAL
VALUE (1) | | | NET UNREALIZED
APPRECIATION
(DEPRECIATION) (2) | | | NET CASH
AND OTHER
RECEIVABLES
(PAYABLES) | | | VALUE | |
| Bank of America | | The Fund receives the total return on a portfolio of long and short equity positions and pays or receives the net of one month LIBOR on long positions and short positions respectively, plus or minus a specified spread (rates range from 0.00% to 0.20%), which is denominated in GBP based on the local currencies of the positions within the swaps. | | 4/30/2020 –
9/30/2020 | | $ | 1,167,546 | | | $ | 58,552 | | | $ | 10,557 | | | $ | 69,109 | |
| �� | | | | | | | | | | | | | | | | | | | |
SEE NOTES TO FINANCIAL STATEMENTS.
| | | | | | | | |
| | | |
| OCTOBER 31, 2019 | | J.P. MORGAN EXCHANGE-TRADED FUNDS | | | | | 79 | |
JPMorgan Long/Short ETF
SCHEDULE OF PORTFOLIO INVESTMENTS
AS OF OCTOBER 31, 2019 (continued)
| | | | | | | | | | | | | | | | |
| REFERENCE ENTITY | | SHARES | | | NOTIONAL
VALUE($) (1) | | | NET UNREALIZED
APPRECIATION
(DEPRECIATION)($) (2) | | | PERCENTAGE
OF NET
ASSETS (%) | |
Long Positions | | | | | | | | | | | | | | | | |
| | | | |
Common Stocks | | | | | | | | | | | | | | | | |
Aerospace & Defense | | | | | | | | | | | | | |
Meggitt plc | | | 2,688 | | | | 21,750 | | | | (59 | ) | | | (0.0 | )(a) |
| | | | | | | | | | | | | | | | |
Airlines | | | | | | | | | | | | | |
Wizz Air Holdings plc* (b) | | | 1,733 | | | | 85,819 | | | | 4,804 | | | | 0.0 | (a) |
| | | | | | | | | | | | | | | | |
Capital Markets | | | | | | | | | | | | | |
3i Group plc | | | 6,204 | | | | 90,658 | | | | 5,391 | | | | 0.0 | (a) |
| | | | | | | | | | | | | | | | |
Distributors | | | | | | | | | | | | | |
Inchcape plc | | | 6,911 | | | | 57,780 | | | | 2,757 | | | | 0.0 | (a) |
| | | | | | | | | | | | | | | | |
Energy Equipment & Services | | | | | | | | | | | | | |
Petrofac Ltd. | | | 13,153 | | | | 65,645 | | | | (1,201 | ) | | | (0.0 | )(a) |
| | | | | | | | | | | | | | | | |
Food Products | | | | | | | | | | | | | |
Greencore Group plc | | | 30,797 | | | | 92,592 | | | | 3,910 | | | | 0.0 | (a) |
| | | | | | | | | | | | | | | | |
Hotels, Restaurants & Leisure | | | | | | | | | | | | | |
Greggs plc | | | 2,763 | | | | 63,552 | | | | 919 | | | | 0.0 | (a) |
| | | | | | | | | | | | | | | | |
Household Durables | | | | | | | | | | | | | |
Barratt Developments plc | | | 8,203 | | | | 67,083 | | | | 4,563 | | | | 0.0 | (a) |
Berkeley Group Holdings plc | | | 1,260 | | | | 71,819 | | | | 6,154 | | | | 0.0 | (a) |
Bovis Homes Group plc | | | 4,739 | | | | 71,822 | | | | 6,389 | | | | 0.0 | (a) |
Redrow plc | | | 8,554 | | | | 66,685 | | | | 1,015 | | | | 0.0 | (a) |
Taylor Wimpey plc | | | 32,215 | | | | 69,092 | | | | 7,290 | | | | 0.1 | |
| | | | | | | | | | | | | | | | |
| | | 54,971 | | | | 346,501 | | | | 25,411 | | | | 0.1 | |
| | | | | | | | | | | | | | | | |
Independent Power and Renewable Electricity Producers | | | | | | | | | | | | | |
Drax Group plc | | | 21,555 | | | | 82,866 | | | | 8,188 | | | | 0.0 | (a) |
| | | | | | | | | | | | | | | | |
Metals & Mining | | | | | | | | | | | | | |
Anglo American plc | | | 2,361 | | | | 60,765 | | | | 1,936 | | | | 0.0 | (a) |
BHP Group plc | | | 2,594 | | | | 55,020 | | | | (1,948 | ) | | | (0.0 | )(a) |
Rio Tinto plc | | | 969 | | | | 50,448 | | | | (1,048 | ) | | | (0.0 | )(a) |
| | | | | | | | | | | | | | | | |
| | | 5,924 | | | | 166,233 | | | | (1,060 | ) | | | (0.0 | )(a) |
| | | | | | | | | | | | | | | | |
Multi-Utilities | | | | | | | | | | | | | | | | |
Centrica plc | | | 78,569 | | | | 73,939 | | | | 6,111 | | | | 0.0 | (a) |
| | | | | | | | | | | | | | | | |
Oil, Gas & Consumable Fuels | | | | | | | | | | | | | | | | |
Royal Dutch Shell plc | | | 764 | | | | 22,003 | | | | (794 | ) | | | (0.0 | )(a) |
Tullow Oil plc | | | 10,766 | | | | 28,770 | | | | 517 | | | | 0.0 | (a) |
| | | | | | | | | | | | | | | | |
| | | 11,530 | | | | 50,773 | | | | (277 | ) | | | (0.0 | )(a) |
| | | | | | | | | | | | | | | | |
Personal Products | | | | | | | | | | | | | |
Unilever plc | | | 1,375 | | | | 82,334 | | | | (2,748 | ) | | | (0.0 | )(a) |
| | | | | | | | | | | | | | | | |
Pharmaceuticals | | | | | | | | | | | | | |
Hikma Pharmaceuticals plc | | | 803 | | | | 20,912 | | | | (315 | ) | | | (0.0 | )(a) |
| | | | | | | | | | | | | | | | |
Software | | | | | | | | | | | | | |
Avast plc(b) | | | 17,018 | | | | 91,377 | | | | 11,075 | | | | 0.0 | (a) |
AVEVA Group plc | | | 1,732 | | | | 93,848 | | | | 11,114 | | | | 0.1 | |
Sage Group plc (The) | | | 8,042 | | | | 74,952 | | | | 4,156 | | | | 0.0 | (a) |
| | | | | | | | | | | | | | | | |
| | | 26,792 | | | | 260,177 | | | | 26,345 | | | | 0.1 | |
| | | | | | | | | | | | | | | | |
Tobacco | | | | | | | | | | | | | |
Imperial Brands plc | | | 3,200 | | | | 70,193 | | | | (7,362 | ) | | | (0.0 | )(a) |
| | | | | | | | | | | | | | | | |
Total Long Positions of Total Return Basket Swap | | | 268,968 | | | | 1,631,724 | | | | 70,814 | | | | 0.2 | |
| | | | | | | | | | | | | | | | |
SEE NOTES TO FINANCIAL STATEMENTS.
| | | | | | |
| | | |
| 80 | | | | J.P. MORGAN EXCHANGE-TRADED FUNDS | | OCTOBER 31, 2019 |
| | | | | | | | | | | | | | | | |
| REFERENCE ENTITY | | SHARES | | | NOTIONAL
VALUE($) (1) | | | NET UNREALIZED
APPRECIATION
(DEPRECIATION)($) (2) | | | PERCENTAGE
OF NET
ASSETS (%) | |
| |
Short Positions | | | | | |
| | | |
Common Stocks | | | | | | | | | | | | | |
Capital Markets | | | | | | | | | | | | | |
St James’s Place plc | | | (3,733 | ) | | | (50,351 | ) | | | (5,291 | ) | | | (0.0 | )(a) |
| | | | | | | | | | | | | | | | |
Chemicals | | | | | | | | | | | | | |
Johnson Matthey plc | | | (1,380 | ) | | | (54,823 | ) | | | (2,793 | ) | | | (0.0 | )(a) |
| | | | | | | | | | | | | | | | |
Electrical Equipment | | | | | | | | | | | | | |
Melrose Industries plc | | | (6,437 | ) | | | (17,790 | ) | | | (1,522 | ) | | | (0.0 | )(a) |
| | | | | | | | | | | | | | | | |
Health Care Providers & Services | | | | | | | | | | | | | |
NMC Health plc | | | (1,985 | ) | | | (56,268 | ) | | | 9,092 | | | | 0.0 | (a) |
| | | | | | | | | | | | | | | | |
Insurance | | | | | | | | | | | | | |
Beazley plc | | | (8,544 | ) | | | (64,937 | ) | | | 1,819 | | | | 0.0 | (a) |
| | | | | | | | | | | | | | | | |
Machinery | | | | | | | | | | | | | |
Weir Group plc (The) | | | (2,366 | ) | | | (41,327 | ) | | | 23 | | | | 0.0 | (a) |
| | | | | | | | | | | | | | | | |
Media | | | | | | | | | | | | | |
ITV plc | | | (30,266 | ) | | | (52,504 | ) | | | (4,698 | ) | | | (0.0 | )(a) |
| | | | | | | | | | | | | | | | |
Metals & Mining | | | | | | | | | | | | | |
Fresnillo plc | | | (5,372 | ) | | | (49,631 | ) | | | (4,124 | ) | | | (0.0 | )(a) |
| | | | | | | | | | | | | | | | |
Multiline Retail | | | | | | | | | | | | | |
B&M European Value Retail SA | | | (10,284 | ) | | | (49,336 | ) | | | (2,922 | ) | | | (0.0 | )(a) |
| | | | | | | | | | | | | | | | |
Professional Services | | | | | | | | | | | | | |
Capita plc* | | | (9,813 | ) | | | (19,850 | ) | | | (992 | ) | | | (0.0 | )(a) |
| | | | | | | | | | | | | | | | |
Real Estate Management & Development | | | | | | | | | | | | | |
Capital & Counties Properties plc | | | (2,227 | ) | | | (7,361 | ) | | | (854 | ) | | | (0.0 | )(a) |
| | | | | | | | | | | | | | | | |
Total Short Positions of Total Return Basket Swap | | | (82,407 | ) | | | (464,178 | ) | | | (12,262 | ) | | | 0.0 | (a) |
| | | | | | | | | | | | | | | | |
Total of Long and Short Positions of Total Return Basket Swap | | | 186,561 | | | | 1,167,546 | | | | 58,552 | | | | 0.2 | |
| | | | | | | | | | | | | | | | |
| | | | | | | | | | | | | | | | | | | | |
| COUNTERPARTY | | DESCRIPTION | | TERMINATION
DATE | | NOTIONAL
VALUE (1) | | | NET UNREALIZED
APPRECIATION
(DEPRECIATION) (2) | | | NET CASH
AND OTHER
RECEIVABLES
(PAYABLES) | | | VALUE | |
| Bank of America | | The Fund receives the total return on a portfolio of short equity positions and pays or receives the net of one month LIBOR on short positions, which is denominated in USD based on the local currencies of the positions within the swaps. | | 5/11/2020 | | $ | (9,908,870 | ) | | $ | (479,206 | ) | | $ | (25,947 | ) | | $ | (505,153 | ) |
| | | | | | | | | | | | | | | | | | | | |
| | | | | | | | | | | | | | | | |
| REFERENCE ENTITY | | SHARES | | | NOTIONAL
VALUE($) (1) | | | NET UNREALIZED
APPRECIATION
(DEPRECIATION)($) (2) | | | PERCENTAGE
OF NET
ASSETS (%) | |
Short Positions | | | | | |
| | | |
Common Stocks | | | | | | | | | | | | | |
Aerospace & Defense | | | | | | | | | | | | | |
BWX Technologies, Inc. | | | (1,272 | ) | | | (73,903 | ) | | | (3,727 | ) | | | (0.0 | )(a) |
Cubic Corp. | | | (222 | ) | | | (16,370 | ) | | | (1,235 | ) | | | (0.0 | )(a) |
Kratos Defense & Security Solutions, Inc.* | | | (1,427 | ) | | | (26,942 | ) | | | 93 | | | | 0.0 | (a) |
| | | | | | | | | | | | | | | | |
| | | (2,921 | ) | | | (117,215 | ) | | | (4,869 | ) | | | (0.0 | )(a) |
| | | | | | | | | | | | | | | | |
SEE NOTES TO FINANCIAL STATEMENTS.
| | | | | | | | |
| | | |
| OCTOBER 31, 2019 | | J.P. MORGAN EXCHANGE-TRADED FUNDS | | | | | 81 | |
JPMorgan Long/Short ETF
SCHEDULE OF PORTFOLIO INVESTMENTS
AS OF OCTOBER 31, 2019 (continued)
| | | | | | | | | | | | | | | | |
| REFERENCE ENTITY | | SHARES | | | NOTIONAL
VALUE($) (1) | | | NET UNREALIZED
APPRECIATION
(DEPRECIATION)($) (2) | | | PERCENTAGE
OF NET
ASSETS (%) | |
Short Positions — continued | | | | | |
| | | |
Common Stocks — continued | | | | | | | | | | | | | |
Air Freight & Logistics | | | | | | | | | | | | | |
Air Transport Services Group, Inc.* | | | (1,277 | ) | | | (26,702 | ) | | | (1,967 | ) | | | (0.0 | )(a) |
FedEx Corp. | | | (497 | ) | | | (75,872 | ) | | | (5,616 | ) | | | (0.0 | )(a) |
| | | | | | | | | | | | | | | | |
| | | (1,774 | ) | | | (102,574 | ) | | | (7,583 | ) | | | (0.0 | )(a) |
| | | | | | | | | | | | | | | | |
Airlines | | | | | | | | | | | | | |
American Airlines Group, Inc. | | | (1,805 | ) | | | (54,258 | ) | | | (5,198 | ) | | | (0.0 | )(a) |
| | | | | | | | | | | | | | | | |
Auto Components | | | | | | | | | | | | | |
Cooper-Standard Holdings, Inc.* | | | (1,667 | ) | | | (53,110 | ) | | | 1,734 | | | | 0.0 | (a) |
Veoneer, Inc.* | | | (4,003 | ) | | | (63,728 | ) | | | (4,684 | ) | | | (0.0 | )(a) |
| | | | | | | | | | | | | | | | |
| | | (5,670 | ) | | | (116,838 | ) | | | (2,950 | ) | | | (0.0 | )(a) |
| | | | | | | | | | | | | | | | |
Banks | | | | | | | | | | | | | |
SVB Financial Group* | | | (83 | ) | | | (18,383 | ) | | | (2,410 | ) | | | (0.0 | )(a) |
| | | | | | | | | | | | | | | | |
Beverages | | | | | | | | | | | | | |
Coca-Cola Consolidated, Inc. | | | (233 | ) | | | (63,926 | ) | | | 4,543 | | | | 0.0 | (a) |
Constellation Brands, Inc. | | | (316 | ) | | | (60,144 | ) | | | 752 | | | | 0.0 | (a) |
National Beverage Corp. | | | (1,445 | ) | | | (63,522 | ) | | | 5,896 | | | | 0.0 | (a) |
| | | | | | | | | | | | | | | | |
| | | (1,994 | ) | | | (187,592 | ) | | | 11,191 | | | | 0.0 | (a) |
| | | | | | | | | | | | | | | | |
Capital Markets | | | | | | | | | | | | | |
Cboe Global Markets, Inc. | | | (168 | ) | | | (19,345 | ) | | | 324 | | | | 0.0 | (a) |
Charles Schwab Corp. (The) | | | (1,905 | ) | | | (77,553 | ) | | | (8,706 | ) | | | (0.1 | ) |
Interactive Brokers Group, Inc. | | | (1,448 | ) | | | (68,881 | ) | | | (376 | ) | | | (0.0 | )(a) |
Northern Trust Corp. | | | (790 | ) | | | (78,747 | ) | | | (8,050 | ) | | | (0.0 | )(a) |
WisdomTree Investments, Inc. | | | (8,027 | ) | | | (41,018 | ) | | | (4,335 | ) | | | (0.0 | )(a) |
| | | | | | | | | | | | | | | | |
| | | (12,338 | ) | | | (285,544 | ) | | | (21,143 | ) | | | (0.1 | ) |
| | | | | | | | | | | | | | | | |
Chemicals | | | | | | | | | | | | | |
Albemarle Corp. | | | (288 | ) | | | (17,493 | ) | | | 1,359 | | | | 0.0 | (a) |
Dow, Inc. | | | (209 | ) | | | (10,552 | ) | | | (1,164 | ) | | | (0.0 | )(a) |
DuPont de Nemours, Inc. | | | (764 | ) | | | (50,355 | ) | | | (2,116 | ) | | | (0.0 | )(a) |
GCP Applied Technologies, Inc.* | | | (1,737 | ) | | | (35,886 | ) | | | (3,543 | ) | | | (0.0 | )(a) |
International Flavors & Fragrances, Inc. | | | (298 | ) | | | (36,359 | ) | | | (1,800 | ) | | | (0.0 | )(a) |
Mosaic Co. (The) | | | (813 | ) | | | (16,163 | ) | | | (439 | ) | | | (0.0 | )(a) |
Orion Engineered Carbons SA | | | (4,056 | ) | | | (67,167 | ) | | | (3,204 | ) | | | (0.0 | )(a) |
RPM International, Inc. | | | (848 | ) | | | (61,421 | ) | | | (3,638 | ) | | | (0.0 | )(a) |
Sensient Technologies Corp. | | | (1,078 | ) | | | (67,440 | ) | | | 1,164 | | | | 0.0 | (a) |
| | | | | | | | | | | | | | | | |
| | | (10,091 | ) | | | (362,836 | ) | | | (13,381 | ) | | | (0.0 | )(a) |
| | | | | | | | | | | | | | | | |
Commercial Services & Supplies | | | | | | | | | | | | | |
Brink’s Co. (The) | | | (760 | ) | | | (64,570 | ) | | | (2,075 | ) | | | (0.0 | )(a) |
Stericycle, Inc.* | | | (1,294 | ) | | | (74,534 | ) | | | (10,481 | ) | | | (0.0 | )(a) |
US Ecology, Inc. | | | (857 | ) | | | (53,331 | ) | | | (189 | ) | | | (0.0 | )(a) |
| | | | | | | | | | | | | | | | |
| | | (2,911 | ) | | | (192,435 | ) | | | (12,745 | ) | | | (0.0 | )(a) |
| | | | | | | | | | | | | | | | |
Communications Equipment | | | | | | | | | | | | | |
Infinera Corp.* | | | (11,668 | ) | | | (65,224 | ) | | | (5,134 | ) | | | (0.0 | )(a) |
NETGEAR, Inc.* | | | (2,122 | ) | | | (57,655 | ) | | | 7,554 | | | | 0.0 | (a) |
ViaSat, Inc.* | | | (976 | ) | | | (67,188 | ) | | | 2,128 | | | | 0.0 | (a) |
| | | | | | | | | | | | | | | | |
| | | (14,766 | ) | | | (190,067 | ) | | | 4,548 | | | | 0.0 | (a) |
| | | | | | | | | | | | | | | | |
SEE NOTES TO FINANCIAL STATEMENTS.
| | | | | | |
| | | |
| 82 | | | | J.P. MORGAN EXCHANGE-TRADED FUNDS | | OCTOBER 31, 2019 |
| | | | | | | | | | | | | | | | |
| REFERENCE ENTITY | | SHARES | | | NOTIONAL
VALUE($) (1) | | | NET UNREALIZED
APPRECIATION
(DEPRECIATION)($) (2) | | | PERCENTAGE
OF NET
ASSETS (%) | |
Short Positions — continued | | | | | |
| | | |
Common Stocks — continued | | | | | | | | | | | | | |
Construction & Engineering | | | | | | | | | | | | | |
Dycom Industries, Inc.* | | | (1,550 | ) | | | (70,664 | ) | | | 186 | | | | 0.0 | (a) |
Fluor Corp. | | | (3,925 | ) | | | (63,232 | ) | | | 7,104 | | | | 0.0 | (a) |
WillScot Corp.* | | | (4,193 | ) | | | (66,082 | ) | | | (167 | ) | | | (0.0 | )(a) |
| | | | | | | | | | | | | | | | |
| | | (9,668 | ) | | | (199,978 | ) | | | 7,123 | | | | 0.0 | (a) |
| | | | | | | | | | | | | | | | |
Construction Materials | | | | | | | | | | | | | |
Martin Marietta Materials, Inc. | | | (233 | ) | | | (61,025 | ) | | | 1,389 | | | | 0.0 | (a) |
Summit Materials, Inc.* | | | (1,612 | ) | | | (36,963 | ) | | | (468 | ) | | | (0.0 | )(a) |
| | | | | | | | | | | | | | | | |
| | | (1,845 | ) | | | (97,988 | ) | | | 921 | | | | 0.0 | (a) |
| | | | | | | | | | | | | | | | |
Consumer Finance | | | | | | | | | | | | | | | | |
Green Dot Corp.* | | | (3,068 | ) | | | (88,481 | ) | | | (17,702 | ) | | | (0.1 | ) |
LendingClub Corp.* | | | (6,316 | ) | | | (79,834 | ) | | | (7,011 | ) | | | (0.0 | )(a) |
PRA Group, Inc.* | | | (2,099 | ) | | | (71,219 | ) | | | (2,939 | ) | | | (0.0 | )(a) |
| | | | | | | | | | | | | | | | |
| | | (11,483 | ) | | | (239,534 | ) | | | (27,652 | ) | | | (0.1 | ) |
| | | | | | | | | | | | | | | | |
Containers & Packaging | | | | | | | | | | | | | |
AptarGroup, Inc. | | | (125 | ) | | | (14,768 | ) | | | (230 | ) | | | (0.0 | )(a) |
Crown Holdings, Inc.* | | | (845 | ) | | | (61,550 | ) | | | (8,628 | ) | | | (0.0 | )(a) |
Graphic Packaging Holding Co. | | | (3,971 | ) | | | (62,186 | ) | | | (5,321 | ) | | | (0.0 | )(a) |
| | | | | | | | | | | | | | | | |
| | | (4,941 | ) | | | (138,504 | ) | | | (14,179 | ) | | | (0.0 | )(a) |
| | | | | | | | | | | | | | | | |
Diversified Telecommunication Services | | | | | | | | | | | | | |
GCI Liberty, Inc.* | | | (1,070 | ) | | | (74,879 | ) | | | (5,832 | ) | | | (0.0 | )(a) |
Iridium Communications, Inc.* | | | (2,870 | ) | | | (70,229 | ) | | | (5,912 | ) | | | (0.0 | )(a) |
| | | | | | | | | | | | | | | | |
| | | (3,940 | ) | | | (145,108 | ) | | | (11,744 | ) | | | (0.0 | )(a) |
| | | | | | | | | | | | | | | | |
Electric Utilities | | | | | | | | | | | | | |
Alliant Energy Corp. | | | (1,202 | ) | | | (64,115 | ) | | | 180 | | | | 0.0 | (a) |
| | | | | | | | | | | | | | | | |
Electrical Equipment | | | | | | | | | | | | | |
GrafTech International Ltd. | | | (2,191 | ) | | | (26,468 | ) | | | (2,059 | ) | | | (0.0 | )(a) |
Vicor Corp.* | | | (295 | ) | | | (10,723 | ) | | | (1,490 | ) | | | (0.0 | )(a) |
| | | | | | | | | | | | | | | | |
| | | (2,486 | ) | | | (37,191 | ) | | | (3,549 | ) | | | (0.0 | )(a) |
| | | | | | | | | | | | | | | | |
Electronic Equipment, Instruments & Components | | | | | | | | | | | | | |
Flex Ltd.* | | | (6,148 | ) | | | (72,239 | ) | | | (13,157 | ) | | | (0.0 | )(a) |
Itron, Inc.* | | | (972 | ) | | | (74,125 | ) | | | (3,509 | ) | | | (0.0 | )(a) |
nLight, Inc.* | | | (3,177 | ) | | | (42,445 | ) | | | 3,844 | | | | 0.0 | (a) |
Rogers Corp.* | | | (530 | ) | | | (71,804 | ) | | | (275 | ) | | | (0.0 | )(a) |
Trimble, Inc.* | | | (278 | ) | | | (11,075 | ) | | | (664 | ) | | | (0.0 | )(a) |
| | | | | | | | | | | | | | | | |
| | | (11,105 | ) | | | (271,688 | ) | | | (13,761 | ) | | | (0.0 | )(a) |
| | | | | | | | | | | | | | | | |
Energy Equipment & Services | | | | | | | | | | | | | |
Core Laboratories NV | | | (1,611 | ) | | | (70,948 | ) | | | (2,255 | ) | | | (0.0 | )(a) |
Diamond Offshore Drilling, Inc.* | | | (5,659 | ) | | | (29,936 | ) | | | (1,302 | ) | | | (0.0 | )(a) |
Nabors Industries Ltd. | | | (42,789 | ) | | | (79,160 | ) | | | (9,841 | ) | | | (0.1 | ) |
Oceaneering International, Inc.* | | | (5,424 | ) | | | (76,804 | ) | | | (3,688 | ) | | | (0.0 | )(a) |
Oil States International, Inc.* | | | (4,203 | ) | | | (59,977 | ) | | | (8,448 | ) | | | (0.0 | )(a) |
Valaris plc | | | (7,689 | ) | | | (31,602 | ) | | | 3,152 | | | | 0.0 | (a) |
| | | | | | | | | | | | | | | | |
| | | (67,375 | ) | | | (348,427 | ) | | | (22,382 | ) | | | (0.1 | ) |
| | | | | | | | | | | | | | | | |
Entertainment | | | | | | | | | | | | | |
Netflix, Inc.* | | | (254 | ) | | | (73,002 | ) | | | (1,760 | ) | | | (0.0 | )(a) |
Spotify Technology SA* | | | (523 | ) | | | (75,469 | ) | | | (16,621 | ) | | | (0.1 | ) |
| | | | | | | | | | | | | | | | |
| | | (777 | ) | | | (148,471 | ) | | | (18,381 | ) | | | (0.1 | ) |
| | | | | | | | | | | | | | | | |
SEE NOTES TO FINANCIAL STATEMENTS.
| | | | | | | | |
| | | |
| OCTOBER 31, 2019 | | J.P. MORGAN EXCHANGE-TRADED FUNDS | | | | | 83 | |
JPMorgan Long/Short ETF
SCHEDULE OF PORTFOLIO INVESTMENTS
AS OF OCTOBER 31, 2019 (continued)
| | | | | | | | | | | | | | | | |
| REFERENCE ENTITY | | SHARES | | | NOTIONAL
VALUE($) (1) | | | NET UNREALIZED
APPRECIATION
(DEPRECIATION)($) (2) | | | PERCENTAGE
OF NET
ASSETS (%) | |
Short Positions — continued | | | | | |
| | | |
Common Stocks — continued | | | | | | | | | | | | | |
Equity Real Estate Investment Trusts (REITs) | | | | | | | | | | | | | |
Alexander & Baldwin, Inc. | | | (466 | ) | | | (10,956 | ) | | | 266 | | | | 0.0 | (a) |
| | | | | | | | | | | | | | | | |
Food & Staples Retailing | | | | | | | | | | | | | |
PriceSmart, Inc. | | | (975 | ) | | | (72,248 | ) | | | (6,611 | ) | | | (0.0 | )(a) |
| | | | | | | | | | | | | | | | |
Food Products | | | | | | | | | | | | | |
Hain Celestial Group, Inc. (The)* | | | (3,006 | ) | | | (71,062 | ) | | | (10,281 | ) | | | (0.1 | ) |
Kraft Heinz Co. (The) | | | (1,596 | ) | | | (51,599 | ) | | | (8,602 | ) | | | (0.0 | )(a) |
| | | | | | | | | | | | | | | | |
| | | (4,602 | ) | | | (122,661 | ) | | | (18,883 | ) | | | (0.1 | ) |
| | | | | | | | | | | | | | | | |
Gas Utilities | | | | | | | | | | | | | |
Northwest Natural Holding Co. | | | (1,015 | ) | | | (70,400 | ) | | | 142 | | | | 0.0 | (a) |
South Jersey Industries, Inc. | | | (2,150 | ) | | | (69,144 | ) | | | 409 | | | | 0.0 | (a) |
Southwest Gas Holdings, Inc. | | | (109 | ) | | | (9,516 | ) | | | 331 | | | | 0.0 | (a) |
| | | | | | | | | | | | | | | | |
| | | (3,274 | ) | | | (149,060 | ) | | | 882 | | | | 0.0 | (a) |
| | | | | | | | | | | | | | | | |
Health Care Equipment & Supplies | | | | | | | | | | | | | |
ABIOMED, Inc.* | | | (431 | ) | | | (89,467 | ) | | | (19,498 | ) | | | (0.1 | ) |
AtriCure, Inc.* | | | (2,774 | ) | | | (73,761 | ) | | | (3,800 | ) | | | (0.0 | )(a) |
Avanos Medical, Inc.* | | | (1,822 | ) | | | (80,241 | ) | | | (8,764 | ) | | | (0.1 | ) |
Axogen, Inc.* | | | (2,238 | ) | | | (27,829 | ) | | | (1,914 | ) | | | (0.0 | )(a) |
Heska Corp.* | | | (655 | ) | | | (53,068 | ) | | | (5,522 | ) | | | (0.0 | )(a) |
Insulet Corp.* | | | (446 | ) | | | (64,813 | ) | | | 4,273 | | | | 0.0 | (a) |
iRhythm Technologies, Inc.* | | | (313 | ) | | | (20,915 | ) | | | (1,055 | ) | | | (0.0 | )(a) |
Nevro Corp.* | | | (901 | ) | | | (77,666 | ) | | | (6,640 | ) | | | (0.0 | )(a) |
Penumbra, Inc.* | | | (142 | ) | | | (22,148 | ) | | | (1,883 | ) | | | (0.0 | )(a) |
ViewRay, Inc.* | | | (27 | ) | | | (70 | ) | | | (8 | ) | | | (0.0 | )(a) |
Wright Medical Group NV* | | | (3,456 | ) | | | (71,885 | ) | | | (4,804 | ) | | | (0.0 | )(a) |
| | | | | | | | | | | | | | | | |
| | | (13,205 | ) | | | (581,863 | ) | | | (49,615 | ) | | | (0.2 | ) |
| | | | | | | | | | | | | | | | |
Health Care Providers & Services | | | | | | | | | | | | | |
Guardant Health, Inc.* | | | (947 | ) | | | (65,816 | ) | | | (8,466 | ) | | | (0.0 | )(a) |
R1 RCM, Inc.* | | | (6,763 | ) | | | (71,891 | ) | | | (9,671 | ) | | | (0.1 | ) |
| | | | | | | | | | | | | | | | |
| | | (7,710 | ) | | | (137,707 | ) | | | (18,137 | ) | | | (0.1 | ) |
| | | | | | | | | | | | | | | | |
Health Care Technology | | | | | | | | | | | | | |
Evolent Health, Inc.* | | | (6,239 | ) | | | (47,541 | ) | | | (1,809 | ) | | | (0.0 | )(a) |
Inspire Medical Systems, Inc.* | | | (1,256 | ) | | | (76,591 | ) | | | (7,712 | ) | | | (0.0 | )(a) |
Tabula Rasa HealthCare, Inc.* | | | (1,068 | ) | | | (54,404 | ) | | | 630 | | | | 0.0 | (a) |
Teladoc Health, Inc.* | | | (162 | ) | | | (12,409 | ) | | | (1,391 | ) | | | (0.0 | )(a) |
Vocera Communications, Inc.* | | | (2,881 | ) | | | (57,390 | ) | | | 14,203 | | | | 0.0 | (a) |
| | | | | | | | | | | | | | | | |
| | | (11,606 | ) | | | (248,335 | ) | | | 3,921 | | | | 0.0 | (a) |
| | | | | | | | | | | | | | | | |
Hotels, Restaurants & Leisure | | | | | | | | | | | | | |
Domino’s Pizza, Inc. | | | (22 | ) | | | (5,976 | ) | | | (371 | ) | | | (0.0 | )(a) |
MGM Resorts International | | | (2,088 | ) | | | (59,508 | ) | | | (2,234 | ) | | | (0.0 | )(a) |
Red Rock Resorts, Inc. | | | (1,372 | ) | | | (29,882 | ) | | | (2,195 | ) | | | (0.0 | )(a) |
Scientific Games Corp.* | | | (2,733 | ) | | | (65,565 | ) | | | (9,661 | ) | | | (0.1 | ) |
Shake Shack, Inc.* | | | (126 | ) | | | (10,367 | ) | | | 1,368 | | | | 0.0 | (a) |
Wynn Resorts Ltd. | | | (535 | ) | | | (64,917 | ) | | | (8,175 | ) | | | (0.0 | )(a) |
| | | | | | | | | | | | | | | | |
| | | (6,876 | ) | | | (236,215 | ) | | | (21,268 | ) | | | (0.1 | ) |
| | | | | | | | | | | | | | | | |
Household Durables | | | | | | | | | | | | | |
Cavco Industries, Inc.* | | | (293 | ) | | | (56,153 | ) | | | (955 | ) | | | (0.0 | )(a) |
iRobot Corp.* | | | (1,040 | ) | | | (49,982 | ) | | | 4,991 | | | | 0.0 | (a) |
SEE NOTES TO FINANCIAL STATEMENTS.
| | | | | | |
| | | |
| 84 | | | | J.P. MORGAN EXCHANGE-TRADED FUNDS | | OCTOBER 31, 2019 |
| | | | | | | | | | | | | | | | |
| REFERENCE ENTITY | | SHARES | | | NOTIONAL
VALUE($) (1) | | | NET UNREALIZED
APPRECIATION
(DEPRECIATION)($) (2) | | | PERCENTAGE
OF NET
ASSETS (%) | |
Short Positions — continued | | | | | |
| | | |
Common Stocks — continued | | | | | | | | | | | | | |
Household Durables — continued | | | | | | | | | | | | | |
LGI Homes, Inc.* | | | (820 | ) | | | (64,354 | ) | | | 2,997 | | | | 0.0 | (a) |
Mohawk Industries, Inc.* | | | (346 | ) | | | (49,609 | ) | | | (6,910 | ) | | | (0.0 | )(a) |
Roku, Inc.* | | | (120 | ) | | | (17,664 | ) | | | (3,728 | ) | | | (0.0 | )(a) |
Sonos, Inc.* | | | (4,869 | ) | | | (63,687 | ) | | | 802 | | | | 0.0 | (a) |
| | | | | | | | | | | | | | | | |
| | | (7,488 | ) | | | (301,449 | ) | | | (2,803 | ) | | | (0.0 | )(a) |
| | | | | | | | | | | | | | | | |
Independent Power and Renewable Electricity Producers | | | | | | | | | | | | | |
Ormat Technologies, Inc. | | | (935 | ) | | | (71,584 | ) | | | (2,309 | ) | | | (0.0 | )(a) |
| | | | | | | | | | | | | | | | |
Insurance | | | | | | | | | | | | | |
Markel Corp.* | | | (7 | ) | | | (8,197 | ) | | | (183 | ) | | | (0.0 | )(a) |
| | | | | | | | | | | | | | | | |
Interactive Media & Services | | | | | | | | | | | | | |
Cargurus, Inc.* | | | (1,880 | ) | | | (63,149 | ) | | | (9,231 | ) | | | (0.1 | ) |
Eventbrite, Inc.* | | | (4,001 | ) | | | (71,938 | ) | | | (3,212 | ) | | | (0.0 | )(a) |
Snap, Inc.* | | | (4,889 | ) | | | (73,628 | ) | | | (4,791 | ) | | | (0.0 | )(a) |
TrueCar, Inc.* | | | (5,179 | ) | | | (16,987 | ) | | | (1,010 | ) | | | (0.0 | )(a) |
Zillow Group, Inc.* | | | (2,086 | ) | | | (67,566 | ) | | | (7,697 | ) | | | (0.0 | )(a) |
| | | | | | | | | | | | | | | | |
| | | (18,035 | ) | | | (293,268 | ) | | | (25,941 | ) | | | (0.1 | ) |
| | | | | | | | | | | | | | | | |
Internet & Direct Marketing Retail | | | | | | | | | | | | | |
Farfetch Ltd.* | | | (4,773 | ) | | | (42,623 | ) | | | (4,678 | ) | | | (0.0 | )(a) |
GrubHub, Inc.* | | | (1,068 | ) | | | (36,376 | ) | | | 20,869 | | | | 0.1 | |
Wayfair, Inc.* | | | (543 | ) | | | (44,651 | ) | | | 12,180 | | | | 0.0 | (a) |
| | | | | | | | | | | | | | | | |
| | | (6,384 | ) | | | (123,650 | ) | | | 28,371 | | | | 0.1 | |
| | | | | | | | | | | | | | | | |
Leisure Products | | | | | | | | | | | | | |
Polaris, Inc. | | | (676 | ) | | | (66,687 | ) | | | (9,478 | ) | | | (0.0 | )(a) |
| | | | | | | | | | | | | | | | |
Machinery | | | | | | | | | | | | | |
Deere & Co. | | | (326 | ) | | | (56,770 | ) | | | (2,067 | ) | | | (0.0 | )(a) |
Evoqua Water Technologies Corp.* | | | (2,415 | ) | | | (41,948 | ) | | | (3,888 | ) | | | (0.0 | )(a) |
Wabtec Corp. | | | (867 | ) | | | (60,144 | ) | | | (3,823 | ) | | | (0.0 | )(a) |
Welbilt, Inc.* | | | (4,246 | ) | | | (80,504 | ) | | | (10,403 | ) | | | (0.1 | ) |
| | | | | | | | | | | | | | | | |
| | | (7,854 | ) | | | (239,366 | ) | | | (20,181 | ) | | | (0.1 | ) |
| | | | | | | | | | | | | | | | |
Marine | | | | | | | | | | | | | |
Kirby Corp.* | | | (114 | ) | | | (9,024 | ) | | | 80 | | | | 0.0 | (a) |
| | | | | | | | | | | | | | | | |
Media | | | | | | | | | | | | | |
Altice USA, Inc.* | | | (200 | ) | | | (6,190 | ) | | | (540 | ) | | | (0.0 | )(a) |
Liberty Broadband Corp.* | | | (648 | ) | | | (76,509 | ) | | | (6,947 | ) | | | (0.0 | )(a) |
| | | | | | | | | | | | | | | | |
| | | (848 | ) | | | (82,699 | ) | | | (7,487 | ) | | | (0.0 | )(a) |
| | | | | | | | | | | | | | | | |
Metals & Mining | | | | | | | | | | | | | |
Alcoa Corp.* | | | (2,874 | ) | | | (59,751 | ) | | | (6,035 | ) | | | (0.0 | )(a) |
Century Aluminum Co.* | | | (9,415 | ) | | | (54,889 | ) | | | 3,060 | | | | 0.0 | (a) |
Coeur Mining, Inc.* | | | (10,483 | ) | | | (57,866 | ) | | | (2,831 | ) | | | (0.0 | )(a) |
Constellium SE* | | | (1,257 | ) | | | (16,756 | ) | | | (767 | ) | | | (0.0 | )(a) |
Hecla Mining Co. | | | (28,443 | ) | | | (65,419 | ) | | | (8,817 | ) | | | (0.1 | ) |
| | | | | | | | | | | | | | | | |
| | | (52,472 | ) | | | (254,681 | ) | | | (15,390 | ) | | | (0.1 | ) |
| | | | | | | | | | | | | | | | |
Multi-Utilities | | | | | | | | | | | | | |
NiSource, Inc. | | | (2,397 | ) | | | (67,212 | ) | | | 2,325 | | | | 0.0 | (a) |
Sempra Energy | | | (458 | ) | | | (66,186 | ) | | | 870 | | | | 0.0 | (a) |
| | | | | | | | | | | | | | | | |
| | | (2,855 | ) | | | (133,398 | ) | | | 3,195 | | | | 0.0 | (a) |
| | | | | | | | | | | | | | | | |
SEE NOTES TO FINANCIAL STATEMENTS.
| | | | | | | | |
| | | |
| OCTOBER 31, 2019 | | J.P. MORGAN EXCHANGE-TRADED FUNDS | | | | | 85 | |
JPMorgan Long/Short ETF
SCHEDULE OF PORTFOLIO INVESTMENTS
AS OF OCTOBER 31, 2019 (continued)
| | | | | | | | | | | | | | | | |
| REFERENCE ENTITY | | SHARES | | | NOTIONAL
VALUE($) (1) | | | NET UNREALIZED
APPRECIATION
(DEPRECIATION)($) (2) | | | PERCENTAGE
OF NET
ASSETS (%) | |
Short Positions — continued | | | | | |
| | | |
Common Stocks — continued | | | | | | | | | | | | | |
Oil, Gas & Consumable Fuels | | | | | | | | | | | | | |
Centennial Resource Development, Inc.* | | | (18,528 | ) | | | (62,995 | ) | | | 5,744 | | | | 0.0 | (a) |
Cheniere Energy, Inc.* | | | (1,113 | ) | | | (68,505 | ) | | | (234 | ) | | | (0.0 | )(a) |
Concho Resources, Inc. | | | (1,122 | ) | | | (75,757 | ) | | | (3,736 | ) | | | (0.0 | )(a) |
Golar LNG Ltd. | | | (3,339 | ) | | | (45,978 | ) | | | 1,803 | | | | 0.0 | (a) |
Matador Resources Co.* | | | (1,748 | ) | | | (24,315 | ) | | | 210 | | | | 0.0 | (a) |
Noble Energy, Inc. | | | (3,550 | ) | | | (68,373 | ) | | | 3,053 | | | | 0.0 | (a) |
Oasis Petroleum, Inc.* | | | (22,780 | ) | | | (59,456 | ) | | | 10,706 | | | | 0.1 | |
Parsley Energy, Inc. | | | (4,378 | ) | | | (69,216 | ) | | | 2,802 | | | | 0.0 | (a) |
Penn Virginia Corp.* | | | (936 | ) | | | (22,277 | ) | | | 1,806 | | | | 0.0 | (a) |
SM Energy Co. | | | (7,106 | ) | | | (55,711 | ) | | | 1,776 | | | | 0.0 | (a) |
Targa Resources Corp. | | | (1,814 | ) | | | (70,528 | ) | | | (308 | ) | | | (0.0 | )(a) |
WPX Energy, Inc.* | | | (7,061 | ) | | | (70,469 | ) | | | 1,130 | | | | 0.0 | (a) |
| | | | | | | | | | | | | | | | |
| | | (73,475 | ) | | | (693,580 | ) | | | 24,752 | | | | 0.1 | |
| | | | | | | | | | | | | | | | |
Pharmaceuticals | | | | | | | | | | | | | |
Aerie Pharmaceuticals, Inc.* | | | (2,632 | ) | | | (58,404 | ) | | | (11,765 | ) | | | (0.1 | ) |
Intersect ENT, Inc.* | | | (1,856 | ) | | | (33,074 | ) | | | (668 | ) | | | (0.0 | )(a) |
MyoKardia, Inc.* | | | (1,370 | ) | | | (78,542 | ) | | | (5,480 | ) | | | (0.0 | )(a) |
Revance Therapeutics, Inc.* | | | (4,050 | ) | | | (63,423 | ) | | | (16,200 | ) | | | (0.1 | ) |
WaVe Life Sciences Ltd.* | | | (1,442 | ) | | | (36,468 | ) | | | (8,840 | ) | | | (0.0 | )(a) |
Zogenix, Inc.* | | | (876 | ) | | | (39,114 | ) | | | (3,889 | ) | | | (0.0 | )(a) |
| | | | | | | | | | | | | | | | |
| | | (12,226 | ) | | | (309,025 | ) | | | (46,842 | ) | | | (0.2 | ) |
| | | | | | | | | | | | | | | | |
Professional Services | | | | | | | | | | | | | |
TransUnion | | | (873 | ) | | | (72,127 | ) | | | (2,453 | ) | | | (0.0 | )(a) |
| | | | | | | | | | | | | | | | |
Road & Rail | | | | | | | | | | | | | |
AMERCO | | | (186 | ) | | | (75,337 | ) | | | (5,680 | ) | | | (0.0 | )(a) |
Avis Budget Group, Inc.* | | | (2,690 | ) | | | (79,920 | ) | | | (8,070 | ) | | | (0.1 | ) |
Hertz Global Holdings, Inc.* | | | (5,567 | ) | | | (75,210 | ) | | | (3,229 | ) | | | (0.0 | )(a) |
JB Hunt Transport Services, Inc. | | | (501 | ) | | | (58,898 | ) | | | (5,000 | ) | | | (0.0 | )(a) |
| | | | | | | | | | | | | | | | |
| | | (8,944 | ) | | | (289,365 | ) | | | (21,979 | ) | | | (0.1 | ) |
| | | | | | | | | | | | | | | | |
Semiconductors & Semiconductor Equipment | | | | | | | | | | | | | |
Advanced Micro Devices, Inc.* | | | (2,446 | ) | | | (82,993 | ) | | | (13,575 | ) | | | (0.1 | ) |
Brooks Automation, Inc. | | | (1,658 | ) | | | (70,415 | ) | | | (10,810 | ) | | | (0.0 | )(a) |
Cohu, Inc. | | | (687 | ) | | | (11,418 | ) | | | (1,979 | ) | | | (0.0 | )(a) |
Cree, Inc.* | | | (545 | ) | | | (26,013 | ) | | | (55 | ) | | | (0.0 | )(a) |
Impinj, Inc.* | | | (2,238 | ) | | | (73,619 | ) | | | (2,853 | ) | | | (0.0 | )(a) |
MACOM Technology Solutions Holdings, Inc.* | | | (2,400 | ) | | | (54,576 | ) | | | (3,288 | ) | | | (0.0 | )(a) |
NVIDIA Corp. | | | (163 | ) | | | (32,766 | ) | | | (2,932 | ) | | | (0.0 | )(a) |
Silicon Laboratories, Inc.* | | | (658 | ) | | | (69,906 | ) | | | 967 | | | | 0.0 | (a) |
| | | | | | | | | | | | | | | | |
| | | (10,795 | ) | | | (421,706 | ) | | | (34,525 | ) | | | (0.1 | ) |
| | | | | | | | | | | | | | | | |
Software | | | | | | | | | | | | | |
2U, Inc.* | | | (4,368 | ) | | | (78,296 | ) | | | (9,413 | ) | | | (0.0 | )(a) |
8x8, Inc.* | | | (3,530 | ) | | | (68,200 | ) | | | 882 | | | | 0.0 | (a) |
Appian Corp.* | | | (1,172 | ) | | | (52,318 | ) | | | 4,735 | | | | 0.0 | (a) |
Autodesk, Inc.* | | | (472 | ) | | | (69,554 | ) | | | (1,241 | ) | | | (0.0 | )(a) |
Avalara, Inc.* | | | (260 | ) | | | (18,460 | ) | | | 104 | | | | 0.0 | (a) |
Benefitfocus, Inc.* | | | (2,470 | ) | | | (56,155 | ) | | | 1,371 | | | | 0.0 | (a) |
FireEye, Inc.* | | | (1,465 | ) | | | (23,206 | ) | | | (1,509 | ) | | | (0.0 | )(a) |
HubSpot, Inc.* | | | (435 | ) | | | (67,469 | ) | | | 2,171 | | | | 0.0 | (a) |
SEE NOTES TO FINANCIAL STATEMENTS.
| | | | | | |
| | | |
| 86 | | | | J.P. MORGAN EXCHANGE-TRADED FUNDS | | OCTOBER 31, 2019 |
| | | | | | | | | | | | | | | | |
| REFERENCE ENTITY | | SHARES | | | NOTIONAL
VALUE($) (1) | | | NET UNREALIZED
APPRECIATION
(DEPRECIATION)($) (2) | | | PERCENTAGE
OF NET
ASSETS (%) | |
Short Positions — continued | | | | | |
| | | |
Common Stocks — continued | | | | | | | | | | | | | |
Software — continued | | | | | | | | | | | | | |
Instructure, Inc.* | | | (1,383 | ) | | | (64,628 | ) | | | (6,542 | ) | | | (0.0 | )(a) |
Nutanix, Inc.* | | | (2,506 | ) | | | (73,225 | ) | | | (13,871 | ) | | | (0.1 | ) |
PROS Holdings, Inc.* | | | (1,161 | ) | | | (59,490 | ) | | | 8,719 | | | | 0.0 | (a) |
Q2 Holdings, Inc.* | | | (931 | ) | | | (66,557 | ) | | | 3,696 | | | | 0.0 | (a) |
RingCentral, Inc.* | | | (399 | ) | | | (64,447 | ) | | | 5,159 | | | | 0.0 | (a) |
Varonis Systems, Inc.* | | | (1,146 | ) | | | (81,996 | ) | | | (9,626 | ) | | | (0.0 | )(a) |
Yext, Inc.* | | | (3,777 | ) | | | (62,169 | ) | | | (5,703 | ) | | | (0.0 | )(a) |
Zuora, Inc.* | | | (4,752 | ) | | | (67,716 | ) | | | 1,283 | | | | 0.0 | (a) |
| | | | | | | | | | | | | | | | |
| | | (30,227 | ) | | | (973,886 | ) | | | (19,785 | ) | | | (0.1 | ) |
| | | | | | | | | | | | | | | | |
Specialty Retail | | | | | | | | | | | | | |
CarMax, Inc.* | | | (645 | ) | | | (60,095 | ) | | | (3,715 | ) | | | (0.0 | )(a) |
Carvana Co.* | | | (690 | ) | | | (55,945 | ) | | | (8,156 | ) | | | (0.0 | )(a) |
Floor & Decor Holdings, Inc.* | | | (979 | ) | | | (44,867 | ) | | | 2,359 | | | | 0.0 | (a) |
National Vision Holdings, Inc.* | | | (1,636 | ) | | | (38,937 | ) | | | (867 | ) | | | (0.0 | )(a) |
| | | | | | | | | | | | | | | | |
| | | (3,950 | ) | | | (199,844 | ) | | | (10,379 | ) | | | (0.0 | )(a) |
| | | | | | | | | | | | | | | | |
Technology Hardware, Storage & Peripherals | | | | | | | | | | | | | |
3D Systems Corp.* | | | (9,252 | ) | | | (87,802 | ) | | | (15,636 | ) | | | (0.1 | ) |
Pure Storage, Inc.* | | | (3,772 | ) | | | (73,403 | ) | | | (10,637 | ) | | | (0.0 | )(a) |
| | | | | | | | | | | | | | | | |
| | | (13,024 | ) | | | (161,205 | ) | | | (26,273 | ) | | | (0.1 | ) |
| | | | | | | | | | | | | | | | |
Tobacco | | | | | | | | | | | | | |
Vector Group Ltd. | | | (2,161 | ) | | | (26,364 | ) | | | (2,053 | ) | | | (0.0 | )(a) |
| | | | | | | | | | | | | | | | |
Trading Companies & Distributors | | | | | | | | | | | | | |
SiteOne Landscape Supply, Inc.* | | | (971 | ) | | | (85,506 | ) | | | (15,856 | ) | | | (0.1 | ) |
| | | | | | | | | | | | | | | | |
Water Utilities | | | | | | | | | | | | | |
American Water Works Co., Inc. | | | (537 | ) | | | (66,196 | ) | | | 956 | | | | 0.0 | (a) |
Aqua America, Inc. | | | (35 | ) | | | (1,587 | ) | | | 5 | | | | 0.0 | (a) |
California Water Service Group | | | (1,332 | ) | | | (74,552 | ) | | | (3,903 | ) | | | (0.0 | )(a) |
SJW Group | | | (997 | ) | | | (72,133 | ) | | | (1,336 | ) | | | (0.0 | )(a) |
| | | | | | | | | | | | | | | | |
| | | (2,901 | ) | | | (214,468 | ) | | | (4,278 | ) | | | (0.0 | )(a) |
| | | | | | | | | | | | | | | | |
Total Short Positions of Total Return Basket Swap | | | (475,104 | ) | | | (9,908,870 | ) | | | (479,206 | ) | | | (1.7 | ) |
| | | | | | | | | | | | | | | | |
| | | | | | | | | | | | | | | | | | | | |
| COUNTERPARTY | | DESCRIPTION | | TERMINATION
DATE | | NOTIONAL
VALUE (1) | | | NET UNREALIZED
APPRECIATION
(DEPRECIATION) (2) | | | NET CASH
AND OTHER
RECEIVABLES
(PAYABLES) | | | VALUE | |
| Bank of America | | The Fund receives the total return on a portfolio of long and short equity positions and pays or receives the net of one month BA on long positions and short positions respectively, plus or minus a specified spread (rates range from 0.00% to 0.50%), which is denominated in CAD based on the local currencies of the positions within the swaps. | | 5/11/2020 | | $ | (135,919 | ) | | $ | (8,198 | ) | | $ | (845 | ) | | $ | (9,043 | ) |
| | | | | | | | | | | | | | | | | | | | |
SEE NOTES TO FINANCIAL STATEMENTS.
| | | | | | | | |
| | | |
| OCTOBER 31, 2019 | | J.P. MORGAN EXCHANGE-TRADED FUNDS | | | | | 87 | |
JPMorgan Long/Short ETF
SCHEDULE OF PORTFOLIO INVESTMENTS
AS OF OCTOBER 31, 2019 (continued)
| | | | | | | | | | | | | | | | |
| REFERENCE ENTITY | | SHARES | | | NOTIONAL
VALUE($) (1) | | | NET UNREALIZED
APPRECIATION
(DEPRECIATION)($) (2) | | | PERCENTAGE
OF NET
ASSETS (%) | |
Long Positions | | | | | |
| | | |
Common Stocks | | | | | | | | | | | | | |
Chemicals | | | | | | | | | | | | | |
Methanex Corp. | | | 1,034 | | | | 39,182 | | | | 3,277 | | | | 0.0 | (a) |
| | | | | | | | | | | | | | | | |
IT Services | | | | | | | | | | | | | |
CGI, Inc.* | | | 852 | | | | 66,227 | | | | (925 | ) | | | (0.0 | )(a) |
| | | | | | | | | | | | | | | | |
Oil, Gas & Consumable Fuels | | | | | | | | | | | | | |
Parex Resources, Inc.* | | | 497 | | | | 6,736 | | | | (235 | ) | | | (0.0 | )(a) |
| | | | | | | | | | | | | | | | |
Total Long Positions of Total Return Basket Swap | | | 2,383 | | | | 112,145 | | | | 2,117 | | | | 0.0 | (a) |
| | | | | | | | | | | | | | | | |
| | | |
Short Positions | | | | | | | | | | | | | |
| | | |
Common Stocks | | | | | | | | | | | | | |
Aerospace & Defense | | | | | | | | | | | | | |
Bombardier, Inc.* | | | (25,554 | ) | | | (32,207 | ) | | | (770 | ) | | | (0.0 | )(a) |
| | | | | | | | | | | | | | | | |
Construction & Engineering | | | | | | | | | | | | | |
SNC-Lavalin Group, Inc. | | | (864 | ) | | | (15,619 | ) | | | (4,133 | ) | | | (0.0 | )(a) |
| | | | | | | | | | | | | | | | |
Diversified Financial Services | | | | | | | | | | | | | |
Onex Corp. | | | (73 | ) | | | (4,292 | ) | | | 50 | | | | 0.0 | (a) |
| | | | | | | | | | | | | | | | |
Food Products | | | | | | | | | | | | | |
Premium Brands Holdings Corp. | | | (818 | ) | | | (53,964 | ) | | | 3,941 | | | | 0.0 | (a) |
| | | | | | | | | | | | | | | | |
Metals & Mining | | | | | | | | | | | | | |
Agnico Eagle Mines Ltd. | | | (963 | ) | | | (59,187 | ) | | | (5,736 | ) | | | (0.0 | )(a) |
First Quantum Minerals Ltd. | | | (3,161 | ) | | | (26,711 | ) | | | (3,590 | ) | | | (0.0 | )(a) |
Franco-Nevada Corp. | | | (578 | ) | | | (56,084 | ) | | | (77 | ) | | | (0.0 | )(a) |
| | | | | | | | | | | | | | | | |
| | | (4,702 | ) | | | (141,982 | ) | | | (9,403 | ) | | | (0.0 | )(a) |
| | | | | | | | | | | | | | | | |
Total Short Positions of Total Return Basket Swap | | | (32,011 | ) | | | (248,064 | ) | | | (10,315 | ) | | | 0.0 | (a) |
| | | | | | | | | | | | | | | | |
Total of Long and Short Positions of Total Return Basket Swap | | | (29,628 | ) | | | (135,919 | ) | | | (8,198 | ) | | | 0.0 | (a) |
| | | | | | | | | | | | | | | | |
| | | | | | | | | | | | | | | | | | | | |
| COUNTERPARTY | | DESCRIPTION | | TERMINATION
DATE | | NOTIONAL
VALUE (1) | | | NET UNREALIZED
APPRECIATION
(DEPRECIATION) (2) | | | NET CASH
AND OTHER
RECEIVABLES
(PAYABLES) | | | VALUE | |
| Bank of America | | The Fund receives the total return on a portfolio of long and short equity positions and pays or receives the net of one month EURIBOR on long positions and short positions respectively, plus or minus a specified spread (rates range from 0.00% to 0.20%), which is denominated in EUR based on the local currencies of the positions within the swaps. | | 4/30/2020 –
9/30/2020 | | $ | 2,440,120 | | | $ | 87,207 | | | $ | (622 | ) | | $ | 86,585 | |
| | | | | | | | | | | | | | | | | | | | |
SEE NOTES TO FINANCIAL STATEMENTS.
| | | | | | |
| | | |
| 88 | | | | J.P. MORGAN EXCHANGE-TRADED FUNDS | | OCTOBER 31, 2019 |
| | | | | | | | | | | | | | | | |
| REFERENCE ENTITY | | SHARES | | | NOTIONAL
VALUE($) (1) | | | NET UNREALIZED
APPRECIATION
(DEPRECIATION)($) (2) | | | PERCENTAGE
OF NET
ASSETS (%) | |
Long Positions | | | | | |
| | | |
Common Stocks | | | | | | | | | | | | | |
Automobiles | | | | | | | | | | | | | |
Peugeot SA | | | 2,495 | | | | 63,189 | | | | 1,884 | | | | 0.0 | (a) |
Chemicals | | | | | | | | | | | | | |
Covestro AG (b) | | | 1,401 | | | | 67,279 | | | | (510 | ) | | | (0.0 | )(a) |
Koninklijke DSM NV | | | 518 | | | | 61,480 | | | | 253 | | | | 0.0 | (a) |
| | | | | | | | | | | | | | | | |
| | | 1,919 | | | | 128,759 | | | | (257 | ) | | | (0.0 | )(a) |
| | | | | | | | | | | | | | | | |
Commercial Services & Supplies | | | | | | | | | | | | | |
Edenred | | | 1,569 | | | | 82,698 | | | | 8,566 | | | | 0.1 | |
SPIE SA | | | 4,244 | | | | 89,572 | | | | 3,867 | | | | 0.0 | (a) |
| | | | | | | | | | | | | | | | |
| | | 5,813 | | | | 172,270 | | | | 12,433 | | | | 0.1 | |
| | | | | | | | | | | | | | | | |
Construction & Engineering | | | | | | | | | | | | | |
ACS Actividades de Construccion y Servicios SA | | | 657 | | | | 26,660 | | | | 930 | | | | 0.0 | (a) |
Eiffage SA | | | 706 | | | | 75,829 | | | | 2,433 | | | | 0.0 | (a) |
HOCHTIEF AG | | | 146 | | | | 18,241 | | | | 1,463 | | | | 0.0 | (a) |
Koninklijke BAM Groep NV | | | 17,964 | | | | 45,608 | | | | 507 | | | | 0.0 | (a) |
| | | | | | | | | | | | | | | | |
| | | 19,473 | | | | 166,338 | | | | 5,333 | | | | 0.0 | (a) |
| | | | | | | | | | | | | | | | |
Construction Materials | | | | | | | | | | | | | |
HeidelbergCement AG | | | 1,019 | | | | 75,547 | | | | 5,390 | | | | 0.0 | (a) |
| | | | | | | | | | | | | | | | |
Diversified Telecommunication Services | | | | | | | | | | | | | |
Deutsche Telekom AG (Registered) | | | 4,496 | | | | 79,110 | | | | 2,357 | | | | 0.0 | (a) |
Koninklijke KPN NV | | | 25,790 | | | | 80,062 | | | | (4,202 | ) | | | (0.0 | )(a) |
Telefonica SA | | | 9,009 | | | | 69,182 | | | | (62 | ) | | | (0.0 | )(a) |
| | | | | | | | | | | | | | | | |
| | | 39,295 | | | | 228,354 | | | | (1,907 | ) | | | (0.0 | )(a) |
| | | | | | | | | | | | | | | | |
Electric Utilities | | | | | | | | | | | | | |
Endesa SA | | | 3,051 | | | | 83,093 | | | | 3,196 | | | | 0.0 | (a) |
Enel SpA | | | 11,197 | | | | 86,781 | | | | 2,263 | | | | 0.0 | (a) |
Iberdrola SA | | | 8,970 | | | | 92,203 | | | | (803 | ) | | | (0.0 | )(a) |
Verbund AG | | | 1,607 | | | | 87,059 | | | | 2,960 | | | | 0.0 | (a) |
| | | | | | | | | | | | | | | | |
| | | 24,825 | | | | 349,136 | | | | 7,616 | | | | 0.0 | (a) |
| | | | | | | | | | | | | | | | |
Electrical Equipment | | | | | | | | | | | | | |
Signify NV (b) | | | 2,628 | | | | 77,001 | | | | 6,692 | | | | 0.0 | (a) |
| | | | | | | | | | | | | | | | |
Energy Equipment & Services | | | | | | | | | | | | | |
SBM Offshore NV | | | 3,292 | | | | 56,772 | | | | 2,262 | | | | 0.0 | (a) |
| | | | | | | | | | | | | | | | |
Food & Staples Retailing | | | | | | | | | | | | | |
Koninklijke Ahold Delhaize NV | | | 534 | | | | 13,307 | | | | (81 | ) | | | (0.0 | )(a) |
| | | | | | | | | | | | | | | | |
Food Products | | | | | | | | | | | | | |
Danone SA | | | 985 | | | | 81,599 | | | | (4,793 | ) | �� | | (0.0 | )(a) |
| | | | | | | | | | | | | | | | |
Gas Utilities | | | | | | | | | | | | | |
Enagas SA | | | 4,005 | | | | 99,102 | | | | 7,567 | | | | 0.0 | (a) |
Italgas SpA | | | 1,849 | | | | 11,903 | | | | 149 | | | | 0.0 | (a) |
Snam SpA | | | 13,755 | | | | 70,617 | | | | 779 | | | | 0.0 | (a) |
| | | | | | | | | | | | | | | | |
| | | 19,609 | | | | 181,622 | | | | 8,495 | | | | 0.0 | (a) |
| | | | | | | | | | | | | | | | |
Health Care Equipment & Supplies | | | | | | | | | | | | | |
Koninklijke Philips NV | | | 1,740 | | | | 76,341 | | | | 2,665 | | | | 0.0 | (a) |
| | | | | | | | | | | | | | | | |
Insurance | | | | | | | | | | | | | |
Ageas | | | 1,636 | | | | 94,349 | | | | 2,469 | | | | 0.0 | (a) |
ASR Nederland NV | | | 1,862 | | | | 68,258 | | | | (278 | ) | | | (0.0 | )(a) |
SEE NOTES TO FINANCIAL STATEMENTS.
| | | | | | | | |
| | | |
| OCTOBER 31, 2019 | | J.P. MORGAN EXCHANGE-TRADED FUNDS | | | | | 89 | |
JPMorgan Long/Short ETF
SCHEDULE OF PORTFOLIO INVESTMENTS
AS OF OCTOBER 31, 2019 (continued)
| | | | | | | | | | | | | | | | |
| REFERENCE ENTITY | | SHARES | | | NOTIONAL
VALUE($) (1) | | | NET UNREALIZED
APPRECIATION
(DEPRECIATION)($) (2) | | | PERCENTAGE
OF NET
ASSETS (%) | |
Long Positions — continued | | | | | |
| | | |
Common Stocks — continued | | | | | | | | | | | | | |
Insurance — continued | | | | | | | | | | | | | |
AXA SA | | | 3,390 | | | | 89,738 | | | | 3,663 | | | | 0.0 | (a) |
Unipol Gruppo SpA | | | 15,997 | | | | 89,280 | | | | 2,754 | | | | 0.0 | (a) |
UnipolSai Assicurazioni SpA | | | 7,296 | | | | 20,363 | | | | 830 | | | | 0.0 | (a) |
| | | | | | | | | | | | | | | | |
| | | 30,181 | | | | 361,988 | | | | 9,438 | | | | 0.0 | (a) |
| | | | | | | | | | | | | | | | |
Machinery | | | | | | | | | | | | | |
Valmet OYJ | | | 2,983 | | | | 66,761 | | | | 8,848 | | | | 0.0 | (a) |
| | | | | | | | | | | | | | | | |
Media | | | | | | | | | | | | | |
ProSiebenSat.1 Media SE | | | 5,290 | | | | 78,115 | | | | 3,709 | | | | 0.0 | (a) |
Publicis Groupe SA | | | 1,038 | | | | 44,674 | | | | (4,495 | ) | | | (0.0 | )(a) |
| | | | | | | | | | | | | | | | |
| | | 6,328 | | | | 122,789 | | | | (786 | ) | | | (0.0 | )(a) |
| | | | | | | | | | | | | | | | |
Multi-Utilities | | | | | | | | | | | | | |
A2A SpA | | | 44,632 | | | | 89,598 | | | | 6,332 | | | | 0.1 | |
Engie SA | | | 5,689 | | | | 95,261 | | | | 2,132 | | | | 0.0 | (a) |
Hera SpA | | | 21,752 | | | | 93,179 | | | | 2,488 | | | | 0.0 | (a) |
RWE AG | | | 2,684 | | | | 81,794 | | | | 581 | | | | 0.0 | (a) |
| | | | | | | | | | | | | | | | |
| | | 74,757 | | | | 359,832 | | | | 11,533 | | | | 0.1 | |
| | | | | | | | | | | | | | | | |
Oil, Gas & Consumable Fuels | | | | | | | | | | | | | |
Eni SpA | | | 4,966 | | | | 75,339 | | | | (439 | ) | | | (0.0 | )(a) |
Neste OYJ | | | 2,401 | | | | 86,754 | | | | 9,003 | | | | 0.1 | |
OMV AG | | | 1,463 | | | | 85,530 | | | | 5,955 | | | | 0.0 | (a) |
Repsol SA | | | 5,136 | | | | 84,640 | | | | 2,638 | | | | 0.0 | (a) |
| | | | | | | | | | | | | | | | |
| | | 13,966 | | | | 332,263 | | | | 17,157 | | | | 0.1 | |
| | | | | | | | | | | | | | | | |
Pharmaceuticals | | | | | | | | | | | | | |
Ipsen SA | | | 708 | | | | 75,464 | | | | 6,759 | | | | 0.0 | (a) |
Merck KGaA | | | 772 | | | | 92,074 | | | | 2,631 | | | | 0.0 | (a) |
| | | | | | | | | | | | | | | | |
| | | 1,480 | | | | 167,538 | | | | 9,390 | | | | 0.0 | (a) |
| | | | | | | | | | | | | | | | |
Semiconductors & Semiconductor Equipment | | | | | | | | | | | | | |
Dialog Semiconductor plc* | | | 1,717 | | | | 77,231 | | | | (4,317 | ) | | | (0.0 | )(a) |
Siltronic AG | | | 1,018 | | | | 96,954 | | | | 18,716 | | | | 0.1 | |
| | | | | | | | | | | | | | | | |
| | | 2,735 | | | | 174,185 | | | | 14,399 | | | | 0.1 | |
| | | | | | | | | | | | | | | | |
Textiles, Apparel & Luxury Goods | | | | | | | | | | | | | |
adidas AG | | | 219 | | | | 67,621 | | | | (441 | ) | | | (0.0 | )(a) |
Christian Dior SE | | | 55 | | | | 27,168 | | | | (146 | ) | | | (0.0 | )(a) |
Kering SA | | | 138 | | | | 78,521 | | | | 7,261 | | | | 0.0 | (a) |
| | | | | | | | | | | | | | | | |
| | | 412 | | | | 173,310 | | | | 6,674 | | | | 0.0 | (a) |
| | | | | | | | | | | | | | | | |
Transportation Infrastructure | | | | | | | | | | | | | |
Aena SME SA (b) | | | 395 | | | | 72,507 | | | | (1,140 | ) | | | (0.0 | )(a) |
| | | | | | | | | | | | | | | | |
Total Long Positions of Total Return Basket Swap | | | 256,864 | | | | 3,501,408 | | | | 121,245 | | | | 0.4 | |
| | | | | | | | | | | | | | | | |
| |
Short Positions | | | | | |
| | | |
Common Stocks | | | | | | | | | | | | | |
Automobiles | | | | | | | | | | | | | |
Daimler AG (Registered) | | | (889 | ) | | | (51,965 | ) | | | (6,762 | ) | | | (0.0 | )(a) |
| | | | | | | | | | | | | | | | |
Banks | | | | | | | | | | | | | |
Bankia SA | | | (20,532 | ) | | | (39,171 | ) | | | (84 | ) | | | (0.0 | )(a) |
FinecoBank Banca Fineco SpA | | | (5,436 | ) | | | (61,282 | ) | | | (3,533 | ) | | | (0.0 | )(a) |
| | | | | | | | | | | | | | | | |
| | | (25,968 | ) | | | (100,453 | ) | | | (3,617 | ) | | | (0.0 | )(a) |
| | | | | | | | | | | | | | | | |
SEE NOTES TO FINANCIAL STATEMENTS.
| | | | | | |
| | | |
| 90 | | | | J.P. MORGAN EXCHANGE-TRADED FUNDS | | OCTOBER 31, 2019 |
| | | | | | | | | | | | | | | | |
| REFERENCE ENTITY | | SHARES | | | NOTIONAL
VALUE($) (1) | | | NET UNREALIZED
APPRECIATION
(DEPRECIATION)($) (2) | | | PERCENTAGE
OF NET
ASSETS (%) | |
Short Positions — continued | | | | | | | | | | | | | | | | |
| | | | |
Common Stocks — continued | | | | | | | | | | | | | | | | |
Chemicals | | | | | | | | | | | | | |
K+S AG (Registered) | | | (4,242 | ) | | | (60,237 | ) | | | (1,385 | ) | | | (0.0 | )(a) |
Wacker Chemie AG | | | (408 | ) | | | (31,963 | ) | | | (3,100 | ) | | | (0.0 | )(a) |
| | | | | | | | | | | | | | | | |
| | | (4,650 | ) | | | (92,200 | ) | | | (4,485 | ) | | | (0.0 | )(a) |
| | | | | | | | | | | | | | | | |
Construction & Engineering | | | | | | | | | | | | | |
Bouygues SA | | | (112 | ) | | | (4,751 | ) | | | (18 | ) | | | (0.0 | )(a) |
| | | | | | | | | | | | | | | | |
Containers & Packaging | | | | | | | | | | | | | |
Huhtamaki OYJ | | | (1,332 | ) | | | (61,679 | ) | | | (6,439 | ) | | | (0.0 | )(a) |
| | | | | | | | | | | | | | | | |
Diversified Telecommunication Services | | | | | | | | | | | | | |
Iliad SA | | | (375 | ) | | | (38,863 | ) | | | (3,183 | ) | | | (0.0 | )(a) |
| | | | | | | | | | | | | | | | |
Food & Staples Retailing | | | | | | | | | | | | | |
Jeronimo Martins SGPS SA | | | (3,972 | ) | | | (66,744 | ) | | | (3 | ) | | | (0.0 | )(a) |
| | | | | | | | | | | | | | | | |
Food Products | | | | | | | | | | | | | |
Kerry Group plc | | | (28 | ) | | | (3,385 | ) | | | (95 | ) | | | (0.0 | )(a) |
| | | | | | | | | | | | | | | | |
Gas Utilities | | | | | | | | | | | | | |
Rubis SCA | | | (1,120 | ) | | | (64,946 | ) | | | 316 | | | | 0.0 | (a) |
| | | | | | | | | | | | | | | | |
Hotels, Restaurants & Leisure | | | | | | | | | | | | | |
Elior Group SA (b) | | | (2,906 | ) | | | (37,635 | ) | | | 829 | | | | 0.0 | (a) |
Flutter Entertainment plc | | | (147 | ) | | | (15,185 | ) | | | (542 | ) | | | (0.0 | )(a) |
| | | | | | | | | | | | | | | | |
| | | (3,053 | ) | | | (52,820 | ) | | | 287 | | | | 0.0 | (a) |
| | | | | | | | | | | | | | | | |
Internet & Direct Marketing Retail | | | | | | | | | | | | | |
Zalando SE* (b) | | | (420 | ) | | | (18,210 | ) | | | 993 | | | | 0.0 | (a) |
| | | | | | | | | | | | | | | | |
Life Sciences Tools & Services | | | | | | | | | | | | | |
Eurofins Scientific SE | | | (124 | ) | | | (62,867 | ) | | | 296 | | | | 0.0 | (a) |
| | | | | | | | | | | | | | | | |
Machinery | | | | | | | | | | | | | |
ANDRITZ AG | | | (1,124 | ) | | | (50,542 | ) | | | (5,327 | ) | | | (0.1 | ) |
Fincantieri SpA | | | (9,569 | ) | | | (10,098 | ) | | | (573 | ) | | | (0.0 | )(a) |
GEA Group AG | | | (986 | ) | | | (30,142 | ) | | | (2,820 | ) | | | (0.0 | )(a) |
| | | | | | | | | | | | | | | | |
| | | (11,679 | ) | | | (90,782 | ) | | | (8,720 | ) | | | (0.1 | ) |
| | | | | | | | | | | | | | | | |
Media | | | | | | | | | | | | | |
Altice Europe NV* | | | (8,084 | ) | | | (46,255 | ) | | | (1,240 | ) | | | (0.0 | )(a) |
| | | | | | | | | | | | | | | | |
Metals & Mining | | | | | | | | | | | | | |
ArcelorMittal | | | (226 | ) | | | (3,361 | ) | | | (156 | ) | | | (0.0 | )(a) |
Outokumpu OYJ | | | (21,041 | ) | | | (59,786 | ) | | | (3,179 | ) | | | (0.0 | )(a) |
thyssenkrupp AG | | | (3,358 | ) | | | (47,887 | ) | | | (1,169 | ) | | | (0.0 | )(a) |
| | | | | | | | | | | | | | | | |
| | | (24,625 | ) | | | (111,034 | ) | | | (4,504 | ) | | | (0.0 | )(a) |
| | | | | | | | | | | | | | | | |
Semiconductors & Semiconductor Equipment | | | | | | | | | | | | | |
AIXTRON SE* | | | (2,215 | ) | | | (20,250 | ) | | | 1,572 | | | | 0.0 | (a) |
Infineon Technologies AG | | | (2,286 | ) | | | (44,277 | ) | | | (3,026 | ) | | | (0.0 | )(a) |
| | | | | | | | | | | | | | | | |
| | | (4,501 | ) | | | (64,527 | ) | | | (1,454 | ) | | | (0.0 | )(a) |
| | | | | | | | | | | | | | | | |
Transportation Infrastructure | | | | | | | | | | | | | |
Getlink SE | | | (3,824 | ) | | | (64,055 | ) | | | (6,045 | ) | | | (0.0 | )(a) |
| | | | | | | | | | | | | | | | |
Wireless Telecommunication Services | | | | | | | | | | | | | |
1&1 Drillisch AG | | | (2,455 | ) | | | (65,752 | ) | | | 10,635 | | | | 0.0 | (a) |
| | | | | | | | | | | | | | | | |
Total Short Positions of Total Return Basket Swap | | | (97,211 | ) | | | (1,061,288 | ) | | | (34,038 | ) | | | (0.1 | ) |
| | | | | | | | | | | | | | | | |
Total of Long and Short Positions of Total Return Basket Swap | | | 159,653 | | | | 2,440,120 | | | | 87,207 | | | | 0.3 | |
| | | | | | | | | | | | | | | | |
SEE NOTES TO FINANCIAL STATEMENTS.
| | | | | | | | |
| | | |
| OCTOBER 31, 2019 | | J.P. MORGAN EXCHANGE-TRADED FUNDS | | | | | 91 | |
JPMorgan Long/Short ETF
SCHEDULE OF PORTFOLIO INVESTMENTS
AS OF OCTOBER 31, 2019 (continued)
| | | | | | | | | | | | | | | | | | | | |
| COUNTERPARTY | | DESCRIPTION | | TERMINATION
DATE | | NOTIONAL
VALUE (1) | | | NET UNREALIZED
APPRECIATION
(DEPRECIATION) (2) | | | NET CASH
AND OTHER
RECEIVABLES
(PAYABLES) | | | VALUE | |
| Bank of America | | The Fund receives the total return on a portfolio of long and short equity positions and pays or receives the net of one month LIBOR on long positions and short positions respectively, plus or minus a specified spread (rates range from 0.00% to 0.20%), which is denominated in CHF based on the local currencies of the positions within the swaps. | | 4/30/2020 –
2/26/2021 | | $ | 187,779 | | | $ | (1,239 | ) | | $ | 96 | | | $ | (1,143 | ) |
| | | | | | | | | | | | | | | | | | | | |
| | | | | | | | | | | | | | | | |
| REFERENCE ENTITY | | SHARES | | | NOTIONAL
VALUE($) (1) | | | NET UNREALIZED
APPRECIATION
(DEPRECIATION)($) (2) | | | PERCENTAGE
OF NET
ASSETS (%) | |
Long Positions | | | | | |
| | | |
Common Stocks | | | | | | | | | | | | | |
Electronic Equipment, Instruments & Components | | | | | | | | | | | | | |
Landis+Gyr Group AG* | | | 943 | | | | 87,561 | | | | 561 | | | | 0.0 | (a) |
| | | | | | | | | | | | | | | | |
Health Care Equipment & Supplies | | | | | | | | | | | | | |
Sonova Holding AG (Registered) | | | 54 | | | | 12,392 | | | | 99 | | | | 0.0 | (a) |
| | | | | | | | | | | | | | | | |
Health Care Providers & Services | | | | | | | | | | | | | |
Galenica AG (b) | | | 1,606 | | | | 96,147 | | | | 3,799 | | | | 0.0 | (a) |
| | | | | | | | | | | | | | | | |
Insurance | | | | | | | | | | | | | |
Zurich Insurance Group AG | | | 246 | | | | 96,358 | | | | 832 | | | | 0.0 | (a) |
| | | | | | | | | | | | | | | | |
Machinery | | | | | | | | | | | | | |
OC Oerlikon Corp. AG (Registered) | | | 6,300 | | | | 64,651 | | | | 2,642 | | | | 0.0 | (a) |
| | | | | | | | | | | | | | | | |
Pharmaceuticals | | | | | | | | | | | | | |
Roche Holding AG | | | 41 | | | | 12,223 | | | | 393 | | | | 0.0 | (a) |
| | | | | | | | | | | | | | | | |
Total Long Positions of Total Return Basket Swap | | | 9,190 | | | | 369,332 | | | | 8,326 | | | | 0.0 | (a) |
| | | | | | | | | | | | | | | | |
Short Positions | | | | | |
| | | |
Common Stocks | | | | | | | | | | | | | |
Chemicals | | | | | | | | | | | | | |
Sika AG (Registered) | | | (280 | ) | | | (48,134 | ) | | | (4,625 | ) | | | (0.0 | )(a) |
| | | | | | | | | | | | | | | | |
Electrical Equipment | | | | | | | | | | | | | |
ABB Ltd. (Registered) | | | (2,577 | ) | | | (54,117 | ) | | | (6,727 | ) | | | (0.0 | )(a) |
| | | | | | | | | | | | | | | | |
Pharmaceuticals | | | | | | | | | | | | | |
Vifor Pharma AG | | | (402 | ) | | | (63,306 | ) | | | 2,265 | | | | 0.0 | (a) |
| | | | | | | | | | | | | | | | |
Semiconductors & Semiconductor Equipment | | | | | | | | | | | | | |
ams AG* | | | (356 | ) | | | (15,996 | ) | | | (478 | ) | | | (0.0 | )(a) |
| | | | | | | | | | | | | | | | |
Total Short Positions of Total Return Basket Swap | | | (3,615 | ) | | | (181,553 | ) | | | (9,565 | ) | | | 0.0 | (a) |
| | | | | | | | | | | | | | | | |
Total of Long and Short Positions of Total Return Basket Swap | | | 5,575 | | | | 187,779 | | | | (1,239 | ) | | | 0.0 | (a) |
| | | | | | | | | | | | | | | | |
SEE NOTES TO FINANCIAL STATEMENTS.
| | | | | | |
| | | |
| 92 | | | | J.P. MORGAN EXCHANGE-TRADED FUNDS | | OCTOBER 31, 2019 |
| | | | | | | | | | | | | | | | | | | | |
| COUNTERPARTY | | DESCRIPTION | | TERMINATION
DATE | | NOTIONAL
VALUE (1) | | | NET UNREALIZED
APPRECIATION
(DEPRECIATION) (2) | | | NET CASH
AND OTHER
RECEIVABLES
(PAYABLES) | | | VALUE | |
| Bank of America | | The Fund receives the total return on a portfolio of long and short equity positions and pays or receives the net of one month BBR on long positions and short positions respectively, plus or minus a specified spread (rates range from (0.75)% to 0.35%), which is denominated in AUD based on the local currencies of the positions within the swaps. | | 4/14/2020 | | $ | (524,233 | ) | | $ | (3,195 | ) | | $ | (4,147 | ) | | $ | (7,342 | ) |
| | | | | | | | | | | | | | | | | | | | |
| | | | | | | | | | | | | | | | |
| REFERENCE ENTITY | | SHARES | | | NOTIONAL
VALUE($) (1) | | | NET UNREALIZED
APPRECIATION
(DEPRECIATION)($) (2) | | | PERCENTAGE
OF NET
ASSETS (%) | |
Long Positions | | | | | | | | | | | | | | | | |
| | | | |
Common Stocks | | | | | | | | | | | | | | | | |
Food & Staples Retailing | | | | | | | | | | | | | | | | |
Metcash Ltd. | | | 37,412 | | | | 72,726 | | | | 981 | | | | 0.0 | (a) |
| | | | | | | | | | | | | | | | |
Oil, Gas & Consumable Fuels | | | | | | | | | | | | | |
Beach Energy Ltd. | | | 559 | | | | 879 | | | | (26 | ) | | | (0.0 | )(a) |
Whitehaven Coal Ltd. | | | 9,494 | | | | 21,593 | | | | 1,286 | | | | 0.0 | (a) |
| | | | | | | | | | | | | | | | |
| | | 10,053 | | | | 22,472 | | | | 1,260 | | | | 0.0 | (a) |
| | | | | | | | | | | | | | | | |
Total Long Positions of Total Return Basket Swap | | | 47,465 | | | | 95,198 | | | | 2,241 | | | | 0.0 | (a) |
| | | | | | | | | | | | | | | | |
| | | | |
Short Positions | | | | | | | | | | | | | | | | |
| | | | |
Common Stocks | | | | | | | | | | | | | | | | |
Beverages | | | | | | | | | | | | | |
Treasury Wine Estates Ltd. | | | (5,684 | ) | | | (68,908 | ) | | | 996 | | | | 0.0 | (a) |
| | | | | | | | | | | | | | | | |
Building Products | | | | | | | | | | | | | |
Reliance Worldwide Corp. Ltd. | | | (26,332 | ) | | | (76,623 | ) | | | (6,648 | ) | | | (0.0 | )(a) |
| | | | | | | | | | | | | | | | |
Capital Markets | | | | | | | | | | | | | |
Platinum Asset Management Ltd. | | | (25,324 | ) | | | (72,304 | ) | | | (54 | ) | | | (0.0 | )(a) |
| | | | | | | | | | | | | | | | |
Chemicals | | | | | | | | | | | | | |
Nufarm Ltd.* | | | (14,432 | ) | | | (58,894 | ) | | | 8,313 | | | | 0.0 | (a) |
| | | | | | | | | | | | | | | | |
Construction Materials | | | | | | | | | | | | | |
Adelaide Brighton Ltd. | | | (26,301 | ) | | | (55,862 | ) | | | (2,887 | ) | | | (0.0 | )(a) |
| | | | | | | | | | | | | | | | |
Food Products | | | | | | | | | | | | | |
GrainCorp., Ltd. | | | (14,397 | ) | | | (71,786 | ) | | | 1,480 | | | | 0.0 | (a) |
| | | | | | | | | | | | | | | | |
Hotels, Restaurants & Leisure | | | | | | | | | | | | | |
Domino’s Pizza Enterprises Ltd. | | | (960 | ) | | | (33,775 | ) | | | (1,464 | ) | | | (0.0 | )(a) |
Star Entertainment Grp Ltd. (The) | | | (8,726 | ) | | | (28,294 | ) | | | (2,509 | ) | | | (0.0 | )(a) |
| | | | | | | | | | | | | | | | |
| | | (9,686 | ) | | | (62,069 | ) | | | (3,973 | ) | | | (0.0 | )(a) |
| | | | | | | | | | | | | | | | |
IT Services | | | | | | | | | | | | | |
Afterpay Touch Group Ltd.* | | | (933 | ) | | | (18,522 | ) | | | 986 | | | | 0.0 | (a) |
NEXTDC Ltd.* | | | (13,402 | ) | | | (59,227 | ) | | | (1,354 | ) | | | (0.0 | )(a) |
| | | | | | | | | | | | | | | | |
| | | (14,335 | ) | | | (77,749 | ) | | | (368 | ) | | | (0.0 | )(a) |
| | | | | | | | | | | | | | | | |
Oil, Gas & Consumable Fuels | | | | | | | | | | | | | |
Oil Search Ltd. | | | (13,384 | ) | | | (66,054 | ) | | | (2,253 | ) | | | (0.0 | )(a) |
| | | | | | | | | | | | | | | | |
Professional Services | | | | | | | | | | | | | |
ALS Ltd. | | | (1,651 | ) | | | (9,182 | ) | | | (42 | ) | | | (0.0 | )(a) |
| | | | | | | | | | | | | | | | |
Total Short Positions of Total Return Basket Swap | | | (151,526 | ) | | | (619,431 | ) | | | (5,436 | ) | | | 0.0 | (a) |
| | | | | | | | | | | | | | | | |
Total of Long and Short Positions of Total Return Basket Swap | | | (104,061 | ) | | | (524,233 | ) | | | (3,195 | ) | | | 0.0 | (a) |
| | | | | | | | | | | | | | | | |
SEE NOTES TO FINANCIAL STATEMENTS.
| | | | | | | | |
| | | |
| OCTOBER 31, 2019 | | J.P. MORGAN EXCHANGE-TRADED FUNDS | | | | | 93 | |
JPMorgan Long/Short ETF
SCHEDULE OF PORTFOLIO INVESTMENTS
AS OF OCTOBER 31, 2019 (continued)
| | | | | | | | | | | | | | | | | | | | |
| COUNTERPARTY | | DESCRIPTION | | TERMINATION
DATE | | NOTIONAL
VALUE (1) | | | NET UNREALIZED
APPRECIATION
(DEPRECIATION) (2) | | | NET CASH
AND OTHER
RECEIVABLES
(PAYABLES) | | | VALUE | |
| Bank of America | | The Fund receives the total return on a portfolio of long and short equity positions and pays or receives the net of one month LIBOR on long positions and short positions respectively, plus or minus a specified spread (rates range from (3.48)% to 0.35%), which is denominated in JPY based on the local currencies of the positions within the swaps. | | 4/13/2020 | | $ | (866,212 | ) | | $ | (34,505 | ) | | $ | (9,272 | ) | | $ | (43,777 | ) |
| | | | | | | | | | | | | | | | | | | | |
| | | | | | | | | | | | | | | | |
| REFERENCE ENTITY | | SHARES | | | NOTIONAL
VALUE($) (1) | | | NET UNREALIZED
APPRECIATION
(DEPRECIATION)($) (2) | | | PERCENTAGE
OF NET
ASSETS (%) | |
| | | | |
Long Positions | | | | | | | | | | | | | | | | |
| | | | |
Common Stocks | | | | | | | | | | | | | | | | |
Auto Components | | | | | | | | | | | | | | | | |
TS Tech Co. Ltd. | | | 400 | | | | 12,811 | | | | 895 | | | | 0.0 | (a) |
| | | | | | | | | | | | | | | | |
Diversified Telecommunication Services | | | | | | | | | | | | | | | | |
Nippon Telegraph & Telephone Corp. | | | 1,500 | | | | 74,464 | | | | (377 | ) | | | (0.0 | )(a) |
| | | | | | | | | | | | | | | | |
Pharmaceuticals | | | | | | | | | | | | | | | | |
Astellas Pharma, Inc. | | | 2,900 | | | | 49,772 | | | | 8,160 | | | | 0.1 | |
Shionogi & Co. Ltd. | | | 1,100 | | | | 66,025 | | | | 6,014 | | | | 0.0 | (a) |
| | | | | | | | | | | | | | | | |
| | | 4,000 | | | | 115,797 | | | | 14,174 | | | | 0.1 | |
| | | | | | | | | | | | | | | | |
Technology Hardware, Storage & Peripherals | | | | | | | | | | | | | | | | |
Brother Industries Ltd. | | | 3,600 | | | | 67,659 | | | | 3,315 | | | | 0.0 | (a) |
| | | | | | | | | | | | | | | | |
Trading Companies & Distributors | | | | | | | | | | | | | | | | |
ITOCHU Corp. | | | 3,800 | | | | 79,450 | | | | 2,420 | | | | 0.0 | (a) |
| | | | | | | | | | | | | | | | |
Wireless Telecommunication Services | | | | | | | | | | | | | | | | |
NTT DOCOMO, Inc. | | | 3,200 | | | | 87,728 | | | | 3,200 | | | | 0.0 | (a) |
| | | | | | | | | | | | | | | | |
Total Long Positions of Total Return Basket Swap | | | 16,500 | | | | 437,909 | | | | 23,627 | | | | 0.1 | |
| | | | | | | | | | | | | | | | |
| | | | |
Short Positions | | | | | | | | | | | | | | | | |
| | | | |
Common Stocks | | | | | | | | | | | | | | | | |
Automobiles | | | | | | | | | | | | | | | | |
Mitsubishi Motors Corp. | | | (12,700 | ) | | | (57,986 | ) | | | (3,510 | ) | | | (0.0 | )(a) |
| | | | | | | | | | | | | | | | |
Chemicals | | | | | | | | | | | | | | | | |
Toray Industries, Inc. | | | (6,100 | ) | | | (43,110 | ) | | | 2,814 | | | | 0.0 | (a) |
| | | | | | | | | | | | | | | | |
Construction & Engineering | | | | | | | | | | | | | | | | |
JGC Holdings Corp. | | | (3,000 | ) | | | (43,390 | ) | | | (4,804 | ) | | | (0.0 | )(a) |
| | | | | | | | | | | | | | | | |
Consumer Finance | | | | | | | | | | | | | | | | |
Aiful Corp.* | | | (25,300 | ) | | | (58,907 | ) | | | (3,609 | ) | | | (0.0 | )(a) |
| | | | | | | | | | | | | | | | |
Electrical Equipment | | | | | | | | | | | | | | | | |
Fujikura Ltd. | | | (3,800 | ) | | | (17,632 | ) | | | (2,661 | ) | | | (0.0 | )(a) |
| | | | | | | | | | | | | | | | |
Electronic Equipment, Instruments & Components | | | | | | | | | | | | | | | | |
Murata Manufacturing Co. Ltd. | | | (700 | ) | | | (38,114 | ) | | | (1,290 | ) | | | (0.0 | )(a) |
| | | | | | | | | | | | | | | | |
Food & Staples Retailing | | | | | | | | | | | | | | | | |
Aeon Co. Ltd. | | | (2,500 | ) | | | (50,301 | ) | | | (1,259 | ) | | | (0.0 | )(a) |
| | | | | | | | | | | | | | | | |
SEE NOTES TO FINANCIAL STATEMENTS.
| | | | | | |
| | | |
| 94 | | | | J.P. MORGAN EXCHANGE-TRADED FUNDS | | OCTOBER 31, 2019 |
| | | | | | | | | | | | | | | | |
| REFERENCE ENTITY | | SHARES | | | NOTIONAL
VALUE($) (1) | | | NET UNREALIZED
APPRECIATION
(DEPRECIATION)($) (2) | | | PERCENTAGE
OF NET
ASSETS (%) | |
| | | | |
Short Positions — continued | | | | | | | | | | | | | | | | |
| | | | |
Common Stocks — continued | | | | | | | | | | | | | | | | |
Food Products | | | | | | | | | | | | | | | | |
Nissin Foods Holdings Co. Ltd. | | | (900 | ) | | | (67,983 | ) | | | (1,284 | ) | | | (0.0 | )(a) |
| | | | | | | | | | | | | | | | |
Hotels, Restaurants & Leisure | | | | | | | | | | | | | | | | |
HIS Co. Ltd. | | | (1,400 | ) | | | (36,331 | ) | | | (1,218 | ) | | | (0.0 | )(a) |
Kyoritsu Maintenance Co. Ltd. | | | (900 | ) | | | (39,812 | ) | | | (1,446 | ) | | | (0.0 | )(a) |
| | | | | | | | | | | | | | | | |
| | | (2,300 | ) | | | (76,143 | ) | | | (2,664 | ) | | | (0.0 | )(a) |
| | | | | | | | | | | | | | | | |
Household Durables | | | | | | | | | | | | | | | | |
Panasonic Corp. | | | (1,200 | ) | | | (10,085 | ) | | | 79 | | | | 0.0 | (a) |
Sharp Corp.* | | | (3,400 | ) | | | (39,002 | ) | | | (1,637 | ) | | | (0.0 | )(a) |
| | | | | | | | | | | | | | | | |
| | | (4,600 | ) | | | (49,087 | ) | | | (1,558 | ) | | | (0.0 | )(a) |
| | | | | | | | | | | | | | | | |
Industrial Conglomerates | | | | | | | | | | | | | | | | |
Toshiba Corp. | | | (1,800 | ) | | | (61,553 | ) | | | (872 | ) | | | (0.0 | )(a) |
| | | | | | | | | | | | | | | | |
Interactive Media & Services | | | | | | | | | | | | | | | | |
LINE Corp.* | | | (800 | ) | | | (29,429 | ) | | | (5 | ) | | | (0.0 | )(a) |
| | | | | | | | | | | | | | | | |
Leisure Products | | | | | | | | | | | | | | | | |
Sega Sammy Holdings, Inc. | | | (3,400 | ) | | | (47,848 | ) | | | 1,329 | | | | 0.0 | (a) |
| | | | | | | | | | | | | | | | |
Machinery | | | | | | | | | | | | | | | | |
FANUC Corp. | | | (300 | ) | | | (59,175 | ) | | | (5,797 | ) | | | (0.1 | ) |
IHI Corp. | | | (2,200 | ) | | | (54,215 | ) | | | (5,749 | ) | | | (0.0 | )(a) |
| | | | | | | | | | | | | | | | |
| | | (2,500 | ) | | | (113,390 | ) | | | (11,546 | ) | | | (0.1 | ) |
| | | | | | | | | | | | | | | | |
Marine | | | | | | | | | | | | | | | | |
Kawasaki Kisen Kaisha Ltd.* | | | (1,900 | ) | | | (28,272 | ) | | | (4,318 | ) | | | (0.1 | ) |
Nippon Yusen KK | | | (2,600 | ) | | | (46,709 | ) | | | (2,647 | ) | | | (0.0 | )(a) |
| | | | | | | | | | | | | | | | |
| | | (4,500 | ) | | | (74,981 | ) | | | (6,965 | ) | | | (0.1 | ) |
| | | | | | | | | | | | | | | | |
Metals & Mining | | | | | | | | | | | | | | | | |
JFE Holdings, Inc. | | | (4,900 | ) | | | (61,288 | ) | | | (2,699 | ) | | | (0.0 | )(a) |
Kobe Steel Ltd. | | | (10,300 | ) | | | (55,378 | ) | | | (1,956 | ) | | | (0.0 | )(a) |
| | | | | | | | | | | | | | | | |
| | | (15,200 | ) | | | (116,666 | ) | | | (4,655 | ) | | | (0.0 | )(a) |
| | | | | | | | | | | | | | | | |
Multiline Retail | | | | | | | | | | | | | | | | |
Marui Group Co. Ltd. | | | (2,000 | ) | | | (44,461 | ) | | | (2,052 | ) | | | (0.0 | )(a) |
Pan Pacific International Holdings Corp. | | | (2,800 | ) | | | (44,076 | ) | | | (222 | ) | | | (0.0 | )(a) |
Ryohin Keikaku Co. Ltd. | | | (300 | ) | | | (6,678 | ) | | | (1,143 | ) | | | (0.0 | )(a) |
Takashimaya Co. Ltd. | | | (1,600 | ) | | | (18,573 | ) | | | (482 | ) | | | (0.0 | )(a) |
| | | | | | | | | | | | | | | | |
| | | (6,700 | ) | | | (113,788 | ) | | | (3,899 | ) | | | (0.0 | )(a) |
| | | | | | | | | | | | | | | | |
Pharmaceuticals | | | | | | | | | | | | | | | | |
Takeda Pharmaceutical Co. Ltd. | | | (2,000 | ) | | | (72,266 | ) | | | (3,948 | ) | | | (0.0 | )(a) |
| | | | | | | | | | | | | | | | |
Road & Rail | | | | | | | | | | | | | | | | |
Nankai Electric Railway Co. Ltd. | | | (500 | ) | | | (12,994 | ) | | | (125 | ) | | | (0.0 | )(a) |
Nippon Express Co. Ltd. | | | (1,100 | ) | | | (62,761 | ) | | | (6,302 | ) | | | (0.0 | )(a) |
Tokyu Corp. | | | (3,300 | ) | | | (62,415 | ) | | | 387 | | | | 0.0 | (a) |
| | | | | | | | | | | | | | | | |
| | | (4,900 | ) | | | (138,170 | ) | | | (6,040 | ) | | | (0.0 | )(a) |
| | | | | | | | | | | | | | | | |
Semiconductors & Semiconductor Equipment | | | | | | | | | | | | | | | | |
Rohm Co. Ltd. | | | (100 | ) | | | (7,923 | ) | | | (225 | ) | | | (0.0 | )(a) |
| | | | | | | | | | | | | | | | |
Technology Hardware, Storage & Peripherals | | | | | | | | | | | | | | | | |
Seiko Epson Corp. | | | (1,800 | ) | | | (25,454 | ) | | | (1,481 | ) | | | (0.0 | )(a) |
| | | | | | | | | | | | | | | | |
Total Short Positions of Total Return Basket Swap | | | (105,600 | ) | | | (1,304,121 | ) | | | (58,132 | ) | | | (0.2 | ) |
| | | | | | | | | | | | | | | | |
Total of Long and Short Positions of Total Return Basket Swap | | | (89,100 | ) | | | (866,212 | ) | | | (34,505 | ) | | | (0.1 | ) |
| | | | | | | | | | | | | | | | |
SEE NOTES TO FINANCIAL STATEMENTS.
| | | | | | | | |
| | | |
| OCTOBER 31, 2019 | | J.P. MORGAN EXCHANGE-TRADED FUNDS | | | | | 95 | |
JPMorgan Long/Short ETF
SCHEDULE OF PORTFOLIO INVESTMENTS
AS OF OCTOBER 31, 2019 (continued)
| | | | | | | | | | | | | | | | | | | | |
| COUNTERPARTY | | DESCRIPTION | | TERMINATION
DATE | | NOTIONAL
VALUE (1) | | | NET UNREALIZED
APPRECIATION
(DEPRECIATION) (2) | | | NET CASH
AND OTHER
RECEIVABLES
(PAYABLES) | | | VALUE | |
| Goldman Sachs | | The Fund receives the total return on a portfolio of long and short equity positions and pays or receives the net of one day SONIA and one month LIBOR on long positions and short positions respectively, plus or minus a specified spread (rates range from (1.45)% to 0.18%), which is denominated in GBP based on the local currencies of the positions within the swaps. | | 5/25/2028 –
11/1/2029 | | $ | (210,580 | ) | | $ | (54,205 | ) | | $ | (18,252 | ) | | $ | (72,457 | ) |
| | | | | | | | | | | | | | | | | | | | |
| | | | | | | | | | | | | | | | |
| REFERENCE ENTITY | | SHARES | | | NOTIONAL
VALUE($) (1) | | | NET UNREALIZED
APPRECIATION
(DEPRECIATION)($) (2) | | | PERCENTAGE
OF NET
ASSETS (%) | |
Long Positions | | | | | | | | | | | | | | | | |
| | | | |
Common Stocks | | | | | | | | | | | | | | | | |
Aerospace & Defense | | | | | | | | | | | | | | | | |
Meggitt plc | | | 9,655 | | | | 78,122 | | | | (212 | ) | | | (0.0 | )(a) |
| | | | | | | | | | | | | | | | |
Airlines | | | | | | | | | | | | | |
Wizz Air Holdings plc* (b) | | | 449 | | | | 22,235 | | | | 1,245 | | | | 0.0 | (a) |
| | | | | | | | | | | | | | | | |
Capital Markets | | | | | | | | | | | | | |
3i Group plc | | | 1,005 | | | | 14,686 | | | | 873 | | | | 0.0 | (a) |
| | | | | | | | | | | | | | | | |
Commercial Services & Supplies | | | | | | | | | | | | | |
Aggreko plc | | | 9,817 | | | | 100,644 | | | | 460 | | | | 0.0 | (a) |
| | | | | | | | | | | | | | | | |
Construction Materials | | | | | | | | | | | | | |
Rhi Magnesita NV | | | 2,062 | | | | 92,932 | | | | (7,153 | ) | | | (0.0 | )(a) |
| | | | | | | | | | | | | | | | |
Distributors | | | | | | | | | | | | | |
Inchcape plc | | | 3,352 | | | | 28,025 | | | | 1,337 | | | | 0.0 | (a) |
| | | | | | | | | | | | | | | | |
Energy Equipment & Services | | | | | | | | | | | | | |
Petrofac Ltd. | | | 6,821 | | | | 34,043 | | | | (623 | ) | | | (0.0 | )(a) |
| | | | | | | | | | | | | | | | |
Food Products | | | | | | | | | | | | | |
Greencore Group plc | | | 4,083 | | | | 12,276 | | | | 519 | | | | 0.0 | (a) |
Tate & Lyle plc | | | 11,064 | | | | 96,503 | | | | (2,650 | ) | | | (0.0 | )(a) |
| | | | | | | | | | | | | | | | |
| | | 15,147 | | | | 108,779 | | | | (2,131 | ) | | | (0.0 | )(a) |
| | | | | | | | | | | | | | | | |
Hotels, Restaurants & Leisure | | | | | | | | | | | | | |
Greggs plc | | | 759 | | | | 17,458 | | | | 253 | | | | 0.0 | (a) |
Playtech plc | | | 15,772 | | | | 80,277 | | | | (951 | ) | | | (0.0 | )(a) |
| | | | | | | | | | | | | | | | |
| | | 16,531 | | | | 97,735 | | | | (698 | ) | | | (0.0 | )(a) |
| | | | | | | | | | | | | | | | |
Household Durables | | | | | | | | | | | | | |
Barratt Developments plc | | | 1,883 | | | | 15,399 | | | | 1,048 | | | | 0.0 | (a) |
Berkeley Group Holdings plc | | | 304 | | | | 17,328 | | | | 1,485 | | | | 0.0 | (a) |
Bovis Homes Group plc | | | 1,098 | | | | 16,641 | | | | 1,480 | | | | 0.0 | (a) |
Redrow plc | | | 1,934 | | | | 15,077 | | | | 229 | | | | 0.0 | (a) |
Taylor Wimpey plc | | | 10,270 | | | | 22,026 | | | | 2,324 | | | | 0.0 | (a) |
| | | | | | | | | | | | | | | | |
| | | 15,489 | | | | 86,471 | | | | 6,566 | | | | 0.0 | (a) |
| | | | | | | | | | | | | | | | |
Independent Power and Renewable Electricity Producers | | | | | | | | | | | | | |
Drax Group plc | | | 4,543 | | | | 17,465 | | | | 1,726 | | | | 0.0 | (a) |
| | | | | | | | | | | | | | | | |
Media | | | | | | | | | | | | | |
WPP plc | | | 7,708 | | | | 96,192 | | | | (1,136 | ) | | | (0.0 | )(a) |
| | | | | | | | | | | | | | | | |
SEE NOTES TO FINANCIAL STATEMENTS.
| | | | | | |
| | | |
| 96 | | | | J.P. MORGAN EXCHANGE-TRADED FUNDS | | OCTOBER 31, 2019 |
| | | | | | | | | | | | | | | | |
| REFERENCE ENTITY | | SHARES | | | NOTIONAL
VALUE($) (1) | | | NET UNREALIZED
APPRECIATION
(DEPRECIATION)($) (2) | | | PERCENTAGE
OF NET
ASSETS (%) | |
Long Positions — continued | | | | | | | | | | | | | | | | |
| | | | |
Common Stocks — continued | | | | | | | | | | | | | | | | |
Metals & Mining | | | | | | | | | | | | | |
Anglo American plc | | | 798 | | | | 20,538 | | | | 654 | | | | 0.0 | (a) |
BHP Group plc | | | 1,263 | | | | 26,789 | | | | (948 | ) | | | (0.0 | )(a) |
Rio Tinto plc | | | 588 | | | | 30,612 | | | | (636 | ) | | | (0.0 | )(a) |
| | | | | | | | | | | | | | | | |
| | | 2,649 | | | | 77,939 | | | | (930 | ) | | | (0.0 | )(a) |
| | | | | | | | | | | | | | | | |
Multi-Utilities | | | | | | | | | | | | | |
Centrica plc | | | 33,189 | | | | 31,233 | | | | 2,581 | | | | 0.0 | (a) |
| | | | | | | | | | | | | | | | |
Oil, Gas & Consumable Fuels | | | | | | | | | | | | | |
Royal Dutch Shell plc | | | 2,593 | | | | 74,678 | | | | (2,694 | ) | | | (0.0 | )(a) |
Tullow Oil plc | | | 25,278 | | | | 67,551 | | | | 718 | | | | 0.0 | (a) |
| | | | | | | | | | | | | | | | |
| | | 27,871 | | | | 142,229 | | | | (1,976 | ) | | | (0.0 | )(a) |
| | | | | | | | | | | | | | | | |
Personal Products | | | | | | | | | | | | | |
Unilever plc | | | 228 | | | | 13,652 | | | | (456 | ) | | | (0.0 | )(a) |
| | | | | | | | | | | | | | | | |
Pharmaceuticals | | | | | | | | | | | | | |
GlaxoSmithKline plc | | | 4,526 | | | | 103,668 | | | | 3,313 | | | | 0.0 | (a) |
Hikma Pharmaceuticals plc | | | 2,630 | | | | 68,492 | | | | (1,033 | ) | | | (0.0 | )(a) |
| | | | | | | | | | | | | | | | |
| | | 7,156 | | | | 172,160 | | | | 2,280 | | | | 0.0 | (a) |
| | | | | | | | | | | | | | | | |
Software | | | | | | | | | | | | | |
Avast plc(b) | | | 1,064 | | | | 5,713 | | | | 692 | | | | 0.0 | (a) |
AVEVA Group plc | | | 103 | | | | 5,581 | | | | 661 | | | | 0.0 | (a) |
Sage Group plc (The) | | | 3,472 | | | | 32,359 | | | | 1,795 | | | | 0.0 | (a) |
| | | | | | | | | | | | | | | | |
| | | 4,639 | | | | 43,653 | | | | 3,148 | | | | 0.0 | (a) |
| | | | | | | | | | | | | | | | |
Tobacco | | | | | | | | | | | | | |
Imperial Brands plc | | | 1,011 | | | | 22,177 | | | | (2,326 | ) | | | (0.0 | )(a) |
| | | | | | | | | | | | | | | | |
Total Long Positions of Total Return Basket Swap | | | 169,322 | | | | 1,280,372 | | | | 2,575 | | | | 0.0 | (a) |
| | | | | | | | | | | | | | | | |
| |
Short Positions | | | | | |
| | | |
Common Stocks | | | | | | | | | | | | | |
Banks | | | | | | | | | | | | | |
Royal Bank of Scotland Group plc | | | (25,780 | ) | | | (71,262 | ) | | | (374 | ) | | | (0.0 | )(a) |
| | | | | | | | | | | | | | | | |
Capital Markets | | | | | | | | | | | | | |
Hargreaves Lansdown plc | | | (3,211 | ) | | | (73,735 | ) | | | (226 | ) | | | (0.0 | )(a) |
St James’s Place plc | | | (2,425 | ) | | | (32,709 | ) | | | (3,437 | ) | | | (0.0 | )(a) |
Standard Life Aberdeen plc | | | (20,177 | ) | | | (79,329 | ) | | | (8,083 | ) | | | (0.1 | ) |
| | | | | | | | | | | | | | | | |
| | | (25,813 | ) | | | (185,773 | ) | | | (11,746 | ) | | | (0.1 | ) |
| | | | | | | | | | | | | | | | |
Chemicals | | | | | | | | | | | | | |
Johnson Matthey plc | | | (160 | ) | | | (6,356 | ) | | | (324 | ) | | | (0.0 | )(a) |
| | | | | | | | | | | | | | | | |
Commercial Services & Supplies | | | | | | | | | | | | | |
IWG plc | | | (14,751 | ) | | | (73,479 | ) | | | 356 | | | | 0.0 | (a) |
| | | | | | | | | | | | | | | | |
Construction & Engineering | | | | | | | | | | | | | |
Balfour Beatty plc | | | (24,851 | ) | | | (72,416 | ) | | | (393 | ) | | | (0.0 | )(a) |
| | | | | | | | | | | | | | | | |
Containers & Packaging | | | | | | | | | | | | | |
DS Smith plc | | | (13,306 | ) | | | (61,690 | ) | | | (2,850 | ) | | | (0.0 | )(a) |
| | | | | | | | | | | | | | | | |
Diversified Telecommunication Services | | | | | | | | | | | | | |
BT Group plc | | | (28,094 | ) | | | (74,558 | ) | | | (7,176 | ) | | | (0.0 | )(a) |
| | | | | | | | | | | | | | | | |
SEE NOTES TO FINANCIAL STATEMENTS.
| | | | | | | | |
| | | |
| OCTOBER 31, 2019 | | J.P. MORGAN EXCHANGE-TRADED FUNDS | | | | | 97 | |
JPMorgan Long/Short ETF
SCHEDULE OF PORTFOLIO INVESTMENTS
AS OF OCTOBER 31, 2019 (continued)
| | | | | | | | | | | | | | | | |
| REFERENCE ENTITY | | SHARES | | | NOTIONAL
VALUE($) (1) | | | NET UNREALIZED
APPRECIATION
(DEPRECIATION)($) (2) | | | PERCENTAGE
OF NET
ASSETS (%) | |
| |
Short Positions — continued | | | | | |
| | | |
Common Stocks — continued | | | | | | | | | | | | | |
Electrical Equipment | | | | | | | | | | | | | |
Melrose Industries plc | | | (19,485 | ) | | | (53,850 | ) | | | (4,607 | ) | | | (0.0 | )(a) |
| | | | | | | | | | | | | | | | |
Electronic Equipment, Instruments & Components | | | | | | | | | | | | | |
Spectris plc | | | (2,325 | ) | | | (72,079 | ) | | | 782 | | | | 0.0 | (a) |
| | | | | | | | | | | | | | | | |
Food & Staples Retailing | | | | | | | | | | | | | |
J Sainsbury plc | | | (27,503 | ) | | | (72,478 | ) | | | 826 | | | | 0.0 | (a) |
| | | | | | | | | | | | | | | | |
Health Care Providers & Services | | | | | | | | | | | | | |
NMC Health plc | | | (295 | ) | | | (8,362 | ) | | | 1,351 | | | | 0.0 | (a) |
| | | | | | | | | | | | | | | | |
Hotels, Restaurants & Leisure | | | | | | | | | | | | | |
Domino’s Pizza Group plc | | | (18,225 | ) | | | (67,536 | ) | | | (8,713 | ) | | | (0.1 | ) |
SSP Group plc | | | (7,442 | ) | | | (61,368 | ) | | | (2,488 | ) | | | (0.0 | )(a) |
TUI AG | | | (4,625 | ) | | | (60,505 | ) | | | (5,294 | ) | | | (0.0 | )(a) |
| | | | | | | | | | | | | | | | |
| | | (30,292 | ) | | | (189,409 | ) | | | (16,495 | ) | | | (0.1 | ) |
| | | | | | | | | | | | | | | | |
Insurance | | | | | | | | | | | | | |
Hiscox Ltd. | | | (3,546 | ) | | | (68,476 | ) | | | 4,776 | | | | 0.0 | (a) |
| | | | | | | | | | | | | | | | |
Machinery | | | | | | | | | | | | | |
Weir Group plc (The) | | | (1,943 | ) | | | (33,938 | ) | | | 19 | | | | 0.0 | (a) |
| | | | | | | | | | | | | | | | |
Media | | | | | | | | | | | | | |
ITV plc | | | (11,593 | ) | | | (20,111 | ) | | | (1,799 | ) | | | (0.0 | )(a) |
| | | | | | | | | | | | | | | | |
Metals & Mining | | | | | | | | | | | | | |
Fresnillo plc | | | (1,706 | ) | | | (15,761 | ) | | | (1,310 | ) | | | (0.0 | )(a) |
| | | | | | | | | | | | | | | | |
Multiline Retail | | | | | | | | | | | | | |
B&M European Value Retail SA | | | (2,755 | ) | | | (13,217 | ) | | | (783 | ) | | | (0.0 | )(a) |
| | | | | | | | | | | | | | | | |
Multi-Utilities | | | | | | | | | | | | | |
National Grid plc | | | (6,162 | ) | | | (72,048 | ) | | | (2,520 | ) | | | (0.0 | )(a) |
| | | | | | | | | | | | | | | | |
Paper & Forest Products | | | | | | | | | | | | | |
Mondi plc | | | (3,005 | ) | | | (62,305 | ) | | | (902 | ) | | | (0.0 | )(a) |
| | | | | | | | | | | | | | | | |
Professional Services | | | | | | | | | | | | | |
Capita plc* | | | (25,528 | ) | | | (51,639 | ) | | | (2,581 | ) | | | (0.0 | )(a) |
Pagegroup plc | | | (12,682 | ) | | | (73,070 | ) | | | 745 | | | | 0.0 | (a) |
| | | | | | | | | | | | | | | | |
| | | (38,210 | ) | | | (124,709 | ) | | | (1,836 | ) | | | (0.0 | )(a) |
| | | | | | | | | | | | | | | | |
Real Estate Management & Development | | | | | | | | | | | | | |
Capital & Counties Properties plc | | | (19,350 | ) | | | (63,955 | ) | | | (7,421 | ) | | | (0.0 | )(a) |
| | | | | | | | | | | | | | | | |
Water Utilities | | | | | | | | | | | | | |
Severn Trent plc | | | (2,558 | ) | | | (74,720 | ) | | | (4,354 | ) | | | (0.0 | )(a) |
| | | | | | | | | | | | | | | | |
Total Short Positions of Total Return Basket Swap | | | (303,483 | ) | | | (1,490,952 | ) | | | (56,780 | ) | | | (0.2 | ) |
| | | | | | | | | | | | | | | | |
Total of Long and Short Positions of Total Return Basket Swap | | | (134,161 | ) | | | (210,580 | ) | | | (54,205 | ) | | | (0.2 | ) |
| | | | | | | | | | | | | | | | |
SEE NOTES TO FINANCIAL STATEMENTS.
| | | | | | |
| | | |
| 98 | | | | J.P. MORGAN EXCHANGE-TRADED FUNDS | | OCTOBER 31, 2019 |
| | | | | | | | | | | | | | | | | | | | |
| COUNTERPARTY | | DESCRIPTION | | TERMINATION
DATE | | NOTIONAL
VALUE (1) | | | NET UNREALIZED
APPRECIATION
(DEPRECIATION) (2) | | | NET CASH
AND OTHER
RECEIVABLES
(PAYABLES) | | | VALUE | |
| Goldman Sachs | | The Fund receives the total return on a portfolio of long and short equity positions and pays or receives the net of one day CORRA and one month BA on long positions and short positions respectively, plus or minus a specified spread (rates range from (0.25)% to 0.25%), which is denominated in CAD based on the local currencies of the positions within the swaps. | | 5/25/2028 –
11/1/2029 | | $ | 365,756 | | | $ | (22,068 | ) | | $ | (3,746 | ) | | $ | (25,814 | ) |
| | | | | | | | | | | | | | | | | | | | |
| | | | | | | | | | | | | | | | |
| REFERENCE ENTITY | | SHARES | | | NOTIONAL
VALUE($) (1) | | | NET UNREALIZED
APPRECIATION
(DEPRECIATION)($) (2) | | | PERCENTAGE
OF NET
ASSETS (%) | |
Long Positions | | | | | |
| | | |
Common Stocks | | | | | | | | | | | | | |
Airlines | | | | | | | | | | | | | |
Air Canada* | | | 2,715 | | | | 96,677 | | | | 151 | | | | 0.0 | (a) |
| | | | | | | | | | | | | | | | |
Banks | | | | | | | | | | | | | |
Laurentian Bank of Canada | | | 2,831 | | | | 97,369 | | | | 985 | | | | 0.0 | (a) |
| | | | | | | | | | | | | | | | |
Chemicals | | | | | | | | | | | | | |
Methanex Corp. | | | 1,172 | | | | 44,412 | | | | 3,714 | | | | 0.0 | (a) |
| | | | | | | | | | | | | | | | |
Construction & Engineering | | | | | | | | | | | | | |
Aecon Group, Inc. | | | 5,814 | | | | 80,339 | | | | 1,849 | | | | 0.0 | (a) |
| | | | | | | | | | | | | | | | |
Food & Staples Retailing | | | | | | | | | | | | | |
Empire Co. Ltd. | | | 3,448 | | | | 91,547 | | | | (1,387 | ) | | | (0.0 | )(a) |
| | | | | | | | | | | | | | | | |
Insurance | | | | | | | | | | | | | |
iA Financial Corp., Inc. | | | 2,160 | | | | 104,023 | | | | 6,526 | | | | 0.0 | (a) |
| | | | | | | | | | | | | | | | |
IT Services | | | | | | | | | | | | | |
CGI, Inc.* | | | 315 | | | | 24,485 | | | | (333 | ) | | | (0.0 | )(a) |
| | | | | | | | | | | | | | | | |
Media | | | | | | | | | | | | | |
Quebecor, Inc. | | | 4,112 | | | | 95,596 | | | | (80 | ) | | | (0.0 | )(a) |
| | | | | | | | | | | | | | | | |
Metals & Mining | | | | | | | | | | | | | |
Teck Resources Ltd. | | | 4,880 | | | | 77,140 | | | | (946 | ) | | | (0.0 | )(a) |
| | | | | | | | | | | | | | | | |
Oil, Gas & Consumable Fuels | | | | | | | | | | | | | |
Imperial Oil Ltd. | | | 3,878 | | | | 96,575 | | | | 3,159 | | | | 0.0 | (a) |
Parex Resources, Inc.* | | | 6,340 | | | | 85,923 | | | | (2,999 | ) | | | (0.0 | )(a) |
Suncor Energy, Inc. | | | 3,230 | | | | 96,034 | | | | (100 | ) | | | (0.0 | )(a) |
| | | | | | | | | | | | | | | | |
| | | 13,448 | | | | 278,532 | | | | 60 | | | | 0.0 | (a) |
| | | | | | | | | | | | | | | | |
Real Estate Management & Development | | | | | | | | | | | | | |
First Capital Realty, Inc. | | | 5,905 | | | | 97,737 | | | | (31 | ) | | | (0.0 | )(a) |
| | | | | | | | | | | | | | | | |
Textiles, Apparel & Luxury Goods | | | | | | | | | | | | | |
Gildan Activewear, Inc. | | | 3,393 | | | | 86,686 | | | | (21,346 | ) | | | (0.0 | )(a) |
| | | | | | | | | | | | | | | | |
Trading Companies & Distributors | | | | | | | | | | | | | |
Toromont Industries Ltd. | | | 2,012 | | | | 103,892 | | | | 6,681 | | | | 0.0 | (a) |
| | | | | | | | | | | | | | | | |
Total Long Positions of Total Return Basket Swap | | | 52,205 | | | | 1,278,435 | | | | (4,157 | ) | | | 0.0 | (a) |
| | | | | | | | | | | | | | | | |
| |
Short Positions | | | | | |
| | | |
Common Stocks | | | | | | | | | | | | | |
Aerospace & Defense | | | | | | | | | | | | | |
Bombardier, Inc.* | | | (33,071 | ) | | | (41,681 | ) | | | (996 | ) | | | (0.0 | )(a) |
| | | | | | | | | | | | | | | | |
Construction & Engineering | | | | | | | | | | | | | |
SNC-Lavalin Group, Inc. | | | (3,915 | ) | | | (70,774 | ) | | | (18,728 | ) | | | (0.1 | ) |
| | | | | | | | | | | | | | | | |
SEE NOTES TO FINANCIAL STATEMENTS.
| | | | | | | | |
| | | |
| OCTOBER 31, 2019 | | J.P. MORGAN EXCHANGE-TRADED FUNDS | | | | | 99 | |
JPMorgan Long/Short ETF
SCHEDULE OF PORTFOLIO INVESTMENTS
AS OF OCTOBER 31, 2019 (continued)
| | | | | | | | | | | | | | | | |
| REFERENCE ENTITY | | SHARES | | | NOTIONAL
VALUE($) (1) | | | NET UNREALIZED
APPRECIATION
(DEPRECIATION)($) (2) | | | PERCENTAGE
OF NET
ASSETS (%) | |
| |
Short Positions — continued | | | | | |
| | | |
Common Stocks — continued | | | | | | | | | | | | | |
Diversified Financial Services | | | | | | | | | | | | | |
Onex Corp. | | | (1,027 | ) | | | (60,375 | ) | | | 696 | | | | 0.0 | (a) |
| | | | | | | | | | | | | | | | |
Food Products | | | | | | | | | | | | | |
Premium Brands Holdings Corp. | | | (175 | ) | | | (11,545 | ) | | | 843 | | | | 0.0 | (a) |
| | | | | | | | | | | | | | | | |
Metals & Mining | | | | | | | | | | | | | |
Agnico Eagle Mines Ltd. | | | (87 | ) | | | (5,347 | ) | | | (518 | ) | | | (0.0 | )(a) |
First Quantum Minerals Ltd. | | | (3,866 | ) | | | (32,669 | ) | | | (4,386 | ) | | | (0.0 | )(a) |
Franco-Nevada Corp. | | | (73 | ) | | | (7,084 | ) | | | (10 | ) | | | (0.0 | )(a) |
Kinross Gold Corp.* | | | (14,250 | ) | | | (69,243 | ) | | | (663 | ) | | | (0.0 | )(a) |
Pan American Silver Corp. | | | (3,820 | ) | | | (64,880 | ) | | | (1,661 | ) | | | (0.0 | )(a) |
Yamana Gold, Inc. | | | (17,590 | ) | | | (64,238 | ) | | | (3,509 | ) | | | (0.0 | )(a) |
| | | | | | | | | | | | | | | | |
| | | (39,686 | ) | | | (243,461 | ) | | | (10,747 | ) | | | (0.0 | )(a) |
| | | | | | | | | | | | | | | | |
Multiline Retail | | | | | | | | | | | | | |
Dollarama, Inc. | | | (1,921 | ) | | | (64,626 | ) | | | 3,549 | | | | 0.0 | (a) |
| | | | | | | | | | | | | | | | |
Multi-Utilities | | | | | | | | | | | | | |
Atco Ltd. | | | (2,069 | ) | | | (72,731 | ) | | | (38 | ) | | | (0.0 | )(a) |
Canadian Utilities Ltd. | | | (2,337 | ) | | | (68,153 | ) | | | 1,887 | | | | 0.0 | (a) |
| | | | | | | | | | | | | | | | |
| | | (4,406 | ) | | | (140,884 | ) | | | 1,849 | | | | 0.0 | (a) |
| | | | | | | | | | | | | | | | |
Oil, Gas & Consumable Fuels | | | | | | | | | | | | | |
MEG Energy Corp.* | | | (18,202 | ) | | | (69,928 | ) | | | 1,392 | | | | 0.0 | (a) |
Vermilion Energy, Inc. | | | (4,748 | ) | | | (62,725 | ) | | | 7,858 | | | | 0.0 | (a) |
| | | | | | | | | | | | | | | | |
| | | (22,950 | ) | | | (132,653 | ) | | | 9,250 | | | | 0.0 | (a) |
| | | | | | | | | | | | | | | | |
Software | | | | | | | | | | | | | |
BlackBerry Ltd.* | | | (14,013 | ) | | | (73,624 | ) | | | (1,824 | ) | | | (0.0 | )(a) |
Kinaxis, Inc.* | | | (1,144 | ) | | | (73,056 | ) | | | (1,803 | ) | | | (0.0 | )(a) |
| | | | | | | | | | | | | | | | |
| | | (15,157 | ) | | | (146,680 | ) | | | (3,627 | ) | | | (0.0 | )(a) |
| | | | | | | | | | | | | | | | |
Total Short Positions of Total Return Basket Swap | | | (122,308 | ) | | | (912,679 | ) | | | (17,911 | ) | | | (0.1 | ) |
| | | | | | | | | | | | | | | | |
Total of Long and Short Positions of Total Return Basket Swap | | | (70,103 | ) | | | 365,756 | | | | (22,068 | ) | | | (0.1 | ) |
| | | | | | | | | | | | | | | | |
| | | | | | | | | | | | | | | | | | | | |
| COUNTERPARTY | | DESCRIPTION | | TERMINATION
DATE | | NOTIONAL
VALUE (1) | | | NET UNREALIZED
APPRECIATION
(DEPRECIATION) (2) | | | NET CASH
AND OTHER
RECEIVABLES
(PAYABLES) | | | VALUE | |
| Goldman Sachs | | The Fund receives the total return on a portfolio of short equity positions and pays or receives the net of one day FEDEF on short positions, plus or minus a specified spread (rates range from (2.36)% to (0.18)%), which is denominated in USD based on the local currencies of the positions within the swaps. | | 5/25/2028 –
11/1/2029 | | $ | (3,519,182 | ) | | $ | (133,798 | ) | | $ | (23,875 | ) | | $ | (157,673 | ) |
| | | | | | | | | | | | | | | | | | | | |
SEE NOTES TO FINANCIAL STATEMENTS.
| | | | | | |
| | | |
| 100 | | | | J.P. MORGAN EXCHANGE-TRADED FUNDS | | OCTOBER 31, 2019 |
| | | | | | | | | | | | | | | | |
| REFERENCE ENTITY | | SHARES | | | NOTIONAL
VALUE($) (1) | | | NET UNREALIZED
APPRECIATION
(DEPRECIATION)($) (2) | | | PERCENTAGE
OF NET
ASSETS (%) | |
Short Positions | | | | | |
| | | |
Common Stocks | | | | | | | | | | | | | |
Aerospace & Defense | | | | | | | | | | | | | |
Cubic Corp. | | | (797 | ) | | | (58,771 | ) | | | (4,431 | ) | | | (0.0 | )(a) |
Kratos Defense & Security Solutions, Inc.* | | | (2,363 | ) | | | (44,613 | ) | | | 153 | | | | 0.0 | (a) |
| | | | | | | | | | | | | | | | |
| | | (3,160 | ) | | | (103,384 | ) | | | (4,278 | ) | | | (0.0 | )(a) |
| | | | | | | | | | | | | | | | |
Air Freight & Logistics | | | | | | | | | | | | | |
Air Transport Services Group, Inc.* | | | (2,350 | ) | | | (49,139 | ) | | | (3,619 | ) | | | (0.0 | )(a) |
| | | | | | | | | | | | | | | | |
Airlines | | | | | | | | | | | | | |
American Airlines Group, Inc. | | | (820 | ) | | | (24,649 | ) | | | (2,361 | ) | | | (0.0 | )(a) |
Spirit Airlines, Inc.* | | | (1,945 | ) | | | (73,054 | ) | | | (190 | ) | | | (0.0 | )(a) |
| | | | | | | | | | | | | | | | |
| | | (2,765 | ) | | | (97,703 | ) | | | (2,551 | ) | | | (0.0 | )(a) |
| | | | | | | | | | | | | | | | |
Auto Components | | | | | | | | | | | | | |
Cooper-Standard Holdings, Inc.* | | | (288 | ) | | | (9,176 | ) | | | 373 | | | | 0.0 | (a) |
Veoneer, Inc.* | | | (56 | ) | | | (891 | ) | | | (66 | ) | | | (0.0 | )(a) |
| | | | | | | | | | | | | | | | |
| | | (344 | ) | | | (10,067 | ) | | | 307 | | | | 0.0 | (a) |
| | | | | | | | | | | | | | | | |
Banks | | | | | | | | | | | | | |
SVB Financial Group* | | | (282 | ) | | | (62,457 | ) | | | (8,189 | ) | | | (0.0 | )(a) |
| | | | | | | | | | | | | | | | |
Beverages | | | | | | | | | | | | | |
Coca-Cola Consolidated, Inc. | | | (33 | ) | | | (9,054 | ) | | | (71 | ) | | | (0.0 | )(a) |
Constellation Brands, Inc. | | | (54 | ) | | | (10,278 | ) | | | 128 | | | | 0.0 | (a) |
MGP Ingredients, Inc. | | | (1,444 | ) | | | (61,933 | ) | | | 3,798 | | | | 0.0 | (a) |
| | | | | | | | | | | | | | | | |
| | | (1,531 | ) | | | (81,265 | ) | | | 3,855 | | | | 0.0 | (a) |
| | | | | | | | | | | | | | | | |
Capital Markets | | | | | | | | | | | | | |
Cboe Global Markets, Inc. | | | (422 | ) | | | (48,593 | ) | | | 814 | | | | 0.0 | (a) |
Charles Schwab Corp. (The) | | | (67 | ) | | | (2,727 | ) | | | (306 | ) | | | (0.0 | )(a) |
Interactive Brokers Group, Inc. | | | (59 | ) | | | (2,807 | ) | | | (15 | ) | | | (0.0 | )(a) |
WisdomTree Investments, Inc. | | | (6,709 | ) | | | (34,283 | ) | | | (3,623 | ) | | | (0.0 | )(a) |
| | | | | | | | | | | | | | | | |
| | | (7,257 | ) | | | (88,410 | ) | | | (3,130 | ) | | | (0.0 | )(a) |
| | | | | | | | | | | | | | | | |
Chemicals | | | | | | | | | | | | | |
Albemarle Corp. | | | (682 | ) | | | (41,425 | ) | | | 3,219 | | | | 0.0 | (a) |
Dow, Inc. | | | (996 | ) | | | (50,288 | ) | | | (5,548 | ) | | | (0.0 | )(a) |
DuPont de Nemours, Inc. | | | (150 | ) | | | (9,887 | ) | | | (415 | ) | | | (0.0 | )(a) |
GCP Applied Technologies, Inc.* | | | (1,192 | ) | | | (24,627 | ) | | | (2,432 | ) | | | (0.0 | )(a) |
International Flavors & Fragrances, Inc. | | | (209 | ) | | | (25,500 | ) | | | (1,262 | ) | | | (0.0 | )(a) |
Mosaic Co. (The) | | | (2,196 | ) | | | (43,656 | ) | | | (1,186 | ) | | | (0.0 | )(a) |
| | | | | | | | | | | | | | | | |
| | | (5,425 | ) | | | (195,383 | ) | | | (7,624 | ) | | | (0.0 | )(a) |
| | | | | | | | | | | | | | | | |
Commercial Services & Supplies | | | | | | | | | | | | | |
Brink’s Co. (The) | | | (111 | ) | | | (9,431 | ) | | | (303 | ) | | | (0.0 | )(a) |
Stericycle, Inc.* | | | (132 | ) | | | (7,603 | ) | | | (1,069 | ) | | | (0.0 | )(a) |
US Ecology, Inc. | | | (208 | ) | | | (12,944 | ) | | | (46 | ) | | | (0.0 | )(a) |
| | | | | | | | | | | | | | | | |
| | | (451 | ) | | | (29,978 | ) | | | (1,418 | ) | | | (0.0 | )(a) |
| | | | | | | | | | | | | | | | |
Communications Equipment | | | | | | | | | | | | | |
Infinera Corp.* | | | (493 | ) | | | (2,756 | ) | | | (217 | ) | | | (0.0 | )(a) |
NETGEAR, Inc.* | | | (594 | ) | | | (16,139 | ) | | | (61 | ) | | | (0.0 | )(a) |
| | | | | | | | | | | | | | | | |
| | | (1,087 | ) | | | (18,895 | ) | | | (278 | ) | | | (0.0 | )(a) |
| | | | | | | | | | | | | | | | |
Construction Materials | | | | | | | | | | | | | |
Summit Materials, Inc.* | | | (1,024 | ) | | | (23,480 | ) | | | (297 | ) | | | (0.0 | )(a) |
| | | | | | | | | | | | | | | | |
Containers & Packaging | | | | | | | | | | | | | |
AptarGroup, Inc. | | | (396 | ) | | | (46,787 | ) | | | (729 | ) | | | (0.0 | )(a) |
| | | | | | | | | | | | | | | | |
SEE NOTES TO FINANCIAL STATEMENTS.
| | | | | | | | |
| | | |
| OCTOBER 31, 2019 | | J.P. MORGAN EXCHANGE-TRADED FUNDS | | | | | 101 | |
JPMorgan Long/Short ETF
SCHEDULE OF PORTFOLIO INVESTMENTS
AS OF OCTOBER 31, 2019 (continued)
| | | | | | | | | | | | | | | | |
| REFERENCE ENTITY | | SHARES | | | NOTIONAL
VALUE($) (1) | | | NET UNREALIZED
APPRECIATION
(DEPRECIATION)($) (2) | | | PERCENTAGE
OF NET
ASSETS (%) | |
| |
Short Positions — continued | | | | | |
| | | |
Common Stocks — continued | | | | | | | | | | | | | |
Electric Utilities | | | | | | | | | | | | | |
Alliant Energy Corp. | | | (181 | ) | | | (9,655 | ) | | | (105 | ) | | | (0.0 | )(a) |
| | | | | | | | | | | | | | | | |
Electrical Equipment | | | | | | | | | | | | | |
GrafTech International Ltd. | | | (3,665 | ) | | | (44,273 | ) | | | (3,445 | ) | | | (0.0 | )(a) |
Vicor Corp.* | | | (1,911 | ) | | | (69,465 | ) | | | (9,651 | ) | | | (0.1 | ) |
| | | | | | | | | | | | | | | | |
| | | (5,576 | ) | | | (113,738 | ) | | | (13,096 | ) | | | (0.1 | ) |
| | | | | | | | | | | | | | | | |
Electronic Equipment, Instruments & Components | | | | | | | | | | | | | |
nLight, Inc.* | | | (1,631 | ) | | | (21,790 | ) | | | 1,974 | | | | 0.0 | (a) |
Trimble, Inc.* | | | (1,577 | ) | | | (62,828 | ) | | | (3,769 | ) | | | (0.0 | )(a) |
| | | | | | | | | | | | | | | | |
| | | (3,208 | ) | | | (84,618 | ) | | | (1,795 | ) | | | (0.0 | )(a) |
| | | | | | | | | | | | | | | | |
Energy Equipment & Services | | | | | | | | | | | | | |
Diamond Offshore Drilling, Inc.* | | | (8,154 | ) | | | (43,135 | ) | | | (1,875 | ) | | | (0.0 | )(a) |
Nabors Industries Ltd. | | | (366 | ) | | | (677 | ) | | | (84 | ) | | | (0.0 | )(a) |
Oil States International, Inc.* | | | (1,255 | ) | | | (17,909 | ) | | | (2,523 | ) | | | (0.0 | )(a) |
US Silica Holdings, Inc. | | | (14,426 | ) | | | (64,340 | ) | | | 9,668 | | | | 0.0 | (a) |
Valaris plc | | | (7,995 | ) | | | (32,859 | ) | | | 3,278 | | | | 0.0 | (a) |
| | | | | | | | | | | | | | | | |
| | | (32,196 | ) | | | (158,920 | ) | | | 8,464 | | | | 0.0 | (a) |
| | | | | | | | | | | | | | | | |
Entertainment | | | | | | | | | | | | | |
Spotify Technology SA* | | | (81 | ) | | | (11,688 | ) | | | (2,574 | ) | | | (0.0 | )(a) |
| | | | | | | | | | | | | | | | |
Equity Real Estate Investment Trusts (REITs) | | | | | | | | | | | | | |
Alexander & Baldwin, Inc. | | | (2,404 | ) | | | (56,518 | ) | | | 1,370 | | | | 0.0 | (a) |
| | | | | | | | | | | | | | | | |
Food Products | | | | | | | | | | | | | |
Archer-Daniels-Midland Co. | | | (1,751 | ) | | | (73,612 | ) | | | (2,528 | ) | | | (0.0 | )(a) |
Hain Celestial Group, Inc. (The)* | | | (434 | ) | | | (10,260 | ) | | | (1,484 | ) | | | (0.0 | )(a) |
Kraft Heinz Co. (The) | | | (1,006 | ) | | | (32,524 | ) | | | (5,423 | ) | | | (0.0 | )(a) |
| | | | | | | | | | | | | | | | |
| | | (3,191 | ) | | | (116,396 | ) | | | (9,435 | ) | | | (0.0 | )(a) |
| | | | | | | | | | | | | | | | |
Gas Utilities | | | | | | | | | | | | | |
Southwest Gas Holdings, Inc. | | | (660 | ) | | | (57,618 | ) | | | 2,006 | | | | 0.0 | (a) |
| | | | | | | | | | | | | | | | |
Health Care Equipment & Supplies | | | | | | | | | | | | | |
Avanos Medical, Inc.* | | | (32 | ) | | | (1,409 | ) | | | (154 | ) | | | (0.0 | )(a) |
Glaukos Corp.* | | | (1,123 | ) | | | (71,681 | ) | | | 642 | | | | 0.0 | (a) |
Heska Corp.* | | | (264 | ) | | | (21,389 | ) | | | (2,225 | ) | | | (0.0 | )(a) |
iRhythm Technologies, Inc.* | | | (753 | ) | | | (50,316 | ) | | | (2,538 | ) | | | (0.0 | )(a) |
Penumbra, Inc.* | | | (360 | ) | | | (56,149 | ) | | | (4,774 | ) | | | (0.1 | ) |
Tactile Systems Technology, Inc.* | | | (1,591 | ) | | | (72,263 | ) | | | (243 | ) | | | (0.0 | )(a) |
ViewRay, Inc.* | | | (7,171 | ) | | | (18,645 | ) | | | (2,079 | ) | | | (0.0 | )(a) |
| | | | | | | | | | | | | | | | |
| | | (11,294 | ) | | | (291,852 | ) | | | (11,371 | ) | | | (0.1 | ) |
| | | | | | | | | | | | | | | | |
Health Care Providers & Services | | | | | | | | | | | | | |
Guardant Health, Inc.* | | | (196 | ) | | | (13,622 | ) | | | (1,752 | ) | | | (0.0 | )(a) |
R1 RCM, Inc.* | | | (910 | ) | | | (9,673 | ) | | | (1,301 | ) | | | (0.0 | )(a) |
| | | | | | | | | | | | | | | | |
| | | (1,106 | ) | | | (23,295 | ) | | | (3,053 | ) | | | (0.0 | )(a) |
| | | | | | | | | | | | | | | | |
Health Care Technology | | | | | | | | | | | | | |
Evolent Health, Inc.* | | | (3,013 | ) | | | (22,959 | ) | | | (874 | ) | | | (0.0 | )(a) |
Tabula Rasa HealthCare, Inc.* | | | (265 | ) | | | (13,499 | ) | | | 156 | | | | 0.0 | (a) |
Teladoc Health, Inc.* | | | (886 | ) | | | (67,868 | ) | | | (7,611 | ) | | | (0.0 | )(a) |
Vocera Communications, Inc.* | | | (651 | ) | | | (12,968 | ) | | | 648 | | | | 0.0 | (a) |
| | | | | | | | | | | | | | | | |
| | | (4,815 | ) | | | (117,294 | ) | | | (7,681 | ) | | | (0.0 | )(a) |
| | | | | | | | | | | | | | | | |
SEE NOTES TO FINANCIAL STATEMENTS.
| | | | | | |
| | | |
| 102 | | | | J.P. MORGAN EXCHANGE-TRADED FUNDS | | OCTOBER 31, 2019 |
| | | | | | | | | | | | | | | | |
| REFERENCE ENTITY | | SHARES | | | NOTIONAL
VALUE($) (1) | | | NET UNREALIZED
APPRECIATION
(DEPRECIATION)($) (2) | | | PERCENTAGE
OF NET
ASSETS (%) | |
| |
Short Positions — continued | | | | | |
| | | |
Common Stocks — continued | | | | | | | | | | | | | |
Hotels, Restaurants & Leisure | | | | | | | | | | | | | |
Domino’s Pizza, Inc. | | | (197 | ) | | | (53,509 | ) | | | (3,320 | ) | | | (0.0 | )(a) |
MGM Resorts International | | | (4 | ) | | | (114 | ) | | | (4 | ) | | | (0.0 | )(a) |
Red Rock Resorts, Inc. | | | (1,425 | ) | | | (31,036 | ) | | | (2,280 | ) | | | (0.0 | )(a) |
Shake Shack, Inc.* | | | (656 | ) | | | (53,976 | ) | | | 5,090 | | | | 0.0 | (a) |
| | | | | | | | | | | | | | | | |
| | | (2,282 | ) | | | (138,635 | ) | | | (514 | ) | | | (0.0 | )(a) |
| | | | | | | | | | | | | | | | |
Household Durables | | | | | | | | | | | | | |
iRobot Corp.* | | | (300 | ) | | | (14,418 | ) | | | 2,157 | | | | 0.0 | (a) |
Mohawk Industries, Inc.* | | | (106 | ) | | | (15,198 | ) | | | (2,117 | ) | | | (0.0 | )(a) |
Roku, Inc.* | | | (394 | ) | | | (57,997 | ) | | | (12,241 | ) | | | (0.1 | ) |
| | | | | | | | | | | | | | | | |
| | | (800 | ) | | | (87,613 | ) | | | (12,201 | ) | | | (0.1 | ) |
| | | | | | | | | | | | | | | | |
Insurance | | | | | | | | | | | | | |
Markel Corp.* | | | (53 | ) | | | (62,063 | ) | | | (1,386 | ) | | | (0.0 | )(a) |
| | | | | | | | | | | | | | | | |
Interactive Media & Services | | | | | | | | | | | | | |
Cargurus, Inc.* | | | (424 | ) | | | (14,242 | ) | | | (2,082 | ) | | | (0.0 | )(a) |
TrueCar, Inc.* | | | (3,793 | ) | | | (12,441 | ) | | | (739 | ) | | | (0.0 | )(a) |
Zillow Group, Inc.* | | | (75 | ) | | | (2,429 | ) | | | (277 | ) | | | (0.0 | )(a) |
| | | | | | | | | | | | | | | | |
| | | (4,292 | ) | | | (29,112 | ) | | | (3,098 | ) | | | (0.0 | )(a) |
| | | | | | | | | | | | | | | | |
Internet & Direct Marketing Retail | | | | | | | | | | | | | |
Farfetch Ltd.* | | | (2,735 | ) | | | (24,424 | ) | | | (2,114 | ) | | | (0.0 | )(a) |
| | | | | | | | | | | | | | | | |
Machinery | | | | | | | | | | | | | |
Deere & Co. | | | (91 | ) | | | (15,847 | ) | | | (577 | ) | | | (0.0 | )(a) |
Evoqua Water Technologies Corp.* | | | (2,082 | ) | | | (36,164 | ) | | | (3,352 | ) | | | (0.0 | )(a) |
Trinity Industries, Inc. | | | (3,663 | ) | | | (72,454 | ) | | | 208 | | | | 0.0 | (a) |
Wabtec Corp. | | | (224 | ) | | | (15,539 | ) | | | (988 | ) | | | (0.0 | )(a) |
| | | | | | | | | | | | | | | | |
| | | (6,060 | ) | | | (140,004 | ) | | | (4,709 | ) | | | (0.0 | )(a) |
| | | | | | | | | | | | | | | | |
Marine | | | | | | | | | | | | | |
Kirby Corp.* | | | (761 | ) | | | (60,241 | ) | | | 533 | | | | 0.0 | (a) |
| | | | | | | | | | | | | | | | |
Media | | | | | | | | | | | | | |
Altice USA, Inc.* | | | (2,143 | ) | | | (66,326 | ) | | | (5,786 | ) | | | (0.0 | )(a) |
| | | | | | | | | | | | | | | | |
Metals & Mining | | | | | | | | | | | | | |
Century Aluminum Co.* | | | (1,675 | ) | | | (9,765 | ) | | | 544 | | | | 0.0 | (a) |
Coeur Mining, Inc.* | | | (1,487 | ) | | | (8,208 | ) | | | (401 | ) | | | (0.0 | )(a) |
Constellium SE* | | | (3,386 | ) | | | (45,136 | ) | | | (2,065 | ) | | | (0.0 | )(a) |
Hecla Mining Co. | | | (776 | ) | | | (1,785 | ) | | | (241 | ) | | | (0.0 | )(a) |
United States Steel Corp. | | | (5,026 | ) | | | (57,849 | ) | | | (6,886 | ) | | | (0.0 | )(a) |
| | | | | | | | | | | | | | | | |
| | | (12,350 | ) | | | (122,743 | ) | | | (9,049 | ) | | | (0.0 | )(a) |
| | | | | | | | | | | | | | | | |
Oil, Gas & Consumable Fuels | | | | | | | | | | | | | |
Antero Resources Corp.* | | | (25,997 | ) | | | (64,992 | ) | | | 8,431 | | | | 0.0 | (a) |
Cheniere Energy, Inc.* | | | (44 | ) | | | (2,708 | ) | | | (9 | ) | | | (0.0 | )(a) |
Golar LNG Ltd. | | | (1,502 | ) | | | (20,683 | ) | | | 811 | | | | 0.0 | (a) |
Matador Resources Co.* | | | (2,882 | ) | | | (40,089 | ) | | | 346 | | | | 0.0 | (a) |
SM Energy Co. | | | (754 | ) | | | (5,911 | ) | | | 188 | | | | 0.0 | (a) |
| | | | | | | | | | | | | | | | |
| | | (31,179 | ) | | | (134,383 | ) | | | 9,767 | | | | 0.0 | (a) |
| | | | | | | | | | | | | | | | |
Pharmaceuticals | | | | | | | | | | | | | |
Aerie Pharmaceuticals, Inc.* | | | (983 | ) | | | (21,813 | ) | | | (4,394 | ) | | | (0.0 | )(a) |
Intersect ENT, Inc.* | | | (2,337 | ) | | | (41,646 | ) | | | (841 | ) | | | (0.0 | )(a) |
Revance Therapeutics, Inc.* | | | (711 | ) | | | (11,134 | ) | | | (2,844 | ) | | | (0.0 | )(a) |
Theravance Biopharma, Inc.* | | | (4,449 | ) | | | (71,718 | ) | | | 6,411 | | | | 0.0 | (a) |
SEE NOTES TO FINANCIAL STATEMENTS.
| | | | | | | | |
| | | |
| OCTOBER 31, 2019 | | J.P. MORGAN EXCHANGE-TRADED FUNDS | | | | | 103 | |
JPMorgan Long/Short ETF
SCHEDULE OF PORTFOLIO INVESTMENTS
AS OF OCTOBER 31, 2019 (continued)
| | | | | | | | | | | | | | | | |
| REFERENCE ENTITY | | SHARES | | | NOTIONAL
VALUE($) (1) | | | NET UNREALIZED
APPRECIATION
(DEPRECIATION)($) (2) | | | PERCENTAGE
OF NET
ASSETS (%) | |
| |
Short Positions — continued | | | | | |
| | | |
Common Stocks — continued | | | | | | | | | | | | | |
Pharmaceuticals — continued | | | | | | | | | | | | | |
WaVe Life Sciences Ltd.* | | | (1,424 | ) | | | (36,013 | ) | | | (8,729 | ) | | | (0.1 | ) |
Zogenix, Inc.* | | | (842 | ) | | | (37,595 | ) | | | (3,739 | ) | | | (0.0 | )(a) |
| | | | | | | | | | | | | | | | |
| | | (10,746 | ) | | | (219,919 | ) | | | (14,136 | ) | | | (0.1 | ) |
| | | | | | | | | | | | | | | | |
Road & Rail | | | | | | | | | | | | | |
JB Hunt Transport Services, Inc. | | | (96 | ) | | | (11,286 | ) | | | (958 | ) | | | (0.0 | )(a) |
| | | | | | | | | | | | | | | | |
Semiconductors & Semiconductor Equipment | | | | | | | | | | | | | |
Cohu, Inc. | | | (3,701 | ) | | | (61,511 | ) | | | (10,659 | ) | | | (0.1 | ) |
Cree, Inc.* | | | (925 | ) | | | (44,150 | ) | | | (92 | ) | | | (0.0 | )(a) |
MACOM Technology Solutions Holdings, Inc.* | | | (842 | ) | | | (19,147 | ) | | | (1,154 | ) | | | (0.0 | )(a) |
NVIDIA Corp. | | | (226 | ) | | | (45,430 | ) | | | (4,066 | ) | | | (0.0 | )(a) |
| | | | | | | | | | | | | | | | |
| | | (5,694 | ) | | | (170,238 | ) | | | (15,971 | ) | | | (0.1 | ) |
| | | | | | | | | | | | | | | | |
Software | | | | | | | | | | | | | |
Appian Corp.* | | | (293 | ) | | | (13,079 | ) | | | 1,184 | | | | 0.0 | (a) |
Avalara, Inc.* | | | (718 | ) | | | (50,978 | ) | | | 287 | | | | 0.0 | (a) |
Benefitfocus, Inc.* | | | (559 | ) | | | (12,709 | ) | | | 310 | | | | 0.0 | (a) |
FireEye, Inc.* | | | (3,445 | ) | | | (54,569 | ) | | | (3,548 | ) | | | (0.0 | )(a) |
Instructure, Inc.* | | | (305 | ) | | | (14,253 | ) | | | (1,443 | ) | | | (0.0 | )(a) |
RingCentral, Inc.* | | | (56 | ) | | | (9,045 | ) | | | 26 | | | | 0.0 | (a) |
Yext, Inc.* | | | (728 | ) | | | (11,983 | ) | | | (1,099 | ) | | | (0.0 | )(a) |
| | | | | | | | | | | | | | | | |
| | | (6,104 | ) | | | (166,616 | ) | | | (4,283 | ) | | | (0.0 | )(a) |
| | | | | | | | | | | | | | | | |
Specialty Retail | | | | | | | | | | | | | |
CarMax, Inc.* | | | (6 | ) | | | (559 | ) | | | (35 | ) | | | (0.0 | )(a) |
Carvana Co.* | | | (142 | ) | | | (11,513 | ) | | | (1,678 | ) | | | (0.0 | )(a) |
Floor & Decor Holdings, Inc.* | | | (418 | ) | | | (19,157 | ) | | | 633 | | | | 0.0 | (a) |
National Vision Holdings, Inc.* | | | (823 | ) | | | (19,588 | ) | | | (436 | ) | | | (0.0 | )(a) |
| | | | | | | | | | | | | | | | |
| | | (1,389 | ) | | | (50,817 | ) | | | (1,516 | ) | | | (0.0 | )(a) |
| | | | | | | | | | | | | | | | |
Tobacco | | | | | | | | | | | | | |
Vector Group Ltd. | | | (3,993 | ) | | | (48,715 | ) | | | (3,793 | ) | | | (0.0 | )(a) |
| | | | | | | | | | | | | | | | |
Trading Companies & Distributors | | | | | | | | | | | | | |
MRC Global, Inc.* | | | (6,127 | ) | | | (69,603 | ) | | | 427 | | | | 0.0 | (a) |
| | | | | | | | | | | | | | | | |
Water Utilities | | | | | | | | | | | | | |
Aqua America, Inc. | | | (1,498 | ) | | | (67,904 | ) | | | 210 | | | | 0.0 | (a) |
| | | | | | | | | | | | | | | | |
Total Short Positions of Total Return Basket Swap | | | (189,086 | ) | | | (3,519,182 | ) | | | (133,798 | ) | | | (0.5 | ) |
| | | | | | | | | | | | | | | | |
| | | | | | | | | | | | | | | | | | | | |
| COUNTERPARTY | | DESCRIPTION | | TERMINATION
DATE | | NOTIONAL
VALUE (1) | | | NET UNREALIZED
APPRECIATION
(DEPRECIATION) (2) | | | NET CASH
AND OTHER
RECEIVABLES
(PAYABLES) | | | VALUE | |
| Goldman Sachs | | The Fund receives the total return on a portfolio of long and short equity positions and pays or receives the net of one day EONIA and one month EURIBOR on long positions and short positions respectively, plus or minus a specified spread (rates range from (8.75)% to 0.23%), which is denominated in EUR based on the local currencies of the positions within the swaps. | | 5/25/2028 –
11/1/2029 | | $ | (473,595 | ) | | $ | 48,239 | | | $ | 10,457 | | | $ | 58,696 | |
| | | | | | | | | | | | | | | | | | | | |
SEE NOTES TO FINANCIAL STATEMENTS.
| | | | | | |
| | | |
| 104 | | | | J.P. MORGAN EXCHANGE-TRADED FUNDS | | OCTOBER 31, 2019 |
| | | | | | | | | | | | | | | | |
| REFERENCE ENTITY | | SHARES | | | NOTIONAL
VALUE($) (1) | | | NET UNREALIZED
APPRECIATION
(DEPRECIATION)($) (2) | | | PERCENTAGE
OF NET
ASSETS (%) | |
Long Positions | | | | | | | | | | | | | | | | |
| | | | |
Common Stocks | | | | | | | | | | | | | | | | |
Air Freight & Logistics | | | | | | | | | | | | | | | | |
Bollore SA | | | 24,470 | | | | 106,013 | | | | 8,186 | | | | 0.0 | (a) |
| | | | | | | | | | | | | | | | |
Automobiles | | | | | | | | | | | | | | | | |
Peugeot SA | | | 785 | | | | 19,881 | | | | 593 | | | | 0.0 | (a) |
| | | | | | | | | | | | | | | | |
Chemicals | | | | | | | | | | | | | | | | |
Covestro AG (b) | | | 272 | | | | 13,062 | | | | (99 | ) | | | (0.0 | )(a) |
Koninklijke DSM NV | | | 181 | | | | 21,482 | | | | 88 | | | | 0.0 | (a) |
| | | | | | | | | | | | | | | | |
| | | 453 | | | | 34,544 | | | | (11 | ) | | | (0.0 | )(a) |
| | | | | | | | | | | | | | | | |
Commercial Services & Supplies | | | | | | | | | | | | | | | | |
Edenred | | | 495 | | | | 26,090 | | | | 2,703 | | | | 0.0 | (a) |
SPIE SA | | | 620 | | | | 13,086 | | | | 565 | | | | 0.0 | (a) |
| | | | | | | | | | | | | | | | |
| | | 1,115 | | | | 39,176 | | | | 3,268 | | | | 0.0 | (a) |
| | | | | | | | | | | | | | | | |
Construction & Engineering | | | | | | | | | | | | | |
ACS Actividades de Construccion y Servicios SA | | | 1,829 | | | | 74,217 | | | | 2,589 | | | | 0.0 | (a) |
Eiffage SA | | | 235 | | | | 25,240 | | | | 810 | | | | 0.0 | (a) |
HOCHTIEF AG | | | 687 | | | | 85,836 | | | | 6,884 | | | | 0.1 | |
Koninklijke BAM Groep NV | | | 20,712 | | | | 52,585 | | | | 585 | | | | 0.0 | (a) |
Vinci SA | | | 904 | | | | 101,426 | | | | 3,477 | | | | 0.0 | (a) |
| | | | | | | | | | | | | | | | |
| | | 24,367 | | | | 339,304 | | | | 14,345 | | | | 0.1 | |
| | | | | | | | | | | | | | | | |
Construction Materials | | | | | | | | | | | | | |
HeidelbergCement AG | | | 103 | | | | 7,636 | | | | 545 | | | | 0.0 | (a) |
| | | | | | | | | | | | | | | | |
Diversified Financial Services | | | | | | | | | | | | | |
Banca IFIS SpA | | | 5,591 | | | | 94,853 | | | | 3,467 | | | | 0.0 | (a) |
| | | | | | | | | | | | | | | | |
Diversified Telecommunication Services | | | | | | | | | | | | | |
Deutsche Telekom AG (Registered) | | | 1,163 | | | | 20,464 | | | | 610 | | | | 0.0 | (a) |
Elisa OYJ | | | 1,838 | | | | 100,384 | | | | 483 | | | | 0.0 | (a) |
Koninklijke KPN NV | | | 4,144 | | | | 12,864 | | | | (675 | ) | | | (0.0 | )(a) |
Telefonica SA | | | 3,178 | | | | 24,405 | | | | (22 | ) | | | (0.0 | )(a) |
| | | | | | | | | | | | | | | | |
| | | 10,323 | | | | 158,117 | | | | 396 | | | | 0.0 | (a) |
| | | | | | | | | | | | | | | | |
Electric Utilities | | | | | | | | | | | | | |
EDP — Energias de Portugal SA | | | 23,989 | | | | 98,816 | | | | 2,638 | | | | 0.0 | (a) |
Endesa SA | | | 610 | | | | 16,613 | | | | 639 | | | | 0.0 | (a) |
Enel SpA | | | 1,573 | | | | 12,192 | | | | 318 | | | | 0.0 | (a) |
Verbund AG | | | 222 | | | | 12,027 | | | | 409 | | | | 0.0 | (a) |
| | | | | | | | | | | | | | | | |
| | | 26,394 | | | | 139,648 | | | | 4,004 | | | | 0.0 | (a) |
| | | | | | | | | | | | | | | | |
Electrical Equipment | | | | | | | | | | | | | |
Signify NV (b) | | | 959 | | | | 28,099 | | | | 2,442 | | | | 0.0 | (a) |
| | | | | | | | | | | | | | | | |
Energy Equipment & Services | | | | | | | | | | | | | |
SBM Offshore NV | | | 2,662 | | | | 45,908 | | | | 1,830 | | | | 0.0 | (a) |
| | | | | | | | | | | | | | | | |
Food & Staples Retailing | | | | | | | | | | | | | |
Koninklijke Ahold Delhaize NV | | | 3,132 | | | | 78,050 | | | | (474 | ) | | | (0.0 | )(a) |
| | | | | | | | | | | | | | | | |
Food Products | | | | | | | | | | | | | |
Danone SA | | | 122 | | | | 10,107 | | | | (593 | ) | | | (0.0 | )(a) |
| | | | | | | | | | | | | | | | |
Gas Utilities | | | | | | | | | | | | | |
Italgas SpA | | | 12,964 | | | | 83,458 | | | | 1,043 | | | | 0.0 | (a) |
Snam SpA | | | 5,090 | | | | 26,132 | | | | 288 | | | | 0.0 | (a) |
| | | | | | | | | | | | | | | | |
| | | 18,054 | | | | 109,590 | | | | 1,331 | | | | 0.0 | (a) |
| | | | | | | | | | | | | | | | |
SEE NOTES TO FINANCIAL STATEMENTS.
| | | | | | | | |
| | | |
| OCTOBER 31, 2019 | | J.P. MORGAN EXCHANGE-TRADED FUNDS | | | | | 105 | |
JPMorgan Long/Short ETF
SCHEDULE OF PORTFOLIO INVESTMENTS
AS OF OCTOBER 31, 2019 (continued)
| | | | | | | | | | | | | | | | |
| REFERENCE ENTITY | | SHARES | | | NOTIONAL
VALUE($) (1) | | | NET UNREALIZED
APPRECIATION
(DEPRECIATION)($) (2) | | | PERCENTAGE
OF NET
ASSETS (%) | |
| | | | |
Long Positions — continued | | | | | | | | | | | | | | | | |
| | | | |
Common Stocks — continued | | | | | | | | | | | | | | | | |
Health Care Equipment & Supplies | | | | | | | | | | | | | |
Koninklijke Philips NV | | | 367 | | | | 16,102 | | | | 562 | | | | 0.0 | (a) |
| | | | | | | | | | | | | | | | |
Insurance | | | | | | | | | | | | | |
ASR Nederland NV | | | 674 | | | | 24,708 | | | | (101 | ) | | | (0.0 | )(a) |
Assicurazioni Generali SpA | | | 4,519 | | | | 91,634 | | | | 1,559 | | | | 0.0 | (a) |
AXA SA | | | 451 | | | | 11,939 | | | | 487 | | | | 0.0 | (a) |
Unipol Gruppo SpA | | | 2,298 | | | | 12,825 | | | | 396 | | | | 0.0 | (a) |
UnipolSai Assicurazioni SpA | | | 29,410 | | | | 82,082 | | | | 3,345 | | | | 0.0 | (a) |
| | | | | | | | | | | | | | | | |
| | | 37,352 | | | | 223,188 | | | | 5,686 | | | | 0.0 | (a) |
| | | | | | | | | | | | | | | | |
Machinery | | | | | | | | | | | | | |
Kone OYJ | | | 1,669 | | | | 106,275 | | | | 9,352 | | | | 0.1 | |
Valmet OYJ | | | 1,267 | | | | 28,356 | | | | 3,758 | | | | 0.0 | (a) |
| | | | | | | | | | | | | | | | |
| | | 2,936 | | | | 134,631 | | | | 13,110 | | | | 0.1 | |
| | | | | | | | | | | | | | | | |
Media | | | | | | | | | | | | | |
ProSiebenSat.1 Media SE | | | 1,796 | | | | 26,521 | | | | 1,259 | | | | 0.0 | (a) |
Publicis Groupe SA | | | 1,020 | | | | 43,899 | | | | (4,417 | ) | | | (0.0 | )(a) |
| | | | | | | | | | | | | | | | |
| | | 2,816 | | | | 70,420 | | | | (3,158 | ) | | | (0.0 | )(a) |
| | | | | | | | | | | | | | | | |
Multi-Utilities | | | | | | | | | | | | | |
A2A SpA | | | 7,214 | | | | 14,482 | | | | 1,024 | | | | 0.0 | (a) |
Iren SpA | | | 32,860 | | | | 101,957 | | | | 1,913 | | | | 0.0 | (a) |
RWE AG | | | 426 | | | | 12,982 | | | | 92 | | | | 0.0 | (a) |
Veolia Environnement SA | | | 3,840 | | | | 101,083 | | | | 3,030 | | | | 0.0 | (a) |
| | | | | | | | | | | | | | | | |
| | | 44,340 | | | | 230,504 | | | | 6,059 | | | | 0.0 | (a) |
| | | | | | | | | | | | | | | | |
Oil, Gas & Consumable Fuels | | | | | | | | | | | | | |
Eni SpA | | | 1,424 | | | | 21,604 | | | | (126 | ) | | | (0.0 | )(a) |
Neste OYJ | | | 602 | | | | 21,752 | | | | 2,257 | | | | 0.0 | (a) |
OMV AG | | | 215 | | | | 12,569 | | | | 875 | | | | 0.0 | (a) |
Repsol SA | | | 1,068 | | | | 17,600 | | | | 549 | | | | 0.0 | (a) |
| | | | | | | | | | | | | | | | |
| | | 3,309 | | | | 73,525 | | | | 3,555 | | | | 0.0 | (a) |
| | | | | | | | | | | | | | | | |
Pharmaceuticals | | | | | | | | | | | | | |
Ipsen SA | | | 308 | | | | 32,829 | | | | 2,940 | | | | 0.0 | (a) |
UCB SA | | | 1,365 | | | | 110,017 | | | | 11,943 | | | | 0.1 | |
| | | | | | | | | | | | | | | | |
| | | 1,673 | | | | 142,846 | | | | 14,883 | | | | 0.1 | |
| | | | | | | | | | | | | | | | |
Semiconductors & Semiconductor Equipment | | | | | | | | | | | | | |
Dialog Semiconductor plc* | | | 313 | | | | 14,079 | | | | (787 | ) | | | (0.0 | )(a) |
| | | | | | | | | | | | | | | | |
Textiles, Apparel & Luxury Goods | | | | | | | | | | | | | |
adidas AG | | | 37 | | | | 11,424 | | | | (74 | ) | | | (0.0 | )(a) |
Christian Dior SE | | | 125 | | | | 61,745 | | | | (305 | ) | | | (0.0 | )(a) |
Kering SA | | | 20 | | | | 11,380 | | | | 1,052 | | | | 0.0 | (a) |
| | | | | | | | | | | | | | | | |
| | | 182 | | | | 84,549 | | | | 673 | | | | 0.0 | (a) |
| | | | | | | | | | | | | | | | |
Transportation Infrastructure | | | | | | | | | | | | | |
Aena SME SA (b) | | | 131 | | | | 24,047 | | | | (378 | ) | | | (0.0 | )(a) |
| | | | | | | | | | | | | | | | |
Total Long Positions of Total Return Basket Swap | | | 211,949 | | | | 2,224,817 | | | | 79,534 | | | | 0.3 | |
| | | | | | | | | | | | | | | | |
SEE NOTES TO FINANCIAL STATEMENTS.
| | | | | | |
| | | |
| 106 | | | | J.P. MORGAN EXCHANGE-TRADED FUNDS | | OCTOBER 31, 2019 |
| | | | | | | | | | | | | | | | |
| REFERENCE ENTITY | | SHARES | | | NOTIONAL
VALUE($) (1) | | | NET UNREALIZED
APPRECIATION
(DEPRECIATION)($) (2) | | | PERCENTAGE
OF NET
ASSETS (%) | |
| |
Short Positions | | | | | |
| | | |
Common Stocks | | | | | | | | | | | | | |
Aerospace & Defense | | | | | | | | | | | | | |
Thales SA | | | (754 | ) | | | (73,711 | ) | | | 6,659 | | | | 0.0 | (a) |
| | | | | | | | | | | | | | | | |
Air Freight & Logistics | | | | | | | | | | | | | |
PostNL NV | | | (35,095 | ) | | | (80,635 | ) | | | (7,089 | ) | | | (0.0 | )(a) |
| | | | | | | | | | | | | | | | |
Automobiles | | | | | | | | | | | | | |
Bayerische Motoren Werke AG | | | (820 | ) | | | (62,791 | ) | | | (4,921 | ) | | | (0.0 | )(a) |
Daimler AG (Registered) | | | (276 | ) | | | (16,133 | ) | | | (2,099 | ) | | | (0.0 | )(a) |
| | | | | | | | | | | | | | | | |
| | | (1,096 | ) | | | (78,924 | ) | | | (7,020 | ) | | | (0.0 | )(a) |
| | | | | | | | | | | | | | | | |
Banks | | | | | | | | | | | | | |
Bankia SA | | | (12,378 | ) | | | (23,615 | ) | | | (50 | ) | | | (0.0 | )(a) |
FinecoBank Banca Fineco SpA | | | (1,438 | ) | | | (16,211 | ) | | | (935 | ) | | | (0.0 | )(a) |
| | | | | | | | | | | | | | | | |
| | | (13,816 | ) | | | (39,826 | ) | | | (985 | ) | | | (0.0 | )(a) |
| | | | | | | | | | | | | | | | |
Chemicals | | | | | | | | | | | | | |
BASF SE | | | (796 | ) | | | (60,511 | ) | | | (4,563 | ) | | | (0.1 | ) |
Umicore SA | | | (1,504 | ) | | | (62,085 | ) | | | (2,740 | ) | | | (0.0 | )(a) |
Wacker Chemie AG | | | (370 | ) | | | (28,987 | ) | | | (2,811 | ) | | | (0.0 | )(a) |
| | | | | | | �� | | | | | | | | | |
| | | (2,670 | ) | | | (151,583 | ) | | | (10,114 | ) | | | (0.1 | ) |
| | | | | | | | | | | | | | | | |
Communications Equipment | | | | | | | | | | | | | |
Nokia OYJ | | | (20,381 | ) | | | (74,819 | ) | | | 17,656 | | | | 0.0 | (a) |
| | | | | | | | | | | | | | | | |
Construction & Engineering | | | | | | | | | | | | | |
Bouygues SA | | | (1,499 | ) | | | (63,585 | ) | | | (238 | ) | | | (0.0 | )(a) |
Ferrovial SA | | | (2,477 | ) | | | (73,079 | ) | | | (1,774 | ) | | | (0.0 | )(a) |
| | | | | | | | | | | | | | | | |
| | | (3,976 | ) | | | (136,664 | ) | | | (2,012 | ) | | | (0.0 | )(a) |
| | | | | | | | | | | | | | | | |
Diversified Financial Services | | | | | | | | | | | | | |
Groupe Bruxelles Lambert SA | | | (740 | ) | | | (74,337 | ) | | | (2,480 | ) | | | (0.0 | )(a) |
Wendel SA | | | (523 | ) | | | (74,160 | ) | | | (2,164 | ) | | | (0.0 | )(a) |
| | | | | | | | | | | | | | | | |
| | | (1,263 | ) | | | (148,497 | ) | | | (4,644 | ) | | | (0.0 | )(a) |
| | | | | | | | | | | | | | | | |
Diversified Telecommunication Services | | | | | | | | | | | | | |
Cellnex Telecom SA* (b) | | | (1,630 | ) | | | (70,332 | ) | | | 3,014 | | | | 0.0 | (a) |
Iliad SA | | | (363 | ) | | | (37,620 | ) | | | (3,082 | ) | | | (0.0 | )(a) |
Masmovil Ibercom SA* | | | (2,836 | ) | | | (65,664 | ) | | | 9,214 | | | | 0.0 | (a) |
United Internet AG (Registered) | | | (2,326 | ) | | | (70,218 | ) | | | 14,350 | | | | 0.1 | |
| | | | | | | | | | | | | | | | |
| | | (7,155 | ) | | | (243,834 | ) | | | 23,496 | | | | 0.1 | |
| | | | | | | | | | | | | | | | |
Electric Utilities | | | | | | | | | | | | | |
Fortum OYJ | | | (2,843 | ) | | | (69,476 | ) | | | (3,123 | ) | | | (0.0 | )(a) |
| | | | | | | | | | | | | | | | |
Electrical Equipment | | | | | | | | | | | | | |
Prysmian SpA | | | (3,405 | ) | | | (78,766 | ) | | | (4,310 | ) | | | (0.0 | )(a) |
| | | | | | | | | | | | | | | | |
Energy Equipment & Services | | | | | | | | | | | | | |
Tenaris SA | | | (5,928 | ) | | | (60,139 | ) | | | 1,423 | | | | 0.0 | (a) |
| | | | | | | | | | | | | | | | |
Food Products | | | | | | | | | | | | | |
Kerry Group plc | | | (569 | ) | | | (68,791 | ) | | | (1,936 | ) | | | (0.0 | )(a) |
| | | | | | | | | | | | | | | | |
Gas Utilities | | | | | | | | | | | | | |
Rubis SCA | | | (164 | ) | | | (9,510 | ) | | | (180 | ) | | | (0.0 | )(a) |
| | | | | | | | | | | | | | | | |
Health Care Providers & Services | | | | | | | | | | | | | |
Orpea | | | (580 | ) | | | (69,857 | ) | | | 1,763 | | | | 0.0 | (a) |
| | | | | | | | | | | | | | | | |
SEE NOTES TO FINANCIAL STATEMENTS.
| | | | | | | | |
| | | |
| OCTOBER 31, 2019 | | J.P. MORGAN EXCHANGE-TRADED FUNDS | | | | | 107 | |
JPMorgan Long/Short ETF
SCHEDULE OF PORTFOLIO INVESTMENTS
AS OF OCTOBER 31, 2019 (continued)
| | | | | | | | | | | | | | | | |
| REFERENCE ENTITY | | SHARES | | | NOTIONAL
VALUE($) (1) | | | NET UNREALIZED
APPRECIATION
(DEPRECIATION)($) (2) | | | PERCENTAGE
OF NET
ASSETS (%) | |
| |
Short Positions — continued | | | | | |
| | | |
Common Stocks — continued | | | | | | | | | | | | | |
Hotels, Restaurants & Leisure | | | | | | | | | | | | | |
Accor SA | | | (1,384 | ) | | | (59,531 | ) | | | (1,912 | ) | | | (0.0 | )(a) |
Autogrill SpA | | | (5,802 | ) | | | (57,363 | ) | | | 167 | | | | 0.0 | (a) |
Elior Group SA(b) | | | (1,466 | ) | | | (18,986 | ) | | | 418 | | | | 0.0 | (a) |
Flutter Entertainment plc | | | (516 | ) | | | (53,302 | ) | | | (3,170 | ) | | | (0.0 | )(a) |
| | | | | | | | | | | | | | | | |
| | | (9,168 | ) | | | (189,182 | ) | | | (4,497 | ) | | | (0.0 | )(a) |
| | | | | | | | | | | | | | | | |
Industrial Conglomerates | | | | | | | | | | | | | |
Rheinmetall AG | | | (549 | ) | | | (66,213 | ) | | | 3,427 | | | | 0.0 | (a) |
| | | | | | | | | | | | | | | | |
Internet & Direct Marketing Retail | | | | | | | | | | | | | |
Delivery Hero SE* (b) | | | (1,304 | ) | | | (61,187 | ) | | | (3,290 | ) | | | (0.0 | )(a) |
Rocket Internet SE* (b) | | | (2,487 | ) | | | (66,043 | ) | | | 200 | | | | 0.0 | (a) |
Zalando SE* (b) | | | (1,012 | ) | | | (43,878 | ) | | | 2,459 | | | | 0.0 | (a) |
| | | | | | | | | | | | | | | | |
| | | (4,803 | ) | | | (171,108 | ) | | | (631 | ) | | | (0.0 | )(a) |
| | | | | | | | | | | | | | | | |
Life Sciences Tools & Services | | | | | | | | | | | | | |
Eurofins Scientific SE | | | (19 | ) | | | (9,633 | ) | | | 45 | | | | 0.0 | (a) |
| | | | | | | | | | | | | | | | |
Machinery | | | | | | | | | | | | | |
ANDRITZ AG | | | (666 | ) | | | (29,948 | ) | | | (3,156 | ) | | | (0.0 | )(a) |
Fincantieri SpA | | | (59,157 | ) | | | (62,425 | ) | | | (3,540 | ) | | | (0.0 | )(a) |
GEA Group AG | | | (1,582 | ) | | | (48,362 | ) | | | (4,525 | ) | | | (0.0 | )(a) |
Konecranes OYJ | | | (2,469 | ) | | | (76,249 | ) | | | (3,675 | ) | | | (0.0 | )(a) |
Metso OYJ | | | (2,045 | ) | | | (77,417 | ) | | | (4,637 | ) | | | (0.1 | ) |
| | | | | | | | | | | | | | | | |
| | | (65,919 | ) | | | (294,401 | ) | | | (19,533 | ) | | | (0.1 | ) |
| | | | | | | | | | | | | | | | |
Media | | | | | | | | | | | | | |
Altice Europe NV* | | | (4,939 | ) | | | (28,260 | ) | | | (757 | ) | | | (0.0 | )(a) |
JCDecaux SA | | | (2,730 | ) | | | (74,626 | ) | | | (2,666 | ) | | | (0.0 | )(a) |
| | | | | | | | | | | | | | | | |
| | | (7,669 | ) | | | (102,886 | ) | | | (3,423 | ) | | | (0.0 | )(a) |
| | | | | | | | | | | | | | | | |
Metals & Mining | | | | | | | | | | | | | |
AMG Advanced Metallurgical Group NV | | | (1,757 | ) | | | (43,228 | ) | | | 4,753 | | | | 0.0 | (a) |
ArcelorMittal | | | (3,702 | ) | | | (55,045 | ) | | | (2,557 | ) | | | (0.0 | )(a) |
thyssenkrupp AG | | | (813 | ) | | | (11,594 | ) | | | (283 | ) | | | (0.0 | )(a) |
| | | | | | | | | | | | | | | | |
| | | (6,272 | ) | | | (109,867 | ) | | | 1,913 | | | | 0.0 | (a) |
| | | | | | | | | | | | | | | | |
Semiconductors & Semiconductor Equipment | | | | | | | | | | | | | |
AIXTRON SE* | | | (4,914 | ) | | | (44,925 | ) | | | 3,488 | | | | 0.0 | (a) |
Infineon Technologies AG | | | (1,766 | ) | | | (34,205 | ) | | | (2,338 | ) | | | (0.0 | )(a) |
SOITEC* | | | (636 | ) | | | (70,152 | ) | | | (4,328 | ) | | | (0.0 | )(a) |
| | | | | | | | | | | | | | | | |
| | | (7,316 | ) | | | (149,282 | ) | | | (3,178 | ) | | | (0.0 | )(a) |
| | | | | | | | | | | | | | | | |
Technology Hardware, Storage & Peripherals | | | | | | | | | | | | | |
S&T AG | | | (2,713 | ) | | | (57,858 | ) | | | (3,625 | ) | | | (0.0 | )(a) |
| | | | | | | | | | | | | | | | |
Trading Companies & Distributors | | | | | | | | | | | | | |
Rexel SA | | | (5,778 | ) | | | (71,633 | ) | | | (8,343 | ) | | | (0.0 | )(a) |
| | | | | | | | | | | | | | | | |
Transportation Infrastructure | | | | | | | | | | | | | |
Aeroports de Paris | | | (373 | ) | | | (70,940 | ) | | | (3,565 | ) | | | (0.0 | )(a) |
Getlink SE | | | (740 | ) | | | (12,396 | ) | | | (1,170 | ) | | | (0.0 | )(a) |
| | | | | | | | | | | | | | | | |
| | | (1,113 | ) | | | (83,336 | ) | | | (4,735 | ) | | | (0.0 | )(a) |
| | | | | | | | | | | | | | | | |
Wireless Telecommunication Services | | | | | | | | | | | | | |
1&1 Drillisch AG | | | (298 | ) | | | (7,981 | ) | | | 1,701 | | | | 0.0 | (a) |
| | | | | | | | | | | | | | | | |
Total Short Positions of Total Return Basket Swap | | | (211,312 | ) | | | (2,698,412 | ) | | | (31,295 | ) | | | (0.1 | ) |
| | | | | | | | | | | | | | | | |
Total of Long and Short Positions of Total Return Basket Swap | | | 637 | | | | (473,595 | ) | | | 48,239 | | | | 0.2 | |
| | | | | | | | | | | | | | | | |
SEE NOTES TO FINANCIAL STATEMENTS.
| | | | | | |
| | | |
| 108 | | | | J.P. MORGAN EXCHANGE-TRADED FUNDS | | OCTOBER 31, 2019 |
| | | | | | | | | | | | | | | | | | | | |
| COUNTERPARTY | | DESCRIPTION | | TERMINATION
DATE | | NOTIONAL
VALUE (1) | | | NET UNREALIZED
APPRECIATION
(DEPRECIATION) (2) | | | NET CASH
AND OTHER
RECEIVABLES
(PAYABLES) | | | VALUE | |
| Goldman Sachs | | The Fund receives the total return on a portfolio of long and short equity positions and pays or receives the net of one day LIBOR and one month LIBOR on long positions and short positions respectively, plus or minus a specified spread (rates range from (0.55)% to 0.18%), which is denominated in CHF based on the local currencies of the positions within the swaps. | | 5/26/2028 –
11/1/2029 | | $ | 265,055 | | | $ | (5,915 | ) | | $ | (2,805 | ) | | $ | (8,720 | ) |
| | | | | | | | | | | | | | | | | | | | |
| | | | | | | | | | | | | | | | |
| REFERENCE ENTITY | | SHARES | | | NOTIONAL
VALUE($) (1) | | | NET UNREALIZED
APPRECIATION
(DEPRECIATION)($) (2) | | | PERCENTAGE
OF NET
ASSETS (%) | |
Long Positions | | | | | |
| | | |
Common Stocks | | | | | | | | | | | | | |
Diversified Telecommunication Services | | | | | | | | | | | | | |
Sunrise Communications Group AG* (b) | | | 1,283 | | | | 99,824 | | | | 1,008 | | | | 0.0 | (a) |
| | | | | | | | | | | | | | | | |
Electronic Equipment, Instruments & Components | | | | | | | | | | | | | |
Landis+Gyr Group AG* | | | 104 | | | | 9,657 | | | | 62 | | | | 0.0 | (a) |
| | | | | | | | | | | | | | | | |
Health Care Equipment & Supplies | | | | | | | | | | | | | |
Sonova Holding AG (Registered) | | | 356 | | | | 81,694 | | | | 654 | | | | 0.0 | (a) |
| | | | | | | | | | | | | | | | |
Machinery | | | | | | | | | | | | | |
OC Oerlikon Corp. AG (Registered) | | | 3,755 | | | | 38,535 | | | | 1,575 | | | | 0.0 | (a) |
| | | | | | | | | | | | | | | | |
Pharmaceuticals | | | | | | | | | | | | | |
Roche Holding AG | | | 267 | | | | 79,600 | | | | 2,560 | | | | 0.0 | (a) |
| | | | | | | | | | | | | | | | |
Professional Services | | | | | | | | | | | | | |
Adecco Group AG (Registered) | | | 1,655 | | | | 98,383 | | | | 45 | | | | 0.0 | (a) |
| | | | | | | | | | | | | | | | |
Real Estate Management & Development | | | | | | | | | | | | | |
PSP Swiss Property AG (Registered) | | | 731 | | | | 96,759 | | | | 803 | | | | 0.0 | (a) |
| | | | | | | | | | | | | | | | |
Total Long Positions of Total Return Basket Swap | | | 8,151 | | | | 504,452 | | | | 6,707 | | | | 0.0 | (a) |
| | | | | | | | | | | | | | | | |
| |
Short Positions | | | | | |
| | | |
Common Stocks | | | | | | | | | | | | | |
Chemicals | | | | | | | | | | | | | |
Givaudan SA (Registered) | | | (21 | ) | | | (61,697 | ) | | | (2,167 | ) | | | (0.0 | )(a) |
Sika AG (Registered) | | | (84 | ) | | | (14,440 | ) | | | (1,387 | ) | | | (0.0 | )(a) |
| | | | | | | | | | | | | | | | |
| | | (105 | ) | | | (76,137 | ) | | | (3,554 | ) | | | (0.0 | )(a) |
| | | | | | | | | | | | | | | | |
Electrical Equipment | | | | | | | | | | | | | |
ABB Ltd. (Registered) | | | (869 | ) | | | (18,249 | ) | | | (2,269 | ) | | | (0.0 | )(a) |
| | | | | | | | | | | | | | | | |
Marine | | | | | | | | | | | | | |
Kuehne + Nagel International AG (Registered) | | | (476 | ) | | | (76,901 | ) | | | (5,019 | ) | | | (0.0 | )(a) |
| | | | | | | | | | | | | | | | |
Pharmaceuticals | | | | | | | | | | | | | |
Vifor Pharma AG | | | (65 | ) | | | (10,236 | ) | | | (52 | ) | | | (0.0 | )(a) |
| | | | | | | | | | | | | | | | |
Semiconductors & Semiconductor Equipment | | | | | | | | | | | | | |
ams AG* | | | (1,288 | ) | | | (57,874 | ) | | | (1,728 | ) | | | (0.0 | )(a) |
| | | | | | | | | | | | | | | | |
Total Short Positions of Total Return Basket Swap | | | (2,803 | ) | | | (239,397 | ) | | | (12,622 | ) | | | 0.0 | (a) |
| | | | | | | | | | | | | | | | |
Total of Long and Short Positions of Total Return Basket Swap | | | 5,348 | | | | 265,055 | | | | (5,915 | ) | | | 0.0 | (a) |
| | | | | | | | | | | | | | | | |
SEE NOTES TO FINANCIAL STATEMENTS.
| | | | | | | | |
| | | |
| OCTOBER 31, 2019 | | J.P. MORGAN EXCHANGE-TRADED FUNDS | | | | | 109 | |
JPMorgan Long/Short ETF
SCHEDULE OF PORTFOLIO INVESTMENTS
AS OF OCTOBER 31, 2019 (continued)
| | | | | | | | | | | | | | | | | | | | |
| COUNTERPARTY | | DESCRIPTION | | TERMINATION
DATE | | NOTIONAL
VALUE (1) | | | NET UNREALIZED
APPRECIATION
(DEPRECIATION) (2) | | | NET CASH
AND OTHER
RECEIVABLES
(PAYABLES) | | | VALUE | |
| Goldman Sachs | | The Fund receives the total return on a portfolio of long and short equity positions and pays or receives the net of one day BOJ TONAR and one month LIBOR on long positions and short positions respectively, plus or minus a specified spread (rates range from (2.50)% to 0.28%), which is denominated in JPY based on the local currencies of the positions within the swaps. | | 5/26/2028 –
11/2/2029 | | $ | 2,117,578 | | | $ | 5,164 | | | $ | 25,968 | | | $ | 31,132 | |
| | | | | | | | | | | | | | | | | | | | |
| | | | | | | | | | | | | | | | |
| REFERENCE ENTITY | | SHARES | | | NOTIONAL
VALUE($) (1) | | | NET UNREALIZED
APPRECIATION
(DEPRECIATION)($) (2) | | | PERCENTAGE
OF NET
ASSETS (%) | |
Long Positions | | | | | |
| | | |
Common Stocks | | | | | | | | | | | | | |
Airlines | | | | | | | | | | | | | |
Japan Airlines Co. Ltd. | | | 3,100 | | | | 96,602 | | | | 2,773 | | | | 0.0 | (a) |
| | | | | | | | | | | | | | | | |
Auto Components | | | | | | | | | | | | | |
TS Tech Co. Ltd. | | | 2,100 | | | | 67,257 | | | | 4,698 | | | | 0.0 | (a) |
Yokohama Rubber Co. Ltd. (The) | | | 3,600 | | | | 80,407 | | | | 8,535 | | | | 0.1 | |
| | | | | | | | | | | | | | | | |
| | | 5,700 | | | | 147,664 | | | | 13,233 | | | | 0.1 | |
| | | | | | | | | | | | | | | | |
Beverages | | | | | | | | | | | | | |
Asahi Group Holdings Ltd. | | | 1,900 | | | | 95,147 | | | | (744 | ) | | | (0.0 | )(a) |
Suntory Beverage & Food Ltd. | | | 2,100 | | | | 89,777 | | | | 310 | | | | 0.0 | (a) |
| | | | | | | | | | | | | | | | |
| | | 4,000 | | | | 184,924 | | | | (434 | ) | | | (0.0 | )(a) |
| | | | | | | | | | | | | | | | |
Chemicals | | | | | | | | | | | | | |
DIC Corp.* | | | 2,900 | | | | 83,071 | | | | 2,966 | | | | 0.0 | (a) |
Kureha Corp. | | | 1,300 | | | | 83,088 | | | | 5,640 | | | | 0.0 | (a) |
Mitsui Chemicals, Inc. | | | 3,500 | | | | 83,235 | | | | 5,274 | | | | 0.0 | (a) |
Showa Denko KK | | | 2,900 | | | | 81,365 | | | | 5,732 | | | | 0.0 | (a) |
Teijin Ltd. | | | 4,600 | | | | 92,177 | | | | 3,795 | | | | 0.0 | (a) |
Tokuyama Corp. | | | 3,100 | | | | 82,813 | | | | 9,652 | | | | 0.1 | |
Zeon Corp. | | | 6,500 | | | | 74,046 | | | | (9,071 | ) | | | (0.0 | )(a) |
| | | | | | | | | | | | | | | | |
| | | 24,800 | | | | 579,795 | | | | 23,988 | | | | 0.1 | |
| | | | | | | | | | | | | | | | |
Commercial Services & Supplies | | | | | | | | | | | | | |
Dai Nippon Printing Co. Ltd. | | | 3,700 | | | | 98,822 | | | | 4,417 | | | | 0.0 | (a) |
Sohgo Security Services Co. Ltd. | | | 1,800 | | | | 97,772 | | | | 4,902 | | | | 0.0 | (a) |
| | | | | | | | | | | | | | | | |
| | | 5,500 | | | | 196,594 | | | | 9,319 | | | | 0.0 | (a) |
| | | | | | | | | | | | | | | | |
Construction & Engineering | | | | | | | | | | | | | |
Hazama Ando Corp. | | | 12,100 | | | | 93,752 | | | | 6,311 | | | | 0.0 | (a) |
Kyowa Exeo Corp. | | | 4,000 | | | | 101,768 | | | | 7,114 | | | | 0.1 | |
Kyudenko Corp. | | | 2,800 | | | | 91,494 | | | | 862 | | | | 0.0 | (a) |
| | | | | | | | | | | | | | | | |
| | | 18,900 | | | | 287,014 | | | | 14,287 | | | | 0.1 | |
| | | | | | | | | | | | | | | | |
Construction Materials | | | | | | | | | | | | | |
Sumitomo Osaka Cement Co. Ltd. | | | 1,900 | | | | 82,939 | | | | 2,146 | | | | 0.0 | (a) |
Taiheiyo Cement Corp. | | | 2,900 | | | | 82,038 | | | | 5,823 | | | | 0.0 | (a) |
| | | | | | | | | | | | | | | | |
| | | 4,800 | | | | 164,977 | | | | 7,969 | | | | 0.0 | (a) |
| | | | | | | | | | | | | | | | |
Containers & Packaging | | | | | | | | | | | | | |
Rengo Co. Ltd. | | | 11,600 | | | | 84,112 | | | | 2,247 | | | | 0.0 | (a) |
| | | | | | | | | | | | | | | | |
SEE NOTES TO FINANCIAL STATEMENTS.
| | | | | | |
| | | |
| 110 | | | | J.P. MORGAN EXCHANGE-TRADED FUNDS | | OCTOBER 31, 2019 |
| | | | | | | | | | | | | | | | |
| REFERENCE ENTITY | | SHARES | | | NOTIONAL
VALUE($) (1) | | | NET UNREALIZED
APPRECIATION
(DEPRECIATION)($) (2) | | | PERCENTAGE
OF NET
ASSETS (%) | |
| |
Long Positions — continued | | | | | |
| | | |
Common Stocks — continued | | | | | | | | | | | | | |
Diversified Financial Services | | | | | | | | | | | | | |
Mitsubishi UFJ Lease & Finance Co. Ltd. | | | 14,900 | | | | 91,471 | | | | 3,550 | | | | 0.0 | (a) |
| | | | | | | | | | | | | | | | |
Diversified Telecommunication Services | | | | | | | | | | | | | |
Nippon Telegraph & Telephone Corp. | | | 300 | | | | 14,893 | | | | (75 | ) | | | (0.0 | )(a) |
| | | | | | | | | | | | | | | | |
Electronic Equipment, Instruments & Components | | | | | | | | | | | | | |
Hitachi Ltd. | | | 2,400 | | | | 89,574 | | | | 2,153 | | | | 0.0 | (a) |
Japan Aviation Electronics Industry Ltd. | | | 5,700 | | | | 106,184 | | | | 18,855 | | | | 0.1 | |
| | | | | | | | | | | | | | | | |
| | | 8,100 | | | | 195,758 | | | | 21,008 | | | | 0.1 | |
| | | | | | | | | | | | | | | | |
Entertainment | | | | | | | | | | | | | |
Akatsuki, Inc.* | | | 1,500 | | | | 83,593 | | | | (8,999 | ) | | | (0.0 | )(a) |
Capcom Co. Ltd. | | | 3,500 | | | | 82,613 | | | | (9,645 | ) | | | (0.0 | )(a) |
GungHo Online Entertainment, Inc.* | | | 4,380 | | | | 94,864 | | | | 4,892 | | | | 0.0 | (a) |
| | | | | | | | | | | | | | | | |
| | | 9,380 | | | | 261,070 | | | | (13,752 | ) | | | (0.0 | )(a) |
| | | | | | | | | | | | | | | | |
Food & Staples Retailing | | | | | | | | | | | | | |
Lawson, Inc. | | | 1,700 | | | | 93,783 | | | | 3,244 | | | | 0.0 | (a) |
| | | | | | | | | | | | | | | | |
Food Products | | | | | | | | | | | | | |
Morinaga & Co. Ltd.* | | | 1,900 | | | | 93,859 | | | | 582 | | | | 0.0 | (a) |
| | | | | | | | | | | | | | | | |
Health Care Providers & Services | | | | | | | | | | | | | |
Alfresa Holdings Corp. | | | 4,200 | | | | 93,781 | | | | 1,614 | | | | 0.0 | (a) |
Medipal Holdings Corp. | | | 4,000 | | | | 91,390 | | | | 3,012 | | | | 0.0 | (a) |
Suzuken Co. Ltd. | | | 1,800 | | | | 96,109 | | | | 409 | | | | 0.0 | (a) |
| | | | | | | | | | | | | | | | |
| | | 10,000 | | | | 281,280 | | | | 5,035 | | | | 0.0 | (a) |
| | | | | | | | | | | | | | | | |
Hotels, Restaurants & Leisure | | | | | | | | | | | | | |
Round One Corp. | | | 6,900 | | | | 88,972 | | | | (8,252 | ) | | | (0.0 | )(a) |
Sushiro Global Holdings Ltd. | | | 1,300 | | | | 89,379 | | | | (2,008 | ) | | | (0.0 | )(a) |
| | | | | | | | | | | | | | | | |
| | | 8,200 | | | | 178,351 | | | | (10,260 | ) | | | (0.0 | )(a) |
| | | | | | | | | | | | | | | | |
Household Durables | | | | | | | | | | | | | |
Sekisui House Ltd. | | | 4,100 | | | | 88,414 | | | | (502 | ) | | | (0.0 | )(a) |
| | | | | | | | | | | | | | | | |
Insurance | | | | | | | | | | | | | |
MS&AD Insurance Group Holdings, Inc. | | | 3,100 | | | | 100,103 | | | | (758 | ) | | | (0.0 | )(a) |
| | | | | | | | | | | | | | | | |
IT Services | | | | | | | | | | | | | |
Nihon Unisys Ltd. | | | 2,800 | | | | 92,427 | | | | 111 | | | | 0.0 | (a) |
Otsuka Corp.* | | | 2,500 | | | | 100,795 | | | | 5,725 | | | | 0.0 | (a) |
TIS, Inc. | | | 1,500 | | | | 90,950 | | | | 101 | | | | 0.0 | (a) |
| | | | | | | | | | | | | | | | |
| | | 6,800 | | | | 284,172 | | | | 5,937 | | | | 0.0 | (a) |
| | | | | | | | | | | | | | | | |
Leisure Products | | | | | | | | | | | | | |
Bandai Namco Holdings, Inc. | | | 1,400 | | | | 86,085 | | | | 204 | | | | 0.0 | (a) |
Tomy Co. Ltd. | | | 8,200 | | | | 88,923 | | | | (91 | ) | | | (0.0 | )(a) |
| | | | | | | | | | | | | | | | |
| | | 9,600 | | | | 175,008 | | | | 113 | | | | 0.0 | (a) |
| | | | | | | | | | | | | | | | |
Machinery | | | | | | | | | | | | | |
Amada Holdings Co. Ltd. | | | 8,400 | | | | 95,660 | | | | 6,389 | | | | 0.0 | (a) |
DMG Mori Co. Ltd. | | | 6,400 | | | | 103,617 | | | | 12,744 | | | | 0.1 | |
Ebara Corp.* | | | 3,200 | | | | 94,676 | | | | 8,955 | | | | 0.0 | (a) |
Glory Ltd. | | | 3,300 | | | | 97,161 | | | | (525 | ) | | | (0.0 | )(a) |
MINEBEA MITSUMI, Inc. | | | 5,500 | | | | 104,454 | | | | 11,725 | | | | 0.1 | |
Mitsubishi Heavy Industries Ltd. | | | 2,300 | | | | 93,080 | | | | 3,463 | | | | 0.0 | (a) |
Shinmaywa Industries Ltd. | | | 8,100 | | | | 99,784 | | | | 411 | | | | 0.0 | (a) |
SEE NOTES TO FINANCIAL STATEMENTS.
| | | | | | | | |
| | | |
| OCTOBER 31, 2019 | | J.P. MORGAN EXCHANGE-TRADED FUNDS | | | | | 111 | |
JPMorgan Long/Short ETF
SCHEDULE OF PORTFOLIO INVESTMENTS
AS OF OCTOBER 31, 2019 (continued)
| | | | | | | | | | | | | | | | |
| REFERENCE ENTITY | | SHARES | | | NOTIONAL
VALUE($) (1) | | | NET UNREALIZED
APPRECIATION
(DEPRECIATION)($) (2) | | | PERCENTAGE
OF NET
ASSETS (%) | |
| |
Long Positions — continued | | | | | |
| | | |
Common Stocks — continued | | | | | | | | | | | | | |
Machinery — continued | | | | | | | | | | | | | |
Takeuchi Manufacturing Co. Ltd. | | | 5,900 | | | | 92,195 | | | | 1,048 | | | | 0.0 | (a) |
THK Co. Ltd. | | | 3,600 | | | | 103,519 | | | | 11,570 | | | | 0.0 | (a) |
| | | | | | | | | | | | | | | | |
| | | 46,700 | | | | 884,146 | | | | 55,780 | | | | 0.2 | |
| | | | | | | | | | | | | | | | |
Media | | | | | | | | | | | | | |
Hakuhodo DY Holdings, Inc. | | | 6,500 | | | | 96,998 | | | | 5,562 | | | | 0.0 | (a) |
| | | | | | | | | | | | | | | | |
Metals & Mining | | | | | | | | | | | | | |
Mitsubishi Materials Corp. | | | 2,900 | | | | 83,390 | | | | 6,372 | | | | 0.1 | |
Tokyo Steel Manufacturing Co. Ltd. | | | 10,300 | | | | 82,922 | | | | 3,924 | | | | 0.0 | (a) |
| | | | | | | | | | | | | | | | |
| | | 13,200 | | | | 166,312 | | | | 10,296 | | | | 0.1 | |
| | | | | | | | | | | | | | | | |
Oil, Gas & Consumable Fuels | | | | | | | | | | | | | |
Cosmo Energy Holdings Co. Ltd. | | | 4,500 | | | | 96,230 | | | | 3,801 | | | | 0.0 | (a) |
| | | | | | | | | | | | | | | | |
Paper & Forest Products | | | | | | | | | | | | | |
Oji Holdings Corp. | | | 15,900 | | | | 82,207 | | | | 5,601 | | | | 0.0 | (a) |
| | | | | | | | | | | | | | | | |
Pharmaceuticals | | | | | | | | | | | | | |
Astellas Pharma, Inc. | | | 3,700 | | | | 63,502 | | | | 10,411 | | | | 0.1 | |
Kaken Pharmaceutical Co. Ltd. | | | 2,100 | | | | 102,960 | | | | 7,126 | | | | 0.0 | (a) |
Kyowa Hakko Kirin Co. Ltd. | | | 5,100 | | | | 93,840 | | | | 1,887 | | | | 0.0 | (a) |
Sawai Pharmaceutical Co. Ltd. | | | 1,800 | | | | 101,569 | | | | 9,991 | | | | 0.0 | (a) |
Shionogi & Co. Ltd. | | | 500 | | | | 30,012 | | | | 2,734 | | | | 0.0 | (a) |
Sumitomo Dainippon Pharma Co. Ltd. | | | 5,800 | | | | 101,228 | | | | 6,412 | | | | 0.0 | (a) |
| | | | | | | | | | | | | | | | |
| | | 19,000 | | | | 493,111 | | | | 38,561 | | | | 0.1 | |
| | | | | | | | | | | | | | | | |
Professional Services | | | | | | | | | | | | | |
Meitec Corp. | | | 1,900 | | | | 99,048 | | | | 4,706 | | | | 0.0 | (a) |
TechnoPro Holdings, Inc.* | | | 1,600 | | | | 98,409 | | | | 2,658 | | | | 0.0 | (a) |
UT Group Co. Ltd. | | | 4,200 | | | | 104,326 | | | | 16,141 | | | | 0.1 | |
| | | | | | | | | | | | | | | | |
| | | 7,700 | | | | 301,783 | | | | 23,505 | | | | 0.1 | |
| | | | | | | | | | | | | | | | |
Real Estate Management & Development | | | | | | | | | | | | | |
SAMTY Co. Ltd.* | | | 5,300 | | | | 99,859 | | | | 3,207 | | | | 0.0 | (a) |
| | | | | | | | | | | | | | | | |
Road & Rail | | | | | | | | | | | | | |
Sankyu, Inc. | | | 1,800 | | | | 91,514 | | | | (4,335 | ) | | | (0.0 | )(a) |
Seino Holdings Co. Ltd. | | | 7,500 | | | | 96,435 | | | | 2,169 | | | | 0.0 | (a) |
| | | | | | | | | | | | | | | | |
| | | 9,300 | | | | 187,949 | | | | (2,166 | ) | | | (0.0 | )(a) |
| | | | | | | | | | | | | | | | |
Semiconductors & Semiconductor Equipment | | | | | | | | | | | | | |
Optorun Co. Ltd.* | | | 3,000 | | | | 90,483 | | | | 3,211 | | | | 0.0 | (a) |
| | | | | | | | | | | | | | | | |
Specialty Retail | | | | | | | | | | | | | |
ABC-Mart, Inc. | | | 1,200 | | | | 82,278 | | | | 4,686 | | | | 0.0 | (a) |
| | | | | | | | | | | | | | | | |
Technology Hardware, Storage & Peripherals | | | | | | | | | | | | | |
Brother Industries Ltd. | | | 1,500 | | | | 28,191 | | | | 1,381 | | | | 0.0 | (a) |
FUJIFILM Holdings Corp. | | | 2,200 | | | | 96,585 | | | | 2,118 | | | | 0.0 | (a) |
| | | | | | | | | | | | | | | | |
| | | 3,700 | | | | 124,776 | | | | 3,499 | | | | 0.0 | (a) |
| | | | | | | | | | | | | | | | |
Trading Companies & Distributors | | | | | | | | | | | | | |
ITOCHU Corp. | | | 800 | | | | 16,726 | | | | 510 | | | | 0.0 | (a) |
Kanamoto Co. Ltd. | | | 3,800 | | | | 101,590 | | | | 7,066 | | | | 0.0 | (a) |
| | | | | | | | | | | | | | | | |
| | | 4,600 | | | | 118,316 | | | | 7,576 | | | | 0.0 | (a) |
| | | | | | | | | | | | | | | | |
Transportation Infrastructure | | | | | | | | | | | | | |
Kamigumi Co. Ltd. | | | 4,200 | | | | 94,967 | | | | (561 | ) | | | (0.0 | )(a) |
| | | | | | | | | | | | | | | | |
SEE NOTES TO FINANCIAL STATEMENTS.
| | | | | | |
| | | |
| 112 | | | | J.P. MORGAN EXCHANGE-TRADED FUNDS | | OCTOBER 31, 2019 |
| | | | | | | | | | | | | | | | |
| REFERENCE ENTITY | | SHARES | | | NOTIONAL
VALUE($) (1) | | | NET UNREALIZED
APPRECIATION
(DEPRECIATION)($) (2) | | | PERCENTAGE
OF NET
ASSETS (%) | |
| |
Long Positions — continued | | | | | |
| | | |
Common Stocks — continued | | | | | | | | | | | | | |
Wireless Telecommunication Services | | | | | | | | | | | | | |
KDDI Corp. | | | 3,200 | | | | 88,548 | | | | 874 | | | | 0.0 | (a) |
NTT DOCOMO, Inc. | | | 200 | | | | 5,483 | | | | 200 | | | | 0.0 | (a) |
| | | | | | | | | | | | | | | | |
| | | 3,400 | | | | 94,031 | | | | 1,074 | | | | 0.0 | (a) |
| | | | | | | | | | | | | | | | |
Total Long Positions of Total Return Basket Swap | | | 304,680 | | | | 6,613,290 | | | | 251,136 | | | | 0.9 | |
| | | | | | | | | | | | | | | | |
| |
Short Positions | | | | | |
| | | |
Common Stocks | | | | | | | | | | | | | |
Auto Components | | | | | | | | | | | | | |
NGK Spark Plug Co. Ltd. | | | (3,000 | ) | | | (60,822 | ) | | | (5,414 | ) | | | (0.0 | )(a) |
Toyo Tire Corp. | | | (4,500 | ) | | | (62,767 | ) | | | (8,158 | ) | | | (0.1 | ) |
| | | | | | | | | | | | | | | | |
| | | (7,500 | ) | | | (123,589 | ) | | | (13,572 | ) | | | (0.1 | ) |
| | | | | | | | | | | | | | | | |
Automobiles | | | | | | | | | | | | | |
Mitsubishi Motors Corp. | | | (1,500 | ) | | | (6,849 | ) | | | 53 | | | | 0.0 | (a) |
Nissan Motor Co. Ltd. | | | (10,300 | ) | | | (64,999 | ) | | | (1,943 | ) | | | (0.0 | )(a) |
| | | | | | | | | | | | | | | | |
| | | (11,800 | ) | | | (71,848 | ) | | | (1,890 | ) | | | (0.0 | )(a) |
| | | | | | | | | | | | | | | | |
Banks | | | | | | | | | | | | | |
Bank of Kyoto Ltd. (The) | | | (1,700 | ) | | | (67,287 | ) | | | (4,672 | ) | | | (0.0 | )(a) |
| | | | | | | | | | | | | | | | |
Beverages | | | | | | | | | | | | | |
Coca-Cola Bottlers Japan Holdings, Inc. | | | (3,000 | ) | | | (68,112 | ) | | | 12 | | | | 0.0 | (a) |
| | | | | | | | | | | | | | | | |
Building Products | | | | | | | | | | | | | |
TOTO Ltd. | | | (1,800 | ) | | | (73,486 | ) | | | (6,187 | ) | | | (0.0 | )(a) |
| | | | | | | | | | | | | | | | |
Capital Markets | | | | | | | | | | | | | |
Nomura Holdings, Inc. | | | (15,900 | ) | | | (72,265 | ) | | | (3,335 | ) | | | (0.0 | )(a) |
| | | | | | | | | | | | | | | | |
Chemicals | | | | | | | | | | | | | |
Air Water, Inc. | | | (3,300 | ) | | | (61,779 | ) | | | (2,323 | ) | | | (0.0 | )(a) |
JSR Corp. | | | (3,300 | ) | | | (61,954 | ) | | | (8,857 | ) | | | (0.1 | ) |
Kuraray Co. Ltd. | | | (5,100 | ) | | | (60,676 | ) | | | 105 | | | | 0.0 | (a) |
Taiyo Nippon Sanso Corp. | | | (2,600 | ) | | | (60,865 | ) | | | (5,542 | ) | | | (0.0 | )(a) |
Toray Industries, Inc. | | | (3,300 | ) | | | (23,322 | ) | | | 1,522 | | | | 0.0 | (a) |
| | | | | | | | | | | | | | | | |
| | | (17,600 | ) | | | (268,596 | ) | | | (15,095 | ) | | | (0.1 | ) |
| | | | | | | | | | | | | | | | |
Construction & Engineering | | | | | | | | | | | | | |
JGC Holdings Corp. | | | (2,300 | ) | | | (33,266 | ) | | | (3,683 | ) | | | (0.0 | )(a) |
Maeda Corp. | | | (7,800 | ) | | | (72,390 | ) | | | 666 | | | | 0.0 | (a) |
SHO-BOND Holdings Co. Ltd.* | | | (1,900 | ) | | | (73,740 | ) | | | (5,526 | ) | | | (0.0 | )(a) |
| | | | | | | | | | | | | | | | |
| | | (12,000 | ) | | | (179,396 | ) | | | (8,543 | ) | | | (0.0 | )(a) |
| | | | | | | | | | | | | | | | |
Consumer Finance | | | | | | | | | | | | | |
Aiful Corp.* | | | (3,700 | ) | | | (8,615 | ) | | | (528 | ) | | | (0.0 | )(a) |
| | | | | | | | | | | | | | | | |
Electrical Equipment | | | | | | | | | | | | | |
Fujikura Ltd. | | | (11,900 | ) | | | (55,217 | ) | | | (8,326 | ) | | | (0.0 | )(a) |
Mabuchi Motor Co. Ltd. | | | (1,800 | ) | | | (72,930 | ) | | | (9,050 | ) | | | (0.1 | ) |
Nidec Corp. | | | (500 | ) | | | (73,613 | ) | | | (6,292 | ) | | | (0.0 | )(a) |
| | | | | | | | | | | | | | | | |
| | | (14,200 | ) | | | (201,760 | ) | | | (23,668 | ) | | | (0.1 | ) |
| | | | | | | | | | | | | | | | |
Electronic Equipment, Instruments & Components | | | | | | | | | | | | | |
Keyence Corp. | | | (100 | ) | | | (63,229 | ) | | | (3,471 | ) | | | (0.0 | )(a) |
Murata Manufacturing Co. Ltd. | | | (600 | ) | | | (32,669 | ) | | | (1,106 | ) | | | (0.0 | )(a) |
Shimadzu Corp. | | | (2,800 | ) | | | (74,777 | ) | | | (7,014 | ) | | | (0.1 | ) |
SEE NOTES TO FINANCIAL STATEMENTS.
| | | | | | | | |
| | | |
| OCTOBER 31, 2019 | | J.P. MORGAN EXCHANGE-TRADED FUNDS | | | | | 113 | |
JPMorgan Long/Short ETF
SCHEDULE OF PORTFOLIO INVESTMENTS
AS OF OCTOBER 31, 2019 (continued)
| | | | | | | | | | | | | | | | |
| REFERENCE ENTITY | | SHARES | | | NOTIONAL
VALUE($) (1) | | | NET UNREALIZED
APPRECIATION
(DEPRECIATION)($) (2) | | | PERCENTAGE
OF NET
ASSETS (%) | |
| |
Short Positions — continued | | | | | |
| | | |
Common Stocks — continued | | | | | | | | | | | | | |
Electronic Equipment, Instruments & Components — continued | | | | | | | | | | | | | |
TDK Corp. | | | (700 | ) | | | (69,072 | ) | | | (4,985 | ) | | | (0.0 | )(a) |
Yaskawa Electric Corp. | | | (1,900 | ) | | | (72,272 | ) | | | (4,757 | ) | | | (0.0 | )(a) |
| | | | | | | | | | | | | | | | |
| | | (6,100 | ) | | | (312,019 | ) | | | (21,333 | ) | | | (0.1 | ) |
| | | | | | | | | | | | | | | | |
Entertainment | | | | | | | | | | | | | |
Square Enix Holdings Co. Ltd. | | | (1,500 | ) | | | (71,382 | ) | | | (134 | ) | | | (0.0 | )(a) |
| | | | | | | | | | | | | | | | |
Food & Staples Retailing | | | | | | | | | | | | | |
Aeon Co. Ltd. | | | (1,200 | ) | | | (24,144 | ) | | | (604 | ) | | | (0.0 | )(a) |
Cosmos Pharmaceutical Corp. | | | (400 | ) | | | (82,604 | ) | | | (375 | ) | | | (0.0 | )(a) |
Kusuri no Aoki Holdings Co. Ltd.* | | | (900 | ) | | | (67,120 | ) | | | (3,338 | ) | | | (0.0 | )(a) |
| | | | | | | | | | | | | | | | |
| | | (2,500 | ) | | | (173,868 | ) | | | (4,317 | ) | | | (0.0 | )(a) |
| | | | | | | | | | | | | | | | |
Food Products | | | | | | | | | | | | | |
Kikkoman Corp. | | | (1,500 | ) | | | (72,154 | ) | | | (2,411 | ) | | | (0.0 | )(a) |
Yamazaki Baking Co. Ltd.* | | | (3,900 | ) | | | (66,490 | ) | | | 2,400 | | | | 0.0 | (a) |
| | | | | | | | | | | | | | | | |
| | | (5,400 | ) | | | (138,644 | ) | | | (11 | ) | | | (0.0 | )(a) |
| | | | | | | | | | | | | | | | |
Gas Utilities | | | | | | | | | | | | | |
Nippon Gas Co. Ltd. | | | (2,300 | ) | | | (65,103 | ) | | | 3,558 | | | | 0.0 | (a) |
| | | | | | | | | | | | | | | | |
Health Care Equipment & Supplies | | | | | | | | | | | | | |
Asahi Intecc Co., Ltd. | | | (2,700 | ) | | | (74,292 | ) | | | (959 | ) | | | (0.0 | )(a) |
| | | | | | | | | | | | | | | | |
Hotels, Restaurants & Leisure | | | | | | | | | | | | | |
HIS Co. Ltd. | | | (1,100 | ) | | | (28,546 | ) | | | (655 | ) | | | (0.0 | )(a) |
Kyoritsu Maintenance Co. Ltd. | | | (600 | ) | | | (26,542 | ) | | | (1,367 | ) | | | (0.0 | )(a) |
Toridoll Holdings Corp. | | | (2,900 | ) | | | (66,230 | ) | | | 1,355 | | | | 0.0 | (a) |
| | | | | | | | | | | | | | | | |
| | | (4,600 | ) | | | (121,318 | ) | | | (667 | ) | | | (0.0 | )(a) |
| | | | | | | | | | | | | | | | |
Household Durables | | | | | | | | | | | | | |
Panasonic Corp. | | | (6,600 | ) | | | (55,469 | ) | | | (2,787 | ) | | | (0.0 | )(a) |
Sharp Corp.* | | | (2,300 | ) | | | (26,384 | ) | | | (1,520 | ) | | | (0.0 | )(a) |
| | | | | | | | | | | | | | | | |
| | | (8,900 | ) | | | (81,853 | ) | | | (4,307 | ) | | | (0.0 | )(a) |
| | | | | | | | | | | | | | | | |
Household Products | | | | | | | | | | | | | |
Pigeon Corp. | | | (1,600 | ) | | | (78,109 | ) | | | (10,846 | ) | | | (0.1 | ) |
| | | | | | | | | | | | | | | | |
Industrial Conglomerates | | | | | | | | | | | | | |
Keihan Holdings Co. Ltd. | | | (1,600 | ) | | | (75,547 | ) | | | 533 | | | | 0.0 | (a) |
Toshiba Corp. | | | (300 | ) | | | (10,259 | ) | | | (146 | ) | | | (0.0 | )(a) |
| | | | | | | | | | | | | | | | |
| | | (1,900 | ) | | | (85,806 | ) | | | 387 | | | | 0.0 | (a) |
| | | | | | | | | | | | | | | | |
Interactive Media & Services | | | | | | | | | | | | | |
LINE Corp.* | | | (1,200 | ) | | | (44,144 | ) | | | (353 | ) | | | (0.0 | )(a) |
| | | | | | | | | | | | | | | | |
IT Services | | | | | | | | | | | | | |
GMO Payment Gateway, Inc. | | | (900 | ) | | | (66,329 | ) | | | (1,722 | ) | | | (0.0 | )(a) |
| | | | | | | | | | | | | | | | |
Leisure Products | | | | | | | | | | | | | |
Sega Sammy Holdings, Inc. | | | (1,200 | ) | | | (16,888 | ) | | | 384 | | | | 0.0 | (a) |
| | | | | | | | | | | | | | | | |
Machinery | | | | | | | | | | | | | |
CKD Corp. | | | (5,100 | ) | | | (71,599 | ) | | | (6,731 | ) | | | (0.0 | )(a) |
Daifuku Co. Ltd. | | | (1,300 | ) | | | (68,980 | ) | | | (1,671 | ) | | | (0.0 | )(a) |
FANUC Corp. | | | (100 | ) | | | (19,725 | ) | | | (1,932 | ) | | | (0.0 | )(a) |
Hino Motors Ltd. | | | (8,500 | ) | | | (80,362 | ) | | | (11,343 | ) | | | (0.1 | ) |
Hitachi Construction Machinery Co. Ltd. | | | (2,800 | ) | | | (72,274 | ) | | | (7,956 | ) | | | (0.0 | )(a) |
IHI Corp. | | | (800 | ) | | | (19,715 | ) | | | (2,091 | ) | | | (0.0 | )(a) |
SEE NOTES TO FINANCIAL STATEMENTS.
| | | | | | |
| | | |
| 114 | | | | J.P. MORGAN EXCHANGE-TRADED FUNDS | | OCTOBER 31, 2019 |
| | | | | | | | | | | | | | | | |
| REFERENCE ENTITY | | SHARES | | | NOTIONAL
VALUE($) (1) | | | NET UNREALIZED
APPRECIATION
(DEPRECIATION)($) (2) | | | PERCENTAGE
OF NET
ASSETS (%) | |
| |
Short Positions — continued | | | | | |
| | | |
Common Stocks — continued | | | | | | | | | | | | | |
Machinery — continued | | | | | | | | | | | | | |
Komatsu Ltd. | | | (3,100 | ) | | | (72,586 | ) | | | (4,104 | ) | | | (0.0 | )(a) |
Makita Corp. | | | (2,400 | ) | | | (80,714 | ) | | | (11,092 | ) | | | (0.1 | ) |
MISUMI Group, Inc. | | | (2,900 | ) | | | (72,902 | ) | | | (8,107 | ) | | | (0.0 | )(a) |
Nabtesco Corp. | | | (2,200 | ) | | | (70,037 | ) | | | (3,066 | ) | | | (0.0 | )(a) |
NGK Insulators Ltd. | | | (4,800 | ) | | | (73,741 | ) | | | (5,563 | ) | | | (0.0 | )(a) |
NTN Corp. | | | (22,900 | ) | | | (71,003 | ) | | | (633 | ) | | | (0.0 | )(a) |
SMC Corp. | | | (200 | ) | | | (86,408 | ) | | | (353 | ) | | | (0.0 | )(a) |
| | | | | | | | | | | | | | | | |
| | | (57,100 | ) | | | (860,046 | ) | | | (64,642 | ) | | | (0.2 | ) |
| | | | | | | | | | | | | | | | |
Marine | | | | | | | | | | | | | |
Kawasaki Kisen Kaisha Ltd.* | | | (3,000 | ) | | | (44,640 | ) | | | (6,814 | ) | | | (0.0 | )(a) |
Nippon Yusen KK | | | (1,500 | ) | | | (26,947 | ) | | | (1,527 | ) | | | (0.0 | )(a) |
| | | | | | | | | | | | | | | | |
| | | (4,500 | ) | | | (71,587 | ) | | | (8,341 | ) | | | (0.0 | )(a) |
| | | | | | | | | | | | | | | | |
Metals & Mining | | | | | | | | | | | | | |
Hitachi Metals Ltd. | | | (5,400 | ) | | | (67,772 | ) | | | (7,977 | ) | | | (0.0 | )(a) |
Kobe Steel Ltd. | | | (800 | ) | | | (4,301 | ) | | | (155 | ) | | | (0.0 | )(a) |
| | | | | | | | | | | | | | | | |
| | | (6,200 | ) | | | (72,073 | ) | | | (8,132 | ) | | | (0.0 | )(a) |
| | | | | | | | | | | | | | | | |
Multiline Retail | | | | | | | | | | | | | |
Isetan Mitsukoshi Holdings Ltd. | | | (8,000 | ) | | | (63,801 | ) | | | 391 | | | | 0.0 | (a) |
Marui Group Co. Ltd. | | | (600 | ) | | | (13,338 | ) | | | (616 | ) | | | (0.0 | )(a) |
Pan Pacific International Holdings Corp. | | | (1,400 | ) | | | (22,038 | ) | | | 48 | | | | 0.0 | (a) |
Ryohin Keikaku Co. Ltd. | | | (2,600 | ) | | | (57,882 | ) | | | (9,903 | ) | | | (0.1 | ) |
Takashimaya Co. Ltd. | | | (4,000 | ) | | | (46,432 | ) | | | (2,114 | ) | | | (0.0 | )(a) |
| | | | | | | | | | | | | | | | |
| | | (16,600 | ) | | | (203,491 | ) | | | (12,194 | ) | | | (0.1 | ) |
| | | | | | | | | | | | | | | | |
Personal Products | | | | | | | | | | | | | |
Kose Corp. | | | (400 | ) | | | (70,918 | ) | | | (1,531 | ) | | | (0.0 | )(a) |
Shiseido Co. Ltd. | | | (900 | ) | | | (74,203 | ) | | | (2,508 | ) | | | (0.0 | )(a) |
| | | | | | | | | | | | | | | | |
| | | (1,300 | ) | | | (145,121 | ) | | | (4,039 | ) | | | (0.0 | )(a) |
| | | | | | | | | | | | | | | | |
Road & Rail | | | | | | | | | | | | | |
Keisei Electric Railway Co. Ltd. | | | (1,700 | ) | | | (69,505 | ) | | | 494 | | | | 0.0 | (a) |
Kyushu Railway Co. | | | (2,200 | ) | | | (72,683 | ) | | | 22 | | | | 0.0 | (a) |
Nankai Electric Railway Co. Ltd. | | | (2,200 | ) | | | (57,171 | ) | | | (550 | ) | | | (0.0 | )(a) |
Nippon Express Co. Ltd. | | | (300 | ) | | | (17,117 | ) | | | (1,718 | ) | | | (0.0 | )(a) |
Odakyu Electric Railway Co. Ltd. | | | (2,900 | ) | | | (70,592 | ) | | | (241 | ) | | | (0.0 | )(a) |
Tokyu Corp. | | | (400 | ) | | | (7,566 | ) | | | 47 | | | | 0.0 | (a) |
| | | | | | | | | | | | | | | | |
| | | (9,700 | ) | | | (294,634 | ) | | | (1,946 | ) | | | (0.0 | )(a) |
| | | | | | | | | | | | | | | | |
Semiconductors & Semiconductor Equipment | | | | | | | | | | | | | |
Disco Corp. | | | (300 | ) | | | (65,471 | ) | | | (7,095 | ) | | | (0.0 | )(a) |
Rohm Co. Ltd. | | | (800 | ) | | | (63,383 | ) | | | (1,801 | ) | | | (0.0 | )(a) |
SCREEN Holdings Co. Ltd.* | | | (1,100 | ) | | | (76,367 | ) | | | (9,172 | ) | | | (0.1 | ) |
| | | | | | | | | | | | | | | | |
| | | (2,200 | ) | | | (205,221 | ) | | | (18,068 | ) | | | (0.1 | ) |
| | | | | | | | | | | | | | | | |
Technology Hardware, Storage & Peripherals | | | | | | | | | | | | | |
Seiko Epson Corp. | | | (3,400 | ) | | | (48,080 | ) | | | (2,796 | ) | | | (0.0 | )(a) |
| | | | | | | | | | | | | | | | |
Textiles, Apparel & Luxury Goods | | | | | | | | | | | | | |
Asics Corp. | | | (3,300 | ) | | | (56,655 | ) | | | (2,303 | ) | | | (0.0 | )(a) |
| | | | | | | | | | | | | | | | |
Transportation Infrastructure | | | | | | | | | | | | | |
Japan Airport Terminal Co. Ltd. | | | (1,500 | ) | | | (74,095 | ) | | | (5,713 | ) | | | (0.0 | )(a) |
| | | | | | | | | | | | | | | | |
Total Short Positions of Total Return Basket Swap | | | (235,800 | ) | | | (4,495,712 | ) | | | (245,972 | ) | | | (0.9 | ) |
| | | | | | | | | | | | | | | | |
Total of Long and Short Positions of Total Return Basket Swap | | | 68,880 | | | | 2,117,578 | | | | 5,164 | | | | 0.0 | (a) |
| | | | | | | | | | | | | | | | |
SEE NOTES TO FINANCIAL STATEMENTS.
| | | | | | | | |
| | | |
| OCTOBER 31, 2019 | | J.P. MORGAN EXCHANGE-TRADED FUNDS | | | | | 115 | |
JPMorgan Long/Short ETF
SCHEDULE OF PORTFOLIO INVESTMENTS
AS OF OCTOBER 31, 2019 (continued)
| | | | | | | | | | | | | | | | | | | | |
| COUNTERPARTY | | DESCRIPTION | | TERMINATION
DATE | | NOTIONAL
VALUE (1) | | | NET UNREALIZED
APPRECIATION
(DEPRECIATION) (2) | | | NET CASH
AND OTHER
RECEIVABLES
(PAYABLES) | | | VALUE | |
| Goldman Sachs | | The Fund receives the total return on a portfolio of long and short equity positions and pays or receives the net of one dayOIS-RBA and one month BBR on long positions and short positions respectively, plus or minus a specified spread (rates range from (0.28)% to 0.30%), which is denominated in AUD based on the local currencies of the positions within the swaps. | | 11/13/2019 –
9/26/2029 | | $ | 851,310 | | | $ | 47,478 | | | $ | (4,567 | ) | | $ | 42,911 | |
| | | | | | | | | | | | | | | | | | | | |
| | | | | | | | | | | | | | | | |
| REFERENCE ENTITY | | SHARES | | | NOTIONAL
VALUE($) (1) | | | NET UNREALIZED
APPRECIATION
(DEPRECIATION)($) (2) | | | PERCENTAGE
OF NET
ASSETS (%) | |
Long Positions | | | | | |
| | | |
Common Stocks | | | | | | | | | | | | | |
Airlines | | | | | | | | | | | | | |
Qantas Airways Ltd. | | | 21,500 | | | | 95,097 | | | | 927 | | | | 0.0 | (a) |
| | | | | | | | | | | | | | | | |
Construction & Engineering | | | | | | | | | | | | | |
CIMIC Group Ltd. | | | 4,476 | | | | 102,003 | | | | 6,645 | | | | 0.0 | (a) |
| | | | | | | | | | | | | | | | |
Food & Staples Retailing | | | | | | | | | | | | | |
Metcash Ltd. | | | 10,453 | | | | 20,320 | | | | 274 | | | | 0.0 | (a) |
| | | | | | | | | | | | | | | | |
Metals & Mining | | | | | | | | | | | | | |
Alumina Ltd. | | | 53,519 | | | | 83,549 | | | | (19 | ) | | | (0.0 | )(a) |
BHP Group Ltd. | | | 3,318 | | | | 81,332 | | | | 805 | | | | 0.0 | (a) |
Iluka Resources Ltd. | | | 13,916 | | | | 90,076 | | | | 16,939 | | | | 0.1 | |
Regis Resources Ltd. | | | 28,371 | | | | 96,151 | | | | (2,529 | ) | | | (0.0 | )(a) |
Rio Tinto Ltd. | | | 1,318 | | | | 82,419 | | | | 2,195 | | | | 0.0 | (a) |
| | | | | | | | | | | | | | | | |
| | | 100,442 | | | | 433,527 | | | | 17,391 | | | | 0.1 | |
| | | | | | | | | | | | | | | | |
Oil, Gas & Consumable Fuels | | | | | | | | | | | | | |
Beach Energy Ltd. | | | 60,867 | | | | 95,743 | | | | (2,815 | ) | | | (0.0 | )(a) |
Santos Ltd. | | | 18,763 | | | | 104,951 | | | | 9,627 | | | | 0.1 | |
Whitehaven Coal Ltd. | | | 34,758 | | | | 79,053 | | | | 4,707 | | | | 0.0 | (a) |
Woodside Petroleum Ltd. | | | 4,484 | | | | 99,381 | | | | 3,829 | | | | 0.0 | (a) |
| | | | | | | | | | | | | | | | |
| | | 118,872 | | | | 379,128 | | | | 15,348 | | | | 0.1 | |
| | | | | | | | | | | | | | | | |
Road & Rail | | | | | | | | | | | | | |
Aurizon Holdings Ltd. | | | 23,973 | | | | 97,528 | | | | 827 | | | | 0.0 | (a) |
| | | | | | | | | | | | | | | | |
Total Long Positions of Total Return Basket Swap | | | 279,716 | | | | 1,127,603 | | | | 41,412 | | | | 0.2 | |
| | | | | | | | | | | | | | | | |
| |
Short Positions | | | | | |
| | | |
Common Stocks | | | | | | | | | | | | | |
Chemicals | | | | | | | | | | | | | |
Nufarm Ltd.* | | | (929 | ) | | | (3,791 | ) | | | 535 | | | | 0.0 | (a) |
| | | | | | | | | | | | | | | | |
Construction Materials | | | | | | | | | | | | | |
Adelaide Brighton Ltd. | | | (3,594 | ) | | | (7,633 | ) | | | (188 | ) | | | (0.0 | )(a) |
| | | | | | | | | | | | | | | | |
Hotels, Restaurants & Leisure | | | | | | | | | | | | | |
Domino’s Pizza Enterprises Ltd. | | | (939 | ) | | | (33,036 | ) | | | (2,152 | ) | | | (0.0 | )(a) |
Star Entertainment Grp Ltd. (The) | | | (10,276 | ) | | | (33,320 | ) | | | (2,954 | ) | | | (0.0 | )(a) |
| | | | | | | | | | | | | | | | |
| | | (11,215 | ) | | | (66,356 | ) | | | (5,106 | ) | | | (0.0 | )(a) |
| | | | | | | | | | | | | | | | |
SEE NOTES TO FINANCIAL STATEMENTS.
| | | | | | |
| | | |
| 116 | | | | J.P. MORGAN EXCHANGE-TRADED FUNDS | | OCTOBER 31, 2019 |
| | | | | | | | | | | | | | | | |
| REFERENCE ENTITY | | SHARES | | | NOTIONAL
VALUE($) (1) | | | NET UNREALIZED
APPRECIATION
(DEPRECIATION)($) (2) | | | PERCENTAGE
OF NET
ASSETS (%) | |
| |
Short Positions — continued | | | | | |
| | | |
Common Stocks — continued | | | | | | | | | | | | | |
IT Services | | | | | | | | | | | | | |
Afterpay Touch Group Ltd.* | | | (2,713 | ) | | | (53,858 | ) | | | 11,612 | | | | 0.0 | (a) |
NEXTDC Ltd.* | | | (2,797 | ) | | | (12,361 | ) | | | (283 | ) | | | (0.0 | )(a) |
| | | | | | | | | | | | | | | | |
| | | (5,510 | ) | | | (66,219 | ) | | | 11,329 | | | | 0.0 | (a) |
| | | | | | | | | | | | | | | | |
Oil, Gas & Consumable Fuels | | | | | | | | | | | | | |
Oil Search Ltd. | | | (1,175 | ) | | | (5,799 | ) | | | (198 | ) | | | (0.0 | )(a) |
| | | | | | | | | | | | | | | | |
Professional Services | | | | | | | | | | | | | |
ALS Ltd. | | | (11,030 | ) | | | (61,344 | ) | | | (281 | ) | | | (0.0 | )(a) |
| | | | | | | | | | | | | | | | |
Transportation Infrastructure | | | | | | | | | | | | | |
Qube Holdings Ltd. | | | (29,058 | ) | | | (65,151 | ) | | | (25 | ) | | | (0.0 | )(a) |
| | | | | | | | | | | | | | | | |
Total Short Positions of Total Return Basket Swap | | | (62,511 | ) | | | (276,293 | ) | | | 6,066 | | | | 0.0 | (a) |
| | | | | | | | | | | | | | | | |
Total of Long and Short Positions of Total Return Basket Swap | | | 217,205 | | | | 851,310 | | | | 47,478 | | | | 0.2 | |
| | | | | | | | | | | | | | | | |
The following reference rates, and their values as of period-end, are used for security descriptions:
| | | | | | |
| | | | | VALUE | |
| 1 day CHF LIBOR | | | | | (0.81 | )% |
| 1 month CHF LIBOR | | | | | (0.79 | ) |
| BA | | | | | 1.83 | |
| BBR | | | | | 0.75 | |
| BOJ TONAR | | | | | (0.10 | ) |
| CORRA | | | | | 1.76 | |
| EONIA | | | | | (0.46 | ) |
| EURIBOR | | | | | (0.44 | ) |
| FEDEF | | | | | 1.58 | |
| GBP LIBOR | | | | | 0.71 | |
| JPY LIBOR | | | | | (0.11 | ) |
| OIS-RBA | | | | | 0.75 | |
| SONIA | | | | | 0.71 | |
| USD LIBOR | | | | | 1.78 | |
| | | | | | | | |
| Summary of total swap contracts outstanding as of October 31, 2019 | |
| | | NET UPFRONT
PAYMENTS
(RECEIPTS)($) | | | VALUE ($) | |
Assets | |
OTC Total return basket swap contracts outstanding | | | — | | | | 288,433 | |
| | | | | | | | |
|
Liabilities | |
| |
OTC Total return basket swap contracts outstanding | | | — | | | | (831,122 | ) |
| | | | | | | | |
SEE NOTES TO FINANCIAL STATEMENTS.
| | | | | | | | |
| | | |
| OCTOBER 31, 2019 | | J.P. MORGAN EXCHANGE-TRADED FUNDS | | | | | 117 | |
JPMorgan Long/Short ETF
SCHEDULE OF PORTFOLIO INVESTMENTS
AS OF OCTOBER 31, 2019 (continued)
Abbreviations
| | |
| AUD | | Australian Dollar |
| BA | | Banker’s Acceptance Rate |
| BBR | | Bank Base Rate |
| BOJ | | Bank of Japan |
| CAD | | Canadian Dollar |
| CHF | | Swiss Franc |
| CORRA | | Canadian Overnight Repo Rate Average |
| EONIA | | Euro Overnight Index Average |
| EUR | | Euro |
| EURIBOR | | Euro Interbank Offered Rate |
| FEDEF | | US Federal Fund Effective Rate (Continuous Series) |
| GBP | | British Pound |
| JPY | | Japanese Yen |
| LIBOR | | London Interbank Offered Rate |
| OIS-RBA | | Overnight Indexed Swap-Reserve Bank of Australia |
| OYJ | | Public Limited Company |
| SCA | | Limited partnership with share capital |
| SGPS | | Holding Company |
| | |
SONIA TONAR USD | | Sterling Overnight Index Average |
| | Tokyo Overnight Average Rate |
| | United States Dollar |
| |
| (a) | | Amount rounds to less than 0.1% of net assets. |
| (b) | | Security exempt from registration pursuant to Regulation S under the Securities Act of 1933, as amended. Regulation S applies to securities offerings that are made outside of the United States and do not involve direct selling efforts in the United States and as such may have restrictions on resale. |
| * | | Non-income producing security. |
| (1) | | Notional value represents market value as of October 31, 2019 of these positions based on the securities’ last sale or closing price on the principal exchange on which the securities are traded. |
| (2) | | Unrealized appreciation (depreciation) represents the unrealized gain(loss) of the positions subsequent to the swap reset. |
SEE NOTES TO FINANCIAL STATEMENTS.
| | | | | | |
| | | |
| 118 | | | | J.P. MORGAN EXCHANGE-TRADED FUNDS | | OCTOBER 31, 2019 |
JPMorgan Managed Futures Strategy ETF
CONSOLIDATED SCHEDULE OF PORTFOLIO INVESTMENTS
AS OF OCTOBER 31, 2019
| | | | | | | | |
| INVESTMENTS | | SHARES | | | VALUE($) | |
Short-Term Investments — 89.0% | |
|
Investment Companies — 89.0% | |
| | |
JPMorgan Prime Money Market
Fund Class IM Shares, 1.94% (a)(b) | | | 44,810,456 | | | | 44,828,379 | |
| | |
JPMorgan U.S. Government Money
Market Fund Class IM Shares,
1.70% (a)(b) | | | 987,579 | | | | 987,579 | |
| | | | | | | | |
| | |
Total Investment Companies
(Cost $45,811,481) | | | | | | | 45,815,958 | |
| | | | | | | | |
| | |
Total Investments — 89.0%
(Cost $45,811,481) | | | | | | | 45,815,958 | |
Other Assets Less Liabilities — 11.0% | | | | | | | 5,683,887 | |
| | | | | | | | |
NET ASSETS — 100.0% | | | | | | | 51,499,845 | |
| | | | | | | | |
Percentages indicated are based on net assets.
| | |
| (a) | | Investmentin an affiliated fund, which is registered under the Investment Company Act of 1940, as amended, and is advised by J.P. Morgan Investment Management Inc. |
| (b) | | Therate shown is the current yield as of October 31, 2019. |
| | | | | | | | | | | | | | | | | | | | |
| Futures contracts outstanding as of October 31, 2019: | |
| DESCRIPTION | | NUMBER OF
CONTRACTS | | | EXPIRATION
DATE | | | TRADING
CURRENCY | | | NOTIONAL
AMOUNT ($) | | | VALUE AND
UNREALIZED
APPRECIATION
(DEPRECIATION) ($) | |
Long Contracts | |
CAC 40 10 Euro Index | | | 15 | | | | 11/2019 | | | | EUR | | | | 959,771 | | | | 5,606 | |
Feeder Cattle | | | 15 | | | | 11/2019 | | | | USD | | | | 1,107,000 | | | | 104,931 | |
IBEX 35 Index | | | 3 | | | | 11/2019 | | | | EUR | | | | 310,732 | | | | (829 | ) |
LME Aluminum Base Metal | | | 25 | | | | 11/2019 | | | | USD | | | | 1,100,938 | | | | (9,900 | ) |
LME Nickel Base Metal | | | 12 | | | | 11/2019 | | | | USD | | | | 1,201,752 | | | | (51,140 | ) |
LME Zinc Base Metal | | | 18 | | | | 11/2019 | | | | USD | | | | 1,136,250 | | | | 122,109 | |
Natural Gas | | | 5 | | | | 11/2019 | | | | USD | | | | 131,750 | | | | 10,180 | |
WTI Crude Oil | | | 1 | | | | 11/2019 | | | | USD | | | | 54,090 | | | | 117 | |
100 oz Gold | | | 18 | | | | 12/2019 | | | | USD | | | | 2,724,660 | | | | 114,012 | |
Australia 10 Year Bond | | | 78 | | | | 12/2019 | | | | AUD | | | | 7,840,046 | | | | (38,752 | ) |
Australia 3 Year Bond | | | 166 | | | | 12/2019 | | | | AUD | | | | 13,201,776 | | | | (3,677 | ) |
Canada 10 Year Bond | | | 31 | | | | 12/2019 | | | | CAD | | | | 3,343,603 | | | | (54,459 | ) |
Cocoa | | | 11 | | | | 12/2019 | | | | USD | | | | 264,330 | | | | (6,313 | ) |
DAX Index | | | 1 | | | | 12/2019 | | | | EUR | | | | 359,322 | | | | 14,241 | |
EURO STOXX 50 Index | | | 39 | | | | 12/2019 | | | | EUR | | | | 1,568,056 | | | | 35,340 | |
Euro-Bobl | | | 78 | | | | 12/2019 | | | | EUR | | | | 11,714,531 | | | | (150,986 | ) |
Euro-Bund | | | 25 | | | | 12/2019 | | | | EUR | | | | 4,792,723 | | | | (108,247 | ) |
Euro-Buxl | | | 7 | | | | 12/2019 | | | | EUR | | | | 1,641,052 | | | | (85,956 | ) |
Euro-Schatz | | | 89 | | | | 12/2019 | | | | EUR | | | | 11,124,755 | | | | (52,519 | ) |
FTSE 100 Index | | | 4 | | | | 12/2019 | | | | GBP | | | | 375,263 | | | | (3,111 | ) |
FTSE/MIB Index | | | 11 | | | | 12/2019 | | | | EUR | | | | 1,391,477 | | | | 37,530 | |
Japan 10 Year Bond | | | 14 | | | | 12/2019 | | | | JPY | | | | 19,993,333 | | | | (98,273 | ) |
Live Cattle | | | 10 | | | | 12/2019 | | | | USD | | | | 468,900 | | | | 14,670 | |
LME Aluminum Base Metal | | | 40 | | | | 12/2019 | | | | USD | | | | 1,766,000 | | | | 38,250 | |
LME Nickel Base Metal | | | 12 | | | | 12/2019 | | | | USD | | | | 1,201,608 | | | | (31,303 | ) |
LME Zinc Base Metal | | | 23 | | | | 12/2019 | | | | USD | | | | 1,441,525 | | | | 45,831 | |
S&P 500E-Mini Index | | | 7 | | | | 12/2019 | | | | USD | | | | 1,062,250 | | | | 9,583 | |
SEE NOTES TO CONSOLIDATED FINANCIAL STATEMENTS.
| | | | | | | | |
| | | |
| OCTOBER 31, 2019 | | J.P. MORGAN EXCHANGE-TRADED FUNDS | | | | | 119 | |
JPMorgan Managed Futures Strategy ETF
CONSOLIDATED SCHEDULE OF PORTFOLIO INVESTMENTS
AS OF OCTOBER 31, 2019 (continued)
| | | | | | | | | | | | | | | | | | | | |
| DESCRIPTION | | NUMBER OF
CONTRACTS | | | EXPIRATION
DATE | | | TRADING
CURRENCY | | | NOTIONAL
AMOUNT ($) | | | VALUE AND
UNREALIZED
APPRECIATION
(DEPRECIATION) ($) | |
Long Contracts — continued | |
Silver | | | 13 | | | | 12/2019 | | | | USD | | | | 1,176,500 | | | | 51,560 | |
SPI 200 Index | | | 10 | | | | 12/2019 | | | | AUD | | | | 1,143,094 | | | | 846 | |
TOPIX Index | | | 2 | | | | 12/2019 | | | | JPY | | | | 306,602 | | | | 2,770 | |
U.S. Treasury 2 Year Note | | | 45 | | | | 12/2019 | | | | USD | | | | 9,703,125 | | | | (16,264 | ) |
U.S. Treasury 5 Year Note | | | 51 | | | | 12/2019 | | | | USD | | | | 6,080,555 | | | | (20,724 | ) |
U.S. Treasury 10 Year Note | | | 48 | | | | 12/2019 | | | | USD | | | | 6,255,750 | | | | (40,363 | ) |
U.S. Treasury Long Bond | | | 20 | | | | 12/2019 | | | | USD | | | | 3,225,625 | | | | (36,670 | ) |
WTI Crude Oil | | | 4 | | | | 12/2019 | | | | USD | | | | 216,600 | | | | (2,381 | ) |
Feeder Cattle | | | 12 | | | | 01/2020 | | | | USD | | | | 868,050 | | | | 36,702 | |
LME Aluminum Base Metal | | | 2 | | | | 01/2020 | | | | USD | | | | 87,600 | | | | 62 | |
Cocoa | | | 12 | | | | 03/2020 | | | | USD | | | | 293,520 | | | | 27,404 | |
Copper | | | 10 | | | | 03/2020 | | | | USD | | | | 662,125 | | | | 12,223 | |
Silver | | | 4 | | | | 03/2020 | | | | USD | | | | 365,200 | | | | 18,664 | |
Cocoa | | | 11 | | | | 05/2020 | | | | USD | | | | 270,050 | | | | (1,663 | ) |
Copper | | | 6 | | | | 05/2020 | | | | USD | | | | 397,875 | | | | 6,034 | |
| | | | | | | | | | | | | | | | | | | | |
| | | | | | | | | | | | | | | | | | | (104,865 | ) |
| | | | | | | | | | | | | | | | | | | | |
Short Contracts | |
Hang Seng Index | | | (7 | ) | | | 11/2019 | | | | HKD | | | | (1,201,749 | ) | | | 1,030 | |
LME Aluminum Base Metal | | | (40 | ) | | | 11/2019 | | | | USD | | | | (1,761,500 | ) | | | (8,154 | ) |
LME Nickel Base Metal | | | (4 | ) | | | 11/2019 | | | | USD | | | | (400,584 | ) | | | 10,764 | |
LME Zinc Base Metal | | | (1 | ) | | | 11/2019 | | | | USD | | | | (63,125 | ) | | | 1,403 | |
Natural Gas | | | (37 | ) | | | 11/2019 | | | | USD | | | | (974,950 | ) | | | (46,693 | ) |
WTI Crude Oil | | | (3 | ) | | | 11/2019 | | | | USD | | | | (162,270 | ) | | | (3,218 | ) |
Canada 10 Year Bond | | | (7 | ) | | | 12/2019 | | | | CAD | | | | (755,007 | ) | | | 17,330 | |
Coffee ‘C’ | | | (17 | ) | | | 12/2019 | | | | USD | | | | (649,931 | ) | | | 13,843 | |
Copper | | | (26 | ) | | | 12/2019 | | | | USD | | | | (1,715,675 | ) | | | (42,644 | ) |
Corn | | | (25 | ) | | | 12/2019 | | | | USD | | | | (487,500 | ) | | | 37,126 | |
Cotton No. 2 | | | (38 | ) | | | 12/2019 | | | | USD | | | | (1,224,360 | ) | | | 8,166 | |
Euro-Bund | | | (11 | ) | | | 12/2019 | | | | EUR | | | | (2,108,798 | ) | | | 52,112 | |
Lean Hogs | | | (50 | ) | | | 12/2019 | | | | USD | | | | (1,320,000 | ) | | | 33,402 | |
Live Cattle | | | (14 | ) | | | 12/2019 | | | | USD | | | | (656,460 | ) | | | (39,291 | ) |
LME Aluminum Base Metal | | | (40 | ) | | | 12/2019 | | | | USD | | | | (1,766,000 | ) | | | 11 | |
LME Zinc Base Metal | | | (13 | ) | | | 12/2019 | | | | USD | | | | (814,775 | ) | | | (71,752 | ) |
Long Gilt | | | (27 | ) | | | 12/2019 | | | | GBP | | | | (4,646,006 | ) | | | 58,547 | |
Natural Gas | | | (18 | ) | | | 12/2019 | | | | USD | | | | (492,120 | ) | | | (19,140 | ) |
Wheat | | | (8 | ) | | | 12/2019 | | | | USD | | | | (203,500 | ) | | | (8,711 | ) |
LME Aluminum Base Metal | | | (50 | ) | | | 01/2020 | | | | USD | | | | (2,190,000 | ) | | | (43,750 | ) |
LME Zinc Base Metal | | | (9 | ) | | | 01/2020 | | | | USD | | | | (561,037 | ) | | | (2,108 | ) |
Soybean | | | (15 | ) | | | 01/2020 | | | | USD | | | | (699,188 | ) | | | 13,468 | |
Lean Hogs | | | (13 | ) | | | 02/2020 | | | | USD | | | | (381,290 | ) | | | 1,292 | |
Live Cattle | | | (9 | ) | | | 02/2020 | | | | USD | | | | (440,460 | ) | | | (46,137 | ) |
Sugar No. 11 | | | (149 | ) | | | 02/2020 | | | | USD | | | | (2,082,662 | ) | | | 34,406 | |
Coffee ‘C’ | | | (12 | ) | | | 03/2020 | | | | USD | | | | (474,525 | ) | | | (5,230 | ) |
Coffee ‘C’ | | | (16 | ) | | | 05/2020 | | | | USD | | | | (645,300 | ) | | | (4,136 | ) |
Corn | | | (16 | ) | | | 05/2020 | | | | USD | | | | (323,800 | ) | | | (8,522 | ) |
| | | | | | | | | | | | | | | | | | | | |
| | | | | | | | | | | | | | | | | | | (66,586 | ) |
| | | | | | | | | | | | | | | | | | | | |
| | | | | | | | | | | | | | | | | | | (171,451 | ) |
| | | | | | | | | | | | | | | | | | | | |
SEE NOTES TO CONSOLIDATED FINANCIAL STATEMENTS.
| | | | | | |
| | | |
| 120 | | | | J.P. MORGAN EXCHANGE-TRADED FUNDS | | OCTOBER 31, 2019 |
Abbreviations
| | |
| AUD | | Australian Dollar |
| CAC | | Continuous Assisted Quotation |
| CAD | | Canadian Dollar |
| DAX | | Deutscher Aktien Index |
| EUR | | Euro |
| FTSE | | Financial Times and the London Stock Exchange |
| GBP | | British Pound |
| HKD | | Hong Kong Dollar |
| | |
| IBEX | | International Business Exchange |
| JPY | | Japanese Yen |
| LME | | London Metal Exchange |
| MIB | | Milan, Italian Stock Exchange |
| SPI | | Australian Securities Exchange |
| TOPIX | | Tokyo Stock Price Index |
| USD | | United States Dollar |
| WTI | | West Texas Intermediate |
| | | | | | | | | | | | | | | | | | | | | | |
| Forward foreign currency exchange contracts outstanding as of October 31, 2019: | |
| CURRENCY PURCHASED | | | CURRENCY SOLD | | | COUNTERPARTY | | SETTLEMENT
DATE | | | UNREALIZED
APPRECIATION
(DEPRECIATION) ($) | |
AUD | | | 1,110,655 | | | | USD | | | | 758,110 | | | Merrill Lynch International | | | 11/12/2019 | | | | 7,712 | |
EUR | | | 79,967 | | | | USD | | | | 87,540 | | | Barclays Bank plc | | | 11/12/2019 | | | | 1,699 | |
USD | | | 83,461 | | | | JPY | | | | 8,895,892 | | | Merrill Lynch International | | | 11/12/2019 | | | | 1,046 | |
AUD | | | 1,956,709 | | | | USD | | | | 1,320,245 | | | Merrill Lynch International | | | 11/18/2019 | | | | 29,160 | |
AUD | | | 41,443 | | | | USD | | | | 27,944 | | | State Street Corp. | | | 11/18/2019 | | | | 637 | |
CAD | | | 6,726,087 | | | | USD | | | | 5,049,003 | | | Citibank, NA | | | 11/18/2019 | | | | 57,866 | |
CHF | | | 521,111 | | | | USD | | | | 525,834 | | | BNP Paribas | | | 11/18/2019 | | | | 2,975 | |
CHF | | | 42,776 | | | | USD | | | | 43,166 | | | Merrill Lynch International | | | 11/18/2019 | | | | 241 | |
EUR | | | 119,446 | | | | CAD | | | | 173,384 | | | HSBC Bank, NA | | | 11/18/2019 | | | | 1,701 | |
EUR | | | 169,705 | | | | USD | | | | 189,107 | | | Merrill Lynch International | | | 11/18/2019 | | | | 344 | |
EUR | | | 34,441 | | | | USD | | | | 38,068 | | | State Street Corp. | | | 11/18/2019 | | | | 381 | |
GBP | | | 67,683 | | | | CAD | | | | 112,379 | | | Barclays Bank plc | | | 11/18/2019 | | | | 2,387 | |
GBP | | | 585,935 | | | | CAD | | | | 992,228 | | | Citibank, NA | | | 11/18/2019 | | | | 5,973 | |
GBP | | | 74,556 | | | | CAD | | | | 125,539 | | | HSBC Bank, NA | | | 11/18/2019 | | | | 1,303 | |
GBP | | | 22,580 | | | | CAD | | | | 37,863 | | | State Street Corp. | | | 11/18/2019 | | | | 515 | |
GBP | | | 267,828 | | | | NOK | | | | 3,172,756 | | | HSBC Bank, NA | | | 11/18/2019 | | | | 2,050 | |
GBP | | | 233,171 | | | | SEK | | | | 2,910,006 | | | Merrill Lynch International | | | 11/18/2019 | | | | 562 | |
GBP | | | 64,083 | | | | USD | | | | 80,550 | | | Citibank, NA | | | 11/18/2019 | | | | 2,498 | |
GBP | | | 28,460 | | | | USD | | | | 35,998 | | | Merrill Lynch International | | | 11/18/2019 | | | | 884 | |
GBP | | | 420,908 | | | | USD | | | | 542,547 | | | State Street Corp. | | | 11/18/2019 | | | | 2,924 | |
IDR | | | 3,938,705,663 | | | | USD | | | | 276,793 | | | Merrill Lynch International** | | | 11/18/2019 | | | | 2,391 | |
INR | | | 19,751,928 | | | | USD | | | | 276,761 | | | Merrill Lynch International** | | | 11/18/2019 | | | | 698 | |
NOK | | | 618,441 | | | | USD | | | | 66,798 | | | Goldman Sachs International | | | 11/18/2019 | | | | 458 | |
NZD | | | 110,476 | | | | USD | | | | 70,404 | | | Citibank, NA | | | 11/18/2019 | | | | 446 | |
NZD | | | 979,277 | | | | USD | | | | 616,919 | | | Merrill Lynch International | | | 11/18/2019 | | | | 11,099 | |
RUB | | | 17,997,339 | | | | USD | | | | 276,027 | | | Goldman Sachs International** | | | 11/18/2019 | | | | 4,086 | |
SEK | | | 1,323,025 | | | | USD | | | | 135,787 | | | Barclays Bank plc | | | 11/18/2019 | | | | 1,341 | |
SEK | | | 3,501,281 | | | | USD | | | | 359,231 | | | State Street Corp. | | | 11/18/2019 | | | | 3,666 | |
USD | | | 29,056 | | | | CAD | | | | 38,156 | | | HSBC Bank, NA | | | 11/18/2019 | | | | 85 | |
USD | | | 277,986 | | | | ILS | | | | 969,403 | | | Merrill Lynch International | | | 11/18/2019 | | | | 2,739 | |
USD | | | 969,308 | | | | NOK | | | | 8,840,916 | | | Merrill Lynch International | | | 11/18/2019 | | | | 7,854 | |
USD | | | 27,691 | | | | NOK | | | | 252,987 | | | State Street Corp. | | | 11/18/2019 | | | | 178 | |
USD | | | 54,383 | | | | SEK | | | | 521,535 | | | Citibank, NA | | | 11/18/2019 | | | | 327 | |
USD | | | 29,041 | | | | ZAR | | | | 426,436 | | | State Street Corp. | | | 11/18/2019 | | | | 875 | |
ZAR | | | 4,212,101 | | | | USD | | | | 276,594 | | | BNP Paribas | | | 11/18/2019 | | | | 1,610 | |
MXN | | | 992,347 | | | | EUR | | | | 45,783 | | | Citibank, NA | | | 11/19/2019 | | | | 348 | |
MXN | | | 4,450,258 | | | | USD | | | | 225,805 | | | Merrill Lynch International | | | 11/19/2019 | | | | 4,977 | |
| | | | | | | | | | | | | | | | | | | | | | |
Total unrealized appreciation | | | | | | | 166,036 | |
| | | | | | | | | | | | | | | | | | | | | | |
EUR | | | 253,036 | | | | USD | | | | 282,788 | | | BNP Paribas | | | 11/12/2019 | | | | (414 | ) |
USD | | | 1,335,276 | | | | AUD | | | | 1,979,348 | | | Merrill Lynch International | | | 11/12/2019 | | | | (29,529 | ) |
USD | | | 725,106 | | | | EUR | | | | 659,692 | | | BNP Paribas | | | 11/12/2019 | | | | (11,074 | ) |
USD | | | 24,608 | | | | EUR | | | | 22,447 | | | Merrill Lynch International | | | 11/12/2019 | | | | (441 | ) |
SEE NOTES TO CONSOLIDATED FINANCIAL STATEMENTS.
| | | | | | | | |
| | | |
| OCTOBER 31, 2019 | | J.P. MORGAN EXCHANGE-TRADED FUNDS | | | | | 121 | |
JPMorgan Managed Futures Strategy ETF
CONSOLIDATED SCHEDULE OF PORTFOLIO INVESTMENTS
AS OF OCTOBER 31, 2019 (continued)
| | | | | | | | | | | | | | | | | | | | | | |
| CURRENCY PURCHASED | | | CURRENCY SOLD | | | COUNTERPARTY | | SETTLEMENT
DATE | | | UNREALIZED
APPRECIATION
(DEPRECIATION) ($) | |
GBP | | | 67,855 | | | | JPY | | | | 9,490,243 | | | BNP Paribas | | | 11/18/2019 | | | | (16 | ) |
JPY | | | 121,476,609 | | | | USD | | | | 1,140,152 | | | Citibank, NA | | | 11/18/2019 | | | | (14,360 | ) |
JPY | | | 3,211,166 | | | | USD | | | | 30,127 | | | Standard Chartered Bank | | | 11/18/2019 | | | | (367 | ) |
KRW | | | 30,617,683 | | | | USD | | | | 26,235 | | | Merrill Lynch International** | | | 11/18/2019 | | | | (67 | ) |
NZD | | | 73,986 | | | | GBP | | | | 37,829 | | | Merrill Lynch International | | | 11/18/2019 | | | | (1,576 | ) |
SEK | | | 743,844 | | | | USD | | | | 77,359 | | | Barclays Bank plc | | | 11/18/2019 | | | | (262 | ) |
USD | | | 27,478 | | | | AUD | | | | 40,148 | | | Merrill Lynch International | | | 11/18/2019 | | | | (210 | ) |
USD | | | 65,127 | | | | AUD | | | | 94,931 | | | Standard Chartered Bank | | | 11/18/2019 | | | | (340 | ) |
USD | | | 37,072 | | | | CHF | | | | 36,829 | | | Barclays Bank plc | | | 11/18/2019 | | | | (301 | ) |
USD | | | 2,591,015 | | | | EUR | | | | 2,356,383 | | | Citibank, NA | | | 11/18/2019 | | | | (39,551 | ) |
USD | | | 32,588 | | | | GBP | | | | 26,640 | | | Barclays Bank plc | | | 11/18/2019 | | | | (1,935 | ) |
USD | | | 3,992,365 | | | | GBP | | | | 3,242,770 | | | Citibank, NA | | | 11/18/2019 | | | | (210,062 | ) |
USD | | | 277,479 | | | | HUF | | | | 84,104,741 | | | Merrill Lynch International | | | 11/18/2019 | | | | (8,196 | ) |
USD | | | 51,618 | | | | JPY | | | | 5,617,213 | | | Citibank, NA | | | 11/18/2019 | | | | (440 | ) |
USD | | | 279,950 | | | | KRW | | | | 335,120,004 | | | Goldman Sachs International** | | | 11/18/2019 | | | | (6,470 | ) |
USD | | | 46,130 | | | | NZD | | | | 72,641 | | | Barclays Bank plc | | | 11/18/2019 | | | | (456 | ) |
USD | | | 277,849 | | | | PLN | | | | 1,096,001 | | | Merrill Lynch International | | | 11/18/2019 | | | | (9,035 | ) |
USD | | | 45,472 | | | | SEK | | | | 448,654 | | | Barclays Bank plc | | | 11/18/2019 | | | | (1,029 | ) |
USD | | | 5,401,167 | | | | SEK | | | | 53,295,668 | | | Citibank, NA | | | 11/18/2019 | | | | (122,776 | ) |
USD | | | 29,018 | | | | SEK | | | | 288,171 | | | Goldman Sachs International | | | 11/18/2019 | | | | (850 | ) |
USD | | | 279,962 | | | | TWD | | | | 8,619,745 | | | Merrill Lynch International** | | | 11/18/2019 | | | | (3,280 | ) |
| | | | | | | | | | | | | | | | | | | | | | |
Total unrealized depreciation | | | | | | | (463,037 | ) |
| | | | | | | | | | | | | | | | | | | | | | |
Net unrealized depreciation | | | | | | | | | | | | | | (297,001 | ) |
| | | | | | | | | | | | | | | | | | | | | | |
Abbreviations
| | |
| AUD | | Australian Dollar |
| CAD | | Canadian Dollar |
| CHF | | Swiss Franc |
| EUR | | Euro |
| GBP | | British Pound |
| HUF | | Hungarian Forint |
| IDR | | Indonesian Rupiah |
| ILS | | Israeli Shekel |
| INR | | Indian Rupee |
| JPY | | Japanese Yen |
| | |
| KRW | | Korean Republic Won |
| MXN | | Mexican Peso |
| NOK | | Norwegian Krone |
| NZD | | New Zealand Dollar |
| PLN | | Polish Zloty |
| RUB | | Russian Ruble |
| SEK | | Swedish Krona |
| TWD | | Taiwan Dollar |
| USD | | United States Dollar |
| ZAR | | South African Rand |
| ** | Non-deliverable forward. |
SEE NOTES TO CONSOLIDATED FINANCIAL STATEMENTS.
| | | | | | |
| | | |
| 122 | | | | J.P. MORGAN EXCHANGE-TRADED FUNDS | | OCTOBER 31, 2019 |
STATEMENTS OF ASSETS AND LIABILITIES
AS OF OCTOBER 31, 2019
| | | | | | | | | | | | | | | | |
| | | JPMorgan
Diversified
Alternatives
ETF (1) | | | JPMorgan
Event
Driven
ETF | | | JPMorgan
Long/Short
ETF | | | JPMorgan
Managed
Futures
Strategy
ETF (1) | |
ASSETS: | |
Investments innon-affiliates, at value | | $ | 55,523,023 | | | $ | 26,457,937 | | | $ | 20,132,075 | | | $ | — | |
Investments in affiliates, at value | | | 31,321,469 | | | | 3,426,892 | | | | 8,133,570 | | | | 45,815,958 | |
Investments of cash collateral received from securities loaned, at value (See Note 2.D.) | | | — | | | | 357,950 | | | | 143,604 | | | | — | |
Restricted cash | | | 600 | | | | — | | | | 600 | | | | — | |
Restricted cash for OTC derivatives | | | 340,000 | | | | — | | | | 300,000 | | | | — | |
Cash | | | 9,225,948 | | | | 6,577 | | | | 11,700 | | | | 373,964 | |
Foreign currency, at value | | | 1,239,610 | | | | 2,990 | | | | 153,830 | | | | 1,516,095 | |
Deposits at broker for futures contracts | | | 3,816,000 | | | | — | | | | 326,000 | | | | 3,898,000 | |
Prepaid Expenses | | | 2,245 | | | | 20,441 | | | | 17,102 | | | | — | |
Receivables: | | | | | | | | | | | | | | | | |
Investment securities sold | | | 2,770,485 | | | | — | | | | 923,599 | | | | — | |
Fund shares sold | | | 2,499,659 | | | | — | | | | — | | | | — | |
Dividends fromnon-affiliates | | | 41,115 | | | | 16,886 | | | | 12,609 | | | | — | |
Dividends from affiliates | | | 69,433 | | | | 183 | | | | 433 | | | | 81,465 | |
Tax reclaims | | | 20,012 | | | | 2,943 | | | | 119 | | | | — | |
Securities lending income (See Note 2.D.) | | | — | | | | 1,440 | | | | 139 | | | | — | |
Variation margin on futures contracts | | | 300,847 | | | | — | | | | — | | | | 290,925 | |
Unrealized appreciation on forward foreign currency exchange contracts | | | 267,753 | | | | 12,343 | | | | 1,847 | | | | 166,036 | |
Outstanding swap contracts, at value | | | 537,926 | | | | 303,970 | | | | 288,433 | | | | — | |
| | | | | | | | | | | | | | | | |
Total Assets | | | 107,976,125 | | | | 30,610,552 | | | | 30,445,660 | | | | 52,142,443 | |
| | | | | | | | | | | | | | | | |
|
LIABILITIES: | |
Payables: | | | | | | | | | | | | | | | | |
Due to custodian | | | 43,104 | | | | — | | | | — | | | | — | |
Investment securities purchased | | | 1,422,799 | | | | 558,017 | | | | 781,656 | | | | — | |
Collateral received on securities loaned
(See Note 2.D.) | | | — | | | | 357,950 | | | | 143,604 | | | | — | |
Variation margin on futures contracts | | | — | | | | — | | | | 14,548 | | | | — | |
Unrealized depreciation on forward foreign currency exchange contracts | | | 712,524 | | | | 25,306 | | | | 5,401 | | | | 463,037 | |
Outstanding swap contracts, at value | | | 680,098 | | | | 8,336 | | | | 831,122 | | | | — | |
Accrued liabilities: | | | | | | | | | | | | | | | | |
Investment advisory fees | | | 39,816 | | | | 18,185 | | | | 12,870 | | | | 11,227 | |
Administration fees | | | 7,959 | | | | 1,853 | | | | 1,703 | | | | 3,731 | |
Custodian, Accounting and Transfer Agent fees | | | 25,994 | | | | 8,505 | | | | 10,037 | | | | 11,711 | |
Trustees’ and Chief Compliance Officer’s fees | | | 1,548 | | | | 126 | | | | 204 | | | | 301 | |
Professional fees | | | 150,774 | | | | 133,605 | | | | 121,903 | | | | 122,079 | |
Other | | | 93,118 | | | | 22,984 | | | | 23,624 | | | | 30,512 | |
| | | | | | | | | | | | | | | | |
Total Liabilities | | | 3,177,734 | | | | 1,134,867 | | | | 1,946,672 | | | | 642,598 | |
| | | | | | | | | | | | | | | | |
Net Assets | | $ | 104,798,391 | | | $ | 29,475,685 | | | $ | 28,498,988 | | | $ | 51,499,845 | |
| | | | | | | | | | | | | | | | |
|
NET ASSETS: | |
Paid-in-Capital | | $ | 103,535,840 | | | $ | 28,844,977 | | | $ | 29,674,968 | | | $ | 49,402,751 | |
Total distributable earnings (loss) | | | 1,262,551 | | | | 630,708 | | | | (1,175,980 | ) | | | 2,097,094 | |
| | | | | | | | | | | | | | | | |
Total Net Assets | | $ | 104,798,391 | | | $ | 29,475,685 | | | $ | 28,498,988 | | | $ | 51,499,845 | |
| | | | | | | | | | | | | | | | |
| | | | |
Outstanding number of shares
(unlimited number of shares authorized — par value $0.0001) | | | 4,200,000 | | | | 1,150,000 | | | | 1,300,000 | | | | 2,050,000 | |
| | | | | | | | | | | | | | | | |
Net asset value, per share | | $ | 24.95 | | | $ | 25.63 | | | $ | 21.92 | | | $ | 25.12 | |
| | | | | | | | | | | | | | | | |
Cost of investments innon-affiliates | | $ | 52,979,220 | | | $ | 26,072,685 | | | $ | 19,002,433 | | | $ | — | |
Cost of investments in affiliates | | | 31,317,626 | | | | 3,426,549 | | | | 8,132,758 | | | | 45,811,481 | |
Cost of foreign currency | | | 1,228,778 | | | | 2,976 | | | | 152,064 | | | | 1,491,911 | |
Investment securities on loan, at value (See Note 2.D.) | | | — | | | | 342,245 | | | | 142,631 | | | | — | |
Cost of investment of cash collateral (See Note 2.D.) | | | — | | | | 357,950 | | | | 143,604 | | | | — | |
| (1) | Consolidated Statement of Assets and Liabilities. |
SEE NOTES TO FINANCIAL STATEMENTS.
| | | | | | | | |
| | | |
| OCTOBER 31, 2019 | | J.P. MORGAN EXCHANGE-TRADED FUNDS | | | | | 123 | |
STATEMENTS OF OPERATIONS
FOR THE YEAR ENDED OCTOBER 31, 2019
| | | | | | | | | | | | | | | | |
| | | JPMorgan
Diversified
Alternatives
ETF (1) | | | JPMorgan
Event Driven
ETF | | | JPMorgan
Long/Short
ETF | | | JPMorgan
Managed
Futures
Strategy
ETF (1) | |
INVESTMENT INCOME: | |
Interest income fromnon-affiliates | | $ | 121,084 | | | $ | 108,884 | | | $ | 51,348 | | | $ | 68,981 | |
Interest income from affiliates | | | 18,580 | | | | 103 | | | | 496 | | | | 3,270 | |
Dividend income fromnon-affiliates | | | 1,752,287 | | | | 264,391 | | | | 321,255 | | | | — | |
Dividend income from affiliates | | | 1,277,164 | | | | 75,726 | | | | 136,071 | | | | 988,706 | |
Non-cash dividend income fromnon-affiliates | | | — | | | | 28,541 | | | | — | | | | — | |
Income from securities lending (net) (See Note 2.D.) | | | — | | | | 5,168 | | | | 1,203 | | | | — | |
Foreign taxes withheld (net) | | | (17,617 | ) | | | (3,794 | ) | | | — | | | | — | |
| | | | | | | | | | | | | | | | |
Total investment income | | | 3,151,498 | | | | 479,019 | | | | 510,373 | | | | 1,060,957 | |
| | | | | | | | | | | | | | | | |
|
EXPENSES: | |
Investment advisory fees (See Note 3.A.) | | | 1,081,393 | | | | 203,476 | | | | 147,220 | | | | 273,977 | |
Administration fees (See Note 3.B.) | | | 143,015 | | | | 20,783 | | | | 18,806 | | | | 42,929 | |
Interest expense tonon-affiliates | | | 10,188 | | | | — | | | | 770 | | | | 7,833 | |
Interest expense to affiliates (See Note 3.C.) | | | 4,348 | | | | 326 | | | | 605 | | | | 2,861 | |
Professional fees | | | 142,847 | | | | 120,935 | | | | 114,197 | | | | 61,885 | |
Trustees’ and Chief Compliance Officer’s fees | | | 31,315 | | | | 605 | | | | 565 | | | | 28,130 | |
Shareholder communication costs | | | 36,385 | | | | 5,321 | | | | 5,638 | | | | 10,286 | |
Registration and filing fees | | | 17,658 | | | | 17,713 | | | | 17,540 | | | | 18,452 | |
Custodian, Accounting and Transfer Agent fees (See Note 3.C.) | | | 116,703 | | | | 48,995 | | | | 51,660 | | | | 65,460 | |
Insurance expense | | | 14,097 | | | | 1,975 | | | | 1,881 | | | | 3,883 | |
Offering costs (See Note 2.G.) | | | — | | | | 1,133 | | | | 8,227 | | | | 3,567 | |
Other | | | 54,416 | | | | 4,103 | | | | 4,047 | | | | 9,833 | |
| | | | | | | | | | | | | | | | |
Total expenses | | | 1,652,365 | | | | 425,365 | | | | 371,156 | | | | 529,096 | |
| | | | | | | | | | | | | | | | |
Less fee waived (See Note 3.D.) | | | (377,443 | ) | | | (200,908 | ) | | | (166,026 | ) | | | (296,585 | ) |
Less expense reimbursements from affiliates (See Note 3.D.) | | | — | | | | — | | | | (43,881 | ) | | | — | |
Less expense reimbursements fromnon-affiliates (See Note 3.C.) | | | (7,200 | ) | | | (400 | ) | | | (1,400 | ) | | | — | |
| | | | | | | | | | | | | | | | |
Net expenses | | | 1,267,722 | | | | 224,057 | | | | 159,849 | | | | 232,511 | |
| | | | | | | | | | | | | | | | |
Net investment income (loss) | | | 1,883,776 | | | | 254,962 | | | | 350,524 | | | | 828,446 | |
| | | | | | | | | | | | | | | | |
| | | | |
REALIZED/UNREALIZED GAINS (LOSSES): | | | | | | | | | | | | | | | | |
Net realized gain (loss) on transactions from: | |
Investments innon-affiliates | | | (1,767,147 | ) | | | (110,275 | ) | | | (961,308 | ) | | | — | |
Investments in affiliates | | | 1,894 | | | | 71 | | | | (96 | ) | | | 277 | |
Futures contracts | | | (225,432 | ) | | | 26,981 | | | | (188,908 | ) | | | 1,854,945 | |
Foreign currency transactions | | | (95,101 | ) | | | 4,046 | | | | (9,701 | ) | | | (19,780 | ) |
Forward foreign currency exchange contracts | | | 1,249,950 | | | | 107,494 | | | | 2,739 | | | | 232,976 | |
Swaps | | | 33,487 | | | | (412,164 | ) | | | 23,576 | | | | — | |
| | | | | | | | | | | | | | | | |
Net realized gain (loss) | | | (802,349 | ) | | | (383,847 | ) | | | (1,133,698 | ) | | | 2,068,418 | |
| | | | | | | | | | | | | | | | |
Change in net unrealized appreciation/depreciation on: | |
Investments innon-affiliates | | | 4,078,651 | | | | 1,149,094 | | | | 1,896,362 | | | | — | |
Investments in affiliates | | | 3,843 | | | | 343 | | | | 812 | | | | 4,477 | |
Futures contracts | | | 506,686 | | | | (18,000 | ) | | | 51,759 | | | | 883,511 | |
Foreign currency translations | | | 26,141 | | | | (111 | ) | | | 2,122 | | | | 30,483 | |
Forward foreign currency exchange contracts | | | (1,038,120 | ) | | | (29,405 | ) | | | (7,808 | ) | | | (397,070 | ) |
Swaps | | | (994,350 | ) | | | 539,918 | | | | (1,577,840 | ) | | | — | |
| | | | | | | | | | | | | | | | |
Change in net unrealized appreciation/depreciation | | | 2,582,851 | | | | 1,641,839 | | | | 365,407 | | | | 521,401 | |
| | | | | | | | | | | | | | | | |
Net realized/unrealized gains (losses) | | | 1,780,502 | | | | 1,257,992 | | | | (768,291 | ) | | | 2,589,819 | |
| | | | | | | | | | | | | | | | |
Change in net assets resulting from operations | | $ | 3,664,278 | | | $ | 1,512,954 | | | $ | (417,767 | ) | | $ | 3,418,265 | |
| | | | | | | | | | | | | | | | |
| (1) | Consolidated Statement of Operations. |
SEE NOTES TO FINANCIAL STATEMENTS.
| | | | | | |
| | | |
| 124 | | | | J.P. MORGAN EXCHANGE-TRADED FUNDS | | OCTOBER 31, 2019 |
STATEMENTS OF CHANGES IN NET ASSETS
FOR THE PERIODS INDICATED
| | | | | | | | | | | | | | | | |
| | |
| | | JPMorgan Diversified Alternatives ETF(1) | | | JPMorgan Event Driven ETF | |
| | | Year Ended
October 31, 2019 | | | Year Ended
October 31, 2018 | | | Year Ended
October 31, 2019 | | | Period Ended
October 31, 2018 (a) | |
CHANGE IN NET ASSETS RESULTING FROM OPERATIONS: | |
Net investment income (loss) | | $ | 1,883,776 | | | $ | 1,300,771 | | | $ | 254,962 | | | $ | 155,470 | |
Net realized gain (loss) | | | (802,349 | ) | | | (11,210,432 | ) | | | (383,847 | ) | | | 821,046 | |
Change in net unrealized appreciation/depreciation | | | 2,582,851 | | | | (3,747,495 | ) | | | 1,641,839 | | | | (973,655 | ) |
| | | | | | | | | | | | | | | | |
Change in net assets resulting from operations | | | 3,664,278 | | | | (13,657,156 | ) | | | 1,512,954 | | | | 2,861 | |
| | | | | | | | | | | | | | | | |
| | | | |
DISTRIBUTIONS TO SHAREHOLDERS: | | | | | | | | | | | | | | | | |
Total distributions to shareholders | | | — | | | | (868 | ) | | | (871,185 | ) | | | (13,930 | ) |
| | | | | | | | | | | | | | | | |
| | | | |
CAPITAL TRANSACTIONS: | | | | | | | | | | | | | | | | |
Change in net assets resulting from capital transactions | | | (100,494,449 | ) | | | 61,503,845 | | | | 2,549,511 | | | | 26,295,474 | |
| | | | | | | | | | | | | | | | |
| | | | |
NET ASSETS: | | | | | | | | | | | | | | | | |
Change in net assets | | | (96,830,171 | ) | | | 47,845,821 | | | | 3,191,280 | | | | 26,284,405 | |
Beginning of period | | | 201,628,562 | | | | 153,782,741 | | | | 26,284,405 | | | | — | |
| | | | | | | | | | | | | | | | |
End of period | | $ | 104,798,391 | | | $ | 201,628,562 | | | $ | 29,475,685 | | | $ | 26,284,405 | |
| | | | | | | | | | | | | | | | |
| | | | |
CAPITAL TRANSACTIONS: | | | | | | | | | | | | | | | | |
Proceeds from shares issued | | $ | 14,929,466 | | | $ | 80,126,851 | | | $ | 2,549,511 | | | $ | 26,295,474 | |
Cost of shares Redeemed | | | (115,423,915 | ) | | | (18,623,006 | ) | | | — | | �� | | — | |
| | | | | | | | | | | | | | | | |
Total change in net assets resulting from capital transactions | | $ | (100,494,449 | ) | | $ | 61,503,845 | | | $ | 2,549,511 | | | $ | 26,295,474 | |
| | | | | | | | | | | | | | | | |
| | | | |
SHARE TRANSACTIONS: | | | | | | | | | | | | | | | | |
Issued | | | 600,000 | | | | 3,150,000 | | | | 100,000 | | | | 1,050,000 | |
Redeemed | | | (4,700,000 | ) | | | (750,000 | ) | | | — | | | | — | |
| | | | | | | | | | | | | | | | |
Net increase (decrease) in shares from share transactions | | | (4,100,000 | ) | | | 2,400,000 | | | | 100,000 | | | | 1,050,000 | |
| | | | | | | | | | | | | | | | |
| (a) | Commencement of operations was November 29, 2017. |
| (1) | Consolidated Statement of Changes in Net Assets. |
SEE NOTES TO FINANCIAL STATEMENTS.
| | | | | | | | |
| | | |
| OCTOBER 31, 2019 | | J.P. MORGAN EXCHANGE-TRADED FUNDS | | | | | 125 | |
STATEMENTS OF CHANGES IN NET ASSETS
FOR THE PERIODS INDICATED (continued)
| | | | | | | | | | | | | | | | |
| | |
| | | JPMorgan Long/Short ETF | | | JPMorgan Managed Futures
Strategy ETF (1) | |
| | | Year Ended
October 31, 2019 | | | Period Ended
October 31, 2018 (a) | | | Year Ended
October 31, 2019 | | | Period Ended
October 31, 2018 (b) | |
CHANGE IN NET ASSETS RESULTING FROM OPERATIONS: | | | | | |
Net investment income (loss) | | $ | 350,524 | | | $ | 208,114 | | | $ | 828,446 | | | $ | 407,053 | |
Net realized gain (loss) | | | (1,133,698 | ) | | | (3,293,298 | ) | | | 2,068,418 | | | | (2,347,424 | ) |
Change in net unrealized appreciation/depreciation | | | 365,407 | | | | 268,758 | | | | 521,401 | | | | (955,575 | ) |
| | | | | | | | | | | | | | | | |
Change in net assets resulting from operations | | | (417,767 | ) | | | (2,816,426 | ) | | | 3,418,265 | | | | (2,895,946 | ) |
| | | | | | | | | | | | | | | | |
| | | | |
DISTRIBUTIONS TO SHAREHOLDERS: | | | | | | | | | | | | | | | | |
Total distributions to shareholders | | | — | | | | — | | | | (353,288 | ) | | | (14,260 | ) |
| | | | | | | | | | | | | | | | |
| | | | |
CAPITAL TRANSACTIONS: | | | | | | | | | | | | | | | | |
Change in net assets resulting from capital transactions | | | 5,460,483 | | | | 26,272,698 | | | | (2,363,081 | ) | | | 53,708,155 | |
| | | | | | | | | | | | | | | | |
| | | | |
NET ASSETS: | | | | | | | | | | | | | | | | |
Change in net assets | | | 5,042,716 | | | | 23,456,272 | | | | 701,896 | | | | 50,797,949 | |
Beginning of period | | | 23,456,272 | | | | — | | | | 50,797,949 | | | | — | |
| | | | | | | | | | | | | | | | |
End of period | | $ | 28,498,988 | | | $ | 23,456,272 | | | $ | 51,499,845 | | | $ | 50,797,949 | |
| | | | | | | | | | | | | | | | |
| | | | |
CAPITAL TRANSACTIONS: | | | | | | | | | | | | | | | | |
Proceeds from shares issued | | $ | 9,931,852 | | | $ | 26,272,698 | | | $ | 3,826,171 | | | $ | 53,708,155 | |
Cost of shares Redeemed | | | (4,471,369 | ) | | | — | | | | (6,189,252 | ) | | | — | |
| | | | | | | | | | | | | | | | |
Total change in net assets resulting from capital transactions | | $ | 5,460,483 | | | $ | 26,272,698 | | | $ | (2,363,081 | ) | | $ | 53,708,155 | |
| | | | | | | | | | | | | | | | |
| | | | |
SHARE TRANSACTIONS: | | | | | | | | | | | | | | | | |
Issued | | | 450,000 | | | | 1,050,000 | | | | 150,000 | | | | 2,150,000 | |
Redeemed | | | (200,000 | ) | | | — | | | | (250,000 | ) | | | — | |
| | | | | | | | | | | | | | | | |
Net increase (decrease) in shares from share transactions | | | 250,000 | | | | 1,050,000 | | | | (100,000 | ) | | | 2,150,000 | |
| | | | | | | | | | | | | | | | |
| (a) | Commencement of operations was January 23, 2018. |
| (b) | Commencement of operations was December 5, 2017. |
| (1) | Consolidated Statement of Changes in Net Assets. |
SEE NOTES TO FINANCIAL STATEMENTS.
| | | | | | |
| | | |
| 126 | | | | J.P. MORGAN EXCHANGE-TRADED FUNDS | | OCTOBER 31, 2019 |
THIS PAGE IS INTENTIONALLY LEFT BLANK
| | | | | | | | |
| | | |
| OCTOBER 31, 2019 | | J.P. MORGAN EXCHANGE-TRADED FUNDS | | | | | 127 | |
FINANCIAL HIGHLIGHTS
FOR THE PERIODS INDICATED
| | | | | | | | | | | | | | | | | | | | | | | | | | | | |
| | | | | | Per share operating performance | | | | |
| | | | | | Investment Operations | | | Distributions | |
| | | Net asset
value,
beginning
of period | | | Net
investment
income
(loss) (b) | | | Net realized
and unrealized
gains
(losses) on
investments | | | Total from
investment
operations | | | Net
investment
income | | | Net
realized
gain | | | Total
distributions | |
| | | | | | | |
JPMorgan Diversified Alternatives ETF(1) | | | | | | | | | | | | | | | | | | | | | | | | | | | | |
Year Ended October 31, 2019 | | $ | 24.29 | | | $ | 0.29 | | | $ | 0.37 | | | $ | 0.66 | | | $ | — | | | $ | — | | | $ | — | |
Year Ended October 31, 2018 | | | 26.06 | | | | 0.17 | | | | (1.94 | ) | | | (1.77 | ) | | | — | (f) | | | — | | | | — | (f) |
Year Ended October 31, 2017 | | | 25.35 | | | | 0.07 | | | | 0.86 | | | | 0.93 | | | | (0.21 | ) | | | (0.01 | ) | | | (0.22 | ) |
September 12, 2016 (g) through October 31, 2016 | | | 25.00 | | | | (0.02 | ) | | | 0.37 | | | | 0.35 | | | | — | | | | — | | | | — | |
| | | | | | | |
JPMorgan Event Driven ETF | | | | | | | | | | | | | | | | | | | | | | | | | | | | |
Year Ended October 31, 2019 | | | 25.03 | | | | 0.24 | | | | 1.19 | | | | 1.43 | | | | (0.83 | ) | | | — | | | | (0.83 | ) |
November 29, 2017 (g) through October 31, 2018 | | | 25.00 | | | | 0.15 | | | | (0.11 | ) | | | 0.04 | | | | (0.01 | ) | | | — | | | | (0.01 | ) |
| | | | | | | |
JPMorgan Long/Short ETF | | | | | | | | | | | | | | | | | | | | | | | | | | | | |
Year Ended October 31, 2019 | | | 22.34 | | | | 0.31 | | | | (0.73 | ) | | | (0.42 | ) | | | — | | | | — | | | | — | |
January 23, 2018 (g) through October 31, 2018 | | | 25.00 | | | | 0.20 | | | | (2.86 | ) | | | (2.66 | ) | | | — | | | | — | | | | — | |
| | | | | | | |
JPMorgan Managed Futures Strategy ETF(1) | | | | | | | | | | | | | | | | | | | | | | | | | | | | |
Year Ended October 31, 2019 | | | 23.63 | | | | 0.39 | | | | 1.26 | | | | 1.65 | | | | (0.16 | ) | | | — | | | | (0.16 | ) |
December 5, 2017 (g) through October 31, 2018 | | | 25.00 | | | | 0.19 | | | | (1.55 | ) | | | (1.36 | ) | | | (0.01 | ) | | | — | | | | (0.01 | ) |
| (a) | Annualized for periods less than one year, unless otherwise indicated. |
| (b) | Calculated based upon average shares outstanding. |
| (c) | Not annualized for periods less than one year. |
| (d) | Includes adjustments in accordance with accounting principles generally accepted in the United States of America and as such, the net asset values for financial reporting purposes and the returns based upon those net asset values may differ from the net asset values and returns for shareholder transactions. |
| (e) | Market price total return is calculated assuming an initial investment made at the beginning of the period market price, reinvestment of all dividends and distributions at market price during the period, and sale at the market price on the last day of the period. The market price presented to calculate the market price total return is themid-point of the bid/ask spread at the close of business on the NYSE Arca, Inc. |
| (f) | Amount rounds to less than $0.005. |
| (g) | Commencement of operations. |
| (h) | Since the Shares of the Fund did not trade in the secondary market until the day after the Fund’s inception, for the period from the inception to the first day of secondary market trading, the NAV is used as a proxy for the secondary market trading price to calculate the market returns. |
| (i) | Certainnon-recurring expenses incurred by the Fund were not annualized for the period indicated. |
| (j) | Portfolio turnover is calculated by dividing the lesser of total purchases or sales of portfolio securities for the reporting period by the monthly average of portfolio securities owned during the reporting period. Excluded from both the numerator and denominator are amounts relating to derivatives and securities whose maturities or expiration dates at the time of acquisition were one year or less. |
| (1) | Consolidated Financial Highlights. |
SEE NOTES TO FINANCIAL STATEMENTS.
| | | | | | |
| | | |
| 128 | | | | J.P. MORGAN EXCHANGE-TRADED FUNDS | | OCTOBER 31, 2019 |
| | | | | | | | | | | | | | | | | | | | | | | | | | | | | | | | | | |
| | | Ratios/Supplemental data | |
| | | | | | | | | | | | | | | | Ratios to average net assets(a) | | | | |
Net asset
value,
end of
period | | | Market price,
end of
period | | | Total
return (c)(d) | | | Market
price
total
return (c)(e) | | | Net assets,
end of
period | | | Net
expenses | | | Net
investment
income
(loss) | | | Expenses
without waivers
and reimbursements | | | Portfolio
turnover
rate (c) | |
| | | | | | | | |
| | | | | | | | | | | | | | | | | | | | | | | | | | | | | | | | | | |
| $ | 24.95 | | | $ | 24.95 | | | | 2.72 | % | | | 2.55 | % | | $ | 104,798,391 | | | | 0.78 | % | | | 1.16 | % | | | 1.02 | % | | | 123 | % |
| | 24.29 | | | | 24.33 | | | | (6.79 | ) | | | (6.75 | ) | | | 201,628,562 | | | | 0.79 | | | | 0.69 | | | | 1.08 | | | | 145 | |
| | 26.06 | | | | 26.09 | | | | 3.68 | | | | 3.51 | | | | 153,782,741 | | | | 0.76 | | | | 0.25 | | | | 1.31 | | | | 107 | |
| | 25.35 | | | | 25.42 | | | | 1.44 | | | | 1.68 | (h) | | | 51,977,433 | | | | 0.85 | (i) | | | 0.47 | | | | 6.65 | (i) | | | 5 | |
| | | | | | | | |
| | | | | | | | | | | | | | | | | | | | | | | | | | | | | | | | | | |
| | 25.63 | | | | 25.72 | | | | 6.17 | | | | 6.07 | | | | 29,475,685 | | | | 0.83 | | | | 0.94 | | | | 1.56 | | | | 206 | |
| | 25.03 | | | | 25.14 | | | | 0.18 | | | | 0.62 | (h) | | | 26,284,405 | | | | 0.74 | (i) | | | 0.64 | | | | 1.85 | (i) | | | 141 | |
| | | | | | | | |
| | | | | | | | | | | | | | | | | | | | | | | | | | | | | | | | | | |
| | 21.92 | | | | 22.04 | | | | (1.88 | ) | | | (2.04 | ) | | | 28,498,988 | | | | 0.65 | | | | 1.43 | | | | 1.51 | | | | 114 | |
| | 22.34 | | | | 22.50 | | | | (10.64 | ) | | | (10.00 | )(h) | | | 23,456,272 | | | | 0.60 | (i) | | | 1.15 | | | | 1.95 | (i) | | | 99 | |
| | | | | | | | |
| | | | | | | | | | | | | | | | | | | | | | | | | | | | | | | | | | |
| | 25.12 | | | | 25.06 | | | | 7.05 | | | | 6.38 | | | | 51,499,845 | | | | 0.46 | | | | 1.63 | | | | 1.04 | | | | — | (j) |
| | 23.63 | | | | 23.72 | | | | (5.45 | ) | | | (5.09 | )(h) | | | 50,797,949 | | | | 0.45 | (i) | | | 0.88 | | | | 1.35 | (i) | | | — | (j) |
SEE NOTES TO FINANCIAL STATEMENTS.
| | | | | | | | |
| | | |
| OCTOBER 31, 2019 | | J.P. MORGAN EXCHANGE-TRADED FUNDS | | | | | 129 | |
NOTES TO FINANCIAL STATEMENTS
AS OF OCTOBER 31, 2019
1. Organization
J.P. Morgan Exchange-Traded Fund Trust (the “Trust”) was formed on February 25, 2010, and is governed by a Declaration of Trust as amended and restated February 19, 2014, and is registered under the Investment Company Act of 1940, as amended (the “1940 Act”), as anopen-end management investment company.
The following are 4 separate funds of the Trust (each, a “Fund” and collectively, the “Funds”) covered by this report:
| | |
| | | Diversification Classification |
| JPMorgan Diversified Alternatives ETF | | Diversified |
| JPMorgan Event Driven ETF | | Diversified |
| JPMorgan Long/Short ETF | | Diversified |
| JPMorgan Managed Futures Strategy ETF | | Non-Diversified |
The investment objective of the JPMorgan Diversified Alternatives ETF (the ��Diversified Alternatives ETF”), JPMorgan Event Driven ETF (the “Event Driven ETF”), JPMorgan Long/Short ETF (the “Long/Short ETF”) and JPMorgan Managed Futures Strategy ETF (the “Managed Futures Strategy ETF”) is to seek to provide long-term total return.
Event Driven ETF, Long/Short ETF and Managed Futures Strategy ETF commenced operations on November 29, 2017, January 23, 2018 and December 5, 2017, respectively.
J.P. Morgan Investment Management Inc. (“JPMIM”), an indirect, wholly-owned subsidiary of JPMorgan Chase & Co. (“JPMorgan”), acts as Adviser (the “Adviser”) and Administrator (the “Administrator”) to the Funds.
Shares of each Fund are listed and traded at market price on the NYSE Arca, Inc. Market prices for the Funds’ shares may be different from their net asset value (“NAV”). The Funds issue and redeem their shares on a continuous basis, through JPMorgan Distribution Services, Inc. (the “Distributor” or “JPMDS”), an indirect, wholly-owned subsidiary of JPMorgan, at NAV in large blocks of shares, typically 50,000 shares referred to as “Creation Units.” Creation Units are issued and redeemed principally in cash. Shares are generally traded in the secondary market in amounts less than a Creation Unit at market prices that change throughout the day. Only individuals or institutions that have entered into an authorized participant agreement with the Distributor may do business directly with the Funds (each, an “Authorized Participant”).
Basis for Consolidation
Diversified Alternatives Fund CS Ltd. and Managed Futures Fund CS Ltd. (each, a “Subsidiary;” collectively, the “Subsidiaries”), are Cayman Islands exempted companies, incorporated on August 17, 2015 and August 17, 2017, respectively, are currently wholly-owned subsidiaries of the Diversified Alternatives ETF and Managed Futures Strategy ETF, respectively. Each Subsidiary acts as an investment vehicle for its respective Fund in order to effect certain investments on behalf of such Fund consistent with the Fund’s investment objectives and policies as described in the Fund’s prospectus. The consolidated financial statements for these Funds include the accounts of the Funds and the Subsidiaries. Subsequent references to the Funds within the Notes to Consolidated Financial Statements collectively refer to the Funds and the Subsidiaries. All significant intercompany balances and transactions have been eliminated in consolidation.
2. Significant Accounting Policies
The following is a summary of significant accounting policies followed by the Funds in the preparation of their consolidated financial statements/financial statements. The Funds are investment companies and, thus, follow the investment company accounting and reporting guidance of the Financial Accounting Standards Board (“FASB”) Accounting Standards Codification Topic 946 —Investment Companies, which is part of US generally accepted accounting principles (“GAAP”). The preparation of financial statements in conformity with GAAP requires management to make estimates and assumptions that affect (i) the reported amounts of assets and liabilities, (ii) disclosure of contingent assets and liabilities at the date of the financial statements, and (iii) the reported amounts of increases and decreases in net assets from operations during the reporting period. Actual results could differ from those estimates.
A. Valuation of Investments — Investments are valued in accordance with GAAP and the Funds’ valuation policies set forth by, and under the supervision and responsibility of, the Board of Trustees of the Trust (the “Board”), which established the following approach to valuation, as described more fully below: (i) investments for which market quotations are readily available shall be valued at their market value, and (ii) all other investments for which market quotations are not readily available shall be valued at their fair value as determined in good faith by the Board.
The Administrator has established the J.P. Morgan Asset Management Americas Valuation Committee (“AVC”) to assist the Board with the oversight and monitoring of the valuation of the Funds’ investments. The Administrator implements the valuation policies of the Funds’ investments, as directed by the Board. The AVC oversees and carries out the policies for the valuation of investments held in the Funds. This includes monitoring the appropriateness of fair values based on results of ongoing valuation oversight including, but not limited to, consideration of macro or security specific events, market events, and pricing vendor and broker due diligence. The Administrator is responsible for discussing and assessing the potential impacts to the fair values on an ongoing basis, and at least on a quarterly basis, with the AVC and the Board.
| | | | | | |
| | | |
| 130 | | | | J.P. MORGAN EXCHANGE-TRADED FUNDS | | OCTOBER 31, 2019 |
A market-based approach is primarily used to value the Funds’ investments. Investments for which market quotations are not readily available are fair valued by approved affiliated and/or unaffiliated pricing vendors or third party broker-dealers (collectively referred to as “Pricing Services”) or may be internally fair valued using methods set forth by the valuation policies approved by the Board. This may include the use of related or comparable assets or liabilities, recent transactions, market multiples, book values and other relevant information for the investment. An income-based valuation approach may be used in which the anticipated future cash flows of the investment are discounted to calculate the fair value. Discounts may also be applied due to the nature or duration of any restrictions on the disposition of the investments. Valuations may be based upon current market prices of securities that are comparable in coupon, rating, maturity and industry. It is possible that the estimated values may differ significantly from the values that would have been used had a ready market for the investments existed, and such differences could be material.
Equities and other exchange-traded instruments are valued at the last sale price or official market closing price on the primary exchange on which the instrument is traded before the NAVs of the Funds are calculated on a valuation date. Certain foreign equity instruments, as well as certain derivatives with equity reference obligations, are valued by applying international fair value factors provided by approved Pricing Services. The factors seek to adjust the local closing price for movements of local markets post closing, but prior to the time the NAVs are calculated.
Fixed income instruments are valued based on prices received from Pricing Services. The Pricing Services use multiple valuation techniques to determine the valuation of fixed income instruments. In instances where sufficient market activity exists, the Pricing Services may utilize a market based approach through which trades or quotes from market makers are used to determine the valuation of these instruments. In instances where sufficient market activity may not exist, the Pricing Services also utilize proprietary valuation models which may consider market transactions in comparable securities and the various relationships between securities in determining fair value and/or market characteristics in order to estimate the relevant cash flows, which are then discounted to calculate the fair values.
Investments inopen-end investment companies, excluding Exchange-Traded Funds (“ETFs”), (“Underlying Funds”) are valued at each Underlying Fund’s NAV per share as of the report date.
Futures contracts are generally valued on the basis of available market quotations. Forward foreign currency exchange contracts, swaps and other derivatives are valued utilizing market quotations from approved Pricing Services.
Valuations reflected in this report are as of the report date. As a result, changes in valuation due to market events and/or issuer-related events after the report date and prior to issuance of the report are not reflected herein.
The various inputs that are used in determining the valuation of the Funds’ investments are summarized into the three broad levels listed below.
| • | | Level 1 — Unadjusted inputs using quoted prices in active markets for identical investments. |
| • | | Level 2 — Other significant observable inputs including, but not limited to, quoted prices for similar investments, inputs other than quoted prices that are observable for investments (such as interest rates, prepayment speeds, credit risk, etc.) or other market corroborated inputs. |
| • | | Level 3 — Significant inputs based on the best information available in the circumstances, to the extent observable inputs are not available (including the Funds’ assumptions in determining the fair value of investments). |
A financial instrument’s level within the fair value hierarchy is based on the lowest level of any input, both individually and in the aggregate, that is significant to the fair value measurement. The inputs or methodology used for valuing instruments are not necessarily an indication of the risk associated with investing in those instruments.
The following tables represent each valuation input as presented on the Consolidated Schedules of Portfolio Investments/Schedules of Portfolio Investments (“CSOIs/SOIs”):
Diversified Alternatives ETF
| | | | | | | | | | | | | | | | |
| | | Level 1
Quoted prices | | | Level 2
Other significant
observable inputs | | | Level 3
Significant
unobservable inputs | | | Total | |
Investments in Securities | | | | | | | | | |
Common Stocks | | | | | | | | | |
Health Care Providers & Services | | $ | 956,727 | | | $ | 307,488 | | | $ | — | | | $ | 1,264,215 | |
Hotels, Restaurants & Leisure | | | 1,176,606 | | | | 124,881 | | | | — | | | | 1,301,487 | |
Household Durables | | | 920,410 | | | | 486,232 | | | | — | | | | 1,406,642 | |
Real Estate Management & Development | | | — | | | | 991,634 | | | | — | | | | 991,634 | |
Other Common Stocks | | | 48,444,312 | | | | — | | | | — | | | | 48,444,312 | |
| | | | | | | | | | | | | | | | |
Total Common Stocks | | | 51,498,055 | | | | 1,910,235 | | | | — | | | | 53,408,290 | |
| | | | | | | | | | | | | | | | |
| | | | | | | | |
| | | |
| OCTOBER 31, 2019 | | J.P. MORGAN EXCHANGE-TRADED FUNDS | | | | | 131 | |
NOTES TO FINANCIAL STATEMENTS
AS OF OCTOBER 31, 2019 (continued)
Diversified Alternatives ETF(continued)
| | | | | | | | | | | | | | | | |
| | | Level 1
Quoted prices | | | Level 2
Other significant
observable inputs | | | Level 3
Significant
unobservable inputs | | | Total | |
Short-Term Investments | | | | | | | | | |
Foreign Government Treasury Bills | | $ | — | | | $ | 2,114,733 | | | $ | — | | | $ | 2,114,733 | |
Investment Companies | | | 31,321,469 | | | | — | | | | — | | | | 31,321,469 | |
| | | | | | | | | | | | | | | | |
Total Short-Term Investments | | | 31,321,469 | | | | 2,114,733 | | | | — | | | | 33,436,202 | |
| | | | | | | | | | | | | | | | |
Total Investments in Securities | | $ | 82,819,524 | | | $ | 4,024,968 | | | $ | — | | | $ | 86,844,492 | |
| | | | | | | | | | | | | | | | |
Appreciation in Other Financial Instruments | | | | | | | | | |
Forward Foreign Currency Exchange Contracts | | $ | — | | | $ | 267,753 | | | $ | — | | | $ | 267,753 | |
Futures Contracts | | | 925,797 | | | | 27,612 | | | | — | | | | 953,409 | |
Swaps | | | — | | | | 435,626 | | | | — | | | | 435,626 | |
| | | | | | | | | | | | | | | | |
Total Appreciation in Other Financial Instruments | | $ | 925,797 | | | $ | 730,991 | | | $ | — | | | $ | 1,656,788 | |
| | | | | | | | | | | | | | | | |
Depreciation in Other Financial Instruments | | | | | | | | | |
Forward Foreign Currency Exchange Contracts | | $ | — | | | $ | (712,524 | ) | | $ | — | | | $ | (712,524 | ) |
Futures Contracts | | | (1,032,846 | ) | | | (1,240 | ) | | | — | | | | (1,034,086 | ) |
Swaps | | | — | | | | (581,728 | ) | | | (1,033 | ) | | | (582,761 | ) |
| | | | | | | | | | | | | | | | |
Total Depreciation in Other Financial Instruments | | $ | (1,032,846 | ) | | $ | (1,295,492 | ) | | $ | (1,033 | ) | | $ | (2,329,371 | ) |
| | | | | | | | | | | | | | | | |
Event Driven ETF
| | | | | | | | | | | | | | | | |
| | | Level 1
Quoted prices | | | Level 2
Other significant
observable inputs | | | Level 3
Significant
unobservable inputs | | | Total | |
Investments in Securities | | | | | | | | | | | | | | | | |
Common Stocks | | | | | | | | | | | | | | | | |
Banks | | $ | 579,545 | | | $ | 184,565 | | | $ | — | | | $ | 764,110 | |
Health Care Providers & Services | | | 531,070 | | | | 53,361 | | | | — | | | | 584,431 | |
Hotels, Restaurants & Leisure | | | 1,493,291 | | | | 66,796 | | | | — | | | | 1,560,087 | |
Household Durables | | | — | | | | 171,393 | | | | — | | | | 171,393 | |
Industrial Conglomerates | | | — | | | | 191,456 | | | | — | | | | 191,456 | |
Real Estate Management & Development | | | — | | | | 267,511 | | | | — | | | | 267,511 | |
Other Common Stocks | | | 17,139,155 | | | | — | | | | — | | | | 17,139,155 | |
| | | | | | | | | | | | | | | | |
Total Common Stocks | | | 19,743,061 | | | | 935,082 | | | | — | | | | 20,678,143 | |
| | | | | | | | | | | | | | | | |
Short-Term Investments | | | | | | | | | |
Foreign Government Treasury Bills | | | — | | | | 1,019,372 | | | | — | | | | 1,019,372 | |
Investment Companies | | | 3,426,892 | | | | — | | | | — | | | | 3,426,892 | |
Investment of cash collateral from securities loaned | | | 357,950 | | | | — | | | | — | | | | 357,950 | |
U.S. Treasury Obligations | | | — | | | | 4,760,422 | | | | — | | | | 4,760,422 | |
| | | | | | | | | | | | | | | | |
Total Short-Term Investments | | | 3,784,842 | | | | 5,779,794 | | | | — | | | | 9,564,636 | |
| | | | | | | | | | | | | | | | |
Total Investments in Securities | | $ | 23,527,903 | | | $ | 6,714,876 | | | $ | — | | | $ | 30,242,779 | |
| | | | | | | | | | | | | | | | |
Appreciation in Other Financial Instruments | | | | | | | | | |
Forward Foreign Currency Exchange Contracts | | $ | — | | | $ | 12,343 | | | $ | — | | | $ | 12,343 | |
Swaps | | | — | | | | 283,521 | | | | — | | | | 283,521 | |
| | | | | | | | | | | | | | | | |
Total Appreciation in Other Financial Instruments | | $ | — | | | $ | 295,864 | | | $ | — | | | $ | 295,864 | |
| | | | | | | | | | | | | | | | |
Depreciation in Other Financial Instruments | | | | | | | | | |
Forward Foreign Currency Exchange Contracts | | $ | — | | | $ | (25,306 | ) | | $ | — | | | $ | (25,306 | ) |
Swaps | | | — | | | | (7,602 | ) | | | — | | | | (7,602 | ) |
| | | | | | | | | | | | | | | | |
Total Depreciation in Other Financial Instruments | | $ | — | | | $ | (32,908 | ) | | $ | — | | | $ | (32,908 | ) |
| | | | | | | | | | | | | | | | |
| | | | | | |
| | | |
| 132 | | | | J.P. MORGAN EXCHANGE-TRADED FUNDS | | OCTOBER 31, 2019 |
Long/Short ETF
| | | | | | | | | | | | | | | | |
| | | Level 1
Quoted prices | | | Level 2
Other significant
observable inputs | | | Level 3
Significant
unobservable inputs | | | Total | |
Investments in Securities | | | | | | | | | |
Common Stocks (a) | | $ | 17,904,579 | | | $ | — | | | $ | — | | | $ | 17,904,579 | |
Short-Term Investments | | | | | | | | | |
Investment Companies | | | 8,133,570 | | | | — | | | | — | | | | 8,133,570 | |
Investment of cash collateral from securities loaned | | | 143,604 | | | | — | | | | — | | | | 143,604 | |
U.S. Treasury Obligations | | | — | | | | 2,227,496 | | | | — | | | | 2,227,496 | |
| | | | | | | | | | | | | | | | |
Total Short-Term Investments | | | 8,277,174 | | | | 2,227,496 | | | | — | | | | 10,504,670 | |
| | | | | | | | | | | | | | | | |
Total Investments in Securities | | $ | 26,181,753 | | | $ | 2,227,496 | | | $ | — | | | $ | 28,409,249 | |
| | | | | | | | | | | | | | | | |
Appreciation in Other Financial Instruments | | | | | | | | | |
Forward Foreign Currency Exchange Contracts | | $ | — | | | $ | 1,847 | | | $ | — | | | $ | 1,847 | |
Futures Contracts | | | 35,199 | | | | 15,592 | | | | — | | | | 50,791 | |
Swaps | | | — | | | | 246,640 | | | | — | | | | 246,640 | |
| | | | | | | | | | | | | | | | |
Total Appreciation in Other Financial Instruments | | $ | 35,199 | | | $ | 264,079 | | | $ | — | | | $ | 299,278 | |
| | | | | | | | | | | | | | | | |
Depreciation in Other Financial Instruments | | | | | | | | | |
Forward Foreign Currency Exchange Contracts | | $ | — | | | $ | (5,401 | ) | | $ | — | | | $ | (5,401 | ) |
Futures Contracts | | | (2,334 | ) | | | (239 | ) | | | — | | | | (2,573 | ) |
Swaps | | | — | | | | (742,329 | ) | | | — | | | | (742,329 | ) |
| | | | | | | | | | | | | | | | |
Total Depreciation in Other Financial Instruments | | $ | (2,334 | ) | | $ | (747,969 | ) | | $ | — | | | $ | (750,303 | ) |
| | | | | | | | | | | | | | | | |
Managed Futures Strategy ETF
| | | | | | | | | | | | | | | | |
| | | Level 1
Quoted prices | | | Level 2
Other significant
observable inputs | | | Level 3
Significant
unobservable inputs | | | Total | |
Total Investments in Securities (a) | | $ | 45,815,958 | | | $ | — | | | $ | — | | | $ | 45,815,958 | |
| | | | | | | | | | | | | | | | |
Appreciation in Other Financial Instruments | |
Forward Foreign Currency Exchange Contracts | | $ | — | | | $ | 166,036 | | | $ | — | | | $ | 166,036 | |
Futures Contracts | | | 952,159 | | | | 39,406 | | | | — | | | | 991,565 | |
| | | | | | | | | | | | | | | | |
Total Appreciation in Other Financial Instruments | | $ | 952,159 | | | $ | 205,442 | | | $ | — | | | $ | 1,157,601 | |
| | | | | | | | | | | | | | | | |
Depreciation in Other Financial Instruments | |
Forward Foreign Currency Exchange Contracts | | $ | — | | | $ | (463,037 | ) | | $ | — | | | $ | (463,037 | ) |
Futures Contracts | | | (1,162,187 | ) | | | (829 | ) | | | — | | | | (1,163,016 | ) |
| | | | | | | | | | | | | | | | |
Total Depreciation in Other Financial Instruments | | $ | (1,162,187 | ) | | $ | (463,866 | ) | | $ | — | | | $ | (1,626,053 | ) |
| | | | | | | | | | | | | | | | |
| (a) | All portfolio holdings designated as level 1 are disclosed individually on the SOIs. Please refer to the SOIs for industry specifics of portfolio holdings. |
There were no transfers into or out of level 3 for the year ended October 31, 2019.
B. Restricted Securities — Certain securities held by the Funds may be subject to legal or contractual restrictions on resale. Restricted securities generally are resold in transactions exempt from registration under the Securities Act of 1933, as amended (the “Securities Act”). Disposal of these securities may involve time-consuming negotiations and expense. Prompt sale at the current valuation may be difficult and could adversely affect the NAVs of the Funds.
As of October 31, 2019, the Funds had no investments in restricted securities.
C. Derivatives — The Funds used derivative instruments including futures, forward foreign currency exchange contracts and swaps, in connection with their respective investment strategies. Derivative instruments may be used as substitutes for securities in which the Funds can invest, to hedge portfolio investments or to generate income or gain to the Funds. Derivatives may also be used to manage duration, sector and yield curve exposures and credit and spread volatility.
The Funds may be subject to various risks from the use of derivatives, including the risk that changes in the value of a derivative may not correlate perfectly with the underlying asset, rate or index; counterparty credit risk related to derivatives counterparties’ failure to perform under contract terms; liquidity risk related to the lack of a liquid market for these contracts allowing a Fund to close out its position(s); and documentation risk
| | | | | | | | |
| | | |
| OCTOBER 31, 2019 | | J.P. MORGAN EXCHANGE-TRADED FUNDS | | | | | 133 | |
NOTES TO FINANCIAL STATEMENTS
AS OF OCTOBER 31, 2019 (continued)
relating to disagreement over contract terms. Investing in certain derivatives also results in a form of leverage and as such, the Funds’ risk of loss associated with these instruments may exceed their value, as recorded on the Consolidated Statements of Assets and Liabilities/Statements of Assets and Liabilities (“CSAL/SAL”).
The Funds are party to various derivative contracts governed by International Swaps and Derivatives Association master agreements (“ISDA agreements”). The Funds’ ISDA agreements, which are separately negotiated with each dealer counterparty, may contain provisions allowing, absent other considerations, a counterparty to exercise rights, to the extent not otherwise waived, against the Funds in the event the Funds’ net assets decline over time by apre-determined percentage or fall below apre-determined floor. The ISDA agreements may also contain provisions allowing, absent other conditions, the Funds to exercise rights, to the extent not otherwise waived, against a counterparty (e.g., decline in a counterparty’s credit rating below a specified level). Such rights for both a counterparty and the Funds often include the ability to terminate (i.e., close out) open contracts at prices which may favor a counterparty, which could have an adverse effect on the Funds. The ISDA agreements give the Funds and a counterparty the right, upon an event of default, to close out all transactions traded under such agreements and to net amounts owed or due across all transactions and offset such net payable or receivable with collateral posted to a segregated account by one party to the other.
Counterparty credit risk may be mitigated to the extent a counterparty posts collateral for mark to market gains to the Funds.
Notes C(1) — C(3) below describe the various derivatives used by the Funds.
(1). Futures Contracts —The Funds used index, commodities and treasury futures contracts to obtain long and short exposure to the underlying commodities markets, to gain or reduce exposure to the stock market, to gain or reduce exposure to particular countries or regions, maintain liquidity, minimize transaction costs or to manage and hedge interest rate risk associated with portfolio investments.
Futures contracts provide for the delayed delivery of the underlying instrument at a fixed price or are settled for a cash amount based on the change in the value of the underlying instrument at a specific date in the future. Upon entering into a futures contract, the Funds are required to deposit with the broker, cash or securities in an amount equal to a certain percentage of the contract amount, which is referred to as the initial margin deposit. Subsequent payments, referred to as variation margin, are made or received by the Funds periodically and are based on changes in the market value of open futures contracts. Changes in the market value of open futures contracts are recorded as Change in net unrealized appreciation/depreciation on the Consolidated Statement of Operations/Statement of Operations (“CSOP/SOP”). Realized gains or losses, representing the difference between the value of the contract at the time it was opened and the value at the time it was closed, are reported on the CSOP/SOP at the closing or expiration of the futures contract. Securities deposited as initial margin are designated in the CSOI/SOIs, while cash deposited, which is considered restricted, is recorded on the CSAL/SAL. A receivable from and/or a payable to brokers for the daily variation margin is also recorded on the CSAL/SAL.
The use of futures contracts exposes the Funds to interest rate risk, commodities risk and equity price risk. The Funds may be subject to the risk that the change in the value of the futures contract may not correlate perfectly with the underlying instrument. Use of long futures contracts subjects the Funds to risk of loss in excess of the amounts shown on the CSAL/SAL, up to the notional amount of the futures contracts. Use of short futures contracts subjects the Funds to unlimited risk of loss. The Funds may enter into futures contracts only on exchanges or boards of trade. The exchange or board of trade acts as the counterparty to each futures transaction; therefore, the Funds’ credit risk is limited to failure of the exchange or board of trade. Under some circumstances, futures exchanges may establish daily limits on the amount that the price of a futures contract can vary from the previous day’s settlement price, which could effectively prevent liquidation of positions.
The Funds’ futures contracts are not subject to master netting arrangements (the right to close out all transactions traded with a counterparty and net amounts owed or due across transactions).
(2). Forward Foreign Currency Exchange Contracts — The Funds are exposed to foreign currency risks associated with some or all of the portfolio investments and used forward foreign currency exchange contracts to hedge or manage certain of these exposures as part of an investment strategy. The Funds also bought forward foreign currency exchange contracts to gain exposure to currencies. Forward foreign currency exchange contracts represent obligations to purchase or sell foreign currency on a specified future date at a price fixed at the time the contracts are entered into.Non-deliverable forward foreign currency exchange contracts are settled with the counterparty in US dollars without the delivery of foreign currency.
The values of the forward foreign currency exchange contracts are adjusted daily based on the applicable exchange rate of the underlying currency. Changes in the value of these contracts are recorded as unrealized appreciation or depreciation until the contract settlement date. When the forward foreign currency exchange contract is closed, the Funds record a realized gain or loss equal to the difference between the value at the time the contract was opened and the value at the time it was closed. The Funds also record a realized gain or loss when a forward foreign currency exchange contract offsets another forward foreign currency exchange contract with the same counterparty upon settlement.
These Funds’ forward foreign currency exchange contracts are subject to master netting arrangements (the right to close out all transactions with a counterparty and net amounts owed or due across transactions).
The Funds may be required to post or receive collateral fornon-deliverable forward foreign currency exchange contracts.
(3). Swaps — The Diversified Alternatives ETF, Event Driven ETF and Long/Short ETF engaged in various swap transactions, including total return basket swaps, to manage credit and total return risks within their respective portfolios. The Funds also used swaps as alternatives to direct
| | | | | | |
| | | |
| 134 | | | | J.P. MORGAN EXCHANGE-TRADED FUNDS | | OCTOBER 31, 2019 |
investments. Swap transactions are contracts negotiated over the counter (“OTC swaps”) between a fund and a counterparty or are centrally cleared (“centrally cleared swaps”) through a central clearinghouse managed by a Futures Commission Merchant (“FCM”) that exchange investment cash flows, assets, foreign currencies or market-linked returns at specified, future intervals.
Upfront payments made and/or received are recorded as assets or liabilities, respectively, on the CSAL/SAL and amortized over the term of the swap. The value of an OTC swap agreement is recorded as either an asset or a liability on the CSAL/SAL at the beginning of the measurement period. Upon entering into a centrally cleared swap, the Funds are required to deposit with the FCM cash or securities, which is referred to as initial margin deposit. Securities deposited as initial margin are designated on the CSOIs/SOIs, while cash deposited, which is considered restricted, is recorded on the CSAL/SAL. Daily changes in valuation of centrally cleared swaps, if any, are recorded as a variation margin receivable or payable on the CSAL/SAL. The change in the value of swaps, including accruals of periodic amounts of interest to be paid or received on swaps, is reported as Change in net unrealized appreciation/depreciation on the CSOP/SOP. A realized gain or loss is recorded upon payment or receipt of a periodic payment or payment made upon termination of a swap agreement.
The Funds may be required to post or receive collateral based on the net value of the Funds’ outstanding OTC swap contracts with the counterparty in the form of cash or securities. Daily movement of collateral is subject to minimum threshold amounts. Collateral posted by the Funds is held in a segregated account at the Funds’ custodian bank. For certain counterparties cash collateral posted or received by the Funds is reported on the CSAL/SAL as Restricted cash for OTC derivatives.
The Funds’ swap contracts (excluding centrally cleared swaps) are subject to master netting arrangements.
Total Return Basket Swaps
The Diversified Alternatives ETF, Event Driven ETF and Long/Short ETF entered into total return basket swap agreements to obtain exposure to a portfolio of long and short securities. This is a highly specialized activity and a significant aspect of each Fund’s investment strategy.
Under the terms of the agreements, each swap is designed to function as a portfolio of direct investments in long and/or short equity positions. This means that a Fund has the ability to trade in and out of long and short positions within each swap and will receive all of the economic benefits and risks equivalent to direct investments in these positions such as: capital appreciation (depreciation), corporate actions and dividends received and paid, all of which are reflected in each swap value. Each swap value also includes interest charges and credits related to the notional values of the long and short positions and cash balances within each swap. These interest charges and credits are based on defined market rates based on the local currencies of the positions in the portfolio plus or minus a specified spread and are referred to herein as “financing costs” and net dividends. Positions within each swap, accrued financing costs and net dividends, are part of the periodic reset. During a reset, any unrealized gains (losses) on positions, accrued financing costs, and net dividends become available for cash settlement between the Fund and the swap counterparty are recorded as Due from/to counterparty for swap contracts on the CSAL/SAL and as Net realized gain (loss) on transactions from swaps on the CSOP/SOP.
Each swap involves additional risks than if a Fund had invested in the underlying positions directly including: the risk that changes in the value of each swap may not correlate perfectly with the underlying long and short securities; counterparty risk related to the counterparty’s failure to perform under contract terms; liquidity risk related to the lack of a liquid market for each swap contract, which may limit the ability of a Fund to close out its positions; and, documentation risk relating to disagreement over contract terms. The total return basket swaps consist of securities that are denominated in foreign currencies. Changes in currency exchange rates will affect the value of, and investment income from, such securities. The Funds’ activities in each total return basket swap are concentrated with a single counterparty. Investing in swaps results in a form of leverage (i.e., a Fund’s risk of loss associated with these instruments may exceed their value as recorded on the CSAL/SAL).
The value of each swap is derived from a combination of (i) the net value of the underlying positions, which are valued daily using the last sale or closing prices on the principal exchange on which the underlying securities are traded; (ii) financing costs; (iii) the value of dividends; (iv) cash balances within the swap; and (v) other factors, as applicable. The value of each swap is reflected on the CSAL/SAL as Outstanding swap contracts, at value. Changes in the value of each swap are recognized as Change in net unrealized appreciation/depreciation of swaps on the CSOP/SOP.
| | | | | | | | |
| | | |
| OCTOBER 31, 2019 | | J.P. MORGAN EXCHANGE-TRADED FUNDS | | | | | 135 | |
NOTES TO FINANCIAL STATEMENTS
AS OF OCTOBER 31, 2019 (continued)
(4). Summary of Derivatives Information
The following tables present the value of derivatives held as of October 31, 2019, by their primary underlying risk exposure and respective location on the CSAL/SAL:
Diversified Alternatives ETF
| | | | | | | | | | | | | | | | | | |
| Derivative Contracts | | CSAL Location | | | | | | | | | | | | |
| Gross Assets: | | | | Futures
Contracts (a) | | | Forward Foreign
Currency Exchange
Contracts | | | OTC
Swaps | | | Total | |
Commodity contracts | | Receivables, Net assets — Unrealized Appreciation | | $ | 731,119 | | | $ | — | | | $ | — | | | $ | 731,119 | |
Equity contracts | | Receivables, Net assets — Unrealized Appreciation | | | 89,539 | | | | — | | | | 537,926 | | | | 627,465 | |
Foreign exchange contracts | | Receivables | | | — | | | | 267,753 | | | | — | | | | 267,753 | |
Interest rate contracts | | Receivables, Net assets — Unrealized Appreciation | | | 132,751 | | | | — | | | | — | | | | 132,751 | |
| | | | | | | | | | | | | | | | | | |
Total | | | | $ | 953,409 | | | $ | 267,753 | | | $ | 537,926 | | | $ | 1,759,088 | |
| | | | | | | | | | | | | | | | | | |
| | | | | |
Gross Liabilities: | | | | | | | | | | | | | | |
Commodity contracts | | Payables, Net assets — Unrealized Depreciation | | $ | (428,765 | ) | | $ | — | | | $ | — | | | $ | (428,765 | ) |
Equity contracts | | Payables, Net assets — Unrealized Depreciation | | | (107,351 | ) | | | — | | | | (680,098 | ) | | | (787,449 | ) |
Foreign exchange contracts | | Payables | | | — | | | | (712,524 | ) | | | — | | | | (712,524 | ) |
Interest rate contracts | | Payables, Net assets — Unrealized Depreciation | | | (497,970 | ) | | | — | | | | — | | | | (497,970 | ) |
| | | | | | | | | | | | | | | | | | |
Total | | | | $ | (1,034,086 | ) | | $ | (712,524 | ) | | $ | (680,098 | ) | | $ | (2,426,708 | ) |
| | | | | | | | | | | | | | | | | | |
Event Driven ETF
| | | | | | | | | | | | | | |
| Derivative Contracts | | SAL Location | | | | | | | | | |
| Gross Assets: | | | | Forward Foreign
Currency Exchange
Contracts | | | OTC
Swaps | | | Total | |
Equity contracts | | Receivables | | $ | — | | | $ | 303,970 | | | $ | 303,970 | |
Foreign exchange contracts | | Receivables | | | 12,343 | | | | — | | | | 12,343 | |
| | | | | | | | | | | | | | |
Total | | | | $ | 12,343 | | | $ | 303,970 | | | $ | 316,313 | |
| | | | | | | | | | | | | | |
| | | | |
Gross Liabilities: | | | | | | | | | | | |
Equity contracts | | Payables | | $ | — | | | $ | (8,336 | ) | | $ | (8,336 | ) |
Foreign exchange contracts | | Payables | | | (25,306 | ) | | | — | | | | (25,306 | ) |
| | | | | | | | | | | | | | |
Total | | | | $ | (25,306 | ) | | $ | (8,336 | ) | | $ | (33,642 | ) |
| | | | | | | | | | | | | | |
Long/Short ETF
| | | | | | | | | | | | | | | | | | |
| Derivative Contracts | | SAL Location | | | | | | | | | | | | |
| Gross Assets: | | | | Futures
Contracts (a) | | | Forward Foreign
Currency Exchange
Contracts | | | OTC
Swaps | | | Total | |
Equity contracts | | Receivables, Net assets — Unrealized Appreciation | | $ | 50,791 | | | $ | — | | | $ | 288,433 | | | $ | 339,224 | |
Foreign exchange contracts | | Receivables | | | — | | | | 1,847 | | | | — | | | | 1,847 | |
| | | | | | | | | | | | | | | | | | |
Total | | | | $ | 50,791 | | | $ | 1,847 | | | $ | 288,433 | | | $ | 341,071 | |
| | | | | | | | | | | | | | | | | | |
| | | | | |
Gross Liabilities: | | | | | | | | | | | | | | |
Equity contracts | | Payables, Net assets — Unrealized Depreciation | | $ | (2,573 | ) | | $ | — | | | $ | (831,122 | ) | | $ | (833,695 | ) |
Foreign exchange contracts | | Payables | | | — | | | | (5,401 | ) | | | — | | | | (5,401 | ) |
| | | | | | | | | | | | | | | | | | |
Total | | | | $ | (2,573 | ) | | $ | (5,401 | ) | | $ | (831,122 | ) | | $ | (839,096 | ) |
| | | | | | | | | | | | | | | | | | |
| | | | | | |
| | | |
| 136 | | | | J.P. MORGAN EXCHANGE-TRADED FUNDS | | OCTOBER 31, 2019 |
Managed Futures Strategy ETF
| | | | | | | | | | | | | | |
| Derivative Contracts | | CSAL Location | | | | | | | | | |
| Gross Assets: | | | | Futures
Contracts (a) | | | Forward Foreign
Currency Exchange
Contracts | | | Total | |
Commodity contracts | | Receivables, Net assets — Unrealized Appreciation | | $ | 756,630 | | | $ | — | | | $ | 756,630 | |
Equity contracts | | Receivables, Net assets — Unrealized Appreciation | | | 106,946 | | | | — | | | | 106,946 | |
Foreign exchange contracts | | Receivables | | | — | | | | 166,036 | | | | 166,036 | |
Interest rate contracts | | Receivables, Net assets — Unrealized Appreciation | | | 127,989 | | | | — | | | | 127,989 | |
| | | | | | | | | | | | | | |
Total | | | | $ | 991,565 | | | $ | 166,036 | | | $ | 1,157,601 | |
| | | | | | | | | | | | | | |
| | | | |
Gross Liabilities: | | | | | | | | | | | |
Commodity contracts | | Payables, Net assets — Unrealized Depreciation | | $ | (452,186 | ) | | $ | — | | | $ | (452,186 | ) |
Equity contracts | | Payables, Net assets — Unrealized Depreciation | | | (3,940 | ) | | | — | | | | (3,940 | ) |
Foreign exchange contracts | | Payables | | | — | | | | (463,037 | ) | | | (463,037 | ) |
Interest rate contracts | | Payables, Net assets — Unrealized Depreciation | | | (706,890 | ) | | | — | | | | (706,890 | ) |
| | | | | | | | | | | | | | |
Total | | | | $ | (1,163,016 | ) | | $ | (463,037 | ) | | $ | (1,626,053 | ) |
| | | | | | | | | | | | | | |
| (a) | This amount represents the cumulative appreciation/depreciation of futures contracts as reported on the CSOI/SOI. The CSAL/SAL only reflects the current day variation margin receivable/payable from/to brokers. |
The following tables present each Fund’s gross derivative assets and liabilities by counterparty net of amounts available for offset under netting arrangements and any related collateral received or posted by the Funds as of October 31, 2019.
Diversified Alternatives ETF
| | | | | | | | | | | | | | | | |
| Counterparty | | Gross Amount of
Derivative Assets
Subject to Netting
Arrangements
Presented on the
CSAL (a) | | | Derivatives
Available
for Offset | | | Collateral
Received | | | Net Amount Due
from Counterparty
(not less than zero) | |
Bank of America | | $ | 45,557 | | | $ | (45,557 | ) | | $ | — | | | $ | — | |
Barclays Bank plc | | | 16,063 | | | | (3,833 | ) | | | — | | | | 12,230 | |
BNP Paribas | | | 9,493 | | | | (9,493 | ) | | | — | | | | — | |
Citibank, NA | | | 110,627 | | | | (110,627 | ) | | | — | | | | — | |
Goldman Sachs International | | | 14,314 | | | | (14,314 | ) | | | — | | | | — | |
HSBC Bank, NA | | | 19,989 | | | | (997 | ) | | | — | | | | 18,992 | |
Merrill Lynch International | | | 83,796 | | | | (83,796 | ) | | | — | | | | — | |
Standard Chartered Bank | | | 9,509 | | | | — | | | | — | | | | 9,509 | |
State Street Corp. | | | 3,962 | | | | (176 | ) | | | — | | | | 3,786 | |
UBS | | | 492,369 | | | | (277,643 | ) | | | (214,726 | )(b) | | | — | |
| | | | | | | | | | | | | | | | |
Total | | $ | 805,679 | | | $ | (546,436 | ) | | $ | (214,726 | ) | | $ | 44,517 | |
| | | | | | | | | | | | | | | | |
| | | | |
| Counterparty | | Gross Amount of
Derivative Liabilities
Subject to Netting
Arrangements
Presented on the
CSAL (a) | | | Derivatives
Available
for Offset | | | Collateral
Posted | | | Net Amount Due
to Counterparty
(not less than zero) | |
Bank of America | | $ | 402,455 | | | $ | (45,557 | ) | | $ | — | | | $ | 356,898 | |
Barclays Bank plc | | | 3,833 | | | | (3,833 | ) | | | — | | | | — | |
BNP Paribas | | | 18,474 | | | | (9,493 | ) | | | — | | | | 8,981 | |
Citibank, NA | | | 515,859 | | | | (110,627 | ) | | | — | | | | 405,232 | |
Goldman Sachs International | | | 29,896 | | | | (14,314 | ) | | | — | | | | 15,582 | |
HSBC Bank, NA | | | 997 | | | | (997 | ) | | | — | | | | — | |
Merrill Lynch International | | | 142,022 | | | | (83,796 | ) | | | (58,226 | )(b) | | | — | |
State Street Corp. | | | 176 | | | | (176 | ) | | | — | | | | — | |
TD Bank Financial Group | | | 1,267 | | | | — | | | | — | | | | 1,267 | |
UBS | | | 277,643 | | | | (277,643 | ) | | | — | | | | — | |
| | | | | | | | | | | | | | | | |
Total | | $ | 1,392,622 | | | $ | (546,436 | ) | | $ | (58,226 | ) | | $ | 787,960 | |
| | | | | | | | | | | | | | | | |
| | | | | | | | |
| | | |
| OCTOBER 31, 2019 | | J.P. MORGAN EXCHANGE-TRADED FUNDS | | | | | 137 | |
NOTES TO FINANCIAL STATEMENTS
AS OF OCTOBER 31, 2019 (continued)
Event Driven ETF
| | | | | | | | | | | | | | | | |
| Counterparty | | Gross Amount of
Derivative Assets
Subject to Netting
Arrangements
Presented on the
SAL(a) | | | Derivatives
Available
for Offset | | | Collateral
Received | | | Net Amount Due
from Counterparty
(not less than zero) | |
Australia & New Zealand Banking Group Ltd. | | $ | 1,702 | | | $ | — | | | $ | — | | | $ | 1,702 | |
Bank of America | | | 39,548 | | | | (2,986 | ) | | | — | | | | 36,562 | |
Citibank, NA | | | 818 | | | | — | | | | — | | | | 818 | |
Goldman Sachs International | | | 264,422 | | | | (10,009 | ) | | | (254,413 | )(b) | | | — | |
Merrill Lynch International | | | 2,877 | | | | (2,877 | ) | | | — | | | | — | |
Standard Chartered Bank | | | 6,946 | | | | — | | | | — | | | | 6,946 | |
| | | | | | | | | | | | | | | | |
Total | | $ | 316,313 | | | $ | (15,872 | ) | | $ | (254,413 | ) | | $ | 46,028 | |
| | | | | | | | | | | | | | | | |
| | | | |
| Counterparty | | Gross Amount of
Derivative Liabilities
Subject to Netting
Arrangements
Presented on the
SAL(a) | | | Derivatives
Available
for Offset | | | Collateral
Posted | | | Net Amount Due
to Counterparty
(not less than zero) | |
Bank of America | | $ | 2,986 | | | $ | (2,986 | ) | | $ | — | | | $ | — | |
BNP Paribas | | | 10,962 | | | | — | | | | — | | | | 10,962 | |
Goldman Sachs International | | | 10,009 | | | | (10,009 | ) | | | — | | | | — | |
Merrill Lynch International | | | 9,685 | | | | (2,877 | ) | | | — | | | | 6,808 | |
| | | | | | | | | | | | | | | | |
Total | | $ | 33,642 | | | $ | (15,872 | ) | | $ | — | | | $ | 17,770 | |
| | | | | | | | | | | | | | | | |
Long/Short ETF
| | | | | | | | | | | | | | | | |
| Counterparty | | Gross Amount of
Derivative Assets
Subject to Netting
Arrangements
Presented on the
SAL(a) | | | Derivatives
Available
for Offset | | | Collateral
Received | | | Net Amount Due
from Counterparty
(not less than zero) | |
Bank of America | | $ | 155,694 | | | $ | (155,694 | ) | | $ | — | | | $ | — | |
BNP Paribas | | | 839 | | | | — | | | | — | | | | 839 | |
Goldman Sachs | | | 132,739 | | | | (132,739 | ) | | | — | | | | — | |
Standard Chartered Bank | | | 406 | | | | — | | | | — | | | | 406 | |
Merrill Lynch International | | | 602 | | | | (31 | ) | | | — | | | | 571 | |
| | | | | | | | | | | | | | | | |
Total | | $ | 290,280 | | | $ | (288,464 | ) | | $ | — | | | $ | 1,816 | |
| | | | | | | | | | | | | | | | |
| | | | |
| Counterparty | | Gross Amount of
Derivative Liabilities
Subject to Netting
Arrangements
Presented on the
SAL(a) | | | Derivatives
Available
for Offset | | | Collateral
Posted | | | Net Amount Due
to Counterparty
(not less than zero) | |
Bank of America | | $ | 566,458 | | | $ | (155,694 | ) | | $ | — | | | $ | 410,764 | |
Citibank, NA | | | 5,370 | | | | — | | | | — | | | | 5,370 | |
Goldman Sachs | | | 264,664 | | | | (132,739 | ) | | | — | | | | 131,925 | |
Merrill Lynch International | | | 31 | | | | (31 | ) | | | — | | | | — | |
| | | | | | | | | | | | | | | | |
Total | | $ | 836,523 | | | $ | (288,464 | ) | | $ | — | | | $ | 548,059 | |
| | | | | | | | | | | | | | | | |
| | | | | | |
| | | |
| 138 | | | | J.P. MORGAN EXCHANGE-TRADED FUNDS | | OCTOBER 31, 2019 |
Managed Futures Strategy ETF
| | | | | | | | | | | | | | | | |
| Counterparty | | Gross Amount of
Derivative Assets
Subject to Netting
Arrangements
Presented on the
CSAL(a) | | | Derivatives
Available
for Offset | | | Collateral
Received | | | Net Amount Due
from Counterparty
(not less than zero) | |
Barclays Bank plc | | $ | 5,427 | | | $ | (3,983 | ) | | $ | — | | | $ | 1,444 | |
BNP Paribas | | | 4,585 | | | | (4,585 | ) | | | — | | | | — | |
Citibank, NA | | | 67,458 | | | | (67,458 | ) | | | — | | | | — | |
Goldman Sachs International | | | 4,544 | | | | (4,544 | ) | | | — | | | | — | |
HSBC Bank, NA | | | 5,139 | | | | — | | | | — | | | | 5,139 | |
Merrill Lynch International | | | 69,707 | | | | (52,334 | ) | | | — | | | | 17,373 | |
State Street Corp. | | | 9,176 | | | | — | | | | — | | | | 9,176 | |
| | | | | | | | | | | | | | | | |
Total | | $ | 166,036 | | | $ | (132,904 | ) | | $ | — | | | $ | 33,132 | |
| | | | | | | | | | | | | | | | |
| | | | |
| Counterparty | | Gross Amount of
Derivative Liabilities
Subject to Netting
Arrangements
Presented on the
CSAL(a) | | | Derivatives
Available
for Offset | | | Collateral
Posted | | | Net Amount Due to Counterparty
(not less than zero) | |
Barclays Bank plc | | $ | 3,983 | | | $ | (3,983 | ) | | $ | — | | | $ | — | |
BNP Paribas | | | 11,504 | | | | (4,585 | ) | | | — | | | | 6,919 | |
Citibank, NA | | | 387,189 | | | | (67,458 | ) | | | — | | | | 319,731 | |
Goldman Sachs International | | | 7,320 | | | | (4,544 | ) | | | — | | | | 2,776 | |
Merrill Lynch International | | | 52,334 | | | | (52,334 | ) | | | — | | | | — | |
Standard Chartered Bank | | | 707 | | | | — | | | | — | | | | 707 | |
| | | | | | | | | | | | | | | | |
Total | | $ | 463,037 | | | $ | (132,904 | ) | | $ | — | | | $ | 330,133 | |
| | | | | | | | | | | | | | | | |
| (a) | For financial reporting purposes, the Fund does not offset derivative assets and derivative liabilities subject to master netting arrangements on the CSAL/SAL. |
| (b) | Collateral received or posted is limited to the net derivative asset or net derivative liability amounts. |
The following tables present the effect of derivatives on the CSOP/SOP for the year ended October 31, 2019, by primary underlying risk exposure:
Diversified Alternatives ETF
| | | | | | | | | | | | | | | | |
| Amount of Realized Gain (Loss) on Derivatives Recognized on the CSOP | |
| Derivative Contracts | | Futures
Contracts | | | Forward Foreign
Currency Exchange
Contracts | | | Swaps | | | Total | |
Commodity contracts | | $ | (3,495,587 | ) | | $ | — | | | $ | — | | | $ | (3,495,587 | ) |
Equity contracts | | | (2,143,728 | ) | | | — | | | | 33,487 | | | | (2,110,241 | ) |
Foreign exchange contracts | | | — | | | | 1,249,950 | | | | — | | | | 1,249,950 | |
Interest rate contracts | | | 5,413,883 | | | | — | | | | — | | | | 5,413,883 | |
| | | | | | | | | | | | | | | | |
Total | | $ | (225,432 | ) | | $ | 1,249,950 | | | $ | 33,487 | | | $ | 1,058,005 | |
| | | | | | | | | | | | | | | | |
|
| Amount of Change in Unrealized Appreciation (Depreciation) on Derivatives Recognized on the CSOP | |
| Derivative Contracts | | Futures
Contracts | | | Forward Foreign
Currency Exchange
Contracts | | | Swaps | | | Total | |
Commodity contracts | | $ | 1,829,114 | | | $ | — | | | $ | — | | | $ | 1,829,114 | |
Equity contracts | | | (1,446,438 | ) | | | — | | | | (994,350 | ) | | | (2,440,788 | ) |
Foreign exchange contracts | | | — | | | | (1,038,120 | ) | | | — | | | | (1,038,120 | ) |
Interest rate contracts | | | 124,010 | | | | — | | | | — | | | | 124,010 | |
| | | | | | | | | | | | | | | | |
Total | | $ | 506,686 | | | $ | (1,038,120 | ) | | $ | (994,350 | ) | | $ | (1,525,784 | ) |
| | | | | | | | | | | | | | | | |
| | | | | | | | | | | | | | | | |
| | | | | | | | |
| | | |
| OCTOBER 31, 2019 | | J.P. MORGAN EXCHANGE-TRADED FUNDS | | | | | 139 | |
NOTES TO FINANCIAL STATEMENTS
AS OF OCTOBER 31, 2019 (continued)
Event Driven ETF
| | | | | | | | | | | | | | | | | | | | |
| Amount of Realized Gain (Loss) on Derivatives Recognized on the SOP | |
| Derivative Contracts | | | | | Futures
Contracts | | | Forward Foreign
Currency Exchange
Contracts | | | Swaps | | | Total | |
Equity contracts | | | | | | $ | 26,981 | | | $ | — | | | $ | (412,164 | ) | | $ | (385,183 | ) |
Foreign exchange contracts | | | | | | | — | | | | 107,494 | | | | — | | | | 107,494 | |
| | | | | | | | | | | | | | | | | | | | |
Total | | | | | | $ | 26,981 | | | $ | 107,494 | | | $ | (412,164 | ) | | $ | (277,689 | ) |
| | | | | | | | | | | | | | | | | | | | |
|
| Amount of Change in Unrealized Appreciation (Depreciation) on Derivatives Recognized on the SOP | |
| Derivative Contracts | | | | | Futures
Contracts | | | Forward Foreign
Currency Exchange
Contracts | | | Swaps | | | Total | |
Equity contracts | | | | | | $ | (18,000 | ) | | $ | — | | | $ | 539,918 | | | $ | 521,918 | |
Foreign exchange contracts | | | | | | | — | | | | (29,405 | ) | | | — | | | | (29,405 | ) |
| | | | | | | | | | | | | | | | | | | | |
Total | | | | | | $ | (18,000 | ) | | $ | (29,405 | ) | | $ | 539,918 | | | $ | 492,513 | |
| | | | | | | | | | | | | | | | | | | | |
Long/Short ETF
| | | | | | | | | | | | | | | | | | | | |
| Amount of Realized Gain (Loss) on Derivatives Recognized on the SOP | |
| Derivative Contracts | | | | | Futures
Contracts | | | Forward Foreign
Currency Exchange
Contracts | | | Swaps | | | Total | |
Equity contracts | | | | | | $ | (188,908 | ) | | $ | — | | | $ | 23,576 | | | $ | (165,332 | ) |
Foreign exchange contracts | | | | | | | — | | | | 2,739 | | | | — | | | | 2,739 | |
| | | | | | | | | | | | | | | | | | | | |
Total | | | | | | $ | (188,908 | ) | | $ | 2,739 | | | $ | 23,576 | | | $ | (162,593 | ) |
| | | | | | | | | | | | | | | | | | | | |
|
| Amount of Change in Unrealized Appreciation (Depreciation) on Derivatives Recognized on the SOP | |
| Derivative Contracts | | | | | Futures
Contracts | | | Forward Foreign
Currency Exchange
Contracts | | | Swaps | | | Total | |
Equity contracts | | | | | | $ | 51,759 | | | $ | — | | | $ | (1,577,840 | ) | | $ | (1,526,081 | ) |
Foreign exchange contracts | | | | | | | — | | | | (7,808 | ) | | | — | | | | (7,808 | ) |
| | | | | | | | | | | | | | | | | | | | |
Total | | | | | | $ | 51,759 | | | $ | (7,808 | ) | | $ | (1,577,840 | ) | | $ | (1,533,889 | ) |
| | | | | | | | | | | | | | | | | | | | |
Managed Futures Strategy ETF
| | | | | | | | | | | | | | | | |
| Amount of Realized Gain (Loss) on Derivatives Recognized on the CSOP | |
| Derivative Contracts | | | | | Futures
Contracts | | | Forward Foreign
Currency Exchange
Contracts | | | Total | |
Commodity contracts | | | | | | $ | (1,879,846 | ) | | $ | — | | | $ | (1,879,846 | ) |
Equity contracts | | | | | | | (516,238 | ) | | | — | | | | (516,238 | ) |
Foreign exchange contracts | | | | | | | — | | | | 232,976 | | | | 232,976 | |
Interest rate contracts | | | | | | | 4,251,029 | | | | — | | | | 4,251,029 | |
| | | | | | | | | | | | | | | | |
Total | | | | | | $ | 1,854,945 | | | $ | 232,976 | | | $ | 2,087,921 | |
| | | | | | | | | | | | | | | | |
|
| Amount of Change in Unrealized Appreciation (Depreciation) on Derivatives Recognized on the CSOP | |
| Derivative Contracts | | | | | Futures
Contracts | | | Forward Foreign
Currency Exchange
Contracts | | | Total | |
Commodity contracts | | | | | | $ | 1,065,925 | | | $ | — | | | $ | 1,065,925 | |
Equity contracts | | | | | | | 140,845 | | | | — | | | | 140,845 | |
Foreign exchange contracts | | | | | | | — | | | | (397,070 | ) | | | (397,070 | ) |
Interest rate contracts | | | | | | | (323,259 | ) | | | — | | | | (323,259 | ) |
| | | | | | | | | | | | | | | | |
Total | | | | | | $ | 883,511 | | | $ | (397,070 | ) | | $ | 486,441 | |
| | | | | | | | | | | | | | | | |
| | | | | | |
| | | |
| 140 | | | | J.P. MORGAN EXCHANGE-TRADED FUNDS | | OCTOBER 31, 2019 |
Derivatives Volume
The table below discloses the volume of the Funds’ futures contracts, forward foreign currency exchange contracts and basket swaps activities for the year ended October 31, 2019. Please refer to the tables in the Summary of Derivatives Information for derivative-related gains and losses associated with volume activity.
| | | | | | | | | | | | | | | | |
| | | Diversified
Alternatives
ETF | | | Event
Driven ETF | | | Long/Short
ETF | | | Managed
Futures
Strategy ETF | |
Futures Contracts — Equity: | | | | | | | | | | | | | | | | |
Average Notional Balance Long | | $ | 3,526,077 | | | $ | — | | | $ | 1,798,748 | | | $ | 3,927,925 | |
Average Notional Balance Short | | | 28,442,159 | | | | 310,392 | (a) | | | 1,672,576 | | | | 4,255,794 | |
Ending Notional Balance Long | | | 5,299,100 | | | | — | | | | 3,328,126 | | | | 7,476,567 | |
Ending Notional Balance Short | | | 17,961,584 | | | | — | | | | 343,357 | | | | 1,201,749 | |
| | | | |
Futures Contracts — Interest Rate: | | | | | | | | | | | | | | | | |
Average Notional Balance Long | | | 129,556,540 | | | | — | | | | — | | | | 114,349,671 | |
Average Notional Balance Short | | | 48,962,758 | | | | — | | | | — | | | | 33,500,193 | |
Ending Notional Balance Long | | | 71,939,362 | | | | — | | | | — | | | | 98,916,874 | |
Ending Notional Balance Short | | | 7,701,520 | | | | — | | | | — | | | | 7,509,811 | |
| | | | |
Futures Contracts — Commodities: | | | | | | | | | | | | | | | | |
Average Notional Balance Long | | | 19,619,506 | | | | — | | | | — | | | | 13,603,053 | |
Average Notional Balance Short | | | 24,143,655 | | | | — | | | | — | | | | 17,886,282 | |
Ending Notional Balance Long | | | 14,994,640 | | | | — | | | | — | | | | 16,936,323 | |
Ending Notional Balance Short | | | 17,323,661 | | | | — | | | | — | | | | 20,491,012 | |
| | | | |
Forward Foreign Currency Exchange Contracts: | | | | | | | | | | | | | | | | |
Average Settlement Value Purchased | | | 36,867,685 | | | | 250,660 | | | | 211,721 | | | | 13,504,491 | |
Average Settlement Value Sold | | | 56,336,228 | | | | 2,351,036 | | | | 528,520 | | | | 19,939,639 | |
Ending Settlement Value Purchased | | | 22,411,450 | | | | 225,882 | | | | 217,602 | | | | 14,765,029 | |
Ending Settlement Value Sold | | | 32,054,353 | | | | 2,814,142 | | | | 508,849 | | | | 16,990,206 | |
| | | | |
Total Return Basket Swaps: | | | | | | | | | | | | | | | | |
Average Notional Balance Long | | | 110,204,973 | | | | 9,900,718 | | | | 16,120,529 | | | | — | |
Average Notional Balance Short | | | 77,118,451 | | | | 2,683,229 | | | | 24,062,987 | | | | — | |
Ending Notional Balance Long | | | 73,759,550 | | | | 7,970,697 | | | | 19,176,685 | | | | — | |
Ending Notional Balance Short | | | 47,791,276 | | | | 1,784,923 | | | | 27,420,132 | | | | — | |
| (a) | For the period November 1, 2018 through November 30, 2018. |
The Funds’ derivatives contracts held at October 31, 2019 are not accounted for as hedging instruments under GAAP.
D. Securities Lending — The Event Driven ETF and Long/Short ETF are authorized to engage in securities lending in order to generate additional income. Event Driven ETF and Long/Short ETF are able to lend to approved borrowers. Citibank N.A. (“Citibank”) serves as lending agent for both of these funds, pursuant to a Securities Lending Agency Agreement (the “Securities Lending Agency Agreement”). Securities loaned are collateralized by cash equal to at least 100% of the market value plus accrued interest on the securities lent, which is invested in the IM Shares of JPMorgan U.S. Government Money Market Fund. The Funds retain loan fees and the interest on cash collateral investments but are required to pay the borrower a rebate for the use of cash collateral. In cases where the lent security is of high value to borrowers, there may be a negative rebate (i.e., a net payment from the borrower to the Funds). Upon termination of a loan, the Funds are required to return to the borrower an amount equal to the cash collateral, plus any rebate owed to the borrowers. The remaining maturities of the securities lending transactions are considered overnight and continuous. Loans are subject to termination by the Funds or the borrower at any time.
The net income earned on the securities lending (after payment of rebates and Citibank’s fee) is included on the SOP as Income from securities lending (net). The Funds also receive payments from the borrower during the period of the loan, equivalent to dividends and interest earned on the securities loaned, which are recorded as Dividend or Interest income, respectively, on the SOP.
Under the Securities Lending Agency Agreement, Citibank marks to market the loaned securities on a daily basis. In the event the cash received from the borrower is less than 102% of the value of the loaned securities (105% for loans ofnon-US securities), Citibank requests additional cash from the borrower so as to maintain a collateralization level of at least 102% of the value of the loaned securities plus accrued interest (105% for loans ofnon-US securities), subject to certainde minimis amounts.
The value of securities out on loan is recorded as an asset on the SAL. The value of the cash collateral received is recorded as a liability on the SAL and details of collateral investments are disclosed in the SOIs.
| | | | | | | | |
| | | |
| OCTOBER 31, 2019 | | J.P. MORGAN EXCHANGE-TRADED FUNDS | | | | | 141 | |
NOTES TO FINANCIAL STATEMENTS
AS OF OCTOBER 31, 2019 (continued)
The Funds bear the risk of loss associated with the collateral investments and are not entitled to additional collateral from the borrower to cover any such losses. To the extent that the value of the collateral investments declines below the amount owed to a borrower, the Funds may incur losses that exceed the amount it earned on lending the security. Upon termination of a loan, the Funds may use leverage (borrow money) to repay the borrower for cash collateral posted if the Adviser does not believe that it is prudent to sell the collateral investments to fund the payment of this liability.
The following table presents for each lending fund, the value of the securities on loan with Citibank, net of amounts available for offset under the master netting arrangements and any related collateral received or posted by the Funds as of October 31, 2019.
| | | | | | | | | | | | |
| | | Investment Securities
On Loan, at Value,
Presented on the
Statements of Assets
and Liabilities | | | Cash Collateral
Posted by Borrower* | | | Net Amount Due
to Counterparty
(not less than zero) | |
Event Driven ETF | | $ | 342,245 | | | $ | (342,245 | ) | | $ | — | |
Long/Short ETF | | | 142,631 | | | | (142,631 | ) | | | — | |
| * | Collateral posted reflects the value of securities on loan and does not include any additional amounts received from the borrower. |
Securities lending also involves counterparty risks, including the risk that the loaned securities may not be returned in a timely manner or at all. Subject to certain conditions, Citibank has agreed to indemnify the Funds from losses resulting from a borrower’s failure to return a loaned security.
JPMIM voluntarily waived investment advisory fees charged to the Funds to reduce the impact of the cash collateral investment in the JPMorgan U.S. Government Money Market Fund from 0.16% to 0.06%. JPMIM waived fees associated with the Funds’ investment in JPMorgan U.S. Government Money Market Fund as follows:
| | | | |
Event Driven ETF | | $ | 140 | |
Long/Short ETF | | | 41 | |
The above waiver is included in the determination of earnings on cash collateral investment and in the calculation of Citibank’s compensation and is included on the SOP as Income from securities lending (net).
E. Investment Transactions with Affiliates — The Funds invested in Underlying Funds which are advised by the Adviser. An issuer which is under common control with a Fund may be considered an affiliate. For the purposes of the financial statements, the Funds assume the issuers listed in the table below to be affiliated issuers. Underlying Funds’ distributions may be reinvested into the Underlying Funds. Reinvestment amounts are included in the purchase cost amounts in the tables below.
Diversified Alternatives ETF
| | | | | | | | | | | | | | | | | | | | | | | | | | | | | | | | | | | | |
| For the year ended October 31, 2019 | |
| Security Description | | Value at
October 31,
2018 | | | Purchases
at Cost | | | Proceeds
from Sales | | | Net Realized
Gain (Loss) | | | Change in
Unrealized
Appreciation/
(Depreciation) | | | Value at
October 31,
2019 | | | Shares at
October 31,
2019 | | | Dividend
Income | | | Capital Gain
Distributions | |
JPMorgan Prime Money Market Fund Class Institutional Shares, 1.88% (a) (b) | | $ | — | | | $ | 90,555,248 | | | $ | 71,650,000 | | | $ | 1,894 | | | $ | 3,843 | | | $ | 18,910,985 | | | | 18,903,424 | | | $ | 357,973 | | | $ | — | |
JPMorgan U.S. Government Money Market Fund Class Institutional Shares, 1.64% (a) (b) | | | 70,832,553 | | | | 71,631,356 | | | | 130,053,425 | | | | — | | | | — | | | | 12,410,484 | | | | 12,410,484 | | | | 919,191 | | | | — | |
| | | | | | | | | | | | | | | | | | | | | | | | | | | | | | | | | | | | |
Total | | $ | 70,832,553 | | | $ | 162,186,604 | | | $ | 201,703,425 | | | $ | 1,894 | | | $ | 3,843 | | | $ | 31,321,469 | | | | | | | $ | 1,277,164 | | | $ | — | |
| | | | | | | | | | | | | | | | | | | | | | | | | | | | | | | | | | | | |
| | | | | | |
| | | |
| 142 | | | | J.P. MORGAN EXCHANGE-TRADED FUNDS | | OCTOBER 31, 2019 |
Event Driven ETF
| | | | | | | | | | | | | | | | | | | | | | | | | | | | | | | | | | | | |
| For the year ended October 31, 2019 | |
| Security Description | | Value at
October 31,
2018 | | | Purchases
at Cost | | | Proceeds
from Sales | | | Net Realized
Gain (Loss) | | | Change in
Unrealized
Appreciation/
(Depreciation) | | | Value at
October 31,
2019 | | | Shares at
October 31,
2019 | | | Dividend
Income | | | Capital Gain
Distributions | |
JPMorgan Prime Money Market Fund Class IM Shares, 1.94% (a) (b) | | $ | — | | | $ | 16,844,063 | | | $ | 13,417,585 | | | $ | 71 | | | $ | 343 | | | $ | 3,426,892 | | | | 3,425,222 | | | $ | 39,688 | | | $ | — | |
JPMorgan U.S. Government Money Market Fund Class IM Shares, 1.70% (a) (b) | | | — | | | | 4,423,655 | | | | 4,065,705 | | | | — | | | | — | | | | 357,950 | | | | 357,950 | | | | 4,258 | * | | | — | |
JPMorgan U.S. Government Money Market Fund Class Institutional Shares (a) | | | 5,600,338 | | | | 9,826,229 | | | | 15,426,567 | | | | — | | | | — | | | | — | | | | — | | | | 36,038 | | | | — | |
| | | | | | | | | | | | | | | | | | | | | | | | | | | | | | | | | | | | |
Total | | $ | 5,600,338 | | | $ | 31,093,947 | | | $ | 32,909,857 | | | $ | 71 | | | $ | 343 | | | $ | 3,784,842 | | | | | | | $ | 79,984 | | | $ | — | |
| | | | | | | | | | | | | | | | | | | | | | | | | | | | | | | | | | | | |
Long/Short ETF
| | | | | | | | | | | | | | | | | | | | | | | | | | | | | | | | | | | | |
| For the year ended October 31, 2019 | |
| Security Description | | Value at
October 31,
2018 | | | Purchases
at Cost | | | Proceeds
from Sales | | | Net Realized
Gain (Loss) | | | Change in
Unrealized
Appreciation/
(Depreciation) | | | Value at
October 31,
2019 | | | Shares at
October 31,
2019 | | | Dividend
Income | | | Capital Gain
Distributions | |
JPMorgan Prime Money Market Fund Class IM Shares, 1.94% (a) (b) | | $ | — | | | $ | 18,796,624 | | | $ | 10,663,770 | | | $ | (96 | ) | | $ | 812 | | | $ | 8,133,570 | | | | 8,130,318 | | | $ | 76,097 | | | $ | — | |
JPMorgan U.S. Government Money Market Fund Class IM Shares, 1.70% (a) (b) | | | — | | | | 1,151,168 | | | | 1,007,564 | | | | — | | | | — | | | | 143,604 | | | | 143,604 | | | | 1,239 | * | | | — | |
JPMorgan U.S. Government Money Market Fund Class Institutional Shares (a) | | | 5,057,344 | | | | 13,790,376 | | | | 18,847,720 | | | | — | | | | — | | | | — | | | | — | | | | 59,974 | | | | — | |
| | | | | | | | | | | | | | | | | | | | | | | | | | | | | | | | | | | | |
Total | | $ | 5,057,344 | | | $ | 33,738,168 | | | $ | 30,519,054 | | | $ | (96 | ) | | $ | 812 | | | $ | 8,277,174 | | | | | | | $ | 137,310 | | | $ | — | |
| | | | | | | | | | | | | | | | | | | | | | | | | | | | | | | | | | | | |
Managed Futures Strategy ETF
| | | | | | | | | | | | | | | | | | | | | | | | | | | | | | | | | | | | |
| For the year ended October 31, 2019 | |
| Security Description | | Value at
October 31,
2018 | | | Purchases
at Cost | | | Proceeds
from Sales | | | Net Realized
Gain (Loss) | | | Change in
Unrealized
Appreciation/
(Depreciation) | | | Value at
October 31,
2019 | | | Shares at
October 31,
2019 | | | Dividend
Income | | | Capital Gain
Distributions | |
JPMorgan Prime Money Market Fund Class IM Shares, 1.94% (a) (b) | | $ | — | | | $ | 55,350,558 | | | $ | 10,526,933 | | | $ | 277 | | | $ | 4,477 | | | $ | 44,828,379 | | | | 44,810,456 | | | $ | 547,719 | | | $ | — | |
JPMorgan U.S. Government Money Market Fund Class IM Shares, 1.70% (a) (b) | | | — | | | | 4,469,745 | | | | 3,482,166 | | | | — | | | | — | | | | 987,579 | | | | 987,579 | | | | 12,641 | | | | — | |
JPMorgan U.S. Government Money Market Fund Class Institutional Shares (a) | | | 42,503,224 | | | | 5,827,447 | | | | 48,330,671 | | | | — | | | | — | | | | — | | | | — | | | | 428,346 | | | | — | |
| | | | | | | | | | | | | | | | | | | | | | | | | | | | | | | | | | | | |
Total | | $ | 42,503,224 | | | $ | 65,647,750 | | | $ | 62,339,770 | | | $ | 277 | | | $ | 4,477 | | | $ | 45,815,958 | | | | | | | $ | 988,706 | | | $ | — | |
| | | | | | | | | | | | | | | | | | | | | | | | | | | | | | | | | | | | |
| (a) | Investment in an affiliated fund, which is registered under the Investment Company Act of 1940, as amended, and is advised by J.P. Morgan Investment Management Inc. |
| (b) | The rate shown is the current yield as of October 31, 2019. |
| * | Amount is included on the SOP as Income from securities lending (net) (after payments of rebates and Citibank’s fee). |
F. Foreign Currency Translation — The books and records of the Funds are maintained in US dollars. Foreign currency amounts are translated into US dollars at the prevailing exchange rates of such currencies against the US dollar. The market value of investment securities and other assets and liabilities are translated at the exchange rate as of the valuation date. Purchases and sales of investment securities, income and expenses are translated at the exchange rate prevailing on the respective dates of such transactions.
The Funds do not isolate the effect of changes in foreign exchange rates from changes in market prices of securities held. Accordingly, such changes are included within Change in net unrealized appreciation/depreciation on investments on the CSOP/SOP.
Reported realized foreign currency gains and losses arise from the disposition of foreign currency, currency gains or losses realized between the trade and settlement dates on securities transactions, and the difference between the amounts of dividends, interest and foreign withholding taxes recorded on each Fund’s books on the transaction date and the US dollar equivalent of the amounts actually received or paid. These reported
| | | | | | | | |
| | | |
| OCTOBER 31, 2019 | | J.P. MORGAN EXCHANGE-TRADED FUNDS | | | | | 143 | |
NOTES TO FINANCIAL STATEMENTS
AS OF OCTOBER 31, 2019 (continued)
realized foreign currency gains and losses are included in Net realized gain (loss) on foreign currency transactions on the CSOP/SOP. Unrealized foreign currency gains and losses arise from changes (due to changes in exchange rates) in the value of foreign currency and other assets and liabilities denominated in foreign currencies, which are held at year end and are included in Change in net unrealized appreciation/ depreciation on foreign currency translations on the CSOP/SOP.
G. Offering and Organizational Costs — Total offering costs incurred in connection with the offering of shares of the Funds are amortized on a straight line basis over 12 months from the date the Funds commenced operations.
Costs paid in connection with the organization of the Funds, if any, were recorded as an expense at the time the Funds commenced operations and are included as offering costs on the CSOP/SOP. For the year ended October 31, 2019, total offering costs amortized were as follows:
| | | | |
Event Driven ETF | | $ | 1,133 | |
Long/Short ETF | | | 8,227 | |
Managed Futures Strategy ETF | | | 3,567 | |
H. Security Transactions and Investment Income — Investment transactions are accounted for on the trade date (the date the order to buy or sell is executed). Securities gains and losses are calculated on a specifically identified cost basis. Interest income is determined on the basis of coupon interest accrued using the effective interest method, which adjusts for amortization of premiums and accretion of discounts. Dividend income net of foreign taxes withheld, if any, distributions of net investment income and realized capital gains from the Underlying Funds and ETFs, if any, and dividend expense on securities sold short, are recorded on theex-dividend date or when a Fund first learns of the dividend.
To the extent such information is publicly available, the Funds record distributions received in excess of income earned from underlying investments as a reduction of cost of investments and/or realized gain. Such amounts are based on estimates if actual amounts are not available and actual amounts of income, realized gain and return of capital may differ from the estimated amounts. The Funds adjust the estimated amounts of the components of distributions (and consequently their net investment income) as necessary once the issuers provide information about the actual composition of the distributions.
I. Allocation of Expenses — Expenses directly attributable to a Fund are charged directly to that Fund, while the expenses attributable to more than one fund of the Trust are allocated among the applicable funds.
J. Federal Income Taxes — Each Fund is treated as a separate taxable entity for Federal income tax purposes. Each Fund’s policy is to comply with the provisions of the Internal Revenue Code (the “Code”), applicable to regulated investment companies and to distribute to shareholders all of its distributable net investment income and net realized capital gains on investments. Accordingly, no provision for Federal income tax is necessary. Management has reviewed the Funds’ tax positions for all open tax years and has determined that as of October 31, 2019, no liability for Federal income tax is required in the Funds’ financial statements for net unrecognized tax benefits. However, management’s conclusions may be subject to future review based on changes in, or the interpretation of, the accounting standards or tax laws and regulations. Each of the Funds’ Federal tax returns for the prior three fiscal years, or since inception if shorter, remains subject to examination by the Internal Revenue Service.
For Federal income tax purposes, taxable income of each Fund and its Subsidiary are separately calculated. The Subsidiary is classified as a controlled foreign corporation under the Code and its taxable income, including net gains, is included as ordinary income in the calculation of each Fund’s taxable income. Net losses of the Subsidiary are not deductible by each Fund either in the current period or carried forward to future periods.
K. Foreign Taxes — The Funds may be subject to foreign taxes on income, gains on investments or currency purchases/repatriation, a portion of which may be recoverable. The Funds will accrue such taxes and recoveries as applicable, based upon their current interpretation of tax rules and regulations that exist in the markets in which they invest. When a capital gain tax is determined to apply, the Funds record an estimated deferred tax liability in an amount that would be payable if the securities were disposed of on the valuation date.
L. Distributions to Shareholders — Distributions from net investment income, if any, are generally declared and paid annually. Net realized capital gains, if any, are distributed by each Fund at least annually. The amount of distributions from net investment income and net realized capital gains is determined in accordance with Federal income tax regulations, which may differ from GAAP. To the extent these “book/tax” differences are permanent in nature (i.e., that they result from other than timing of recognition — “temporary differences”), such amounts are reclassified within the capital accounts based on their Federaltax-basis treatment.
The following amounts were reclassified within the capital accounts:
| | | | | | | | | | | | |
| | | Paid-in-Capital | | | Accumulated
undistributed
(distributions in
excess of)
net investment
income | | | Accumulated
net realized
gains (losses) | |
Diversified Alternatives ETF | | $ | (1,624,193 | ) | | $ | 4,457,451 | | | $ | (2,833,258 | ) |
Event Driven ETF | | | — | | | | (287,595 | ) | | | 287,595 | |
Long/Short ETF | | | (1,222,453 | ) | | | 1,235,197 | | | | (12,744 | ) |
Managed Futures Strategy ETF | | | (789,741 | ) | | | 2,671,933 | | | | (1,882,192 | ) |
The reclassifications for the Funds related primarily to investments in subsidiary, foreign currency gain/loss, investments in swaps contracts, net operating losses and non-taxable dividends.
| | | | | | |
| | | |
| 144 | | | | J.P. MORGAN EXCHANGE-TRADED FUNDS | | OCTOBER 31, 2019 |
3. Fees and Other Transactions with Affiliates
A. Investment Advisory Fee — Pursuant to Investment Advisory Agreements, the Adviser manages the investments of each Fund and Subsidiary and for such services is paid a fee. The investment advisory fee is accrued daily and paid monthly based on each Fund’s respective average daily net assets. The annual rate for each Fund is as follows:
| | | | |
Diversified Alternatives ETF | | | 0.60 | % |
Event Driven ETF | | | 0.75 | % |
Long/Short ETF | | | 0.60 | % |
Managed Futures Strategy ETF | | | 0.50 | % |
Each Subsidiary has entered into separate contracts with the Adviser and its affiliates to provide investment advisory and other services to the Subsidiary. The fee for services to the Subsidiary is accrued daily and paid monthly at an annual rate of 0.60% for the Diversified Alternatives ETF and 0.50% for the Managed Futures Strategy ETF of the Subsidiary’s average daily net assets. The Adviser has agreed to waive the advisory fee that it receives from the Fund in an amount equal to the advisory fee paid to the Adviser by the Subsidiary. This waiver will continue in effect so long as the Fund invests in the Subsidiary and may not be terminated without approval by the Fund’s Board.
The Adviser waived investment advisory fees and/or reimbursed expenses as outlined in Note 3.D.
B. Administration Fee —Pursuant to an Administration Agreement, the Administrator provides certain administration services to the Funds and the Subsidiaries. In consideration of these services, effective January 1, 2019, the Administrator receives a fee accrued daily and paid monthly at an annual rate of 0.075% of each Fund’s respective average daily net assets. Prior to January 1, 2019, the Administrator received a fee accrued daily and paid monthly at an annual rate of 0.085% each Fund’s respective average daily net assets. In consideration for services rendered to each Subsidiary, the Administrator receives a fee accrued daily and paid monthly at an annualized rate of 0.10% of the average daily net assets of the Subsidiary.
The Administrator waived administration fees as outlined in Note 3.D.
JPMorgan Chase Bank, N.A. (“JPMCB”), a wholly-owned subsidiary of JPMorgan, serves as the Funds’sub-administrator (the“Sub-administrator”). For its services asSub-administrator, JPMCB receives a portion of the fees payable to the Administrator.
C. Custodian, Accounting and Transfer Agent Fees— JPMCB provides portfolio custody, accounting and transfer agency services to the Funds. The amounts paid directly to JPMCB by the Funds for custody services are included in the Custodian, Accounting and Transfer Agent fees on the CSOP/SOP. Interest income earned on cash balances at the custodian, if any, is included in Interest income from affiliates on the CSOP/SOP. With respect to the transfer agency services provided by JPMCB for each creation or redemption transaction, the Authorized Participant will generally be responsible for such associated expenses; during the year ended October 31, 2019, the Funds paid no transfer agency fees to JPMCB.
Additionally, Authorized Participants generally pay transaction fees associated with the creation and redemption of Fund shares. These fees are used to offset certain custodian charges incurred by the Fund for these transactions. For the year ended October 31, 2019, the amount of transaction fees paid by the Authorized Participants that were used to reimburse Custodian and Transfer Agent fees were as follows:
| | | | |
Diversified Alternatives ETF | | $ | 7,200 | |
Event Driven ETF | | | 400 | |
Long/Short ETF | | | 1,400 | |
Such amounts are included in expense reimbursements fromnon-affiliates in the CSOP/SOP.
Restricted cash on the CSAL/SAL is cash received from Authorized Participants for the reimbursement of creation and/or redemption of Fund shares.
Interest expense paid to the custodian related to cash overdrafts, if any, is included in Interest expense to affiliates on the CSOP/SOP.
D. Waivers and Reimbursements — The Adviser, Administrator and JPMDS have contractually agreed to waive fees and/or reimburse the Funds to the extent that total annual operating expenses, inclusive of each Subsidiary (excluding acquired fund fees and expenses other than certain money market fund fees as described below, dividend and interest expenses related to short sales, interest, taxes, expenses related to litigation and potential litigation, and extraordinary expenses), exceed the percentages of the Funds’ respective average daily net assets as shown in the below table:
| | | | |
| | | Expense Cap | |
Diversified Alternatives ETF | | | 0.85 | % |
Event Driven ETF | | | 0.85 | % |
Long/Short ETF | | | 0.69 | % |
Managed Futures Strategy ETF | | | 0.59 | % |
| | | | | | | | |
| | | |
| OCTOBER 31, 2019 | | J.P. MORGAN EXCHANGE-TRADED FUNDS | | | | | 145 | |
NOTES TO FINANCIAL STATEMENTS
AS OF OCTOBER 31, 2019 (continued)
The expense limitation agreements were in effect for the year ended October 31, 2019. For the year ended October 31, 2019, the Funds’ service providers waived fees and/or reimbursed expenses for each of the Funds as follows.
| | | | | | | | | | | | | | | | |
| | | Contractual Waivers | | | | |
| | | Investment
Advisory Fees | | | Administration
Fees | | | Total | | | Contractual
Reimbursements | |
Diversified Alternatives ETF | | $ | 150,545 | | | $ | 100,363 | | | $ | 250,908 | | | $ | — | |
Event Driven ETF | | | 173,173 | | | | 20,783 | | | | 193,956 | | | | — | |
Long/Short ETF | | | 136,295 | | | | 18,806 | | | | 155,101 | | | | 43,881 | |
Managed Futures Strategy ETF | | | 175,219 | | | | 42,929 | | | | 218,148 | | | | — | |
None of these parties expect the Funds to repay any such waived fees and/or reimbursed expenses in future years.
Additionally, the Funds may invest in one or more money market funds advised by the Adviser (affiliated money market funds). The Adviser has contractually agreed to waive fees and/or reimburse expenses in an amount sufficient to offset the respective fees and expenses of the affiliated money market funds incurred by each Fund because of each Fund’s investment in such money market funds, except for investments of securities lending collateral.
The amounts of these waivers resulting from investments in these money market funds for the year ended October 31, 2019 were as follows:
| | | | |
Diversified Alternatives ETF | | $ | 126,535 | |
Event Driven ETF | | | 6,952 | |
Long/Short ETF | | | 10,925 | |
Managed Futures Strategy ETF | | | 78,437 | |
The Diversified Alternatives ETF and Managed Futures Strategy ETF invest in Subsidiaries and, as a result, bear a portion of the expenses incurred by these Subsidiaries. These expenses are reflected in the fees waived shown on the CSOP and are included in the ratios to average net assets shown in the Financial Highlights.
The amounts of these waivers resulting from investments in Subsidiaries for the year ended October 31, 2019 were as follows:
| | | | |
Diversified Alternatives ETF | | $ | 216,448 | |
Managed Futures Strategy ETF | | | 80,354 | |
E. Distribution Services— The Distributor or its agent distributes Creation Units for each Fund on an agency basis. The Distributor does not maintain a secondary market in shares of each Fund. JPMDS receives no fees for their distribution services under the distribution agreement with the Trust (the “Distribution Agreement”). Although the Trust does not pay any fees under the Distribution Agreement, JPMIM pays JPMDS for certain distribution related services.
F. Other — Certain officers of the Trust are affiliated with the Adviser, the Administrator and JPMDS. Such officers, with the exception of the Chief Compliance Officer, receive no compensation from the Funds for serving in their respective roles.
The Board has designated and appointed a Chief Compliance Officer to the Funds pursuant to Rule38a-1 under the 1940 Act. Each Fund, along with affiliated funds, makes reimbursement payments, on apro-rata basis, to the Administrator for a portion of the fees associated with the office of the Chief Compliance Officer. Such fees are included in Trustees’ and Chief Compliance Officer’s fees on the CSOP/SOP.
The Securities and Exchange Commission (“SEC”) has granted an exemptive order permitting the Funds to engage in principal transactions with J.P. Morgan Securities, Inc., an affiliated broker, involving taxable money market instruments, subject to certain conditions.
G.Management Fee —Effective November 1, 2019, the Investment Advisory Agreement, Administration Agreement and Expense Limitation Agreement for each Fund was replaced by a Management Agreement. Under the Management Agreement, JPMIM is responsible for substantially all expenses of each Fund (including expenses of the Trust relating to each Fund and any Subsidiary expenses), except for the management fees, payments under a Fund’s12b-1 plan (if any), interest expenses, dividend and interest expenses related to short sales, taxes, acquired fund fees and expenses (other than fees for funds advised by the adviser and/or its affiliates), costs of holding shareholder meetings, the costs of any securities lending program, and litigation and potential litigation and other extraordinary expenses not incurred in the ordinary course of each Fund’s business. Additionally, each Fund shall be responsible for itsnon-operating expenses, including brokerage commissions and fees and expense associated with a Fund’s securities lending program, if applicable. For the avoidance of doubt, the Adviser’s payment of such expenses may be accomplished through a Fund’s payment of such expenses and a corresponding reduction in the fee payable to the Adviser, provided, however, that if the amount of expenses paid by a Fund exceeds the fee payable to the Adviser, the Adviser will reimburse that Fund for such amount. The management fee is accrued daily and paid no more frequently than monthly based on each Fund’s respective average daily net assets at following rate:
| | | | |
Diversified Alternatives ETF | | | 0.85 | % |
Event Driven ETF | | | 0.85 | % |
Long/Short ETF | | | 0.69 | % |
Managed Futures Strategy ETF | | | 0.59 | % |
| | | | | | |
| | | |
| 146 | | | | J.P. MORGAN EXCHANGE-TRADED FUNDS | | OCTOBER 31, 2019 |
4. Investment Transactions
During the year ended October 31, 2019, purchases and sales of investments (excluding short-term investments) were as follows:
| | | | | | | | |
| | | Purchases
(excluding U.S.
Government) | | | Sales
(excluding U.S.
Government) | |
Diversified Alternatives ETF | | $ | 132,829,941 | | | $ | 201,973,611 | |
Event Driven ETF | | | 43,049,315 | | | | 38,458,462 | |
Long/Short ETF | | | 20,142,198 | | | | 17,894,834 | |
Managed Futures Strategy ETF | | | — | | | | — | |
During the year ended October 31, 2019, there were no purchases or sales of US Government securities.
5. Federal Income Tax Matters
For Federal income tax purposes, the estimated cost and unrealized appreciation (depreciation) in value of investment securities, including each Subsidiary, held at October 31, 2019 were as follows:
| | | | | | | | | | | | | | | | |
| | | Aggregate
Cost | | | Gross Unrealized Appreciation | | | Gross Unrealized Depreciation | | | Net Unrealized
Appreciation
(Depreciation) | |
Diversified Alternatives ETF | | $ | 90,087,066 | | | $ | 6,642,108 | | | $ | 8,850,679 | | | $ | (2,208,571 | ) |
Event Driven ETF | | | 30,139,861 | | | | 1,389,377 | | | | 1,003,788 | | | | 385,589 | |
Long/Short ETF | | | 27,088,841 | | | | 2,262,831 | | | | 1,440,448 | | | | 822,383 | |
Managed Futures Strategy ETF | | | 49,882,774 | | | | 490,052 | | | | 2,809,169 | | | | (2,319,117 | ) |
For the Funds, the difference between book and tax basis appreciation (depreciation) on investments is primarily attributed to mark to market of futures contracts, mark to market of forward foreign currency contracts, investments in swap contracts, wash sale loss deferrals and investments in subsidiaries.
The Federal income tax unrealized appreciation (depreciation) in value of investment securities includes unrealized depreciation of the Diversified Alternatives ETF’s investment in its Subsidiary of $(4,432,885) and Managed Futures Strategy ETF’s investment in its Subsidiary of $(2,191,824), when if realized is not deductible for income tax purposes.
The tax character of distributions paid during the year ended October 31, 2019 was as follows:
| | | | | | | | |
| | | Ordinary
Income* | | | Total
Distributions
Paid | |
Event Driven ETF | | $ | 871,185 | | | $ | 871,185 | |
Managed Futures Strategy ETF | | | 353,288 | | | | 353,288 | |
| * | Short-term gain distributions are treated as ordinary income for income tax purposes. |
The tax character of distributions paid during the year ended October 31, 2018 was as follows:
| | | | | | | | |
| | | Ordinary
Income* | | | Total
Distributions
Paid | |
Diversified Alternatives ETF | | $ | 868 | | | $ | 868 | |
Event Driven ETF | | | 13,930 | | | | 13,930 | |
Managed Futures Strategy ETF | | | 14,260 | | | | 14,260 | |
| * | Short-term gain distributions are treated as ordinary income for income tax purposes. |
As of October 31, 2019, the estimated components of net assets (excluding paid-in-capital) on a tax basis were as follows:
| | | | | | | | | | | | |
| | | Current
Distributable
Ordinary
Income | | | Current
Distributable
Long-Term
Capital Gain
(Tax Basis Capital
Loss Carryover) | | | Unrealized
Appreciation
(Depreciation) | |
Diversified Alternatives ETF | | $ | 4,323,948 | | | $ | (5,029,624 | ) | | $ | 1,968,224 | |
Event Driven ETF | | | 464,396 | | | | (219,195 | ) | | | 385,506 | |
Long/Short ETF | | | — | | | | (1,979,795 | ) | | | 803,817 | |
Managed Futures Strategy ETF | | | 2,944,962 | | | | (430,324 | ) | | | (417,543 | ) |
| | | | | | | | |
| | | |
| OCTOBER 31, 2019 | | J.P. MORGAN EXCHANGE-TRADED FUNDS | | | | | 147 | |
NOTES TO FINANCIAL STATEMENTS
AS OF OCTOBER 31, 2019 (continued)
For the Funds, the cumulative timing differences primarily consist of wash sale loss deferrals, mark to market of forward foreign currency contracts, mark to market of futures contracts, straddle loss deferrals and investments in swap contracts.
During the year ended October 31, 2019, the Diversified Alternatives Fund CS Ltd. and Managed Futures Fund CS Ltd. had approximately $1,579,996 and $789,486 of losses for tax purposes. The Subsidiaries’ loss for the current year are not available to offset their future taxable income.
As of October 31, 2019, the Funds had the following net capital loss carryforwards:
| | | | | | | | |
| | | Capital Loss Carryforward | |
| | | Short-Term | | | Long-Term | |
Diversified Alternatives ETF | | $ | 5,006,942 | | | $ | 22,682 | |
Event Driven ETF | | | — | | | | 219,195 | |
Long/Short ETF | | | 1,671,917 | | | | 307,878 | |
Managed Futures Strategy ETF | | | 430,324 | | | | — | |
During the year ended October 31, 2019, the following Funds utilized capital loss carryforwards as follows:
| | | | | | | | |
| | | Capital Loss Utilized | |
| | | Short-Term | | | Long-Term | |
Diversified Alternatives ETF | | $ | — | | | $ | 597,607 | |
Managed Futures Strategy ETF | | | 264,845 | | | | 873,417 | |
6. Capital Share Transactions
The Trust issues and redeems shares of the Funds only in Creation Units through the Distributor at NAV. Capital shares transactions detail can be found in the Statements of Changes in Net Assets.
Shares of the Funds may only be purchased or redeemed by Authorized Participants. Such Authorized Participants may from time to time hold, of record or beneficially, a substantial percentage of the Funds’ shares outstanding and act as executing or clearing broker for investment transactions on behalf of the Funds. An Authorized Participant is either (1) a “Participating Party” or other participant in the clearing process through the Continuous Net Settlement System of the National Securities Clearing Corporation (“NSCC”); or (2) a DTC Participant; which, in either case, must have executed an agreement with the Distributor.
Creation Units of a Fund may be created in advance of receipt by the Trust of all or a portion of the applicable basket of equity securities and other instruments (“Deposit Instruments”) and cash as described in the Funds’ registration statement. In these instances, the initial Deposit Instruments and cash must be deposited in an amount equal to the sum of the cash amount. A transaction fee may be imposed to offset transfer and other transaction costs associated with the purchase or redemption of Creation Units.
Authorized Participants transacting in Creation Units for cash may also pay a variable fee to compensate the relevant fund for market impact expenses relating to investing in portfolio securities. Such variable fees, if any, are included in “Proceeds from shares issued” in the Statements of Changes in Net Assets.
7. Risks, Concentrations and Indemnifications
In the normal course of business, the Funds enter into contracts that contain a variety of representations which provide general indemnifications. Each Fund’s maximum exposure under these arrangements is unknown. The amount of exposure would depend on future claims that may be brought against each Fund. However, based on experience, the Funds expect the risk of loss to be remote.
As of October 31, 2019, the Adviser owns shares representing more than 10% of net assets of the following Funds:
| | | | |
| | | %
of Ownership | |
Diversified Alternatives ETF | | | 16 | % |
Event Driven ETF | | | 86 | |
Long/Short ETF | | | 77 | |
Managed Futures Strategy ETF | | | 87 | |
Significant shareholder transactions by the Adviser may impact the Funds’ performance.
By investing in each Subsidiary, the Diversified Alternatives ETF and Managed Futures Strategy ETF are indirectly exposed to the risks associated with the Subsidiary’s investments. The derivatives and other investments held by the Subsidiary are generally similar to those that are permitted to be held by the Fund and are subject to the same risks that apply to similar investments if held directly by the Fund.
The Funds will employ various alternative investment strategies that involve the use of complicated investment techniques. There is no guarantee that these strategies will succeed and their use may subject the Funds to greater volatility and loss.
| | | | | | |
| | | |
| 148 | | | | J.P. MORGAN EXCHANGE-TRADED FUNDS | | OCTOBER 31, 2019 |
Derivatives, including swap agreements, commodity options, forwards, futures and options on futures, may be riskier than other types of investments because they may be more sensitive to changes in economic or market conditions than other types of investments and could result in losses that significantly exceed the Funds’ original investment. Many derivatives create leverage thereby causing a Fund to be more volatile than it would be if it had not used derivatives. Derivatives also expose the Funds to counterparty risk and to the credit risk of the derivative counterparty. The possible lack of a liquid secondary market for derivatives and the resulting ability of the Funds to sell or otherwise close a derivatives position could expose the Funds to losses.
The Funds are also subject to counterparty credit risk, which is the risk that a counterparty fails to perform on agreements with a Fund such as swap and option contracts, credit linked notes, exchange-traded notes and forward foreign currency exchange contracts.
Disruptions to creations and redemptions, the existence of significant market volatility or potential lack of an active trading market for the Shares (including through a trading halt), as well as other factors, may result in Shares trading significantly above (at a premium) or below (at a discount) to the NAV or to the intraday value of the Fund’s holdings. During such periods, investors may incur significant losses if shares are sold.
Since the Managed Futures Strategy ETF isnon-diversified, it may invest a greater percentage of its assets in a particular issuer or group of issuers than a diversified fund would. This increased investment in fewer issuers may result in the Fund’s shares being more sensitive to economic results of those issuing the securities.
The London InterBank Offered Rate (“LIBOR”) is intended to represent the rate at which contributing banks may obtain short-term borrowings from each other in the London interbank market. The regulatory authority that oversees financial services firms and financial markets in the U.K. has announced that, after the end of 2021, it would no longer persuade or compel contributing banks to make rate submissions for purposes of determining the LIBOR rate. As a result, it is possible that commencing in 2022, LIBOR may no longer be available or no longer deemed an appropriate reference rate upon which to determine the interest rate on or impacting certain loans, notes, derivatives and other instruments or investments comprising some or all of a Fund’s portfolio. In light of this eventuality, public and private sector industry initiatives are currently underway to identify new or alternative reference rates to be used in place of LIBOR. There is no assurance that the composition or characteristics of any such alternative reference rate will be similar to or produce the same value or economic equivalence as LIBOR or that it will have the same volume or liquidity as did LIBOR prior to its discontinuance or unavailability, which may affect the value or liquidity or return on certain investments of a Fund and result in costs incurred in connection with closing out positions and entering into new trades. These risks may also apply with respect to changes in connection with other interbank offering rates (e.g., Euribor) and a wide range of other index levels, rates and values that are treated as “benchmarks” and are the subject of recent regulatory reform.
| | | | | | | | |
| | | |
| OCTOBER 31, 2019 | | J.P. MORGAN EXCHANGE-TRADED FUNDS | | | | | 149 | |
REPORT OF INDEPENDENT REGISTERED PUBLIC ACCOUNTING FIRM
To the Board of Trustees of J.P. Morgan Exchange-Traded Fund Trust and Shareholders of each of the four funds listed in the table below
Opinions on the Financial Statements
We have audited the accompanying statements of assets and liabilities, including the schedules of portfolio investments, of each of the funds listed in the table below (four of the funds constituting J.P. Morgan Exchange-Traded Fund Trust, hereafter collectively referred to as the “Funds”) as of October 31, 2019, the related statements of operations and of changes in net assets for each of the periods indicated in the table below, including the related notes, and the financial highlights for each of the periods indicated therein (collectively referred to as the “financial statements”). In our opinion, the financial statements present fairly, in all material respects, the financial position of each of the Funds as of October 31, 2019, the results of each of their operations and the changes in each of their net assets for the periods indicated in the table below, and each of the financial highlights for each of the periods indicated therein, in conformity with accounting principles generally accepted in the United States of America.
| | | | |
| JPMorgan Diversified Alternatives ETF (1) | | JPMorgan Event Driven ETF (2) | | JPMorgan Long/Short ETF (3) |
JPMorgan Managed Futures Strategy ETF (4) | | | | |
| | (1) | Statement of operations for the year ended October 31, 2019 and statement of changes in net assets for the years ended October 31, 2019 and 2018 |
| | (2) | Statement of operations for the year ended October 31, 2019, and statement of changes in net assets for the year ended October 31, 2019 and the period November 29, 2017 (commencement of operations) through October 31, 2018 |
| | (3) | Statement of operations for the year ended October 31, 2019, and statement of changes in net assets for the year ended October 31, 2019 and the period January 23, 2018 (commencement of operations) through October 31, 2018 |
| | (4) | Statement of operations for the year ended October 31, 2019, and statement of changes in net assets for the year ended October 31, 2019 and the period December 5, 2017 (commencement of operations) through October 31, 2018 |
Basis for Opinions
These financial statements are the responsibility of the Funds’ management. Our responsibility is to express an opinion on the Funds’ financial statements based on our audits. We are a public accounting firm registered with the Public Company Accounting Oversight Board (United States) (PCAOB) and are required to be independent with respect to the Funds in accordance with the U.S. federal securities laws and the applicable rules and regulations of the Securities and Exchange Commission and the PCAOB.
We conducted our audits of these financial statements in accordance with the standards of the PCAOB. Those standards require that we plan and perform the audit to obtain reasonable assurance about whether the financial statements are free of material misstatement, whether due to error or fraud.
Our audits included performing procedures to assess the risks of material misstatement of the financial statements, whether due to error or fraud, and performing procedures that respond to those risks. Such procedures included examining, on a test basis, evidence regarding the amounts and disclosures in the financial statements. Our audits also included evaluating the accounting principles used and significant estimates made by management, as well as evaluating the overall presentation of the financial statements. Our procedures included confirmation of securities owned as of October 31, 2019 by correspondence with the custodian, transfer agent and brokers; when replies were not received from brokers, we performed other auditing procedures. We believe that our audits provide a reasonable basis for our opinions.
/s/PricewaterhouseCoopers LLP
New York, New York
December 20, 2019
We have served as the auditor of one or more investment companies in the JPMorgan Funds complex since 1993.
| | | | | | |
| | | |
| 150 | | | | J.P. MORGAN EXCHANGE-TRADED FUNDS | | OCTOBER 31, 2019 |
TRUSTEES
(Unaudited)
The Funds’ Statements of Additional Information includes additional information about the Funds’ Trustees and is available, without charge, upon request by calling1-844-457-6383 or on the J.P. Morgan Funds’ website at www.jpmorganfunds.com.
| | | | | | | | |
Name (Year of Birth;
Positions With
the Funds since) | | Principal Occupation
During Past 5 Years | | Number of
Funds in Fund
Complex Overseen
by Trustee (1) | | | Other Directorships Held
During the Past 5 Years |
Independent Trustees | | | | | | | | |
| | | |
Gary L. French (1951);
Trustee of the Trust since 2014 | | Real Estate Investor (2011–present); Consultant to the Mutual Fund Industry (2011-present); Senior Consultant for The Regulatory Fundamentals Group LLC (2011–2017); Senior Vice President–Fund Administration, State Street Corporation (2002–2010). | | | 35 | | | Independent Trustee, The China Fund, Inc. (2013-2019); Exchange Traded Concepts Trust II (2012-2014); Exchange Traded Concepts Trust I (2011-2014). |
| | | |
| Robert J. Grassi (1957); Trustee of the Trust since 2014 | | Sole Proprietor, Academy Hills Advisors LLC (2012-present); Pension Director, Corning Incorporated (2002-2012). | | | 35 | | | None. |
| | | |
| Thomas P. Lemke (1954); Trustee of the Trust since 2014 | | Retired; Executive Vice President and General Counsel, Legg Mason (2005-2013). | | | 35 | | | SEI family of funds (Independent Trustee of Advisors’ Inner Circle Fund III (20 portfolios) (from February 2014 to present); Independent Trustee of Winton Diversified Opportunities Fund (from December 2014 to 2018); Independent Trustee of Gallery Trust (from August 2015 to present); Independent Trustee of Schroder Series Trust (from 2017 to present) Independent Trustee of Schroder Global Series Trust (from February 2017 to present); Independent Trustee of O’Connor EQUUS (May 2014-April 2016), Independent Trustee of Winton Series Trust (December 2014-March 2017); Independent Trustee of AXA Premier VIP Trust (2014-June 2017); Independent Director of The Victory Funds (or their predecessor funds) (35 portfolios) (2014-March 2015); Symmetry Panoramic Trust (16 portfolios) (2018-present). |
| | | |
| Lawrence R. Maffia (1950); Trustee of the Trust since 2014 | | Retired; Director and President, ICI Mutual Insurance Company (2006-2013). | | | 35 | | | Director, ICI Mutual Insurance Company (1999-2013). |
| | | |
| Emily A. Youssouf (1951); Trustee of the Trust since 2014 | | Clinical Professor, NYU Schack Institute of Real Estate (2009-present); Board Member(2005-present), Chair of Capital Committee (2006-2016), Chair of Audit Committee(2005-present), and Chair of IT Committee (2016-present), NYC Health and Hospitals Corporation; Board Member and Member of the Audit Committee and Related Parties Committee (2013-2018) and Member of the Risk Management Committee (2017-2018), PennyMac Financial Services, Inc. | | | 35 | | | Trustee, NYC School Construction Authority (2009-present); Board Member, NYS Job Development Authority (2008-present); Trustee (2015-present) and Chair of the Audit and Finance Committee (2015-present) of the Transit Center Foundation; Vice Chair (2011-2013) and Board Member (2013-2014) of New York City Housing Authority. |
Interested Trustee | | | | | | | | |
| | | |
| Robert Deutsch (2) (1957); Chairman and Trustee of the Trust since 2014 | | Retired; Head of the Global ETF Business for JPMorgan Asset Management (2013-2017); Head of the Global Liquidity Business for JPMorgan Asset Management (2003-2013). | | | 35 | | | Board of Directors of the JUST Capital Foundation (2017–present). |
| (1) | A Fund Complex means two or more registered investment companies that hold themselves out to investors as related companies for purposes of investment and investor services or have a common investment adviser or have an investment adviser that is an affiliated person of the investment adviser of any of the other registered investment companies. Thirty three series of the Trust have commenced operations. |
| (2) | Mr. Deutsch is an interested trustee because he was an employee of the Adviser until August 2017. |
The contact address for each of the Trustees is 277 Park Avenue, New York, NY 10172.
| | | | | | | | |
| | | |
| OCTOBER 31, 2019 | | J.P. MORGAN EXCHANGE-TRADED FUNDS | | | | | 151 | |
OFFICERS
(Unaudited)
| | |
Name (Year of Birth),
Positions Held with
the Trusts (Since) | | Principal Occupations During Past 5 Years |
| |
Joanna Gallegos (1975), President and Principal Executive Officer (2017) | | Managing Director, Head of J.P. Morgan Asset Management’s U.S. Exchange Traded Funds business. Previously, Head of J.P. Morgan Asset Management’s ETF Product Development team from August 2013 to July 2017. |
| |
Lauren A. Paino (1973), Treasurer and Principal Financial Officer (2016)* | | Executive Director, J.P. Morgan Investment Management Inc. (formerly JPMorgan Funds Management, Inc.) since August 2013. |
| |
Brian S. Shlissel (1964), Vice President (2016) | | Managing Director and Chief Administrative Officer for J.P. Morgan pooled vehicles, J.P. Morgan Investment Management Inc. (formerly JPMorgan Funds Management, Inc.) (from 2014 to present); Managing Director and Head of Mutual Fund Services, Allianz Global Investors; President and Chief Executive Officer, Allianz Global Investors Mutual Funds and PIMCO Closed-End Funds (from 1999 to 2014). |
| |
Paul Shield (1960), Vice President and Assistant Treasurer (2016) | | Managing Director and head of Business Management for JPMorgan Asset Management’s Exchange Traded Fund platform since 2013. |
| |
| Elizabeth A. Davin (1964), Secretary (2018)** | | Executive Director and Assistant General Counsel, JPMorgan Chase. Ms. Davin has been with JPMorgan Chase (formerly Bank One Corporation) since 2004. |
| |
Stephen M. Ungerman (1953), Chief Compliance Officer (2014) | | Managing Director, JPMorgan Chase & Co.; Mr. Ungerman has been with JPMorgan Chase & Co. since 2000. |
| |
Jessica K. Ditullio (1962), Assistant Secretary (2014)** | | Executive Director and Assistant General Counsel, JPMorgan Chase. Ms. Ditullio has been with JPMorgan Chase (formerly Bank One Corporation) since 1990. |
| |
Anthony Geron (1971), Assistant Secretary (2019)* | | Vice President and Assistant General Counsel, JPMorgan Chase since September 2018; Lead Director and Counsel, AXA Equitable Life Insurance Company from 2015 to 2018 and Senior Director and Counsel, AXA Equitable Life Insurance Company from 2014 to 2015; Associate, Willkie Farr & Gallagher (law firm) from 2007 to 2014. |
| |
Carmine Lekstutis (1980), Assistant Secretary (2014)* | | Executive Director and Assistant General Counsel, JPMorgan Chase since February 2015; formerly Vice President and Assistant General Counsel, JPMorgan Chase from 2011 to February 2015. |
| |
Keri E. Riemer (1976), Assistant Secretary (2019)* | | Executive Director and Assistant General Counsel, JPMorgan Chase since February 2019; Counsel, Seward & Kissel LLP (2016-2019); Associate, Seward & Kissel LLP (2011-2016). |
| |
Gregory S. Samuels (1980), Assistant Secretary (2014)* | | Executive Director and Assistant General Counsel, JPMorgan Chase since February 2014; formerly Vice President and Assistant General Counsel, JPMorgan Chase from 2010. |
| |
| Zachary E. Vonnegut-Gabovitch (1986), Assistant Secretary (2017)* | | Vice President and Assistant General Counsel, JPMorgan Chase since September 2016; Associate, Morgan Lewis & Bockius (law firm) from 2012 to 2016. |
| |
| Frederick J. Cavaliere (1978), Assistant Treasurer (2015)* | | Executive Director, J.P. Morgan Investment Management Inc. since February 2016; formerly, Vice President, J.P. Morgan Investment Management Inc. (formerly JPMorgan Funds Management, Inc.) since September 2010 to February 2016. Mr. Cavaliere has been with JPMorgan since May 2006. |
| |
Timothy J. Clemens (1975), Assistant Treasurer (2019)* | | Executive Director, J.P. Morgan Investment Management Inc. (formerly JPMorgan Funds Management, Inc.) since February 2016; Vice President, JPMorgan Funds Management, Inc. from October 2013 to January 2016. |
| |
Michael M. D’Ambrosio (1969), Assistant Treasurer (2014) | | Managing Director, J.P. Morgan Investment Management Inc. (formerly JPMorgan Funds Management, Inc.) since May 2014; formerly Executive Director, J.P. Morgan Investment Management Inc. (formerly JPMorgan Funds Management, Inc.) from 2012 to May 2014. |
| |
Shannon Gaines (1977), Assistant Treasurer (2019)** | | Vice President, J.P. Morgan Investment Management Inc. (formerly JPMorgan Funds Management, Inc.) since January 2014. |
| |
Jason Ronca (1978), Assistant Treasurer (2014)*** | | Executive Director, Assistant Treasurer and ETF Platform Manager for J.P. Morgan Asset Management since February 2017; formerly Vice President, Assistant Treasurer and ETF Platform Manager for J.P. Morgan Asset Management from May 2014 to February 2017. ETF Product Manager for Corporate Investment Bank responsible for setting the strategy and control agenda for the ETF servicing business from 2010 to May 2014; Prior to 2010, a Vice President in Fund Accounting within J.P. Morgan Investor Services, supporting a series of U.S. registered mutual funds. |
The contact address for each of the officers, unless otherwise noted, is 277 Park Avenue, New York, NY 10172.
| * | The contact address for the officer is 4 New York Plaza, New York, NY 10004. |
| ** | The contact address for the officer is 1111 Polaris Parkway, Columbus, OH 43240. |
| *** | The contact address for the officer is 50 Rowes Wharf, Floor 3, Boston, MA 02110. |
| | | | | | |
| | | |
| 152 | | | | J.P. MORGAN EXCHANGE-TRADED FUNDS | | OCTOBER 31, 2019 |
SCHEDULE OF SHAREHOLDER EXPENSES
(Unaudited)
Hypothetical $1,000 Investment
As a shareholder of the Funds, you incur two types of costs: (1) transaction costs, including brokerage commissions on your purchase and sales of Fund shares and (2) ongoing costs, including investment advisory fees, administration fees and other Fund expenses. The examples below are intended to help you understand your ongoing costs (in dollars) of investing in the Funds and to compare these ongoing costs with the ongoing costs of investing in other funds. The examples assume that you had a $1,000 investment at the beginning of the reporting period, May 1, 2019 and continued to hold your shares at the end of the reporting period, October 31, 2019.
Actual Expenses
For each Fund in the table below, the first line provides information about actual account values and actual expenses. You may use the information in this line, together with the amount you invested, to estimate the expenses that you paid over the period. Simply divide your account value by $1,000 (for example, an $8,600 account value divided by $1,000 = 8.6), then
multiply the result by the number under the heading entitled “Expenses Paid During the Period” to estimate the expenses you paid on your account during this period.
Hypothetical Example for Comparison Purposes
The second line in the table below provides information about hypothetical account values and hypothetical expenses based on the Fund’s actual expense ratio and an assumed rate of return of 5% per year before expenses, which is not the Funds’ actual return. The hypothetical account values and expenses may not be used to estimate the actual ending account balance or expenses you paid for the period. You may use this information to compare the ongoing costs of investing in the Funds and other funds. To do so, compare this 5% hypothetical example with the 5% hypothetical examples that appear in the shareholder reports of other funds. The examples also assume all dividends and distributions have been reinvested. The examples do not take into account brokerage commissions that you pay when purchasing or selling shares of a Fund.
| | | | | | | | | | | | | | | | |
| | | Beginning
Account Value
May 1, 2019 | | | Ending
Account Value
October 31, 2019 | | | Annualized
Expense
Ratio(1) | | | Expenses
Paid During the Period | |
JPMorgan Diversified Alternatives ETF | | | | | | | | | | | | | | | | |
Actual | | $ | 1,000.00 | | | $ | 999.60 | | | | 0.78 | % | | $ | 3.93 | |
Hypothetical | | | 1,000.00 | | | | 1,021.27 | | | | 0.78 | | | | 3.97 | |
| | | | |
JPMorgan Event Driven ETF | | | | | | | | | | | | | | | | |
Actual | | $ | 1,000.00 | | | $ | 977.10 | | | | 0.83 | % | | $ | 4.14 | |
Hypothetical | | | 1,000.00 | | | | 1,021.02 | | | | 0.83 | | | | 4.23 | |
| | | | |
JPMorgan Long/Short ETF | | | | | | | | | | | | | | | | |
Actual | | $ | 1,000.00 | | | $ | 1,013.40 | | | | 0.66 | % | | $ | 3.35 | |
Hypothetical | | | 1,000.00 | | | | 1,021.88 | | | | 0.66 | | | | 3.36 | |
| | | | |
JPMorgan Managed Futures Strategy ETF | | | | | | | | | | | | | | | | |
Actual | | $ | 1,000.00 | | | $ | 1,040.60 | | | | 0.48 | % | | $ | 2.47 | |
Hypothetical | | | 1,000.00 | | | | 1,022.79 | | | | 0.48 | | | | 2.45 | |
| (1) | Expenses are equal to each Fund’s annualized expense ratio, multiplied by the average account value over the period, multiplied by 184/365 (to reflect the actual period). |
| | | | | | | | |
| | | |
| OCTOBER 31, 2019 | | J.P. MORGAN EXCHANGE-TRADED FUNDS | | | | | 153 | |
SPECIAL SHAREHOLDER MEETING RESULTS
(Unaudited)
J.P. Morgan Exchange-Traded Trust (the “Trust”) held a special meeting of shareholders on August 22, 2019, for the purpose of considering and voting upon the approval of a new Management Agreement with J.P. Morgan Investment Management Inc. which will implement a unitary fee structure for each of the Funds covered by this report.
The new Management Agreement was approved by shareholders of the Funds.
The results of the voting for the Funds were as follows:
| | | | | | | | | | | | |
| | | Voting Results | |
| Fund | | For | | | Against | | | Abstain | |
Diversified Alternatives ETF | | | 101,909,354 | | | | 90,108 | | | | 450,757 | |
Event Driven ETF | | | 24,880,425 | | | | — | | | | — | |
Long/Short ETF | | | 22,338,067 | | | | — | | | | — | |
Managed Futures Strategy ETF | | | 45,651,916 | | | | 24,837 | | | | — | |
| | | | | | |
| | | |
| 154 | | | | J.P. MORGAN EXCHANGE-TRADED FUNDS | | OCTOBER 31, 2019 |
TAX LETTER
(Unaudited)
Certain tax information for the J.P. Morgan Funds is required to be provided to shareholders based upon the Funds’ income and distributions for the taxable year ended October 31, 2019. The information and distributions reported in this letter may differ from the information and taxable distributions reported to the shareholders for the calendar year ending December 31, 2019. The information necessary to complete your income tax returns for the calendar year ending December 31, 2019 will be provided under separate cover.
Dividends Received Deduction (DRD)
The Fund listed below had the following percentage, or maximum allowable percentage, of ordinary income distributions eligible for the dividends received deduction for corporate shareholders for the fiscal year ended October 31, 2019:
| | | | |
| | | Dividends
Received
Deduction | |
Event Driven ETF | | | 22.23 | % |
Qualified Dividend Income (QDI)
The Fund listed below had the following amount, or maximum allowable amount, of ordinary income distributions treated as qualified dividends for the fiscal year ended October 31, 2019:
| | | | |
| | | Qualified
Dividend
Income | |
Event Driven ETF | | $ | 277,896 | |
| | | | | | | | |
| | | |
| OCTOBER 31, 2019 | | J.P. MORGAN EXCHANGE-TRADED FUNDS | | | | | 155 | |
BOARD APPROVAL OF MANAGEMENT AGREEMENT
(Unaudited)
JPMorgan Diversified Alternatives ETF, JPMorgan Event Driven ETF, JPMorgan Long/Short ETF, JPMorgan Managed Futures Strategy ETF
The Board meets regularly throughout the year and considers factors that are relevant to its consideration of investment advisory agreements at each meeting. The Board also meets for the specific purpose of considering approvals of amendments to and new investment advisory agreements for the Funds. At the June 11-12, 2019 quarterly Board meeting, the Trustees, including a majority of the Trustees who are not “interested persons” (as defined in the 1940 Act) of the Trust, Adviser or any of its affiliates (“Independent Trustees”), approved a new Management Agreement (the “New Management Agreement”) on behalf of each Fund. The Board also recommended that the Fund’s shareholders approve the New Management Agreement. Such approval was recently obtained, and the agreement went into effect November 1, 2019.
As part of their review of the New Management Agreement, the Trustees considered and reviewed information received from the Adviser about the proposed changes to the previously existing advisory agreements to convert them to a “unitary fee” structure. They also considered information received in connection with the December 2018 board meeting when the Trustees last approved the Investment Advisory Agreement for certain Funds. This included comprehensive information concerning the nature and quality of services provided by the Adviser, “fall-out” benefits received by the Adviser, and information on profitability and performance of the Funds. The Board noted that the possibility of proposing a unitary fee had been raised by the Adviser at an earlier meeting, and that prior to the June 11-12, 2019 meeting, the Adviser and the Board had several discussions about unitary fees generally, industry practice, the potential impact on the Funds, and related matters. Before voting on the New Management Agreement, the Trustees reviewed the agreement with representatives of the Adviser, counsel to the Trust and independent legal counsel and received a memorandum from independent legal counsel to the Trustees discussing the legal standards for their consideration of the New Management Agreement. The Trustees also discussed the New Management Agreement in executive sessions with independent legal counsel at which no representatives of the Adviser were present. A summary of the material factors evaluated by the Trustees in determining whether to approve New Management Agreement is provided below.
The Trustees considered information provided with respect to the Funds over the course of the year, as well as the materials furnished specifically in connection with this approval process. Each Trustee attributed his or her own evaluation of the significance of the various factors and no factor alone was considered determinative. The Trustees determined that the proposed compensation to be received by the Adviser from each Fund under the New Management Agreement was fair and reasonable
and that the approval of the New Management Agreement was in the best interests of each Fund and its shareholders.
The factors summarized below were considered and discussed by the Trustees in reaching their conclusions:
Nature, Extent and Quality of Services Provided by the Adviser
In connection with the approval of the New Management Agreement on behalf of each Fund, the Trustees received and considered information regarding the nature, extent and quality of the services provided to each Fund under its then-existing separate Investment Advisory and Administration Agreements, as well as the services that will be provided under the New Management Agreement. They also considered management’s representation that the services provided to the Funds will not change as a result of the transition to the unitary fee structure. The Trustees also took into account information furnished throughout the year at Trustee meetings, including consideration of the background and experience of the Adviser’s senior management and the qualifications, backgrounds and responsibilities of the portfolio management team primarily responsible for the day-to-day management of each Fund. The Trustees also considered each Fund’s investment strategy, and the infrastructure supporting the portfolio management teams. In addition, the Trustees considered information about the structure and distribution strategies of the Funds, how they fit within the Trust’s fund offerings, and how each Fund is positioned against peer funds, as identified by management and/or Broadridge Investor Communication Solutions Inc. (“Broadridge”), an independent provider of investment company data. The Trustees reviewed information relating to the Adviser’s risk governance model and reports showing the Adviser’s compliance structure and ongoing compliance processes.
The Trustees also considered their knowledge of the nature and quality of services provided by the Adviser and its affiliates gained from their experience as Trustees of the Trust and in the financial industry in general. In addition, they considered the overall reputation and capabilities of the Adviser and its affiliates, the commitment of the Adviser to continue to provide high quality service to the Funds, their overall confidence in the Adviser’s integrity and the Adviser’s responsiveness to requests for additional information, questions or concerns raised by them.
Based upon these considerations and other factors, the Trustees concluded that they were satisfied with the nature, extent and quality of services provided to each Fund by the Adviser.
Fall-Out Benefits
The Trustees reviewed information regarding potential “fall-out” or ancillary benefits received by the Adviser and its affiliates as a result of their relationships with the Funds, particularly those benefits potentially impacted by the implementation of the unitary fee structure. The Trustees also
| | | | | | |
| | | |
| 156 | | | | J.P. MORGAN EXCHANGE-TRADED FUNDS | | OCTOBER 31, 2019 |
considered the benefits the Adviser receives as the result of JPMorgan Chase Bank, N.A.’s (“JPMCB”) roles as custodian, fund accountant and transfer agent for the Funds.
The Trustees also considered that adopting the New Management Agreement would benefit the Adviser by bringing the Funds in line with industry practice, which could potentially improve their marketability and ultimately increase the Adviser’s assets under management.
Costs of Services Provided and Profitability to the Adviser and its Affiliates
While information concerning the actual profitability to the Adviser and its affiliates with respect to the New Management Agreement was not available (because the New Management Agreement was not yet in effect), the Trustees received and considered information regarding the profitability to the Adviser in providing services to each Fund when renewing the then-existing Investment Advisory Agreement for each applicable Fund. In conjunction with the consideration of the New Management Agreement, the Trustees also considered that the Adviser’s profitability was not expected to increase in the near term as a result of the transition to the unitary fee structure. The Trustees reviewed and discussed the profitability information. The Trustees recognized that this information is not audited and represents the Adviser’s determination of its and its affiliates’ revenues from the contractual services provided to the Funds, less expenses of providing such services. Expenses include direct and indirect costs and are calculated using allocation methodologies developed by the Adviser. The Trustees also recognized that it is difficult to make direct comparisons of profitability from fund investment advisory contracts because comparative information is not generally publicly available and is affected by numerous factors, including the structure of the particular adviser, the types of funds it manages, its business mix, numerous assumptions regarding allocations and the fact that publicly-traded fund managers’ operating profits and net income are net of distribution and marketing expenses. Based upon their review, the Trustees concluded that the profitability to the Adviser under the then-existing Investment Advisory Agreement was not unreasonable in light of the services and benefits provided to each Fund.
The Trustees also considered the fees that the Adviser earned from the Funds for providing administrative services. The Trustees also considered the fees paid to JPMCB, also an affiliate of the Adviser, for custody, transfer agency and other related services for each Fund. It was noted that under the new fee structure, the Adviser will be responsible for providing the administrative services under the Management Agreement and for paying JPMCB for the services that it provides.
The Trustees also considered the fact that because each Fund’s total expense ratio would decrease, or stay the same, the Adviser’s profitability was not expected to increase in the near
term as a result of the transition to the unitary fee structure under the New Management Agreement. They also noted, however, that if Fund assets increase, Fund fees will not necessarily decrease even if the Fund and the Adviser achieve economies of scale. In this regard, the Trustees noted that after the New Management Agreement’s initial two-year term, the Trustees would have the opportunity to review the fee each year as part of the annual contract review process.
Based on these considerations and other factors, the Trustees concluded that the projected profitability to the Adviser under the New Management Agreement would not be unreasonable in light of the anticipated services and benefits provided to each Fund under the new fee structure.
Economies of Scale
In connection with its review of the then-existing Investment Advisory Agreement, the Board discussed potential economies of scale or other efficiencies that may result from increases in the Funds’ asset levels. The Trustees noted that the management fees and other expenses paid by the Funds under the New Management Agreement would be the same as or less than the amounts the Funds would have paid under the prior structure, which involved the then-existing Investment Advisory and Administration Agreements operating in conjunction with a terminable expense limitation agreement. The Trustees further considered that shareholders would benefit because expenses would be limited even when Funds are new or if assets decreased. The Trustees also considered the fact that increases in assets would not lead to fee decreases even if economies of scale were achieved, but that they will have the opportunity to further review the appropriateness of the fee payable to the Adviser under the New Management Agreement in the future. In this regard, the Trustees noted that after the New Management Agreement’s initial two-year term, the Trustees would have the opportunity to review the fee each year as part of the annual contract renewal process.
Investment Performance
The Trustees considered each Fund’s investment strategy and process, portfolio management team and competitive positioning against identified peer funds and benchmark indexes. Performance for each Fund was considered by the Board in approving the continuation of the Funds’ Investment Advisory Agreement in December 2018 and is also reviewed by the Trustees at regular Board Meetings. After considering such information, the Trustees concluded that the prospects for competitive future performance were acceptable.
Management Fees and Expense Ratios
The Trustees considered the contractual unitary management fee rate that will be paid by each Fund to the Adviser and compared that rate to the information prepared by Broadridge concerning management fee rates paid by other funds in the
| | | | | | | | |
| | | |
| OCTOBER 31, 2019 | | J.P. MORGAN EXCHANGE-TRADED FUNDS | | | | | 157 | |
BOARD APPROVAL OF MANAGEMENT AGREEMENT
(Unaudited) (continued)
same Broadridge category as each Fund. The Trustees also considered additional fund comparisons proposed by the Adviser. The Trustees also considered information comparing the management fee for the Fund to the expense ratios of mutual funds with similar investment objectives or in similar asset classes managed by the Adviser.
The Trustees noted that each Fund’s estimated unitary management fees were in line with fees for identified peer funds. After
considering the factors identified above, the Trustees concluded that the proposed management fees were reasonable.
Based on the foregoing, the Board, including all of the Independent Trustees, unanimously: (a) concluded that the terms of the New Management Agreement are fair and reasonable; (b) concluded that the proposed fees were reasonable in light of the services that the Adviser will provide to each Fund; and (c) approved the New Management Agreement.
| | | | | | |
| | | |
| 158 | | | | J.P. MORGAN EXCHANGE-TRADED FUNDS | | OCTOBER 31, 2019 |
J.P. Morgan Exchange-Traded Funds are distributed by JPMorgan Distribution Services, Inc., an indirect, wholly-owned subsidiary of JPMorgan Chase & Co.
Contact J.P. Morgan Exchange-Traded Funds at 1-844-457-6383 (844-4JPM ETF) for a fund prospectus. You can also visit us at www.jpmorganfunds.com. Investors should carefully consider the investment objectives and risks as well as charges and expenses of the fund before investing. The prospectus contains this and other information about the fund. Read the prospectus carefully before investing.
Investors may obtain information about the Securities Investor Protection Corporation (SIPC), including the SIPC brochure by visiting www.sipc.org or by calling SIPC at 202-371-8300.
Each Fund files a complete schedule of its fund holdings for the first and third quarters of its fiscal year with the SEC onForm N-PORT. Prior to March 31, 2019, each Fund filed a complete schedule of its fund holdings for the first and third quarters of its fiscal year with the SEC on Form N-Q. The Funds’ Form N-PORT and Form N-Q are available on the SEC’s website at http://www.sec.gov. Each Fund’s quarterly holdings can be found by visiting the J.P. Morgan Funds’ website at www.jpmorganfunds.com.
A description of each Fund’s policies and procedures with respect to the disclosure of each Fund’s holdings is available in the prospectus and Statement of Additional Information.
A copy of proxy policies and procedures is available without charge upon request by calling 1-844-457-6383 and on the Funds’ website at www.jpmorganfunds.com. A description of such policies and procedures is on the SEC’s website at www.sec.gov. The Trustees have delegated the authority to vote proxies for securities owned by the Funds to the Adviser. A copy of the Funds’ voting record for the most recent 12-month period ended June 30 is available on the SEC’s website at www.sec.gov or at the Funds’ website at www.jpmorganfunds.com no later than August 31 of each year. The Funds’ proxy voting record will include, among other things, a brief description of the matter voted on for each fund security, and will state how each vote was cast, for example, for or against the proposal.


J.P. Morgan Asset Management is the brand name for the asset management business of JPMorgan Chase & Co. and its affiliates worldwide.
| | | | |
| | © JPMorgan Chase & Co., 2019. All rights reserved. October 2019. | | AN-DAETF-1019 |
ITEM 2. CODE OF ETHICS.
Disclose whether, as of the end of the period covered by the report, the registrant has adopted a code of ethics that applies to the registrant’s principal executive officer, principal financial officer, principal accounting officer or controller, or persons performing similar functions, regardless of whether these individuals are employed by the registrant or a third party. If the registrant has not adopted such a code of ethics, explain why it has not done so.
The registrant must briefly describe the nature of any amendment, during the period covered by the report, to a provision of its code of ethics that applies to the registrant’s principal executive officer, principal financial officer, principal accounting officer or controller, or persons performing similar functions, regardless of whether these individuals are employed by the registrant or a third party, and that relates to any element of the code of ethics definition enumerated in paragraph (b) of this Item. The registrant must file a copy of any such amendment as an exhibit pursuant to Item 13(a)(1), unless the registrant has elected to satisfy paragraph (f) of this Item by positing its code of ethics on its website pursuant to paragraph (f)(2) of this Item, or by undertaking to provide its code of ethics to any person without charge, upon request, pursuant to paragraph (f)(3) of this Item.
If the registrant has, during the period covered by the report, granted a waiver, including an implicit waiver, from a provision of the code of ethics that applies to the registrant’s principal executive officer, principal financial officer, principal accounting officer or controller, or persons performing similar functions, regardless of whether these individuals are employed by the registrant or third party, that relates to one or more items set forth in paragraph (b) of this Item, the registrant must briefly describe the nature of the waiver, the name of the person to whom the waiver was granted, and the date of the waiver.
The Registrant has adopted a code of ethics that applies to the Registrant’s principal executive officer and principal financial officer. There were no amendments to the code of ethics or waivers granted with respect to the code of ethics in the period covered by the report.
ITEM 3. AUDIT COMMITTEE FINANCIAL EXPERT.
(a) (1) Disclose that the registrant’s board of directors has determined that the registrant either:
| | (i) | Has at least one audit committee financial expert serving on its audit committee; or |
| | (ii) | Does not have an audit committee financial expert serving on its audit committee. |
The Registrant’s Board of Trustees has determined that the Registrant has at least one audit committee financial expert serving on its audit committee. The Securities and Exchange Commission has stated that the designation or identification of a person as an audit committee financial expert pursuant to this Item 3 of Form N-CSR does not impose on such person any duties, obligations or liabilities that are greater than the duties, obligations and liabilities imposed on such person as a member of the Audit Committee and the Board of Trustees in the absence of such designation or identification.
(2) If the registrant provides the disclosure required by paragraph (a)(1)(i) of this Item, it must disclose the name of the audit committee financial expert and whether that person is “independent.” In order to be considered “independent” for purposes of this Item, a member of an audit committee may not, other than in his or her capacity as a member of the audit committee, the board of directors, or any other board committee:
| | (i) | Accept directly or indirectly any consulting, advisory, or other compensatory fee from the issuer; or |
| | (ii) | Be an “interested person” of the investment company as defined in Section 2(a)(19) of the Act (15 U.S.C. 80a-2(a)(19)). |
The audit committee financial experts are Gary L. French, Robert J. Grassi, Thomas P. Lemke, Lawrence R. Maffia and EmilyA. Youssouf, each of which is not an “interested person” of the Registrant and is also “independent” as defined by the U.S. Securities and Exchange Commission for purposes of audit committee financial expert determinations.
(3) If the registrant provides the disclosure required by paragraph (a)(1)(ii) of this Item, it must explain why it does not have an audit committee financial expert.
Not applicable.
ITEM 4. PRINCIPAL ACCOUNTANT FEES AND SERVICES.
(a) Disclose, under the caption Audit Fees, the aggregate fees billed for each of the last two fiscal years for professional services rendered by the principal accountant for the audit of the registrant’s annual financial statements or services that are normally provided by the accountant in connection with statutory and regulatory filings or engagements for those fiscal years.
AUDIT FEES
2019 – $722,000
2018 – $732,999
(b) Disclose, under the caption Audit-Related Fees, the aggregate fees billed in each of the last two fiscal years for assurance and related services by the principal accountant that are reasonably related to the performance of the audit of the registrant’s financial statements and are not reported under paragraph (a) of this Item. Registrants shall describe the nature of the services comprising the fees disclosed under this category.
AUDIT-RELATED FEES
2019 – $146,800
2018 – $142,410
Audit-related fees consist of security count procedures performed as required under Rule 17f-2 of the Investment Company Act of 1940 during the Registrant’s fiscal year.
(c) Disclose, under the caption Tax Fees, the aggregate fees billed in each of the last two fiscal years for professional services rendered by the principal accountant for tax compliance, tax advice, and tax planning. Registrants shall describe the nature of the services comprising the fees disclosed under this category.
TAX FEES
2019 – $278,620
2018 – $267,970
The tax fees consist of fees billed in connection with preparing the federal regulated investment company income tax returns for the Registrant for the tax years ended October 31, 2019 and 2018, respectively.
For the last fiscal year, no tax fees were required to be approved pursuant to paragraph (c)(7)(ii) of Rule 2-01 of Regulation S-X.
(d) Disclose, under the caption All Other Fees, the aggregate fees billed in each of the last two fiscal years for products and services provided by the principal accountant, other than the services reported in paragraphs (a) through (c) of this Item. Registrants shall describe the nature of the services comprising the fees disclosed under this category.
ALL OTHER FEES
2019 – $0
2018 – $0
(e)(1) Disclose the audit committee’s pre-approval policies and procedures described in paragraph (c)(7) of Rule 2-01 of Regulation S-X.
Pursuant to the Registrant’s Audit Committee Charter and written policies and procedures for the pre-approval of audit and non-audit services (the “Pre-approval Policy”), the Audit Committee pre-approves all audit and non-audit services performed by the Registrant’s independent public registered accounting firm for the Registrant. In addition, the Audit Committee pre-approves the auditor’s engagement for non-audit services with the Registrant’s investment adviser (not including a sub-adviser whose role is primarily portfolio management and is sub-contracted or overseen by another investment adviser) and any Service Affiliate in accordance with paragraph (c)(7)(ii) of Rule 2-01 of Regulation S-X, if the engagement relates directly to the operations and financial reporting of the Registrant. Proposed services may be
pre-approved either 1) without consideration of specific case-by- case services or 2) require the specific pre-approval of the Audit Committee. Therefore, initially the Pre-approval Policy listed a number of audit and non-audit services that have been approved by the Audit Committee, or which were not subject to pre- approval under the transition provisions of Sarbanes-Oxley Act of 2002 (the “Pre-approval List”). The Audit Committee annually reviews and pre-approves the services included on the Pre-approval List that may be provided by the independent public registered accounting firm without obtaining additional specific pre-approval of individual services from the Audit Committee. The Audit Committee adds to, or subtracts from, the list of general pre-approved services from time to time, based on subsequent determinations. All other audit and non-audit services not on the Pre-approval List must be specifically pre-approved by the Audit Committee.
One or more members of the Audit Committee may be appointed as the Committee’s delegate for the purposes of considering whether to approve such services. Any pre-approvals granted by the delegate will be reported, for informational purposes only, to the Audit Committee at its next scheduled meeting. The Audit Committee’s responsibilities to pre-approve services performed by the independent public registered accounting firm are not delegated to management.
(2) Disclose the percentage of services described in each of paragraphs (b) through (d) of this Item that were approved by the audit committee pursuant to paragraph (c)(7)(i)(C) of Rule 2-01 of Regulation S-X.
2019 – 0.0%
2018 – 0.0%
(f) If greater than 50 percent, disclose the percentage of hours expended on the principal accountant’s engagement to audit the registrant’s financial statements for the most recent fiscal year that were attributed to work performed by persons other than the principal accountant’s full-time, permanent employees.
Not applicable.
(g) Disclose the aggregate non-audit fees billed by the registrant’s accountant for services rendered to the registrant, and rendered to the registrant’s investment adviser (not including any sub-adviser whose role is primarily portfolio management and is subcontracted with or overseen by another investment adviser), and any entity controlling, controlled by, or under common control with the adviser that provides ongoing services to the registrant for each of the last two fiscal years of the registrant.
The aggregate non-audit fees billed by the independent registered public accounting firm for services rendered to the Registrant, and rendered to Service Affiliates, for the last two calendar year ends were:
2019 – $32.2 million
2018 – $32.9 million
(h) Disclose whether the registrant’s audit committee of the board of directors has considered whether the provision of non-audit services that were rendered to the registrant’s investment adviser (not including any subadviser whose role is primarily portfolio management and is subcontracted with or overseen by another investment adviser), and any entity controlling, controlled by, or under common control with the investment adviser that provides ongoing services to the registrant that were not pre-approved pursuant to paragraph (c)(7)(ii) of Rule 2-01 of Regulation S-X is compatible with maintaining the principal accountant’s independence.
The Registrant’s Audit Committee has considered whether the provision of the non-audit services that were rendered to Service Affiliates that were not pre-approved (not requiring pre-approval) is compatible with maintaining the independent public registered accounting firm’s independence. All services provided by the independent public registered accounting firm to the Registrant or to Service Affiliates that were required to be pre-approved were pre-approved as required.
ITEM 5. AUDIT COMMITTEE OF LISTED REGISTRANTS.
(a) If the registrant is a listed issuer as defined in Rule 10A-3 under the Exchange Act (17CFR 240.10A-3), state whether or not the registrant has a separately-designated standing audit committee established in accordance with Section 3(a)(58)(A) of the Exchange Act (15 U.S.C. 78c(a)(58)(A)). If the registrant has such a committee, however designated, identify each committee member. If the entire board of directors is acting as the registrant’s audit committee as specified in Section 3(a)(58)(B) of the Exchange Act (15 U.S.C. 78c(a)(58)(B)), so state.
The registrant has a separately designated Audit Committee established in accordance with Section 3(a)(58)(A) of the Exchange Act. The members of the Audit Committee are Gary L. French, Robert J. Grassi, Thomas P. Lemke, Lawrence R. Maffia and Emily A. Youssouf.
(b) If applicable, provide the disclosure required by Rule 10A-3(d) under the Exchange Act (17CFR 240.10A-3(d)) regarding an exemption from the listing standards for all audit committees.
Not applicable.
ITEM 6. SCHEDULE OF INVESTMENTS.
File Schedule I – Investments in securities of unaffiliated issuers as of the close of the reporting period as set forth in Section 210.12-12 of Regulation S-X, unless the schedule is included as part of the report to shareholders filed under Item 1 of this Form.
Included in Item 1.
ITEM 7. DISCLOSURE OF PROXY VOTING POLICIES AND PROCEDURES FOR CLOSED-END MANAGEMENT INVESTMENT COMPANIES.
A closed-end management investment company that is filing an annual report on this Form N-CSR must, unless it invests exclusively in non-voting securities, describe the policies and procedures that it uses to determine how to vote proxies relating to portfolio securities, including the procedures that the company uses when a vote presents a conflict between the interests of its shareholders, on the one hand, and those of the company’s investment adviser; principal underwriter; or any affiliated person (as defined in Section 2(a)(3) of the Investment Company Act of 1940 (15 U.S.C. 80a-2(a)(3)) and the rules thereunder) of the company, its investment adviser, or its principal underwriter, on the other. Include any policies and procedures of the company’s investment adviser, or any other third party, that the company uses, or that are used on the company’s behalf, to determine how to vote proxies relating to portfolio securities.
Not applicable.
ITEM 8. PORTFOLIO MANAGERS OF CLOSED-END MANAGEMENT INVESTMENT COMPANIES.
Not applicable.
ITEM 9. PURCHASE OF EQUITY SECURITIES BY CLOSED-END MANAGEMENT INVESTMENT COMPANY AND AFFILIATED PURCHASERS.
(a) If the registrant is a closed-end management investment company, provide the information specified in paragraph (b) of this Item with respect to any purchase made by or on behalf of the registrant or any “affiliated purchaser,” as defined in Rule 10b-18(a)(3) under the Exchange Act (17 CFR 240.10b-18(a)(3)), of shares or other units of any class of the registrant’s equity securities that is registered by the registrant pursuant to Section 12 of the Exchange Act (15 U.S.C. 781).
Not applicable.
ITEM 10. SUBMISSION OF MATTERS TO A VOTE OF SECURITY HOLDERS.
Describe any material changes to the procedures by which shareholders may recommend nominees to the registrant’s board of directors, where those changes were implemented after the registrant last provided disclosure in response to the requirements of Item 7(d)(2)(ii)(G) of Schedule 14A (17 CFR 240.14a-101), or this Item.
No material changes to report.
ITEM 11. CONTROLS AND PROCEDURES.
(a) Disclose the conclusions of the registrant’s principal executive and principal financial officers, or persons performing similar functions, regarding the effectiveness of the registrant’s disclosure controls and procedures (as defined in Rule 30a-3(c) under the Act (17 CFR 270.30a-3(c))) as of a date within 90 days of the filing date of the report that includes the disclosure required by this paragraph, based on the evaluation of these controls and procedures required by Rule 30a-3(b) under the Act (17 CFR 270.30a-3(b))
and Rules 13a-15(b) or 15d-15(b) under the Exchange Act (17 CFR 240.13a-15(b) or 240.15d-15(b)).
The Registrant’s principal executive and principal financial officers have concluded, based on their evaluation of the Registrant’s disclosure controls and procedures as of a date within 90 days of the filing date of this report, that the Registrant’s disclosure controls and procedures are reasonably designed to ensure that information required to be disclosed by the Registrant on Form N-CSR is recorded, processed, summarized and reported within the required time periods and that information required to be disclosed by the Registrant in the reports that it files or submits on Form N-CSR is accumulated and communicated to the Registrant’s management, including its principal executive and principal financial officers, as appropriate to allow timely decisions regarding required disclosure.
(b) Disclose any change in the registrant’s internal control over financial reporting (as defined in Rule 30a-3(d) under the Act (17 CFR 270.30a-3(d)) that occurred during the registrant’s second fiscal quarter of the period covered by this report that has materially affected, or is reasonably likely to materially affect, the registrant’s internal control over financial reporting.
There were no changes in the Registrant’s internal control over financial reporting that occurred during the last fiscal quarter covered by this report that have materially affected, or are reasonably likely to materially affect, the Registrant’s internal control over financial reporting.
ITEM 12. DISCLOSURE OF SECURITIES LENDING ACTIVITIES FORCLOSED-END MANAGEMENT INVESTMENT COMPANIES.
Not applicable.
ITEM 13. EXHIBITS.
| (a) | File the exhibits listed below as part of this Form. Letter or number the exhibits in the sequence indicated. |
(a)(1) Any code of ethics, or amendment thereto, that is the subject of the disclosure required by Item 2, to the extent that the registrant intends to satisfy the Item 2 requirements through filing of an exhibit.
Code of Ethics applicable to its Principal Executive and Principal Financial Officers pursuant to Section 406 of the Sarbanes-Oxley Act of 2002 attached hereto.
(a)(2) A separate certification for each principal executive officer and principal financial officer of the registrant as required by Rule 30a-2(a) under the Act (17 CFR 270.30a-2).
Certifications pursuant to Rule 30a-2(a) under the Investment Company Act of 1940 are attached hereto.
(a)(3) Any written solicitation to purchase securities under Rule 23c-1 under the Act (17 CFR 270.23c-1) sent or given during the period covered by the report by or on behalf of the registrant to 10 or more persons.
Not applicable.
(b) A separate or combined certification for each principal executive officer and principal officer of the registrant as required by Rule 30a-2(b) under the Act of 1940.
Certifications pursuant to Rule 30a-2(b) under the Investment Company Act of 1940 are attached hereto.
SIGNATURES
Pursuant to the requirements of the Securities Exchange Act of 1934 and the Investment Company Act of 1940, the registrant has duly caused this report to be signed on its behalf by the undersigned, thereunto duly authorized.
J.P. Morgan Exchange-Traded Fund Trust
| | |
| By: | | /s/ Joanna M. Gallegos |
| | Joanna M. Gallegos |
| | President and Principal Executive Officer |
| | January 2, 2020 |
Pursuant to the requirements of the Securities Exchange Act of 1934 and the Investment Company Act of 1940, this report has been signed below by the following persons on behalf of the registrant and in the capacities and on the dates indicated.
| | |
| By: | | /s/ Joanna M. Gallegos |
| | Joanna M. Gallegos |
| | President and Principal Executive Officer |
| | January 2, 2020 |
| |
| By: | | /s/ Lauren A. Paino |
| | Lauren A. Paino |
| | Treasurer and Principal Financial Officer |
| | January 2, 2020 |