UNITED STATES
SECURITIES AND EXCHANGE COMMISSION
Washington, D.C. 20549
FORM N-CSR
CERTIFIED SHAREHOLDER REPORT OF REGISTERED
MANAGEMENT INVESTMENT COMPANIES
Investment Company Act file number: 811-22903
J.P. Morgan Exchange-Traded Fund Trust
(Exact name of registrant as specified in charter)
277 Park Avenue
New York, NY 10172
(Address of principal executive offices) (Zip code)
Gregory S. Samuels
J.P. Morgan Investment Management Inc.
277 Park Avenue
New York, NY 10172
(Name and Address of Agent for Service)
With copies to:
| | |
Elizabeth A. Davin, Esq. JPMorgan Chase & Co. 1111 Polaris Parkway Columbus, OH 43240 | | Jon S. Rand, Esq. Dechert LLP 1095 Avenue of the Americas New York, NY 10036 |
Registrant’s telephone number, including area code: 1-844-457-6383
Date of fiscal year end: Last day of February
Date of reporting period: March 1, 2020 through August 31, 2020
Form N-CSR is to be used by management investment companies to file reports with the Commission not later than 10 days after the transmission to stockholders of any report that is required to be transmitted to stockholders under Rule 30e-1 under the Investment Company Act of 1940 (17 CFR 270.30e-1). The Commission may use the information provided on Form N-CSR in its regulatory, disclosure review, inspection, and policymaking roles.
A registrant is required to disclose the information specified by Form N-CSR, and the Commission will make this information public. A registrant is not required to respond to the collection of information contained in Form N-CSR unless the Form displays a currently valid Office of Management and Budget (“OMB”) control number. Please direct comments concerning the accuracy of the information collection burden estimate and any suggestions for reducing the burden to Secretary, Securities and Exchange Commission, 450 Fifth Street, NW, Washington, DC 20549-0609. The OMB has reviewed this collection of information under the clearance requirements of 44 U.S.C. Section 3507.
ITEM 1. REPORTS TO STOCKHOLDERS.
The following is a copy of the report transmitted to shareholders pursuant to Rule 30e-1 under the Investment Company Act of 1940 (17 CFR 270.30e-1).
Semi-Annual Report
J.P. Morgan Exchange-Traded Funds
August 31, 2020 (Unaudited)
JPMorgan BetaBuilders 1-5 Year U.S. Aggregate Bond ETF
JPMorgan Core Plus Bond ETF
JPMorgan Corporate Bond Research Enhanced ETF
JPMorgan High Yield Research Enhanced ETF
JPMorgan International Bond Opportunities ETF (formerly known as JPMorgan Global Bond Opportunities ETF )
JPMorgan Municipal ETF
JPMorgan U.S. Aggregate Bond ETF
JPMorgan Ultra-Short Income ETF
JPMorgan Ultra-Short Municipal Income ETF
JPMorgan USD Emerging Markets Sovereign Bond ETF
Beginning on January 1, 2021, as permitted by regulations adopted by the Securities and Exchange Commission, paper copies of the Funds’ annual and semi-annual shareholder reports will no longer be sent by mail, unless you specifically request paper copies of the reports. Instead, the reports will be made available on the Funds’ website www.jpmorganfunds.com and you will be notified by mail each time a report is posted and provided with a website to access the report. If you already elected to receive shareholder reports electronically, you will not be affected by this change and you need not take any action.
You may elect to receive shareholder reports and other communications from the Funds electronically anytime by contacting your financial intermediary (such as a broker dealer, bank, or retirement plan).
Alternatively, you may elect to receive paper copies of all future reports free of charge by contacting your financial intermediary. Your election to receive paper reports will apply to all funds held within your account(s).
CONTENTS
Investments in a Fund are not bank deposits or obligations of, or guaranteed or endorsed by, any bank and are not insured or guaranteed by the FDIC, the Federal Reserve Board or any other government agency. You could lose money if you sell when a Fund’s share price is lower than when you invested.
Past performance is no guarantee of future performance. The general market views expressed in this report are opinions based on market and other conditions through the end of the reporting period and are subject to change without notice. These views are not intended to predict the future performance of a Fund or the securities markets. References to specific securities and their issuers are for illustrative purposes only and are not intended to be, and should not be interpreted as, recommendations to purchase or sell such securities. Such views are not meant as investment advice and may not be relied on as an indication of trading intent on behalf of the Funds.
Prospective investors should refer to the Funds’ prospectuses for a discussion of the Funds’ investment objectives, strategies and risks. Call J.P. Morgan Exchange-Traded Funds at (844) 457-6383 for a prospectus containing more complete information about a Fund, including management fees and other expenses. Please read it carefully before investing.
Shares are bought and sold throughout the day on an exchange at market price (not at net asset value) through a brokerage account, and are not individually subscribed and redeemed from a Fund. Shares may only be subscribed and redeemed directly from a Fund by Authorized Participants, in large creation/redemption units. Brokerage commissions will reduce returns.
PRESIDENT’S LETTER
October 6, 2020 (Unaudited)
Dear Shareholder,
While the U.S. economy has suffered from a severe contraction and historically high job losses, financial markets have managed to rebound from lows reached in March 2020, backed by unprecedented central bank support, strength in corporate earnings in select sectors and investor optimism about efforts to contain the spread of COVID-19.
| | |
 | | “While the economic and financial market environments may remain challenging, J.P. Morgan Exchange-Traded Funds will continue to seek to provide innovative and quality solutions to help investors build durable portfolios.” – Brian S. Shlissel |
The six month reporting period that ended August 31, 2020, began amid a sharp sell-off in financial markets as the World Health Organization declared the novel coronavirus a pandemic and large sectors of national economies across the globe closed down. The U.S. Federal Reserve (the Fed) responded by cutting interest rates and headed off a potential liquidity crisis in financial markets by creating an array of lending and asset purchase programs in the second half of March 2020. In the following months, financial market volatility subsided and asset prices generally began to rebound.
Meanwhile, the U.S. Congress also responded with a $2.2 trillion fiscal stimulus package that included direct payments to individuals, increased unemployment compensation and aid to state and local governments and businesses. However, the
stimulus program ended in July 2020 and negotiations for further stimulus remained deadlocked at the end of the reporting period. Over the course of the period, U.S. unemployment fell from a high of 14.7% in April to 8.4% in August. By the end of the second quarter of 2020, U.S. gross domestic product had decreased 31.4%.
However, financial markets largely provided positive returns for the reporting period despite investor uncertainty over the trajectory of the pandemic and the outcome of U.S. elections. For the six months ended August 31, 2020, the S&P 500 Index returned 19.6% and the Bloomberg Barclays U.S. Aggregate Index returned 2.9%.
While the economic and financial market environments may remain challenging, J.P. Morgan Exchange-Traded Funds will continue to seek to provide innovative and quality solutions to help investors build durable portfolios.
Sincerely,

Brian S. Shlissel
Interim President, J.P. Morgan Exchange-Traded Funds
J.P Morgan Asset Management
1-844-4JPM-ETF or jpmorgan.com/etfs for more information
| | | | | | | | |
| | | |
| AUGUST 31, 2020 | | J.P. MORGAN EXCHANGE-TRADED FUNDS | | | | | 1 | |
J.P. Morgan Exchange-Traded Funds
MARKET OVERVIEW
SIX MONTHS ENDED AUGUST 31, 2020 (Unaudited)
The reporting period began amid a steep sell-off in global financial markets as COVID-19 was declared a pandemic and economic activity was sharply curtailed. However, from April 2020 through the end of August 2020, financial markets largely rebounded amid unprecedented support from leading central banks and the efforts of national governments to both provide fiscal stimulus and limit the spread of COVID-19.
Investor uncertainty about the impact of the global response to the pandemic led to a sharp decline in global asset prices in February and March 2020 and increased demand for U.S. Treasury bonds and sovereign debt from other developed market nations. A potential liquidity crisis in U.S. credit markets was headed off by the U.S. Federal Reserve, which slashed interest rates and unleashed an array of programs in mid-March designed to ensure the flow of credit in the private and public sectors. Globally, leading central banks also responded with lower interest rates and/or asset purchasing programs.
In the subsequent months, bond markets recovered somewhat and issuance of new bonds increased. Investment grade corporate debt and high yield debt (also known as “junk bonds”) rallied as investors sought higher yields amid falling interest rates and historically low yields on U.S. Treasury bonds. While emerging markets debt also rebounded somewhat during the reporting period, select emerging market nations were hurt by a record drop in global oil prices while others faced rising pandemic infection rates. Overall, higher quality bonds outperformed lower quality bonds within each sector of the market during the reporting period and bonds of shorter duration underperformed longer duration bonds. Generally, bonds of longer duration experience a larger increase in price when interest rates fall. For the six months ended August 31, 2020, the Bloomberg Barclays U.S. Aggregate Index returned 2.98% and the Bloomberg Barclays Multiverse Index returned 3.98%.
| | | | | | |
| | | |
| 2 | | | | J.P. MORGAN EXCHANGE-TRADED FUNDS | | AUGUST 31, 2020 |
JPMorgan BetaBuilders 1-5 Year U.S. Aggregate Bond ETF
FUND COMMENTARY
SIX MONTHS ENDED AUGUST 31, 2020 (Unaudited)
| | | | |
| REPORTING PERIOD RETURN: | | | |
| Net Asset Value* | | | 2.27% | |
| Market Price** | | | 2.82% | |
| Bloomberg Barclays Short-Term U.S. Aggregate Bond Index | | | 2.32% | |
| |
| Net Assets as of 8/31/2020 | | $ | 41,951,397 | |
| Duration as of 8/31/2020 | | | 2.7 Years | |
INVESTMENT OBJECTIVE***
The JPMorgan BetaBuilders 1-5 Year U.S. Aggregate Bond ETF (the “Fund”) seeks investment results that closely correspond, before fees and expenses, to the performance of the Bloomberg Barclays Short-Term U.S. Aggregate Bond Index (the “Underlying Index”).
INVESTMENT APPROACH
The Underlying Index, which includes bonds with remaining effective maturities between one and five years, is a subset of the Bloomberg Barclays U.S. Aggregate Index which consists of U.S. dollar denominated investment-grade taxable bonds. Using a “passive” investment approach, the Fund attempts to replicate the Underlying Index as closely as possible and invests at least 80% of its assets in securities included in the Underlying Index.
HOW DID THE FUND PERFORM?
For the six months ended August 31, 2020, the Fund performed in line with the Underlying Index, before considering the effects of operating expenses, fees and tax management of the Fund’s portfolio.
The Fund’s and the Underlying Index’s exposure to U.S. Treasury bonds was a leading contributor to performance during the reporting period.
HOW WAS THE FUND POSITIONED?
At the end of the reporting period, the Fund’s and the Underlying Index’s largest allocations were to the U.S. Treasury and corporate bond sectors and the smallest allocations were to the securitized debt and government related bond sectors.
| | | | |
PORTFOLIO COMPOSITION**** | |
U.S. Treasury Obligations | | | 54.8 | % |
Corporate Bonds | | | 25.7 | |
Mortgage-Backed Securities | | | 7.4 | |
Supranational | | | 3.3 | |
U.S. Government Agency Securities | | | 3.3 | |
Commercial Mortgage-Backed Securities | | | 2.4 | |
Foreign Government Securities | | | 1.4 | |
Others (each less than 1.0%) | | | 1.0 | |
Short-Term Investments | | | 0.7 | |
| * | | The return shown is based on net asset value and may differ from the return shown in the financial highlights, which reflects adjustments made to the net asset value in accordance with accounting principles generally accepted in the United States of America. The net asset value was $26.22 as of August 31, 2020. |
| ** | | Market price return was calculated assuming an initial investment made at the market price at the beginning of the reporting period, reinvestment of all dividends and distributions at market price during the period, and sale at the market price on the last day of the period. The price used to calculate the market price return was the closing price on the Cboe BZX Exchange, Inc. As of August 31, 2020, the closing price was $26.34. |
| *** | | The adviser seeks to achieve the Fund’s objective. There can be no guarantee it will be achieved. |
| **** | | Percentages indicated are based on total investments as of August 31, 2020. The Fund’s composition is subject to change. |
| | | | | | | | |
| | | |
| AUGUST 31, 2020 | | J.P. MORGAN EXCHANGE-TRADED FUNDS | | | | | 3 | |
JPMorgan BetaBuilders 1-5 Year U.S. Aggregate Bond ETF
FUND COMMENTARY
SIX MONTHS ENDED AUGUST 31, 2020 (Unaudited) (continued)
| | | | | | | | | | | | | | | | |
AVERAGE ANNUAL TOTAL RETURNS AS OF AUGUST 31, 2020 (Unaudited) | |
| | | INCEPTION DATE | | | SIX MONTHS* | | | 1 YEAR | | | SINCE
INCEPTION | |
JPMorgan BetaBuilders 1-5 Year U.S. Aggregate Bond ETF | | | | | | | | | | | | | | | | |
Net Asset Value | | | March 12, 2019 | | | | 2.27 | % | | | 4.61 | % | | | 5.60 | % |
Market Price | | | | | | | 2.82 | % | | | 5.01 | % | | | 5.92 | % |
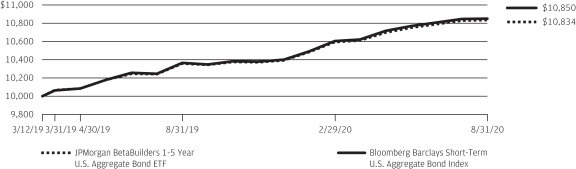
LIFE OF FUND PERFORMANCE (3/12/19 TO 8/31/20)
The performance quoted is past performance and is not a guarantee of future results. Exchange-traded funds are subject to certain market risks. Investment returns and principal value of an investment will fluctuate so that an investor’s shares, when sold or redeemed, may be worth more or less than their original cost. Current performance may be higher or lower than the performance data shown. For up-to-date, month-end performance information please call 1-844-457-6383.
Fund commenced operations on March 12, 2019.
The graph illustrates comparative performance for $10,000 invested in shares of the JPMorgan BetaBuilders 1-5 Year U.S. Aggregate Bond ETF and the Bloomberg Barclays Short-Term U.S. Aggregate Bond Index from March 12, 2019 to August 31, 2020. The performance of the Fund reflects the deduction of Fund expenses and assumes reinvestment of all dividends and capital gain distributions, if any. The performance of the Bloomberg Barclays Short-Term U.S. Aggregate Bond Index does not reflect the deduction of expenses associated with an exchange-traded fund and has been adjusted to reflect reinvestment of
all dividends and capital gain distributions of the securities included in the Index, if applicable. The Bloomberg Barclays Short-Term U.S. Aggregate Bond Index is an unmanaged index that represents securities that are SEC-registered, taxable, and dollar denominated. The index covers the U.S. investment grade fixed rate bond market, with index components for government and corporate securities, mortgage pass-through securities, and asset-backed securities. Investors cannot invest directly in an index.
Fund performance reflects the waiver of the Fund’s fees and reimbursement of expenses for certain periods since the applicable inception date. Without these waivers and reimbursements, performance would have been lower. Also, performance shown in this section does not reflect the deduction of taxes that a shareholder may pay on Fund distributions or on gains resulting from redemption or sale of Fund shares.
The returns shown are based on net asset values calculated for shareholder transactions and may differ from the returns shown in the financial highlights, which reflect adjustments made to the net asset values in accordance with accounting principles generally accepted in the United States of America.
| | | | | | |
| | | |
| 4 | | | | J.P. MORGAN EXCHANGE-TRADED FUNDS | | AUGUST 31, 2020 |
JPMorgan Core Plus Bond ETF
FUND COMMENTARY
SIX MONTHS ENDED AUGUST 31, 2020 (Unaudited)
| | | | |
| REPORTING PERIOD RETURN: | | | |
| Net Asset Value* | | | 3.62% | |
| Market Price** | | | 3.05% | |
| Bloomberg Barclays U.S. Aggregate Index | | | 2.98% | |
| |
| Net Assets as of 8/31/2020 | | $ | 105,830,165 | |
| Duration as of 8/31/2020 | | | 5.9 Years | |
INVESTMENT OBJECTIVE***
The JPMorgan Core Plus Bond ETF (the “Fund”) seeks to provide a high level of current income by investing primarily in a diversified portfolio of high, medium and low-grade debt securities.
INVESTMENT APPROACH
The Fund invests primarily in investment grade bonds, with the flexibility to invest up to 35% in high yield debt (also known as “junk bonds”). Up to 35% of the Fund’s assets may be invested in foreign securities. The portfolio managers allocate the Fund’s assets among a range of sectors based on strategic positioning and other tactical considerations. In buying and selling investments for the Fund, the adviser looks for market sectors and securities that it believes will perform well over time. The adviser selects individual securities after performing a risk/reward analysis that includes an evaluation of interest rate risk, credit risk, currency risk, legal provisions and the structure of the transactions.
HOW DID THE FUND PERFORM?
For the six months ended August 31, 2020, the Fund outperformed the Bloomberg Barclays U.S. Aggregate Index (the “Index”).
Relative to the Benchmark, the Fund’s overweight allocations to non-agency mortgage-backed securities, commercial mortgage-backed securities and asset-backed securities were leading detractors from performance as those securities did not fully rebound from the sell-off in March 2020.
The Fund’s underweight allocation to investment grade debt was a leading contributor to relative performance as the sector did not fully rebound from the sell-off in March 2020.
HOW WAS THE FUND POSITIONED?
The Fund’s portfolio managers focused on security selection and relative value, which seeks to take advantage of pricing discrepancies between individual securities or market sectors. The Fund’s portfolio managers employed macro-economic
analysis to determine asset allocations and positioning on the yield curve. The yield curve shows the relationship between yields and maturity dates for a set of similar bonds at a given point in time. The Fund’s portfolio managers used bottom-up research and top-down macro perspective to construct a diversified portfolio of fixed income securities. As a result of this process, the Fund’s largest sector allocations at the end of the reporting period were to corporate bonds and mortgage-backed securities and its smallest allocations were to emerging markets debt and commercial mortgage-backed securities.
| | | | |
PORTFOLIO COMPOSITION**** | |
Corporate Bonds | | | 25.0 | % |
Mortgage-Backed Securities | | | 21.2 | |
U.S. Treasury Obligations | | | 13.1 | |
Asset-Backed Securities | | | 11.8 | |
Collateralized Mortgage Obligations | | | 2.5 | |
Commercial Mortgage-Backed Securities | | | 2.2 | |
Others (each less than 1.0%) | | | 0.0 | (a) |
Short-Term Investments | | | 24.2 | |
| * | | The return shown is based on net asset value and may differ from the return shown in the financial highlights, which reflects adjustments made to the net asset value in accordance with accounting principles generally accepted in the United States of America. The net asset value was $55.70 as of August 31, 2020. |
| ** | | Market price return was calculated assuming an initial investment made at the market price at the beginning of the reporting period, reinvestment of all dividends and distributions at market price during the period, and sale at the market price on the last day of the period. The price used to calculate the market price return was the closing price on the Cboe BZX Exchange, Inc. As of August 31, 2020, the closing price was $55.68. |
| *** | | The adviser seeks to achieve the Fund’s objective. There can be no guarantee it will be achieved. |
| **** | | Percentages indicated are based on total investments as of August 31, 2020. The Fund’s composition is subject to change. |
| (a) | | Amount rounds to less than 0.1% |
| | | | | | | | |
| | | |
| AUGUST 31, 2020 | | J.P. MORGAN EXCHANGE-TRADED FUNDS | | | | | 5 | |
JPMorgan Core Plus Bond ETF
FUND COMMENTARY
SIX MONTHS ENDED AUGUST 31, 2020 (Unaudited) (continued)
| | | | | | | | | | | | | | | | |
AVERAGE ANNUAL TOTAL RETURNS AS OF AUGUST 31, 2020 (Unaudited) | |
| | | INCEPTION DATE | | | SIX MONTHS* | | | 1 YEAR | | | SINCE INCEPTION | |
JPMorgan Core Plus Bond ETF | | | | | | | | | | | | | | | | |
Net Asset Value | | | January 28, 2019 | | | | 3.62 | % | | | 7.00 | % | | | 10.01 | % |
Market Price | | | | | | | 3.05 | % | | | 6.72 | % | | | 9.98 | % |
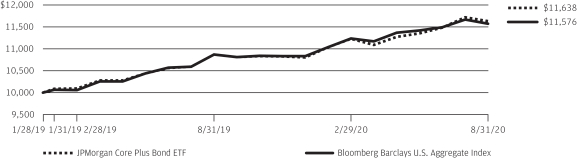
LIFE OF FUND PERFORMANCE (1/28/19 TO 8/31/20)
The performance quoted is past performance and is not a guarantee of future results. Exchange-traded funds are subject to certain market risks. Investment returns and principal value of an investment will fluctuate so that an investor’s shares, when sold or redeemed, may be worth more or less than their original cost. Current performance may be higher or lower than the performance data shown. For up-to-date, month-end performance information please call 1-844-457-6383.
Fund commenced operations on January 28, 2019.
The graph illustrates comparative performance for $10,000 invested in shares of the JPMorgan Core Plus Bond ETF and the Bloomberg Barclays U.S. Aggregate Index from January 28, 2019 to August 31, 2020. The performance of the Fund reflects the deduction of Fund expenses and assumes reinvestment of all dividends and capital gain distributions, if any. The performance of the Bloomberg Barclays U.S. Aggregate Index does not reflect the deduction of expenses associated with an exchange-traded fund and has been adjusted to reflect reinvestment of all dividends and capital gain distributions of the
securities included in the Index, if applicable. The Bloomberg Barclays U.S. Aggregate Index is an unmanaged index that represents securities that are SEC-registered, taxable, and dollar denominated. The index covers the U.S. investment grade fixed rate bond market, with index components for government and corporate securities, mortgage pass-through securities, and asset-backed securities. Investors cannot invest directly in an index.
Fund performance reflects the waiver of the Fund’s fees and reimbursement of expenses for certain periods since the applicable inception date. Without these waivers and reimbursements, performance would have been lower. Also, performance shown in this section does not reflect the deduction of taxes that a shareholder may pay on Fund distributions or on gains resulting from redemption or sale of Fund shares.
The returns shown are based on net asset values calculated for shareholder transactions and may differ from the returns shown in the financial highlights, which reflect adjustments made to the net asset values in accordance with accounting principles generally accepted in the United States of America.
| | | | | | |
| | | |
| 6 | | | | J.P. MORGAN EXCHANGE-TRADED FUNDS | | AUGUST 31, 2020 |
JPMorgan Corporate Bond Research Enhanced ETF
FUND COMMENTARY
SIX MONTHS ENDED AUGUST 31, 2020 (Unaudited)
| | | | |
| REPORTING PERIOD RETURN: | |
| Net Asset Value* | | | 3.02% | |
| Market Price** | | | 2.81% | |
| Bloomberg Barclays U.S. Corporate Bond Index | | | 3.11% | |
| |
| Net Assets as of 8/31/2020 | | | $42,921,995 | |
| Duration as of 8/31/2020 | | | 8.6 Years | |
INVESTMENT OBJECTIVE***
The JPMorgan Corporate Bond Research Enhanced ETF (the “Fund”) seeks to provide total return from a portfolio of investment grade corporate bonds.
INVESTMENT APPROACH
The Fund invests primarily in investment grade bonds and uses fundamental credit research for enhanced security selection and sector allocation. The Fund seeks to outperform the Bloomberg Barclays U.S. Corporate Bond Index (the “Index”) while maintaining similar risk characteristics.
HOW DID THE FUND PERFORM?
For the six months ended August 31, 2020, the Fund underperformed the Index.
Relative to the Index, the Fund’s security selection within the information technology sector was a leading detractor from performance. Specifically, the Fund’s allocation to Dell Technologies Inc., a provider of hardware, software and services, detracted from performance as the company reduced its debts and reported lower-than-expected earnings during the reporting period. In the energy sector, the Fund’s overweight allocation to Occidental Petroleum Corp. also detracted from relative performance as the company’s bonds were downgraded to below investment grade in March 2020.
The Fund’s security selection within the financials sector, specifically within banking sub-sector, was a leading contributor to performance. The Fund’s overweight position in T-Mobile US Inc. was the largest individual contributor to performance due to the company’s better-than-expected second quarter earnings.
HOW WAS THE FUND POSITIONED?
During the reporting period, the Fund’s portfolio managers sought to invest in companies that they believed were attractive from a fundamental and relative value analysis, while seeking to underweight companies that were unattractive based on their analysis. From a sector perspective, the Fund remained largely in line with the sector weightings in the Index, with its largest underweight allocations to the insurance and basic industry sectors and its largest overweight allocations to the consumer non-cyclicals and communications sectors.
| | | | |
PORTFOLIO COMPOSITION**** | |
| Corporate Bonds | | | 99.1 | % |
| Others (each less than 1.0%) | | | 0.6 | |
| Short-Term Investments | | | 0.3 | |
| * | | The return shown is based on net asset value and may differ from the return shown in the financial highlights, which reflects adjustments made to the net asset value in accordance with accounting principles generally accepted in the United States of America. The net asset value was $57.23 as of August 31, 2020. |
| ** | | Market price return was calculated assuming an initial investment made at the market price at the beginning of the reporting period, reinvestment of all dividends and distributions at market price during the period, and sale at the market price on the last day of the period. The price used to calculate the market price return was the closing price on the NYSE Arca, Inc. As of August 31, 2020, the closing price was $57.36. |
| *** | | The adviser seeks to achieve the Fund’s objective. There can be no guarantee it will be achieved. |
| **** | | Percentages indicated are based on total investments as of August 31, 2020. The Fund’s composition is subject to change. |
| | | | | | | | |
| | | |
| AUGUST 31, 2020 | | J.P. MORGAN EXCHANGE-TRADED FUNDS | | | | | 7 | |
JPMorgan Corporate Bond Research Enhanced ETF
FUND COMMENTARY
SIX MONTHS ENDED AUGUST 31, 2020 (Unaudited) (continued)
| | | | | | | | | | | | | | | | |
AVERAGE ANNUAL TOTAL RETURNS AS OF AUGUST 31, 2020 (Unaudited) | |
| | | INCEPTION DATE | | | SIX MONTHS* | | | 1 YEAR | | | SINCE
INCEPTION | |
JPMorgan Corporate Bond Research Enhanced ETF | | | | | | | | | | | | | | | | |
Net Asset Value | | | December 12, 2018 | | | | 3.02 | % | | | 7.15 | % | | | 12.86 | % |
Market Price | | | | | | | 2.81 | % | | | 7.19 | % | | | 13.00 | % |
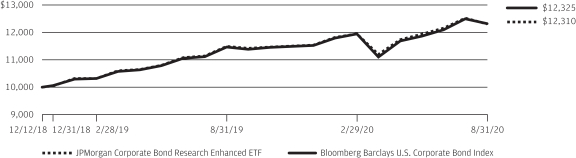
LIFE OF FUND PERFORMANCE (12/12/18 TO 8/31/20)
The performance quoted is past performance and is not a guarantee of future results. Exchange-traded funds are subject to certain market risks. Investment returns and principal value of an investment will fluctuate so that an investor’s shares, when sold or redeemed, may be worth more or less than their original cost. Current performance may be higher or lower than the performance data shown. For up-to-date, month-end performance information please call 1-844-457-6383.
Fund commenced operations on December 12, 2018.
The graph illustrates comparative performance for $10,000 invested in shares of the JPMorgan Corporate Bond Research Enhanced ETF and the Bloomberg Barclays U.S. Corporate Bond Index from December 12, 2018 to August 31, 2020. The performance of the Fund reflects the deduction of Fund expenses and assumes reinvestment of all dividends and capital gain distributions, if any. The performance of the Bloomberg Barclays U.S. Corporate Bond Index does not reflect the deduction of expenses associated with an exchange-traded fund and has been adjusted to reflect reinvestment of all dividends and capital gain
distributions of the securities included in the Index, if applicable. The Bloomberg Barclays U.S. Corporate Bond Index broadly measures the investment grade, fixed-rate, taxable, corporate bond market. It includes USD denominated securities publicly issued by U.S. and non-U.S. industrial, utility, and financial issuers that meet specified maturity, liquidity, and quality requirements. Securities in the index roll up to the U.S. Credit and U.S. Aggregate Indices.
Fund performance reflects the waiver of the Fund’s fees and reimbursement of expenses for certain periods since the applicable inception date. Without these waivers and reimbursements, performance would have been lower. Also, performance shown in this section does not reflect the deduction of taxes that a shareholder may pay on Fund distributions or on gains resulting from redemption or sale of Fund shares.
The returns shown are based on net asset values calculated for shareholder transactions and may differ from the returns shown in the financial highlights, which reflect adjustments made to the net asset values in accordance with accounting principles generally accepted in the United States of America.
| | | | | | |
| | | |
| 8 | | | | J.P. MORGAN EXCHANGE-TRADED FUNDS | | AUGUST 31, 2020 |
JPMorgan High Yield Research Enhanced ETF
FUND COMMENTARY
SIX MONTHS ENDED AUGUST 31, 2020 (Unaudited)
| | | | |
| REPORTING PERIOD RETURN: | |
| Net Asset Value* | | | 3.03% | |
| Market Price** | | | 2.43% | |
| Bloomberg Barclays U.S. Corporate High Yield — 2% Issuer Capped Index | | | 3.04% | |
| |
| Net Assets as of 8/31/2020 | | $ | 212,771,481 | |
| Duration as of 8/31/2020 | | | 3.4 Years | |
INVESTMENT OBJECTIVE***
The JPMorgan High Yield Research Enhanced ETF (the “Fund”) seeks to provide a high level of income. Capital appreciation is a secondary objective.
INVESTMENT APPROACH
The Fund invests in a diversified portfolio of high-yield securities (also called “junk bonds”). Issuers may be domestic or foreign, but the Fund only invests in U.S. dollar-denominated investments.
HOW DID THE FUND PERFORM?
For the six months ended August 31, 2020, the Fund posted a positive absolute performance and underperformed the Bloomberg Barclays U.S. Corporate High Yield — 2% Issuer Capped Index (the “Benchmark”).
During the reporting period, bonds rated single-B and CCC and lower significantly underperformed bonds rated BB and single-B as prices for lower rated bonds generally fell.
Relative to the Benchmark, the Fund’s security selection in the energy and financials sectors detracted from performance. The Fund’s overweight allocation to bonds rated BB and its underweight allocation to bonds rated CCC were leading contributors to relative performance. The Fund’s security selection in the communications and basic industry sectors also contributed to relative performance.
HOW WAS THE FUND POSITIONED?
During the reporting period, the Fund was neutral to its Benchmark in terms of industry groups and duration structure. The portfolio managers selected securities based on the views of their credit analysts and the Fund was underweight in securities rated CCC or lower and overweight in securities rated BB and B.
| | | | | | | | |
| | | |
| AUGUST 31, 2020 | | J.P. MORGAN EXCHANGE-TRADED FUNDS | | | | | 9 | |
JPMorgan High Yield Research Enhanced ETF
FUND COMMENTARY
SIX MONTHS ENDED AUGUST 31, 2020 (Unaudited) (continued)
| | | | |
PORTFOLIO COMPOSITION BY INDUSTRY**** | |
Oil, Gas & Consumable Fuels | | | 12.0 | % |
Hotels, Restaurants & Leisure | | | 8.2 | |
Health Care Providers & Services | | | 6.5 | |
Media | | | 6.0 | |
Diversified Telecommunication Services | | | 6.0 | |
Chemicals | | | 3.3 | |
Equity Real Estate Investment Trusts (REITs) | | | 2.8 | |
Consumer Finance | | | 2.8 | |
Metals & Mining | | | 2.7 | |
Entertainment | | | 2.5 | |
Pharmaceuticals | | | 2.5 | |
Food Products | | | 2.5 | |
Trading Companies & Distributors | | | 2.4 | |
Wireless Telecommunication Services | | | 2.4 | |
Commercial Services & Supplies | | | 2.2 | |
Auto Components | | | 2.2 | |
Specialty Retail | | | 2.2 | |
Thrifts & Mortgage Finance | | | 2.1 | |
Containers & Packaging | | | 1.9 | |
Electric Utilities | | | 1.7 | |
Building Products | | | 1.6 | |
Aerospace & Defense | | | 1.4 | |
Food & Staples Retailing | | | 1.4 | |
Household Durables | | | 1.4 | |
Technology Hardware, Storage & Peripherals | | | 1.2 | |
Software | | | 1.1 | |
Communications Equipment | | | 1.1 | |
Others (each less than 1.0%) | | | 11.8 | |
Short-Term Investments | | | 4.1 | |
| * | | The return shown is based on net asset value and may differ from the return shown in the financial highlights, which reflects adjustments made to the net asset value in accordance with accounting principles generally accepted in the United States of America. The net asset value was $50.67 as of August 31, 2020. |
| ** | | Market price return was calculated assuming an initial investment made at the market price at the beginning of the reporting period, reinvestment of all dividends and distributions at market price during the period, and sale at the market price on the last day of the period. The price used to calculate the market price return was the closing price on the Cboe BZX Exchange, Inc. As of August 31, 2020, the closing price was $50.71. |
| *** | | The adviser seeks to achieve the Fund’s objective. There can be no guarantee it will be achieved. |
| **** | | Percentages indicated are based on total investments as of August 31, 2020. The Fund’s composition is subject to change. |
| | | | | | |
| | | |
| 10 | | | | J.P. MORGAN EXCHANGE-TRADED FUNDS | | AUGUST 31, 2020 |
| | | | | | | | | | | | | | | | |
AVERAGE ANNUAL TOTAL RETURNS AS OF AUGUST 31, 2020 (Unaudited) | |
| | | INCEPTION DATE | | | SIX MONTHS* | | | 1 YEAR | | | SINCE
INCEPTION | |
JPMorgan High Yield Research Enhanced ETF | | | | | | | | | | | | | | | | |
Net Asset Value | | | September 14, 2016 | | | | 3.03 | % | | | 3.66 | % | | | 5.33 | % |
Market Price | | | | | | | 2.43 | % | | | 3.57 | % | | | 5.33 | % |
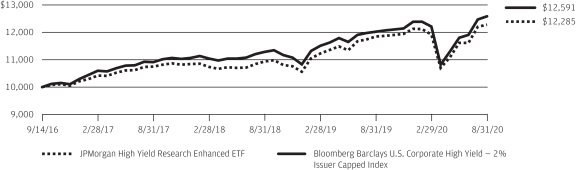
LIFE OF FUND PERFORMANCE (9/14/16 TO 8/31/20)
The performance quoted is past performance and is not a guarantee of future results. Exchange-traded funds are subject to certain market risks. Investment returns and principal value of an investment will fluctuate so that an investor’s shares, when sold or redeemed, may be worth more or less than their original cost. Current performance may be higher or lower than the performance data shown. For up-to-date, month-end performance information please call 1-844-457-6383.
Fund commenced operations on September 14, 2016.
The graph illustrates comparative performance for $10,000 invested in shares of the JPMorgan High Yield Research Enhanced ETF, the Bloomberg Barclays U.S. Corporate High Yield — 2% Issuer Capped Index from September 14, 2016 to August 31, 2020. The performance of the Fund reflects the deduction of Fund expenses and assumes reinvestment of all dividends and capital gain distributions, if any. The performance of the Bloomberg Barclays U.S. Corporate High Yield — 2% Issuer Capped Index does not reflect the deduction of expenses associated with an exchange-traded fund and has been adjusted to reflect reinvestment of all dividends and capital gain distributions of the securities included in the Index, if applicable.
The Bloomberg Barclays U.S. Corporate High Yield — 2% Issuer Capped Index is an unmanaged index comprised of fixed rate, non-investment grade debt securities that are dollar denominated and non-convertible. The index limits the maximum exposure to any one issuer to 2%. Investors cannot invest directly in an index.
Fund performance reflects the partial waiver of the Fund’s fees and reimbursement of expenses for certain periods since the applicable inception date. Without these waivers and reimbursements, performance would have been lower. Also, performance shown in this section does not reflect the deduction of taxes that a shareholder may pay on Fund distributions or on gains resulting from redemption or sale of Fund shares.
The returns shown are based on net asset values calculated for shareholder transactions and may differ from the returns shown in the financial highlights, which reflect adjustments made to the net asset values in accordance with accounting principles generally accepted in the United States of America.
| | | | | | | | |
| | | |
| AUGUST 31, 2020 | | J.P. MORGAN EXCHANGE-TRADED FUNDS | | | | | 11 | |
JPMorgan International Bond Opportunities ETF
(formerly known as JPMorgan Global Bond Opportunities ETF )1
FUND COMMENTARY
SIX MONTHS ENDED AUGUST 31, 2020 (Unaudited)
| | | | |
| REPORTING PERIOD RETURN: | | | |
| Net Asset Value* | | | 2.49% | |
| Market Price** | | | 3.35% | |
| Bloomberg Barclays Multiverse Index | | | 3.98% | |
| |
| Net Assets as of 8/31/2020 | | | $167,176,599 | |
| Duration as of 8/31/2020 | | | 4.5 Years | |
INVESTMENT OBJECTIVE***
The JPMorgan Global Bond Opportunities ETF (the “Fund”) seeks to provide total return.
INVESTMENT APPROACH
The Fund invests across sectors in developed and emerging markets without benchmark constraints. The Fund is flexible and opportunistic and the Fund’s adviser has broad discretion to shift the Fund’s exposures to strategies, sectors, countries or currencies based on changing market conditions and its view of the best mix of investment opportunities.
HOW DID THE FUND PERFORM?
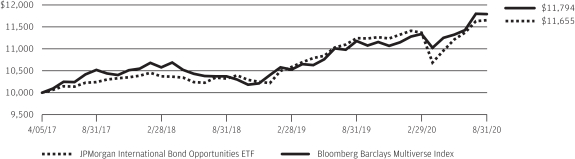
For the six months ended August 31, 2020, the Fund posted a positive return of 2. 49%. The Fund is managed with an unconstrained orientation and is not managed relative to a benchmark index. While the Fund is not managed to a benchmark, its return is compared to the Bloomberg Barclays Multiverse Index, which returned 3.98% for the reporting period.
In terms of absolute performance, the Fund’s allocation to investment grade corporate credit was the leading contributor to absolute performance. The Fund’s allocation to corporate high yield debt (also known as “junk bonds”) also contributed to absolute performance. The Fund’s investments in securitized debt provided flat returns overall for the Fund.
Relative to the Bloomberg Barclays Multiverse Index, the Fund’s shorter overall duration detracted from performance as interest rates fell during the period. Generally, bonds with shorter duration will experience smaller price appreciation when interest rates fall, compared with bonds of longer duration.
HOW WAS THE FUND POSITIONED?
The Fund’s managers reduced its exposure to emerging markets debt and high yield debt by roughly 50% at the start of March 2020, in response to the market impact of the COVID-19 pandemic. The managers also adjusted the Fund’s currency positioning and increased overall duration to 5.8 years at the end of March 2020. As financial market stability returned, the Fund subsequently invested in new issues of U.S. investment grade debt and continued to increase its allocation to investment grade debt throughout the second quarter of 2020. By the end of the reporting period, the managers had increased the Fund’s allocation to emerging markets debt and corporate high yield debt, while reducing the Fund’s overall duration. The managers also trimmed the Fund’s exposures to securitized debt and debt from peripheral Europe. The managers also significantly reduced overall duration, primarily by moving to a net short position in U.S. Treasury securities.
The managers increased the length of the Fund’s overall duration through an increase in high quality government bonds, as well as longer duration investment grade debt during March. The managers subsequently reduced duration to 4.54 years at August 31, 2020 from 5.19 years at February 29, 2020.
| 1 | | On September 14, 2020, the Fund’s name was changed to JPMorgan International Bond Opportunities ETF. The Fund’s main investment strategies also changed and its securities benchmark was changed to the Bloomberg Barclays Multiverse Index ex USA (USD Hedged). |
| | | | | | |
| | | |
| 12 | | | | J.P. MORGAN EXCHANGE-TRADED FUNDS | | AUGUST 31, 2020 |
| | | | |
PORTFOLIO COMPOSITION BY COUNTRY**** | |
United States | | | 50.6 | % |
Italy | | | 3.8 | |
United Kingdom | | | 3.6 | |
France | | | 3.1 | |
China | | | 2.7 | |
Indonesia | | | 2.2 | |
Spain | | | 1.9 | |
New Zealand | | | 1.7 | |
Switzerland | | | 1.6 | |
Mexico | | | 1.6 | |
Greece | | | 1.5 | |
Russia | | | 1.4 | |
Australia | | | 1.4 | |
Portugal | | | 1.2 | |
Netherlands | | | 1.0 | |
Germany | | | 1.0 | |
| Luxembourg | | | 1.0 | |
| Others (each less than 1.0%) | | | 16.8 | |
| Short-Term Investments | | | 1.9 | |
| * | | The return shown is based on net asset value and may differ from the return shown in the financial highlights, which reflects adjustments made to the net asset value in accordance with accounting principles generally accepted in the United States of America. The net asset value was $50.66 as of August 31, 2020. |
| ** | | Market price return was calculated assuming an initial investment made at the market price at the beginning of the reporting period, reinvestment of all dividends and distributions at market price during the period, and sale at the market price on the last day of the period. The price used to calculate the market price return was the closing price on the Cboe BZX Exchange, Inc. As of August 31, 2020, the closing price was $50.94. |
| *** | | The adviser seeks to achieve the Fund’s objective. There can be no guarantee it will be achieved. |
| **** | | Percentages indicated are based on total investments as of August 31, 2020. The Fund’s composition is subject to change. |
| | | | | | | | |
| | | |
| AUGUST 31, 2020 | | J.P. MORGAN EXCHANGE-TRADED FUNDS | | | | | 13 | |
JPMorgan International Bond Opportunities ETF
(formerly known as JPMorgan Global Bond Opportunities ETF )
FUND COMMENTARY
SIX MONTHS ENDED AUGUST 31, 2020 (Unaudited) (continued)
| | | | | | | | | | | | | | | | |
AVERAGE ANNUAL TOTAL RETURNS AS OF AUGUST 31, 2020 (Unaudited) | |
| | | INCEPTION DATE | | | SIX MONTHS* | | | 1 YEAR | | | SINCE
INCEPTION | |
JPMorgan International Bond Opportunities ETF | |
Net Asset Value | | | April 5, 2017 | | | | 2.49 | % | | | 3.63 | % | | | 4.60 | % |
Market Price | | | | | | | 3.35 | % | | | 3.90 | % | | | 4.77 | % |
LIFE OF FUND PERFORMANCE (4/5/17 TO 8/31/20)
The performance quoted is past performance and is not a guarantee of future results. Exchange-traded funds are subject to certain market risks. Investment returns and principal value of an investment will fluctuate so that an investor’s shares, when sold or redeemed, may be worth more or less than their original cost. Current performance may be higher or lower than the performance data shown. For up-to-date, month-end performance information please call 1-844-457-6383.
Fund commenced operations on April 5, 2017.
The graph illustrates comparative performance for $10,000 invested in shares of the JPMorgan International Bond Opportunities ETF and the Bloomberg Barclays Multiverse Index from April 5, 2017 to August 31, 2020. The performance of the Fund reflects the deduction of Fund expenses and assumes reinvestment of all dividends and capital gain distributions, if any. The performance of the Bloomberg Barclays Multiverse Index does not reflect the deduction of expenses associated with an exchange-traded fund and has been adjusted to reflect reinvestment of all dividends and capital gain distributions of the securities included in the Index, if applicable.
The Bloomberg Barclays Multiverse Index is an unmanaged index, which measure the global fixed-income bond market that combines the Bloomberg Barclays Global Aggregate Index and the Bloomberg Barclays Global High Yield Index. The Bloomberg Barclays Global Aggregate Index measures global investment grade debt from twenty-four different local currency markets. The Bloomberg Barclays Global High-Yield Index measures the global high-yield fixed income markets. Investors cannot invest directly in an index.
Fund performance reflects the partial waiver of the Fund’s fees and reimbursement of expenses for certain periods since the applicable inception date. Without these waivers and reimbursements, performance would have been lower. Also, performance shown in this section does not reflect the deduction of taxes that a shareholder may pay on Fund distributions or on gains resulting from redemption or sale of Fund shares.
The returns shown are based on net asset values calculated for shareholder transactions and may differ from the returns shown in the financial highlights, which reflect adjustments made to the net asset values in accordance with accounting principles generally accepted in the United States of America.
| | | | | | |
| | | |
| 14 | | | | J.P. MORGAN EXCHANGE-TRADED FUNDS | | AUGUST 31, 2020 |
JPMorgan Municipal ETF
FUND COMMENTARY
SIX MONTHS ENDED AUGUST 31, 2020 (Unaudited)
| | | | |
| REPORTING PERIOD RETURN: | | | |
Net Asset Value* | | | (0.23)% | |
| Market Price** | | | 0.06% | |
| Bloomberg Barclays U.S. 1-15 Year Blend (1-17) Municipal Bond Index | | | 0.76% | |
| |
| Net Assets as of 8/31/2020 | | $ | 59,962,002 | |
| Duration as of 8/31/2020 | | | 5.9 Years | |
INVESTMENT OBJECTIVE***
The JPMorgan Municipal ETF (the “Fund”) seeks to provide monthly dividends, which are excluded from gross income, and to protect the value of your investment by investing primarily in municipal obligations. For purposes of the Fund’s investment objective, “gross income” means gross income for federal income tax purposes.
INVESTMENT APPROACH
The Fund invests primarily in a diversified portfolio of intermediate-term municipal bonds, the income from which is exempt from federal income tax. The Fund seeks to maintain an average weighted maturity between three and ten years.
HOW DID THE FUND PERFORM?
For the six months ended August 31, 2020, the Fund underperformed to the Bloomberg Barclays U.S. 1-15 Year Blend (1-17) Municipal Bond Index (the “Index”). Interest rates in the tax free bond sector fell during the reporting period and higher rated bonds generally outperformed lower rated bonds.
Relative to the Index, the Fund’s overweight allocations to bonds rated BBB and BB were leading detractors from performance. The Fund’s underweight allocations to water & sewer bonds and general obligation bonds and its security selection in education bonds also detracted from relative performance.
The Fund’s underweight allocation and security selection in New York State bonds were leading contributors to relative performance. The Fund’s underweight allocation to housing and transportation bonds, and its overweight allocation to durations of 10 years and longer also contributed to relative
performance. Generally, bonds with longer duration will experience a larger increase in price when interest rates fall compared with shorter duration bonds.
HOW WAS THE FUND POSITIONED?
At the end of the reporting period, the Fund’s largest allocations were to revenue bonds and general obligation bonds. In terms of quality, the Fund was overweight in bonds rated single-A and BBB. The Fund’s overall duration was 5.9 years compared with 4.4 years for the Index.
| | | | |
PORTFOLIO COMPOSITION**** | |
Municipal Bonds | | | 96.9 | % |
Short-Term Investments | | | 3.1 | |
| * | | The return shown is based on net asset value and may differ from the return shown in the financial highlights, which reflects adjustments made to the net asset value in accordance with accounting principles generally accepted in the United States of America. The net asset value was $54.51 as of August 31, 2020. |
| ** | | Market price return was calculated assuming an initial investment made at the market price at the beginning of the reporting period, reinvestment of all dividends and distributions at market price during the period, and sale at the market price on the last day of the period. The price used to calculate the market price return was the closing price on the Cboe BZX Exchange, Inc. As of August 31, 2020, the closing price was $54.59. |
| *** | | The adviser seeks to achieve the Fund’s objective. There can be no guarantee it will be achieved. |
| **** | | Percentages indicated are based on total investments as of August 31, 2020. The Fund’s composition is subject to change. |
| | | | | | | | |
| | | |
| AUGUST 31, 2020 | | J.P. MORGAN EXCHANGE-TRADED FUNDS | | | | | 15 | |
JPMorgan Municipal ETF
FUND COMMENTARY
SIX MONTHS ENDED AUGUST 31, 2020 (Unaudited) (continued)
| | | | | | | | | | | | | | | | |
AVERAGE ANNUAL TOTAL RETURNS AS OF AUGUST 31, 2020 (Unaudited) | |
| | | INCEPTION DATE | | | SIX MONTHS* | | | 1 YEAR | | | SINCE
INCEPTION | |
JPMorgan Municipal ETF | | | | | | | | | | | | | | | | |
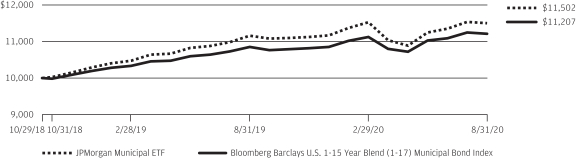
Net Asset Value | | | October 29, 2018 | | | | (0.23 | )% | | | 3.05 | % | | | 7.91 | % |
Market Price | | | | | | | 0.06 | % | | | 3.16 | % | | | 7.99 | % |
LIFE OF FUND PERFORMANCE (10/29/18 TO 8/31/20)
The performance quoted is past performance and is not a guarantee of future results. Exchange-traded funds are subject to certain market risks. Investment returns and principal value of an investment will fluctuate so that an investor’s shares, when sold or redeemed, may be worth more or less than their original cost. Current performance may be higher or lower than the performance data shown. For up-to-date, month-end performance information please call 1-844-457-6383.
Fund commenced operations on October 29, 2018.
The graph illustrates comparative performance for $10,000 invested in shares of the JPMorgan Municipal ETF and the Bloomberg Barclays U.S. 1-15 Year Blend (1-17) Municipal Bond Index from October 29, 2018 to August 31, 2020. The performance of the Fund reflects the deduction of Fund expenses and assumes reinvestment of all dividends and capital gain distributions, if any. The performance of the Bloomberg Barclays U.S. 1-15 Year Blend (1-17) Municipal Bond Index does not reflect the deduction of expenses associated with an
exchange-traded fund and has been adjusted to reflect reinvestment of all dividends and capital gain distributions of the securities included in the Index, if applicable. The Bloomberg Barclays U.S. 1-15 Year Blend (1-17) Municipal Bond Index represents the performance of municipal bonds with maturities from 1 to 17 years.
Fund performance reflects the waiver of the Fund’s fees and reimbursement of expenses for certain periods since the applicable inception date. Without these waivers and reimbursements, performance would have been lower. Also, performance shown in this section does not reflect the deduction of taxes that a shareholder may pay on Fund distributions or on gains resulting from redemption or sale of Fund shares.
The returns shown are based on net asset values calculated for shareholder transactions and may differ from the returns shown in the financial highlights, which reflect adjustments made to the net asset values in accordance with accounting principles generally accepted in the United States of America.
| | | | | | |
| | | |
| 16 | | | | J.P. MORGAN EXCHANGE-TRADED FUNDS | | AUGUST 31, 2020 |
JPMorgan U.S. Aggregate Bond ETF
FUND COMMENTARY
SIX MONTHS ENDED AUGUST 31, 2020 (Unaudited)
| | | | |
| REPORTING PERIOD RETURN: | | | |
| Net Asset Value* | | | 2.88% | |
| Market Price** | | | 2.73% | |
| Bloomberg Barclays U.S. Aggregate Index | | | 2.98% | |
| |
| Net Assets as of 8/31/2020 | | $ | 685,606,171 | |
| Duration as of 8/31/2020 | | | 5.9 Years | |
INVESTMENT OBJECTIVE***
The JPMorgan U.S. Aggregate Bond ETF (the “Fund”) seeks to provide long-term total return.
INVESTMENT APPROACH
The Fund invests in a diversified portfolio of high-quality fixed income securities, including corporate bonds, U.S. Treasury obligations and other U.S. government and agency securities, and asset-backed, mortgage-related and mortgage-backed securities. With respect to corporate sub-sectors, the Fund applies a multi-factor credit screening process that seeks exposure to corporate debt issuers with attractive value, quality and momentum characteristics.
HOW DID THE FUND PERFORM?
For the six months ended August 31, 2020, the Fund underperformed the Bloomberg Barclays U.S. Aggregate Index (the “Index”). During the reporting period, interest rates generally declined and higher quality bonds outperformed lower quality bonds.
Relative to the Index, the Fund’s security selection within corporate bonds detracted from performance.
HOW WAS THE FUND POSITIONED?
During the reporting period, the Fund applied a multi-factor credit screening process to the corporate sub-sectors of the Index that sought exposure to corporate debt issuers that the Fund’s portfolio managers believed had attractive value, quality and momentum characteristics. The Fund’s and the Index’s largest allocations at the end of the reporting period were to government bonds and corporate bonds and their smallest allocations were to agency debt and municipal bonds.
| | | | |
PORTFOLIO COMPOSITION**** | |
U.S. Treasury Obligations | | | 36.7 | % |
Corporate Bonds | | | 27.9 | |
Mortgage-Backed Securities | | | 26.7 | |
Commercial Mortgage-Backed Securities | | | 2.1 | |
Foreign Government Securities | | | 1.8 | |
U.S. Government Agency Securities | | | 1.6 | |
Supranational | | | 1.5 | |
Others (each less than 1.0%) | | | 0.9 | |
Short-Term Investments | | | 0.8 | |
| * | | The return shown is based on net asset value and may differ from the return shown in the financial highlights, which reflects adjustments made to the net asset value in accordance with accounting principles generally accepted in the United States of America. The net asset value was $27.99 as of August 31, 2020. |
| ** | | Market price return was calculated assuming an initial investment made at the market price at the beginning of the reporting period, reinvestment of all dividends and distributions at market price during the period, and sale at the market price on the last day of the period. The price used to calculate the market price return was the closing price on the NYSE Arca, Inc. As of August 31, 2020, the closing price was $27.98. |
| *** | | The adviser seeks to achieve the Fund’s objective. There can be no guarantee it will be achieved. |
| **** | | Percentages indicated are based on total investments as of August 31, 2020. The Fund’s composition is subject to change. |
| | | | | | | | |
| | | |
| AUGUST 31, 2020 | | J.P. MORGAN EXCHANGE-TRADED FUNDS | | | | | 17 | |
JPMorgan U.S. Aggregate Bond ETF
FUND COMMENTARY
SIX MONTHS ENDED AUGUST 31, 2020 (Unaudited) (continued)
| | | | | | | | | | | | | | | | |
AVERAGE ANNUAL TOTAL RETURNS AS OF AUGUST 31, 2020 (Unaudited) | |
| | | INCEPTION DATE | | | SIX MONTHS* | | | 1 YEAR | | | SINCE
INCEPTION | |
JPMorgan U.S. Aggregate Bond ETF | | | | | | | | | | | | | | | | |
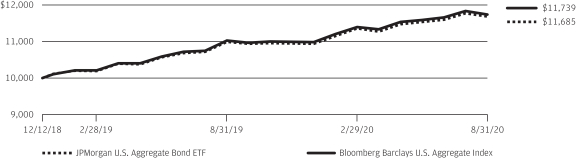
Net Asset Value | | | December 12, 2018 | | | | 2.88 | % | | | 6.30 | % | | | 9.49 | % |
Market Price | | | | | | | 2.73 | % | | | 5.98 | % | | | 9.46 | % |
LIFE OF FUND PERFORMANCE (12/12/18 TO 8/31/20)
The performance quoted is past performance and is not a guarantee of future results. Exchange-traded funds are subject to certain market risks. Investment returns and principal value of an investment will fluctuate so that an investor’s shares, when sold or redeemed, may be worth more or less than their original cost. Current performance may be higher or lower than the performance data shown. For up-to-date, month-end performance information please call 1-844-457-6383.
Fund commenced operations on December 12, 2018.
The graph illustrates comparative performance for $10,000 invested in shares of the JPMorgan U.S. Aggregate Bond ETF and the Bloomberg Barclays U.S, Aggregate Index from December 12, 2018 to August 31, 2020. The performance of the Fund reflects the deduction of Fund expenses and assumes reinvestment of all dividends and capital gain distributions, if any. The performance of the Bloomberg Barclays U.S. Aggregate Index does not reflect the deduction of expenses associated with an exchange-traded fund and has been adjusted to reflect reinvestment of all dividends and capital gain distributions of the securities included in the Index, if applicable.
The Bloomberg Barclays U.S. Aggregate Index is an unmanaged index that represents securities that are SEC-registered, taxable, and dollar denominated. The index covers the U.S. investment grade fixed rate bond market, with index components for government and corporate securities, mortgage pass-through securities, and asset-backed securities. Investors cannot invest directly in an index.
Fund performance reflects the waiver of the Fund’s fees and reimbursement of expenses for certain periods since the applicable inception date. Without these waivers and reimbursements, performance would have been lower. Also, performance shown in this section does not reflect the deduction of taxes that a shareholder may pay on Fund distributions or on gains resulting from redemption or sale of Fund shares.
The returns shown are based on net asset values calculated for shareholder transactions and may differ from the returns shown in the financial highlights, which reflect adjustments made to the net asset values in accordance with accounting principles generally accepted in the United States of America.
| | | | | | |
| | | |
| 18 | | | | J.P. MORGAN EXCHANGE-TRADED FUNDS | | AUGUST 31, 2020 |
JPMorgan Ultra-Short Income ETF
FUND COMMENTARY
SIX MONTHS ENDED AUGUST 31, 2020 (Unaudited)
| | | | |
| REPORTING PERIOD RETURN: | | | |
| Net Asset Value* | | | 1.31% | |
| Market Price** | | | 1.35% | |
| ICE BofAML 3-Month US Treasury Bill Index | | | 0.34% | |
| |
| Net Assets as of 8/31/2020 | | $ | 13,902,104,552 | |
| Duration as of 8/31/2020 | | | 0.94 Years | |
INVESTMENT OBJECTIVE***
The JPMorgan Ultra-Short Income ETF (the “Fund”) seeks to provide current income while seeking to maintain a low volatility of principal.
INVESTMENT APPROACH
The Fund primarily invests mainly in investment grade, U.S. dollar-denominated short-term fixed, variable and floating-rate debt. The Fund seeks to maintain a duration of one year or less, although under certain market conditions, the Fund’s duration may be longer than one year. Duration measures the price sensitivity of a portfolio of bonds to relative changes in interest rates. Generally, bonds with longer duration will experience a larger decrease or increase in price as interest rates rise or fall, respectively, versus bonds with shorter duration. The Fund’s adviser has broad discretion to shift the Fund’s exposure to strategies and sectors based on changing market conditions and its view of the best mix of investment opportunities.
HOW DID THE FUND PERFORM?
For the six months ended August 31, 2020, the Fund outperformed the ICE BofAML 3-Month US Treasury Bill Index (the “Index”). Interest rates fell during the reporting period and higher rated bonds generally outperformed lower rated bonds.
The Fund’s allocations to investment grade corporate bonds and money market securities were leading contributors to both absolute performance and performance relative to the Index. The Fund’s allocation to collateralized loan obligations, asset-backed securities and mortgage-backed securities also contributed to absolute and relative performance.
There were no significant detractors from absolute or relative performance during the reporting period.
HOW WAS THE FUND POSITIONED?
Early in the reporting period, the Fund’s portfolio managers increased the Fund’s duration in anticipation of a decision by the U.S. Federal Reserve (the “Fed”) to cut interest rates in response to the COVID-19 pandemic’s impact on the economy. Generally, bonds with longer duration will experience a larger increase in price when interest rates fall compared with shorter duration bonds. The portfolio managers also reduced the Fund’s exposure to longer-dated credit securities and increased the Fund’s allocation to money market securities and U.S. Treasury securities in
response to decreased liquidity and increased volatility in credit markets. In the latter part of March, the Fed launched several programs to bolster liquidity and shore up credit markets. In response, the portfolio managers reallocated some assets into corporate bonds.
At the end of the reporting period, the portfolio managers’ outlook for bond markets remained positive given the unprecedented levels of Fed support for financial markets. The portfolio managers were focused on adding high quality securities to the Fund and limiting exposure to issuers at the lower end of the investment grade spectrum in an effort to insulate the portfolio from further potential volatility in markets. In descending order, the Fund’s largest allocations were in corporate bonds, money market securities, collateralized loan obligations, mortgage-backed securities, asset-backed securities and non-corporate credit.
| | | | |
PORTFOLIO COMPOSITION BY SECTOR**** | |
Financials | | | 52.5 | % |
Asset-Backed Security | | | 4.7 | |
Utilities | | | 3.6 | |
Health Care | | | 3.2 | |
Energy | | | 2.6 | |
Consumer Staples | | | 2.5 | |
Consumer Discretionary | | | 2.5 | |
Industrials | | | 2.2 | |
Communication Services | | | 2.1 | |
Information Technology | | | 2.0 | |
Commercial Mortgage-Backed Securities | | | 1.0 | |
Others (each less than 1.0%) | | | 1.8 | |
Short-Term Investments | | | 19.3 | |
| * | | The return shown is based on net asset value and may differ from the return shown in the financial highlights, which reflects adjustments made to the net asset value in accordance with accounting principles generally accepted in the United States of America. The net asset value was $50.81 as of August 31, 2020. |
| ** | | Market price return was calculated assuming an initial investment made at the market price at the beginning of the reporting period, reinvestment of all dividends and distributions at market price during the period, and sale at the market price on the last day of the period. The price used to calculate the market price return was the closing price on the Cboe BZX Exchange, Inc. As of August 31, 2020, the closing price was $50.87. |
| *** | | The adviser seeks to achieve the Fund’s objective. There can be no guarantee it will be achieved. |
| **** | | Percentages indicated are based on total investments as of August 31, 2020. The Fund’s composition is subject to change. |
| | | | | | | | |
| | | |
| AUGUST 31, 2020 | | J.P. MORGAN EXCHANGE-TRADED FUNDS | | | | | 19 | |
JPMorgan Ultra-Short Income ETF
FUND COMMENTARY
SIX MONTHS ENDED AUGUST 31, 2020 (Unaudited) (continued)
| | | | | | | | | | | | | | | | |
AVERAGE ANNUAL TOTAL RETURNS AS OF AUGUST 31, 2020 (Unaudited) | |
| | | INCEPTION DATE | | | SIX MONTHS* | | | 1 YEAR | | | SINCE
INCEPTION | |
JPMorgan Ultra-Short Income ETF | | | | | | | | | | | | | | | | |
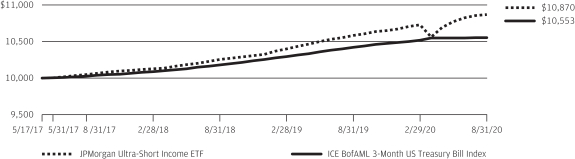
Net Asset Value | | | May 17, 2017 | | | | 1.31 | % | | | 2.70 | % | | | 2.57 | % |
Market Price | | | | | | | 1.35 | % | | | 2.76 | % | | | 2.60 | % |
LIFE OF FUND PERFORMANCE (5/17/17 TO 8/31/20)
The performance quoted is past performance and is not a guarantee of future results. Exchange-traded funds are subject to certain market risks. Investment returns and principal value of an investment will fluctuate so that an investor’s shares, when sold or redeemed, may be worth more or less than their original cost. Current performance may be higher or lower than the performance data shown. For up-to-date, month-end performance information please call 1-844-457-6383.
Fund commenced operations on May 17, 2017.
The graph illustrates comparative performance for $10,000 invested in shares of the JPMorgan Ultra-Short Income ETF and the ICE BofAML 3-Month US Treasury Bill Index from May 17, 2017 to August 31, 2020. The performance of the Fund reflects the deduction of Fund expenses and assumes reinvestment of all dividends and capital gain distributions, if any. The performance of the ICE BofAML 3-Month US Treasury Bill Index does not reflect the deduction of expenses associated with an exchange-traded fund and has been adjusted to reflect reinvestment of all dividends and capital gain distributions of the
securities included in the Index, if applicable. The ICE BofAML 3-Month US Treasury Bill Index is comprised of a single issue purchased at the beginning of the month and held for a full month. The index is rebalanced monthly and the issue selected is the outstanding Treasury Bill that matures closest to, but not beyond 3 months from the rebalancing date. Investors cannot invest directly in an index.
Fund performance reflects the partial waiver of the Fund’s fees and reimbursement of expenses for certain periods since the applicable inception date. Without these waivers and reimbursements, performance would have been lower. Also, performance shown in this section does not reflect the deduction of taxes that a shareholder may pay on Fund distributions or on gains resulting from redemption or sale of Fund shares.
The returns shown are based on net asset values calculated for shareholder transactions and may differ from the returns shown in the financial highlights, which reflect adjustments made to the net asset values in accordance with accounting principles generally accepted in the United States of America.
| | | | | | |
| | | |
| 20 | | | | J.P. MORGAN EXCHANGE-TRADED FUNDS | | AUGUST 31, 2020 |
JPMorgan Ultra-Short Municipal Income ETF
FUND COMMENTARY
SIX MONTHS ENDED AUGUST 31, 2020 (Unaudited)
| | | | |
| REPORTING PERIOD RETURN: | | | |
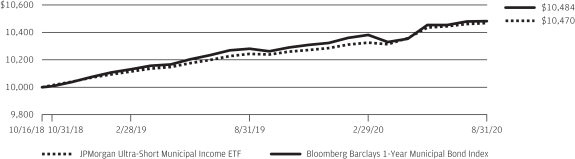
| Net Asset Value* | | | 1.39% | |
| Market Price** | | | 1.33% | |
| Bloomberg Barclays 1-Year Municipal Bond Index | | | 0.98% | |
| |
| Net Assets as of 8/31/2020 | | $ | 583,777,535 | |
| Duration as of 8/31/2020 | | | 0.7 Years | |
INVESTMENT OBJECTIVE***
The JPMorgan Ultra-Short Municipal Income ETF (the “Fund”) seeks as high a level of current income exempt from federal income tax as is consistent with relative stability of principal.
INVESTMENT APPROACH
The Fund invests primarily in investment grade fixed, variable and floating rate municipal securities, the income from which is exempt from federal income tax. The Fund seeks to maintain an average weighted maturity of two years or less.
HOW DID THE FUND PERFORM?
For the six months ended August 31, 2020, the Fund outperformed the Bloomberg Barclays 1-Year Municipal Bond Index (the “Index”). Interest rates fell during the reporting period and higher quality bonds generally outperformed lower quality bonds.
Relative to the Index, the Fund’s overweight allocation to local general obligation bonds and its underweight allocation to state general obligation bonds were leading contributors to performance. The Fund’s security selection in the leasing and hospital bonds sectors, its underweight allocation and security selection in bonds rated single-A and BBB also helped relative performance.
The Fund’s shorter overall duration was a leading detractor from relative performance. Generally, bonds with shorter duration experience a smaller increase in price compared with longer duration bonds when interest rates fall. The Fund’s allocation to variable rate demand notes (“VDRNs”), which are not held in the Index, also detracted from performance as VDRNs
do not generally benefit from falling interest rates. The Fund’s allocation to non-rated securities, which were not held in the Index, also detracted from relative performance.
HOW WAS THE FUND POSITIONED?
At the end of the reporting period, the Fund’s largest allocation was to revenue bonds. In terms of quality, the Fund was overweight in non-rated bonds and bonds rated AAA. The Fund’s overall duration was 0.7 years compared with 1.4 years for the Index.
| | | | |
PORTFOLIO COMPOSITION**** | |
Municipal Bonds | | | 83.5 | % |
Short-Term Investments | | | 16.5 | |
| * | | The return shown is based on net asset value and may differ from the return shown in the financial highlights, which reflects adjustments made to the net asset value in accordance with accounting principles generally accepted in the United States of America. The net asset value was $50.99 as of August 31, 2020. |
| ** | | Market price return was calculated assuming an initial investment made at the market price at the beginning of the reporting period, reinvestment of all dividends and distributions at market price during the period, and sale at the market price on the last day of the period. The price used to calculate the market price return was the closing price on the Cboe BZX Exchange, Inc. As of August 31, 2020, the closing price was $51.00. |
| *** | | The adviser seeks to achieve the Fund’s objective. There can be no guarantee it will be achieved. |
| **** | | Percentages indicated are based on total investments as of August 31, 2020. The Fund’s composition is subject to change. |
| | | | | | | | |
| | | |
| AUGUST 31, 2020 | | J.P. MORGAN EXCHANGE-TRADED FUNDS | | | | | 21 | |
JPMorgan Ultra-Short Municipal Income ETF
FUND COMMENTARY
SIX MONTHS ENDED AUGUST 31, 2020 (Unaudited) (continued)
| | | | | | | | | | | | | | | | |
AVERAGE ANNUAL TOTAL RETURNS AS OF AUGUST 31, 2020 (Unaudited) | |
| | | INCEPTION DATE | | | SIX MONTHS* | | | 1 YEAR | | | SINCE
INCEPTION | |
JPMorgan Ultra-Short Municipal Income ETF | | | | | | | | | | | | | | | | |
Net Asset Value | | | October 16, 2018 | | | | 1.39 | % | | | 2.20 | % | | | 2.48 | % |
Market Price | | | | | | | 1.33 | % | | | 2.16 | % | | | 2.49 | % |
LIFE OF FUND PERFORMANCE (10/16/18 TO 8/31/20)
The performance quoted is past performance and is not a guarantee of future results. Exchange-traded funds are subject to certain market risks. Investment returns and principal value of an investment will fluctuate so that an investor’s shares, when sold or redeemed, may be worth more or less than their original cost. Current performance may be higher or lower than the performance data shown. For up-to-date, month-end performance information please call 1-844-457-6383.
Fund commenced operations on October 16, 2018.
The graph illustrates comparative performance for $10,000 invested in shares of the JPMorgan Ultra-Short Municipal Income ETF and the Bloomberg Barclays 1-Year Municipal Bond Index from October 16, 2018 to August 31, 2020. The performance of the Fund reflects the deduction of Fund expenses and assumes reinvestment of all dividends and capital gain distributions, if any. The performance of the Bloomberg Barclays 1-Year Municipal Bond Index does not reflect the deduction of expenses associated with an exchange-traded fund and has been adjusted to reflect reinvestment of all dividends and capital gain distributions of the securities included in the Index, if applicable. The Bloomberg
Barclays 1 Year Municipal Bond Index is an unmanaged index that includes bonds with a minimum credit rating of BAA3, are issued as part of a deal of at least $50 million, have an amount outstanding of at least $5 million, and have maturities of 1 to 2 years. The performance of the index does not reflect the deduction of expenses associated with a mutual fund, such as investment management fees. By contrast, the performance of the Fund reflects the deduction of the mutual fund expenses, including sales charges if applicable. An individual cannot invest directly in an index.
Fund performance reflects the waiver of the Fund’s fees and reimbursement of expenses for certain periods since the applicable inception date. Without these waivers and reimbursements, performance would have been lower. Also, performance shown in this section does not reflect the deduction of taxes that a shareholder may pay on Fund distributions or redemption on gains resulting from or sale of Fund shares.
The returns shown are based on net asset values calculated for shareholder transactions and may differ from the returns shown in the financial highlights, which reflect adjustments made to the net asset values in accordance with accounting principles generally accepted in the United States of America.
| | | | | | |
| | | |
| 22 | | | | J.P. MORGAN EXCHANGE-TRADED FUNDS | | AUGUST 31, 2020 |
JPMorgan USD Emerging Markets Sovereign Bond ETF
FUND COMMENTARY
SIX MONTHS ENDED AUGUST 31, 2020 (Unaudited)
| | | | |
| REPORTING PERIOD RETURN: | | | |
| Net Asset Value* | | | (1.29)% | |
| Market Price** | | | (1.19)% | |
| JPMorgan Emerging Markets Risk-Aware Bond Index | | | (0.81)% | |
| |
| Net Assets as of 8/31/2020 | | $ | 83,806,913 | |
| Duration as of 8/31/2020 | | | 7.6 Years | |
INVESTMENT OBJECTIVE***
The JPMorgan USD Emerging Markets Sovereign Bond ETF (the “Fund”) seeks investment results that closely correspond, before fees and expenses, to the performance of the JPMorgan Emerging Markets Risk-Aware Bond Index (the “Underlying Index”).
INVESTMENT APPROACH
The Fund is passively managed to the Underlying Index, which is comprised of liquid, U.S. dollar-denominated sovereign and quasi-sovereign fixed and floating rate debt securities from emerging markets. The Underlying Index utilizes a rules-based, proprietary methodology that filters for liquidity and country risk and allocates risk across credit ratings. The Underlying Index methodology includes monthly rebalancing within countries and semi-annual rebalancing across countries. The Fund also employs optimization techniques that seek to minimize tracking error to the Underlying Index.
HOW DID THE FUND PERFORM?
For the six months ended August 31, 2020, the Fund performed in line with the Underlying Index. The majority of the Fund’s deviation against the Underlying Index was due to operating expenses, fees and tax management of the Fund’s portfolio.
The Fund’s and the Underlying Index’s risk filter screened out exposure to Lebanon amid political instability, which was a positive contributor to absolute performance. The Fund’s and the Underlying Index’s allocation to high yield debt (also known as “junk bonds”) detracted from absolute performance as high yield debt generally underperformed during the reporting period.
HOW WAS THE FUND POSITIONED?
The Fund invested at least 80% of its assets in securities included in the Underlying Index. During the reporting period, the Fund’s and Underlying Index’s largest allocations were to Turkey and Brazil and their smallest allocations were to Slovak Republic and Lithuania.
| | | | | | | | |
| | | |
| AUGUST 31, 2020 | | J.P. MORGAN EXCHANGE-TRADED FUNDS | | | | | 23 | |
JPMorgan USD Emerging Markets Sovereign Bond ETF
FUND COMMENTARY
SIX MONTHS ENDED AUGUST 31, 2020 (Unaudited) (continued)
| | | | |
PORTFOLIO COMPOSITION BY COUNTRY**** | |
Brazil | | | 7.8 | % |
Turkey | | | 7.3 | |
Dominican Republic | | | 6.7 | |
Oman | | | 6.3 | |
Egypt | | | 6.2 | |
Bahrain | | | 5.7 | |
Ukraine | | | 5.6 | |
South Africa | | | 5.4 | |
Mexico | | | 3.0 | |
Indonesia | | | 2.8 | |
Saudi Arabia | | | 2.5 | |
Azerbaijan | | | 2.5 | |
Qatar | | | 2.3 | |
Kenya | | | 2.3 | |
Russia | | | 2.3 | |
Philippines | | | 2.1 | |
China | | | 2.0 | |
United Arab Emirates | | | 1.9 | |
Colombia | | | 1.9 | |
Panama | | | 1.8 | |
Kazakhstan | | | 1.7 | |
Pakistan | | | 1.6 | |
Chile | | | 1.6 | |
Uruguay | | | 1.5 | |
Iraq | | | 1.5 | |
Peru | | | 1.5 | |
Ivory Coast | | | 1.4 | |
Jordan | | | 1.4 | |
Others (each less than 1.0%) | | | 6.7 | |
Short-Term Investments | | | 2.7 | |
| * | | The return shown is based on net asset value and may differ from the return shown in the financial highlights, which reflects adjustments made to the net asset value in accordance with accounting principles generally accepted in the United States of America. The net asset value was $49.30 as of August 31, 2020. |
| ** | | Market price return was calculated assuming an initial investment made at the market price at the beginning of the reporting period, reinvestment of all dividends and distributions at market price during the period, and sale at the market price on the last day of the period. The price used to calculate the market price return was the closing price on the NYSE Arca, Inc. As of August 31, 2020, the closing price was $49.55. |
| *** | | The adviser seeks to achieve the Fund’s objective. There can be no guarantee it will be achieved. |
| **** | | Percentages indicated are based on total investments as of August 31, 2020. The Fund’s composition is subject to change. |
| | | | | | |
| | | |
| 24 | | | | J.P. MORGAN EXCHANGE-TRADED FUNDS | | AUGUST 31, 2020 |
| | | | | | | | | | | | | | | | |
AVERAGE ANNUAL TOTAL RETURNS AS OF AUGUST 31, 2020 (Unaudited) | |
| | | INCEPTION DATE | | | SIX MONTHS* | | | 1 YEAR | | | SINCE
INCEPTION | |
JPMorgan USD Emerging Markets Sovereign Bond ETF | | | | | | | | | | | | | | | | |
Net Asset Value | | | January 29, 2018 | | | | (1.29 | )% | | | 1.08 | % | | | 4.13 | % |
Market Price | | | | | | | (1.19 | )% | | | 1.05 | % | | | 4.31 | % |
LIFE OF FUND PERFORMANCE (1/29/18 TO 8/31/20)
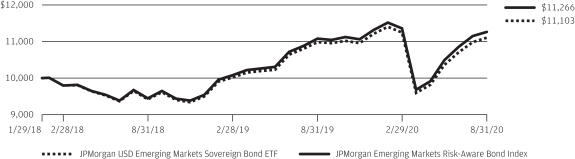
The performance quoted is past performance and is not a guarantee of future results. Exchange-traded funds are subject to certain market risks. Investment returns and principal value of an investment will fluctuate so that an investor’s shares, when sold or redeemed, may be worth more or less than their original cost. Current performance may be higher or lower than the performance data shown. For up-to-date, month-end performance information please call 1-844-457-6383.
Fund commenced operations on January 29, 2018.
The graph illustrates comparative performance for $10,000 invested in shares of the JPMorgan USD Emerging Markets Sovereign Bond ETF and the JPMorgan Emerging Markets Risk-Aware Bond Index from January 29, 2018 to August 31, 2020. The performance of the Fund reflects the deduction of Fund expenses and assumes reinvestment of all dividends and capital gain distributions, if any. The performance of the JPMorgan Emerging Markets Risk-Aware Bond Index does not reflect the deduction of expenses associated with an exchange-traded fund and has been adjusted to reflect reinvestment of all dividends and capital gain distributions of the securities included in the Index, if applicable. The JPMorgan Emerging Markets Risk-Aware Bond Index (the “index”) is comprised of liquid, U.S. dollar-denominated sovereign and quasi-sovereign fixed and floating rate debt securities from emerging markets selected using a rules-based methodology and is owned by J.P. Morgan Investment Inc., the Fund’s adviser (the “Adviser”). The Index is maintained and calculated by J.P. Morgan Securities LLC (“JPMS” or the “Index Provider”), which selects securities in accordance with the methodology from among the components of the J.P. Morgan Emerging Market Bond Index Global Diversified, which was developed and is maintained by the Index Provider. The Index Provider and the Adviser are both wholly-owned subsidiaries of JPMorgan Chase & Co., a publicly-held financial services holding company. The Index
starts with the J.P. Morgan Emerging Market Bond Index Global Diversified and applies a proprietary methodology that filters for liquidity and for country risk and allocates risk based on credit rating. Historically, the J.P. Morgan Emerging Markets Bond Index Global Diversified has included bonds issued by the countries of Angola, Argentina, Armenia, Azerbaijan, Belize, Bolivia, Brazil, Cameroon, Chile, China, Colombia, Costa Rica, Cote D’Ivoire, Croatia, Dominican Republic, Ecuador, Egypt, El Salvador, Ethiopia, Gabon, Georgia, Ghana, Guatemala, Honduras, Hungary, India, Indonesia, Iraq, Jamaica, Jordan, Kazakhstan, Kenya, Latvia, Lebanon, Lithuania, Malaysia, Mexico, Mongolia, Morocco, Mozambique, Namibia, Nigeria, Oman, Pakistan, Panama, Paraguay, Peru, Philippines, Poland, Romania, Russian Federation, Senegal, Serbia, Slovakia, South Africa, Sri Lanka, Suriname, Trinidad and Tobago, Tunisia, Turkey, Ukraine, Uruguay, Venezuela, Vietnam, Zambia; however, this universe of countries may change in accordance with the Index Provider’s determination of eligible emerging market countries and there is no assurance that a particular country will be represented in the Underlying Index at any given time. Investors cannot invest directly in an index.
Fund performance reflects the partial waiver of the Fund’s fees and reimbursement of expenses for certain periods since the applicable inception date. Without these waivers and reimbursements, performance would have been lower. Also, performance shown in this section does not reflect the deduction of taxes that a shareholder may pay on Fund distributions or on gains resulting from redemption or sale of Fund shares.
The returns shown are based on net asset values calculated for shareholder transactions and may differ from the returns shown in the financial highlights, which reflect adjustments made to the net asset values in accordance with accounting principles generally accepted in the United States of America.
| | | | | | | | |
| | | |
| AUGUST 31, 2020 | | J.P. MORGAN EXCHANGE-TRADED FUNDS | | | | | 25 | |
JPMorgan BetaBuilders 1-5 Year U.S. Aggregate Bond ETF
SCHEDULE OF PORTFOLIO INVESTMENTS
AS OF AUGUST 31, 2020 (Unaudited)
| | | | | | | | |
| INVESTMENTS | | PRINCIPAL AMOUNT ($) | | | VALUE ($) | |
U.S. Treasury Obligations — 54.8% | |
| | |
U.S. Treasury Notes | | | | | | | | |
| | |
1.13%, 9/30/2021 | | | 614,000 | | | | 620,500 | |
| | |
2.00%, 12/31/2021 | | | 4,378,000 | | | | 4,486,082 | |
| | |
1.75%, 6/30/2022 | | | 200,000 | | | | 205,867 | |
| | |
1.50%, 8/15/2022 | | | 105,000 | | | | 107,793 | |
| | |
1.63%, 8/15/2022 | | | 482,000 | | | | 495,952 | |
| | |
1.50%, 9/15/2022 | | | 360,000 | | | | 370,012 | |
| | |
1.88%, 9/30/2022 | | | 130,000 | | | | 134,672 | |
| | |
1.38%, 10/15/2022 | | | 900,000 | | | | 923,555 | |
| | |
2.00%, 11/30/2022 | | | 655,000 | | | | 682,326 | |
| | |
1.63%, 12/15/2022 | | | 23,000 | | | | 23,783 | |
| | |
1.75%, 1/31/2023 | | | 600,000 | | | | 623,297 | |
| | |
2.00%, 2/15/2023 | | | 400,000 | | | | 418,187 | |
| | |
1.50%, 2/28/2023 | | | 705,000 | | | | 728,849 | |
| | |
1.50%, 3/31/2023 | | | 24,000 | | | | 24,840 | |
| | |
0.25%, 6/15/2023 | | | 1,750,000 | | | | 1,755,059 | |
| | |
0.13%, 7/15/2023 | | | 131,000 | | | | 130,918 | |
| | |
1.25%, 7/31/2023 | | | 467,000 | | | | 481,922 | |
| | |
2.75%, 7/31/2023 | | | 687,000 | | | | 738,901 | |
| | |
0.13%, 8/15/2023 | | | 864,000 | | | | 863,392 | |
| | |
2.75%, 11/15/2023 | | | 600,000 | | | | 649,547 | |
| | |
2.63%, 12/31/2023 | | | 15,000 | | | | 16,222 | |
| | |
2.75%, 2/15/2024 | | | 16,000 | | | | 17,420 | |
| | |
2.38%, 2/29/2024 | | | 2,627,000 | | | | 2,827,924 | |
| | |
2.13%, 3/31/2024 | | | 70,000 | | | | 74,845 | |
| | |
2.00%, 4/30/2024 | | | 480,000 | | | | 511,762 | |
| | |
2.25%, 4/30/2024 | | | 15,000 | | | | 16,129 | |
| | |
2.00%, 5/31/2024 | | | 335,000 | | | | 357,560 | |
| | |
1.75%, 6/30/2024 | | | 282,000 | | | | 298,656 | |
| | |
1.75%, 7/31/2024 | | | 695,000 | | | | 736,809 | |
| | |
1.50%, 9/30/2024 | | | 1,070,000 | | | | 1,125,841 | |
| | |
1.50%, 11/30/2024 | | | 15,000 | | | | 15,809 | |
| | |
1.75%, 12/31/2024 | | | 545,000 | | | | 580,723 | |
| | |
1.38%, 1/31/2025 | | | 451,000 | | | | 473,550 | |
| | |
0.38%, 4/30/2025 | | | 839,000 | | | | 843,850 | |
| | |
0.25%, 5/31/2025 | | | 349,000 | | | | 348,973 | |
| | |
0.25%, 6/30/2025 | | | 281,000 | | | | 280,890 | |
| | | | | | | | |
| | |
Total U.S. Treasury Obligations
(Cost $22,207,996) | | | | | | | 22,992,417 | |
| | | | | | | | |
Corporate Bonds — 25.7% | |
|
Aerospace & Defense — 0.4% | |
| | |
Boeing Co. (The)
2.35%, 10/30/2021 | | | 17,000 | | | | 17,150 | |
| | |
2.13%, 3/1/2022 | | | 8,000 | | | | 8,045 | |
| | |
2.70%, 5/1/2022 | | | 6,000 | | | | 6,117 | |
| | |
4.88%, 5/1/2025 | | | 18,000 | | | | 19,592 | |
| | | | | | | | |
| INVESTMENTS | | PRINCIPAL AMOUNT ($) | | | VALUE ($) | |
| |
|
Aerospace & Defense — continued | |
| | |
General Dynamics Corp.
2.25%, 11/15/2022 | | | 16,000 | | | | 16,596 | |
| | |
3.25%, 4/1/2025 | | | 15,000 | | | | 16,682 | |
| | |
Howmet Aerospace, Inc. 6.88%, 5/1/2025 | | | 20,000 | | | | 22,721 | |
| | |
Leidos, Inc. 3.63%, 5/15/2025 (a) | | | 15,000 | | | | 16,735 | |
| | |
Lockheed Martin Corp. 3.10%, 1/15/2023 | | | 5,000 | | | | 5,298 | |
| | |
Northrop Grumman Corp. 2.55%, 10/15/2022 | | | 15,000 | | | | 15,672 | |
| | |
Precision Castparts Corp. 3.25%, 6/15/2025 | | | 18,000 | | | | 20,102 | |
| | |
Raytheon Technologies Corp. 2.80%, 3/15/2022 (a) | | | 19,000 | | | | 19,644 | |
| | | | | | | | |
| | |
| | | | | | | 184,354 | |
| | | | | | | | |
|
Air Freight & Logistics — 0.1% | |
| | |
FedEx Corp.
4.00%, 1/15/2024 | | | 10,000 | | | | 11,091 | |
| | |
3.80%, 5/15/2025 | | | 10,000 | | | | 11,311 | |
| | |
United Parcel Service, Inc.
2.35%, 5/16/2022 | | | 8,000 | | | | 8,260 | |
| | |
2.20%, 9/1/2024 | | | 15,000 | | | | 15,898 | |
| | | | | | | | |
| | |
| | | | | | | 46,560 | |
| | | | | | | | |
|
Airlines — 0.1% | |
| | |
Southwest Airlines Co. 5.25%, 5/4/2025 | | | 19,000 | | | | 20,692 | |
| | | | | | | | |
|
Auto Components — 0.1% | |
| | |
Aptiv Corp. 4.15%, 3/15/2024 | | | 17,000 | | | | 18,743 | |
| | |
Magna International, Inc. (Canada) 3.63%, 6/15/2024 | | | 10,000 | | | | 11,056 | |
| | | | | | | | |
| | |
| | | | | | | 29,799 | |
| | | | | | | | |
|
Automobiles — 0.2% | |
| | |
General Motors Co. 4.88%, 10/2/2023 | | | 15,000 | | | | 16,377 | |
| | |
Toyota Motor Corp. (Japan) 2.36%, 7/2/2024 | | | 76,000 | | | | 81,051 | |
| | | | | | | | |
| | |
| | | | | | | 97,428 | |
| | | | | | | | |
|
Banks — 7.0% | |
| | |
Bank of America Corp. | | | | | | | | |
| | |
(ICE LIBOR USD 3 Month + 1.02%), 2.88%, 4/24/2023 (b) | | | 15,000 | | | | 15,558 | |
| | |
(ICE LIBOR USD 3 Month + 0.93%), 2.82%, 7/21/2023 (b) | | | 17,000 | | | | 17,697 | |
| | |
4.13%, 1/22/2024 | | | 15,000 | | | | 16,761 | |
| | |
(SOFR + 1.46%), 1.49%, 5/19/2024 (b) | | | 7,000 | | | | 7,166 | |
| | |
(ICE LIBOR USD 3 Month + 0.97%), 3.46%, 3/15/2025 (b) | | | 24,000 | | | | 26,209 | |
| | |
Series L, 3.95%, 4/21/2025 | | | 40,000 | | | | 44,968 | |
SEE NOTES TO FINANCIAL STATEMENTS.
| | | | | | |
| | | |
| 26 | | | | J.P. MORGAN EXCHANGE-TRADED FUNDS | | AUGUST 31, 2020 |
| | | | | | | | |
| INVESTMENTS | | PRINCIPAL AMOUNT ($) | | | VALUE ($) | |
Corporate Bonds — continued | |
|
Banks — continued | |
| | |
(ICE LIBOR USD 3 Month + 0.64%), 2.01%, 2/13/2026 (b) | | | 40,000 | | | | 41,706 | |
| | |
(SOFR + 1.15%), 1.32%, 6/19/2026 (b) | | | 114,000 | | | | 115,459 | |
| | |
Bank of Montreal (Canada)
2.35%, 9/11/2022 | | | 24,000 | | | | 24,994 | |
| | |
Series E, 3.30%, 2/5/2024 | | | 5,000 | | | | 5,455 | |
| | |
2.50%, 6/28/2024 | | | 18,000 | | | | 19,260 | |
| | |
(USD Swap Semi 5 Year + 1.28%), 4.34%, 10/5/2028 (b) | | | 25,000 | | | | 27,113 | |
| | |
Bank of Nova Scotia (The) (Canada)
2.70%, 3/7/2022 | | | 15,000 | | | | 15,553 | |
| | |
2.00%, 11/15/2022 | | | 24,000 | | | | 24,826 | |
| | |
3.40%, 2/11/2024 | | | 17,000 | | | | 18,589 | |
| | |
2.20%, 2/3/2025 | | | 12,000 | | | | 12,753 | |
| | |
Barclays plc (United Kingdom) 3.65%, 3/16/2025 | | | 40,000 | | | | 43,763 | |
| | |
BNP Paribas SA (France) 3.25%, 3/3/2023 | | | 20,000 | | | | 21,406 | |
| | |
Canadian Imperial Bank of Commerce (Canada)
0.95%, 6/23/2023 | | | 18,000 | | | | 18,200 | |
| | |
2.25%, 1/28/2025 | | | 20,000 | | | | 21,235 | |
| | |
Citigroup, Inc.
2.90%, 12/8/2021 | | | 24,000 | | | | 24,712 | |
| | |
2.75%, 4/25/2022 | | | 16,000 | | | | 16,571 | |
| | |
4.05%, 7/30/2022 | | | 15,000 | | | | 15,970 | |
| | |
(ICE LIBOR USD 3 Month + 0.72%), 3.14%, 1/24/2023 (b) | | | 92,000 | | | | 95,161 | |
| | |
(ICE LIBOR USD 3 Month + 0.95%), 2.88%, 7/24/2023 (b) | | | 20,000 | | | | 20,833 | |
| | |
3.88%, 10/25/2023 | | | 7,000 | | | | 7,716 | |
| | |
(ICE LIBOR USD 3 Month + 1.02%), 4.04%, 6/1/2024 (b) | | | 12,000 | | | | 13,055 | |
| | |
Comerica, Inc. 3.70%, 7/31/2023 | | | 15,000 | | | | 16,267 | |
| | |
Cooperatieve Rabobank UA (Netherlands) 3.88%, 2/8/2022 | | | 59,000 | | | | 61,991 | |
| | |
Fifth Third Bancorp
3.50%, 3/15/2022 | | | 25,000 | | | | 26,093 | |
| | |
4.30%, 1/16/2024 | | | 12,000 | | | | 13,275 | |
| | |
First Horizon National Corp. 3.55%, 5/26/2023 | | | 24,000 | | | | 25,192 | |
| | |
First Niagara Financial Group, Inc. 7.25%, 12/15/2021 | | | 20,000 | | | | 21,570 | |
| | |
HSBC Holdings plc (United Kingdom)
4.88%, 1/14/2022 | | | 20,000 | | | | 21,183 | |
| | |
4.00%, 3/30/2022 | | | 45,000 | | | | 47,417 | |
| | |
(ICE LIBOR USD 3 Month + 1.14%), 2.63%, 11/7/2025 (b) | | | 30,000 | | | | 31,518 | |
| | | | | | | | |
| INVESTMENTS | | PRINCIPAL AMOUNT ($) | | | VALUE ($) | |
| |
|
Banks — continued | |
| | |
Huntington Bancshares, Inc.
2.63%, 8/6/2024 | | | 17,000 | | | | 18,214 | |
| | |
4.00%, 5/15/2025 | | | 8,000 | | | | 9,120 | |
| | |
Kreditanstalt fuer Wiederaufbau (Germany)
2.63%, 1/25/2022 | | | 18,000 | | | | 18,606 | |
| | |
2.50%, 2/15/2022 | | | 16,000 | | | | 16,530 | |
| | |
2.00%, 10/4/2022 | | | 194,000 | | | | 201,201 | |
| | |
1.38%, 8/5/2024 | | | 70,000 | | | | 72,956 | |
| | |
2.50%, 11/20/2024 | | | 13,000 | | | | 14,185 | |
| | |
0.38%, 7/18/2025 | | | 26,000 | | | | 26,002 | |
| | |
Landwirtschaftliche Rentenbank (Germany)
3.13%, 11/14/2023 | | | 54,000 | | | | 58,899 | |
| | |
Series 40, 0.50%, 5/27/2025 | | | 22,000 | | | | 22,095 | |
| | |
Lloyds Bank plc (United Kingdom)
3.30%, 5/7/2021 | | | 35,000 | | | | 35,705 | |
| | |
M&T Bank Corp. 3.55%, 7/26/2023 | | | 22,000 | | | | 23,958 | |
| | |
Mitsubishi UFJ Financial Group, Inc. (Japan)
3.00%, 2/22/2022 | | | 40,000 | | | | 41,485 | |
| | |
2.67%, 7/25/2022 | | | 40,000 | | | | 41,592 | |
| | |
3.41%, 3/7/2024 | | | 33,000 | | | | 35,917 | |
| | |
3.78%, 3/2/2025 | | | 27,000 | | | | 30,316 | |
| | |
MUFG Americas Holdings Corp.
3.50%, 6/18/2022 | | | 5,000 | | | | 5,272 | |
| | |
MUFG Union Bank NA 2.10%, 12/9/2022 | | | 20,000 | | | | 20,687 | |
| | |
Natwest Group plc (United Kingdom)
6.13%, 12/15/2022 | | | 15,000 | | | | 16,445 | |
| | |
6.10%, 6/10/2023 | | | 15,000 | | | | 16,649 | |
| | |
6.00%, 12/19/2023 | | | 50,000 | | | | 56,309 | |
| | |
Oesterreichische Kontrollbank AG (Austria)
3.13%, 11/7/2023 | | | 103,000 | | | | 112,114 | |
| | |
1.50%, 2/12/2025 | | | 17,000 | | | | 17,803 | |
| | |
People’s United Financial, Inc.
3.65%, 12/6/2022 | | | 27,000 | | | | 28,653 | |
| | |
PNC Financial Services Group, Inc. (The)
3.30%, 3/8/2022 | | | 20,000 | | | | 20,842 | |
| | |
2.85%, 11/9/2022 (c) | | | 12,000 | | | | 12,628 | |
| | |
3.50%, 1/23/2024 | | | 31,000 | | | | 33,970 | |
| | |
2.20%, 11/1/2024 | | | 20,000 | | | | 21,291 | |
| | |
Regions Financial Corp. 3.80%, 8/14/2023 | | | 15,000 | | | | 16,364 | |
| | |
Royal Bank of Canada (Canada)
2.75%, 2/1/2022 | | | 8,000 | | | | 8,278 | |
| | |
1.95%, 1/17/2023 | | | 28,000 | | | | 29,016 | |
| | |
3.70%, 10/5/2023 | | | 15,000 | | | | 16,467 | |
| | |
2.55%, 7/16/2024 | | | 20,000 | | | | 21,498 | |
| | |
Santander Holdings USA, Inc. | | | | | | | | |
| | |
4.45%, 12/3/2021 | | | 38,000 | | | | 39,546 | |
| | |
3.40%, 1/18/2023 | | | 26,000 | | | | 27,250 | |
SEE NOTES TO FINANCIAL STATEMENTS.
| | | | | | | | |
| | | |
| AUGUST 31, 2020 | | J.P. MORGAN EXCHANGE-TRADED FUNDS | | | | | 27 | |
JPMorgan BetaBuilders 1-5 Year U.S. Aggregate Bond ETF
SCHEDULE OF PORTFOLIO INVESTMENTS
AS OF AUGUST 31, 2020 (Unaudited) (continued)
| | | | | | | | |
| INVESTMENTS | | PRINCIPAL AMOUNT ($) | | | VALUE ($) | |
Corporate Bonds — continued | |
|
Banks — continued | |
| | |
Santander UK plc (United Kingdom)
4.00%, 3/13/2024 | | | 55,000 | | | | 61,118 | |
| | |
Sumitomo Mitsui Financial Group, Inc. (Japan)
2.44%, 10/19/2021 | | | 40,000 | | | | 40,896 | |
| | |
3.10%, 1/17/2023 | | | 18,000 | | | | 19,088 | |
| | |
3.94%, 10/16/2023 | | | 33,000 | | | | 36,359 | |
| | |
Toronto-Dominion Bank (The) (Canada)
3.25%, 3/11/2024 | | | 30,000 | | | | 32,772 | |
| | |
2.65%, 6/12/2024 | | | 20,000 | | | | 21,513 | |
| | |
Truist Bank | | | | | | | | |
| | |
(ICE LIBOR USD 3 Month + 0.59%), 3.50%, 8/2/2022 (b) | | | 20,000 | | | | 20,550 | |
| | |
3.20%, 4/1/2024 | | | 10,000 | | | | 10,930 | |
| | |
Truist Financial Corp.
3.20%, 9/3/2021 | | | 27,000 | | | | 27,718 | |
| | |
2.20%, 3/16/2023 | | | 7,000 | | | | 7,305 | |
| | |
3.75%, 12/6/2023 | | | 22,000 | | | | 24,241 | |
| | |
2.85%, 10/26/2024 | | | 12,000 | | | | 13,109 | |
| | |
3.70%, 6/5/2025 | | | 6,000 | | | | 6,838 | |
| | |
US Bancorp | | | | | | | | |
| | |
Series V, 2.63%, 1/24/2022 | | | 28,000 | | | | 28,846 | |
| | |
3.00%, 3/15/2022 | | | 50,000 | | | | 51,951 | |
| | |
2.95%, 7/15/2022 | | | 20,000 | | | | 20,934 | |
| | |
3.60%, 9/11/2024 | | | 7,000 | | | | 7,786 | |
| | |
Wells Fargo & Co.
2.63%, 7/22/2022 | | | 15,000 | | | | 15,598 | |
| | |
Series M, 3.45%, 2/13/2023 | | | 40,000 | | | | 42,523 | |
| | |
4.13%, 8/15/2023 | | | 15,000 | | | | 16,408 | |
| | |
3.75%, 1/24/2024 | | | 17,000 | | | | 18,576 | |
| | |
(SOFR + 1.60%), 1.65%, 6/2/2024 (b) | | | 15,000 | | | | 15,342 | |
| | |
3.30%, 9/9/2024 | | | 41,000 | | | | 44,994 | |
| | |
3.00%, 2/19/2025 | | | 25,000 | | | | 27,153 | |
| | |
(ICE LIBOR USD 3 Month + 0.75%), 2.16%, 2/11/2026 (b) | | | 50,000 | | | | 52,162 | |
| | |
Westpac Banking Corp. (Australia)
2.00%, 8/19/2021 | | | 17,000 | | | | 17,284 | |
| | |
(US Treasury Yield Curve Rate T Note Constant Maturity 5 Year + 1.35%), 2.89%, 2/4/2030 (b) | | | 57,000 | | | | 59,015 | |
| | | | | | | | |
| | |
| | | | | | | 2,926,067 | |
| | | | | | | | |
|
Beverages — 0.5% | |
| | |
Anheuser-Busch InBev Finance, Inc. (Belgium) 3.70%, 2/1/2024 | | | 15,000 | | | | 16,515 | |
| | |
Anheuser-Busch InBev Worldwide, Inc. (Belgium) 4.15%, 1/23/2025 | | | 20,000 | | | | 22,727 | |
| | | | | | | | |
| INVESTMENTS | | PRINCIPAL AMOUNT ($) | | | VALUE ($) | |
| |
|
Beverages — continued | |
| | |
Beam Suntory, Inc. (Japan) 3.25%, 5/15/2022 | | | 10,000 | | | | 10,344 | |
| | |
Coca-Cola Co. (The)
3.30%, 9/1/2021 | | | 20,000 | | | | 20,613 | |
| | |
2.20%, 5/25/2022 | | | 15,000 | | | | 15,501 | |
| | |
Constellation Brands, Inc. 2.65%, 11/7/2022 | | | 15,000 | | | | 15,634 | |
| | |
Diageo Investment Corp. (United Kingdom)
2.88%, 5/11/2022 | | | 22,000 | | | | 22,921 | |
| | |
8.00%, 9/15/2022 | | | 10,000 | | | | 11,473 | |
| | |
Keurig Dr Pepper, Inc. 3.13%, 12/15/2023 | | | 19,000 | | | | 20,459 | |
| | |
Molson Coors Beverage Co. 3.50%, 5/1/2022 | | | 7,000 | | | | 7,310 | |
| | |
PepsiCo, Inc.
2.25%, 5/2/2022 | | | 8,000 | | | | 8,249 | |
| | |
3.10%, 7/17/2022 | | | 17,000 | | | | 17,803 | |
| | |
3.60%, 3/1/2024 | | | 20,000 | | | | 22,004 | |
| | | | | | | | |
| | |
| | | | | | | 211,553 | |
| | | | | | | | |
|
Biotechnology — 0.5% | |
| | |
AbbVie, Inc.
3.75%, 11/14/2023 | | | 40,000 | | | | 43,831 | |
| | |
3.85%, 6/15/2024 (a) | | | 17,000 | | | | 18,740 | |
| | |
2.60%, 11/21/2024 (a) | | | 37,000 | | | | 39,603 | |
| | |
3.80%, 3/15/2025 (a) | | | 27,000 | | | | 30,173 | |
| | |
3.60%, 5/14/2025 | | | 15,000 | | | | 16,737 | |
| | |
Amgen, Inc.
2.70%, 5/1/2022 | | | 7,000 | | | | 7,236 | |
| | |
3.63%, 5/22/2024 | | | 15,000 | | | | 16,550 | |
| | |
1.90%, 2/21/2025 | | | 10,000 | | | | 10,510 | |
| | |
Baxalta, Inc. 4.00%, 6/23/2025 | | | 6,000 | | | | 6,872 | |
| | |
Gilead Sciences, Inc.
1.95%, 3/1/2022 | | | 23,000 | | | | 23,524 | |
| | |
3.25%, 9/1/2022 | | | 10,000 | | | | 10,531 | |
| | | | | | | | |
| | |
| | | | | | | 224,307 | |
| | | | | | | | |
|
Building Products — 0.0% (d) | |
| | |
Carrier Global Corp. 2.24%, 2/15/2025 (a) | | | 15,000 | | | | 15,722 | |
| | | | | | | | |
|
Capital Markets — 2.1% | |
| | |
Ameriprise Financial, Inc. 3.70%, 10/15/2024 | | | 10,000 | | | | 11,249 | |
| | |
Ares Capital Corp. 3.50%, 2/10/2023 | | | 18,000 | | | | 18,446 | |
| | |
Bank of New York Mellon Corp. (The)
1.95%, 8/23/2022 | | | 15,000 | | | | 15,490 | |
| | |
(ICE LIBOR USD 3 Month + 0.63%), 2.66%, 5/16/2023 (b) | | | 42,000 | | | | 43,565 | |
| | |
1.60%, 4/24/2025 | | | 35,000 | | | | 36,517 | |
| | |
BGC Partners, Inc. 3.75%, 10/1/2024 | | | 15,000 | | | | 15,016 | |
SEE NOTES TO FINANCIAL STATEMENTS.
| | | | | | |
| | | |
| 28 | | | | J.P. MORGAN EXCHANGE-TRADED FUNDS | | AUGUST 31, 2020 |
| | | | | | | | |
| INVESTMENTS | | PRINCIPAL AMOUNT ($) | | | VALUE ($) | |
Corporate Bonds — continued | |
|
Capital Markets — continued | |
| | |
Brookfield Finance, Inc. (Canada) 4.00%, 4/1/2024 | | | 15,000 | | | | 16,549 | |
| | |
Charles Schwab Corp. (The) 4.20%, 3/24/2025 | | | 20,000 | | | | 23,185 | |
| | |
CME Group, Inc. 3.00%, 9/15/2022 | | | 20,000 | | | | 21,077 | |
| | |
Deutsche Bank AG (Germany) | | | | | | | | |
| | |
Series D, 5.00%, 2/14/2022 | | | 20,000 | | | | 21,010 | |
| | |
3.70%, 5/30/2024 | | | 28,000 | | | | 29,878 | |
| | |
Franklin Resources, Inc. 2.85%, 3/30/2025 | | | 15,000 | | | | 16,429 | |
| | |
FS KKR Capital Corp. 4.63%, 7/15/2024 | | | 15,000 | | | | 15,070 | |
| | |
Goldman Sachs Group, Inc. (The)
3.20%, 2/23/2023 | | | 25,000 | | | | 26,604 | |
| | |
(ICE LIBOR USD 3 Month + 1.05%), 2.91%, 6/5/2023 (b) | | | 83,000 | | | | 86,217 | |
| | |
3.85%, 7/8/2024 | | | 15,000 | | | | 16,576 | |
| | |
3.50%, 4/1/2025 | | | 50,000 | | | | 55,446 | |
| | |
(ICE LIBOR USD 3 Month + 1.20%), 3.27%, 9/29/2025 (b) | | | 20,000 | | | | 21,779 | |
| | |
Intercontinental Exchange, Inc. 4.00%, 10/15/2023 | | | 10,000 | | | | 11,048 | |
| | |
Janus Capital Group, Inc. (United Kingdom) 4.88%, 8/1/2025 | | | 16,000 | | | | 18,240 | |
| | |
Main Street Capital Corp. 5.20%, 5/1/2024 | | | 15,000 | | | | 15,581 | |
| | |
Moody’s Corp. 4.88%, 2/15/2024 | | | 17,000 | | | | 19,239 | |
| | |
Morgan Stanley
2.63%, 11/17/2021 | | | 15,000 | | | | 15,397 | |
| | |
2.75%, 5/19/2022 | | | 15,000 | | | | 15,578 | |
| | |
3.13%, 1/23/2023 | | | 32,000 | | | | 33,923 | |
| | |
(ICE LIBOR USD 3 Month + 0.85%), 3.74%, 4/24/2024 (b) | | | 60,000 | | | | 64,841 | |
| | |
Series F, 3.88%, 4/29/2024 | | | 15,000 | | | | 16,680 | |
| | |
3.70%, 10/23/2024 | | | 30,000 | | | | 33,513 | |
| | |
Northern Trust Corp. 2.38%, 8/2/2022 | | | 30,000 | | | | 31,177 | |
| | |
Oaktree Specialty Lending Corp. 3.50%, 2/25/2025 | | | 15,000 | | | | 15,101 | |
| | |
State Street Corp. | | | | | | | | |
| | |
(ICE LIBOR USD 3 Month + 0.64%), 2.65%, 5/15/2023 (b) | | | 23,000 | | | | 23,902 | |
| | |
3.10%, 5/15/2023 | | | 15,000 | | | | 16,059 | |
| | |
3.70%, 11/20/2023 | | | 8,000 | | | | 8,841 | |
| | |
(ICE LIBOR USD 3 Month + 0.77%), 3.78%, 12/3/2024 (b) | | | 12,000 | | | | 13,227 | |
| | |
(SOFR + 0.94%), 2.35%, 11/1/2025 (b) | | | 31,000 | | | | 33,049 | |
| | | | | | | | |
| | |
| | | | | | | 875,499 | |
| | | | | | | | |
|
Chemicals — 0.4% | |
| | |
Dow Chemical Co. (The) 3.50%, 10/1/2024 | | | 10,000 | | | | 10,965 | |
| | | | | | | | |
| INVESTMENTS | | PRINCIPAL AMOUNT ($) | | | VALUE ($) | |
| |
|
Chemicals — continued | |
| | |
DuPont de Nemours, Inc. 4.21%, 11/15/2023 | | | 25,000 | | | | 27,624 | |
| | |
Eastman Chemical Co. 3.60%, 8/15/2022 | | | 18,000 | | | | 18,854 | |
| | |
Ecolab, Inc. 4.35%, 12/8/2021 | | | 16,000 | | | | 16,769 | |
| | |
LYB International Finance BV 4.00%, 7/15/2023 | | | 15,000 | | | | 16,333 | |
| | |
Nutrien Ltd. (Canada) 3.63%, 3/15/2024 | | | 16,000 | | | | 17,451 | |
| | |
PPG Industries, Inc. 2.40%, 8/15/2024 | | | 15,000 | | | | 15,955 | |
| | |
Praxair, Inc. 2.70%, 2/21/2023 | | | 15,000 | | | | 15,723 | |
| | |
Syngenta Finance NV (Switzerland) 3.13%, 3/28/2022 | | | 36,000 | | | | 36,633 | |
| | | | | | | | |
| | |
| | | | | | | 176,307 | |
| | | | | | | | |
|
Commercial Services & Supplies — 0.1% | |
| | |
Cintas Corp. No. 2 2.90%, 4/1/2022 | | | 5,000 | | | | 5,182 | |
| | |
Republic Services, Inc. 2.50%, 8/15/2024 | | | 10,000 | | | | 10,681 | |
| | |
Waste Management, Inc. 2.90%, 9/15/2022 | | | 12,000 | | | | 12,527 | |
| | | | | | | | |
| | |
| | | | | | | 28,390 | |
| | | | | | | | |
|
Communications Equipment — 0.1% | |
| | |
Cisco Systems, Inc. 2.20%, 9/20/2023 | | | 27,000 | | | | 28,458 | |
| | |
Motorola Solutions, Inc. 3.75%, 5/15/2022 | | | 6,000 | | | | 6,332 | |
| | | | | | | | |
| | |
| | | | | | | 34,790 | |
| | | | | | | | |
|
Consumer Finance — 1.4% | |
| | |
Ally Financial, Inc.
4.13%, 2/13/2022 | | | 14,000 | | | | 14,521 | |
| | |
3.88%, 5/21/2024 | | | 35,000 | | | | 37,248 | |
| | |
American Express Co.
2.50%, 8/1/2022 | | | 15,000 | | | | 15,569 | |
| | |
2.65%, 12/2/2022 | | | 12,000 | | | | 12,601 | |
| | |
3.40%, 2/27/2023 | | | 26,000 | | | | 27,819 | |
| | |
2.50%, 7/30/2024 | | | 30,000 | | | | 32,111 | |
| | |
American Honda Finance Corp.
2.60%, 11/16/2022 | | | 25,000 | | | | 26,147 | |
| | |
3.63%, 10/10/2023 | | | 16,000 | | | | 17,463 | |
| | |
1.20%, 7/8/2025 | | | 15,000 | | | | 15,147 | |
| | |
Capital One Financial Corp.
3.05%, 3/9/2022 | | | 15,000 | | | | 15,542 | |
| | |
3.50%, 6/15/2023 | | | 6,000 | | | | 6,437 | |
| | |
3.90%, 1/29/2024 | | | 32,000 | | | | 35,005 | |
| | |
3.30%, 10/30/2024 | | | 15,000 | | | | 16,329 | |
| | |
Caterpillar Financial Services Corp.
2.85%, 6/1/2022 | | | 12,000 | | | | 12,523 | |
| | |
0.65%, 7/7/2023 | | | 28,000 | | | | 28,194 | |
| | |
3.30%, 6/9/2024 | | | 12,000 | | | | 13,189 | |
| | |
3.25%, 12/1/2024 | | | 6,000 | | | | 6,635 | |
SEE NOTES TO FINANCIAL STATEMENTS.
| | | | | | | | |
| | | |
| AUGUST 31, 2020 | | J.P. MORGAN EXCHANGE-TRADED FUNDS | | | | | 29 | |
JPMorgan BetaBuilders 1-5 Year U.S. Aggregate Bond ETF
SCHEDULE OF PORTFOLIO INVESTMENTS
AS OF AUGUST 31, 2020 (Unaudited) (continued)
| | | | | | | | |
| INVESTMENTS | | PRINCIPAL AMOUNT ($) | | | VALUE ($) | |
Corporate Bonds — continued | |
|
Consumer Finance — continued | |
| | |
Discover Financial Services 3.85%, 11/21/2022 | | | 25,000 | | | | 26,674 | |
| | |
General Motors Financial Co., Inc. | | | | | | | | |
| | |
3.45%, 1/14/2022 | | | 15,000 | | | | 15,387 | |
| | |
5.10%, 1/17/2024 | | | 55,000 | | | | 60,426 | |
| | |
2.90%, 2/26/2025 | | | 28,000 | | | | 29,056 | |
| | |
John Deere Capital Corp.
3.15%, 10/15/2021 | | | 18,000 | | | | 18,567 | |
| | |
3.45%, 6/7/2023 | | | 23,000 | | | | 24,915 | |
| | |
0.70%, 7/5/2023 | | | 7,000 | | | | 7,060 | |
| | |
2.65%, 6/24/2024 | | | 15,000 | | | | 16,169 | |
| | |
Synchrony Financial 3.75%, 8/15/2021 | | | 19,000 | | | | 19,414 | |
| | |
Toyota Motor Credit Corp.
2.63%, 1/10/2023 | | | 18,000 | | | | 18,906 | |
| | |
1.35%, 8/25/2023 | | | 18,000 | | | | 18,472 | |
| | | | | | | | |
| | |
| | | | | | | 587,526 | |
| | | | | | | | |
|
Diversified Financial Services — 0.4% | |
| | |
Berkshire Hathaway, Inc. 3.40%, 1/31/2022 | | | 30,000 | | | | 31,342 | |
| | |
National Rural Utilities Cooperative Finance Corp. (ICE LIBOR USD 3 Month + 2.91%), 4.75%, 4/30/2043 (b) | | | 15,000 | | | | 15,355 | |
| | |
ORIX Corp. (Japan) 4.05%, 1/16/2024 | | | 15,000 | | | | 16,469 | |
| | |
Private Export Funding Corp. | | | | | | | | |
| | |
Series II, 2.05%, 11/15/2022 | | | 38,000 | | | | 39,365 | |
| | |
Shell International Finance BV (Netherlands)
1.75%, 9/12/2021 | | | 11,000 | | | | 11,162 | |
| | |
3.40%, 8/12/2023 | | | 10,000 | | | | 10,869 | |
| | |
2.00%, 11/7/2024 | | | 23,000 | | | | 24,269 | |
| | |
Voya Financial, Inc. 3.13%, 7/15/2024 | | | 15,000 | | | | 16,156 | |
| | | | | | | | |
| | |
| | | | | | | 164,987 | |
| | | | | | | | |
|
Diversified Telecommunication Services — 0.3% | |
| | |
AT&T, Inc.
3.00%, 6/30/2022 | | | 35,000 | | | | 36,506 | |
| | |
4.45%, 4/1/2024 | | | 32,000 | | | | 35,903 | |
| | |
Verizon Communications, Inc.
5.15%, 9/15/2023 | | | 20,000 | | | | 22,784 | |
| | |
3.38%, 2/15/2025 | | | 22,000 | | | | 24,607 | |
| | | | | | | | |
| | |
| | | | | | | 119,800 | |
| | | | | | | | |
|
Electric Utilities — 0.6% | |
| | |
Avangrid, Inc. 3.20%, 4/15/2025 | | | 8,000 | | | | 8,835 | |
| | |
Duke Energy Corp. 3.75%, 4/15/2024 | | | 8,000 | | | | 8,814 | |
| | |
Duke Energy Florida LLC 3.10%, 8/15/2021 | | | 27,000 | | | | 27,531 | |
| | |
Entergy Louisiana LLC 4.05%, 9/1/2023 | | | 15,000 | | | | 16,435 | |
| | | | | | | | |
| INVESTMENTS | | PRINCIPAL AMOUNT ($) | | | VALUE ($) | |
| |
|
Electric Utilities — continued | |
| | |
Florida Power & Light Co. 3.25%, 6/1/2024 | | | 15,000 | | | | 16,281 | |
| | |
Georgia Power Co. Series A, 2.20%, 9/15/2024 | | | 10,000 | | | | 10,574 | |
| | |
Hydro-Quebec (Canada) Series HY, 8.40%, 1/15/2022 | | | 17,000 | | | | 18,843 | |
| | |
NextEra Energy Capital Holdings, Inc.
3.15%, 4/1/2024 | | | 15,000 | | | | 16,288 | |
| | |
2.75%, 5/1/2025 | | | 10,000 | | | | 10,881 | |
| | |
Oncor Electric Delivery Co. LLC 2.75%, 6/1/2024 | | | 20,000 | | | | 21,565 | |
| | |
Pacific Gas and Electric Co.
1.75%, 6/16/2022 | | | 15,000 | | | | 15,049 | |
| | |
3.45%, 7/1/2025 | | | 15,000 | | | | 15,812 | |
| | |
PPL Capital Funding, Inc. 3.50%, 12/1/2022 | | | 15,000 | | | | 15,862 | |
| | |
Public Service Co. of Colorado 2.25%, 9/15/2022 | | | 18,000 | | | | 18,535 | |
| | |
Public Service Co. of New Hampshire 3.50%, 11/1/2023 | | | 15,000 | | | | 16,291 | |
| | |
Public Service Electric and Gas Co. 2.38%, 5/15/2023 | | | 15,000 | | | | 15,696 | |
| | |
Southern California Edison Co. | | | | | | | | |
| | |
Series A, 2.90%, 3/1/2021 | | | 8,000 | | | | 8,099 | |
| | | | | | | | |
| | |
| | | | | | | 261,391 | |
| | | | | | | | |
|
Electrical Equipment — 0.2% | |
| | |
ABB Finance USA, Inc. (Switzerland)
2.88%, 5/8/2022 | | | 24,000 | | | | 24,965 | |
| | |
3.38%, 4/3/2023 | | | 16,000 | | | | 17,096 | |
| | |
Eaton Corp. 2.75%, 11/2/2022 | | | 15,000 | | | | 15,757 | |
| | |
Emerson Electric Co. 2.63%, 12/1/2021 | | | 6,000 | | | | 6,159 | |
| | |
Legrand France SA (France) 8.50%, 2/15/2025 | | | 19,000 | | | | 25,237 | |
| | | | | | | | |
| | |
| | | | | | | 89,214 | |
| | | | | | | | |
|
Electronic Equipment, Instruments & Components — 0.1% | |
| | |
Arrow Electronics, Inc. 4.00%, 4/1/2025 | | | 10,000 | | | | 10,864 | |
| | |
Flex Ltd. 5.00%, 2/15/2023 | | | 8,000 | | | | 8,741 | |
| | |
Tyco Electronics Group SA (Switzerland) 3.50%, 2/3/2022 | | | 15,000 | | | | 15,535 | |
| | | | | | | | |
| | |
| | | | | | | 35,140 | |
| | | | | | | | |
|
Energy Equipment & Services — 0.1% | |
| | |
Halliburton Co. 3.25%, 11/15/2021 | | | 15,000 | | | | 15,377 | |
| | |
Schlumberger Investment SA 3.65%, 12/1/2023 | | | 15,000 | | | | 16,264 | |
| | | | | | | | |
| | |
| | | | | | | 31,641 | |
| | | | | | | | |
SEE NOTES TO FINANCIAL STATEMENTS.
| | | | | | |
| | | |
| 30 | | | | J.P. MORGAN EXCHANGE-TRADED FUNDS | | AUGUST 31, 2020 |
| | | | | | | | |
| INVESTMENTS | | PRINCIPAL AMOUNT ($) | | | VALUE ($) | |
Corporate Bonds — continued | |
|
Entertainment — 0.1% | |
| | |
TWDC Enterprises 18 Corp.
2.45%, 3/4/2022 | | | 20,000 | | | | 20,622 | |
| | |
2.35%, 12/1/2022 | | | 10,000 | | | | 10,428 | |
| | |
Walt Disney Co. (The) | | | | | | | | |
| | |
1.75%, 8/30/2024 | | | 8,000 | | | | 8,335 | |
| | | | | | | | |
| | |
| | | | | | | 39,385 | |
| | | | | | | | |
|
Equity Real Estate Investment Trusts (REITs) — 0.8% | |
| | |
Alexandria Real Estate Equities, Inc. 4.00%, 1/15/2024 | | | 15,000 | | | | 16,577 | |
| | |
American Campus Communities Operating Partnership LP 3.75%, 4/15/2023 | | | 16,000 | | | | 16,776 | |
| | |
American Tower Corp.
4.70%, 3/15/2022 | | | 6,000 | | | | 6,383 | |
| | |
3.38%, 5/15/2024 | | | 15,000 | | | | 16,368 | |
| | |
2.40%, 3/15/2025 | | | 8,000 | | | | 8,523 | |
| | |
AvalonBay Communities, Inc. 4.20%, 12/15/2023 | | | 6,000 | | | | 6,627 | |
| | |
Boston Properties LP 3.13%, 9/1/2023 | | | 15,000 | | | | 15,876 | |
| | |
Brixmor Operating Partnership LP 3.65%, 6/15/2024 | | | 15,000 | | | | 15,712 | |
| | |
CC Holdings GS V LLC 3.85%, 4/15/2023 | | | 24,000 | | | | 25,925 | |
| | |
Equinix, Inc. 2.63%, 11/18/2024 | | | 8,000 | | | | 8,562 | |
| | |
ERP Operating LP 4.63%, 12/15/2021 | | | 15,000 | | | | 15,639 | |
| | |
GLP Capital LP 3.35%, 9/1/2024 | | | 16,000 | | | | 16,175 | |
| | |
Healthpeak Properties, Inc. 3.88%, 8/15/2024 | | | 15,000 | | | | 16,704 | |
| | |
Kimco Realty Corp. 3.40%, 11/1/2022 | | | 6,000 | | | | 6,338 | |
| | |
Office Properties Income Trust 4.25%, 5/15/2024 | | | 15,000 | | | | 15,240 | |
| | |
Prologis LP 4.25%, 8/15/2023 | | | 15,000 | | | | 16,740 | |
| | |
Realty Income Corp. 3.88%, 4/15/2025 | | | 20,000 | | | | 22,661 | |
| | |
Sabra Health Care LP 4.80%, 6/1/2024 | | | 21,000 | | | | 21,826 | |
| | |
Simon Property Group LP 3.75%, 2/1/2024 | | | 25,000 | | | | 27,109 | |
| | |
Ventas Realty LP 3.13%, 6/15/2023 | | | 16,000 | | | | 16,678 | |
| | | | | | | | |
| | |
| | | | | | | 312,439 | |
| | | | | | | | |
|
Food & Staples Retailing — 0.3% | |
| | |
Costco Wholesale Corp. 2.30%, 5/18/2022 | | | 6,000 | | | | 6,208 | |
| | |
Kroger Co. (The) 2.95%, 11/1/2021 | | | 16,000 | | | | 16,433 | |
| | |
Sysco Corp. 5.65%, 4/1/2025 | | | 20,000 | | | | 23,661 | |
| | |
Walgreens Boots Alliance, Inc. 3.30%, 11/18/2021 | | | 15,000 | | | | 15,404 | |
| | |
Walmart, Inc.
2.35%, 12/15/2022 | | | 24,000 | | | | 25,070 | |
| | |
2.55%, 4/11/2023 | | | 9,000 | | | | 9,473 | |
| | |
3.40%, 6/26/2023 | | | 16,000 | | | | 17,337 | |
| | | | | | | | |
| | |
| | | | | | | 113,586 | |
| | | | | | | | |
| | | | | | | | |
| INVESTMENTS | | PRINCIPAL AMOUNT ($) | | | VALUE ($) | |
| | | | | | | | |
|
Food Products — 0.2% | |
| | |
Campbell Soup Co. 2.50%, 8/2/2022 | | | 6,000 | | | | 6,213 | |
| | |
Conagra Brands, Inc. 3.20%, 1/25/2023 | | | 10,000 | | | | 10,544 | |
| | |
General Mills, Inc. 3.15%, 12/15/2021 | | | 15,000 | | | | 15,408 | |
| | |
Kellogg Co. 3.13%, 5/17/2022 | | | 10,000 | | | | 10,431 | |
| | |
Mondelez International, Inc. 3.63%, 5/7/2023 | | | 20,000 | | | | 21,602 | |
| | |
Tyson Foods, Inc. 2.25%, 8/23/2021 | | | 10,000 | | | | 10,170 | |
| | | | | | | | |
| | |
| | | | | | | 74,368 | |
| | | | | | | | |
|
Gas Utilities — 0.1% | |
| | |
Dominion Energy Gas Holdings LLC 3.55%, 11/1/2023 | | | 17,000 | | | | 18,411 | |
| | |
ONE Gas, Inc. 3.61%, 2/1/2024 | | | 8,000 | | | | 8,759 | |
| | | | | | | | |
| | |
| | | | | | | 27,170 | |
| | | | | | | | |
|
Health Care Equipment & Supplies — 0.3% | |
| | |
Abbott Laboratories 2.55%, 3/15/2022 | | | 15,000 | | | | 15,512 | |
| | |
Becton Dickinson and Co.
3.13%, 11/8/2021 | | | 7,000 | | | | 7,206 | |
| | |
2.89%, 6/6/2022 | | | 15,000 | | | | 15,561 | |
| | |
Boston Scientific Corp. 3.38%, 5/15/2022 | | | 15,000 | | | | 15,712 | |
| | |
Medtronic, Inc. 3.15%, 3/15/2022 | | | 12,000 | | | | 12,518 | |
| | |
3.63%, 3/15/2024 | | | 20,000 | | | | 21,960 | |
| | |
Stryker Corp. 1.15%, 6/15/2025 | | | 30,000 | | | | 30,487 | |
| | |
Zimmer Biomet Holdings, Inc. 3.15%, 4/1/2022 | | | 10,000 | | | | 10,363 | |
| | | | | | | | |
| | |
| | | | | | | 129,319 | |
| | | | | | | | |
|
Health Care Providers & Services — 0.7% | |
| | |
Aetna, Inc. 2.75%, 11/15/2022 | | | 11,000 | | | | 11,478 | |
| | |
Anthem, Inc.
2.95%, 12/1/2022 | | | 7,000 | | | | 7,371 | |
| | |
3.50%, 8/15/2024 | | | 15,000 | | | | 16,507 | |
| | |
Cardinal Health, Inc. 2.62%, 6/15/2022 | | | 20,000 | | | | 20,666 | |
| | |
Cigna Corp.
4.00%, 2/15/2022 | | | 8,000 | | | | 8,251 | |
| | |
3.00%, 7/15/2023 | | | 20,000 | | | | 21,351 | |
| | |
3.50%, 6/15/2024 | | | 10,000 | | | | 10,960 | |
| | |
CommonSpirit Health 2.76%, 10/1/2024 | | | 16,000 | | | | 16,772 | |
| | |
CVS Health Corp.
3.70%, 3/9/2023 | | | 10,000 | | | | 10,767 | |
| | |
4.10%, 3/25/2025 | | | 5,000 | | | | 5,702 | |
| | |
3.88%, 7/20/2025 | | | 33,000 | | | | 37,403 | |
| | |
HCA, Inc. 4.75%, 5/1/2023 | | | 18,000 | | | | 19,780 | |
| | |
Humana, Inc. 3.15%, 12/1/2022 | | | 15,000 | | | | 15,777 | |
| | |
Laboratory Corp. of America Holdings
3.75%, 8/23/2022 | | | 7,000 | | | | 7,376 | |
| | |
3.60%, 2/1/2025 | | | 15,000 | | | | 16,737 | |
SEE NOTES TO FINANCIAL STATEMENTS.
| | | | | | | | |
| | | |
| AUGUST 31, 2020 | | J.P. MORGAN EXCHANGE-TRADED FUNDS | | | | | 31 | |
JPMorgan BetaBuilders 1-5 Year U.S. Aggregate Bond ETF
SCHEDULE OF PORTFOLIO INVESTMENTS
AS OF AUGUST 31, 2020 (Unaudited) (continued)
| | | | | | | | |
| INVESTMENTS | | PRINCIPAL AMOUNT ($) | | | VALUE ($) | |
Corporate Bonds — continued | |
|
Health Care Providers & Services — continued | |
| | |
McKesson Corp. 2.70%, 12/15/2022 | | | 10,000 | | | | 10,416 | |
| | |
UnitedHealth Group, Inc.
3.35%, 7/15/2022 | | | 37,000 | | | | 39,093 | |
| | |
2.38%, 8/15/2024 | | | 15,000 | | | | 16,055 | |
| | | | | | | | |
| | |
| | | | | | | 292,462 | |
| | | | | | | | |
|
Hotels, Restaurants & Leisure — 0.2% | |
| | |
Las Vegas Sands Corp. 2.90%, 6/25/2025 | | | 18,000 | | | | 17,898 | |
| | |
Marriott International, Inc. | | | | | | | | |
| | |
Series N, 3.13%, 10/15/2021 | | | 5,000 | | | | 5,099 | |
| | |
3.60%, 4/15/2024 | | | 15,000 | | | | 15,536 | |
| | |
McDonald’s Corp. 2.63%, 1/15/2022 | | | 17,000 | | | | 17,511 | |
| | |
Starbucks Corp. 3.85%, 10/1/2023 | | | 15,000 | | | | 16,406 | |
| | | | | | | | |
| | |
| | | | | | | 72,450 | |
| | | | | | | | |
|
Household Durables — 0.1% | |
| | |
DR Horton, Inc.
5.75%, 8/15/2023 | | | 6,000 | | | | 6,777 | |
| | |
2.50%, 10/15/2024 | | | 4,000 | | | | 4,253 | |
| | |
Whirlpool Corp. 4.00%, 3/1/2024 | | | 10,000 | | | | 11,002 | |
| | | | | | | | |
| | |
| | | | | | | 22,032 | |
| | | | | | | | |
|
Household Products — 0.1% | |
| | |
Colgate-Palmolive Co. 2.10%, 5/1/2023 | | | 15,000 | | | | 15,702 | |
| | |
Procter & Gamble Co. (The) 3.10%, 8/15/2023 | | | 17,000 | | | | 18,419 | |
| | | | | | | | |
| | |
| | | | | | | 34,121 | |
| | | | | | | | |
|
Independent Power and Renewable Electricity Producers — 0.1% | |
| | |
Enel Generacion Chile SA (Chile) 4.25%, 4/15/2024 | | | 39,000 | | | | 42,820 | |
| | |
Southern Power Co. Series E, 2.50%, 12/15/2021 | | | 17,000 | | | | 17,435 | |
| | | | | | | | |
| | |
| | | | | | | 60,255 | |
| | | | | | | | |
|
Industrial Conglomerates — 0.3% | |
| | |
3M Co.
2.25%, 3/15/2023 | | | 6,000 | | | | 6,275 | |
| | |
2.65%, 4/15/2025 | | | 18,000 | | | | 19,588 | |
| | |
General Electric Co.
3.10%, 1/9/2023 | | | 17,000 | | | | 17,926 | |
| | |
3.45%, 5/15/2024 | | | 16,000 | | | | 17,206 | |
| | |
Honeywell International, Inc.
2.15%, 8/8/2022 | | | 5,000 | | | | 5,168 | |
| | |
3.35%, 12/1/2023 | | | 10,000 | | | | 10,927 | |
| | |
1.35%, 6/1/2025 | | | 21,000 | | | | 21,640 | |
| | |
Roper Technologies, Inc. 3.13%, 11/15/2022 | | | 10,000 | | | | 10,497 | |
| | | | | | | | |
| | |
| | | | | | | 109,227 | |
| | | | | | | | |
| | | | | | | | |
| INVESTMENTS | | PRINCIPAL AMOUNT ($) | | | VALUE ($) | |
| | | | | | | | |
|
Insurance — 0.4% | |
| | |
Aflac, Inc. 3.25%, 3/17/2025 | | | 20,000 | | | | 22,290 | |
| | |
American International Group, Inc.
4.88%, 6/1/2022 | | | 23,000 | | | | 24,751 | |
| | |
4.13%, 2/15/2024 | | | 13,000 | | | | 14,486 | |
| | |
Aon Corp. 2.20%, 11/15/2022 | | | 15,000 | | | | 15,565 | |
| | |
Aspen Insurance Holdings Ltd. (Bermuda) 4.65%, 11/15/2023 | | | 11,000 | | | | 11,950 | |
| | |
Assurant, Inc. 4.00%, 3/15/2023 | | | 3,000 | | | | 3,185 | |
| | |
Chubb INA Holdings, Inc. 2.70%, 3/13/2023 | | | 15,000 | | | | 15,840 | |
| | |
Marsh & McLennan Cos., Inc. 2.75%, 1/30/2022 | | | 15,000 | | | | 15,457 | |
| | |
MetLife, Inc. | | | | | | | | |
| | |
Series D, 4.37%, 9/15/2023 (c) | | | 12,000 | | | | 13,409 | |
| | |
3.60%, 4/10/2024 | | | 5,000 | | | | 5,560 | |
| | |
Prudential Financial, Inc. (ICE LIBOR USD 3 Month + 3.04%), 5.20%, 3/15/2044 (b) | | | 19,000 | | | | 20,145 | |
| | |
Trinity Acquisition plc 3.50%, 9/15/2021 | | | 5,000 | | | | 5,122 | |
| | | | | | | | |
| | |
| | | | | | | 167,760 | |
| | | | | | | | |
|
Interactive Media & Services — 0.0% (d) | |
| | |
Alphabet, Inc. 3.38%, 2/25/2024 | | | 6,000 | | | | 6,620 | |
| | | | | | | | |
|
Internet & Direct Marketing Retail — 0.3% | |
| | |
Amazon.com, Inc.
2.50%, 11/29/2022 | | | 10,000 | | | | 10,446 | |
| | |
2.80%, 8/22/2024 | | | 17,000 | | | | 18,510 | |
| | |
0.80%, 6/3/2025 | | | 11,000 | | | | 11,143 | |
| | |
eBay, Inc.
3.80%, 3/9/2022 | | | 12,000 | | | | 12,580 | |
| | |
2.60%, 7/15/2022 | | | 7,000 | | | | 7,240 | |
| | |
1.90%, 3/11/2025 | | | 15,000 | | | | 15,737 | |
| | |
Expedia Group, Inc. 4.50%, 8/15/2024 | | | 34,000 | | | | 35,578 | |
| | | | | | | | |
| | |
| | | | | | | 111,234 | |
| | | | | | | | |
|
IT Services — 0.5% | |
| | |
DXC Technology Co. 4.13%, 4/15/2025 | | | 15,000 | | | | 16,241 | |
| | |
Fiserv, Inc. 2.75%, 7/1/2024 | | | 18,000 | | | | 19,328 | |
| | |
Global Payments, Inc. 3.75%, 6/1/2023 | | | 15,000 | | | | 16,118 | |
| | |
International Business Machines Corp. 1.88%, 8/1/2022 | | | 80,000 | | | | 82,358 | |
| | |
Mastercard, Inc. 3.38%, 4/1/2024 | | | 12,000 | | | | 13,266 | |
| | |
PayPal Holdings, Inc. 2.40%, 10/1/2024 | | | 18,000 | | | | 19,226 | |
| | |
Visa, Inc. 2.80%, 12/14/2022 | | | 20,000 | | | | 21,083 | |
| | | | | | | | |
| | |
| | | | | | | 187,620 | |
| | | | | | | | |
|
Leisure Products — 0.0% (d) | |
| | |
Hasbro, Inc. 3.00%, 11/19/2024 | | | 15,000 | | | | 15,830 | |
| | | | | | | | |
SEE NOTES TO FINANCIAL STATEMENTS.
| | | | | | |
| | | |
| 32 | | | | J.P. MORGAN EXCHANGE-TRADED FUNDS | | AUGUST 31, 2020 |
| | | | | | | | |
| INVESTMENTS | | PRINCIPAL AMOUNT ($) | | | VALUE ($) | |
Corporate Bonds — continued | |
|
Life Sciences Tools & Services — 0.0% (d) | |
| | |
Thermo Fisher Scientific, Inc. 3.00%, 4/15/2023 | | | 11,000 | | | | 11,678 | |
| | | | | | | | |
|
Machinery — 0.1% | |
| | |
CNH Industrial NV (United Kingdom) 4.50%, 8/15/2023 | | | 25,000 | | | | 26,863 | |
| | |
nVent Finance SARL (United Kingdom) 3.95%, 4/15/2023 | | | 15,000 | | | | 15,830 | |
| | | | | | | | |
| | |
| | | | | | | 42,693 | |
| | | | | | | | |
|
Media — 0.5% | |
| | |
Charter Communications Operating LLC
4.50%, 2/1/2024 | | | 35,000 | | | | 39,037 | |
| | |
4.91%, 7/23/2025 | | | 15,000 | | | | 17,461 | |
| | |
Comcast Corp.
3.00%, 2/1/2024 | | | 18,000 | | | | 19,449 | |
| | |
3.70%, 4/15/2024 | | | 29,000 | | | | 32,178 | |
| | |
Discovery Communications LLC 3.90%, 11/15/2024 | | | 15,000 | | | | 16,653 | |
| | |
Fox Corp. 3.05%, 4/7/2025 | | | 20,000 | | | | 21,928 | |
| | |
Time Warner Entertainment Co. LP 8.38%, 3/15/2023 | | | 12,000 | | | | 14,244 | |
| | |
ViacomCBS, Inc.
3.38%, 3/1/2022 | | | 7,000 | | | | 7,232 | |
| | |
3.50%, 1/15/2025 | | | 20,000 | | | | 22,111 | |
| | |
WPP Finance 2010 (United Kingdom)
3.63%, 9/7/2022 | | | 6,000 | | | | 6,301 | |
| | |
3.75%, 9/19/2024 | | | 15,000 | | | | 16,445 | |
| | | | | | | | |
| | |
| | | | | | | 213,039 | |
| | | | | | | | |
|
Metals & Mining — 0.1% | |
| | |
BHP Billiton Finance USA Ltd. (Australia) 3.25%, 11/21/2021 | | | 25,000 | | | | 25,837 | |
| | |
Nucor Corp. 4.00%, 8/1/2023 | | | 7,000 | | | | 7,636 | |
| | |
Rio Tinto Finance USA Ltd. (Australia) 3.75%, 6/15/2025 | | | 15,000 | | | | 16,994 | |
| | | | | | | | |
| | |
| | | | | | | 50,467 | |
| | | | | | | | |
|
Multiline Retail — 0.1% | |
| | |
Kohl’s Corp. 4.25%, 7/17/2025 (e) | | | 15,000 | | | | 14,944 | |
| | |
Target Corp. 2.90%, 1/15/2022 | | | 16,000 | | | | 16,570 | |
| | | | | | | | |
| | |
| | | | | | | 31,514 | |
| | | | | | | | |
|
Multi-Utilities — 0.3% | |
| | |
Berkshire Hathaway Energy Co. 3.75%, 11/15/2023 | | | 15,000 | | | | 16,431 | |
| | |
CenterPoint Energy, Inc. 3.85%, 2/1/2024 | | | 15,000 | | | | 16,461 | |
| | |
Delmarva Power & Light Co. 3.50%, 11/15/2023 | | | 35,000 | | | | 38,114 | |
| | |
Dominion Energy, Inc. 3.07%, 8/15/2024 (c) | | | 10,000 | | | | 10,847 | |
| | | | | | | | |
| INVESTMENTS | | PRINCIPAL AMOUNT ($) | | | VALUE ($) | |
| |
|
Multi-Utilities — continued | |
| | |
DTE Energy Co. Series D, 3.70%, 8/1/2023 | | | 18,000 | | | | 19,553 | |
| | |
San Diego Gas & Electric Co. 3.00%, 8/15/2021 | | | 21,000 | | | | 21,525 | |
| | |
Southern Co. Gas Capital Corp. 3.50%, 9/15/2021 | | | 10,000 | | | | 10,243 | |
| | | | | | | | |
| | |
| | | | | | | 133,174 | |
| | | | | | | | |
|
Oil, Gas & Consumable Fuels — 1.9% | |
| | |
BP Capital Markets America, Inc. 3.22%, 4/14/2024 | | | 21,000 | | | | 22,707 | |
| | |
BP Capital Markets plc (United Kingdom)
2.75%, 5/10/2023 | | | 8,000 | | | | 8,433 | |
| | |
3.99%, 9/26/2023 | | | 43,000 | | | | 47,420 | |
| | |
Canadian Natural Resources Ltd. (Canada) 3.90%, 2/1/2025 | | | 16,000 | | | | 17,497 | |
| | |
Cheniere Corpus Christi Holdings LLC 5.88%, 3/31/2025 | | | 12,000 | | | | 13,848 | |
| | |
Chevron Corp.
1.14%, 5/11/2023 | | | 6,000 | | | | 6,124 | |
| | |
1.55%, 5/11/2025 | | | 35,000 | | | | 36,431 | |
| | |
Ecopetrol SA (Colombia)
5.88%, 9/18/2023 | | | 17,000 | | | | 18,796 | |
| | |
4.13%, 1/16/2025 | | | 26,000 | | | | 27,508 | |
| | |
Enbridge Energy Partners LP 4.20%, 9/15/2021 | | | 15,000 | | | | 15,439 | |
| | |
Energy Transfer Operating LP
4.90%, 2/1/2024 | | | 27,000 | | | | 29,151 | |
| | |
2.90%, 5/15/2025 | | | 15,000 | | | | 15,424 | |
| | |
Enterprise Products Operating LLC 3.75%, 2/15/2025 | | | 20,000 | | | | 22,357 | |
| | |
EOG Resources, Inc. 2.63%, 3/15/2023 | | | 25,000 | | | | 26,280 | |
| | |
Equinor ASA (Norway)
2.75%, 11/10/2021 | | | 19,000 | | | | 19,541 | |
| | |
3.15%, 1/23/2022 | | | 9,000 | | | | 9,348 | |
| | |
7.75%, 6/15/2023 | | | 15,000 | | | | 17,866 | |
| | |
2.88%, 4/6/2025 | | | 26,000 | | | | 28,506 | |
| | |
Exxon Mobil Corp.
3.18%, 3/15/2024 | | | 22,000 | | | | 23,880 | |
| | |
2.02%, 8/16/2024 (e) | | | 15,000 | | | | 15,824 | |
| | |
2.99%, 3/19/2025 | | | 25,000 | | | | 27,482 | |
| | |
Kinder Morgan Energy Partners LP
5.00%, 10/1/2021 | | | 15,000 | | | | 15,532 | |
| | |
4.15%, 2/1/2024 | | | 21,000 | | | | 23,035 | |
| | |
Marathon Petroleum Corp. 4.70%, 5/1/2025 | | | 15,000 | | | | 17,103 | |
| | |
MPLX LP 4.88%, 12/1/2024 | | | 46,000 | | | | 51,897 | |
| | |
Newfield Exploration Co. 5.75%, 1/30/2022 | | | 16,000 | | | | 16,372 | |
SEE NOTES TO FINANCIAL STATEMENTS.
| | | | | | | | |
| | | |
| AUGUST 31, 2020 | | J.P. MORGAN EXCHANGE-TRADED FUNDS | | | | | 33 | |
JPMorgan BetaBuilders 1-5 Year U.S. Aggregate Bond ETF
SCHEDULE OF PORTFOLIO INVESTMENTS
AS OF AUGUST 31, 2020 (Unaudited) (continued)
| | | | | | | | |
| INVESTMENTS | | PRINCIPAL AMOUNT ($) | | | VALUE ($) | |
Corporate Bonds — continued | |
|
Oil, Gas & Consumable Fuels — continued | |
| | |
Noble Energy, Inc. 3.90%, 11/15/2024 | | | 15,000 | | | | 16,667 | |
| | |
ONEOK Partners LP 5.00%, 9/15/2023 | | | 24,000 | | | | 26,064 | |
| | |
Petroleos Mexicanos (Mexico) 6.84%, 1/23/2030 (f) | | | 1 | | | | 1 | |
| | |
Phillips 66 3.85%, 4/9/2025 | | | 10,000 | | | | 11,190 | |
| | |
Plains All American Pipeline LP 3.85%, 10/15/2023 | | | 15,000 | | | | 15,898 | |
| | |
Sabine Pass Liquefaction LLC 5.63%, 3/1/2025 | | | 20,000 | | | | 23,275 | |
| | |
Suncor Energy, Inc. (Canada) 3.10%, 5/15/2025 | | | 20,000 | | | | 21,971 | |
| | |
Sunoco Logistics Partners Operations LP 4.25%, 4/1/2024 | | | 16,000 | | | | 16,997 | |
| | |
Total Capital International SA (France)
2.88%, 2/17/2022 | | | 10,000 | | | | 10,368 | |
| | |
3.75%, 4/10/2024 | | | 20,000 | | | | 22,226 | |
| | |
Valero Energy Corp. 2.85%, 4/15/2025 | | | 20,000 | | | | 21,394 | |
| | |
Williams Cos., Inc. (The)
3.60%, 3/15/2022 | | | 15,000 | | | | 15,580 | |
| | |
3.90%, 1/15/2025 | | | 25,000 | | | | 27,524 | |
| | | | | | | | |
| | |
| | | | | | | 802,956 | |
| | | | | | | | |
|
Paper & Forest Products — 0.1% | |
| | |
Fibria Overseas Finance Ltd. (Brazil)
5.25%, 5/12/2024 | | | 5,000 | | | | 5,448 | |
| | |
4.00%, 1/14/2025 | | | 15,000 | | | | 15,757 | |
| | |
Georgia-Pacific LLC 8.00%, 1/15/2024 | | | 15,000 | | | | 18,585 | |
| | | | | | | | |
| | |
| | | | | | | 39,790 | |
| | | | | | | | |
|
Personal Products — 0.0% (d) | |
| | |
Estee Lauder Cos., Inc. (The) 2.00%, 12/1/2024 | | | 17,000 | | | | 18,002 | |
| | | | | | | | |
|
Pharmaceuticals — 0.7% | |
| | |
AstraZeneca plc (United Kingdom) 3.50%, 8/17/2023 | | | 15,000 | | | | 16,268 | |
| | |
Bristol-Myers Squibb Co.
3.25%, 11/1/2023 | | | 15,000 | | | | 16,335 | |
| | |
3.63%, 5/15/2024 | | | 20,000 | | | | 22,105 | |
| | |
2.90%, 7/26/2024 | | | 16,000 | | | | 17,425 | |
| | |
Eli Lilly and Co. 2.75%, 6/1/2025 | | | 15,000 | | | | 16,491 | |
| | |
GlaxoSmithKline Capital plc (United Kingdom) 3.00%, 6/1/2024 | | | 18,000 | | | | 19,555 | |
| | |
GlaxoSmithKline Capital, Inc. (United Kingdom) 2.80%, 3/18/2023 | | | 10,000 | | | | 10,609 | |
| | |
Johnson & Johnson
2.25%, 3/3/2022 | | | 20,000 | | | | 20,571 | |
| | |
2.63%, 1/15/2025 | | | 19,000 | | | | 20,697 | |
| | | | | | | | |
| INVESTMENTS | | PRINCIPAL AMOUNT ($) | | | VALUE ($) | |
| | | | | | | | |
|
Pharmaceuticals — continued | |
| | |
Merck & Co., Inc.
2.40%, 9/15/2022 | | | 6,000 | | | | 6,228 | |
| | |
2.75%, 2/10/2025 | | | 35,000 | | | | 38,200 | |
| | |
Mylan, Inc. 4.20%, 11/29/2023 | | | 15,000 | | | | 16,470 | |
| | |
Novartis Capital Corp. (Switzerland) 2.40%, 5/17/2022 | | | 37,000 | | | | 38,350 | |
| | |
Pfizer, Inc.
3.00%, 9/15/2021 | | | 21,000 | | | | 21,600 | |
| | |
3.40%, 5/15/2024 | | | 15,000 | | | | 16,556 | |
| | |
Shire Acquisitions Investments Ireland DAC 2.40%, 9/23/2021 | | | 9,000 | | | | 9,174 | |
| | | | | | | | |
| | |
| | | | | | | 306,634 | |
| | | | | | | | |
|
Road & Rail — 0.2% | |
| | |
Burlington Northern Santa Fe LLC
3.00%, 3/15/2023 | | | 15,000 | | | | 15,937 | |
| | |
3.85%, 9/1/2023 | | | 4,000 | | | | 4,372 | |
| | |
3.75%, 4/1/2024 | | | 8,000 | | | | 8,856 | |
| | |
CSX Corp.
4.25%, 6/1/2021 | | | 4,000 | | | | 4,075 | |
| | |
3.40%, 8/1/2024 | | | 4,000 | | | | 4,417 | |
| | |
Norfolk Southern Corp. 3.85%, 1/15/2024 | | | 13,000 | | | | 14,280 | |
| | |
Ryder System, Inc.
2.50%, 9/1/2022 | | | 8,000 | | | | 8,288 | |
| | |
3.75%, 6/9/2023 | | | 15,000 | | | | 16,159 | |
| | |
Union Pacific Corp.
2.95%, 3/1/2022 | | | 6,000 | | | | 6,239 | |
| | |
4.16%, 7/15/2022 | | | 15,000 | | | | 15,915 | |
| | | | | | | | |
| | |
| | | | | | | 98,538 | |
| | | | | | | | |
|
Semiconductors & Semiconductor Equipment — 0.4% | |
| | |
Analog Devices, Inc. 3.13%, 12/5/2023 | | | 6,000 | | | | 6,469 | |
| | |
Broadcom Corp. 3.13%, 1/15/2025 | | | 25,000 | | | | 26,816 | |
| | |
Broadcom, Inc. 3.63%, 10/15/2024 | | | 12,000 | | | | 13,160 | |
| | |
Intel Corp.
2.35%, 5/11/2022 | | | 16,000 | | | | 16,530 | |
| | |
2.70%, 12/15/2022 | | | 15,000 | | | | 15,829 | |
| | |
3.40%, 3/25/2025 | | | 20,000 | | | | 22,433 | |
| | |
Microchip Technology, Inc. 4.33%, 6/1/2023 | | | 5,000 | | | | 5,393 | |
| | |
NXP BV (Netherlands) 4.88%, 3/1/2024 (a) | | | 15,000 | | | | 16,892 | |
| | |
QUALCOMM, Inc. 2.60%, 1/30/2023 | | | 30,000 | | | | 31,515 | |
| | |
Texas Instruments, Inc. 1.38%, 3/12/2025 | | | 16,000 | | | | 16,591 | |
| | | | | | | | |
| | |
| | | | | | | 171,628 | |
| | | | | | | | |
|
Software — 0.6% | |
| | |
Adobe, Inc. 1.90%, 2/1/2025 | | | 9,000 | | | | 9,534 | |
SEE NOTES TO FINANCIAL STATEMENTS.
| | | | | | |
| | | |
| 34 | | | | J.P. MORGAN EXCHANGE-TRADED FUNDS | | AUGUST 31, 2020 |
| | | | | | | | |
| INVESTMENTS | | PRINCIPAL AMOUNT ($) | | | VALUE ($) | |
Corporate Bonds — continued | |
|
Software — continued | |
| | |
Microsoft Corp.
2.38%, 2/12/2022 | | | 58,000 | | | | 59,694 | |
| | |
2.70%, 2/12/2025 | | | 25,000 | | | | 27,288 | |
| | |
Oracle Corp.
1.90%, 9/15/2021 | | | 30,000 | | | | 30,469 | |
| | |
2.50%, 5/15/2022 | | | 10,000 | | | | 10,330 | |
| | |
2.40%, 9/15/2023 | | | 39,000 | | | | 41,195 | |
| | |
3.40%, 7/8/2024 | | | 16,000 | | | | 17,583 | |
| | |
2.95%, 11/15/2024 | | | 25,000 | | | | 27,285 | |
| | |
VMware, Inc. 2.95%, 8/21/2022 | | | 15,000 | | | | 15,648 | |
| | | | | | | | |
| | |
| | | | | | | 239,026 | |
| | | | | | | | |
|
Specialty Retail — 0.2% | |
| | |
Advance Auto Parts, Inc. 4.50%, 1/15/2022 | | | 15,000 | | | | 15,644 | |
| | |
AutoZone, Inc. 2.88%, 1/15/2023 | | | 10,000 | | | | 10,468 | |
| | |
Home Depot, Inc. (The)
3.25%, 3/1/2022 (e) | | | 15,000 | | | | 15,672 | |
| | |
2.70%, 4/1/2023 | | | 15,000 | | | | 15,828 | |
| | |
Lowe’s Cos., Inc.
3.80%, 11/15/2021 | | | 6,000 | | | | 6,193 | |
| | |
3.13%, 9/15/2024 | | | 8,000 | | | | 8,746 | |
| | |
TJX Cos., Inc. (The) 3.50%, 4/15/2025 | | | 25,000 | | | | 27,899 | |
| | | | | | | | |
| | |
| | | | | | | 100,450 | |
| | | | | | | | |
|
Technology Hardware, Storage & Peripherals — 0.6% | |
| | |
Apple, Inc.
2.50%, 2/9/2022 | | | 10,000 | | | | 10,298 | |
| | |
2.10%, 9/12/2022 | | | 15,000 | | | | 15,531 | |
| | |
2.85%, 2/23/2023 | | | 15,000 | | | | 15,876 | |
| | |
2.40%, 5/3/2023 | | | 15,000 | | | | 15,834 | |
| | |
3.45%, 5/6/2024 | | | 10,000 | | | | 11,064 | |
| | |
2.85%, 5/11/2024 | | | 16,000 | | | | 17,316 | |
| | |
1.80%, 9/11/2024 | | | 18,000 | | | | 18,917 | |
| | |
2.75%, 1/13/2025 | | | 10,000 | | | | 10,917 | |
| | |
2.50%, 2/9/2025 | | | 20,000 | | | | 21,680 | |
| | |
1.13%, 5/11/2025 | | | 24,000 | | | | 24,628 | |
| | |
Dell International LLC
4.00%, 7/15/2024 (a) | | | 15,000 | | | | 16,226 | |
| | |
5.85%, 7/15/2025 (a) | | | 16,000 | | | | 18,773 | |
| | |
Hewlett Packard Enterprise Co.
4.40%, 10/15/2022 (c) | | | 3,000 | | | | 3,215 | |
| | |
1.45%, 4/1/2024 | | | 16,000 | | | | 16,192 | |
| | |
4.65%, 10/1/2024 | | | 15,000 | | | | 16,961 | |
| | |
HP, Inc. 4.05%, 9/15/2022 | | | 12,000 | | | | 12,807 | |
| | |
Seagate HDD Cayman 4.88%, 3/1/2024 | | | 16,000 | | | | 17,527 | |
| | | | | | | | |
| | |
| | | | | | | 263,762 | |
| | | | | | | | |
| | | | | | | | |
| INVESTMENTS | | PRINCIPAL AMOUNT ($) | | | VALUE ($) | |
| | | | | | | | |
|
Textiles, Apparel & Luxury Goods — 0.1% | |
| | |
NIKE, Inc. 2.40%, 3/27/2025 | | | 20,000 | | | | 21,568 | |
| | | | | | | | |
|
Tobacco — 0.3% | |
| | |
Altria Group, Inc.
2.85%, 8/9/2022 | | | 15,000 | | | | 15,657 | |
| | |
3.80%, 2/14/2024 | | | 23,000 | | | | 25,240 | |
| | |
BAT Capital Corp. (United Kingdom)
2.76%, 8/15/2022 | | | 22,000 | | | | 22,868 | |
| | |
2.79%, 9/6/2024 | | | 15,000 | | | | 15,970 | |
| | |
Philip Morris International, Inc.
2.13%, 5/10/2023 | | | 25,000 | | | | 26,029 | |
| | |
1.50%, 5/1/2025 | | | 10,000 | | | | 10,345 | |
| | |
Reynolds American, Inc. (United Kingdom) 4.45%, 6/12/2025 | | | 16,000 | | | | 18,215 | |
| | | | | | | | |
| | |
| | | | | | | 134,324 | |
| | | | | | | | |
|
Trading Companies & Distributors — 0.2% | |
| | |
Air Lease Corp.
2.75%, 1/15/2023 | | | 15,000 | | | | 15,139 | |
| | |
3.00%, 9/15/2023 | | | 15,000 | | | | 15,164 | |
| | |
2.30%, 2/1/2025 | | | 8,000 | | | | 7,815 | |
| | |
Aircastle Ltd. 5.50%, 2/15/2022 | | | 15,000 | | | | 15,321 | |
| | |
International Lease Finance Corp. 5.88%, 8/15/2022 | | | 31,000 | | | | 33,511 | |
| | | | | | | | |
| | |
| | | | | | | 86,950 | |
| | | | | | | | |
|
Wireless Telecommunication Services — 0.1% | |
| | |
T-Mobile USA, Inc. 3.50%, 4/15/2025 (a) | | | 30,000 | | | | 33,169 | |
| | |
Vodafone Group plc (United Kingdom) | | | | | | | | |
| | |
3.75%, 1/16/2024 | | | 20,000 | | | | 21,931 | |
| | | | | | | | |
| | |
| | | | | | | 55,100 | |
| | | | | | | | |
| |
Total Corporate Bonds
(Cost $10,409,470) | | | | 10,758,338 | |
| | | | | |
Mortgage-Backed Securities — 7.4% | |
| | |
FHLMC Gold Pools, 15 Year | | | | | | | | |
| | |
Pool # J14776, 3.00%, 3/1/2026 | | | 18,526 | | | | 19,465 | |
| | |
Pool # G14783, 3.50%, 10/1/2026 | | | 17,336 | | | | 18,352 | |
| | |
Pool # J20134, 3.00%, 8/1/2027 | | | 11,204 | | | | 11,789 | |
| | |
Pool # G18452, 2.50%, 12/1/2027 | | | 43,326 | | | | 45,467 | |
| | |
Pool # E04178, 2.50%, 2/1/2028 | | | 12,033 | | | | 12,647 | |
| | |
Pool # J23906, 2.50%, 5/1/2028 | | | 44,400 | | | | 46,636 | |
| | |
Pool # J23582, 3.00%, 5/1/2028 | | | 15,659 | | | | 16,557 | |
| | |
Pool # G15724, 4.00%, 1/1/2029 | | | 4,029 | | | | 4,287 | |
| | |
Pool # G16577, 4.00%, 1/1/2029 | | | 8,794 | | | | 9,353 | |
| | |
Pool # G18511, 2.50%, 5/1/2029 | | | 8,524 | | | | 8,967 | |
| | |
Pool # G18512, 3.00%, 5/1/2029 | | | 14,236 | | | | 15,047 | |
| | |
Pool # G15164, 3.00%, 9/1/2029 | | | 5,951 | | | | 6,293 | |
SEE NOTES TO FINANCIAL STATEMENTS.
| | | | | | | | |
| | | |
| AUGUST 31, 2020 | | J.P. MORGAN EXCHANGE-TRADED FUNDS | | | | | 35 | |
JPMorgan BetaBuilders 1-5 Year U.S. Aggregate Bond ETF
SCHEDULE OF PORTFOLIO INVESTMENTS
AS OF AUGUST 31, 2020 (Unaudited) (continued)
| | | | | | | | |
| INVESTMENTS | | PRINCIPAL AMOUNT ($) | | | VALUE ($) | |
Mortgage-Backed Securities — continued | |
| | |
Pool # G18549, 2.50%, 4/1/2030 | | | 35,578 | | | | 37,456 | |
| | |
Pool # G16749, 2.00%, 7/1/2030 | | | 11,139 | | | | 11,593 | |
| | |
Pool # G18568, 2.50%, 9/1/2030 | | | 16,882 | | | | 17,773 | |
| | |
Pool # J33012, 3.00%, 10/1/2030 | | | 34,270 | | | | 36,486 | |
| | |
Pool # G18587, 3.00%, 2/1/2031 | | | 18,019 | | | | 18,995 | |
| | |
Pool # G18600, 2.50%, 5/1/2031 | | | 12,741 | | | | 13,406 | |
| | |
Pool # G18611, 2.50%, 9/1/2031 | | | 22,836 | | | | 24,029 | |
| | |
Pool # J35495, 2.50%, 10/1/2031 | | | 35,661 | | | | 37,854 | |
| | |
Pool # G18620, 3.00%, 11/1/2031 | | | 13,823 | | | | 14,573 | |
| | |
Pool # G18626, 2.50%, 1/1/2032 | | | 74,065 | | | | 77,936 | |
| | |
Pool # G18632, 3.00%, 2/1/2032 | | | 14,132 | | | | 14,898 | |
| | |
Pool # J37147, 3.00%, 6/1/2032 | | | 11,405 | | | | 12,177 | |
| | |
Pool # G16207, 3.50%, 7/1/2032 | | | 11,832 | | | | 12,851 | |
| | |
Pool # J38058, 3.00%, 11/1/2032 | | | 37,582 | | | | 40,364 | |
| | |
Pool # J39722, 3.00%, 10/1/2033 | | | 12,634 | | | | 13,435 | |
| | |
Pool # G18715, 3.00%, 12/1/2033 | | | 12,291 | | | | 12,913 | |
| | |
Pool # G18720, 3.50%, 1/1/2034 | | | 8,981 | | | | 9,479 | |
| | |
Pool # G18726, 3.50%, 3/1/2034 | | | 7,455 | | | | 7,880 | |
| | |
FHLMC UMBS, 15 Year | | | | | | | | |
| | |
Pool # ZK2607, 3.50%, 10/1/2025 | | | 4,044 | | | | 4,284 | |
| | |
Pool # ZK7463, 3.50%, 3/1/2027 | | | 9,340 | | | | 9,892 | |
| | |
Pool # ZS8020, 3.00%, 9/1/2027 | | | 17,538 | | | | 18,459 | |
| | |
Pool # ZS6596, 3.00%, 11/1/2027 | | | 8,858 | | | | 9,339 | |
| | |
Pool # ZK5814, 3.00%, 7/1/2028 | | | 26,331 | | | | 27,847 | |
| | |
Pool # ZK5986, 3.50%, 9/1/2028 | | | 9,207 | | | | 9,821 | |
| | |
Pool # ZK6024, 3.50%, 9/1/2028 | | | 19,345 | | | | 20,636 | |
| | |
Pool # ZK6594, 3.00%, 4/1/2029 | | | 7,882 | | | | 8,333 | |
| | |
Pool # ZK6827, 3.00%, 8/1/2029 | | | 9,709 | | | | 10,292 | |
| | |
Pool # ZS8622, 3.00%, 9/1/2031 | | | 24,454 | | | | 25,776 | |
| | |
Pool # ZS8628, 2.00%, 11/1/2031 | | | 4,155 | | | | 4,346 | |
| | |
Pool # ZS7938, 2.50%, 1/1/2033 | | | 9,792 | | | | 10,408 | |
| | |
Pool # ZS7988, 3.50%, 2/1/2033 | | | 16,612 | | | | 18,001 | |
| | |
Pool # ZK9341, 3.00%, 3/1/2033 | | | 4,691 | | | | 5,002 | |
| | |
Pool # ZT0716, 3.00%, 10/1/2033 | | | 6,925 | | | | 7,273 | |
| | |
Pool # SB0257, 4.00%, 11/1/2033 | | | 7,466 | | | | 7,939 | |
| | |
Pool # SB0194, 2.50%, 12/1/2033 | | | 11,397 | | | | 11,976 | |
| | |
Pool # ZT1725, 3.50%, 1/1/2034 | | | 6,812 | | | | 7,294 | |
| | |
Pool # ZT1799, 3.50%, 3/1/2034 | | | 3,976 | | | | 4,205 | |
| | |
Pool # SB8008, 2.50%, 8/1/2034 | | | 13,891 | | | | 14,562 | |
| | |
Pool # SB8013, 2.50%, 9/1/2034 | | | 8,698 | | | | 9,118 | |
| | |
Pool # SB8010, 2.50%, 10/1/2034 | | | 16,822 | | | | 17,635 | |
| | |
Pool # SB8012, 3.50%, 10/1/2034 | | | 8,056 | | | | 8,519 | |
| | |
Pool # SB0109, 2.50%, 11/1/2034 | | | 44,415 | | | | 46,924 | |
| | |
Pool # SB8015, 2.50%, 11/1/2034 | | | 30,513 | | | | 31,988 | |
| | |
Pool # SB8017, 3.50%, 11/1/2034 | | | 17,033 | | | | 18,012 | |
| | |
Pool # SB8021, 3.00%, 12/1/2034 | | | 12,529 | | | | 13,145 | |
| | | | | | | | |
| INVESTMENTS | | PRINCIPAL AMOUNT ($) | | | VALUE ($) | |
| | | | | | | | |
| | |
Pool # SB0260, 2.50%, 2/1/2035 | | | 20,051 | | | | 21,020 | |
| | |
Pool # SB0264, 2.50%, 2/1/2035 | | | 24,110 | | | | 25,567 | |
| | |
Pool # SB8036, 3.00%, 3/1/2035 | | | 46,786 | | | | 49,086 | |
| | |
Pool # QN2057, 3.00%, 5/1/2035 | | | 15,705 | | | | 16,858 | |
| | |
Pool # SB0394, 2.50%, 7/1/2035 | | | 17,808 | | | | 18,706 | |
| | |
Pool # SB8062, 2.50%, 9/1/2035 | | | 28,000 | | | | 29,411 | |
| | |
FNMA UMBS, 15 Year | | | | | | | | |
| | |
Pool # AE0988, 4.00%, 9/1/2025 | | | 5,260 | | | | 5,589 | |
| | |
Pool # AL1168, 3.50%, 1/1/2026 | | | 5,428 | | | | 5,751 | |
| | |
Pool # AH9695, 4.00%, 4/1/2026 | | | 6,628 | | | | 7,050 | |
| | |
Pool # AL4643, 4.00%, 7/1/2026 | | | 6,294 | | | | 6,688 | |
| | |
Pool # AJ9357, 3.50%, 1/1/2027 | | | 11,493 | | | | 12,176 | |
| | |
Pool # AW7396, 3.50%, 1/1/2027 | | | 12,113 | | | | 12,833 | |
| | |
Pool # AK3264, 3.00%, 2/1/2027 | | | 12,259 | | | | 12,878 | |
| | |
Pool # AW7395, 3.00%, 2/1/2027 | | | 11,009 | | | | 11,564 | |
| | |
Pool # AK5412, 3.00%, 3/1/2027 | | | 11,261 | | | | 11,849 | |
| | |
Pool # AL1746, 3.50%, 3/1/2027 | | | 6,668 | | | | 7,064 | |
| | |
Pool # AB5095, 3.00%, 5/1/2027 | | | 11,082 | | | | 11,681 | |
| | |
Pool # AL2224, 3.50%, 7/1/2027 | | | 11,770 | | | | 12,550 | |
| | |
Pool # AQ5118, 2.50%, 11/1/2027 | | | 7,948 | | | | 8,339 | |
| | |
Pool # AQ1688, 2.00%, 12/1/2027 | | | 8,472 | | | | 8,814 | |
| | |
Pool # MA1277, 2.50%, 12/1/2027 | | | 69,082 | | | | 72,483 | |
| | |
Pool # AR1045, 2.50%, 1/1/2028 | | | 16,397 | | | | 17,204 | |
| | |
Pool # AL3041, 2.00%, 2/1/2028 | | | 11,755 | | | | 12,230 | |
| | |
Pool # AR4180, 2.50%, 2/1/2028 | | | 35,526 | | | | 37,422 | |
| | |
Pool # AL3060, 3.00%, 2/1/2028 | | | 31,039 | | | | 32,652 | |
| | |
Pool # AT2769, 2.00%, 5/1/2028 | | | 15,128 | | | | 15,743 | |
| | |
Pool # BM3954, 2.50%, 12/1/2028 | | | 57,994 | | | | 60,904 | |
| | |
Pool # AV8783, 3.00%, 1/1/2029 | | | 29,256 | | | | 30,926 | |
| | |
Pool # AV4793, 3.50%, 5/1/2029 | | | 9,832 | | | | 10,487 | |
| | |
Pool # AW3641, 3.00%, 6/1/2029 (g) | | | 18,088 | | | | 19,112 | |
| | |
Pool # AW8317, 2.50%, 9/1/2029 | | | 9,821 | | | | 10,328 | |
| | |
Pool # AL7205, 3.50%, 12/1/2029 | | | 3,836 | | | | 4,092 | |
| | |
Pool # AX7696, 3.00%, 1/1/2030 | | | 28,154 | | | | 29,749 | |
| | |
Pool # AS4489, 2.50%, 3/1/2030 | | | 3,201 | | | | 3,379 | |
| | |
Pool # AY6338, 2.50%, 3/1/2030 | | | 53,542 | | | | 56,358 | |
| | |
Pool # AS4678, 3.00%, 3/1/2030 | | | 39,373 | | | | 41,504 | |
| | |
Pool # AS5237, 2.50%, 6/1/2030 | | | 11,241 | | | | 11,832 | |
| | |
Pool # AL9852, 3.00%, 9/1/2030 | | | 24,879 | | | | 26,226 | |
| | |
Pool # BA6893, 2.50%, 2/1/2031 | | | 7,458 | | | | 7,850 | |
| | |
Pool # BC9099, 2.50%, 3/1/2031 | | | 11,486 | | | | 12,090 | |
| | |
Pool # BC2482, 3.00%, 3/1/2031 | | | 28,598 | | | | 30,137 | |
| | |
Pool # AL9421, 4.00%, 3/1/2031 | | | 7,128 | | | | 7,583 | |
| | |
Pool # BM3754, 3.50%, 4/1/2031 | | | 4,583 | | | | 4,887 | |
| | |
Pool # FM1336, 3.50%, 6/1/2031 | | | 11,536 | | | | 12,320 | |
| | |
Pool # AS7467, 2.50%, 7/1/2031 | | | 15,398 | | | | 16,199 | |
SEE NOTES TO FINANCIAL STATEMENTS.
| | | | | | |
| | | |
| 36 | | | | J.P. MORGAN EXCHANGE-TRADED FUNDS | | AUGUST 31, 2020 |
| | | | | | | | |
| INVESTMENTS | | PRINCIPAL AMOUNT ($) | | | VALUE ($) | |
Mortgage-Backed Securities — continued | |
| | |
Pool # AS7606, 2.50%, 7/1/2031 | | | 39,924 | | | | 42,294 | |
| | |
Pool # AS7620, 2.50%, 7/1/2031 | | | 91,294 | | | | 96,472 | |
| | |
Pool # MA2774, 2.00%, 10/1/2031 | | | 2,282 | | | | 2,387 | |
| | |
Pool # BM3174, 3.50%, 5/1/2032 | | | 5,971 | | | | 6,409 | |
| | |
Pool # 890822, 3.00%, 12/1/2032 | | | 72,234 | | | | 77,008 | |
| | |
Pool # BM3207, 3.00%, 12/1/2032 | | | 18,718 | | | | 19,978 | |
| | |
Pool # BM3276, 3.50%, 12/1/2032 | | | 17,252 | | | | 18,482 | |
| | |
Pool # CA1089, 3.00%, 2/1/2033 | | | 12,929 | | | | 13,867 | |
| | |
Pool # BJ9052, 3.50%, 2/1/2033 | | | 7,357 | | | | 7,988 | |
| | |
Pool # FM1309, 2.00%, 3/1/2033 | | | 5,065 | | | | 5,297 | |
| | |
Pool # MA3312, 3.00%, 3/1/2033 | | | 5,401 | | | | 5,671 | |
| | |
Pool # MA3437, 3.00%, 8/1/2033 | | | 12,182 | | | | 12,793 | |
| | |
Pool # FM4036, 2.50%, 12/1/2033 | | | 19,000 | | | | 19,967 | |
| | |
Pool # BN3975, 3.00%, 1/1/2034 | | | 8,021 | | | | 8,423 | |
| | |
Pool # MA3559, 3.50%, 1/1/2034 | | | 5,156 | | | | 5,441 | |
| | |
Pool # MA3588, 3.50%, 2/1/2034 | | | 21,239 | | | | 22,411 | |
| | |
Pool # MA3589, 4.00%, 2/1/2034 | | | 22,884 | | | | 24,277 | |
| | |
Pool # MA3631, 3.00%, 4/1/2034 | | | 26,819 | | | | 28,137 | |
| | |
Pool # CA3440, 3.50%, 4/1/2034 | | | 2,979 | | | | 3,213 | |
| | |
Pool # FM1810, 4.00%, 4/1/2034 | | | 7,488 | | | | 8,084 | |
| | |
Pool # MA3657, 3.00%, 5/1/2034 | | | 15,908 | | | | 16,689 | |
| | |
Pool # FM1071, 3.50%, 5/1/2034 | | | 13,004 | | | | 14,118 | |
| | |
Pool # FM1112, 4.00%, 5/1/2034 | | | 4,713 | | | | 5,104 | |
| | |
Pool # MA3682, 3.50%, 6/1/2034 | | | 4,459 | | | | 4,715 | |
| | |
Pool # FM1111, 4.00%, 6/1/2034 | | | 12,179 | | | | 13,225 | |
| | |
Pool # BO0130, 2.50%, 7/1/2034 | | | 10,122 | | | | 10,620 | |
| | |
Pool # MA3729, 2.50%, 7/1/2034 | | | 16,457 | | | | 17,249 | |
| | |
Pool # MA3695, 3.00%, 7/1/2034 | | | 10,432 | | | | 10,945 | |
| | |
Pool # BJ5549, 3.00%, 8/1/2034 | | | 5,078 | | | | 5,338 | |
| | |
Pool # MA3797, 2.50%, 10/1/2034 | | | 9,176 | | | | 9,618 | |
| | |
Pool # FM1900, 2.50%, 11/1/2034 | | | 13,812 | | | | 14,641 | |
| | |
Pool # MA4012, 2.00%, 5/1/2035 | | | 38,753 | | | | 40,345 | |
| | |
Pool # MA4013, 2.50%, 5/1/2035 | | | 47,944 | | | | 50,357 | |
| | |
Pool # FM3493, 3.50%, 5/1/2035 | | | 14,174 | | | | 15,240 | |
| | |
Pool # BP5762, 2.50%, 6/1/2035 | | | 59,120 | | | | 62,095 | |
| | |
Pool # MA4074, 2.00%, 7/1/2035 | | | 101,623 | | | | 105,797 | |
| | |
Pool # MA4075, Class 177, 2.50%, 7/1/2035 | | | 24,619 | | | | 25,858 | |
| | |
Pool # MA4095, 2.00%, 8/1/2035 | | | 116,261 | | | | 121,036 | |
| | |
Pool # MA4099, 2.50%, 8/1/2035 | | | 55,608 | | | | 58,406 | |
| | |
Pool # MA4122, 1.50%, 9/1/2035 | | | 16,000 | | | | 16,375 | |
| | |
Pool # MA4123, 2.00%, 9/1/2035 | | | 103,000 | | | | 107,230 | |
| | |
GNMA II, 15 Year | | | | | | | | |
| | |
Pool # 796502, 3.00%, 4/20/2022 | | | 7,734 | | | | 8,134 | |
| | |
Pool # MA1134, 3.00%, 7/20/2028 | | | 12,684 | | | | 13,321 | |
| | |
Pool # MA4559, 3.00%, 7/20/2032 | | | 14,421 | | | | 15,186 | |
| | | | | | | | |
| INVESTMENTS | | PRINCIPAL AMOUNT ($) | | | VALUE ($) | |
| | | | | | | | |
| | |
Pool # MA4625, 3.50%, 8/20/2032 | | | 10,167 | | | | 10,756 | |
| | |
Pool # MA5791, 3.50%, 3/20/2034 | | | 6,649 | | | | 7,046 | |
| | |
Pool # MA6256, 3.50%, 12/20/2034 | | | 12,796 | | | | 13,559 | |
| | | | | | | | |
| |
Total Mortgage-Backed Securities
(Cost $3,021,932) | | | | 3,110,757 | |
| | | | | |
Supranational — 3.3% | |
| |
African Development Bank (Supranational) | | | | | |
| | |
1.63%, 9/16/2022 | | | 36,000 | | | | 37,015 | |
| | |
3.00%, 9/20/2023 | | | 15,000 | | | | 16,245 | |
| |
Asian Development Bank (Supranational) | | | | | |
| | |
2.13%, 11/24/2021 | | | 10,000 | | | | 10,232 | |
| | |
1.88%, 2/18/2022 | | | 15,000 | | | | 15,360 | |
| | |
0.63%, 4/7/2022 | | | 93,000 | | | | 93,596 | |
| | |
1.88%, 8/10/2022 | | | 29,000 | | | | 29,920 | |
| | |
1.50%, 10/18/2024 | | | 30,000 | | | | 31,458 | |
| | |
0.63%, 4/29/2025 | | | 18,000 | | | | 18,189 | |
| | |
Asian Infrastructure Investment Bank (The) (Supranational) | | | | | | | | |
| | |
2.25%, 5/16/2024 | | | 21,000 | | | | 22,475 | |
| |
Corp. Andina de Fomento (Supranational) | | | | | |
| | |
2.13%, 9/27/2021 | | | 15,000 | | | | 15,202 | |
| | |
3.75%, 11/23/2023 | | | 22,000 | | | | 23,810 | |
| | |
Council of Europe Development Bank (Supranational) | | | | | | | | |
| | |
1.63%, 3/16/2021 | | | 12,000 | | | | 12,091 | |
| | |
European Bank for Reconstruction & Development (Supranational) | | | | | | | | |
| | |
1.50%, 11/2/2021 | | | 32,000 | | | | 32,469 | |
| | |
2.13%, 3/7/2022 | | | 43,000 | | | | 44,222 | |
| |
European Investment Bank (Supranational) | | | | | |
| | |
2.25%, 8/15/2022 | | | 54,000 | | | | 56,142 | |
| | |
2.50%, 3/15/2023 | | | 145,000 | | | | 153,352 | |
| | |
3.25%, 1/29/2024 | | | 8,000 | | | | 8,811 | |
| | |
2.25%, 6/24/2024 | | | 48,000 | | | | 51,570 | |
| | |
2.50%, 10/15/2024 | | | 17,000 | | | | 18,524 | |
| | |
1.63%, 3/14/2025 | | | 61,000 | | | | 64,464 | |
| | |
Inter-American Development Bank (Supranational) | | | | | | | | |
| | |
1.75%, 4/14/2022 | | | 70,000 | | | | 71,716 | |
| | |
1.75%, 9/14/2022 | | | 43,000 | | | | 44,322 | |
| | |
2.50%, 1/18/2023 | | | 36,000 | | | | 37,924 | |
| | |
0.50%, 5/24/2023 | | | 17,000 | | | | 17,124 | |
| | |
0.63%, 7/15/2025 | | | 43,000 | | | | 43,459 | |
| | |
International Bank for Reconstruction & Development (Supranational) | | | | | | | | |
| | |
1.38%, 9/20/2021 | | | 24,000 | | | | 24,289 | |
| | |
2.00%, 1/26/2022 | | | 115,000 | | | | 117,849 | |
SEE NOTES TO FINANCIAL STATEMENTS.
| | | | | | | | |
| | | |
| AUGUST 31, 2020 | | J.P. MORGAN EXCHANGE-TRADED FUNDS | | | | | 37 | |
JPMorgan BetaBuilders 1-5 Year U.S. Aggregate Bond ETF
SCHEDULE OF PORTFOLIO INVESTMENTS
AS OF AUGUST 31, 2020 (Unaudited) (continued)
| | | | | | | | |
| INVESTMENTS | | PRINCIPAL AMOUNT ($) | | | VALUE ($) | |
Supranational — continued | |
| | |
2.13%, 7/1/2022 | | | 35,000 | | | | 36,215 | |
| | |
2.50%, 3/19/2024 | | | 18,000 | | | | 19,406 | |
| | |
2.50%, 11/25/2024 | | | 15,000 | | | | 16,360 | |
| | |
0.75%, 3/11/2025 | | | 22,000 | | | | 22,370 | |
| | |
0.63%, 4/22/2025 | | | 25,000 | | | | 25,280 | |
| | |
0.38%, 7/28/2025 | | | 58,000 | | | | 57,930 | |
| | |
2.50%, 7/29/2025 | | | 18,000 | | | | 19,834 | |
| |
International Finance Corp. (Supranational) | | | | | |
| | |
2.88%, 7/31/2023 | | | 30,000 | | | | 32,289 | |
| | |
1.38%, 10/16/2024 | | | 15,000 | | | | 15,644 | |
| | |
0.38%, 7/16/2025 | | | 15,000 | | | | 14,997 | |
| | | | | | | | |
| |
Total Supranational
(Cost $1,340,152) | | | | 1,372,155 | |
| | | | | |
U.S. Government Agency Securities — 3.2% | |
| | |
FFCB
1.63%, 12/27/2021 | | | 25,000 | | | | 25,434 | |
| | |
1.55%, 1/28/2022 | | | 133,000 | | | | 135,544 | |
| | |
1.85%, 3/3/2022 | | | 27,000 | | | | 27,003 | |
| | |
0.73%, 12/3/2024 | | | 19,000 | | | | 19,002 | |
| | |
FHLB
1.13%, 7/14/2021 | | | 85,000 | | | | 85,727 | |
| | |
2.38%, 9/10/2021 | | | 25,000 | | | | 25,564 | |
| | |
2.50%, 3/11/2022 | | | 70,000 | | | | 72,489 | |
| | |
2.13%, 6/10/2022 | | | 20,000 | | | | 20,697 | |
| | |
2.50%, 2/13/2024 | | | 15,000 | | | | 16,160 | |
| | |
1.50%, 8/15/2024 | | | 60,000 | | | | 62,940 | |
| | |
FHLMC
2.38%, 1/13/2022 | | | 234,000 | | | | 241,140 | |
| | |
0.25%, 6/26/2023 | | | 98,000 | | | | 98,020 | |
| | |
1.50%, 2/12/2025 | | | 62,000 | | | | 65,050 | |
| | |
0.38%, 7/21/2025 | | | 39,000 | | | | 38,916 | |
| | |
FNMA
1.25%, 8/17/2021 | | | 35,000 | | | | 35,371 | |
| | |
1.38%, 10/7/2021 | | | 34,000 | | | | 34,458 | |
| | |
2.63%, 1/11/2022 | | | 50,000 | | | | 51,687 | |
| | |
2.00%, 10/5/2022 | | | 35,000 | | | | 36,325 | |
| | |
0.74%, 4/27/2023 | | | 15,000 | | | | 15,014 | |
| | |
0.25%, 5/22/2023 | | | 12,000 | | | | 12,009 | |
| | |
1.75%, 7/2/2024 | | | 15,000 | | | | 15,828 | |
| | |
2.63%, 9/6/2024 | | | 15,000 | | | | 16,407 | |
| | |
1.63%, 10/15/2024 | | | 40,000 | | | | 42,117 | |
| | |
1.63%, 1/7/2025 | | | 40,000 | | | | 42,171 | |
| | |
0.63%, 4/22/2025 | | | 40,000 | | | | 40,388 | |
| | |
0.50%, 6/17/2025 | | | 32,000 | | | | 32,119 | |
| | |
Israel Government AID Bond (Israel) 5.50%, 4/26/2024 | | | 15,000 | | | | 17,821 | |
| | | | | | | | |
| INVESTMENTS | | PRINCIPAL AMOUNT ($) | | | VALUE ($) | |
| | | | | | | | |
| | |
Tennessee Valley Authority
1.88%, 8/15/2022 | | | 10,000 | | | | 10,308 | |
| | |
2.88%, 9/15/2024 | | | 20,000 | | | | 21,926 | |
| | | | | | | | |
| |
Total U.S. Government Agency Securities
(Cost $1,338,374) | | | | 1,357,635 | |
| | | | | |
Commercial Mortgage-Backed Securities — 2.4% | |
| | |
Benchmark Mortgage Trust Series 2019-B12, Class A2, 3.00%, 8/15/2052 | | | 7,000 | | | | 7,331 | |
| | |
CD Mortgage Trust Series 2017-CD6, Class ASB, 3.33%, 11/13/2050 | | | 22,000 | | | | 23,980 | |
| | |
CGMS Commercial Mortgage Trust Series 2017-B1, Class AAB, 3.24%, 8/15/2050 | | | 16,000 | | | | 17,358 | |
| | |
Citigroup Commercial Mortgage Trust | | | | | | | | |
| | |
Series 2013-GC17, Class A4, 4.13%, 11/10/2046 | | | 20,000 | | | | 21,740 | |
| | |
Series 2016-C1, Class AAB, 3.00%, 5/10/2049 | | | 12,000 | | | | 12,679 | |
| | |
Series 2020-GC46, Class A2, 2.71%, 2/15/2053 | | | 20,000 | | | | 20,826 | |
| | |
Commercial Mortgage Trust | | | | | | | | |
| | |
Series 2013-CR6, Class A4, 3.10%, 3/10/2046 | | | 15,000 | | | | 15,665 | |
| | |
Series 2014-CR16, Class A3, 3.78%, 4/10/2047 | | | 24,969 | | | | 26,859 | |
| | |
Series 2014-LC15, Class A4, 4.01%, 4/10/2047 | | | 20,000 | | | | 21,823 | |
| | |
Series 2014-UBS4, Class A5, 3.69%, 8/10/2047 | | | 50,000 | | | | 54,456 | |
| | |
Series 2013-CR11, Class ASB, 3.66%, 8/10/2050 | | | 13,435 | | | | 13,970 | |
| | |
FHLMC, Multi-Family Structured Pass-Through Certificates | | | | | | | | |
| | |
Series K016, Class A2, 2.97%, 10/25/2021 | | | 27,522 | | | | 27,899 | |
| | |
Series K019, Class A2, 2.27%, 3/25/2022 | | | 15,626 | | | | 15,905 | |
| | |
Series K020, Class A2, 2.37%, 5/25/2022 | | | 10,000 | | | | 10,169 | |
| | |
Series K720, Class A2, 2.72%, 6/25/2022 | | | 15,000 | | | | 15,380 | |
| | |
Series K027, Class A2, 2.64%, 1/25/2023 | | | 26,000 | | | | 27,161 | |
| | |
Series K028, Class A2, 3.11%, 2/25/2023 | | | 10,000 | | | | 10,560 | |
| | |
Series K044, Class A2, 2.81%, 1/25/2025 | | | 16,000 | | | | 17,387 | |
| | |
Series K733, Class A2, 3.75%, 8/25/2025 | | | 100,000 | | | | 112,798 | |
SEE NOTES TO FINANCIAL STATEMENTS.
| | | | | | |
| | | |
| 38 | | | | J.P. MORGAN EXCHANGE-TRADED FUNDS | | AUGUST 31, 2020 |
| | | | | | | | |
| INVESTMENTS | | PRINCIPAL AMOUNT ($) | | | VALUE ($) | |
Commercial Mortgage-Backed Securities — continued | |
| | |
Series K737, Class A1, 2.12%, 6/25/2026 | | | 59,615 | | | | 62,382 | |
| | |
FNMA ACES | | | | | | | | |
| | |
Series 2017-M10, Class AV2, 2.64%, 7/25/2024 (h) | | | 14,000 | | | | 14,892 | |
| | |
Series 2017-M7, Class A1, 2.60%, 12/25/2026 | | | 56,494 | | | | 59,246 | |
| | |
GS Mortgage Securities Trust | | | | | | | | |
| | |
Series 2013-GC12, Class C, 4.18%, 6/10/2046 ‡ (h) | | | 25,000 | | | | 22,597 | |
| | |
Series 2014-GC18, Class A4, 4.07%, 1/10/2047 | | | 30,000 | | | | 32,662 | |
| | |
Series 2014-GC18, Class AS, 4.38%, 1/10/2047 | | | 17,000 | | | | 18,484 | |
| | |
J.P. Morgan Chase Commercial Mortgage Securities Trust Series 2013-LC11, Class C, 3.96%, 4/15/2046 ‡ (h) | | | 22,000 | | | | 17,614 | |
| | |
JP Morgan Chase Commercial Mortgage Securities Trust Series 2013-C10, Class AS, 3.37%, 12/15/2047 ‡ | | | 20,000 | | | | 20,879 | |
| | |
JPMBB Commercial Mortgage Securities Trust | | | | | | | | |
| | |
Series 2013-C17, Class ASB, 3.71%, 1/15/2047 | | | 13,804 | | | | 14,454 | |
| | |
Series 2014-C19, Class C, 4.83%, 4/15/2047 ‡ (h) | | | 10,000 | | | | 9,588 | |
| | |
Series 2014-C22, Class AS, 4.11%, 9/15/2047 | | | 15,000 | | | | 16,248 | |
| | |
Series 2014-C23, Class C, 4.62%, 9/15/2047 ‡ (h) | | | 20,000 | | | | 19,945 | |
| | |
Morgan Stanley Bank of America Merrill Lynch Trust | | | | | | | | |
| | |
Series 2012-C5, Class A4, 3.18%, 8/15/2045 | | | 12,000 | | | | 12,408 | |
| | |
Series 2014-C19, Class A3, 3.25%, 12/15/2047 | | | 6,385 | | | | 6,816 | |
| | |
Series 2015-C25, Class ASB, 3.38%, 10/15/2048 | | | 40,000 | | | | 42,216 | |
| | |
Morgan Stanley Capital I Trust Series 2011-C3, Class A4, 4.12%, 7/15/2049 | | | 3,995 | | | | 4,053 | |
| | |
UBS Commercial Mortgage Trust Series 2018-C13, Class A2, 4.21%, 10/15/2051 | | | 9,841 | | | | 10,519 | |
| | |
UBS-Barclays Commercial Mortgage Trust Series 2013-C6, Class A4, 3.24%, 4/10/2046 | | | 23,000 | | | | 24,177 | |
| | |
Wells Fargo Commercial Mortgage Trust | | | | | | | | |
| | |
Series 2012-LC5, Class B, 4.14%, 10/15/2045 ‡ | | | 14,000 | | | | 14,536 | |
| | | | | | | | |
| INVESTMENTS | | PRINCIPAL AMOUNT ($) | | | VALUE ($) | |
| | | | | | | | |
| | |
Series 2013-LC12, Class A4, 4.22%, 7/15/2046 (h) | | | 12,000 | | | | 12,877 | |
| | |
Series 2019-C54, Class A2, 3.01%, 12/15/2052 | | | 35,000 | | | | 36,730 | |
| | |
WFRBS Commercial Mortgage Trust | | | | | | | | |
| | |
Series 2012-C7, Class AS, 4.09%, 6/15/2045 (h) | | | 32,000 | | | | 33,190 | |
| | |
Series 2012-C10, Class A3, 2.88%, 12/15/2045 | | | 12,000 | | | | 12,411 | |
| | |
Series 2012-C10, Class B, 3.74%, 12/15/2045 ‡ | | | 15,000 | | | | 13,093 | |
| | |
Series 2014-C20, Class A5, 4.00%, 5/15/2047 | | | 12,000 | | | | 13,118 | |
| | | | | | | | |
| |
Total Commercial Mortgage-Backed Securities
(Cost $1,012,855) | | | | 1,019,081 | |
| | | | | |
Foreign Government Securities — 1.4% | |
| |
Canada Government Bond (Canada) | | | | | |
| | |
2.63%, 1/25/2022 | | | 10,000 | | | | 10,337 | |
| | |
2.00%, 11/15/2022 | | | 50,000 | | | | 51,938 | |
| | |
1.63%, 1/22/2025 | | | 10,000 | | | | 10,546 | |
| |
Export Development Canada (Canada) | | | | | |
| | |
2.75%, 3/15/2023 | | | 25,000 | | | | 26,554 | |
| | |
2.63%, 2/21/2024 | | | 20,000 | | | | 21,615 | |
| |
Hungary Government Bond (Hungary) | | | | | |
| | |
5.38%, 2/21/2023 | | | 18,000 | | | | 19,892 | |
| | |
5.75%, 11/22/2023 | | | 20,000 | | | | 22,983 | |
| |
Italian Republic Government Bond (Italy) | | | | | |
| | |
6.88%, 9/27/2023 | | | 36,000 | | | | 42,008 | |
| |
Oriental Republic of Uruguay (Uruguay) | | | | | |
| | |
4.50%, 8/14/2024 | | | 7,000 | | | | 7,717 | |
| |
Province of Alberta (Canada) | | | | | |
| | |
2.20%, 7/26/2022 | | | 22,000 | | | | 22,757 | |
| | |
1.00%, 5/20/2025 | | | 10,000 | | | | 10,162 | |
| |
Province of British Columbia (Canada) | | | | | |
| | |
2.65%, 9/22/2021 | | | 16,000 | | | | 16,404 | |
| | |
2.00%, 10/23/2022 | | | 15,000 | | | | 15,551 | |
| | |
1.75%, 9/27/2024 | | | 24,000 | | | | 25,293 | |
| |
Province of Ontario (Canada) | | | | | |
| | |
2.50%, 9/10/2021 | | | 15,000 | | | | 15,332 | |
| | |
2.25%, 5/18/2022 | | | 21,000 | | | | 21,689 | |
| | |
2.45%, 6/29/2022 | | | 15,000 | | | | 15,576 | |
| | |
3.05%, 1/29/2024 | | | 16,000 | | | | 17,394 | |
| | |
3.20%, 5/16/2024 | | | 15,000 | | | | 16,478 | |
| |
Province of Quebec (Canada) | | | | | |
| | |
2.63%, 2/13/2023 | | | 20,000 | | | | 21,092 | |
| | |
2.50%, 4/9/2024 | | | 15,000 | | | | 16,100 | |
| | |
1.50%, 2/11/2025 | | | 10,000 | | | | 10,423 | |
SEE NOTES TO FINANCIAL STATEMENTS.
| | | | | | | | |
| | | |
| AUGUST 31, 2020 | | J.P. MORGAN EXCHANGE-TRADED FUNDS | | | | | 39 | |
JPMorgan BetaBuilders 1-5 Year U.S. Aggregate Bond ETF
SCHEDULE OF PORTFOLIO INVESTMENTS
AS OF AUGUST 31, 2020 (Unaudited) (continued)
| | | | | | | | |
| INVESTMENTS | | PRINCIPAL AMOUNT ($) | | | VALUE ($) | |
Foreign Government Securities — continued | |
| |
Republic of Colombia (Colombia) | | | | | |
| | |
8.13%, 5/21/2024 | | | 20,000 | | | | 24,308 | |
| |
Republic of Philippines (Philippines) | | | | | |
| | |
9.50%, 10/21/2024 | | | 5,000 | | | | 6,729 | |
| | |
10.63%, 3/16/2025 | | | 33,000 | | | | 46,964 | |
| |
Republic of Poland (Poland) | | | | | |
| | |
3.00%, 3/17/2023 | | | 12,000 | | | | 12,751 | |
| | |
4.00%, 1/22/2024 | | | 7,000 | | | | 7,813 | |
| |
United Mexican States (Mexico) | | | | | |
| | |
3.63%, 3/15/2022 | | | 24,000 | | | | 25,145 | |
| | | | | | | | |
| |
Total Foreign Government Securities
(Cost $542,658) | | | | 561,551 | |
| | | | | |
Asset-Backed Securities — 0.9% | |
| | |
Ally Auto Receivables Trust Series 2018-3, Class A4, 3.12%, 7/17/2023 | | | 10,000 | | | | 10,337 | |
| | |
American Express Credit Account Master Trust Series 2017-7, Class A, 2.35%, 5/15/2025 | | | 30,000 | | | | 31,279 | |
| | |
AmeriCredit Automobile Receivables Trust Series 2017-3, Class D, 3.18%, 7/18/2023 | | | 15,000 | | | | 15,459 | |
| | |
Capital One Multi-Asset Execution Trust Series 2019-A1, Class A1, 2.84%, 12/15/2024 | | | 30,000 | | | | 31,100 | |
| | |
CarMax Auto Owner Trust | | | | | | | | |
| | |
Series 2016-3, Class B, 1.90%, 4/15/2022 | | | 7,000 | | | | 7,012 | |
| | |
Series 2020-1, Class A3, 1.89%, 12/16/2024 | | | 30,000 | | | | 30,833 | |
| | |
Citibank Credit Card Issuance Trust Series 2018-A3, Class A3, 3.29%, 5/23/2025 | | | 33,000 | | | | 35,586 | |
| | |
Ford Credit Auto Lease Trust Series 2018-B, Class A3, 3.19%, 12/15/2021 | | | 5,235 | | | | 5,264 | |
| | |
Ford Credit Auto Owner Trust | | | | | | | | |
| | |
Series 2018-A, Class A3, 3.03%, 11/15/2022 | | | 3,211 | | | | 3,254 | |
| | |
Series 2017-A, Class C, 2.41%, 7/15/2023 | | | 6,000 | | | | 6,026 | |
| | |
Ford Credit Floorplan Master Owner Trust A | | | | | | | | |
| | |
Series 2018-2, Class A, 3.17%, 3/15/2025 | | | 15,000 | | | | 16,004 | |
| | |
Series 2019-2, Class A, 3.06%, 4/15/2026 | | | 8,000 | | | | 8,627 | |
| | |
GM Financial Automobile Leasing Trust | | | | | | | | |
| | |
Series 2018-3, Class A3, 3.18%, 6/21/2021 | | | 2,675 | | | | 2,683 | |
| | |
Series 2019-3, Class A3, 2.03%, 6/20/2022 | | | 24,000 | | | | 24,310 | |
| | | | | | | | |
| INVESTMENTS | | PRINCIPAL AMOUNT ($) | | | VALUE ($) | |
| | | | | | | | |
| | |
GM Financial Consumer Automobile Receivables Trust | | | | | | | | |
| | |
Series 2018-1, Class A3, 2.32%, 7/18/2022 | | | 4,511 | | | | 4,544 | |
| | |
Series 2020-1, Class A3, 1.84%, 9/16/2024 | | | 10,000 | | | | 10,236 | |
| | |
Series 2020-2, Class A4, 1.74%, 8/18/2025 | | | 22,000 | | | | 22,890 | |
| | |
Hyundai Auto Receivables Trust Series 2018-B, Class A3, 3.20%, 12/15/2022 | | | 7,375 | | | | 7,504 | |
| | |
Nissan Auto Lease Trust Series 2019-A, Class A3, 2.76%, 3/15/2022 | | | 7,000 | | | | 7,084 | |
| | |
Santander Drive Auto Receivables Trust | | | | | | | | |
| | |
Series 2020-1, Class B, 3.03%, 11/15/2024 | | | 16,000 | | | | 16,732 | |
| | |
Series 2019-1, Class C, 3.42%, 4/15/2025 | | | 10,000 | | | | 10,270 | |
| | |
Synchrony Credit Card Master Note Trust Series 2018-2, Class A, 3.47%, 5/15/2026 | | | 15,000 | | | | 16,069 | |
| | |
Toyota Auto Receivables Owner Trust | | | | | | | | |
| | |
Series 2018-C, Class A3, 3.02%, 12/15/2022 | | | 12,000 | | | | 12,202 | |
| | |
Series 2019-D, Class A3, 1.92%, 1/16/2024 | | | 8,000 | | | | 8,196 | |
| | |
Series 2020-A, Class A3, 1.66%, 5/15/2024 | | | 26,000 | | | | 26,610 | |
| | |
World Omni Auto Receivables Trust Series 2018-D, Class B, 3.67%, 12/16/2024 | | | 15,000 | | | | 15,955 | |
| | | | | | | | |
| |
Total Asset-Backed Securities
(Cost $377,944) | | | | 386,066 | |
| | | | | |
Municipal Bonds — 0.1% (i) | |
|
Illinois — 0.0% (d) | |
| | |
State of Illinois, Taxable Pension Series 2003, GO, 4.95%, 6/1/2023 | | | 17,727 | | | | 18,000 | |
| | | | | | | | |
|
New Jersey — 0.1% | |
| | |
New Jersey Economic Development Authority, Cityscape Schools., Inc. Series B, Rev., AGM, Zero Coupon, 2/15/2021 | | | 10,000 | | | | 9,962 | |
| | |
New Jersey Economic Development Authority, Pension Funding Series 1997B, Rev., AGM, Zero Coupon, 2/15/2024 | | | 31,000 | | | | 29,762 | |
| | | | | | | | |
| | |
Total New Jersey | | | | | | | 39,724 | |
| | | | | | | | |
| |
Total Municipal Bonds
(Cost $57,625) | | | | 57,724 | |
| | | | | |
SEE NOTES TO FINANCIAL STATEMENTS.
| | | | | | |
| | | |
| 40 | | | | J.P. MORGAN EXCHANGE-TRADED FUNDS | | AUGUST 31, 2020 |
| | | | | | | | |
| INVESTMENTS | | SHARES | | | Value ($) | |
Short-Term Investments — 0.7% | |
Investment Companies — 0.6% | |
| | |
JPMorgan U.S. Government Money Market Fund Class Institutional Shares, 0.01% (j) (k) (Cost $269,143) | | | 269,143 | | | | 269,143 | |
| | | | | | | | |
Investment of Cash Collateral from Securities Loaned — 0.1% | |
| | |
JPMorgan Securities Lending Money Market Fund Agency SL Class Shares, 0.32% (j) (k) | | | 14,996 | | | | 15,000 | |
| | |
JPMorgan U.S. Government Money Market Fund Class IM Shares, 0.07% (j) (k) | | | 29,450 | | | | 29,450 | |
| | | | | | | | |
| | |
Total Investment of Cash Collateral from Securities Loaned
(Cost $44,450) | | | | | | | 44,450 | |
| | | | | |
| | |
Total Short-Term Investments
(Cost $313,593) | | | | | | | 313,593 | |
| | | | | | | | |
| | |
Total Investments — 99.9%
(Cost $40,622,599) | | | | | | | 41,929,317 | |
| | |
Other Assets Less Liabilities — 0.1% | | | | | | | 22,080 | |
| | | | | |
| |
NET ASSETS — 100.0% | | | | 41,951,397 | |
| | | | | |
Percentages indicated are based on net assets.
Abbreviations
| | |
ACES | | Alternative Credit Enhancement Securities |
AGM | | Insured by Assured Guaranty Municipal Corp. |
FFCB | | Federal Farm Credit Bank |
FHLB | | Federal Home Loan Bank |
FHLMC | | Federal Home Loan Mortgage Corp. |
FNMA | | Federal National Mortgage Association |
GNMA | | Government National Mortgage Association |
GO | | General Obligation |
ICE | | Intercontinental Exchange |
LIBOR | | London Interbank Offered Rate |
Rev. | | Revenue |
SOFR | | Secured Overnight Financing Rate |
UMBS | | Uniform Mortgage-Backed Securities |
USD | | United States Dollar |
| |
(a) | | Securities exempt from registration under Rule 144A or section 4(a)(2), of the Securities Act of 1933, as amended. |
(b) | | Variable or floating rate security, linked to the referenced benchmark. The interest rate shown is the current rate as of August 31, 2020. |
(c) | | Step bond. Interest rate is a fixed rate for an initial period that either resets at a specific date or may reset in the future contingent upon a predetermined trigger. The interest rate shown is the current rate as of August 31, 2020. |
(d) | | Amount rounds to less than 0.1% of net assets. |
(e) | | The security or a portion of this security is on loan at August 31, 2020. The total value of securities on loan at August 31, 2020 is $43,344. |
(f) | | Security exempt from registration pursuant to Regulation S under the Securities Act of 1933, as amended. Regulation S applies to securities offerings that are made outside of the United States and do not involve direct selling efforts in the United States and as such may have restrictions on resale. |
(g) | | All or a portion of the security is a when-issued security, delayed delivery security, or forward commitment. |
(h) | | Variable or floating rate security, the interest rate of which adjusts periodically based on changes in current interest rates and prepayments on the underlying pool of assets. The interest rate shown is the current rate as of August 31, 2020. |
(i) | | The date shown represents the earliest of the prerefunded date, next put date or final maturity date. |
(j) | | Investment in an affiliated fund, which is registered under the Investment Company Act of 1940, as amended, and is advised by J.P. Morgan Investment Management Inc. |
(k) | | The rate shown is the current yield as of August 31, 2020. |
| ‡ | | Value determined using significant unobservable inputs. |
SEE NOTES TO FINANCIAL STATEMENTS.
| | | | | | | | |
| | | |
| AUGUST 31, 2020 | | J.P. MORGAN EXCHANGE-TRADED FUNDS | | | | | 41 | |
JPMorgan Core Plus Bond ETF
SCHEDULE OF PORTFOLIO INVESTMENTS
AS OF AUGUST 31, 2020 (Unaudited)
| | | | | | | | |
| INVESTMENTS | | PRINCIPAL
AMOUNT ($) | | | VALUE ($) | |
Corporate Bonds — 29.4% | |
|
Aerospace & Defense — 0.6% | |
| | |
Boeing Co. (The) | | | | | | | | |
| | |
3.60%, 5/1/2034 | | | 20,000 | | | | 19,419 | |
| | |
3.25%, 2/1/2035 | | | 20,000 | | | | 18,744 | |
| | |
Bombardier, Inc. (Canada) 5.75%, 3/15/2022 (a) | | | 10,000 | | | | 8,925 | |
| | |
Howmet Aerospace, Inc.
5.13%, 10/1/2024 | | | 142,000 | | | | 152,313 | |
| | |
5.95%, 2/1/2037 | | | 14,000 | | | | 15,831 | |
| | |
Lockheed Martin Corp. 4.09%, 9/15/2052 | | | 68,000 | | | | 87,828 | |
| | |
Moog, Inc. 4.25%, 12/15/2027 (a) | | | 20,000 | | | | 20,650 | |
| | |
Precision Castparts Corp. 4.38%, 6/15/2045 | | | 33,000 | | | | 41,062 | |
| | |
Raytheon Technologies Corp.
3.50%, 3/15/2027 (a) | | | 40,000 | | | | 45,287 | |
| | |
4.13%, 11/16/2028 | | | 85,000 | | | | 101,117 | |
| | |
Spirit AeroSystems, Inc. 7.50%, 4/15/2025 (a) | | | 105,000 | | | | 105,984 | |
| | |
TransDigm, Inc. 6.25%, 3/15/2026 (a) | | | 25,000 | | | | 26,381 | |
| | |
Triumph Group, Inc.
6.25%, 9/15/2024 (a) | | | 10,000 | | | | 8,180 | |
| | |
7.75%, 8/15/2025 | | | 16,000 | | | | 9,480 | |
| | | | | | | | |
| | |
| | | | | | | 661,201 | |
| | | | | | | | |
|
Air Freight & Logistics — 0.0% (b) | |
| | |
XPO Logistics, Inc. 6.13%, 9/1/2023 (a) | | | 40,000 | | | | 40,650 | |
| | | | | | | | |
|
Airlines — 0.1% | |
| | |
Continental Airlines Pass-Through Trust Series 2012-2, Class A Shares, 4.00%, 10/29/2024 | | | 29,678 | | | | 27,776 | |
| | |
United Airlines Holdings, Inc.
5.00%, 2/1/2024 | | | 20,000 | | | | 18,050 | |
| | |
4.88%, 1/15/2025 | | | 16,000 | | | | 13,720 | |
| | | | | | | | |
| | |
| | | | | | | 59,546 | |
| | | | | | | | |
|
Auto Components — 0.3% | |
| | |
Adient US LLC 7.00%, 5/15/2026 (a) | | | 15,000 | | | | 16,114 | |
| | |
Allison Transmission, Inc. 5.00%, 10/1/2024 (a) | | | 18,000 | | | | 18,181 | |
| | |
American Axle & Manufacturing, Inc. 6.25%, 4/1/2025 | | | 73,000 | | | | 75,281 | |
| | |
Cooper-Standard Automotive, Inc.
13.00%, 6/1/2024 (a) | | | 5,000 | | | | 5,300 | |
| | |
5.63%, 11/15/2026 (a) | | | 30,000 | | | | 16,935 | |
| | |
Dana Financing Luxembourg SARL 6.50%, 6/1/2026 (a) | | | 15,000 | | | | 15,806 | |
| | |
Dana, Inc. 5.38%, 11/15/2027 | | | 60,000 | | | | 63,635 | |
| | |
Delphi Technologies plc 5.00%, 10/1/2025 (a) | | | 52,000 | | | | 59,605 | |
| | | | | | | | |
| INVESTMENTS | | PRINCIPAL
AMOUNT ($) | | | VALUE ($) | |
| | | | | | | | |
| | |
Auto Components — continued | | | | | | | | |
| | |
Goodyear Tire & Rubber Co. (The) 5.00%, 5/31/2026 | | | 19,000 | | | | 19,063 | |
| | |
Icahn Enterprises LP 6.38%, 12/15/2025 | | | 22,000 | | | | 22,825 | |
| | | | | | | | |
| | |
| | | | | | | 312,745 | |
| | | | | | | | |
|
Automobiles — 0.1% | |
| | |
Ford Motor Co.
8.50%, 4/21/2023 | | | 70,000 | | | | 77,379 | |
| | |
9.00%, 4/22/2025 | | | 20,000 | | | | 23,405 | |
| | | | | | | | |
| | |
| | | | | | | 100,784 | |
| | | | | | | | |
|
Banks — 5.0% | |
| | |
Bank of America Corp. | | | | | | | | |
| | |
(ICE LIBOR USD 3 Month + 0.63%), 3.50%, 5/17/2022 (c) | | | 61,000 | | | | 62,351 | |
| | |
(ICE LIBOR USD 3 Month + 0.79%), 3.00%, 12/20/2023 (c) | | | 239,000 | | | | 251,878 | |
| | |
(ICE LIBOR USD 3 Month + 0.97%), 3.46%, 3/15/2025 (c) | | | 215,000 | | | | 234,929 | |
| | |
3.88%, 8/1/2025 | | | 125,000 | | | | 142,698 | |
| | |
(ICE LIBOR USD 3 Month + 0.87%), 2.46%, 10/22/2025 (c) | | | 235,000 | | | | 248,980 | |
| | |
(ICE LIBOR USD 3 Month + 1.06%), 3.56%, 4/23/2027 (c) | | | 40,000 | | | | 44,962 | |
| | |
(ICE LIBOR USD 3 Month + 1.58%), 3.82%, 1/20/2028 (c) | | | 52,000 | | | | 59,129 | |
| | |
(ICE LIBOR USD 3 Month + 1.51%), 3.71%, 4/24/2028 (c) | | | 20,000 | | | | 22,665 | |
| | |
(ICE LIBOR USD 3 Month + 1.07%), 3.97%, 3/5/2029 (c) | | | 135,000 | | | | 155,675 | |
| | |
(ICE LIBOR USD 3 Month + 1.32%), 4.08%, 4/23/2040 (c) | | | 47,000 | | | | 56,665 | |
| | |
(SOFR + 1.93%), 2.68%, 6/19/2041 (c) | | | 100,000 | | | | 101,717 | |
| | |
(ICE LIBOR USD 3 Month + 1.52%), 4.33%, 3/15/2050 (c) | | | 61,000 | | | | 78,904 | |
| | |
Bank of Nova Scotia (The) (Canada) 1.63%, 5/1/2023 | | | 26,000 | | | | 26,767 | |
| | |
BNP Paribas SA (France) 3.25%, 3/3/2023 | | | 27,000 | | | | 28,934 | |
| | |
Canadian Imperial Bank of Commerce (Canada) | | | | | | | | |
| | |
(ICE LIBOR USD 3 Month + 0.79%), 2.61%, 7/22/2023 (c) | | | 37,000 | | | | 38,440 | |
| | |
3.10%, 4/2/2024 | | | 61,000 | | | | 66,070 | |
| | |
CIT Group, Inc. 5.25%, 3/7/2025 | | | 24,000 | | | | 26,160 | |
| | |
Citigroup, Inc. 2.75%, 4/25/2022 | | | 115,000 | | | | 119,146 | |
| | |
(ICE LIBOR USD 3 Month + 1.02%), 4.04%, 6/1/2024 (c) | | | 160,000 | | | | 174,158 | |
SEE NOTES TO FINANCIAL STATEMENTS.
| | | | | | |
| | | |
| 42 | | | | J.P. MORGAN EXCHANGE-TRADED FUNDS | | AUGUST 31, 2020 |
| | | | | | | | |
| INVESTMENTS | | PRINCIPAL
AMOUNT ($) | | | VALUE ($) | |
Corporate Bonds — continued | | | | | | | | |
| | |
Banks — continued | | | | | | | | |
| | |
(ICE LIBOR USD 3 Month + 1.19%), 4.07%, 4/23/2029 (c) | | | 93,000 | | | | 108,146 | |
| | |
(SOFR + 1.42%), 2.98%, 11/5/2030 (c) | | | 25,000 | | | | 27,145 | |
| | |
(SOFR + 3.91%), 4.41%, 3/31/2031 (c) | | | 155,000 | | | | 188,246 | |
| | |
(SOFR + 2.11%), 2.57%, 6/3/2031 (c) | | | 60,000 | | | | 63,403 | |
| | |
(ICE LIBOR USD 3 Month + 1.84%), 4.28%, 4/24/2048 (c) | | | 27,000 | | | | 34,992 | |
| | |
Citizens Financial Group, Inc. 2.50%, 2/6/2030 | | | 7,000 | | | | 7,405 | |
| | |
Comerica, Inc. 3.70%, 7/31/2023 | | | 19,000 | | | | 20,599 | |
| | |
HSBC Holdings plc (United Kingdom) | | | | | | | | |
| | |
(ICE LIBOR USD 3 Month + 1.06%), 3.26%, 3/13/2023 (c) | | | 650,000 | | | | 675,968 | |
| | |
7.63%, 5/17/2032 | | | 87,000 | | | | 120,554 | |
| | |
6.10%, 1/14/2042 | | | 123,000 | | | | 180,457 | |
| | |
KeyCorp 2.25%, 4/6/2027 | | | 33,000 | | | | 34,899 | |
| | |
Mitsubishi UFJ Financial Group, Inc. (Japan) 2.67%, 7/25/2022 | | | 53,000 | | | | 55,097 | |
| | |
3.78%, 3/2/2025 | | | 35,000 | | | | 39,348 | |
| | |
MUFG Americas Holdings Corp. 3.50%, 6/18/2022 | | | 12,000 | | | | 12,631 | |
| | |
Natwest Group plc (United Kingdom) 6.10%, 6/10/2023 | | | 19,000 | | | | 21,130 | |
| | |
3.88%, 9/12/2023 | | | 200,000 | | | | 217,018 | |
| | |
PNC Financial Services Group, Inc. (The) 2.55%, 1/22/2030 | | | 116,000 | | | | 125,988 | |
| | |
Royal Bank of Canada (Canada) 4.65%, 1/27/2026 | | | 27,000 | | | | 31,972 | |
| | |
Sumitomo Mitsui Financial Group, Inc. (Japan)
2.85%, 1/11/2022 | | | 43,000 | | | | 44,391 | |
| | |
3.75%, 7/19/2023 | | | 30,000 | | | | 32,689 | |
| | |
Toronto-Dominion Bank (The) (Canada) 3.25%, 3/11/2024 | | | 23,000 | | | | 25,086 | |
| | |
2.65%, 6/12/2024 | | | 49,000 | | | | 52,685 | |
| | |
Truist Bank 4.05%, 11/3/2025 | | | 31,000 | | | | 36,079 | |
| | |
Truist Financial Corp.
2.85%, 10/26/2024 | | | 79,000 | | | | 86,304 | |
| | |
1.95%, 6/5/2030 | | | 15,000 | | | | 15,464 | |
| | |
US Bancorp 3.00%, 7/30/2029 | | | 54,000 | | | | 59,732 | |
| | |
Wells Fargo & Co. 3.55%, 9/29/2025 | | | 49,000 | | | | 54,851 | |
| | |
(ICE LIBOR USD 3 Month + 0.75%), 2.16%, 2/11/2026 (c) | | | 59,000 | | | | 61,535 | |
| | |
3.00%, 10/23/2026 | | | 184,000 | | | | 203,011 | |
| | |
(ICE LIBOR USD 3 Month + 1.17%), 3.20%, 6/17/2027 (c) | | | 185,000 | | | | 202,514 | |
| | | | | | | | |
| INVESTMENTS | | PRINCIPAL
AMOUNT ($) | | | VALUE ($) | |
| | | | | | | | |
| | |
Banks — continued | | | | | | | | |
| | |
(ICE LIBOR USD 3 Month + 1.31%), 3.58%, 5/22/2028 (c) | | | 212,000 | | | | 237,479 | |
| | |
(ICE LIBOR USD 3 Month + 1.00%), 2.57%, 2/11/2031 (c) | | | 105,000 | | | | 110,140 | |
| | |
4.90%, 11/17/2045 | | | 25,000 | | | | 31,778 | |
| | |
4.75%, 12/7/2046 | | | 15,000 | | | | 18,915 | |
| | |
Westpac Banking Corp. (Australia)
3.65%, 5/15/2023 | | | 58,000 | | | | 62,935 | |
| | |
2.85%, 5/13/2026 | | | 17,000 | | | | 18,877 | |
| | | | | | | | |
| | |
| | | | | | | 5,259,691 | |
| | | | | | | | |
|
Beverages — 0.3% | |
| | |
Anheuser-Busch Cos. LLC (Belgium) 4.90%, 2/1/2046 | | | 45,000 | | | | 55,341 | |
| | |
Anheuser-Busch InBev Worldwide, Inc. (Belgium) 4.75%, 1/23/2029 | | | 90,000 | | | | 109,898 | |
| | |
4.90%, 1/23/2031 | | | 25,000 | | | | 31,848 | |
| | |
Coca-Cola Co. (The) 2.60%, 6/1/2050 | | | 25,000 | | | | 25,332 | |
| | |
Keurig Dr Pepper, Inc.
3.40%, 11/15/2025 | | | 23,000 | | | | 25,830 | |
| | |
4.60%, 5/25/2028 | | | 23,000 | | | | 27,780 | |
| | |
PepsiCo, Inc. 4.25%, 10/22/2044 | | | 44,000 | | | | 56,892 | |
| | | | | | | | |
| | |
| | | | | | | 332,921 | |
| | | | | | | | |
|
Biotechnology — 0.8% | |
| | |
AbbVie, Inc.
2.60%, 11/21/2024 (a) | | | 225,000 | | | | 241,135 | |
| | |
2.95%, 11/21/2026 (a) | | | 85,000 | | | | 93,485 | |
| | |
3.20%, 11/21/2029 (a) | | | 33,000 | | | | 36,523 | |
| | |
4.05%, 11/21/2039 (a) | | | 88,000 | | | | 102,639 | |
| | |
4.63%, 10/1/2042 (a) | | | 55,000 | | | | 67,394 | |
| | |
Amgen, Inc.
2.20%, 2/21/2027 | | | 7,000 | | | | 7,408 | |
| | |
2.30%, 2/25/2031 | | | 100,000 | | | | 104,985 | |
| | |
3.15%, 2/21/2040 | | | 13,000 | | | | 13,726 | |
| | |
Biogen, Inc. 3.15%, 5/1/2050 | | | 20,000 | | | | 20,240 | |
| | |
Gilead Sciences, Inc. 2.95%, 3/1/2027 | | | 123,000 | | | | 137,608 | |
| | | | | | | | |
| | |
| | | | | | | 825,143 | |
| | | | | | | | |
|
Building Products — 0.2% | |
| | |
American Woodmark Corp. 4.88%, 3/15/2026 (a) | | | 20,000 | | | | 20,350 | |
| | |
Griffon Corp. 5.75%, 3/1/2028 | | | 50,000 | | | | 53,063 | |
| | |
Standard Industries, Inc.
6.00%, 10/15/2025 (a) | | | 32,000 | | | | 33,001 | |
| | |
5.00%, 2/15/2027 (a) | | | 20,000 | | | | 20,884 | |
| | |
Summit Materials LLC 5.13%, 6/1/2025 (a) | | | 25,000 | | | | 25,250 | |
| | | | | | | | |
| | |
| | | | | | | 152,548 | |
| | | | | | | | |
SEE NOTES TO FINANCIAL STATEMENTS.
| | | | | | | | |
| | | |
| AUGUST 31, 2020 | | J.P. MORGAN EXCHANGE-TRADED FUNDS | | | | | 43 | |
JPMorgan Core Plus Bond ETF
SCHEDULE OF PORTFOLIO INVESTMENTS
AS OF AUGUST 31, 2020 (Unaudited) (continued)
| | | | | | | | |
| INVESTMENTS | | PRINCIPAL
AMOUNT ($) | | | VALUE ($) | |
Corporate Bonds — continued | | | | | | | | |
|
Capital Markets — 2.2% | |
| | |
Ameriprise Financial, Inc. 4.00%, 10/15/2023 | | | 33,000 | | | | 36,631 | |
| | |
Bank of New York Mellon Corp. (The) 3.50%, 4/28/2023 | | | 32,000 | | | | 34,692 | |
| | |
2.10%, 10/24/2024 | | | 21,000 | | | | 22,381 | |
| | |
Goldman Sachs Group, Inc. (The) | | | | | | | | |
| | |
(ICE LIBOR USD 3 Month + 1.05%), 2.91%, 6/5/2023 (c) | | | 184,000 | | | | 191,501 | |
| | |
3.63%, 2/20/2024 | | | 60,000 | | | | 65,460 | |
| | |
3.50%, 4/1/2025 | | | 280,000 | | | | 310,233 | |
| | |
(ICE LIBOR USD 3 Month + 1.20%), 3.27%, 9/29/2025 (c) | | | 130,000 | | | | 141,601 | |
| | |
3.50%, 11/16/2026 | | | 111,000 | | | | 123,791 | |
| | |
3.85%, 1/26/2027 | | | 73,000 | | | | 83,123 | |
| | |
(ICE LIBOR USD 3 Month + 1.51%), 3.69%, 6/5/2028 (c) | | | 70,000 | | | | 79,320 | |
| | |
Morgan Stanley
3.75%, 2/25/2023 | | | 146,000 | | | | 157,577 | |
| | |
(ICE LIBOR USD 3 Month + 0.85%), 3.74%, 4/24/2024 (c) | | | 65,000 | | | | 70,230 | |
| | |
(SOFR + 1.15%), 2.72%, 7/22/2025 (c) | | | 180,000 | | | | 192,538 | |
| | |
3.88%, 1/27/2026 | | | 76,000 | | | | 87,243 | |
| | |
3.13%, 7/27/2026 | | | 130,000 | | | | 145,056 | |
| | |
3.63%, 1/20/2027 | | | 65,000 | | | | 73,839 | |
| | |
(ICE LIBOR USD 3 Month + 1.34%), 3.59%, 7/22/2028 (c) | | | 80,000 | | | | 90,340 | |
| | |
4.38%, 1/22/2047 | | | 49,000 | | | | 65,119 | |
| | |
Northern Trust Corp. 3.95%, 10/30/2025 | | | 41,000 | | | | 47,538 | |
| | |
S&P Global, Inc. 3.25%, 12/1/2049 | | | 50,000 | | | | 57,795 | |
| | |
State Street Corp. 3.10%, 5/15/2023 | | | 40,000 | | | | 42,761 | |
| | |
TD Ameritrade Holding Corp. 2.75%, 10/1/2029 | | | 28,000 | | | | 31,404 | |
| | |
UBS Group AG (Switzerland) (ICE LIBOR USD 3 Month + 1.47%), 3.13%, 8/13/2030 (a) (c) | | | 200,000 | | | | 221,992 | |
| | | | | | | | |
| | |
| | | | | | | 2,372,165 | |
| | | | | | | | |
|
Chemicals — 0.7% | |
| | |
CF Industries, Inc. 4.95%, 6/1/2043 | | | 30,000 | | | | 35,400 | |
| | |
Chemours Co. (The)
6.63%, 5/15/2023 | | | 65,000 | | | | 65,324 | |
| | |
7.00%, 5/15/2025 | | | 22,000 | | | | 22,495 | |
| | |
CVR Partners LP 9.25%, 6/15/2023 (a) | | | 15,000 | | | | 14,737 | |
| | |
Dow Chemical Co. (The) 3.50%, 10/1/2024 | | | 20,000 | | | | 21,874 | |
| | |
Ecolab, Inc. 3.25%, 12/1/2027 | | | 31,000 | | | | 34,927 | |
| | | | | | | | |
| INVESTMENTS | | PRINCIPAL
AMOUNT ($) | | | VALUE ($) | |
| | | | | | | | |
| | |
Chemicals — continued | | | | | | | | |
| | |
NOVA Chemicals Corp. (Canada) 5.25%, 6/1/2027 (a) | | | 55,000 | | | | 53,213 | |
| | |
Olin Corp. 5.13%, 9/15/2027 | | | 13,000 | | | | 12,805 | |
| | |
Scotts Miracle-Gro Co. (The) 4.50%, 10/15/2029 | | | 375,000 | | | | 401,228 | |
| | |
Trinseo Materials Operating SCA 5.38%, 9/1/2025 (a) | | | 10,000 | | | | 10,028 | |
| | |
Valvoline, Inc. 4.38%, 8/15/2025 | | | 10,000 | | | | 10,377 | |
| | | | | | | | |
| | |
| | | | | | | 682,408 | |
| | | | | | | | |
|
Commercial Services & Supplies — 0.3% | |
| | |
ACCO Brands Corp. 5.25%, 12/15/2024 (a) | | | 23,000 | | | | 23,522 | |
| | |
ADT Security Corp. (The)
4.13%, 6/15/2023 | | | 26,000 | | | | 27,170 | |
| | |
4.88%, 7/15/2032 (a) | | | 20,000 | | | | 21,400 | |
| | |
Aramark Services, Inc. 4.75%, 6/1/2026 | | | 25,000 | | | | 24,855 | |
| | |
Brink’s Co. (The) 4.63%, 10/15/2027 (a) | | | 25,000 | | | | 25,961 | |
| | |
GFL Environmental, Inc. (Canada) 3.75%, 8/1/2025 (a) | | | 105,000 | | | | 105,651 | |
| | |
Nielsen Finance LLC 5.00%, 4/15/2022 (a) | | | 25,000 | | | | 25,024 | |
| | |
Prime Security Services Borrower LLC 5.25%, 4/15/2024 (a) | | | 25,000 | | | | 26,500 | |
| | |
5.75%, 4/15/2026 (a) | | | 42,000 | | | | 46,410 | |
| | | | | | | | |
| | |
| | | | | | | 326,493 | |
| | | | | | | | |
|
Communications Equipment — 0.1% | |
| | |
CommScope, Inc. 6.00%, 3/1/2026 (a) | | | 62,000 | | | | 65,875 | |
| | |
Nokia OYJ (Finland) 4.38%, 6/12/2027 | | | 13,000 | | | | 14,229 | |
| | |
Plantronics, Inc. 5.50%, 5/31/2023 (a) | | | 20,000 | | | | 18,880 | |
| | | | | | | | |
| | |
| | | | | | | 98,984 | |
| | | | | | | | |
|
Construction & Engineering — 0.0% (b) | |
| | |
AECOM 5.13%, 3/15/2027 | | | 18,000 | | | | 19,738 | |
| | | | | | | | |
|
Consumer Finance — 0.4% | |
| | |
Ally Financial, Inc.
5.75%, 11/20/2025 | | | 64,000 | | | | 71,842 | |
| | |
8.00%, 11/1/2031 | | | 37,000 | | | | 50,264 | |
| | |
Avolon Holdings Funding Ltd. (Ireland) 5.25%, 5/15/2024 (a) | | | 50,000 | | | | 48,489 | |
| | |
Capital One Financial Corp. 3.20%, 1/30/2023 | | | 60,000 | | | | 63,426 | |
| | |
Curo Group Holdings Corp. 8.25%, 9/1/2025 (a) | | | 8,000 | | | | 6,600 | |
| | |
John Deere Capital Corp. 2.65%, 6/10/2026 | | | 74,000 | | | | 81,993 | |
| | |
Navient Corp. 5.88%, 10/25/2024 | | | 20,000 | | | | 20,575 | |
SEE NOTES TO FINANCIAL STATEMENTS.
| | | | | | |
| | | |
| 44 | | | | J.P. MORGAN EXCHANGE-TRADED FUNDS | | AUGUST 31, 2020 |
| | | | | | | | |
| INVESTMENTS | | PRINCIPAL
AMOUNT ($) | | | VALUE ($) | |
Corporate Bonds — continued | | | | | | | | |
|
Consumer Finance — continued | |
| | |
OneMain Finance Corp. 7.13%, 3/15/2026 | | | 59,000 | | | | 67,702 | |
| | | | | | | | |
| | |
| | | | | | | 410,891 | |
| | | | | | | | |
|
Containers & Packaging — 0.4% | |
| | |
Ardagh Packaging Finance plc 5.25%, 4/30/2025 (a) | | | 200,000 | | | | 212,231 | |
| | |
Ball Corp. 5.25%, 7/1/2025 | | | 20,000 | | | | 22,665 | |
| | |
Berry Global, Inc. 4.88%, 7/15/2026 (a) | | | 55,000 | | | | 58,437 | |
| | |
Crown Americas LLC 4.25%, 9/30/2026 | | | 13,000 | | | | 13,821 | |
| | |
Greif, Inc. 6.50%, 3/1/2027 (a) | | | 25,000 | | | | 26,625 | |
| | |
Mauser Packaging Solutions Holding Co. 5.50%, 4/15/2024 (a) | | | 40,000 | | | | 40,600 | |
| | |
Sealed Air Corp. 5.50%, 9/15/2025 (a) | | | 12,000 | | | | 13,440 | |
| | | | | | | | |
| | |
| | | | | | | 387,819 | |
| | | | | | | | |
|
Distributors — 0.0% (b) | |
| | |
Performance Food Group, Inc. 5.50%, 10/15/2027 (a) | | | 11,000 | | | | 11,468 | |
| | |
Wolverine Escrow LLC 9.00%, 11/15/2026 (a) | | | 20,000 | | | | 15,400 | |
| | | | | | | | |
| | |
| | | | | | | 26,868 | |
| | | | | | | | |
|
Diversified Consumer Services — 0.0% (b) | |
| | |
Service Corp. International 5.38%, 5/15/2024 | | | 12,000 | | | | 12,220 | |
| | | | | | | | |
|
Diversified Financial Services — 0.4% | |
| | |
AIG Global Funding 1.90%, 10/6/2021 (a) | | | 25,000 | | | | 25,428 | |
| | |
CNG Holdings, Inc. 12.50%, 6/15/2024 (a) | | | 8,000 | | | | 7,120 | |
| | |
MPH Acquisition Holdings LLC 7.13%, 6/1/2024 (a) | | | 3,000 | | | | 3,046 | |
| | |
National Rural Utilities Cooperative Finance Corp.
3.40%, 2/7/2028 | | | 46,000 | | | | 53,491 | |
| | |
4.40%, 11/1/2048 | | | 46,000 | | | | 60,741 | |
| | |
ORIX Corp. (Japan) 4.05%, 1/16/2024 | | | 38,000 | | | | 41,694 | |
| | |
Sabre GLBL, Inc. 9.25%, 4/15/2025 (a) | | | 15,000 | | | | 16,687 | |
| | |
Shell International Finance BV (Netherlands)
3.25%, 5/11/2025 | | | 100,000 | | | | 111,709 | |
| | |
3.63%, 8/21/2042 | | | 34,000 | | | | 37,651 | |
| | |
3.75%, 9/12/2046 | | | 39,000 | | | | 44,345 | |
| | |
3.13%, 11/7/2049 | | | 25,000 | | | | 26,213 | |
| | | | | | | | |
| | |
| | | | | | | 428,125 | |
| | | | | | | | |
|
Diversified Telecommunication Services — 1.1% | |
| | |
AT&T, Inc.
1.65%, 2/1/2028 | | | 110,000 | | | | 111,486 | |
| | | | | | | | |
| INVESTMENTS | | PRINCIPAL
AMOUNT ($) | | | VALUE ($) | |
| | | | | | | | |
|
Diversified Telecommunication Services — continued | |
| | |
2.25%, 2/1/2032 | | | 100,000 | | | | 101,359 | |
| | |
3.10%, 2/1/2043 | | | 35,000 | | | | 34,735 | |
| | |
4.75%, 5/15/2046 | | | 20,000 | | | | 23,876 | |
| | |
CCO Holdings LLC
5.75%, 2/15/2026 (a) | | | 114,000 | | | | 119,479 | |
| | |
5.13%, 5/1/2027 (a) | | | 25,000 | | | | 26,626 | |
| | |
5.88%, 5/1/2027 (a) | | | 30,000 | | | | 31,537 | |
| | |
5.00%, 2/1/2028 (a) | | | 40,000 | | | | 42,300 | |
| | |
4.75%, 3/1/2030 (a) | | | 75,000 | | | | 80,576 | |
| | |
CenturyLink, Inc. | | | | | | | | |
| | |
Series T, 5.80%, 3/15/2022 | | | 12,000 | | | | 12,539 | |
| | |
5.63%, 4/1/2025 | | | 17,000 | | | | 18,339 | |
| | |
5.13%, 12/15/2026 (a) | | | 10,000 | | | | 10,370 | |
| | |
4.00%, 2/15/2027 (a) | | | 15,000 | | | | 15,242 | |
| | |
Series G, 6.88%, 1/15/2028 | | | 3,000 | | | | 3,300 | |
| | |
Cincinnati Bell, Inc.
7.00%, 7/15/2024 (a) | | | 20,000 | | | | 20,675 | |
| | |
8.00%, 10/15/2025 (a) | | | 9,000 | | | | 9,620 | |
| | |
Embarq Corp. 8.00%, 6/1/2036 | | | 13,000 | | | | 15,590 | |
| | |
Frontier Communications Corp. 6.88%, 1/15/2025 (d) | | | 35,000 | | | | 13,960 | |
| | |
Intelsat Jackson Holdings SA (Luxembourg) 8.00%, 2/15/2024 (a) (d) (e) | | | 15,000 | | | | 15,300 | |
| | |
8.50%, 10/15/2024 (a) (d) | | | 28,000 | | | | 19,040 | |
| | |
Level 3 Financing, Inc.
5.38%, 5/1/2025 | | | 20,000 | | | | 20,598 | |
| | |
5.25%, 3/15/2026 | | | 54,000 | | | | 56,300 | |
| | |
Qwest Corp. 6.75%, 12/1/2021 | | | 25,000 | | | | 26,497 | |
| | |
Sprint Capital Corp. 8.75%, 3/15/2032 | | | 45,000 | | | | 67,970 | |
| | |
Telecom Italia Capital SA (Italy) 6.00%, 9/30/2034 | | | 24,000 | | | | 29,160 | |
| | |
Verizon Communications, Inc.
4.02%, 12/3/2029 | | | 33,000 | | | | 39,599 | |
| | |
3.85%, 11/1/2042 | | | 75,000 | | | | 89,244 | |
| | |
4.67%, 3/15/2055 | | | 49,000 | | | | 66,558 | |
| | |
Windstream Services LLC 8.63%, 10/31/2025 (a) (d) (e) | | | 15,000 | | | | 9,085 | |
| | | | | | | | |
| | |
| | | | | | | 1,130,960 | |
| | | | | | | | |
|
Electric Utilities — 1.7% | |
| | |
Alabama Power Co. Series 13-A, 3.55%, 12/1/2023 | | | 35,000 | | | | 38,260 | |
| | |
Arizona Public Service Co. 3.15%, 5/15/2025 | | | 21,000 | | | | 23,161 | |
| | |
Commonwealth Edison Co. 3.70%, 8/15/2028 | | | 100,000 | | | | 116,571 | |
| | |
Connecticut Light and Power Co. (The) 4.00%, 4/1/2048 | | | 35,000 | | | | 44,573 | |
SEE NOTES TO FINANCIAL STATEMENTS.
| | | | | | | | |
| | | |
| AUGUST 31, 2020 | | J.P. MORGAN EXCHANGE-TRADED FUNDS | | | | | 45 | |
JPMorgan Core Plus Bond ETF
SCHEDULE OF PORTFOLIO INVESTMENTS
AS OF AUGUST 31, 2020 (Unaudited) (continued)
| | | | | | | | |
| INVESTMENTS | | PRINCIPAL
AMOUNT ($) | | | VALUE ($) | |
Corporate Bonds — continued | | | | | | | | |
| | |
Electric Utilities — continued | | | | | | | | |
| | |
Duke Energy Carolinas LLC 3.20%, 8/15/2049 | | | 32,000 | | | | 35,997 | |
| | |
Duke Energy Indiana LLC Series YYY, 3.25%, 10/1/2049 | | | 42,000 | | | | 46,891 | |
| | |
Edison International 5.75%, 6/15/2027 | | | 75,000 | | | | 85,236 | |
| | |
Entergy Arkansas LLC 4.00%, 6/1/2028 | | | 5,000 | | | | 5,909 | |
| | |
Entergy Louisiana LLC
2.40%, 10/1/2026 | | | 44,000 | | | | 47,989 | |
| | |
3.05%, 6/1/2031 | | | 125,000 | | | | 142,638 | |
| | |
FirstEnergy Corp. Series B, 3.90%, 7/15/2027 | | | 25,000 | | | | 27,410 | |
| | |
Indiana Michigan Power Co. | | | | | | | | |
| | |
Series K, 4.55%, 3/15/2046 | | | 34,000 | | | | 43,400 | |
| | |
Kentucky Utilities Co. 5.13%, 11/1/2040 | | | 45,000 | | | | 60,824 | |
| | |
MidAmerican Energy Co. 3.65%, 4/15/2029 | | | 23,000 | | | | 27,410 | |
| | |
Monongahela Power Co. 4.10%, 4/15/2024 (a) | | | 93,000 | | | | 102,259 | |
| | |
NextEra Energy Capital Holdings, Inc. 2.75%, 11/1/2029 | | | 50,000 | | | | 54,612 | |
| | |
2.25%, 6/1/2030 | | | 86,000 | | | | 90,082 | |
| | |
NRG Energy, Inc.
6.63%, 1/15/2027 | | | 59,000 | | | | 63,142 | |
| | |
5.75%, 1/15/2028 | | | 35,000 | | | | 38,062 | |
| | |
Ohio Power Co. Series P, 2.60%, 4/1/2030 | | | 31,000 | | | | 33,996 | |
| | |
Pacific Gas and Electric Co.
3.75%, 2/15/2024 | | | 100,000 | | | | 105,469 | |
| | |
3.30%, 3/15/2027 | | | 120,000 | | | | 122,845 | |
| | |
Public Service Electric and Gas Co. 3.00%, 5/15/2027 | | | 31,000 | | | | 34,382 | |
| | |
Southern California Edison Co. | | | | | | | | |
| | |
Series C, 3.60%, 2/1/2045 | | | 35,000 | | | | 35,963 | |
| | |
Series C, 4.13%, 3/1/2048 | | | 56,000 | | | | 61,898 | |
| | |
Southwestern Public Service Co.
3.30%, 6/15/2024 | | | 29,000 | | | | 31,470 | |
| | |
4.50%, 8/15/2041 | | | 46,000 | | | | 58,207 | |
| | |
Tucson Electric Power Co.
3.05%, 3/15/2025 | | | 30,000 | | | | 32,664 | |
| | |
4.85%, 12/1/2048 | | | 46,000 | | | | 61,889 | |
| | |
Vistra Operations Co. LLC
5.50%, 9/1/2026 (a) | | | 19,000 | | | | 19,950 | |
| | |
5.00%, 7/31/2027 (a) | | | 55,000 | | | | 58,326 | |
| | |
Wisconsin Public Service Corp. 4.75%, 11/1/2044 | | | 42,000 | | | | 54,754 | |
| | | | | | | | |
| | |
| | | | | | | 1,806,239 | |
| | | | | | | | |
| | | | | | | | |
| INVESTMENTS | | PRINCIPAL
AMOUNT ($) | | | VALUE ($) | |
| | | | | | | | |
|
Electrical Equipment — 0.1% | |
| | |
EnerSys 5.00%, 4/30/2023 (a) | | | 26,000 | | | | 26,980 | |
| | |
Sensata Technologies BV 5.00%, 10/1/2025 (a) | | | 40,000 | | | | 43,468 | |
| | | | | | | | |
| | |
| | | | | | | 70,448 | |
| | | | | | | | |
|
Electronic Equipment, Instruments & Components — 0.0% (b) | |
| | |
CDW LLC
5.00%, 9/1/2025 | | | 12,000 | | | | 12,435 | |
| | |
4.25%, 4/1/2028 | | | 30,000 | | | | 31,350 | |
| | | | | | | | |
| | |
| | | | | | | 43,785 | |
| | | | | | | | |
|
Energy Equipment & Services — 0.1% | |
| | |
Baker Hughes a GE Co. LLC
4.49%, 5/1/2030 | | | 20,000 | | | | 23,413 | |
| | |
4.08%, 12/15/2047 | | | 10,000 | | | | 10,534 | |
| | |
Nabors Industries, Inc. 5.75%, 2/1/2025 | | | 15,000 | | | | 4,312 | |
| | |
Schlumberger Holdings Corp. 3.90%, 5/17/2028 (a) | | | 83,000 | | | | 90,622 | |
| | |
Transocean Pontus Ltd. 6.13%, 8/1/2025 (a) | | | 17,160 | | | | 15,367 | |
| | | | | | | | |
| | |
| | | | | | | 144,248 | |
| | | | | | | | |
|
Entertainment — 0.5% | |
| | |
Cinemark USA, Inc. 4.88%, 6/1/2023 | | | 15,000 | | | | 13,803 | |
| | |
Live Nation Entertainment, Inc.
5.63%, 3/15/2026 (a) | | | 2,000 | | | | 1,970 | |
| | |
6.50%, 5/15/2027 (a) | | | 10,000 | | | | 10,925 | |
| | |
4.75%, 10/15/2027 (a) | | | 40,000 | | | | 37,837 | |
| | |
NBCUniversal Media LLC 2.88%, 1/15/2023 | | | 88,000 | | | | 93,173 | |
| | |
Netflix, Inc.
4.88%, 4/15/2028 | | | 100,000 | | | | 115,750 | |
| | |
5.88%, 11/15/2028 | | | 35,000 | | | | 42,962 | |
| | |
4.88%, 6/15/2030 (a) | | | 55,000 | | | | 63,731 | |
| | |
Walt Disney Co. (The)
2.00%, 9/1/2029 | | | 29,000 | | | | 30,152 | |
| | |
3.80%, 3/22/2030 | | | 50,000 | | | | 59,233 | |
| | | | | | | | |
| | |
| | | | | | | 469,536 | |
| | | | | | | | |
|
Equity Real Estate Investment Trusts (REITs) — 0.7% | |
| | |
Alexandria Real Estate Equities, Inc. 1.88%, 2/1/2033 | | | 30,000 | | | | 29,656 | |
| | |
American Tower Corp. 2.10%, 6/15/2030 | | | 125,000 | | | | 127,571 | |
| | |
AvalonBay Communities, Inc. 3.35%, 5/15/2027 | | | 18,000 | | | | 20,169 | |
| | |
Brookfield Property REIT, Inc. 5.75%, 5/15/2026 (a) | | | 24,000 | | | | 19,560 | |
| | |
Crown Castle International Corp. 3.25%, 1/15/2051 | | | 25,000 | | | | 25,815 | |
| | |
Duke Realty LP 1.75%, 7/1/2030 | | | 30,000 | | | | 30,074 | |
SEE NOTES TO FINANCIAL STATEMENTS.
| | | | | | |
| | | |
| 46 | | | | J.P. MORGAN EXCHANGE-TRADED FUNDS | | AUGUST 31, 2020 |
| | | | | | | | |
| INVESTMENTS | | PRINCIPAL
AMOUNT ($) | | | VALUE ($) | |
Corporate Bonds — continued | | | | | | | | |
|
Equity Real Estate Investment Trusts (REITs) — continued | |
| | |
ERP Operating LP 3.25%, 8/1/2027 | | | 17,000 | | | | 18,936 | |
| | |
ESH Hospitality, Inc. 4.63%, 10/1/2027 (a) | | | 25,000 | | | | 24,999 | |
| | |
GLP Capital LP 4.00%, 1/15/2030 | | | 10,000 | | | | 10,376 | |
| | |
Healthpeak Properties, Inc. 3.00%, 1/15/2030 | | | 20,000 | | | | 21,738 | |
| | |
MGM Growth Properties Operating Partnership LP
5.63%, 5/1/2024 | | | 12,000 | | | | 12,960 | |
| | |
4.50%, 9/1/2026 | | | 35,000 | | | | 36,750 | |
| | |
National Retail Properties, Inc. 3.60%, 12/15/2026 | | | 20,000 | | | | 21,676 | |
| | |
Prologis LP 2.13%, 10/15/2050 | | | 110,000 | | | | 100,509 | |
| | |
Realty Income Corp.
4.13%, 10/15/2026 | | | 27,000 | | | | 31,320 | |
| | |
3.25%, 1/15/2031 | | | 5,000 | | | | 5,556 | |
| | |
RHP Hotel Properties LP 4.75%, 10/15/2027 | | | 25,000 | | | | 22,750 | |
| | |
Simon Property Group LP
2.75%, 6/1/2023 | | | 65,000 | | | | 67,976 | |
| | |
3.50%, 9/1/2025 | | | 48,000 | | | | 52,773 | |
| | |
3.25%, 9/13/2049 | | | 31,000 | | | | 28,992 | |
| | |
VICI Properties LP
4.25%, 12/1/2026 (a) | | | 30,000 | | | | 30,675 | |
| | |
4.63%, 12/1/2029 (a) | | | 20,000 | | | | 20,800 | |
| | | | | | | | |
| | |
| | | | | | | 761,631 | |
| | | | | | | | |
|
Food & Staples Retailing — 0.3% | |
| | |
Albertsons Cos., Inc.
6.63%, 6/15/2024 | | | 18,000 | | | | 18,579 | |
| | |
5.75%, 3/15/2025 | | | 60,000 | | | | 61,650 | |
| | |
4.63%, 1/15/2027 (a) | | | 20,000 | | | | 21,133 | |
| | |
4.88%, 2/15/2030 (a) | | | 20,000 | | | | 21,500 | |
| | |
New Albertsons LP 8.00%, 5/1/2031 | | | 10,000 | | | | 11,500 | |
| | |
Sysco Corp. 5.95%, 4/1/2030 | | | 90,000 | | | | 113,471 | |
| | |
Walmart, Inc. 3.63%, 12/15/2047 | | | 15,000 | | | | 18,350 | |
| | | | | | | | |
| | |
| | | | | | | 266,183 | |
| | | | | | | | |
| | |
Food Products — 0.4% | | | | | | | | |
| | |
JBS USA LUX SA 5.75%, 6/15/2025 (a) | | | 50,000 | | | | 51,625 | |
| | |
Kraft Heinz Foods Co.
3.00%, 6/1/2026 | | | 25,000 | | | | 26,065 | |
| | |
4.63%, 1/30/2029 | | | 35,000 | | | | 39,623 | |
| | |
5.00%, 6/4/2042 | | | 50,000 | | | | 55,157 | |
| | |
Lamb Weston Holdings, Inc. 4.88%, 11/1/2026 (a) | | | 65,000 | | | | 68,015 | |
| | |
Mead Johnson Nutrition Co. (United Kingdom) 4.13%, 11/15/2025 | | | 35,000 | | | | 40,692 | |
| | | | | | | | |
| INVESTMENTS | | PRINCIPAL
AMOUNT ($) | | | VALUE ($) | |
| | | | | | | | |
| | |
Food Products — continued | | | | | | | | |
| | |
Pilgrim’s Pride Corp. 5.75%, 3/15/2025 (a) | | | 16,000 | | | | 16,440 | |
| | |
Post Holdings, Inc.
5.50%, 12/15/2029 (a) | | | 25,000 | | | | 27,405 | |
| | |
4.63%, 4/15/2030 (a) | | | 30,000 | | | | 31,312 | |
| | |
Tyson Foods, Inc. 4.35%, 3/1/2029 | | | 31,000 | | | | 37,401 | |
| | | | | | | | |
| | |
| | | | | | | 393,735 | |
| | | | | | | | |
| | |
Gas Utilities — 0.1% | | | | | | | | |
| | |
AmeriGas Partners LP
5.50%, 5/20/2025 | | | 23,000 | | | | 25,243 | |
| | |
5.88%, 8/20/2026 | | | 10,000 | | | | 11,332 | |
| | |
Atmos Energy Corp. 5.50%, 6/15/2041 | | | 29,000 | | | | 40,944 | |
| | |
Boston Gas Co. 3.00%, 8/1/2029 (a) | | | 22,000 | | | | 24,432 | |
| | |
Brooklyn Union Gas Co. (The) 3.87%, 3/4/2029 (a) | | | 10,000 | | | | 11,658 | |
| | |
Southern California Gas Co. Series XX, 2.55%, 2/1/2030 | | | 20,000 | | | | 21,793 | |
| | | | | | | | |
| | |
| | | | | | | 135,402 | |
| | | | | | | | |
|
Health Care Equipment & Supplies — 0.2% | |
| | |
Abbott Laboratories 1.15%, 1/30/2028 | | | 10,000 | | | | 10,114 | |
| | |
Becton Dickinson and Co. 3.70%, 6/6/2027 | | | 60,000 | | | | 67,994 | |
| | |
Boston Scientific Corp. 4.70%, 3/1/2049 | | | 50,000 | | | | 66,463 | |
| | |
Medtronic, Inc. 4.63%, 3/15/2045 | | | 38,000 | | | | 52,167 | |
| | |
Teleflex, Inc. 4.63%, 11/15/2027 | | | 20,000 | | | | 21,250 | |
| | | | | | | | |
| | |
| | | | | | | 217,988 | |
| | | | | | | | |
| | |
Health Care Providers & Services — 1.2% | | | | | | | | |
| | |
Centene Corp.
5.25%, 4/1/2025 (a) | | | 24,000 | | | | 24,900 | |
| | |
5.38%, 6/1/2026 (a) | | | 54,000 | | | | 57,105 | |
| | |
4.63%, 12/15/2029 | | | 85,000 | | | | 93,146 | |
| | |
Community Health Systems, Inc. 6.25%, 3/31/2023 | | | 25,000 | | | | 25,063 | |
| | |
CVS Health Corp. | | | | | | | | |
| | |
2.88%, 6/1/2026 | | | 10,000 | | | | 10,887 | |
| | |
1.30%, 8/21/2027 | | | 140,000 | | | | 139,119 | |
| | |
4.30%, 3/25/2028 | | | 10,000 | | | | 11,773 | |
| | |
2.70%, 8/21/2040 | | | 30,000 | | | | 29,213 | |
| | |
Encompass Health Corp. | | | | | | | | |
| | |
4.50%, 2/1/2028 | | | 15,000 | | | | 15,381 | |
| | |
Envision Healthcare Corp. 8.75%, 10/15/2026 (a) | | | 20,000 | | | | 8,800 | |
| | |
HCA, Inc.
5.25%, 6/15/2026 | | | 174,000 | | | | 205,340 | |
| | |
5.38%, 9/1/2026 | | | 155,000 | | | | 175,925 | |
SEE NOTES TO FINANCIAL STATEMENTS.
| | | | | | | | |
| | | |
| AUGUST 31, 2020 | | J.P. MORGAN EXCHANGE-TRADED FUNDS | | | | | 47 | |
JPMorgan Core Plus Bond ETF
SCHEDULE OF PORTFOLIO INVESTMENTS
AS OF AUGUST 31, 2020 (Unaudited) (continued)
| | | | | | | | |
| INVESTMENTS | | PRINCIPAL
AMOUNT ($) | | | VALUE ($) | |
Corporate Bonds — continued | | | | | | | | |
|
Health Care Providers & Services — continued | |
| | |
5.88%, 2/1/2029 | | | 25,000 | | | | 30,367 | |
| | |
3.50%, 9/1/2030 | | | 25,000 | | | | 26,218 | |
| | |
MultiCare Health System 2.80%, 8/15/2050 | | | 10,000 | | | | 10,034 | |
| | |
New York and Presbyterian Hospital (The) 2.61%, 8/1/2060 | | | 5,000 | | | | 4,890 | |
| | |
Polaris Intermediate Corp. 8.50% (cash), 12/1/2022 (a) (f) | | | 5,000 | | | | 5,081 | |
| | |
Team Health Holdings, Inc. 6.38%, 2/1/2025 (a) | | | 23,000 | | | | 15,640 | |
| | |
Tenet Healthcare Corp.
4.63%, 9/1/2024 (a) | | | 140,000 | | | | 143,850 | |
| | |
4.88%, 1/1/2026 (a) | | | 20,000 | | | | 20,800 | |
| | |
5.13%, 11/1/2027 (a) | | | 10,000 | | | | 10,550 | |
| | |
UnitedHealth Group, Inc.
3.38%, 4/15/2027 | | | 58,000 | | | | 66,540 | |
| | |
2.00%, 5/15/2030 | | | 10,000 | | | | 10,469 | |
| | |
2.75%, 5/15/2040 | | | 57,000 | | | | 60,118 | |
| | |
4.63%, 11/15/2041 | | | 78,000 | | | | 103,388 | |
| | | | | | | | |
| | |
| | | | | | | 1,304,597 | |
| | | | | | | | |
| | |
Hotels, Restaurants & Leisure — 0.5% | | | | | | | | |
| | |
1011778 BC ULC (Canada) 3.88%, 1/15/2028 (a) | | | 17,000 | | | | 17,425 | |
| | |
Boyne USA, Inc. 7.25%, 5/1/2025 (a) | | | 19,000 | | | | 20,140 | |
| | |
CCM Merger, Inc. 6.00%, 3/15/2022 (a) | | | 10,000 | | | | 9,950 | |
| | |
Downstream Development Authority of the Quapaw Tribe of Oklahoma 10.50%, 2/15/2023 (a) | | | 14,000 | | | | 12,740 | |
| | |
Enterprise Development Authority (The) 12.00%, 7/15/2024 (a) | | | 7,000 | | | | 7,665 | |
| | |
Hilton Domestic Operating Co., Inc. 5.13%, 5/1/2026 | | | 79,000 | | | | 81,570 | |
| | |
Hilton Grand Vacations Borrower LLC 6.13%, 12/1/2024 | | | 20,000 | | | | 20,675 | |
| | |
Marriott Ownership Resorts, Inc. 6.50%, 9/15/2026 | | | 20,000 | | | | 20,775 | |
| | |
MGM Resorts International 5.50%, 4/15/2027 | | | 41,000 | | | | 43,357 | |
| | |
Scientific Games International, Inc. 5.00%, 10/15/2025 (a) | | | 26,000 | | | | 25,724 | |
| | |
Six Flags Theme Parks, Inc. 7.00%, 7/1/2025 (a) | | | 30,000 | | | | 32,466 | |
| | |
Starbucks Corp. 3.35%, 3/12/2050 | | | 25,000 | | | | 25,475 | |
| | |
Station Casinos LLC 5.00%, 10/1/2025 (a) | | | 25,000 | | | | 24,703 | |
| | |
Vail Resorts, Inc. 6.25%, 5/15/2025 (a) | | | 70,000 | | | | 74,988 | |
| | |
Wyndham Destinations, Inc. 5.40%, 4/1/2024(e) | | | 25,000 | | | | 25,495 | |
| | | | | | | | |
| INVESTMENTS | | PRINCIPAL
AMOUNT ($) | | | VALUE ($) | |
| | | | | | | | |
|
Hotels, Restaurants & Leisure — continued | |
| | |
Wynn Las Vegas LLC 5.50%, 3/1/2025 (a) | | | 25,000 | | | | 24,750 | |
| | |
Wynn Resorts Finance LLC 5.13%, 10/1/2029 (a) | | | 15,000 | | | | 14,625 | |
| | |
Yum! Brands, Inc. 7.75%, 4/1/2025 (a) | | | 35,000 | | | | 39,069 | |
| | | | | | | | |
| | |
| | | | | | | 521,592 | |
| | | | | | | | |
| | |
Household Durables — 0.3% | | | | | | | | |
| | |
Lennar Corp.
4.75%, 11/15/2022 (e) | | | 20,000 | | | | 21,000 | |
| | |
4.75%, 5/30/2025 | | | 30,000 | | | | 32,850 | |
| | |
5.25%, 6/1/2026 | | | 20,000 | | | | 22,571 | |
| | |
Newell Brands, Inc.
4.70%, 4/1/2026 (e) | | | 55,000 | | | | 59,541 | |
| | |
5.87%, 4/1/2036 (e) | | | 50,000 | | | | 56,259 | |
| | |
Tempur Sealy International, Inc. 5.50%, 6/15/2026 | | | 80,000 | | | | 83,700 | |
| | |
Toll Brothers Finance Corp. 4.88%, 11/15/2025 | | | 13,000 | | | | 14,500 | |
| | | | | | | | |
| | |
| | | | | | | 290,421 | |
| | | | | | | | |
|
Household Products — 0.1% | |
| | |
Central Garden & Pet Co. 5.13%, 2/1/2028 | | | 20,000 | | | | 21,200 | |
| | |
Energizer Holdings, Inc. 6.38%, 7/15/2026 (a) | | | 30,000 | | | | 31,800 | |
| | |
Kimberly-Clark Corp. 3.20%, 4/25/2029 | | | 23,000 | | | | 26,405 | |
| | |
Spectrum Brands, Inc. 5.75%, 7/15/2025 | | | 70,000 | | | | 72,275 | |
| | | | | | | | |
| | |
| | | | | | | 151,680 | |
| | | | | | | | |
|
Independent Power and Renewable Electricity Producers — 0.1% | |
| | |
AES Corp. (The) 5.50%, 4/15/2025 | | | 79,000 | | | | 81,377 | |
| | |
Calpine Corp. 5.25%, 6/1/2026 (a) | | | 10,000 | | | | 10,438 | |
| | |
Exelon Generation Co. LLC 3.25%, 6/1/2025 | | | 22,000 | | | | 24,247 | |
| | | | | | | | |
| | |
| | | | | | | 116,062 | |
| | | | | | | | |
|
Industrial Conglomerates — 0.0% (b) | |
| | |
General Electric Co. 4.38%, 9/16/2020 | | | 3,000 | | | | 3,005 | |
| | |
4.13%, 10/9/2042 | | | 30,000 | | | | 30,088 | |
| | | | | | | | |
| | |
| | | | | | | 33,093 | |
| | | | | | | | |
|
Insurance — 0.4% | |
| | |
Aflac, Inc. 3.25%, 3/17/2025 | | | 12,000 | | | | 13,392 | |
| | |
Allstate Corp. (The) 5.35%, 6/1/2033 | | | 12,000 | | | | 16,507 | |
| | |
Athene Global Funding 2.95%, 11/12/2026 (a) | | | 26,000 | | | | 27,386 | |
| | |
Berkshire Hathaway Finance Corp. 4.25%, 1/15/2049 | | | 24,000 | | | | 31,026 | |
SEE NOTES TO FINANCIAL STATEMENTS.
| | | | | | |
| | | |
| 48 | | | | J.P. MORGAN EXCHANGE-TRADED FUNDS | | AUGUST 31, 2020 |
| | | | | | | | |
| INVESTMENTS | | PRINCIPAL
AMOUNT ($) | | | VALUE ($) | |
Corporate Bonds — continued | | | | | | | | |
|
Insurance — continued | |
| | |
Jackson National Life Global Funding 2.50%, 6/27/2022 (a) | | | 36,000 | | | | 37,299 | |
| | |
Lincoln National Corp. 3.35%, 3/9/2025 | | | 17,000 | | | | 18,610 | |
| | |
Manulife Financial Corp. (Canada) 4.15%, 3/4/2026 | | | 29,000 | | | | 34,444 | |
| | |
MetLife, Inc. 4.13%, 8/13/2042 | | | 50,000 | | | | 61,050 | |
| | |
New York Life Global Funding 3.00%, 1/10/2028 (a) | | | 32,000 | | | | 35,855 | |
| | |
Pacific Life Insurance Co. (ICE LIBOR USD 3 Month + 2.80%), 4.30%, 10/24/2067 (a) (c) | | | 19,000 | | | | 19,994 | |
| | |
Principal Financial Group, Inc. 3.70%, 5/15/2029 | | | 23,000 | | | | 26,783 | |
| | |
Progressive Corp. (The) 4.35%, 4/25/2044 | | | 23,000 | | | | 29,955 | |
| | |
Prudential Financial, Inc. 3.88%, 3/27/2028 | | | 27,000 | | | | 31,928 | |
| | |
Travelers Cos., Inc. (The) 5.35%, 11/1/2040 | | | 25,000 | | | | 34,929 | |
| | | | | | | | |
| | |
| | | | | | | 419,158 | |
| | | | | | | | |
|
Interactive Media & Services — 0.0% (b) | |
| | |
Alphabet, Inc. 2.25%, 8/15/2060 | | | 20,000 | | | | 18,996 | |
| | | | | | | | |
|
Internet & Direct Marketing Retail — 0.3% | |
| | |
Amazon.com, Inc.
3.15%, 8/22/2027 | | | 124,000 | | | | 141,965 | |
| | |
2.50%, 6/3/2050 | | | 47,000 | | | | 47,276 | |
| | |
2.70%, 6/3/2060 | | | 30,000 | | | | 30,626 | |
| | |
Expedia Group, Inc. 7.00%, 5/1/2025 (a) | | | 35,000 | | | | 38,047 | |
| | |
Photo Holdings Merger Sub, Inc. 8.50%, 10/1/2026 (a) | | | 13,000 | | | | 11,948 | |
| | | | | | | | |
| | |
| | | | | | | 269,862 | |
| | | | | | | | |
|
IT Services — 0.2% | |
| | |
Gartner, Inc. 5.13%, 4/1/2025 (a) | | | 50,000 | | | | 51,985 | |
| | |
Global Payments, Inc. 2.90%, 5/15/2030 | | | 25,000 | | | | 26,943 | |
| | |
International Business Machines Corp. 5.60%, 11/30/2039 | | | 50,000 | | | | 71,522 | |
| | |
Presidio Holdings, Inc. 4.88%, 2/1/2027 (a) | | | 20,000 | | | | 20,500 | |
| | | | | | | | |
| | |
| | | | | | | 170,950 | |
| | | | | | | | |
|
Leisure Products — 0.1% | |
| | |
Mattel, Inc. 6.75%, 12/31/2025 (a) | | | 53,000 | | | | 56,246 | |
| | | | | | | | |
|
Life Sciences Tools & Services — 0.1% | |
| | |
Avantor, Inc. 6.00%, 10/1/2024 (a) | | | 20,000 | | | | 20,950 | |
| | |
Thermo Fisher Scientific, Inc. 2.60%, 10/1/2029 | | | 50,000 | | | | 54,153 | |
| | | | | | | | |
| | |
| | | | | | | 75,103 | |
| | | | | | | | |
| | | | | | | | |
| INVESTMENTS | | PRINCIPAL
AMOUNT ($) | | | VALUE ($) | |
| | | | | | | | |
|
Machinery — 0.3% | |
| | |
ATS Automation Tooling Systems, Inc. (Canada) 6.50%, 6/15/2023 (a) | | | 15,000 | | | | 15,172 | |
| | |
Caterpillar, Inc. 4.30%, 5/15/2044 | | | 47,000 | | | | 59,944 | |
| | |
Colfax Corp. 6.00%, 2/15/2024 (a) | | | 5,000 | | | | 5,187 | |
| | |
Parker-Hannifin Corp. 3.25%, 3/1/2027 | | | 54,000 | | | | 59,586 | |
| | |
Tennant Co. 5.63%, 5/1/2025 | | | 10,000 | | | | 10,387 | |
| | |
Vertical US Newco, Inc. (Germany) 5.25%, 7/15/2027 (a) | | | 200,000 | | | | 208,250 | |
| | | | | | | | |
| | |
| | | | | | | 358,526 | |
| | | | | | | | |
|
Media — 1.5% | |
| | |
AMC Networks, Inc.
4.75%, 12/15/2022 | | | 20,000 | | | | 20,050 | |
| | |
5.00%, 4/1/2024 | | | 12,000 | | | | 12,225 | |
| | |
Charter Communications Operating LLC 4.80%, 3/1/2050 | | | 60,000 | | | | 68,229 | |
| | |
Clear Channel Worldwide Holdings, Inc.
9.25%, 2/15/2024 | | | 30,000 | | | | 29,400 | |
| | |
5.13%, 8/15/2027 (a) | | | 47,000 | | | | 47,484 | |
| | |
Comcast Corp.
2.35%, 1/15/2027 | | | 100,000 | | | | 107,370 | |
| | |
4.25%, 10/15/2030 | | | 43,000 | | | | 53,113 | |
| | |
3.90%, 3/1/2038 | | | 70,000 | | | | 83,672 | |
| | |
3.25%, 11/1/2039 | | | 72,000 | | | | 79,583 | |
| | |
4.75%, 3/1/2044 | | | 150,000 | | | | 197,795 | |
| | |
3.40%, 7/15/2046 | | | 15,000 | | | | 16,572 | |
| | |
4.00%, 3/1/2048 | | | 45,000 | | | | 54,278 | |
| | |
2.45%, 8/15/2052 | | | 50,000 | | | | 47,588 | |
| | |
2.65%, 8/15/2062 | | | 45,000 | | | | 43,157 | |
| | |
CSC Holdings LLC 5.50%, 4/15/2027 (a) | | | 200,000 | | | | 213,292 | |
| | |
Diamond Sports Group LLC 5.38%, 8/15/2026 (a) | | | 35,000 | | | | 27,300 | |
| | |
DISH DBS Corp.
6.75%, 6/1/2021 | | | 20,000 | | | | 20,500 | |
| | |
5.88%, 11/15/2024 | | | 66,000 | | | | 69,760 | |
| | |
iHeartCommunications, Inc.
6.38%, 5/1/2026 | | | 25,000 | | | | 26,000 | |
| | |
8.38%, 5/1/2027 | | | 25,000 | | | | 25,125 | |
| | |
Lamar Media Corp.
5.75%, 2/1/2026 | | | 24,000 | | | | 25,027 | |
| | |
3.75%, 2/15/2028 (a) | | | 40,000 | | | | 39,950 | |
| | |
Midcontinent Communications 5.38%, 8/15/2027 (a) | | | 15,000 | | | | 15,508 | |
| | |
Nexstar Broadcasting, Inc. 5.63%, 7/15/2027 (a) | | | 40,000 | | | | 42,200 | |
| | |
Outfront Media Capital LLC 5.00%, 8/15/2027 (a) | | | 21,000 | | | | 20,626 | |
SEE NOTES TO FINANCIAL STATEMENTS.
| | | | | | | | |
| | | |
| AUGUST 31, 2020 | | J.P. MORGAN EXCHANGE-TRADED FUNDS | | | | | 49 | |
JPMorgan Core Plus Bond ETF
SCHEDULE OF PORTFOLIO INVESTMENTS
AS OF AUGUST 31, 2020 (Unaudited) (continued)
| | | | | | | | |
| INVESTMENTS | | PRINCIPAL
AMOUNT ($) | | | VALUE ($) | |
Corporate Bonds — continued | | | | | | | | |
|
Media — continued | |
| | |
Sirius XM Radio, Inc.
5.38%, 7/15/2026 (a) | | | 30,000 | | | | 31,388 | |
| | |
5.00%, 8/1/2027 (a) | | | 55,000 | | | | 58,337 | |
| | |
ViacomCBS, Inc.
4.20%, 5/19/2032 | | | 47,000 | | | | 53,342 | |
| | |
(ICE LIBOR USD 3 Month + 3.90%), 5.87%, 2/28/2057 (c) | | | 18,000 | | | | 18,669 | |
| | |
Videotron Ltd. (Canada)
5.38%, 6/15/2024 (a) | | | 37,000 | | | | 40,278 | |
| | |
5.13%, 4/15/2027 (a) | | | 25,000 | | | | 26,438 | |
| | | | | | | | |
| | |
| | | | | | | 1,614,256 | |
| | | | | | | | |
|
Metals & Mining — 0.4% | |
| | |
Allegheny Technologies, Inc. 7.88%, 8/15/2023 (e) | | | 30,000 | | | | 31,521 | |
| | |
Arconic Corp.
6.00%, 5/15/2025 (a) | | | 40,000 | | | | 42,400 | |
| | |
6.13%, 2/15/2028 (a) | | | 35,000 | | | | 36,925 | |
| | |
Commercial Metals Co. 4.88%, 5/15/2023 | | | 28,000 | | | | 29,120 | |
| | |
Freeport-McMoRan, Inc. 5.45%, 3/15/2043 | | | 30,000 | | | | 33,736 | |
| | |
Glencore Funding LLC (Australia)
1.63%, 9/1/2025 (a) | | | 10,000 | | | | 9,975 | |
| | |
2.50%, 9/1/2030 (a) | | | 30,000 | | | | 29,450 | |
| | |
Kaiser Aluminum Corp. 4.63%, 3/1/2028 (a) | | | 85,000 | | | | 84,075 | |
| | |
Rio Tinto Finance USA Ltd. (Australia) 7.13%, 7/15/2028 | | | 36,000 | | | | 50,954 | |
| | |
Steel Dynamics, Inc. 4.13%, 9/15/2025 | | | 13,000 | | | | 13,298 | |
| | |
United States Steel Corp. 12.00%, 6/1/2025 (a) | | | 20,000 | | | | 21,200 | |
| | | | | | | | |
| | |
| | | | | | | 382,654 | |
| | | | | | | | |
|
Multiline Retail — 0.0% (b) | |
| | |
Neiman Marcus Group Ltd. LLC 14.00% (Blend (cash 8.00% + PIK 6.00%)), 4/25/2024 (a) (d) (f) | | | 14,361 | | | | 3,877 | |
| | | | | | | | |
|
Multi-Utilities — 0.3% | |
| | |
Ameren Corp. 3.50%, 1/15/2031 | | | 14,000 | | | | 16,047 | |
| | |
Berkshire Hathaway Energy Co.
3.25%, 4/15/2028 | | | 36,000 | | | | 40,883 | |
| | |
5.15%, 11/15/2043 | | | 56,000 | | | | 77,091 | |
| | |
3.80%, 7/15/2048 | | | 15,000 | | | | 17,836 | |
| | |
Consolidated Edison Co. of New York, Inc. | | | | | | | | |
| | |
Series A, 4.13%, 5/15/2049 | | | 41,000 | | | | 50,481 | |
| | |
Puget Sound Energy, Inc. 5.76%, 7/15/2040 | | | 55,000 | | | | 74,926 | |
| | | | | | | | |
| | |
| | | | | | | 277,264 | |
| | | | | | | | |
| | | | | | | | |
| INVESTMENTS | | PRINCIPAL
AMOUNT ($) | | | VALUE ($) | |
| | | | | | | | |
|
Oil, Gas & Consumable Fuels — 2.1% | |
| | |
Antero Resources Corp. 5.13%, 12/1/2022 | | | 13,000 | | | | 11,294 | |
| | |
Apache Corp. 3.25%, 4/15/2022 | | | 65,000 | | | | 64,884 | |
| | |
Blue Racer Midstream LLC 6.13%, 11/15/2022 (a) | | | 19,000 | | | | 18,905 | |
| | |
BP Capital Markets America, Inc.
3.02%, 1/16/2027 | | | 57,000 | | | | 62,492 | |
| | |
4.23%, 11/6/2028 | | | 190,000 | | | | 226,311 | |
| | |
3.00%, 2/24/2050 | | | 76,000 | | | | 74,761 | |
| | |
2.77%, 11/10/2050 | | | 30,000 | | | | 28,288 | |
| | |
BP Capital Markets plc (United Kingdom) | | | | | | | | |
| | |
(US Treasury Yield Curve Rate T Note Constant Maturity 5 Year + 4.04%), 4.38%, 6/22/2025 (c) (g) (h) | | | 85,000 | | | | 89,250 | |
| | |
(US Treasury Yield Curve Rate T Note Constant Maturity 5 Year + 4.40%), 4.88%, 3/22/2030 (c) (g) (h) | | | 80,000 | | | | 87,376 | |
| | |
Buckeye Partners LP
3.95%, 12/1/2026 | | | 10,000 | | | | 9,911 | |
| | |
4.13%, 12/1/2027 | | | 15,000 | | | | 15,000 | |
| | |
Cenovus Energy, Inc. (Canada) 5.38%, 7/15/2025 | | | 50,000 | | | | 50,877 | |
| | |
Cheniere Energy Partners LP
5.25%, 10/1/2025 | | | 12,000 | | | | 12,279 | |
| | |
5.63%, 10/1/2026 | | | 10,000 | | | | 10,482 | |
| | |
Chesapeake Energy Corp. 11.50%, 1/1/2025 (a)(d) | | | 15,000 | | | | 1,943 | |
| | |
Chevron Corp.
2.00%, 5/11/2027 | | | 12,000 | | | | 12,722 | |
| | |
2.24%, 5/11/2030 | | | 10,000 | | | | 10,658 | |
| | |
2.98%, 5/11/2040 | | | 12,000 | | | | 12,936 | |
| | |
Chevron USA, Inc. 2.34%, 8/12/2050 | | | 50,000 | | | | 47,650 | |
| | |
Comstock Resources, Inc. 7.50%, 5/15/2025 (a) | | | 20,000 | | | | 19,847 | |
| | |
Continental Resources, Inc. 5.00%, 9/15/2022 | | | 80,000 | | | | 79,940 | |
| | |
DCP Midstream Operating LP 5.38%, 7/15/2025 | | | 20,000 | | | | 21,486 | |
| | |
EnLink Midstream Partners LP
4.40%, 4/1/2024 | | | 8,000 | | | | 7,400 | |
| | |
5.60%, 4/1/2044 | | | 9,000 | | | | 5,940 | |
| | |
Enterprise Products Operating LLC 2.80%, 1/31/2030 | | | 30,000 | | | | 32,018 | |
| | |
EP Energy LLC
9.38%, 5/1/2024 (a) (d) | | | 10,000 | | | | 1 | |
| | |
8.00%, 11/29/2024 (a) (d) | | | 17,000 | | | | 17 | |
| | |
7.75%, 5/15/2026 (a) (d) | | | 25,000 | | | | 5,437 | |
SEE NOTES TO FINANCIAL STATEMENTS.
| | | | | | |
| | | |
| 50 | | | | J.P. MORGAN EXCHANGE-TRADED FUNDS | | AUGUST 31, 2020 |
| | | | | | | | |
| INVESTMENTS | | PRINCIPAL
AMOUNT ($) | | | VALUE ($) | |
Corporate Bonds — continued | | | | | | | | |
|
Oil, Gas & Consumable Fuels — continued | |
| | |
EQM Midstream Partners LP 4.00%, 8/1/2024 | | | 85,000 | | | | 85,425 | |
| | |
EQT Corp. 7.88%, 2/1/2025 (e) | | | 80,000 | | | | 91,834 | |
| | |
Exxon Mobil Corp.
2.99%, 3/19/2025 | | | 14,000 | | | | 15,372 | |
| | |
2.61%, 10/15/2030 | | | 36,000 | | | | 39,103 | |
| | |
3.10%, 8/16/2049 | | | 35,000 | | | | 36,582 | |
| | |
Gulfport Energy Corp.
6.63%, 5/1/2023 | | | 5,000 | | | | 3,050 | |
| | |
6.00%, 10/15/2024 | | | 10,000 | | | | 5,950 | |
| | |
Hilcorp Energy I LP 5.00%, 12/1/2024 (a) | | | 26,000 | | | | 24,635 | |
| | |
MEG Energy Corp. (Canada)
6.50%, 1/15/2025 (a) | | | 8,000 | | | | 8,160 | |
| | |
7.13%, 2/1/2027 (a) | | | 5,000 | | | | 4,784 | |
| | |
NGPL PipeCo LLC 4.38%, 8/15/2022 (a) | | | 5,000 | | | | 5,184 | |
| | |
Noble Energy, Inc. 3.85%, 1/15/2028 | | | 95,000 | | | | 107,760 | |
| | |
NuStar Logistics LP 5.63%, 4/28/2027 | | | 20,000 | | | | 20,100 | |
| | |
Oasis Petroleum, Inc. 6.25%, 5/1/2026 (a) | | | 10,000 | | | | 1,800 | |
| | |
Occidental Petroleum Corp. 2.70%, 8/15/2022 | | | 40,000 | | | | 39,327 | |
| | |
Parsley Energy LLC
5.38%, 1/15/2025 (a) | | | 10,000 | | | | 10,187 | |
| | |
5.25%, 8/15/2025 (a) | | | 5,000 | | | | 5,135 | |
| | |
PBF Holding Co. LLC 6.00%, 2/15/2028 (a) | | | 20,000 | | | | 16,865 | |
| | |
Range Resources Corp.
5.00%, 8/15/2022 | | | 6,000 | | | | 6,030 | |
| | |
4.88%, 5/15/2025 | | | 5,000 | | | | 4,662 | |
| | |
Southwestern Energy Co.
6.45%, 1/23/2025 (e) | | | 10,000 | | | | 10,045 | |
| | |
7.50%, 4/1/2026 | | | 15,000 | | | | 15,075 | |
| | |
Spectra Energy Partners LP 4.50%, 3/15/2045 | | | 15,000 | | | | 17,529 | |
| | |
Suncor Energy, Inc. (Canada) 6.80%, 5/15/2038 | | | 46,000 | | | | 62,472 | |
| | |
Sunoco Logistics Partners Operations LP 5.35%, 5/15/2045 | | | 45,000 | | | | 43,012 | |
| | |
Sunoco LP 5.50%, 2/15/2026 | | | 22,000 | | | | 22,668 | |
| | |
Tallgrass Energy Partners LP 5.50%, 9/15/2024 (a) | | | 12,000 | | | | 11,760 | |
| | |
Targa Resources Partners LP
5.13%, 2/1/2025 | | | 73,000 | | | | 74,553 | |
| | |
6.88%, 1/15/2029 | | | 25,000 | | | | 27,625 | |
| | |
Total Capital International SA (France) 3.46%, 2/19/2029 | | | 105,000 | | | | 120,940 | |
| | |
3.46%, 7/12/2049 | | | 63,000 | | | | 69,851 | |
| | |
3.13%, 5/29/2050 | | | 30,000 | | | | 31,412 | |
| | | | | | | | |
| INVESTMENTS | | PRINCIPAL
AMOUNT ($) | | | VALUE ($) | |
| | | | | | | | |
|
Oil, Gas & Consumable Fuels — continued | |
| | |
TransCanada PipeLines Ltd. (Canada) 3.75%, 10/16/2023 | | | 57,000 | | | | 62,190 | |
| | |
5.10%, 3/15/2049 | | | 40,000 | | | | 53,134 | |
| | |
WPX Energy, Inc. 5.75%, 6/1/2026 | | | 85,000 | | | | 86,781 | |
| | | | | | | | |
| | |
| | | | | | | 2,261,097 | |
| | | | | | | | |
|
Personal Products — 0.1% | |
| | |
Edgewell Personal Care Co. 5.50%, 6/1/2028 (a) | | | 15,000 | | | | 16,012 | |
| | |
Estee Lauder Cos., Inc. (The) 2.60%, 4/15/2030 | | | 50,000 | | | | 54,904 | |
| | |
Prestige Brands, Inc. 6.38%, 3/1/2024 (a) | | | 30,000 | | | | 30,969 | |
| | | | | | | | |
| | |
| | | | | | | 101,885 | |
| | | | | | | | |
|
Pharmaceuticals — 1.1% | |
| | |
Advanz Pharma Corp. Ltd. (Canada) 8.00%, 9/6/2024 | | | 23,000 | | | | 22,655 | |
| | |
AstraZeneca plc (United Kingdom)
1.38%, 8/6/2030 | | | 45,000 | | | | 44,076 | |
| | |
2.13%, 8/6/2050 | | | 85,000 | | | | 78,692 | |
| | |
Bausch Health Americas, Inc.
9.25%, 4/1/2026 (a) | | | 8,000 | | | | 8,870 | |
| | |
8.50%, 1/31/2027 (a) | | | 8,000 | | | | 8,800 | |
| | |
Bausch Health Cos., Inc.
7.00%, 3/15/2024 (a) | | | 55,000 | | | | 57,143 | |
| | |
5.50%, 11/1/2025 (a) | | | 55,000 | | | | 56,771 | |
| | |
5.75%, 8/15/2027 (a) | | | 30,000 | | | | 32,221 | |
| | |
5.00%, 1/30/2028 (a) | | | 30,000 | | | | 29,550 | |
| | |
Bristol-Myers Squibb Co.
3.40%, 7/26/2029 | | | 40,000 | | | | 46,679 | |
| | |
4.13%, 6/15/2039 | | | 93,000 | | | | 118,976 | |
| | |
5.00%, 8/15/2045 | | | 29,000 | | | | 41,280 | |
| | |
4.25%, 10/26/2049 | | | 15,000 | | | | 19,911 | |
| | |
Eli Lilly and Co.
2.25%, 5/15/2050 | | | 25,000 | | | | 23,693 | |
| | |
4.15%, 3/15/2059 | | | 39,000 | | | | 51,171 | |
| | |
2.50%, 9/15/2060 | | | 20,000 | | | | 18,973 | |
| | |
Merck & Co., Inc. 2.45%, 6/24/2050 | | | 25,000 | | | | 24,935 | |
| | |
Par Pharmaceutical, Inc. 7.50%, 4/1/2027 (a) | | | 10,000 | | | | 10,675 | |
| | |
Pfizer, Inc.
3.60%, 9/15/2028 | | | 115,000 | | | | 135,967 | |
| | |
2.63%, 4/1/2030 | | | 30,000 | | | | 33,477 | |
| | |
2.70%, 5/28/2050 | | | 50,000 | | | | 51,885 | |
| | |
Royalty Pharma plc
1.20%, 9/2/2025 (a) | | | 5,000 | | | | 4,986 | |
| | |
1.75%, 9/2/2027 (a) | | | 5,000 | | | | 4,986 | |
SEE NOTES TO FINANCIAL STATEMENTS.
| | | | | | | | |
| | | |
| AUGUST 31, 2020 | | J.P. MORGAN EXCHANGE-TRADED FUNDS | | | | | 51 | |
JPMorgan Core Plus Bond ETF
SCHEDULE OF PORTFOLIO INVESTMENTS
AS OF AUGUST 31, 2020 (Unaudited) (continued)
| | | | | | | | |
| INVESTMENTS | | PRINCIPAL
AMOUNT ($) | | | VALUE ($) | |
Corporate Bonds — continued | | | | | | | | |
|
Pharmaceuticals — continued | |
| | |
Takeda Pharmaceutical Co. Ltd. (Japan) 3.18%, 7/9/2050 | | | 200,000 | | | | 203,214 | |
| | |
Upjohn, Inc.
1.65%, 6/22/2025 (a) | | | 25,000 | | | | 25,678 | |
| | |
2.30%, 6/22/2027 (a) | | | 20,000 | | | | 20,818 | |
| | | | | | | | |
| | |
| | | | | | | 1,176,082 | |
| | | | | | | | |
|
Professional Services — 0.0% (b) | |
| | |
AMN Healthcare, Inc. 5.13%, 10/1/2024 (a) | | | 35,000 | | | | 35,612 | |
| | | | | | | | |
|
Road & Rail — 0.2% | |
| | |
Avis Budget Car Rental LLC 5.25%, 3/15/2025 (a) | | | 11,000 | | | | 10,497 | |
| | |
Burlington Northern Santa Fe LLC
4.70%, 9/1/2045 | | | 45,000 | | | | 60,555 | |
| | |
3.55%, 2/15/2050 | | | 31,000 | | | | 36,785 | |
| | |
CSX Corp. 3.80%, 4/15/2050 | | | 25,000 | | | | 29,884 | |
| | |
Norfolk Southern Corp. 3.05%, 5/15/2050 | | | 25,000 | | | | 26,364 | |
| | |
Union Pacific Corp. 3.25%, 2/5/2050 | | | 25,000 | | | | 27,390 | |
| | | | | | | | |
| | |
| | | | | | | 191,475 | |
| | | | | | | | |
|
Semiconductors & Semiconductor Equipment — 0.3% | |
| | |
Amkor Technology, Inc. 6.63%, 9/15/2027 (a) | | | 7,000 | | | | 7,612 | |
| | |
Broadcom Corp. 3.88%, 1/15/2027 | | | 65,000 | | | | 72,029 | |
| | |
ON Semiconductor Corp. 3.88%, 9/1/2028 (a) | | | 25,000 | | | | 26,087 | |
| | |
Qorvo, Inc. 5.50%, 7/15/2026 | | | 95,000 | | | | 100,781 | |
| | |
QUALCOMM, Inc.
1.30%, 5/20/2028 (a) | | | 105,000 | | | | 105,230 | |
| | |
3.25%, 5/20/2050 | | | 25,000 | | | | 28,112 | |
| | | | | | | | |
| | |
| | | | | | | 339,851 | |
| | | | | | | | |
|
Software — 0.5% | |
| | |
CDK Global, Inc. 5.88%, 6/15/2026 | | | 80,000 | | | | 84,030 | |
| | |
Microsoft Corp.
3.50%, 2/12/2035 | | | 20,000 | | | | 24,632 | |
| | |
3.70%, 8/8/2046 | | | 45,000 | | | | 56,029 | |
| | |
2.68%, 6/1/2060 | | | 33,000 | | | | 34,677 | |
| | |
Nuance Communications, Inc. 5.63%, 12/15/2026 | | | 33,000 | | | | 34,980 | |
| | |
Open Text Corp. (Canada) 5.88%, 6/1/2026 (a) | | | 14,000 | | | | 14,700 | |
| | |
Oracle Corp.
2.65%, 7/15/2026 | | | 141,000 | | | | 154,654 | |
| | |
2.95%, 4/1/2030 | | | 50,000 | | | | 55,953 | |
| | |
4.38%, 5/15/2055 | | | 77,000 | | | | 96,517 | |
| | | | | | | | |
| | |
| | | | | | | 556,172 | |
| | | | | | | | |
| | | | | | | | |
| INVESTMENTS | | PRINCIPAL
AMOUNT ($) | | | VALUE ($) | |
| | | | | | | | |
|
Specialty Retail — 0.4% | |
| | |
Home Depot, Inc. (The)
3.90%, 12/6/2028 | | | 68,000 | | | | 81,428 | |
| | |
4.25%, 4/1/2046 | | | 71,000 | | | | 90,689 | |
| | |
3.13%, 12/15/2049 | | | 25,000 | | | | 27,371 | |
| | |
3.50%, 9/15/2056 | | | 20,000 | | | | 23,694 | |
| | |
L Brands, Inc.
5.63%, 10/15/2023 | | | 10,000 | | | | 10,427 | |
| | |
6.88%, 11/1/2035 | | | 15,000 | | | | 15,341 | |
| | |
Lowe’s Cos., Inc. 4.05%, 5/3/2047 | | | 25,000 | | | | 29,714 | |
| | |
Penske Automotive Group, Inc. 5.50%, 5/15/2026 | | | 80,000 | | | | 83,300 | |
| | |
PetSmart, Inc. 7.13%, 3/15/2023 (a) | | | 24,000 | | | | 24,177 | |
| | |
Staples, Inc.
7.50%, 4/15/2026 (a) | | | 35,000 | | | | 31,157 | |
| | |
10.75%, 4/15/2027 (a) | | | 23,000 | | | | 15,985 | |
| | | | | | | | |
| | |
| | | | | | | 433,283 | |
| | | | | | | | |
|
Technology Hardware, Storage & Peripherals — 0.5% | |
| | |
Apple, Inc.
3.35%, 2/9/2027 | | | 35,000 | | | | 40,055 | |
| | |
2.20%, 9/11/2029 | | | 28,000 | | | | 30,262 | |
| | |
1.65%, 5/11/2030 | | | 10,000 | | | | 10,353 | |
| | |
3.85%, 5/4/2043 | | | 15,000 | | | | 18,389 | |
| | |
3.45%, 2/9/2045 | | | 45,000 | | | | 52,278 | |
| | |
4.38%, 5/13/2045 | | | 70,000 | | | | 91,874 | |
| | |
2.40%, 8/20/2050 | | | 75,000 | | | | 74,284 | |
| | |
2.55%, 8/20/2060 | | | 60,000 | | | | 58,601 | |
| | |
EMC Corp. 3.38%, 6/1/2023 | | | 56,000 | | | | 57,820 | |
| | |
Hewlett Packard Enterprise Co. 1.45%, 4/1/2024 | | | 20,000 | | | | 20,257 | |
| | |
NCR Corp.
5.75%, 9/1/2027 (a) | | | 50,000 | | | | 52,500 | |
| | |
6.13%, 9/1/2029 (a) | | | 21,000 | | | | 22,523 | |
| | |
Western Digital Corp. 4.75%, 2/15/2026 | | | 16,000 | | | | 17,314 | |
| | |
Xerox Corp. 4.12%, 3/15/2023 (e) | | | 13,000 | | | | 13,344 | |
| | | | | | | | |
| | |
| | | | | | | 559,854 | |
| | | | | | | | |
|
Textiles, Apparel & Luxury Goods — 0.0% (b) | |
| | |
Hanesbrands, Inc.
4.63%, 5/15/2024 (a) | | | 13,000 | | | | 13,650 | |
| | |
4.88%, 5/15/2026 (a) | | | 20,000 | | | | 21,775 | |
| | | | | | | | |
| | |
| | | | | | | 35,425 | |
| | | | | | | | |
|
Thrifts & Mortgage Finance — 0.0% (b) | |
| | |
Ladder Capital Finance Holdings LLLP | | | | | | | | |
| | |
REIT, 5.25%, 10/1/2025 (a) | | | 13,000 | | | | 12,350 | |
| | |
Quicken Loans LLC 5.75%, 5/1/2025 (a) | | | 20,000 | | | | 20,600 | |
| | | | | | | | |
| | |
| | | | | | | 32,950 | |
| | | | | | | | |
SEE NOTES TO FINANCIAL STATEMENTS.
| | | | | | |
| | | |
| 52 | | | | J.P. MORGAN EXCHANGE-TRADED FUNDS | | AUGUST 31, 2020 |
| | | | | | | | |
| INVESTMENTS | | PRINCIPAL
AMOUNT ($) | | | VALUE ($) | |
Corporate Bonds — continued | | | | | | | | |
|
Tobacco — 0.6% | |
| | |
Altria Group, Inc.
3.40%, 5/6/2030 | | | 112,000 | | | | 123,370 | |
| | |
3.88%, 9/16/2046 | | | 70,000 | | | | 72,642 | |
| | |
BAT Capital Corp. (United Kingdom) 3.56%, 8/15/2027 | | | 215,000 | | | | 235,012 | |
| | |
4.39%, 8/15/2037 | | | 10,000 | | | | 10,888 | |
| | |
Philip Morris International, Inc.
3.13%, 3/2/2028 | | | 29,000 | | | | 32,455 | |
| | |
2.10%, 5/1/2030 | | | 100,000 | | | | 103,630 | |
| | |
4.38%, 11/15/2041 | | | 10,000 | | | | 12,236 | |
| | | | | | | | |
| | |
| | | | | | | 590,233 | |
| | | | | | | | |
|
Trading Companies & Distributors — 0.1% | |
| | |
Ahern Rentals, Inc. 7.38%, 5/15/2023 (a) | | | 20,000 | | | | 8,300 | |
| | |
Air Lease Corp. 3.38%, 7/1/2025 | | | 40,000 | | | | 40,706 | |
| | |
United Rentals North America, Inc. 4.63%, 10/15/2025 | | | 77,000 | | | | 78,732 | |
| | |
WESCO Distribution, Inc. 5.38%, 6/15/2024 | | | 13,000 | | | | 13,358 | |
| | | | | | | | |
| | |
| | | | | | | 141,096 | |
| | | | | | | | |
|
Wireless Telecommunication Services — 0.6% | |
| | |
Hughes Satellite Systems Corp.
5.25%, 8/1/2026 | | | 45,000 | | | | 49,275 | |
| | |
6.63%, 8/1/2026 | | | 15,000 | | | | 16,987 | |
| | |
Sprint Corp.
7.88%, 9/15/2023 | | | 8,000 | | | | 9,305 | |
| | |
7.13%, 6/15/2024 | | | 30,000 | | | | 34,866 | |
| | |
7.63%, 3/1/2026 | | | 25,000 | | | | 30,746 | |
| | |
T-Mobile USA, Inc.
6.38%, 3/1/2025 | | | 50,000 | | | | 51,063 | |
| | |
5.13%, 4/15/2025 | | | 59,000 | | | | 60,482 | |
| | |
4.75%, 2/1/2028 | | | 10,000 | | | | 10,775 | |
| | |
2.05%, 2/15/2028 (a) | | | 60,000 | | | | 61,457 | |
| | |
3.88%, 4/15/2030 (a) | | | 115,000 | | | | 131,435 | |
| | |
2.55%, 2/15/2031 (a) | | | 50,000 | | | | 52,282 | |
| | |
4.38%, 4/15/2040 (a) | | | 50,000 | | | | 60,133 | |
| | |
4.50%, 4/15/2050 (a) | | | 25,000 | | | | 30,537 | |
| | | | | | | | |
| | |
| | | | | | | 599,343 | |
| | | | | | | | |
| |
Total Corporate Bonds
(Cost $29,737,080) | | | | 31,069,790 | |
| | | | | |
Mortgage-Backed Securities — 24.9% | |
| | |
FHLMC Gold Pools, 30 Year Pool # G60855, 4.50%, 12/1/2045 | | | 157,841 | | | | 176,485 | |
| | |
FHLMC Gold Pools, Other Pool # N31271, 4.50%, 1/1/2036 | | | 24,468 | | | | 26,305 | |
| | | | | | | | |
| INVESTMENTS | | PRINCIPAL
AMOUNT ($) | | | VALUE ($) | |
| | | | | | | | |
| | |
FHLMC UMBS, 30 Year Pool # QA5045, 4.00%, 11/1/2049 | | | 154,140 | | | | 164,267 | |
| | |
FNMA UMBS, 20 Year Pool # MA3004, 4.00%, 5/1/2037 | | | 832,865 | | | | 901,126 | |
| | |
FNMA UMBS, 30 Year | | | | | | | | |
| | |
Pool # AL2374, 4.00%, 12/1/2041 | | | 187,029 | | | | 210,635 | |
| | |
Pool # AL4244, 4.00%, 7/1/2042 | | | 193,508 | | | | 220,004 | |
| | |
Pool # BM1164, 3.50%, 12/1/2045 | | | 229,378 | | | | 244,430 | |
| | |
Pool # MA3073, 4.50%, 7/1/2047 | | | 61,906 | | | | 67,195 | |
| | |
Pool # BK4769, 5.00%, 8/1/2048 | | | 1,042,701 | | | | 1,147,931 | |
| | |
Pool # BN5013, 5.00%, 1/1/2049 | | | 202,628 | | | | 229,737 | |
| | |
Pool # BO1073, 4.50%, 6/1/2049 | | | 118,407 | | | | 127,969 | |
| | |
Pool # BO3039, 3.00%, 7/1/2049 | | | 274,778 | | | | 292,394 | |
| | |
Pool # BN6475, 4.00%, 7/1/2049 | | | 159,309 | | | | 170,277 | |
| | |
Pool # BO2562, 4.00%, 7/1/2049 | | | 197,702 | | | | 211,253 | |
| | |
Pool # BO4519, 4.00%, 8/1/2049 | | | 17,909 | | | | 19,134 | |
| | |
Pool # BO2203, 3.50%, 9/1/2049 | | | 768,871 | | | | 810,408 | |
| | |
FNMA, Other | | | | | | | | |
| | |
Pool # AN3099, 2.53%, 10/1/2024 | | | 93,923 | | | | 99,759 | |
| | |
Pool # AM8846, 2.68%, 5/1/2025 | | | 149,463 | | | | 161,067 | |
| | |
Pool # AN7560, 2.90%, 12/1/2027 | | | 190,000 | | | | 213,569 | |
| | |
Pool # AN9917, 3.80%, 7/1/2028 | | | 344,997 | | | | 404,885 | |
| | |
Pool # AN8227, 3.13%, 2/1/2030 | | | 150,000 | | | | 172,879 | |
| | |
Pool # AN3609, 3.14%, 12/1/2031 | | | 125,000 | | | | 143,057 | |
| | |
Pool # BL6367, 1.82%, 4/1/2032 | | | 330,000 | | | | 347,591 | |
| | |
Pool # AN9725, 3.76%, 7/1/2033 | | | 106,637 | | | | 127,071 | |
| | |
Pool # MA1072, 3.50%, 5/1/2042 | | | 23,266 | | | | 24,849 | |
| | |
FNMA/FHLMC UMBS, Single Family, 30 Year | | | | | | | | |
| | |
TBA, 2.50%, 9/25/2050 (i) | | | 3,513,365 | | | | 3,697,954 | |
| | |
TBA, 2.00%, 10/25/2050 (i) | | | 12,500,000 | | | | 12,860,492 | |
| | |
TBA, 2.50%, 10/25/2050 (i) | | | 2,336,635 | | | | 2,454,954 | |
| | |
GNMA II, 30 Year | | | | | | | | |
| | |
Pool # AJ9020, 4.50%, 10/20/2044 | | | 73,019 | | | | 77,813 | |
| | |
Pool # BB3525, 4.00%, 9/20/2047 | | | 57,495 | | | | 61,949 | |
| | |
Pool # BM2418, 4.00%, 8/20/2049 | | | 49,590 | | | | 53,914 | |
| | |
Pool # BN7049, 4.50%, 8/20/2049 | | | 246,133 | | | | 274,109 | |
| | |
Pool # BP7160, 4.50%, 9/20/2049 | | | 135,485 | | | | 150,766 | |
| | | | | | | | |
| |
Total Mortgage-Backed Securities
(Cost $26,036,555) | | | | 26,346,228 | |
| | | | | |
U.S. Treasury Obligations — 15.3% | |
| | |
U.S. Treasury Bonds
5.00%, 5/15/2037 | | | 192,000 | | | | 310,155 | |
| | |
1.13%, 5/15/2040 | | | 29,100 | | | | 28,568 | |
| | |
4.38%, 5/15/2040 | | | 370,000 | | | | 577,778 | |
| | |
3.75%, 11/15/2043 | | | 668,000 | | | | 985,561 | |
SEE NOTES TO FINANCIAL STATEMENTS.
| | | | | | | | |
| | | |
| AUGUST 31, 2020 | | J.P. MORGAN EXCHANGE-TRADED FUNDS | | | | | 53 | |
JPMorgan Core Plus Bond ETF
SCHEDULE OF PORTFOLIO INVESTMENTS
AS OF AUGUST 31, 2020 (Unaudited) (continued)
| | | | | | | | |
| INVESTMENTS | | PRINCIPAL
AMOUNT ($) | | | VALUE ($) | |
U.S. Treasury Obligations — continued | | | | | | | | |
| | |
3.00%, 11/15/2045 | | | 83,000 | | | | 110,724 | |
| | |
3.00%, 2/15/2047 | | | 338,000 | | | | 454,016 | |
| | |
3.38%, 11/15/2048 | | | 1,069,000 | | | | 1,547,043 | |
| | |
2.00%, 2/15/2050 | | | 1,097,000 | | | | 1,234,639 | |
| | |
U.S. Treasury Notes
0.50%, 3/15/2023 | | | 662,000 | | | | 668,025 | |
| | |
2.88%, 11/30/2023 | | | 522,000 | | | | 567,634 | |
| | |
2.63%, 12/31/2023 | | | 1,785,000 | | | | 1,929,962 | |
| | |
2.13%, 2/29/2024 | | | 156,000 | | | | 166,536 | |
| | |
1.13%, 2/28/2025 | | | 565,000 | | | | 587,379 | |
| | |
1.50%, 8/15/2026 | | | 434,000 | | | | 462,278 | |
| | |
0.50%, 5/31/2027 | | | 1,297,000 | | | | 1,299,331 | |
| | |
1.50%, 2/15/2030 | | | 594,000 | | | | 639,107 | |
| | |
U.S. Treasury STRIPS Bonds
1.02%, 5/15/2033 (j) | | | 1,467,000 | | | | 1,281,658 | |
| | |
1.03%, 8/15/2039 (j) | | | 744,000 | | | | 592,064 | |
| | |
2.17%, 8/15/2041 (j) | | | 207,000 | | | | 152,268 | |
| | |
2.13%, 11/15/2041 (j) | | | 845,000 | | | | 634,606 | |
| | |
2.40%, 2/15/2042 (j) | | | 718,000 | | | | 522,654 | |
| | |
1.35%, 2/15/2045 (j) | | | 649,000 | | | | 449,173 | |
| | |
3.23%, 8/15/2048 (j) | | | 1,558,000 | | | | 1,010,921 | |
| | | | | | | | |
| |
Total U.S. Treasury Obligations
(Cost $15,408,066) | | | | 16,212,080 | |
| | | | | |
Asset-Backed Securities — 13.9% | |
| | |
American Credit Acceptance Receivables Trust Series 2020-2, Class C, 3.88%, 4/13/2026 (a) | | | 280,000 | | | | 294,115 | |
| | |
American Homes 4 Rent Series 2015-SFR1, Class E, 5.64%, 4/17/2052‡ (a) | | | 150,000 | | | | 164,929 | |
| | |
American Homes 4 Rent Trust | | | | | | | | |
| | |
Series 2014-SFR3, Class B, 4.20%, 12/17/2036 (a) | | | 125,000 | | | | 135,105 | |
| | |
Series 2015-SFR2, Class A, 3.73%, 10/17/2052‡ (a) | | | 94,405 | | | | 102,668 | |
| | |
AmeriCredit Automobile Receivables Trust Series 2017-2, Class D, 3.42%, 4/18/2023 | | | 250,000 | | | | 256,273 | |
| | |
AMSR Trust | | | | | | | | |
| | |
Series 2020-SFR1, Class E, 3.22%, 4/17/2037 (a) | | | 500,000 | | | | 508,432 | |
| | |
Series 2020-SFR2, Class E2, 4.28%, 7/17/2037‡ (a) | | | 375,000 | | | | 388,982 | |
| | |
Series 2020-SFR3, Class E2, 2.76%, 9/17/2037 (a) | | | 350,000 | | | | 350,139 | |
| | |
Aqua Finance Trust Series 2019-A, Class B, 3.47%, 7/16/2040‡ (a) | | | 246,000 | | | | 253,102 | |
| | | | | | | | |
| INVESTMENTS | | PRINCIPAL
AMOUNT ($) | | | VALUE ($) | |
| | | | | | | | |
| | |
Avid Automobile Receivables Trust Series 2019-1, Class D, 4.03%, 7/15/2026 (a) | | | 300,000 | | | | 305,035 | |
| | |
B2R Mortgage Trust Series 2016-1, Class B, 3.87%, 6/15/2049 ‡ (a) | | | 100,000 | | | | 100,846 | |
| | |
Carvana Auto Receivables Trust | | | | | | | | |
| | |
Series 2020-N1A, Class B, 2.01%, 3/17/2025 (a) | | | 500,000 | | | | 509,050 | |
| | |
Series 2019-4A, Class D, 3.07%, 7/15/2025 (a) | | | 110,000 | | | | 112,271 | |
| | |
CPS Auto Receivables Trust | | | | | | | | |
| | |
Series 2015-C, Class D, 4.63%, 8/16/2021 (a) | | | 24,022 | | | | 24,181 | |
| | |
Series 2017-C, Class D, 3.79%, 6/15/2023 (a) | | | 100,000 | | | | 101,586 | |
| | |
Series 2020-B, Class C, 3.30%, 4/15/2026 (a) | | | 400,000 | | | | 413,501 | |
| | |
Credit Acceptance Auto Loan Trust Series 2020-1A, Class C, 2.59%, 6/15/2029 (a) | | | 750,000 | | | | 749,013 | |
| | |
Delta Air Lines Pass-Through Trust | | | | | | | | |
| | |
Series 2007-1, Class A, 6.82%, 8/10/2022 | | | 733 | | | | 732 | |
| | |
Series 2019-1, Class AA, 3.20%, 4/25/2024 | | | 15,000 | | | | 14,919 | |
| | |
Drive Auto Receivables Trust Series 2020-2, Class D, 3.05%, 5/15/2028 | | | 750,000 | | | | 777,846 | |
| | |
DT Auto Owner Trust | | | | | | | | |
| | |
Series 2017-3A, Class D, 3.58%, 5/15/2023 (a) | | | 55,531 | | | | 55,961 | |
| | |
Series 2020-2A, Class D, 4.73%, 3/16/2026��(a) | | | 500,000 | | | | 538,085 | |
| | |
Exeter Automobile Receivables Trust | | | | | | | | |
| | |
Series 2020-2A, Class C, 3.28%, 5/15/2025 (a) | | | 250,000 | | | | 260,330 | |
| | |
Series 2020-2A, Class D, 4.73%, 4/15/2026 (a) | | | 400,000 | | | | 428,386 | |
| | |
First Investors Auto Owner Trust | | | | | | | | |
| | |
Series 2016-2A, Class D, 3.35%, 11/15/2022 (a) | | | 90,000 | | | | 91,264 | |
| | |
Series 2017-1A, Class D, 3.60%, 4/17/2023 (a) | | | 81,000 | | | | 82,379 | |
| | |
FirstKey Homes Trust Series 2020-SFR1, Class F1, 3.64%, 9/17/2025 (a) | | | 500,000 | | | | 507,581 | |
| | |
Flagship Credit Auto Trust Series 2017-2, Class C, 2.96%, 7/15/2023 (a) | | | 85,000 | | | | 85,766 | |
| | |
FNMA, Grantor Trust Series 2017-T1, Class A, 2.90%, 6/25/2027 | | | 598,143 | | | | 658,099 | |
SEE NOTES TO FINANCIAL STATEMENTS.
| | | | | | |
| | | |
| 54 | | | | J.P. MORGAN EXCHANGE-TRADED FUNDS | | AUGUST 31, 2020 |
| | | | | | | | |
| INVESTMENTS | | PRINCIPAL
AMOUNT ($) | | | VALUE ($) | |
Asset-Backed Securities — continued | | | | | | | | |
| | |
Foundation Finance Trust | | | | | | | | |
| | |
Series 2020-1A, Class B, 4.62%, 7/16/2040 ‡ (a) | | | 300,000 | | | | 308,026 | |
| | |
Series 2020-1A, Class C, 5.75%, 7/16/2040 ‡ (a) | | | 150,000 | | | | 150,058 | |
| | |
Genesis Private Label Amortizing Trust Series 2020-1, Class B, 2.83%, 7/20/2030 (a) | | | 220,000 | | | | 221,131 | |
| | |
Genesis Sales Finance Master Trust Series 2019-AA, Class A, 4.68%, 8/20/2023 (a) | | | 250,000 | | | | 251,520 | |
| | |
GLS Auto Receivables Trust Series 2018-3A, Class B, 3.78%, 8/15/2023 (a) | | | 150,000 | | | | 152,702 | |
| | |
Hertz Vehicle Financing II LP Series 2019-3A, Class B, 3.03%, 12/26/2025 (a) | | | 101,000 | | | | 100,398 | |
| | |
Hilton Grand Vacations Trust Series 2020-AA, Class C, 6.42%, 2/25/2039‡ (a) | | | 463,343 | | | | 494,580 | |
| | |
Lendmark Funding Trust | | | | | | | | |
| | |
Series 2018-2A, Class A, 4.23%, 4/20/2027 (a) | | | 118,000 | | | | 119,229 | |
| | |
Series 2019-2A, Class C, 3.72%, 4/20/2028 ‡ (a) | | | 100,000 | | | | 92,895 | |
| | |
MVW LLC | | | | | | | | |
| | |
Series 2020-1A, Class C, 4.21%, 10/20/2037 ‡ (a) | | | 344,361 | | | | 357,065 | |
| | |
Series 2019-2A, Class B, 2.44%, 10/20/2038 ‡ (a) | | | 162,647 | | | | 163,415 | |
| | |
MVW Owner Trust Series 2019-1A, Class C, 3.33%, 11/20/2036 ‡ (a) | | | 109,896 | | | | 110,811 | |
| | |
Prestige Auto Receivables Trust Series 2018-1A, Class D, 4.14%, 10/15/2024 (a) | | | 115,000 | | | | 117,813 | |
| | |
Pretium Mortgage Credit Partners I LLC Series 2019-CFL1, Class A1, 3.72%, 1/25/2059 ‡ (a) (e) | | | 227,562 | | | | 226,381 | |
| | |
Progress Residential Trust | | | | | | | | |
| | |
Series 2017-SFR1, Class A, 2.77%, 8/17/2034 (a) | | | 99,458 | | | | 101,241 | |
| | |
Series 2017-SFR1, Class D, 3.57%, 8/17/2034 ‡ (a) | | | 150,000 | | | | 152,851 | |
| | |
Series 2020-SFR2, Class D, 3.87%, 6/17/2037‡ (a) | | | 750,000 | | | | 784,594 | |
| | |
ReadyCap Lending Small Business Loan Trust Series 2019-2, Class A, 2.75%, 12/27/2044 (a) (k) | | | 168,100 | | | | 156,547 | |
| | |
Regional Management Issuance Trust Series 2018-1, Class A, 3.83%, 7/15/2027 (a) | | | 164,484 | | | | 164,646 | |
| | | | | | | | |
| INVESTMENTS | | PRINCIPAL
AMOUNT ($) | | | VALUE ($) | |
| | | | | | | | |
| | |
Santander Drive Auto Receivables Trust Series 2019-1, Class C, 3.42%, 4/15/2025 | | | 90,000 | | | | 92,436 | |
| | |
Santander Revolving Auto Loan Trust Series 2019-A, Class D, 3.45%, 1/26/2032 (a) | | | 150,000 | | | | 156,175 | |
| | |
Small Business Lending Trust Series 2020-A, Class A, 2.62%, 12/15/2026 (a) | | | 257,553 | | | | 253,222 | |
| | |
Tricon American Homes Series 2020-SFR1, Class E, 3.54%, 7/17/2038 ‡ (a) | | | 300,000 | | | | 311,639 | |
| | |
Upstart Securitization Trust Series 2018-1, Class C, 5.00%, 8/20/2025 ‡ (a) | | | 116,024 | | | | 115,961 | |
| | |
US Airways Pass-Through Trust Series 2011-1, Class A, 7.13%, 10/22/2023 | | | 17,547 | | | | 14,511 | |
| | |
USASF Receivables LLC Series 2020-1A, Class B, 3.22%, 5/15/2024 (a) | | | 500,000 | | | | 501,976 | |
| | |
Vericrest Opportunity Loan Trust Series 2019-NPL4, Class A1B, 4.15%, 8/25/2049 ‡ (a) (e) | | | 200,000 | | | | 193,322 | |
| | |
VOLT LXXX LLC Series 2019-NPL6, Class A1B, 4.09%, 10/25/2049 (a) (e) | | | 250,000 | | | | 241,418 | |
| | |
Westgate Resorts LLC Series 2020-1A, Class C, 6.21%, 3/20/2034 ‡ (a) | | | 294,288 | | | | 304,227 | |
| | | | | | | | |
| |
Total Asset-Backed Securities
(Cost $14,283,814) | | | | 14,681,366 | |
| | | | | |
Collateralized Mortgage Obligations — 3.0% | |
| | |
FHLMC, REMIC | | | | | | | | |
| | |
Series 2708, Class ZD, 5.50%, 11/15/2033 | | | 164,267 | | | | 188,410 | |
| | |
Series 4302, Class PA, 4.00%, 12/15/2043 | | | 149,310 | | | | 165,412 | |
| | |
Series 4281, Class BC, 4.50%, 12/15/2043 (k) | | | 194,438 | | | | 220,138 | |
| | |
FNMA, REMIC | | | | | | | | |
| | |
Series 2003-7, Class FA, 0.93%, 2/25/2033 (k) | | | 155,991 | | | | 157,745 | |
| | |
Series 2013-108, Class GU, 3.00%, 10/25/2033 | | | 545,000 | | | | 605,722 | |
| | |
Series 2005-110, Class TY, 5.50%, 12/25/2035 | | | 87,016 | | | | 102,118 | |
| | |
Series 2007-89, Class F, 0.76%, 9/25/2037 (k) | | | 169,687 | | | | 171,221 | |
| | |
Series 2011-112, Class PB, 4.00%, 11/25/2041 | | | 200,000 | | | | 229,829 | |
| | |
GNMA | | | | | | | | |
| | |
Series 2010-H24, Class FA, 0.51%, 10/20/2060 (k) | | | 100,190 | | | | 99,864 | |
SEE NOTES TO FINANCIAL STATEMENTS.
| | | | | | | | |
| | | |
| AUGUST 31, 2020 | | J.P. MORGAN EXCHANGE-TRADED FUNDS | | | | | 55 | |
JPMorgan Core Plus Bond ETF
SCHEDULE OF PORTFOLIO INVESTMENTS
AS OF AUGUST 31, 2020 (Unaudited) (continued)
| | | | | | | | |
| INVESTMENTS | | PRINCIPAL
AMOUNT ($) | | | VALUE ($) | |
Collateralized Mortgage Obligations — continued | |
| | |
Series 2014-H03, Class FA, 0.76%, 1/20/2064 (k) | | | 109,424 | | | | 109,710 | |
| | |
Series 2015-H05, Class FC, 0.64%, 2/20/2065 (k) | | | 338,820 | | | | 338,216 | |
| | |
New Residential Mortgage Loan Trust Series 2020-RPL2, Class A1, 3.58%, 8/25/2025 (a) (k) | | | 100,000 | | | | 100,006 | |
| | |
Seasoned Credit Risk Transfer Trust | | | | | | | | |
| | |
Series 2018-3, Class MA, 3.50%, 8/25/2057 ‡ | | | 122,704 | | | | 132,161 | |
| | |
Series 2019-1, Class MA, 3.50%, 7/25/2058 ‡ | | | 230,522 | | | | 249,046 | |
| | |
Series 2019-2, Class MA, 3.50%, 8/25/2058 ‡ | | | 247,682 | | | | 268,214 | |
| | | | | | | | |
| |
Total Collateralized Mortgage Obligations
(Cost $2,977,156) | | | | 3,137,812 | |
| | | | | |
Commercial Mortgage-Backed Securities — 2.6% | |
| | |
Bancorp Commercial Mortgage Trust Series 2019-CRE6, Class D, 2.46%, 9/15/2036 ‡ (a) (k) | | | 150,000 | | | | 136,150 | |
| | |
FHLMC, Multi-Family Structured Pass-Through Certificates | | | | | | | | |
| | |
Series KJ08, Class A2, 2.36%, 8/25/2022 | | | 48,607 | | | | 49,581 | |
| | |
Series K088, Class A2, 3.69%, 1/25/2029 | | | 350,000 | | | | 418,730 | |
| | |
FNMA ACES Series 2017-M3, Class A2, 2.57%, 12/25/2026 (k) | | | 350,000 | | | | 378,535 | |
| | |
FREMF Mortgage Trust | | | | | | | | |
| | |
Series 2015-K720, Class B, 3.51%, 7/25/2022 (a) (k) | | | 180,000 | | | | 185,773 | |
| | |
Series 2015-K44, Class B, 3.81%, 1/25/2048 (a) (k) | | | 200,000 | | | | 213,968 | |
| | |
Series 2015-K45, Class B, 3.71%, 4/25/2048 (a) (k) | | | 100,000 | | | | 106,971 | |
| | |
Series 2015-K48, Class B, 3.76%, 8/25/2048 (a) (k) | | | 200,000 | | | | 214,436 | |
| | |
Series 2015-K50, Class B, 3.91%, 10/25/2048 (a) (k) | | | 200,000 | | | | 216,162 | |
| | |
Series 2015-K51, Class B, 4.09%, 10/25/2048 (a) (k) | | | 175,000 | | | | 190,786 | |
| | |
Series 2016-K52, Class B, 4.06%, 1/25/2049 (a) (k) | | | 250,000 | | | | 275,366 | |
| | |
Series 2016-K53, Class C, 4.16%, 3/25/2049 (a) (k) | | | 50,000 | | | | 53,076 | |
| | |
Series 2017-K729, Class B, 3.80%, 11/25/2049 (a) (k) | | | 300,000 | | | | 318,013 | |
| | | | | | | | |
| |
Total Commercial Mortgage-Backed Securities
(Cost $2,572,512) | | | | 2,757,547 | |
| | | | | |
| | | | | | | | |
| INVESTMENTS | | PRINCIPAL
AMOUNT ($) | | | VALUE ($) | |
Municipal Bonds — 0.0% (b) | |
|
Ohio — 0.0% (b) | |
| | |
Ohio State University, General Receipts Rev., 5.59%, 12/1/2114
(Cost $32,791) | | | 25,000 | | | | 37,199 | |
| | | | | | | | |
| | |
| | | SHARES | | | | |
Preferred Stocks — 0.0% (b) | |
|
Internet & Direct Marketing Retail — 0.0% (b) | |
| | |
MYT Holding Co., 10.00%, 6/7/2029 (a)
(Cost $3,213) | | | 3,382 | | | | 3,027 | |
| | | | | | | | |
Short-Term Investments — 28.4% | |
|
Investment Companies — 28.4% | |
| | |
JPMorgan U.S. Government Money Market Fund Class Institutional Shares, 0.01% (l) (m)
(Cost $30,087,297) | | | 30,087,297 | | | | 30,087,297 | |
| | | | | | | | |
| | |
Total Investments — 117.5%
(Cost $121,138,484) | | | | | | | 124,332,346 | |
| | |
Liabilities in Excess of
Other Assets — (17.5)% | | | | | | | (18,502,181) | |
| | | | | |
| | |
NET ASSETS — 100.0% | | | | | | | 105,830,165 | |
| | | | | |
Percentages indicated are based on net assets.
Abbreviations
| | |
| ACES | | Alternative Credit Enhancement Securities |
| FHLMC | | Federal Home Loan Mortgage Corp. |
| FNMA | | Federal National Mortgage Association |
| GNMA | | Government National Mortgage Association |
| ICE | | Intercontinental Exchange |
| LIBOR | | London Interbank Offered Rate |
| OYJ | | Public Limited Company |
| REIT | | Real Estate Investment Trust |
| REMIC | | Real Estate Mortgage Investment Conduit |
| Rev. | | Revenue |
| SCA | | Limited partnership with share capital |
| SOFR | | Secured Overnight Financing Rate |
| STRIPS | | Separate Trading of Registered Interest and Principal of Securities. The STRIPS Program lets investors hold and trade individual interest and principal components of eligible notes and bonds as separate securities. |
| TBA | | To Be Announced; Security is subject to delayed delivery |
| UMBS | | Uniform Mortgage-Backed Securities |
| USD | | United States Dollar |
| |
| (a) | | Securities exempt from registration under Rule 144A or section 4(a)(2), of the Securities Act of 1933, as amended. |
| (b) | | Amount rounds to less than 0.1% of net assets. |
| (c) | | Variable or floating rate security, linked to the referenced benchmark. The interest rate shown is the current rate as of August 31, 2020. |
SEE NOTES TO FINANCIAL STATEMENTS.
| | | | | | |
| | | |
| 56 | | | | J.P. MORGAN EXCHANGE-TRADED FUNDS | | AUGUST 31, 2020 |
| | |
| (d) | | Defaulted security. |
| (e) | | Step bond. Interest rate is a fixed rate for an initial period that either resets at a specific date or may reset in the future contingent upon a predetermined trigger. The interest rate shown is the current rate as of August 31, 2020. |
| (f) | | Security has the ability to pay in kind (“PIK”) or pay income in cash. When applicable, separate rates of such payments are disclosed. |
| (g) | | Security is perpetual and thus, does not have a predetermined maturity date. The coupon rate for this security is fixed for a period of time and may be structured to adjust thereafter. The date shown, if applicable, reflects the next call date. The coupon rate shown is the rate in effect as of August 31, 2020. |
| (h) | | Security is an interest bearing note with preferred security characteristics. |
| | |
| (i) | | All or a portion of the security is a when-issued security, delayed delivery security, or forward commitment. |
| (j) | | The rate shown is the effective yield as of August 31, 2020. |
| (k) | | Variable or floating rate security, the interest rate of which adjusts periodically based on changes in current interest rates and prepayments on the underlying pool of assets. The interest rate shown is the current rate as of August 31, 2020. |
| (l) | | Investment in an affiliated fund, which is registered under the Investment Company Act of 1940, as amended, and is advised by J.P. Morgan Investment Management Inc. |
| (m) | | The rate shown is the current yield as of August 31, 2020. |
| ‡ | | Value determined using significant unobservable inputs. |
| | | | | | | | | | | | | | | | | | | | |
| Futures contracts outstanding as of August 31, 2020: | |
| DESCRIPTION | | NUMBER OF
CONTRACTS | | | EXPIRATION
DATE | | | TRADING
CURRENCY | | | NOTIONAL
AMOUNT ($) | | | VALUE AND
UNREALIZED
APPRECIATION
(DEPRECIATION) ($) | |
Long Contracts | | | | | | | | | | | | | | | | | | | | |
U.S. Treasury 2 Year Note | | | 18 | | | | 12/2020 | | | | USD | | | | 3,976,875 | | | | 1,652 | |
U.S. Treasury 5 Year Note | | | 29 | | | | 12/2020 | | | | USD | | | | 3,654,000 | | | | 2,442 | |
U.S. Treasury 10 Year Ultra Note | | | 5 | | | | 12/2020 | | | | USD | | | | 795,938 | | | | (659 | ) |
U.S. Treasury Long Bond | | | 7 | | | | 12/2020 | | | | USD | | | | 1,226,313 | | | | (5,703 | ) |
U.S. Treasury Ultra Bond | | | 2 | | | | 12/2020 | | | | USD | | | | 438,812 | | | | (5,512 | ) |
| | | | | | | | | | | | | | | | | | | | |
| | | | | | | | | | | | | | | | | | | (7,780 | ) |
| | | | | | | | | | | | | | | | | | | | |
Short Contracts | | | | | | | | | | | | | |
U.S. Treasury 10 Year Note | | | (14 | ) | | | 12/2020 | | | | USD | | | | (1,948,188 | ) | | | (1,482 | ) |
U.S. Treasury Ultra Bond | | | (1 | ) | | | 12/2020 | | | | USD | | | | (219,406 | ) | | | 2,068 | |
| | | | | | | | | | | | | | | | | | | | |
| | | | | | | | | | | | | | | | | | | 586 | |
| | | | | | | | | | | | | | | | | | | | |
| | | | | | | | | | | | | | | | | | | (7,194 | ) |
| | | | | | | | | | | | | | | | | | | | |
| | |
| Abbreviations |
| |
| USD | | United States Dollar |
SEE NOTES TO FINANCIAL STATEMENTS.
| | | | | | | | |
| | | |
| AUGUST 31, 2020 | | J.P. MORGAN EXCHANGE-TRADED FUNDS | | | | | 57 | |
JPMorgan Corporate Bond Research Enhanced ETF
SCHEDULE OF PORTFOLIO INVESTMENTS
AS OF AUGUST 31, 2020 (Unaudited)
| | | | | | | | |
| INVESTMENTS | | PRINCIPAL
AMOUNT ($) | | | VALUE ($) | |
Corporate Bonds — 98.8% | |
| | |
Aerospace & Defense — 4.4% | | | | | | | | |
| | |
BAE Systems plc (United Kingdom) 3.40%, 4/15/2030 (a) | | | 35,000 | | | | 39,386 | |
| | |
Boeing Co. (The)
4.51%, 5/1/2023 | | | 150,000 | | | | 158,408 | |
| | |
4.88%, 5/1/2025 | | | 149,000 | | | | 162,080 | |
| | |
5.04%, 5/1/2027 | | | 141,000 | | | | 155,147 | |
| | |
5.15%, 5/1/2030 | | | 102,000 | | | | 114,206 | |
| | |
3.60%, 5/1/2034 | | | 127,000 | | | | 123,313 | |
| | |
5.71%, 5/1/2040 | | | 35,000 | | | | 40,580 | |
| | |
5.81%, 5/1/2050 | | | 20,000 | | | | 23,892 | |
| | |
L3Harris Technologies, Inc. 4.40%, 6/15/2028 | | | 34,000 | | | | 40,546 | |
| | |
Leidos, Inc. 4.38%, 5/15/2030 (a) | | | 190,000 | | | | 222,353 | |
| | |
Lockheed Martin Corp.
3.55%, 1/15/2026 | | | 34,000 | | | | 38,809 | |
| | |
4.09%, 9/15/2052 | | | 109,000 | | | | 140,783 | |
| | |
Northrop Grumman Corp. | | | | | | | | |
| | |
3.25%, 1/15/2028 | | | 74,000 | | | | 83,674 | |
| | |
4.03%, 10/15/2047 | | | 121,000 | | | | 147,358 | |
| | |
Precision Castparts Corp. 3.25%, 6/15/2025 | | | 24,000 | | | | 26,800 | |
| | |
Raytheon Technologies Corp. | | | | | | | | |
| | |
3.50%, 3/15/2027 (a) | | | 63,000 | | | | 71,327 | |
| | |
3.13%, 5/4/2027 | | | 114,000 | | | | 126,203 | |
| | |
4.45%, 11/16/2038 | | | 83,000 | | | | 102,356 | |
| | |
3.75%, 11/1/2046 | | | 72,000 | | | | 82,923 | |
| | | | | | | | |
| | |
| | | | | | | 1,900,144 | |
| | | | | | | | |
|
Banks — 16.9% | |
|
Bank of America Corp. | |
| | |
(ICE LIBOR USD 3 Month + 0.79%), 3.00%, 12/20/2023(b) | | | 415,000 | | | | 437,362 | |
| | |
(ICE LIBOR USD 3 Month + 0.78%), 3.55%, 3/5/2024(b) | | | 114,000 | | | | 122,034 | |
| | |
(ICE LIBOR USD 3 Month + 0.87%), 2.46%, 10/22/2025(b) | | | 30,000 | | | | 31,785 | |
| | |
(ICE LIBOR USD 3 Month + 1.06%), 3.56%, 4/23/2027(b) | | | 122,000 | | | | 137,134 | |
| | |
(ICE LIBOR USD 3 Month + 1.58%), 3.82%, 1/20/2028(b) | | | 114,000 | | | | 129,629 | |
| | |
(ICE LIBOR USD 3 Month + 1.04%), 3.42%, 12/20/2028(b) | | | 155,000 | | | | 173,212 | |
| | |
(ICE LIBOR USD 3 Month + 0.99%), 2.50%, 2/13/2031(b) | | | 83,000 | | | | 87,460 | |
| | |
(ICE LIBOR USD 3 Month + 1.81%), 4.24%, 4/24/2038(b) | | | 124,000 | | | | 151,067 | |
| | |
(ICE LIBOR USD 3 Month + 1.19%), 3.95%, 1/23/2049(b) | | | 20,000 | | | | 24,421 | |
| | | | | | | | |
| INVESTMENTS | | PRINCIPAL
AMOUNT ($) | | | VALUE ($) | |
| |
|
Banks — continued | |
| | |
(ICE LIBOR USD 3 Month + 3.15%), 4.08%, 3/20/2051 (b) | | | 62,000 | | | | 77,182 | |
| | |
Bank of Nova Scotia (The) (Canada) 2.70%, 3/7/2022 | | | 83,000 | | | | 86,219 | |
| | |
Citigroup, Inc. | | | | | | | | |
| | |
(ICE LIBOR USD 3 Month + 0.95%), 2.88%, 7/24/2023(b) | | | 233,000 | | | | 242,821 | |
| | |
(ICE LIBOR USD 3 Month + 0.90%), 3.35%, 4/24/2025 (b) | | | 52,000 | | | | 56,566 | |
| | |
(SOFR + 2.75%), 3.11%, 4/8/2026(b) | | | 62,000 | | | | 67,267 | |
| | |
3.20%, 10/21/2026 | | | 233,000 | | | | 259,402 | |
| | |
(ICE LIBOR USD 3 Month + 1.39%), 3.67%, 7/24/2028 (b) | | | 60,000 | | | | 67,741 | |
| | |
(SOFR + 1.15%), 2.67%, 1/29/2031 (b) | | | 83,000 | | | | 88,376 | |
| | |
(SOFR + 3.91%), 4.41%, 3/31/2031 (b) | | | 124,000 | | | | 150,596 | |
| | |
(ICE LIBOR USD 3 Month + 1.17%), 3.88%, 1/24/2039 (b) | | | 71,000 | | | | 84,297 | |
| | |
4.65%, 7/23/2048 | | | 62,000 | | | | 83,025 | |
| | |
Citizens Financial Group, Inc.
4.30%, 12/3/2025 | | | 128,000 | | | | 147,253 | |
| | |
Cooperatieve Rabobank UA (Netherlands) 3.88%, 2/8/2022 | | | 61,000 | | | | 64,110 | |
| | |
HSBC Holdings plc (United Kingdom) 4.00%, 3/30/2022 | | | 135,000 | | | | 142,283 | |
| | |
(ICE LIBOR USD 3 Month + 1.61%), 3.97%, 5/22/2030 (b) | | | 200,000 | | | | 227,386 | |
| | |
Huntington Bancshares, Inc. | | | | | | | | |
| | |
2.30%, 1/14/2022 | | | 186,000 | | | | 190,660 | |
| | |
2.63%, 8/6/2024 | | | 47,000 | | | | 50,314 | |
| | |
Mitsubishi UFJ Financial Group, Inc. (Japan) | | | | | | | | |
| | |
2.67%, 7/25/2022 | | | 103,000 | | | | 107,076 | |
| | |
3.76%, 7/26/2023 | | | 308,000 | | | | 335,557 | |
| | |
3.68%, 2/22/2027 | | | 31,000 | | | | 35,280 | |
| | |
3.96%, 3/2/2028 | | | 39,000 | | | | 45,409 | |
| | |
3.74%, 3/7/2029 | | | 183,000 | | | | 210,979 | |
| | |
Natwest Group plc (United Kingdom) | | | | | | | | |
| | |
6.13%, 12/15/2022 | | | 395,000 | | | | 433,631 | |
| | |
6.00%, 12/19/2023 | | | 181,000 | | | | 204,067 | |
| | |
5.13%, 5/28/2024 | | | 201,000 | | | | 222,485 | |
| | |
PNC Financial Services Group, Inc. (The) | | | | | | | | |
| | |
3.90%, 4/29/2024 | | | 13,000 | | | | 14,406 | |
| | |
2.60%, 7/23/2026 | | | 197,000 | | | | 216,250 | |
| | |
3.15%, 5/19/2027 | | | 23,000 | | | | 25,887 | |
| |
Sumitomo Mitsui Financial Group, Inc. (Japan) | | | | | |
| | |
2.78%, 7/12/2022 | | | 83,000 | | | | 86,548 | |
| | |
2.63%, 7/14/2026 | | | 72,000 | | | | 78,219 | |
| | |
3.36%, 7/12/2027 | | | 61,000 | | | | 68,474 | |
SEE NOTES TO FINANCIAL STATEMENTS.
| | | | | | |
| | | |
| 58 | | | | J.P. MORGAN EXCHANGE-TRADED FUNDS | | AUGUST 31, 2020 |
| | | | | | | | |
| INVESTMENTS | | PRINCIPAL
AMOUNT ($) | | | VALUE ($) | |
Corporate Bonds — continued | |
|
Banks — continued | |
| | |
US Bancorp Series V, 2.38%, 7/22/2026 | | | 105,000 | | | | 114,989 | |
| | |
Wells Fargo & Co. | | | | | | | | |
| | |
2.63%, 7/22/2022 | | | 248,000 | | | | 257,986 | |
| | |
3.75%, 1/24/2024 | | | 114,000 | | | | 124,544 | |
| | |
(ICE LIBOR USD 3 Month + 0.83%), 2.41%, 10/30/2025 (b) | | | 72,000 | | | | 75,852 | |
| | |
(SOFR + 2.00%), 2.19%, 4/30/2026 (b) | | | 83,000 | | | | 86,732 | |
| | |
3.00%, 10/23/2026 | | | 148,000 | | | | 163,292 | |
| | |
4.30%, 7/22/2027 | | | 72,000 | | | | 82,773 | |
| | |
(ICE LIBOR USD 3 Month + 1.31%), 3.58%, 5/22/2028 (b) | | | 146,000 | | | | 163,547 | |
| | |
(ICE LIBOR USD 3 Month + 1.17%), 2.88%, 10/30/2030 (b) | | | 162,000 | | | | 174,143 | |
| | |
3.90%, 5/1/2045 | | | 93,000 | | | | 108,954 | |
| | |
4.75%, 12/7/2046 | | | 52,000 | | | | 65,572 | |
| | |
Westpac Banking Corp. (Australia) | | | | | | | | |
| | |
2.75%, 1/11/2023 | | | 72,000 | | | | 75,957 | |
| | |
2.85%, 5/13/2026 | | | 193,000 | | | | 214,309 | |
| | |
(US Treasury Yield Curve Rate T Note Constant Maturity 5 Year + 2.00%), 4.11%, 7/24/2034 (b) | | | 83,000 | | | | 93,690 | |
| | | | | | | | |
| | |
| | | | | | | 7,266,210 | |
| | | | | | | | |
|
Beverages — 2.2% | |
| | |
Anheuser-Busch Cos. LLC (Belgium) | | | | | | | | |
| | |
3.65%, 2/1/2026 | | | 83,000 | | | | 93,750 | |
| | |
4.70%, 2/1/2036 | | | 61,000 | | | | 72,752 | |
| | |
4.90%, 2/1/2046 | | | 128,000 | | | | 157,414 | |
| | |
Anheuser-Busch InBev Worldwide, Inc. (Belgium) | | | | | | | | |
| | |
4.00%, 4/13/2028 | | | 41,000 | | | | 47,498 | |
| | |
4.90%, 1/23/2031 | | | 26,000 | | | | 33,122 | |
| | |
4.60%, 4/15/2048 | | | 126,000 | | | | 149,873 | |
| | |
4.44%, 10/6/2048 | | | 31,000 | | | | 35,991 | |
| | |
Keurig Dr Pepper, Inc. | | | | | | | | |
| | |
4.06%, 5/25/2023 | | | 137,000 | | | | 149,685 | |
| | |
3.80%, 5/1/2050 | | | 20,000 | | | | 23,095 | |
| | |
PepsiCo, Inc. | | | | | | | | |
| | |
2.75%, 3/19/2030 | �� | | 83,000 | | | | 92,987 | |
| | |
3.45%, 10/6/2046 | | | 52,000 | | | | 60,787 | |
| | |
3.63%, 3/19/2050 | | | 20,000 | | | | 24,215 | |
| | | | | | | | |
| | |
| | | | | | | 941,169 | |
| | | | | | | | |
|
Biotechnology — 3.0% | |
| | |
AbbVie, Inc. | | | | | | | | |
| | |
3.45%, 3/15/2022 (a) | | | 52,000 | | | | 54,044 | |
| | |
2.90%, 11/6/2022 | | | 165,000 | | | | 173,600 | |
| | | | | | | | |
| INVESTMENTS | | PRINCIPAL
AMOUNT ($) | | | VALUE ($) | |
| |
|
Biotechnology — continued | |
| | |
2.60%, 11/21/2024 (a) | | | 47,000 | | | | 50,370 | |
| | |
3.60%, 5/14/2025 | | | 52,000 | | | | 58,034 | |
| | |
2.95%, 11/21/2026 (a) | | | 98,000 | | | | 107,783 | |
| | |
4.25%, 11/14/2028 | | | 98,000 | | | | 116,660 | |
| | |
4.05%, 11/21/2039 (a) | | | 129,000 | | | | 150,459 | |
| | |
4.70%, 5/14/2045 | | | 52,000 | | | | 64,855 | |
| | |
4.25%, 11/21/2049 (a) | | | 57,000 | | | | 68,606 | |
| | |
Amgen, Inc. | | | | | | | | |
| | |
2.20%, 2/21/2027 | | | 52,000 | | | | 55,030 | |
| | |
2.45%, 2/21/2030 | | | 47,000 | | | | 50,068 | |
| | |
4.40%, 5/1/2045 | | | 20,000 | | | | 24,833 | |
| | |
3.38%, 2/21/2050 | | | 20,000 | | | | 21,825 | |
| | |
Gilead Sciences, Inc. | | | | | | | | |
| | |
3.65%, 3/1/2026 | | | 72,000 | | | | 82,241 | |
| | |
4.15%, 3/1/2047 | | | 169,000 | | | | 216,303 | |
| | | | | | | | |
| | |
| | | | | | | 1,294,711 | |
| | | | | | | | |
|
Building Products — 0.1% | |
| | |
Carrier Global Corp.
3.58%, 4/5/2050 (a) | | | 20,000 | | | | 21,191 | |
| | | | | | | | |
|
Capital Markets — 5.7% | |
| | |
Bank of New York Mellon Corp. (The) | | | | | | | | |
| | |
2.20%, 8/16/2023 | | | 62,000 | | | | 65,044 | |
| | |
(ICE LIBOR USD 3 Month + 1.07%), 3.44%, 2/7/2028(b) | | | 116,000 | | | | 134,067 | |
| | |
CME Group, Inc. 3.00%, 3/15/2025 | | | 85,000 | | | | 93,136 | |
| | |
Credit Suisse Group AG (Switzerland) (ICE LIBOR USD 3 Month + 1.24%), 4.21%, 6/12/2024 (a) (b) | | | 250,000 | | | | 271,724 | |
| | |
Goldman Sachs Group, Inc. (The) | | | | | | | | |
| | |
5.75%, 1/24/2022 | | | 210,000 | | | | 225,411 | |
| | |
4.00%, 3/3/2024 | | | 194,000 | | | | 214,934 | |
| | |
3.85%, 1/26/2027 | | | 75,000 | | | | 85,401 | |
| | |
(ICE LIBOR USD 3 Month + 1.30%), 4.22%, 5/1/2029(b) | | | 107,000 | | | | 125,692 | |
| | |
3.80%, 3/15/2030 | | | 124,000 | | | | 144,441 | |
| | |
(ICE LIBOR USD 3 Month + 1.37%), 4.02%, 10/31/2038 (b) | | | 153,000 | | | | 180,195 | |
| | |
Morgan Stanley | | | | | | | | |
| | |
2.75%, 5/19/2022 | | | 188,000 | | | | 195,236 | |
| | |
3.70%, 10/23/2024 | | | 52,000 | | | | 58,050 | |
| | |
(SOFR + 1.99%), 2.19%, 4/28/2026 (b) | | | 40,000 | | | | 42,078 | |
| | |
3.63%, 1/20/2027 | | | 72,000 | | | | 81,791 | |
| | |
(ICE LIBOR USD 3 Month + 1.14%), 3.77%, 1/24/2029 (b) | | | 165,000 | | | | 189,513 | |
| | |
(SOFR + 1.14%), 2.70%, 1/22/2031 (b) | | | 93,000 | | | | 100,218 | |
SEE NOTES TO FINANCIAL STATEMENTS.
| | | | | | | | |
| | | |
| AUGUST 31, 2020 | | J.P. MORGAN EXCHANGE-TRADED FUNDS | | | | | 59 | |
JPMorgan Corporate Bond Research Enhanced ETF
SCHEDULE OF PORTFOLIO INVESTMENTS
AS OF AUGUST 31, 2020 (Unaudited) (continued)
| | | | | | | | |
| INVESTMENTS | | PRINCIPAL
AMOUNT ($) | | | VALUE ($) | |
Corporate Bonds — continued | |
|
Capital Markets — continued | |
| | |
(SOFR + 3.12%), 3.62%, 4/1/2031 (b) | | | 62,000 | | | | 72,002 | |
| | |
(ICE LIBOR USD 3 Month + 1.46%), 3.97%, 7/22/2038(b) | | | 114,000 | | | | 136,980 | |
| | |
4.30%, 1/27/2045 | | | 21,000 | | | | 27,390 | |
| | | | | | | | |
| | |
| | | | | | | 2,443,303 | |
| | | | | | | | |
|
Chemicals — 1.8% | |
| | |
Dow Chemical Co. (The) 3.50%, 10/1/2024 | | | 88,000 | | | | 96,246 | |
| | |
DuPont de Nemours, Inc. | | | | | | | | |
| | |
4.21%, 11/15/2023 | | | 170,000 | | | | 187,818 | |
| | |
4.73%, 11/15/2028 | | | 109,000 | | | | 133,243 | |
| | |
Huntsman International LLC 4.50%, 5/1/2029 | | | 62,000 | | | | 69,229 | |
| | |
Nutrien Ltd. (Canada) 4.20%, 4/1/2029 | | | 100,000 | | | | 119,224 | |
| | |
Sherwin-Williams Co. (The) | | | | | | | | |
| | |
2.75%, 6/1/2022 | | | 4,000 | | | | 4,151 | |
| | |
3.45%, 6/1/2027 | | | 60,000 | | | | 68,040 | |
| | |
2.95%, 8/15/2029 | | | 100,000 | | | | 109,950 | |
| | | | | | | | |
| | |
| | | | | | | 787,901 | |
| | | | | | | | |
|
Commercial Services & Supplies — 0.1% | |
| | |
Waste Management, Inc. 4.15%, 7/15/2049 | | | 32,000 | | | | 40,176 | |
| | | | | | | | |
|
Consumer Finance — 1.9% | |
| | |
American Express Co. 3.70%, 8/3/2023 | | | 62,000 | | | | 67,531 | |
| | |
Capital One Financial Corp. | | | | | | | | |
| | |
3.30%, 10/30/2024 | | | 142,000 | | | | 154,670 | |
| | |
3.80%, 1/31/2028 | | | 124,000 | | | | 138,483 | |
| | |
Discover Financial Services 4.10%, 2/9/2027 | | | 129,000 | | | | 143,608 | |
| | |
General Motors Financial Co., Inc. 3.20%, 7/6/2021 | | | 159,000 | | | | 161,656 | |
| | |
John Deere Capital Corp. | | | | | | | | |
| | |
1.20%, 4/6/2023 | | | 21,000 | | | | 21,462 | |
| | |
2.60%, 3/7/2024 | | | 103,000 | | | | 110,398 | |
| | | | | | | | |
| | |
| | | | | | | 797,808 | |
| | | | | | | | |
|
Containers & Packaging — 0.5% | |
| | |
International Paper Co. | | | | | | | | |
| | |
4.40%, 8/15/2047 | | | 72,000 | | | | 86,464 | |
| | |
4.35%, 8/15/2048 | | | 40,000 | | | | 47,832 | |
| | |
WRKCo, Inc. 4.65%, 3/15/2026 | | | 56,000 | | | | 65,866 | |
| | | | | | | | |
| | |
| | | | | | | 200,162 | |
| | | | | | | | |
|
Diversified Consumer Services — 0.1% | |
| | |
University of Chicago (The) Series 20B, 2.76%, 4/1/2045 | | | 21,000 | | | | 22,183 | |
| | | | | | | | |
| INVESTMENTS | | PRINCIPAL
AMOUNT ($) | | | VALUE ($) | |
| |
| |
Diversified Consumer Services — continued | | | | | |
| | |
William Marsh Rice University 2.60%, 5/15/2050 | | | 20,000 | | | | 20,427 | |
| | | | | | | | |
| | |
| | | | | | | 42,610 | |
| | | | | | | | |
| |
Diversified Financial Services — 1.3% | | | | | |
| | |
GE Capital International Funding Co. Unlimited Co. 2.34%, 11/15/2020 | | | 200,000 | | | | 200,806 | |
| | |
ORIX Corp. (Japan) 2.90%, 7/18/2022 | | | 10,000 | | | | 10,396 | |
| | |
Shell International Finance BV (Netherlands) | | | | | | | | |
| | |
2.38%, 4/6/2025 | | | 41,000 | | | | 44,040 | |
| | |
3.25%, 5/11/2025 | | | 23,000 | | | | 25,693 | |
| | |
4.13%, 5/11/2035 | | | 165,000 | | | | 204,528 | |
| | |
4.38%, 5/11/2045 | | | 35,000 | | | | 43,358 | |
| | |
4.00%, 5/10/2046 | | | 21,000 | | | | 24,906 | |
| | |
3.25%, 4/6/2050 | | | 21,000 | | | | 22,612 | |
| | | | | | | | |
| | |
| | | | | | | 576,339 | |
| | | | | | | | |
| |
Diversified Telecommunication Services — 3.1% | | | | | |
| | |
AT&T, Inc. | | | | | | | | |
| | |
3.00%, 6/30/2022 | | | 154,000 | | | | 160,750 | |
| | |
4.30%, 2/15/2030 | | | 142,000 | | | | 169,642 | |
| | |
2.25%, 2/1/2032 | | | 130,000 | | | | 131,766 | |
| | |
4.50%, 5/15/2035 | | | 100,000 | | | | 119,540 | |
| | |
5.25%, 3/1/2037 | | | 67,000 | | | | 84,371 | |
| | |
4.50%, 3/9/2048 | | | 193,000 | | | | 226,053 | |
| | |
Verizon Communications, Inc. | | | | | | | | |
| | |
3.38%, 2/15/2025 | | | 90,000 | | | | 100,715 | |
| | |
4.33%, 9/21/2028 | | | 45,000 | | | | 54,513 | |
| | |
4.02%, 12/3/2029 | | | 40,000 | | | | 47,999 | |
| | |
4.40%, 11/1/2034 | | | 20,000 | | | | 24,957 | |
| | |
4.27%, 1/15/2036 | | | 168,000 | | | | 205,414 | |
| | | | | | | | |
| | |
| | | | | | | 1,325,720 | |
| | | | | | | | |
| | |
Electric Utilities — 5.7% | | | | | | | | |
| | |
Commonwealth Edison Co. 3.00%, 3/1/2050 | | | 60,000 | | | | 64,388 | |
| | |
Duke Energy Corp. | | | | | | | | |
| | |
3.75%, 4/15/2024 | | | 217,000 | | | | 239,145 | |
| | |
2.65%, 9/1/2026 | | | 18,000 | | | | 19,648 | |
| | |
3.75%, 9/1/2046 | | | 93,000 | | | | 106,855 | |
| | |
Duke Energy Indiana LLC | | | | | | | | |
| | |
Series YYY, 3.25%, 10/1/2049 | | | 20,000 | | | | 22,329 | |
| | |
2.75%, 4/1/2050 | | | 20,000 | | | | 20,525 | |
| | |
Edison International | | | | | | | | |
| | |
3.13%, 11/15/2022 | | | 57,000 | | | | 59,350 | |
| | |
2.95%, 3/15/2023 | | | 155,000 | | | | 159,572 | |
| | |
4.13%, 3/15/2028 | | | 26,000 | | | | 27,136 | |
SEE NOTES TO FINANCIAL STATEMENTS.
| | | | | | |
| | | |
| 60 | | | | J.P. MORGAN EXCHANGE-TRADED FUNDS | | AUGUST 31, 2020 |
| | | | | | | | |
| INVESTMENTS | | PRINCIPAL
AMOUNT ($) | | | VALUE ($) | |
Corporate Bonds — continued | |
|
Electric Utilities — continued | |
| | |
Emera US Finance LP (Canada) 4.75%, 6/15/2046 | | | 101,000 | | | | 125,218 | |
| | |
Entergy Louisiana LLC | | | | | | | | |
| | |
4.00%, 3/15/2033 | | | 179,000 | | | | 224,668 | |
| | |
2.90%, 3/15/2051 | | | 7,000 | | | | 7,388 | |
| | |
Entergy Texas, Inc. 3.55%, 9/30/2049 | | | 36,000 | | | | 40,679 | |
| | |
Evergy, Inc. | | | | | | | | |
| | |
2.45%, 9/15/2024 | | | 103,000 | | | | 109,291 | |
| | |
2.90%, 9/15/2029 | | | 78,000 | | | | 84,354 | |
| | |
FirstEnergy Corp. | | | | | | | | |
| | |
2.65%, 3/1/2030 | | | 24,000 | | | | 24,677 | |
| | |
Series C, 4.85%, 7/15/2047 | | | 52,000 | | | | 63,825 | |
| | |
Florida Power & Light Co. | | | | | | | | |
| | |
3.95%, 3/1/2048 | | | 30,000 | | | | 38,284 | |
| | |
3.15%, 10/1/2049 | | | 72,000 | | | | 81,645 | |
| | |
Fortis, Inc. (Canada) 3.06%, 10/4/2026 | | | 116,000 | | | | 126,756 | |
| | |
NextEra Energy Capital Holdings, Inc. | | | | | | | | |
| | |
1.95%, 9/1/2022 | | | 80,000 | | | | 82,112 | |
| | |
3.15%, 4/1/2024 | | | 30,000 | | | | 32,554 | |
| | |
2.75%, 11/1/2029 | | | 93,000 | | | | 101,579 | |
| | |
Pacific Gas and Electric Co. 4.50%, 7/1/2040 | | | 210,000 | | | | 220,275 | |
| | |
PPL Electric Utilities Corp. 3.00%, 10/1/2049 | | | 20,000 | | | | 21,504 | |
| | |
Southern California Edison Co. | | | | | | | | |
| | |
2.25%, 6/1/2030 | | | 10,000 | | | | 10,163 | |
| | |
Series 13-A, 3.90%, 3/15/2043 | | | 6,000 | | | | 6,464 | |
| | |
Series C, 3.60%, 2/1/2045 | | | 87,000 | | | | 89,394 | |
| | |
4.00%, 4/1/2047 | | | 52,000 | | | | 56,591 | |
| | |
3.65%, 2/1/2050 | | | 14,000 | | | | 14,863 | |
| | |
Southern Co. (The) 4.40%, 7/1/2046 | | | 56,000 | | | | 66,767 | |
| | |
Virginia Electric & Power Co. | | | | | | | | |
| | |
Series A, 3.15%, 1/15/2026 | | | 17,000 | | | | 18,947 | |
| | |
Series A, 3.50%, 3/15/2027 | | | 43,000 | | | | 48,887 | |
| | |
4.60%, 12/1/2048 | | | 30,000 | | | | 41,357 | |
| | | | | | | | |
| | |
| | | | | | | 2,457,190 | |
| | | | | | | | |
|
Electronic Equipment, Instruments & Components — 0.2% | |
| | |
Corning, Inc. 5.45%, 11/15/2079 | | | 62,000 | | | | 77,471 | |
| | | | | | | | |
| | |
Entertainment — 0.6% | | | | | | | | |
| | |
Walt Disney Co. (The) | | | | | | | | |
| | |
2.00%, 9/1/2029 | | | 50,000 | | | | 51,987 | |
| | |
2.65%, 1/13/2031 | | | 40,000 | | | | 43,280 | |
| | |
3.50%, 5/13/2040 | | | 80,000 | | | | 89,913 | |
| | |
2.75%, 9/1/2049 | | | 60,000 | | | | 58,834 | |
| | | | | | | | |
| | |
| | | | | | | 244,014 | |
| | | | | | | | |
| | | | | | | | |
| INVESTMENTS | | PRINCIPAL
AMOUNT ($) | | | VALUE ($) | |
| |
|
Equity Real Estate Investment Trusts (REITs) — 3.9% | |
| | |
Alexandria Real Estate Equities, Inc. 2.75%, 12/15/2029 | | | 78,000 | | | | 84,759 | |
| | |
American Tower Corp. | | | | | | | | |
| | |
3.38%, 10/15/2026 | | | 134,000 | | | | 150,713 | |
| | |
3.55%, 7/15/2027 | | | 163,000 | | | | 183,730 | |
| | |
3.80%, 8/15/2029 | | | 83,000 | | | | 95,893 | |
| | |
3.10%, 6/15/2050 | | | 20,000 | | | | 20,557 | |
| | |
Boston Properties LP 4.50%, 12/1/2028 | | | 31,000 | | | | 36,650 | |
| | |
Crown Castle International Corp. | | | | | | | | |
| | |
3.80%, 2/15/2028 | | | 52,000 | | | | 59,359 | |
| | |
3.30%, 7/1/2030 | | | 88,000 | | | | 97,662 | |
| | |
2.25%, 1/15/2031 | | | 50,000 | | | | 51,108 | |
| | |
Healthpeak Properties, Inc. | | | | | | | | |
| | |
4.00%, 6/1/2025 | | | 341,000 | | | | 384,232 | |
| | |
2.88%, 1/15/2031 | | | 50,000 | | | | 53,341 | |
| | |
Prologis LP 3.75%, 11/1/2025 | | | 155,000 | | | | 177,633 | |
| | |
Simon Property Group LP | | | | | | | | |
| | |
2.45%, 9/13/2029 | | | 62,000 | | | | 61,988 | |
| | |
3.25%, 9/13/2049 | | | 40,000 | | | | 37,410 | |
| | |
UDR, Inc. 3.00%, 8/15/2031 | | | 20,000 | | | | 21,934 | |
| | |
Welltower, Inc. 3.63%, 3/15/2024 | | | 145,000 | | | | 156,766 | |
| | | | | | | | |
| | |
| | | | | | | 1,673,735 | |
| | | | | | | | |
|
Food & Staples Retailing — 0.7% | |
| | |
Costco Wholesale Corp. 1.60%, 4/20/2030 | | | 70,000 | | | | 71,656 | |
| | |
Kroger Co. (The) | | | | | | | | |
| | |
4.45%, 2/1/2047 | | | 45,000 | | | | 55,078 | |
| | |
3.95%, 1/15/2050 | | | 60,000 | | | | 69,800 | |
| | |
Walmart, Inc. | | | | | | | | |
| | |
3.70%, 6/26/2028 | | | 25,000 | | | | 29,632 | |
| | |
4.05%, 6/29/2048 | | | 51,000 | | | | 65,788 | |
| | | | | | | | |
| | |
| | | | | | | 291,954 | |
| | | | | | | | |
|
Gas Utilities — 0.1% | |
| | |
Atmos Energy Corp. 4.13%, 10/15/2044 | | | 31,000 | | | | 38,382 | |
| | | | | | | | |
|
Health Care Equipment & Supplies — 1.6% | |
| | |
Becton Dickinson and Co. | | | | | | | | |
| | |
2.89%, 6/6/2022 | | | 303,000 | | | | 314,561 | |
| | |
3.70%, 6/6/2027 | | | 50,000 | | | | 56,662 | |
| | |
4.69%, 12/15/2044 | | | 57,000 | | | | 71,814 | |
| | |
4.67%, 6/6/2047 | | | 41,000 | | | | 51,495 | |
| | |
3.79%, 5/20/2050 | | | 21,000 | | | | 23,580 | |
| | |
DH Europe Finance II SARL 3.25%, 11/15/2039 | | | 83,000 | | | | 93,128 | |
| | |
Medtronic, Inc. 3.50%, 3/15/2025 | | | 52,000 | | | | 58,513 | |
| | | | | | | | |
| | |
| | | | | | | 669,753 | |
| | | | | | | | |
SEE NOTES TO FINANCIAL STATEMENTS.
| | | | | | | | |
| | | |
| AUGUST 31, 2020 | | J.P. MORGAN EXCHANGE-TRADED FUNDS | | | | | 61 | |
JPMorgan Corporate Bond Research Enhanced ETF
SCHEDULE OF PORTFOLIO INVESTMENTS
AS OF AUGUST 31, 2020 (Unaudited) (continued)
| | | | | | | | |
| INVESTMENTS | | PRINCIPAL
AMOUNT ($) | | | VALUE ($) | |
Corporate Bonds — continued | |
|
Health Care Providers & Services — 4.1% | |
| | |
Aetna, Inc. | | | | | | | | |
| | |
2.80%, 6/15/2023 | | | 222,000 | | | | 234,071 | |
| | |
3.88%, 8/15/2047 | | | 40,000 | | | | 46,437 | |
| | |
Anthem, Inc. 4.65%, 8/15/2044 | | | 99,000 | | | | 126,065 | |
| | |
Cigna Corp. | | | | | | | | |
| | |
3.25%, 4/15/2025 | | | 134,000 | | | | 147,993 | |
| | |
2.40%, 3/15/2030 | | | 30,000 | | | | 31,477 | |
| | |
4.80%, 8/15/2038 | | | 70,000 | | | | 88,068 | |
| | |
CVS Health Corp. | | | | | | | | |
| | |
3.70%, 3/9/2023 | | | 50,000 | | | | 53,821 | |
| | |
2.63%, 8/15/2024 | | | 10,000 | | | | 10,726 | |
| | |
4.30%, 3/25/2028 | | | 94,000 | | | | 110,663 | |
| | |
2.70%, 8/21/2040 | | | 200,000 | | | | 194,755 | |
| | |
5.05%, 3/25/2048 | | | 50,000 | | | | 64,904 | |
| | |
HCA, Inc. | | | | | | | | |
| | |
4.50%, 2/15/2027 | | | 72,000 | | | | 82,205 | |
| | |
5.25%, 6/15/2049 | | | 135,000 | | | | 168,618 | |
| | |
UnitedHealth Group, Inc. | | | | | | | | |
| | |
3.75%, 7/15/2025 | | | 70,000 | | | | 80,094 | |
| | |
3.50%, 8/15/2039 | | | 98,000 | | | | 113,556 | |
| | |
2.75%, 5/15/2040 | | | 205,000 | | | | 216,215 | |
| | | | | | | | |
| | |
| | | | | | | 1,769,668 | |
| | | | | | | | |
|
Hotels, Restaurants & Leisure — 0.7% | |
| | |
McDonald’s Corp.
2.13%, 3/1/2030 | | | 15,000 | | | | 15,586 | |
| | |
3.63%, 9/1/2049 | | | 114,000 | | | | 127,205 | |
| | |
Starbucks Corp. 3.50%, 11/15/2050 | | | 130,000 | | | | 137,734 | |
| | | | | | | | |
| | |
| | | | | | | 280,525 | |
| | | | | | | | |
|
Industrial Conglomerates — 0.9% | |
| | |
General Electric Co.
2.70%, 10/9/2022 | | | 165,000 | | | | 172,516 | |
| | |
6.75%, 3/15/2032 | | | 32,000 | | | | 40,080 | |
| | |
5.88%, 1/14/2038 | | | 146,000 | | | | 168,602 | |
| | |
4.13%, 10/9/2042 | | | 8,000 | | | | 8,024 | |
| | | | | | | | |
| | |
| | | | | | | 389,222 | |
| | | | | | | | |
|
Insurance — 1.3% | |
| | |
Aflac, Inc. 3.60%, 4/1/2030 | | | 40,000 | | | | 46,834 | |
| | |
American International Group, Inc. 3.90%, 4/1/2026 | | | 28,000 | | | | 32,030 | |
| | |
4.50%, 7/16/2044 | | | 70,000 | | | | 82,112 | |
| | |
Berkshire Hathaway Finance Corp. 4.20%, 8/15/2048 | | | 114,000 | | | | 145,813 | |
| | |
4.25%, 1/15/2049 | | | 20,000 | | | | 25,855 | |
| | | | | | | | |
| INVESTMENTS | | PRINCIPAL
AMOUNT ($) | | | VALUE ($) | |
| |
|
Insurance — continued | |
| | |
Marsh & McLennan Cos., Inc. 4.38%, 3/15/2029 | | | 30,000 | | | | 36,488 | |
| | |
MetLife, Inc. 4.13%, 8/13/2042 | | | 20,000 | | | | 24,420 | |
| | |
New York Life Global Funding 2.88%, 4/10/2024 (a) | | | 62,000 | | | | 66,957 | |
| | |
Northwestern Mutual Life Insurance Co. (The) 3.85%, 9/30/2047 (a) | | | 20,000 | | | | 22,734 | |
| | |
Prudential Financial, Inc. | | | | | | | | |
| | |
3.91%, 12/7/2047 | | | 21,000 | | | | 23,767 | |
| | |
3.70%, 3/13/2051 | | | 52,000 | | | | 57,878 | |
| | | | | | | | |
| | |
| | | | | | | 564,888 | |
| | | | | | | | |
|
Internet & Direct Marketing Retail — 0.7% | |
| | |
Amazon.com, Inc.
3.88%, 8/22/2037 | | | 228,000 | | | | 284,823 | |
| | |
4.05%, 8/22/2047 | | | 10,000 | | | | 12,927 | |
| | | | | | | | |
| | |
| | | | | | | 297,750 | |
| | | | | | | | |
|
IT Services — 2.2% | |
| | |
Fidelity National Information Services, Inc. 3.00%, 8/15/2026 | | | 197,000 | | | | 220,244 | |
| | |
Global Payments, Inc.
3.20%, 8/15/2029 | | | 114,000 | | | | 124,849 | |
| | |
4.15%, 8/15/2049 | | | 12,000 | | | | 14,100 | |
| | |
International Business Machines Corp.
3.00%, 5/15/2024 | | | 100,000 | | | | 108,706 | |
| | |
3.30%, 5/15/2026 | | | 300,000 | | | | 340,552 | |
| | |
Mastercard, Inc.
2.95%, 6/1/2029 | | | 35,000 | | | | 39,604 | |
| | |
3.35%, 3/26/2030 | | | 10,000 | | | | 11,728 | |
| | |
Visa, Inc.
3.15%, 12/14/2025 | | | 72,000 | | | | 80,955 | |
| | |
3.65%, 9/15/2047 | | | 20,000 | | | | 24,530 | |
| | | | | | | | |
| | |
| | | | | | | 965,268 | |
| | | | | | | | |
|
Life Sciences Tools & Services — 0.2% | |
| | |
Thermo Fisher Scientific, Inc. 3.00%, 4/15/2023 | | | 72,000 | | | | 76,450 | |
| | |
4.10%, 8/15/2047 | | | 23,000 | | | | 29,376 | |
| | | | | | | | |
| | |
| | | | | | | 105,826 | |
| | | | | | | | |
|
Machinery — 0.6% | |
| | |
Caterpillar, Inc. 3.80%, 8/15/2042 | | | 20,000 | | | | 24,493 | |
| | |
Deere & Co.
2.75%, 4/15/2025 | | | 20,000 | | | | 21,885 | |
| | |
3.75%, 4/15/2050 | | | 88,000 | | | | 107,971 | |
| | |
Otis Worldwide Corp.
2.06%, 4/5/2025 (a) | | | 40,000 | | | | 42,175 | |
| | |
2.57%, 2/15/2030 (a) | | | 40,000 | | | | 42,676 | |
SEE NOTES TO FINANCIAL STATEMENTS.
| | | | | | |
| | | |
| 62 | | | | J.P. MORGAN EXCHANGE-TRADED FUNDS | | AUGUST 31, 2020 |
| | | | | | | | |
| INVESTMENTS | | PRINCIPAL
AMOUNT ($) | | | VALUE ($) | |
Corporate Bonds — continued | |
|
Machinery — continued | |
| | |
3.36%, 2/15/2050 (a) | | | 20,000 | | | | 21,865 | |
| | | | | | | | |
| | |
| | | | | | | 261,065 | |
| | | | | | | | |
|
Media — 4.0% | |
| | |
Charter Communications Operating LLC 4.46%, 7/23/2022 | | | 194,000 | | | | 206,724 | |
| | |
2.80%, 4/1/2031 | | | 40,000 | | | | 42,026 | |
| | |
6.48%, 10/23/2045 | | | 65,000 | | | | 86,828 | |
| | |
4.80%, 3/1/2050 | | | 83,000 | | | | 94,384 | |
| | |
3.70%, 4/1/2051 | | | 25,000 | | | | 24,778 | |
| | |
Comcast Corp. | | | | | | | | |
| | |
3.70%, 4/15/2024 | | | 173,000 | | | | 192,080 | |
| | |
3.95%, 10/15/2025 | | | 81,000 | | | | 93,381 | |
| | |
3.15%, 3/1/2026 | | | 72,000 | | | | 80,763 | |
| | |
4.15%, 10/15/2028 | | | 77,000 | | | | 93,275 | |
| | |
3.40%, 4/1/2030 | | | 40,000 | | | | 46,239 | |
| | |
3.90%, 3/1/2038 | | | 118,000 | | | | 141,047 | |
| | |
4.60%, 10/15/2038 | | | 184,000 | | | | 235,843 | |
| | |
4.00%, 11/1/2049 | | | 30,000 | | | | 36,227 | |
| | |
3.45%, 2/1/2050 | | | 20,000 | | | | 22,422 | |
| | |
2.45%, 8/15/2052 | | | 20,000 | | | | 19,035 | |
| | |
Discovery Communications LLC | | | | | | | | |
| | |
3.95%, 3/20/2028 | | | 60,000 | | | | 67,871 | |
| | |
5.00%, 9/20/2037 | | | 30,000 | | | | 35,351 | |
| | |
4.65%, 5/15/2050 | | | 97,000 | | | | 110,794 | |
| | |
ViacomCBS, Inc. 4.95%, 5/19/2050 | | | 60,000 | | | | 69,646 | |
| | | | | | | | |
| | |
| | | | | | | 1,698,714 | |
| | | | | | | | |
|
Metals & Mining — 0.7% | |
| | |
Glencore Funding LLC (Australia) 4.13%, 5/30/2023 (a) | | | 103,000 | | | | 110,789 | |
| | |
Vale Overseas Ltd. (Brazil) 6.25%, 8/10/2026 | | | 142,000 | | | | 168,767 | |
| | | | | | | | |
| | |
| | | | | | | 279,556 | |
| | | | | | | | |
|
Multi-Utilities — 2.1% | |
| | |
Ameren Corp. 2.50%, 9/15/2024 | | | 109,000 | | | | 116,344 | |
| | |
Berkshire Hathaway Energy Co. | | | | | | | | |
| | |
4.50%, 2/1/2045 | | | 83,000 | | | | 106,068 | |
| | |
3.80%, 7/15/2048 | | | 60,000 | | | | 71,345 | |
| | |
4.45%, 1/15/2049 | | | 31,000 | | | | 39,837 | |
| | |
Dominion Energy, Inc. 3.90%, 10/1/2025 | | | 17,000 | | | | 19,432 | |
| | |
NiSource, Inc.
2.95%, 9/1/2029 | | | 35,000 | | | | 38,361 | |
| | |
3.60%, 5/1/2030 | | | 40,000 | | | | 46,066 | |
| | |
San Diego Gas & Electric Co. Series TTT, 4.10%, 6/15/2049 | | | 31,000 | | | | 37,916 | |
| | | | | | | | |
| INVESTMENTS | | PRINCIPAL
AMOUNT ($) | | | VALUE ($) | |
| |
|
Multi-Utilities — continued | |
| | |
Sempra Energy | | | | | | | | |
| | |
3.25%, 6/15/2027 | | | 40,000 | | | | 44,349 | |
| | |
3.80%, 2/1/2038 | | | 38,000 | | | | 43,145 | |
| | |
4.00%, 2/1/2048 | | | 52,000 | | | | 60,241 | |
| | |
Southern Co. Gas Capital Corp. | | | | | | | | |
| | |
2.45%, 10/1/2023 | | | 165,000 | | | | 173,419 | |
| | |
Series 20-A, 1.75%, 1/15/2031 | | | 120,000 | | | | 118,820 | |
| | | | | | | | |
| | |
| | | | | | | 915,343 | |
| | | | | | | | |
|
Oil, Gas & Consumable Fuels — 6.1% | |
|
BP Capital Markets America, Inc. | |
| | |
4.23%, 11/6/2028 | | | 31,000 | | | | 36,924 | |
| | |
3.63%, 4/6/2030 | | | 52,000 | | | | 59,744 | |
| | |
3.00%, 2/24/2050 | | | 67,000 | | | | 65,908 | |
| | |
BP Capital Markets plc (United Kingdom) 3.28%, 9/19/2027 | | | 217,000 | | | | 242,197 | |
| | |
Cameron LNG LLC
2.90%, 7/15/2031 (a) | | | 30,000 | | | | 32,809 | |
| | |
3.30%, 1/15/2035 (a) | | | 25,000 | | | | 28,120 | |
| | |
3.70%, 1/15/2039 (a) | | | 5,000 | | | | 5,581 | |
| | |
Chevron Corp.
1.55%, 5/11/2025 | | | 83,000 | | | | 86,349 | |
| | |
2.95%, 5/16/2026 | | | 72,000 | | | | 80,142 | |
| | |
Columbia Pipeline Group, Inc. 4.50%, 6/1/2025 | | | 152,000 | | | | 176,913 | |
| | |
Concho Resources, Inc. 4.30%, 8/15/2028 | | | 60,000 | | | | 67,704 | |
| | |
Enbridge, Inc. (Canada) 4.25%, 12/1/2026 | | | 63,000 | | | | 72,811 | |
| | |
Energy Transfer Operating LP 4.95%, 6/15/2028 | | | 32,000 | | | | 34,274 | |
| | |
Enterprise Products Operating LLC 3.13%, 7/31/2029 | | | 21,000 | | | | 22,914 | |
| | |
5.10%, 2/15/2045 | | | 44,000 | | | | 52,455 | |
| | |
4.20%, 1/31/2050 | | | 36,000 | | | | 39,165 | |
| | |
Exxon Mobil Corp.
2.99%, 3/19/2025 | | | 62,000 | | | | 68,075 | |
| | |
2.61%, 10/15/2030 | | | 165,000 | | | | 179,221 | |
| | |
3.00%, 8/16/2039 | | | 145,000 | | | | 155,475 | |
| | |
4.33%, 3/19/2050 | | | 20,000 | | | | 25,545 | |
| | |
Hess Corp. 4.30%, 4/1/2027 | | | 52,000 | | | | 55,339 | |
| | |
Kinder Morgan, Inc.
4.30%, 6/1/2025 | | | 86,000 | | | | 97,628 | |
| | |
2.00%, 2/15/2031 | | | 50,000 | | | | 48,865 | |
| | |
5.55%, 6/1/2045 | | | 65,000 | | | | 80,184 | |
| | |
Marathon Petroleum Corp. 4.75%, 9/15/2044 | | | 17,000 | | | | 18,989 | |
| | |
MPLX LP
4.25%, 12/1/2027 | | | 28,000 | | | | 31,253 | |
| | |
4.00%, 3/15/2028 | | | 34,000 | | | | 37,434 | |
SEE NOTES TO FINANCIAL STATEMENTS.
| | | | | | | | |
| | | |
| AUGUST 31, 2020 | | J.P. MORGAN EXCHANGE-TRADED FUNDS | | | | | 63 | |
JPMorgan Corporate Bond Research Enhanced ETF
SCHEDULE OF PORTFOLIO INVESTMENTS
AS OF AUGUST 31, 2020 (Unaudited) (continued)
| | | | | | | | |
| INVESTMENTS | | PRINCIPAL
AMOUNT ($) | | | VALUE ($) | |
Corporate Bonds — continued | |
|
Oil, Gas & Consumable Fuels — continued | |
| | |
4.50%, 4/15/2038 | | | 62,000 | | | | 65,637 | |
| | |
5.50%, 2/15/2049 | | | 20,000 | | | | 23,615 | |
| | |
Plains All American Pipeline LP 3.55%, 12/15/2029 | | | 60,000 | | | | 59,718 | |
| | |
Sabine Pass Liquefaction LLC 5.63%, 3/1/2025 | | | 93,000 | | | | 108,230 | |
| | |
Sunoco Logistics Partners Operations LP 5.40%, 10/1/2047 | | | 117,000 | | | | 114,596 | |
| | |
Total Capital International SA (France)
2.43%, 1/10/2025 | | | 72,000 | | | | 77,226 | |
| | |
2.83%, 1/10/2030 | | | 134,000 | | | | 148,822 | |
| | |
3.46%, 7/12/2049 | | | 20,000 | | | | 22,175 | |
| | |
TransCanada PipeLines Ltd. (Canada) 4.63%, 3/1/2034 | | | 84,000 | | | | 100,912 | |
| | | | | | | | |
| | |
| | | | | | | 2,622,949 | |
| | | | | | | | |
|
Pharmaceuticals — 4.1% | |
| | |
AstraZeneca plc (United Kingdom) 4.38%, 11/16/2045 | | | 52,000 | | | | 68,450 | |
| | |
Bristol-Myers Squibb Co.
3.40%, 7/26/2029 | | | 52,000 | | | | 60,683 | |
| | |
4.35%, 11/15/2047 | | | 72,000 | | | | 95,986 | |
| | |
4.25%, 10/26/2049 | | | 72,000 | | | | 95,574 | |
| | |
Eli Lilly and Co. 2.25%, 5/15/2050 | | | 124,000 | | | | 117,518 | |
| | |
Merck & Co., Inc.
2.75%, 2/10/2025 | | | 103,000 | | | | 112,218 | |
| | |
3.40%, 3/7/2029 | | | 30,000 | | | | 35,023 | |
| | |
Novartis Capital Corp. (Switzerland) 2.75%, 8/14/2050 | | | 20,000 | | | | 21,145 | |
| | |
Pfizer, Inc.
4.00%, 12/15/2036 | | | 40,000 | | | | 49,093 | |
| | |
2.55%, 5/28/2040 | | | 30,000 | | | | 31,319 | |
| | |
4.40%, 5/15/2044 | | | 20,000 | | | | 26,559 | |
| | |
2.70%, 5/28/2050 | | | 100,000 | | | | 103,771 | |
| | |
Shire Acquisitions Investments Ireland DAC
2.40%, 9/23/2021 | | | 76,000 | | | | 77,528 | |
| | |
2.88%, 9/23/2023 | | | 124,000 | | | | 132,037 | |
| | |
3.20%, 9/23/2026 | | | 260,000 | | | | 291,164 | |
| | |
Upjohn, Inc.
1.13%, 6/22/2022 (a) | | | 90,000 | | | | 90,809 | |
| | |
1.65%, 6/22/2025 (a) | | | 25,000 | | | | 25,678 | |
| | |
2.30%, 6/22/2027 (a) | | | 20,000 | | | | 20,818 | |
| | |
2.70%, 6/22/2030 (a) | | | 80,000 | | | | 83,453 | |
| | |
3.85%, 6/22/2040 (a) | | | 20,000 | | | | 21,672 | |
| | |
4.00%, 6/22/2050 (a) | | | 25,000 | | | | 27,221 | |
| | |
Zoetis, Inc.
3.00%, 9/12/2027 | | | 83,000 | | | | 92,584 | |
| | |
4.70%, 2/1/2043 | | | 40,000 | | | | 52,803 | |
| | | | | | | | |
| INVESTMENTS | | PRINCIPAL
AMOUNT ($) | | | VALUE ($) | |
| | | | | | | | |
| | |
Pharmaceuticals — continued | | | | | | | | |
| | |
3.00%, 5/15/2050 | | | 40,000 | | | | 43,180 | |
| | | | | | | | |
| | |
| | | | | | | 1,776,286 | |
| | | | | | | | |
|
Road & Rail — 2.5% | |
| | |
Burlington Northern Santa Fe LLC
4.55%, 9/1/2044 | | | 25,000 | | | | 32,969 | |
| | |
4.15%, 4/1/2045 | | | 73,000 | | | | 91,998 | |
| | |
CSX Corp.
3.25%, 6/1/2027 | | | 190,000 | | | | 214,847 | |
| | |
4.25%, 3/15/2029 | | | 40,000 | | | | 48,203 | |
| | |
4.10%, 3/15/2044 | | | 20,000 | | | | 24,411 | |
| | |
4.30%, 3/1/2048 | | | 59,000 | | | | 74,367 | |
| | |
3.80%, 4/15/2050 | | | 10,000 | | | | 11,954 | |
| | |
Norfolk Southern Corp. | | | | | | | | |
| | |
4.15%, 2/28/2048 | | | 134,000 | | | | 166,530 | |
| | |
3.16%, 5/15/2055 (a) | | | 40,000 | | | | 41,798 | |
| | |
Union Pacific Corp. | | | | | | | | |
| | |
3.95%, 9/10/2028 | | | 122,000 | | | | 144,961 | |
| | |
3.70%, 3/1/2029 | | | 72,000 | | | | 84,232 | |
| | |
4.38%, 9/10/2038 | | | 42,000 | | | | 52,090 | |
| | |
4.30%, 3/1/2049 | | | 52,000 | | | | 66,870 | |
| | |
3.25%, 2/5/2050 | | | 26,000 | | | | 28,486 | |
| | | | | | | | |
| | |
| | | | | | | 1,083,716 | |
| | | | | | | | |
|
Semiconductors & Semiconductor Equipment — 1.9% | |
| | |
Analog Devices, Inc. 3.50%, 12/5/2026 | | | 84,000 | | | | 95,503 | |
| | |
Broadcom Corp. | | | | | | | | |
| | |
3.63%, 1/15/2024 | | | 114,000 | | | | 123,094 | |
| | |
3.88%, 1/15/2027 | | | 193,000 | | | | 213,870 | |
| | |
Broadcom, Inc. | | | | | | | | |
| | |
3.15%, 11/15/2025 | | | 81,000 | | | | 87,686 | |
| | |
4.75%, 4/15/2029 | | | 52,000 | | | | 60,828 | |
| | |
Intel Corp. | | | | | | | | |
| | |
3.73%, 12/8/2047 | | | 30,000 | | | | 35,583 | |
| | |
3.25%, 11/15/2049 | | | 100,000 | | | | 111,313 | |
| | |
4.75%, 3/25/2050 | | | 20,000 | | | | 27,419 | |
| | |
NXP BV (Netherlands) 4.30%, 6/18/2029 (a) | | | 40,000 | | | | 46,551 | |
| | |
QUALCOMM, Inc. 3.25%, 5/20/2050 | | | 20,000 | | | | 22,489 | |
| | | | | | | | |
| | |
| | | | | | | 824,336 | |
| | | | | | | | |
|
Software — 2.3% | |
| | |
Microsoft Corp. | | | | | | | | |
| | |
3.30%, 2/6/2027 | | | 30,000 | | | | 34,321 | |
| | |
3.45%, 8/8/2036 | | | 72,000 | | | | 86,415 | |
| | |
4.10%, 2/6/2037 | | | 72,000 | | | | 92,673 | |
| | |
3.70%, 8/8/2046 | | | 141,000 | | | | 175,558 | |
SEE NOTES TO FINANCIAL STATEMENTS.
| | | | | | |
| | | |
| 64 | | | | J.P. MORGAN EXCHANGE-TRADED FUNDS | | AUGUST 31, 2020 |
| | | | | | | | |
| INVESTMENTS | | PRINCIPAL
AMOUNT ($) | | | VALUE ($) | |
Corporate Bonds — continued | |
| | |
Software — continued | | | | | | | | |
| | |
2.53%, 6/1/2050 | | | 60,000 | | | | 62,771 | |
| | |
Oracle Corp. | | | | | | | | |
| | |
2.50%, 4/1/2025 | | | 83,000 | | | | 89,472 | |
| | |
3.25%, 11/15/2027 | | | 55,000 | | | | 62,087 | |
| | |
2.95%, 4/1/2030 | | | 67,000 | | | | 74,978 | |
| | |
3.80%, 11/15/2037 | | | 52,000 | | | | 60,206 | |
| | |
3.60%, 4/1/2040 | | | 62,000 | | | | 69,878 | |
| | |
4.00%, 7/15/2046 | | | 31,000 | | | | 36,340 | |
| | |
3.60%, 4/1/2050 | | | 124,000 | | | | 138,383 | |
| | | | | | | | |
| | |
| | | | | | | 983,082 | |
| | | | | | | | |
|
Specialty Retail — 2.0% | |
| | |
AutoZone, Inc. 1.65%, 1/15/2031 | | | 90,000 | | | | 88,835 | |
| | |
Home Depot, Inc. (The) | | | | | | | | |
| | |
2.70%, 4/15/2030 | | | 62,000 | | | | 68,650 | |
| | |
4.20%, 4/1/2043 | | | 30,000 | | | | 37,588 | |
| | |
3.13%, 12/15/2049 | | | 47,000 | | | | 51,457 | |
| | |
3.35%, 4/15/2050 | | | 20,000 | | | | 22,754 | |
| | |
3.50%, 9/15/2056 | | | 20,000 | | | | 23,694 | |
| | |
Lowe’s Cos., Inc. | | | | | | | | |
| | |
3.10%, 5/3/2027 | | | 40,000 | | | | 44,543 | |
| | |
3.70%, 4/15/2046 | | | 83,000 | | | | 93,715 | |
| | |
4.05%, 5/3/2047 | | | 40,000 | | | | 47,542 | |
| | |
O’Reilly Automotive, Inc. 3.60%, 9/1/2027 | | | 255,000 | | | | 293,485 | |
| | |
TJX Cos., Inc. (The) 3.50%, 4/15/2025 | | | 83,000 | | | | 92,637 | |
| | | | | | | | |
| | |
| | | | | | | 864,900 | |
| | | | | | | | |
|
Technology Hardware, Storage & Peripherals — 2.1% | |
| | |
Apple, Inc. | | | | | | | | |
| | |
2.40%, 5/3/2023 | | | 80,000 | | | | 84,443 | |
| | |
3.25%, 2/23/2026 | | | 64,000 | | | | 72,309 | |
| | |
2.90%, 9/12/2027 | | | 73,000 | | | | 82,089 | |
| | |
1.65%, 5/11/2030 | | | 40,000 | | | | 41,412 | |
| | |
3.85%, 5/4/2043 | | | 20,000 | | | | 24,519 | |
| | |
3.45%, 2/9/2045 | | | 83,000 | | | | 96,424 | |
| | |
4.65%, 2/23/2046 | | | 121,000 | | | | 165,617 | |
| | |
Dell International LLC | | | | | | | | |
| | |
4.42%, 6/15/2021 (a) | | | 52,000 | | | | 53,347 | |
| | |
5.45%, 6/15/2023 (a) | | | 176,000 | | | | 194,361 | |
| | |
6.02%, 6/15/2026 (a) | | | 40,000 | | | | 47,092 | |
| | |
5.30%, 10/1/2029 (a) | | | 40,000 | | | | 45,620 | |
| | | | | | | | |
| | |
| | | | | | | 907,233 | |
| | | | | | | | |
|
Textiles, Apparel & Luxury Goods — 0.3% | |
| | |
NIKE, Inc. | | | | | | | | |
| | |
3.25%, 3/27/2040 | | | 30,000 | | | | 33,664 | |
| | | | | | | | |
| INVESTMENTS | | PRINCIPAL
AMOUNT ($) | | | VALUE ($) | |
| | | | | | | | |
|
Textiles, Apparel & Luxury Goods — continued | |
| | |
3.38%, 3/27/2050 | | | 90,000 | | | | 103,004 | |
| | | | | | | | |
| | |
| | | | | | | 136,668 | |
| | | | | | | | |
|
Thrifts & Mortgage Finance — 0.5% | |
| | |
Nationwide Building Society (United Kingdom) (ICE LIBOR USD 3 Month + 1.18%), 3.62%, 4/26/2023 (a) (b) | | | 200,000 | | | | 209,131 | |
| | | | | | | | |
|
Tobacco — 2.2% | |
| | |
Altria Group, Inc. | | | | | | | | |
| | |
2.85%, 8/9/2022 | | | 103,000 | | | | 107,518 | |
| | |
4.80%, 2/14/2029 | | | 114,000 | | | | 136,336 | |
| | |
5.80%, 2/14/2039 | | | 52,000 | | | | 66,040 | |
| | |
5.38%, 1/31/2044 | | | 83,000 | | | | 102,580 | |
| | |
5.95%, 2/14/2049 | | | 20,000 | | | | 27,028 | |
| | |
BAT Capital Corp. (United Kingdom) | | | | | | | | |
| | |
4.39%, 8/15/2037 | | | 186,000 | | | | 202,524 | |
| | |
4.54%, 8/15/2047 | | | 52,000 | | | | 56,611 | |
| | |
Philip Morris International, Inc. 3.88%, 8/21/2042 | | | 40,000 | | | | 45,892 | |
| | |
Reynolds American, Inc. (United Kingdom) | | | | | | | | |
| | |
4.00%, 6/12/2022 | | | 127,000 | | | | 134,569 | |
| | |
4.45%, 6/12/2025 | | | 60,000 | | | | 68,305 | |
| | | | | | | | |
| | |
| | | | | | | 947,403 | |
| | | | | | | | |
|
Trading Companies & Distributors — 1.2% | |
| | |
Air Lease Corp.
3.00%, 9/15/2023 | | | 266,000 | | | | 267,431 | |
| | |
2.30%, 2/1/2025 | | | 114,000 | | | | 112,250 | |
| | |
3.75%, 6/1/2026 | | | 62,000 | | | | 63,766 | |
| | |
3.25%, 10/1/2029 | | | 52,000 | | | | 50,747 | |
| | | | | | | | |
| | |
| | | | | | | 494,194 | |
| | | | | | | | |
|
Water Utilities — 0.2% | |
| | |
American Water Capital Corp. | | | | | | | | |
| | |
2.80%, 5/1/2030 | | | 47,000 | | | | 51,439 | |
| | |
3.45%, 5/1/2050 | | | 40,000 | | | | 45,362 | |
| | | | | | | | |
| | |
| | | | | | | 96,801 | |
| | | | | | | | |
|
Wireless Telecommunication Services — 2.0% | |
| | |
Rogers Communications, Inc. (Canada) 3.70%, 11/15/2049 | | | 83,000 | | | | 95,135 | |
| | |
T-Mobile USA, Inc. | | | | | | | | |
| | |
3.50%, 4/15/2025 (a) | | | 155,000 | | | | 171,244 | |
| | |
3.75%, 4/15/2027 (a) | | | 93,000 | | | | 105,175 | |
| | |
3.88%, 4/15/2030 (a) | | | 40,000 | | | | 45,716 | |
| | |
4.38%, 4/15/2040 (a) | | | 25,000 | | | | 30,067 | |
| | |
4.50%, 4/15/2050 (a) | | | 67,000 | | | | 81,839 | |
SEE NOTES TO FINANCIAL STATEMENTS.
| | | | | | | | |
| | | |
| AUGUST 31, 2020 | | J.P. MORGAN EXCHANGE-TRADED FUNDS | | | | | 65 | |
JPMorgan Corporate Bond Research Enhanced ETF
SCHEDULE OF PORTFOLIO INVESTMENTS
AS OF AUGUST 31, 2020 (Unaudited) (continued)
| | | | | | | | |
| INVESTMENTS | | PRINCIPAL
AMOUNT ($) | | | VALUE ($) | |
Corporate Bonds — continued | |
|
Wireless Telecommunication Services — continued | |
| | |
Vodafone Group plc (United Kingdom) | | | | | | | | |
| | |
3.75%, 1/16/2024 | | | 134,000 | | | | 146,876 | |
| | |
4.38%, 5/30/2028 | | | 52,000 | | | | 62,233 | |
| | |
4.25%, 9/17/2050 | | | 92,000 | | | | 106,800 | |
| | | | | | | | |
| | | | | | | 845,085 | |
| | | | | | | | |
| |
Total Corporate Bonds
(Cost $38,938,598) | | | | 42,409,552 | |
| | | | | | | | |
U.S. Treasury Obligations — 0.5% | |
| | |
U.S. Treasury Bonds 2.38%, 11/15/2049
(Cost $188,612) | | | 158,300 | | | | 192,310 | |
| | | | | | | | |
Asset-Backed Securities — 0.1% | |
| | |
Air Canada Pass-Through Trust (Canada) Series 2017-1, Class AA, 3.30%, 1/15/2030 (a) | | | 26,928 | | | | 25,034 | |
| | |
United Airlines Pass-Through Trust Series 2019-2, Class AA, 2.70%, 5/1/2032 | | | 20,000 | | | | 18,442 | |
| | | | | | | | |
| |
Total Asset-Backed Securities
(Cost $46,148) | | | | 43,476 | |
| | | | | | | | |
| | | | | | | | |
| INVESTMENTS | |
SHARES | | | VALUE ($) | |
Short-Term Investments — 0.3% | |
Investment Companies — 0.3% | |
| | |
JPMorgan U.S. Government Money Market Fund Class Institutional Shares, 0.01% (c) (d)
(Cost $147,739) | | | 147,739 | | | | 147,739 | |
| | | | | | | | |
Total Investments — 99.7%
(Cost $39,321,097) | | | | | | | 42,793,077 | |
Other Assets Less Liabilities — 0.3% | | | | | | | 128,918 | |
| | | | | | | | |
NET ASSETS — 100.0% | | | | | | | 42,921,995 | |
| | | | | | | | |
Percentages indicated are based on net assets.
| | |
| Abbreviations |
| ICE | | Intercontinental Exchange |
| LIBOR | | London Interbank Offered Rate |
| SOFR | | Secured Overnight Financing Rate |
| USD | | United States Dollar |
| |
| (a) | | Securities exempt from registration under Rule 144A or section 4(a)(2), of the Securities Act of 1933, as amended. |
| (b) | | Variable or floating rate security, linked to the referenced benchmark. The interest rate shown is the current rate as of August 31, 2020. |
| (c) | | Investment in an affiliated fund, which is registered under the Investment Company Act of 1940, as amended, and is advised by J.P. Morgan Investment Management Inc. |
| (d) | | The rate shown is the current yield as of August 31, 2020. |
| | | | | | | | | | | | | | | | | | | | |
| Futures contracts outstanding as of August 31, 2020: | |
| DESCRIPTION | | NUMBER OF
CONTRACTS | | | EXPIRATION
DATE | | | TRADING
CURRENCY | | | NOTIONAL
AMOUNT ($) | | | VALUE AND
UNREALIZED
APPRECIATION
(DEPRECIATION) ($) | |
Long Contracts | |
| | | | | |
| U.S. Treasury 5 Year Note | | | 2 | | | | 12/2020 | | | | USD | | | | 252,000 | | | | 168 | |
| | | | | |
| U.S. Treasury Long Bond | | | 16 | | | | 12/2020 | | | | USD | | | | 2,803,000 | | | | (13,034 | ) |
| | | | | | | | | | | | | | | | | | | | |
| | | | | | | | | | | | | | | | | | | (12,866 | ) |
| | | | | | | | | | | | | | | | | | | | |
Short Contracts | |
| | | | | |
| U.S. Treasury 10 Year Note | | | (8 | ) | | | 12/2020 | | | | USD | | | | (1,113,250 | ) | | | (525 | ) |
| | | | | |
| U.S. Treasury 10 Year Ultra Note | | | (9 | ) | | | 12/2020 | | | | USD | | | | (1,432,687 | ) | | | 1,692 | |
| | | | | |
| U.S. Treasury Ultra Bond | | | (3 | ) | | | 12/2020 | | | | USD | | | | (658,219 | ) | | | 8,267 | |
| | | | | | | | | | | | | | | | | | | | |
| | | | | | | | | | | | | | | | | | | 9,434 | |
| | | | | | | | | | | | | | | | | | | | |
| | | | | | | | | | | | | | | | | | | (3,432 | ) |
| | | | | | | | | | | | | | | | | | | | |
| | |
| Abbreviations |
| |
| USD | | United States Dollar |
SEE NOTES TO FINANCIAL STATEMENTS.
| | | | | | |
| | | |
| 66 | | | | J.P. MORGAN EXCHANGE-TRADED FUNDS | | AUGUST 31, 2020 |
JPMorgan High Yield Research Enhanced ETF
SCHEDULE OF PORTFOLIO INVESTMENTS
AS OF AUGUST 31, 2020 (Unaudited)
| | | | | | | | |
| INVESTMENTS | | PRINCIPAL
AMOUNT ($) | | | VALUE ($) | |
Corporate Bonds — 97.3% | |
| | |
Aerospace & Defense — 1.4% | | | | | | | | |
| | |
BWX Technologies, Inc. 5.38%, 7/15/2026 (a) | | | 136,000 | | | | 142,460 | |
| | |
Spirit AeroSystems, Inc. 7.50%, 4/15/2025 (a) | | | 429,000 | | | | 433,020 | |
| | |
TransDigm, Inc. 6.25%, 3/15/2026 (a) | | | 1,892,000 | | | | 1,996,457 | |
| | |
5.50%, 11/15/2027 | | | 503,000 | | | | 491,029 | |
| | | | | | | | |
| | |
| | | | | | | 3,062,966 | |
| | | | | | | | |
|
Air Freight & Logistics — 0.8% | |
| | |
XPO Logistics, Inc.
6.50%, 6/15/2022 (a) | | | 332,000 | | | | 333,021 | |
| | |
6.75%, 8/15/2024 (a) | | | 840,000 | | | | 893,214 | |
| | |
6.25%, 5/1/2025 (a) | | | 535,000 | | | | 571,112 | |
| | | | | | | | |
| | |
| | | | | | | 1,797,347 | |
| | | | | | | | |
|
Auto Components — 2.2% | |
| | |
Adient Global Holdings Ltd. 4.88%, 8/15/2026 (a) | | | 200,000 | | | | 187,500 | |
| | |
Adient US LLC 7.00%, 5/15/2026 (a) | | | 429,000 | | | | 460,845 | |
| | |
Allison Transmission, Inc.
5.00%, 10/1/2024 (a) | | | 166,000 | | | | 167,665 | |
| | |
5.88%, 6/1/2029 (a) | | | 112,000 | | | | 122,640 | |
| | |
American Axle & Manufacturing, Inc.
6.25%, 4/1/2025 | | | 440,000 | | | | 453,750 | |
| | |
6.50%, 4/1/2027 | | | 349,000 | | | | 358,598 | |
| | |
Clarios Global LP
6.25%, 5/15/2026 (a) | | | 490,000 | | | | 519,706 | |
| | |
8.50%, 5/15/2027 (a) | | | 264,000 | | | | 280,312 | |
| | |
Cooper-Standard Automotive, Inc.
13.00%, 6/1/2024 (a) | | | 173,000 | | | | 183,380 | |
| | |
5.63%, 11/15/2026 (a) | | | 108,000 | | | | 60,966 | |
| | |
Dana, Inc.
5.50%, 12/15/2024 | | | 250,000 | | | | 255,000 | |
| | |
5.38%, 11/15/2027 | | | 192,000 | | | | 203,633 | |
| | |
5.63%, 6/15/2028 | | | 106,000 | | | | 111,830 | |
| | |
Delphi Technologies plc 5.00%, 10/1/2025 (a) | | | 221,000 | | | | 253,321 | |
| | |
Icahn Enterprises LP
4.75%, 9/15/2024 | | | 106,000 | | | | 109,445 | |
| | |
6.25%, 5/15/2026 | | | 420,000 | | | | 448,350 | |
| | |
5.25%, 5/15/2027 | | | 420,000 | | | | 446,250 | |
| | |
Tenneco, Inc. 5.00%, 7/15/2026 | | | 140,000 | | | | 102,550 | |
| | | | | | | | |
| | |
| | | | | | | 4,725,741 | |
| | | | | | | | |
|
Automobiles — 0.3% | |
| | |
Ford Motor Co.
8.50%, 4/21/2023 | | | 216,000 | | | | 238,768 | |
| | |
7.45%, 7/16/2031 | | | 257,000 | | | | 299,483 | |
| | | | | | | | |
| | |
| | | | | | | 538,251 | |
| | | | | | | | |
| | | | | | | | |
| INVESTMENTS | | PRINCIPAL
AMOUNT ($) | | | VALUE ($) | |
| | | | | | | | |
|
Banks — 0.5% | |
| | |
CIT Group, Inc. 6.13%, 3/9/2028 | | | 852,000 | | | | 1,004,295 | |
| | | | | | | | |
|
Building Products — 1.7% | |
| | |
American Woodmark Corp. 4.88%, 3/15/2026 (a) | | | 35,000 | | | | 35,613 | |
| | |
Builders FirstSource, Inc. 6.75%, 6/1/2027 (a) | | | 431,000 | | | | 469,790 | |
| | |
Griffon Corp. 5.75%, 3/1/2028 | | | 349,000 | | | | 370,376 | |
| | |
JELD-WEN, Inc. 4.88%, 12/15/2027 (a) | | | 426,000 | | | | 443,040 | |
| | |
Masonite International Corp. 5.38%, 2/1/2028 (a) | | | 37,000 | | | | 39,590 | |
| | |
PGT Innovations, Inc. 6.75%, 8/1/2026 (a) | | | 108,000 | | | | 115,290 | |
| | |
Standard Industries, Inc.
6.00%, 10/15/2025 (a) | | | 575,000 | | | | 592,997 | |
| | |
5.00%, 2/15/2027 (a) | | | 127,000 | | | | 132,612 | |
| | |
4.75%, 1/15/2028 (a) | | | 683,000 | | | | 718,858 | |
| | |
Summit Materials LLC 6.50%, 3/15/2027 (a) | | | 560,000 | | | | 597,800 | |
| | | | | | | | |
| | |
| | | | | | | 3,515,966 | |
| | | | | | | | |
|
Capital Markets — 0.9% | |
| | |
LPL Holdings, Inc.
5.75%, 9/15/2025 (a) | | | 502,000 | | | | 522,080 | |
| | |
4.63%, 11/15/2027 (a) | | | 311,000 | | | | 323,440 | |
| | |
MSCI, Inc.
5.38%, 5/15/2027 (a) | | | 356,000 | | | | 384,379 | |
| | |
4.00%, 11/15/2029 (a) | | | 730,000 | | | | 781,100 | |
| | | | | | | | |
| | |
| | | | | | | 2,010,999 | |
| | | | | | | | |
|
Chemicals — 3.4% | |
| | |
Ashland LLC 4.75%, 8/15/2022(b) | | | 11,000 | | | | 11,522 | |
| | |
Avient Corp. 5.75%, 5/15/2025 (a) | | | 160,000 | | | | 170,000 | |
| | |
Axalta Coating Systems LLC 4.75%, 6/15/2027 (a) | | | 500,000 | | | | 523,750 | |
| | |
Blue Cube Spinco LLC 9.75%, 10/15/2023 | | | 112,000 | | | | 115,595 | |
| | |
CF Industries, Inc.
3.45%, 6/1/2023 | | | 89,000 | | | | 92,534 | |
| | |
4.95%, 6/1/2043 | | | 38,000 | | | | 44,840 | |
| | |
5.38%, 3/15/2044 | | | 284,000 | | | | 352,870 | |
| | |
Chemours Co. (The)
6.63%, 5/15/2023 | | | 483,000 | | | | 485,410 | |
| | |
7.00%, 5/15/2025 | | | 363,000 | | | | 371,168 | |
| | |
5.38%, 5/15/2027 | | | 362,000 | | | | 363,810 | |
| | |
CVR Partners LP 9.25%, 6/15/2023 (a) | | | 292,000 | | | | 286,890 | |
| | |
Element Solutions, Inc. 5.
88%, 12/1/2025 (a) | | | 77,000 | | | | 79,984 | |
| | |
Hexion, Inc. 7.88%, 7/15/2027 (a) | | | 401,000 | | | | 402,002 | |
SEE NOTES TO FINANCIAL STATEMENTS.
| | | | | | | | |
| | | |
| AUGUST 31, 2020 | | J.P. MORGAN EXCHANGE-TRADED FUNDS | | | | | 67 | |
JPMorgan High Yield Research Enhanced ETF
SCHEDULE OF PORTFOLIO INVESTMENTS
AS OF AUGUST 31, 2020 (Unaudited) (continued)
| | | | | | | | |
| INVESTMENTS | | PRINCIPAL
AMOUNT ($) | | | VALUE ($) | |
Corporate Bonds — continued | |
| | |
Chemicals — continued | | | | | | | | |
| | |
INEOS Group Holdings SA (Luxembourg) 5.63%, 8/1/2024 (a) | | | 200,000 | | | | 202,433 | |
| | |
Methanex Corp. (Canada) 5.25%, 12/15/2029 | | | 193,000 | | | | 194,682 | |
| | |
OCI NV (Netherlands) 6.63%, 4/15/2023 (a) | | | 271,000 | | | | 281,162 | |
| | |
Olin Corp.
9.50%, 6/1/2025 (a) | | | 158,000 | | | | 182,885 | |
| | |
5.13%, 9/15/2027 | | | 60,000 | | | | 59,100 | |
| | |
5.63%, 8/1/2029 | | | 200,000 | | | | 200,000 | |
| | |
Rain CII Carbon LLC 7.25%, 4/1/2025 (a) | | | 355,000 | | | | 350,563 | |
| | |
Scotts Miracle-Gro Co. (The) 4.50%, 10/15/2029 | | | 150,000 | | | | 160,491 | |
| | |
Trinseo Materials Operating SCA 5.38%, 9/1/2025 (a) | | | 451,000 | | | | 452,263 | |
| | |
Tronox, Inc.
6.50%, 5/1/2025 (a) | | | 158,000 | | | | 169,455 | |
| | |
6.50%, 4/15/2026 (a) | | | 609,000 | | | | 627,064 | |
| | |
Valvoline, Inc.
4.38%, 8/15/2025 | | | 140,000 | | | | 145,278 | |
| | |
4.25%, 2/15/2030 (a) | | | 66,000 | | | | 70,043 | |
| | |
Venator Finance SARL 9.50%, 7/1/2025 (a) | | | 173,000 | | | | 181,650 | |
| | |
W.R. Grace & Co.-Conn. 4.88%, 6/15/2027 (a) | | | 612,000 | | | | 641,070 | |
| | | | | | | | |
| | |
| | | | | | | 7,218,514 | |
| | | | | | | | |
|
Commercial Services & Supplies — 2.3% | |
| | |
ACCO Brands Corp. 5.25%, 12/15/2024 (a) | | | 246,000 | | | | 251,587 | |
| | |
ADT Security Corp. (The)
3.50%, 7/15/2022 | | | 452,000 | | | | 463,092 | |
| | |
4.13%, 6/15/2023 | | | 313,000 | | | | 327,090 | |
| | |
4.88%, 7/15/2032 (a) | | | 200,000 | | | | 214,000 | |
| | |
Allied Universal Holdco LLC
6.63%, 7/15/2026 (a) | | | 522,000 | | | | 559,845 | |
| | |
9.75%, 7/15/2027 (a) | | | 278,000 | | | | 307,885 | |
| | |
Brink’s Co. (The) 4.63%, 10/15/2027 (a) | | | 170,000 | | | | 176,536 | |
| | |
Garda World Security Corp. (Canada) 4.63%, 2/15/2027 (a) | | | 206,000 | | | | 211,665 | |
| | |
9.50%, 11/1/2027 (a) | | | 376,000 | | | | 407,960 | |
| | |
GFL Environmental, Inc. (Canada)
4.25%, 6/1/2025 (a) | | | 431,000 | | | | 439,081 | |
| | |
8.50%, 5/1/2027 (a) | | | 284,000 | | | | 308,955 | |
| | |
Nielsen Co. Luxembourg SARL (The) 5.00%, 2/1/2025 (a) | | | 15,000 | | | | 15,263 | |
| | |
Nielsen Finance LLC 5.00%, 4/15/2022 (a) | | | 141,000 | | | | 141,134 | |
| | | | | | | | |
| INVESTMENTS | | PRINCIPAL
AMOUNT ($) | | | VALUE ($) | |
| | | | | | | | |
|
Commercial Services & Supplies — continued | |
| | |
Prime Security Services Borrower LLC 5.25%, 4/15/2024 (a) | | | 220,000 | | | | 233,200 | |
| | |
5.75%, 4/15/2026 (a) | | | 688,000 | | | | 760,240 | |
| | | | | | | | |
| | |
| | | | | | | 4,817,533 | |
| | | | | | | | |
|
Communications Equipment — 1.1% | |
| | |
CommScope Technologies LLC
6.00%, 6/15/2025 (a) | | | 670,000 | | | | 686,891 | |
| | |
5.00%, 3/15/2027 (a) | | | 219,000 | | | | 217,357 | |
| | |
CommScope, Inc.
5.50%, 3/1/2024 (a) | | | 188,000 | | | | 194,110 | |
| | |
6.00%, 3/1/2026 (a) | | | 553,000 | | | | 587,562 | |
| | |
8.25%, 3/1/2027 (a) | | | 532,000 | | | | 575,885 | |
| | |
ViaSat, Inc. 5.63%, 4/15/2027 (a) | | | 18,000 | | | | 19,080 | |
| | | | | | | | |
| | |
| | | | | | | 2,280,885 | |
| | | | | | | | |
|
Construction & Engineering — 0.5% | |
| | |
AECOM
5.88%, 10/15/2024 | | | 562,000 | | | | 625,928 | |
| | |
5.13%, 3/15/2027 | | | 333,000 | | | | 365,151 | |
| | | | | | | | |
| | |
| | | | | | | 991,079 | |
| | | | | | | | |
|
Consumer Finance — 2.8% | |
| | |
Ally Financial, Inc. 5.75%, 11/20/2025 | | | 547,000 | | | | 614,024 | |
| | |
Curo Group Holdings Corp. 8.25%, 9/1/2025 (a) | | | 127,000 | | | | 104,775 | |
| | |
Ford Motor Credit Co. LLC
5.88%, 8/2/2021 | | | 700,000 | | | | 714,924 | |
| | |
5.58%, 3/18/2024 | | | 1,100,000 | | | | 1,172,765 | |
| | |
OneMain Finance Corp.
6.13%, 5/15/2022 | | | 579,000 | | | | 607,950 | |
| | |
6.13%, 3/15/2024 | | | 897,000 | | | | 972,590 | |
| | |
7.13%, 3/15/2026 | | | 1,639,000 | | | | 1,880,744 | |
| | | | | | | | |
| | |
| | | | | | | 6,067,772 | |
| | | | | | | | |
|
Containers & Packaging — 1.9% | |
| | |
Ardagh Packaging Finance plc
5.25%, 4/30/2025 (a) | | | 200,000 | | | | 212,231 | |
| | |
4.13%, 8/15/2026 (a) | | | 200,000 | | | | 208,640 | |
| | |
5.25%, 8/15/2027 (a) | | | 200,000 | | | | 208,076 | |
| | |
Ball Corp.
4.00%, 11/15/2023 | | | 68,000 | | | | 72,250 | |
| | |
5.25%, 7/1/2025 | | | 326,000 | | | | 369,446 | |
| | |
4.88%, 3/15/2026 | | | 78,000 | | | | 87,360 | |
| | |
Berry Global, Inc. 4.88%, 7/15/2026 (a) | | | 537,000 | | | | 570,562 | |
| | |
Graphic Packaging International LLC 4.88%, 11/15/2022 | | | 99,000 | | | | 103,702 | |
| | |
4.75%, 7/15/2027 (a) | | | 54,000 | | | | 59,660 | |
SEE NOTES TO FINANCIAL STATEMENTS.
| | | | | | |
| | | |
| 68 | | | | J.P. MORGAN EXCHANGE-TRADED FUNDS | | AUGUST 31, 2020 |
| | | | | | | | |
| INVESTMENTS | | PRINCIPAL
AMOUNT ($) | | | VALUE ($) | |
Corporate Bonds — continued | |
|
Containers & Packaging — continued | |
| | |
Greif, Inc. 6.50%, 3/1/2027 (a) | | | 139,000 | | | | 148,035 | |
| | |
LABL Escrow Issuer LLC
6.75%, 7/15/2026 (a) | | | 236,000 | | | | 253,110 | |
| | |
Mauser Packaging Solutions Holding Co. | | | | | | | | |
| | |
5.50%, 4/15/2024 (a) | | | 402,000 | | | | 408,030 | |
| | |
7.25%, 4/15/2025 (a) | | | 544,000 | | | | 528,882 | |
| | |
Owens-Brockway Glass Container, Inc. 5.88%, 8/15/2023 (a) | | | 158,000 | | | | 168,073 | |
| | |
6.63%, 5/13/2027 (a) | | | 158,000 | | | | 173,800 | |
| | |
Sealed Air Corp.
4.00%, 12/1/2027 (a) | | | 162,000 | | | | 172,935 | |
| | |
6.88%, 7/15/2033 (a) | | | 150,000 | | | | 191,136 | |
| | |
Trivium Packaging Finance BV (Netherlands) 5.50%, 8/15/2026 (a) (b) | | | 200,000 | | | | 210,924 | |
| | | | | | | | |
| | |
| | | | | | | 4,146,852 | |
| | | | | | | | |
|
Distributors — 0.6% | |
| | |
American Builders & Contractors Supply Co., Inc. 4.00%, 1/15/2028 (a) | | | 429,000 | | | | 441,870 | |
| | |
Performance Food Group, Inc.
5.50%, 10/15/2027 (a) | | | 595,000 | | | | 620,287 | |
| | |
Wolverine Escrow LLC
8.50%, 11/15/2024 (a) | | | 181,000 | | | | 139,370 | |
| | |
9.00%, 11/15/2026 (a) | | | 102,000 | | | | 78,540 | |
| | | | | | | | |
| | |
| | | | | | | 1,280,067 | |
| | | | | | | | |
|
Diversified Consumer Services — 0.1% | |
| | |
Service Corp. International
5.38%, 5/15/2024 | | | 66,000 | | | | 67,208 | |
| | |
4.63%, 12/15/2027 | | | 30,000 | | | | 32,325 | |
| | |
5.13%, 6/1/2029 | | | 135,000 | | | | 149,562 | |
| | | | | | | | |
| | |
| | | | | | | 249,095 | |
| | | | | | | | |
|
Diversified Financial Services — 0.5% | |
| | |
CNG Holdings, Inc. 12.50%, 6/15/2024 (a) | | | 149,000 | | | | 132,610 | |
| | |
MPH Acquisition Holdings LLC 7.13%, 6/1/2024 (a) | | | 393,000 | | | | 399,013 | |
| | |
Sabre GLBL, Inc.
5.38%, 4/15/2023 (a) | | | 358,000 | | | | 361,580 | |
| | |
9.25%, 4/15/2025 (a) | | | 252,000 | | | | 280,350 | |
| | | | | | | | |
| | |
| | | | | | | 1,173,553 | |
| | | | | | | | |
|
Diversified Telecommunication Services — 6.1% | |
| | |
Altice France Holding SA (Luxembourg) 10.50%, 5/15/2027 (a) | | | 700,000 | | | | 802,375 | |
| | |
Altice France SA (France)
7.38%, 5/1/2026 (a) | | | 630,000 | | | | 668,839 | |
| | |
5.50%, 1/15/2028 (a) | | | 1,050,000 | | | | 1,102,500 | |
| | | | | | | | |
| INVESTMENTS | | PRINCIPAL
AMOUNT ($) | | | VALUE ($) | |
| | | | | | | | |
|
Diversified Telecommunication Services — continued | |
| | |
CCO Holdings LLC
5.75%, 2/15/2026 (a) | | | 2,247,000 | | | | 2,354,991 | |
| | |
5.50%, 5/1/2026 (a) | | | 47,000 | | | | 49,115 | |
| | |
5.13%, 5/1/2027 (a) | | | 1,358,000 | | | | 1,446,297 | |
| | |
5.38%, 6/1/2029 (a) | | | 485,000 | | | | 533,001 | |
| | |
4.75%, 3/1/2030 (a) | | | 1,192,000 | | | | 1,280,625 | |
| | |
CenturyLink, Inc. | | | | | | | | |
| | |
Series T, 5.80%, 3/15/2022 | | | 397,000 | | | | 414,831 | |
| | |
Series Y, 7.50%, 4/1/2024 | | | 72,000 | | | | 81,630 | |
| | |
Series U, 7.65%, 3/15/2042 | | | 34,000 | | | | 39,233 | |
| | |
Cincinnati Bell, Inc. 7.00%, 7/15/2024 (a) | | | 323,000 | | | | 333,901 | |
| | |
Embarq Corp. 8.00%, 6/1/2036 | | | 181,000 | | | | 217,061 | |
| | |
Level 3 Financing, Inc. 4.63%, 9/15/2027 (a) | | | 231,000 | | | | 241,972 | |
| | |
Sprint Capital Corp.
6.88%, 11/15/2028 | | | 633,000 | | | | 809,759 | |
| | |
8.75%, 3/15/2032 | | | 404,000 | | | | 610,217 | |
| | |
Telecom Italia Capital SA (Italy) 7.72%, 6/4/2038 | | | 734,000 | | | | 1,022,631 | |
| | |
Telecom Italia SpA (Italy) 5.30%, 5/30/2024 (a) | | | 251,000 | | | | 277,094 | |
| | |
Virgin Media Secured Finance plc (United Kingdom)
5.50%, 8/15/2026 (a) | | | 200,000 | | | | 210,750 | |
| | |
4.50%, 8/15/2030 (a) | | | 250,000 | | | | 263,188 | |
| | |
Zayo Group Holdings, Inc.
4.00%, 3/1/2027 (a) | | | 127,000 | | | | 125,571 | |
| | | | | | | | |
| | |
| | | | | | | 12,885,581 | |
| | | | | | | | |
|
Electric Utilities — 1.7% | |
| | |
DPL, Inc. 4.35%, 4/15/2029 | | | 98,000 | | | | 107,387 | |
| | |
NextEra Energy Operating Partners LP 4.25%, 7/15/2024 (a) | | | 35,000 | | | | 37,357 | |
| | |
4.50%, 9/15/2027 (a) | | | 252,000 | | | | 275,310 | |
| | |
NRG Energy, Inc.
6.63%, 1/15/2027 | | | 459,000 | | | | 491,222 | |
| | |
5.75%, 1/15/2028 | | | 299,000 | | | | 325,162 | |
| | |
5.25%, 6/15/2029 (a) | | | 273,000 | | | | 297,570 | |
| | |
PG&E Corp. 5.25%, 7/1/2030 | | | 877,000 | | | | 874,755 | |
| | |
Vistra Operations Co. LLC
5.50%, 9/1/2026 (a) | | | 544,000 | | | | 571,200 | |
| | |
5.63%, 2/15/2027 (a) | | | 672,000 | | | | 710,640 | |
| | | | | | | | |
| | |
| | | | | | | 3,690,603 | |
| | | | | | | | |
|
Electrical Equipment — 0.1% | |
| | |
EnerSys 5.00%, 4/30/2023 (a) | | | 155,000 | | | | 160,845 | |
SEE NOTES TO FINANCIAL STATEMENTS.
| | | | | | | | |
| | | |
| AUGUST 31, 2020 | | J.P. MORGAN EXCHANGE-TRADED FUNDS | | | | | 69 | |
JPMorgan High Yield Research Enhanced ETF
SCHEDULE OF PORTFOLIO INVESTMENTS
AS OF AUGUST 31, 2020 (Unaudited) (continued)
| | | | | | | | |
| INVESTMENTS | | PRINCIPAL
AMOUNT ($) | | | VALUE ($) | |
Corporate Bonds — continued | |
|
Electrical Equipment — continued | |
| | |
Sensata Technologies BV
4.88%, 10/15/2023 (a) | | | 25,000 | | | | 26,375 | |
| | |
5.00%, 10/1/2025 (a) | | | 28,000 | | | | 30,428 | |
| | | | | | | | |
| | |
| | | | | | | 217,648 | |
| | | | | | | | |
|
Electronic Equipment, Instruments & Components — 0.8% | |
| | |
CDW LLC 5.50%, 12/1/2024 | | | 15,000 | | | | 16,645 | |
| | |
4.13%, 5/1/2025 | | | 216,000 | | | | 225,228 | |
| | |
5.00%, 9/1/2025 | | | 67,000 | | | | 69,429 | |
| | |
3.25%, 2/15/2029 | | | 420,000 | | | | 428,980 | |
| | |
MTS Systems Corp. 5.75%, 8/15/2027 (a) | | | 110,000 | | | | 111,417 | |
| | |
Sensata Technologies, Inc.
4.38%, 2/15/2030 (a) | | | 773,000 | | | | 815,515 | |
| | | | | | | | |
| | |
| | | | | | | 1,667,214 | |
| | | | | | | | |
|
Energy Equipment & Services — 0.3% | |
| | |
Archrock Partners LP
6.88%, 4/1/2027 (a) | | | 136,000 | | | | 140,080 | |
| | |
6.25%, 4/1/2028 (a) | | | 6,000 | | | | 6,029 | |
| | |
Precision Drilling Corp. (Canada)
5.25%, 11/15/2024 | | | 221,000 | | | | 155,253 | |
| | |
7.13%, 1/15/2026 (a) | | | 161,000 | | | | 109,480 | |
| | |
Transocean Guardian Ltd.
5.88%, 1/15/2024 (a) | | | 76,440 | | | | 61,627 | |
| | |
Transocean Pontus Ltd. 6.13%, 8/1/2025 (a) | | | 46,800 | | | | 41,910 | |
| | |
Transocean Proteus Ltd. 6.25%, 12/1/2024 (a) | | | 24,700 | | | | 21,736 | |
| | | | | | | | |
| | |
| | | | | | | 536,115 | |
| | | | | | | | |
|
Entertainment — 2.6% | |
| | |
Cinemark USA, Inc.
4.88%, 6/1/2023 | | | 296,000 | | | | 272,379 | |
| | |
8.75%, 5/1/2025 (a) | | | 300,000 | | | | 321,750 | |
| | |
Live Nation Entertainment, Inc.
4.88%, 11/1/2024 (a) | | | 384,000 | | | | 377,318 | |
| | |
6.50%, 5/15/2027 (a) | | | 825,000 | | | | 901,288 | |
| | |
4.75%, 10/15/2027 (a) | | | 450,000 | | | | 425,671 | |
| | |
Netflix, Inc.
5.50%, 2/15/2022 | | | 65,000 | | | | 68,412 | |
| | |
5.88%, 2/15/2025 | | | 716,000 | | | | 826,980 | |
| | |
5.88%, 11/15/2028 | | | 1,567,000 | | | | 1,923,493 | |
| | |
WMG Acquisition Corp.
5.50%, 4/15/2026 (a) | | | 193,000 | | | | 200,720 | |
| | |
3.88%, 7/15/2030 (a) | | | 109,000 | | | | 114,178 | |
| | | | | | | | |
| | |
| | | | | | | 5,432,189 | |
| | | | | | | | |
| | | | | | | | |
| INVESTMENTS | | PRINCIPAL
AMOUNT ($) | | | VALUE ($) | |
| | | | | | | | |
|
Equity Real Estate Investment Trusts (REITs) — 2.9% | |
| | |
Brookfield Property REIT, Inc.
5.75%, 5/15/2026 (a) | | | 170,000 | | | | 138,550 | |
| | |
CoreCivic, Inc. 4.63%, 5/1/2023 | | | 210,000 | | | | 199,500 | |
| | |
ESH Hospitality, Inc.
5.25%, 5/1/2025 (a) | | | 504,000 | | | | 511,560 | |
| | |
4.63%, 10/1/2027 (a) | | | 631,000 | | | | 630,987 | |
| | |
HAT Holdings I LLC 5.25%, 7/15/2024 (a) | | | 66,000 | | | | 69,115 | |
| | |
Iron Mountain, Inc.
4.88%, 9/15/2027 (a) | | | 183,000 | | | | 189,862 | |
| | |
iStar, Inc. 4.75%, 10/1/2024 | | | 257,000 | | | | 255,073 | |
| | |
MGM Growth Properties Operating Partnership LP
5.63%, 5/1/2024 | | | 325,000 | | | | 351,000 | |
| | |
5.75%, 2/1/2027 | | | 718,000 | | | | 794,288 | |
| | |
RHP Hotel Properties LP 4.75%, 10/15/2027 | | | 535,000 | | | | 486,850 | |
| | |
SBA Communications Corp. 3.88%, 2/15/2027 (a) | | | 420,000 | | | | 435,939 | |
| | |
Uniti Group LP 6.00%, 4/15/2023 (a) | | | 457,000 | | | | 461,684 | |
| | |
8.25%, 10/15/2023 | | | 265,000 | | | | 262,350 | |
| | |
VICI Properties LP 3.50%, 2/15/2025 (a) | | | 127,000 | | | | 127,224 | |
| | |
4.25%, 12/1/2026 (a) | | | 641,000 | | | | 655,422 | |
| | |
4.63%, 12/1/2029 (a) | | | 541,000 | | | | 562,640 | |
| | | | | | | | |
| | |
| | | | | | | 6,132,044 | |
| | | | | | | | |
|
Food & Staples Retailing — 1.4% | |
| | |
Albertsons Cos., Inc.
6.63%, 6/15/2024 | | | 505,000 | | | | 521,261 | |
| | |
4.63%, 1/15/2027 (a) | | | 853,000 | | | | 901,314 | |
| | |
5.88%, 2/15/2028 (a) | | | 414,000 | | | | 447,120 | |
| | |
4.88%, 2/15/2030 (a) | | | 257,000 | | | | 276,275 | |
| | |
Rite Aid Corp. 7.50%, 7/1/2025 (a) | | | 179,000 | | | | 179,000 | |
| | |
8.00%, 11/15/2026 (a) | | | 523,000 | | | | 529,537 | |
| | |
Safeway, Inc. 7.25%, 2/1/2031 | | | 33,000 | | | | 36,960 | |
| | |
US Foods, Inc.
5.88%, 6/15/2024 (a) | | | 76,000 | | | | 77,140 | |
| | |
6.25%, 4/15/2025 (a) | | | 76,000 | | | | 80,560 | |
| | | | | | | | |
| | |
| | | | | | | 3,049,167 | |
| | | | | | | | |
|
Food Products — 2.5% | |
| | |
B&G Foods, Inc.
5.25%, 4/1/2025 | | | 252,000 | | | | 260,747 | |
| | |
5.25%, 9/15/2027 | | | 449,000 | | | | 480,147 | |
| | |
Darling Ingredients, Inc.
5.25%, 4/15/2027 (a) | | | 101,000 | | | | 107,186 | |
| | |
Dole Food Co., Inc. 7.25%, 6/15/2025 (a) | | | 90,000 | | | | 90,000 | |
SEE NOTES TO FINANCIAL STATEMENTS.
| | | | | | |
| | | |
| 70 | | | | J.P. MORGAN EXCHANGE-TRADED FUNDS | | AUGUST 31, 2020 |
| | | | | | | | |
| INVESTMENTS | | PRINCIPAL
AMOUNT ($) | | | VALUE ($) | |
Corporate Bonds — continued | |
|
Food Products — continued | |
| | |
JBS USA LUX SA
5.75%, 6/15/2025 (a) | | | 384,000 | | | | 396,480 | |
| | |
6.50%, 4/15/2029 (a) | | | 434,000 | | | | 492,672 | |
| | |
5.50%, 1/15/2030 (a) | | | 267,000 | | | | 296,616 | |
| | |
Lamb Weston Holdings, Inc.
4.63%, 11/1/2024 (a) | | | 136,000 | | | | 141,922 | |
| | |
4.88%, 11/1/2026 (a) | | | 127,000 | | | | 132,890 | |
| | |
4.88%, 5/15/2028 (a) | | | 494,000 | | | | 543,605 | |
| | |
Pilgrim’s Pride Corp.
5.75%, 3/15/2025 (a) | | | 252,000 | | | | 258,930 | |
| | |
5.88%, 9/30/2027 (a) | | | 8,000 | | | | 8,500 | |
| | |
Post Holdings, Inc.
5.00%, 8/15/2026 (a) | | | 612,000 | | | | 635,134 | |
| | |
5.75%, 3/1/2027 (a) | | | 489,000 | | | | 516,506 | |
| | |
5.50%, 12/15/2029 (a) | | | 869,000 | | | | 952,598 | |
| | | | | | | | |
| | |
| | | | | | | 5,313,933 | |
| | | | | | | | |
|
Gas Utilities — 0.5% | |
| | |
AmeriGas Partners LP
5.50%, 5/20/2025 | | | 332,000 | | | | 364,370 | |
| | |
5.88%, 8/20/2026 | | | 571,000 | | | | 647,054 | |
| | | | | | | | |
| | |
| | | | | | | 1,011,424 | |
| | | | | | | | |
|
Health Care Equipment & Supplies — 0.2% | |
| | |
Hill-Rom Holdings, Inc. 4.38%, 9/15/2027 (a) | | | 84,000 | | | | 87,827 | |
| | |
Hologic, Inc.
4.38%, 10/15/2025 (a) | | | 151,000 | | | | 154,118 | |
| | |
4.63%, 2/1/2028 (a) | | | 59,000 | | | | 62,642 | |
| | |
Teleflex, Inc. 4.63%, 11/15/2027 | | | 168,000 | | | | 178,500 | |
| | | | | | | | |
| | |
| | | | | | | 483,087 | |
| | | | | | | | |
|
Health Care Providers & Services — 6.6% | |
| | |
Acadia Healthcare Co., Inc. 5.63%, 2/15/2023 | | | 461,000 | | | | 466,763 | |
| | |
Air Medical Group Holdings, Inc. 6.38%, 5/15/2023 (a) | | | 89,000 | | | | 87,795 | |
| | |
Centene Corp.
5.25%, 4/1/2025 (a) | | | 318,000 | | | | 329,925 | |
| | |
5.38%, 6/1/2026 (a) | | | 1,248,000 | | | | 1,319,760 | |
| | |
5.38%, 8/15/2026 (a) | | | 342,000 | | | | 362,093 | |
| | |
4.25%, 12/15/2027 | | | 818,000 | | | | 858,900 | |
| | |
4.63%, 12/15/2029 | | | 826,000 | | | | 905,164 | |
| | |
3.38%, 2/15/2030 | | | 150,000 | | | | 156,000 | |
| | |
Community Health Systems, Inc.
6.25%, 3/31/2023 | | | 221,000 | | | | 221,552 | |
| | |
8.00%, 3/15/2026 (a) | | | 567,000 | | | | 587,554 | |
| | |
DaVita, Inc. 4.63%, 6/1/2030 (a) | | | 952,000 | | | | 1,000,790 | |
| | | | | | | | |
| INVESTMENTS | | PRINCIPAL
AMOUNT ($) | | | VALUE ($) | |
| | | | | | | | |
|
Health Care Providers & Services — continued | |
| | |
Encompass Health Corp.
4.50%, 2/1/2028 | | | 689,000 | | | | 706,480 | |
| | |
4.75%, 2/1/2030 | | | 181,000 | | | | 188,839 | |
| | |
Envision Healthcare Corp. 8.75%, 10/15/2026 (a) | | | 267,000 | | | | 117,480 | |
| | |
HCA, Inc.
5.38%, 2/1/2025 | | | 910,000 | | | | 1,024,796 | |
| | |
5.38%, 9/1/2026 | | | 200,000 | | | | 227,000 | |
| | |
5.63%, 9/1/2028 | | | 1,107,000 | | | | 1,316,572 | |
| | |
5.88%, 2/1/2029 | | | 385,000 | | | | 467,650 | |
| | |
MEDNAX, Inc. 6.25%, 1/15/2027 (a) | | | 46,000 | | | | 48,760 | |
| | |
Polaris Intermediate Corp. 8.50% (cash), 12/1/2022 (a) (c) | | | 45,000 | | | | 45,731 | |
| | |
RegionalCare Hospital Partners Holdings, Inc. 9.75%, 12/1/2026 (a) | | | 135,000 | | | | 146,298 | |
| | |
Select Medical Corp. 6.25%, 8/15/2026 (a) | | | 316,000 | | | | 339,469 | |
| | |
Tenet Healthcare Corp.
6.75%, 6/15/2023 | | | 236,000 | | | | 251,340 | |
| | |
4.88%, 1/1/2026 (a) | | | 463,000 | | | | 481,520 | |
| | |
6.25%, 2/1/2027 (a) | | | 541,000 | | | | 568,050 | |
| | |
5.13%, 11/1/2027 (a) | | | 1,485,000 | | | | 1,566,675 | |
| | |
6.88%, 11/15/2031 | | | 222,000 | | | | 220,890 | |
| | |
US Renal Care, Inc. 10.63%, 7/15/2027 (a) | | | 83,000 | | | | 89,640 | |
| | | | | | | | |
| | |
| | | | | | | 14,103,486 | |
| | | | | | | | |
|
Health Care Technology — 0.3% | |
| | |
IQVIA, Inc. 5.00%, 5/15/2027 (a) | | | 591,000 | | | | 622,090 | |
| | | | | | | | |
|
Hotels, Restaurants & Leisure — 8.4% | |
| | |
1011778 BC ULC (Canada)
4.25%, 5/15/2024 (a) | | | 920,000 | | | | 937,250 | |
| | |
5.00%, 10/15/2025 (a) | | | 667,000 | | | | 684,949 | |
| | |
3.88%, 1/15/2028 (a) | | | 419,000 | | | | 429,475 | |
| | |
Boyd Gaming Corp.
6.38%, 4/1/2026 | | | 322,000 | | | | 335,688 | |
| | |
4.75%, 12/1/2027 | | | 613,000 | | | | 610,701 | |
| | |
Boyne USA, Inc. 7.25%, 5/1/2025 (a) | | | 112,000 | | | | 118,720 | |
| | |
Caesars Resort Collection LLC 5.25%, 10/15/2025 (a) | | | 505,000 | | | | 483,472 | |
| | |
Carnival Corp.
11.50%, 4/1/2023 (a) | | | 1,014,000 | | | | 1,131,158 | |
| | |
10.50%, 2/1/2026 (a) | | | 300,000 | | | | 315,000 | |
| | |
Cedar Fair LP
5.50%, 5/1/2025 (a) | | | 492,000 | | | | 507,990 | |
| | |
5.25%, 7/15/2029 | | | 113,000 | | | | 109,511 | |
| | |
Churchill Downs, Inc. 5.50%, 4/1/2027 (a) | | | 333,000 | | | | 349,650 | |
SEE NOTES TO FINANCIAL STATEMENTS.
| | | | | | | | |
| | | |
| AUGUST 31, 2020 | | J.P. MORGAN EXCHANGE-TRADED FUNDS | | | | | 71 | |
JPMorgan High Yield Research Enhanced ETF
SCHEDULE OF PORTFOLIO INVESTMENTS
AS OF AUGUST 31, 2020 (Unaudited) (continued)
| | | | | | | | |
| INVESTMENTS | | PRINCIPAL
AMOUNT ($) | | | VALUE ($) | |
Corporate Bonds — continued | |
|
Hotels, Restaurants & Leisure — continued | |
| | |
Colt Merger Sub, Inc. 5.75%, 7/1/2025 (a) | | | 325,000 | | | | 340,437 | |
| | |
Constellation Merger Sub, Inc. 8.50%, 9/15/2025 (a) | | | 124,000 | | | | 105,400 | |
| | |
Enterprise Development Authority (The) 12.00%, 7/15/2024 (a) | | | 112,000 | | | | 122,640 | |
| | |
Gateway Casinos & Entertainment Ltd. (Canada) 8.25%, 3/1/2024 (a) | | | 70,000 | | | | 58,800 | |
| | |
Hilton Domestic Operating Co., Inc.
5.13%, 5/1/2026 | | | 707,000 | | | | 729,999 | |
| | |
4.88%, 1/15/2030 | | | 341,000 | | | | 351,230 | |
| | |
Hilton Grand Vacations Borrower LLC 6.13%, 12/1/2024 | | | 73,000 | | | | 75,464 | |
| | |
Hilton Worldwide Finance LLC
4.63%, 4/1/2025 | | | 214,000 | | | | 216,140 | |
| | |
4.88%, 4/1/2027 | | | 415,000 | | | | 425,375 | |
| | |
International Game Technology plc
6.50%, 2/15/2025 (a) | | | 600,000 | | | | 652,500 | |
| | |
5.25%, 1/15/2029 (a) | | | 400,000 | | | | 410,000 | |
| | |
IRB Holding Corp.
7.00%, 6/15/2025 (a) | | | 394,000 | | | | 420,595 | |
| | |
6.75%, 2/15/2026 (a) | | | 122,000 | | | | 123,982 | |
| | |
KFC Holding Co.
5.00%, 6/1/2024 (a) | | | 141,000 | | | | 145,481 | |
| | |
5.25%, 6/1/2026 (a) | | | 758,000 | | | | 786,425 | |
| | |
4.75%, 6/1/2027 (a) | | | 60,000 | | | | 63,000 | |
| | |
Marriott Ownership Resorts, Inc.
6.13%, 9/15/2025 (a) | | | 173,000 | | | | 183,812 | |
| | |
6.50%, 9/15/2026 | | | 174,000 | | | | 180,743 | |
| | |
4.75%, 1/15/2028 | | | 89,000 | | | | 83,924 | |
| | |
MGM Resorts International
6.00%, 3/15/2023 | | | 342,000 | | | | 360,810 | |
| | |
5.50%, 4/15/2027 | | | 949,000 | | | | 1,003,567 | |
| | |
Royal Caribbean Cruises Ltd. 11.50%, 6/1/2025 (a) | | | 543,000 | | | | 629,831 | |
| | |
Scientific Games International, Inc. 5.00%, 10/15/2025 (a) | | | 862,000 | | | | 852,846 | |
| | |
Six Flags Entertainment Corp. 5.50%, 4/15/2027 (a) | | | 173,000 | | | | 168,675 | |
| | |
Six Flags Theme Parks, Inc. 7.00%, 7/1/2025 (a) | | | 343,000 | | | | 371,195 | |
| | |
Stars Group Holdings BV (Canada) 7.00%, 7/15/2026 (a) | | | 303,000 | | | | 322,998 | |
| | |
Station Casinos LLC 4.50%, 2/15/2028 (a) | | | 140,000 | | | | 133,084 | |
| | |
Vail Resorts, Inc. 6.25%, 5/15/2025 (a) | | | 140,000 | | | | 149,975 | |
| | |
Wyndham Destinations, Inc.
4.25%, 3/1/2022 | | | 60,000 | | | | 60,583 | |
| | | | | | | | |
| INVESTMENTS | | PRINCIPAL
AMOUNT ($) | | | VALUE ($) | |
| | | | | | | | |
Hotels, Restaurants & Leisure — continued | |
| | |
6.35%, 10/1/2025(b) | | | 35,000 | | | | 36,750 | |
| | |
5.75%, 4/1/2027(b) | | | 89,000 | | | | 91,225 | |
| | |
Wyndham Hotels & Resorts, Inc. 5.38%, 4/15/2026 (a) | | | 28,000 | | | | 29,050 | |
| | |
Wynn Las Vegas LLC
4.25%, 5/30/2023 (a) | | | 100,000 | | | | 98,127 | |
| | |
5.50%, 3/1/2025 (a) | | | 552,000 | | | | 546,480 | |
| | |
5.25%, 5/15/2027 (a) | | | 295,000 | | | | 287,330 | |
| | |
Wynn Resorts Finance LLC
5.13%, 10/1/2029 (a) | | | 346,000 | | | | 337,350 | |
| | |
Yum! Brands, Inc.
4.75%, 1/15/2030 (a) | | | 516,000 | | | | 568,890 | |
| | |
6.88%, 11/15/2037 | | | 199,000 | | | | 241,536 | |
| | | | | | | | |
| | |
| | | | | | | 17,779,813 | |
| | | | | | | | |
|
Household Durables — 1.4% | |
| | |
KB Home 4.80%, 11/15/2029 | | | 210,000 | | | | 227,325 | |
| | |
Lennar Corp.
4.13%, 1/15/2022 | | | 516,000 | | | | 527,610 | |
| | |
4.50%, 4/30/2024 | | | 450,000 | | | | 482,625 | |
| | |
5.25%, 6/1/2026 | | | 450,000 | | | | 507,838 | |
| | |
4.75%, 11/29/2027 | | | 262,000 | | | | 298,680 | |
| | |
Newell Brands, Inc. 4.70%, 4/1/2026 (b) | | | 267,000 | | | | 289,046 | |
| | |
PulteGroup, Inc.
5.50%, 3/1/2026 | | | 135,000 | | | | 155,085 | |
| | |
6.38%, 5/15/2033 | | | 97,000 | | | | 121,966 | |
| | |
Taylor Morrison Communities, Inc. 5.88%, 6/15/2027 (a) | | | 158,000 | | | | 177,425 | |
| | |
Tempur Sealy International, Inc. 5.50%, 6/15/2026 | | | 230,000 | | | | 240,638 | |
| | | | | | | | |
| | |
| | | | | | | 3,028,238 | |
| | | | | | | | |
|
Household Products — 0.8% | |
| | |
Central Garden & Pet Co. 5.13%, 2/1/2028 | | | 140,000 | | | | 148,400 | |
| | |
Energizer Holdings, Inc.
6.38%, 7/15/2026 (a) | | | 288,000 | | | | 305,280 | |
| | |
4.75%, 6/15/2028 (a) | | | 568,000 | | | | 592,708 | |
| | |
Spectrum Brands, Inc.
5.75%, 7/15/2025 | | | 393,000 | | | | 405,773 | |
| | |
5.00%, 10/1/2029 (a) | | | 290,000 | | | | 301,600 | |
| | | | | | | | |
| | |
| | | | | | | 1,753,761 | |
| | | | | | | | |
|
Independent Power and Renewable Electricity Producers — 0.4% | |
| | |
AES Corp. (The) 5.13%, 9/1/2027 | | | 166,000 | | | | 179,195 | |
| | |
Calpine Corp.
5.25%, 6/1/2026 (a) | | | 291,000 | | | | 303,760 | |
| | |
4.50%, 2/15/2028 (a) | | | 290,000 | | | | 300,626 | |
SEE NOTES TO FINANCIAL STATEMENTS.
| | | | | | |
| | | |
| 72 | | | | J.P. MORGAN EXCHANGE-TRADED FUNDS | | AUGUST 31, 2020 |
| | | | | | | | |
| INVESTMENTS | | PRINCIPAL
AMOUNT ($) | | | VALUE ($) | |
Corporate Bonds — continued | |
|
Independent Power and Renewable Electricity Producers — continued | |
| | |
Clearway Energy Operating LLC 5.75%, 10/15/2025 | | | 140,000 | | | | 148,400 | |
| | | | | | | | |
| | |
| | | | | | | 931,981 | |
| | | | | | | | |
|
Insurance — 0.2% | |
| | |
HUB International Ltd. 7.00%, 5/1/2026 (a) | | | 323,000 | | | | 335,113 | |
| | | | | | | | |
|
Internet & Direct Marketing Retail — 0.3% | |
| | |
Go Daddy Operating Co. LLC 5.25%, 12/1/2027 (a) | | | 138,000 | | | | 146,625 | |
| | |
Photo Holdings Merger Sub, Inc. 8.50%, 10/1/2026 (a) | | | 165,000 | | | | 151,645 | |
| | |
QVC, Inc. 4.38%, 3/15/2023 | | | 384,000 | | | | 400,320 | |
| | | | | | | | |
| | |
| | | | | | | 698,590 | |
| | | | | | | | |
|
IT Services — 0.7% | |
| | |
Gartner, Inc.
5.13%, 4/1/2025 (a) | | | 485,000 | | | | 504,254 | |
| | |
4.50%, 7/1/2028 (a) | | | 325,000 | | | | 339,625 | |
| | |
Presidio Holdings, Inc.
4.88%, 2/1/2027 (a) | | | 344,000 | | | | 352,600 | |
| | |
8.25%, 2/1/2028 (a) | | | 127,000 | | | | 132,715 | |
| | |
Science Applications International Corp. 4.88%, 4/1/2028 (a) | | | 127,000 | | | | 131,604 | |
| | | | | | | | |
| | |
| | | | | | | 1,460,798 | |
| | | | | | | | |
|
Leisure Products — 0.3% | |
| | |
Mattel, Inc.
6.75%, 12/31/2025 (a) | | | 283,000 | | | | 300,334 | |
| | |
5.88%, 12/15/2027 (a) | | | 157,000 | | | | 170,753 | |
| | |
5.45%, 11/1/2041 | | | 140,000 | | | | 127,575 | |
| | |
Vista Outdoor, Inc. 5.88%, 10/1/2023 | | | 66,000 | | | | 67,072 | |
| | | | | | | | |
| | |
| | | | | | | 665,734 | |
| | | | | | | | |
|
Life Sciences Tools & Services — 0.1% | |
| | |
Avantor, Inc. 6.00%, 10/1/2024 (a) | | | 244,000 | | | | 255,590 | |
| | | | | | | | |
|
Machinery — 0.7% | |
| | |
Amsted Industries, Inc. 5.63%, 7/1/2027 (a) | | | 34,000 | | | | 36,125 | |
| | |
EnPro Industries, Inc. 5.75%, 10/15/2026 | | | 295,000 | | | | 308,275 | |
| | |
Hillman Group, Inc. (The) 6.38%, 7/15/2022 (a) | | | 117,000 | | | | 114,660 | |
| | |
Mueller Water Products, Inc. 5.50%, 6/15/2026 (a) | | | 160,000 | | | | 166,800 | |
| | |
RBS Global, Inc. 4.88%, 12/15/2025 (a) | | | 201,000 | | | | 205,774 | |
| | |
Tennant Co. 5.63%, 5/1/2025 | | | 108,000 | | | | 112,185 | |
| | |
Terex Corp. 5.63%, 2/1/2025 (a) | | | 66,000 | | | | 66,820 | |
| | |
TriMas Corp. 4.88%, 10/15/2025 (a) | | | 112,000 | | | | 113,820 | |
| | | | | | | | |
| INVESTMENTS | | PRINCIPAL
AMOUNT ($) | | | VALUE ($) | |
| | | | | | | | |
|
Machinery — continued | |
| | |
Vertical US Newco, Inc. (Germany) | | | | | | | | |
| | |
5.25%, 7/15/2027 (a) | | | 300,000 | | | | 312,375 | |
| | | | | | | | |
| | |
| | | | | | | 1,436,834 | |
| | | | | | | | |
|
Media — 6.1% | |
| | |
AMC Networks, Inc. 5.00%, 4/1/2024 | | | 299,000 | | | | 304,606 | |
| | |
Clear Channel Worldwide Holdings, Inc.
9.25%, 2/15/2024 | | | 833,000 | | | | 816,340 | |
| | |
5.13%, 8/15/2027 (a) | | | 453,000 | | | | 457,666 | |
| | |
CSC Holdings LLC
5.50%, 4/15/2027 (a) | | | 1,200,000 | | | | 1,279,752 | |
| | |
6.50%, 2/1/2029 (a) | | | 1,025,000 | | | | 1,155,047 | |
| | |
5.75%, 1/15/2030 (a) | | | 900,000 | | | | 981,000 | |
| | |
Diamond Sports Group LLC 5.38%, 8/15/2026 (a) | | | 216,000 | | | | 168,480 | |
| | |
DISH DBS Corp.
6.75%, 6/1/2021 | | | 14,000 | | | | 14,350 | |
| | |
5.00%, 3/15/2023 | | | 231,000 | | | | 239,085 | |
| | |
5.88%, 11/15/2024 | | | 537,000 | | | | 567,594 | |
| | |
7.75%, 7/1/2026 | | | 360,000 | | | | 412,200 | |
| | |
Gray Television, Inc. 7.00%, 5/15/2027 (a) | | | 77,000 | | | | 83,545 | |
| | |
iHeartCommunications, Inc.
6.38%, 5/1/2026 | | | 341,967 | | | | 355,646 | |
| | |
8.38%, 5/1/2027 | | | 759,267 | | | | 763,063 | |
| | |
Lamar Media Corp.
5.00%, 5/1/2023 | | | 61,000 | | | | 61,686 | |
| | |
5.75%, 2/1/2026 | | | 151,000 | | | | 157,463 | |
| | |
3.75%, 2/15/2028 (a) | | | 151,000 | | | | 150,811 | |
| | |
LCPR Senior Secured Financing DAC 6.75%, 10/15/2027 (a) | | | 230,000 | | | | 246,675 | |
| | |
Meredith Corp. 6.88%, 2/1/2026 | | | 557,000 | | | | 483,859 | |
| | |
Nexstar Broadcasting, Inc.
5.63%, 8/1/2024 (a) | | | 197,000 | | | | 202,130 | |
| | |
5.63%, 7/15/2027 (a) | | | 703,000 | | | | 741,665 | |
| | |
Outfront Media Capital LLC 5.00%, 8/15/2027 (a) | | | 77,000 | | | | 75,630 | |
| | |
Scripps Escrow, Inc. 5.88%, 7/15/2027 (a) | | | 260,000 | | | | 260,000 | |
| | |
Sinclair Television Group, Inc. 5.50%, 3/1/2030 (a) | | | 117,000 | | | | 114,332 | |
| | |
Sirius XM Radio, Inc.
4.63%, 7/15/2024 (a) | | | 613,000 | | | | 637,520 | |
| | |
5.00%, 8/1/2027 (a) | | | 393,000 | | | | 416,847 | |
| | |
5.50%, 7/1/2029 (a) | | | 585,000 | | | | 642,494 | |
| | |
TEGNA, Inc. 5.00%, 9/15/2029 (a) | | | 57,000 | | | | 57,334 | |
SEE NOTES TO FINANCIAL STATEMENTS.
| | | | | | | | |
| | | |
| AUGUST 31, 2020 | | J.P. MORGAN EXCHANGE-TRADED FUNDS | | | | | 73 | |
JPMorgan High Yield Research Enhanced ETF
SCHEDULE OF PORTFOLIO INVESTMENTS
AS OF AUGUST 31, 2020 (Unaudited) (continued)
| | | | | | | | |
| INVESTMENTS | | PRINCIPAL
AMOUNT ($) | | | VALUE ($) | |
Corporate Bonds — continued | |
|
Media — continued | |
| | |
ViacomCBS, Inc. | | | | | | | | |
| | |
(ICE LIBOR USD 3 Month + 3.90%), 5.87%, 2/28/2057(d) | | | 13,000 | | | | 13,483 | |
| | |
(ICE LIBOR USD 3 Month + 3.90%), 6.25%, 2/28/2057(d) | | | 27,000 | | | | 30,105 | |
| | |
Ziggo BV (Netherlands) 5.50%, 1/15/2027 (a) | | | 1,100,000 | | | | 1,156,111 | |
| | | | | | | | |
| | |
| | | | | | | 13,046,519 | |
| | | | | | | | |
|
Metals & Mining — 2.7% | |
| | |
Alcoa Nederland Holding BV
6.75%, 9/30/2024 (a) | | | 624,000 | | | | 645,453 | |
| | |
6.13%, 5/15/2028 (a) | | | 911,000 | | | | 983,880 | |
| | |
Allegheny Technologies, Inc. 7.88%, 8/15/2023(b) | | | 312,000 | | | | 327,819 | |
| | |
Arconic Corp.
6.00%, 5/15/2025 (a) | | | 433,000 | | | | 458,980 | |
| | |
6.13%, 2/15/2028 (a) | | | 367,000 | | | | 387,185 | |
| | |
Constellium SE 6.63%, 3/1/2025 (a) | | | 266,000 | | | | 273,980 | |
| | |
Freeport-McMoRan, Inc.
4.55%, 11/14/2024 | | | 378,000 | | | | 407,628 | |
| | |
4.63%, 8/1/2030 | | | 262,000 | | | | 280,010 | |
| | |
5.40%, 11/14/2034 | | | 396,000 | | | | 447,634 | |
| | |
5.45%, 3/15/2043 | | | 382,000 | | | | 429,574 | |
| | |
Kaiser Aluminum Corp. 4.63%, 3/1/2028 (a) | | | 361,000 | | | | 357,072 | |
| | |
Novelis Corp. 5.88%, 9/30/2026 (a) | | | 457,000 | | | | 477,474 | |
| | |
United States Steel Corp. 12.00%, 6/1/2025 (a) | | | 288,000 | | | | 305,280 | |
| | | | | | | | |
| | |
| | | | | | | 5,781,969 | |
| | | | | | | | |
|
Multiline Retail — 0.2% | |
| | |
Macy’s, Inc. 8.38%, 6/15/2025 (a) | | | 316,000 | | | | 331,680 | |
| | | | | | | | |
|
Oil, Gas & Consumable Fuels — 12.2% | |
| | |
Antero Midstream Partners LP
5.38%, 9/15/2024 | | | 49,000 | | | | 45,202 | |
| | |
5.75%, 3/1/2027 (a) | | | 193,000 | | | | 172,253 | |
| | |
Apache Corp.
3.25%, 4/15/2022 | | | 509,000 | | | | 508,094 | |
| | |
4.38%, 10/15/2028 | | | 400,000 | | | | 396,984 | |
| | |
5.10%, 9/1/2040 | | | 1,477,000 | | | | 1,436,663 | |
| | |
Blue Racer Midstream LLC 6.13%, 11/15/2022 (a) | | | 230,000 | | | | 228,850 | |
| | |
Buckeye Partners LP
4.15%, 7/1/2023 | | | 200,000 | | | | 200,000 | |
| | |
3.95%, 12/1/2026 | | | 198,000 | | | | 196,248 | |
| | |
4.50%, 3/1/2028 (a) | | | 940,000 | | | | 959,589 | |
| | | | | | | | |
| INVESTMENTS | | PRINCIPAL
AMOUNT ($) | | | VALUE ($) | |
| | | | | | | | |
|
Oil, Gas & Consumable Fuels — continued | |
| | |
Cenovus Energy, Inc. (Canada)
3.00%, 8/15/2022 | | | 127,000 | | | | 129,050 | |
| | |
3.80%, 9/15/2023 | | | 189,000 | | | | 188,285 | |
| | |
6.75%, 11/15/2039 | | | 236,000 | | | | 244,504 | |
| | |
Cheniere Energy Partners LP
5.25%, 10/1/2025 | | | 517,000 | | | | 529,015 | |
| | |
4.50%, 10/1/2029 | | | 738,000 | | | | 767,203 | |
| | |
CNX Resources Corp.
5.88%, 4/15/2022 | | | 23,000 | | | | 23,097 | |
| | |
7.25%, 3/14/2027 (a) | | | 66,000 | | | | 68,640 | |
| | |
Comstock Resources, Inc. 9.75%, 8/15/2026 | | | 698,000 | | | | 738,142 | |
| | |
Continental Resources, Inc.
4.50%, 4/15/2023 | | | 516,000 | | | | 519,225 | |
| | |
3.80%, 6/1/2024 | | | 127,000 | | | | 125,217 | |
| | |
Crestwood Midstream Partners LP | | | | | | | | |
| | |
5.63%, 5/1/2027 (a) | | | 343,000 | | | | 314,703 | |
| | |
DCP Midstream Operating LP
4.75%, 9/30/2021 (a) | | | 168,000 | | | | 171,360 | |
| | |
5.38%, 7/15/2025 | | | 867,000 | | | | 931,418 | |
| | |
5.13%, 5/15/2029 | | | 713,000 | | | | 755,787 | |
| | |
EnLink Midstream Partners LP
4.15%, 6/1/2025 | | | 141,000 | | | | 125,662 | |
| | |
5.45%, 6/1/2047 | | | 223,000 | | | | 145,797 | |
| | |
EQM Midstream Partners LP
4.75%, 7/15/2023 | | | 485,000 | | | | 494,220 | |
| | |
4.00%, 8/1/2024 | | | 288,000 | | | | 289,440 | |
| | |
5.50%, 7/15/2028 | | | 909,000 | | | | 941,869 | |
| | |
EQT Corp.
3.00%, 10/1/2022 | | | 565,000 | | | | 558,632 | |
| | |
7.88%, 2/1/2025(b) | | | 750,000 | | | | 860,948 | |
| | |
Genesis Energy LP
6.00%, 5/15/2023 | | | 156,000 | | | | 145,911 | |
| | |
6.50%, 10/1/2025 | | | 197,000 | | | | 170,346 | |
| | |
Hess Infrastructure Partners LP
5.63%, 2/15/2026 (a) | | | 25,000 | | | | 26,011 | |
| | |
Hess Midstream Operations LP
5.63%, 2/15/2026 (a) | | | 99,000 | | | | 103,004 | |
| | |
5.13%, 6/15/2028 (a) | | | 34,000 | | | | 34,956 | |
| | |
Hilcorp Energy I LP
5.75%, 10/1/2025 (a) | | | 117,000 | | | | 109,980 | |
| | |
6.25%, 11/1/2028 (a) | | | 74,000 | | | | 69,560 | |
| | |
Jagged Peak Energy LLC 5.88%, 5/1/2026 | | | 109,000 | | | | 111,180 | |
| | |
MEG Energy Corp. (Canada)
7.00%, 3/31/2024 (a) | | | 174,000 | | | | 172,695 | |
| | |
7.13%, 2/1/2027 (a) | | | 450,000 | | | | 430,547 | |
SEE NOTES TO FINANCIAL STATEMENTS.
| | | | | | |
| | | |
| 74 | | | | J.P. MORGAN EXCHANGE-TRADED FUNDS | | AUGUST 31, 2020 |
| | | | | | | | |
| INVESTMENTS | | PRINCIPAL
AMOUNT ($) | | | VALUE ($) | |
Corporate Bonds — continued | |
|
Oil, Gas & Consumable Fuels — continued | |
| | |
Murphy Oil Corp.
5.75%, 8/15/2025 | | | 165,000 | | | | 158,194 | |
| | |
5.88%, 12/1/2027 | | | 59,000 | | | | 56,676 | |
| | |
6.37%, 12/1/2042(b) | | | 83,000 | | | | 70,965 | |
| | |
NuStar Logistics LP
6.00%, 6/1/2026 | | | 30,000 | | | | 31,397 | |
| | |
5.63%, 4/28/2027 | | | 154,000 | | | | 154,770 | |
| | |
Oasis Petroleum, Inc.
6.88%, 3/15/2022 | | | 582,000 | | | | 113,126 | |
| | |
6.25%, 5/1/2026 (a) | | | 195,000 | | | | 35,100 | |
| | |
Occidental Petroleum Corp.
2.70%, 8/15/2022 | | | 782,000 | | | | 768,843 | |
| | |
2.90%, 8/15/2024 | | | 487,000 | | | | 448,040 | |
| | |
6.45%, 9/15/2036 | | | 805,000 | | | | 789,415 | |
| | |
4.20%, 3/15/2048 | | | 127,000 | | | | 96,203 | |
| | |
Parsley Energy LLC
5.38%, 1/15/2025 (a) | | | 776,000 | | | | 790,550 | |
| | |
5.63%, 10/15/2027 (a) | | | 381,000 | | | | 394,335 | |
| | |
PBF Holding Co. LLC 9.25%, 5/15/2025 (a) | | | 230,000 | | | | 251,850 | |
| | |
PBF Logistics LP 6.88%, 5/15/2023 | | | 66,000 | | | | 65,465 | |
| | |
Rockies Express Pipeline LLC
3.60%, 5/15/2025 (a) | | | 131,000 | | | | 128,647 | |
| | |
4.95%, 7/15/2029 (a) | | | 131,000 | | | | 131,492 | |
| | |
SM Energy Co.
5.63%, 6/1/2025 | | | 43,000 | | | | 21,930 | |
| | |
6.75%, 9/15/2026 | | | 118,000 | | | | 57,820 | |
| | |
6.63%, 1/15/2027 | | | 121,000 | | | | 59,290 | |
| | |
Southwestern Energy Co.
6.45%, 1/23/2025 (b) | | | 173,000 | | | | 173,786 | |
| | |
7.75%, 10/1/2027 | | | 57,000 | | | | 58,288 | |
| | |
Sunoco LP
4.88%, 1/15/2023 | | | 170,000 | | | | 172,772 | |
| | |
6.00%, 4/15/2027 | | | 122,000 | | | | 129,868 | |
| | |
Tallgrass Energy Partners LP
5.50%, 9/15/2024 (a) | | | 417,000 | | | | 408,660 | |
| | |
5.50%, 1/15/2028 (a) | | | 365,000 | | | | 333,975 | |
| | |
Targa Resources Partners LP
4.25%, 11/15/2023 | | | 390,000 | | | | 392,449 | |
| | |
5.88%, 4/15/2026 | | | 1,165,000 | | | | 1,226,163 | |
| | |
6.88%, 1/15/2029 | | | 1,067,000 | | | | 1,179,035 | |
| | |
5.50%, 3/1/2030 (a) | | | 206,000 | | | | 217,265 | |
| | |
TerraForm Power Operating LLC 5.00%, 1/31/2028 (a) | | | 260,000 | | | | 288,895 | |
| | |
Western Midstream Operating LP
4.00%, 7/1/2022 | | | 127,000 | | | | 129,222 | |
| | |
4.10%, 2/1/2025(b) | | | 127,000 | | | | 126,698 | |
| | |
5.05%, 2/1/2030(b) | | | 561,000 | | | | 575,137 | |
| | | | | | | | |
| INVESTMENTS | | PRINCIPAL
AMOUNT ($) | | | VALUE ($) | |
| | | | | | | | |
|
Oil, Gas & Consumable Fuels — continued | |
| | |
WPX Energy, Inc.
8.25%, 8/1/2023 | | | 33,000 | | | | 37,089 | |
| | |
5.25%, 9/15/2024 | | | 1,133,000 | | | | 1,155,093 | |
| | |
4.50%, 1/15/2030 | | | 265,000 | | | | 253,075 | |
| | | | | | | | |
| | |
| | | | | | | 25,921,865 | |
| | | | | | | | |
|
Personal Products — 0.3% | |
| | |
Edgewell Personal Care Co. 5.50%, 6/1/2028 (a) | | | 395,000 | | | | 421,666 | |
| | |
Prestige Brands, Inc. 6.38%, 3/1/2024 (a) | | | 247,000 | | | | 254,976 | |
| | | | | | | | |
| | |
| | | | | | | 676,642 | |
| | | | | | | | |
|
Pharmaceuticals — 2.5% | |
| | |
Bausch Health Americas, Inc. 8.50%, 1/31/2027 (a) | | | 688,000 | | | | 756,800 | |
| | |
Bausch Health Cos., Inc.
6.13%, 4/15/2025 (a) | | | 2,175,000 | | | | 2,237,531 | |
| | |
5.00%, 1/30/2028 (a) | | | 918,000 | | | | 904,230 | |
| | |
7.25%, 5/30/2029 (a) | | | 520,000 | | | | 570,700 | |
| | |
Catalent Pharma Solutions, Inc. 5.00%, 7/15/2027 (a) | | | 226,000 | | | | 238,430 | |
| | |
Elanco Animal Health, Inc. 5.90%, 8/28/2028(b) | | | 66,000 | | | | 78,746 | |
| | |
Par Pharmaceutical, Inc. 7.50%, 4/1/2027 (a) | | | 586,000 | | | | 625,555 | |
| | | | | | | | |
| | |
| | | | | | | 5,411,992 | |
| | | | | | | | |
|
Professional Services — 0.5% | |
| | |
Dun & Bradstreet Corp. (The)
6.88%, 8/15/2026 (a) | | | 205,000 | | | | 222,425 | |
| | |
10.25%, 2/15/2027 (a) | | | 148,000 | | | | 168,720 | |
| | |
Jaguar Holding Co. II 5.00%, 6/15/2028 (a) | | | 544,000 | | | | 576,640 | |
| | | | | | | | |
| | |
| | | | | | | 967,785 | |
| | | | | | | | |
|
Real Estate Management & Development — 0.1% | |
| | |
Kennedy-Wilson, Inc. 5.88%, 4/1/2024 | | | 211,000 | | | | 213,570 | |
| | | | | | | | |
|
Road & Rail — 0.3% | |
| | |
Avis Budget Car Rental LLC
5.25%, 3/15/2025 (a) | | | 193,000 | | | | 184,170 | |
| | |
10.50%, 5/15/2025 (a) | | | 396,000 | | | | 459,051 | |
| | | | | | | | |
| | |
| | | | | | | 643,221 | |
| | | | | | | | |
|
Semiconductors & Semiconductor Equipment — 0.3% | |
| | |
Entegris, Inc. 4.63%, 2/10/2026 (a) | | | 325,000 | | | | 335,663 | |
| | |
Microchip Technology, Inc. 4.25%, 9/1/2025 (a) | | | 343,000 | | | | 357,159 | |
| | | | | | | | |
| | |
| | | | | | | 692,822 | |
| | | | | | | | |
SEE NOTES TO FINANCIAL STATEMENTS.
| | | | | | | | |
| | | |
| AUGUST 31, 2020 | | J.P. MORGAN EXCHANGE-TRADED FUNDS | | | | | 75 | |
JPMorgan High Yield Research Enhanced ETF
SCHEDULE OF PORTFOLIO INVESTMENTS
AS OF AUGUST 31, 2020 (Unaudited) (continued)
| | | | | | | | |
| INVESTMENTS | | PRINCIPAL
AMOUNT ($) | | | VALUE ($) | |
Corporate Bonds — continued | |
|
Software — 1.1% | |
| | |
ACI Worldwide, Inc. 5.75%, 8/15/2026 (a) | | | 35,000 | | | | 36,789 | |
| | |
Ascend Learning LLC 6.88%, 8/1/2025 (a) | | | 244,000 | | | | 251,320 | |
| | |
CDK Global, Inc. 4.88%, 6/1/2027 | | | 290,000 | | | | 305,950 | |
| | |
5.25%, 5/15/2029 (a) | | | 22,000 | | | | 24,000 | |
| | |
Change Healthcare Holdings LLC 5.75%, 3/1/2025 (a) | | | 316,000 | | | | 322,320 | |
| | |
Fair Isaac Corp. 5.25%, 5/15/2026 (a) | | | 206,000 | | | | 236,550 | |
| | |
Nuance Communications, Inc. 5.63%, 12/15/2026 | | | 176,000 | | | | 186,560 | |
| | |
PTC, Inc. 4.00%, 2/15/2028 (a) | | | 322,000 | | | | 333,367 | |
| | |
Solera LLC 10.50%, 3/1/2024 (a) | | | 97,000 | | | | 101,729 | |
| | |
SS&C Technologies, Inc. 5.50%, 9/30/2027 (a) | | | 581,000 | | | | 622,309 | |
| | | | | | | | |
| | |
| | | | | | | 2,420,894 | |
| | | | | | | | |
|
Specialty Retail — 2.2% | |
| | |
Gap, Inc. (The)
8.63%, 5/15/2025 (a) | | | 282,000 | | | | 314,782 | |
| | |
8.88%, 5/15/2027 (a) | | | 469,000 | | | | 528,798 | |
| | |
L Brands, Inc.
5.63%, 2/15/2022 | | | 71,000 | | | | 72,953 | |
| | |
5.63%, 10/15/2023 | | | 33,000 | | | | 34,409 | |
| | |
6.88%, 7/1/2025 (a) | | | 526,000 | | | | 569,121 | |
| | |
7.50%, 6/15/2029 | | | 267,000 | | | | 284,355 | |
| | |
6.88%, 11/1/2035 | | | 765,000 | | | | 782,366 | |
| | |
Penske Automotive Group, Inc. 5.50%, 5/15/2026 | | | 76,000 | | | | 79,135 | |
| | |
PetSmart, Inc.
7.13%, 3/15/2023 (a) | | | 663,000 | | | | 667,900 | |
| | |
5.88%, 6/1/2025 (a) | | | 446,000 | | | | 458,822 | |
| | |
Staples, Inc.
7.50%, 4/15/2026 (a) | | | 765,000 | | | | 681,003 | |
| | |
10.75%, 4/15/2027 (a) | | | 250,000 | | | | 173,750 | |
| | | | | | | | |
| | |
| | | | | | | 4,647,394 | |
| | | | | | | | |
|
Technology Hardware, Storage & Peripherals — 1.2% | |
| | |
Dell International LLC 7.13%, 6/15/2024 (a) | | | 257,000 | | | | 266,841 | |
| | |
Dell, Inc. 6.50%, 4/15/2038 | | | 257,000 | | | | 298,891 | |
| | |
Diebold Nixdorf, Inc. 9.38%, 7/15/2025 (a) | | | 262,000 | | | | 281,650 | |
| | |
NCR Corp.
5.00%, 7/15/2022 | | | 200,000 | | | | 199,654 | |
| | |
6.38%, 12/15/2023 | | | 5,000 | | | | 5,100 | |
| | |
5.75%, 9/1/2027 (a) | | | 447,000 | | | | 469,350 | |
| | |
6.13%, 9/1/2029 (a) | | | 1,001,000 | | | | 1,073,572 | |
| | | | | | | | |
| | |
| | | | | | | 2,595,058 | |
| | | | | | | | |
| | | | | | | | |
| INVESTMENTS | | PRINCIPAL
AMOUNT ($) | | | VALUE ($) | |
| | | | | | | | |
|
Textiles, Apparel & Luxury Goods — 0.2% | |
| | |
Hanesbrands, Inc.
4.63%, 5/15/2024 (a) | | | 117,000 | | | | 122,850 | |
| | |
4.88%, 5/15/2026 (a) | | | 35,000 | | | | 38,106 | |
| | |
William Carter Co. (The) 5.63%, 3/15/2027 (a) | | | 166,000 | | | | 176,355 | |
| | | | | | | | |
| | |
| | | | | | | 337,311 | |
| | | | | | | | |
|
Thrifts & Mortgage Finance — 2.1% | |
| | |
Ladder Capital Finance Holdings LLLP | | | | | | | | |
| | |
REIT, 5.25%, 3/15/2022 (a) | | | 210,000 | | | | 207,900 | |
| | |
REIT, 4.25%, 2/1/2027 (a) | | | 784,000 | | | | 719,320 | |
| | |
Nationstar Mortgage Holdings, Inc.
9.13%, 7/15/2026 (a) | | | 788,000 | | | | 857,202 | |
| | |
5.50%, 8/15/2028 (a) | | | 416,000 | | | | 437,528 | |
| | |
Quicken Loans LLC
5.75%, 5/1/2025 (a) | | | 704,000 | | | | 725,120 | |
| | |
5.25%, 1/15/2028 (a) | | | 599,000 | | | | 638,687 | |
| | |
Radian Group, Inc. 4.88%, 3/15/2027 | | | 913,000 | | | | 915,611 | |
| | | | | | | | |
| | |
| | | | | | | 4,501,368 | |
| | | | | | | | |
|
Trading Companies & Distributors — 2.5% | |
| | |
AerCap Holdings NV (Ireland) (US Treasury Yield Curve Rate T Note Constant Maturity 5 Year + 4.54%), 5.87%, 10/10/2079 (d) | | | 400,000 | | | | 323,084 | |
| | |
Beacon Roofing Supply, Inc. 4.88%, 11/1/2025 (a) | | | 212,000 | | | | 210,170 | |
| | |
H&E Equipment Services, Inc. 5.63%, 9/1/2025 | | | 67,000 | | | | 69,513 | |
| | |
Herc Holdings, Inc. 5.50%, 7/15/2027 (a) | | | 469,000 | | | | 491,278 | |
| | |
United Rentals North America, Inc.
5.88%, 9/15/2026 | | | 231,000 | | | | 245,853 | |
| | |
5.50%, 5/15/2027 | | | 287,000 | | | | 307,047 | |
| | |
4.88%, 1/15/2028 | | | 1,269,000 | | | | 1,349,226 | |
| | |
5.25%, 1/15/2030 | | | 823,000 | | | | 914,020 | |
| | |
WESCO Distribution, Inc.
5.38%, 6/15/2024 | | | 257,000 | | | | 264,067 | |
| | |
7.13%, 6/15/2025 (a) | | | 484,000 | | | | 531,882 | |
| | |
7.25%, 6/15/2028 (a) | | | 484,000 | | | | 539,999 | |
| | | | | | | | |
| | |
| | | | | | | 5,246,139 | |
| | | | | | | | |
|
Wireless Telecommunication Services — 2.5% | |
| | |
Hughes Satellite Systems Corp. 6.63%, 8/1/2026 | | | 67,000 | | | | 75,877 | |
| | |
Sprint Communications, Inc. 6.00%, 11/15/2022 | | | 220,000 | | | | 238,700 | |
| | |
Sprint Corp.
7.88%, 9/15/2023 | | | 2,281,000 | | | | 2,653,088 | |
| | |
7.13%, 6/15/2024 | | | 288,000 | | | | 334,717 | |
SEE NOTES TO FINANCIAL STATEMENTS.
| | | | | | |
| | | |
| 76 | | | | J.P. MORGAN EXCHANGE-TRADED FUNDS | | AUGUST 31, 2020 |
| | | | | | | | |
| INVESTMENTS | | PRINCIPAL
AMOUNT ($) | | | VALUE ($) | |
Corporate Bonds — continued | |
|
Wireless Telecommunication Services — continued | |
| | |
T-Mobile USA, Inc.
6.50%, 1/15/2026 | | | 1,152,000 | | | | 1,206,000 | |
| | |
4.50%, 2/1/2026 | | | 231,000 | | | | 238,464 | |
| | |
4.75%, 2/1/2028 | | | 232,000 | | | | 249,980 | |
| | |
United States Cellular Corp. 6.70%, 12/15/2033 | | | 102,000 | | | | 132,348 | |
| | |
Vodafone Group plc (United Kingdom) (USD Swap Semi 5 Year + 4.87%), 7.00%, 4/4/2079(d) | | | 85,000 | | | | 102,267 | |
| | | | | | | | |
| | |
| | | | | | | 5,231,441 | |
| | | | | | | | |
| |
Total Corporate Bonds
(Cost $203,317,964) | | | | 207,039,618 | |
| | | | | |
| | |
| | | SHARES | | | | |
Short-Term Investments — 4.2% | |
|
Investment Companies — 4.2% | |
| | |
JPMorgan U.S. Government Money Market Fund Class Institutional Shares, 0.01% (e) (f)
(Cost $8,904,727) | | | 8,904,727 | | | | 8,904,727 | |
| | | | | | | | |
Total Investments — 101.5%
(Cost $212,222,691) | | | | | | | 215,944,345 | |
Liabilities in Excess of
Other Assets — (1.5)% | | | | | | | (3,172,864) | |
| | | | | | | | |
NET ASSETS — 100.0% | | | | | | | 212,771,481 | |
| | | | | | | | |
Percentages indicated are based on net assets.
| | |
| Abbreviations |
| ICE | | Intercontinental Exchange |
| LIBOR | | London Interbank Offered Rate |
| REIT | | Real Estate Investment Trust |
| SCA | | Limited partnership with share capital |
| USD | | United States Dollar |
| |
| (a) | | Securities exempt from registration under Rule 144A or section 4(a)(2), of the Securities Act of 1933, as amended. |
| (b) | | Step bond. Interest rate is a fixed rate for an initial period that either resets at a specific date or may reset in the future contingent upon a predetermined trigger. The interest rate shown is the current rate as of August 31, 2020. |
| (c) | | Security has the ability to pay in kind (“PIK”) or pay income in cash. When applicable, separate rates of such payments are disclosed. |
| (d) | | Variable or floating rate security, linked to the referenced benchmark. The interest rate shown is the current rate as of August 31, 2020. |
| (e) | | Investment in an affiliated fund, which is registered under the Investment Company Act of 1940, as amended, and is advised by J.P. Morgan Investment Management Inc. |
| (f) | | The rate shown is the current yield as of August 31, 2020. |
SEE NOTES TO FINANCIAL STATEMENTS.
| | | | | | | | |
| | | |
| AUGUST 31, 2020 | | J.P. MORGAN EXCHANGE-TRADED FUNDS | | | | | 77 | |
JPMorgan International Bond Opportunities ETF
(formerly known as JPMorgan Global Bond Opportunities ETF)
SCHEDULE OF PORTFOLIO INVESTMENTS
AS OF AUGUST 31, 2020 (Unaudited)
| | | | | | | | |
| INVESTMENTS | | PRINCIPAL
AMOUNT ($) | | | VALUE ($) | |
Corporate Bonds — 54.0% | |
|
Argentina — 0.1% | |
| | |
Agua y Saneamientos Argentinos SA 6.63%, 2/1/2023 (a) | | | 280,000 | | | | 163,537 | |
| | | | | | | | |
| | |
Australia — 0.3% | | | | | | | | |
| | |
Glencore Finance Europe Ltd. 6.00%, 4/3/2022 (a) (b) | | GBP | 100,000 | | | | 143,123 | |
| | |
Glencore Funding LLC 2.50%, 9/1/2030 (c) | | | 100,000 | | | | 98,166 | |
| | |
Transurban Finance Co. Pty. Ltd. 2.00%, 8/28/2025 (a) | | EUR | 150,000 | | | | 187,720 | |
| | |
Westpac Banking Corp. (US Treasury Yield Curve Rate T Note Constant Maturity 5 Year + 2.00%), 4.11%, 7/24/2034 (d) | | | 75,000 | | | | 84,660 | |
| | | | | | | | |
| |
| | | | 513,669 | |
| | | | | | | | |
| | |
Azerbaijan — 0.2% | | | | | | | | |
| | |
State Oil Co. of the Azerbaijan Republic 4.75%, 3/13/2023 (a) | | | 260,000 | | | | 273,260 | |
| | | | | | | | |
| | |
Belgium — 0.8% | | | | | | | | |
| | |
Anheuser-Busch Cos. LLC | | | | | | | | |
| | |
4.70%, 2/1/2036 | | | 20,000 | | | | 23,853 | |
| | |
4.90%, 2/1/2046 | | | 85,000 | | | | 104,533 | |
| | |
Anheuser-Busch InBev Worldwide, Inc. | | | | | | | | |
| | |
4.90%, 1/23/2031 | | | 95,000 | | | | 121,022 | |
| | |
4.44%, 10/6/2048 | | | 114,000 | | | | 132,353 | |
| | |
5.55%, 1/23/2049 | | | 180,000 | | | | 242,919 | |
| | |
KBC Group NV (EUR Swap Annual 5 Year + 4.69%), 4.75%, 3/5/2024 (a) (d) (e) (f) | | EUR | 400,000 | | | | 498,563 | |
| | |
Solvay Finance SACA (EUR Swap Annual 5 Year + 3.70%), 5.42%, 11/12/2023 (a) (d) (e) (f) | | EUR | 100,000 | | | | 130,521 | |
| | |
Solvay SA (EUR Swap Annual 5 Year + 3.92%), 4.25%, 12/4/2023 (a) (d) (e) (f) | | EUR | 100,000 | | | | 126,440 | |
| | | | | | | | |
| |
| | | | 1,380,204 | |
| | | | | | | | |
| | |
Brazil — 0.4% | | | | | | | | |
| | |
Braskem Netherlands Finance BV 4.50%, 1/31/2030 (a) | | | 200,000 | | | | 190,300 | |
| | |
Gerdau Trade, Inc. 4.88%, 10/24/2027 (a) | | | 200,000 | | | | 217,000 | |
| | |
Petrobras Global Finance BV 6.90%, 3/19/2049 | | | 250,000 | | | | 285,134 | |
| | | | | | | | |
| | |
| | | | | | | 692,434 | |
| | | | | | | | |
| | | | | | | | |
| INVESTMENTS | | PRINCIPAL
AMOUNT ($) | | | VALUE ($) | |
| | | | | | | | |
| | |
Canada — 0.6% | | | | | | | | |
| | |
1011778 BC ULC | | | | | | | | |
| | |
4.25%, 5/15/2024 (c) | | | 25,000 | | | | 25,469 | |
| | |
5.00%, 10/15/2025 (c) | | | 15,000 | | | | 15,403 | |
| | |
Advanz Pharma Corp. Ltd. 8.00%, 9/6/2024 | | | 45,000 | | | | 44,325 | |
| | |
ATS Automation Tooling Systems, Inc. 6.50%, 6/15/2023 (c) | | | 13,000 | | | | 13,149 | |
| | |
Bombardier, Inc. | | | | | | | | |
| | |
6.00%, 10/15/2022 (c) | | | 10,000 | | | | 8,500 | |
| | |
7.50%, 12/1/2024 (c) | | | 35,000 | | | | 26,250 | |
| | |
7.88%, 4/15/2027 (c) | | | 37,000 | | | | 26,814 | |
| | |
Cenovus Energy, Inc. 5.38%, 7/15/2025 | | | 55,000 | | | | 55,965 | |
| | |
Emera US Finance LP 4.75%, 6/15/2046 | | | 110,000 | | | | 136,376 | |
| | |
Enbridge, Inc. 3.13%, 11/15/2029 | | | 180,000 | | | | 193,798 | |
| | |
Gateway Casinos & Entertainment Ltd. 8.25%, 3/1/2024 (c) | | | 36,000 | | | | 30,240 | |
| | |
MEG Energy Corp. 6.50%, 1/15/2025 (c) | | | 21,000 | | | | 21,420 | |
| | |
NOVA Chemicals Corp. | | | | | | | | |
| | |
4.88%, 6/1/2024 (c) | | | 80,000 | | | | 79,400 | |
| | |
5.00%, 5/1/2025 (c) | | | 19,000 | | | | 19,000 | |
| | |
5.25%, 6/1/2027 (c) | | | 45,000 | | | | 43,537 | |
| | |
Open Text Corp. 5.88%, 6/1/2026 (c) | | | 40,000 | | | | 42,000 | |
| | |
Precision Drilling Corp. | | | | | | | | |
| | |
7.75%, 12/15/2023 | | | 65,000 | | | | 50,700 | |
| | |
7.13%, 1/15/2026 (c) | | | 6,000 | | | | 4,080 | |
| | |
Quebecor Media, Inc. 5.75%, 1/15/2023 | | | 32,000 | | | | 34,320 | |
| | |
Stars Group Holdings BV 7.00%, 7/15/2026 (c) | | | 14,000 | | | | 14,924 | |
| | |
Transcanada Trust | | | | | | | | |
| | |
Series 16-A, (ICE LIBOR USD 3 Month + 4.64%), 5.87%, 8/15/2076 (d) | | | 57,000 | | | | 62,278 | |
| | |
Videotron Ltd. 5.13%, 4/15/2027 (c) | | | 40,000 | | | | 42,300 | |
| | | | | | | | |
| | |
| | | | | | | 990,248 | |
| | | | | | | | |
| | |
Chile — 0.3% | | | | | | | | |
| | |
Empresa de Transporte de Pasajeros Metro SA 4.70%, 5/7/2050 (c) | | | 200,000 | | | | 249,000 | |
| | |
Kenbourne Invest SA 6.88%, 11/26/2024 (c) | | | 200,000 | | | | 207,437 | |
| | | | | | | | |
| | |
| | | | | | | 456,437 | |
| | | | | | | | |
SEE NOTES TO FINANCIAL STATEMENTS.
| | | | | | |
| | | |
| 78 | | | | J.P. MORGAN EXCHANGE-TRADED FUNDS | | AUGUST 31, 2020 |
| | | | | | | | |
| INVESTMENTS | | PRINCIPAL
AMOUNT ($) | | | VALUE ($) | |
Corporate Bonds — continued | |
| | |
China — 1.0% | | | | | | | | |
| | |
Alibaba Group Holding Ltd. 3.40%, 12/6/2027 | | | 200,000 | | | | 225,272 | |
| | |
China Evergrande Group 8.75%, 6/28/2025 (a) | | | 290,000 | | | | 243,904 | |
| | |
CNAC HK Finbridge Co. Ltd. 4.13%, 7/19/2027 (a) | | | 200,000 | | | | 222,062 | |
| | |
GCL New Energy Holdings Ltd. 7.10%, 1/30/2021 (a) | | | 200,000 | | | | 102,500 | |
| | |
Huarong Finance 2017 Co. Ltd. 4.25%, 11/7/2027 (a) | | | 200,000 | | | | 218,312 | |
| | |
New Metro Global Ltd. 6.50%, 4/23/2021 (a) | | | 200,000 | | | | 202,022 | |
| | |
Tencent Holdings Ltd. 3.98%, 4/11/2029 (a) | | | 200,000 | | | | 230,188 | |
| | |
Yuzhou Group Holdings Co. Ltd. 8.38%, 10/30/2024 (a) | | | 200,000 | | | | 210,063 | |
| | | | | | | | |
| |
| | | | 1,654,323 | |
| | | | | | | | |
| | |
Colombia — 0.3% | | | | | | | | |
| | |
Ecopetrol SA 5.88%, 5/28/2045 | | | 400,000 | | | | 453,920 | |
| | | | | | | | |
| | |
Denmark — 0.3% | | | | | | | | |
| | |
Danske Bank A/S (US Treasury Yield Curve Rate T Note Constant Maturity 1 Year + 1.73%), 5.00%, 1/12/2023 (c) (d) | | | 200,000 | | | | 210,255 | |
| | |
Nykredit Realkredit A/S Series CCE, 1.00%, 10/1/2050 (a) | | DKK | 645,472 | | | | 102,880 | |
| | |
TDC A/S 5.00%, 3/2/2022 (b) | | EUR | 200,000 | | | | 249,523 | |
| | | | | | | | |
| |
| | | | 562,658 | |
| | | | | | | | |
| | |
Finland — 0.1% | | | | | | | | |
| | |
Nokia OYJ 2.00%, 3/15/2024 (a) | | EUR | 100,000 | | | | 125,257 | |
| | | | | | | | |
| | |
France — 3.1% | | | | | | | | |
| | |
Altice France SA | | | | | | | | |
| | |
7.38%, 5/1/2026 (c) | | | 200,000 | | | | 212,330 | |
| | |
3.38%, 1/15/2028 (c) | | EUR | 100,000 | | | | 117,871 | |
| | |
Banijay Entertainment SASU 3.50%, 3/1/2025 (a) | | EUR | 125,000 | | | | 147,215 | |
| | |
BPCE SA | | | | | | | | |
| | |
3.00%, 5/22/2022 (c) | | | 250,000 | | | | 259,727 | |
| | |
5.15%, 7/21/2024 (c) | | | 600,000 | | | | 674,451 | |
| | |
(EUR Swap Annual 5 Year + 2.37%), 2.75%, 11/30/2027 (a) (d) | | EUR | 200,000 | | | | 250,359 | |
| | |
Burger King France SAS 6.00%, 5/1/2024 (a) | | EUR | 100,000 | | | | 120,562 | |
| | |
Casino Guichard Perrachon SA 4.56%, 1/25/2023 (a) (b) | | EUR | 200,000 | | | | 217,249 | |
| | | | | | | | |
| INVESTMENTS | | PRINCIPAL
AMOUNT ($) | | | VALUE ($) | |
| | | | | | | | |
| | |
France — continued | | | | | | | | |
| | |
Credit Agricole SA | | | | | | | | |
| | |
(EUR Swap Annual 5 Year + 5.12%), 6.50%, 6/23/2021 (a) (d) (e) (f) | | EUR | 300,000 | | | | 368,300 | |
| | |
3.25%, 10/4/2024 (c) | | | 376,000 | | | | 409,587 | |
| | |
(USD Swap Semi 5 Year + 6.19%), 8.12%, 12/23/2025 (c) (d) (e) (f) | | | 400,000 | | | | 474,000 | |
| | |
Elis SA 1.88%, 2/15/2023 (a) | | EUR | 300,000 | | | | 359,938 | |
| | |
Europcar Mobility Group 4.13%, 11/15/2024 (a) | | EUR | 100,000 | | | | 58,332 | |
| | |
Faurecia SE 3.13%, 6/15/2026 (a) | | EUR | 100,000 | | | | 119,785 | |
| | |
La Financiere Atalian SASU 4.00%, 5/15/2024 (a) | | EUR | 100,000 | | | | 101,435 | |
| | |
Orano SA 3.13%, 3/20/2023 (a) | | EUR | 100,000 | | | | 123,810 | |
| | |
Quatrim SASU 5.88%, 1/15/2024 (a) | | EUR | 100,000 | | | | 119,108 | |
| | |
Rexel SA 2.63%, 6/15/2024 (a) | | EUR | 300,000 | | | | 361,537 | |
| | |
Societe Generale SA (US Treasury Yield Curve Rate T Note Constant Maturity 5 Year + 3.00%), 3.65%, 7/8/2035 (c) (d) | | | 200,000 | | | | 205,375 | |
| | |
SPIE SA 3.13%, 3/22/2024 (a) | | EUR | 200,000 | | | | 245,878 | |
| | |
Total Capital International SA 3.13%, 5/29/2050 | | | 50,000 | | | | 52,354 | |
| | |
TOTAL SE (EUR Swap Annual 5 Year + 3.78%), 3.87%, 5/18/2022 (a) (d) (e) (f) | | EUR | 100,000 | | | | 125,289 | |
| | | | | | | | |
| |
| | | | 5,124,492 | |
| | | | | | | | |
| | |
Germany — 1.0% | | | | | | | | |
| | |
Bayer Capital Corp. BV 2.13%, 12/15/2029 (a) | | EUR | 100,000 | | | | 132,125 | |
| | |
Deutsche Bank AG 4.25%, 10/14/2021 | | | 100,000 | | | | 103,319 | |
| | |
IHO Verwaltungs GmbH 3.75% (cash), 9/15/2026 (a) (g) | | EUR | 125,000 | | | | 152,540 | |
| | |
Nidda BondCo GmbH 5.00%, 9/30/2025 (a) | | EUR | 225,000 | | | | 265,937 | |
| | |
Nidda Healthcare Holding GmbH 3.50%, 9/30/2024 (a) | | EUR | 100,000 | | | | 118,733 | |
| | |
Rebecca Bidco GmbH 5.75%, 7/15/2025 (c) | | EUR | 100,000 | | | | 121,513 | |
| | |
Techem Verwaltungsgesellschaft 674 mbH 6.00%, 7/30/2026 (a) | | EUR | 250,000 | | | | 310,253 | |
| | |
thyssenkrupp AG | | | | | | | | |
| | |
1.38%, 3/3/2022 (a) | | EUR | 300,000 | | | | 349,771 | |
| | |
2.50%, 2/25/2025 (a) | | EUR | 100,000 | | | | 113,010 | |
| | | | | | | | |
| |
| | | | 1,667,201 | |
| | | | | | | | |
| | |
Greece — 0.6% | | | | | | | | |
| | |
Alpha Bank AE 2.50%, 2/5/2023 (a) | | EUR | 780,000 | | | | 971,017 | |
| | | | | | | | |
SEE NOTES TO FINANCIAL STATEMENTS.
| | | | | | | | |
| | | |
| AUGUST 31, 2020 | | J.P. MORGAN EXCHANGE-TRADED FUNDS | | | | | 79 | |
JPMorgan International Bond Opportunities ETF
(formerly known as JPMorgan Global Bond Opportunities ETF)
SCHEDULE OF PORTFOLIO INVESTMENTS
AS OF AUGUST 31, 2020 (Unaudited) (continued)
| | | | | | | | |
| INVESTMENTS | | PRINCIPAL
AMOUNT ($) | | | VALUE ($) | |
Corporate Bonds — continued | |
|
Guatemala — 0.1% | |
| | |
Comunicaciones Celulares SA 6.88%, 2/6/2024 (a) | | | 200,000 | | | | 203,375 | |
| | | | | | | | |
| | |
Hong Kong — 0.1% | | | | | | | | |
| | |
Metropolitan Light Co. Ltd. 5.50%, 11/21/2022 (c) | | | 151,000 | | | | 152,887 | |
| | | | | | | | |
| | |
India — 0.2% | | | | | | | | |
| | |
Adani Ports & Special Economic Zone Ltd. 3.95%, 1/19/2022 (a) | | | 200,000 | | | | 204,063 | |
| | |
NTPC Ltd. 3.75%, 4/3/2024 (a) | | | 200,000 | | | | 208,000 | |
| | | | | | | | |
| |
| | | | 412,063 | |
| | | | | | | | |
| | |
Indonesia — 0.5% | | | | | | | | |
| | |
Indonesia Asahan Aluminium Persero PT 5.45%, 5/15/2030 (c) | | | 200,000 | | | | 235,000 | |
| | |
Pertamina Persero PT 3.65%, 7/30/2029 (c) | | | 400,000 | | | | 426,375 | |
| | |
Perusahaan Perseroan Persero PT Perusahaan Listrik Negara 4.13%, 5/15/2027 (a) | | | 200,000 | | | | 218,250 | |
| | | | | | | | |
| |
| | | | 879,625 | |
| | | | | | | | |
| | |
Ireland — 0.9% | | | | | | | | |
| | |
AerCap Ireland Capital DAC 4.63%, 7/1/2022 | | | 330,000 | | | | 338,150 | |
| | |
Allied Irish Banks plc (EUR Swap Annual 5 Year + 3.95%), 4.13%, 11/26/2025 (a) (d) | | EUR | 100,000 | | | | 120,263 | |
| | |
Avolon Holdings Funding Ltd. | | | | | | | | |
| | |
3.95%, 7/1/2024 (c) | | | 126,000 | | | | 116,402 | |
| | |
4.38%, 5/1/2026 (c) | | | 60,000 | | | | 55,255 | |
| | |
eircom Finance DAC 3.50%, 5/15/2026 (a) | | EUR | 200,000 | | | | 241,243 | |
| | |
Park Aerospace Holdings Ltd. 5.50%, 2/15/2024 (c) | | | 129,000 | | | | 127,175 | |
| | |
Smurfit Kappa Acquisitions ULC 2.38%, 2/1/2024 (a) | | EUR | 350,000 | | | | 431,543 | |
| | | | | | | | |
| |
| | | | 1,430,031 | |
| | | | | | | | |
| | |
Israel — 0.3% | | | | | | | | |
| | |
Leviathan Bond Ltd. | | | | | | | | |
| | |
6.13%, 6/30/2025 (a) | | | 200,000 | | | | 207,540 | |
| | |
6.50%, 6/30/2027 (a) | | | 200,000 | | | | 208,688 | |
| | | | | | | | |
| |
| | | | 416,228 | |
| | | | | | | | |
| | |
Italy — 1.3% | | | | | | | | |
| | |
Atlantia SpA 1.63%, 2/3/2025 (a) | | EUR | 100,000 | | | | 116,772 | |
| | |
Autostrade per l’Italia SpA 1.63%, 6/12/2023 | | EUR | 100,000 | | | | 117,956 | |
| | |
Enel Finance International NV 3.50%, 4/6/2028 (c) | | | 200,000 | | | | 222,322 | |
| | | | | | | | |
| INVESTMENTS | | PRINCIPAL
AMOUNT ($) | | | VALUE ($) | |
| | | | | | | | |
| | |
Italy — continued | | | | | | | | |
| | |
Leonardo SpA 4.88%, 3/24/2025 | | EUR | 100,000 | | | | 134,341 | |
| | |
Rossini SARL 6.75%, 10/30/2025 (a) | | EUR | 100,000 | | | | 127,629 | |
| | |
Saipem Finance International BV | | | | | | | | |
| | |
3.75%, 9/8/2023 (a) | | EUR | 125,000 | | | | 155,613 | |
| | |
2.63%, 1/7/2025 (a) | | EUR | 150,000 | | | | 178,452 | |
| | |
Telecom Italia Capital SA | | | | | | | | |
| | |
6.00%, 9/30/2034 | | | 30,000 | | | | 36,450 | |
| | |
7.20%, 7/18/2036 | | | 135,000 | | | | 177,525 | |
| | |
Telecom Italia SpA | | | | | | | | |
| | |
5.25%, 2/10/2022 (a) | | EUR | 100,000 | | | | 127,257 | |
| | |
3.25%, 1/16/2023 (a) | | EUR | 200,000 | | | | 250,723 | |
| | |
3.63%, 1/19/2024 (a) | | EUR | 100,000 | | | | 126,662 | |
| | |
3.63%, 5/25/2026 (a) | | EUR | 225,000 | | | | 291,132 | |
| | |
2.38%, 10/12/2027 (a) | | EUR | 150,000 | | | | 180,828 | |
| | | | | | | | |
| |
| | | | 2,243,662 | |
| | | | | | | | |
| | |
Japan — 0.2% | | | | | | | | |
| | |
Takeda Pharmaceutical Co. Ltd. 3.03%, 7/9/2040 | | | 270,000 | | | | 279,536 | |
| | | | | | | | |
| | |
Kazakhstan — 0.2% | | | | | | | | |
| | |
KazMunayGas National Co. JSC 4.75%, 4/19/2027 (a) | | | 355,000 | | | | 400,617 | |
| | | | | | | | |
| | |
Kuwait — 0.1% | | | | | | | | |
| | |
MEGlobal Canada ULC 5.00%, 5/18/2025 (c) | | | 200,000 | | | | 217,875 | |
| | | | | | | | |
| | |
Luxembourg — 1.0% | | | | | | | | |
| | |
Altice Financing SA 7.50%, 5/15/2026 (c) | | | 200,000 | | | | 213,440 | |
| | |
Altice Finco SA 4.75%, 1/15/2028 (a) | | EUR | 200,000 | | | | 224,990 | |
| | |
Altice France Holding SA | | | | | | | | |
| | |
8.00%, 5/15/2027 | | EUR | 150,000 | | | | 194,314 | |
| | |
8.00%, 5/15/2027 (c) | | EUR | 123,000 | | | | 159,338 | |
| | |
ARD Finance SA 5.00% (cash), 6/30/2027 (c) (g) | | EUR | 100,000 | | | | 119,092 | |
| | |
Intelsat Jackson Holdings SA | | | | | | | | |
| | |
5.50%, 8/1/2023 (h) | | | 80,000 | | | | 53,200 | |
| | |
8.50%, 10/15/2024 (c) (h) | | | 99,000 | | | | 67,320 | |
| | |
9.75%, 7/15/2025 (c) (h) | | | 120,000 | | | | 82,800 | |
| | |
Matterhorn Telecom SA 3.13%, 9/15/2026 (c) | | EUR | 100,000 | | | | 114,883 | |
| | |
Monitchem HoldCo 3 SA 5.25%, 3/15/2025 (a) | | EUR | 100,000 | | | | 122,808 | |
| | |
SES SA (EUR Swap Annual 5 Year + 4.66%), 4.62%, 1/2/2022 (a) (d) (e) (f) | | EUR | 250,000 | | | | 304,254 | |
| | | | | | | | |
| |
| | | | 1,656,439 | |
| | | | | | | | |
SEE NOTES TO FINANCIAL STATEMENTS.
| | | | | | |
| | | |
| 80 | | | | J.P. MORGAN EXCHANGE-TRADED FUNDS | | AUGUST 31, 2020 |
| | | | | | | | |
| INVESTMENTS | | PRINCIPAL
AMOUNT ($) | | | VALUE ($) | |
Corporate Bonds — continued | |
| | |
Mexico — 0.8% | | | | | | | | |
| | |
Banco Mercantil del Norte SA (US Treasury Yield Curve Rate T Note Constant Maturity 5 Year + 5.04%), 6.87%, 7/6/2022 (c) (d) (e) (f) | | | 200,000 | | | | 200,938 | |
| | |
BBVA Bancomer SA (US Treasury Yield Curve Rate T Note Constant Maturity 5 Year + 2.65%), 5.13%, 1/18/2033 (c) (d) | | | 200,000 | | | | 191,000 | |
| | |
Fomento Economico Mexicano SAB de CV 3.50%, 1/16/2050 | | | 150,000 | | | | 160,030 | |
| | |
Petroleos Mexicanos | | | | | | | | |
| | |
6.75%, 9/21/2047 | | | 575,000 | | | | 477,911 | |
| | |
6.95%, 1/28/2060 (c) | | | 410,000 | | | | 340,772 | |
| | | | | | | | |
| |
| | | | 1,370,651 | |
| | | | | | | | |
| | |
Morocco — 0.2% | | | | | | | | |
| | |
OCP SA 6.88%, 4/25/2044 (a) | | | 200,000 | | | | 255,625 | |
| | | | | | | | |
| | |
Netherlands — 1.0% | | | | | | | | |
| | |
ABN AMRO Bank NV 4.75%, 7/28/2025 (c) | | | 200,000 | | | | 225,781 | |
| | |
ING Groep NV (EUR Swap Annual 5 Year + 2.85%), 3.00%, 4/11/2028 (d) | | EUR | 100,000 | | | | 126,124 | |
| | |
Nouryon Holding BV 6.50%, 10/1/2026 (a) | | EUR | 125,000 | | | | 155,938 | |
| | |
OCI NV 3.13%, 11/1/2024 (a) | | EUR | 100,000 | | | | 119,340 | |
| | |
Sigma Holdco BV 5.75%, 5/15/2026 (a) | | EUR | 125,000 | | | | 148,915 | |
| | |
Sunshine Mid BV 6.50%, 5/15/2026 (a) | | EUR | 200,000 | | | | 247,842 | |
| | |
UPCB Finance IV Ltd. 4.00%, 1/15/2027 (a) | | EUR | 180,000 | | | | 218,928 | |
| | |
Ziggo Bond Co. BV 3.38%, 2/28/2030 (a) | | EUR | 200,000 | | | | 234,217 | |
| | |
Ziggo BV 4.25%, 1/15/2027 (a) | | EUR | 180,000 | | | | 223,334 | |
| | | | | | | | |
| |
| | | | 1,700,419 | |
| | | | | | | | |
| | |
Peru — 0.1% | | | | | | | | |
| | |
Hudbay Minerals, Inc. 7.25%, 1/15/2023 (c) | | | 20,000 | | | | 20,250 | |
| | |
Southern Copper Corp. 5.88%, 4/23/2045 | | | 140,000 | | | | 192,762 | |
| | | | | | | | |
| |
| | | | 213,012 | |
| | | | | | | | |
| | |
Portugal — 0.2% | | | | | | | | |
| | |
EDP Finance BV 2.38%, 3/23/2023 (a) | | EUR | 200,000 | | | | 252,972 | |
| | | | | | | | |
| | |
Qatar — 0.1% | | | | | | | | |
| | |
ABQ Finance Ltd. 3.50%, 2/22/2022 (a) | | | 200,000 | | | | 205,375 | |
| | | | | | | | |
| INVESTMENTS | | PRINCIPAL
AMOUNT ($) | | | VALUE ($) | |
| | | | | | | | |
|
Qatar — continued | |
| | |
Ras Laffan Liquefied Natural Gas Co. Ltd. II 5.30%, 9/30/2020 (a) | | | 14,125 | | | | 14,125 | |
| | | | | | | | |
| |
| | | | 219,500 | |
| | | | | | | | |
| | |
Russia — 0.2% | | | | | | | | |
| | |
Gazprom PJSC 3.25%, 2/25/2030 (a) | | | 200,000 | | | | 203,000 | |
| | |
Lukoil Securities BV 3.88%, 5/6/2030 (a) | | | 200,000 | | | | 212,938 | |
| | | | | | | | |
| |
| | | | 415,938 | |
| | | | | | | | |
|
Spain — 1.5% | |
| | |
AI Candelaria Spain SLU 7.50%, 12/15/2028 (a) | | | 250,000 | | | | 274,377 | |
| | |
CaixaBank SA | | | | | | | | |
| | |
(EUR Swap Annual 5 Year + 6.50%), 6.75%, 6/13/2024 (a) (d) (e) (f) | | EUR | 200,000 | | | | 248,002 | |
| | |
(EUR Swap Annual 5 Year + 3.35%), 3.50%, 2/15/2027 (a) (d) | | EUR | 200,000 | | | | 245,438 | |
| | |
Grifols SA | | | | | | | | |
| | |
1.63%, 2/15/2025 (c) | | EUR | 100,000 | | | | 118,371 | |
| | |
3.20%, 5/1/2025 (a) | | EUR | 200,000 | | | | 241,360 | |
| | |
2.25%, 11/15/2027 (c) | | EUR | 100,000 | | | | 119,617 | |
| | |
Grupo Antolin-Irausa SA | | | | | | | | |
| | |
3.25%, 4/30/2024 (a) | | EUR | 100,000 | | | | 105,892 | |
| | |
Repsol International Finance BV (EUR Swap Annual 10 Year + 4.20%), 4.50%, 3/25/2075 (a) (d) | | EUR | 200,000 | | | | 253,330 | |
| | |
Telefonica Europe BV (EUR Swap Annual 5 Year + 3.86%), 3.75%, 3/15/2022 (a) (d) (e) (f) | | EUR | 300,000 | | | | 363,426 | |
| | |
(EUR Swap Annual 5 Year + 2.33%), 2.63%, 3/7/2023 (a) (d) (e) (f) | | EUR | 200,000 | | | | 236,657 | |
| | |
Series NC5, (EUR Swap Annual 5 Year + 2.45%), 3.00%, 9/4/2023 (a) (d) (e) (f) | | EUR | 300,000 | | | | 356,914 | |
| | | | | | | | |
| |
| | | | 2,563,384 | |
| | | | | | | | |
| | |
Sweden — 0.2% | | | | | | | | |
| | |
Telefonaktiebolaget LM Ericsson | | | | | | | | |
| | |
1.88%, 3/1/2024 (a) | | EUR | 125,000 | | | | 155,311 | |
| | |
Verisure Midholding AB | | | | | | | | |
| | |
5.75%, 12/1/2023 (a) | | EUR | 200,000 | | | | 240,417 | |
| | | | | | | | |
| |
| | | | 395,728 | |
| | | | | | | | |
SEE NOTES TO FINANCIAL STATEMENTS.
| | | | | | | | |
| | | |
| AUGUST 31, 2020 | | J.P. MORGAN EXCHANGE-TRADED FUNDS | | | | | 81 | |
JPMorgan International Bond Opportunities ETF
(formerly known as JPMorgan Global Bond Opportunities ETF)
SCHEDULE OF PORTFOLIO INVESTMENTS
AS OF AUGUST 31, 2020 (Unaudited) (continued)
| | | | | | | | |
| INVESTMENTS | | PRINCIPAL
AMOUNT ($) | | | VALUE ($) | |
Corporate Bonds — continued | |
| | |
Switzerland — 1.6% | | | | | | | | |
| | |
Credit Suisse AG 2.95%, 4/9/2025 | | | 260,000 | | | | 285,615 | |
| | |
Credit Suisse Group AG | | | | | | | | |
| | |
(USD Swap Semi 5 Year + 4.60%), 7.50%, 12/11/2023 (c) (d) (e) (f) | | | 450,000 | | | | 499,487 | |
| | |
(US Treasury Yield Curve Rate T Note Constant Maturity 5 Year + 4.89%), 5.25%, 2/11/2027 (c) (d) (e) (f) | | | 200,000 | | | | 203,750 | |
| | |
(SOFR + 3.73%), 4.19%, 4/1/2031 (c) (d) | | | 290,000 | | | | 338,300 | |
| | |
Dufry One BV | | | | | | | | |
| | |
2.50%, 10/15/2024 (a) | | EUR | 100,000 | | | | 100,699 | |
| | |
UBS Group AG | | | | | | | | |
| | |
(EUR Swap Annual 5 Year + 5.29%), 5.75%, 2/19/2022 (a) (d) (e) (f) | | EUR | 600,000 | | | | 748,969 | |
| | |
(USD Swap Semi 5 Year + 4.87%), 7.00%, 2/19/2025 (a) (d) (e) (f) | | | 200,000 | | | | 226,000 | |
| | |
(USD Swap Semi 5 Year + 4.59%), 6.87%, 8/7/2025 (a) (d) (e) (f) | | | 200,000 | | | | 221,292 | |
| | | | | | | | |
| |
| | | | 2,624,112 | |
| | | | | | | | |
| | |
Taiwan — 0.1% | | | | | | | | |
| | |
Competition Team Technologies Ltd. 3.75%, 3/12/2024 (a) | | | 200,000 | | | | 213,813 | |
| | | | | | | | |
| | |
United Arab Emirates — 0.0% (i) | | | | | | | | |
| | |
Shelf Drilling Holdings Ltd. 8.25%, 2/15/2025 (c) | | | 39,000 | | | | 14,820 | |
| | | | | | | | |
| | |
United Kingdom — 3.3% | | | | | | | | |
| | |
BAT Capital Corp. | | | | | | | | |
| | |
4.70%, 4/2/2027 | | | 50,000 | | | | 57,922 | |
| | |
3.56%, 8/15/2027 | | | 520,000 | | | | 568,400 | |
| | |
4.39%, 8/15/2037 | | | 115,000 | | | | 125,217 | |
| | |
4.54%, 8/15/2047 | | | 130,000 | | | | 141,528 | |
| | |
BP Capital Markets plc | | | | | | | | |
| | |
(US Treasury Yield Curve Rate T Note Constant Maturity 5 Year + 4.04%), 4.38%, 6/22/2025 (d) (e) (f) | | | 204,000 | | | | 214,200 | |
| | |
(US Treasury Yield Curve Rate T Note Constant Maturity 5 Year + 4.40%), 4.88%, 3/22/2030 (d) (e) (f) | | | 94,000 | | | | 102,667 | |
| | |
eG Global Finance plc 4.38%, 2/7/2025 (a) | | | EUR 200,000 | | | | 225,703 | |
| | | | | | | | |
| INVESTMENTS | | PRINCIPAL
AMOUNT ($) | | | VALUE ($) | |
| | | | | | | | |
| | |
United Kingdom — continued | | | | | | | | |
| | |
FCE Bank plc | | | | | | | | |
| | |
1.88%, 6/24/2021 (a) | | EUR | 100,000 | | | | 118,477 | |
| | |
1.13%, 2/10/2022 (a) | | EUR | 300,000 | | | | 352,387 | |
| | |
Fiat Chrysler Finance Europe SENC | | | | | | | | |
| | |
4.75%, 3/22/2021 (a) | | EUR | 100,000 | | | | 121,908 | |
| | |
4.75%, 7/15/2022 (a) | | EUR | 100,000 | | | | 126,049 | |
| | |
Iceland Bondco plc 4.63%, 3/15/2025 (a) | | GBP | 100,000 | | | | 125,548 | |
| | |
Lloyds Banking Group plc 4.58%, 12/10/2025 | | | 200,000 | | | | 225,144 | |
| | |
Natwest Group plc | | | | | | | | |
| | |
(USD Swap Semi 5 Year + 7.60%), 8.62%, 8/15/2021 (d) (e) (f) | | | 200,000 | | | | 210,234 | |
| | |
(ICE LIBOR USD 3 Month + 1.48%), 3.50%, 5/15/2023 (d) | | | 235,000 | | | | 245,165 | |
| | |
6.10%, 6/10/2023 | | | 30,000 | | | | 33,363 | |
| | |
(US Treasury Yield Curve Rate T Note Constant Maturity 5 Year + 5.63%), 6.00%, 12/29/2025 (d) (e) (f) | | | 322,000 | | | | 339,217 | |
| | |
Sky Ltd. | | | | | | | | |
| | |
1.50%, 9/15/2021 (a) | | EUR | 200,000 | | | | 242,584 | |
| | |
2.25%, 11/17/2025 (a) | | EUR | 200,000 | | | | 265,513 | |
| | |
Standard Chartered plc | | | | | | | | |
| | |
(USD Swap Semi 5 Year + 5.72%), 7.75%, 4/2/2023 (c) (d) (e) (f) | | | 200,000 | | | | 216,864 | |
| | |
(US Treasury Yield Curve Rate T Note Constant Maturity 5 Year + 3.85%), 4.64%, 4/1/2031 (c) (d) | | | 200,000 | | | | 234,424 | |
| | |
Synlab Unsecured Bondco plc 8.25%, 7/1/2023 (a) | | EUR | 200,000 | | | | 244,207 | |
| | |
Virgin Media Secured Finance plc 5.50%, 5/15/2029 (c) | | | 200,000 | | | | 216,250 | |
| | |
Vodafone Group plc | | | | | | | | |
| | |
5.25%, 5/30/2048 | | | 180,000 | | | | 235,049 | |
| | |
4.88%, 6/19/2049 | | | 121,000 | | | | 150,818 | |
| | |
(EUR Swap Annual 5 Year + 2.67%), 3.10%, 1/3/2079 (a) (d) | | EUR | 300,000 | | | | 366,426 | |
| | | | | | | | |
| |
| | | | 5,505,264 | |
| | | | | | | | |
| | |
United States — 30.7% | | | | | | | | |
| | |
Abbott Ireland Financing DAC 1.50%, 9/27/2026 (a) | | EUR | 200,000 | | | | 256,785 | |
| | |
AbbVie, Inc. | | | | | | | | |
| | |
3.20%, 11/21/2029 (c) | | | 270,000 | | | | 298,828 | |
| | |
4.05%, 11/21/2039 (c) | | | 165,000 | | | | 192,447 | |
SEE NOTES TO FINANCIAL STATEMENTS.
| | | | | | |
| | | |
| 82 | | | | J.P. MORGAN EXCHANGE-TRADED FUNDS | | AUGUST 31, 2020 |
| | | | | | | | |
| INVESTMENTS | | PRINCIPAL
AMOUNT ($) | | | VALUE ($) | |
Corporate Bonds — continued | |
| | |
United States — continued | | | | | | | | |
| | |
4.70%, 5/14/2045 | | | 90,000 | | | | 112,250 | |
| | |
4.45%, 5/14/2046 | | | 50,000 | | | | 60,271 | |
| | |
Acadia Healthcare Co., Inc. 6.50%, 3/1/2024 | | | 54,000 | | | | 55,620 | |
| | |
ACCO Brands Corp. 5.25%, 12/15/2024 (c) | | | 120,000 | | | | 122,725 | |
| | |
Adient Global Holdings Ltd. 3.50%, 8/15/2024 (a) | | EUR | 100,000 | | | | 110,368 | |
| | |
Adient US LLC 9.00%, 4/15/2025 (c) | | | 110,000 | | | | 122,100 | |
| | |
AES Corp. (The) 5.50%, 4/15/2025 | | | 15,000 | | | | 15,451 | |
| | |
Ahern Rentals, Inc. 7.38%, 5/15/2023 (c) | | | 30,000 | | | | 12,450 | |
| | |
Air Lease Corp. | | | | | | | | |
| | |
3.25%, 3/1/2025 | | | 45,000 | | | | 45,726 | |
| | |
2.88%, 1/15/2026 | | | 102,000 | | | | 101,346 | |
| | |
3.25%, 10/1/2029 | | | 140,000 | | | | 136,626 | |
| | |
Air Medical Group Holdings, Inc. 6.38%, 5/15/2023 (c) | | | 30,000 | | | | 29,594 | |
| | |
Air Products and Chemicals, Inc. 2.05%, 5/15/2030 | | | 60,000 | | | | 63,336 | |
| | |
Albertsons Cos., Inc. | | | | | | | | |
| | |
6.63%, 6/15/2024 | | | 40,000 | | | | 41,288 | |
| | |
5.75%, 3/15/2025 | | | 25,000 | | | | 25,687 | |
| | |
Alexandria Real Estate Equities, Inc. REIT, 1.88%, 2/1/2033 | | | 60,000 | | | | 59,311 | |
| | |
Allison Transmission, Inc. | | | | | | | | |
| | |
5.00%, 10/1/2024 (c) | | | 20,000 | | | | 20,201 | |
| | |
4.75%, 10/1/2027 (c) | | | 50,000 | | | | 52,250 | |
| | |
5.88%, 6/1/2029 (c) | | | 60,000 | | | | 65,700 | |
| | |
Ally Financial, Inc. | | | | | | | | |
| | |
4.63%, 5/19/2022 | | | 74,000 | | | | 77,891 | |
| | |
5.75%, 11/20/2025 | | | 80,000 | | | | 89,802 | |
| | |
Altria Group, Inc. | | | | | | | | |
| | |
1.70%, 6/15/2025 | | EUR | 300,000 | | | | 375,637 | |
| | |
2.20%, 6/15/2027 | | EUR | 250,000 | | | | 320,852 | |
| | |
3.40%, 5/6/2030 | | | 230,000 | | | | 253,349 | |
| | |
Amazon.com, Inc. 2.70%, 6/3/2060 | | | 60,000 | | | | 61,252 | |
| | |
AMC Entertainment Holdings, Inc. | | | | | | | | |
| | |
10.50%, 4/24/2026 (c) | | | 45,000 | | | | 38,700 | |
| | |
12.00% (PIK), 6/15/2026 (c) (g) | | | 121,000 | | | | 43,504 | |
| | |
AMC Networks, Inc. 5.00%, 4/1/2024 | | | 119,000 | | | | 121,231 | |
| | |
Ameren Corp. 3.50%, 1/15/2031 | | | 160,000 | | | | 183,398 | |
| | |
American Airlines Group, Inc. 5.00%, 6/1/2022 (c) | | | 15,000 | | | | 9,675 | |
| | |
American Axle & Manufacturing, Inc. | | | | | | | | |
| | |
6.25%, 4/1/2025 | | | 11,000 | | | | 11,344 | |
| | |
6.50%, 4/1/2027 | | | 7,000 | | | | 7,192 | |
| | | | | | | | |
| INVESTMENTS | | PRINCIPAL
AMOUNT ($) | | | VALUE ($) | |
| | | | | | | | |
| | |
United States — continued | | | | | | | | |
| | |
American Tower Corp. | | | | | | | | |
| | |
REIT, 5.00%, 2/15/2024 | | | 570,000 | | | | 649,912 | |
| | |
REIT, 1.38%, 4/4/2025 | | EUR | 140,000 | | | | 174,512 | |
| | |
REIT, 2.10%, 6/15/2030 | | | 160,000 | | | | 163,291 | |
| | |
American Water Capital Corp. 2.80%, 5/1/2030 | | | 28,000 | | | | 30,644 | |
| | |
American Woodmark Corp. 4.88%, 3/15/2026 (c) | | | 95,000 | | | | 96,662 | |
| | |
AmeriGas Partners LP 5.50%, 5/20/2025 | | | 35,000 | | | | 38,412 | |
| | |
Amkor Technology, Inc. 6.63%, 9/15/2027 (c) | | | 12,000 | | | | 13,050 | |
| | |
AMN Healthcare, Inc. 5.13%, 10/1/2024 (c) | | | 21,000 | | | | 21,367 | |
| | |
Amsted Industries, Inc. 5.63%, 7/1/2027 (c) | | | 9,000 | | | | 9,562 | |
| | |
ANGI Group LLC 3.88%, 8/15/2028 (c) | | | 55,000 | | | | 55,714 | |
| | |
Antero Resources Corp. 5.13%, 12/1/2022 | | | 134,000 | | | | 116,412 | |
| | |
Apple, Inc. | | | | | | | | |
| | |
3.85%, 5/4/2043 | | | 70,000 | | | | 85,817 | |
| | |
2.40%, 8/20/2050 | | | 240,000 | | | | 237,708 | |
| | |
2.55%, 8/20/2060 | | | 195,000 | | | | 190,453 | |
| | |
Aramark International Finance SARL 3.13%, 4/1/2025 (a) | | EUR | 100,000 | | | | 113,437 | |
| | |
Aramark Services, Inc. 5.00%, 2/1/2028 (c) | | | 80,000 | | | | 80,100 | |
| | |
Archrock Partners LP 6.88%, 4/1/2027 (c) | | | 11,000 | | | | 11,330 | |
| | |
Arconic Corp. 6.00%, 5/15/2025 (c) | | | 57,000 | | | | 60,420 | |
| | |
Ardagh Packaging Finance plc | | | | | | | | |
| | |
2.13%, 8/15/2026 (c) | | EUR | 100,000 | | | | 118,933 | |
| | |
4.13%, 8/15/2026 (c) | | | 200,000 | | | | 208,640 | |
| | |
AT&T, Inc. | | | | | | | | |
| | |
2.95%, 7/15/2026 | | | 42,000 | | | | 46,292 | |
| | |
2.30%, 6/1/2027 | | | 100,000 | | | | 106,045 | |
| | |
2.25%, 2/1/2032 | | | 230,000 | | | | 233,125 | |
| | |
4.75%, 5/15/2046 | | | 75,000 | | | | 89,538 | |
| | |
Avantor, Inc. 6.00%, 10/1/2024 (c) | | | 65,000 | | | | 68,087 | |
| | |
Avis Budget Car Rental LLC | | | | | | | | |
| | |
6.38%, 4/1/2024 (c) | | | 45,000 | | | | 44,100 | |
| | |
5.25%, 3/15/2025 (c) | | | 42,000 | | | | 40,078 | |
| | |
5.75%, 7/15/2027 (c) | | | 14,000 | | | | 13,421 | |
| | |
B&G Foods, Inc. 5.25%, 4/1/2025 | | | 49,000 | | | | 50,701 | |
| | |
Ball Corp. 4.38%, 12/15/2023 | | EUR | 150,000 | | | | 197,345 | |
SEE NOTES TO FINANCIAL STATEMENTS.
| | | | | | | | |
| | | |
| AUGUST 31, 2020 | | J.P. MORGAN EXCHANGE-TRADED FUNDS | | | | | 83 | |
JPMorgan International Bond Opportunities ETF
(formerly known as JPMorgan Global Bond Opportunities ETF)
SCHEDULE OF PORTFOLIO INVESTMENTS
AS OF AUGUST 31, 2020 (Unaudited) (continued)
| | | | | | | | |
| INVESTMENTS | | PRINCIPAL
AMOUNT ($) | | | VALUE ($) | |
Corporate Bonds — continued | |
| | |
United States — continued | | | | | | | | |
| | |
Bank of America Corp. | | | | | | | | |
| | |
Series Z, (ICE LIBOR USD 3 Month + 4.17%), 6.50%, 10/23/2024 (d) (e) (f) | | | 29,000 | | | | 32,763 | |
| | |
Series DD, (ICE LIBOR USD 3 Month + 4.55%), 6.30%, 3/10/2026 (d) (e) (f) | | | 230,000 | | | | 265,963 | |
| | |
3.25%, 10/21/2027 | | | 290,000 | | | | 322,802 | |
| | |
(ICE LIBOR USD 3 Month + 1.19%), 2.88%, 10/22/2030 (d) | | | 190,000 | | | | 206,502 | |
| | |
(SOFR + 1.53%), 1.90%, 7/23/2031 (d) | | | 180,000 | | | | 181,602 | |
| | |
(SOFR + 1.93%), 2.68%, 6/19/2041 (d) | | | 25,000 | | | | 25,429 | |
| | |
Bank of New York Mellon Corp. (The) Series G, (US Treasury Yield Curve Rate T Note Constant Maturity 5 Year + 4.36%), 4.70%, 9/20/2025 (d) (e) (f) | | | 56,000 | | | | 60,816 | |
| | |
Bausch Health Cos., Inc. | | | | | | | | |
| | |
4.50%, 5/15/2023 | | EUR | 100,000 | | | | 118,993 | |
| | |
5.88%, 5/15/2023 (c) | | | 15,000 | | | | 15,000 | |
| | |
7.00%, 3/15/2024 (c) | | | 100,000 | | | | 103,896 | |
| | |
6.13%, 4/15/2025 (c) | | | 525,000 | | | | 540,094 | |
| | |
5.50%, 11/1/2025 (c) | | | 70,000 | | | | 72,254 | |
| | |
Beacon Roofing Supply, Inc. 4.88%, 11/1/2025 (c) | | | 20,000 | | | | 19,827 | |
| | |
Becton Dickinson and Co. | | | | | | | | |
| | |
1.40%, 5/24/2023 | | EUR | 100,000 | | | | 122,423 | |
| | |
2.82%, 5/20/2030 | | | 195,000 | | | | 211,560 | |
| | |
3.79%, 5/20/2050 | | | 55,000 | | | | 61,758 | |
| | |
Belden, Inc. 3.38%, 7/15/2027 (a) | | EUR | 100,000 | | | | 118,055 | |
| | |
Berry Global, Inc. | | | | | | | | |
| | |
5.13%, 7/15/2023 | | | 21,000 | | | | 21,263 | |
| | |
4.50%, 2/15/2026 (c) | | | 13,000 | | | | 13,255 | |
| | |
4.88%, 7/15/2026 (c) | | | 50,000 | | | | 53,125 | |
| | |
5.63%, 7/15/2027 (c) | | | 3,000 | | | | 3,172 | |
| | |
Biogen, Inc. 2.25%, 5/1/2030 | | | 70,000 | | | | 71,745 | |
| | |
Black Knight InfoServ LLC 3.63%, 9/1/2028 (c) | | | 55,000 | | | | 55,705 | |
| | |
Blue Racer Midstream LLC 6.13%, 11/15/2022 (c) | | | 155,000 | | | | 154,225 | |
| | |
Boeing Co. (The) | | | | | | | | |
| | |
4.88%, 5/1/2025 | | | 210,000 | | | | 228,434 | |
| | |
5.04%, 5/1/2027 | | | 260,000 | | | | 286,088 | |
| | |
3.50%, 3/1/2039 | | | 135,000 | | | | 121,212 | |
| | |
5.71%, 5/1/2040 | | | 65,000 | | | | 75,363 | |
| | | | | | | | |
| INVESTMENTS | | PRINCIPAL
AMOUNT ($) | | | VALUE ($) | |
| | | | | | | | |
| | |
United States — continued | | | | | | | | |
| | |
Boyd Gaming Corp. 6.38%, 4/1/2026 | | | 58,000 | | | | 60,466 | |
| | |
Boyne USA, Inc. 7.25%, 5/1/2025 (c) | | | 93,000 | | | | 98,580 | |
| | |
BP Capital Markets America, Inc. | | | | | | | | |
| | |
3.63%, 4/6/2030 | | | 180,000 | | | | 206,808 | |
| | |
2.77%, 11/10/2050 | | | 70,000 | | | | 66,005 | |
| | |
Brink’s Co. (The) 4.63%, 10/15/2027 (c) | | | 42,000 | | | | 43,615 | |
| | |
Bristol-Myers Squibb Co. 2.90%, 7/26/2024 | | | 242,000 | | | | 263,687 | |
| | |
Broadcom, Inc. | | | | | | | | |
| | |
2.25%, 11/15/2023 | | | 240,000 | | | | 249,673 | |
| | |
4.25%, 4/15/2026 | | | 175,000 | | | | 198,420 | |
| | |
BWX Technologies, Inc. 5.38%, 7/15/2026 (c) | | | 10,000 | | | | 10,475 | |
| | |
BY Crown Parent LLC 4.25%, 1/31/2026 (c) | | | 90,000 | | | | 91,903 | |
| | |
Caesars Resort Collection LLC 5.25%, 10/15/2025 (c) | | | 25,000 | | | | 23,934 | |
| | |
Callon Petroleum Co. | | | | | | | | |
| | |
6.25%, 4/15/2023 | | | 47,000 | | | | 16,627 | |
| | |
6.13%, 10/1/2024 | | | 38,000 | | | | 12,410 | |
| | |
Calpine Corp. | | | | | | | | |
| | |
5.25%, 6/1/2026 (c) | | | 69,000 | | | | 72,026 | |
| | |
Catalent Pharma Solutions, Inc. | | | | | | | | |
| | |
4.88%, 1/15/2026 (c) | | | 35,000 | | | | 35,700 | |
| | |
CCO Holdings LLC | | | | | | | | |
| | |
5.75%, 2/15/2026 (c) | | | 391,000 | | | | 409,791 | |
| | |
5.13%, 5/1/2027 (c) | | | 160,000 | | | | 170,403 | |
| | |
5.00%, 2/1/2028 (c) | | | 155,000 | | | | 163,913 | |
| | |
5.38%, 6/1/2029 (c) | | | 16,000 | | | | 17,584 | |
| | |
4.75%, 3/1/2030 (c) | | | 181,000 | | | | 194,457 | |
| | |
CD&R Smokey Buyer, Inc. 6.75%, 7/15/2025 (c) | | | 24,000 | | | | 25,680 | |
| | |
CDK Global, Inc. 5.25%, 5/15/2029 (c) | | | 35,000 | | | | 38,182 | |
| | |
CDW LLC | | | | | | | | |
| | |
4.25%, 4/1/2028 | | | 145,000 | | | | 151,525 | |
| | |
3.25%, 2/15/2029 | | | 21,000 | | | | 21,449 | |
| | |
Cedar Fair LP 5.25%, 7/15/2029 | | | 4,000 | | | | 3,876 | |
| | |
Centene Corp. | | | | | | | | |
| | |
5.25%, 4/1/2025 (c) | | | 28,000 | | | | 29,050 | |
| | |
4.63%, 12/15/2029 | | | 305,000 | | | | 334,231 | |
| | |
CenterPoint Energy, Inc. 2.95%, 3/1/2030 | | | 79,000 | | | | 86,857 | |
| | |
Central Garden & Pet Co. 6.13%, 11/15/2023 | | | 20,000 | | | | 20,425 | |
SEE NOTES TO FINANCIAL STATEMENTS.
| | | | | | |
| | | |
| 84 | | | | J.P. MORGAN EXCHANGE-TRADED FUNDS | | AUGUST 31, 2020 |
| | | | | | | | |
| INVESTMENTS | | PRINCIPAL
AMOUNT ($) | | | VALUE ($) | |
Corporate Bonds — continued | |
| | |
United States — continued | | | | | | | | |
| | |
CenturyLink, Inc. | | | | | | | | |
| | |
Series T, 5.80%, 3/15/2022 | | | 80,000 | | | | 83,593 | |
| | |
Series W, 6.75%, 12/1/2023 | | | 15,000 | | | | 16,613 | |
| | |
Series Y, 7.50%, 4/1/2024 | | | 65,000 | | | | 73,694 | |
| | |
CF Industries, Inc. 4.50%, 12/1/2026 (c) | | | 190,000 | | | | 215,722 | |
| | |
Charter Communications Operating LLC | | | | | | | | |
| | |
2.80%, 4/1/2031 | | | 170,000 | | | | 178,611 | |
| | |
5.38%, 5/1/2047 | | | 68,000 | | | | 81,835 | |
| | |
3.70%, 4/1/2051 | | | 125,000 | | | | 123,888 | |
| | |
Chemours Co. (The) | | | | | | | | |
| | |
6.63%, 5/15/2023 | | | 40,000 | | | | 40,200 | |
| | |
7.00%, 5/15/2025 | | | 73,000 | | | | 74,642 | |
| | |
4.00%, 5/15/2026 | | EUR | 100,000 | | | | 114,263 | |
| | |
Cheniere Energy Partners LP 5.25%, 10/1/2025 | | | 30,000 | | | | 30,697 | |
| | |
Chesapeake Energy Corp. 11.50%, 1/1/2025 (c) (h) | | | 93,000 | | | | 12,044 | |
| | |
Chevron Corp. | | | | | | | | |
| | |
1.55%, 5/11/2025 | | | 250,000 | | | | 260,087 | |
| | |
2.24%, 5/11/2030 | | | 110,000 | | | | 117,232 | |
| | |
Chevron USA, Inc. 2.34%, 8/12/2050 | | | 40,000 | | | | 38,120 | |
| | |
Cigna Corp. 3.40%, 3/15/2050 | | | 85,000 | | | | 90,997 | |
| | |
Cincinnati Bell, Inc. | | | | | | | | |
| | |
7.00%, 7/15/2024 (c) | | | 29,000 | | | | 29,979 | |
| | |
8.00%, 10/15/2025 (c) | | | 4,000 | | | | 4,275 | |
| | |
Cinemark USA, Inc. 4.88%, 6/1/2023 | | | 38,000 | | | | 34,968 | |
| | |
Citigroup, Inc. | | | | | | | | |
| | |
Series Q, (ICE LIBOR USD 3 Month + 4.10%), 4.38%, 11/15/2020 (d) (e) (f) | | | 183,000 | | | | 182,112 | |
| | |
(ICE LIBOR USD 3 Month + 0.72%), 3.14%, 1/24/2023 (d) | | | 100,000 | | | | 103,473 | |
| | |
Series V, (SOFR + 3.23%), 4.70%, 1/30/2025 (d) (e) (f) | | | 170,000 | | | | 169,150 | |
| | |
Series P, (ICE LIBOR USD 3 Month + 3.91%), 5.95%, 5/15/2025 (d) (e) (f) | | | 190,000 | | | | 205,162 | |
| | |
(SOFR + 2.75%), 3.11%, 4/8/2026 (d) | | | 140,000 | | | | 151,894 | |
| | |
Series T, (ICE LIBOR USD 3 Month + 4.52%), 6.25%, 8/15/2026 (d) (e) (f) | | | 200,000 | | | | 227,000 | |
| | |
(SOFR + 3.91%), 4.41%, 3/31/2031 (d) | | | 305,000 | | | | 370,419 | |
| | |
(SOFR + 2.11%), 2.57%, 6/3/2031 (d) | | | 370,000 | | | | 390,982 | |
| | | | | | | | |
| INVESTMENTS | | PRINCIPAL
AMOUNT ($) | | | VALUE ($) | |
| |
| | |
United States — continued | | | | | | | | |
| | |
Clarios Global LP 6.25%, 5/15/2026 (c) | | | 65,000 | | | | 68,941 | |
| | |
Clean Harbors, Inc. 4.88%, 7/15/2027 (c) | | | 25,000 | | | | 26,228 | |
| | |
Clear Channel Worldwide Holdings, Inc. | | | | | | | | |
| | |
9.25%, 2/15/2024 | | | 85,000 | | | | 83,300 | |
| | |
5.13%, 8/15/2027 (c) | | | 155,000 | | | | 156,596 | |
| | |
Clearwater Paper Corp. 4.50%, 2/1/2023 | | | 37,000 | | | | 37,296 | |
| | |
Clearway Energy Operating LLC 5.00%, 9/15/2026 | | | 44,000 | | | | 46,176 | |
| | |
Clorox Co. (The) 1.80%, 5/15/2030 | | | 30,000 | | | | 30,674 | |
| | |
CNO Financial Group, Inc. 5.25%, 5/30/2025 | | | 15,000 | | | | 17,114 | |
| | |
CNX Midstream Partners LP 6.50%, 3/15/2026 (c) | | | 20,000 | | | | 20,030 | |
| | |
Cogent Communications Group, Inc. 5.38%, 3/1/2022 (c) | | | 25,000 | | | | 25,750 | |
| | |
Comcast Corp. | | | | | | | | |
| | |
3.95%, 10/15/2025 | | | 250,000 | | | | 288,212 | |
| | |
3.90%, 3/1/2038 | | | 40,000 | | | | 47,813 | |
| | |
3.75%, 4/1/2040 | | | 94,000 | | | | 110,863 | |
| | |
4.60%, 8/15/2045 | | | 105,000 | | | | 136,338 | |
| | |
Commercial Metals Co. 4.88%, 5/15/2023 | | | 15,000 | | | | 15,600 | |
| | |
CommScope Technologies LLC 6.00%, 6/15/2025 (c) | | | 191,000 | | | | 195,815 | |
| | |
CommScope, Inc. | | | | | | | | |
| | |
6.00%, 3/1/2026 (c) | | | 45,000 | | | | 47,812 | |
| | |
8.25%, 3/1/2027 (c) | | | 48,000 | | | | 51,960 | |
| | |
Community Health Systems, Inc. | | | | | | | | |
| | |
6.25%, 3/31/2023 | | | 21,000 | | | | 21,052 | |
| | |
8.63%, 1/15/2024 (c) | | | 37,000 | | | | 38,665 | |
| | |
Comstock Resources, Inc. 7.50%, 5/15/2025 (c) | | | 38,000 | | | | 37,710 | |
| | |
Concho Resources, Inc. 3.75%, 10/1/2027 | | | 53,000 | | | | 58,132 | |
| | |
Constellation Merger Sub, Inc. 8.50%, 9/15/2025 (c) | | | 21,000 | | | | 17,850 | |
| | |
Constellium SE 4.25%, 2/15/2026 (a) | | EUR | 100,000 | | | | 118,652 | |
| | |
Coty, Inc. 6.50%, 4/15/2026 (c) | | | 50,000 | | | | 41,184 | |
| | |
Covanta Holding Corp. 5.88%, 7/1/2025 | | | 14,000 | | | | 14,607 | |
| | |
Crestwood Midstream Partners LP 5.75%, 4/1/2025 | | | 60,000 | | | | 57,400 | |
| | |
Crown Castle International Corp. | | | | | | | | |
| | |
REIT, 3.30%, 7/1/2030 | | | 155,000 | | | | 172,018 | |
SEE NOTES TO FINANCIAL STATEMENTS.
| | | | | | | | |
| | | |
| AUGUST 31, 2020 | | J.P. MORGAN EXCHANGE-TRADED FUNDS | | | | | 85 | |
JPMorgan International Bond Opportunities ETF
(formerly known as JPMorgan Global Bond Opportunities ETF)
SCHEDULE OF PORTFOLIO INVESTMENTS
AS OF AUGUST 31, 2020 (Unaudited) (continued)
| | | | | | | | |
| INVESTMENTS | | PRINCIPAL
AMOUNT ($) | | | VALUE ($) | |
Corporate Bonds — continued | |
| | |
United States — continued | | | | | | | | |
| | |
REIT, 4.15%, 7/1/2050 | | | 20,000 | | | | 23,484 | |
| | |
Crown European Holdings SA | | | | | | | | |
| | |
4.00%, 7/15/2022 (a) | | EUR | 250,000 | | | | 313,254 | |
| | |
2.63%, 9/30/2024 (a) | | EUR | 125,000 | | | | 155,562 | |
| | |
CSC Holdings LLC | | | | | | | | |
| | |
5.88%, 9/15/2022 | | | 20,000 | | | | 21,200 | |
| | |
5.25%, 6/1/2024 | | | 215,000 | | | | 232,737 | |
| | |
CSX Corp. 2.40%, 2/15/2030 | | | 350,000 | | | | 369,884 | |
| | |
Curo Group Holdings Corp. 8.25%, 9/1/2025 (c) | | | 110,000 | | | | 90,750 | |
| | |
CVR Partners LP 9.25%, 6/15/2023 (c) | | | 98,000 | | | | 96,285 | |
| | |
CVS Health Corp. | | | | | | | | |
| | |
3.25%, 8/15/2029 | | | 103,000 | | | | 114,249 | |
| | |
1.75%, 8/21/2030 | | | 150,000 | | | | 148,148 | |
| | |
4.13%, 4/1/2040 | | | 100,000 | | | | 116,192 | |
| | |
Dana Financing Luxembourg SARL 6.50%, 6/1/2026 (c) | | | 105,000 | | | | 110,644 | |
| | |
DaVita, Inc. 3.75%, 2/15/2031 (c) | | | 42,000 | | | | 41,455 | |
| | |
DCP Midstream Operating LP 3.88%, 3/15/2023 | | | 74,000 | | | | 74,925 | |
| | |
Deere & Co. | | | | | | | | |
| | |
3.10%, 4/15/2030 | | | 50,000 | | | | 57,002 | |
| | |
3.75%, 4/15/2050 | | | 205,000 | | | | 251,523 | |
| | |
Delek Logistics Partners LP 6.75%, 5/15/2025 | | | 29,000 | | | | 26,752 | |
| | |
Dell International LLC | | | | | | | | |
| | |
7.13%, 6/15/2024 (c) | | | 37,000 | | | | 38,417 | |
| | |
6.02%, 6/15/2026 (c) | | | 270,000 | | | | 317,873 | |
| | |
Diamond Sports Group LLC 5.38%, 8/15/2026(c) | | | 93,000 | | | | 72,540 | |
| | |
Diamondback Energy, Inc. 5.38%, 5/31/2025 | | | 40,000 | | | | 41,657 | |
| | |
Diebold Nixdorf, Inc. 9.38%, 7/15/2025 (c) | | | 15,000 | | | | 16,125 | |
| | |
Discovery Communications LLC 4.65%, 5/15/2050 | | | 75,000 | | | | 85,665 | |
| | |
DISH DBS Corp. | | | | | | | | |
| | |
6.75%, 6/1/2021 | | | 10,000 | | | | 10,250 | |
| | |
5.88%, 11/15/2024 | | | 300,000 | | | | 317,092 | |
| | |
7.75%, 7/1/2026 | | | 235,000 | | | | 269,075 | |
| | |
Dole Food Co., Inc. 7.25%, 6/15/2025 (c) | | | 39,000 | | | | 39,000 | |
| | |
Downstream Development Authority of the Quapaw Tribe of Oklahoma 10.50%, 2/15/2023 (c) | | | 60,000 | | | | 54,600 | |
| | | | | | | | |
| INVESTMENTS | | PRINCIPAL
AMOUNT ($) | | | VALUE ($) | |
| | | | | | | | |
| | |
United States — continued | | | | | | | | |
| | |
Duke Energy Ohio, Inc. 2.13%, 6/1/2030 | | | 120,000 | | | | 126,844 | |
| | |
Dun & Bradstreet Corp. (The) 6.88%, 8/15/2026 (c) | | | 13,000 | | | | 14,105 | |
| | |
Edgewell Personal Care Co. | | | | | | | | |
| | |
4.70%, 5/24/2022 | | | 25,000 | | | | 26,125 | |
| | |
5.50%, 6/1/2028 (c) | | | 20,000 | | | | 21,350 | |
| | |
Edison International 3.55%, 11/15/2024 | | | 150,000 | | | | 159,758 | |
| | |
Embarq Corp. 8.00%, 6/1/2036 | | | 70,000 | | | | 83,946 | |
| | |
Encompass Health Corp. | | | | | | | | |
| | |
5.75%, 11/1/2024 | | | 70,000 | | | | 70,349 | |
| | |
5.75%, 9/15/2025 | | | 105,000 | | | | 108,602 | |
| | |
Energizer Holdings, Inc. | | | | | | | | |
| | |
7.75%, 1/15/2027 (c) | | | 65,000 | | | | 71,194 | |
| | |
4.75%, 6/15/2028 (c) | | | 131,000 | | | | 136,698 | |
| | |
EnLink Midstream Partners LP | | | | | | | | |
| | |
4.40%, 4/1/2024 | | | 20,000 | | | | 18,500 | |
| | |
4.15%, 6/1/2025 | | | 20,000 | | | | 17,824 | |
| | |
5.60%, 4/1/2044 | | | 20,000 | | | | 13,200 | |
| | |
Entegris, Inc. 4.63%, 2/10/2026 (c) | | | 65,000 | | | | 67,133 | |
| | |
Entercom Media Corp. 7.25%, 11/1/2024 (c) | | | 20,000 | | | | 16,000 | |
| | |
Enterprise Development Authority (The) 12.00%, 7/15/2024 (c) | | | 63,000 | | | | 68,985 | |
| | |
Envision Healthcare Corp. 8.75%, 10/15/2026 (c) | | | 93,000 | | | | 40,920 | |
| | |
EP Energy LLC | | | | | | | | |
| | |
9.38%, 5/1/2024 (c) (h) | | | 40,000 | | | | 4 | |
| | |
8.00%, 11/29/2024 (c) (h) | | | 37,000 | | | | 37 | |
| | |
7.75%, 5/15/2026 (c) (h) | | | 36,000 | | | | 7,830 | |
| | |
EQM Midstream Partners LP 4.00%, 8/1/2024 | | | 44,000 | | | | 44,220 | |
| | |
EQT Corp. 3.90%, 10/1/2027 | | | 75,000 | | | | 72,108 | |
| | |
ESH Hospitality, Inc. | | | | | | | | |
| | |
REIT, 5.25%, 5/1/2025 (c) | | | 130,000 | | | | 131,950 | |
| | |
REIT, 4.63%, 10/1/2027 (c) | | | 18,000 | | | | 18,000 | |
| | |
Evergy Metro, Inc. Series 2020, 2.25%, 6/1/2030 | | | 119,000 | | | | 126,786 | |
| | |
Exela Intermediate LLC 10.00%, 7/15/2023 (c) | | | 56,000 | | | | 16,240 | |
| | |
FirstCash, Inc. 5.38%, 6/1/2024 (c) | | | 15,000 | | | | 15,404 | |
| | |
FirstEnergy Corp. | | | | | | | | |
| | |
Series B, 3.90%, 7/15/2027 | | | 364,000 | | | | 399,094 | |
| | |
2.65%, 3/1/2030 | | | 110,000 | | | | 113,103 | |
| | |
Series B, 2.25%, 9/1/2030 | | | 53,000 | | | | 52,701 | |
SEE NOTES TO FINANCIAL STATEMENTS.
| | | | | | |
| | | |
| 86 | | | | J.P. MORGAN EXCHANGE-TRADED FUNDS | | AUGUST 31, 2020 |
| | | | | | | | |
| INVESTMENTS | | PRINCIPAL
AMOUNT ($) | | | VALUE ($) | |
Corporate Bonds — continued | |
| | |
United States — continued | | | | | | | | |
| | |
Ford Motor Co. 9.00%, 4/22/2025 | | | 325,000 | | | | 380,336 | |
| | |
Ford Motor Credit Co. LLC 5.13%, 6/16/2025 | | | 320,000 | | | | 336,234 | |
| | |
Fox Corp. 3.50%, 4/8/2030 | | | 180,000 | | | | 202,557 | |
| | |
Freeport-McMoRan, Inc. 5.40%, 11/14/2034 | | | 50,000 | | | | 56,519 | |
| | |
Frontier Communications Corp. | | | | | | | | |
| | |
7.63%, 4/15/2024 (h) | | | 15,000 | | | | 6,225 | |
| | |
6.88%, 1/15/2025 (h) | | | 35,000 | | | | 13,960 | |
| | |
Gartner, Inc. 4.50%, 7/1/2028 (c) | | | 130,000 | | | | 135,850 | |
| | |
General Electric Co. 1.50%, 5/17/2029 | | EUR | 100,000 | | | | 115,220 | |
| | |
General Motors Co. 5.15%, 4/1/2038 | | | 30,000 | | | | 31,837 | |
| | |
Genesis Energy LP | | | | | | | | |
| | |
5.63%, 6/15/2024 | | | 20,000 | | | | 17,650 | |
| | |
6.25%, 5/15/2026 | | | 15,000 | | | | 12,681 | |
| | |
Global Partners LP 7.00%, 6/15/2023 | | | 25,000 | | | | 25,000 | |
| | |
Goldman Sachs Group, Inc. (The) | | | | | | | | |
| | |
(ICE LIBOR USD 3 Month + 0.99%), 2.90%, 7/24/2023 (d) | | | 205,000 | | | | 213,606 | |
| | |
(ICE LIBOR USD 3 Month + 1.60%), 1.86%, 11/29/2023 (d) | | | 130,000 | | | | 134,222 | |
| | |
3.50%, 4/1/2025 | | | 385,000 | | | | 426,571 | |
| | |
3.85%, 1/26/2027 | | | 159,000 | | | | 181,050 | |
| | |
(ICE LIBOR USD 3 Month + 1.37%), 4.02%, 10/31/2038 (d) | | | 35,000 | | | | 41,221 | |
| | |
Gray Television, Inc. 7.00%, 5/15/2027 (c) | | | 95,000 | | | | 103,075 | |
| | |
Griffon Corp. 5.75%, 3/1/2028 | | | 70,000 | | | | 74,287 | |
| | |
Gulfport Energy Corp. 6.00%, 10/15/2024 | | | 78,000 | | | | 46,410 | |
| | |
H&E Equipment Services, Inc. 5.63%, 9/1/2025 | | | 15,000 | | | | 15,562 | |
| | |
HCA, Inc. | | | | | | | | |
| | |
5.88%, 5/1/2023 | | | 82,000 | | | | 89,790 | |
| | |
5.38%, 2/1/2025 | | | 130,000 | | | | 146,400 | |
| | |
5.88%, 2/15/2026 | | | 360,000 | | | | 412,200 | |
| | |
4.50%, 2/15/2027 | | | 140,000 | | | | 159,842 | |
| | |
5.63%, 9/1/2028 | | | 119,000 | | | | 141,528 | |
| | |
Herc Holdings, Inc. 5.50%, 7/15/2027 (c) | | | 89,000 | | | | 93,227 | |
| | |
Hertz Corp. (The) | | | | | | | | |
| | |
7.63%, 6/1/2022 (c) (h) | | | 4,000 | | | | 3,480 | |
| | |
5.50%, 10/15/2024 (c) (h) | | | 128,000 | | | | 51,840 | |
| | |
7.13%, 8/1/2026 (c) (h) | | | 15,000 | | | | 6,075 | |
| | | | | | | | |
| INVESTMENTS | | PRINCIPAL
AMOUNT ($) | | | VALUE ($) | |
| |
| | |
United States — continued | | | | | | | | |
| | |
Hilcorp Energy I LP | | | | | | | | |
| | |
5.00%, 12/1/2024 (c) | | | 23,000 | | | | 21,792 | |
| | |
6.25%, 11/1/2028 (c) | | | 25,000 | | | | 23,500 | |
| | |
Hill-Rom Holdings, Inc. 5.00%, 2/15/2025 (c) | | | 15,000 | | | | 15,490 | |
| | |
Hilton Domestic Operating Co., Inc. 5.13%, 5/1/2026 | | | 12,000 | | | | 12,390 | |
| | |
Hilton Grand Vacations Borrower LLC 6.13%, 12/1/2024 | | | 15,000 | | | | 15,506 | |
| | |
Hilton Worldwide Finance LLC | | | | | | | | |
| | |
4.63%, 4/1/2025 | | | 88,000 | | | | 88,880 | |
| | |
4.88%, 4/1/2027 | | | 113,000 | | | | 115,825 | |
| | |
Hologic, Inc. 4.38%, 10/15/2025 (c) | | | 15,000 | | | | 15,310 | |
| | |
Home Depot, Inc. (The) 2.70%, 4/15/2030 | | | 120,000 | | | | 132,871 | |
| | |
Howmet Aerospace, Inc. 5.90%, 2/1/2027 | | | 60,000 | | | | 67,842 | |
| | |
Hughes Satellite Systems Corp. 6.63%, 8/1/2026 | | | 15,000 | | | | 16,988 | |
| | |
Hyundai Capital America 3.50%, 11/2/2026 (a) | | | 150,000 | | | | 162,000 | |
| | |
Icahn Enterprises LP 6.38%, 12/15/2025 | | | 25,000 | | | | 25,938 | |
| | |
iHeartCommunications, Inc. 5.25%, 8/15/2027 (c) | | | 50,000 | | | | 49,875 | |
| | |
International Business Machines Corp. | | | | | | | | |
| | |
2.85%, 5/15/2040 | | | 100,000 | | | | 105,824 | |
| | |
2.95%, 5/15/2050 | | | 100,000 | | | | 102,890 | |
| | |
International Game Technology plc 4.75%, 2/15/2023 (a) | | EUR | 100,000 | | | | 123,350 | |
| | |
IQVIA, Inc. | | | | | | | | |
| | |
3.25%, 3/15/2025 (a) | | EUR | 200,000 | | | | 242,098 | |
| | |
5.00%, 5/15/2027 (c) | | | 200,000 | | | | 210,521 | |
| | |
IRB Holding Corp. 6.75%, 2/15/2026 (c) | | | 39,000 | | | | 39,634 | |
| | |
Iron Mountain, Inc. REIT, 4.88%, 9/15/2029 (c) | | | 70,000 | | | | 72,730 | |
| | |
ITC Holdings Corp. | | | | | | | | |
| | |
3.35%, 11/15/2027 | | | 140,000 | | | | 156,912 | |
| | |
2.95%, 5/14/2030 (c) | | | 280,000 | | | | 303,811 | |
| | |
JBS USA LUX SA | | | | | | | | |
| | |
5.88%, 7/15/2024 (c) | | | 3,000 | | | | 3,060 | |
| | |
5.75%, 6/15/2025 (c) | | | 6,000 | | | | 6,195 | |
| | |
6.50%, 4/15/2029 (c) | | | 43,000 | | | | 48,813 | |
| | |
JELD-WEN, Inc. 4.63%, 12/15/2025 (c) | | | 70,000 | | | | 70,350 | |
SEE NOTES TO FINANCIAL STATEMENTS.
| | | | | | | | |
| | | |
| AUGUST 31, 2020 | | J.P. MORGAN EXCHANGE-TRADED FUNDS | | | | | 87 | |
JPMorgan International Bond Opportunities ETF
(formerly known as JPMorgan Global Bond Opportunities ETF)
SCHEDULE OF PORTFOLIO INVESTMENTS
AS OF AUGUST 31, 2020 (Unaudited) (continued)
| | | | | | | | |
| INVESTMENTS | | PRINCIPAL
AMOUNT ($) | | | VALUE ($) | |
Corporate Bonds — continued | |
| | |
United States — continued | | | | | | | | |
| | |
Kennedy-Wilson, Inc. 5.88%, 4/1/2024 | | | 14,000 | | | | 14,171 | |
| | |
Keurig Dr Pepper, Inc. 3.20%, 5/1/2030 | | | 140,000 | | | | 157,065 | |
| | |
Kroger Co. (The) 2.65%, 10/15/2026 | | | 135,000 | | | | 147,398 | |
| | |
L Brands, Inc. | | | | | | | | |
| | |
5.63%, 10/15/2023 | | | 45,000 | | | | 46,922 | |
| | |
5.25%, 2/1/2028 | | | 18,000 | | | | 17,280 | |
| | |
L3Harris Technologies, Inc. 4.85%, 4/27/2035 | | | 185,000 | | | | 244,612 | |
| | |
LABL Escrow Issuer LLC 6.75%, 7/15/2026 (c) | | | 120,000 | | | | 128,700 | |
| | |
Lamar Media Corp. | | | | | | | | |
| | |
5.75%, 2/1/2026 | | | 65,000 | | | | 67,782 | |
| | |
Lamb Weston Holdings, Inc. 4.88%, 11/1/2026 (c) | | | 95,000 | | | | 99,406 | |
| | |
Lennar Corp. 5.88%, 11/15/2024 | | | 48,000 | | | | 53,640 | |
| | |
Level 3 Financing, Inc. | | | | | | | | |
| | |
5.38%, 5/1/2025 | | | 25,000 | | | | 25,747 | |
| | |
5.25%, 3/15/2026 | | | 61,000 | | | | 63,599 | |
| | |
4.63%, 9/15/2027 (c) | | | 140,000 | | | | 146,650 | |
| | |
Liberty Mutual Group, Inc. 3.95%, 10/15/2050 (c) | | | 15,000 | | | | 16,731 | |
| | |
Live Nation Entertainment, Inc. | | | | | | | | |
| | |
4.88%, 11/1/2024 (c) | | | 95,000 | | | | 93,347 | |
| | |
5.63%, 3/15/2026 (c) | | | 19,000 | | | | 18,715 | |
| | |
LKQ European Holdings BV 3.63%, 4/1/2026 (a) | | EUR | 100,000 | | | | 122,336 | |
| | |
LKQ Italia Bondco SpA 3.88%, 4/1/2024 (a) | | EUR | 200,000 | | | | 251,054 | |
| | |
Lowe’s Cos., Inc. 5.13%, 4/15/2050 | | | 110,000 | | | | 151,568 | |
| | |
LPL Holdings, Inc. 5.75%, 9/15/2025 (c) | | | 38,000 | | | | 39,520 | |
| | |
Marriott Ownership Resorts, Inc. 6.50%, 9/15/2026 | | | 29,000 | | | | 30,124 | |
| | |
Martin Midstream Partners LP | | | | | | | | |
| | |
10.00%, 2/29/2024 (c) | | | 8,735 | | | | 9,071 | |
| | |
11.50%, 2/28/2025 (c) | | | 39,674 | | | | 35,409 | |
| | |
Matador Resources Co. 5.88%, 9/15/2026 | | | 21,000 | | | | 18,270 | |
| | |
Mattel, Inc. | | | | | | | | |
| | |
3.15%, 3/15/2023 | | | 10,000 | | | | 9,827 | |
| | |
6.75%, 12/31/2025 (c) | | | 170,000 | | | | 180,413 | |
| | | | | | | | |
| INVESTMENTS | | PRINCIPAL
AMOUNT ($) | | | VALUE ($) | |
| |
| | |
United States — continued | | | | | | | | |
| | |
Mauser Packaging Solutions Holding Co. 5.50%, 4/15/2024 (c) | | | 125,000 | | | | 126,875 | |
| | |
McDonald’s Corp. 3.30%, 7/1/2025 | | | 59,000 | | | | 65,949 | |
| | |
Meredith Corp. | | | | | | | | |
| | |
6.50%, 7/1/2025 (c) | | | 75,000 | | | | 77,625 | |
| | |
6.88%, 2/1/2026 | | | 35,000 | | | | 30,404 | |
| | |
MetLife, Inc. | | | | | | | | |
| | |
6.40%, 12/15/2036 | | | 130,000 | | | | 162,449 | |
| | |
MGM Resorts International | | | | | | | | |
| | |
6.00%, 3/15/2023 | | | 315,000 | | | | 332,325 | |
| | |
4.63%, 9/1/2026 | | | 43,000 | | | | 43,752 | |
| | |
5.50%, 4/15/2027 | | | 85,000 | | | | 89,888 | |
| | |
Microchip Technology, Inc. 4.25%, 9/1/2025 (c) | | | 225,000 | | | | 234,288 | |
| | |
MidAmerican Energy Co. 4.25%, 5/1/2046 | | | 55,000 | | | | 70,144 | |
| | |
Midcontinent Communications 5.38%, 8/15/2027 (c) | | | 9,000 | | | | 9,305 | |
| | |
Morgan Stanley | | | | | | | | |
| | |
Series J, (ICE LIBOR USD 3 Month + 3.81%), 4.08%, 10/15/2020 (d) (e) (f) | | | 321,000 | | | | 316,488 | |
| | |
(ICE LIBOR USD 3 Month + 1.14%), 3.77%, 1/24/2029 (d) | | | 15,000 | | | | 17,228 | |
| | |
(SOFR + 3.12%), 3.62%, 4/1/2031 (d) | | | 310,000 | | | | 360,009 | |
| | |
(ICE LIBOR USD 3 Month + 1.46%), 3.97%, 7/22/2038 (d) | | | 240,000 | | | | 288,380 | |
| | |
MPH Acquisition Holdings LLC 7.13%, 6/1/2024 (c) | | | 79,000 | | | | 80,209 | |
| | |
MPLX LP | | | | | | | | |
| | |
4.13%, 3/1/2027 | | | 101,000 | | | | 111,717 | |
| | |
4.00%, 3/15/2028 | | | 74,000 | | | | 81,474 | |
| | |
MSCI, Inc. 5.38%, 5/15/2027 (c) | | | 34,000 | | | | 36,710 | |
| | |
MTS Systems Corp. 5.75%, 8/15/2027 (c) | | | 14,000 | | | | 14,180 | |
| | |
Nabors Industries, Inc. 5.75%, 2/1/2025 | | | 90,000 | | | | 25,875 | |
| | |
NCR Corp. | | | | | | | | |
| | |
5.75%, 9/1/2027 (c) | | | 15,000 | | | | 15,750 | |
| | |
5.00%, 10/1/2028 (c) | | | 18,000 | | | | 18,135 | |
| | |
6.13%, 9/1/2029 (c) | | | 152,000 | | | | 163,020 | |
| | |
Netflix, Inc. | | | | | | | | |
| | |
4.38%, 11/15/2026 | | | 17,000 | | | | 18,916 | |
| | |
3.63%, 5/15/2027 | | EUR | 200,000 | | | | 261,308 | |
SEE NOTES TO FINANCIAL STATEMENTS.
| | | | | | |
| | | |
| 88 | | | | J.P. MORGAN EXCHANGE-TRADED FUNDS | | AUGUST 31, 2020 |
| | | | | | | | |
| INVESTMENTS | | PRINCIPAL
AMOUNT ($) | | | VALUE ($) | |
Corporate Bonds — continued | |
| | |
United States — continued | | | | | | | | |
| | |
4.88%, 4/15/2028 | | | 85,000 | | | | 98,387 | |
| | |
5.88%, 11/15/2028 | | | 45,000 | | | | 55,238 | |
| | |
4.88%, 6/15/2030 (c) | | | 53,000 | | | | 61,414 | |
| | |
New Albertsons LP 8.00%, 5/1/2031 | | | 103,000 | | | | 118,450 | |
| | |
Newell Brands, Inc. 4.70%, 4/1/2026 (b) | | | 90,000 | | | | 97,431 | |
| | |
Nexstar Broadcasting, Inc. 5.63%, 7/15/2027 (c) | | | 35,000 | | | | 36,925 | |
| | |
NextEra Energy Capital Holdings, Inc. 2.25%, 6/1/2030 | | | 200,000 | | | | 209,494 | |
| | |
NextEra Energy Operating Partners LP 4.25%, 9/15/2024 (c) | | | 10,000 | | | | 10,650 | |
| | |
Nielsen Co. Luxembourg SARL (The) 5.00%, 2/1/2025 (c) | | | 30,000 | | | | 30,525 | |
| | |
Nielsen Finance LLC 5.00%, 4/15/2022 (c) | | | 38,000 | | | | 38,036 | |
| | |
NIKE, Inc. 3.38%, 3/27/2050 | | | 15,000 | | | | 17,167 | |
| | |
Noble Energy, Inc. 3.85%, 1/15/2028 | | | 354,000 | | | | 401,547 | |
| | |
Novelis Corp. 5.88%, 9/30/2026 (c) | | | 74,000 | | | | 77,315 | |
| | |
NRG Energy, Inc. 6.63%, 1/15/2027 | | | 45,000 | | | | 48,159 | |
| | |
Nuance Communications, Inc. 5.63%, 12/15/2026 | | | 58,000 | | | | 61,480 | |
| | |
NuStar Logistics LP 5.63%, 4/28/2027 | | | 30,000 | | | | 30,150 | |
| | |
Oasis Petroleum, Inc. | | | | | | | | |
| | |
6.88%, 1/15/2023 | | | 125,000 | | | | 23,984 | |
| | |
6.25%, 5/1/2026 (c) | | | 33,000 | | | | 5,940 | |
| | |
Occidental Petroleum Corp. | | | | | | | | |
| | |
3.50%, 6/15/2025 | | | 65,000 | | | | 59,150 | |
| | |
8.88%, 7/15/2030 | | | 65,000 | | | | 73,450 | |
| | |
6.63%, 9/1/2030 | | | 45,000 | | | | 46,238 | |
| | |
ON Semiconductor Corp. 3.88%, 9/1/2028 (c) | | | 106,000 | | | | 110,609 | |
| | |
OneMain Finance Corp. | | | | | | | | |
| | |
5.63%, 3/15/2023 | | | 60,000 | | | | 63,600 | |
| | |
7.13%, 3/15/2026 | | | 32,000 | | | | 36,720 | |
| | |
Oracle Corp. 2.95%, 4/1/2030 | | | 290,000 | | | | 324,531 | |
| | |
Owens-Brockway Glass Container, Inc. 5.38%, 1/15/2025 (c) | | | 68,000 | | | | 71,740 | |
| | |
Pacific Gas and Electric Co. | | | | | | | | |
| | |
3.85%, 11/15/2023 | | | 305,000 | | | | 323,341 | |
| | |
3.75%, 2/15/2024 | | | 94,000 | | | | 99,141 | |
| | |
2.95%, 3/1/2026 | | | 60,000 | | | | 61,258 | |
| | |
4.60%, 6/15/2043 | | | 100,000 | | | | 102,783 | |
| | |
4.75%, 2/15/2044 | | | 86,000 | | | | 90,282 | |
| | |
4.25%, 3/15/2046 | | | 30,000 | | | | 29,744 | |
| | | | | | | | |
| INVESTMENTS | | PRINCIPAL
AMOUNT ($) | | | VALUE ($) | |
| |
| | |
United States — continued | | | | | | | | |
| | |
PacifiCorp | | | | | | | | |
| | |
2.70%, 9/15/2030 | | | 120,000 | | | | 132,772 | |
| | |
3.30%, 3/15/2051 | | | 27,000 | | | | 30,491 | |
| | |
Par Pharmaceutical, Inc. 7.50%, 4/1/2027 (c) | | | 9,000 | | | | 9,608 | |
| | |
Parsley Energy LLC 4.13%, 2/15/2028 (c) | | | 34,000 | | | | 32,895 | |
| | |
PBF Holding Co. LLC 7.25%, 6/15/2025 | | | 22,000 | | | | 20,889 | |
| | |
Penske Automotive Group, Inc. | | | | | | | | |
| | |
5.75%, 10/1/2022 | | | 35,000 | | | | 35,025 | |
| | |
5.50%, 5/15/2026 | | | 48,000 | | | | 49,980 | |
| | |
PetSmart, Inc. | | | | | | | | |
| | |
7.13%, 3/15/2023 (c) | | | 75,000 | | | | 75,554 | |
| | |
5.88%, 6/1/2025 (c) | | | 101,000 | | | | 103,904 | |
| | |
Pfizer, Inc. | | | | | | | | |
| | |
2.55%, 5/28/2040 | | | 60,000 | | | | 62,638 | |
| | |
2.70%, 5/28/2050 | | | 110,000 | | | | 114,148 | |
| | |
Philip Morris International, Inc. | | | | | | | | |
| | |
1.50%, 5/1/2025 | | | 100,000 | | | | 103,457 | |
| | |
2.10%, 5/1/2030 | | | 60,000 | | | | 62,178 | |
| | |
Phillips 66 2.15%, 12/15/2030 | | | 51,000 | | | | 49,967 | |
| | |
Photo Holdings Merger Sub, Inc. 8.50%, 10/1/2026 (c) | | | 40,000 | | | | 36,762 | |
| | |
Pilgrim’s Pride Corp. 5.75%, 3/15/2025 (c) | | | 63,000 | | | | 64,733 | |
| | |
Plantronics, Inc. 5.50%, 5/31/2023 (c) | | | 53,000 | | | | 50,032 | |
| | |
Polaris Intermediate Corp. | | | | | | | | |
| | |
8.50% (cash), 12/1/2022 (c) (g) | | | 25,000 | | | | 25,406 | |
| | |
Post Holdings, Inc. | | | | | | | | |
| | |
5.75%, 3/1/2027 (c) | | | 50,000 | | | | 52,812 | |
| | |
5.63%, 1/15/2028 (c) | | | 50,000 | | | | 53,453 | |
| | |
5.50%, 12/15/2029 (c) | | | 20,000 | | | | 21,924 | |
| | |
Prime Security Services Borrower LLC | | | | | | | | |
| | |
5.25%, 4/15/2024 (c) | | | 16,000 | | | | 16,960 | |
| | |
5.75%, 4/15/2026 (c) | | | 16,000 | | | | 17,680 | |
| | |
QEP Resources, Inc. | | | | | | | | |
| | |
5.38%, 10/1/2022 | | | 38,000 | | | | 33,250 | |
| | |
5.63%, 3/1/2026 | | | 5,000 | | | | 3,213 | |
| | |
Qorvo, Inc. 5.50%, 7/15/2026 | | | 52,000 | | | | 55,164 | |
| | |
Quicken Loans LLC 5.75%, 5/1/2025 (c) | | | 53,000 | | | | 54,590 | |
| | |
Radian Group, Inc. 4.50%, 10/1/2024 | | | 25,000 | | | | 25,125 | |
| | |
Rain CII Carbon LLC 7.25%, 4/1/2025 (c) | | | 50,000 | | | | 49,375 | |
SEE NOTES TO FINANCIAL STATEMENTS.
| | | | | | | | |
| | | |
| AUGUST 31, 2020 | | J.P. MORGAN EXCHANGE-TRADED FUNDS | | | | | 89 | |
JPMorgan International Bond Opportunities ETF
(formerly known as JPMorgan Global Bond Opportunities ETF)
SCHEDULE OF PORTFOLIO INVESTMENTS
AS OF AUGUST 31, 2020 (Unaudited) (continued)
| | | | | | | | |
| INVESTMENTS | | PRINCIPAL
AMOUNT ($) | | | VALUE ($) | |
Corporate Bonds — continued | |
| | |
United States — continued | | | | | | | | |
| | |
Raytheon Technologies Corp. | | | | | | | | |
| | |
3.70%, 12/15/2023 (c) | | | 325,000 | | | | 354,748 | |
| | |
3.20%, 3/15/2024 (c) | | | 400,000 | | | | 432,318 | |
| | |
3.95%, 8/16/2025 | | | 17,000 | | | | 19,446 | |
| | |
4.13%, 11/16/2028 | | | 200,000 | | | | 237,923 | |
| | |
3.75%, 11/1/2046 | | | 115,000 | | | | 132,447 | |
| | |
RBS Global, Inc. 4.88%, 12/15/2025 (c) | | | 14,000 | | | | 14,333 | |
| | |
Realty Income Corp. REIT, 3.00%, 1/15/2027 | | | 170,000 | | | | 183,705 | |
| | |
Refinitiv US Holdings, Inc. | | | | | | | | |
| | |
6.25%, 5/15/2026 (c) | | | 21,000 | | | | 22,549 | |
| | |
8.25%, 11/15/2026 (c) | | | 9,000 | | | | 9,967 | |
| | |
RHP Hotel Properties LP REIT, 4.75%, 10/15/2027 | | | 9,000 | | | | 8,190 | |
| | |
Rite Aid Corp. | | | | | | | | |
| | |
7.50%, 7/1/2025 (c) | | | 60,000 | | | | 60,000 | |
| | |
8.00%, 11/15/2026 (c) | | | 84,000 | | | | 85,050 | |
| | |
Sabre GLBL, Inc. 7.38%, 9/1/2025 (c) | | | 55,000 | | | | 57,456 | |
| | |
San Diego Gas & Electric Co. Series UUU, 3.32%, 4/15/2050 | | | 40,000 | | | | 44,314 | |
| | |
SBA Communications Corp. | | | | | | | | |
| | |
REIT, 4.88%, 9/1/2024 | | | 25,000 | | | | 25,680 | |
| | |
REIT, 3.88%, 2/15/2027 (c) | | | 80,000 | | | | 83,036 | |
| | |
Scotts Miracle-Gro Co. (The) 4.50%, 10/15/2029 | | | 130,000 | | | | 139,092 | |
| | |
Sealed Air Corp. 5.13%, 12/1/2024 (c) | | | 94,000 | | | | 103,400 | |
| | |
Sempra Energy 3.80%, 2/1/2038 | | | 145,000 | | | | 164,635 | |
| | |
Sensata Technologies BV | | | | | | | | |
| | |
4.88%, 10/15/2023 (c) | | | 85,000 | | | | 89,675 | |
| | |
5.00%, 10/1/2025 (c) | | | 14,000 | | | | 15,214 | |
| | |
Sensata Technologies, Inc. 3.75%, 2/15/2031 (c) | | | 89,000 | | | | 88,778 | |
| | |
Service Corp. International 7.50%, 4/1/2027 | | | 70,000 | | | | 84,700 | |
| | |
5.13%, 6/1/2029 | | | 70,000 | | | | 77,551 | |
| | |
Silgan Holdings, Inc. 3.25%, 3/15/2025 | | EUR | 200,000 | | | | 242,181 | |
| | |
Sinclair Television Group, Inc. 5.63%, 8/1/2024 (c) | | | 61,000 | | | | 61,000 | |
| | |
Sirius XM Radio, Inc. | | | | | | | | |
| | |
5.38%, 7/15/2026 (c) | | | 2,000 | | | | 2,092 | |
| | |
5.00%, 8/1/2027 (c) | | | 162,000 | | | | 171,830 | |
| | |
5.50%, 7/1/2029 (c) | | | 14,000 | | | | 15,376 | |
| | |
4.13%, 7/1/2030 (c) | | | 45,000 | | | | 47,363 | |
| | | | | | | | |
| INVESTMENTS | | PRINCIPAL
AMOUNT ($) | | | VALUE ($) | |
| |
| | |
United States — continued | | | | | | | | |
| | |
Six Flags Entertainment Corp. | | | | | | | | |
| | |
4.88%, 7/31/2024 (c) | | | 10,000 | | | | 9,697 | |
| | |
5.50%, 4/15/2027 (c) | | | 7,000 | | | | 6,825 | |
| | |
Six Flags Theme Parks, Inc. 7.00%, 7/1/2025 (c) | | | 52,000 | | | | 56,274 | |
| | |
SM Energy Co. 6.13%, 11/15/2022 | | | 75,000 | | | | 58,535 | |
| | |
Solera LLC 10.50%, 3/1/2024 (c) | | | 36,000 | | | | 37,755 | |
| | |
Southern California Edison Co. | | | | | | | | |
| | |
Series A, 4.20%, 3/1/2029 | | | 120,000 | | | | 138,554 | |
| | |
2.25%, 6/1/2030 | | | 28,000 | | | | 28,455 | |
| | |
Series 13-A, 3.90%, 3/15/2043 | | | 37,000 | | | | 39,864 | |
| | |
3.65%, 2/1/2050 | | | 79,000 | | | | 83,867 | |
| | |
Southwestern Energy Co. 6.45%, 1/23/2025 (b) | | | 87,000 | | | | 87,395 | |
| | |
Spectrum Brands, Inc. | | | | | | | | |
| | |
5.75%, 7/15/2025 | | | 165,000 | | | | 170,363 | |
| | |
5.00%, 10/1/2029 (c) | | | 40,000 | | | | 41,600 | |
| | |
Sprint Capital Corp. 8.75%, 3/15/2032 | | | 202,000 | | | | 305,108 | |
| | |
Sprint Corp. | | | | | | | | |
| | |
7.63%, 2/15/2025 | | | 376,000 | | | | 450,260 | |
| | |
7.63%, 3/1/2026 | | | 65,000 | | | | 79,938 | |
| | |
SS&C Technologies, Inc. 5.50%, 9/30/2027 (c) | | | 150,000 | | | | 160,665 | |
| | |
Standard Industries, Inc. | | | | | | | | |
| | |
6.00%, 10/15/2025 (c) | | | 24,000 | | | | 24,751 | |
| | |
4.75%, 1/15/2028 (c) | | | 60,000 | | | | 63,150 | |
| | |
Staples, Inc. | | | | | | | | |
| | |
7.50%, 4/15/2026 (c) | | | 140,000 | | | | 124,628 | |
| | |
10.75%, 4/15/2027 (c) | | | 46,000 | | | | 31,970 | |
| | |
Starbucks Corp. 2.55%, 11/15/2030 | | | 340,000 | | | | 360,290 | |
| | |
State Street Corp. (SOFR + 2.60%), 2.90%, 3/30/2026 (c) (d) | | | 20,000 | | | | 21,885 | |
| | |
Station Casinos LLC 5.00%, 10/1/2025 (c) | | | 21,000 | | | | 20,751 | |
| | |
Summit Midstream Holdings LLC 5.75%, 4/15/2025 | | | 20,000 | | | | 11,400 | |
| | |
Sunoco Logistics Partners Operations LP 5.35%, 5/15/2045 | | | 130,000 | | | | 124,257 | |
| | |
Tallgrass Energy Partners LP 5.50%, 9/15/2024 (c) | | | 28,000 | | | | 27,440 | |
| | |
Targa Resources Partners LP | | | | | | | | |
| | |
4.25%, 11/15/2023 | | | 62,000 | | | | 62,389 | |
| | |
6.75%, 3/15/2024 | | | 170,000 | | | | 173,111 | |
| | |
5.88%, 4/15/2026 | | | 80,000 | | | | 84,200 | |
| | |
Target Corp. 2.65%, 9/15/2030 | | | 90,000 | | | | 99,751 | |
SEE NOTES TO FINANCIAL STATEMENTS.
| | | | | | |
| | | |
| 90 | | | | J.P. MORGAN EXCHANGE-TRADED FUNDS | | AUGUST 31, 2020 |
| | | | | | | | |
| INVESTMENTS | | PRINCIPAL
AMOUNT ($) | | | VALUE ($) | |
Corporate Bonds — continued | |
| | |
United States — continued | | | | | | | | |
| | |
Team Health Holdings, Inc. 6.38%, 2/1/2025 (c) | | | 53,000 | | | | 36,040 | |
| | |
Tempur Sealy International, Inc. | | | | | | | | |
| | |
5.63%, 10/15/2023 | | | 110,000 | | | | 111,925 | |
| | |
5.50%, 6/15/2026 | | | 155,000 | | | | 162,169 | |
| | |
Tenet Healthcare Corp. | | | | | | | | |
| | |
6.75%, 6/15/2023 | | | 170,000 | | | | 181,050 | |
| | |
4.63%, 9/1/2024 (c) | | | 6,000 | | | | 6,165 | |
| | |
5.13%, 5/1/2025 | | | 75,000 | | | | 76,500 | |
| | |
4.88%, 1/1/2026 (c) | | | 55,000 | | | | 57,200 | |
| | |
6.25%, 2/1/2027 (c) | | | 35,000 | | | | 36,750 | |
| | |
5.13%, 11/1/2027 (c) | | | 96,000 | | | | 101,280 | |
| | |
Tennant Co. 5.63%, 5/1/2025 | | | 33,000 | | | | 34,279 | |
| | |
Tenneco, Inc. 5.00%, 7/15/2026 | | | 65,000 | | | | 47,613 | |
| | |
TerraForm Power Operating LLC | | | | | | | | |
| | |
4.25%, 1/31/2023 (c) | | | 17,000 | | | | 17,598 | |
| | |
Texas Instruments, Inc. 1.75%, 5/4/2030 | | | 70,000 | | | | 72,107 | |
| | |
T-Mobile USA, Inc. | | | | | | | | |
| | |
6.38%, 3/1/2025 | | | 129,000 | | | | 131,741 | |
| | |
6.50%, 1/15/2026 | | | 240,000 | | | | 251,250 | |
| | |
4.50%, 2/1/2026 | | | 50,000 | | | | 51,615 | |
| | |
3.75%, 4/15/2027 (c) | | | 525,000 | | | | 593,728 | |
| | |
3.88%, 4/15/2030 (c) | | | 170,000 | | | | 194,295 | |
| | |
4.50%, 4/15/2050 (c) | | | 100,000 | | | | 122,148 | |
| | |
TransDigm, Inc. 6.25%, 3/15/2026 (c) | | | 70,000 | | | | 73,865 | |
| | |
Transocean Pontus Ltd. 6.13%, 8/1/2025 (c) | | | 16,380 | | | | 14,669 | |
| | |
Transocean Poseidon Ltd. 6.88%, 2/1/2027 (c) | | | 10,000 | | | | 8,300 | |
| | |
Transocean Proteus Ltd. 6.25%, 12/1/2024 (c) | | | 31,200 | | | | 27,456 | |
| | |
Transocean, Inc. 7.50%, 1/15/2026 (c) | | | 55,000 | | | | 17,050 | |
| | |
Trinseo Materials Operating SCA 5.38%, 9/1/2025 (c) | | | 28,000 | | | | 28,078 | |
| | |
TripAdvisor, Inc. 7.00%, 7/15/2025 (c) | | | 45,000 | | | | 47,475 | |
| | |
Triumph Group, Inc. 7.75%, 8/15/2025 | | | 75,000 | | | | 44,438 | |
| | |
Tronox Finance plc 5.75%, 10/1/2025 (c) | | | 8,000 | | | | 8,102 | |
| | |
Tronox, Inc. 6.50%, 4/15/2026 (c) | | | 19,000 | | | | 19,564 | |
| | |
Truist Financial Corp. Series Q, (US Treasury Yield Curve Rate T Note Constant Maturity 10 Year + 4.35%), 5.10%, 3/1/2030 (d) (e) (f) | | | 160,000 | | | | 175,600 | |
| | | | | | | | |
| INVESTMENTS | | PRINCIPAL
AMOUNT ($) | | | VALUE ($) | |
| |
| | |
United States — continued | | | | | | | | |
| | |
United Airlines Holdings, Inc. | | | | | | | | |
| | |
5.00%, 2/1/2024 | | | 25,000 | | | | 22,562 | |
| | |
4.88%, 1/15/2025 | | | 13,000 | | | | 11,148 | |
| | |
United Rentals North America, Inc. 5.50%, 5/15/2027 | | | 199,000 | | | | 212,900 | |
| | |
United States Cellular Corp. 6.70%, 12/15/2033 | | | 143,000 | | | | 185,547 | |
| | |
Uniti Group LP REIT, 6.00%, 4/15/2023 (c) | | | 85,000 | | | | 85,871 | |
| | |
Verizon Communications, Inc. 4.86%, 8/21/2046 | | | 75,000 | | | | 100,682 | |
| | |
Vista Outdoor, Inc. 5.88%, 10/1/2023 | | | 85,000 | | | | 86,381 | |
| | |
Vistra Operations Co. LLC | | | | | | | | |
| | |
5.50%, 9/1/2026 (c) | | | 55,000 | | | | 57,750 | |
| | |
5.63%, 2/15/2027 (c) | | | 25,000 | | | | 26,438 | |
| | |
Wabash National Corp. 5.50%, 10/1/2025 (c) | | | 55,000 | | | | 54,450 | |
| | |
Welbilt, Inc. 9.50%, 2/15/2024 | | | 25,000 | | | | 25,375 | |
| | |
Wells Fargo & Co. | | | | | | | | |
| | |
(SOFR + 2.10%), 2.39%, 6/2/2028 (d) | | | 230,000 | | | | 240,237 | |
| | |
(ICE LIBOR USD 3 Month + 1.00%), 2.57%, 2/11/2031 (d) | | | 165,000 | | | | 173,077 | |
| | |
4.90%, 11/17/2045 | | | 150,000 | | | | 190,665 | |
| | |
WESCO Distribution, Inc. | | | | | | | | |
| | |
5.38%, 6/15/2024 | | | 17,000 | | | | 17,467 | |
| | |
7.13%, 6/15/2025 (c) | | | 60,000 | | | | 65,936 | |
| | |
Whiting Petroleum Corp. | | | | | | | | |
| | |
5.75%, 3/15/2021 (h) | | | 85,000 | | | | 19,125 | |
| | |
6.63%, 1/15/2026 (h) | | | 21,000 | | | | 4,935 | |
| | |
William Carter Co. (The) 5.63%, 3/15/2027 (c) | | | 8,000 | | | | 8,499 | |
| | |
Williams Cos., Inc. (The) 4.00%, 9/15/2025 | | | 166,000 | | | | 185,527 | |
| | |
Windstream Services LLC 8.63%, 10/31/2025 (b) (c) (h) | | | 15,000 | | | | 9,085 | |
| | |
WMG Acquisition Corp. | | | | | | | | |
| | |
3.00%, 2/15/2031 (c) | | | 25,000 | | | | 24,875 | |
| | |
Wolverine Escrow LLC 9.00%, 11/15/2026 (c) | | | 70,000 | | | | 53,900 | |
| | |
WPX Energy, Inc. | | | | | | | | |
| | |
8.25%, 8/1/2023 | | | 41,000 | | | �� | 46,080 | |
| | |
5.88%, 6/15/2028 | | | 60,000 | | | | 60,900 | |
| | |
Wyndham Destinations, Inc. | | | | | | | | |
| | |
5.40%, 4/1/2024 (b) | | | 4,000 | | | | 4,079 | |
| | |
6.35%, 10/1/2025 (b) | | | 13,000 | | | | 13,650 | |
SEE NOTES TO FINANCIAL STATEMENTS.
| | | | | | | | |
| | | |
| AUGUST 31, 2020 | | J.P. MORGAN EXCHANGE-TRADED FUNDS | | | | | 91 | |
JPMorgan International Bond Opportunities ETF
(formerly known as JPMorgan Global Bond Opportunities ETF)
SCHEDULE OF PORTFOLIO INVESTMENTS
AS OF AUGUST 31, 2020 (Unaudited) (continued)
| | | | | | | | |
| INVESTMENTS | | PRINCIPAL
AMOUNT ($) | | | VALUE ($) | |
Corporate Bonds — continued | |
| | |
United States — continued | | | | | | | | |
| | |
5.75%, 4/1/2027 (b) | | | 17,000 | | | | 17,425 | |
| | |
Wynn Las Vegas LLC 5.50%, 3/1/2025 (c) | | | 121,000 | | | | 119,790 | |
| | |
Xcel Energy, Inc. 3.40%, 6/1/2030 | | | 40,000 | | | | 46,049 | |
| | |
Zoetis, Inc. | | | | | | | | |
| | |
2.00%, 5/15/2030 | | | 100,000 | | | | 103,912 | |
| | |
3.00%, 5/15/2050 | | | 40,000 | | | | 43,179 | |
| | | | | | | | |
| |
| | | | 51,263,358 | |
| | | | | | | | |
| |
Total Corporate Bonds
(Cost $87,166,634) | | | | 90,329,591 | |
| | | | | | | | |
Foreign Government Securities — 23.0% | |
| | |
Australia — 1.0% | | | | | | | | |
| | |
Commonwealth of Australia 3.00%, 3/21/2047 (a) | | AUD | 1,860,000 | | | | 1,711,449 | |
| | | | | | | | |
| | |
Austria — 0.3% | | | | | | | | |
| | |
Republic of Austria 0.85%, 6/30/2120 (a) | | EUR | 365,000 | | | | 472,705 | |
| | | | | | | | |
| | |
Bahrain — 0.2% | | | | | | | | |
| | |
Kingdom of Bahrain 6.00%, 9/19/2044 (a) | | | 335,000 | | | | 331,441 | |
| | | | | | | | |
| | |
Benin — 0.2% | | | | | | | | |
| | |
Benin Government Bond 5.75%, 3/26/2026 (c) | | EUR | 320,000 | | | | 365,642 | |
| | | | | | | | |
|
Brazil — 0.2% | |
| | |
Federative Republic of Brazil | | | | | | | | |
| | |
3.88%, 6/12/2030 | | | 280,000 | | | | 287,420 | |
| | | | | | | | |
| | |
China — 1.7% | | | | | | | | |
| | |
People’s Republic of China 2.68%, 5/21/2030 | | CNY | 20,000,000 | | | | 2,827,988 | |
| | | | | | | | |
| | |
Colombia — 0.4% | | | | | | | | |
| | |
Republic of Colombia | | | | | | | | |
| | |
3.13%, 4/15/2031 | | | 210,000 | | | | 217,035 | |
| | |
5.00%, 6/15/2045 | | | 200,000 | | | | 238,750 | |
| | |
4.13%, 5/15/2051 | | | 200,000 | | | | 214,000 | |
| | | | | | | | |
| |
| | | | 669,785 | |
| | | | | | | | |
| | |
Cyprus — 0.6% | | | | | | | | |
| | |
Republic of Cyprus | | | | | | | | |
| | |
2.75%, 6/27/2024 (a) | | EUR | 230,000 | | | | 300,717 | |
| | |
2.38%, 9/25/2028 (a) | | EUR | 400,000 | | | | 537,455 | |
| | |
2.75%, 2/26/2034 (a) | | EUR | 180,000 | | | | 254,877 | |
| | | | | | | | |
| |
| | | | 1,093,049 | |
| | | | | | | | |
| | | | | | | | |
| INVESTMENTS | | PRINCIPAL
AMOUNT ($) | | | VALUE ($) | |
| | | | | | | | |
| | |
Czech Republic — 0.5% | | | | | | | | |
| | |
Czech Republic 2.00%, 10/13/2033 | | CZK | 15,770,000 | | | | 785,414 | |
| | | | | | | | |
| | |
Dominican Republic — 0.5% | | | | | | | | |
| | |
Dominican Republic Government Bond | | | | | | | | |
| | |
9.75%, 6/5/2026 (c) | | DOP | 14,000,000 | | | | 236,957 | |
| | |
6.40%, 6/5/2049 (a) | | | 184,000 | | | | 186,530 | |
| | |
5.88%, 1/30/2060 (c) | | | 414,000 | | | | 395,629 | |
| | | | | | | | |
| |
| | | | 819,116 | |
| | | | | | | | |
| | |
Egypt — 0.4% | | | | | | | | |
| | |
Arab Republic of Egypt | | | | | | | | |
| | |
5.75%, 5/29/2024 (c) | | | 200,000 | | | | 206,125 | |
| | |
7.60%, 3/1/2029 (c) | | | 280,000 | | | | 294,087 | |
| | |
7.05%, 1/15/2032 (c) | | | 230,000 | | | | 228,563 | |
| | | | | | | | |
| |
| | | | 728,775 | |
| | | | | | | | |
| | |
El Salvador — 0.4% | | | | | | | | |
| | |
Republic of El Salvador | | | | | | | | |
| | |
7.75%, 1/24/2023 (a) | | | 82,000 | | | | 82,385 | |
| | |
5.88%, 1/30/2025 (a) | | | 195,000 | | | | 183,239 | |
| | |
6.38%, 1/18/2027 (a) | | | 195,000 | | | | 181,228 | |
| | |
7.12%, 1/20/2050 (c) | | | 227,000 | | | | 195,220 | |
| | | | | | | | |
| |
| | | | 642,072 | |
| | | | | | | | |
| | |
Ethiopia — 0.1% | | | | | | | | |
| | |
Federal Democratic Republic of Ethiopia 6.63%, 12/11/2024 (a) | | | 200,000 | | | | 202,000 | |
| | | | | | | | |
| | |
Ghana — 0.3% | | | | | | | | |
| | |
Republic of Ghana | | | | | | | | |
| | |
7.63%, 5/16/2029 (a) | | | 320,000 | | | | 305,000 | |
| | |
8.63%, 6/16/2049 (a) | | | 220,000 | | | | 199,375 | |
| | | | | | | | |
| |
| | | | 504,375 | |
| | | | | | | | |
| | |
Greece — 0.8% | | | | | | | | |
| | |
Hellenic Republic | | | | | | | | |
| | |
3.38%, 2/15/2025 (a) | | EUR | 396,000 | | | | 532,642 | |
| | |
1.88%, 7/23/2026 (a) | | EUR | 466,000 | | | | 596,762 | |
| | |
3.88%, 3/12/2029 (a) | | EUR | 190,000 | | | | 279,862 | |
| | | | | | | | |
| |
| | | | 1,409,266 | |
| | | | | | | | |
|
Hungary — 0.3% | |
| | |
Hungary Government Bond | | | | | | | | |
| | |
1.00%, 11/26/2025 | | HUF | 72,850,000 | | | | 235,970 | |
| | |
7.63%, 3/29/2041 | | | 150,000 | | | | 265,638 | |
| | | | | | | | |
| |
| | | | 501,608 | |
| | | | | | | | |
SEE NOTES TO FINANCIAL STATEMENTS.
| | | | | | |
| | | |
| 92 | | | | J.P. MORGAN EXCHANGE-TRADED FUNDS | | AUGUST 31, 2020 |
| | | | | | | | |
| INVESTMENTS | | PRINCIPAL
AMOUNT ($) | | | VALUE ($) | |
Foreign Government Securities — continued | |
| | |
Indonesia — 1.6% | | | | | | | | |
| | |
Republic of Indonesia | | | | | | | | |
| | |
8.13%, 5/15/2024 | | IDR | 10,251,000,000 | | | | 769,397 | |
| | |
7.00%, 9/15/2030 | | IDR | 21,517,000,000 | | | | 1,487,166 | |
| | |
6.63%, 2/17/2037 (a) | | | 340,000 | | | | 485,669 | |
| | | | | | | | |
| |
| | | | 2,742,232 | |
| | | | | | | | |
| | |
Israel — 0.4% | | | | | | | | |
| | |
State of Israel Government Bond 3.38%, 1/15/2050 | | | 570,000 | | | | 628,425 | |
| | | | | | | | |
| | |
Italy — 2.4% | | | | | | | | |
| | |
Buoni Poliennali del Tesoro 3.85%, 9/1/2049 (a) | | EUR | 885,000 | | | | 1,475,498 | |
| | |
Italian Republic Government Bond | | | | | | | | |
| | |
2.38%, 10/17/2024 | | | 1,345,000 | | | | 1,391,020 | |
| | |
2.88%, 10/17/2029 | | | 1,135,000 | | | | 1,162,994 | |
| | | | | | | | |
| |
| | | | 4,029,512 | |
| | | | | | | | |
| | |
Ivory Coast — 0.4% | | | | | | | | |
| | |
Republic of Cote d’Ivoire | | | | | | | | |
| | |
6.38%, 3/3/2028 (a) | | | 270,000 | | | | 280,125 | |
| | |
6.88%, 10/17/2040 (c) | | EUR | 310,000 | | | | 354,679 | |
| | | | | | | | |
| |
| | | | 634,804 | |
| | | | | | | | |
| | |
Jamaica — 0.2% | | | | | | | | |
| | |
Jamaica Government Bond 7.88%, 7/28/2045 | | | 200,000 | | | | 262,500 | |
| | | | | | | | |
| | |
Jordan — 0.3% | | | | | | | | |
| | |
Hashemite Kingdom of Jordan 5.85%, 7/7/2030 (c) | | | 440,000 | | | | 444,400 | |
| | | | | | | | |
| | |
Kazakhstan — 0.3% | | | | | | | | |
| | |
Republic of Kazakhstan 1.50%, 9/30/2034 (c) | | EUR | 370,000 | | | | 434,916 | |
| | | | | | | | |
| | |
Kenya — 0.1% | | | | | | | | |
| | |
Republic of Kenya 6.88%, 6/24/2024 (a) | | | 200,000 | | | | 205,500 | |
| | | | | | | | |
| | |
Lebanon — 0.0% (i) | | | | | | | | |
| | |
Lebanese Republic | | | | | | | | |
| | |
6.65%, 4/22/2024 (a) (h) | | | 227,000 | | | | 36,604 | |
| | |
6.65%, 11/3/2028 (a) (h) | | | 226,000 | | | | 35,312 | |
| | | | | | | | |
| |
| | | | 71,916 | |
| | | | | | | | |
| | |
Mexico — 0.7% | | | | | | | | |
| | |
Mex Bonos Desarr Fix Rt | | | | | | | | |
| | |
Series M 20, 8.50%, 5/31/2029 | | MXN | 15,000,000 | | | | 808,651 | |
| | |
7.75%, 5/29/2031 | | MXN | 8,090,000 | | | | 417,365 | |
| | | | | | | | |
| |
| | | | 1,226,016 | |
| | | | | | | | |
| | | | | | | | |
| INVESTMENTS | | PRINCIPAL
AMOUNT ($) | | | VALUE ($) | |
| | | | | | | | |
| | |
Morocco — 0.4% | | | | | | | | |
| | |
Kingdom of Morocco | | | | | | | | |
| | |
1.50%, 11/27/2031 (c) | | EUR | 180,000 | | | | 208,695 | |
| | |
5.50%, 12/11/2042 (a) | | | 320,000 | | | | 409,200 | |
| | | | | | | | |
| |
| | | | 617,895 | |
| | | | | | | | |
|
New Zealand — 1.7% | |
| | |
New Zealand Government Bond | | | | | | | | |
| | |
4.50%, 4/15/2027 (a) | | NZD | 2,030,000 | | | | 1,740,943 | |
| | |
2.75%, 4/15/2037 (a) | | NZD | 1,267,000 | | | | 1,075,604 | |
| | | | | | | | |
| |
| | | | 2,816,547 | |
| | | | | | | | |
| | |
Nigeria — 0.2% | | | | | | | | |
| | |
Federal Republic of Nigeria 7.63%, 11/21/2025 (a) | | | 300,000 | | | | 317,344 | |
| | | | | | | | |
| | |
Panama — 0.4% | | | | | | | | |
| | |
Republic of Panama | | | | | | | | |
| | |
4.50%, 4/1/2056 | | | 200,000 | | | | 260,000 | |
| | |
3.87%, 7/23/2060 | | | 400,000 | | | | 473,500 | |
| | | | | | | | |
| |
| | | | 733,500 | |
| | | | | | | | |
| | |
Paraguay — 0.3% | | | | | | | | |
| | |
Republic of Paraguay 5.00%, 4/15/2026 (a) | | | 420,000 | | | | 483,394 | |
| | | | | | | | |
| | |
Peru — 0.5% | | | | | | | | |
| | |
Bonos de la Tesoreria 5.40%, 8/12/2034 | | PEN | 1,219,000 | | | | 371,515 | |
| | |
Republic of Peru | | | | | | | | |
| | |
2.78%, 1/23/2031 | | | 390,000 | | | | 425,295 | |
| | |
6.95%, 8/12/2031 (a) | | PEN | 358,000 | | | | 127,053 | |
| | | | | | | | |
| |
| | | | 923,863 | |
| | | | | | | | |
| | |
Philippines — 0.2% | | | | | | | | |
| | |
Republic of Philippines 2.95%, 5/5/2045 | | | 330,000 | | | | 348,459 | |
| | | | | | | | |
| | |
Poland — 0.5% | | | | | | | | |
| | |
Republic of Poland 1.25%, 10/25/2030 | | PLN | 3,040,000 | | | | 811,569 | |
| | | | | | | | |
| | |
Portugal — 1.0% | | | | | | | | |
| | |
Obrigacoes do Tesouro 0.48%, 10/18/2030 (a) | | EUR | 650,000 | | | | 779,621 | |
| | |
Portuguese Republic 5.13%, 10/15/2024 (a) | | | 740,000 | | | | 862,316 | |
| | | | | | | | |
| |
| | | | 1,641,937 | |
| | | | | | | | |
| | |
Qatar — 0.4% | | | | | | | | |
| | |
State of Qatar | | | | | | | | |
| | |
5.10%, 4/23/2048 (a) | | | 245,000 | | | | 346,369 | |
| | |
4.40%, 4/16/2050 (c) | | | 200,000 | | | | 259,500 | |
| | | | | | | | |
| |
| | | | 605,869 | |
| | | | | | | | |
SEE NOTES TO FINANCIAL STATEMENTS.
| | | | | | | | |
| | | |
| AUGUST 31, 2020 | | J.P. MORGAN EXCHANGE-TRADED FUNDS | | | | | 93 | |
JPMorgan International Bond Opportunities ETF
(formerly known as JPMorgan Global Bond Opportunities ETF)
SCHEDULE OF PORTFOLIO INVESTMENTS
AS OF AUGUST 31, 2020 (Unaudited) (continued)
| | | | | | | | |
| INVESTMENTS | | PRINCIPAL
AMOUNT ($) | | | VALUE ($) | |
Foreign Government Securities — continued | |
| | |
Romania — 0.1% | | | | | | | | |
| | |
Romania Government Bond 4.63%, 4/3/2049 (c) | | EUR | 156,000 | | | | 216,356 | |
| | | | | | | | |
| | |
Russia — 1.2% | | | | | | | | |
| | |
Russian Federation | | | | | | | | |
| | |
6.00%, 10/6/2027 | | RUB | 13,330,000 | | | | 183,006 | |
| | |
7.65%, 4/10/2030 | | RUB | 46,710,000 | | | | 705,242 | |
| | |
7.25%, 5/10/2034 | | RUB | 21,393,000 | | | | 314,273 | |
| | |
7.70%, 3/16/2039 | | RUB | 11,860,000 | | | | 183,996 | |
| | |
5.88%, 9/16/2043 (a) | | | 400,000 | | | | 564,000 | |
| | | | | | | | |
| |
| | | | 1,950,517 | |
| | | | | | | | |
| | |
Senegal — 0.1% | | | | | | | | |
| | |
Republic of Senegal 6.25%, 5/23/2033 (a) | | | 200,000 | | | | 205,750 | |
| | | | | | | | |
|
Serbia — 0.2% | |
| | |
Republic of Serbia 1.50%, 6/26/2029 (c) | | EUR | 230,000 | | | | 264,864 | |
| | | | | | | | |
| | |
South Africa — 0.4% | | | | | | | | |
| | |
Republic of South Africa 8.88%, 2/28/2035 | | ZAR | 14,320,000 | | | | 722,401 | |
| | | | | | | | |
| | |
Spain — 0.3% | | | | | | | | |
| | |
Bonos and Obligaciones del Estado | | | | | | | | |
| | |
1.85%, 7/30/2035 (a) | | EUR | 70,000 | | | | 96,702 | |
| | |
1.20%, 10/31/2040 (a) | | EUR | 300,000 | | | | 371,690 | |
| | | | | | | | |
| |
| | | | 468,392 | |
| | | | | | | | |
| | |
Ukraine — 0.3% | | | | | | | | |
| | |
Ukraine Government Bond | | | | | | | | |
| | |
7.75%, 9/1/2026 (a) | | | 270,000 | | | | 285,120 | |
| | |
7.38%, 9/25/2032 (a) | | | 230,000 | | | | 232,645 | |
| | | | | | | | |
| |
| | | | 517,765 | |
| | | | | | | | |
| | |
United Arab Emirates — 0.3% | | | | | | | | |
| | |
United Arab Emirates Government Bond 4.00%, 7/28/2050 (c) | | | 400,000 | | | | 427,500 | |
| | | | | | | | |
| | |
Uruguay — 0.2% | | | | | | | | |
| | |
Oriental Republic of Uruguay 5.10%, 6/18/2050 | | | 250,000 | | | | 345,859 | |
| | | | | | | | |
| |
Total Foreign Government Securities
(Cost $36,875,568) | | | | 38,452,107 | |
| | | | | | | | |
Asset-Backed Securities — 7.0% | |
| | |
United States — 7.0% | | | | | | | | |
| | |
ACC Trust Series 2019-1, Class A, 3.75%, 5/20/2022 (c) | | | 36,139 | | | | 36,395 | |
| | |
Accelerated Assets LLC Series 2018-1, Class C, 6.65%, 12/2/2033 ‡ (c) | | | 187,405 | | | | 190,591 | |
| | | | | | | | |
| INVESTMENTS | | PRINCIPAL
AMOUNT ($) | | | VALUE ($) | |
| | | | | | | | |
| | |
United States — continued | | | | | | | | |
| | |
American Credit Acceptance Receivables Trust | | | | | | | | |
| | |
Series 2016-4, Class D, 4.11%, 4/12/2023 (c) | | | 29,888 | | | | 29,979 | |
| | |
Series 2019-3, Class B, 2.59%, 8/14/2023 (c) | | | 290,000 | | | | 292,983 | |
| | |
Series 2018-3, Class C, 3.75%, 10/15/2024 (c) | | | 38,934 | | | | 39,299 | |
| | |
Series 2019-3, Class C, 2.76%, 9/12/2025 (c) | | | 96,000 | | | | 97,674 | |
| | |
Series 2019-3, Class D, 2.89%, 9/12/2025 (c) | | | 97,000 | | | | 98,827 | |
| | |
Business Jet Securities LLC Series 2018-2, Class C, 6.66%, 6/15/2033 (c) | | | 124,033 | | | | 124,189 | |
| | |
Chase Funding Trust Series 2003-6, Class 1A7, 4.99%, 11/25/2034 ‡ (b) | | | 108,423 | | | | 113,054 | |
| | |
Conn’s Receivables Funding LLC | | | | | | | | |
| | |
Series 2019-A, Class B, 4.36%, 10/16/2023 ‡ (c) | | | 72,112 | | | | 71,946 | |
| | |
Series 2019-A, Class C, 5.29%, 10/16/2023 ‡ (c) | | | 65,556 | | | | 63,162 | |
| | |
CPS Auto Receivables Trust Series 2018-A, Class D, 3.66%, 12/15/2023 (c) | | | 400,000 | | | | 408,864 | |
| | |
Credit Acceptance Auto Loan Trust | | | | | | | | |
| | |
Series 2018-1A, Class C, 3.77%, 6/15/2027 (c) | | | 250,000 | | | | 253,904 | |
| | |
Series 2018-3A, Class B, 3.89%, 10/15/2027 (c) | | | 250,000 | | | | 258,170 | |
| | |
Credit-Based Asset Servicing & Securitization LLC Series 2004-CB5, Class M1, 1.09%, 1/25/2034 ‡ (j) | | | 102,065 | | | | 99,371 | |
| | |
Drive Auto Receivables Trust | | | | | | | | |
| | |
Series 2018-3, Class D, 4.30%, 9/16/2024 | | | 256,000 | | | | 267,292 | |
| | |
Series 2018-4, Class C, 3.66%, 11/15/2024 | | | 182,480 | | | | 184,786 | |
| | |
DT Auto Owner Trust | | | | | | | | |
| | |
Series 2018-3A, Class C, 3.79%, 7/15/2024 (c) | | | 260,000 | | | | 265,584 | |
| | |
Series 2019-1A, Class D, 3.87%, 11/15/2024 (c) | | | 65,000 | | | | 67,177 | |
| | |
Series 2019-1A, Class E, 4.94%, 2/17/2026 (c) | | | 100,000 | | | | 101,388 | |
| | |
Exeter Automobile Receivables Trust | | | | | | | | |
| | |
Series 2018-3A, Class C, 3.71%, 6/15/2023 (c) | | | 99,000 | | | | 100,341 | |
SEE NOTES TO FINANCIAL STATEMENTS.
| | | | | | |
| | | |
| 94 | | | | J.P. MORGAN EXCHANGE-TRADED FUNDS | | AUGUST 31, 2020 |
| | | | | | | | |
| INVESTMENTS | | PRINCIPAL
AMOUNT ($) | | | VALUE ($) | |
Asset-Backed Securities — continued | |
| | |
United States — continued | | | | | | | | |
| | |
Series 2017-3A, Class C, 3.68%, 7/17/2023 (c) | | | 180,000 | | | | 183,564 | |
| | |
Series 2016-3A, Class D, 6.40%, 7/17/2023 (c) | | | 350,000 | | | | 360,627 | |
| | |
Series 2018-2A, Class D, 4.04%, 3/15/2024 (c) | | | 60,000 | | | | 61,254 | |
| | |
Series 2018-3A, Class D, 4.35%, 6/17/2024 (c) | | | 210,000 | | | | 217,610 | |
| | |
Flagship Credit Auto Trust | | | | | | | | |
| | |
Series 2018-3, Class A, 3.07%, 2/15/2023 (c) | | | 69,578 | | | | 70,083 | |
| | |
Series 2017-4, Class D, 3.58%, 1/15/2024 (c) | | | 280,000 | | | | 287,326 | |
| | |
Series 2017-2, Class E, 5.55%, 7/15/2024 (c) | | | 380,000 | | | | 396,703 | |
| | |
Series 2018-3, Class C, 3.79%, 12/16/2024 (c) | | | 170,000 | | | | 175,343 | |
| | |
FREED ABS Trust | | | | | | | | |
| | |
Series 2018-1, Class A, 3.61%, 7/18/2024 (c) | | | 7,579 | | | | 7,587 | |
| | |
Series 2018-1, Class B, 4.56%, 7/18/2024 ‡ (c) | | | 100,000 | | | | 100,176 | |
| | |
GLS Auto Receivables Issuer Trust | | | | | | | | |
| | |
Series 2019-2A, Class B, 3.32%, 3/15/2024 (c) | | | 200,000 | | | | 206,145 | |
| | |
Series 2019-1A, Class C, 3.87%, 12/16/2024 (c) | | | 155,000 | | | | 160,217 | |
| | |
Lendmark Funding Trust | | | | | | | | |
| | |
Series 2019-2A, Class C, 3.72%, 4/20/2028 ‡ (c) | | | 580,000 | | | | 538,792 | |
| | |
Marlette Funding Trust | | | | | | | | |
| | |
Series 2018-1A, Class C, 3.69%, 3/15/2028 (c) | | | 66,668 | | | | 66,938 | |
| | |
Series 2018-2A, Class B, 3.61%, 7/17/2028 ‡ (c) | | | 111,783 | | | | 112,072 | |
| | |
Series 2018-2A, Class C, 4.37%, 7/17/2028 (c) | | | 280,000 | | | | 277,519 | |
| | |
MFA LLC | | | | | | | | |
| | |
Series 2017-NPL1, Class A1, 3.35%, 11/25/2047 ‡ (b) (c) | | | 158,184 | | | | 158,825 | |
| | |
Series 2018-NPL2, Class A1, 4.16%, 7/25/2048 ‡ (b) (c) | | | 109,570 | | | | 109,538 | |
| | |
Morgan Stanley ABS Capital I, Inc. Trust Series 2004-NC8, Class B1, 2.80%, 9/25/2034 ‡ (j) | | | 192,614 | | | | 194,141 | |
| | |
OneMain Direct Auto Receivables Trust | | | | | | | | |
| | |
Series 2018-1A, Class B, 3.71%, 4/14/2025 (c) | | | 100,000 | | | | 102,263 | |
| | | | | | | | |
| INVESTMENTS | | PRINCIPAL
AMOUNT ($) | | | VALUE ($) | |
| |
| | |
United States — continued | | | | | | | | |
| | |
Series 2018-1A, Class D, 4.40%, 1/14/2028 (c) | | | 160,000 | | | | 164,849 | |
| | |
Onemain Financial Issuance Trust Series 2018-1A, Class D, 4.08%, 3/14/2029 ‡ (c) | | | 100,000 | | | | 101,861 | |
| | |
PNMAC GMSR Issuer Trust Series 2018-GT2, Class A, 2.83%, 8/25/2025 (c) (j) | | | 210,000 | | | | 200,685 | |
| | |
Prestige Auto Receivables Trust Series 2018-1A, Class C, 3.75%, 10/15/2024 (c) | | | 440,000 | | | | 450,663 | |
| | |
Pretium Mortgage Credit Partners I LLC Series 2019-NPL2, Class A2, 5.93%, 12/27/2058 ‡ (b) (c) | | | 250,000 | | | | 248,899 | |
| | |
Progress Residential Trust Series 2018-SFR3, Class E, 4.87%, 10/17/2035 ‡ (c) | | | 262,000 | | | | 270,611 | |
| | |
Santander Drive Auto Receivables Trust Series 2018-4, Class D, 3.98%, 12/15/2025 | | | 350,000 | | | | 360,913 | |
| | |
Santander Revolving Auto Loan Trust | | | | | | | | |
| | |
Series 2019-A, Class C, 3.00%, 1/26/2032 (c) | | | 150,000 | | | | 157,451 | |
| | |
Series 2019-A, Class D, 3.45%, 1/26/2032 (c) | | | 650,000 | | | | 676,757 | |
| | |
SoFi Consumer Loan Program Trust Series 2018-1, Class B, 3.65%, 2/25/2027 (c) | | | 100,000 | | | | 102,896 | |
| | |
Structured Asset Investment Loan Trust | | | | | | | | |
| | |
Series 2004-8, Class M3, 1.15%, 9/25/2034 ‡ (j) | | | 69,659 | | | | 68,626 | |
| | |
Series 2005-HE3, Class M1, 0.90%, 9/25/2035 ‡ (j) | | | 75,829 | | | | 75,227 | |
| | |
Tricolor Auto Securitization Trust Series 2018-2A, Class C, 5.75%, 5/16/2022 (c) | | | 380,888 | | | | 382,083 | |
| | |
VOLT LXXX LLC Series 2019-NPL6, Class A1B, 4.09%, 10/25/2049 (b) (c) | | | 675,000 | | | | 651,829 | |
| | |
VOLT LXXXIII LLC Series 2019-NPL9, Class A1B, 4.09%, 11/26/2049 ‡ (b) (c) | | | 580,000 | | | | 565,895 | |
| | |
Westlake Automobile Receivables Trust Series 2018-2A, Class E, 4.86%, 1/16/2024 (c) | | | 310,000 | | | | 321,028 | |
| | | | | | | | |
| |
Total Asset-Backed Securities
(Cost $11,630,600) | | | | 11,751,972 | |
| | | | | | | | |
SEE NOTES TO FINANCIAL STATEMENTS.
| | | | | | | | |
| | | |
| AUGUST 31, 2020 | | J.P. MORGAN EXCHANGE-TRADED FUNDS | | | | | 95 | |
JPMorgan International Bond Opportunities ETF
(formerly known as JPMorgan Global Bond Opportunities ETF)
SCHEDULE OF PORTFOLIO INVESTMENTS
AS OF AUGUST 31, 2020 (Unaudited) (continued)
| | | | | | | | |
| INVESTMENTS | | PRINCIPAL
AMOUNT ($) | | | VALUE ($) | |
Collateralized Mortgage Obligations — 5.6% | |
| | |
United Kingdom — 0.3% | | | | | | | | |
| | |
Brass NO 8 plc Series 8A, Class A1, 0.98%, 11/16/2066 (c) (j) | | | 189,661 | | | | 189,783 | |
| | |
Lanark Master Issuer plc Series 2019-1A, Class 1A1, 1.13%, 12/22/2069 (c) (j) | | | 140,000 | | | | 140,138 | |
| | |
Permanent Master Issuer plc Series 2018-1A, Class 1A1, 0.65%, 7/15/2058 (c) (j) | | | 63,750 | | | | 63,722 | |
| | | | | | | | |
| | |
| | | | | | | 393,643 | |
| | | | | | | | |
| | |
United States — 5.3% | | | | | | | | |
| | |
Alternative Loan Trust | | | | | | | | |
| | |
Series 2004-25CB, Class A1, 6.00%, 12/25/2034 | | | 143,264 | | | | 145,850 | |
| | |
Series 2005-6CB, Class 1A6, 5.50%, 4/25/2035 | | | 87,715 | | | | 87,703 | |
| | |
Series 2005-80CB, Class 5A1, 6.00%, 2/25/2036 | | | 118,184 | | | | 120,297 | |
| | |
Series 2007-2CB, Class 1A6, 5.75%, 3/25/2037 | | | 156,551 | | | | 124,505 | |
| | |
Angel Oak Mortgage Trust Series 2019-5, Class A1, 2.59%, 10/25/2049 (c) (j) | | | 524,049 | | | | 528,536 | |
| | |
Antler Mortgage Trust Series 2019-RTL1, Class A2, 4.95%, 8/25/2022 (c) (j) | | | 600,000 | | | | 614,395 | |
| | |
Chase Mortgage Finance Trust Series 2007-A1, Class 1A5, 3.78%, 2/25/2037 (j) | | | 29,426 | | | | 28,845 | |
| | |
CHL Mortgage Pass-Through Trust Series 2007-16, Class A1, 6.50%, 10/25/2037 | | | 62,381 | | | | 47,720 | |
| | |
CIM Trust Series 2019-INV3, Class A11, 1.12%, 8/25/2049 (c) (j) | | | 213,084 | | | | 211,978 | |
| | |
COLT Mortgage Loan Trust Series 2019-4, Class A1, 2.58%, 11/25/2049 (c) (j) | | | 130,407 | | | | 131,217 | |
| | |
Deephaven Residential Mortgage Trust | | | | | | | | |
| | |
Series 2019-4A, Class A1, 2.79%, 10/25/2059 (c) (j) | | | 212,531 | | | | 215,521 | |
| | |
Series 2020-1, Class A1, 2.34%, 1/25/2060 (c) (j) | | | 145,287 | | | | 146,729 | |
| | |
FHLMC Structured Agency Credit Risk Debt Notes Series 2018-HQA1, Class M2, 2.48%, 9/25/2030 (j) | | | 47,843 | | | | 46,884 | |
| | |
FHLMC, REMIC | | | | | | | | |
| | |
Series 2916, Class S, IF, IO, 7.09%, 1/15/2035 (j) | | | 2,034,075 | | | | 476,022 | |
| | | | | | | | |
| INVESTMENTS | | PRINCIPAL
AMOUNT ($) | | | VALUE ($) | |
| | | | | | | | |
| | |
United States — continued | | | | | | | | |
| | |
Series 4305, Class SK, IF, IO, 6.44%, 2/15/2044 (j) | | | 746,453 | | | | 171,337 | |
| | |
Series 4689, Class SD, IF, IO, 5.99%, 6/15/2047 (j) | | | 565,957 | | | | 108,649 | |
| | |
Series 4714, Class SA, IF, IO, 5.99%, 8/15/2047 (j) | | | 439,570 | | | | 94,076 | |
| | |
Series 4839, Class WS, IF, IO, 5.94%, 8/15/2056 (j) | | | 2,875,424 | | | | 744,426 | |
| | |
Flagstar Mortgage Trust Series 2020-1INV, Class A11, 1.03%, 3/25/2050 (c) (j) | | | 142,579 | | | | 142,038 | |
| | |
FNMA, Connecticut Avenue Securities | | | | | | | | |
| | |
Series 2015-C03, Class 2M2, 5.18%, 7/25/2025 (j) | | | 94,195 | | | | 96,160 | |
| | |
Series 2016-C06, Class 1M2, 4.43%, 4/25/2029 (j) | | | 48,837 | | | | 50,181 | |
| | |
Series 2018-C05, Class 1M2, 2.53%, 1/25/2031 (j) | | | 7,954 | | | | 7,844 | |
| | |
Series 2018-C06, Class 1M2, 2.18%, 3/25/2031 (j) | | | 74,101 | | | | 72,336 | |
| | |
Series 2018-C06, Class 2M2, 2.28%, 3/25/2031 (j) | | | 20,909 | | | | 20,380 | |
| | |
FNMA, REMIC | | | | | | | | |
| | |
Series 2010-57, Class ID, IO, 4.00%, 6/25/2025 | | | 249,978 | | | | 8,340 | |
| | |
Series 2012-146, Class AI, IO, 3.00%, 1/25/2028 | | | 1,569,735 | | | | 96,295 | |
| | |
Series 2016-68, Class BI, IO, 3.00%, 10/25/2031 | | | 948,733 | | | | 79,024 | |
| | |
Series 2012-93, Class SE, IF, IO, 5.92%, 9/25/2042 (j) | | | 137,841 | | | | 32,665 | |
| | |
Series 2012-124, Class UI, IO, 4.00%, 11/25/2042 | | | 173,882 | | | | 22,539 | |
| | |
Series 2012-133, Class NS, IF, IO, 5.97%, 12/25/2042 (j) | | | 254,479 | | | | 61,176 | |
| | |
Series 2015-40, Class LS, IF, IO, 5.99%, 6/25/2045 (j) | | | 394,453 | | | | 93,202 | |
| | |
Series 2016-75, Class SC, IF, IO, 5.92%, 10/25/2046 (j) | | | 837,282 | | | | 176,862 | |
| | |
Series 2017-31, Class SG, IF, IO, 5.92%, 5/25/2047 (j) | | | 1,433,360 | | | | 278,887 | |
| | |
Series 2017-39, Class ST, IF, IO, 5.92%, 5/25/2047 (j) | | | 398,334 | | | | 90,686 | |
| | |
Series 2017-69, Class SH, IF, IO, 6.02%, 9/25/2047 (j) | | | 635,086 | | | | 136,632 | |
| | |
Series 2019-42, Class SK, IF, IO, 5.87%, 8/25/2049 (j) | | | 1,107,294 | | | | 203,382 | |
| | |
FNMA, STRIPS Series 409, Class 27, IO, 4.00%, 4/25/2027 (j) | | | 220,329 | | | | 16,444 | |
SEE NOTES TO FINANCIAL STATEMENTS.
| | | | | | |
| | | |
| 96 | | | | J.P. MORGAN EXCHANGE-TRADED FUNDS | | AUGUST 31, 2020 |
| | | | | | | | |
| INVESTMENTS | | PRINCIPAL
AMOUNT ($) | | | VALUE ($) | |
Collateralized Mortgage Obligations — continued | |
| | |
United States — continued | | | | | | | | |
| | |
GCAT Trust Series 2020-NQM1, Class A1, 2.25%, 1/25/2060 (b) (c) | | | 485,814 | | | | 493,766 | |
| | |
GNMA | | | | | | | | |
| | |
Series 2017-107, Class KS, IF, IO, 6.04%, 7/20/2047 (j) | | | 452,104 | | | | 82,249 | |
| | |
Series 2019-42, Class SJ, IF, IO, 5.89%, 4/20/2049 (j) | | | 1,166,844 | | | | 169,023 | |
| | |
Series 2015-H13, Class GI, IO, 1.61%, 4/20/2065 (j) | | | 228,231 | | | | 10,022 | |
| | |
Series 2017-H14, Class FG, 1.59%, 6/20/2067 (j) | | | 366,057 | | | | 374,316 | |
|
Homeward Opportunities Fund I Trust | |
| | |
Series 2018-1, Class A1, 3.77%, 6/25/2048 (c) (j) | | | 43,648 | | | | 43,663 | |
| | |
Series 2019-1, Class M1, 3.95%, 1/25/2059 ‡ (c) (j) | | | 150,000 | | | | 150,353 | |
| | |
Merrill Lynch Mortgage Investors Trust Series 2004-C, Class A1, 0.73%, 7/25/2029 (j) | | | 78,803 | | | | 74,906 | |
| | |
OBX Trust | | | | | | | | |
| | |
Series 2019-EXP1, Class 2A1B, 1.13%, 1/25/2059 (c) (j) | | | 206,000 | | | | 201,875 | |
| | |
Series 2019-EXP3, Class 2A1B, 1.08%, 10/25/2059 (c) (j) | | | 130,000 | | | | 130,174 | |
| | |
PRPM LLC Series 2019-1A, Class A1, 4.50%, 1/25/2024 (b) (c) | | | 425,053 | | | | 428,101 | |
| | |
Starwood Mortgage Residential Trust Series 2020-1, Class A1, 2.27%, 2/25/2050 (c) (j) | | | 210,672 | | | | 214,087 | |
| | |
Structured Adjustable Rate Mortgage Loan Trust Series 2004-8, Class 3A, 3.11%, 7/25/2034 (j) | | | 18,402 | | | | 18,844 | |
| | |
Toorak Mortgage Corp. Ltd. Series 2018-1, Class A1, 4.34%, 8/25/2021 (b)(c) | | | 120,000 | | | | 121,171 | |
| | |
Verus Securitization Trust | | | | | | | | |
| | |
Series 2018-2, Class A1, 3.68%, 6/1/2058(c) (j) | | | 100,862 | | | | 102,015 | |
| | |
Series 2019-1, Class A1, 3.84%, 2/25/2059(c) (j) | | | 155,790 | | | | 158,705 | |
| | |
Series 2019-INV3, Class A1, 2.69%, 11/25/2059(c) (j) | | | 349,331 | | | | 353,756 | |
| | | | | | | | |
| | |
| | | | | | | 8,856,789 | |
| | | | | | | | |
| |
Total Collateralized Mortgage Obligations
(Cost $8,979,361) | | | | 9,250,432 | |
| | | | | | | | |
Commercial Mortgage-Backed Securities — 4.1% | |
| | |
United States — 4.1% | | | | | | | | |
| | |
BAMLL Re-REMIC Trust Series 2014-FRR4, Class BK29, PO, 4/27/2023(c) | | | 400,000 | | | | 326,460 | |
| | | | | | | | |
| INVESTMENTS | | PRINCIPAL
AMOUNT ($) | | | VALUE ($) | |
| | | | | | | | |
| | |
United States — continued | | | | | | | | |
| | |
Banc of America Commercial Mortgage Trust Series 2007-5, Class AJ, 6.02%, 2/10/2051 (j) | | | 336,812 | | | | 357,229 | |
| | |
BANK Series 2020-BN25, Class XA, IO, 0.89%, 1/15/2063 (j) | | | 4,594,476 | | | | 314,165 | |
| | |
BX Commercial Mortgage Trust Series 2018-BIOA, Class D, 1.48%, 3/15/2037 ‡ (c) (j) | | | 485,000 | | | | 475,281 | |
| | |
BXMT Ltd. Series 2017-FL1, Class D, 2.86%, 6/15/2035 ‡ (c) (j) | | | 210,000 | | | | 205,275 | |
| | |
Citigroup Commercial Mortgage Trust Series 2015-P1, Class D, 3.23%, 9/15/2048 ‡ (c) | | | 205,000 | | | | 157,300 | |
| | |
FHLMC, Multi-Family Structured Pass-Through Certificates | | | | | | | | |
| | |
Series K033, Class X1, IO, 0.41%, 7/25/2023 (j) | | | 3,874,254 | | | | 29,352 | |
| | |
Series K078, Class X3, IO, 2.29%, 10/25/2028 (j) | | | 1,820,000 | | | | 255,077 | |
| | |
Series K153, Class X3, IO, 3.90%, 4/25/2035 (j) | | | 340,000 | | | | 101,796 | |
| | |
Series K036, Class X3, IO, 2.18%, 12/25/2041 (j) | | | 2,640,000 | | | | 162,107 | |
| | |
Series K720, Class X3, IO, 1.38%, 8/25/2042 (j) | | | 6,800,000 | | | | 142,933 | |
| | |
Series K041, Class X3, IO, 1.70%, 11/25/2042 (j) | | | 3,470,000 | | | | 210,784 | |
| | |
Series K718, Class X3, IO, 1.48%, 2/25/2043 (j) | | | 10,025,000 | | | | 168,531 | |
| | |
Series K054, Class X3, IO, 1.65%, 4/25/2043 (j) | | | 1,365,000 | | | | 103,715 | |
| | |
Series K050, Class X3, IO, 1.61%, 10/25/2043 (j) | | | 1,010,000 | | | | 69,076 | |
| | |
Series K051, Class X3, IO, 1.67%, 10/25/2043 (j) | | | 1,395,000 | | | | 100,733 | |
| | |
Series K052, Class X3, IO, 1.67%, 1/25/2044 (j) | | | 750,000 | | | | 56,086 | |
| | |
Series K726, Class X3, IO, 2.21%, 7/25/2044 (j) | | | 2,890,000 | | | | 200,125 | |
| | |
Series K067, Class X3, IO, 2.19%, 9/25/2044 (j) | | | 1,385,000 | | | | 171,754 | |
| | |
Series K072, Class X3, IO, 2.21%, 12/25/2045 (j) | | | 400,000 | | | | 52,090 | |
| | |
Series K089, Class X3, IO, 2.37%, 1/25/2046 (j) | | | 850,000 | | | | 133,394 | |
| | |
Series K088, Class X3, IO, 2.42%, 2/25/2047 (j) | | | 980,000 | | | | 157,495 | |
| | |
FREMF Series 2018-KF46, Class B, 2.10%, 3/25/2028 (c) (j) | | | 512,663 | | | | 497,414 | |
SEE NOTES TO FINANCIAL STATEMENTS.
| | | | | | | | |
| | | |
| AUGUST 31, 2020 | | J.P. MORGAN EXCHANGE-TRADED FUNDS | | | | | 97 | |
JPMorgan International Bond Opportunities ETF
(formerly known as JPMorgan Global Bond Opportunities ETF)
SCHEDULE OF PORTFOLIO INVESTMENTS
AS OF AUGUST 31, 2020 (Unaudited) (continued)
| | | | | | | | |
| INVESTMENTS | | PRINCIPAL
AMOUNT ($) | | | VALUE ($) | |
Commercial Mortgage-Backed Securities — continued | |
| | |
United States — continued | | | | | | | | |
| | |
FREMF Mortgage Trust | | | | | | | | |
| | |
Series 2017-KF31, Class B, 3.05%, 4/25/2024 (c) (j) | | | 38,243 | | | | 37,277 | |
| | |
Series 2017-KF36, Class B, 2.80%, 8/25/2024 (c) (j) | | | 58,397 | | | | 56,797 | |
| | |
Series 2017-KF38, Class B, 2.65%, 9/25/2024 (c) (j) | | | 46,262 | | | | 44,485 | |
| | |
Series 2018-KF47, Class B, 2.15%, 5/25/2025 (c) (j) | | | 35,305 | | | | 33,475 | |
| | |
Series 2018-KF49, Class B, 2.05%, 6/25/2025 (c) (j) | | | 425,024 | | | | 403,985 | |
| | |
Series 2017-K728, Class B, 3.76%, 11/25/2050 (c) (j) | | | 190,000 | | | | 204,192 | |
| | |
Series 2017-K728, Class C, 3.76%, 11/25/2050 (c) (j) | | | 105,000 | | | | 109,610 | |
| | |
GNMA Series 2017-23, IO, 0.72%, 5/16/2059 (j) | | | 552,131 | | | | 27,789 | |
| | |
GS Mortgage Securities Trust Series 2012-GCJ9, Class D, 4.90%, 11/10/2045 ‡ (c) (j) | | | 320,000 | | | | 287,846 | |
| | |
LB Commercial Mortgage Trust Series 2007-C3, Class AJ, 6.11%, 7/15/2044 (j) | | | 19,302 | | | | 19,066 | |
| | |
LB-UBS Commercial Mortgage Trust Series 2006-C6, Class AJ, 5.45%, 9/15/2039 ‡ (j) | | | 231,572 | | | | 133,386 | |
| | |
Morgan Stanley Capital I Trust Series 2005-HQ7, Class E, 5.54%, 11/14/2042 ‡ (j) | | | 47,974 | | | | 47,414 | |
| | |
Velocity Commercial Capital Loan Trust | | | | | | | | |
| | |
Series 2018-2, Class A, 4.05%, 10/26/2048 (c) (j) | | | 198,587 | | | | 201,862 | |
| | |
Series 2019-1, Class A, 3.76%, 3/25/2049 (c) (j) | | | 472,443 | | | | 475,250 | |
| | |
Series 2019-1, Class M1, 3.94%, 3/25/2049 ‡ (c) (j) | | | 222,608 | | | | 220,731 | |
| | | | | | | | |
| |
Total Commercial Mortgage-Backed Securities
(Cost $6,911,792) | | | | 6,751,337 | |
| | | | | | | | |
U.S. Treasury Obligations — 2.7% | | | | | | | | |
| | |
U.S. Treasury Bonds 3.00%, 2/15/2048 | | | 50,000 | | | | 67,543 | |
| | |
U.S. Treasury Notes 0.25%, 6/30/2025 | | | 4,420,000 | | | | 4,417,583 | |
| | | | | | | | |
| |
Total U.S. Treasury Obligations
(Cost $4,476,818) | | | | 4,485,126 | |
| | | | | | | | |
Supranational — 0.1% | |
| | |
African Export-Import Bank (The) 5.25%, 10/11/2023(a)
(Cost $211,304) | | | 200,000 | | | | 217,000 | |
| | | | | | | | |
| | | | | | | | |
| INVESTMENTS | | SHARES | | | VALUE ($) | |
Preferred Stocks — 0.0% (i) | | | | | | | | |
| | |
United States — 0.0% (i) | | | | | | | | |
| | |
Wells Fargo & Co., Series Z, 4.75%, 3/15/2025 ($25 par value) (k)
(Cost $27,168) | | | 1,175 | | | | 29,128 | |
| | | | | | | | |
| | |
| | | NO. OF
WARRANTS | | | | |
Warrants — 0.0% (i) | | | | | | | | |
| | |
United States — 0.0% (i) | | | | | | | | |
| | |
Ultra Petroleum Corp.expiring 7/14/2025, price 1.00 USD *
(Cost $—) | | | 2,450 | | | | 86 | |
| | | | | | | | |
| | |
| | | SHARES | | | | |
Short-Term Investments — 1.8% | | | | | | | | |
| | |
Investment Companies — 1.8% | | | | | | | | |
| | |
JPMorgan U.S. Government Money Market Fund Class Institutional Shares, 0.01% (l) (m)
(Cost $3,063,953) | | | 3,063,953 | | | | 3,063,953 | |
| | | | | | | | |
Total Investments — 98.3%
(Cost $159,343,198) | | | | 164,330,732 | |
Other Assets Less Liabilities — 1.7% | | | | 2,845,867 | |
| | | | | | | | |
NET ASSETS — 100.0% | | | | 167,176,599 | |
| | | | | | | | |
Percentages indicated are based on net assets.
Abbreviations
| | |
| ABS | | Asset-backed securities |
| AUD | | Australian Dollar |
| CNY | | China Yuan |
| CZK | | Czech Republic Koruna |
| DKK | | Danish Krone |
| DOP | | Dominican Republic Peso |
| EUR | | Euro |
| FHLMC | | Federal Home Loan Mortgage Corp. |
| FNMA | | Federal National Mortgage Association |
| GBP | | British Pound |
| GNMA | | Government National Mortgage Association |
| HUF | | Hungarian Forint |
| ICE | | Intercontinental Exchange |
| IDR | | Indonesian Rupiah |
| IF | | Inverse Floaters represent securities that pay interest at a rate that increases (decreases) with a decline (incline) in a specified index or have an interest rate that adjusts periodically based on changes in current interest rates and prepayments on the underlying pool of assets. The interest rate shown is the rate in effect as of August 31, 2020. The rate may be subject to a cap and floor. |
SEE NOTES TO FINANCIAL STATEMENTS.
| | | | | | |
| | | |
| 98 | | | | J.P. MORGAN EXCHANGE-TRADED FUNDS | | AUGUST 31, 2020 |
| | |
| IO | | Interest Only represents the right to receive the monthly interest payments on an underlying pool of mortgage loans. The principal amount shown represents the par value on the underlying pool. The yields on these securities are subject to accelerated principal paydowns as a result of prepayment or refinancing of the underlying pool of mortgage instruments. As a result, interest income may be reduced considerably. |
| JSC | | Joint Stock Company |
| LIBOR | | London Interbank Offered Rate |
| MXN | | Mexican Peso |
| NZD | | New Zealand Dollar |
| OYJ | | Public Limited Company |
| PEN | | Peruvian Nuevo Sol |
| PJSC | | Public Joint Stock Company |
| PLN | | Polish Zloty |
| PO | | Principal Only represents the right to receive the principal portion only on an underlying pool of mortgage loans. The market value of these securities is extremely volatile in response to changes in market interest rates. As prepayments on the underlying mortgages of these securities increase, the yield on these securities increases. |
| PT | | Limited liability company |
| REIT | | Real Estate Investment Trust |
| REMIC | | Real Estate Mortgage Investment Conduit |
| Re-REMIC | | Combined Real Estate Mortgage Investment Conduit |
| RUB | | Russian Ruble |
| SCA | | Limited partnership with share capital |
| SOFR | | Secured Overnight Financing Rate |
| STRIPS | | Separate Trading of Registered Interest and Principal of Securities. The STRIPS Program lets investors hold and trade individual interest and principal components of eligible notes and bonds as separate securities. |
| USD | | United States Dollar |
| ZAR | | South African Rand |
| |
| (a) | | Security exempt from registration pursuant to Regulation S under the Securities Act of 1933, as amended. Regulation S applies to securities offerings that are made outside of the United States and do not involve direct selling efforts in the United States and as such may have restrictions on resale. |
| | |
| (b) | | Step bond. Interest rate is a fixed rate for an initial period that either resets at a specific date or may reset in the future contingent upon a predetermined trigger. The interest rate shown is the current rate as of August 31, 2020. |
| (c) | | Securities exempt from registration under Rule 144A or section 4(a)(2), of the Securities Act of 1933, as amended. |
| (d) | | Variable or floating rate security, linked to the referenced benchmark. The interest rate shown is the current rate as of August 31, 2020. |
| (e) | | Security is perpetual and thus, does not have a predetermined maturity date. The coupon rate for this security is fixed for a period of time and may be structured to adjust thereafter. The date shown, if applicable, reflects the next call date. The coupon rate shown is the rate in effect as of August 31, 2020. |
| (f) | | Security is an interest bearing note with preferred security characteristics. |
| (g) | | Security has the ability to pay in kind (“PIK”) or pay income in cash. When applicable, separate rates of such payments are disclosed. |
| (h) | | Defaulted security. |
| (i) | | Amount rounds to less than 0.1% of net assets. |
| (j) | | Variable or floating rate security, the interest rate of which adjusts periodically based on changes in current interest rates and prepayments on the underlying pool of assets. The interest rate shown is the current rate as of August 31, 2020. |
| (k) | | The date shown reflects the next call date on which the issuer may redeem the security at par value. The coupon rate for this security is based on par value and is in effect as of August 31, 2020. |
| (l) | | Investment in an affiliated fund, which is registered under the Investment Company Act of 1940, as amended, and is advised by J.P. Morgan Investment Management Inc. |
| (m) | | The rate shown is the current yield as of August 31, 2020. |
| * | | Non-income producing security. |
| ‡ | | Value determined using significant unobservable inputs. |
| | | | | | | | | | | | | | | | | | | | |
| Futures contracts outstanding as of August 31, 2020: | |
| DESCRIPTION | | NUMBER OF
CONTRACTS | | | EXPIRATION
DATE | | | TRADING
CURRENCY | | | NOTIONAL
AMOUNT
($) | | | VALUE AND
UNREALIZED
APPRECIATION
(DEPRECIATION) ($) | |
|
Long Contracts | |
| | | | | |
| Australia 10 Year Bond | | | 8 | | | | 09/2020 | | | | AUD | | | | 870,123 | | | | 2,540 | |
| | | | | |
| Euro-Bobl | | | 56 | | | | 09/2020 | | | | EUR | | | | 8,995,663 | | | | (16,923 | ) |
| | | | | |
| Euro-BTP | | | 4 | | | | 09/2020 | | | | EUR | | | | 697,919 | | | | 17,244 | |
| | | | | |
| Euro-Bund | | | 57 | | | | 09/2020 | | | | EUR | | | | 11,936,316 | | | | (53,584 | ) |
| | | | | |
| U.S. Treasury 2 Year Note | | | 23 | | | | 12/2020 | | | | USD | | | | 5,081,563 | | | | 2,111 | |
| | | | | |
| U.S. Treasury 5 Year Note | | | 53 | | | | 12/2020 | | | | USD | | | | 6,678,000 | | | | 4,456 | |
| | | | | |
| U.S. Treasury 10 Year Note | | | 19 | | | | 12/2020 | | | | USD | | | | 2,643,969 | | | | 1,655 | |
| | | | | |
| U.S. Treasury 10 Year Ultra Note | | | 28 | | | | 12/2020 | | | | USD | | | | 4,457,250 | | | | (3,668 | ) |
| | | | | |
| U.S. Treasury Ultra Bond | | | 4 | | | | 12/2020 | | | | USD | | | | 877,625 | | | | (11,040 | ) |
| | | | | | | | | | | | | | | | | | | | |
| | | | | |
| | | | | | | | | | | | | | | | | | | (57,209 | ) |
| | | | | | | | | | | | | | | | | | | | |
SEE NOTES TO FINANCIAL STATEMENTS.
| | | | | | | | |
| | | |
| AUGUST 31, 2020 | | J.P. MORGAN EXCHANGE-TRADED FUNDS | | | | | 99 | |
JPMorgan International Bond Opportunities ETF
(formerly known as JPMorgan Global Bond Opportunities ETF)
SCHEDULE OF PORTFOLIO INVESTMENTS
AS OF AUGUST 31, 2020 (Unaudited) (continued)
| | | | | | | | | | | | | | | | | | | | |
| DESCRIPTION | | NUMBER OF
CONTRACTS | | | EXPIRATION
DATE | | | TRADING
CURRENCY | | | NOTIONAL
AMOUNT ($) | | | VALUE AND
UNREALIZED
APPRECIATION
(DEPRECIATION) ($) | |
| | | | | |
Short Contracts | | | | | | | | | | | | | | | | | | | | |
| | | | | |
| Euro-Buxl | | | (36) | | | | 09/2020 | | | | EUR | | | | (9,289,800 | ) | | | 40,288 | |
| | | | | |
| Euro-OAT | | | (28) | | | | 09/2020 | | | | EUR | | | | (5,594,473 | ) | | | 7,090 | |
| | | | | |
| U.S. Treasury 5 Year Note | | | (19) | | | | 12/2020 | | | | USD | | | | (2,394,000 | ) | | | (1,671 | ) |
| | | | | |
| U.S. Treasury 10 Year Note | | | (136) | | | | 12/2020 | | | | USD | | | | (18,925,250 | ) | | | (17,168 | ) |
| | | | | |
| U.S. Treasury 10 Year Ultra Note | | | (50) | | | | 12/2020 | | | | USD | | | | (7,959,375 | ) | | | 8,543 | |
| | | | | |
| U.S. Treasury Long Bond | | | (2) | | | | 12/2020 | | | | USD | | | | (350,375 | ) | | | 1,621 | |
| | | | | |
| U.S. Treasury Ultra Bond | | | (3) | | | | 12/2020 | | | | USD | | | | (658,219 | ) | | | 8,267 | |
| | | | | | | | | | | | | | | | | | | | |
| | | | | |
| | | | | | | | | | | | | | | | | | | 46,970 | |
| | | | | | | | | | | | | | | | | | | | |
| | | | | |
| | | | | | | | | | | | | | | | | | | (10,239 | ) |
| | | | | | | | | | | | | | | | | | | | |
| | |
| Abbreviations |
| AUD | | Australian Dollar |
| EUR | | Euro |
| USD | | United States Dollar |
| | | | | | | | | | | | | | | | | | | | |
| Forward foreign currency exchange contracts outstanding as of August 31, 2020: | |
| CURRENCY PURCHASED | | | CURRENCY SOLD | | | COUNTERPARTY | | SETTLEMENT
DATE | | | UNREALIZED
APPRECIATION
(DEPRECIATION) ($) | |
| EUR | | | 91,536 | | | USD | | | 107,455 | | | Goldman Sachs International | | | 9/2/2020 | | | | 1,779 | |
| EUR | | | 104,985 | | | USD | | | 125,281 | | | State Street Corp. | | | 9/2/2020 | | | | 3 | |
| EUR | | | 17,739,752 | | | USD | | | 21,136,647 | | | TD Bank Financial Group | | | 9/2/2020 | | | | 33,087 | |
| GBP | | | 195,157 | | | USD | | | 259,720 | | | State Street Corp. | | | 9/2/2020 | | | | 1,155 | |
| CLP | | | 526,506,000 | | | USD | | | 660,691 | | | Goldman Sachs International * * | | | 9/23/2020 | | | | 16,453 | |
| CLP | | | 139,957,632 | | | USD | | | 177,148 | | | Merrill Lynch International * * | | | 9/23/2020 | | | | 2,853 | |
| COP | | | 3,215,786,313 | | | USD | | | 839,129 | | | Citibank, NA * * | | | 9/23/2020 | | | | 19,254 | |
| CZK | | | 20,369,616 | | | USD | | | 921,116 | | | HSBC Bank, NA | | | 9/23/2020 | | | | 4,404 | |
| EUR | | | 1,095,421 | | | USD | | | 1,291,859 | | | Merrill Lynch International | | | 9/23/2020 | | | | 15,975 | |
| MXN | | | 19,148,164 | | | USD | | | 859,097 | | | Citibank, NA | | | 9/23/2020 | | | | 13,718 | |
| NZD | | | 423,009 | | | USD | | | 277,946 | | | HSBC Bank, NA | | | 9/23/2020 | | | | 6,984 | |
| NZD | | | 204,422 | | | USD | | | 134,918 | | | Merrill Lynch International | | | 9/23/2020 | | | | 2,776 | |
| PEN | | | 1,890,255 | | | USD | | | 527,827 | | | Merrill Lynch International * * | | | 9/23/2020 | | | | 5,602 | |
| PLN | | | 82,882 | | | USD | | | 22,263 | | | HSBC Bank, NA | | | 9/23/2020 | | | | 245 | |
| RUB | | | 13,282,639 | | | USD | | | 176,561 | | | Citibank, NA * * | | | 9/23/2020 | | | | 2,020 | |
| | | | | | | | | | | | | | | | | | | | |
| Total unrealized appreciation | | | | 126,308 | |
| | | | | | | | | | | | | | | | | | | | |
| USD | | | 259,108 | | | EUR | | | 220,064 | | | BNP Paribas | | | 9/2/2020 | | | | (3,505 | ) |
| USD | | | 103,114 | | | EUR | | | 87,839 | | | Citibank, NA | | | 9/2/2020 | | | | (1,709 | ) |
| USD | | | 20,869,568 | | | EUR | | | 17,628,370 | | | State Street Corp. | | | 9/2/2020 | | | | (167,247 | ) |
| USD | | | 255,960 | | | GBP | | | 195,157 | | | State Street Corp. | | | 9/2/2020 | | | | (4,915 | ) |
| BRL | | | 4,449,965 | | | USD | | | 824,893 | | | Goldman Sachs International * * | | | 9/23/2020 | | | | (13,164 | ) |
| EUR | | | 704,403 | | | USD | | | 842,861 | | | Citibank, NA | | | 9/23/2020 | | | | (1,868 | ) |
| HUF | | | 171,250,532 | | | USD | | | 585,758 | | | Citibank, NA | | | 9/23/2020 | | | | (11,027 | ) |
| KRW | | | 964,891,234 | | | USD | | | 813,774 | | | Barclays Bank plc * * | | | 9/23/2020 | | | | (1,341 | ) |
| RUB | | | 8,362,459 | | | USD | | | 113,526 | | | Goldman Sachs International * * | | | 9/23/2020 | | | | (1,095 | ) |
| USD | | | 1,707,221 | | | AUD | | | 2,389,175 | | | BNP Paribas | | | 9/23/2020 | | | | (55,050 | ) |
| USD | | | 1,575,910 | | | CAD | | | 2,086,350 | | | Citibank, NA | | | 9/23/2020 | | | | (23,727 | ) |
| USD | | | 2,871,168 | | | CNY | | | 20,000,000 | | | State Street Corp. * * | | | 9/23/2020 | | | | (43,307 | ) |
| USD | | | 10,722,583 | | | EUR | | | 9,072,519 | | | Barclays Bank plc | | | 9/23/2020 | | | | (109,184 | ) |
| USD | | | 15,574 | | | EUR | | | 13,177 | | | HSBC Bank, NA | | | 9/23/2020 | | | | (158 | ) |
SEE NOTES TO FINANCIAL STATEMENTS.
| | | | | | |
| | | |
| 100 | | | | J.P. MORGAN EXCHANGE-TRADED FUNDS | | AUGUST 31, 2020 |
| | | | | | | | | | | | | | | | | | | | |
| CURRENCY PURCHASED | | | CURRENCY SOLD | | | COUNTERPARTY | | SETTLEMENT
DATE | | | UNREALIZED
APPRECIATION
(DEPRECIATION) ($) | |
| USD | | | 11,335 | | | EUR | | | 9,607 | | | Royal Bank of Canada | | | 9/23/2020 | | | | (134 | ) |
| USD | | | 153,845 | | | MXN | | | 3,400,842 | | | Goldman Sachs International | | | 9/23/2020 | | | | (1,173 | ) |
| USD | | | 270,660 | | | MXN | | | 5,992,410 | | | Royal Bank of Canada | | | 9/23/2020 | | | | (2,488 | ) |
| USD | | | 2,974,350 | | | NZD | | | 4,551,074 | | | BNP Paribas | | | 9/23/2020 | | | | (91,153 | ) |
| USD | | | 1,731,586 | | | NZD | | | 2,623,441 | | | Merrill Lynch International | | | 9/23/2020 | | | | (35,505 | ) |
| USD | | | 368,672 | | | PEN | | | 1,310,886 | | | Citibank, NA * * | | | 9/23/2020 | | | | (1,260 | ) |
| USD | | | 1,571,283 | | | TRY | | | 11,784,980 | | | BNP Paribas | | | 9/23/2020 | | | | (24,069 | ) |
| USD | | | 728,982 | | | ZAR | | | 12,791,927 | | | HSBC Bank, NA | | | 9/23/2020 | | | | (23,806 | ) |
| USD | | | 21,151,905 | | | EUR | | | 17,739,752 | | | TD Bank Financial Group | | | 10/5/2020 | | | | (33,563 | ) |
| USD | | | 259,775 | | | GBP | | | 195,157 | | | State Street Corp. | | | 10/5/2020 | | | | (1,162 | ) |
| | | | | | | | | | | | | | | | | | | | |
| Total unrealized depreciation | | | | (651,610 | ) |
| | | | | | | | | | | | | | | | | | | | |
| Net unrealized depreciation | | | | (525,302 | ) |
| | | | | | | | | | | | | | | | | | | | |
| | |
| Abbreviations |
| |
| AUD | | Australian Dollar |
| BRL | | Brazilian Real |
| CAD | | Canadian Dollar |
| CLP | | Chilean Peso |
| CNY | | China Yuan |
| COP | | Colombian Peso |
| CZK | | Czech Republic Koruna |
| EUR | | Euro |
| GBP | | British Pound |
| HUF | | Hungarian Forint |
| KRW | | Korean Republic Won |
| MXN | | Mexican Peso |
| NZD | | New Zealand Dollar |
| PEN | | Peruvian Sol |
| PLN | | Polish Zloty |
| RUB | | Russian Ruble |
| TRY | | Turkish Lira |
| USD | | United States Dollar |
| ZAR | | South African Rand |
| * | * Non-deliverable forward. |
| | | | | | | | | | | | | | | | | | | | | | | | | | | | | | | | | | |
| Over-the-Counter (“OTC”) Credit default swap contracts outstanding — buy protection (a) as of August 31, 2020: | |
REFERENCE
OBLIGATION/INDEX | | FINANCING RATE
PAID BY THE
FUND (%) | | PAYMENT
FREQUENCY | | | COUNTERPARTY | | | MATURITY
DATE | | | IMPLIED
CREDIT
SPREAD
(%) (b) | | | NOTIONAL
AMOUNT (c) | | | UPFRONT
PAYMENTS
(RECEIPTS)
($) (d) | | | UNREALIZED
APPRECIATION
(DEPRECIATION)
($) | | | VALUE
($) | |
CDX.NA.EM.32-V3 | | 1.00 | | | Quarterly | | |
| Goldman Sachs
International |
| | | 12/20/2024 | | | | 1.58 | | | USD | 3,700,000 | | | | 337,816 | | | | (261,759 | ) | | | 76,057 | |
CDX.NA.EM.33-V2 | | 1.00 | | | Quarterly | | | | Morgan Stanley | | | | 6/20/2025 | | | | 1.74 | | | USD | 1,610,000 | | | | 74,544 | | | | (25,675 | ) | | | 48,869 | |
| | | | | | | | | | | | | | | | | | | | | | | | | | | | | | | | | | |
| | | | | | | | | | | | | | | | | | | | | | | | | 412,360 | | | | (287,434 | ) | | | 124,926 | |
| | | | | | | | | | | | | | | | | | | | | | | | | | | | | | | | | | |
SEE NOTES TO FINANCIAL STATEMENTS.
| | | | | | | | |
| | | |
| AUGUST 31, 2020 | | J.P. MORGAN EXCHANGE-TRADED FUNDS | | | | | 101 | |
JPMorgan International Bond Opportunities ETF
(formerly known as JPMorgan Global Bond Opportunities ETF)
SCHEDULE OF PORTFOLIO INVESTMENTS
AS OF AUGUST 31, 2020 (Unaudited) (continued)
| | | | | | | | | | | | | | | | | | | | | | | | | | | | | | |
| Centrally Cleared Credit default swap contracts outstanding — buy protection (a) as of August 31, 2020: | |
REFERENCE OBLIGATION/INDEX | | FINANCING RATE
PAID BY THE
FUND (%) | | PAYMENT
FREQUENCY | | | MATURITY
DATE | | | IMPLIED
CREDIT
SPREAD
(%) (b) | | | NOTIONAL
AMOUNT (c) | | | UPFRONT
PAYMENTS
(RECEIPTS)
($) (d) | | | UNREALIZED
APPRECIATION
(DEPRECIATION)
($) | | | VALUE
($) | |
| | | | | | | | |
| CDX.NA.HY.34-V8 | | 5.00 | | | Quarterly | | | | 6/20/2025 | | | | 3.64 | | | USD | 1,246,000 | | | | 58,689 | | | | (137,463 | ) | | | (78,774 | ) |
| | | | | | | | |
| iTraxx.Europe.Crossover.33-V1 | | 5.00 | | | Quarterly | | | | 6/20/2025 | | | | 3.19 | | | EUR | 1,500,000 | | | | (70,503 | ) | | | (85,500 | ) | | | (156,003 | ) |
| | | | | | | | |
| iTraxx.Europe.Crossover.33-V1 | | 5.00 | | | Quarterly | | | | 6/20/2025 | | | | 3.19 | | | EUR | 1,975,000 | | | | 148,520 | | | | (353,924 | ) | | | (205,404 | ) |
| | | | | | | | |
| iTraxx.Europe.Crossover.33-V1 | | 5.00 | | | Quarterly | | | | 6/20/2025 | | | | 3.19 | | | EUR | 460,000 | | | | (1,239 | ) | | | (46,602 | ) | | | (47,841 | ) |
| | | | | | | | | | | | | | | | | | | | | | | | | | | | | | |
| | | | | | | | |
| | | | | | | | | | | | | | | | | | | | | 76,778 | | | | (486,026 | ) | | | (409,248 | ) |
| | | | | | | | | | | | | | | | | | | | | | | | | | | | | | |
| | | | | | | | |
| | | | | | | | | | | | | | | | | | | | | 135,467 | | | | (623,489 | ) | | | (488,022 | ) |
| | | | | | | | | | | | | | | | | | | | | | | | | | | | | | |
| (a) | The Fund, as a buyer of credit protection, is generally obligated to make periodic payments and may also pay or receive an upfront premium to or from the protection seller, in exchange for the right to receive a contingent payment, upon occurrence of a credit event with respect to an underlying reference obligation, as defined under the terms of individual swap contracts. |
| (b) | Implied credit spreads are an indication of the seller’s performance risk, related to the likelihood of a credit event occurring that would require a seller to make payment to a buyer. Implied credit spreads are used to determine the value of swap contracts and reflect the cost of buying/selling protection, which may include upfront payments made to enter into the contract. Therefore, higher spreads would indicate a greater likelihood that a seller will be obligated to perform (i.e. make payment) under the swap contract. Increasing values, in absolute terms and relative to notional amounts, are also indicative of greater performance risk. Implied credit spreads for credit default swaps on credit indices are linked to the weighted average spread across the underlying reference obligations included in a particular index. |
| (c) | The notional amount is the maximum amount that a seller of credit protection would be obligated to pay and a buyer of credit protection would receive, upon occurrence of a credit event. |
| (d) | Upfront payments and receipts generally represent premiums paid or received at the initiation of the agreement to compensate the differences between the stated terms of the swap agreement and current market conditions (credit spreads, interest rates and other relevant factors). |
| | |
| Abbreviations |
| |
| CDX | | CreditDefault Swap Index |
| EUR | | Euro |
| USD | | UnitedStates Dollar |
| | | | | | |
| Summary of total OTC swap contracts outstanding as of August 31, 2020: | | | | | |
| | | NET UPFRONT PAYMENTS
(RECEIPTS) ($) | | VALUE
($) | |
Assets | |
| | |
| OTC Credit default swap contracts outstanding—buy protection | | 412,360 | | | 124,926 | |
| | | | | | |
SEE NOTES TO FINANCIAL STATEMENTS.
| | | | | | |
| | | |
| 102 | | | | J.P. MORGAN EXCHANGE-TRADED FUNDS | | AUGUST 31, 2020 |
JPMorgan Municipal ETF
SCHEDULE OF PORTFOLIO INVESTMENTS
AS OF AUGUST 31, 2020 (Unaudited)
| | | | | | | | |
| INVESTMENTS | | PRINCIPAL
AMOUNT ($) | | | VALUE ($) | |
Municipal Bonds — 97.8% (a) | |
|
Alabama — 1.9% | |
| | |
Alabama Federal Aid Highway Finance Authority Series 2016A, Rev., 5.00%, 9/1/2034 | | | 75,000 | | | | 92,133 | |
| | |
Black Belt Energy Gas District
Series 2020A-1, Rev., 4.00%, 10/1/2026 (b) | | | 250,000 | | | | 290,642 | |
| | |
Black Belt Energy Gas District, Gas Supply Series 2017A, Rev., LIQ: Royal Bank of Canada, 4.00%, 7/1/2022 (b) | | | 30,000 | | | | 31,785 | |
| | |
City of Pell City Series A, GO, 5.00%, 2/1/2025 | | | 100,000 | | | | 119,296 | |
| | |
Selma Industrial Development Board, International Paper Company Project Series 2020A, Rev., 1.37%, 6/16/2025 (b) | | | 100,000 | | | | 101,796 | |
| | |
Southeast Alabama Gas Supply District (The), Project No. 1 Series 2018A, Rev., 4.00%, 4/1/2024 (b) | | | 25,000 | | | | 27,620 | |
| | |
University of Alabama (The) Series B-2, Rev., 5.00%, 9/1/2031 | | | 95,000 | | | | 121,908 | |
| | |
University of South Alabama Rev., AGM, 5.00%, 4/1/2030 | | | 250,000 | | | | 331,778 | |
| | | | | | | | |
| | |
Total Alabama | | | | | | | 1,116,958 | |
| | | | | | | | |
|
Alaska — 0.9% | |
| | |
Alaska Industrial Development and Export Authority, Tanana Chiefs Conference Project Series 2019A, Rev., 5.00%, 10/1/2024 | | | 200,000 | | | | 233,296 | |
| | |
Alaska Municipal Bond Bank Authority | | | | | | | | |
| | |
Series 3, Rev., 5.00%, 10/1/2025 | | | 20,000 | | | | 23,374 | |
| | |
Series 3, Rev., 5.00%, 12/1/2028 | | | 225,000 | | | | 275,762 | |
| | | | | | | | |
| | |
Total Alaska | | | | | | | 532,432 | |
| | | | | | | | |
|
Arizona — 2.9% | |
| | |
Arizona Industrial Development Authority Series 2020A, Rev., 4.00%, 7/15/2040 (c) | | | 125,000 | | | | 121,320 | |
| | |
Arizona Industrial Development Authority, Cadence Campus Project Series 2020A, Rev., 4.00%, 7/15/2030 (c) | | | 125,000 | | | | 129,040 | |
| | |
Arizona Industrial Development Authority, Equitable School Revolving Funds Series A, Rev., 5.00%, 11/1/2044 | | | 250,000 | | | | 301,967 | |
| | |
Arizona Industrial Development Authority, Great Lakes Senior Living Communities LLC Project Series 2019A, Rev., 5.00%, 1/1/2036 | | | 250,000 | | | | 238,640 | |
| | | | | | | | |
| INVESTMENTS | | PRINCIPAL
AMOUNT ($) | | | VALUE ($) | |
| | | | | | | | |
|
Arizona — continued | |
| | |
Arizona Industrial Development Authority, Phoenix Children’s Hospital | | | | | | | | |
| | |
Series 2020A, Rev., 5.00%, 2/1/2024 | | | 55,000 | | | | 63,374 | |
| | |
Series 2020A, Rev., 5.00%, 2/1/2025 | | | 70,000 | | | | 83,541 | |
| | |
Series 2020A, Rev., 5.00%, 2/1/2031 | | | 150,000 | | | | 196,875 | |
| | |
Series 2020A, Rev., 5.00%, 2/1/2032 | | | 200,000 | | | | 260,520 | |
| | |
City of Phoenix Civic Improvement Corp., Junior Lien, Airport Special Obligation Series 2017D, Rev., 5.00%, 7/1/2026 | | | 160,000 | | | | 195,019 | |
| | |
Maricopa County School District No. 3 Tempe Elementary, School Improvement Series A, GO, 5.00%, 7/1/2027 | | | 30,000 | | | | 38,551 | |
| | |
Salt Verde Financial Corp. Rev., 5.25%, 12/1/2026 | | | 100,000 | | | | 123,248 | |
| | | | | | | | |
| | |
Total Arizona | | | | | | | 1,752,095 | |
| | | | | | | | |
|
Arkansas — 0.2% | |
| | |
City of Fort Smith, Water and Sewer Construction Rev., 5.00%, 10/1/2024 | | | 75,000 | | | | 88,213 | |
| | |
University of Arkansas, UAMS Campus Rev., 5.00%, 11/1/2021 | | | 40,000 | | | | 42,255 | |
| | | | | | | | |
| | |
Total Arkansas | | | | | | | 130,468 | |
| | | | | | | | |
|
California — 8.0% | |
| | |
Baldwin Park Financing Authority, Rail Crossings Safety Improvements Project Rev., 5.00%, 6/1/2024 | | | 100,000 | | | | 118,006 | |
| | |
Brentwood Infrastructure Financing Authority, Civic Center Project Rev., 5.00%, 10/1/2025 | | | 45,000 | | | | 54,456 | |
| | |
California Health Facilities Financing Authority, Kaiser Permanente Series 2006C, Rev., 5.00%, 11/1/2029 (b) | | | 300,000 | | | | 400,734 | |
| | |
California Municipal Finance Authority, San Antonio Gardens Project Rev., 5.00%, 11/15/2039 | | | 150,000 | | | | 163,243 | |
| | |
California Statewide Communities Development Authority, Emanate Health, Tax-Exempt Series 2020A, Rev., 5.00%, 4/1/2030 | | | 150,000 | | | | 199,701 | |
| | |
Chula Vista Municipal Financing Authority Rev., 4.00%, 5/1/2026 | | | 60,000 | | | | 71,120 | |
| | |
Chula Vista Municipal Financing Authority, Green Bonds Series 2017B, Rev., 4.00%, 12/1/2028 | | | 45,000 | | | | 57,064 | |
| | |
City of Livermore Series 2020B, COP, 4.00%, 10/1/2030 | | | 200,000 | | | | 254,932 | |
| | |
City of Los Angeles Department of Airports Series A, Rev., AMT, 5.00%, 5/15/2022 | | | 125,000 | | | | 134,059 | |
| | |
Series A, Rev., AMT, 5.00%, 5/15/2033 | | | 100,000 | | | | 115,883 | |
SEE NOTES TO FINANCIAL STATEMENTS.
| | | | | | | | |
| | | |
| AUGUST 31, 2020 | | J.P. MORGAN EXCHANGE-TRADED FUNDS | | | | | 103 | |
JPMorgan Municipal ETF
SCHEDULE OF PORTFOLIO INVESTMENTS
AS OF AUGUST 31, 2020 (Unaudited) (continued)
| | | | | | | | |
| INVESTMENTS | | PRINCIPAL
AMOUNT ($) | | | VALUE ($) | |
Municipal Bonds — continued | | | | | | | | |
|
California — continued | |
| | |
City of Los Angeles Department of Airports, International Airport Subordinate | | | | | | | | |
| | |
Series 2019E, Rev., AMT, 5.00%, 5/15/2026 | | | 10,000 | | | | 12,396 | |
| | |
City of Roseville, 316 Vernon Street Project COP, 5.00%, 8/1/2025 | | | 70,000 | | | | 86,012 | |
| | |
City of Santa Rosa, Courthouse Square Project and Lease COP, 4.00%, 10/1/2024 | | | 90,000 | | | | 103,135 | |
| | |
County of Santa Clara Series 2017C, GO, 5.00%, 8/1/2033 | | | 40,000 | | | | 51,042 | |
| | |
El Monte City School District, Election 2014 Series A, GO, 5.00%, 8/1/2025 | | | 55,000 | | | | 66,979 | |
| | |
Golden State Tobacco Securitization Corp., Tobacco Settlement Series A-1, Rev., 5.00%, 6/1/2032 | | | 250,000 | | | | 305,885 | |
| | |
Hermosa Beach City School District, Election of 2016 Series A, GO, 4.00%, 8/1/2023 | | | 15,000 | | | | 16,664 | |
| | |
Los Angeles County Metropolitan Transportation Authority, Green Bond | | | | | | | | |
| | |
Series 2020A, Rev., 5.00%, 6/1/2032 | | | 1,000,000 | | | | 1,354,300 | |
| | |
Metropolitan Water District of Southern California, Waterworks Series 2019A, Rev., 5.00%, 7/1/2034 | | | 25,000 | | | | 33,014 | |
| | |
Municipal Improvement Corp. of Los Angeles, Real Property Series 2014-A, Rev., 5.00%, 5/1/2023 | | | 20,000 | | | | 22,513 | |
| | |
Northern California Power Agency Series 2019A, Rev., 5.00%, 7/1/2022 | | | 20,000 | | | | 21,466 | |
| | |
Salinas Facilities Financing Authority Series 2020A-1, Rev., AGM, 4.00%, 11/1/2027 | | | 100,000 | | | | 122,717 | |
| | |
San Dieguito Union High School District Series A-2, GO, 5.00%, 8/1/2024 | | | 150,000 | | | | 170,997 | |
| | |
San Francisco City and County Airport Commission, International Airport, Governmental Purpose Series 2016A, Rev., 5.00%, 5/1/2026 | | | 95,000 | | | | 117,048 | |
| | |
San Francisco City and County Airport Comm-San Francisco International Airport Series 2016A, Rev., 5.00%, 5/1/2023 | | | 105,000 | | | | 117,508 | |
| | |
San Jose Evergreen Community College District Series A, GO, 5.00%, 9/1/2022 | | | 100,000 | | | | 109,711 | |
| | |
Santa Cruz County Capital Financing Authority Series 2020A, Rev., 4.00%, 6/1/2025 | | | 100,000 | | | | 114,960 | |
| | |
Sequoia Union High School District GO, 5.00%, 7/1/2027 | | | 25,000 | | | | 31,617 | |
| | |
Sierra View Local Health Care District | | | | | | | | |
| | |
Rev., 4.00%, 7/1/2021 (d) | | | 150,000 | | | | 153,851 | |
| | |
Rev., 4.00%, 7/1/2023 (d) | | | 165,000 | | | | 178,538 | |
| | | | | | | | |
| INVESTMENTS | | PRINCIPAL
AMOUNT ($) | | | VALUE ($) | |
| | | | | | | | |
|
California — continued | |
| | |
State of California, Various Purpose GO, 5.00%, 11/1/2020 | | | 25,000 | | | | 25,198 | |
| | | | | | | | |
| | |
Total California | | | | | | | 4,784,749 | |
| | | | | | | | |
|
Colorado — 2.0% | |
| | |
Colorado Health Facilities Authority, Boulder Community Health Project | | | | | | | | |
| | |
Rev., 5.00%, 10/1/2021 | | | 100,000 | | | | 104,787 | |
| | |
Rev., 5.00%, 10/1/2022 | | | 225,000 | | | | 245,268 | |
| | |
Rev., 5.00%, 10/1/2023 | | | 175,000 | | | | 197,626 | |
| | |
Southlands Metropolitan District No. 1 Series A-1, GO, 5.00%, 12/1/2037 | | | 250,000 | | | | 266,410 | |
| | |
State of Colorado, Higher Education Capital Construction, Lease Purchase Financing Program Series 2014A, COP, 5.00%, 11/1/2025 | | | 10,000 | | | | 12,242 | |
| | |
STC Metropolitan District No. 2 Series 2019A, GO, 5.00%, 12/1/2038 | | | 300,000 | | | | 306,738 | |
| | |
University of Colorado, University Enterprise Series A-2, Rev., 5.00%, 6/1/2026 | | | 40,000 | | | | 49,950 | |
| | | | | | | | |
| | |
Total Colorado | | | | | | | 1,183,021 | |
| | | | | | | | |
|
Connecticut — 1.0% | |
| | |
Connecticut State Health and Educational Facilities Authority, Yale University Issue | | | | | | | | |
| | |
Series A-2, Rev., 5.00%, 7/1/2022 (b) | | | 100,000 | | | | 108,740 | |
| | |
State of Connecticut Series A, GO, 5.00%, 4/15/2033 | | | 135,000 | | | | 164,897 | |
| | |
State of Connecticut Special Tax | | | | | | | | |
| | |
Series 2020A, Rev., 5.00%, 5/1/2023 | | | 200,000 | | | | 224,618 | |
| | |
State of Connecticut, Special Tax Transportation Infrastructure Purposes | | | | | | | | |
| | |
Series B, Rev., 5.00%, 8/1/2023 | | | 75,000 | | | | 85,076 | |
| | |
Town of Trumbull Series 2012A, GO, 4.00%, 9/1/2020 (e) | | | 10,000 | | | | 10,000 | |
| | | | | | | | |
| | |
Total Connecticut | | | | | | | 593,331 | |
| | | | | | | | |
|
Delaware — 0.1% | |
| | |
Delaware Transportation Authority | | | | | | | | |
| | |
Rev., 5.00%, 7/1/2022 | | | 40,000 | | | | 43,553 | |
| | | | | | | | |
|
District of Columbia — 2.9% | |
| | |
District of Columbia | | | | | | | | |
| | |
Series F, Rev., 5.00%, 12/1/2021 | | | 50,000 | | | | 53,021 | |
| | |
Rev., 4.00%, 7/1/2039 | | | 100,000 | | | | 108,506 | |
| | |
District of Columbia, Income Tax | | | | | | | | |
| | |
Series C, Rev., 5.00%, 12/1/2021 | | | 25,000 | | | | 26,510 | |
| | |
Series 2020C, Rev., 5.00%, 5/1/2033 | | | 1,000,000 | | | | 1,348,040 | |
SEE NOTES TO FINANCIAL STATEMENTS.
| | | | | | |
| | | |
| 104 | | | | J.P. MORGAN EXCHANGE-TRADED FUNDS | | AUGUST 31, 2020 |
| | | | | | | | |
| INVESTMENTS | | PRINCIPAL
AMOUNT ($) | | | VALUE ($) | |
Municipal Bonds — continued | |
| | |
District of Columbia — continued | | | | | | | | |
| | |
District of Columbia, International School Issue Rev., 5.00%, 7/1/2039 | | | 125,000 | | | | 144,255 | |
| | |
District of Columbia, Water and Sewer Authority Series B, Rev., 5.00%, 10/1/2025 | | | 65,000 | | | | 80,303 | |
| | | | | | | | |
| | |
Total District of Columbia | | | | | | | 1,760,635 | |
| | | | | | | | |
|
Florida — 3.8% | |
| | |
City of Cape Coral, Water and Sewer Rev., 5.00%, 10/1/2022 | | | 25,000 | | | | 27,411 | |
| | |
City of Miami Beach, Water and Sewer Rev., 5.00%, 9/1/2033 | | | 25,000 | | | | 31,353 | |
| | |
City of Orlando Series 2010B, Rev., 5.00%, 10/1/2020 | | | 10,000 | | | | 10,039 | |
| | |
City of Orlando, Capital Improvement | | | | | | | | |
| | |
Series D, Rev., 5.00%, 10/1/2022 | | | 75,000 | | | | 82,380 | |
| | |
Series B, Rev., 5.00%, 10/1/2024 | | | 60,000 | | | | 71,372 | |
| | |
City of Tampa, H. Lee Moffitt Cancer Center Project | | | | | | | | |
| | |
Series 2020B, Rev., 5.00%, 7/1/2022 | | | 50,000 | | | | 53,846 | |
| | |
Series 2020B, Rev., 5.00%, 7/1/2023 | | | 50,000 | | | | 55,792 | |
| | |
Series 2020B, Rev., 5.00%, 7/1/2024 | | | 50,000 | | | | 57,744 | |
| | |
County of Broward Series 2019A, Rev., 5.00%, 9/1/2030 | | | 50,000 | | | | 63,447 | |
| | |
County of Hillsborough Rev., 5.00%, 10/1/2024 | | | 40,000 | | | | 47,689 | |
| | |
County of Lee Rev., 5.00%, 10/1/2025 | | | 40,000 | | | | 47,526 | |
| | |
County of Okaloosa Rev., 5.00%, 10/1/2024 | | | 30,000 | | | | 35,686 | |
| | |
County of Osceola, Sales Tax Series 2016A, Rev., 4.00%, 10/1/2023 | | | 10,000 | | | | 11,089 | |
| | |
County of Palm Beach, Atlantic University | | | | | | | | |
| | |
Rev., 5.00%, 4/1/2029 (c) | | | 100,000 | | | | 104,150 | |
| | |
Rev., 5.00%, 4/1/2039 (c) | | | 100,000 | | | | 99,636 | |
| | |
County of Seminole, Special Obligation Rev., 4.00%, 10/1/2024 | | | 90,000 | | | | 102,939 | |
| | |
East Central Regional Wastewater Treatment Facilities Operation Board, Green Bonds, Bio Solids Project Rev., 5.00%, 10/1/2024 | | | 30,000 | | | | 35,686 | |
| | |
Escambia County School Board Rev., 5.00%, 9/1/2020 | | | 10,000 | | | | 10,000 | |
| | |
Florida Atlantic University Finance Corp. Series 2019B, Rev., 5.00%, 7/1/2032 | | | 250,000 | | | | 306,897 | |
| | |
Florida State Board of Education, Public Education Capital Outlay
Series B, GO, 5.00%, 6/1/2024 | | | 30,000 | | | | 35,340 | |
| | |
Series B, GO, 5.00%, 6/1/2026 | | | 20,000 | | | | 25,207 | |
| | |
Series B, GO, 5.00%, 6/1/2031 | | | 75,000 | | | | 95,847 | |
| | | | | | | | |
| INVESTMENTS | | PRINCIPAL
AMOUNT ($) | | | VALUE ($) | |
| | | | | | | | |
|
Florida — continued | |
| | |
Monroe County School District Series 2018A, COP, 4.00%, 6/1/2025 | | | 45,000 | | | | 52,188 | |
| | |
Orange County School Board Series 2015D, COP, 5.00%, 8/1/2025 | | | 25,000 | | | | 30,256 | |
| | |
Palm Beach County Health Facilities Authority, ACTS Retirement Life Communities Inc. Obligated Group Rev., 5.00%, 11/15/2032 | | | 240,000 | | | | 279,970 | |
| | |
Palm Beach County School District Series 2015B, COP, 5.00%, 8/1/2021 | | | 10,000 | | | | 10,435 | |
| | |
Pinellas County Industrial Development Authority, Drs. Kiran & Pallavi Patel 2017 Foundation For Global Understanding, Inc., Project Rev., 5.00%, 7/1/2029 | | | 125,000 | | | | 138,303 | |
| | |
Reedy Creek Improvement District Series 2016-A, GO, 5.00%, 6/1/2026 | | | 50,000 | | | | 62,405 | |
| | |
State of Florida, State Board of Education, Lottery | | | | | | | | |
| | |
Series 2016B, Rev., 5.00%, 7/1/2023 | | | 40,000 | | | | 45,321 | |
| | |
Series A, Rev., 5.00%, 7/1/2026 | | | 75,000 | | | | 94,357 | |
| | |
Tampa Bay Water Utility System Series C, Rev., 5.00%, 10/1/2025 | | | 55,000 | | | | 67,730 | |
| | |
Tampa-Hillsborough County Expressway Authority Series B, Rev., 5.00%, 7/1/2031 | | | 40,000 | | | | 51,184 | |
| | |
Tohopekaliga Water Authority, Utility System Rev., 5.00%, 10/1/2025 | | | 10,000 | | | | 12,332 | |
| | | | | | | | |
| | |
Total Florida | | | | | | | 2,255,557 | |
| | | | | | | | |
|
Georgia — 1.7% | |
| | |
Carroll City-County Hospital Authority, Tanner Medical Center Project Rev., GTD, 4.00%, 7/1/2024 | | | 200,000 | | | | 226,938 | |
| | |
City of Atlanta, Water and Wastewater Series 2013B, Rev., 5.00%, 11/1/2020 | | | 45,000 | | | | 45,358 | |
| | |
Cobb County, Kennestone Hospital Authority, Wellstar Health System, Inc. Project | | | | | | | | |
| | |
Series 2020B, Rev., 5.00%, 4/1/2022(d) | | | 150,000 | | | | 157,824 | |
| | |
Series 2020A, Rev., 5.00%, 4/1/2050 | | | 200,000 | | | | 246,844 | |
| | |
County of DeKalb, Water and Sewerage Series 2006B, Rev., 5.25%, 10/1/2026 | | | 25,000 | | | | 31,929 | |
| | |
Glynn-Brunswick Memorial Hospital Authority Rev., 4.00%, 8/1/2037 | | | 255,000 | | | | 288,058 | |
| | |
Richmond County Hospital Authority, University Health Services, Inc. Project Rev., RAN, 5.00%, 1/1/2022 | | | 20,000 | | | | 21,178 | |
| | |
State of Georgia Series 2011J-1, GO, 4.50%, 7/1/2022 | | | 25,000 | | | | 25,902 | |
| | | | | | | | |
| | |
Total Georgia | | | | | | | 1,044,031 | |
| | | | | | | | |
SEE NOTES TO FINANCIAL STATEMENTS.
| | | | | | | | |
| | | |
| AUGUST 31, 2020 | | J.P. MORGAN EXCHANGE-TRADED FUNDS | | | | | 105 | |
JPMorgan Municipal ETF
SCHEDULE OF PORTFOLIO INVESTMENTS
AS OF AUGUST 31, 2020 (Unaudited) (continued)
| | | | | | | | |
| INVESTMENTS | | PRINCIPAL
AMOUNT ($) | | | VALUE ($) | |
Municipal Bonds — continued | |
|
Hawaii — 0.3% | |
| | |
City and County of Honolulu, Tax-Exempt Series D, GO, 5.00%, 9/1/2032 | | | 45,000 | | | | 56,817 | |
| | |
State of Hawaii | | | | | | | | |
| | |
Series EE, GO, 5.00%, 11/1/2022 (e) | | | 15,000 | | | | 16,547 | |
| | |
Series EP, GO, 5.00%, 8/1/2023 | | | 40,000 | | | | 45,473 | |
| | |
Series FK, GO, 5.00%, 5/1/2033 | | | 30,000 | | | | 37,326 | |
| | |
State of Hawaii, Highway Fund Series B, Rev., 5.00%, 1/1/2027 | | | 25,000 | | | | 31,192 | |
| | | | | | | | |
| | |
Total Hawaii | | | | | | | 187,355 | |
| | | | | | | | |
|
Illinois — 4.5% | |
| | |
Champaign County Community Unit School District No. 4 Champaign, School Building GO, 5.00%, 1/1/2027 | | | 45,000 | | | | 55,354 | |
| | |
Chicago O’Hare International Airport, Third Lien Series 2017B, Rev., 5.00%, 1/1/2034 | | | 40,000 | | | | 47,377 | |
| | |
City of Decatur GO, 5.00%, 3/1/2027 | | | 130,000 | | | | 158,691 | |
| | |
Cook and DuPage Counties, Village of Elk Grove GO, 5.00%, 1/1/2029 | | | 25,000 | | | | 31,535 | |
| | |
Grundy & Will Counties Community Unit School District No. 1 Coal City GO, 5.00%, 2/1/2027 | | | 225,000 | | | | 275,402 | |
| | |
Illinois Finance Authority, Clean Water Initiative Revolving Fund Rev., 5.00%, 7/1/2032 | | | 35,000 | | | | 43,554 | |
| | |
Illinois State Toll Highway Authority | | | | | | | | |
| | |
Series D, Rev., 5.00%, 1/1/2024 | | | 25,000 | | | | 28,672 | |
| | |
Series A, Rev., 5.00%, 1/1/2036 | | | 250,000 | | | | 317,002 | |
| | |
Kane McHenry Cook and De Kalb Counties Unit School District No. 300, School Bonds GO, 5.00%, 1/1/2024 | | | 35,000 | | | | 40,266 | |
| | |
Kendall and Kane Counties Community Unit School District No. 115 Series 2017B, GO, 5.00%, 1/1/2027 | | | 25,000 | | | | 31,079 | |
| | |
Lake and McHenry Counties Community Unit School District No. 118 Wauconda GO, 5.00%, 1/1/2022 | | | 50,000 | | | | 53,118 | |
| | |
Lake County Forest Preserve District GO, 5.00%, 12/15/2028 | | | 165,000 | | | | 217,110 | |
| | |
McLean & Woodford Counties Community Unit School District No. 5 Normal Series 2017A, GO, 4.00%, 12/1/2023 | | | 80,000 | | | | 88,593 | |
| | |
Northern Illinois University Series 2020B, Rev., 5.00%, 4/1/2034 | | | 200,000 | | | | 250,224 | |
| | |
Southwestern Illinois Development Authority Rev., 5.00%, 4/15/2030 | | | 625,000 | | | | 833,963 | |
| | |
State of Illinois GO,
5.00%, 4/1/2024 | | | 30,000 | | | | 32,689 | |
| | | | | | | | |
| INVESTMENTS | | PRINCIPAL
AMOUNT ($) | | | VALUE ($) | |
| | | | | | | | |
|
Illinois — continued | |
| | |
Series A, GO, 5.00%, 10/1/2024 | | | 30,000 | | | | 33,008 | |
| | |
Village of Bolingbrook Series A, GO, AGM, 5.00%, 1/1/2033 | | | 125,000 | | | | 154,624 | |
| | |
Will & Kendall Counties Community Consolidated School District 202 Plainfield GO, 4.00%, 1/1/2023 | | | 10,000 | | | | 10,807 | |
| | | | | | | | |
| | |
Total Illinois | | | | | | | 2,703,068 | |
| | | | | | | | |
|
Indiana — 1.4% | |
| | |
Adams Central Elementary School Building Corp., Valorem Property Tax First Mortgage Rev., 5.00%, 1/15/2027 | | | 20,000 | | | | 25,154 | |
| | |
Ball State University, Student Fee Series R, Rev., 5.00%, 7/1/2024 | | | 35,000 | | | | 40,882 | |
| | |
Decatur County Jail Building Corp. Rev., 5.00%, 7/15/2028 | | | 250,000 | | | | 314,565 | |
| | |
Hamilton Southeastern Consolidated School Building Corp., Valorem Property Tax First Mortgage Rev., 5.00%, 7/15/2026 | | | 25,000 | | | | 31,289 | |
| | |
Indiana Finance Authority Series 2016A, Rev., 5.00%, 12/1/2022 | | | 10,000 | | | | 10,985 | |
| | |
Indiana Finance Authority, Highway Series C, Rev., 5.00%, 12/1/2025 | | | 35,000 | | | | 43,258 | |
| | |
Indiana State University, Housing and Dining System Rev., 5.00%, 4/1/2031 | | | 75,000 | | | | 91,432 | |
| | |
Indiana State University, Student Fee Series R, Rev., 5.00%, 10/1/2022 | | | 10,000 | | | | 10,936 | |
| | |
Indiana University | | | | | | | | |
| | |
Series A, Rev., 5.00%, 6/1/2022 | | | 25,000 | | | | 27,110 | |
| | |
Series Y, Rev., 5.00%, 8/1/2028 | | | 25,000 | | | | 32,231 | |
| | |
IPS Multi-School Building Corp., Indiana Unlimited Ad Valorem Property Tax First Mortgage Rev., 5.00%, 7/15/2029 | | | 50,000 | | | | 66,500 | |
| | |
Perry Township Multi School Building Corp. Rev., 5.00%, 7/15/2025 | | | 35,000 | | | | 42,094 | |
| | |
Portage Township Multi-School Building Corp. Rev., 5.00%, 7/15/2028 | | | 75,000 | | | | 97,592 | |
| | | | | | | | |
| | |
Total Indiana | | | | | | | 834,028 | |
| | | | | | | | |
|
Iowa — 0.3% | |
| | |
City of Cedar Rapids Series 2018D, Rev., 5.00%, 6/1/2022 | | | 70,000 | | | | 75,844 | |
| | |
City of West Des Moines, Urban Renewal Series 2016B, GO, 5.00%, 6/1/2024 | | | 35,000 | | | | 41,187 | |
| | |
Iowa Finance Authority, State Revolving Fund, Green Bonds Rev., 5.00%, 8/1/2027 | | | 30,000 | | | | 39,012 | |
| | | | | | | | |
| | |
Total Iowa | | | | | | | 156,043 | |
| | | | | | | | |
SEE NOTES TO FINANCIAL STATEMENTS.
| | | | | | |
| | | |
| 106 | | | | J.P. MORGAN EXCHANGE-TRADED FUNDS | | AUGUST 31, 2020 |
| | | | | | | | |
| INVESTMENTS | | PRINCIPAL
AMOUNT ($) | | | VALUE ($) | |
Municipal Bonds — continued | |
|
Kansas — 0.1% | |
| | |
Johnson County Water District No. 1 Series 2017A, Rev., 5.00%, 1/1/2025 | | | 50,000 | | | | 60,197 | |
| | |
Seward County Unified School District No. 480 Liberal GO, 5.00%, 9/1/2020 | | | 10,000 | | | | 10,000 | |
| | | | | | | | |
| | |
Total Kansas | | | | | | | 70,197 | |
| | | | | | | | |
|
Kentucky — 2.3% | |
| | |
Kentucky Asset Liability Commission, Project Notes, Federal Highway Trust Series 2015A, Rev., 5.00%, 9/1/2020 | | | 10,000 | | | | 10,000 | |
| | |
Kentucky Economic Development Finance Authority, Baptist Healthcare System Obligated Group Series B, Rev., 5.00%, 8/15/2029 | | | 165,000 | | | | 201,001 | |
| | |
Kentucky Public Energy Authority Series 2019C, Rev., 4.00%, 2/1/2028 (b) | | | 300,000 | | | | 352,371 | |
| | |
Kentucky Public Energy Authority, Gas Supply Series 2018C-1, Rev., 4.00%, 6/1/2025 (b) | | | 605,000 | | | | 684,176 | |
| | |
Louisville & Jefferson County Metropolitan Government, Health System, Norton Healthcare, Inc. Series 2016-A, Rev., 4.00%, 10/1/2036 | | | 65,000 | | | | 71,985 | |
| | |
Louisville & Jefferson County Metropolitan Sewer and Drainage District Rev., BAN, 3.00%, 10/23/2020 | | | 10,000 | | | | 10,035 | |
| | |
Louisville & Jefferson County Metropolitan Sewer District, Sewer and Drainage System | | | | | | | | |
| | |
Series B, Rev., 5.00%, 5/15/2024 | | | 25,000 | | | | 29,338 | |
| | |
Series 2017A, Rev., 5.00%, 5/15/2027 | | | 40,000 | | | | 50,769 | |
| | | | | | | | |
| | |
Total Kentucky | | | | | | | 1,409,675 | |
| | | | | | | | |
|
Louisiana — 1.9% | |
| | |
City of Shreveport, Water and Sewer, Junior Lien Series 2019B, Rev., AGM, 5.00%, 12/1/2032 | | | 200,000 | | | | 253,058 | |
| | |
Louisiana Local Government Environmental Facilities and Community Development Authority Rev., 5.00%, 12/1/2030 | | | 250,000 | | | | 332,573 | |
| | |
Louisiana Public Facilities Authority, Tulane University of Louisiana Project | | | | | | | | |
| | |
Series 2020A, Rev., 5.00%, 4/1/2029 | | | 220,000 | | | | 290,851 | |
| | |
Series 2020A, Rev., 5.00%, 4/1/2030 | | | 135,000 | | | | 182,039 | |
| | |
State of Louisiana Series 2016-B, GO, 4.00%, 8/1/2026 | | | 30,000 | | | | 35,642 | |
| | |
State of Louisiana, Gas and Fuels Tax Series 2012A-1, Rev., 5.00%, 5/1/2022 (e) | | | 55,000 | | | | 59,335 | |
| | | | | | | | |
| | |
Total Louisiana | | | | | | | 1,153,498 | |
| | | | | | | | |
| | | | | | | | |
| INVESTMENTS | | PRINCIPAL
AMOUNT ($) | | | VALUE ($) | |
| | | | | | | | |
|
Maine — 1.8% | |
| | |
Maine Health and Higher Educational Facilities Authority | | | | | | | | |
| | |
Series 2020A, Rev., 4.00%, 7/1/2021 | | | 150,000 | | | | 154,281 | |
| | |
Series 2020A, Rev., 4.00%, 7/1/2022 | | | 225,000 | | | | 239,076 | |
| | |
Series 2020A, Rev., 5.00%, 7/1/2023 | | | 125,000 | | | | 140,417 | |
| | |
Maine Health and Higher Educational Facilities Authority, Mainehealth Series 2020A, Rev., 5.00%, 7/1/2027 | | | 300,000 | | | | 377,307 | |
| | |
Maine Municipal Bond Bank | | | | | | | | |
| | |
Series C, Rev., 5.00%, 11/1/2024 | | | 75,000 | | | | 89,240 | |
| | |
Series 2018A, Rev., GAN, 5.00%, 9/1/2026 | | | 45,000 | | | | 56,423 | |
| | | | | | | | |
| | |
Total Maine | | | | | | | 1,056,744 | |
| | | | | | | | |
|
Maryland — 1.0% | |
| | |
County of Baltimore GO, 5.00%, 8/1/2023 | | | 100,000 | | | | 109,182 | |
| | |
County of Spotsylvania, Commissioners of St. Mary’s, Public Improvement GO, 4.00%, 7/15/2027 | | | 70,000 | | | | 85,887 | |
| | |
Maryland Economic Development Corp. Rev., 4.00%, 7/1/2040 | | | 200,000 | | | | 201,076 | |
| | |
State of Maryland Department of Transportation Rev., 5.00%, 9/1/2026 | | | 75,000 | | | | 95,097 | |
| | |
State of Maryland, State and Local Facilities Loan of 2017 Series A, GO, 5.00%, 8/1/2025 | | | 45,000 | | | | 55,343 | |
| | |
Washington Suburban Sanitary District Rev., GTD, 5.00%, 6/15/2030 | | | 40,000 | | | | 51,114 | |
| | | | | | | | |
| | |
Total Maryland | | | | | | | 597,699 | |
| | | | | | | | |
|
Massachusetts — 2.7% | |
| | |
City of Boston Series 2017A, GO, 5.00%, 4/1/2025 | | | 10,000 | | | | 12,157 | |
| | |
Commonwealth of Massachusetts Series C, GO, 5.00%, 10/1/2026 | | | 25,000 | | | | 31,744 | |
| | |
Massachusetts Bay Transportation Authority, Sales Tax Series A, Rev., 5.00%, 7/1/2022 | | | 20,000 | | | | 21,749 | |
| | |
Massachusetts Development Finance Agency, Mass General Brigham Issue Series 2020A-1, Rev., 5.00%, 1/31/2030(b) | | | 500,000 | | | | 653,990 | |
| | |
Massachusetts Development Finance Agency, Milford Regional Medical Center Series G, Rev., 5.00%, 7/15/2037(c) | | | 245,000 | | | | 281,106 | |
| | |
Massachusetts Development Finance Agency, Wellforce Issue | | | | | | | | |
| | |
Series 2020C, Rev., AGM, 5.00%, 10/1/2030 | | | 175,000 | | | | 232,832 | |
| | |
Series 2020C, Rev., AGM, 5.00%, 10/1/2031 | | | 215,000 | | | | 284,140 | |
SEE NOTES TO FINANCIAL STATEMENTS.
| | | | | | | | |
| | | |
| AUGUST 31, 2020 | | J.P. MORGAN EXCHANGE-TRADED FUNDS | | | | | 107 | |
JPMorgan Municipal ETF
SCHEDULE OF PORTFOLIO INVESTMENTS
AS OF AUGUST 31, 2020 (Unaudited) (continued)
| | | | | | | | |
| INVESTMENTS | | PRINCIPAL
AMOUNT ($) | | | VALUE ($) | |
Municipal Bonds — continued | |
|
Massachusetts — continued | |
| | |
Massachusetts State College Building Authority Series D, Rev., 5.00%, 5/1/2027 | | | 45,000 | | | | 57,739 | |
| | |
Springfield Water & Sewer Commission Series C, Rev., 5.00%, 7/15/2023 | | | 10,000 | | | | 11,342 | |
| | |
Town of Hopkinton GO, 5.00%, 11/15/2024 | | | 30,000 | | | | 35,980 | |
| | | | | | | | |
| | |
Total Massachusetts | | | | | | | 1,622,779 | |
| | | | | | | | |
|
Michigan — 1.1% | |
| | |
Berrien Springs Public Schools, School Building and Site GO, Q-SBLF, 5.00%, 5/1/2030 | | | 250,000 | | | | 334,603 | |
| | |
City of Grand Rapids, Sanitary Sewer System Improvement Rev., 5.00%, 1/1/2030 | | | 30,000 | | | | 40,611 | |
| | |
Marquette Board of Light and Power, Electric Utility System Series 2016A, Rev., 5.00%, 7/1/2026 | | | 185,000 | | | | 228,790 | |
| | |
Michigan State Hospital Finance Authority, Trinity Health Credit Group Series C, Rev., 5.00%, 12/1/2025 | | | 25,000 | | | | 30,333 | |
| | | | | | | | |
| | |
Total Michigan | | | | | | | 634,337 | |
| | | | | | | | |
|
Minnesota — 0.6% | |
| | |
Alexandria Lake Area Sanitation District, Sanitary Sewer Board Series 2015A, GO, 5.00%, 2/1/2022 | | | 30,000 | | | | 32,050 | |
| | |
Bloomington Independent School District No. 271 Series 2019A, GO, 5.00%, 2/1/2028 | | | 25,000 | | | | 31,813 | |
| | |
City of Apple Valley, Minnesota Senior Housing, Orchard Path Project Rev., 4.25%, 9/1/2038 | | | 250,000 | | | | 251,567 | |
| | |
City of Hopkins Series 2017B, GO, 4.00%, 2/1/2025 | | | 20,000 | | | | 23,159 | |
| | |
Minnesota State Colleges And Universities Foundation Series 2017A, Rev., 3.00%, 10/1/2020 | | | 10,000 | | | | 10,021 | |
| | |
University of Minnesota Series 2017B, Rev., 5.00%, 12/1/2020 | | | 10,000 | | | | 10,119 | |
| | |
University of Minnesota, Board of Regents Series B, Rev., 5.00%, 12/1/2025 | | | 15,000 | | | | 18,513 | |
| | | | | | | | |
| | |
Total Minnesota | | | | | | | 377,242 | |
| | | | | | | | |
|
Mississippi — 0.4% | |
| | |
Mississippi Development Bank, Special Obligation, Hinds County School District Project Rev., 4.00%, 3/1/2031 | | | 25,000 | | | | 28,661 | |
| | |
Mississippi State University Educational Building Corp., New Facilities and Refinancing Project Rev., 5.00%, 8/1/2025 | | | 35,000 | | | | 42,472 | |
| | | | | | | | |
| INVESTMENTS | | PRINCIPAL
AMOUNT ($) | | | VALUE ($) | |
| | | | | | | | |
|
Mississippi — continued | |
| | |
State of Mississippi | | | | | | | | |
| | |
Series B, GO, 5.00%, 12/1/2025 | | | 20,000 | | | | 24,765 | |
| | |
Series 2015F, GO, 5.00%, 11/1/2028 | | | 35,000 | | | | 42,682 | |
| | |
Series A, GO, 5.00%, 11/1/2031 | | | 60,000 | | | | 74,836 | |
| | |
University of Mississippi Educational Building Corp. Series 2016A, Rev., 5.00%, 10/1/2030 | | | 40,000 | | | | 48,751 | |
| | | | | | | | |
| | |
Total Mississippi | | | | | | | 262,167 | |
| | | | | | | | |
|
Missouri — 1.6% | |
| | |
Bi-State Development Agency, Metropolitan District, St. Clair County Metrolink Project Rev., AGM, 5.25%, 7/1/2024 | | | 40,000 | | | | 47,385 | |
| | |
City of Kansas, Sanitary Sewer System Series B, Rev., 5.00%, 1/1/2033 | | | 25,000 | | | | 31,517 | |
| | |
Health and Educational Facilities Authority of the State of Missouri Rev., 5.00%, 9/1/2026 | | | 200,000 | | | | 235,678 | |
| | |
Health and Educational Facilities Authority of the State of Missouri, City Art Institute Rev., 5.00%, 9/1/2030 | | | 200,000 | | | | 239,636 | |
| | |
Health and Educational Facilities Authority of the State of Missouri, St. Luke’s Episcopal-Presbyterian Hospitals Series 2015B, Rev., 5.00%, 12/1/2026 | | | 165,000 | | | | 194,548 | |
| | |
Metropolitan St. Louis Sewer District, Wastewater System Series 2012A, Rev., 5.00%, 5/1/2022 (e) | | | 125,000 | | | | 134,961 | |
| | |
Metropolitan St. Louis Sewer District, Wastewater System Improvement Series 2017A, Rev., 5.00%, 5/1/2027 | | | 45,000 | | | | 58,180 | |
| | |
Missouri Development Finance Board, Fulton State Hospital Project Series 2016, Rev., 5.00%, 10/1/2025 | | | 25,000 | | | | 29,679 | |
| | | | | | | | |
| | |
Total Missouri | | | | | | | 971,584 | |
| | | | | | | | |
|
Montana — 0.1% | |
| | |
County of Missoula Series 2016, GO, 4.00%, 7/1/2025 | | | 50,000 | | | | 58,656 | |
| | | | | | | | |
|
Nebraska — 1.9% | |
| | |
Central Plains Energy Project, Gas Project No. 3 Series 2017A, Rev., 5.00%, 9/1/2030 | | | 320,000 | | | | 411,770 | |
| | |
City of Lincoln, Electric System | | | | | | | | |
| | |
Rev., 5.00%, 9/1/2026 | | | 85,000 | | | | 107,203 | |
| | |
Rev., 5.00%, 9/1/2028 | | | 50,000 | | | | 63,506 | |
| | |
City of Omaha, Sewer Rev., 5.00%, 4/1/2027 | | | 50,000 | | | | 62,197 | |
| | |
Douglas County School District, Omaha Public School GO, 5.00%, 12/15/2026 | | | 30,000 | | | | 38,302 | |
SEE NOTES TO FINANCIAL STATEMENTS.
| | | | | | |
| | | |
| 108 | | | | J.P. MORGAN EXCHANGE-TRADED FUNDS | | AUGUST 31, 2020 |
| | | | | | | | |
| INVESTMENTS | | PRINCIPAL
AMOUNT ($) | | | VALUE ($) | |
Municipal Bonds — continued | |
|
Nebraska — continued | |
| | |
Nebraska Educational Health Cultural and Social Services Finance Authority | | | | | | | | |
| | |
Series 2019A, Rev., 4.00%, 1/1/2033 | | | 250,000 | | | | 282,580 | |
| | |
Omaha Public Power District, Electric System Series B, Rev., 5.00%, 2/1/2025 | | | 20,000 | | | | 23,640 | |
| | |
Series 2016A, Rev., 5.00%, 2/1/2026 | | | 40,000 | | | | 49,680 | |
| | |
Series A, Rev., 5.00%, 2/1/2027 | | | 30,000 | | | | 37,147 | |
| | |
University of Nebraska Facilities Corp., UNMC Global Center Project Series 2017, Rev., 5.00%, 12/15/2025 | | | 35,000 | | | | 43,369 | |
| | | | | | | | |
| | |
Total Nebraska | | | | | | | 1,119,394 | |
| | | | | | | | |
|
Nevada — 1.0% | |
| | |
City of Sparks, Senior Sales Tax Series 2019A, Rev., 2.50%, 6/15/2024 (c) | | | 90,000 | | | | 89,291 | |
| | |
Clark County Rev., 5.00%, 7/1/2028 | | | 25,000 | | | | 31,087 | |
| | |
Clark County School District, Limited Tax | | | | | | | | |
| | |
Series A, GO, 5.00%, 6/15/2032 | | | 95,000 | | | | 117,680 | |
| | |
Series A, GO, 4.00%, 6/15/2035 | | | 90,000 | | | | 103,724 | |
| | |
County of Clark NV Passenger Facility Charge Series 2019E, Rev., 5.00%, 7/1/2033 | | | 155,000 | | | | 197,056 | |
| | |
Truckee Meadows Water Authority Rev., 5.00%, 7/1/2029 | | | 50,000 | | | | 63,348 | |
| | | | | | | | |
| | |
Total Nevada | | | | | | | 602,186 | |
| | | | | | | | |
|
New Hampshire — 0.0% (f) | |
| | |
State of New Hampshire Rev., 5.00%, 9/1/2020 | | | 10,000 | | | | 10,000 | |
| | | | | | | | |
|
New Jersey — 1.5% | |
| | |
City of New Brunswick Series 2015, GO, 4.00%, 3/15/2024 | | | 10,000 | | | | 11,293 | |
| | |
City of North Wildwood GO, 5.00%, 8/1/2022 | | | 10,000 | | | | 10,898 | |
| | |
City of Wildwood GO, 4.00%, 9/15/2020 | | | 100,000 | | | | 100,123 | |
| | |
County of Gloucester GO, 4.00%, 10/1/2020 | | | 10,000 | | | | 10,031 | |
| | |
Manalapan-Englishtown Regional Board of Education GO, 4.00%, 10/1/2020 | | | 15,000 | | | | 15,046 | |
| | |
New Jersey Economic Development Authority, School Facilities Construction Series II, Rev., 5.00%, 3/1/2022 (e) | | | 115,000 | | | | 123,248 | |
| | |
New Jersey Transportation Trust Fund Authority, Transportation System Series A, Rev., 4.00%, 12/15/2031 | | | 250,000 | | | | 272,755 | |
| | |
Passaic County Improvement Authority, City of Paterson Project Series 2017, Rev., 5.00%, 6/15/2025 | | | 10,000 | | | | 12,154 | |
| | |
Tobacco Settlement Financing Corp. Series 2018A, Rev., 5.00%, 6/1/2027 | | | 265,000 | | | | 332,127 | |
| | | | | | | | |
| | |
Total New Jersey | | | | | | | 887,675 | |
| | | | | | | | |
| | | | | | | | |
| INVESTMENTS | | PRINCIPAL
AMOUNT ($) | | | VALUE ($) | |
|
| |
|
New Mexico — 1.4% | |
| | |
City of Albuquerque, General Purpose Series 2016A, GO, 5.00%, 7/1/2023 | | | 75,000 | | | | 84,999 | |
| | |
City of Albuquerque, Gross Receipts Series 2015A, Rev., 5.00%, 7/1/2026 | | | 240,000 | | | | 291,996 | |
| | |
New Mexico Finance Authority, Senior Lien Public Project Revolving Fund | | | | | | | | |
| | |
Series 2016C, Rev., 5.00%, 6/1/2022 | | | 30,000 | | | | 32,527 | |
| | |
Series 2016E, Rev., 5.00%, 6/1/2024 | | | 25,000 | | | | 29,378 | |
| | |
New Mexico Finance Authority, State Transportation, Subordinate Lien Series 2108A, Rev., 5.00%, 6/15/2027 | | | 100,000 | | | | 127,968 | |
| | |
New Mexico Hospital Equipment Loan Council, Presbyterian Healthcare Services Series 2015A, Rev., 5.00%, 8/1/2025 | | | 25,000 | | | | 29,841 | |
| | |
State of New Mexico, Severance Tax Permanent Fund Series 2016B, Rev., 4.00%, 7/1/2021 | | | 80,000 | | | | 82,515 | |
| | |
University of New Mexico (The) Rev., 5.00%, 6/1/2028 | | | 140,000 | | | | 177,086 | |
| | | | | | | | |
| | |
Total New Mexico | | | | | | | 856,310 | |
| | | | | | | | |
|
New York — 11.7% | |
| | |
Buffalo Fiscal Stability Authority Series 2015A, Rev., 5.00%, 9/1/2020 | | | 10,000 | | | | 10,000 | |
| | |
City of New York Series 2014E, GO, 5.00%, 8/1/2027 | | | 35,000 | | | | 39,614 | |
| | |
City of New York, Fiscal Year 2013 | | | | | | | | |
| | |
Series 2013J, GO, 5.00%, 8/1/2023 | | | 40,000 | | | | 45,223 | |
| | |
Series I, GO, 5.00%, 8/1/2023 | | | 25,000 | | | | 28,265 | |
| | |
City of New York, Fiscal Year 2017 Series C, GO, 4.00%, 8/1/2022 | | | 10,000 | | | | 10,714 | |
| | |
County of Onondaga GO, 5.00%, 3/15/2026 | | | 20,000 | | | | 23,443 | |
| | |
Erie County Water Authority Rev., 5.00%, 12/1/2027 | | | 30,000 | | | | 38,153 | |
| | |
Farmingdale Union Free School District GO, 5.00%, 9/15/2020 | | | 10,000 | | | | 10,018 | |
| | |
Longwood Central School District Suffolk County GO, 5.00%, 6/15/2025 | | | 175,000 | | | | 214,742 | |
| | |
Metropolitan Transportation Authority Series 2018C, Subseries C-1, Rev., BAN, 5.00%, 9/1/2020 | | | 360,000 | | | | 360,000 | |
| | |
Series 2014B, Rev., 5.00%, 11/15/2020 | | | 200,000 | | | | 201,176 | |
| | |
Series 2018C, Subseries 2018C-2, Rev., BAN, 5.00%, 9/1/2021 | | | 350,000 | | | | 358,389 | |
| | |
Series 2016A, Rev., 5.00%, 11/15/2023 | | | 315,000 | | | | 353,216 | |
| | |
Monroe County IDA, School Facility, Rochester School Modernization Project Rev., 5.00%, 5/1/2030 | | | 80,000 | | | | 95,162 | |
SEE NOTES TO FINANCIAL STATEMENTS.
| | | | | | | | |
| | | |
| AUGUST 31, 2020 | | J.P. MORGAN EXCHANGE-TRADED FUNDS | | | | | 109 | |
JPMorgan Municipal ETF
SCHEDULE OF PORTFOLIO INVESTMENTS
AS OF AUGUST 31, 2020 (Unaudited) (continued)
| | | | | | | | |
| INVESTMENTS | | PRINCIPAL
AMOUNT ($) | | | VALUE ($) | |
Municipal Bonds — continued | |
|
New York — continued | |
| | |
New York City Transitional Finance Authority Future Tax Secured | | | | | | | | |
| | |
Series 2013G, Rev., 5.00%, 11/1/2026 | | | 30,000 | | | | 33,599 | |
| | |
Subseries B-1, Rev., 5.00%, 11/1/2029 | | | 125,000 | | | | 151,824 | |
| | |
Series 2017E1, Rev., 5.00%, 2/1/2030 | | | 150,000 | | | | 186,613 | |
| | |
New York City Transitional Finance Authority Future Tax Secured, Fiscal Year 2015 Series 2015A-1, Rev., 5.00%, 8/1/2029 | | | 50,000 | | | | 58,304 | |
| | |
New York City Transitional Finance Authority Future Tax Secured, Tax-Exempt, Fiscal Year 2013 Series 2013H, Rev., 5.00%, 11/1/2023 | | | 50,000 | | | | 56,283 | |
| | |
New York City Transitional Finance Authority Future Tax Secured, Tax-Exempt, Fiscal Year 2014 Series D, Subseries D-1, Rev., 5.00%, 2/1/2026 | | | 30,000 | | | | 34,523 | |
| | |
New York City Transitional Finance Authority Future Tax Secured, Tax-Exempt, Fiscal Year 2017 | | | | | | | | |
| | |
Series C, Rev., 4.00%, 11/1/2024 | | | 45,000 | | | | 51,607 | |
| | |
Subseries A-1, Rev., 5.00%, 5/1/2029 | | | 65,000 | | | | 80,166 | |
| | |
Series B, Subseries B-1, Rev., 5.00%, 8/1/2030 | | | 195,000 | | | | 241,281 | |
| | |
New York City Transitional Finance Authority, Building Aid, Fiscal Year 2019 Series S-2A, Rev., 5.00%, 7/15/2025 | | | 50,000 | | | | 60,891 | |
| | |
New York City Transitional Finance Authority, Future Tax Secured, Fiscal Year 2015 Series C, Rev., 5.00%, 11/1/2022 | | | 25,000 | | | | 27,523 | |
| | |
New York City Transitional Finance Authority, Future Tax Secured, Fiscal Year 2018 Series 1, Rev., 5.00%, 11/1/2026 | | | 25,000 | | | | 31,442 | |
| | |
New York State Dormitory Authority | | | | | | | | |
| | |
Series 2015E, Rev., 5.00%, 3/15/2022 | | | 25,000 | | | | 26,836 | |
| | |
Series 2015A, Rev., 4.00%, 3/15/2023 | | | 25,000 | | | | 27,343 | |
| | |
Series 2018A, Rev., 5.00%, 7/1/2024 | | | 300,000 | | | | 348,804 | |
| | |
Series 2018A, Rev., 5.00%, 3/15/2031 | | | 25,000 | | | | 32,128 | |
| | |
Series 2019D, Rev., 5.00%, 7/1/2033 | | | 135,000 | | | | 196,021 | |
| | |
Series 2020A, Rev., AGM, 3.00%, 9/1/2050 | | | 150,000 | | | | 154,890 | |
| | |
Series 2020A, Rev., 4.00%, 9/1/2050 | | | 100,000 | | | | 107,951 | |
| | |
New York State Dormitory Authority, Columbia University Series B, Rev., 5.00%, 10/1/2038 | | | 25,000 | | | | 31,673 | |
| | |
New York State Dormitory Authority, Maimonides Medical Center, FHA-Insured Mortgage Hospital Rev., FHA, 5.00%, 8/1/2024 | | | 275,000 | | | | 322,182 | |
| | | | | | | | |
| INVESTMENTS | | PRINCIPAL
AMOUNT ($) | | | VALUE ($) | |
| | | | | | | | |
|
New York — continued | |
| | |
New York State Environmental Facilities Corp. Series 2019B, Rev., 5.00%, 6/15/2031 | | | 100,000 | | | | 134,877 | |
| | |
New York State Urban Development Corp. | | | | | | | | |
| | |
Series 2016A, Rev., 5.00%, 3/15/2026 | | | 45,000 | | | | 55,742 | |
| | |
Series 2016A, Rev., 5.00%, 3/15/2027 | | | 30,000 | | | | 36,712 | |
| | |
Series 2013A-1, Rev., 5.00%, 3/15/2028 | | | 25,000 | | | | 27,825 | |
| | |
Series 2016A, Rev., 5.00%, 3/15/2028 | | | 75,000 | | | | 91,688 | |
| | |
New York State Urban Development Corp., State Personal Income Tax, General Purpose | | | | | | | | |
| | |
Series 2017A, Rev., 5.00%, 3/15/2026 | | | 125,000 | | | | 154,837 | |
| | |
Series 2020C, Rev., 5.00%, 3/15/2026 | | | 45,000 | | | | 55,742 | |
| | |
Series 2017-A, Rev., 5.00%, 3/15/2028 | | | 150,000 | | | | 188,658 | |
| | |
New York State Urban Development Corp., State Personal Income Tax, General Purpose, Tax-Exempt Series 2020C, Rev., 5.00%, 3/15/2029 | | | 1,275,000 | | | | 1,684,428 | |
| | |
New York Transportation Development Corp., Delta Air Lines, Inc., LaGuardia Airport Terminals C&D Redevelopment Project Rev., AMT, 5.00%, 1/1/2022 | | | 200,000 | | | | 206,258 | |
| | |
Orange County Funding Corp., Mount Saint Mary College Project Series 2012B, Rev., 4.00%, 7/1/2023 | | | 200,000 | | | | 203,082 | |
| | |
Port Authority of New York and New Jersey, Consolidated Series 205, Rev., 5.00%, 11/15/2028 | | | 30,000 | | | | 38,075 | |
| | |
Smithtown Central School District GO, 5.00%, 8/1/2022 | | | 70,000 | | | | 76,500 | |
| | | | | | | | |
| | |
Total New York | | | | | | | 7,004,423 | |
| | | | | | | | |
|
North Carolina — 0.3% | |
| | |
County of Davidson GO, 5.00%, 6/1/2027 | | | 35,000 | | | | 44,876 | |
| | |
County of Onslow Rev., 5.00%, 12/1/2027 | | | 25,000 | | | | 30,162 | |
| | |
County of Wayne Rev., 5.00%, 6/1/2024 | | | 25,000 | | | | 29,297 | |
| | |
North Carolina Turnpike Authority Rev., 5.00%, 1/1/2021 | | | 20,000 | | | | 20,297 | |
| | |
State of North Carolina, Limited Obligation Series C, Rev., 5.00%, 5/1/2024 | | | 25,000 | | | | 29,284 | |
| | | | | | | | |
| | |
Total North Carolina | | | | | | | 153,916 | |
| | | | | | | | |
|
North Dakota — 0.0% (f) | |
| | |
North Dakota Public Finance Authority, State Revolving Fund Program Series 2011A, Rev., 5.00%, 10/1/2021 | | | 25,000 | | | | 26,295 | |
| | | | | | | | |
|
Ohio — 5.1% | |
| | |
American Municipal Power, Inc., Greenup Hydro-Electric Project Series 2016A, Rev., 5.00%, 2/15/2030 | | | 25,000 | | | | 30,274 | |
SEE NOTES TO FINANCIAL STATEMENTS.
| | | | | | |
| | | |
| 110 | | | | J.P. MORGAN EXCHANGE-TRADED FUNDS | | AUGUST 31, 2020 |
| | | | | | | | |
| INVESTMENTS | | PRINCIPAL
AMOUNT ($) | | | VALUE ($) | |
Municipal Bonds — continued | |
|
Ohio — continued | |
| | |
Bowling Green State University Series 2016A, Rev., 5.00%, 6/1/2024 | | | 25,000 | | | | 28,841 | |
| | |
Buckeye Tobacco Settlement Financing Authority Series 2020A-2, Class I, Rev., 4.00%, 6/1/2048 | | | 500,000 | | | | 552,205 | |
| | |
City of Middleburg Heights, General Health Center Project | | | | | | | | |
| | |
Series 2020A, Rev., 4.00%, 8/1/2021 | | | 125,000 | | | | 128,820 | |
| | |
Series 2020A, Rev., 4.00%, 8/1/2022 | | | 150,000 | | | | 159,511 | |
| | |
City of Reynoldsburg GO, 5.00%, 12/1/2026 | | | 15,000 | | | | 19,024 | |
| | |
County of Warren, Otterbein Homes Series A, Rev., 4.00%, 7/1/2033 | | | 205,000 | | | | 230,088 | |
| | |
Ohio Higher Educational Facility Commission | | | | | | | | |
| | |
Rev., 5.00%, 3/1/2027 | | | 55,000 | | | | 60,644 | |
| | |
Rev., 5.00%, 11/1/2034 | | | 125,000 | | | | 138,465 | |
| | |
Ohio Higher Educational Facility Commission, Denison University Series A, Rev., 5.00%, 11/1/2025 | | | 75,000 | | | | 91,477 | |
| | |
Ohio Higher Educational Facility Commission, University of Findlay 2019 Project Rev., 5.00%, 3/1/2034 | | | 160,000 | | | | 173,893 | |
| | |
Ohio Higher Educational Facility Commission, Xavier University 2020 Project | | | | | | | | |
| | |
Rev., 5.00%, 5/1/2023 | | | 195,000 | | | | 217,181 | |
| | |
Rev., 5.00%, 5/1/2024 | | | 245,000 | | | | 282,711 | |
| | |
Ohio Turnpike and Infrastructure Commission Series A, Rev., 5.00%, 2/15/2027 | | | 135,000 | | | | 169,293 | |
| | |
Ohio Water Development Authority Rev., 5.25%, 12/1/2021 | | | 20,000 | | | | 21,023 | |
| | |
Ohio Water Development Authority, Fresh Water Series 2016B, Rev., 5.00%, 6/1/2026 | | | 30,000 | | | | 37,675 | |
| | |
Ohio Water Development Authority, Water Pollution Control Loan Fund Series A, Rev., 5.00%, 12/1/2026 | | | 45,000 | | | | 57,325 | |
| | |
South-Western City School District, School Facilities Construction and Improvement Bonds GO, 5.00%, 6/1/2022 (e) | | | 160,000 | | | | 173,242 | |
| | |
State of Ohio, Capital Facilities Lease-Appropriation Series 2018A, Rev., 5.00%, 6/1/2025 | | | 25,000 | | | | 30,345 | |
| | |
State of Ohio, Cleveland Clinic Health System Obligated Group Series 2017A, Rev., 5.00%, 1/1/2028 | | | 25,000 | | | | 32,264 | |
| | |
State of Ohio, Highway Capital Improvements Bonds, Full Faith and Credit/Highway User Receipts Series R, GO, 5.00%, 5/1/2021 | | | 20,000 | | | | 20,646 | |
| | |
State of Ohio, Infrastructure Improvement Bonds Series A, GO, 5.00%, 9/1/2028 | | | 25,000 | | | | 33,313 | |
| | | | | | | | |
| INVESTMENTS | | PRINCIPAL
AMOUNT ($) | | | VALUE ($) | |
| | | | | | | | |
|
Ohio — continued | |
| | |
State of Ohio, Natural Resources Series V, GO, 5.00%, 10/1/2027 | | | 35,000 | | | | 45,689 | |
| | |
University of Akron (The), General Receipts Series 2019A, Rev., 5.00%, 1/1/2030 | | | 250,000 | | | | 328,545 | |
| | | | | | | | |
| | |
Total Ohio | | | | | | | 3,062,494 | |
| | | | | | | | |
|
Oklahoma — 0.7% | |
| | |
Cleveland County Educational Facilities Authority, Norman Public Schools Project Series 2019, Rev., 5.00%, 6/1/2025 | | | 150,000 | | | | 178,567 | |
| | |
Edmond Public Works Authority Rev., 4.00%, 7/1/2021 | | | 10,000 | | | | 10,317 | |
| | |
Oklahoma Capitol Improvement Authority | | | | | | | | |
| | |
Series C, Rev., 5.00%, 1/1/2030 | | | 10,000 | | | | 12,450 | |
| | |
Series 2018C, Rev., 5.00%, 1/1/2036 | | | 45,000 | | | | 54,648 | |
| | |
Oklahoma Capitol Improvement Authority, State Highway Rev., 5.00%, 7/1/2024 | | | 100,000 | | | | 117,346 | |
| | |
Oklahoma Water Resources Board, Clean Water Program Rev., 5.00%, 4/1/2023 | | | 35,000 | | | | 39,292 | |
| | | | | | | | |
| | |
Total Oklahoma | | | | | | | 412,620 | |
| | | | | | | | |
|
Oregon — 0.1% | |
| | |
Hillsboro School District No. 1J GO, 5.00%, 6/15/2028 | | | 25,000 | | | | 32,144 | |
| | |
Tri-County Metropolitan Transportation District of Oregon Series A, Rev., 5.00%, 9/1/2030 | | | 45,000 | | | | 57,817 | |
| | | | | | | | |
| | |
Total Oregon | | | | | | | 89,961 | |
| | | | | | | | |
|
Pennsylvania — 7.1% | |
| | |
Aliquippa School District GO, 3.88%, 12/1/2037 | | | 200,000 | | | | 225,284 | |
| | |
Berks County Industrial Development Authority, Healthcare Facilities Series 2017A, Rev., 5.00%, 5/15/2037 | | | 250,000 | | | | 267,898 | |
| | |
Bucks County Community College Authority Series 2019A, Rev., GTD, 5.00%, 6/15/2033 | | | 35,000 | | | | 44,925 | |
| | |
Central Dauphin School District Series 2016A, GO, 4.00%, 11/15/2020 | | | 10,000 | | | | 10,078 | |
| | |
Chester County Industrial Development Authority, Longwood Gardens Project Rev., 4.00%, 12/1/2024 | | | 35,000 | | | | 40,438 | |
| | |
Commonwealth Financing Authority, Tobacco Master Settlement Payment Rev., 5.00%, 6/1/2035 | | | 225,000 | | | | 278,082 | |
| | |
County of Chester GO, 5.00%, 11/15/2027 | | | 30,000 | | | | 39,334 | |
| | |
County of Lehigh, Health Network Hospital Series A, Rev., 4.00%, 7/1/2035 | | | 175,000 | | | | 194,808 | |
SEE NOTES TO FINANCIAL STATEMENTS.
| | | | | | | | |
| | | |
| AUGUST 31, 2020 | | J.P. MORGAN EXCHANGE-TRADED FUNDS | | | | | 111 | |
JPMorgan Municipal ETF
SCHEDULE OF PORTFOLIO INVESTMENTS
AS OF AUGUST 31, 2020 (Unaudited) (continued)
| | | | | | | | |
| INVESTMENTS | | PRINCIPAL
AMOUNT ($) | | | VALUE ($) | |
Municipal Bonds — continued | |
|
Pennsylvania — continued | |
| | |
Erie City Water Authority Series 2019D, Rev., 5.00%, 12/1/2027 | | | 65,000 | | | | 83,830 | |
| | |
Geisinger Authority, Health System Series 2020B, Rev., 5.00%, 2/15/2027 (b) | | | 250,000 | | | | 306,700 | |
| | |
Series 2020A, Rev., 4.00%, 4/1/2039 | | | 335,000 | | | | 389,933 | |
| | |
Lancaster County Hospital Authority Rev., 5.00%, 3/1/2040 | | | 250,000 | | | | 257,855 | |
| | |
Montgomery County Higher Education and Health Authority, Arcadia University | | | | | | | | |
| | |
Rev., 5.00%, 4/1/2034 | | | 250,000 | | | | 279,645 | |
| | |
Rev., 4.00%, 4/1/2035 | | | 205,000 | | | | 209,865 | |
| | |
Montgomery County Higher Education and Health Authority, Thomas Jefferson University Series 2018A, Rev., 4.00%, 9/1/2038 | | | 135,000 | | | | 149,195 | |
| | |
Northampton County General Purpose Authority, Moravian College Project Series 2016, Rev., 5.00%, 10/1/2027 | | | 185,000 | | | | 203,263 | |
| | |
Pennsylvania Higher Educational Facilities Authority, State System of Higher Education Series 2017AU-1, Rev., 5.00%, 6/15/2026 | | | 70,000 | | | | 86,070 | |
| | |
Pennsylvania Turnpike Commission | | | | | | | | |
| | |
Series A-1, Rev., 5.00%, 12/1/2029 | | | 105,000 | | | | 132,702 | |
| | |
Series A-1, Rev., 5.00%, 12/1/2031 | | | 60,000 | | | | 75,027 | |
| | |
Seneca Valley School District Series 2015C, GO, 5.00%, 3/1/2028 | | | 30,000 | | | | 35,976 | |
| | |
State Public School Building Authority Rev., 5.00%, 10/1/2027 | | | 25,000 | | | | 30,720 | |
| | |
Township of Palmer | | | | | | | | |
| | |
Series 2020C, GO, 4.00%, 11/15/2031 | | | 300,000 | | | | 352,332 | |
| | |
Series 2020C, GO, 4.00%, 11/15/2032 | | | 275,000 | | | | 320,991 | |
| | |
Township of Upper St. Clair Series A, GO, 4.00%, 6/1/2025 | | | 20,000 | | | | 23,297 | |
| | |
West Mifflin School District GO, 3.00%, 4/1/2034 | | | 200,000 | | | | 221,198 | |
| | | | | | | | |
| | |
Total Pennsylvania | | | | | | | 4,259,446 | |
| | | | | | | | |
|
Rhode Island — 0.2% | |
| | |
State of Rhode Island Series 2014A, GO, 3.00%, 11/1/2020 | | | 10,000 | | | | 10,047 | |
| | |
State of Rhode Island and Providence Plantations, Consolidated Capital Development Loan of 2018 Series 2018A, GO, 5.00%, 4/1/2029 | | | 75,000 | | | | 96,640 | |
| | | | | | | | |
| | |
Total Rhode Island | | | | | | | 106,687 | |
| | | | | | | | |
| | | | | | | | |
| INVESTMENTS | | PRINCIPAL
AMOUNT ($) | | | VALUE ($) | |
| | | | | | | | |
|
South Carolina — 0.8% | |
| | |
Charleston County Airport District Rev., 5.00%, 7/1/2035 | | | 250,000 | | | | 312,325 | |
| | |
South Carolina Jobs-Economic Development Authority Rev., 5.00%, 4/1/2029 | | | 10,000 | | | | 12,220 | |
| | |
South Carolina Jobs-Economic Development Authority, South Carolina Episcopal Home at Still Homes Series 2018A, Rev., 5.00%, 4/1/2033 | | | 125,000 | | | | 134,346 | |
| | | | | | | | |
| | |
Total South Carolina | | | | | | | 458,891 | |
| | | | | | | | |
|
South Dakota — 0.2% | |
| | |
City of Rapid City, Sales Tax Rev., 5.00%, 12/1/2023 | | | 25,000 | | | | 28,784 | |
| | |
South Dakota Board of Regents, Housing and Auxiliary Facility System Rev., 5.00%, 4/1/2027 | | | 35,000 | | | | 43,019 | |
| | |
South Dakota Conservancy District, State Revolving Fund Program Series 2018, Rev., 5.00%, 8/1/2025 | | | 35,000 | | | | 43,006 | |
| | | | | | | | |
| | |
Total South Dakota | | | | | | | 114,809 | |
| | | | | | | | |
|
Tennessee — 1.2% | |
| | |
City of Chattanooga Series A, Rev., 5.00%, 9/1/2020 | | | 10,000 | | | | 10,000 | |
| | |
City of Johnson City Series 2016A, GO, 5.00%, 6/1/2023 | | | 15,000 | | | | 16,938 | |
| | |
City of Murfreesboro GO, 4.00%, 4/1/2025 | | | 25,000 | | | | 28,234 | |
| | |
County of Maury GO, 5.00%, 4/1/2027 | | | 40,000 | | | | 51,236 | |
| | |
County of Robertson GO, 5.00%, 6/1/2025 | | | 25,000 | | | | 30,280 | |
| | |
County of Sullivan GO, 5.00%, 5/1/2026 | | | 30,000 | | | | 37,452 | |
| | |
County of Washington Series 2016A, GO, 4.00%, 6/1/2027 | | | 50,000 | | | | 59,435 | |
| | |
County of Williamson GO, 5.00%, 4/1/2024 | | | 20,000 | | | | 23,399 | |
| | |
County of Wilson GO, 4.00%, 4/1/2021 | | | 20,000 | | | | 20,447 | |
| | |
Metropolitan Government of Nashville & Davidson County
GO, 5.00%, 7/1/2022 (e) | | | 20,000 | | | | 21,734 | |
| | |
Series 2015A, GO, 5.00%, 7/1/2025 | | | 10,000 | | | | 12,231 | |
| | |
Metropolitan Government of Nashville and Davidson County, Electric System Series 2014A, Rev., 5.00%, 5/15/2024 | | | 10,000 | | | | 11,739 | |
| | |
Montgomery County, Public Improvement GO, 5.00%, 4/1/2027 | | | 25,000 | | | | 31,819 | |
| | |
Shelby County Health Educational & Housing Facilities Board | | | | | | | | |
| | |
Series 2019A, Rev., 5.00%, 10/1/2029 | | | 150,000 | | | | 150,159 | |
| | |
Series 2019A, Rev., 5.50%, 10/1/2034 | | | 150,000 | | | | 149,556 | |
| | |
State of Tennessee Series A, GO, 5.00%, 9/1/2025 | | | 25,000 | | | | 29,726 | |
SEE NOTES TO FINANCIAL STATEMENTS.
| | | | | | |
| | | |
| 112 | | | | J.P. MORGAN EXCHANGE-TRADED FUNDS | | AUGUST 31, 2020 |
| | | | | | | | |
| INVESTMENTS | | PRINCIPAL
AMOUNT ($) | | | VALUE ($) | |
Municipal Bonds — continued | |
|
Tennessee — continued | |
| | |
Tennessee Energy Acquisition Corp., Gas Project Series 2017A, Rev., 4.00%, 5/1/2023 (b) | | | 20,000 | | | | 21,604 | |
| | | | | | | | |
| | |
Total Tennessee | | | | | | | 705,989 | |
| | | | | | | | |
|
Texas — 8.5% | |
| | |
Alamo Community College District, Limited Tax GO, 5.00%, 2/15/2024 | | | 75,000 | | | | 87,076 | |
| | |
Arlington Higher Education Finance Corp., Uplift Education Project | | | | | | | | |
| | |
Series 2020A, Rev., PSF-GTD, 4.00%, 12/1/2023 | | | 200,000 | | | | 223,126 | |
| | |
Series 2020A, Rev., PSF-GTD, 4.00%, 12/1/2024 | | | 325,000 | | | | 373,272 | |
| | |
Brushy Creek Regional Utility Authority, Inc., Water Treatment And Distribution Project Rev., 5.00%, 8/1/2026 | | | 85,000 | | | | 106,062 | |
| | |
City of Austin, Airport System Series 2019B, Rev., AMT, 5.00%, 11/15/2029 | | | 240,000 | | | | 310,142 | |
| | |
City of Austin, Public Improvement Series 2012A, GO, 4.00%, 9/1/2026 | | | 25,000 | | | | 26,813 | |
| | |
City of Corpus Christi Series 2016A, GO, 4.00%, 3/1/2026 | | | 200,000 | | | | 236,852 | |
| | |
City of Houston, Combined Utility System, First Lien Series 2018D, Rev., 5.00%, 11/15/2030 | | | 45,000 | | | | 59,549 | |
| | |
City of Hutto GO, 5.00%, 8/1/2026 | | | 80,000 | | | | 99,982 | |
| | |
City of League City GO, 5.00%, 2/15/2027 | | | 20,000 | | | | 24,661 | |
| | |
City of Pflugerville GO, 5.00%, 8/1/2026 | | | 25,000 | | | | 31,327 | |
| | |
City of San Angelo GO, 5.00%, 2/15/2027 | | | 20,000 | | | | 24,896 | |
| | |
City of San Antonio, General Improvement GO, 5.00%, 2/1/2022 (e) | | | 75,000 | | | | 80,081 | |
| | |
City of San Marcos GO, 5.00%, 8/15/2031 | | | 170,000 | | | | 214,501 | |
| | |
Clifton Higher Education Finance Corp., Yes Prep Public Schools, Inc. | | | | | | | | |
| | |
Rev., PSF-GTD, 5.00%, 4/1/2029 | | | 100,000 | | | | 132,013 | |
| | |
Rev., PSF-GTD, 5.00%, 4/1/2030 | | | 185,000 | | | | 249,262 | |
| | |
Rev., PSF-GTD, 4.00%, 4/1/2031 | | | 175,000 | | | | 216,688 | |
| | |
Clint Independent School District, Unlimited Tax Series A, GO, PSF-GTD, 5.00%, 2/15/2024 | | | 25,000 | | | | 28,988 | |
| | |
County of Fort Bend Series 2016B, GO, 5.00%, 3/1/2022 | | | 35,000 | | | | 37,483 | |
| | |
County of Hays, Limited Tax GO, 5.00%, 2/15/2026 | | | 20,000 | | | | 24,734 | |
| | |
County of Montgomery, Unlimited Tax GO, 5.00%, 3/1/2025 | | | 25,000 | | | | 30,141 | |
| | |
County of Williamson, Limited Tax GO, 5.00%, 2/15/2026 | | | 40,000 | | | | 49,857 | |
| | | | | | | | |
| INVESTMENTS | | PRINCIPAL
AMOUNT ($) | | | VALUE ($) | |
| | | | | | | | |
|
Texas — continued | |
| | |
Cypress-Fairbanks Independent School District, School Building Series 2015A, GO, PSF-GTD, 5.00%, 2/15/2025 | | | 20,000 | | | | 24,095 | |
| | |
Danbury Higher Education Authority, Inc. Series 2019A, Rev., 5.00%, 8/15/2039 | | | 250,000 | | | | 260,497 | |
| | |
Harris County, Unlimited Tax Series 2017A, GO, 5.00%, 10/1/2026 | | | 25,000 | | | | 31,675 | |
| | |
Laredo Independent School District, Unlimited Tax GO, PSF-GTD, 5.00%, 8/1/2024 | | | 25,000 | | | | 29,534 | |
| | |
Lower Colorado River Authority, Transmission Contract, LCRA Transmission Services Corp. Project Rev., 5.00%, 5/15/2035 | | | 155,000 | | | | 195,094 | |
| | |
Metropolitan Transit Authority of Harris County | | | | | | | | |
| | |
Series 2017A, Rev., 5.00%, 11/1/2025 | | | 45,000 | | | | 55,194 | |
| | |
Series B, Rev., 5.00%, 11/1/2029 | | | 25,000 | | | | 32,032 | |
| | |
Metropolitan Transit Authority of Harris County Sales & Use Tax Series 2017B, Rev., 5.00%, 11/1/2020 | | | 10,000 | | | | 10,078 | |
| | |
North East Independent School District GO, PSF-GTD, 5.00%, 8/1/2025 | | | 20,000 | | | | 24,443 | |
| | |
North Texas Municipal Water District, Water System Rev., 5.00%, 6/1/2027 | | | 20,000 | | | | 25,811 | |
| | |
Northside Independent School District GO, PSF-GTD, 5.00%, 8/15/2024 | | | 65,000 | | | | 77,156 | |
| | |
Old Spanish Trail-Alemda Corridors Redevelopment Authority Rev., 5.00%, 9/1/2028 | | | 125,000 | | | | 160,516 | |
| | |
Pearland Independent School District Series A, GO, PSF-GTD, 5.00%, 2/15/2023 | | | 25,000 | | | | 27,911 | |
| | |
Permanent University Fund — Texas A&M University System Series A, Rev., 5.00%, 7/1/2024 | | | 85,000 | | | | 100,064 | |
| | |
Prosper Independent School District, Unlimited Tax School Building GO, PSF-GTD, 5.00%, 2/15/2037 | | | 25,000 | | | | 31,602 | |
| | |
Regents of the University of Texas | | | | | | | | |
| | |
Series A, Rev., 5.00%, 2/15/2024 | | | 35,000 | | | | 40,584 | |
| | |
San Antonio Water System Series A, Rev., 5.00%, 5/15/2025 | | | 25,000 | | | | 30,470 | |
| | |
Sherman Independent School District Series A, GO, PSF-GTD, 5.00%, 2/15/2030 | | | 25,000 | | | | 32,356 | |
| | |
Socorro Independent School District, Unlimited Tax Series 2017A, GO, PSF-GTD, 5.00%, 8/15/2028 | | | 50,000 | | | | 64,134 | |
| | |
State of Texas, Transportation Commission Mobility Series 2015-A, GO, 5.00%, 10/1/2024 | | | 50,000 | | | | 59,589 | |
| | |
Stephen F Austin State University Series 2019A, Rev., 5.00%, 10/15/2026 | | | 60,000 | | | | 72,880 | |
SEE NOTES TO FINANCIAL STATEMENTS.
| | | | | | | | |
| | | |
| AUGUST 31, 2020 | | J.P. MORGAN EXCHANGE-TRADED FUNDS | | | | | 113 | |
JPMorgan Municipal ETF
SCHEDULE OF PORTFOLIO INVESTMENTS
AS OF AUGUST 31, 2020 (Unaudited) (continued)
| | | | | | | | |
| INVESTMENTS | | PRINCIPAL
AMOUNT ($) | | | VALUE ($) | |
Municipal Bonds — continued | |
|
Texas — continued | |
| | |
Tarrant Regional Water District Rev., 5.00%, 3/1/2025 | | | 125,000 | | | | 150,270 | |
| | |
Texas A&M University, Financing System Series E, Rev., 5.00%, 5/15/2030 | | | 155,000 | | | | 197,521 | |
| | |
Texas Water Development Board | | | | | | | | |
| | |
Series 2017A, Rev., 5.00%, 4/15/2028 | | | 40,000 | | | | 52,164 | |
| | |
Series 2018A, Rev., 5.00%, 10/15/2028 | | | 235,000 | | | | 310,155 | |
| | |
Trinity River Authority Central Regional Wastewater System Rev., 5.00%, 8/1/2034 | | | 145,000 | | | | 182,707 | |
| | |
Trinity River Authority LLC, Tarrant County Water Project Rev., 5.00%, 2/1/2026 | | | 60,000 | | | | 73,978 | |
| | |
University of Texas (The), Board of Regents, Financing System Series 2016D, Rev., 5.00%, 8/15/2024 | | | 50,000 | | | | 59,416 | |
| | | | | | | | |
| | |
Total Texas | | | | | | | 5,079,432 | |
| | | | | | | | |
|
Utah — 1.5% | |
| | |
City of Park City Rev., 5.00%, 6/15/2022 | | | 30,000 | | | | 32,572 | |
| | |
City of South Jordan Rev., 5.00%, 8/15/2029 | | | 45,000 | | | | 61,141 | |
| | |
County of Summit, Sales Tax Rev., 5.00%, 12/15/2023 | | | 70,000 | | | | 79,241 | |
| | |
Jordan Valley Water Conservancy District Series 2019A, Rev., 5.00%, 10/1/2029 | | | 25,000 | | | | 31,386 | |
| | |
Snyderville Basin Special Recreation District Series 2017, GO, 4.00%, 12/15/2025 | | | 100,000 | | | | 118,747 | |
| | |
Utah Charter School Finance Authority Series A, Rev., 5.00%, 4/15/2030 | | | 110,000 | | | | 139,771 | |
| | |
Utah State Board of Regents, University of Utah (The) Series B, Rev., 5.00%, 8/1/2023 (e) | | | 25,000 | | | | 28,422 | |
| | |
Utah Transit Authority Series A, Rev., BHAC-CR, 5.00%, 6/15/2035 | | | 295,000 | | | | 412,900 | |
| | |
Washington County Water Conservancy District Series 2017A, Rev., 5.00%, 10/1/2021 | | | 10,000 | | | | 10,523 | |
| | | | | | | | |
| | |
Total Utah | | | | | | | 914,703 | |
| | | | | | | | |
|
Vermont — 0.0% (f) | |
| | |
Vermont Municipal Bond Bank Series 2019-2, Rev., 5.00%, 12/1/2025 | | | 25,000 | | | | 31,001 | |
| | | | | | | | |
|
Virginia — 1.7% | |
| | |
City of Richmond Series B, GO, 5.00%, 7/15/2027 | | | 175,000 | | | | 227,836 | |
| | |
Commonwealth of Virginia Series A, GO, 5.00%, 6/1/2030 | | | 25,000 | | | | 33,151 | |
| | |
County of Spotsylvania, Public Improvement GO, 5.00%, 7/15/2029 | | | 85,000 | | | | 112,884 | |
| | | | | | | | |
| INVESTMENTS | | PRINCIPAL
AMOUNT ($) | | | VALUE ($) | |
| | | | | | | | |
|
Virginia — continued | |
| | |
Hampton Roads Sanitation District, Wastewater Series 2014A, Rev., 5.00%, 7/1/2021 | | | 15,000 | | | | 15,604 | |
| | |
Roanoke Economic Development Authority, Carilion Clinic Obligated Group Series 2010D, Rev., 5.00%, 7/1/2030 (b) | | | 200,000 | | | | 263,450 | |
| | |
Virginia College Building Authority, 21st Century College and Equipment Programs Series 2017B, Rev., 5.00%, 2/1/2024 | | | 75,000 | | | | 87,168 | |
| | |
Virginia College Building Authority, Educational Facilities, Public Higher Education Financing Program Series 2011A, Rev., 5.00%, 9/1/2020 (e) | | | 20,000 | | | | 20,000 | |
| | |
Virginia Commonwealth Transportation Board Rev., 5.00%, 5/15/2023 | | | 35,000 | | | | 39,531 | |
| | |
Virginia Public Building Authority, Public Facilities Series A, Rev., 5.00%, 8/1/2022 | | | 25,000 | | | | 27,332 | |
| | |
Virginia Public School Authority Series 2018B, Rev., 5.00%, 8/1/2021 | | | 125,000 | | | | 130,535 | |
| | |
Virginia Resources Authority, Infrastructure, Pooled Financing Program Series 2013-C, Rev., 5.00%, 11/1/2023 | | | 35,000 | | | | 40,261 | |
| | | | | | | | |
| | |
Total Virginia | | | | | | | 997,752 | |
| | | | | | | | |
|
Washington — 3.7% | |
| | |
Benton County School District No. 17 Kennewick GO, 5.00%, 12/1/2024 | | | 45,000 | | | | 53,868 | |
| | |
Central Puget Sound Regional Transit Authority, Sales Tax Series 2015S-1, Rev., 5.00%, 11/1/2024 | | | 30,000 | | | | 35,765 | |
| | |
City of Bonney Lake, Water & Sewer System Rev., 4.00%, 12/1/2030 | | | 10,000 | | | | 11,535 | |
| | |
City of Richland Rev., 4.00%, 11/1/2022 | | | 10,000 | | | | 10,775 | |
| | |
City of Seattle, Drainage and Wastewater System Improvement Rev., 4.00%, 4/1/2026 | | | 20,000 | | | | 23,897 | |
| | |
City of Seattle, Municipal Light and Power Improvement Series 2011A, Rev., 5.00%, 2/1/2021 (e) | | | 20,000 | | | | 20,396 | |
| | |
City of Seattle, Wastewater System Improvement Rev., 5.00%, 8/1/2024 | | | 35,000 | | | | 41,423 | |
| | |
City of University Place, Limited Tax GO, 5.00%, 12/1/2026 | | | 85,000 | | | | 105,817 | |
| | |
Clark County School District No. 101 La Center, Unlimited Tax GO, 5.00%, 12/1/2029 | | | 50,000 | | | | 65,354 | |
| | |
County of King, Limited Tax
Series A, GO, 5.00%, 7/1/2025 | | | 50,000 | | | | 59,984 | |
| | |
Series B, GO, 5.00%, 12/1/2025 | | | 20,000 | | | | 23,048 | |
| | |
County of Snohomish, Limited Tax GO, 5.00%, 12/1/2025 | | | 10,000 | | | | 12,159 | |
SEE NOTES TO FINANCIAL STATEMENTS.
| | | | | | |
| | | |
| 114 | | | | J.P. MORGAN EXCHANGE-TRADED FUNDS | | AUGUST 31, 2020 |
| | | | | | | | |
| INVESTMENTS | | PRINCIPAL
AMOUNT ($) | | | VALUE ($) | |
Municipal Bonds — continued | |
|
Washington — continued | |
| | |
Energy Northwest, Electric | | | | | | | | |
| | |
Series 2016-A, Rev., 5.00%, 7/1/2028 | | | 25,000 | | | | 31,273 | |
| | |
Series 2017A, Rev., 5.00%, 7/1/2028 | | | 55,000 | | | | 70,757 | |
| | |
King County Public Hospital District No. 2, EvergreenHealth GO, 5.00%, 12/1/2031 | | | 105,000 | | | | 124,034 | |
| | |
King County School District No. 403 Renton GO, 5.00%, 12/1/2022 | | | 100,000 | | | | 108,333 | |
| | |
King County School District No. 405 Bellevue, Credit Enhancement Program | | | | | | | | |
| | |
GO, 5.00%, 12/1/2021 | | | 30,000 | | | | 31,808 | |
| | |
GO, 5.00%, 12/1/2026 | | | 20,000 | | | | 25,478 | |
| | |
King County School District No. 411 Issaquah GO, 5.00%, 12/1/2024 | | | 35,000 | | | | 41,963 | |
| | |
Mason County School District No. 309 Shelton, Unlimited Tax GO, 5.00%, 12/1/2029 | | | 45,000 | | | | 56,986 | |
| | |
Pasco School District No. 1, Franklin County, Unlimited Tax GO, 5.00%, 12/1/2030 | | | 35,000 | | | | 44,917 | |
| | |
Pend Oreille County Public Utility District No. 1 Box Canyon Rev., 5.00%, 1/1/2027 | | | 65,000 | | | | 74,733 | |
| | |
Pierce County School District No. 3, Unlimited Tax, Washington State SD Credit Enhancement Program GO, 5.00%, 12/1/2031 | | | 305,000 | | | | 383,065 | |
| | |
Pierce County, White River School District No. 416 GO, 5.00%, 12/1/2025 | | | 50,000 | | | | 61,914 | |
| | |
Snohomish County School District No. 15 Edmonds | | | | | | | | |
| | |
GO, 5.00%, 12/1/2025 | | | 25,000 | | | | 30,972 | |
| | |
GO, 5.00%, 12/1/2027 | | | 25,000 | | | | 30,752 | |
| | |
Snohomish County School District No. 4 Lake Stevens GO, 5.00%, 12/1/2024 | | | 25,000 | | | | 29,868 | |
| | |
Spokane County, Mead School District No. 354 GO, 5.00%, 12/1/2024 | | | 20,000 | | | | 23,895 | |
| | |
State of Washington | | | | | | | | |
| | |
Series 2015G, GO, 5.00%, 7/1/2026 | | | 125,000 | | | | 149,776 | |
| | |
Series 2015-C, COP, 5.00%, 1/1/2029 | | | 55,000 | | | | 67,720 | |
| | |
Washington Health Care Facilities Authority, Providence St. Joseph Health Series 2018B, Rev., 5.00%, 10/1/2028 | | | 30,000 | | | | 38,830 | |
| | |
Washington Higher Education Facilities Authority, Seattle University Project | | | | | | | | |
| | |
Rev., 5.00%, 5/1/2022 | | | 200,000 | | | | 212,240 | |
| | |
Rev., 5.00%, 5/1/2023 | | | 125,000 | | | | 137,161 | |
| | | | | | | | |
| | |
Total Washington | | | | | | | 2,240,496 | |
| | | | | | | | |
|
Wisconsin — 3.7% | |
| | |
City of Milwaukee, Promissory Notes Series N4 & B5, GO, 5.00%, 4/1/2023 | | | 85,000 | | | | 95,307 | |
| | |
Hamilton School District, School Building Improvement GO, 5.00%, 4/1/2025 | | | 60,000 | | | | 72,788 | |
| | | | | | | | |
| INVESTMENTS | | PRINCIPAL
AMOUNT ($) | | | VALUE ($) | |
| | | | | | | | |
|
Wisconsin — continued | |
| | |
Public Finance Authority Series 2019A, Rev., 5.00%, 10/1/2029 (c) | | | 150,000 | | | | 163,950 | |
| | |
Public Finance Authority, Acts Retirement-Life Communities, Inc. Obligated Group Series 2020A, Rev., 4.00%, 11/15/2037 | | | 300,000 | | | | 333,414 | |
| | |
Public Finance Authority, Blue Ridge Healthcare Facilities | | | | | | | | |
| | |
Series 2020A, Rev., 5.00%, 1/1/2022 | | | 175,000 | | | | 184,971 | |
| | |
Series 2020A, Rev., 5.00%, 1/1/2023 | | | 300,000 | | | | 329,085 | |
| | |
Public Finance Authority, Piedmont Community Charter School Rev., 5.00%, 6/15/2039 | | | 200,000 | | | | 230,532 | |
| | |
State of Wisconsin | | | | | | | | |
| | |
Series B, GO, 4.00%, 5/1/2023 | | | 40,000 | | | | 44,021 | |
| | |
Series 1, GO, 5.00%, 11/1/2024 | | | 40,000 | | | | 47,852 | |
| | |
Series 2, GO, 5.00%, 11/1/2026 | | | 50,000 | | | | 62,993 | |
| | |
State of Wisconsin Environmental Improvement Fund | | | | | | | | |
| | |
Series A, Rev., 5.00%, 6/1/2025 | | | 35,000 | | | | 42,761 | |
| | |
Series A, Rev., 5.00%, 6/1/2026 | | | 20,000 | | | | 25,207 | |
| | |
State of Wisconsin, Clean Water Fund, Leveraged Loan Portfolio | | | | | | | | |
| | |
Series 1, Rev., 5.00%, 6/1/2023 (e) | | | 25,000 | | | | 28,227 | |
| | |
Rev., 5.00%, 6/1/2024 (e) | | | 65,000 | | | | 76,348 | |
| | |
Village of Pleasant Prairie GO, 4.00%, 8/1/2024 | | | 10,000 | | | | 11,388 | |
| | |
Wisconsin Department of Transportation | | | | | | | | |
| | |
Series 2, Rev., 5.00%, 7/1/2031 | | | 180,000 | | | | 228,350 | |
| | |
Series 2, Rev., 5.00%, 7/1/2032 | | | 50,000 | | | | 63,076 | |
| | |
Wisconsin Health and Educational Facilities Authority, St. Camillus Health System Series 2019A, Rev., 5.00%, 11/1/2029 | | | 150,000 | | | | 164,856 | |
| | | | | | | | |
| | |
Total Wisconsin | | | | | | | 2,205,126 | |
| | | | | | | | |
| |
Total Municipal Bonds
(Cost $56,432,557) | | | | 58,631,508 | |
| | | | | |
| | |
SHARES | | | | |
Short-Term Investments — 3.1% | | | | | | | | |
|
Investment Companies — 3.1% | |
| | |
JPMorgan Institutional Tax Free Money Market Fund Class IM Shares, 0.04% (g) (h) (Cost $1,894,612) | | | 1,893,358 | | | | 1,894,684 | |
| | | | | | | | |
| |
Total Investments — 100.9%
(Cost $58,327,169) | | | | 60,526,192 | |
| |
Liabilities in Excess of
Other Assets — (0.9)% | | | | (564,190) | |
| | | | | |
| |
NET ASSETS — 100.0% | | | | 59,962,002 | |
| | | | | |
Percentages indicated are based on net assets.
SEE NOTES TO FINANCIAL STATEMENTS.
| | | | | | | | |
| | | |
| AUGUST 31, 2020 | | J.P. MORGAN EXCHANGE-TRADED FUNDS | | | | | 115 | |
JPMorgan Municipal ETF
SCHEDULE OF PORTFOLIO INVESTMENTS
AS OF AUGUST 31, 2020 (Unaudited) (continued)
| | |
Abbreviations |
| AGM | | Insured by Assured Guaranty Municipal Corp. |
| AMT | | Alternative Minimum Tax |
| BAN | | Bond Anticipation Note |
| BHAC | | Insured by Berkshire Hathaway Assurance Corp. |
| COP | | Certificate of Participation |
| CR | | Custodial Receipts |
| FHA | | Federal Housing Administration |
| GAN | | Grant Anticipation Note |
| GO | | General Obligation |
| GTD | | Guaranteed |
| IDA | | Industrial Development Authority |
| LIQ | | Liquidity Agreement |
| PSF-GTD | | Permanent School Fund Guaranteed |
| Q-SBLF | | Qualified School Bond Loan Fund |
| RAN | | Revenue Anticipation Note |
| Rev. | | Revenue |
| | |
| |
| (a) | | The date shown represents the earliest of the prerefunded date, next put date or final maturity date. |
| (b) | | Variable or floating rate security, the interest rate of which adjusts periodically based on changes in current interest rates and prepayments on the underlying pool of assets. The interest rate shown is the current rate as of August 31, 2020. |
| (c) | | Securities exempt from registration under Rule 144A or section 4(a)(2), of the Securities Act of 1933, as amended. |
| (d) | | All or a portion of the security is a when-issued security, delayed delivery security, or forward commitment. |
| (e) | | Security is prerefunded or escrowed to maturity. |
| (f) | | Amount rounds to less than 0.1% of net assets. |
| (g) | | Investment in an affiliated fund, which is registered under the Investment Company Act of 1940, as amended, and is advised by J.P. Morgan Investment Management Inc. |
| (h) | | The rate shown is the current yield as of August 31, 2020. |
SEE NOTES TO FINANCIAL STATEMENTS.
| | | | | | |
| | | |
| 116 | | | | J.P. MORGAN EXCHANGE-TRADED FUNDS | | AUGUST 31, 2020 |
JPMorgan U.S. Aggregate Bond ETF
SCHEDULE OF PORTFOLIO INVESTMENTS
AS OF AUGUST 31, 2020 (Unaudited)
| | | | | | | | |
| INVESTMENTS | | PRINCIPAL
AMOUNT ($) | | | VALUE ($) | |
U.S. Treasury Obligations — 36.5% | |
| | |
U.S. Treasury Bonds | | | | | | | | |
| | |
8.13%, 8/15/2021 | | | 2,852,000 | | | | 3,068,017 | |
| | |
8.00%, 11/15/2021 | | | 8,280,000 | | | | 9,056,897 | |
| | |
6.75%, 8/15/2026 | | | 1,391,000 | | | | 1,914,255 | |
| | |
6.63%, 2/15/2027 | | | 2,750,000 | | | | 3,836,895 | |
| | |
6.38%, 8/15/2027 | | | 4,380,000 | | | | 6,155,953 | |
| | |
6.13%, 11/15/2027 | | | 3,495,000 | | | | 4,895,184 | |
| | |
5.50%, 8/15/2028 | | | 160,000 | | | | 221,775 | |
| | |
5.25%, 11/15/2028 | | | 2,210,000 | | | | 3,043,584 | |
| | |
6.13%, 8/15/2029 | | | 150,000 | | | | 222,398 | |
| | |
6.25%, 5/15/2030 | | | 410,000 | | | | 626,467 | |
| | |
4.75%, 2/15/2037 | | | 256,000 | | | | 403,080 | |
| | |
5.00%, 5/15/2037 | | | 2,230,000 | | | | 3,613,994 | |
| | |
4.38%, 2/15/2038 | | | 600,000 | | | | 922,594 | |
| | |
4.50%, 5/15/2038 | | | 2,074,000 | | | | 3,236,412 | |
| | |
3.50%, 2/15/2039 | | | 3,082,000 | | | | 4,318,171 | |
| | |
4.25%, 5/15/2039 | | | 526,000 | | | | 805,520 | |
| | |
4.50%, 8/15/2039 | | | 1,283,000 | | | | 2,024,534 | |
| | |
4.38%, 11/15/2039 | | | 356,000 | | | | 555,026 | |
| | |
4.63%, 2/15/2040 | | | 2,660,000 | | | | 4,275,950 | |
| | |
2.88%, 5/15/2043 | | | 926,000 | | | | 1,206,549 | |
| | |
3.00%, 11/15/2044 | | | 100,000 | | | | 133,453 | |
| | |
2.50%, 2/15/2045 | | | 3,415,000 | | | | 4,198,316 | |
| | |
3.00%, 5/15/2045 | | | 2,368,000 | | | | 3,167,200 | |
| | |
3.00%, 11/15/2045 | | | 66,000 | | | | 88,584 | |
| | |
2.25%, 8/15/2046 | | | 2,971,000 | | | | 3,506,244 | |
| | |
3.00%, 2/15/2047 | | | 1,424,000 | | | | 1,925,737 | |
| | |
3.00%, 5/15/2047 | | | 21,000 | | | | 28,429 | |
| | |
3.00%, 2/15/2048 | | | 2,000,000 | | | | 2,719,062 | |
| | |
3.38%, 11/15/2048 | | | 359,000 | | | | 522,794 | |
| | |
3.00%, 2/15/2049 | | | 1,936,000 | | | | 2,649,598 | |
| | |
2.25%, 8/15/2049 | | | 3,753,000 | | | | 4,470,175 | |
| | |
2.38%, 11/15/2049 | | | 3,863,000 | | | | 4,724,328 | |
| | |
2.00%, 2/15/2050 | | | 2,549,000 | | | | 2,888,336 | |
| | |
1.25%, 5/15/2050 | | | 2,196,000 | | | | 2,086,200 | |
| | |
U.S. Treasury Notes | | | | | | | | |
| | |
1.50%, 8/31/2021 | | | 375,000 | | | | 380,098 | |
| | |
1.13%, 9/30/2021 | | | 3,164,000 | | | | 3,197,494 | |
| | |
2.88%, 10/15/2021 | | | 4,000,000 | | | | 4,122,344 | |
| | |
1.50%, 11/30/2021 | | | 1,100,000 | | | | 1,118,605 | |
| | |
2.63%, 12/15/2021 | | | 522,000 | | | | 538,659 | |
| | |
2.00%, 12/31/2021 | | | 8,779,000 | | | | 8,995,732 | |
| | |
2.13%, 12/31/2021 | | | 100,000 | | | | 102,629 | |
| | |
1.50%, 1/31/2022 | | | 5,305,000 | | | | 5,406,334 | |
| | |
1.88%, 2/28/2022 | | | 112,000 | | | | 114,896 | |
| | |
0.13%, 5/15/2023 | | | 1,174,000 | | | | 1,173,450 | |
| | | | | | | | |
| INVESTMENTS | | PRINCIPAL
AMOUNT ($) | | | VALUE ($) | |
| | | | | | | | |
| | |
1.63%, 5/31/2023 | | | 600,000 | | | | 624,328 | |
| | |
0.25%, 6/15/2023 | | | 15,000,000 | | | | 15,043,359 | |
| | |
0.13%, 7/15/2023 | | | 551,000 | | | | 550,656 | |
| | |
1.25%, 7/31/2023 | | | 5,200,000 | | | | 5,366,156 | |
| | |
1.38%, 8/31/2023 | | | 360,000 | | | | 373,163 | |
| | |
1.38%, 9/30/2023 | | | 15,431,000 | | | | 16,009,662 | |
| | |
2.88%, 9/30/2023 | | | 700,000 | | | | 758,406 | |
| | |
2.88%, 11/30/2023 | | | 2,077,000 | | | | 2,259,062 | |
| | |
2.25%, 12/31/2023 | | | 267,000 | | | | 285,440 | |
| | |
2.63%, 12/31/2023 | | | 621,000 | | | | 671,602 | |
| | |
2.25%, 1/31/2024 | | | 653,000 | | | | 699,118 | |
| | |
2.50%, 1/31/2024 | | | 3,854,000 | | | | 4,159,008 | |
| | |
2.13%, 2/29/2024 | | | 500,000 | | | | 533,906 | |
| | |
2.38%, 2/29/2024 | | | 10,212,000 | | | | 10,993,058 | |
| | |
2.13%, 3/31/2024 | | | 1,397,000 | | | | 1,493,699 | |
| | |
2.50%, 5/15/2024 | | | 100,000 | | | | 108,531 | |
| | |
2.00%, 5/31/2024 | | | 3,850,000 | | | | 4,109,273 | |
| | |
1.75%, 6/30/2024 | | | 1,967,000 | | | | 2,083,176 | |
| | |
1.75%, 7/31/2024 | | | 410,000 | | | | 434,664 | |
| | |
1.25%, 8/31/2024 | | | 800,000 | | | | 833,125 | |
| | |
1.88%, 8/31/2024 | | | 3,961,000 | | | | 4,223,726 | |
| | |
1.50%, 9/30/2024 | | | 100,000 | | | | 105,219 | |
| | |
1.50%, 11/30/2024 | | | 1,255,000 | | | | 1,322,652 | |
| | |
1.75%, 12/31/2024 | | | 142,000 | | | | 151,308 | |
| | |
1.38%, 1/31/2025 | | | 1,860,000 | | | | 1,953,000 | |
| | |
2.50%, 1/31/2025 | | | 450,000 | | | | 494,719 | |
| | |
2.00%, 2/15/2025 | | | 530,000 | | | | 571,365 | |
| | |
1.13%, 2/28/2025 | | | 1,153,000 | | | | 1,199,030 | |
| | |
0.50%, 3/31/2025 | | | 58,000 | | | | 58,680 | |
| | |
2.13%, 5/15/2025 | | | 163,000 | | | | 177,262 | |
| | |
2.88%, 5/31/2025 | | | 12,000,000 | | | | 13,484,063 | |
| | |
0.25%, 6/30/2025 | | | 1,802,000 | | | | 1,801,296 | |
| | |
2.00%, 8/15/2025 | | | 600,000 | | | | 650,859 | |
| | |
2.25%, 11/15/2025 | | | 104,000 | | | | 114,489 | |
| | |
2.63%, 12/31/2025 | | | 2,231,000 | | | | 2,504,123 | |
| | |
1.63%, 2/15/2026 | | | 4,739,000 | | | | 5,071,470 | |
| | |
2.50%, 2/28/2026 | | | 136,000 | | | | 152,139 | |
| | |
2.25%, 3/31/2026 | | | 408,000 | | | | 451,191 | |
| | |
2.13%, 5/31/2026 | | | 200,000 | | | | 220,141 | |
| | |
1.88%, 7/31/2026 | | | 383,000 | | | | 416,722 | |
| | |
1.50%, 8/15/2026 | | | 507,000 | | | | 540,351 | |
| | |
1.38%, 8/31/2026 | | | 788,000 | | | | 834,295 | |
| | |
1.63%, 9/30/2026 | | | 150,000 | | | | 161,121 | |
| | |
1.63%, 10/31/2026 | | | 7,371,000 | | | | 7,920,370 | |
| | |
1.63%, 11/30/2026 | | | 1,820,000 | | | | 1,956,500 | |
| | |
1.75%, 12/31/2026 | | | 2,300,000 | | | | 2,491,547 | |
SEE NOTES TO FINANCIAL STATEMENTS.
| | | | | | | | |
| | | |
| AUGUST 31, 2020 | | J.P. MORGAN EXCHANGE-TRADED FUNDS | | | | | 117 | |
JPMorgan U.S. Aggregate Bond ETF
SCHEDULE OF PORTFOLIO INVESTMENTS
AS OF AUGUST 31, 2020 (Unaudited) (continued)
| | | | | | | | |
| INVESTMENTS | | PRINCIPAL
AMOUNT ($) | | | VALUE ($) | |
U.S. Treasury Obligations — continued | |
| | |
2.25%, 2/15/2027 | | | 1,800,000 | | | | 2,008,828 | |
| | |
0.63%, 3/31/2027 | | | 300,000 | | | | 303,516 | |
| | |
2.38%, 5/15/2027 | | | 1,900,000 | | | | 2,141,359 | |
| | |
0.38%, 7/31/2027 | | | 25,000 | | | | 24,832 | |
| | |
2.25%, 8/15/2027 | | | 2,000,000 | | | | 2,243,125 | |
| | |
2.25%, 11/15/2027 | | | 400,000 | | | | 449,750 | |
| | |
2.75%, 2/15/2028 | | | 29,000 | | | | 33,740 | |
| | |
2.88%, 5/15/2028 | | | 400,000 | | | | 470,625 | |
| | |
2.88%, 8/15/2028 | | | 55,000 | | | | 64,934 | |
| | |
3.13%, 11/15/2028 | | | 1,060,000 | | | | 1,276,969 | |
| | |
2.63%, 2/15/2029 | | | 1,746,000 | | | | 2,038,455 | |
| | |
1.63%, 8/15/2029 | | | 1,562,000 | | | | 1,698,431 | |
| | |
1.50%, 2/15/2030 | | | 404,000 | | | | 435,373 | |
| | |
0.63%, 5/15/2030 | | | 8,259,000 | | | | 8,216,415 | |
| | | | | | | | |
| |
Total U.S. Treasury Obligations
(Cost $237,277,186) | | | | 250,485,334 | |
| | | | | |
Corporate Bonds — 27.9% | |
|
Aerospace & Defense — 0.4% | |
| | |
Huntington Ingalls Industries, Inc. | | | | | | | | |
| | |
3.48%, 12/1/2027 | | | 436,000 | | | | 475,322 | |
| | |
4.20%, 5/1/2030 (a) | | | 120,000 | | | | 137,843 | |
| | |
L3Harris Technologies, Inc. | | | | | | | | |
| | |
3.85%, 6/15/2023 | | | 573,000 | | | | 622,587 | |
| | |
3.83%, 4/27/2025 | | | 40,000 | | | | 44,970 | |
| | |
4.40%, 6/15/2028 | | | 300,000 | | | | 359,113 | |
| | |
2.90%, 12/15/2029 | | | 470,000 | | | | 516,105 | |
| | |
4.85%, 4/27/2035 | | | 109,000 | | | | 142,812 | |
| | |
5.05%, 4/27/2045 | | | 25,000 | | | | 33,515 | |
| | |
Lockheed Martin Corp. | | | | | | | | |
| | |
3.10%, 1/15/2023 | | | 174,000 | | | | 184,364 | |
| | |
4.07%, 12/15/2042 | | | 33,000 | | | | 41,724 | |
| | | | | | | | |
| | |
| | | | | | | 2,558,355 | |
| | | | | | | | |
|
Banks — 2.7% | |
| | |
Canadian Imperial Bank of Commerce (Canada) | | | | | | | | |
| | |
2.55%, 6/16/2022 | | | 300,000 | | | | 311,854 | |
| | |
(ICE LIBOR USD 3 Month + 0.79%), 2.61%, 7/22/2023 (b) | | | 280,000 | | | | 290,973 | |
| | |
3.50%, 9/13/2023 | | | 386,000 | | | | 421,545 | |
| | |
3.10%, 4/2/2024 | | | 370,000 | | | | 400,547 | |
| | |
2.25%, 1/28/2025 | | | 742,000 | | | | 787,829 | |
| | |
Capital One NA | | | | | | | | |
| | |
2.95%, 7/23/2021 | | | 200,000 | | | | 204,081 | |
| | |
2.25%, 9/13/2021 | | | 200,000 | | | | 203,439 | |
| | | | | | | | |
| INVESTMENTS | | PRINCIPAL
AMOUNT ($) | | | VALUE ($) | |
| | | | | | | | |
|
Banks — continued | |
| | |
Comerica, Inc. | | | | | | | | |
| | |
3.70%, 7/31/2023 | | | 203,000 | | | | 220,147 | |
| | |
4.00%, 2/1/2029 | | | 25,000 | | | | 28,908 | |
| | |
Discover Bank 4.20%, 8/8/2023 | | | 250,000 | | | | 275,382 | |
| | |
4.25%, 3/13/2026 | | | 636,000 | | | | 721,550 | |
| | |
3.45%, 7/27/2026 | | | 90,000 | | | | 98,762 | |
| | |
4.65%, 9/13/2028 | | | 350,000 | | | | 410,809 | |
| | |
First Republic Bank | | | | | | | | |
| | |
2.50%, 6/6/2022 | | | 250,000 | | | | 257,499 | |
| | |
(SOFR + 0.62%), 1.91%, 2/12/2024 (b) | | | 300,000 | | | | 308,762 | |
| | |
Huntington Bancshares, Inc. | | | | | | | | |
| | |
2.63%, 8/6/2024 | | | 740,000 | | | | 792,845 | |
| | |
4.00%, 5/15/2025 | | | 248,000 | | | | 282,707 | |
| | |
2.55%, 2/4/2030 | | | 625,000 | | | | 655,888 | |
| | |
Huntington National Bank (The) | | | | | | | | |
| | |
3.13%, 4/1/2022 | | | 334,000 | | | | 347,195 | |
| | |
2.50%, 8/7/2022 | | | 300,000 | | | | 311,467 | |
| | |
3.55%, 10/6/2023 | | | 110,000 | | | | 119,997 | |
| | |
Intesa Sanpaolo SpA (Italy) 5.25%, 1/12/2024 | | | 400,000 | | | | 444,739 | |
| | |
Kreditanstalt fuer Wiederaufbau (Germany) 2.38%, 8/25/2021 | | | 25,000 | | | | 25,527 | |
| | |
1.75%, 9/15/2021 | | | 30,000 | | | | 30,474 | |
| | |
2.63%, 1/25/2022 | | | 65,000 | | | | 67,188 | |
| | |
2.50%, 2/15/2022 | | | 50,000 | | | | 51,656 | |
| | |
2.13%, 3/7/2022 (c) | | | 125,000 | | | | 128,626 | |
| | |
2.13%, 6/15/2022 | | | 158,000 | | | | 163,375 | |
| | |
2.38%, 12/29/2022 | | | 190,000 | | | | 199,491 | |
| | |
2.13%, 1/17/2023 | | | 200,000 | | | | 209,005 | |
| | |
1.63%, 2/15/2023 | | | 33,000 | | | | 34,125 | |
| | |
2.63%, 2/28/2024 | | | 36,000 | | | | 38,950 | |
| | |
2.50%, 11/20/2024 | | | 60,000 | | | | 65,470 | |
| | |
2.00%, 5/2/2025 (c) | | | 183,000 | | | | 196,902 | |
| | |
2.88%, 4/3/2028 | | | 311,000 | | | | 362,772 | |
| | |
1.75%, 9/14/2029 | | | 47,000 | | | | 50,976 | |
| | |
Zero Coupon, 4/18/2036 | | | 91,000 | | | | 74,720 | |
| | |
Zero Coupon, 6/29/2037 | | | 537,000 | | | | 434,975 | |
| | |
Landesbank Baden-Wuerttemberg (Germany) 7.63%, 2/1/2023 | | | 25,000 | | | | 29,171 | |
| | |
Landwirtschaftliche Rentenbank (Germany) 2.25%, 10/1/2021 | | | 76,000 | | | | 77,658 | |
| | |
Series 36, 2.00%, 12/6/2021 | | | 100,000 | | | | 102,197 | |
| | |
3.13%, 11/14/2023 | | | 31,000 | | | | 33,812 | |
| | |
2.00%, 1/13/2025 | | | 25,000 | | | | 26,736 | |
| | |
2.38%, 6/10/2025 | | | 75,000 | | | | 81,870 | |
SEE NOTES TO FINANCIAL STATEMENTS.
| | | | | | |
| | | |
| 118 | | | | J.P. MORGAN EXCHANGE-TRADED FUNDS | | AUGUST 31, 2020 |
| | | | | | | | |
| INVESTMENTS | | PRINCIPAL
AMOUNT ($) | | | VALUE ($) | |
Corporate Bonds — continued | | | | | | | | |
|
Banks — continued | |
| | |
Lloyds Bank plc (United Kingdom) 2.25%, 8/14/2022 | | | 382,000 | | | | 394,834 | |
| | |
Lloyds Banking Group plc (United Kingdom) 3.75%, 1/11/2027 | | | 727,000 | | | | 816,138 | |
| | |
4.38%, 3/22/2028 | | | 794,000 | | | | 939,875 | |
| | |
4.55%, 8/16/2028 | | | 401,000 | | | | 479,987 | |
| | |
(ICE LIBOR USD 3 Month + 1.21%), 3.57%, 11/7/2028 (b) | | | 300,000 | | | | 334,928 | |
| | |
National Bank of Canada (Canada) 2.10%, 2/1/2023 | | | 652,000 | | | | 675,021 | |
| | |
Oesterreichische Kontrollbank AG (Austria) 2.88%, 9/7/2021 | | | 97,000 | | | | 99,560 | |
| | |
2.38%, 10/1/2021 | | | 25,000 | | | | 25,570 | |
| | |
2.63%, 1/31/2022 | | | 25,000 | | | | 25,834 | |
| | |
2.88%, 3/13/2023 | | | 120,000 | | | | 127,791 | |
| | |
1.50%, 2/12/2025 | | | 150,000 | | | | 157,086 | |
| | |
Royal Bank of Canada (Canada) | | | | | | | | |
| | |
2.75%, 2/1/2022 | | | 150,000 | | | | 155,219 | |
| | |
2.80%, 4/29/2022 | | | 235,000 | | | | 244,504 | |
| | |
1.95%, 1/17/2023 | | | 385,000 | | | | 398,970 | |
| | |
1.60%, 4/17/2023 | | | 120,000 | | | | 123,641 | |
| | |
3.70%, 10/5/2023 | | | 64,000 | | | | 70,257 | |
| | |
2.55%, 7/16/2024 | | | 262,000 | | | | 281,622 | |
| | |
2.25%, 11/1/2024 | | | 1,570,000 | | | | 1,671,541 | |
| | |
SVB Financial Group | | | | | | | | |
| | |
3.50%, 1/29/2025 | | | 681,000 | | | | 733,026 | |
| | |
3.13%, 6/5/2030 | | | 267,000 | | | | 297,696 | |
| | | | | | | | |
| | |
| | | | | | | 18,435,701 | |
| | | | | | | | |
|
Beverages — 0.1% | |
| | |
Brown-Forman Corp. | | | | | | | | |
| | |
3.50%, 4/15/2025 | | | 56,000 | | | | 62,432 | |
| | |
4.00%, 4/15/2038 | | | 93,000 | | | | 112,333 | |
| | |
4.50%, 7/15/2045 | | | 269,000 | | | | 356,913 | |
| | | | | | | | |
| | |
| | | | | | | 531,678 | |
| | | | | | | | |
|
Biotechnology — 0.8% | |
| | |
Biogen, Inc. 3.63%, 9/15/2022 | | | 62,000 | | | | 65,937 | |
| | |
4.05%, 9/15/2025 (c) | | | 136,000 | | | | 156,837 | |
| | |
2.25%, 5/1/2030 | | | 680,000 | | | | 702,233 | |
| | |
5.20%, 9/15/2045 | | | 1,429,000 | | | | 1,942,583 | |
| | |
3.15%, 5/1/2050 | | | 400,000 | | | | 405,932 | |
| | |
Gilead Sciences, Inc. | | | | | | | | |
| | |
2.50%, 9/1/2023 | | | 1,828,000 | | | | 1,934,124 | |
| | |
4.00%, 9/1/2036 | | | 38,000 | | | | 47,517 | |
| | | | | | | | |
| | |
| | | | | | | 5,255,163 | |
| | | | | | | | |
| | | | | | | | |
| INVESTMENTS | | PRINCIPAL
AMOUNT ($) | | | VALUE ($) | |
| | | | | | | | |
|
Building Products — 0.1% | |
| | |
Allegion plc 3.50%, 10/1/2029 | | | 138,000 | | | | 150,519 | |
| | |
Lennox International, Inc. | | | | | | | | |
| | |
3.00%, 11/15/2023 | | | 70,000 | | | | 73,660 | |
| | |
1.35%, 8/1/2025 | | | 350,000 | | | | 353,278 | |
| | | | | | | | |
| | |
| | | | | | | 577,457 | |
| | | | | | | | |
| | | | | | | | |
|
Capital Markets — 3.8% | |
| | |
Affiliated Managers Group, Inc. | | | | | | | | |
| | |
4.25%, 2/15/2024 | | | 410,000 | | | | 451,952 | |
| | |
3.30%, 6/15/2030 | | | 108,000 | | | | 115,692 | |
| | |
Ameriprise Financial, Inc. | | | | | | | | |
| | |
3.00%, 3/22/2022 | | | 636,000 | | | | 661,114 | |
| | |
4.00%, 10/15/2023 | | | 331,000 | | | | 367,583 | |
| | |
3.70%, 10/15/2024 | | | 86,000 | | | | 96,744 | |
| | |
2.88%, 9/15/2026 | | | 541,000 | | | | 598,060 | |
| | |
BGC Partners, Inc. 4.38%, 12/15/2025 (a) | | | 685,000 | | | | 691,610 | |
| | |
BlackRock, Inc. | | | | | | | | |
| | |
2.40%, 4/30/2030 | | | 1,063,000 | | | | 1,162,465 | |
| | |
1.90%, 1/28/2031 | | | 977,000 | | | | 1,019,280 | |
| | |
Brookfield Asset Management, Inc. (Canada) 4.00%, 1/15/2025 | | | 436,000 | | | | 487,295 | |
| | |
Brookfield Finance LLC (Canada) 3.45%, 4/15/2050 | | | 312,000 | | | | 310,256 | |
| | |
Brookfield Finance, Inc. (Canada) | | | | | | | | |
| | |
3.90%, 1/25/2028 | | | 153,000 | | | | 173,382 | |
| | |
4.85%, 3/29/2029 | | | 70,000 | | | | 83,361 | |
| | |
4.70%, 9/20/2047 | | | 847,000 | | | | 996,944 | |
| | |
Cboe Global Markets, Inc. 3.65%, 1/12/2027 | | | 284,000 | | | | 325,294 | |
| | |
Charles Schwab Corp. (The) | | | | | | | | |
| | |
2.65%, 1/25/2023 | | | 461,000 | | | | 485,401 | |
| | |
3.85%, 5/21/2025 | | | 83,000 | | | | 94,708 | |
| | |
3.20%, 1/25/2028 | | | 29,000 | | | | 33,038 | |
| | |
3.25%, 5/22/2029 | | | 1,311,000 | | | | 1,512,494 | |
| | |
4.63%, 3/22/2030 (c) | | | 560,000 | | | | 713,807 | |
| | |
CME Group, Inc. | | | | | | | | |
| | |
3.00%, 9/15/2022 | | | 170,000 | | | | 179,156 | |
| | |
3.00%, 3/15/2025 | | | 100,000 | | | | 109,704 | |
| | |
3.75%, 6/15/2028 | | | 190,000 | | | | 225,507 | |
| | |
5.30%, 9/15/2043 | | | 87,000 | | | | 127,014 | |
| | |
4.15%, 6/15/2048 | | | 524,000 | | | | 689,365 | |
| | |
Deutsche Bank AG (Germany) | | | | | | | | |
| | |
4.25%, 10/14/2021 | | | 107,000 | | | | 110,594 | |
| | |
3.70%, 5/30/2024 | | | 400,000 | | | | 427,699 | |
| | |
4.10%, 1/13/2026 | | | 1,637,000 | | | | 1,764,918 | |
SEE NOTES TO FINANCIAL STATEMENTS.
| | | | | | | | |
| | | |
| AUGUST 31, 2020 | | J.P. MORGAN EXCHANGE-TRADED FUNDS | | | | | 119 | |
JPMorgan U.S. Aggregate Bond ETF
SCHEDULE OF PORTFOLIO INVESTMENTS
AS OF AUGUST 31, 2020 (Unaudited) (continued)
| | | | | | | | |
| INVESTMENTS | | PRINCIPAL
AMOUNT ($) | | | VALUE ($) | |
Corporate Bonds — continued | | | | | | | | |
|
Capital Markets — continued | |
| | |
E*TRADE Financial Corp. | | | | | | | | |
| | |
2.95%, 8/24/2022 | | | 772,000 | | | | 806,449 | |
| | |
3.80%, 8/24/2027 | | | 60,000 | | | | 67,200 | |
| | |
4.50%, 6/20/2028 | | | 45,000 | | | | 52,734 | |
| | |
Eaton Vance Corp. | | | | | | | | |
| | |
3.63%, 6/15/2023 | | | 145,000 | | | | 155,131 | |
| | |
3.50%, 4/6/2027 | | | 142,000 | | | | 156,740 | |
| | |
Franklin Resources, Inc. | | | | | | | | |
| | |
2.80%, 9/15/2022 | | | 25,000 | | | | 26,109 | |
| | |
2.85%, 3/30/2025 | | | 94,000 | | | | 102,954 | |
| | |
Intercontinental Exchange, Inc. | | | | | | | | |
| | |
2.35%, 9/15/2022 | | | 445,000 | | | | 460,863 | |
| | |
3.45%, 9/21/2023 | | | 139,000 | | | | 150,780 | |
| | |
4.00%, 10/15/2023 | | | 125,000 | | | | 138,104 | |
| | |
3.10%, 9/15/2027 | | | 164,000 | | | | 182,513 | |
| | |
3.75%, 9/21/2028 | | | 711,000 | | | | 828,609 | |
| | |
2.10%, 6/15/2030 | | | 96,000 | | | | 99,893 | |
| | |
4.25%, 9/21/2048 | | | 669,000 | | | | 841,576 | |
| | |
3.00%, 6/15/2050 | | | 128,000 | | | | 134,571 | |
| | |
Janus Capital Group, Inc. (United Kingdom) 4.88%, 8/1/2025 | | | 142,000 | | | | 161,881 | |
| | |
Lazard Group LLC | | | | | | | | |
| | |
3.75%, 2/13/2025 | | | 1,109,000 | | | | 1,197,599 | |
| | |
3.63%, 3/1/2027 (c) | | | 539,000 | | | | 580,019 | |
| | |
4.50%, 9/19/2028 | | | 280,000 | | | | 323,463 | |
| | |
4.38%, 3/11/2029 | | | 352,000 | | | | 404,463 | |
| | |
Legg Mason, Inc. | | | | | | | | |
| | |
4.75%, 3/15/2026 | | | 400,000 | | | | 476,175 | |
| | |
5.63%, 1/15/2044 | | | 61,000 | | | | 83,302 | |
| | |
Nasdaq, Inc. | | | | | | | | |
| | |
4.25%, 6/1/2024 | | | 423,000 | | | | 472,946 | |
| | |
3.85%, 6/30/2026 | | | 350,000 | | | | 403,063 | |
| | |
3.25%, 4/28/2050 | | | 206,000 | | | | 221,496 | |
| | |
Raymond James Financial, Inc. | | | | | | | | |
| | |
3.63%, 9/15/2026 | | | 333,000 | | | | 383,061 | |
| | |
4.65%, 4/1/2030 | | | 90,000 | | | | 110,045 | |
| | |
4.95%, 7/15/2046 | | | 110,000 | | | | 140,726 | |
| | |
S&P Global, Inc. | | | | | | | | |
| | |
4.00%, 6/15/2025 | | | 30,000 | | | | 34,362 | |
| | |
2.95%, 1/22/2027 | | | 384,000 | | | | 428,093 | |
| | |
2.50%, 12/1/2029 | | | 462,000 | | | | 502,882 | |
| | |
1.25%, 8/15/2030 | | | 29,000 | | | | 28,667 | |
| | |
3.25%, 12/1/2049 | | | 661,000 | | | | 772,735 | |
| | |
Stifel Financial Corp. 4.25%, 7/18/2024 | | | 325,000 | | | | 358,091 | |
| | | | | | | | |
| INVESTMENTS | | PRINCIPAL
AMOUNT ($) | | | VALUE ($) | |
| | | | | | | | |
|
Capital Markets — continued | |
| | |
TD Ameritrade Holding Corp. | | | | | | | | |
| | |
2.95%, 4/1/2022 | | | 445,000 | | | | 461,679 | |
| | |
3.75%, 4/1/2024 | | | 144,000 | | | | 159,652 | |
| | |
3.63%, 4/1/2025 | | | 167,000 | | | | 187,853 | |
| | |
3.30%, 4/1/2027 | | | 55,000 | | | | 62,247 | |
| | |
2.75%, 10/1/2029 | | | 100,000 | | | | 111,760 | |
| | | | | | | | |
| | |
| | | | | | | 26,284,923 | |
| | | | | | | | |
|
Chemicals — 0.4% | |
| | |
Air Products and Chemicals, Inc. | | | | | | | | |
| | |
3.00%, 11/3/2021 (c) | | | 92,000 | | | | 94,793 | |
| | |
3.35%, 7/31/2024 | | | 259,000 | | | | 284,278 | |
| | |
Ecolab, Inc. | | | | | | | | |
| | |
2.38%, 8/10/2022 | | | 429,000 | | | | 445,100 | |
| | |
3.25%, 1/14/2023 | | | 53,000 | | | | 56,224 | |
| | |
3.25%, 12/1/2027 | | | 155,000 | | | | 175,646 | |
| | |
4.80%, 3/24/2030 | | | 57,000 | | | | 72,338 | |
| | |
5.50%, 12/8/2041 | | | 60,000 | | | | 86,520 | |
| | |
3.95%, 12/1/2047 | | | 1,002,000 | | | | 1,277,188 | |
| | |
LYB International Finance BV | | | | | | | | |
| | |
5.25%, 7/15/2043 | | | 26,000 | | | | 31,842 | |
| | |
4.88%, 3/15/2044 | | | 26,000 | | | | 30,923 | |
| | |
NewMarket Corp. 4.10%, 12/15/2022 | | | 223,000 | | | | 238,440 | |
| | | | | | | | |
| | |
| | | | | | | 2,793,292 | |
| | | | | | | | |
|
Commercial Services & Supplies — 0.2% | |
| | |
RELX Capital, Inc. (United Kingdom) 3.50%, 3/16/2023 | | | 94,000 | | | | 100,436 | |
| | |
4.00%, 3/18/2029 | | | 44,000 | | | | 51,944 | |
| | |
3.00%, 5/22/2030 | | | 798,000 | | | | 876,603 | |
| | | | | | | | |
| | |
| | | | | | | 1,028,983 | |
| | | | | | | | |
|
Consumer Finance — 1.5% | |
| | |
American Express Co. | | | | | | | | |
| | |
3.70%, 11/5/2021 | | | 69,000 | | | | 71,542 | |
| | |
2.75%, 5/20/2022 | | | 120,000 | | | | 124,569 | |
| | |
2.50%, 8/1/2022 | | | 202,000 | | | | 209,668 | |
| | |
2.65%, 12/2/2022 | | | 82,000 | | | | 86,103 | |
| | |
3.40%, 2/27/2023 | | | 40,000 | | | | 42,799 | |
| | |
3.70%, 8/3/2023 | | | 300,000 | | | | 326,830 | |
| | |
3.40%, 2/22/2024 | | | 329,000 | | | | 360,559 | |
| | |
3.00%, 10/30/2024 | | | 28,000 | | | | 30,517 | |
| | |
4.20%, 11/6/2025 | | | 100,000 | | | | 117,039 | |
| | |
3.13%, 5/20/2026 | | | 240,000 | | | | 269,583 | |
| | |
4.05%, 12/3/2042 | | | 1,166,000 | | | | 1,478,860 | |
SEE NOTES TO FINANCIAL STATEMENTS.
| | | | | | |
| | | |
| 120 | | | | J.P. MORGAN EXCHANGE-TRADED FUNDS | | AUGUST 31, 2020 |
| | | | | | | | |
| INVESTMENTS | | PRINCIPAL
AMOUNT ($) | | | VALUE ($) | |
Corporate Bonds — continued | | | | | | | | |
|
Consumer Finance — continued | |
| | |
American Express Credit Corp. | | | | | | | | |
| | |
2.70%, 3/3/2022 | | | 95,000 | | | | 98,209 | |
| | |
3.30%, 5/3/2027 | | | 336,000 | | | | 384,343 | |
| | |
Capital One Financial Corp. | | | | | | | | |
| | |
3.05%, 3/9/2022 | | | 543,000 | | | | 562,612 | |
| | |
3.50%, 6/15/2023 | | | 229,000 | | | | 245,684 | |
| | |
3.20%, 2/5/2025 | | | 270,000 | | | | 294,557 | |
| | |
3.80%, 1/31/2028 | | | 60,000 | | | | 67,069 | |
| | |
Discover Financial Services | | | | | | | | |
| | |
5.20%, 4/27/2022 | | | 464,000 | | | | 496,718 | |
| | |
3.85%, 11/21/2022 | | | 744,000 | | | | 793,829 | |
| | |
3.95%, 11/6/2024 | | | 82,000 | | | | 90,051 | |
| | |
3.75%, 3/4/2025 | | | 44,000 | | | | 48,054 | |
| | |
4.50%, 1/30/2026 | | | 20,000 | | | | 22,941 | |
| | |
4.10%, 2/9/2027 | | | 274,000 | | | | 305,346 | |
| | |
Navient Solutions LLC | | | | | | | | |
| | |
Zero Coupon, 10/3/2022 | | | 50,000 | | | | 49,519 | |
| | |
Synchrony Financial | | | | | | | | |
| | |
2.85%, 7/25/2022 | | | 667,000 | | | | 689,841 | |
| | |
4.38%, 3/19/2024 | | | 283,000 | | | | 304,813 | |
| | |
3.70%, 8/4/2026 | | | 378,000 | | | | 394,979 | |
| | |
5.15%, 3/19/2029 | | | 1,769,000 | | | | 2,026,294 | |
| | | | | | | | |
| | |
| | | | | | | 9,992,928 | |
| | | | | | | | |
|
Containers & Packaging — 0.0% (d) | |
| | |
Avery Dennison Corp. 4.88%, 12/6/2028 (c) | | | 174,000 | | | | 215,566 | |
| | | | | | | | |
|
Diversified Financial Services — 0.1% | |
| | |
Private Export Funding Corp. Series BB, 4.30%, 12/15/2021 | | | 27,000 | | | | 28,328 | |
| | |
Synchrony Bank 3.00%, 6/15/2022 | | | 450,000 | | | | 464,948 | |
| | | | | | | | |
| | |
| | | | | | | 493,276 | |
| | | | | | | | |
|
Diversified Telecommunication Services — 0.6% | |
| | |
Verizon Communications, Inc. | | | | | | | | |
| | |
2.95%, 3/15/2022 | | | 249,000 | | | | 259,064 | |
| | |
2.45%, 11/1/2022 | | | 299,000 | | | | 311,225 | |
| | |
3.50%, 11/1/2024 | | | 202,000 | | | | 224,538 | |
| | |
3.38%, 2/15/2025 | | | 50,000 | | | | 55,925 | |
| | |
2.63%, 8/15/2026 | | | 85,000 | | | | 93,678 | |
| | |
4.33%, 9/21/2028 | | | 50,000 | | | | 60,529 | |
| | |
3.88%, 2/8/2029 | | | 411,000 | | | | 486,292 | |
| | |
4.02%, 12/3/2029 | | | 160,000 | | | | 192,038 | |
| | |
3.15%, 3/22/2030 | | | 278,000 | | | | 314,505 | |
| | |
7.75%, 12/1/2030 (c) | | | 80,000 | | | | 124,085 | |
| | |
4.50%, 8/10/2033 | | | 193,000 | | | | 244,518 | |
| | | | | | | | |
| INVESTMENTS | | PRINCIPAL
AMOUNT ($) | | | VALUE ($) | |
| | | | | | | | |
|
Diversified Telecommunication Services — continued | |
| | |
4.40%, 11/1/2034 | | | 137,000 | | | | 171,463 | |
| | |
4.27%, 1/15/2036 | | | 155,000 | | | | 190,050 | |
| | |
5.25%, 3/16/2037 | | | 111,000 | | | | 150,421 | |
| | |
4.81%, 3/15/2039 | | | 255,000 | | | | 336,735 | |
| | |
3.85%, 11/1/2042 | | | 280,000 | | | | 333,085 | |
| | |
5.01%, 4/15/2049 | | | 84,000 | | | | 117,712 | |
| | |
4.00%, 3/22/2050 | | | 214,000 | | | | 268,373 | |
| | |
4.67%, 3/15/2055 | | | 212,000 | | | | 290,750 | |
| | | | | | | | |
| | |
| | | | | | | 4,224,986 | |
| | | | | | | | |
|
Electric Utilities — 1.6% | |
| | |
AEP Texas, Inc. 3.95%, 6/1/2028 | | | 74,000 | | | | 85,751 | |
| | |
AEP Transmission Co. LLC 3.15%, 9/15/2049 | | | 100,000 | | | | 107,784 | |
| | |
American Electric Power Co., Inc. | | | | | | | | |
| | |
Series F, 2.95%, 12/15/2022 | | | 188,000 | | | | 197,326 | |
| | |
Series J, 4.30%, 12/1/2028 | | | 56,000 | | | | 66,096 | |
| | |
3.25%, 3/1/2050 | | | 30,000 | | | | 31,414 | |
| | |
Avangrid, Inc. | | | | | | | | |
| | |
3.15%, 12/1/2024 | | | 279,000 | | | | 305,353 | |
| | |
3.20%, 4/15/2025 | | | 52,000 | | | | 57,430 | |
| | |
3.80%, 6/1/2029 | | | 175,000 | | | | 204,224 | |
| | |
Enel Americas SA (Chile) 4.00%, 10/25/2026 (c) | | | 286,000 | | | | 313,692 | |
| | |
Enel Chile SA (Chile) 4.88%, 6/12/2028 | | | 401,000 | | | | 482,913 | |
| | |
FirstEnergy Corp. | | | | | | | | |
| | |
Series B, 4.25%, 3/15/2023 | | | 445,000 | | | | 473,084 | |
| | |
Series A, 1.60%, 1/15/2026 | | | 36,000 | | | | 35,900 | |
| | |
Gulf Power Co. Series A, 3.30%, 5/30/2027 | | | 291,000 | | | | 328,339 | |
| | |
Hydro-Quebec (Canada) | | | | | | | | |
| | |
Series IO, 8.05%, 7/7/2024 | | | 35,000 | | | | 44,523 | |
| | |
8.50%, 12/1/2029 | | | 50,000 | | | | 80,223 | |
| | |
Iberdrola International BV (Spain) | | | | | | | | |
| | |
5.81%, 3/15/2025 | | | 30,000 | | | | 35,751 | |
| | |
6.75%, 7/15/2036 | | | 178,000 | | | | 254,253 | |
| | |
Indiana Michigan Power Co. 6.05%, 3/15/2037 | | | 240,000 | | | | 337,802 | |
| | |
Series K, 4.55%, 3/15/2046 | | | 150,000 | | | | 191,612 | |
| | |
Interstate Power and Light Co. 6.25%, 7/15/2039 | | | 202,000 | | | | 291,530 | |
| | |
NextEra Energy Capital Holdings, Inc. | | | | | | | | |
| | |
2.40%, 9/1/2021 | | | 172,000 | | | | 175,592 | |
| | |
3.20%, 2/25/2022 | | | 148,000 | | | | 154,147 | |
| | |
2.90%, 4/1/2022 | | | 124,000 | | | | 128,840 | |
| | |
3.30%, 8/15/2022 | | | 120,000 | | | | 126,541 | |
SEE NOTES TO FINANCIAL STATEMENTS.
| | | | | | | | |
| | | |
| AUGUST 31, 2020 | | J.P. MORGAN EXCHANGE-TRADED FUNDS | | | | | 121 | |
JPMorgan U.S. Aggregate Bond ETF
SCHEDULE OF PORTFOLIO INVESTMENTS
AS OF AUGUST 31, 2020 (Unaudited) (continued)
| | | | | | | | |
| INVESTMENTS | | PRINCIPAL
AMOUNT ($) | | | VALUE ($) | |
Corporate Bonds — continued | | | | | | | | |
|
Electric Utilities — continued | |
| | |
2.80%, 1/15/2023 | | | 378,000 | | | | 397,602 | |
| | |
3.15%, 4/1/2024 | | | 300,000 | | | | 325,754 | |
| | |
3.25%, 4/1/2026 | | | 610,000 | | | | 686,682 | |
| | |
3.55%, 5/1/2027 | | | 156,000 | | | | 178,826 | |
| | |
3.50%, 4/1/2029 | | | 150,000 | | | | 171,921 | |
| | |
2.75%, 11/1/2029 | | | 1,226,000 | | | | 1,341,479 | |
| | |
Ohio Power Co. | | | | | | | | |
| | |
Series P, 2.60%, 4/1/2030 | | | 83,000 | | | | 90,893 | |
| | |
4.15%, 4/1/2048 | | | 25,000 | | | | 31,125 | |
| | |
Oklahoma Gas & Electric Co. | | | | | | | | |
| | |
3.30%, 3/15/2030 | | | 420,000 | | | | 472,621 | |
| | |
Southwestern Electric Power Co. | | | | | | | | |
| | |
6.20%, 3/15/2040 | | | 39,000 | | | | 53,067 | |
| | |
Series J, 3.90%, 4/1/2045 | | | 65,000 | | | | 73,284 | |
| | |
Union Electric Co. 3.90%, 9/15/2042 | | | 908,000 | | | | 1,085,856 | |
| | |
Xcel Energy, Inc. | | | | | | | | |
| | |
2.60%, 12/1/2029 | | | 1,402,000 | | | | 1,517,571 | |
| | |
3.50%, 12/1/2049 | | | 50,000 | | | | 56,817 | |
| | | | | | | | |
| | |
| | | | | | | 10,993,618 | |
| | | | | | | | |
|
Electrical Equipment — 0.0% (d) | |
| | |
Legrand France SA (France) 8.50%, 2/15/2025 | | | 154,000 | | | | 204,555 | |
| | | | | | | | |
|
Electronic Equipment, Instruments & Components — 0.2% | |
| | |
Allegion US Holding Co., Inc. | | | | | | | | |
| | |
3.20%, 10/1/2024 | | | 214,000 | | | | 227,217 | |
| | |
3.55%, 10/1/2027 | | | 126,000 | | | | 136,655 | |
| | |
Amphenol Corp. | | | | | | | | |
| | |
3.20%, 4/1/2024 | | | 56,000 | | | | 60,399 | |
| | |
2.05%, 3/1/2025 | | | 570,000 | | | | 600,276 | |
| | |
2.80%, 2/15/2030 | | | 127,000 | | | | 139,754 | |
| | | | | | | | |
| | |
| | | | | | | 1,164,301 | |
| | | | | | | | |
|
Energy Equipment & Services — 0.0% (d) | |
| | |
Helmerich & Payne, Inc. | | | | | | | | |
| | |
4.65%, 3/15/2025 | | | 176,000 | | | | 193,546 | |
| | |
4.65%, 3/15/2025 (a) | | | 30,000 | | | | 32,991 | |
| | | | | | | | |
| | |
| | | | | | | 226,537 | |
| | | | | | | | |
|
Entertainment — 0.4% | |
| | |
Activision Blizzard, Inc. | | | | | | | | |
| | |
2.30%, 9/15/2021 | | | 87,000 | | | | 88,633 | |
| | |
2.60%, 6/15/2022 | | | 222,000 | | | | 230,764 | |
| | |
3.40%, 9/15/2026 | | | 310,000 | | | | 354,545 | |
| | |
3.40%, 6/15/2027 | | | 200,000 | | | | 225,451 | |
| | |
4.50%, 6/15/2047 | | | 221,000 | | | | 285,219 | |
| | |
2.50%, 9/15/2050 | | | 288,000 | | | | 270,187 | |
| | | | | | | | |
| INVESTMENTS | | PRINCIPAL
AMOUNT ($) | | | VALUE ($) | |
| | | | | | | | |
|
Entertainment — continued | |
| | |
Electronic Arts, Inc. 4.80%, 3/1/2026 | | | 787,000 | | | | 935,289 | |
| | | | | | | | |
| | |
| | | | | | | 2,390,088 | |
| | | | | | | | |
|
Equity Real Estate Investment Trusts (REITs) — 0.2% | |
| | |
American Tower Corp. | | | | | | | | |
| | |
4.70%, 3/15/2022 | | | 150,000 | | | | 159,574 | |
| | |
3.50%, 1/31/2023 | | | 79,000 | | | | 84,502 | |
| | |
3.38%, 5/15/2024 | | | 336,000 | | | | 366,636 | |
| | |
1.30%, 9/15/2025 | | | 70,000 | | | | 71,110 | |
| | |
3.13%, 1/15/2027 | | | 288,000 | | | | 317,197 | |
| | |
3.80%, 8/15/2029 | | | 36,000 | | | | 41,669 | |
| | | | | | | | |
| | |
| | | | | | | 1,040,688 | |
| | | | | | | | |
|
Food & Staples Retailing — 0.6% | |
| | |
Ahold Finance USA LLC (Netherlands) 6.88%, 5/1/2029 | | | 94,000 | | | | 132,403 | |
| | |
Koninklijke Ahold Delhaize NV (Netherlands) 5.70%, 10/1/2040 | | | 491,000 | | | | 689,863 | |
| | |
Sysco Corp. | | | | | | | | |
| | |
2.60%, 6/12/2022 | | | 53,000 | | | | 54,797 | |
| | |
3.55%, 3/15/2025 | | | 155,000 | | | | 169,082 | |
| | |
5.65%, 4/1/2025 | | | 25,000 | | | | 29,577 | |
| | |
3.75%, 10/1/2025 | | | 298,000 | | | | 328,803 | |
| | |
3.30%, 7/15/2026 | | | 317,000 | | | | 343,994 | |
| | |
3.25%, 7/15/2027 | | | 614,000 | | | | 660,826 | |
| | |
2.40%, 2/15/2030 | | | 265,000 | | | | 265,826 | |
| | |
5.38%, 9/21/2035 | | | 316,000 | | | | 389,325 | |
| | |
6.60%, 4/1/2040 | | | 328,000 | | | | 436,256 | |
| | |
4.85%, 10/1/2045 | | | 125,000 | | | | 139,401 | |
| | |
4.50%, 4/1/2046 | | | 25,000 | | | | 26,628 | |
| | |
4.45%, 3/15/2048 | | | 50,000 | | | | 54,242 | |
| | |
3.30%, 2/15/2050 | | | 446,000 | | | | 413,010 | |
| | |
6.60%, 4/1/2050 | | | 59,000 | | | | 81,201 | |
| | | | | | | | |
| | |
| | | | | | | 4,215,234 | |
| | | | | | | | |
|
Food Products — 0.1% | |
| | |
Flowers Foods, Inc. | | | | | | | | |
| | |
4.38%, 4/1/2022 | | | 36,000 | | | | 37,360 | |
| | |
3.50%, 10/1/2026 | | | 101,000 | | | | 108,869 | |
| | |
Hormel Foods Corp. 1.80%, 6/11/2030 | | | 374,000 | | | | 387,505 | |
| | | | | | | | |
| | |
| | | | | | | 533,734 | |
| | | | | | | | |
|
Gas Utilities — 0.2% | |
| | |
Dominion Energy Gas Holdings LLC | | | | | | | | |
| | |
3.55%, 11/1/2023 | | | 48,000 | | | | 51,985 | |
| | |
3.60%, 12/15/2024 | | | 25,000 | | | | 27,769 | |
| | |
Series B, 3.00%, 11/15/2029 | | | 72,000 | | | | 79,675 | |
SEE NOTES TO FINANCIAL STATEMENTS.
| | | | | | |
| | | |
| 122 | | | | J.P. MORGAN EXCHANGE-TRADED FUNDS | | AUGUST 31, 2020 |
| | | | | | | | |
| INVESTMENTS | | PRINCIPAL
AMOUNT ($) | | | VALUE ($) | |
Corporate Bonds — continued | | | | | | | | |
|
Gas Utilities — continued | |
| | |
National Fuel Gas Co. | | | | | | | | |
| | |
3.75%, 3/1/2023 | | | 244,000 | | | | 252,823 | |
| | |
5.20%, 7/15/2025 | | | 50,000 | | | | 55,348 | |
| | |
5.50%, 1/15/2026 | | | 622,000 | | | | 681,807 | |
| | |
3.95%, 9/15/2027 | | | 350,000 | | | | 356,096 | |
| | | | | | | | |
| | |
| | | | | | | 1,505,503 | |
| | | | | | | | |
|
Health Care Equipment & Supplies — 0.4% | |
| | |
Baxter International, Inc. | | | | | | | | |
| | |
1.70%, 8/15/2021 | | | 26,000 | | | | 26,316 | |
| | |
2.60%, 8/15/2026 | | | 360,000 | | | | 394,809 | |
| | |
3.50%, 8/15/2046 | | | 120,000 | | | | 136,189 | |
| | |
Danaher Corp. 3.35%, 9/15/2025 | | | 50,000 | | | | 55,882 | |
| | |
DH Europe Finance II SARL | | | | | | | | |
| | |
2.05%, 11/15/2022 | | | 142,000 | | | | 146,644 | |
| | |
2.20%, 11/15/2024 | | | 25,000 | | | | 26,474 | |
| | |
2.60%, 11/15/2029 | | | 267,000 | | | | 290,785 | |
| | |
Edwards Lifesciences Corp. 4.30%, 6/15/2028 | | | 495,000 | | | | 596,911 | |
| | |
Koninklijke Philips NV (Netherlands) | | | | | | | | |
| | |
6.88%, 3/11/2038 | | | 263,000 | | | | 399,209 | |
| | |
5.00%, 3/15/2042 | | | 682,000 | | | | 893,580 | |
| | | | | | | | |
| | |
| | | | | | | 2,966,799 | |
| | | | | | | | |
|
Health Care Providers & Services — 0.2% | |
| | |
AmerisourceBergen Corp. | | | | | | | | |
| | |
3.40%, 5/15/2024 | | | 500,000 | | | | 543,552 | |
| | |
3.25%, 3/1/2025 | | | 55,000 | | | | 60,525 | |
| | |
3.45%, 12/15/2027 | | | 429,000 | | | | 490,601 | |
| | |
4.25%, 3/1/2045 | | | 76,000 | | | | 86,767 | |
| | |
4.30%, 12/15/2047 | | | 175,000 | | | | 204,174 | |
| | | | | | | | |
| | |
| | | | | | | 1,385,619 | |
| | | | | | | | |
|
Hotels, Restaurants & Leisure — 0.1% | |
| | |
Choice Hotels International, Inc. | | | | | | | | |
| | |
3.70%, 12/1/2029 | | | 315,000 | | | | 329,583 | |
| | |
3.70%, 1/15/2031 | | | 292,000 | | | | 308,005 | |
| | | | | | | | |
| | |
| | | | | | | 637,588 | |
| | | | | | | | |
|
Household Durables — 0.1% | |
| | |
Harman International Industries, Inc. 4.15%, 5/15/2025 | | | 100,000 | | | | 110,963 | |
NVR, Inc. | | | | | | | | |
| | |
3.95%, 9/15/2022 | | | 230,000 | | | | 242,964 | |
| | |
3.00%, 5/15/2030 | | | 147,000 | | | | 159,535 | |
| | | | | | | | |
| | |
| | | | | | | 513,462 | |
| | | | | | | | |
| | | | | | | | |
| INVESTMENTS | | PRINCIPAL
AMOUNT ($) | | | VALUE ($) | |
| | | | | | | | |
|
Household Products — 0.3% | |
| | |
Church & Dwight Co., Inc. | | | | | | | | |
| | |
2.45%, 8/1/2022 | | | 109,000 | | | | 112,646 | |
| | |
2.88%, 10/1/2022 (c) | | | 102,000 | | | | 106,819 | |
| | |
3.15%, 8/1/2027 | | | 312,000 | | | | 343,764 | |
| | |
3.95%, 8/1/2047 | | | 240,000 | | | | 285,591 | |
| | |
Clorox Co. (The) | | | | | | | | |
| | |
3.80%, 11/15/2021 | | | 36,000 | | | | 37,448 | |
| | |
3.05%, 9/15/2022 | | | 234,000 | | | | 244,997 | |
| | |
3.50%, 12/15/2024 | | | 685,000 | | | | 762,754 | |
| | |
3.90%, 5/15/2028 | | | 42,000 | | | | 49,756 | |
| | | | | | | | |
| | |
| | | | | | | 1,943,775 | |
| | | | | | | | |
|
Independent Power and Renewable Electricity Producers — 0.0% (d) | |
| | |
Enel Generacion Chile SA (Chile) 4.25%, 4/15/2024 | | | 224,000 | | | | 245,943 | |
| | | | | | | | |
|
Industrial Conglomerates — 0.1% | |
| | |
Carlisle Cos., Inc. | | | | | | | | |
| | |
3.75%, 11/15/2022 | | | 217,000 | | | | 227,400 | |
| | |
3.50%, 12/1/2024 | | | 100,000 | | | | 109,006 | |
| | |
3.75%, 12/1/2027 | | | 298,000 | | | | 337,096 | |
| | |
2.75%, 3/1/2030 | | | 179,000 | | | | 189,851 | |
| | |
Pentair Finance SARL 4.50%, 7/1/2029 | | | 129,000 | | | | 145,224 | |
| | | | | | | | |
| | |
| | | | | | | 1,008,577 | |
| | | | | | | | |
|
Interactive Media & Services — 0.2% | |
| | |
Alphabet, Inc. 3.38%, 2/25/2024 | | | 422,000 | | | | 465,580 | |
| | |
2.00%, 8/15/2026 | | | 1,130,000 | | | | 1,214,205 | |
| | | | | | | | |
| | |
| | | | | | | 1,679,785 | |
| | | | | | | | |
|
Internet & Direct Marketing Retail — 0.7% | |
| | |
Alibaba Group Holding Ltd. (China) | | | | | | | | |
| | |
2.80%, 6/6/2023 | | | 200,000 | | | | 211,529 | |
| | |
4.50%, 11/28/2034 | | | 200,000 | | | | 252,791 | |
| | |
4.00%, 12/6/2037 | | | 835,000 | | | | 990,805 | |
| | |
4.40%, 12/6/2057 | | | 1,600,000 | | | | 2,172,949 | |
| | |
Booking Holdings, Inc. | | | | | | | | |
| | |
2.75%, 3/15/2023 | | | 385,000 | | | | 405,445 | |
| | |
3.65%, 3/15/2025 | | | 126,000 | | | | 139,984 | |
| | |
4.10%, 4/13/2025 | | | 26,000 | | | | 29,544 | |
| | |
3.60%, 6/1/2026 | | | 59,000 | | | | 66,252 | |
| | |
3.55%, 3/15/2028 | | | 110,000 | | | | 122,640 | |
| | |
4.63%, 4/13/2030 | | | 70,000 | | | | 84,617 | |
| | |
JD.com, Inc. (China) 4.13%, 1/14/2050 | | | 450,000 | | | | 508,905 | |
| | | | | | | | |
| | |
| | | | | | | 4,985,461 | |
| | | | | | | | |
SEE NOTES TO FINANCIAL STATEMENTS.
| | | | | | | | |
| | | |
| AUGUST 31, 2020 | | J.P. MORGAN EXCHANGE-TRADED FUNDS | | | | | 123 | |
JPMorgan U.S. Aggregate Bond ETF
SCHEDULE OF PORTFOLIO INVESTMENTS
AS OF AUGUST 31, 2020 (Unaudited) (continued)
| | | | | | | | |
| INVESTMENTS | | PRINCIPAL
AMOUNT ($) | | | VALUE ($) | |
Corporate Bonds — continued | | | | | | | | |
|
IT Services — 0.4% | |
| | |
Broadridge Financial Solutions, Inc. 3.40%, 6/27/2026 | | | 336,000 | | | | 377,367 | |
| | |
2.90%, 12/1/2029 | | | 126,000 | | | | 137,418 | |
| | |
Mastercard, Inc. | | | | | | | | |
| | |
2.00%, 11/21/2021 | | | 100,000 | | | | 101,990 | |
| | |
3.38%, 4/1/2024 | | | 86,000 | | | | 95,071 | |
| | |
2.00%, 3/3/2025 | | | 350,000 | | | | 373,622 | |
| | |
2.95%, 11/21/2026 | | | 75,000 | | | | 84,808 | |
| | |
3.50%, 2/26/2028 | | | 110,000 | | | | 128,485 | |
| | |
2.95%, 6/1/2029 | | | 153,000 | | | | 173,155 | |
| | |
3.35%, 3/26/2030 | | | 126,000 | | | | 148,061 | |
| | |
3.80%, 11/21/2046 | | | 702,000 | | | | 863,273 | |
| | |
3.95%, 2/26/2048 | | | 180,000 | | | | 227,908 | |
| | |
3.65%, 6/1/2049 | | | 48,000 | | | | 58,427 | |
| | | | | | | | |
| | |
| | | | | | | 2,769,585 | |
| | | | | | | | |
|
Leisure Products — 0.2% | |
| | |
Hasbro, Inc. | | | | | | | | |
| | |
3.00%, 11/19/2024 | | | 26,000 | | | | 27,438 | |
| | |
3.55%, 11/19/2026 | | | 141,000 | | | | 148,590 | |
| | |
3.50%, 9/15/2027 | | | 188,000 | | | | 193,908 | |
| | |
3.90%, 11/19/2029 | | | 30,000 | | | | 31,479 | |
| | |
6.35%, 3/15/2040 | | | 585,000 | | | | 690,768 | |
| | | | | | | | |
| | |
| | | | | | | 1,092,183 | |
| | | | | | | | |
|
Life Sciences Tools & Services — 0.1% | |
| | |
Agilent Technologies, Inc. | | | | | | | | |
| | |
3.20%, 10/1/2022 | | | 178,000 | | | | 186,790 | |
| | |
3.88%, 7/15/2023 | | | 309,000 | | | | 335,401 | |
| | |
3.05%, 9/22/2026 | | | 40,000 | | | | 44,240 | |
| | |
2.75%, 9/15/2029 | | | 260,000 | | | | 281,631 | |
| | | | | | | | |
| | |
| | | | | | | 848,062 | |
| | | | | | | | |
|
Machinery — 0.1% | |
| | |
IDEX Corp. | | | | | | | | |
| | |
4.20%, 12/15/2021 | | | 50,000 | | | | 51,711 | |
| | |
3.00%, 5/1/2030 | | | 295,000 | | | | 323,154 | |
| | |
Oshkosh Corp. | | | | | | | | |
| | |
3.10%, 3/1/2030 | | | 125,000 | | | | 132,064 | |
| | | | | | | | |
| | |
| | | | | | | 506,929 | |
| | | | | | | | |
|
Metals & Mining — 2.3% | |
| | |
Barrick Gold Corp. (Canada) | | | | | | | | |
| | |
6.45%, 10/15/2035 | | | 95,000 | | | | 129,709 | |
| | |
5.25%, 4/1/2042 | | | 127,000 | | | | 174,116 | |
| | | | | | | | |
| INVESTMENTS | | PRINCIPAL
AMOUNT ($) | | | VALUE ($) | |
| | | | | | | | |
|
Metals & Mining — continued | |
| | |
Barrick North America Finance LLC (Canada) | | | | | | | | |
| | |
5.70%, 5/30/2041 | | | 192,000 | | | | 270,637 | |
| | |
5.75%, 5/1/2043 | | | 971,000 | | | | 1,411,474 | |
| | |
Barrick PD Australia Finance Pty. Ltd. (Canada) 5.95%, 10/15/2039 | | | 97,000 | | | | 138,586 | |
| | |
Kinross Gold Corp. (Canada) | | | | | | | | |
| | |
5.13%, 9/1/2021 | | | 205,000 | | | | 211,668 | |
| | |
5.95%, 3/15/2024 | | | 75,000 | | | | 85,861 | |
| | |
4.50%, 7/15/2027 | | | 330,000 | | | | 376,683 | |
| | |
Newmont Corp. | | | | | | | | |
| | |
3.50%, 3/15/2022 | | | 372,000 | | | | 386,034 | |
| | |
3.70%, 3/15/2023 | | | 302,000 | | | | 320,430 | |
| | |
2.80%, 10/1/2029 | | | 338,000 | | | | 366,887 | |
| | |
2.25%, 10/1/2030 | | | 579,000 | | | | 605,124 | |
| | |
5.88%, 4/1/2035 | | | 314,000 | | | | 451,711 | |
| | |
6.25%, 10/1/2039 | | | 101,000 | | | | 149,593 | |
| | |
4.88%, 3/15/2042 | | | 233,000 | | | | 321,182 | |
| | |
5.45%, 6/9/2044 | | | 400,000 | | | | 563,651 | |
| | |
Reliance Steel & Aluminum Co. 4.50%, 4/15/2023 | | | 168,000 | | | | 181,107 | |
| | |
Rio Tinto Alcan, Inc. (Canada) | | | | | | | | |
| | |
7.25%, 3/15/2031 | | | 476,000 | | | | 704,297 | |
| | |
6.13%, 12/15/2033 | | | 90,000 | | | | 131,560 | |
| | |
5.75%, 6/1/2035 | | | 71,000 | | | | 103,730 | |
| | |
Rio Tinto Finance USA Ltd. (Australia) 5.20%, 11/2/2040 | | | 480,000 | | | | 684,910 | |
| | |
Rio Tinto Finance USA plc (Australia) | | | | | | | | |
| | |
4.75%, 3/22/2042 | | | 61,000 | | | | 83,178 | |
| | |
4.13%, 8/21/2042 | | | 1,370,000 | | | | 1,755,328 | |
| | |
Southern Copper Corp. (Peru) | | | | | | | | |
| | |
3.88%, 4/23/2025 | | | 527,000 | | | | 583,353 | |
| | |
5.25%, 11/8/2042 | | | 228,000 | | | | 292,042 | |
| | |
5.88%, 4/23/2045 | | | 1,214,000 | | | | 1,686,945 | |
| | |
Vale Overseas Ltd. (Brazil) | | | | | | | | |
| | |
6.25%, 8/10/2026 | | | 554,000 | | | | 660,520 | |
| | |
6.88%, 11/21/2036 | | | 125,000 | | | | 165,861 | |
| | |
6.88%, 11/10/2039 | | | 263,000 | | | | 354,594 | |
| | |
Vale SA (Brazil) 5.63%, 9/11/2042 | | | 2,066,000 | | | | 2,474,534 | |
| | | | | | | | |
| | |
| | | | | | | 15,825,305 | |
| | | | | | | | |
|
Multiline Retail — 0.2% | |
| | |
Dollar General Corp. 3.25%, 4/15/2023 | | | 427,000 | | | | 453,422 | |
| | |
4.15%, 11/1/2025 | | | 259,000 | | | | 299,433 | |
| | |
3.88%, 4/15/2027 | | | 120,000 | | | | 138,501 | |
| | |
4.13%, 5/1/2028 | | | 230,000 | | | | 271,451 | |
SEE NOTES TO FINANCIAL STATEMENTS.
| | | | | | |
| | | |
| 124 | | | | J.P. MORGAN EXCHANGE-TRADED FUNDS | | AUGUST 31, 2020 |
| | | | | | | | |
| INVESTMENTS | | PRINCIPAL
AMOUNT ($) | | | VALUE ($) | |
Corporate Bonds — continued | | | | | | | | |
|
Multiline Retail — continued | |
| | |
3.50%, 4/3/2030 | | | 325,000 | | | | 372,147 | |
| | |
4.13%, 4/3/2050 | | | 75,000 | | | | 90,603 | |
| | | | | | | | |
| | |
| | | | | | | 1,625,557 | |
| | | | | | | | |
|
Multi-Utilities — 0.3% | |
| | |
Ameren Corp. | | | | | | | | |
| | |
2.50%, 9/15/2024 | | | 349,000 | | | | 372,806 | |
| | |
3.50%, 1/15/2031 | | | 61,000 | | | | 70,139 | |
| | |
Dominion Energy, Inc. | | | | | | | | |
| | |
Series C, 2.00%, 8/15/2021 | | | 26,000 | | | | 26,359 | |
| | |
Series B, 2.75%, 9/15/2022 | | | 300,000 | | | | 311,093 | |
| | |
3.90%, 10/1/2025 | | | 25,000 | | | | 28,567 | |
| | |
Series D, 2.85%, 8/15/2026 | | | 55,000 | | | | 60,550 | |
| | |
4.25%, 6/1/2028 | | | 25,000 | | | | 29,469 | |
| | |
Series C, 3.38%, 4/1/2030 | | | 267,000 | | | | 303,870 | |
| | |
Series E, 6.30%, 3/15/2033 | | | 127,000 | | | | 172,213 | |
| | |
Series F, 5.25%, 8/1/2033 | | | 25,000 | | | | 31,656 | |
| | |
Series B, 5.95%, 6/15/2035 | | | 50,000 | | | | 68,695 | |
| | |
Series C, 4.90%, 8/1/2041 | | | 94,000 | | | | 121,180 | |
| | |
Series A, 4.60%, 3/15/2049 | | | 127,000 | | | | 169,951 | |
| | | | | | | | |
| | |
| | | | | | | 1,766,548 | |
| | | | | | | | |
|
Oil, Gas & Consumable Fuels — 3.2% | |
| | |
Burlington Resources LLC | | | | | | | | |
| | |
7.20%, 8/15/2031 | | | 39,000 | | | | 56,329 | |
| | |
7.40%, 12/1/2031 | | | 60,000 | | | | 88,543 | |
| | |
5.95%, 10/15/2036 | | | 376,000 | | | | 525,130 | |
| | |
CNOOC Petroleum North America ULC (China) | | | | | | | | |
| | |
7.88%, 3/15/2032 | | | 135,000 | | | | 210,576 | |
| | |
5.88%, 3/10/2035 | | | 29,000 | | | | 41,798 | |
| | |
6.40%, 5/15/2037 | | | 122,000 | | | | 179,306 | |
| | |
7.50%, 7/30/2039 | | | 40,000 | | | | 67,215 | |
| | |
Conoco Funding Co. 7.25%, 10/15/2031 | | | 151,000 | | | | 225,829 | |
| | |
ConocoPhillips | | | | | | | | |
| | |
5.90%, 10/15/2032 | | | 123,000 | | | | 171,199 | |
| | |
6.50%, 2/1/2039 | | | 50,000 | | | | 75,545 | |
| | |
ConocoPhillips Co. | | | | | | | | |
| | |
2.40%, 12/15/2022 | | | 435,000 | | | | 452,264 | |
| | |
3.35%, 11/15/2024 | | | 197,000 | | | | 217,747 | |
| | |
4.95%, 3/15/2026 | | | 300,000 | | | | 360,770 | |
| | |
6.95%, 4/15/2029 | | | 132,000 | | | | 184,821 | |
| | |
4.30%, 11/15/2044 | | | 947,000 | | | | 1,196,480 | |
| | |
5.95%, 3/15/2046 | | | 33,000 | | | | 49,974 | |
| | | | | | | | |
| INVESTMENTS | | PRINCIPAL
AMOUNT ($) | | | VALUE ($) | |
| | | | | | | | |
|
Oil, Gas & Consumable Fuels — continued | |
| | |
Ecopetrol SA (Colombia) | | | | | | | | |
| | |
4.13%, 1/16/2025 | | | 119,000 | | | | 125,902 | |
| | |
7.38%, 9/18/2043 | | | 114,000 | | | | 148,300 | |
| | |
5.88%, 5/28/2045 | | | 87,000 | | | | 98,738 | |
| | |
Eni USA, Inc. (Italy) 7.30%, 11/15/2027 | | | 160,000 | | | | 202,516 | |
| | |
EOG Resources, Inc. | | | | | | | | |
| | |
2.63%, 3/15/2023 | | | 39,000 | | | | 40,997 | |
| | |
4.15%, 1/15/2026 | | | 600,000 | | | | 695,224 | |
| | |
4.38%, 4/15/2030 (c) | | | 700,000 | | | | 839,634 | |
| | |
3.90%, 4/1/2035 | | | 25,000 | | | | 29,308 | |
| | |
4.95%, 4/15/2050 | | | 162,000 | | | | 207,182 | |
| | |
Equinor ASA (Norway) | | | | | | | | |
| | |
3.15%, 1/23/2022 | | | 60,000 | | | | 62,318 | |
| | |
2.45%, 1/17/2023 | | | 63,000 | | | | 66,027 | |
| | |
2.65%, 1/15/2024 | | | 154,000 | | | | 164,726 | |
| | |
3.70%, 3/1/2024 | | | 40,000 | | | | 44,525 | |
| | |
3.63%, 9/10/2028 (c) | | | 40,000 | | | | 46,857 | |
| | |
3.95%, 5/15/2043 | | | 39,000 | | | | 45,732 | |
| | |
3.25%, 11/18/2049 | | | 74,000 | | | | 79,691 | |
| | |
3.70%, 4/6/2050 | | | 58,000 | | | | 67,400 | |
| | |
HollyFrontier Corp. 5.88%, 4/1/2026 | | | 785,000 | | | | 862,826 | |
| | |
Magellan Midstream Partners LP | | | | | | | | |
| | |
5.00%, 3/1/2026 | | | 650,000 | | | | 760,109 | |
| | |
3.25%, 6/1/2030 | | | 25,000 | | | | 27,003 | |
| | |
5.15%, 10/15/2043 | | | 26,000 | | | | 30,411 | |
| | |
4.25%, 9/15/2046 | | | 100,000 | | | | 107,343 | |
| | |
4.20%, 10/3/2047 | | | 50,000 | | | | 53,403 | |
| | |
3.95%, 3/1/2050 | | | 1,000,000 | | | | 1,053,959 | |
Petroleos Mexicanos (Mexico) 6.95%, 1/28/2060 (a) | | | 21,000 | | | | 17,523 | |
| | |
Phillips | | | | | | | | |
| | |
66 4.30%, 4/1/2022 | | | 879,000 | | | | 931,360 | |
| | |
3.70%, 4/6/2023 | | | 200,000 | | | | 215,280 | |
| | |
3.90%, 3/15/2028 (c) | | | 1,142,000 | | | | 1,298,277 | |
| | |
2.15%, 12/15/2030 | | | 572,000 | | | | 562,372 | |
| | |
4.65%, 11/15/2034 | | | 465,000 | | | | 570,312 | |
| | |
5.88%, 5/1/2042 | | | 162,000 | | | | 217,496 | |
| | |
4.88%, 11/15/2044 | | | 240,000 | | | | 291,393 | |
Pioneer Natural Resources Co. 4.45%, 1/15/2026 | | | 368,000 | | | | 427,930 | |
| | |
Suncor Energy, Inc. (Canada) | | | | | | | | |
| | |
5.95%, 5/15/2035 | | | 850,000 | | | | 1,057,536 | |
4.00%, 11/15/2047 | | | 2,211,000 | | | | 2,391,074 | |
Tosco Corp. 8.13%, 2/15/2030 | | | 26,000 | | | | 38,335 | |
SEE NOTES TO FINANCIAL STATEMENTS.
| | | | | | | | |
| | | |
| AUGUST 31, 2020 | | J.P. MORGAN EXCHANGE-TRADED FUNDS | | | | | 125 | |
JPMorgan U.S. Aggregate Bond ETF
SCHEDULE OF PORTFOLIO INVESTMENTS
AS OF AUGUST 31, 2020 (Unaudited) (continued)
| | | | | | | | |
| INVESTMENTS | | PRINCIPAL
AMOUNT ($) | | | VALUE ($) | |
Corporate Bonds — continued | | | | | | | | |
|
Oil, Gas & Consumable Fuels — continued | |
| | |
Valero Energy Corp. | | | | | | | | |
| | |
2.70%, 4/15/2023 | | | 333,000 | | | | 347,711 | |
| | |
3.65%, 3/15/2025 (c) | | | 519,000 | | | | 570,910 | |
| | |
2.85%, 4/15/2025 | | | 150,000 | | | | 160,456 | |
| | |
3.40%, 9/15/2026 | | | 905,000 | | | | 996,753 | |
| | |
4.35%, 6/1/2028 | | | 224,000 | | | | 256,250 | |
| | |
4.00%, 4/1/2029 | | | 191,000 | | | | 214,823 | |
| | |
7.50%, 4/15/2032 | | | 147,000 | | | | 210,396 | |
| | |
6.63%, 6/15/2037 | | | 210,000 | | | | 282,887 | |
| | |
4.90%, 3/15/2045 | | | 136,000 | | | | 161,314 | |
| | |
Valero Energy Partners LP | | | | | | | | |
| | |
4.38%, 12/15/2026 | | | 287,000 | | | | 330,171 | |
| | |
4.50%, 3/15/2028 | | | 302,000 | | | | 346,649 | |
| | | | | | | | |
| | |
| | | | | | | 21,860,865 | |
| | | | | | | | |
| | | | | | | | |
|
Personal Products — 0.1% | |
| | |
Estee Lauder Cos., Inc. (The) | | | | | | | | |
| | |
2.00%, 12/1/2024 | | | 50,000 | | | | 52,948 | |
| | |
3.15%, 3/15/2027 | | | 160,000 | | | | 181,041 | |
| | |
2.38%, 12/1/2029 | | | 27,000 | | | | 29,009 | |
| | |
2.60%, 4/15/2030 | | | 43,000 | | | | 47,131 | |
| | |
6.00%, 5/15/2037 | | | 130,000 | | | | 189,755 | |
| | |
4.38%, 6/15/2045 | | | 191,000 | | | | 246,216 | |
| | |
4.15%, 3/15/2047 (c) | | | 125,000 | | | | 159,062 | |
| | |
3.13%, 12/1/2049 | | | 81,000 | | | | 90,765 | |
| | | | | | | | |
| | |
| | | | | | | 995,927 | |
| | | | | | | | |
|
Pharmaceuticals — 1.2% | |
| | |
Bristol-Myers Squibb Co. | | | | | | | | |
| | |
3.40%, 7/26/2029 | | | 25,000 | | | | 29,187 | |
| | |
4.13%, 6/15/2039 | | | 212,000 | | | | 272,189 | |
| | |
3.25%, 8/1/2042 | | | 401,000 | | | | 471,681 | |
| | |
4.55%, 2/20/2048 | | | 34,000 | | | | 46,776 | |
| | |
4.25%, 10/26/2049 | | | 621,000 | | | | 830,165 | |
| | |
Johnson & Johnson | | | | | | | | |
| | |
2.25%, 3/3/2022 | | | 83,000 | | | | 85,370 | |
| | |
2.05%, 3/1/2023 | | | 44,000 | | | | 45,763 | |
| | |
2.63%, 1/15/2025 | | | 108,000 | | | | 117,647 | |
| | |
0.55%, 9/1/2025 | | | 36,000 | | | | 36,099 | |
| | |
2.45%, 3/1/2026 | | | 29,000 | | | | 31,834 | |
| | |
2.90%, 1/15/2028 | | | 220,000 | | | | 249,164 | |
| | |
6.95%, 9/1/2029 | | | 50,000 | | | | 73,450 | |
| | |
4.38%, 12/5/2033 | | | 227,000 | | | | 297,592 | |
| | |
3.55%, 3/1/2036 | | | 192,000 | | | | 230,066 | |
| | |
3.63%, 3/3/2037 | | | 170,000 | | | | 207,893 | |
| | | | | | | | |
| INVESTMENTS | | PRINCIPAL
AMOUNT ($) | | | VALUE ($) | |
| | | | | | | | |
|
Pharmaceuticals — continued | |
| | |
5.95%, 8/15/2037 | | | 25,000 | | | | 38,549 | |
| | |
3.40%, 1/15/2038 | | | 286,000 | | | | 338,801 | |
| | |
4.50%, 9/1/2040 | | | 73,000 | | | | 99,026 | |
| | |
4.50%, 12/5/2043 | | | 25,000 | | | | 34,541 | |
| | |
3.70%, 3/1/2046 | | | 699,000 | | | | 871,627 | |
| | |
3.75%, 3/3/2047 | | | 87,000 | | | | 108,971 | |
| | |
3.50%, 1/15/2048 | | | 796,000 | | | | 983,064 | |
| | |
Zoetis, Inc. | | | | | | | | |
| | |
3.25%, 8/20/2021 | | | 43,000 | | | | 44,184 | |
| | |
3.25%, 2/1/2023 | | | 522,000 | | | | 553,243 | |
| | |
4.50%, 11/13/2025 | | | 45,000 | | | | 53,010 | |
| | |
3.00%, 9/12/2027 (c) | | | 625,000 | | | | 695,634 | |
| | |
3.90%, 8/20/2028 | | | 497,000 | | | | 589,951 | |
| | |
2.00%, 5/15/2030 | | | 25,000 | | | | 26,015 | |
| | |
4.70%, 2/1/2043 | | | 219,000 | | | | 289,167 | |
| | |
3.95%, 9/12/2047 | | | 154,000 | | | | 190,132 | |
| | |
4.45%, 8/20/2048 | | | 135,000 | | | | 177,664 | |
| | |
3.00%, 5/15/2050 | | | 173,000 | | | | 186,702 | |
| | | | | | | | |
| | |
| | | | | | | 8,305,157 | |
| | | | | | | | |
|
Professional Services — 0.6% | |
| | |
Thomson Reuters Corp. (Canada) | | | | | | | | |
| | |
4.30%, 11/23/2023 | | | 139,000 | | | | 152,723 | |
| | |
3.35%, 5/15/2026 | | | 600,000 | | | | 665,854 | |
| | |
5.50%, 8/15/2035 | | | 100,000 | | | | 129,626 | |
| | |
5.85%, 4/15/2040 | | | 25,000 | | | | 33,437 | |
| | |
5.65%, 11/23/2043 | | | 1,343,000 | | | | 1,770,807 | |
| | |
Verisk Analytics, Inc. | | | | | | | | |
| | |
4.13%, 9/12/2022 | | | 100,000 | | | | 106,569 | |
| | |
4.00%, 6/15/2025 | | | 325,000 | | | | 372,079 | |
| | |
3.63%, 5/15/2050 | | | 562,000 | | | | 644,800 | |
| | | | | | | | |
| | |
| | | | | | | 3,875,895 | |
| | | | | | | | |
|
Semiconductors & Semiconductor Equipment — 1.0% | |
| | |
Maxim Integrated Products, Inc. | | | | | | | | |
| | |
3.38%, 3/15/2023 | | | 98,000 | | | | 104,009 | |
| | |
3.45%, 6/15/2027 | | | 160,000 | | | | 177,099 | |
| | |
Micron Technology, Inc. | | | | | | | | |
| | |
2.50%, 4/24/2023 | | | 544,000 | | | | 567,596 | |
| | |
4.64%, 2/6/2024 | | | 421,000 | | | | 468,766 | |
| | |
4.98%, 2/6/2026 | | | 398,000 | | | | 464,094 | |
| | |
4.19%, 2/15/2027 | | | 125,000 | | | | 143,473 | |
| | |
5.33%, 2/6/2029 | | | 100,000 | | | | 119,973 | |
| | |
4.66%, 2/15/2030 | | | 210,000 | | | | 244,683 | |
SEE NOTES TO FINANCIAL STATEMENTS.
| | | | | | |
| | | |
| 126 | | | | J.P. MORGAN EXCHANGE-TRADED FUNDS | | AUGUST 31, 2020 |
| | | | | | | | |
| INVESTMENTS | | PRINCIPAL
AMOUNT ($) | | | VALUE ($) | |
Corporate Bonds — continued | | | | | | | | |
|
Semiconductors & Semiconductor Equipment — continued | |
| | |
NVIDIA Corp. | | | | | | | | |
| | |
3.20%, 9/16/2026 | | | 175,000 | | | | 197,854 | |
| | |
2.85%, 4/1/2030 | | | 559,000 | | | | 621,475 | |
| | |
3.50%, 4/1/2040 | | | 209,000 | | | | 240,782 | |
| | |
3.50%, 4/1/2050 | | | 257,000 | | | | 291,736 | |
| | |
3.70%, 4/1/2060 | | | 1,170,000 | | | | 1,367,956 | |
| | |
Texas Instruments, Inc. | | | | | | | | |
| | |
1.85%, 5/15/2022 | | | 25,000 | | | | 25,622 | |
| | |
2.25%, 5/1/2023 | | | 65,000 | | | | 68,048 | |
| | |
2.63%, 5/15/2024 | | | 40,000 | | | | 43,000 | |
| | |
2.90%, 11/3/2027 | | | 230,000 | | | | 258,617 | |
| | |
2.25%, 9/4/2029 | | | 50,000 | | | | 53,752 | |
| | |
1.75%, 5/4/2030 | | | 62,000 | | | | 63,965 | |
| | |
3.88%, 3/15/2039 | | | 754,000 | | | | 947,038 | |
| | |
4.15%, 5/15/2048 | | | 469,000 | | | | 617,952 | |
| | | | | | | | |
| | |
| | | | | | | 7,087,490 | |
| | | | | | | | |
|
Software — 0.3% | |
| | |
Cadence Design Systems, Inc. 4.38%, 10/15/2024 | | | 194,000 | | | | 218,558 | |
| | |
Citrix Systems, Inc. | | | | | | | | |
| | |
4.50%, 12/1/2027 | | | 385,000 | | | | 442,756 | |
| | |
3.30%, 3/1/2030 | | | 208,000 | | | | 221,803 | |
| | |
Intuit, Inc. | | | | | | | | |
| | |
0.65%, 7/15/2023 | | | 757,000 | | | | 763,268 | |
| | |
1.35%, 7/15/2027 | | | 324,000 | | | | 331,216 | |
| | | | | | | | |
| | |
| | | | | | | 1,977,601 | |
| | | | | | | | |
| | | | | | | | |
|
Specialty Retail — 0.6% | |
| | |
Best Buy Co., Inc. 4.45%, 10/1/2028 | | | 602,000 | | | | 711,674 | |
| | |
Ross Stores, Inc. | | | | | | | | |
| | |
4.60%, 4/15/2025 | | | 25,000 | | | | 28,853 | |
| | |
4.70%, 4/15/2027 | | | 535,000 | | | | 628,488 | |
| | |
4.80%, 4/15/2030 | | | 120,000 | | | | 144,753 | |
| | |
5.45%, 4/15/2050 | | | 314,000 | | | | 404,952 | |
| | |
TJX Cos., Inc. (The) | | | | | | | | |
| | |
2.50%, 5/15/2023 | | | 645,000 | | | | 675,615 | |
| | |
2.25%, 9/15/2026 | | | 440,000 | | | | 469,993 | |
| | |
3.75%, 4/15/2027 | | | 100,000 | | | | 115,135 | |
| | |
3.88%, 4/15/2030 | | | 447,000 | | | | 531,693 | |
| | |
4.50%, 4/15/2050 | | | 311,000 | | | | 396,408 | |
| | | | | | | | |
| | |
| | | | | | | 4,107,564 | |
| | | | | | | | |
| | | | | | | | |
| INVESTMENTS | | PRINCIPAL
AMOUNT ($) | | | VALUE ($) | |
| | | | | | | | |
|
Technology Hardware, Storage & Peripherals — 0.3% | |
| | |
Seagate HDD Cayman | | | | | | | | |
| | |
4.75%, 6/1/2023 | | | 97,000 | | | | 104,602 | |
| | |
4.88%, 3/1/2024 | | | 1,050,000 | | | | 1,150,198 | |
| | |
4.75%, 1/1/2025 | | | 107,000 | | | | 116,546 | |
| | |
4.88%, 6/1/2027 | | | 182,000 | | | | 203,158 | |
| | |
5.75%, 12/1/2034 | | | 378,000 | | | | 430,217 | |
| | | | | | | | |
| | |
| | | | | | | 2,004,721 | |
| | | | | | | | |
|
Textiles, Apparel & Luxury Goods — 0.2% | |
| | |
NIKE, Inc. | | | | | | | | |
| | |
2.25%, 5/1/2023 | | | 72,000 | | | | 75,140 | |
| | |
2.40%, 3/27/2025 | | | 44,000 | | | | 47,450 | |
| | |
2.38%, 11/1/2026 | | | 125,000 | | | | 136,407 | |
| | |
2.85%, 3/27/2030 | | | 25,000 | | | | 27,929 | |
| | |
3.63%, 5/1/2043 | | | 306,000 | | | | 361,353 | |
| | |
3.88%, 11/1/2045 | | | 80,000 | | | | 97,119 | |
| | |
3.38%, 11/1/2046 | | | 566,000 | | | | 642,139 | |
| | |
3.38%, 3/27/2050 | | | 100,000 | | | | 114,925 | |
| | | | | | | | |
| | |
| | | | | | | 1,502,462 | |
| | | | | | | | |
|
Trading Companies & Distributors — 0.2% | |
| | |
WW Grainger, Inc. 1.85%, 2/15/2025 | | | 400,000 | | | | 419,800 | |
| | |
4.60%, 6/15/2045 | | | 499,000 | | | | 644,104 | |
| | | | | | | | |
| | |
| | | | | | | 1,063,904 | |
| | | | | | | | |
|
Wireless Telecommunication Services — 0.5% | |
| | |
T-Mobile USA, Inc. | | | | | | | | |
| | |
3.88%, 4/15/2030 (a) | | | 1,338,000 | | | | 1,533,130 | |
| | |
4.38%, 4/15/2040 (a) | | | 770,000 | | | | 926,811 | |
| | |
4.50%, 4/15/2050 (a) | | | 1,000,000 | | | | 1,221,272 | |
| | | | | | | | |
| | |
| | | | | | | 3,681,213 | |
| | | | | | | | |
| | |
Total Corporate Bonds
(Cost $182,683,722) | | | | | | | 190,930,543 | |
| | | | | | | | |
Mortgage-Backed Securities — 26.6% | |
| | |
FHLMC Gold Pools, 15 Year | | | | | | | | |
| | |
Pool # G14541, 2.50%, 8/1/2022 | | | 14,063 | | | | 14,719 | |
| | |
Pool # J10548, 4.00%, 8/1/2024 | | | 45,269 | | | | 48,109 | |
| | |
Pool # J15449, 4.00%, 5/1/2026 | | | 167,114 | | | | 177,798 | |
| | |
Pool # G14781, 3.50%, 3/1/2027 | | | 95,378 | | | | 100,968 | |
| | |
Pool # G15201, 4.00%, 5/1/2027 | | | 41,319 | | | | 43,911 | |
| | |
Pool # J20129, 2.50%, 8/1/2027 | | | 145,378 | | | | 152,561 | |
| | |
Pool # G15438, 4.00%, 9/1/2027 | | | 30,310 | | | | 32,238 | |
| | |
Pool # G15602, 2.50%, 11/1/2027 | | | 105,564 | | | | 111,032 | |
| | |
Pool # E09028, 2.00%, 3/1/2028 | | | 156,032 | | | | 162,398 | |
| | |
Pool # J23362, 2.00%, 4/1/2028 | | | 151,399 | | | | 157,575 | |
| | |
Pool # G18466, 2.00%, 5/1/2028 | | | 22,601 | | | | 23,523 | |
| | |
Pool # G18465, 2.50%, 5/1/2028 | | | 43,609 | | | | 45,806 | |
SEE NOTES TO FINANCIAL STATEMENTS.
| | | | | | | | |
| | | |
| AUGUST 31, 2020 | | J.P. MORGAN EXCHANGE-TRADED FUNDS | | | | | 127 | |
JPMorgan U.S. Aggregate Bond ETF
SCHEDULE OF PORTFOLIO INVESTMENTS
AS OF AUGUST 31, 2020 (Unaudited) (continued)
| | | | | | | | |
| INVESTMENTS | | PRINCIPAL
AMOUNT ($) | | | VALUE ($) | |
Mortgage-Backed Securities — continued | |
| | |
Pool # G16762, 3.50%, 12/1/2028 | | | 42,151 | | | | 44,569 | |
| | |
Pool # G15601, 2.50%, 1/1/2029 | | | 93,816 | | | | 98,883 | |
| | |
Pool # G14957, 3.50%, 1/1/2029 | | | 197,831 | | | | 211,048 | |
| | |
Pool # G15093, 3.00%, 4/1/2029 | | | 238,408 | | | | 252,164 | |
| | |
Pool # G16570, 4.00%, 7/1/2029 | | | 29,522 | | | | 31,374 | |
| | |
Pool # G18540, 2.50%, 2/1/2030 | | | 59,833 | | | | 62,991 | |
| | |
Pool # G18556, 2.50%, 6/1/2030 | | | 71,650 | | | | 75,432 | |
| | |
Pool # V60840, 3.00%, 6/1/2030 | | | 17,702 | | | | 18,847 | |
| | |
Pool # G16622, 3.00%, 11/1/2030 | | | 72,073 | | | | 75,992 | |
| | |
Pool # G16019, 3.50%, 12/1/2030 | | | 37,158 | | | | 39,336 | |
| | |
Pool # J33545, 3.00%, 1/1/2031 | | | 181,507 | | | | 193,853 | |
| | |
Pool # G16044, 2.50%, 1/1/2032 | | | 188,642 | | | | 198,500 | |
| | |
Pool # J36524, 3.00%, 3/1/2032 | | | 212,406 | | | | 223,753 | |
| | |
Pool # J36660, 3.00%, 3/1/2032 | | | 129,890 | | | | 138,680 | |
| | |
Pool # J38270, 2.50%, 1/1/2033 | | | 648,495 | | | | 681,581 | |
| | |
Pool # G16568, 2.50%, 4/1/2033 | | | 273,098 | | | | 287,031 | |
| | |
Pool # G18706, 3.00%, 9/1/2033 | | | 24,040 | | | | 25,258 | |
| | |
Pool # G18736, 3.00%, 6/1/2034 | | | 70,315 | | | | 73,730 | |
| | |
FHLMC Gold Pools, 20 Year | | | | | | | | |
| | |
Pool # K90941, 3.50%, 8/1/2033 | | | 32,858 | | | | 35,542 | |
| | |
FHLMC Gold Pools, 30 Year | | | | | | | | |
| | |
Pool # V81680, 4.50%, 12/1/2034 | | | 130,738 | | | | 147,060 | |
| | |
Pool # A30892, 5.00%, 1/1/2035 | | | 145,019 | | | | 167,565 | |
| | |
Pool # A39210, 5.50%, 10/1/2035 | | | 43,506 | | | | 51,251 | |
| | |
Pool # V83754, 5.50%, 1/1/2036 | | | 59,096 | | | | 69,222 | |
| | |
Pool # A82255, 5.50%, 9/1/2036 | | | 124,596 | | | | 145,944 | |
| | |
Pool # G03381, 5.50%, 9/1/2037 | | | 39,677 | | | | 46,580 | |
| | |
Pool # A89760, 4.50%, 12/1/2039 | | | 44,282 | | | | 49,809 | |
| | |
Pool # A92197, 5.00%, 5/1/2040 | | | 116,494 | | | | 132,999 | |
| | |
Pool # G06856, 6.00%, 5/1/2040 | | | 7,069 | | | | 8,400 | |
| | |
Pool # A93359, 4.00%, 8/1/2040 | | | 20,177 | | | | 22,245 | |
| | |
Pool # G06222, 4.00%, 1/1/2041 | | | 468,167 | | | | 516,178 | |
| | |
Pool # G07794, 5.50%, 6/1/2041 | | | 18,319 | | | | 21,437 | |
| | |
Pool # Q03514, 4.50%, 9/1/2041 | | | 125,242 | | | | 140,695 | |
| | |
Pool # Q03516, 4.50%, 9/1/2041 | | | 47,044 | | | | 52,848 | |
| | |
Pool # Q04088, 3.50%, 10/1/2041 | | | 50,088 | | | | 54,401 | |
| | |
Pool # Q04688, 4.00%, 11/1/2041 | | | 6,201 | | | | 6,851 | |
| | |
Pool # G08477, 3.50%, 2/1/2042 | | | 18,220 | | | | 19,789 | |
| | |
Pool # Q06771, 3.00%, 3/1/2042 | | | 69,656 | | | | 74,771 | |
| | |
Pool # C03858, 3.50%, 4/1/2042 | | | 153,352 | | | | 167,210 | |
| | |
Pool # Q08646, 3.50%, 6/1/2042 | | | 47,015 | | | | 51,054 | |
| | |
Pool # G60737, 4.50%, 8/1/2042 | | | 191,475 | | | | 214,838 | |
| | |
Pool # Q11220, 3.50%, 9/1/2042 | | | 185,916 | | | | 201,885 | |
| | |
Pool # Q13477, 3.00%, 12/1/2042 | | | 204,604 | | | | 219,629 | |
| | |
Pool # Q14321, 3.00%, 12/1/2042 | | | 56,154 | | | | 60,278 | |
| | |
Pool # C04420, 3.00%, 1/1/2043 | | | 293,902 | | | | 315,495 | |
| | | | | | | | |
| INVESTMENTS | | PRINCIPAL
AMOUNT ($) | | | VALUE ($) | |
| | | | | | | | |
| | |
Pool # Q14694, 3.00%, 1/1/2043 | | | 2,069,881 | | | | 2,264,188 | |
| | |
Pool # G61723, 3.50%, 1/1/2043 | | | 107,378 | | | | 120,798 | |
| | |
Pool # Q15020, 4.00%, 1/1/2043 | | | 45,220 | | | | 49,967 | |
| | |
Pool # C09031, 2.50%, 2/1/2043 | | | 182,735 | | | | 195,333 | |
| | |
Pool # C09029, 3.00%, 3/1/2043 | | | 321,650 | | | | 345,269 | |
| | |
Pool # Q17370, 3.00%, 4/1/2043 | | | 226,247 | | | | 248,832 | |
| | |
Pool # V80026, 3.00%, 4/1/2043 | | | 88,934 | | | | 95,419 | |
| | |
Pool # Q17374, 4.00%, 4/1/2043 | | | 134,216 | | | | 153,319 | |
| | |
Pool # Q20542, 3.00%, 7/1/2043 | | | 77,758 | | | | 83,428 | |
| | |
Pool # C09044, 3.50%, 7/1/2043 | | | 34,492 | | | | 37,360 | |
| | |
Pool # G62033, 4.00%, 11/1/2043 | | | 244,273 | | | | 271,350 | |
| | |
Pool # G08599, 3.50%, 8/1/2044 | | | 94,913 | | | | 102,017 | |
| | |
Pool # Q27903, 4.00%, 8/1/2044 | | | 156,649 | | | | 171,412 | |
| | |
Pool # Z40090, 4.50%, 9/1/2044 | | | 63,073 | | | | 70,348 | |
| | |
Pool # G60183, 4.00%, 12/1/2044 | | | 58,033 | | | | 64,470 | |
| | |
Pool # G61769, 4.50%, 12/1/2044 | | | 125,148 | | | | 140,417 | |
| | |
Pool # Q30868, 3.50%, 1/1/2045 | | | 89,864 | | | | 96,590 | |
| | |
Pool # G61617, 4.50%, 1/1/2045 | | | 37,371 | | | | 42,368 | |
| | |
Pool # Q33006, 3.50%, 4/1/2045 | | | 49,343 | | | | 52,902 | |
| | |
Pool # V81760, 4.00%, 5/1/2045 | | | 38,236 | | | | 41,781 | |
| | |
Pool # Q34508, 3.50%, 6/1/2045 | | | 940,873 | | | | 1,008,650 | |
| | |
Pool # G08651, 4.00%, 6/1/2045 | | | 237,846 | | | | 259,898 | |
| | |
Pool # Q33685, 4.00%, 6/1/2045 | | | 63,955 | | | | 69,881 | |
| | |
Pool # G08653, 3.00%, 7/1/2045 | | | 115,891 | | | | 123,094 | |
| | |
Pool # Q35223, 4.00%, 8/1/2045 | | | 24,607 | | | | 26,588 | |
| | |
Pool # G08669, 4.00%, 9/1/2045 | | | 399,409 | | | | 436,424 | |
| | |
Pool # G60480, 4.50%, 11/1/2045 | | | 155,317 | | | | 173,244 | |
| | |
Pool # G08697, 3.00%, 3/1/2046 | | | 960,668 | | | | 1,015,796 | |
| | |
Pool # Q39432, 3.50%, 3/1/2046 | | | 775,691 | | | | 843,694 | |
| | |
Pool # G60506, 3.50%, 4/1/2046 | | | 80,959 | | | | 88,174 | |
| | |
Pool # Q39844, 3.50%, 4/1/2046 | | | 303,232 | | | | 323,983 | |
| | |
Pool # G08703, 4.00%, 4/1/2046 | | | 172,994 | | | | 186,754 | |
| | |
Pool # G61260, 4.50%, 4/1/2046 | | | 45,873 | | | | 51,276 | |
| | |
Pool # G08706, 3.50%, 5/1/2046 | | | 573,731 | | | | 608,975 | |
| | |
Pool # G08710, 3.00%, 6/1/2046 | | | 84,522 | | | | 89,372 | |
| | |
Pool # Q41024, 3.00%, 6/1/2046 | | | 18,215 | | | | 19,675 | |
| | |
Pool # Q42045, 3.50%, 7/1/2046 | | | 50,195 | | | | 54,063 | |
| | |
Pool # G08724, 2.50%, 9/1/2046 | | | 28,439 | | | | 30,107 | |
| | |
Pool # G61070, 3.00%, 9/1/2046 | | | 746,988 | | | | 801,392 | |
| | |
Pool # G61730, 3.00%, 9/1/2046 | | | 254,265 | | | | 272,783 | |
| | |
Pool # Q42921, 3.50%, 9/1/2046 | | | 172,415 | | | | 185,701 | |
| | |
Pool # G61235, 4.50%, 9/1/2046 | | | 51,043 | | | | 57,308 | |
| | |
Pool # Q44608, 4.00%, 10/1/2046 | | | 131,400 | | | | 141,843 | |
| | |
Pool # Q43892, 4.50%, 10/1/2046 | | | 132,954 | | | | 151,748 | |
| | |
Pool # G08736, 2.50%, 12/1/2046 | | | 24,766 | | | | 26,219 | |
| | |
Pool # G08747, 3.00%, 2/1/2047 | | | 363,800 | | | | 384,677 | |
SEE NOTES TO FINANCIAL STATEMENTS.
| | | | | | |
| | | |
| 128 | | | | J.P. MORGAN EXCHANGE-TRADED FUNDS | | AUGUST 31, 2020 |
| | | | | | | | |
| INVESTMENTS | | PRINCIPAL
AMOUNT ($) | | | VALUE ($) | |
Mortgage-Backed Securities — continued | |
| | |
Pool # G61623, 3.00%, 4/1/2047 | | | 54,507 | | | | 57,890 | |
| | |
Pool # G60985, 3.00%, 5/1/2047 | | | 151,982 | | | | 164,156 | |
| | |
Pool # G60996, 3.50%, 5/1/2047 | | | 15,330 | | | | 16,674 | |
| | |
Pool # Q47884, 4.00%, 5/1/2047 | | | 50,876 | | | | 54,550 | |
| | |
Pool # V83233, 4.00%, 6/1/2047 | | | 231,038 | | | | 251,733 | |
| | |
Pool # Q49796, 3.50%, 8/1/2047 | | | 217,431 | | | | 237,140 | |
| | |
Pool # G08775, 4.00%, 8/1/2047 | | | 97,343 | | | | 104,372 | |
| | |
Pool # Q51268, 3.50%, 10/1/2047 | | | 125,243 | | | | 132,442 | |
| | |
Pool # G08791, 3.00%, 12/1/2047 | | | 361,979 | | | | 381,400 | |
| | |
Pool # G61681, 3.00%, 12/1/2047 | | | 18,720 | | | | 19,724 | |
| | |
Pool # Q52866, 3.00%, 12/1/2047 | | | 30,239 | | | | 32,837 | |
| | |
Pool # G08793, 4.00%, 12/1/2047 | | | 89,264 | | | | 95,709 | |
| | |
Pool # G08795, 3.00%, 1/1/2048 | | | 563,798 | | | | 594,046 | |
| | |
Pool # Q53670, 3.50%, 1/1/2048 | | | 217,083 | | | | 229,562 | |
| | |
Pool # Q53751, 3.50%, 1/1/2048 | | | 254,099 | | | | 268,706 | |
| | |
Pool # Q53872, 4.00%, 1/1/2048 | | | 127,701 | | | | 138,879 | |
| | |
Pool # G08799, 3.00%, 2/1/2048 | | | 703,176 | | | | 740,902 | |
| | |
Pool # G08800, 3.50%, 2/1/2048 | | | 14,704 | | | | 15,550 | |
| | |
Pool # G08812, 3.00%, 4/1/2048 | | | 27,171 | | | | 28,618 | |
| | |
Pool # Q55484, 3.50%, 4/1/2048 | | | 811,663 | | | | 857,690 | |
| | |
Pool # G61866, 4.00%, 6/1/2048 | | | 53,852 | | | | 59,238 | |
| | |
Pool # G08829, 3.00%, 7/1/2048 | | | 97,996 | | | | 103,215 | |
| | |
Pool # Q57420, 4.50%, 7/1/2048 | | | 83,530 | | | | 90,688 | |
| | |
Pool # Q58587, 3.50%, 9/1/2048 | | | 16,037 | | | | 16,947 | |
| | |
Pool # G08837, 4.50%, 9/1/2048 | | | 13,704 | | | | 14,819 | |
| | |
Pool # G61607, 4.50%, 9/1/2048 | | | 236,229 | | | | 262,028 | |
| | |
Pool # G08855, 3.00%, 10/1/2048 | | | 117,249 | | | | 123,494 | |
| | |
Pool # G08841, 3.50%, 10/1/2048 | | | 47,845 | | | | 50,558 | |
| | |
Pool # G08842, 4.00%, 10/1/2048 | | | 49,933 | | | | 53,173 | |
| | |
Pool # G61737, 3.50%, 11/1/2048 | | | 458,281 | | | | 496,309 | |
| | |
Pool # V84897, 4.00%, 11/1/2048 | | | 91,805 | | | | 98,181 | |
| | |
Pool # G61885, 4.50%, 11/1/2048 | | | 77,687 | | | | 84,009 | |
| | |
Pool # Q59805, 4.50%, 11/1/2048 | | | 158,628 | | | | 171,537 | |
| | |
Pool # G08853, 4.50%, 12/1/2048 | | | 49,266 | | | | 53,275 | |
| | |
Pool # Q62234, 4.50%, 12/1/2048 | | | 266,956 | | | | 290,876 | |
| | |
Pool # G67718, 4.00%, 1/1/2049 | | | 25,579 | | | | 27,713 | |
| | |
Pool # G08862, 4.00%, 2/1/2049 | | | 78,012 | | | | 83,075 | |
| | |
Pool # Q61487, 4.00%, 2/1/2049 | | | 77,200 | | | | 83,386 | |
| | |
Pool # G08875, 3.00%, 3/1/2049 | | | 79,394 | | | | 83,623 | |
| | |
Pool # V85252, 3.50%, 3/1/2049 | | | 196,727 | | | | 209,028 | |
| | |
Pool # Q62004, 4.00%, 3/1/2049 | | | 87,831 | | | | 95,246 | |
| | |
Pool # Q63195, 3.00%, 4/1/2049 | | | 123,407 | | | | 130,078 | |
| | |
Pool # Q63081, 3.50%, 4/1/2049 | | | 481,509 | | | | 509,390 | |
| | |
Pool # G08874, 5.00%, 4/1/2049 | | | 31,868 | | | | 35,044 | |
| | |
Pool # Q63756, 3.00%, 5/1/2049 | | | 178,705 | | | | 191,671 | |
| | |
Pool # G08876, 3.50%, 5/1/2049 | | | 157,810 | | | | 166,104 | |
| | |
Pool # G08887, 3.00%, 6/1/2049 | | | 115,729 | | | | 121,784 | |
| | | | | | | | |
| INVESTMENTS | | PRINCIPAL
AMOUNT ($) | | | VALUE ($) | |
| | | | | | | | |
| | |
FHLMC UMBS, 15 Year | | | | | | | | |
| | |
Pool # ZS8368, 4.50%, 3/1/2024 | | | 418 | | | | 435 | |
| | |
Pool # ZS5890, 4.00%, 7/1/2024 | | | 289,994 | | | | 308,177 | |
| | |
Pool # ZK2080, 4.00%, 1/1/2025 | | | 105,895 | | | | 112,535 | |
| | |
Pool # ZA2587, 4.00%, 9/1/2025 | | | 22,915 | | | | 24,385 | |
| | |
Pool # ZK2723, 3.50%, 11/1/2025 | | | 39,696 | | | | 42,059 | |
| | |
Pool # ZK3540, 3.00%, 9/1/2026 | | | 166,575 | | | | 175,181 | |
| | |
Pool # ZS8460, 3.00%, 4/1/2027 | | | 38,692 | | | | 40,702 | |
| | |
Pool # SB0031, 3.50%, 10/1/2027 | | | 73,513 | | | | 77,889 | |
| | |
Pool # ZS7751, 3.00%, 1/1/2029 | | | 229,003 | | | | 242,103 | |
| | |
Pool # SB0071, 2.50%, 5/1/2030 | | | 60,028 | | | | 62,984 | |
| | |
Pool # ZS7331, 3.00%, 12/1/2030 | | | 45,230 | | | | 48,150 | |
| | |
Pool # ZS7938, 2.50%, 1/1/2033 | | | 126,637 | | | | 134,615 | |
| | |
Pool # SB0256, 4.00%, 11/1/2033 | | | 254,751 | | | | 270,725 | |
| | |
Pool # SB0077, 3.50%, 10/1/2034 | | | 157,656 | | | | 166,385 | |
| | |
Pool # QN1148, 2.50%, 12/1/2034 | | | 115,659 | | | | 122,452 | |
| | |
Pool # SB8031, 2.50%, 2/1/2035 | | | 397,649 | | | | 416,865 | |
| | |
Pool # QN2407, 2.00%, 6/1/2035 | | | 234,789 | | | | 244,433 | |
| | |
Pool # SB8500, 2.50%, 7/1/2035 | | | 599,643 | | | | 638,525 | |
| | |
FHLMC UMBS, 20 Year | | | | | | | | |
| | |
Pool # ZA2277, 3.00%, 9/1/2032 | | | 139,267 | | | | 147,788 | |
| | |
Pool # ZJ9491, 3.50%, 12/1/2032 | | | 29,326 | | | | 31,748 | |
| | |
Pool # ZA2463, 3.50%, 6/1/2037 | | | 86,245 | | | | 91,735 | |
| | |
Pool # RB5001, 3.50%, 7/1/2039 | | | 55,232 | | | | 58,204 | |
| | |
Pool # QK0054, 3.00%, 8/1/2039 | | | 59,836 | | | | 63,292 | |
| | |
Pool # RB5026, 2.50%, 11/1/2039 | | | 123,810 | | | | 130,170 | |
| | |
Pool # QK0157, 2.50%, 1/1/2040 | | | 220,334 | | | | 231,653 | |
| | |
Pool # RB5032, 2.50%, 2/1/2040 | | | 88,388 | | | | 92,929 | |
| | |
Pool # QK0167, 3.00%, 2/1/2040 | | | 101,843 | | | | 107,969 | |
| | |
Pool # RB5037, 2.50%, 3/1/2040 | | | 289,717 | | | | 304,601 | |
| | |
Pool # RB5043, 2.50%, 4/1/2040 | | | 228,497 | | | | 240,842 | |
| | |
Pool # RB5048, 2.50%, 5/1/2040 | | | 214,237 | | | | 225,811 | |
| | |
FHLMC UMBS, 30 Year | | | | | | | | |
| | |
Pool # ZI3765, 5.50%, 11/1/2035 | | | 48,362 | | | | 56,951 | |
| | |
Pool # ZS2546, 5.00%, 2/1/2039 | | | 34,786 | | | | 39,788 | |
| | |
Pool # ZJ0449, 4.00%, 9/1/2040 | | | 43,836 | | | | 48,328 | |
| | |
Pool # ZL3548, 3.50%, 8/1/2042 | | | 188,385 | | | | 204,566 | |
| | |
Pool # ZS3712, 3.50%, 4/1/2043 | | | 245,122 | | | | 275,806 | |
| | |
Pool # ZS4077, 3.50%, 1/1/2044 | | | 36,298 | | | | 40,259 | |
| | |
Pool # ZL8869, 3.50%, 12/1/2044 | | | 50,789 | | | | 55,320 | |
| | |
Pool # ZS4596, 3.50%, 12/1/2044 | | | 20,556 | | | | 22,099 | |
| | |
Pool # ZS4598, 3.00%, 1/1/2045 | | | 25,170 | | | | 26,852 | |
| | |
Pool # ZL9010, 3.50%, 1/1/2045 | | | 26,022 | | | | 28,343 | |
| | |
Pool # ZS4609, 3.00%, 4/1/2045 | | | 97,021 | | | | 103,021 | |
| | |
Pool # ZM0037, 3.50%, 8/1/2045 | | | 311,179 | | | | 333,535 | |
| | |
Pool # ZS9809, 4.50%, 9/1/2045 | | | 48,724 | | | | 54,327 | |
SEE NOTES TO FINANCIAL STATEMENTS.
| | | | | | | | |
| | | |
| AUGUST 31, 2020 | | J.P. MORGAN EXCHANGE-TRADED FUNDS | | | | | 129 | |
JPMorgan U.S. Aggregate Bond ETF
SCHEDULE OF PORTFOLIO INVESTMENTS
AS OF AUGUST 31, 2020 (Unaudited) (continued)
| | | | | | | | |
| INVESTMENTS | | PRINCIPAL
AMOUNT ($) | | | VALUE ($) | |
Mortgage-Backed Securities — continued | |
| | |
Pool # ZS9589, 4.50%, 12/1/2045 | | | 87,134 | | | | 97,154 | |
| | |
Pool # ZA4628, 4.00%, 3/1/2046 | | | 76,386 | | | | 84,871 | |
| | |
Pool # ZS9743, 4.00%, 5/1/2046 | | | 1,498,146 | | | | 1,636,446 | |
| | |
Pool # SD0073, 4.50%, 6/1/2046 | | | 126,457 | | | | 141,289 | |
| | |
Pool # ZM1621, 4.50%, 9/1/2046 | | | 195,451 | | | | 227,401 | |
| | |
Pool # SD0146, 3.00%, 11/1/2046 | | | 342,705 | | | | 362,277 | |
| | |
Pool # ZM2209, 3.50%, 12/1/2046 | | | 419,900 | | | | 451,255 | |
| | |
Pool # ZA4816, 4.00%, 2/1/2047 | | | 57,583 | | | | 63,010 | |
| | |
Pool # ZM3134, 3.50%, 5/1/2047 | | | 195,949 | | | | 212,161 | |
| | |
Pool # ZT0132, 4.00%, 5/1/2047 | | | 417,059 | | | | 450,865 | |
| | |
Pool # SD0225, 3.00%, 12/1/2047 | | | 1,104,057 | | | | 1,177,638 | |
| | |
Pool # ZS4750, 3.00%, 1/1/2048 | | | 71,035 | | | | 74,823 | |
| | |
Pool # ZM6887, 3.00%, 5/1/2048 | | | 157,122 | | | | 165,401 | |
| | |
Pool # ZS4777, 3.50%, 7/1/2048 | | | 17,081 | | | | 18,037 | |
| | |
Pool # ZM7669, 3.50%, 8/1/2048 | | | 160,931 | | | | 174,148 | |
| | |
Pool # ZA5677, 4.00%, 9/1/2048 | | | 80,334 | | | | 85,917 | |
| | |
Pool # ZT1597, 3.00%, 12/1/2048 | | | 52,995 | | | | 55,787 | |
| | |
Pool # ZA6286, 4.00%, 2/1/2049 | | | 442,156 | | | | 474,454 | |
| | |
Pool # ZT1776, 3.50%, 3/1/2049 | | | 95,071 | | | | 100,091 | |
| | |
Pool # ZN5087, 4.00%, 4/1/2049 | | | 324,888 | | | | 349,541 | |
| | |
Pool # ZT1864, 4.00%, 4/1/2049 | | | 12,803 | | | | 13,643 | |
| | |
Pool # ZT1951, 3.50%, 5/1/2049 | | | 31,468 | | | | 33,130 | |
| | |
Pool # ZT1952, 4.00%, 5/1/2049 | | | 198,164 | | | | 211,173 | |
| | |
Pool # QA4907, 3.00%, 6/1/2049 | | | 288,893 | | | | 304,809 | |
| | |
Pool # ZT2086, 3.50%, 6/1/2049 | | | 171,987 | | | | 181,069 | |
| | |
Pool # ZT2087, 4.00%, 6/1/2049 | | | 80,322 | | | | 85,595 | |
| | |
Pool # SD0040, 3.00%, 7/1/2049 | | | 101,607 | | | | 107,037 | |
| | |
Pool # SD7502, 3.50%, 7/1/2049 | | | 334,206 | | | | 357,728 | |
| | |
Pool # SD8001, 3.50%, 7/1/2049 | | | 60,592 | | | | 63,792 | |
| | |
Pool # SD7501, 4.00%, 7/1/2049 | | | 179,959 | | | | 197,694 | |
| | |
Pool # QA1790, 3.00%, 8/1/2049 | | | 175,637 | | | | 185,023 | |
| | |
Pool # QA1997, 3.00%, 8/1/2049 | | | 58,704 | | | | 61,841 | |
| | |
Pool # SD8005, 3.50%, 8/1/2049 | | | 216,475 | | | | 227,907 | |
| | |
Pool # SD8006, 4.00%, 8/1/2049 | | | 122,309 | | | | 130,339 | |
| | |
Pool # SD8014, 5.00%, 8/1/2049 | | | 370,084 | | | | 406,424 | |
| | |
Pool # SD8016, 3.00%, 10/1/2049 | | | 66,974 | | | | 70,553 | |
| | |
Pool # SD8023, 2.50%, 11/1/2049 | | | 23,485 | | | | 24,690 | |
| | |
Pool # SD8025, 3.50%, 11/1/2049 | | | 575,487 | | | | 605,878 | |
| | |
Pool # QA7416, 3.00%, 2/1/2050 | | | 1,693,272 | | | | 1,789,133 | |
| | |
Pool # RA2116, 3.00%, 2/1/2050 | | | 1,188,004 | | | | 1,261,763 | |
| | |
Pool # QA8174, 4.50%, 3/1/2050 | | | 663,690 | | | | 745,826 | |
| | |
Pool # SD0303, 2.50%, 4/1/2050 | | | 1,215,227 | | | | 1,293,515 | |
| | |
Pool # SD8080, 2.00%, 6/1/2050 | | | 98,845 | | | | 102,025 | |
| | |
Pool # SD8089, 2.50%, 7/1/2050 | | | 2,975,888 | | | | 3,133,651 | |
| | |
Pool # SD8083, 2.50%, 8/1/2050 | | | 2,261,214 | | | | 2,381,089 | |
| | | | | | | | |
| INVESTMENTS | | PRINCIPAL
AMOUNT ($) | | | VALUE ($) | |
| | | | | | | | |
| | |
FNMA UMBS, 15 Year | | | | | | | | |
| | |
Pool # AC8711, 4.00%, 12/1/2024 | | | 434,537 | | | | 461,746 | |
| | |
Pool # AC7007, 4.50%, 1/1/2025 | | | 46,168 | | | | 48,371 | |
| | |
Pool # AL9580, 4.00%, 3/1/2025 | | | 37,162 | | | | 39,489 | |
| | |
Pool # 932724, 4.00%, 4/1/2025 | | | 15,966 | | | | 16,980 | |
| | |
Pool # AE0971, 4.00%, 5/1/2025 | | | 75,849 | | | | 80,599 | |
| | |
Pool # AE0939, 3.50%, 2/1/2026 | | | 89,406 | | | | 94,723 | |
| | |
Pool # FM2968, 4.00%, 5/1/2026 | | | 25,728 | | | | 27,361 | |
| | |
Pool # AJ6632, 3.00%, 11/1/2026 | | | 90,768 | | | | 95,452 | |
| | |
Pool # AJ9357, 3.50%, 1/1/2027 | | | 198,092 | | | | 209,856 | |
| | |
Pool # AK4047, 3.00%, 2/1/2027 | | | 39,749 | | | | 41,754 | |
| | |
Pool # AL4586, 4.00%, 2/1/2027 | | | 93,169 | | | | 99,083 | |
| | |
Pool # AB5095, 3.00%, 5/1/2027 | | | 35,539 | | | | 37,458 | |
| | |
Pool # AO0527, 3.00%, 5/1/2027 | | | 49,369 | | | | 51,975 | |
| | |
Pool # AO4400, 2.50%, 7/1/2027 | | | 98,820 | | | | 103,868 | |
| | |
Pool # AB5823, 3.50%, 8/1/2027 | | | 178,222 | | | | 190,031 | |
| | |
Pool # AL8138, 4.00%, 9/1/2027 | | | 53,836 | | | | 57,253 | |
| | |
Pool # AB6811, 2.50%, 10/1/2027 | | | 27,652 | | | | 29,013 | |
| | |
Pool # AQ9442, 2.00%, 12/1/2027 | | | 54,410 | | | | 56,612 | |
| | |
Pool # AB8447, 2.50%, 2/1/2028 | | | 50,016 | | | | 52,478 | |
| | |
Pool # AR4180, 2.50%, 2/1/2028 | | | 24,276 | | | | 25,572 | |
| | |
Pool # AL3802, 3.00%, 2/1/2028 | | | 153,050 | | | | 161,005 | |
| | |
Pool # AB8787, 2.00%, 3/1/2028 | | | 159,483 | | | | 165,962 | |
| | |
Pool # AP6059, 2.00%, 6/1/2028 | | | 23,223 | | | | 24,166 | |
| | |
Pool # BM5381, 3.00%, 6/1/2028 | | | 163,415 | | | | 171,909 | |
| | |
Pool # BM1892, 2.50%, 9/1/2028 | | | 48,688 | | | | 51,188 | |
| | |
Pool # AU6682, 3.00%, 9/1/2028 | | | 28,346 | | | | 29,845 | |
| | |
Pool # AS0761, 3.00%, 10/1/2028 | | | 62,694 | | | | 66,009 | |
| | |
Pool # AU6961, 3.00%, 10/1/2028 | | | 114,580 | | | | 120,640 | |
| | |
Pool # AL6132, 4.50%, 3/1/2029 | | | 23,381 | | | | 24,537 | |
| | |
Pool # FM1105, 2.50%, 6/1/2029 | | | 99,482 | | | | 104,379 | |
| | |
Pool # AS3345, 2.00%, 7/1/2029 | | | 18,216 | | | | 18,956 | |
| | |
Pool # MA2061, 3.00%, 10/1/2029 | | | 126,250 | | | | 133,401 | |
| | |
Pool # AL7205, 3.50%, 12/1/2029 | | | 233,333 | | | | 248,881 | |
| | |
Pool # BM4202, 3.50%, 12/1/2029 | | | 145,486 | | | | 155,181 | |
| | |
Pool # FM1465, 3.00%, 5/1/2030 | | | 284,637 | | | | 300,992 | |
| | |
Pool # 890666, 2.00%, 6/1/2030 | | | 55,275 | | | | 57,520 | |
| | |
Pool # MA2684, 3.00%, 7/1/2031 | | | 223,224 | | | | 235,234 | |
| | |
Pool # AL9418, 3.50%, 8/1/2031 | | | 82,210 | | | | 88,056 | |
| | |
Pool # BD5647, 2.00%, 11/1/2031 | | | 28,283 | | | | 29,579 | |
| | |
Pool # 890776, 3.50%, 11/1/2031 | | | 59,932 | | | | 63,921 | |
| | |
Pool # BM5490, 3.50%, 11/1/2031 | | | 41,532 | | | | 44,296 | |
| | |
Pool # BM4993, 3.50%, 3/1/2032 | | | 96,357 | | | | 102,742 | |
| | |
Pool # BM4741, 3.00%, 4/1/2032 | | | 30,131 | | | | 31,725 | |
| | |
Pool # FM1645, 3.00%, 4/1/2032 | | | 316,771 | | | | 333,525 | |
| | |
Pool # BE8694, 3.50%, 7/1/2032 | | | 83,889 | | | | 90,244 | |
SEE NOTES TO FINANCIAL STATEMENTS.
| | | | | | |
| | | |
| 130 | | | | J.P. MORGAN EXCHANGE-TRADED FUNDS | | AUGUST 31, 2020 |
| | | | | | | | |
| INVESTMENTS | | PRINCIPAL
AMOUNT ($) | | | VALUE ($) | |
Mortgage-Backed Securities — continued | |
| | |
Pool # MA3124, 2.50%, 9/1/2032 | | | 93,716 | | | | 98,486 | |
| | |
Pool # FM3099, 3.50%, 9/1/2032 | | | 125,886 | | | | 133,239 | |
| | |
Pool # CA0775, 2.50%, 11/1/2032 | | | 56,830 | | | | 60,100 | |
| | |
Pool # MA3188, 3.00%, 11/1/2032 | | | 51,420 | | | | 54,148 | |
| | |
Pool # BH7081, 2.50%, 12/1/2032 | | | 100,051 | | | | 105,143 | |
| | |
Pool # BH8720, 3.50%, 12/1/2032 | | | 66,236 | | | | 71,523 | |
| | |
Pool # FM1161, 2.50%, 1/1/2033 | | | 81,613 | | | | 86,457 | |
| | |
Pool # FM1691, 2.50%, 1/1/2033 | | | 34,464 | | | | 36,243 | |
| | |
Pool # FM2549, 2.50%, 1/1/2033 | | | 165,890 | | | | 175,221 | |
| | |
Pool # MA3353, 4.00%, 4/1/2033 | | | 41,189 | | | | 43,698 | |
| | |
Pool # BM5716, 4.00%, 6/1/2033 | | | 163,355 | | | | 175,150 | |
| | |
Pool # MA3393, 4.00%, 6/1/2033 | | | 263,754 | | | | 279,818 | |
| | |
Pool # FM1123, 4.00%, 9/1/2033 | | | 291,829 | | | | 314,017 | |
| | |
Pool # FM2153, 4.00%, 11/1/2033 | | | 501,856 | | | | 533,280 | |
| | |
Pool # MA3547, 3.00%, 12/1/2033 | | | 19,473 | | | | 20,450 | |
| | |
Pool # BD9105, 4.00%, 1/1/2034 | | | 130,126 | | | | 139,701 | |
| | |
Pool # BM5306, 4.00%, 1/1/2034 | | | 14,506 | | | | 15,661 | |
| | |
Pool # FM1842, 3.50%, 6/1/2034 | | | 467,906 | | | | 494,239 | |
| | |
Pool # MA3764, 2.50%, 9/1/2034 | | | 28,781 | | | | 30,167 | |
| | |
Pool # MA3910, 2.00%, 1/1/2035 | | | 52,058 | | | | 54,168 | |
| | |
Pool # FM3569, 3.00%, 1/1/2035 | | | 239,225 | | | | 256,280 | |
| | |
Pool # FM2708, 3.00%, 3/1/2035 | | | 138,863 | | | | 147,810 | |
| | |
Pool # MA3985, 3.00%, 4/1/2035 | | | 427,573 | | | | 451,767 | |
| | |
Pool # MA4014, 3.00%, 5/1/2035 | | | 256,505 | | | | 271,026 | |
| | |
Pool # BP8801, 2.00%, 7/1/2035 | | | 950,940 | | | | 989,995 | |
| | |
Pool # MA4075, Class 177, 2.50%, 7/1/2035 | | | 829,180 | | | | 870,904 | |
| | |
Pool # MA4076, 3.00%, 7/1/2035 | | | 294,681 | | | | 311,367 | |
| | |
Pool # FM4035, 2.50%, 8/1/2035 | | | 129,000 | | | | 135,212 | |
| | |
Pool # MA4123, 2.00%, 9/1/2035 | | | 224,000 | | | | 233,200 | |
| | |
FNMA UMBS, 20 Year | | | | | | | | |
| | |
Pool # AE6799, 4.50%, 11/1/2030 | | | 3,841 | | | | 4,215 | |
| | |
Pool # MA0885, 3.50%, 10/1/2031 | | | 58,944 | | | | 63,500 | |
| | |
Pool # AB4853, 3.00%, 4/1/2032 | | | 60,747 | | | | 64,465 | |
| | |
Pool # MA1058, 3.00%, 5/1/2032 | | | 25,578 | | | | 27,143 | |
| | |
Pool # MA1165, 3.00%, 9/1/2032 | | | 144,738 | | | | 153,595 | |
| | |
Pool # MA2079, 4.00%, 11/1/2034 | | | 29,973 | | | | 32,894 | |
| | |
Pool # AL8620, 3.00%, 2/1/2035 | | | 40,368 | | | | 42,803 | |
| | |
Pool # AS4442, 3.00%, 2/1/2035 | | | 115,861 | | | | 122,850 | |
| | |
Pool # MA2287, 3.00%, 6/1/2035 | | | 77,547 | | | | 82,018 | |
| | |
Pool # AL6970, 3.50%, 7/1/2035 | | | 48,988 | | | | 52,479 | |
| | |
Pool # AL7654, 3.00%, 9/1/2035 | | | 133,406 | | | | 141,098 | |
| | |
Pool # MA2472, 3.00%, 12/1/2035 | | | 28,611 | | | | 30,261 | |
| | |
Pool # FM1133, 4.00%, 6/1/2036 | | | 61,922 | | | | 67,957 | |
| | |
Pool # MA3099, 4.00%, 8/1/2037 | | | 225,961 | | | | 241,758 | |
| | |
Pool # BM5330, 2.50%, 12/1/2037 | | | 100,334 | | | | 105,571 | |
| | | | | | | | |
| INVESTMENTS | | PRINCIPAL
AMOUNT ($) | | | VALUE ($) | |
| | | | | | | | |
| | |
Pool # FM3204, 4.00%, 10/1/2038 | | | 84,111 | | | | 91,380 | |
| | |
Pool # MA3519, 4.00%, 11/1/2038 | | | 36,959 | | | | 39,526 | |
| | |
Pool # MA3958, 3.00%, 3/1/2040 | | | 91,961 | | | | 97,236 | |
| | |
Pool # MA4046, 3.00%, 6/1/2040 | | | 24,619 | | | | 26,031 | |
| | |
Pool # MA4072, 2.50%, 7/1/2040 | | | 297,522 | | | | 313,549 | |
| | |
Pool # MA4128, 2.00%, 9/1/2040 | | | 2,402,000 | | | | 2,481,682 | |
| | |
FNMA UMBS, 30 Year | | | | | | | | |
| | |
Pool # 254447, 6.00%, 9/1/2032 | | | 37,696 | | | | 43,970 | |
| | |
Pool # 708506, 5.50%, 5/1/2033 | | | 61,899 | | | | 72,477 | |
| | |
Pool # 711215, 5.50%, 6/1/2033 | | | 24,704 | | | | 28,926 | |
| | |
Pool # AA1005, 5.00%, 12/1/2033 | | | 20,057 | | | | 23,010 | |
| | |
Pool # 725232, 5.00%, 3/1/2034 | | | 18,218 | | | | 20,900 | |
| | |
Pool # 725228, 6.00%, 3/1/2034 | | | 93,304 | | | | 109,390 | |
| | |
Pool # 790003, 6.00%, 8/1/2034 | | | 23,168 | | | | 27,433 | |
| | |
Pool # 735503, 6.00%, 4/1/2035 | | | 64,111 | | | | 75,619 | |
| | |
Pool # 190360, 5.00%, 8/1/2035 | | | 51,606 | | | | 59,610 | |
| | |
Pool # 904601, 6.00%, 11/1/2036 | | | 60,294 | | | | 71,726 | |
| | |
Pool # 888538, 5.50%, 1/1/2037 | | | 36,166 | | | | 42,593 | |
| | |
Pool # AB0284, 6.00%, 2/1/2037 | | | 71,113 | | | | 84,333 | |
| | |
Pool # AL2627, 5.00%, 7/1/2037 | | | 33,521 | | | | 38,456 | |
| | |
Pool # 956965, 6.50%, 12/1/2037 | | | 21,076 | | | | 23,452 | |
| | |
Pool # BH7907, 6.50%, 12/1/2037 | | | 29,440 | | | | 35,808 | |
| | |
Pool # 961793, 5.00%, 3/1/2038 | | | 136,500 | | | | 156,005 | |
| | |
Pool # 985661, 5.50%, 6/1/2038 | | | 24,427 | | | | 28,573 | |
| | |
Pool # AU7519, 3.50%, 9/1/2038 | | | 59,045 | | | | 63,942 | |
| | |
Pool # AA7402, 4.50%, 6/1/2039 | | | 204,215 | | | | 229,673 | |
| | |
Pool # AL0100, 6.00%, 10/1/2039 | | | 88,555 | | | | 105,223 | |
| | |
Pool # AC4886, 5.00%, 11/1/2039 | | | 48,634 | | | | 55,551 | |
| | |
Pool # 190399, 5.50%, 11/1/2039 | | | 152,326 | | | | 178,181 | |
| | |
Pool # AS4787, 3.00%, 4/1/2040 | | | 262,617 | | | | 278,865 | |
| | |
Pool # AB1143, 4.50%, 6/1/2040 | | | 144,754 | | | | 164,104 | |
| | |
Pool # AD6938, 4.50%, 6/1/2040 | | | 192,853 | | | | 216,339 | |
| | |
Pool # AD5479, 5.00%, 6/1/2040 | | | 58,051 | | | | 66,244 | |
| | |
Pool # AB1259, 5.00%, 7/1/2040 | | | 72,232 | | | | 82,425 | |
| | |
Pool # AB1292, 5.00%, 8/1/2040 | | | 30,807 | | | | 35,155 | |
| | |
Pool # AL5437, 5.00%, 8/1/2040 | | | 176,241 | | | | 201,113 | |
| | |
Pool # AB1421, 5.00%, 9/1/2040 | | | 69,669 | | | | 80,007 | |
| | |
Pool # AE4142, 5.00%, 9/1/2040 | | | 41,650 | | | | 47,528 | |
| | |
Pool # AE8289, 4.00%, 12/1/2040 | | | 217,966 | | | | 240,313 | |
| | |
Pool # MA0622, 3.50%, 1/1/2041 | | | 59,224 | | | | 64,338 | |
| | |
Pool # AH2312, 5.00%, 1/1/2041 | | | 122,879 | | | | 140,220 | |
| | |
Pool # AE0828, 3.50%, 2/1/2041 | | | 40,227 | | | | 43,700 | |
| | |
Pool # BM3090, 3.50%, 2/1/2041 | | | 243,068 | | | | 260,507 | |
| | |
Pool # AH3804, 4.00%, 2/1/2041 | | | 43,617 | | | | 48,089 | |
| | |
Pool # MA0639, 4.00%, 2/1/2041 | | | 73,417 | | | | 80,944 | |
| | |
Pool # AB2676, 3.50%, 4/1/2041 | | | 166,055 | | | | 181,671 | |
SEE NOTES TO FINANCIAL STATEMENTS.
| | | | | | | | |
| | | |
| AUGUST 31, 2020 | | J.P. MORGAN EXCHANGE-TRADED FUNDS | | | | | 131 | |
JPMorgan U.S. Aggregate Bond ETF
SCHEDULE OF PORTFOLIO INVESTMENTS
AS OF AUGUST 31, 2020 (Unaudited) (continued)
| | | | | | | | |
| INVESTMENTS | | PRINCIPAL
AMOUNT ($) | | | VALUE ($) | |
Mortgage-Backed Securities — continued | |
| | |
Pool # AL0241, 4.00%, 4/1/2041 | | | 115,692 | | | | 127,553 | |
| | |
Pool # BM3118, 6.00%, 7/1/2041 | | | 137,414 | | | | 162,990 | |
| | |
Pool # AJ2293, 4.00%, 9/1/2041 | | | 48,577 | | | | 53,760 | |
| | |
Pool # AL0933, 5.00%, 10/1/2041 | | | 169,401 | | | | 193,350 | |
| | |
Pool # AW8154, 3.50%, 1/1/2042 | | | 39,875 | | | | 43,300 | |
| | |
Pool # AX5318, 4.50%, 1/1/2042 | | | 135,146 | | | | 151,785 | |
| | |
Pool # BD4480, 4.50%, 1/1/2042 | | | 501,832 | | | | 563,620 | |
| | |
Pool # AB4698, 4.00%, 3/1/2042 | | | 127,531 | | | | 145,885 | |
| | |
Pool # AL1998, 4.00%, 3/1/2042 | | | 186,355 | | | | 206,241 | |
| | |
Pool # AK7028, 4.00%, 4/1/2042 | | | 135,504 | | | | 149,700 | |
| | |
Pool # AO4134, 3.50%, 6/1/2042 | | | 23,140 | | | | 25,223 | |
| | |
Pool # AO8694, 4.50%, 7/1/2042 | | | 38,531 | | | | 42,436 | |
| | |
Pool # AP4258, 3.00%, 8/1/2042 | | | 212,169 | | | | 227,703 | |
| | |
Pool # AL2417, 3.50%, 8/1/2042 | | | 160,570 | | | | 174,313 | |
| | |
Pool # AO9798, 3.50%, 8/1/2042 | | | 51,562 | | | | 55,975 | |
| | |
Pool # AP2424, 4.00%, 8/1/2042 | | | 178,842 | | | | 197,578 | |
| | |
Pool # AP3958, 3.00%, 9/1/2042 | | | 552,901 | | | | 593,380 | |
| | |
Pool # AB6632, 3.50%, 10/1/2042 | | | 268,657 | | | | 291,651 | |
| | |
Pool # AB6633, 3.50%, 10/1/2042 | | | 51,733 | | | | 56,161 | |
| | |
Pool # AL3344, 4.50%, 10/1/2042 | | | 224,660 | | | | 257,165 | |
| | |
Pool # AB6828, 3.50%, 11/1/2042 | | | 212,485 | | | | 231,615 | |
| | |
Pool # AL3182, 3.50%, 12/1/2042 | | | 31,009 | | | | 34,631 | |
| | |
Pool # AQ9316, 2.50%, 1/1/2043 | | | 97,110 | | | | 103,749 | |
| | |
Pool # AB7580, 3.00%, 1/1/2043 | | | 213,598 | | | | 229,236 | |
| | |
Pool # AQ1104, 3.00%, 1/1/2043 | | | 61,523 | | | | 66,031 | |
| | |
Pool # AR0168, 3.00%, 2/1/2043 | | | 86,354 | | | | 93,447 | |
| | |
Pool # AR4239, 3.00%, 2/1/2043 | | | 63,224 | | | | 67,818 | |
| | |
Pool # AB7964, 3.50%, 2/1/2043 | | | 111,947 | | | | 125,910 | |
| | |
Pool # BM4751, 3.50%, 3/1/2043 | | | 62,148 | | | | 67,467 | |
| | |
Pool # AB8742, 4.00%, 3/1/2043 | | | 25,943 | | | | 29,640 | |
| | |
Pool # AR6770, 4.00%, 3/1/2043 | | | 27,521 | | | | 30,575 | |
| | |
Pool # AT2015, 3.00%, 4/1/2043 | | | 71,033 | | | | 76,194 | |
| | |
Pool # AT2016, 3.00%, 4/1/2043 | | | 1,081,618 | | | | 1,160,207 | |
| | |
Pool # AT2035, 3.50%, 4/1/2043 | | | 109,933 | | | | 119,050 | |
| | |
Pool # AR8293, 3.00%, 5/1/2043 | | | 483,835 | | | | 518,989 | |
| | |
Pool # AT2723, 3.00%, 5/1/2043 | | | 109,983 | | | | 117,974 | |
| | |
Pool # AB9194, 3.50%, 5/1/2043 | | | 213,786 | | | | 233,080 | |
| | |
Pool # AS0021, 3.00%, 7/1/2043 | | | 126,117 | | | | 135,281 | |
| | |
Pool # AT8912, 3.00%, 7/1/2043 | | | 73,274 | | | | 78,598 | |
| | |
Pool # AU1629, 3.00%, 7/1/2043 | | | 166,091 | | | | 178,159 | |
| | |
Pool # BM3785, 3.50%, 7/1/2043 | | | 216,547 | | | | 238,038 | |
| | |
Pool # BM3704, 3.00%, 9/1/2043 | | | 70,539 | | | | 75,664 | |
| | |
Pool # AT2612, 3.50%, 9/1/2043 | | | 152,854 | | | | 165,530 | |
| | |
Pool # AU4256, 3.50%, 9/1/2043 | | | 59,064 | | | | 64,394 | |
| | |
Pool # AU4283, 3.50%, 9/1/2043 | | | 35,035 | | | | 38,520 | |
| | |
Pool # AL4062, 4.00%, 9/1/2043 | | | 55,574 | | | | 62,622 | |
| | | | | | | | |
| INVESTMENTS | | PRINCIPAL
AMOUNT ($) | | | VALUE ($) | |
| |
| | |
Pool # AS0560, 4.50%, 9/1/2043 | | | 30,920 | | | | 34,542 | |
| | |
Pool # BM4635, 2.50%, 10/1/2043 | | | 280,367 | | | | 299,336 | |
| | |
Pool # AS1121, 4.00%, 11/1/2043 | | | 86,684 | | | | 95,363 | |
| | |
Pool # AL7696, 3.00%, 12/1/2043 | | | 111,423 | | | | 119,519 | |
| | |
Pool # AS1557, 4.00%, 1/1/2044 | | | 92,724 | | | | 102,007 | |
| | |
Pool # AV6103, 4.00%, 1/1/2044 | | | 386,584 | | | | 425,285 | |
| | |
Pool # BC1737, 4.00%, 1/1/2044 | | | 193,629 | | | | 213,482 | |
| | |
Pool # BM5365, 4.00%, 3/1/2044 | | | 141,341 | | | | 155,832 | |
| | |
Pool # FM1744, 3.50%, 5/1/2044 | | | 50,570 | | | | 56,877 | |
| | |
Pool # AS2700, 4.00%, 6/1/2044 | | | 84,697 | | | | 94,066 | |
| | |
Pool # AW6233, 4.50%, 6/1/2044 | | | 619,320 | | | | 695,008 | |
| | |
Pool # AS2947, 4.00%, 7/1/2044 | | | 82,980 | | | | 90,847 | |
| | |
Pool # AL9072, 5.00%, 7/1/2044 | | | 134,782 | | | | 153,836 | |
| | |
Pool # AS3133, 3.50%, 8/1/2044 | | | 40,346 | | | | 44,289 | |
| | |
Pool # AL9569, 5.00%, 8/1/2044 | | | 308,464 | | | | 352,072 | |
| | |
Pool # AX0152, 4.50%, 9/1/2044 | | | 45,713 | | | | 50,621 | |
| | |
Pool # BM4620, 3.00%, 10/1/2044 | | | 174,223 | | | | 186,979 | |
| | |
Pool # AL5926, 3.50%, 10/1/2044 | | | 164,983 | | | | 183,363 | |
| | |
Pool # AS3611, 3.50%, 10/1/2044 | | | 25,727 | | | | 28,242 | |
| | |
Pool # AS3470, 4.00%, 10/1/2044 | | | 47,250 | | | | 51,686 | |
| | |
Pool # AX2491, 4.00%, 10/1/2044 | | | 16,584 | | | | 18,141 | |
| | |
Pool # AS3710, 4.00%, 11/1/2044 | | | 55,597 | | | | 60,868 | |
| | |
Pool # AS3867, 4.00%, 11/1/2044 | | | 23,946 | | | | 26,216 | |
| | |
Pool # AX4855, 4.00%, 11/1/2044 | | | 173,018 | | | | 189,262 | |
| | |
Pool # AS3935, 3.50%, 12/1/2044 | | | 867,117 | | | | 951,862 | |
| | |
Pool # AS4012, 3.50%, 12/1/2044 | | | 111,240 | | | | 121,266 | |
| | |
Pool # FM1746, 3.50%, 1/1/2045 | | | 165,925 | | | | 184,696 | |
| | |
Pool # AS4402, 3.50%, 2/1/2045 | | | 115,158 | | | | 127,410 | |
| | |
Pool # AS4457, 3.50%, 2/1/2045 | | | 284,647 | | | | 305,881 | |
| | |
Pool # AX7699, 3.50%, 2/1/2045 | | | 86,896 | | | | 93,378 | |
| | |
Pool # AY3671, 3.50%, 2/1/2045 | | | 93,077 | | | | 104,509 | |
| | |
Pool # FM0015, 4.00%, 2/1/2045 | | | 171,865 | | | | 193,871 | |
| | |
Pool # MA2193, 4.50%, 2/1/2045 | | | 41,641 | | | | 46,434 | |
| | |
Pool # AS4541, 3.00%, 3/1/2045 | | | 127,713 | | | | 138,031 | |
| | |
Pool # AS4571, 3.50%, 3/1/2045 | | | 110,985 | | | | 120,168 | |
| | |
Pool # FM3414, 4.00%, 3/1/2045 | | | 193,994 | | | | 212,387 | |
| | |
Pool # AZ1682, 3.50%, 4/1/2045 | | | 50,290 | | | | 53,898 | |
| | |
Pool # BM3398, 3.50%, 4/1/2045 | | | 24,220 | | | | 26,346 | |
| | |
Pool # AY8617, 3.00%, 5/1/2045 | | | 24,160 | | | | 25,655 | |
| | |
Pool # BM5471, 3.50%, 6/1/2045 | | | 566,603 | | | | 622,976 | |
| | |
Pool # AZ5985, 3.00%, 7/1/2045 | | | 155,014 | | | | 169,332 | |
| | |
Pool # AS5570, 3.50%, 8/1/2045 | | | 125,196 | | | | 134,449 | |
| | |
Pool # FM1476, 3.50%, 8/1/2045 | | | 159,103 | | | | 172,720 | |
| | |
Pool # AS5806, 3.00%, 9/1/2045 | | | 292,191 | | | | 310,268 | |
| | |
Pool # AS5778, 3.50%, 9/1/2045 | | | 37,274 | | | | 39,948 | |
| | |
Pool # AZ2947, 4.00%, 9/1/2045 | | | 42,068 | | | | 45,951 | |
SEE NOTES TO FINANCIAL STATEMENTS.
| | | | | | |
| | | |
| 132 | | | | J.P. MORGAN EXCHANGE-TRADED FUNDS | | AUGUST 31, 2020 |
| | | | | | | | |
| INVESTMENTS | | PRINCIPAL
AMOUNT ($) | | | VALUE ($) | |
Mortgage-Backed Securities — continued | |
| | |
Pool # AS5851, 4.50%, 9/1/2045 | | | 32,925 | | | | 36,739 | |
| | |
Pool # AY8859, 4.00%, 10/1/2045 | | | 448,622 | | | | 490,035 | |
| | |
Pool # AS6184, 3.50%, 11/1/2045 | | | 248,183 | | | | 275,872 | |
| | |
Pool # AS6196, 3.50%, 11/1/2045 | | | 44,880 | | | | 48,100 | |
| | |
Pool # FM1869, 4.00%, 11/1/2045 | | | 145,843 | | | | 159,537 | |
| | |
Pool # FM1708, 3.00%, 12/1/2045 | | | 66,219 | | | | 71,658 | |
| | |
Pool # BA3077, 3.50%, 12/1/2045 | | | 41,303 | | | | 44,970 | |
| | |
Pool # BC0066, 3.50%, 12/1/2045 | | | 46,988 | | | | 50,461 | |
| | |
Pool # BC0676, 3.50%, 12/1/2045 | | | 82,925 | | | | 88,874 | |
| | |
Pool # FM1923, 3.50%, 1/1/2046 | | | 87,675 | | | | 93,965 | |
| | |
Pool # FM3413, 4.00%, 1/1/2046 | | | 209,923 | | | | 233,216 | |
| | |
Pool # MA2512, 4.00%, 1/1/2046 | | | 39,662 | | | | 43,323 | |
| | |
Pool # AS6654, 3.50%, 2/1/2046 | | | 36,582 | | | | 39,206 | |
| | |
Pool # FM2323, 4.00%, 2/1/2046 | | | 86,495 | | | | 95,553 | |
| | |
Pool # AL9128, 4.50%, 2/1/2046 | | | 41,826 | | | | 46,976 | |
| | |
Pool # AS6811, 3.00%, 3/1/2046 | | | 80,119 | | | | 84,704 | |
| | |
Pool # BM4834, 3.00%, 3/1/2046 | | | 46,190 | | | | 50,252 | |
| | |
Pool # FM1782, 4.00%, 3/1/2046 | | | 24,960 | | | | 27,326 | |
| | |
Pool # FM2195, 4.00%, 3/1/2046 | | | 68,208 | | | | 75,351 | |
| | |
Pool # AS7003, 3.00%, 4/1/2046 | | | 99,765 | | | | 105,474 | |
| | |
Pool # FM1370, 3.00%, 4/1/2046 | | | 34,836 | | | | 36,991 | |
| | |
Pool # FM1224, 3.50%, 4/1/2046 | | | 228,757 | | | | 245,169 | |
| | |
Pool # BC1863, 2.50%, 5/1/2046 | | | 129,524 | | | | 137,093 | |
| | |
Pool # AL8936, 4.50%, 5/1/2046 | | | 32,811 | | | | 36,587 | |
| | |
Pool # AS7198, 4.50%, 5/1/2046 | | | 238,799 | | | | 265,082 | |
| | |
Pool # BD0166, 2.50%, 6/1/2046 | | | 286,585 | | | | 303,332 | |
| | |
Pool # BM5168, 2.50%, 6/1/2046 | | | 44,569 | | | | 47,616 | |
| | |
Pool # AS7343, 3.00%, 6/1/2046 | | | 317,309 | | | | 335,465 | |
| | |
Pool # AS7376, 3.00%, 6/1/2046 | | | 498,720 | | | | 527,258 | |
| | |
Pool # AS7386, 3.50%, 6/1/2046 | | | 31,087 | | | | 32,988 | |
| | |
Pool # BM5587, 4.00%, 6/1/2046 | | | 96,412 | | | | 106,064 | |
| | |
Pool # AS7660, 2.50%, 8/1/2046 | | | 506,844 | | | | 536,461 | |
| | |
Pool # MA2730, 2.50%, 8/1/2046 | | | 82,529 | | | | 87,352 | |
| | |
Pool # AS8185, 3.00%, 10/1/2046 | | | 441,823 | | | | 467,105 | |
| | |
Pool # FM3810, 3.00%, 10/1/2046 | | | 179,174 | | | | 193,650 | |
| | |
Pool # AL9385, 3.00%, 11/1/2046 | | | 93,935 | | | | 100,666 | |
| | |
Pool # MA2806, 3.00%, 11/1/2046 | | | 392,200 | | | | 414,642 | |
| | |
Pool # BM3288, 3.50%, 12/1/2046 | | | 44,169 | | | | 48,032 | |
| | |
Pool # FM2321, 3.50%, 12/1/2046 | | | 218,354 | | | | 234,019 | |
| | |
Pool # BM4990, 2.50%, 1/1/2047 | | | 21,179 | | | | 22,612 | |
| | |
Pool # FM2807, 3.00%, 1/1/2047 | | | 138,800 | | | | 150,793 | |
| | |
Pool # 890856, 3.50%, 1/1/2047 | | | 240,539 | | | | 262,722 | |
| | |
Pool # FM3374, 3.50%, 1/1/2047 | | | 349,699 | | | | 379,629 | |
| | |
Pool # AS8823, 4.00%, 2/1/2047 | | | 133,048 | | | | 143,597 | |
| | |
Pool # BM5955, 4.00%, 2/1/2047 | | | 77,920 | | | | 85,307 | |
| | |
Pool # BM5270, 4.50%, 2/1/2047 | | | 36,334 | | | | 40,807 | |
| | | | | | | | |
| INVESTMENTS | | PRINCIPAL
AMOUNT ($) | | | VALUE ($) | |
| | | | | | | | |
| | |
Pool # MA2920, 3.00%, 3/1/2047 | | | 16,981 | | | | 17,953 | |
| | |
Pool # FM3107, 3.50%, 3/1/2047 | | | 706,285 | | | | 756,957 | |
| | |
Pool # AS9313, 4.00%, 3/1/2047 | | | 38,741 | | | | 42,210 | |
| | |
Pool # FM1511, 3.00%, 4/1/2047 | | | 200,552 | | | | 212,960 | |
| | |
Pool # AS9480, 4.50%, 4/1/2047 | | | 79,386 | | | | 88,499 | |
| | |
Pool # BM2000, 3.50%, 5/1/2047 | | | 1,181,755 | | | | 1,254,032 | |
| | |
Pool # BM5220, 3.50%, 5/1/2047 | | | 65,037 | | | | 69,015 | |
| | |
Pool # BE0628, 4.50%, 5/1/2047 | | | 92,523 | | | | 100,781 | |
| | |
Pool # FM1772, 4.50%, 5/1/2047 | | | 34,078 | | | | 38,273 | |
| | |
Pool # AS9946, 3.50%, 7/1/2047 | | | 98,698 | | | | 106,864 | |
| | |
Pool # BM1568, 3.50%, 7/1/2047 | | | 110,956 | | | | 124,605 | |
| | |
Pool # AS9988, 4.50%, 7/1/2047 | | | 59,602 | | | | 64,653 | |
| | |
Pool # BH7375, 3.50%, 8/1/2047 | | | 138,846 | | | | 146,786 | |
| | |
Pool # CA0110, 3.50%, 8/1/2047 | | | 37,487 | | | | 39,672 | |
| | |
Pool # CA0553, 4.00%, 8/1/2047 | | | 221,563 | | | | 237,539 | |
| | |
Pool # CA0148, 4.50%, 8/1/2047 | | | 49,431 | | | | 53,620 | |
| | |
Pool # CA0850, 3.00%, 9/1/2047 | | | 107,206 | | | | 112,968 | |
| | |
Pool # BH9317, 3.50%, 9/1/2047 | | | 235,868 | | | | 251,383 | |
| | |
Pool # CA0407, 3.50%, 9/1/2047 | | | 212,308 | | | | 224,680 | |
| | |
Pool # MA3147, 3.00%, 10/1/2047 | | | 118,347 | | | | 124,708 | |
| | |
Pool # BH9394, 3.50%, 10/1/2047 | | | 256,389 | | | | 273,254 | |
| | |
Pool # BH9392, 3.50%, 11/1/2047 | | | 47,094 | | | | 49,744 | |
| | |
Pool # CA0681, 3.50%, 11/1/2047 | | | 752,584 | | | | 829,306 | |
| | |
Pool # FM0028, 3.00%, 12/1/2047 | | | 79,906 | | | | 86,361 | |
| | |
Pool # MA3209, 3.00%, 12/1/2047 | | | 755,949 | | | | 796,578 | |
| | |
Pool # FM1420, 3.50%, 12/1/2047 | | | 431,184 | | | | 473,385 | |
| | |
Pool # MA3210, 3.50%, 12/1/2047 | | | 327,477 | | | | 346,203 | |
| | |
Pool # BJ5376, 4.50%, 12/1/2047 | | | 83,717 | | | | 91,134 | |
| | |
Pool # CA4015, 3.00%, 1/1/2048 | | | 21,794 | | | | 22,965 | |
| | |
Pool # MA3237, 3.00%, 1/1/2048 | | | 618,010 | | | | 651,225 | |
| | |
Pool # MA3238, 3.50%, 1/1/2048 | | | 154,407 | | | | 163,236 | |
| | |
Pool # BM3475, 4.00%, 1/1/2048 | | | 53,083 | | | | 59,250 | |
| | |
Pool # MA3275, 3.00%, 2/1/2048 | | | 209,684 | | | | 220,954 | |
| | |
Pool # BJ5910, 3.50%, 2/1/2048 | | | 285,692 | | | | 319,555 | |
| | |
Pool # BM5526, 3.50%, 2/1/2048 | | | 556,593 | | | | 588,422 | |
| | |
Pool # CA4155, 3.50%, 2/1/2048 | | | 39,968 | | | | 42,253 | |
| | |
Pool # MA3304, 3.00%, 3/1/2048 | | | 119,373 | | | | 125,789 | |
| | |
Pool # BM3990, 4.00%, 3/1/2048 | | | 48,221 | | | | 51,698 | |
| | |
Pool # FM3494, 2.50%, 4/1/2048 | | | 26,344 | | | | 27,883 | |
| | |
Pool # FM3232, 3.50%, 4/1/2048 | | | 166,892 | | | | 176,436 | |
| | |
Pool # BM3899, 4.00%, 4/1/2048 | | | 715,123 | | | | 766,689 | |
| | |
Pool # FM1936, 4.00%, 4/1/2048 | | | 116,338 | | | | 124,727 | |
| | |
Pool # CA2687, 3.00%, 5/1/2048 | | | 40,972 | | | | 44,109 | |
| | |
Pool # FM2177, 3.50%, 5/1/2048 | | | 1,243,903 | | | | 1,352,706 | |
| | |
Pool # BM4054, 4.00%, 5/1/2048 | | | 227,820 | | | | 246,844 | |
| | |
Pool # MA3425, 3.00%, 6/1/2048 | | | 90,843 | | | | 95,666 | |
SEE NOTES TO FINANCIAL STATEMENTS.
| | | | | | | | |
| | | |
| AUGUST 31, 2020 | | J.P. MORGAN EXCHANGE-TRADED FUNDS | | | | | 133 | |
JPMorgan U.S. Aggregate Bond ETF
SCHEDULE OF PORTFOLIO INVESTMENTS
AS OF AUGUST 31, 2020 (Unaudited) (continued)
| | | | | | | | |
| INVESTMENTS | | PRINCIPAL
AMOUNT ($) | | | VALUE ($) | |
Mortgage-Backed Securities — continued | |
| | |
Pool # BM4757, 3.50%, 7/1/2048 | | | 112,075 | | | | 118,930 | |
| | |
Pool # FM1911, 3.50%, 7/1/2048 | | | 217,331 | | | | 232,923 | |
| | |
Pool # FM2997, 4.00%, 8/1/2048 | | | 214,357 | | | | 231,323 | |
| | |
Pool # MA3443, 4.00%, 8/1/2048 | | | 48,731 | | | | 51,895 | |
| | |
Pool # BK4769, 5.00%, 8/1/2048 | | | 30,238 | | | | 33,124 | |
| | |
Pool # BM2007, 4.00%, 9/1/2048 | | | 16,503 | | | | 17,575 | |
| | |
Pool # CA2368, 4.00%, 9/1/2048 | | | 90,980 | | | | 98,280 | |
| | |
Pool # FM1247, 4.00%, 9/1/2048 | | | 59,823 | | | | 64,137 | |
| | |
Pool # MA3472, 5.00%, 9/1/2048 | | | 31,998 | | | | 35,051 | |
| | |
Pool # CA4655, 3.50%, 10/1/2048 | | | 183,536 | | | | 198,720 | |
| | |
Pool # MA3495, 4.00%, 10/1/2048 | | | 119,505 | | | | 127,264 | |
| | |
Pool # FM2510, 3.00%, 11/1/2048 | | | 242,163 | | | | 255,179 | |
| | |
Pool # BM4678, 4.00%, 11/1/2048 | | | 337,322 | | | | 364,388 | |
| | |
Pool # FM1248, 4.50%, 11/1/2048 | | | 62,916 | | | | 68,247 | |
| | |
Pool # FM2275, 4.50%, 11/1/2048 | | | 63,926 | | | | 70,961 | |
| | |
Pool # FM1148, 3.50%, 12/1/2048 | | | 105,062 | | | | 110,997 | |
| | |
Pool # FM1866, 4.00%, 12/1/2048 | | | 372,443 | | | | 396,623 | |
| | |
Pool # MA3536, 4.00%, 12/1/2048 | | | 155,035 | | | | 165,100 | |
| | |
Pool # MA3577, 3.00%, 1/1/2049 | | | 43,528 | | | | 45,839 | |
| | |
Pool # BM5256, 4.50%, 1/1/2049 | | | 104,348 | | | | 114,073 | |
| | |
Pool # FM0030, 3.00%, 2/1/2049 | | | 117,363 | | | | 124,079 | |
| | |
Pool # FM1527, 3.00%, 2/1/2049 | | | 178,739 | | | | 188,966 | |
| | |
Pool # MA3603, 3.00%, 2/1/2049 | | | 22,036 | | | | 23,206 | |
| | |
Pool # BM5446, 3.50%, 2/1/2049 | | | 30,533 | | | | 32,258 | |
| | |
Pool # MA3592, 4.00%, 2/1/2049 | | | 8,652 | | | | 9,214 | |
| | |
Pool # MA3593, 4.50%, 2/1/2049 | | | 192,283 | | | | 207,925 | |
| | |
Pool # BN4380, 3.00%, 3/1/2049 | | | 25,675 | | | | 27,046 | |
| | |
Pool # MA3614, 3.50%, 3/1/2049 | | | 17,389 | | | | 18,310 | |
| | |
Pool # FM0017, 4.00%, 3/1/2049 | | | 140,644 | | | | 149,775 | |
| | |
Pool # MA3637, 3.50%, 4/1/2049 | | | 76,530 | | | | 80,582 | |
| | |
Pool # MA3638, 4.00%, 4/1/2049 | | | 64,365 | | | | 68,580 | |
| | |
Pool # BN5418, 4.50%, 4/1/2049 | | | 46,333 | | | | 51,046 | |
| | |
Pool # MA3639, 4.50%, 4/1/2049 | | | 15,465 | | | | 16,693 | |
| | |
Pool # MA3664, 4.00%, 5/1/2049 | | | 35,404 | | | | 37,722 | |
| | |
Pool # MA3665, 4.50%, 5/1/2049 | | | 50,024 | | | | 53,998 | |
| | |
Pool # CA3528, 5.00%, 5/1/2049 | | | 28,496 | | | | 31,296 | |
| | |
Pool # MA3686, 3.50%, 6/1/2049 | | | 446,257 | | | | 469,884 | |
| | |
Pool # MA3687, 4.00%, 6/1/2049 | | | 375,366 | | | | 399,945 | |
| | |
Pool # FM1389, 4.50%, 6/1/2049 | | | 23,726 | | | | 25,656 | |
| | |
Pool # MA3688, 4.50%, 6/1/2049 | | | 13,921 | | | | 15,027 | |
| | |
Pool # FM1198, 3.00%, 7/1/2049 | | | 81,609 | | | | 86,345 | |
| | |
Pool # BO1169, 3.50%, 7/1/2049 | | | 140,875 | | | | 148,333 | |
| | |
Pool # CA4358, 3.50%, 7/1/2049 | | | 53,792 | | | | 56,640 | |
| | |
Pool # BO1766, 4.50%, 7/1/2049 | | | 201,726 | | | | 217,752 | |
| | |
Pool # FM1672, 4.50%, 7/1/2049 | | | 262,083 | | | | 294,352 | |
| | |
Pool # FM1241, 3.50%, 8/1/2049 | | | 140,458 | | | | 150,369 | |
| | | | | | | | |
| INVESTMENTS | | PRINCIPAL
AMOUNT ($) | | | VALUE ($) | |
| | | | | | | | |
| | |
Pool # MA3746, 4.00%, 8/1/2049 | | | 51,427 | | | | 54,794 | |
| | |
Pool # MA3747, 4.50%, 8/1/2049 | | | 29,604 | | | | 31,956 | |
| | |
Pool # BO4012, 3.00%, 9/1/2049 | | | 154,817 | | | | 166,223 | |
| | |
Pool # MA3774, 3.00%, 9/1/2049 | | | 1,090,367 | | | | 1,148,589 | |
| | |
Pool # BO2200, 3.50%, 9/1/2049 | | | 502,731 | | | | 529,377 | |
| | |
Pool # MA3775, 3.50%, 9/1/2049 | | | 33,007 | | | | 34,755 | |
| | |
Pool # FM3572, 4.50%, 9/1/2049 | | | 204,232 | | | | 224,792 | |
| | |
Pool # MA3803, 3.50%, 10/1/2049 | | | 163,027 | | | | 171,658 | |
| | |
Pool # MA3818, 5.00%, 10/1/2049 | | | 41,025 | | | | 45,056 | |
| | |
Pool # MA3833, 2.50%, 11/1/2049 | | | 371,475 | | | | 390,482 | |
| | |
Pool # BO5017, 3.50%, 12/1/2049 | | | 421,882 | | | | 444,218 | |
| | |
Pool # MA3905, 3.00%, 1/1/2050 | | | 3,219,369 | | | | 3,391,274 | |
| | |
Pool # CA5021, 3.50%, 1/1/2050 | | | 126,693 | | | | 134,313 | |
| | |
Pool # MA3906, 3.50%, 1/1/2050 | | | 154,783 | | | | 162,978 | |
| | |
Pool # MA3936, 2.50%, 2/1/2050 | | | 407,487 | | | | 428,338 | |
| | |
Pool # FM2482, 3.00%, 2/1/2050 | | | 827,089 | | | | 872,656 | |
| | |
Pool # FM2733, 2.50%, 3/1/2050 | | | 192,617 | | | | 204,420 | |
| | |
Pool # BP4015, 3.00%, 3/1/2050 | | | 255,439 | | | | 270,130 | |
| | |
Pool # CA5306, 3.00%, 3/1/2050 | | | 1,147,056 | | | | 1,212,744 | |
| | |
Pool # BP1358, 3.50%, 3/1/2050 | | | 714,538 | | | | 757,996 | |
| | |
Pool # MA3972, 4.50%, 3/1/2050 | | | 266,304 | | | | 287,460 | |
| | |
Pool # MA3998, 4.50%, 4/1/2050 | | | 253,519 | | | | 275,385 | |
| | |
Pool # BP5001, 2.50%, 5/1/2050 | | | 1,276,336 | | | | 1,343,978 | |
| | |
Pool # FM3257, 3.00%, 5/1/2050 | | | 372,800 | | | | 406,085 | |
| | |
Pool # MA4026, 4.00%, 5/1/2050 | | | 169,900 | | | | 182,411 | |
| | |
Pool # BK2753, 2.50%, 7/1/2050 | | | 1,845,765 | | | | 1,943,586 | |
| | |
Pool # MA4078, 2.50%, 7/1/2050 | | | 694,997 | | | | 731,830 | |
| | |
Pool # BP7217, 3.00%, 7/1/2050 | | | 777,114 | | | | 846,499 | |
| | |
Pool # MA4079, 3.00%, 7/1/2050 | | | 297,334 | | | | 314,194 | |
| | |
Pool # MA4100, 2.00%, 8/1/2050 | | | 1,642,114 | | | | 1,694,950 | |
| | |
Pool # BP9500, 2.50%, 8/1/2050 | | | 149,000 | | | | 156,897 | |
| | |
Pool # MA4097, 3.00%, 8/1/2050 | | | 273,670 | | | | 289,187 | |
| | |
Pool # BK3044, 2.50%, 9/1/2050 | | | 2,848,000 | | | | 2,998,936 | |
| | |
GNMA I, 30 Year | | | | | | | | |
| | |
Pool # 704155, 5.50%, 1/15/2039 | | | 29,752 | | | | 34,308 | |
| | |
Pool # 726769, 5.00%, 9/15/2039 | | | 26,957 | | | | 29,872 | |
| | |
Pool # 721340, 5.00%, 12/15/2039 | | | 51,219 | | | | 55,334 | |
| | |
Pool # 754439, 3.50%, 12/15/2041 | | | 195,594 | | | | 212,708 | |
| | |
Pool # 711674, 3.00%, 9/15/2042 | | | 65,197 | | | | 68,794 | |
| | |
Pool # AD7257, 3.50%, 3/15/2043 | | | 187,731 | | | | 205,405 | |
| | |
Pool # 783748, 3.50%, 4/15/2043 | | | 109,299 | | | | 118,376 | |
| | |
Pool # 784660, 4.00%, 4/15/2043 | | | 11,000 | | | | 12,096 | |
| | |
Pool # AC2224, 3.50%, 6/15/2043 | | | 87,562 | | | | 94,433 | |
| | |
Pool # 785088, 3.50%, 7/15/2043 | | | 91,000 | | | | 100,025 | |
| | |
Pool # AL2280, 3.00%, 3/15/2045 | | | 49,112 | | | | 51,817 | |
| | |
Pool # AL9314, 3.00%, 3/15/2045 | | | 94,127 | | | | 99,311 | |
SEE NOTES TO FINANCIAL STATEMENTS.
| | | | | | |
| | | |
| 134 | | | | J.P. MORGAN EXCHANGE-TRADED FUNDS | | AUGUST 31, 2020 |
| | | | | | | | |
| INVESTMENTS | | PRINCIPAL
AMOUNT ($) | | | VALUE ($) | |
Mortgage-Backed Securities — continued | |
| | |
Pool # 784664, 4.00%, 4/15/2045 | | | 45,924 | | | | 50,499 | |
| | |
Pool # 670030, 3.00%, 7/15/2045 | | | 84,373 | | | | 89,020 | |
| | |
Pool # AM8960, 4.00%, 7/15/2045 | | | 29,884 | | | | 32,516 | |
| | |
Pool # AO0544, 3.00%, 8/15/2045 | | | 53,031 | | | | 55,953 | |
| | |
Pool # 784371, 4.00%, 8/15/2045 | | | 109,786 | | | | 121,275 | |
| | |
Pool # 627030, 3.00%, 12/15/2045 | | | 28,213 | | | | 29,823 | |
| | |
Pool # 784429, 3.00%, 8/15/2046 | | | 155,958 | | | | 164,999 | |
| | |
Pool # AF8266, 3.50%, 10/15/2048 | | | 97,684 | | | | 103,575 | |
| | |
GNMA II, 15 Year | | | | | | | | |
| | |
Pool # MA0513, 2.50%, 11/20/2027 | | | 133,938 | | | | 141,288 | |
| | |
Pool # MA4625, 3.50%, 8/20/2032 | | | 50,835 | | | | 53,778 | |
| | |
GNMA II, 30 Year | | | | | | | | |
| | |
Pool # 3330, 4.50%, 12/20/2032 | | | 35 | | | | 38 | |
| | |
Pool # 711773, 3.50%, 6/20/2033 | | | 72,909 | | | | 77,879 | |
| | |
Pool # 3459, 5.50%, 10/20/2033 | | | 79,258 | | | | 90,417 | |
| | |
Pool # AQ5932, 3.50%, 1/20/2036 | | | 237,275 | | | | 249,720 | |
| | |
Pool # 4222, 6.00%, 8/20/2038 | | | 15,882 | | | | 18,605 | |
| | |
Pool # 709148, 4.50%, 2/20/2039 | | | 31,293 | | | | 34,919 | |
| | |
Pool # 4446, 4.50%, 5/20/2039 | | | 5,484 | | | | 6,119 | |
| | |
Pool # 4467, 4.00%, 6/20/2039 | | | 24,813 | | | | 27,539 | |
| | |
Pool # 4468, 4.50%, 6/20/2039 | | | 4,980 | | | | 5,557 | |
| | |
Pool # 4494, 4.00%, 7/20/2039 | | | 28,205 | | | | 31,303 | |
| | |
Pool # 4495, 4.50%, 7/20/2039 | | | 21,306 | | | | 23,775 | |
| | |
Pool # 4519, 4.50%, 8/20/2039 | | | 8,048 | | | | 8,980 | |
| | |
Pool # 4558, 4.50%, 10/20/2039 | | | 6,539 | | | | 7,297 | |
| | |
Pool # 4576, 4.00%, 11/20/2039 | | | 12,663 | | | | 14,055 | |
| | |
Pool # 4598, 4.50%, 12/20/2039 | | | 13,046 | | | | 14,557 | |
| | |
Pool # 4617, 4.50%, 1/20/2040 | | | 7,135 | | | | 7,962 | |
| | |
Pool # 4636, 4.50%, 2/20/2040 | | | 9,907 | | | | 11,055 | |
| | |
Pool # 4656, 4.00%, 3/20/2040 | | | 19,190 | | | | 21,236 | |
| | |
Pool # 4677, 4.00%, 4/20/2040 | | | 54,395 | | | | 60,194 | |
| | |
Pool # 4678, 4.50%, 4/20/2040 | | | 2,416 | | | | 2,703 | |
| | |
Pool # 4695, 4.00%, 5/20/2040 | | | 6,110 | | | | 6,762 | |
| | |
Pool # 4696, 4.50%, 5/20/2040 | | | 2,527 | | | | 2,826 | |
| | |
Pool # 4712, 4.00%, 6/20/2040 | | | 9,106 | | | | 10,077 | |
| | |
Pool # 4800, 4.00%, 9/20/2040 | | | 10,235 | | | | 11,326 | |
| | |
Pool # 737727, 4.00%, 12/20/2040 | | | 68,784 | | | | 76,117 | |
| | |
Pool # 4945, 4.00%, 2/20/2041 | | | 20,957 | | | | 23,191 | |
| | |
Pool # 4950, 5.50%, 2/20/2041 | | | 35,495 | | | | 40,333 | |
| | |
Pool # 4976, 3.50%, 3/20/2041 | | | 22,703 | | | | 24,674 | |
| | |
Pool # 4977, 4.00%, 3/20/2041 | | | 38,323 | | | | 42,416 | |
| | |
Pool # 5016, 4.00%, 4/20/2041 | | | 14,544 | | | | 16,097 | |
| | |
Pool # 5054, 4.00%, 5/20/2041 | | | 22,665 | | | | 25,085 | |
| | |
Pool # 5114, 4.00%, 7/20/2041 | | | 3,092 | | | | 3,422 | |
| | |
Pool # 779497, 3.50%, 10/20/2041 | | | 20,576 | | | | 22,362 | |
| | |
Pool # 5233, 4.00%, 11/20/2041 | | | 3,647 | | | | 4,036 | |
| | | | | | | | |
| INVESTMENTS | | PRINCIPAL
AMOUNT ($) | | | VALUE ($) | |
| | | | | | | | |
| | |
Pool # 5258, 3.50%, 12/20/2041 | | | 222,669 | | | | 242,000 | |
| | |
Pool # 5259, 4.00%, 12/20/2041 | | | 13,840 | | | | 15,318 | |
| | |
Pool # 5279, 3.50%, 1/20/2042 | | | 41,750 | | | | 45,374 | |
| | |
Pool # 5330, 3.00%, 3/20/2042 | | | 27,193 | | | | 28,990 | |
| | |
Pool # 754406, 3.50%, 5/20/2042 | | | 83,492 | | | | 90,740 | |
| | |
Pool # MA0220, 3.50%, 7/20/2042 | | | 17,865 | | | | 19,379 | |
| | |
Pool # MA0318, 3.50%, 8/20/2042 | | | 251,937 | | | | 273,289 | |
| | |
Pool # 796468, 4.00%, 9/20/2042 | | | 44,980 | | | | 49,595 | |
| | |
Pool # MA0462, 3.50%, 10/20/2042 | | | 157,734 | | | | 171,102 | |
| | |
Pool # AA6040, 3.00%, 1/20/2043 | | | 121,009 | | | | 129,112 | |
| | |
Pool # AD1584, 3.00%, 1/20/2043 | | | 281,678 | | | | 300,301 | |
| | |
Pool # AA6054, 3.00%, 2/20/2043 | | | 308,431 | | | | 338,883 | |
| | |
Pool # AD1744, 3.00%, 2/20/2043 | | | 25,302 | | | | 27,800 | |
| | |
Pool # 783755, 3.00%, 4/20/2043 | | | 248,689 | | | | 265,264 | |
| | |
Pool # 783976, 3.50%, 4/20/2043 | | | 40,744 | | | | 44,197 | |
| | |
Pool # MA1157, 3.50%, 7/20/2043 | | | 40,974 | | | | 44,268 | |
| | |
Pool # AE7804, 3.00%, 8/20/2043 | | | 22,551 | | | | 24,055 | |
| | |
Pool # MA1284, 3.00%, 9/20/2043 | | | 33,244 | | | | 35,459 | |
| | |
Pool # 785065, 3.50%, 10/20/2043 | | | 424,307 | | | | 458,413 | |
| | |
Pool # MA1376, 4.00%, 10/20/2043 | | | 217,763 | | | | 238,962 | |
| | |
Pool # MA1995, 3.50%, 6/20/2044 | | | 165,213 | | | | 177,546 | |
| | |
Pool # AI7106, 4.00%, 6/20/2044 | | | 108,813 | | | | 119,234 | |
| | |
Pool # MA2223, 3.50%, 9/20/2044 | | | 131,257 | | | | 141,055 | |
| | |
Pool # MA2444, 3.00%, 12/20/2044 | | | 34,958 | | | | 37,086 | |
| | |
Pool # 784026, 3.50%, 12/20/2044 | | | 257,660 | | | | 276,893 | |
| | |
Pool # AK6860, 3.00%, 1/20/2045 | | | 68,813 | | | | 74,530 | |
| | |
Pool # MA2677, 3.00%, 3/20/2045 | | | 49,645 | | | | 52,521 | |
| | |
Pool # MA2678, 3.50%, 3/20/2045 | | | 328,130 | | | | 351,269 | |
| | |
Pool # MA2679, 4.00%, 3/20/2045 | | | 89,327 | | | | 97,882 | |
| | |
Pool # MA2753, 3.00%, 4/20/2045 | | | 406,133 | | | | 429,657 | |
| | |
Pool # MA2754, 3.50%, 4/20/2045 | | | 15,746 | | | | 16,857 | |
| | |
Pool # 626942, 3.00%, 5/20/2045 | | | 215,283 | | | | 228,369 | |
| | |
Pool # MA2825, 3.00%, 5/20/2045 | | | 442,443 | | | | 468,070 | |
| | |
Pool # MA2829, 5.00%, 5/20/2045 | | | 50,416 | | | | 57,696 | |
| | |
Pool # 784800, 3.00%, 6/20/2045 | | | 51,701 | | | | 55,147 | |
| | |
Pool # AM9881, 3.00%, 6/20/2045 | | | 27,080 | | | | 28,873 | |
| | |
Pool # MA2891, 3.00%, 6/20/2045 | | | 18,001 | | | | 19,043 | |
| | |
Pool # AN2972, 4.00%, 9/20/2045 | | | 91,995 | | | | 99,928 | |
| | |
Pool # 784623, 3.50%, 10/20/2045 | | | 107,962 | | | | 116,640 | |
| | |
Pool # AO8403, 3.50%, 10/20/2045 | | | 52,352 | | | | 56,044 | |
| | |
Pool # MA3247, 5.00%, 11/20/2045 | | | 45,921 | | | | 52,552 | |
| | |
Pool # AO9442, 3.50%, 12/20/2045 | | | 32,318 | | | | 35,112 | |
| | |
Pool # MA3375, 3.00%, 1/20/2046 | | | 99,649 | | | | 105,421 | |
| | |
Pool # 784119, 3.00%, 2/20/2046 | | | 369,314 | | | | 390,705 | |
| | |
Pool # MA3458, 5.50%, 2/20/2046 | | | 61,086 | | | | 66,364 | |
| | |
Pool # AS2837, 3.50%, 3/20/2046 | | | 313,117 | | | | 333,399 | |
SEE NOTES TO FINANCIAL STATEMENTS.
| | | | | | | | |
| | | |
| AUGUST 31, 2020 | | J.P. MORGAN EXCHANGE-TRADED FUNDS | | | | | 135 | |
JPMorgan U.S. Aggregate Bond ETF
SCHEDULE OF PORTFOLIO INVESTMENTS
AS OF AUGUST 31, 2020 (Unaudited) (continued)
| | | | | | | | |
| INVESTMENTS | | PRINCIPAL
AMOUNT ($) | | | VALUE ($) | |
Mortgage-Backed Securities — continued | |
| | |
Pool # MA3523, 4.50%, 3/20/2046 | | | 23,343 | | | | 26,049 | |
| | |
Pool # MA3596, 3.00%, 4/20/2046 | | | 745,704 | | | | 788,738 | |
| | |
Pool # MA3597, 3.50%, 4/20/2046 | | | 279,103 | | | | 297,182 | |
| | |
Pool # MA3662, 3.00%, 5/20/2046 | | | 254,093 | | | | 268,756 | |
| | |
Pool # MA3735, 3.00%, 6/20/2046 | | | 749,889 | | | | 793,164 | |
| | |
Pool # AS5902, 3.50%, 6/20/2046 | | | 88,041 | | | | 94,867 | |
| | |
Pool # AT7138, 3.50%, 6/20/2046 | | | 44,819 | | | | 47,959 | |
| | |
Pool # MA3736, 3.50%, 6/20/2046 | | | 225,335 | | | | 239,931 | |
| | |
Pool # MA3935, 2.50%, 9/20/2046 | | | 196,628 | | | | 208,367 | |
| | |
Pool # 784768, 3.00%, 9/20/2046 | | | 142,472 | | | | 153,199 | |
| | |
Pool # AT8215, 3.00%, 9/20/2046 | | | 42,045 | | | | 45,211 | |
| | |
Pool # AX8668, 3.50%, 9/20/2046 | | | 176,608 | | | | 188,047 | |
| | |
Pool # MA4002, 2.50%, 10/20/2046 | | | 968,411 | | | | 1,026,228 | |
| | |
Pool # AV8383, 3.00%, 10/20/2046 | | | 60,131 | | | | 63,626 | |
| | |
Pool # AW0199, 3.00%, 10/20/2046 | | | 98,853 | | | | 104,575 | |
| | |
Pool # MA4003, 3.00%, 10/20/2046 | | | 157,030 | | | | 166,092 | |
| | |
Pool # MA4068, 3.00%, 11/20/2046 | | | 30,921 | | | | 32,705 | |
| | |
Pool # MA4072, 5.00%, 11/20/2046 | | | 49,954 | | | | 57,071 | |
| | |
Pool # MA4125, 2.50%, 12/20/2046 | | | 850,811 | | | | 901,607 | |
| | |
Pool # MA4126, 3.00%, 12/20/2046 | | | 142,712 | | | | 150,948 | |
| | |
Pool # MA4127, 3.50%, 12/20/2046 | | | 64,273 | | | | 68,436 | |
| | |
Pool # MA4260, 2.50%, 2/20/2047 | | | 131,490 | | | | 139,340 | |
| | |
Pool # AZ3119, 3.50%, 3/20/2047 | | | 43,259 | | | | 46,314 | |
| | |
Pool # 675725, 3.50%, 6/20/2047 | | | 11,187 | | | | 11,722 | |
| | |
Pool # 784801, 3.50%, 6/20/2047 | | | 107,143 | | | | 115,755 | |
| | |
Pool # BA5041, 5.00%, 6/20/2047 | | | 180,302 | | | | 196,999 | |
| | |
Pool # MA4584, 2.50%, 7/20/2047 | | | 137,321 | | | | 145,519 | |
| | |
Pool # MA4718, 3.00%, 9/20/2047 | | | 20,953 | | | | 22,106 | |
| | |
Pool # MA4721, 4.50%, 9/20/2047 | | | 95,825 | | | | 103,444 | |
| | |
Pool # MA4836, 3.00%, 11/20/2047 | | | 30,060 | | | | 31,715 | |
| | |
Pool # BD5420, 3.50%, 12/20/2047 | | | 314,179 | | | | 345,610 | |
| | |
Pool # BD6940, 3.50%, 12/20/2047 | | | 704 | | | | 750 | |
| | |
Pool # MA4900, 3.50%, 12/20/2047 | | | 276,551 | | | | 294,627 | |
| | |
Pool # MA4961, 3.00%, 1/20/2048 | | | 133,078 | | | | 140,403 | |
| | |
Pool # MA4962, 3.50%, 1/20/2048 | | | 729,894 | | | | 777,601 | |
| | |
Pool # 784474, 3.50%, 2/20/2048 | | | 240,204 | | | | 261,445 | |
| | |
Pool # 784899, 4.00%, 2/20/2048 | | | 81,845 | | | | 87,911 | |
| | |
Pool # BF6382, 3.00%, 3/20/2048 | | | 148,186 | | | | 153,315 | |
| | |
Pool # MA5077, 3.50%, 3/20/2048 | | | 108,078 | | | | 114,569 | |
| | |
Pool # MA5137, 4.00%, 4/20/2048 | | | 923,209 | | | | 988,154 | |
| | |
Pool # MA5138, 4.50%, 4/20/2048 | | | 48,993 | | | | 52,889 | |
| | |
Pool # 785033, 3.50%, 5/20/2048 | | | 350,468 | | | | 384,552 | |
| | |
Pool # MA5191, 3.50%, 5/20/2048 | | | 68,896 | | | | 73,034 | |
| | |
Pool # MA5264, 4.00%, 6/20/2048 | | | 89,796 | | | | 96,113 | |
| | |
Pool # MA5329, 3.50%, 7/20/2048 | | | 25,622 | | | | 27,161 | |
| | |
Pool # MA5330, 4.00%, 7/20/2048 | | | 74,967 | | | | 80,241 | |
| | | | | | | | |
| INVESTMENTS | | PRINCIPAL
AMOUNT ($) | | | VALUE ($) | |
| | | | | | | | |
| | |
Pool # BG8682, 3.00%, 9/20/2048 | | | 569,603 | | | | 592,493 | |
| | |
Pool # BK1677, 4.50%, 9/20/2048 | | | 299,053 | | | | 325,155 | |
| | |
Pool # MA5468, 5.00%, 9/20/2048 | | | 23,355 | | | | 25,446 | |
| | |
Pool # MA5527, 3.50%, 10/20/2048 | | | 101,571 | | | | 107,671 | |
| | |
Pool # MA5528, 4.00%, 10/20/2048 | | | 54,962 | | | | 58,828 | |
| | |
Pool # BJ6774, 4.00%, 11/20/2048 | | | 83,090 | | | | 88,780 | |
| | |
Pool # MA5595, 4.00%, 11/20/2048 | | | 131,811 | | | | 141,083 | |
| | |
Pool # BJ6759, 4.50%, 11/20/2048 | | | 930,347 | | | | 1,005,879 | |
| | |
Pool # MA5650, 3.50%, 12/20/2048 | | | 39,394 | | | | 41,759 | |
| | |
Pool # MA5651, 4.00%, 12/20/2048 | | | 621,256 | | | | 664,959 | |
| | |
Pool # MA5709, 3.50%, 1/20/2049 | | | 250,445 | | | | 266,814 | |
| | |
Pool # BI6473, 4.00%, 1/20/2049 | | | 1,464,397 | | | | 1,567,412 | |
| | |
Pool # BJ9901, 3.00%, 2/20/2049 | | | 59,514 | | | | 62,980 | |
| | |
Pool # MA5763, 4.00%, 2/20/2049 | | | 183,667 | | | | 196,587 | |
| | |
Pool # MA5815, 3.00%, 3/20/2049 | | | 227,144 | | | | 239,122 | |
| | |
Pool # MA5816, 3.50%, 3/20/2049 | | | 381,210 | | | | 404,105 | |
| | |
Pool # 784900, 4.00%, 4/20/2049 | | | 489,741 | | | | 524,193 | |
| | |
Pool # MA5876, 4.00%, 4/20/2049 | | | 117,161 | | | | 124,760 | |
| | |
Pool # MA5930, 3.50%, 5/20/2049 | | | 43,095 | | | | 45,305 | |
| | |
Pool # MA5931, 4.00%, 5/20/2049 | | | 380,211 | | | | 404,873 | |
| | |
Pool # MA5983, 2.50%, 6/20/2049 | | | 270,669 | | | | 286,829 | |
| | |
Pool # MA5984, 3.00%, 6/20/2049 | | | 284,693 | | | | 299,707 | |
| | |
Pool # MA5985, 3.50%, 6/20/2049 | | | 170,195 | | | | 178,921 | |
| | |
Pool # MA5986, 4.00%, 6/20/2049 | | | 97,878 | | | | 104,226 | |
| | |
Pool # MA5987, 4.50%, 6/20/2049 | | | 143,615 | | | | 154,262 | |
| | |
Pool # MA5988, 5.00%, 6/20/2049 | | | 31,630 | | | | 34,463 | |
| | |
Pool # MA6039, 3.50%, 7/20/2049 | | | 290,741 | | | | 305,648 | |
| | |
Pool # MA6040, 4.00%, 7/20/2049 | | | 61,516 | | | | 65,507 | |
| | |
Pool # BM5450, 4.50%, 7/20/2049 | | | 188,843 | | | | 205,603 | |
| | |
Pool # MA6089, 3.00%, 8/20/2049 | | | 73,546 | | | | 77,360 | |
| | |
Pool # MA6090, 3.50%, 8/20/2049 | | | 288,278 | | | | 303,058 | |
| | |
Pool # BP4603, 3.50%, 9/20/2049 | | | 49,171 | | | | 53,191 | |
| | |
Pool # BP8717, 3.50%, 9/20/2049 | | | 294,735 | | | | 318,835 | |
| | |
Pool # MA6154, 3.50%, 9/20/2049 | | | 89,865 | | | | 94,473 | |
| | |
Pool # MA6155, 4.00%, 9/20/2049 | | | 857,056 | | | | 912,646 | |
| | |
Pool # BQ7205, 3.50%, 10/20/2049 | | | 561,432 | | | | 615,769 | |
| | |
Pool # MA6219, 3.50%, 10/20/2049 | | | 855,693 | | | | 899,567 | |
| | |
Pool # MA6220, 4.00%, 10/20/2049 | | | 788,237 | | | | 839,364 | |
| | |
Pool # MA6221, 4.50%, 10/20/2049 | | | 249,101 | | | | 267,569 | |
| | |
Pool # BR4627, 3.00%, 11/20/2049 | | | 683,437 | | | | 736,942 | |
| | |
Pool # MA6283, 3.00%, 11/20/2049 | | | 367,363 | | | | 386,417 | |
| | |
Pool # MA6284, 3.50%, 11/20/2049 | | | 122,597 | | | | 128,883 | |
| | |
Pool # BR2455, 3.00%, 12/20/2049 | | | 916,246 | | | | 951,200 | |
| | |
Pool # MA6338, 3.00%, 12/20/2049 | | | 1,666,626 | | | | 1,753,067 | |
| | |
Pool # MA6339, 3.50%, 12/20/2049 | | | 792,420 | | | | 833,049 | |
| | |
Pool # BS1714, 4.00%, 12/20/2049 | | | 434,100 | | | | 462,257 | |
SEE NOTES TO FINANCIAL STATEMENTS.
| | | | | | |
| | | |
| 136 | | | | J.P. MORGAN EXCHANGE-TRADED FUNDS | | AUGUST 31, 2020 |
| | | | | | | | |
| INVESTMENTS | | PRINCIPAL
AMOUNT ($) | | | VALUE ($) | |
Mortgage-Backed Securities — continued | |
| | |
Pool # MA6341, 4.50%, 12/20/2049 | | | 590,943 | | | | 634,754 | |
| | |
Pool # BT1382, 3.00%, 1/20/2050 | | | 299,245 | | | | 327,006 | |
| | |
Pool # MA6409, 3.00%, 1/20/2050 | | | 977,762 | | | | 1,028,474 | |
| | |
Pool # MA6410, 3.50%, 1/20/2050 | | | 399,487 | | | | 419,970 | |
| | |
Pool # BR2145, 3.00%, 2/20/2050 | | | 258,945 | | | | 274,290 | |
| | |
Pool # MA6474, 3.00%, 2/20/2050 | | | 236,124 | | | | 249,226 | |
| | |
Pool # MA6478, 5.00%, 2/20/2050 | | | 112,414 | | | | 122,825 | |
| | |
Pool # BT3619, 3.00%, 3/20/2050 | | | 102,110 | | | | 107,777 | |
| | |
Pool # MA6542, 3.50%, 3/20/2050 | | | 460,262 | | | | 483,861 | |
| | |
Pool # MA6545, 5.00%, 3/20/2050 | | | 143,927 | | | | 157,256 | |
| | |
Pool # BU6116, 2.50%, 4/20/2050 | | | 596,866 | | | | 618,166 | |
| | |
Pool # BT6608, 3.00%, 4/20/2050 | | | 239,087 | | | | 247,393 | |
| | |
Pool # MA6599, Class 357, 3.00%, 4/20/2050 | | | 341,173 | | | | 360,105 | |
| | |
Pool # MA6656, 3.00%, 5/20/2050 | | | 118,972 | | | | 125,574 | |
| | |
Pool # MA6657, 3.50%, 5/20/2050 | | | 118,422 | | | | 124,494 | |
| | |
Pool # MA6709, 2.50%, 6/20/2050 | | | 1,133,239 | | | | 1,194,932 | |
| | |
Pool # MA6769, 4.50%, 7/20/2050 | | | 251,157 | | | | 271,362 | |
| | |
Pool # MA6820, 3.00%, 8/20/2050 | | | 350,000 | | | | 369,422 | |
| | |
GNMA II, 30 Year, Single Family | | | | | | | | |
| | |
Pool # MA1012, 3.50%, 5/20/2043 | | | 203,633 | | | | 220,001 | |
| | |
Pool # MA5194, 5.00%, 5/20/2048 | | | 300,609 | | | | 328,447 | |
| | | | | | | | |
| | |
Total Mortgage-Backed Securities
(Cost $178,685,670) | | | | | | | 182,213,414 | |
| | | | | |
Commercial Mortgage-Backed Securities — 2.1% | |
| | |
Banc of America Commercial Mortgage Trust Series 2017-BNK3, Class A4, 3.57%, 2/15/2050 | | | 20,000 | | | | 22,502 | |
| | |
BANK | | | | | | | | |
| | |
Series 2017-BNK4, Class ASB, 3.42%, 5/15/2050 | | | 30,000 | | | | 32,579 | |
| | |
Series 2019-BN16, Class A4, 4.01%, 2/15/2052 | | | 60,000 | | | | 70,824 | |
| | |
Series 2019-BN21, Class A5, 2.85%, 10/17/2052 | | | 60,000 | | | | 66,127 | |
| | |
Series 2019-BN23, Class A3, 2.92%, 12/15/2052 | | | 142,000 | | | | 157,415 | |
| | |
Series 2018-BN10, Class A5, 3.69%, 2/15/2061 | | | 20,000 | | | | 22,883 | |
| | |
Series 2018-BN10, Class AS, 3.90%, 2/15/2061 (e) | | | 180,000 | | | | 203,016 | |
| | |
Series 2019-BN19, Class A3, 3.18%, 8/15/2061 | | | 100,000 | | | | 112,476 | |
| | |
Series 2019-BN22, Class A4, 2.98%, 11/15/2062 | | | 260,000 | | | | 289,771 | |
| | |
BBCMS Mortgage Trust Series 2018-C2, Class A5, 4.31%, 12/15/2051 | | | 40,000 | | | | 47,741 | |
| | | | | | | | |
| INVESTMENTS | | PRINCIPAL
AMOUNT ($) | | | VALUE ($) | |
| | | | | | | | |
| | |
Benchmark Mortgage Trust | | | | | | | | |
| | |
Series 2018-B1, Class A5, 3.67%, 1/15/2051 (e) | | | 50,000 | | | | 57,288 | |
| | |
Series 2018-B2, Class B, 4.34%, 2/15/2051 ‡ (e) | | | 20,000 | | | | 21,664 | |
| | |
Series 2018-B5, Class A4, 4.21%, 7/15/2051 | | | 110,000 | | | | 131,011 | |
| | |
Series 2018-B6, Class A2, 4.20%, 10/10/2051 | | | 50,000 | | | | 53,625 | |
| | |
Series 2018-B8, Class A5, 4.23%, 1/15/2052 | | | 40,000 | | | | 47,887 | |
| | |
Series 2020-B16, Class AM, 2.94%, 2/15/2053 ‡ (e) | | | 180,000 | | | | 194,498 | |
| | |
Cantor Commercial Real Estate Lending | | | | | | | | |
| | |
Series 2019-CF2, Class AS, 3.12%, 11/15/2052 | | | 75,000 | | | | 80,941 | |
| | |
CD Mortgage Trust | | | | | | | | |
| | |
Series 2017-CD3, Class A4, 3.63%, 2/10/2050 | | | 50,000 | | | | 56,716 | |
| | |
Series 2017-CD6, Class ASB, 3.33%, 11/13/2050 | | | 20,000 | | | | 21,800 | |
| | |
Series 2017-CD6, Class AM, 3.71%, 11/13/2050 (e) | | | 30,000 | | | | 32,168 | |
| | |
CFCRE Commercial Mortgage Trust | | | | | | | | |
| | |
Series 2017-C8, Class A4, REIT, 3.57%, 6/15/2050 | | | 30,000 | | | | 33,911 | |
| | |
Series 2016-C7, Class ASB, 3.64%, 12/10/2054 | | | 20,000 | | | | 21,771 | |
| | |
Citigroup Commercial Mortgage Trust | | | | | | | | |
| | |
Series 2014-GC21, Class AAB, 3.48%, 5/10/2047 | | | 15,263 | | | | 15,974 | |
| | |
Series 2014-GC23, Class B, 4.17%, 7/10/2047 ‡ (e) | | | 30,000 | | | | 32,319 | |
| | |
Series 2014-GC25, Class AAB, 3.37%, 10/10/2047 | | | 24,389 | | | | 25,542 | |
| | |
Series 2015-GC29, Class C, 4.30%, 4/10/2048 ‡ (e) | | | 40,000 | | | | 39,132 | |
| | |
Series 2016-C1, Class AAB, 3.00%, 5/10/2049 | | | 100,000 | | | | 105,662 | |
| | |
Series 2016-P5, Class A2, 2.40%, 10/10/2049 | | | 50,000 | | | | 50,602 | |
| | |
Series 2017-P7, Class A2, 3.21%, 4/14/2050 | | | 407,000 | | | | 415,213 | |
| | |
Series 2019-GC43, Class A4, 3.04%, 11/10/2052 | | | 50,000 | | | | 55,686 | |
| | |
Commercial Mortgage Trust | | | | | | | | |
| | |
Series 2013-CR9, Class A4, 4.36%, 7/10/2045 (e) | | | 120,000 | | | | 129,800 | |
| | |
Series 2012-CR3, Class A3, 2.82%, 10/15/2045 | | | 159,394 | | | | 163,256 | |
SEE NOTES TO FINANCIAL STATEMENTS.
| | | | | | | | |
| | | |
| AUGUST 31, 2020 | | J.P. MORGAN EXCHANGE-TRADED FUNDS | | | | | 137 | |
JPMorgan U.S. Aggregate Bond ETF
SCHEDULE OF PORTFOLIO INVESTMENTS
AS OF AUGUST 31, 2020 (Unaudited) (continued)
| | | | | | | | |
| INVESTMENTS | | PRINCIPAL
AMOUNT ($) | | | VALUE ($) | |
Commercial Mortgage-Backed Securities — continued | |
| | |
Series 2012-CR4, Class A3, 2.85%, 10/15/2045 | | | 24,848 | | | | 25,685 | |
| | |
Series 2013-CR6, Class A4, 3.10%, 3/10/2046 | | | 20,000 | | | | 20,887 | |
| | |
Series 2013-CR7, Class A4, 3.21%, 3/10/2046 | | | 48,255 | | | | 50,624 | |
| | |
Series 2014-CR14, Class C, 4.77%, 2/10/2047 ‡ (e) | | | 30,000 | | | | 29,700 | |
| | |
Series 2014-UBS4, Class C, 4.80%, 8/10/2047 ‡ (e) | | | 54,000 | | | | 52,953 | |
| | |
Series 2014-UBS5, Class AM, 4.19%, 9/10/2047 (e) | | | 40,000 | | | | 43,370 | |
| | |
Series 2014-CR20, Class A3, 3.33%, 11/10/2047 | | | 45,000 | | | | 48,374 | |
| | |
Series 2014-UBS6, Class A4, 3.38%, 12/10/2047 | | | 140,000 | | | | 151,402 | |
| | |
Series 2015-LC19, Class A4, 3.18%, 2/10/2048 | | | 200,000 | | | | 216,279 | |
| | |
Series 2015-LC21, Class AM, 4.04%, 7/10/2048 (e) | | | 30,000 | | | | 32,632 | |
| | |
Series 2015-CR25, Class A4, 3.76%, 8/10/2048 | | | 30,000 | | | | 33,399 | |
| | |
CSAIL Commercial Mortgage Trust | | | | | | | | |
| | |
Series 2015-C3, Class A4, 3.72%, 8/15/2048 | | | 30,000 | | | | 33,140 | |
| | |
Series 2015-C3, Class B, 4.24%, 8/15/2048 ‡ (e) | | | 70,000 | | | | 62,315 | |
| | |
Series 2016-C5, Class A5, 3.76%, 11/15/2048 | | | 27,000 | | | | 30,134 | |
| | |
Series 2019-C15, Class A4, 4.05%, 3/15/2052 | | | 210,000 | | | | 247,522 | |
| | |
DBGS Mortgage Trust Series 2018-C1, Class A4, 4.47%, 10/15/2051 | | | 20,000 | | | | 24,083 | |
| | |
DBJPM Mortgage Trust Series 2017-C6, Class A5, 3.33%, 6/10/2050 | | | 20,000 | | | | 22,430 | |
| | |
FHLMC, Multi-Family Structured Pass-Through Certificates | | | | | | | | |
| | |
Series K027, Class A2, 2.64%, 1/25/2023 | | | 267,000 | | | | 278,927 | |
| | |
Series K028, Class A2, 3.11%, 2/25/2023 | | | 100,000 | | | | 105,601 | |
| | |
Series K029, Class A2, 3.32%, 2/25/2023 | | | 150,000 | | | | 159,306 | |
| | |
Series K033, Class A2, 3.06%, 7/25/2023 (e) | | | 220,000 | | | | 234,522 | |
| | |
Series K036, Class A2, 3.53%, 10/25/2023 (e) | | | 162,000 | | | | 175,808 | |
| | |
Series K725, Class AM, 3.10%, 2/25/2024 (e) | | | 50,000 | | | | 53,793 | |
| | | | | | | | |
| INVESTMENTS | | PRINCIPAL
AMOUNT ($) | | | VALUE ($) | |
| | |
| | | | | | | | |
| | |
Series K728, Class A2, 3.06%, 8/25/2024 (e) | | | 50,000 | | | | 54,256 | |
| | |
Series K040, Class A2, 3.24%, 9/25/2024 | | | 70,000 | | | | 76,918 | |
| | |
Series K731, Class A2, 3.60%, 2/25/2025 (e) | | | 50,000 | | | | 55,234 | |
| | |
Series K051, Class A2, 3.31%, 9/25/2025 | | | 40,000 | | | | 44,849 | |
| | |
Series K734, Class A2, 3.21%, 2/25/2026 | | | 370,000 | | | | 413,673 | |
| | |
Series K735, Class A2, 2.86%, 5/25/2026 | | | 50,000 | | | | 55,367 | |
| | |
Series K057, Class A2, 2.57%, 7/25/2026 | | | 63,000 | | | | 68,828 | |
| | |
Series K063, Class A1, 3.05%, 8/25/2026 | | | 44,830 | | | | 48,239 | |
| | |
Series K084, Class A2, 3.78%, 10/25/2028 (e) | | | 500,000 | | | | 594,487 | |
| | |
Series K085, Class A2, 4.06%, 10/25/2028 (e) | | | 120,000 | | | | 145,031 | |
| | |
Series K096, Class A2, 2.52%, 7/25/2029 | | | 295,000 | | | | 329,226 | |
| | |
Series K100, Class A2, 2.67%, 9/25/2029 | | | 400,000 | | | | 452,436 | |
| | |
Series K-1512, Class A2, 2.99%, 5/25/2031 | | | 75,000 | | | | 88,179 | |
| | |
Series K156, Class A3, 3.70%, 6/25/2033 (e) | | | 91,000 | | | | 112,301 | |
| | |
Series K-1512, Class A3, 3.06%, 4/25/2034 | | | 150,000 | | | | 178,012 | |
| | |
Series K-1513, Class A3, 2.80%, 8/25/2034 | | | 325,000 | | | | 372,411 | |
| | |
Series K-1514, Class A2, 2.86%, 10/25/2034 | | | 400,000 | | | | 461,525 | |
| | |
FNMA ACES | | | | | | | | |
| | |
Series 2012-M1, Class A2, 2.73%, 10/25/2021 | | | 29,022 | | | | 29,331 | |
| | |
Series 2014-M2, Class A2, 3.51%, 12/25/2023 (e) | | | 38,734 | | | | 42,163 | |
| | |
Series 2014-M3, Class A2, 3.50%, 1/25/2024 (e) | | | 36,016 | | | | 39,252 | |
| | |
Series 2017-M10, Class AV2, 2.64%, 7/25/2024 (e) | | | 50,000 | | | | 53,186 | |
| | |
Series 2016-M6, Class A1, 2.14%, 5/25/2026 | | | 43,828 | | | | 45,492 | |
| | |
Series 2016-M11, Class A1, 2.08%, 7/25/2026 | | | 47,965 | | | | 49,711 | |
| | |
Series 2017-M1, Class A2, 2.50%, 10/25/2026 (e) | | | 200,000 | | | | 216,605 | |
SEE NOTES TO FINANCIAL STATEMENTS.
| | | | | | |
| | | |
| 138 | | | | J.P. MORGAN EXCHANGE-TRADED FUNDS | | AUGUST 31, 2020 |
| | | | | | | | |
| INVESTMENTS | | PRINCIPAL
AMOUNT ($) | | | VALUE ($) | |
Commercial Mortgage-Backed Securities — continued | |
| | |
Series 2017-M7, Class A2, 2.96%, 2/25/2027 (e) | | | 200,000 | | | | 222,334 | |
| | |
Series 2017-M12, Class A1, 2.75%, 6/25/2027 | | | 31,007 | | | | 32,596 | |
| | |
Series 2017-M12, Class A2, 3.18%, 6/25/2027 (e) | | | 202,756 | | | | 228,855 | |
| | |
Series 2018-M10, Class A2, 3.48%, 7/25/2028 (e) | | | 40,000 | | | | 46,569 | |
| | |
Series 2018-M14, Class A2, 3.70%, 8/25/2028 (e) | | | 450,000 | | | | 531,930 | |
| | |
Series 2019-M1, Class A2, 3.67%, 9/25/2028 (e) | | | 85,000 | | | | 100,330 | |
| | |
Series 2018-M13, Class A1, 3.82%, 3/25/2030 (e) | | | 34,489 | | | | 39,898 | |
| | |
GS Mortgage Securities Trust | | | | | | | | |
| | |
Series 2012-GCJ9, Class A3, 2.77%, 11/10/2045 | | | 78,273 | | | | 80,247 | |
| | |
Series 2014-GC24, Class AAB, 3.65%, 9/10/2047 | | | 20,161 | | | | 21,235 | |
| | |
Series 2014-GC24, Class AS, 4.16%, 9/10/2047 (e) | | | 170,000 | | | | 185,300 | |
| | |
Series 2015-GC28, Class A4, 3.14%, 2/10/2048 | | | 40,000 | | | | 43,036 | |
| | |
Series 2016-GS4, Class A2, 2.91%, 11/10/2049 | | | 500,000 | | | | 509,964 | |
| | |
Series 2015-GC30, Class A4, 3.38%, 5/10/2050 | | | 25,000 | | | | 27,290 | |
| | |
Series 2019-GSA1, Class A4, 3.05%, 11/10/2052 | | | 260,000 | | | | 288,777 | |
| | |
JP Morgan Chase Commercial Mortgage Securities Trust | | | | | | | | |
| | |
Series 2012-C8, Class A3, 2.83%, 10/15/2045 | | | 7,260 | | | | 7,477 | |
| | |
Series 2012-LC9, Class A5, 2.84%, 12/15/2047 | | | 19,879 | | | | 20,521 | |
| | |
JPMBB Commercial Mortgage Securities Trust | | | | | | | | |
| | |
Series 2013-C12, Class C, 4.24%, 7/15/2045 ‡ (e) | | | 240,000 | | | | 236,202 | |
| | |
Series 2015-C29, Class B, 4.12%, 5/15/2048 ‡ (e) | | | 40,000 | | | | 39,729 | |
| | |
Series 2015-C31, Class A3, 3.80%, 8/15/2048 | | | 40,000 | | | | 44,573 | |
| | |
JPMDB Commercial Mortgage Securities Trust | | | | | | | | |
| | |
Series 2016-C2, Class B, 3.99%, 6/15/2049 (e) | | | 20,000 | | | | 19,542 | |
| | |
Series 2017-C5, Class B, 4.01%, 3/15/2050‡ (e) | | | 20,000 | | | | 21,191 | |
| | | | | | | | |
| INVESTMENTS | | PRINCIPAL
AMOUNT ($) | | | VALUE ($) | |
| | | | | | | | |
| | |
Morgan Stanley Bank of America Merrill Lynch Trust | | | | | | | | |
| | |
Series 2012-C5, Class A4, 3.18%, 8/15/2045 | | | 20,000 | | | | 20,681 | |
| | |
Series 2013-C9, Class A4, 3.10%, 5/15/2046 | | | 30,000 | | | | 31,471 | |
| | |
Series 2013-C11, Class AS, 4.50%, 8/15/2046 ‡ (e) | | | 120,000 | | | | 129,349 | |
| | |
Series 2015-C22, Class AS, 3.56%, 4/15/2048 ‡ | | | 40,000 | | | | 42,575 | |
| | |
Series 2015-C25, Class ASB, 3.38%, 10/15/2048 | | | 50,000 | | | | 52,770 | |
| | |
Series 2015-C25, Class A5, 3.64%, 10/15/2048 | | | 40,000 | | | | 44,311 | |
| | |
Series 2016-C32, Class A4, 3.72%, 12/15/2049 | | | 295,000 | | | | 333,901 | |
| | |
Morgan Stanley Capital I Trust | | | | | | | | |
| | |
Series 2012-C4, Class A4, 3.24%, 3/15/2045 | | | 38,000 | | | | 38,871 | |
| | |
Series 2017-H1, Class C, 4.28%, 6/15/2050 ‡ (e) | | | 25,000 | | | | 24,292 | |
| | |
Series 2019-L2, Class A4, 4.07%, 3/15/2052 | | | 50,000 | | | | 59,351 | |
| | |
Series 2019-L3, Class A4, 3.13%, 11/15/2052 | | | 100,000 | | | | 111,807 | |
| | |
UBS Commercial Mortgage Trust | | | | | | | | |
| | |
Series 2012-C1, Class A3, 3.40%, 5/10/2045 | | | 122,004 | | | | 125,646 | |
| | |
Series 2017-C1, Class A2, 2.98%, 6/15/2050 | | | 30,000 | | | | 30,662 | |
| | |
Series 2017-C4, Class ASB, 3.37%, 10/15/2050 | | | 40,000 | | | | 43,541 | |
| | |
Series 2017-C5, Class AS, 3.78%, 11/15/2050 (e) | | | 70,000 | | | | 76,406 | |
| | |
Series 2017-C7, Class AS, 4.06%, 12/15/2050 (e) | | | 50,000 | | | | 56,737 | |
| | |
UBS-Barclays Commercial Mortgage Trust | | | | | | | | |
| | |
Series 2013-C5, Class A4, 3.18%, 3/10/2046 | | | 40,000 | | | | 41,750 | |
| | |
Series 2012-C2, Class A4, 3.53%, 5/10/2063 | | | 20,000 | | | | 20,752 | |
| | |
Wells Fargo Commercial Mortgage Trust | | | | | | | | |
| | |
Series 2012-LC5, Class A3, 2.92%, 10/15/2045 | | | 72,342 | | | | 74,702 | |
| | |
Series 2013-LC12, Class A4, 4.22%, 7/15/2046 (e) | | | 300,000 | | | | 321,922 | |
| | |
Series 2015-C27, Class A4, 3.19%, 2/15/2048 | | | 42,549 | | | | 45,504 | |
| | |
Series 2015-C28, Class A4, 3.54%, 5/15/2048 | | | 20,000 | | | | 22,046 | |
SEE NOTES TO FINANCIAL STATEMENTS.
| | | | | | | | |
| | | |
| AUGUST 31, 2020 | | J.P. MORGAN EXCHANGE-TRADED FUNDS | | | | | 139 | |
JPMorgan U.S. Aggregate Bond ETF
SCHEDULE OF PORTFOLIO INVESTMENTS
AS OF AUGUST 31, 2020 (Unaudited) (continued)
| | | | | | | | |
| INVESTMENTS | | PRINCIPAL
AMOUNT ($) | | | VALUE ($) | |
Commercial Mortgage-Backed Securities — continued | |
| | |
Series 2015-C29, Class A4, 3.64%, 6/15/2048 | | | 120,000 | | | | 132,921 | |
| | |
Series 2018-C45, Class A3, 3.92%, 6/15/2051 | | | 45,000 | | | | 52,402 | |
| | |
Series 2019-C53, Class A4, 3.04%, 10/15/2052 | | | 125,000 | | | | 139,680 | |
| | |
Series 2020-C55, Class A5, 2.73%, 2/15/2053 | | | 240,000 | | | | 261,461 | |
| | |
WFRBS Commercial Mortgage Trust | | | | | | | | |
| | |
Series 2012-C9, Class AS, 3.39%, 11/15/2045 | | | 60,000 | | | | 62,368 | |
| | |
Series 2012-C10, Class A3, 2.88%, 12/15/2045 | | | 40,000 | | | | 41,370 | |
| | |
Series 2013-C15, Class AS, 4.36%, 8/15/2046 (e) | | | 190,000 | | | | 203,655 | |
| | |
Series 2014-C22, Class A4, 3.49%, 9/15/2057 | | | 40,000 | | | | 42,908 | |
| | |
Series 2014-C22, Class A5, 3.75%, 9/15/2057 | | | 25,000 | | | | 27,428 | |
| | | | | | | | |
| | |
Total Commercial Mortgage-Backed Securities
(Cost $13,929,673) | | | | | | | 14,432,234 | |
| | | | | |
Foreign Government Securities — 1.8% | |
| | |
Canada Government Bond (Canada) | | | | | | | | |
| | |
2.63%, 1/25/2022 | | | 350,000 | | | | 361,794 | |
| | |
1.63%, 1/22/2025 | | | 35,000 | | | | 36,911 | |
| | |
Export Development Canada (Canada) | | | | | | | | |
| | |
2.00%, 5/17/2022 | | | 25,000 | | | | 25,751 | |
| | |
1.75%, 7/18/2022 | | | 60,000 | | | | 61,688 | |
| | |
2.50%, 1/24/2023 | | | 120,000 | | | | 126,437 | |
| | |
2.63%, 2/21/2024 | | | 55,000 | | | | 59,441 | |
| | |
FMS Wertmanagement AoeR (Germany) 2.75%, 1/30/2024 | | | 200,000 | | | | 216,686 | |
| | |
Hungary Government Bond (Hungary) | | | | | | | | |
| | |
5.38%, 2/21/2023 | | | 142,000 | | | | 156,927 | |
| | |
5.75%, 11/22/2023 | | | 50,000 | | | | 57,457 | |
| | |
5.38%, 3/25/2024 | | | 26,000 | | | | 29,943 | |
| | |
Italian Republic Government Bond (Italy) | | | | | | | | |
| | |
6.88%, 9/27/2023 | | | 44,000 | | | | 51,343 | |
| | |
5.38%, 6/15/2033 | | | 163,000 | | | | 204,884 | |
| | |
Japan Bank for International Cooperation (Japan) | | | | | | | | |
| | |
1.63%, 10/17/2022 | | | 200,000 | | | | 205,186 | |
| | |
1.75%, 1/23/2023 | | | 200,000 | | | | 206,401 | |
| | |
2.50%, 5/28/2025 | | | 220,000 | | | | 239,639 | |
| | |
2.88%, 6/1/2027 | | | 202,000 | | | | 228,941 | |
| | |
2.88%, 7/21/2027 | | | 218,000 | | | | 247,233 | |
| | | | | | | | |
| INVESTMENTS | | PRINCIPAL
AMOUNT ($) | | | VALUE ($) | |
| | | | | | | | |
| | |
Oriental Republic of Uruguay (Uruguay) | | | | | | | | |
| | |
8.00%, 11/18/2022 | | | 25,000 | | | | 27,155 | |
| | |
4.50%, 8/14/2024 | | | 140,000 | | | | 154,341 | |
| | |
4.38%, 10/27/2027 | | | 80,000 | | | | 92,946 | |
| | |
5.10%, 6/18/2050 (c) | | | 101,000 | | | | 140,221 | |
| | |
4.98%, 4/20/2055 | | | 55,000 | | | | 76,108 | |
| | |
Province of Alberta (Canada) | | | | | | | | |
| | |
2.20%, 7/26/2022 | | | 90,000 | | | | 93,097 | |
| | |
3.35%, 11/1/2023 | | | 100,000 | | | | 108,982 | |
| | |
2.95%, 1/23/2024 | | | 50,000 | | | | 54,111 | |
| | |
1.88%, 11/13/2024 | | | 52,000 | | | | 54,776 | |
| | |
3.30%, 3/15/2028 | | | 25,000 | | | | 29,159 | |
| | |
1.30%, 7/22/2030 | | | 57,000 | | | | 57,359 | |
| | |
Province of British Columbia (Canada) | | | | | | | | |
| | |
2.65%, 9/22/2021 | | | 117,000 | | | | 119,954 | |
| | |
2.00%, 10/23/2022 | | | 144,000 | | | | 149,286 | |
| | |
1.75%, 9/27/2024 | | | 100,000 | | | | 105,388 | |
| | |
2.25%, 6/2/2026 | | | 49,000 | | | | 53,541 | |
| | |
Province of Manitoba (Canada) | | | | | | | | |
| | |
8.88%, 9/15/2021 | | | 58,000 | | | | 62,935 | |
| | |
2.13%, 5/4/2022 | | | 33,000 | | | | 33,968 | |
| | |
Province of Ontario (Canada) | | | | | | | | |
| | |
2.50%, 9/10/2021 | | | 410,000 | | | | 419,079 | |
| | |
2.40%, 2/8/2022 | | | 95,000 | | | | 97,831 | |
| | |
2.55%, 4/25/2022 | | | 297,000 | | | | 307,825 | |
| | |
1.75%, 1/24/2023 | | | 150,000 | | | | 154,994 | |
| | |
3.40%, 10/17/2023 | | | 95,000 | | | | 103,721 | |
| | |
3.05%, 1/29/2024 | | | 55,000 | | | | 59,791 | |
| | |
2.50%, 4/27/2026 | | | 30,000 | | | | 32,963 | |
| | |
2.30%, 6/15/2026 | | | 30,000 | | | | 32,627 | |
| | |
2.00%, 10/2/2029 | | | 25,000 | | | | 26,978 | |
| | |
Province of Quebec (Canada) | | | | | | | | |
| | |
2.75%, 8/25/2021 | | | 26,000 | | | | 26,617 | |
| | |
2.38%, 1/31/2022 | | | 235,000 | | | | 241,737 | |
| | |
1.50%, 2/11/2025 (c) | | | 120,000 | | | | 125,072 | |
| | |
2.50%, 4/20/2026 | | | 55,000 | | | | 60,512 | |
| | |
Republic of Chile (Chile) | | | | | | | | |
| | |
3.25%, 9/14/2021 | | | 102,000 | | | | 105,079 | |
| | |
2.55%, 1/27/2032 | | | 150,000 | | | | 159,055 | |
| | |
Republic of Colombia (Colombia) | | | | | | | | |
| | |
8.13%, 5/21/2024 | | | 93,000 | | | | 113,033 | |
| | |
4.50%, 1/28/2026 (c) | | | 200,000 | | | | 222,343 | |
| | |
4.50%, 3/15/2029 | | | 90,000 | | | | 101,786 | |
| | |
10.38%, 1/28/2033 | | | 76,000 | | | | 120,229 | |
| | |
5.00%, 6/15/2045 | | | 200,000 | | | | 239,914 | |
SEE NOTES TO FINANCIAL STATEMENTS.
| | | | | | |
| | | |
| 140 | | | | J.P. MORGAN EXCHANGE-TRADED FUNDS | | AUGUST 31, 2020 |
| | | | | | | | |
| INVESTMENTS | | PRINCIPAL
AMOUNT ($) | | | VALUE ($) | |
Foreign Government Securities — continued | |
| |
Republic of Indonesia (Indonesia) | | | | | |
| | |
5.35%, 2/11/2049 | | | 200,000 | | | | 271,513 | |
| | |
3.50%, 2/14/2050 | | | 200,000 | | | | 213,453 | |
| |
Republic of Korea (South Korea) | | | | | |
| | |
5.63%, 11/3/2025 | | | 200,000 | | | | 249,230 | |
| | |
2.75%, 1/19/2027 | | | 207,000 | | | | 226,710 | |
| | |
3.88%, 9/20/2048 | | | 200,000 | | | | 274,763 | |
| |
Republic of Panama (Panama) | | | | | |
| | |
7.13%, 1/29/2026 | | | 100,000 | | | | 127,200 | |
| | |
8.88%, 9/30/2027 | | | 33,000 | | | | 47,575 | |
| | |
9.38%, 4/1/2029 | | | 80,000 | | | | 124,402 | |
| | |
6.70%, 1/26/2036 | | | 37,000 | | | | 55,010 | |
| | |
4.50%, 4/1/2056 | | | 200,000 | | | | 259,407 | |
| |
Republic of Peru (Peru) | | | | | |
| | |
7.35%, 7/21/2025 | | | 80,000 | | | | 102,904 | |
| | |
2.39%, 1/23/2026 | | | 45,000 | | | | 47,347 | |
| | |
8.75%, 11/21/2033 | | | 75,000 | | | | 127,801 | |
| | |
6.55%, 3/14/2037 (c) | | | 25,000 | | | | 38,979 | |
| | |
5.63%, 11/18/2050 | | | 80,000 | | | | 132,767 | |
| |
Republic of Philippines (Philippines) | | | | | |
| | |
7.50%, 9/25/2024 | | | 250,000 | | | | 299,495 | |
| | |
9.50%, 10/21/2024 | | | 125,000 | | | | 168,215 | |
| | |
10.63%, 3/16/2025 | | | 72,000 | | | | 102,467 | |
| | |
9.50%, 2/2/2030 | | | 47,000 | | | | 77,352 | |
| | |
2.95%, 5/5/2045 | | | 200,000 | | | | 213,221 | |
| |
Republic of Poland (Poland) | | | | | |
| | |
5.00%, 3/23/2022 | | | 151,000 | | | | 161,984 | |
| | |
3.25%, 4/6/2026 | | | 85,000 | | | | 96,060 | |
| |
State of Israel Government Bond (Israel) | | | | | |
| | |
3.15%, 6/30/2023 | | | 200,000 | | | | 214,366 | |
| | |
2.88%, 3/16/2026 | | | 200,000 | | | | 219,996 | |
| |
Svensk Exportkredit AB (Sweden) | | | | | |
| | |
0.75%, 4/6/2023 (c) | | | 292,000 | | | | 295,061 | |
| |
United Mexican States (Mexico) | | | | | |
| | |
3.63%, 3/15/2022 | | | 240,000 | | | | 251,447 | |
| | |
8.00%, 9/24/2022 | | | 51,000 | | | | 57,996 | |
| | |
4.00%, 10/2/2023 | | | 36,000 | | | | 39,279 | |
| | |
4.50%, 4/22/2029 | | | 280,000 | | | | 315,935 | |
| | |
6.75%, 9/27/2034 | | | 25,000 | | | | 34,259 | |
| | |
5.55%, 1/21/2045 | | | 200,000 | | | | 249,564 | |
| | |
4.60%, 1/23/2046 | | | 200,000 | | | | 221,824 | |
| | |
5.75%, 10/12/2110 | | | 394,000 | | | | 483,766 | |
| | | | | | | | |
| | |
Total Foreign Government Securities
(Cost $12,038,128) | | | | | | | 12,482,523 | |
| | | | | |
| | | | | | | | |
| INVESTMENTS | | PRINCIPAL
AMOUNT ($) | | | VALUE ($) | |
U.S. Government Agency Securities — 1.6% | |
| |
FFCB | | | | | |
| | |
1.95%, 11/2/2021 | | | 44,000 | | | | 44,788 | |
| | |
1.63%, 12/27/2021 | | | 240,000 | | | | 244,170 | |
| | |
0.53%, 1/18/2022 | | | 309,000 | | | | 310,387 | |
| | |
0.38%, 4/8/2022 | | | 290,000 | | | | 290,982 | |
| | |
1.85%, 8/5/2022 | | | 34,000 | | | | 34,935 | |
| | |
0.57%, 7/2/2024 | | | 45,000 | | | | 45,122 | |
| | |
0.73%, 12/3/2024 | | | 292,000 | | | | 292,037 | |
| | |
2.50%, 2/4/2031 | | | 43,000 | | | | 43,410 | |
| |
FHLB | | | | | |
| | |
3.00%, 10/12/2021 | | | 30,000 | | | | 30,953 | |
| | |
1.63%, 11/19/2021 | | | 25,000 | | | | 25,450 | |
| | |
1.88%, 11/29/2021 | | | 80,000 | | | | 81,721 | |
| | |
2.63%, 12/10/2021 | | | 140,000 | | | | 144,371 | |
| | |
2.38%, 6/10/2022 | | | 25,000 | | | | 25,981 | |
| | |
3.00%, 12/9/2022 | | | 70,000 | | | | 74,292 | |
| | |
1.38%, 2/17/2023 | | | 95,000 | | | | 97,787 | |
| | |
3.38%, 12/8/2023 | | | 100,000 | | | | 109,967 | |
| | |
2.50%, 2/13/2024 | | | 180,000 | | | | 193,915 | |
| | |
2.88%, 9/13/2024 | | | 130,000 | | | | 142,986 | |
| | |
2.75%, 12/13/2024 | | | 100,000 | | | | 110,018 | |
| | |
2.38%, 3/14/2025 | | | 35,000 | | | | 38,069 | |
| | |
3.25%, 11/16/2028 | | | 850,000 | | | | 1,014,891 | |
| | |
2.13%, 9/14/2029 | | | 100,000 | | | | 109,421 | |
| | |
5.63%, 3/14/2036 | | | 50,000 | | | | 77,779 | |
| | |
5.50%, 7/15/2036 | | | 35,000 | | | | 54,594 | |
| |
FHLMC | | | | | |
| | |
1.13%, 8/12/2021 | | | 60,000 | | | | 60,562 | |
| | |
2.38%, 1/13/2022 | | | 330,000 | | | | 340,070 | |
| | |
0.25%, 6/8/2022 | | | 350,000 | | | | 350,668 | |
| | |
0.35%, 6/30/2022 | | | 95,000 | | | | 94,973 | |
| | |
0.13%, 7/25/2022 | | | 500,000 | | | | 499,517 | |
| | |
0.38%, 5/5/2023 | | | 600,000 | | | | 602,708 | |
| | |
2.75%, 6/19/2023 | | | 282,000 | | | | 301,796 | |
| | |
0.25%, 6/26/2023 | | | 200,000 | | | | 200,040 | |
| | |
1.50%, 2/12/2025 | | | 379,000 | | | | 397,646 | |
| | |
0.38%, 7/21/2025 | | | 263,000 | | | | 262,435 | |
| | |
2.55%, 12/14/2029 (f) | | | 80,000 | | | | 70,787 | |
| | |
6.25%, 7/15/2032 | | | 80,000 | | | | 125,138 | |
| |
FNMA | | | | | |
| | |
1.25%, 8/17/2021 | | | 35,000 | | | | 35,371 | |
| | |
1.38%, 10/7/2021 | | | 48,000 | | | | 48,646 | |
| | |
2.00%, 1/5/2022 | | | 310,000 | | | | 317,757 | |
| | |
2.25%, 4/12/2022 | | | 68,000 | | | | 70,320 | |
| | |
1.38%, 9/6/2022 | | | 62,000 | | | | 63,496 | |
| | |
2.38%, 1/19/2023 | | | 121,000 | | | | 127,233 | |
SEE NOTES TO FINANCIAL STATEMENTS.
| | | | | | | | |
| | | |
| AUGUST 31, 2020 | | J.P. MORGAN EXCHANGE-TRADED FUNDS | | | | | 141 | |
JPMorgan U.S. Aggregate Bond ETF
SCHEDULE OF PORTFOLIO INVESTMENTS
AS OF AUGUST 31, 2020 (Unaudited) (continued)
| | | | | | | | |
| INVESTMENTS | | PRINCIPAL
AMOUNT ($) | | | VALUE ($) | |
U.S. Government Agency Securities — continued | |
| | |
0.50%, 5/25/2023 | | | 129,000 | | | | 129,047 | |
| | |
2.88%, 9/12/2023 | | | 400,000 | | | | 431,822 | |
| | |
2.50%, 2/5/2024 | | | 161,000 | | | | 173,394 | |
| | |
2.63%, 9/6/2024 | | | 55,000 | | | | 60,160 | |
| | |
0.63%, 4/22/2025 | | | 120,000 | | | | 121,163 | |
| | |
0.50%, 6/17/2025 | | | 445,000 | | | | 446,659 | |
| | |
2.13%, 4/24/2026 | | | 165,000 | | | | 180,243 | |
| | |
1.88%, 9/24/2026 | | | 83,000 | | | | 89,606 | |
| | |
6.25%, 5/15/2029 | | | 300,000 | | | | 433,513 | |
| | |
7.13%, 1/15/2030 | | | 31,000 | | | | 47,959 | |
| | |
6.63%, 11/15/2030 | | | 98,000 | | | | 150,589 | |
| | |
6.21%, 8/6/2038 | | | 45,000 | | | | 76,691 | |
| |
Israel Government AID Bond (Israel) | | | | | |
| | |
5.50%, 12/4/2023 | | | 145,000 | | | | 169,479 | |
| |
Tennessee Valley Authority | | | | | |
| | |
3.88%, 2/15/2021 | | | 20,000 | | | | 20,328 | |
| | |
1.88%, 8/15/2022 | | | 129,000 | | | | 132,978 | |
| | |
7.13%, 5/1/2030 | | | 166,000 | | | | 255,450 | |
| | |
Series B, 4.70%, 7/15/2033 | | | 252,000 | | | | 348,634 | |
| | |
6.15%, 1/15/2038 | | | 35,000 | | | | 56,849 | |
| | |
3.50%, 12/15/2042 | | | 50,000 | | | | 63,227 | |
| | |
5.38%, 4/1/2056 | | | 55,000 | | | | 91,458 | |
| | |
4.25%, 9/15/2065 | | | 35,000 | | | | 50,954 | |
| | | | | | | | |
| | |
Total U.S. Government Agency Securities
(Cost $10,816,185) | | | | | | | 11,137,392 | |
| | | | | |
Supranational — 1.5% | |
| |
African Development Bank (Supranational) | | | | | |
| | |
0.50%, 4/22/2022 | | | 37,000 | | | | 37,158 | |
| | |
0.75%, 4/3/2023 | | | 240,000 | | | | 243,102 | |
| | |
3.00%, 9/20/2023 | | | 50,000 | | | | 54,151 | |
| |
Asian Development Bank (Supranational) | | | | | |
| | |
1.88%, 2/18/2022 | | | 147,000 | | | | 150,530 | |
| | |
0.63%, 4/7/2022 | | | 360,000 | | | | 362,308 | |
| | |
1.75%, 9/13/2022 | | | 273,000 | | | | 281,362 | |
| | |
1.63%, 1/24/2023 | | | 100,000 | | | | 103,309 | |
| | |
2.75%, 3/17/2023 | | | 25,000 | | | | 26,587 | |
| | |
2.63%, 1/30/2024 | | | 150,000 | | | | 161,920 | |
| | |
1.50%, 10/18/2024 | | | 60,000 | | | | 62,915 | |
| | |
2.00%, 1/22/2025 | | | 100,000 | | | | 107,038 | |
| | |
0.63%, 4/29/2025 | | | 100,000 | | | | 101,047 | |
| | |
2.50%, 11/2/2027 | | | 80,000 | | | | 90,203 | |
| | |
2.75%, 1/19/2028 | | | 100,000 | | | | 114,877 | |
| | |
3.13%, 9/26/2028 | | | 80,000 | | | | 94,634 | |
| | |
1.88%, 1/24/2030 | | | 93,000 | | | | 101,700 | |
| | | | | | | | |
| INVESTMENTS | | PRINCIPAL
AMOUNT ($) | | | VALUE ($) | |
| | | | | | | | |
Supranational — continued | |
| |
Asian Infrastructure Investment Bank (The) (Supranational) | | | | | |
| | |
2.25%, 5/16/2024 | | | 30,000 | | | | 32,107 | |
| | |
0.50%, 5/28/2025 | | | 84,000 | | | | 84,217 | |
| |
Corp. Andina de Fomento (Supranational) | | | | | |
| | |
2.13%, 9/27/2021 | | | 60,000 | | | | 60,806 | |
| | |
4.38%, 6/15/2022 | | | 320,000 | | | | 338,594 | |
| | |
3.75%, 11/23/2023 | | | 25,000 | | | | 27,057 | |
| |
Council of Europe Development Bank (Supranational) | | | | | |
| | |
2.63%, 2/13/2023 | | | 49,000 | | | | 51,814 | |
| | |
1.38%, 2/27/2025 | | | 191,000 | | | | 199,297 | |
| |
European Bank for Reconstruction & Development (Supranational) | | | | | |
| | |
1.50%, 11/2/2021 | | | 200,000 | | | | 202,932 | |
| | |
2.13%, 3/7/2022 | | | 25,000 | | | | 25,710 | |
| | |
0.50%, 5/19/2025 | | | 350,000 | | | | 351,723 | |
| |
European Investment Bank (Supranational) | | | | | |
| | |
1.38%, 9/15/2021 | | | 120,000 | | | | 121,432 | |
| | |
2.88%, 12/15/2021 | | | 30,000 | | | | 31,026 | |
| | |
2.25%, 3/15/2022 | | | 30,000 | | | | 30,941 | |
| | |
2.63%, 5/20/2022 | | | 26,000 | | | | 27,073 | |
| | |
2.38%, 6/15/2022 | | | 67,000 | | | | 69,589 | |
| | |
1.38%, 9/6/2022 | | | 85,000 | | | | 86,987 | |
| | |
2.00%, 12/15/2022 | | | 200,000 | | | | 208,165 | |
| | |
2.50%, 3/15/2023 | | | 395,000 | | | | 417,751 | |
| | |
3.25%, 1/29/2024 | | | 420,000 | | | | 462,583 | |
| | |
2.63%, 3/15/2024 | | | 40,000 | | | | 43,305 | |
| | |
1.88%, 2/10/2025 (c) | | | 200,000 | | | | 213,357 | |
| | |
0.63%, 7/25/2025 | | | 86,000 | | | | 87,024 | |
| | |
2.38%, 5/24/2027 (c) | | | 41,000 | | | | 45,805 | |
| | |
1.63%, 10/9/2029 | | | 130,000 | | | | 139,401 | |
| |
Inter-American Development Bank (Supranational) | | | | | |
| | |
2.50%, 1/18/2023 | | | 314,000 | | | | 330,783 | |
| | |
7.00%, 6/15/2025 | | | 91,000 | | | | 117,802 | |
| | |
2.00%, 6/2/2026 | | | 100,000 | | | | 108,341 | |
| | |
2.38%, 7/7/2027 | | | 26,000 | | | | 28,976 | |
| | |
3.13%, 9/18/2028 | | | 109,000 | | | | 129,230 | |
| | |
2.25%, 6/18/2029 | | | 95,000 | | | | 106,495 | |
| | |
3.20%, 8/7/2042 | | | 320,000 | | | | 411,895 | |
| | |
4.38%, 1/24/2044 | | | 300,000 | | | | 458,361 | |
| |
International Bank for Reconstruction & Development (Supranational) | | | | | |
| | |
1.38%, 9/20/2021 | | | 588,000 | | | | 595,074 | |
| | |
2.13%, 12/13/2021 | | | 30,000 | | | | 30,730 | |
| | |
2.00%, 1/26/2022 | | | 440,000 | | | | 450,899 | |
| | |
2.13%, 2/13/2023 | | | 25,000 | | | | 26,153 | |
SEE NOTES TO FINANCIAL STATEMENTS.
| | | | | | |
| | | |
| 142 | | | | J.P. MORGAN EXCHANGE-TRADED FUNDS | | AUGUST 31, 2020 |
| | | | | | | | |
| INVESTMENTS | | PRINCIPAL
AMOUNT ($) | | | VALUE ($) | |
Supranational — continued | |
| | |
2.50%, 3/19/2024 | | | 110,000 | | | | 118,594 | |
| | |
2.50%, 11/25/2024 | | | 50,000 | | | | 54,533 | |
| | |
1.63%, 1/15/2025 | | | 100,000 | | | �� | 105,388 | |
| | |
0.63%, 4/22/2025 | | | 300,000 | | | | 303,359 | |
| | |
2.50%, 7/29/2025 | | | 70,000 | | | | 77,131 | |
| | |
3.13%, 11/20/2025 | | | 70,000 | | | | 79,715 | |
| | |
1.88%, 10/27/2026 | | | 89,000 | | | | 96,110 | |
| | |
2.50%, 11/22/2027 | | | 30,000 | | | | 33,884 | |
| | |
1.75%, 10/23/2029 | | | 283,000 | | | | 306,109 | |
| | |
0.75%, 8/26/2030 | | | 26,000 | | | | 25,710 | |
| | |
4.75%, 2/15/2035 | | | 100,000 | | | | 146,923 | |
| |
International Finance Corp. (Supranational) | | | | | |
| | |
2.00%, 10/24/2022 | | | 60,000 | | | | 62,275 | |
| |
Nordic Investment Bank (Supranational) | | | | | |
| | |
2.13%, 2/1/2022 | | | 200,000 | | | | 205,313 | |
| | | | | | | | |
| | |
Total Supranational
(Cost $9,544,669) | | | | | | | 9,861,320 | |
| | | | | |
Municipal Bonds — 0.6% (g) | | | | | | | | |
| | |
California — 0.3% | | | | | | | | |
| | |
Bay Area Toll Authority Series 2009F-2, Rev., 6.26%, 4/1/2049 | | | 100,000 | | | | 171,394 | |
| | |
Bay Area Toll Authority, Toll Bridge, San Francisco Bay Area Series 2010S-1, Rev., 6.92%, 4/1/2040 | | | 40,000 | | | | 62,848 | |
| | |
California State University | | | | | | | | |
| | |
Series 2020B, Rev., 2.98%, 11/1/2051 | | | 25,000 | | | | 26,473 | |
| | |
East Bay Municipal Utility District, Water System, Build America Bonds | | | | | | | | |
| | |
Series 2010B, Rev., 5.87%, 6/1/2040 | | | 155,000 | | | | 236,677 | |
| | |
Los Angeles Unified School District | | | | | | | | |
| | |
GO, 5.75%, 7/1/2034 | | | 20,000 | | | | 27,733 | |
| | |
Series 2010RY, GO, 6.76%, 7/1/2034 | | | 105,000 | | | | 156,037 | |
| | |
Regents of the University of California Medical Center Pooled | | | | | | | | |
| | |
Series H, Rev., 6.55%, 5/15/2048 | | | 40,000 | | | | 64,240 | |
| | |
Santa Clara Valley Transportation Authority | | | | | | | | |
| | |
Rev., 5.88%, 4/1/2032 | | | 215,000 | | | | 274,159 | |
| | |
State of California | | | | | | | | |
| | |
GO, 7.50%, 4/1/2034 | | | 245,000 | | | | 405,451 | |
| | |
GO, 7.60%, 11/1/2040 | | | 25,000 | | | | 45,652 | |
| | |
State of California Department of Water Resources Power Supply Series 2016P, Rev., 2.00%, 5/1/2022 | | | 35,000 | | | | 35,818 | |
| | |
State of California, Various Purpose | | | | | | | | |
| | |
GO, 5.70%, 11/1/2021 | | | 50,000 | | | | 53,114 | |
| | |
GO, 7.55%, 4/1/2039 (c) | | | 100,000 | | | | 175,813 | |
| | | | | | | | |
| INVESTMENTS | | PRINCIPAL
AMOUNT ($) | | | VALUE ($) | |
| | | | | | | | |
| | |
California — continued | | | | | | | | |
| | |
University of California Series 2017AX, Rev., 3.06%, 7/1/2025 | | | 55,000 | | | | 60,951 | |
| | | | | | | | |
| | |
Total California | | | | | | | 1,796,360 | |
| | | | | | | | |
|
Connecticut — 0.0% (d) | |
| | |
State of Connecticut Series A, GO, 5.85%, 3/15/2032 | | | 75,000 | | | | 104,343 | |
| | | | | | | | |
|
Illinois — 0.1% | |
| | |
Chicago O’Hare International Airport, Senior Lien Series 2018C, Rev., 4.47%, 1/1/2049 | | | 25,000 | | | | 32,338 | |
| | |
City of Chicago Series 2015B, GO, 7.75%, 1/1/2025 (h) | | | 100,000 | | | | 130,342 | |
| | |
Metropolitan Water Reclamation District of Greater Chicago, Build America Bonds GO, 5.72%, 12/1/2038 | | | 55,000 | | | | 80,361 | |
| | |
Sales Tax Securitization Corp. | | | | | | | | |
| | |
Series 2019A, Rev., 4.64%, 1/1/2040 | | | 60,000 | | | | 71,921 | |
| | |
State of Illinois GO, 5.10%, 6/1/2033 | | | 345,000 | | | | 349,468 | |
| | |
State of Illinois, Taxable Pension Series 2003, GO, 4.95%, 6/1/2023 | | | 53,182 | | | | 54,002 | |
| | | | | | | | |
| | |
Total Illinois | | | | | | | 718,432 | |
| | | | | | | | |
|
Massachusetts — 0.0% (d) | |
| | |
Commonwealth of Massachusetts, Consolidated Loan of 2010, Build America Bonds Series 2010E, GO, 4.20%, 12/1/2021 | | | 40,000 | | | | 41,245 | |
| | | | | | | | |
|
Missouri — 0.0% (d) | |
| | |
Health and Educational Facilities Authority of the State of Missouri, Educational Facilities, The Washington University Series 2017A, Rev., 3.65%, 8/15/2057 | | | 45,000 | | | | 57,499 | |
| | | | | | | | |
|
Nebraska — 0.0% (d) | |
| | |
University of Nebraska Facilities Corp. | | | | | | | | |
| | |
Series 2019A, Rev., 3.04%, 10/1/2049 | | | 50,000 | | | | 54,440 | |
| | | | | | | | |
|
New Jersey — 0.0% (d) | |
| | |
New Jersey Economic Development Authority, Pension Funding | | | | | | | | |
| | |
Series 1997B, Rev., AGM, Zero Coupon, 2/15/2023 | | | 40,000 | | | | 38,873 | |
| | |
Series 1997A, Rev., NATL-RE, 7.43%, 2/15/2029 | | | 35,000 | | | | 43,597 | |
| | |
New Jersey Transportation Trust Fund Authority, Build America Bonds | | | | | | | | |
| | |
Series C, Rev., 6.10%, 12/15/2020(h) | | | 145,000 | | | | 147,371 | |
| | |
Series 2010C, Rev., 5.75%, 12/15/2028 | | | 155,000 | | | | 172,701 | |
SEE NOTES TO FINANCIAL STATEMENTS.
| | | | | | | | |
| | | |
| AUGUST 31, 2020 | | J.P. MORGAN EXCHANGE-TRADED FUNDS | | | | | 143 | |
JPMorgan U.S. Aggregate Bond ETF
SCHEDULE OF PORTFOLIO INVESTMENTS
AS OF AUGUST 31, 2020 (Unaudited) (continued)
| | | | | | | | |
| INVESTMENTS | | PRINCIPAL
AMOUNT ($) | | | VALUE ($) | |
Municipal Bonds — continued | | | | | | | | |
|
New Jersey — continued | |
| | |
New Jersey Turnpike Authority | | | | | | | | |
| | |
Series F, Rev., 7.41%, 1/1/2040 | | | 10,000 | | | | 17,082 | |
| | | | | | | | |
| | |
Total New Jersey | | | | | | | 419,624 | |
| | | | | | | | |
|
New York — 0.1% | |
| | |
City of New York, Build America Bonds Series H-1, GO, 6.25%, 10/9/2020 | | | 25,000 | | | | 25,111 | |
| | |
City of New York, Fiscal Year 2010, Build America Bonds Subseries A-2, GO, 5.21%, 10/1/2031 | | | 25,000 | | | | 31,768 | |
| | |
New York City Water and Sewer System Series GG, Rev., 5.72%, 6/15/2042 | | | 40,000 | | | | 62,420 | |
| | |
New York State Urban Development Corp., State Personal Income Tax, Build America Bonds Series 2009E, Rev., 5.77%, 3/15/2039 | | | 25,000 | | | | 31,838 | |
| | |
New York State Urban Development Corp., State Personal Income Tax, General Purpose Series 2019B, Rev., 3.90%, 3/15/2033 | | | 65,000 | | | | 74,100 | |
| | |
Port Authority of New York and New Jersey, Consolidated | | | | | | | | |
| | |
Series 182, Rev., 5.31%, 8/1/2046 | | | 60,000 | | | | 68,267 | |
| | |
Rev., 4.81%, 10/15/2065 | | | 120,000 | | | | 164,233 | |
| | | | | | | | |
| | |
Total New York | | | | | | | 457,737 | |
| | | | | | | | |
|
Ohio — 0.0% (d) | |
| | |
American Municipal Power, Inc., Combined Hydroelectric Projects Series 2010B, Rev., 7.83%, 2/15/2041 | | | 25,000 | | | | 40,288 | |
| | | | | | | | |
|
Oregon — 0.0% (d) | |
| | |
State of Oregon | | | | | | | | |
| | |
GO, 5.76%, 6/1/2023 | | | 26,806 | | | | 29,389 | |
| | |
GO, 5.89%, 6/1/2027 | | | 55,000 | | | | 69,397 | |
| | | | | | | | |
| | |
Total Oregon | | | | | | | 98,786 | |
| | | | | | | | |
|
Texas — 0.1% | |
| | |
City of Houston GO, 3.96%, 3/1/2047 | | | 40,000 | | | | 49,294 | |
| | |
Grand Parkway Transportation Corp. Series 2020B, Rev., 3.24%, 10/1/2052 | | | 100,000 | | | | 104,709 | |
| | |
Permanent University Fund—Texas A&M University System Series B, Rev., 3.66%, 7/1/2047 | | | 20,000 | | | | 21,893 | |
| | |
State of Texas Series 2009A, GO, 5.52%, 4/1/2039 | | | 120,000 | | | | 176,970 | |
| | |
State of Texas, Transportation Commission Highway Improvement Series 2010A, GO, 4.68%, 4/1/2040 | | | 45,000 | | | | 61,670 | |
| | | | | | | | |
| INVESTMENTS | | PRINCIPAL
AMOUNT ($) | | | VALUE ($) | |
| | | | | | | | |
|
Texas — continued | |
| | |
Texas Transportation Commission State Highway Fund Rev., 5.18%, 4/1/2030 | | | 125,000 | | | | 163,243 | |
| | | | | | | | |
| | |
Total Texas | | | | | | | 577,779 | |
| | | | | | | | |
| | |
Total Municipal Bonds
(Cost $4,225,930) | | | | | | | 4,366,533 | |
| | | | | | | | |
Asset-Backed Securities — 0.3% | |
| | |
AmeriCredit Automobile Receivables Trust Series 2018-1, Class C, 3.50%, 1/18/2024 | | | 15,000 | | | | 15,617 | |
| | |
Capital One Multi-Asset Execution Trust | | | | | | | | |
| | |
Series 2016-A5, Class A5, 1.66%, 6/17/2024 | | | 20,000 | | | | 20,266 | |
| | |
Series 2019-A1, Class A1, 2.84%, 12/15/2024 | | | 50,000 | | | | 51,833 | |
| | |
Series 2017-A6, Class A6, 2.29%, 7/15/2025 | | | 10,000 | | | | 10,393 | |
| | |
Series 2019-A3, Class A3, 2.06%, 8/15/2028 | | | 400,000 | | | | 429,226 | |
| | |
CarMax Auto Owner Trust | | | | | | | | |
| | |
Series 2018-1, Class A4, 2.64%, 6/15/2023 | | | 25,000 | | | | 25,747 | |
| | |
Series 2019-1, Class A3, 3.05%, 3/15/2024 | | | 120,000 | | | | 123,422 | |
| | |
Series 2018-1, Class D, 3.37%, 7/15/2024 | | | 50,000 | | | | 51,236 | |
| | |
Citibank Credit Card Issuance Trust | | | | | | | | |
| | |
Series 2018-A6, Class A6, 3.21%, 12/7/2024 | | | 50,000 | | | | 53,173 | |
| | |
Series 2018-A7, Class A7, 3.96%, 10/13/2030 | | | 100,000 | | | | 121,469 | |
| | |
Discover Card Execution Note Trust Series 2018-A1, Class A1, 3.03%, 8/15/2025 | | | 18,000 | | | | 19,178 | |
| | |
Ford Credit Auto Owner Trust Series 2019-A, Class A3, 2.78%, 9/15/2023 | | | 120,000 | | | | 123,120 | |
| | |
Ford Credit Floorplan Master Owner Trust A | | | | | | | | |
| | |
Series 2019-1, Class A, 2.84%, 3/15/2024 | | | 120,000 | | | | 124,168 | |
| | |
Series 2019-3, Class A1, 2.23%, 9/15/2024 | | | 75,000 | | | | 77,482 | |
| | |
GM Financial Consumer Automobile Receivables Trust Series 2019-2, Class A3, 2.65%, 2/16/2024 | | | 120,000 | | | | 122,707 | |
| | |
Honda Auto Receivables Owner Trust Series 2019-2, Class A3, 2.52%, 6/21/2023 | | | 90,000 | | | | 92,414 | |
SEE NOTES TO FINANCIAL STATEMENTS.
| | | | | | |
| | | |
| 144 | | | | J.P. MORGAN EXCHANGE-TRADED FUNDS | | AUGUST 31, 2020 |
| | | | | | | | |
| INVESTMENTS | | PRINCIPAL
AMOUNT ($) | | | VALUE ($) | |
Asset-Backed Securities — continued | |
| | |
Mercedes-Benz Auto Lease Trust Series 2020-A, Class A3, 1.84%, 12/15/2022 | | | 75,000 | | | | 76,317 | |
| | |
Nissan Auto Receivables Owner Trust | | | | | | | | |
| | |
Series 2019-A, Class A3, 2.90%, 10/16/2023 | | | 25,000 | | | | 25,653 | |
| | |
Series 2019-B, Class A3, 2.50%, 11/15/2023 | | | 180,000 | | | | 184,682 | |
| | |
Synchrony Credit Card Master Note Trust Series 2018-2, Class A, 3.47%, 5/15/2026 | | | 50,000 | | | | 53,562 | |
| | |
Toyota Auto Receivables Owner Trust Series 2019-D, Class A3, 1.92%, 1/16/2024 | | | 50,000 | | | | 51,225 | |
| | |
World Omni Auto Receivables Trust Series 2018-D, Class A3, 3.33%, 4/15/2024 | | | 70,000 | | | | 71,950 | |
| | |
World Omni Select Auto Trust Series 2019-A, Class D, 2.59%, 12/15/2025 | | | 182,000 | | | | 183,413 | |
| | | | | | | | |
| | |
Total Asset-backed Securities
(Cost $2,058,931) | | | | | | | 2,108,253 | |
| | | | | | | | |
| | |
| | | SHARES | | | | |
Short-Term Investments — 0.8% | | | | | | | | |
|
Investment Companies — 0.2% | |
| | |
JPMorgan U.S. Government Money Market Fund Class Institutional Shares, 0.01% (i) (j)
(Cost $1,428,775) | | | 1,428,775 | | | | 1,428,775 | |
| | | | | | | | |
|
Investment of Cash Collateral from Securities Loaned — 0.6% | |
| | |
JPMorgan Securities Lending Money Market Fund Agency SL Class Shares, 0.32% (i) (j) | | | 3,498,950 | | | | 3,500,000 | |
| | |
JPMorgan U.S. Government Money Market Fund Class IM Shares, 0.07% (i) (j) | | | 505,230 | | | | 505,230 | |
| | | | | | | | |
| | |
Total Investment of Cash Collateral from Securities Loaned
(Cost $4,005,230) | | | | | | | 4,005,230 | |
| | | | | | | | |
| | |
Total Short-Term Investments
(Cost $5,434,005) | | | | | | | 5,434,005 | |
| | | | | | | | |
| |
Total Investments — 99.7%
(Cost $656,694,099) | | | | 683,451,551 | |
| |
Other Assets Less Liabilities — 0.3% | | | | 2,154,620 | |
| | | | | | | | |
| |
Net Assets — 100.0% | | | | 685,606,171 | |
| | | | | | | | |
Percentages indicated are based on net assets.
| | |
Abbreviations |
ACES | | Alternative Credit Enhancement Securities |
AGM | | Insured by Assured Guaranty Municipal Corp. |
FFCB | | Federal Farm Credit Bank |
FHLB | | Federal Home Loan Bank |
FHLMC | | Federal Home Loan Mortgage Corp. |
FNMA | | Federal National Mortgage Association |
GNMA | | Government National Mortgage Association |
GO | | General Obligation |
ICE | | Intercontinental Exchange |
LIBOR | | London Interbank Offered Rate |
NATL | | Insured by National Public Finance Guarantee Corp. |
RE | | Reinsured |
REIT | | Real Estate Investment Trust |
Rev. | | Revenue |
SOFR | | Secured Overnight Financing Rate |
USD | | United States Dollar |
| |
(a) | | Securities exempt from registration under Rule 144A or section 4(a)(2), of the Securities Act of 1933, as amended. |
(b) | | Variable or floating rate security, linked to the referenced benchmark. The interest rate shown is the current rate as of August 31, 2020. |
(c) | | The security or a portion of this security is on loan at August 31, 2020. The total value of securities on loan at August 31, 2020 is $3,838,768. |
(d) | | Amount rounds to less than 0.1% of net assets. |
(e) | | Variable or floating rate security, the interest rate of which adjusts periodically based on changes in current interest rates and prepayments on the underlying pool of assets. The interest rate shown is the current rate as of August 31, 2020. |
(f) | | The rate shown is the effective yield as of August 31, 2020. |
(g) | | The date shown represents the earliest of the prerefunded date, next put date or final maturity date. |
(h) | | Security is prerefunded or escrowed to maturity. |
(i) | | Investment in an affiliated fund, which is registered under the Investment Company Act of 1940, as amended, and is advised by J.P. Morgan Investment Management Inc. |
(j) | | The rate shown is the current yield as of August 31, 2020. |
‡ | | Value determined using significant unobservable inputs. |
SEE NOTES TO FINANCIAL STATEMENTS.
| | | | | | | | |
| | | |
| AUGUST 31, 2020 | | J.P. MORGAN EXCHANGE-TRADED FUNDS | | | | | 145 | |
JPMorgan Ultra-Short Income ETF
SCHEDULE OF PORTFOLIO INVESTMENTS
AS OF AUGUST 31, 2020 (Unaudited)
| | | | | | | | |
| INVESTMENTS | | PRINCIPAL
AMOUNT ($) | | | VALUE ($) | |
Corporate Bonds — 74.8% | |
|
Aerospace & Defense — 0.7% | |
| | |
Boeing Co. (The) 4.51%, 5/1/2023 | | | 31,519,000 | | | | 33,285,730 | |
| | |
General Dynamics Corp. | | | | | | | | |
| | |
(ICE LIBOR USD 3 Month + 0.38%), 0.63%, 5/11/2021 (a) | | | 7,055,000 | | | | 7,070,104 | |
| | |
3.25%, 4/1/2025 | | | 2,578,000 | | | | 2,864,528 | |
| | |
Leidos, Inc. 2.95%, 5/15/2023 (b) | | | 30,973,000 | | | | 32,576,008 | |
| | |
Northrop Grumman Corp. | | | | | | | | |
| | |
2.55%, 10/15/2022 (c) | | | 5,000,000 | | | | 5,230,386 | |
| | |
2.93%, 1/15/2025 | | | 4,099,000 | | | | 4,472,372 | |
| | |
Raytheon Technologies Corp. | | | | | | | | |
| | |
2.50%, 12/15/2022 (b) | | | 3,131,000 | | | | 3,259,592 | |
| | |
3.20%, 3/15/2024 (b) | | | 5,792,000 | | | | 6,259,966 | |
| | | | | | | | |
| | |
| | | | | | | 95,018,686 | |
| | | | | | | | |
| | |
Automobiles — 2.2% | | | | | | | | |
| | |
BMW US Capital LLC (Germany) | | | | | | | | |
| | |
(ICE LIBOR USD 3 Month + 0.41%), 0.68%, 4/12/2021 (a) (b) | | | 12,300,000 | | | | 12,314,710 | |
| | |
3.10%, 4/12/2021 (b) | | | 6,383,000 | | | | 6,488,195 | |
| | |
(ICE LIBOR USD 3 Month + 0.50%), 0.75%, 8/13/2021 (a) (b) | | | 979,000 | | | | 979,994 | |
| | |
2.95%, 4/14/2022 (b) (c) | | | 18,360,000 | | | | 19,104,255 | |
| | |
Daimler Finance North America LLC (Germany) | | | | | | | | |
| | |
(ICE LIBOR USD 3 Month + 0.43%), 0.69%, 2/12/2021 (a) (b) | | | 3,400,000 | | | | 3,398,421 | |
| | |
(ICE LIBOR USD 3 Month + 0.45%), 0.71%, 2/22/2021 (a) (b) | | | 15,023,000 | | | | 15,025,316 | |
| | |
(ICE LIBOR USD 3 Month + 0.55%), 0.80%, 5/4/2021 (a) (b) | | | 1,658,000 | | | | 1,657,563 | |
| | |
(ICE LIBOR USD 3 Month + 0.90%), 1.18%, 2/15/2022 (a) (b) | | | 24,697,000 | | | | 24,758,869 | |
| | |
(ICE LIBOR USD 3 Month + 0.88%), 1.14%, 2/22/2022 (a) (b) | | | 28,500,000 | | | | 28,556,883 | |
| | |
3.40%, 2/22/2022 (b) (c) | | | 15,649,000 | | | | 16,258,651 | |
| | |
2.55%, 8/15/2022 (b) | | | 3,106,000 | | | | 3,216,131 | |
| | |
Hyundai Capital America | | | | | | | | |
| | |
2.75%, 9/18/2020 (b) | | | 1,170,000 | | | | 1,169,269 | |
| | |
3.00%, 10/30/2020 (b) (c) | | | 7,778,000 | | | | 7,809,598 | |
| | |
3.45%, 3/12/2021 (b) | | | 14,976,000 | | | | 15,163,200 | |
| | |
3.00%, 3/18/2021 (b) | | | 5,245,000 | | | | 5,299,705 | |
| | |
2.45%, 6/15/2021 (b) (c) | | | 10,000,000 | | | | 10,111,000 | |
| | |
(ICE LIBOR USD 3 Month + 0.94%), 1.22%, 7/8/2021 (a) (b) | | | 8,250,000 | | | | 8,248,322 | |
| | |
3.10%, 4/5/2022 (b) | | | 2,303,000 | | | | 2,368,492 | |
| | | | | | | | |
| INVESTMENTS | | PRINCIPAL
AMOUNT ($) | | | VALUE ($) | |
| | | | | | | | |
|
Automobiles — continued | |
| | |
2.85%, 11/1/2022 (b) | | | 10,000,000 | | | | 10,344,400 | |
| | |
5.75%, 4/6/2023 (b) | | | 10,021,000 | | | | 11,154,626 | |
| | |
Volkswagen Group of America Finance LLC (Germany) | | | | | | | | |
| | |
(ICE LIBOR USD 3 Month + 0.77%), 1.02%, 11/13/2020 (a) (b) | | | 1,173,000 | | | | 1,174,485 | |
| | |
3.88%, 11/13/2020(b) | | | 203,000 | | | | 204,349 | |
| | |
(ICE LIBOR USD 3 Month + 0.86%), 1.16%, 9/24/2021 (a) (b) | | | 20,965,000 | | | | 20,978,955 | |
| | |
(ICE LIBOR USD 3 Month + 0.94%), 1.20%, 11/12/2021 (a) (b) | | | 7,106,000 | | | | 7,109,593 | |
| | |
4.00%, 11/12/2021 (b) | | | 12,228,000 | | | | 12,721,265 | |
| | |
2.90%, 5/13/2022 (b) (c) | | | 29,836,000 | | | | 30,958,931 | |
| | |
2.70%, 9/26/2022 (b) | | | 9,928,000 | | | | 10,320,851 | |
| | |
3.13%, 5/12/2023 (b) | | | 22,136,000 | | | | 23,488,370 | |
| | | | | | | | |
| | |
| | | | | | | 310,384,399 | |
| | | | | | | | |
| | |
Banks — 33.3% | | | | | | | | |
| | |
ABN AMRO Bank NV (Netherlands) | | | | | | | | |
| | |
(ICE LIBOR USD 3 Month + 0.41%), 0.68%, 1/19/2021 (a) (b) | | | 4,400,000 | | | | 4,405,764 | |
| | |
2.65%, 1/19/2021 (b) | | | 21,596,000 | | | | 21,777,389 | |
| | |
(ICE LIBOR USD 3 Month + 0.57%), 0.82%, 8/27/2021 (a) (b) | | | 12,765,000 | | | | 12,819,124 | |
| | |
3.40%, 8/27/2021 (b) | | | 28,298,000 | | | | 29,084,741 | |
| | |
ANZ New Zealand Int’l Ltd. (New Zealand) | | | | | | | | |
| | |
2.75%, 1/22/2021 (b) | | | 10,611,000 | | | | 10,710,075 | |
| | |
2.75%, 2/3/2021 (b) | | | 1,635,000 | | | | 1,651,274 | |
| | |
(ICE LIBOR USD 3 Month + 1.01%), 1.26%, 7/28/2021 (a) (b) | | | 13,356,000 | | | | 13,472,472 | |
| | |
2.13%, 7/28/2021 (b) | | | 8,095,000 | | | | 8,231,640 | |
| | |
2.88%, 1/25/2022 (b) | | | 2,585,000 | | | | 2,675,278 | |
| | |
1.90%, 2/13/2023 (b) | | | 3,630,000 | | | | 3,751,495 | |
| | |
3.40%, 3/19/2024 (b) | | | 10,500,000 | | | | 11,433,326 | |
| | |
Australia & New Zealand Banking Group Ltd. (Australia) | | | | | | | | |
| | |
(ICE LIBOR USD 3 Month + 0.32%), 0.56%, 11/9/2020 (a) (b) | | | 4,341,000 | | | | 4,343,717 | |
| | |
2.25%, 11/9/2020 | | | 1,110,000 | | | | 1,114,052 | |
| | |
(ICE LIBOR USD 3 Month + 0.46%), 0.74%, 5/17/2021 (a) (b) | | | 2,300,000 | | | | 2,306,926 | |
| | |
(ICE LIBOR USD 3 Month + 0.99%), 1.34%, 6/1/2021 (a) (b) | | | 2,850,000 | | | | 2,870,066 | |
| | |
2.30%, 6/1/2021 | | | 1,150,000 | | | | 1,167,740 | |
| | |
(ICE LIBOR USD 3 Month + 0.87%), 1.13%, 11/23/2021 (a) (b) | | | 1,470,000 | | | | 1,483,280 | |
SEE NOTES TO FINANCIAL STATEMENTS.
| | | | | | |
| | | |
| 146 | | | | J.P. MORGAN EXCHANGE-TRADED FUNDS | | AUGUST 31, 2020 |
| | | | | | | | |
| INVESTMENTS | | PRINCIPAL
AMOUNT ($) | | | VALUE ($) | |
Corporate Bonds — continued | | | | | | | | |
|
Banks — continued | |
| | |
2.55%, 11/23/2021 | | | 375,000 | | | | 385,356 | |
| | |
2.63%, 5/19/2022 (c) | | | 11,522,000 | | | | 11,980,635 | |
| | |
2.63%, 11/9/2022 | | | 16,021,000 | | | | 16,839,982 | |
| | |
2.05%, 11/21/2022 | | | 12,527,000 | | | | 12,986,118 | |
| | |
Banco Santander SA (Spain) | | | | | | | | |
| | |
3.50%, 4/11/2022 | | | 7,600,000 | | | | 7,923,556 | |
| | |
3.85%, 4/12/2023 | | | 6,400,000 | | | | 6,885,593 | |
| | |
2.75%, 5/28/2025 | | | 10,000,000 | | | | 10,629,185 | |
| | |
Bank of America Corp. | | | | | | | | |
| | |
5.00%, 5/13/2021 | | | 3,000,000 | | | | 3,098,408 | |
| | |
(ICE LIBOR USD 3 Month + 0.63%), 2.33%, 10/1/2021 (a) | | | 2,458,000 | | | | 2,461,843 | |
| | |
(ICE LIBOR USD 3 Month + 0.37%), 2.74%, 1/23/2022 (a) | | | 29,591,000 | | | | 29,857,977 | |
| | |
(ICE LIBOR USD 3 Month + 0.63%), 3.50%, 5/17/2022 (a) | | | 8,560,000 | | | | 8,749,614 | |
| | |
(ICE LIBOR USD 3 Month + 0.65%), 0.95%, 6/25/2022 (a) | | | 10,680,000 | | | | 10,727,724 | |
| | |
2.50%, 10/21/2022 | | | 1,006,000 | | | | 1,029,770 | |
| | |
3.30%, 1/11/2023 | | | 1,473,000 | | | | 1,571,329 | |
| | |
(ICE LIBOR USD 3 Month + 1.16%), 3.12%, 1/20/2023 (a) | | | 313,000 | | | | 324,016 | |
| | |
(ICE LIBOR USD 3 Month + 1.02%), 2.88%, 4/24/2023 (a) | | | 8,532,000 | | | | 8,846,678 | |
| | |
(ICE LIBOR USD 3 Month + 0.93%), 2.82%, 7/21/2023 (a) | | | 2,515,000 | | | | 2,617,540 | |
| | |
4.10%, 7/24/2023 | | | 1,101,000 | | | | 1,214,137 | |
| | |
(ICE LIBOR USD 3 Month + 0.79%), 3.00%, 12/20/2023 (a) | | | 4,611,000 | | | | 4,859,463 | |
| | |
4.13%, 1/22/2024 | | | 693,000 | | | | 774,955 | |
| | |
(ICE LIBOR USD 3 Month + 0.78%), 3.55%, 3/5/2024 (a) | | | 41,517,000 | | | | 44,442,735 | |
| | |
4.00%, 4/1/2024 | | | 625,000 | | | | 697,521 | |
| | |
(ICE LIBOR USD 3 Month + 0.94%), 3.86%, 7/23/2024 (a) | | | 18,545,000 | | | | 20,172,956 | |
| | |
(ICE LIBOR USD 3 Month + 0.97%), 3.46%, 3/15/2025 (a) | | | 2,392,000 | | | | 2,613,721 | |
| | |
Bank of Montreal (Canada) | | | | | | | | |
| | |
(ICE LIBOR USD 3 Month + 0.40%), 0.66%, 1/22/2021 (a) | | | 51,605,000 | | | | 51,675,230 | |
| | |
Series D, (ICE LIBOR USD 3 Month + 0.46%), 0.73%, 4/13/2021 (a) | | | 3,635,000 | | | | 3,645,893 | |
| | |
Series D, 3.10%, 4/13/2021 | | | 2,099,000 | | | | 2,136,240 | |
| | |
(ICE LIBOR USD 3 Month + 0.79%), 1.04%, 8/27/2021 (a) | | | 525,000 | | | | 528,904 | |
| | |
1.90%, 8/27/2021 | | | 5,975,000 | | | | 6,084,353 | |
| | | | | | | | |
| INVESTMENTS | | PRINCIPAL
AMOUNT ($) | | | VALUE ($) | |
| | | | | | | | |
|
Banks — continued | |
| | |
(ICE LIBOR USD 3 Month + 0.40%), 0.71%, 9/10/2021 (a) | | | 25,665,000 | | | | 25,742,046 | |
| | |
(ICE LIBOR USD 3 Month + 0.57%), 0.85%, 3/26/2022 (a) | | | 30,500,000 | | | | 30,702,678 | |
| | |
2.90%, 3/26/2022 | | | 8,690,000 | | | | 9,038,683 | |
| | |
2.35%, 9/11/2022 (c) | | | 5,511,000 | | | | 5,743,050 | |
| | |
2.05%, 11/1/2022 | | | 5,930,000 | | | | 6,136,564 | |
| | |
Series E, 3.30%, 2/5/2024 | | | 4,833,000 | | | | 5,272,159 | |
| | |
1.85%, 5/1/2025 | | | 8,037,000 | | | | 8,438,489 | |
| | |
Bank of New Zealand (New Zealand) | | | | | | | | |
| | |
3.50%, 2/20/2024 (b) | | | 10,515,000 | | | | 11,470,857 | |
| | |
Bank of Nova Scotia (The) (Canada) | | | | | | | | |
| | |
(ICE LIBOR USD 3 Month + 0.29%), 0.57%, 1/8/2021 (a) | | | 125,000 | | | | 125,122 | |
| | |
2.50%, 1/8/2021 | | | 8,413,000 | | | | 8,479,994 | |
| | |
2.45%, 3/22/2021 | | | 1,909,000 | | | | 1,932,855 | |
| | |
(ICE LIBOR USD 3 Month + 0.44%), 0.71%, 4/20/2021 (a) | | | 221,000 | | | | 221,586 | |
| | |
3.13%, 4/20/2021 | | | 3,243,000 | | | | 3,302,431 | |
| | |
2.80%, 7/21/2021 | | | 315,000 | | | | 322,148 | |
| | |
(ICE LIBOR USD 3 Month + 0.64%), 0.96%, 3/7/2022 (a) | | | 10,108,000 | | | | 10,184,575 | |
| | |
2.70%, 3/7/2022 (c) | | | 11,850,000 | | | | 12,309,616 | |
| | |
2.45%, 9/19/2022 (c) | | | 5,887,000 | | | | 6,147,605 | |
| | |
1.95%, 2/1/2023 (c) | | | 11,814,000 | | | | 12,231,566 | |
| | |
1.63%, 5/1/2023 | | | 2,850,000 | | | | 2,934,054 | |
| | |
0.80%, 6/15/2023 | | | 29,206,000 | | | | 29,385,808 | |
| | |
3.40%, 2/11/2024 (c) | | | 2,682,000 | | | | 2,930,920 | |
| | |
2.20%, 2/3/2025 | | | 11,499,000 | | | | 12,205,291 | |
| | |
1.30%, 6/11/2025 | | | 23,200,000 | | | | 23,737,962 | |
| | |
Banque Federative du Credit Mutuel SA (France) | | | | | | | | |
| | |
2.75%, 10/15/2020 (b) | | | 33,112,000 | | | | 33,212,922 | |
| | |
2.50%, 4/13/2021 (b) | | | 4,724,000 | | | | 4,786,324 | |
| | |
1.96%, 7/21/2021 (b) | | | 55,575,000 | | | | 56,377,656 | |
| | |
2.70%, 7/20/2022 (b) (c) | | | 10,055,000 | | | | 10,458,723 | |
| | |
2.13%, 11/21/2022 (b) | | | 17,217,000 | | | | 17,806,610 | |
| | |
3.75%, 7/20/2023 (b) (c) | | | 4,865,000 | | | | 5,288,074 | |
| | |
2.38%, 11/21/2024 (b) | | | 14,071,000 | | | | 14,992,156 | |
| | |
Barclays Bank plc (United Kingdom) | | | | | | | | |
| | |
1.70%, 5/12/2022 | | | 23,728,000 | | | | 24,164,719 | |
| | |
Barclays plc (United Kingdom) | | | | | | | | |
| | |
3.25%, 1/12/2021 | | | 4,567,000 | | | | 4,611,939 | |
| | |
(ICE LIBOR USD 3 Month + 2.11%), 2.35%, 8/10/2021 (a) | | | 21,100,000 | | | | 21,456,084 | |
| | |
3.20%, 8/10/2021 | | | 42,609,000 | | | | 43,611,164 | |
SEE NOTES TO FINANCIAL STATEMENTS.
| | | | | | | | |
| | | |
| AUGUST 31, 2020 | | J.P. MORGAN EXCHANGE-TRADED FUNDS | | | | | 147 | |
JPMorgan Ultra-Short Income ETF
SCHEDULE OF PORTFOLIO INVESTMENTS
AS OF AUGUST 31, 2020 (Unaudited) (continued)
| | | | | | | | |
| INVESTMENTS | | PRINCIPAL
AMOUNT ($) | | | VALUE ($) | |
Corporate Bonds — continued | | | | | | | | |
|
Banks — continued | |
| | |
BBVA USA | | | | | | | | |
| | |
(ICE LIBOR USD 3 Month + 0.73%), 1.04%, 6/11/2021 (a) (c) | | | 9,511,000 | | | | 9,537,269 | |
| | |
3.50%, 6/11/2021 | | | 37,394,000 | | | | 38,158,030 | |
| | |
BNP Paribas SA (France) | | | | | | | | |
| | |
5.00%, 1/15/2021 | | | 13,409,000 | | | | 13,643,921 | |
| | |
(ICE LIBOR USD 3 Month + 0.39%), 0.63%, 8/7/2021 (a) (b) | | | 34,808,000 | | | | 34,889,287 | |
| | |
2.95%, 5/23/2022(b) | | | 8,058,000 | | | | 8,375,547 | |
| | |
3.50%, 3/1/2023 (b) | | | 9,132,000 | | | | 9,724,273 | |
| | |
3.38%, 1/9/2025 (b) | | | 5,000,000 | | | | 5,466,643 | |
| | |
BNZ International Funding Ltd. (New Zealand) | | | | | | | | |
| | |
2.75%, 3/2/2021 (b) | | | 750,000 | | | | 759,057 | |
| | |
(ICE LIBOR USD 3 Month + 0.98%), 1.29%, 9/14/2021 (a) (b) | | | 21,969,000 | | | | 22,131,142 | |
| | |
2.10%, 9/14/2021 (b) | | | 7,705,000 | | | | 7,837,107 | |
| | |
2.65%, 11/3/2022 (b) | | | 4,855,000 | | | | 5,075,863 | |
| | |
3.38%, 3/1/2023 (b) | | | 13,260,000 | | | | 14,158,512 | |
| | |
Canadian Imperial Bank of Commerce (Canada) | | | | | | | | |
| | |
(ICE LIBOR USD 3 Month + 0.32%), 0.57%, 2/2/2021 (a) | | | 1,689,000 | | | | 1,691,059 | |
| | |
2.70%, 2/2/2021 (c) | | | 2,324,000 | | | | 2,348,062 | |
| | |
2.55%, 6/16/2022 | | | 740,000 | | | | 769,693 | |
| | |
0.95%, 6/23/2023 (c) | | | 40,429,000 | | | | 40,918,239 | |
| | |
(ICE LIBOR USD 3 Month + 0.79%), 2.61%, 7/22/2023 (a) | | | 12,898,000 | | | | 13,400,015 | |
| | |
3.50%, 9/13/2023 (c) | | | 14,238,000 | | | | 15,582,330 | |
| | |
3.10%, 4/2/2024 | | | 6,532,000 | | | | 7,074,927 | |
| | |
2.25%, 1/28/2025 (c) | | | 11,181,000 | | | | 11,836,109 | |
| | |
Capital One Bank USA NA (SOFR + 0.62%), 2.01%, 1/27/2023 (a) | | | 2,246,000 | | | | 2,288,458 | |
| | |
Capital One NA | | | | | | | | |
| | |
2.95%, 7/23/2021 | | | 4,410,000 | | | | 4,495,842 | |
| | |
2.25%, 9/13/2021 | | | 9,212,000 | | | | 9,364,131 | |
| | |
2.15%, 9/6/2022 (c) | | | 24,273,000 | | | | 25,019,207 | |
| | |
Citibank NA | | | | | | | | |
| | |
2.13%, 10/20/2020 | | | 2,100,000 | | | | 2,102,730 | |
| | |
(ICE LIBOR USD 3 Month + 0.35%), 0.61%, 2/12/2021 (a) | | | 1,050,000 | | | | 1,051,217 | |
| | |
2.85%, 2/12/2021 | | | 9,828,000 | | | | 9,920,808 | |
| | |
(ICE LIBOR USD 3 Month + 0.57%), 0.83%, 7/23/2021 (a) | | | 4,545,000 | | | | 4,562,664 | |
| | |
3.40%, 7/23/2021 | | | 850,000 | | | | 871,919 | |
| | | | | | | | |
| INVESTMENTS | | PRINCIPAL
AMOUNT ($) | | | VALUE ($) | |
| | | | | | | | |
|
Banks — continued | |
| | |
(ICE LIBOR USD 3 Month + 0.53%), 0.80%, 2/19/2022 (a) | | | 31,435,000 | | | | 31,479,422 | |
| | |
(ICE LIBOR USD 3 Month + 0.53%), 3.16%, 2/19/2022 (a) | | | 22,000,000 | | | | 22,285,557 | |
| | |
Citigroup, Inc. | | | | | | | | |
| | |
(ICE LIBOR USD 3 Month + 1.31%), 1.55%, 10/26/2020 (a) | | | 650,000 | | | | 651,112 | |
| | |
(ICE LIBOR USD 3 Month + 1.38%), 1.69%, 3/30/2021 (a) | | | 9,735,000 | | | | 9,805,049 | |
| | |
2.70%, 3/30/2021 | | | 3,754,000 | | | | 3,806,383 | |
| | |
(ICE LIBOR USD 3 Month + 1.19%), 1.44%, 8/2/2021 (a) (c) | | | 7,950,000 | | | | 8,020,096 | |
| | |
(ICE LIBOR USD 3 Month + 1.07%), 1.39%, 12/8/2021 (a) | | | 7,645,000 | | | | 7,727,446 | |
| | |
2.90%, 12/8/2021 | | | 4,511,000 | | | | 4,645,666 | |
| | |
2.75%, 4/25/2022 | | | 7,335,000 | | | | 7,599,473 | |
| | |
(SOFR + 0.87%), 2.31%, 11/4/2022 (a) | | | 6,152,000 | | | | 6,275,939 | |
| | |
(ICE LIBOR USD 3 Month + 0.95%), 2.88%, 7/24/2023 (a) | | | 2,097,000 | | | | 2,185,392 | |
| | |
(SOFR + 1.67%), 1.68%, 5/15/2024 (a) | | | 500,000 | | | | 512,705 | |
| | |
(ICE LIBOR USD 3 Month + 1.02%), 4.04%, 6/1/2024 (a) | | | 1,937,000 | | | | 2,108,403 | |
| | |
(ICE LIBOR USD 3 Month + 0.90%), 3.35%, 4/24/2025 (a) | | | 21,891,000 | | | | 23,813,316 | |
| | |
Citizens Bank NA | | | | | | | | |
| | |
2.25%, 10/30/2020 | | | 28,030,000 | | | | 28,073,033 | |
| | |
2.55%, 5/13/2021 | | | 16,676,000 | | | | 16,903,409 | |
| | |
(ICE LIBOR USD 3 Month + 0.72%), 0.98%, 2/14/2022 (a) | | | 13,543,000 | | | | 13,592,827 | |
| | |
3.25%, 2/14/2022 | | | 15,501,000 | | | | 16,087,167 | |
| | |
2.65%, 5/26/2022 | | | 5,954,000 | | | | 6,157,888 | |
| | |
Comerica Bank 2.50%, 7/23/2024 (c) | | | 725,000 | | | | 774,018 | |
| | |
Commonwealth Bank of Australia (Australia) | | | | | | | | |
| | |
2.20%, 11/9/2020 (b) | | | 1,000,000 | | | | 1,003,584 | |
| | |
(ICE LIBOR USD 3 Month + 0.70%), 1.01%, 3/10/2022 (a) (b) | | | 2,348,000 | | | | 2,367,724 | |
| | |
2.75%, 3/10/2022 (b) | | | 1,452,000 | | | | 1,506,513 | |
| | |
2.50%, 9/18/2022 (b) (c) | | | 13,980,000 | | | | 14,575,337 | |
| | |
1.63%, 10/17/2022 (b) | | | 25,290,000 | | | | 25,956,418 | |
| | |
3.45%, 3/16/2023 (b) (c) | | | 1,553,000 | | | | 1,668,677 | |
| | |
3.35%, 6/4/2024 (b) (c) | | | 1,060,000 | | | | 1,163,446 | |
| | |
Cooperatieve Rabobank UA (Netherlands) | | | | | | | | |
| | |
4.50%, 1/11/2021 | | | 1,886,000 | | | | 1,914,593 | |
SEE NOTES TO FINANCIAL STATEMENTS.
| | | | | | |
| | | |
| 148 | | | | J.P. MORGAN EXCHANGE-TRADED FUNDS | | AUGUST 31, 2020 |
| | | | | | | | |
| INVESTMENTS | | PRINCIPAL
AMOUNT ($) | | | VALUE ($) | |
Corporate Bonds — continued | | | | | | | | |
|
Banks — continued | |
| | |
2.50%, 1/19/2021 | | | 3,950,000 | | | | 3,983,421 | |
| | |
(ICE LIBOR USD 3 Month + 0.43%), 0.67%, 4/26/2021 (a) | | | 7,490,000 | | | | 7,510,987 | |
| | |
3.13%, 4/26/2021 | | | 13,515,000 | | | | 13,771,937 | |
| | |
(ICE LIBOR USD 3 Month + 0.83%), 1.10%, 1/10/2022 (a) | | | 3,700,000 | | | | 3,737,252 | |
| | |
2.75%, 1/10/2022 | | | 420,000 | | | | 434,116 | |
| | |
3.88%, 2/8/2022 | | | 18,176,000 | | | | 19,102,580 | |
| | |
2.75%, 1/10/2023 | | | 2,089,000 | | | | 2,203,235 | |
| | |
3.88%, 9/26/2023 (b) | | | 6,490,000 | | | | 7,134,106 | |
| | |
Credit Agricole Corporate & Investment Bank SA (France) | | | | | | | | |
| | |
(ICE LIBOR USD 3 Month + 0.63%), 0.92%, 10/3/2021 (a) | | | 32,889,000 | | | | 32,902,433 | |
| | |
Credit Agricole SA (France) | | | | | | | | |
| | |
3.75%, 4/24/2023 (b) | | | 10,180,000 | | | | 10,988,618 | |
| | |
3.25%, 10/4/2024 (b) | | | 4,458,000 | | | | 4,856,219 | |
| | |
Credit Suisse Group Funding Guernsey Ltd. (Switzerland) | | | | | | | | |
| | |
3.13%, 12/10/2020 | | | 51,883,000 | | | | 52,290,704 | |
| | |
(ICE LIBOR USD 3 Month + 2.29%), 2.56%, 4/16/2021 (a) | | | 6,956,000 | | | | 7,048,932 | |
| | |
3.45%, 4/16/2021 | | | 17,850,000 | | | | 18,187,827 | |
| | |
DBS Group Holdings Ltd. (Singapore) | | | | | | | | |
| | |
2.85%, 4/16/2022 (b) | | | 44,859,000 | | | | 46,288,428 | |
| | |
DNB Bank ASA (Norway) | | | | | | | | |
| | |
(ICE LIBOR USD 3 Month + 0.37%), 0.67%, 10/2/2020 (a) (b) | | | 8,050,000 | | | | 8,052,708 | |
| | |
2.13%, 10/2/2020(b) | | | 87,271,000 | | | | 87,412,218 | |
| | |
2.38%, 6/2/2021 (b) | | | 7,871,000 | | | | 7,991,418 | |
| | |
2.15%, 12/2/2022 (b) | | | 35,121,000 | | | | 36,451,724 | |
| | |
Federation des Caisses Desjardins du Quebec (Canada) | | | | | | | | |
| | |
(ICE LIBOR USD 3 Month + 0.33%), 0.60%, 10/30/2020 (a) (b) | | | 5,967,000 | | | | 5,971,146 | |
| | |
2.25%, 10/30/2020 (b) | | | 102,391,000 | | | | 102,710,460 | |
| | |
2.05%, 2/10/2025 (b) (c) | | | 5,200,000 | | | | 5,428,753 | |
| | |
Fifth Third Bancorp | | | | | | | | |
| | |
1.63%, 5/5/2023 | | | 18,545,000 | | | | 19,026,739 | |
| | |
3.65%, 1/25/2024 | | | 23,511,000 | | | | 25,716,084 | |
| | |
2.38%, 1/28/2025 | | | 1,056,000 | | | | 1,121,509 | |
| | |
Fifth Third Bank NA | | | | | | | | |
| | |
(ICE LIBOR USD 3 Month + 0.25%), 0.52%, 10/30/2020 (a) | | | 10,655,000 | | | | 10,657,469 | |
| | |
2.20%, 10/30/2020 (c) | | | 9,340,000 | | | | 9,354,144 | |
| | |
(ICE LIBOR USD 3 Month + 0.44%), 0.68%, 7/26/2021 (a) | | | 14,045,000 | | | | 14,091,580 | |
| | | | | | | | |
| INVESTMENTS | | PRINCIPAL
AMOUNT ($) | | | VALUE ($) | |
| | | | | | | | |
|
Banks — continued | |
| | |
First Republic Bank | | | | | | | | |
| | |
(SOFR + 0.62%), 1.91%, 2/12/2024 (a) | | | 592,000 | | | | 609,434 | |
| | |
HSBC Holdings plc (United Kingdom) | | | | | | | | |
| | |
(ICE LIBOR USD 3 Month + 1.66%), 1.91%, 5/25/2021 (a) | | | 13,153,000 | | | | 13,295,447 | |
| | |
2.95%, 5/25/2021 | | | 69,745,000 | | | | 71,078,473 | |
| | |
(ICE LIBOR USD 3 Month + 0.65%), 0.97%, 9/11/2021 (a) | | | 14,857,000 | | | | 14,858,749 | |
| | |
2.65%, 1/5/2022 (c) | | | 1,241,000 | | | | 1,277,281 | |
| | |
4.00%, 3/30/2022 | | | 1,530,000 | | | | 1,612,543 | |
| | |
HSBC USA, Inc. | | | | | | | | |
| | |
5.00%, 9/27/2020 | | | 2,661,000 | | | | 2,669,806 | |
| | |
3.50%, 6/23/2024 | | | 5,000,000 | | | | 5,500,190 | |
| | |
Huntington Bancshares, Inc. | | | | | | | | |
| | |
3.15%, 3/14/2021 | | | 5,019,000 | | | | 5,083,414 | |
| | |
2.63%, 8/6/2024 (c) | | | 23,250,000 | | | | 24,889,267 | |
| | |
Huntington National Bank (The) | | | | | | | | |
| | |
(ICE LIBOR USD 3 Month + 0.55%), 0.80%, 2/5/2021 (a) | | | 11,594,000 | | | | 11,613,687 | |
| | |
3.25%, 5/14/2021 | | | 7,344,000 | | | | 7,478,164 | |
| | |
3.13%, 4/1/2022 | | | 2,128,000 | | | | 2,212,211 | |
| | |
2.50%, 8/7/2022 | | | 16,029,000 | | | | 16,644,282 | |
| | |
1.80%, 2/3/2023 | | | 500,000 | | | | 514,855 | |
| | |
3.55%, 10/6/2023 | | | 1,640,000 | | | | 1,790,952 | |
| | |
ING Groep NV (Netherlands) | | | | | | | | |
| | |
(ICE LIBOR USD 3 Month + 1.15%), 1.46%, 3/29/2022 (a) | | | 21,325,000 | | | | 21,559,815 | |
| | |
3.15%, 3/29/2022 | | | 58,170,000 | | | | 60,510,111 | |
| | |
4.10%, 10/2/2023 | | | 3,730,000 | | | | 4,116,976 | |
| | |
KeyBank NA | | | | | | | | |
| | |
2.40%, 6/9/2022 | | | 965,000 | | | | 997,636 | |
| | |
2.30%, 9/14/2022 | | | 5,119,000 | | | | 5,310,977 | |
| | |
1.25%, 3/10/2023 | | | 500,000 | | | | 509,999 | |
| | |
KeyCorp | | | | | | | | |
| | |
2.90%, 9/15/2020 | | | 21,166,000 | | | | 21,185,473 | |
| | |
5.10%, 3/24/2021 | | | 12,301,000 | | | | 12,632,369 | |
| | |
Lloyds Bank plc (United Kingdom) | | | | | | | | |
| | |
(ICE LIBOR USD 3 Month + 0.49%), 0.73%, 5/7/2021 (a) | | | 2,101,000 | | | | 2,106,127 | |
| | |
Lloyds Banking Group plc (United Kingdom) | | | | | | | | |
| | |
(ICE LIBOR USD 3 Month + 0.80%), 1.11%, 6/21/2021 (a) | | | 300,000 | | | | 301,458 | |
| | |
3.10%, 7/6/2021 | | | 1,445,000 | | | | 1,478,322 | |
| | |
3.00%, 1/11/2022 | | | 7,896,000 | | | | 8,165,626 | |
SEE NOTES TO FINANCIAL STATEMENTS.
| | | | | | | | |
| | | |
| AUGUST 31, 2020 | | J.P. MORGAN EXCHANGE-TRADED FUNDS | | | | | 149 | |
JPMorgan Ultra-Short Income ETF
SCHEDULE OF PORTFOLIO INVESTMENTS
AS OF AUGUST 31, 2020 (Unaudited) (continued)
| | | | | | | | |
| INVESTMENTS | | PRINCIPAL
AMOUNT ($) | | | VALUE ($) | |
Corporate Bonds — continued | | | | | | | | |
|
Banks — continued | |
| | |
(ICE LIBOR USD 3 Month + 1.25%), 2.86%, 3/17/2023 (a) (c) | | | 320,000 | | | | 330,614 | |
| | |
4.05%, 8/16/2023 (c) | | | 2,116,000 | | | | 2,314,398 | |
| | |
(ICE LIBOR USD 3 Month + 0.81%), 2.91%, 11/7/2023 (a) | | | 3,334,000 | | | | 3,485,237 | |
| | |
Manufacturers & Traders Trust Co. | | | | | | | | |
| | |
2.63%, 1/25/2021 | | | 265,000 | | | | 266,975 | |
| | |
2.50%, 5/18/2022 | | | 250,000 | | | | 258,625 | |
| | |
Mitsubishi UFJ Financial Group, Inc. (Japan) | | | | | | | | |
| | |
2.95%, 3/1/2021 | | | 3,584,000 | | | | 3,631,254 | |
| | |
(ICE LIBOR USD 3 Month + 0.65%), 0.89%, 7/26/2021 (a) | | | 9,060,000 | | | | 9,098,617 | |
| | |
3.54%, 7/26/2021 | | | 17,367,000 | | | | 17,853,874 | |
| | |
(ICE LIBOR USD 3 Month + 1.06%), 1.37%, 9/13/2021 (a) | | | 6,387,000 | | | | 6,441,945 | |
| | |
2.19%, 9/13/2021 | | | 1,877,000 | | | | 1,911,833 | |
| | |
(ICE LIBOR USD 3 Month + 0.92%), 1.18%, 2/22/2022 (a) | | | 4,789,000 | | | | 4,837,135 | |
| | |
3.00%, 2/22/2022 | | | 42,869,000 | | | | 44,479,691 | |
| | |
(ICE LIBOR USD 3 Month + 0.70%), 1.02%, 3/7/2022 (a) | | | 22,890,000 | | | | 23,045,694 | |
| | |
2.62%, 7/18/2022 | | | 20,517,000 | | | | 21,341,885 | |
| | |
2.67%, 7/25/2022 | | | 10,807,000 | | | | 11,234,656 | |
| | |
3.46%, 3/2/2023 | | | 351,000 | | | | 375,186 | |
| | |
3.76%, 7/26/2023 | | | 2,493,000 | | | | 2,716,049 | |
| | |
2.19%, 2/25/2025 (c) | | | 5,619,000 | | | | 5,909,861 | |
| | |
1.41%, 7/17/2025 | | | 10,000,000 | | | | 10,174,192 | |
| | |
Mizuho Bank Ltd. (Japan) 3.20%, 3/26/2025 (b) | | | 600,000 | | | | 658,377 | |
| | |
Mizuho Financial Group, Inc. (Japan) | | | | | | | | |
| | |
2.63%, 4/12/2021 (b) | | | 54,552,000 | | | | 55,321,178 | |
| | |
(ICE LIBOR USD 3 Month + 1.14%), 1.45%, 9/13/2021 (a) | | | 15,690,000 | | | | 15,844,044 | |
| | |
(ICE LIBOR USD 3 Month + 0.94%), 1.20%, 2/28/2022 (a) | | | 6,865,000 | | | | 6,929,958 | |
| | |
(ICE LIBOR USD 3 Month + 0.88%), 1.19%, 9/11/2022 (a) | | | 6,000,000 | | | | 6,059,040 | |
| | |
2.60%, 9/11/2022 | | | 6,986,000 | | | | 7,274,365 | |
| | |
3.55%, 3/5/2023 | | | 3,942,000 | | | | 4,219,771 | |
| | |
(ICE LIBOR USD 3 Month + 0.84%), 2.72%, 7/16/2023 (a) | | | 4,363,000 | | | | 4,524,182 | |
| | |
(ICE LIBOR USD 3 Month + 0.99%), 1.24%, 7/10/2024 (a) | | | 15,000,000 | | | | 15,182,692 | |
| | |
(ICE LIBOR USD 3 Month + 1.00%), 3.92%, 9/11/2024 (a) | | | 8,066,000 | | | | 8,779,031 | |
| | | | | | | | |
| INVESTMENTS | | PRINCIPAL
AMOUNT ($) | | | VALUE ($) | |
| | | | | | | | |
|
Banks — continued | |
| | |
MUFG Americas Holdings Corp. 3.50%, 6/18/2022 | | | 9,413,000 | | | | 9,908,099 | |
| | |
MUFG Bank Ltd. (Japan) 4.10%, 9/9/2023 (b) | | | 200,000 | | | | 220,089 | |
| | |
MUFG Union Bank NA | | | | | | | | |
| | |
3.15%, 4/1/2022 | | | 1,220,000 | | | | 1,272,212 | |
| | |
(SOFR + 0.71%), 0.78%, 12/9/2022 (a) | | | 24,750,000 | | | | 24,796,238 | |
| | |
National Australia Bank Ltd. (Australia) | | | | | | | | |
| | |
(ICE LIBOR USD 3 Month + 0.35%), 0.62%, 1/12/2021 (a) (b) | | | 7,670,000 | | | | 7,679,995 | |
| | |
2.50%, 1/12/2021 | | | 1,735,000 | | | | 1,747,613 | |
| | |
2.63%, 1/14/2021 | | | 1,048,000 | | | | 1,057,048 | |
| | |
(ICE LIBOR USD 3 Month + 1.00%), 1.27%, 7/12/2021 (a) (b) (c) | | | 4,750,000 | | | | 4,787,439 | |
| | |
1.88%, 7/12/2021 | | | 3,895,000 | | | | 3,949,491 | |
| | |
3.38%, 9/20/2021 | | | 6,250,000 | | | | 6,451,500 | |
| | |
(ICE LIBOR USD 3 Month + 0.71%), 0.96%, 11/4/2021 (a) (b) | | | 18,111,000 | | | | 18,243,836 | |
| | |
3.70%, 11/4/2021 | | | 250,000 | | | | 257,155 | |
| | |
2.50%, 5/22/2022 | | | 8,967,000 | | | | 9,308,021 | |
| | |
1.88%, 12/13/2022 | | | 7,765,000 | | | | 8,035,144 | |
| | |
3.00%, 1/20/2023 | | | 5,600,000 | | | | 5,930,321 | |
| | |
2.88%, 4/12/2023 (c) | | | 3,345,000 | | | | 3,539,244 | |
| | |
National Bank of Canada (Canada) | | | | | | | | |
| | |
2.20%, 11/2/2020 | | | 3,148,000 | | | | 3,152,871 | |
| | |
(ICE LIBOR USD 3 Month + 0.40%), 0.71%, 3/21/2021 (a) (b) | | | 60,000,000 | | | | 60,050,361 | |
| | |
2.15%, 10/7/2022 (b) | | | 13,125,000 | | | | 13,569,023 | |
| | |
2.10%, 2/1/2023 | | | 43,700,000 | | | | 45,241,504 | |
| | |
(US Treasury Yield Curve Rate T Note Constant Maturity 1 Year + 0.77%), 0.90%, 8/15/2023 (a) (c) | | | 15,000,000 | | | | 15,088,916 | |
| | |
Natwest Group plc (United Kingdom) | | | | | | | | |
| | |
(US Treasury Yield Curve Rate T Note Constant Maturity 1 Year + 2.15%), 2.36%, 5/22/2024 (a) | | | 133,000 | | | | 137,691 | |
| | |
(ICE LIBOR USD 3 Month + 1.76%), 4.27%, 3/22/2025 (a) | | | 10,045,000 | | | | 11,041,806 | |
| | |
Nordea Bank Abp (Finland) | | | | | | | | |
| | |
2.50%, 9/17/2020 (b) | | | 4,505,000 | | | | 4,509,413 | |
| | |
4.88%, 1/14/2021 (b) | | | 4,908,000 | | | | 4,991,681 | |
| | |
(ICE LIBOR USD 3 Month + 0.99%), 1.24%, 5/27/2021 (a) (b) | | | 4,600,000 | | | | 4,634,246 | |
| | |
2.25%, 5/27/2021 (b) (c) | | | 46,490,000 | | | | 47,154,089 | |
| | |
1.00%, 6/9/2023(b) | | | 15,826,000 | | | | 16,029,587 | |
SEE NOTES TO FINANCIAL STATEMENTS.
| | | | | | |
| | | |
| 150 | | | | J.P. MORGAN EXCHANGE-TRADED FUNDS | | AUGUST 31, 2020 |
| | | | | | | | |
| INVESTMENTS | | PRINCIPAL
AMOUNT ($) | | | VALUE ($) | |
Corporate Bonds — continued | | | | | | | | |
|
Banks — continued | |
| | |
0.75%, 8/28/2025 (b) (c) | | | 20,000,000 | | | | 19,933,005 | |
| | |
PNC Bank NA | | | | | | | | |
| | |
2.45%, 11/5/2020 | | | 6,833,000 | | | | 6,846,681 | |
| | |
(ICE LIBOR USD 3 Month + 0.25%), 0.51%, 1/22/2021 (a) | | | 1,850,000 | | | | 1,850,935 | |
| | |
2.15%, 4/29/2021 | | | 10,230,000 | | | | 10,344,007 | |
| | |
(ICE LIBOR USD 3 Month + 0.44%), 2.23%, 7/22/2022 (a) | | | 6,211,000 | | | | 6,313,931 | |
| | |
(ICE LIBOR USD 3 Month + 0.42%), 2.03%, 12/9/2022 (a) | | | 3,610,000 | | | | 3,682,317 | |
| | |
(ICE LIBOR USD 3 Month + 0.00%), 1.74%, 2/24/2023 (a) | | | 2,405,000 | | | | 2,451,846 | |
| | |
PNC Financial Services Group, Inc. (The) 2.85%, 11/9/2022 (d) | | | 1,465,000 | | | | 1,541,481 | |
| | |
Regions Financial Corp. 2.25%, 5/18/2025 | | | 1,680,000 | | | | 1,783,603 | |
| | |
Royal Bank of Canada (Canada) | | | | | | | | |
| | |
(ICE LIBOR USD 3 Month + 0.24%), 0.48%, 10/26/2020 (a) | | | 269,000 | | | | 269,119 | |
| | |
2.15%, 10/26/2020 | | | 28,753,000 | | | | 28,837,780 | |
| | |
2.50%, 1/19/2021 | | | 215,000 | | | | 216,861 | |
| | |
(ICE LIBOR USD 3 Month + 0.40%), 0.64%, 1/25/2021 (a) | | | 11,147,000 | | | | 11,165,482 | |
| | |
(ICE LIBOR USD 3 Month + 0.39%), 0.66%, 4/30/2021 (a) | | | 8,135,000 | | | | 8,156,094 | |
| | |
(ICE LIBOR USD 3 Month + 0.73%), 0.98%, 2/1/2022 (a) | | | 1,333,000 | | | | 1,345,508 | |
| | |
1.95%, 1/17/2023 | | | 479,000 | | | | 496,410 | |
| | |
1.60%, 4/17/2023 | | | 43,938,000 | | | | 45,383,151 | |
| | |
3.70%, 10/5/2023 | | | 7,562,000 | | | | 8,298,147 | |
| | |
2.25%, 11/1/2024 | | | 10,000,000 | | | | 10,659,876 | |
| | |
1.15%, 6/10/2025 (c) | | | 25,000,000 | | | | 25,449,423 | |
| | |
Santander UK Group Holdings plc (United Kingdom) | | | | | | | | |
| | |
2.88%, 10/16/2020 | | | 9,770,000 | | | | 9,800,385 | |
| | |
3.13%, 1/8/2021 | | | 54,211,000 | | | | 54,731,342 | |
| | |
2.88%, 8/5/2021 | | | 4,092,000 | | | | 4,184,199 | |
| | |
Santander UK plc (United Kingdom) | | | | | | | | |
| | |
2.13%, 11/3/2020 | | | 6,923,000 | | | | 6,944,407 | |
| | |
2.50%, 1/5/2021 | | | 5,590,000 | | | | 5,632,259 | |
| | |
(ICE LIBOR USD 3 Month + 0.62%), 0.97%, 6/1/2021 (a) (c) | | | 3,000,000 | | | | 3,011,671 | |
| | |
3.40%, 6/1/2021 | | | 6,638,000 | | | | 6,792,924 | |
| | |
(ICE LIBOR USD 3 Month + 0.66%), 0.94%, 11/15/2021 (a) (c) | | | 6,288,000 | | | | 6,325,439 | |
| | |
2.10%, 1/13/2023 (c) | | | 26,835,000 | | | | 27,784,358 | |
| | | | | | | | |
| INVESTMENTS | | PRINCIPAL
AMOUNT ($) | | | VALUE ($) | |
| | | | | | | | |
|
Banks — continued | |
| | |
2.88%, 6/18/2024 (c) | | | 2,200,000 | | | | 2,380,481 | |
| | |
Skandinaviska Enskilda Banken AB (Sweden) | | | | | | | | |
| | |
2.63%, 11/17/2020 (b) | | | 457,000 | | | | 459,289 | |
| | |
(ICE LIBOR USD 3 Month + 0.43%), 0.71%, 5/17/2021 (a) (b) | | | 200,000 | | | | 200,549 | |
| | |
3.25%, 5/17/2021 (b) | | | 41,540,000 | | | | 42,353,436 | |
| | |
1.88%, 9/13/2021 | | | 22,200,000 | | | | 22,572,693 | |
| | |
3.05%, 3/25/2022 (b) | | | 13,760,000 | | | | 14,307,510 | |
| | |
2.20%, 12/12/2022 (b) | | | 10,957,000 | | | | 11,391,634 | |
| | |
0.55%, 9/1/2023 (b) | | | 21,337,000 | | | | 21,331,026 | |
| | |
Societe Generale SA (France) | | | | | | | | |
| | |
2.63%, 9/16/2020 (b) (c) | | | 6,562,000 | | | | 6,568,115 | |
| | |
(ICE LIBOR USD 3 Month + 1.33%), 1.61%, 4/8/2021 (a) (b) | | | 5,150,000 | | | | 5,187,455 | |
| | |
2.50%, 4/8/2021 (b) (c) | | | 20,365,000 | | | | 20,625,425 | |
| | |
5.20%, 4/15/2021 (b) | | | 60,174,000 | | | | 61,995,094 | |
| | |
4.25%, 9/14/2023 (b) | | | 5,300,000 | | | | 5,750,098 | |
| | |
2.63%, 1/22/2025 (b) | | | 5,000,000 | | | | 5,231,429 | |
| | |
1.38%, 7/8/2025 (b) (c) | | | 50,000,000 | | | | 51,152,207 | |
| | |
Standard Chartered plc (United Kingdom) 3.05%, 1/15/2021 (b) (c) | | | 39,774,000 | | | | 40,134,393 | |
| | |
(ICE LIBOR USD 3 Month + 1.20%), 2.74%, 9/10/2022 (a) (b) (c) | | | 4,300,000 | | | | 4,377,765 | |
| | |
(ICE LIBOR USD 3 Month + 1.15%), 4.25%, 1/20/2023 (a) (b) | | | 12,157,000 | | | | 12,646,268 | |
| | |
Sumitomo Mitsui Banking Corp. (Japan) 3.20%, 7/18/2022 | | | 2,203,000 | | | | 2,310,993 | |
| | |
Sumitomo Mitsui Financial Group, Inc. (Japan) | | | | | | | | |
| | |
(ICE LIBOR USD 3 Month + 1.68%), 1.99%, 3/9/2021 (a) | | | 6,353,000 | | | | 6,404,780 | |
| | |
2.93%, 3/9/2021 | | | 6,815,000 | | | | 6,908,046 | |
| | |
(ICE LIBOR USD 3 Month + 1.11%), 1.38%, 7/14/2021 (a) | | | 5,404,000 | | | | 5,447,714 | |
| | |
2.06%, 7/14/2021 | | | 1,582,000 | | | | 1,604,799 | |
| | |
(ICE LIBOR USD 3 Month + 1.14%), 1.41%, 10/19/2021 (a) | | | 5,067,000 | | | | 5,122,045 | |
| | |
2.44%, 10/19/2021 | | | 29,688,000 | | | | 30,371,632 | |
| | |
(ICE LIBOR USD 3 Month + 0.97%), 1.24%, 1/11/2022 (a) (c) | | | 19,000,000 | | | | 19,165,813 | |
| | |
2.85%, 1/11/2022 | | | 262,000 | | | | 270,476 | |
| | |
2.78%, 7/12/2022 | | | 34,567,000 | | | | 36,044,638 | |
| | |
2.78%, 10/18/2022 | | | 6,875,000 | | | | 7,200,083 | |
| | |
3.10%, 1/17/2023 | | | 184,000 | | | | 195,115 | |
SEE NOTES TO FINANCIAL STATEMENTS.
| | | | | | | | |
| | | |
| AUGUST 31, 2020 | | J.P. MORGAN EXCHANGE-TRADED FUNDS | | | | | 151 | |
JPMorgan Ultra-Short Income ETF
SCHEDULE OF PORTFOLIO INVESTMENTS
AS OF AUGUST 31, 2020 (Unaudited) (continued)
| | | | | | | | |
| INVESTMENTS | | PRINCIPAL
AMOUNT ($) | | | VALUE ($) | |
Corporate Bonds — continued | | | | | | | | |
|
Banks — continued | |
| | |
2.70%, 7/16/2024 | | | 3,728,000 | | | | 4,000,237 | |
| | |
2.35%, 1/15/2025 | | | 5,701,000 | | | | 6,054,020 | |
| | |
1.47%, 7/8/2025 | | | 15,000,000 | | | | 15,321,081 | |
| | |
Svenska Handelsbanken AB (Sweden) | | | | | | | | |
| | |
1.95%, 9/8/2020 | | | 11,736,000 | | | | 11,739,197 | |
| | |
2.40%, 10/1/2020 | | | 18,947,000 | | | | 18,980,348 | |
| | |
2.45%, 3/30/2021 | | | 12,529,000 | | | | 12,689,650 | |
| | |
(ICE LIBOR USD 3 Month + 0.47%), 0.73%, 5/24/2021 (a) | | | 45,347,000 | | | | 45,498,459 | |
| | |
3.35%, 5/24/2021 | | | 68,161,000 | | | | 69,688,576 | |
| | |
1.88%, 9/7/2021 | | | 4,537,000 | | | | 4,609,877 | |
| | |
0.63%, 6/30/2023 (b) (c) | | | 33,026,000 | | | | 33,140,335 | |
| | |
Toronto-Dominion Bank (The) (Canada) | | | | | | | | |
| | |
(ICE LIBOR USD 3 Month + 0.93%), 1.24%, 12/14/2020 (a) | | | 2,401,000 | | | | 2,407,534 | |
| | |
(ICE LIBOR USD 3 Month + 0.24%), 0.48%, 1/25/2021 (a) (c) | | | 350,000 | | | | 350,306 | |
| | |
2.55%, 1/25/2021 | | | 1,100,000 | | | | 1,110,108 | |
| | |
(ICE LIBOR USD 3 Month + 0.27%), 0.57%, 3/17/2021 (a) | | | 4,905,000 | | | | 4,913,020 | |
| | |
(ICE LIBOR USD 3 Month + 1.00%), 1.28%, 4/7/2021 (a) | | | 52,000 | | | | 52,308 | |
| | |
(ICE LIBOR USD 3 Month + 0.43%), 0.74%, 6/11/2021 (a) | | | 2,435,000 | | | | 2,441,823 | |
| | |
3.25%, 6/11/2021 | | | 11,301,000 | | | | 11,569,223 | |
| | |
(ICE LIBOR USD 3 Month + 0.90%), 1.17%, 7/13/2021 (a) | | | 5,890,000 | | | | 5,934,264 | |
| | |
1.80%, 7/13/2021 | | | 980,000 | | | | 993,164 | |
| | |
1.90%, 12/1/2022 | | | 3,189,000 | | | | 3,298,674 | |
| | |
(SOFR + 0.48%), 0.55%, 1/27/2023 (a) | | | 29,380,000 | | | | 29,444,695 | |
| | |
0.75%, 6/12/2023 (c) | | | 33,955,000 | | | | 34,298,377 | |
| | |
2.65%, 6/12/2024 (c) | | | 7,132,000 | | | | 7,668,290 | |
| | |
1.15%, 6/12/2025 (c) | | | 24,000,000 | | | | 24,509,407 | |
| | |
Truist Bank | | | | | | | | |
| | |
2.85%, 4/1/2021 | | | 4,492,000 | | | | 4,548,055 | |
| | |
(ICE LIBOR USD 3 Month + 0.50%), 0.74%, 10/26/2021 (a) | | | 1,940,000 | | | | 1,941,396 | |
| | |
(ICE LIBOR USD 3 Month + 0.50%), 3.53%, 10/26/2021 (a) | | | 31,321,000 | | | | 31,467,404 | |
| | |
Truist Financial Corp. | | | | | | | | |
| | |
(ICE LIBOR USD 3 Month + 0.22%), 0.47%, 2/1/2021 (a) | | | 10,007,000 | | | | 10,013,535 | |
| | |
2.15%, 2/1/2021 | | | 1,000,000 | | | | 1,006,181 | |
| | |
2.90%, 3/3/2021 | | | 8,319,000 | | | | 8,411,016 | |
| | |
3.20%, 9/3/2021 | | | 1,300,000 | | | | 1,334,849 | |
| | | | | | | | |
| INVESTMENTS | | PRINCIPAL
AMOUNT ($) | | | VALUE ($) | |
| | | | | | | | |
|
Banks — continued | |
| | |
2.70%, 1/27/2022 | | | 271,000 | | | | 279,286 | |
| | |
3.05%, 6/20/2022 | | | 17,689,000 | | | | 18,479,307 | |
| | |
3.75%, 12/6/2023 | | | 8,520,000 | | | | 9,387,763 | |
| | |
4.00%, 5/1/2025 | | | 21,109,000 | | | | 24,092,773 | |
| | |
US Bancorp | | | | | | | | |
| | |
2.35%, 1/29/2021 | | | 9,682,000 | | | | 9,748,142 | |
| | |
(ICE LIBOR USD 3 Month + 0.64%), 0.90%, 1/24/2022 (a) | | | 54,000 | | | | 54,372 | |
| | |
3.38%, 2/5/2024 (c) | | | 20,000,000 | | | | 21,867,900 | |
| | |
1.45%, 5/12/2025 | | | 24,500,000 | | | | 25,373,305 | |
| | |
US Bank NA | | | | | | | | |
| | |
(ICE LIBOR USD 3 Month + 0.31%), 0.56%, 2/4/2021 (a) | | | 21,496,000 | | | | 21,521,227 | |
| | |
3.00%, 2/4/2021 | | | 910,000 | | | | 918,411 | |
| | |
(ICE LIBOR USD 3 Month + 0.32%), 0.56%, 4/26/2021 (a) | | | 1,831,000 | | | | 1,834,253 | |
| | |
(ICE LIBOR USD 3 Month + 0.38%), 0.66%, 11/16/2021 (a) | | | 9,732,000 | | | | 9,761,104 | |
| | |
3.45%, 11/16/2021 | | | 279,000 | | | | 288,929 | |
| | |
(ICE LIBOR USD 3 Month + 0.18%), 0.45%, 1/21/2022 (a) | | | 82,771,000 | | | | 82,876,766 | |
| | |
1.80%, 1/21/2022 | | | 500,000 | | | | 510,542 | |
| | |
2.65%, 5/23/2022 | | | 2,081,000 | | | | 2,162,137 | |
| | |
2.05%, 1/21/2025 | | | 894,000 | | | | 948,205 | |
| | |
2.80%, 1/27/2025 | | | 4,210,000 | | | | 4,593,460 | |
| | |
Wells Fargo & Co. | | | | | | | | |
| | |
(ICE LIBOR USD 3 Month + 1.01%), 1.33%, 12/7/2020 (a) | | | 4,393,000 | | | | 4,403,948 | |
| | |
(ICE LIBOR USD 3 Month + 1.34%), 1.67%, 3/4/2021 (a) | | | 5,595,000 | | | | 5,629,208 | |
| | |
(ICE LIBOR USD 3 Month + 1.03%), 1.27%, 7/26/2021 (a) | | | 260,000 | | | | 262,173 | |
| | |
2.10%, 7/26/2021 | | | 9,698,000 | | | | 9,848,780 | |
| | |
(ICE LIBOR USD 3 Month + 0.93%), 1.18%, 2/11/2022 (a) | | | 11,657,000 | | | | 11,696,187 | |
| | |
2.63%, 7/22/2022 | | | 13,919,000 | | | | 14,479,442 | |
| | |
3.75%, 1/24/2024 | | | 4,790,000 | | | | 5,233,052 | |
| | |
(SOFR + 1.60%), 1.65%, 6/2/2024 (a) | | | 24,600,000 | | | | 25,149,924 | |
| | |
3.30%, 9/9/2024 | | | 14,904,000 | | | | 16,329,771 | |
| | |
3.00%, 2/19/2025 | | | 5,000,000 | | | | 5,428,182 | |
| | |
Wells Fargo Bank NA | | | | | | | | |
| | |
(ICE LIBOR USD 3 Month + 0.51%), 0.77%, 10/22/2021 (a) | | | 445,000 | | | | 446,810 | |
| | |
(ICE LIBOR USD 3 Month + 0.61%), 2.90%, 5/27/2022 (a) | | | 1,900,000 | | | | 1,934,524 | |
SEE NOTES TO FINANCIAL STATEMENTS.
| | | | | | |
| | | |
| 152 | | | | J.P. MORGAN EXCHANGE-TRADED FUNDS | | AUGUST 31, 2020 |
| | | | | | | | |
| INVESTMENTS | | PRINCIPAL
AMOUNT ($) | | | VALUE ($) | |
Corporate Bonds — continued | | | | | | | | |
|
Banks — continued | |
| | |
(ICE LIBOR USD 3 Month + 0.65%), 2.08%, 9/9/2022 (a) | | | 14,699,000 | | | | 14,929,902 | |
| | |
3.55%, 8/14/2023 | | | 16,330,000 | | | | 17,736,582 | |
| | |
Westpac Banking Corp. (Australia) | | | | | | | | |
| | |
(ICE LIBOR USD 3 Month + 0.36%), 0.71%, 9/1/2020 (a) (b) | | | 950,000 | | | | 950,000 | |
| | |
2.60%, 11/23/2020 | | | 8,727,000 | | | | 8,773,593 | |
| | |
2.65%, 1/25/2021 (c) | | | 9,058,000 | | | | 9,145,084 | |
| | |
(ICE LIBOR USD 3 Month + 1.00%), 1.25%, 5/13/2021 (a) | | | 430,000 | | | | 432,949 | |
| | |
(ICE LIBOR USD 3 Month + 0.85%), 1.12%, 8/19/2021 (a) | | | 1,750,000 | | | | 1,763,085 | |
| | |
(ICE LIBOR USD 3 Month + 0.85%), 1.12%, 1/11/2022 (a) | | | 4,524,000 | | | | 4,568,121 | |
| | |
2.50%, 6/28/2022 | | | 8,763,000 | | | | 9,114,766 | |
| | |
2.00%, 1/13/2023 | | | 1,140,000 | | | | 1,182,790 | |
| | |
3.65%, 5/15/2023 | | | 11,504,000 | | | | 12,482,857 | |
| | |
2.35%, 2/19/2025 | | | 54,950,000 | | | | 58,733,614 | |
| | | | | | | | |
| | |
| | | | | | | 4,626,984,535 | |
| | | | | | | | |
| | |
Beverages — 0.7% | | | | | | | | |
| | |
Anheuser-Busch InBev Finance, Inc. (Belgium) (ICE LIBOR USD 3 Month + 1.26%), 1.51%, 2/1/2021 (a) | | | 100,000 | | | | 100,478 | |
| | |
Anheuser-Busch InBev Worldwide, Inc. (Belgium) | | | | | | | | |
| | |
3.50%, 1/12/2024 | | | 3,325,000 | | | | 3,622,549 | |
| | |
4.15%, 1/23/2025 | | | 9,151,000 | | | | 10,411,502 | |
| | |
Coca-Cola Co. (The) 3.15%, 11/15/2020 | | | 1,149,000 | | | | 1,155,899 | |
| | |
Constellation Brands, Inc. (ICE LIBOR USD 3 Month + 0.70%), 0.98%, 11/15/2021 (a) | | | 14,460,000 | | | | 14,460,835 | |
| | |
Diageo Capital plc (United Kingdom) 2.63%, 4/29/2023 | | | 5,799,000 | | | | 6,097,578 | |
| | |
Heineken NV (Netherlands) 2.75%, 4/1/2023 (b) | | | 6,250,000 | | | | 6,585,465 | |
| | |
Keurig Dr Pepper, Inc. | | | | | | | | |
| | |
3.55%, 5/25/2021 | | | 43,023,000 | | | | 44,034,081 | |
| | |
3.20%, 11/15/2021 | | | 2,505,000 | | | | 2,570,794 | |
| | |
PepsiCo, Inc. 3.10%, 7/17/2022 (c) | | | 7,570,000 | | | | 7,926,826 | |
| | | | | | | | |
| | |
| | | | | | | 96,966,007 | |
| | | | | | | | |
| | |
Biotechnology — 0.7% | | | | | | | | |
| | |
AbbVie, Inc. | | | | | | | | |
| | |
2.30%, 5/14/2021 (c) | | | 10,248,000 | | | | 10,372,475 | |
| | | | | | | | |
| INVESTMENTS | | PRINCIPAL
AMOUNT ($) | | | VALUE ($) | |
| | | | | | | | |
|
Biotechnology — continued | |
| | |
(ICE LIBOR USD 3 Month + 0.35%), 0.60%, 5/21/2021 (a) (b) | | | 100,000 | | | | 100,131 | |
| | |
(ICE LIBOR USD 3 Month + 0.46%), 0.73%, 11/19/2021 (a) (b) | | | 19,800,000 | | | | 19,862,429 | |
| | |
2.15%, 11/19/2021 (b) | | | 38,122,000 | | | | 38,893,354 | |
| | |
5.00%, 12/15/2021 (b) | | | 7,500,000 | | | | 7,837,333 | |
| | |
3.80%, 3/15/2025 (b) | | | 1,332,000 | | | | 1,489,062 | |
| | |
Gilead Sciences, Inc. | | | | | | | | |
| | |
2.55%, 9/1/2020 | | | 7,233,000 | | | | 7,233,000 | |
| | |
3.25%, 9/1/2022 | | | 11,140,000 | | | | 11,710,770 | |
| | |
3.70%, 4/1/2024 | | | 2,780,000 | | | | 3,068,270 | |
| | |
3.50%, 2/1/2025 | | | 500,000 | | | | 560,489 | |
| | | | | | | | |
| | |
| | | | | | | 101,127,313 | |
| | | | | | | | |
| | |
Capital Markets — 5.8% | | | | | | | | |
| | |
Ameriprise Financial, Inc. | | | | | | | | |
| | |
4.00%, 10/15/2023 | | | 1,606,000 | | | | 1,782,702 | |
| | |
3.00%, 4/2/2025 | | | 1,853,000 | | | | 2,028,578 | |
| | |
Bank of New York Mellon Corp. (The) | | | | | | | | |
| | |
4.15%, 2/1/2021 | | | 2,340,000 | | | | 2,377,315 | |
| | |
2.50%, 4/15/2021 | | | 798,000 | | | | 807,598 | |
| | |
2.05%, 5/3/2021 | | | 3,892,000 | | | | 3,932,659 | |
| | |
2.60%, 2/7/2022 | | | 383,000 | | | | 395,037 | |
| | |
1.85%, 1/27/2023 (c) | | | 9,380,000 | | | | 9,697,475 | |
| | |
2.95%, 1/29/2023 | | | 396,000 | | | | 419,624 | |
| | |
3.50%, 4/28/2023 | | | 818,000 | | | | 886,817 | |
| | |
(ICE LIBOR USD 3 Month + 0.63%), 2.66%, 5/16/2023 (a) | | | 5,401,000 | | | | 5,598,215 | |
| | |
2.20%, 8/16/2023 | | | 515,000 | | | | 540,286 | |
| | |
3.40%, 5/15/2024 (c) | | | 1,240,000 | | | | 1,369,453 | |
| | |
3.25%, 9/11/2024 (c) | | | 1,972,000 | | | | 2,176,190 | |
| | |
1.60%, 4/24/2025 | | | 19,650,000 | | | | 20,494,450 | |
| | |
Brookfield Asset Management, Inc. (Canada) 4.00%, 1/15/2025 | | | 4,046,000 | | | | 4,463,503 | |
| | |
Charles Schwab Corp. (The) | | | | | | | | |
| | |
(ICE LIBOR USD 3 Month + 0.32%), 0.57%, 5/21/2021 (a) | | | 11,272,000 | | | | 11,292,662 | |
| | |
3.23%, 9/1/2022 | | | 300,000 | | | | 317,279 | |
| | |
2.65%, 1/25/2023 | | | 3,499,000 | | | | 3,684,669 | |
| | |
4.20%, 3/24/2025 | | | 86,000 | | | | 99,589 | |
| | |
Credit Suisse AG (Switzerland) | | | | | | | | |
| | |
2.80%, 4/8/2022 | | | 64,724,000 | | | | 67,242,277 | |
| | |
1.00%, 5/5/2023 | | | 31,313,000 | | | | 31,776,020 | |
| | |
Goldman Sachs Group, Inc. (The) | | | | | | | | |
| | |
2.60%, 12/27/2020 | | | 19,729,000 | | | | 19,867,643 | |
SEE NOTES TO FINANCIAL STATEMENTS.
| | | | | | | | |
| | | |
| AUGUST 31, 2020 | | J.P. MORGAN EXCHANGE-TRADED FUNDS | | | | | 153 | |
JPMorgan Ultra-Short Income ETF
SCHEDULE OF PORTFOLIO INVESTMENTS
AS OF AUGUST 31, 2020 (Unaudited) (continued)
| | | | | | | | |
| INVESTMENTS | | PRINCIPAL
AMOUNT ($) | | | VALUE ($) | |
Corporate Bonds — continued | | | | | | | | |
|
Capital Markets — continued | |
| | |
(ICE LIBOR USD 3 Month + 1.77%), 2.02%, 2/25/2021 (a) | | | 13,319,000 | | | | 13,426,903 | |
| | |
(ICE LIBOR USD 3 Month + 1.36%), 1.60%, 4/23/2021 (a) | | | 3,240,000 | | | | 3,261,056 | |
| | |
2.63%, 4/25/2021 | | | 1,673,000 | | | | 1,695,014 | |
| | |
5.25%, 7/27/2021 | | | 10,950,000 | | | | 11,433,012 | |
| | |
(ICE LIBOR USD 3 Month + 1.17%), 1.45%, 11/15/2021 (a) | | | 11,881,000 | | | | 11,905,735 | |
| | |
5.75%, 1/24/2022 | | | 21,568,000 | | | | 23,150,752 | |
| | |
(ICE LIBOR USD 3 Month + 0.82%), 2.88%, 10/31/2022 (a) | | | 4,870,000 | | | | 4,997,028 | |
| | |
ING Bank NV (Netherlands) | | | | | | | | |
| | |
2.75%, 3/22/2021 (b) | | | 24,459,000 | | | | 24,799,188 | |
| | |
5.00%, 6/9/2021 (b) | | | 15,208,000 | | | | 15,759,257 | |
| | |
Intercontinental Exchange, Inc. | | | | | | | | |
| | |
2.35%, 9/15/2022 (c) | | | 2,115,000 | | | | 2,187,946 | |
| | |
Macquarie Bank Ltd. (Australia) | | | | | | | | |
| | |
2.85%, 1/15/2021 (b) | | | 16,688,000 | | | | 16,840,279 | |
| | |
(ICE LIBOR USD 3 Month + 0.45%), 0.70%, 8/6/2021 (a) (b) | | | 40,914,000 | | | | 41,019,686 | |
| | |
(ICE LIBOR USD 3 Month + 0.45%), 0.71%, 11/24/2021 (a) (b) | | | 47,038,000 | | | | 47,243,581 | |
| | |
2.10%, 10/17/2022 (b) | | | 4,920,000 | | | | 5,091,484 | |
| | |
2.30%, 1/22/2025 (b) (c) | | | 8,275,000 | | | | 8,813,424 | |
| | |
Macquarie Group Ltd. (Australia) | | | | | | | | |
| | |
6.25%, 1/14/2021 (b) | | | 6,778,000 | | | | 6,924,552 | |
| | |
Moody’s Corp. | | | | | | | | |
| | |
4.50%, 9/1/2022 | | | 2,048,000 | | | | 2,195,989 | |
| | |
3.75%, 3/24/2025 | | | 6,340,000 | | | | 7,163,626 | |
| | |
Morgan Stanley | | | | | | | | |
| | |
5.75%, 1/25/2021 | | | 11,152,000 | | | | 11,391,696 | |
| | |
(ICE LIBOR USD 3 Month + 1.40%), 1.67%, 4/21/2021 (a) | | | 11,354,000 | | | | 11,452,464 | |
| | |
2.50%, 4/21/2021 | | | 500,000 | | | | 507,033 | |
| | |
5.50%, 7/28/2021 | | | 7,295,000 | | | | 7,629,528 | |
| | |
2.63%, 11/17/2021 | | | 24,860,000 | | | | 25,530,024 | |
| | |
(ICE LIBOR USD 3 Month + 1.18%), 1.45%, 1/20/2022 (a) | | | 5,320,000 | | | | 5,341,403 | |
| | |
2.75%, 5/19/2022 | | | 26,535,000 | | | | 27,556,364 | |
| | |
3.13%, 1/23/2023 | | | 18,075,000 | | | | 19,164,044 | |
| | |
Series F, 3.88%, 4/29/2024 | | | 1,805,000 | | | | 2,007,317 | |
| | |
3.70%, 10/23/2024 | | | 6,500,000 | | | | 7,256,306 | |
| | |
Nomura Holdings, Inc. (Japan) | | | | | | | | |
| | |
2.65%, 1/16/2025 | | | 1,000,000 | | | | 1,054,089 | |
| | |
1.85%, 7/16/2025 | | | 22,000,000 | | | | 22,415,003 | |
| | | | | | | | |
| INVESTMENTS | | PRINCIPAL
AMOUNT ($) | | | VALUE ($) | |
| | | | | | | | |
|
Capital Markets — continued | |
| | |
State Street Corp. | | | | | | | | |
| | |
1.95%, 5/19/2021 | | | 315,000 | | | | 318,867 | |
| | |
(SOFR + 2.69%), 2.82%, 3/30/2023 (a) (b) | | | 15,059,000 | | | | 15,604,926 | |
| | |
(ICE LIBOR USD 3 Month + 0.77%), 3.78%, 12/3/2024 (a) | | | 12,695,000 | | | | 13,989,686 | |
| | |
UBS AG (Switzerland) 1.75%, 4/21/2022 (b) | | | 77,443,000 | | | | 79,021,216 | |
| | |
UBS Group AG (Switzerland) | | | | | | | | |
| | |
(ICE LIBOR USD 3 Month + 1.78%), 2.05%, 4/14/2021 (a) (b) | | | 1,400,000 | | | | 1,414,732 | |
| | |
3.00%, 4/15/2021 (b) (c) | | | 54,932,000 | | | | 55,849,792 | |
| | |
(ICE LIBOR USD 3 Month + 1.53%), 1.78%, 2/1/2022 (a) (b) | | | 15,805,000 | | | | 16,096,247 | |
| | |
3.49%, 5/23/2023 (b) | | | 290,000 | | | | 304,150 | |
| | |
(US Treasury Yield Curve Rate T Note Constant Maturity 1 Year + 0.83%), 1.01%, 7/30/2024 (a) (b) | | | 40,000,000 | | | | 40,219,206 | |
| | | | | | | | |
| | |
| | | | | | | 803,282,646 | |
| | | | | | | | |
| | |
Chemicals — 0.4% | | | | | | | | |
| | |
Air Liquide Finance SA (France) | | | | | | | | |
| | |
1.75%, 9/27/2021 (b) | | | 20,860,000 | | | | 21,155,605 | |
| | |
Chevron Phillips Chemical Co. LLC | | | | | | | | |
| | |
3.30%, 5/1/2023 (b) | | | 4,703,000 | | | | 4,990,139 | |
| | |
DuPont de Nemours, Inc. (ICE LIBOR USD 3 Month + 0.71%), 0.99%, 11/15/2020 (a) (c) | | | 7,099,000 | | | | 7,107,755 | |
| | |
Ecolab, Inc. 4.35%, 12/8/2021 | | | 4,200,000 | | | | 4,411,752 | |
| | |
Nutrien Ltd. (Canada) 1.90%, 5/13/2023 (c) | | | 22,880,000 | | | | 23,693,416 | |
| | |
PPG Industries, Inc. 2.40%, 8/15/2024 | | | 270,000 | | | | 287,352 | |
| | | | | | | | |
| | |
| | | | | | | 61,646,019 | |
| | | | | | | | |
| | |
Consumer Finance — 4.0% | | | | | | | | |
| | |
American Express Co. | | | | | | | | |
| | |
(ICE LIBOR USD 3 Month + 0.33%), 0.60%, 10/30/2020 (a) | | | 1,051,000 | | | | 1,051,221 | |
| | |
2.20%, 10/30/2020 | | | 47,469,000 | | | | 47,536,650 | |
| | |
3.00%, 2/22/2021 | | | 15,608,000 | | | | 15,770,533 | |
| | |
(ICE LIBOR USD 3 Month + 0.53%), 0.81%, 5/17/2021 (a) | | | 7,803,000 | | | | 7,827,441 | |
| | |
3.38%, 5/17/2021 | | | 1,500,000 | | | | 1,528,913 | |
| | |
(ICE LIBOR USD 3 Month + 0.60%), 0.85%, 11/5/2021 (a) | | | 12,004,000 | | | | 12,071,235 | |
SEE NOTES TO FINANCIAL STATEMENTS.
| | | | | | |
| | | |
| 154 | | | | J.P. MORGAN EXCHANGE-TRADED FUNDS | | AUGUST 31, 2020 |
| | | | | | | | |
| INVESTMENTS | | PRINCIPAL
AMOUNT ($) | | | VALUE ($) | |
Corporate Bonds — continued | | | | | | | | |
|
Consumer Finance — continued | |
| | |
2.75%, 5/20/2022 | | | 117,000 | | | | 121,442 | |
| | |
2.50%, 8/1/2022 | | | 8,699,000 | | | | 9,029,655 | |
| | |
2.65%, 12/2/2022 | | | 885,000 | | | | 928,932 | |
| | |
3.40%, 2/27/2023 (c) | | | 4,933,000 | | | | 5,279,219 | |
| | |
3.70%, 8/3/2023 | | | 3,130,000 | | | | 3,409,229 | |
| | |
3.40%, 2/22/2024 | | | 230,000 | | | | 251,501 | |
| | |
3.00%, 10/30/2024 | | | 2,500,000 | | | | 2,725,372 | |
| | |
American Express Credit Corp. (ICE LIBOR USD 3 Month + 0.70%), 1.04%, 3/3/2022 (a) | | | 235,000 | | | | 236,712 | |
| | |
American Honda Finance Corp. 0.88%, 7/7/2023 | | | 37,111,000 | | | | 37,450,118 | |
| | |
Avolon Holdings Funding Ltd. (Ireland) | | | | | | | | |
| | |
3.63%, 5/1/2022 (b) | | | 26,415,000 | | | | 25,565,653 | |
| | |
Capital One Financial Corp. | | | | | | | | |
| | |
3.45%, 4/30/2021 | | | 41,973,000 | | | | 42,718,572 | |
| | |
(ICE LIBOR USD 3 Month + 0.95%), 1.26%, 3/9/2022 (a) | | | 8,214,000 | | | | 8,280,007 | |
| | |
2.60%, 5/11/2023 | | | 25,000,000 | | | | 26,214,098 | |
| | |
Caterpillar Financial Services Corp. | | | | | | | | |
| | |
(ICE LIBOR USD 3 Month + 0.30%), 0.62%, 3/8/2021 (a) | | | 40,629,000 | | | | 40,681,536 | |
| | |
(ICE LIBOR USD 3 Month + 0.23%), 0.54%, 3/15/2021 (a) | | | 60,425,000 | | | | 60,486,218 | |
| | |
Series I, (ICE LIBOR USD 3 Month + 0.39%), 0.67%, 5/17/2021 (a) | | | 402,000 | | | | 403,059 | |
| | |
(ICE LIBOR USD 3 Month + 0.28%), 0.60%, 9/7/2021 (a) | | | 5,838,000 | | | | 5,850,227 | |
| | |
(ICE LIBOR USD 3 Month + 0.22%), 0.50%, 1/6/2022 (a) | | | 1,730,000 | | | | 1,732,597 | |
| | |
0.95%, 5/13/2022 (c) | | | 25,206,000 | | | | 25,469,170 | |
| | |
1.95%, 11/18/2022 | | | 7,500,000 | | | | 7,755,186 | |
| | |
2.55%, 11/29/2022 | | | 9,656,000 | | | | 10,126,630 | |
| | |
John Deere Capital Corp. | | | | | | | | |
| | |
(ICE LIBOR USD 3 Month + 0.17%), 0.44%, 10/9/2020 (a) | | | 455,000 | | | | 455,101 | |
| | |
(ICE LIBOR USD 3 Month + 0.16%), 0.44%, 1/8/2021 (a) | | | 100,000 | | | | 100,047 | |
| | |
2.80%, 3/4/2021 | | | 6,778,000 | | | | 6,862,749 | |
| | |
(ICE LIBOR USD 3 Month + 0.26%), 0.57%, 9/10/2021 (a) | | | 300,000 | | | | 300,436 | |
| | |
3.15%, 10/15/2021 | | | 7,600,000 | | | | 7,851,420 | |
| | |
3.20%, 1/10/2022 | | | 189,000 | | | | 196,576 | |
| | |
(ICE LIBOR USD 3 Month + 0.38%), 0.70%, 3/7/2022 (a) | | | 145,000 | | | | 145,517 | |
| | |
2.75%, 3/15/2022 | | | 1,000,000 | | | | 1,036,967 | |
| | |
2.80%, 1/27/2023 | | | 573,000 | | | | 605,404 | |
| | | | | | | | |
| INVESTMENTS | | PRINCIPAL
AMOUNT ($) | | | VALUE ($) | |
| | | | | | | | |
|
Consumer Finance — continued | |
| | |
PACCAR Financial Corp. | | | | | | | | |
| | |
(ICE LIBOR USD 3 Month + 0.20%), 0.45%, 11/13/2020 (a) | | | 11,340,000 | | | | 11,343,862 | |
| | |
(ICE LIBOR USD 3 Month + 0.26%), 0.50%, 5/10/2021 (a) | | | 1,099,000 | | | | 1,100,237 | |
| | |
0.80%, 6/8/2023 | | | 7,324,000 | | | | 7,417,338 | |
| | |
0.35%, 8/11/2023 | | | 26,872,000 | | | | 26,872,449 | |
| | |
Toyota Motor Credit Corp. | | | | | | | | |
| | |
(SOFR + 0.40%), 0.47%, 10/23/2020 (a) | | | 27,217,000 | | | | 27,225,643 | |
| | |
(ICE LIBOR USD 3 Month + 0.13%), 0.38%, 8/13/2021 (a) | | | 14,319,000 | | | | 14,331,950 | |
| | |
(ICE LIBOR USD 3 Month + 0.15%), 0.41%, 2/14/2022 (a) | | | 30,437,000 | | | | 30,451,082 | |
| | |
0.45%, 7/22/2022 (c) | | | 13,171,000 | | | | 13,185,645 | |
| | | | | | | | |
| | |
| | | | | | | 549,983,549 | |
| | | | | | | | |
| | |
Diversified Financial Services — 1.0% | | | | | | | | |
| | |
AIG Global Funding | | | | | | | | |
| | |
(ICE LIBOR USD 3 Month + 0.65%), 0.91%, 1/22/2021 (a) (b) | | | 25,952,000 | | | | 25,990,154 | |
| | |
1.90%, 10/6/2021 (b) | | | 11,007,000 | | | | 11,195,395 | |
| | |
2.70%, 12/15/2021 (b) | | | 412,000 | | | | 424,591 | |
| | |
2.30%, 7/1/2022 (b) | | | 2,125,000 | | | | 2,190,327 | |
| | |
0.80%, 7/7/2023 (b) | | | 8,310,000 | | | | 8,372,870 | |
| | |
Berkshire Hathaway, Inc. 2.20%, 3/15/2021 | | | 1,898,000 | | | | 1,915,168 | |
| | |
CK Hutchison International 16 Ltd. (United Kingdom) | | | | | | | | |
| | |
1.88%, 10/3/2021 (b) | | | 38,819,000 | | | | 39,182,928 | |
| | |
CK Hutchison International 17 II Ltd. (United Kingdom) | | | | | | | | |
| | |
2.25%, 9/29/2020 (b) | | | 12,996,000 | | | | 13,030,521 | |
| | |
CK Hutchison International 17 Ltd. (United Kingdom) | | | | | | | | |
| | |
2.88%, 4/5/2022 (b) | | | 3,245,000 | | | | 3,330,613 | |
| | |
National Rural Utilities Cooperative Finance Corp. | | | | | | | | |
| | |
2.30%, 9/15/2022 | | | 2,070,000 | | | | 2,145,401 | |
| | |
2.95%, 2/7/2024 | | | 887,000 | | | | 952,877 | |
| | |
ORIX Corp. (Japan) 2.90%, 7/18/2022 | | | 147,000 | | | | 152,816 | |
| | |
Siemens Financieringsmaatschappij NV (Germany) | | | | | | | | |
| | |
1.70%, 9/15/2021 (b) | | | 1,805,000 | | | | 1,831,687 | |
| | |
(ICE LIBOR USD 3 Month + 0.61%), 0.93%, 3/16/2022 (a) (b) | | | 1,227,000 | | | | 1,235,907 | |
SEE NOTES TO FINANCIAL STATEMENTS.
| | | | | | | | |
| | | |
| AUGUST 31, 2020 | | J.P. MORGAN EXCHANGE-TRADED FUNDS | | | | | 155 | |
JPMorgan Ultra-Short Income ETF
SCHEDULE OF PORTFOLIO INVESTMENTS
AS OF AUGUST 31, 2020 (Unaudited) (continued)
| | | | | | | | |
| INVESTMENTS | | PRINCIPAL
AMOUNT ($) | | | VALUE ($) | |
Corporate Bonds — continued | | | | | | | | |
|
Diversified Financial Services — continued | |
| | |
2.00%, 9/15/2023 (b) | | | 10,000,000 | | | | 10,446,019 | |
| | |
3.13%, 3/16/2024 (b) | | | 17,407,000 | | | | 18,930,441 | |
| | | | | | | | |
| | |
| | | | | | | 141,327,715 | |
| | | | | | | | |
| |
Diversified Telecommunication Services — 0.3% | | | | | |
| | |
Telstra Corp. Ltd. (Australia) | | | | | | | | |
| | |
4.80%, 10/12/2021 (b) | | | 700,000 | | | | 732,492 | |
| | |
Verizon Communications, Inc. | | | | | | | | |
| | |
3.45%, 3/15/2021 | | | 5,603,000 | | | | 5,697,717 | |
| | |
(ICE LIBOR USD 3 Month + 1.00%), 1.32%, 3/16/2022 (a) | | | 28,319,000 | | | | 28,728,933 | |
| | |
3.38%, 2/15/2025 (c) | | | 1,754,000 | | | | 1,962,813 | |
| | | | | | | | |
| | |
| | | | | | | 37,121,955 | |
| | | | | | | | |
|
Electric Utilities — 3.1% | |
| | |
American Electric Power Co., Inc. 2.15%, 11/13/2020 | | | 49,378,000 | | | | 49,557,508 | |
| | |
Appalachian Power Co. 4.60%, 3/30/2021 | | | 16,917,000 | | | | 17,161,238 | |
| | |
Duke Energy Corp. | | | | | | | | |
| | |
(ICE LIBOR USD 3 Month + 0.50%), 0.76%, 5/14/2021 (a) (b) | | | 17,301,000 | | | | 17,352,170 | |
| | |
3.55%, 9/15/2021 | | | 5,959,000 | | | | 6,106,257 | |
| | |
2.40%, 8/15/2022 | | | 1,279,000 | | | | 1,324,928 | |
| | |
3.75%, 4/15/2024 | | | 10,000,000 | | | | 11,020,497 | |
| | |
Duke Energy Progress LLC | | | | | | | | |
| | |
Series A, (ICE LIBOR USD 3 Month + 0.18%), 0.43%, 2/18/2022 (a) | | | 15,373,000 | | | | 15,376,121 | |
| | |
Electricite de France SA (France) | | | | | | | | |
| | |
2.35%, 10/13/2020 (b) | | | 7,100,000 | | | | 7,111,105 | |
| | |
Entergy Corp. 0.90%, 9/15/2025 | | | 10,000,000 | | | | 9,994,684 | |
| | |
Eversource Energy | | | | | | | | |
| | |
Series N, 3.80%, 12/1/2023 | | | 174,000 | | | | 191,161 | |
| | |
Exelon Corp. | | | | | | | | |
| | |
5.15%, 12/1/2020 | | | 3,434,000 | | | | 3,446,725 | |
| | |
2.45%, 4/15/2021 | | | 7,911,000 | | | | 8,001,378 | |
| | |
Florida Power & Light Co. | | | | | | | | |
| | |
(ICE LIBOR USD 3 Month + 0.38%), 0.64%, 7/28/2023 (a) | | | 76,259,000 | | | | 76,332,274 | |
| | |
NextEra Energy Capital Holdings, Inc. | | | | | | | | |
| | |
(ICE LIBOR USD 3 Month + 0.48%), 0.73%, 5/4/2021 (a) (c) | | | 485,000 | | | | 485,888 | |
| | |
2.40%, 9/1/2021 | | | 25,763,000 | | | | 26,307,676 | |
| | |
(ICE LIBOR USD 3 Month + 0.72%), 0.97%, 2/25/2022 (a) | | | 42,944,000 | | | | 43,289,195 | |
| | |
2.90%, 4/1/2022 | | | 4,780,000 | | | | 4,966,144 | |
| | |
2.75%, 5/1/2025 | | | 13,157,000 | | | | 14,308,339 | |
| | | | | | | | |
| INVESTMENTS | | PRINCIPAL
AMOUNT ($) | | | VALUE ($) | |
| | | | | | | | |
|
Electric Utilities — continued | |
| | |
PECO Energy Co. 1.70%, 9/15/2021 | | | 1,250,000 | | | | 1,264,960 | |
| | |
Pinnacle West Capital Corp. 1.30%, 6/15/2025 | | | 49,286,000 | | | | 50,300,760 | |
| | |
PPL Capital Funding, Inc. 3.95%, 3/15/2024 | | | 1,449,000 | | | | 1,589,253 | |
| | |
Progress Energy, Inc. 4.40%, 1/15/2021 | | | 1,601,000 | | | | 1,609,063 | |
| | |
Public Service Electric and Gas Co. 3.05%, 11/15/2024 | | | 6,000,000 | | | | 6,515,054 | |
| | |
Southern Co. (The) 2.35%, 7/1/2021 | | | 33,111,000 | | | | 33,592,320 | |
| | |
Tampa Electric Co. 5.40%, 5/15/2021 | | | 5,014,000 | | | | 5,179,834 | |
| | |
Wisconsin Electric Power Co. 2.95%, 9/15/2021 | | | 11,716,000 | | | | 11,955,577 | |
| | |
Xcel Energy, Inc. 2.40%, 3/15/2021 | | | 650,000 | | | | 655,882 | |
| | | | | | | | |
| | |
| | | | | | | 424,995,991 | |
| | | | | | | | |
| | |
Electrical Equipment — 0.0% (e) | | | | | | | | |
| | |
ABB Finance USA, Inc. (Switzerland) 2.88%, 5/8/2022 | | | 1,400,000 | | | | 1,455,638 | |
| | |
Eaton Corp. 2.75%, 11/2/2022 | | | 4,062,000 | | | | 4,266,524 | |
| | | | | | | | |
| | |
| | | | | | | 5,722,162 | |
| | | | | | | | |
|
Electronic Equipment, Instruments & Components — 0.0% (e) | |
| | |
ABB Treasury Center USA, Inc. (Switzerland) 4.00%, 6/15/2021 (b) | | | 1,000,000 | | | | 1,028,211 | |
| | | | | | | | |
|
Energy Equipment & Services — 0.0% (e) | |
| | |
Schlumberger Investment SA 3.30%, 9/14/2021 (b) | | | 7,324,000 | | | | 7,467,279 | |
| | | | | | | | |
|
Entertainment — 0.6% | |
| | |
TWDC Enterprises 18 Corp. | | | | | | | | |
| | |
2.30%, 2/12/2021 (c) | | | 5,436,000 | | | | 5,484,689 | |
| | |
3.75%, 6/1/2021 | | | 1,475,000 | | | | 1,514,058 | |
| | |
2.75%, 8/16/2021 | | | 484,000 | | | | 495,432 | |
| | |
2.55%, 2/15/2022 | | | 3,453,000 | | | | 3,563,609 | |
| | |
2.35%, 12/1/2022 (c) | | | 5,400,000 | | | | 5,631,812 | |
| | |
Walt Disney Co. (The) | | | | | | | | |
| | |
(ICE LIBOR USD 3 Month + 0.25%), 0.60%, 9/1/2021 (a) | | | 6,678,000 | | | | 6,689,715 | |
| | |
1.65%, 9/1/2022 | | | 19,999,000 | | | | 20,499,168 | |
| | |
3.00%, 9/15/2022 | | | 5,500,000 | | | | 5,788,761 | |
| | |
1.75%, 8/30/2024 (c) | | | 8,582,000 | | | | 8,935,109 | |
| | |
3.35%, 3/24/2025 | | | 18,710,000 | | | | 20,889,789 | |
| | | | | | | | |
| | |
| | | | | | | 79,492,142 | |
| | | | | | | | |
SEE NOTES TO FINANCIAL STATEMENTS.
| | | | | | |
| | | |
| 156 | | | | J.P. MORGAN EXCHANGE-TRADED FUNDS | | AUGUST 31, 2020 |
| | | | | | | | |
| INVESTMENTS | | PRINCIPAL
AMOUNT ($) | | | VALUE ($) | |
Corporate Bonds — continued | | | | | | | | |
|
Equity Real Estate Investment Trusts (REITs) — 0.5% | |
| | |
Scentre Group Trust 1 (Australia) 2.38%, 4/28/2021 (b) | | | 7,774,000 | | | | 7,823,691 | |
| | |
WEA Finance LLC (France) 3.25%, 10/5/2020 (b) | | | 66,249,000 | | | | 66,298,119 | |
| | | | | | | | |
| | |
| | | | | | | 74,121,810 | |
| | | | | | | | |
| | |
Food Products — 0.8% | | | | | | | | |
| | |
Archer-Daniels-Midland Co. 2.75%, 3/27/2025 | | | 8,910,000 | | | | 9,703,126 | |
| | |
Cargill, Inc. | | | | | | | | |
| | |
3.05%, 4/19/2021 (b) | | | 3,285,000 | | | | 3,345,876 | |
| | |
4.31%, 5/14/2021 (b) | | | 2,700,000 | | | | 2,768,092 | |
| | |
3.30%, 3/1/2022 (b) | | | 3,075,000 | | | | 3,182,995 | |
| | |
1.38%, 7/23/2023 (b) (c) | | | 18,124,000 | | | | 18,552,815 | |
| | |
General Mills, Inc. | | | | | | | | |
| | |
(ICE LIBOR USD 3 Month + 0.54%), 0.81%, 4/16/2021 (a) | | | 18,608,000 | | | | 18,656,537 | |
| | |
3.20%, 4/16/2021 | | | 7,098,000 | | | | 7,241,555 | |
| | |
Mondelez International Holdings Netherlands BV | | | | | | | | |
| | |
2.13%, 9/19/2022 (b) | | | 18,605,000 | | | | 19,213,217 | |
| | |
2.25%, 9/19/2024 (b) | | | 3,916,000 | | | | 4,139,228 | |
| | |
Mondelez International, Inc. | | | | | | | | |
| | |
0.63%, 7/1/2022 (c) | | | 7,039,000 | | | | 7,071,073 | |
| | |
1.50%, 5/4/2025 | | | 14,732,000 | | | | 15,250,773 | |
| | |
Nestle Holdings, Inc. 3.10%, 9/24/2021 (b) | | | 451,000 | | | | 463,169 | |
| | |
Unilever Capital Corp. (United Kingdom) | | | | | | | | |
| | |
1.38%, 7/28/2021 | | | 347,000 | | | | 350,456 | |
| | |
3.00%, 3/7/2022 | | | 1,541,000 | | | | 1,605,040 | |
| | | | | | | | |
| | |
| | | | | | | 111,543,952 | |
| | | | | | | | |
| | |
Gas Utilities — 0.0% (e) | | | | | | | | |
| | |
Dominion Energy Gas Holdings LLC 2.80%, 11/15/2020 | | | 1,385,000 | | | | 1,388,975 | |
| | | | | | | | |
|
Health Care Equipment & Supplies — 0.1% | |
| | |
Abbott Laboratories 2.55%, 3/15/2022 | | | 143,000 | | | | 147,900 | |
| | |
Covidien International Finance SA 2.95%, 6/15/2023 (c) | | | 4,800,000 | | | | 5,103,716 | |
| | |
DH Europe Finance II SARL | | | | | | | | |
| | |
2.05%, 11/15/2022 | | | 1,000,000 | | | | 1,034,132 | |
| | |
2.20%, 11/15/2024 | | | 7,713,000 | | | | 8,175,289 | |
| | |
Medtronic, Inc. 3.63%, 3/15/2024 | | | 570,000 | | | | 626,654 | |
| | |
Zimmer Biomet Holdings, Inc. | | | | | | | | |
| | |
(ICE LIBOR USD 3 Month + 0.75%), 1.07%, 3/19/2021 (a) | | | 1,510,000 | | | | 1,510,380 | |
| | | | | | | | |
| | |
| | | | | | | 16,598,071 | |
| | | | | | | | |
| | | | | | | | |
| INVESTMENTS | | PRINCIPAL
AMOUNT ($) | | | VALUE ($) | |
| | | | | | | | |
|
Health Care Providers & Services — 1.0% | |
| | |
Cigna Corp. 3.20%, 9/17/2020 | | | 40,318,000 | | | | 40,367,085 | |
| | |
(ICE LIBOR USD 3 Month + 0.65%), 0.95%, 9/17/2021 (a) | | | 1,510,000 | | | | 1,510,334 | |
| | |
CVS Health Corp. | | | | | | | | |
| | |
(ICE LIBOR USD 3 Month + 0.72%), 1.03%, 3/9/2021 (a) | | | 1,858,000 | | | | 1,864,105 | |
| | |
3.35%, 3/9/2021 | | | 26,406,000 | | | | 26,820,862 | |
| | |
2.13%, 6/1/2021 | | | 8,193,000 | | | | 8,296,024 | |
| | |
4.10%, 3/25/2025 | | | 2,754,000 | | | | 3,140,555 | |
| | |
Express Scripts Holding Co. | | | | | | | | |
| | |
(ICE LIBOR USD 3 Month + 0.75%), 1.01%, 11/30/2020 (a) | | | 3,400,000 | | | | 3,400,725 | |
| | |
2.60%, 11/30/2020 | | | 18,314,000 | | | | 18,415,574 | |
| | |
Laboratory Corp. of America Holdings | | | | | | | | |
| | |
2.30%, 12/1/2024 | | | 23,704,000 | | | | 25,196,792 | |
| | |
McKesson Corp. 3.65%, 11/30/2020 | | | 1,560,000 | | | | 1,572,445 | |
| | |
UnitedHealth Group, Inc. | | | | | | | | |
| | |
3.38%, 11/15/2021 | | | 1,051,000 | | | | 1,081,277 | |
| | |
2.88%, 12/15/2021 | | | 1,265,000 | | | | 1,306,788 | |
| | |
2.88%, 3/15/2022 | | | 6,495,000 | | | | 6,712,771 | |
| | |
3.35%, 7/15/2022 (c) | | | 2,251,000 | | | | 2,376,629 | |
| | | | | | | | |
| | |
| | | | | | | 142,061,966 | |
| | | | | | | | |
|
Hotels, Restaurants & Leisure — 0.1% | |
| | |
Starbucks Corp. 1.30%, 5/7/2022 (c) | | | 10,231,000 | | | | 10,391,703 | |
| | | | | | | | |
| | |
Household Products — 0.3% | | | | | | | | |
| | |
Church & Dwight Co., Inc. 2.45%, 8/1/2022 | | | 5,800,000 | | | | 5,996,883 | |
| | |
Kimberly-Clark Corp. 3.88%, 3/1/2021 | | | 247,000 | | | | 251,419 | |
| | |
Reckitt Benckiser Treasury Services plc (United Kingdom) | | | | | | | | |
| | |
2.38%, 6/24/2022 (b) | | | 30,205,000 | | | | 31,208,708 | |
| | | | | | | | |
| | |
| | | | | | | 37,457,010 | |
| | | | | | | | |
| | |
Industrial Conglomerates — 0.9% | | | | | | | | |
| | |
3M Co. | | | | | | | | |
| | |
1.75%, 2/14/2023 | | | 205,000 | | | | 211,794 | |
| | |
2.25%, 3/15/2023 | | | 5,202,000 | | | | 5,445,194 | |
| | |
2.65%, 4/15/2025 | | | 16,333,000 | | | | 17,781,518 | |
| | |
Honeywell International, Inc. | | | | | | | | |
| | |
2.15%, 8/8/2022 | | | 3,051,000 | | | | 3,153,348 | |
| | |
0.48%, 8/19/2022 | | | 75,000,000 | | | | 75,168,834 | |
| | |
1.35%, 6/1/2025 | | | 10,000,000 | | | | 10,297,673 | |
| | |
Ingersoll-Rand Global Holding Co. Ltd. | | | | | | | | |
| | |
2.90%, 2/21/2021 | | | 2,150,000 | | | | 2,176,757 | |
SEE NOTES TO FINANCIAL STATEMENTS.
| | | | | | | | |
| | | |
| AUGUST 31, 2020 | | J.P. MORGAN EXCHANGE-TRADED FUNDS | | | | | 157 | |
JPMorgan Ultra-Short Income ETF
SCHEDULE OF PORTFOLIO INVESTMENTS
AS OF AUGUST 31, 2020 (Unaudited) (continued)
| | | | | | | | |
| INVESTMENTS | | PRINCIPAL
AMOUNT ($) | | | VALUE ($) | |
Corporate Bonds — continued | |
| |
Industrial Conglomerates — continued | | | | | |
| | |
Roper Technologies, Inc. 0.45%, 8/15/2022 | | | 5,216,000 | | | | 5,218,231 | |
| | | | | | | | |
| | |
| | | | | | | 119,453,349 | |
| | | | | | | | |
| | |
Insurance — 6.9% | | | | | | | | |
| | |
AIA Group Ltd. (Hong Kong) | | | | | | | | |
| | |
(ICE LIBOR USD 3 Month + 0.52%), 0.83%, 9/20/2021 (a) (b) | | | 10,683,000 | | | | 10,618,401 | |
| | |
American International Group, Inc. | | | | | | | | |
| | |
6.40%, 12/15/2020 | | | 5,739,000 | | | | 5,836,443 | |
| | |
3.30%, 3/1/2021 | | | 19,967,000 | | | | 20,210,311 | |
| | |
4.88%, 6/1/2022 (c) | | | 291,000 | | | | 313,065 | |
| | |
2.50%, 6/30/2025 | | | 20,400,000 | | | | 21,813,958 | |
| | |
Athene Global Funding 4.00%, 1/25/2022 (b) | | | 21,796,000 | | | | 22,730,670 | |
| | |
Chubb INA Holdings, Inc. | | | | | | | | |
| | |
2.30%, 11/3/2020 | | | 77,000 | | | | 77,138 | |
| | |
3.35%, 5/15/2024 | | | 8,600,000 | | | | 9,460,166 | |
| | |
3.15%, 3/15/2025 | | | 9,215,000 | | | | 10,266,957 | |
| | |
Guardian Life Global Funding | | | | | | | | |
| | |
2.00%, 4/26/2021 (b) | | | 800,000 | | | | 809,005 | |
| | |
2.50%, 5/8/2022 (b) | | | 5,994,000 | | | | 6,208,247 | |
| | |
3.40%, 4/25/2023 (b) | | | 500,000 | | | | 538,357 | |
| | |
Jackson National Life Global Funding | | | | | | | | |
| | |
(ICE LIBOR USD 3 Month + 0.30%), 0.57%, 10/15/2020 (a) (b) | | | 32,768,000 | | | | 32,777,830 | |
| | |
2.60%, 12/9/2020 (b) | | | 3,319,000 | | | | 3,339,512 | |
| | |
(ICE LIBOR USD 3 Month + 0.31%), 0.63%, 3/16/2021 (a) (b) | | | 40,046,000 | | | | 40,093,901 | |
| | |
2.25%, 4/29/2021 (b) | | | 23,984,000 | | | | 24,293,208 | |
| | |
(ICE LIBOR USD 3 Month + 0.48%), 0.79%, 6/11/2021 (a) (b) | | | 837,000 | | | | 839,512 | |
| | |
3.30%, 2/1/2022 (b) | | | 4,970,000 | | | | 5,165,945 | |
| | |
2.50%, 6/27/2022 (b) | | | 2,091,000 | | | | 2,166,440 | |
| | |
2.38%, 9/15/2022 (b) | | | 900,000 | | | | 928,936 | |
| | |
(SOFR + 0.60%), 0.67%, 1/6/2023 (a) (b) | | | 19,908,000 | | | | 19,893,914 | |
| | |
3.25%, 1/30/2024 (b) | | | 46,148,000 | | | | 49,733,803 | |
| | |
3.88%, 6/11/2025 (b) | | | 6,953,000 | | | | 7,836,476 | |
| | |
Marsh & McLennan Cos., Inc. | | | | | | | | |
| | |
3.50%, 12/29/2020 | | | 135,000 | | | | 136,417 | |
| | |
(ICE LIBOR USD 3 Month + 1.20%), 1.51%, 12/29/2021 (a) | | | 1,000,000 | | | | 1,000,770 | |
| | |
MassMutual Global Funding II | | | | | | | | |
| | |
2.00%, 4/15/2021 (b) | | | 200,000 | | | | 202,212 | |
| | |
0.85%, 6/9/2023 (b) | | | 49,446,000 | | | | 50,030,712 | |
| | |
0.48%, 8/28/2023 (b) | | | 56,050,000 | | | | 56,008,869 | |
| | |
2.75%, 6/22/2024 (b) | | | 3,350,000 | | | | 3,605,444 | |
| | | | | | | | |
| INVESTMENTS | | PRINCIPAL
AMOUNT ($) | | | VALUE ($) | |
| |
|
Insurance — continued | |
| | |
Met Tower Global Funding 0.55%, 7/13/2022 (b) | | | 35,928,000 | | | | 35,972,026 | |
| | |
Metropolitan Life Global Funding I | | | | | | | | |
| | |
(ICE LIBOR USD 3 Month + 0.23%), 0.51%, 1/8/2021 (a) (b) | | | 18,947,000 | | | | 18,959,977 | |
| | |
2.40%, 1/8/2021 (b) | | | 21,905,000 | | | | 22,068,485 | |
| | |
(SOFR + 0.50%), 0.57%, 5/28/2021 (a) (b) | | | 1,460,000 | | | | 1,462,713 | |
| | |
1.95%, 9/15/2021 (b) | | | 7,177,000 | | | | 7,302,850 | |
| | |
3.45%, 10/9/2021 (b) | | | 7,975,000 | | | | 8,250,620 | |
| | |
3.38%, 1/11/2022 (b) | | | 850,000 | | | | 885,028 | |
| | |
3.00%, 1/10/2023 (b) | | | 243,000 | | | | 257,485 | |
| | |
0.90%, 6/8/2023 (b) | | | 16,933,000 | | | | 17,141,999 | |
| | |
0.45%, 9/1/2023 (b) | | | 40,993,000 | | | | 40,878,308 | |
| | |
New York Life Global Funding | | | | | | | | |
| | |
2.95%, 1/28/2021 (b) | | | 430,000 | | | | 434,680 | |
| | |
2.00%, 4/13/2021 (b) | | | 450,000 | | | | 454,717 | |
| | |
(ICE LIBOR USD 3 Month + 0.32%), 0.57%, 8/6/2021 (a) (b) | | | 2,417,000 | | | | 2,424,083 | |
| | |
3.25%, 8/6/2021 (b) | | | 335,000 | | | | 344,331 | |
| | |
(ICE LIBOR USD 3 Month + 0.28%), 0.55%, 1/21/2022 (a) (b) | | | 19,500,000 | | | | 19,549,277 | |
| | |
2.30%, 6/10/2022 (b) | | | 1,650,000 | | | | 1,709,008 | |
| | |
0.40%, 9/20/2022 (b) | | | 52,840,000 | | | | 53,019,526 | |
| | |
1.10%, 5/5/2023 (b) (c) | | | 15,873,000 | | | | 16,176,469 | |
| | |
0.95%, 6/24/2025 (b) | | | 35,855,000 | | | | 36,277,216 | |
| | |
Pricoa Global Funding I | | | | | | | | |
| | |
2.55%, 11/24/2020 (b) | | | 600,000 | | | | 602,600 | |
| | |
2.20%, 6/3/2021 (b) | | | 6,025,000 | | | | 6,109,982 | |
| | |
Principal Life Global Funding II | | | | | | | | |
| | |
2.63%, 11/19/2020 (b) | | | 294,000 | | | | 295,466 | |
| | |
(ICE LIBOR USD 3 Month + 0.33%), 0.67%, 3/2/2021 (a) (b) | | | 9,572,000 | | | | 9,580,931 | |
| | |
(ICE LIBOR USD 3 Month + 0.40%), 0.70%, 10/6/2021 (a) (b) | | | 40,392,000 | | | | 40,391,987 | |
| | |
2.38%, 11/21/2021 (b) | | | 485,000 | | | | 496,595 | |
| | |
1.25%, 5/11/2023 (b) | | | 84,951,000 | | | | 85,064,429 | |
| | |
Protective Life Global Funding | | | | | | | | |
| | |
2.16%, 9/25/2020 (b) | | | 2,458,000 | | | | 2,461,044 | |
| | |
2.70%, 11/25/2020 (b) | | | 7,952,000 | | | | 7,997,998 | |
| | |
(ICE LIBOR USD 3 Month + 0.52%), 0.83%, 6/28/2021 (a) (b) | | | 6,490,000 | | | | 6,513,722 | |
| | |
3.40%, 6/28/2021 (b) | | | 15,246,000 | | | | 15,670,158 | |
| | |
1.08%, 6/9/2023 (b) (c) | | | 20,009,000 | | | | 20,294,762 | |
| | |
1.17%, 7/15/2025 (b) | | | 20,000,000 | | | | 20,147,562 | |
SEE NOTES TO FINANCIAL STATEMENTS.
| | | | | | |
| | | |
| 158 | | | | J.P. MORGAN EXCHANGE-TRADED FUNDS | | AUGUST 31, 2020 |
| | | | | | | | |
| INVESTMENTS | | PRINCIPAL
AMOUNT ($) | | | VALUE ($) | |
Corporate Bonds — continued | |
|
Insurance — continued | |
| | |
Prudential Financial, Inc. 4.50%, 11/15/2020 | | | 725,000 | | | | 731,352 | |
| | |
Reliance Standard Life Global Funding II | | | | | | | | |
| | |
3.05%, 1/20/2021 (b) | | | 9,470,000 | | | | 9,538,423 | |
| | |
2.15%, 1/21/2023 (b) | | | 9,976,000 | | | | 10,235,438 | |
| | |
Suncorp-Metway Ltd. (Australia) | | | | | | | | |
| | |
2.38%, 11/9/2020 (b) | | | 2,866,000 | | | | 2,877,036 | |
| | |
2.80%, 5/4/2022 (b) (c) | | | 145,000 | | | | 150,342 | |
| | |
Swiss Re Treasury U.S. Corp. (Switzerland) | | | | | | | | |
| | |
2.88%, 12/6/2022 (b) | | | 35,796,000 | | | | 36,797,156 | |
| | | | | | | | |
| | |
| | | | | | | 966,462,400 | |
| | | | | | | | |
|
Internet & Direct Marketing Retail — 0.2% | |
| | |
Alibaba Group Holding Ltd. (China) | | | | | | | | |
| | |
3.13%, 11/28/2021 | | | 2,039,000 | | | | 2,091,667 | |
| | |
Amazon.com, Inc. 0.40%, 6/3/2023 | | | 25,518,000 | | | | 25,607,041 | |
| | | | | | | | |
| | |
| | | | | | | 27,698,708 | |
| | | | | | | | |
| | |
IT Services — 0.7% | | | | | | | | |
| | |
IBM Credit LLC | | | | | | | | |
| | |
(ICE LIBOR USD 3 Month + 0.47%), 0.73%, 11/30/2020 (a) | | | 515,000 | | | | 515,623 | |
| | |
(ICE LIBOR USD 3 Month + 0.26%), 0.53%, 1/20/2021 (a) (c) | | | 2,440,000 | | | | 2,442,654 | |
| | |
1.80%, 1/20/2021 | | | 103,000 | | | | 103,634 | |
| | |
(ICE LIBOR USD 3 Month + 0.16%), 0.41%, 2/5/2021 (a) (c) | | | 650,000 | | | | 650,433 | |
| | |
3.60%, 11/30/2021 (c) | | | 300,000 | | | | 312,571 | |
| | |
2.20%, 9/8/2022 | | | 9,193,000 | | | | 9,560,979 | |
| | |
International Business Machines Corp. | | | | | | | | |
| | |
(ICE LIBOR USD 3 Month + 0.40%), 0.65%, 5/13/2021 (a) | | | 37,803,000 | | | | 37,906,962 | |
| | |
2.85%, 5/13/2022 | | | 37,561,000 | | | | 39,166,287 | |
| | |
1.88%, 8/1/2022 | | | 1,775,000 | | | | 1,829,822 | |
| | |
2.88%, 11/9/2022 | | | 2,215,000 | | | | 2,338,645 | |
| | |
3.63%, 2/12/2024 | | | 1,140,000 | | | | 1,257,473 | |
| | |
3.00%, 5/15/2024 | | | 2,320,000 | | | | 2,521,991 | |
| | | | | | | | |
| | |
| | | | | | | 98,607,074 | |
| | | | | | | | |
|
Life Sciences Tools & Services — 0.2% | |
| | |
Thermo Fisher Scientific, Inc. 4.13%, 3/25/2025 (c) | | | 30,709,000 | | | | 35,236,659 | |
| | | | | | | | |
| | |
Machinery — 0.2% | | | | | | | | |
| | |
Caterpillar, Inc. 3.90%, 5/27/2021 | | | 2,746,000 | | | | 2,819,301 | |
| | | | | | | | |
| INVESTMENTS | | PRINCIPAL
AMOUNT ($) | | | VALUE ($) | |
| | | | | | | | |
| | |
Machinery — continued | | | | | | | | |
| | |
Otis Worldwide Corp. | | | | | | | | |
| | |
(ICE LIBOR USD 3 Month + 0.45%), 0.75%, 4/5/2023 (a) (b) | | | 15,000,000 | | | | 14,990,323 | |
| | |
Stanley Black & Decker, Inc. 2.90%, 11/1/2022 | | | 3,975,000 | | | | 4,189,612 | |
| | | | | | | | |
| | |
| | | | | | | 21,999,236 | |
| | | | | | | | |
| | |
Media — 0.7% | | | | | | | | |
| | |
Comcast Corp. | | | | | | | | |
| | |
(ICE LIBOR USD 3 Month + 0.33%), 0.63%, 10/1/2020 (a) | | | 13,984,000 | | | | 13,988,626 | |
| | |
2.75%, 3/1/2023 | | | 6,327,000 | | | | 6,691,522 | |
| | |
3.00%, 2/1/2024 | | | 601,000 | | | | 649,575 | |
| | |
3.60%, 3/1/2024 (c) | | | 5,000,000 | | | | 5,543,486 | |
| | |
3.38%, 2/15/2025 | | | 3,000,000 | | | | 3,343,873 | |
| | |
3.10%, 4/1/2025 (c) | | | 1,130,000 | | | | 1,252,748 | |
| | |
Omnicom Group, Inc. | | | | | | | | |
| | |
3.63%, 5/1/2022 | | | 9,683,000 | | | | 10,171,094 | |
| | |
ViacomCBS, Inc. 3.88%, 4/1/2024 | | | 50,000,000 | | | | 54,573,604 | |
| | | | | | | | |
| | |
| | | | | | | 96,214,528 | |
| | | | | | | | |
| | |
Metals & Mining — 0.2% | | | | | | | | |
| | |
Newmont Corp. 3.63%, 6/9/2021 | | | 16,929,000 | | | | 17,240,745 | |
| | |
Nucor Corp. 2.00%, 6/1/2025 | | | 10,000,000 | | | | 10,489,537 | |
| | | | | | | | |
| | |
| | | | | | | 27,730,282 | |
| | | | | | | | |
| | |
Multi-Utilities — 0.6% | | | | | | | | |
| | |
Berkshire Hathaway Energy Co. | | | | | | | | |
| | |
2.38%, 1/15/2021 | | | 312,000 | | | | 314,330 | |
| | |
3.75%, 11/15/2023 | | | 2,000,000 | | | | 2,197,051 | |
| | |
3.50%, 2/1/2025 | | | 1,555,000 | | | | 1,730,008 | |
| | |
CenterPoint Energy, Inc. 3.60%, 11/1/2021 | | | 9,921,000 | | | | 10,275,000 | |
| | |
Consolidated Edison Co. of New York, Inc. Series C, (ICE LIBOR USD 3 Month + 0.40%), 0.70%, 6/25/2021 (a) | | | 2,631,000 | | | | 2,638,400 | |
| | |
Dominion Energy, Inc. 2.72%, 8/15/2021 (d) | | | 20,166,000 | | | | 20,581,824 | |
| | |
Integrys Holding, Inc. 4.17%, 11/1/2020 | | | 6,785,000 | | | | 6,824,226 | |
| | |
NiSource, Inc. 0.95%, 8/15/2025 | | | 24,700,000 | | | | 24,761,874 | |
| | |
Public Service Enterprise Group, Inc. | | | | | | | | |
| | |
2.88%, 6/15/2024 (c) | | | 250,000 | | | | 269,948 | |
| | |
Sempra Energy | | | | | | | | |
| | |
2.85%, 11/15/2020 | | | 545,000 | | | | 546,509 | |
| | |
(ICE LIBOR USD 3 Month + 0.50%), 0.78%, 1/15/2021 (a) | | | 2,867,000 | | | | 2,868,080 | |
SEE NOTES TO FINANCIAL STATEMENTS.
| | | | | | | | |
| | | |
| AUGUST 31, 2020 | | J.P. MORGAN EXCHANGE-TRADED FUNDS | | | | | 159 | |
JPMorgan Ultra-Short Income ETF
SCHEDULE OF PORTFOLIO INVESTMENTS
AS OF AUGUST 31, 2020 (Unaudited) (continued)
| | | | | | | | |
| INVESTMENTS | | PRINCIPAL
AMOUNT ($) | | | VALUE ($) | |
Corporate Bonds — continued | |
|
Multi-Utilities — continued | |
| | |
(ICE LIBOR USD 3 Month + 0.45%), 0.76%, 3/15/2021 (a) | | | 4,488,000 | | | | 4,494,741 | |
| | | | | | | | |
| | |
| | | | | | | 77,501,991 | |
| | | | | | | | |
| | |
Oil, Gas & Consumable Fuels — 2.5% | | | | | | | | |
| | |
BG Energy Capital plc (United Kingdom) 4.00%, 12/9/2020 (b) | | | 6,673,000 | | | | 6,742,922 | |
| | |
BP Capital Markets America, Inc. | | | | | | | | |
| | |
4.50%, 10/1/2020 | | | 4,183,000 | | | | 4,196,984 | |
| | |
4.74%, 3/11/2021 | | | 7,072,000 | | | | 7,239,310 | |
| | |
Chevron Corp. 1.55%, 5/11/2025 | | | 19,663,000 | | | | 20,456,403 | |
| | |
Chevron USA, Inc. | | | | | | | | |
| | |
0.33%, 8/12/2022 (c) | | | 16,407,000 | | | | 16,432,264 | |
| | |
0.43%, 8/11/2023 | | | 20,348,000 | | | | 20,402,787 | |
| | |
0.69%, 8/12/2025 (c) | | | 19,075,000 | | | | 19,084,885 | |
| | |
Enbridge Energy Partners LP 4.20%, 9/15/2021 | | | 2,363,000 | | | | 2,432,713 | |
| | |
Enterprise Products Operating LLC | | | | | | | | |
| | |
5.20%, 9/1/2020 | | | 23,600,000 | | | | 23,600,000 | |
| | |
2.80%, 2/15/2021 | | | 2,554,000 | | | | 2,582,192 | |
| | |
EOG Resources, Inc. 4.10%, 2/1/2021 | | | 1,630,000 | | | | 1,654,310 | |
| | |
Equinor ASA (Norway) | | | | | | | | |
| | |
2.90%, 11/8/2020 | | | 3,070,000 | | | | 3,085,262 | |
| | |
2.45%, 1/17/2023 | | | 1,130,000 | | | | 1,183,685 | |
| | |
2.88%, 4/6/2025 | | | 3,649,000 | | | | 4,000,997 | |
| | |
Exxon Mobil Corp. | | | | | | | | |
| | |
1.90%, 8/16/2022 (c) | | | 10,747,000 | | | | 11,099,705 | |
| | |
1.57%, 4/15/2023 (c) | | | 48,100,000 | | | | 49,596,009 | |
| | |
Marathon Petroleum Corp. | | | | | | | | |
| | |
3.40%, 12/15/2020 | | | 16,241,000 | | | | 16,336,484 | |
| | |
5.13%, 3/1/2021 | | | 2,704,000 | | | | 2,766,552 | |
| | |
MPLX LP (ICE LIBOR USD 3 Month + 0.90%), 1.21%, 9/9/2021 (a) (c) | | | 12,857,000 | | | | 12,856,559 | |
| | |
Phillips 66 | | | | | | | | |
| | |
(ICE LIBOR USD 3 Month + 0.60%), 0.83%, 2/26/2021 (a) | | | 1,115,000 | | | | 1,114,287 | |
| | |
3.85%, 4/9/2025 | | | 25,000,000 | | | | 27,949,828 | |
| | |
Spectra Energy Partners LP 4.60%, 6/15/2021 | | | 2,700,000 | | | | 2,758,013 | |
| | |
Suncor Energy, Inc. (Canada) 3.60%, 12/1/2024 | | | 17,000,000 | | | | 18,739,281 | |
| | |
Total Capital International SA (France) | | | | | | | | |
| | |
2.22%, 7/12/2021 | | | 16,284,000 | | | | 16,521,983 | |
| | | | | | | | |
| INVESTMENTS | | PRINCIPAL
AMOUNT ($) | | | VALUE ($) | |
| | | | | | | | |
|
Oil, Gas & Consumable Fuels — continued | |
| | |
TransCanada PipeLines Ltd. (Canada) | | | | | | | | |
| | |
3.80%, 10/1/2020 | | | 28,655,000 | | | | 28,733,185 | |
| | |
9.88%, 1/1/2021 | | | 911,000 | | | | 938,793 | |
| | |
3.75%, 10/16/2023 | | | 25,013,000 | | | | 27,290,369 | |
| | | | | | | | |
| | |
| | | | | | | 349,795,762 | |
| | | | | | | | |
| | |
Personal Products — 0.0% (e) | | | | | | | | |
| | |
Estee Lauder Cos., Inc. (The) 1.70%, 5/10/2021 | | | 300,000 | | | | 302,599 | |
| | | | | | | | |
| | |
Pharmaceuticals — 1.1% | | | | | | | | |
| | |
Bristol-Myers Squibb Co. | | | | | | | | |
| | |
3.95%, 10/15/2020 | | | 460,000 | | | | 461,863 | |
| | |
(ICE LIBOR USD 3 Month + 0.20%), 0.48%, 11/16/2020 (a) | | | 13,848,000 | | | | 13,851,746 | |
| | |
2.88%, 2/19/2021 | | | 3,029,000 | | | | 3,066,269 | |
| | |
2.55%, 5/14/2021 | | | 3,968,000 | | | | 4,030,989 | |
| | |
2.25%, 8/15/2021 | | | 1,530,000 | | | | 1,559,910 | |
| | |
2.60%, 5/16/2022 | | | 6,770,000 | | | | 7,036,884 | |
| | |
3.55%, 8/15/2022 | | | 503,000 | | | | 534,269 | |
| | |
2.90%, 7/26/2024 | | | 3,960,000 | | | | 4,314,881 | |
| | |
GlaxoSmithKline Capital plc (United Kingdom) | | | | | | | | |
| | |
(ICE LIBOR USD 3 Month + 0.35%), 0.61%, 5/14/2021 (a) | | | 3,393,000 | | | | 3,400,045 | |
| | |
3.13%, 5/14/2021 | | | 11,586,000 | | | | 11,824,627 | |
| | |
2.85%, 5/8/2022 | | | 15,098,000 | | | | 15,734,948 | |
| | |
2.88%, 6/1/2022 | | | 4,285,000 | | | | 4,468,395 | |
| | |
3.00%, 6/1/2024 | | | 3,275,000 | | | | 3,557,051 | |
| | |
GlaxoSmithKline Capital, Inc. (United Kingdom) 3.38%, 5/15/2023 (c) | | | 3,185,000 | | | | 3,441,123 | |
| | |
Novartis Capital Corp. (Switzerland) | | | | | | | | |
| | |
1.75%, 2/14/2025 | | | 16,514,000 | | | | 17,301,466 | |
| | |
Pfizer, Inc. | | | | | | | | |
| | |
1.95%, 6/3/2021 | | | 374,000 | | | | 379,043 | |
| | |
3.00%, 9/15/2021 | | | 221,000 | | | | 227,206 | |
| | |
2.80%, 3/11/2022 | | | 247,000 | | | | 256,419 | |
| | |
2.95%, 3/15/2024 | | | 1,450,000 | | | | 1,573,311 | |
| | |
3.40%, 5/15/2024 | | | 2,257,000 | | | | 2,492,249 | |
| | |
Sanofi (France) 4.00%, 3/29/2021 | | | 1,014,000 | | | | 1,035,541 | |
| | |
Shire Acquisitions Investments Ireland DAC 2.40%, 9/23/2021 | | | 11,998,000 | | | | 12,239,241 | |
| | |
Upjohn, Inc. 1.13%, 6/22/2022 (b) | | | 17,844,000 | | | | 18,004,461 | |
| | |
Zoetis, Inc. | | | | | | | | |
| | |
3.45%, 11/13/2020 | | | 5,772,000 | | | | 5,791,949 | |
SEE NOTES TO FINANCIAL STATEMENTS.
| | | | | | |
| | | |
| 160 | | | | J.P. MORGAN EXCHANGE-TRADED FUNDS | | AUGUST 31, 2020 |
| | | | | | | | |
| INVESTMENTS | | PRINCIPAL
AMOUNT ($) | | | VALUE ($) | |
Corporate Bonds — continued | |
|
Pharmaceuticals — continued | |
| | |
(ICE LIBOR USD 3 Month + 0.44%), 0.69%, 8/20/2021 (a) | | | 22,902,000 | | | | 22,949,115 | |
| | | | | | | | |
| | |
| | | | | | | 159,533,001 | |
| | | | | | | | |
| | |
Road & Rail — 0.2% | | | | | | | | |
| | |
ERAC USA Finance LLC | | | | | | | | |
| | |
5.25%, 10/1/2020 (b) | | | 1,125,000 | | | | 1,128,849 | |
| | |
4.50%, 8/16/2021 (b) | | | 250,000 | | | | 258,861 | |
| | |
2.60%, 12/1/2021 (b) (c) | | | 2,225,000 | | | | 2,266,365 | |
| | |
Penske Truck Leasing Co. LP | | | | | | | | |
| | |
3.30%, 4/1/2021 (b) (c) | | | 2,160,000 | | | | 2,189,974 | |
| | |
3.65%, 7/29/2021 (b) | | | 15,088,000 | | | | 15,481,686 | |
| | |
Ryder System, Inc. 2.88%, 6/1/2022 | | | 6,291,000 | | | | 6,531,496 | |
| | | | | | | | |
| | |
| | | | | | | 27,857,231 | |
| | | | | | | | |
|
Semiconductors & Semiconductor Equipment — 0.2% | |
| | |
Analog Devices, Inc. | | | | | | | | |
| | |
2.95%, 1/12/2021 | | | 21,700,000 | | | | 21,908,904 | |
| | |
2.50%, 12/5/2021 | | | 3,000,000 | | | | 3,072,253 | |
| | |
Intel Corp. | | | | | | | | |
| | |
1.70%, 5/19/2021 | | | 1,426,000 | | | | 1,439,815 | |
| | |
3.30%, 10/1/2021 | | | 1,011,000 | | | | 1,044,260 | |
| | | | | | | | |
| | |
| | | | | | | 27,465,232 | |
| | | | | | | | |
| | |
Software — 0.6% | | | | | | | | |
| | |
Oracle Corp. | | | | | | | | |
| | |
1.90%, 9/15/2021 | | | 2,136,000 | | | | 2,169,557 | |
| | |
2.50%, 5/15/2022 | | | 6,980,000 | | | | 7,215,710 | |
| | |
2.50%, 10/15/2022 | | | 12,679,000 | | | | 13,249,416 | |
| | |
2.40%, 9/15/2023 | | | 1,799,000 | | | | 1,901,334 | |
| | |
2.95%, 11/15/2024 | | | 2,249,000 | | | | 2,455,063 | |
| | |
2.50%, 4/1/2025 | | | 50,000,000 | | | | 53,899,079 | |
| | | | | | | | |
| | |
| | | | | | | 80,890,159 | |
| | | | | | | | |
|
Technology Hardware, Storage & Peripherals — 0.5% | |
| | |
Apple, Inc. | | | | | | | | |
| | |
2.00%, 11/13/2020 (c) | | | 245,000 | | | | 245,894 | |
| | |
2.85%, 5/6/2021 | | | 6,679,000 | | | | 6,802,358 | |
| | |
1.55%, 8/4/2021 | | | 400,000 | | | | 404,540 | |
| | |
1.70%, 9/11/2022 | | | 21,091,000 | | | | 21,718,159 | |
| | |
0.75%, 5/11/2023 (c) | | | 17,165,000 | | | | 17,363,895 | |
| | |
3.45%, 5/6/2024 | | | 1,739,000 | | | | 1,925,081 | |
| | |
2.85%, 5/11/2024 | | | 1,205,000 | | | | 1,304,333 | |
| | |
1.80%, 9/11/2024 (c) | | | 9,030,000 | | | | 9,493,396 | |
| | |
2.75%, 1/13/2025 | | | 3,000,000 | | | | 3,274,194 | |
| | |
2.50%, 2/9/2025 | | | 2,530,000 | | | | 2,742,614 | |
| | | | | | | | |
| | |
| | | | | | | 65,274,464 | |
| | | | | | | | |
| | | | | | | | |
| INVESTMENTS | | PRINCIPAL
AMOUNT ($) | | | VALUE ($) | |
| | | | | | | | |
|
Thrifts & Mortgage Finance — 1.8% | |
| | |
BPCE SA (France) | | | | | | | | |
| | |
2.65%, 2/3/2021 | | | 10,768,000 | | | | 10,880,988 | |
| | |
2.75%, 12/2/2021 | | | 10,782,000 | | | | 11,099,225 | |
| | |
(ICE LIBOR USD 3 Month + 0.30%), 0.57%, 1/14/2022 (a) (b) | | | 75,926,000 | | | | 76,010,356 | |
| | |
(SOFR + 0.44%), 0.51%, 2/17/2022 (a) (b) | | | 53,697,000 | | | | 53,570,515 | |
| | |
3.00%, 5/22/2022 (b) | | | 11,561,000 | | | | 12,010,804 | |
| | |
2.75%, 1/11/2023 (b) | | | 5,000,000 | | | | 5,252,663 | |
| | |
Nationwide Building Society (United Kingdom) | | | | | | | | |
| | |
2.45%, 7/27/2021 (b) | | | 6,750,000 | | | | 6,872,114 | |
| | |
2.00%, 1/27/2023 (b) | | | 55,589,000 | | | | 57,490,595 | |
| | |
1.00%, 8/28/2025 (b) | | | 19,718,000 | | | | 19,718,986 | |
| | | | | | | | |
| | |
| | | | | | | 252,906,246 | |
| | | | | | | | |
| | |
Tobacco — 0.8% | | | | | | | | |
| | |
Altria Group, Inc. | | | | | | | | |
| | |
4.75%, 5/5/2021 | | | 53,175,000 | | | | 54,781,731 | |
| | |
3.49%, 2/14/2022 | | | 8,640,000 | | | | 9,012,338 | |
| | |
Philip Morris International, Inc. | | | | | | | | |
| | |
1.88%, 2/25/2021 | | | 2,069,000 | | | | 2,083,178 | |
| | |
4.13%, 5/17/2021 | | | 1,060,000 | | | | 1,087,386 | |
| | |
2.38%, 8/17/2022 | | | 11,000,000 | | | | 11,403,341 | |
| | |
2.50%, 8/22/2022 | | | 160,000 | | | | 166,936 | |
| | |
2.50%, 11/2/2022 | | | 2,620,000 | | | | 2,734,232 | |
| | |
1.13%, 5/1/2023 | | | 11,985,000 | | | | 12,200,197 | |
| | |
2.88%, 5/1/2024 | | | 3,425,000 | | | | 3,695,103 | |
| | |
Reynolds American, Inc. (United Kingdom) 4.00%, 6/12/2022 | | | 8,983,000 | | | | 9,518,387 | |
| | | | | | | | |
| | |
| | | | | | | 106,682,829 | |
| | | | | | | | |
|
Trading Companies & Distributors — 0.3% | |
| | |
Aviation Capital Group LLC | | | | | | | | |
| | |
(ICE LIBOR USD 3 Month + 0.95%), 1.30%, 6/1/2021 (a) (b) | | | 15,273,000 | | | | 14,879,872 | |
| | |
(ICE LIBOR USD 3 Month + 0.67%), 0.94%, 7/30/2021 (a) (b) | | | 6,254,000 | | | | 6,054,285 | |
| | |
2.88%, 1/20/2022 (b) | | | 2,986,000 | | | | 2,967,624 | |
| | |
BOC Aviation Ltd. (Singapore) | | | | | | | | |
| | |
(ICE LIBOR USD 3 Month + 1.05%), 1.30%, 5/2/2021 (a) (b) | | | 5,737,000 | | | | 5,715,486 | |
| | |
2.38%, 9/15/2021 (b) | | | 6,200,000 | | | | 6,242,625 | |
| | | | | | | | |
| | |
| | | | | | | 35,859,892 | |
| | | | | | | | |
SEE NOTES TO FINANCIAL STATEMENTS.
| | | | | | | | |
| | | |
| AUGUST 31, 2020 | | J.P. MORGAN EXCHANGE-TRADED FUNDS | | | | | 161 | |
JPMorgan Ultra-Short Income ETF
SCHEDULE OF PORTFOLIO INVESTMENTS
AS OF AUGUST 31, 2020 (Unaudited) (continued)
| | | | | | | | |
| INVESTMENTS | | PRINCIPAL
AMOUNT ($) | | | VALUE ($) | |
Corporate Bonds — continued | |
|
Wireless Telecommunication Services — 0.6% | |
| | |
Rogers Communications, Inc. (Canada) | | | | | | | | |
| | |
(ICE LIBOR USD 3 Month + 0.60%), 0.91%, 3/22/2022 (a) | | | 66,444,000 | | | | 66,885,653 | |
| | |
3.00%, 3/15/2023 | | | 1,586,000 | | | | 1,677,337 | |
| | |
Vodafone Group plc (United Kingdom) | | | | | | | | |
| | |
3.75%, 1/16/2024 | | | 12,160,000 | | | | 13,328,499 | |
| | | | | | | | |
| | |
| | | | | | | 81,891,489 | |
| | | | | | | | |
| | |
Total Corporate Bonds
(Cost $10,271,432,476) | | | | | | | 10,395,475,227 | |
| | | | | | | | |
Asset-Backed Securities — 4.7% | |
| | |
AIMCO CLO (Cayman Islands) Series 2015-AA, Class AR, 1.13%, 1/15/2028 (b) (f) | | | 9,504,647 | | | | 9,450,433 | |
| | |
Allegro CLO II-S Ltd. (Cayman Islands) Series 2014-1RA, Class X, 0.92%, 10/21/2028 (b) (f) | | | 200,000 | | | | 200,000 | |
| | |
Apidos CLO (Cayman Islands) Series 2015-21A, Class A1R, 1.20%, 7/18/2027 (b) (f) | | | 20,100,000 | | | | 19,930,838 | |
| | |
Avery Point CLO Ltd. (Cayman Islands) Series 2015-6A, Class AR, 1.30%, 8/5/2027 (b) (f) | | | 47,444,963 | | | | 47,195,118 | |
| | |
Barings CLO Ltd. (Cayman Islands) Series 2013-IA, Class AR, 1.07%, 1/20/2028 (b) (f) | | | 33,817,476 | | | | 33,467,533 | |
| | |
Benefit Street Partners CLO Ltd. (Cayman Islands) Series 2013-IIA, Class X, 1.98%, 7/15/2029 ‡ (b) (f) | | | 68,750 | | | | 68,664 | |
| | |
BlueMountain CLO Ltd. (Cayman Islands) | | | | | | | | |
| | |
Series 2012-2A, Class AR2, 1.30%, 11/20/2028 (b) (f) | | | 7,310,000 | | | | 7,251,520 | |
| | |
Series 2013-1A, Class A1R2, 1.50%, 1/20/2029 (b) (f) | | | 2,969,895 | | | | 2,962,105 | |
| | |
Series 2014-2A, Class X, 0.87%, 10/20/2030 (b) (f) | | | 426,954 | | | | 426,954 | |
| | |
Series 2016-3A, Class X, 0.90%, 11/15/2030 (b) (f) | | | 664,886 | | | | 664,853 | |
| | |
Carlyle Global Market Strategies CLO Ltd. Series 2012-4A, Class XRR, 1.01%, 4/22/2032 (b) (f) | | | 644,434 | | | | 644,401 | |
| | |
CIFC Funding Ltd. (Cayman Islands) | | | | | | | | |
| | |
Series 2012-2RA, Class A1, 1.07%, 1/20/2028 (b) (f) | | | 4,886,184 | | | | 4,822,649 | |
| | |
Series 2017-5A, Class A1, 1.45%, 11/16/2030 (b) (f) | | | 33,500,000 | | | | 33,266,806 | |
| | |
Clear Creek CLO (Cayman Islands) Series 2015-1A, Class X, 1.27%, 10/20/2030 ‡ (b) (f) | | | 85,938 | | | | 85,830 | |
| | | | | | | | |
| INVESTMENTS | | PRINCIPAL
AMOUNT ($) | | | VALUE ($) | |
| | | | | | | | |
| | |
Cloud Pass-Through Trust Series 2019-1A, Class CLOU, 3.55%, 12/5/2022 (b) (f) | | | 17,200,199 | | | | 17,446,599 | |
| | |
Columbia Cent CLO Ltd. (Cayman Islands) Series 2018-27A, Class X, 0.94%, 10/25/2028 (b) (f) | | | 358,331 | | | | 358,331 | |
| | |
Dell Equipment Finance Trust Series 2019-1, Class A2, 2.78%, 8/23/2021 (b) | | | 9,585,535 | | | | 9,632,069 | |
| | |
Dorchester Park CLO DAC Series 2015-1A, Class AR, 1.17%, 4/20/2028 (b) (f) | | | 8,529,008 | | | | 8,457,603 | |
| | |
Drive Auto Receivables Trust Series 2019-2, Class A3, 3.04%, 3/15/2023 | | | 8,539,292 | | | | 8,563,215 | |
| | |
Dryden Senior Loan Fund (Cayman Islands) | | | | | | | | |
| | |
Series 2013-30A, Class AR, 1.10%, 11/15/2028 (b) (f) | | | 7,000,000 | | | | 6,918,324 | |
| | |
Series 2014-36A, Class XR2, 0.92%, 4/15/2029 ‡ (b) (f) | | | 600,000 | | | | 600,048 | |
| | |
Ford Credit Auto Owner Trust Series 2016-1, Class A, 2.31%, 8/15/2027 (b) | | | 6,444,000 | | | | 6,492,987 | |
| | |
GT Loan Financing I Ltd. (Cayman Islands) Series 2013-1A, Class XR, 0.90%, 7/28/2031 (b) (f) | | | 214,284 | | | | 214,284 | |
| | |
KKR CLO Ltd. (Cayman Islands) | | | | | | | | |
| | |
Series 13, Class A1R, 1.07%, 1/16/2028 (b) (f) | | | 11,440,839 | | | | 11,305,494 | |
| | |
Series 17, Class A, 1.62%, 4/15/2029 (b) (f) | | | 3,000,000 | | | | 2,985,207 | |
| | |
KREF Ltd. Series 2018-FL1, Class A, 1.26%, 6/15/2036 (b) (f) | | | 5,000,000 | | | | 4,937,500 | |
| | |
LCM XVII LP (Cayman Islands) Series 17A, Class XR, 0.88%, 10/15/2031 (b) (f) | | | 540,000 | | | | 540,000 | |
| | |
LCM XX LP (Cayman Islands) Series 20A, Class AR, 1.31%, 10/20/2027 (b) (f) | | | 23,602,000 | | | | 23,447,879 | |
| | |
Magnetite Ltd. (Cayman Islands) | | | | | | | | |
| | |
Series 2016-18A, Class AR, 1.36%, 11/15/2028 (b) (f) | | | 3,800,000 | | | | 3,768,487 | |
| | |
Series 2020-27A, Class A1, 1.80%, 7/20/2033 (b) (f) | | | 22,058,000 | | | | 22,058,000 | |
| | |
Neuberger Berman CLO Ltd. (Cayman Islands) | | | | | | | | |
| | |
Series 2015-19A, Class A1R2, 1.08%, 7/15/2027 (b) (f) | | | 3,858,523 | | | | 3,813,540 | |
SEE NOTES TO FINANCIAL STATEMENTS.
| | | | | | |
| | | |
| 162 | | | | J.P. MORGAN EXCHANGE-TRADED FUNDS | | AUGUST 31, 2020 |
| | | | | | | | |
| INVESTMENTS | | PRINCIPAL
AMOUNT ($) | | | VALUE ($) | |
Asset-Backed Securities — continued | |
| | |
Series 2017-16SA, Class A, 1.13%, 1/15/2028 (b) (f) | | | 34,088,169 | | | | 33,746,196 | |
| | |
Series 2013-14A, Class AR2, 1.28%, 1/28/2030 (b) (f) | | | 8,825,000 | | | | 8,692,502 | |
| | |
Newark BSL CLO 2 Ltd. (Cayman Islands) Series 2017-1A, Class A1, 1.51%, 7/25/2030 (b) (f) | | | 2,000,000 | | | | 1,992,138 | |
| | |
Newark BSL CLO Ltd. (Cayman Islands) Series 2016-1A, Class A1R, 1.34%, 12/21/2029 (b) (f) | | | 2,500,000 | | | | 2,485,890 | |
| | |
Oak Hill Credit Partners Ltd. (Cayman Islands) Series 2014-10RA, Class X, 0.90%, 12/12/2030 (b) (f) | | | 1,037,500 | | | | 1,037,500 | |
| | |
OCP CLO Ltd. (Cayman Islands) | | | | | | | | |
| | |
Series 2015-8A, Class A1R, 1.12%, 4/17/2027 (b) (f) | | | 13,301,878 | | | | 13,225,844 | |
| | |
Series 2015-9A, Class A1R, 1.08%, 7/15/2027 (b) (f) | | | 26,232,718 | | | | 26,135,604 | |
| | |
Series 2016-12A, Class A1R, 1.39%, 10/18/2028 (b) (f) | | | 1,000,000 | | | | 992,775 | |
| | |
Octagon Investment Partners 25 Ltd. (Cayman Islands) Series 2015-1A, Class AR, 1.07%, 10/20/2026 (b) (f) | | | 16,322,773 | | | | 16,202,866 | |
| | |
Octagon Investment Partners 35 Ltd. (Cayman Islands) Series 2018-1A, Class A1A, 1.33%, 1/20/2031 (b) (f) | | | 35,000,000 | | | | 34,658,820 | |
| | |
OHA Credit Funding Ltd. (Cayman Islands) Series 2018-1A, Class X, 0.92%, 10/20/2030 (b) (f) | | | 333,333 | | | | 333,333 | |
| | |
Palmer Square Loan Funding Ltd. (Cayman Islands) | | | | | | | | |
| | |
Series 2019-2A, Class A1, 1.24%, 4/20/2027 (b) (f) | | | 10,036,802 | | | | 9,946,592 | |
| | |
Series 2019-4A, Class A1, 1.16%, 10/24/2027 (b) (f) | | | 29,242,246 | | | | 28,897,392 | |
| | |
Series 2020-1A, Class A1, 1.05%, 2/20/2028 (b) (f) | | | 10,574,550 | | | | 10,513,461 | |
| | |
Series 2020-2A, Class A1, 1.27%, 4/20/2028 (b) (f) | | | 14,745,417 | | | | 14,615,598 | |
| | |
Shackleton CLO Ltd. (Cayman Islands) | | | | | | | | |
| | |
Series 2015-8A, Class A1R, 1.19%, 10/20/2027 (b) (f) | | | 18,465,544 | | | | 18,307,608 | |
| | |
Series 2015-8A, Class A2R, 1.19%, 10/20/2027 (b) (f) | | | 8,205,241 | | | | 8,135,062 | |
| | |
Stratus CLO Ltd. (Cayman Islands) Series 2020-2A, Class A, 1.57%, 10/15/2028 (b) (f) | | | 46,000,000 | | | | 46,000,000 | |
| | |
Symphony CLO Ltd. (Cayman Islands) | | | | | | | | |
| | |
Series 2014-14A, Class AR, 1.22%, 7/14/2026 (b) (f) | | | 33,348,309 | | | | 33,095,529 | |
| | |
Series 2018-20A, Class X, 1.27%, 1/16/2032 (b) (f) | | | 1,750,000 | | | | 1,750,000 | |
| | | | | | | | |
| INVESTMENTS | | PRINCIPAL
AMOUNT ($) | | | VALUE ($) | |
| | | | | | | | |
| | |
Series 2014-15A, Class XR2, 0.97%, 1/17/2032 (b) (f) | | | 2,666,667 | | | | 2,666,667 | |
| | |
THL Credit Wind River CLO Ltd. (Cayman Islands) Series 2012-1A, Class AR2, 1.15%, 1/15/2026 (b) (f) | | | 5,614,979 | | | | 5,593,339 | |
| | |
Treman Park CLO Ltd. (Cayman Islands) Series 2015-1A, Class ARR, 1.34%, 10/20/2028 (b) (f) | | | 10,000,000 | | | | 9,937,480 | |
| | |
Verizon Owner Trust | | | | | | | | |
| | |
Series 2017-3A, Class A1B, 0.43%, 4/20/2022 (b) (f) | | | 68,644 | | | | 68,665 | |
| | |
Series 2017-3A, Class A1A, 2.06%, 4/20/2022 (b) | | | 5,363,403 | | | | 5,375,927 | |
| | |
Series 2018-1A, Class A1A, 2.82%, 9/20/2022 (b) | | | 22,505,198 | | | | 22,680,230 | |
| | |
Volvo Financial Equipment LLC Series 2019-1A, Class A2, 2.90%, 11/15/2021 (b) | | | 1,677,031 | | | | 1,683,438 | |
| | |
Voya CLO Ltd. (Cayman Islands) Series 2014-3A, Class A1R, 0.96%, 7/25/2026 (b) (f) | | | 1,284,563 | | | | 1,278,189 | |
| | |
Westlake Automobile Receivables Trust Series 2019-1A, Class A2A, 3.06%, 5/16/2022 (b) | | | 1,666,823 | | | | 1,673,166 | |
| | | | | | | | |
| | |
Total Asset-Backed Securities
(Cost $654,261,357) | | | | | | | 653,699,082 | |
| | | | | | | | |
Commercial Mortgage-Backed Securities — 1.0% | |
| | |
Benchmark Mortgage Trust | | | | | | | | |
| | |
Series 2018-B3, Class A2, 3.85%, 4/10/2051 | | | 5,500,000 | | | | 5,843,463 | |
| | |
Series 2018-B5, Class A2, 4.08%, 7/15/2051 | | | 5,000,000 | | | | 5,372,036 | |
| | |
BX Commercial Mortgage Trust Series 2020-BXLP, Class A, 0.96%, 12/15/2036 (b) (f) | | | 22,968,977 | | | | 22,890,014 | |
| | |
BXMT Ltd. Series 2017-FL1, Class A, 1.03%, 6/15/2035 (b) (f) | | | 460,289 | | | | 457,412 | |
| | |
CGDBB Commercial Mortgage Trust Series 2017-BIOC, Class A, 0.95%, 7/15/2032 (b) (f) | | | 822,189 | | | | 820,131 | |
| | |
Citigroup Commercial Mortgage Trust Series 2018-B2, Class A2, 3.79%, 3/10/2051 | | | 6,000,000 | | | | 6,296,588 | |
| | |
Credit Suisse Mortgage Capital Certificates Series 2019-ICE4, Class A, 1.14%, 5/15/2036 (b) (f) | | | 28,000,000 | | | | 28,051,439 | |
| | |
CSAIL Commercial Mortgage Trust Series 2017-CX9, Class A2, 3.05%, 9/15/2050 | | | 2,500,000 | | | | 2,580,690 | |
| | |
DBGS Mortgage Trust Series 2018-BIOD, Class A, 0.96%, 5/15/2035 (b) (f) | | | 26,753,605 | | | | 26,652,832 | |
SEE NOTES TO FINANCIAL STATEMENTS.
| | | | | | | | |
| | | |
| AUGUST 31, 2020 | | J.P. MORGAN EXCHANGE-TRADED FUNDS | | | | | 163 | |
JPMorgan Ultra-Short Income ETF
SCHEDULE OF PORTFOLIO INVESTMENTS
AS OF AUGUST 31, 2020 (Unaudited) (continued)
| | | | | | | | |
| INVESTMENTS | | PRINCIPAL
AMOUNT ($) | | | VALUE ($) | |
Commercial Mortgage-Backed Securities — continued | |
| | |
GS Mortgage Securities Trust Series 2017-GS5, Class A2, 3.22%, 3/10/2050 | | | 1,750,000 | | | | 1,775,104 | |
| | |
KNDL Mortgage Trust Series 2019-KNSQ, Class A, 0.96%, 5/15/2036 (b) (f) | | | 5,600,000 | | | | 5,582,441 | |
| | |
Morgan Stanley Bank of America Merrill Lynch Trust Series 2013-C8, Class A3, 2.86%, 12/15/2048 | | | 7,730,939 | | | | 7,989,680 | |
| | |
Morgan Stanley Capital I Trust Series 2018-H3, Class A2, 4.00%, 7/15/2051 | | | 6,250,000 | | | | 6,683,373 | |
| | |
UBS Commercial Mortgage Trust | | | | | | | | |
| | |
Series 2018-C8, Class A2, 3.71%, 2/15/2051 | | | 6,569,000 | | | | 6,862,363 | |
| | |
Series 2018-C11, Class A2, 3.99%, 6/15/2051 | | | 4,647,000 | | | | 4,907,814 | |
| | |
Wells Fargo Commercial Mortgage Trust Series 2018-C46, Class A2, 4.06%, 8/15/2051 | | | 11,750,000 | | | | 12,572,716 | |
| | | | | | | | |
| |
Total Commercial Mortgage-Backed Securities
(Cost $145,369,203) | | | | 145,338,096 | |
| | | | | | | | |
Certificates of Deposit — 0.6% | | | | | | | | |
| | |
Credit Agricole Corporate and Investment Bank (France) (ICE LIBOR USD 3 Month + 0.48%), 0.78%, 9/17/2021 (a) | | | 33,446,000 | | | | 33,508,484 | |
| | |
Sumitomo Mitsui Banking Corp. (Japan) (ICE LIBOR USD 3 Month + 0.32%), 0.58%, 11/22/2021 (a) | | | 47,564,000 | | | | 47,546,512 | |
| | | | | | | | |
| |
Total Certificates of Deposit
(Cost $80,996,260) | | | | 81,054,996 | |
| | | | | | | | |
Collateralized Mortgage Obligations — 0.0% (e) | |
| | |
FHLMC, REMIC Series 4002, Class MA, 2.00%, 1/15/2039
(Cost $5,440,349) | | | 5,434,136 | | | | 5,452,501 | |
| | | | | | | | |
Short-Term Investments — 19.5% | | | | | | | | |
| | |
Certificates of Deposit — 4.9% | | | | | | | | |
| | |
Bank of Nova Scotia (The) (Canada) (ICE LIBOR USD 3 Month + 0.28%), 0.59%, 9/21/2020 (a) | | | 3,000,000 | | | | 3,000,522 | |
| | |
Barclays Bank plc (United Kingdom) | | | | | | | | |
| | |
0.90%, 6/24/2021 | | | 65,865,000 | | | | 66,059,813 | |
| | |
0.70%, 7/29/2021 | | | 6,500,000 | | | | 6,507,435 | |
| | |
Canadian Imperial Bank of Commerce (Canada) 0.42%, 6/22/2021 | | | 90,500,000 | | | | 90,656,829 | |
| | |
Chiba Bank Ltd. (Japan) | | | | | | | | |
| | |
0.37%, 11/13/2020 | | | 61,391,000 | | | | 61,392,379 | |
| | |
0.37%, 11/30/2020 | | | 39,000,000 | | | | 38,999,703 | |
| | | | | | | | |
| INVESTMENTS | | PRINCIPAL
AMOUNT ($) | | | VALUE ($) | |
| | |
| | | | | | | | |
| | |
Certificates of Deposit — continued | | | | | | | | |
| | |
Credit Agricole Corporate and Investment Bank (France) (ICE LIBOR USD 3 Month + 0.21%), 0.45%, 8/9/2021 (a) | | | 36,098,000 | | | | 36,141,973 | |
| | |
First Abu Dhabi Bank USA NV (ICE LIBOR USD 3 Month + 0.20%), 0.47%, 1/21/2021 (a) | | | 21,927,000 | | | | 21,926,996 | |
| | |
Lloyds Bank Corporate Markets plc (United Kingdom) | | | | | | | | |
| | |
(ICE LIBOR USD 3 Month + 0.50%), 0.80%, 9/24/2020 (a) | | | 23,000,000 | | | | 23,007,726 | |
| | |
0.61%, 6/17/2021 | | | 100,500,000 | | | | 100,739,045 | |
| | |
Natixis SA (France) 1.93%, 11/13/2020 | | | 1,019,000 | | | | 1,022,727 | |
| | |
Nordea Bank Abp (Finland) 1.71%, 10/28/2020 | | | 52,800,000 | | | | 52,935,211 | |
| | |
Shizuoka Bank (Japan) | | | | | | | | |
| | |
0.00%, 11/25/2020 | | | 19,000,000 | | | | 18,999,591 | |
| | |
0.00%, 11/30/2020 | | | 20,000,000 | | | | 19,998,989 | |
| | |
0.39%, 2/10/2021 | | | 20,000,000 | | | | 20,000,354 | |
| | |
0.39%, 2/12/2021 | | | 50,000,000 | | | | 50,001,125 | |
| | |
Standard Chartered Bank (United Kingdom) 1.78%, 10/26/2020 | | | 54,733,000 | | | | 54,865,656 | |
| | |
Svenska Handelsbanken AB (Sweden) (ICE LIBOR USD 3 Month + 0.28%), 0.59%, 9/11/2020 (a) | | | 6,000,000 | | | | 6,000,495 | |
| | | | | | | | |
| |
Total Certificates of Deposit
(Cost $671,217,729) | | | | 672,256,569 | |
| | | | | | | | |
|
Commercial Paper — 7.5% | |
| | |
American Honda Finance Corp. 1.99%, 9/3/2020 (g) | | | 110,000,000 | | | | 109,998,534 | |
| | |
AstraZeneca plc (United Kingdom) | | | | | | | | |
| | |
2.12%, 10/16/2020 (b) (g) | | | 29,000,000 | | | | 28,986,475 | |
| | |
2.12%, 10/28/2020 (b) (g) | | | 45,000,000 | | | | 44,973,247 | |
| | |
Banco Santander SA (Spain) 0.36%, 9/21/2020 (b) (g) | | | 1,700,000 | | | | 1,699,903 | |
| | |
BP Capital Markets plc (United Kingdom) | | | | | | | | |
| | |
1.53%, 9/8/2020 (b) (g) | | | 52,484,000 | | | | 52,481,189 | |
| | |
1.34%, 11/23/2020 (b) (g) | | | 74,000,000 | | | | 73,957,869 | |
| | |
BPCE SA (France) | | | | | | | | |
| | |
0.30%, 7/1/2021 (b) (g) | | | 3,000,000 | | | | 2,993,236 | |
| | |
Campbell Soup Co. 2.04%, 3/1/2021 (b) (g) | | | 29,450,000 | | | | 29,358,882 | |
| | |
Dominion Energy, Inc. 2.89%, 10/1/2020 (b) (g) | | | 20,000,000 | | | | 19,996,711 | |
| | |
DZ Bank AG (Germany) 0.25%, 9/8/2020 (b) (g) | | | 6,800,000 | | | | 6,799,894 | |
SEE NOTES TO FINANCIAL STATEMENTS.
| | | | | | |
| | | |
| 164 | | | | J.P. MORGAN EXCHANGE-TRADED FUNDS | | AUGUST 31, 2020 |
| | | | | | | | |
| INVESTMENTS | | PRINCIPAL
AMOUNT ($) | | | VALUE ($) | |
Short-Term Investments – continued | |
|
Commercial Paper — continued | |
| | |
Electricite de France SA (France) 0.56%, 6/28/2021 (b) (g) | | | 90,000,000 | | | | 89,759,200 | |
| | |
Enbridge Energy Partners LP 0.80%, 9/14/2020 (b) (g) | | | 27,636,000 | | | | 27,634,087 | |
| | |
Enel Finance America LLC 0.40%, 10/2/2020 (b) (g) | | | 23,549,000 | | | | 23,545,002 | |
| | |
Eni Finance USA, Inc. (Italy) | | | | | | | | |
| | |
0.78%, 11/5/2020 (b) (g) | | | 20,170,000 | | | | 20,146,851 | |
| | |
0.78%, 11/9/2020 (b) (g) | | | 25,000,000 | | | | 24,969,375 | |
| | |
0.58%, 7/30/2021 (b) (g) | | | 21,075,000 | | | | 20,878,107 | |
| | |
Erste Abwicklungsanstalt (Germany) | | | | | | | | |
| | |
0.23%, 9/30/2020 (b) (g) | | | 7,000,000 | | | | 6,999,475 | |
| | |
Exxon Mobil Corp. 0.10%, 10/21/2020 (g) | | | 18,000,000 | | | | 17,997,781 | |
| | |
Federation des caisses Desjardins du Quebec (Canada) | | | | | | | | |
| | |
0.14%, 9/21/2020 (b) (g) | | | 6,250,000 | | | | 6,249,643 | |
| | |
First Abu Dhabi Bank PJSC (United Arab Emirates) | | | | | | | | |
| | |
0.20%, 11/16/2020 (b) (g) | | | 10,000,000 | | | | 9,997,070 | |
| | |
0.32%, 8/27/2021 (b) (g) | | | 174,311,000 | | | | 173,753,402 | |
| | |
Glencore Funding LLC (Australia) | | | | | | | | |
| | |
1.63%, 9/8/2020 (b) (g) | | | 33,900,000 | | | | 33,897,936 | |
| | |
0.60%, 9/22/2020 (b) (g) | | | 30,000,000 | | | | 29,992,391 | |
| | |
Komatsu Finance America, Inc. | | | | | | | | |
| | |
0.40%, 9/1/2020 (b) (g) | | | 9,200,000 | | | | 9,199,977 | |
| | |
NatWest Markets plc (United Kingdom) | | | | | | | | |
| | |
0.61%, 4/29/2021 (b) (g) | | | 16,590,000 | | | | 16,542,133 | |
| | |
0.66%, 7/26/2021 (b) (g) | | | 27,281,000 | | | | 27,163,820 | |
| | |
Rogers Communications, Inc. (Canada) | | | | | | | | |
| | |
0.55%, 8/26/2021 (b) (g) | | | 39,167,000 | | | | 38,963,332 | |
| | |
Schlumberger Holdings Corp. | | | | | | | | |
| | |
0.47%, 7/29/2021 (b) (g) | | | 15,300,000 | | | | 15,228,039 | |
| | |
0.49%, 8/16/2021 (b) (g) | | | 42,000,000 | | | | 41,789,709 | |
| | |
Shell International Finance BV (Netherlands) 3.25%, 3/29/2021 (b) (g) | | | 34,360,000 | | | | 34,299,870 | |
| | | | | | | | |
| |
Total Commercial Paper
(Cost $1,038,709,020) | | | | 1,040,253,140 | |
| | | | | | | | |
| | |
| | |
SHARES | | | | |
|
Investment Companies — 6.2% | |
| | |
JPMorgan U.S. Government Money Market Fund Class Institutional Shares, 0.01% (h) (i)
(Cost $867,938,428) | | | 867,938,428 | | | | 867,938,428 | |
| | | | | | | | |
| | | | | | | | |
| INVESTMENTS | |
SHARES | | | VALUE ($) | |
| | |
| | | | | | | | |
|
Investment of Cash Collateral From Securities Loaned — 0.4% | |
| | |
JPMorgan Securities Lending Money Market Fund Agency SL Class Shares, 0.32% (h) (i) | | | 47,229,932 | | | | 47,244,101 | |
| | |
JPMorgan U.S. Government Money Market Fund Class IM Shares, 0.07% (h) (i) | | | 6,510,728 | | | | 6,510,728 | |
| | | | | | | | |
| |
Total Investment of Cash Collateral
From Securities Loaned
(Cost $53,754,829) | | | | 53,754,829 | |
| | | | | | | | |
| | |
| | | PRINCIPAL
AMOUNT ($) | | | | |
|
Repurchase Agreements — 0.5% | |
| | |
Citigroup Global Markets Holdings, Inc., 2.34%, dated 8/31/2020, due 10/23/2020, repurchase price $12,041,324, collateralized by Asset-Backed Securities, 2.71% — 2.84%, due 11/28/2053 — 6/28/2057, Collateralized Mortgage Obligations, 0.00% — 3.16%, due 12/15/2021 — 10/18/2052 and FNMA Connecticut Avenue Securities, 3.43% — 10.18%, due 1/25/2040 — 7/25/2050, with the value of $12,960,001. | | | 12,000,000 | | | | 12,000,000 | |
| | |
Wells Fargo Securities LLC, 0.75%, dated 8/31/2020, due 09/28/2020, repurchase price $60,035,000, collateralized by Asset-Backed Securities, 3.55%, due 8/15/2025, Collateralized Mortgage Obligations, 1.14% — 4.61%, due 2/15/2036 — 9/17/2060 and Municipal Debt Securities, 5.00% — 6.31%, due 1/1/2022 — 1/1/2044, with the value of $64,510,345. | | | 60,000,000 | | | | 60,000,000 | |
| | | | | | | | |
| |
Total Repurchase Agreements
(Cost $72,000,000) | | | | 72,000,000 | |
| | | | | | | | |
| | |
Total Short-Term Investments
(Cost $2,703,620,006) | | | | | | | 2,706,202,966 | |
| | | | | | | | |
| | |
Total Investments — 100.6%
(Cost $13,861,119,651) | | | | | | | 13,987,222,868 | |
| | |
Liabilities in Excess of Other Assets — (0.6)% | | | | | | | (85,118,316) | |
| | | | | | | | |
| |
NET ASSETS — 100.0% | | | | 13,902,104,552 | |
| | | | | | | | |
Percentages indicated are based on net assets.
SEE NOTES TO FINANCIAL STATEMENTS.
| | | | | | | | |
| | | |
| AUGUST 31, 2020 | | J.P. MORGAN EXCHANGE-TRADED FUNDS | | | | | 165 | |
JPMorgan Ultra-Short Income ETF
SCHEDULE OF PORTFOLIO INVESTMENTS
AS OF AUGUST 31, 2020 (Unaudited) (continued)
Abbreviations
| | |
| CIFC | | Commercial Industrial Finance Corp. |
| CLO | | Collateralized Loan Obligations |
| FHLMC | | Federal Home Loan Mortgage Corp. |
| FNMA | | Federal National Mortgage Association |
| ICE | | Intercontinental Exchange |
| LIBOR | | London Interbank Offered Rate |
| REIT | | Real Estate Investment Trust |
| REMIC | | Real Estate Mortgage Investment Conduit |
| SOFR | | Secured Overnight Financing Rate |
| USD | | United States Dollar |
| PJSC | | Public Joint Stock Company |
| |
| (a) | | Variable or floating rate security, linked to the referenced benchmark. The interest rate shown is the current rate as of August 31, 2020. |
| (b) | | Securities exempt from registration under Rule 144A or section 4(a)(2), of the Securities Act of 1933, as amended. |
| (c) | | The security or a portion of this security is on loan at August 31, 2020. The total value of securities on loan at August 31, 2020 is $52,396,832. |
| | |
| |
| (d) | | Step bond. Interest rate is a fixed rate for an initial period that either resets at a specific date or may reset in the future contingent upon a predetermined trigger. The interest rate shown is the current rate as of August 31, 2020. |
| (e) | | Amount rounds to less than 0.1% of net assets. |
| (f) | | Variable or floating rate security, the interest rate of which adjusts periodically based on changes in current interest rates and prepayments on the underlying pool of assets. The interest rate shown is the current rate as of August 31, 2020. |
| (g) | | The rate shown is the effective yield as of August 31, 2020. |
| (h) | | Investment in an affiliated fund, which is registered under the Investment Company Act of 1940, as amended, and is advised by J.P. Morgan Investment Management Inc. |
| (i) | | The rate shown is the current yield as of August 31, 2020. |
| ‡ | | Value determined using significant unobservable inputs. |
| | | | | | | | | | | | | | | | | | | | |
| Futures contracts outstanding as of August 31, 2020: | |
| DESCRIPTION | | NUMBER OF
CONTRACTS | | | EXPIRATION
DATE | | | TRADING
CURRENCY | | | NOTIONAL
AMOUNT ($) | | | VALUE AND
UNREALIZED
APPRECIATION
(DEPRECIATION) ($) | |
Short Contracts | |
| U.S. Treasury 2 Year Note | | | (719 | ) | | | 12/2020 | | | | USD | | | | (158,854,063 | ) | | | (80,042 | ) |
| U.S. Treasury 5 Year Note | | | (5,834 | ) | | | 12/2020 | | | | USD | | | | (735,084,000 | ) | | | (543,776 | ) |
| | | | | | | | | | | | | | | | | | | | |
| | | | | | | | | | | | | | | | | | | (623,818 | ) |
| | | | | | | | | | | | | | | | | | | | |
Abbreviations
SEE NOTES TO FINANCIAL STATEMENTS.
| | | | | | |
| | | |
| 166 | | | | J.P. MORGAN EXCHANGE-TRADED FUNDS | | AUGUST 31, 2020 |
JPMorgan Ultra-Short Municipal Income ETF
SCHEDULE OF PORTFOLIO INVESTMENTS
AS OF AUGUST 31, 2020 (Unaudited)
| | | | | | | | |
| INVESTMENTS | | PRINCIPAL
AMOUNT ($) | | | VALUE ($) | |
Municipal Bonds — 84.5% (a) | |
|
Alabama — 0.4% | |
| | |
Alabama 21st Century Authority
Series 2012A, Rev., 5.00%, 6/1/2021 | | | 55,000 | | | | 56,941 | |
| | |
Alabama Federal Aid Highway Finance Authority | | | | | | | | |
| | |
Rev., 5.00%, 9/1/2020 | | | 25,000 | | | | 25,000 | |
| | |
Series 2012A, Rev., GAN, 5.00%, 9/1/2021 | | | 100,000 | | | | 104,687 | |
| | |
Series A, Rev., 5.00%, 9/1/2023 | | | 25,000 | | | | 28,541 | |
| | |
Alabama Public School & College Authority Series 2014-A, Rev., 5.00%, 2/1/2022 | | | 20,000 | | | | 21,328 | |
| | |
Alabama Public School and College Authority, Capital Improvement Series 2013-C, Rev., 5.00%, 9/1/2020 | | | 45,000 | | | | 45,000 | |
| | |
Alabama Public School and College Authority, Capital Improvement Economic Development and Training Series 2012B, Rev., 5.00%, 3/1/2021 | | | 45,000 | | | | 46,055 | |
| | |
Black Belt Energy Gas District, Gas Prepay Series 2018A, Rev., 4.00%, 12/1/2023 (b) | | | 170,000 | | | | 186,512 | |
| | |
Black Belt Energy Gas District, Gas Supply Series 2016A, Rev., LIQ: Royal Bank of Canada, 4.00%, 6/1/2021 (b) | | | 905,000 | | | | 925,942 | |
| | |
City of Auburn GO, 3.00%, 5/1/2022 | | | 20,000 | | | | 20,944 | |
| | |
City of Dothan GO, 5.00%, 9/1/2020 | | | 35,000 | | | | 35,000 | |
| | |
City of Florence, Warrants | | | | | | | | |
| | |
GO, 5.00%, 9/1/2020 | | | 25,000 | | | | 25,000 | |
| | |
City of Huntsville Series 2014B, GO, 3.00%, 11/1/2020 | | | 30,000 | | | | 30,140 | |
| | |
City of Huntsville, Capital Improvement Series 2011B, GO, 5.00%, 5/1/2021 (c) | | | 110,000 | | | | 113,456 | |
| | |
City of Huntsville, Warrants Series 2013-D, GO, 5.00%, 11/1/2020 | | | 40,000 | | | | 40,318 | |
| | |
City of Orange Beach, Warrants GO, 5.00%, 2/1/2021 | | | 30,000 | | | | 30,602 | |
| | |
City of Oxford, Warrants Series 2013B, GO, 4.00%, 9/1/2020 (c) | | | 20,000 | | | | 20,000 | |
| | |
City of Troy, Electric Water and Sewer System | | | | | | | | |
| | |
Rev., AGM, 4.75%, 10/1/2020 (c) | | | 20,000 | | | | 20,073 | |
| | |
Rev., AGM, 5.25%, 10/1/2020 (c) | | | 100,000 | | | | 100,407 | |
| | |
County of Montgomery | | | | | | | | |
| | |
Series 2010A, GO, 5.00%, 11/1/2020 | | | 35,000 | | | | 35,137 | |
| | |
GO, 5.00%, 3/1/2021 | | | 30,000 | | | | 30,723 | |
| | |
Cullman Utilities Board Water Division Rev., AGM, 4.75%, 9/1/2020 | | | 130,000 | | | | 130,000 | |
| | |
Madison County Board of Education Series 2019C, 5.00%, 3/1/2021 | | | 25,000 | | | | 25,590 | |
| | | | | | | | |
| INVESTMENTS | | PRINCIPAL
AMOUNT ($) | | | VALUE ($) | |
| |
|
Alabama — continued | |
| | |
Madison County Board of Education, Capital Outlay Tax Anticipation Warrants Rev., 5.00%, 9/1/2020 | | | 25,000 | | | | 25,000 | |
| | |
Montgomery County Public Education Cooperative District Rev., 5.00%, 4/1/2021 | | | 100,000 | | | | 102,813 | |
| | |
North Marshall Utilities Board, Water Rev., AGM, 3.00%, 10/1/2020 | | | 110,000 | | | | 110,231 | |
| | |
Oxford Public Building Authority Series 2015A, Rev., 5.00%, 10/1/2022 | | | 25,000 | | | | 27,290 | |
| | |
Water Works Board of the City of Birmingham (The) Rev., 5.00%, 1/1/2021 | | | 20,000 | | | | 20,322 | |
| | | | | | | | |
| | |
Total Alabama | | | | | | | 2,383,052 | |
| | | | | | | | |
|
Alaska — 0.5% | |
| | |
Alaska Housing Finance Corp. Series A, Rev., 1.50%, 6/1/2024 | | | 305,000 | | | | 314,275 | |
| | |
Alaska Housing Finance Corp., Capital Project Series 2011A, Rev., 5.00%, 12/1/2020 (c) | | | 50,000 | | | | 50,599 | |
| | |
Alaska Housing Finance Corp., State Capital Project Series A, Rev., 5.00%, 12/1/2020 (c) | | | 20,000 | | | | 20,240 | |
| | |
Alaska Industrial Development and Export Authority, Greater Fairbanks Community Hospital Foundation Project Rev., 5.00%, 4/1/2021 | | | 325,000 | | | | 333,177 | |
| | |
Alaska Municipal Bond Bank Authority | | | | | | | | |
| | |
Series 3, Rev., 5.00%, 9/1/2020 | | | 200,000 | | | | 200,000 | |
| | |
Series 1, Rev., 5.00%, 12/1/2020 | | | 200,000 | | | | 202,244 | |
| | |
Series 1, Rev., 5.00%, 12/1/2021 | | | 450,000 | | | | 475,141 | |
| | |
Borough of Matanuska-Susitna | | | | | | | | |
| | |
Rev., 5.00%, 9/1/2020 | | | 375,000 | | | | 375,000 | |
| | |
Series 2007A, GO, NATL-RE, 5.00%, 4/1/2021 | | | 35,000 | | | | 35,976 | |
| | |
Borough of Matanuska-Susitna, Goose Creek Correctional Center Project Rev., 5.00%, 9/1/2021 | | | 195,000 | | | | 204,038 | |
| | |
Borough of North Slope | | | | | | | | |
| | |
Series B, GO, 4.00%, 10/30/2020 | | | 20,000 | | | | 20,123 | |
| | |
Series 2018A, GO, 5.00%, 6/30/2021 | | | 20,000 | | | | 20,795 | |
| | |
Borough of North Slope AK Series 2012A, GO, 5.00%, 6/30/2022 | | | 20,000 | | | | 21,747 | |
| | |
Municipality of Anchorage | | | | | | | | |
| | |
Series C, GO, 5.00%, 9/1/2020 | | | 20,000 | | | | 20,000 | |
| | |
Series C, GO, 5.00%, 9/1/2021 | | | 25,000 | | | | 26,198 | |
SEE NOTES TO FINANCIAL STATEMENTS.
| | | | | | | | |
| | | |
| AUGUST 31, 2020 | | J.P. MORGAN EXCHANGE-TRADED FUNDS | | | | | 167 | |
JPMorgan Ultra-Short Municipal Income ETF
SCHEDULE OF PORTFOLIO INVESTMENTS
AS OF AUGUST 31, 2020 (Unaudited) (continued)
| | | | | | | | |
| INVESTMENTS | | PRINCIPAL
AMOUNT ($) | | | VALUE ($) | |
Municipal Bonds — continued | |
|
Alaska — continued | |
| | |
Municipality of Anchorage, General Purpose Series B, GO, 5.00%, 9/1/2020 | | | 20,000 | | | | 20,000 | |
| | |
Municipality of Anchorage, Schools Series D, GO, 5.00%, 9/1/2020 | | | 30,000 | | | | 30,000 | |
| | |
State of Alaska, Alaska Native Tribal Health Consortium Housing Facility Project COP, 5.00%, 6/1/2021 | | | 170,000 | | | | 175,632 | |
| | |
State of Alaska, Native Tribal Health Consortium housing facility project Series 2014, COP, 4.00%, 6/1/2022 | | | 295,000 | | | | 312,617 | |
| | |
University of Alaska Series V-2, Rev., 5.00%, 10/1/2020 | | | 200,000 | | | | 200,462 | |
| | | | | | | | |
| | |
Total Alaska | | | | | | | 3,058,264 | |
| | | | | | | | |
|
Arizona — 0.9% | |
| | |
Arizona Department of Transportation State Highway Fund Series 2013A, Rev., 5.00%, 7/1/2022 (c) | | | 35,000 | | | | 38,068 | |
| | |
Arizona Health Facilities Authority, Banner Health Series 2015A, Rev., 5.00%, 1/1/2021 | | | 25,000 | | | | 25,350 | |
| | |
Arizona Industrial Development Authority, Equitable School Revolving Fund | | | | | | | | |
| | |
Series 2019A, Rev., 5.00%, 11/1/2021 | | | 190,000 | | | | 200,045 | |
| | |
Series 2019A, Rev., 5.00%, 11/1/2022 | | | 400,000 | | | | 438,532 | |
| | |
Series 2019A, Rev., 5.00%, 11/1/2024 | | | 75,000 | | | | 88,186 | |
| | |
Arizona School Facilities Board Series 2015A, COP, 5.00%, 9/1/2020 | | | 300,000 | | | | 300,000 | |
| | |
Arizona Water Infrastructure Finance Authority | | | | | | | | |
| | |
Series 2010A, Rev., 5.00%, 10/1/2020 (c) | | | 30,000 | | | | 30,117 | |
| | |
Series 2010A, Rev., 5.00%, 10/1/2020 | | | 70,000 | | | | 70,270 | |
| | |
Chandler Industrial Development Authority, Intel Corp. Project Series 2018, Rev., 2.40%, 8/14/2023 (b) | | | 1,975,000 | | | | 2,077,463 | |
| | |
City of Mesa Rev., 5.00%, 7/1/2022 | | | 50,000 | | | | 54,422 | |
| | |
City of Phoenix Civic Improvement Corp. | | | | | | | | |
| | |
Rev., 5.00%, 7/1/2021 | | | 20,000 | | | | 20,803 | |
| | |
Series 2017D, Rev., 5.00%, 7/1/2024 | | | 400,000 | | | | 461,948 | |
| | |
City of Surprise AZ Utility System Rev., 5.00%, 7/1/2022 | | | 35,000 | | | | 38,095 | |
| | |
County of Maricopa COP, 5.00%, 7/1/2022 | | | 275,000 | | | | 298,735 | |
| | |
County of Pima AZ Sewer System Rev., 5.00%, 7/1/2022 | | | 60,000 | | | | 65,283 | |
| | |
Industrial Development Authority of the County of Pima (The) Series 2009A, Rev., 4.95%, 10/1/2020 | | | 295,000 | | | | 296,094 | |
| | | | | | | | |
| INVESTMENTS | | PRINCIPAL
AMOUNT ($) | | | VALUE ($) | |
| |
|
Arizona — continued | |
| | |
Industrial Development Authority of the County of Yavapai (The), Yavapai Regional Medical Center Series 2013A, Rev., 4.00%, 8/1/2021 | | | 135,000 | | | | 139,113 | |
| | |
Maricopa County Industrial Development Authority, Banner Health Series C, Rev., 5.00%, 10/18/2024 (b) | | | 50,000 | | | | 58,766 | |
| | |
Maricopa County Industrial Development Authority, Banner Health Obligated Group Series 2016A, Rev., 5.00%, 1/1/2021 | | | 90,000 | | | | 91,259 | |
| | |
Maricopa County School District No. 3 Tempe Elementary GO, 4.00%, 7/1/2023 | | | 35,000 | | | | 38,649 | |
| | |
Maricopa County Unified School District No. 80 Chandler Series 2017B, GO, 3.50%, 7/1/2022 | | | 25,000 | | | | 26,521 | |
| | |
Maricopa County Unified School District No. 97-Deer Valley Series 2017C, GO, 5.00%, 7/1/2022 | | | 30,000 | | | | 32,641 | |
| | |
Maricopa County Union High School District No. 210-Phoenix GO, 5.00%, 7/1/2022 | | | 30,000 | | | | 32,642 | |
| | |
Mohave County Unified School District No. 1 Lake Havasu Series 2017A, GO, 4.00%, 7/1/2023 | | | 45,000 | | | | 49,691 | |
| | |
Pima County Regional Transportation Authority Rev., 5.00%, 6/1/2024 | | | 25,000 | | | | 29,399 | |
| | |
Regional Public Transportation Authority, Transportation Excise Tax, Maricopa County Public Transportation Fund Rev., 5.25%, 7/1/2021 | | | 30,000 | | | | 31,267 | |
| | |
Salt River Project Agricultural Improvement & Power District | | | | | | | | |
| | |
Series 2016A, Rev., 5.00%, 1/1/2021 | | | 30,000 | | | | 30,481 | |
| | |
Series 2011A, Rev., 5.00%, 12/1/2024 | | | 25,000 | | | | 26,483 | |
| | |
Salt River Project Agricultural Improvement & Power District, Arizona Salt River Project, Tax Exempt Series 2010-B, Rev., 5.00%, 12/1/2020 | | | 55,000 | | | | 55,661 | |
| | |
State of Arizona COP, 5.00%, 9/1/2020 | | | 50,000 | | | | 50,000 | |
| | |
Yavapai County Union High School District No. 4 Mingus GO, 4.00%, 7/1/2021 | | | 25,000 | | | | 25,767 | |
| | | | | | | | |
| | |
Total Arizona | | | | | | | 5,221,751 | |
| | | | | | | | |
|
Arkansas — 0.1% | |
| | |
Arkansas Development Finance Authority Rev., AMBAC, Zero Coupon, 7/1/2023 | | | 25,000 | | | | 24,553 | |
| | |
Bentonville School District No. 6, Construction Series A, GO, 3.00%, 9/1/2020 | | | 70,000 | | | | 70,000 | |
SEE NOTES TO FINANCIAL STATEMENTS.
| | | | | | |
| | | |
| 168 | | | | J.P. MORGAN EXCHANGE-TRADED FUNDS | | AUGUST 31, 2020 |
| | | | | | | | |
| INVESTMENTS | | PRINCIPAL
AMOUNT ($) | | | VALUE ($) | |
Municipal Bonds — continued | |
|
Arkansas — continued | |
| | |
Cedarville School District No. 44 | | | | | | | | |
| | |
GO, 3.50%, 12/1/2020 | | | 120,000 | | | | 120,972 | |
| | |
GO, 3.63%, 12/1/2020 | | | 130,000 | | | | 131,093 | |
| | |
Pulaski County Special School District GO, 3.00%, 2/1/2021 (c) | | | 105,000 | | | | 106,114 | |
| | |
University of Arkansas | | | | | | | | |
| | |
Series 2011B, Rev., 5.00%, 11/1/2020 | | | 30,000 | | | | 30,239 | |
| | |
Series 2015C, Rev., 5.00%, 11/1/2020 | | | 70,000 | | | | 70,557 | |
| | |
Rev., 4.00%, 5/1/2022 | | | 30,000 | | | | 31,825 | |
| | |
Series 2013A, Rev., 5.00%, 9/15/2022 | | | 25,000 | | | | 27,421 | |
| | |
University of Arkansas, Ualr Campus Rev., 4.00%, 10/1/2020 | | | 25,000 | | | | 25,078 | |
| | | | | | | | |
| | |
Total Arkansas | | | | | | | 637,852 | |
| | | | | | | | |
|
California — 2.8% | |
| | |
Abag Finance Authority for Nonprofit Corps. Series 2014-A, Rev., 4.00%, 9/2/2020 | | | 140,000 | | | | 140,000 | |
| | |
Alhambra Unified School District Series 2016B, GO, 5.00%, 8/1/2022 | | | 30,000 | | | | 32,792 | |
| | |
Berkeley Joint Powers Financing Authority Rev., 5.00%, 10/1/2020 | | | 65,000 | | | | 65,256 | |
| | |
Brentwood Infrastructure Financing Authority | | | | | | | | |
| | |
Rev., 4.00%, 10/1/2020 | | | 85,000 | | | | 85,236 | |
| | |
Rev., 5.00%, 10/1/2024 | | | 40,000 | | | | 46,923 | |
| | |
Buena Park Public Financing Authority Rev., 4.00%, 5/1/2021 | | | 110,000 | | | | 112,809 | |
| | |
California County Tobacco Securitization Agency, Senior | | | | | | | | |
| | |
Series 2020A, Rev., 3.00%, 6/1/2021 | | | 350,000 | | | | 357,073 | |
| | |
Series 2020A, Rev., 4.00%, 6/1/2022 | | | 350,000 | | | | 372,228 | |
| | |
Series 2020A, Rev., 4.00%, 6/1/2023 | | | 350,000 | | | | 384,150 | |
| | |
California Health Facilities Financing Authority | | | | | | | | |
| | |
Series 2011A, Rev., 5.25%, 3/1/2022 | | | 175,000 | | | | 178,582 | |
| | |
Series C, Rev., 5.00%, 11/1/2022 (b) | | | 560,000 | | | | 616,375 | |
| | |
Rev., 5.00%, 11/15/2024 | | | 210,000 | | | | 249,726 | |
| | |
California Health Facilities Financing Authority, Memorial Health Services Series 2012A, Rev., 4.00%, 10/1/2021 | | | 245,000 | | | | 254,663 | |
| | |
California Health Facilities Financing Authority, St. Joseph Health System | | | | | | | | |
| | |
Series 2013D, Rev., 5.00%, 10/15/2020 (b) | | | 1,040,000 | | | | 1,045,949 | |
| | |
Series 2009D, Rev., 1.70%, 10/18/2022(b) | | | 265,000 | | | | 271,856 | |
| | |
Series 2009C, Rev., 5.00%, 10/18/2022 (b) | | | 85,000 | | | | 93,130 | |
| | | | | | | | |
| INVESTMENTS | | PRINCIPAL
AMOUNT ($) | | | VALUE ($) | |
| |
|
California — continued | |
| | |
California Infrastructure & Economic Development Bank | | | | | | | | |
| | |
Rev., 5.00%, 10/1/2020 | | | 25,000 | | | | 25,098 | |
| | |
Rev., 5.00%, 11/1/2022 | | | 100,000 | | | | 110,434 | |
| | |
California Infrastructure & Economic Development Bank, The J. Paul Getty Trust Series 2020A-2, Rev., (SIFMA Municipal Swap Index Yield — 0.05%), 0.04%, 9/10/2020 (d) | | | 750,000 | | | | 748,485 | |
| | |
California Public Finance Authority Rev., 3.00%, 10/1/2021 | | | 25,000 | | | | 25,777 | |
| | |
California State Public Works Board | | | | | | | | |
| | |
Series 2014A, Rev., 5.00%, 9/1/2020 | | | 200,000 | | | | 200,000 | |
| | |
Series 2013C, Rev., 4.00%, 3/1/2021 (c) | | | 75,000 | | | | 76,427 | |
| | |
California Statewide Communities Development Authority, Multi-Family Housing, Ethel Arnold Bradley Apartments Series S-1, Rev., 1.25%, 6/1/2021 (b) | | | 165,000 | | | | 165,970 | |
| | |
California Statewide Communities Development Authority, Multi-Family Housing, Robert Farrell Manor & Western Gardens Apartments Series T-1, Rev., 1.25%, 6/1/2021 (b) | | | 165,000 | | | | 165,970 | |
| | |
Castaic Lake Water Agency Series 1999A, COP, AMBAC, Zero Coupon, 8/1/2023 | | | 45,000 | | | | 44,413 | |
| | |
Chino Redevelopment Agency Successor Agency Series A, 5.00%, 9/1/2020 | | | 125,000 | | | | 125,000 | |
| | |
City & County of San Francisco Series 2010A, COP, 4.00%, 10/1/2020 | | | 25,000 | | | | 25,076 | |
| | |
City & County of San Francisco, Moscone Center South Regunding Project Series 2011A, COP, 5.00%, 9/1/2021 | | | 30,000 | | | | 31,326 | |
| | |
City & County of San Francisco, Multifamily Housing, Transbay Block 8 Tower Apartments Series 2016H-2, Rev., VRDO, LOC: Bank of China Ltd., 0.19%, 9/10/2020 (b) | | | 710,000 | | | | 710,000 | |
| | |
City And County of San Francisco Finance Corp. Series 2010-R1, Rev., 3.50%, 4/1/2021 | | | 25,000 | | | | 25,068 | |
| | |
City of Bakersfield, Wastewater Series 2015A, Rev., 5.00%, 9/15/2020 | | | 50,000 | | | | 50,088 | |
| | |
City of Berkeley GO, 5.00%, 9/1/2020 | | | 25,000 | | | | 25,000 | |
| | |
City of Long Beach | | | | | | | | |
| | |
Series 2014B, Rev., 5.00%, 5/15/2023 | | | 50,000 | | | | 56,041 | |
| | |
Series 2020A, Rev., 4.00%, 5/15/2024 | | | 20,000 | | | | 22,584 | |
| | |
City of Los Angeles Series 2011-B, GO, 5.00%, 9/1/2020 | | | 25,000 | | | | 25,000 | |
| | |
City of Newark COP, 5.00%, 6/1/2023 | | | 45,000 | | | | 50,629 | |
SEE NOTES TO FINANCIAL STATEMENTS.
| | | | | | | | |
| | | |
| AUGUST 31, 2020 | | J.P. MORGAN EXCHANGE-TRADED FUNDS | | | | | 169 | |
JPMorgan Ultra-Short Municipal Income ETF
SCHEDULE OF PORTFOLIO INVESTMENTS
AS OF AUGUST 31, 2020 (Unaudited) (continued)
| | | | | | | | |
| INVESTMENTS | | PRINCIPAL
AMOUNT ($) | | | VALUE ($) | |
Municipal Bonds — continued | |
|
California — continued | |
| | |
City of Pasadena Series 2012A, Rev., 4.00%, 6/1/2022 | | | 20,000 | | | | 21,350 | |
| | |
City of Richmond Rev., FGIC, Zero Coupon, 8/1/2023 (c) | | | 200,000 | | | | 197,282 | |
| | |
City of Roseville, 316 Vernon Street Project COP, 5.00%, 8/1/2022 | | | 40,000 | | | | 43,642 | |
| | |
City of San Francisco Subseries C, Rev., 5.00%, 11/1/2021 (c) | | | 45,000 | | | | 47,510 | |
| | |
City of San Mateo GO, 4.00%, 8/1/2021 | | | 20,000 | | | | 20,709 | |
| | |
City of Santa Clara COP, 4.00%, 2/1/2021 | | | 25,000 | | | | 25,391 | |
| | |
City of Sausalito COP, 4.00%, 5/1/2023 | | | 25,000 | | | | 27,528 | |
| | |
Coronado Community Development Agency Successor Agency | | | | | | | | |
| | |
Series 2018A, 5.00%, 9/1/2020 | | | 100,000 | | | | 100,000 | |
| | |
Series 2018A, 5.00%, 9/1/2021 | | | 100,000 | | | | 104,862 | |
| | |
County of Napa COP, 5.00%, 6/1/2022 | | | 40,000 | | | | 43,325 | |
| | |
County of San Bernardino, Arrowhead Project Series 2019A, COP, 5.00%, 10/1/2020 | | | 25,000 | | | | 25,094 | |
| | |
County of San Diego COP, 4.00%, 2/1/2025 | | | 30,000 | | | | 30,457 | |
| | |
County of Sonoma, Limited Tax Series 2015A, Rev., 5.00%, 9/1/2020 | | | 700,000 | | | | 700,000 | |
| | |
Culver Redevelopment Agency Successor Agency, Tax Allocation Series 2017A, 4.00%, 11/1/2020 | | | 100,000 | | | | 100,632 | |
| | |
Department of Veterans Affairs Veteran’s Farm & Home Purchase Program Series 2012A, Rev., 2.75%, 12/1/2020 | | | 45,000 | | | | 45,270 | |
| | |
Desert Community College District GO, 5.00%, 8/1/2022 | | | 30,000 | | | | 32,786 | |
| | |
East Bay Regional Park District, Election of 2008 Series 2013A, GO, 4.00%, 9/1/2020 | | | 20,000 | | | | 20,000 | |
| | |
El Monte City School District, Capital Appreciation, Election of 2004 Series 2008C, GO, AGC, Zero Coupon, 8/1/2023 | | | 600,000 | | | | 575,400 | |
| | |
Evergreen School District GO, 4.00%, 9/1/2020 | | | 25,000 | | | | 25,000 | |
| | |
Fontana Redevelopment Agency Successor Agency | | | | | | | | |
| | |
Series 2017A, 5.00%, 10/1/2020 | | | 150,000 | | | | 150,550 | |
| | |
Series 2017A, 5.00%, 10/1/2023 | | | 30,000 | | | | 33,820 | |
| | |
Fremont Public Financing Authority Series 2017B, Rev., 5.00%, 10/1/2023 | | | 25,000 | | | | 28,678 | |
| | |
Fresno Unified School District, Election of 2001 Series G, GO, Zero Coupon, 8/1/2041 | | | 405,000 | | | | 101,910 | |
| | | | | | | | |
| INVESTMENTS | | PRINCIPAL
AMOUNT ($) | | | VALUE ($) | |
| |
|
California — continued | |
| | |
Gavilan Joint Community College District, Election of 2004 Series 2011D, GO, 4.00%, 8/1/2021 | | | 25,000 | | | | 25,886 | |
| | |
Glendale Unified School District GO, 5.00%, 9/1/2020 | | | 90,000 | | | | 90,000 | |
| | |
Golden State Tobacco Securitization Corp. Series 2018A, Rev., 3.00%, 6/1/2022 | | | 100,000 | | | | 104,811 | |
| | |
Golden State Tobacco Securitization Corp., Tobacco Settlement Series 2015A, Rev., 5.00%, 6/1/2021 | | | 700,000 | | | | 724,962 | |
| | |
Grossmont Healthcare District Series C, GO, 5.00%, 7/15/2024 | | | 25,000 | | | | 29,379 | |
| | |
Imperial Irrigation District Electric System Series 2011C, Rev., 5.00%, 11/1/2020 (c) | | | 25,000 | | | | 25,198 | |
| | |
Jefferson Union High School District Series D, GO, Zero Coupon, 8/1/2021 (c) | | | 150,000 | | | | 52,378 | |
| | |
Lodi Unified School District GO, AGM, 5.00%, 8/1/2023 | | | 240,000 | | | | 260,539 | |
| | |
Los Alamitos Unified School District GO, 5.00%, 8/1/2021 | | | 40,000 | | | | 41,782 | |
| | |
Los Angeles Community College District GO, 4.00%, 8/1/2021 | | | 45,000 | | | | 46,598 | |
| | |
Los Angeles County Metropolitan Transportation Authority Series 2016A, Rev., 5.00%, 6/1/2021 | | | 25,000 | | | | 25,913 | |
| | |
Los Angeles County Public Works Financing Authority Series 2019E1, Rev., 4.00%, 12/1/2023 | | | 85,000 | | | | 94,682 | |
| | |
Los Angeles County Redevelopment Refunding Authority Redev Agency Successor Agy 5.00%, 12/1/2022 | | | 50,000 | | | | 54,986 | |
| | |
Los Angeles Department of Water Series 2011A, Rev., 5.00%, 7/1/2021 | | | 35,000 | | | | 35,566 | |
| | |
Marin Water District Financing Authority Series 2012A, Rev., 4.00%, 7/1/2021 | | | 25,000 | | | | 25,805 | |
| | |
Merced Union High School District GO, AGM, Zero Coupon, 2/18/2025 (c) | | | 250,000 | | | | 79,135 | |
| | |
Metropolitan Water District of Southern California, Waterworks Series 2010A, GO, 5.00%, 9/1/2020 | | | 100,000 | | | | 100,000 | |
| | |
Mojave Water Agency Public Facilities Corp Series 2014A, Rev., 4.00%, 9/1/2020 | | | 20,000 | | | | 20,000 | |
| | |
Morongo Unified School District Series 2012C, GO, Zero Coupon, 8/15/2022 (c) | | | 95,000 | | | | 35,965 | |
| | |
Mountain View-Whisman School District, Santa Clara County GO, 5.00%, 9/1/2020 | | | 20,000 | | | | 20,000 | |
SEE NOTES TO FINANCIAL STATEMENTS.
| | | | | | |
| | | |
| 170 | | | | J.P. MORGAN EXCHANGE-TRADED FUNDS | | AUGUST 31, 2020 |
| | | | | | | | |
| INVESTMENTS | | PRINCIPAL
AMOUNT ($) | | | VALUE ($) | |
Municipal Bonds — continued | |
|
California — continued | |
| | |
Newport Mesa Unified School District, Election of 2005 GO, Zero Coupon, 8/1/2021 (c) | | | 200,000 | | | | 48,862 | |
| | |
Northern California Power Agency Series 1986A, Rev., AMBAC, 7.50%, 7/1/2021 (c) | | | 180,000 | | | | 190,633 | |
| | |
Ohlone Community College District GO, 4.00%, 8/1/2021 | | | 35,000 | | | | 36,240 | |
| | |
Ontario Public Financing Authority Rev., 5.00%, 7/1/2021 | | | 35,000 | | | | 36,417 | |
| | |
Orchard School District GO, 5.00%, 8/1/2023 | | | 25,000 | | | | 28,499 | |
| | |
Padre Dam Municipal Water District Series 2017A, COP, 5.00%, 10/1/2024 | | | 50,000 | | | | 59,656 | |
| | |
Palm Springs Community Redevelopment Agency, Successor Agency 3.00%, 9/1/2020 | | | 200,000 | | | | 200,000 | |
| | |
Palm Springs Financing Authority | | | | | | | | |
| | |
Series 2012B, Rev., 4.00%, 6/1/2022 | | | 75,000 | | | | 80,064 | |
| | |
Series 2012A, Rev., 3.13%, 11/1/2022 | | | 25,000 | | | | 26,468 | |
| | |
Series 2012A, Rev., 3.25%, 11/1/2023 | | | 55,000 | | | | 58,338 | |
| | |
Palm Springs Financing Authority, Convention Center Project | | | | | | | | |
| | |
Series 2012A, Rev., 3.00%, 11/1/2020 | | | 25,000 | | | | 25,108 | |
| | |
Series 2012A, Rev., 3.00%, 11/1/2021 | | | 150,000 | | | | 154,576 | |
| | |
Palomar Community College District GO, 5.00%, 5/1/2024 | | | 50,000 | | | | 58,808 | |
| | |
Pasadena Public Financing Authority Series 2016A, Rev., 5.00%, 4/1/2022 | | | 25,000 | | | | 26,909 | |
| | |
Port of Los Angeles | | | | | | | | |
| | |
Series 2014B, Rev., 5.00%, 8/1/2021 | | | 30,000 | | | | 31,229 | |
| | |
Series 2015A, Rev., 5.00%, 8/1/2021 | | | 25,000 | | | | 26,025 | |
| | |
Puente Basin Water Agency Series 2013A, Rev., 5.00%, 6/1/2023 | | | 25,000 | | | | 28,304 | |
| | |
Rancho Cucamonga Redevelopment Agency, Redevelopment Project AGM, 5.00%, 9/1/2020 | | | 350,000 | | | | 350,000 | |
| | |
Rancho Santiago Community College District GO, 4.00%, 9/1/2020 | | | 75,000 | | | | 75,000 | |
| | |
Regents of the University of California Series AK, Rev., 5.00%, 5/15/2023 (b) | | | 180,000 | | | | 202,628 | |
| | |
Rescue Union School District Series 1998A, GO, NATL-RE, Zero Coupon, 9/1/2020 | | | 25,000 | | | | 25,000 | |
| | |
San Diego County Regional Transportation Commission Series 2012A, Rev., 5.00%, 4/1/2021 | | | 35,000 | | | | 35,980 | |
| | |
San Diego Public Facilities Financing Authority Series 2016A, Rev., 4.00%, 5/15/2021 | | | 35,000 | | | | 35,946 | |
| | | | | | | | |
| INVESTMENTS | | PRINCIPAL
AMOUNT ($) | | | VALUE ($) | |
| |
|
California — continued | |
| | |
San Diego Public Facilities Financing Authority, Master Refunding Project | | | | | | | | |
| | |
Series 2010A, Rev., 5.00%, 9/1/2020 (c) | | | 80,000 | | | | 80,000 | |
| | |
Series 2010A, Rev., 5.25%, 9/1/2020 (c) | | | 40,000 | | | | 40,000 | |
| | |
San Diego Redevelopment Agency, Naval Training Center Redevelopment Project Series 2010A, 5.50%, 9/1/2020 (c) | | | 45,000 | | | | 45,000 | |
| | |
San Francisco Bay Area Rapid Transit District Sales Tax Series 2015A, Rev., 5.00%, 7/1/2022 | | | 20,000 | | | | 21,800 | |
| | |
San Francisco Municipal Transportation Agency Rev., 5.00%, 3/1/2021 | | | 35,000 | | | | 35,799 | |
| | |
San Francisco Unified School District GO, 4.00%, 9/28/2020 | | | 50,000 | | | | 50,139 | |
| | |
San Joaquin Hills Transportation Corridor Agency Rev., Zero Coupon, 1/1/2025 (c) | | | 120,000 | | | | 117,992 | |
| | |
San Jose Financing Authority | | | | | | | | |
| | |
Series 2013A, Rev., 4.00%, 6/1/2021 | | | 25,000 | | | | 25,671 | |
| | |
Series 2013A, Rev., 5.00%, 6/1/2022 | | | 75,000 | | | | 80,973 | |
| | |
Series 2013A, Rev., 5.00%, 6/1/2023 | | | 30,000 | | | | 33,752 | |
| | |
San Juan Unified School District GO, 3.00%, 8/1/2023 | | | 25,000 | | | | 27,047 | |
| | |
San Juan Water District Rev., 5.00%, 2/1/2025 | | | 45,000 | | | | 54,516 | |
| | |
San Marcos Unified School District, Community Facilities District No. 5, Special Tax 5.00%, 9/1/2020 | | | 125,000 | | | | 125,000 | |
| | |
San Mateo Joint Powers Financing Authority Series 2014A, Rev., 4.00%, 6/15/2021 | | | 30,000 | | | | 30,895 | |
| | |
Santa Monica Community College District Series 2014B, GO, 5.00%, 8/1/2022 | | | 35,000 | | | | 38,257 | |
| | |
Santa Monica Public Financing Authority | | | | | | | | |
| | |
Rev., 5.00%, 7/1/2021 | | | 35,000 | | | | 36,417 | |
| | |
Series 2011A, Rev., 5.00%, 6/1/2023 | | | 25,000 | | | | 25,890 | |
| | |
Silicon Valley Clean Water Rev., 5.00%, 8/1/2022 | | | 25,000 | | | | 27,327 | |
| | |
Simi Valley Public Financing Authority Series 2014A, Rev., 5.00%, 10/1/2022 | | | 70,000 | | | | 77,012 | |
| | |
Solano County Community College District Series 2014A, GO, 5.00%, 8/1/2023 | | | 40,000 | | | | 45,599 | |
| | |
Sonoma County Junior College District Series B, GO, 4.00%, 8/1/2023 | | | 55,000 | | | | 61,101 | |
| | |
South San Francisco Unified School District | | | | | | | | |
| | |
Rev., NATL-RE, 5.25%, 9/15/2020 | | | 25,000 | | | | 25,046 | |
| | |
Rev., NATL-RE, 5.25%, 9/15/2022 | | | 35,000 | | | | 38,643 | |
| | |
State of California Department of Water Resources Series AV, Rev., 5.00%, 12/1/2020 | | | 35,000 | | | | 35,423 | |
SEE NOTES TO FINANCIAL STATEMENTS.
| | | | | | | | |
| | | |
| AUGUST 31, 2020 | | J.P. MORGAN EXCHANGE-TRADED FUNDS | | | | | 171 | |
JPMorgan Ultra-Short Municipal Income ETF
SCHEDULE OF PORTFOLIO INVESTMENTS
AS OF AUGUST 31, 2020 (Unaudited) (continued)
| | | | | | | | |
| INVESTMENTS | | PRINCIPAL
AMOUNT ($) | | | VALUE ($) | |
Municipal Bonds — continued | |
|
California — continued | |
| | |
State of California Department of Water Resources, Central Valley Project, Water System Series AW, Rev., 4.00%, 12/1/2020 | | | 20,000 | | | | 20,192 | |
| | |
State of California, Various Purpose GO, 5.00%, 9/1/2020 | | | 50,000 | | | | 50,000 | |
| | |
Sunnyvale Elementary School District Series 2019C, GO, 4.00%, 9/1/2021 | | | 25,000 | | | | 25,967 | |
| | |
Tahoe-Truckee Sanitation Agency Rev., 5.00%, 7/1/2024 | | | 30,000 | | | | 35,531 | |
| | |
Tracy Unified School District Series 2011B, GO, Zero Coupon, 8/1/2021 (c) | | | 100,000 | | | | 38,495 | |
| | |
Tustin Unified School District, Community Facilities District No. 88-1 5.00%, 9/1/2020 | | | 200,000 | | | | 200,000 | |
| | |
Twin Rivers Unified School District Series 2014A, GO, Zero Coupon, 2/1/2024 (c) | | | 350,000 | | | | 168,490 | |
| | |
University of California Series 2016AT, Rev., 1.40%, 5/15/2021 (b) | | | 965,000 | | | | 967,480 | |
| | |
Ventura County Community College District Series 2008C, GO, Zero Coupon, 8/1/2021 | | | 100,000 | | | | 99,699 | |
| | |
Washington Township Health Care District Series 2015A, Rev., 5.00%, 7/1/2021 | | | 275,000 | | | | 284,235 | |
| | |
West Hollywood Public Financing Authority Rev., 5.00%, 4/1/2024 | | | 75,000 | | | | 87,481 | |
| | |
Yountville Finance Authority Rev., 5.00%, 12/1/2021 | | | 25,000 | | | | 26,510 | |
| | | | | | | | |
| | |
Total California | | | | | | | 16,433,984 | |
| | | | | | | | |
|
Colorado — 1.4% | |
| | |
Adams & Arapahoe Joint School District 28J Aurora GO, 5.00%, 12/1/2024 | | | 25,000 | | | | 27,671 | |
| | |
Apex Park & Recreation District GO, 3.00%, 12/1/2024 | | | 50,000 | | | | 55,572 | |
| | |
Arapahoe County School District No. 5 Cherry Creek GO, 3.00%, 12/15/2020 | | | 25,000 | | | | 25,204 | |
| | |
Board of Water Commissioners City & County of Denver (The) Series A, Rev., 5.00%, 9/15/2020 | | | 25,000 | | | | 25,044 | |
| | |
City & County of Denver | | | | | | | | |
| | |
Series 2010A, Rev., 5.00%, 11/15/2020 | | | 110,000 | | | | 111,047 | |
| | |
Series 2011-A, GO, 3.00%, 8/1/2021 (c) | | | 25,000 | | | | 25,636 | |
| | |
Series 2010A, Rev., 5.00%, 11/15/2022 | | | 150,000 | | | | 151,368 | |
| | |
Series 2010A, Rev., 5.00%, 11/15/2024 | | | 155,000 | | | | 156,375 | |
| | |
Series B, Rev., 5.00%, 11/15/2024 | | | 125,000 | | | | 147,103 | |
| | |
City of Colorado Springs | | | | | | | | |
| | |
Series 2013A, Rev., 5.00%, 11/15/2020 | | | 40,000 | | | | 40,394 | |
| | |
Series C-1, Rev., 5.00%, 11/15/2020 | | | 50,000 | | | | 50,493 | |
| | | | | | | | |
| INVESTMENTS | | PRINCIPAL
AMOUNT ($) | | | VALUE ($) | |
| |
|
Colorado — continued | |
| | |
Series 2011-A, Rev., 5.00%, 11/15/2022 | | | 25,000 | | | | 26,449 | |
| | |
Series A-3, Rev., 5.00%, 11/15/2022 | | | 50,000 | | | | 55,285 | |
| | |
City of Colorado Springs, Utility System | | | | | | | | |
| | |
Series 2010D-2, Rev., 5.00%, 11/15/2020 | | | 50,000 | | | | 50,487 | |
| | |
Series 2020B, Rev., 5.00%, 11/15/2021 | | | 35,000 | | | | 37,035 | |
| | |
Colorado Educational and Cultural Facilities Authority, Charter School, Salida Del Sol Academy Building Corp. Rev., 7.25%, 6/1/2023 (c) | | | 130,000 | | | | 152,441 | |
| | |
Colorado Educational and Cultural Facilities Authority, University of Denver Project Rev., 4.00%, 3/1/2021 | | | 110,000 | | | | 111,660 | |
| | |
Colorado Health Facilities Authority | | | | | | | | |
| | |
Series 2011A, Rev., 5.00%, 2/1/2021 (c) | | | 155,000 | | | | 158,036 | |
| | |
Series 2009B-1, Rev., 5.00%, 11/9/2022 (c) | | | 20,000 | | | | 22,014 | |
| | |
Series 2019A, Rev., 5.00%, 1/1/2023 | | | 145,000 | | | | 159,876 | |
| | |
Colorado Health Facilities Authority, Catholic health Initiatives Series 2011A, Rev., 5.00%, 2/1/2021 (c) | | | 70,000 | | | | 71,371 | |
| | |
Colorado Health Facilities Authority, Catholic Health Initiatives | | | | | | | | |
| | |
Series 2011A, Rev., 5.00%, 2/1/2021 (c) | | | 195,000 | | | | 198,820 | |
| | |
Series A, Rev., 5.00%, 2/1/2021 (c) | | | 480,000 | | | | 489,403 | |
| | |
Series 2011A, Rev., 5.25%, 2/1/2021 (c) | | | 810,000 | | | | 826,711 | |
| | |
Series 2009B-1, Rev., 4.00%, 11/9/2022 (c) | | | 20,000 | | | | 21,579 | |
| | |
Series 2013A, Rev., 5.25%, 1/1/2023 (c) | | | 525,000 | | | | 584,393 | |
| | |
Colorado Health Facilities Authority, Covenant Retirement Communities, Inc. Series 2012C, Rev., 5.00%, 12/1/2021 | | | 75,000 | | | | 77,511 | |
| | |
Colorado Health Facilities Authority, Parkview Medical Center, Inc. Project | | | | | | | | |
| | |
Series 2015A, Rev., 4.00%, 9/1/2022 | | | 80,000 | | | | 84,583 | |
| | |
Rev., 5.00%, 9/1/2022 | | | 155,000 | | | | 166,935 | |
| | |
Colorado Water Resources & Power Development Authority Series 2010A, Rev., 4.00%, 9/1/2024 | | | 25,000 | | | | 25,075 | |
| | |
Colorado Water Resources and Power Development Authority, Clean Water Series 2008-A, Rev., 4.00%, 9/1/2020 | | | 250,000 | | | | 250,000 | |
| | |
County of Adams | | | | | | | | |
| | |
COP, 5.00%, 12/1/2020 | | | 325,000 | | | | 328,819 | |
| | |
COP, 5.00%, 12/1/2023 | | | 705,000 | | | | 811,455 | |
| | |
County of Boulder | | | | | | | | |
| | |
COP, 5.00%, 12/1/2020 | | | 140,000 | | | | 141,645 | |
SEE NOTES TO FINANCIAL STATEMENTS.
| | | | | | |
| | | |
| 172 | | | | J.P. MORGAN EXCHANGE-TRADED FUNDS | | AUGUST 31, 2020 |
| | | | | | | | |
| INVESTMENTS | | PRINCIPAL
AMOUNT ($) | | | VALUE ($) | |
Municipal Bonds — continued | |
|
Colorado — continued | |
| | |
COP, 5.00%, 12/1/2021 | | | 160,000 | | | | 161,877 | |
| | |
County of Eagle | | | | | | | | |
| | |
COP, 4.00%, 12/1/2020 | | | 120,000 | | | | 121,114 | |
| | |
COP, 5.00%, 12/1/2021 | | | 245,000 | | | | 259,345 | |
| | |
County of El Paso COP, 4.00%, 12/1/2020 | | | 100,000 | | | | 100,928 | |
| | |
Dawson Ridge Metropolitan District No.1 Series A, GO, Zero Coupon, 10/1/2022 (c) | | | 50,000 | | | | 49,597 | |
| | |
Douglas County School District No. Re-1 Douglas and Elbert Counties GO, 4.00%, 12/15/2020 | | | 25,000 | | | | 25,275 | |
| | |
E-470 Public Highway Authority Series 2010C, Rev., 5.25%, 9/1/2020 | | | 500,000 | | | | 500,000 | |
| | |
E-470 Public Highway Authority, Capital Appreciation Series 2004B, Rev., NATL-RE, Zero Coupon, 9/1/2020 | | | 345,000 | | | | 220,752 | |
| | |
Jefferson County School District R-1 GO, 5.00%, 12/15/2020 | | | 50,000 | | | | 50,690 | |
| | |
Regional Transportation District Series 2013A, COP, 5.00%, 6/1/2022 | | | 200,000 | | | | 216,404 | |
| | |
Snowmass-Wildcat Fire Protection District GO, 4.00%, 12/1/2020 | | | 25,000 | | | | 25,239 | |
| | |
State of Colorado Department of Transportation COP, 5.00%, 9/9/2020 | | | 100,000 | | | | 100,093 | |
| | |
The Regents of the University of Colorado, Enterprise System Series 2012A-1, Rev., 4.00%, 6/1/2022 (c) | | | 25,000 | | | | 26,635 | |
| | |
University of Colorado | | | | | | | | |
| | |
Series 2011A, Rev., 4.13%, 6/1/2021 (c) | | | 25,000 | | | | 25,738 | |
| | |
Series A, Rev., 5.00%, 6/1/2023 | | | 25,000 | | | | 28,230 | |
| | |
University of Colorado Hospital Authority | | | | | | | | |
| | |
Series 2017C-2, Rev., 5.00%, 3/1/2022 (b) | | | 365,000 | | | | 380,045 | |
| | |
Series 2019C, Rev., 5.00%, 11/15/2024 (b) | | | 250,000 | | | | 290,365 | |
| | | | | | | | |
| | |
Total Colorado | | | | | | | 8,249,817 | |
| | | | | | | | |
|
Connecticut — 1.9% | |
| | |
City of Stamford | | | | | | | | |
| | |
GO, 4.00%, 9/17/2020 | | | 100,000 | | | | 100,161 | |
| | |
Connecticut Housing Finance Authority | | | | | | | | |
| | |
Subseries 2018C-3, Rev., VRDO, LIQ: TD Bank NA, 0.08%, 9/10/2020 (b) | | | 4,105,000 | | | | 4,105,000 | |
| | |
Subseries A-1, Rev., 2.35%, 11/15/2020 | | | 220,000 | | | | 220,796 | |
| | |
Connecticut Housing Finance Authority, Housing Mortgage Finance Program Series 2016A, Subseries A-3, Rev., VRDO, LIQ: Royal Bank of Canada, 0.08%, 9/10/2020 (b) | | | 2,305,000 | | | | 2,305,000 | |
| | | | | | | | |
| INVESTMENTS | | PRINCIPAL
AMOUNT ($) | | | VALUE ($) | |
| |
|
Connecticut — continued | |
| | |
Connecticut State Health & Educational Facilities Authority | | | | | | | | |
| | |
Series 2010A-3, Rev., 1.80%, 2/9/2021 (b) | | | 355,000 | | | | 357,474 | |
| | |
Series X-2, Rev., 1.80%, 2/9/2021 (b) | | | 225,000 | | | | 226,568 | |
| | |
Series U-1, Rev., 2.00%, 2/8/2022 (b) | | | 430,000 | | | | 441,025 | |
| | |
Rev., 1.10%, 2/7/2023 (b) | | | 165,000 | | | | 168,454 | |
| | |
Rev., 3.00%, 12/1/2023 | | | 100,000 | | | | 107,500 | |
| | |
Connecticut State Health and Educational Facilities Authority, Yale New Haven Health Issue Series E, Rev., 5.00%, 7/1/2022 | | | 235,000 | | | | 253,974 | |
| | |
State of Connecticut Series 2019A, GO, 5.00%, 4/15/2021 | | | 270,000 | | | | 277,933 | |
| | |
Series 2017A, GO, 5.00%, 4/15/2023 | | | 125,000 | | | | 140,240 | |
| | |
Series 2014E, GO, 5.00%, 9/1/2023 | | | 350,000 | | | | 398,664 | |
| | |
Series 2013A, GO, 5.00%, 10/15/2023 | | | 130,000 | | | | 148,791 | |
| | |
Series 2017A, GO, 5.00%, 4/15/2025 | | | 1,045,000 | | | | 1,253,990 | |
| | |
State of Connecticut Special Tax Series 2018B, Rev., 5.00%, 10/1/2020 | | | 100,000 | | | | 100,383 | |
| | |
State of Connecticut, Special Tax, Transportation Infrastructure Purposes Series A, Rev., 5.00%, 9/1/2020 | | | 240,000 | | | | 240,000 | |
| | |
Town of Cromwell Series 2016A, GO, 4.00%, 8/1/2022 | | | 25,000 | | | | 26,834 | |
| | |
Town of Greenwich GO, 4.00%, 6/1/2023 | | | 25,000 | | | | 25,075 | |
| | |
Town of West Hartford Series 2017A, GO, 5.00%, 1/15/2021 | | | 35,000 | | | | 35,627 | |
| | |
Town of Wethersfield GO, 4.00%, 3/1/2022 | | | 20,000 | | | | 21,148 | |
| | |
University of Connecticut | | | | | | | | |
| | |
Series 2011A, Rev., 5.00%, 2/15/2022 | | | 200,000 | | | | 204,138 | |
| | |
Series 2010A, Rev., 5.00%, 2/15/2023 | | | 100,000 | | | | 100,378 | |
| | | | | | | | |
| | |
Total Connecticut | | | | | | | 11,259,153 | |
| | | | | | | | |
|
Delaware — 0.2% | |
| | |
City of Wilmington | | | | | | | | |
| | |
Series 2010-A, GO, 5.00%, 12/1/2020 | | | 50,000 | | | | 50,600 | |
| | |
Series 2013A, GO, 4.00%, 10/1/2021 | | | 30,000 | | | | 31,247 | |
| | |
County of New Castle | | | | | | | | |
| | |
GO, 5.00%, 10/1/2020 | | | 25,000 | | | | 25,098 | |
| | |
GO, 5.00%, 4/1/2024 | | | 25,000 | | | | 29,287 | |
| | |
Delaware State Economic Development Authority, Delmarva Power and Light Co. Project Series 2020A, Rev., 1.05%, 7/1/2025 (b) | | | 570,000 | | | | 574,788 | |
| | |
Delaware State Health Facilities Authority, Bayhealth Medical Center Project Series 2017A, Rev., 5.00%, 7/1/2021 | | | 115,000 | | | | 119,559 | |
SEE NOTES TO FINANCIAL STATEMENTS.
| | | | | | | | |
| | | |
| AUGUST 31, 2020 | | J.P. MORGAN EXCHANGE-TRADED FUNDS | | | | | 173 | |
JPMorgan Ultra-Short Municipal Income ETF
SCHEDULE OF PORTFOLIO INVESTMENTS
AS OF AUGUST 31, 2020 (Unaudited) (continued)
| | | | | | | | |
| INVESTMENTS | | PRINCIPAL
AMOUNT ($) | | | VALUE ($) | |
Municipal Bonds — continued | |
|
Delaware — continued | |
| | |
State of Delaware Series 2019A, GO, 5.00%, 10/1/2020 | | | 25,000 | | | | 25,097 | |
| | |
University of Delaware Series 2013A, Rev., 5.00%, 5/1/2023 (c) | | | 25,000 | | | | 28,101 | |
| | |
Wilmington Parking Authority (The) | | | | | | | | |
| | |
Rev., 5.00%, 3/15/2021 | | | 25,000 | | | | 25,650 | |
| | |
Rev., 5.00%, 3/15/2022 | | | 75,000 | | | | 80,567 | |
| | | | | | | | |
| | |
Total Delaware | | | | | | | 989,994 | |
| | | | | | | | |
|
District of Columbia — 0.4% | |
| | |
District of Columbia | | | | | | | | |
| | |
Series 2012A, Rev., 5.00%, 12/1/2020 | | | 25,000 | | | | 25,300 | |
| | |
Series F, Rev., 5.00%, 12/1/2020 | | | 35,000 | | | | 35,421 | |
| | |
Series 2013A, GO, 5.00%, 6/1/2022 | | | 25,000 | | | | 27,110 | |
| | |
Rev., GAN, 5.00%, 12/1/2024 | | | 175,000 | | | | 207,613 | |
| | |
District of Columbia Children’s Hospital Rev., 5.00%, 7/15/2021 | | | 105,000 | | | | 109,047 | |
| | |
District of Columbia Housing Finance Agency Rev., VRDO, 2.00%, 9/1/2021 (b) | | | 200,000 | | | | 200,000 | |
| | |
Series 2019B-2, Rev., FHA, 1.70%, 3/1/2023 | | | 165,000 | | | | 168,549 | |
| | |
District of Columbia Water and Sewer Authority Series 2014C, Rev., 5.00%, 10/1/2024 | | | 25,000 | | | | 29,738 | |
| | |
District of Columbia, Children’s Hospital Obligated Group Issue Rev., 5.00%, 7/15/2022 | | | 180,000 | | | | 194,841 | |
| | |
District of Columbia, Howard University Series 2011A, Rev., 6.50%, 4/1/2021 (c) | | | 750,000 | | | | 776,678 | |
| | |
District of Columbia, Income Tax | | | | | | | | |
| | |
Series 2019C, Rev., 5.00%, 10/1/2020 | | | 125,000 | | | | 125,489 | |
| | |
Series 2012D, Rev., 5.00%, 12/1/2020 | | | 25,000 | | | | 25,300 | |
| | |
Series 2014A, Rev., 5.00%, 12/1/2020 | | | 40,000 | | | | 40,481 | |
| | |
Series F, Rev., 4.00%, 12/1/2021 | | | 35,000 | | | | 36,678 | |
| | |
Metropolitan Washington Airports Authority, Airport System | | | | | | | | |
| | |
Series 2010-A, Rev., 5.00%, 10/1/2020 | | | 375,000 | | | | 376,451 | |
| | |
Series 2010F-1, Rev., 5.00%, 10/1/2020 | | | 125,000 | | | | 125,476 | |
| | | | | | | | |
| | |
Total District of Columbia | | | | | | | 2,504,172 | |
| | | | | | | | |
|
Florida — 5.3% | |
| | |
Board of Governors State University System of Florida Series 2014A, Rev., 5.00%, 7/1/2022 | | | 70,000 | | | | 75,839 | |
| | |
Brevard County Health Facilities Authority, Health First, Inc. Project Series 2014, Rev., 5.00%, 4/1/2021 | | | 310,000 | | | | 317,800 | |
| | | | | | | | |
| INVESTMENTS | | PRINCIPAL
AMOUNT ($) | | | VALUE ($) | |
| |
|
Florida — continued | |
| | |
Brevard County School District COP, 5.00%, 7/1/2021 | | | 125,000 | | | | 129,944 | |
| | |
Broward County, Water and Sewer Utility Series 2012B, Rev., 5.00%, 10/1/2020 | | | 135,000 | | | | 135,528 | |
| | |
Capital Trust Agency, Inc., Alexander Apartments Project Series 2011A, Rev., 6.00%, 7/1/2021 (c) | | | 355,000 | | | | 370,215 | |
| | |
Capital Trust Agency, Inc., Liza Jackson Preparatory School, Inc. Project Series 2020A, Rev., 0.80%, 3/1/2022 (b) | | | 10,450,000 | | | | 10,494,204 | |
| | |
Capital Trust Agency, Inc., Mission Springs Apartments Project Series A, Rev., 4.25%, 12/1/2022 (c) | | | 375,000 | | | | 425,201 | |
| | |
City of Apopka Rev., 5.00%, 10/1/2023 | | | 30,000 | | | | 32,919 | |
| | |
City of Cape Coral Rev., 5.00%, 10/1/2020 | | | 50,000 | | | | 50,195 | |
| | |
City of Dunedin Rev., AGM, 4.00%, 10/1/2020 | | | 200,000 | | | | 200,596 | |
| | |
City of Gulf Breeze, Local Government Loan Program, Remarketing | | | | | | | | |
| | |
Series 1985-L, Rev., 3.10%, 12/1/2020 | | | 100,000 | | | | 100,639 | |
| | |
Series 1985J, Rev., 4.50%, 12/1/2020 | | | 200,000 | | | | 202,048 | |
| | |
City of Hallandale Beach Rev., 5.00%, 10/1/2023 | | | 25,000 | | | | 28,504 | |
| | |
City of Jacksonville, Health Care Facilities | | | | | | | | |
| | |
Rev., 5.00%, 10/1/2020 | | | 250,000 | | | | 250,895 | |
| | |
Series 2019A, Rev., 5.00%, 10/1/2020 | | | 325,000 | | | | 326,254 | |
| | |
Series 2012B, Rev., 5.00%, 10/1/2021 | | | 225,000 | | | | 235,571 | |
| | |
City of Orlando | | | | | | | | |
| | |
Series 2010C, Rev., 4.00%, 10/1/2020 (c) | | | 50,000 | | | | 50,154 | |
| | |
Series 2016C, Rev., 5.00%, 10/1/2020 | | | 25,000 | | | | 25,098 | |
| | |
Series 2016B, Rev., 5.00%, 10/1/2024 | | | 25,000 | | | | 29,738 | |
| | |
City of Orlando, Capital Improvement Series 2010C, Rev., 5.00%, 10/1/2020 | | | 40,000 | | | | 40,156 | |
| | |
City of Palm Coast Rev., 5.00%, 10/1/2020 | | | 150,000 | | | | 150,569 | |
| | |
City of Pembroke Pines, Capital Improvement Rev., AGM, 5.00%, 12/1/2021 | | | 100,000 | | | | 105,976 | |
| | |
City of Sarasota, Water & Sewer System Rev., 5.00%, 10/1/2020 | | | 20,000 | | | | 20,078 | |
| | |
City of St. Petersburg, Public Utility Rev., 5.00%, 10/1/2020 | | | 125,000 | | | | 125,481 | |
| | |
City of Sunrise, Utility System Series A, Rev., 4.00%, 10/1/2020 | | | 35,000 | | | | 35,109 | |
| | |
City of Tallahassee Rev., 5.00%, 10/1/2020 | | | 305,000 | | | | 306,193 | |
SEE NOTES TO FINANCIAL STATEMENTS.
| | | | | | |
| | | |
| 174 | | | | J.P. MORGAN EXCHANGE-TRADED FUNDS | | AUGUST 31, 2020 |
| | | | | | | | |
| INVESTMENTS | | PRINCIPAL
AMOUNT ($) | | | VALUE ($) | |
Municipal Bonds — continued | |
|
Florida — continued | |
| | |
City of Tallahassee Memorial Healthcare, Inc. Project Series 2016A, Rev., 5.00%, 12/1/2020 | | | 95,000 | | | | 95,891 | |
| | |
City of Tallahassee, Energy System | | | | | | | | |
| | |
Rev., 5.00%, 10/1/2020 | | | 155,000 | | | | 155,600 | |
| | |
Rev., 5.00%, 10/1/2021 | | | 35,000 | | | | 36,812 | |
| | |
City of Tallahassee, Utility System | | | | | | | | |
| | |
Series 2010B, Rev., 4.00%, 10/1/2020 (c) | | | 20,000 | | | | 20,061 | |
| | |
Rev., 5.00%, 10/1/2020 | | | 25,000 | | | | 25,098 | |
| | |
Collier County School Board Series 2005A, COP, AGM, 5.25%, 2/15/2021 | | | 25,000 | | | | 25,567 | |
| | |
County of Broward Series 2007B, GO, 5.00%, 1/1/2021 | | | 65,000 | | | | 66,041 | |
| | |
County of Broward, Airport System Series 2012Q-1, Rev., 5.00%, 10/1/2020 | | | 220,000 | | | | 220,834 | |
| | |
County of Broward, Half-Cent Sales Tax Series A, Rev., 5.00%, 10/1/2020 | | | 55,000 | | | | 55,215 | |
| | |
County of Charlotte Rev., 4.00%, 10/1/2020 | | | 25,000 | | | | 25,049 | |
| | |
County of Collier | | | | | | | | |
| | |
Rev., 5.00%, 10/1/2020 | | | 25,000 | | | | 25,098 | |
| | |
Series 2010B, Rev., 5.00%, 10/1/2021 | | | 30,000 | | | | 31,570 | |
| | |
Rev., 5.00%, 10/1/2023 | | | 25,000 | | | | 26,269 | |
| | |
County of Hillsborough | | | | | | | | |
| | |
Rev., 5.00%, 11/1/2020 | | | 225,000 | | | | 226,640 | |
| | |
Rev., 5.00%, 10/1/2024 | | | 35,000 | | | | 41,728 | |
| | |
County of Lee County Series 2013B, Rev., 5.00%, 10/1/2022 | | | 35,000 | | | | 38,160 | |
| | |
County of Lee FL Tourist Development Tax Series 2019A, Rev., 5.00%, 10/1/2024 | | | 25,000 | | | | 29,020 | |
| | |
County of Manatee FL Public Utilities Rev., 5.00%, 10/1/2022 | | | 25,000 | | | | 27,493 | |
| | |
County of Miami-Dade | | | | | | | | |
| | |
Rev., AGM, 5.00%, 10/1/2020 (c) | | | 350,000 | | | | 351,369 | |
| | |
Rev., 5.00%, 10/1/2020 | | | 150,000 | | | | 150,584 | |
| | |
Series 2010A-1, Rev., 5.38%, 10/1/2020 (c) | | | 80,000 | | | | 80,334 | |
| | |
Series A, Rev., 5.00%, 4/1/2021 | | | 125,000 | | | | 128,494 | |
| | |
Series 2016A, GO, 5.00%, 7/1/2021 | | | 80,000 | | | | 83,195 | |
| | |
Series 2011C, GO, 4.75%, 10/1/2021 | | | 25,000 | | | | 26,235 | |
| | |
GO, 5.00%, 7/1/2022 | | | 45,000 | | | | 48,962 | |
| | |
GO, 5.00%, 7/1/2023 | | | 75,000 | | | | 75,122 | |
| | |
Series 2016A, GO, 5.00%, 7/1/2024 | | | 30,000 | | | | 35,354 | |
| | |
Series 2010A-1, Rev., 4.88%, 10/1/2024 | | | 200,000 | | | | 200,656 | |
| | | | | | | | |
| INVESTMENTS | | PRINCIPAL
AMOUNT ($) | | | VALUE ($) | |
| |
|
Florida — continued | |
| | |
County of Miami-Dade, Aviation Project | | | | | | | | |
| | |
Series 2010B, Rev., 5.00%, 10/1/2020 (c) | | | 35,000 | | | | 35,137 | |
| | |
Series 2010B, Rev., AGM, 5.00%, 10/1/2020 | | | 50,000 | | | | 50,185 | |
| | |
County of Miami-Dade, Aviation Project, Miami International Airport Series 2010A-1, Rev., 5.00%, 10/1/2021 | | | 150,000 | | | | 150,555 | |
| | |
County of Miami-Dade, Water and Sewer System Series 2008B, Rev., AGM, 5.25%, 10/1/2020 | | | 100,000 | | | | 100,409 | |
| | |
County of Okaloosa Rev., 4.00%, 10/1/2020 | | | 55,000 | | | | 55,171 | |
| | |
County of Palm Beach | | | | | | | | |
| | |
Rev., 5.00%, 11/1/2020 | | | 60,000 | | | | 60,477 | |
| | |
Rev., 5.00%, 6/1/2024 | | | 30,000 | | | | 32,456 | |
| | |
County of Palm Beach, Public Improvement Series 2014A, Rev., 5.00%, 11/1/2020 | | | 45,000 | | | | 45,358 | |
| | |
County of Polk, Refunding and Improvement Rev., 4.00%, 12/1/2020 (c) | | | 300,000 | | | | 302,778 | |
| | |
County of Sarasota Rev., 5.00%, 10/1/2020 | | | 130,000 | | | | 130,508 | |
| | |
County of Sarasota, Infrastructure Sales Surtax Rev., 5.00%, 10/1/2020 | | | 100,000 | | | | 100,391 | |
| | |
County of Sarasota, Utility System Series 2011B, Rev., 3.00%, 10/1/2020 | | | 30,000 | | | | 30,069 | |
| | |
Escambia County Housing Finance Authority Series 2019B, Rev., GNMA COLL, 1.65%, 4/1/2023 | | | 100,000 | | | | 102,320 | |
| | |
Escambia County School Board Rev., 5.00%, 9/1/2022 | | | 40,000 | | | | 43,791 | |
| | |
Florida Atlantic University Finance Corp. Series 2012A, Rev., 4.00%, 7/1/2021 | | | 75,000 | | | | 76,666 | |
| | |
Florida Department of Environmental Protection | | | | | | | | |
| | |
Series 2011B, Rev., 5.00%, 7/1/2021 | | | 100,000 | | | | 104,007 | |
| | |
Series 2014-A, Rev., 5.00%, 7/1/2021 | | | 20,000 | | | | 20,801 | |
| | |
Series 2016A, Rev., 5.00%, 7/1/2022 | | | 75,000 | | | | 81,604 | |
| | |
Florida Department of Management Services | | | | | | | | |
| | |
Series 2017A, Rev., 5.00%, 9/1/2020 | | | 50,000 | | | | 50,000 | |
| | |
Series 2015A, COP, 5.00%, 8/1/2021 | | | 70,000 | | | | 73,100 | |
| | |
Florida Housing Finance Corp., Multi-Family Housing, Azure Estates Series 2019J, Rev., 1.45%, 3/1/2022 (b) | | | 100,000 | | | | 101,391 | |
| | |
Florida Housing Finance Corp., Multi-Family Mortgage, Parrish Oaks Series 2020A, Rev., 1.25%, 2/1/2022 (b) | | | 375,000 | | | | 380,261 | |
SEE NOTES TO FINANCIAL STATEMENTS.
| | | | | | | | |
| | | |
| AUGUST 31, 2020 | | J.P. MORGAN EXCHANGE-TRADED FUNDS | | | | | 175 | |
JPMorgan Ultra-Short Municipal Income ETF
SCHEDULE OF PORTFOLIO INVESTMENTS
AS OF AUGUST 31, 2020 (Unaudited) (continued)
| | | | | | | | |
| INVESTMENTS | | PRINCIPAL
AMOUNT ($) | | | VALUE ($) | |
Municipal Bonds — continued | |
|
Florida — continued | |
| | |
Florida Municipal Power Agency | | | | | | | | |
| | |
Series 2012A, Rev., 5.00%, 10/1/2020 | | | 85,000 | | | | 85,318 | |
| | |
Series 2012A, Rev., 5.00%, 10/1/2021 | | | 200,000 | | | | 209,886 | |
| | |
Series 2012A, Rev., 5.00%, 10/1/2023 | | | 335,000 | | | | 366,862 | |
| | |
Series 2016A, Rev., 5.00%, 10/1/2024 | | | 100,000 | | | | 117,175 | |
| | |
Florida Municipal Power Agency, St. Lucie Project Series A, Rev., 5.00%, 10/1/2020 | | | 330,000 | | | | 331,181 | |
| | |
Florida Ports Financing Commission, State Transportation Trust Fund — Intermodal Program Series 2011A, Rev., 5.00%, 10/1/2020 | | | 115,000 | | | | 115,443 | |
| | |
Florida State Board of Governors Series 2010A, Rev., 5.00%, 7/1/2024 | | | 500,000 | | | | 506,880 | |
| | |
Florida State Board of Governors, University System Improvement Series 2017B, Rev., 5.00%, 7/1/2021 | | | 50,000 | | | | 51,987 | |
| | |
Highlands County Health Facilities Authority, Adventist Health System Series I-1, Rev., VRDO, 0.10%, 9/10/2020 (b) | | | 5,725,000 | | | | 5,725,000 | |
| | |
Jacksonville Transportation Authority Rev., 5.00%, 8/1/2024 | | | 25,000 | | | | 29,577 | |
| | |
JEA Electric System Series D, Rev., 5.00%, 10/1/2020 | | | 95,000 | | | | 95,344 | |
| | |
JEA FL Bulk Power Supply System Series 2014A, Rev., 2.00%, 10/1/2020 | | | 50,000 | | | | 50,066 | |
| | |
Lee County Industrial Development Authority | | | | | | | | |
| | |
Rev., 5.00%, 11/1/2021 | | | 50,000 | | | | 50,397 | |
| | |
Rev., 5.00%, 11/1/2023 | | | 35,000 | | | | 35,272 | |
| | |
Miami-Dade County Housing Finance Authority Rev., 1.42%, 5/1/2022 (b) | | | 275,000 | | | | 278,875 | |
| | |
Monroe County School District, Sales Tax Rev., AGM, 5.00%, 10/1/2020 | | | 260,000 | | | | 260,978 | |
| | |
Orange County Housing Finance Authority, Willow Key Apartments Series 2019A, Rev., 1.90%, 4/1/2021 (b) | | | 250,000 | | | | 252,013 | |
| | |
Orange County School Board Series 2015D, COP, 5.00%, 8/1/2023 | | | 200,000 | | | | 226,618 | |
| | |
Orlando Utilities Commission | | | | | | | | |
| | |
Series 2017A, Rev., 3.00%, 10/1/2020 (b) | | | 50,000 | | | | 50,112 | |
| | |
Series 2011B, Rev., 5.00%, 10/1/2020 | | | 60,000 | | | | 60,235 | |
| | |
Series 2013A, Rev., 5.00%, 10/1/2020 | | | 85,000 | | | | 85,332 | |
| | |
Series 2010C, Rev., 5.25%, 10/1/2022 | | | 25,000 | | | | 27,623 | |
| | |
Palm Beach County Health Facilities Authority Rev., 5.00%, 8/15/2024 | | | 475,000 | | | | 553,822 | |
| | | | | | | | |
| INVESTMENTS | | PRINCIPAL
AMOUNT ($) | | | VALUE ($) | |
| |
|
Florida — continued | |
| | |
Palm Beach County School District Series 2012A, COP, 5.00%, 8/1/2022 (c) | | | 25,000 | | | | 27,286 | |
| | |
Palm Beach County Solid Waste Authority Rev., 5.00%, 10/1/2020 | | | 50,000 | | | | 50,189 | |
| | |
Pasco County School Board | | | | | | | | |
| | |
Rev., 5.00%, 10/1/2020 | | | 245,000 | | | | 245,838 | |
| | |
Series 2013A, COP, 5.00%, 8/1/2021 | | | 100,000 | | | | 104,258 | |
| | |
Polk County School District Rev., 5.00%, 10/1/2023 | | | 25,000 | | | | 28,570 | |
| | |
Reedy Creek Improvement District Series A, GO, 5.00%, 6/1/2022 | | | 65,000 | | | | 70,451 | |
| | |
Sarasota County Public Hospital District Series 1998B, Rev., NATL-RE, 5.25%, 7/1/2024 | | | 385,000 | | | | 442,211 | |
| | |
School Board of Miami-Dade County (The) | | | | | | | | |
| | |
Series 2006C, COP, AMBAC, 5.00%, 10/1/2020 | | | 110,000 | | | | 110,423 | |
| | |
Series D, COP, 5.00%, 2/1/2021 | | | 100,000 | | | | 101,972 | |
| | |
Series 2015D, COP, 5.00%, 2/1/2024 | | | 300,000 | | | | 346,449 | |
| | |
School District of Broward County | | | | | | | | |
| | |
Series A, COP, 5.00%, 7/1/2021 | | | 80,000 | | | | 83,164 | |
| | |
Series 2012A, COP, 5.00%, 7/1/2024 | | | 125,000 | | | | 135,045 | |
| | |
Series 2015B, COP, 5.00%, 7/1/2024 | | | 115,000 | | | | 133,424 | |
| | |
South Florida Water Management District COP, 5.00%, 10/1/2020 | | | 230,000 | | | | 230,892 | |
| | |
St. Johns River Power Park Series 26, Rev., 5.00%, 10/1/2020 (c) | | | 25,000 | | | | 25,098 | |
| | |
St. Lucie County School Board Series 2015A, COP, 5.00%, 7/1/2021 | | | 30,000 | | | | 31,161 | |
| | |
State of Florida | | | | | | | | |
| | |
Series 2011B, GO, 5.00%, 7/1/2023 | | | 30,000 | | | | 31,202 | |
| | |
Series 2011F, GO, 5.00%, 6/1/2024 | | | 25,000 | | | | 25,899 | |
| | |
State of Florida Department of Transportation Rev., 5.00%, 7/1/2024 | | | 35,000 | | | | 41,159 | |
| | |
State of Florida Department of Transportation Turnpike System Series 2019A, Rev., 5.00%, 7/1/2022 | | | 85,000 | | | | 92,500 | |
| | |
State of Florida Lottery Series 2010F, Rev., 5.00%, 7/1/2021 | | | 160,000 | | | | 160,627 | |
| | |
Sunshine State Governmental Financing Commission Series 2018B, Rev., 5.00%, 10/1/2022 | | | 35,000 | | | | 38,475 | |
| | |
Tampa Bay Water A Regional Water Supply Authority Utility System Rev., 5.00%, 10/1/2020 | | | 40,000 | | | | 40,156 | |
| | |
Town of Palm Beach Series 2016A, Rev., 5.00%, 1/1/2023 | | | 25,000 | | | | 27,800 | |
SEE NOTES TO FINANCIAL STATEMENTS.
| | | | | | |
| | | |
| 176 | | | | J.P. MORGAN EXCHANGE-TRADED FUNDS | | AUGUST 31, 2020 |
| | | | | | | | |
| INVESTMENTS | | PRINCIPAL
AMOUNT ($) | | | VALUE ($) | |
Municipal Bonds — continued | |
|
Florida — continued | |
| | |
University of Florida Department of Housing & Residence Education Hsg Sys Rev Series 2012A, Rev., 4.00%, 7/1/2022 | | | 55,000 | | | | 56,724 | |
| | | | | | | | |
| | |
Total Florida | | | | | | | 30,991,759 | |
| | | | | | | | |
|
Georgia — 1.0% | |
| | |
Atlanta & Fulton County Recreation Authority Series A, Rev., 5.00%, 12/1/2023 | | | 25,000 | | | | 28,828 | |
| | |
Augusta Housing Authority, Multi-Family Housing, River Glen Apartments Project Series 2019A, Rev., VRDO, 2.00%, 9/1/2020 (b) | | | 275,000 | | | | 275,000 | |
| | |
Braselton Urban Redevelopment Agency Rev., 4.00%, 7/1/2024 | | | 30,000 | | | | 34,041 | |
| | |
Brookhaven Development Authority Rev., 5.00%, 7/1/2021 | | | 500,000 | | | | 519,265 | |
| | |
City of Atlanta, Water and Wastewater System Series 2018B, Rev., 5.00%, 11/1/2020 | | | 25,000 | | | | 25,199 | |
| | |
Clark County, Board of Education, Sales Tax GO, 5.00%, 9/1/2020 | | | 25,000 | | | | 25,000 | |
| | |
Clarke County School District, Sales Tax GO, 5.00%, 9/1/2021 | | | 30,000 | | | | 31,443 | |
| | |
Cobb County, Kennestone Hospital Authority, Wellstar Health System, Inc. Project | | | | | | | | |
| | |
Rev., 4.00%, 4/1/2022 | | | 100,000 | | | | 105,552 | |
| | |
Rev., 5.00%, 4/1/2022 | | | 100,000 | | | | 107,125 | |
| | |
Series 2020B, Rev., 5.00%, 4/1/2022 (e) | | | 150,000 | | | | 157,824 | |
| | |
Series 2020B, Rev., 5.00%, 4/1/2023 (e) | | | 175,000 | | | | 191,046 | |
| | |
Cobb-Marietta Coliseum & Exhibit Hall Authority Rev., GTD, 4.00%, 1/1/2024 | | | 25,000 | | | | 27,187 | |
| | |
Columbia County School District GO, 5.00%, 10/1/2020 | | | 25,000 | | | | 25,097 | |
| | |
DeKalb County School District GO, 4.00%, 10/1/2020 | | | 20,000 | | | | 20,062 | |
| | |
Development Authority of Gwinnett County COP, NATL-RE, 5.25%, 1/1/2022 | | | 70,000 | | | | 74,733 | |
| | |
Development Authority of Gwinnett County, Civic and Cultural Center Expansion Project Rev., GTD, 5.00%, 9/1/2020 | | | 20,000 | | | | 20,000 | |
| | |
Dougherty County School District, Sales Tax Series 2018, GO, 4.00%, 12/1/2020 | | | 60,000 | | | | 60,565 | |
| | |
Downtown Savannah Authority Series 2018A, Rev., 5.00%, 8/1/2022 | | | 25,000 | | | | 27,311 | |
| | |
Forsyth County Water & Sewerage Authority Rev., GTD, 4.00%, 4/1/2023 | | | 25,000 | | | | 25,551 | |
| | | | | | | | |
| INVESTMENTS | | PRINCIPAL
AMOUNT ($) | | | VALUE ($) | |
| |
|
Georgia — continued | |
| | |
Fulton County Development Authority Series A, Rev., 4.00%, 5/1/2021 | | | 200,000 | | | | 205,066 | |
| | |
Glynn-Brunswick Memorial Hospital Authority, Southeast Georgia Health System Project Rev., 5.00%, 8/1/2021 | | | 50,000 | | | | 51,884 | |
| | |
Henry County Development Authority Rev., GTD, 3.00%, 8/1/2021 | | | 35,000 | | | | 35,911 | |
| | |
Jackson County Industrial Development Authority Rev., GTD, 5.00%, 7/1/2023 | | | 55,000 | | | | 62,199 | |
| | |
Main Street Natural Gas, Inc., Gas Supply | | | | | | | | |
| | |
Series 2019B, Rev., 4.00%, 6/1/2022 | | | 450,000 | | | | 477,779 | |
| | |
Series 2019B, Rev., 4.00%, 12/1/2022 | | | 345,000 | | | | 372,272 | |
| | |
Series 2019B, Rev., 4.00%, 6/1/2023 | | | 240,000 | | | | 262,987 | |
| | |
Series A, Rev., LIQ: Royal Bank of Canada, 4.00%, 9/1/2023 (b) | | | 170,000 | | | | 186,555 | |
| | |
Series 2018C, Rev., LIQ: Royal Bank of Canada, 4.00%, 12/1/2023 (b) | | | 165,000 | | | | 182,262 | |
| | |
Metropolitan Atlanta Rapid Transit Authority Series 2007A, Rev., NATL-RE, 5.25%, 7/1/2023 | | | 40,000 | | | | 45,578 | |
| | |
Municipal Electric Authority of Georgia, Combined Cycle Project | | | | | | | | |
| | |
Series 2012A, Rev., 3.00%, 11/1/2020 | | | 200,000 | | | | 200,834 | |
| | |
Series 2010-A, Rev., 5.00%, 11/1/2020 | | | 100,000 | | | | 100,744 | |
| | |
Municipal Gas Authority of Georgia Series A, Rev., 5.00%, 10/1/2020 | | | 300,000 | | | | 301,143 | |
| | |
Paulding County Industrial Building Authority Series 2012B, Rev., GTD, 3.00%, 12/1/2020 | | | 20,000 | | | | 20,136 | |
| | |
Private Colleges & Universities Authority Series 2020B, Rev., 5.00%, 9/1/2025 | | | 980,000 | | | | 1,206,478 | |
| | |
State of Georgia | | | | | | | | |
| | |
Series 2011E-2, GO, 5.00%, 9/1/2020 | | | 50,000 | | | | 50,000 | |
| | |
Series 2010-B, GO, 5.00%, 10/1/2020 | | | 30,000 | | | | 30,117 | |
| | |
Valdosta Housing Authority, Brown Rural Development Portfolio Project Rev., 2.25%, 12/1/2020 (b) | | | 460,000 | | | | 462,144 | |
| | | | | | | | |
| | |
Total Georgia | | | | | | | 6,034,918 | |
| | | | | | | | |
|
Hawaii — 0.1% | |
| | |
City & County Honolulu | | | | | | | | |
| | |
Series B, Rev., 4.00%, 7/1/2021 | | | 25,000 | | | | 25,790 | |
| | |
Series B, Rev., 5.00%, 7/1/2022 | | | 25,000 | | | | 27,191 | |
| | |
Series B, Rev., 5.00%, 7/1/2023 | | | 75,000 | | | | 84,999 | |
| | |
Series B, Rev., 5.00%, 7/1/2024 | | | 25,000 | | | | 29,473 | |
| | |
City & County of Honolulu | | | | | | | | |
| | |
Series B, GO, 5.00%, 9/1/2020 | | | 25,000 | | | | 25,000 | |
| | |
Series B, GO, 5.00%, 10/1/2020 | | | 25,000 | | | | 25,097 | |
SEE NOTES TO FINANCIAL STATEMENTS.
| | | | | | | | |
| | | |
| AUGUST 31, 2020 | | J.P. MORGAN EXCHANGE-TRADED FUNDS | | | | | 177 | |
JPMorgan Ultra-Short Municipal Income ETF
SCHEDULE OF PORTFOLIO INVESTMENTS
AS OF AUGUST 31, 2020 (Unaudited) (continued)
| | | | | | | | |
| INVESTMENTS | | PRINCIPAL
AMOUNT ($) | | | VALUE ($) | |
Municipal Bonds — continued | |
|
Hawaii — continued | |
| | |
County of Hawaii Series A, GO, 5.00%, 9/1/2022 | | | 25,000 | | | | 27,391 | |
| | |
State of Hawaii Series EL, GO, 3.00%, 8/1/2023 | | | 50,000 | | | | 53,942 | |
| | |
State of Hawaii Department of Hawaiian Home Lands Series 2017A, COP, 4.00%, 11/1/2022 | | | 25,000 | | | | 26,978 | |
| | |
State of Hawaii Harbor System Series 2010A, Rev., 4.75%, 7/1/2024 | | | 50,000 | | | | 50,177 | |
| | | | | | | | |
| | |
Total Hawaii | | | | | | | 376,038 | |
| | | | | | | | |
|
Idaho — 0.8% | |
| | |
Bonneville County School District No. 91 Idaho Falls Series 2012B, GO, 4.00%, 9/15/2020 | | | 40,000 | | | | 40,056 | |
| | |
Idaho Health Facilities Authority Series 2010-D, Rev., 4.50%, 12/1/2020 (c) | | | 200,000 | | | | 202,124 | |
| | |
Idaho Housing and Finance Association Series 2009A, Class I, Rev., VRDO, 0.28%, 9/1/2020 (b) | | | 4,300,000 | | | | 4,300,000 | |
| | |
University of Idaho Rev., 5.25%, 4/1/2021 (b) | | | 115,000 | | | | 117,838 | |
| | | | | | | | |
| | |
Total Idaho | | | | | | | 4,660,018 | |
| | | | | | | | |
|
Illinois — 2.7% | |
| | |
City of Lake Forest GO, 5.00%, 12/15/2020 | | | 235,000 | | | | 238,231 | |
| | |
City of Springfield Rev., 5.00%, 3/1/2021 | | | 135,000 | | | | 138,047 | |
| | |
Cook County School District No. 144 Prairie Hills, School Bonds Series 2010A, GO, AGM, 5.00%, 12/1/2020 (c) | | | 100,000 | | | | 101,173 | |
| | |
Cook County School District No. 81 Schiller Park, School Bonds GO, 4.00%, 12/1/2021 | | | 80,000 | | | | 83,497 | |
| | |
County of Cook | | | | | | | | |
| | |
Series 2011A, GO, 5.00%, 11/15/2020 | | | 750,000 | | | | 756,517 | |
| | |
Series 2012C, GO, 5.00%, 11/15/2020 | | | 385,000 | | | | 388,346 | |
| | |
Illinois Finance Authority | | | | | | | | |
| | |
Series 2014A, Rev., 5.00%, 10/1/2020 | | | 380,000 | | | | 381,463 | |
| | |
Rev., 5.00%, 1/1/2021 | | | 100,000 | | | | 101,575 | |
| | |
Rev., 5.00%, 7/1/2023 | | | 75,000 | | | | 84,999 | |
| | |
Illinois Finance Authority, Ann and Robert H Lurie Children’s Hospital Obligated Group Rev., 5.00%, 8/15/2025 | | | 100,000 | | | | 119,497 | |
| | |
Illinois Finance Authority, Ascension Health Alliance Senior Credit Group Series E-2, Rev., 1.75%, 4/1/2021 (b) | | | 120,000 | | | | 120,847 | |
| | |
Illinois Finance Authority, Downers Grove Community High School District Number 99 Project Rev., 4.00%, 12/15/2020 | | | 635,000 | | | | 641,674 | |
| | | | | | | | |
| INVESTMENTS | | PRINCIPAL
AMOUNT ($) | | | VALUE ($) | |
| |
|
Illinois — continued | |
| | |
Illinois Finance Authority, Health Facilities, Unitypoint Health Series 2016D, Rev., 5.00%, 2/15/2021 | | | 195,000 | | | | 198,918 | |
| | |
Illinois Finance Authority, Silver Cross Hospital and Medical Centers Series C, Rev., 5.00%, 8/15/2021 | | | 60,000 | | | | 62,340 | |
| | |
Illinois Finance Authority, The University of Chicago Medical Center Series 2009E-1, Rev., VRDO, LOC: Wells Fargo Bank NA, 0.03%, 9/1/2020 (b) | | | 1,350,000 | | | | 1,350,000 | |
| | |
Illinois Finance Authority, Unitypoint Health | | | | | | | | |
| | |
Series 2016D, Rev., 5.00%, 2/15/2023 | | | 70,000 | | | | 77,512 | |
| | |
Series 2016, Rev., 5.00%, 2/15/2024 | | | 90,000 | | | | 103,119 | |
| | |
Illinois Finance Authority, University of Chicago Series 2012A, Class A, Rev., 5.00%, 10/1/2020 | | | 350,000 | | | | 351,347 | |
| | |
Illinois Housing Development Authority | | | | | | | | |
| | |
Rev., VRDO, 2.31%, 9/1/2020 (b) | | | 185,000 | | | | 185,000 | |
| | |
Rev., 1.90%, 10/1/2021 (b) | | | 125,000 | | | | 127,072 | |
| | |
Kane & DeKalb Counties Community Unit School District No. 302 Kaneland GO, 4.00%, 2/1/2021 | | | 290,000 | | | | 294,472 | |
| | |
Kane County School District No. 131 Aurora East Side | | | | | | | | |
| | |
Series 2020C, GO, 5.00%, 12/1/2020 | | | 100,000 | | | | 101,099 | |
| | |
Series 2020C, GO, 5.00%, 12/1/2021 | | | 140,000 | | | | 147,732 | |
| | |
Series 2020C, GO, 5.00%, 12/1/2022 | | | 160,000 | | | | 174,109 | |
| | |
Lake County Forest Preserve District Series 2007A, GO, (ICE LIBOR USD 3 Month + 0.48%), 0.69%, 9/15/2020 (d) | | | 50,000 | | | | 49,952 | |
| | |
Lake County Township High School District No. 121 Series 2016A, GO, 3.00%, 1/1/2024 (c) | | | 370,000 | | | | 403,337 | |
| | |
Macoupin County Community Unit School District No. 7 Gillespie, School Building GO, AGC, 6.00%, 12/1/2021 (c) | | | 50,000 | | | | 53,564 | |
| | |
Metropolitan Water Reclamation District of Greater Chicago Series 2007A, GO, 5.00%, 12/1/2020 | | | 25,000 | | | | 25,286 | |
| | |
Railsplitter Tobacco Settlement Authority | | | | | | | | |
| | |
Rev., 5.25%, 6/1/2021 | | | 265,000 | | | | 274,294 | |
| | |
Rev., 5.38%, 6/1/2021 | | | 425,000 | | | | 440,300 | |
| | |
Tender Option Bond Trust Receipts/Certificates Series 2017-XF2500, Rev., VRDO, LIQ: Citibank NA, 0.17%, 9/10/2020 (b) (f) | | | 7,580,000 | | | | 7,580,000 | |
| | |
Village of McCook | | | | | | | | |
| | |
Series 2019A, GO, AGM, 4.00%, 12/1/2020 | | | 100,000 | | | | 100,793 | |
SEE NOTES TO FINANCIAL STATEMENTS.
| | | | | | |
| | | |
| 178 | | | | J.P. MORGAN EXCHANGE-TRADED FUNDS | | AUGUST 31, 2020 |
| | | | | | | | |
| INVESTMENTS | | PRINCIPAL
AMOUNT ($) | | | VALUE ($) | |
Municipal Bonds — continued | |
|
Illinois — continued | |
| | |
Series 2019A, GO, AGM, 4.00%, 12/1/2021 | | | 135,000 | | | | 140,366 | |
| | |
Village of Midlothian | | | | | | | | |
| | |
GO, AGM, 4.00%, 1/1/2022 | | | 15,000 | | | | 15,654 | |
| | |
GO, AGM, 4.00%, 1/1/2023 | | | 15,000 | | | | 16,116 | |
| | |
GO, AGM, 4.00%, 1/1/2024 | | | 70,000 | | | | 77,288 | |
| | |
GO, AGM, 4.00%, 1/1/2025 | | | 40,000 | | | | 45,272 | |
| | |
Village of Rantoul GO, 4.00%, 1/1/2025 | | | 350,000 | | | | 393,428 | |
| | |
Village of Schaumburg Series 2016A, GO, 2.00%, 12/1/2020 | | | 25,000 | | | | 25,112 | |
| | | | | | | | |
| | |
Total Illinois | | | | | | | 15,969,348 | |
| | | | | | | | |
|
Indiana — 2.3% | |
| | |
2004 Plainfield Community High School Building Corp. Rev., 2.00%, 1/15/2021 | | | 30,000 | | | | 30,203 | |
| | |
Allen County War Memorial Coliseum Additions Building Corp. Series 2016A, Rev., 4.00%, 5/1/2021 | | | 25,000 | | | | 25,609 | |
| | |
Avon Community School Building Corp. Rev., 5.00%, 7/15/2024 | | | 110,000 | | | | 128,482 | |
| | |
Carmel 2002 School Building Corp. Rev., 5.00%, 1/15/2021 | | | 50,000 | | | | 50,897 | |
| | |
Carmel Redevelopment Authority | | | | | | | | |
| | |
Series 2014B, Rev., 5.00%, 1/1/2024 | | | 35,000 | | | | 40,191 | |
| | |
Series 2014B, Rev., 5.00%, 7/1/2024 | | | 20,000 | | | | 23,311 | |
| | |
City of Lafayette, Sewage Works Rev., 5.00%, 7/1/2022 | | | 25,000 | | | | 27,124 | |
| | |
City of Lawrence, Waterworks Series 2017A, Rev., 4.00%, 1/1/2021 | | | 200,000 | | | | 202,314 | |
| | |
City of Rockport, Michigan Power Company Project Series D, Rev., 2.05%, 6/1/2021 (b) | | | 1,575,000 | | | | 1,588,293 | |
| | |
Clark Pleasant Middle School Corp. Rev., 5.00%, 1/15/2021 | | | 200,000 | | | | 203,490 | |
| | |
Crothersville 2000 School Building Corp. Rev., AMBAC, 5.00%, 7/15/2021 | | | 155,000 | | | | 159,208 | |
| | |
Fort Wayne Redevelopment Authority Rev., 4.00%, 2/1/2022 | | | 50,000 | | | | 52,601 | |
| | |
Franklin Township-Marion County Multiple School Building Corp. Rev., 5.00%, 7/10/2021 | | | 30,000 | | | | 31,238 | |
| | |
Hamilton Southeastern Consolidated School Building Corp. | | | | | | | | |
| | |
Rev., 5.00%, 7/15/2021 | | | 25,000 | | | | 26,055 | |
| | |
Series B, Rev., 5.00%, 7/15/2022 | | | 35,000 | | | | 38,168 | |
| | |
Rev., 4.00%, 1/15/2024 | | | 25,000 | | | | 28,013 | |
| | |
Hammond Local Public Improvement Bond Bank Series 2020A, Rev., 2.38%, 12/31/2020 | | | 1,375,000 | | | | 1,381,078 | |
| | | | | | | | |
| INVESTMENTS | | PRINCIPAL
AMOUNT ($) | | | VALUE ($) | |
| |
|
Indiana — continued | |
| | |
Indiana Bond Bank | | | | | | | | |
| | |
Series 2012D, Rev., 5.00%, 2/1/2023 | | | 40,000 | | | | 42,594 | |
| | |
Series 2012D, Rev., 3.00%, 2/1/2025 | | | 100,000 | | | | 103,378 | |
| | |
Indiana Finance Authority | | | | | | | | |
| | |
Series 2016A, Rev., 4.00%, 10/1/2020 | | | 150,000 | | | | 150,447 | |
| | |
Series 2011A, Rev., 5.00%, 10/1/2020 | | | 70,000 | | | | 70,265 | |
| | |
Rev., 4.00%, 9/1/2021 | | | 100,000 | | | | 103,681 | |
| | |
Series 2014A, Rev., 5.00%, 10/1/2021 | | | 85,000 | | | | 89,306 | |
| | |
Series 2015A, Rev., 5.00%, 2/1/2022 | | | 990,000 | | | | 1,050,222 | |
| | |
Series 2011 I, Rev., 1.65%, 7/1/2022 (b) | | | 250,000 | | | | 253,140 | |
| | |
Series A, Rev., 5.00%, 7/1/2022 | | | 50,000 | | | | 52,016 | |
| | |
Series 2011B, Rev., 5.25%, 10/1/2022 | | | 120,000 | | | | 126,240 | |
| | |
Series 2010A, Rev., 5.00%, 12/1/2022 | | | 25,000 | | | | 27,683 | |
| | |
Series 2016B, Rev., 5.00%, 11/1/2024 | | | 260,000 | | | | 305,243 | |
| | |
Indiana Finance Authority, Health Obligation Series H, Rev., 1.65%, 7/1/2022 (b) | | | 1,000,000 | | | | 1,012,560 | |
| | |
Indiana Finance Authority, Lease Appropriation, Convention Center Expansion Project Series 2019B, Rev., 5.00%, 2/1/2025 | | | 90,000 | | | | 108,239 | |
| | |
Indiana Finance Authority, Parkview Health | | | | | | | | |
| | |
Series 2017A, Rev., 5.00%, 11/1/2020 | | | 450,000 | | | | 453,281 | |
| | |
Series 2017A, Rev., 5.00%, 11/1/2021 | | | 200,000 | | | | 210,310 | |
| | |
Indiana Health and Educational Facilities Financing Authority, Ascension Senior Credit Group Series 2006B-3, Rev., 1.75%, 11/2/2021 (b) | | | 100,000 | | | | 101,417 | |
| | |
Indiana Municipal Power Agency Series 2017A, Rev., 5.00%, 1/1/2022 | | | 200,000 | | | | 212,610 | |
| | |
Indiana Municipal Power Agency, Power Supply System Series 2014A, Rev., 5.00%, 1/1/2021 | | | 20,000 | | | | 20,314 | |
| | |
Indiana Transportation Finance Authority Series 2004C, Rev., NATL-RE, 5.50%, 12/1/2020 | | | 30,000 | | | | 30,397 | |
| | |
Indiana University Rev., 5.00%, 8/1/2021 | | | 30,000 | | | | 31,328 | |
| | |
Indianapolis Local Public Improvement Bond Bank Series 2014C, Rev., 4.00%, 2/1/2022 | | | 25,000 | | | | 26,344 | |
| | |
Ivy Tech Community College of Indiana | | | | | | | | |
| | |
Series V, Rev., 5.00%, 7/1/2021 | | | 25,000 | | | | 25,999 | |
| | |
Series V, Rev., 5.00%, 7/1/2022 | | | 110,000 | | | | 119,579 | |
| | |
Jennings County School Building Corp., First Mortgage | | | | | | | | |
| | |
Series 2019A, Rev., 2.00%, 1/15/2021 | | | 90,000 | | | | 90,574 | |
| | |
Series 2019B, Rev., 3.00%, 1/15/2021 | | | 15,000 | | | | 15,151 | |
SEE NOTES TO FINANCIAL STATEMENTS.
| | | | | | | | |
| | | |
| AUGUST 31, 2020 | | J.P. MORGAN EXCHANGE-TRADED FUNDS | | | | | 179 | |
JPMorgan Ultra-Short Municipal Income ETF
SCHEDULE OF PORTFOLIO INVESTMENTS
AS OF AUGUST 31, 2020 (Unaudited) (continued)
| | | | | | | | |
| INVESTMENTS | | PRINCIPAL
AMOUNT ($) | | | VALUE ($) | |
Municipal Bonds — continued | |
|
Indiana — continued | |
| | |
Series 2019B, Rev., 3.00%, 7/15/2021 | | | 50,000 | | | | 51,184 | |
| | |
Series 2019A, Rev., 2.00%, 1/15/2022 | | | 90,000 | | | | 92,127 | |
| | |
Series 2019B, Rev., 3.00%, 1/15/2022 | | | 40,000 | | | | 41,492 | |
| | |
Series 2019A, Rev., 2.00%, 1/15/2023 | | | 60,000 | | | | 62,169 | |
| | |
Lafayette School Corp. GO, 4.00%, 1/15/2021 | | | 425,000 | | | | 430,164 | |
| | |
Lake Central Multi-District School Building Corp. Series 2012B, Rev., 5.00%, 7/15/2024 | | | 100,000 | | | | 110,852 | |
| | |
Lake Central Multi-District School Building Corp., First Mortgage Series 2012B, Rev., 5.00%, 7/15/2021 | | | 250,000 | | | | 260,150 | |
| | |
Mishawaka School City Multi-School Building Corp. Rev., 5.00%, 7/15/2021 | | | 200,000 | | | | 205,532 | |
| | |
MSD of Wabash County Multi-School Building Corp. Rev., 3.40%, 7/15/2022 | | | 25,000 | | | | 25,635 | |
| | |
North Putnam Middle School Building Corp., Property Tax, First Mortgage Series 2019, Rev., 3.00%, 1/15/2021 | | | 200,000 | | | | 202,014 | |
| | |
Pike Township Multi-School Building Corp. | | | | | | | | |
| | |
Rev., 5.00%, 1/15/2024 | | | 320,000 | | | | 368,106 | |
| | |
Rev., 5.00%, 7/15/2024 | | | 350,000 | | | | 409,980 | |
| | |
Rev., 5.00%, 1/15/2025 | | | 335,000 | | | | 398,730 | |
| | |
South Bend Community School Corp. Rev., 4.00%, 7/15/2022 | | | 30,000 | | | | 32,138 | |
| | |
South Bend Redevelopment Authority Rev., 4.00%, 2/15/2021 | | | 25,000 | | | | 25,424 | |
| | |
Southeast Dubois County School Building Corp. Series 2012A, Rev., 3.00%, 7/15/2022 | | | 640,000 | | | | 666,771 | |
| | |
Union Township School Corp. Rev., 2.00%, 12/31/2020 | | | 900,000 | | | | 904,419 | |
| | |
Valparaiso Middle School Building Corp. Series 2012A, Rev., 3.00%, 7/15/2022 | | | 100,000 | | | | 103,687 | |
| | |
Wa-Nee Community Schools GO, 3.00%, 1/15/2023 | | | 125,000 | | | | 131,520 | |
| | |
Warsaw Multi-School Building Corp. Rev., 4.00%, 1/15/2021 | | | 100,000 | | | | 101,376 | |
| | |
Whitestown Redevelopment Authority Rev., 3.00%, 1/15/2024 | | | 25,000 | | | | 26,605 | |
| | |
Zionsville Community Schools Building Corp. Series 2014B, Rev., 4.00%, 1/15/2021 | | | 25,000 | | | | 25,357 | |
| | |
Series 2003Z, Rev., NATL-RE, Zero Coupon, 1/15/2025 | | | 25,000 | | | | 24,297 | |
| | | | | | | | |
| | |
Total Indiana | | | | | | | 13,568,322 | |
| | | | | | | | |
|
Iowa — 0.8% | |
| | |
Ankeny Community School District GO, 5.00%, 6/1/2021 | | | 140,000 | | | | 144,992 | |
| | | | | | | | |
| INVESTMENTS | | PRINCIPAL
AMOUNT ($) | | | VALUE ($) | |
| |
|
Iowa — continued | |
| | |
Iowa Finance Authority, Single Family Series 2017C, Rev., GNMA/FNMA/FHLMC, 1.70%, 1/1/2023 | | | 165,000 | | | | 169,260 | |
| | |
Iowa Finance Authority, Single Family Mortgage-Backed Securities Program Series 2019E, Rev., VRDO, GNMA/FNMA/FHLMC, LIQ: TD Bank NA, 0.08%, 9/10/2020 (b) | | | 3,055,000 | | | | 3,055,000 | |
| | |
Iowa Finance Authority, Unitypoint Health Series 2018B, Rev., 5.00%, 2/15/2021 | | | 415,000 | | | | 423,337 | |
| | |
Iowa State Board of Regents, University of Iowa Hospitals and Clinics Rev., 4.00%, 9/1/2020 | | | 25,000 | | | | 25,000 | |
| | |
Iowa State University of Science & Technology Series ISU, Rev., 4.00%, 11/1/2021 | | | 50,000 | | | | 52,190 | |
| | |
Pella Community School District GO, 2.10%, 6/1/2022 | | | 395,000 | | | | 395,533 | |
| | |
State of Iowa, Ijobs Program Series A, Rev., 5.00%, 6/1/2021 | | | 20,000 | | | | 20,723 | |
| | |
University of Iowa (The) Series 2016A, Rev., 3.00%, 7/1/2021 | | | 135,000 | | | | 138,078 | |
| | |
Waukee Community School District | | | | | | | | |
| | |
Series 2014C, GO, 5.00%, 6/1/2021 | | | 40,000 | | | | 41,427 | |
| | |
Series 2016A, GO, 5.00%, 6/1/2021 | | | 35,000 | | | | 36,248 | |
| | | | | | | | |
| | |
Total Iowa | | | | | | | 4,501,788 | |
| | | | | | | | |
|
Kansas — 0.5% | |
| | |
Blue Valley Recreation Commission Series A, COP, AGM, 5.00%, 10/1/2022 | | | 25,000 | | | | 27,460 | |
| | |
City of Lawrence, Temporary Notes Series I, GO, 2.00%, 5/1/2021 | | | 290,000 | | | | 290,258 | |
| | |
City of Manhattan Series B, GO, 3.00%, 11/1/2021 | | | 20,000 | | | | 20,636 | |
| | |
City of Olathe | | | | | | | | |
| | |
Series 230, GO, 5.00%, 10/1/2021 | | | 35,000 | | | | 36,832 | |
| | |
Series 230, GO, 5.00%, 10/1/2023 | | | 40,000 | | | | 45,818 | |
| | |
City of Olathe, Improvement Bonds Series 229, GO, 2.00%, 10/1/2020 | | | 45,000 | | | | 45,067 | |
| | |
City of Topeka Series 2019A, GO, 4.00%, 10/1/2020 | | | 310,000 | | | | 310,970 | |
| | |
County of Leavenworth Series 2019-1, GO, 4.00%, 12/1/2020 | | | 125,000 | | | | 126,141 | |
| | |
County of Shawnee | | | | | | | | |
| | |
COP, 4.00%, 9/1/2020 | | | 35,000 | | | | 35,000 | |
| | |
COP, 3.00%, 9/1/2024 | | | 35,000 | | | | 38,336 | |
| | |
Hesston Public Building Commission Series 2016A, Rev., 2.00%, 10/1/2020 | | | 40,000 | | | | 40,057 | |
SEE NOTES TO FINANCIAL STATEMENTS.
| | | | | | |
| | | |
| 180 | | | | J.P. MORGAN EXCHANGE-TRADED FUNDS | | AUGUST 31, 2020 |
| | | | | | | | |
| INVESTMENTS | | PRINCIPAL
AMOUNT ($) | | | VALUE ($) | |
Municipal Bonds — continued | |
|
Kansas — continued | |
| | |
Johnson County Public Building Commission | | | | | | | | |
| | |
Series 2015B, Rev., 2.00%, 9/1/2020 | | | 800,000 | | | | 800,000 | |
| | |
Series 2011A, Rev., 4.00%, 9/1/2020 | | | 50,000 | | | | 50,000 | |
| | |
Johnson County Unified School District No. 232 Series 2015-A, GO, 5.00%, 9/1/2020 | | | 50,000 | | | | 50,000 | |
| | |
Johnson County Unified School District No. 233 Olathe Series 2016C, GO, 5.00%, 9/1/2023 | | | 50,000 | | | | 56,952 | |
| | |
Johnson County Unified School District No. 512 Shawnee Mission Series 2016B, GO, 4.00%, 10/1/2021 | | | 25,000 | | | | 26,039 | |
| | |
Kansas Development Finance Authority | | | | | | | | |
| | |
Series 2020SRF, Rev., 5.00%, 5/1/2021 | | | 25,000 | | | | 25,804 | |
| | |
Series 2017A, Rev., 5.00%, 5/1/2022 | | | 40,000 | | | | 43,146 | |
| | |
Kansas State Department Transportation Highway Series 2009A, Rev., 5.00%, 9/1/2020 | | | 80,000 | | | | 80,000 | |
| | |
Sedgwick County Unified School District No. 261 Haysville GO, 5.00%, 11/1/2020 | | | 200,000 | | | | 201,542 | |
| | |
Sedgwick County Unified School District No. 265 Goddard GO, 3.00%, 10/1/2020 | | | 25,000 | | | | 25,056 | |
| | |
Sedgwick County Unified School District No. 266 Maize Series 2015B, GO, 5.00%, 9/1/2021 | | | 25,000 | | | | 26,203 | |
| | |
State of Kansas, Department of Transportation Series 2012C, Rev., 5.00%, 9/1/2020 | | | 150,000 | | | | 150,000 | |
| | |
Wyandotte County-Kansas City Unified Government Series 2016A, Rev., 2.00%, 11/1/2020 | | | 100,000 | | | | 100,272 | |
| | |
Wyandotte County-Kansas City Unified Government Utility System | | | | | | | | |
| | |
Series 2014A, Rev., 5.00%, 9/1/2020 | | | 100,000 | | | | 100,000 | |
| | |
Series 2014A, Rev., 5.00%, 9/1/2021 | | | 175,000 | | | | 183,166 | |
| | |
Wyandotte County-Kansas City Unified Government, Kansas International Speedway Corp. Project Rev., 5.00%, 12/1/2020 | | | 20,000 | | | | 20,235 | |
| | | | | | | | |
| | |
Total Kansas | | | | | | | 2,954,990 | |
| | | | | | | | |
|
Kentucky — 0.6% | |
| | |
City of Bowling Green Series 2016C, GO, 4.00%, 6/1/2021 | | | 50,000 | | | | 51,433 | |
| | |
County of Kenton | | | | | | | | |
| | |
Series B, GO, 5.00%, 10/1/2020 | | | 315,000 | | | | 316,232 | |
| | |
Series B, GO, 5.00%, 10/1/2021 | | | 215,000 | | | | 226,229 | |
| | | | | | | | |
| INVESTMENTS | | PRINCIPAL
AMOUNT ($) | | | VALUE ($) | |
| |
|
Kentucky — continued | |
| | |
Series 2017A, GO, 5.00%, 4/1/2022 | | | 25,000 | | | | 26,905 | |
| | |
Kentucky Association of Counties Finance Corp. Series C, Rev., 3.25%, 2/1/2021 | | | 50,000 | | | | 50,578 | |
| | |
Kentucky Economic Development Finance Authority, Catholic Health Initiatives Series 2013A, Rev., 5.25%, 1/1/2023 (c) | | | 100,000 | | | | 110,942 | |
| | |
Kentucky Housing Corp., Westminster Village Project Series 2019, Rev., 2.00%, 4/1/2021 (b) | | | 350,000 | | | | 353,346 | |
| | |
Kentucky Infrastructure Authority Series 2018A, Rev., 3.00%, 2/1/2024 | | | 25,000 | | | | 27,294 | |
| | |
Kentucky Rural Water Finance Corp., Public Projects Construction Notes Series 2019E-1, Rev., 1.45%, 6/1/2021 | | | 945,000 | | | | 947,495 | |
| | |
Lexington-Fayette Urban County Government GO, 5.00%, 9/1/2020 | | | 125,000 | | | | 125,000 | |
| | |
Louisville & Jefferson County Metropolitan Government | | | | | | | | |
| | |
Series 2016A, Rev., 5.00%, 10/1/2020 | | | 50,000 | | | | 50,175 | |
| | |
Series 2012A, Rev., 4.00%, 6/1/2022 (c) | | | 20,000 | | | | 21,289 | |
| | |
Series 2012A, Rev., 5.00%, 6/1/2022 (c) | | | 40,000 | | | | 43,273 | |
| | |
Louisville & Jefferson County Metropolitan Government, Catholic Health Initiatives Series 2012A, Rev., 4.25%, 6/1/2022 | | | 5,000 | | | | 5,344 | |
| | |
Louisville & Jefferson County Metropolitan Sewer and Drainage District Rev., BAN, 3.00%, 10/23/2020 | | | 750,000 | | | | 752,647 | |
| | |
Louisville & Jefferson County Metropolitan Sewer District | | | | | | | | |
| | |
Rev., 5.00%, 5/15/2022 | | | 125,000 | | | | 135,171 | |
| | |
Series 2016C, Rev., 5.00%, 5/15/2022 | | | 50,000 | | | | 54,069 | |
| | |
Murray State University Series 2011B, Rev., 3.75%, 9/1/2021 | | | 110,000 | | | | 110,966 | |
| | |
University of Kentucky Series 2015B, Rev., 5.00%, 10/1/2020 | | | 200,000 | | | | 200,782 | |
| | | | | | | | |
| | |
Total Kentucky | | | | | | | 3,609,170 | |
| | | | | | | | |
|
Louisiana — 0.0% (g) | |
| | |
Lafayette Public Trust Financing Authority, Ragin’ Cajun Facilities Inc. Housing and Parking Project Rev., AGM, 5.00%, 10/1/2020 (c) | | | 150,000 | | | | 150,580 | |
| | |
Louisiana Local Government Environmental Facilities and Community Development Authority Rev., 5.00%, 4/1/2023 | | | 100,000 | | | | 111,878 | |
| | | | | | | | |
| | |
Total Louisiana | | | | | | | 262,458 | |
| | | | | | | | |
SEE NOTES TO FINANCIAL STATEMENTS.
| | | | | | | | |
| | | |
| AUGUST 31, 2020 | | J.P. MORGAN EXCHANGE-TRADED FUNDS | | | | | 181 | |
JPMorgan Ultra-Short Municipal Income ETF
SCHEDULE OF PORTFOLIO INVESTMENTS
AS OF AUGUST 31, 2020 (Unaudited) (continued)
| | | | | | | | |
| INVESTMENTS | | PRINCIPAL
AMOUNT ($) | | | VALUE ($) | |
Municipal Bonds — continued | |
|
Maine — 0.1% | |
| | |
Maine Municipal Bond Bank | | | | | | | | |
| | |
Series 2014C, Rev., 5.00%, 11/1/2020 | | | 85,000 | | | | 85,676 | |
| | |
Series 2016C, Rev., 5.00%, 11/1/2020 | | | 25,000 | | | | 25,199 | |
| | |
Series 2017A, Rev., 5.00%, 11/1/2020 | | | 25,000 | | | | 25,199 | |
| | |
Series 2019A, Rev., 5.00%, 11/1/2020 | | | 25,000 | | | | 25,199 | |
| | |
Series C, Rev., 5.00%, 11/1/2020 | | | 100,000 | | | | 100,796 | |
| | |
Series 2015A, Rev., 5.00%, 9/1/2022 | | | 25,000 | | | | 27,412 | |
| | |
Maine Municipal Bond Bank, Transportation Infrastructure Series 2011A, Rev., 5.00%, 9/1/2020 | | | 20,000 | | | | 20,000 | |
| | |
Town of Gorham Series 2016B, GO, 5.00%, 10/1/2021 | | | 25,000 | | | | 26,309 | |
| | |
Town of Scarborough GO, 5.00%, 11/1/2020 | | | 100,000 | | | | 100,764 | |
| | |
Town of York GO, 2.00%, 10/1/2020 | | | 40,000 | | | | 40,060 | |
| | | | | | | | |
| | |
Total Maine | | | | | | | 476,614 | |
| | | | | | | | |
|
Maryland — 0.6% | |
| | |
City of Baltimore | | | | | | | | |
| | |
Series 2013A, GO, 4.00%, 10/15/2020 | | | 25,000 | | | | 25,115 | |
| | |
Series 2013A, Rev., 5.00%, 7/1/2022 | | | 25,000 | | | | 27,196 | |
| | |
City of Frederick GO, 5.00%, 9/1/2020 | | | 70,000 | | | | 70,000 | |
| | |
County of Anne Arundel | | | | | | | | |
| | |
GO, 5.00%, 4/1/2021 | | | 50,000 | | | | 51,406 | |
| | |
GTD, 5.00%, 7/1/2023 | | | 50,000 | | | | 56,758 | |
| | |
County of Baltimore | | | | | | | | |
| | |
COP, 5.00%, 3/1/2021 | | | 45,000 | | | | 46,062 | |
| | |
COP, 5.00%, 3/1/2022 | | | 375,000 | | | | 401,542 | |
| | |
GO, 5.00%, 3/1/2023 | | | 70,000 | | | | 78,388 | |
| | |
County of Baltimore, Health and Social Services Building Project COP, 3.00%, 10/1/2021 | | | 50,000 | | | | 51,483 | |
| | |
County of Cecil GO, 4.00%, 12/1/2020 | | | 20,000 | | | | 20,191 | |
| | |
County of Charles, Consolidated Public Improvement GO, 5.00%, 10/1/2020 | | | 60,000 | | | | 60,235 | |
| | |
County of Frederick GO, 5.00%, 5/1/2021 | | | 25,000 | | | | 25,804 | |
| | |
County of Harford GO, 5.00%, 9/15/2022 | | | 70,000 | | | | 76,885 | |
| | |
County of Montgomery | | | | | | | | |
| | |
Series 2017C, GO, 5.00%, 10/1/2020 | | | 25,000 | | | | 25,098 | |
| | |
Series 2012A, GO, 5.00%, 11/1/2020 | | | 50,000 | | | | 50,398 | |
| | |
Series 2014A, GO, 5.00%, 11/1/2020 | | | 120,000 | | | | 120,955 | |
| | |
Series 2013A, GO, 5.00%, 11/1/2021 | | | 25,000 | | | | 26,409 | |
| | |
Series 2016A, COP, 5.00%, 11/1/2021 | | | 25,000 | | | | 26,379 | |
| | |
Rev., 5.00%, 6/1/2022 | | | 75,000 | | | | 77,693 | |
| | |
Series 2015B, GO, 5.00%, 12/1/2023 | | | 35,000 | | | | 40,421 | |
| | |
County of Prince George’s COP, 5.00%, 10/1/2023 | | | 25,000 | | | | 25,096 | |
| | | | | | | | |
| INVESTMENTS | | PRINCIPAL
AMOUNT ($) | | | VALUE ($) | |
| |
|
Maryland — continued | |
| | |
County of Queen Anne’s GO, 5.00%, 1/15/2023 | | | 25,000 | | | | 27,833 | |
| | |
County of Wicomico GO, 5.00%, 11/1/2020 | | | 25,000 | | | | 25,197 | |
| | |
Maryland Community Development Administration Series 2019A, Rev., 2.10%, 3/1/2024 | | | 25,000 | | | | 26,128 | |
| | |
Maryland Community Development Administration Local Government Infrastructure Series A-2, Rev., 3.00%, 6/1/2021 | | | 25,000 | | | | 25,507 | |
| | |
Maryland Community Development Administration, Department of Housing and Community Development, Residential Series 2018A, Rev., 2.55%, 3/1/2022 | | | 20,000 | | | | 20,591 | |
| | |
Maryland Economic Development Corp. Rev., 4.00%, 6/1/2023 | | | 50,000 | | | | 51,427 | |
| | |
Maryland Environmental Service Rev., 3.00%, 11/1/2020 | | | 80,000 | | | | 80,374 | |
| | |
Maryland Health and Higher Educational Facilities Authority, Lifebridge Health Rev., 4.00%, 7/1/2021 | | | 180,000 | | | | 185,137 | |
| | |
Maryland Stadium Authority | | | | | | | | |
| | |
Rev., 5.00%, 5/1/2022 | | | 80,000 | | | | 86,277 | |
| | |
Rev., 5.00%, 6/15/2023 | | | 65,000 | | | | 73,514 | |
| | |
Montgomery County Housing Opportunites Commission Series 2011A, Rev., VRDO, GNMA/FNMA/FHLMC, LOC: TD Bank NA, 0.09%, 9/10/2020 (b) | | | 1,150,000 | | | | 1,150,000 | |
| | |
State of Maryland | | | | | | | | |
| | |
Series 2014A, GO, 5.00%, 3/1/2022 (c) | | | 65,000 | | | | 69,662 | |
| | |
Series 2017A, GO, 5.00%, 8/1/2022 | | | 100,000 | | | | 109,286 | |
| | |
State of Maryland Department of Transportation Rev., 4.00%, 5/15/2021 | | | 50,000 | | | | 51,345 | |
| | |
University System of Maryland | | | | | | | | |
| | |
Series 2012D, Rev., 5.00%, 10/1/2020 | | | 50,000 | | | | 50,196 | |
| | |
Series 2016A, Rev., 5.00%, 4/1/2021 | | | 60,000 | | | | 61,688 | |
| | |
Series 2017B, Rev., 5.00%, 4/1/2022 | | | 85,000 | | | | 91,491 | |
| | |
Series 2011A, Rev., 3.00%, 4/1/2024 | | | 25,000 | | | | 25,383 | |
| | | | | | | | |
| | |
Total Maryland | | | | | | | 3,594,550 | |
| | | | | | | | |
|
Massachusetts — 5.2% | |
| | |
Berkshire Hills Regional School District GO, 5.00%, 10/15/2020 | | | 20,000 | | | | 20,116 | |
| | |
Berkshire Regional Transit Authority Series B, Rev., RAN, 1.25%, 7/29/2021 | | | 5,300,000 | | | | 5,336,570 | |
| | |
Boston Water & Sewer Commission Series 2012A, Rev., 4.00%, 11/1/2020 | | | 20,000 | | | | 20,126 | |
| | |
Brockton Area Transit Authority Rev., RAN, 1.50%, 7/30/2021 | | | 3,050,000 | | | | 3,074,125 | |
SEE NOTES TO FINANCIAL STATEMENTS.
| | | | | | |
| | | |
| 182 | | | | J.P. MORGAN EXCHANGE-TRADED FUNDS | | AUGUST 31, 2020 |
| | | | | | | | |
| INVESTMENTS | | PRINCIPAL
AMOUNT ($) | | | VALUE ($) | |
Municipal Bonds — continued | |
|
Massachusetts — continued | |
| | |
Cape Cod Regional Transit Authority Rev., RAN, 1.50%, 7/23/2021 | | | 3,000,000 | | | | 3,022,980 | |
| | |
City of Beverly GO, 4.00%, 9/1/2020 | | | 10,000 | | | | 10,000 | |
| | |
City of Malden GO, 5.00%, 11/15/2020 | | | 35,000 | | | | 35,343 | |
| | |
City of Methuen GO, BAN, 2.00%, 9/1/2021 | | | 3,235,000 | | | | 3,285,628 | |
| | |
City of Newton Series B, GO, 3.00%, 11/1/2020 | | | 50,000 | | | | 50,236 | |
| | |
City of Revere GO, 4.00%, 12/1/2021 | | | 25,000 | | | | 26,189 | |
| | |
City of Waltham GO, 4.10%, 2/1/2023 | | | 35,000 | | | | 35,108 | |
| | |
City of Woburn GO, 5.00%, 9/15/2020 | | | 35,000 | | | | 35,062 | |
| | |
Commonwealth of Massachusetts | | | | | | | | |
| | |
Series 2003D, GO, 5.50%, 10/1/2020 | | | 130,000 | | | | 130,563 | |
| | |
Series 2001D, GO, AGM-CR, 5.50%, 11/1/2020 | | | 25,000 | | | | 25,220 | |
| | |
Series C, GO, 5.00%, 10/1/2023 | | | 25,000 | | | | 28,653 | |
| | |
Commonwealth of Massachusetts Transportation Fund Series 2012A, Rev., 5.00%, 6/1/2022 | | | 50,000 | | | | 51,810 | |
| | |
Commonwealth of Massachusetts, Consolidated Loan of 2013 Series 2013A, GO, 4.00%, 4/1/2021 (c) | | | 25,000 | | | | 25,557 | |
| | |
Lowell Regional Transit Authority Rev., RAN, 1.25%, 8/19/2021 | | | 6,000,000 | | | | 6,042,780 | |
| | |
Massachusetts Bay Transportation Authority Series 2008B, Rev., 5.00%, 7/1/2021 | | | 25,000 | | | | 26,002 | |
| | |
Massachusetts Clean Water Trust (The) Rev., 5.00%, 8/1/2021 | | | 20,000 | | | | 20,880 | |
| | |
Massachusetts Development Finance Agency | | | | | | | | |
| | |
Series 2010B-1, Rev., 5.00%, 10/15/2020 | | | 75,000 | | | | 75,438 | |
| | |
Series I, Rev., 6.25%, 1/1/2021 (c) | | | 50,000 | | | | 51,003 | |
| | |
Rev., 1.39%, 2/1/2022 (b) | | | 84,000 | | | | 85,034 | |
| | |
Series 2017S-4, Rev., 5.00%, 1/25/2024 (b) | | | 200,000 | | | | 230,894 | |
| | |
Series 2019DD-1, Rev., 5.00%, 4/1/2024 (b) | | | 475,000 | | | | 539,220 | |
| | |
Massachusetts Development Finance Agency, Dana-Farber Cancer Institute Series 2019O, Rev., 5.00%, 12/1/2020 | | | 195,000 | | | | 197,143 | |
| | |
Massachusetts Development Finance Agency, Milton Academy Rev., 5.00%, 9/1/2020 | | | 100,000 | | | | 100,000 | |
| | |
Massachusetts Development Finance Agency, Partners Healthcare System Series 2017S, Rev., (SIFMA Municipal Swap Index Yield + 0.50%), 0.59%, 9/10/2020 (d) | | | 250,000 | | | | 249,170 | |
| | | | | | | | |
| INVESTMENTS | | PRINCIPAL
AMOUNT ($) | | | VALUE ($) | |
| |
|
Massachusetts — continued | |
| | |
Massachusetts Development Finance Agency, Umass Memorial Health Care Obligated Group Series I, Rev., 5.00%, 7/1/2022 | | | 245,000 | | | | 261,942 | |
| | |
Massachusetts Housing Finance Agency Series 2018A, Rev., 2.40%, 12/1/2021 (b) | | | 100,000 | | | | 102,634 | |
| | |
Massachusetts School Building Authority Series 2012A, Rev., 5.00%, 8/15/2021 | | | 55,000 | | | | 57,539 | |
| | |
Springfield Water & Sewer Commission Series 2017B, Rev., 5.00%, 4/15/2022 | | | 25,000 | | | | 26,914 | |
| | |
Town of Arlington, Municipal Purpose Loan GO, 5.00%, 12/1/2020 | | | 20,000 | | | | 20,241 | |
| | |
Town of Bedford GO, 3.00%, 10/1/2020 | | | 25,000 | | | | 25,057 | |
| | |
Town of Boxborough GO, BAN, 1.25%, 2/12/2021 | | | 1,512,900 | | | | 1,516,803 | |
| | |
Town of Charlton GO, BAN, 1.13%, 5/28/2021 | | | 3,007,000 | | | | 3,017,765 | |
| | |
Town of Dedham GO, BAN, 1.13%, 5/12/2021 | | | 1,000,000 | | | | 1,003,580 | |
| | |
Town of Dracut GO, 5.00%, 9/15/2021 | | | 25,000 | | | | 26,260 | |
| | |
Town of Edgartown Series A, GO, 5.00%, 1/15/2021 | | | 35,000 | | | | 35,629 | |
| | |
Town of Hamilton GO, BAN, 1.25%, 8/27/2021 | | | 667,767 | | | | 672,969 | |
| | |
Town of Lexington GO, 4.00%, 2/1/2021 | | | 75,000 | | | | 76,201 | |
| | |
Town of Lunenburg GO, 4.00%, 6/1/2021 | | | 150,000 | | | | 150,468 | |
| | |
Town of Reading GO, 3.00%, 4/15/2021 | | | 25,000 | | | | 25,444 | |
| | |
Town of Scituate, Municipal Purpose Loan GO, 5.00%, 9/15/2020 | | | 25,000 | | | | 25,044 | |
| | |
Town of Shrewsbury GO, 5.00%, 7/1/2021 | | | 40,000 | | | | 41,616 | |
| | |
Town of South Hadley Series 2013A, GO, 3.00%, 5/15/2021 | | | 150,000 | | | | 152,947 | |
| | |
Town of Westborough GO, 5.00%, 11/15/2020 | | | 45,000 | | | | 45,445 | |
| | |
Town of Winthrop GO, 4.00%, 9/1/2021 | | | 25,000 | | | | 25,964 | |
| | |
University of Massachusetts Building Authority Series 2, Rev., 5.00%, 11/1/2020 | | | 40,000 | | | | 40,315 | |
| | | | | | | | |
| | |
Total Massachusetts | | | | | | | 30,181,627 | |
| | | | | | | | |
|
Michigan — 3.0% | |
| | |
Ann Arbor School District GO, Q-SBLF, 5.00%, 5/1/2021 | | | 60,000 | | | | 61,922 | |
| | |
Central Michigan University Rev., 5.00%, 10/1/2020 | | | 325,000 | | | | 326,056 | |
| | |
Charter Township of Lyon Series 2006-A, GO, 4.13%, 11/1/2023 | | | 45,000 | | | | 45,285 | |
SEE NOTES TO FINANCIAL STATEMENTS.
| | | | | | | | |
| | | |
| AUGUST 31, 2020 | | J.P. MORGAN EXCHANGE-TRADED FUNDS | | | | | 183 | |
JPMorgan Ultra-Short Municipal Income ETF
SCHEDULE OF PORTFOLIO INVESTMENTS
AS OF AUGUST 31, 2020 (Unaudited) (continued)
| | | | | | | | |
| INVESTMENTS | | PRINCIPAL
AMOUNT ($) | | | VALUE ($) | |
Municipal Bonds — continued | |
|
Michigan — continued | |
| | |
Charter Township of Meridian, Unlimited Tax GO, 5.00%, 10/1/2020 | | | 40,000 | | | | 40,156 | |
| | |
City of Grand Rapids GO, 5.00%, 4/1/2024 | | | 50,000 | | | | 58,321 | |
| | |
City of Marquette, Capital Improvement | | | | | | | | |
| | |
GO, 4.00%, 5/1/2023 | | | 200,000 | | | | 218,538 | |
| | |
GO, 4.00%, 5/1/2024 | | | 210,000 | | | | 236,208 | |
| | |
GO, 4.00%, 5/1/2025 | | | 290,000 | | | | 335,037 | |
| | |
City of Marquette, Limited Tax | | | | | | | | |
| | |
GO, 4.00%, 5/1/2023 | | | 170,000 | | | | 185,757 | |
| | |
GO, 4.00%, 5/1/2024 | | | 125,000 | | | | 140,600 | |
| | |
GO, 4.00%, 5/1/2025 | | | 105,000 | | | | 121,307 | |
| | |
City of Novi GO, 4.00%, 10/1/2021 | | | 60,000 | | | | 62,393 | |
| | |
City of Royal Oak | | | | | | | | |
| | |
GO, 4.00%, 4/1/2021 | | | 50,000 | | | | 51,072 | |
| | |
GO, 3.00%, 10/1/2021 | | | 85,000 | | | | 87,474 | |
| | |
City of Southfield GO, 3.00%, 5/1/2023 | | | 30,000 | | | | 32,137 | |
| | |
Clarkston Community Schools Series 2016A, GO, Q-SBLF, 5.00%, 5/1/2021 | | | 215,000 | | | | 221,695 | |
| | |
County of Jackson GO, 2.00%, 5/1/2024 | | | 250,000 | | | | 264,870 | |
| | |
County of Jackson, Capital Improvement, Limited Tax Series 2018C, GO, 3.00%, 9/1/2020 | | | 135,000 | | | | 135,000 | |
| | |
County of Kent GO, 5.00%, 1/1/2021 | | | 110,000 | | | | 111,754 | |
| | |
County of Muskegon GO, 5.00%, 7/1/2022 | | | 25,000 | | | | 25,093 | |
| | |
Dearborn School District, Limited Tax | | | | | | | | |
| | |
GO, 3.00%, 5/1/2021 | | | 915,000 | | | | 931,369 | |
| | |
GO, 3.00%, 5/1/2022 | | | 915,000 | | | | 955,818 | |
| | |
Detroit City School District Series 2002A, GO, FGIC, Q-SBLF, 6.00%, 5/1/2021 | | | 30,000 | | | | 31,129 | |
| | |
Dexter Community Schools GO, Q-SBLF, 4.00%, 5/1/2022 | | | 100,000 | | | | 106,344 | |
| | |
East Lansing School District Series 2020-II, GO, Q-SBLF, 4.00%, 5/1/2023 | | | 180,000 | | | | 196,783 | |
| | |
Ferris State University Rev., 5.00%, 10/1/2020 | | | 200,000 | | | | 200,664 | |
| | |
Forest Hills Public Schools Series I, GO, 3.00%, 5/1/2022 | | | 50,000 | | | | 52,341 | |
| | |
Forest Hills Public Schools, Unlimited Tax GO, 5.00%, 5/1/2021 | | | 35,000 | | | | 36,121 | |
| | |
Glen Lake Community Schools GO, AGM, Q-SBLF, 4.00%, 5/1/2021 | | | 150,000 | | | | 150,465 | |
| | |
Grand Traverse County Hospital Finance Authority, Munson Healthcare Obligated Group Series 2019A, Rev., 5.00%, 7/1/2024 | | | 130,000 | | | | 150,934 | |
| | |
Grand Valley State University | | | | | | | | |
| | |
Series 2014B, Rev., 5.00%, 12/1/2020 | | | 165,000 | | | | 166,698 | |
| | | | | | | | |
| INVESTMENTS | | PRINCIPAL
AMOUNT ($) | | | VALUE ($) | |
| |
|
Michigan — continued | |
| | |
Series 2016A, Rev., 5.00%, 12/1/2021 | | | 415,000 | | | | 436,422 | |
| | |
Series 2014B, Rev., 5.00%, 12/1/2023 | | | 310,000 | | | | 348,545 | |
| | |
Series 2016A, Rev., 5.00%, 12/1/2024 | | | 670,000 | | | | 777,093 | |
| | |
Kent Hospital Finance Authority, Spectrum Health System Series 2011A, Rev., 5.00%, 11/15/2021 | | | 500,000 | | | | 526,260 | |
| | |
Lakeview Public School District, Unlimited Tax GO, Q-SBLF, 5.00%, 11/1/2020 | | | 175,000 | | | | 176,333 | |
| | |
L’Anse Creuse Public Schools GO, VRDO, Q-SBLF, LOC: TD Bank NA, 0.08%, 9/10/2020 (b) | | | 725,000 | | | | 725,000 | |
| | |
Livonia Municipal Building Authority Rev., 4.00%, 5/1/2024 | | | 40,000 | | | | 45,023 | |
| | |
Macomb County Building Authority Rev., 2.50%, 5/1/2021 | | | 50,000 | | | | 50,772 | |
| | |
Michigan Finance Authority | | | | | | | | |
| | |
Series 2016MI-2, Rev., (SIFMA Municipal Swap Index Yield + 0.48%), 0.57%, 9/10/2020 (d) | | | 145,000 | | | | 144,767 | |
| | |
Series 2015MI, Rev., (ICE LIBOR USD 1 Month + 0.54%), 0.65%, 9/10/2020 (d) | | | 875,000 | | | | 874,668 | |
| | |
Rev., 5.00%, 10/1/2020 | | | 25,000 | | | | 25,098 | |
| | |
Series 2015MI, Rev., 5.00%, 12/1/2020 | | | 100,000 | | | | 101,115 | |
| | |
Series 2015MI, Rev., 5.00%, 12/1/2021 | | | 110,000 | | | | 116,160 | |
| | |
Rev., 5.00%, 11/15/2022 | | | 330,000 | | | | 361,122 | |
| | |
Series 2017A-MI, Rev., 5.00%, 12/1/2022 | | | 315,000 | | | | 345,813 | |
| | |
Series 2019MI-1, Rev., 5.00%, 12/1/2023 | | | 100,000 | | | | 113,914 | |
| | |
Series 2016B, Rev., 5.00%, 10/1/2024 | | | 150,000 | | | | 178,632 | |
| | |
Series 2017A, Rev., 5.00%, 12/1/2024 | | | 140,000 | | | | 164,991 | |
| | |
Series 2019MI-2, Rev., 5.00%, 2/1/2025 (b) | | | 200,000 | | | | 236,958 | |
| | |
Michigan Finance Authority, Bronson Healthcare Group, Inc. Series B, Rev., 3.50%, 11/15/2022 (b) | | | 320,000 | | | | 339,197 | |
| | |
Michigan Finance Authority, Clean Water Revolving Fund | | | | | | | | |
| | |
Series 2016B, Rev., 4.00%, 10/1/2020 | | | 110,000 | | | | 110,340 | |
| | |
Rev., 5.00%, 10/1/2020 | | | 25,000 | | | | 25,097 | |
| | |
Michigan Finance Authority, Henry Ford Health System | | | | | | | | |
| | |
Rev., 5.00%, 11/15/2020 | | | 185,000 | | | | 186,630 | |
| | |
Rev., 5.00%, 11/15/2021 | | | 140,000 | | | | 147,283 | |
| | |
Michigan Finance Authority, Revolving Fund Cleanwater Series 2011, Rev., 5.00%, 10/1/2020 | | | 60,000 | | | | 60,234 | |
SEE NOTES TO FINANCIAL STATEMENTS.
| | | | | | |
| | | |
| 184 | | | | J.P. MORGAN EXCHANGE-TRADED FUNDS | | AUGUST 31, 2020 |
| | | | | | | | |
| INVESTMENTS | | PRINCIPAL
AMOUNT ($) | | | VALUE ($) | |
Municipal Bonds — continued | |
|
Michigan — continued | |
| | |
Michigan Finance Authority, Trinity Health Credit Group Rev., 5.00%, 12/1/2021 | | | 340,000 | | | | 359,040 | |
| | |
Michigan Municipal Bond Authority Rev., 5.00%, 10/1/2020 | | | 115,000 | | | | 115,450 | |
| | |
Michigan State Building Authority Series I-A, Rev., 5.00%, 10/15/2020 | | | 95,000 | | | | 95,547 | |
| | |
Michigan State Building Authority, Facilities Program Series I, Rev., 5.00%, 4/15/2021 | | | 100,000 | | | | 102,983 | |
| | |
Michigan State Hospital Finance Authority Series 2008C, Rev., 5.00%, 12/1/2024 | | | 160,000 | | | | 188,562 | |
| | |
Michigan State Hospital Finance Authority, Ascension Health Series 2010 F-1, Rev., 4.00%, 6/1/2023 (b) | | | 50,000 | | | | 54,688 | |
| | |
Michigan State Hospital Finance Authority, Ascension Health Credit Group Series 2010F-2, Rev., 1.90%, 4/1/2021 (b) | | | 750,000 | | | | 755,947 | |
| | |
Michigan State Hospital Finance Authority, Ascension Health Senior Credit Group Series F-5, Rev., 2.40%, 3/15/2023 (b) | | | 305,000 | | | | 319,198 | |
| | |
Michigan State Hospital Finance Authority, Trinity Health Credit Group | | | | | | | | |
| | |
Series 2008C, Rev., 5.00%, 12/1/2020 | | | 100,000 | | | | 101,115 | |
| | |
Series C, Rev., 5.00%, 12/1/2025 | | | 150,000 | | | | 181,999 | |
| | |
Michigan State University Series 2019C, Rev., 5.00%, 8/15/2022 | | | 45,000 | | | | 49,032 | |
| | |
Michigan Strategic Fund, Cadillac Place Office Building Project Rev., 5.00%, 10/15/2020 | | | 200,000 | | | | 201,024 | |
| | |
Michigan Strategic Fund, The Detroit Edison Co. Exampt Facilities Project Series 2008ET-2, Rev., 1.45%, 9/1/2021 (b) | | | 250,000 | | | | 251,212 | |
| | |
Michigan Strategic Fund, The Detroit Edison Company Pollution Control Bonds Project Series CC, Rev., 1.45%, 9/1/2021 (b) | | | 300,000 | | | | 301,455 | |
| | |
Michigan Technological University, Board of Control Series 2015A, Rev., AGM, 5.00%, 10/1/2020 | | | 100,000 | | | | 100,366 | |
| | |
Muskegon Local Development Finance Authority Rev., AGM, 3.00%, 11/1/2022 | | | 50,000 | | | | 51,197 | |
| | |
New Haven Community Schools GO, Q-SBLF, 5.00%, 5/1/2022 | | | 25,000 | | | | 27,010 | |
| | |
Northwestern Michigan College, Limited Tax GO, 3.25%, 5/1/2021 | | | 35,000 | | | | 35,675 | |
| | |
Novi Community School District, School Building and Site Bonds Series I, GO, 4.00%, 5/1/2021 | | | 25,000 | | | | 25,635 | |
| | |
Plymouth-Canton Community School District GO, Q-SBLF, 5.00%, 5/1/2023 | | | 45,000 | | | | 50,616 | |
| | | | | | | | |
| INVESTMENTS | | PRINCIPAL
AMOUNT ($) | | | VALUE ($) | |
| |
|
Michigan — continued | |
| | |
Royal Oak Hospital Finance Authority, Health Beaumont Health Credit Group | | | | | | | | |
| | |
Series 2014D, Rev., 5.00%, 9/1/2021 | | | 150,000 | | | | 156,629 | |
| | |
Royal Oak Hospital Finance Authority, William Beaumont Hospital Obligated Group Series 2014D, Rev., 5.00%, 9/1/2020 | | | 85,000 | | | | 85,000 | |
| | |
Royal Oak School District | | | | | | | | |
| | |
GO, 4.00%, 5/1/2022 | | | 30,000 | | | | 31,903 | |
| | |
GO, 5.00%, 5/1/2022 | | | 40,000 | | | | 43,202 | |
| | |
Schoolcraft Community College District GO, 3.00%, 5/1/2024 | | | 115,000 | | | | 125,012 | |
| | |
State of Michigan | | | | | | | | |
| | |
Series 2010A, GO, 5.00%, 11/1/2020 | | | 205,000 | | | | 206,632 | |
| | |
Series 2015A, GO, 5.00%, 12/1/2020 | | | 180,000 | | | | 182,162 | |
| | |
Rev., GAN, 5.00%, 3/15/2021 | | | 185,000 | | | | 189,451 | |
| | |
State of Michigan, Environmental Program, Tax-Exempt GO, 3.00%, 11/1/2020 | | | 25,000 | | | | 25,117 | |
| | |
Troy School District GO, Q-SBLF, 5.00%, 5/1/2021 | | | 70,000 | | | | 72,242 | |
| | |
Wayne County Airport Authority Series 2012A, Rev., 5.00%, 12/1/2020 | | | 150,000 | | | | 151,713 | |
| | |
Wayne County Airport Authority, Junior Lien | | | | | | | | |
| | |
Series 2017A, Rev., 5.00%, 12/1/2020 | | | 100,000 | | | | 101,142 | |
| | |
Wayne State University Series 2019A, Rev., 5.00%, 11/15/2024 | | | 175,000 | | | | 206,183 | |
| | |
Ypsilanti Community Utilities Authority Rev., 4.00%, 4/1/2023 | | | 175,000 | | | | 191,154 | |
| | | | | | | | |
| | |
Total Michigan | | | | | | | 17,492,101 | |
| | | | | | | | |
|
Minnesota — 0.6% | |
| | |
Alexandria Lake Area Sanitation District Series 2015A, GO, 5.00%, 2/1/2023 | | | 25,000 | | | | 27,833 | |
| | |
City of Brooklyn Center, Unity Place Project Rev., 1.95%, 12/1/2020 (b) | | | 75,000 | | | | 75,058 | |
| | |
City of Columbia Heights Series 2017B, GO, 3.00%, 2/1/2023 | | | 35,000 | | | | 37,197 | |
| | |
City of Eden Prairie Series 2012C, GO, 2.00%, 1/15/2021 | | | 40,000 | | | | 40,056 | |
| | |
City of Rochester, Health Care Facilities, Mayo Clinic Rev., 4.50%, 11/15/2021 (b) | | | 100,000 | | | | 103,854 | |
| | |
County of Clay Series 2017A, GO, 5.00%, 2/1/2025 | | | 50,000 | | | | 60,157 | |
| | |
County of Hennepin Series 2010B, GO, 4.00%, 12/1/2020 | | | 25,000 | | | | 25,238 | |
| | |
County of Ramsey Series 2012A, GO, 4.00%, 2/1/2021 | | | 40,000 | | | | 40,637 | |
| | |
Duluth Independent School District No. 709 | | | | | | | | |
SEE NOTES TO FINANCIAL STATEMENTS.
| | | | | | | | |
| | | |
| AUGUST 31, 2020 | | J.P. MORGAN EXCHANGE-TRADED FUNDS | | | | | 185 | |
JPMorgan Ultra-Short Municipal Income ETF
SCHEDULE OF PORTFOLIO INVESTMENTS
AS OF AUGUST 31, 2020 (Unaudited) (continued)
| | | | | | | | |
| INVESTMENTS | | PRINCIPAL
AMOUNT ($) | | | VALUE ($) | |
Municipal Bonds — continued | |
|
Minnesota — continued | |
| | |
Series 2019C, COP, 5.00%, 2/1/2022 | | | 130,000 | | | | 137,774 | |
| | |
Series A, COP, 5.00%, 2/1/2022 | | | 200,000 | | | | 211,960 | |
| | |
Series 2016A, COP, 5.00%, 2/1/2025 | | | 200,000 | | | | 235,908 | |
| | |
Housing and Redevelopment Authority of The City of St. Paul Minnesota, Fairview Health Services Series 2017A, Rev., 5.00%, 11/15/2022 | | | 200,000 | | | | 219,326 | |
| | |
Housing and Redevelopment Authority of The City of St. Paul, Legends Berry Senior Apartments Project Series A, Rev., VRDO, 2.20%, 9/1/2021 (b) | | | 325,000 | | | | 325,000 | |
| | |
Metropolitan Council Series 2012E, GO, 5.00%, 9/1/2020 | | | 50,000 | | | | 50,000 | |
| | |
Metropolitan Council, Wastewater Series 2014D, GO, 5.00%, 9/1/2020 | | | 40,000 | | | | 40,000 | |
| | |
Minneapolis Special School District No. 1 | | | | | | | | |
| | |
Series 2011-F, COP, 3.00%, 2/1/2021 | | | 30,000 | | | | 30,066 | |
| | |
Series 2012B, GO, 3.00%, 2/1/2021 | | | 25,000 | | | | 25,295 | |
| | |
Series 2014D, COP, 5.00%, 2/1/2025 | | | 30,000 | | | | 33,331 | |
| | |
Minneapolis-St Paul Metropolitan Airports Commission | | | | | | | | |
| | |
Series B, Rev., 3.00%, 1/1/2021 | | | 70,000 | | | | 70,530 | |
| | |
Series 2016B, Rev., 5.00%, 1/1/2022 | | | 275,000 | | | | 290,631 | |
| | |
Series 2019C, Rev., 5.00%, 1/1/2023 | | | 150,000 | | | | 164,469 | |
| | |
Minnesota Higher Education Facilities Authority Rev., 5.00%, 3/1/2021 | | | 25,000 | | | | 25,602 | |
| | |
Minnesota Housing Finance Agency | | | | | | | | |
| | |
Rev., AMT, GNMA/FNMA/FHLMC, 2.10%, 7/1/2021 | | | 105,000 | | | | 106,294 | |
| | |
Series 2018C, Rev., 5.00%, 8/1/2021 | | | 20,000 | | | | 20,814 | |
| | |
Series C, Rev., AMT, GNMA/FNMA/FHLMC, 2.55%, 1/1/2023 | | | 105,000 | | | | 109,649 | |
| | |
Minnesota Public Facilities Authority Series 2010A, Rev., 5.00%, 3/1/2023 | | | 50,000 | | | | 55,978 | |
| | |
Minnesota State Colleges And Universities Foundation Series 2011A, Rev., 4.00%, 10/1/2020 | | | 25,000 | | | | 25,074 | |
| | |
Minnetonka Independent School District No. 276 | | | | | | | | |
| | |
Series E, COP, 3.00%, 10/1/2021 | | | 155,000 | | | | 159,510 | |
| | |
Series E, COP, 3.00%, 10/1/2022 | | | 85,000 | | | | 89,803 | |
| | |
Series E, COP, 4.00%, 10/1/2023 | | | 115,000 | | | | 127,901 | |
| | |
State of Minnesota | | | | | | | | |
| | |
Series 2010D, GO, 5.00%, 9/14/2020 | | | 40,000 | | | | 40,065 | |
| | |
Series 2017E, GO, 4.00%, 10/1/2020 | | | 40,000 | | | | 40,124 | |
| | |
Series 2013D, GO, 5.00%, 10/1/2020 | | | 135,000 | | | | 135,526 | |
| | |
Series 2013F, GO, 5.00%, 10/1/2020 | | | 20,000 | | | | 20,078 | |
| | | | | | | | |
| INVESTMENTS | | PRINCIPAL
AMOUNT ($) | | | VALUE ($) | |
| |
|
Minnesota — continued | |
| | |
Series 2018B, GO, 5.00%, 8/1/2023 | | | 25,000 | | | | 28,484 | |
| | | | | | | | |
| | |
Total Minnesota | | | | | | | 3,229,222 | |
| | | | | | | | |
|
Mississippi — 0.7% | |
| | |
Alcorn State University Educational Building Corp. (The) Rev., 3.00%, 9/1/2022 | | | 30,000 | | | | 31,421 | |
| | |
City of Ridgeland GO, 4.00%, 8/1/2024 | | | 25,000 | | | | 28,427 | |
| | |
City of Starkville Rev., 4.00%, 5/1/2023 | | | 55,000 | | | | 60,159 | |
| | |
Mississippi Business Finance Corp. Rev., VRDO, 0.55%, 9/1/2021 (b) | | | 350,000 | | | | 350,000 | |
| | |
Mississippi Development Bank | | | | | | | | |
| | |
Rev., 5.00%, 1/1/2022 (c) | | | 50,000 | | | | 53,187 | |
| | |
Rev., 5.00%, 1/1/2022 | | | 50,000 | | | | 53,125 | |
| | |
Rev., 5.00%, 6/1/2022 | | | 295,000 | | | | 319,143 | |
| | |
Mississippi Development Bank, Special Obligation, Water and Sewer System Project Rev., AGM, 3.00%, 12/1/2020 | | | 100,000 | | | | 100,626 | |
| | |
Mississippi Hospital Equipment & Facilities Authority Series 2020-I, Rev., 5.00%, 10/1/2020 | | | 160,000 | | | | 160,573 | |
| | |
Mississippi State University Educational Building Corp. Series 2014A, Rev., 5.00%, 8/1/2023 | | | 25,000 | | | | 28,366 | |
| | |
Oxford School District GO, 2.00%, 12/1/2020 | | | 150,000 | | | | 150,210 | |
| | |
Rankin County School District | | | | | | | | |
| | |
GO, 5.00%, 10/1/2020 | | | 50,000 | | | | 50,192 | |
| | |
GO, 3.00%, 8/1/2023 | | | 75,000 | | | | 75,141 | |
| | |
State of Mississippi | | | | | | | | |
| | |
Series 2015C, GO, 5.00%, 10/1/2020 | | | 25,000 | | | | 25,098 | |
| | |
Series 2009F, GO, 5.25%, 10/1/2020 | | | 45,000 | | | | 45,185 | |
| | |
Series E, Rev., 5.00%, 10/15/2020 | | | 1,750,000 | | | | 1,758,645 | |
| | |
Series 2012B, GO, 3.00%, 11/1/2020 | | | 25,000 | | | | 25,117 | |
| | |
Series 2003D, GO, 5.25%, 11/1/2020 | | | 85,000 | | | | 85,711 | |
| | |
University of Mississippi Educational Building Corp. | | | | | | | | |
| | |
Series 2009B, Rev., 5.00%, 10/1/2020 | | | 55,000 | | | | 55,211 | |
| | |
Series 2019A, Rev., 5.00%, 10/1/2020 | | | 75,000 | | | | 75,289 | |
| | |
Rev., 3.00%, 10/1/2022 | | | 180,000 | | | | 189,668 | |
| | |
Rev., 5.00%, 10/1/2024 | | | 95,000 | | | | 112,157 | |
| | |
University of Southern Mississippi (The) Rev., 3.00%, 3/1/2023 | | | 50,000 | | | | 52,641 | |
| | | | | | | | |
| | |
Total Mississippi | | | | | | | 3,885,292 | |
| | | | | | | | |
SEE NOTES TO FINANCIAL STATEMENTS.
| | | | | | |
| | | |
| 186 | | | | J.P. MORGAN EXCHANGE-TRADED FUNDS | | AUGUST 31, 2020 |
| | | | | | | | |
| INVESTMENTS | | PRINCIPAL
AMOUNT ($) | | | VALUE ($) | |
Municipal Bonds — continued | |
|
Missouri — 0.8% | |
| | |
Bi-State Development Agency of the Missouri-Illinois Metropolitan District Series 2013A, Rev., 5.00%, 10/1/2020 (c) | | | 70,000 | | | | 70,274 | |
| | |
City of Chesterfield COP, 5.00%, 12/1/2023 | | | 25,000 | | | | 28,802 | |
| | |
City of Kansas City | | | | | | | | |
| | |
Series 2009E, Rev., Zero Coupon, 2/1/2021 | | | 100,000 | | | | 99,367 | |
| | |
Series 2018A, GO, 5.00%, 2/1/2021 | | | 105,000 | | | | 107,106 | |
| | |
Series 2011A, Rev., 5.00%, 1/1/2022 | | | 25,000 | | | | 25,400 | |
| | |
Series E, Rev., Zero Coupon, 2/1/2024 | | | 250,000 | | | | 235,193 | |
| | |
Series 2012A, GO, 4.50%, 2/1/2024 | | | 25,000 | | | | 26,456 | |
| | |
City of O’Fallon GO, 5.00%, 3/1/2021 | | | 25,000 | | | | 25,603 | |
| | |
City of St. Charles COP, 5.00%, 2/1/2021 | | | 100,000 | | | | 101,875 | |
| | |
County of Clay | | | | | | | | |
| | |
Series 2018A, COP, 4.00%, 5/1/2021 | | | 100,000 | | | | 102,486 | |
| | |
Series 2018A, COP, 4.00%, 5/1/2024 | | | 30,000 | | | | 33,884 | |
| | |
Curators of the University of Missouri (The) Series 2014A, Rev., 5.00%, 11/1/2022 (c) | | | 25,000 | | | | 27,550 | |
| | |
Hannibal IDA, Healthcare Facilities Rev., 5.00%, 10/1/2020 | | | 285,000 | | | | 285,875 | |
| | |
Health and Educational Facilities Authority of the State of Missouri | | | | | | | | |
| | |
Rev., 5.00%, 9/1/2020 | | | 100,000 | | | | 100,000 | |
| | |
Rev., 5.00%, 9/1/2021 | | | 230,000 | | | | 237,868 | |
| | |
Health and Educational Facilities Authority of the State of Missouri, BJC Health System Series C, Rev., VRDO, LIQ: BJC Health System, 0.07%, 9/10/2020 (b) | | | 810,000 | | | | 810,000 | |
| | |
Health and Educational Facilities Authority of the State of Missouri, Coxhealth Series 2013A, Rev., 5.00%, 11/15/2022 | | | 75,000 | | | | 82,073 | |
| | |
Kirkwood School District Educational Facilities Authority Rev., 3.00%, 2/15/2022 | | | 25,000 | | | | 26,030 | |
| | |
Missouri Development Finance Board, Fulton State Hospital Project Rev., 5.00%, 10/1/2020 | | | 100,000 | | | | 100,391 | |
| | |
Missouri Joint Municipal Electric Utility Commission | | | | | | | | |
| | |
Series 2015A, Rev., 5.00%, 12/1/2020 | | | 780,000 | | | | 789,110 | |
| | |
Series 2014A, Rev., 5.00%, 1/1/2022 | | | 50,000 | | | | 53,118 | |
| | |
Series 2015A, Rev., 5.00%, 12/1/2023 | | | 100,000 | | | | 114,925 | |
| | |
Missouri State Board of Public Buildings | | | | | | | | |
| | |
Series 2013A, Rev., 3.00%, 10/1/2020 | | | 300,000 | | | | 300,675 | |
| | |
Series 2012A, Rev., 4.00%, 10/1/2020 | | | 240,000 | | | | 240,737 | |
| | | | | | | | |
| INVESTMENTS | | PRINCIPAL
AMOUNT ($) | | | VALUE ($) | |
| |
|
Missouri — continued | |
| | |
Series 2012A, Rev., 5.00%, 10/1/2020 (c) | | | 135,000 | | | | 135,522 | |
| | |
Missouri State Environmental Improvement & Energy Resources Authority | | | | | | | | |
| | |
Series 2015B, Rev., 4.00%, 1/1/2021 | | | 25,000 | | | | 25,318 | |
| | |
Series 2013A, Rev., 5.00%, 7/1/2024 | | | 60,000 | | | | 68,091 | |
| | |
Springfield School District No. R-12 Series 2014B, GO, 5.00%, 3/1/2021 | | | 70,000 | | | | 71,687 | |
| | |
St Charles County Public Water Supply District No. 2 | | | | | | | | |
| | |
Series 2016B, COP, 5.00%, 12/1/2020 | | | 60,000 | | | | 60,711 | |
| | |
Series 2016B, COP, 5.00%, 12/1/2021 | | | 45,000 | | | | 47,648 | |
| | |
St Louis Junior College District Building Corp. Rev., 3.00%, 4/1/2022 | | | 50,000 | | | | 50,102 | |
| | | | | | | | |
| | |
Total Missouri | | | | | | | 4,483,877 | |
| | | | | | | | |
|
Montana — 0.9% | |
| | |
Montana Facility Finance Authority, Billings Clinic Obligated Group | | | | | | | | |
| | |
Series 2018C, Rev., (SIFMA Municipal Swap Index Yield + 0.55%), 0.64%, 9/10/2020 (d) | | | 5,135,000 | | | | 5,126,527 | |
| | | | | | | | |
|
Nebraska — 0.1% | |
| | |
City of Fremont, Combined Utility System Rev., 3.00%, 10/15/2021 | | | 65,000 | | | | 66,901 | |
| | |
City of Lincoln Series 2015A, Rev., 5.00%, 9/1/2020 | | | 220,000 | | | | 220,000 | |
| | |
City of Omaha | | | | | | | | |
| | |
Series A, GO, 5.00%, 1/15/2021 | | | 25,000 | | | | 25,447 | |
| | |
GO, 5.25%, 4/1/2021 | | | 25,000 | | | | 25,740 | |
| | |
Series A, GO, 4.00%, 11/15/2021 | | | 50,000 | | | | 52,312 | |
| | |
City of Omaha, Sewer Rev., 5.00%, 11/15/2020 | | | 50,000 | | | | 50,493 | |
| | |
Nebraska Investment Finance Authority Series 2018C, Rev., 2.13%, 9/1/2022 | | | 55,000 | | | | 56,583 | |
| | |
Nebraska Investment Finance Authority, Single Family Housing Series 2019D, Rev., GNMA/FNMA/FHLMC, 1.45%, 9/1/2021 | | | 155,000 | | | | 156,324 | |
| | |
Nebraska Public Power District Series A, Rev., 5.00%, 1/1/2021 | | | 50,000 | | | | 50,797 | |
| | |
Omaha Public Power District Series 2011C, Rev., 5.00%, 2/1/2021 | | | 25,000 | | | | 25,496 | |
| | |
State of Nebraska COP, 4.00%, 11/1/2021 | | | 25,000 | | | | 26,083 | |
| | |
University of Nebraska Rev., 3.25%, 5/15/2024 (c) | | | 60,000 | | | | 66,442 | |
| | | | | | | | |
| | |
Total Nebraska | | | | | | | 822,618 | |
| | | | | | | | |
SEE NOTES TO FINANCIAL STATEMENTS.
| | | | | | | | |
| | | |
| AUGUST 31, 2020 | | J.P. MORGAN EXCHANGE-TRADED FUNDS | | | | | 187 | |
JPMorgan Ultra-Short Municipal Income ETF
SCHEDULE OF PORTFOLIO INVESTMENTS
AS OF AUGUST 31, 2020 (Unaudited) (continued)
| | | | | | | | |
| INVESTMENTS | | PRINCIPAL
AMOUNT ($) | | | VALUE ($) | |
Municipal Bonds — continued | |
|
Nevada — 1.0% | |
| | |
City of Henderson Series 2012A, GO, 5.00%, 6/1/2023 | | | 25,000 | | | | 27,564 | |
| | |
City of Las Vegas Series 2015C, GO, 5.00%, 9/1/2024 | | | 125,000 | | | | 147,864 | |
| | |
Clark County, Department of Aviation, Las Vegas-McCarran International Airport Passenger Facility Charge Rev., 5.00%, 7/1/2022 | | | 225,000 | | | | 243,383 | |
| | |
Clark County, Department of Aviation, Nevada Airport System, Subordinate Lien Series 2011D-2-B, Rev., VRDO, LOC: Royal Bank of Canada, 0.09%, 9/10/2020 (b) | | | 3,500,000 | | | | 3,500,000 | |
| | |
County of Clark | | | | | | | | |
| | |
Series 2016B, GO, 5.00%, 11/1/2024 | | | 45,000 | | | | 53,544 | |
| | |
GO, 5.00%, 12/1/2024 | | | 25,000 | | | | 29,833 | |
| | |
County of Clark Department of Aviation | | | | | | | | |
| | |
Series 2019A, Rev., 5.00%, 7/1/2023 | | | 140,000 | | | | 156,805 | |
| | |
Series 2019D, Rev., 5.00%, 7/1/2023 | | | 520,000 | | | | 582,421 | |
| | |
Series 2019D, Rev., 5.00%, 7/1/2024 | | | 300,000 | | | | 348,063 | |
| | |
County of Washoe Series 2012A, GO, 3.00%, 3/1/2024 | | | 50,000 | | | | 52,001 | |
| | |
Las Vegas Valley Water District | | | | | | | | |
| | |
Series 2017A, GO, 5.00%, 6/1/2022 | | | 45,000 | | | | 48,774 | |
| | |
Series 2016A, GO, 5.00%, 6/1/2023 | | | 25,000 | | | | 28,252 | |
| | |
State of Nevada | | | | | | | | |
| | |
Series 2014A, GO, 5.00%, 4/1/2021 | | | 25,000 | | | | 25,703 | |
| | |
Series 2015B, GO, 5.00%, 11/1/2022 | | | 65,000 | | | | 71,618 | |
| | |
Series 2010C, GO, 5.00%, 6/1/2023 | | | 25,000 | | | | 25,096 | |
| | |
Series 2015B, GO, 5.00%, 11/1/2024 | | | 25,000 | | | | 29,804 | |
| | |
State of Nevada Highway Improvement Rev., 5.00%, 12/1/2020 | | | 35,000 | | | | 35,420 | |
| | |
State of Nevada, Capital Improvement and Cultural Affairs Series 2012B, GO, 5.00%, 8/1/2021 | | | 30,000 | | | | 31,328 | |
| | |
State of Nevada, Highway Improvement Revenue, Motor Vehicle Fuel Tax Rev., 5.00%, 12/1/2020 | | | 30,000 | | | | 30,360 | |
| | |
Truckee Meadows Water Authority Rev., 5.00%, 7/1/2022 | | | 40,000 | | | | 43,537 | |
| | |
Washoe County School District, Limited Tax, School Improvement Series 2011-A, GO, 5.00%, 6/1/2021 (c) | | | 40,000 | | | | 41,442 | |
| | | | | | | | |
| | |
Total Nevada | | | | | | | 5,552,812 | |
| | | | | | | | |
|
New Hampshire — 0.0% (g) | |
| | |
New Hampshire Health and Education Facilities Authority Act Rev., 5.00%, 7/1/2021 | | | 25,000 | | | | 25,993 | |
| | | | | | | | |
| INVESTMENTS | | PRINCIPAL
AMOUNT ($) | | | VALUE ($) | |
| |
|
New Hampshire — continued | |
| | |
New Hampshire Health and Education Facilities Authority, Paul’s School Rev., 3.00%, 10/1/2020 | | | 25,000 | | | | 25,058 | |
| | | | | | | | |
| | |
Total New Hampshire | | | | | | | 51,051 | |
| | | | | | | | |
|
New Jersey — 7.0% | |
| | |
Bergen County Improvement Authority (The), Borough of East Rutherford Refunding Project Rev., GTD, 5.00%, 12/15/2020 | | | 100,000 | | | | 101,392 | |
| | |
Bergen County Improvement Authority (The), Fort Lee Board of Education Project Rev., GTD, 4.00%, 12/1/2020 | | | 25,000 | | | | 25,239 | |
| | |
Bergen County Improvement Authority (The), New Bridge Medical Center Project Series 2019A, Rev., GTD, 4.00%, 9/1/2020 | | | 835,000 | | | | 835,000 | |
| | |
Bernards Township School District Series 2013B, GO, 5.00%, 1/1/2021 | | | 20,000 | | | | 20,317 | |
| | |
Borough of Carlstadt GO, BAN, 2.00%, 6/25/2021 | | | 8,675,000 | | | | 8,765,914 | |
| | |
Borough of Runnemede Series A, GO, BAN, 1.25%, 6/30/2021 | | | 2,363,125 | | | | 2,374,657 | |
| | |
Borough of Saddle River GO, BAN, 1.25%, 4/23/2021 | | | 2,494,000 | | | | 2,504,076 | |
| | |
Brick Township Municipal Utilities Authority (The) Series 2016A, Rev., 5.00%, 12/1/2020 | | | 75,000 | | | | 75,897 | |
| | |
Burlington County Bridge Commission, Government Loan Program Series 2013A, Rev., GTD, 5.00%, 12/1/2020 | | | 40,000 | | | | 40,481 | |
| | |
Burlington County Bridge Commission, Governmental Leasing Program Series 2020AB, Rev., 3.50%, 4/15/2021 | | | 75,000 | | | | 75,896 | |
| | |
Camden County Improvement Authority (The) | | | | | | | | |
| | |
Series 2011A, Rev., GTD, 4.00%, 9/1/2021 | | | 35,000 | | | | 36,249 | |
| | |
Series 2012A, Rev., GTD, 5.00%, 9/1/2021 | | | 50,000 | | | | 52,400 | |
| | |
Rev., GTD, 5.00%, 6/1/2023 | | | 50,000 | | | | 54,028 | |
| | |
Series 2015A, Rev., GTD, 5.00%, 9/1/2024 | | | 25,000 | | | | 29,573 | |
| | |
City of Brigantine GO, 4.00%, 10/15/2022 | | | 25,000 | | | | 26,878 | |
| | |
City of Elizabeth | | | | | | | | |
| | |
GO, 3.00%, 4/1/2022 | | | 50,000 | | | | 52,249 | |
| | |
GO, AGM, 3.00%, 4/1/2022 | | | 25,000 | | | | 26,124 | |
| | |
GO, 4.00%, 8/15/2022 | | | 25,000 | | | | 26,876 | |
| | |
City of Jersey City Series 2012A-B, GO, AGM, 3.00%, 9/1/2021 | | | 25,000 | | | | 25,649 | |
SEE NOTES TO FINANCIAL STATEMENTS.
| | | | | | |
| | | |
| 188 | | | | J.P. MORGAN EXCHANGE-TRADED FUNDS | | AUGUST 31, 2020 |
| | | | | | | | |
| INVESTMENTS | | PRINCIPAL
AMOUNT ($) | | | VALUE ($) | |
Municipal Bonds — continued | |
|
New Jersey — continued | |
| | |
City of Newark, Water Utility System Series 2010D-2, GO, 4.25%, 10/1/2020 | | | 100,000 | | | | 100,323 | |
| | |
City of North Wildwood GO, 5.00%, 9/1/2020 | | | 10,000 | | | | 10,000 | |
| | |
City of Ocean City GO, 4.00%, 9/15/2023 | | | 75,000 | | | | 83,248 | |
| | |
County of Burlington Series 2013B, GO, 3.50%, 9/1/2020 | | | 75,000 | | | | 75,000 | |
| | |
County of Cape May GO, 2.00%, 9/1/2020 | | | 100,000 | | | | 100,000 | |
| | |
County of Hudson | | | | | | | | |
| | |
GO, BAN, 2.00%, 9/10/2020 | | | 345,000 | | | | 346,642 | |
| | |
GO, 5.00%, 12/1/2022 | | | 25,000 | | | | 27,630 | |
| | |
County of Monmouth Series 2015C, GO, 5.00%, 7/15/2022 | | | 30,000 | | | | 32,715 | |
| | |
County of Ocean GO, 5.00%, 11/1/2021 | | | 45,000 | | | | 47,483 | |
| | |
County of Passaic Series 2018B, GO, 4.00%, 12/1/2024 | | | 165,000 | | | | 189,207 | |
| | |
East Rutherford Board of Education GO, 1.25%, 7/15/2021 | | | 8,000,000 | | | | 8,044,480 | |
| | |
Emerson Board of Education GO, 3.00%, 9/1/2020 | | | 250,000 | | | | 250,000 | |
| | |
Essex County Improvement Authority Rev., GTD, 5.00%, 12/15/2020 | | | 50,000 | | | | 50,696 | |
| | |
Flemington Raritan Regional Board of Education GO, 4.00%, 6/15/2021 | | | 20,000 | | | | 20,590 | |
| | |
Garden State Preservation Trust Series A, Rev., 5.00%, 11/1/2020 | | | 25,000 | | | | 25,111 | |
| | |
Gloucester County Improvement Authority (The), Shady Lane Nursing Home Project Rev., GTD, 4.00%, 12/1/2022 | | | 480,000 | | | | 518,616 | |
| | |
Hainesport Township School District GO, 5.00%, 1/15/2024 | | | 35,000 | | | | 40,363 | |
| | |
Hopewell Valley Regional School District GO, 3.25%, 1/15/2025 | | | 25,000 | | | | 27,757 | |
| | |
Livingston Township School District GO, 5.00%, 7/15/2021 | | | 25,000 | | | | 26,039 | |
| | |
Mahwah Township School District GO, 5.00%, 9/15/2020 | | | 10,000 | | | | 10,017 | |
| | |
Middlesex County Improvement Authority Rev., GTD, 4.00%, 9/15/2020 | | | 25,000 | | | | 25,035 | |
| | |
Monmouth County Improvement Authority (The), Capital Equipment Pooled Lease Rev., GTD, 5.00%, 10/1/2020 | | | 50,000 | | | | 50,196 | |
| | |
Monmouth County Improvement Authority (The), Governmental Pooled Loan Project Series 2013B, Rev., GTD, 5.00%, 12/1/2020 | | | 25,000 | | | | 25,301 | |
| | |
Mount Olive Township Board of Education GO, 4.00%, 7/15/2021 | | | 25,000 | | | | 25,820 | |
| | | | | | | | |
| INVESTMENTS | | PRINCIPAL
AMOUNT ($) | | | VALUE ($) | |
| |
|
New Jersey — continued | |
| | |
New Jersey Building Authority Series 2013A, Rev., 5.00%, 6/15/2021 | | | 125,000 | | | | 128,954 | |
| | |
New Jersey Economic Development Authority | | | | | | | | |
| | |
Series 2011EE, Rev., 5.00%, 9/1/2020 | | | 100,000 | | | | 100,000 | |
| | |
Rev., AMBAC, Zero Coupon, 1/1/2021 | | | 135,000 | | | | 134,667 | |
| | |
New Jersey Economic Development Authority, School Facilities Construction | | | | | | | | |
| | |
Series EE, Rev., 5.00%, 9/1/2020 (c) | | | 20,000 | | | | 20,000 | |
| | |
Series GG, Rev., 5.00%, 9/1/2020 (c) | | | 105,000 | | | | 105,000 | |
| | |
Series XX, Rev., 5.00%, 6/15/2021 | | | 100,000 | | | | 103,163 | |
| | |
New Jersey Educational Facilities Authority Series 2014C, Rev., 5.00%, 9/1/2020 | | | 390,000 | | | | 390,000 | |
| | |
New Jersey Health Care Facilities Financing Authority, Greystone Park Psychiatric Hospital Project Series 2013B, Rev., 5.00%, 9/15/2020 | | | 250,000 | | | | 250,328 | |
| | |
New Jersey Housing and Mortgage Finance Agency, Multifamily Conduit, Georgia King Village Project Series 2018-E, Rev., 2.45%, 10/1/2020 (b) | | | 240,000 | | | | 240,408 | |
| | |
New Jersey Infrastructure Bank | | | | | | | | |
| | |
Series 2010A, Rev., 3.25%, 9/1/2020 | | | 40,000 | | | | 40,000 | |
| | |
Series 2012A-R, Rev., 4.00%, 9/1/2022 | | | 30,000 | | | | 32,277 | |
| | |
Series 2017A-R2, Rev., 4.00%, 9/1/2022 | | | 35,000 | | | | 37,657 | |
| | |
Series 2012A-R, Rev., 4.00%, 9/1/2023 | | | 30,000 | | | | 33,373 | |
| | |
New Jersey Infrastructure Bank, Environmental Infrastructure, Financing Program Series 2001A, Rev., 5.25%, 9/1/2020 | | | 150,000 | | | | 150,000 | |
| | |
New Jersey Transportation Trust Fund Authority | | | | | | | | |
| | |
Series 2006A, Rev., 5.25%, 12/15/2020 | | | 440,000 | | | | 445,399 | |
| | |
Series 2005B, Rev., NATL-RE, 5.50%, 12/15/2020 | | | 215,000 | | | | 217,823 | |
| | |
Series 2011B, Rev., 5.00%, 6/15/2021 (c) | | | 250,000 | | | | 259,482 | |
| | |
Series 2006A, Rev., 5.25%, 12/15/2021 | | | 30,000 | | | | 31,644 | |
| | |
Rev., Zero Coupon, 12/15/2023 | | | 120,000 | | | | 112,066 | |
| | |
New Jersey Transportation Trust Fund Authority, Transportation System Rev., AMBAC, 4.38%, 12/15/2020 | | | 115,000 | | | | 116,141 | |
| | |
North Brunswick Township Board of Education GO, 5.00%, 7/15/2022 | | | 30,000 | | | | 30,117 | |
SEE NOTES TO FINANCIAL STATEMENTS.
| | | | | | | | |
| | | |
| AUGUST 31, 2020 | | J.P. MORGAN EXCHANGE-TRADED FUNDS | | | | | 189 | |
JPMorgan Ultra-Short Municipal Income ETF
SCHEDULE OF PORTFOLIO INVESTMENTS
AS OF AUGUST 31, 2020 (Unaudited) (continued)
| | | | | | | | |
| INVESTMENTS | | PRINCIPAL
AMOUNT ($) | | | VALUE ($) | |
Municipal Bonds — continued | |
|
New Jersey — continued | |
| | |
Ocean Township Board of Education/Monmouth County GO, 4.00%, 3/1/2021 | | | 25,000 | | | | 25,078 | |
| | |
Passaic County Utilities Authority Rev., GTD, 4.50%, 3/1/2024 | | | 75,000 | | | | 85,222 | |
| | |
Pequannock Township Board of Education GO, 4.00%, 1/15/2025 | | | 50,000 | | | | 57,265 | |
| | |
Ramsey School District GO, 3.13%, 1/15/2023 | | | 25,000 | | | | 26,688 | |
| | |
Rancocas Valley Regional High School District GO, 5.00%, 2/1/2023 | | | 40,000 | | | | 44,451 | |
| | |
River Dell Regional School District GO, 4.00%, 3/1/2022 | | | 20,000 | | | | 21,126 | |
| | |
Somerset County Improvement Authority Rev., GTD, 4.00%, 10/1/2022 | | | 25,000 | | | | 26,931 | |
| | |
South Brunswick Township Board of Education GO, 4.00%, 8/1/2022 | | | 25,000 | | | | 26,804 | |
| | |
Tobacco Settlement Financing Corp. | | | | | | | | |
| | |
Series A, Rev., 5.00%, 6/1/2021 | | | 275,000 | | | | 284,086 | |
| | |
Series A, Rev., 5.00%, 6/1/2022 | | | 365,000 | | | | 392,948 | |
| | |
Series A, Rev., 5.00%, 6/1/2023 | | | 885,000 | | | | 990,165 | |
| | |
Town of Boonton GO, BAN, 2.00%, 6/25/2021 | | | 2,809,265 | | | | 2,845,870 | |
| | |
Town of Phillipsburg GO, BAN, 2.00%, 6/1/2021 | | | 2,455,000 | | | | 2,477,341 | |
| | |
Township of East Amwell GO, 4.00%, 2/15/2023 | | | 25,000 | | | | 27,210 | |
| | |
Township of East Brunswick GO, BAN, 1.50%, 9/24/2020 | | | 600,000 | | | | 600,438 | |
| | |
Township of Harding GO, BAN, 1.25%, 8/20/2021 | | | 1,677,850 | | | | 1,690,652 | |
| | |
Township of Lebanon GO, BAN, 1.25%, 7/23/2021 | | | 1,035,138 | | | | 1,040,572 | |
| | |
Township of Little Falls GO, BAN, 2.00%, 12/11/2020 | | | 533,638 | | | | 535,495 | |
| | |
Township of Livingston GO, BAN, 2.00%, 10/9/2020 | | | 200,000 | | | | 200,368 | |
| | |
Township of Moorestown GO, 5.00%, 2/1/2023 | | | 25,000 | | | | 27,833 | |
| | |
Township of Parsippany-Troy Hills Series 2017ABCD, GO, 2.00%, 9/15/2020 | | | 70,000 | | | | 70,046 | |
| | |
Township of Pequannock GO, 4.00%, 4/1/2022 | | | 25,000 | | | | 26,519 | |
| | |
Township of Readington GO, 5.00%, 1/15/2025 | | | 25,000 | | | | 29,816 | |
| | |
Township of Toms River GO, 3.00%, 12/15/2023 | | | 30,000 | | | | 32,623 | |
| | |
Township of Washington, Gloucester County Series 2020A, GO, BAN, 1.75%, 6/22/2021 | | | 571,940 | | | | 577,980 | |
| | | | | | | | |
| INVESTMENTS | | PRINCIPAL
AMOUNT ($) | | | VALUE ($) | |
| |
|
New Jersey — continued | |
| | |
Township of West Deptford, Gloucester County GO, 4.00%, 9/1/2020 | | | 100,000 | | | | 100,000 | |
| | | | | | | | |
| | |
Total New Jersey | | | | | | | 40,543,190 | |
| | | | | | | | |
|
New Mexico — 0.2% | |
| | |
Albuquerque Bernalillo County Water Utility Authority Rev., 5.00%, 7/1/2022 | | | 25,000 | | | | 27,206 | |
| | |
County of Dona Ana Rev., 2.00%, 5/1/2021 | | | 315,000 | | | | 318,654 | |
| | |
New Mexico Finance Authority | | | | | | | | |
| | |
Series 2015C, Rev., 3.00%, 6/1/2021 | | | 50,000 | | | | 51,060 | |
| | |
Series 2016C, Rev., 5.00%, 6/1/2021 | | | 25,000 | | | | 25,903 | |
| | |
Series 2017D, Rev., 5.00%, 6/15/2022 | | | 25,000 | | | | 27,153 | |
| | |
Series B-2, Rev., 5.00%, 6/15/2022 | | | 25,000 | | | | 27,153 | |
| | |
Series 2017A, Rev., 5.00%, 6/1/2023 | | | 55,000 | | | | 62,122 | |
| | |
Series 2010-B, Rev., 5.00%, 6/15/2023 | | | 85,000 | | | | 85,327 | |
| | |
Series 2017D, Rev., 5.00%, 6/15/2023 | | | 80,000 | | | | 90,430 | |
| | |
Series 2019C-1, Rev., 5.00%, 6/15/2023 | | | 40,000 | | | | 45,215 | |
| | |
Series 2017B, Rev., 3.50%, 6/15/2024 | | | 50,000 | | | | 55,963 | |
| | |
Series 2018C-1, Rev., 4.00%, 6/15/2024 | | | 30,000 | | | | 34,141 | |
| | |
New Mexico Finance Authority, Senior Lien Public Project Revolving Fund Series 2013A, Rev., 4.00%, 6/1/2021 | | | 20,000 | | | | 20,573 | |
| | |
New Mexico Finance Authority, State Transportation, Senior Lien Series 2010B, Rev., 5.00%, 6/15/2024 | | | 60,000 | | | | 60,227 | |
| | |
New Mexico Finance Authority, Subordinate Lien Series 2010A-2, Rev., 5.00%, 12/15/2020 | | | 25,000 | | | | 25,348 | |
| | |
New Mexico Hospital Equipment Loan Council Series 2012A, Rev., 5.00%, 8/1/2022 (c) | | | 100,000 | | | | 108,942 | |
| | |
State of New Mexico Severance Tax Permanent Fund Series A-1, Rev., 3.00%, 7/1/2021 | | | 100,000 | | | | 100,225 | |
| | |
State of New Mexico, Capital Projects GO, 5.00%, 3/1/2021 | | | 30,000 | | | | 30,714 | |
| | | | | | | | |
| | |
Total New Mexico | | | | | | | 1,196,356 | |
| | | | | | | | |
|
New York — 13.1% | |
| | |
Albany Municipal Water Finance Authority Series 2011A, Rev., 5.00%, 12/1/2020 | | | 45,000 | | | | 45,535 | |
| | |
Battery Park City Authority, Tax-Exempt Series 2013A, Rev., 5.00%, 11/1/2020 | | | 25,000 | | | | 25,199 | |
| | |
Bayport-Blue Point Union Free School District GO, 3.00%, 10/1/2020 | | | 55,000 | | | | 55,128 | |
SEE NOTES TO FINANCIAL STATEMENTS.
| | | | | | |
| | | |
| 190 | | | | J.P. MORGAN EXCHANGE-TRADED FUNDS | | AUGUST 31, 2020 |
| | | | | | | | |
| INVESTMENTS | | PRINCIPAL
AMOUNT ($) | | | VALUE ($) | |
Municipal Bonds — continued | |
|
New York — continued | |
| | |
City of New York | | | | | | | | |
| | |
Series 2018B-1, GO, 4.00%, 10/1/2020 | | | 115,000 | | | | 115,348 | |
| | |
Series 2015B, GO, 5.00%, 8/1/2021 | | | 45,000 | | | | 46,950 | |
| | |
Series 2018C, GO, 5.00%, 8/1/2021 | | | 45,000 | | | | 46,950 | |
| | |
Series C, GO, 5.00%, 8/1/2021 | | | 35,000 | | | | 36,517 | |
| | |
Series I, GO, 5.00%, 8/1/2021 | | | 50,000 | | | | 52,166 | |
| | |
Series 2014J, GO, 5.00%, 8/1/2022 | | | 50,000 | | | | 54,521 | |
| | |
Series C, GO, 5.00%, 8/1/2022 | | | 200,000 | | | | 218,086 | |
| | |
Series 1, GO, 5.00%, 8/1/2023 | | | 240,000 | | | | 271,342 | |
| | |
Series 1994A, GO, 5.00%, 8/1/2023 | | | 125,000 | | | | 130,475 | |
| | |
Series 2014I-1, GO, 5.00%, 3/1/2024 | | | 75,000 | | | | 86,462 | |
| | |
Series 2013J, GO, 5.00%, 8/1/2024 | | | 295,000 | | | | 334,722 | |
| | |
Series A, GO, 5.00%, 8/1/2024 | | | 20,000 | | | | 23,406 | |
| | |
Series E, GO, 5.00%, 8/1/2024 | | | 50,000 | | | | 58,514 | |
| | |
Series 2018F-1, GO, 4.00%, 4/1/2025 | | | 30,000 | | | | 34,499 | |
| | |
City of New York, Fiscal Year 2006 Series H, Subseries H-A, GO, 4.00%, 1/1/2021 | | | 40,000 | | | | 40,495 | |
| | |
City of New York, Fiscal Year 2012 Series D, Subseries D-1, GO, 5.00%, 10/1/2020 | | | 25,000 | | | | 25,096 | |
| | |
City of White Plains Series 2017C, GO, 3.00%, 3/1/2021 | | | 30,000 | | | | 30,426 | |
| | |
Clarence Central School District GO, 5.00%, 6/15/2021 | | | 75,000 | | | | 77,869 | |
| | |
Clifton-Fine Central School District GO, BAN, 2.00%, 6/30/2021 | | | 3,980,000 | | | | 4,027,760 | |
| | |
Commack Union Free School District GO, 4.00%, 11/15/2020 | | | 35,000 | | | | 35,275 | |
| | |
County of Albany Series 2019A, GO, 5.00%, 9/15/2022 | | | 20,000 | | | | 21,971 | |
| | |
County of Dutchess GO, 5.00%, 5/1/2021 | | | 25,000 | | | | 25,785 | |
| | |
County of Orange Series 2015A, GO, AGM, 5.00%, 3/1/2021 | | | 25,000 | | | | 25,605 | |
| | |
County of Putnam, Public Improvement GO, 5.00%, 1/15/2021 | | | 30,000 | | | | 30,532 | |
| | |
County of Rensselaer, Public Improvement GO, 3.13%, 9/28/2020 | | | 120,000 | | | | 120,254 | |
| | |
County of Sullivan GO, 3.00%, 5/15/2021 | | | 45,000 | | | | 45,907 | |
| | |
County of Ulster GO, 5.00%, 11/15/2021 | | | 25,000 | | | | 26,463 | |
| | |
County of Ulster, Public Improvement GO, 5.00%, 11/15/2020 | | | 25,000 | | | | 25,247 | |
| | |
County of Warren GO, AGM, 5.00%, 7/15/2021 | | | 30,000 | | | | 31,269 | |
| | |
County of Westchester | | | | | | | | |
| | |
Series 2011A, GO, 5.00%, 10/15/2020 | | | 30,000 | | | | 30,175 | |
| | |
Series 2011B, GO, 4.00%, 7/1/2021 | | | 100,000 | | | | 103,101 | |
| | |
Croton-Harmon Union Free School District GO, BAN, 1.25%, 8/20/2021 | | | 755,000 | | | | 760,761 | |
| | | | | | | | |
| INVESTMENTS | | PRINCIPAL
AMOUNT ($) | | | VALUE ($) | |
| |
|
New York — continued | |
| | |
Erie County Industrial Development Agency (The) Series 2016A, Rev., 5.00%, 5/1/2021 | | | 40,000 | | | | 41,292 | |
| | |
Fayetteville-Manlius Central School District Series 2020A, GO, BAN, 1.25%, 7/29/2021 | | | 500,000 | | | | 503,315 | |
| | |
Grand Island Central School District GO, 5.00%, 12/1/2020 | | | 30,000 | | | | 30,362 | |
| | |
Herricks Union Free School District Series 2014A, GO, 2.00%, 5/1/2021 | | | 20,000 | | | | 20,249 | |
| | |
Lafayette Central School District GO, RAN, 1.25%, 6/18/2021 | | | 4,500,000 | | | | 4,534,020 | |
| | |
Lakeland Central School District GO, BAN, 1.25%, 8/20/2021 | | | 2,321,785 | | | | 2,339,500 | |
| | |
Lansing Central School District GO, BAN, 1.25%, 7/23/2021 | | | 4,817,400 | | | | 4,846,593 | |
| | |
Long Island Power Authority Series 2016B, Rev., 5.00%, 9/1/2023 | | | 200,000 | | | | 228,260 | |
| | |
Metropolitan Transportation Authority | | | | | | | | |
| | |
Series 2019E, Rev., BAN, 4.00%, 9/1/2020 | | | 2,510,000 | | | | 2,510,000 | |
| | |
Series 2018C, Subseries C-1, Rev., BAN, 5.00%, 9/1/2020 | | | 6,025,000 | | | | 6,025,000 | |
| | |
Series 2002B-3D, Rev., (SIFMA Municipal Swap Index Yield + 1.00%), 1.09%, 9/10/2020 (d) | | | 750,000 | | | | 748,042 | |
| | |
Series 2010D, Rev., 4.00%, 11/15/2020 | | | 100,000 | | | | 100,381 | |
| | |
Series 2012D, Rev., 5.00%, 11/15/2020 | | | 110,000 | | | | 110,647 | |
| | |
Series 2014C, Rev., 5.00%, 11/15/2020 | | | 310,000 | | | | 311,823 | |
| | |
Series 2016B, Rev., 5.00%, 11/15/2020 | | | 125,000 | | | | 125,735 | |
| | |
Series 2017A, Rev., 5.00%, 11/15/2020 | | | 195,000 | | | | 196,533 | |
| | |
Series 2018A-1, Rev., 5.00%, 11/15/2020 (b) | | | 100,000 | | | | 100,277 | |
| | |
Series A-2, Rev., 5.00%, 11/15/2020 | | | 100,000 | | | | 100,588 | |
| | |
Subseries A-1, Rev., 5.00%, 11/15/2020 | | | 100,000 | | | | 100,588 | |
| | |
Series 2018B, Subseries 2018B-2A, Rev., BAN, 5.00%, 5/15/2021 | | | 2,405,000 | | | | 2,445,861 | |
| | |
Series 2018B, Subseries 2018B-2B, Rev., BAN, 5.00%, 5/15/2021 | | | 1,910,000 | | | | 1,942,451 | |
| | |
Series 2018B, Subseries 2018B-2D, Rev., BAN, 5.00%, 5/15/2021 | | | 525,000 | | | | 533,920 | |
| | |
Series 2018C, Subseries 2018C-2, Rev., BAN, 5.00%, 9/1/2021 | | | 145,000 | | | | 148,475 | |
| | |
Subseries 2008B-4, Rev., 5.00%, 11/15/2021 | | | 20,000 | | | | 20,928 | |
SEE NOTES TO FINANCIAL STATEMENTS.
| | | | | | | | |
| | | |
| AUGUST 31, 2020 | | J.P. MORGAN EXCHANGE-TRADED FUNDS | | | | | 191 | |
JPMorgan Ultra-Short Municipal Income ETF
SCHEDULE OF PORTFOLIO INVESTMENTS
AS OF AUGUST 31, 2020 (Unaudited) (continued)
| | | | | | | | |
| INVESTMENTS | | PRINCIPAL
AMOUNT ($) | | | VALUE ($) | |
Municipal Bonds — continued | |
|
New York — continued | |
| | |
Series 2019A, Rev., BAN, 5.00%, 3/1/2022 | | | 600,000 | | | | 628,566 | |
| | |
Series 2016A, Rev., 5.00%, 11/15/2023 | | | 100,000 | | | | 112,132 | |
| | |
Series 2012A, Rev., 5.00%, 11/15/2024 | | | 510,000 | | | | 552,784 | |
| | |
Series 2013B-1, Rev., 5.00%, 11/15/2024 | | | 125,000 | | | | 140,120 | |
| | |
Metropolitan Transportation Authority, Dedicated Tax Fund Series A, Rev., 5.00%, 11/15/2020 | | | 145,000 | | | | 146,137 | |
| | |
Monroe County Industrial Development Corp. | | | | | | | | |
| | |
Rev., 5.00%, 5/1/2021 | | | 400,000 | | | | 412,020 | |
| | |
Series 2012A, Rev., 5.00%, 5/1/2021 | | | 25,000 | | | | 25,751 | |
| | |
Morrisville-Eaton Central School District GO, BAN, 1.75%, 5/28/2021 | | | 1,750,000 | | | | 1,767,080 | |
| | |
New Hyde Park-Garden City Park Union Free School District GO, 5.00%, 11/15/2020 | | | 20,000 | | | | 20,198 | |
| | |
New York City Municipal Water Finance Authority, Water and Sewer System, Second General Resolution, Fiscal Year 2009 Subseries BB-1, Rev., VRDO, LIQ: Landesbank Hessen-Thueringen, 0.04%, 9/1/2020 (b) | | | 4,485,000 | | | | 4,485,000 | |
| | |
New York City Municipal Water Finance Authority, Water and Sewer System, Second General Resolution, Fiscal Year 2013 Series AA, Subseries AA-1, Rev., VRDO, LIQ: PNC Bank NA, 0.10%, 9/10/2020 (b) | | | 8,815,000 | | | | 8,815,000 | |
| | |
New York City Transitional Finance Authority Future Tax Secured | | | | | | | | |
| | |
Series 2010B, Rev., 3.50%, 9/1/2020 | | | 300,000 | | | | 300,000 | |
| | |
Series 2010B, Rev., 5.00%, 10/1/2020 | | | 100,000 | | | | 100,393 | |
| | |
Series 2010D, Rev., 5.00%, 10/1/2020 | | | 790,000 | | | | 793,105 | |
| | |
Series F, Rev., 3.63%, 11/1/2020 | | | 25,000 | | | | 25,140 | |
| | |
Series 2014C, Rev., 4.00%, 11/1/2020 | | | 25,000 | | | | 25,155 | |
| | |
Series 2012A, Rev., 5.00%, 11/1/2020 | | | 85,000 | | | | 85,668 | |
| | |
Series 2014C, Rev., 5.00%, 11/1/2020 | | | 100,000 | | | | 100,786 | |
| | |
Series 2017C, Rev., 5.00%, 11/1/2020 | | | 105,000 | | | | 105,825 | |
| | |
Subseries 13, Rev., 5.00%, 11/1/2020 | | | 235,000 | | | | 236,847 | |
| | |
Subseries A-1, Rev., 5.00%, 11/1/2020 | | | 60,000 | | | | 60,472 | |
| | |
Series 2011D-1, Rev., 5.00%, 2/1/2021 | | | 25,000 | | | | 25,489 | |
| | |
Series 2012F-1, Rev., 5.00%, 5/1/2021 | | | 40,000 | | | | 41,254 | |
| | |
Series A, Subseries A-1, Rev., 5.00%, 5/1/2021 | | | 25,000 | | | | 25,784 | |
| | |
Series 2016C, Rev., 5.00%, 11/1/2021 | | | 40,000 | | | | 42,197 | |
| | |
Series 2020B-1, Rev., 5.00%, 11/1/2021 | | | 45,000 | | | | 47,471 | |
| | | | | | | | |
| INVESTMENTS | | PRINCIPAL
AMOUNT ($) | | | VALUE ($) | |
| |
|
New York — continued | |
| | |
Series 2012E-1, Rev., 5.00%, 2/1/2022 | | | 25,000 | | | | 26,664 | |
| | |
Series 2016E-1, Rev., 5.00%, 2/1/2025 | | | 25,000 | | | | 29,933 | |
| | |
New York City Transitional Finance Authority Future Tax Secured, Fiscal Year 2011 Series 2011C, Rev., 5.00%, 11/1/2020 | | | 50,000 | | | | 50,393 | |
| | |
New York City Transitional Finance Authority Future Tax Secured, Fiscal Year 2012 Series 2012C, Rev., 4.00%, 11/1/2020 | | | 25,000 | | | | 25,156 | |
| | |
New York City Transitional Finance Authority Future Tax Secured, Tax-Exempt, Fiscal Year 2013 | | | | | | | | |
| | |
Series B, Rev., 5.00%, 11/1/2020 | | | 75,000 | | | | 75,590 | |
| | |
Series B, Rev., 5.00%, 11/1/2021 | | | 170,000 | | | | 179,336 | |
| | |
New York City Transitional Finance Authority, Future Tax Secured, Fiscal Year 2013 Subseries C-5, Rev., VRDO, LOC: Sumitomo Mitsui Banking Corp., 0.09%, 9/10/2020 (b) | | | 1,955,000 | | | | 1,955,000 | |
| | |
New York City Water and Sewer System | | | | | | | | |
| | |
Subseries 2016CC-1, Rev., 4.00%, 6/15/2021 (c) | | | 20,000 | | | | 20,597 | |
| | |
Series 2011GG, Rev., 5.00%, 6/15/2021 (c) | | | 65,000 | | | | 67,449 | |
| | |
Series 2018FF, Rev., 5.00%, 6/15/2021 (c) | | | 25,000 | | | | 25,942 | |
| | |
Series 2012EE, Rev., 4.00%, 6/15/2023 | | | 50,000 | | | | 53,444 | |
| | |
Series 2019DD-2, Rev., 5.00%, 6/15/2024 | | | 35,000 | | | | 38,863 | |
| | |
New York State Dormitory Authority | | | | | | | | |
| | |
Series 2012A, Rev., 3.00%, 12/15/2020 | | | 25,000 | | | | 25,201 | |
| | |
Series 2012A, Rev., 5.00%, 12/15/2020 | | | 65,000 | | | | 65,896 | |
| | |
Series 2016D, Rev., 4.00%, 2/15/2021 | | | 25,000 | | | | 25,431 | |
| | |
Series 2017A, Rev., 5.00%, 2/15/2021 | | | 90,000 | | | | 91,958 | |
| | |
Series 2012A, Rev., 2.25%, 7/1/2021 | | | 225,000 | | | | 228,902 | |
| | |
Series 2017F, Rev., 5.00%, 10/1/2021 | | | 750,000 | | | | 789,172 | |
| | |
Series 2012A, Rev., 5.00%, 12/15/2021 | | | 50,000 | | | | 53,088 | |
| | |
Series 2016A, Rev., 5.00%, 7/1/2022 | | | 35,000 | | | | 38,122 | |
| | |
Series 2011A, Rev., 5.00%, 10/1/2022 | | | 50,000 | | | | 51,397 | |
| | |
Series 2016D, Rev., 5.00%, 2/15/2023 | | | 40,000 | | | | 44,606 | |
| | |
Series 2017B, Rev., 5.00%, 2/15/2023 | | | 330,000 | | | | 368,000 | |
| | |
Series 1990B, Rev., 5.00%, 7/1/2023 | | | 55,000 | | | | 55,214 | |
| | |
Series 2012E, Rev., 5.00%, 2/15/2024 | | | 400,000 | | | | 427,076 | |
| | |
Series 2019D, Rev., 5.00%, 2/15/2024 | | | 40,000 | | | | 46,383 | |
| | |
Series 2013A, Rev., 5.00%, 3/15/2024 | | | 340,000 | | | | 381,177 | |
| | |
Series 2016A, Rev., 5.00%, 3/15/2024 | | | 50,000 | | | | 58,146 | |
| | |
Series 2018A, Rev., 5.00%, 3/15/2024 | | | 525,000 | | | | 610,738 | |
SEE NOTES TO FINANCIAL STATEMENTS.
| | | | | | |
| | | |
| 192 | | | | J.P. MORGAN EXCHANGE-TRADED FUNDS | | AUGUST 31, 2020 |
| | | | | | | | |
| INVESTMENTS | | PRINCIPAL
AMOUNT ($) | | | VALUE ($) | |
Municipal Bonds — continued | |
|
New York — continued | |
| | |
New York State Dormitory Authority, Columbia University | | | | | | | | |
| | |
Series 2012A, Rev., 5.00%, 10/1/2020 | | | 45,000 | | | | 45,175 | |
| | |
Series 2015B, Rev., 5.00%, 10/1/2020 | | | 75,000 | | | | 75,293 | |
| | |
Series 2012A, Rev., 5.00%, 10/1/2021 | | | 25,000 | | | | 26,306 | |
| | |
New York State Dormitory Authority, School Districts Financing Program Series 2016E, Rev., 5.00%, 10/1/2020 | | | 300,000 | | | | 301,164 | |
| | |
New York State Dormitory Authority, State Personal Income Tax, General Purpose | | | | | | | | |
| | |
Series 2014A, Rev., 5.00%, 2/15/2021 | | | 70,000 | | | | 71,523 | |
| | |
Series 2015B, Rev., 5.00%, 2/15/2021 | | | 35,000 | | | | 35,765 | |
| | |
Series 2012B, Rev., 5.00%, 3/15/2021 | | | 20,000 | | | | 20,515 | |
| | |
New York State Environmental Facilities Corp. | | | | | | | | |
| | |
Series 2007A, Rev., 5.25%, 12/15/2020 | | | 25,000 | | | | 25,362 | |
| | |
Series 2012A, Rev., 3.00%, 6/15/2021 | | | 25,000 | | | | 25,564 | |
| | |
Series 2016B, Rev., 4.00%, 8/15/2021 | | | 25,000 | | | | 25,921 | |
| | |
New York State Thruway Authority | | | | | | | | |
| | |
Series 2012A, Rev., 5.00%, 3/15/2021 | | | 25,000 | | | | 25,644 | |
| | |
Series 2013A, Rev., 5.00%, 3/15/2021 | | | 35,000 | | | | 35,902 | |
| | |
New York State Thruway Authority Highway & Bridge Trust Fund Series 2011A-1, Rev., 5.00%, 4/1/2021 | | | 50,000 | | | | 51,400 | |
| | |
New York State Thruway Authority, Transportation, State Personal Income Tax | | | | | | | | |
| | |
Series 2010A, Rev., 3.63%, 9/15/2020 | | | 100,000 | | | | 100,124 | |
| | |
Series 2010A, Rev., 5.00%, 9/15/2020 | | | 130,000 | | | | 130,226 | |
| | |
Series 2010A, Class A, Rev., 5.00%, 9/15/2020 | | | 250,000 | | | | 250,435 | |
| | |
New York State Urban Development Corp. | | | | | | | | |
| | |
Series 2013D, Rev., 5.00%, 3/15/2021 | | | 25,000 | | | | 25,644 | |
| | |
Series 2011A, Rev., 4.00%, 3/15/2024 | | | 250,000 | | | | 254,760 | |
| | |
Series 2014A, Rev., 5.00%, 3/15/2024 | | | 25,000 | | | | 29,054 | |
| | |
New York State Urban Development Corp., State Personal Income Tax, General Purpose Series 2016A, Rev., 5.00%, 3/15/2021 | | | 45,000 | | | | 46,159 | |
| | |
New York State Urban Development Corp., State Personal Income Tax, State Facilities and Equipment Series A-2, Rev., NATL-RE, 5.50%, 3/15/2021 | | | 45,000 | | | | 46,280 | |
| | |
Newburgh City School District GO, 5.00%, 9/1/2020 | | | 25,000 | | | | 25,000 | |
| | |
Niskayuna Central School District GO, 4.00%, 4/15/2021 | | | 115,000 | | | | 117,754 | |
| | | | | | | | |
| INVESTMENTS | | PRINCIPAL
AMOUNT ($) | | | VALUE ($) | |
| |
|
New York — continued | |
| | |
North Salem Central School District GO, BAN, 1.50%, 6/25/2021 | | | 2,250,000 | | | | 2,263,163 | |
| | |
Northport-East Northport Union Free School District Series 2013A, GO, 4.00%, 4/1/2021 | | | 20,000 | | | | 20,449 | |
| | |
Owego Apalachin Central School District GO, RAN, 1.00%, 6/25/2021 | | | 500,000 | | | | 500,910 | |
| | |
Oyster Bay-East Norwich Central School District GO, 5.00%, 9/15/2020 | | | 140,000 | | | | 140,246 | |
| | |
Peekskill City School District GO, BAN, 2.00%, 6/29/2021 | | | 500,000 | | | | 506,355 | |
| | |
Port Authority of New York and New Jersey, Consolidated Series 179, Rev., 5.00%, 12/1/2020 | | | 100,000 | | | | 101,158 | |
| | |
Ramapo Central School District GO, 5.00%, 10/15/2020 | | | 20,000 | | | | 20,117 | |
| | |
Roslyn Union Free School District GO, BAN, 2.00%, 9/3/2021 | | | 1,174,407 | | | | 1,193,374 | |
| | |
Sachem Central School District | | | | | | | | |
| | |
GO, 5.00%, 10/15/2020 | | | 100,000 | | | | 100,583 | |
| | |
GO, 5.00%, 8/15/2021 | | | 20,000 | | | | 20,927 | |
| | |
Sales Tax Asset Receivable Corp. | | | | | | | | |
| | |
Series 2015A, Rev., 5.00%, 10/15/2020 | | | 130,000 | | | | 130,744 | |
| | |
Series 2015A, Rev., 4.00%, 10/15/2021 | | | 25,000 | | | | 26,079 | |
| | |
Series 2015A, Rev., 5.00%, 10/15/2021 | | | 25,000 | | | | 26,358 | |
| | |
Sales Tax Asset Receivable Corp., Fiscal Year 2015 Series 2015A, Rev., 5.00%, 10/15/2022 | | | 20,000 | | | | 22,049 | |
| | |
Shenendehowa Central School District | | | | | | | | |
| | |
Series 2011B, GO, 4.00%, 1/15/2021 | | | 60,000 | | | | 60,857 | |
| | |
Smithtown Central School District GO, 5.00%, 10/15/2020 | | | 80,000 | | | | 80,466 | |
| | |
South Country Central School District at Brookhaven GO, 5.00%, 10/15/2020 | | | 35,000 | | | | 35,204 | |
| | |
Town of Amherst Series 2019A, GO, BAN, 1.75%, 11/6/2020 | | | 140,000 | | | | 140,197 | |
| | |
Town of Brookhaven Series 2013B, GO, 2.00%, 1/15/2021 | | | 100,000 | | | | 100,690 | |
| | |
Town of Cornwall | | | | | | | | |
| | |
GO, BAN, 1.25%, 7/23/2021 | | | 2,100,000 | | | | 2,111,214 | |
| | |
GO, 3.50%, 3/1/2023 | | | 40,000 | | | | 40,103 | |
| | |
Town of Erwin GO, 4.00%, 9/15/2020 | | | 15,000 | | | | 15,021 | |
| | |
Town of Islip Series 2016B, GO, 4.00%, 10/15/2020 | | | 75,000 | | | | 75,347 | |
| | |
Town of Oyster Bay | | | | | | | | |
| | |
GO, 2.00%, 11/1/2021 | | | 420,000 | | | | 426,947 | |
| | |
GO, 4.00%, 11/1/2022 | | | 410,000 | | | | 439,762 | |
SEE NOTES TO FINANCIAL STATEMENTS.
| | | | | | | | |
| | | |
| AUGUST 31, 2020 | | J.P. MORGAN EXCHANGE-TRADED FUNDS | | | | | 193 | |
JPMorgan Ultra-Short Municipal Income ETF
SCHEDULE OF PORTFOLIO INVESTMENTS
AS OF AUGUST 31, 2020 (Unaudited) (continued)
| | | | | | | | |
| INVESTMENTS | | PRINCIPAL
AMOUNT ($) | | | VALUE ($) | |
Municipal Bonds — continued | |
|
New York — continued | |
| | |
Triborough Bridge and Tunnel Authority Series 1999-B, Rev., 5.50%, 1/1/2022 (c) | | | 20,000 | | | | 21,336 | |
| | |
Triborough Bridge and Tunnel Authority, MTA Bridges and Tunnels Series 2013A, Rev., 4.00%, 11/15/2020 | | | 300,000 | | | | 302,193 | |
| | |
Troy Capital Resource Corp., Rensselaer Polytechnic Institute Project | | | | | | | | |
| | |
Series 2010A, Rev., 5.00%, 9/1/2020 | | | 115,000 | | | | 115,000 | |
| | |
Series 2010A, Rev., 5.13%, 9/1/2020 | | | 425,000 | | | | 425,000 | |
| | |
Village of Lake Success GO, BAN, 1.50%, 6/18/2021 | | | 1,029,313 | | | | 1,034,861 | |
| | |
Wantagh Union Free School District Series 2013A, GO, 4.00%, 9/1/2020 | | | 20,000 | | | | 20,000 | |
| | |
West Islip Fire District GO, BAN, 2.00%, 7/9/2021 | | | 3,590,000 | | | | 3,628,808 | |
| | |
Westchester Tobacco Asset Securitization Corp. Series B, Rev., 5.00%, 6/1/2021 | | | 260,000 | | | | 267,857 | |
| | |
Yorktown Central School District GO, 2.00%, 10/1/2022 | | | 110,000 | | | | 113,818 | |
| | | | | | | | |
| | |
Total New York | | | | | | | 76,532,062 | |
| | | | | | | | |
|
North Carolina — 0.8% | |
| | |
Appalachian State University Series A, Rev., 5.00%, 10/1/2022 | | | 40,000 | | | | 43,717 | |
| | |
Charlotte-Mecklenburg Hospital Authority (The) Series 2016A, Rev., 5.00%, 1/15/2025 | | | 290,000 | | | | 342,690 | |
| | |
City of Charlotte | | | | | | | | |
| | |
Series 2015C, COP, 5.00%, 12/1/2020 | | | 75,000 | | | | 75,901 | |
| | |
Series 2012A, GO, 5.00%, 7/1/2021 | | | 25,000 | | | | 26,010 | |
| | |
Series 2010A, COP, 5.00%, 10/1/2022 | | | 50,000 | | | | 50,193 | |
| | |
Series 2019A, COP, 5.00%, 6/1/2024 | | | 50,000 | | | | 58,287 | |
| | |
City of Greensboro Rev., 5.00%, 6/1/2021 | | | 25,000 | | | | 25,909 | |
| | |
City of Raleigh Rev., 5.00%, 2/1/2024 | | | 50,000 | | | | 58,001 | |
| | |
County of Dare Series 2013A, Rev., 4.00%, 6/1/2022 | | | 25,000 | | | | 26,670 | |
| | |
County of Durham | | | | | | | | |
| | |
GO, 5.00%, 10/1/2020 | | | 20,000 | | | | 20,078 | |
| | |
GO, 4.00%, 11/1/2021 | | | 25,000 | | | | 26,125 | |
| | |
County of Guilford | | | | | | | | |
| | |
GO, 4.00%, 3/1/2021 | | | 25,000 | | | | 25,481 | |
| | |
Series 2017A, GO, 5.00%, 5/1/2022 | | | 40,000 | | | | 43,229 | |
| | |
County of Henderson Series 2018A, Rev., 4.00%, 6/1/2021 | | | 20,000 | | | | 20,578 | |
| | |
County of Iredell Rev., 5.00%, 12/1/2020 | | | 225,000 | | | | 227,713 | |
| | |
County of Johnston Series 2010B, GO, 4.00%, 2/1/2021 | | | 25,000 | | | | 25,400 | |
| | | | | | | | |
| INVESTMENTS | | PRINCIPAL
AMOUNT ($) | | | VALUE ($) | |
| |
|
North Carolina — continued | |
| | |
County of Mecklenburg | | | | | | | | |
| | |
Series 2016A, GO, 5.00%, 9/1/2020 | | | 25,000 | | | | 25,000 | |
| | |
Series 2015A, Rev., 5.00%, 10/1/2020 | | | 50,000 | | | | 50,196 | |
| | |
County of New Hanover, Limited Obligation Rev., 5.00%, 12/1/2020 | | | 30,000 | | | | 30,359 | |
| | |
County of Onslow GO, 4.00%, 12/1/2020 | | | 30,000 | | | | 30,288 | |
| | |
County of Wake Series 2016A, Rev., 5.00%, 12/1/2020 | | | 50,000 | | | | 50,603 | |
| | |
County of Wake, Limited Obligation Rev., 5.00%, 9/1/2020 | | | 100,000 | | | | 100,000 | |
| | |
Durham Capital Financing Corp. Rev., GTD, 5.00%, 6/1/2022 (c) | | | 60,000 | | | | 65,021 | |
| | |
Durham Housing Authority Rev., 1.30%, 10/1/2020 (b) | | | 150,000 | | | | 150,117 | |
| | |
Series 2012A, Rev., 5.00%, 12/1/2022 (c) | | | 440,000 | | | | 476,027 | |
| | |
Fayetteville Metropolitan Housing Authority, Cross Creek Pointe Project Rev., 1.95%, 1/1/2021 (b) | | | 200,000 | | | | 200,982 | |
| | |
North Carolina Eastern Municipal Power Agency Series 2010A, Rev., 5.00%, 1/1/2021 (c) | | | 25,000 | | | | 25,383 | |
| | |
North Carolina Housing Finance Agency, Catawba Pines Apartments Rev., VRDO, 2.00%, 9/1/2020 (b) | | | 500,000 | | | | 500,000 | |
| | |
North Carolina Medical Care Commission, Health Care Facilities, Wake Forest Baptist Obligated Group Series 2012B, Rev., 5.00%, 12/1/2020 | | | 250,000 | | | | 252,685 | |
| | |
North Carolina Medical Care Commission, Wake Forest Baptist Obligated Group Series 2019B, Rev., 2.20%, 12/1/2022 (b) | | | 90,000 | | | | 91,271 | |
| | |
North Carolina Turnpike Authority Rev., 3.00%, 7/1/2022 | | | 60,000 | | | | 61,186 | |
| | |
Orange County Public Facilities Co. Rev., 4.00%, 10/1/2020 | | | 25,000 | | | | 25,078 | |
| | |
State of North Carolina | | | | | | | | |
| | |
Series 2011B, Rev., 5.00%, 11/1/2020 | | | 25,000 | | | | 25,200 | |
| | |
Series 2014C, Rev., 5.00%, 5/1/2021 | | | 50,000 | | | | 51,616 | |
| | |
Series 2014B, Rev., 5.00%, 6/1/2021 | | | 40,000 | | | | 41,454 | |
| | |
Series 2015A, GO, 5.00%, 6/1/2022 | | | 25,000 | | | | 27,119 | |
| | |
University of North Carolina System | | | | | | | | |
| | |
Rev., 5.00%, 2/1/2023 | | | 185,000 | | | | 202,673 | |
| | |
Rev., 5.00%, 2/1/2024 | | | 150,000 | | | | 169,672 | |
| | |
Rev., 5.00%, 2/1/2025 | | | 295,000 | | | | 344,056 | |
| | |
University of North Carolina, University Hospital at Chapel Hill Series 2009-A, Rev., VRDO, LIQ: TD Bank NA, 0.07%, 9/10/2020 (b) | | | 525,000 | | | | 525,000 | |
| | | | | | | | |
| | |
Total North Carolina | | | | | | | 4,616,968 | |
| | | | | | | | |
SEE NOTES TO FINANCIAL STATEMENTS.
| | | | | | |
| | | |
| 194 | | | | J.P. MORGAN EXCHANGE-TRADED FUNDS | | AUGUST 31, 2020 |
| | | | | | | | |
| INVESTMENTS | | PRINCIPAL
AMOUNT ($) | | | VALUE ($) | |
Municipal Bonds — continued | |
|
North Dakota — 0.3% | |
| | |
City of Bismarck Rev., 5.00%, 5/1/2021 | | | 200,000 | | | | 206,366 | |
| | |
City of Fargo Series 2015B, GO, 5.00%, 5/1/2021 | | | 50,000 | | | | 51,591 | |
| | |
City of Fargo, NSDU Development Foundation Project Series 2012A, Rev., 3.00%, 12/1/2021 | | | 50,000 | | | | 51,034 | |
| | |
North Dakota Housing Finance Agency, Housing Finance Program, Home Mortgage Series C, Rev., 1.75%, 7/1/2021 | | | 900,000 | | | | 907,956 | |
| | |
North Dakota Public Finance Authority | | | | | | | | |
| | |
Series 2011A, Rev., 5.00%, 10/1/2020 | | | 30,000 | | | | 30,116 | |
| | |
Series A, Rev., 1.75%, 11/1/2023 | | | 430,000 | | | | 440,531 | |
| | | | | | | | |
| | |
Total North Dakota | | | | | | | 1,687,594 | |
| | | | | | | | |
|
Ohio — 8.4% | |
| | |
American Municipal Power, Inc. | | | | | | | | |
| | |
Series 2010D, Rev., 5.00%, 2/15/2021 | | | 100,000 | | | | 102,153 | |
| | |
Rev., BAN, 2.25%, 3/4/2021 | | | 165,000 | | | | 166,599 | |
| | |
American Municipal Power, Inc., Combined Hydroelectric Projects Series 2016A, Rev., 5.00%, 2/15/2022 | | | 260,000 | | | | 277,662 | |
| | |
American Municipal Power, Inc., Electric System Improvement, Village of Jackson Center Project Rev., BAN, 1.50%, 8/12/2021 | | | 645,000 | | | | 651,702 | |
| | |
American Municipal Power, Inc., Village of Carey Project Rev., BAN, 2.25%, 12/3/2020 | | | 765,000 | | | | 768,764 | |
| | |
American Municipal Power, Inc., Village of Genoa Project Rev., BAN, 2.25%, 12/10/2020 | | | 615,000 | | | | 618,278 | |
| | |
American Municipal Power, Inc., Village of Woodsfield Project Rev., BAN, 2.25%, 1/22/2021 | | | 220,000 | | | | 221,679 | |
| | |
Bellbrook-Sugarcreek Local School District | | | | | | | | |
| | |
GO, 4.00%, 12/1/2020 | | | 35,000 | | | | 35,332 | |
| | |
GO, 4.00%, 12/1/2021 | | | 30,000 | | | | 31,431 | |
| | |
Bowling Green State University, General Receipts Series 2016A, Rev., 5.00%, 6/1/2022 | | | 100,000 | | | | 107,435 | |
| | |
Central Ohio Solid Waste Authority GO, 5.00%, 12/1/2023 | | | 45,000 | | | | 51,890 | |
| | |
City of Akron | | | | | | | | |
| | |
Rev., 4.00%, 12/1/2020 | | | 50,000 | | | | 50,473 | |
| | |
Series 2012A, Rev., 4.00%, 12/1/2020 | | | 25,000 | | | | 25,236 | |
| | |
Series 2012A, Rev., 5.00%, 12/1/2021 | | | 30,000 | | | | 31,801 | |
| | |
Rev., 5.00%, 12/1/2022 | | | 35,000 | | | | 38,656 | |
| | |
Series 2012A, Rev., 5.00%, 12/1/2022 | | | 25,000 | | | | 27,033 | |
| | | | | | | | |
| INVESTMENTS | | PRINCIPAL
AMOUNT ($) | | | VALUE ($) | |
| |
|
Ohio — continued | |
| | |
City of Akron, Income Tax | | | | | | | | |
| | |
Rev., 2.00%, 12/1/2020 | | | 25,000 | | | | 25,113 | |
| | |
Series 2012A, Rev., 5.00%, 12/1/2020 | | | 100,000 | | | | 101,193 | |
| | |
City of Avon GO, 2.00%, 12/1/2021 | | | 100,000 | | | | 102,178 | |
| | |
City of Avon Lake GO, 5.00%, 12/1/2020 | | | 140,000 | | | | 141,628 | |
| | |
City of Cincinnati Series 2016A, GO, 4.00%, 12/1/2020 | | | 50,000 | | | | 50,477 | |
| | |
City of Cincinnati, Water System Series 2011A, Rev., 5.00%, 12/1/2020 | | | 25,000 | | | | 25,300 | |
| | |
City of Cleveland, Airport System Series 2016A, Rev., AGM, 5.00%, 1/1/2021 | | | 85,000 | | | | 86,147 | |
| | |
City of Columbus Series 2012-1, GO, 3.00%, 7/1/2021 | | | 25,000 | | | | 25,591 | |
| | |
City of Reynoldsburg GO, 5.00%, 12/1/2020 | | | 60,000 | | | | 60,705 | |
| | |
City of Toledo, Various Purpose GO, AGM, 4.00%, 12/1/2020 | | | 100,000 | | | | 100,903 | |
| | |
City of Whitehall Rev., 2.25%, 12/9/2020 | | | 1,115,000 | | | | 1,120,720 | |
| | |
Cleveland-Cuyahoga County Port Authority | | | | | | | | |
| | |
Rev., 3.50%, 10/1/2020 | | | 100,000 | | | | 100,265 | |
| | |
Rev., 5.00%, 10/1/2020 | | | 420,000 | | | | 421,260 | |
| | |
Cleveland-Cuyahoga County Port Authority, The Cleveland Museum Art Project | | | | | | | | |
| | |
Rev., 5.00%, 10/1/2020 | | | 360,000 | | | | 361,350 | |
| | |
Rev., 5.00%, 10/1/2020 | | | 30,000 | | | | 30,117 | |
| | |
Coldwater Exempted Village School District GO, 3.00%, 12/1/2023 | | | 380,000 | | | | 408,500 | |
| | |
Columbus City School District GO, 4.00%, 12/1/2020 | | | 25,000 | | | | 25,237 | |
| | |
County of Allen Series 2010B, Rev., 4.75%, 9/1/2020 (c) | | | 110,000 | | | | 110,000 | |
| | |
County of Allen OH Hospital Facilities Series 2017A, Rev., 5.00%, 8/1/2024 | | | 300,000 | | | | 351,471 | |
| | |
County of Allen, Catholic Healthcare Partners Series 2012A, Rev., 5.00%, 5/1/2021 | | | 210,000 | | | | 216,325 | |
| | |
County of Allen, Hospital Facilities, Catholic Healthcare Partners Series B, Rev., 4.13%, 9/1/2020 | | | 100,000 | | | | 100,000 | |
| | |
County of Allen, Hospital Facilities, Mercy Health Series 2017A, Rev., 5.00%, 8/1/2021 | | | 540,000 | | | | 562,383 | |
| | |
County of Butler Rev., 5.50%, 11/1/2020 (c) | | | 150,000 | | | | 151,303 | |
| | |
County of Cuyahoga | | | | | | | | |
| | |
Series A, GO, 5.00%, 12/1/2020 | | | 50,000 | | | | 50,601 | |
SEE NOTES TO FINANCIAL STATEMENTS.
| | | | | | | | |
| | | |
| AUGUST 31, 2020 | | J.P. MORGAN EXCHANGE-TRADED FUNDS | | | | | 195 | |
JPMorgan Ultra-Short Municipal Income ETF
SCHEDULE OF PORTFOLIO INVESTMENTS
AS OF AUGUST 31, 2020 (Unaudited) (continued)
| | | | | | | | |
| INVESTMENTS | | PRINCIPAL
AMOUNT ($) | | | VALUE ($) | |
Municipal Bonds — continued | |
|
Ohio — continued | |
| | |
Series A, GO, 4.00%, 12/1/2024 | | | 25,000 | | | | 25,231 | |
| | |
County of Franklin, Nationwide Children’s Hospital Project | | | | | | | | |
| | |
Series 2012A, Rev., 3.00%, 11/1/2020 | | | 35,000 | | | | 35,146 | |
| | |
Series 2012A, Rev., 5.00%, 11/1/2022 | | | 40,000 | | | | 42,925 | |
| | |
County of Hamilton Series 2014A, Rev., 5.00%, 12/1/2020 | | | 170,000 | | | | 172,042 | |
| | |
County of Hamilton, Healthcare Facilities, Christ Hospital Project Rev., 5.00%, 6/1/2021 | | | 170,000 | | | | 175,372 | |
| | |
County of Montgomery Series 2008D-2, Rev., 5.45%, 11/13/2023 (c) | | | 120,000 | | | | 139,273 | |
| | |
County of Summit, Various Purpose Series 2002R, GO, NATL-RE, 5.50%, 12/1/2020 | | | 25,000 | | | | 25,331 | |
| | |
Cuyahoga Metropolitan Housing Authority, Riverside Park Phase II Project Series 2019, Rev., 2.00%, 4/1/2021 (b) | | | 2,370,000 | | | | 2,391,140 | |
| | |
Franklin County Convention Facilities Authority | | | | | | | | |
| | |
Rev., 5.00%, 12/1/2023 | | | 50,000 | | | | 57,044 | |
| | |
Rev., 5.00%, 12/1/2024 | | | 75,000 | | | | 88,457 | |
| | |
Huber Heights City School District GO, 5.00%, 12/1/2020 | | | 30,000 | | | | 30,356 | |
| | |
Johnstown-Monroe Local School District GO, Zero Coupon, 12/1/2021 | | | 200,000 | | | | 199,246 | |
| | |
Lake Local School District GO, 4.00%, 12/1/2020 | | | 25,000 | | | | 25,235 | |
| | |
Lakota Local School District/Butler County GO, 5.00%, 12/1/2020 | | | 30,000 | | | | 30,359 | |
| | |
Lancaster Port Authority, Gas Supply | | | | | | | | |
| | |
Series 2019A, Rev., LIQ: Royal Bank of Canada, 5.00%, 8/1/2021 | | | 300,000 | | | | 312,546 | |
| | |
Series 2019A, Rev., LIQ: Royal Bank of Canada, 5.00%, 2/1/2022 | | | 190,000 | | | | 202,185 | |
| | |
Lebanon City School District, School Facilities Construction and Improvement, Unlimited Tax GO, 3.00%, 12/1/2020 | | | 300,000 | | | | 302,121 | |
| | |
Lucas-Plaza Housing Development Corp. Rev., FHA, Zero Coupon, 6/1/2024 (c) | | | 710,000 | | | | 695,275 | |
| | |
Miami University, A State University of Ohio Rev., 5.00%, 9/1/2020 | | | 30,000 | | | | 30,000 | |
| | |
North Royalton City School District GO, 4.00%, 12/1/2020 | | | 75,000 | | | | 75,712 | |
| | |
Ohio Higher Educational Facility Commission, Case Western University Project Series 2012A, Rev., 5.00%, 12/1/2021 | | | 200,000 | | | | 210,658 | |
| | | | | | | | |
| INVESTMENTS | | PRINCIPAL
AMOUNT ($) | | | VALUE ($) | |
| |
|
Ohio — continued | |
| | |
Ohio Higher Educational Facility Commission, Oberlin College 2017 Project Rev., 4.00%, 10/1/2020 | | | 100,000 | | | | 100,290 | |
| | |
Ohio Housing Finance Agency | | | | | | | | |
| | |
Rev., 1.40%, 9/1/2020 | | | 6,280,000 | | | | 6,280,000 | |
| | |
Rev., 1.75%, 6/1/2021 (b) | | | 470,000 | | | | 475,334 | |
| | |
Ohio Housing Finance Agency, Multi-Family Housing Wesley Tower Apartments Project Rev., 1.40%, 6/1/2021 (b) | | | 10,500,000 | | | | 10,574,340 | |
| | |
Ohio Housing Finance Agency, Single Family Mortgage Series 1, Rev., GNMA/FNMA/FHLMC, 5.00%, 11/1/2020 | | | 75,000 | | | | 75,564 | |
| | |
Ohio State Building Authority Series 2011B, Rev., 5.00%, 10/1/2020 | | | 20,000 | | | | 20,078 | |
| | |
Ohio State Building Authority, Facilities Admin Bldg Series 2001A, Class A, Rev., AGM, 5.00%, 10/1/2020 | | | 100,000 | | | | 100,391 | |
| | |
Ohio State University (The), Multiyear Debt Issuance Program Rev., 5.00%, 12/1/2020 | | | 25,000 | | | | 25,300 | |
| | |
Ohio Turnpike & Infrastructure Commission Series 2013A-1, Rev., 5.00%, 2/15/2025 | | | 100,000 | | | | 110,473 | |
| | |
Ohio Water Development Authority Water Pollution Control Loan Fund Series 2014B, Rev., 5.00%, 12/1/2020 | | | 75,000 | | | | 75,904 | |
| | |
Ohio Water Development Authority, Water Pollution Control Loan Fund Rev., 5.25%, 12/1/2020 | | | 340,000 | | | | 344,308 | |
| | |
Perrysburg Exempted Village School District GO, 5.00%, 12/1/2023 | | | 30,000 | | | | 34,373 | |
| | |
Port of Greater Cincinnati Development Authority Rev., 5.00%, 12/1/2024 | | | 200,000 | | | | 238,200 | |
| | |
Reading Community City School District Series 2016A, GO, 3.00%, 11/1/2020 | | | 25,000 | | | | 25,111 | |
| | |
RiverSouth Authority Series 2012A, Rev., 4.00%, 12/1/2020 | | | 275,000 | | | | 277,624 | |
| | |
State of Ohio | | | | | | | | |
| | |
Series 2011A, GO, 5.00%, 9/1/2020 (c) | | | 20,000 | | | | 20,000 | |
| | |
Series 2011A, GO, 5.00%, 9/1/2020 | | | 30,000 | | | | 30,000 | |
| | |
Series 2010C, GO, 2.50%, 9/15/2020 | | | 100,000 | | | | 100,086 | |
| | |
Series 2011A, GO, 5.00%, 9/15/2020 (c) | | | 25,000 | | | | 25,044 | |
| | |
Series 2016A, Rev., 4.00%, 10/1/2020 | | | 180,000 | | | | 180,553 | |
| | |
Series 2016D, Rev., 4.00%, 10/1/2020 | | | 85,000 | | | | 85,261 | |
| | |
Series 2013A, Rev., 5.00%, 10/1/2020 | | | 25,000 | | | | 25,097 | |
| | |
Series 2012-1, Rev., 5.00%, 12/15/2020 | | | 210,000 | | | | 212,887 | |
SEE NOTES TO FINANCIAL STATEMENTS.
| | | | | | |
| | | |
| 196 | | | | J.P. MORGAN EXCHANGE-TRADED FUNDS | | AUGUST 31, 2020 |
| | | | | | | | |
| INVESTMENTS | | PRINCIPAL
AMOUNT ($) | | | VALUE ($) | |
Municipal Bonds — continued | |
|
Ohio — continued | |
| | |
Series 2018-1, Rev., 5.00%, 12/15/2020 | | | 230,000 | | | | 233,163 | |
| | |
Series 2015A, Rev., 5.00%, 2/1/2021 | | | 125,000 | | | | 127,481 | |
| | |
Series 2018A, GO, 5.00%, 2/1/2021 | | | 25,000 | | | | 25,502 | |
| | |
Series 2018A, GO, 2.00%, 3/1/2021 | | | 50,000 | | | | 50,462 | |
| | |
Series 2014A, COP, 5.00%, 9/1/2021 | | | 30,000 | | | | 31,434 | |
| | |
COP, 4.00%, 3/1/2022 | | | 30,000 | | | | 31,699 | |
| | |
Series 2016A, Rev., 5.00%, 6/1/2022 | | | 25,000 | | | | 27,087 | |
| | |
Series 2013A, GO, 5.00%, 9/15/2022 | | | 75,000 | | | | 82,376 | |
| | |
Series 2016A, Rev., 5.00%, 6/1/2023 | | | 30,000 | | | | 33,902 | |
| | |
Series 2016A, Rev., 5.00%, 10/1/2023 | | | 30,000 | | | | 34,364 | |
| | |
Series 2016-1, Rev., 5.00%, 12/15/2023 | | | 25,000 | | | | 28,873 | |
| | |
Series 2018-1, Rev., 5.00%, 12/15/2023 | | | 35,000 | | | | 40,422 | |
| | |
Series 2015A, Rev., 5.00%, 2/1/2024 | | | 170,000 | | | | 197,013 | |
| | |
Series 2014A, GO, 4.00%, 5/1/2024 | | | 50,000 | | | | 56,865 | |
| | |
Series 2012-1, Rev., 5.00%, 12/15/2024 | | | 55,000 | | | | 59,591 | |
| | |
State of Ohio Department of Administration COP, 5.00%, 9/1/2023 | | | 100,000 | | | | 114,162 | |
| | |
State of Ohio, Capital Facilities Lease-Appropriation Series 2013B, Rev., 5.00%, 4/1/2021 (c) | | | 25,000 | | | | 25,702 | |
| | |
State of Ohio, Capital Facilities, Adult Correctional Building Fund Projects Series 2015B, Rev., 5.00%, 10/1/2020 | | | 105,000 | | | | 105,406 | |
| | |
State of Ohio, Cleveland Clinic Health System Series 2017A, Rev., 5.00%, 1/1/2021 | | | 250,000 | | | | 253,860 | |
| | |
State of Ohio, Common Schools Series 2009C, GO, 5.00%, 9/15/2020 | | | 30,000 | | | | 30,053 | |
| | |
State of Ohio, Department of Administrative Services, Certificates of Participation Multi-Agencey Radio Communication System Project | | | | | | | | |
| | |
COP, 5.00%, 9/1/2020 | | | 165,000 | | | | 165,000 | |
| | |
COP, 5.00%, 9/1/2021 | | | 150,000 | | | | 157,170 | |
| | |
State of Ohio, Department of Administrative Services, Certificates of Participation, Enterprise Data Center Solutions Project COP, 5.00%, 9/1/2021 | | | 50,000 | | | | 52,390 | |
| | |
State of Ohio, Infrastructure Improvement Bonds Series 2015A, GO, 5.00%, 9/1/2020 (c) | | | 50,000 | | | | 50,000 | |
| | |
State of Ohio, University Hospitals Health System, Inc. Series B, Rev., VRDO, 0.45%, 9/1/2020 (b) | | | 5,500,000 | | | | 5,500,000 | |
| | | | | | | | |
| INVESTMENTS | | PRINCIPAL
AMOUNT ($) | | | VALUE ($) | |
| |
|
Ohio — continued | |
| | |
Tender Option Bond Trust Receipts/Certificates | | | | | | | | |
| | |
Series 2018-XF2703, GO, VRDO, LIQ: Citibank NA, 0.29%, 9/10/2020 (b) (f) | | | 4,000,000 | | | | 4,000,000 | |
| | |
Series C, Rev., VRDO, LIQ: Citibank NA, 0.29%, 9/10/2020 (b) (f) | | | 4,000,000 | | | | 4,000,000 | |
| | |
Township of Symmes, Hamilton County Parkland Acquisition and Improvement Limited Tax GO, 3.80%, 12/1/2020 (c) | | | 35,000 | | | | 35,314 | |
| | |
University of Akron (The) | | | | | | | | |
| | |
Series 2019A, Rev., 4.00%, 1/1/2021 | | | 325,000 | | | | 328,640 | |
| | |
Series 2015A, Rev., 5.00%, 1/1/2021 | | | 175,000 | | | | 177,538 | |
| | |
Village of Bluffton, Ohio Hospital Facilities, Blanchard Valley Health System Rev., 5.00%, 12/1/2021 | | | 185,000 | | | | 194,979 | |
| | |
Westlake City School District GO, 4.00%, 12/1/2022 | | | 30,000 | | | | 31,369 | |
| | | | | | | | |
| | |
Total Ohio | | | | | | | 48,918,580 | |
| | | | | | | | |
|
Oklahoma — 0.5% | |
| | |
Canadian County Independent School District No. 69 Mustang | | | | | | | | |
| | |
GO, 3.00%, 4/1/2022 | | | 20,000 | | | | 20,864 | |
| | |
GO, 2.00%, 6/1/2023 | | | 45,000 | | | | 46,995 | |
| | |
City of Oklahoma City GO, 5.00%, 3/1/2021 | | | 25,000 | | | | 25,602 | |
| | |
McClain County Economic Development Authority Rev., 4.00%, 9/1/2022 | | | 265,000 | | | | 283,081 | |
| | |
Oklahoma County Independent School District No. 12, Edmond School District GO, 3.00%, 3/1/2021 | | | 65,000 | | | | 65,901 | |
| | |
Oklahoma County Independent School District No. 52 Midwest City-Del City Series 2018B, GO, 3.00%, 7/1/2021 | | | 50,000 | | | | 51,140 | |
| | |
Oklahoma Department of Transportation | | | | | | | | |
| | |
Series 2018A, Rev., GAN, 5.00%, 9/1/2020 | | | 50,000 | | | | 50,000 | |
| | |
Series 2018A, Rev., GAN, 5.00%, 9/1/2022 | | | 20,000 | | | | 21,887 | |
| | |
Oklahoma Development Finance Authority | | | | | | | | |
| | |
Rev., 3.00%, 4/1/2021 | | | 190,000 | | | | 192,582 | |
| | |
Series 2020A, Rev., 4.00%, 6/1/2021 | | | 220,000 | | | | 226,070 | |
| | |
Series 2013A, Rev., 3.00%, 6/1/2022 | | | 25,000 | | | | 26,171 | |
| | |
Series 2014A, Rev., 3.00%, 6/1/2022 | | | 25,000 | | | | 26,171 | |
| | |
Series 2020A, Rev., 4.00%, 6/1/2022 | | | 250,000 | | | | 266,060 | |
| | |
Series 2020A, Rev., 4.00%, 6/1/2023 | | | 260,000 | | | | 283,855 | |
| | |
Series 2020A, Rev., 4.00%, 6/1/2024 | | | 445,000 | | | | 499,975 | |
| | |
Oklahoma Housing Finance Agency Rev., 1.60%, 1/1/2022 (b) | | | 75,000 | | | | 75,778 | |
SEE NOTES TO FINANCIAL STATEMENTS.
| | | | | | | | |
| | | |
| AUGUST 31, 2020 | | J.P. MORGAN EXCHANGE-TRADED FUNDS | | | | | 197 | |
JPMorgan Ultra-Short Municipal Income ETF
SCHEDULE OF PORTFOLIO INVESTMENTS
AS OF AUGUST 31, 2020 (Unaudited) (continued)
| | | | | | | | |
| INVESTMENTS | | PRINCIPAL
AMOUNT ($) | | | VALUE ($) | |
Municipal Bonds — continued | |
|
Oklahoma — continued | |
| | |
Oklahoma Housing Finance Agency, Sooner Haven Apartments Rev., 2.37%, 10/1/2020 (b) | | | 170,000 | | | | 170,279 | |
| | |
Oklahoma Water Resources Board Rev., 5.00%, 4/1/2021 | | | 50,000 | | | | 51,406 | |
| | |
Tulsa County Independent School District No. 5, Jenks Public Schools GO, 4.00%, 6/1/2021 | | | 50,000 | | | | 51,410 | |
| | |
Tulsa County Industrial Authority Rev., 3.00%, 9/1/2020 | | | 100,000 | | | | 100,000 | |
| | |
Tulsa Metropolitan Utility Authority Series 2016C, Rev., 5.00%, 10/1/2020 | | | 100,000 | | | | 100,391 | |
| | |
Tulsa Public Facilities Authority | | | | | | | | |
| | |
Rev., 3.00%, 6/1/2023 | | | 110,000 | | | | 117,102 | |
| | |
Rev., 5.00%, 6/1/2024 | | | 100,000 | | | | 116,171 | |
| | |
University of Oklahoma (The) Series 2016A, Rev., 5.00%, 7/1/2023 | | | 250,000 | | | | 279,635 | |
| | | | | | | | |
| | |
Total Oklahoma | | | | | | | 3,148,526 | |
| | | | | | | | |
|
Oregon — 1.0% | |
| | |
City of Portland Series 2014A, Rev., 5.00%, 10/1/2020 | | | 30,000 | | | | 30,117 | |
| | |
City of Wilsonville GO, 4.00%, 6/1/2022 | | | 25,000 | | | | 25,669 | |
| | |
Hospital Facilities Authority of Multnomah County Oregon Rev., 5.00%, 3/1/2025 (b) | | | 175,000 | | | | 200,256 | |
| | |
Metropolitan Wastewater Management Commission Rev., 5.00%, 11/1/2020 | | | 25,000 | | | | 25,199 | |
| | |
Oregon State Bond Bank Series 201A-1, Rev., 3.50%, 1/1/2022 | | | 25,000 | | | | 25,277 | |
| | |
Oregon State Department of Administrative Services, Oregon State Lottery | | | | | | | | |
| | |
Series 2016-XF2290, Rev., VRDO, LIQ: Citibank NA, 0.30%, 9/10/2020 (b) (f) | | | 4,000,000 | | | | 4,000,000 | |
| | |
Series A, Rev., 5.00%, 4/1/2021 | | | 25,000 | | | | 25,703 | |
| | |
State of Oregon | | | | | | | | |
| | |
Series L, GO, 5.00%, 11/1/2020 | | | 25,000 | | | | 25,199 | |
| | |
Series N, GO, 5.00%, 12/1/2020 | | | 45,000 | | | | 45,540 | |
| | |
State of Oregon Housing & Community Services Department | | | | | | | | |
| | |
Rev., 1.45%, 6/1/2022 (b) | | | 240,000 | | | | 245,148 | |
| | |
Series 2020A, Rev., 0.88%, 1/1/2024 | | | 470,000 | | | | 471,711 | |
| | |
Series 2020A, Rev., 0.90%, 7/1/2024 | | | 630,000 | | | | 632,860 | |
| | |
State of Oregon, Article XI-N Seismic Projects, Tax-Exempt Series D, GO, 3.00%, 6/1/2021 | | | 25,000 | | | | 25,532 | |
| | |
Tri-County Metropolitan Transportation District of Oregon Series 2018A, Rev., 5.00%, 10/1/2020 | | | 220,000 | | | | 220,843 | |
| | | | | | | | |
| | |
Total Oregon | | | | | | | 5,999,054 | |
| | | | | | | | |
| | | | | | | | |
| INVESTMENTS | | PRINCIPAL
AMOUNT ($) | | | VALUE ($) | |
| | | | | | | | |
|
Pennsylvania — 1.6% | |
| | |
Borough of Columbia GO, 3.00%, 6/15/2022 | | | 50,000 | | | | 52,219 | |
| | |
Carlisle Area School District GO, 3.00%, 9/1/2024 | | | 25,000 | | | | 27,581 | |
| | |
Central Bradford Progress Authority, Guthrie Health Issue Rev., 4.00%, 12/1/2021 | | | 380,000 | | | | 396,272 | |
| | |
Chambersburg Area School District Series A, GO, 5.00%, 3/1/2021 | | | 25,000 | | | | 25,586 | |
| | |
City of Philadelphia, Airport System Series 2017A, Rev., 5.00%, 7/1/2021 | | | 100,000 | | | | 103,707 | |
| | |
County of Allegheny Series C-65, GO, 5.00%, 5/1/2021 (c) | | | 25,000 | | | | 25,802 | |
| | |
County of Berks GO, 4.00%, 11/15/2021 | | | 25,000 | | | | 25,195 | |
| | |
County of Dauphin | | | | | | | | |
| | |
GO, 4.00%, 11/15/2020 | | | 40,000 | | | | 40,313 | |
| | |
GO, 5.00%, 11/15/2021 | | | 45,000 | | | | 47,621 | |
| | |
County of Delaware GO, 5.00%, 10/1/2020 | | | 35,000 | | | | 35,137 | |
| | |
County of Lancaster | | | | | | | | |
| | |
Series 2017C, GO, 4.00%, 11/1/2022 | | | 20,000 | | | | 21,515 | |
| | |
GO, 5.00%, 5/1/2023 | | | 25,000 | | | | 28,034 | |
| | |
County of Montgomery Series 2009C, GO, 5.00%, 12/15/2023 | | | 25,000 | | | | 25,095 | |
| | |
County of Northampton Series B, GO, 5.00%, 10/1/2020 (c) | | | 20,000 | | | | 20,078 | |
| | |
County of Wayne GO, 4.00%, 11/15/2020 | | | 130,000 | | | | 130,961 | |
| | |
County of York | | | | | | | | |
| | |
Series A, GO, 4.00%, 6/1/2022 | | | 35,000 | | | | 37,280 | |
| | |
GO, 4.00%, 12/1/2022 | | | 30,000 | | | | 32,512 | |
| | |
Series 2016A, GO, 3.00%, 12/1/2023 | | | 30,000 | | | | 32,503 | |
| | |
Derry Township School District Series 2015A, GO, 4.00%, 9/1/2020 | | | 25,000 | | | | 25,000 | |
| | |
Hamburg Area School District GO, 5.00%, 4/1/2023 | | | 20,000 | | | | 22,387 | |
| | |
Hollidaysburg Area School District GO, 4.00%, 3/15/2021 | | | 100,000 | | | | 101,991 | |
| | |
Ligonier Valley School District Series 2016A, GO, 5.00%, 3/1/2022 | | | 25,000 | | | | 26,769 | |
| | |
Manheim Township School District Series 2018B, GO, 2.00%, 2/1/2021 | | | 25,000 | | | | 25,181 | |
| | |
Methacton School District Series A, GO, 4.00%, 9/15/2020 | | | 10,000 | | | | 10,014 | |
| | |
Methacton School District, Montgomery County GO, 4.00%, 3/1/2022 | | | 25,000 | | | | 26,396 | |
| | |
Monroeville Finance Authority, Universirty of Pittsburg Medical Center Rev., 5.00%, 2/15/2021 | | | 100,000 | | | | 102,055 | |
SEE NOTES TO FINANCIAL STATEMENTS.
| | | | | | |
| | | |
| 198 | | | | J.P. MORGAN EXCHANGE-TRADED FUNDS | | AUGUST 31, 2020 |
| | | | | | | | |
| INVESTMENTS | | PRINCIPAL
AMOUNT ($) | | | VALUE ($) | |
Municipal Bonds — continued | |
|
Pennsylvania — continued | |
| | |
Montgomery County Industrial Development Authority, Waverly Heights Ltd. Project | | | | | | | | |
| | |
Series 2019, Rev., 4.00%, 12/1/2021 | | | 100,000 | | | | 102,462 | |
| | |
Series 2019, Rev., 4.00%, 12/1/2022 | | | 100,000 | | | | 104,214 | |
| | |
Series 2019, Rev., 4.00%, 12/1/2023 | | | 125,000 | | | | 132,292 | |
| | |
North Penn School District Series 2019A, GO, 3.00%, 1/15/2025 | | | 30,000 | | | | 33,356 | |
| | |
Northampton County General Purpose Authority Rev., 5.00%, 10/1/2020 | | | 75,000 | | | | 75,136 | |
| | |
Northampton County General Purpose Authority, St. Luke’S University Health Network Project Series 2016A, Rev., 5.00%, 8/15/2022 | | | 95,000 | | | | 102,793 | |
| | |
Owen J Roberts School District Series 2016A, GO, 3.00%, 8/15/2021 | | | 25,000 | | | | 25,654 | |
| | |
Parkland School District GO, 4.00%, 4/15/2021 | | | 30,000 | | | | 30,696 | |
| | |
Pennsbury School District Series 2015B, GO, 4.00%, 2/1/2022 | | | 25,000 | | | | 25,386 | |
| | |
Pennsylvania Economic Development Financing Authority Series 2017A, Rev., 4.00%, 11/15/2020 | | | 80,000 | | | | 80,576 | |
| | |
Pennsylvania Economic Development Financing Authority, University Of Pittsburgh Medical Center | | | | | | | | |
| | |
Series 2013A, Rev., 5.00%, 7/1/2021 | | | 100,000 | | | | 103,767 | |
| | |
Series 2017A, Rev., 4.00%, 11/15/2021 | | | 130,000 | | | | 135,529 | |
| | |
Pennsylvania Economic Development Financing Authority, Waste Management, Inc. Project Rev., 2.80%, 12/1/2021 (b) | | | 130,000 | | | | 133,977 | |
| | |
Pennsylvania Higher Educational Facilities Authority | | | | | | | | |
| | |
Series 2011A, Rev., 5.00%, 3/1/2021 (c) | | | 50,000 | | | | 51,190 | |
| | |
Rev., 5.00%, 12/1/2023 | | | 25,000 | | | | 28,626 | |
| | |
Rev., 5.00%, 12/1/2024 | | | 70,000 | | | | 83,110 | |
| | |
Pennsylvania Higher Educational Facilities Authority, Saint Josephs University Series 2010A, Rev., 5.00%, 11/1/2020 | | | 230,000 | | | | 231,773 | |
| | |
Pennsylvania Higher Educational Facilities Authority, University Of Pennsylvania | | | | | | | | |
| | |
Rev., 5.00%, 9/1/2020 (c) | | | 50,000 | | | | 50,000 | |
| | |
Rev., 2.50%, 10/1/2020 (b) (c) | | | 100,000 | | | | 100,181 | |
| | |
Pennsylvania Higher Educational Facilities Authority, University Of Pennsylvania Health System Rev., 5.00%, 8/15/2021 | | | 240,000 | | | | 250,135 | |
| | | | | | | | |
| INVESTMENTS | | PRINCIPAL
AMOUNT ($) | | | VALUE ($) | |
| |
|
Pennsylvania — continued | |
| | |
Pennsylvania Housing Finance Agency Series 2019-130A, Rev., 1.40%, 4/1/2024 | | | 260,000 | | | | 265,759 | |
| | |
Pennsylvania State University (The) Series 2015B, Rev., 5.00%, 9/1/2022 | | | 50,000 | | | | 54,739 | |
| | |
Pennsylvania Turnpike Commission | | | | | | | | |
| | |
Series 2nd, Rev., VRDO, LOC: TD Bank NA, 0.07%, 9/10/2020 (b) | | | 4,095,000 | | | | 4,095,000 | |
| | |
Series 2010B-2, Rev., 6.00%, 12/1/2020 (c) | | | 100,000 | | | | 101,440 | |
| | |
Pennsylvania Turnpike Commission, Motor License Fund-Enhanced Turnpike Series B, Rev., 5.00%, 12/1/2021 (c) | | | 50,000 | | | | 52,988 | |
| | |
Pennsylvania Turnpike Commission, Motor Licensed Fund Series 2010B-2, Rev., 5.13%, 12/1/2020 (c) | | | 100,000 | | | | 101,229 | |
| | |
Philadelphia Authority for Industrial Development Rev., VRDO, LOC: TD Bank NA, 0.08%, 9/10/2020 (b) | | | 700,000 | | | | 700,000 | |
| | |
Saint Mary Hospital Authority, Health System Series 2012B, Rev., 5.00%, 11/15/2020 | | | 125,000 | | | | 126,127 | |
| | |
South Middleton School District Series 2016B, GO, 4.00%, 10/1/2020 | | | 50,000 | | | | 50,152 | |
| | |
Springfield School District/Delaware County GO, 4.00%, 9/1/2021 | | | 50,000 | | | | 51,918 | |
| | |
State Public School Building Authority Series 2014B, Rev., 5.00%, 9/1/2020 | | | 50,000 | | | | 50,000 | |
| | |
Susquehanna Township School District | | | | | | | | |
| | |
GO, 4.00%, 5/15/2021 | | | 35,000 | | | | 35,946 | |
| | |
GO, 4.00%, 5/15/2022 | | | 130,000 | | | | 138,485 | |
| | |
Township of Dover GO, 3.00%, 9/1/2021 | | | 25,000 | | | | 25,677 | |
| | |
Township of Lower Paxton | | | | | | | | |
| | |
GO, 4.00%, 4/1/2021 | | | 35,000 | | | | 35,701 | |
| | |
GO, 4.00%, 4/1/2024 | | | 30,000 | | | | 33,549 | |
| | |
Township of North Coventry GO, AGM, 2.00%, 11/15/2020 | | | 30,000 | | | | 30,045 | |
| | |
Township of Susquehanna GO, 3.00%, 10/1/2021 | | | 25,000 | | | | 25,769 | |
| | |
Trinity Area School District GO, AGM, 4.00%, 11/1/2020 (c) | | | 30,000 | | | | 30,187 | |
| | |
Tuscarora School District/Franklin County GO, 2.00%, 4/1/2021 | | | 50,000 | | | | 50,075 | |
| | |
Union County Higher Educational Facilities Financing Authority Series 2013A, Rev., 5.00%, 4/1/2021 | | | 45,000 | | | | 46,266 | |
| | |
West Jefferson Hills School District GO, 3.00%, 8/1/2024 | | | 25,000 | | | | 27,346 | |
| | | | | | | | |
| | |
Total Pennsylvania | | | | | | | 9,456,455 | |
| | | | | | | | |
SEE NOTES TO FINANCIAL STATEMENTS.
| | | | | | | | |
| | | |
| AUGUST 31, 2020 | | J.P. MORGAN EXCHANGE-TRADED FUNDS | | | | | 199 | |
JPMorgan Ultra-Short Municipal Income ETF
SCHEDULE OF PORTFOLIO INVESTMENTS
AS OF AUGUST 31, 2020 (Unaudited) (continued)
| | | | | | | | |
| INVESTMENTS | | PRINCIPAL
AMOUNT ($) | | | VALUE ($) | |
Municipal Bonds — continued | |
|
Rhode Island — 1.5% | |
| | |
Rhode Island Commerce Corp., Department of Transportation Series 2016-A, Rev., GAN, 5.00%, 6/15/2022 | | | 335,000 | | | | 361,458 | |
| | |
Rhode Island Convention Center Authority Series 2015A, Rev., 5.00%, 5/15/2022 | | | 1,000,000 | | | | 1,069,640 | |
| | |
Rhode Island Health & Educational Building Corp. | | | | | | | | |
| | |
Series 2016A, Rev., 5.00%, 5/15/2021 | | | 150,000 | | | | 153,878 | |
| | |
Series 2019A, Rev., 5.00%, 5/15/2021 | | | 25,000 | | | | 25,817 | |
| | |
Rhode Island Health and Educational Building Corp. Rev., 5.00%, 9/1/2021 | | | 50,000 | | | | 52,385 | |
| | |
Rhode Island Health and Educational Building Corp., Brown University Series A, Rev., 4.50%, 9/1/2021 | | | 25,000 | | | | 26,068 | |
| | |
Rhode Island Health and Educational Building Corp., Bryant University Rev., VRDO, LOC: TD Bank NA, 0.11%, 9/10/2020 (b) | | | 6,510,000 | | | | 6,510,000 | |
| | |
Rhode Island Infrastructure Bank Water Pollution Control Revolving Fund | | | | | | | | |
| | |
Series 2010A, Rev., 4.00%, 10/1/2020 | | | 30,000 | | | | 30,093 | |
| | |
Series 2014A, Rev., 4.00%, 10/1/2020 | | | 45,000 | | | | 45,139 | |
| | |
State of Rhode Island | | | | | | | | |
| | |
Series 2010A, GO, 5.00%, 10/1/2020 | | | 100,000 | | | | 100,391 | |
| | |
Series 2012A, GO, 5.00%, 8/1/2022 | | | 25,000 | | | | 27,311 | |
| | |
State of Rhode Island and Providence Plantations Lease Participation Certificates, Central Power Plant Project Series E, COP, 5.00%, 10/1/2020 | | | 20,000 | | | | 20,075 | |
| | |
State of Rhode Island and Providence Plantations Lease Participation Certificates, Pastore Center Energy Conservation Project Series A, COP, 5.00%, 11/1/2020 | | | 435,000 | | | | 438,315 | |
| | |
Town of North Kingstown Series 2015A, GO, 5.00%, 7/15/2021 | | | 45,000 | | | | 46,895 | |
| | | | | | | | |
| | |
Total Rhode Island | | | | | | | 8,907,465 | |
| | | | | | | | |
|
South Carolina — 0.4% | |
| | |
Beaufort County School District Series 2018B, GO, SCSDE, 5.00%, 3/1/2021 | | | 50,000 | | | | 51,205 | |
| | |
Charleston Educational Excellence Finance Corp., Installment Purchase Rev., 5.00%, 12/1/2020 | | | 100,000 | | | | 101,188 | |
| | |
Clemson University Rev., 5.00%, 5/1/2023 | | | 30,000 | | | | 33,591 | |
| | |
County of Charleston Rev., 5.00%, 12/1/2020 | | | 100,000 | | | | 101,201 | |
| | |
County of Florence, McLeod Medical Center Project Rev., 5.00%, 11/1/2022 | | | 245,000 | | | | 267,432 | |
| | | | | | | | |
| INVESTMENTS | | PRINCIPAL
AMOUNT ($) | | | VALUE ($) | |
| |
|
South Carolina — continued | |
| | |
Fort Mill School District No. 4 | | | | | | | | |
| | |
Series 2013B, GO, SCSDE, 5.00%, 3/1/2021 | | | 35,000 | | | | 35,840 | |
| | |
Series 2016D, GO, SCSDE, 5.00%, 3/1/2021 | | | 30,000 | | | | 30,720 | |
| | |
Greenville County School District | | | | | | | | |
| | |
Rev., 5.00%, 12/1/2020 | | | 30,000 | | | | 30,359 | |
| | |
Rev., 5.00%, 12/1/2021 | | | 75,000 | | | | 79,511 | |
| | |
Rev., 5.00%, 12/1/2022 | | | 25,000 | | | | 27,612 | |
| | |
Horry County School District GO, SCSDE, 5.00%, 3/1/2021 | | | 50,000 | | | | 51,200 | |
| | |
Lexington County Health Services District, Inc. Rev., 5.00%, 11/1/2022 | | | 200,000 | | | | 218,992 | |
| | |
Lexington County School District No. 1 Series 2019B, GO, SCSDE, 5.00%, 2/1/2021 | | | 30,000 | | | | 30,599 | |
| | |
Piedmont Municipal Power Agency | | | | | | | | |
| | |
Series 2010A-5, Rev., 5.00%, 1/1/2022 | | | 200,000 | | | | 203,002 | |
| | |
Series 2017B, Rev., 5.00%, 1/1/2024 | | | 100,000 | | | | 114,045 | |
| | |
South Carolina Jobs-Economic Development Authority, Hospital Refunding and Improvement, Mcleod Health Projects Rev., 5.00%, 11/1/2022 | | | 165,000 | | | | 180,107 | |
| | |
State of South Carolina, Highway Series A, GO, 5.00%, 10/1/2020 | | | 25,000 | | | | 25,098 | |
| | |
Town of Summerville Series 2015B, Rev., 5.00%, 10/1/2023 | | | 300,000 | | | | 337,614 | |
| | |
University of South Carolina | | | | | | | | |
| | |
Series 2017A, Rev., 5.00%, 5/1/2021 | | | 50,000 | | | | 51,540 | |
| | |
Rev., 5.00%, 5/1/2024 | | | 25,000 | | | | 26,838 | |
| | |
Rev., 5.00%, 5/1/2025 | | | 20,000 | | | | 24,024 | |
| | | | | | | | |
| | |
Total South Carolina | | | | | | | 2,021,718 | |
| | | | | | | | |
|
South Dakota — 0.3% | |
| | |
City of Sioux Falls, Sales Tax Series 2012A, Rev., 4.00%, 11/15/2021 | | | 130,000 | | | | 135,948 | |
| | |
Rapid City Area School District No. 51-4/SD, Go Limited Tax Capital Outlay Refunding Certificate GO, 4.00%, 8/1/2023 | | | 630,000 | | | | 693,680 | |
| | |
South Dakota Board of Regents, Housing and Auxiliary Facility System Series 2013A, Rev., 5.00%, 4/1/2021 | | | 70,000 | | | | 71,736 | |
| | |
South Dakota Building Authority Series D, Rev., 4.50%, 9/1/2020 | | | 100,000 | | | | 100,000 | |
| | |
South Dakota Health and Educational Facilities Authority, Hospitals & Health System Rev., 5.00%, 11/1/2020 | | | 350,000 | | | | 352,552 | |
SEE NOTES TO FINANCIAL STATEMENTS.
| | | | | | |
| | | |
| 200 | | | | J.P. MORGAN EXCHANGE-TRADED FUNDS | | AUGUST 31, 2020 |
| | | | | | | | |
| INVESTMENTS | | PRINCIPAL
AMOUNT ($) | | | VALUE ($) | |
Municipal Bonds — continued | |
|
South Dakota — continued | |
| | |
South Dakota Housing Development Authority Series B, Rev., 2.70%, 11/1/2021 | | | 20,000 | | | | 20,500 | |
| | |
South Dakota State Building Authority | | | | | | | | |
| | |
Series 2011A, Rev., 5.00%, 9/1/2021 | | | 60,000 | | | | 62,874 | |
| | |
Series 2019A, Rev., 4.00%, 6/1/2024 | | | 30,000 | | | | 34,101 | |
| | |
Series 2014D, Rev., 5.00%, 9/1/2024 | | | 25,000 | | | | 29,627 | |
| | | | | | | | |
| | |
Total South Dakota | | | | | | | 1,501,018 | |
| | | | | | | | |
|
Tennessee — 0.3% | |
| | |
Chattanooga Health Educational and Housing Facility Board, Catholic Health Initiatives Series 2013A, Rev., 5.25%, 1/1/2023 (c) | | | 545,000 | | | | 605,980 | |
| | |
City of Chattanooga Series A, Rev., 5.00%, 9/1/2020 | | | 45,000 | | | | 45,000 | |
| | |
City of Memphis Rev., 5.00%, 10/1/2020 | | | 20,000 | | | | 20,078 | |
| | |
City of Memphis, Improvement Series 2014A, GO, 4.00%, 11/1/2020 | | | 25,000 | | | | 25,158 | |
| | |
City of Morristown GO, 4.00%, 10/1/2024 | | | 100,000 | | | | 103,899 | |
| | |
City of Springfield GO, AGM, 4.00%, 9/1/2020 | | | 25,000 | | | | 25,000 | |
| | |
Columbia Housing & Redevelopment Corp. Rev., 2.40%, 9/1/2021 (b) | | | 100,000 | | | | 101,986 | |
| | |
County of Bradley GO, 5.00%, 6/1/2021 | | | 20,000 | | | | 20,724 | |
| | |
County of Robertson GO, 5.00%, 5/1/2021 | | | 75,000 | | | | 77,413 | |
| | |
County of Shelby Series 2015A, GO, 5.00%, 4/1/2021 | | | 25,000 | | | | 25,703 | |
| | |
County of Williamson GO, 4.00%, 4/1/2021 | | | 30,000 | | | | 30,670 | |
| | |
Harpeth Valley Utilities District of Davidson & Williamson Counties Rev., 3.00%, 9/1/2020 | | | 25,000 | | | | 25,000 | |
| | |
Highlands Residential Services, Walnut Village Project Series 2019, Rev., GNMA COLL, 1.80%, 4/1/2021 (b) | | | 50,000 | | | | 50,388 | |
| | |
Metropolitan Government Nashville & Davidson County Health and Educational Facilities Board, Multifamily Housing, Trevecca Towers I/East Project Rev., 2.00%, 1/1/2021 (b) | | | 500,000 | | | | 502,530 | |
| | |
Metropolitan Government of Nashville & Davidson County | | | | | | | | |
| | |
Series 2015A, Rev., 5.00%, 5/15/2021 | | | 45,000 | | | | 46,532 | |
| | |
GO, 5.00%, 7/1/2022 | | | 25,000 | | | | 27,211 | |
| | |
Pigeon Forge Industrial Development Board Rev., 5.00%, 6/1/2022 | | | 50,000 | | | | 51,610 | |
| | |
Rutherford County Health and Educational Facilities Board Rev., 2.50%, 11/1/2020 (b) | | | 75,000 | | | | 75,263 | |
| | | | | | | | |
| INVESTMENTS | | PRINCIPAL
AMOUNT ($) | | | VALUE ($) | |
| |
|
Tennessee — continued | |
| | |
State of Tennessee Series A, GO, 5.00%, 9/1/2020 | | | 30,000 | | | | 30,000 | |
| | |
Tennergy Corp. Series 2019A, Rev., LIQ: Royal Bank of Canada, 5.00%, 10/1/2024 (b) | | | 50,000 | | | | 58,508 | |
| | | | | | | | |
| | |
Total Tennessee | | | | | | | 1,948,653 | |
| | | | | | | | |
|
Texas — 5.6% | |
| | |
Alamo Community College District GO, 5.00%, 2/15/2022 | | | 25,000 | | | | 25,539 | |
| | |
Alamo Community College District, Financing System Senior lien Series 2012A, Rev., 5.00%, 11/1/2020 | | | 20,000 | | | | 20,157 | |
| | |
Alamo Regional Mobility Authority, Vehicle Registration Fee Senior Lien Rev., 5.00%, 6/15/2021 | | | 25,000 | | | | 25,952 | |
| | |
Aledo Independent School District GO, PSF-GTD, Zero Coupon, 2/15/2022 | | | 85,000 | | | | 84,562 | |
| | |
Amarillo College | | | | | | | | |
| | |
GO, 3.00%, 2/15/2021 | | | 30,000 | | | | 30,366 | |
| | |
GO, 5.00%, 2/15/2021 | | | 35,000 | | | | 35,744 | |
| | |
Amarillo Independent School District GO, PSF-GTD, 5.00%, 2/1/2021 | | | 45,000 | | | | 45,899 | |
| | |
Arlington Independent School District GO, PSF-GTD, 4.00%, 2/15/2021 | | | 30,000 | | | | 30,520 | |
| | |
Austin Community College District | | | | | | | | |
| | |
Series 2016A, Rev., 4.00%, 2/1/2023 | | | 125,000 | | | | 135,973 | |
| | |
GO, 5.00%, 8/1/2023 | | | 30,000 | | | | 31,288 | |
| | |
Austin Community College District Public Facility Corp. Rev., 4.00%, 8/1/2022 (c) | | | 25,000 | | | | 26,784 | |
| | |
Austin Community College District, Combined Fee Series 2014A, Rev., 5.00%, 2/1/2021 | | | 45,000 | | | | 45,893 | |
| | |
Barbers Hill Independent School District GO, 5.00%, 2/15/2021 | | | 30,000 | | | | 30,658 | |
| | |
Bastrop Independent School District Series 2013A, GO, PSF-GTD, 3.00%, 2/15/2023 | | | 205,000 | | | | 213,087 | |
| | |
Bexar County Hospital District | | | | | | | | |
| | |
GO, 5.00%, 2/15/2021 | | | 40,000 | | | | 40,872 | |
| | |
GO, 5.00%, 2/15/2022 | | | 25,000 | | | | 26,744 | |
| | |
GO, 5.00%, 2/15/2023 | | | 200,000 | | | | 223,024 | |
| | |
Boerne Public Facilities Corp. Rev., 2.75%, 11/1/2021 (b) | | | 100,000 | | | | 102,794 | |
| | |
Brazos River Authority Rev., 5.00%, 9/1/2020 | | | 25,000 | | | | 25,000 | |
| | |
Brazosport Independent School District Series 2012A, GO, PSF-GTD, 3.00%, 2/15/2021 | | | 55,000 | | | | 55,704 | |
SEE NOTES TO FINANCIAL STATEMENTS.
| | | | | | | | |
| | | |
| AUGUST 31, 2020 | | J.P. MORGAN EXCHANGE-TRADED FUNDS | | | | | 201 | |
JPMorgan Ultra-Short Municipal Income ETF
SCHEDULE OF PORTFOLIO INVESTMENTS
AS OF AUGUST 31, 2020 (Unaudited) (continued)
| | | | | | | | |
| INVESTMENTS | | PRINCIPAL
AMOUNT ($) | | | VALUE ($) | |
Municipal Bonds — continued | |
|
Texas — continued | |
| | |
Buna Independent School District, School Building GO, PSF-GTD, 2.25%, 8/15/2023 | | | 120,000 | | | | 123,595 | |
| | |
Capital Area Housing Finance Corp., Mission Trail at El Camino Real Apartments Rev., 2.10%, 9/1/2022 (b) | | | 125,000 | | | | 126,693 | |
| | |
Central Texas Turnpike System Series C, Rev., 5.00%, 8/15/2022 | | | 150,000 | | | | 160,908 | |
| | |
City of Abilene GO, 5.00%, 2/15/2024 | | | 25,000 | | | | 28,960 | |
| | |
City of Austin | | | | | | | | |
| | |
Series 2015A, Rev., 3.00%, 11/15/2020 | | | 40,000 | | | | 40,232 | |
| | |
Rev., 5.00%, 11/15/2024 | | | 50,000 | | | | 52,836 | |
| | |
City of Baytown GO, 4.50%, 2/1/2021 | | | 100,000 | | | | 101,757 | |
| | |
City of Beaumont Rev., 5.00%, 9/1/2020 | | | 125,000 | | | | 125,000 | |
| | |
City of Brownsville GO, 4.00%, 2/15/2022 | | | 265,000 | | | | 279,363 | |
| | |
City of Bryan GO, 3.00%, 8/15/2022 | | | 25,000 | | | | 26,248 | |
| | |
City of Cedar Hill GO, 5.00%, 2/15/2021 | | | 40,000 | | | | 40,868 | |
| | |
City of Cedar Park GO, 5.00%, 2/15/2021 | | | 80,000 | | | | 81,730 | |
| | |
City of Celina GO, 2.00%, 9/1/2020 | | | 50,000 | | | | 50,000 | |
| | |
City of College Station GO, 3.00%, 2/15/2021 | | | 50,000 | | | | 50,633 | |
| | |
City of Dallas | | | | | | | | |
| | |
Rev., 5.00%, 10/1/2020 | | | 25,000 | | | | 25,098 | |
| | |
GO, 5.00%, 2/15/2021 | | | 75,000 | | | | 76,628 | |
| | |
Rev., 5.00%, 10/1/2023 | | | 40,000 | | | | 40,156 | |
| | |
City of Dallas Housing Finance Corp. Rev., 1.50%, 4/1/2022 (b) | | | 425,000 | | | | 433,530 | |
| | |
City of Dallas, Waterworks & Sewer System | | | | | | | | |
| | |
Rev., 5.00%, 10/1/2020 | | | 25,000 | | | | 25,098 | |
| | |
Series 2020A, Rev., 5.00%, 10/1/2020 | | | 80,000 | | | | 80,313 | |
| | |
City of Deer Park GO, 3.00%, 3/15/2024 | | | 25,000 | | | | 27,271 | |
| | |
City of Del Rio | | | | | | | | |
| | |
GO, AGM, 3.00%, 6/1/2021 | | | 50,000 | | | | 51,034 | |
| | |
City of Denton GO, 3.00%, 2/15/2021 | | | 25,000 | | | | 25,320 | |
| | |
City of Edinburg GO, 5.00%, 3/1/2022 | | | 20,000 | | | | 21,416 | |
| | |
City of El Paso | | | | | | | | |
| | |
Series 2012A, Rev., 4.00%, 3/1/2021 | | | 25,000 | | | | 25,478 | |
| | |
GO, 5.00%, 8/15/2021 | | | 30,000 | | | | 31,341 | |
| | |
City of El Paso, Refunding and Improvement GO, 5.00%, 8/15/2021 | | | 25,000 | | | | 26,117 | |
| | |
City of Farmers Branch GO, 4.00%, 2/15/2025 | | | 35,000 | | | | 40,554 | |
| | |
City of Fort Worth Rev., 3.25%, 2/15/2025 | | | 25,000 | | | | 25,314 | |
| | |
City of Frisco | | | | | | | | |
| | |
Series 2016A, GO, 4.00%, 2/15/2021 | | | 85,000 | | | | 86,465 | |
| | |
GO, 5.00%, 2/15/2021 | | | 25,000 | | | | 25,544 | |
| | | | | | | | |
| INVESTMENTS | | PRINCIPAL
AMOUNT ($) | | | VALUE ($) | |
| |
|
Texas — continued | |
| | |
City of Garland Series 2016B, Rev., 5.00%, 3/1/2023 | | | 220,000 | | | | 245,133 | |
| | |
City of Grand Prairie, Combination Tax Series 2013A, GO, 5.00%, 2/15/2021 | | | 65,000 | | | | 66,426 | |
| | |
City of Houston | | | | | | | | |
| | |
Series 2017B, Rev., 4.00%, 11/15/2020 | | | 95,000 | | | | 95,737 | |
| | |
Series 2017B, Rev., 4.00%, 11/15/2021 | | | 35,000 | | | | 36,605 | |
| | |
Series 2019B, Rev., 4.00%, 11/15/2021 | | | 25,000 | | | | 26,147 | |
| | |
Series 2016B, Rev., 5.00%, 11/15/2022 | | | 50,000 | | | | 55,239 | |
| | |
Series A, Rev., AGM, Zero Coupon, 12/1/2024 | | | 50,000 | | | | 48,714 | |
| | |
City of Houston, Airport System Subordinate Lien Rev., VRDO, LOC: Barclays Bank plc, 0.10%, 9/10/2020 (b) | | | 3,490,000 | | | | 3,490,000 | |
| | |
City of Houston, Combined Utility System, First Lien Series 2014C, Rev., 5.00%, 5/15/2021 | | | 25,000 | | | | 25,846 | |
| | |
City of Hutto GO, 5.00%, 2/1/2021 | | | 110,000 | | | | 112,169 | |
| | |
City of Irving Rev., 5.00%, 8/15/2022 | | | 50,000 | | | | 50,196 | |
| | |
City of Lakeway GO, 4.00%, 2/1/2024 | | | 45,000 | | | | 50,460 | |
| | |
City of Laredo | | | | | | | | |
| | |
GO, 5.00%, 2/15/2021 | | | 50,000 | | | | 51,086 | |
| | |
GO, 5.00%, 2/15/2024 | | | 25,000 | | | | 28,755 | |
| | |
City of Lewisville GO, 5.00%, 2/15/2021 | | | 30,000 | | | | 30,658 | |
| | |
City of Lubbock Series 2016A, GO, 4.00%, 2/15/2021 | | | 30,000 | | | | 30,523 | |
| | |
City of McKinney GO, 5.00%, 8/15/2021 | | | 25,000 | | | | 26,154 | |
| | |
City of Mesquite Rev., 3.00%, 3/1/2023 | | | 45,000 | | | | 47,918 | |
| | |
City of Mesquite, Refunding & Improvement, Waterworks and Sewer System Rev., 4.00%, 3/1/2021 | | | 25,000 | | | | 25,441 | |
| | |
City of Midlothian GO, 3.00%, 8/15/2024 | | | 25,000 | | | | 27,450 | |
| | |
City of Missouri City | | | | | | | | |
| | |
Series 2018A, GO, 5.00%, 6/15/2022 | | | 20,000 | | | | 21,699 | |
| | |
GO, 5.00%, 6/15/2023 | | | 35,000 | | | | 39,480 | |
| | |
City of Paris GO, 4.50%, 12/15/2020 | | | 30,000 | | | | 30,367 | |
| | |
City of Pasadena Series 2012A, GO, 5.00%, 2/15/2024 | | | 55,000 | | | | 55,209 | |
| | |
City of Pearland GO, 4.00%, 3/1/2022 | | | 25,000 | | | | 26,408 | |
| | |
City of Sachse Series 2017A, GO, 4.00%, 2/15/2025 | | | 65,000 | | | | 74,632 | |
| | |
City of San Antonio | | | | | | | | |
| | |
GO, 4.50%, 8/1/2021 | | | 25,000 | | | | 25,986 | |
| | |
Rev., 5.00%, 2/1/2023 | | | 50,000 | | | | 54,581 | |
| | |
City of San Antonio, Electric and Gas Systems Rev., 5.00%, 2/1/2021 | | | 20,000 | | | | 20,400 | |
| | |
City of San Marcos GO, 3.00%, 8/15/2021 | | | 25,000 | | | | 25,652 | |
SEE NOTES TO FINANCIAL STATEMENTS.
| | | | | | |
| | | |
| 202 | | | | J.P. MORGAN EXCHANGE-TRADED FUNDS | | AUGUST 31, 2020 |
| | | | | | | | |
| INVESTMENTS | | PRINCIPAL
AMOUNT ($) | | | VALUE ($) | |
Municipal Bonds — continued | |
|
Texas — continued | |
| | |
City of Sugar Land TX Waterworks & Sewer System Rev., 4.00%, 8/15/2022 | | | 20,000 | | | | 21,468 | |
| | |
City of Tyler Series 2015B, Rev., 2.75%, 9/1/2021 | | | 25,000 | | | | 25,645 | |
| | |
City of Victoria Rev., 5.00%, 12/1/2022 | | | 25,000 | | | | 27,564 | |
| | |
City of Waco GO, 5.00%, 2/1/2024 | | | 20,000 | | | | 23,178 | |
| | |
City of Wylie GO, 5.00%, 2/15/2021 | | | 25,000 | | | | 25,549 | |
| | |
Clear Lake City Water Authority | | | | | | | | |
| | |
GO, 4.00%, 3/1/2021 | | | 125,000 | | | | 126,962 | |
| | |
GO, 4.00%, 3/1/2022 | | | 105,000 | | | | 109,927 | |
| | |
GO, 4.00%, 3/1/2023 | | | 145,000 | | | | 156,720 | |
| | |
Clifton Higher Education Finance Corp., Idea Public Schools Rev., 4.80%, 8/15/2021 (c) | | | 155,000 | | | | 161,646 | |
| | |
Coastal Water Authority, City of Houston Projects Rev., 5.00%, 12/15/2020 | | | 20,000 | | | | 20,278 | |
| | |
Columbia-Brazoria Independent School District GO, PSF-GTD, 3.00%, 2/1/2025 | | | 200,000 | | | | 220,720 | |
| | |
Comal Independent School District | | | | | | | | |
| | |
Series 2015A, GO, PSF-GTD, 5.00%, 2/1/2021 | | | 50,000 | | | | 50,999 | |
| | |
GO, PSF-GTD, 5.00%, 2/1/2025 | | | 25,000 | | | | 30,042 | |
| | |
Series B, GO, PSF-GTD, 5.00%, 2/1/2025 | | | 25,000 | | | | 28,917 | |
| | |
Conroe Independent School District, School Building Series 2012, GO, PSF-GTD, 5.00%, 2/15/2021 (c) | | | 20,000 | | | | 20,433 | |
| | |
County of Bexar GO, 5.00%, 6/15/2024 | | | 45,000 | | | | 52,923 | |
| | |
County of Bexar, Certificates of Obligation Series B, GO, 5.00%, 6/15/2021 | | | 20,000 | | | | 20,757 | |
| | |
County of Brazos GO, 5.00%, 9/1/2020 | | | 70,000 | | | | 70,000 | |
| | |
County of Galveston GO, 5.00%, 2/1/2024 | | | 50,000 | | | | 57,797 | |
| | |
County of Harris | | | | | | | | |
| | |
Series 2019A, GO, 5.00%, 10/1/2021 | | | 35,000 | | | | 36,847 | |
| | |
Series 2015B, Rev., 5.00%, 8/15/2022 | | | 55,000 | | | | 60,041 | |
| | |
Series 2010A, GO, 5.00%, 10/1/2023 | | | 50,000 | | | | 50,191 | |
| | |
Series 2010-A, GO, 5.00%, 10/1/2023 | | | 100,000 | | | | 100,384 | |
| | |
Series 2016A, Rev., 5.00%, 8/15/2024 | | | 35,000 | | | | 41,288 | |
| | |
Series 2007C, GO, 5.25%, 8/15/2024 | | | 280,000 | | | | 334,871 | |
| | |
Series 2010A, GO, 5.00%, 10/1/2024 | | | 30,000 | | | | 30,114 | |
| | |
County of Harris, Permanent Improvement | | | | | | | | |
| | |
Series 2015A, GO, 5.00%, 10/1/2020 | | | 20,000 | | | | 20,079 | |
| | |
Series 2015B, GO, 5.00%, 10/1/2020 | | | 25,000 | | | | 25,098 | |
| | |
County of Hidalgo GO, 5.00%, 8/15/2021 | | | 45,000 | | | | 47,077 | |
| | |
County of Montgomery GO, 5.00%, 3/1/2021 | | | 25,000 | | | | 25,596 | |
| | |
County of Taylor GO, 5.00%, 2/15/2021 | | | 20,000 | | | | 20,439 | |
| | | | | | | | |
| INVESTMENTS | | PRINCIPAL
AMOUNT ($) | | | VALUE ($) | |
| |
|
Texas — continued | |
| | |
GO, 5.00%, 2/15/2025 | | | 30,000 | | | | 36,039 | |
| | |
County of Travis Series 2019A, GO, 5.00%, 3/1/2021 | | | 30,000 | | | | 30,723 | |
| | |
County of Travis, Limited Tax GO, 5.00%, 3/1/2024 | | | 100,000 | | | | 116,456 | |
| | |
County of Williamson GO, 5.00%, 2/15/2021 | | | 35,000 | | | | 35,768 | |
| | |
Cypress-Fairbanks Independent School District | | | | | | | | |
| | |
GO, PSF-GTD, 5.00%, 2/15/2021 | | | 25,000 | | | | 25,546 | |
| | |
GO, PSF-GTD, 4.00%, 2/15/2023 | | | 25,000 | | | | 25,421 | |
| | |
Dallas Area Rapid Transit Series 2014A, Rev., 5.00%, 12/1/2020 | | | 25,000 | | | | 25,298 | |
| | |
Dallas Area Rapid Transit, Senior Lien Rev., 4.00%, 12/1/2020 | | | 35,000 | | | | 35,331 | |
| | |
Dallas County Utility & Reclamation District GO, 5.00%, 2/15/2024 | | | 115,000 | | | | 132,402 | |
| | |
Dallas/Fort Worth International Airport | | | | | | | | |
| | |
Series 2011C, Rev., 5.00%, 11/1/2020 | | | 825,000 | | | | 831,386 | |
| | |
Series 2012G, Rev., 5.00%, 11/1/2020 | | | 100,000 | | | | 100,796 | |
| | |
Series B, Rev., 5.00%, 11/1/2020 | | | 200,000 | | | | 201,592 | |
| | |
Series 2014E, Rev., 5.00%, 11/1/2021 | | | 100,000 | | | | 105,480 | |
| | |
Series F, Rev., 5.00%, 11/1/2024 | | | 250,000 | | | | 284,852 | |
| | |
Del Mar College District GO, 5.00%, 8/15/2023 | | | 30,000 | | | | 31,366 | |
| | |
Eanes Independent School District Series B, GO, 4.00%, 8/1/2021 | | | 20,000 | | | | 20,697 | |
| | |
El Paso Downtown Development Corp. Rev., 5.00%, 8/15/2021 | | | 250,000 | | | | 257,882 | |
| | |
Fort Bend County Water Control & Improvement District No. 2 GO, 4.00%, 9/1/2020 | | | 125,000 | | | | 125,000 | |
| | |
Harris County Cultural Education Facilities Finance Corp. | | | | | | | | |
| | |
Series 2015-1, Rev., 5.00%, 10/1/2020 | | | 75,000 | | | | 75,281 | |
| | |
Series 2015-1, Rev., 5.00%, 10/1/2021 | | | 200,000 | | | | 210,020 | |
| | |
Harris County Cultural Education Facilities Finance Corp., Memorial Hermann Health System Series 2013A, Rev., 5.00%, 12/1/2023 | | | 120,000 | | | | 131,735 | |
| | |
Harris County Municipal Utility District No. 180, Unlimited Tax GO, 4.45%, 9/1/2020 | | | 100,000 | | | | 100,000 | |
| | |
Harris County Municipal Utility District No. 468 GO, AGM, 2.00%, 9/1/2020 | | | 15,000 | | | | 15,000 | |
| | |
Harris County Toll Road Authority (The) Series A, Rev., 5.00%, 8/15/2021 | | | 20,000 | | | | 20,911 | |
SEE NOTES TO FINANCIAL STATEMENTS.
| | | | | | | | |
| | | |
| AUGUST 31, 2020 | | J.P. MORGAN EXCHANGE-TRADED FUNDS | | | | | 203 | |
JPMorgan Ultra-Short Municipal Income ETF
SCHEDULE OF PORTFOLIO INVESTMENTS
AS OF AUGUST 31, 2020 (Unaudited) (continued)
| | | | | | | | |
| INVESTMENTS | | PRINCIPAL
AMOUNT ($) | | | VALUE ($) | |
Municipal Bonds — continued | |
|
Texas — continued | |
| | |
Hays Consolidated Independent School District, School Building Series 2018B, GO, PSF-GTD, 2.70%, 8/15/2023 (b) | | | 100,000 | | | | 104,127 | |
| | |
Hidalgo County Drain District No. 1, Improvement GO, 5.00%, 9/1/2022 | | | 100,000 | | | | 109,499 | |
| | |
Houston Community College System GO, 4.00%, 2/15/2023 | | | 50,000 | | | | 50,810 | |
| | |
Houston Independent School District | | | | | | | | |
| | |
GO, 5.00%, 7/15/2021 | | | 25,000 | | | | 26,053 | |
| | |
GO, PSF-GTD, 5.00%, 2/15/2025 | | | 25,000 | | | | 30,156 | |
| | |
Houston Independent School District Public Facility Corp. | | | | | | | | |
| | |
Series 1998A, Rev., AMBAC, Zero Coupon, 9/15/2020 | | | 40,000 | | | | 39,995 | |
| | |
Rev., 5.00%, 9/15/2020 | | | 130,000 | | | | 130,227 | |
| | |
Hudson Independent School District GO, PSF-GTD, 4.00%, 2/15/2022 | | | 200,000 | | | | 210,840 | |
| | |
Jefferson County Drain District No. 7, Maintenance Tax Notes Rev., 4.00%, 3/1/2022 | | | 100,000 | | | | 105,694 | |
| | |
Keller Independent School District, Unlimited Tax Series A, GO, PSF-GTD, 5.00%, 8/15/2021 | | | 20,000 | | | | 20,919 | |
| | |
Klein Independent School District | | | | | | | | |
| | |
Series 2012B, GO, PSF-GTD, 4.00%, 2/1/2021 | | | 60,000 | | | | 60,950 | |
| | |
Series 2015A, GO, PSF-GTD, 5.00%, 8/1/2024 | | | 65,000 | | | | 76,901 | |
| | |
Las Varas Public Facility Corp., Wurzbach Manor Apartments Rev., 1.70%, 12/1/2020(b) | | | 605,000 | | | | 607,003 | |
| | |
Lone Star College System | | | | | | | | |
| | |
GO, 4.00%, 2/15/2021 | | | 30,000 | | | | 30,523 | |
| | |
Series B, GO, 5.00%, 2/15/2021 | | | 30,000 | | | | 30,658 | |
| | |
GO, 5.00%, 2/15/2024 | | | 40,000 | | | | 42,762 | |
| | |
Lower Colorado River Authority | | | | | | | | |
| | |
Rev., 5.00%, 5/15/2023 | | | 250,000 | | | | 280,418 | |
| | |
Rev., 5.00%, 5/15/2024 | | | 225,000 | | | | 261,818 | |
| | |
Lower Colorado River Authority, LCRA Transmission Corporation Project | | | | | | | | |
| | |
Rev., 5.00%, 5/15/2021 | | | 250,000 | | | | 258,295 | |
| | |
Series 2011A, Rev., 5.00%, 5/15/2021 | | | 140,000 | | | | 144,645 | |
| | |
Magnolia Independent School District | | | | | | | | |
| | |
GO, PSF-GTD, 3.25%, 8/15/2021 (c) | | | 40,000 | | | | 41,157 | |
| | |
GO, 5.00%, 8/15/2021 | | | 40,000 | | | | 41,846 | |
| | |
McLennan County Junior College District GO, 5.00%, 8/15/2021 | | | 20,000 | | | | 20,919 | |
| | | | | | | | |
| INVESTMENTS | | PRINCIPAL
AMOUNT ($) | | | VALUE ($) | |
| |
|
Texas — continued | |
| | |
Metropolitan Transit Authority of Harris County, Sales and Use Tax Series 2016D, Rev., 5.00%, 11/1/2020 | | | 300,000 | | | | 302,349 | |
| | |
Midland College District GO, 5.00%, 2/15/2023 | | | 25,000 | | | | 26,700 | |
| | |
Mueller Local Government Corp., Tax Increment Contract 5.00%, 9/1/2020 | | | 150,000 | | | | 150,000 | |
| | |
Mustang Special Utility District | | | | | | | | |
| | |
Series 2018A, Rev., 5.00%, 9/1/2021 | | | 45,000 | | | | 47,151 | |
| | |
Rev., 3.00%, 9/1/2022 | | | 25,000 | | | | 26,415 | |
| | |
North Central Texas Health Facility Development Corp. Rev., 5.00%, 8/15/2021 | | | 360,000 | | | | 375,908 | |
| | |
North Texas Municipal Water District | | | | | | | | |
| | |
Rev., 5.00%, 9/1/2020 | | | 50,000 | | | | 50,000 | |
| | |
Rev., 5.00%, 6/1/2023 | | | 25,000 | | | | 28,282 | |
| | |
North Texas Municipal Water District Water System | | | | | | | | |
| | |
Rev., 5.00%, 9/1/2020 | | | 50,000 | | | | 50,000 | |
| | |
Series 2019A, Rev., 3.00%, 9/1/2024 | | | 40,000 | | | | 44,382 | |
| | |
Rev., 5.00%, 9/1/2024 | | | 30,000 | | | | 35,671 | |
| | |
North Texas Tollway Authority Rev., 6.00%, 1/1/2021 (c) | | | 310,000 | | | | 315,958 | |
| | |
Northside Independent School District | | | | | | | | |
| | |
Series 2014A, GO, PSF-GTD, 5.00%, 2/15/2021 | | | 30,000 | | | | 30,656 | |
| | |
Series 2019A, GO, PSF-GTD, 5.00%, 8/15/2021 | | | 45,000 | | | | 47,068 | |
| | |
Rockwall Independent School District GO, PSF-GTD, Zero Coupon, 2/15/2025 | | | 25,000 | | | | 24,170 | |
| | |
Sam Rayburn Municipal Power Agency, Texas Power Supply System Rev., 5.00%, 10/1/2021 | | | 145,000 | | | | 151,908 | |
| | |
San Antonio Education Facilities Corp. Rev., 5.00%, 6/1/2023 (c) | | | 50,000 | | | | 56,454 | |
| | |
San Antonio Housing Trust Finance Corp. Rev., FHA, 1.37%, 9/1/2021 (b) | | | 40,000 | | | | 40,416 | |
| | |
San Antonio Public Facilities Corp. Rev., 5.00%, 9/15/2024 | | | 35,000 | | | | 38,102 | |
| | |
San Antonio Water System | | | | | | | | |
| | |
Series 2013E, Rev., 5.00%, 5/15/2021 | | | 30,000 | | | | 31,019 | |
| | |
Series 2017A, Rev., 5.00%, 5/15/2021 | | | 20,000 | | | | 20,680 | |
| | |
Series 2016A, Rev., 5.00%, 5/15/2024 | | | 25,000 | | | | 29,379 | |
| | |
San Jacinto College District Series 2016C, GO, 5.00%, 2/15/2021 | | | 50,000 | | | | 51,097 | |
SEE NOTES TO FINANCIAL STATEMENTS.
| | | | | | |
| | | |
| 204 | | | | J.P. MORGAN EXCHANGE-TRADED FUNDS | | AUGUST 31, 2020 |
| | | | | | | | |
| INVESTMENTS | | PRINCIPAL
AMOUNT ($) | | | VALUE ($) | |
Municipal Bonds — continued | |
|
Texas — continued | |
| | |
State of Texas | | | | | | | | |
| | |
Series 2011B, GO, VRDO, LIQ: State Street Bank & Trust, 0.14%, 9/10/2020 (b) | | | 2,915,000 | | | | 2,915,000 | |
| | |
GO, 5.00%, 10/1/2020 | | | 80,000 | | | | 80,315 | |
| | |
Series 2014A, GO, 5.00%, 10/1/2020 | | | 50,000 | | | | 50,197 | |
| | |
Series 2011B, GO, 5.00%, 8/1/2022 | | | 40,000 | | | | 41,779 | |
| | |
State of Texas, Transportation Commission Highway Improvement Series 2012A, GO, 5.00%, 4/1/2021 | | | 35,000 | | | | 35,993 | |
| | |
State of Texas, Veterans | | | | | | | | |
| | |
Series 2010C, GO, VRDO, LIQ: State Street Bank & Trust, 0.14%, 9/10/2020 (b) | | | 3,660,000 | | | | 3,660,000 | |
| | |
Series 2015 A, GO, VRDO, LIQ: State Street Bank & Trust, 0.14%, 9/10/2020 (b) | | | 3,925,000 | | | | 3,925,000 | |
| | |
Tarrant County Cultural Education Facilities Finance Corp., Cook Children’S Medical Center | | | | | | | | |
| | |
Rev., 5.00%, 12/1/2020 | | | 100,000 | | | | 101,137 | |
| | |
Texas City Industrial Development Corp. Rev., 7.38%, 10/1/2020 | | | 300,000 | | | | 301,671 | |
| | |
Texas Department of Housing & Community Affairs, Crosby Plaza Apartments Rev., 1.17%, 2/1/2021 (b) | | | 100,000 | | | | 100,053 | |
| | |
Texas Municipal Gas Acquisition and Supply Corp. Series 2006A, Rev., 5.25%, 12/15/2020 | | | 100,000 | | | | 101,300 | |
| | |
Texas Municipal Power Agency Rev., 5.00%, 9/1/2020 | | | 275,000 | | | | 275,000 | |
| | |
Texas State Technical College Rev., 5.00%, 10/15/2020 | | | 50,000 | | | | 50,290 | |
| | |
Texas State University System Series 2019A, Rev., 4.00%, 3/15/2021 | | | 50,000 | | | | 51,021 | |
| | |
Texas Tech University System Series 2012A, Rev., 5.00%, 8/15/2021 (c) | | | 40,000 | | | | 41,811 | |
| | |
Texas Transportation Commission State Highway Fund Rev., 5.00%, 10/1/2023 | | | 40,000 | | | | 45,778 | |
| | |
Texas Transportation Commission, State Highway Fund Rev., 5.00%, 10/1/2020 | | | 135,000 | | | | 135,528 | |
| | |
Texas Water Development Board Series 2015A, Rev., 5.00%, 10/15/2020 | | | 255,000 | | | | 256,479 | |
| | |
Texas Woman’s University | | | | | | | | |
| | |
Rev., 4.00%, 7/1/2021 | | | 100,000 | | | | 103,126 | |
| | |
Rev., 4.00%, 7/1/2022 | | | 25,000 | | | | 25,743 | |
| | |
Travis County Health Facilities Development Corp. Rev., 7.13%, 11/1/2020 (c) | | | 355,000 | | | | 358,923 | |
| | | | | | | | |
| INVESTMENTS | | PRINCIPAL
AMOUNT ($) | | | VALUE ($) | |
| |
|
Texas — continued | |
| | |
Trinity River Authority | | | | | | | | |
| | |
Rev., 4.00%, 2/1/2021 | | | 35,000 | | | | 35,545 | |
| | |
Rev., 5.00%, 2/1/2025 | | | 40,000 | | | | 47,815 | |
| | |
Trinity River Authority Central Regional Wastewater System Rev., 5.00%, 8/1/2021 | | | 60,000 | | | | 62,645 | |
| | |
Trinity River Authority Denton Creek Wastewater Treatment System Rev., 5.00%, 2/1/2024 | | | 40,000 | | | | 46,208 | |
| | |
Tyler Independent School District GO, PSF-GTD, 5.00%, 2/15/2023 (c) | | | 25,000 | | | | 27,889 | |
| | |
University of Houston | | | | | | | | |
| | |
Series 2011A, Rev., 5.00%, 2/15/2021 (c) | | | 30,000 | | | | 30,643 | |
| | |
Series 2017A, Rev., 5.00%, 2/15/2025 | | | 45,000 | | | | 53,927 | |
| | |
University of North Texas System | | | | | | | | |
| | |
Series 2017A, Rev., 5.00%, 4/15/2021 | | | 25,000 | | | | 25,734 | �� |
| | |
Series 2018A, Rev., 5.00%, 4/15/2023 | | | 30,000 | | | | 33,641 | |
| | |
University of Texas System (The) | | | | | | | | |
| | |
Series 2010B, Rev., 5.00%, 8/15/2021 | | | 25,000 | | | | 26,156 | |
| | |
Series 2012B, Rev., 5.00%, 8/15/2022 (c) | | | 175,000 | | | | 191,328 | |
| | |
Upper Trinity Regional Water District Rev., 5.00%, 8/1/2022 | | | 320,000 | | | | 348,230 | |
| | |
Weatherford Independent School District GO, PSF-GTD, Zero Coupon, 2/15/2025 | | | 50,000 | | | | 48,683 | |
| | |
Weslaco Housing Opportunities Corp. Rev., 1.42%, 1/1/2022 (b) | | | 460,000 | | | | 465,212 | |
| | |
Wylie Independent School District Series 2015C, GO, PSF-GTD, 6.75%, 8/15/2021 | | | 25,000 | | | | 26,565 | |
| | | | | | | | |
| | |
Total Texas | | | | | | | 32,402,008 | |
| | | | | | | | |
|
Utah — 0.5% | |
| | |
Alpine School District GO, 5.00%, 3/15/2021 | | | 25,000 | | | | 25,647 | |
| | |
Central Utah Water Conservancy District Series 2012B, Rev., 5.00%, 10/1/2020 | | | 20,000 | | | | 20,078 | |
| | |
City of Ogden City | | | | | | | | |
| | |
Rev., 3.00%, 1/15/2022 | | | 270,000 | | | | 280,522 | |
| | |
City of South Jordan 4.00%, 11/1/2021 | | | 755,000 | | | | 788,786 | |
| | |
City of St. George | | | | | | | | |
| | |
GO, 4.00%, 8/1/2023 | | | 75,000 | | | | 75,233 | |
| | |
Rev., AGM, 5.00%, 6/1/2024 | | | 150,000 | | | | 175,473 | |
| | |
County of Utah | | | | | | | | |
| | |
Series 2016B, Rev., 5.00%, 5/15/2022 | | | 105,000 | | | | 113,262 | |
SEE NOTES TO FINANCIAL STATEMENTS.
| | | | | | | | |
| | | |
| AUGUST 31, 2020 | | J.P. MORGAN EXCHANGE-TRADED FUNDS | | | | | 205 | |
JPMorgan Ultra-Short Municipal Income ETF
SCHEDULE OF PORTFOLIO INVESTMENTS
AS OF AUGUST 31, 2020 (Unaudited) (continued)
| | | | | | | | |
| INVESTMENTS | | PRINCIPAL
AMOUNT ($) | | | VALUE ($) | |
Municipal Bonds — continued | |
|
Utah — continued | |
| | |
Series 2018B-1, Rev., 5.00%, 8/1/2022 (b) | | | 250,000 | | | | 268,165 | |
| | |
County of Weber, Summit Mountain Assessment Area 5.00%, 1/15/2021 | | | 105,000 | | | | 106,880 | |
| | |
Magna Water District | | | | | | | | |
| | |
GO, 5.00%, 6/1/2023 | | | 50,000 | | | | 56,372 | |
| | |
Ogden City School District Municipal Building Authority | | | | | | | | |
| | |
Rev., 5.00%, 1/15/2022 | | | 125,000 | | | | 133,023 | |
| | |
Southern Utah University | | | | | | | | |
| | |
Rev., 4.00%, 5/1/2022 | | | 50,000 | | | | 52,999 | |
| | |
State of Utah | | | | | | | | |
| | |
GO, 5.00%, 7/1/2024 | | | 75,000 | | | | 88,638 | |
| | |
Utah Associated Municipal Power Systems, San Juan Project | | | | | | | | |
| | |
Series 2011A, Rev., 5.50%, 6/1/2021 | | | 300,000 | | | | 311,403 | |
| | |
Utah Charter School Finance Authority | | | | | | | | |
| | |
Series A, Rev., 5.00%, 4/15/2021 | | | 35,000 | | | | 35,973 | |
| | |
Series A, Rev., 5.00%, 4/15/2022 | | | 130,000 | | | | 139,401 | |
| | |
Series A, Rev., 5.00%, 4/15/2023 | | | 80,000 | | | | 88,599 | |
| | | | | | | | |
| | |
Total Utah | | | | | | | 2,760,454 | |
| | | | | | | | |
|
Vermont — 0.0% (g) | |
| | |
City of Burlington | | | | | | | | |
| | |
Series 2018D, GO, 5.00%, 11/1/2020 | | | 65,000 | | | | 65,503 | |
| | |
Vermont Housing Finance Agency Series 2018A, Rev., AMT, 2.10%, 11/1/2020 | | | 100,000 | | | | 100,268 | |
| | |
Vermont Municipal Bond Bank Series 2019-2, Rev., 3.00%, 12/1/2020 | | | 30,000 | | | | 30,212 | |
| | | | | | | | |
| | |
Total Vermont | | | | | | | 195,983 | |
| | | | | | | | |
|
Virginia — 0.8% | |
| | |
Chesapeake Hospital Authority, Regional Medical Center Rev., 4.00%, 7/1/2021 | | | 200,000 | | | | 205,540 | |
| | |
City of Alexandria Series 2012A, GO, 4.50%, 6/15/2021 | | | 30,000 | | | | 31,025 | |
| | |
City of Lynchburg GO, 3.00%, 8/1/2021 | | | 25,000 | | | | 25,650 | |
| | |
City of Norfolk | | | | | | | | |
| | |
Series A, GO, 5.00%, 10/1/2020 | | | 50,000 | | | | 50,195 | |
| | |
Series G, GO, 5.00%, 10/1/2020 | | | 25,000 | | | | 25,098 | |
| | |
City of Portsmouth Series 2016A, GO, 3.00%, 8/1/2021 | | | 25,000 | | | | 25,651 | |
| | |
City of Richmond Series 2013A, GO, 5.00%, 3/1/2021 | | | 35,000 | | | | 35,844 | |
| | |
City of Suffolk GO, 5.00%, 2/1/2021 | | | 30,000 | | | | 30,602 | |
| | | | | | | | |
| INVESTMENTS | | PRINCIPAL
AMOUNT ($) | | | VALUE ($) | |
| | | | | | | | |
| | |
Virginia — continued | | | | | | | | |
| | |
County of Hanover Series A, GO, 4.00%, 1/15/2021 | | | 25,000 | | | | 25,355 | |
| | |
County of Loudoun | | | | | | | | |
| | |
Series 2011A, GO, 5.00%, 12/1/2020 | | | 25,000 | | | | 25,301 | |
| | |
Series 2016A, GO, 5.00%, 12/1/2021 | | | 25,000 | | | | 26,510 | |
| | |
County of Pittsylvania GO, 5.00%, 6/15/2021 | | | 50,000 | | | | 51,884 | |
| | |
County of Prince William COP, 5.00%, 10/1/2020 | | | 100,000 | | | | 100,383 | |
| | |
County of Pulaski GO, 5.00%, 2/1/2024 | | | 40,000 | | | | 46,356 | |
| | |
County of Spotsylvania GO, 5.00%, 1/15/2021 | | | 50,000 | | | | 50,895 | |
| | |
County of Spotsylvania, Public Improvement Series 2011A, GO, 4.00%, 1/15/2021 | | | 30,000 | | | | 30,426 | |
| | |
Culpeper County Economic Development Authority Rev., 5.00%, 6/1/2024 | | | 30,000 | | | | 35,266 | |
| | |
Fairfax County Economic Development Authority, Route 28 Project 4.00%, 4/1/2021 | | | 25,000 | | | | 25,558 | |
| | |
Loudoun County Economic Development Authority, Public Facilities, Loudoun County Public Facilities Project Series 2016B, Rev., 5.00%, 12/1/2021 | | | 40,000 | | | | 42,416 | |
| | |
Loudoun County Sanitation Authority Series 2010A, Rev., 5.00%, 1/1/2021 | | | 25,000 | | | | 25,401 | |
| | |
Montgomery County Economic Development Authority Rev., 5.00%, 2/1/2021 | | | 35,000 | | | | 35,686 | |
| | |
Roanoke Economic Development Authority, Carilion Clinic Obligated Group Series 2020A, Rev., 5.00%, 7/1/2021 | | | 175,000 | | | | 181,368 | |
| | |
University of Virginia Series 2015B, Rev., 2.00%, 8/1/2021 | | | 30,000 | | | | 30,512 | |
| | |
Virginia Biotechnology Research Partnership Authority, Consolidated Laboratories Project Rev., 5.00%, 9/1/2020 | | | 30,000 | | | | 30,000 | |
| | |
Virginia College Building Authority | | | | | | | | |
| | |
Series 2013A, Rev., 3.00%, 9/1/2020 | | | 40,000 | | | | 40,000 | |
| | |
Series 2009E-1, Rev., 5.00%, 2/1/2021 | | | 90,000 | | | | 91,805 | |
| | |
Virginia College Building Authority, Educational Facilities, Public Higher Education Financing Program Series 2012-A, Rev., 5.00%, 9/1/2021 | | | 25,000 | | | | 26,208 | |
SEE NOTES TO FINANCIAL STATEMENTS.
| | | | | | |
| | | |
| 206 | | | | J.P. MORGAN EXCHANGE-TRADED FUNDS | | AUGUST 31, 2020 |
| | | | | | | | |
| INVESTMENTS | | PRINCIPAL
AMOUNT ($) | | | VALUE ($) | |
Municipal Bonds — continued | | | | | | | | |
| | |
Virginia — continued | | | | | | | | |
| | |
Virginia Commonwealth Transportation Board | | | | | | | | |
| | |
Rev., GAN, 5.00%, 9/15/2020 | | | 100,000 | | | | 100,175 | |
| | |
Series 2014B, Rev., 5.00%, 5/15/2021 | | | 35,000 | | | | 36,189 | |
| | |
Rev., GAN, 5.00%, 9/15/2022 | | | 25,000 | | | | 27,453 | |
| | |
Series 2013A, Rev., GAN, 5.00%, 3/15/2023 (c) | | | 140,000 | | | | 156,915 | |
| | |
Virginia Housing Development Authority | | | | | | | | |
| | |
Series 2012C-4, Rev., 2.49%, 1/1/2022 | | | 200,000 | | | | 204,964 | |
| | |
Series 2018A, Rev., 2.05%, 3/1/2022 | | | 20,000 | | | | 20,016 | |
| | |
Virginia Polytechnic Institute & State University Series 2015A, Rev., 5.00%, 6/1/2021 | | | 50,000 | | | | 51,810 | |
| | |
Virginia Public Building Authority | | | | | | | | |
| | |
Series 2014C, Rev., 5.00%, 8/1/2021 | | | 25,000 | | | | 26,114 | |
| | |
Virginia Public School Authority | | | | | | | | |
| | |
Series 2011A, Rev., 4.13%, 8/1/2021 (c) | | | 30,000 | | | | 31,077 | |
| | |
Series 2014B, Rev., 5.00%, 8/1/2022 | | | 25,000 | | | | 27,311 | |
| | |
Series VI, Rev., 5.00%, 4/15/2023 | | | 80,000 | | | | 90,046 | |
| | |
Virginia Resources Authority | | | | | | | | |
| | |
Rev., 5.00%, 10/1/2020 | | | 15,000 | | | | 15,059 | |
| | |
Series 2014B, Rev., 5.00%, 10/1/2020 | | | 25,000 | | | | 25,097 | |
| | |
Rev., 5.50%, 10/1/2020 | | | 95,000 | | | | 95,409 | |
| | |
Series 2014C, Rev., AMT, 4.00%, 11/1/2020 | | | 25,000 | | | | 25,158 | |
| | |
Series 2012B, Rev., 5.00%, 11/1/2020 | | | 30,000 | | | | 30,238 | |
| | |
Series 2010A, Rev., 5.00%, 11/1/2023 | | | 15,000 | | | | 15,119 | |
| | |
Virginia Resources Authority, Pooled Financing Program | | | | | | | | |
| | |
Series 2015C, Rev., 2.00%, 11/1/2020 | | | 25,000 | | | | 25,076 | |
| | |
Series 2010A, Rev., 5.00%, 11/1/2020 (c) | | | 10,000 | | | | 10,079 | |
| | |
Virginia Small Business Financing Authority, Healthcare Facilities, Sentara Healthcare Rev., 3.00%, 11/1/2020 | | | 450,000 | | | | 451,809 | |
| | |
Western Regional Jail Authority Rev., 4.00%, 12/1/2022 | | | 50,000 | | | | 54,164 | |
| | |
Wise County Industrial Development Authority Series 2010A, Rev., 1.20%, 5/31/2024 (b) | | | 1,640,000 | | | | 1,662,927 | |
| | | | | | | | |
| | |
Total Virginia | | | | | | | 4,533,140 | |
| | | | | | | | |
|
Washington — 1.9% | |
| | |
Central Washington University Rev., AGM, 5.00%, 5/1/2024 | | | 360,000 | | | | 415,836 | |
| | | | | | | | |
| INVESTMENTS | | PRINCIPAL
AMOUNT ($) | | | VALUE ($) | |
| | | | | | | | |
| | |
Washington — continued | | | | | | | | |
| | |
City of Bellingham, Water & Sewer System Series 2016-ZF2389, Rev., VRDO, LIQ: Citibank NA, 0.29%, 9/10/2020 (b) (f) | | | 5,480,000 | | | | 5,480,000 | |
| | |
City of Edmonds Rev., 4.00%, 12/1/2020 | | | 25,000 | | | | 25,238 | |
| | |
City of Kent, Utility System Rev., 5.00%, 12/1/2020 | | | 25,000 | | | | 25,300 | |
| | |
City of Olympia GO, 5.00%, 12/1/2024 | | | 25,000 | | | | 29,927 | |
| | |
City of Redmond GO, 5.00%, 12/1/2020 | | | 35,000 | | | | 35,420 | |
| | |
City of Richland Series 2013A, GO, 4.00%, 12/1/2021 | | | 40,000 | | | | 41,918 | |
| | |
City of Seattle WA Drainage & Wastewater Rev., 5.00%, 9/1/2024 | | | 25,000 | | | | 26,775 | |
| | |
City of Seattle WA Municipal Light & Power | | | | | | | | |
| | |
Series 2012A, Rev., 5.00%, 6/1/2024 | | | 25,000 | | | | 27,065 | |
| | |
City of Spokane Rev., 5.00%, 12/1/2020 | | | 45,000 | | | | 45,540 | |
| | |
City of University Place GO, 4.00%, 12/1/2023 | | | 35,000 | | | | 39,228 | |
| | |
Clark County Public Utility District No. 1 Rev., 5.00%, 1/1/2024 | | | 15,000 | | | | 17,338 | |
| | |
Clark County School District No. 37 Vancouver GO, 3.00%, 12/1/2023 | | | 25,000 | | | | 27,212 | |
| | |
County of King | | | | | | | | |
| | |
Series 2013A, Rev., 5.00%, 1/1/2021 | | | 20,000 | | | | 20,320 | |
| | |
Series 2014B, Rev., 5.00%, 7/1/2021 | | | 25,000 | | | | 26,006 | |
| | |
County of King, Limited Tax Series 2015E, GO, 5.00%, 12/1/2020 | | | 30,000 | | | | 30,360 | |
| | |
County of King, Sewer | | | | | | | | |
| | |
Rev., 5.00%, 1/1/2021 (c) | | | 25,000 | | | | 25,400 | |
| | |
Series 2011C, Rev., 5.00%, 1/1/2021 (c) | | | 25,000 | | | | 25,399 | |
| | |
County of Kitsap GO, 4.00%, 12/1/2020 | | | 20,000 | | | | 20,190 | |
| | |
County of Skagit GO, 5.00%, 12/1/2024 | | | 60,000 | | | | 71,740 | |
| | |
County of Skagit, Limited Tax GO, 5.00%, 12/1/2021 | | | 20,000 | | | | 21,208 | |
| | |
East Wenatchee Water District Rev., 4.00%, 8/1/2023 | | | 25,000 | | | | 27,581 | |
| | |
Energy Northwest Series A, Rev., 5.00%, 7/1/2021 | | | 25,000 | | | | 25,999 | |
| | |
Energy Northwest, Electric Series A, Rev., 5.00%, 7/1/2021 | | | 25,000 | | | | 25,999 | |
| | |
FYI Properties | | | | | | | | |
| | |
Rev., 5.00%, 6/1/2021 | | | 110,000 | | | | 113,855 | |
| | |
Rev., 5.00%, 6/1/2023 | | | 45,000 | | | | 50,261 | |
| | |
Grant County Public Utility District No. 2, Electric System Series 2011-I, Rev., 5.00%, 1/1/2021 (c) | | | 25,000 | | | | 25,400 | |
SEE NOTES TO FINANCIAL STATEMENTS.
| | | | | | | | |
| | | |
| AUGUST 31, 2020 | | J.P. MORGAN EXCHANGE-TRADED FUNDS | | | | | 207 | |
JPMorgan Ultra-Short Municipal Income ETF
SCHEDULE OF PORTFOLIO INVESTMENTS
AS OF AUGUST 31, 2020 (Unaudited) (continued)
| | | | | | | | |
| INVESTMENTS | | PRINCIPAL
AMOUNT ($) | | | VALUE ($) | |
Municipal Bonds — continued | | | | | | | | |
| | |
Washington — continued | | | | | | | | |
| | |
Grays Harbor County Public Utility District No. 1 Series 2015A, Rev., 5.00%, 1/1/2025 | | | 100,000 | | | | 119,203 | |
| | |
King County Fire Protection District No. 39 | | | | | | | | |
| | |
Series 2015A, GO, 5.00%, 12/1/2024 | | | 40,000 | | | | 47,902 | |
| | |
King County Public Hospital District No. 2, Evergreenhealth GO, 5.00%, 12/1/2021 | | | 60,000 | | | | 63,625 | |
| | |
King County School District No. 405 Bellevue GO, 5.00%, 12/1/2024 | | | 160,000 | | | | 191,682 | |
| | |
King County School District No. 405 Bellevue, Credit Enhancement Program GO, 5.00%, 12/1/2020 | | | 20,000 | | | | 20,240 | |
| | |
King County School District No. 414 Lake Washington GO, 5.00%, 12/1/2020 | | | 50,000 | | | | 50,599 | |
| | |
Lewis County Public Utility District No. 1 Rev., 5.00%, 10/1/2023 | | | 100,000 | | | | 114,546 | |
| | |
Snohomish County Public Transportation Benefit Area Corp. Rev., 5.00%, 8/1/2022 | | | 50,000 | | | | 54,623 | |
| | |
Snohomish County, Everett School District No. 2 GO, 5.00%, 12/1/2020 | | | 55,000 | | | | 55,659 | |
| | |
Spokane & Whitman Counties School District No. 360 Cheney GO, 5.00%, 12/1/2022 | | | 25,000 | | | | 27,671 | |
| | |
State of Washington | | | | | | | | |
| | |
Series R-2011A, GO, 5.00%, 1/1/2021 | | | 50,000 | | | | 50,801 | |
| | |
Series 2012D, GO, 5.00%, 2/1/2021 | | | 45,000 | | | | 45,903 | |
| | |
Series 2013D, GO, 5.00%, 2/1/2021 | | | 25,000 | | | | 25,502 | |
| | |
Series 2015C, COP, 5.00%, 7/1/2021 | | | 70,000 | | | | 72,811 | |
| | |
Series 2016A, COP, 5.00%, 7/1/2021 | | | 50,000 | | | | 52,008 | |
| | |
Series R-2020D, GO, 5.00%, 7/1/2021 | | | 30,000 | | | | 31,207 | |
| | |
Series 2011A, COP, 4.40%, 1/1/2022 | | | 50,000 | | | | 50,688 | |
| | |
Series 2017A, COP, 5.00%, 7/1/2022 | | | 80,000 | | | | 86,951 | |
| | |
Series 2019D, COP, 5.00%, 7/1/2022 | | | 65,000 | | | | 70,648 | |
| | |
Series 2012F, Rev., 5.00%, 9/1/2022 | | | 355,000 | | | | 387,752 | |
| | |
Series 2015C, COP, 5.00%, 7/1/2023 | | | 55,000 | | | | 62,300 | |
| | |
Series 2016A, COP, 5.00%, 7/1/2023 | | | 35,000 | | | | 39,645 | |
| | |
Series 2017A, COP, 5.00%, 7/1/2023 | | | 45,000 | | | | 50,972 | |
| | |
Series 2019B, COP, 5.00%, 7/1/2023 | | | 30,000 | | | | 33,982 | |
| | |
Series 2011A, GO, 5.00%, 1/1/2024 | | | 50,000 | | | | 50,793 | |
| | |
Series R-2021A, GO, 5.00%, 6/1/2024 (e) | | | 500,000 | | | | 576,225 | |
| | |
Series 2014B, COP, 5.00%, 7/1/2024 | | | 40,000 | | | | 47,122 | |
| | |
Series 2015E, GO, 5.00%, 7/1/2024 | | | 25,000 | | | | 29,525 | |
| | |
Series 2018C, COP, 5.00%, 7/1/2024 | | | 35,000 | | | | 41,232 | |
| | |
Series 2012F, Rev., 5.00%, 9/1/2024 | | | 150,000 | | | | 163,894 | |
| | | | | | | | |
| INVESTMENTS | | PRINCIPAL
AMOUNT ($) | | | VALUE ($) | |
| | | | | | | | |
| | |
Washington — continued | | | | | | | | |
| | |
Series 2011D, COP, 4.50%, 1/1/2025 | | | 50,000 | | | | 52,779 | |
| | |
Series 2012C, GO, 5.25%, 6/1/2026 | | | 330,000 | | | | 341,877 | |
| | |
Series 2012C, GO, 5.00%, 6/1/2041 | | | 80,000 | | | | 82,730 | |
| | |
State of Washington, Federal Highway, SR 520 Corridor Program Series 2012F, Rev., GAN, 5.00%, 9/1/2020 | | | 345,000 | | | | 345,000 | |
| | |
State of Washington, Motor Vehicle Fuel Tax Series 2003C, GO, NATL-RE, Zero Coupon, 6/1/2021 | | | 40,000 | | | | 39,925 | |
| | |
State of Washington, Motor Vehicle Fuel Tax, SR 520 Corridor Program Series 2012C, GO, 5.00%, 6/1/2022 | | | 15,000 | | | | 15,512 | |
| | |
State of Washington, SR 520 Corridor Program Series 2012C, GO, 5.25%, 6/1/2027 | | | 10,000 | | | | 10,360 | |
| | |
State of Washington, State and Local Agency Real and Personal Property Series 2017A, COP, 5.00%, 7/1/2021 | | | 30,000 | | | | 31,205 | |
| | |
University of Washington Series 2016A, Rev., 5.00%, 12/1/2020 | | | 25,000 | | | | 25,300 | |
| | |
Washington Biomedical Research Properties Series 2015A, Rev., 5.00%, 1/1/2021 | | | 65,000 | | | | 66,041 | |
| | |
Washington Economic Development Finance Authority Series A, Rev., 5.00%, 6/1/2022 | | | 50,000 | | | | 54,221 | |
| | |
Washington Health Care Facilities Authority | | | | | | | | |
| | |
Series 2011A, Rev., 5.00%, 2/1/2021 (c) | | | 120,000 | | | | 122,326 | |
| | |
Washington Health Care Facilities Authority, Healthcare Facilities, Seattle Children’S Hospital Series 2010B, Rev., 5.00%, 10/1/2021 | | | 225,000 | | | | 225,824 | |
| | |
Washington Health Care Facilities Authority, Multicare Health System Rev., 5.00%, 8/15/2021 | | | 100,000 | | | | 104,223 | |
| | |
Washington State University | | | | | | | | |
| | |
Rev., 5.00%, 10/1/2020 | | | 35,000 | | | | 35,136 | |
| | |
Rev., 5.00%, 10/1/2021 | | | 250,000 | | | | 250,950 | |
| | | | | | | | |
| | |
Total Washington | | | | | | | 11,265,635 | |
| | | | | | | | |
|
West Virginia — 1.2% | |
| | |
West Virginia Commissioner of Highways | | | | | | | | |
| | |
Series 2017A, Rev., 5.00%, 9/1/2020 | | | 175,000 | | | | 175,000 | |
| | |
West Virginia Economic Development Authority, Appalachian Power Co. —AMOS Project Series 2009-B, Rev., 2.63%, 6/1/2022 (b) | | | 500,000 | | | | 515,295 | |
SEE NOTES TO FINANCIAL STATEMENTS.
| | | | | | |
| | | |
| 208 | | | | J.P. MORGAN EXCHANGE-TRADED FUNDS | | AUGUST 31, 2020 |
| | | | | | | | |
| INVESTMENTS | | PRINCIPAL
AMOUNT ($) | | | VALUE ($) | |
Municipal Bonds — continued | | | | | | | | |
|
West Virginia — continued | |
| | |
West Virginia Hospital Finance Authority, United Health System | | | | | | | | |
| | |
Series 2016A, Rev., 5.00%, 6/1/2021 | | | 5,670,000 | | | | 5,854,786 | |
| | |
Series 2016A, Rev., 5.00%, 6/1/2022 | | | 20,000 | | | | 21,505 | |
| | |
West Virginia University Series 2019A, Rev., 5.00%, 10/1/2022 | | | 275,000 | | | | 300,011 | |
| | | | | | | | |
| | |
Total West Virginia | | | | | | | 6,866,597 | |
| | | | | | | | |
|
Wisconsin — 3.4% | |
| | |
City of Brookfield GO, 2.00%, 11/1/2020 | | | 390,000 | | | | 391,154 | |
| | |
City of Kaukauna, Electric System Rev., 4.00%, 12/15/2020 | | | 100,000 | | | | 101,057 | |
| | |
City of La Crosse/Wisconsin Series 2011-C, GO, 3.00%, 10/1/2024 | | | 100,000 | | | | 102,920 | |
| | |
City of Madison Rev., BAN, 1.50%, 11/1/2024 | | | 1,075,000 | | | | 1,077,171 | |
| | |
City of Madison, Promissory Notes | | | | | | | | |
| | |
Series 2016A, GO, 3.00%, 10/1/2020 | | | 145,000 | | | | 145,334 | |
| | |
Series 2014A, GO, 4.00%, 10/1/2020 | | | 40,000 | | | | 40,124 | |
| | |
City of Manitowoc | | | | | | | | |
| | |
GO, 2.00%, 2/1/2021 | | | 385,000 | | | | 387,818 | |
| | |
GO, 2.00%, 2/1/2023 | | | 320,000 | | | | 331,383 | |
| | |
City of Merrill | | | | | | | | |
| | |
Series 2019A, GO, 3.00%, 10/1/2020 | | | 95,000 | | | | 95,215 | |
| | |
Series 2019A, GO, 3.00%, 10/1/2021 | | | 60,000 | | | | 61,812 | |
| | |
Series 2019A, GO, 3.00%, 10/1/2022 | | | 60,000 | | | | 62,929 | |
| | |
City of Oshkosh | | | | | | | | |
| | |
Series A, GO, 0.05%, 12/1/2022 | | | 70,000 | | | | 69,483 | |
| | |
Series A, GO, 2.00%, 12/1/2023 | | | 200,000 | | | | 210,236 | |
| | |
City of Shawano, Promissory Notes Series 2019, GO, 3.00%, 4/1/2022 | | | 140,000 | | | | 146,160 | |
| | |
City of Waukesha | | | | | | | | |
| | |
Series 2014B, GO, 2.00%, 10/1/2020 | | | 40,000 | | | | 40,058 | |
| | |
Series 2016A, GO, 2.00%, 10/1/2020 | | | 200,000 | | | | 200,292 | |
| | |
Series A, GO, 4.00%, 10/1/2020 | | | 20,000 | | | | 20,062 | |
| | |
County of Milwaukee | | | | | | | | |
| | |
Series 2016C, GO, 2.00%, 9/1/2020 (c) | | | 10,000 | | | | 10,000 | |
| | |
Series 2013A, GO, 3.00%, 9/1/2020 | | | 50,000 | | | | 50,000 | |
| | |
Series 2018D, GO, 3.00%, 8/1/2024 | | | 100,000 | | | | 110,038 | |
| | |
County of Sauk GO, 2.00%, 10/1/2020 | | | 100,000 | | | | 100,146 | |
| | |
East Troy Community School District GO, 3.00%, 3/1/2021 | | | 25,000 | | | | 25,352 | |
| | |
Fox Valley Technical College District Series 2019A, GO, 3.00%, 12/1/2021 | | | 155,000 | | | | 160,383 | |
| | |
Ithaca School District, School Improvement Series 2014, GO, 3.00%, 3/1/2021 | | | 175,000 | | | | 177,434 | |
| | | | | | | | |
| INVESTMENTS | | PRINCIPAL
AMOUNT ($) | | | VALUE ($) | |
| | | | | | | | |
| | |
Wisconsin — continued | | | | | | | | |
| | |
Madison Area Technical College | | | | | | | | |
| | |
Series 2010-11B, GO, 4.00%, 3/1/2021 (c) | | | 25,000 | | | | 25,477 | |
| | |
Series 2018-19B, GO, 4.00%, 3/1/2021 | | | 60,000 | | | | 61,148 | |
| | |
Milwaukee Redevelopment Authority, Milwaukee Public Schools | | | | | | | | |
| | |
Series 2017, Rev., 5.00%, 11/15/2022 | | | 365,000 | | | | 401,708 | |
| | |
Series 2017, Rev., 5.00%, 11/15/2023 | | | 130,000 | | | | 148,651 | |
| | |
Milwaukee Redevelopment Authority, Milwaukee Public Schools —Neighborhood Schools Initiative Rev., NATL-RE, 4.00%, 8/1/2023 | | | 400,000 | | | | 440,556 | |
| | |
Milwaukee Redevelopment Authority, Public Schools — Neighborhood Schools Initiative Rev., 4.00%, 8/1/2021 | | | 100,000 | | | | 103,374 | |
| | |
Public Finance Authority | | | | | | | | |
| | |
Series 2015A, Rev., 5.15%, 12/1/2020 (c) | | | 6,050,000 | | | | 6,422,317 | |
| | |
Series 2015A, Rev., 5.35%, 12/1/2020 (c) | | | 1,790,000 | | | | 1,901,033 | |
| | |
Rev., 5.00%, 3/1/2023 | | | 25,000 | | | | 27,514 | |
| | |
Public Finance Authority, KU Campus Development Corporation — Central District Development Project Rev., 5.00%, 3/1/2021 | | | 100,000 | | | | 102,055 | |
| | |
Public Finance Authority, Searstone CCRC Project Series 2020A, Rev., 8.63%, 6/1/2022 (c) | | | 125,000 | | | | 142,093 | |
| | |
Sevastopol School District | | | | | | | | |
| | |
GO, 4.00%, 3/1/2024 | | | 985,000 | | | | 1,102,944 | |
| | |
GO, 4.00%, 3/1/2025 | | | 625,000 | | | | 717,237 | |
| | |
Sheboygan Area School District GO, 2.00%, 3/1/2021 | | | 50,000 | | | | 50,074 | |
| | |
State of Wisconsin | | | | | | | | |
| | |
Series 2, GO, 5.00%, 11/1/2020 | | | 20,000 | | | | 20,159 | |
| | |
Series 2016-1, GO, 5.00%, 11/1/2020 | | | 70,000 | | | | 70,557 | |
| | |
Series 3, GO, 5.00%, 11/1/2020 | | | 65,000 | | | | 65,518 | |
| | |
Sun Prairie Area School District | | | | | | | | |
| | |
GO, 5.00%, 3/1/2021 | | | 45,000 | | | | 46,059 | |
| | |
University of Wisconsin Hospitals & Clinics Series 2013A, Rev., 5.00%, 4/1/2021 | | | 150,000 | | | | 153,774 | |
| | |
Village of DeForest Series 2019A, GO, 0.05%, 5/1/2021 | | | 95,000 | | | | 94,906 | |
| | |
Village of Fox Crossing GO, 3.00%, 4/1/2024 | | | 185,000 | | | | 201,450 | |
SEE NOTES TO FINANCIAL STATEMENTS.
| | | | | | | | |
| | | |
| AUGUST 31, 2020 | | J.P. MORGAN EXCHANGE-TRADED FUNDS | | | | | 209 | |
JPMorgan Ultra-Short Municipal Income ETF
SCHEDULE OF PORTFOLIO INVESTMENTS
AS OF AUGUST 31, 2020 (Unaudited) (continued)
| | | | | | | | |
| INVESTMENTS | | PRINCIPAL
AMOUNT ($) | | | VALUE ($) | |
Municipal Bonds — continued | | | | | | | | |
| | |
Wisconsin — continued | | | | | | | | |
| | |
Village of Menomonee Falls | | | | | | | | |
| | |
Series B, GO, 3.50%, 2/1/2022 | | | 150,000 | | | | 156,963 | |
| | |
Series B, GO, 3.50%, 2/1/2023 | | | 155,000 | | | | 166,822 | |
| | |
Series B, GO, 3.50%, 2/1/2024 | | | 245,000 | | | | 270,757 | |
| | |
Village of Sussex Series 2019C, GO, 5.00%, 10/1/2020 | | | 115,000 | | | | 115,406 | |
| | |
Village of Waunakee Series 2012A, GO, 4.00%, 4/1/2021 | | | 80,000 | | | | 80,248 | |
| | |
Wauwatosa School District Series 2019B, GO, 5.00%, 9/1/2020 | | | 65,000 | | | | 65,000 | |
| | |
West Salem School District GO, 1.25%, 4/1/2022 | | | 200,000 | | | | 200,158 | |
| | |
Wisconsin Department of Transportation Series 2019A, Rev., 5.00%, 7/1/2021 | | | 55,000 | | | | 57,213 | |
| | |
Wisconsin Health & Educational Facilities Authority | | | | | | | | |
| | |
Rev., 5.00%, 8/15/2021 | | | 150,000 | | | | 156,335 | |
| | |
Rev., 5.00%, 8/15/2023 | | | 100,000 | | | | 112,850 | |
| | |
Series 2019A, Rev., 5.00%, 11/15/2024 | | | 200,000 | | | | 237,284 | |
| | |
Series 2014A, Rev., 5.00%, 12/1/2025 | | | 120,000 | | | | 140,352 | |
| | |
Wisconsin Health & Educational Facilities Authority, Ascension Health Alliance Senior Credit Group Series 2013B-1, Rev., 4.00%, 11/15/2020 | | | 70,000 | | | | 70,507 | |
| | |
Wisconsin Health and Educational Facilities Authority, Advocate Aurora Health Credit Group Series 2018B-1, Rev., 5.00%, 1/26/2022 (b) | | | 155,000 | | | | 165,011 | |
| | |
Series 2018B-2, Rev., 5.00%, 1/25/2023 (b) | | | 205,000 | | | | 226,669 | |
| | |
Series 2018B-3, Rev., 5.00%, 1/31/2024 (b) | | | 1,000,000 | | | | 1,147,480 | |
| | |
Wisconsin Health and Educational Facilities Authority, Ascension Health Credit Group | | | | | | | | |
| | |
Series 2013A, Rev., 5.00%, 11/15/2020 | | | 45,000 | | | | 45,420 | |
| | |
Wisconsin Health and Educational Facilities Authority, Unity Point Health Series 2014A, Rev., 5.00%, 12/1/2021 | | | 140,000 | | | | 147,732 | |
| | |
Wisconsin Housing & Economic Development Authority Series 2019A, Rev., 1.55%, 11/1/2021 (b) | | | 100,000 | | | | 100,178 | |
| | | | | | | | |
| | |
Total Wisconsin | | | | | | | 20,077,550 | |
| | | | | | | | |
|
Wyoming — 0.0% (g) | |
| | |
University of Wyoming | | | | | | | | |
| | |
Series 2011B, Rev., 3.50%, 6/1/2022 | | | 45,000 | | | | 46,053 | |
| | |
Series 2012A, Rev., 5.00%, 6/1/2023 | | | 30,000 | | | | 32,423 | |
| | | | | | | | |
| INVESTMENTS | | PRINCIPAL
AMOUNT ($) | | | VALUE ($) | |
| | | | | | | | |
|
Wyoming — continued | |
| | |
Wyoming State Loan & Investment Board Series 2012A, Rev., 5.00%, 10/1/2023 | | | 30,000 | | | | 32,926 | |
| | | | | | | | |
| | |
Total Wyoming | | | | | | | 111,402 | |
| | | | | | | | |
| | |
Total Municipal Bonds
(Cost $490,462,801) | | | | | | | 493,253,547 | |
| | | | | |
| | |
| | | SHARES | | | | |
Short-Term Investments — 16.7% | |
|
Investment Companies — 16.7% | |
| | |
JPMorgan Institutional Tax Free Money Market Fund Class IM Shares, 0.04% (h) (i)
(Cost $97,750,190) | | | 97,689,030 | | | | 97,757,412 | |
| | | | | | | | |
Total Investments — 101.2%
(Cost $588,212,991) | | | | | | | 591,010,959 | |
Liabilities in Excess of Other Assets — (1.2)% | | | | (7,233,424) | |
| | | | | | | | |
NET ASSETS — 100.0% | | | | | | | 583,777,535 | |
| | | | | | | | |
Percentages indicated are based on net assets.
Abbreviations
| | |
AGC | | Insured by Assured Guaranty Corp. |
AGM | | Insured by Assured Guaranty Municipal Corp. |
AMBAC | | Insured by American Municipal Bond Assurance Corp. |
BAN | | Bond Anticipation Note |
COLL | | Collateral |
COP | | Certificate of Participation |
CR | | Custodial Receipts |
FGIC | | Insured by Financial Guaranty Insurance Co. |
FHA | | Federal Housing Administration |
FHLMC | | Federal Home Loan Mortgage Corp. |
FNMA | | Federal National Mortgage Association |
GAN | | Grant Anticipation Note |
GNMA | | Government National Mortgage Association |
GO | | General Obligation |
GTD | | Guaranteed |
ICE | | Intercontinental Exchange |
IDA | | Industrial Development Authority |
LIBOR | | London Interbank Offered Rate |
LIQ | | Liquidity Agreement |
LOC | | Letter of Credit |
MTA | | Metropolitan Transportation Authority |
NATL | | Insured by National Public Finance Guarantee Corp. |
PSF-GTD | | Permanent School Fund Guaranteed |
Q-SBLF | | Qualified School Bond Loan Fund |
RAN | | Revenue Anticipation Note |
RE | | Reinsured |
Rev. | | Revenue |
SCSDE | | South Carolina School District Enhancement |
SIFMA | | The Securities Industry and Financial Markets Association |
USD | | United States Dollar |
VRDO | �� | Variable Rate Demand Obligation |
SEE NOTES TO FINANCIAL STATEMENTS.
| | | | | | |
| | | |
| 210 | | | | J.P. MORGAN EXCHANGE-TRADED FUNDS | | AUGUST 31, 2020 |
| | |
(a) | | The date shown represents the earliest of the prerefunded date, next put date or final maturity date. |
(b) | | Variable or floating rate security, the interest rate of which adjusts periodically based on changes in current interest rates and prepayments on the underlying pool of assets. The interest rate shown is the current rate as of August 31, 2020. |
(c) | | Security is prerefunded or escrowed to maturity. |
(d) | | Variable or floating rate security, linked to the referenced benchmark. The interest rate shown is the current rate as of August 31, 2020. |
(e) | | All or a portion of the security is a when-issued security, delayed delivery security, or forward commitment. |
(f) | | Securities exempt from registration under Rule 144A or section 4(a)(2), of the Securities Act of 1933, as amended. |
(g) | | Amount rounds to less than 0.1% of net assets. |
(h) | | Investment in an affiliated fund, which is registered under the Investment Company Act of 1940, as amended, and is advised by J.P. Morgan Investment Management Inc. |
(i) | | The rate shown is the current yield as of August 31, 2020. |
SEE NOTES TO FINANCIAL STATEMENTS.
| | | | | | | | |
| | | |
| AUGUST 31, 2020 | | J.P. MORGAN EXCHANGE-TRADED FUNDS | | | | | 211 | |
JPMorgan USD Emerging Markets Sovereign Bond ETF
SCHEDULE OF PORTFOLIO INVESTMENTS
AS OF AUGUST 31, 2020 (Unaudited)
| | | | | | | | |
| INVESTMENTS | | PRINCIPAL
AMOUNT ($) | | | VALUE ($) | |
Foreign Government Securities — 88.0% | |
|
Azerbaijan — 1.2% | |
| | |
Republic of Azerbaijan | | | | | | | | |
| | |
4.75%, 3/18/2024 (a) | | | 493,000 | | | | 535,398 | |
| | |
3.50%, 9/1/2032 (b) | | | 473,000 | | | | 482,460 | |
| | | | | | | | |
| | |
| | | | | | | 1,017,858 | |
| | | | | | | | |
|
Bahrain — 5.2% | |
| | |
CBB International Sukuk Co. 7 SPC | | | | | | | | |
| | |
6.88%, 10/5/2025 (a) | | | 205,000 | | | | 231,778 | |
| | |
CBB International Sukuk Programme Co. SPC | | | | | | | | |
| | |
6.25%, 11/14/2024 (a) | | | 270,000 | | | | 293,287 | |
| | |
4.50%, 3/30/2027 (b) (c) | | | 389,000 | | | | 400,792 | |
| | |
Kingdom of Bahrain | | | | | | | | |
| | |
6.13%, 8/1/2023 (a) | | | 300,000 | | | | 320,438 | |
| | |
6.13%, 8/1/2023 (b) | | | 240,000 | | | | 256,350 | |
| | |
7.00%, 1/26/2026 (b) | | | 321,000 | | | | 365,438 | |
| | |
7.00%, 1/26/2026 (a) | | | 189,000 | | | | 215,165 | |
| | |
7.00%, 10/12/2028 (b) | | | 680,000 | | | | 774,137 | |
| | |
7.00%, 10/12/2028 (a) | | | 200,000 | | | | 227,688 | |
| | |
6.75%, 9/20/2029 (a) | | | 200,000 | | | | 225,187 | |
| | |
5.63%, 9/30/2031 (a) | | | 627,000 | | | | 652,864 | |
| | |
6.00%, 9/19/2044 (a) | | | 228,000 | | | | 225,578 | |
| | |
6.00%, 9/19/2044 (b) | | | 200,000 | | | | 197,875 | |
| | | | | | | | |
| | |
| | | | | | | 4,386,577 | |
| | | | | | | | |
|
Bolivia, Plurinational State of — 0.4% | |
| | |
Plurinational State of Bolivia | | | | | | | | |
| | |
4.50%, 3/20/2028 (b) | | | 200,000 | | | | 175,000 | |
| | |
4.50%, 3/20/2028 (a) | | | 200,000 | | | | 175,000 | |
| | | | | | | | |
| | |
| | | | | | | 350,000 | |
| | | | | | | | |
|
Brazil — 7.5% | |
| | |
Federative Republic of Brazil | | | | | | | | |
| | |
2.63%, 1/5/2023 | | | 408,000 | | | | 420,622 | |
| | |
8.88%, 4/15/2024 | | | 225,000 | | | | 279,562 | |
| | |
4.25%, 1/7/2025 | | | 427,000 | | | | 461,427 | |
| | |
6.00%, 4/7/2026 | | | 181,000 | | | | 212,505 | |
| | |
4.63%, 1/13/2028 | | | 1,355,000 | | | | 1,496,005 | |
| | |
4.50%, 5/30/2029 | | | 510,000 | | | | 551,438 | |
| | |
8.25%, 1/20/2034 | | | 586,000 | | | | 808,680 | |
| | |
5.63%, 1/7/2041 | | | 101,000 | | | | 113,341 | |
| | |
5.00%, 1/27/2045 | | | 465,000 | | | | 482,583 | |
| | |
5.63%, 2/21/2047 | | | 342,000 | | | | 383,040 | |
| | |
4.75%, 1/14/2050 | | | 850,000 | | | | 852,922 | |
| | |
State of Minas Gerais | | | | | | | | |
| | |
5.33%, 2/15/2028 (a) | | | 191,200 | | | | 194,487 | |
| | | | | | | | |
| | |
| | | | | | | 6,256,612 | |
| | | | | | | | |
| | | | | | | | |
| INVESTMENTS | | PRINCIPAL
AMOUNT ($) | | | VALUE ($) | |
| | | | | | | | |
|
Chile — 0.4% | |
| | |
Republic of Chile | | | | | | | | |
| | |
3.50%, 1/25/2050 | | | 270,000 | | | | 315,478 | |
| | | | | | | | |
| | |
China — 0.5% | | | | | | | | |
| | |
People’s Republic of China | | | | | | | | |
| | |
1.88%, 12/3/2022 (a) | | | 220,000 | | | | 226,669 | |
| | |
3.50%, 10/19/2028 (a) | | | 200,000 | | | | 234,812 | |
| | | | | | | | |
| | |
| | | | | | | 461,481 | |
| | | | | | | | |
|
Colombia — 1.9% | |
| | |
Republic of Colombia | | | | | | | | |
| | |
8.13%, 5/21/2024 | | | 250,000 | | | | 303,875 | |
| | |
3.88%, 4/25/2027 | | | 216,000 | | | | 235,440 | |
| | |
7.38%, 9/18/2037 | | | 204,000 | | | | 291,847 | |
| | |
5.63%, 2/26/2044 | | | 205,000 | | | | 259,581 | |
| | |
5.00%, 6/15/2045 | | | 437,000 | | | | 521,669 | |
| | | | | | | | |
| | |
| | | | | | | 1,612,412 | |
| | | | | | | | |
|
Croatia — 0.4% | |
| | |
Republic of Croatia | | | | | | | | |
| | |
6.00%, 1/26/2024 (b) (c) | | | 265,000 | | | | 307,400 | |
| | | | | | | | |
| | |
Dominican Republic — 6.8% | | | | | | | | |
| | |
Dominican Republic Government Bond | | | | | | | | |
| | |
5.88%, 4/18/2024 (b) | | | 378,000 | | | | 398,436 | |
| | |
5.88%, 4/18/2024 (a) | | | 322,000 | | | | 339,408 | |
| | |
5.50%, 1/27/2025 (b) | | | 218,000 | | | | 227,265 | |
| | |
6.88%, 1/29/2026 (a) | | | 130,000 | | | | 143,894 | |
| | |
5.95%, 1/25/2027 (a) | | | 877,000 | | | | 936,472 | |
| | |
5.95%, 1/25/2027 (b) | | | 198,000 | | | | 211,427 | |
| | |
6.00%, 7/19/2028 (b) | | | 360,000 | | | | 386,887 | |
| | |
6.00%, 7/19/2028 (a) | | | 49,000 | | | | 52,660 | |
| | |
4.50%, 1/30/2030 (a) | | | 270,000 | | | | 266,203 | |
| | |
7.45%, 4/30/2044 (b) | | | 419,000 | | | | 474,517 | |
| | |
6.85%, 1/27/2045 (b) | | | 860,000 | | | | 911,600 | |
| | |
6.40%, 6/5/2049 (b) | | | 305,000 | | | | 309,194 | |
| | |
5.88%, 1/30/2060 (a) | | | 1,064,000 | | | | 1,016,785 | |
| | | | | | | | |
| | |
| | | | | | | 5,674,748 | |
| | | | | | | | |
|
Egypt — 6.3% | |
| | |
Arab Republic of Egypt | | | | | | | | |
| | |
5.58%, 2/21/2023 (a) | | | 401,000 | | | | 414,185 | |
| | |
5.88%, 6/11/2025 (a) | | | 519,000 | | | | 533,921 | |
| | |
7.50%, 1/31/2027 (b) | | | 330,000 | | | | 352,275 | |
| | |
7.50%, 1/31/2027 (a) | | | 25,000 | | | | 26,688 | |
| | |
6.59%, 2/21/2028 (a) | | | 750,000 | | | | 755,859 | |
| | |
7.60%, 3/1/2029 (b) | | | 200,000 | | | | 210,062 | |
| | |
7.05%, 1/15/2032 (b) | | | 822,000 | | | | 816,863 | |
SEE NOTES TO FINANCIAL STATEMENTS.
| | | | | | |
| | | |
| 212 | | | | J.P. MORGAN EXCHANGE-TRADED FUNDS | | AUGUST 31, 2020 |
| | | | | | | | |
| INVESTMENTS | | PRINCIPAL
AMOUNT ($) | | | VALUE ($) | |
Foreign Government Securities — continued | |
|
Egypt — continued | |
| | |
7.63%, 5/29/2032 (a) | | | 250,000 | | | | 254,375 | |
| | |
8.50%, 1/31/2047 (b) | | | 500,000 | | | | 512,656 | |
| | |
8.50%, 1/31/2047 (a) | | | 400,000 | | | | 410,125 | |
| | |
7.90%, 2/21/2048 (a) | | | 400,000 | | | | 386,625 | |
| | |
8.70%, 3/1/2049 (a) | | | 582,000 | | | | 596,914 | |
| | | | | | | | |
| | |
| | | | | | | 5,270,548 | |
| | | | | | | | |
|
Ethiopia — 0.5% | |
| | |
Federal Democratic Republic of Ethiopia | | | | | | | | |
| | |
6.63%, 12/11/2024 (b) | | | 400,000 | | | | 404,000 | |
| | | | | | | | |
| | |
Hungary — 0.8% | | | | | | | | |
| | |
Hungary Government Bond | | | | | | | | |
| | |
5.38%, 2/21/2023 | | | 100,000 | | | | 110,437 | |
| | |
5.75%, 11/22/2023 | | | 300,000 | | | | 344,156 | |
| | |
7.63%, 3/29/2041 | | | 142,000 | | | | 251,471 | |
| | | | | | | | |
| | |
| | | | | | | 706,064 | |
| | | | | | | | |
|
India — 0.3% | |
| | |
Export-Import Bank of India | | | | | | | | |
| | |
3.25%, 1/15/2030 (a) | | | 249,000 | | | | 254,058 | |
| | | | | | | | |
|
Indonesia — 2.5% | |
| | |
Perusahaan Penerbit SBSN Indonesia III | | | | | | | | |
| | |
4.55%, 3/29/2026 (b) | | | 200,000 | | | | 229,687 | |
| | |
4.15%, 3/29/2027 (b) | | | 200,000 | | | | 225,563 | |
| | |
Republic of Indonesia | | | | | | | | |
| | |
5.38%, 10/17/2023 (a) | | | 200,000 | | | | 225,250 | |
| | |
3.50%, 1/11/2028 | | | 200,000 | | | | 220,125 | |
| | |
4.10%, 4/24/2028 | | | 200,000 | | | | 228,063 | |
| | |
Series REGS, 8.50%, 10/12/2035 (a) | | | 142,000 | | | | 231,194 | |
| | |
6.63%, 2/17/2037 (b) | | | 145,000 | | | | 207,123 | |
| | |
6.75%, 1/15/2044 (b) | | | 200,000 | | | | 305,187 | |
| | |
3.70%, 10/30/2049 | | | 200,000 | | | | 216,188 | |
| | | | | | | | |
| | |
| | | | | | | 2,088,380 | |
| | | | | | | | |
|
Iraq — 1.5% | |
| | |
Republic of Iraq | | | | | | | | |
| | |
6.75%, 3/9/2023 (b) | | | 790,000 | | | | 772,225 | |
| | |
6.75%, 3/9/2023 (a) | | | 247,000 | | | | 241,443 | |
| | |
5.80%, 1/15/2028 (b) | | | 252,188 | | | | 236,451 | |
| | | | | | | | |
| | |
| | | | | | | 1,250,119 | |
| | | | | | | | |
|
Ivory Coast — 1.5% | |
| | |
Republic of Cote d’Ivoire | | | | | | | | |
| | |
6.38%, 3/3/2028 (b) | | | 422,000 | | | | 437,825 | |
| | |
5.75%, 12/31/2032 (b) (d) | | | 378,480 | | | | 369,964 | |
| | |
6.13%, 6/15/2033 (b) | | | 410,000 | | | | 413,075 | |
| | | | | | | | |
| | |
| | | | | | | 1,220,864 | |
| | | | | | | | |
| | | | | | | | |
| INVESTMENTS | | PRINCIPAL
AMOUNT ($) | | | VALUE ($) | |
| | | | | | | | |
|
Jamaica — 0.2% | |
| | |
Jamaica Government Bond | | | | | | | | |
| | |
8.00%, 3/15/2039 | | | 116,000 | | | | 153,627 | |
| | | | | | | | |
|
Jordan — 1.4% | |
| | |
Hashemite Kingdom of Jordan | | | | | | | | |
| | |
6.13%, 1/29/2026 (b) (c) | | | 466,000 | | | | 488,135 | |
| | |
5.75%, 1/31/2027 (b) | | | 202,000 | | | | 207,555 | |
| | |
7.38%, 10/10/2047 (b) | | | 225,000 | | | | 234,562 | |
| | |
7.38%, 10/10/2047 (a) | | | 220,000 | | | | 229,350 | |
| | | | | | | | |
| | |
| | | | | | | 1,159,602 | |
| | | | | | | | |
|
Kazakhstan — 0.8% | |
| | |
Republic of Kazakhstan | | | | | | | | |
| | |
3.88%, 10/14/2024 (b) | | | 350,000 | | | | 384,475 | |
| | |
6.50%, 7/21/2045 (b) | | | 200,000 | | | | 316,500 | |
| | | | | | | | |
| | |
| | | | | | | 700,975 | |
| | | | | | | | |
|
Kenya — 2.3% | |
| | |
Republic of Kenya | | | | | | | | |
| | |
6.88%, 6/24/2024 (a) | | | 483,000 | | | | 496,283 | |
| | |
6.88%, 6/24/2024 (b) | | | 390,000 | | | | 400,725 | |
| | |
7.25%, 2/28/2028 (b) | | | 335,000 | | | | 338,350 | |
| | |
8.00%, 5/22/2032 (a) | | | 200,000 | | | | 205,000 | |
| | |
8.25%, 2/28/2048 (b) | | | 280,000 | | | | 282,100 | |
| | |
8.25%, 2/28/2048 (a) | | | 203,000 | | | | 204,522 | |
| | | | | | | | |
| | |
| | | | | | | 1,926,980 | |
| | | | | | | | |
|
Kuwait — 0.5% | |
| | |
State of Kuwait | | | | | | | | |
| | |
3.50%, 3/20/2027 (b) | | | 400,000 | | | | 453,250 | |
| | | | | | | | |
|
Malaysia — 0.3% | |
| | |
Malaysia Sovereign Sukuk Bhd. | | | | | | | | |
| | |
3.04%, 4/22/2025 (b) | | | 200,000 | | | | 217,125 | |
| | | | | | | | |
|
Mexico — 1.5% | |
| | |
United Mexican States | | | | | | | | |
| | |
4.13%, 1/21/2026 | | | 461,000 | | | | 514,245 | |
| | |
6.05%, 1/11/2040 | | | 102,000 | | | | 131,293 | |
| | |
4.75%, 3/8/2044 | | | 76,000 | | | | 85,334 | |
| | |
5.55%, 1/21/2045 | | | 140,000 | | | | 173,994 | |
| | |
4.35%, 1/15/2047 | | | 200,000 | | | | 213,563 | |
| | |
5.75%, 10/12/2110 | | | 110,000 | | | | 134,303 | |
| | | | | | | | |
| | |
| | | | | | | 1,252,732 | |
| | | | | | | | |
|
Mongolia — 0.2% | |
| | |
State of Mongolia | | | | | | | | |
| | |
5.13%, 12/5/2022 (b) | | | 200,000 | | | | 203,375 | |
| | | | | | | | |
SEE NOTES TO FINANCIAL STATEMENTS.
| | | | | | | | |
| | | |
| AUGUST 31, 2020 | | J.P. MORGAN EXCHANGE-TRADED FUNDS | | | | | 213 | |
JPMorgan USD Emerging Markets Sovereign Bond ETF
SCHEDULE OF PORTFOLIO INVESTMENTS
AS OF AUGUST 31, 2020 (Unaudited) (continued)
| | | | | | | | |
| INVESTMENTS | | PRINCIPAL
AMOUNT ($) | | | VALUE ($) | |
Foreign Government Securities — continued | |
|
Morocco — 0.3% | |
| | |
Kingdom of Morocco | | | | | | | | |
| | |
4.25%, 12/11/2022 (a) | | | 200,000 | | | | 210,187 | |
| | | | | | | | |
|
Oman — 6.4% | |
| | |
Oman Sovereign Sukuk SAOC | | | | | | | | |
| | |
4.40%, 6/1/2024 (a) | | | 276,000 | | | | 276,690 | |
| | |
5.93%, 10/31/2025 (a) | | | 533,000 | | | | 566,812 | |
| | |
Sultanate of Oman Government Bond | | | | | | | | |
| | |
4.13%, 1/17/2023 (a) | | | 528,000 | | | | 519,750 | |
| | |
4.75%, 6/15/2026 (b) | | | 500,000 | | | | 472,656 | |
| | |
5.38%, 3/8/2027 (b) | | | 581,000 | | | | 565,749 | |
| | |
5.38%, 3/8/2027 (a) | | | 200,000 | | | | 194,750 | |
| | |
5.63%, 1/17/2028 (a) | | | 300,000 | | | | 291,656 | |
| | |
5.63%, 1/17/2028 (b) | | | 200,000 | | | | 194,438 | |
| | |
6.00%, 8/1/2029 (b) (c) | | | 1,074,000 | | | | 1,052,520 | |
| | |
6.50%, 3/8/2047 (a) | | | 548,000 | | | | 484,980 | |
| | |
6.50%, 3/8/2047 (b) | | | 254,000 | | | | 224,790 | |
| | |
6.75%, 1/17/2048 (a) | | | 560,000 | | | | 500,325 | |
| | | | | | | | |
| | |
| | | | | | | 5,345,116 | |
| | | | | | | | |
|
Pakistan — 1.6% | |
| | |
Islamic Republic of Pakistan | | | | | | | | |
| | |
8.25%, 4/15/2024 (b) | | | 471,000 | | | | 512,654 | |
| | |
6.88%, 12/5/2027 (b) | | | 590,000 | | | | 609,913 | |
| | |
Third Pakistan International Sukuk Co. Ltd. (The) | | | | | | | | |
| | |
5.63%, 12/5/2022(b) | | | 206,000 | | | | 208,768 | |
| | | | | | | | |
| | |
| | | | | | | 1,331,335 | |
| | | | | | | | |
|
Panama — 1.8% | |
| | |
Republic of Panama | | | | | | | | |
| | |
3.88%, 3/17/2028 | | | 400,000 | | | | 456,375 | |
| | |
3.16%, 1/23/2030 | | | 200,000 | | | | 217,875 | |
| | |
6.70%, 1/26/2036 | | | 127,000 | | | | 188,397 | |
| | |
4.50%, 5/15/2047 | | | 206,000 | | | | 264,452 | |
| | |
4.30%, 4/29/2053 | | | 296,000 | | | | 373,238 | |
| | | | | | | | |
| | |
| | | | | | | 1,500,337 | |
| | | | | | | | |
|
Peru — 1.2% | |
| | |
Republic of Peru | | | | | | | | |
| | |
7.35%, 7/21/2025 | | | 100,000 | | | | 128,687 | |
| | |
4.13%, 8/25/2027 | | | 314,000 | | | | 366,104 | |
| | |
2.78%, 1/23/2031 | | | 50,000 | | | | 54,525 | |
| | |
8.75%, 11/21/2033 | | | 90,000 | | | | 153,315 | |
| | |
6.55%, 3/14/2037 | | | 54,000 | | | | 83,903 | |
| | |
5.63%, 11/18/2050 | | | 128,000 | | | | 210,480 | |
| | | | | | | | |
| | |
| | | | | | | 997,014 | |
| | | | | | | | |
| | | | | | | | |
| INVESTMENTS | | PRINCIPAL
AMOUNT ($) | | | VALUE ($) | |
| | | | | | | | |
|
Philippines — 2.1% | |
| | |
Republic of Philippines | | | | | | | | |
| | |
10.63%, 3/16/2025 | | | 123,000 | | | | 174,699 | |
| | |
5.50%, 3/30/2026 | | | 200,000 | | | | 245,125 | |
| | |
9.50%, 2/2/2030 | | | 57,000 | | | | 93,658 | |
| | |
6.38%, 1/15/2032 | | | 278,000 | | | | 391,806 | |
| | |
6.38%, 10/23/2034 | | | 247,000 | | | | 360,388 | |
| | |
3.70%, 3/1/2041 | | | 214,000 | | | | 246,836 | |
| | |
3.70%, 2/2/2042 | | | 200,000 | | | | 232,000 | |
| | | | | | | | |
| | |
| | | | | | | 1,744,512 | |
| | | | | | | | |
|
Poland — 0.6% | |
| | |
Republic of Poland | | | | | | | | |
| | |
3.00%, 3/17/2023 | | | 316,000 | | | | 335,947 | |
| | |
3.25%, 4/6/2026 | | | 119,000 | | | | 134,470 | |
| | | | | | | | |
| | |
| | | | | | | 470,417 | |
| | | | | | | | |
|
Qatar — 2.3% | |
| | |
State of Qatar | | | | | | | | |
| | |
3.88%, 4/23/2023 (b) | | | 215,000 | | | | 231,058 | |
| | |
3.38%, 3/14/2024 (a) | | | 250,000 | | | | 269,297 | |
| | |
4.00%, 3/14/2029 (b) | | | 214,000 | | | | 250,327 | |
| | |
9.75%, 6/15/2030 (b) | | | 130,000 | | | | 219,334 | |
| | |
4.63%, 6/2/2046 (b) | | | 305,000 | | | | 405,936 | |
| | |
5.10%, 4/23/2048 (a) | | | 400,000 | | | | 565,500 | |
| | | | | | | | |
| | |
| | | | | | | 1,941,452 | |
| | | | | | | | |
|
Romania — 0.4% | |
| | |
Romania Government Bond | | | | | | | | |
| | |
4.38%, 8/22/2023 (a) | | | 50,000 | | | | 53,891 | |
| | |
4.88%, 1/22/2024 (a) | | | 64,000 | | | | 70,420 | |
| | |
6.13%, 1/22/2044 (a) | | | 50,000 | | | | 66,016 | |
| | |
5.13%, 6/15/2048 (b) | | | 130,000 | | | | 154,090 | |
| | | | | | | | |
| | |
| | | | | | | 344,417 | |
| | | | | | | | |
|
Russia — 2.1% | |
| | |
Russian Federation | | | | | | | | |
| | |
4.25%, 6/23/2027 (b) | | | 200,000 | | | | 226,000 | |
| | |
12.75%, 6/24/2028 (b) | | | 130,000 | | | | 224,290 | |
| | |
7.50%, 3/31/2030 (a) (d) | | | 223,020 | | | | 255,846 | |
| | |
5.10%, 3/28/2035 (b) | | | 400,000 | | | | 498,000 | |
| | |
5.25%, 6/23/2047 (b) | | | 200,000 | | | | 272,500 | |
| | |
5.25%, 6/23/2047 (b) | | | 200,000 | | | | 272,500 | |
| | | | | | | | |
| | |
| | | | | | | 1,749,136 | |
| | | | | | | | |
|
Saudi Arabia — 2.5% | |
| | |
Kingdom of Saudi Arabia | | | | | | | | |
| | |
2.88%, 3/4/2023 (b) | | | 320,000 | | | | 333,400 | |
| | |
3.63%, 3/4/2028 (a) | | | 308,000 | | | | 340,821 | |
SEE NOTES TO FINANCIAL STATEMENTS.
| | | | | | |
| | | |
| 214 | | | | J.P. MORGAN EXCHANGE-TRADED FUNDS | | AUGUST 31, 2020 |
| | | | | | | | |
| INVESTMENTS | | PRINCIPAL
AMOUNT ($) | | | VALUE ($) | |
Foreign Government Securities — continued | |
|
Saudi Arabia — continued | |
| | |
4.50%, 4/17/2030 (b) | | | 282,000 | | | | 336,109 | |
| | |
4.63%, 10/4/2047 (b) | | | 247,000 | | | | 302,884 | |
| | |
5.00%, 4/17/2049 (a) | | | 200,000 | | | | 260,687 | |
| | |
4.50%, 4/22/2060 (a) | | | 270,000 | | | | 336,555 | |
| | |
KSA Sukuk Ltd. | | | | | | | | |
| | |
2.97%, 10/29/2029 (a) | | | 205,000 | | | | 217,608 | |
| | | | | | | | |
| | |
| | | | | | | 2,128,064 | |
| | | | | | | | |
|
South Africa — 4.5% | |
| | |
Republic of South Africa | | | | | | | | |
| | |
4.67%, 1/17/2024 | | | 275,000 | | | | 284,625 | |
| | |
5.88%, 9/16/2025 | | | 262,000 | | | | 281,650 | |
| | |
4.88%, 4/14/2026 | | | 588,000 | | | | 600,495 | |
| | |
4.85%, 9/27/2027 | | | 284,000 | | | | 285,065 | |
| | |
4.30%, 10/12/2028 | | | 737,000 | | | | 702,914 | |
| | |
5.88%, 6/22/2030 | | | 256,000 | | | | 268,480 | |
| | |
5.00%, 10/12/2046 | | | 728,000 | | | | 614,250 | |
| | |
5.65%, 9/27/2047 | | | 221,000 | | | | 198,900 | |
| | |
5.75%, 9/30/2049 | | | 592,000 | | | | 529,285 | |
| | | | | | | | |
| | |
| | | | | | | 3,765,664 | |
| | | | | | | | |
| | |
Trinidad and Tobago — 0.5% | | | | | | | | |
| | |
Republic of Trinidad and Tobago | | | | | | | | |
| | |
4.50%, 8/4/2026 (b) (c) | | | 400,000 | | | | 411,875 | |
| | | | | | | | |
|
Turkey — 7.3% | |
| | |
Hazine Mustesarligi Varlik Kiralama A/S | | | | | | | | |
| | |
4.49%, 11/25/2024 (b) | | | 203,000 | | | | 190,122 | |
| | |
Republic of Turkey | | | | | | | | |
| | |
6.25%, 9/26/2022 | | | 635,000 | | | | 641,350 | |
| | |
7.25%, 12/23/2023 | | | 401,000 | | | | 416,038 | |
| | |
5.75%, 3/22/2024 | | | 275,000 | | | | 270,789 | |
| | |
4.25%, 4/14/2026 | | | 768,000 | | | | 694,560 | |
| | |
4.88%, 10/9/2026 | | | 226,000 | | | | 208,132 | |
| | |
6.00%, 3/25/2027 | | | 870,000 | | | | 840,094 | |
| | |
6.13%, 10/24/2028 | | | 290,000 | | | | 280,303 | |
| | |
11.88%, 1/15/2030 | | | 423,000 | | | | 563,251 | |
| | |
8.00%, 2/14/2034 | | | 254,000 | | | | 267,732 | |
| | |
6.88%, 3/17/2036 | | | 341,000 | | | | 328,319 | |
| | |
7.25%, 3/5/2038 | | | 130,000 | | | | 127,603 | |
| | |
6.75%, 5/30/2040 | | | 397,000 | | | | 368,342 | |
| | |
4.88%, 4/16/2043 | | | 450,000 | | | | 350,016 | |
| | |
6.63%, 2/17/2045 | | | 455,000 | | | | 409,073 | |
| | |
5.75%, 5/11/2047 | | | 214,000 | | | | 175,279 | |
| | | | | | | | |
| | |
| | | | | | | 6,131,003 | |
| | | | | | | | |
| | | | | | | | |
| INVESTMENTS | | PRINCIPAL
AMOUNT ($) | | | VALUE ($) | |
| | | | | | | | |
|
Ukraine — 5.6% | |
| | |
Ukraine Government Bond | | | | | | | | |
| | |
7.75%, 9/1/2022 (b) | | | 275,000 | | | | 289,025 | |
| | |
7.75%, 9/1/2023 (b) | | | 350,000 | | | | 372,116 | |
| | |
7.75%, 9/1/2024 (b) | | | 1,083,000 | | | | 1,147,642 | |
| | |
7.75%, 9/1/2025 (b) | | | 192,000 | | | | 202,596 | |
| | |
7.75%, 9/1/2026 (b) | | | 384,000 | | | | 405,504 | |
| | |
7.75%, 9/1/2027 (b) | | | 615,000 | | | | 647,287 | |
| | |
7.75%, 9/1/2027 (a) | | | 329,000 | | | | 346,272 | |
| | |
9.75%, 11/1/2028 (a) | | | 200,000 | | | | 228,700 | |
| | |
7.38%, 9/25/2032 (b) | | | 850,000 | | | | 859,775 | |
| | |
7.38%, 9/25/2032 (a) | | | 208,000 | | | | 210,392 | |
| | | | | | | | |
| | |
| | | | | | | 4,709,309 | |
| | | | | | | | |
|
United Arab Emirates — 1.9% | |
| | |
Sharjah Sukuk Program Ltd. | | | | | | | | |
| | |
4.23%, 3/14/2028 (a) | | | 400,000 | | | | 449,875 | |
| | |
United Arab Emirates Government Bond | | | | | | | | |
| | |
2.50%, 10/11/2022 (b) | | | 300,000 | | | | 310,281 | |
| | |
3.13%, 10/11/2027 (a) | | | 300,000 | | | | 333,356 | |
| | |
4.13%, 10/11/2047 (b) | | | 200,000 | | | | 253,000 | |
| | |
3.13%, 9/30/2049 (b) | | | 265,000 | | | | 284,875 | |
| | | | | | | | |
| | |
| | | | | | | 1,631,387 | |
| | | | | | | | |
|
Uruguay — 1.5% | |
| | |
Oriental Republic of Uruguay | | | | | | | | |
| | |
4.38%, 10/27/2027 | | | 207,000 | | | | 240,443 | |
| | |
4.38%, 1/23/2031 | | | 66,000 | | | | 79,159 | |
| | |
7.63%, 3/21/2036 | | | 192,000 | | | | 302,820 | |
| | |
5.10%, 6/18/2050 | | | 157,000 | | | | 217,200 | |
| | |
4.98%, 4/20/2055 | | | 310,000 | | | | 425,184 | |
| | | | | | | | |
| | |
| | | | | | | 1,264,806 | |
| | | | | | | | |
|
Vietnam — 0.5% | |
| | |
Socialist Republic of Vietnam | | | | | | | | |
| | |
4.80%, 11/19/2024 (b) | | | 400,000 | | | | 447,875 | |
| | | | | | | | |
| |
Total Foreign Government Securities
(Cost $70,806,851) | | | | 73,768,171 | |
| | | | | |
Corporate Bonds — 10.0% | |
|
Azerbaijan — 1.3% | |
| | |
Southern Gas Corridor CJSC | | | | | | | | |
| | |
6.88%, 3/24/2026 (b) | | | 601,000 | | | | 717,294 | |
| | |
State Oil Co. of the Azerbaijan Republic | | | | | | | | |
| | |
4.75%, 3/13/2023 (a) | | | 350,000 | | | | 367,850 | |
| | | | | | | | |
| | |
| | | | | | | 1,085,144 | |
| | | | | | | | |
SEE NOTES TO FINANCIAL STATEMENTS.
| | | | | | | | |
| | | |
| AUGUST 31, 2020 | | J.P. MORGAN EXCHANGE-TRADED FUNDS | | | | | 215 | |
JPMorgan USD Emerging Markets Sovereign Bond ETF
SCHEDULE OF PORTFOLIO INVESTMENTS
AS OF AUGUST 31, 2020 (Unaudited) (continued)
| | | | | | | | |
| INVESTMENTS | | PRINCIPAL
AMOUNT ($) | | | VALUE ($) | |
Corporate Bonds — continued | |
|
Bahrain — 0.5% | |
| | |
Oil and Gas Holding Co. BSCC (The) | | | | | | | | |
| | |
7.50%, 10/25/2027 (b) | | | 203,000 | | | | 222,793 | |
| | |
7.50%, 10/25/2027 (a) | | | 200,000 | | | | 219,500 | |
| | | | | | | | |
| | |
| | | | | | | 442,293 | |
| | | | | | | | |
|
Brazil — 0.4% | |
| | |
Banco Nacional de Desenvolvimento Economico e Social | | | | | | | | |
| | |
5.75%, 9/26/2023 (b) | | | 280,000 | | | | 309,225 | |
| | | | | | | | |
| | |
Chile — 1.2% | | | | | | | | |
| | |
Corp. Nacional del Cobre de Chile | | | | | | | | |
| | |
3.63%, 8/1/2027 (b) | | | 372,000 | | | | 406,410 | |
| | |
3.00%, 9/30/2029 (a) | | | 250,000 | | | | 262,578 | |
| | |
3.70%, 1/30/2050 (a) | | | 320,000 | | | | 342,300 | |
| | | | | | | | |
| | |
| | | | | | | 1,011,288 | |
| | | | | | | | |
|
China — 1.4% | |
| | |
CNAC HK Finbridge Co. Ltd. | | | | | | | | |
| | |
3.38%, 6/19/2024 (a) | | | 204,000 | | | | 215,475 | |
| | |
CNOOC Curtis Funding No. 1 Pty. Ltd. | | | | | | | | |
| | |
4.50%, 10/3/2023 (b) (c) | | | 200,000 | | | | 220,750 | |
| | |
Sinopec Group Overseas Development 2012 Ltd. | | | | | | | | |
| | |
Series REGS, 4.88%, 5/17/2042 (a) | | | 200,000 | | | | 264,500 | |
| | |
Sinopec Group Overseas Development 2017 Ltd. | | | | | | | | |
| | |
3.63%, 4/12/2027 (b) | | | 200,000 | | | | 221,784 | |
| | |
State Grid Overseas Investment 2016 Ltd. | | | | | | | | |
| | |
3.50%, 5/4/2027 (b) | | | 250,000 | | | | 279,609 | |
| | | | | | | | |
| | |
| | | | | | | 1,202,118 | |
| | | | | | | | |
|
Indonesia — 0.3% | |
| | |
Perusahaan Perseroan Persero PT Perusahaan Listrik Negara | | | | | | | | |
| | |
6.15%, 5/21/2048(a) | | | 201,000 | | | | 263,184 | |
| | | | | | | | |
|
Kazakhstan — 0.9% | |
| | |
Development Bank of Kazakhstan JSC | | | | | | | | |
| | |
4.13%, 12/10/2022 (a) | | | 200,000 | | | | 210,438 | |
| | |
KazMunayGas National Co. JSC | | | | | | | | |
| | |
5.75%, 4/19/2047 (a) | | | 203,000 | | | | 253,496 | |
| | |
6.38%, 10/24/2048 (b) | | | 200,000 | | | | 269,500 | |
| | | | | | | | |
| | |
| | | | | | | 733,434 | |
| | | | | | | | |
|
Malaysia — 0.6% | |
| | |
Petronas Capital Ltd. | | | | | | | | |
| | |
3.50%, 3/18/2025 (b) | | | 453,000 | | | | 497,026 | |
| | | | | | | | |
| | | | | | | | |
|
Mexico — 1.5% | |
| | |
Comision Federal de Electricidad | | | | | | | | |
| | |
4.75%, 2/23/2027 (b) | | | 100,000 | | | | 107,031 | |
| | | | | | | | |
| INVESTMENTS | | PRINCIPAL
AMOUNT ($) | | | VALUE ($) | |
| | | | | | | | |
Mexico — continued | | | | | | | | |
| | |
Petroleos Mexicanos | | | | | | | | |
| | |
3.50%, 1/30/2023 | | | 150,000 | | | | 148,601 | |
| | |
4.88%, 1/18/2024 | | | 50,000 | | | | 49,970 | |
| | |
6.50%, 3/13/2027 | | | 148,000 | | | | 145,854 | |
| | |
5.95%, 1/28/2031 (a) | | | 51,000 | | | | 45,882 | |
| | |
6.63%, 6/15/2035 | | | 386,000 | | | | 339,559 | |
| | |
6.50%, 6/2/2041 | | | 62,000 | | | | 51,634 | |
| | |
6.35%, 2/12/2048 | | | 50,000 | | | | 40,326 | |
| | |
6.95%, 1/28/2060 (b) | | | 406,000 | | | | 337,447 | |
| | | | | | | | |
| | |
| | | | | | | 1,266,304 | |
| | | | | | | | |
|
Peru — 0.3% | |
| | |
Petroleos del Peru SA | | | | | | | | |
| | |
5.63%, 6/19/2047 (b) | | | 200,000 | | | | 244,250 | |
| | | | | | | | |
|
Russia — 0.2% | |
| | |
Vnesheconombank Via VEB Finance plc | | | | | | | | |
| | |
6.80%, 11/22/2025 (b) | | | 140,000 | | | | 168,350 | |
| | | | | | | | |
| | |
South Africa — 0.9% | | | | | | | | |
| | |
Eskom Holdings SOC Ltd. | | | | | | | | |
| | |
6.75%, 8/6/2023 (b) | | | 242,000 | | | | 230,807 | |
| | |
7.13%, 2/11/2025 (b) | | | 327,000 | | | | 307,380 | |
| | |
6.35%, 8/10/2028 (b) | | | 240,000 | | | | 246,000 | |
| | | | | | | | |
| | |
| | | | | | | 784,187 | |
| | | | | | | | |
|
Tunisia — 0.5% | |
| | |
Banque Centrale de Tunisie International Bond | | | | | | | | |
| | |
5.75%, 1/30/2025 (b) | | | 400,000 | | | | 373,876 | |
| | | | | | | | |
| |
Total Corporate Bonds
(Cost $8,129,908) | | | | 8,380,679 | |
| | | | | | | | |
| | |
| | | SHARES | | | | |
|
Short-Term Investments — 2.7% | |
|
Investment Companies — 0.6% | |
| | |
JPMorgan U.S. Government Money Market Fund Class Institutional Shares, 0.01% (e) (f) (Cost $471,490) | | | 471,490 | | | | 471,490 | |
| | | | | | | | |
|
Investment of Cash Collateral from Securities Loaned — 2.1% | |
| | |
JPMorgan U.S. Government Money Market Fund Class IM Shares, 0.07% (e) (f) (Cost $1,783,213) | | | 1,783,213 | | | | 1,783,213 | |
| | | | | | | | |
| | |
Total Short-Term Investments
(Cost $2,254,703) | | | | | | | 2,254,703 | |
| | | | | | | | |
| |
Total Investments — 100.7%
(Cost $81,191,462) | | | | 84,403,553 | |
| |
Liabilities in Excess of
Other Assets — (0.7)% | | | | (596,640) | |
| | | | | | | | |
| |
NET ASSETS — 100.0% | | | | 83,806,913 | |
| | | | | | | | |
Percentages indicated are based on net assets.
SEE NOTES TO FINANCIAL STATEMENTS.
| | | | | | |
| | | |
| 216 | | | | J.P. MORGAN EXCHANGE-TRADED FUNDS | | AUGUST 31, 2020 |
Abbreviations
| | |
CJSC | | Closed Joint Stock Company |
JSC | | Joint Stock Company |
PT | | Limited liability company |
SPC | | Special purpose company |
| |
(a) | | Security exempt from registration pursuant to Regulation S under the Securities Act of 1933, as amended. Regulation S applies to securities offerings that are made outside of the United States and do not involve direct selling efforts in the United States and as such may have restrictions on resale. |
(b) | | Securities exempt from registration under Rule 144A or section 4(a)(2), of the Securities Act of 1933, as amended. |
| | |
| |
(c) | | The security or a portion of this security is on loan at August 31, 2020. The total value of securities on loan at August 31, 2020 is $1,727,633. |
(d) | | Step bond. Interest rate is a fixed rate for an initial period that either resets at a specific date or may reset in the future contingent upon a predetermined trigger. The interest rate shown is the current rate as of August 31, 2020. |
(e) | | Investment in an affiliated fund, which is registered under the Investment Company Act of 1940, as amended, and is advised by J.P. Morgan Investment Management Inc. |
(f) | | The rate shown is the current yield as of August 31, 2020. |
SEE NOTES TO FINANCIAL STATEMENTS.
| | | | | | | | |
| | | |
| AUGUST 31, 2020 | | J.P. MORGAN EXCHANGE-TRADED FUNDS | | | | | 217 | |
STATEMENTS OF ASSETS AND LIABILITIES
AS OF AUGUST 31, 2020 (Unaudited)
| | | | | | | | | | | | |
| | |
JPMorgan
BetaBuilders
1-5 Year U.S.
Aggregate
Bond ETF | | | JPMorgan
Core Plus
Bond ETF | | | JPMorgan
Corporate Bond
Research
Enhanced ETF | |
ASSETS: | |
Investments in non-affiliates, at value | | $ | 41,615,724 | | | $ | 94,245,049 | | | $ | 42,645,338 | |
Investments in affiliates, at value | | | 269,143 | | | | 30,087,297 | | | | 147,739 | |
Investments of cash collateral received from securities loaned, at value (Note 2.E.) | | | 44,450 | | | | — | | | | — | |
Cash | | | 1,664 | | | | — | | | | — | |
Deposits at broker for futures contracts | | | — | | | | 156,000 | | | | 36,000 | |
Receivables: | | | | | | | | | | | | |
Investment securities sold | | | 1,353,115 | | | | 18,060 | | | | — | |
Investment securities sold — delayed delivery securities | | | — | | | | 15,363,884 | | | | — | |
Interest from non-affiliates | | | 170,630 | | | | 443,727 | | | | 371,343 | |
Dividends from affiliates | | | 5 | | | | 359 | | | | 5 | |
Securities lending income (Note 2.E.) | | | 22 | | | | — | | | | — | |
Variation margin on futures contracts | | | — | | | | 4,507 | | | | — | |
| | | | | | | | | | | | |
Total Assets | | | 43,454,753 | | | | 140,318,883 | | | | 43,200,425 | |
| | | | | | | | | | | | |
|
LIABILITIES: | |
Payables: | | | | | | | | | | | | |
Due to custodian | | | — | | | | 108 | | | | — | |
Investment securities purchased | | | 1,438,176 | | | | 57,587 | | | | 271,321 | |
Investment securities purchased—delayed delivery securities | | | 19,071 | | | | 34,399,719 | | | | — | |
Collateral received on securities loaned (Note 2.E.) | | | 44,450 | | | | — | | | | — | |
Variation margin on futures contracts | | | — | | | | — | | | | 2,019 | |
Accrued liabilities: | | | | | | | | | | | | |
Management fees (See Note 3.A.) | | | 1,659 | | | | 31,304 | | | | 5,090 | |
| | | | | | | | | | | | |
Total Liabilities | | | 1,503,356 | | | | 34,488,718 | | | | 278,430 | |
| | | | | | | | | | | | |
Net Assets | | $ | 41,951,397 | | | $ | 105,830,165 | | | $ | 42,921,995 | |
| | | | | | | | | | | | |
|
NET ASSETS: | |
Paid-in-Capital | | $ | 40,412,664 | | | $ | 101,077,006 | | | $ | 38,837,819 | |
Total distributable earnings (loss) | | | 1,538,733 | | | | 4,753,159 | | | | 4,084,176 | |
| | | | | | | | | | | | |
Total Net Assets | | $ | 41,951,397 | | | $ | 105,830,165 | | | $ | 42,921,995 | |
| | | | | | | | | | | | |
| | | |
Outstanding number of shares
(unlimited number of shares authorized — par value $0.0001) | | | 1,600,000 | | | | 1,900,000 | | | | 750,000 | |
| | | | | | | | | | | | |
Net asset value, per share | | $ | 26.22 | | | $ | 55.70 | | | $ | 57.23 | |
| | | | | | | | | | | | |
| | | |
Cost of investments in non-affiliates | | $ | 40,309,006 | | | $ | 91,051,187 | | | $ | 39,173,358 | |
Cost of investments in affiliates | | | 269,143 | | | | 30,087,297 | | | | 147,739 | |
Investment securities on loan, at value (Note 2.E.) | | | 43,344 | | | | — | | | | — | |
Cost of investment of cash collateral (Note 2.E.) | | | 44,450 | | | | — | | | | — | |
SEE NOTES TO FINANCIAL STATEMENTS.
| | | | | | |
| | | |
| 218 | | | | J.P. MORGAN EXCHANGE-TRADED FUNDS | | AUGUST 31, 2020 |
| | | | | | | | | | | | |
| | | JPMorgan High
Yield Research
Enhanced ETF | | | JPMorgan
International
Bond
Opportunities ETF
(formerly known
as JPMorgan
Global Bond
Opportunities ETF) | | | JPMorgan
Municipal ETF | |
ASSETS: | |
Investments in non-affiliates, at value | | $ | 207,039,618 | | | $ | 161,266,779 | | | $ | 58,631,508 | |
Investments in affiliates, at value | | | 8,904,727 | | | | 3,063,953 | | | | 1,894,684 | |
Foreign currency, at value | | | — | | | | 115,638 | | | | — | |
Deposits at broker for futures contracts | | | — | | | | 854,000 | | | | — | |
Deposits at broker for centrally cleared swaps | | | — | | | | 510,000 | | | | — | |
Segregated cash balance with Authorized Participant for deposit securities | | | 20,092 | | | | — | | | | — | |
Receivables: | | | | | | | | | | | | |
Investment securities sold | | | 189,851 | | | | 463,932 | | | | 311,722 | |
Fund shares sold | | | 10,131,949 | | | | — | | | | — | |
Interest from non-affiliates | | | 3,191,475 | | | | 1,753,577 | | | | 537,196 | |
Dividends from affiliates | | | 55 | | | | 72 | | | | 310 | |
Tax reclaims | | | — | | | | 4,098 | | | | — | |
Variation margin on futures contracts | | | — | | | | 295,914 | | | | — | |
Unrealized appreciation on forward foreign currency exchange contracts | | | — | | | | 126,308 | | | | — | |
Outstanding OTC swap contracts, at value (net upfront payments of $0, $412,360 and $0, respectively) | | | — | | | | 124,926 | | | | — | |
| | | | | | | | | | | | |
Total Assets | | | 229,477,767 | | | | 168,579,197 | | | | 61,375,420 | |
| | | | | | | | | | | | |
|
LIABILITIES: | |
Payables: | | | | | | | | | | | | |
Due to custodian | | | 20,557 | | | | 2,768 | | | | — | |
Investment securities purchased | | | 16,629,351 | | | | 640,676 | | | | 911,558 | |
Investment securities purchased — delayed delivery securities | | | — | | | | — | | | | 490,308 | |
Collateral upon return of deposit securities | | | 20,092 | | | | — | | | | — | |
Unrealized depreciation on forward foreign currency exchange contracts | | | — | | | | 651,610 | | | | — | |
Variation margin on centrally cleared swaps (net upfront payments of $0, $135,467 and $0, respectively) | | | — | | | | 10,750 | | | | — | |
Accrued liabilities: | | | | | | | | | | | | |
Management fees (See Note 3.A.) | | | 36,286 | | | | 70,149 | | | | 11,552 | |
Deferred foreign capital gains tax | | | — | | | | 26,645 | | | | — | |
| | | | | | | | | | | | |
Total Liabilities | | | 16,706,286 | | | | 1,402,598 | | | | 1,413,418 | |
| | | | | | | | | | | | |
Net Assets | | $ | 212,771,481 | | | $ | 167,176,599 | | | $ | 59,962,002 | |
| | | | | | | | | | | | |
|
NET ASSETS: | |
Paid-in-Capital | | $ | 218,050,517 | | | $ | 170,193,082 | | | $ | 57,579,717 | |
Total distributable earnings (loss) | | | (5,279,036 | ) | | | (3,016,483 | ) | | | 2,382,285 | |
| | | | | | | | | | | | |
Total Net Assets | | $ | 212,771,481 | | | $ | 167,176,599 | | | $ | 59,962,002 | |
| | | | | | | | | | | | |
| | | |
Outstanding number of shares
(unlimited number of shares authorized — par value $0.0001) | | | 4,200,000 | | | | 3,300,000 | | | | 1,100,000 | |
| | | | | | | | | | | | |
Net asset value, per share | | $ | 50.66 | | | $ | 50.66 | | | $ | 54.51 | |
| | | | | | | | | | | | |
| | | |
Cost of investments in non-affiliates | | $ | 203,317,964 | | | $ | 156,279,245 | | | $ | 56,432,557 | |
Cost of investments in affiliates | | | 8,904,727 | | | | 3,063,953 | | | | 1,894,612 | |
Cost of foreign currency | | | — | | | | 372,254 | | | | — | |
SEE NOTES TO FINANCIAL STATEMENTS.
| | | | | | | | |
| | | |
| AUGUST 31, 2020 | | J.P. MORGAN EXCHANGE-TRADED FUNDS | | | | | 219 | |
STATEMENTS OF ASSETS AND LIABILITIES
AS OF AUGUST 31, 2020 (Unaudited) (continued)
| | | | | | | | | | | | | | | | |
| | | JPMorgan U.S.
Aggregate
Bond ETF | | | JPMorgan Ultra-
Short Income
ETF | | | JPMorgan
Ultra-Short
Municipal
Income ETF | | |
JPMorgan USD
Emerging
Markets
Sovereign
Bond ETF | |
ASSETS: | |
Investments in non-affiliates, at value | | $ | 678,017,546 | | | $ | 12,993,529,611 | | | $ | 493,253,547 | | | $ | 82,148,850 | |
Investments in affiliates, at value | | | 1,428,775 | | | | 867,938,428 | | | | 97,757,412 | | | | 471,490 | |
Investments of cash collateral received from securities loaned, at value (Note 2.E.) | | | 4,005,230 | | | | 53,754,829 | | | | — | | | | 1,783,213 | |
Repurchase agreements, at value | | | — | | | | 72,000,000 | | | | — | | | | — | |
Cash | | | 91,249 | | | | 732,073 | | | | — | | | | 1,627 | |
Deposits at broker for futures contracts | | | — | | | | 4,111,000 | | | | — | | | | — | |
Segregated cash balance with Authorized Participant for deposit securities | | | 4,445,381 | | | | — | | | | — | | | | — | |
Receivables: | | | | | | | | | | | | | | | | |
Due from custodian | | | — | | | | — | | | | 201,816 | | | | — | |
Investment securities sold | | | 20,951,931 | | | | — | | | | — | | | | — | |
Fund shares sold | | | — | | | | 55,936,217 | | | | 4,943 | | | | — | |
Interest from non-affiliates | | | 3,794,891 | | | | 60,041,335 | | | | 3,540,276 | | | | 1,212,168 | |
Dividends from affiliates | | | 23 | | | | 12,504 | | | | 6,905 | | | | 6 | |
Securities lending income (Note 2.E.) | | | 1,331 | | | | 13,075 | | | | — | | | | 463 | |
| | | | | | | | | | | | | | | | |
Total Assets | | | 712,736,357 | | | | 14,108,069,072 | | | | 594,764,899 | | | | 85,617,817 | |
| | | | | | | | | | | | | | | | |
|
LIABILITIES: | |
Payables: | | | | | | | | | | | | | | | | |
Investment securities purchased | | | 18,639,900 | | | | 150,254,138 | | | | 10,015,015 | | | | — | |
Investment securities purchased — delayed delivery securities | | | — | | | | — | | | | 898,158 | | | | — | |
Collateral received on securities loaned (Note 2.E.) | | | 4,005,230 | | | | 53,754,829 | | | | — | | | | 1,783,213 | |
Collateral upon return of deposit securities | | | 4,445,381 | | | | — | | | | — | | | | — | |
Variation margin on futures contracts | | | — | | | | 39,971 | | | | — | | | | — | |
Accrued liabilities: | | | | | | | | | | | | | | | | |
Management fees (See Note 3.A.) | | | 39,675 | | | | 1,915,582 | | | | 74,191 | | | | 27,691 | |
| | | | | | | | | | | | | | | | |
Total Liabilities | | | 27,130,186 | | | | 205,964,520 | | | | 10,987,364 | | | | 1,810,904 | |
| | | | | | | | | | | | | | | | |
Net Assets | | $ | 685,606,171 | | | $ | 13,902,104,552 | | | $ | 583,777,535 | | | $ | 83,806,913 | |
| | | | | | | | | | | | | | | | |
|
NET ASSETS: | |
Paid-in-Capital | | $ | 654,296,426 | | | $ | 13,807,667,124 | | | $ | 580,663,129 | | | $ | 85,408,932 | |
Total distributable earnings (loss) | | | 31,309,745 | | | | 94,437,428 | | | | 3,114,406 | | | | (1,602,019 | ) |
| | | | | | | | | | | | | | | | |
Total Net Assets | | $ | 685,606,171 | | | $ | 13,902,104,552 | | | $ | 583,777,535 | | | $ | 83,806,913 | |
| | | | | | | | | | | | | | | | |
| | | | |
Outstanding number of shares
(unlimited number of shares authorized — par value $0.0001) | | | 24,500,000 | | | | 273,600,000 | | | | 11,450,000 | | | | 1,700,000 | |
| | | | | | | | | | | | | | | | |
Net asset value, per share | | $ | 27.98 | | | $ | 50.81 | | | $ | 50.98 | | | $ | 49.30 | |
| | | | | | | | | | | | | | | | |
| | | | |
Cost of investments in non-affiliates | | $ | 651,260,094 | | | $ | 12,867,426,394 | | | $ | 490,462,801 | | | $ | 78,936,759 | |
Cost of investments in affiliates | | | 1,428,775 | | | | 867,938,428 | | | | 97,750,190 | | | | 471,490 | |
Cost of repurchase agreements | | | — | | | | 72,000,000 | | | | — | | | | — | |
Investment securities on loan, at value (Note 2.E.) | | | 3,838,768 | | | | 52,396,832 | | | | — | | | | 1,727,633 | |
Cost of investment of cash collateral (Note 2.E.) | | | 4,005,230 | | | | 53,754,829 | | | | — | | | | 1,783,213 | |
SEE NOTES TO FINANCIAL STATEMENTS.
| | | | | | |
| | | |
| 220 | | | | J.P. MORGAN EXCHANGE-TRADED FUNDS | | AUGUST 31, 2020 |
STATEMENTS OF OPERATIONS
FOR THE SIX MONTHS ENDED AUGUST 31, 2020 (Unaudited)
| | | | | | | | | | | | |
| | |
JPMorgan
BetaBuilders
1-5 Year U.S.
Aggregate
Bond ETF | | | JPMorgan
Core Plus
Bond ETF | | | JPMorgan
Corporate Bond
Research
Enhanced ETF | |
INVESTMENT INCOME: | |
Interest income from non-affiliates | | $ | 386,804 | | | $ | 851,976 | | | $ | 619,593 | |
Interest income from affiliates | | | 7 | | | | — | | | | — | |
Dividend income from affiliates | | | 156 | | | | 16,620 | | | | 625 | |
Income from securities lending (net) (See Note 2.E.) | | | 342 | | | | 5 | | | | — | |
| | | | | | | | | | | | |
Total investment income | | | 387,309 | | | | 868,601 | | | | 620,218 | |
| | | | | | | | | | | | |
|
EXPENSES: | |
Management fees (See Note 3.A.) | | | 9,309 | | | | 144,479 | | | | 27,265 | |
Interest expense to non-affiliates | | | — | | | | 22 | | | | 1 | |
| | | | | | | | | | | | |
Total expenses | | | 9,309 | | | | 144,501 | | | | 27,266 | |
| | | | | | | | | | | | |
Net investment income (loss) | | | 378,000 | | | | 724,100 | | | | 592,952 | |
| | | | | | | | | | | | |
| | | |
REALIZED/UNREALIZED GAINS (LOSSES): | | | | | | | | | | | | |
Net realized gain (loss) on transactions from: | |
Investments in non-affiliates | | | 119,354 | | | | 921,901 | | | | 217,855 | |
Futures contracts | | | — | | | | 150,897 | | | | 1,193 | |
| | | | | | | | | | | | |
Net realized gain (loss) | | | 119,354 | | | | 1,072,798 | | | | 219,048 | |
| | | | | | | | | | | | |
Change in net unrealized appreciation/depreciation on: | | | | | | | | | | | | |
Investments in non-affiliates | | | 319,356 | | | | 1,104,621 | | | | 515,691 | |
Futures contracts | | | — | | | | (76,578 | ) | | | (5,952 | ) |
| | | | | | | | | | | | |
Change in net unrealized appreciation/depreciation | | | 319,356 | | | | 1,028,043 | | | | 509,739 | |
| | | | | | | | | | | | |
Net realized/unrealized gains (losses) | | | 438,710 | | | | 2,100,841 | | | | 728,787 | |
| | | | | | | | | | | | |
Change in net assets resulting from operations | | $ | 816,710 | | | $ | 2,824,941 | | | $ | 1,321,739 | |
| | | | | | | | | | | | |
SEE NOTES TO FINANCIAL STATEMENTS.
| | | | | | | | |
| | | |
| AUGUST 31, 2020 | | J.P. MORGAN EXCHANGE-TRADED FUNDS | | | | | 221 | |
STATEMENTS OF OPERATIONS
FOR THE SIX MONTHS ENDED AUGUST 31, 2020 (Unaudited) (continued)
| | | | | | | | | | | | |
| | | JPMorgan High
Yield Research
Enhanced ETF | | | JPMorgan
International
Bond
Opportunities ETF
(formerly known
as JPMorgan
Global Bond
Opportunities ETF) | | | JPMorgan
Municipal ETF | |
INVESTMENT INCOME: | |
Interest income from non-affiliates | | $ | 3,739,769 | | | $ | 2,988,456 | | | $ | 561,690 | |
Interest income from affiliates | | | — | | | | 96 | | | | — | |
Dividend income from non-affiliates | | | — | | | | 349 | | | | — | |
Dividend income from affiliates | | | 3,008 | | | | 10,327 | | | | 5,120 | |
Income from securities lending (net) (See Note 2.E.) | | | 1,854 | | | | — | | | | — | |
Foreign taxes withheld (net) | | | — | | | | (18,460 | ) | | | — | |
| | | | | | | | | | | | |
Total investment income | | | 3,744,631 | | | | 2,980,768 | | | | 566,810 | |
| | | | | | | | | | | | |
|
EXPENSES: | |
Management fees (See Note 3.A.) | | | 171,730 | | | | 386,519 | | | | 56,652 | |
Interest expense to non-affiliates | | | — | | | | 211 | | | | — | |
Interest expense to affiliates | | | — | | | | 803 | | | | — | |
Other | | | — | | | | 684 | | �� | | — | |
| | | | | | | | | | | | |
Total expenses | | | 171,730 | | | | 388,217 | | | | 56,652 | |
| | | | | | | | | | | | |
Net investment income (loss) | | | 3,572,901 | | | | 2,592,551 | | | | 510,158 | |
| | | | | | | | | | | | |
| | | |
REALIZED/UNREALIZED GAINS (LOSSES): | | | | | | | | | | | | |
Net realized gain (loss) on transactions from: | |
Investments in non-affiliates | | | (3,921,813 | ) | | | (4,059,286 | )(a) | | | (23,787 | ) |
Investments in affiliates | | | — | | | | — | | | | (1,118 | ) |
In-kind redemptions of investments in non-affiliates | | | (5,409,895 | ) | | | — | | | | — | |
Futures contracts | | | — | | | | 998,146 | | | | — | |
Foreign currency transactions | | | — | | | | (167,600 | ) | | | — | |
Forward foreign currency exchange contracts | | | — | | | | (1,103,206 | ) | | | — | |
Swaps | | | — | | | | 1,823,402 | | | | — | |
| | | | | | | | | | | | |
Net realized gain (loss) | | | (9,331,708 | ) | | | (2,508,544 | ) | | | (24,905 | ) |
| | | | | | | | | | | | |
Change in net unrealized appreciation/depreciation on: | | | | | | | | | | | | |
Investments in non-affiliates | | | 5,084,193 | | | | 2,658,705 | (b) | | | (924,369 | ) |
Investments in affiliates | | | — | | | | — | | | | 58 | |
Futures contracts | | | — | | | | (51,293 | ) | | | — | |
Foreign currency translations | | | — | | | | 90,533 | | | | — | |
Forward foreign currency exchange contracts | | | — | | | | (445,051 | ) | | | — | |
Swaps | | | — | | | | (959,089 | ) | | | — | |
| | | | | | | | | | | | |
Change in net unrealized appreciation/depreciation | | | 5,084,193 | | | | 1,293,805 | | | | (924,311 | ) |
| | | | | | | | | | | | |
Net realized/unrealized gains (losses) | | | (4,247,515 | ) | | | (1,214,739 | ) | | | (949,216 | ) |
| | | | | | | | | | | | |
Change in net assets resulting from operations | | $ | (674,614 | ) | | $ | 1,377,812 | | | $ | (439,058 | ) |
| | | | | | | | | | | | |
| (a) | Net of foreign capital gains tax of $(9,939). |
| (b) | Net change in foreign capital gains tax of $2,611. |
SEE NOTES TO FINANCIAL STATEMENTS.
| | | | | | |
| | | |
| 222 | | | | J.P. MORGAN EXCHANGE-TRADED FUNDS | | AUGUST 31, 2020 |
| | | | | | | | | | | | | | | | |
| | | JPMorgan U.S.
Aggregate
Bond ETF | | | JPMorgan Ultra-
Short Income
ETF | | | JPMorgan
Ultra-Short
Municipal
Income ETF | | |
JPMorgan USD
Emerging
Markets
Sovereign
Bond ETF | |
INVESTMENT INCOME: | |
Interest income from non-affiliates | | $ | 5,843,587 | | | $ | 96,029,489 | | | $ | 2,003,679 | | | $ | 2,083,718 | |
Interest income from affiliates | | | 3 | | | | — | | | | — | | | | — | |
Dividend income from affiliates | | | 2,192 | | | | 1,149,503 | | | | 42,955 | | | | 578 | |
Income from securities lending (net) (See Note 2.E.) | | | 9,103 | | | | 79,676 | | | | — | | | | 5,493 | |
| | | | | | | | | | | | | | | | |
Total investment income | | | 5,854,885 | | | | 97,258,668 | | | | 2,046,634 | | | | 2,089,789 | |
| | | | | | | | | | | | | | | | |
|
EXPENSES: | |
Management fees (See Note 3.A.) | | | 209,567 | | | | 9,600,733 | | | | 288,015 | | | | 164,318 | |
Interest expense to non-affiliates | | | — | | | | 559 | | | | — | | | | — | |
Interest expense to affiliates | | | — | | | | 13,789 | | | | — | | | | — | |
| | | | | | | | | | | | | | | | |
Total expenses | | | 209,567 | | | | 9,615,081 | | | | 288,015 | | | | 164,318 | |
| | | | | | | | | | | | | | | | |
Net investment income (loss) | | | 5,645,318 | | | | 87,643,587 | | | | 1,758,619 | | | | 1,925,471 | |
| | | | | | | | | | | | | | | | |
| | | | |
REALIZED/UNREALIZED GAINS (LOSSES): | | | | | | | | | | | | | | | | |
Net realized gain (loss) on transactions from: | |
Investments in non-affiliates | | | 1,532,597 | | | | (48,262,012 | ) | | | 4,631 | | | | (4,806,081 | ) |
Investments in affiliates | | | — | | | | — | | | | (346 | ) | | | — | |
In-kind redemptions of investments in non-affiliates | | | 1,556,148 | | | | — | | | | — | | | | 150,800 | |
Futures contracts | | | — | | | | 4,226,333 | | | | — | | | | — | |
| | | | | | | | | | | | | | | | |
Net realized gain (loss) | | | 3,088,745 | | | | (44,035,679 | ) | | | 4,285 | | | | (4,655,281 | ) |
| | | | | | | | | | | | | | | | |
Change in net unrealized appreciation/depreciation on: | | | | | | | | | | | | | | | | |
Investments in non-affiliates | | | 6,811,084 | | | | 81,925,706 | | | | 2,129,915 | | | | 926,530 | |
Investments in affiliates | | | — | | | | — | | | | 7,222 | | | | — | |
Futures contracts | | | — | | | | (428,836 | ) | | | — | | | | — | |
| | | | | | | | | | | | | | | | |
Change in net unrealized appreciation/depreciation | | | 6,811,084 | | | | 81,496,870 | | | | 2,137,137 | | | | 926,530 | |
| | | | | | | | | | | | | | | | |
Net realized/unrealized gains (losses) | | | 9,899,829 | | | | 37,461,191 | | | | 2,141,422 | | | | (3,728,751 | ) |
| | | | | | | | | | | | | | | | |
Change in net assets resulting from operations | | $ | 15,545,147 | | | $ | 125,104,778 | | | $ | 3,900,041 | | | $ | (1,803,280 | ) |
| | | | | | | | | | | | | | | | |
SEE NOTES TO FINANCIAL STATEMENTS.
| | | | | | | | |
| | | |
| AUGUST 31, 2020 | | J.P. MORGAN EXCHANGE-TRADED FUNDS | | | | | 223 | |
STATEMENTS OF CHANGES IN NET ASSETS
FOR THE PERIODS INDICATED
| | | | | | | | | | | | | | | | |
| | |
| | |
JPMorgan BetaBuilders 1-5 Year U.S.
Aggregate Bond ETF | | | JPMorgan Core Plus Bond ETF | |
| | | Six Months Ended
August 31, 2020
(Unaudited) | | | Period Ended
February 29, 2020 (a) | | | Six Months Ended
August 31, 2020
(Unaudited) | | | Year Ended
February 29, 2020 | |
CHANGE IN NET ASSETS RESULTING FROM OPERATIONS: | |
Net investment income (loss) | | $ | 378,000 | | | $ | 750,051 | | | $ | 724,100 | | | $ | 927,088 | |
Net realized gain (loss) | | | 119,354 | | | | 91,623 | | | | 1,072,798 | | | | 620,050 | |
Change in net unrealized appreciation/depreciation | | | 319,356 | | | | 987,362 | | | | 1,028,043 | | | | 2,065,672 | |
| | | | | | | | | | | | | | | | |
Change in net assets resulting from operations | | | 816,710 | | | | 1,829,036 | | | | 2,824,941 | | | | 3,612,810 | |
| | | | | | | | | | | | | | | | |
|
DISTRIBUTIONS TO SHAREHOLDERS: | |
Total distributions to shareholders | | | (320,582 | ) | | | (786,431 | ) | | | (596,342 | ) | | | (1,191,282 | ) |
| | | | | | | | | | | | | | | | |
|
CAPITAL TRANSACTIONS: | |
Change in net assets resulting from capital transactions | | | 3,960,185 | | | | 36,452,479 | | | | 49,432,742 | | | | 26,569,194 | |
| | | | | | | | | | | | | | | | |
|
NET ASSETS: | |
Change in net assets | | | 4,456,313 | | | | 37,495,084 | | | | 51,661,341 | | | | 28,990,722 | |
Beginning of period | | | 37,495,084 | | | | — | | | | 54,168,824 | | | | 25,178,102 | |
| | | | | | | | | | | | | | | | |
End of period | | $ | 41,951,397 | | | $ | 37,495,084 | | | $ | 105,830,165 | | | $ | 54,168,824 | |
| | | | | | | | | | | | | | | | |
| | | | |
CAPITAL TRANSACTIONS: | | | | | | | | | | | | | | | | |
Proceeds from shares issued | | $ | 5,250,331 | | | $ | 36,452,479 | | | $ | 49,432,742 | | | $ | 26,569,194 | |
Cost of shares redeemed | | | (1,290,146 | ) | | | — | | | | — | | | | — | |
| | | | | | | | | | | | | | | | |
Total change in net assets resulting from capital transactions | | $ | 3,960,185 | | | $ | 36,452,479 | | | $ | 49,432,742 | | | $ | 26,569,194 | |
| | | | | | | | | | | | | | | | |
|
SHARE TRANSACTIONS: | |
Issued | | | 200,000 | | | | 1,450,000 | | | | 900,000 | | | | 500,000 | |
Redeemed | | | (50,000 | ) | | | — | | | | — | | | | — | |
| | | | | | | | | | | | | | | | |
Net increase in shares from share transactions | | | 150,000 | | | | 1,450,000 | | | | 900,000 | | | | 500,000 | |
| | | | | | | | | | | | | | | | |
| (a) | Commencement of operations was March 12, 2019. |
SEE NOTES TO FINANCIAL STATEMENTS.
| | | | | | |
| | | |
| 224 | | | | J.P. MORGAN EXCHANGE-TRADED FUNDS | | AUGUST 31, 2020 |
| | | | | | | | | | | | | | | | |
| | |
| | |
JPMorgan Corporate Bond Research
Enhanced ETF | | | JPMorgan High Yield Research
Enhanced ETF | |
| | | Six Months Ended
August 31, 2020
(Unaudited) | | | Year Ended
February 29, 2020 | | | Six Months Ended
August 31, 2020
(Unaudited) | | | Year Ended
February 29, 2020 | |
CHANGE IN NET ASSETS RESULTING FROM OPERATIONS: | |
Net investment income (loss) | | $ | 592,952 | | | $ | 1,051,195 | | | $ | 3,572,901 | | | $ | 8,026,465 | |
Net realized gain (loss) | | | 219,048 | | | | 780,622 | | | | (9,331,708 | ) | | | 1,508,193 | |
Change in net unrealized appreciation/depreciation | | | 509,739 | | | | 2,449,608 | | | | 5,084,193 | | | | (189,354 | ) |
| | | | | | | | | | | | | | | | |
Change in net assets resulting from operations | | | 1,321,739 | | | | 4,281,425 | | | | (674,614 | ) | | | 9,345,304 | |
| | | | | | | | | | | | | | | | |
|
DISTRIBUTIONS TO SHAREHOLDERS: | |
Total distributions to shareholders | | | (497,915 | ) | | | (1,566,538 | ) | | | (3,075,155 | ) | | | (8,310,507 | ) |
| | | | | | | | | | | | | | | | |
|
CAPITAL TRANSACTIONS: | |
Change in net assets resulting from capital transactions | | | 6,927,777 | | | | 6,860,014 | | | | 45,483,926 | | | | 15,432,142 | |
| | | | | | | | | | | | | | | | |
|
NET ASSETS: | |
Change in net assets | | | 7,751,601 | | | | 9,574,901 | | | | 41,734,157 | | | | 16,466,939 | |
Beginning of period | | | 35,170,394 | | | | 25,595,493 | | | | 171,037,324 | | | | 154,570,385 | |
| | | | | | | | | | | | | | | | |
End of period | | $ | 42,921,995 | | | $ | 35,170,394 | | | $ | 212,771,481 | | | $ | 171,037,324 | |
| | | | | | | | | | | | | | | | |
| | | | |
CAPITAL TRANSACTIONS: | | | | | | | | | | | | | | | | |
Proceeds from shares issued | | $ | 6,927,777 | | | $ | 6,860,014 | | | $ | 89,592,015 | | | $ | 15,432,142 | |
Cost of shares redeemed | | | — | | | | — | | | | (44,108,089 | ) | | | — | |
| | | | | | | | | | | | | | | | |
Total change in net assets resulting from capital transactions | | $ | 6,927,777 | | | $ | 6,860,014 | | | $ | 45,483,926 | | | $ | 15,432,142 | |
| | | | | | | | | | | | | | | | |
|
SHARE TRANSACTIONS: | |
Issued | | | 125,000 | | | | 125,000 | | | | 1,800,000 | | | | 300,000 | |
Redeemed | | | — | | | | — | | | | (1,000,000 | ) | | | — | |
| | | | | | | | | | | | | | | | |
Net increase in shares from share transactions | | | 125,000 | | | | 125,000 | | | | 800,000 | | | | 300,000 | |
| | | | | | | | | | | | | | | | |
SEE NOTES TO FINANCIAL STATEMENTS.
| | | | | | | | |
| | | |
| AUGUST 31, 2020 | | J.P. MORGAN EXCHANGE-TRADED FUNDS | | | | | 225 | |
STATEMENTS OF CHANGES IN NET ASSETS
FOR THE PERIODS INDICATED (continued)
| | | | | | | | | | | | | | | | |
| | |
| | |
JPMorgan International Bond
Opportunities ETF (formerly known as
JPMorgan Global Bond Opportunities ETF) | | | JPMorgan Municipal ETF | |
| | | Six Months Ended
August 31, 2020
(Unaudited) | | | Year Ended
February 29, 2020 | | | Six Months Ended
August 31, 2020
(Unaudited) | | | Year Ended
February 29, 2020 | |
CHANGE IN NET ASSETS RESULTING FROM OPERATIONS: | |
Net investment income (loss) | | $ | 2,592,551 | | | $ | 6,285,285 | | | $ | 510,158 | | | $ | 860,167 | |
Net realized gain (loss) | | | (2,508,544 | ) | | | 2,702,947 | | | | (24,905 | ) | | | 575,968 | |
Change in net unrealized appreciation/depreciation | | | 1,293,805 | | | | 4,105,639 | | | | (924,311 | ) | | | 2,214,073 | |
| | | | | | | | | | | | | | | | |
Change in net assets resulting from operations | | | 1,377,812 | | | | 13,093,871 | | | | (439,058 | ) | | | 3,650,208 | |
| | | | | | | | | | | | | | | | |
|
DISTRIBUTIONS TO SHAREHOLDERS: | |
Total distributions to shareholders | | | (1,594,453 | ) | | | (8,337,390 | ) | | | (425,044 | ) | | | (1,413,794 | ) |
| | | | | | | | | | | | | | | | |
|
CAPITAL TRANSACTIONS: | |
Change in net assets resulting from capital transactions | | | (2,535,599 | ) | | | (15,184,873 | ) | | | 8,435,222 | | | | 19,000,910 | |
| | | | | | | | | | | | | | | | |
|
NET ASSETS: | |
Change in net assets | | | (2,752,240 | ) | | | (10,428,392 | ) | | | 7,571,120 | | | | 21,237,324 | |
Beginning of period | | | 169,928,839 | | | | 180,357,231 | | | | 52,390,882 | | | | 31,153,558 | |
| | | | | | | | | | | | | | | | |
End of period | | $ | 167,176,599 | | | $ | 169,928,839 | | | $ | 59,962,002 | | | $ | 52,390,882 | |
| | | | | | | | | | | | | | | | |
| | | | |
CAPITAL TRANSACTIONS: | | | | | | | | | | | | | | | | |
Proceeds from shares issued | | $ | 24,863,232 | | | $ | 5,073,164 | | | $ | 19,016,427 | | | $ | 29,682,599 | |
Cost of shares redeemed | | | (27,398,831 | ) | | | (20,258,037 | ) | | | (10,581,205 | ) | | | (10,681,689 | ) |
| | | | | | | | | | | | | | | | |
Total change in net assets resulting from capital transactions | | $ | (2,535,599 | ) | | $ | (15,184,873 | ) | | $ | 8,435,222 | | | $ | 19,000,910 | |
| | | | | | | | | | | | | | | | |
|
SHARE TRANSACTIONS: | |
Issued | | | 500,000 | | | | 100,000 | | | | 350,000 | | | | 550,000 | |
Redeemed | | | (600,000 | ) | | | (400,000 | ) | | | (200,000 | ) | | | (200,000 | ) |
| | | | | | | | | | | | | | | | |
Net increase (decrease) in shares from share transactions | | | (100,000 | ) | | | (300,000 | ) | | | 150,000 | | | | 350,000 | |
| | | | | | | | | | | | | | | | |
SEE NOTES TO FINANCIAL STATEMENTS.
| | | | | | |
| | | |
| 226 | | | | J.P. MORGAN EXCHANGE-TRADED FUNDS | | AUGUST 31, 2020 |
| | | | | | | | | | | | | | | | |
| | |
| | |
JPMorgan U.S. Aggregate Bond ETF | | | JPMorgan Ultra-Short Income ETF | |
| | | Six Months Ended
August 31, 2020
(Unaudited) | | | Year Ended
February 29, 2020 | | | Six Months Ended
August 31, 2020
(Unaudited) | | | Year Ended
February 29, 2020 | |
CHANGE IN NET ASSETS RESULTING FROM OPERATIONS: | |
Net investment income (loss) | | $ | 5,645,318 | | | $ | 6,135,910 | | | $ | 87,643,587 | | | $ | 215,229,392 | |
Net realized gain (loss) | | | 3,088,745 | | | | 1,526,368 | | | | (44,035,679 | ) | | | 4,869,131 | |
Change in net unrealized appreciation/depreciation | | | 6,811,084 | | | | 19,826,834 | | | | 81,496,870 | | | | 41,300,189 | |
| | | | | | | | | | | | | | | | |
Change in net assets resulting from operations | | | 15,545,147 | | | | 27,489,112 | | | | 125,104,778 | | | | 261,398,712 | |
| | | | | | | | | | | | | | | | |
|
DISTRIBUTIONS TO SHAREHOLDERS: | |
Total distributions to shareholders | | | (4,817,353 | ) | | | (7,057,507 | ) | | | (76,438,138 | ) | | | (218,564,137 | ) |
| | | | | | | | | | | | | | | | |
|
CAPITAL TRANSACTIONS: | |
Change in net assets resulting from capital transactions | | | 131,807,431 | | | | 423,909,259 | | | | 2,261,948,408 | | | | 5,845,592,654 | |
| | | | | | | | | | | | | | | | |
|
NET ASSETS: | |
Change in net assets | | | 142,535,225 | | | | 444,340,864 | | | | 2,310,615,048 | | | | 5,888,427,229 | |
Beginning of period | | | 543,070,946 | | | | 98,730,082 | | | | 11,591,489,504 | | | | 5,703,062,275 | |
| | | | | | | | | | | | | | | | |
End of period | | $ | 685,606,171 | | | $ | 543,070,946 | | | $ | 13,902,104,552 | | | $ | 11,591,489,504 | |
| | | | | | | | | | | | | | | | |
| | | | |
CAPITAL TRANSACTIONS: | | | | | | | | | | | | | | | | |
Proceeds from shares issued | | $ | 168,136,155 | | | $ | 445,988,689 | | | $ | 4,671,659,696 | | | $ | 6,133,315,027 | |
Cost of shares redeemed | | | (36,328,724 | ) | | | (22,079,430 | ) | | | (2,409,711,288 | ) | | | (287,722,373 | ) |
| | | | | | | | | | | | | | | | |
Total change in net assets resulting from capital transactions | | $ | 131,807,431 | | | $ | 423,909,259 | | | $ | 2,261,948,408 | | | $ | 5,845,592,654 | |
| | | | | | | | | | | | | | | | |
|
SHARE TRANSACTIONS: | |
Issued | | | 6,050,000 | | | | 16,750,000 | | | | 92,300,000 | | | | 121,600,000 | |
Redeemed | | | (1,350,000 | ) | | | (850,000 | ) | | | (48,200,000 | ) | | | (5,700,000 | ) |
| | | | | | | | | | | | | | | | |
Net increase in shares from share transactions | | | 4,700,000 | | | | 15,900,000 | | | | 44,100,000 | | | | 115,900,000 | |
| | | | | | | | | | | | | | | | |
SEE NOTES TO FINANCIAL STATEMENTS.
| | | | | | | | |
| | | |
| AUGUST 31, 2020 | | J.P. MORGAN EXCHANGE-TRADED FUNDS | | | | | 227 | |
STATEMENTS OF CHANGES IN NET ASSETS
FOR THE PERIODS INDICATED (continued)
| | | | | | | | | | | | | | | | |
| | |
| | |
JPMorgan Ultra-Short Municipal Income ETF | | | JPMorgan USD Emerging Markets
Sovereign Bond ETF | |
| | | Six Months Ended
August 31, 2020
(Unaudited) | | | Year Ended
February 29, 2020 | | | Six Months Ended
August 31, 2020
(Unaudited) | | | Year Ended
February 29, 2020 | |
CHANGE IN NET ASSETS RESULTING FROM OPERATIONS: | |
Net investment income (loss) | | $ | 1,758,619 | | | $ | 1,852,136 | | | $ | 1,925,471 | | | $ | 3,299,525 | |
Net realized gain (loss) | | | 4,285 | | | | (20,822 | ) | | | (4,655,281 | ) | | | 380,895 | |
Change in net unrealized appreciation/depreciation | | | 2,137,137 | | | | 526,419 | | | | 926,530 | | | | 3,946,502 | |
| | | | | | | | | | | | | | | | |
Change in net assets resulting from operations | | | 3,900,041 | | | | 2,357,733 | | | | (1,803,280 | ) | | | 7,626,922 | |
| | | | | | | | | | | | | | | | |
|
DISTRIBUTIONS TO SHAREHOLDERS: | |
Total distributions to shareholders | | | (1,411,432 | ) | | | (1,868,857 | ) | | | (1,629,997 | ) | | | (3,288,107 | ) |
| | | | | | | | | | | | | | | | |
|
CAPITAL TRANSACTIONS: | |
Change in net assets resulting from capital transactions | | | 374,103,344 | | | | 148,897,115 | | | | (4,473,264 | ) | | | 25,597,892 | |
| | | | | | | | | | | | | | | | |
|
NET ASSETS: | |
Change in net assets | | | 376,591,953 | | | | 149,385,991 | | | | (7,906,541 | ) | | | 29,936,707 | |
Beginning of period | | | 207,185,582 | | | | 57,799,591 | | | | 91,713,454 | | | | 61,776,747 | |
| | | | | | | | | | | | | | | | |
End of period | | $ | 583,777,535 | | | $ | 207,185,582 | | | $ | 83,806,913 | | | $ | 91,713,454 | |
| | | | | | | | | | | | | | | | |
| | | | |
CAPITAL TRANSACTIONS: | | | | | | | | | | | | | | | | |
Proceeds from shares issued | | $ | 374,103,344 | | | $ | 151,415,332 | | | $ | 19,156,204 | | | $ | 25,597,892 | |
Cost of shares redeemed | | | — | | | | (2,518,217 | ) | | | (23,629,468 | ) | | | — | |
| | | | | | | | | | | | | | | | |
Total change in net assets resulting from capital transactions | | $ | 374,103,344 | | | $ | 148,897,115 | | | $ | (4,473,264 | ) | | $ | 25,597,892 | |
| | | | | | | | | | | | | | | | |
|
SHARE TRANSACTIONS: | |
Issued | | | 7,350,000 | | | | 3,000,000 | | | | 400,000 | | | | 500,000 | |
Redeemed | | | — | | | | (50,000 | ) | | | (500,000 | ) | | | — | |
| | | | | | | | | | | | | | | | |
Net increase (decrease) in shares from share transactions | | | 7,350,000 | | | | 2,950,000 | | | | (100,000 | ) | | | 500,000 | |
| | | | | | | | | | | | | | | | |
SEE NOTES TO FINANCIAL STATEMENTS.
| | | | | | |
| | | |
| 228 | | | | J.P. MORGAN EXCHANGE-TRADED FUNDS | | AUGUST 31, 2020 |
THIS PAGE IS INTENTIONALLY LEFT BLANK
| | | | | | | | |
| | | |
| AUGUST 31, 2020 | | J.P. MORGAN EXCHANGE-TRADED FUNDS | | | | | 229 | |
FINANCIAL HIGHLIGHTS
FOR THE PERIODS INDICATED
| | | | | | | | | | | | | | | | | | | | | | | | | | | | |
| | | | | | | | | Per share operating performance | |
| | | | | | Investment operations | | | Distributions | |
| | | Net asset
value,
beginning
of period | | | Net
investment
income
(loss) (b) | | | Net realized
and unrealized
gains
(losses) on
investments | | | Total from
investment
operations | | | Net
investment
income | | | Net
realized
gain | | | Total
distributions | |
|
JPMorgan BetaBuilders 1-5 Year U.S. Aggregate Bond ETF | |
Six Months Ended August 31, 2020 (Unaudited) | | $ | 25.86 | | | $ | 0.26 | | | $ | 0.33 | | | $ | 0.59 | | | $ | (0.23 | ) | | $ | — | | | $ | (0.23 | ) |
March 12, 2019 (f) through February 29, 2020 | | | 25.00 | | | | 0.59 | | | | 0.88 | | | | 1.47 | | | | (0.61 | ) | | | — | | | | (0.61 | ) |
|
JPMorgan Core Plus Bond ETF | |
Six Months Ended August 31, 2020 (Unaudited) | | | 54.17 | | | | 0.49 | | | | 1.45 | | | | 1.94 | | | | (0.41 | ) | | | — | | | | (0.41 | ) |
Year Ended February 29, 2020 | | | 50.36 | | | | 1.45 | | | | 4.13 | | | | 5.58 | | | | (1.44 | ) | | | (0.33 | ) | | | (1.77 | ) |
January 28, 2019 (f) through February 28, 2019 | | | 50.00 | | | | 0.13 | | | | 0.36 | | | | 0.49 | | | | (0.13 | ) | | | — | | | | (0.13 | ) |
|
JPMorgan Corporate Bond Research Enhanced ETF | |
Six Months Ended August 31, 2020 (Unaudited) | | | 56.27 | | | | 0.84 | | | | 0.82 | | | | 1.66 | | | | (0.70 | ) | | | — | | | | (0.70 | ) |
Year Ended February 29, 2020 | | | 51.19 | | | | 1.95 | | | | 5.96 | | | | 7.91 | | | | (1.93 | ) | | | (0.90 | ) | | | (2.83 | ) |
December 12, 2018 (f) through February 28, 2019 | | | 50.00 | | | | 0.44 | | | | 1.19 | | | | 1.63 | | | | (0.44 | ) | | | — | | | | (0.44 | ) |
|
JPMorgan High Yield Research Enhanced ETF | |
Six Months Ended August 31, 2020 (Unaudited) | | | 50.31 | | | | 1.19 | | | | 0.22 | (l) | | | 1.41 | | | | (1.06 | ) | | | — | | | | (1.06 | ) |
Year Ended February 29, 2020 | | | 49.86 | | | | 2.50 | | | | 0.53 | | | | 3.03 | | | | (2.58 | ) | | | — | | | | (2.58 | ) |
Year Ended February 28, 2019 | | | 50.09 | | | | 2.47 | | | | (0.23 | ) | | | 2.24 | | | | (2.47 | ) | | | — | | | | (2.47 | ) |
Year Ended February 28, 2018 | | | 50.96 | | | | 2.44 | | | | (0.92 | ) | | | 1.52 | | | | (2.39 | ) | | | — | | | | (2.39 | ) |
September 14, 2016 (f) through February 28, 2017 | | | 50.00 | | | | 1.14 | | | | 0.96 | | | | 2.10 | | | | (1.14 | ) | | | — | (k) | | | (1.14 | ) |
| | | | | | | |
JPMorgan International Bond Opportunities ETF (formerly
known as JPMorgan Global Bond Opportunities ETF) | | | | | | | | | | | | | | | | | | | | | | | | | | | | |
Six Months Ended August 31, 2020 (Unaudited) | | | 49.98 | | | | 0.82 | | | | 0.38 | (l) | | | 1.20 | | | | (0.52 | ) | | | — | | | | (0.52 | ) |
Year Ended February 29, 2020 | | | 48.75 | | | | 1.71 | | | | 1.86 | | | | 3.57 | | | | (2.34 | ) | | | — | | | | (2.34 | ) |
Year Ended February 28, 2019 | | | 50.54 | | | | 1.94 | | | | (0.97 | ) | | | 0.97 | | | | (2.56 | ) | | | (0.20 | ) | | | (2.76 | ) |
April 5, 2017 (f) through February 28, 2018 | | | 50.00 | | | | 1.83 | | | | 0.05 | (l) | | | 1.88 | | | | (1.34 | ) | | | — | | | | (1.34 | ) |
|
JPMorgan Municipal ETF | |
Six Months Ended August 31, 2020 (Unaudited) | | | 55.15 | | | | 0.57 | | | | (0.72 | ) | | | (0.15 | ) | | | (0.49 | ) | | | — | | | | (0.49 | ) |
Year Ended February 29, 2020 | | | 51.92 | | | | 1.24 | | | | 3.91 | | | | 5.15 | | | | (1.22 | ) | | | (0.70 | ) | | | (1.92 | ) |
October 29, 2018 (f) through February 28, 2019 | | | 50.00 | | | | 0.46 | | | | 1.90 | | | | 2.36 | | | | (0.44 | ) | | | — | | | | (0.44 | ) |
|
JPMorgan U.S. Aggregate Bond ETF | |
Six Months Ended August 31, 2020 (Unaudited) | | | 27.43 | | | | 0.26 | | | | 0.52 | | | | 0.78 | | | | (0.23 | ) | | | — | | | | (0.23 | ) |
Year Ended February 29, 2020 | | | 25.32 | | | | 0.69 | | | | 2.18 | | | | 2.87 | | | | (0.72 | ) | | | (0.04 | ) | | | (0.76 | ) |
December 12, 2018 (f) through February 28, 2019 | | | 25.00 | | | | 0.18 | | | | 0.29 | | | | 0.47 | | | | (0.15 | ) | | | — | | | | (0.15 | ) |
|
JPMorgan Ultra-Short Income ETF | |
Six Months Ended August 31, 2020 (Unaudited) | | | 50.51 | | | | 0.38 | | | | 0.27 | | | | 0.65 | | | | (0.35 | ) | | | — | | | | (0.35 | ) |
Year Ended February 29, 2020 | | | 50.20 | | | | 1.28 | | | | 0.32 | | | | 1.60 | | | | (1.29 | ) | | | — | | | | (1.29 | ) |
Year Ended February 28, 2019 | | | 50.01 | | | | 1.37 | | | | (0.04 | ) (l) | | | 1.33 | | | | (1.14 | ) | | | — | | | | (1.14 | ) |
May 17, 2017 (f) through February 28, 2018 | | | 50.00 | | | | 0.70 | | | | (0.08 | ) | | | 0.62 | | | | (0.61 | ) | | | — | | | | (0.61 | ) |
|
JPMorgan Ultra-Short Municipal Income ETF | |
Six Months Ended August 31, 2020 (Unaudited) | | | 50.53 | | | | 0.26 | | | | 0.42 | | | | 0.68 | | | | (0.23 | ) | | | — | | | | (0.23 | ) |
Year Ended February 29, 2020 | | | 50.26 | | | | 0.78 | | | | 0.26 | | | | 1.04 | | | | (0.77 | ) | | | — | | | | (0.77 | ) |
October 16, 2018 (f) through February 28, 2019 | | | 50.00 | | | | 0.35 | | | | 0.23 | | | | 0.58 | | | | (0.32 | ) | | | — | | | | (0.32 | ) |
|
JPMorgan USD Emerging Markets Sovereign Bond ETF | |
Six Months Ended August 31, 2020 (Unaudited) | | | 50.95 | | | | 1.07 | | | | (1.80 | ) | | | (0.73 | ) | | | (0.92 | ) | | | — | | | | (0.92 | ) |
Year Ended February 29, 2020 | | | 47.52 | | | | 2.32 | | | | 3.40 | | | | 5.72 | | | | (2.29 | ) | | | — | | | | (2.29 | ) |
Year Ended February 28, 2019 | | | 48.83 | | | | 2.31 | | | | (1.30 | ) | | | 1.01 | | | | (2.32 | ) | | | — | | | | (2.32 | ) |
January 29, 2018 (f) through February 28, 2018 | | | 50.00 | | | | 0.19 | | | | (1.21 | ) | | | (1.02 | ) | | | (0.15 | ) | | | — | | | | (0.15 | ) |
| (a) | Annualized for periods less than one year, unless otherwise indicated. |
| (b) | Calculated based upon average shares outstanding. |
| (c) | Not annualized for periods less than one year. |
| (d) | Includes adjustments in accordance with accounting principles generally accepted in the United States of America and as such, the net asset values for financial reporting purposes and the returns based upon those net asset values may differ from the net asset values and returns for shareholder transactions. |
| (e) | Prior to December 9, 2019, market price return was calculated assuming an initial investment made at the market price at the beginning of the reporting period, reinvestment of all dividends and distributions at market price during the period, and sale at the market price on the last day of the period. The price used to calculate the market price return was the midpoint of the bid/ask spread at the close of business on the listing exchange of the fund. Effective December 9, 2019, the closing price was used to calculate the market price return; however, any prices used in the calculation for market price return prior to December 9, 2019, would have used the midpoint of the bid/ask spread at the close of business on the exchange. |
| (f) | Commencement of operations. |
| (g) | Since the Shares of the Fund did not trade in the secondary market until the day after the Fund’s inception, for the period from the inception to the first day of secondary market trading, the NAV is used as a proxy for the secondary market trading price to calculate the market returns. |
| (h) | Prior to November 1, 2019, the Fund may have waived fees if expenses exceeded the expense cap. On November 1, 2019, the Fund adopted a unitary fee structure where a management fee is accrued by the fund based on prior day net assets and other expenses are paid by the Advisor. |
| (i) | Certain non-recurring expenses incurred by the Fund were not annualized for the period indicated. |
| (j) | Amount rounds to less than 0.5% |
| (k) | Amount rounds to less than $0.005. |
| (l) | Calculation of the net realized and unrealized gains (losses) per share do not correlate with the Fund’s net realized and unrealized gains (losses) presented in the Statement of Operations due to the timing of capital transactions in relation to the fluctuating market values of the Fund’s investments. |
SEE NOTES TO FINANCIAL STATEMENTS.
| | | | | | |
| | | |
| 230 | | | | J.P. MORGAN EXCHANGE-TRADED FUNDS | | AUGUST 31, 2020 |
| | | | | | | | | | | | | | | | | | | | | | | | | | | | | | | | | | |
| Ratios/Supplemental data | |
| | | | | | | | | | | | | | | | Ratios to average net assets (a) | | | | |
Net asset
value,
end of
period | | | Market
price,
end of
period | | | Total
return (c)(d) | | | Market
price
total
return (c)(e) | | | Net assets, end of period | | | Net
expenses | | | Net
investment
income
(loss) | | |
Expenses without
waivers and
reimbursements | | | Portfolio
turnover
rate (c) | |
| | | | | | | | |
| | | | | | | | | | | | | | | | | | | | | | | | | | | | | | | | | | |
| $ | 26.22 | | | $ | 26.34 | | | | 2.27 | % | | | 2.82 | % | | $ | 41,951,397 | | | | 0.05 | % | | | 1.99 | % | | | 0.05 | % | | | 24 | % |
| | 25.86 | | | | 25.84 | | | | 5.93 | | | | 5.85 | (g) | | | 37,495,084 | | | | 0.05 | | | | 2.38 | | | | 0.05 | | | | 56 | |
| | | | | | | | |
| | | | | | | | | | | | | | | | | | | | | | | | | | | | | | | | | | |
| | 55.70 | | | | 55.68 | | | | 3.60 | | | | 3.05 | | | | 105,830,165 | | | | 0.36 | | | | 1.78 | | | | 0.36 | | | | 132 | |
| | 54.17 | | | | 54.44 | | | | 11.24 | | | | 11.52 | | | | 54,168,824 | | | | 0.38 | | | | 2.76 | | | | 0.69 | (h) | | | 91 | |
| | 50.36 | | | | 50.48 | | | | 0.97 | | | | 1.21 | (g) | | | 25,178,102 | | | | 0.38 | (i) | | | 2.96 | | | | 5.38 | (h)(i) | | | — | (j) |
| | | | | | | | |
| | | | | | | | | | | | | | | | | | | | | | | | | | | | | | | | | | |
| | 57.23 | | | | 57.36 | | | | 3.00 | | | | 2.81 | | | | 42,921,995 | | | | 0.14 | | | | 2.99 | | | | 0.14 | | | | 22 | |
| | 56.27 | | | | 56.50 | | | | 15.74 | | | | 15.95 | | | | 35,170,394 | | | | 0.14 | | | | 3.58 | | | | 0.65 | (h) | | | 67 | |
| | 51.19 | | | | 51.30 | | | | 3.26 | | | | 3.48 | (g) | | | 25,595,493 | | | | 0.14 | (i) | | | 3.98 | | | | 2.13 | (h)(i) | | | 12 | |
| | | | | | | | |
| | | | | | | | | | | | | | | | | | | | | | | | | | | | | | | | | | |
| | 50.66 | | | | 50.71 | | | | 2.97 | | | | 2.43 | | | | 212,771,481 | | | | 0.24 | | | | 4.90 | | | | 0.24 | | | | 28 | |
| | 50.31 | | | | 50.62 | | | | 6.15 | | | | 6.88 | | | | 171,037,324 | | | | 0.32 | | | | 4.90 | | | | 0.44 | (h) | | | 128 | |
| | 49.86 | | | | 49.82 | | | | 4.66 | | | | 4.00 | | | | 154,570,385 | | | | 0.40 | | | | 5.01 | | | | 0.57 | (h) | | | 23 | |
| | 50.09 | | | | 50.36 | | | | 3.00 | | | | 3.12 | | | | 105,191,308 | | | | 0.40 | | | | 4.78 | | | | 0.98 | (h) | | | 23 | |
| | 50.96 | | | | 51.16 | | | | 4.24 | | | | 4.64 | (g) | | | 30,574,068 | | | | 0.39 | (i) | | | 4.99 | | | | 1.74 | (h)(i) | | | 8 | |
| | | | | | | | |
|
|
| | | | | | | | | | | | | | | | | | | | | | | | | | | | | | | | |
| | 50.66 | | | | 50.94 | | | | 2.47 | | | | 3.35 | | | | 167,176,599 | | | | 0.49 | | | | 3.30 | | | | 0.49 | | | | 60 | |
| | 49.98 | | | | 49.83 | | | | 7.39 | | | | 6.89 | | | | 169,928,839 | | | | 0.53 | | | | 3.40 | | | | 0.69 | (h) | | | 88 | |
| | 48.75 | | | | 48.83 | | | | 2.09 | | | | 2.13 | | | | 180,357,231 | | | | 0.54 | | | | 3.92 | | | | 0.82 | (h) | | | 73 | |
| | 50.54 | | | | 50.60 | | | | 3.76 | | | | 3.88 | (g) | | | 151,634,232 | | | | 0.53 | (i) | | | 3.98 | | | | 1.10 | (h)(i) | | | 52 | |
| | | | | | | | |
| | | | | | | | | | | | | | | | | | | | | | | | | | | | | | | | | | |
| | 54.51 | | | | 54.59 | | | | (0.25 | ) | | | 0.06 | | | | 59,962,002 | | | | 0.23 | | | | 2.09 | | | | 0.23 | | | | 42 | |
| | 55.15 | | | | 55.06 | | | | 10.09 | | | | 9.71 | | | | 52,390,882 | | | | 0.23 | | | | 2.31 | | | | 0.67 | (h) | | | 51 | |
| | 51.92 | | | | 52.01 | | | | 4.74 | | | | 4.92 | (g) | | | 31,153,558 | | | | 0.23 | (i) | | | 2.65 | | | | 1.06 | (h)(i) | | | 15 | |
| | | | | | | | |
| | | | | | | | | | | | | | | | | | | | | | | | | | | | | | | | | | |
| | 27.98 | | | | 27.98 | | | | 2.84 | | | | 2.73 | | | | 685,606,171 | | | | 0.07 | | | | 1.87 | | | | 0.07 | | | | 32 | |
| | 27.43 | | | | 27.46 | | | | 11.46 | | | | 11.49 | | | | 543,070,946 | | | | 0.07 | | | | 2.61 | | | | 0.20 | (h) | | | 57 | |
| | 25.32 | | | | 25.34 | | | | 1.90 | | | | 1.98 | (g) | | | 98,730,082 | | | | 0.07 | (i) | | | 3.26 | | | | 1.14 | (h)(i) | | | 53 | |
| | | | | | | | |
| | | | | | | | | | | | | | | | | | | | | | | | | | | | | | | | | | |
| | 50.81 | | | | 50.87 | | | | 1.29 | | | | 1.35 | | | | 13,902,104,552 | | | | 0.16 | | | | 1.49 | | | | 0.16 | | | | 60 | |
| | 50.51 | | | | 50.54 | | | | 3.22 | | | | 3.22 | | | | 11,591,489,504 | | | | 0.18 | | | | 2.53 | | | | 0.22 | (h) | | | 46 | |
| | 50.20 | | | | 50.23 | | | | 2.68 | | | | 2.66 | | | | 5,703,062,275 | | | | 0.17 | | | | 2.74 | | | | 0.28 | (h) | | | 43 | |
| | 50.01 | | | | 50.05 | | | | 1.25 | | | | 1.33 | (g) | | | 200,051,266 | | | | 0.16 | (i) | | | 1.77 | | | | 0.55 | (h)(i) | | | 25 | |
| | | | | | | | |
| | | | | | | | | | | | | | | | | | | | | | | | | | | | | | | | | | |
| | 50.98 | | | | 51.00 | | | | 1.35 | | | | 1.33 | | | | 583,777,535 | | | | 0.17 | | | | 1.01 | | | | 0.17 | | | | 53 | |
| | 50.53 | | | | 50.56 | | | | 2.09 | | | | 2.09 | | | | 207,185,582 | | | | 0.18 | | | | 1.55 | | | | 0.34 | (h) | | | 153 | |
| | 50.26 | | | | 50.29 | | | | 1.16 | | | | 1.22 | (g) | | | 57,799,591 | | | | 0.17 | (i) | | | 1.88 | | | | 0.79 | (h)(i) | | | 61 | |
| | | | | | | | |
| | | | | | | | | | | | | | | | | | | | | | | | | | | | | | | | | | |
| | 49.30 | | | | 49.55 | | | | (1.29 | ) | | | (1.19 | ) | | | 83,806,913 | | | | 0.39 | | | | 4.56 | | | | 0.39 | | | | 28 | |
| | 50.95 | | | | 51.15 | | | | 12.25 | | | | 12.44 | | | | 91,713,454 | | | | 0.39 | | | | 4.64 | | | | 0.58 | (h) | | | 53 | |
| | 47.52 | | | | 47.62 | | | | 2.29 | | | | 2.23 | | | | 61,776,747 | | | | 0.39 | | | | 4.96 | | | | 0.87 | (h) | | | 28 | |
| | 48.83 | | | | 48.95 | | | | (2.03 | ) | | | (1.79 | )(g) | | | 53,713,929 | | | | 0.35 | (i) | | | 4.79 | | | | 2.74 | (h)(i) | | | 2 | |
SEE NOTES TO FINANCIAL STATEMENTS.
| | | | | | | | |
| | | |
| AUGUST 31, 2020 | | J.P. MORGAN EXCHANGE-TRADED FUNDS | | | | | 231 | |
NOTES TO FINANCIAL STATEMENTS
AS OF AUGUST 31, 2020 (Unaudited)
1. Organization
J.P. Morgan Exchange-Traded Fund Trust (the “Trust”) was formed on February 25, 2010, and is governed by a Declaration of Trust as amended and restated February 19, 2014, and is registered under the Investment Company Act of 1940, as amended (the “1940 Act”), as an open-end management investment company.
The following are 10 separate funds of the Trust (each, a “Fund” and collectively, the “Funds”) covered by this report:
| | |
| | | Diversification Classification |
| JPMorgan BetaBuilders 1-5 Year U.S. Aggregate Bond ETF | | Diversified |
| JPMorgan Core Plus Bond ETF | | Diversified |
| JPMorgan Corporate Bond Research Enhanced ETF | | Diversified |
| JPMorgan High Yield Research Enhanced ETF | | Diversified |
| JPMorgan International Bond Opportunities ETF(1) | | Diversified |
| JPMorgan Municipal ETF | | Diversified |
| JPMorgan U.S. Aggregate Bond ETF | | Diversified |
| JPMorgan Ultra-Short Income ETF | | Diversified |
| JPMorgan Ultra-Short Municipal Income ETF | | Diversified |
| JPMorgan USD Emerging Markets Sovereign Bond ETF | | Diversified |
| (1) | Effective September 14, 2020, JPMorgan Global Bond Opportunities ETF changed its name to JPMorgan International Bond Opportunities ETF. |
JPMorgan BetaBuilders 1-5 Year U.S. Aggregate Bond ETF (the “BetaBuilders 1-5 Year U.S. Aggregate Bond ETF”) commenced operations on March 12, 2019. The investment objective of the Fund is to seek investment results that closely correspond, before fees and expenses, to the performance of the Bloomberg Barclays Short-Term U.S. Aggregate Bond Index.
The investment objective of JPMorgan Core Plus Bond ETF (the “Core Plus Bond ETF”) is to seek a high level of current income by investing primarily in a diversified portfolio of high-, medium- and low-grade debt securities.
The investment objective of JPMorgan Corporate Bond Research Enhanced ETF (the “Corporate Bond Research Enhanced ETF”) is to seek to provide total return from a portfolio of investment grade corporate bonds.
The investment objective of JPMorgan High Yield Research Enhanced ETF (the “High Yield Research Enhanced ETF”) is to seek to provide a high level of income with capital appreciation as a secondary objective.
The investment objective of JPMorgan International Bond Opportunities ETF (formerly JPMorgan Global Bond Opportunities ETF) (the “International Bond Opportunities ETF”) is to seek to provide total return.
The investment objective of JPMorgan Municipal ETF (the “Municipal ETF”) is to seek to provide monthly dividends, which are excluded from gross income, and to protect the value of your investment by investing primarily in municipal obligations. For purposes of the Fund’s investment objective, “gross income” means gross income for federal income tax purposes.
The investment objective of JPMorgan U.S. Aggregate Bond ETF (the “U.S. Aggregate Bond ETF”) is to seek long-term total return.
The investment objective of JPMorgan Ultra-Short Income ETF (the “Ultra-Short Income ETF”) is to seek to provide current income while seeking to maintain a low volatility of principal.
The investment objective of JPMorgan Ultra-Short Municipal Income ETF (the “Ultra-Short Municipal Income ETF”) is to seek to provide as high a level of current income exempt from federal income tax as is consistent with relative stability of principal.
The investment objective of JPMorgan USD Emerging Markets Sovereign Bond ETF (the “USD Emerging Markets Sovereign Bond ETF”) is to seek investment results that closely correspond, before fees and expenses, to the performance of the JPMorgan Emerging Markets Risk-Aware Bond Index.
J.P. Morgan Investment Management Inc. (“JPMIM”), an indirect, wholly-owned subsidiary of JPMorgan Chase & Co. (“JPMorgan”), acts as Adviser (the “Adviser”) and Administrator (the “Administrator”) to the Funds.
| | | | | | |
| | | |
| 232 | | | | J.P. MORGAN EXCHANGE-TRADED FUNDS | | AUGUST 31, 2020 |
Shares of each Fund are listed and traded at market price on an exchange as follows:
| | |
| | | Listing Exchange |
| BetaBuilders 1-5 Year U.S. Aggregate Bond ETF | | Cboe BZX Exchange, Inc. |
| Core Plus Bond ETF | | Cboe BZX Exchange, Inc. |
| Corporate Bond Research Enhanced ETF | | NYSE Arca, Inc. |
| High Yield Research Enhanced ETF | | Cboe BZX Exchange, Inc. |
| International Bond Opportunities ETF | | Cboe BZX Exchange, Inc. |
| Municipal ETF | | Cboe BZX Exchange, Inc. |
| U.S. Aggregate Bond ETF | | NYSE Arca, Inc. |
| Ultra-Short Income ETF | | Cboe BZX Exchange, Inc. |
| Ultra-Short Municipal Income ETF | | Cboe BZX Exchange, Inc. |
| USD Emerging Markets Sovereign Bond ETF | | NYSE Arca, Inc. |
Market prices for the Funds’ shares may be different from their net asset value (“NAV”).
The Funds issue and redeem their shares on a continuous basis, through JPMorgan Distribution Services, Inc. (the “Distributor” or “JPMDS”), an indirect, wholly-owned subsidiary of JPMorgan, at NAV in large blocks of shares, referred to as “Creation Units” as shown in the table below:
| | | | |
| | | Shares per Creation Unit | |
BetaBuilders 1-5 Year U.S. Aggregate Bond ETF | | | 50,000 | |
Core Plus Bond ETF | | | 100,000 | |
Corporate Bond Research Enhanced ETF | | | 25,000 | |
High Yield Research Enhanced ETF | | | 100,000 | |
International Bond Opportunities ETF | | | 100,000 | |
Municipal ETF | | | 50,000 | |
U.S. Aggregate Bond ETF | | | 50,000 | |
Ultra-Short Income ETF | | | 50,000 | |
Ultra-Short Municipal Income ETF | | | 50,000 | |
USD Emerging Markets Sovereign Bond ETF | | | 100,000 | |
The Funds may elect creations and redemptions in cash or partially in cash. Shares are generally traded in the secondary market in amounts less than a Creation Unit at market prices that change throughout the day. Only individuals or institutions that have entered into an authorized participant agreement with the Distributor may do business directly with the Funds (each, an “Authorized Participant”).
2. Significant Accounting Policies
The following is a summary of significant accounting policies followed by the Funds in the preparation of their financial statements. The Funds are investment companies and, accordingly, follow the investment company accounting and reporting guidance of the Financial Accounting Standards Board (“FASB”) Accounting Standards Codification Topic 946 — Investment Companies, which is part of U.S. generally accepted accounting principles (“GAAP”). The preparation of financial statements in conformity with GAAP requires management to make estimates and assumptions that affect (i) the reported amounts of assets and liabilities, (ii) disclosure of contingent assets and liabilities at the date of the financial statements, and (iii) the reported amounts of increases and decreases in net assets from operations during the reporting period. Actual results could differ from those estimates.
A. Valuation of Investments — Investments are valued in accordance with GAAP and the Funds’ valuation policies set forth by, and under the supervision and responsibility of, the Board of Trustees of the Trust (the “Board”), which established the following approach to valuation, as described more fully below: (i) investments for which market quotations are readily available shall be valued at their market value and (ii) all other investments for which market quotations are not readily available shall be valued at their fair value as determined in good faith by the Board.
The Administrator has established the J.P. Morgan Asset Management Americas Valuation Committee (“AVC”) to assist the Board with the oversight and monitoring of the valuation of the Funds’ investments. The Administrator implements the valuation policies of the Funds’ investments, as directed by the Board. The AVC oversees and carries out the policies for the valuation of investments held in the Funds. This includes monitoring the appropriateness of fair values based on results of ongoing valuation oversight including, but not limited to, consideration of macro or security specific events, market events, and pricing vendor and broker due diligence. The Administrator is responsible for discussing and assessing the potential impacts to the fair values on an ongoing basis, and, at least on a quarterly basis, with the AVC and the Board.
A market-based approach is primarily used to value the Funds’ investments. Investments for which market quotations are not readily available are fair valued by approved affiliated and/or unaffiliated pricing vendors or third party broker-dealers (collectively referred to as “Pricing Services”) or may be internally fair valued using methods set forth by the valuation policies approved by the Board. This may include the use of related or comparable assets or liabilities, recent transactions, market multiples, book values and other relevant information for the investment. An income-based valuation approach may be used in which the anticipated future cash flows of the investment are discounted to calculate the fair value. Discounts may also be applied due to the nature or duration of any restrictions on the disposition of the investments. Valuations may be based upon current
| | | | | | | | |
| | | |
| AUGUST 31, 2020 | | J.P. MORGAN EXCHANGE-TRADED FUNDS | | | | | 233 | |
NOTES TO FINANCIAL STATEMENTS
AS OF AUGUST 31, 2020 (Unaudited) (continued)
market prices of securities that are comparable in coupon, rating, maturity and industry. It is possible that the estimated values may differ significantly from the values that would have been used had a ready market for the investments existed, and such differences could be material.
Fixed income instruments are valued based on prices received from Pricing Services. The Pricing Services use multiple valuation techniques to determine the valuation of fixed income instruments. In instances where sufficient market activity exists, the Pricing Services may utilize a market based approach through which trades or quotes from market makers are used to determine the valuation of these instruments. In instances where sufficient market activity may not exist, the Pricing Services also utilize proprietary valuation models which may consider market transactions in comparable securities and the various relationships between securities in determining fair value and/or market characteristics in order to estimate the relevant cash flows, which are then discounted to calculate the fair values.
Investments in open-end investment companies, excluding exchange-traded funds (“ETFs”) (“Underlying Funds”), are valued at each Underlying Fund’s NAV per share as of the report date.
Futures contracts are generally valued on the basis of available market quotations. Swaps and forward foreign currency exchange contracts are valued utilizing market quotations from approved Pricing Services.
See the table on “Quantitative Information about Level 3 Fair Value Measurements” for information on the valuation techniques and inputs used to value level 3 securities held by Core Plus Bond ETF and International Bond Opportunities ETF at August 31, 2020.
Valuations reflected in this report are as of the report date. As a result, changes in valuation due to market events and/or issuer-related events after the report date and prior to issuance of the report are not reflected herein.
The various inputs that are used in determining the valuation of the Funds’ investments are summarized into the three broad levels listed below.
| • | | Level 1 — Unadjusted inputs using quoted prices in active markets for identical investments. |
| • | | Level 2 — Other significant observable inputs including, but not limited to, quoted prices for similar investments, inputs other than quoted prices that are observable for investments (such as interest rates, prepayment speeds, credit risk, etc.) or other market corroborated inputs. |
| • | | Level 3 — Significant inputs based on the best information available in the circumstances, to the extent observable inputs are not available (including the Funds’ assumptions in determining the fair value of investments). |
A financial instrument’s level within the fair value hierarchy is based on the lowest level of any input, both individually and in the aggregate, that is significant to the fair value measurement. The inputs or methodology used for valuing instruments are not necessarily an indication of the risk associated with investing in those instruments.
The following tables represent each valuation input as presented on the Schedules of Portfolio Investments (“SOIs”):
BetaBuilders 1-5 Year U.S. Aggregate Bond ETF
| | | | | | | | | | | | | | | | |
| | | Level 1
Quoted prices | | | Level 2
Other significant observable inputs | | | Level 3
Significant unobservable inputs | | | Total | |
Investments in Securities | | | | | | | | | | | | | | | | |
Asset-Backed Securities | | $ | — | | | $ | 386,066 | | | $ | — | | | $ | 386,066 | |
Commercial Mortgage-Backed Securities | | | — | | | | 900,829 | | | | 118,252 | | | | 1,019,081 | |
Corporate Bonds | | | — | | | | 10,758,338 | | | | — | | | | 10,758,338 | |
Foreign Government Securities | | | — | | | | 561,551 | | | | — | | | | 561,551 | |
Mortgage-Backed Securities | | | — | | | | 3,110,757 | | | | — | | | | 3,110,757 | |
Municipal Bonds | | | — | | | | 57,724 | | | | — | | | | 57,724 | |
Supranational | | | — | | | | 1,372,155 | | | | — | | | | 1,372,155 | |
U.S. Government Agency Securities | | | — | | | | 1,357,635 | | | | — | | | | 1,357,635 | |
U.S. Treasury Obligations | | | — | | | | 22,992,417 | | | | — | | | | 22,992,417 | |
Short-Term Investments | | | | | | | | | | | | | | | | |
Investment Companies | | | 269,143 | | | | — | | | | — | | | | 269,143 | |
Investment of cash collateral from securities loaned | | | 44,450 | | | | — | | | | — | | | | 44,450 | |
| | | | | | | | | | | | | | | | |
Total Short-Term Investments | | | 313,593 | | | | — | | | | — | | | | 313,593 | |
| | | | | | | | | | | | | | | | |
Total Investments in Securities | | $ | 313,593 | | | $ | 41,497,472 | | | $ | 118,252 | | | $ | 41,929,317 | |
| | | | | | | | | | | | | | | | |
| | | | | | |
| | | |
| 234 | | | | J.P. MORGAN EXCHANGE-TRADED FUNDS | | AUGUST 31, 2020 |
Core Plus Bond ETF
| | | | | | | | | | | | | | | | |
| | | Level 1
Quoted prices | | | Level 2
Other significant
observable inputs | | | Level 3
Significant
unobservable inputs | | | Total | |
Investments in Securities | | | | | | | | | |
Asset-Backed Securities | | $ | — | | | $ | 9,905,014 | | | $ | 4,776,352 | | | $ | 14,681,366 | |
Collateralized Mortgage Obligations | | | – | | | | 2,488,391 | | | | 649,421 | | | | 3,137,812 | |
Commercial Mortgage-Backed Securities | | | – | | | | 2,621,397 | | | | 136,150 | | | | 2,757,547 | |
Corporate Bonds | | | — | | | | 31,069,790 | | | | — | | | | 31,069,790 | |
Mortgage-Backed Securities | | | — | | | | 26,346,228 | | | | — | | | | 26,346,228 | |
Municipal Bonds | | | — | | | | 37,199 | | | | — | | | | 37,199 | |
Preferred Stocks | | | — | | | | 3,027 | | | | — | | | | 3,027 | |
U.S. Treasury Obligations | | | — | | | | 16,212,080 | | | | — | | | | 16,212,080 | |
Short-Term Investments | | | | | | | | | |
Investment Companies | | | 30,087,297 | | | | — | | | | — | | | | 30,087,297 | |
| | | | | | | | | | | | | | | | |
Total Investments in Securities | | $ | 30,087,297 | | | $ | 88,683,126 | | | $ | 5,561,923 | | | $ | 124,332,346 | |
| | | | | | | | | | | | | | | | |
Appreciation in Other Financial Instruments | | | | | | | | | |
Futures Contracts | | $ | 6,162 | | | $ | — | | | $ | — | | | $ | 6,162 | |
| | | | | | | | | | | | | | | | |
Depreciation in Other Financial Instruments | | | | | | | | | |
Futures Contracts | | $ | (13,356 | ) | | $ | — | | | $ | — | | | $ | (13,356 | ) |
| | | | | | | | | | | | | | | | |
Corporate Bond Research Enhanced ETF
| | | | | | | | | | | | | | | | |
| | | Level 1
Quoted prices | | | Level 2
Other significant
observable inputs | | | Level 3
Significant
unobservable inputs | | | Total | |
Investments in Securities | | | | | | | | | |
Asset-Backed Securities | | $ | — | | | $ | 43,476 | | | $ | — | | | $ | 43,476 | |
Corporate Bonds | | | — | | | | 42,409,552 | | | | — | | | | 42,409,552 | |
U.S. Treasury Obligations | | | — | | | | 192,310 | | | | — | | | | 192,310 | |
Short-Term Investments | | | | | | | | | |
Investment Companies | | | 147,739 | | | | — | | | | — | | | | 147,739 | |
| | | | | | | | | | | | | | | | |
Total Investments in Securities | | $ | 147,739 | | | $ | 42,645,338 | | | $ | — | | | $ | 42,793,077 | |
| | | | | | | | | | | | | | | | |
Appreciation in Other Financial Instruments | | | | | | | | | |
Futures Contracts | | $ | 10,127 | | | $ | — | | | $ | — | | | $ | 10,127 | |
| | | | | | | | | | | | | | | | |
Depreciation in Other Financial Instruments | | | | | | | | | |
Futures Contracts | | $ | (13,559 | ) | | $ | — | | | $ | — | | | $ | (13,559 | ) |
| | | | | | | | | | | | | | | | |
High Yield Research Enhanced ETF
| | | | | | | | | | | | | | | | |
| | | Level 1
Quoted prices | | | Level 2
Other significant
observable inputs | | | Level 3
Significant
unobservable inputs | | | Total | |
Investments in Securities | | | | | | | | | |
Corporate Bonds | | $ | — | | | $ | 207,039,618 | | | $ | — | | | $ | 207,039,618 | |
Short-Term Investments | | | | | | | | | |
Investment Companies | | | 8,904,727 | | | | — | | | | — | | | | 8,904,727 | |
| | | | | | | | | | | | | | | | |
Total Investments in Securities | | $ | 8,904,727 | | | $ | 207,039,618 | | | $ | — | | | $ | 215,944,345 | |
| | | | | | | | | | | | | | | | |
| | | | | | | | |
| | | |
| AUGUST 31, 2020 | | J.P. MORGAN EXCHANGE-TRADED FUNDS | | | | | 235 | |
NOTES TO FINANCIAL STATEMENTS
AS OF AUGUST 31, 2020 (Unaudited) (continued)
International Bond Opportunities ETF
| | | | | | | | | | | | | | | | |
| | | Level 1
Quoted prices | | | Level 2
Other significant
observable inputs | | | Level 3
Significant
unobservable inputs | | | Total | |
Investments in Securities | |
Asset-Backed Securities | |
United States | | $ | — | | | $ | 8,669,185 | | | $ | 3,082,787 | | | $ | 11,751,972 | |
Collateralized Mortgage Obligations | |
United States | | | — | | | | 8,706,436 | | | | 150,353 | | | | 8,856,789 | |
United Kingdom | | | — | | | | 393,643 | | | | – | | | | 393,643 | |
| | | | | | | | | | | | | | | | |
Total Collateralized Mortgage Obligations | | | — | | | | 9,100,079 | | | | 150,353 | | | | 9,250,432 | |
| | | | | | | | | | | | | | | | |
Commercial Mortgage-Backed Securities | | | | | | | | | | | | | | | | |
United States | | | — | | | | 5,224,104 | | | | 1,527,233 | | | | 6,751,337 | |
Corporate Bonds | | | — | | | | 90,329,591 | | | | — | | | | 90,329,591 | |
Foreign Government Securities | | | — | | | | 38,452,107 | | | | — | | | | 38,452,107 | |
Preferred Stocks | | | 29,128 | | | | – | | | | — | | | | 29,128 | |
Supranational | | | — | | | | 217,000 | | | | — | | | | 217,000 | |
U.S. Treasury Obligations | | | — | | | | 4,485,126 | | | | — | | | | 4,485,126 | |
Warrants | | | — | | | | 86 | | | | — | | | | 86 | |
Short-Term Investments | |
Investment Companies | | | 3,063,953 | | | | — | | | | — | | | | 3,063,953 | |
| | | | | | | | | | | | | | | | |
Total Investments in Securities | | $ | 3,093,081 | | | $ | 156,477,278 | | | $ | 4,760,373 | | | $ | 164,330,732 | |
| | | | | | | | | | | | | | | | |
Appreciation in Other Financial Instruments | |
Forward Foreign Currency Exchange Contracts | | $ | — | | | $ | 126,308 | | | $ | — | | | $ | 126,308 | |
Futures Contracts | | | 93,815 | | | | – | | | | — | | | | 93,815 | |
| | | | | | | | | | | | | | | | |
Total Appreciation in Other Financial Instruments | | $ | 93,815 | | | $ | 126,308 | | | $ | — | | | $ | 220,123 | |
| | | | | | | | | | | | | | | | |
Depreciation in Other Financial Instruments | |
Forward Foreign Currency Exchange Contracts | | $ | — | | | $ | (651,610 | ) | | $ | — | | | $ | (651,610 | ) |
Futures Contracts | | | (104,054 | ) | | | – | | | | — | | | | (104,054 | ) |
Swaps | | | — | | | | (910,923 | ) | | | — | | | | (910,923 | ) |
| | | | | | | | | | | | | | | | |
Total Depreciation in Other Financial Instruments | | $ | (104,054 | ) | | $ | (1,562,533 | ) | | $ | — | | | $ | (1,666,587 | ) |
| | | | | | | | | | | | | | | | |
Municipal ETF
| | | | | | | | | | | | | | | | |
| | | Level 1
Quoted prices | | | Level 2
Other significant
observable inputs | | | Level 3
Significant
unobservable inputs | | | Total | |
Investments in Securities | | | | | | | | | |
Municipal Bonds | | $ | — | | | $ | 58,631,508 | | | $ | — | | | $ | 58,631,508 | |
Short-Term Investments | | | | | | | | | |
Investment Companies | | | 1,894,684 | | | | — | | | | — | | | | 1,894,684 | |
| | | | | | | | | | | | | | | | |
Total Investments in Securities | | $ | 1,894,684 | | | $ | 58,631,508 | | | $ | — | | | $ | 60,526,192 | |
| | | | | | | | | | | | | | | | |
| | | | | | |
| | | |
| 236 | | | | J.P. MORGAN EXCHANGE-TRADED FUNDS | | AUGUST 31, 2020 |
U.S. Aggregate Bond ETF
| | | | | | | | | | | | | | | | |
| | | Level 1
Quoted prices | | | Level 2
Other significant
observable inputs | | | Level 3
Significant
unobservable inputs | | | Total | |
Investments in Securities | | | | | | | | | |
Asset-Backed Securities | | $ | — | | | $ | 2,108,253 | | | $ | — | | | $ | 2,108,253 | |
Commercial Mortgage-Backed Securities | | | — | | | | 13,506,315 | | | | 925,919 | | | | 14,432,234 | |
Corporate Bonds | | | — | | | | 190,930,543 | | | | — | | | | 190,930,543 | |
Foreign Government Securities | | | — | | | | 12,482,523 | | | | — | | | | 12,482,523 | |
Mortgage-Backed Securities | | | — | | | | 182,213,414 | | | | — | | | | 182,213,414 | |
Municipal Bonds | | | — | | | | 4,366,533 | | | | — | | | | 4,366,533 | |
Supranational | | | — | | | | 9,861,320 | | | | — | | | | 9,861,320 | |
U.S. Government Agency Securities | | | — | | | | 11,137,392 | | | | — | | | | 11,137,392 | |
U.S. Treasury Obligations | | | — | | | | 250,485,334 | | | | — | | | | 250,485,334 | |
Short-Term Investments | | | | | | | | | |
Investment Companies | | | 1,428,775 | | | | — | | | | — | | | | 1,428,775 | |
Investment of cash collateral from securities loaned | | | 4,005,230 | | | | — | | | | — | | | | 4,005,230 | |
| | | | | | | | | | | | | | | | |
Total Short-Term Investments | | | 5,434,005 | | | | — | | | | — | | | | 5,434,005 | |
| | | | | | | | | | | | | | | | |
Total Investments in Securities | | $ | 5,434,005 | | | $ | 677,091,627 | | | $ | 925,919 | | | $ | 683,451,551 | |
| | | | | | | | | | | | | | | | |
Ultra-Short Income ETF
| | | | | | | | | | | | | | | | |
| | | Level 1
Quoted prices | | | Level 2
Other significant
observable inputs | | | Level 3
Significant
unobservable
inputs | | | Total | |
Investments in Securities | | | | | | | | | |
Asset-Backed Securities | | $ | — | | | $ | 652,944,540 | | | $ | 754,542 | | | $ | 653,699,082 | |
Certificates of Deposit | | | — | | | | 81,054,996 | | | | — | | | | 81,054,996 | |
Collateralized Mortgage Obligations | | | — | | | | 5,452,501 | | | | — | | | | 5,452,501 | |
Commercial Mortgage-Backed Securities | | | — | | | | 145,338,096 | | | | — | | | | 145,338,096 | |
Corporate Bonds | | | — | | | | 10,395,475,227 | | | | — | | | | 10,395,475,227 | |
Short-Term Investments | | | | | | | | | |
Certificates of Deposit | | | — | | | | 672,256,569 | | | | — | | | | 672,256,569 | |
Commercial Paper | | | — | | | | 1,040,253,140 | | | | — | | | | 1,040,253,140 | |
Investment Companies | | | 867,938,428 | | | | — | | | | — | | | | 867,938,428 | |
Investment of cash collateral from securities loaned | | | 53,754,829 | | | | — | | | | — | | | | 53,754,829 | |
Repurchase Agreements | | | — | | | | 72,000,000 | | | | — | | | | 72,000,000 | |
| | | | | | | | | | | | | | | | |
Total Short-Term Investments | | | 921,693,257 | | | | 1,784,509,709 | | | | — | | | | 2,706,202,966 | |
| | | | | | | | | | | | | | | | |
Total Investments in Securities | | $ | 921,693,257 | | | $ | 13,064,775,069 | | | $ | 754,542 | | | $ | 13,987,222,868 | |
| | | | | | | | | | | | | | | | |
Depreciation in Other Financial Instruments | | | | | | | | | |
Futures Contracts | | $ | (623,818 | ) | | $ | — | | | $ | — | | | $ | (623,818 | ) |
| | | | | | | | | | | | | | | | |
Ultra-Short Municipal Income ETF
| | | | | | | | | | | | | | | | |
| | | Level 1
Quoted prices | | | Level 2
Other significant
observable inputs | | | Level 3
Significant
unobservable inputs | | | Total | |
Municipal Bonds | | $ | — | | | $ | 493,253,547 | | | $ | — | | | $ | 493,253,547 | |
Short-Term Investments | | | | | | | | | |
Investment Companies | | | 97,757,412 | | | | — | | | | — | | | | 97,757,412 | |
| | | | | | | | | | | | | | | | |
Total Investments in Securities | | $ | 97,757,412 | | | $ | 493,253,547 | | | $ | — | | | $ | 591,010,959 | |
| | | | | | | | | | | | | | | | |
| | | | | | | | |
| | | |
| AUGUST 31, 2020 | | J.P. MORGAN EXCHANGE-TRADED FUNDS | | | | | 237 | |
NOTES TO FINANCIAL STATEMENTS
AS OF AUGUST 31, 2020 (Unaudited) (continued)
USD Emerging Markets Sovereign Bond ETF
| | | | | | | | | | | | | | | | |
| | | Level 1
Quoted prices | | | Level 2
Other significant
observable inputs | | | Level 3
Significant
unobservable inputs | | | Total | |
Investments in Securities | | | | | | | | | |
Corporate Bonds | | $ | — | | | $ | 8,380,679 | | | $ | — | | | $ | 8,380,679 | |
Foreign Government Securities | | | — | | | | 73,768,171 | | | | — | | | | 73,768,171 | |
Short-Term Investments | | | | | | | | | |
Investment Companies | | | 471,490 | | | | — | | | | — | | | | 471,490 | |
Investment of cash collateral from securities loaned | | | 1,783,213 | | | | — | | | | — | | | | 1,783,213 | |
| | | | | | | | | | | | | | | | |
Total Short-Term Investments | | | 2,254,703 | | | | — | | | | — | | | | 2,254,703 | |
| | | | | | | | | | | | | | | | |
Total Investments in Securities | | $ | 2,254,703 | | | $ | 82,148,850 | | | $ | — | | | $ | 84,403,553 | |
| | | | | | | | | | | | | | | | |
There were no significant transfers into or out of level 3 for the six months ended August 31, 2020 for BetaBuilders 1-5 Year U.S. Aggregate Bond ETF and U.S. Aggregate Bond ETF.
The following is a summary of investments for which significant unobservable inputs (level 3) were used in determining fair value:
| | | | | | | | | | | | | | | | | | | | | | | | | | | | | | | | | | | | |
| Core Plus Bond ETF | | Balance as of
February 29,
2020 | | | Realized
gain (loss) | | | Change in
unrealized
appreciation
(depreciation) | | | Net accretion
(amortization) | | | Purchases1 | | | Sales2 | | | Transfers
into Level 3 | | | Transfers
out
of Level 3 | | | Balance as of
August 31,
2020 | |
Investments in Securities | | | | | | | | | | | | | | | | | | | | | | | | | | | | | | | | | | | | |
Asset-Backed Securities | | $ | 2,033,177 | | | $ | (24 | ) | | $ | 92,510 | | | $ | (242 | ) | | $ | 3,020,620 | | | $ | (719,929 | ) | | $ | 737,471 | | | $ | (387,231 | ) | | $ | 4,776,352 | |
Collateralized Mortgage Obligations | | | 691,915 | | | | — | | | | 7,698 | | | | (152 | ) | | | — | | | | (50,040 | ) | | | — | | | | — | | | | 649,421 | |
Commercial Mortgage-Backed Securities | | | 150,000 | | | | — | | | | (13,850 | ) | | | — | | | | — | | | | — | | | | — | | | | — | | | | 136,150 | |
| | | | | | | | | | | | | | | | | | | | | | | | | | | | | | | | | | | | |
Total | | $ | 2,875,092 | | | $ | (24 | ) | | $ | 86,358 | | | $ | (394 | ) | | $ | 3,020,620 | | | $ | (769,969 | ) | | $ | 737,471 | | | $ | (387,231 | ) | | $ | 5,561,923 | |
| | | | | | | | | | | | | | | | | | | | | | | | | | | | | | | | | | | | |
| | | | | | | | | | | | | | | | | | | | | | | | | | | | | | | | | | | | |
International Bond
Opportunities ETF | | Balance as of
February 29,
2020 | | | Realized
gain (loss) | | | Change in
unrealized
appreciation
(depreciation) | | | Net accretion
(amortization) | | | Purchases1 | | | Sales2 | | | Transfers
into Level 3 | | | Transfers
out
of Level 3 | | | Balance as of
August 31,
2020 | |
Investments in Securities | | | | | | | | | | | | | | | | | | | | | | | | | | | | | | | | | | | | |
Asset-Backed Securities — Cayman Islands | | $ | 348,565 | | | $ | (24,080 | ) | | $ | 1,435 | | | $ | — | | | $ | — | | | $ | (325,920 | ) | | $ | — | | | $ | — | | | $ | — | |
Asset-Backed Securities — United States | | | 4,749,667 | | | | — | | | | (116,563 | ) | | | 271 | | | | — | | | | (866,385 | ) | | | — | | | | (684,203 | ) | | | 3,082,787 | |
Collateralized Mortgage Obligations — United States | | | 153,617 | | | | — | | | | (3,264 | ) | | | — | | | | — | | | | — | | | | — | | | | — | | | | 150,353 | |
Commercial Mortgage-Backed Securities —United States | | | 1,776,971 | | | | (13,557 | ) | | | (117,860 | ) | | | 1,027 | | | | — | | | | (262,988 | ) | | | 143,640 | | | | — | | | | 1,527,233 | |
Corporate Bonds —Luxembourg | | | 336,188 | | | | — | | | | (12,682 | ) | | | 127 | | | | — | | | | (323,633 | ) | | | — | | | | — | | | | — | |
Corporate Bonds — United States | | | — | (a) | | | 7,488 | | | | — | | | | — | | | | — | | | | (7,488 | ) | | | — | | | | — | | | | — | |
| | | | | | | | | | | | | | | | | | | | | | | | | | | | | | | | | | | | |
Total | | $ | 7,365,008 | | | $ | (30,149 | ) | | $ | (248,934 | ) | | $ | 1,425 | | | $ | — | | | $ | (1,786,414 | ) | | $ | 143,640 | | | $ | (684,203 | ) | | $ | 4,760,373 | |
| | | | | | | | | | | | | | | | | | | | | | | | | | | | | | | | | | | | |
| 1 | Purchases include all purchases of securities and securities received in corporate actions. |
| 2 | Sales include all sales of securities, maturities, paydowns and securities tendered in corporate actions. |
The changes in net unrealized appreciation (depreciation) attributable to securities owned at August 31, 2020, which were valued using significant unobservable inputs (level 3) were as follows:
| | | | |
Core Plus Bond ETF | | $ | 86,358 | |
International Bond Opportunities ETF | | | (236,147 | ) |
| | | | | | |
| | | |
| 238 | | | | J.P. MORGAN EXCHANGE-TRADED FUNDS | | AUGUST 31, 2020 |
Transfers from level 2 and level 3 are due to a decline in market activity (e.g. frequency of trades), which resulted in a lack or increase of available market inputs to determine the price for the six months ended August 31, 2020 for Core Plus Bond ETF.
There were no significant transfers into or out of level 3 for the six months ended August 31, 2020 for International Bond Opportunities ETF.
Core Plus Bond ETF
Quantitative Information about Level 3 Fair Value Measurements
| | | | | | | | | | | | |
| | | Fair Value at
August 31,
2020 | | | Valuation Technique(s) | | Unobservable Input | | Range (Weighted Average) (a) | |
| | $ | 4,776,352 | | | Discounted Cash Flow | | Constant Prepayment Rate | | | 0.00% - 100.00% (20.18%) | |
| | | | | | | | Yield (Discount Rate of Cash Flows) | | | 1.35% - 6.08% (3.28%) | |
| | | | | | | | | | | | |
| Asset-Backed Securities | | | 4,776,352 | | | | | | | | | |
| |
| | | 649,421 | | | Discounted Cash Flow | | Constant Prepayment Rate | | | 100.00% - 100.00% (13.06%) | |
| | | | | | | | Yield (Discount Rate of Cash Flows) | | | 1.35% - 1.37% (0.19%) | |
| | | | | | | | | | | | |
| | | | | | | | | | | | |
| Collateralized Mortgage Obligations | | | 649,421 | | | | | | | | | |
| |
| | | 136,150 | | | Discounted Cash Flow | | Yield (Discount Rate of Cash Flows) | | | 5.26% (5.26%) | |
| | | | | | | | | | | | |
| Commercial Mortgage-Backed Securities | | | 136,150 | | | | | | | | | |
| |
| Total | | $ | 5,561,923 | | | | | | | | | |
| |
| (a) | Unobservable inputs were weighted by the relative fair value of the instruments. |
The significant unobservable inputs used in the fair value measurement of the Fund’s investments are listed above. Generally, a change in the assumptions used in any input in isolation may be accompanied by a change in another input. Significant changes in any of the unobservable inputs may significantly impact the fair value measurement. The impact is based on the relationship between each unobservable input and the fair value measurement. Significant increases (decreases) in the default rate may decrease (increase) the fair value measurement. A significant change in the discount rate or prepayment rate (Constant Prepayment Rate or PSA Prepayment Model) may decrease or increase the fair value measurement.
International Bond Opportunities ETF
Quantitative Information about Level 3 Fair Value Measurements #
| | | | | | | | | | | | |
| | | Fair Value at
August 31,
2020 | | | Valuation Technique(s) | | Unobservable Input | | Range (Weighted Average) (a) | |
| | $ | 3,082,787 | | | Discounted Cash Flow | | Constant Prepayment Rate | | | 0.00% - 35.00% (16.37%) | |
| | | | | | | | Constant Default Rate | | | 0.00% - 3.00% (0.46%) | |
| | | | | | | | Yield (Discount Rate of Cash Flows) | | | 1.31% - 13.86% (4.67%) | |
| | | | | | | | | | | | |
| Asset-Backed Securities | | | 3,082,787 | | | | | | | | | |
| |
| | | 1,321,958 | | | Discounted Cash Flow | | Constant Prepayment Rate | | | 0.00% - 100.00% (16.70%) | |
| | | | | | | | Constant Default Rate | | | 0.00% - 2.00% (0.33%) | |
| | | | | | | | Yield (Discount Rate of Cash Flows) | | | 2.23% - 199.0% (26.03%) | |
| | | | | | | | | | | | |
| Commercial Mortgage-Backed Securities | | | 1,321,958 | | | | | | | | | |
| |
| | | 150,353 | | | Discounted Cash Flow | | Constant Prepayment Rate | | | 20.00% (20.00%) | |
| | | | | | | | Constant Default Rate | | | 0.50% (0.50%) | |
| | | | | | | | Yield (Discount Rate of Cash Flows) | | | 3.89% (3.89%) | |
| | | | | | | | | | | | |
| Commercial Mortgage Obligation | | | 150,353 | | | | | | | | | |
| |
| Total | | $ | 4,555,098 | | | | | | | | | |
| |
| # | The table above does not include certain level 3 securities that are valued by brokers and pricing services. At August 31, 2020, the value of these securities was $205,275. The inputs for these securities are not readily available or cannot be reasonably estimated and are generally those inputs described in Note 2. A. |
| (a) | Unobservable inputs were weighted by the relative fair value of the instruments. |
| | | | | | | | |
| | | |
| AUGUST 31, 2020 | | J.P. MORGAN EXCHANGE-TRADED FUNDS | | | | | 239 | |
NOTES TO FINANCIAL STATEMENTS
AS OF AUGUST 31, 2020 (Unaudited) (continued)
The significant unobservable inputs used in the fair value measurement of the Fund’s investments are listed above. Generally, a change in the assumptions used in any input in isolation may be accompanied by a change in another input. Significant changes in any of the unobservable inputs may significantly impact the fair value measurement. The impact is based on the relationship between each unobservable input and the fair value measurement. Significant increases (decreases) in the default rate may decrease (increase) the fair value measurement. A significant change in the discount rate or prepayment rate (Constant Prepayment Rate or PSA Prepayment Model) may decrease or increase the fair value measurement.
B. Restricted Securities — Certain securities held by the Funds may be subject to legal or contractual restrictions on resale. Restricted securities generally are resold in transactions exempt from registration under the Securities Act of 1933, as amended (the “Securities Act”). Disposal of these securities may involve time-consuming negotiations and expense. Prompt sale at the current valuation may be difficult and could adversely affect the NAVs of the Funds.
As of August 31, 2020, the Funds had no investments in restricted securities other than securities sold to the Funds under Rule 144A and/or Regulation S under the Securities Act.
C. Repurchase Agreements — The Funds may enter into repurchase agreement transactions that meet the credit guidelines of JPMIM. Repurchase agreements involve the purchase of securities subject to the seller’s agreement to repurchase the securities at a mutually agreed upon date and price. The Funds require that the collateral received in a repurchase agreement transaction be transferred to a custodian in a manner sufficient to enable the Funds to obtain collateral in the event of a counterparty default. If the counterparty defaults and the fair value of the collateral declines, realization of the collateral by the Funds may be delayed or limited. Repurchase agreement collateral may be held in segregated accounts maintained by JPMorgan Chase Bank, N.A. (“JPMCB”), a wholly-owned subsidiary of JPMorgan.
The Funds’ repurchase agreements are not subject to master netting arrangements.
D. When-Issued Securities, Delayed Delivery Securities and Forward Commitments — BetaBuilders 1-5 Year U.S. Aggregate Bond ETF, Core Plus Bond ETF, Municipal ETF and Ultra-Short Municipal Income ETF purchased when-issued securities, including To Be Announced (“TBA”) securities, and entered into contracts to purchase or sell securities for a fixed price that may be settled a month or more after the trade date. When-issued securities are securities that have been authorized, but not issued in the market. A forward commitment involves entering into a contract to purchase or sell securities for a fixed price at a future date that may be settled a month or more after the trade date. A delayed delivery security is agreed upon in advance between the buyer and the seller of the security and is generally delivered beyond seven days of the agreed upon date. The purchase of securities on a when-issued, delayed delivery or forward commitment basis involves the risk that the value of the security to be purchased declines before the settlement date. The sale of securities on a forward commitment basis involves the risk that the value of the securities sold may increase before the settlement date. The Funds may be exposed to credit risk if the counterparty fails to perform under the terms of the transaction. Interest income for securities purchased on a when-issued, delayed delivery or forward commitment basis is not accrued until the settlement date.
BetaBuilders 1-5 Year U.S. Aggregate Bond ETF, Core Plus Bond ETF, Municipal ETF and Ultra-Short Municipal Income ETF had delayed delivery securities outstanding as of August 31, 2020, which are shown as a Receivable for Investment securities sold — delayed delivery securities and Payable for Investment securities purchased — delayed delivery securities, respectively, on the Statements of Assets and Liabilities (“SAL”). The values of these securities held at August 31, 2020 are detailed on the SOIs.
E. Securities Lending — The Funds, except International Bond Opportunities ETF, are authorized to engage in securities lending in order to generate additional income. The Funds are able to lend to approved borrowers. Citibank N.A. (“Citibank”) serves as lending agent for the Funds, pursuant to a Securities Lending Agency Agreement (the “Securities Lending Agency Agreement”). Securities loaned are collateralized by cash equal to at least 100% of the market value plus accrued interest on the securities lent, which is invested in the Class IM Shares of the JPMorgan U.S. Government Money Market Fund and the Agency SL Class Shares of the JPMorgan Securities Lending Money Market Fund. The Funds retain loan fees and the interest on cash collateral investments but are required to pay the borrower a rebate for the use of cash collateral. In cases where the lent security is of high value to borrowers, there may be a negative rebate (i.e., a net payment from the borrower to the Funds). Upon termination of a loan, the Funds are required to return to the borrower an amount equal to the cash collateral, plus any rebate owed to the borrowers. The remaining maturities of the securities lending transactions are considered overnight and continuous. Loans are subject to termination by the Funds or the borrower at any time.
The net income earned on the securities lending (after payment of rebates and Citibank’s fee) is included on the SOP as Income from securities lending (net). The Funds also receive payments from the borrower during the period of the loan, equivalent to dividends and interest earned on the securities loaned, which are recorded as Dividend or Interest income, respectively, on the SOP.
Under the Securities Lending Agency Agreement, Citibank marks to market the loaned securities on a daily basis. In the event the cash received from the borrower is less than 102% of the value of the loaned securities (105% for loans of non-U.S. securities), Citibank requests additional cash from the borrower so as to maintain a collateralization level of at least 102% of the value of the loaned securities plus accrued interest (105% for loans of non-U.S. securities), subject to certain de minimis amounts.
The value of securities out on loan is recorded as an asset on the SALs. The value of the cash collateral received is recorded as a liability on the SAL and details of collateral investments are disclosed on the SOIs.
The Funds bear the risk of loss associated with the collateral investments and are not entitled to additional collateral from the borrower to cover any such losses. To the extent that the value of the collateral investments declines below the amount owed to a borrower, the Funds may incur losses
| | | | | | |
| | | |
| 240 | | | | J.P. MORGAN EXCHANGE-TRADED FUNDS | | AUGUST 31, 2020 |
that exceed the amount they earned on lending the security. Upon termination of a loan, the Funds may use leverage (borrow money) to repay the borrower for cash collateral posted if the Adviser does not believe that it is prudent to sell the collateral investments to fund the payment of this liability. Securities lending activity is subject to master netting arrangements.
The following table presents for each lending Fund, the value of the securities on loan with Citibank, net of amounts available for offset under the master netting arrangements and any related collateral received or posted by the Funds as of August 31, 2020.
| | | | | | | | | | | | |
| | | Investment Securities
on Loan, at Value,
Presented on the
Statements of Assets
and Liabilities | | | Cash Collateral
Posted by Borrower* | | | Net Amount Due
to Counterparty
(not less than zero) | |
BetaBuilders 1-5 Year U.S. Aggregate Bond ETF | | $ | 43,344 | | | $ | (43,344 | ) | | $ | — | |
U.S. Aggregate Bond ETF | | | 3,838,768 | | | | (3,838,768 | ) | | | — | |
Ultra-Short Income ETF | | | 52,396,832 | | | | (52,396,832 | ) | | | — | |
USD Emerging Markets Sovereign Bond ETF | | | 1,727,633 | | | | (1,727,633 | ) | | | — | |
| * | Collateral posted reflects the value of securities on loan and does not include any additional amounts received from the borrower. |
Securities lending also involves counterparty risks, including the risk that the loaned securities may not be returned in a timely manner or at all. Subject to certain conditions, Citibank has agreed to indemnify the Funds from losses resulting from a borrower’s failure to return a loaned security.
JPMIM voluntarily waived management fees and investment advisory fees charged to the Funds to reduce the impact of the cash collateral investment in the JPMorgan U.S. Government Money Market Fund from 0.15% to 0.06%. For the six months ended August 31, 2020, JPMIM waived fees associated with the Funds’ investment in the JPMorgan U.S. Government Money Market Fund as follows:
| | | | |
BetaBuilders 1-5 Year U.S. Aggregate Bond ETF | | $ | 64 | |
Core Plus Bond ETF | | | 1 | |
High Yield Research Enhanced ETF | | | 460 | |
U.S. Aggregate Bond ETF | | | 1,551 | |
Ultra-Short Income ETF | | | 2,737 | |
USD Emerging Markets Sovereign Bond ETF | | | 740 | |
The above waiver is included in the determination of earnings on cash collateral investment and in the calculation of Citibank’s compensation and is included on the SOP as Income from securities lending (net).
Corporate Bond Research Enhanced ETF, Municipal ETF and Ultra-Short Municipal Income ETF did not lend out any securities during the six months ended August 31, 2020.
F. Investment Transactions with Affiliates — The Funds invested in Underlying Funds which are advised by the Adviser. An issuer which is under common control with a Fund may be considered an affiliate. For the purposes of the financial statements, the Funds assume the issuers listed in the tables below to be affiliated issuers. Underlying Funds’ distributions may be reinvested into the Underlying Funds. Reinvestment amounts are included in the purchase cost amounts in the tables below. Included in the purchases and sales amounts in the tables below are exchanges between certain shares of the Underlying Funds. Such exchanges are not treated as purchases and sales for the purpose of recognizing realized gains (losses) or calculating portfolio turnover.
BetaBuilders 1-5 Year U.S. Aggregate Bond ETF
| | | | | | | | | | | | | | | | | | | | | | | | | | | | | | | | | | | | |
| For the six months ended August 31, 2020 | |
| Security Description | | Value at
February 29,
2020 | | | Purchases at Cost | | | Proceeds
from Sales | | | Net
Realized
Gain
(Loss) | | | Change in
Unrealized
Appreciation/
(Depreciation) | | | Value at
August 31,
2020 | | | Shares at
August 31,
2020 | | | Dividend
Income | | | Capital Gain
Distributions | |
JPMorgan Securities Lending Money Market Fund Agency SL Class Shares, 0.32% (a) (b) | | $ | — | | | $ | 15,000 | | | $ | — | | | $ | — | | | $ | — | | | $ | 15,000 | | | | 14,996 | | | $ | 3 | * | | $ | — | |
JPMorgan U.S. Government Money Market Fund Class IM Shares, 0.07% (a) (b) | | | — | | | | 2,137,010 | | | | 2,107,560 | | | | — | | | | — | | | | 29,450 | | | | 29,450 | | | | 236 | * | | | — | |
JPMorgan U.S. Government Money Market Fund Class Institutional Shares, 0.01% (a) (b) | | | 95,622 | | | | 9,267,745 | | | | 9,094,224 | | | | — | | | | — | | | | 269,143 | | | | 269,143 | | | | 156 | | | | — | |
| | | | | | | | | | | | | | | | | | | | | | | | | | | | | | | | | | | | |
Total | | $ | 95,622 | | | $ | 11,419,755 | | | $ | 11,201,784 | | | $ | — | | | $ | — | | | $ | 313,593 | | | | | | | $ | 395 | | | $ | — | |
| | | | | | | | | | | | | | | | | | | | | | | | | | | | | | | | | | | | |
| | | | | | | | |
| | | |
| AUGUST 31, 2020 | | J.P. MORGAN EXCHANGE-TRADED FUNDS | | | | | 241 | |
NOTES TO FINANCIAL STATEMENTS
AS OF AUGUST 31, 2020 (Unaudited) (continued)
Core Plus Bond ETF
| | | | | | | | | | | | | | | | | | | | | | | | | | | | | | | | | | | | |
| For the six months ended August 31, 2020 | |
| Security Description | | Value at
February 29,
2020 | | | Purchases at Cost | | | Proceeds
from Sales | | | Net
Realized
Gain
(Loss) | | | Change in
Unrealized
Appreciation/
(Depreciation) | | | Value at
August 31, 2020 | | | Shares at
August 31,
2020 | | | Dividend
Income | | | Capital Gain
Distributions | |
JPMorgan U.S. Government Money Market Fund Class IM Shares (a) | | $ | — | | | $ | 111,875 | | | $ | 111,875 | | | $ | — | | | $ | — | | | $ | — | | | | — | | | $ | 8 | * | | $ | — | |
JPMorgan U.S. Government Money Market Fund Class Institutional Shares,
0.01% (a) (b) | | | 10,592,327 | | | | 46,687,285 | | | | 27,192,315 | | | | — | | | | — | | | | 30,087,297 | | | | 30,087,297 | | | | 16,620 | | | | — | |
| | | | | | | | | | | | | | | | | | | | | | | | | | | | | | | | | | | | |
Total | | $ | 10,592,327 | | | $ | 46,799,160 | | | $ | 27,304,190 | | | $ | — | | | $ | — | | | $ | 30,087,297 | | | | | | | $ | 16,628 | | | $ | — | |
| | | | | | | | | | | | | | | | | | | | | | | | | | | | | | | | | | | | |
Corporate Bond Research Enhanced ETF
| | | | | | | | | | | | | | | | | | | | | | | | | | | | | | | | | | | | |
| For the six months ended August 31, 2020 | |
| Security Description | | Value at
February 29,
2020 | | | Purchases
at Cost | | | Proceeds
from Sales | | | Net
Realized
Gain
(Loss) | | | Change in
Unrealized
Appreciation/
(Depreciation) | | | Value at
August 31,
2020 | | | Shares at
August 31,
2020 | | | Dividend
Income | | | Capital Gain
Distributions | |
JPMorgan U.S. Government Money Market Fund Class Institutional Shares,
0.01% (a) (b) | | $ | 326,606 | | | $ | 8,601,327 | | | $ | 8,780,194 | | | $ | — | | | $ | — | | | $ | 147,739 | | | | 147,739 | | | $ | 625 | | | $ | — | |
| | | | | | | | | | | | | | | | | | | | | | | | | | | | | | | | | | | | |
High Yield Research Enhanced ETF
| | | | | | | | | | | | | | | | | | | | | | | | | | | | | | | | | | | | |
| For the six months ended August 31, 2020 | |
| Security Description | | Value at
February 29,
2020 | | | Purchases
at Cost | | | Proceeds
from Sales | | | Net
Realized
Gain
(Loss) | | | Change in
Unrealized
Appreciation/
(Depreciation) | | | Value at
August 31,
2020 | | | Shares at
August 31,
2020 | | | Dividend
Income | | | Capital Gain
Distributions | |
JPMorgan U.S. Government Money Market Fund Class IM Shares (a) | | $ | 2,675,130 | | | $ | 9,260,615 | | | $ | 11,935,745 | | | $ | — | | | $ | — | | | $ | — | | | | — | | | $ | 3,631 | * | | $ | — | |
JPMorgan U.S. Government Money Market Fund Class Institutional Shares, 0.01% (a) (b) | | | 1,006,572 | | | | 62,921,538 | | | | 55,023,383 | | | | — | | | | — | | | | 8,904,727 | | | | 8,904,727 | | | | 3,008 | | | | — | |
| | | | | | | | | | | | | | | | | | | | | | | | | | | | | | | | | | | | |
Total | | $ | 3,681,702 | | | $ | 72,182,153 | | | $ | 66,959,128 | | | $ | — | | | $ | — | | | $ | 8,904,727 | | | | | | | $ | 6,639 | | | $ | — | |
| | | | | | | | | | | | | | | | | | | | | | | | | | | | | | | | | | | | |
International Bond Opportunities ETF
| | | | | | | | | | | | | | | | | | | | | | | | | | | | | | | | | | | | |
| For the six months ended August 31, 2020 | |
| Security Description | | Value at
February 29,
2020 | | | Purchases
at Cost | | | Proceeds
from Sales | | | Net
Realized
Gain
(Loss) | | | Change in
Unrealized
Appreciation/
(Depreciation) | | | Value at
August 31,
2020 | | | Shares at
August 31,
2020 | | | Dividend
Income | | | Capital Gain
Distributions | |
JPMorgan U.S. Government Money Market Fund Class Institutional Shares, 0.01% (a) (b) | | $ | 2,920,684 | | | $ | 66,614,393 | | | $ | 66,471,124 | | | $ | — | | | $ | — | | | $ | 3,063,953 | | | | 3,063,953 | | | $ | 10,327 | | | $ | — | |
| | | | | | | | | | | | | | | | | | | | | | | | | | | | | | | | | | | | |
Municipal ETF
| | | | | | | | | | | | | | | | | | | | | | | | | | | | | | | | | | | | |
| For the six months ended August 31, 2020 | |
| Security Description | | Value at
February 29,
2020 | | | Purchases at Cost | | | Proceeds
from Sales | | | Net
Realized
Gain
(Loss) | | | Change in
Unrealized
Appreciation/
(Depreciation) | | | Value at
August 31,
2020 | | | Shares at
August 31,
2020 | | | Dividend
Income | | | Capital Gain
Distributions | |
JPMorgan Institutional Tax Free Money Market Fund Class IM Shares,
0.04% (a) (b) | | $ | 5,501,376 | | | $ | 33,467,713 | | | $ | 37,073,345 | | | $ | (1,118 | ) | | $ | 58 | | | $ | 1,894,684 | | | | 1,893,358 | | | $ | 5,120 | | | $ | — | |
| | | | | | | | | | | | | | | | | | | | | | | | | | | | | | | | | | | | |
| | | | | | |
| | | |
| 242 | | | | J.P. MORGAN EXCHANGE-TRADED FUNDS | | AUGUST 31, 2020 |
U.S. Aggregate Bond ETF
| | | | | | | | | | | | | | | | | | | | | | | | | | | | | | | | | | | | |
| For the six months ended August 31, 2020 | |
| Security Description | | Value at
February 29,
2020 | | | Purchases at Cost | | | Proceeds
from Sales | | | Net
Realized
Gain
(Loss) | | | Change in
Unrealized
Appreciation/
(Depreciation) | | | Value at
August 31,
2020 | | | Shares at
August 31,
2020 | | | Dividend
Income | | | Capital Gain
Distributions | |
JPMorgan Securities Lending Money Market Fund Agency SL Class Shares, 0.32% (a) (b) | | $ | — | | | $ | 5,500,000 | | | $ | 2,000,000 | | | $ | — | | | $ | — | | | $ | 3,500,000 | | | | 3,498,950 | | | $ | 447 | * | | $ | — | |
JPMorgan U.S. Government Money Market Fund Class IM Shares, 0.07% (a) (b) | | | — | | | | 40,151,484 | | | | 39,646,254 | | | | — | | | | — | | | | 505,230 | | | | 505,230 | | | | 5,622 | * | | | — | |
JPMorgan U.S. Government Money Market Fund Class Institutional Shares, 0.01% (a) (b) | | | 1,208,867 | | | | 80,640,380 | | | | 80,420,472 | | | | — | | | | — | | | | 1,428,775 | | | | 1,428,775 | | | | 2,192 | | | | — | |
| | | | | | | | | | | | | | | | | | | | | | | | | | | | | | | | | | | | |
Total | | $ | 1,208,867 | | | $ | 126,291,864 | | | $ | 122,066,726 | | | $ | — | | | $ | — | | | $ | 5,434,005 | | | | | | | $ | 8,261 | | | $ | — | |
| | | | | | | | | | | | | | | | | | | | | | | | | | | | | | | | | | | | |
Ultra-Short Income ETF
| | | | | | | | | | | | | | | | | | | | | | | | | | | | | | | | | | | | |
| For the six months ended August 31, 2020 | |
| Security Description | | Value at
February 29,
2020 | | | Purchases
at Cost | | | Proceeds
from Sales | | | Net
Realized
Gain
(Loss) | | | Change in
Unrealized
Appreciation/
(Depreciation) | | | Value at
August 31,
2020 | | | Shares at
August 31,
2020 | | | Dividend
Income | | | Capital Gain
Distributions | |
JPMorgan Securities Lending Money Market Fund Agency SL Class Shares, 0.32% (a) (b) | | $ | 1,000,000 | | | $ | 220,000,000 | | | $ | 173,750,000 | | | $ | (5,899 | )* | | $ | — | | | $ | 47,244,101 | | | | 47,229,932 | | | $ | 60,009 | * | | $ | — | |
JPMorgan U.S. Government Money Market Fund Class IM Shares, 0.07% (a) (b) | | | 1,286,200 | | | | 209,969,307 | | | | 204,744,779 | | | | — | | | | — | | | | 6,510,728 | | | | 6,510,728 | | | | 9,690 | * | | | — | |
JPMorgan U.S. Government Money Market Fund Class Institutional Shares, 0.01% (a) (b) | | | 667,817,128 | | | | 6,139,457,824 | | | | 5,939,336,524 | | | | — | | | | — | | | | 867,938,428 | | | | 867,938,428 | | | | 1,149,503 | | | | — | |
| | | | | | | | | | | | | | | | | | | | | | | | | | | | | | | | | | | | |
Total | | $ | 670,103,328 | | | $ | 6,569,427,131 | | | $ | 6,317,831,303 | | | $ | (5,899 | ) | | $ | — | | | $ | 921,693,257 | | | | | | | $ | 1,219,202 | | | $ | — | |
| | | | | | | | | | | | | | | | | | | | | | | | | | | | | | | | | | | | |
Ultra-Short Municipal Income ETF
| | | | | | | | | | | | | | | | | | | | | | | | | | | | | | | | | | | | |
| For the six months ended August 31, 2020 | |
Security
Description | | Value at
February 29,
2020 | | | Purchases
at Cost | | | Proceeds
from Sales | | | Net
Realized
Gain
(Loss) | | | Change in
Unrealized
Appreciation/
(Depreciation) | | | Value at
August 31, 2020 | | | Shares at
August 31,
2020 | | | Dividend
Income | | | Capital Gain
Distributions | |
JPMorgan Institutional Tax Free Money Market Fund Class IM Shares, 0.04% (a) (b) | | $ | 8,637,248 | | | $ | 364,822,703 | | | $ | 275,709,415 | | | $ | (346 | ) | | $ | 7,222 | | | $ | 97,757,412 | | | | 97,689,030 | | | $ | 42,955 | | | $ | — | |
| | | | | | | | | | | | | | | | | | | | | | | | | | | | | | | | | | | | |
| | | | | | | | |
| | | |
| AUGUST 31, 2020 | | J.P. MORGAN EXCHANGE-TRADED FUNDS | | | | | 243 | |
NOTES TO FINANCIAL STATEMENTS
AS OF AUGUST 31, 2020 (Unaudited) (continued)
USD Emerging Markets Sovereign Bond ETF
| | | | | | | | | | | | | | | | | | | | | | | | | | | | | | | | | | | | |
|
| For the six months ended August 31, 2020 | |
| Security Description | | Value at
February 29,
2020 | | | Purchases
at Cost | | | Proceeds
from Sales | | | Net
Realized
Gain
(Loss) | | | Change in
Unrealized
Appreciation/
(Depreciation) | | | Value at
August 31,
2020 | | | Shares at
August 31,
2020 | | | Dividend
Income | | | Capital Gain
Distributions | |
JPMorgan U.S. Government Money Market Fund Class IM Shares, 0.07% (a) (b) | | $ | — | | | $ | 16,655,380 | | | $ | 14,872,167 | | | $ | — | | | $ | — | | | $ | 1,783,213 | | | | 1,783,213 | | | $ | 2,466 | * | | $ | — | |
JPMorgan U.S. Government Money Market Fund Class Institutional Shares, 0.01% (a) (b) | | | 355,735 | | | | 10,963,280 | | | | 10,847,525 | | | | — | | | | — | | | | 471,490 | | | | 471,490 | | | | 578 | | | | — | |
| | | | | | | | | | | | | | | | | | | | | | | | | | | | | | | | | | | | |
Total | | $ | 355,735 | | | $ | 27,618,660 | | | $ | 25,719,692 | | | $ | — | | | $ | — | | | $ | 2,254,703 | | | | | | | $ | 3,044 | | | $ | — | |
| | | | | | | | | | | | | | | | | | | | | | | | | | | | | | | | | | | | |
| (a) | Investment in an affiliated fund, which is registered under the Investment Company Act of 1940, as amended, and is advised by J.P. Morgan Investment Management Inc. |
| (b) | The rate shown is the current yield as of August 31, 2020. |
| * | Amount is included on the Statements of Operations as Income from securities lending (net) (after payments of rebates and Citibank’s fee). |
G. Foreign Currency Translation — The books and records of the Funds are maintained in U.S. dollars. Foreign currency amounts are translated into U.S. dollars at the prevailing exchange rates of such currencies against the U.S. dollar. The market value of investment securities and other assets and liabilities are translated at the exchange rate as of the valuation date. Purchases and sales of investment securities, income and expenses are translated at the exchange rate prevailing on the respective dates of such transactions.
The Funds do not isolate the effect of changes in foreign exchange rates from changes in market prices on securities held. Accordingly, such changes are included within Change in net unrealized appreciation/depreciation on investments on the SOP.
Reported realized foreign currency gains and losses arise from the disposition of foreign currency, currency gains or losses realized between the trade and settlement dates on securities transactions, and the difference between the amounts of dividends, interest and foreign withholding taxes recorded on each Fund’s books on the transaction date and the U.S. dollar equivalent of the amounts actually received or paid. These reported realized foreign currency gains and losses are included in Net realized gain (loss) on foreign currency transactions on the SOP. Unrealized foreign currency gains and losses arise from changes (due to changes in exchange rates) in the value of foreign currency and other assets and liabilities denominated in foreign currencies, which are held at year end and are included in Change in net unrealized appreciation/ depreciation on foreign currency translations on the SOP.
H. Derivatives — The Funds used derivative instruments including futures and forward foreign currency exchange contracts, in connection with their respective investment strategies. Derivative instruments may be used as substitutes for securities in which the Funds can invest, to hedge portfolio investments or to generate income or gain to the Funds. Derivatives may also be used to manage duration, sector and yield curve exposures and credit and spread volatility.
The Funds may be subject to various risks from the use of derivatives, including the risk that changes in the value of a derivative may not correlate perfectly with the underlying asset, rate or index; counterparty credit risk related to derivatives counterparties’ failure to perform under contract terms; liquidity risk related to the potential lack of a liquid market for these contracts allowing a Fund to close out its position(s); and documentation risk relating to disagreement over contract terms. Investing in certain derivatives also results in a form of leverage and as such, the Funds’ risk of loss associated with these instruments may exceed their value, as recorded on the SAL.
The Funds are party to various derivative contracts governed by International Swaps and Derivatives Association master agreements (“ISDA agreements”). The Funds’ ISDA agreements, which are separately negotiated with each dealer counterparty, may contain provisions allowing, absent other considerations, a counterparty to exercise rights, to the extent not otherwise waived, against the Funds in the event the Funds’ net assets decline over time by a pre-determined percentage or fall below a pre-determined floor. The ISDA agreements may also contain provisions allowing, absent other conditions, the Funds to exercise rights, to the extent not otherwise waived, against a counterparty (e.g., decline in a counterparty’s credit rating below a specified level). Such rights for both a counterparty and the Funds often include the ability to terminate (i.e., close out) open contracts at prices which may favor a counterparty, which could have an adverse effect on the Funds. The ISDA agreements give the Funds and a counterparty the right, upon an event of default, to close out all transactions traded under such agreements and to net amounts owed or due across all transactions and offset such net payable or receivable against collateral posted to a segregated account by one party for the benefit of the other.
Counterparty credit risk may be mitigated to the extent a counterparty posts additional collateral for mark to market gains to the Funds.
Notes (1) — (3) below describe the various derivatives used by the Funds.
| | | | | | |
| | | |
| 244 | | | | J.P. MORGAN EXCHANGE-TRADED FUNDS | | AUGUST 31, 2020 |
(1). Futures Contracts — The Core Bond Plus ETF, Corporate Bond Research Enhanced ETF, International Bond Opportunities ETF and Ultra-Short Income ETF used treasury futures contracts to manage and hedge interest rate risk associated with portfolio investments. The Funds also purchased futures contracts to immediately invest incoming cash in the market or sold futures in response to cash outflows, thereby simulating an invested position in the underlying index while maintaining a cash balance for liquidity.
Futures contracts provide for the delayed delivery of the underlying instrument at a fixed price or are settled for a cash amount based on the change in the value of the underlying instrument at a specific date in the future. Upon entering into a futures contract, the Funds are required to deposit with the broker, cash or securities in an amount equal to a certain percentage of the contract amount, which is referred to as the initial margin deposit. Subsequent payments, referred to as variation margin, are made or received by the Funds periodically and are based on changes in the market value of open futures contracts. Changes in the market value of open futures contracts are recorded as Change in net unrealized appreciation/depreciation on the Statements of Operations (“SOP”). Realized gains or losses, representing the difference between the value of the contract at the time it was opened and the value at the time it was closed, are reported on the SOP at the closing or expiration of the futures contract. Securities deposited as initial margin are designated on the SOIs, while cash deposited, which is considered restricted, is recorded on the SAL. A receivable from and/or a payable to brokers for the daily variation margin is also recorded on the SAL.
The use of futures contracts exposes the Funds to interest rate risk. The Funds may be subject to the risk that the change in the value of the futures contract may not correlate perfectly with the underlying instrument. Use of long futures contracts subjects the Funds to risk of loss in excess of the amounts shown on the SAL, up to the notional amount of the futures contracts. Use of short futures contracts subjects the Funds to unlimited risk of loss. The Funds may enter into futures contracts only on exchanges or boards of trade. The exchange or board of trade acts as the counterparty to each futures transaction; therefore, the Funds’ credit risk is limited to failure of the exchange or board of trade. Under some circumstances, futures exchanges may establish daily limits on the amount that the price of a futures contract can vary from the previous day’s settlement price, which could effectively prevent liquidation of positions.
The Funds’ futures contracts are not subject to master netting arrangements (the right to close out all transactions traded with a counterparty and net amounts owed or due across transactions).
(2). Forward Foreign Currency Exchange Contracts — The International Bond Opportunities ETF is exposed to foreign currency risks associated with some or all of the portfolio investments and used forward foreign currency exchange contracts to hedge or manage certain of these exposures as part of an investment strategy. The Fund also bought forward foreign currency exchange contracts to gain exposure to currencies. Forward foreign currency exchange contracts represent obligations to purchase or sell foreign currency on a specified future date at a price fixed at the time the contracts are entered into. Non-deliverable forward foreign currency exchange contracts are settled with the counterparty in U.S. Dollar without the delivery of the foreign currency.
The values of the forward foreign currency exchange contracts are adjusted daily based on the applicable exchange rate of the underlying currency. Changes in the value of these contracts are recorded as unrealized appreciation or depreciation until the contract settlement date. When the forward foreign currency exchange contract is closed, the Fund records a realized gain or loss equal to the difference between the value at the time the contract was opened and the value at the time it was closed. The Fund also records a realized gain or loss, upon settlement, when a forward foreign currency exchange contract offsets another forward foreign currency exchange contract with the same counterparty.
The Fund’s forward foreign currency exchange contracts are subject to master netting arrangements (the right to close out all transactions with a counterparty and net amounts owed or due across transactions).
The Fund may be required to post or receive collateral for non-deliverable forward foreign currency exchange contracts.
(3). Swaps — The International Bond Opportunities ETF engaged in various swap transactions, including credit default and index swaps, to manage credit and interest rate (e.g., duration, yield curve) risks within its portfolio. The Fund also used swaps as alternatives to direct investments. Swap transactions are contracts negotiated over the counter (“OTC swaps”) between the Fund and a counterparty or are centrally cleared (“centrally cleared swaps”) through a central clearinghouse managed by a Futures Commission Merchant (“FCM”) that exchange investment cash flows, assets, foreign currencies or market-linked returns at specified, future intervals.
Upfront payments made and/or received by the Fund are recorded as assets or liabilities, respectively, on the SAL and amortized over the term of the swap. The value of an OTC swap agreement is recorded as either an asset or a liability on the SAL at the beginning of the measurement period. Upon entering into a centrally cleared swap, the Fund is required to deposit with the FCM cash or securities, which is referred to as initial margin deposit. Securities deposited as initial margin are designated on the SOI, while cash deposited, which is considered restricted, is recorded on the SAL. Daily changes in valuation of centrally cleared swaps, if any, are recorded as a variation margin receivable or payable on the SAL. The change in the value of swaps, including accruals of periodic amounts of interest to be paid or received on swaps, is reported as Change in net unrealized appreciation/depreciation on the SOP. A realized gain or loss is recorded upon payment or receipt of a periodic payment or payment made upon termination of a swap agreement.
The central clearinghouse acts as the counterparty to each centrally cleared swap transaction, therefore credit risk is limited to the failure of the clearinghouse.
The Fund’s swap contracts (excluding centrally cleared swaps) are subject to master netting arrangements.
| | | | | | | | |
| | | |
| AUGUST 31, 2020 | | J.P. MORGAN EXCHANGE-TRADED FUNDS | | | | | 245 | |
NOTES TO FINANCIAL STATEMENTS
AS OF AUGUST 31, 2020 (Unaudited) (continued)
Credit Default Swaps
The International Bond Opportunities ETF entered into credit default and interest rate swaps to simulate long and/or short bond positions or to take an active long and/or short position with respect to the likelihood of a default or credit event by the issuer of the underlying reference obligation.
The underlying reference obligation may be a single issuer of corporate or sovereign debt, a basket of issuers or a credit index. A credit index is a list of credit instruments or exposures that reference a fixed number of obligors with shared characteristics that represents some part of the credit market as a whole. Index credit default swaps have standardized terms including a fixed spread and standard maturity dates. The composition of the obligations within a particular index changes periodically.
Credit default swaps involve one party, the protection buyer, making a stream of payments to another party, the protection seller, in exchange for the right to receive a contingent payment if there is a credit event related to the underlying reference obligation. In the event that the reference obligation matures prior to the termination date of the contract, a similar security will be substituted for the duration of the contract term. Credit events are defined under individual swap agreements and generally include bankruptcy, failure to pay, restructuring, repudiation/moratorium, obligation acceleration and obligation default.
If a credit event occurs, the Fund, as protection seller, would be obligated to make a payment, which may be either: (i) a net cash settlement equal to the notional amount of the swap less the auction value of the reference obligation or (ii) the notional amount of the swap in exchange for the delivery of the reference obligation. Selling protection effectively adds leverage to the Fund’s portfolio up to the notional amount of swap agreements. The notional amount represents the maximum potential liability under a contract and is not reflected on the SAL. Potential liabilities under these contracts may be reduced by: the auction rates of the underlying reference obligations; upfront payments received at the inception of a swap; and net amounts received from credit default swaps purchased with the identical reference obligation.
Interest Rate Swaps
The International Bond Opportunities ETF entered into interest rate swap contracts to manage fund exposure to interest rates or to either preserve or generate a return on a particular investment or portion of its portfolios. These are agreements between counterparties to exchange periodic interest payments based on interest rates. One cash flow stream will typically be a floating rate payment based upon a specified interest rate while the other is typically based on a fixed interest rate.
(4). Summary of Derivatives Information
The following tables present the value of derivatives held as of August 31, 2020 by their primary underlying risk exposure and respective location on the SAL:
| | | | | | |
|
| Core Plus Bond ETF | |
| Derivative Contracts | | Statements of Assets and Liabilities Location | | | |
| Gross Assets: | | | | Futures
Contracts (a) | |
| Interest rate contracts | | Receivables, Net assets — Unrealized Appreciation | | $ | 6,162 | |
| | | | | | |
| | |
Gross Liabilities: | | | | | |
| Interest rate contracts | | Payables, Net assets — Unrealized Depreciation | | $ | (13,356 | ) |
| | | | | | |
| (a) | This amount reflects the cumulative appreciation/depreciation of futures contracts as reported on the SOIs. The SAL only reflects the current day variation margin receivable/payable from/to brokers. |
| | | | | | |
|
| Corporate Bond Research Enhanced ETF | |
| Derivative Contracts | | Statements of Assets and Liabilities Location | | | |
| Gross Assets: | | | | Futures
Contracts (a) | |
| Interest rate contracts | | Receivables, Net assets — Unrealized Appreciation | | $ | 10,127 | |
| | | | | | |
| | |
Gross Liabilities: | | | | | |
| Interest rate contracts | | Payables, Net assets — Unrealized Depreciation | | $ | (13,559 | ) |
| | | | | | |
| (a) | This amount reflects the cumulative appreciation/depreciation of futures contracts as reported on the SOIs. The SAL only reflects the current day variation margin receivable/payable from/to brokers. |
| | | | | | |
| | | |
| 246 | | | | J.P. MORGAN EXCHANGE-TRADED FUNDS | | AUGUST 31, 2020 |
| | | | | | | | | | | | | | | | | | | | | | | | |
| International Bond Opportunities ETF | |
| Derivative Contracts | | Statements of Assets and Liabilities Location | | | | |
| Gross Assets: | | | | | Futures
Contracts (a) | | | Forward Foreign
Currency Exchange
Contracts | | | Centrally
Cleared
Swaps (b) | | | OTC Swaps | | | Total | |
| Credit contracts | | | Receivables | | | $ | — | | | $ | — | | | $ | — | | | $ | 124,926 | | | $ | 124,926 | |
| Foreign exchange contracts | | | Receivables | | | | — | | | | 126,308 | | | | — | | | | — | | | | 126,308 | |
| Interest rate contracts | |
| Receivables, Net assets
— Unrealized Appreciation |
| | | 93,815 | | | | — | | | | — | | | | — | | | | 93,815 | |
| | | | | | | | | | | | | | | | | | | | | | | | |
Total | | | | | | $ | 93,815 | | | $ | 126,308 | | | $ | — | | | $ | 124,926 | | | $ | 345,049 | |
| | | | | | | | | | | | | | | | | | | | | | | | |
| | | | | | |
Gross Liabilities: | | | | | | | | | | | | | | | | | | |
| Credit contracts | | | Payables | | | $ | — | | | $ | — | | | $ | (488,022 | ) | | $ | — | | | $ | (488,022 | ) |
| Foreign exchange contracts | | | Payables | | | | — | | | | (651,610 | ) | | | — | | | | — | | | | (651,610 | ) |
| Interest rate contracts | |
| Payables, Net assets
— Unrealized Depreciation |
| | | (104,054 | ) | | | — | | | | — | | | | — | | | | (104,054 | ) |
| | | | | | | | | | | | | | | | | | | | | | | | |
Total | | | | | | $ | (104,054 | ) | | $ | (651,610 | ) | | $ | (488,022 | ) | | $ | – | | | $ | (1,243,686 | ) |
| | | | | | | | | | | | | | | | | | | | | | | | |
| (a) | This amount reflects the cumulative appreciation/depreciation of futures contracts as reported on the SOIs. The SAL only reflects the current day variation margin receivable/payable from/to brokers. |
| (b) | This amount represents the value of centrally cleared swaps as reported on the SOIs. The SAL only reflect the current day variation margin receivable/payable from/to brokers. |
| | | | | | |
|
| Ultra-Short Income ETF | |
| Derivative Contracts | | Statements of Assets and Liabilities Location | | | |
| Gross Liabilities: | | | | Futures
Contracts (a) | |
| Interest rate contracts | | Payables, Net assets — Unrealized Depreciation | | $ | (623,818 | ) |
| | | | | | |
| (a) | This amount reflects the cumulative appreciation/depreciation of futures contracts as reported on the SOIs. The SAL only reflects the current day variation margin receivable/payable from/to brokers. |
The following tables present the effect of derivatives on the SOP for the six months ended August 31, 2020, by primary underlying risk exposure:
| | | | |
| Core Plus Bond ETF | |
| Amount of Realized Gain (Loss) on Derivatives Recognized on the Statements of Operations | |
| Derivative Contracts | | Futures
Contracts | |
Interest rate contracts | | $ | 150,897 | |
| | | | |
| Amount of Change in Unrealized Appreciation (Depreciation) on Derivatives Recognized on the Statements of Operations | |
| Derivative Contracts | | Futures
Contracts | |
Interest rate contracts | | $ | (76,578 | ) |
| | | | |
| Corporate Bond Research Enhanced ETF | |
| Amount of Realized Gain (Loss) on Derivatives Recognized on the Statements of Operations | |
| Derivative Contracts | | Futures
Contracts | |
Interest rate contracts | | $ | 1,193 | |
| | | | |
| Amount of Change in Unrealized Appreciation (Depreciation) on Derivatives Recognized on the Statements of Operations | |
| Derivative Contracts | | Futures
Contracts | |
Interest rate contracts | | $ | (5,952 | ) |
| | | | |
| | | | | | | | |
| | | |
| AUGUST 31, 2020 | | J.P. MORGAN EXCHANGE-TRADED FUNDS | | | | | 247 | |
NOTES TO FINANCIAL STATEMENTS
AS OF AUGUST 31, 2020 (Unaudited) (continued)
| | | | | | | | | | | | | | | | |
| International Bond Opportunities ETF | |
| Amount of Realized Gain (Loss) on Derivatives Recognized on the Statements of Operations | |
| Derivative Contracts | | Futures
Contracts | | | Forward Foreign
Currency Exchange
Contracts | | | Swaps | | | Total | |
Credit contracts | | $ | — | | | $ | — | | | $ | 1,932,794 | | | $ | 1,932,794 | |
Foreign exchange contracts | | | — | | | | (1,103,206 | ) | | | – | | | | (1,103,206 | ) |
Interest rate contracts | | | 998,146 | | | | — | | | | (109,392 | ) | | | 888,754 | |
| | | | | | | | | | | | | | | | |
Total | | $ | 998,146 | | | $ | (1,103,206 | ) | | $ | 1,823,402 | | | $ | 1,718,342 | |
| | | | | | | | | | | | | | | | |
|
| Amount of Change in Unrealized Appreciation (Depreciation) on Derivatives Recognized on the Statements of Operations | |
| Derivative Contracts | | Futures
Contracts | | | Forward Foreign
Currency Exchange
Contracts | | | Swaps | | | Total | |
Credit contracts | | $ | — | | | $ | — | | | $ | (1,008,576 | ) | | $ | (1,008,576 | ) |
Foreign exchange contracts | | | — | | | | (445,051 | ) | | | – | | | | (445,051 | ) |
Interest rate contracts | | | (51,293 | ) | | | — | | | | 49,487 | | | | (1,806 | ) |
| | | | | | | | | | | | | | | | |
Total | | $ | (51,293 | ) | | $ | (445,051 | ) | | $ | (959,089 | ) | | $ | (1,455,433 | ) |
| | | | | | | | | | | | | | | | |
| | | | |
| Ultra-Short Income ETF | |
| Amount of Realized Gain (Loss) on Derivatives Recognized on the Statements of Operations | |
Derivative Contracts | | Futures
Contracts | |
Interest rate contracts | | $ | 4,226,333 | |
| | | | |
| Amount of Change in Unrealized Appreciation (Depreciation) on Derivatives Recognized on the Statements of Operations | |
Derivative Contracts | | Futures
Contracts | |
Interest rate contracts | | $ | (428,836 | ) |
| | | | |
Derivatives Volume
The table below discloses the volume of the Funds’ futures contracts and forward foreign currency exchange contracts activity during the six months ended August 31, 2020. Please refer to the tables in the Summary of Derivatives Information for derivative-related gains and losses associated with volume activity.
| | | | | | | | | | | | | | | | |
| | | Core Plus
Bond ETF | | | Corporate
Bond Research
Enhanced ETF | | | International
Bond
Opportunities
ETF | | | Ultra-Short Income ETF | |
Futures Contracts — Interest: | | | | | | | | | | | | | | | | |
Average Notional Balance Long | | $ | 8,704,262 | | | $ | 2,840,142 | | | $ | 37,894,911 | | | $ | 1,818,884,879 | (a) |
Average Notional Balance Short | | | 1,606,650 | | | | 2,647,324 | | | | 28,713,115 | | | | 416,803,405 | |
Ending Notional Balance Long | | | 10,091,938 | | | | 3,055,000 | | | | 42,238,428 | | | | — | |
Ending Notional Balance Short | | | 2,167,594 | | | | 3,204,156 | | | | 45,171,492 | | | | 893,938,063 | |
| | | | |
Forward Foreign Currency Exchange Contracts: | | | | | | | | | | | | | | | | |
Average Settlement Value Purchased | | | — | | | | — | | | | 32,481,541 | | | | — | |
Average Settlement Value Sold | | | — | | | | — | | | | 71,425,839 | | | | — | |
Ending Settlement Value Purchased | | | — | | | | — | | | | 30,698,470 | | | | — | |
Ending Settlement Value Sold | | | — | | | | — | | | | 67,602,599 | | | | — | |
| | | | |
Credit Default Swaps: | | | | | | | | | | | | | | | | |
Average Notional Balance — Buy Protection | | | — | | | | — | | | | 14,462,784 | | | | — | |
Ending Notional Balance — Buy Protection | | | — | | | | — | | | | 11,251,832 | | | | — | |
| | | | |
Interest Rate-Related Swaps: | | | | | | | | | | | — | | | | | |
Average Notional Balance — Pays Fixed rate | | | — | | | | — | | | | 2,370,634 | (a) | | | — | |
Average Notional Balance — Receives Fixed rate | | | — | | | | — | | | | 8,718,620 | (a) | | | — | |
| (a) | For the period March 1, 2020 through March 31, 2020. |
| | | | | | |
| | | |
| 248 | | | | J.P. MORGAN EXCHANGE-TRADED FUNDS | | AUGUST 31, 2020 |
The Fund may be required to post or receive collateral based on the net value of the Fund’s outstanding OTC swap contracts with the counterparty in the form of cash or securities. Daily movement of collateral is subject to minimum threshold amounts. Collateral posted by the Fund is held in a segregated account at the Fund’s custodian bank. The cash collateral is included on the SAL as Restricted cash. Collateral received by the Fund is held in a separate segregated account maintained by JPMCB, an affiliate of the Funds. These amounts are not reflected on the Fund’s Statement of Assets and Liabilities and are disclosed in the table below.
The Fund’s derivative contracts collateral requirements and collateral posted or received by the counterparty as of August 31, 2020 are as follows:
| | | | | | | | | | | | |
| Fund | | | | Counterparty | | Value of
swap
contracts | | | Collateral
amount | |
International Bond Opportunities ETF | | Collateral Received | | Goldman Sachs International | | $ | 76,057 | | | $ | (60,000 | ) |
The Funds’ derivatives contracts held at August 31, 2020 are not accounted for as hedging instruments under GAAP.
I. Security Transactions and Investment Income — Investment transactions are accounted for on the trade date (the date the order to buy or sell is executed). Securities gains and losses are calculated on a specifically identified cost basis. Interest income is determined on the basis of coupon interest accrued using the effective interest method, which adjusts for amortization of premiums and accretion of discounts. Dividend income net of foreign taxes withheld, if any, is recorded on the ex-dividend date or when a Fund first learns of the dividend.
J. Federal Income Taxes — Each Fund is treated as a separate taxable entity for Federal income tax purposes. Each Fund’s policy is to comply with the provisions of the Internal Revenue Code (the “Code”) applicable to regulated investment companies and to distribute to shareholders all of its distributable net investment income and net realized capital gains on investments. Accordingly, no provision for Federal income tax is necessary. Management has reviewed the Funds’ tax positions for all open tax years and has determined that as of August 31, 2020, no liability for Federal income tax is required in the Funds’ financial statements for net unrecognized tax benefits. However, management’s conclusions may be subject to future review based on changes in, or the interpretation of, the accounting standards or tax laws and regulations. Each Fund’s Federal tax returns for the prior three fiscal years, or since inception if shorter, remain subject to examination by the Internal Revenue Service.
K. Foreign Taxes — The Funds may be subject to foreign taxes on income, gains on investments or currency purchases/repatriation, a portion of which may be recoverable. The Funds will accrue such taxes and recoveries as applicable, based upon their current interpretation of tax rules and regulations that exist in the markets in which they invest. When a capital gain tax is determined to apply, the Funds record an estimated deferred tax liability in an amount that would be payable if the securities were disposed of on the valuation date.
L. Distributions to Shareholders — Distributions from net investment income, if any, are generally declared and paid monthly. Net realized capital gains, if any, are distributed by each Fund at least annually. The amount of distributions from net investment income and net realized capital gains is determined in accordance with Federal income tax regulations, which may differ from GAAP. To the extent these “book/tax” differences are permanent in nature (i.e., that they result from other than timing of recognition — “temporary differences”), such amounts are reclassified within the capital accounts based on their Federal tax basis treatment.
3. Fees and Other Transactions with Affiliates
A. Management Fee — JPMIM manages the investments of each Fund pursuant to the Fund’s respective Management Agreement. For such services, JPMIM is paid a fee which is accrued daily and paid no more frequently than monthly based on each Fund’s respective average daily net assets at the following rate:
| | | | |
BetaBuilders 1-5 Year U.S Aggregate Bond ETF | | | 0.05 | % |
Core Plus Bond ETF | | | 0.40 | |
Corporate Bond Research Enhanced ETF | | | 0.14 | |
High Yield Research Enhanced ETF | | | 0.24 | |
International Bond Opportunities ETF | | | 0.50 | |
Municipal ETF | | | 0.24 | |
U.S. Aggregate Bond ETF | | | 0.07 | |
Ultra-Short Income ETF | | | 0.18 | |
Ultra-Short Municipal Income ETF | | | 0.18 | |
USD Emerging Markets Sovereign Bond ETF | | | 0.39 | |
Under the Management Agreements, JPMIM is responsible for substantially all expenses of the Fund, (including expenses of the Trust relating to each Fund), except for the management fees, payments under the Funds’ 12b-1 plan (if any), interest expenses, dividend and interest expenses related to short sales, taxes, acquired fund fees and expenses (other than fees for funds advised by the adviser and/or its affiliates), costs of holding shareholder meetings, and litigation and potential litigation and other extraordinary expenses not incurred in the ordinary course of the Fund’s business. Additionally, each Fund shall be responsible for its non-operating expenses, including brokerage commissions and fees and expenses associated with each Fund’s securities lending program, if applicable. For the avoidance of doubt, the Adviser’s payment of such expenses may be accomplished through a Fund’s payment of such expenses and a corresponding reduction in the fee payable to the Adviser, provided, however, that if the amount of expenses paid by a Fund exceeds the fee payable to the Adviser, the Adviser will reimburse that Fund for such amount.
| | | | | | | | |
| | | |
| AUGUST 31, 2020 | | J.P. MORGAN EXCHANGE-TRADED FUNDS | | | | | 249 | |
NOTES TO FINANCIAL STATEMENTS
AS OF AUGUST 31, 2020 (Unaudited) (continued)
B. Administration Fee — JPMIM provides administration services to the Funds. Pursuant to each Fund’s Management Agreement, JPMIM is compensated as described in Note 3.A.
JPMorgan Chase Bank, N.A. (“JPMCB”), a wholly-owned subsidiary of JPMorgan, serves as the Funds’ sub-administrator (the “Sub-administrator”). For its services as Sub-administrator, JPMCB receives a portion of the management fees payable to JPMIM.
C. Custodian, Accounting and Transfer Agent Fees — JPMCB provides custody, accounting and transfer agency services to the Funds. For performing these services, JPMIM pays JPMCB transaction and asset-based fees that vary according to the number of transactions and positions, plus out-of-pocket expenses.
Additionally, Authorized Participants generally pay transaction fees associated with the creation and redemption of fund shares. These fees are paid to JPMIM to offset certain custodian charges incurred by JPMIM covered under the Management Agreement.
Interest income earned on cash balances at the custodian, if any, is included in Interest income from affiliates on the SOP. Interest expense paid to the custodian related to cash overdrafts, if any, is included in Interest expense to affiliates on the SOP.
D. Waivers and Reimbursements — The Funds may invest in one or more money market funds advised by the Adviser (affiliated money market funds). The fees for affiliated money market funds are covered under the Management Agreement as described in Note 3.A.
E. Distribution Services — The Distributor or its agent distributes Creation Units for each Fund on an agency basis. The Distributor does not maintain a secondary market in shares of each Fund. JPMDS receives no fees for their distribution services under the distribution agreement with the Trust (the “Distribution Agreement”). Although the Trust does not pay any fees under the Distribution Agreement, JPMIM pays JPMDS for certain distribution related services.
F. Other — Certain officers of the Trust are affiliated with the Adviser, the Administrator and JPMDS. Such officers, with the exception of the Chief Compliance Officer, receive no compensation from the Funds for serving in their respective roles.
The Board designated and appointed a Chief Compliance Officer to the Funds pursuant to Rule 38a-1 under the 1940 Act. The fees associated with the Office of the Chief Compliance Officer are paid for by JPMIM as described in Note 3.A.
During the six months ended August 31, 2020, Core Plus Bond ETF, Corporate Bond Research Enhanced ETF, International Bond Opportunities ETF, Municipal ETF, Ultra-Short Income ETF and Ultra-Short Municipal Income ETF purchased securities from an underwriting syndicate in which the principal underwriter or members of the syndicate were affiliated with the Adviser.
The Securities and Exchange Commission (“SEC”) has granted an exemptive order permitting the Funds to engage in principal transactions with J.P. Morgan Securities LLC, an affiliated broker, involving taxable money market instruments, subject to certain conditions.
4. Investment Transactions
During the six months ended August 31, 2020, purchases and sales of investments (excluding short-term investments) were as follows:
| | | | | | | | | | | | | | | | |
| | | Purchases
(excluding U.S.
Government) | | | Sales
(excluding U.S.
Government) | | | Purchases
of U.S.
Government | | | Sales of
U.S.
Government | |
BetaBuilders 1-5 Year U.S. Aggregate Bond ETF | | $ | 7,640,180 | | | $ | 4,542,311 | | | $ | 5,344,458 | | | $ | 4,494,132 | |
Core Plus Bond ETF | | | 124,756,588 | | | | 87,047,408 | | | | 14,251,085 | | | | 7,226,869 | |
Corporate Bond Research
Enhanced ETF | | | 14,537,110 | | | | 7,887,197 | | | | 573,138 | | | | 539,284 | |
High Yield Research Enhanced ETF | | | 90,948,417 | | | | 42,612,251 | | | | — | | | | — | |
International Bond Opportunities ETF | | | 84,958,283 | | | | 86,414,158 | | | | 6,610,555 | | | | 2,163,069 | |
Municipal ETF | | | 28,933,859 | | | | 19,395,969 | | | | — | | | | — | |
U.S. Aggregate Bond ETF | | | 235,847,020 | | | | 132,605,746 | | | | 86,631,746 | | | | 59,015,063 | |
Ultra-Short Income ETF | | | 6,724,499,176 | | | | 4,319,187,912 | | | | 284,011,934 | | | | 721,541,926 | |
Ultra-Short Municipal Income ETF | | | 368,925,342 | | | | 123,872,315 | | | | — | | | | — | |
USD Emerging Markets Sovereign Bond ETF | | | 42,999,550 | | | | 23,234,130 | | | | — | | | | — | |
For the six months ended August 31, 2020, in-kind transactions associated with creations and redemptions were as follows:
| | | | | | | | |
| | | In-Kind
Creations | | | In-Kind
Redemptions | |
Corporate Bond Research Enhanced ETF | | $ | 1,178,282 | | | $ | — | |
High Yield Research Enhanced ETF | | | 33,615,367 | | | | 38,219,470 | |
U.S. Aggregate Bond ETF | | | 20,342,859 | | | | 15,695,299 | |
USD Emerging Markets Sovereign Bond ETF | | | — | | | | 23,007,595 | |
| | | | | | |
| | | |
| 250 | | | | J.P. MORGAN EXCHANGE-TRADED FUNDS | | AUGUST 31, 2020 |
5. Federal Income Tax Matters
For Federal income tax purposes, the estimated cost and unrealized appreciation (depreciation) in value of investments held at August 31, 2020 were as follows:
| | | | | | | | | | | | | | | | |
| | | Aggregate
Cost | | | Gross
Unrealized
Appreciation | | | Gross
Unrealized
Depreciation | | | Net Unrealized
Appreciation
(Depreciation) | |
BetaBuilders 1-5 Year U.S. Aggregate Bond ETF | | $ | 40,622,599 | | | $ | 1,323,420 | | | $ | 16,702 | | | $ | 1,306,718 | |
Core Plus Bond ETF | | | 121,138,484 | | | | 3,571,560 | | | | 384,892 | | | | 3,186,668 | |
Corporate Bond Research Enhanced ETF | | | 39,321,097 | | | | 3,542,990 | | | | 74,442 | | | | 3,468,548 | |
High Yield Research Enhanced ETF | | | 212,222,691 | | | | 5,354,155 | | | | 1,632,501 | | | | 3,721,654 | |
International Bond Opportunities ETF | | | 159,891,025 | | | | 7,966,921 | | | | 4,425,851 | | | | 3,541,070 | |
Municipal ETF | | | 58,327,169 | | | | 2,491,178 | | | | 292,155 | | | | 2,199,023 | |
U.S. Aggregate Bond ETF | | | 656,694,099 | | | | 27,555,660 | | | | 798,208 | | | | 26,757,452 | |
Ultra-Short Income ETF | | | 13,861,119,651 | | | | 130,617,461 | | | | 5,138,062 | | | | 125,479,399 | |
Ultra-Short Municipal Income ETF | | | 588,212,991 | | | | 2,848,318 | | | | 50,350 | | | | 2,797,968 | |
USD Emerging Markets Sovereign Bond ETF | | | 81,191,462 | | | | 4,048,681 | | | | 836,590 | | | | 3,212,091 | |
As of February 29, 2020, the following Funds had the following net capital loss carryforwards:
| | | | | | | | |
| | | Capital Loss Carryforward | |
| | | Short-Term | | | Long-Term | |
International Bond Opportunities ETF | | $ | 959,701 | | | $ | 2,182,707 | |
USD Emerging Markets Sovereign Bond ETF | | | 324,559 | | | | — | |
Net capital losses incurred after October 31, and within the taxable year are deemed to arise on the first business day of the Funds’ next taxable year.
For the year ended February 29, 2020, the Funds deferred to March 1, 2020 the following net capital losses of:
| | | | | | | | |
| | | Net Capital Losses (Gains) | |
| | | Short-
Term | | | Long-Term | |
International Bond Opportunities ETF | | $ | 439,019 | | | $ | 445,832 | |
Ultra-Short Municipal Income ETF | | | 27,516 | | | | (2,048 | ) |
During the year ended February 29, 2020, the following Funds utilized capital loss carryforwards as follows:
| | | | | | | | |
| | | Capital Loss Utilized | |
| | | Short-Term | | | Long-Term | |
Global Bond Opportunities ETF | | $ | 223,858 | | | $ | — | |
High Yield Research Enhanced ETF | | | 278,732 | | | | 77,763 | |
USD Emerging Markets Sovereign Bond ETF | | | 337,778 | | | | — | |
6. Capital Share Transactions
The Trust issues and redeems shares of the Funds only in Creation Units through the Distributor at NAV. Capital shares transactions detail can be found in the Statements of Changes in Net Assets.
Shares of the Funds may only be purchased or redeemed by Authorized Participants. Such Authorized Participants may from time to time hold, of record or beneficially, a substantial percentage of the Funds’ shares outstanding and act as executing or clearing broker for investment transactions on behalf of the Funds. An Authorized Participant is either (1) a “Participating Party” or other participant in the clearing process through the Continuous Net Settlement System of the National Securities Clearing Corporation (“NSCC”); or (2) a DTC Participant; which, in either case, must have executed an agreement with the Distributor.
Creation Units of a Fund may be created in advance of receipt by the Trust of all or a portion of the applicable basket of equity securities and other instruments (“Deposit Instruments”) and cash as described in the Funds’ registration statement. In these instances, the initial Deposit Instruments and cash must be deposited in an amount equal to the sum of the cash amount, plus at least 105%, for BetaBuilders 1-5 Year U.S. Aggregate Bond ETF, Corporate Bond Research Enhanced ETF, International Bond Opportunities ETF, High Yield Research Enhanced ETF, U.S. Aggregate Bond ETF, Ultra-Short Income ETF and USD Emerging Markets Sovereign Bond ETF, of the market value of undelivered Deposit Instruments. A transaction fee may be imposed to offset transfer and other transaction costs associated with the purchase or redemption of Creation Units.
| | | | | | | | |
| | | |
| AUGUST 31, 2020 | | J.P. MORGAN EXCHANGE-TRADED FUNDS | | | | | 251 | |
NOTES TO FINANCIAL STATEMENTS
AS OF AUGUST 31, 2020 (Unaudited) (continued)
Authorized Participants transacting in Creation Units for cash may also pay a variable fee to compensate the relevant fund for market impact expenses relating to investing in portfolio securities. Such variable fees, if any, are included in “Proceeds from shares issued” in the Statements of Changes in Net Assets.
7. Risks, Concentrations and Indemnifications
In the normal course of business, the Funds enter into contracts that contain a variety of representations which provide general indemnifications. Each Fund’s maximum exposure under these arrangements is unknown. The amount of exposure would depend on future claims that may be brought against each Fund. However, based on experience, the Funds expect the risk of loss to be remote.
As of August 31, 2020, the Adviser owns shares representing more than 10% of net assets of the following Funds:
| | | | |
| | | % of Ownership | |
BetaBuilders 1-5 Year U.S. Aggregate Bond ETF | | | 61 | % |
Core Plus Bond ETF | | | 16 | |
Corporate Bond Research Enhanced ETF | | | 66 | |
Municipal ETF | | | 43 | |
USD Emerging Markets Sovereign Bond ETF | | | 59 | |
As of August 31, 2020, JPMorgan SmartRetirement Blend Funds, which are affiliated funds of funds, owned in the aggregate, shares representing more than 10% of the net assets of a certain Fund as follows:
| | | | |
| | | JPMorgan
SmartRetirement Blend
Funds | |
U.S. Aggregate Bond ETF | | | 14.6 | % |
Significant shareholder transactions by the Adviser may impact the Funds’ performance.
The Core Plus Bond ETF, International Bond Opportunities ETF, U.S. Aggregate Bond ETF and Ultra-Short Income ETF are subject to risks associated with securities with contractual cash flows including asset backed and mortgage-related securities such as collateralized mortgage obligations, mortgage-pass-through securities and commercial mortgage-backed securities, including securities backed by sub-prime mortgage loans. The value, liquidity and related income of these securities are sensitive to changes in economic conditions, including real estate value, pre-payments, delinquencies and/or defaults, and may be adversely affected by shifts in the market’s perception of the issuers and changes in interest rates.
The High Yield Research Enhanced ETF invests in high yield securities that are not rated or rated below investment grade (commonly known as “junk bonds.”) These securities are considered to be high risk investments. Investments in lower-rated securities or unrated securities of comparable quality tend to be more sensitive to economic conditions than higher rated securities. Junk bonds involve a greater risk of default by the issuer because such securities are generally unsecured and are often subordinated to other creditors’ claims. The market price of these securities can change suddenly and unexpectedly. As a result, the Fund is intended for investors who are able and willing to assume a high degree of risk.
International Bond Opportunities ETF’s and USD Emerging Markets Sovereign Bond ETF’s investments in sovereign and corporate debt obligations within emerging market countries may be subject to potentially higher risks than investments in more developed markets and the prices of such investments may be volatile. The yields of emerging market debt obligations reflect, among other things, perceived credit risk. The consequences of political, social or economic instability in these markets may have disruptive effects on the market prices of the Funds’ investments and the income they generate, as well as the Funds’ ability to repatriate such amounts.
Derivatives may be riskier than other types of investments because they may be more sensitive to changes in economic and market conditions and could result in losses that significantly exceed the Funds’ original investment. Many derivatives create leverage thereby causing the Funds to be more volatile than they would have been if they had not used derivatives. Derivatives also expose the Funds to counterparty risk (the risk that the derivative counterparty will not fulfill its contractual obligations), including credit risk of the derivative counterparty. The possible lack of a liquid secondary market for derivatives and the resulting inability of the Funds to sell or otherwise close a derivatives position could expose the Funds to losses.
The International Bond Opportunities ETF is also subject to counterparty credit risk, which is the risk that a counterparty fails to perform on agreements with the Fund such as swaps, forward foreign currency exchange contracts and TBA securities.
The Funds are subject to interest rate and credit risk. The value of debt securities may decline as interest rates increase. The Funds could lose money if the issuer of a fixed income security is unable to pay interest or repay principal when it is due. The Funds invest in floating rate loans and other floating rate debt securities. Although these investments are generally less sensitive to interest rate changes than other fixed rate instruments, the value of floating rate loans and other floating rate investments may decline if their interest rates do not rise as quickly, or as much, as general interest rates. Many factors can cause interest rates to rise. Some examples include central bank monetary policy, rising inflation rates and general economic conditions. The Funds may face a heightened level of interest rate risk due to certain changes in monetary policy. During the periods when interest rates are low or there are negative interest rates, the Funds’ yield (and total return) also may be low or the Funds may be
| | | | | | |
| | | |
| 252 | | | | J.P. MORGAN EXCHANGE-TRADED FUNDS | | AUGUST 31, 2020 |
unable to maintain positive returns. The ability of the issuers of debt to meet their obligations may be affected by economic and political developments in a specific industry or region. The value of a Fund’s investments may be adversely affected if any of the issuers or counterparties it is invested in are subject to an actual or perceived deterioration in their credit quality.
The Funds may have elements of risk not typically associated with investments in the United States of America due to concentrated investments in a limited number of countries or regions, which may vary throughout the period depending on the Funds. Such concentrations may subject each Fund to additional risks resulting from political or economic conditions in such countries or regions and the possible imposition of adverse governmental laws or currency exchange restrictions could cause the securities and their markets to be less liquid and their prices to be more volatile than those of comparable U.S. securities.
Disruptions to creations and redemptions, the existence of significant market volatility or potential lack of an active trading market for the Shares (including through a trading halt), as well as other factors, may result in Shares trading significantly above (at a premium) or below (at a discount) to the NAV or to the intraday value of the Funds’ holdings. During such periods, investors may incur significant losses if shares are sold.
BetaBuilders 1-5 Year U.S. Aggregate Bond ETF and USD Emerging Markets Sovereign Bond ETF may not track the return of their underlying index for a number of reasons and therefore may not achieve their investment objective. For example, the Funds incur a number of operating expenses not applicable to their underlying index, and incur costs in buying and selling securities, especially when rebalancing the Funds’ securities holdings to reflect changes in the composition of the underlying index. In addition, each Fund’s return may differ from the return of its underlying index as a result of, among other things, pricing differences and the inability to purchase certain securities included in the underlying index due to regulatory or other restrictions. To the extent of the previously outlined items, the Funds’ return may differ from the return of the underlying index.
The London InterBank Offered Rate (“LIBOR”) is intended to represent the rate at which contributing banks may obtain short-term borrowings from each other in the London interbank market. The regulatory authority that oversees financial services firms and financial markets in the U.K. has announced that, after the end of 2021, it would no longer persuade or compel contributing banks to make rate submissions for purposes of determining the LIBOR rate. As a result, it is possible that commencing in 2022, LIBOR may no longer be available or no longer deemed an appropriate reference rate upon which to determine the interest rate on or impacting certain loans, notes, derivatives and other instruments or investments comprising some or all of a Fund’s portfolio. In light of this eventuality, public and private sector industry initiatives are currently underway to identify new or alternative reference rates to be used in place of LIBOR. There is no assurance that the composition or characteristics of any such alternative reference rate will be similar to or produce the same value or economic equivalence as LIBOR or that it will have the same volume or liquidity as did LIBOR prior to its discontinuance or unavailability, which may affect the value or liquidity or return on certain investments of a Fund and result in costs incurred in connection with closing out positions and entering into new trades. These risks may also apply with respect to changes in connection with other interbank offering rates (e.g., Euribor) and a wide range of other index levels, rates and values that are treated as “benchmarks” and are the subject of recent regulatory reform.
The Funds are subject to infectious disease epidemics/pandemics risk. Recently, the worldwide outbreak of COVID-19, a novel coronavirus disease, has negatively affected economies, markets and individual companies throughout the world. The effects of this COVID-19 pandemic to public health, and business and market conditions, including exchange trading suspensions and closures may continue to have a significant negative impact on the performance of a Fund’s investments, increase a Fund’s volatility, negatively impact a Fund’s arbitrage and pricing mechanisms, exacerbate other pre-existing political, social and economic risks to the Funds and negatively impact broad segments of businesses and populations. The Funds’ operations may be interrupted as a result, which may have a significant negative impact on investment performance. In addition, governments, their regulatory agencies, or self-regulatory organizations may take actions in response to the pandemic that affect the instruments in which the Funds invest, or the issuers of such instruments, in ways that could also have a significant negative impact on a Fund’s investment performance. The full impact of this COVID-19 pandemic, or other future epidemics/pandemics, is currently unknown.
| | | | | | | | |
| | | |
| AUGUST 31, 2020 | | J.P. MORGAN EXCHANGE-TRADED FUNDS | | | | | 253 | |
SCHEDULE OF SHAREHOLDER EXPENSES
(Unaudited)
Hypothetical $1,000 Investment
As a shareholder of the Funds, you incur two types of costs: (1) transaction costs, including brokerage commissions on your purchase and sales of Fund Shares and (2) ongoing costs, primarily management fees. The examples assume that you had a $1,000 investment at the beginning of the reporting period, March 1, 2020 and continued to hold your shares at the end of the reporting period, August 31, 2020.
Actual Expenses
For the Fund in the table below, the first line provides information about actual account values and actual expenses. You may use the information in this line, together with the amount you invested, to estimate the expenses that you paid over the period. Simply divide your account value by $1,000 (for example, an $8,600 account value divided by $1,000 = 8.6), then multiply the result by the number under the heading titled “Expenses Paid During the Period” to estimate the expenses you paid on your account during this period.
Hypothetical Example for Comparison Purposes
The second line in the table below provides information about hypothetical account values and hypothetical expenses based on the Fund’s actual expense ratio and an assumed rate of return of 5% per year before expenses, which is not the Fund’s actual return. The hypothetical account values and expenses may not be used to estimate the actual ending account balance or expenses you paid for the period. You may use this information to compare the ongoing costs of investing in the Fund and other Funds. To do so, compare this 5% hypothetical example with the 5% hypothetical examples that appear in the shareholder reports of other funds. The examples also assume all dividends and distributions have been reinvested. The examples do not take into account brokerage commissions that you pay when purchasing or selling shares of a Fund.
| | | | | | | | | | | | | | | | |
| | | Beginning
Account Value
March 1, 2020 | | | Ending
Account Value
August 31, 2020 | | | Annualized
Expense
Ratio (1) | | | Expenses
Paid During
the Period | |
JPMorgan BetaBuilders 1-5 Year U.S. Aggregate Bond ETF | |
Actual | | $ | 1,000.00 | | | $ | 1,022.70 | | | | 0.05 | % | | $ | 0.25 | |
Hypothetical | | | 1,000.00 | | | | 1,024.95 | | | | 0.05 | | | | 0.26 | |
JPMorgan Core Plus Bond ETF | |
Actual | | | 1,000.00 | | | | 1,036.00 | | | | 0.36 | | | | 1.85 | |
Hypothetical | | | 1,000.00 | | | | 1,023.39 | | | | 0.36 | | | | 1.84 | |
JPMorgan Corporate Bond Research Enhanced ETF | |
Actual | | | 1,000.00 | | | | 1,030.00 | | | | 0.14 | | | | 0.72 | |
Hypothetical | | | 1,000.00 | | | | 1,024.50 | | | | 0.14 | | | | 0.71 | |
JPMorgan High Yield Research Enhanced ETF | |
Actual | | | 1,000.00 | | | | 1,029.70 | | | | 0.24 | | | | 1.23 | |
Hypothetical | | | 1,000.00 | | | | 1,024.00 | | | | 0.24 | | | | 1.22 | |
JPMorgan International Bond Opportunities ETF
(formerly known as JPMorgan Global Bond Opportunities ETF) | | | | | |
Actual | | | 1,000.00 | | | | 1,024.70 | | | | 0.49 | | | | 2.50 | |
Hypothetical | | | 1,000.00 | | | | 1,022.74 | | | | 0.49 | | | | 2.50 | |
JPMorgan Municipal ETF | |
Actual | | | 1,000.00 | | | | 997.50 | | | | 0.23 | | | | 1.16 | |
Hypothetical | | | 1,000.00 | | | | 1,024.05 | | | | 0.23 | | | | 1.17 | |
JPMorgan U.S. Aggregate Bond ETF | |
Actual | | | 1,000.00 | | | | 1,028.40 | | | | 0.07 | | | | 0.36 | |
Hypothetical | | | 1,000.00 | | | | 1,024.85 | | | | 0.07 | | | | 0.36 | |
JPMorgan Ultra-Short Income ETF | |
Actual | | | 1,000.00 | | | | 1,012.90 | | | | 0.16 | | | | 0.81 | |
Hypothetical | | | 1,000.00 | | | | 1,024.40 | | | | 0.16 | | | | 0.82 | |
JPMorgan Ultra-Short Municipal Income ETF | |
Actual | | | 1,000.00 | | | | 1,013.50 | | | | 0.17 | | | | 0.86 | |
Hypothetical | | | 1,000.00 | | | | 1,024.35 | | | | 0.17 | | | | 0.87 | |
JPMorgan USD Emerging Markets Sovereign Bond ETF | |
Actual | | | 1,000.00 | | | | 987.10 | | | | 0.39 | | | | 1.95 | |
Hypothetical | | | 1,000.00 | | | | 1,023.24 | | | | 0.39 | | | | 1.99 | |
| (1) | Expenses are equal to each Fund’s annualized net expense ratio, multiplied by the average account value over the period, multiplied by 184/365 (to reflect the one-half year period). |
| | | | | | |
| | | |
| 254 | | | | J.P. MORGAN EXCHANGE-TRADED FUNDS | | AUGUST 31, 2020 |
LIQUIDITY RISK MANAGEMENT PROGRAM
(Unaudited)
Each of the Funds has adopted the J.P. Morgan Exchange-Traded Funds Liquidity Risk Management Program (the “Program”) under Rule 22e-4 under the 1940 Act (the “Liquidity Rule”). The Program seeks to assess, manage and review each Fund’s Liquidity Risk. “Liquidity Risk” is defined as the risk that a fund could not meet requests to redeem shares issued by the fund without significant dilution of remaining investors’ interests in the fund. Among other things, the Liquidity Rule requires that a written report be provided to the Board of Trustees (the “Board”) on an annual basis that addresses the operation of the Program and assesses the adequacy and effectiveness of its implementation, including the operation of any Highly Liquidity Investment Minimum (“HLIM”), where applicable, and any material changes to the Program.
The Board has appointed J.P. Morgan Asset Management’s Liquidity Risk Forum to be the program administrator for the Program (the “Program Administrator”). On March 9, 2020, the Board of Trustees reviewed the Program Administrator’s initial written report (the “Report”) concerning the operation of the Program for the period from December 1, 2018 through December 31, 2019 (the “Program Reporting Period”). The Report addressed the operation of the Program and assessed its adequacy and effectiveness of implementation, including, where applicable, the operation of a Fund’s HLIM. There were no material changes to the Program during the Program Reporting Period.
The Report summarized the operation of the Program and the information and factors considered by the Program Administrator in
assessing whether the Program has been adequately and effectively implemented with respect to each Fund. Such information and factors included, among other things: (1) the effectiveness of the Program with respect to the identification of each Fund that qualifies as an “In-Kind ETF” (as defined in the Liquidity Rule); (2) the liquidity risk framework used to assess, manage, and periodically review each Fund’s Liquidity Risk and the results of this assessment; (3) the methodology and inputs for classifying the investments of a Fund (other than an In-Kind ETF) into one of four liquidity categories that reflect an estimate of their liquidity under current market conditions (and, for In-Kind ETFs, the methodology and inputs for determining whether any investments should be classified as “illiquid investments” (as defined under the Liquidity Rule)): (4) whether a Fund (other than an In-Kind ETF) invested primarily in “Highly Liquid Investments” (as defined under the Liquidity Rule), whether an HLIM should be established for such a Fund and the procedures for monitoring any HLIM; (5) whether a Fund invested more than 15% of its assets in “Illiquid Investments” and the procedures for monitoring for this limit; and (6) specific liquidity events arising during the Program Reporting Period, including the impact on Fund liquidity caused by extended non-U.S. market closures.
Based on this review, the Report concluded that: (1) the Program continues to be reasonably designed to effectively assess and manage each Fund’s Liquidity Risk; and (2) the Program has been adequately and effectively implemented with respect to each Fund during the Program Reporting Period.
| | | | | | | | |
| | | |
| AUGUST 31, 2020 | | J.P. MORGAN EXCHANGE-TRADED FUNDS | | | | | 255 | |
J.P. Morgan Exchange-Traded Funds are distributed by JPMorgan Distribution Services, Inc., an indirect, wholly-owned subsidiary of JPMorgan Chase & Co.
Contact J.P. Morgan Exchange-Traded Funds at 1-844-457-6383 (844-4JPM ETF) for a fund prospectus. You can also visit us at www.jpmorganfunds.com. Investors should carefully consider the investment objectives and risks as well as charges and expenses of the fund before investing. The prospectus contains this and other information about the fund. Read the prospectus carefully before investing.
Investors may obtain information about the Securities Investor Protection Corporation (SIPC), including the SIPC brochure, by visiting www.sipc.org or by calling SIPC at 202-371-8300.
Each Fund files a complete schedule of its fund holdings for the first and third quarters of its fiscal year with the SEC as an exhibit to its report on Form N-PORT. The Funds’ Form N-PORT reports are available on the SEC’s website at http://www.sec.gov. The Fund’s quarterly holdings can be found by visiting the J.P. Morgan Funds’ website at www.jpmorganfunds.com.
A description of each Fund’s policies and procedures with respect to the disclosure of each Fund’s holdings is available in the prospectus and Statement of Additional Information.
A copy of proxy policies and procedures is available without charge upon request by calling 1-844-457-6383 and on the Funds’ website at www.jpmorganfunds.com. A description of such policies and procedures is on the SEC’s website at www.sec.gov. The Trustees have delegated the authority to vote proxies for securities owned by the Fund to the Adviser. A copy of the Funds’ voting record for the most recent 12-month period ended June 30 is available on the SEC’s website at www.sec.gov or at the Funds’ website at www.jpmorganfunds.com no later than August 31 of each year. The Funds’ proxy voting record will include, among other things, a brief description of the matter voted on for each fund security, and will state how each vote was cast, for example, for or against the proposal.


J.P. Morgan Asset Management is the brand name for the asset management business of JPMorgan Chase & Co. and its affiliates worldwide.
| | | | |
| | © JPMorgan Chase & Co., 2020. All rights reserved. August 2020. | | SAN-FIETF-820 |
Semi-Annual Report
J.P. Morgan Exchange-Traded Funds
August 31, 2020 (Unaudited)
JPMorgan BetaBuilders MSCI US REIT ETF
Beginning on January 1, 2021, as permitted by regulations adopted by the Securities and Exchange Commission, paper copies of the Fund’s annual and semi-annual shareholder reports will no longer be sent by mail, unless you specifically request paper copies of the reports. Instead, the reports will be made available on the Fund’s website www.jpmorganfunds.com and you will be notified by mail each time a report is posted and provided with a website to access the report. If you already elected to receive shareholder reports electronically, you will not be affected by this change and you need not take any action.
You may elect to receive shareholder reports and other communications from the Fund electronically anytime by contacting your financial intermediary (such as a broker dealer, bank, or retirement plan).
Alternatively, you may elect to receive paper copies of all future reports free of charge by contacting your financial intermediary. Your election to receive paper reports will apply to all funds held within your account(s).
CONTENTS
Investments in the Fund are not bank deposits or obligations of, or guaranteed or endorsed by, any bank and are not insured or guaranteed by the FDIC, the Federal Reserve Board or any other government agency. You could lose money if you sell when the Fund’s share price is lower than when you invested.
Past performance is no guarantee of future performance. The general market views expressed in this report are opinions based on market and other conditions through the end of the reporting period and are subject to change without notice. These views are not intended to predict the future performance of the Fund or the securities markets. References to specific securities and their issuers are for illustrative purposes only and are not intended to be, and should not be interpreted as, recommendations to purchase or sell such securities. Such views are not meant as investment advice and may not be relied on as an indication of trading intent on behalf of the Fund.
Prospective investors should refer to the Fund’s prospectus for a discussion of the Fund’s investment objectives, strategies and risks. Call J.P. Morgan Exchange-Traded Funds at (844) 457-6383 for a prospectus containing more complete information about the Fund, including management fees and other expenses. Please read it carefully before investing.
Shares are bought and sold throughout the day on an exchange at market price (not at net asset value) through a brokerage account, and are not individually subscribed and redeemed from the Fund. Shares may only be subscribed and redeemed directly from the Fund by Authorized Participants, in large creation/redemption units. Brokerage commissions will reduce returns.
PRESIDENT’S LETTER
October 6, 2020 (Unaudited)
Dear Shareholder,
While the U.S. economy has suffered from a severe contraction and historically high job losses, financial markets have managed to rebound from lows reached in March 2020, backed by unprecedented central bank support, strength in corporate earnings in select sectors and investor optimism about efforts to contain the spread of COVID-19.
| | |
 | | “While the economic and financial market environments may remain challenging, J.P. Morgan Exchange-Traded Funds will continue to seek to provide innovative and quality solutions to help investors build durable portfolios.” – Brian S. Shlissel |
The six month reporting period that ended August 31, 2020, began amid a sharp sell-off in financial markets as the World Health Organization declared the novel coronavirus a pandemic and large sectors of national economies across the globe closed down. The U.S. Federal Reserve (the Fed) responded by cutting interest rates and headed off a potential liquidity crisis in financial markets by creating an array of lending and asset purchase programs in the second half of March 2020. In the following months, financial market volatility subsided and asset prices generally began to rebound.
Meanwhile, the U.S. Congress also responded with a $2.2 trillion fiscal stimulus package that included direct payments to individuals, increased unemployment compensation and aid to state and local governments and businesses. However, the
stimulus program ended in July 2020 and negotiations for further stimulus remained deadlocked at the end of the reporting period. Over the course of the period, U.S. unemployment fell from a high of 14.7% in April to 8.4% in August. By the end of the second quarter of 2020, U.S. gross domestic product had decreased 31.4%.
However, financial markets largely provided positive returns for the reporting period despite investor uncertainty over the trajectory of the pandemic and the outcome of U.S. elections. For the six months ended August 31, 2020, the S&P 500 Index returned 19.6% and the Bloomberg Barclays U.S. Aggregate Index returned 2.9%.
While the economic and financial market environments may remain challenging, J.P. Morgan Exchange-Traded Funds will continue to seek to provide innovative and quality solutions to help investors build durable portfolios.
Sincerely,

Brian S. Shlissel
Interim President, J.P. Morgan Exchange-Traded Funds
J.P Morgan Asset Management
1-844-4JPM-ETF or jpmorgan.com/etfs for more information
| | | | | | | | |
| | | |
| AUGUST 31, 2020 | | J.P. MORGAN EXCHANGE-TRADED FUNDS | | | | | 1 | |
JPMorgan BetaBuilders MSCI US REIT ETF
FUND COMMENTARY
SIX MONTHS ENDED AUGUST 31, 2020 (Unaudited)
| | | | |
| REPORTING PERIOD RETURN: | | | |
| Net Asset Value* | | | (8.02)% | |
| Market Price** | | | (8.08)% | |
| MSCI US REIT Index | | | (8.08)% | |
| |
| Net Assets as of 8/31/2020 | | $ | 902,167,810 | |
INVESTMENT OBJECTIVE***
The JPMorgan BetaBuilders MSCI US REIT ETF (the “Fund”) seeks investment results that closely correspond, before fees and expenses, to the performance of the MSCI US REIT Index (the “Underlying Index”).
INVESTMENT APPROACH
The Underlying Index is a free-float adjusted market-cap weighted index made up of the stocks of publicly traded equity real estate investment trusts (REITs). Using a passive investment approach, the Fund attempts to replicate the Underlying Index as closely as possible and invests at least 80% of its assets in securities included in the Underlying Index.
HOW DID THE MARKET PERFORM?
Overall, real estate equity sector underperformed the broader equity market, largely due to investor concerns about the impact of the COVID-19 pandemic on the leisure and shopping center real estate investment trusts (REITs). However, demand for lumber increased as low interest rates provided support for
new home construction and at-home quarantines led to a surge in do-it-yourself projects. Data center REITs benefitted from the mass adoption of work-from-home arrangements.
HOW DID THE FUND PERFORM?
For the six months ended August 31, 2020, the Fund performed in line with the Underlying Index, before considering the effects of operating expenses, fees and tax management of the Fund’s portfolio.
The Fund’s and the Underlying Index’s exposures to the specialized and industrial REIT sectors were leading contributors to absolute performance. The Fund’s and the Underlying Index’s exposures to the retail REIT and residential sectors were leading detractors from absolute performance.
HOW WAS THE FUND POSITIONED?
At the end of the reporting period, the Fund’s and the Underlying Index’s largest allocations were to the specialized and residential REIT sectors and the smallest allocations were to the diversified and the hotel & resorts REIT sectors.
| | | | | | |
| | | |
| 2 | | | | J.P. MORGAN EXCHANGE-TRADED FUNDS | | AUGUST 31, 2020 |
| | | | | | | | |
| TOP TEN EQUITY HOLDINGS OF THE PORTFOLIO**** | |
| | 1. | | | Prologis, Inc. | | | 8.3 | % |
| | 2. | | | Equinix, Inc. | | | 7.7 | |
| | 3. | | | Digital Realty Trust, Inc. | | | 4.6 | |
| | 4. | | | Public Storage | | | 3.7 | |
| | 5. | | | Welltower, Inc. | | | 2.6 | |
| | 6. | | | AvalonBay Communities, Inc. | | | 2.4 | |
| | 7. | | | Realty Income Corp. | | | 2.3 | |
| | 8. | | | Alexandria Real Estate Equities, Inc. | | | 2.3 | |
| | 9. | | | Equity Residential | | | 2.3 | |
| | 10. | | | Simon Property Group, Inc. | | | 2.3 | |
| | | | |
PORTFOLIO COMPOSITION BY SECTOR**** | |
| Industrial | | | 24.8 | % |
| Apartments | | | 21.6 | |
| Health Care | | | 10.6 | |
| Office | | | 10.0 | |
| Storage | | | 9.6 | |
| Diversified | | | 8.0 | |
| Shopping Centers | | | 3.6 | |
| Hotels | | | 3.0 | |
| Regional Malls | | | 2.7 | |
| Short-Term Investments | | | 6.1 | |
| * | | The return shown is based on net asset value and may differ from the return shown in the financial highlights, which reflects adjustments made to the net asset value in accordance with accounting principles generally accepted in the United States of America. The net asset value was $74.87 as of August 31, 2020. |
| ** | | Market price return was calculated assuming an initial investment made at the market price at the beginning of the reporting period, reinvestment of all dividends and distributions at market price during the period, and sale at the market price on the last day of the period. The price used to calculate the market price return was the closing price on the Cboe BZX Exchange, Inc. As of August 31, 2020, the closing price was $74.92. |
| *** | | The adviser seeks to achieve the Fund’s objective. There can be no guarantee it will be achieved. |
| **** | | Percentages indicated are based on total investments as of August 31, 2020. The Fund’s composition is subject to change. |
| | | | | | | | |
| | | |
| AUGUST 31, 2020 | | J.P. MORGAN EXCHANGE-TRADED FUNDS | | | | | 3 | |
JPMorgan BetaBuilders MSCI US REIT ETF
FUND COMMENTARY
SIX MONTHS ENDED AUGUST 31, 2020 (Unaudited) (continued)
| | | | | | | | | | | | | | | | |
AVERAGE ANNUAL TOTAL RETURNS AS OF AUGUST 31, 2020 (Unaudited) | |
| | | INCEPTION DATE | | | SIX MONTHS* | | | 1 YEAR | | | SINCE INCEPTION | |
JPMorgan BetaBuilders MSCI US REIT ETF | | | | | | | | | | | | | | | | |
Net Asset Value | | | June 15, 2018 | | | | (8.02 | )% | | | (12.60 | )% | | | 2.11% | |
Market Price | | | | | | | (8.08 | )% | | | (12.52 | )% | | | 2.14% | |
LIFE OF FUND PERFORMANCE (6/15/18 TO 8/31/20)
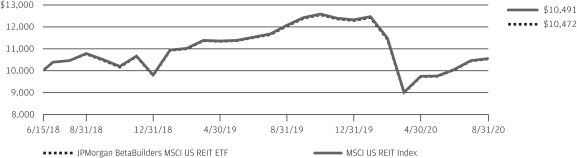
The performance quoted is past performance and is not a guarantee of future results. Exchange-traded funds are subject to certain market risks. Investment returns and principal value of an investment will fluctuate so that an investor’s shares, when sold or redeemed, may be worth more or less than their original cost. Current performance may be higher or lower than the performance data shown. For up-to-date, month-end performance information please call 1-844-457-6383.
Fund commenced operations on June 15, 2018.
The graph illustrates comparative performance for $10,000 invested in shares of the JPMorgan BetaBuilders MSCI US REIT ETF and the MSCI US REIT Index from June 15, 2018 to August 31, 2020. The performance of the Fund reflects the deduction of Fund expenses and assumes reinvestment of all dividends and capital gain distributions, if any. The performance of the MSCI US REIT Index does not reflect the deduction of expenses associated with an exchange-traded fund and has been adjusted to reflect reinvestment of all dividends and capital gain distributions of the securities included in the Index, if applicable. The Underlying Index is a free-float adjusted market-cap weighted index designed to measure the performance of U.S. equity real estate investment trust (REIT) securities. The Underlying Index is made up of the stocks of publicly traded U.S. equity REITs, as determined by MSCI Inc., the index provider. To be included
initially in the Underlying Index, an equity REIT must meet certain criteria established by the index provider, including meeting a minimum market capitalization threshold as well as a liquidity threshold based on a number of factors, including trading volume and frequency of trading. Equity REITs in the Underlying Index tend to be small- and mid-cap stocks, and may include Health Care REITs, Hotel & Resort REITs, Industrial REITs, Office REITs, Residential REITs, Retail REITs, Diversified REITs and certain Specialized REITs. Specialized REITs that may be included in the Underlying Index own and/or operate (i) storage and self-storage facilities, (ii) data centers, (iii) correctional facilities, (iv) theaters, (v) casinos and gaming facilities or (vi) restaurants.
Fund performance reflects the waiver of the Fund’s fees and reimbursement of expenses for certain periods since the Fund’s inception date. Without these waivers and reimbursements, performance would have been lower. Also, performance shown in this section does not reflect the deduction of taxes that a shareholder may pay on Fund distributions or on gains resulting from redemption or sale of Fund shares.
The returns shown are based on net asset values calculated for shareholder transactions and may differ from the returns shown in the financial highlights, which reflect adjustments made to the net asset values in accordance with accounting principles generally accepted in the United States of America.
| | | | | | |
| | | |
| 4 | | | | J.P. MORGAN EXCHANGE-TRADED FUNDS | | AUGUST 31, 2020 |
JPMorgan BetaBuilders MSCI US REIT ETF
SCHEDULE OF PORTFOLIO INVESTMENTS
AS OF AUGUST 31, 2020 (Unaudited)
| | | | | | | | |
| INVESTMENTS | | SHARES | | | VALUE($) | |
Common Stocks — 99.4% | | | | | | | | |
|
Apartments — 22.8% | |
Agree Realty Corp., REIT (a) | | | 56,469 | | | | 3,778,905 | |
American Campus Communities, Inc., REIT | | | 144,294 | | | | 4,891,567 | |
American Homes 4 Rent, Class A, REIT | | | 283,425 | | | | 8,117,292 | |
Apartment Investment & Management Co., Class A, REIT | | | 156,102 | | | | 5,624,355 | |
AvalonBay Communities, Inc., REIT | | | 147,573 | | | | 23,325,388 | |
Camden Property Trust, REIT | | | 102,116 | | | | 9,286,429 | |
Equity LifeStyle Properties, Inc., REIT | | | 181,452 | | | | 12,028,453 | |
Equity Residential, REIT | | | 390,218 | | | | 22,027,806 | |
Essential Properties Realty Trust, Inc., REIT | | | 96,465 | | | | 1,637,011 | |
Essex Property Trust, Inc., REIT | | | 68,598 | | | | 14,852,153 | |
Front Yard Residential Corp., REIT | | | 53,906 | | | | 525,584 | |
Getty Realty Corp., REIT | | | 36,893 | | | | 1,080,596 | |
Independence Realty Trust, Inc., REIT | | | 99,313 | | | | 1,162,955 | |
Investors Real Estate Trust, REIT | | | 12,757 | | | | 907,023 | |
Invitation Homes, Inc., REIT | | | 570,204 | | | | 16,324,941 | |
Mid-America Apartment Communities, Inc., REIT | | | 119,911 | | | | 14,043,976 | |
National Retail Properties, Inc., REIT | | | 180,325 | | | | 6,390,718 | |
NexPoint Residential Trust, Inc., REIT | | | 20,385 | | | | 843,939 | |
Preferred Apartment Communities, Inc., Class A, REIT | | | 49,899 | | | | 329,333 | |
Realty Income Corp., REIT | | | 360,112 | | | | 22,337,747 | |
Spirit Realty Capital, Inc., REIT | | | 107,945 | | | | 3,833,127 | |
STORE Capital Corp., REIT | | | 243,573 | | | | 6,586,214 | |
Sun Communities, Inc., REIT | | | 103,047 | | | | 15,362,247 | |
UDR, Inc., REIT | | | 309,223 | | | | 10,764,053 | |
| | | | | | | | |
| | |
| | | | | | | 206,061,812 | |
| | | | | | | | |
|
Diversified — 8.5% | |
Alexander & Baldwin, Inc., REIT | | | 72,031 | | | | 872,295 | |
American Assets Trust, Inc., REIT | | | 53,540 | | | | 1,367,947 | |
American Finance Trust, Inc., REIT | | | 113,804 | | | | 777,850 | |
Armada Hoffler Properties, Inc., REIT | | | 59,239 | | | | 598,314 | |
Colony Capital, Inc., REIT (a) | | | 504,597 | | | | 1,367,458 | |
CoreCivic, Inc., REIT | | | 125,445 | | | | 1,167,893 | |
Cousins Properties, Inc., REIT | | | 155,760 | | | | 4,649,436 | |
Duke Realty Corp., REIT | | | 386,292 | | | | 14,891,557 | |
EPR Properties, REIT (a) | | | 81,247 | | | | 2,625,090 | |
Four Corners Property Trust, Inc., REIT | | | 73,743 | | | | 1,862,011 | |
Gaming and Leisure Properties, Inc., REIT | | | 221,128 | | | | 8,038,003 | |
GEO Group, Inc. (The), REIT | | | 127,262 | | | | 1,420,244 | |
Gladstone Commercial Corp., REIT | | | 35,585 | | | | 697,822 | |
Global Net Lease, Inc., REIT | | | 93,814 | | | | 1,641,745 | |
iStar, Inc., REIT (a) | | | 80,214 | | | | 993,049 | |
Lexington Realty Trust, REIT | | | 287,327 | | | | 3,266,908 | |
One Liberty Properties, Inc., REIT | | | 17,120 | | | | 328,019 | |
PS Business Parks, Inc., REIT | | | 21,612 | | | | 2,727,434 | |
Safehold, Inc., REIT (a) | | | 13,379 | | | | 742,133 | |
UMH Properties, Inc., REIT | | | 38,855 | | | | 564,952 | |
VICI Properties, Inc., REIT (a) | | | 491,402 | | | | 10,977,921 | |
Washington, REIT | | | 86,319 | | | | 1,893,839 | |
| | | | | | | | |
| INVESTMENTS | | SHARES | | | VALUE($) | |
| |
|
Diversified — continued | |
Whitestone, REIT | | | 39,765 | | | | 255,689 | |
WP Carey, Inc., REIT | | | 180,784 | | | | 12,540,986 | |
| | | | | | | | |
| | |
| | | | | | | 76,268,595 | |
| | | | | | | | |
|
Health Care — 11.3% | |
CareTrust REIT, Inc., REIT | | | 100,365 | | | | 1,944,070 | |
Community Healthcare Trust, Inc., REIT | | | 22,079 | | | | 1,031,089 | |
Diversified Healthcare Trust, REIT | | | 249,460 | | | | 947,948 | |
Global Medical REIT, Inc., REIT | | | 44,841 | | | | 573,517 | |
Healthcare Realty Trust, Inc., REIT | | | 141,492 | | | | 4,082,044 | |
Healthcare Trust of America, Inc., Class A, REIT (a) | | | 229,103 | | | | 6,046,028 | |
Healthpeak Properties, Inc., REIT | | | 564,440 | | | | 15,601,122 | |
LTC Properties, Inc., REIT (a) | | | 41,125 | | | | 1,500,651 | |
Medical Properties Trust, Inc., REIT | | | 554,019 | | | | 10,293,673 | |
National Health Investors, Inc., REIT | | | 46,821 | | | | 2,914,607 | |
Omega Healthcare Investors, Inc., REIT (a) | | | 237,933 | | | | 7,368,785 | |
Physicians Realty Trust, REIT | | | 212,408 | | | | 3,855,205 | |
Sabra Health Care REIT, Inc., REIT | | | 215,553 | | | | 3,196,651 | |
Universal Health Realty Income Trust, REIT | | | 13,704 | | | | 914,331 | |
Ventas, Inc., REIT | | | 391,213 | | | | 16,121,888 | |
Welltower, Inc., REIT | | | 437,776 | | | | 25,180,876 | |
| | | | | | | | |
| | |
| | | | | | | 101,572,485 | |
| | | | | | | | |
|
Hotels — 3.2% | |
Apple Hospitality REIT, Inc., REIT | | | 222,366 | | | | 2,261,462 | |
Chatham Lodging Trust, REIT | | | 49,246 | | | | 340,782 | |
DiamondRock Hospitality Co., REIT | | | 208,930 | | | | 1,107,329 | |
Host Hotels & Resorts, Inc., REIT | | | 739,233 | | | | 8,301,587 | |
MGM Growth Properties LLC, Class A, REIT | | | 137,806 | | | | 3,868,214 | |
Park Hotels & Resorts, Inc., REIT | | | 247,048 | | | | 2,344,486 | |
Pebblebrook Hotel Trust, REIT | | | 137,113 | | | | 1,730,366 | |
RLJ Lodging Trust, REIT | | | 173,132 | | | | 1,634,366 | |
Ryman Hospitality Properties, Inc., REIT | | | 54,760 | | | | 2,089,642 | |
Service Properties Trust, REIT | | | 172,567 | | | | 1,416,775 | |
Summit Hotel Properties, Inc., REIT | | | 110,737 | | | | 652,241 | |
Sunstone Hotel Investors, Inc., REIT | | | 226,119 | | | | 1,883,571 | |
Xenia Hotels & Resorts, Inc., REIT | | | 118,973 | | | | 1,068,378 | |
| | | | | | | | |
| | |
| | | | | | | 28,699,199 | |
| | | | | | | | |
|
Industrial — 26.3% | |
CoreSite Realty Corp., REIT | | | 39,746 | | | | 4,866,898 | |
CyrusOne, Inc., REIT | | | 120,801 | | | | 10,090,508 | |
Digital Realty Trust, Inc., REIT (a) | | | 281,358 | | | | 43,793,373 | |
EastGroup Properties, Inc., REIT | | | 40,953 | | | | 5,453,301 | |
Equinix, Inc., REIT | | | 92,818 | | | | 73,305,800 | |
First Industrial Realty Trust, Inc., REIT | | | 133,392 | | | | 5,689,169 | |
Industrial Logistics Properties Trust, REIT | | | 68,355 | | | | 1,474,417 | |
Innovative Industrial Properties, Inc., REIT (a) | | | 22,333 | | | | 2,748,969 | |
Monmouth Real Estate Investment Corp., REIT | | | 97,510 | | | | 1,414,870 | |
Prologis, Inc., REIT | | | 774,490 | | | | 78,889,551 | |
SEE NOTES TO FINANCIAL STATEMENTS.
| | | | | | | | |
| | | |
| AUGUST 31, 2020 | | J.P. MORGAN EXCHANGE-TRADED FUNDS | | | | | 5 | |
JPMorgan BetaBuilders MSCI US REIT ETF
SCHEDULE OF PORTFOLIO INVESTMENTS
AS OF AUGUST 31, 2020 (Unaudited) (continued)
| | | | | | | | |
| INVESTMENTS | | SHARES | | | VALUE($) | |
Common Stocks — continued | |
|
Industrial — continued | |
STAG Industrial, Inc., REIT | | | 155,943 | | | | 5,036,959 | |
Terreno Realty Corp., REIT | | | 70,987 | | | | 4,233,665 | |
| | | | | | | | |
| | |
| | | | | | | 236,997,480 | |
| | | | | | | | |
|
Office — 10.6% | |
Alexandria Real Estate Equities, Inc., REIT (a) | | | 132,330 | | | | 22,281,725 | |
Boston Properties, Inc., REIT | | | 154,777 | | | | 13,445,478 | |
Brandywine Realty Trust, REIT | | | 178,785 | | | | 1,989,877 | |
City Office REIT, Inc., REIT | | | 49,884 | | | | 401,067 | |
Columbia Property Trust, Inc., REIT | | | 119,976 | | | | 1,415,717 | |
Corporate Office Properties Trust, REIT | | | 117,623 | | | | 2,898,231 | |
Douglas Emmett, Inc., REIT | | | 174,706 | | | | 4,877,791 | |
Easterly Government Properties, Inc., REIT | | | 78,769 | | | | 1,905,422 | |
Empire State Realty Trust, Inc., Class A, REIT | | | 155,489 | | | | 979,581 | |
Equity Commonwealth, REIT | | | 127,410 | | | | 3,999,400 | |
Franklin Street Properties Corp., REIT | | | 112,484 | | | | 498,304 | |
Highwoods Properties, Inc., REIT | | | 108,937 | | | | 4,058,993 | |
Hudson Pacific Properties, Inc., REIT | | | 160,749 | | | | 3,774,386 | |
JBG SMITH Properties, REIT | | | 126,085 | | | | 3,488,772 | |
Kilroy Realty Corp., REIT | | | 108,601 | | | | 6,355,330 | |
Mack-Cali Realty Corp., REIT | | | 95,001 | | | | 1,199,863 | |
Office Properties Income Trust, REIT | | | 50,545 | | | | 1,204,993 | |
Paramount Group, Inc., REIT | | | 186,025 | | | | 1,376,585 | |
Piedmont Office Realty Trust, Inc., Class A, REIT | | | 132,043 | | | | 2,021,578 | |
SL Green Realty Corp., REIT (a) | | | 80,260 | | | | 3,752,958 | |
VEREIT, Inc., REIT | | | 1,130,251 | | | | 7,595,287 | |
Vornado Realty Trust, REIT (a) | | | 170,346 | | | | 6,103,497 | |
| | | | | | | | |
| | |
| | | | | | | 95,624,835 | |
| | | | | | | | |
|
Regional Malls — 2.8% | |
Macerich Co. (The), REIT (a) | | | 111,312 | | | | 882,704 | |
Simon Property Group, Inc., REIT | | | 320,612 | | | | 21,753,524 | |
Tanger Factory Outlet Centers, Inc., REIT (a) | | | 98,010 | | | | 557,677 | |
Taubman Centers, Inc., REIT | | | 64,604 | | | | 2,474,333 | |
| | | | | | | | |
| | |
| | | | | | | 25,668,238 | |
| | | | | | | | |
|
Shopping Centers — 3.8% | |
Acadia Realty Trust, REIT (a) | | | 90,275 | | | | 1,023,718 | |
Alexander’s, Inc., REIT | | | 2,410 | | | | 614,719 | |
Brixmor Property Group, Inc., REIT | | | 310,862 | | | | 3,668,172 | |
Federal Realty Investment Trust, REIT (a) | | | 75,345 | | | | 5,970,338 | |
Kimco Realty Corp., REIT | | | 453,554 | | | | 5,438,112 | |
Kite Realty Group Trust, REIT (a) | | | 88,207 | | | | 991,447 | |
Regency Centers Corp., REIT | | | 177,876 | | | | 7,063,456 | |
Retail Opportunity Investments Corp., REIT | | | 122,013 | | | | 1,358,005 | |
Retail Properties of America, Inc., Class A, REIT (a) | | | 224,532 | | | | 1,416,797 | |
RPT Realty, REIT | | | 84,504 | | | | 495,193 | |
Saul Centers, Inc., REIT | | | 14,597 | | | | 409,008 | |
| | | | | | | | |
| INVESTMENTS | | SHARES | | | VALUE($) | |
| | | | | | | | |
|
Shopping Centers — continued | |
Seritage Growth Properties, Class A, REIT* (a) | | | 38,475 | | | | 539,804 | |
SITE Centers Corp., REIT | | | 162,031 | | | | 1,216,853 | |
Urban Edge Properties, REIT | | | 122,200 | | | | 1,290,432 | |
Urstadt Biddle Properties, Inc., Class A, REIT | | | 31,450 | | | | 292,485 | |
Weingarten Realty Investors, REIT | | | 127,615 | | | | 2,229,434 | |
| | | | | | | | |
| | |
| | | | | | | 34,017,973 | |
| | | | | | | | |
|
Storage — 10.1% | |
Americold Realty Trust, REIT | | | 210,019 | | | | 8,054,229 | |
CubeSmart, REIT | | | 203,000 | | | | 6,418,860 | |
Extra Space Storage, Inc., REIT | | | 135,363 | | | | 14,422,928 | |
Iron Mountain, Inc., REIT (a) | | | 301,879 | | | | 9,083,539 | |
Jernigan Capital, Inc., REIT | | | 24,403 | | | | 420,708 | |
Life Storage, Inc., REIT | | | 49,192 | | | | 5,186,312 | |
National Storage Affiliates Trust, REIT | | | 71,457 | | | | 2,451,690 | |
Public Storage, REIT | | | 164,962 | | | | 35,037,929 | |
QTS Realty Trust, Inc., Class A, REIT (a) | | | 63,202 | | | | 4,286,359 | |
Rexford Industrial Realty, Inc., REIT | | | 128,650 | | | | 6,172,627 | |
| | | | | | | | |
| | |
| | | | | | | 91,535,181 | |
| | | | | | | | |
Total Common Stocks
(Cost $1,070,273,688) | | | | 896,445,798 | |
| | | | | |
|
Short-Term Investments — 6.4% | |
|
Investment Companies — 0.9% | |
JPMorgan U.S. Government Money Market Fund Class Institutional Shares, 0.01% (b) (c)
(Cost $7,919,505) | | | 7,919,505 | | | | 7,919,505 | |
| | | | | | | | |
|
Investment of Cash Collateral from Securities Loaned — 5.5% | |
JPMorgan Securities Lending Money Market Fund Agency SL Class Shares, 0.32% (b) (c) | | | 45,003,152 | | | | 45,016,653 | |
JPMorgan U.S. Government Money Market Fund Class IM Shares, 0.07% (b) (c) | | | 5,155,295 | | | | 5,155,295 | |
| | | | | | | | |
Total Investment of Cash Collateral From Securities Loaned
(Cost $50,171,948) | | | | 50,171,948 | |
| | | | | |
Total Short-Term Investments
(Cost $58,091,453) | | | | 58,091,453 | |
| | | | | |
Total Investments — 105.8%
(Cost $1,128,365,141) | | | | 954,537,251 | |
Liabilities in Excess of
Other Assets — (5.8)% | | | | (52,369,441 | ) |
| | | | | |
NET ASSETS — 100.0% | | | | 902,167,810 | |
| | | | | |
Percentages indicated are based on net assets.
SEE NOTES TO FINANCIAL STATEMENTS.
| | | | | | |
| | | |
| 6 | | | | J.P. MORGAN EXCHANGE-TRADED FUNDS | | AUGUST 31, 2020 |
| | |
| Abbreviations |
| REIT | | RealEstate Investment Trust |
| (a) | | Thesecurity or a portion of this security is on loan at August 31, 2020. The total value of securities on loan at August 31, 2020 is $46,779,691. |
| (b) | | Investmentin an affiliated fund, which is registered under the Investment Company Act of 1940, as amended, and is advised by J.P. Morgan Investment Management Inc. |
| (c) | | Therate shown is the current yield as of August 31, 2020. |
| * | | Non-incomeproducing security. |
| | | | | | | | | | | | | | | | | | | | |
| Futures contracts outstanding as of August 31, 2020: | |
| DESCRIPTION | | NUMBER OF
CONTRACTS | | | EXPIRATION
DATE | | | TRADING
CURRENCY | | | NOTIONAL AMOUNT
($) | | | VALUE AND
UNREALIZED
APPRECIATION
(DEPRECIATION)($) | |
Long Contracts | |
DJ US Real Estate Index | | | 172 | | | | 09/2020 | | | | USD | | | | 5,548,720 | | | | 231,739 | |
| | | | | | | | | | | | | | | | | | | | |
| | |
| Abbreviations |
| USD | | UnitedStates Dollar |
SEE NOTES TO FINANCIAL STATEMENTS.
| | | | | | | | |
| | | |
| AUGUST 31, 2020 | | J.P. MORGAN EXCHANGE-TRADED FUNDS | | | | | 7 | |
STATEMENT OF ASSETS AND LIABILITIES
AS OF AUGUST 31, 2020
| | | | |
| | | JPMorgan
BetaBuilders MSCI
US REIT ETF | |
ASSETS: | |
Investments in non-affiliates, at value | | $ | 896,445,798 | |
Investments in affiliates, at value | | | 7,919,505 | |
Investments of cash collateral received from securities loaned, at value (Note 2.C.) | | | 50,171,948 | |
Cash | | | 15,414 | |
Deposits at broker for futures contracts | | | 964,000 | |
Receivables: | | | | |
Investment securities sold | | | 7,898,868 | |
Dividends from non-affiliates | | | 679,617 | |
Dividends from affiliates | | | 80 | |
Securities lending income (Note 2.C.) | | | 19,099 | |
| | | | |
Total Assets | | | 964,114,329 | |
| | | | |
|
LIABILITIES: | |
Payables: | | | | |
Investment securities purchased | | | 7,855,463 | |
Collateral received on securities loaned (Note 2.C.) | | | 50,171,948 | |
Fund shares redeemed | | | 3,743,426 | |
Variation margin on futures contracts | | | 91,389 | |
Accrued liabilities: | | | | |
Management fees (See Note 3.A.) | | | 84,293 | |
| | | | |
Total Liabilities | | | 61,946,519 | |
| | | | |
Net Assets | | $ | 902,167,810 | |
| | | | |
|
NET ASSETS: | |
Paid-in-Capital | | $ | 1,125,543,037 | |
Total distributable earnings (loss) | | | (223,375,227 | ) |
| | | | |
Total Net Assets | | $ | 902,167,810 | |
| | | | |
| |
Outstanding number of shares
(unlimited number of shares authorized — par value $0.0001) | | | 12,050,000 | |
| | | | |
Net asset value, per share | | $ | 74.87 | |
| | | | |
| |
Cost of investments in non-affiliates | | $ | 1,070,273,688 | |
Cost of investments in affiliates | | | 7,919,505 | |
Investment securities on loan, at value (Note 2.C.) | | | 46,779,691 | |
Cost of investment of cash collateral (Note 2.C.) | | | 50,171,948 | |
SEE NOTES TO FINANCIAL STATEMENTS.
| | | | | | |
| | | |
| 8 | | | | J.P. MORGAN EXCHANGE-TRADED FUNDS | | AUGUST 31, 2020 |
STATEMENT OF OPERATIONS
FOR THE SIX MONTHS ENDED AUGUST 31, 2020 (Unaudited)
| | | | |
| | | JPMorgan
BetaBuilders MSCI
US REIT ETF | |
INVESTMENT INCOME: | | | | |
Interest income from non-affiliates | | $ | 288 | |
Dividend income from non-affiliates | | | 15,200,221 | |
Dividend income from affiliates | | | 4,800 | |
Income from securities lending (net) (See Note 2.C.) | | | 218,396 | |
| | | | |
Total investment income | | | 15,423,705 | |
| | | | |
| |
EXPENSES: | | | | |
Management fees (See Note 3.A.) | | | 519,553 | |
Interest expense to non-affiliates | | | 611 | |
| | | | |
Total expenses | | | 520,164 | |
| | | | |
Net investment income (loss) | | | 14,903,541 | |
| | | | |
| |
REALIZED/UNREALIZED GAINS (LOSSES): | | | | |
Net realized gain (loss) on transactions from: | | | | |
Investments in non-affiliates | | | (17,681,910 | ) |
In-kind redemptions of investments in non-affiliates | | | (36,005,166 | ) |
Futures contracts | | | 159,368 | |
| | | | |
Net realized gain (loss) | | | (53,527,708 | ) |
| | | | |
Change in net unrealized appreciation/depreciation on: | | | | |
Investments in non-affiliates | | | (91,343,780 | ) |
Futures contracts | | | 462,638 | |
| | | | |
Change in net unrealized appreciation/depreciation | | | (90,881,142 | ) |
| | | | |
Net realized/unrealized gains (losses) | | | (144,408,850 | ) |
| | | | |
Change in net assets resulting from operations | | $ | (129,505,309 | ) |
| | | | |
SEE NOTES TO FINANCIAL STATEMENTS.
| | | | | | | | |
| | | |
| AUGUST 31, 2020 | | J.P. MORGAN EXCHANGE-TRADED FUNDS | | | | | 9 | |
STATEMENTS OF CHANGES IN NET ASSETS
FOR THE PERIODS INDICATED
| | | | | | | | |
| | | JPMorgan BetaBuilders MSCI US REIT ETF | |
| | | Six Months Ended
August 31, 2020
(Unaudited) | | | Year Ended
February 29, 2020 | |
CHANGE IN NET ASSETS RESULTING FROM OPERATIONS: | |
Net investment income (loss) | | $ | 14,903,541 | | | $ | 18,248,268 | |
Net realized gain (loss) | | | (53,527,708 | ) | | | 21,867,375 | |
Change in net unrealized appreciation/depreciation | | | (90,881,142 | ) | | | (89,222,724 | ) |
| | | | | | | | |
Change in net assets resulting from operations | | | (129,505,309 | ) | | | (49,107,081 | ) |
| | | | | | | | |
|
DISTRIBUTIONS TO SHAREHOLDERS: | |
Total distributions to shareholders | | | (13,745,895 | ) | | | (15,092,951 | ) |
| | | | | | | | |
|
CAPITAL TRANSACTIONS: | |
Change in net assets resulting from capital transactions | | | (160,878,479 | ) | | | 1,134,468,601 | |
| | | | | | | | |
|
NET ASSETS: | |
Change in net assets | | | (304,129,683 | ) | | | 1,070,268,569 | |
Beginning of period | | | 1,206,297,493 | | | | 136,028,924 | |
| | | | | | | | |
End of period | | $ | 902,167,810 | | | $ | 1,206,297,493 | |
| | | | | | | | |
| | |
CAPITAL TRANSACTIONS: | | | | | | | | |
Proceeds from shares issued | | $ | 152,913,186 | | | $ | 1,284,582,953 | |
Cost of shares redeemed | | | (313,791,665 | ) | | | (150,114,352 | ) |
| | | | | | | | |
Total change in net assets resulting from capital transactions | | $ | (160,878,479 | ) | | $ | 1,134,468,601 | |
| | | | | | | | |
|
SHARE TRANSACTIONS: | |
Issued | | | 2,250,000 | | | | 14,625,000 | |
Redeemed | | | (4,800,000 | ) | | | (1,700,000 | ) |
| | | | | | | | |
Net increase (decrease) in shares from share transactions | | | (2,550,000 | ) | | | 12,925,000 | |
| | | | | | | | |
SEE NOTES TO FINANCIAL STATEMENTS.
| | | | | | |
| | | |
| 10 | | | | J.P. MORGAN EXCHANGE-TRADED FUNDS | | AUGUST 31, 2020 |
THIS PAGE IS INTENTIONALLY LEFT BLANK
| | | | | | | | |
| | | |
| AUGUST 31, 2020 | | J.P. MORGAN EXCHANGE-TRADED FUNDS | | | | | 11 | |
FINANCIAL HIGHLIGHTS
FOR THE PERIODS INDICATED
| | | | | | | | | | | | | | | | | | | | | | | | | | | | |
| | | Per share operating performance | |
| | | | | | Investment Operations | | | Distributions | |
| | | Net asset
value,
beginning
of period | | | Net
investment
income
(loss) (b) | | | Net realized and
unrealized gains
(losses) on
investments | | | Total from
investment
operations | | | Net
investment
income | | | Net
realized
gain | | | Total
distributions | |
| | | | | | | |
JPMorgan BetaBuilders MSCI US REIT ETF | | | | | | | | | | | | | | | | | | | | | | | | | | | | |
Six Months Ended August 31, 2020 (Unaudited) | | $ | 82.62 | | | $ | 1.11 | | | $ | (7.87 | ) | | $ | (6.76 | ) | | $ | (0.99 | ) | | $ | — | | | $ | (0.99 | ) |
Year Ended February 29, 2020 | | | 81.21 | | | | 2.55 | | | | 0.80 | (f) | | | 3.35 | | | | (1.85 | ) | | | (0.09 | ) | | | (1.94 | ) |
June 15, 2018 (h) through February 28, 2019 | | | 75.67 | | | | 1.85 | | | | 5.10 | | | | 6.95 | | | | (1.35 | ) | | | (0.06 | ) | | | (1.41 | ) |
| (a) | Annualized for periods less than one year, unless otherwise indicated. |
| (b) | Calculated based upon average shares outstanding. |
| (c) | Not annualized for periods less than one year. |
| (d) | Includes adjustments in accordance with accounting principles generally accepted in the United States of America and as such, the net asset values for financial reporting purposes and the returns based upon those net asset values may differ from the net asset values and returns for shareholder transactions. |
| (e) | Prior to December 9, 2019, market price return was calculated assuming an initial investment made at the market price at the beginning of the reporting period, reinvestment of all dividends and distributions at market price during the period, and sale at the market price on the last day of the period. The price used to calculate the market price return was the midpoint of the bid/ask spread at the close of business on the listing exchange of the fund. Effective December 9, 2019, the closing price was used to calculate the market price return; however, any prices used in the calculation for market price return prior to December 9, 2019, would have used the midpoint of the bid/ask spread at the close of business on the exchange. |
| (f) | Calculation of the net realized and unrealized gains (losses) per share do not correlate with the Fund’s net realized and unrealized gains (losses) presented in the Statement of Operations due to the timing of capital transactions in relation to the fluctuating market values of the Fund’s investments. |
| (g) | Prior to November 1, 2019, the Fund may have waived fees if expenses exceeded the expense cap. On November 1, 2019, the Fund adopted a unitary fee structure where a management fee is accrued by the fund based on prior day net assets and other expenses are generally paid by the Advisor. |
| (h) | Commencement of operations. |
| (i) | Since the Shares of the Fund did not trade in the secondary market until the day after the Fund’s inception, for the period from the inception to the first day of secondary market trading, the NAV is used as a proxy for the secondary market trading price to calculate the market returns. |
| (j) | Certain non-recurring expenses incurred by the Fund were not annualized for the period indicated. |
SEE NOTES TO FINANCIAL STATEMENTS.
| | | | | | |
| | | |
| 12 | | | | J.P. MORGAN EXCHANGE-TRADED FUNDS | | AUGUST 31, 2020 |
| | | | | | | | | | | | | | | | | | | | | | | | | | | | | | | | | | |
| Ratios/Supplemental data | |
| | | | | | | | | | | | | | | | Ratios to average net assets (a) | | | | |
Net asset
value,
end of
period | | | Market
price,
end of
period | | | Total
return (c)(d) | | | Market
price total
return (c)(e) | | | Net assets,
end of period | | | Net
expenses | | | Net
investment
income
(loss) | | | Expenses without
waivers,
reimbursements
and earnings credits | | | Portfolio
turnover
rate (c) | |
| | | | | | | | |
| | | | | | | | | | | | | | | | | | | | | | | | | | | | | | | | | | |
| $ | 74.87 | | | $ | 74.92 | | | | (8.02 | )% | | | (8.08 | )% | | $ | 902,167,810 | | | | 0.11 | % | | | 3.13 | % | | | 0.11 | % | | | 4 | % |
| | 82.62 | | | | 82.73 | | | | 4.06 | | | | 4.18 | | | | 1,206,297,493 | | | | 0.11 | | | | 2.88 | | | | 0.16 | (g) | | | 5 | |
| | 81.21 | | | | 81.22 | | | | 9.40 | | | | 9.41 | (i) | | | 136,028,924 | | | | 0.11 | (j) | | | 3.37 | | | | 0.40 | (g)(j) | | | 5 | |
| | | | | | | | |
| | | |
| AUGUST 31, 2020 | | J.P. MORGAN EXCHANGE-TRADED FUNDS | | | | | 13 | |
NOTES TO FINANCIAL STATEMENTS
AS OF AUGUST 31, 2020 (Unaudited)
1. Organization
J.P. Morgan Exchange-Traded Fund Trust (the “Trust”) was formed on February 25, 2010, and is governed by a Declaration of Trust as amended and restated February 19, 2014, and is registered under the Investment Company Act of 1940, as amended (the “1940 Act”), as an open-end management investment company. JPMorgan BetaBuilders MSCI US REIT ETF (the “Fund” or the “MSCI US REIT ETF”) is a separate diversified series of the Trust covered in this report.
The investment objective of the Fund is to seek investment results that closely correspond, before fees and expenses, to the performance of the MSCI US REIT Index.
J.P. Morgan Investment Management Inc. (“JPMIM”), an indirect, wholly-owned subsidiary of JPMorgan Chase & Co. (“JPMorgan”), acts as Adviser (the “Adviser”) and Administrator (the “Administrator”) to the Fund.
Shares of the Fund are listed and traded at market price on the Cboe BZX Exchange, Inc. Market prices for the Fund’s shares may be different from its net asset value (“NAV”). The Fund issues and redeems its shares on a continuous basis, through JPMorgan Distribution Services, Inc. (the “Distributor” or “JPMDS”), an indirect, wholly-owned subsidiary of JPMorgan, at NAV in large blocks of shares, typically 25,000 shares, referred to as “Creation Units”.
Creation Units are issued and redeemed principally in-kind for a basket of securities. A cash amount may be substituted if the Fund has sizeable exposure to market or sponsor restricted securities. Shares are generally traded in the secondary market in amounts less than a Creation Unit at market prices that change throughout the day. Only individuals or institutions that have entered into an authorized participant agreement with the Distributor may do business directly with the Fund (each, an “Authorized Participant”).
2. Significant Accounting Policies
The following is a summary of significant accounting policies followed by the Fund in the preparation of its financial statements. The Fund is an investment company and, accordingly, follows the investment company accounting and reporting guidance of the Financial Accounting Standards Board (“FASB”) Accounting Standards Codification Topic 946 — Investment Companies, which is part of U.S. generally accepted accounting principles (“GAAP”). The preparation of financial statements in conformity with GAAP requires management to make estimates and assumptions that affect (i) the reported amounts of assets and liabilities, (ii) disclosure of contingent assets and liabilities at the date of the financial statements, and (iii) the reported amounts of increases and decreases in net assets from operations during the reporting period. Actual results could differ from those estimates.
A. Valuation of Investments — Investments are valued in accordance with GAAP and the Fund’s valuation policies set forth by, and under the supervision and responsibility of, the Board of Trustees of the Trust (the “Board”), which established the following approach to valuation, as described more fully below: (i) investments for which market quotations are readily available shall be valued at their market value and (ii) all other investments for which market quotations are not readily available shall be valued at their fair value as determined in good faith by the Board.
The Administrator has established the J.P. Morgan Asset Management Americas Valuation Committee (“AVC”) to assist the Board with the oversight and monitoring of the valuation of the Fund’s investments. The Administrator implements the valuation policies of the Fund’s investments, as directed by the Board. The AVC oversees and carries out the policies for the valuation of investments held in the Fund. This includes monitoring the appropriateness of fair values based on results of ongoing valuation oversight including, but not limited to, consideration of macro or security specific events, market events, and pricing vendor and broker due diligence. The Administrator is responsible for discussing and assessing the potential impacts to the fair values on an ongoing basis, and, at least on a quarterly basis, with the AVC and the Board.
Equities and other exchange-traded instruments are valued at the last sale price or official market closing price on the primary exchange on which the instrument is traded before the NAV of the Fund is calculated on a valuation date.
Investments in open-end investment companies excluding exchange-traded funds (“ETFs”), (“Underlying Funds”) are valued at each Underlying Fund’s NAV per share as of the report date.
Futures contracts are generally valued on the basis of available market quotations.
Valuations reflected in this report are as of the report date. As a result, changes in valuation due to market events and/or issuer-related events after the report date and prior to issuance of the report are not reflected herein.
The various inputs that are used in determining the valuation of the Fund’s investments are summarized into the three broad levels listed below.
| • | | Level 1 — Unadjusted inputs using quoted prices in active markets for identical investments. |
| • | | Level 2 — Other significant observable inputs including, but not limited to, quoted prices for similar investments, inputs other than quoted prices that are observable for investments (such as interest rates, prepayment speeds, credit risk, etc.) or other market corroborated inputs. |
| • | | Level 3 — Significant inputs based on the best information available in the circumstances, to the extent observable inputs are not available (including the Fund’s assumptions in determining the fair value of investments). |
A financial instrument’s level within the fair value hierarchy is based on the lowest level of any input, both individually and in the aggregate, that is significant to the fair value measurement. The inputs or methodology used for valuing instruments are not necessarily an indication of the risk associated with investing in those instruments.
| | | | | | |
| | | |
| 14 | | | | J.P. MORGAN EXCHANGE-TRADED FUNDS | | AUGUST 31, 2020 |
The following table represents each valuation input as presented on the Schedule of Portfolio Investments (“SOI”):
| | | | | | | | | | | | | | | | |
| | | Level 1
Quoted prices | | | Level 2 Other significant observable inputs | | | Level 3 Significant unobservable inputs | | | Total | |
Total Investments in Securities (a) | | $ | 954,537,251 | | | $ | — | | | $ | — | | | $ | 954,537,251 | |
| | | | | | | | | | | | | | | | |
Appreciation in Other Financial Instruments | |
Futures Contracts (a) | | $ | 231,739 | | | $ | — | | | $ | — | | | $ | 231,739 | |
| | | | | | | | | | | | | | | | |
| (a) | Please refer to the SOI for specifics of portfolio holdings. |
B. Restricted Securities — Certain securities held by the Fund may be subject to legal or contractual restrictions on resale. Restricted securities generally are resold in transactions exempt from registration under the Securities Act of 1933, as amended (the “Securities Act”). Disposal of these securities may involve time-consuming negotiations and expense. Prompt sale at the current valuation may be difficult and could adversely affect the NAV of the Fund.
As of August 31, 2020, the Fund had no investments in restricted securities.
C. Securities Lending — The Fund is authorized to engage in securities lending in order to generate additional income. The Fund is able to lend to approved borrowers. Citibank N.A. (“Citibank”) serves as lending agent for the Fund, pursuant to a Securities Lending Agency Agreement (the “Securities Lending Agency Agreement”). Securities loaned are collateralized by cash equal to at least 100% of the market value plus accrued interest on the securities lent, which is invested in the Class IM Shares of the JPMorgan U.S. Government Money Market Fund and the Agency SL Class Shares of the JPMorgan Securities Lending Money Market Fund. The Fund retains loan fees and the interest on cash collateral investments but is required to pay the borrower a rebate for the use of cash collateral. In cases where the lent security is of high value to borrowers, there may be a negative rebate (i.e., a net payment from the borrower to the Fund). Upon termination of a loan, the Fund is required to return to the borrower an amount equal to the cash collateral, plus any rebate owed to the borrowers. The remaining maturities of the securities lending transactions are considered overnight and continuous. Loans are subject to termination by the Fund or the borrower at any time.
The net income earned on the securities lending (after payment of rebates and Citibank’s fee) is included on the SOP as Income from securities lending (net). The Fund also receives payments from the borrower during the period of the loan, equivalent to dividends and interest earned on the securities loaned, which are recorded as Dividend or Interest income, respectively, on the SOP.
Under the Securities Lending Agency Agreement, Citibank marks to market the loaned securities on a daily basis. In the event the cash received from the borrower is less than 102% of the value of the loaned securities (105% for loans of non-U.S. securities), Citibank requests additional cash from the borrower so as to maintain a collateralization level of at least 102% of the value of the loaned securities plus accrued interest (105% for loans of non-U.S. securities), subject to certain de minimis amounts.
The value of securities out on loan is recorded as an asset on the SAL. The value of the cash collateral received is recorded as a liability on the SAL and details of collateral investments are disclosed on the SOI.
The Fund bears the risk of loss associated with the collateral investments and is not entitled to additional collateral from the borrower to cover any such losses. To the extent that the value of the collateral investments declines below the amount owed to a borrower, the Fund may incur losses that exceed the amount it earned on lending the security. Upon termination of a loan, the Fund may use leverage (borrow money) to repay the borrower for cash collateral posted if the Adviser does not believe that it is prudent to sell the collateral investments to fund the payment of this liability. Securities lending activity is subject to master netting arrangements.
The following table presents the Fund’s value of the securities on loan with Citibank, net of amounts available for offset under the master netting arrangements and any related collated received or posted by the Fund as of August 31, 2020.
| | | | | | | | | | | | |
| | | Investment Securities
on Loan, at value,
Presented on the
Statement of Assets
and Liabilities | | | Cash Collateral
Posted by Borrower* | | | Net Amount Due
to Counterparty
(not less than zero) | |
| | $ | 46,779,691 | | | $ | (46,779,691 | ) | | $ | — | |
| * | Collateral posted reflects the value of securities on loan and does not include any additional amounts received from the borrower. |
Securities lending also involves counterparty risks, including the risk that the loaned securities may not be returned in a timely manner or at all. Subject to certain conditions, Citibank has agreed to indemnify the Fund from losses resulting from a borrower’s failure to return a loaned security.
JPMIM waived fees associated with the Fund’s investment in JPMorgan U.S. Government Money Market Fund in the amount of $4,121. JPMIM voluntarily waived management fees and investment advisory fees charged to the Fund to reduce the impact of the cash collateral investment in the JPMorgan U.S. Government Money Market Fund from 0.15% to 0.06%. The above waiver is included in the determination of earnings on cash collateral investment and in the calculation of Citibank’s compensation and is included on the SOP as Income from securities lending (net).
| | | | | | | | |
| | | |
| AUGUST 31, 2020 | | J.P. MORGAN EXCHANGE-TRADED FUNDS | | | | | 15 | |
NOTES TO FINANCIAL STATEMENTS
AS OF AUGUST 31, 2020 (Unaudited) (continued)
D. Investment Transactions with Affiliates — The Fund invested in Underlying Funds which are advised by the Adviser. An issuer which is under common control with the Fund may be considered an affiliate. For the purposes of the financial statements, the Fund assumes the issuers listed in the table below to be affiliated issuers. The Underlying Funds’ distributions may be reinvested into the Underlying Funds. Reinvestment amounts are included in the purchase cost amounts in the table below.
| | | | | | | | | | | | | | | | | | | | | | | | | | | | | | | | | | | | |
| For the six months ended August 31, 2020 | |
| Security Description | | Value at
February 29,
2020 | | | Purchases
at Cost | | | Proceeds
from Sales | | | Net
Realized
Gain
(Loss) | | | Change in
Unrealized
Appreciation/
(Depreciation) | | | Value at
August 31,
2020 | | | Shares at
August 31,
2020 | | | Dividend
Income | | | Capital Gain
Distributions | |
JPMorgan Securities Lending Money Market Fund Agency SL Class Shares, 0.32% (a)(b) | | $ | 46,004,799 | | | $ | 277,000,000 | | | $ | 277,999,999 | | | $ | 11,853 | * | | $ | — | | | $ | 45,016,653 | | | | 45,003,152 | | | $ | 206,540 | * | | $ | — | |
JPMorgan U.S. Government Money Market Fund Class IM Shares, 0.07% (a)(b) | | | 4,817,421 | | | | 205,914,547 | | | | 205,576,673 | | | | — | | | | — | | | | 5,155,295 | | | | 5,155,295 | | | | 15,288 | * | | | — | |
JPMorgan U.S. Government Money Market Fund Class Institutional Shares, 0.01% (a)(b) | | | 10,488,851 | | | | 39,149,692 | | | | 41,719,038 | | | | — | | | | — | | | | 7,919,505 | | | | 7,919,505 | | | | 4,800 | | | | — | |
| | | | | | | | | | | | | | | | | | | | | | | | | | | | | | | | | | | | |
Total | | $ | 61,311,071 | | | $ | 522,064,239 | | | $ | 525,295,710 | | | $ | 11,853 | | | $ | — | | | $ | 58,091,453 | | | | | | | $ | 226,628 | | | $ | — | |
| | | | | | | | | | | | | | | | | | | | | | | | | | | | | | | | | | | | |
| (a) | Investment in an affiliated fund, which is registered under the Investment Company Act of 1940, as amended, and is advised by J.P. Morgan Investment Management Inc. |
| (b) | The rate shown is the current yield as of August 31, 2020. |
| * | Amount is included on the Statement of Operations as Income from securities lending (net) (after payments of rebates and Citibank’s fee). |
E. Futures Contracts — The Fund used index futures contracts to gain or reduce exposure to the stock market, maintain liquidity or minimize transaction costs. The Fund also purchased futures contracts to invest incoming cash in the market or sold futures in response to cash outflows, thereby simulating an invested position in the underlying index while maintaining cash balance for liquidity.
Futures contracts provide for the delayed delivery of the underlying instrument at a fixed price or are settled for a cash amount based on the change in the value of the underlying instrument at a specific date in the future. Upon entering into a futures contract, the Fund is required to deposit with the broker, cash or securities in an amount equal to a certain percentage of the contract amount, which is referred to as the initial margin deposit. Subsequent payments, referred to as variation margin, are made or received by the Fund periodically and are based on changes in the market value of open futures contracts. Changes in the market value of open futures contracts are recorded as Change in net unrealized appreciation/depreciation on the Statement of Operations (“SOP”). Realized gains or losses, representing the difference between the value of the contract at the time it was opened and the value at the time it was closed, are reported on the SOP at the closing or expiration of the futures contract. Securities deposited as initial margin are designated on the SOI, while cash deposited, which is considered restricted, is recorded on the Statement of Assets and Liabilities (“SAL”). A receivable from and/or a payable to brokers for the daily variation margin is also recorded on the SAL.
The use of futures contracts exposes the Fund to equity price risk. The Fund may be subject to the risk that the change in the value of the futures contract may not correlate perfectly with the underlying instrument. Use of long futures contracts subjects the Fund to risk of loss in excess of the amounts shown on the SAL, up to the notional amount of the futures contracts. Use of short futures contracts subjects the Fund to unlimited risk of loss. The Fund may enter into futures contracts only on exchanges or boards of trade. The exchange or board of trade acts as the counterparty to each futures transaction; therefore, the Fund’s credit risk is limited to failure of the exchange or board of trade. Under some circumstances, futures exchanges may establish daily limits on the amount that the price of a futures contract can vary from the previous day’s settlement price, which could effectively prevent liquidation of positions.
The Fund’s futures contracts are not subject to master netting arrangements (the right to close out all transactions traded with a counterparty and net amounts owed or due across transactions).
| | | | | | |
| | | |
| 16 | | | | J.P. MORGAN EXCHANGE-TRADED FUNDS | | AUGUST 31, 2020 |
Derivatives Volume
The table below discloses the volume of the Fund’s futures contracts activity during the six months ended August 31, 2020: Please refer to the tables in the Summary of Derivatives Information for derivative-related gains and losses associated with volume activity.
| | | | |
Futures Contracts — Equity: | | | | |
Average Notional Balance Long | | $ | 6,901,659 | |
Ending Notional Balance Long | | | 5,548,720 | |
F. Security Transactions and Investment Income — Investment transactions are accounted for on the trade date (the date the order to buy or sell is executed). Securities gains and losses are calculated on a specifically identified cost basis. Interest income is determined on the basis of coupon interest accrued using the effective interest method, which adjusts for amortization of premiums and accretion of discounts. Dividend income, net of foreign taxes withheld, if any, is recorded on the ex-dividend date or when the Fund first learns of the dividend.
To the extent such information is publicly available, the Fund records distributions received in excess of income earned from underlying investments as a reduction of cost of investments and/or realized gain. Such amounts are based on estimates if actual amounts are not available and actual amounts of income, realized gain and return of capital may differ from the estimated amounts. The Fund adjusts the estimated amounts of the components of distributions (and consequently its net investment income) as necessary, once the issuers provide information about the actual composition of the distributions.
G. Federal Income Taxes — The Fund is treated as a separate taxable entity for Federal income tax purposes. The Fund’s policy is to comply with the provisions of the Internal Revenue Code (the “Code”) applicable to regulated investment companies and to distribute to shareholders all of its distributable net investment income and net realized capital gains on investments. Accordingly, no provision for Federal income tax is necessary. Management has reviewed the Fund’s tax positions for all open tax years and has determined that as of August 31, 2020, no liability for Federal income tax is required in the Fund’s financial statements for net unrecognized tax benefits. However, management’s conclusions may be subject to future review based on changes in, or the interpretation of, the accounting standards or tax laws and regulations. The Fund’s Federal tax returns since inception remain subject to examination by the Internal Revenue Service.
H. Distributions to Shareholders — Distributions from net investment income, if any, are generally declared and paid quarterly. Net realized capital gains, if any, are distributed by the Fund at least annually. The amount of distributions from net investment income and net realized capital gains is determined in accordance with Federal income tax regulations, which may differ from GAAP. To the extent these “book/tax” differences are permanent in nature (i.e., that they result from other than timing of recognition — “temporary differences”), such amounts are reclassified within the capital accounts based on their Federal tax basis treatment.
3. Fees and Other Transactions with Affiliates
A. Management Fee — JPMIM manages the investments of the Fund pursuant to the Management Agreement. For such services, JPMIM is paid a fee, which is accrued daily and paid no more frequently than monthly at an annual rate of 0.11% of the Fund’s average daily net assets. Under the Management Agreement, JPMIM is responsible for substantially all expenses of the Fund (including expenses of the Trust relating to the Fund) except for the management fees, payments under the Fund’s 12b-1 plan (if any), interest expenses, dividend and interest expenses related to short sales, taxes, acquired fund fees and expenses (other than fees for funds advised by the adviser and/or its affiliates), costs of holdings shareholder meetings, and litigation and potential litigation and other extraordinary expenses not incurred in the ordinary course of the Fund’s business. Additionally, the Fund shall be responsible for its non-operating expenses, including brokerage commissions and fees and expenses associated with the Fund’s securities lending program, if applicable. For the avoidance of doubt, the Adviser’s payment of such expenses may be accomplished through the Fund’s payment of such expenses and a corresponding reduction of the fee payable to the Adviser, provided, however, that if the amount of expenses paid by the Fund exceeds the fee payable to the Adviser, the Adviser will reimburse the Fund for such amount.
B. Administration Fee — JPMIM provides administration services to the Funds. Pursuant to each Fund’s Management Agreement, JPMIM is compensated as described in Note 3.A.
JPMorgan Chase Bank, N.A. (“JPMCB”), a wholly-owned subsidiary of JPMorgan, serves as the Funds’ sub-administrator (the“Sub-administrator”). For its services as Sub-administrator, JPMCB receives a portion of the management fees payable to JPMIM.
D. Custodian, Accounting and Transfer Agent Fees — JPMCB provides portfolio custody, accounting and transfer agency services to the Funds. For performing these services, JPMIM pays JPMCB transaction and asset-based fees that vary according to the number of transactions and positions, plus out-of-pocket expenses.
Additionally, Authorized Participants generally pay transaction fees associated with the creation and redemption of fund shares. These fees are paid to JPMIM to offset certain custodian charges incurred by JPMIM covered under the Management Agreement.
Interest income earned on cash balances at the custodian, if any, is included in income from affiliates on the SOP. Interest expense paid to the custodian related to cash overdrafts, if any, is included in Interest expense to affiliates on the SOP.
E. Waivers and Reimbursements — The Funds may invest in one or more money market funds advised by the Adviser (affiliated money market funds). The fees for affiliated money market funds are covered under the Management Agreement as described in Note 3.A.
| | | | | | | | |
| | | |
| AUGUST 31, 2020 | | J.P. MORGAN EXCHANGE-TRADED FUNDS | | | | | 17 | |
NOTES TO FINANCIAL STATEMENTS
AS OF AUGUST 31, 2020 (Unaudited) (continued)
F. Distribution Services — The Distributor or its agent distributes Creation Units for the Fund on an agency basis. The Distributor does not maintain a secondary market in shares of the Fund. JPMDS receives no fees for their distribution services under its distribution agreement with the Trust (the “Distribution Agreement”). Although the Trust does not pay any fees under the Distribution Agreement, JPMIM pays JPMDS for certain distribution related services.
G. Other — Certain officers of the Trust are affiliated with the Adviser, the Administrator and JPMDS. Such officers, with the exception of the Chief Compliance Officer, receive no compensation from the Fund for serving in their respective roles.
The Board designated and appointed a Chief Compliance Officer to the Funds pursuant to Rule 38a-1 under the 1940 Act. The fees associated with the Office of the Chief Compliance Officer are paid for by JPMIM as described in Note 3.A.
The Securities and Exchange Commission (“SEC”) has granted an exemptive order permitting the Fund to engage in principal transactions with J.P. Morgan Securities LLC, an affiliated broker, involving taxable money market instruments, subject to certain conditions.
4. Investment Transactions
During the six months ended August 31, 2020, purchases and sales of investments (excluding short-term investments) were as follows:
| | | | | | | | |
| | | Purchases
(excluding U.S.
Government) | | | Sales
(excluding U.S.
Government) | |
| | $ | 41,328,488 | | | $ | 36,283,514 | |
During the six months ended August 31, 2020, there were no purchases or sales of U.S. Government securities.
For the six months ended August 31, 2020, in-kind transactions associated with creations and redemptions were as follows:
| | | | | | | | |
| | | In-Kind
Creations | | | In-Kind
Redemptions | |
| | $ | 148,720,746 | | | $ | 308,553,418 | |
5. Federal Income Tax Matters
For Federal income tax purposes, the estimated cost and unrealized appreciation (depreciation) in value of investments held at August 31, 2020 were as follows:
| | | | | | | | | | | | | | | | |
| | | Aggregate
Cost | | | Gross
Unrealized
Appreciation | | | Gross
Unrealized
Depreciation | | | Net Unrealized
Appreciation
(Depreciation) | |
| | $ | 1,128,365,141 | | | $ | 52,003,385 | | | $ | 225,599,536 | | | $ | (173,596,151 | ) |
At February 29, 2020, the Fund did not have any net capital loss carryforwards.
Net capital losses incurred after October 31, and within the taxable year are deemed to arise on the first business day of the Funds’ next taxable year. For the year ended February 29, 2020, the Fund deferred to March 1, 2020 the following net capital losses of:
| | | | | | | | |
| | | Net Capital Losses | |
| | | Short-Term | | | Long-Term | |
| | $ | 1,306,840 | | | $ | 471,676 | |
6. Capital Share Transactions
The Trust issues and redeems shares of the Fund only in Creation Units through the Distributor at NAV. Capital shares transactions detail can be found in the Statements of Changes in Net Assets.
Shares of the Fund may only be purchased or redeemed by Authorized Participants. Such Authorized Participants may from time to time hold, of record or beneficially, a substantial percentage of the Fund’s shares outstanding, and act as executing or clearing broker for investment transactions on behalf of the Fund. An Authorized Participant is either (1) a “Participating Party” or other participant in the clearing process through the Continuous Net Settlement System of the National Securities Clearing Corporation (“NSCC”); or (2) a DTC Participant; which, in either case, must have executed an agreement with the Distributor.
7. Risks, Concentrations and Indemnifications
In the normal course of business, the Fund enters into contracts that contain a variety of representations which provide general indemnifications. The Fund’s maximum exposure under these arrangements is unknown. The amount of exposure would depend on future claims that may be brought against the Fund. However, based on experience, the Fund expects the risk of loss to be remote.
| | | | | | |
| | | |
| 18 | | | | J.P. MORGAN EXCHANGE-TRADED FUNDS | | AUGUST 31, 2020 |
As of August 31, 2020, JPMorgan SmartRetirement Blend Funds and JPMorgan SmartRetirement Funds, which are affiliated funds of funds, owned in the aggregate, shares representing more than 10% of the net assets of the Fund as follows:
| | | | | | | | |
| | | JPMorgan
SmartRetirement
Blend Funds | | | JPMorgan
SmartRetirement
Funds | |
| | | 33.5 | % | | | 33.4 | % |
Significant shareholder transactions by these shareholders may impact the Fund’s performance.
Because the Fund may invest a significant portion of its assets in REITs, the Fund may be subject to certain risks similar to those associated with direct investments in real estate. REITs may be affected by changes in the value of their underlying properties and by defaults by tenants. REITs depend generally on their ability to generate cash flow to make distributions to shareholders, and certain REITs have self-liquidation provisions by which mortgages held may be paid in full and distributions of capital returns may be made at any time.
Disruptions to creations and redemptions, the existence of significant market volatility or potential lack of an active trading market for the Shares (including through a trading halt), as well as other factors, may result in Shares trading significantly above (at a premium) or below (at a discount) to the NAV or to the intraday value of the Fund’s holdings. During such periods, investors may incur significant losses if shares are sold.
The Fund may not track the return of the underlying index for a number of reasons and therefore may not achieve its investment objective. For example, the Fund incurs a number of operating expenses not applicable to its underlying index, and incurs costs in buying and selling securities, especially when rebalancing the Fund’s securities holdings to reflect changes in the composition of the underlying index. In addition, a Fund’s return may differ from the return of its underlying index as a result of, among other things, pricing differences and the inability to purchase certain securities included in the underlying index due to regulatory or other restrictions. To the extent of the previously outlined items, the Fund’s return differs from the return of the underlying index.
Derivatives may be riskier than other types of investments because they may be more sensitive to changes in economic and market conditions and could result in losses that significantly exceed the Fund’s original investment. Derivatives also expose the Fund to counterparty risk (the risk that the derivative counterparty will not fulfill its contractual obligations), including credit risk of the derivative counterparty. The possible lack of a liquid secondary market for derivatives and the resulting inability of the Fund to sell or otherwise close a derivatives position could expose the Fund to losses.
The Fund is subject to infectious disease epidemics/pandemics risk. Recently, the worldwide outbreak of COVID-19, a novel coronavirus disease, has negatively affected economies, markets and individual companies throughout the world. The effects of this COVID-19 pandemic to public health, and business and market conditions, including exchange trading suspensions and closures may continue to have a significant negative impact on the performance of the Fund’s investments, increase the Fund’s volatility, negatively impact the Fund’s arbitrage and pricing mechanisms, exacerbate other pre-existing political, social and economic risks to the Fund and negatively impact broad segments of businesses and populations. The Fund’s operations may be interrupted as a result, which may have a significant negative impact on investment performance. In addition, governments, their regulatory agencies, or self-regulatory organizations may take actions in response to the pandemic that affect the instruments in which the Fund invests, or the issuers of such instruments, in ways that could also have a significant negative impact on the Fund’s investment performance. The full impact of this COVID-19 pandemic, or other future epidemics/pandemics, is currently unknown.
8. Subsequent Events
On September 15, 2020, the Board approved the following changes to the Fund, which are expected to become effective on or about November 30, 2020: (i) a change to the Fund’s underlying index from the MSCI US REIT Index to the MSCI USA/REIT 25-50 Custom Index (the “New Index”); (ii) a change to the Fund’s investment objective so that the Fund will seek investment results that closely correspond to the performance of the New Index; and (iii) a change to one of the Fund’s investment policies so that the Fund will invest at least 80% of its assets, plus the amount of any borrowing for investment purposes, in securities held in the New Index.
| | | | | | | | |
| | | |
| AUGUST 31, 2020 | | J.P. MORGAN EXCHANGE-TRADED FUNDS | | | | | 19 | |
SCHEDULE OF SHAREHOLDER EXPENSES
(Unaudited)
Hypothetical $1,000 Investment
As a shareholder of the Fund, you incur two types of costs: (1) transaction costs, including brokerage commissions on your purchase and sales of Fund shares and (2) ongoing costs, primarily management fees. The examples below are intended to help you understand your ongoing costs (in dollars) of investing in the Fund and to compare these ongoing costs with the ongoing costs of investing in other funds. The examples assume that you had a $1,000 investment at the beginning of the reporting period March 1, 2020 and continued to hold your shares at the end of the reporting period, August 31, 2020.
Actual Expenses
For the Fund in the table below, the first line provides information about actual account values and actual expenses. You may use the information in this line, together with the amount you invested, to estimate the expenses that you paid over the period. Simply divide your account value by $1,000 (for example, an $8,600 account value divided by $1,000 = 8.6),
then multiply the result by the number under the heading entitled “Expenses Paid During the Period” to estimate the expenses you paid on your account during this period.
Hypothetical Example for Comparison Purposes
The second line in the table below provides information about hypothetical account values and hypothetical expenses based on the Fund’s actual expense ratio and an assumed rate of return of 5% per year before expenses, which is not the Fund’s actual return. The hypothetical account values and expenses may not be used to estimate the actual ending account balance or expenses you paid for the period. You may use this information to compare the ongoing costs of investing in the Fund and other Funds. To do so, compare this 5% hypothetical example with the 5% hypothetical examples that appear in the shareholder reports of other funds. The examples also assume all dividends and distributions have been reinvested.
| | | | | | | | | | | | | | | | |
| | | Beginning
Account Value
March 1, 2020 | | | Ending
Account Value
August 31, 2020 | | | Annualized
Expense
Ratio (1) | | | Expenses
Paid During
the Period | |
JPMorgan BetaBuilders MSCI US REIT ETF | | | | | | | | | | | | | | | | |
Actual | | $ | 1,000.00 | | | $ | 919.80 | | | | 0.11 | % | | $ | 0.53 | |
Hypothetical | | | 1,000.00 | | | | 1,024.65 | | | | 0.11 | | | | 0.56 | |
| (1) | Expenses are equal to each Fund’s annualized net expense ratio, multiplied by the average account value over the period, multiplied by 184/365 (to reflect the one-half year period). |
| | | | | | |
| | | |
| 20 | | | | J.P. MORGAN EXCHANGE-TRADED FUNDS | | AUGUST 31, 2020 |
LIQUIDITY RISK MANAGEMENT PROGRAM
(Unaudited)
The Fund has adopted the J.P. Morgan Exchange-Traded Funds Liquidity Risk Management Program (the “Program”) under Rule 22e-4 under the 1940 Act (the “Liquidity Rule”). The Program seeks to assess, manage and review the Fund’s Liquidity Risk. “Liquidity Risk” is defined as the risk that a fund could not meet requests to redeem shares issued by the fund without significant dilution of remaining investors’ interests in the fund. Among other things, the Liquidity Rule requires that a written report be provided to the Board of Trustees (the “Board”) on an annual basis that addresses the operation of the Program and assesses the adequacy and effectiveness of its implementation, including the operation of any Highly Liquidity Investment Minimum (“HLIM”), where applicable, and any material changes to the Program.
The Board has appointed J.P. Morgan Asset Management’s Liquidity Risk Forum to be the program administrator for the Program (the “Program Administrator”). On March 9, 2020, the Board of Trustees reviewed the Program Administrator’s initial written report (the “Report”) concerning the operation of the Program for the period from December 1, 2018 through December 31, 2019 (the “Program Reporting Period”). The Report addressed the operation of the Program and assessed its adequacy and effectiveness of implementation, including, where applicable, the operation of the Fund’s HLIM. There were no material changes to the Program during the Program Reporting Period.
The Report summarized the operation of the Program and the information and factors considered by the Program Administrator in assessing whether the Program has been adequately
and effectively implemented with respect to the Fund. Such information and factors included, among other things: (1) the effectiveness of the Program with respect to the identification the Fund qualifies as an “In-Kind ETF” (as defined in the Liquidity Rule); (2) the liquidity risk framework used to assess, manage, and periodically review the Fund’s Liquidity Risk and the results of this assessment; (3) the methodology and inputs for classifying the investments of the Fund (other than an In-Kind ETF) into one of four liquidity categories that reflect an estimate of their liquidity under current market conditions (and, for In-Kind ETFs, the methodology and inputs for determining whether any investments should be classified as “illiquid investments” (as defined under the Liquidity Rule)): (4) whether the Fund (other than an In-Kind ETF) invested primarily in “Highly Liquid Investments” (as defined under the Liquidity Rule), whether an HLIM should be established for the Fund and the procedures for monitoring any HLIM; (5) whether the Fund invested more than 15% of its assets in “Illiquid Investments” and the procedures for monitoring for this limit; and (6) specific liquidity events arising during the Program Reporting Period, including the impact on Fund liquidity caused by extended non-U.S. market closures.
Based on this review, the Report concluded that: (1) the Program continues to be reasonably designed to effectively assess and manage the Fund’s Liquidity Risk; and (2) the Program has been adequately and effectively implemented with respect to the Fund during the Program Reporting Period.
| | | | | | | | |
| | | |
| AUGUST 31, 2020 | | J.P. MORGAN EXCHANGE-TRADED FUNDS | | | | | 21 | |
J.P. Morgan Exchange-Traded Funds are distributed by JPMorgan Distribution Services, Inc., an indirect, wholly-owned subsidiary of JPMorgan Chase & Co.
Contact J.P. Morgan Exchange-Traded Funds at 1-844-457-6383 (844-4JPM ETF) for a fund prospectus. You can also visit us at www.jpmorganfunds.com. Investors should carefully consider the investment objectives and risks as well as charges and expenses of the fund before investing. The prospectus contains this and other information about the fund. Read the prospectus carefully before investing.
Investors may obtain information about the Securities Investor Protection Corporation (SIPC), including the SIPC brochure, by visiting www.sipc.org or by calling SIPC at 202-371-8300.
The Fund files a complete schedule of its fund holdings for the first and third quarters of its fiscal year with the SEC as an exhibit to its report on Form N-PORT. The Fund’s Form N-PORT reports are available on the SEC’s website at http://www.sec.gov. The Fund’s quarterly holdings can be found by visiting the J.P. Morgan Funds’ website at www.jpmorganfunds.com.
A description of the Fund’s policies and procedures with respect to the disclosure of the Fund’s holdings is available in the prospectus and Statement of Additional Information.
A copy of proxy policies and procedures is available without charge upon request by calling 1-844-457-6383 and on the Fund’s website at www.jpmorganfunds.com. A description of such policies and procedures is on the SEC’s website at www.sec.gov. The Trustees have delegated the authority to vote proxies for securities owned by the Fund to the Adviser. A copy of the Fund’s voting record for the most recent 12-month period ended June 30 is available on the SEC’s website at www.sec.gov or at the Fund’s website at www.jpmorganfunds.com no later than August 31 of each year. The Fund’s proxy voting record will include, among other things, a brief description of the matter voted on for each fund security, and will state how each vote was cast, for example, for or against the proposal.

J.P. Morgan Asset Management is the brand name for the asset management businesses of JPMorgan Chase & Co. and its affiliates worldwide.
| | | | |
| | © JPMorgan Chase & Co., 2020. All rights reserved. August 2020. | | SAN-USREITETF-820 |
ITEM 2. CODE OF ETHICS.
Disclose whether, as of the end of the period covered by the report, the registrant has adopted a code of ethics that applies to the registrant’s principal executive officer, principal financial officer, principal accounting officer or controller, or persons performing similar functions, regardless of whether these individuals are employed by the registrant or a third party. If the registrant has not adopted such a code of ethics, explain why it has not done so.
The registrant must briefly describe the nature of any amendment, during the period covered by the report, to a provision of its code of ethics that applies to the registrant’s principal executive officer, principal financial officer, principal accounting officer or controller, or persons performing similar functions, regardless of whether these individuals are employed by the registrant or a third party, and that relates to any element of the code of ethics definition enumerated in paragraph (b) of this Item. The registrant must file a copy of any such amendment as an exhibit pursuant to Item 13(a)(1), unless the registrant has elected to satisfy paragraph (f) of this Item by positing its code of ethics on its website pursuant to paragraph (f)(2) of this Item, or by undertaking to provide its code of ethics to any person without charge, upon request, pursuant to paragraph (f)(3) of this Item.
If the registrant has, during the period covered by the report, granted a waiver, including an implicit waiver, from a provision of the code of ethics that applies to the registrant’s principal executive officer, principal financial officer, principal accounting officer or controller, or persons performing similar functions, regardless of whether these individuals are employed by the registrant or third party, that relates to one or more items set forth in paragraph (b) of this Item, the registrant must briefly describe the nature of the waiver, the name of the person to whom the waiver was granted, and the date of the waiver.
Not applicable to a semi-annual report.
ITEM 3. AUDIT COMMITTEE FINANCIAL EXPERT.
(a) (1) Disclose that the registrant’s board of directors has determined that the registrant either:
(i) Has at least one audit committee financial expert serving on its audit committee; or
(ii) Does not have an audit committee financial expert serving on its audit committee.
(2) If the registrant provides the disclosure required by paragraph (a)(1)(i) of this Item, it must disclose the name of the audit committee financial expert and whether that person is “independent.” In order to be considered “independent” for purposes of this Item, a member of an audit committee may not, other than in his or her capacity as a member of the audit committee, the board of directors, or any other board committee:
(i) Accept directly or indirectly any consulting, advisory, or other compensatory fee from the issuer; or
(ii) Be an “interested person” of the investment company as defined in Section 2(a)(19) of the Act (15 U.S.C. 80a -2(a)(19)).
(3) If the registrant provides the disclosure required by paragraph (a)(1)(ii) of this Item, it must explain why it does not have an audit committee financial expert.
Not applicable to a semi-annual report.
ITEM 4. PRINCIPAL ACCOUNTANT FEES AND SERVICES.
(a) Disclose, under the caption Audit Fees, the aggregate fees billed for each of the last two fiscal years for professional services rendered by the principal accountant for the audit of the registrant’s annual financial statements or services that are normally provided by the accountant in connection with statutory and regulatory filings or engagements for those fiscal years.
(b) Disclose, under the caption Audit -Related Fees, the aggregate fees billed in each of the last two fiscal years for assurance and related services by the principal accountant that are reasonably related to the performance of the audit of the registrant’s financial statements and are not reported under paragraph (a) of this Item. Registrants shall describe the nature of the services comprising the fees disclosed under this category.
(c) Disclose, under the caption Tax Fees, the aggregate fees billed in each of the last two fiscal years for professional services rendered by the principal accountant for tax compliance, tax advice, and tax planning. Registrants shall describe the nature of the services comprising the fees disclosed under this category.
(d) Disclose, under the caption All Other Fees, the aggregate fees billed in each of the last two fiscal years for products and services provided by the principal accountant, other than the services reported in paragraphs (a) through (c) of this Item. Registrants shall describe the nature of the services comprising the fees disclosed under this category.
(e) (1) Disclose the audit committee’s pre -approval policies and procedures described in paragraph (c)(7) of Rule 2 -01 of Regulation S -X.
(2) Disclose the percentage of services described in each of paragraphs (b) through (d) of this Item that were approved by the audit committee pursuant to paragraph (c)(7)(i)(C) of Rule 2 -01 of Regulation S -X.
(f) If greater than 50 percent, disclose the percentage of hours expended on the principal accountant’s engagement to audit the registrant’s financial statements for the most recent fiscal year that were attributed to work performed by persons other than the principal accountant’s full -time, permanent employees.
(g) Disclose the aggregate non -audit fees billed by the registrant’s accountant for services rendered to the registrant, and rendered to the registrant’s investment adviser (not including any sub -adviser whose role is primarily portfolio management and is subcontracted with or overseen by another investment adviser), and any entity controlling, controlled by, or under common control with the adviser that provides ongoing services to the registrant for each of the last two fiscal years of the registrant.
(h) Disclose whether the registrant’s audit committee of the board of directors has considered whether the provision of non -audit services that were rendered to the registrant’s investment adviser (not including any subadviser whose role is primarily portfolio management and is subcontracted with or overseen by another investment adviser), and any entity controlling, controlled by, or under common control with the investment adviser that provides ongoing services to the registrant that were not pre -approved pursuant to paragraph (c)(7)(ii) of Rule 2 -01 of Regulation S -X is compatible with maintaining the principal accountant’s independence.
Not applicable to a semi-annual report.
ITEM 5. AUDIT COMMITTEE OF LISTED REGISTRANTS.
(a) If the registrant is a listed issuer as defined in Rule 10A -3 under the Exchange Act (17CFR 240.10A -3), state whether or not the registrant has a separately -designated standing audit committee established in accordance with Section 3(a)(58)(A) of the Exchange Act (15 U.S.C. 78c(a)(58)(A)). If the registrant has such a committee, however designated, identify each committee member. If the entire board of directors is acting as the registrant’s audit committee as specified in Section 3(a)(58)(B) of the Exchange Act (15
U.S.C. 78c(a)(58)(B)), so state.
(b) If applicable, provide the disclosure required by Rule 10A -3(d) under the Exchange Act (17CFR 240.10A -3(d)) regarding an exemption from the listing standards for all audit committees.
Not applicable to a semi-annual report.
ITEM 6. SCHEDULE OF INVESTMENTS.
File Schedule I – Investments in securities of unaffiliated issuers as of the close of the reporting period as set forth in Section 210.12 -12 of Regulation S -X, unless the schedule is included as part of the report to shareholders filed under Item 1 of this Form.
Included in Item 1.
ITEM 7. DISCLOSURE OF PROXY VOTING POLICIES AND PROCEDURES FOR CLOSED -END MANAGEMENT INVESTMENT COMPANIES.
Not applicable.
ITEM 8. PORTFOLIO MANAGERS OF CLOSED -END MANAGEMENT INVESTMENT COMPANIES.
Not applicable.
ITEM 9. PURCHASE OF EQUITY SECURITIES BY CLOSED -END MANAGEMENT INVESTMENT COMPANY AND AFFILIATED PURCHASERS.
Not applicable.
ITEM 10. SUBMISSION OF MATTERS TO A VOTE OF SECURITY HOLDERS.
Describe any material changes to the procedures by which shareholders may recommend nominees to the registrant’s board of directors, where those changes were implemented after the registrant last provided disclosure in response to the requirements of Item 7(d)(2)(ii)(G) of Schedule 14A (17 CFR 240.14a -101), or this Item.
No material changes to report.
ITEM 11. CONTROLS AND PROCEDURES.
(a) Disclose the conclusions of the registrant’s principal executive and principal financial officers, or persons performing similar functions, regarding the effectiveness of the registrant’s disclosure controls and procedures (as defined in Rule 30a -3(c) under the Act (17 CFR 270.30a -3(c))) as of a date within 90 days of the filing date of the report that includes the disclosure required by this paragraph, based on the evaluation of these controls and procedures required by Rule 30a -3(b) under the Act (17 CFR 270.30a -3(b))and Rules 13a -15(b) or 15d -15(b) under the Exchange Act (17 CFR 240.13a -15(b) or 240.15d -15(b)).
The Registrant’s principal executive and principal financial officers have concluded, based on their evaluation of the Registrant’s disclosure controls and procedures as of a date within 90 days of the filing date of this report, that the Registrant’s disclosure controls and procedures are reasonably designed to ensure that information required to be disclosed by the Registrant on Form N -CSR is recorded, processed, summarized and reported within the required time periods and that information required to be disclosed by the Registrant in the reports that it files or submits on Form N -CSR is accumulated and communicated to the Registrant’s management, including its principal executive and principal financial officers, as appropriate to allow timely decisions regarding required disclosure.
(b) Disclose any change in the registrant’s internal control over financial reporting (as defined in Rule 30a -3(d) under the Act (17 CFR 270.30a -3(d)) that occurred during the registrant’s second fiscal quarter of the period covered by this report that has materially affected, or is reasonably likely to materially affect, the registrant’s internal control over financial reporting.
There were no changes in the Registrant’s internal control over financial reporting that occurred during the last fiscal quarter covered by this report that have materially affected, or are reasonably likely to materially affect, the Registrant’s internal control over financial reporting.
ITEM 12. DISCLOSURE OF SECURITIES LENDING ACTIVITIES FOR CLOSED-END MANAGEMENT INVESTMENT COMPANIES.
Not applicable.
ITEM 13. EXHIBITS.
(a) File the exhibits listed below as part of this Form. Letter or number the exhibits in the sequence indicated.
(1) Any code of ethics, or amendment thereto, that is the subject of the disclosure required by Item 2, to the extent that the registrant intends to satisfy the Item 2 requirements through filing of an exhibit.
Not applicable.
(2) A separate certification for each principal executive officer and principal financial officer of the registrant as required by Rule 30a -2(a) under the Act (17 CFR 270.30a -2).
Certifications pursuant to Rule 30a -2(a) under the Investment Company Act of 1940 are attached hereto.
(3) Any written solicitation to purchase securities under Rule 23c -1 under the Act (17 CFR 270.23c -1) sent or given during the period covered by the report by or on behalf of the registrant to 10 or more persons.
Not applicable.
(b) A separate or combined certification for each principal executive officer and principal officer of the registrant as required by Rule 30a -2(b) under the Act of 1940.
Certifications pursuant to Rule 30a -2(b) under the Investment Company Act of 1940 are attached hereto.
SIGNATURES
Pursuant to the requirements of the Securities Exchange Act of 1934 and the Investment Company Act of 1940, the registrant has duly caused this report to be signed on its behalf by the undersigned, thereunto duly authorized.
| | |
J.P. Morgan Exchange-Traded Fund Trust |
| |
By: | | /s/ Brian S. Shlissel |
| | Brian S. Shlissel |
| | Interim President and Principal Executive Officer |
| | November 2, 2020 |
Pursuant to the requirements of the Securities Exchange Act of 1934 and the Investment Company Act of 1940, this report has been signed below by the following persons on behalf of the registrant and in the capacities and on the dates indicated.
| | |
| |
By: | | /s/ Brian S. Shlissel |
| | Brian S. Shlissel |
| | Interim President and Principal Executive Officer |
| | November 2, 2020 |
| | |
| |
By: | | /s/ Timothy J. Clemens |
| | Timothy J. Clemens |
| | Treasurer and Principal Financial Officer |
| | November 2, 2020 |