UNITED STATES
SECURITIES AND EXCHANGE COMMISSION
Washington, D.C. 20549
FORM N-CSR
CERTIFIED SHAREHOLDER REPORT OF REGISTERED
MANAGEMENT INVESTMENT COMPANIES
Investment Company Act file number: 811-22903
J.P. Morgan Exchange-Traded Fund Trust
(Exact name of registrant as specified in charter)
277 Park Avenue
New York, NY 10172
(Address of principal executive offices) (Zip code)
Gregory S. Samuels
J.P. Morgan Investment Management Inc.
277 Park Avenue
New York, NY 10172
(Name and Address of Agent for Service)
With copies to:
| | |
| Elizabeth A. Davin, Esq. | | Jon S. Rand, Esq. |
| JPMorgan Chase & Co. | | Dechert LLP |
| 1111 Polaris Parkway | | 1095 Avenue of the Americas |
| Columbus, OH 43240 | | New York, NY 10036 |
Registrant’s telephone number, including area code: 1-844-457-6383
Date of fiscal year end: June 30
Date of reporting period: July 1, 2020 through December 31, 2020
Form N-CSR is to be used by management investment companies to file reports with the Commission not later than 10 days after the transmission to stockholders of any report that is required to be transmitted to stockholders under Rule 30e-1 under the Investment Company Act of 1940 (17 CFR 270.30e-1). The Commission may use the information provided on Form N-CSR in its regulatory, disclosure review, inspection, and policymaking roles.
A registrant is required to disclose the information specified by Form N-CSR, and the Commission will make this information public. A registrant is not required to respond to the collection of information contained in Form N-CSR unless the Form displays a currently valid Office of Management and Budget (“OMB”) control number. Please direct comments concerning the accuracy of the information collection burden estimate and any suggestions for reducing the burden to Secretary, Securities and Exchange Commission, 450 Fifth Street, NW, Washington, DC 20549-0609. The OMB has reviewed this collection of information under the clearance requirements of 44 U.S.C. Section 3507.
ITEM 1. REPORTS TO STOCKHOLDERS.
a.) The following is a copy of the report transmitted to shareholders pursuant to Rule 30e-1 under the Investment Company Act of 1940 (17 CFR 270.30e-1).
b.) A copy of the notice transmitted to shareholders in reliance on Rule 30e-3 under the 1940 Act that contains disclosures specified by paragraph (c)(3) of that rule is included in the Annual Report. Not Applicable. Notices do not incorporate disclosures from the shareholder report.
Semi-Annual Report
J.P. Morgan Exchange-Traded Funds
December 31, 2020 (Unaudited)
JPMorgan Equity Premium Income ETF
CONTENTS
Investments in the Fund are not bank deposits or obligations of, or guaranteed or endorsed by, any bank and are not insured or guaranteed by the FDIC, the Federal Reserve Board or any other government agency. You could lose money if you sell when the Fund’s share price is lower than when you invested.
Past performance is no guarantee of future performance. The general market views expressed in this report are opinions based on market and other conditions through the end of the reporting period and are subject to change without notice. These views are not intended to predict the future performance of the Fund or the securities markets. References to specific securities and their issuers are for illustrative purposes only and are not intended to be, and should not be interpreted as, recommendations to purchase or sell such securities. Such views are not meant as investment advice and may not be relied on as an indication of trading intent on behalf of the Fund.
Prospective investors should refer to the Fund’s prospectus for a discussion of the Fund’s investment objectives, strategies and risks. Call J.P. Morgan Exchange-Traded Funds at (844) 457-6383 for a prospectus containing more complete information about the Fund, including management fees and other expenses. Please read it carefully before investing.
Shares are bought and sold throughout the day on an exchange at market price (not at net asset value) through a brokerage account, and are not individually subscribed and redeemed from the Fund. Shares may only be subscribed and redeemed directly from the Fund by Authorized Participants, in very large creation/redemption units. Brokerage commissions will reduce returns.
PRESIDENT’S LETTER
January 28, 2021 (Unaudited)
Dear Shareholder,
In spite of the enormous challenges of the past year, J.P. Morgan Exchange-Traded Funds launched three innovative ETFs and has built up more than $46 billion in assets under management spread over 33 funds. Throughout, our mission has remained helping investors build durable portfolios to achieve their goals via our extensive platform of well-diversified solutions.
| | |
 | | “Throughout the multiple challenges brought on by the pandemic, we have demonstrated our resiliency and maintained our focus on giving investors innovative, quality solutions to help them build durable portfolios that meet their needs, regardless of the market environment.” — Joanna M. Gallegos |
Equity markets in the U.S. rallied in the second half of 2020 as investor appetite risk assets was driven by continued policy support from leading central banks, massive government relief and stimulus programs and the approvals of the first vaccines against Covid-19. Globally, equity markets maintained upward momentum through the end of 2020 largely driven by investor expectations that mass vaccinations and the reopening of economies in 2021 would unleash pent up demand from consumers, businesses and governments. Emerging markets equity outperformed developed markets equity, including U.S. equity, as China, Taiwan and South Korea appeared to have greater success in containing the pandemic.
In the U.S., growth stocks continued to outperform value stocks but the difference narrowed somewhat during the final months of 2020 as share price valuations rose. At year’s end, the largest 10 companies in the S&P 500 Index made up 27.4% of the index’s value, compared with 22.7% at the end of 2019 and 21.0% at the end of 2018.
Meanwhile, our Equity Premium Income ETF (JEPI) has performed as designed since its launch in May 2020. While it underperformed the S&P 500 Index for the six months ended December 31, 2020, the Fund’s use of options-based equity-linked notes allowed it to capture 74% of the benchmark index’s total return with about 58% of the index’s volatility during the period.
Throughout the multiple challenges brought on by the pandemic, we have demonstrated our resiliency and maintained our focus on giving investors innovative, quality solutions to help them build durable portfolios that meet their needs, regardless of the market environment. We are proud of accomplishments and our ability to adapt to new global realities. Thank you for your belief in our Firm and our process.
Sincerely,

Joanna M. Gallegos
President, J.P. Morgan Exchange-Traded Funds
J.P Morgan Asset Management
1-844-4JPM-ETF or jpmorgan.com/etfs for more information
| | | | | | | | |
| | | |
| DECEMBER 31, 2020 | | J.P. MORGAN EXCHANGE-TRADED FUNDS | | | | | 1 | |
JPMorgan Equity Premium Income ETF
FUND COMMENTARY
SIX MONTHS ENDED DECEMBER 31, 2020 (Unaudited)
| | | | |
| REPORTING PERIOD RETURN: | | | |
| JPMorgan Equity Premium Income ETF | | | | |
| Net Asset Value* | | | 16.50% | |
| Market Price** | | | 16.25% | |
| S&P 500 Index | | | 22.16% | |
| ICE BofAML 3-Month US Treasury Bill Index | | | 0.07% | |
| |
| Net Assets as of 12/31/2020 (In Thousands) | | $ | 169,816,325 | |
INVESTMENT OBJECTIVE***
The JPMorgan Equity Premium Income ETF (the “Fund”) seeks current income while maintaining prospects for capital appreciation.
INVESTMENT APPROACH
The Fund generates income by investing in a combination of options-based equity-linked notes and U.S. large cap stocks, seeking to deliver a monthly income stream from associated option premiums and stock dividends. The Fund uses a proprietary research process designed to identify over- and undervalued stocks with attractive risk/return characteristics.
HOW DID THE MARKET PERFORM?
Overall, the second half of 2020 was marked by U.S. equity market gains in the final months of the year amid the rollout of multiple vaccines against Covid-19, followed by the approval of $900 billion in federal pandemic relief that was signed into law on December 27, 2020.
Globally, U.S. equity led a broad rebound in both developed markets and emerging markets equity at the start of the period. Leading U.S. equity indexes rose in July and August 2020, punctuated by five consecutive record high closings for the S&P 500 Index in late August — a stretch not seen since 2017. Notably, Apple Inc. issued a 4-for-1 stock split in August and became the first publicly listed company with a valuation surpassing $2 trillion. The U.S. Federal Reserve (the “Fed”) signaled its continued support for asset purchases and low benchmark interest rates. While the spread of Covid-19 accelerated in the U.S., multiple candidate vaccines were being developed around the world and the number of hospitalizations at the end of the summer was relatively small compared with what was to come at the end of the year.
In September and October 2020, re-closings across Asia and Europe in response to the pandemic dented investor optimism. The inability of the U.S. Congress to adopt further spending for pandemic relief put acute pressure on the S&P 500 Index in the final week of October.
U.S. equity prices began to rebound in November and by mid-month the S&P 500 Index reached a closing high and
crossed 3,600 points for the first time amid the U.S. Food and Drug Administration’s approvals of the first Covid-19 vaccines. While the results of the U.S. presidential election were contested, President-elect Joe Biden’s early cabinet choices — including former Fed Chairwoman Janet Yellen — removed some investor uncertainty. The Fed kept interest rates and policies unchanged and Congressional negotiations over proposed relief and stimulus spending continued through the month.
U.S. growth stocks continued to outperform value stocks but the difference narrowed somewhat during the period as share price valuations rose. Additionally, shares of select companies that had seen their stock prices plummet in the first half of 2020 benefitted from increased investor appetite for bargains in the second half of the year. At year’s end, the largest 10 companies in the S&P 500 Index made up 27.4% of the index’s value, compared with 22.7% at the end of 2019 and 21.0% at the end of 2018.
Overall, equity outperformed fixed income, particularly U.S. Treasury bonds, as investors sought higher yields amid historically low interest rates.
WHAT WERE THE MAIN DRIVERS OF THE FUND’S PERFORMANCE?
The Fund underperformed the S&P 500 Index (the “Benchmark”) and outperformed the ICE BofAML 3-Month US Treasury Bill Index for the six months ended December 31, 2020.
The Fund’s use of options-based equity-linked notes allowed the Fund to generally perform as designed, delivering returns with less volatility than the Benchmark during the reporting period. The Fund captured 74% of the Benchmark’s total return with about 58% of the Benchmark’s volatility during the reporting period, resulting in income of $3.23 per share.
The Fund’s security selection and underweight position in the information technology sector and its overweight position in the financials sector were leading detractors from performance relative to the Benchmark, while the Fund’s underweight position in the energy sector and its overweight position in the industrials sector were leading contributors to relative performance.
| | | | | | |
| | | |
| 2 | | | | J.P. MORGAN EXCHANGE-TRADED FUNDS | | DECEMBER 31, 2020 |
Leading individual detractors from relative performance included the Fund’s underweight position in Apple Inc. and its overweight positions in Jack Henry & Associates Inc. and Northrop Grumman Corp. Shares of Apple, an information technology conglomerate, rose amid investor demand for the largest of the large capitalization stocks, better-than-expected quarterly earnings and investor expectations for the company’s planned 5G smartphone. Shares of Jack Henry & Associates, a payment processing provider mainly serving the financial services sector, fell after the company reported lower-than-expected revenue for its fiscal fourth quarter and issued a lower-than-expected revenue forecast for its fiscal year. Shares of Northrop Grumman, an aerospace and defense manufacturer, underperformed the broader market amid the December 23 veto of the 2021 U.S. military budget act by then-President Donald Trump — subsequently overridden by the U.S. Congress — and investor expectations that the defense sector would be unlikely to immediately benefit from a potential reopening of the economy in 2021.
Leading individual contributors to relative performance included the Fund’s underweight positions in Microsoft Corp. and Intel Corp., and its overweight position in Target Corp. Shares of Microsoft, a technology conglomerate, underperformed the broader market after a run-up in the stock price early in the period amid general investor demand for the largest cap stocks. Shares of Intel, a semiconductor manufacturer, fell after news reports that large technology companies develop their own semiconductors rather than buy them from Intel and other sources. Shares of Target, a discount department store chain, rose amid two consecutive quarters of better-than-expected growth in earnings and revenue.
HOW WAS THE FUND POSITIONED?
During the reporting period, the Fund’s portfolio managers maintained a defensive equity portfolio, investing primarily in common stocks of large capitalization U.S. companies, with reduced volatility compared with the Benchmark, while using index options-based equity-linked notes in a consistent and disciplined manner. The combination of the diversified portfolio of equity securities and income from index options-based equity-linked notes provided the Fund with a portion of the returns associated with equity market investments, less risk compared with the equity market, and a stream of distributable monthly income.
| | | | | | |
TOP TEN EQUITY HOLDINGS OF THE PORTFOLIO**** | |
| 1. | | BNP Paribas, ELN, 62.53%, 1/29/2021, (linked to S&P 500 Index) | | | 3.8 | % |
| 2. | | Royal Bank of Canada, ELN, 62.43%, 2/5/2021, (linked to S&P 500 Index) | | | 3.3 | |
| 3. | | BMO Capital Markets Corp., ELN, 55.06%, 1/15/2021, (linked to S&P 500 Index) | | | 3.1 | |
| 4. | | Toronto-Dominion Bank (The), ELN, 55.50%, 1/22/2021, (linked to S&P 500 Index) | | | 3.0 | |
| 5. | | Barclays Bank plc, ELN, 53.15%, 1/8/2021, (linked to S&P 500 Index) | | | 2.5 | |
| 6. | | Accenture plc, Class A | | | 1.6 | |
| 7. | | Microsoft Corp. | | | 1.5 | |
| 8. | | Alphabet, Inc., Class A | | | 1.5 | |
| 9. | | Honeywell International, Inc. | | | 1.5 | |
| 10. | | Target Corp. | | | 1.4 | |
| | | | |
PORTFOLIO COMPOSITION BY SECTOR**** | |
Other***** | | | 15.7 | % |
| Information Technology | | | 13.2 | |
| Consumer Staples | | | 11.3 | |
| Health Care | | | 10.9 | |
| Industrials | | | 9.4 | |
| Financials | | | 9.0 | |
| Communication Services | | | 8.1 | |
| Consumer Discretionary | | | 7.9 | |
| Utilities | | | 7.2 | |
| Materials | | | 2.5 | |
| Real Estate | | | 2.3 | |
| Energy | | | 0.4 | |
| Short-Term Investments | | | 2.1 | |
| * | | The return shown is based on net asset value and may differ from the return shown in the financial highlights, which reflects adjustments made to the net asset value in accordance with accounting principles generally accepted in the United States of America. The net asset value was $55.68 as of December 31, 2020. |
| ** | | Market price return was calculated assuming an initial investment made at the market price at the beginning of the reporting period, reinvestment of all dividends and distributions at market price during the period, and sale at the market price on the last day of the period. The price used to calculate the market price return was the closing price on the NYSE Arca. As of December 31, 2020, the closing price was $55.75. |
| *** | | The adviser seeks to achieve the Fund’s objective. There can be no guarantee it will be achieved. |
| **** | | Percentages indicated are based on total investments as of December 31, 2020. The Fund’s composition is subject to change. |
| ***** | | Equity-Linked Notes that are linked to the S&P 500 Index. |
| | | | | | | | |
| | | |
| DECEMBER 31, 2020 | | J.P. MORGAN EXCHANGE-TRADED FUNDS | | | | | 3 | |
JPMorgan Equity Premium Income ETF
FUND COMMENTARY
SIX MONTHS ENDED DECEMBER 31, 2020 (Unaudited) (continued)
| | | | | | | | | | | | |
TOTAL RETURNS AS OF DECEMBER 31, 2020 (Unaudited) | |
| | | INCEPTION DATE | | | SIX MONTHS* | | | CUMULATIVE SINCE
INCEPTION | |
Net Asset Value | | | May 20, 2020 | | | | 16.50% | | | | 18.29% | |
Market Price | | | | | | | 16.25% | | | | 18.44% | |
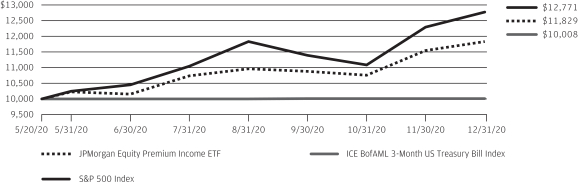
LIFE OF FUND PERFORMANCE (5/20/20 TO 12/31/20)
The performance quoted is past performance and is not a guarantee of future results. Exchange-traded funds are subject to certain market risks. Investment returns and principal value of an investment will fluctuate so that an investor’s shares, when sold or redeemed, may be worth more or less than their original cost. Current performance may be higher or lower than the performance data shown. For up-to-date, month-end performance information please call 1-844-457-6383.
Fund commenced operations on May 20, 2020.
The graph illustrates comparative performance for $10,000 invested in shares of the JPMorgan Equity Premium Income ETF, the S&P 500 Index and the ICE BofAML 3-Month U.S. Treasury Bill Index from May 20, 2020 to December 31, 2020. The performance of the Fund reflects the deduction of Fund expenses and assumes reinvestment of all dividends and capital gain distributions, if any. The performance of the S&P 500 Index and the ICE BofAML 3-Month U.S. Treasury Bill Index does not reflect the deduction of expenses associated with an exchange-traded fund and approximates the minimum possible dividend reinvestment of the securities included in the benchmarks, if applicable.
The S&P 500 Index is an unmanaged index generally representative of the performance of large companies in the U.S. stock market. The ICE BofAML
3-Month U.S. Treasury Bill Index is comprised of a single issue purchased at the beginning of the month and held for a full month. Each month the ICE BofAML 3-Month U.S. Treasury Bill Index is rebalanced and the issue selected is the outstanding Treasury Bill that matures closest to, but not beyond, 3 months from the rebalancing date. Investors cannot invest directly in an index.
The returns shown are based on net asset values calculated for shareholder transactions and may differ from the returns shown in the financial highlights, which reflect adjustments made to the net asset values in accordance with accounting principles generally accepted in the United States of America.
| | | | | | |
| | | |
| 4 | | | | J.P. MORGAN EXCHANGE-TRADED FUNDS | | DECEMBER 31, 2020 |
JPMorgan Equity Premium Income ETF
SCHEDULE OF PORTFOLIO INVESTMENTS
AS OF DECEMBER 31, 2020 (Unaudited)
| | | | | | | | |
| INVESTMENTS | | SHARES | | | VALUE($) | |
Common Stocks — 82.4% | |
|
Aerospace & Defense — 0.9% | |
Northrop Grumman Corp. | | | 5,279 | | | | 1,608,617 | |
| | | | | | | | |
|
Air Freight & Logistics — 0.6% | |
United Parcel Service, Inc., Class B | | | 5,533 | | | | 931,757 | |
| | | | | | | | |
|
Banks — 0.5% | |
US Bancorp | | | 17,098 | | | | 796,596 | |
| | | | | | | | |
|
Beverages — 2.8% | |
Coca-Cola Co. (The) | | | 32,245 | | | | 1,768,316 | |
Constellation Brands, Inc., Class A | | | 3,602 | | | | 789,018 | |
PepsiCo, Inc. | | | 14,797 | | | | 2,194,395 | |
| | | | | | | | |
| | |
| | | | | | | 4,751,729 | |
| | | | | | | | |
|
Biotechnology — 3.1% | |
AbbVie, Inc. | | | 21,653 | | | | 2,320,119 | |
Alexion Pharmaceuticals, Inc. * | | | 9,996 | | | | 1,561,775 | |
Regeneron Pharmaceuticals, Inc. * | | | 1,458 | | | | 704,374 | |
Vertex Pharmaceuticals, Inc. * | | | 3,043 | | | | 719,183 | |
| | | | | | | | |
| | |
| | | | | | | 5,305,451 | |
| | | | | | | | |
|
Building Products — 1.3% | |
Trane Technologies plc | | | 14,613 | | | | 2,121,223 | |
| | | | | | | | |
|
Capital Markets — 2.6% | |
BlackRock, Inc. | | | 1,559 | | | | 1,124,881 | |
Intercontinental Exchange, Inc. | | | 19,974 | | | | 2,302,803 | |
S&P Global, Inc. | | | 3,002 | | | | 986,847 | |
| | | | | | | | |
| | |
| | | | | | | 4,414,531 | |
| | | | | | | | |
|
Chemicals — 1.5% | |
Linde plc (United Kingdom) | | | 7,853 | | | | 2,069,344 | |
PPG Industries, Inc. | | | 3,359 | | | | 484,435 | |
| | | | | | | | |
| | |
| | | | | | | 2,553,779 | |
| | | | | | | | |
|
Commercial Services & Supplies — 0.6% | |
Waste Management, Inc. | | | 8,560 | | | | 1,009,481 | |
| | | | | | | | |
|
Containers & Packaging — 1.0% | |
Silgan Holdings, Inc. | | | 46,198 | | | | 1,713,022 | |
| | | | | | | | |
|
Diversified Financial Services — 1.2% | |
Berkshire Hathaway, Inc., Class B * | | | 9,061 | | | | 2,100,974 | |
| | | | | | | | |
|
Diversified Telecommunication Services — 1.1% | |
Verizon Communications, Inc. | | | 30,769 | | | | 1,807,679 | |
| | | | | | | | |
|
Electric Utilities — 2.6% | |
NextEra Energy, Inc. | | | 30,922 | | | | 2,385,633 | |
Xcel Energy, Inc. | | | 30,375 | | | | 2,025,101 | |
| | | | | | | | |
| | |
| | | | | | | 4,410,734 | |
| | | | | | | | |
|
Electrical Equipment — 0.7% | |
Eaton Corp. plc | | | 10,102 | | | | 1,213,654 | |
| | | | | | | | |
|
Entertainment — 0.9% | |
Netflix, Inc. * | | | 2,800 | | | | 1,514,044 | |
| | | | | | | | |
|
Equity Real Estate Investment Trusts (REITs) — 2.3% | |
Equinix, Inc. | | | 1,895 | | | | 1,353,371 | |
| | | | | | | | |
| INVESTMENTS | | SHARES | | | VALUE($) | |
| | | | | | | | |
|
Equity Real Estate Investment Trusts (REITs) — continued | |
Prologis, Inc. | | | 10,394 | | | | 1,035,866 | |
Public Storage | | | 3,482 | | | | 804,098 | |
Sun Communities, Inc. | | | 4,531 | | | | 688,486 | |
| | | | | | | | |
| | |
| | | | | | | 3,881,821 | |
| | | | | | | | |
|
Food & Staples Retailing — 2.4% | |
Costco Wholesale Corp. | | | 5,899 | | | | 2,222,625 | |
Kroger Co. (The) | | | 17,681 | | | | 561,549 | |
Walmart, Inc. | | | 8,473 | | | | 1,221,383 | |
| | | | | | | | |
| | |
| | | | | | | 4,005,557 | |
| | | | | | | | |
|
Food Products — 2.5% | |
Conagra Brands, Inc. | | | 19,891 | | | | 721,248 | |
General Mills, Inc. | | | 11,721 | | | | 689,195 | |
Hershey Co. (The) | | | 4,479 | | | | 682,286 | |
Mondelez International, Inc., Class A | | | 37,171 | | | | 2,173,388 | |
| | | | | | | | |
| | |
| | | | | | | 4,266,117 | |
| | | | | | | | |
|
Health Care Equipment & Supplies — 0.5% | |
Medtronic plc | | | 7,818 | | | | 915,800 | |
| | | | | | | | |
|
Health Care Providers & Services — 0.5% | |
UnitedHealth Group, Inc. | | | 2,488 | | | | 872,492 | |
| | | | | | | | |
|
Hotels, Restaurants & Leisure — 0.3% | |
McDonald’s Corp. | | | 2,274 | | | | 487,955 | |
| | | | | | | | |
|
Household Products — 2.3% | |
Kimberly-Clark Corp. | | | 12,760 | | | | 1,720,431 | |
Procter & Gamble Co. (The) | | | 15,963 | | | | 2,221,092 | |
| | | | | | | | |
| | |
| | | | | | | 3,941,523 | |
| | | | | | | | |
|
Industrial Conglomerates — 1.5% | |
Honeywell International, Inc. | | | 11,686 | | | | 2,485,612 | |
| | | | | | | | |
|
Insurance — 4.7% | |
Allstate Corp. (The) | | | 19,869 | | | | 2,184,199 | |
Chubb Ltd. | | | 12,299 | | | | 1,893,062 | |
Marsh & McLennan Cos., Inc. | | | 11,797 | | | | 1,380,249 | |
Progressive Corp. (The) | | | 23,154 | | | | 2,289,468 | |
RenaissanceRe Holdings Ltd. (Bermuda) | | | 1,817 | | | | 301,295 | |
| | | | | | | | |
| | |
| | | | | | | 8,048,273 | |
| | | | | | | | |
|
Interactive Media & Services — 2.2% | |
Alphabet, Inc., Class A * | | | 1,443 | | | | 2,529,059 | |
Facebook, Inc., Class A * | | | 4,685 | | | | 1,279,755 | |
| | | | | | | | |
| | |
| | | | | | | 3,808,814 | |
| | | | | | | | |
|
Internet & Direct Marketing Retail — 1.4% | |
Amazon.com, Inc. * | | | 745 | | | | 2,426,413 | |
| | | | | | | | |
|
IT Services — 7.0% | |
Accenture plc, Class A | | | 10,220 | | | | 2,669,567 | |
Automatic Data Processing, Inc. | | | 2,784 | | | | 490,541 | |
Booz Allen Hamilton Holding Corp. | | | 20,071 | | | | 1,749,790 | |
Leidos Holdings, Inc. | | | 18,595 | | | | 1,954,706 | |
SEE NOTES TO FINANCIAL STATEMENTS.
| | | | | | | | |
| | | |
| DECEMBER 31, 2020 | | J.P. MORGAN EXCHANGE-TRADED FUNDS | | | | | 5 | |
JPMorgan Equity Premium Income ETF
SCHEDULE OF PORTFOLIO INVESTMENTS
AS OF DECEMBER 31, 2020 (Unaudited) (continued)
| | | | | | | | |
| INVESTMENTS | | SHARES | | | VALUE($) | |
Common Stocks — continued | |
|
IT Services — continued | |
Mastercard, Inc., Class A | | | 6,457 | | | | 2,304,762 | |
PayPal Holdings, Inc. * | | | 4,474 | | | | 1,047,811 | |
Visa, Inc., Class A | | | 7,250 | | | | 1,585,792 | |
| | | | | | | | |
| | |
| | | | | | | 11,802,969 | |
| | | | | | | | |
|
Life Sciences Tools & Services — 1.6% | |
PerkinElmer, Inc. | | | 5,178 | | | | 743,043 | |
Thermo Fisher Scientific, Inc. | | | 4,352 | | | | 2,027,075 | |
| | | | | | | | |
| | |
| | | | | | | 2,770,118 | |
| | | | | | | | |
|
Machinery — 1.6% | |
Cummins, Inc. | | | 4,306 | | | | 977,892 | |
Deere & Co. | | | 2,074 | | | | 558,010 | |
PACCAR, Inc. | | | 14,214 | | | | 1,226,384 | |
| | | | | | | | |
| | |
| | | | | | | 2,762,286 | |
| | | | | | | | |
|
Media — 2.7% | |
Charter Communications, Inc., Class A * | | | 3,560 | | | | 2,355,118 | |
Comcast Corp., Class A | | | 40,896 | | | | 2,142,950 | |
| | | | | | | | |
| | |
| | | | | | | 4,498,068 | |
| | | | | | | | |
|
Multiline Retail — 2.3% | |
Dollar General Corp. | | | 3,179 | | | | 668,544 | |
Dollar Tree, Inc. * | | | 6,747 | | | | 728,946 | |
Target Corp. | | | 13,816 | | | | 2,438,938 | |
| | | | | | | | |
| | |
| | | | | | | 3,836,428 | |
| | | | | | | | |
|
Multi-Utilities — 4.6% | |
Ameren Corp. | | | 25,291 | | | | 1,974,215 | |
CMS Energy Corp. | | | 30,679 | | | | 1,871,726 | |
Public Service Enterprise Group, Inc. | | | 36,461 | | | | 2,125,676 | |
Sempra Energy | | | 10,714 | | | | 1,365,071 | |
WEC Energy Group, Inc. | | | 5,919 | | | | 544,726 | |
| | | | | | | | |
| | |
| | | | | | | 7,881,414 | |
| | | | | | | | |
|
Oil, Gas & Consumable Fuels — 0.4% | |
TC Energy Corp. (Canada) | | | 16,659 | | | | 678,354 | |
| | | | | | | | |
|
Pharmaceuticals — 5.1% | |
Bristol-Myers Squibb Co. | | | 33,633 | | | | 2,086,255 | |
Eli Lilly and Co. | | | 14,185 | | | | 2,394,995 | |
Johnson & Johnson | | | 13,044 | | | | 2,052,865 | |
Merck & Co., Inc. | | | 25,176 | | | | 2,059,397 | |
| | | | | | | | |
| | |
| | | | | | | 8,593,512 | |
| | | | | | | | |
|
Road & Rail — 2.3% | |
Norfolk Southern Corp. | | | 5,405 | | | | 1,284,282 | |
Old Dominion Freight Line, Inc. | | | 10,092 | | | | 1,969,757 | |
Union Pacific Corp. | | | 2,879 | | | | 599,465 | |
| | | | | | | | |
| | |
| | | | | | | 3,853,504 | |
| | | | | | | | |
|
Semiconductors & Semiconductor Equipment — 0.9% | |
Analog Devices, Inc. | | | 10,152 | | | | 1,499,755 | |
| | | | | | | | |
| | | | | | | | |
| INVESTMENTS | | SHARES | | | VALUE($) | |
| | | | | | | | |
|
Software — 3.6% | |
Intuit, Inc. | | | 6,293 | | | | 2,390,396 | |
Microsoft Corp. | | | 11,416 | | | | 2,539,146 | |
salesforce.com, Inc. * | | | 5,426 | | | | 1,207,448 | |
| | | | | | | | |
| | |
| | | | | | | 6,136,990 | |
| | | | | | | | |
|
Specialty Retail — 3.1% | |
AutoZone, Inc. * | | | 1,876 | | | | 2,223,885 | |
Home Depot, Inc. (The) | | | 4,455 | | | | 1,183,337 | |
Lowe’s Cos., Inc. | | | 6,264 | | | | 1,005,435 | |
TJX Cos., Inc. (The) | | | 13,139 | | | | 897,262 | |
| | | | | | | | |
| | |
| | | | | | | 5,309,919 | |
| | | | | | | | |
|
Technology Hardware, Storage & Peripherals — 1.8% | |
Apple, Inc. | | | 17,073 | | | | 2,265,416 | |
Seagate Technology plc | | | 12,100 | | | | 752,136 | |
| | | | | | | | |
| | |
| | | | | | | 3,017,552 | |
| | | | | | | | |
|
Textiles, Apparel & Luxury Goods — 0.8% | |
NIKE, Inc., Class B | | | 10,044 | | | | 1,420,925 | |
| | | | | | | | |
|
Tobacco — 1.3% | |
Altria Group, Inc. | | | 23,390 | | | | 958,990 | |
Philip Morris International, Inc. | | | 15,251 | | | | 1,262,630 | |
| | | | | | | | |
| | |
| | | | | | | 2,221,620 | |
| | | | | | | | |
|
Wireless Telecommunication Services — 1.3% | |
T-Mobile US, Inc. * | | | 16,508 | | | | 2,226,104 | |
| | | | | | | | |
Total Common Stocks
(Cost $128,417,727) | | | | 139,903,166 | |
| | | | | |
| | |
| | | PRINCIPAL
AMOUNT($) | | | | |
Equity-Linked Notes — 15.7% | |
Barclays Bank plc, ELN, 53.15%, 1/8/2021, (linked to S&P 500 Index) (a) | | | 1,174 | | | | 4,308,916 | |
BMO Capital Markets Corp., ELN, 55.06%, 1/15/2021, (linked to S&P 500 Index) (a) | | | 1,404 | | | | 5,207,850 | |
BNP Paribas, ELN, 62.53%, 1/29/2021, (linked to S&P 500 Index) (a) | | | 1,763 | | | | 6,418,537 | |
Royal Bank of Canada, ELN, 62.43%, 2/5/2021, (linked to S&P 500 Index) (a) | | | 1,503 | | | | 5,561,160 | |
Toronto-Dominion Bank (The), ELN, 55.50%, 1/22/2021, (linked to S&P 500 Index) (a) | | | 1,407 | | | | 5,150,313 | |
| | | | | | | | |
Total Equity-Linked Notes
(Cost $26,798,386) | | | | 26,646,776 | |
| | | | | |
SEE NOTES TO FINANCIAL STATEMENTS.
| | | | | | |
| | | |
| 6 | | | | J.P. MORGAN EXCHANGE-TRADED FUNDS | | DECEMBER 31, 2020 |
| | | | | | | | |
| INVESTMENTS | | SHARES | | | VALUE($) | |
Short-Term Investments — 2.1% | |
|
Investment Companies — 2.1% | |
JPMorgan U.S. Government Money Market Fund Class Institutional Shares, 0.03% (b) (c) (Cost $3,650,193) | | | 3,650,193 | | | | 3,650,193 | |
| | | | | | | | |
Total Investments — 100.2%
(Cost $158,866,306) | | | | 170,200,135 | |
Liabilities in Excess of
Other Assets — (0.2)% | | | | (383,810 | ) |
| | | | | |
Net Assets — 100.0% | | | | 169,816,325 | |
| | | | | |
Percentages indicated are based on net assets.
Abbreviations
| | |
| ELN | | Equity-Linked Note |
| |
| (a) | | Securities exempt from registration under Rule 144A or section 4(a)(2), of the Securities Act of 1933, as amended. |
| (b) | | Investment in an affiliated fund, which is registered under the Investment Company Act of 1940, as amended, and is advised by J.P. Morgan Investment Management Inc. |
| (c) | | The rate shown is the current yield as of December 31, 2020. |
| * | | Non-income producing security. |
SEE NOTES TO FINANCIAL STATEMENTS.
| | | | | | | | |
| | | |
| DECEMBER 31, 2020 | | J.P. MORGAN EXCHANGE-TRADED FUNDS | | | | | 7 | |
STATEMENT OF ASSETS AND LIABILITIES
AS OF DECEMBER 31, 2020 (Unaudited)
| | | | |
| | | JPMorgan
Equity Premium
Income ETF | |
ASSETS: | |
Investments in non-affiliates, at value | | $ | 166,549,942 | |
Investments in affiliates, at value | | | 3,650,193 | |
Receivables: | | | | |
Investment securities sold | | | 6,032,726 | |
Interest from non-affiliates | | | 686,694 | |
Dividends from non-affiliates | | | 200,723 | |
Dividends from affiliates | | | 51 | |
| | | | |
Total Assets | | | 177,120,329 | |
| | | | |
|
LIABILITIES: | |
Payables: | | | | |
Due to custodian | | | 231 | |
Distributions | | | 1,655,601 | |
Investment securities purchased | | | 5,601,741 | |
Accrued liabilities: | | | | |
Management fees (See Note 3.A.) | | | 46,431 | |
| | | | |
Total Liabilities | | | 7,304,004 | |
| | | | |
Net Assets | | $ | 169,816,325 | |
| | | | |
|
NET ASSETS: | |
Paid-in-Capital | | $ | 162,047,762 | |
Total distributable earnings (loss) | | | 7,768,563 | |
| | | | |
Total Net Assets | | $ | 169,816,325 | |
| | | | |
| |
Outstanding number of shares
(unlimited number of shares authorized — par value $0.0001) | | | 3,050,000 | |
| | | | |
Net asset value, per share | | $ | 55.68 | |
| | | | |
| |
Cost of investments in non-affiliates | | $ | 155,216,113 | |
Cost of investments in affiliates | | | 3,650,193 | |
SEE NOTES TO FINANCIAL STATEMENTS.
| | | | | | |
| | | |
| 8 | | | | J.P. MORGAN EXCHANGE-TRADED FUNDS | | DECEMBER 31, 2020 |
STATEMENT OF OPERATIONS
FOR THE SIX MONTHS ENDED DECEMBER 31, 2020 (Unaudited)
| | | | |
| | | JPMorgan
Equity Premium
Income ETF | |
INVESTMENT INCOME: | |
Interest income from non-affiliates | | $ | 5,109,407 | |
Dividend income from non-affiliates | | | 839,153 | |
Dividend income from affiliates | | | 196 | |
| | | | |
Total investment income | | | 5,948,756 | |
| | | | |
|
EXPENSES: | |
Management fees (See Note 3.A.) | | | 174,703 | |
Interest expense to non-affiliates | | | 22 | |
Interest expense to affiliates | | | 441 | |
| | | | |
Total expenses | | | 175,166 | |
| | | | |
Net investment income (loss) | | | 5,773,590 | |
| | | | |
| |
REALIZED/UNREALIZED GAINS (LOSSES): | | | | |
Net realized gain (loss) on transactions from: | |
Investments in non-affiliates | | | (3,281,958 | ) |
In-kind redemptions of investments in non-affiliates | | | 139,491 | |
Futures contracts | | | 63,347 | |
| | | | |
Net realized gain (loss) | | | (3,079,120 | ) |
| | | | |
Change in net unrealized appreciation/depreciation on: | | | | |
Investments in non-affiliates | | | 10,995,342 | |
| | | | |
Change in net unrealized appreciation/depreciation | | | 10,995,342 | |
| | | | |
Net realized/unrealized gains (losses) | | | 7,916,222 | |
| | | | |
Change in net assets resulting from operations | | $ | 13,689,812 | |
| | | | |
SEE NOTES TO FINANCIAL STATEMENTS.
| | | | | | | | |
| | | |
| DECEMBER 31, 2020 | | J.P. MORGAN EXCHANGE-TRADED FUNDS | | | | | 9 | |
STATEMENTS OF CHANGES IN NET ASSETS
FOR THE PERIODS INDICATED
| | | | | | | | |
| | | JPMorgan Equity Premium Income ETF | |
| | | Six Months Ended
December 31, 2020
(Unaudited) | | | Period Ended
June 30, 2020 (a) | |
CHANGE IN NET ASSETS RESULTING FROM OPERATIONS: | |
Net investment income (loss) | | $ | 5,773,590 | | | $ | 295,482 | |
Net realized gain (loss) | | | (3,079,120 | ) | | | (380,996 | ) |
Change in net unrealized appreciation/depreciation | | | 10,995,342 | | | | 338,487 | |
| | | | | | | | |
Change in net assets resulting from operations | | | 13,689,812 | | | | 252,973 | |
| | | | | | | | |
|
DISTRIBUTIONS TO SHAREHOLDERS: | |
Total distributions to shareholders | | | (6,174,222 | ) (b) | | | — | |
| | | | | | | | |
|
CAPITAL TRANSACTIONS: | |
Change in net assets resulting from capital transactions | | | 134,384,149 | | | | 27,663,613 | |
| | | | | | | | |
|
NET ASSETS: | |
Change in net assets | | | 141,899,739 | | | | 27,916,586 | |
Beginning of period | | | 27,916,586 | | | | — | |
| | | | | | | | |
End of period | | $ | 169,816,325 | | | $ | 27,916,586 | |
| | | | | | | | |
| | |
CAPITAL TRANSACTIONS: | | | | | | | | |
Proceeds from shares issued | | $ | 135,725,366 | | | $ | 27,663,613 | |
Cost of shares redeemed | | | (1,341,217 | ) | | | — | |
| | | | | | | | |
Total change in net assets resulting from capital transactions | | $ | 134,384,149 | | | $ | 27,663,613 | |
| | | | | | | | |
|
SHARE TRANSACTIONS: | |
Issued | | | 2,525,000 | | | | 550,000 | |
Redeemed | | | (25,000 | ) | | | — | |
| | | | | | | | |
Net increase in shares from share transactions | | | 2,500,000 | | | | 550,000 | |
| | | | | | | | |
| (a) | Commencement of operations was May 20, 2020. |
| (b) | During the period the Fund distributed $105,150 in excess of net investment income. This amount was factored into a subsequent distribution to shareholders and the Fund’s overdistribution position has been resolved. |
SEE NOTES TO FINANCIAL STATEMENTS.
| | | | | | |
| | | |
| 10 | | | | J.P. MORGAN EXCHANGE-TRADED FUNDS | | DECEMBER 31, 2020 |
THIS PAGE IS INTENTIONALLY LEFT BLANK
| | | | | | | | |
| | | |
| DECEMBER 31, 2020 | | J.P. MORGAN EXCHANGE-TRADED FUNDS | | | | | 11 | |
FINANCIAL HIGHLIGHTS
FOR THE PERIODS INDICATED
| | | | | | | | | | | | | | | | | | | | | | | | |
| | | Per share operating performance | |
| | | | | | Investment operations | | | Distributions | | | | |
| | | Net asset
value,
beginning
of period | | | Net
investment
income
(loss) (b) | | | Net realized
and unrealized
gains
(losses) on
investments | | | Total from
investment
operations | | | Net
investment
income | | | Net asset
value,
end of
period | |
| | | | | | |
JPMorgan Equity Premium Income ETF | | | | | | | | | | | | | | | | | | | | | | | | |
Six Months Ended December 31, 2020 (Unaudited) | | $ | 50.76 | | | $ | 3.13 | | | $ | 5.02 | | | $ | 8.15 | | | $ | (3.23 | ) | | $ | 55.68 | |
May 20, 2020 (f) through June 30, 2020 | | | 50.00 | | | | 0.63 | | | | 0.13 | (g) | | | 0.76 | | | | — | | | | 50.76 | |
| (a) | Annualized for periods less than one year, unless otherwise indicated. |
| (b) | Calculated based upon average shares outstanding. |
| (c) | Not annualized for periods less than one year. |
| (d) | Includes adjustments in accordance with accounting principles generally accepted in the United States of America and as such, the net asset values for financial reporting purposes and the returns based upon those net asset values may differ from the net asset values and returns for shareholder transactions. |
| (e) | Market price return was calculated assuming an initial investment made at the market price at the beginning of the reporting period, reinvestment of all dividends and distributions at market price during the period, and sale at the market price on the last day of the period. The closing price was used to calculate the market price return. |
| (f) | Commencement of operations. |
| (g) | Calculation of the net realized and unrealized gains (losses) per share do not correlate with the Fund’s net realized and unrealized gains (losses) presented in the Statement of Operations due to the timing of capital transactions in relation to the fluctuating market values of the Fund’s investments. |
| (h) | Since the Shares of the Fund did not trade in the secondary market until the day after the Fund’s inception, for the period from the inception to the first day of secondary market trading, the NAV is used as a proxy for the secondary market trading price to calculate the market returns. |
SEE NOTES TO FINANCIAL STATEMENTS.
| | | | | | |
| | | |
| 12 | | | | J.P. MORGAN EXCHANGE-TRADED FUNDS | | DECEMBER 31, 2020 |
| | | | | | | | | | | | | | | | | | | | | | | | | | |
| | | Ratios/Supplemental data | |
| | | | | | | | | | | | | Ratios to average net assets (a) | | | | |
Market
price,
end of
period | | | Total return (c)(d) | | | Market
price total
return (c)(e) | | | Net assets,
end of period | | | Net
expenses | | | Net
investment
income
(loss) | | | Portfolio
turnover
rate (c) | |
| | | | | | |
| | | | | | | | | | | | | | | | | | | | | | | | | | |
| $ | 55.75 | | | | 16.52 | % | | | 16.25 | % | | $ | 169,816,325 | | | | 0.35 | % | | | 11.48 | % | | | 126 | % |
| | 50.94 | | | | 1.52 | | | | 1.88 | (h) | | | 27,916,586 | | | | 0.35 | | | | 11.11 | | | | 13 | |
SEE NOTES TO FINANCIAL STATEMENTS.
| | | | | | | | |
| | | |
| DECEMBER 31, 2020 | | J.P. MORGAN EXCHANGE-TRADED FUNDS | | | | | 13 | |
NOTES TO FINANCIAL STATEMENTS
AS OF DECEMBER 31, 2020 (Unaudited)
1. Organization
J.P. Morgan Exchange-Traded Fund Trust (the “Trust”) was formed on February 25, 2010, and is governed by a Declaration of Trust as amended and restated February 19, 2014, and is registered under the Investment Company Act of 1940, as amended (the “1940 Act”), as an open-end management investment company. JPMorgan Equity Premium Income ETF (the “Fund” or the “Equity Premium Income ETF”) is a separate diversified series of the Trust covered in this report.
The Fund commenced operations on May 20, 2020. The investment objective of the Fund is to seek current income while maintaining prospects for capital appreciation.
J.P. Morgan Investment Management Inc. (“JPMIM”), an indirect, wholly-owned subsidiary of JPMorgan Chase & Co. (“JPMorgan”), acts as Adviser (the “Adviser”) and Administrator (the “Administrator”) to the Fund.
Shares of the Fund are listed and traded at market price on the NYSE Arca, Inc. Market prices for the Fund’s shares may be different from its net asset value (“NAV”). The Fund issues and redeems its shares on a continuous basis, through JPMorgan Distribution Services, Inc. (the “Distributor” or “JPMDS”), an indirect, wholly-owned subsidiary of JPMorgan, at NAV in large blocks of shares, typically 25,000 shares, referred to as “Creation Units.”
Creation Units are issued and redeemed principally in-kind for a basket of securities. A cash amount may be substituted if the Fund has sizeable exposure to market or sponsor restricted securities. Shares are generally traded in the secondary market in amounts less than a Creation Unit at market prices that change throughout the day. Only individuals or institutions that have entered into an authorized participant agreement with the Distributor may do business directly with the Fund (each, an “Authorized Participant”).
2. Significant Accounting Policies
The following is a summary of significant accounting policies followed by the Fund in the preparation of its financial statements. The Fund is an investment company and, accordingly, follows the investment company accounting and reporting guidance of the Financial Accounting Standards Board (“FASB”) Accounting Standards Codification Topic 946 — Investment Companies, which is part of U.S. generally accepted accounting principles (“GAAP”). The preparation of financial statements in conformity with GAAP requires management to make estimates and assumptions that affect (i) the reported amounts of assets and liabilities, (ii) disclosure of contingent assets and liabilities at the date of the financial statements, and (iii) the reported amounts of increases and decreases in net assets from operations during the reporting period. Actual results could differ from those estimates.
A. Valuation of Investments — Investments are valued in accordance with GAAP and the Fund’s valuation policies set forth by, and under the supervision and responsibility of, the Board of Trustees of the Trust (the “Board”), which established the following approach to valuation, as described more fully below: (i) investments for which market quotations are readily available shall be valued at their market value and (ii) all other investments for which market quotations are not readily available shall be valued at their fair value as determined in good faith by the Board.
The Administrator has established the J.P. Morgan Asset Management Americas Valuation Committee (“AVC”) to assist the Board with the oversight and monitoring of the valuation of the Fund’s investments. The Administrator implements the valuation policies of the Fund’s investments, as directed by the Board. The AVC oversees and carries out the policies for the valuation of investments held in the Fund. This includes monitoring the appropriateness of fair values based on results of ongoing valuation oversight including, but not limited to, consideration of macro or security specific events, market events, and pricing vendor and broker due diligence. The Administrator is responsible for discussing and assessing the potential impacts to the fair values on an ongoing basis, and, at least on a quarterly basis, with the AVC and the Board.
Fixed income instruments are valued based on prices received from approved affiliated and unaffiliated pricing vendors or third party broker-dealers (collectively referred to as “Pricing Services”). The Pricing Services use multiple valuation techniques to determine the valuation of fixed income instruments. In instances where sufficient market activity exists, the Pricing Services may utilize a market-based approach through which trades or quotes from market makers are used to determine the valuation of these instruments. In instances where sufficient market activity may not exist, the Pricing Services also utilize proprietary valuation models which may consider market transactions in comparable securities and the various relationships between securities in determining fair value and/or market characteristics in order to estimate the relevant cash flows, which are then discounted to calculate the fair values.
Equities and other exchange-traded instruments are valued at the last sale price or official market closing price on the primary exchange on which the instrument is traded before the NAV of the Fund is calculated on a valuation date.
Investments in open-end investment companies (“Underlying Funds”) are valued at each Underlying Fund’s NAV per share as of the report date.
Futures contracts are generally valued on the basis of available market quotations.
Valuations reflected in this report are as of the report date. As a result, changes in valuation due to market events and/or issuer-related events after the report date and prior to issuance of the report are not reflected herein.
The various inputs that are used in determining the valuation of the Fund’s investments are summarized into the three broad levels listed below.
| • | | Level 1 — Unadjusted inputs using quoted prices in active markets for identical investments. |
| | | | | | |
| | | |
| 14 | | | | J.P. MORGAN EXCHANGE-TRADED FUNDS | | DECEMBER 31, 2020 |
| • | | Level 2 — Other significant observable inputs including, but not limited to, quoted prices for similar investments, inputs other than quoted prices that are observable for investments (such as interest rates, prepayment speeds, credit risk, etc.) or other market corroborated inputs. |
| • | | Level 3 — Significant inputs based on the best information available in the circumstances, to the extent observable inputs are not available (including the Fund’s assumptions in determining the fair value of investments). |
A financial instrument’s level within the fair value hierarchy is based on the lowest level of any input, both individually and in the aggregate, that is significant to the fair value measurement. The inputs or methodology used for valuing instruments are not necessarily an indication of the risk associated with investing in those instruments.
The following table represents each valuation input as presented on the Schedule of Portfolio Investments (“SOI”):
| | | | | | | | | | | | | | | | |
| | | Level 1
Quoted prices | | | Level 2
Other significant
observable inputs | | | Level 3
Significant
unobservable inputs | | | Total | |
Investments in Securities | | | | | | | | | |
Common Stocks | | $ | 139,903,166 | | | $ | — | | | $ | — | | | $ | 139,903,166 | |
Equity-Linked Notes | | | — | | | | 26,646,776 | | | | — | | | | 26,646,776 | |
Short-Term Investments | | | | | | | | | |
Investment Companies | | | 3,650,193 | | | | — | | | | — | | | | 3,650,193 | |
| | | | | | | | | | | | | | | | |
Total Investments in Securities | | $ | 143,553,359 | | | $ | 26,646,776 | | | $ | — | | | $ | 170,200,135 | |
| | | | | | | | | | | | | | | | |
B. Restricted Securities — Certain securities held by the Fund may be subject to legal or contractual restrictions on resale. Restricted securities generally are resold in transactions exempt from registration under the Securities Act of 1933, as amended (the “Securities Act”). Disposal of these securities may involve time-consuming negotiations and expense. Prompt sale at the current valuation may be difficult and could adversely affect the NAV of the Fund.
As of December 31, 2020, the Fund had no investments in restricted securities other than securities sold to the Fund under Rule 144A and/or Regulation S under the Securities Act.
C. Securities Lending — The Fund is authorized to engage in securities lending in order to generate additional income. The Fund is able to lend to approved borrowers. Citibank N.A. (“Citibank”) serves as lending agent for the Fund, pursuant to a Securities Lending Agency Agreement (the “Securities Lending Agency Agreement”). Securities loaned are collateralized by cash equal to at least 100% of the market value plus accrued interest on the securities lent, which is invested in an affiliated money market fund. The Fund retains loan fees and the interest on cash collateral investments but is required to pay the borrower a rebate for the use of cash collateral. In cases where the lent security is of high value to borrowers, there may be a negative rebate (i.e., a net payment from the borrower to the Fund). Upon termination of a loan, the Fund is required to return to the borrower an amount equal to the cash collateral, plus any rebate owed to the borrowers. The remaining maturities of the securities lending transactions are considered overnight and continuous. Loans are subject to termination by the Fund or the borrower at any time.
The net income earned on the securities lending (after payment of rebates and Citibank’s fee) is included on the Statement of Operations as Income from securities lending (net). The Fund also receives payments from the borrower during the period of the loan, equivalent to dividends and interest earned on the securities loaned, which are recorded as Dividend or Interest income, respectively, on the Statement of Operations.
Under the Securities Lending Agency Agreement, Citibank marks to market the loaned securities on a daily basis. In the event the cash received from the borrower is less than 102% of the value of the loaned securities (105% for loans of non-U.S. securities), Citibank requests additional cash from the borrower so as to maintain a collateralization level of at least 102% of the value of the loaned securities plus accrued interest (105% for loans of non-U.S. securities), subject to certain de minimis amounts.
The value of securities out on loan is recorded as an asset on the Statement of Assets and Liabilities. The value of the cash collateral received is recorded as a liability on the Statement of Assets and Liabilities and details of collateral investments are disclosed on the SOI.
The Fund bears the risk of loss associated with the collateral investments and is not entitled to additional collateral from the borrower to cover any such losses. To the extent that the value of the collateral investments declines below the amount owed to a borrower, the Fund may incur losses that exceed the amount it earned on lending the security. Upon termination of a loan, the Fund may use leverage (borrow money) to repay the borrower for cash collateral posted if the Adviser does not believe that it is prudent to sell the collateral investments to fund the payment of this liability. Securities lending activity is subject to master netting arrangements.
Securities lending also involves counterparty risks, including the risk that the loaned securities may not be returned in a timely manner or at all. Subject to certain conditions, Citibank has agreed to indemnify the Fund from losses resulting from a borrower’s failure to return a loaned security.
The Fund did not lend out any securities during the six months ended December 31, 2020.
| | | | | | | | |
| | | |
| DECEMBER 31, 2020 | | J.P. MORGAN EXCHANGE-TRADED FUNDS | | | | | 15 | |
NOTES TO FINANCIAL STATEMENTS
AS OF DECEMBER 31, 2020 (Unaudited) (continued)
D. Investment Transactions with Affiliates — The Fund invested in an Underlying Fund which is advised by the Adviser. An issuer which is under common control with the Fund may be considered an affiliate. For the purposes of the financial statements, the Fund assumes the issuers listed in the table below to be affiliated issuers. The Underlying Fund’s distributions may be reinvested into the Underlying Fund. Reinvestment amounts are included in the purchase cost amounts in the table below.
| | | | | | | | | | | | | | | | | | | | | | | | | | | | | | | | | | | | |
| For the six months ended December 31, 2020 | |
Security Description | | Value at
June 30,
2020 | | | Purchases
at Cost | | | Proceeds
from Sales | | | Net Realized
Gain (Loss) | | | Change in
Unrealized
Appreciation/
(Depreciation) | | | Value at
December 31,
2020 | | | Shares at
December 31,
2020 | | | Dividend
Income | | | Capital Gain
Distributions | |
JPMorgan U.S. Government Money Market Fund Class Institutional Shares, 0.03% (a)(b) | | $ | 458,683 | | | $ | 62,899,531 | | | $ | 59,708,021 | | | $ | — | | | $ | — | | | $ | 3,650,193 | | | | 3,650,193 | | | $ | 196 | | | $ | — | |
| | | | | | | | | | | | | | | | | | | | | | | | | | | | | | | | | | | | |
| (a) | Investment in an affiliated fund, which is registered under the Investment Company Act of 1940, as amended, and is advised by J.P. Morgan Investment Management Inc. |
| (b) | The rate shown is the current yield as of December 31, 2020. |
E. Futures Contracts — The Fund used index futures contracts to gain or reduce exposure to the stock market, or maintain liquidity or minimize transaction costs. The Fund also purchased futures contracts to invest incoming cash in the market or sold futures in response to cash outflows, thereby simulating an invested position in the underlying index while maintaining a cash balance for liquidity.
Futures contracts provide for the delayed delivery of the underlying instrument at a fixed price or are settled for a cash amount based on the change in the value of the underlying instrument at a specific date in the future. Upon entering into a futures contract, the Fund is required to deposit with the broker, cash or securities in an amount equal to a certain percentage of the contract amount, which is referred to as the initial margin deposit. Subsequent payments, referred to as variation margin, are made or received by the Fund periodically and are based on changes in the market value of open futures contracts. Changes in the market value of open futures contracts are recorded as Change in net unrealized appreciation/depreciation on futures contracts on the Statement of Operations. Realized gains or losses, representing the difference between the value of the contract at the time it was opened and the value at the time it was closed, are reported on the Statement of Operations at the closing or expiration of the futures contract. Securities deposited as initial margin are designated on the SOI, while cash deposited, which is considered restricted, is recorded on the Statement of Assets and Liabilities. A receivable from and/or a payable to brokers for the daily variation margin is also recorded on the Statement of Assets and Liabilities.
The use of futures contracts exposes the Fund to equity price risk. The Fund may be subject to the risk that the change in the value of the futures contract may not correlate perfectly with the underlying instrument. Use of long futures contracts subjects the Fund to risk of loss in excess of the amounts shown on the Statement of Assets and Liabilities, up to the notional amount of the futures contracts. Use of short futures contracts subjects the Fund to unlimited risk of loss. The Fund may enter into futures contracts only on exchanges or boards of trade. The exchange or board of trade acts as the counterparty to each futures transaction; therefore, the Fund’s credit risk is limited to failure of the exchange or board of trade. Under some circumstances, futures exchanges may establish daily limits on the amount that the price of a futures contract can vary from the previous day’s settlement price, which could effectively prevent liquidation of positions.
The Fund’s futures contracts are not subject to master netting arrangements (the right to close out all transactions traded with a counterparty and net amounts owed or due across transactions).
The table below discloses the volume of the Fund’s futures contracts activity during the six months ended December 31, 2020:
| | | | |
Futures Contracts—Equity: | | | | |
Average Notional Balance Short | | $ | 500,100 | |
F. Equity-Linked Notes — The Fund invested in Equity-Linked Notes (“ELNs”). These are hybrid instruments which combine both debt and equity characteristics into a single note form. ELNs’ values are linked to the performance of an underlying index. ELNs are unsecured debt obligations of an issuer and may not be publicly listed or traded on an exchange. ELNs are valued daily, under procedures adopted by the Board, based on values provided by an approved pricing source. These notes have a coupon which is accrued and recorded as interest income on the Statement of Operations. Changes in the market value of ELNs are recorded as Change in net unrealized appreciation or depreciation on the Statement of Operations. The Fund realizes a gain or loss when an ELN is sold or matures, which is recorded as Net realized gain (loss) on transactions from investments in non-affiliates on the Statement of Operations.
As of December 31, 2020, the Fund had outstanding ELNs as listed on the SOI.
G. Security Transactions and Investment Income — Investment transactions are accounted for on the trade date (the date the order to buy or sell is executed). Securities gains and losses are calculated on a specifically identified cost basis. Interest income is determined on the basis of coupon
| | | | | | |
| | | |
| 16 | | | | J.P. MORGAN EXCHANGE-TRADED FUNDS | | DECEMBER 31, 2020 |
interest accrued using the effective interest method, which adjusts for amortization of premiums and accretion of discounts. Dividend income, net of foreign taxes withheld, if any, is recorded on the ex-dividend date or when the Fund first learns of the dividend.
To the extent such information is publicly available, the Fund records distributions received in excess of income earned from underlying investments as a reduction of cost of investments and/or realized gain. Such amounts are based on estimates if actual amounts are not available and actual amounts of income, realized gain and return of capital may differ from the estimated amounts. The Fund adjusts the estimated amounts of the components of distributions (and consequently its net investment income) as necessary, once the issuers provide information about the actual composition of the distributions.
H. Federal Income Taxes — The Fund is treated as a separate taxable entity for Federal income tax purposes. The Fund’s policy is to comply with the provisions of the Internal Revenue Code (the “Code”) applicable to regulated investment companies and to distribute to shareholders all of its distributable net investment income and net realized capital gains on investments. Accordingly, no provision for Federal income tax is necessary. Management has reviewed the Fund’s tax positions for all open tax years and has determined that as of December 31, 2020, no liability for Federal income tax is required in the Fund’s financial statements for net unrecognized tax benefits. However, management’s conclusions may be subject to future review based on changes in, or the interpretation of, the accounting standards or tax laws and regulations. The Fund’s Federal tax returns for the prior three fiscal years, or since inception if shorter, will be subject to examination by the Internal Revenue Service.
I. Distributions to Shareholders — Distributions from net investment income, if any, are generally declared and paid monthly. Net realized capital gains, if any, are distributed at least annually. The amount of distributions from net investment income and net realized capital gains is determined in accordance with Federal income tax regulations, which may differ from GAAP. To the extent these “book/tax” differences are permanent in nature (i.e., that they result from other than timing of recognition — “temporary differences”), such amounts are reclassified within the capital accounts based on their Federal tax basis treatment.
J. Recent Accounting Pronouncement — In March 2020, the FASB issued Accounting Standards Update No. 2020-04 (“ASU 2020-04”), Reference Rate Reform (Topic 848) – Facilitation of the Effects of Reference Rate Reform on Financial Reporting. ASU 2020-04 provides optional temporary financial reporting relief from the effect of certain types of contract modifications due to the planned discontinuation of the London Interbank Offered Rate (“LIBOR”) and other interbank-offered based reference rates as of the end of 2021. ASU 2020-04 became effective upon the issuance and its optional relief can be applied through December 31, 2022. Management is currently evaluating the impact, if any, to the Fund’s financial statements of applying ASU 2020-04.
3. Fees and Other Transactions with Affiliates
A. Management Fee — JPMIM manages the investments of the Fund pursuant to the Management Agreement. For such services, JPMIM is paid a fee, which is accrued daily and paid no more frequently than monthly at an annual rate of 0.35% of the Fund’s average daily net assets. Under the Management Agreement, JPMIM is responsible for substantially all expenses of the Fund, (including expenses of the Trust relating to the Fund), except for the management fee, payments under the Fund’s 12b-1 plan (if any), interest expenses, dividend and interest expenses related to short sales, taxes, acquired fund fees and expenses (other than fees for funds advised by the adviser and/or its affiliates), costs of holding shareholder meetings, and litigation and potential litigation and other extraordinary expenses not incurred in the ordinary course of the Fund’s business. Additionally, the Fund shall be responsible for its non-operating expenses, including brokerage commissions and fees and expenses associated with the Fund’s securities lending program, if applicable. For the avoidance of doubt, the Adviser’s payment of such expenses may be accomplished through the Fund’s payment of such expenses and a corresponding reduction in the fee payable to the Adviser, provided, however, that if the amount of expenses paid by the Fund exceeds the fee payable to the Adviser, the Adviser will reimburse the Fund for such amount.
B. Administration Fee — JPMIM provides administration services to the Fund. Pursuant to the Management Agreement for the Fund, JPMIM is compensated as described in Note 3.A.
JPMorgan Chase Bank, N.A. (“JPMCB”), a wholly-owned subsidiary of JPMorgan, serves as the Fund’s sub-administrator (the “Sub-administrator”). For its services as Sub-administrator, JPMCB receives a portion of the fees payable to JPMIM.
C. Custodian, Accounting and Transfer Agent Fees — JPMCB provides custody, accounting and transfer agency services to the Fund. For performing these services, JPMIM pays JPMCB transaction and asset-based fees that vary according to the number of transactions and positions, plus out-of-pocket expenses.
Additionally, Authorized Participants generally pay transaction fees associated with the creation and redemption of Fund shares. These fees are paid to JPMIM to offset certain custodian charges that are covered by the Management Agreement.
Interest income earned on cash balances at the custodian, if any, is included in Interest income from affiliates on the Statement of Operations.
Interest expense paid to the custodian related to cash overdrafts, if any, is included in Interest expense to affiliates on the Statement of Operations.
D. Distribution Services — The Distributor or its agent distributes Creation Units for the Fund on an agency basis. The Distributor does not maintain a secondary market in shares of the Fund. JPMDS receives no fees for their distribution services under the distribution agreement with the Trust (the “Distribution Agreement”). Although the Trust does not pay any fees under the Distribution Agreement, JPMIM pays JPMDS for certain distribution related services.
| | | | | | | | |
| | | |
| DECEMBER 31, 2020 | | J.P. MORGAN EXCHANGE-TRADED FUNDS | | | | | 17 | |
NOTES TO FINANCIAL STATEMENTS
AS OF DECEMBER 31, 2020 (Unaudited) (continued)
E. Waivers and Reimbursements — The Fund may invest in one or more money market funds advised by the Adviser (affiliated money market funds). The fees for the affiliated money market funds are covered under the Management Agreement as described in Note 3.A.
F. Other — Certain officers of the Trust are affiliated with the Adviser, the Administrator and JPMDS. Such officers receive no compensation from the Fund for serving in their respective roles.
The Board designated and appointed a Chief Compliance Officer to the Fund pursuant to Rule 38a-1 under the 1940 Act. The fees associated with the Office of the Chief Compliance Officer are paid for by JPMIM as described in Note 3.A.
The Securities and Exchange Commission (“SEC”) has granted an exemptive order permitting the Fund to engage in principal transactions with J.P. Morgan Securities LLC, an affiliated broker, involving taxable money market instruments, subject to certain conditions.
4. Investment Transactions
During the six months ended December 31, 2020, purchases and sales of investments (excluding short-term investments) were as follows:
| | | | | | | | |
| | | Purchases
(excluding U.S.
Government) | | | Sales
(excluding U.S.
Government) | |
| | $ | 141,693,908 | | | $ | 98,884,374 | |
During the six months ended December 31, 2020, there were no purchases or sales of U.S. Government securities.
For the six months ended December 31, 2020, in-kind transactions associated with creations and redemptions were:
| | | | | | | | |
| | | In-Kind
Creations | | | In-Kind
Redemptions | |
| | $ | 116,680,614 | | | $ | 1,083,366 | |
5. Federal Income Tax Matters
For Federal income tax purposes, the estimated cost and unrealized appreciation (depreciation) in value of investments held at December 31, 2020 were as follows:
| | | | | | | | | | | | | | | | |
| | | Aggregate
Cost | | | Gross
Unrealized
Appreciation | | | Gross
Unrealized
Depreciation | | | Net Unrealized
Appreciation
(Depreciation) | |
| | $ | 158,866,306 | | | $ | 12,067,253 | | | $ | 733,424 | | | $ | 11,333,829 | |
As of June 30, 2020, the Fund had the following net capital loss carryforwards:
| | | | | | | | |
| | | Capital Loss Carryforward Character | |
| | | Short-Term | | | Long-Term | |
| | $ | 117,176 | | | $ | 208,967 | |
6. Capital Share Transactions
The Trust issues and redeems shares of the Fund only in Creation Units through the Distributor at NAV. Capital shares transactions detail can be found in the Statement of Changes in Net Assets.
Shares of the Fund may only be purchased or redeemed by Authorized Participants. Such Authorized Participants may from time to time hold, of record or beneficially, a substantial percentage of the Fund’s shares outstanding and act as executing or clearing broker for investment transactions on behalf of the Fund. An Authorized Participant is either (1) a “Participating Party” or other participant in the clearing process through the Continuous Net Settlement System of the National Securities Clearing Corporation (“NSCC”); or (2) a DTC Participant; which, in either case, must have executed an agreement with the Distributor.
7. Risks, Concentrations and Indemnifications
In the normal course of business, the Fund enters into contracts that contain a variety of representations which provide general indemnifications. The Fund’s maximum exposure under these arrangements is unknown. The amount of exposure would depend on future claims that may be brought against the Fund. However, based on experience, the Fund expects the risk of loss to be remote.
As of December 31, 2020, the Adviser owns shares representing 10.0% of net assets of the Fund.
Significant shareholder transactions by the Adviser may impact the Fund’s performance.
Derivatives may be riskier than other types of investments because they may be more sensitive to changes in economic and market conditions and could result in losses that significantly exceed the Fund’s original investment. Many derivatives create leverage thereby causing the Fund to be more volatile than they would have been if they had not used derivatives. Derivatives also expose the Fund to counterparty risk (the risk that the derivative counterparty will not fulfill its contractual obligations), including credit risk of the derivative counterparty. The possible lack of a liquid secondary market for derivatives and the resulting inability of the Fund to sell or otherwise close a derivatives position could expose the Fund to losses.
Disruptions to creations and redemptions, the existence of significant market volatility or potential lack of an active trading market for the Shares (including through a trading halt), as well as other factors, may result in Shares trading significantly above (at a premium) or below (at a discount) to the NAV or to the intraday value of the Fund’s holdings. During such periods, investors may incur significant losses if shares are sold.
| | | | | | |
| | | |
| 18 | | | | J.P. MORGAN EXCHANGE-TRADED FUNDS | | DECEMBER 31, 2020 |
The Fund’s investments in ELNs entail varying degrees of risks. The Fund is subject to loss of their full principal amount. In addition, the ELNs are subject to a stated maximum return which may limit the payment at maturity. The Fund may also be exposed to additional risks associated with structured notes including: counterparty credit risk related to the issuer’s ability to make payment at maturity; liquidity risk related to a lack of liquid market for these notes, preventing the Fund from trading or selling the notes easily; and a greater degree of market risk than other types of debt securities because the investor bears the risk associated with the underlying financial instruments.
The Fund is subject to infectious disease epidemics/pandemics risk. The worldwide outbreak of COVID-19, a novel coronavirus disease, has negatively affected economies, markets and individual companies throughout the world. The effects of this COVID-19 pandemic to public health, and business and market conditions, including exchange trading suspensions and closures may continue to have a significant negative impact on the performance of the Fund’s investments, increase the Fund’s volatility, negatively impact the Fund’s arbitrage and pricing mechanisms, exacerbate other pre-existing political, social and economic risks to the Fund and negatively impact broad segments of businesses and populations. The Fund’s operations may be interrupted as a result, which may have a significant negative impact on investment performance. In addition, governments, their regulatory agencies, or self-regulatory organizations may take actions in response to the pandemic that affect the instruments in which the Fund invests, or the issuers of such instruments, in ways that could also have a significant negative impact on the Fund’s investment performance. The full impact of this COVID-19 pandemic, or other future epidemics/pandemics, is currently unknown.
| | | | | | | | |
| | | |
| DECEMBER 31, 2020 | | J.P. MORGAN EXCHANGE-TRADED FUNDS | | | | | 19 | |
SCHEDULE OF SHAREHOLDER EXPENSES
(Unaudited)
Hypothetical $1,000 Investment
As a shareholder of the Fund, you incur two types of costs: (1) transaction costs, including brokerage commissions on your purchase and sales of Fund shares and (2) ongoing costs, primarily management fees. The examples below are intended to help you understand your ongoing costs (in dollars) of investing in the Fund and to compare these ongoing costs with the ongoing costs of investing in other funds. The examples assume that you had a $1,000 investment at the beginning of the reporting period July 1, 2020 and continued to hold your shares at the end of the reporting period, December 31, 2020.
Actual Expenses
For the Fund in the table below, the first line provides information about actual account values and actual expenses. You may use the information in this line, together with the amount you invested, to estimate the expenses that you paid over the period. Simply divide your account value by $1,000 (for example, an $8,600 account value divided by $1,000 = 8.6),
then multiply the result by the number under the heading entitled “Expenses Paid During the Period” to estimate the expenses you paid on your account during this period.
Hypothetical Example for Comparison Purposes
The second line in the table below provides information about hypothetical account values and hypothetical expenses based on the Fund’s actual expense ratio and an assumed rate of return of 5% per year before expenses, which is not the Fund’s actual return. The hypothetical account values and expenses may not be used to estimate the actual ending account balance or expenses you paid for the period. You may use this information to compare the ongoing costs of investing in the Fund and other Funds. To do so, compare this 5% hypothetical example with the 5% hypothetical examples that appear in the shareholder reports of other funds. The examples also assume all dividends and distributions have been reinvested.
| | | | | | | | | | | | | | | | |
| | | Beginning
Account Value
July 1, 2020 | | | Ending
Account Value
December 31, 2020 | | | Annualized
Expense
Ratio (1) | | | Expenses
Paid During
the Period | |
JPMorgan Equity Premium Income ETF | | | | | | | | | | | | | | | | |
Actual | | $ | 1,000.00 | | | $ | 1,165.20 | | | | 0.35 | % | | $ | 1.91 | |
Hypothetical | | | 1,000.00 | | | | 1,023.44 | | | | 0.35 | | | | 1.79 | |
| (1) | Expenses are equal to the Fund’s annualized net expense ratio, multiplied by the average account value over the period, multiplied by 184/365 (to reflect the one-half year period). |
| | | | | | |
| | | |
| 20 | | | | J.P. MORGAN EXCHANGE-TRADED FUNDS | | DECEMBER 31, 2020 |
J.P. Morgan Exchange-Traded Funds are distributed by JPMorgan Distribution Services, Inc., an indirect, wholly-owned subsidiary of JPMorgan Chase & Co.
Contact J.P. Morgan Exchange-Traded Funds at 1-844-457-6383 (844-4JPM ETF) for a fund prospectus. You can also visit us at www.jpmorganfunds.com. Investors should carefully consider the investment objectives and risks as well as charges and expenses of the fund before investing. The prospectus contains this and other information about the fund. Read the prospectus carefully before investing.
Investors may obtain information about the Securities Investor Protection Corporation (SIPC), including the SIPC brochure, by visiting www.sipc.org or by calling SIPC at 202-371-8300.
The Fund files a complete schedule of its fund holdings for the first and third quarters of its fiscal year with the SEC as an exhibit to its report on Form N-PORT. The Fund’s Form N-PORT reports are available on the SEC’s website at http://www.sec.gov. The Fund’s quarterly holdings can be found by visiting the J.P. Morgan Funds’ website at www.jpmorganfunds.com.
A description of the Fund’s policies and procedures with respect to the disclosure of the Fund’s holdings is available in the prospectus and Statement of Additional Information.
A copy of proxy policies and procedures is available without charge upon request by calling 1-844-457-6383 and on the Fund’s website at www.jpmorganfunds.com. A description of such policies and procedures is on the SEC’s website at www.sec.gov. The Trustees have delegated the authority to vote proxies for securities owned by the Fund to the Adviser. A copy of the Fund’s voting record for the most recent 12-month period ended June 30 is available on the SEC’s website at www.sec.gov or at the Fund’s website at www.jpmorganfunds.com no later than August 31 of each year. The Fund’s proxy voting record will include, among other things, a brief description of the matter voted on for each fund security, and will state how each vote was cast, for example, for or against the proposal.


J.P. Morgan Asset Management is the brand name for the asset management business of JPMorgan Chase & Co. and its affiliates worldwide.
| | | | |
| | © JPMorgan Chase & Co., 2020. All rights reserved. December 2020. | | SAN-EPIETF-1220 |
ITEM 2. CODE OF ETHICS.
Disclose whether, as of the end of the period covered by the report, the registrant has adopted a code of ethics that applies to the registrant’s principal executive officer, principal financial officer, principal accounting officer or controller, or persons performing similar functions, regardless of whether these individuals are employed by the registrant or a third party. If the registrant has not adopted such a code of ethics, explain why it has not done so.
The registrant must briefly describe the nature of any amendment, during the period covered by the report, to a provision of its code of ethics that applies to the registrant’s principal executive officer, principal financial officer, principal accounting officer or controller, or persons performing similar functions, regardless of whether these individuals are employed by the registrant or a third party, and that relates to any element of the code of ethics definition enumerated in paragraph (b) of this Item. The registrant must file a copy of any such amendment as an exhibit pursuant to Item 13(a)(1), unless the registrant has elected to satisfy paragraph (f) of this Item by positing its code of ethics on its website pursuant to paragraph (f)(2) of this Item, or by undertaking to provide its code of ethics to any person without charge, upon request, pursuant to paragraph (f)(3) of this Item.
If the registrant has, during the period covered by the report, granted a waiver, including an implicit waiver, from a provision of the code of ethics that applies to the registrant’s principal executive officer, principal financial officer, principal accounting officer or controller, or persons performing similar functions, regardless of whether these individuals are employed by the registrant or third party, that relates to one or more items set forth in paragraph (b) of this Item, the registrant must briefly describe the nature of the waiver, the name of the person to whom the waiver was granted, and the date of the waiver.
Not applicable to a semi-annual report.
ITEM 3. AUDIT COMMITTEE FINANCIAL EXPERT.
(a) (1) Disclose that the registrant’s board of directors has determined that the registrant either:
(i) Has at least one audit committee financial expert serving on its audit committee; or
(ii) Does not have an audit committee financial expert serving on its audit committee.
(2) If the registrant provides the disclosure required by paragraph (a)(1)(i) of this Item, it must disclose the name of the audit committee financial expert and whether that person is “independent.” In order to be considered “independent” for purposes of this Item, a member of an audit committee may not, other than in his or her capacity as a member of the audit committee, the board of directors, or any other board committee:
(i) Accept directly or indirectly any consulting, advisory, or other compensatory fee from the issuer; or
(ii) Be an “interested person” of the investment company as defined in Section 2(a)(19) of the Act (15 U.S.C. 80a-2(a)(19)).
(3) If the registrant provides the disclosure required by paragraph (a)(1)(ii) of this Item, it must explain why it does not have an audit committee financial expert.
Not applicable to a semi-annual report.
ITEM 4. PRINCIPAL ACCOUNTANT FEES AND SERVICES.
(a) Disclose, under the caption Audit Fees, the aggregate fees billed for each of the last two fiscal years for professional services rendered by the principal accountant for the audit of the registrant’s annual financial statements or services that are normally provided by the accountant in connection with statutory and regulatory filings or engagements for those fiscal years.
(b) Disclose, under the caption Audit-Related Fees, the aggregate fees billed in each of the last two fiscal years for assurance and related services by the principal accountant that are reasonably related to the performance of the audit of the registrant’s financial statements and are not reported under paragraph (a) of this Item. Registrants shall describe the nature of the services comprising the fees disclosed under this category.
(c) Disclose, under the caption Tax Fees, the aggregate fees billed in each of the last two fiscal years for professional services rendered by the principal accountant for tax compliance, tax advice, and tax planning. Registrants shall describe the nature of the services comprising the fees disclosed under this category.
(d) Disclose, under the caption All Other Fees, the aggregate fees billed in each of the last two fiscal years for products and services provided by the principal accountant, other than the services reported in paragraphs (a) through (c) of this Item. Registrants shall describe the nature of the services comprising the fees disclosed under this category.
(e) (1) Disclose the audit committee’s pre-approval policies and procedures described in paragraph (c)(7) of Rule 2-01 of Regulation S-X.
(2) Disclose the percentage of services described in each of paragraphs (b) through (d) of this Item that were approved by the audit committee pursuant to paragraph (c)(7)(i)(C) of Rule 2-01 of Regulation S-X.
(f) If greater than 50 percent, disclose the percentage of hours expended on the principal accountant’s engagement to audit the registrant’s financial statements for the most recent fiscal year that were attributed to work performed by persons other than the principal accountant’s full-time, permanent employees.
(g) Disclose the aggregate non-audit fees billed by the registrant’s accountant for services rendered to the registrant, and rendered to the registrant’s investment adviser (not including any sub-adviser whose role is primarily portfolio management and is subcontracted with or overseen by another investment adviser), and any entity controlling, controlled by, or under common control with the adviser that provides ongoing services to the registrant for each of the last two fiscal years of the registrant.
(h) Disclose whether the registrant’s audit committee of the board of directors has considered whether the provision of non-audit services that were rendered to the registrant’s investment adviser (not including any subadviser whose role is primarily portfolio management and is subcontracted with or overseen by another investment adviser), and any entity controlling, controlled by, or under common control with the investment adviser that provides ongoing services to the registrant that were not pre-approved pursuant to paragraph (c)(7)(ii) of Rule 2-01 of Regulation S-X is compatible with maintaining the principal accountant’s independence.
Not applicable to a semi-annual report.
ITEM 5. AUDIT COMMITTEE OF LISTED REGISTRANTS.
(a) If the registrant is a listed issuer as defined in Rule 10A-3 under the Exchange Act (17CFR 240.10A-3), state whether or not the registrant has a separately-designated standing audit committee established in accordance with Section 3(a)(58)(A) of the Exchange Act (15 U.S.C. 78c(a)(58)(A)). If the registrant has such a committee, however designated, identify each committee member. If the entire board of directors is acting as the registrant’s audit committee as specified in Section 3(a)(58)(B) of the Exchange Act (15
U.S.C. 78c(a)(58)(B)), so state.
(b) If applicable, provide the disclosure required by Rule 10A-3(d) under the Exchange Act (17CFR 240.10A-3(d)) regarding an exemption from the listing standards for all audit committees.
Not applicable to a semi-annual report.
ITEM 6. SCHEDULE OF INVESTMENTS.
File Schedule I – Investments in securities of unaffiliated issuers as of the close of the reporting period as set forth in Section 210.12-12 of Regulation S-X, unless the schedule is included as part of the report to shareholders filed under Item 1 of this Form.
Included in Item 1.
ITEM 7. DISCLOSURE OF PROXY VOTING POLICIES AND PROCEDURES FOR CLOSED-END MANAGEMENT INVESTMENT COMPANIES.
Not applicable.
ITEM 8. PORTFOLIO MANAGERS OF CLOSED-END MANAGEMENT INVESTMENT COMPANIES.
Not applicable.
ITEM 9. PURCHASE OF EQUITY SECURITIES BY CLOSED-END MANAGEMENT INVESTMENT COMPANY AND AFFILIATED PURCHASERS.
Not applicable.
ITEM 10. SUBMISSION OF MATTERS TO A VOTE OF SECURITY HOLDERS.
Describe any material changes to the procedures by which shareholders may recommend nominees to the registrant’s board of directors, where those changes were implemented after the registrant last provided disclosure in response to the requirements of Item 7(d)(2)(ii)(G) of Schedule 14A (17 CFR 240.14a-101), or this Item.
No material changes to report.
ITEM 11. CONTROLS AND PROCEDURES.
(a) Disclose the conclusions of the registrant’s principal executive and principal financial officers, or persons performing similar functions, regarding the effectiveness of the registrant’s disclosure controls and procedures (as defined in Rule 30a-3(c) under the Act (17 CFR 270.30a-3(c))) as of a date within 90 days of the filing date of the report that includes the disclosure required by this paragraph, based on the evaluation of these controls and procedures required by Rule 30a-3(b) under the Act (17 CFR 270.30a-3(b))and Rules 13a-15(b) or 15d-15(b) under the Exchange Act (17 CFR 240.13a-15(b) or 240.15d-15(b)).
The Registrant’s principal executive and principal financial officers have concluded, based on their evaluation of the Registrant’s disclosure controls and procedures as of a date within 90 days of the filing date of this report, that the Registrant’s disclosure controls and procedures are reasonably designed to ensure that information required to be disclosed by the Registrant on Form N-CSR is recorded, processed, summarized and reported within the required time periods and that information required to be disclosed by the Registrant in the reports that it files or submits on Form N-CSR is accumulated and communicated to the Registrant’s management, including its principal executive and principal financial officers, as appropriate to allow timely decisions regarding required disclosure.
(b) Disclose any change in the registrant’s internal control over financial reporting (as defined in Rule 30a-3(d) under the Act (17 CFR 270.30a-3(d)) that occurred during the registrant’s second fiscal quarter of the period covered by this report that has materially affected, or is reasonably likely to materially affect, the registrant’s internal control over financial reporting.
There were no changes in the Registrant’s internal control over financial reporting that occurred during the last fiscal quarter covered by this report that have materially affected, or are reasonably likely to materially affect, the Registrant’s internal control over financial reporting.
ITEM 12. DISCLOSURE OF SECURITIES LENDING ACTIVITIES FOR CLOSED-END MANAGEMENT INVESTMENT COMPANIES.
Not applicable.
ITEM 13. EXHIBITS.
(a) File the exhibits listed below as part of this Form. Letter or number the exhibits in the sequence indicated.
(1) Any code of ethics, or amendment thereto, that is the subject of the disclosure required by Item 2, to the extent that the registrant intends to satisfy the Item 2 requirements through filing of an exhibit.
Not applicable.
(2) A separate certification for each principal executive officer and principal financial officer of the registrant as required by Rule 30a-2(a) under the Act (17 CFR 270.30a-2).
Certifications pursuant to Rule 30a-2(a) under the Investment Company Act of 1940 are attached hereto.
(3) Any written solicitation to purchase securities under Rule 23c-1 under the Act (17 CFR 270.23c-1) sent or given during the period covered by the report by or on behalf of the registrant to 10 or more persons.
Not applicable.
(b) A separate or combined certification for each principal executive officer and principal officer of the registrant as required by Rule 30a-2(b) under the Act of 1940.
Certifications pursuant to Rule 30a-2(b) under the Investment Company Act of 1940 are attached hereto.
SIGNATURES
Pursuant to the requirements of the Securities Exchange Act of 1934 and the Investment Company Act of 1940, the registrant has duly caused this report to be signed on its behalf by the undersigned, thereunto duly authorized.
| | |
| J.P. Morgan Exchange-Traded Fund Trust |
| |
| By: | | /s/ Joanna M. Gallegos |
| | Joanna M. Gallegos |
| | President and Principal Executive Officer |
| | March 5, 2021 |
Pursuant to the requirements of the Securities Exchange Act of 1934 and the Investment Company Act of 1940, this report has been signed below by the following persons on behalf of the registrant and in the capacities and on the dates indicated.
| | |
| |
| By: | | /s/ Joanna M. Gallegos |
| | Joanna M. Gallegos |
| | President and Principal Executive Officer |
| | March 5, 2021 |
| |
| By: | | /s/ Timothy J. Clemens |
| | Timothy J. Clemens |
| | Treasurer and Principal Financial Officer |
| | March 5, 2021 |