UNITED STATES
SECURITIES AND EXCHANGE COMMISSION
Washington, D.C. 20549
FORM N-CSR
CERTIFIED SHAREHOLDER REPORT OF REGISTERED
MANAGEMENT INVESTMENT COMPANIES
Investment Company Act file number: 811-22903
J.P. Morgan Exchange-Traded Fund Trust
(Exact name of registrant as specified in charter)
277 Park Avenue
New York, NY 10172
(Address of principal executive offices) (Zip code)
Gregory S. Samuels
J.P. Morgan Investment Management Inc.
277 Park Avenue
New York, NY 10172
(Name and Address of Agent for Service)
With copies to:
| | |
| Elizabeth A. Davin, Esq. | | Jon S. Rand, Esq. |
| JPMorgan Chase & Co. | | Dechert LLP |
| 1111 Polaris Parkway | | 1095 Avenue of the Americas |
| Columbus, OH 43240 | | New York, NY 10036 |
Registrant’s telephone number, including area code: 1-844-457-6383
Date of fiscal year end: June 30
Date of reporting period: July 1, 2021 through December 31, 2021
Form N-CSR is to be used by management investment companies to file reports with the Commission not later than 10 days after the transmission to stockholders of any report that is required to be transmitted to stockholders under Rule 30e-1 under the Investment Company Act of 1940 (17 CFR 270.30e-1). The Commission may use the information provided on Form N-CSR in its regulatory, disclosure review, inspection, and policymaking roles.
A registrant is required to disclose the information specified by Form N-CSR, and the Commission will make this information public. A registrant is not required to respond to the collection of information contained in Form N-CSR unless the Form displays a currently valid Office of Management and Budget (“OMB”) control number. Please direct comments concerning the accuracy of the information collection burden estimate and any suggestions for reducing the burden to Secretary, Securities and Exchange Commission, 450 Fifth Street, NW, Washington, DC 20549-0609. The OMB has reviewed this collection of information under the clearance requirements of 44 U.S.C. Section 3507.
ITEM 1. REPORTS TO STOCKHOLDERS.
a.) The following is a copy of the report transmitted to shareholders pursuant to Rule 30e-1 under the Investment Company Act of 1940 (17 CFR 270.30e-1).
b.) A copy of the notice transmitted to shareholders in reliance on Rule 30e-3 under the 1940 Act that contains disclosures specified by paragraph (c)(3) of that rule is included in the Annual Reports. Not Applicable. Notices do not incorporate disclosures from the shareholder report.
Semi-Annual Report
J.P. Morgan Exchange-Traded Funds
December 31, 2021 (Unaudited)
| | | | | | |
| | Ticker | | Listing Exchange | | |
| JPMorgan ActiveBuilders U.S. Large Cap Equity ETF | | JUSA | | NYSE Arca | | |
| JPMorgan Active Value ETF | | JAVA | | NYSE Arca | | |
| JPMorgan Equity Premium Income ETF | | JEPI | | NYSE Arca | | |
CONTENTS
Investments in a Fund are not bank deposits or obligations of, or guaranteed or endorsed by, any bank and are not insured or guaranteed by the FDIC, the Federal Reserve Board or any other government agency. You could lose money if you sell when the Fund’s share price is lower than when you invested.
Past performance is no guarantee of future performance. The general market views expressed in this report are opinions based on market and other conditions through the end of the reporting period and are subject to change without notice. These views are not intended to predict the future performance of a Fund or the securities markets.
Prospective investors should refer to the Funds’ prospectuses for a discussion of the Funds’ investment objectives, strategies and risks. Call J.P. Morgan Exchange-Traded Funds at (844) 457-6383 for a prospectus containing more complete information about a Fund, including management fees and other expenses. Please read it carefully before investing.
Shares are bought and sold throughout the day on an exchange at market price (not at net asset value) through a brokerage account, and are not individually subscribed and redeemed from a Fund. Shares may only be subscribed and redeemed directly from a Fund by Authorized Participants, in very large creation/redemption units. Brokerage commissions will reduce returns.
PRESIDENT’S LETTER
FEBRUARY 8, 2022 (Unaudited)
Dear Shareholder,
U.S. equity markets largely outperformed other financial markets during the second half of 2021 on the back of continued monetary and fiscal policy support, record corporate earnings and a boom in U.S. consumer wealth. While a resurgence in the pandemic late last year contributed to increased volatility in financial markets, we believe the overall impact on the U.S. economy appeared to be muted.
| | |
 | | “While the path of the pandemic, inflationary pressure and central bank policies are likely to significantly impact financial market performance in the months ahead, the U.S. economy is forecast to continue expanding through 2022, which we believe should support both corporate earnings and consumer spending.” – Brian S. Shlissel |
During the second half of 2021, J.P. Morgan Exchange-Traded Funds expanded its suite of investment solutions with the launch of its Active Value ETF (JAVA) and ActiveBuilders U.S. Large Cap Equity ETF (JUSA). JAVA invests in companies whose securities are, in the portfolio managers’ opinion, undervalued when purchased, but which have the potential to increase the intrinsic per-share value and employs a bottom-up approach to security selection, focusing on company fundamentals, quantitative screening and proprietary fundamental analysis. Meanwhile, JUSA serves as a key component of our ActiveBuilders ETFs suite, which engages the expertise of the J.P. Morgan Global Equities platform’s qualitative and quantitative insights while seeking to improve investor returns and better manage risk. Both JAVA and JUSA incorporate environmental, social and governance factors within a transparent ETF structure. By the end of 2021, the complete suite of JPMorgan ETFs included 39 funds with combined assets of $70.05 billion.1
As we look forward, certain of the issues that had focused investors’ attention toward the end of last year remain. While the path of the pandemic, inflationary pressure and central bank policies are likely to significantly impact financial market performance in the months ahead, the U.S. economy is forecast to continue expanding through 2022, which we believe should support both corporate earnings and consumer spending. Against this backdrop, we seek to continue to provide investors with an array of diversified innovative investment solutions that can provide the tools for building durable portfolios and meeting their financial goals.
Sincerely,

Brian S. Shlissel
President, J.P. Morgan Funds
J.P. Morgan Asset Management
1-844-4JPM-ETF or jpmorgan.com/etfs for more information
| 1 | J.P. Morgan Asset Management, December 31, 2021. |
| | | | | | | | | | |
| | | | | |
| DECEMBER 31, 2021 | | J.P. MORGAN EXCHANGE-TRADED FUNDS | | | | | | | | 1 |
MARKET OVERVIEW
Six Months Ended December 31, 2021
Overall, U.S. equity markets generated positive returns in the second half of 2021, bolstered by continued monetary and fiscal support as well as strong consumer spending and record high corporate profits. Despite historically high equity valuations in the U.S., the S&P 500 Index posted at least one new record closing high each month during the period. U.S. fixed income markets largely underperformed U.S. equity markets amid historically low interest rates on U.S. Treasury securities and accelerating inflation.
Notably, the emergence of the omicron variant of COVID-19 in the final months of 2021 led to higher volatility in financial markets and briefly pulled oil prices lower.
The first months of the period saw strong upward momentum in U.S. equity prices after second quarter 2021 results showed record high earnings and revenue from U.S. companies. However, equity markets ended the month of September lower amid investor concerns about global supply chain disruptions, inflationary pressure and the ongoing pandemic.
In October, equity markets resumed their broad upward trajectory only to stall again in November and then ended December with higher returns. The global resurgence in pandemic infections in late 2021 raised investor concerns about the reimposition of social restrictions and their potential impact on specific industries and companies. However, the U.S. economic backdrop remained positive overall, with a strong labor market, surging corporate profits and a boom in U.S. consumer wealth.
Within U.S. equity, large cap stocks generally outperformed mid cap stocks and small cap stock prices largely declined over the second half of 2021.
| | | | | | | | | | |
| | | | | |
| 2 | | | | | | | | J.P. MORGAN EXCHANGE-TRADED FUNDS | | DECEMBER 31, 2021 |
JPMorgan ActiveBuilders U.S. Large Cap Equity ETF
FUND COMMENTARY
FOR THE PERIOD JULY 7, 2021 (INCEPTION DATE) THROUGH DECEMBER 31, 2021 (Unaudited)
| | | | |
| REPORTING PERIOD RETURN: | | | |
| JPMorgan ActiveBuilders U.S. Large Cap Equity ETF | | | | |
| Net Asset Value* | | | 9.63% | |
| Market Price** | | | 9.71% | |
| S&P 500 Index | | | 10.09% | |
| |
| Net Assets as of 12/31/2021 | | $ | 29,387,547 | |
| Fund Ticker | | | JUSA | |
INVESTMENT OBJECTIVE***
The JPMorgan ActiveBuilders U.S. Large Cap Equity ETF (the “Fund”) seeks to provide long-term capital appreciation.
INVESTMENT APPROACH
The Fund invests primarily in equity securities of large, well-established companies located in the U.S. The Fund allocates to a variety of securities selected from across the adviser’s actively managed U.S. equity strategies and seeks to outperform the S&P 500 Index (the “Index”) over time while maintaining similar risk characteristics, including sector risks.
WHAT WERE THE MAIN DRIVERS OF THE FUND’S PERFORMANCE?
For the period from inception on July 7, 2021 to December 31, 2021, the Fund underperformed the Index. The Fund’s security selection in the semiconductors & semiconductor equipment sector and the technology hardware & equipment sector were leading detractors from performance relative to the Index, while the Fund’s security selection in the capital goods and software & services sectors was a leading contributor to relative performance.
Leading individual detractors from relative performance included the Fund’s overweight positions in Analog Devices Inc. and Biogen Inc., and its underweight position in Pfizer Inc.
Shares of Analog Devices, a semiconductor manufacturer, fell
amid investor concerns about the company’s ability to meet surging demand. Shares of Biogen, a pharmaceuticals developer, fell amid investor concerns about the company’s treatment for Alzheimer’s disease. Shares of Pfizer, a pharmaceutical manufacturer, rose amid a resurgence in the pandemic in late 2021 and the U.S. Food and Drug Administration’s approval for the company’s COVID-19 pill.
Leading individual contributors to relative performance included the Fund’s overweight positions in Lowes Cos. and Eaton Corp., and its underweight position in Intel Corp. Shares of Lowe’s, a home improvement retail chain, rose after the company reported better-than-expected earnings and revenue for the third quarter of 2021, issued a better-than-expected forecast for fiscal 2022 and announced a $13 billion share repurchase plan. Shares of Eaton, a provider of industrial power systems, rose after the company reported better-than-expected earnings for the third quarter of 2021. Shares of Intel, a semiconductor manufacturer, fell after the company issued a weaker-than-expected earnings forecast with its third quarter 2021 results.
HOW WAS THE FUND POSITIONED?
During the period, the Fund’s largest overweight allocations relative to the Index were to the diversified financials and banks sectors and its largest underweight allocations were to the technology hardware & equipment and software & services sectors.
| | | | | | | | | | |
| | | | | |
| DECEMBER 31, 2021 | | J.P. MORGAN EXCHANGE-TRADED FUNDS | | | | | | | | 3 |
JPMorgan ActiveBuilders U.S. Large Cap Equity ETF
FUND COMMENTARY
FOR THE PERIOD JULY 7, 2021 (INCEPTION DATE) THROUGH DECEMBER 31, 2021 (Unaudited) (continued)
| | | | | | | | |
TOP TEN EQUITY HOLDINGS OF
THE PORTFOLIO AS OF DECEMBER 31, 2021 | | PERCENT OF
TOTAL
INVESTMENTS | |
| | 1. | | | Microsoft Corp. | |
| 6.7
| %
|
| | 2. | | | Apple, Inc. | |
| 5.3
|
|
| | 3. | | | Amazon.com, Inc. | |
| 3.5
|
|
| | 4. | | | Alphabet, Inc., Class A | |
| 2.8
|
|
| | 5. | | | Alphabet, Inc., Class C | |
| 2.3
|
|
| | 6. | | | Tesla, Inc. | |
| 1.9
|
|
| | 7. | | | Wells Fargo & Co. | |
| 1.6
|
|
| | 8. | | | AbbVie, Inc. | |
| 1.5
|
|
| | 9. | | | Lowe’s Cos., Inc. | |
| 1.5
|
|
| | 10. | | | Eaton Corp. plc | |
| 1.4
|
|
| | | | |
PORTFOLIO COMPOSITION BY SECTOR AS
OF DECEMBER 31, 2021 | | PERCENT OF
TOTAL
INVESTMENTS | |
| Information Technology | |
| 24.5
| %
|
| Consumer Discretionary | |
| 14.8
|
|
| Financials | |
| 14.7
|
|
| Health Care | |
| 13.4
|
|
| Industrials | |
| 10.2
|
|
| Communication Services | |
| 8.7
|
|
| Consumer Staples | |
| 3.3
|
|
| Materials | |
| 2.9
|
|
| Utilities | |
| 2.8
|
|
| Real Estate | |
| 2.3
|
|
| Energy | |
| 2.2
|
|
| Short-Term Investments | |
| 0.2
|
|
| * | | The return shown is based on net asset value and may differ from the return shown in the financial highlights, which reflects adjustments made to the net asset value in accordance with accounting principles generally accepted in the United States of America. The net asset value was $53.43 as of December 31, 2021. |
| ** | | Market price return was calculated assuming an initial investment made at the inception date net asset value, reinvestment of all dividends and distributions at market price during the period, and sale at the market price on the last day of the period. The price used to calculate the market price return was the closing price on the NYSE Arca. As of December 31, 2021, the closing price was $53.47. |
| *** | | The adviser seeks to achieve the Fund’s objective. There can be no guarantee it will be achieved. |
| | | | | | | | | | |
| | | | | |
| 4 | | | | | | | | J.P. MORGAN EXCHANGE-TRADED FUNDS | | DECEMBER 31, 2021 |
| | | | | | | | |
TOTAL RETURNS AS OF DECEMBER 31, 2021 (Unaudited) | |
| | | INCEPTION DATE | | | CUMULATIVE
SINCE
INCEPTION | |
Net Asset Value | | | July 7, 2021 | | | | 9.63 | % |
Market Price | | | | | | | 9.71 | % |
LIFE OF FUND PERFORMANCE (07/07/21 TO 12/31/21)
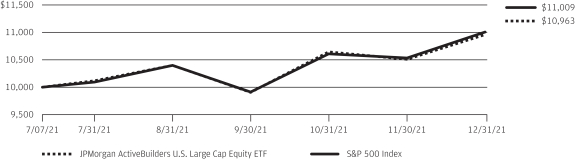
The performance quoted is past performance and is not a guarantee of future results. Exchange-traded funds are subject to certain market risks. Investment returns and principal value of an investment will fluctuate so that an investor’s shares, when sold or redeemed, may be worth more or less than their original cost. Current performance may be higher or lower than the performance data shown. For up-to-date, month-end performance information please call 1-844-457-6383.
Fund commenced operations on July 7, 2021.
The graph illustrates comparative performance for $10,000 invested in shares of the JPMorgan ActiveBuilders U.S. Large Cap Equity ETF and the S&P 500 Index from July 7, 2021 to December 31, 2021. The performance of the Fund reflects the deduction of Fund expenses and assumes reinvestment of all dividends and capital gain distributions, if any. The performance of the S&P 500 Index does not
reflect the deduction of expenses associated with an exchange-traded fund and approximates the minimum possible dividend reinvestment of the securities included in the Index, if applicable. The S&P 500 Index is an unmanaged index generally representative of the performance of large companies in the U.S. stock market. Investors cannot invest directly in an index.
Performance shown in this section does not reflect the deduction of taxes that a shareholder may pay on Fund distributions or on gains resulting from redemption or sale of Fund shares.
The returns shown are based on net asset values calculated for shareholder transactions and may differ from the returns shown in the financial highlights, which reflect adjustments made to the net asset values in accordance with accounting principles generally accepted in the United States of America.
| | | | | | | | | | |
| | | | | |
| DECEMBER 31, 2021 | | J.P. MORGAN EXCHANGE-TRADED FUNDS | | | | | | | | 5 |
JPMorgan Active Value ETF
FUND COMMENTARY
FOR THE PERIOD OCTOBER 4, 2021 (INCEPTION DATE) THROUGH DECEMBER 31, 2021 (Unaudited)
| | | | |
| REPORTING PERIOD RETURN: | | | |
| JPMorgan Active Value ETF | | | | |
| Net Asset Value* | | | 6.22% | |
| Market Price** | | | 6.28% | |
| Russell 1000 Value Index | | | 6.94% | |
| |
| Net Assets as of 12/31/2021 | | $ | 27,466,348 | |
| Fund Ticker | | | JAVA | |
INVESTMENT OBJECTIVE***
The JPMorgan Active Value ETF (the “Fund”) seeks to provide long-term capital appreciation.
INVESTMENT APPROACH
The Fund invests primarily in large- and mid-cap equity securities that are attractively valued based on their growth potential over the long-term. The Fund employs a bottom-up approach to stock selection, focusing on company fundamentals, quantitative screening and proprietary fundamental analysis.
WHAT WERE THE MAIN DRIVERS OF THE FUND’S PERFORMANCE?
For the period from inception on October 4, 2021 to December 31, 2021, the Fund underperformed the Russell 1000 Value Index (the “Index”).
The Fund’s security selection in the financials sector and its underweight position and security selection in the real estate sector were leading detractors from performance relative to the Benchmark, while the Fund’s security selection in the materials sector and underweight position in the communication services sector were leading contributors to relative performance.
Leading individual detractors from relative performance included the Fund’s overweight position in Royal Caribbean Cruises Ltd. and Zimmer Biomet Holdings Inc. and its underweight position in Pfizer Inc. Shares of Royal Caribbean Cruises, a cruise ship operator, fell amid investor concerns that the emergence of the omicron variant of COVID-19 would hurt the travel and hospitality sectors. Shares of Zimmer Biomet Holdings, a medical device manufacturer, fell amid investor expectations that the resurgence of the pandemic in late 2021 may
reduce demand for elective surgeries. Shares of Pfizer, a pharmaceutical and vaccines manufacturer, rose amid a resurgence in the pandemic in late 2021 and the U.S. Food and Drug Administration’s approval for the company’s COVID-19 pill.
Leading individual contributors to relative performance included the Fund’s out-of-Benchmark position in Seagate Technology Holdings PLC, its underweight position in JPMorgan Chase & Co. and its overweight position in Centene Corp. Shares of Seagate Technology Holdings, a data storage products manufacturer, rose after the company reported better-than-expected earnings and revenue for its fiscal second quarter. Shares of JPMorgan Chase, a banking and financial services company that the Fund is prohibited from owning because of JPMorgan Chase’s affiliation with the Fund adviser, fell after the company reported rising consumer debt delinquencies. Shares of Centene, a health insurance provider, rose after the company issued a better-than-expected forecast for earnings and revenue for fiscal year 2022.
HOW WAS THE FUND POSITIONED?
During the period, the Fund’s portfolio managers employed a bottom-up approach to stock selection, based on company fundamentals, quantitative screening and proprietary fundamental analysis. As a result of this process, the Fund’s largest sector allocations were to the financials and health care sectors and its smallest allocations were to the real estate and utilities sector.
| | | | | | | | | | |
| | | | | |
| 6 | | | | | | | | J.P. MORGAN EXCHANGE-TRADED FUNDS | | DECEMBER 31, 2021 |
| | | | | | | | |
TOP TEN EQUITY HOLDINGS OF THE
PORTFOLIO AS OF DECEMBER 31, 2021 | | PERCENT OF
TOTAL
INVESTMENTS | |
| | 1. | | | Wells Fargo & Co. | |
| 3.1
| %
|
| | 2. | | | Bank of America Corp. | |
| 3.0
|
|
| | 3. | | | Chevron Corp. | |
| 2.2
|
|
| | 4. | | | Bristol-Myers Squibb Co. | |
| 2.1
|
|
| | 5. | | | Centene Corp. | |
| 1.8
|
|
| | 6. | | | Royal Caribbean Cruises Ltd. | |
| 1.7
|
|
| | 7. | | | Truist Financial Corp. | |
| 1.7
|
|
| | 8. | | | US Foods Holding Corp. | |
| 1.7
|
|
| | 9. | | | Parker-Hannifin Corp. | |
| 1.6
|
|
| | 10. | | | Raytheon Technologies Corp. | |
| 1.5
|
|
| | | | |
PORTFOLIO COMPOSITION BY SECTOR AS
OF DECEMBER 31, 2021 | | PERCENT OF
TOTAL
INVESTMENTS | |
| Financials | |
| 23.9
| %
|
| Health Care | |
| 17.3
|
|
| Industrials | |
| 12.1
|
|
| Consumer Discretionary | |
| 10.1
|
|
| Consumer Staples | |
| 7.1
|
|
| Energy | |
| 6.9
|
|
| Materials | |
| 6.5
|
|
| Information Technology | |
| 5.6
|
|
| Communication Services | |
| 4.0
|
|
| Utilities | |
| 2.9
|
|
| Real Estate | |
| 2.0
|
|
| Short-Term Investments | |
| 1.6
|
|
| * | | The return shown is based on net asset value and may differ from the return shown in the financial highlights, which reflects adjustments made to the net asset value in accordance with accounting principles generally accepted in the United States of America. The net asset value was $52.32 as of December 31, 2021. |
| ** | | Market price return was calculated assuming an initial investment made at the inception date net asset value, reinvestment of all dividends and distributions at market price during the period, and sale at the market price on the last day of the period. The price used to calculate the market price return was the closing price on the NYSE Arca. As of December 31, 2021, the closing price was $52.35. |
| *** | | The adviser seeks to achieve the Fund’s objective. There can be no guarantee it will be achieved. |
| | | | | | | | | | |
| | | | | |
| DECEMBER 31, 2021 | | J.P. MORGAN EXCHANGE-TRADED FUNDS | | | | | | | | 7 |
JPMorgan Active Value ETF
FUND COMMENTARY
FOR THE PERIOD OCTOBER 4, 2021 (INCEPTION DATE) THROUGH DECEMBER 31, 2021 (Unaudited) (continued)
| | | | | | | | |
TOTAL RETURNS AS OF DECEMBER 31, 2021 (Unaudited) | |
| | | INCEPTION DATE | | | CUMULATIVE
SINCE
INCEPTION | |
Net Asset Value | | | October 4, 2021 | | | | 6.22 | % |
Market Price | | | | | | | 6.28 | % |
LIFE OF FUND PERFORMANCE (10/04/21 TO 12/31/21)
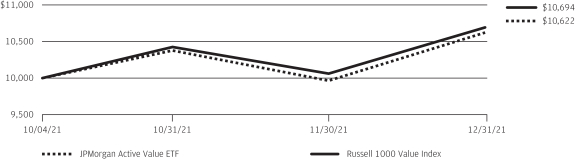
The performance quoted is past performance and is not a guarantee of future results. Exchange-traded funds are subject to certain market risks. Investment returns and principal value of an investment will fluctuate so that an investor’s shares, when sold or redeemed, may be worth more or less than their original cost. Current performance may be higher or lower than the performance data shown. For up-to-date, month-end performance information please call 1-844-457-6383.
Fund commenced operations on October 4, 2021.
The graph illustrates comparative performance for $10,000 invested in shares of the JPMorgan Active Value ETF and the Russell 1000 Value Index from October 4, 2021 to December 31, 2021.
The performance of the Fund reflects the deduction of Fund expenses and assumes reinvestment of all dividends and capital gain distributions, if any. The Russell 1000 Value Index does not reflect the deduction of expenses associated
with an exchange-traded fund and has been adjusted to reflect reinvestment of
all dividends and capital gain distributions of the securities included in the Index, if applicable. The Russell 1000 Value Index is an unmanaged index measuring the performance of those Russell 1000 companies with lower price to-book ratios and lower forecasted growth values. Investors cannot invest directly in an index.
Performance shown in this section does not reflect the deduction of taxes that a shareholder may pay on Fund distributions or on gains resulting from redemption or sale of Fund shares.
The returns shown are based on net asset values calculated for shareholder transactions and may differ from the returns shown in the financial highlights, which reflect adjustments made to the net asset values in accordance with accounting principles generally accepted in the United States of America.
| | | | | | | | | | |
| | | | | |
| 8 | | | | | | | | J.P. MORGAN EXCHANGE-TRADED FUNDS | | DECEMBER 31, 2021 |
JPMorgan Equity Premium Income ETF
FUND COMMENTARY
SIX MONTHS ENDED DECEMBER 31, 2021 (Unaudited)
| | | | |
| REPORTING PERIOD RETURN: | | | |
| JPMorgan Equity Premium Income ETF | | | | |
| Net Asset Value* | | | 8.82% | |
| Market Price** | | | 8.74% | |
| S&P 500 Index | | | 11.67% | |
| ICE BofAML 3-Month US Treasury Bill Index | | | 0.02% | |
| |
| Net Assets as of 12/31/2021 | | $ | 5,879,914,577 | |
| Fund Ticker | | | JEPI | |
INVESTMENT OBJECTIVE***
The JPMorgan Equity Premium Income ETF (the “Fund”) seeks current income while maintaining prospects for capital appreciation.
INVESTMENT APPROACH
The Fund generates income by investing in a combination of options-based equity-linked notes and U.S. large cap stocks, seeking to deliver a monthly distributions at a relatively stable level. The Fund uses a proprietary research process designed to identify over- and undervalued stocks with attractive risk/return characteristics.
WHAT WERE THE MAIN DRIVERS OF THE FUND’S PERFORMANCE?
The Fund underperformed the S&P 500 Index (the “Benchmark”) and outperformed the ICE BofAML 3-Month US Treasury Bill Index for the six months ended December 31, 2021.
The Fund’s use of options-based equity-linked notes allowed the Fund to generally perform as designed, delivering returns with less volatility than the Benchmark during the reporting period. The Fund captured 75% of the Benchmark’s total return with about 66% of the Benchmark’s volatility during the reporting period, resulting in income of $X.XX per share.
The Fund’s underweight position in the information technology sector and its security selection in the consumer discretionary sector were leading detractors from performance relative to the Benchmark, while the Fund’s security selection in the industrials and financials sectors was a leading contributor to relative performance.
Leading individual detractors from relative performance included the Fund’s underweight positions in Tesla Inc., Apple Inc. and Nvidia Inc. Shares of Tesla, a producer of electric vehicles and battery systems that was not held in the Fund, rose after the
company reported better-than-expected production and deliveries during the period. Shares of Apple, a provider of computers, mobile devices and related services, rose amid consecutive quarter of record earnings and strong demand for mobile devices. Shares of Nvidia, a semiconductor maker not held in the Fund, rose after the company reported better-than-expected earnings and revenue for the third quarter of 2021 amid growth in sales to the data center and gaming industries.
Leading individual contributors to relative performance included the Fund’s overweight position in Old Dominion Freight Line Inc. and its underweight positions in PayPal Holdings Inc. and Amazon.com Inc. Shares of Old Dominion Freight Inc., a trucking and transport provider, rose after the company reported better-than-expected earnings and revenue for the third quarter amid a surge in demand for its services. Shares of PayPal Holdings, a digital payments platform provider not held in the Fund, fell after the company issued a lower-than-expected earnings forecast for the third quarter of 2021 and amid general weakness in financial technology stocks. Shares of Amazon.com, an online retailer and services provider not held in the Fund, fell after the company reported lower-than-expected earnings and revenue for the third quarter of 2021 and issued a lower-than-expected forecast for the fourth quarter of 2021.
HOW WAS THE FUND POSITIONED?
During the reporting period, the Fund’s portfolio managers maintained a defensive equity portfolio, investing primarily in common stocks of large cap U.S. companies, with reduced volatility compared with the Benchmark, while using index options-based equity-linked notes in a consistent and disciplined manner. The combination of the diversified portfolio of equity securities and income from index options-based equity-linked notes provided the Fund with a portion of the returns associated with equity market investments, less risk compared with the equity market, and a stream of distributable monthly income.
| | | | | | | | | | |
| | | | | |
| DECEMBER 31, 2021 | | J.P. MORGAN EXCHANGE-TRADED FUNDS | | | | | | | | 9 |
JPMorgan Equity Premium Income ETF
FUND COMMENTARY
SIX MONTHS ENDED DECEMBER 31, 2021 (Unaudited) (continued)
| | | | | | | | |
TOP TEN EQUITY HOLDINGS OF THE
PORTFOLIO AS OF DECEMBER 31, 2021 | | PERCENT OF
TOTAL
INVESTMENTS | |
| | 1. | | | UBS AG, ELN, 40.24%, 2/7/2022, (linked to S&P 500 Index) (Switzerland) | |
| 2.1
| %
|
| | 2. | | | Barclays Bank plc, ELN, 48.30%, 1/14/2022, (linked to S&P 500 Index) (United Kingdom) | |
| 1.8
|
|
| | 3. | | | Bank of Montreal, ELN, 47.00%, 1/18/2022, (linked to S&P 500 Index) (Canada) | |
| 1.7
|
|
| | 4. | | | Credit Suisse AG, ELN, 42.00%, 2/4/2022, (linked to S&P 500 Index) (Switzerland) | |
| 1.7
|
|
| | 5. | | | Accenture plc, Class A | |
| 1.7
|
|
| | 6. | | | Old Dominion Freight Line, Inc. | |
| 1.6
|
|
| | 7. | | | Microsoft Corp. | |
| 1.6
|
|
| | 8. | | | DTE Energy Co. | |
| 1.6
|
|
| | 9. | | | Royal Bank of Canada, ELN, 55.31%, 1/7/2022, (linked to S&P 500 Index) (Canada) | |
| 1.6
|
|
| | 10. | | | Eli Lilly & Co. | |
| 1.6
|
|
| | | | |
PORTFOLIO COMPOSITION BY SECTOR AS
OF DECEMBER 31, 2021 | | PERCENT OF
TOTAL
INVESTMENTS | |
| Health Care | |
| 12.1
| %
|
| Information Technology | |
| 12.0
|
|
| Industrials | |
| 11.8
|
|
| Consumer Staples | |
| 10.9
|
|
| Financials | |
| 8.8
|
|
| Consumer Discretionary | |
| 7.6
|
|
| Utilities | |
| 7.3
|
|
| Communication Services | |
| 6.0
|
|
| Materials | |
| 3.4
|
|
| Real Estate | |
| 3.1
|
|
| Energy | |
| 0.7
|
|
| Other**** | |
| 16.2
|
|
| Short-Term Investments | |
| 0.1
|
|
| * | | The return shown is based on net asset value and may differ from the return shown in the financial highlights, which reflects adjustments made to the net asset value in accordance with accounting principles generally accepted in the United States of America. The net asset value was $63.16 as of December 31, 2021. |
| ** | | Market price return was calculated assuming an initial investment made at the market price at the beginning of the reporting period, reinvestment of all dividends and distributions at market price during the period, and sale at the market price on the last day of the period. The price used to calculate the market price return was the closing price on the NYSE Arca. As of December 31, 2021, the closing price was $63.19. |
| *** | | The adviser seeks to achieve the Fund’s objective. There can be no guarantee it will be achieved. |
| **** | | Equity-Linked Notes that are linked to the S&P 500 Index. |
| | | | | | | | | | |
| | | | | |
| 10 | | | | | | | | J.P. MORGAN EXCHANGE-TRADED FUNDS | | DECEMBER 31, 2021 |
| | | | | | | | | | | | | | | | |
AVERAGE ANNUAL TOTAL RETURNS AS OF DECEMBER 31, 2021 (Unaudited) | |
| | | INCEPTION DATE | | | SIX MONTHS* | | | 1 YEAR | | | SINCE
INCEPTION | |
| Net Asset Value | | | May 20, 2020 | | | | 8.82 | % | | | 21.61 | % | | | 25.23 | % |
| Market Price | | | | | | | 8.74 | % | | | 21.50 | % | | | 25.25 | % |
LIFE OF FUND PERFORMANCE (5/20/20 TO 12/31/21)
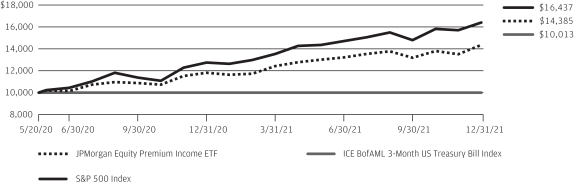
The performance quoted is past performance and is not a guarantee of future results. Exchange-traded funds are subject to certain market risks. Investment returns and principal value of an investment will fluctuate so that an investor’s shares, when sold or redeemed, may be worth more or less than their original cost. Current performance may be higher or lower than the performance data shown. For up-to-date, month-end performance information please call 1-844-457-6383.
Fund commenced operations on May 20, 2020.
The graph illustrates comparative performance for $10,000 invested in shares of the JPMorgan Equity Premium Income ETF, the S&P 500 Index and the ICE BofAML 3-Month US Treasury Bill Index from May 20, 2020 to December 31, 2021. The performance of the Fund reflects the deduction of Fund expenses and assumes reinvestment of all dividends and capital gain distributions, if any. The performance of the S&P 500 Index and the ICE BofAML 3-Month US Treasury Bill Index does not reflect the deduction of expenses associated with an exchange-traded fund and approximates the minimum possible dividend
reinvestment of the securities included in the benchmarks, if applicable. The S&P 500 Index is an unmanaged index generally representative of the performance of large companies in the U.S. stock market. The ICE BofAML
3-Month US Treasury Bill Index is comprised of a single issue purchased at the beginning of the month and held for a full month. Each month the ICE BofAML 3-Month US Treasury Bill Index is rebalanced and the issue selected is the outstanding Treasury Bill that matures closest to, but not beyond, 3 months from the rebalancing date. Investors cannot invest directly in an index.
Performance shown in this section does not reflect the deduction of taxes that a shareholder may pay on Fund distributions or on gains resulting from redemption or sale of Fund shares.
The returns shown are based on net asset values calculated for shareholder transactions and may differ from the returns shown in the financial highlights, which reflect adjustments made to the net asset values in accordance with accounting principles generally accepted in the United States of America.
| | | | | | | | | | |
| | | | | |
| DECEMBER 31, 2021 | | J.P. MORGAN EXCHANGE-TRADED FUNDS | | | | | | | | 11 |
JPMorgan ActiveBuilders U. S. Large Cap Equity ETF
SCHEDULE OF PORTFOLIO INVESTMENTS
AS OF DECEMBER 31, 2021 (Unaudited)
| | | | | | | | |
| INVESTMENTS | | SHARES | | | VALUE ($) | |
Common Stocks — 99.7% | | | | | | | | |
Aerospace & Defense — 1.7% | |
General Dynamics Corp. | | | 468 | | | | 97,564 | |
Northrop Grumman Corp. | | | 641 | | | | 248,112 | |
Raytheon Technologies Corp. | | | 1,682 | | | | 144,753 | |
| | | | | | | | |
| | | | | | | 490,429 | |
| | | | | | | | |
Air Freight & Logistics — 0.6% | |
FedEx Corp. | | | 119 | | | | 30,778 | |
United Parcel Service, Inc., Class B | | | 633 | | | | 135,677 | |
| | | | | | | | |
| | | | | | | 166,455 | |
| | | | | | | | |
Airlines — 0.2% | |
Southwest Airlines Co. * | | | 1,670 | | | | 71,543 | |
| | | | | | | | |
Auto Components — 0.1% | |
Aptiv plc * | | | 55 | | | | 9,072 | |
Magna International, Inc. (Canada) | | | 194 | | | | 15,703 | |
| | | | | | | | |
| | | | | | | 24,775 | |
| | | | | | | | |
Automobiles — 2.2% | |
General Motors Co. * | | | 347 | | | | 20,345 | |
Rivian Automotive, Inc., Class A * | | | 460 | | | | 47,697 | |
Tesla, Inc. * | | | 535 | | | | 565,377 | |
| | | | | | | | |
| | | | | | | 633,419 | |
| | | | | | | | |
Banks — 5.9% | |
Bank of America Corp. | | | 4,428 | | | | 197,002 | |
Citigroup, Inc. | | | 2,836 | | | | 171,266 | |
Citizens Financial Group, Inc. | | | 651 | | | | 30,760 | |
Fifth Third Bancorp | | | 612 | | | | 26,653 | |
M&T Bank Corp. | | | 259 | | | | 39,777 | |
PNC Financial Services Group, Inc. (The) | | | 467 | | | | 93,643 | |
Regions Financial Corp. | | | 1,178 | | | | 25,680 | |
SVBFinancial Group * | | | 130 | | | | 88,171 | |
Truist Financial Corp. | | | 5,638 | | | | 330,105 | |
US Bancorp | | | 4,706 | | | | 264,336 | |
Wells Fargo & Co. | | | 9,703 | | | | 465,550 | |
| | | | | | | | |
| | | | | | | 1,732,943 | |
| | | | | | | | |
Beverages — 1.1% | |
Coca-Cola Co. (The) | | | 3,312 | | | | 196,103 | |
Constellation Brands, Inc., Class A | | | 127 | | | | 31,873 | |
Monster Beverage Corp. * | | | 573 | | | | 55,031 | |
PepsiCo, Inc. | | | 218 | | | | 37,869 | |
| | | | | | | | |
| | | | | | | 320,876 | |
| | | | | | | | |
Biotechnology — 3.2% | |
AbbVie, Inc. | | | 3,255 | | �� | | 440,727 | |
Amgen, Inc. | | | 151 | | | | 33,970 | |
Biogen, Inc. * | | | 451 | | | | 108,204 | |
Exact Sciences Corp. * | | | 93 | | | | 7,238 | |
Moderna, Inc. * | | | 70 | | | | 17,779 | |
Regeneron Pharmaceuticals, Inc. * | | | 350 | | | | 221,032 | |
Seagen, Inc. * | | | 278 | | | | 42,979 | |
Vertex Pharmaceuticals, Inc. * | | | 344 | | | | 75,542 | |
| | | | | | | | |
| | | | | | | 947,471 | |
| | | | | | | | |
| | | | | | | | |
| INVESTMENTS | | SHARES | | | VALUE ($) | |
| | | | | | | | |
Building Products — 1.0% | |
Johnson Controls International plc | | | 442 | | | | 35,939 | |
Masco Corp. | | | 285 | | | | 20,013 | |
Trane Technologies plc | | | 1,164 | | | | 235,163 | |
| | | | | | | | |
| | | | | | | 291,115 | |
| | | | | | | | |
Capital Markets — 5.4% | |
Ameriprise Financial, Inc. | | | 393 | | | | 118,552 | |
BlackRock, Inc. | | | 179 | | | | 163,885 | |
Blackstone, Inc. | | | 999 | | | | 129,261 | |
Charles Schwab Corp. (The) | | | 2,101 | | | | 176,694 | |
Goldman Sachs Group, Inc. (The) | | | 328 | | | | 125,476 | |
Intercontinental Exchange, Inc. | | | 204 | | | | 27,901 | |
Morgan Stanley | | | 3,650 | | | | 358,284 | |
MSCI, Inc. | | | 37 | | | | 22,670 | |
S&P Global, Inc. | | | 628 | | | | 296,372 | |
State Street Corp. | | | 555 | | | | 51,615 | |
T. Rowe Price Group, Inc. | | | 668 | | | | 131,356 | |
| | | | | | | | |
| | | | | | | 1,602,066 | |
| | | | | | | | |
Chemicals — 2.3% | |
Air Products and Chemicals, Inc. | | | 335 | | | | 101,927 | |
Axalta Coating Systems Ltd. * | | | 3,167 | | | | 104,891 | |
Celanese Corp. | | | 77 | | | | 12,941 | |
DuPont de Nemours, Inc. | | | 605 | | | | 48,872 | |
Eastman Chemical Co. | | | 756 | | | | 91,408 | |
Linde plc (United Kingdom) | | | 82 | | | | 28,407 | |
PPG Industries, Inc. | | | 1,283 | | | | 221,241 | |
Sherwin-Williams Co. (The) | | | 177 | | | | 62,332 | |
| | | | | | | | |
| | | | | | | 672,019 | |
| | | | | | | | |
Commercial Services & Supplies — 0.2% | |
Cintas Corp. | | | 23 | | | | 10,193 | |
Republic Services, Inc. | | | 335 | | | | 46,716 | |
| | | | | | | | |
| | | | | | | 56,909 | |
| | | | | | | | |
Communications Equipment — 0.1% | |
Cisco Systems, Inc. | | | 295 | | | | 18,694 | |
| | | | | | | | |
Construction Materials — 0.2% | |
Vulcan Materials Co. | | | 335 | | | | 69,539 | |
| | | | | | | | |
Consumer Finance — 0.7% | |
American Express Co. | | | 440 | | | | 71,984 | |
Capital One Financial Corp. | | | 973 | | | | 141,173 | |
| | | | | | | | |
| | | | | | | 213,157 | |
| | | | | | | | |
Containers & Packaging — 0.2% | |
Avery Dennison Corp. | | | 73 | | | | 15,810 | |
Ball Corp. | | | 212 | | | | 20,409 | |
Westrock Co. | | | 235 | | | | 10,424 | |
| | | | | | | | |
| | | | | | | 46,643 | |
| | | | | | | | |
Diversified Financial Services — 0.9% | |
Berkshire Hathaway, Inc., Class B * | | | 874 | | | | 261,326 | |
| | | | | | | | |
Diversified Telecommunication Services — 0.1% | |
Verizon Communications, Inc. | | | 537 | | | | 27,903 | |
| | | | | | | | |
SEE NOTES TO FINANCIAL STATEMENTS.
| | | | | | | | | | |
| | | | | |
| 12 | | | | | | | | J.P. MORGAN EXCHANGE-TRADED FUNDS | | DECEMBER 31, 2021 |
| | | | | | | | |
| INVESTMENTS | | SHARES | | | VALUE ($) | |
Common Stocks — continued | | | | | | | | |
Electric Utilities — 2.2% | |
Edison International | | | 256 | | | | 17,472 | |
Entergy Corp. | | | 380 | | | | 42,807 | |
Evergy, Inc. | | | 314 | | | | 21,544 | |
FirstEnergy Corp. | | | 785 | | | | 32,648 | |
NextEra Energy, Inc. | | | 4,265 | | | | 398,180 | |
Xcel Energy, Inc. | | | 2,098 | | | | 142,035 | |
| | | | | | | | |
| | | | | | | 654,686 | |
| | | | | | | | |
Electrical Equipment — 1.7% | |
Eaton Corp. plc | | | 2,455 | | | | 424,273 | |
Rockwell Automation, Inc. | | | 213 | | | | 74,305 | |
| | | | | | | | |
| | | | | | | 498,578 | |
| | | | | | | | |
Electronic Equipment, Instruments & Components — 0.2% | |
Amphenol Corp., Class A | | | 617 | | | | 53,963 | |
| | | | | | | | |
Entertainment — 0.7% | |
Netflix, Inc. * | | | 251 | | | | 151,213 | |
Walt Disney Co. (The)* | | | 379 | | | | 58,703 | |
| | | | | | | | |
| | | | | | | 209,916 | |
| | | | | | | | |
Equity Real Estate Investment Trusts (REITs) — 2.2% | |
AvalonBay Communities, Inc. | | | 109 | | | | 27,532 | |
Camden Property Trust | | | 157 | | | | 28,053 | |
Equinix, Inc. | | | 33 | | | | 27,913 | |
Equity LifeStyle Properties, Inc. | | | 208 | | | | 18,233 | |
Host Hotels & Resorts, Inc. * | | | 2,700 | | | | 46,953 | |
Kimco Realty Corp. | | | 593 | | | | 14,617 | |
Prologis, Inc. | | | 2,315 | | | | 389,753 | |
SBA Communications Corp. | | | 43 | | | | 16,728 | |
Sun Communities, Inc. | | | 113 | | | | 23,727 | |
Ventas, Inc. | | | 1,024 | | | | 52,347 | |
Vornado Realty Trust | | | 382 | | | | 15,991 | |
| | | | | | | | |
| | | | | | | 661,847 | |
| | | | | | | | |
Food & Staples Retailing — 0.2% | |
Walmart, Inc. | | | 415 | | | | 60,046 | |
| | | | | | | | |
Food Products — 0.3% | |
Mondelez International, Inc., Class A | | | 1,560 | | | | 103,444 | |
| | | | | | | | |
Health Care Equipment & Supplies — 3.0% | |
Abbott Laboratories | | | 446 | | | | 62,770 | |
ABIOMED, Inc. * | | | 42 | | | | 15,085 | |
Align Technology, Inc. * | | | 124 | | | | 81,491 | |
Baxter International, Inc. | | | 111 | | | | 9,528 | |
Becton Dickinson and Co. | | | 370 | | | | 93,048 | |
Boston Scientific Corp. * | | | 4,113 | | | | 174,720 | |
Dexcom, Inc. * | | | 94 | | | | 50,473 | |
Intuitive Surgical, Inc. * | | | 463 | | | | 166,356 | |
Medtronic plc | | | 1,489 | | | | 154,037 | |
Zimmer Biomet Holdings, Inc. | | | 624 | | | | 79,273 | |
| | | | | | | | |
| | | | | | | 886,781 | |
| | | | | | | | |
Health Care Providers & Services — 3.0% | |
Anthem, Inc. | | | 242 | | | | 112,177 | |
Centene Corp. * | | | 1,985 | | | | 163,564 | |
Cigna Corp. | | | 359 | | | | 82,437 | |
HCA Healthcare, Inc. | | | 352 | | | | 90,436 | |
| | | | | | | | |
| INVESTMENTS | | SHARES | | | VALUE ($) | |
| | | | | | | | |
Health Care Providers & Services — continued | |
Humana, Inc. | | | 152 | | | | 70,507 | |
McKesson Corp. | | | 325 | | | | 80,785 | |
UnitedHealth Group, Inc. | | | 590 | | | | 296,262 | |
| | | | | | | | |
| | | | | | | 896,168 | |
| | | | | | | | |
Hotels, Restaurants & Leisure — 2.8% | |
Booking Holdings, Inc. * | | | 57 | | | | 136,756 | |
Chipotle Mexican Grill, Inc. * | | | 49 | | | | 85,664 | |
Hilton Worldwide Holdings, Inc. * | | | 168 | | | | 26,206 | |
Marriott International, Inc., Class A * | | | 1,159 | | | | 191,513 | |
McDonald’s Corp. | | | 1,121 | | | | 300,507 | |
Yum! Brands, Inc. | | | 631 | | | | 87,621 | |
| | | | | | | | |
| | | | | | | 828,267 | |
| | | | | | | | |
Household Durables — 0.3% | |
Lennar Corp., Class A | | | 366 | | | | 42,515 | |
Newell Brands, Inc. | | | 1,177 | | | | 25,706 | |
Toll Brothers, Inc. | | | 178 | | | | 12,885 | |
| | | | | | | | |
| | | | | | | 81,106 | |
| | | | | | | | |
Household Products — 0.8% | |
Kimberly-Clark Corp. | | | 199 | | | | 28,441 | |
Procter & Gamble Co. (The) | | | 1,184 | | | | 193,679 | |
| | | | | | | | |
| | | | | | | 222,120 | |
| | | | | | | | |
Industrial Conglomerates — 0.1% | |
Honeywell International, Inc. | | | 120 | | | | 25,021 | |
| | | | | | | | |
Insurance — 1.7% | |
Chubb Ltd. | | | 578 | | | | 111,733 | |
Hartford Financial Services Group, Inc. (The) | | | 1,463 | | | | 101,005 | |
Loews Corp. | | | 493 | | | | 28,476 | |
Marsh & McLennan Cos., Inc. | | | 188 | | | | 32,678 | |
MetLife, Inc. | | | 797 | | | | 49,805 | |
Progressive Corp. (The) | | | 1,182 | | | | 121,332 | |
Prudential Financial, Inc. | | | 452 | | | | 48,924 | |
Travelers Cos., Inc. (The) | | | 55 | | | | 8,604 | |
| | | | | | | | |
| | | | | | | 502,557 | |
| | | | | | | | |
Interactive Media & Services — 6.8% | |
Alphabet, Inc., Class A * | | | 285 | | | | 825,656 | |
Alphabet, Inc., Class C * | | | 231 | | | | 668,419 | |
Match Group, Inc. * | | | 215 | | | | 28,434 | |
Meta Platforms, Inc., Class A * | | | 1,117 | | | | 375,703 | |
Snap, Inc., Class A * | | | 1,765 | | | | 83,008 | |
ZoomInfo Technologies, Inc., Class A * | | | 210 | | | | 13,482 | |
| | | | | | | | |
| | | | | | | 1,994,702 | |
| | | | | | | | |
Internet & Direct Marketing Retail — 3.7% | |
Amazon.com, Inc. * | | | 312 | | | | 1,040,314 | |
Etsy, Inc. * | | | 176 | | | | 38,533 | |
| | | | | | | | |
| | | | | | | 1,078,847 | |
| | | | | | | | |
IT Services — 3.3% | |
Accenture plc, Class A | | | 297 | | | | 123,121 | |
Affirm Holdings, Inc. * | | | 224 | | | | 22,525 | |
Block, Inc., Class A * | | | 156 | | | | 25,195 | |
SEE NOTES TO FINANCIAL STATEMENTS.
| | | | | | | | | | |
| | | | | |
| DECEMBER 31, 2021 | | J.P. MORGAN EXCHANGE-TRADED FUNDS | | | | | | | | 13 |
JPMorgan ActiveBuilders U. S. Large Cap Equity ETF
SCHEDULE OF PORTFOLIO INVESTMENTS
AS OF DECEMBER 31, 2021 (Unaudited) (continued)
| | | | | | | | |
| INVESTMENTS | | SHARES | | | VALUE ($) | |
Common Stocks — continued | | | | | | | | |
IT Services — continued | |
Fidelity National Information Services, Inc. | | | 318 | | | | 34,710 | |
FleetCor Technologies, Inc. * | | | 277 | | | | 62,004 | |
International Business Machines Corp. | | | 304 | | | | 40,633 | |
Mastercard, Inc., Class A | | | 1,173 | | | | 421,482 | |
MongoDB, Inc. * | | | 39 | | | | 20,645 | |
PayPal Holdings, Inc. * | | | 205 | | | | 38,659 | |
Shopify, Inc., Class A (Canada) * | | | 54 | | | | 74,379 | |
Visa, Inc., Class A | | | 455 | | | | 98,603 | |
| | | | | | | | |
| | | | | | | 961,956 | |
| | | | | | | | |
Life Sciences Tools & Services — 0.6% | |
Danaher Corp. | | | 85 | | | | 27,966 | |
Illumina, Inc. * | | | 31 | | | | 11,793 | |
Thermo Fisher Scientific, Inc. | | | 187 | | | | 124,774 | |
| | | | | | | | |
| | | | | | | 164,533 | |
| | | | | | | | |
Machinery — 2.8% | |
Deere & Co. | | | 1,006 | | | | 344,947 | |
Dover Corp. | | | 636 | | | | 115,498 | |
Ingersoll Rand, Inc. | | | 244 | | | | 15,096 | |
Otis Worldwide Corp. | | | 541 | | | | 47,105 | |
Parker-Hannifin Corp. | | | 457 | | | | 145,381 | |
Stanley Black & Decker, Inc. | | | 815 | | | | 153,725 | |
| | | | | | | | |
| | | | | | | 821,752 | |
| | | | | | | | |
Media — 0.8% | |
Charter Communications, Inc., Class A * | | | 51 | | | | 33,251 | |
Comcast Corp., Class A | | | 3,777 | | | | 190,096 | |
| | | | | | | | |
| | | | | | | 223,347 | |
| | | | | | | | |
Metals & Mining — 0.3% | |
Freeport-McMoRan, Inc. | | | 1,827 | | | | 76,241 | |
| | | | | | | | |
Multiline Retail — 0.4% | |
Dollar General Corp. | | | 301 | | | | 70,985 | |
Dollar Tree, Inc. * | | | 74 | | | | 10,398 | |
Target Corp. | | | 177 | | | | 40,965 | |
| | | | | | | | |
| | | | | | | 122,348 | |
| | | | | | | | |
Multi-Utilities — 0.5% | |
CenterPoint Energy, Inc. | | | 1,264 | | | | 35,278 | |
CMS Energy Corp. | | | 1,152 | | | | 74,938 | |
DTE Energy Co. | | | 149 | | | | 17,812 | |
Public Service Enterprise Group, Inc. | | | 347 | | | | 23,155 | |
| | | | | | | | |
| | | | | | | 151,183 | |
| | | | | | | | |
Oil, Gas & Consumable Fuels — 2.2% | |
Cheniere Energy, Inc. | | | 105 | | | | 10,649 | |
Chevron Corp. | | | 1,302 | | | | 152,790 | |
ConocoPhillips | | | 3,091 | | | | 223,108 | |
Diamondback Energy, Inc. | | | 324 | | | | 34,944 | |
EOG Resources, Inc. | | | 1,276 | | | | 113,347 | |
Pioneer Natural Resources Co. | | | 357 | | | | 64,931 | |
Valero Energy Corp. | | | 358 | | | | 26,889 | |
Williams Cos., Inc. (The) | | | 522 | | | | 13,593 | |
| | | | | | | | |
| | | | | | | 640,251 | |
| | | | | | | | |
| | | | | | | | |
| INVESTMENTS | | SHARES | | | VALUE ($) | |
| | | | | | | | |
Personal Products — 0.3% | |
Estee Lauder Cos., Inc. (The), Class A | | | 261 | | | | 96,622 | |
| | | | | | | | |
Pharmaceuticals — 3.6% | |
Bristol-Myers Squibb Co. | | | 5,983 | | | | 373,040 | |
Eli Lilly & Co. | | | 1,259 | | | | 347,761 | |
Johnson & Johnson | | | 1,167 | | | | 199,639 | |
Merck & Co., Inc. | | | 775 | | | | 59,396 | |
Pfizer, Inc. | | | 1,203 | | | | 71,037 | |
| | | | | | | | |
| | | | | | | 1,050,873 | |
| | | | | | | | |
Professional Services — 0.6% | |
Booz Allen Hamilton Holding Corp. | | | 123 | | | | 10,429 | |
Equifax, Inc. | | | 124 | | | | 36,306 | |
Leidos Holdings, Inc. | | | 1,032 | | | | 91,745 | |
Verisk Analytics, Inc. | | | 167 | | | | 38,198 | |
| | | | | | | | |
| | | | | | | 176,678 | |
| | | | | | | | |
Road & Rail — 1.3% | |
CSX Corp. | | | 2,106 | | | | 79,185 | |
Lyft, Inc., Class A * | | | 234 | | | | 9,999 | |
Norfolk Southern Corp. | | | 918 | | | | 273,298 | |
Union Pacific Corp. | | | 131 | | | | 33,003 | |
| | | | | | | | |
| | | | | | | 395,485 | |
| | | | | | | | |
Semiconductors & Semiconductor Equipment — 7.0% | |
Advanced Micro Devices, Inc. * | | | 2,714 | | | | 390,545 | |
Analog Devices, Inc. | | | 2,211 | | | | 388,627 | |
Applied Materials, Inc. | | | 415 | | | | 65,304 | |
ASML Holding NV (Registered), NYRS (Netherlands) | | | 97 | | | | 77,226 | |
Enphase Energy, Inc. * | | | 53 | | | | 9,696 | |
Intel Corp. | | | 193 | | | | 9,940 | |
Lam Research Corp. | | | 215 | | | | 154,617 | |
Microchip Technology, Inc. | | | 201 | | | | 17,499 | |
Micron Technology, Inc. | | | 94 | | | | 8,756 | |
NVIDIA Corp. | | | 948 | | | | 278,816 | |
NXP Semiconductors NV (China) | | | 1,748 | | | | 398,159 | |
QUALCOMM, Inc. | | | 99 | | | | 18,104 | |
Texas Instruments, Inc. | | | 1,342 | | | | 252,927 | |
| | | | | | | | |
| | | | | | | 2,070,216 | |
| | | | | | | | |
Software — 8.5% | |
Ceridian HCM Holding, Inc. * | | | 433 | | | | 45,231 | |
Fortinet, Inc. * | | | 29 | | | | 10,422 | |
HubSpot, Inc. * | | | 38 | | | | 25,048 | |
Intuit, Inc. | | | 308 | | | | 198,112 | |
Microsoft Corp. | | | 5,868 | | | | 1,973,526 | |
Oracle Corp. | | | 1,189 | | | | 103,693 | |
salesforce.com, Inc. * | | | 129 | | | | 32,783 | |
Synopsys, Inc. * | | | 167 | | | | 61,539 | |
Workday, Inc., Class A * | | | 140 | | | | 38,245 | |
| | | | | | | | |
| | | | | | | 2,488,599 | |
| | | | | | | | |
Specialty Retail — 4.2% | |
AutoZone, Inc. * | | | 83 | | | | 174,000 | |
Best Buy Co., Inc. | | | 324 | | | | 32,919 | |
Carvana Co. * | | | 139 | | | | 32,219 | |
SEE NOTES TO FINANCIAL STATEMENTS.
| | | | | | | | | | |
| | | | | |
| 14 | | | | | | | | J.P. MORGAN EXCHANGE-TRADED FUNDS | | DECEMBER 31, 2021 |
| | | | | | | | |
| INVESTMENTS | | SHARES | | | VALUE ($) | |
Common Stocks — continued | | | | | | | | |
Specialty Retail — continued | |
Gap, Inc. (The) | | | 1,462 | | | | 25,804 | |
Home Depot, Inc. (The) | | | 399 | | | | 165,589 | |
Lowe’s Cos., Inc. | | | 1,650 | | | | 426,492 | |
O’Reilly Automotive, Inc. * | | | 249 | | | | 175,851 | |
Ross Stores, Inc. | | | 852 | | | | 97,367 | |
TJX Cos., Inc. (The) | | | 1,538 | | | | 116,765 | |
| | | | | | | | |
| | | | | | | 1,247,006 | |
| | | | | | | | |
Technology Hardware, Storage & Peripherals — 5.5% | |
Apple, Inc. | | | 8,807 | | | | 1,563,859 | |
Seagate Technology Holdings plc | | | 408 | | | | 46,096 | |
| | | | | | | | |
| | | | | | | 1,609,955 | |
| | | | | | | | |
Textiles, Apparel & Luxury Goods — 1.1% | |
NIKE, Inc., Class B | | | 1,627 | | | | 271,172 | |
Tapestry, Inc. | | | 1,193 | | | | 48,436 | |
| | | | | | | | |
| | | | | | | 319,608 | |
| | | | | | | | |
Tobacco — 0.6% | |
Altria Group, Inc. | | | 810 | | | | 38,386 | |
Philip Morris International, Inc. | | | 1,421 | | | | 134,995 | |
| | | | | | | | |
| | | | | | | 173,381 | |
| | | | | | | | |
Wireless Telecommunication Services — 0.3% | |
T-Mobile US, Inc. * | | | 832 | | | | 96,495 | |
| | | | | | | | |
Total Common Stocks
(Cost $26,802,793) | | | | | | | 29,291,860 | |
| | | | | | | | |
| | | | | | | | |
| INVESTMENTS | | SHARES | | | VALUE ($) | |
Short-Term Investments — 0.2% | |
|
Investment Companies — 0.2% | |
JPMorgan U.S. Government Money Market Fund Class IM Shares, 0.03% (a) (b)
(Cost $64,327) | | | 64,327 | | | | 64,327 | |
| | | | | | | | |
Total Investments — 99.9%
(Cost $26,867,120) | | | | 29,356,187 | |
Other Assets Less Liabilities — 0.1% | | | | 31,360 | |
| | | | | |
NET ASSETS — 100.0% | | | | 29,387,547 | |
| | | | | |
Percentages indicated are based on net assets.
Abbreviations
| | |
| NYRS | | New York Registry Shares |
| (a) | | Investment in an affiliated fund, which is registered under the Investment Company Act of 1940, as amended, and is advised by J.P. Morgan Investment Management Inc. |
| (b) | | The rate shown is the current yield as of December 31, 2021. |
| * | | Non-income producing security. |
| | | | | | | | | | | | | | | | | | |
| Futures contracts outstanding as of December 31, 2021: | |
| DESCRIPTION | | NUMBER OF
CONTRACTS | | EXPIRATION
DATE | | | TRADING
CURRENCY | | | NOTIONAL
AMOUNT ($) | | | VALUE AND
UNREALIZED
APPRECIATION
(DEPRECIATION) ($) | |
|
Long Contracts | |
| | | | | |
| Micro E-Mini S&P 500 Index | | 2 | | | 03/2022 | | | | USD | | | | 47,598 | | | | 579 | |
| | | | | | | | | | | | | | | | | | |
Abbreviations
SEE NOTES TO FINANCIAL STATEMENTS.
| | | | | | | | | | |
| | | | | |
| DECEMBER 31, 2021 | | J.P. MORGAN EXCHANGE-TRADED FUNDS | | | | | | | | 15 |
JPMorgan Active Value ETF
SCHEDULE OF PORTFOLIO INVESTMENTS
AS OF DECEMBER 31, 2021 (Unaudited)
| | | | | | | | |
| INVESTMENTS | | SHARES | | | VALUE ($) | |
Common Stocks — 98.4% | | | | | | | | |
Aerospace & Defense — 3.5% | |
Boeing Co. (The) * | | | 959 | | | | 193,066 | |
General Dynamics Corp. | | | 899 | | | | 187,414 | |
Northrop Grumman Corp. | | | 416 | | | | 161,021 | |
Raytheon Technologies Corp. | | | 4,929 | | | | 424,190 | |
| | | | | | | | |
| | | | | | | 965,691 | |
| | | | | | | | |
Air Freight & Logistics — 1.2% | |
FedEx Corp. | | | 807 | | | | 208,722 | |
United Parcel Service, Inc., Class B | | | 614 | | | | 131,605 | |
| | | | | | | | |
| | | | | | | 340,327 | |
| | | | | | | | |
Airlines — 0.9% | |
Delta Air Lines, Inc. * | | | 1,875 | | | | 73,275 | |
Southwest Airlines Co. * | | | 4,032 | | | | 172,731 | |
| | | | | | | | |
| | | | | | | 246,006 | |
| | | | | | | | |
Auto Components — 0.4% | |
Lear Corp. | | | 566 | | | | 103,550 | |
| | | | | | | | |
Automobiles — 1.1% | |
General Motors Co. * | | | 5,009 | | | | 293,678 | |
| | | | | | | | |
Banks — 11.7% | |
Bank of America Corp. | | | 18,396 | | | | 818,438 | |
Citigroup, Inc. | | | 6,108 | | | | 368,862 | |
Citizens Financial Group, Inc. | | | 1,285 | | | | 60,716 | |
M&T Bank Corp. | | | 506 | | | | 77,712 | |
People’s United Financial, Inc. | | | 14,899 | | | | 265,500 | |
PNC Financial Services Group, Inc. (The) | | | 918 | | | | 184,077 | |
Truist Financial Corp. | | | 8,125 | | | | 475,719 | |
US Bancorp | | | 1,685 | | | | 94,647 | |
Wells Fargo & Co. | | | 17,890 | | | | 858,362 | |
| | | | | | | | |
| | | | | | | 3,204,033 | |
| | | | | | | | |
Beverages — 1.3% | |
Coca-Cola Co. (The) | | | 4,740 | | | | 280,655 | |
PepsiCo, Inc. | | | 419 | | | | 72,785 | |
| | | | | | | | |
| | | | | | | 353,440 | |
| | | | | | | | |
Biotechnology — 4.7% | |
AbbVie, Inc. | | | 2,953 | | | | 399,836 | |
Amgen, Inc. | | | 294 | | | | 66,141 | |
Biogen, Inc. * | | | 369 | | | | 88,531 | |
BioMarin Pharmaceutical, Inc. * | | | 464 | | | | 40,994 | |
Neurocrine Biosciences, Inc. * | | | 906 | | | | 77,164 | |
Regeneron Pharmaceuticals, Inc. * | | | 430 | | | | 271,554 | |
Vertex Pharmaceuticals, Inc. * | | | 1,549 | | | | 340,160 | |
| | | | | | | | |
| | | | | | | 1,284,380 | |
| | | | | | | | |
Building Products — 0.4% | |
Trane Technologies plc | | | 536 | | | | 108,288 | |
| | | | | | | | |
Capital Markets — 6.3% | |
BlackRock, Inc. | | | 351 | | | | 321,362 | |
Charles Schwab Corp. (The) | | | 1,817 | | | | 152,810 | |
Goldman Sachs Group, Inc. (The) | | | 412 | | | | 157,611 | |
Intercontinental Exchange, Inc. | | | 1,347 | | | | 184,229 | |
Morgan Stanley | | | 2,651 | | | | 260,222 | |
S&P Global, Inc. | | | 214 | | | | 100,993 | |
| | | | | | | | |
| INVESTMENTS | | SHARES | | | VALUE ($) | |
| | | | | | | | |
Capital Markets — continued | |
State Street Corp. | | | 4,089 | | | | 380,277 | |
T. Rowe Price Group, Inc. | | | 877 | | | | 172,453 | |
| | | | | | | | |
| | | | | | | 1,729,957 | |
| | | | | | | | |
Chemicals — 3.5% | |
Air Products and Chemicals, Inc. | | | 566 | | | | 172,211 | |
Axalta Coating Systems Ltd. * | | | 6,240 | | | | 206,669 | |
Celanese Corp. | | | 1,001 | | | | 168,228 | |
DuPont de Nemours, Inc. | | | 527 | | | | 42,571 | |
Eastman Chemical Co. | | | 1,150 | | | | 139,046 | |
FMC Corp. | | | 2,040 | | | | 224,176 | |
| | | | | | | | |
| | | | | | | 952,901 | |
| | | | | | | | |
Commercial Services & Supplies — 0.3% | |
Republic Services, Inc. | | | 645 | | | | 89,945 | |
| | | | | | | | |
Construction Materials — 0.5% | |
Vulcan Materials Co. | | | 653 | | | | 135,550 | |
| | | | | | | | |
Consumer Finance — 1.0% | |
American Express Co. | | | 881 | | | | 144,132 | |
Capital One Financial Corp. | | | 981 | | | | 142,333 | |
| | | | | | | | |
| | | | | | | 286,465 | |
| | | | | | | | |
Containers & Packaging — 0.3% | |
Ball Corp. | | | 416 | | | | 40,048 | |
Sealed Air Corp. | | | 815 | | | | 54,988 | |
| | | | | | | | |
| | | | | | | 95,036 | |
| | | | | | | | |
Diversified Financial Services — 1.2% | |
Berkshire Hathaway, Inc., Class B * | | | 1,139 | | | | 340,561 | |
| | | | | | | | |
Electric Utilities — 1.7% | |
Edison International | | | 2,507 | | | | 171,103 | |
Entergy Corp. | | | 403 | | | | 45,398 | |
FirstEnergy Corp. | | | 1,476 | | | | 61,387 | |
NextEra Energy, Inc. | | | 1,369 | | | | 127,810 | |
Xcel Energy, Inc. | | | 1,012 | | | | 68,512 | |
| | | | | | | | |
| | | | | | | 474,210 | |
| | | | | | | | |
Electrical Equipment — 1.1% | |
Eaton Corp. plc | | | 1,776 | | | | 306,928 | |
| | | | | | | | |
Entertainment — 1.5% | |
Activision Blizzard, Inc. | | | 3,385 | | | | 225,204 | |
Electronic Arts, Inc. | | | 836 | | | | 110,268 | |
Walt Disney Co. (The) * | | | 518 | | | | 80,233 | |
| | | | | | | | |
| | | | | | | 415,705 | |
| | | | | | | | |
Equity Real Estate Investment Trusts (REITs) — 2.0% | |
AvalonBay Communities, Inc. | | | 212 | | | | 53,549 | |
Host Hotels & Resorts, Inc. * | | | 18,043 | | | | 313,768 | |
Ventas, Inc. | | | 1,117 | | | | 57,101 | |
Vornado Realty Trust | | | 2,315 | | | | 96,906 | |
Weyerhaeuser Co. | | | 852 | | | | 35,085 | |
| | | | | | | | |
| | | | | | | 556,409 | |
| | | | | | | | |
Food & Staples Retailing — 2.7% | |
BJ’s Wholesale Club Holdings, Inc. * | | | 1,346 | | | | 90,142 | |
Performance Food Group Co. * | | | 940 | | | | 43,137 | |
SEE NOTES TO FINANCIAL STATEMENTS.
| | | | | | | | | | |
| | | | | |
| 16 | | | | | | | | J.P. MORGAN EXCHANGE-TRADED FUNDS | | DECEMBER 31, 2021 |
| | | | | | | | |
| INVESTMENTS | | SHARES | | | VALUE ($) | |
Common Stocks — continued | | | | | | | | |
Food & Staples Retailing — continued | |
US Foods Holding Corp. * | | | 13,393 | | | | 466,478 | |
Walmart, Inc. | | | 996 | | | | 144,111 | |
| | | | | | | | |
| | | | | | | 743,868 | |
| | | | | | | | |
Food Products — 1.9% | |
Bunge Ltd. | | | 299 | | | | 27,915 | |
Lamb Weston Holdings, Inc. | | | 6,079 | | | | 385,287 | |
Mondelez International, Inc., Class A | | | 1,687 | | | | 111,865 | |
| | | | | | | | |
| | | | | | | 525,067 | |
| | | | | | | | |
Health Care Equipment & Supplies — 2.5% | |
Becton Dickinson and Co. | | | 541 | | | | 136,051 | |
Medtronic plc | | | 1,861 | | | | 192,520 | |
Zimmer Biomet Holdings, Inc. | | | 2,751 | | | | 349,487 | |
| | | | | | | | |
| | | | | | | 678,058 | |
| | | | | | | | |
Health Care Providers & Services — 5.7% | |
Anthem, Inc. | | | 190 | | | | 88,072 | |
Centene Corp. * | | | 5,947 | | | | 490,033 | |
Cigna Corp. | | | 1,802 | | | | 413,793 | |
Humana, Inc. | | | 217 | | | | 100,658 | |
McKesson Corp. | | | 624 | | | | 155,108 | |
UnitedHealth Group, Inc. | | | 634 | | | | 318,357 | |
| | | | | | | | |
| | | | | | | 1,566,021 | |
| | | | | | | | |
Hotels, Restaurants & Leisure — 3.2% | |
Booking Holdings, Inc. * | | | 111 | | | | 266,314 | |
McDonald’s Corp. | | | 485 | | | | 130,014 | |
Royal Caribbean Cruises Ltd. * | | | 6,201 | | | | 476,857 | |
| | | | | | | | |
| | | | | | | 873,185 | |
| | | | | | | | |
Household Durables — 0.5% | |
Newell Brands, Inc. | | | 6,617 | | | | 144,515 | |
| | | | | | | | |
Household Products — 0.6% | |
Procter & Gamble Co. (The) | | | 962 | | | | 157,364 | |
| | | | | | | | |
Industrial Conglomerates — 0.5% | |
Honeywell International, Inc. | | | 641 | | | | 133,655 | |
| | | | | | | | |
Insurance — 3.7% | |
Allstate Corp. (The) | | | 375 | | | | 44,119 | |
American International Group, Inc. | | | 3,823 | | | | 217,376 | |
Chubb Ltd. | | | 1,039 | | | | 200,849 | |
Hartford Financial Services Group, Inc. (The) | | | 1,812 | | | | 125,100 | |
Loews Corp. | | | 966 | | | | 55,796 | |
Marsh & McLennan Cos., Inc. | | | 368 | | | | 63,966 | |
MetLife, Inc. | | | 1,566 | | | | 97,859 | |
Prudential Financial, Inc. | | | 1,130 | | | | 122,311 | |
Travelers Cos., Inc. (The) | | | 523 | | | | 81,813 | |
| | | | | | | | |
| | | | | | | 1,009,189 | |
| | | | | | | | |
Interactive Media & Services — 0.9% | |
Alphabet, Inc., Class C * | | | 81 | | | | 234,381 | |
| | | | | | | | |
IT Services — 0.7% | |
Fidelity National Information Services, Inc. | | | 610 | | | | 66,582 | |
International Business Machines Corp. | | | 596 | | | | 79,661 | |
Sabre Corp. * | | | 6,538 | | | | 56,161 | |
| | | | | | | | |
| | | | | | | 202,404 | |
| | | | | | | | |
| | | | | | | | |
| INVESTMENTS | | SHARES | | | VALUE ($) | |
| | | | | | | | |
Machinery — 2.9% | |
Dover Corp. | | | 1,245 | | | | 226,092 | |
Parker-Hannifin Corp. | | | 1,395 | | | | 443,777 | |
Stanley Black & Decker, Inc. | | | 245 | | | | 46,212 | |
Terex Corp. | | | 601 | | | | 26,414 | |
Timken Co. (The) | | | 738 | | | | 51,136 | |
| | | | | | | | |
| | | | | | | 793,631 | |
| | | | | | | | |
Media — 1.3% | |
Comcast Corp., Class A | | | 7,000 | | | | 352,310 | |
| | | | | | | | |
Metals & Mining — 2.2% | |
Alcoa Corp. | | | 3,728 | | | | 222,114 | |
Freeport-McMoRan, Inc. | | | 8,294 | | | | 346,109 | |
Rio Tinto plc, ADR (Australia) | | | 522 | | | | 34,943 | |
| | | | | | | | |
| | | | | | | 603,166 | |
| | | | | | | | |
Multiline Retail — 0.7% | |
Dollar General Corp. | | | 511 | | | | 120,509 | |
Kohl’s Corp. | | | 1,506 | | | | 74,381 | |
| | | | | | | | |
| | | | | | | 194,890 | |
| | | | | | | | |
Multi-Utilities — 1.2% | |
CenterPoint Energy, Inc. | | | 4,795 | | | | 133,829 | |
CMS Energy Corp. | | | 2,222 | | | | 144,541 | |
Public Service Enterprise Group, Inc. | | | 680 | | | | 45,376 | |
| | | | | | | | |
| | | | | | | 323,746 | |
| | | | | | | | |
Oil, Gas & Consumable Fuels — 6.9% | |
Chevron Corp. | | | 5,100 | | | | 598,485 | |
ConocoPhillips | | | 4,557 | | | �� | 328,924 | |
Diamondback Energy, Inc. | | | 2,315 | | | | 249,673 | |
EOG Resources, Inc. | | | 2,083 | | | | 185,033 | |
Hess Corp. | | | 1,683 | | | | 124,592 | |
Occidental Petroleum Corp. | | | 3,708 | | | | 107,495 | |
Pioneer Natural Resources Co. | | | 1,294 | | | | 235,353 | |
Valero Energy Corp. | | | 717 | | | | 53,854 | |
| | | | | | | | |
| | | | | | | 1,883,409 | |
| | | | | | | | |
Pharmaceuticals — 4.5% | |
Bristol-Myers Squibb Co. | | | 9,247 | | | | 576,551 | |
Eli Lilly & Co. | | | 581 | | | | 160,484 | |
Johnson & Johnson | | | 1,803 | | | | 308,439 | |
Merck & Co., Inc. | | | 596 | | | | 45,677 | |
Organon & Co. | | | 1,493 | | | | 45,462 | |
Pfizer, Inc. | | | 1,634 | | | | 96,488 | |
| | | | | | | | |
| | | | | | | 1,233,101 | |
| | | | | | | | |
Road & Rail — 1.2% | |
CSX Corp. | | | 4,087 | | | | 153,671 | |
Norfolk Southern Corp. | | | 486 | | | | 144,687 | |
Union Pacific Corp. | | | 145 | | | | 36,530 | |
| | | | | | | | |
| | | | | | | 334,888 | |
| | | | | | | | |
Semiconductors & Semiconductor Equipment — 2.5% | |
Analog Devices, Inc. | | | 1,254 | | | | 220,416 | |
Lam Research Corp. | | | 81 | | | | 58,251 | |
NXP Semiconductors NV (China) | | | 743 | | | | 169,240 | |
Texas Instruments, Inc. | | | 1,223 | | | | 230,499 | |
| | | | | | | | |
| | | | | | | 678,406 | |
| | | | | | | | |
SEE NOTES TO FINANCIAL STATEMENTS.
| | | | | | | | | | |
| | | | | |
| DECEMBER 31, 2021 | | J.P. MORGAN EXCHANGE-TRADED FUNDS | | | | | | | | 17 |
JPMorgan Active Value ETF
SCHEDULE OF PORTFOLIO INVESTMENTS
AS OF DECEMBER 31, 2021 (Unaudited) (continued)
| | | | | | | | |
| INVESTMENTS | | SHARES | | | VALUE ($) | |
Common Stocks — continued | | | | | | | | |
Software — 0.8% | |
Microsoft Corp. | | | 654 | | | | 219,953 | |
| | | | | | | | |
Specialty Retail — 2.9% | |
AutoZone, Inc. * | | | 80 | | | | 167,711 | |
Gap, Inc. (The) | | | 2,857 | | | | 50,426 | |
Home Depot, Inc. (The) | | | 456 | | | | 189,245 | |
Lowe’s Cos., Inc. | | | 627 | | | | 162,067 | |
O’Reilly Automotive, Inc. * | | | 98 | | | | 69,211 | |
TJX Cos., Inc. (The) | | | 2,107 | | | | 159,963 | |
| | | | | | | | |
| | | | | | | 798,623 | |
| | | | | | | | |
Technology Hardware, Storage & Peripherals — 1.6% | |
Apple, Inc. | | | 449 | | | | 79,729 | |
Seagate Technology Holdings plc | | | 3,222 | | | | 364,022 | |
| | | | | | | | |
| | | | | | | 443,751 | |
| | | | | | | | |
Textiles, Apparel & Luxury Goods — 1.3% | |
Kontoor Brands, Inc. | | | 966 | | | | 49,508 | |
NIKE, Inc., Class B | | | 1,023 | | | | 170,503 | |
Tapestry, Inc. | | | 3,335 | | | | 135,401 | |
| | | | | | | | |
| | | | | | | 355,412 | |
| | | | | | | | |
Tobacco — 0.6% | |
Philip Morris International, Inc. | | | 1,796 | | | | 170,620 | |
| | | | | | | | |
Wireless Telecommunication Services — 0.3% | |
T-Mobile US, Inc. * | | | 760 | | | | 88,145 | |
| | | | | | | | |
Total Common Stocks
(Cost $25,534,721) | | | | | | | 27,024,818 | |
| | | | | | | | |
| | | | | | | | |
| INVESTMENTS | | SHARES | | | VALUE ($) | |
Short-Term Investments — 1.6% | |
|
Investment Companies — 1.6% | |
JPMorgan U.S. Government Money Market Fund Class IM Shares, 0.03% (a) (b)
(Cost $429,866) | | | 429,866 | | | | 429,866 | |
| | | | | | | | |
Total Investments — 100.0%
(Cost $25,964,587) | | | | 27,454,684 | |
Other Assets Less Liabilities — 0.0% (c) | | | | 11,664 | |
| | | | | |
NET ASSETS — 100.0% | | | | 27,466,348 | |
| | | | | |
Percentages indicated are based on net assets.
Abbreviations
| | |
| ADR | | American Depositary Receipt |
| (a) | | Investment in an affiliated fund, which is registered under the Investment Company Act of 1940, as amended, and is advised by J.P. Morgan Investment Management Inc. |
| (b) | | The rate shown is the current yield as of December 31, 2021. |
| (c) | | Amount rounds to less than 0.1% of net assets. |
| * | | Non-income producing security. |
SEE NOTES TO FINANCIAL STATEMENTS.
| | | | | | | | | | |
| | | | | |
| 18 | | | | | | | | J.P. MORGAN EXCHANGE-TRADED FUNDS | | DECEMBER 31, 2021 |
JPMorgan Equity Premium Income ETF
SCHEDULE OF PORTFOLIO INVESTMENTS
AS OF DECEMBER 31, 2021 (Unaudited)
| | | | | | | | |
| INVESTMENTS | |
SHARES | | | VALUE ($) | |
Common Stocks — 82.6% | | | | | | | | |
Aerospace & Defense — 0.4% | |
Northrop Grumman Corp. | | | 59,502 | | | | 23,031,439 | |
| | | | | | | | |
Air Freight & Logistics — 1.3% | |
United Parcel Service, Inc., Class B | | | 358,119 | | | | 76,759,226 | |
| | | | | | | | |
Banks — 1.6% | |
US Bancorp | | | 1,092,686 | | | | 61,376,173 | |
Wells Fargo & Co. | | | 664,346 | | | | 31,875,321 | |
| | | | | | | | |
| | | | | | | 93,251,494 | |
| | | | | | | | |
Beverages — 3.2% | |
Coca-Cola Co. (The) | | | 1,295,541 | | | | 76,708,983 | |
Constellation Brands, Inc., Class A | | | 124,263 | | | | 31,186,285 | |
PepsiCo, Inc. | | | 443,755 | | | | 77,084,681 | |
| | | | | | | | |
| | | | | | | 184,979,949 | |
| | | | | | | | |
Biotechnology — 2.7% | |
AbbVie, Inc. | | | 622,609 | | | | 84,301,259 | |
Regeneron Pharmaceuticals, Inc. * | | | 53,544 | | | | 33,814,107 | |
Vertex Pharmaceuticals, Inc. * | | | 183,431 | | | | 40,281,447 | |
| | | | | | | | |
| | | | | | | 158,396,813 | |
| | | | | | | | |
Building Products — 1.4% | |
Trane Technologies plc | | | 403,642 | | | | 81,547,793 | |
| | | | | | | | |
Capital Markets — 2.2% | |
Intercontinental Exchange, Inc. | | | 397,800 | | | | 54,407,106 | |
S&P Global, Inc. | | | 152,905 | | | | 72,160,457 | |
| | | | | | | | |
| | | | | | | 126,567,563 | |
| | | | | | | | |
Chemicals — 2.7% | |
Air Products and Chemicals, Inc. | | | 105,719 | | | | 32,166,063 | |
Corteva, Inc. | | | 755,329 | | | | 35,711,955 | |
Linde plc (United Kingdom) | | | 117,909 | | | | 40,847,215 | |
PPG Industries, Inc. | | | 289,747 | | | | 49,963,973 | |
| | | | | | | | |
| | | | | | | 158,689,206 | |
| | | | | | | | |
Containers & Packaging — 0.6% | |
Avery Dennison Corp. | | | 174,414 | | | | 37,772,840 | |
| | | | | | | | |
Diversified Financial Services — 0.9% | |
Berkshire Hathaway, Inc., Class B* | | | 185,925 | | | | 55,591,575 | |
| | | | | | | | |
Diversified Telecommunication Services — 1.1% | |
Verizon Communications, Inc. | | | 1,241,027 | | | | 64,483,763 | |
| | | | | | | | |
Electric Utilities — 4.2% | |
Alliant Energy Corp. | | | 751,648 | | | | 46,203,802 | |
Duke Energy Corp. | | | 446,769 | | | | 46,866,068 | |
Evergy, Inc. | | | 508,429 | | | | 34,883,314 | |
FirstEnergy Corp. | | | 719,139 | | | | 29,908,991 | |
NextEra Energy, Inc. | | | 825,906 | | | | 77,106,584 | |
Xcel Energy, Inc. | | | 197,164 | | | | 13,348,003 | |
| | | | | | | | |
| | | | | | | 248,316,762 | |
| | | | | | | | |
Electrical Equipment — 1.0% | |
Eaton Corp. plc | | | 342,251 | | | | 59,147,818 | |
| | | | | | | | |
| | | | | | | | |
| INVESTMENTS | |
SHARES | | | VALUE ($) | |
| | | | | | | | |
Entertainment — 0.4% | |
Netflix, Inc. * | | | 42,507 | | | | 25,607,917 | |
| | | | | | | | |
Equity Real Estate Investment Trusts (REITs) — 3.0% | |
Camden Property Trust | | | 57,982 | | | | 10,360,224 | |
Equinix, Inc. | | | 46,103 | | | | 38,995,761 | |
Prologis, Inc. | | | 310,971 | | | | 52,355,078 | |
Public Storage | | | 114,470 | | | | 42,875,883 | |
Sun Communities, Inc. | | | 163,209 | | | | 34,268,994 | |
| | | | | | | | |
| | | | | | | 178,855,940 | |
| | | | | | | | |
Food & Staples Retailing — 1.7% | |
Costco Wholesale Corp. | | | 85,439 | | | | 48,503,720 | |
Walmart, Inc. | | | 340,188 | | | | 49,221,802 | |
| | | | | | | | |
| | | | | | | 97,725,522 | |
| | | | | | | | |
Food Products — 2.5% | |
Hershey Co. (The) | | | 376,920 | | | | 72,922,712 | |
Mondelez International, Inc., Class A | | | 1,118,929 | | | | 74,196,182 | |
| | | | | | | | |
| | | | | | | 147,118,894 | |
| | | | | | | | |
Health Care Equipment & Supplies — 1.2% | |
Abbott Laboratories | | | 174,563 | | | | 24,567,997 | |
Boston Scientific Corp. * | | | 356,060 | | | | 15,125,429 | |
Medtronic plc | | | 290,808 | | | | 30,084,087 | |
| | | | | | | | |
| | | | | | | 69,777,513 | |
| | | | | | | | |
Health Care Providers & Services — 1.9% | |
Anthem, Inc. | | | 68,267 | | | | 31,644,485 | |
UnitedHealth Group, Inc. | | | 163,401 | | | | 82,050,178 | |
| | | | | | | | |
| | | | | | | 113,694,663 | |
| | | | | | | | |
Hotels, Restaurants & Leisure — 0.8% | |
McDonald’s Corp. | | | 173,190 | | | | 46,427,043 | |
| | | | | | | | |
Household Products — 2.4% | |
Kimberly-Clark Corp. | | | 439,793 | | | | 62,855,216 | |
Procter & Gamble Co. (The) | | | 483,507 | | | | 79,092,075 | |
| | | | | | | | |
| | | | | | | 141,947,291 | |
| | | | | | | | |
Insurance — 4.0% | |
Arthur J Gallagher & Co. | | | 399,185 | | | | 67,729,719 | |
Chubb Ltd. | | | 339,578 | | | | 65,643,823 | |
Hartford Financial Services Group, Inc. (The) | | | 335,180 | | | | 23,140,828 | |
Progressive Corp. (The) | | | 777,171 | | | | 79,776,603 | |
| | | | | | | | |
| | | | | | | 236,290,973 | |
| | | | | | | | |
Interactive Media & Services — 1.5% | |
Alphabet, Inc., Class A* | | | 30,868 | | | | 89,425,831 | |
| | | | | | | | |
Internet & Direct Marketing Retail — 1.3% | |
Amazon.com, Inc. * | | | 21,990 | | | | 73,322,137 | |
| | | | | | | | |
IT Services — 6.0% | |
Accenture plc, Class A | | | 239,239 | | | | 99,176,528 | |
Automatic Data Processing, Inc. | | | 107,478 | | | | 26,501,925 | |
International Business Machines Corp. | | | 287,578 | | | | 38,437,676 | |
Jack Henry & Associates, Inc. | | | 270,122 | | | | 45,107,673 | |
SEE NOTES TO FINANCIAL STATEMENTS.
| | | | | | | | | | |
| | | | | |
| DECEMBER 31, 2021 | | J.P. MORGAN EXCHANGE-TRADED FUNDS | | | | | | | | 19 |
JPMorgan Equity Premium Income ETF
SCHEDULE OF PORTFOLIO INVESTMENTS
AS OF DECEMBER 31, 2021 (Unaudited) (continued)
| | | | | | | | |
| INVESTMENTS | |
SHARES | | | VALUE ($) | |
Common Stocks — continued | | | | | | | | |
IT Services — continued | |
Mastercard, Inc., Class A | | | 221,879 | | | | 79,725,562 | |
Visa, Inc., Class A | | | 306,809 | | | | 66,488,578 | |
| | | | | | | | |
| | | | | | | 355,437,942 | |
| | | | | | | | |
Life Sciences Tools & Services — 1.5% | |
Thermo Fisher Scientific, Inc. | | | 131,321 | | | | 87,622,624 | |
| | | | | | | | |
Machinery — 2.8% | |
Deere & Co. | | | 169,336 | | | | 58,063,621 | |
Otis Worldwide Corp. | | | 440,245 | | | | 38,332,132 | |
Stanley Black & Decker, Inc. | | | 358,181 | | | | 67,560,100 | |
| | | | | | | | |
| | | | | | | 163,955,853 | |
| | | | | | | | |
Media — 2.0% | |
Charter Communications, Inc., Class A * (a) | | | 56,159 | | | | 36,613,983 | |
Comcast Corp., Class A | | | 1,558,078 | | | | 78,418,066 | |
| | | | | | | | |
| | | | | | | 115,032,049 | |
| | | | | | | | |
Multiline Retail — 1.3% | |
Target Corp. | | | 336,942 | | | | 77,981,856 | |
| | | | | | | | |
Multi-Utilities — 3.0% | |
CenterPoint Energy, Inc. | | | 1,388,032 | | | | 38,739,973 | |
DTE Energy Co. | | | 760,976 | | | | 90,967,071 | |
WEC Energy Group, Inc. | | | 449,218 | | | | 43,605,591 | |
| | | | | | | | |
| | | | | | | 173,312,635 | |
| | | | | | | | |
Oil, Gas & Consumable Fuels — 0.7% | |
TC Energy Corp. (Canada) | | | 863,059 | | | | 40,166,766 | |
| | | | | | | | |
Personal Products — 0.1% | |
Estee Lauder Cos., Inc. (The), Class A | | | 21,594 | | | | 7,994,099 | |
| | | | | | | | |
Pharmaceuticals — 4.7% | |
Bristol-Myers Squibb Co. | | | 1,217,664 | | | | 75,921,351 | |
Eli Lilly & Co. | | | 325,977 | | | | 90,041,367 | |
Johnson & Johnson | | | 336,347 | | | | 57,538,881 | |
Merck & Co., Inc. | | | 653,188 | | | | 50,060,328 | |
| | | | | | | | |
| | | | | | | 273,561,927 | |
| | | | | | | | |
Professional Services — 0.5% | |
Booz Allen Hamilton Holding Corp. | | | 365,795 | | | | 31,015,758 | |
| | | | | | | | |
Road & Rail — 4.3% | |
Norfolk Southern Corp. | | | 273,234 | | | | 81,344,494 | |
Old Dominion Freight Line, Inc. | | | 263,502 | | | | 94,433,847 | |
Union Pacific Corp. | | | 295,649 | | | | 74,482,852 | |
| | | | | | | | |
| | | | | | | 250,261,193 | |
| | | | | | | | |
Semiconductors & Semiconductor Equipment — 1.7% | |
Analog Devices, Inc. | | | 163,618 | | | | 28,759,136 | |
Texas Instruments, Inc. | | | 381,106 | | | | 71,827,048 | |
| | | | | | | | |
| | | | | | | 100,586,184 | |
| | | | | | | | |
Software — 3.1% | |
Intuit, Inc. | | | 138,120 | | | | 88,841,546 | |
Microsoft Corp. | | | 279,177 | | | | 93,892,809 | |
| | | | | | | | |
| | | | | | | 182,734,355 | |
| | | | | | | | |
| | | | | | | | |
| INVESTMENTS | |
SHARES | | | VALUE ($) | |
| | | | | | | | |
Specialty Retail — 3.2% | |
Best Buy Co., Inc. | | | 198,698 | | | | 20,187,717 | |
Lowe’s Cos., Inc. | | | 325,769 | | | | 84,204,771 | |
O’Reilly Automotive, Inc. * | | | 114,409 | | | | 80,799,068 | |
| | | | | | | | |
| | | | | | | 185,191,556 | |
| | | | | | | | |
Technology Hardware, Storage & Peripherals — 1.0% | |
Apple, Inc. | | | 167,931 | | | | 29,819,508 | |
Seagate Technology Holdings plc | | | 247,439 | | | | 27,955,658 | |
| | | | | | | | |
| | | | | | | 57,775,166 | |
| | | | | | | | |
Textiles, Apparel & Luxury Goods — 1.0% | |
NIKE, Inc., Class B | | | 352,990 | | | | 58,832,843 | |
| | | | | | | | |
Tobacco — 0.8% | |
Altria Group, Inc. | | | 474,895 | | | | 22,505,274 | |
Philip Morris International, Inc. | | | 281,666 | | | | 26,758,270 | |
| | | | | | | | |
| | | | | | | 49,263,544 | |
| | | | | | | | |
Wireless Telecommunication Services — 0.9% | |
T-Mobile US, Inc. * | | | 465,110 | | | | 53,943,458 | |
| | | | | | | | |
Total Common Stocks
(Cost $4,431,912,856) | | | | | | | 4,853,399,773 | |
| | | | | |
| | |
| | | PRINCIPAL
AMOUNT($) | | | | |
Equity-Linked Notes — 16.0% | |
Bank of Montreal, ELN, 47.00%, 1/18/2022, (linked to S&P 500 Index) (Canada) (b) | | | 21,271 | | | | 101,001,641 | |
Barclays Bank plc, ELN, 48.30%, 1/14/2022, (linked to S&P 500 Index) (United Kingdom) (c) | | | 22,404 | | | | 105,556,623 | |
BNP Paribas, ELN, 48.00%, 1/21/2022, (linked to S&P 500 Index) (b) | | | 16,832 | | | | 76,406,225 | |
Credit Suisse AG, ELN, 42.00%, 2/4/2022, (linked to S&P 500 Index) (Switzerland) (b) | | | 20,892 | | | | 100,953,567 | |
GS Finance Corp., ELN, 50.02%, 1/31/2022, (linked to S&P 500 Index) (b) | | | 19,163 | | | | 89,911,088 | |
GS Finance Corp., ELN, 60.43%, 1/28/2022, (linked to S&P 500 Index) (b) | | | 18,927 | | | | 86,467,628 | |
Royal Bank of Canada, ELN, 40.85%, 1/24/2022, (linked to S&P 500 Index) (Canada) (b) | | | 16,986 | | | | 80,525,127 | |
Royal Bank of Canada, ELN, 55.31%, 1/7/2022, (linked to S&P 500 Index) (Canada) (b) | | | 20,802 | | | | 90,873,727 | |
SEE NOTES TO FINANCIAL STATEMENTS.
| | | | | | | | | | |
| | | | | |
| 20 | | | | | | | | J.P. MORGAN EXCHANGE-TRADED FUNDS | | DECEMBER 31, 2021 |
| | | | | | | | |
| INVESTMENTS | | PRINCIPAL
AMOUNT($) | | | VALUE ($) | |
| | |
Equity-Linked Notes — continued | | | | | | | | |
UBS AG, ELN, 40.24%, 2/7/2022, (linked to S&P 500 Index) (Switzerland) (b) | | | 25,036 | | | | 120,714,654 | |
UBS AG, ELN, 62.75%, 1/10/2022, (linked to S&P 500 Index) (Switzerland) (b) | | | 21,493 | | | | 87,714,868 | |
| | | | | | | | |
Total Equity-Linked Notes
(Cost $952,997,032) | | | | | | | 940,125,148 | |
| | | | | | | | |
| | |
| | | SHARES | | | | |
Short-Term Investments — 0.1% | |
|
Investment of Cash Collateral from Securities Loaned — 0.1% | |
JPMorgan U.S. Government Money Market Fund Class IM Shares, 0.03% (d) (e)
(Cost $7,798,093) | | | 7,798,093 | | | | 7,798,093 | |
| | | | | | | | |
Total Investments — 98.7%
(Cost $5,392,707,981) | | | | 5,801,323,014 | |
Other Assets Less Liabilities — 1.3% | | | | 78,591,563 | |
| | | | | |
NET ASSETS — 100.0% | | | | 5,879,914,577 | |
| | | | | |
Percentages indicated are based on net assets.
Abbreviations
| | |
| ELN | | Equity-Linked Note |
| |
| (a) | | The security or a portion of this security is on loan at December 31, 2021. The total value of securities on loan at December 31, 2021 is $7,583,715. |
| (b) | | Securities exempt from registration under Rule 144A or section 4(a)(2), of the Securities Act of 1933, as amended. |
| (c) | | Security exempt from registration pursuant to Regulation S under the Securities Act of 1933, as amended. Regulation S applies to securities offerings that are made outside of the United States and do not involve direct selling efforts in the United States and as such may have restrictions on resale. |
| (d) | | Investment in an affiliated fund, which is registered under the Investment Company Act of 1940, as amended, and is advised by J.P. Morgan Investment Management Inc. |
| (e) | | The rate shown is the current yield as of December 31, 2021. |
| * | | Non-income producing security. |
| | | | | | | | | | | | | | | | | | |
Futures contracts outstanding as of December 31, 2021: | |
| DESCRIPTION | | NUMBER OF
CONTRACTS | | EXPIRATION
DATE | | | TRADING
CURRENCY | | | NOTIONAL
AMOUNT ($) | | | VALUE AND
UNREALIZED
APPRECIATION
(DEPRECIATION) ($) | |
|
Long Contracts | |
| | | | | |
| S&P 500 E-Mini Index | | 115 | | | 03/2022 | | | | USD | | | | 27,359,938 | | | | 197,554 | |
| | | | | | | | | | | | | | | | | | |
Abbreviations
SEE NOTES TO FINANCIAL STATEMENTS.
| | | | | | | | | | |
| | | | | |
| DECEMBER 31, 2021 | | J.P. MORGAN EXCHANGE-TRADED FUNDS | | | | | | | | 21 |
STATEMENTS OF ASSETS AND LIABILITIES
AS OF DECEMBER 31, 2021 (Unaudited)
| | | | | | | | | | | | |
| | |
JPMorgan
ActiveBuilders
U. S. Large Cap
Equity ETF | | | JPMorgan
Active Value
ETF | | | JPMorgan
Equity Premium
Income ETF | |
ASSETS: | |
Investments in non-affiliates, at value | | $ | 29,291,860 | | | $ | 27,024,818 | | | $ | 5,793,524,921 | |
Investments in affiliates, at value | | | 64,327 | | | | 429,866 | | | | — | |
Investments of cash collateral received from securities loaned, at value (See Note 2.C.) | | | — | | | | — | | | | 7,798,093 | |
Cash | | | 4 | | | | 11 | | | | 74,405,892 | |
Deposits at broker for futures contracts | | | 19,000 | | | | — | | | | 1,332,500 | |
Receivables: | | | | | | | | | | | | |
Investment securities sold | | | — | | | | — | | | | 140,928,830 | |
Fund shares sold | | | — | | | | — | | | | 39,410,450 | |
Interest from non-affiliates | | | — | | | | — | | | | 20,969,846 | |
Dividends from non-affiliates | | | 16,840 | | | | 21,669 | | | | 5,929,547 | |
Securities lending income (See Note 2.C.) | | | — | | | | — | | | | 164 | |
Other assets | | | — | | | | — | | | | 82,519 | |
| | | | | | | | | | | | |
Total Assets | | | 29,392,031 | | | | 27,476,364 | | | | 6,084,382,762 | |
| | | | | | | | | | | | |
|
LIABILITIES: | |
Payables: | | | | | | | | | | | | |
Distributions | | | — | | | | — | | | | 42,306,773 | |
Investment securities purchased | | | — | | | | — | | | | 152,734,530 | |
Collateral received on securities loaned (See Note 2.C.) | | | — | | | | — | | | | 7,798,093 | |
Variation margin on futures contracts | | | 125 | | | | ��� | | | | 80,472 | |
Accrued liabilities: | | | | | | | | | | | | |
Management fees (See Note 3.A.) | | | 4,174 | | | | 10,016 | | | | 1,548,317 | |
Other | | | 185 | | | | — | | | | — | |
| | | | | | | | | | | | |
Total Liabilities | | | 4,484 | | | | 10,016 | | | | 204,468,185 | |
| | | | | | | | | | | | |
Net Assets | | $ | 29,387,547 | | | $ | 27,466,348 | | | $ | 5,879,914,577 | |
| | | | | | | | | | | | |
|
NET ASSETS: | |
Paid-in-Capital | | $ | 26,962,153 | | | $ | 25,998,786 | | | $ | 5,610,383,749 | |
Total distributable earnings (loss) | | | 2,425,394 | | | | 1,467,562 | | | | 269,530,828 | |
| | | | | | | | | | | | |
Total Net Assets | | $ | 29,387,547 | | | $ | 27,466,348 | | | $ | 5,879,914,577 | |
| | | | | | | | | | | | |
| | | |
Outstanding number of shares
(unlimited number of shares authorized — par value $0.0001) | | | 550,000 | | | | 525,000 | | | | 93,100,000 | |
| | | | | | | | | | | | |
Net asset value, per share | | $ | 53.43 | | | $ | 52.32 | | | $ | 63.16 | |
| | | | | | | | | | | | |
| | | |
Cost of investments in non-affiliates | | $ | 26,802,793 | | | $ | 25,534,721 | | | $ | 5,384,909,888 | |
Cost of investments in affiliates | | | 64,327 | | | | 429,866 | | | | — | |
Investment securities on loan, at value (See Note 2.C.) | | | — | | | | — | | | | 7,583,715 | |
Cost of investment of cash collateral (See Note 2.C.) | | | — | | | | — | | | | 7,798,093 | |
SEE NOTES TO FINANCIAL STATEMENTS.
| | | | | | | | | | |
| | | | | |
| 22 | | | | | | | | J.P. MORGAN EXCHANGE-TRADED FUNDS | | DECEMBER 31, 2021 |
STATEMENTS OF OPERATIONS
FOR THE SIX MONTHS ENDED DECEMBER 31, 2021 (Unaudited)
| | | | | | | | | | | | |
| | |
JPMorgan
ActiveBuilders
U. S. Large Cap
Equity ETF | | | JPMorgan
Active Value
ETF | | | JPMorgan
Equity Premium
Income ETF | |
INVESTMENT INCOME: | |
Interest income from non-affiliates | | $ | — | | | $ | — | | | $ | 130,489,792 | |
Dividend income from non-affiliates | | | 178,874 | | | | 120,129 | | | | 28,246,278 | |
Dividend income from affiliates | | | 36 | | | | 28 | | | | 6,811 | |
Income from securities lending (net) (See Note 2.C.) | | | — | | | | — | | | | 164 | |
| | | | | | | | | | | | |
Total investment income | | | 178,910 | | | | 120,157 | | | | 158,743,045 | |
| | | | | | | | | | | | |
|
EXPENSES: | |
Management fees (See Note 3.A.) | | | 22,907 | | | | 28,435 | | | | 6,752,105 | |
Interest expense to non-affiliates | | | — | | | | — | | | | 625 | |
Other | | | 226 | | | | — | | | | 25,044 | |
| | | | | | | | | | | | |
Total expenses | | | 23,133 | | | | 28,435 | | | | 6,777,774 | |
| | | | | | | | | | | | |
Net investment income (loss) | | | 155,777 | | | | 91,722 | | | | 151,965,271 | |
| | | | | | | | | | | | |
| | | |
REALIZED/UNREALIZED GAINS (LOSSES): | | | | | | | | | | | | |
Net realized gain (loss) on transactions from: | |
Investments in non-affiliates | | | (76,769 | ) | | | 17,645 | | | | (141,182,468 | ) |
In-kind redemptions of investments in non-affiliates (See Note 4) | | | — | | | | — | | | | 18,481,417 | |
Futures contracts | | | 11,598 | | | | — | | | | (4,861,969 | ) |
| | | | | | | | | | | | |
Net realized gain (loss) | | | (65,171 | ) | | | 17,645 | | | | (127,563,020 | ) |
| | | | | | | | | | | | |
Change in net unrealized appreciation/depreciation on: | | | | | | | | | | | | |
Investments in non-affiliates | | | 2,489,067 | | | | 1,490,097 | | | | 317,902,084 | |
Futures contracts | | | 579 | | | | — | | | | 218,563 | |
| | | | | | | | | | | | |
Change in net unrealized appreciation/depreciation | | | 2,489,646 | | | | 1,490,097 | | | | 318,120,647 | |
| | | | | | | | | | | | |
Net realized/unrealized gains (losses) | | | 2,424,475 | | | | 1,507,742 | | | | 190,557,627 | |
| | | | | | | | | | | | |
Change in net assets resulting from operations | | $ | 2,580,252 | | | $ | 1,599,464 | | | $ | 342,522,898 | |
| | | | | | | | | | | | |
SEE NOTES TO FINANCIAL STATEMENTS.
| | | | | | | | | | |
| | | | | |
| DECEMBER 31, 2021 | | J.P. MORGAN EXCHANGE-TRADED FUNDS | | | | | | | | 23 |
STATEMENTS OF CHANGES IN NET ASSETS
FOR THE PERIODS INDICATED (Unaudited)
| | | | | | | | |
| | | JPMorgan ActiveBuilders
U. S. Large Cap
Equity ETF | | | JPMorgan Active
Value ETF | |
| | | Period Ended
December 31, 2021
(Unaudited) (a) | | | Period Ended
December 31, 2021
(Unaudited) (b) | |
CHANGE IN NET ASSETS RESULTING FROM OPERATIONS: | |
Net investment income (loss) | | $ | 155,777 | | | $ | 91,722 | |
Net realized gain (loss) | | | (65,171 | ) | | | 17,645 | |
Change in net unrealized appreciation/depreciation | | | 2,489,646 | | | | 1,490,097 | |
| | | | | | | | |
Change in net assets resulting from operations | | | 2,580,252 | | | | 1,599,464 | |
| | | | | | | | |
|
DISTRIBUTIONS TO SHAREHOLDERS: | |
Total distributions to shareholders | | | (154,858 | ) | | | (131,902 | ) |
| | | | | | | | |
|
CAPITAL TRANSACTIONS: | |
Change in net assets resulting from capital transactions | | | 26,962,153 | | | | 25,998,786 | |
| | | | | | | | |
|
NET ASSETS: | |
Change in net assets | | | 29,387,547 | | | | 27,466,348 | |
Beginning of period | | | — | | | | — | |
| | | | | | | | |
End of period | | $ | 29,387,547 | | | $ | 27,466,348 | |
| | | | | | | | |
| | |
CAPITAL TRANSACTIONS: | | | | | | | | |
Proceeds from shares issued | | $ | 26,962,153 | | | $ | 25,998,786 | |
Cost of shares redeemed | | | — | | | | — | |
| | | | | | | | |
Total change in net assets resulting from capital transactions | | $ | 26,962,153 | | | $ | 25,998,786 | |
| | | | | | | | |
|
SHARE TRANSACTIONS: | |
Issued | | | 550,000 | | | | 525,000 | |
Redeemed | | | — | | | | — | |
| | | | | | | | |
Net increase in shares from share transactions | | | 550,000 | | | | 525,000 | |
| | | | | | | | |
| (a) | Commencement of operations was July 7, 2021. |
| (b) | Commencement of operations was October 4, 2021. |
SEE NOTES TO FINANCIAL STATEMENTS.
| | | | | | | | | | |
| | | | | |
| 24 | | | | | | | | J.P. MORGAN EXCHANGE-TRADED FUNDS | | DECEMBER 31, 2021 |
| | | | | | | | |
| | |
JPMorgan Equity Premium Income ETF | |
| | | Six Months Ended
December 31, 2021
(Unaudited) | | | Year Ended
June 30, 2021 | |
CHANGE IN NET ASSETS RESULTING FROM OPERATIONS: | |
Net investment income (loss) | | $ | 151,965,271 | | | $ | 43,088,958 | |
Net realized gain (loss) | | | (127,563,020 | ) | | | (10,834,458 | ) |
Change in net unrealized appreciation/depreciation | | | 318,120,647 | | | | 90,353,453 | |
| | | | | | | | |
Change in net assets resulting from operations | | | 342,522,898 | | | | 122,607,953 | |
| | | | | | | | |
|
DISTRIBUTIONS TO SHAREHOLDERS: | |
Total distributions to shareholders | | | (164,864,757 | ) | | | (30,358,853 | ) |
| | | | | | | | |
|
CAPITAL TRANSACTIONS: | |
Change in net assets resulting from capital transactions | | | 3,785,837,349 | | | | 1,796,253,401 | |
| | | | | | | | |
|
NET ASSETS: | |
Change in net assets | | | 3,963,495,490 | | | | 1,888,502,501 | |
Beginning of period | | | 1,916,419,087 | | | | 27,916,586 | |
| | | | | | | | |
End of period | | $ | 5,879,914,577 | | | $ | 1,916,419,087 | |
| | | | | | | | |
| | |
CAPITAL TRANSACTIONS: | | | | | | | | |
Proceeds from shares issued | | $ | 3,879,663,133 | | | $ | 1,800,470,830 | |
Cost of shares redeemed | | | (93,825,784 | ) | | | (4,217,429 | ) |
| | | | | | | | |
Total change in net assets resulting from capital transactions | | $ | 3,785,837,349 | | | $ | 1,796,253,401 | |
| | | | | | | | |
|
SHARE TRANSACTIONS: | |
Issued | | | 62,950,000 | | | | 31,200,000 | |
Redeemed | | | (1,525,000 | ) | | | (75,000 | ) |
| | | | | | | | |
Net increase in shares from share transactions | | | 61,425,000 | | | | 31,125,000 | |
| | | | | | | | |
SEE NOTES TO FINANCIAL STATEMENTS.
| | | | | | | | | | |
| | | | | |
| DECEMBER 31, 2021 | | J.P. MORGAN EXCHANGE-TRADED FUNDS | | | | | | | | 25 |
FINANCIAL HIGHLIGHTS
FOR THE PERIODS INDICATED
| | | | | | | | | | | | | | | | | | | | | | | | | | | | |
| | | Per share operating performance | |
| | | | | | Investment operations | | | Distributions | |
| | | Net asset
value,
beginning
of period | | | Net
investment
income
(loss) (b) | | | Net realized
and unrealized
gains
(losses) on
investments | | | Total from
investment
operations | | | Net
investment
income | | | Net
realized
gain | | | Total
distributions | |
| | | | | | | |
JPMorgan ActiveBuilders U. S. Large Cap Equity ETF | | | | | | | | | | | | | | | | | | | | | | | | | | | | |
July 7, 2021 (f) through December 31, 2021 (Unaudited) | | $ | 49.00 | | | $ | 0.29 | | | $ | 4.42 | | | $ | 4.71 | | | $ | (0.28 | ) | | $ | — | | | $ | (0.28 | ) |
| | | | | | | |
JPMorgan Active Value ETF | | | | | | | | | | | | | | | | | | | | | | | | | | | | |
October 4, 2021 (f) through December 31, 2021 (Unaudited) | | | 49.50 | | | | 0.18 | | | | 2.89 | | | | 3.07 | | | | (0.18 | ) | | | (0.07 | ) | | | (0.25 | ) |
| | | | | | | |
JPMorgan Equity Premium Income ETF | | | | | | | | | | | | | | | | | | | | | | | | | | | | |
Six Months Ended December 31, 2021 (Unaudited) | | | 60.50 | | | | 2.43 | | | | 2.77 | | | | 5.20 | | | | (2.54 | ) | | | — | | | | (2.54 | ) |
Year Ended June 30, 2021 | | | 50.76 | | | | 5.17 | | | | 9.42 | | | | 14.59 | | | | (4.85 | ) | | | — | | | | (4.85 | ) |
May 20, 2020 (f) through June 30, 2020 | | | 50.00 | | | | 0.63 | | | | 0.13 | (h) | | | 0.76 | | | | — | | | | — | | | | — | |
| (a) | Annualized for periods less than one year, unless otherwise indicated. |
| (b) | Calculated based upon average shares outstanding. |
| (c) | Not annualized for periods less than one year. |
| (d) | Includes adjustments in accordance with accounting principles generally accepted in the United States of America and as such, the net asset values for financial reporting purposes and the returns based upon those net asset values may differ from the net asset values and returns for shareholder transactions. |
| (e) | Market price return was calculated assuming an initial investment made at the market price at the beginning of the reporting period, reinvestment of all dividends and distributions at market price during the period, and sale at the market price on the last day of the period. The closing price was used to calculate the market price return. |
| (f) | Commencement of operations. |
| (g) | Since the Shares of the Fund did not trade in the secondary market until the day after the Fund’s inception, for the period from the inception to the first day of secondary market trading, the NAV is used as a proxy for the secondary market trading price to calculate the market returns. |
| (h) | Calculation of the net realized and unrealized gains (losses) per share do not correlate with the Fund’s net realized and unrealized gains (losses) presented in the Statement of Operations due to the timing of capital transactions in relation to the fluctuating market values of the Fund’s investments. |
SEE NOTES TO FINANCIAL STATEMENTS.
| | | | | | | | | | |
| | | | | |
| 26 | | | | | | | | J.P. MORGAN EXCHANGE-TRADED FUNDS | | DECEMBER 31, 2021 |
| | | | | | | | | | | | | | | | | | | | | | | | | | | | | | |
| | | | | | Ratios/Supplemental data | |
| | | | | | | | | | | | | | | | Ratios to average net assets (a) | | | | |
Net asset
value,
end of
period | | |
Market
price,
end of
period | | | Total
return (c)(d) | | | Market
price total
return (c)(e) | | | Net assets,
end of period | | | Net
expenses | | | Net
investment
income
(loss) | | | Portfolio
turnover
rate (c) | |
| | | | | | | |
| | | | | | | | | | | | | | | | | | | | | | | | | | | | | | |
| $ | 53.43 | | | $ | 53.47 | | | | 9.63 | % | | | 9.71 | %(g) | | $ | 29,387,547 | | | | 0.17 | % | | | 1.15 | % | | | 16 | % |
| | | | | | | |
| | | | | | | | | | | | | | | | | | | | | | | | | | | | | | |
| | 52.32 | | | | 52.35 | | | | 6.22 | | | | 6.28 | (g) | | | 27,466,348 | | | | 0.44 | | | | 1.40 | | | | 16 | |
| | | | | | | |
| | | | | | | | | | | | | | | | | | | | | | | | | | | | | | |
| | 63.16 | | | | 63.19 | | | | 8.82 | | | | 8.74 | | | | 5,879,914,577 | | | | 0.35 | | | | 7.82 | | | | 101 | |
| | 60.50 | | | | 60.57 | | | | 30.22 | | | | 29.90 | | | | 1,916,419,087 | | | | 0.35 | | | | 8.89 | | | | 195 | |
| | 50.76 | | | | 50.94 | | | | 1.52 | | | | 1.88 | (g) | | | 27,916,586 | | | | 0.35 | | | | 11.11 | | | | 13 | |
SEE NOTES TO FINANCIAL STATEMENTS.
| | | | | | | | | | |
| | | | | |
| DECEMBER 31, 2021 | | J.P. MORGAN EXCHANGE-TRADED FUNDS | | | | | | | | 27 |
NOTES TO FINANCIAL STATEMENTS
AS OF DECEMBER 31, 2021 (Unaudited)
1. Organization
J.P. Morgan Exchange-Traded Fund Trust (the “Trust”) was formed on February 25, 2010, and is governed by a Declaration of Trust as amended and restated February 19, 2014, and is registered under the Investment Company Act of 1940, as amended (the “1940 Act”), as an open-end management investment company.
The following are 3 separate funds of the Trust (each, a “Fund” and collectively, the “Funds”) covered by this report:
| | |
| | | Diversification Classification |
JPMorgan ActiveBuilders U.S. Large Cap Equity ETF(1) | | Diversified |
JPMorgan Active Value ETF(2) | | Diversified |
JPMorgan Equity Premium Income ETF | | Diversified |
| (1) | Commenced operations on July 7, 2021. |
| (2) | Commenced operations on October 4, 2021. |
The investment objective of JPMorgan ActiveBuilders U.S. Large Cap Equity ETF (“ActiveBuilders U.S. Large Cap Equity ETF”) and JPMorgan Active Value ETF (“Active Value ETF”) is to seek to provide long-term capital appreciation.
The investment objective of JPMorgan Equity Premium Income ETF (“Equity Premium Income ETF”) is to seek current income while maintaining prospects for capital appreciation.
J.P. Morgan Investment Management Inc. (“JPMIM”), an indirect, wholly-owned subsidiary of JPMorgan Chase & Co. (“JPMorgan”), acts as Adviser (the “Adviser”) and Administrator (the “Administrator”) to the Funds.
Shares of each Fund are listed and traded at market price on the NYSE Arca, Inc.
Market prices for the Funds’ shares may be different from their net asset value (“NAV”).
The Funds issue and redeem their shares on a continuous basis, through JPMorgan Distribution Services, Inc. (the “Distributor” or “JPMDS”), an indirect, wholly-owned subsidiary of JPMorgan, at NAV in large blocks of shares, referred to as “Creation Units” as shown in the table below:
| | | | |
| | | Shares per Creation Unit | |
ActiveBuilders U.S. Large Cap Equity ETF | | | 50,000 | |
Active Value ETF | | | 25,000 | |
Equity Premium Income ETF | | | 25,000 | |
Creation Units are issued and redeemed principally in-kind for a basket of securities. A cash amount may be substituted if a Fund has sizeable exposure to market or sponsor restricted securities. Shares are generally traded in the secondary market in amounts less than a Creation Unit at market prices that change throughout the day. Only individuals or institutions that have entered into an authorized participant agreement with the Distributor may do business directly with the Funds (each, an “Authorized Participant”).
2. Significant Accounting Policies
The following is a summary of significant accounting policies followed by the Funds in the preparation of its financial statements. The Funds are investment company and, accordingly, follows the investment company accounting and reporting guidance of the Financial Accounting Standards Board (“FASB”) Accounting Standards Codification Topic 946 — Investment Companies, which is part of U.S. generally accepted accounting principles (“GAAP”). The preparation of financial statements in conformity with GAAP requires management to make estimates and assumptions that affect (i) the reported amounts of assets and liabilities, (ii) disclosure of contingent assets and liabilities at the date of the financial statements, and (iii) the reported amounts of increases and decreases in net assets from operations during the reporting period. Actual results could differ from those estimates.
A. Valuation of Investments — Investments are valued in accordance with GAAP and the Funds’ valuation policies set forth by, and under the supervision and responsibility of, the Board of Trustees of the Trust (the “Board”), which established the following approach to valuation, as described more fully below: (i) investments for which market quotations are readily available shall be valued at their market value and (ii) all other investments for which market quotations are not readily available shall be valued at their fair value as determined in good faith by the Board.
The Administrator has established the J.P. Morgan Asset Management Americas Valuation Committee (“AVC”) to assist the Board with the oversight and monitoring of the valuation of the Funds’ investments. The Administrator implements the valuation policies of the Funds’ investments, as directed by the Board. The AVC oversees and carries out the policies for the valuation of investments held in the Funds. This includes monitoring the appropriateness of fair values based on results of ongoing valuation oversight including, but not limited to, consideration of macro or security specific events, market events, and pricing vendor and broker due diligence. The Administrator is responsible for discussing and assessing the potential impacts to the fair values on an ongoing basis, and, at least on a quarterly basis, with the AVC and the Board.
Fixed income instruments are valued based on prices received from approved affiliated and unaffiliated pricing vendors or third party broker-dealers (collectively referred to as “Pricing Services”). The Pricing Services use multiple valuation techniques to determine the valuation of fixed
| | | | | | | | | | |
| | | | | |
| 28 | | | | | | | | J.P. MORGAN EXCHANGE-TRADED FUNDS | | DECEMBER 31, 2021 |
income instruments. In instances where sufficient market activity exists, the Pricing Services may utilize a market-based approach through which trades or quotes from market makers are used to determine the valuation of these instruments. In instances where sufficient market activity may not exist, the Pricing Services also utilize proprietary valuation models which may consider market transactions in comparable securities and the various relationships between securities in determining fair value and/or market characteristics in order to estimate the relevant cash flows, which are then discounted to calculate the fair values.
Equities and other exchange-traded instruments are valued at the last sale price or official market closing price on the primary exchange on which the instrument is traded before the NAV of the Funds are calculated on a valuation date.
Investments in open-end investment companies (“Underlying Funds”) are valued at each Underlying Fund’s NAV per share as of the report date.
Futures contracts are generally valued on the basis of available market quotations.
Valuations reflected in this report are as of the report date. As a result, changes in valuation due to market events and/or issuer-related events after the report date and prior to issuance of the report are not reflected herein.
The various inputs that are used in determining the valuation of the Funds’ investments are summarized into the three broad levels listed below.
| • | | Level 1 — Unadjusted inputs using quoted prices in active markets for identical investments. |
| • | | Level 2 — Other significant observable inputs including, but not limited to, quoted prices for similar investments, inputs other than quoted prices that are observable for investments (such as interest rates, prepayment speeds, credit risk, etc.) or other market corroborated inputs. |
| • | | Level 3 — Significant inputs based on the best information available in the circumstances, to the extent observable inputs are not available (including the Funds’ assumptions in determining the fair value of investments). |
A financial instrument’s level within the fair value hierarchy is based on the lowest level of any input, both individually and in the aggregate, that is significant to the fair value measurement. The inputs or methodology used for valuing instruments are not necessarily an indication of the risk associated with investing in those instruments.
The following table represents each valuation input as presented on the Schedule of Portfolio Investments (“SOI”):
ActiveBuilders U. S. Large Cap Equity ETF
| | | | | | | | | | | | | | | | |
| | | Level 1
Quoted prices | | | Level 2
Other significant
observable inputs | | | Level 3
Significant
unobservable inputs | | | Total | |
Total Investments in Securities (a) | | $ | 29,356,187 | | | $ | — | | | $ | — | | | $ | 29,356,187 | |
| | | | | | | | | | | | | | | | |
Appreciation in Other Financial Instruments | | | | | | | | | | | | | | | | |
Futures Contracts (a) | | $ | 579 | | | $ | — | | | $ | — | | | $ | 579 | |
| | | | | | | | | | | | | | | | |
| (a) | Please refer to the SOI’s for specifics of portfolio holdings. |
Active Value ETF
| | | | | | | | | | | | | | | | |
| | | Level 1
Quoted prices | | | Level 2
Other significant
observable inputs | | | Level 3
Significant
unobservable inputs | | | Total | |
Total Investments in Securities (a) | | $ | 27,454,684 | | | $ | — | | | $ | — | | | $ | 27,454,684 | |
| | | | | | | | | | | | | | | | |
| (a) | Please refer to the SOI’s for specifics of portfolio holdings. |
Equity Premium Income ETF
| | | | | | | | | | | | | | | | |
| | | Level 1
Quoted prices | | | Level 2
Other significant
observable inputs | | | Level 3
Significant
unobservable inputs | | | Total | |
Investments in Securities | | | | | | | | | | | | | | | | |
Common Stocks | | $ | 4,853,399,773 | | | $ | — | | | $ | — | | | $ | 4,853,399,773 | |
Equity-Linked Notes | | | — | | | | 940,125,148 | | | | — | | | | 940,125,148 | |
Short-Term Investments | | | | | | | | | |
Investment of Cash Collateral from Securities Loaned | | | 7,798,093 | | | | — | | | | — | | | | 7,798,093 | |
| | | | | | | | | | | | | | | | |
Total Investments in Securities | | $ | 4,861,197,866 | | | $ | 940,125,148 | | | $ | — | | | $ | 5,801,323,014 | |
| | | | | | | | | | | | | | | | |
Appreciation in Other Financial Instruments | | | | | | | | | | | | | | | | |
Futures Contracts | | $ | 197,554 | | | $ | — | | | $ | — | | | $ | 197,554 | |
| | | | | | | | | | | | | | | | |
| | | | | | | | | | |
| | | | | |
| DECEMBER 31, 2021 | | J.P. MORGAN EXCHANGE-TRADED FUNDS | | | | | | | | 29 |
NOTES TO FINANCIAL STATEMENTS
AS OF DECEMBER 31, 2021 (Unaudited) (continued)
B. Restricted Securities — Certain securities held by the Funds may be subject to legal or contractual restrictions on resale. Restricted securities generally are resold in transactions exempt from registration under the Securities Act of 1933, as amended (the “Securities Act”). Disposal of these securities may involve time-consuming negotiations and expense. Prompt sale at the current valuation may be difficult and could adversely affect the NAV of the Funds.
As of December 31, 2021, the Funds had no investments in restricted securities other than securities sold to the Funds under Rule 144A and/or Regulation S under the Securities Act.
C. Securities Lending — The Funds are authorized to engage in securities lending in order to generate additional income. The Funds are able to lend to approved borrowers. Citibank N.A. (“Citibank”) serves as lending agent for the Funds, pursuant to a Securities Lending Agency Agreement (the “Securities Lending Agency Agreement”). Securities loaned are collateralized by cash equal to at least 100% of the market value plus accrued interest on the securities lent, which is invested in the Class IM Shares of the JPMorgan U.S. Government Money Market Fund. The Funds retain the interest earned on cash collateral investments but are required to pay the borrower a rebate for the use of the cash collateral. In cases where the lent security is of high value to borrowers, there may be a negative rebate (i.e., a net payment from the borrower to the Funds). Upon termination of a loan, the Funds are required to return to the borrower an amount equal to the cash collateral, plus any rebate owed to the borrowers. The remaining maturities of the securities lending transactions are considered overnight and continuous. Loans are subject to termination by the Funds or the borrower at any time.
The net income earned on the securities lending (after payment of rebates and Citibank’s fee) is included on the Statement of Operations as Income from securities lending (net). The Funds also receives payments from the borrower during the period of the loan, equivalent to dividends and interest earned on the securities loaned, which are recorded as Dividend or Interest income, respectively, on the Statement of Operations.
Under the Securities Lending Agency Agreement, Citibank marks to market the loaned securities on a daily basis. In the event the cash received from the borrower is less than 102% of the value of the loaned securities (105% for loans of non-U.S. securities), Citibank requests additional cash from the borrower so as to maintain a collateralization level of at least 102% of the value of the loaned securities plus accrued interest (105% for loans of non-U.S. securities), subject to certain de minimis amounts.
The value of securities out on loan is recorded as an asset on the Statements of Assets and Liabilities. The value of the cash collateral received is recorded as a liability on the Statements of Assets and Liabilities and details of collateral investments are disclosed on the SOI.
The Funds bear the risk of loss associated with the collateral investments and is not entitled to additional collateral from the borrower to cover any such losses. To the extent that the value of the collateral investments declines below the amount owed to a borrower, the Fund may incur losses that exceed the amount it earned on lending the security. Upon termination of a loan, the Funds may use leverage (borrow money) to repay the borrower for cash collateral posted if the Adviser does not believe that it is prudent to sell the collateral investments to fund the payment of this liability. Securities lending activity is subject to master netting arrangements.
The following table presents for each lending Fund, the value of the securities on loan with Citibank, net of amounts available for offset under the master netting arrangements and any related collateral received or posted by the Funds as of December 31, 2021.
| | | | | | | | | | | | |
| | | Investment Securities
on Loan, at value,
Presented on the
Statement of Assets
and Liabilities | | | Cash Collateral
Posted by Borrower* | | | Net Amount Due
to Counterparty
(not less than zero) | |
Equity Premium Income ETF | | $ | 7,583,715 | | | $ | (7,583,715 | ) | | $ | — | |
| * | Collateral posted reflects the value of securities on loan and does not include any additional amounts received from the borrower. |
Securities lending also involves counterparty risks, including the risk that the loaned securities may not be returned in a timely manner or at all. Subject to certain conditions, Citibank has agreed to indemnify the Funds from losses resulting from a borrower’s failure to return a loaned security.
JPMIM voluntarily waived management fees charged to the Funds to reduce the impact of the cash collateral investment in the JPMorgan U.S. Government Money Market Fund from 0.12% to 0.06%.
Active Value ETF did not lend out any securities during the six months ended December 31, 2021. ActiveBuilders U.S. Large Cap Equity ETF did not have any securities out on loan at December 31, 2021.
D. Investment Transactions with Affiliates — The Funds invested in an Underlying Fund, which is advised by the Adviser. An issuer which is under common control with the Funds may be considered an affiliate. For the purposes of the financial statements, the Funds assume the issuer listed in the tables below to be an affiliated issuer. The Underlying Fund’s distributions may be reinvested into such Underlying Fund. Reinvestment amounts are included in the purchases at cost amounts in the tables below.
| | | | | | | | | | |
| | | | | |
| 30 | | | | | | | | J.P. MORGAN EXCHANGE-TRADED FUNDS | | DECEMBER 31, 2021 |
ActiveBuilders U. S. Large Cap Equity ETF
| | | | | | | | | | | | | | | | | | | | | | | | | | | | | | | | | | | | |
| For the period ended December 31, 2021 | |
| Security Description | | Value at
July 7,
2021 (a) | | | Purchases
at Cost | | | Proceeds
from Sales | | | Net Realized
Gain (Loss) | | | Change in
Unrealized
Appreciation/
(Depreciation) | | | Value at
December 31,
2021 | | | Shares at
December 31,
2021 | | | Dividend
Income | | | Capital Gain
Distributions | |
JPMorgan U.S. Government Money Market Fund Class IM Shares, 0.03% (b) (c) | | $ | — | | | $ | 24,864,648 | | | $ | 24,800,321 | | | $ | — | | | $ | — | | | $ | 64,327 | | | | 64,327 | | | $ | 36 | | | $ | — | |
| | | | | | | | | | | | | | | | | | | | | | | | | | | | | | | | | | | | |
| (a) | Commencement of operations was July 7, 2021. |
| (b) | Investment in an affiliated fund, which is registered under the Investment Company Act of 1940, as amended, and is advised by J.P. Morgan Investment Management Inc. |
| (c) | The rate shown is the current yield as of December 31, 2021. |
Active Value ETF
| | | | | | | | | | | | | | | | | | | | | | | | | | | | | | | | | | | | |
| For the period ended December 31, 2021 | |
| Security Description | | Value at
October 4,
2021 (a) | | | Purchases
at Cost | | | Proceeds
from Sales | | | Net Realized
Gain (Loss) | | | Change in
Unrealized
Appreciation/
(Depreciation) | | | Value at
December 31,
2021 | | | Shares at
December 31,
2021 | | | Dividend
Income | | | Capital Gain
Distributions | |
JPMorgan U.S. Government Money Market Fund Class IM Shares, 0.03% (b) (c) | | $ | — | | | $ | 631,268 | | | $ | 201,402 | | | $ | — | | | $ | — | | | $ | 429,866 | | | | 429,866 | | | $ | 28 | | | $ | — | |
| | | | | | | | | | | | | | | | | | | | | | | | | | | | | | | | | | | | |
| (a) | Commencement of operations was October 4, 2021. |
| (b) | Investment in an affiliated fund, which is registered under the Investment Company Act of 1940, as amended, and is advised by J.P. Morgan Investment Management Inc. |
| (c) | The rate shown is the current yield as of December 31, 2021. |
Equity Premium Income ETF
| | | | | | | | | | | | | | | | | | | | | | | | | | | | | | | | | | | | |
| For the six months ended December 31, 2021 | |
| Security Description | | Value at
June 30,
2021 | | | Purchases
at Cost | | | Proceeds
from Sales | | | Net Realized
Gain (Loss) | | | Change in
Unrealized
Appreciation/
(Depreciation) | | | Value at
December 31,
2021 | | | Shares at
December 31,
2021 | | | Dividend
Income | | | Capital Gain
Distributions | |
JPMorgan U.S. Government Money Market Fund Class IM Shares, 0.03% (a) (b) | | $ | — | | | $ | 7,798,093 | | | $ | — | | | $ | — | | | $ | — | | | $ | 7,798,093 | | | | 7,798,093 | | | $ | 49 | * | | $ | — | |
JPMorgan U.S. Government Money Market Fund Class IM Shares, 0.03% (a) (b) | | | 26,638,228 | | | | 1,250,622,340 | | | | 1,277,260,568 | | | | — | | | | — | | | | — | | | | — | | | | 6,811 | | | | — | |
| | | | | | | | | | | | | | | | | | | | | | | | | | | | | | | | | | | | |
Total | | $ | 26,638,228 | | | $ | 1,258,420,433 | | | $ | 1,277,260,568 | | | $ | — | | | $ | — | | | $ | 7,798,093 | | | | | | | $ | 6,860 | | | $ | — | |
| | | | | | | | | | | | | | | | | | | | | | | | | | | | | | | | | | | | |
| (a) | Investment in an affiliated fund, which is registered under the Investment Company Act of 1940, as amended, and is advised by J.P. Morgan Investment Management Inc. |
| (b) | The rate shown is the current yield as of December 31, 2021. |
| * | Amount is included on the Statements of Operations as Income from securities lending (net) (after payments of rebates and Citibank’s fee). |
E. Futures Contracts — ActiveBuilders U.S. Large Cap Equity ETF and Equity Premium Income ETF used index futures contracts to gain or reduce exposure to the stock market, or maintain liquidity or minimize transaction costs. The Funds also purchased futures contracts to invest incoming cash in the market or sold futures in response to cash outflows, thereby simulating an invested position in the underlying index while maintaining a cash balance for liquidity.
Futures contracts provide for the delayed delivery of the underlying instrument at a fixed price or are settled for a cash amount based on the change in the value of the underlying instrument at a specific date in the future. Upon entering into a futures contract, the Funds are required to
| | | | | | | | | | |
| | | | | |
| DECEMBER 31, 2021 | | J.P. MORGAN EXCHANGE-TRADED FUNDS | | | | | | | | 31 |
NOTES TO FINANCIAL STATEMENTS
AS OF DECEMBER 31, 2021 (Unaudited) (continued)
deposit with the broker, cash or securities in an amount equal to a certain percentage of the contract amount, which is referred to as the initial margin deposit. Subsequent payments, referred to as variation margin, are made or received by the Funds periodically and are based on changes in the market value of open futures contracts. Changes in the market value of open futures contracts are recorded as Change in net unrealized appreciation/depreciation on futures contracts on the Statements of Operations. Realized gains or losses, representing the difference between the value of the contract at the time it was opened and the value at the time it was closed, are reported on the Statement of Operations at the closing or expiration of the futures contract. Securities deposited as initial margin are designated on the SOI, while cash deposited, which is considered restricted, is recorded on the Statement of Assets and Liabilities. A receivable from and/or a payable to brokers for the daily variation margin is also recorded on the Statement of Assets and Liabilities.
The use of futures contracts exposes the Funds to equity price risk. The Funds may be subject to the risk that the change in the value of the futures contract may not correlate perfectly with the underlying instrument. Use of long futures contracts subjects the Funds to risk of loss in excess of the amounts shown on the Statements of Assets and Liabilities, up to the notional amount of the futures contracts. Use of short futures contracts subjects the Funds to unlimited risk of loss. The Funds may enter into futures contracts only on exchanges or boards of trade. The exchange or board of trade acts as the counterparty to each futures transaction; therefore, the Funds’ credit risk is limited to failure of the exchange or board of trade. Under some circumstances, futures exchanges may establish daily limits on the amount that the price of a futures contract can vary from the previous day’s settlement price, which could effectively prevent liquidation of positions.
The Funds’ futures contracts are not subject to master netting arrangements (the right to close out all transactions traded with a counterparty and net amounts owed or due across transactions).
The table below discloses the volume of the Funds’ futures contracts activity during the six months ended December 31, 2021:
| | | | | | | | |
| | | ActiveBuilders
U.S. Large Cap
Equity ETF | | | Equity
Premium
Income ETF | |
Futures Contracts: | | | | | | | | |
Average Notional Balance Long | | $ | 112,256 | | | $ | 29,441,755 | |
Average Notional Balance Short | | | — | | | | 10,731,804 | |
Ending Notional Balance Long | | | 47,598 | | | | 27,359,938 | |
F. Equity-Linked Notes — Equity Premium Income ETF invested in Equity-Linked Notes (“ELNs”). These are hybrid instruments which combine both debt and equity characteristics into a single note form. ELNs’ values are linked to the performance of an underlying index. ELNs are unsecured debt obligations of an issuer and may not be publicly listed or traded on an exchange. ELNs are valued daily, under procedures adopted by the Board, based on values provided by an approved pricing source. These notes have a coupon which is accrued and recorded as interest income on the Statements of Operations. Changes in the market value of ELNs are recorded as Change in net unrealized appreciation or depreciation on the Statements of Operations. The Fund realizes a gain or loss when an ELN is sold or matures, which is recorded as Net realized gain (loss) on transactions from investments in non-affiliates on the Statements of Operations.
As of December 31, 2021, Equity Premium Income ETF had outstanding ELNs as listed on the SOI.
G. Security Transactions and Investment Income — Investment transactions are accounted for on the trade date (the date the order to buy or sell is executed). Securities gains and losses are calculated on a specifically identified cost basis. Interest income is determined on the basis of coupon interest accrued using the effective interest method, which adjusts for amortization of premiums and accretion of discounts.
Dividend income is recorded on the ex-dividend date or when the Funds first learn of the dividend.
To the extent such information is publicly available, the Funds record distributions received in excess of income earned from underlying investments as a reduction of cost of investments and/or realized gain. Such amounts are based on estimates if actual amounts are not available and actual amounts of income, realized gain and return of capital may differ from the estimated amounts. The Funds adjust the estimated amounts of the components of distributions (and consequently its net investment income) as necessary, once the issuers provide information about the actual composition of the distributions.
H. Federal Income Taxes — The Funds are treated as a separate taxable entity for Federal income tax purposes. The Funds’ policy is to comply with the provisions of the Internal Revenue Code (the “Code”) applicable to regulated investment companies and to distribute to shareholders all of its distributable net investment income and net realized capital gains on investments. Accordingly, no provision for Federal income tax is necessary. Management has reviewed the Funds’ tax positions for all open tax years and has determined that as of December 31, 2021, no liability for Federal income tax is required in the Funds’ financial statements for net unrecognized tax benefits. However, management’s conclusions may be subject to future review based on changes in, or the interpretation of, the accounting standards or tax laws and regulations. The Funds’ Federal tax returns for the prior three fiscal years, or since inception if shorter, remain subject to examination by the Internal Revenue Service.
I. Distributions to Shareholders — Distributions from net investment income, if any, are generally declared and paid at least monthly for Equity Premium Income ETF and at least annually for ActiveBuilders U.S. Large Cap Equity ETF and Active Value ETF. Net realized capital gains, if any, are distributed at least annually. The amount of distributions from net investment income and net realized capital gains is determined in accordance with Federal income tax regulations, which may differ from GAAP. To the extent these “book/tax” differences are permanent in nature (i.e., that they result from other than timing of recognition — “temporary differences”), such amounts are reclassified within the capital accounts based on their Federal tax basis treatment.
| | | | | | | | | | |
| | | | | |
| 32 | | | | | | | | J.P. MORGAN EXCHANGE-TRADED FUNDS | | DECEMBER 31, 2021 |
3. Fees and Other Transactions with Affiliates
A. Management Fee — JPMIM manages the investments of the Funds pursuant to the Management Agreement. For such services, JPMIM is paid a fee, which is accrued daily and paid no more frequently than monthly based on each Fund’s respective average daily net assets at the following rate:
| | | | |
ActiveBuilders U.S. Large Cap Equity ETF | | | 0.17 | % |
Active Value ETF | | | 0.44 | |
Equity Premium Income ETF | | | 0.35 | |
Under the Management Agreement, JPMIM is responsible for substantially all expenses of the Funds, (including expenses of the Trust relating to the Funds), except for the management fee, payments under the Funds’ 12b-1 plan (if any), interest expenses, dividend and interest expenses related to short sales, taxes, acquired fund fees and expenses (other than fees for funds advised by the adviser and/or its affiliates), costs of holding shareholder meetings, and litigation and potential litigation and other extraordinary expenses not incurred in the ordinary course of the Funds’ business. Additionally, the Funds are responsible for its non-operating expenses, including brokerage commissions and fees and expenses associated with the Funds’ securities lending program, if applicable. For the avoidance of doubt, the Adviser’s payment of such expenses may be accomplished through the Funds’ payment of such expenses and a corresponding reduction in the fee payable to the Adviser, provided, however, that if the amount of expenses paid by the Funds exceed the fee payable to the Adviser, the Adviser will reimburse the Funds for such amount.
B. Administration Fee — JPMIM provides administration services to the Funds. Pursuant to the Management Agreement for the Funds, JPMIM is compensated as described in Note 3.A.
JPMorgan Chase Bank, N.A. (“JPMCB”), a wholly-owned subsidiary of JPMorgan, serves as the Funds’ sub-administrator (the “Sub-administrator”). For its services as Sub-administrator, JPMCB receives a portion of the management fees payable to JPMIM.
C. Custodian, Accounting and Transfer Agent Fees — JPMCB provides custody, accounting and transfer agency services to the Funds. For performing these services, JPMIM pays JPMCB transaction and asset-based fees that vary according to the number of transactions and positions, plus out-of-pocket expenses.
Additionally, Authorized Participants generally pay transaction fees associated with the creation and redemption of Fund shares. These fees are paid to JPMIM to offset certain custodian charges that are covered by the Management Agreement.
Interest income earned on cash balances at the custodian, if any, is included in Interest income from affiliates on the Statements of Operations.
Interest expense paid to the custodian related to cash overdrafts, if any, is included in Interest expense to affiliates on the Statements of Operations.
D. Distribution Services — The Distributor or its agent distributes Creation Units for the Funds on an agency basis. The Distributor does not maintain a secondary market in shares of the Funds. JPMDS receives no fees for their distribution services under the distribution agreement with the Trust (the “Distribution Agreement”). Although the Trust does not pay any fees under the Distribution Agreement, JPMIM pays JPMDS for certain distribution related services.
E. Waivers and Reimbursements — The Funds may invest in one or more money market funds advised by the Adviser (affiliated money market funds). The fees for the affiliated money market funds are covered under the Management Agreement as described in Note 3.A.
F. Other — Certain officers of the Trust are affiliated with the Adviser, the Administrator and JPMDS. Such officers receive no compensation from the Funds for serving in their respective roles.
The Board designated and appointed a Chief Compliance Officer to the Funds pursuant to Rule 38a-1 under the 1940 Act. The fees associated with the office of the Chief Compliance Officer are paid for by JPMIM as described in Note 3.A.
The Securities and Exchange Commission (“SEC”) has granted an exemptive order permitting the Funds to engage in principal transactions with J.P. Morgan Securities LLC, an affiliated broker, involving taxable money market instruments, subject to certain conditions.
4. Investment Transactions
During the six months ended December 31, 2021, purchases and sales of investments (excluding short-term investments) were as follows:
| | | | | | | | |
| | | Purchases
(excluding U.S.
Government) | | | Sales
(excluding U.S.
Government) | |
ActiveBuilders U.S. Large Cap Equity ETF | | $ | 29,016,926 | | | $ | 4,516,112 | |
Active Value ETF | | | 28,519,401 | | | | 4,167,011 | |
Equity Premium Income ETF | | | 4,435,693,492 | | | | 3,845,574,568 | |
During the six months ended December 31, 2021, there were no purchases or sales of U.S. Government securities.
| | | | | | | | | | |
| | | | | |
| DECEMBER 31, 2021 | | J.P. MORGAN EXCHANGE-TRADED FUNDS | | | | | | | | 33 |
NOTES TO FINANCIAL STATEMENTS
AS OF DECEMBER 31, 2021 (Unaudited) (continued)
For the six months ended December 31, 2021, in-kind transactions associated with creations and redemptions were as follows:
| | | | | | | | |
| | | In-Kind Creations | | | In-Kind
Redemptions | |
ActiveBuilders U.S. Large Cap Equity ETF | | $ | 2,379,994 | | | $ | — | |
Active Value ETF | | | 1,164,955 | | | | — | |
Equity Premium Income ETF | | | 3,194,159,812 | | | | 76,921,448 | |
During the six months ended December 31, 2021, the Funds delivered portfolio securities for the redemption of Fund Shares (in-kind redemptions). Cash and portfolio securities were transferred for redemptions at fair value. For financial reporting purposes, the Funds recorded net realized gains and losses in connection with each in-kind redemption transaction.
5. Federal Income Tax Matters
For Federal income tax purposes, the estimated cost and unrealized appreciation (depreciation) in value of investments held at December 31, 2021 were as follows:
| | | | | | | | | | | | | | | | |
| | | Aggregate
Cost | | | Gross
Unrealized
Appreciation | | | Gross
Unrealized
Depreciation | | | Net Unrealized
Appreciation
(Depreciation) | |
ActiveBuilders U.S. Large Cap Equity ETF | | $ | 26,867,120 | | | $ | 3,078,792 | | | $ | 589,146 | | | $ | 2,489,646 | |
Active Value ETF | | | 25,964,587 | | | | 2,053,300 | | | | 563,203 | | | | 1,490,097 | |
Equity Premium Income ETF | | | 5,392,707,981 | | | | 454,847,869 | | | | 46,035,282 | | | | 408,812,587 | |
At June 30, 2021, the following Fund had the following net capital loss carryforwards:
| | | | | | | | |
| | | Capital Loss Carryforward Character | |
| | | Short-Term | | | Long-Term | |
Equity Premium Income ETF | | $ | 1,201,736 | | | $ | 531,274 | |
Net capital losses incurred after October 31, and within the taxable year are deemed to arise on the first business day of the Funds’ next taxable year. For the year ended June 30, 2021, the following Fund deferred to July 1, 2021 the following net capital losses (gains) of:
| | | | | | | | |
| | | Net Capital Losses (Gains) | |
| | | Short-Term | | | Long-Term | |
Equity Premium Income ETF | | $ | (4,159,818 | ) | | $ | 12,120,508 | |
6. Capital Share Transactions
The Trust issues and redeems shares of the Funds only in Creation Units through the Distributor at NAV. Capital shares transactions detail can be found in the Statements of Changes in Net Assets.
Shares of the Funds may only be purchased or redeemed by Authorized Participants. Such Authorized Participants may from time to time hold, of record or beneficially, a substantial percentage of the Funds’ shares outstanding and act as executing or clearing broker for investment transactions on behalf of the Funds. An Authorized Participant is either (1) a “Participating Party” or other participant in the clearing process through the Continuous Net Settlement System of the National Securities Clearing Corporation (“NSCC”); or (2) a DTC Participant; which, in either case, must have executed an agreement with the Distributor.
Creation Units of a Fund may be created in advance of receipt by the Trust of all or a portion of the applicable basket of fixed income securities and other instruments (“Deposit Instruments”) and cash as described in the Funds’ registration statement. In these instances, the initial Deposit Instruments and cash must be deposited in an amount equal to the sum of the cash amount, plus at least 105%, for the Funds, of the market value of undelivered Deposit Instruments. A transaction fee may be imposed to offset transfer and other transaction costs associated with the purchase or redemption of Creation Units.
Authorized Participants transacting in Creation Units for cash may also pay a variable fee to compensate the relevant fund for market impact expenses relating to investing in portfolio securities. Such variable fees, if any, are included in “Proceeds from shares issued” in the Statements of Changes in Net Assets.
7. Risks, Concentrations and Indemnifications
In the normal course of business, the Funds enter into contracts that contain a variety of representations which provide general indemnifications. The Funds’ maximum exposure under these arrangements is unknown. The amount of exposure would depend on future claims that may be brought against the Funds. However, based on experience, the Funds expect the risk of loss to be remote.
| | | | | | | | | | |
| | | | | |
| 34 | | | | | | | | J.P. MORGAN EXCHANGE-TRADED FUNDS | | DECEMBER 31, 2021 |
As of December 31, 2021, the Adviser owns shares representing more than 10% of net assets of the following Funds:
| | | | |
| | | % of Ownership | |
ActiveBuilders U.S. Large Cap Equity ETF | | | 91 | % |
Active Value ETF | | | 95 | |
Significant shareholder transactions by the Adviser may impact a Fund’s performance.
Disruptions to creations and redemptions, the existence of significant market volatility or potential lack of an active trading market for the Shares (including through a trading halt), as well as other factors, may result in Shares trading significantly above (at a premium) or below (at a discount) to the NAV or to the intraday value of the Funds’ holdings. During such periods, investors may incur significant losses if shares are sold.
The Funds’ investments in ELNs entail varying degrees of risks. The Funds are subject to loss of their full principal amount. In addition, the ELNs are subject to a stated maximum return which may limit the payment at maturity. The Funds may also be exposed to additional risks associated with structured notes including: counterparty credit risk related to the issuer’s ability to make payment at maturity; liquidity risk related to a lack of liquid market for these notes, preventing the Funds from trading or selling the notes easily; and a greater degree of market risk than other types of debt securities because the investor bears the risk associated with the underlying financial instruments.
The Funds are subject to infectious disease epidemics/pandemics risk. The worldwide outbreak of COVID-19, a novel coronavirus disease, has negatively affected economies, markets and individual companies throughout the world. The effects of this COVID-19 pandemic to public health, and business and market conditions, including exchange trading suspensions and closures may continue to have a significant negative impact on the performance of the Funds’ investments, increase the Funds’ volatility, negatively impact the Funds’ arbitrage and pricing mechanisms, exacerbate other pre-existing political, social and economic risks to the Funds and negatively impact broad segments of businesses and populations. The Funds’ operations may be interrupted as a result, which may have a significant negative impact on investment performance. In addition, governments, their regulatory agencies, or self-regulatory organizations may take actions in response to the pandemic that affect the instruments in which the Funds invest, or the issuers of such instruments, in ways that could also have a significant negative impact on the Funds’ investment performance. The full impact of this COVID-19 pandemic, or other future epidemics/pandemics, is currently unknown.
8. Subsequent Event
At its February 2022 meeting, the Trustees approved a change to the Active Value ETF’s net investment income distribution frequency from annually to quarterly.
| | | | | | | | | | |
| | | | | |
| DECEMBER 31, 2021 | | J.P. MORGAN EXCHANGE-TRADED FUNDS | | | | | | | | 35 |
SCHEDULE OF SHAREHOLDER EXPENSES
(Unaudited)
Hypothetical $1,000 Investment
As a shareholder of the Fund, you incur two types of costs: (1) transaction costs, including brokerage commissions on your purchase and sales of Fund shares and (2) ongoing costs, primarily management fees. The examples below are intended to help you understand your ongoing costs (in dollars) of investing in the Fund and to compare these ongoing costs with the ongoing costs of investing in other funds. The examples assume that you had a $1,000 investment at the beginning of the reporting period July 1, 2021 and continued to hold your shares at the end of the reporting period, December 31, 2021.
Actual Expenses
For the Fund in the table below, the first line provides information about actual account values and actual expenses. You may use the information in this line, together with the amount you invested, to estimate the expenses that you paid over the period. Simply divide your account value by $1,000 (for example, an $8,600 account value divided by $1,000 = 8.6),
then multiply the result by the number under the heading entitled “Expenses Paid During the Period” to estimate the expenses you paid on your account during this period.
Hypothetical Example for Comparison Purposes
The second line in the table below provides information about hypothetical account values and hypothetical expenses based on the Fund’s actual expense ratio and an assumed rate of return of 5% per year before expenses, which is not the Fund’s actual return. The hypothetical account values and expenses may not be used to estimate the actual ending account balance or expenses you paid for the period. You may use this information to compare the ongoing costs of investing in the Fund and other Funds. To do so, compare this 5% hypothetical example with the 5% hypothetical examples that appear in the shareholder reports of other funds. The examples also assume all dividends and distributions have been reinvested.
| | | | | | | | | | | | | | | | |
| | | Beginning
Account Value
May 1, 2021 | | | Ending Account Value
December 31, 2021 | | | Expenses
Paid During
the Period | | | Annualized
Expense
Ratio | |
JPMorgan ActiveBuilders U. S. Large Cap Equity ETF | | | | | | | | | | | | | | | | |
Actual (1) | | $ | 1,000.00 | | | $ | 1,096.30 | | | $ | 0.87 | | | | 0.17 | % |
Hypothetical (2) | | | 1,000.00 | | | | 1,024.35 | | | | 0.87 | | | | 0.17 | |
| | | | |
JPMorgan Active Value ETF | | | | | | | | | | | | | | | | |
Actual (3) | | | 1,000.00 | | | | 1,062.20 | | | | 1.11 | | | | 0.44 | |
Hypothetical (2) | | | 1,000.00 | | | | 1,022.99 | | | | 2.24 | | | | 0.44 | |
| | | | |
JPMorgan Equity Premium Income ETF | | | | | | | | | | | | | | | | |
Actual (2) | | | 1,000.00 | | | | 1,088.20 | | | | 1.84 | | | | 0.35 | |
Hypothetical (2) | | | 1,000.00 | | | | 1,023.44 | | | | 1.79 | | | | 0.35 | |
| (1) | Expenses are equal to the Fund’s annualized net expense ratio, multiplied by the average account value over the period, multiplied by 177/365 (to reflect the actual period). The Fund commenced operations on July 7, 2021. |
| (2) | Expenses are equal to the Fund’s annualized net expense ratio, multiplied by the average account value over the period, multiplied by 184/365 (to reflect the one-half year period). |
| (3) | Expenses are equal to the Fund’s annualized net expense ratio, multiplied by the average account value over the period, multiplied by 88/365 (to reflect the actual period). The Fund commenced operations on October 4, 2021. |
| | | | | | | | | | |
| | | | | |
| 36 | | | | | | | | J.P. MORGAN EXCHANGE-TRADED FUNDS | | DECEMBER 31, 2021 |
BOARD APPROVAL OF INITIAL MANAGEMENT AGREEMENTS
(Unaudited)
JPMorgan ActiveBuilders U.S. Large Cap Equity ETF and JPMorgan Active Value ETF
On March 9-10, 2021 and June 8-9, 2021, the Board of Trustees (the “Board” or the “Trustees”) of JPMorgan Exchange-Traded Funds Trust (the “Trust”) held meetings and approved the initial management agreements (each a “Management Agreement” and collectively, the “Management Agreements”) for the JPMorgan ActiveBuilders U.S. Large Cap Equity ETF and JPMorgan Active Value ETF (the “Funds”), respectively. The meetings were held by videoconference in reliance upon the Division of Investment Management Staff Statement on Fund Board Meetings and Unforeseen or Emergency Circumstances Related to Coronavirus Disease 2019. Each Management Agreement was approved by a majority of the Trustees who are not “Interested Persons” (as defined in the Investment Company Act of 1940) of any party to that Management Agreement or any of their affiliates. In connection with the approval of each Management Agreement, the Trustees reviewed written materials prepared by the Adviser and received oral presentations from Adviser personnel. Before voting on the proposed Management Agreement, the Trustees reviewed each Management Agreement with representatives of the Adviser and with counsel to the Trust and independent legal counsel to the Trustees and received a memorandum from independent legal counsel discussing the legal standards for their consideration of the proposed Management Agreements. They also considered information they received from the Adviser over the course of the year in connection with their oversight of other funds managed by the Adviser. The Trustees also discussed each proposed Management Agreement with independent legal counsel in executive session at which no representatives of the Adviser were present.
A summary of the material factors evaluated by the Trustees in determining whether to approve each Management Agreement is provided below. The Trustees considered information provided with respect to the Funds and the approval of the Management Agreements. Each Trustee attributed his or her own evaluation of the significance of the various factors, and no factor alone was considered determinative. The Trustees determined that the proposed compensation to be received by the Adviser from each Fund under its respective Management Agreement was fair and reasonable and that initial approval of the Management Agreement was in the best interests of each Fund and its potential shareholders.
Summarized below are the material factors considered and discussed by the Trustees in reaching their conclusions:
Nature, Extent and Quality of Services Provided by the Adviser
In connection with the approval of each Fund’s initial Management Agreement, the Trustees considered the materials furnished specifically in connection with the approval of the Management Agreement, as well as other relevant information furnished for the Trustees, regarding the nature, extent, and
quality of services provided by the adviser. Among other things, the Trustees considered:
| | (i) | The background and experience of the Adviser’s senior management and investment personnel; |
| | (ii) | The qualifications, backgrounds and responsibilities of the portfolio management team to be primarily responsible for the day-to-day management each of the Funds; |
| | (iii) | The investment strategy for each Fund, and the infrastructure supporting the portfolio management team; |
| | (iv) | Information about the structure and distribution strategy of each of the Funds and how it fits within the Trust’s other fund offerings; |
| | (v) | The administration services to be provided by the Adviser under the Management Agreement; |
| | (vi) | Their knowledge of the nature and quality of the services provided by the Adviser and its affiliates gained from their experience as Trustees of the Trust and in the financial industry generally; |
| | (vii) | The overall reputation and capabilities of the Adviser and its affiliates; |
| | (viii) | The commitment of the Adviser to provide high quality service to the Funds; |
| | (ix) | Their overall confidence in the Adviser’s integrity; |
| | (x) | The Adviser’s responsiveness to requests for additional information, questions or concerns raised by them; and |
| | (xi) | The Adviser’s business continuity plan, steps the Adviser and its affiliates would be taking to provide services to each Fund during the COVID-19 pandemic and the Adviser’s and its affiliates’ success in continuing to provide services to the other J.P. Morgan ETFs and their shareholders throughout this period. |
Based upon these considerations and other factors, the Trustees concluded that they were satisfied with the nature, extent and quality of services to be provided to each Fund by the Adviser.
Fall-Out Benefits
The Trustees reviewed information regarding potential “fall-out” or ancillary benefits expected to be received by the Adviser and its affiliates as a result of their relationship with each Fund. Additionally, the Trustees considered that any fall-out or ancillary benefits would be comparable to those related to the other funds in the complex.
| | | | | | | | | | |
| | | | | |
| DECEMBER 31, 2021 | | J.P. MORGAN EXCHANGE-TRADED FUNDS | | | | | | | | 37 |
BOARD APPROVAL OF INITIAL MANAGEMENT AGREEMENTS
(Unaudited) (continued)
The Trustees also considered the benefits the Adviser is expected to receive as the result of JPMorgan Chase Bank, N.A.’s (“JPMCB”), an affiliate of the Adviser, roles as custodian, fund accountant and transfer agent for the Funds, including the profitability of those arrangements to JPMCB.
Economies of Scale
The Trustees considered the extent to which each Fund will benefit from economies of scale. The Trustees noted that the proposed unitary management fee schedule for each Fund does not contain breakpoints. The Trustees considered that shareholders would benefit because expenses would be limited even when a Fund is new and not achieving economies of scale. The Trustees considered the fact that increases in assets would not lead to fee decreases even if economies of scale are achieved, but also that the Trustees would have the opportunity to further review the appropriateness of the fee payable to the Adviser under its Management Agreement in the future. After considering the factors identified above, the Trustees concluded that each Fund’s shareholders will receive the benefits of potential economies of scale.
Fees Relative to Adviser’s Other Clients
The Trustees requested, received and considered information about the nature and extent of investment advisory services and fee rates offered to other investment companies and/or institutional accounts advised by the Adviser in the same asset class as each Fund. The Trustees noted the Adviser’s view that it does not manage other accounts with a substantially similar investment strategy as that of either Fund. The Trustees concluded that the fees to be charged to each Fund in comparison to those charged to such other clients were reasonable.
Investment Performance
The Trustees considered each Fund’s investment strategy and processes, the portfolio management team and competitive
positioning against identified peer funds and concluded that the prospects for competitive future performance were acceptable.
Management Fees and Expense Ratios
The Trustees considered that under the Management Agreement, the Adviser will provide advisory and administrative services and will be responsible for substantially all expenses of each Fund (“unitary fee structure”). The Trustees considered the contractual management fee rate that will be paid by each Fund to the Adviser and compared that rate to information prepared by Broadridge Investor Communications Solutions Inc. (“Broadridge”), an independent provider of investment company data, providing management fee rates paid by other funds in the same Morningstar category as each Fund. The Trustees also compared the management fee for each Fund to fees charged to other funds managed by the Adviser that are in the same Morningstar category as each Fund. The Trustees also considered the fees paid to JPMCB, for custody, transfer agency and other related services for the Funds and the profitability of these arrangements to JPMCB.
The Trustees considered how each Fund will be positioned against peer funds, as identified by management and/or Broadridge and noted that each Fund’s proposed management fee compared favorably with identified peer funds. The Trustees also noted that because each Fund was not yet operational, no profitability information was available. After considering the factors identified above and other factors, in light of the information, the Trustees concluded that each Fund’s proposed management fee was reasonable.
| | | | | | | | | | |
| | | | | |
| 38 | | | | | | | | J.P. MORGAN EXCHANGE-TRADED FUNDS | | DECEMBER 31, 2021 |
BOARD APPROVAL OF MANAGEMENT AGREEMENT
(Unaudited)
JPMorgan Equity Premium Income ETF
The Board of Trustees of the JPMorgan Exchange-Traded Fund Trust (the “Trust”) met regularly throughout the year ended December 31, 2021 (the “Board of Trustees” or the “Board”) and considered factors that are relevant to their annual consideration of management agreements at each meeting. The Board also met specifically to consider management agreement annual renewals. The Board of Trustees held meetings on November 9, 2021 and December 14-15, 2021, at which the Trustees considered the continuation of the management agreement (the “Management Agreement”) for JPMorgan Equity Premium Income ETF (the “Fund”). The meetings were held by videoconference in reliance upon the Division of Investment Management Staff Statement on Fund Board Meetings and Unforeseen or Emergency Circumstances Related to Coronavirus Disease 2019. In connection with these meetings, the Board reviewed and considered performance, expense and other information individually for the Fund. The Trustees, including a majority of the Trustees who are not “Interested Persons” (as defined in the 1940 Act) of any party to the Management Agreement or any of their affiliates, approved the continuation of the Management Agreement.
As part of their review of the Management Agreement, the Trustees considered and reviewed performance and other information about the Fund received from the Adviser. This information included the Fund’s performance as compared to the performance of its benchmark and analyses by the Adviser of the Fund’s performance. In addition, in preparation for the December meeting, the Trustees requested, received and evaluated extensive materials from the Adviser, including performance and expense information compiled by Broadridge Investor Communications Solutions Inc. (“Broadridge”), an independent provider of investment company data, and met with representatives of Broadridge. Before voting on the Management Agreement, the Trustees reviewed the Management Agreement with representatives of the Adviser, counsel to the Trust and independent legal counsel and received a memorandum from independent legal counsel to the Trustees discussing the legal standards for their consideration of the Management Agreement. The Trustees also discussed the Management Agreement with independent legal counsel in executive sessions at which no representatives of the Adviser were present.
A summary of the material factors evaluated by the Trustees in determining whether to approve the Management Agreement is provided below. The Trustees considered information provided with respect to the Fund over the course of the year, as well as the materials furnished specifically in connection with this annual renewal process. Each Trustee attributed his or her own evaluation of the significance of the various factors and no factor alone was considered determinative. As part of their review process, the Trustees considered and placed emphasis on relevant information in light of changing circumstances in
market and economic conditions. The Trustees determined that the compensation received by the Adviser from the Fund under the Management Agreement was fair and reasonable and that the continuance of the Management Agreement was in the best interests of the Fund and its shareholders.
The factors summarized below were considered and discussed by the Trustees in reaching their conclusions:
Nature, Extent and Quality of Services Provided by the Adviser
The Trustees received and considered information regarding the nature, extent and quality of the services provided to the Fund under its Management Agreement. The Trustees took into account information furnished throughout the year at Trustee meetings, as well as the materials furnished specifically in connection with this annual review process. Among other things, the Trustees considered:
| | (i) | The background and experience of the Adviser’s senior management and investment personnel; |
| | (ii) | The qualifications, backgrounds and responsibilities of the portfolio management team primarily responsible for the day-to-day management of the Fund; |
| | (iii) | The investment strategy for the Fund, and the infrastructure supporting the portfolio management team; |
| | (iv) | Information about the structure and distribution strategy of the Fund and how it fits within the Trust’s other fund offerings; |
| | (v) | The administration services provided by the Adviser under the Management Agreement; |
| | (vi) | Their knowledge of the nature and quality of the services provided by the Adviser and its affiliates gained from their experience as Trustees of the Trust and in the financial industry generally; |
| | (vii) | The overall reputation and capabilities of the Adviser and its affiliates; |
| | (viii) | The commitment of the Adviser to provide high quality service to the Fund; |
| | (ix) | Their overall confidence in the Adviser’s integrity; |
| | (x) | The Adviser’s responsiveness to requests for additional information, questions or concerns raised by them; and |
| | (xi) | The Adviser’s business continuity plan and steps the Adviser and its affiliates were taking to provide ongoing services to the Fund during the COVID-19 pandemic, and the Adviser’s and its affiliates’ success in continuing to provide services to the Fund and its shareholders throughout this period. |
| | | | | | | | | | |
| | | | | |
| DECEMBER 31, 2021 | | J.P. MORGAN EXCHANGE-TRADED FUNDS | | | | | | | | 39 |
BOARD APPROVAL OF MANAGEMENT AGREEMENT
(Unaudited) (continued)
Based upon these considerations and other factors, the Trustees concluded that they were satisfied with the nature, extent and quality of services to be provided to the Fund by the Adviser.
Costs of Services Provided and Profitability to the Adviser and its Affiliates
The Trustees received, reviewed, considered and discussed information regarding the profitability to the Adviser and its affiliates in providing services to the Fund. The Trustees recognized that this information is not audited and represents the Adviser’s determination of its and its affiliates’ revenues from the contractual services provided to the Fund, less expenses of providing such services. Expenses include direct and indirect costs and are calculated using allocation methodologies developed by the Adviser. The Trustees also recognized that it is difficult to make direct comparisons of profitability from fund management contracts because comparative information is not generally publicly available and is affected by numerous factors, including the structure of the particular adviser, the types of funds it manages, its business mix, numerous assumptions regarding allocations and the fact that publicly-traded fund managers’ operating profits and net income are net of distribution and marketing expenses. Based upon their review, the Trustees concluded that the profitability to the Adviser under the Management Agreement was not unreasonable in light of the services and benefits provided to the Fund.
The Trustees also considered (i) that under the Management Agreement, the Adviser earns fees from the Fund for providing administrative services and (ii) fees paid to J.P. Morgan Chase Bank, N.A. (“JPMCB”), an affiliate of the Adviser, for custody, transfer agency and other related services for the Fund.
Fall-Out Benefits
The Trustees reviewed information regarding potential “fall-out” or ancillary benefits received by the Adviser and its affiliates as a result of their relationships with the Fund. Additionally, the Trustees considered that any fall-out or ancillary benefits would be comparable to those related to the other funds in the complex.
The Trustees also considered the benefits the Adviser receives as the result of JPMCB’s roles as custodian, fund accountant and transfer agent for the Fund, including the profitability of those arrangements to JPMCB.
Economies of Scale
The Trustees considered the extent to which the Fund benefits from economies of scale. The Trustees noted that the management fee schedule for the Fund does not contain breakpoints. The Trustees considered that shareholders benefited when the Fund was new and not achieving economies of scale. The Trustees considered the fact that increases in assets
would not lead to fee decreases even if economies of scale are achieved, but also that the Trustees would have the opportunity to further review the appropriateness of the fee payable to the Adviser under the Management Agreement in the future. After considering the factors identified above, the Trustees concluded that the Fund’s shareholders will receive the benefits of potential economies of scale.
Fees Relative to Adviser’s Other Clients
The Trustees requested, received and considered information about the nature and extent of investment advisory services and fee rates offered to other investment companies and/or institutional accounts advised by the Adviser in the same asset class as the Fund. The Trustees noted the Adviser’s view that it does not manage other accounts with substantially similar investment strategies as that of the Fund. The Trustees concluded that the fees charged to the Fund in comparison to those charged to such other clients were reasonable.
Investment Performance
The Trustees received and considered absolute and relative performance information for the Fund in a report prepared by Broadridge. The Trustees considered the total return performance information, which included ranking the Fund within a performance universe made up of funds with the same Morningstar investment classification and objective (the “Universe”), as well as a subset of funds within the Universe (the “Peer Group”), by total return for applicable one-year periods. The Trustees reviewed a description of Broadridge’s methodology for selecting exchange-traded funds in the Fund’s Peer Group and Universe and noted that the Peer Group quintile rankings were not calculated if the number of funds in the Peer Group did not meet a predetermined minimum. The Trustees also considered the Fund’s investment strategy and processes, portfolio management teams and competitive positioning against peer funds, as identified by Broadridge and/or management. As part of this review, the Trustees reviewed the Fund’s performance against its benchmark and considered the Fund’s performance information provided at regular Board meetings by the Adviser. After consideration, the Trustees determined that the Fund’s performance was consistent with its investment objective. The Broadridge performance data noted by the Trustees as part of their review and the determinations made by the Trustees with respect to the Fund’s performance are summarized below:
The Trustees noted that the Fund’s performance was in the first quintile based upon the Universe for the one-year period ended August 31, 2021. (Broadridge did not calculate a quintile ranking for the Peer Group for this fund.) The Trustees discussed the performance and investment strategy of the Fund with the Adviser and based upon these discussions and various other factors, the Trustees concluded that the Fund’s performance was satisfactory.
| | | | | | | | | | |
| | | | | |
| 40 | | | | | | | | J.P. MORGAN EXCHANGE-TRADED FUNDS | | DECEMBER 31, 2021 |
Management Fees and Expense Ratios
The Trustees considered the contractual management fee rate paid by the Fund to the Adviser and compared the rate to the information prepared by Broadridge concerning management fee rates paid by other funds in the same Morningstar category as the Fund. This review included ranking of the Fund within an expense universe made up of funds with the same Morningstar investment classification and objective (the “Universe”), as well as a subset of funds within the Universe (the “Peer Group”). The Trustees reviewed a description of Broadridge’s methodology for selecting funds in the Peer Group and Universe, as applicable, and noted that Universe and Peer Group quintile rankings were not calculated if the number of funds in the Universe and/or Peer Group did not meet a predetermined minimum. The Trustees also reviewed information about other expenses and the total expense ratio for the Fund. The Trustees compared the management fee for the Fund to fees charged to
mutual funds and/or institutional accounts with similar investment objectives or in similar asset classes managed by the Adviser. The Trustees recognized that it is difficult to make comparisons of management fees because there are variations in the services that are included in the fees paid by other accounts. The Trustees considered how the Fund are positioned against peer funds, as identified by management and/or Broadridge and noted that the Fund’s management fee was appropriate as compared to identified peer funds. The Trustees’ determinations as a result of the review of the Fund’s management fees and expense ratios are summarized below:
The Trustees noted that the Fund’s net management fee and actual total expenses were in the first quintile of the Universe. (Broadridge did not calculate a quintile ranking for the Peer Group for this fund.) After considering the factors identified above, in light of this information, the Trustees concluded that the management fee was satisfactory.
| | | | | | | | | | |
| | | | | |
| DECEMBER 31, 2021 | | J.P. MORGAN EXCHANGE-TRADED FUNDS | | | | | | | | 41 |
SPECIAL SHAREHOLDER MEETING RESULTS
(Unaudited)
The Trust held a special meeting of shareholders on October 27, 2021, for the purpose of considering and voting upon the election of Trustees:
Trustees were elected by the shareholders of all of the series of the Trust (other than Funds that launched subsequent to the record date), including Active Builders U.S. Large Cap Equity ETF and Equity Premium Income ETF. The results of the voting were as follows:
| | | | |
| | | Votes Received
(Amounts in
thousands) | |
Independent Nominee | | | | |
| John F. Finn | | | | |
In Favor | | | 932,618 | |
Withheld | | | 6,740 | |
| |
| Steven P. Fisher | | | | |
In Favor | | | 937,481 | |
Withheld | | | 1,877 | |
| |
| Gary L. French | | | | |
In Favor | | | 936,343 | |
Withheld | | | 3,014 | |
| |
| Kathleen M. Gallagher | | | | |
In Favor | | | 937,527 | |
Withheld | | | 1,831 | |
| |
| Robert J. Grassi | | | | |
In Favor | | | 936,385 | |
Withheld | | | 2,973 | |
| |
| Frankie D. Hughes | | | | |
In Favor | | | 937,172 | |
Withheld | | | 2,186 | |
| |
| Raymond Kanner | | | | |
In Favor | | | 937,371 | |
Withheld | | | 1,987 | |
| |
| Thomas P. Lemke | | | | |
In Favor | | | 936,312 | |
Withheld | | | 3,046 | |
| | | | |
| | | Votes Received
(Amounts in
thousands) | |
| |
| Lawrence R. Maffia | | | | |
In Favor | | | 935,575 | |
Withheld | | | 3,783 | |
| |
| Mary E. Martinez | | | | |
In Favor | | | 937,595 | |
Withheld | | | 1,762 | |
| |
| Marilyn McCoy | | | | |
In Favor | | | 937,226 | |
Withheld | | | 2,132 | |
| |
| Dr. Robert A. Oden, Jr. | | | | |
In Favor | | | 932,572 | |
Withheld | | | 6,785 | |
| |
| Marian U. Pardo | | | | |
In Favor | | | 937,464 | |
Withheld | | | 1,894 | |
| |
| Emily A. Youssouf | | | | |
In Favor | | | 936,422 | |
Withheld | | | 2,936 | |
| |
Interested Nominee | | | | |
| Robert F. Deutsch | | | | |
In Favor | | | 936,144 | |
Withheld | | | 3,214 | |
| |
| Nina O. Shenker | | | | |
In Favor | | | 937,258 | |
Withheld | | | 2,100 | |
| | | | | | | | | | |
| | | | | |
| 42 | | | | | | | | J.P. MORGAN EXCHANGE-TRADED FUNDS | | DECEMBER 31, 2021 |
J.P. Morgan Exchange-Traded Funds are distributed by JPMorgan Distribution Services, Inc., an indirect, wholly-owned subsidiary of JPMorgan Chase & Co.
Contact J.P. Morgan Exchange-Traded Funds at 1-844-457-6383 (844-4JPM ETF) for a fund prospectus. You can also visit us at www.jpmorganfunds.com. Investors should carefully consider the investment objectives and risks as well as charges and expenses of the fund before investing. The prospectus contains this and other information about the fund. Read the prospectus carefully before investing.
Investors may obtain information about the Securities Investor Protection Corporation (SIPC), including the SIPC brochure, by visiting www.sipc.org or by calling SIPC at 202-371-8300.
Each Fund files a complete schedule of its fund holdings for the first and third quarters of its fiscal year with the SEC as an exhibit to its report on Form N-PORT. The Funds’ Form N-PORT reports are available on the SEC’s website at http://www.sec.gov. The Fund’s quarterly holdings can be found by visiting the J.P. Morgan Funds’ website at www.jpmorganfunds.com.
A description of each Fund’s policies and procedures with respect to the disclosure of each Fund’s holdings is available in the prospectus and Statement of Additional Information.
A copy of proxy policies and procedures is available without charge upon request by calling 1-844-457-6383 and on the Funds’ website at www.jpmorganfunds.com. A description of such policies and procedures is on the SEC’s website at www.sec.gov. The Trustees have delegated the authority to vote proxies for securities owned by the Fund to the Adviser. A copy of the Funds’ voting record for the most recent 12-month period ended June 30 is available on the SEC’s website at www.sec.gov or at the Funds’ website at www.jpmorganfunds.com no later than August 31 of each year. The Funds’ proxy voting record will include, among other things, a brief description of the matter voted on for each fund security, and will state how each vote was cast, for example, for or against the proposal.


J.P. Morgan Asset Management is the brand name for the asset management business of JPMorgan Chase & Co. and its affiliates worldwide.
| | | | |
| | © JPMorgan Chase & Co., 2021. All rights reserved. December 2021. | | SAN-ETF-1221 |
ITEM 2. CODE OF ETHICS.
Disclose whether, as of the end of the period covered by the report, the registrant has adopted a code of ethics that applies to the registrant’s principal executive officer, principal financial officer, principal accounting officer or controller, or persons performing similar functions, regardless of whether these individuals are employed by the registrant or a third party. If the registrant has not adopted such a code of ethics, explain why it has not done so.
The registrant must briefly describe the nature of any amendment, during the period covered by the report, to a provision of its code of ethics that applies to the registrant’s principal executive officer, principal financial officer, principal accounting officer or controller, or persons performing similar functions, regardless of whether these individuals are employed by the registrant or a third party, and that relates to any element of the code of ethics definition enumerated in paragraph (b) of this Item. The registrant must file a copy of any such amendment as an exhibit pursuant to Item 13(a)(1), unless the registrant has elected to satisfy paragraph (f) of this Item by positing its code of ethics on its website pursuant to paragraph (f)(2) of this Item, or by undertaking to provide its code of ethics to any person without charge, upon request, pursuant to paragraph (f)(3) of this Item.
If the registrant has, during the period covered by the report, granted a waiver, including an implicit waiver, from a provision of the code of ethics that applies to the registrant’s principal executive officer, principal financial officer, principal accounting officer or controller, or persons performing similar functions, regardless of whether these individuals are employed by the registrant or third party, that relates to one or more items set forth in paragraph (b) of this Item, the registrant must briefly describe the nature of the waiver, the name of the person to whom the waiver was granted, and the date of the waiver.
Not applicable to a semi-annual report.
ITEM 3. AUDIT COMMITTEE FINANCIAL EXPERT.
| | (a) | (1) Disclose that the registrant’s board of directors has determined that the registrant either: |
| | (i) | Has at least one audit committee financial expert serving on its audit committee; or |
| | (ii) | Does not have an audit committee financial expert serving on its audit committee. |
(2) If the registrant provides the disclosure required by paragraph (a)(1)(i) of this Item, it must disclose the name of the audit committee financial expert and whether that person is “independent.” In order to be considered “independent” for purposes of this Item, a member of an audit committee may not, other than in his or her capacity as a member of the audit committee, the board of directors, or any other board committee:
| | (i) | Accept directly or indirectly any consulting, advisory, or other compensatory fee from the issuer; or |
| | (ii) | Be an “interested person” of the investment company as defined in Section 2(a)(19) of the Act (15 U.S.C. 80a-2(a)(19)). |
(3) If the registrant provides the disclosure required by paragraph (a)(1)(ii) of this Item, it must explain why it does not have an audit committee financial expert.
Not applicable to a semi-annual report.
ITEM 4. PRINCIPAL ACCOUNTANT FEES AND SERVICES.
(a) Disclose, under the caption Audit Fees, the aggregate fees billed for each of the last two fiscal years for professional services rendered by the principal accountant for the audit of the registrant’s annual financial statements or services that are normally provided by the accountant in connection with statutory and regulatory filings or engagements for those fiscal years.
(b) Disclose, under the caption Audit-Related Fees, the aggregate fees billed in each of the last two fiscal years for assurance and related services by the principal accountant that are reasonably related to the performance of the audit of the registrant’s financial statements and are not reported under paragraph (a) of this Item. Registrants shall describe the nature of the services comprising the fees disclosed under this category.
(c) Disclose, under the caption Tax Fees, the aggregate fees billed in each of the last two fiscal years for professional services rendered by the principal accountant for tax compliance, tax advice, and tax planning. Registrants shall describe the nature of the services comprising the fees disclosed under this category.
(d) Disclose, under the caption All Other Fees, the aggregate fees billed in each of the last two fiscal years for products and services provided by the principal accountant, other than the services reported in paragraphs (a) through (c) of this Item. Registrants shall describe the nature of the services comprising the fees disclosed under this category.
(e) (1) Disclose the audit committee’s pre-approval policies and procedures described in paragraph (c)(7) of Rule 2-01 of Regulation S-X.
(2) Disclose the percentage of services described in each of paragraphs (b) through (d) of this Item that were approved by the audit committee pursuant to paragraph (c)(7)(i)(C) of Rule 2-01 of Regulation S-X.
(f) If greater than 50 percent, disclose the percentage of hours expended on the principal accountant’s engagement to audit the registrant’s financial statements for the most recent fiscal year that were attributed to work performed by persons other than the principal accountant’s full-time, permanent employees.
(g) Disclose the aggregate non-audit fees billed by the registrant’s accountant for services rendered to the registrant, and rendered to the registrant’s investment adviser (not including any sub-adviser whose role is primarily portfolio management and is subcontracted with or overseen by another investment adviser), and any entity controlling, controlled by, or under common control with the adviser that provides ongoing services to the registrant for each of the last two fiscal years of the registrant.
(h) Disclose whether the registrant’s audit committee of the board of directors has considered whether the provision of non-audit services that were rendered to the registrant’s investment adviser (not including any subadviser whose role is primarily portfolio management and is subcontracted with or overseen by another investment adviser), and any entity controlling, controlled by, or under common control with the investment adviser that provides ongoing services to the registrant that were not pre-approved pursuant to paragraph (c)(7)(ii) of Rule 2-01 of Regulation S-X is compatible with maintaining the principal accountant’s independence.
Not applicable to a semi-annual report.
ITEM 5. AUDIT COMMITTEE OF LISTED REGISTRANTS.
(a) If the registrant is a listed issuer as defined in Rule 10A-3 under the Exchange Act (17CFR 240.10A-3), state whether or not the registrant has a separately-designated standing audit committee established in accordance with Section 3(a)(58)(A) of the Exchange Act (15 U.S.C. 78c(a)(58)(A)). If the registrant has such a committee, however designated, identify each committee member. If the entire board of directors is acting as the registrant’s audit committee as specified in Section 3(a)(58)(B) of the Exchange Act (15
U.S.C. 78c(a)(58)(B)), so state.
(b) If applicable, provide the disclosure required by Rule 10A-3(d) under the Exchange Act (17CFR 240.10A-3(d)) regarding an exemption from the listing standards for all audit committees.
Not applicable to a semi-annual report.
ITEM 6. SCHEDULE OF INVESTMENTS.
File Schedule I – Investments in securities of unaffiliated issuers as of the close of the reporting period as set forth in Section 210.12-12 of Regulation S-X, unless the schedule is included as part of the report to shareholders filed under Item 1 of this Form.
Included in Item 1.
ITEM 7. DISCLOSURE OF PROXY VOTING POLICIES AND PROCEDURES FOR CLOSED-END MANAGEMENT INVESTMENT COMPANIES.
Not applicable.
ITEM 8. PORTFOLIO MANAGERS OF CLOSED-END MANAGEMENT INVESTMENT COMPANIES.
Not applicable.
ITEM 9. PURCHASE OF EQUITY SECURITIES BY CLOSED-END MANAGEMENT INVESTMENT COMPANY AND AFFILIATED PURCHASERS.
Not applicable.
ITEM 10. SUBMISSION OF MATTERS TO A VOTE OF SECURITY HOLDERS.
Describe any material changes to the procedures by which shareholders may recommend nominees to the registrant`s board of directors, where those changes were implemented after the registrant last provided disclosure in response to the requirements of Item 7(d)(2)(ii)(G) of Schedule 14A (17 CFR 240.14a-101), or this Item.
No material changes to report.
ITEM 11. CONTROLS AND PROCEDURES.
(a) Disclose the conclusions of the registrant’s principal executive and principal financial officers, or persons performing similar functions, regarding the effectiveness of the registrant’s disclosure controls and procedures (as defined in Rule 30a-3(c) under the Act (17 CFR 270.30a-3(c))) as of a date within 90 days of the filing date of the report that includes the disclosure required by this paragraph, based on the evaluation of these controls and procedures required by Rule 30a-3(b) under the Act (17 CFR 270.30a-3(b))and Rules 13a-15(b) or 15d-15(b) under the Exchange Act (17 CFR 240.13a-15(b) or 240.15d-15(b)).
The Registrant’s principal executive and principal financial officers have concluded, based on their evaluation of the Registrant’s disclosure controls and procedures as of a date within 90 days of the filing date of this report, that the Registrant’s disclosure controls and procedures are reasonably designed to ensure that information required to be disclosed by the Registrant on Form N-CSR is recorded, processed, summarized and reported within the required time periods and that information required to be disclosed by the Registrant in the reports that it files or submits on Form N-CSR is accumulated and communicated to the Registrant’s management, including its principal executive and principal financial officers, as appropriate to allow timely decisions regarding required disclosure.
(b) Disclose any change in the registrant’s internal control over financial reporting (as defined in Rule 30a-3(d) under the Act (17 CFR 270.30a-3(d)) that occurred during the registrant’s second fiscal quarter of the period covered by this report that has materially affected, or is reasonably likely to materially affect, the registrant’s internal control over financial reporting.
There were no changes in the Registrant’s internal control over financial reporting that occurred during the last fiscal quarter covered by this report that have materially affected, or are reasonably likely to materially affect, the Registrant’s internal control over financial reporting.
ITEM 12. DISCLOSURE OF SECURITIES LENDING ACTIVITIES FOR CLOSED-END MANAGEMENT INVESTMENT COMPANIES.
Not applicable.
ITEM 13. EXHIBITS.
| | (a) | File the exhibits listed below as part of this Form. Letter or number the exhibits in the sequence indicated. |
(1) Any code of ethics, or amendment thereto, that is the subject of the disclosure required by Item 2, to the extent that the registrant intends to satisfy the Item 2 requirements through filing of an exhibit.
Not applicable.
(2) A separate certification for each principal executive officer and principal financial officer of the registrant as required by Rule 30a-2(a) under the Act (17 CFR 270.30a-2).
Certifications pursuant to Rule 30a-2(a) under the Investment Company Act of 1940 are attached hereto.
(3) Any written solicitation to purchase securities under Rule 23c-1 under the Act (17 CFR 270.23c-1) sent or given during the period covered by the report by or on behalf of the registrant to 10 or more persons.
Not applicable.
(b) A separate or combined certification for each principal executive officer and principal officer of the registrant as required by Rule 30a-2(b) under the Act of 1940.
Certifications pursuant to Rule 30a-2(b) under the Investment Company Act of 1940 are attached hereto.
SIGNATURES
Pursuant to the requirements of the Securities Exchange Act of 1934 and the Investment Company Act of 1940, the registrant has duly caused this report to be signed on its behalf by the undersigned, thereunto duly authorized.
| | |
| J.P. Morgan Exchange-Traded Fund Trust |
| |
| By: | | /s/ Brian S. Shlissel |
| | Brian S. Shlissel |
| | President and Principal Executive Officer |
| | March 3, 2022 |
Pursuant to the requirements of the Securities Exchange Act of 1934 and the Investment Company Act of 1940, this report has been signed below by the following persons on behalf of the registrant and in the capacities and on the dates indicated.
| | |
| By: | | /s/ Brian S. Shlissel |
| | Brian S. Shlissel |
| | President and Principal Executive Officer |
| | March 3, 2022 |
| |
| By: | | /s/ Timothy J. Clemens |
| | Timothy J. Clemens |
| | Treasurer and Principal Financial Officer |
| | March 3, 2022 |