UNITED STATES
SECURITIES AND EXCHANGE COMMISSION
Washington, D.C. 20549
FORM N-CSR
CERTIFIED SHAREHOLDER REPORT OF REGISTERED
MANAGEMENT INVESTMENT COMPANIES
Investment Company Act file number: 811-22903
J.P. Morgan Exchange-Traded Fund Trust
(Exact name of registrant as specified in charter)
277 Park Avenue
New York, NY 10172
(Address of principal executive offices) (Zip code)
Gregory S. Samuels
J.P. Morgan Investment Management Inc.
277 Park Avenue
New York, NY 10172
(Name and Address of Agent for Service)
With copies to:
| | |
Elizabeth A. Davin, Esq. JPMorgan Chase & Co. 1111 Polaris Parkway Columbus, OH 43240 | | Jon S. Rand, Esq. Dechert LLP 1095 Avenue of the Americas New York, NY 10036 |
|
|
|
Registrant’s telephone number, including area code: 1-844-457-6383
Date of fiscal year end: Last day of February
Date of reporting period: March 1, 2020 through February 28, 2021
Form N-CSR is to be used by management investment companies to file reports with the Commission not later than 10 days after the transmission to stockholders of any report that is required to be transmitted to stockholders under Rule 30e-1 under the Investment Company Act of 1940 (17 CFR 270.30e-1). The Commission may use the information provided on Form N-CSR in its regulatory, disclosure review, inspection, and policymaking roles.
A registrant is required to disclose the information specified by Form N-CSR, and the Commission will make this information public. A registrant is not required to respond to the collection of information contained in Form N-CSR unless the Form displays a currently valid Office of Management and Budget (“OMB”) control number. Please direct comments concerning the accuracy of the information collection burden estimate and any suggestions for reducing the burden to Secretary, Securities and Exchange Commission, 450 Fifth Street, NW, Washington, DC 20549-0609. The OMB has reviewed this collection of information under the clearance requirements of 44 U.S.C. Section 3507.
ITEM 1. REPORTS TO STOCKHOLDERS.
a.) The following is a copy of the report transmitted to shareholders pursuant to Rule 30e-1 under the Investment Company Act of 1940 (17 CFR 270.30e-1).
b.) A copy of the notice transmitted to shareholders in reliance on Rule 30e-3 under the 1940 Act that contains disclosures specified by paragraph (c)(3) of that rule is included in the Annual Report. Not Applicable. Notices do not incorporate disclosures from the shareholder reports.
Annual Report
J.P. Morgan Exchange-Traded Funds
February 28, 2021
JPMorgan BetaBuilders 1-5 Year U.S. Aggregate Bond ETF
JPMorgan Core Plus Bond ETF
JPMorgan Corporate Bond Research Enhanced ETF
JPMorgan High Yield Research Enhanced ETF
JPMorgan International Bond Opportunities ETF (formerly known as JPMorgan Global Bond Opportunities ETF )
JPMorgan Municipal ETF
JPMorgan U.S. Aggregate Bond ETF
JPMorgan Ultra-Short Income ETF
JPMorgan Ultra-Short Municipal Income ETF
JPMorgan USD Emerging Markets Sovereign Bond ETF
CONTENTS
Investments in a Fund are not bank deposits or obligations of, or guaranteed or endorsed by, any bank and are not insured or guaranteed by the FDIC, the Federal Reserve Board or any other government agency. You could lose money if you sell when a Fund’s share price is lower than when you invested.
Past performance is no guarantee of future performance. The general market views expressed in this report are opinions based on market and other conditions through the end of the reporting period and are subject to change without notice. These views are not intended to predict the future performance of a Fund or the securities markets. References to specific securities and their issuers are for illustrative purposes only and are not intended to be, and should not be interpreted as, recommendations to purchase or sell such securities. Such views are not meant as investment advice and may not be relied on as an indication of trading intent on behalf of the Fund.
Prospective investors should refer to the Funds’ prospectuses for a discussion of the Funds’ investment objectives, strategies and risks. Call J.P. Morgan Exchange-Traded Funds at (844) 457-6383 for a prospectus containing more complete information about a Fund, including management fees and other expenses. Please read it carefully before investing.
Shares are bought and sold throughout the day on an exchange at market price (not at net asset value) through a brokerage account, and are not individually subscribed and redeemed from a Fund. Shares may only be subscribed and redeemed directly from a Fund by Authorized Participants, in large creation/redemption units. Brokerage commissions will reduce returns.
PRESIDENT’S LETTER
April 13, 2021 (Unaudited)
Dear Shareholder,
Financial markets largely proved to be resilient over the past four quarters, thanks to continued support from monetary and fiscal policies, the distribution of the first vaccines against COVID-19 and the prospect for an expanded re-opening of local, national and global economies. At the end of the twelve months ended February 28, 2021, J.P. Morgan Exchange-Traded Funds had expanded in the U.S. to more than $50 billion in assets under management across 33 funds.
| | |
 | | “From the initial turmoil of the pandemic through the impressive rebound in financial markets, we have remained focused on providing investors with a diversified platform of solutions to help them build durable portfolios.” – Joanna M. Gallegos |
The investment environment has drastically changed since the World Health Organization declared the spread of the virus a pandemic in early March 2020. Though an outright financial crisis was headed off by the rapid response of leading central banks, the yields on both 10-year U.S. Treasury bonds and 30-year U.S. Treasury bonds fell to record lows and leading equity indexes lost 20% or more of their value in first quarter of 2020. Over the second half of 2020 and into the first months of 2021, financial markets recovered amid continued central bank support, additional government spending and the eventual development and distribution of vaccines.
Notably, the first months of 2021 were marked by the passage of the $1.9 trillion American Rescue Plan -- signed into law March 11 -- and the initial debate over President Biden’s proposed $2 trillion American Jobs Act. The potential economic impact of massive government spending and an expanded vaccination effort has bolstered investor expectations for a surge of economic activity that will potentially lift corporate profits and job growth this year. This investor optimism has helped push the Standard & Poor’s 500 Index above 4,000 points for the first time. However, the path to a fully re-opened economy includes a range of uncertainties, from the threat of new strains of COVID-19 and a resurgence in infections -- both in the U.S. and Europe -- to the potential for accelerating inflation and rising long-term interest rates.
From the initial turmoil of the pandemic through the impressive rebound in financial markets, we have remained focused on providing investors with a diversified platform of solutions to help them build durable portfolios. Regardless of the market environment, we seek to deliver innovative, quality ETFs that meet the needs of investors and we are proud of our accomplishments and our ability to adapt to new global realities. Thank you for your belief in our Firm and our process.
Sincerely,

Joanna M. Gallegos
President, J.P. Morgan Exchange-Traded Funds
J.P Morgan Asset Management
1-844-4JPM-ETF or jpmorgan.com/etfs for more information
| | | | | | | | |
| | | |
| FEBRUARY 28, 2021 | | J.P. MORGAN EXCHANGE-TRADED FUNDS | | | | | 1 | |
J.P. Morgan Exchange-Traded Funds
MARKET OVERVIEW
TWELVE MONTHS ENDED FEBRUARY 28, 2021 (Unaudited)
Financial markets largely recovered from a sharp sell-off in February and March of 2020, led by a sustained rally in equity markets. While bonds generally provided positive returns for the period, fixed income markets generally underperformed equity markets amid historically low interest rates.
Investors initially responded to the pandemic and the closure of large sectors of national economies by buying developed market government bonds as well as commodity gold. Yields on both the 10-year and 30-year U.S. Treasury bonds briefly fell to record lows in March 2020. By the end of the first quarter of 2020, leading developed market equity indexes had fallen by 20% or more and crude oil prices had plummeted by 60%.
Central banks around the world responded by cutting interest rates, initiating or extending asset purchasing programs and working to ensure liquidity in capital markets. Governments also responded with massive stimulus and relief spending. At the start of the second half of 2020, U.S. equity led a broad rebound in both developed markets and emerging markets equity, which was interrupted in September and October 2020 as re-closings across parts of Asia and Europe in response to resurgent infections dented investor optimism.
However, the approvals of the first vaccines against COVID-19 in late 2020 reignited investor demand for equity amid expectations that mass vaccinations would lead to the re-opening of businesses, schools and other parts of national economies. Within fixed income markets, high yield bonds (also known as “junk bonds”) and emerging markets debt outperformed U.S investment grade debt and U.S. Treasury bonds.
For the twelve months ended February 28, 2021, the Bloomberg Barclays U.S. Aggregate Index returned 1.38% and the Bloomberg Barclays Global Multiverse Index returned 4.50%.
| | | | | | |
| | | |
| 2 | | | | J.P. MORGAN EXCHANGE-TRADED FUNDS | | FEBRUARY 28, 2021 |
JPMorgan BetaBuilders 1-5 Year U.S. Aggregate Bond ETF
FUND COMMENTARY
TWELVE MONTHS ENDED FEBRUARY 28, 2021 (Unaudited)
| | | | |
| REPORTING PERIOD RETURN: | | | |
| Net Asset Value* | | | 2.28% | |
| Market Price** | | | 2.55% | |
| Bloomberg Barclays Short-Term U.S. Aggregate Bond Index | | | 2.36% | |
| |
| Net Assets as of 2/28/2021 | | $ | 59,654,406 | |
| Duration as of 2/28/2021 | | | 2.7 Years | |
INVESTMENT OBJECTIVE***
The JPMorgan BetaBuilders 1-5 Year US Aggregate Bond ETF (the “Fund”) seeks investment results that closely correspond, before fees and expenses, to the performance of the Bloomberg Barclays Short-Term U.S. Aggregate Bond Index (the “Underlying Index”).
INVESTMENT APPROACH
The Underlying Index, which includes bonds with remaining effective maturities between one and five years, is a subset of the Bloomberg Barclays U.S. Aggregate Index which consists of U.S. dollar denominated investment-grade taxable bonds. Using a “passive” investment approach, the Fund attempts to replicate the Underlying Index as closely as possible and invests at least 80% of its assets in securities included in the Underlying Index.
HOW DID THE FUND PERFORM?
For the twelve months ended February 28, 2021, the Fund performed in line with the Underlying Index, before considering the effects of operating expenses, fees and tax management of the Fund’s portfolio.
The Fund’s and the Underlying Index’s exposure to U.S. Treasury bonds was a leading contributor to performance during the reporting period.
HOW WAS THE FUND POSITIONED?
At the end of the reporting period, the Fund’s and the Underlying Index’s largest allocations were to the U.S. Treasury and corporate bond sectors and the smallest allocations were to the securitized debt and foreign government related bond sectors.
| | | | |
PORTFOLIO COMPOSITION**** | |
| U.S. Treasury Obligations | | | 55.2 | % |
| Corporate Bonds | | | 24.7 | |
| Mortgage-Backed Securities | | | 8.2 | |
| Supranational | | | 3.1 | |
| U.S. Government Agency Securities | | | 2.7 | |
| Commercial Mortgage-Backed Securities | | | 2.5 | |
| Foreign Government Securities | | | 1.6 | |
| Others (each less than 1.0%) | | | 1.0 | |
| Short-Term Investments | | | 1.0 | |
| * | | The return shown is based on net asset value and may differ from the return shown in the financial highlights, which reflects adjustments made to the net asset value in accordance with accounting principles generally accepted in the United States of America. The net asset value was $25.93 as of February 28, 2021. |
| ** | | Market price return was calculated assuming an initial investment made at the market price at the beginning of the reporting period, reinvestment of all dividends and distributions at market price during the period, and sale at the market price on the last day of the period. The price used to calculate the market price return was the closing price on the Cboe BZX Exchange, Inc. As of February 28, 2021, the closing price was $25.98. |
| *** | | The adviser seeks to achieve the Fund’s objective. There can be no guarantee it will be achieved. |
| **** | | Percentages indicated are based on total investments as of February 28, 2021. The Fund’s composition is subject to change. |
| | | | | | | | |
| | | |
| FEBRUARY 28, 2021 | | J.P. MORGAN EXCHANGE-TRADED FUNDS | | | | | 3 | |
JPMorgan BetaBuilders 1-5 Year U.S. Aggregate Bond ETF
FUND COMMENTARY
TWELVE MONTHS ENDED FEBRUARY 28, 2021 (Unaudited) (continued)
| | | | | | | | | | | | |
AVERAGE ANNUAL TOTAL RETURNS AS OF FEBRUARY 28, 2021 (Unaudited) | |
| | | INCEPTION DATE | | | 1 YEAR | | | SINCE
INCEPTION | |
JPMorgan BetaBuilders 1-5 Year U.S. Aggregate Bond ETF | | | | | | | | | | | | |
Net Asset Value | | | March 12, 2019 | | | | 2.28 | % | | | 4.16 | % |
Market Price | | | | | | | 2.55 | % | | | 4.26 | % |
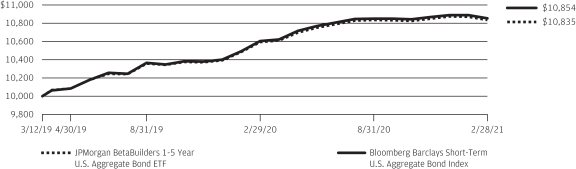
LIFE OF FUND PERFORMANCE (3/12/19 TO 2/28/21)
The performance quoted is past performance and is not a guarantee of future results. Exchange-traded funds are subject to certain market risks. Investment returns and principal value of an investment will fluctuate so that an investor’s shares, when sold or redeemed, may be worth more or less than their original cost. Current performance may be higher or lower than the performance data shown. For up-to-date, month-end performance information please call 1-844-457-6383.
Fund commenced operations on March 12, 2019.
The graph illustrates comparative performance for $10,000 invested in shares of the JPMorgan BetaBuilders 1-5 Year U.S. Aggregate Bond ETF and the Bloomberg Barclays Short-Term U.S. Aggregate Bond Index from March 12, 2019 to February 28, 2021. The performance of the Fund reflects the deduction of Fund expenses and assumes reinvestment of all dividends and capital gain distributions, if any. The performance of the Bloomberg Barclays Short-Term U.S. Aggregate Bond Index does not reflect the deduction of expenses associated with an exchange-traded fund and has been adjusted to reflect reinvestment of all dividends and capital gain distributions of the securities
included in the Index, if applicable. The Bloomberg Barclays Short-Term U.S. Aggregate Bond Index is an unmanaged index that represents securities that are SEC-registered, taxable, and dollar denominated. The index covers the U.S. investment grade fixed rate bond market, with index components for government and corporate securities, mortgage pass-through securities, and asset-backed securities. Investors cannot invest directly in an index.
Fund performance reflects any waiver, if applicable, of the Fund’s fees and reimbursement of expenses for certain periods since the applicable inception date. Without these waivers and reimbursements, performance would have been lower. Also, performance shown in this section does not reflect the deduction of taxes that a shareholder may pay on Fund distributions or on gains resulting from redemption or sale of Fund shares.
The returns shown are based on net asset values calculated for shareholder transactions and may differ from the returns shown in the financial highlights, which reflect adjustments made to the net asset values in accordance with accounting principles generally accepted in the United States of America.
| | | | | | |
| | | |
| 4 | | | | J.P. MORGAN EXCHANGE-TRADED FUNDS | | FEBRUARY 28, 2021 |
JPMorgan Core Plus Bond ETF
FUND COMMENTARY
TWELVE MONTHS ENDED FEBRUARY 28, 2021 (Unaudited)
| | | | |
| REPORTING PERIOD RETURN: | | | |
| Net Asset Value* | | | 3.08% | |
| Market Price** | | | 2.87% | |
| Bloomberg Barclays U.S. Aggregate Index | | | 1.38% | |
| |
| Net Assets as of 2/28/2021 | | $ | 146,648,110 | |
| Duration as of 2/28/2021 | | | 5.9 Years | |
INVESTMENT OBJECTIVE***
The JPMorgan Core Plus Bond ETF (the “Fund”) seeks to provide a high level of current income by investing primarily in a diversified portfolio of high, medium and low-grade debt securities.
INVESTMENT APPROACH
The Fund invests primarily in investment grade bonds, with the flexibility to invest up to 30% in high yield debt (also known as “junk bonds”). Up to 25% of the Fund’s assets may be invested in foreign securities. The portfolio managers allocate the Fund’s assets among a range of sectors based on strategic positioning and other tactical considerations. In buying and selling investments for the Fund, the adviser looks for market sectors and securities that it believes will perform well over time. The adviser selects individual securities after performing a risk/reward analysis that includes an evaluation of interest rate risk, credit risk, currency risk, legal provisions and the structure of the transactions.
HOW DID THE FUND PERFORM?
For the twelve months ended February 28, 2021, the Fund outperformed the Bloomberg Barclays U.S. Aggregate Index (the “Index”).
Relative to the Index, the Fund’s overweight allocations to high yield corporate credit, asset-backed securities, commercial mortgage-backed securities and non-agency residential mortgage-backed securities were leading contributors to performance as yields within these sectors generally rebounded to pre-pandemic levels after March 2020.
The Fund’s interest rate positioning detracted marginally from performance during the period. The Fund’s dynamic duration positioning in March and April 2020 detracted from returns as interest rates traded in a tight range after the surge in interest rate volatility during late February and early March 2020. Much of this negative performance was offset by interest rate positioning during January and February 2021 when the Fund was positioned with shorter duration and was underweight in the long end of the yield curve as interest rates moved higher and the yield curve steepened. Generally, bonds with shorter duration will experience a smaller decrease in price as interest rates rise, relative to bonds with longer duration. The yield curve shows the relationship between yields and maturity dates for a set of similar bonds at a given point in time.
HOW WAS THE FUND POSITIONED?
The Fund’s portfolio managers focused on security selection and relative value, which seeks to take advantage of pricing discrepancies between individual securities or market sectors. The managers employed macro-economic analysis to determine asset allocations and positioning on the yield curve. The managers used bottom-up research and top-down macro perspective to construct a diversified portfolio of fixed income securities. As a result of this process, the Fund’s largest sector allocations at the end of the reporting period were to securitized debt, which includes agency and non-agency residential mortgage-backed securities, asset-backed securities and commercial mortgage-backed securities, and corporate bonds. The Fund’s smallest allocations were to emerging markets debt and U.S. government obligations, including Treasury bonds and agency debentures.
| | | | |
PORTFOLIO COMPOSITION**** | |
Corporate Bonds | | | 33.8 | % |
Mortgage-Backed Securities | | | 18.3 | |
Asset-Backed Securities | | | 13.3 | |
U.S. Treasury Obligations | | | 9.1 | |
Collateralized Mortgage Obligations | | | 2.9 | |
Commercial Mortgage-Backed Securities | | | 2.6 | |
Others (each less than 1.0%) | | | 0.0 | (a) |
Short-Term Investments | | | 20.0 | |
| * | | The return shown is based on net asset value and may differ from the return shown in the financial highlights, which reflects adjustments made to the net asset value in accordance with accounting principles generally accepted in the United States of America. The net asset value was $54.30 as of February 28, 2021. |
| ** | | Market price return was calculated assuming an initial investment made at the market price at the beginning of the reporting period, reinvestment of all dividends and distributions at market price during the period, and sale at the market price on the last day of the period. The price used to calculate the market price return was the closing price on the Cboe BZX Exchange, Inc. As of February 28, 2021, the closing price was $54.48. |
| *** | | The adviser seeks to achieve the Fund’s objective. There can be no guarantee it will be achieved. |
| **** | | Percentages indicated are based on total investments as of February 28, 2021. The Fund’s composition is subject to change. |
| (a) | | Amount rounds to less than 0.1% |
| | | | | | | | |
| | | |
| FEBRUARY 28, 2021 | | J.P. MORGAN EXCHANGE-TRADED FUNDS | | | | | 5 | |
JPMorgan Core Plus Bond ETF
FUND COMMENTARY
TWELVE MONTHS ENDED FEBRUARY 28, 2021 (Unaudited) (continued)
| | | | | | | | | | | | |
AVERAGE ANNUAL TOTAL RETURNS AS OF FEBRUARY 28, 2021 (Unaudited) | |
| | | INCEPTION DATE | | | 1 YEAR | | | SINCE
INCEPTION | |
JPMorgan Core Plus Bond ETF | | | | | | | | | | | | |
Net Asset Value | | | January 28, 2019 | | | | 3.08 | % | | | 7.27 | % |
Market Price | | | | | | | 2.87 | % | | | 7.43 | % |
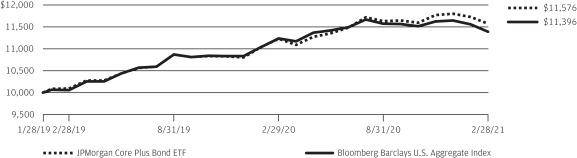
LIFE OF FUND PERFORMANCE (1/28/19 TO 2/28/21)
The performance quoted is past performance and is not a guarantee of future results. Exchange-traded funds are subject to certain market risks. Investment returns and principal value of an investment will fluctuate so that an investor’s shares, when sold or redeemed, may be worth more or less than their original cost. Current performance may be higher or lower than the performance data shown. For up-to-date, month-end performance information please call 1-844-457-6383.
Fund commenced operations on January 28, 2019.
The graph illustrates comparative performance for $10,000 invested in shares of the JPMorgan Core Plus Bond ETF and the Bloomberg Barclays U.S. Aggregate Index from January 28, 2019 to February 28, 2021. The performance of the Fund reflects the deduction of Fund expenses and assumes reinvestment of all dividends and capital gain distributions, if any. The performance of the Bloomberg Barclays U.S. Aggregate Index does not reflect the deduction of expenses associated with an exchange-traded fund and has been adjusted to reflect reinvestment of all dividends and capital gain distributions of the
securities included in the Index, if applicable. The Bloomberg Barclays U.S. Aggregate Index is an unmanaged index that represents securities that are SEC-registered, taxable, and dollar denominated. The index covers the U.S. investment grade fixed rate bond market, with index components for government and corporate securities, mortgage pass-through securities, and asset-backed securities. Investors cannot invest directly in an index.
Fund performance reflects waiver of a portion of the Fund’s fees and reimbursement of expenses for certain periods from the Fund’s inception date and prior to implementation of a unitary fee structure on November 19, 2019. Without these waivers and reimbursements, performance would have been lower. Also, performance shown in this section does not reflect the deduction of taxes that a shareholder may pay on Fund distributions or on gains resulting from redemption or sale of Fund shares.
The returns shown are based on net asset values calculated for shareholder transactions and may differ from the returns shown in the financial highlights, which reflect adjustments made to the net asset values in accordance with accounting principles generally accepted in the United States of America.
| | | | | | |
| | | |
| 6 | | | | J.P. MORGAN EXCHANGE-TRADED FUNDS | | FEBRUARY 28, 2021 |
JPMorgan Corporate Bond Research Enhanced ETF
FUND COMMENTARY
TWELVE MONTHS ENDED FEBRUARY 28, 2021 (Unaudited)
| | | | |
| REPORTING PERIOD RETURN: | |
| Net Asset Value* | | | 2.22% | |
| Market Price** | | | 2.09% | |
| Bloomberg Barclays U.S. Corporate Index | | | 2.79% | |
| |
| Net Assets as of 2/28/2021 | | | $55,332,638 | |
| Duration as of 2/28/2021 | | | 8.5 Years | |
INVESTMENT OBJECTIVE***
The JPMorgan Corporate Bond Research Enhanced ETF (the “Fund”) seeks to provide total return from a portfolio of investment grade corporate bonds.
INVESTMENT APPROACH
The Fund invests primarily in investment grade bonds and uses fundamental credit research for enhanced security selection and sector allocation. The Fund seeks to outperform the Bloomberg Barclays U.S. Corporate Index (the “Index”) while maintaining similar risk characteristics.
HOW DID THE FUND PERFORM?
For the twelve months ended February 28, 2021, the Fund underperformed the Index.
Relative to the Index, the Fund’s security selection within the financial sector, specifically the insurance subsector, was a leading detractor from performance. In particular, the Fund’s underweight position in Athene Holding Ltd., a retirement services company not held in the Fund, detracted from performance after the company posted better-than-expected earnings for the fourth quarter of 2020 and amid investor expectations that it will expand operations. In the energy sector, the Fund’s position in Occidental Petroleum Corp. also detracted from relative performance as the company’s bonds were downgraded to below investment grade in March 2020.
The Fund’s security selection within the communications sector was a leading contributor to performance. The Fund’s overweight position in Boeing Co. was the largest individual contributor to performance amid investor expectations that the company would benefit from a resumption in demand for air travel in 2021, as well as pending regulatory approvals of its 737 Max aircraft.
HOW WAS THE FUND POSITIONED?
During the reporting period, the Fund’s portfolio managers sought to invest in companies that they believed were attractive from a fundamental and relative value analysis, while seeking to underweight companies that were unattractive based on their analysis. From a sector perspective, the Fund remained largely in line with the sector weightings in the Index, with its largest underweight allocations to the basic industry and other industrial sectors and its largest overweight allocations to the consumer non-cyclical and technology sectors.
| | | | |
PORTFOLIO COMPOSITION**** | |
Corporate Bonds | | | 98.8 | % |
Others (each less than 1.0%) | | | 0.8 | |
Short-Term Investments | | | 0.4 | |
| * | | The return shown is based on net asset value and may differ from the return shown in the financial highlights, which reflects adjustments made to the net asset value in accordance with accounting principles generally accepted in the United States of America. The net asset value was $55.31 as of February 28, 2021. |
| ** | | Market price return was calculated assuming an initial investment made at the market price at the beginning of the reporting period, reinvestment of all dividends and distributions at market price during the period, and sale at the market price on the last day of the period. The price used to calculate the market price return was the closing price on the NYSE Arca, Inc. As of February 28, 2021, the closing price was $55.48. |
| *** | | The adviser seeks to achieve the Fund’s objective. There can be no guarantee it will be achieved. |
| **** | | Percentages indicated are based on total investments as of February 28, 2021. The Fund’s composition is subject to change. |
| | | | | | | | |
| | | |
| FEBRUARY 28, 2021 | | J.P. MORGAN EXCHANGE-TRADED FUNDS | | | | | 7 | |
JPMorgan Corporate Bond Research Enhanced ETF
FUND COMMENTARY
TWELVE MONTHS ENDED FEBRUARY 28, 2021 (Unaudited) (continued)
| | | | | | | | | | | | |
AVERAGE ANNUAL TOTAL RETURNS AS OF FEBRUARY 28, 2021 (Unaudited) | |
| | | INCEPTION DATE | | | 1 YEAR | | | SINCE
INCEPTION | |
JPMorgan Corporate Bond Research Enhanced ETF | | | | | | | | | | | | |
Net Asset Value | | | December 12, 2018 | | | | 2.22 | % | | | 9.46 | % |
Market Price | | | | | | | 2.09 | % | | | 9.60 | % |
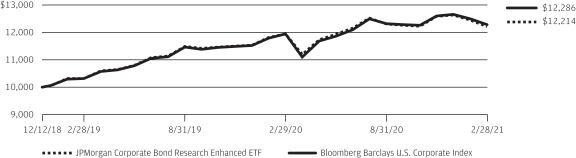
LIFE OF FUND PERFORMANCE (12/12/18 TO 2/28/21)
The performance quoted is past performance and is not a guarantee of future results. Exchange-traded funds are subject to certain market risks. Investment returns and principal value of an investment will fluctuate so that an investor’s shares, when sold or redeemed, may be worth more or less than their original cost. Current performance may be higher or lower than the performance data shown. For up-to-date, month-end performance information please call 1-844-457-6383.
Fund commenced operations on December 12, 2018.
The graph illustrates comparative performance for $10,000 invested in shares of the JPMorgan Corporate Bond Research Enhanced ETF and the Bloomberg Barclays U.S. Corporate Index from December 12, 2018 to February 28, 2021. The performance of the Fund reflects the deduction of Fund expenses and assumes reinvestment of all dividends and capital gain distributions, if any. The performance of the Bloomberg Barclays U.S. Corporate Index does not reflect the deduction of expenses associated with an exchange-traded fund and has been adjusted to reflect reinvestment of all dividends and capital gain
distributions of the securities included in the Index, if applicable. The Bloomberg Barclays U.S. Corporate Index broadly measures the investment grade, fixed-rate, taxable, corporate bond market. It includes USD denominated securities publicly issued by U.S. and non-U.S. industrial, utility, and financial issuers that meet specified maturity, liquidity, and quality requirements. Securities in the index roll up to the U.S. Credit and U.S. Aggregate Indices.
Fund performance reflects waiver of a portion of the Fund’s fees and reimbursement of expenses for certain periods from the Fund’s inception date and prior to implementation of a unitary fee structure on November 19, 2019. Without these waivers and reimbursements, performance would have been lower. Also, performance shown in this section does not reflect the deduction of taxes that a shareholder may pay on Fund distributions or on gains resulting from redemption or sale of Fund shares.
The returns shown are based on net asset values calculated for shareholder transactions and may differ from the returns shown in the financial highlights, which reflect adjustments made to the net asset values in accordance with accounting principles generally accepted in the United States of America.
| | | | | | |
| | | |
| 8 | | | | J.P. MORGAN EXCHANGE-TRADED FUNDS | | FEBRUARY 28, 2021 |
JPMorgan High Yield Research Enhanced ETF
FUND COMMENTARY
TWELVE MONTHS ENDED FEBRUARY 28, 2021 (Unaudited)
| | | | |
| REPORTING PERIOD RETURN: | |
| Net Asset Value* | | | 7.14% | |
| Market Price** | | | 6.43% | |
| Bloomberg Barclays U.S. Corporate High Yield – 2% Issuer Capped Index | | | 9.31% | |
| |
| Net Assets as of 2/28/2021 | | $ | 1,559,634,055 | |
| Duration as of 2/28/2021 | | | 4.3 Years | |
INVESTMENT OBJECTIVE***
The JPMorgan High Yield Research Enhanced ETF (the “Fund”) seeks to provide a high level of income. Capital appreciation is a secondary objective.
INVESTMENT APPROACH
The Fund invests in a diversified portfolio of high-yield securities (also called “junk bonds”). Issuers may be domestic or foreign, but the Fund only invests in U.S. dollar-denominated investments.
HOW DID THE FUND PERFORM?
For the twelve months ended February 28, 2021, the Fund posted a positive absolute performance and underperformed the Bloomberg Barclays U.S. Corporate High Yield – 2% Issuer Capped Index (the “Benchmark”).
During the period, bonds rated single-B and CCC and lower significantly underperformed bonds rated BB as prices for lower rated bonds generally fell.
Relative to the Benchmark, the Fund’s security selection in the energy and consumer non-cyclical sectors detracted from performance. The Fund’s overweight allocation to bonds rated BB and its underweight allocation to bonds rated CCC were leading contributors to relative performance. The Fund’s security selection in the communications and basic industry sectors also contributed to relative performance.
HOW WAS THE FUND POSITIONED?
During the period, the Fund was neutral to its Benchmark in terms of industry groups and duration structure. The portfolio managers selected securities based on the views of their credit analysts and the Fund was underweight in securities rated CCC or lower and overweight in securities rated BB and B.
| | | | | | | | |
| | | |
| FEBRUARY 28, 2021 | | J.P. MORGAN EXCHANGE-TRADED FUNDS | | | | | 9 | |
JPMorgan High Yield Research Enhanced ETF
FUND COMMENTARY
TWELVE MONTHS ENDED FEBRUARY 28, 2021 (Unaudited) (continued)
| | | | |
PORTFOLIO COMPOSITION BY INDUSTRY**** | |
Oil, Gas & Consumable Fuels | | | 11.9 | % |
Hotels, Restaurants & Leisure | | | 7.6 | |
Media | | | 6.4 | |
Health Care Providers & Services | | | 6.3 | |
Diversified Telecommunication Services | | | 5.8 | |
Consumer Finance | | | 4.5 | |
Equity Real Estate Investment Trusts (REITs) | | | 3.4 | |
Metals & Mining | | | 3.3 | |
Aerospace & Defense | | | 3.2 | |
Food Products | | | 2.8 | |
Chemicals | | | 2.8 | |
Commercial Services & Supplies | | | 2.7 | |
Pharmaceuticals | | | 2.5 | |
Trading Companies & Distributors | | | 2.5 | |
Auto Components | | | 2.4 | |
Entertainment | | | 2.4 | |
Electric Utilities | | | 2.2 | |
Thrifts & Mortgage Finance | | | 2.1 | |
Specialty Retail | | | 1.8 | |
Building Products | | | 1.8 | |
Wireless Telecommunication Services | | | 1.8 | |
Containers & Packaging | | | 1.5 | |
Technology Hardware, Storage & Peripherals | | | 1.3 | |
Communications Equipment | | | 1.2 | |
IT Services | | | 1.2 | |
Food & Staples Retailing | | | 1.1 | |
Software | | | 1.0 | |
Others (each less than 1.0%) | | | 11.6 | |
Short-Term Investments | | | 0 .9 | |
| * | | The return shown is based on net asset value and may differ from the return shown in the financial highlights, which reflects adjustments made to the net asset value in accordance with accounting principles generally accepted in the United States of America. The net asset value was $51.61 as of February 28, 2021. |
| ** | | Market price return was calculated assuming an initial investment made at the market price at the beginning of the reporting period, reinvestment of all dividends and distributions at market price during the period, and sale at the market price on the last day of the period. The price used to calculate the market price return was the closing price on the Cboe BZX Exchange, Inc. As of February 28, 2021, the closing price was $51.61. |
| *** | | The adviser seeks to achieve the Fund’s objective. There can be no guarantee it will be achieved. |
| **** | | Percentages indicated are based on total investments as of February 28, 2021. The Fund’s composition is subject to change. |
| | | | | | |
| | | |
| 10 | | | | J.P. MORGAN EXCHANGE-TRADED FUNDS | | FEBRUARY 28, 2021 |
| | | | | | | | | | | | |
AVERAGE ANNUAL TOTAL RETURNS AS OF FEBRUARY 28, 2021 (Unaudited) | |
| | | INCEPTION DATE | | | 1 YEAR | | | SINCE
INCEPTION | |
JPMorgan High Yield Research Enhanced ETF | | | | | | | | | | | | |
Net Asset Value | | | September 14, 2016 | | | | 7.14 | % | | | 5.65 | % |
Market Price | | | | | | | 6.43 | % | | | 5.63 | % |
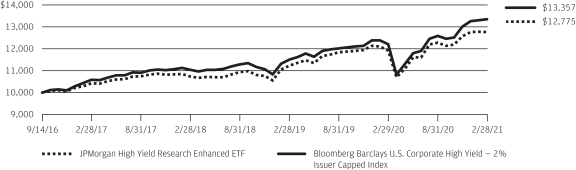
LIFE OF FUND PERFORMANCE (9/14/16 TO 2/28/21)
The performance quoted is past performance and is not a guarantee of future results. Exchange-traded funds are subject to certain market risks. Investment returns and principal value of an investment will fluctuate so that an investor’s shares, when sold or redeemed, may be worth more or less than their original cost. Current performance may be higher or lower than the performance data shown. For up-to-date, month-end performance information please call 1-844-457-6383.
Fund commenced operations on September 14, 2016.
The graph illustrates comparative performance for $10,000 invested in shares of the JPMorgan High Yield Research Enhanced ETF, the Bloomberg Barclays U.S. Corporate High Yield — 2% Issuer Capped Index from September 14, 2016 to February 28, 2021. The performance of the Fund reflects the deduction of Fund expenses and assumes reinvestment of all dividends and capital gain distributions, if any. The performance of the Bloomberg Barclays U.S. Corporate High Yield — 2% Issuer Capped Index does not reflect the deduction of expenses associated with an exchange-traded fund and has been adjusted to reflect reinvestment of all dividends and capital gain distributions of the securities included in the Index, if applicable.
The Bloomberg Barclays U.S. Corporate High Yield — 2% Issuer Capped Index is an unmanaged index comprised of fixed rate, non-investment grade debt securities that are dollar denominated and non-convertible. The index limits the maximum exposure to any one issuer to 2%. Investors cannot invest directly in an index.
Fund performance reflects waiver of a portion of the Fund’s fees and reimbursement of expenses for certain periods from the Fund’s inception date and prior to implementation of a unitary fee structure on November 19, 2019. Without these waivers and reimbursements, performance would have been lower. Also, performance shown in this section does not reflect the deduction of taxes that a shareholder may pay on Fund distributions or on gains resulting from redemption or sale of Fund shares.
The returns shown are based on net asset values calculated for shareholder transactions and may differ from the returns shown in the financial highlights, which reflect adjustments made to the net asset values in accordance with accounting principles generally accepted in the United States of America.
| | | | | | | | |
| | | |
| FEBRUARY 28, 2021 | | J.P. MORGAN EXCHANGE-TRADED FUNDS | | | | | 11 | |
JPMorgan International Bond Opportunities ETF
(formerly known as JPMorgan Global Bond Opportunities ETF )1
FUND COMMENTARY
TWELVE MONTHS ENDED FEBRUARY 28, 2021 (Unaudited)
| | | | |
| REPORTING PERIOD RETURN: | | | |
| Net Asset Value* | | | 5.04% | |
| Market Price** | | | 5.95% | |
| Bloomberg Barclays Multiverse ex-USA (USD Hedged) Index | | | (0.24)% | |
| Bloomberg Barclays Multiverse Index | | | 4.50% | |
| |
| Net Assets as of 2/28/2021 | | | $250,097,283 | |
| Duration as of 2/28/2021 | | | 3.4 Years | |
INVESTMENT OBJECTIVE***
The JPMorgan International Bond Opportunities ETF (the “Fund”) seeks to provide total return.
INVESTMENT APPROACH
The Fund invests across sectors in developed and emerging markets without benchmark constraints. The Fund is flexible and opportunistic and the Fund’s adviser has broad discretion to shift the Fund’s exposures to strategies, sectors, countries or currencies based on changing market conditions and its view of the best mix of investment opportunities.
HOW DID THE FUND PERFORM?
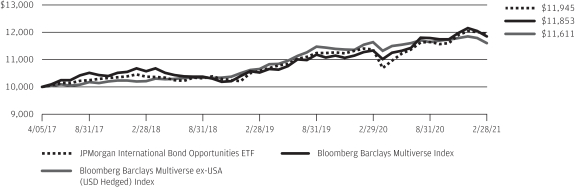
For the twelve months ended February 28, 2021, the Fund posted a positive return of 5.04%. The Fund is managed with an unconstrained orientation and is not managed relative to a benchmark index. While the Fund is not managed to a benchmark, its return is compared to the Bloomberg Barclays Multiverse ex-USA (USD Hedged) Index, which returned -0.24% for the reporting period.
In terms of absolute performance, the Fund’s allocation to investment grade corporate credit was the leading contributor to absolute performance. The Fund’s allocation to corporate high yield debt (also known as “junk bonds”), government interest rates (via government bonds and interest rate futures) and emerging markets debt, including local currency denominated debt, also contributed to absolute performance. The Fund’s investments in securitized debt also provided positive returns for the Fund.
Relative to the Bloomberg Barclays Multiverse ex-USA (USD Hedged) Index, the Fund’s shorter overall duration contributed
to performance as interest rates rose during the period. Generally, bonds with shorter duration experience smaller price declines when interest rates rise, compared with bonds of longer duration.
HOW WAS THE FUND POSITIONED?
The Fund’s managers reduced its exposure to emerging markets debt and high yield debt by roughly 50% at the start of March 2020, in response to the market impact of the COVID-19 pandemic. The managers also adjusted the Fund’s currency positioning and increased overall duration to 5.8 years at the end of March 2020. As financial market stability returned, the Fund subsequently invested in new issues of U.S. investment grade debt and continued to increase its allocation to investment grade debt throughout the second quarter of 2020. By the end of the reporting period, the managers had increased the Fund’s allocation to emerging markets debt and corporate high yield debt, while reducing the Fund’s overall duration. The managers also trimmed the Fund’s exposures to securitized debt and debt from peripheral Europe. The managers also significantly reduced overall duration, primarily by moving to a net short position in U.S. Treasury securities.
The managers increased the length of the Fund’s overall duration through an increase in high quality government bonds, as well as longer duration investment grade debt during March. The managers subsequently reduced duration to 3.44 years at February 28, 2021 from 5.19 years at February 29, 2020.
| 1 | | On September 14, 2020, the Fund’s name was changed to JPMorgan International Bond Opportunities ETF. The Fund’s main investment strategies also changed and its securities benchmark was changed from Bloomberg Barclays Multiverse Index to the Bloomberg Barclays Multiverse Index ex-USA (USD Hedged) Index. |
| | | | | | |
| | | |
| 12 | | | | J.P. MORGAN EXCHANGE-TRADED FUNDS | | FEBRUARY 28, 2021 |
| | | | |
PORTFOLIO COMPOSITION BY COUNTRY**** | |
United States | | | 11.5 | % |
United Kingdom | | | 9.7 | |
France | | | 8.9 | |
Italy | | | 6.7 | |
Germany | | | 6.5 | |
Spain | | | 5.8 | |
Australia | | | 5.7 | |
Netherlands | | | 3.1 | |
Canada | | | 2.4 | |
China | | | 2.4 | |
Portugal | | | 2.3 | |
Mexico | | | 2.3 | |
Luxembourg | | | 2.3 | |
Switzerland | | | 2.0 | |
Ireland | | | 1.8 | |
Indonesia | | | 1.6 | |
South Africa | | | 1.5 | |
| Belgium | | | 1.5 | |
| New Zealand | | | 1.3 | |
Others (each less than 1.0%) | | | 15.7 | |
Short-Term Investments | | | 5.0 | |
| * | | The return shown is based on net asset value and may differ from the return shown in the financial highlights, which reflects adjustments made to the net asset value in accordance with accounting principles generally accepted in the United States of America. The net asset value was $51.04 as of February 28, 2021. |
| ** | | Market price return was calculated assuming an initial investment made at the market price at the beginning of the reporting period, reinvestment of all dividends and distributions at market price during the period, and sale at the market price on the last day of the period. The price used to calculate the market price return was the closing price on the Cboe BZX Exchange, Inc. As of February 28, 2021, the closing price was $51.34. |
| *** | | The adviser seeks to achieve the Fund’s objective. There can be no guarantee it will be achieved. |
| **** | | Percentages indicated are based on total investments as of February 28, 2021. The Fund’s composition is subject to change. |
| | | | | | | | |
| | | |
| FEBRUARY 28, 2021 | | J.P. MORGAN EXCHANGE-TRADED FUNDS | | | | | 13 | |
JPMorgan International Bond Opportunities ETF
(formerly known as JPMorgan Global Bond Opportunities ETF )
FUND COMMENTARY
TWELVE MONTHS ENDED FEBRUARY 28, 2021 (Unaudited) (continued)
| | | | | | | | | | | | |
AVERAGE ANNUAL TOTAL RETURNS AS OF FEBRUARY 28, 2021 (Unaudited) | |
| | | INCEPTION DATE | | | 1 YEAR | | | SINCE
INCEPTION | |
JPMorgan International Bond Opportunities ETF | | | | | | | | | | | | |
Net Asset Value | | | April 5, 2017 | | | | 5.04 | % | | | 4.66 | % |
Market Price | | | | | | | 5.95 | % | | | 4.82 | % |
LIFE OF FUND PERFORMANCE (4/5/17 TO 2/28/21)
The performance quoted is past performance and is not a guarantee of future results. Exchange-traded funds are subject to certain market risks. Investment returns and principal value of an investment will fluctuate so that an investor’s shares, when sold or redeemed, may be worth more or less than their original cost. Current performance may be higher or lower than the performance data shown. For up-to-date, month-end performance information please call 1-844-457-6383.
Fund commenced operations on April 5, 2017.
The graph illustrates comparative performance for $10,000 invested in shares of the JPMorgan International Bond Opportunities ETF, the Bloomberg Barclays Multiverse Index and the Bloomberg Barclays Multiverse ex-USA (USD Hedged) Index from April 5, 2017 to February 28, 2021. The performance of the Fund reflects the deduction of Fund expenses and assumes reinvestment of all dividends and capital gain distributions, if any. The performance of the Bloomberg Barclays Multiverse Index and the Bloomberg Barclays Multiverse ex-USA (USD Hedged) Index does not reflect the deduction of expenses associated with an exchange-traded fund and has been adjusted to reflect reinvestment of all dividends and capital gain distributions of the securities included in the respective Index, if applicable.
The Bloomberg Barclays Multiverse Index is an unmanaged index, which measure the global fixed-income bond market that combines the Bloomberg Barclays Global Aggregate Index and the Bloomberg Barclays Global High Yield Index. The Bloomberg Barclays Global Aggregate Index measures global investment grade debt from twenty-four different local currency markets. The Bloomberg Barclays Global High-Yield Index measures the global high-yield fixed income markets. Investors cannot invest directly in an index.
The Bloomberg Barclays Multiverse Index ex-USA (USD Hedged) Index is a measure of the global fixed income bond market that combines the Barclays Global Aggregate Index, which measures investment-grade debt from 24 different local currency markets, and the Barclays Global High Yield Index, which measures the global high yield fixed income markets. It excludes U.S. securities and is hedged to the U.S. dollar.
Fund performance reflects waiver of a portion of the Fund’s fees and reimbursement of expenses for certain periods from the Fund’s inception date and prior to implementation of a unitary fee structure on November 19, 2019. Without these waivers and reimbursements, performance would have been lower. Also, performance shown in this section does not reflect the deduction of taxes that a shareholder may pay on Fund distributions or on gains resulting from redemption or sale of Fund shares.
Effective September 14, 2020, the Fund changed its investment strategies. The Fund’s past performance would have been different if the Fund were managed using the current strategies. Past performance is not necessarily an indication of how the Fund will perform in the future. Also on September 14, 2020, the Fund’s Benchmark changed from Bloomberg Barclays Multiverse Index to Bloomberg Barclays Multiverse ex-USA (USD Hedged) Index because the adviser believes that the Bloomberg Barclays Multiverse ex-USA (USD Hedged) Index is a more appropriate comparison in light of the Fund’s new name and investment strategies.
The returns shown are based on net asset values calculated for shareholder transactions and may differ from the returns shown in the financial highlights, which reflect adjustments made to the net asset values in accordance with accounting principles generally accepted in the United States of America.
| | | | | | |
| | | |
| 14 | | | | J.P. MORGAN EXCHANGE-TRADED FUNDS | | FEBRUARY 28, 2021 |
JPMorgan Municipal ETF
FUND COMMENTARY
TWELVE MONTHS ENDED FEBRUARY 28, 2021 (Unaudited)
| | | | |
| REPORTING PERIOD RETURN: | |
| Net Asset Value* | | | 0.53% | |
| Market Price** | | | 0.67% | |
| Bloomberg Barclays U.S. 1-15 Year Blend (1-17) Municipal Bond Index | | | 1.38% | |
| |
| Net Assets as of 2/28/2021 | | $ | 76,120,305 | |
| Duration as of 2/28/2021 | | | 5.7 Years | |
INVESTMENT OBJECTIVE***
The JPMorgan Municipal ETF (the “Fund”) seeks to provide monthly dividends, which are excluded from gross income, and to protect the value of your investment by investing primarily in municipal obligations. For purposes of the Fund’s investment objective, “gross income” means gross income for federal income tax purposes.
INVESTMENT APPROACH
The Fund invests primarily in a diversified portfolio of intermediate-term municipal bonds, the income from which is exempt from federal income tax. The Fund seeks to maintain an average weighted maturity between three and ten years.
HOW DID THE FUND PERFORM?
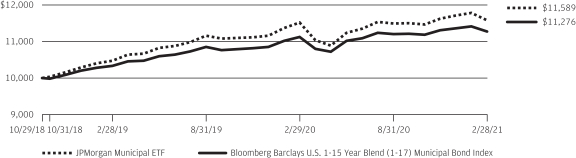
For the twelve months ended February 28, 2021, the Fund underperformed to the Bloomberg Barclays U.S. 1-15 Year Blend (1-17) Municipal Bond Index (the “Index”). Interest rates in the tax free bond sector fell for bonds with maturities of five years and less and rose for bonds with maturities for ten years and longer.
Relative to the Index, the Fund’s overweight allocations to bonds rated BBB and BB were leading detractors from performance. The Fund’s security selection in the education sector also detracted from relative performance.
The Fund’s underweight allocation and security selection in New York State bonds were leading contributors to relative performance. The Fund’s security selection in the
transportation sector and its overweight allocation and security selection in the hospitals sector bonds also contributed to relative performance.
HOW WAS THE FUND POSITIONED?
At the end of the period, the Fund’s largest allocations were to revenue bonds and general obligation bonds. In terms of quality, the Fund was overweight in bonds rated single A and BBB. The Fund’s duration was 5.7 years compared with 4.3 years for the Index.
| | | | |
PORTFOLIO COMPOSITION**** | |
| Municipal Bonds | | | 100.0 | % |
| * | | The return shown is based on net asset value and may differ from the return shown in the financial highlights, which reflects adjustments made to the net asset value in accordance with accounting principles generally accepted in the United States of America. The net asset value was $54.35 as of February 28, 2021. |
| ** | | Market price return was calculated assuming an initial investment made at the market price at the beginning of the reporting period, reinvestment of all dividends and distributions at market price during the period, and sale at the market price on the last day of the period. The price used to calculate the market price return was the closing price on the Cboe BZX Exchange, Inc. As of February 28, 2021, the closing price was $54.35. |
| *** | | The adviser seeks to achieve the Fund’s objective. There can be no guarantee it will be achieved. |
| **** | | Percentages indicated are based on total investments as of February 28, 2021. The Fund’s composition is subject to change. |
| | | | | | | | |
| | | |
| FEBRUARY 28, 2021 | | J.P. MORGAN EXCHANGE-TRADED FUNDS | | | | | 15 | |
JPMorgan Municipal ETF
FUND COMMENTARY
TWELVE MONTHS ENDED FEBRUARY 28, 2021 (Unaudited) (continued)
| | | | | | | | | | | | |
AVERAGE ANNUAL TOTAL RETURNS AS OF FEBRUARY 28, 2021 (Unaudited) | |
| | | INCEPTION DATE | | | 1 YEAR | | | SINCE
INCEPTION | |
JPMorgan Municipal ETF | | | | | | | | | | | | |
Net Asset Value | | | October 29, 2018 | | | | 0.53 | % | | | 6.52 | % |
Market Price | | | | | | | 0.67 | % | | | 6.52 | % |
LIFE OF FUND PERFORMANCE (10/29/18 TO 2/28/21)
The performance quoted is past performance and is not a guarantee of future results. Exchange-traded funds are subject to certain market risks. Investment returns and principal value of an investment will fluctuate so that an investor’s shares, when sold or redeemed, may be worth more or less than their original cost. Current performance may be higher or lower than the performance data shown. For up-to-date, month-end performance information please call 1-844-457-6383.
Fund commenced operations on October 29, 2018.
The graph illustrates comparative performance for $10,000 invested in shares of the JPMorgan Municipal ETF and the Bloomberg Barclays U.S. 1-15 Year Blend (1-17) Municipal Bond Index from October 29, 2018 to February 28, 2021. The performance of the Fund reflects the deduction of Fund expenses and assumes reinvestment of all dividends and capital gain distributions, if any. The performance of the Bloomberg Barclays U.S. 1-15 Year Blend (1-17) Municipal Bond Index does not reflect the deduction of expenses associated with an
exchange-traded fund and has been adjusted to reflect reinvestment of all dividends and capital gain distributions of the securities included in the Index, if applicable. The Bloomberg Barclays U.S. 1-15 Year Blend (1-17) Municipal Bond Index represents the performance of municipal bonds with maturities from 1 to 17 years.
Fund performance reflects waiver of a portion of the Fund’s fees and reimbursement of expenses for certain periods from the Fund’s inception date and prior to implementation of a unitary fee structure on November 19, 2019. Without these waivers and reimbursements, performance would have been lower. Also, performance shown in this section does not reflect the deduction of taxes that a shareholder may pay on Fund distributions or on gains resulting from redemption or sale of Fund shares.
The returns shown are based on net asset values calculated for shareholder transactions and may differ from the returns shown in the financial highlights, which reflect adjustments made to the net asset values in accordance with accounting principles generally accepted in the United States of America.
| | | | | | |
| | | |
| 16 | | | | J.P. MORGAN EXCHANGE-TRADED FUNDS | | FEBRUARY 28, 2021 |
JPMorgan U.S. Aggregate Bond ETF
FUND COMMENTARY
TWELVE MONTHS ENDED FEBRUARY 28, 2021 (Unaudited)
| | | | |
| REPORTING PERIOD RETURN: | |
| Net Asset Value* | | | 1.00% | |
| Market Price** | | | 0.85% | |
| Bloomberg Barclays U.S. Aggregate Index | | | 1.38% | |
| |
| Net Assets as of 2/28/2021 | | $ | 826,789,330 | |
| Duration as of 2/28/2021 | | | 6.2 Years | |
INVESTMENT OBJECTIVE***
The JPMorgan U.S. Aggregate Bond ETF (the “Fund”) seeks to provide long-term total return.
INVESTMENT APPROACH
The Fund invests in a diversified portfolio of high-quality fixed income securities, including corporate bonds, U.S. Treasury obligations and other U.S. government and agency securities, and asset-backed, mortgage-related and mortgage-backed securities. With respect to corporate sub-sectors, the Fund applies a multi-factor credit screening process that seeks exposure to corporate debt issuers with attractive value, quality and momentum characteristics.
HOW DID THE FUND PERFORM?
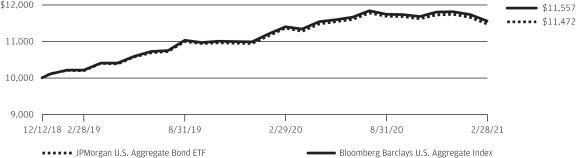
For the twelve months ended February 28, 2021, the Fund underperformed the Bloomberg Barclays U.S. Aggregate Index (the “Index”). During the period, interest rates generally declined and lower quality bonds outperformed higher quality bonds.
Relative to the Index, the Fund’s security selection within corporate bonds detracted from performance.
HOW WAS THE FUND POSITIONED?
During the period, the Fund applied a multi-factor credit screening process to the corporate sub-sectors of the Index that sought exposure to corporate debt issuers that the Fund’s portfolio managers believed had attractive value, quality and momentum characteristics. Among the Fund’s largest
allocations at the end of the period were government bonds and mortgage-backed securities and among its smallest allocations were agency debt and supranational debt.
| | | | |
PORTFOLIO COMPOSITION**** | |
| U.S. Treasury Obligations | | | 36.3 | % |
| Mortgage-Backed Securities | | | 26.8 | |
| Corporate Bonds | | | 26.0 | |
| Commercial Mortgage-Backed Securities | | | 2.1 | |
| Foreign Government Securities | | | 1.9 | |
| U.S. Government Agency Securities | | | 1.6 | |
| Supranational | | | 1.4 | |
| Others (each less than 1.0%) | | | 0.9 | |
| Short-Term Investments | | | 3.0 | |
| * | | The return shown is based on net asset value and may differ from the return shown in the financial highlights, which reflects adjustments made to the net asset value in accordance with accounting principles generally accepted in the United States of America. The net asset value was $27.19 as of February 28, 2021. |
| ** | | Market price return was calculated assuming an initial investment made at the market price at the beginning of the reporting period, reinvestment of all dividends and distributions at market price during the period, and sale at the market price on the last day of the period. The price used to calculate the market price return was the closing price on the NYSE Arca, Inc. As of February 28, 2021, the closing price was $27.18. |
| *** | | The adviser seeks to achieve the Fund’s objective. There can be no guarantee it will be achieved. |
| **** | | Percentages indicated are based on total investments as of February 28, 2021. The Fund’s composition is subject to change. |
| | | | | | | | |
| | | |
| FEBRUARY 28, 2021 | | J.P. MORGAN EXCHANGE-TRADED FUNDS | | | | | 17 | |
JPMorgan U.S. Aggregate Bond ETF
FUND COMMENTARY
TWELVE MONTHS ENDED FEBRUARY 28, 2021 (Unaudited) (continued)
| | | | | | | | | | | | |
AVERAGE ANNUAL TOTAL RETURNS AS OF FEBRUARY 28, 2021 (Unaudited) | |
| | | INCEPTION DATE | | | 1 YEAR | | | SINCE
INCEPTION | |
JPMorgan U.S. Aggregate Bond ETF | | | | | | | | | �� | | | |
Net Asset Value | | | December 12, 2018 | | | | 1.00 | % | | | 6.40 | % |
Market Price | | | | | | | 0.85 | % | | | 6.38 | % |
LIFE OF FUND PERFORMANCE (12/12/18 TO 2/28/21)
The performance quoted is past performance and is not a guarantee of future results. Exchange-traded funds are subject to certain market risks. Investment returns and principal value of an investment will fluctuate so that an investor’s shares, when sold or redeemed, may be worth more or less than their original cost. Current performance may be higher or lower than the performance data shown. For up-to-date, month-end performance information please call 1-844-457-6383.
Fund commenced operations on December 12, 2018.
The graph illustrates comparative performance for $10,000 invested in shares of the JPMorgan U.S. Aggregate Bond ETF and the Bloomberg Barclays U.S, Aggregate Index from December 12, 2018 to February 28, 2021. The performance of the Fund reflects the deduction of Fund expenses and assumes reinvestment of all dividends and capital gain distributions, if any. The performance of the Bloomberg Barclays U.S. Aggregate Index does not reflect the deduction of expenses associated with an exchange-traded fund and has been adjusted to reflect reinvestment of all dividends and capital gain distributions of the securities included in the Index, if applicable.
The Bloomberg Barclays U.S. Aggregate Index is an unmanaged index that represents securities that are SEC-registered, taxable, and dollar denominated. The index covers the U.S. investment grade fixed rate bond market, with index components for government and corporate securities, mortgage pass-through securities, and asset-backed securities. Investors cannot invest directly in an index.
Fund performance reflects waiver of a portion of the Fund’s fees and reimbursement of expenses for certain periods from the Fund’s inception date and prior to implementation of a unitary fee structure on November 19, 2019. Without these waivers and reimbursements, performance would have been lower. Also, performance shown in this section does not reflect the deduction of taxes that a shareholder may pay on Fund distributions or on gains resulting from redemption or sale of Fund shares.
The returns shown are based on net asset values calculated for shareholder transactions and may differ from the returns shown in the financial highlights, which reflect adjustments made to the net asset values in accordance with accounting principles generally accepted in the United States of America.
| | | | | | |
| | | |
| 18 | | | | J.P. MORGAN EXCHANGE-TRADED FUNDS | | FEBRUARY 28, 2021 |
JPMorgan Ultra-Short Income ETF
FUND COMMENTARY
TWELVE MONTHS ENDED FEBRUARY 28, 2021 (Unaudited)
| | | | |
| REPORTING PERIOD RETURN: | | | |
| Net Asset Value* | | | 1.72% | |
| Market Price** | | | 1.67% | |
| ICE BofAML 3-Month US Treasury Bill Index | | | 0.40% | |
| |
| Net Assets as of 2/28/2021 | | | $16,144,037,713 | |
| Duration as of 2/28/2021 | | | 0.7 Years | |
INVESTMENT OBJECTIVE***
The JPMorgan Ultra-Short Income ETF (the “Fund”) seeks to provide current income while seeking to maintain a low volatility of principal.
INVESTMENT APPROACH
The Fund primarily invests in investment grade, U.S. dollar-denominated short-term fixed, variable and floating-rate debt. The Fund seeks to maintain a duration of one year or less, although under certain market conditions, the Fund’s duration may be longer than one year. Duration measures the price sensitivity of a portfolio of bonds to relative changes in interest rates. Generally, bonds with longer duration will experience a larger decrease or increase in price as interest rates rise or fall, respectively, versus bonds with shorter duration. The Fund’s adviser has broad discretion to shift the Fund’s exposure to strategies and sectors based on changing market conditions and its view of the best mix of investment opportunities.
HOW DID THE FUND PERFORM?
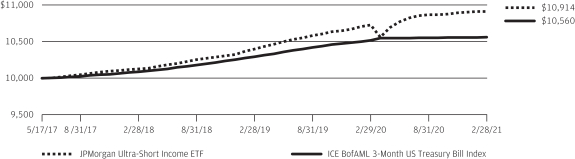
For the twelve months ended February 28, 2021, the Fund outperformed the ICE BofAML 3-Month US Treasury Bill Index (the “Index”).
The Fund’s exposure to investment grade corporate bonds and money market securities were leading contributors to both positive absolute performance and performance relative to the Index. The Fund’s allocations to collateralized loan obligations, asset-backed securities, and mortgage-backed securities also contributed to both absolute and relative performance.
There were no significant detractors from absolute or relative performance during the reporting period.
HOW WAS THE FUND POSITIONED?
Early in the reporting period, the Fund’s portfolio managers increased the Fund’s duration in anticipation of a decision by the U.S. Federal Reserve (the “Fed”) to cut interest rates in response to the pandemic’s impact on the economy. After the Fed cut rates to near-zero in March 2020, the portfolio managers maintained a long duration position according to their belief that interest rates would continue to remain zero-bound. From a credit positioning standpoint, early in 2020 the
portfolio managers shifted to a more defensive stance given the severity of the pandemic. Following the Fed’s launch of lending facilities in March 2020, the portfolio managers increased the Fund’s exposure to the corporate sector. The portfolio management team focused on adding high quality securities to the Fund and limiting exposure to issuers at the lower end of the investment grade spectrum in order to insulate the portfolio from further volatility in markets. Toward the end of the reporting period, the Fund’s duration was reduced. In descending order, the Fund’s largest allocations were in corporate bonds, money market securities, collateralized loan obligations, mortgage-backed securities, asset-backed securities, treasuries and non-corporate credit.
| | | | |
PORTFOLIO COMPOSITION BY SECTOR**** | |
| Financials | | | 43.0 | % |
| Asset-Backed Securities | | | 11.4 | |
| Utilities | | | 3.1 | |
| Consumer Discretionary | | | 3.0 | |
| Consumer Staples | | | 2.4 | |
| Commercial Mortgage-Backed Securities | | | 2.3 | |
| Health Care | | | 1.7 | |
| Industrials | | | 1.6 | |
| U.S. Treasury Obligations | | | 1.3 | |
| Energy | | | 1.2 | |
| Communication Services | | | 1.1 | |
| Others (each less than 1.0%) | | | 1.8 | |
| Short-Term Investments | | | 26.1 | |
| * | | The return shown is based on net asset value and may differ from the return shown in the financial highlights, which reflects adjustments made to the net asset value in accordance with accounting principles generally accepted in the United States of America. The net asset value was $50.77 as of February 28, 2021. |
| ** | | Market price return was calculated assuming an initial investment made at the market price at the beginning of the reporting period, reinvestment of all dividends and distributions at market price during the period, and sale at the market price on the last day of the period. The price used to calculate the market price return was the closing price on the Cboe BZX Exchange, Inc. As of February 28, 2021, the closing price was $50.79. |
| *** | | The adviser seeks to achieve the Fund’s objective. There can be no guarantee it will be achieved. |
| **** | | Percentages indicated are based on total investments as of February 28, 2021. The Fund’s composition is subject to change. |
| | | | | | | | |
| | | |
| FEBRUARY 28, 2021 | | J.P. MORGAN EXCHANGE-TRADED FUNDS | | | | | 19 | |
JPMorgan Ultra-Short Income ETF
FUND COMMENTARY
TWELVE MONTHS ENDED FEBRUARY 28, 2021 (Unaudited) (continued)
| | | | | | | | | | | | |
AVERAGE ANNUAL TOTAL RETURNS AS OF FEBRUARY 28, 2021 (Unaudited) | |
| | | INCEPTION DATE | | | 1 YEAR | | | SINCE
INCEPTION | |
JPMorgan Ultra-Short Income ETF | | | | | | | | | | | | |
Net Asset Value | | | May 17, 2017 | | | | 1.72 | % | | | 2.34 | % |
Market Price | | | | | | | 1.67 | % | | | 2.35 | % |
LIFE OF FUND PERFORMANCE (5/17/17 TO 2/28/21)
The performance quoted is past performance and is not a guarantee of future results. Exchange-traded funds are subject to certain market risks. Investment returns and principal value of an investment will fluctuate so that an investor’s shares, when sold or redeemed, may be worth more or less than their original cost. Current performance may be higher or lower than the performance data shown. For up-to-date, month-end performance information please call 1-844-457-6383.
Fund commenced operations on May 17, 2017.
The graph illustrates comparative performance for $10,000 invested in shares of the JPMorgan Ultra-Short Income ETF and the ICE BofAML 3-Month US Treasury Bill Index from May 17, 2017 to February 28, 2021. The performance of the Fund reflects the deduction of Fund expenses and assumes reinvestment of all dividends and capital gain distributions, if any. The performance of the ICE BofAML 3-Month US Treasury Bill Index does not reflect the deduction of expenses associated with an exchange-traded fund and has been adjusted to reflect reinvestment of all dividends and capital gain distributions of the
securities included in the Index, if applicable. The ICE BofAML 3-Month US Treasury Bill Index is comprised of a single issue purchased at the beginning of the month and held for a full month. The index is rebalanced monthly and the issue selected is the outstanding Treasury Bill that matures closest to, but not beyond 3 months from the rebalancing date. Investors cannot invest directly in an index.
Fund performance reflects waiver of a portion of the Fund’s fees and reimbursement of expenses for certain periods from the Fund’s inception date and prior to implementation of a unitary fee structure on November 19, 2019. Without these waivers and reimbursements, performance would have been lower. Also, performance shown in this section does not reflect the deduction of taxes that a shareholder may pay on Fund distributions or on gains resulting from redemption or sale of Fund shares.
The returns shown are based on net asset values calculated for shareholder transactions and may differ from the returns shown in the financial highlights, which reflect adjustments made to the net asset values in accordance with accounting principles generally accepted in the United States of America.
| | | | | | |
| | | |
| 20 | | | | J.P. MORGAN EXCHANGE-TRADED FUNDS | | FEBRUARY 28, 2021 |
JPMorgan Ultra-Short Municipal Income ETF
FUND COMMENTARY
TWELVE MONTHS ENDED FEBRUARY 28, 2021 (Unaudited)
| | | | |
| REPORTING PERIOD RETURN: | |
| Net Asset Value* | | | 1.64% | |
| Market Price** | | | 1.64% | |
| Bloomberg Barclays 1-Year Municipal Bond Index | | | 1.33% | |
| |
| Net Assets as of 2/28/2021 | | $ | 1,410,311,158 | |
| Duration as of 2/28/2021 | | | 0.7 Years | |
INVESTMENT OBJECTIVE***
The JPMorgan Ultra-Short Municipal Income ETF (the “Fund”) seeks as high a level of current income exempt from federal income tax as is consistent with relative stability of principal.
INVESTMENT APPROACH
The Fund invests primarily in investment grade fixed, variable and floating rate municipal securities, the income from which is exempt from federal income tax. The Fund seeks to maintain an average weighted maturity of two years or less.
HOW DID THE FUND PERFORM?
For the twelve months ended February 28, 2021, the Fund outperformed the Bloomberg Barclays 1-Year Municipal Bond Index (the “Index”). Interest rates fell during the reporting period on bonds with maturities of five years and less and rose on bonds with maturities of ten years and longer.
Relative to the Index, the Fund’s security selection in the local general obligation bonds sector and its allocation to unrated notes within that sector were leading contributors to performance. The Fund’s security selection in the hospitals and special tax sectors and its underweight position in California bonds also contributed to relative performance.
The Fund’s shorter overall duration was a leading detractor from relative performance. Generally, bonds with shorter duration experience a smaller increase in price compared with longer duration bonds when interest rates fall. The Fund’s allocation to variable rate demand notes (“VDRNs”), which are not held in the Index, also detracted from performance as VDRNs do not generally benefit from falling interest rates. The Fund’s underweight allocation to bonds rated BBB also detracted from relative performance.
HOW WAS THE FUND POSITIONED?
At the end of the period, the Fund’s largest allocation was to revenue bonds. In terms of quality, the Fund was overweight in non-rated bonds and bonds rated AAA. The Fund’s duration was 0.7 years compared with 1.4 years for the Index.
| | | | |
PORTFOLIO COMPOSITION**** | |
| Municipal Bonds | | | 90.0 | % |
| Short-Term Investments | | | 10.0 | |
| * | | The return shown is based on net asset value and may differ from the return shown in the financial highlights, which reflects adjustments made to the net asset value in accordance with accounting principles generally accepted in the United States of America. The net asset value was $50.99 as of February 28, 2021. |
| ** | | Market price return was calculated assuming an initial investment made at the market price at the beginning of the reporting period, reinvestment of all dividends and distributions at market price during the period, and sale at the market price on the last day of the period. The price used to calculate the market price return was the closing price on the Cboe BZX Exchange, Inc. As of February 28, 2021, the closing price was $51.03. |
| *** | | The adviser seeks to achieve the Fund’s objective. There can be no guarantee it will be achieved. |
| **** | | Percentages indicated are based on total investments as of February 28, 2021. The Fund’s composition is subject to change. |
| | | | | | | | |
| | | |
| FEBRUARY 28, 2021 | | J.P. MORGAN EXCHANGE-TRADED FUNDS | | | | | 21 | |
JPMorgan Ultra-Short Municipal Income ETF
FUND COMMENTARY
TWEVLE MONTHS ENDED FEBRUARY 28, 2021 (Unaudited) (continued)
| | | | | | | | | | | | |
AVERAGE ANNUAL TOTAL RETURNS AS OF FEBRUARY 28, 2021 (Unaudited) | |
| | | INCEPTION DATE | | | 1 YEAR | | | SINCE
INCEPTION | |
JPMorgan Ultra-Short Municipal Income ETF | | | | | | | | | | | | |
Net Asset Value | | | October 16, 2018 | | | | 1.64 | % | | | 2.06 | % |
Market Price | | | | | | | 1.64 | % | | | 2.09 | % |
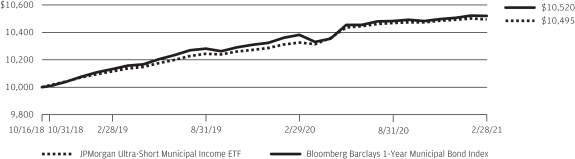
LIFE OF FUND PERFORMANCE (10/16/18 TO 2/28/21)
The performance quoted is past performance and is not a guarantee of future results. Exchange-traded funds are subject to certain market risks. Investment returns and principal value of an investment will fluctuate so that an investor’s shares, when sold or redeemed, may be worth more or less than their original cost. Current performance may be higher or lower than the performance data shown. For up-to-date, month-end performance information please call 1-844-457-6383.
Fund commenced operations on October 16, 2018.
The graph illustrates comparative performance for $10,000 invested in shares of the JPMorgan Ultra-Short Municipal Income ETF and the Bloomberg Barclays 1-Year Municipal Bond Index from October 16, 2018 to February 28, 2021. The performance of the Fund reflects the deduction of Fund expenses and assumes reinvestment of all dividends and capital gain distributions, if any. The performance of the Bloomberg Barclays 1-Year Municipal Bond Index does not reflect the deduction of expenses associated with an exchange-traded fund and has been adjusted to reflect reinvestment of all dividends and capital gain distributions of the securities included in the Index, if applicable. The Bloomberg Barclays 1 Year Municipal Bond Index is an unmanaged index that includes
bonds with a minimum credit rating of BAA3, are issued as part of a deal of at least $50 million, have an amount outstanding of at least $5 million, and have maturities of 1 to 2 years. The performance of the index does not reflect the deduction of expenses associated with a mutual fund, such as investment management fees. By contrast, the performance of the Fund reflects the deduction of the mutual fund expenses, including sales charges if applicable. An individual cannot invest directly in an index.
Fund performance reflects waiver of a portion of the Fund’s fees and reimbursement of expenses for certain periods from the Fund’s inception date and prior to implementation of a unitary fee structure on November 19, 2019. Without these waivers and reimbursements, performance would have been lower. Also, performance shown in this section does not reflect the deduction of taxes that a shareholder may pay on Fund distributions or redemption on gains resulting from or sale of Fund shares.
The returns shown are based on net asset values calculated for shareholder transactions and may differ from the returns shown in the financial highlights, which reflect adjustments made to the net asset values in accordance with accounting principles generally accepted in the United States of America.
| | | | | | |
| | | |
| 22 | | | | J.P. MORGAN EXCHANGE-TRADED FUNDS | | FEBRUARY 28, 2021 |
JPMorgan USD Emerging Markets Sovereign Bond ETF
FUND COMMENTARY
TWELVE MONTHS ENDED FEBRUARY 28, 2021 (Unaudited)
| | | | |
| REPORTING PERIOD RETURN: | | | |
| Net Asset Value* | | | 0.79% | |
| Market Price** | | | 0.50% | |
| JPMorgan Emerging Markets Risk-Aware Bond Index | | | 1.62% | |
| |
| Net Assets as of 2/28/2021 | | | $83,750,663 | |
| Duration as of 2/28/2021 | | | 8.0 Years | |
INVESTMENT OBJECTIVE***
The JPMorgan USD Emerging Markets Sovereign Bond ETF (the “Fund”) seeks investment results that closely correspond, before fees and expenses, to the performance of the JPMorgan Emerging Markets Risk-Aware Bond Index (the “Underlying Index”).
INVESTMENT APPROACH
The Fund is passively managed to the Underlying Index, which is comprised of liquid, U.S. dollar-denominated sovereign and quasi-sovereign fixed and floating rate debt securities from emerging markets. The Underlying Index utilizes a rules-based, proprietary methodology that filters for liquidity and country risk and allocates risk across credit ratings. The Underlying Index methodology includes monthly rebalancing within countries and semi-annual rebalancing across countries. The Fund also employs optimization techniques that seek to minimize tracking error to the Underlying Index.
HOW DID THE FUND PERFORM?
For the twelve months ended February 28, 2021, the Fund performed in line with the Underlying Index. The majority of
the Fund’s deviation against the Underlying Index was primarily due to operating expenses, fees and tax management of the Fund’s portfolio.
The Fund’s and the Underlying Index’s risk filter screened out exposure to Lebanon amid political instability, which was a positive contributor to absolute performance. The Fund’s and the Underlying Index’s allocation to high yield debt (also known as “junk bonds”) detracted from absolute performance as high yield debt generally underperformed during the reporting period.
HOW WAS THE FUND POSITIONED?
The Fund invested at least 80% of its assets in securities included in the Underlying Index. During the reporting period, the Fund’s and Underlying Index’s largest allocations were to Turkey and Brazil and their smallest allocations were to Slovak Republic and Lithuania.
| | | | | | | | |
| | | |
| FEBRUARY 28, 2021 | | J.P. MORGAN EXCHANGE-TRADED FUNDS | | | | | 23 | |
JPMorgan USD Emerging Markets Sovereign Bond ETF
FUND COMMENTARY
TWELVE MONTHS ENDED FEBRUARY 28, 2021 (Unaudited) (continued)
| | | | |
PORTFOLIO COMPOSITION BY COUNTRY**** | |
| Turkey | | | 8.4 | % |
| Brazil | | | 7.5 | |
| Egypt | | | 6.3 | |
| Dominican Republic | | | 6.3 | |
| Oman | | | 5.9 | |
| South Africa | | | 5.3 | |
| Bahrain | | | 4.8 | |
| Ukraine | | | 4.5 | |
| Mexico | | | 3.3 | |
| Indonesia | | | 2.9 | |
| Saudi Arabia | | | 2.7 | |
| Qatar | | | 2.5 | |
| United Arab Emirates | | | 2.4 | |
| Russia | | | 2.3 | |
| Philippines | | | 2.1 | |
| Jamaica | | | 2.0 | |
| Kenya | | | 2.0 | |
| Azerbaijan | | | 1.9 | |
| Colombia | | | 1.9 | |
| China | | | 1.8 | |
| Panama | | | 1.7 | |
| Chile | | | 1.7 | |
| Jordan | | | 1.6 | |
| Peru | | | 1.5 | |
| Malaysia | | | 1.4 | |
| Kazakhstan | | | 1.4 | |
| Uruguay | | | 1.4 | |
| Pakistan | | | 1.3 | |
| Ivory Coast | | | 1.2 | |
| Iraq | | | 1.1 | |
| Others (each less than 1.0%) | | | 5.8 | |
| Short-Term Investments | | | 3.1 | |
| * | | The return shown is based on net asset value and may differ from the return shown in the financial highlights, which reflects adjustments made to the net asset value in accordance with accounting principles generally accepted in the United States of America. The net asset value was $49.24 as of February 28, 2021. |
| ** | | Market price return was calculated assuming an initial investment made at the market price at the beginning of the reporting period, reinvestment of all dividends and distributions at market price during the period, and sale at the market price on the last day of the period. The price used to calculate the market price return was the closing price on the NYSE Arca, Inc. As of February 28, 2021, the closing price was $49.30. |
| *** | | The adviser seeks to achieve the Fund’s objective. There can be no guarantee it will be achieved. |
| **** | | Percentages indicated are based on total investments as of February 28, 2021. The Fund’s composition is subject to change. |
| | | | | | |
| | | |
| 24 | | | | J.P. MORGAN EXCHANGE-TRADED FUNDS | | FEBRUARY 28, 2021 |
| | | | | | | | | | | | |
AVERAGE ANNUAL TOTAL RETURNS AS OF FEBRUARY 28, 2021 (Unaudited) | |
| | | INCEPTION DATE | | | 1 YEAR | | | SINCE
INCEPTION | |
JPMorgan USD Emerging Markets Sovereign Bond ETF | | | | | | | | | | | | |
Net Asset Value | | | January 29, 2018 | | | | 0.79 | % | | | 4.16 | % |
Market Price | | | | | | | 0.50 | % | | | 4.18 | % |
LIFE OF FUND PERFORMANCE (1/29/18 TO 2/28/21)
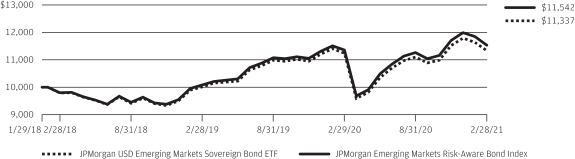
The performance quoted is past performance and is not a guarantee of future results. Exchange-traded funds are subject to certain market risks. Investment returns and principal value of an investment will fluctuate so that an investor’s shares, when sold or redeemed, may be worth more or less than their original cost. Current performance may be higher or lower than the performance data shown. For up-to-date, month-end performance information please call 1-844-457-6383.
Fund commenced operations on January 29, 2018.
The graph illustrates comparative performance for $10,000 invested in shares of the JPMorgan USD Emerging Markets Sovereign Bond ETF and the JPMorgan Emerging Markets Risk-Aware Bond Index from January 29, 2018 to February 28, 2021. The performance of the Fund reflects the deduction of Fund expenses and assumes reinvestment of all dividends and capital gain distributions, if any. The performance of the JPMorgan Emerging Markets Risk-Aware Bond Index does not reflect the deduction of expenses associated with an exchange-traded fund and has been adjusted to reflect reinvestment of all dividends and capital gain distributions of the securities included in the Index, if applicable. The JPMorgan Emerging Markets Risk-Aware Bond Index (the “index”) is comprised of liquid, U.S. dollar-denominated sovereign and quasi-sovereign fixed and floating rate debt securities from emerging markets selected using a rules-based methodology and is owned by J.P. Morgan Investment Inc., the Fund’s adviser (the “Adviser”). The Index is maintained and calculated by J.P. Morgan Securities LLC (“JPMS” or the “Index Provider”), which selects securities in accordance with the methodology from among the components of the J.P. Morgan Emerging Market Bond Index Global Diversified, which was developed and is maintained by the Index Provider. The Index Provider and the Adviser are both wholly-owned subsidiaries of JPMorgan Chase & Co., a publicly-held financial services holding company. The Index
starts with the J.P. Morgan Emerging Market Bond Index Global Diversified and applies a proprietary methodology that filters for liquidity and for country risk and allocates risk based on credit rating. Historically, the J.P. Morgan Emerging Markets Bond Index Global Diversified has included bonds issued by the countries of Angola, Argentina, Armenia, Azerbaijan, Belize, Bolivia, Brazil, Cameroon, Chile, China, Colombia, Costa Rica, Cote D’Ivoire, Croatia, Dominican Republic, Ecuador, Egypt, El Salvador, Ethiopia, Gabon, Georgia, Ghana, Guatemala, Honduras, Hungary, India, Indonesia, Iraq, Jamaica, Jordan, Kazakhstan, Kenya, Latvia, Lebanon, Lithuania, Malaysia, Mexico, Mongolia, Morocco, Mozambique, Namibia, Nigeria, Oman, Pakistan, Panama, Paraguay, Peru, Philippines, Poland, Romania, Russian Federation, Senegal, Serbia, Slovakia, South Africa, Sri Lanka, Suriname, Trinidad and Tobago, Tunisia, Turkey, Ukraine, Uruguay, Venezuela, Vietnam, Zambia; however, this universe of countries may change in accordance with the Index Provider’s determination of eligible emerging market countries and there is no assurance that a particular country will be represented in the Underlying Index at any given time. Investors cannot invest directly in an index.
Fund performance reflects waiver of a portion of the Fund’s fees and reimbursement of expenses for certain periods from the Fund’s inception date and prior to implementation of a unitary fee structure on November 19, 2019. Without these waivers and reimbursements, performance would have been lower. Also, performance shown in this section does not reflect the deduction of taxes that a shareholder may pay on Fund distributions or on gains resulting from redemption or sale of Fund shares.
The returns shown are based on net asset values calculated for shareholder transactions and may differ from the returns shown in the financial highlights, which reflect adjustments made to the net asset values in accordance with accounting principles generally accepted in the United States of America.
| | | | | | | | |
| | | |
| FEBRUARY 28, 2021 | | J.P. MORGAN EXCHANGE-TRADED FUNDS | | | | | 25 | |
JPMorgan BetaBuilders 1-5 Year U.S. Aggregate Bond ETF
SCHEDULE OF PORTFOLIO INVESTMENTS
AS OF FEBRUARY 28, 2021
| | | | | | | | |
| INVESTMENTS | | PRINCIPAL AMOUNT ($) | | | VALUE ($) | |
U.S. Treasury Obligations — 55.3% | | | | | | | | |
| | |
U.S. Treasury Bonds 7.63%, 2/15/2025 | | | 150,000 | | | | 191,977 | |
| | |
U.S. Treasury Notes | | | | | | | | |
| | |
2.00%, 12/31/2021 | | | 2,594,000 | | | | 2,635,241 | |
| | |
1.88%, 1/31/2022 | | | 128,000 | | | | 130,090 | |
| | |
2.00%, 2/15/2022 | | | 776,000 | | | | 790,156 | |
| | |
1.13%, 2/28/2022 | | | 350,000 | | | | 353,568 | |
| | |
1.88%, 2/28/2022 | | | 427,000 | | | | 434,539 | |
| | |
1.75%, 6/30/2022 | | | 200,000 | | | | 204,359 | |
| | |
1.50%, 8/15/2022 | | | 105,000 | | | | 107,121 | |
| | |
1.63%, 8/15/2022 | | | 482,000 | | | | 492,544 | |
| | |
1.50%, 9/15/2022 | | | 360,000 | | | | 367,622 | |
| | |
0.13%, 9/30/2022 | | | 64,000 | | | | 64,010 | |
| | |
1.88%, 9/30/2022 | | | 130,000 | | | | 133,585 | |
| | |
1.38%, 10/15/2022 | | | 900,000 | | | | 918,176 | |
| | |
2.00%, 10/31/2022 | | | 100,000 | | | | 103,113 | |
| | |
2.00%, 11/30/2022 | | | 655,000 | | | | 676,364 | |
| | |
1.63%, 12/15/2022 | | | 23,000 | | | | 23,616 | |
| | |
1.75%, 1/31/2023 | | | 600,000 | | | | 618,516 | |
| | |
2.00%, 2/15/2023 | | | 400,000 | | | | 414,531 | |
| | |
1.50%, 2/28/2023 | | | 705,000 | | | | 724,057 | |
| | |
1.50%, 3/31/2023 | | | 24,000 | | | | 24,673 | |
| | |
0.25%, 6/15/2023 | | | 2,857,000 | | | | 2,861,687 | |
| | |
0.13%, 7/15/2023 | | | 131,000 | | | | 130,816 | |
| | |
1.25%, 7/31/2023 | | | 467,000 | | | | 478,967 | |
| | |
2.75%, 7/31/2023 | | | 687,000 | | | | 729,347 | |
| | |
0.13%, 8/15/2023 | | | 864,000 | | | | 862,448 | |
| | |
0.25%, 11/15/2023 | | | 320,000 | | | | 320,150 | |
| | |
2.75%, 11/15/2023 | | | 793,000 | | | | 846,837 | |
| | |
2.63%, 12/31/2023 | | | 15,000 | | | | 16,005 | |
| | |
2.75%, 2/15/2024 | | | 1,032,000 | | | | 1,107,384 | |
| | |
2.13%, 2/29/2024 | | | 16,000 | | | | 16,879 | |
| | |
2.38%, 2/29/2024 | | | 2,627,000 | | | | 2,790,982 | |
| | |
2.13%, 3/31/2024 | | | 70,000 | | | | 73,910 | |
| | |
2.00%, 4/30/2024 | | | 480,000 | | | | 505,425 | |
| | |
2.25%, 4/30/2024 | | | 15,000 | | | | 15,912 | |
| | |
2.00%, 5/31/2024 | | | 335,000 | | | | 353,006 | |
| | |
1.75%, 6/30/2024 | | | 282,000 | | | | 295,020 | |
| | |
1.75%, 7/31/2024 | | | 717,000 | | | | 750,497 | |
| | |
2.38%, 8/15/2024 | | | 1,947,000 | | | | 2,080,856 | |
| | |
1.50%, 9/30/2024 | | | 1,070,000 | | | | 1,111,463 | |
| | |
1.50%, 10/31/2024 | | | 280,000 | | | | 290,850 | |
| | |
1.50%, 11/30/2024 | | | 254,000 | | | | 263,882 | |
| | |
2.13%, 11/30/2024 | | | 185,000 | | | | 196,534 | |
| | |
1.75%, 12/31/2024 | | | 545,000 | | | | 571,484 | |
| | |
1.38%, 1/31/2025 | | | 451,000 | | | | 466,433 | |
| | |
0.50%, 3/31/2025 | | | 310,000 | | | | 309,661 | |
| | | | | | | | |
| INVESTMENTS | | PRINCIPAL AMOUNT ($) | | | VALUE ($) | |
| |
| | |
0.38%, 4/30/2025 | | | 839,000 | | | | 832,970 | |
| | |
0.25%, 5/31/2025 | | | 515,000 | | | | 508,120 | |
| | |
0.25%, 6/30/2025 | | | 382,000 | | | | 376,509 | |
| | |
2.75%, 6/30/2025 | | | 130,000 | | | | 142,096 | |
| | |
0.25%, 7/31/2025 | | | 135,000 | | | | 132,922 | |
| | |
2.00%, 8/15/2025 | | | 308,000 | | | | 327,009 | |
| | |
0.25%, 8/31/2025 | | | 1,092,000 | | | | 1,073,999 | |
| | |
0.25%, 9/30/2025 | | | 703,000 | | | | 690,588 | |
| | |
0.25%, 10/31/2025 | | | 934,000 | | | | 916,706 | |
| | |
2.25%, 11/15/2025 | | | 310,000 | | | | 332,984 | |
| | |
0.38%, 11/30/2025 | | | 210,000 | | | | 207,096 | |
| | |
0.38%, 1/31/2026 | | | 602,000 | | | | 592,406 | |
| | | | | | | | |
| | |
Total U.S. Treasury Obligations
(Cost $32,527,015) | | | | | | | 32,987,698 | |
| | | | | | | | |
|
Corporate Bonds — 24.8% | |
|
Aerospace & Defense — 0.4% | |
| | |
Boeing Co. (The) | | | | | | | | |
| | |
2.13%, 3/1/2022 | | | 8,000 | | | | 8,100 | |
| | |
2.70%, 5/1/2022 | | | 35,000 | | | | 35,811 | |
| | |
4.88%, 5/1/2025 | | | 33,000 | | | | 36,911 | |
| | |
2.60%, 10/30/2025 (a) | | | 10,000 | | | | 10,316 | |
| | |
2.75%, 2/1/2026 | | | 27,000 | | | | 27,953 | |
| | |
General Dynamics Corp. | | | | | | | | |
| | |
2.25%, 11/15/2022 | | | 16,000 | | | | 16,453 | |
| | |
3.25%, 4/1/2025 | | | 15,000 | | | | 16,328 | |
| | |
Leidos, Inc. 3.63%, 5/15/2025 (b) | | | 15,000 | | | | 16,465 | |
| | |
Lockheed Martin Corp. 3.10%, 1/15/2023 | | | 5,000 | | | | 5,233 | |
| | |
Northrop Grumman Corp. 2.55%, 10/15/2022 | | | 15,000 | | | | 15,509 | |
| | |
Precision Castparts Corp. 3.25%, 6/15/2025 | | | 18,000 | | | | 19,654 | |
| | |
Raytheon Technologies Corp. | | | | | | | | |
| | |
2.50%, 12/15/2022 | | | 15,000 | | | | 15,481 | |
| | |
3.20%, 3/15/2024 | | | 15,000 | | | | 16,106 | |
| | | | | | | | |
| | |
| | | | | | | 240,320 | |
| | | | | | | | |
| | |
Air Freight & Logistics — 0.1% | | | | | | | | |
| | |
FedEx Corp. | | | | | | | | |
| | |
2.63%, 8/1/2022 | | | 15,000 | | | | 15,480 | |
| | |
4.00%, 1/15/2024 | | | 10,000 | | | | 10,962 | |
| | |
3.80%, 5/15/2025 | | | 10,000 | | | | 11,073 | |
| | |
United Parcel Service, Inc. | | | | | | | | |
| | |
2.35%, 5/16/2022 | | | 8,000 | | | | 8,189 | |
| | |
2.20%, 9/1/2024 | | | 10,000 | | | | 10,546 | |
| | | | | | | | |
| | |
| | | | | | | 56,250 | |
| | | | | | | | |
SEE NOTES TO FINANCIAL STATEMENTS.
| | | | | | |
| | | |
| 26 | | | | J.P. MORGAN EXCHANGE-TRADED FUNDS | | FEBRUARY 28, 2021 |
| | | | | | | | |
| INVESTMENTS | | PRINCIPAL AMOUNT ($) | | | VALUE ($) | |
Corporate Bonds — continued | |
| | |
Airlines — 0.1% | | | | | | | | |
| | |
Southwest Airlines Co. 5.25%, 5/4/2025 | | | 34,000 | | | | 38,994 | |
| | | | | | | | |
| | |
Auto Components — 0.1% | | | | | | | | |
| | |
Aptiv Corp. 4.15%, 3/15/2024 | | | 17,000 | | | | 18,619 | |
| | |
Magna International, Inc. (Canada) 3.63%, 6/15/2024 | | | 10,000 | | | | 10,876 | |
| | | | | | | | |
| | |
| | | | | | | 29,495 | |
| | | | | | | | |
| | |
Automobiles — 0.2% | | | | | | | | |
| | |
General Motors Co. 4.88%, 10/2/2023 | | | 15,000 | | | | 16,514 | �� |
| | |
Toyota Motor Corp. (Japan) 2.36%, 7/2/2024 | | | 76,000 | | | | 80,376 | |
| | | | | | | | |
| | |
| | | | | | | 96,890 | |
| | | | | | | | |
| | |
Banks — 6.4% | | | | | | | | |
| | |
Banco Bilbao Vizcaya Argentaria SA (Spain) 0.88%, 9/18/2023 | | | 200,000 | | | | 201,549 | |
| | |
Bank of America Corp. | | | | | | | | |
| | |
2.50%, 10/21/2022 | | | 5,000 | | | | 5,068 | |
| | |
(ICE LIBOR USD 3 Month + 1.02%),
2.88%, 4/24/2023 (c) | | | 15,000 | | | | 15,422 | |
| | |
(ICE LIBOR USD 3 Month + 0.93%),
2.82%, 7/21/2023 (c) | | | 17,000 | | | | 17,560 | |
| | |
(ICE LIBOR USD 3 Month + 0.79%),
3.00%, 12/20/2023 (c) | | | 10,000 | | | | 10,453 | |
| | |
4.13%, 1/22/2024 | | | 65,000 | | | | 71,711 | |
| | |
4.20%, 8/26/2024 | | | 15,000 | | | | 16,651 | |
| | |
(ICE LIBOR USD 3 Month + 0.97%),
3.46%, 3/15/2025 (c) | | | 24,000 | | | | 25,914 | |
| | |
Series L, 3.95%, 4/21/2025 | | | 40,000 | | | | 44,267 | |
| | |
(ICE LIBOR USD 3 Month + 0.64%),
2.01%, 2/13/2026 (c) | | | 40,000 | | | | 41,339 | |
| | |
(SOFR + 1.15%), 1.32%, 6/19/2026 (c) | | | 114,000 | | | | 114,777 | |
| | |
(SOFR + 1.01%), 1.20%, 10/24/2026 (c) | | | 39,000 | | | | 38,924 | |
| | |
Bank of Montreal (Canada) | | | | | | | | |
| | |
2.35%, 9/11/2022 | | | 42,000 | | | | 43,357 | |
| | |
Series E, 3.30%, 2/5/2024 | | | 5,000 | | | | 5,392 | |
| | |
2.50%, 6/28/2024 | | | 18,000 | | | | 19,101 | |
| | |
(USD Swap Semi 5 Year + 1.28%),
4.34%, 10/5/2028 (c) | | | 25,000 | | | | 27,212 | |
| | |
Bank of Nova Scotia (The) (Canada) | | | | | | | | |
| | |
2.70%, 3/7/2022 | | | 15,000 | | | | 15,377 | |
| | |
2.00%, 11/15/2022 | | | 24,000 | | | | 24,701 | |
| | |
3.40%, 2/11/2024 | | | 17,000 | | | | 18,394 | |
| | |
2.20%, 2/3/2025 | | | 12,000 | | | | 12,538 | |
| | |
Barclays plc (United Kingdom) 3.65%, 3/16/2025 | | | 40,000 | | | | 43,528 | |
| | | | | | | | |
| INVESTMENTS | | PRINCIPAL AMOUNT ($) | | | VALUE ($) | |
| |
|
Banks — continued | |
| | |
BNP Paribas SA (France) 3.25%, 3/3/2023 | | | 62,000 | | | | 65,731 | |
| | |
Canadian Imperial Bank of Commerce (Canada) | | | | | | | | |
| | |
0.95%, 6/23/2023 | | | 18,000 | | | | 18,205 | |
| | |
2.25%, 1/28/2025 | | | 20,000 | | | | 20,897 | |
| | |
0.95%, 10/23/2025 | | | 133,000 | | | | 132,375 | |
| | |
Citigroup, Inc. | | | | | | | | |
| | |
2.75%, 4/25/2022 | | | 16,000 | | | | 16,414 | |
| | |
4.05%, 7/30/2022 | | | 15,000 | | | | 15,753 | |
| | |
(ICE LIBOR USD 3 Month + 0.72%),
3.14%, 1/24/2023 (c) | | | 107,000 | | | | 109,583 | |
| | |
(ICE LIBOR USD 3 Month + 0.95%),
2.88%, 7/24/2023 (c) | | | 20,000 | | | | 20,661 | |
| | |
3.88%, 10/25/2023 | | | 7,000 | | | | 7,629 | |
| | |
(ICE LIBOR USD 3 Month + 1.02%),
4.04%, 6/1/2024 (c) | | | 12,000 | | | | 12,952 | |
| | |
Comerica, Inc. 3.70%, 7/31/2023 | | | 15,000 | | | | 16,121 | |
| | |
Cooperatieve Rabobank UA (Netherlands) 3.88%, 2/8/2022 | | | 54,000 | | | | 55,850 | |
| | |
Fifth Third Bancorp | | | | | | | | |
| | |
3.50%, 3/15/2022 | | | 25,000 | | | | 25,763 | |
| | |
4.30%, 1/16/2024 | | | 12,000 | | | | 13,192 | |
| | |
First Horizon Corp. 3.55%, 5/26/2023 | | | 24,000 | | | | 25,419 | |
| | |
First Niagara Financial Group, Inc. 7.25%, 12/15/2021 | | | 25,000 | | | | 26,328 | |
| | |
HSBC Holdings plc (United Kingdom) | | | | | | | | |
| | |
4.00%, 3/30/2022 | | | 75,000 | | | | 77,993 | |
| | |
(ICE LIBOR USD 3 Month + 1.14%),
2.63%, 11/7/2025 (c) | | | 30,000 | | | | 31,730 | |
| | |
Huntington Bancshares, Inc. | | | | | | | | |
| | |
2.63%, 8/6/2024 | | | 17,000 | | | | 18,063 | |
| | |
4.00%, 5/15/2025 | | | 8,000 | | | | 8,959 | |
| | |
Kreditanstalt fuer Wiederaufbau (Germany) | | | | | | | | |
| | |
2.50%, 2/15/2022 | | | 16,000 | | | | 16,355 | |
| | |
2.00%, 9/29/2022 | | | 23,000 | | | | 23,662 | |
| | |
2.00%, 10/4/2022 | | | 220,000 | | | | 226,338 | |
| | |
1.38%, 8/5/2024 | | | 70,000 | | | | 72,185 | |
| | |
2.50%, 11/20/2024 | | | 13,000 | | | | 13,947 | |
| | |
0.38%, 7/18/2025 | | | 26,000 | | | | 25,615 | |
| | |
0.63%, 1/22/2026 | | | 30,000 | | | | 29,703 | |
| | |
Landwirtschaftliche Rentenbank (Germany) | | | | | | | | |
| | |
3.13%, 11/14/2023 | | | 54,000 | | | | 58,050 | |
| | |
Series 40, 0.50%, 5/27/2025 | | | 22,000 | | | | 21,868 | |
| | |
M&T Bank Corp. 3.55%, 7/26/2023 | | | 45,000 | | | | 48,339 | |
SEE NOTES TO FINANCIAL STATEMENTS.
| | | | | | | | |
| | | |
| FEBRUARY 28, 2021 | | J.P. MORGAN EXCHANGE-TRADED FUNDS | | | | | 27 | |
JPMorgan BetaBuilders 1-5 Year U.S. Aggregate Bond ETF
SCHEDULE OF PORTFOLIO INVESTMENTS
AS OF FEBRUARY 28, 2021 (continued)
| | | | | | | | |
| INVESTMENTS | | PRINCIPAL AMOUNT ($) | | | VALUE ($) | |
Corporate Bonds — continued | |
|
Banks — continued | |
| | |
Mitsubishi UFJ Financial Group, Inc. (Japan) | | | | | | | | |
| | |
3.00%, 2/22/2022 | | | 40,000 | | | | 41,054 | |
| | |
2.67%, 7/25/2022 | | | 35,000 | | | | 36,115 | |
| | |
3.41%, 3/7/2024 | | | 28,000 | | | | 30,249 | |
| | |
3.78%, 3/2/2025 | | | 9,000 | | | | 9,914 | |
| | |
MUFG Americas Holdings Corp. 3.50%, 6/18/2022 | | | 55,000 | | | | 57,252 | |
| | |
MUFG Union Bank NA 2.10%, 12/9/2022 | | | 20,000 | | | | 20,587 | |
| | |
Natwest Group plc (United Kingdom)
6.00%, 12/19/2023 | | | 87,000 | | | | 98,631 | |
| | |
Oesterreichische Kontrollbank AG (Austria) | | | | | | | | |
| | |
2.88%, 3/13/2023 | | | 24,000 | | | | 25,287 | |
| | |
3.13%, 11/7/2023 | | | 90,000 | | | | 96,658 | |
| | |
1.50%, 2/12/2025 | | | 41,000 | | | | 42,553 | |
| | |
0.38%, 9/17/2025 | | | 20,000 | | | | 19,624 | |
| | |
0.50%, 2/2/2026 | | | 13,000 | | | | 12,783 | |
| | |
People’s United Financial, Inc. 3.65%, 12/6/2022 | | | 27,000 | | | | 28,265 | |
| | |
PNC Financial Services Group, Inc. (The) | | | | | | | | |
| | |
3.30%, 3/8/2022 | | | 20,000 | | | | 20,568 | |
| | |
2.85%, 11/9/2022 (d) | | | 12,000 | | | | 12,521 | |
| | |
3.50%, 1/23/2024 | | | 31,000 | | | | 33,645 | |
| | |
2.20%, 11/1/2024 | | | 20,000 | | | | 21,151 | |
| | |
Regions Financial Corp. | | | | | | | | |
| | |
3.80%, 8/14/2023 | | | 15,000 | | | | 16,149 | |
| | |
2.25%, 5/18/2025 | | | 15,000 | | | | 15,698 | |
| | |
Royal Bank of Canada (Canada) | | | | | | | | |
| | |
2.75%, 2/1/2022 | | | 8,000 | | | | 8,183 | |
| | |
1.95%, 1/17/2023 | | | 28,000 | | | | 28,854 | |
| | |
3.70%, 10/5/2023 | | | 15,000 | | | | 16,273 | |
| | |
0.43%, 1/19/2024 | | | 21,000 | | | | 20,942 | |
| | |
2.55%, 7/16/2024 | | | 20,000 | | | | 21,280 | |
| | |
Santander Holdings USA, Inc. | | | | | | | | |
| | |
4.45%, 12/3/2021 | | | 10,000 | | | | 10,263 | |
| | |
3.40%, 1/18/2023 | | | 26,000 | | | | 27,215 | |
| | |
Santander UK plc (United Kingdom) 4.00%, 3/13/2024 | | | 96,000 | | | | 105,427 | |
| | |
Sumitomo Mitsui Financial Group, Inc. (Japan) | | | | | | | | |
| | |
2.78%, 7/12/2022 | | | 18,000 | | | | 18,596 | |
| | |
3.10%, 1/17/2023 | | | 18,000 | | | | 18,910 | |
| | |
3.94%, 10/16/2023 | | | 33,000 | | | | 35,973 | |
| | |
Synovus Financial Corp. 3.13%, 11/1/2022 | | | 16,000 | | | | 16,561 | |
| | |
Toronto-Dominion Bank (The) (Canada) | | | | | | | | |
| | |
0.25%, 1/6/2023 | | | 100,000 | | | | 99,908 | |
| | |
3.25%, 3/11/2024 | | | 30,000 | | | | 32,398 | |
| | | | | | | | |
| INVESTMENTS | | PRINCIPAL AMOUNT ($) | | | VALUE ($) | |
| |
|
Banks — continued | |
| | |
2.65%, 6/12/2024 | | | 20,000 | | | | 21,341 | |
| | |
0.75%, 1/6/2026 | | | 100,000 | | | | 98,362 | |
| | |
Truist Bank | | | | | | | | |
| | |
3.00%, 2/2/2023 | | | 15,000 | | | | 15,735 | |
| | |
3.20%, 4/1/2024 | | | 10,000 | | | | 10,792 | |
| | |
Truist Financial Corp. | | | | | | | | |
| | |
2.20%, 3/16/2023 | | | 30,000 | | | | 31,079 | |
| | |
3.75%, 12/6/2023 | | | 22,000 | | | | 23,950 | |
| | |
2.85%, 10/26/2024 | | | 12,000 | | | | 12,900 | |
| | |
3.70%, 6/5/2025 | | | 6,000 | | | | 6,663 | |
| | |
1.20%, 8/5/2025 | | | 29,000 | | | | 29,277 | |
| | |
US Bancorp | | | | | | | | |
| | |
3.00%, 3/15/2022 | | | 50,000 | | | | 51,347 | |
| | |
2.95%, 7/15/2022 | | | 20,000 | | | | 20,675 | |
| | |
3.60%, 9/11/2024 | | | 7,000 | | | | 7,697 | |
| | |
Wells Fargo & Co. | | | | | | | | |
| | |
2.63%, 7/22/2022 | | | 15,000 | | | | 15,478 | |
| | |
Series M, 3.45%, 2/13/2023 | | | 40,000 | | | | 42,354 | |
| | |
4.13%, 8/15/2023 | | | 15,000 | | | | 16,309 | |
| | |
3.75%, 1/24/2024 | | | 17,000 | | | | 18,469 | |
| | |
(SOFR + 1.60%), 1.65%, 6/2/2024 (c) | | | 15,000 | | | | 15,378 | |
| | |
3.30%, 9/9/2024 | | | 17,000 | | | | 18,518 | |
| | |
3.00%, 2/19/2025 | | | 25,000 | | | | 26,877 | |
| | |
(ICE LIBOR USD 3 Month + 0.75%), 2.16%, 2/11/2026 (c) | | | 50,000 | | | | 52,008 | |
| | |
(SOFR + 2.00%), 2.19%, 4/30/2026 (c) | | | 25,000 | | | | 26,022 | |
| | |
Westpac Banking Corp. (Australia) (US Treasury Yield Curve Rate T Note Constant Maturity 5 Year + 1.35%), 2.89%, 2/4/2030 (c) | | | 73,000 | | | | 75,797 | |
| | | | | | | | |
| | |
| | | | | | | 3,805,430 | |
| | | | | | | | |
| | |
Beverages — 0.5% | | | | | | | | |
| | |
Anheuser-Busch InBev Finance, Inc. (Belgium) 3.65%, 2/1/2026 | | | 28,000 | | | | 31,025 | |
| | |
Anheuser-Busch InBev Worldwide, Inc. (Belgium) 4.15%, 1/23/2025 | | | 20,000 | | | | 22,339 | |
| | |
Beam Suntory, Inc. (Japan) 3.25%, 5/15/2022 | | | 10,000 | | | | 10,262 | |
| | |
Coca-Cola Co. (The) | | | | | | | | |
| | |
1.75%, 9/6/2024 | | | 15,000 | | | | 15,648 | |
| | |
2.88%, 10/27/2025 | | | 57,000 | | | | 62,085 | |
| | |
Constellation Brands, Inc. 2.65%, 11/7/2022 | | | 15,000 | | | | 15,522 | |
| | |
Diageo Investment Corp. (United Kingdom) | | | | | | | | |
| | |
2.88%, 5/11/2022 | | | 22,000 | | | | 22,675 | |
| | |
8.00%, 9/15/2022 | | | 10,000 | | | | 11,158 | |
SEE NOTES TO FINANCIAL STATEMENTS.
| | | | | | |
| | | |
| 28 | | | | J.P. MORGAN EXCHANGE-TRADED FUNDS | | FEBRUARY 28, 2021 |
| | | | | | | | |
| INVESTMENTS | | PRINCIPAL AMOUNT ($) | | | VALUE ($) | |
Corporate Bonds — continued | |
|
Beverages — continued | |
| | |
Keurig Dr Pepper, Inc. | | | | | | | | |
| | |
3.13%, 12/15/2023 | | | 19,000 | | | | 20,304 | |
| | |
3.40%, 11/15/2025 | | | 5,000 | | | | 5,488 | |
| | |
Molson Coors Beverage Co. 3.50%, 5/1/2022 | | | 7,000 | | | | 7,240 | |
| | |
PepsiCo, Inc. | | | | | | | | |
| | |
2.75%, 3/5/2022 | | | 15,000 | | | | 15,384 | |
| | |
2.25%, 5/2/2022 | | | 8,000 | | | | 8,172 | |
| | |
3.10%, 7/17/2022 | | | 17,000 | | | | 17,584 | |
| | |
3.60%, 3/1/2024 | | | 20,000 | | | | 21,800 | |
| | |
2.85%, 2/24/2026 | | | 12,000 | | | | 13,016 | |
| | | | | | | | |
| | |
| | | | | | | 299,702 | |
| | | | | | | | |
| | |
Biotechnology — 0.6% | | | | | | | | |
| | |
AbbVie, Inc. | | | | | | | | |
| | |
3.25%, 10/1/2022 | | | 60,000 | | | | 62,231 | |
| | |
3.75%, 11/14/2023 | | | 40,000 | | | | 43,296 | |
| | |
3.85%, 6/15/2024 | | | 17,000 | | | | 18,600 | |
| | |
2.60%, 11/21/2024 | | | 37,000 | | | | 39,298 | |
| | |
3.80%, 3/15/2025 | | | 27,000 | | | | 29,715 | |
| | |
3.60%, 5/14/2025 | | | 15,000 | | | | 16,461 | |
| | |
Amgen, Inc. | | | | | | | | |
| | |
2.70%, 5/1/2022 | | | 52,000 | | | | 53,227 | |
| | |
3.63%, 5/22/2024 | | | 15,000 | | | | 16,342 | |
| | |
1.90%, 2/21/2025 | | | 10,000 | | | | 10,351 | |
| | |
Baxalta, Inc. 4.00%, 6/23/2025 | | | 6,000 | | | | 6,674 | |
| | |
Gilead Sciences, Inc. | | | | | | | | |
| | |
1.95%, 3/1/2022 | | | 23,000 | | | | 23,380 | |
| | |
3.25%, 9/1/2022 | | | 10,000 | | | | 10,380 | |
| | |
2.50%, 9/1/2023 | | | 22,000 | | | | 23,050 | |
| | | | | | | | |
| | |
| | | | | | | 353,005 | |
| | | | | | | | |
| | |
Building Products — 0.0% (e) | | | | | | | | |
| | |
Carrier Global Corp. 2.24%, 2/15/2025 | | | 15,000 | | | | 15,656 | |
| | | | | | | | |
| | |
Capital Markets — 2.1% | | | | | | | | |
| | |
Ameriprise Financial, Inc. 3.70%, 10/15/2024 | | | 10,000 | | | | 11,059 | |
| | |
Ares Capital Corp. 3.50%, 2/10/2023 | | | 5,000 | | | | 5,248 | |
| | |
Bank of New York Mellon Corp. (The) | | | | | | | | |
| | |
1.95%, 8/23/2022 | | | 15,000 | | | | 15,377 | |
| | |
(ICE LIBOR USD 3 Month + 0.63%), 2.66%, 5/16/2023 (c) | | | 42,000 | | | | 43,178 | |
| | |
1.60%, 4/24/2025 | | | 35,000 | | | | 36,035 | |
| | |
BGC Partners, Inc. 3.75%, 10/1/2024 | | | 36,000 | | | | 37,762 | |
| | |
Blackstone Secured Lending Fund 3.63%, 1/15/2026 (b) | | | 7,000 | | | | 7,259 | |
| | | | | | | | |
| INVESTMENTS | | PRINCIPAL AMOUNT ($) | | | VALUE ($) | |
| |
|
Capital Markets — continued | |
| | |
Brookfield Finance, Inc. (Canada) 4.00%, 4/1/2024 | | | 15,000 | | | | 16,401 | |
| | |
Charles Schwab Corp. (The) 4.20%, 3/24/2025 | | | 20,000 | | | | 22,502 | |
| | |
CME Group, Inc. 3.00%, 9/15/2022 | | | 20,000 | | | | 20,822 | |
| | |
Deutsche Bank AG (Germany) 3.70%, 5/30/2024 | | | 76,000 | | | | 81,966 | |
| | |
Franklin Resources, Inc. 2.85%, 3/30/2025 | | | 15,000 | | | | 16,101 | |
| | |
FS KKR Capital Corp. 3.40%, 1/15/2026 | | | 6,000 | | | | 6,001 | |
| | |
Goldman Sachs BDC, Inc. 2.88%, 1/15/2026 | | | 5,000 | | | | 5,104 | |
| | |
Goldman Sachs Group, Inc. (The) | | | | | | | | |
| | |
3.20%, 2/23/2023 | | | 25,000 | | | | 26,294 | |
| | |
(ICE LIBOR USD 3 Month + 1.05%),
2.91%, 6/5/2023 (c) | | | 83,000 | | | | 85,535 | |
| | |
3.85%, 7/8/2024 | | | 115,000 | | | | 125,967 | |
| | |
3.50%, 4/1/2025 | | | 50,000 | | | | 54,739 | |
| | |
3.75%, 5/22/2025 | | | 15,000 | | | | 16,552 | |
| | |
(ICE LIBOR USD 3 Month + 1.20%),
3.27%, 9/29/2025 (c) | | | 20,000 | | | | 21,688 | |
| | |
(SOFR + 0.79%), 1.09%, 12/9/2026 (c) | | | 34,000 | | | | 33,705 | |
| | |
Intercontinental Exchange, Inc. | | | | | | | | |
| | |
4.00%, 10/15/2023 | | | 10,000 | | | | 10,902 | |
| | |
3.75%, 12/1/2025 | | | 10,000 | | | | 11,117 | |
| | |
Invesco Finance plc 3.75%, 1/15/2026 | | | 12,000 | | | | 13,358 | |
| | |
Janus Capital Group, Inc. 4.88%, 8/1/2025 | | | 11,000 | | | | 12,543 | |
| | |
Moody’s Corp. 4.88%, 2/15/2024 | | | 17,000 | | | | 18,909 | |
| | |
Morgan Stanley | | | | | | | | |
| | |
2.75%, 5/19/2022 | | | 78,000 | | | | 80,358 | |
| | |
3.13%, 1/23/2023 | | | 32,000 | | | | 33,638 | |
| | |
3.75%, 2/25/2023 | | | 40,000 | | | | 42,619 | |
| | |
(SOFR + 0.47%), 0.56%, 11/10/2023 (c) | | | 13,000 | | | | 13,019 | |
| | |
(ICE LIBOR USD 3 Month + 0.85%),
3.74%, 4/24/2024 (c) | | | 60,000 | | | | 64,074 | |
| | |
Series F, 3.88%, 4/29/2024 | | | 15,000 | | | | 16,491 | |
| | |
3.70%, 10/23/2024 | | | 30,000 | | | | 33,131 | |
| | |
(SOFR + 0.72%), 0.98%, 12/10/2026 (c) | | | 6,000 | | | | 5,927 | |
| | |
Northern Trust Corp. 2.38%, 8/2/2022 | | | 30,000 | | | | 30,892 | |
| | |
State Street Corp. | | | | | | | | |
| | |
(ICE LIBOR USD 3 Month + 0.64%),
2.65%, 5/15/2023 (c) | | | 23,000 | | | | 23,642 | |
| | |
3.10%, 5/15/2023 | | | 15,000 | | | | 15,905 | |
| | |
3.70%, 11/20/2023 | | | 8,000 | | | | 8,738 | |
| | |
(ICE LIBOR USD 3 Month + 0.77%),
3.78%, 12/3/2024 (c) | | | 12,000 | | | | 13,092 | |
SEE NOTES TO FINANCIAL STATEMENTS.
| | | | | | | | |
| | | |
| FEBRUARY 28, 2021 | | J.P. MORGAN EXCHANGE-TRADED FUNDS | | | | | 29 | |
JPMorgan BetaBuilders 1-5 Year U.S. Aggregate Bond ETF
SCHEDULE OF PORTFOLIO INVESTMENTS
AS OF FEBRUARY 28, 2021 (continued)
| | | | | | | | |
| INVESTMENTS | | PRINCIPAL AMOUNT ($) | | | VALUE ($) | |
Corporate Bonds — continued | |
|
Capital Markets — continued | |
| | |
3.55%, 8/18/2025 | | | 24,000 | | | | 26,709 | |
| | |
(SOFR + 0.94%), 2.35%, 11/1/2025 (c) | | | 48,000 | | | | 50,963 | |
| | |
Stifel Financial Corp. 4.25%, 7/18/2024 | | | 15,000 | | | | 16,702 | |
| | | | | | | | |
| | |
| | | | | | | 1,232,024 | |
| | | | | | | | |
| | |
Chemicals — 0.4% | | | | | | | | |
| | |
Air Products and Chemicals, Inc. 1.50%, 10/15/2025 | | | 33,000 | | | | 33,753 | |
| | |
Celanese US Holdings LLC 3.50%, 5/8/2024 | | | 31,000 | | | | 33,312 | |
| | |
Dow Chemical Co. (The) 3.50%, 10/1/2024 | | | 7,000 | | | | 7,606 | |
| | |
DuPont de Nemours, Inc. | | | | | | | | |
| | |
4.21%, 11/15/2023 | | | 25,000 | | | | 27,399 | |
| | |
4.49%, 11/15/2025 | | | 10,000 | | | | 11,450 | |
| | |
Eastman Chemical Co. 3.60%, 8/15/2022 | | | 9,000 | | | | 9,341 | |
| | |
Linde, Inc. 2.70%, 2/21/2023 | | | 15,000 | | | | 15,594 | |
| | |
LYB International Finance BV 4.00%, 7/15/2023 | | | 15,000 | | | | 16,222 | |
| | |
Mosaic Co. (The) 4.25%, 11/15/2023 | | | 10,000 | | | | 10,868 | |
| | |
Nutrien Ltd. (Canada) | | | | | | | | |
| | |
3.63%, 3/15/2024 | | | 16,000 | | | | 17,312 | |
| | |
3.00%, 4/1/2025 | | | 15,000 | | | | 16,075 | |
| | |
PPG Industries, Inc. 2.40%, 8/15/2024 | | | 15,000 | | | | 15,802 | |
| | | | | | | | |
| | |
| | | | | | | 214,734 | |
| | | | | | | | |
| | |
Commercial Services & Supplies — 0.2% | | | | | | | | |
| | |
Cintas Corp. No. 2 2.90%, 4/1/2022 | | | 5,000 | | | | 5,128 | |
| | |
Republic Services, Inc. | | | | | | | | |
| | |
2.50%, 8/15/2024 | | | 10,000 | | | | 10,601 | |
| | |
0.88%, 11/15/2025 | | | 62,000 | | | | 61,282 | |
| | |
Waste Management, Inc. | | | | | | | | |
| | |
2.90%, 9/15/2022 | | | 12,000 | | | | 12,391 | |
| | |
0.75%, 11/15/2025 | | | 15,000 | | | | 14,790 | |
| | | | | | | | |
| | |
| | | | | | | 104,192 | |
| | | | | | | | |
| | |
Communications Equipment — 0.1% | | | | | | | | |
| | |
Cisco Systems, Inc. 2.20%, 9/20/2023 | | | 27,000 | | | | 28,271 | |
| | |
Juniper Networks, Inc. 1.20%, 12/10/2025 | | | 15,000 | | | | 14,990 | |
| | |
Telefonaktiebolaget LM Ericsson (Sweden) 4.13%, 5/15/2022 | | | 5,000 | | | | 5,184 | |
| | | | | | | | |
| | |
| | | | | | | 48,445 | |
| | | | | | | | |
| | |
Consumer Finance — 1.9% | | | | | | | | |
| | |
AerCap Ireland Capital DAC (Ireland)
3.15%, 2/15/2024 | | | 150,000 | | | | 157,116 | |
| | |
Ally Financial, Inc. | | | | | | | | |
| | |
4.13%, 2/13/2022 | | | 14,000 | | | | 14,482 | |
| | |
3.88%, 5/21/2024 | | | 35,000 | | | | 38,081 | |
| | | | | | | | |
| INVESTMENTS | | PRINCIPAL AMOUNT ($) | | | VALUE ($) | |
| |
|
Consumer Finance — continued | |
| | |
American Express Co. | | | | | | | | |
| | |
2.50%, 8/1/2022 | | | 15,000 | | | | 15,447 | |
| | |
2.65%, 12/2/2022 | | | 112,000 | | | | 116,490 | |
| | |
3.40%, 2/27/2023 | | | 26,000 | | | | 27,496 | |
| | |
3.70%, 8/3/2023 | | | 30,000 | | | | 32,295 | |
| | |
2.50%, 7/30/2024 | | | 30,000 | | | | 31,812 | |
| | |
American Honda Finance Corp. | | | | | | | | |
| | |
2.60%, 11/16/2022 | | | 25,000 | | | | 25,957 | |
| | |
3.63%, 10/10/2023 | | | 16,000 | | | | 17,314 | |
| | |
1.20%, 7/8/2025 | | | 15,000 | | | | 15,113 | |
| | |
1.00%, 9/10/2025 | | | 15,000 | | | | 14,933 | |
| | |
Capital One Financial Corp. | | | | | | | | |
| | |
3.05%, 3/9/2022 | | | 15,000 | | | | 15,383 | |
| | |
3.50%, 6/15/2023 | | | 6,000 | | | | 6,408 | |
| | |
3.90%, 1/29/2024 | | | 89,000 | | | | 96,777 | |
| | |
3.30%, 10/30/2024 | | | 15,000 | | | | 16,270 | |
| | |
Caterpillar Financial Services Corp. | | | | | | | | |
| | |
2.85%, 6/1/2022 | | | 12,000 | | | | 12,386 | |
| | |
0.65%, 7/7/2023 | | | 28,000 | | | | 28,213 | |
| | |
3.30%, 6/9/2024 | | | 12,000 | | | | 13,043 | |
| | |
3.25%, 12/1/2024 | | | 6,000 | | | | 6,579 | |
| | |
1.45%, 5/15/2025 | | | 15,000 | | | | 15,296 | |
| | |
0.80%, 11/13/2025 | | | 22,000 | | | | 21,793 | |
| | |
Discover Financial Services 3.85%, 11/21/2022 | | | 25,000 | | | | 26,428 | |
| | |
General Motors Financial Co., Inc. | | | | | | | | |
| | |
3.45%, 4/10/2022 | | | 15,000 | | | | 15,409 | |
| | |
3.25%, 1/5/2023 | | | 15,000 | | | | 15,680 | |
| | |
5.10%, 1/17/2024 | | | 55,000 | | | | 61,209 | |
| | |
2.90%, 2/26/2025 | | | 28,000 | | | | 29,597 | |
| | |
1.25%, 1/8/2026 | | | 28,000 | | | | 27,681 | |
| | |
John Deere Capital Corp. | | | | | | | | |
| | |
2.70%, 1/6/2023 | | | 23,000 | | | | 24,019 | |
| | |
3.45%, 6/7/2023 | | | 23,000 | | | | 24,617 | |
| | |
0.70%, 7/5/2023 | | | 7,000 | | | | 7,068 | |
| | |
2.65%, 6/24/2024 | | | 15,000 | | | | 16,019 | |
| | |
0.70%, 1/15/2026 | | | 20,000 | | | | 19,695 | |
| | |
Navient Solutions LLC Zero Coupon, 10/3/2022 | | | 30,000 | | | | 29,613 | |
| | |
PACCAR Financial Corp. 2.00%, 9/26/2022 | | | 15,000 | | | | 15,401 | |
| | |
Toyota Motor Credit Corp. | | | | | | | | |
| | |
2.63%, 1/10/2023 | | | 18,000 | | | | 18,766 | |
| | |
1.35%, 8/25/2023 | | | 18,000 | | | | 18,416 | |
| | |
0.80%, 10/16/2025 | | | 15,000 | | | | 14,844 | |
| | |
0.80%, 1/9/2026 | | | 8,000 | | | | 7,920 | |
| | | | | | | | |
| | |
| | | | | | | 1,111,066 | |
| | | | | | | | |
SEE NOTES TO FINANCIAL STATEMENTS.
| | | | | | |
| | | |
| 30 | | | | J.P. MORGAN EXCHANGE-TRADED FUNDS | | FEBRUARY 28, 2021 |
| | | | | | | | |
| INVESTMENTS | | PRINCIPAL AMOUNT ($) | | | VALUE ($) | |
Corporate Bonds — continued | |
| | |
Containers & Packaging — 0.0% (e) | | | | | | | | |
| | |
Berry Global, Inc. 1.57%, 1/15/2026 (b) | | | 10,000 | | | | 9,963 | |
| | | | | | | | |
|
Diversified Financial Services — 0.4% | |
| | |
Berkshire Hathaway, Inc. 3.40%, 1/31/2022 | | | 15,000 | | | | 15,440 | |
| | |
National Rural Utilities Cooperative Finance Corp. (ICE LIBOR USD 3 Month + 2.91%), 4.75%, 4/30/2043 (c) | | | 29,000 | | | | 30,070 | |
| | |
ORIX Corp. (Japan)
2.90%, 7/18/2022 | | | 5,000 | | | | 5,162 | |
| | |
4.05%, 1/16/2024 | | | 8,000 | | | | 8,740 | |
| | |
Private Export Funding Corp. Series II, 2.05%, 11/15/2022 | | | 38,000 | | | | 39,012 | |
| | |
Shell International Finance BV (Netherlands) | | | | | | | | |
| | |
2.38%, 8/21/2022 | | | 69,000 | | | | 71,120 | |
| | |
3.40%, 8/12/2023 | | | 10,000 | | | | 10,741 | |
| | |
2.00%, 11/7/2024 | | | 23,000 | | | | 24,049 | |
| | |
Voya Financial, Inc. 3.13%, 7/15/2024 | | | 15,000 | | | | 16,146 | |
| | | | | | | | |
| | |
| | | | | | | 220,480 | |
| | | | | | | | |
|
Diversified Telecommunication Services — 0.3% | |
| | |
AT&T, Inc. | | | | | | | | |
| | |
3.00%, 6/30/2022 | | | 35,000 | | | | 36,080 | |
| | |
4.45%, 4/1/2024 | | | 32,000 | | | | 35,394 | |
| | |
4.13%, 2/17/2026 | | | 5,000 | | | | 5,655 | |
| | |
Verizon Communications, Inc. | | | | | | | | |
| | |
5.15%, 9/15/2023 | | | 13,000 | | | | 14,506 | |
| | |
3.38%, 2/15/2025 | | | 22,000 | | | | 24,030 | |
| | |
0.85%, 11/20/2025 | | | 66,000 | | | | 65,054 | |
| | | | | | | | |
| | |
| | | | | | | 180,719 | |
| | | | | | | | |
| | |
Electric Utilities — 0.7% | | | | | | | | |
| | |
American Electric Power Co., Inc. Series N, 1.00%, 11/1/2025 | | | 15,000 | | | | 14,874 | |
| | |
Avangrid, Inc. 3.20%, 4/15/2025 | | | 8,000 | | | | 8,649 | |
| | |
Duke Energy Corp. | | | | | | | | |
| | |
3.75%, 4/15/2024 | | | 8,000 | | | | 8,701 | |
| | |
0.90%, 9/15/2025 | | | 24,000 | | | | 23,772 | |
| | |
Edison International 4.95%, 4/15/2025 | | | 25,000 | | | | 28,108 | |
| | |
Entergy Louisiana LLC | | | | | | | | |
| | |
4.05%, 9/1/2023 | | | 15,000 | | | | 16,200 | |
| | |
0.62%, 11/17/2023 | | | 13,000 | | | | 13,023 | |
| | |
Florida Power & Light Co. 3.25%, 6/1/2024 | | | 15,000 | | | | 16,116 | |
| | |
Georgia Power Co. Series A, 2.20%, 9/15/2024 | | | 10,000 | | | | 10,484 | |
| | |
Hydro-Quebec (Canada) Series HY, 8.40%, 1/15/2022 | | | 17,000 | | | | 18,171 | |
| | | | | | | | |
| INVESTMENTS | | PRINCIPAL AMOUNT ($) | | | VALUE ($) | |
| |
|
Electric Utilities — continued | |
| | |
NextEra Energy Capital Holdings, Inc. | | | | | | | | |
| | |
3.15%, 4/1/2024 | | | 15,000 | | | | 16,108 | |
| | |
2.75%, 5/1/2025 | | | 10,000 | | | | 10,658 | |
| | |
Oncor Electric Delivery Co. LLC | | | | | | | | |
| | |
2.75%, 6/1/2024 | | | 37,000 | | | | 39,546 | |
| | |
0.55%, 10/1/2025 (b) | | | 89,000 | | | | 87,394 | |
| | |
Pacific Gas and Electric Co. | | | | | | | | |
| | |
1.75%, 6/16/2022 | | | 15,000 | | | | 15,041 | |
| | |
3.75%, 2/15/2024 | | | 23,000 | | | | 24,577 | |
| | |
3.45%, 7/1/2025 | | | 15,000 | | | | 16,129 | |
| | |
PPL Capital Funding, Inc. 3.50%, 12/1/2022 | | | 15,000 | | | | 15,677 | |
| | |
Public Service Co. of Colorado 2.25%, 9/15/2022 | | | 13,000 | | | | 13,265 | |
| | |
Public Service Co. of New Hampshire 3.50%, 11/1/2023 | | | 15,000 | | | | 16,138 | |
| | |
Public Service Electric and Gas Co. 2.38%, 5/15/2023 | | | 15,000 | | | | 15,608 | |
| | | | | | | | |
| | |
| | | | | | | 428,239 | |
| | | | | | | | |
| | |
Electrical Equipment — 0.1% | | | | | | | | |
| | |
ABB Finance USA, Inc. (Switzerland) 2.88%, 5/8/2022 | | | 24,000 | | | | 24,712 | |
| | |
Eaton Corp. 2.75%, 11/2/2022 | | | 15,000 | | | | 15,602 | |
| | |
Legrand France SA (France) 8.50%, 2/15/2025 | | | 19,000 | | | | 24,347 | |
| | | | | | | | |
| | |
| | | | | | | 64,661 | |
| | | | | | | | |
|
Electronic Equipment, Instruments & Components — 0.0% (e) | |
| | |
Arrow Electronics, Inc. 4.00%, 4/1/2025 | | | 10,000 | | | | 10,826 | |
| | |
Flex Ltd. 5.00%, 2/15/2023 | | | 8,000 | | | | 8,625 | |
| | | | | | | | |
| | |
| | | | | | | 19,451 | |
| | | | | | | | |
| | |
Energy Equipment & Services — 0.0% (e) | | | | | | | | |
| | |
Halliburton Co. 3.50%, 8/1/2023 | | | 10,000 | | | | 10,619 | |
| | |
Schlumberger Investment SA 3.65%, 12/1/2023 | | | 15,000 | | | | 16,183 | |
| | | | | | | | |
| | |
| | | | | | | 26,802 | |
| | | | | | | | |
| | |
Entertainment — 0.1% | | | | | | | | |
| | |
TWDC Enterprises 18 Corp. | | | | | | | | |
| | |
2.45%, 3/4/2022 | | | 20,000 | | | | 20,433 | |
| | |
2.35%, 12/1/2022 | | | 10,000 | | | | 10,347 | |
| | |
Walt Disney Co. (The) | | | | | | | | |
| | |
1.75%, 8/30/2024 | | | 31,000 | | | | 32,166 | |
| | |
1.75%, 1/13/2026 | | | 24,000 | | | | 24,704 | |
| | | | | | | | |
| | |
| | | | | | | 87,650 | |
| | | | | | | | |
SEE NOTES TO FINANCIAL STATEMENTS.
| | | | | | | | |
| | | |
| FEBRUARY 28, 2021 | | J.P. MORGAN EXCHANGE-TRADED FUNDS | | | | | 31 | |
JPMorgan BetaBuilders 1-5 Year U.S. Aggregate Bond ETF
SCHEDULE OF PORTFOLIO INVESTMENTS
AS OF FEBRUARY 28, 2021 (continued)
| | | | | | | | |
| INVESTMENTS | | PRINCIPAL AMOUNT ($) | | | VALUE ($) | |
Corporate Bonds — continued | |
|
Equity Real Estate Investment Trusts (REITs) — 1.0% | |
| | |
American Campus Communities Operating Partnership LP 3.75%, 4/15/2023 | | | 16,000 | | | | 16,937 | |
| | |
American Tower Corp. | | | | | | | | |
| | |
3.38%, 5/15/2024 | | | 15,000 | | | | 16,178 | |
| | |
2.40%, 3/15/2025 | | | 8,000 | | | | 8,383 | |
| | |
1.30%, 9/15/2025 | | | 28,000 | | | | 28,156 | |
| | |
AvalonBay Communities, Inc. 4.20%, 12/15/2023 | | | 6,000 | | | | 6,570 | |
| | |
Boston Properties LP | | | | | | | | |
| | |
3.13%, 9/1/2023 | | | 15,000 | | | | 15,851 | |
| | |
3.65%, 2/1/2026 | | | 10,000 | | | | 11,118 | |
| | |
Brixmor Operating Partnership LP 3.65%, 6/15/2024 | | | 65,000 | | | | 70,274 | |
| | |
CC Holdings GS V LLC 3.85%, 4/15/2023 | | | 42,000 | | | | 44,856 | |
| | |
Equinix, Inc. | | | | | | | | |
| | |
2.63%, 11/18/2024 | | | 8,000 | | | | 8,479 | |
| | |
1.00%, 9/15/2025 (a) | | | 121,000 | | | | 119,615 | |
| | |
ERP Operating LP 4.63%, 12/15/2021 | | | 15,000 | | | | 15,341 | |
| | |
Essex Portfolio LP 3.50%, 4/1/2025 | | | 15,000 | | | | 16,332 | |
| | |
Federal Realty Investment Trust 1.25%, 2/15/2026 | | | 7,000 | | | | 7,009 | |
| | |
GLP Capital LP 3.35%, 9/1/2024 | | | 16,000 | | | | 16,986 | |
| | |
Kimco Realty Corp. | | | | | | | | |
| | |
3.40%, 11/1/2022 | | | 6,000 | | | | 6,264 | |
| | |
2.70%, 3/1/2024 | | | 15,000 | | | | 15,816 | |
| | |
Office Properties Income Trust 4.25%, 5/15/2024 | | | 15,000 | | | | 15,860 | |
| | |
Public Storage 0.88%, 2/15/2026 | | | 6,000 | | | | 5,929 | |
| | |
Realty Income Corp. 3.88%, 4/15/2025 | | | 20,000 | | | | 22,196 | |
| | |
Sabra Health Care LP 4.80%, 6/1/2024 | | | 21,000 | | | | 22,984 | |
| | |
Simon Property Group LP | | | | | | | | |
| | |
3.75%, 2/1/2024 | | | 25,000 | | | | 27,003 | |
| | |
3.50%, 9/1/2025 | | | 7,000 | | | | 7,634 | |
| | |
SL Green Operating Partnership LP 3.25%, 10/15/2022 | | | 15,000 | | | | 15,550 | |
| | |
Ventas Realty LP 3.13%, 6/15/2023 | | | 16,000 | | | | 16,829 | |
| | |
Washington 3.95%, 10/15/2022 | | | 15,000 | | | | 15,638 | |
| | |
Welltower, Inc. 4.00%, 6/1/2025 | | | 17,000 | | | | 18,865 | |
| | | | | | | | |
| | |
| | | | | | | 592,653 | |
| | | | | | | | |
|
Food & Staples Retailing — 0.2% | |
| | |
Costco Wholesale Corp. 2.30%, 5/18/2022 | | | 30,000 | | | | 30,702 | |
| | |
Kroger Co. (The) 2.95%, 11/1/2021 | | | 5,000 | | | | 5,077 | |
| | |
Sysco Corp. 5.65%, 4/1/2025 | | | 20,000 | | | | 23,486 | |
| | |
Walgreens Boots Alliance, Inc. 3.80%, 11/18/2024 | | | 15,000 | | | | 16,516 | |
| | | | | | | | |
| INVESTMENTS | | PRINCIPAL AMOUNT ($) | | | VALUE ($) | |
| |
|
Food & Staples Retailing — continued | |
| | |
Walmart, Inc. | | | | | | | | |
| | |
2.35%, 12/15/2022 | | | 24,000 | | | | 24,854 | |
| | |
2.55%, 4/11/2023 | | | 9,000 | | | | 9,383 | |
| | |
3.40%, 6/26/2023 | | | 16,000 | | | | 17,104 | |
| | |
2.65%, 12/15/2024 | | | 15,000 | | | | 16,120 | |
| | | | | | | | |
| | |
| | | | | | | 143,242 | |
| | | | | | | | |
| | |
Food Products — 0.2% | | | | | | | | |
| | |
Bunge Ltd. Finance Corp. 1.63%, 8/17/2025 | | | 17,000 | | | | 17,206 | |
| | |
Campbell Soup Co. 2.50%, 8/2/2022 | | | 6,000 | | | | 6,176 | |
| | |
Conagra Brands, Inc. 3.20%, 1/25/2023 | | | 6,000 | | | | 6,273 | |
| | |
Hershey Co. (The) 3.38%, 5/15/2023 | | | 15,000 | | | | 15,967 | |
| | |
McCormick & Co., Inc. 0.90%, 2/15/2026 | | | 13,000 | | | | 12,789 | |
| | |
Mondelez International, Inc. 0.63%, 7/1/2022 | | | 9,000 | | | | 9,036 | |
| | |
Tyson Foods, Inc. 3.90%, 9/28/2023 | | | 30,000 | | | | 32,558 | |
| | | | | | | | |
| | |
| | | | | | | 100,005 | |
| | | | | | | | |
| | |
Gas Utilities — 0.0% (e) | | | | | | | | |
| | |
Eastern Energy Gas Holdings LLC 3.55%, 11/1/2023 | | | 17,000 | | | | 18,236 | |
| | | | | | | | |
| | |
Health Care Equipment & Supplies — 0.2% | | | | | | | | |
| | |
Abbott Laboratories | | | | | | | | |
| | |
2.55%, 3/15/2022 | | | 15,000 | | | | 15,353 | |
| | |
2.95%, 3/15/2025 | | | 5,000 | | | | 5,389 | |
| | |
Becton Dickinson and Co. 2.89%, 6/6/2022 | | | 13,000 | | | | 13,373 | |
| | |
DH Europe Finance II SARL 2.20%, 11/15/2024 | | | 18,000 | | | | 18,965 | |
| | |
Stryker Corp. 1.15%, 6/15/2025 | | | 30,000 | | | | 30,128 | |
| | |
Zimmer Biomet Holdings, Inc. | | | | | | | | |
| | |
3.15%, 4/1/2022 | | | 10,000 | | | | 10,247 | |
| | |
3.05%, 1/15/2026 | | | 14,000 | | | | 15,180 | |
| | | | | | | | |
| | |
| | | | | | | 108,635 | |
| | | | | | | | |
| | |
Health Care Providers & Services — 0.6% | | | | | | | | |
| | |
Aetna, Inc. 2.75%, 11/15/2022 | | | 11,000 | | | | 11,375 | |
| | |
Anthem, Inc. | | | | | | | | |
| | |
2.95%, 12/1/2022 | | | 7,000 | | | | 7,299 | |
| | |
3.50%, 8/15/2024 | | | 15,000 | | | | 16,349 | |
| | |
3.35%, 12/1/2024 | | | 15,000 | | | | 16,382 | |
| | |
Cardinal Health, Inc. 2.62%, 6/15/2022 | | | 20,000 | | | | 20,518 | |
| | |
Cigna Corp. | | | | | | | | |
| | |
4.00%, 2/15/2022 | | | 8,000 | | | | 8,182 | |
| | |
3.00%, 7/15/2023 | | | 31,000 | | | | 32,727 | |
| | |
3.50%, 6/15/2024 | | | 10,000 | | | | 10,844 | |
| | |
4.13%, 11/15/2025 | | | 5,000 | | | | 5,627 | |
SEE NOTES TO FINANCIAL STATEMENTS.
| | | | | | |
| | | |
| 32 | | | | J.P. MORGAN EXCHANGE-TRADED FUNDS | | FEBRUARY 28, 2021 |
| | | | | | | | |
| INVESTMENTS | | PRINCIPAL AMOUNT ($) | | | VALUE ($) | |
Corporate Bonds — continued | |
|
Health Care Providers & Services — continued | |
| | |
CommonSpirit Health 2.76%, 10/1/2024 | | | 16,000 | | | | 17,029 | |
| | |
CVS Health Corp. | | | | | | | | |
| | |
3.70%, 3/9/2023 | | | 4,000 | | | | 4,254 | |
| | |
2.63%, 8/15/2024 | | | 17,000 | | | | 18,066 | |
| | |
3.88%, 7/20/2025 | | | 33,000 | | | | 36,707 | |
| | |
HCA, Inc. | | | | | | | | |
| | |
4.75%, 5/1/2023 | | | 18,000 | | | | 19,516 | |
| | |
5.25%, 4/15/2025 | | | 9,000 | | | | 10,376 | |
| | |
Humana, Inc. 3.15%, 12/1/2022 | | | 15,000 | | | | 15,599 | |
| | |
Laboratory Corp. of America Holdings | | | | | | | | |
| | |
3.75%, 8/23/2022 | | | 7,000 | | | | 7,281 | |
| | |
3.60%, 2/1/2025 | | | 15,000 | | | | 16,377 | |
| | |
McKesson Corp. | | | | | | | | |
| | |
2.70%, 12/15/2022 | | | 10,000 | | | | 10,347 | |
| | |
0.90%, 12/3/2025 | | | 32,000 | | | | 31,504 | |
| | |
UnitedHealth Group, Inc. | | | | | | | | |
| | |
3.35%, 7/15/2022 | | | 22,000 | | | | 22,908 | |
| | |
2.75%, 2/15/2023 | | | 25,000 | | | | 26,035 | |
| | |
2.38%, 8/15/2024 | | | 15,000 | | | | 15,921 | |
| | | | | | | | |
| | |
| | | | | | | 381,223 | |
| | | | | | | | |
|
Hotels, Restaurants & Leisure — 0.2% | |
| | |
Las Vegas Sands Corp. 2.90%, 6/25/2025 | | | 33,000 | | | | 34,206 | |
| | |
Marriott International, Inc. 3.60%, 4/15/2024 | | | 15,000 | | | | 16,042 | |
| | |
McDonald’s Corp. | | | | | | | | |
| | |
3.35%, 4/1/2023 | | | 9,000 | | | | 9,529 | |
| | |
3.25%, 6/10/2024 | | | 15,000 | | | | 16,261 | |
| | |
Starbucks Corp. | | | | | | | | |
| | |
3.10%, 3/1/2023 | | | 15,000 | | | | 15,770 | |
| | |
3.85%, 10/1/2023 | | | 15,000 | | | | 16,170 | |
| | | | | | | | |
| | |
| | | | | | | 107,978 | |
| | | | | | | | |
| | |
Household Durables — 0.0% (e) | | | | | | | | |
| | |
DR Horton, Inc. | | | | | | | | |
| | |
5.75%, 8/15/2023 | | | 6,000 | | | | 6,665 | |
| | |
2.50%, 10/15/2024 | | | 4,000 | | | | 4,234 | |
| | |
Mohawk Industries, Inc. 3.85%, 2/1/2023 | | | 15,000 | | | | 15,820 | |
| | | | | | | | |
| | |
| | | | | | | 26,719 | |
| | | | | | | | |
|
Household Products — 0.2% | |
| | |
Colgate-Palmolive Co. 2.10%, 5/1/2023 | | | 15,000 | | | | 15,584 | |
| | |
Kimberly-Clark Corp. 3.05%, 8/15/2025 | | | 16,000 | | | | 17,448 | |
| | |
Procter & Gamble Co. (The) | | | | | | | | |
| | |
3.10%, 8/15/2023 | | | 32,000 | | | | 34,260 | |
| | |
0.55%, 10/29/2025 | | | 69,000 | | | | 68,287 | |
| | | | | | | | |
| | |
| | | | | | | 135,579 | |
| | | | | | | | |
| | | | | | | | |
| INVESTMENTS | | PRINCIPAL AMOUNT ($) | | | VALUE ($) | |
| |
|
Independent Power and Renewable Electricity Producers — 0.1% | |
| | |
Enel Generacion Chile SA (Chile) 4.25%, 4/15/2024 | | | 39,000 | | | | 42,151 | |
| | | | | | | | |
|
Industrial Conglomerates — 0.3% | |
| | |
3M Co. | | | | | | | | |
| | |
1.75%, 2/14/2023 | | | 15,000 | | | | 15,425 | |
| | |
2.25%, 3/15/2023 | | | 6,000 | | | | 6,237 | |
| | |
2.65%, 4/15/2025 | | | 18,000 | | | | 19,254 | |
| | |
General Electric Co. 3.45%, 5/15/2024 | | | 16,000 | | | | 17,265 | |
| | |
Honeywell International, Inc. | | | | | | | | |
| | |
2.15%, 8/8/2022 | | | 5,000 | | | | 5,127 | |
| | |
3.35%, 12/1/2023 | | | 10,000 | | | | 10,820 | |
| | |
2.30%, 8/15/2024 | | | 29,000 | | | | 30,765 | |
| | |
1.35%, 6/1/2025 | | | 21,000 | | | | 21,441 | |
| | |
Roper Technologies, Inc. | | | | | | | | |
| | |
3.13%, 11/15/2022 | | | 10,000 | | | | 10,393 | |
| | |
3.65%, 9/15/2023 | | | 15,000 | | | | 16,176 | |
| | | | | | | | |
| | |
| | | | | | | 152,903 | |
| | | | | | | | |
|
Insurance — 0.5% | |
| | |
Aflac, Inc. 3.25%, 3/17/2025 | | | 20,000 | | | | 21,724 | |
| | |
Allstate Corp. (The) | | | | | | | | |
| | |
0.75%, 12/15/2025 | | | 72,000 | | | | 71,285 | |
| | |
Series B, (ICE LIBOR USD 3 Month + 2.94%), 5.75%, 8/15/2053 (c) | | | 6,000 | | | | 6,413 | |
| | |
American International Group, Inc. | | | | | | | | |
| | |
4.88%, 6/1/2022 | | | 21,000 | | | | 22,164 | |
| | |
4.13%, 2/15/2024 | | | 13,000 | | | | 14,351 | |
| | |
Aon Corp. 2.20%, 11/15/2022 | | | 27,000 | | | | 27,842 | |
| | |
Aspen Insurance Holdings Ltd. (Bermuda) 4.65%, 11/15/2023 | | | 6,000 | | | | 6,579 | |
| | |
Assurant, Inc. 4.00%, 3/15/2023 | | | 3,000 | | | | 3,205 | |
| | |
Chubb INA Holdings, Inc. 2.70%, 3/13/2023 | | | 15,000 | | | | 15,716 | |
| | |
Kemper Corp. 4.35%, 2/15/2025 | | | 27,000 | | | | 29,692 | |
| | |
MetLife, Inc. | | | | | | | | |
| | |
3.05%, 12/15/2022 (d) | | | 6,000 | | | | 6,296 | |
| | |
Series D, 4.37%, 9/15/2023 (d) | | | 12,000 | | | | 13,186 | |
| | |
3.60%, 4/10/2024 | | | 5,000 | | | | 5,468 | |
| | |
Prudential Financial, Inc. | | | | | | | | |
| | |
(ICE LIBOR USD 3 Month + 3.92%),
5.63%, 6/15/2043 (c) | | | 10,000 | | | | 10,715 | |
| | |
(ICE LIBOR USD 3 Month + 3.04%),
5.20%, 3/15/2044 (c) | | | 19,000 | | | | 20,221 | |
| | | | | | | | |
| | |
| | | | | | | 274,857 | |
| | | | | | | | |
SEE NOTES TO FINANCIAL STATEMENTS.
| | | | | | | | |
| | | |
| FEBRUARY 28, 2021 | | J.P. MORGAN EXCHANGE-TRADED FUNDS | | | | | 33 | |
JPMorgan BetaBuilders 1-5 Year U.S. Aggregate Bond ETF
SCHEDULE OF PORTFOLIO INVESTMENTS
AS OF FEBRUARY 28, 2021 (continued)
| | | | | | | | |
| INVESTMENTS | | PRINCIPAL AMOUNT ($) | | | VALUE ($) | |
Corporate Bonds — continued | |
|
Interactive Media & Services — 0.0% (e) | |
| | |
Alphabet, Inc. | | | | | | | | |
| | |
3.38%, 2/25/2024 | | | 6,000 | | | | 6,525 | |
| | |
0.45%, 8/15/2025 | | | 20,000 | | | | 19,719 | |
| | | | | | | | |
| | |
| | | | | | | 26,244 | |
| | | | | | | | |
|
Internet & Direct Marketing Retail — 0.3% | |
| | |
Amazon.com, Inc. | | | | | | | | |
| | |
3.30%, 12/5/2021 | | | 5,000 | | | | 5,090 | |
| | |
2.50%, 11/29/2022 | | | 10,000 | | | | 10,334 | |
| | |
2.80%, 8/22/2024 | | | 59,000 | | | | 63,469 | |
| | |
0.80%, 6/3/2025 | | | 11,000 | | | | 10,991 | |
| | |
eBay, Inc. | | | | | | | | |
| | |
3.80%, 3/9/2022 | | | 12,000 | | | | 12,389 | |
| | |
2.60%, 7/15/2022 | | | 7,000 | | | | 7,171 | |
| | |
1.90%, 3/11/2025 | | | 15,000 | | | | 15,482 | |
| | |
Expedia Group, Inc. | | | | | | | | |
| | |
3.60%, 12/15/2023 (b) | | | 16,000 | | | | 17,051 | |
| | |
4.50%, 8/15/2024 | | | 34,000 | | | | 37,368 | |
| | | | | | | | |
| | |
| | | | | | | 179,345 | |
| | | | | | | | |
|
IT Services — 0.3% | |
| | |
DXC Technology Co. 4.13%, 4/15/2025 | | | 30,000 | | | | 32,781 | |
| | |
Fiserv, Inc. 2.75%, 7/1/2024 | | | 18,000 | | | | 19,138 | |
| | |
Global Payments, Inc. 3.75%, 6/1/2023 | | | 15,000 | | | | 15,966 | |
| | |
International Business Machines Corp. 1.88%, 8/1/2022 | | | 80,000 | | | | 81,802 | |
| | |
Mastercard, Inc. 3.38%, 4/1/2024 | | | 12,000 | | | | 13,057 | |
| | |
PayPal Holdings, Inc. 2.40%, 10/1/2024 | | | 18,000 | | | | 19,079 | |
| | |
Visa, Inc. 2.80%, 12/14/2022 | | | 20,000 | | | | 20,823 | |
| | | | | | | | |
| | |
| | | | | | | 202,646 | |
| | | | | | | | |
|
Leisure Products — 0.0% (e) | |
| | |
Hasbro, Inc. 3.00%, 11/19/2024 | | | 15,000 | | | | 16,096 | |
| | | | | | | | |
|
Machinery — 0.2% | |
| | |
CNH Industrial NV (United Kingdom) 4.50%, 8/15/2023 | | | 25,000 | | | | 27,308 | |
| | |
Cummins, Inc. 0.75%, 9/1/2025 | | | 45,000 | | | | 44,686 | |
| | |
nVent Finance SARL (United Kingdom) 3.95%, 4/15/2023 | | | 15,000 | | | | 15,737 | |
| | | | | | | | |
| | |
| | | | | | | 87,731 | |
| | | | | | | | |
|
Media — 0.4% | |
| | |
Charter Communications Operating LLC | | | | | | | | |
| | |
4.50%, 2/1/2024 | | | 35,000 | | | | 38,532 | |
| | |
4.91%, 7/23/2025 | | | 15,000 | | | | 17,093 | |
| | |
Comcast Corp. | | | | | | | | |
| | |
3.60%, 3/1/2024 | | | 6,000 | | | | 6,553 | |
| | | | | | | | |
| INVESTMENTS | | PRINCIPAL AMOUNT ($) | | | VALUE ($) | |
| |
|
Media — continued | |
| | |
3.70%, 4/15/2024 | | | 29,000 | | | | 31,799 | |
| | |
3.38%, 8/15/2025 | | | 15,000 | | | | 16,463 | |
| | |
3.95%, 10/15/2025 | | | 15,000 | | | | 16,891 | |
| | |
Discovery Communications LLC 3.90%, 11/15/2024 | | | 15,000 | | | | 16,534 | |
| | |
Fox Corp. 3.05%, 4/7/2025 | | | 20,000 | | | | 21,512 | |
| | |
Omnicom Group, Inc. 3.65%, 11/1/2024 | | | 15,000 | | | | 16,416 | |
| | |
TCI Communications, Inc. 7.88%, 2/15/2026 | | | 7,000 | | | | 9,203 | |
| | |
Time Warner Entertainment Co. LP 8.38%, 3/15/2023 | | | 12,000 | | | | 13,897 | |
| | |
ViacomCBS, Inc. | | | | | | | | |
| | |
3.50%, 1/15/2025 | | | 20,000 | | | | 21,637 | |
| | |
4.00%, 1/15/2026 | | | 14,000 | | | | 15,671 | |
| | |
WPP Finance 2010 (United Kingdom) | | | | | | | | |
| | |
3.63%, 9/7/2022 | | | 6,000 | | | | 6,275 | |
| | |
3.75%, 9/19/2024 | | | 15,000 | | | | 16,501 | |
| | | | | | | | |
| | |
| | | | | | | 264,977 | |
| | | | | | | | |
|
Metals & Mining — 0.1% | |
| | |
Nucor Corp. 4.00%, 8/1/2023 | | | 7,000 | | | | 7,534 | |
| | |
Rio Tinto Finance USA Ltd. (Australia) 3.75%, 6/15/2025 | | | 15,000 | | | | 16,640 | |
| | |
Southern Copper Corp. (Peru) 3.88%, 4/23/2025 | | | 5,000 | | | | 5,520 | |
| | | | | | | | |
| | |
| | | | | | | 29,694 | |
| | | | | | | | |
|
Multiline Retail — 0.1% | |
| | |
Kohl’s Corp. 4.25%, 7/17/2025 | | | 15,000 | | | | 16,321 | |
| | |
Target Corp. | | | | | | | | |
| | |
2.90%, 1/15/2022 | | | 16,000 | | | | 16,378 | |
| | |
2.25%, 4/15/2025 | | | 15,000 | | | | 15,796 | |
| | | | | | | | |
| | |
| | | | | | | 48,495 | |
| | | | | | | | |
| | |
Multi-Utilities — 0.3% | | | | | | | | |
| | |
Berkshire Hathaway Energy Co. | | | | | | | | |
| | |
2.80%, 1/15/2023 | | | 15,000 | | | | 15,659 | |
| | |
3.75%, 11/15/2023 | | | 39,000 | | | | 42,187 | |
| | |
CenterPoint Energy, Inc. 3.85%, 2/1/2024 | | | 7,000 | | | | 7,603 | |
| | |
Delmarva Power & Light Co. 3.50%, 11/15/2023 | | | 35,000 | | | | 37,667 | |
| | |
Dominion Energy, Inc. | | | | | | | | |
| | |
Series B, 2.75%, 1/15/2022 | | | 9,000 | | | | 9,175 | |
| | |
3.07%, 8/15/2024 (d) | | | 10,000 | | | | 10,766 | |
| | |
DTE Energy Co. Series D, 3.70%, 8/1/2023 | | | 18,000 | | | | 19,336 | |
| | |
NiSource, Inc. 0.95%, 8/15/2025 | | | 10,000 | | | | 9,887 | |
| | |
Sempra Energy 2.88%, 10/1/2022 | | | 23,000 | | | | 23,737 | |
| | | | | | | | |
| | |
| | | | | | | 176,017 | |
| | | | | | | | |
SEE NOTES TO FINANCIAL STATEMENTS.
| | | | | | |
| | | |
| 34 | | | | J.P. MORGAN EXCHANGE-TRADED FUNDS | | FEBRUARY 28, 2021 |
| | | | | | | | |
| INVESTMENTS | | PRINCIPAL AMOUNT ($) | | | VALUE ($) | |
Corporate Bonds — continued | |
|
Oil, Gas & Consumable Fuels — 1.8% | |
| | |
BP Capital Markets America, Inc. | | | | | | | | |
| | |
2.75%, 5/10/2023 | | | 15,000 | | | | 15,751 | |
| | |
3.22%, 4/14/2024 | | | 21,000 | | | | 22,545 | |
| | |
3.41%, 2/11/2026 | | | 8,000 | | | | 8,795 | |
| | |
BP Capital Markets plc (United Kingdom) | | | | | | | | |
| | |
2.75%, 5/10/2023 | | | 8,000 | | | | 8,398 | |
| | |
3.99%, 9/26/2023 | | | 43,000 | | | | 46,897 | |
| | |
Canadian Natural Resources Ltd. (Canada) 3.90%, 2/1/2025 | | | 16,000 | | | | 17,366 | |
| | |
Cheniere Corpus Christi Holdings LLC 5.88%, 3/31/2025 | | | 12,000 | | | | 13,815 | |
| | |
Chevron Corp. | | | | | | | | |
| | |
2.41%, 3/3/2022 | | | 10,000 | | | | 10,184 | |
| | |
1.14%, 5/11/2023 | | | 6,000 | | | | 6,107 | |
| | |
1.55%, 5/11/2025 | | | 35,000 | | | | 35,810 | |
| | |
Chevron USA, Inc. | | | | | | | | |
| | |
0.33%, 8/12/2022 | | | 55,000 | | | | 55,067 | |
| | |
0.43%, 8/11/2023 | | | 26,000 | | | | 26,041 | |
| | |
3.90%, 11/15/2024 | | | 15,000 | | | | 16,643 | |
| | |
Ecopetrol SA (Colombia) | | | | | | | | |
| | |
5.88%, 9/18/2023 | | | 10,000 | | | | 11,097 | |
| | |
4.13%, 1/16/2025 | | | 27,000 | | | | 28,956 | |
| | |
Energy Transfer Operating LP | | | | | | | | |
| | |
4.90%, 2/1/2024 | | | 27,000 | | | | 29,548 | |
| | |
2.90%, 5/15/2025 | | | 15,000 | | | | 15,729 | |
| | |
Enterprise Products Operating LLC | | | | | | | | |
| | |
3.50%, 2/1/2022 | | | 28,000 | | | | 28,811 | |
| | |
3.75%, 2/15/2025 | | | 20,000 | | | | 21,973 | |
| | |
Series D, (ICE LIBOR USD 3 Month + 2.99%), 4.88%, 8/16/2077 (c) | | | 19,000 | | | | 18,034 | |
| | |
EOG Resources, Inc. 2.63%, 3/15/2023 | | | 25,000 | | | | 26,021 | |
| | |
Equinor ASA (Norway) 2.88%, 4/6/2025 | | | 98,000 | | | | 105,237 | |
| | |
Exxon Mobil Corp. | | | | | | | | |
| | |
2.73%, 3/1/2023 | | | 20,000 | | | | 20,887 | |
| | |
3.18%, 3/15/2024 | | | 22,000 | | | | 23,631 | |
| | |
2.02%, 8/16/2024 | | | 15,000 | | | | 15,712 | |
| | |
2.99%, 3/19/2025 | | | 25,000 | | | | 26,966 | |
| | |
Kinder Morgan Energy Partners LP | | | | | | | | |
| | |
4.15%, 3/1/2022 | | | 15,000 | | | | 15,546 | |
| | |
4.15%, 2/1/2024 | | | 21,000 | | | | 22,871 | |
| | |
Marathon Petroleum Corp. | | | | | | | | |
| | |
4.50%, 5/1/2023 | | | 21,000 | | | | 22,654 | |
| | |
4.70%, 5/1/2025 | | | 15,000 | | | | 17,056 | |
| | |
MPLX LP 4.88%, 12/1/2024 | | | 46,000 | | | | 51,965 | |
| | | | | | | | |
| INVESTMENTS | | PRINCIPAL AMOUNT ($) | | | VALUE ($) | |
| |
|
Oil, Gas & Consumable Fuels — continued | |
| | |
ONEOK Partners LP | | | | | | | | |
| | |
3.38%, 10/1/2022 | | | 15,000 | | | | 15,537 | |
| | |
5.00%, 9/15/2023 | | | 24,000 | | | | 26,222 | |
| | |
ONEOK, Inc. 2.20%, 9/15/2025 | | | 30,000 | | | | 30,835 | |
| | |
Petroleos Mexicanos (Mexico) 6.84%, 1/23/2030 (f) | | | 1 | | | | 1 | |
| | |
Phillips 66 | | | | | | | | |
| | |
3.85%, 4/9/2025 | | | 10,000 | | | | 11,030 | |
| | |
1.30%, 2/15/2026 | | | 19,000 | | | | 18,976 | |
| | |
Pioneer Natural Resources Co. 1.13%, 1/15/2026 | | | 15,000 | | | | 14,857 | |
| | |
Plains All American Pipeline LP 3.85%, 10/15/2023 | | | 15,000 | | | | 15,974 | |
| | |
Sabine Pass Liquefaction LLC 5.63%, 3/1/2025 | | | 36,000 | | | | 41,466 | |
| | |
Suncor Energy, Inc. (Canada) 3.10%, 5/15/2025 | | | 20,000 | | | | 21,483 | |
| | |
Sunoco Logistics Partners Operations LP 4.25%, 4/1/2024 | | | 16,000 | | | | 17,322 | |
| | |
Total Capital International SA (France) | | | | | | | | |
| | |
2.88%, 2/17/2022 | | | 10,000 | | | | 10,256 | |
| | |
3.75%, 4/10/2024 | | | 20,000 | | | | 21,980 | |
| | |
Valero Energy Corp. 2.85%, 4/15/2025 | | | 20,000 | | | | 21,099 | |
| | |
Williams Cos., Inc. (The) | | | | | | | | |
| | |
3.60%, 3/15/2022 | | | 15,000 | | | | 15,408 | |
| | |
3.90%, 1/15/2025 | | | 25,000 | | | | 27,284 | |
| | | | | | | | |
| | |
| | | | | | | 1,095,843 | |
| | | | | | | | |
|
Paper & Forest Products — 0.1% | |
| | |
Fibria Overseas Finance Ltd. (Brazil) 4.00%, 1/14/2025 | | | 15,000 | | | | 16,120 | |
| | |
Georgia-Pacific LLC 8.00%, 1/15/2024 | | | 15,000 | | | | 18,170 | |
| | | | | | | | |
| | |
| | | | | | | 34,290 | |
| | | | | | | | |
|
Personal Products — 0.0% (e) | |
| | |
Estee Lauder Cos., Inc. (The)
2.00%, 12/1/2024 | | | 17,000 | | | | 17,868 | |
| | | | | | | | |
|
Pharmaceuticals — 0.7% | |
| | |
AstraZeneca plc (United Kingdom) | | | | | | | | |
| | |
3.50%, 8/17/2023 | | | 15,000 | | | | 16,074 | |
| | |
3.38%, 11/16/2025 | | | 5,000 | | | | 5,500 | |
| | |
Bristol-Myers Squibb Co. | | | | | | | | |
| | |
3.25%, 11/1/2023 | | | 15,000 | | | | 16,137 | |
| | |
2.90%, 7/26/2024 | | | 11,000 | | | | 11,858 | |
| | |
3.88%, 8/15/2025 | | | 8,000 | | | | 8,981 | |
| | |
0.75%, 11/13/2025 | | | 58,000 | | | | 57,806 | |
| | |
Eli Lilly and Co. 2.75%, 6/1/2025 | | | 15,000 | | | | 16,096 | |
SEE NOTES TO FINANCIAL STATEMENTS.
| | | | | | | | |
| | | |
| FEBRUARY 28, 2021 | | J.P. MORGAN EXCHANGE-TRADED FUNDS | | | | | 35 | |
JPMorgan BetaBuilders 1-5 Year U.S. Aggregate Bond ETF
SCHEDULE OF PORTFOLIO INVESTMENTS
AS OF FEBRUARY 28, 2021 (continued)
| | | | | | | | |
| INVESTMENTS | | PRINCIPAL AMOUNT ($) | | | VALUE ($) | |
Corporate Bonds — continued | |
|
Pharmaceuticals — continued | |
| | |
GlaxoSmithKline Capital plc (United Kingdom) 3.00%, 6/1/2024 | | | 18,000 | | | | 19,322 | |
| | |
GlaxoSmithKline Capital, Inc. (United Kingdom) | | | | | | | | |
| | |
2.80%, 3/18/2023 | | | 10,000 | | | | 10,495 | |
| | |
3.38%, 5/15/2023 | | | 25,000 | | | | 26,653 | |
| | |
Johnson & Johnson | | | | | | | | |
| | |
2.25%, 3/3/2022 | | | 20,000 | | | | 20,377 | |
| | |
3.38%, 12/5/2023 | | | 41,000 | | | | 44,537 | |
| | |
0.55%, 9/1/2025 | | | 91,000 | | | | 89,999 | |
| | |
Merck & Co., Inc. | | | | | | | | |
| | |
2.40%, 9/15/2022 | | | 6,000 | | | | 6,164 | |
| | |
2.75%, 2/10/2025 | | | 35,000 | | | | 37,482 | |
| | |
0.75%, 2/24/2026 | | | 7,000 | | | | 6,924 | |
| | |
Mylan, Inc. 4.20%, 11/29/2023 | | | 15,000 | | | | 16,297 | |
| | |
Pfizer, Inc. 3.40%, 5/15/2024 | | | 15,000 | | | | 16,366 | |
| | | | | | | | |
| | |
| | | | | | | 427,068 | |
| | | | | | | | |
|
Professional Services — 0.0% (e) | |
| | |
Verisk Analytics, Inc. 4.13%, 9/12/2022 | | | 17,000 | | | | 17,921 | |
| | | | | | | | |
|
Road & Rail — 0.2% | |
| | |
BNSF Funding Trust I (ICE LIBOR USD 3 Month + 2.35%), 6.61%, 12/15/2055 (c) | | | 5,000 | | | | 5,752 | |
| | |
Burlington Northern Santa Fe LLC | | | | | | | | |
| | |
3.00%, 3/15/2023 | | | 15,000 | | | | 15,713 | |
| | |
3.85%, 9/1/2023 | | | 4,000 | | | | 4,310 | |
| | |
3.75%, 4/1/2024 | | | 8,000 | | | | 8,703 | |
| | |
3.65%, 9/1/2025 | | | 8,000 | | | | 8,896 | |
| | |
CSX Corp. 3.40%, 8/1/2024 | | | 20,000 | | | | 21,758 | |
| | |
Norfolk Southern Corp. 3.85%, 1/15/2024 | | | 10,000 | | | | 10,838 | |
| | |
Ryder System, Inc. | | | | | | | | |
| | |
3.75%, 6/9/2023 | | | 15,000 | | | | 16,069 | |
| | |
4.63%, 6/1/2025 | | | 8,000 | | | | 9,103 | |
| | |
Union Pacific Corp. | | | | | | | | |
| | |
2.95%, 3/1/2022 | | | 6,000 | | | | 6,161 | |
| | |
4.16%, 7/15/2022 | | | 15,000 | | | | 15,639 | |
| | |
3.75%, 7/15/2025 | | | 15,000 | | | | 16,675 | |
| | | | | | | | |
| | |
| | | | | | | 139,617 | |
| | | | | | | | |
|
Semiconductors & Semiconductor Equipment — 0.5% | |
| | |
Analog Devices, Inc. 3.13%, 12/5/2023 | | | 6,000 | | | | 6,414 | |
| | |
Broadcom Corp. 3.13%, 1/15/2025 | | | 25,000 | | | | 26,719 | |
| | |
Broadcom, Inc. | | | | | | | | |
| | |
3.63%, 10/15/2024 | | | 62,000 | | | | 67,578 | |
| | |
4.70%, 4/15/2025 | | | 12,000 | | | | 13,559 | |
| | |
Intel Corp. | | | | | | | | |
| | |
2.35%, 5/11/2022 | | | 16,000 | | | | 16,368 | |
| | | | | | | | |
| INVESTMENTS | | PRINCIPAL AMOUNT ($) | | | VALUE ($) | |
| |
|
Semiconductors & Semiconductor Equipment — continued | |
| | |
2.70%, 12/15/2022 | | | 30,000 | | | | 31,286 | |
| | |
3.40%, 3/25/2025 | | | 20,000 | | | | 21,890 | |
| | |
Microchip Technology, Inc. 4.33%, 6/1/2023 | | | 5,000 | | | | 5,398 | |
| | |
NXP BV (Netherlands) 4.88%, 3/1/2024 (b) | | | 30,000 | | | | 33,463 | |
| | |
QUALCOMM, Inc. 2.60%, 1/30/2023 | | | 30,000 | | | | 31,235 | |
| | |
Texas Instruments, Inc. 1.38%, 3/12/2025 | | | 16,000 | | | | 16,391 | |
| | | | | | | | |
| | |
| | | | | | | 270,301 | |
| | | | | | | | |
|
Software — 0.5% | |
| | |
Adobe, Inc. 1.90%, 2/1/2025 | | | 9,000 | | | | 9,357 | |
| | |
Microsoft Corp. | | | | | | | | |
| | |
2.38%, 2/12/2022 | | | 58,000 | | | | 59,104 | |
| | |
2.65%, 11/3/2022 | | | 34,000 | | | | 35,232 | |
| | |
3.63%, 12/15/2023 | | | 15,000 | | | | 16,274 | |
| | |
2.70%, 2/12/2025 | | | 25,000 | | | | 26,728 | |
| | |
Oracle Corp. | | | | | | | | |
| | |
2.50%, 5/15/2022 | | | 15,000 | | | | 15,347 | |
| | |
2.50%, 10/15/2022 | | | 16,000 | | | | 16,579 | |
| | |
2.40%, 9/15/2023 | | | 39,000 | | | | 40,881 | |
| | |
3.40%, 7/8/2024 | | | 16,000 | | | | 17,372 | |
| | |
2.95%, 11/15/2024 | | | 25,000 | | | | 26,974 | |
| | |
VMware, Inc. 2.95%, 8/21/2022 | | | 15,000 | | | | 15,518 | |
| | | | | | | | |
| | |
| | | | | | | 279,366 | |
| | | | | | | | |
|
Specialty Retail — 0.2% | |
| | |
AutoZone, Inc. 2.88%, 1/15/2023 | | | 10,000 | | | | 10,403 | |
| | |
Home Depot, Inc. (The) | | | | | | | | |
| | |
3.25%, 3/1/2022 | | | 15,000 | | | | 15,453 | |
| | |
2.70%, 4/1/2023 | | | 15,000 | | | | 15,654 | |
| | |
Lowe’s Cos., Inc. | | | | | | | | |
| | |
3.13%, 9/15/2024 | | | 30,000 | | | | 32,454 | |
| | |
3.38%, 9/15/2025 | | | 32,000 | | | | 35,154 | |
| | |
TJX Cos., Inc. (The) 3.50%, 4/15/2025 | | | 25,000 | | | | 27,415 | |
| | | | | | | | |
| | |
| | | | | | | 136,533 | |
| | | | | | | | |
|
Technology Hardware, Storage & Peripherals — 0.5% | |
| | |
Apple, Inc. | | | | | | | | |
| | |
2.50%, 2/9/2022 | | | 10,000 | | | | 10,199 | |
| | |
2.10%, 9/12/2022 | | | 15,000 | | | | 15,397 | |
| | |
2.85%, 2/23/2023 | | | 15,000 | | | | 15,695 | |
| | |
2.40%, 5/3/2023 | | | 15,000 | | | | 15,680 | |
| | |
3.45%, 5/6/2024 | | | 10,000 | | | | 10,939 | |
| | |
2.85%, 5/11/2024 | | | 16,000 | | | | 17,129 | |
| | |
1.80%, 9/11/2024 | | | 18,000 | | | | 18,794 | |
| | |
2.75%, 1/13/2025 | | | 10,000 | | | | 10,705 | |
| | |
2.50%, 2/9/2025 | | | 20,000 | | | | 21,256 | |
SEE NOTES TO FINANCIAL STATEMENTS.
| | | | | | |
| | | |
| 36 | | | | J.P. MORGAN EXCHANGE-TRADED FUNDS | | FEBRUARY 28, 2021 |
| | | | | | | | |
| INVESTMENTS | | PRINCIPAL AMOUNT ($) | | | VALUE ($) | |
Corporate Bonds — continued | |
|
Technology Hardware, Storage & Peripherals — continued | |
| | |
1.13%, 5/11/2025 | | | 24,000 | | | | 24,280 | |
| | |
0.55%, 8/20/2025 | | | 30,000 | | | | 29,629 | |
| | |
Dell International LLC | | | | | | | | |
| | |
4.00%, 7/15/2024 (b) | | | 15,000 | | | | 16,424 | |
| | |
5.85%, 7/15/2025 (b) | | | 16,000 | | | | 18,843 | |
| | |
Hewlett Packard Enterprise Co. | | | | | | | | |
| | |
1.45%, 4/1/2024 | | | 16,000 | | | | 16,364 | |
| | |
4.65%, 10/1/2024 | | | 15,000 | | | | 16,886 | |
| | |
HP, Inc. | | | | | | | | |
| | |
4.05%, 9/15/2022 | | | 12,000 | | | | 12,664 | |
| | |
2.20%, 6/17/2025 | | | 27,000 | | | | 28,182 | |
| | | | | | | | |
| | |
| | | | | | | 299,066 | |
| | | | | | | | |
|
Textiles, Apparel & Luxury Goods — 0.0% (e) | |
| | |
NIKE, Inc. 2.40%, 3/27/2025 | | | 20,000 | | | | 21,217 | |
| | | | | | | | |
|
Tobacco — 0.2% | |
| | |
BAT Capital Corp. (United Kingdom) 2.79%, 9/6/2024 | | | 15,000 | | | | 15,962 | |
| | |
Philip Morris International, Inc. | | | | | | | | |
| | |
2.63%, 3/6/2023 | | | 20,000 | | | | 20,910 | |
| | |
2.13%, 5/10/2023 | | | 25,000 | | | | 25,883 | |
| | |
1.50%, 5/1/2025 | | | 10,000 | | | | 10,207 | |
| | |
Reynolds American, Inc. (United Kingdom) 4.45%, 6/12/2025 | | | 16,000 | | | | 17,867 | |
| | | | | | | | |
| | |
| | | | | | | 90,829 | |
| | | | | | | | |
|
Trading Companies & Distributors — 0.1% | |
| | |
Air Lease Corp. | | | | | | | | |
| | |
2.75%, 1/15/2023 | | | 22,000 | | | | 22,769 | |
| | |
3.00%, 9/15/2023 | | | 15,000 | | | | 15,730 | |
| | |
2.88%, 1/15/2026 | | | 26,000 | | | | 27,083 | |
| | |
Aircastle Ltd. 4.13%, 5/1/2024 | | | 6,000 | | | | 6,333 | |
| | | | | | | | |
| | |
| | | | | | | 71,915 | |
| | | | | | | | |
|
Water Utilities — 0.0% (e) | |
| | |
American Water Capital Corp. 3.40%, 3/1/2025 | | | 6,000 | | | | 6,528 | |
| | | | | | | | |
|
Wireless Telecommunication Services — 0.1% | |
| | |
T-Mobile USA, Inc. 3.50%, 4/15/2025 (b) | | | 30,000 | | | | 32,577 | |
| | | | | | | | |
| | |
Vodafone Group plc (United Kingdom) | | | | | | | | |
| | |
3.75%, 1/16/2024 | | | 20,000 | | | | 21,801 | |
| | |
4.13%, 5/30/2025 | | | 8,000 | | | | 8,995 | |
| | | | | | | | |
| | |
| | | | | | | 63,373 | |
| | | | | | | | |
| |
Total Corporate Bonds
(Cost $14,499,900) | | | | 14,771,329 | |
| | | | | | | | |
| | | | | | | | |
| INVESTMENTS | | PRINCIPAL AMOUNT ($) | | | VALUE ($) | |
| | |
Mortgage-Backed Securities — 8.2% | | | | | | | | |
| | |
FHLMC Gold Pools, 15 Year | | | | | | | | |
| | |
Pool # J14776, 3.00%, 3/1/2026 | | | 14,507 | | | | 15,349 | |
| | |
Pool # G14783, 3.50%, 10/1/2026 | | | 13,923 | | | | 14,868 | |
| | |
Pool # G14415, 2.50%, 4/1/2027 | | | 24,239 | | | | 25,374 | |
| | |
Pool # J20134, 3.00%, 8/1/2027 | | | 9,449 | | | | 10,000 | |
| | |
Pool # G18452, 2.50%, 12/1/2027 | | | 35,871 | | | | 37,551 | |
| | |
Pool # E04178, 2.50%, 2/1/2028 | | | 10,452 | | | | 10,956 | |
| | |
Pool # J22899, 2.00%, 3/1/2028 | | | 19,599 | | | | 20,295 | |
| | |
Pool # J23906, 2.50%, 5/1/2028 | | | 37,032 | | | | 38,757 | |
| | |
Pool # J23582, 3.00%, 5/1/2028 | | | 14,028 | | | | 14,927 | |
| | |
Pool # J24561, 2.50%, 6/1/2028 | | | 7,955 | | | | 8,365 | |
| | |
Pool # G15724, 4.00%, 1/1/2029 | | | 3,214 | | | | 3,428 | |
| | |
Pool # G16577, 4.00%, 1/1/2029 | | | 6,984 | | | | 7,452 | |
| | |
Pool # G18511, 2.50%, 5/1/2029 | | | 6,732 | | | | 7,050 | |
| | |
Pool # G18512, 3.00%, 5/1/2029 | | | 11,758 | | | | 12,495 | |
| | |
Pool # G15164, 3.00%, 9/1/2029 | | | 5,173 | | | | 5,512 | |
| | |
Pool # G18533, 2.50%, 12/1/2029 | | | 10,383 | | | | 10,873 | |
| | |
Pool # G18549, 2.50%, 4/1/2030 | | | 29,370 | | | | 30,789 | |
| | |
Pool # G16749, 2.00%, 7/1/2030 | | | 9,400 | | | | 9,734 | |
| | |
Pool # G18568, 2.50%, 9/1/2030 | | | 13,959 | | | | 14,633 | |
| | |
Pool # J33012, 3.00%, 10/1/2030 | | | 30,635 | | | | 32,846 | |
| | |
Pool # G18587, 3.00%, 2/1/2031 | | | 14,777 | | | | 15,648 | |
| | |
Pool # G18600, 2.50%, 5/1/2031 | | | 10,283 | | | | 10,784 | |
| | |
Pool # G16028, 3.00%, 8/1/2031 | | | 7,839 | | | | 8,384 | |
| | |
Pool # G18611, 2.50%, 9/1/2031 | | | 18,759 | | | | 19,674 | |
| | |
Pool # J35495, 2.50%, 10/1/2031 | | | 30,331 | | | | 32,367 | |
| | |
Pool # G18620, 3.00%, 11/1/2031 | | | 11,152 | | | | 11,811 | |
| | |
Pool # G18626, 2.50%, 1/1/2032 | | | 62,299 | | | | 65,337 | |
| | |
Pool # G18632, 3.00%, 2/1/2032 | | | 11,187 | | | | 11,848 | |
| | |
Pool # J37147, 3.00%, 6/1/2032 | | | 10,919 | | | | 11,782 | |
| | |
Pool # G16207, 3.50%, 7/1/2032 | | | 10,529 | | | | 11,555 | |
| | |
Pool # J38058, 3.00%, 11/1/2032 | | | 34,966 | | | | 37,925 | |
| | |
Pool # J39722, 3.00%, 10/1/2033 | | | 9,747 | | | | 10,473 | |
| | |
Pool # G18713, 3.50%, 11/1/2033 | | | 22,417 | | | | 23,936 | |
| | |
Pool # G18715, 3.00%, 12/1/2033 | | | 8,535 | | | | 9,026 | |
| | |
Pool # G16756, 3.50%, 1/1/2034 | | | 10,585 | | | | 11,491 | |
| | |
Pool # G18720, 3.50%, 1/1/2034 | | | 6,123 | | | | 6,538 | |
| | |
Pool # G18723, 3.50%, 2/1/2034 | | | 5,707 | | | | 6,093 | |
| | |
Pool # G18726, 3.50%, 3/1/2034 | | | 5,301 | | | | 5,661 | |
| | |
FHLMC UMBS, 15 Year | | | | | | | | |
| | |
Pool # ZK2607, 3.50%, 10/1/2025 | | | 3,172 | | | | 3,389 | |
| | |
Pool # ZK2904, 3.50%, 1/1/2026 | | | 9,558 | | | | 10,207 | |
| | |
Pool # ZS8020, 3.00%, 9/1/2027 | | | 14,920 | | | | 15,794 | |
| | |
Pool # ZS6596, 3.00%, 11/1/2027 | | | 7,497 | | | | 7,954 | |
| | |
Pool # ZA2838, 2.50%, 4/1/2028 | | | 9,488 | | | | 9,964 | |
| | |
Pool # ZK5814, 3.00%, 7/1/2028 | | | 23,276 | | | | 24,786 | |
SEE NOTES TO FINANCIAL STATEMENTS.
| | | | | | | | |
| | | |
| FEBRUARY 28, 2021 | | J.P. MORGAN EXCHANGE-TRADED FUNDS | | | | | 37 | |
JPMorgan BetaBuilders 1-5 Year U.S. Aggregate Bond ETF
SCHEDULE OF PORTFOLIO INVESTMENTS
AS OF FEBRUARY 28, 2021 (continued)
| | | | | | | | |
| INVESTMENTS | | PRINCIPAL AMOUNT ($) | | | VALUE ($) | |
Mortgage-Backed Securities — continued | |
| | |
Pool # ZK5986, 3.50%, 9/1/2028 | | | 7,725 | | | | 8,348 | |
| | |
Pool # ZK6024, 3.50%, 9/1/2028 | | | 17,468 | | | | 18,876 | |
| | |
Pool # ZK6594, 3.00%, 4/1/2029 | | | 6,529 | | | | 6,957 | |
| | |
Pool # ZK6713, 3.00%, 6/1/2029 | | | 14,456 | | | | 15,429 | |
| | |
Pool # ZK6827, 3.00%, 8/1/2029 | | | 8,433 | | | | 9,001 | |
| | |
Pool # ZS8598, 3.00%, 2/1/2031 | | | 18,743 | | | | 19,848 | |
| | |
Pool # ZS8617, 2.50%, 8/1/2031 | | | 22,651 | | | | 23,752 | |
| | |
Pool # ZS8622, 3.00%, 9/1/2031 | | | 19,404 | | | | 20,548 | |
| | |
Pool # ZS8628, 2.00%, 11/1/2031 | | | 3,466 | | | | 3,586 | |
| | |
Pool # SB0084, 3.00%, 2/1/2032 | | | 7,631 | | | | 8,131 | |
| | |
Pool # ZK9051, 3.00%, 11/1/2032 | | | 24,438 | | | | 26,331 | |
| | |
Pool # ZS7938, 2.50%, 1/1/2033 | | | 8,521 | | | | 9,057 | |
| | |
Pool # ZS7988, 3.50%, 2/1/2033 | | | 14,527 | | | | 15,898 | |
| | |
Pool # ZK9341, 3.00%, 3/1/2033 | | | 3,894 | | | | 4,197 | |
| | |
Pool # ZT0716, 3.00%, 10/1/2033 | | | 4,880 | | | | 5,159 | |
| | |
Pool # SB0257, 4.00%, 11/1/2033 | | | 5,898 | | | | 6,292 | |
| | |
Pool # SB0194, 2.50%, 12/1/2033 | | | 9,373 | | | | 9,816 | |
| | |
Pool # ZT1557, 4.00%, 12/1/2033 | | | 5,581 | | | | 5,945 | |
| | |
Pool # ZT1725, 3.50%, 1/1/2034 | | | 5,292 | | | | 5,747 | |
| | |
Pool # ZT1799, 3.50%, 3/1/2034 | | | 2,827 | | | | 3,019 | |
| | |
Pool # SB8008, 2.50%, 8/1/2034 | | | 9,314 | | | | 9,729 | |
| | |
Pool # SB8013, 2.50%, 9/1/2034 | | | 5,918 | | | | 6,182 | |
| | |
Pool # SB8010, 2.50%, 10/1/2034 | | | 11,695 | | | | 12,216 | |
| | |
Pool # SB8012, 3.50%, 10/1/2034 | | | 5,914 | | | | 6,316 | |
| | |
Pool # SB0109, 2.50%, 11/1/2034 | | | 36,321 | | | | 38,399 | |
| | |
Pool # QN1052, 3.00%, 11/1/2034 | | | 7,357 | | | | 7,829 | |
| | |
Pool # SB8017, 3.50%, 11/1/2034 | | | 11,352 | | | | 12,123 | |
| | |
Pool # SB8021, 3.00%, 12/1/2034 | | | 9,201 | | | | 9,712 | |
| | |
Pool # SB0260, 2.50%, 2/1/2035 | | | 15,033 | | | | 15,703 | |
| | |
Pool # SB0264, 2.50%, 2/1/2035 | | | 22,074 | | | | 23,525 | |
| | |
Pool # SB8045, 2.50%, 5/1/2035 | | | 10,430 | | | | 10,910 | |
| | |
Pool # QN2057, 3.00%, 5/1/2035 | | | 15,213 | | | | 16,511 | |
| | |
Pool # SB0345, 2.00%, 6/1/2035 | | | 92,089 | | | | 95,816 | |
| | |
Pool # SB0401, 2.00%, 7/1/2035 | | | 26,393 | | | | 27,302 | |
| | |
Pool # SB0394, 2.50%, 7/1/2035 | | | 15,926 | | | | 16,660 | |
| | |
Pool # SB8501, 2.00%, 8/1/2035 | | | 105,490 | | | | 109,760 | |
| | |
Pool # SB0406, 2.50%, 8/1/2035 | | | 28,526 | | | | 30,208 | |
| | |
Pool # SB8067, 1.50%, 9/1/2035 | | | 32,153 | | | | 32,530 | |
| | |
Pool # SB8061, 2.00%, 9/1/2035 | | | 130,170 | | | | 134,652 | |
| | |
Pool # SB8062, 2.50%, 9/1/2035 | | | 99,248 | | | | 103,820 | |
| | |
Pool # RC1591, 1.50%, 10/1/2035 | | | 74,253 | | | | 75,367 | |
| | |
Pool # SB8068, 1.50%, 10/1/2035 | | | 24,634 | | | | 24,923 | |
| | |
Pool # SB0430, 2.00%, 10/1/2035 | | | 45,301 | | | | 46,946 | |
| | |
Pool # QN4490, 1.50%, 12/1/2035 | | | 106,287 | | | | 107,785 | |
| | |
Pool # SB0450, 2.00%, 12/1/2035 | | | 56,489 | | | | 58,830 | |
| | |
Pool # QN4861, 1.50%, 1/1/2036 | | | 84,315 | | | | 85,453 | |
| | |
Pool # SB8088, 1.50%, 2/1/2036 | | | 40,691 | | | | 41,168 | |
| | | | | | | | |
| INVESTMENTS | | PRINCIPAL AMOUNT ($) | | | VALUE ($) | |
| | | | | | | | |
| | |
FNMA UMBS, 15 Year | | | | | | | | |
| | |
Pool # AE0988, 4.00%, 9/1/2025 | | | 4,013 | | | | 4,275 | |
| | |
Pool # AL1168, 3.50%, 1/1/2026 | | | 4,252 | | | | 4,549 | |
| | |
Pool # AL0519, 4.00%, 3/1/2026 | | | 3,907 | | | | 4,169 | |
| | |
Pool # AH9695, 4.00%, 4/1/2026 | | | 5,486 | | | | 5,851 | |
| | |
Pool # AL4643, 4.00%, 7/1/2026 | | | 4,940 | | | | 5,262 | |
| | |
Pool # AB4086, 3.00%, 12/1/2026 | | | 18,863 | | | | 19,955 | |
| | |
Pool # AJ9357, 3.50%, 1/1/2027 | | | 9,500 | | | | 10,166 | |
| | |
Pool # AW7396, 3.50%, 1/1/2027 | | | 9,873 | | | | 10,542 | |
| | |
Pool # AK3264, 3.00%, 2/1/2027 | | | 9,823 | | | | 10,392 | |
| | |
Pool # AW7395, 3.00%, 2/1/2027 | | | 9,111 | | | | 9,639 | |
| | |
Pool # AK5412, 3.00%, 3/1/2027 | | | 9,126 | | | | 9,663 | |
| | |
Pool # AL1746, 3.50%, 3/1/2027 | | | 5,561 | | | | 5,951 | |
| | |
Pool # AB5095, 3.00%, 5/1/2027 | | | 9,929 | | | | 10,529 | |
| | |
Pool # AO4079, 3.00%, 5/1/2027 | | | 14,484 | | | | 15,327 | |
| | |
Pool # AL2224, 3.50%, 7/1/2027 | | | 10,230 | | | | 10,946 | |
| | |
Pool # AQ5118, 2.50%, 11/1/2027 | | | 6,765 | | | | 7,081 | |
| | |
Pool # AQ1688, 2.00%, 12/1/2027 | | | 6,862 | | | | 7,097 | |
| | |
Pool # MA1277, 2.50%, 12/1/2027 | | | 57,389 | | | | 60,066 | |
| | |
Pool # AR1045, 2.50%, 1/1/2028 | | | 13,837 | | | | 14,482 | |
| | |
Pool # AL3041, 2.00%, 2/1/2028 | | | 9,872 | | | | 10,209 | |
| | |
Pool # AR3175, 2.50%, 2/1/2028 | | | 15,169 | | | | 15,905 | |
| | |
Pool # AR4180, 2.50%, 2/1/2028 | | | 31,139 | | | | 32,725 | |
| | |
Pool # AL3060, 3.00%, 2/1/2028 | | | 25,473 | | | | 26,956 | |
| | |
Pool # AT2769, 2.00%, 5/1/2028 | | | 12,926 | | | | 13,382 | |
| | |
Pool # AL3764, 3.50%, 5/1/2028 | | | 14,578 | | | | 15,752 | |
| | |
Pool # MA1467, 2.00%, 6/1/2028 | | | 7,499 | | | | 7,764 | |
| | |
Pool # BM3954, 2.50%, 12/1/2028 | | | 49,162 | | | | 51,442 | |
| | |
Pool # AV8783, 3.00%, 1/1/2029 | | | 14,995 | | | | 15,951 | |
| | |
Pool # AV4793, 3.50%, 5/1/2029 | | | 9,354 | | | | 10,108 | |
| | |
Pool # AW3641, 3.00%, 6/1/2029 | | | 14,533 | | | | 15,440 | |
| | |
Pool # AW8317, 2.50%, 9/1/2029 | | | 8,341 | | | | 8,732 | |
| | |
Pool # AL7205, 3.50%, 12/1/2029 | | | 3,231 | | | | 3,491 | |
| | |
Pool # AX7696, 3.00%, 1/1/2030 | | | 23,581 | | | | 25,053 | |
| | |
Pool # AS4489, 2.50%, 3/1/2030 | | | 2,867 | | | | 3,021 | |
| | |
Pool # AY6338, 2.50%, 3/1/2030 | | | 46,770 | | | | 49,020 | |
| | |
Pool # AS4678, 3.00%, 3/1/2030 | | | 29,573 | | | | 31,439 | |
| | |
Pool # AS4860, 2.50%, 5/1/2030 | | | 22,630 | | | | 23,883 | |
| | |
Pool # AL9852, 3.00%, 9/1/2030 | | | 20,618 | | | | 21,920 | |
| | |
Pool # BC0035, 3.00%, 11/1/2030 | | | 47,232 | | | | 51,080 | |
| | |
Pool # BA6893, 2.50%, 2/1/2031 | | | 6,249 | | | | 6,550 | |
| | |
Pool # BC1973, 2.50%, 3/1/2031 | | | 24,092 | | | | 25,258 | |
| | |
Pool # BC9099, 2.50%, 3/1/2031 | | | 9,669 | | | | 10,134 | |
| | |
Pool # BC2482, 3.00%, 3/1/2031 | | | 21,501 | | | | 22,765 | |
| | |
Pool # AL9421, 4.00%, 3/1/2031 | | | 5,924 | | | | 6,319 | |
| | |
Pool # AS7067, 3.50%, 4/1/2031 | | | 7,541 | | | | 8,185 | |
SEE NOTES TO FINANCIAL STATEMENTS.
| | | | | | |
| | | |
| 38 | | | | J.P. MORGAN EXCHANGE-TRADED FUNDS | | FEBRUARY 28, 2021 |
| | | | | | | | |
| INVESTMENTS | | PRINCIPAL AMOUNT ($) | | | VALUE ($) | |
Mortgage-Backed Securities — continued | |
| | |
Pool # BD4574, 2.00%, 6/1/2031 | | | 17,955 | | | | 18,578 | |
| | |
Pool # FM1336, 3.50%, 6/1/2031 | | | 9,866 | | | | 10,661 | |
| | |
Pool # AS7467, 2.50%, 7/1/2031 | | | 11,516 | | | | 12,074 | |
| | |
Pool # AS7606, 2.50%, 7/1/2031 | | | 35,499 | | | | 37,585 | |
| | |
Pool # AS7620, 2.50%, 7/1/2031 | | | 77,920 | | | | 82,383 | |
| | |
Pool # AS7657, 2.50%, 8/1/2031 | | | 17,924 | | | | 19,040 | |
| | |
Pool # MA2774, 2.00%, 10/1/2031 | | | 1,901 | | | | 1,966 | |
| | |
Pool # FM1324, 3.00%, 11/1/2031 | | | 22,248 | | | | 23,543 | |
| | |
Pool # FM1773, 3.00%, 12/1/2031 | | | 28,486 | | | | 30,215 | |
| | |
Pool # BE5622, 2.50%, 1/1/2032 | | | 4,904 | | | | 5,142 | |
| | |
Pool # MA3187, 2.50%, 11/1/2032 | | | 25,457 | | | | 26,659 | |
| | |
Pool # MA3188, 3.00%, 11/1/2032 | | | 5,583 | | | | 5,905 | |
| | |
Pool # 890822, 3.00%, 12/1/2032 | | | 62,147 | | | | 66,940 | |
| | |
Pool # BM3207, 3.00%, 12/1/2032 | | | 16,533 | | | | 17,835 | |
| | |
Pool # BM3276, 3.50%, 12/1/2032 | | | 14,321 | | | | 15,552 | |
| | |
Pool # CA1089, 3.00%, 2/1/2033 | | | 11,261 | | | | 12,178 | |
| | |
Pool # FM1309, 2.00%, 3/1/2033 | | | 4,345 | | | | 4,496 | |
| | |
Pool # FM3937, 3.00%, 4/1/2033 | | | 12,092 | | | | 12,962 | |
| | |
Pool # MA3437, 3.00%, 8/1/2033 | | | 8,690 | | | | 9,187 | |
| | |
Pool # CA2407, 4.00%, 9/1/2033 | | | 14,945 | | | | 16,087 | |
| | |
Pool # FM4036, 2.50%, 12/1/2033 | | | 15,301 | | | | 16,023 | |
| | |
Pool # BN3975, 3.00%, 1/1/2034 | | | 1,593 | | | | 1,684 | |
| | |
Pool # MA3559, 3.50%, 1/1/2034 | | | 3,650 | | | | 3,897 | |
| | |
Pool # MA3588, 3.50%, 2/1/2034 | | | 14,566 | | | | 15,552 | |
| | |
Pool # MA3589, 4.00%, 2/1/2034 | | | 16,276 | | | | 17,335 | |
| | |
Pool # MA3631, 3.00%, 4/1/2034 | | | 16,592 | | | | 17,512 | |
| | |
Pool # FM1810, 4.00%, 4/1/2034 | | | 5,849 | | | | 6,334 | |
| | |
Pool # FM1071, 3.50%, 5/1/2034 | | | 11,620 | | | | 12,757 | |
| | |
Pool # MA3709, 2.50%, 6/1/2034 | | | 9,484 | | | | 9,907 | |
| | |
Pool # MA3729, 2.50%, 7/1/2034 | | | 3,178 | | | | 3,320 | |
| | |
Pool # MA3695, 3.00%, 7/1/2034 | | | 6,974 | | | | 7,361 | |
| | |
Pool # BJ5549, 3.00%, 8/1/2034 | | | 4,442 | | | | 4,699 | |
| | |
Pool # FM2403, 3.50%, 9/1/2034 | | | 16,126 | | | | 17,549 | |
| | |
Pool # FM5400, 2.50%, 10/1/2034 | | | 19,657 | | | | 20,609 | |
| | |
Pool # MA3797, 2.50%, 10/1/2034 | | | 6,222 | | | | 6,500 | |
| | |
Pool # FM1900, 2.50%, 11/1/2034 | | | 12,417 | | | | 13,230 | |
| | |
Pool # MA3827, 2.50%, 11/1/2034 | | | 81,360 | | | | 84,989 | |
| | |
Pool # MA3828, 3.00%, 11/1/2034 | | | 15,612 | | | | 16,478 | |
| | |
Pool # FM4671, 3.50%, 1/1/2035 | | | 20,871 | | | | 22,913 | |
| | |
Pool # MA3956, 3.00%, 3/1/2035 | | | 34,641 | | | | 36,825 | |
| | |
Pool # MA4012, 2.00%, 5/1/2035 | | | 145,115 | | | | 150,101 | |
| | |
Pool # MA4013, 2.50%, 5/1/2035 | | | 37,303 | | | | 39,023 | |
| | |
Pool # FM3493, 3.50%, 5/1/2035 | | | 12,211 | | | | 13,279 | |
| | |
Pool # BP5762, 2.50%, 6/1/2035 | | | 55,291 | | | | 57,840 | |
| | |
Pool # FM3654, 3.00%, 6/1/2035 | | | 39,918 | | | | 42,968 | |
| | |
Pool # MA4074, 2.00%, 7/1/2035 | | | 88,504 | | | | 91,545 | |
| | | | | | | | |
| INVESTMENTS | | PRINCIPAL AMOUNT ($) | | | VALUE ($) | |
| |
| | |
Pool # MA4075, Class 177, 2.50%, 7/1/2035 | | | 21,409 | | | | 22,396 | |
| | |
Pool # MA4095, 2.00%, 8/1/2035 | | | 102,548 | | | | 106,072 | |
| | |
Pool # FM3936, 2.50%, 8/1/2035 | | | 17,605 | | | | 18,667 | |
| | |
Pool # MA4099, 2.50%, 8/1/2035 | | | 49,447 | | | | 51,727 | |
| | |
Pool # MA4122, 1.50%, 9/1/2035 | | | 15,003 | | | | 15,180 | |
| | |
Pool # MA4123, 2.00%, 9/1/2035 | | | 95,108 | | | | 98,376 | |
| | |
Pool # MA4154, 1.50%, 10/1/2035 | | | 114,604 | | | | 115,949 | |
| | |
Pool # CA7497, 2.50%, 10/1/2035 | | | 13,504 | | | | 14,301 | |
| | |
Pool # FM4368, 1.50%, 11/1/2035 | | | 36,669 | | | | 37,099 | |
| | |
Pool # FM4850, 2.00%, 11/1/2035 | | | 49,843 | | | | 51,663 | |
| | |
Pool # MA4179, 2.00%, 11/1/2035 | | | 54,043 | | | | 55,900 | |
| | |
Pool # MA4180, 2.50%, 11/1/2035 | | | 33,790 | | | | 35,348 | |
| | |
Pool # FM5396, 2.00%, 12/1/2035 | | | 64,046 | | | | 66,765 | |
| | |
Pool # MA4206, 2.00%, 12/1/2035 | | | 14,670 | | | | 15,174 | |
| | |
Pool # CA8788, 2.00%, 1/1/2036 | | | 94,882 | | | | 98,256 | |
| | |
GNMA I, 15 Year Pool # AA8397, 2.50%, 3/15/2028 | | | 7,476 | | | | 7,831 | |
| | |
GNMA II, 15 Year | | | | | | | | |
| | |
Pool # 796502, 3.00%, 4/20/2022 | | | 3,712 | | | | 3,924 | |
| | |
Pool # MA1134, 3.00%, 7/20/2028 | | | 10,666 | | | | 11,259 | |
| | |
Pool # MA4559, 3.00%, 7/20/2032 | | | 11,144 | | | | 11,791 | |
| | |
Pool # MA4625, 3.50%, 8/20/2032 | | | 8,288 | | | | 8,844 | |
| | |
Pool # MA5791, 3.50%, 3/20/2034 | | | 1,948 | | | | 2,086 | |
| | |
Pool # MA6256, 3.50%, 12/20/2034 | | | 9,397 | | | | 10,064 | |
| | |
Pool # MA6906, 2.50%, 10/20/2035 | | | 21,269 | | | | 22,316 | |
| | | | | | | | |
| | |
Total Mortgage-Backed Securities
(cost $4,814,734) | | | | | | | 4,878,625 | |
| | | | | | | | |
Supranational — 3.0% | | | | | | | | |
| | |
African Development Bank (Supranational) | | | | | | | | |
| | |
3.00%, 12/6/2021 | | | 12,000 | | | | 12,259 | |
| | |
1.63%, 9/16/2022 | | | 36,000 | | | | 36,791 | |
| | |
3.00%, 9/20/2023 | | | 15,000 | | | | 16,021 | |
| | |
Asian Development Bank (Supranational) | | | | | | | | |
| | |
0.63%, 4/7/2022 | | | 93,000 | | | | 93,475 | |
| | |
1.88%, 8/10/2022 | | | 45,000 | | | | 46,095 | |
| | |
2.75%, 3/17/2023 | | | 38,000 | | | | 39,968 | |
| | |
1.50%, 10/18/2024 | | | 30,000 | | | | 31,070 | |
| | |
2.00%, 1/22/2025 | | | 23,000 | | | | 24,269 | |
| | |
0.63%, 4/29/2025 | | | 68,000 | | | | 68,016 | |
| | |
Asian Infrastructure Investment Bank (The) (Supranational) | | | | | | | | |
| | |
2.25%, 5/16/2024 | | | 101,000 | | | | 106,900 | |
| | |
0.50%, 5/28/2025 | | | 45,000 | | | | 44,719 | |
| | |
Corp. Andina de Fomento (Supranational) 3.75%, 11/23/2023 | | | 38,000 | | | | 40,869 | |
SEE NOTES TO FINANCIAL STATEMENTS.
| | | | | | | | |
| | | |
| FEBRUARY 28, 2021 | | J.P. MORGAN EXCHANGE-TRADED FUNDS | | | | | 39 | |
JPMorgan BetaBuilders 1-5 Year U.S. Aggregate Bond ETF
SCHEDULE OF PORTFOLIO INVESTMENTS
AS OF FEBRUARY 28, 2021 (continued)
| | | | | | | | |
| INVESTMENTS | | PRINCIPAL AMOUNT ($) | | | VALUE ($) | |
Supranational — continued | |
| | |
European Bank for Reconstruction & Development (Supranational) | | | | | | | | |
| | |
2.13%, 3/7/2022 | | | 43,000 | | | | 43,844 | |
| | |
1.50%, 2/13/2025 | | | 30,000 | | | | 31,087 | |
| | |
0.50%, 11/25/2025 | | | 30,000 | | | | 29,608 | |
| | |
European Investment Bank (Supranational) | | | | | | | | |
| | |
2.25%, 8/15/2022 | | | 90,000 | | | | 92,713 | |
| | |
1.38%, 9/6/2022 | | | 15,000 | | | | 15,272 | |
| | |
2.50%, 3/15/2023 | | | 145,000 | | | | 151,774 | |
| | |
3.25%, 1/29/2024 | | | 8,000 | | | | 8,671 | |
| | |
2.25%, 6/24/2024 | | | 48,000 | | | | 50,867 | |
| | |
2.50%, 10/15/2024 | | | 39,000 | | | | 41,799 | |
| | |
1.63%, 3/14/2025 | | | 61,000 | | | | 63,535 | |
| | |
Inter-American Development Bank (Supranational) | | | | | | | | |
| | |
1.75%, 4/14/2022 | | | 70,000 | | | | 71,244 | |
| | |
1.75%, 9/14/2022 | | | 43,000 | | | | 44,036 | |
| | |
2.50%, 1/18/2023 | | | 36,000 | | | | 37,558 | |
| | |
0.50%, 5/24/2023 | | | 17,000 | | | | 17,111 | |
| | |
3.00%, 2/21/2024 | | | 16,000 | | | | 17,245 | |
| | |
0.63%, 7/15/2025 | | | 43,000 | | | | 42,800 | |
| | |
International Bank for Reconstruction & Development (Supranational) | | | | | | | | |
| | |
2.13%, 7/1/2022 | | | 5,000 | | | | 5,130 | |
| | |
1.88%, 6/19/2023 | | | 19,000 | | | | 19,703 | |
| | |
2.50%, 3/19/2024 | | | 37,000 | | | | 39,388 | |
| | |
2.50%, 11/25/2024 | | | 15,000 | | | | 16,098 | |
| | |
2.13%, 3/3/2025 | | | 29,000 | | | | 30,781 | |
| | |
0.75%, 3/11/2025 | | | 22,000 | | | | 22,163 | |
| | |
0.63%, 4/22/2025 | | | 25,000 | | | | 25,015 | |
| | |
0.38%, 7/28/2025 | | | 250,000 | | | | 246,253 | |
| | |
2.50%, 7/29/2025 | | | 34,000 | | | | 36,612 | |
| | |
International Finance Corp. (Supranational) | | | | | | | | |
| | |
2.88%, 7/31/2023 | | | 30,000 | | | | 31,852 | |
| | |
1.38%, 10/16/2024 | | | 15,000 | | | | 15,474 | |
| | |
0.38%, 7/16/2025 | | | 15,000 | | | | 14,773 | |
| | | | | | | | |
| |
Total Supranational
(Cost $1,806,498) | | | | 1,822,858 | |
| | | | | | | | |
U.S. Government Agency Securities — 2.7% | |
| | |
FFCB | | | | | | | | |
| | |
3.00%, 10/19/2021 | | | 50,000 | | | | 50,904 | |
| | |
0.38%, 4/8/2022 | | | 50,000 | | | | 50,140 | |
| | |
0.13%, 11/23/2022 | | | 40,000 | | | | 39,988 | |
| | |
FHLB | | | | | | | | |
| | |
2.38%, 9/10/2021 | | | 25,000 | | | | 25,283 | |
| | |
1.63%, 11/19/2021 | | | 20,000 | | | | 20,218 | |
| | | | | | | | |
| INVESTMENTS | | PRINCIPAL AMOUNT ($) | | | VALUE ($) | |
| |
| | |
2.25%, 3/11/2022 | | | 45,000 | | | | 45,965 | |
| | |
2.50%, 3/11/2022 | | | 70,000 | | | | 71,735 | |
| | |
2.13%, 6/10/2022 | | | 20,000 | | | | 20,508 | |
| | |
2.50%, 2/13/2024 | | | 15,000 | | | | 15,975 | |
| | |
1.50%, 8/15/2024 | | | 60,000 | | | | 62,318 | |
| | |
0.50%, 4/14/2025 | | | 120,000 | | | | 119,800 | |
| | |
FHLMC | | | | | | | | |
| | |
0.38%, 5/5/2023 | | | 50,000 | | | | 50,236 | |
| | |
0.25%, 6/26/2023 | | | 125,000 | | | | 125,186 | |
| | |
0.25%, 8/24/2023 | | | 55,000 | | | | 55,065 | |
| | |
0.25%, 9/8/2023 | | | 50,000 | | | | 50,028 | |
| | |
0.30%, 9/28/2023 | | | 50,000 | | | | 49,961 | |
| | |
0.38%, 3/25/2024 | | | 27,000 | | | | 26,944 | |
| | |
1.50%, 2/12/2025 | | | 62,000 | | | | 64,449 | |
| | |
0.38%, 7/21/2025 | | | 39,000 | | | | 38,568 | |
| | |
0.38%, 9/23/2025 | | | 50,000 | | | | 49,249 | |
| | |
FNMA | | | | | | | | |
| | |
2.63%, 1/11/2022 | | | 22,000 | | | | 22,476 | |
| | |
2.25%, 4/12/2022 | | | 35,000 | | | | 35,822 | |
| | |
2.00%, 10/5/2022 | | | 160,000 | | | | 164,745 | |
| | |
0.25%, 5/22/2023 | | | 12,000 | | | | 12,024 | |
| | |
2.88%, 9/12/2023 | | | 60,000 | | | | 63,972 | |
| | |
1.75%, 7/2/2024 | | | 15,000 | | | | 15,698 | |
| | |
2.63%, 9/6/2024 | | | 41,000 | | | | 44,217 | |
| | |
1.63%, 10/15/2024 | | | 40,000 | | | | 41,764 | |
| | |
1.63%, 1/7/2025 | | | 40,000 | | | | 41,717 | |
| | |
0.63%, 4/22/2025 | | | 40,000 | | | | 40,068 | |
| | |
0.50%, 6/17/2025 | | | 32,000 | | | | 31,844 | |
| | |
0.50%, 11/7/2025 | | | 15,000 | | | | 14,847 | |
| | |
Israel Government AID Bond (Israel) 5.50%, 4/26/2024 | | | 15,000 | | | | 17,382 | |
| | |
Tennessee Valley Authority | | | | | | | | |
| | |
1.88%, 8/15/2022 | | | 10,000 | | | | 10,247 | |
| | |
2.88%, 9/15/2024 | | | 20,000 | | | | 21,660 | |
| | | | | | | | |
| |
Total U.S. Government Agency Securities
(Cost $1,605,372) | | | | 1,611,003 | |
| | | | | | | | |
Commercial Mortgage-Backed Securities — 2.5% | |
| | |
Benchmark Mortgage Trust | | | | | | | | |
| | |
Series 2018-B3, Class A3, 3.75%, 4/10/2051 | | | 25,000 | | | | 27,124 | |
| | |
Series 2019-B12, Class A2, 3.00%, 8/15/2052 | | | 7,000 | | | | 7,388 | |
| | |
Series 2020-B17, Class A2, 2.21%, 3/15/2053 | | | 50,000 | | | | 52,105 | |
| | |
CD Mortgage Trust Series 2017-CD6, Class ASB, 3.33%, 11/13/2050 | | | 50,000 | | | | 54,578 | |
SEE NOTES TO FINANCIAL STATEMENTS.
| | | | | | |
| | | |
| 40 | | | | J.P. MORGAN EXCHANGE-TRADED FUNDS | | FEBRUARY 28, 2021 |
| | | | | | | | |
| INVESTMENTS | | PRINCIPAL AMOUNT ($) | | | VALUE ($) | |
Commercial Mortgage-Backed Securities — continued | |
| | |
CGMS Commercial Mortgage Trust Series 2017-B1, Class AAB, 3.24%, 8/15/2050 | | | 16,000 | | | | 17,381 | |
| | |
Citigroup Commercial Mortgage Trust | | | | | | | | |
| | |
Series 2013-GC17, Class A4, 4.13%, 11/10/2046 | | | 20,000 | | | | 21,731 | |
| | |
Series 2016-C1, Class AAB, 3.00%, 5/10/2049 | | | 12,000 | | | | 12,729 | |
| | |
Series 2020-GC46, Class A2, 2.71%, 2/15/2053 | | | 20,000 | | | | 20,830 | |
| | |
Commercial Mortgage Trust | | | | | | | | |
| | |
Series 2013-CR6, Class A4, 3.10%, 3/10/2046 | | | 15,000 | | | | 15,672 | |
| | |
Series 2014-CR16, Class A3, 3.78%, 4/10/2047 | | | 24,969 | | | | 26,864 | |
| | |
Series 2014-LC15, Class A4, 4.01%, 4/10/2047 | | | 20,000 | | | | 21,819 | |
| | |
Series 2014-UBS3, Class A3, 3.55%, 6/10/2047 | | | 42,968 | | | | 46,033 | |
| | |
Series 2014-UBS4, Class A5, 3.69%, 8/10/2047 | | | 50,000 | | | | 54,482 | |
| | |
Series 2015-CR25, Class A4, 3.76%, 8/10/2048 | | | 32,000 | | | | 35,509 | |
| | |
Series 2013-CR11, Class ASB, 3.66%, 8/10/2050 | | | 11,660 | | | | 12,124 | |
| | |
CSAIL Commercial Mortgage Trust Series 2015-C3, Class A4, 3.72%, 8/15/2048 | | | 40,000 | | | | 44,271 | |
| | |
FHLMC, Multi-Family Structured Pass-Through Certificates | | | | | | | | |
| | |
Series K016, Class A2, 2.97%, 10/25/2021 | | | 27,195 | | | | 27,337 | |
| | |
Series K019, Class A2, 2.27%, 3/25/2022 | | | 15,200 | | | | 15,347 | |
| | |
Series K020, Class A2, 2.37%, 5/25/2022 | | | 10,000 | | | | 10,126 | |
| | |
Series K720, Class A2, 2.72%, 6/25/2022 | | | 15,000 | | | | 15,237 | |
| | |
Series K027, Class A2, 2.64%, 1/25/2023 | | | 26,000 | | | | 26,765 | |
| | |
Series K028, Class A2, 3.11%, 2/25/2023 | | | 10,000 | | | | 10,395 | |
| | |
Series K042, Class A1, 2.27%, 6/25/2024 | | | 73,634 | | | | 75,421 | |
| | |
Series K044, Class A2, 2.81%, 1/25/2025 | | | 16,000 | | | | 17,143 | |
| | |
Series K046, Class A2, 3.21%, 3/25/2025 | | | 26,000 | | | | 28,311 | |
| | |
Series K733, Class A2, 3.75%, 8/25/2025 | | | 100,000 | | | | 110,873 | |
| | |
Series K737, Class A1, 2.12%, 6/25/2026 | | | 59,224 | | | | 61,338 | |
| | |
FNMA | | | | | | | | |
| | |
ACES Series 2017-M10, Class AV2, 2.56%, 7/25/2024 (g) | | | 13,896 | | | | 14,607 | |
| | |
Series 2017-M7, Class A1, 2.60%, 12/25/2026 | | | 52,689 | | | | 55,214 | |
| | |
GS Mortgage Securities Trust | | | | | | | | |
| | |
Series 2014-GC18, Class A4, 4.07%, 1/10/2047 | | | 30,000 | | | | 32,515 | |
| | | | | | | | |
| INVESTMENTS | | PRINCIPAL AMOUNT ($) | | | VALUE ($) | |
| | | | | | | | |
| | |
Series 2014-GC18, Class AS, 4.38%, 1/10/2047 | | | 17,000 | | | | 18,284 | |
| | |
Series 2015-GC32, Class A4, 3.76%, 7/10/2048 | | | 50,000 | | | | 55,344 | |
| | |
JPMBB Commercial Mortgage Securities Trust | | | | | | | | |
| | |
Series 2013-C17, Class ASB, 3.71%, 1/15/2047 | | | 11,490 | | | | 12,027 | |
| | |
Series 2014-C19, Class C, 4.68%, 4/15/2047 ‡ (g) | | | 10,000 | | | | 10,587 | |
| | |
Series 2014-C22, Class AS, 4.11%, 9/15/2047 | | | 15,000 | | | | 16,321 | |
| | |
Series 2014-C23, Class C, 4.47%, 9/15/2047 ‡ (g) | | | 20,000 | | | | 20,809 | |
| | |
Series 2015-C32, Class B, 4.39%, 11/15/2048 ‡ (g) | | | 23,000 | | | | 23,562 | |
| | |
JPMorgan Chase Commercial Mortgage Securities Trust | | | | | | | | |
| | |
Series 2013-LC11, Class C, 3.96%, 4/15/2046 ‡ (g) | | | 22,000 | | | | 19,191 | |
| | |
Series 2013-C10, Class AS, 3.37%, 12/15/2047 ‡ | | | 20,000 | | | | 20,904 | |
| | |
Series 2015-JP1, Class D, 4.23%, 1/15/2049 ‡ (g) | | | 10,000 | | | | 9,496 | |
| | |
Morgan Stanley Bank of America Merrill Lynch Trust | | | | | | | | |
| | |
Series 2012-C5, Class A4, 3.18%, 8/15/2045 | | | 12,000 | | | | 12,362 | |
| | |
Series 2014-C19, Class A3, 3.25%, 12/15/2047 | | | 6,385 | | | | 6,829 | |
| | |
Series 2015-C25, Class ASB, 3.38%, 10/15/2048 | | | 37,266 | | | | 39,480 | |
| | |
Series 2015-C25, Class B, 4.52%, 10/15/2048 ‡ (g) | | | 20,000 | | | | 22,188 | |
| | |
Series 2015-C23, Class A3, 3.45%, 7/15/2050 | | | 43,773 | | | | 47,368 | |
| | |
Morgan Stanley Capital I Trust Series 2011-C3, Class A4, 4.12%, 7/15/2049 | | | 3,373 | | | | 3,397 | |
| | |
UBS Commercial Mortgage Trust Series 2018-C13, Class A2, 4.21%, 10/15/2051 | | | 6,829 | | | | 7,302 | |
| | |
UBS-Barclays Commercial Mortgage Trust Series 2013-C6, Class A4, 3.24%, 4/10/2046 | | | 23,000 | | | | 24,030 | |
| | |
Wells Fargo Commercial Mortgage Trust | | | | | | | | |
| | |
Series 2012-LC5, Class B, 4.14%, 10/15/2045 ‡ | | | 14,000 | | | | 14,512 | |
| | |
Series 2013-LC12, Class A4, 4.22%, 7/15/2046 (g) | | | 12,000 | | | | 12,861 | |
| | |
Series 2019-C54, Class A2, 3.01%, 12/15/2052 | | | 35,000 | | | | 37,005 | |
SEE NOTES TO FINANCIAL STATEMENTS.
| | | | | | | | |
| | | |
| FEBRUARY 28, 2021 | | J.P. MORGAN EXCHANGE-TRADED FUNDS | | | | | 41 | |
JPMorgan BetaBuilders 1-5 Year U.S. Aggregate Bond ETF
SCHEDULE OF PORTFOLIO INVESTMENTS
AS OF FEBRUARY 28, 2021 (continued)
| | | | | | | | |
| INVESTMENTS | | PRINCIPAL AMOUNT ($) | | | VALUE ($) | |
Commercial Mortgage-Backed Securities — continued | |
| | |
WFRBS Commercial Mortgage Trust | | | | | | | | |
| | |
Series 2012-C7, Class AS, 4.09%, 6/15/2045 (g) | | | 32,000 | | | | 32,072 | |
| | |
Series 2012-C10, Class A3, 2.88%, 12/15/2045 | | | 12,000 | | | | 12,443 | |
| | |
Series 2012-C10, Class B, 3.74%, 12/15/2045 ‡ | | | 15,000 | | | | 14,342 | |
| | |
Series 2014-C20, Class A5, 4.00%, 5/15/2047 | | | 12,000 | | | | 13,110 | |
| | | | | | | | |
| |
Total Commercial Mortgage-Backed Securities
(Cost $1,465,018) | | | | 1,477,095 | |
| | | | | | | | |
| | |
Foreign Government Securities — 1.6% | | | | | | | | |
| | |
Canada Government Bond (Canada) | | | | | | | | |
| | |
2.63%, 1/25/2022 | | | 10,000 | | | | 10,220 | |
| | |
2.00%, 11/15/2022 | | | 50,000 | | | | 51,553 | |
| | |
1.63%, 1/22/2025 (a) | | | 10,000 | | | | 10,424 | |
| | |
Export Development Canada (Canada) | | | | | | | | |
| | |
2.50%, 1/24/2023 | | | 35,000 | | | | 36,523 | |
| | |
2.75%, 3/15/2023 | | | 25,000 | | | | 26,281 | |
| | |
2.63%, 2/21/2024 | | | 20,000 | | | | 21,331 | |
| | |
Hungary Government Bond (Hungary) | | | | | | | | |
| | |
5.38%, 2/21/2023 | | | 18,000 | | | | 19,710 | |
| | |
5.75%, 11/22/2023 | | | 55,000 | | | | 62,477 | |
| | |
Italian Republic Government Bond (Italy) 6.88%, 9/27/2023 | | | 5,000 | | | | 5,769 | |
| | |
Oriental Republic of Uruguay (Uruguay) 4.50%, 8/14/2024 | | | 7,000 | | | | 7,628 | |
| | |
Province of Alberta (Canada) | | | | | | | | |
| | |
2.20%, 7/26/2022 | | | 22,000 | | | | 22,596 | |
| | |
1.00%, 5/20/2025 | | | 10,000 | | | | 10,105 | |
| | |
Province of British Columbia (Canada) | | | | | | | | |
| | |
2.00%, 10/23/2022 | | | 30,000 | | | | 30,880 | |
| | |
1.75%, 9/27/2024 | | | 24,000 | | | | 25,070 | |
| | |
Province of Ontario (Canada) | | | | | | | | |
| | |
2.40%, 2/8/2022 | | | 10,000 | | | | 10,200 | |
| | |
2.25%, 5/18/2022 | | | 35,000 | | | | 35,846 | |
| | |
2.45%, 6/29/2022 | | | 15,000 | | | | 15,433 | |
| | |
3.05%, 1/29/2024 | | | 16,000 | | | | 17,207 | |
| | |
3.20%, 5/16/2024 | | | 15,000 | | | | 16,292 | |
| | |
Province of Quebec (Canada) | | | | | | | | |
| | |
2.63%, 2/13/2023 | | | 20,000 | | | | 20,915 | |
| | |
2.50%, 4/9/2024 | | | 15,000 | | | | 15,942 | |
| | |
1.50%, 2/11/2025 | | | 10,000 | | | | 10,329 | |
| | |
Republic of Colombia (Colombia) 8.13%, 5/21/2024 | | | 53,000 | | | | 63,526 | |
| | |
Republic of Korea (South Korea) 5.63%, 11/3/2025 | | | 100,000 | | | | 121,232 | |
| | | | | | | | |
| INVESTMENTS | | PRINCIPAL AMOUNT ($) | | | VALUE ($) | |
| | | | | | | | |
| | |
Republic of Peru (Peru) 2.39%, 1/23/2026 | | | 44,000 | | | | 45,860 | |
| | |
Republic of Philippines (Philippines) 10.63%, 3/16/2025 | | | 12,000 | | | | 16,680 | |
| | |
Republic of Poland (Poland) 4.00%, 1/22/2024 | | | 7,000 | | | | 7,710 | |
| | |
Svensk Exportkredit AB (Sweden) 0.75%, 4/6/2023 | | | 200,000 | | | | 202,030 | |
| | | | | | | | |
| |
Total Foreign Government Securities
(Cost $928,427) | | | | 939,769 | |
| | | | | | | | |
Asset-Backed Securities — 0.8% | |
| | |
Ally Auto Receivables Trust Series 2018-3, Class A4, 3.12%, 7/17/2023 | | | 10,000 | | | | 10,225 | |
| | |
American Express Credit Account Master Trust Series 2017-7, Class A, 2.35%, 5/15/2025 | | | 30,000 | | | | 31,031 | |
| | |
AmeriCredit Automobile Receivables Trust Series 2017-3, Class D, 3.18%, 7/18/2023 | | | 15,000 | | | | 15,407 | |
| | |
Capital One Multi-Asset Execution Trust Series 2019-A1, Class A1, 2.84%, 12/15/2024 | | | 30,000 | | | | 30,751 | |
| | |
Capital One Prime Auto Receivables Trust Series 2019-2, Class A4, 1.96%, 2/18/2025 | | | 32,000 | | | | 32,962 | |
| | |
CarMax Auto Owner Trust Series 2020-1, Class A3, 1.89%, 12/16/2024 | | | 30,000 | | | | 30,688 | |
| | |
Citibank Credit Card Issuance Trust Series 2018-A3, Class A3, 3.29%, 5/23/2025 | | | 33,000 | | | | 35,164 | |
| | |
Ford Credit Floorplan Master Owner Trust A | | | | | | | | |
| | |
Series 2019-3, Class A1, 2.23%, 9/15/2024 | | | 40,000 | | | | 41,171 | |
| | |
Series 2018-2, Class A, 3.17%, 3/15/2025 | | | 15,000 | | | | 15,841 | |
| | |
Series 2019-2, Class A, 3.06%, 4/15/2026 | | | 8,000 | | | | 8,598 | |
| | |
GM Financial Consumer Automobile Receivables Trust | | | | | | | | |
| | |
Series 2020-1, Class A3, 1.84%, 9/16/2024 | | | 10,000 | | | | 10,170 | |
| | |
Series 2020-2, Class A4, 1.74%, 8/18/2025 | | | 22,000 | | | | 22,681 | |
| | |
Honda Auto Receivables Owner Trust Series 2020-3, Class A3, 0.37%, 10/18/2024 | | | 59,000 | | | | 59,076 | |
| | |
Hyundai Auto Receivables Trust Series 2019-B, Class A3, 1.94%, 2/15/2024 | | | 22,000 | | | | 22,346 | |
| | |
Nissan Auto Lease Trust Series 2019-A, Class A3, 2.76%, 3/15/2022 | | | 3,528 | | | | 3,543 | |
| | |
Santander Drive Auto Receivables Trust Series 2020-1, Class B, 3.03%, 11/15/2024 | | | 16,000 | | | | 16,500 | |
SEE NOTES TO FINANCIAL STATEMENTS.
| | | | | | |
| | | |
| 42 | | | | J.P. MORGAN EXCHANGE-TRADED FUNDS | | FEBRUARY 28, 2021 |
| | | | | | | | |
| INVESTMENTS | | PRINCIPAL AMOUNT ($) | | | VALUE ($) | |
Asset-Backed Securities — continued | |
| | |
Synchrony Credit Card Master Note Trust Series 2018-2, Class A, 3.47%, 5/15/2026 | | | 15,000 | | | | 16,012 | |
| | |
Toyota Auto Receivables Owner Trust | | | | | | | | |
| | |
Series 2019-D, Class A3, 1.92%, 1/16/2024 | | | 24,000 | | | | 24,436 | |
| | |
Series 2020-A, Class A3, 1.66%, 5/15/2024 | | | 26,000 | | | | 26,461 | |
| | |
World Omni Auto Receivables Trust Series 2018-D, Class B, 3.67%, 12/16/2024 | | | 15,000 | | | | 15,743 | |
| | | | | | | | |
| | |
Total Asset-Backed Securities
(Cost $463,106) | | | | | | | 468,806 | |
| | | | | | | | |
Municipal Bonds — 0.2% (h) | |
| | |
California — 0.0% (e) | | | | | | | | |
| | |
University of California, Taxable Series 2020BG, Rev., 0.88%, 5/15/2025 | | | 5,000 | | | | 5,054 | |
| | | | | | | | |
|
Florida — 0.1% | |
| | |
State Board of Administration Finance Corp. Series 2020A, Rev., 1.26%, 7/1/2025 | | | 45,000 | | | | 45,407 | |
| | | | | | | | |
|
Illinois — 0.0% (e) | |
| | |
State of Illinois, Taxable Pension GO, 4.95%, 6/1/2023 | | | 17,727 | | | | 18,359 | |
| | | | | | | | |
|
New Jersey — 0.1% | |
| | |
New Jersey Economic Development Authority, Pension Funding Series 1997B, Rev., AGM, Zero Coupon, 2/15/2024 | | | 60,000 | | | | 58,816 | |
| | | | | | | | |
| |
Total Municipal Bonds
(Cost $126,711) | | | | 127,636 | |
| | | | | | | | |
| | |
| | | SHARES | | | | |
Short-Term Investments — 1.0% | |
Investment Companies — 0.8% | |
| | |
JPMorgan U.S. Government Money Market Fund Class Institutional Shares, 0.03% (i) (j)
(Cost $514,056) | | | 514,056 | | | | 514,056 | |
| | | | | | | | |
Investment Of Cash Collateral From Securities Loaned — 0.2% | |
| | |
JPMorgan U.S. Government Money Market Fund Class IM Shares, 0.04% (i) (j)
(Cost $104,878) | | | 104,878 | | | | 104,878 | |
| | | | | | | | |
| | |
Total Short-Term Investments
(Cost $618,934) | | | | | | | 618,934 | |
| | | | | | | | |
| | |
Total Investments — 100.1%
(Cost $58,855,715) | | | | | | | 59,703,753 | |
| | |
Liabilities in Excess of
Other Assets — (0.1)% | | | | | | | (49,347) | |
| | | | | | | | |
| |
Net Assets — 100.0% | | | | 59,654,406 | |
| | | | | | | | |
Percentages indicated are based on net assets.
Abbreviations
| | |
ACES | | Alternative Credit Enhancement Securities |
AGM | | Insured by Assured Guaranty Municipal Corp. |
FFCB | | Federal Farm Credit Bank |
FHLB | | Federal Home Loan Bank |
FHLMC | | Federal Home Loan Mortgage Corp. |
FNMA | | Federal National Mortgage Association |
GNMA | | Government National Mortgage Association |
GO | | General Obligation |
ICE | | Intercontinental Exchange |
LIBOR | | London Interbank Offered Rate |
Rev. | | Revenue |
SOFR | | Secured Overnight Financing Rate |
UMBS | | Uniform Mortgage-Backed Securities |
USD | | United States Dollar |
| |
(a) | | The security or a portion of this security is on loan at February 28, 2021. The total value of securities on loan at February 28, 2021 is $102,693. |
(b) | | Securities exempt from registration under Rule 144A or section 4(a)(2), of the Securities Act of 1933, as amended. |
(c) | | Variable or floating rate security, linked to the referenced benchmark. The interest rate shown is the current rate as of February 28, 2021. |
(d) | | Step bond. Interest rate is a fixed rate for an initial period that either resets at a specific date or may reset in the future contingent upon a predetermined trigger. The interest rate shown is the current rate as of February 28, 2021. |
(e) | | Amount rounds to less than 0.1% of net assets. |
(f) | | Security exempt from registration pursuant to Regulation S under the Securities Act of 1933, as amended. Regulation S applies to securities offerings that are made outside of the United States and do not involve direct selling efforts in the United States and as such may have restrictions on resale. |
(g) | | Variable or floating rate security, the interest rate of which adjusts periodically based on changes in current interest rates and prepayments on the underlying pool of assets. The interest rate shown is the current rate as of February 28, 2021. |
(h) | | The date shown represents the earliest of the prerefunded date, next put date or final maturity date. |
(i) | | Investment in an affiliated fund, which is registered under the Investment Company Act of 1940, as amended, and is advised by J.P. Morgan Investment Management Inc. |
(j) | | The rate shown is the current yield as of February 28, 2021. |
| ‡ | | Value determined using significant unobservable inputs. |
SEE NOTES TO FINANCIAL STATEMENTS.
| | | | | | | | |
| | | |
| FEBRUARY 28, 2021 | | J.P. MORGAN EXCHANGE-TRADED FUNDS | | | | | 43 | |
JPMorgan Core Plus Bond ETF
SCHEDULE OF PORTFOLIO INVESTMENTS
AS OF FEBRUARY 28, 2021
| | | | | | | | |
| INVESTMENTS | | PRINCIPAL
AMOUNT ($) | | | VALUE ($) | |
Corporate Bonds — 37.7% | | | | | | | | |
| | |
Aerospace & Defense — 1.0% | | | | | | | | |
| | |
BAE Systems plc (United Kingdom) 3.40%, 4/15/2030 (a) | | | 200,000 | | | | 218,219 | |
| | |
Boeing Co. (The) | | | | | | | | |
| | |
1.17%, 2/4/2023 | | | 80,000 | | | | 80,339 | |
| | |
1.95%, 2/1/2024 | | | 18,000 | | | | 18,452 | |
| | |
1.43%, 2/4/2024 | | | 35,000 | | | | 35,061 | |
| | |
2.75%, 2/1/2026 | | | 20,000 | | | | 20,715 | |
| | |
2.20%, 2/4/2026 | | | 175,000 | | | | 175,365 | |
| | |
3.10%, 5/1/2026 | | | 15,000 | | | | 15,768 | |
| | |
2.70%, 2/1/2027 | | | 65,000 | | | | 66,746 | |
| | |
3.25%, 2/1/2028 | | | 205,000 | | | | 215,157 | |
| | |
3.60%, 5/1/2034 | | | 20,000 | | | | 20,543 | |
| | |
3.25%, 2/1/2035 | | | 20,000 | | | | 19,676 | |
| | |
Howmet Aerospace, Inc. | | | | | | | | |
| | |
5.13%, 10/1/2024 | | | 142,000 | | | | 154,411 | |
| | |
5.95%, 2/1/2037 | | | 14,000 | | | | 16,834 | |
| | |
Moog, Inc. 4.25%, 12/15/2027 (a) | | | 20,000 | | | | 20,550 | |
| | |
Precision Castparts Corp. 4.38%, 6/15/2045 | | | 54,000 | | | | 64,206 | |
| | |
Raytheon Technologies Corp. | | | | | | | | |
| | |
3.50%, 3/15/2027 | | | 40,000 | | | | 44,469 | |
| | |
4.13%, 11/16/2028 | | | 135,000 | | | | 155,651 | |
| | |
Spirit AeroSystems, Inc. 7.50%, 4/15/2025 (a) | | | 105,000 | | | | 111,069 | |
| | |
TransDigm, Inc. 6.25%, 3/15/2026 (a) | | | 25,000 | | | | 26,347 | |
| | |
Triumph Group, Inc. | | | | | | | | |
| | |
6.25%, 9/15/2024 (a) | | | 10,000 | | | | 10,050 | |
| | |
7.75%, 8/15/2025 | | | 16,000 | | | | 15,520 | |
| | | | | | | | |
| | |
| | | | | | | 1,505,148 | |
| | | | | | | | |
| | |
Air Freight & Logistics — 0.1% | | | | | | | | |
| | |
XPO Logistics, Inc. | | | | | | | | |
| | |
6.13%, 9/1/2023 (a) | | | 40,000 | | | | 40,650 | |
| | |
6.75%, 8/15/2024 (a) | | | 75,000 | | | | 78,750 | |
| | | | | | | | |
| | |
| | | | | | | 119,400 | |
| | | | | | | | |
| | |
Airlines — 0.0% (b) | | | | | | | | |
| | |
Continental Airlines Pass-Through Trust Series 2012-2, Class A Shares, 4.00%, 10/29/2024 | | | 33,167 | | | | 34,147 | |
| | |
United Airlines Holdings, Inc. | | | | | | | | |
| | |
5.00%, 2/1/2024 | | | 20,000 | | | | 20,525 | |
| | |
4.88%, 1/15/2025 | | | 16,000 | | | | 16,393 | |
| | | | | | | | |
| | |
| | | | | | | 71,065 | |
| | | | | | | | |
| | | | | | | | |
| INVESTMENTS | | PRINCIPAL
AMOUNT ($) | | | VALUE ($) | |
| | | | | | | | |
| | |
Auto Components — 0.3% | | | | | | | | |
| | |
Adient US LLC 7.00%, 5/15/2026 (a) | | | 105,000 | | | | 113,018 | |
| | |
Allison Transmission, Inc. 3.75%, 1/30/2031 (a) | | | 75,000 | | | | 71,719 | |
| | |
American Axle & Manufacturing, Inc. 6.25%, 4/1/2025 | | | 73,000 | | | | 75,197 | |
| | |
BorgWarner, Inc. 5.00%, 10/1/2025 (a) | | | 20,000 | | | | 23,296 | |
| | |
Cooper-Standard Automotive, Inc. | | | | | | | | |
| | |
13.00%, 6/1/2024 (a) | | | 5,000 | | | | 5,738 | |
| | |
5.63%, 11/15/2026 (a) | | | 30,000 | | | | 26,079 | |
| | |
Dana Financing Luxembourg SARL 6.50%, 6/1/2026 (a) | | | 15,000 | | | | 15,563 | |
| | |
Dana, Inc. 5.38%, 11/15/2027 | | | 60,000 | | | | 62,700 | |
| | |
Goodyear Tire & Rubber Co. (The) 5.00%, 5/31/2026 | | | 19,000 | | | | 19,411 | |
| | |
Icahn Enterprises LP | | | | | | | | |
| | |
6.38%, 12/15/2025 | | | 22,000 | | | | 22,741 | |
| | |
5.25%, 5/15/2027 | | | 60,000 | | | | 63,000 | |
| | | | | | | | |
| | |
| | | | | | | 498,462 | |
| | | | | | | | |
| | |
Automobiles — 0.3% | | | | | | | | |
| | |
Ford Motor Co. | | | | | | | | |
| | |
8.50%, 4/21/2023 | | | 70,000 | | | | 78,225 | |
| | |
9.00%, 4/22/2025 | | | 95,000 | | | | 114,929 | |
| | |
9.63%, 4/22/2030 | | | 65,000 | | | | 91,955 | |
| | |
General Motors Co. | | | | | | | | |
| | |
6.13%, 10/1/2025 | | | 15,000 | | | | 17,857 | |
| | |
5.15%, 4/1/2038 | | | 35,000 | | | | 41,852 | |
| | |
Hyundai Capital America 1.80%, 1/10/2028 (a) | | | 50,000 | | | | 48,649 | |
| | | | | | | | |
| | |
| | | | | | | 393,467 | |
| | | | | | | | |
| | |
Banks — 5.7% | | | | | | | | |
| | |
Bank of America Corp. | | | | | | | | |
| | |
(ICE LIBOR USD 3 Month + 0.97%), 3.46%, 3/15/2025 (c) | | | 215,000 | | | | 232,389 | |
| | |
3.88%, 8/1/2025 | | | 203,000 | | | | 227,035 | |
| | |
(ICE LIBOR USD 3 Month + 0.87%), 2.46%, 10/22/2025 (c) | | | 235,000 | | | | 248,542 | |
| | |
(ICE LIBOR USD 3 Month + 1.06%), 3.56%, 4/23/2027 (c) | | | 40,000 | | | | 44,257 | |
| | |
(ICE LIBOR USD 3 Month + 1.58%), 3.82%, 1/20/2028 (c) | | | 236,000 | | | | 265,548 | |
| | |
(ICE LIBOR USD 3 Month + 1.51%), 3.71%, 4/24/2028 (c) | | | 170,000 | | | | 190,493 | |
| | |
(ICE LIBOR USD 3 Month + 1.37%), 3.59%, 7/21/2028 (c) | | | 61,000 | | | | 68,126 | |
| | |
(ICE LIBOR USD 3 Month + 1.04%), 3.42%, 12/20/2028 (c) | | | 169,000 | | | | 186,392 | |
SEE NOTES TO FINANCIAL STATEMENTS.
| | | | | | |
| | | |
| 44 | | | | J.P. MORGAN EXCHANGE-TRADED FUNDS | | FEBRUARY 28, 2021 |
| | | | | | | | |
| INVESTMENTS | | PRINCIPAL
AMOUNT ($) | | | VALUE ($) | |
Corporate Bonds — continued | | | | | | | | |
| | |
Banks — continued | | | | | | | | |
| | |
(ICE LIBOR USD 3 Month + 1.07%), 3.97%, 3/5/2029 (c) | | | 135,000 | | | | 153,140 | |
| | |
(SOFR + 1.37%), 1.92%, 10/24/2031 (c) | | | 50,000 | | | | 48,537 | |
| | |
(ICE LIBOR USD 3 Month + 1.32%), 4.08%, 4/23/2040 (c) | | | 82,000 | | | | 95,353 | |
| | |
(SOFR + 1.93%), 2.68%, 6/19/2041 (c) | | | 150,000 | | | | 145,421 | |
| | |
(ICE LIBOR USD 3 Month + 1.52%), 4.33%, 3/15/2050 (c) | | | 86,000 | | | | 102,539 | |
| | |
Bank of Nova Scotia (The) (Canada) | | | | | | | | |
| | |
1.63%, 5/1/2023 | | | 20,000 | | | | 20,541 | |
| | |
2.20%, 2/3/2025 | | | 12,000 | | | | 12,542 | |
| | |
BNP Paribas SA (France) 3.25%, 3/3/2023 | | | 35,000 | | | | 37,113 | |
| | |
Canadian Imperial Bank of Commerce (Canada) | | | | | | | | |
| | |
(ICE LIBOR USD 3 Month + 0.79%), 2.61%, 7/22/2023 (c) | | | 49,000 | | | | 50,521 | |
| | |
3.10%, 4/2/2024 | | | 34,000 | | | | 36,479 | |
| | |
CIT Group, Inc. 5.25%, 3/7/2025 | | | 24,000 | | | | 27,300 | |
| | |
Citigroup, Inc. | | | | | | | | |
| | |
(ICE LIBOR USD 3 Month + 1.02%), 4.04%, 6/1/2024 (c) | | | 160,000 | | | | 172,547 | |
| | |
(US Treasury Yield Curve Rate T Note Constant Maturity 5 Year + 3.42%), 3.88%, 2/18/2026 (c) (d) (e) | | | 145,000 | | | | 144,275 | |
| | |
(ICE LIBOR USD 3 Month + 1.56%), 3.89%, 1/10/2028 (c) | | | 350,000 | | | | 392,794 | |
| | |
(ICE LIBOR USD 3 Month + 1.39%), 3.67%, 7/24/2028 (c) | | | 30,000 | | | | 33,396 | |
| | |
(ICE LIBOR USD 3 Month + 1.19%), 4.07%, 4/23/2029 (c) | | | 195,000 | | | | 222,085 | |
| | |
(SOFR + 1.42%), 2.98%, 11/5/2030 (c) | | | 25,000 | | | | 26,524 | |
| | |
(SOFR + 3.91%), 4.41%, 3/31/2031 (c) | | | 155,000 | | | | 180,310 | |
| | |
(ICE LIBOR USD 3 Month + 1.84%), 4.28%, 4/24/2048 (c) | | | 55,000 | | | | 66,866 | |
| | |
Citizens Financial Group, Inc. 2.50%, 2/6/2030 | | | 11,000 | | | | 11,329 | |
| | |
Comerica, Inc. 3.70%, 7/31/2023 | | | 28,000 | | | | 30,111 | |
| | |
HSBC Holdings plc (United Kingdom) | | | | | | | | |
| | |
(ICE LIBOR USD 3 Month + 1.06%), 3.26%, 3/13/2023 (c) | | | 400,000 | | | | 411,852 | |
| | |
(SOFR + 1.73%), 2.01%, 9/22/2028 (c) | | | 200,000 | | | | 200,944 | |
| | | | | | | | |
| INVESTMENTS | | PRINCIPAL
AMOUNT ($) | | | VALUE ($) | |
| | | | | | | | |
| | |
Banks — continued | | | | | | | | |
| | |
(ICE LIBOR USD 3 Month + 1.61%), 3.97%, 5/22/2030 (c) | | | 200,000 | | | | 223,503 | |
| | |
7.63%, 5/17/2032 | | | 143,000 | | | | 202,971 | |
| | |
6.10%, 1/14/2042 | | | 230,000 | | | | 331,356 | |
| | |
KeyCorp 2.25%, 4/6/2027 | | | 57,000 | | | | 59,700 | |
| | |
Mitsubishi UFJ Financial Group, Inc. (Japan) | | | | | | | | |
| | |
2.67%, 7/25/2022 | | | 70,000 | | | | 72,263 | |
| | |
3.78%, 3/2/2025 | | | 69,000 | | | | 75,971 | |
| | |
MUFG Americas Holdings Corp. 3.50%, 6/18/2022 | | | 16,000 | | | | 16,648 | |
| | |
Natwest Group plc (United Kingdom) 3.88%, 9/12/2023 | | | 200,000 | | | | 215,854 | |
| | |
PNC Financial Services Group, Inc. (The) 2.55%, 1/22/2030 | | | 99,000 | | | | 103,981 | |
| | |
Royal Bank of Canada (Canada) 4.65%, 1/27/2026 | | | 45,000 | | | | 52,194 | |
| | |
Societe Generale SA (France) | | | | | | | | |
| | |
4.25%, 4/14/2025 (a) | | | 200,000 | | | | 218,553 | |
| | |
4.00%, 1/12/2027 (a) | | | 200,000 | | | | 222,622 | |
| | |
Standard Chartered plc (United Kingdom) (US Treasury Yield Curve Rate T Note Constant Maturity 1 Year + 0.78%), 0.99%, 1/12/2025 (a) (c) | | | 200,000 | | | | 199,780 | |
| | |
Sumitomo Mitsui Financial Group, Inc. (Japan) 3.75%, 7/19/2023 | | | 53,000 | | | | 57,149 | |
| | |
Sumitomo Mitsui Trust Bank Ltd. (Japan) 1.05%, 9/12/2025 (a) | | | 60,000 | | | | 59,612 | |
| | |
Toronto-Dominion Bank (The) (Canada) | | | | | | | | |
| | |
3.25%, 3/11/2024 | | | 33,000 | | | | 35,634 | |
| | |
2.65%, 6/12/2024 | | | 81,000 | | | | 86,427 | |
| | |
Truist Bank 4.05%, 11/3/2025 | | | 60,000 | | | | 68,005 | |
| | |
Truist Financial Corp. 2.85%, 10/26/2024 | | | 114,000 | | | | 122,743 | |
| | |
US Bancorp 3.00%, 7/30/2029 | | | 97,000 | | | | 104,591 | |
| | |
Wells Fargo & Co. | | | | | | | | |
| | |
3.55%, 9/29/2025 | | | 77,000 | | | | 84,993 | |
| | |
(ICE LIBOR USD 3 Month + 0.75%), 2.16%, 2/11/2026 (c) | | | 163,000 | | | | 169,501 | |
| | |
(US Treasury Yield Curve Rate T Note Constant Maturity 5 Year + 3.45%), 3.90%, 3/15/2026 (c) (d) (e) | | | 155,000 | | | | 154,403 | |
| | |
3.00%, 10/23/2026 | | | 285,000 | | | | 309,228 | |
| | |
(ICE LIBOR USD 3 Month + 1.17%), 3.20%, 6/17/2027 (c) | | | 185,000 | | | | 201,349 | |
| | |
(ICE LIBOR USD 3 Month + 1.31%), 3.58%, 5/22/2028 (c) | | | 501,000 | | | | 554,767 | |
SEE NOTES TO FINANCIAL STATEMENTS.
| | | | | | | | |
| | | |
| FEBRUARY 28, 2021 | | J.P. MORGAN EXCHANGE-TRADED FUNDS | | | | | 45 | |
JPMorgan Core Plus Bond ETF
SCHEDULE OF PORTFOLIO INVESTMENTS
AS OF FEBRUARY 28, 2021 (continued)
| | | | | | | | |
| INVESTMENTS | | PRINCIPAL
AMOUNT ($) | | | VALUE ($) | |
Corporate Bonds — continued | | | | | | | | |
| | |
Banks — continued | | | | | | | | |
| | |
(ICE LIBOR USD 3 Month + 1.00%), 2.57%, 2/11/2031 (c) | | | 105,000 | | | | 108,691 | |
| | |
(SOFR + 2.53%), 3.07%, 4/30/2041 (c) | | | 30,000 | | | | 30,791 | |
| | |
4.90%, 11/17/2045 | | | 25,000 | | | | 30,983 | |
| | |
4.75%, 12/7/2046 | | | 45,000 | | | | 55,361 | |
| | |
Westpac Banking Corp. (Australia) | | | | | | | | |
| | |
3.65%, 5/15/2023 | | | 77,000 | | | | 82,563 | |
| | |
2.85%, 5/13/2026 | | | 25,000 | | | | 27,122 | |
| | | | | | | | |
| | |
| | | | | | | 8,424,610 | |
| | | | | | | | |
| | |
Beverages — 0.6% | | | | | | | | |
| | |
Anheuser-Busch Cos. LLC (Belgium) | | | | | | | | |
| | |
4.70%, 2/1/2036 | | | 105,000 | | | | 126,060 | |
| | |
4.90%, 2/1/2046 | | | 65,000 | | | | 78,181 | |
| | |
Anheuser-Busch InBev Worldwide, Inc. (Belgium) | | | | | | | | |
| | |
4.75%, 1/23/2029 | | | 205,000 | | | | 242,480 | |
| | |
4.38%, 4/15/2038 | | | 45,000 | | | | 52,338 | |
| | |
Coca-Cola Femsa SAB de CV (Mexico) 2.75%, 1/22/2030 | | | 150,000 | | | | 153,750 | |
| | |
Keurig Dr Pepper, Inc. | | | | | | | | |
| | |
3.40%, 11/15/2025 | | | 38,000 | | | | 41,749 | |
| | |
4.60%, 5/25/2028 | | | 50,000 | | | | 59,044 | |
| | |
PepsiCo, Inc. 4.25%, 10/22/2044 | | | 72,000 | | | | 88,558 | |
| | | | | | | | |
| | |
| | | | | | | 842,160 | |
| | | | | | | | |
| | |
Biotechnology — 1.2% | | | | | | | | |
| | |
AbbVie, Inc. | | | | | | | | |
| | |
2.60%, 11/21/2024 | | | 300,000 | | | | 318,972 | |
| | |
2.95%, 11/21/2026 | | | 138,000 | | | | 149,196 | |
| | |
3.20%, 11/21/2029 | | | 156,000 | | | | 168,654 | |
| | |
4.05%, 11/21/2039 | | | 184,000 | | | | 211,313 | |
| | |
4.63%, 10/1/2042 | | | 75,000 | | | | 91,447 | |
| | |
Amgen, Inc. | | | | | | | | |
| | |
2.20%, 2/21/2027 | | | 14,000 | | | | 14,612 | |
| | |
2.30%, 2/25/2031 | | | 150,000 | | | | 151,154 | |
| | |
3.15%, 2/21/2040 | | | 27,000 | | | | 27,877 | |
| | |
Biogen, Inc. 2.25%, 5/1/2030 | | | 80,000 | | | | 80,076 | |
| | |
Emergent BioSolutions, Inc. 3.88%, 8/15/2028 (a) | | | 50,000 | | | | 50,703 | |
| | |
Gilead Sciences, Inc. | | | | | | | | |
| | |
2.95%, 3/1/2027 | | | 195,000 | | | | 211,094 | |
| | |
1.65%, 10/1/2030 | | | 133,000 | | | | 127,887 | |
| | |
2.60%, 10/1/2040 | | | 50,000 | | | | 47,371 | |
| | |
2.80%, 10/1/2050 | | | 50,000 | | | | 46,163 | |
| | | | | | | | |
| INVESTMENTS | | PRINCIPAL
AMOUNT ($) | | | VALUE ($) | |
| | | | | | | | |
| | |
Biotechnology — continued | | | | | | | | |
| | |
Regeneron Pharmaceuticals, Inc. 2.80%, 9/15/2050 | | | 50,000 | | | | 44,560 | |
| | | | | | | | |
| | |
| | | | | | | 1,741,079 | |
| | | | | | | | |
| | |
Building Products — 0.2% | | | | | | | | |
| | |
American Woodmark Corp. 4.88%, 3/15/2026 (a) | | | 20,000 | | | | 20,370 | |
| | |
Griffon Corp. 5.75%, 3/1/2028 | | | 50,000 | | | | 52,500 | |
| | |
Standard Industries, Inc. | | | | | | | | |
| | |
5.00%, 2/15/2027 (a) | | | 20,000 | | | | 20,650 | |
| | |
4.75%, 1/15/2028 (a) | | | 100,000 | | | | 103,750 | |
| | |
Summit Materials LLC 5.13%, 6/1/2025 (a) | | | 25,000 | | | | 25,375 | |
| | | | | | | | |
| | |
| | | | | | | 222,645 | |
| | | | | | | | |
| | |
Capital Markets — 2.8% | | | | | | | | |
| | |
Ameriprise Financial, Inc. 4.00%, 10/15/2023 | | | 47,000 | | | | 51,402 | |
| | |
Bank of New York Mellon Corp. (The) | | | | | | | | |
| | |
3.50%, 4/28/2023 | | | 42,000 | | | | 44,862 | |
| | |
2.10%, 10/24/2024 | | | 30,000 | | | | 31,664 | |
| | |
Charles Schwab Corp. (The) | | | | | | | | |
| | |
0.90%, 3/11/2026 | | | 30,000 | | | | 29,827 | |
| | |
Series H, (US Treasury Yield Curve Rate T Note Constant Maturity 10 Year + 3.08%), 4.00%, 12/1/2030 (c) (d) (e) | | | 140,000 | | | | 140,525 | |
| | |
Credit Suisse Group AG (Switzerland) (SOFR + 3.73%), 4.19%, 4/1/2031 (a) (c) | | | 250,000 | | | | 284,937 | |
| | |
Credit Suisse USA, Inc. (Switzerland) 7.13%, 7/15/2032 | | | 53,000 | | | | 79,156 | |
| | |
Goldman Sachs Group, Inc. (The) | | | | | | | | |
| | |
(ICE LIBOR USD 3 Month + 1.05%), 2.91%, 6/5/2023 (c) | | | 243,000 | | | | 250,378 | |
| | |
3.63%, 2/20/2024 | | | 60,000 | | | | 65,039 | |
| | |
3.50%, 4/1/2025 | | | 280,000 | | | | 306,236 | |
| | |
(ICE LIBOR USD 3 Month + 1.20%), 3.27%, 9/29/2025 (c) | | | 201,000 | | | | 217,943 | |
| | |
3.50%, 11/16/2026 | | | 211,000 | | | | 232,391 | |
| | |
3.85%, 1/26/2027 | | | 135,000 | | | | 150,746 | |
| | |
(ICE LIBOR USD 3 Month + 1.51%), 3.69%, 6/5/2028 (c) | | | 220,000 | | | | 247,139 | |
| | |
Morgan Stanley | | | | | | | | |
| | |
(SOFR + 1.15%), 2.72%, 7/22/2025 (c) | | | 180,000 | | | | 191,365 | |
| | |
3.88%, 1/27/2026 | | | 170,000 | | | | 191,383 | |
| | |
3.13%, 7/27/2026 | | | 130,000 | | | | 142,108 | |
| | |
3.63%, 1/20/2027 | | | 190,000 | | | | 213,158 | |
SEE NOTES TO FINANCIAL STATEMENTS.
| | | | | | |
| | | |
| 46 | | | | J.P. MORGAN EXCHANGE-TRADED FUNDS | | FEBRUARY 28, 2021 |
| | | | | | | | |
| INVESTMENTS | | PRINCIPAL
AMOUNT ($) | | | VALUE ($) | |
Corporate Bonds — continued | | | | | | | | |
| | |
Capital Markets — continued | | | | | | | | |
| | |
(ICE LIBOR USD 3 Month + 1.34%), 3.59%, 7/22/2028 (c) | | | 330,000 | | | | 368,778 | |
| | |
(ICE LIBOR USD 3 Month + 1.63%), 4.43%, 1/23/2030 (c) | | | 123,000 | | | | 144,036 | |
| | |
(SOFR + 1.14%), 2.70%, 1/22/2031 (c) | | | 70,000 | | | | 72,752 | |
| | |
4.38%, 1/22/2047 | | | 72,000 | | | | 89,480 | |
| | |
(SOFR + 1.43%), 2.80%, 1/25/2052 (c) | | | 100,000 | | | | 95,203 | |
| | |
Northern Trust Corp. 3.95%, 10/30/2025 | | | 60,000 | | | | 67,895 | |
| | |
S&P Global, Inc. 3.25%, 12/1/2049 | | | 73,000 | | | | 76,807 | |
| | |
TD Ameritrade Holding Corp. 2.75%, 10/1/2029 | | | 46,000 | | | | 48,933 | |
| | |
UBS Group AG (Switzerland) (ICE LIBOR USD 3 Month + 1.47%), 3.13%, 8/13/2030 (a) (c) | | | 200,000 | | | | 215,499 | |
| | | | | | | | |
| | |
| | | | | | | 4,049,642 | |
| | | | | | | | |
| | |
Chemicals — 0.5% | | | | | | | | |
| | |
CF Industries, Inc. 4.95%, 6/1/2043 | | | 30,000 | | | | 35,329 | |
| | |
Chemours Co. (The) | | | | | | | | |
| | |
7.00%, 5/15/2025 | | | 22,000 | | | | 22,679 | |
| | |
5.75%, 11/15/2028 (a) | | | 35,000 | | | | 35,875 | |
| | |
CVR Partners LP 9.25%, 6/15/2023 (a) | | | 15,000 | | | | 15,231 | |
| | |
Dow Chemical Co. (The) 3.50%, 10/1/2024 | | | 24,000 | | | | 26,096 | |
| | |
Ecolab, Inc. 3.25%, 12/1/2027 | | | 52,000 | | | | 57,951 | |
| | |
NOVA Chemicals Corp. (Canada) 5.25%, 6/1/2027 (a) | | | 30,000 | | | | 31,275 | |
| | |
Nutrien Ltd. (Canada) 2.95%, 5/13/2030 | | | 20,000 | | | | 21,313 | |
| | |
Nutrition & Biosciences, Inc. | | | | | | | | |
| | |
1.83%, 10/15/2027 (a) | | | 36,000 | | | | 36,165 | |
| | |
3.27%, 11/15/2040 (a) | | | 25,000 | | | | 25,760 | |
| | |
3.47%, 12/1/2050 (a) | | | 13,000 | | | | 13,275 | |
| | |
Olin Corp. 5.13%, 9/15/2027 | | | 13,000 | | | | 13,480 | |
| | |
Scotts Miracle-Gro Co. (The) 4.50%, 10/15/2029 | | | 375,000 | | | | 397,631 | |
| | |
Trinseo Materials Operating SCA 5.38%, 9/1/2025 (a) | | | 10,000 | | | | 10,141 | |
| | | | | | | | |
| | |
| | | | | | | 742,201 | |
| | | | | | | | |
| | |
Commercial Services & Supplies — 0.5% | | | | | | | | |
| | |
ACCO Brands Corp.5.25%, 12/15/2024 (a) | | | 23,000 | | | | 23,575 | |
| | |
ADT Security Corp. (The) | | | | | | | | |
| | |
4.13%, 6/15/2023 | | | 26,000 | | | | 27,091 | |
| | |
4.88%, 7/15/2032 (a) | | | 20,000 | | | | 21,175 | |
| | | | | | | | |
| INVESTMENTS | | PRINCIPAL
AMOUNT ($) | | | VALUE ($) | |
| | | | | | | | |
| |
Commercial Services & Supplies — continued | | | | | |
| | |
Aramark Services, Inc. 4.75%, 6/1/2026 | | | 25,000 | | | | 25,375 | |
| | |
Brink’s Co. (The) 4.63%, 10/15/2027 (a) | | | 25,000 | | | | 25,763 | |
| | |
GFL Environmental, Inc. (Canada) 3.75%, 8/1/2025 (a) | | | 105,000 | | | | 107,231 | |
| | |
Nielsen Finance LLC | | | | | | | | |
| | |
5.00%, 4/15/2022 (a) | | | 9,000 | | | | 9,023 | |
| | |
5.63%, 10/1/2028 (a) | | | 80,000 | | | | 84,288 | |
| | |
Prime Security Services Borrower LLC | | | | | | | | |
| | |
5.25%, 4/15/2024 (a) | | | 25,000 | | | | 26,656 | |
| | |
5.75%, 4/15/2026 (a) | | | 42,000 | | | | 45,255 | |
| | |
Republic Services, Inc. 1.45%, 2/15/2031 | | | 30,000 | | | | 28,206 | |
| | |
Stericycle, Inc. 3.88%, 1/15/2029 (a) | | | 245,000 | | | | 246,752 | |
| | | | | | | | |
| | |
| | | | | | | 670,390 | |
| | | | | | | | |
| | |
Communications Equipment — 0.1% | | | | | | | | |
| | |
CommScope, Inc. 6.00%, 3/1/2026 (a) | | | 172,000 | | | | 180,815 | |
| | |
Nokia OYJ (Finland) 4.38%, 6/12/2027 | | | 13,000 | | | | 14,040 | |
| | |
Plantronics, Inc. 5.50%, 5/31/2023 (a) | | | 20,000 | | | | 20,118 | |
| | | | | | | | |
| | |
| | | | | | | 214,973 | |
| | | | | | | | |
| | |
Construction & Engineering — 0.1% | | | | | | | | |
| | |
AECOM 5.13%, 3/15/2027 | | | 18,000 | | | | 19,665 | |
| | |
MasTec, Inc. 4.50%, 8/15/2028 (a) | | | 75,000 | | | | 78,390 | |
| | |
Weekley Homes LLC 4.88%, 9/15/2028 (a) | | | 20,000 | | | | 20,900 | |
| | | | | | | | |
| | |
| | | | | | | 118,955 | |
| | | | | | | | |
| | |
Consumer Finance — 1.1% | | | | | | | | |
| | |
AerCap Ireland Capital DAC (Ireland) 3.15%, 2/15/2024 | | | 150,000 | | | | 157,516 | |
| | |
Ally Financial, Inc. | | | | | | | | |
| | |
5.75%, 11/20/2025 | | | 64,000 | | | | 73,345 | |
| | |
8.00%, 11/1/2031 | | | 37,000 | | | | 52,982 | |
| | |
Avolon Holdings Funding Ltd. (Ireland) | | | | | | | | |
| | |
5.50%, 1/15/2023 (a) | | | 17,000 | | | | 18,054 | |
| | |
5.25%, 5/15/2024 (a) | | | 80,000 | | | | 87,107 | |
| | |
2.13%, 2/21/2026 (a) | | | 75,000 | | | | 72,308 | |
| | |
4.25%, 4/15/2026 (a) | | | 25,000 | | | | 26,423 | |
| | |
Capital One Financial Corp. 3.20%, 1/30/2023 | | | 79,000 | | | | 82,985 | |
| | |
Curo Group Holdings Corp. 8.25%, 9/1/2025 (a) | | | 8,000 | | | | 8,060 | |
| | |
Ford Motor Credit Co. LLC 4.39%, 1/8/2026 | | | 200,000 | | | | 211,186 | |
| | |
General Motors Financial Co., Inc. 3.60%, 6/21/2030 | | | 60,000 | | | | 64,848 | |
| | |
Hyundai Capital Services, Inc. (South Korea) 1.25%, 2/8/2026 (a) | | | 200,000 | | | | 196,525 | |
SEE NOTES TO FINANCIAL STATEMENTS.
| | | | | | | | |
| | | |
| FEBRUARY 28, 2021 | | J.P. MORGAN EXCHANGE-TRADED FUNDS | | | | | 47 | |
JPMorgan Core Plus Bond ETF
SCHEDULE OF PORTFOLIO INVESTMENTS
AS OF FEBRUARY 28, 2021 (continued)
| | | | | | | | |
| INVESTMENTS | | PRINCIPAL
AMOUNT ($) | | | VALUE ($) | |
Corporate Bonds — continued | | | | | | | | |
| | |
Consumer Finance — continued | | | | | | | | |
| | |
John Deere Capital Corp. 2.65%, 6/10/2026 | | | 119,000 | | | | 128,432 | |
| | |
Navient Corp. | | | | | | | | |
| | |
6.13%, 3/25/2024 | | | 50,000 | | | | 52,719 | |
| | |
5.88%, 10/25/2024 | | | 20,000 | | | | 21,050 | |
| | |
OneMain Finance Corp. | | | | | | | | |
| | |
7.13%, 3/15/2026 | | | 59,000 | | | | 68,145 | |
| | |
6.63%, 1/15/2028 | | | 95,000 | | | | 108,034 | |
| | |
Park Aerospace Holdings Ltd. (Ireland) | | | | | | | | |
| | |
5.25%, 8/15/2022 (a) | | | 65,000 | | | | 67,953 | |
| | |
4.50%, 3/15/2023 (a) | | | 5,000 | | | | 5,229 | |
| | |
5.50%, 2/15/2024 (a) | | | 55,000 | | | | 59,865 | |
| | | | | | | | |
| | |
| | | | | | | 1,562,766 | |
| | | | | | | | |
| | |
Containers & Packaging — 0.4% | | | | | | | | |
| | |
Ardagh Packaging Finance plc 5.25%, 4/30/2025 (a) | | | 200,000 | | | | 211,000 | |
| | |
Ball Corp. 5.25%, 7/1/2025 | | | 20,000 | | | | 22,500 | |
| | |
Berry Global, Inc. 4.88%, 7/15/2026 (a) | | | 55,000 | | | | 58,735 | |
| | |
Crown Americas LLC 4.25%, 9/30/2026 | | | 13,000 | | | | 14,008 | |
| | |
Greif, Inc. 6.50%, 3/1/2027 (a) | | | 25,000 | | | | 26,250 | |
| | |
LABL Escrow Issuer LLC 6.75%, 7/15/2026 (a) | | | 50,000 | | | | 53,625 | |
| | |
Mauser Packaging Solutions Holding Co. 5.50%, 4/15/2024 (a) | | | 110,000 | | | | 110,550 | |
| | |
Reynolds Group Issuer, Inc. 4.00%, 10/15/2027 (a) | | | 45,000 | | | | 44,859 | |
| | |
Sealed Air Corp. 5.50%, 9/15/2025 (a) | | | 12,000 | | | | 13,320 | |
| | | | | | | | |
| | |
| | | | | | | 554,847 | |
| | | | | | | | |
| | |
Distributors — 0.0% (b) | | | | | | | | |
| | |
Performance Food Group, Inc. 5.50%, 10/15/2027 (a) | | | 11,000 | | | | 11,551 | |
| | |
Wolverine Escrow LLC 9.00%, 11/15/2026 (a) | | | 20,000 | | | | 19,700 | |
| | | | | | | | |
| | |
| | | | | | | 31,251 | |
| | | | | | | | |
| | |
Diversified Consumer Services — 0.1% | | | | | | | | |
| | |
Service Corp. International 5.13%, 6/1/2029 | | | 105,000 | | | | 113,466 | |
| | | | | | | | |
| | |
Diversified Financial Services — 0.5% | | | | | | | | |
| | |
AIG Global Funding 1.90%, 10/6/2021 (a) | | | 33,000 | | | | 33,324 | |
| | |
GE Capital Funding LLC 4.05%, 5/15/2027 (a) | | | 200,000 | | | | 225,564 | |
| | |
National Rural Utilities Cooperative Finance Corp. | | | | | | | | |
| | |
3.40%, 2/7/2028 | | | 76,000 | | | | 84,724 | |
| | |
4.40%, 11/1/2048 | | | 61,000 | | | | 76,413 | |
| | | | | | | | |
| INVESTMENTS | | PRINCIPAL
AMOUNT ($) | | | VALUE ($) | |
| | | | | | | | |
| |
Diversified Financial Services — continued | | | | | |
| | |
ORIX Corp. (Japan) 4.05%, 1/16/2024 | | | 62,000 | | | | 67,580 | |
| | |
Sabre GLBL, Inc. 9.25%, 4/15/2025 (a) | | | 50,000 | | | | 59,312 | |
| | |
Shell International Finance BV (Netherlands) | | | | | | | | |
| | |
3.63%, 8/21/2042 | | | 50,000 | | | | 54,185 | |
| | |
3.75%, 9/12/2046 | | | 41,000 | | | | 44,883 | |
| | |
3.13%, 11/7/2049 | | | 25,000 | | | | 24,797 | |
| | |
3.25%, 4/6/2050 | | | 52,000 | | | | 52,610 | |
| | | | | | | | |
| | |
| | | | | | | 723,392 | |
| | | | | | | | |
| |
Diversified Telecommunication Services — 1.9% | | | | | |
| | |
AT&T, Inc. | | | | | | | | |
| | |
1.65%, 2/1/2028 | | | 160,000 | | | | 157,217 | |
| | |
2.25%, 2/1/2032 | | | 150,000 | | | | 144,022 | |
| | |
3.10%, 2/1/2043 | | | 70,000 | | | | 65,716 | |
| | |
3.50%, 9/15/2053 (a) | | | 120,000 | | | | 110,079 | |
| | |
3.55%, 9/15/2055 (a) | | | 73,000 | | | | 67,024 | |
| | |
CCO Holdings LLC | | | | | | | | |
| | |
5.75%, 2/15/2026 (a) | | | 114,000 | | | | 117,825 | |
| | |
5.13%, 5/1/2027 (a) | | | 25,000 | | | | 26,190 | |
| | |
5.88%, 5/1/2027 (a) | | | 30,000 | | | | 31,050 | |
| | |
5.00%, 2/1/2028 (a) | | | 340,000 | | | | 356,150 | |
| | |
4.75%, 3/1/2030 (a) | | | 75,000 | | | | 78,277 | |
| | |
Cincinnati Bell, Inc. | | | | | | | | |
| | |
7.00%, 7/15/2024 (a) | | | 20,000 | | | | 20,800 | |
| | |
8.00%, 10/15/2025 (a) | | | 9,000 | | | | 9,585 | |
| | |
Embarq Corp. 8.00%, 6/1/2036 | | | 13,000 | | | | 15,454 | |
| | |
Frontier Communications Corp. 5.88%, 10/15/2027 (a) | | | 65,000 | | | | 69,550 | |
| | |
Intelsat Jackson Holdings SA (Luxembourg) | | | | | | | | |
| | |
8.00%, 2/15/2024 (a) (f) (g) | | | 15,000 | | | | 15,487 | |
| | |
8.50%, 10/15/2024 (a) (g) | | | 28,000 | | | | 18,200 | |
| | |
Level 3 Financing, Inc. | | | | | | | | |
| | |
5.38%, 5/1/2025 | | | 20,000 | | | | 20,520 | |
| | |
5.25%, 3/15/2026 | | | 54,000 | | | | 55,577 | |
| | |
Lumen Technologies, Inc. | | | | | | | | |
| | |
Series T, 5.80%, 3/15/2022 | | | 12,000 | | | | 12,440 | |
| | |
5.63%, 4/1/2025 | | | 17,000 | | | | 18,210 | |
| | |
5.13%, 12/15/2026 (a) | | | 60,000 | | | | 62,550 | |
| | |
4.00%, 2/15/2027 (a) | | | 150,000 | | | | 153,330 | |
| | |
Series G, 6.88%, 1/15/2028 | | | 3,000 | | | | 3,384 | |
| | |
Qwest Corp. 6.75%, 12/1/2021 | | | 25,000 | | | | 25,969 | |
| | |
Sprint Capital Corp. 8.75%, 3/15/2032 | | | 175,000 | | | | 260,400 | |
| | |
Switch Ltd. 3.75%, 9/15/2028 (a) | | | 45,000 | | | | 45,844 | |
SEE NOTES TO FINANCIAL STATEMENTS.
| | | | | | |
| | | |
| 48 | | | | J.P. MORGAN EXCHANGE-TRADED FUNDS | | FEBRUARY 28, 2021 |
| | | | | | | | |
| INVESTMENTS | | PRINCIPAL
AMOUNT ($) | | | VALUE ($) | |
Corporate Bonds — continued | | | | | | | | |
| |
Diversified Telecommunication Services — continued | | | | | |
| | |
Telecom Italia Capital SA (Italy) 6.00%, 9/30/2034 | | | 24,000 | | | | 27,602 | |
| | |
Verizon Communications, Inc. | | | | | | | | |
| | |
4.02%, 12/3/2029 | | | 54,000 | | | | 61,892 | |
| | |
4.50%, 8/10/2033 | | | 110,000 | | | | 131,189 | |
| | |
2.65%, 11/20/2040 | | | 145,000 | | | | 135,504 | |
| | |
3.85%, 11/1/2042 | | | 125,000 | | | | 137,358 | |
| | |
4.67%, 3/15/2055 | | | 49,000 | | | | 59,462 | |
| | |
Virgin Media Secured Finance plc (United Kingdom) 5.50%, 5/15/2029 (a) | | | 200,000 | | | | 214,364 | |
| | | | | | | | |
| | |
| | | | | | | 2,728,221 | |
| | | | | | | | |
| | |
Electric Utilities — 1.8% | | | | | | | | |
| | |
Commonwealth Edison Co. 3.70%, 8/15/2028 | | | 100,000 | | | | 114,728 | |
| | |
Connecticut Light and Power Co. (The) 4.00%, 4/1/2048 | | | 46,000 | | | | 55,550 | |
| | |
Duke Energy Carolinas LLC 3.20%, 8/15/2049 | | | 64,000 | | | | 65,990 | |
| | |
Duke Energy Indiana LLC Series YYY, 3.25%, 10/1/2049 | | | 55,000 | | | | 56,457 | |
| | |
Duquesne Light Holdings, Inc. 2.53%, 10/1/2030 (a) | | | 48,000 | | | | 47,847 | |
| | |
Edison International 5.75%, 6/15/2027 | | | 75,000 | | | | 88,320 | |
| | |
Entergy Arkansas LLC | | | | | | | | |
| | |
4.00%, 6/1/2028 | | | 13,000 | | | | 14,853 | |
| | |
2.65%, 6/15/2051 | | | 14,000 | | | | 12,995 | |
| | |
Entergy Louisiana LLC | | | | | | | | |
| | |
2.40%, 10/1/2026 | | | 69,000 | | | | 73,272 | |
| | |
1.60%, 12/15/2030 | | | 10,000 | | | | 9,712 | |
| | |
3.05%, 6/1/2031 | | | 175,000 | | | | 190,524 | |
| | |
Indiana Michigan Power Co. Series K, 4.55%, 3/15/2046 | | | 50,000 | | | | 61,606 | |
| | |
Kentucky Utilities Co. 5.13%, 11/1/2040 | | | 74,000 | | | | 95,151 | |
| | |
MidAmerican Energy Co. 3.65%, 4/15/2029 | | | 46,000 | | | | 52,862 | |
| | |
Monongahela Power Co. 4.10%, 4/15/2024 (a) | | | 100,000 | | | | 107,437 | |
| | |
NextEra Energy Capital Holdings, Inc. | | | | | | | | |
| | |
2.75%, 11/1/2029 | | | 70,000 | | | | 73,387 | |
| | |
2.25%, 6/1/2030 | | | 106,000 | | | | 107,010 | |
| | |
NRG Energy, Inc. | | | | | | | | |
| | |
6.63%, 1/15/2027 | | | 59,000 | | | | 61,353 | |
| | |
5.75%, 1/15/2028 | | | 65,000 | | | | 69,062 | |
| | |
Ohio Power Co. Series P, 2.60%, 4/1/2030 | | | 50,000 | | | | 52,594 | |
| | | | | | | | |
| INVESTMENTS | | PRINCIPAL
AMOUNT ($) | | | VALUE ($) | |
| | | | | | | | |
| | |
Electric Utilities — continued | | | | | | | | |
| | |
Pacific Gas and Electric Co. | | | | | | | | |
| | |
(ICE LIBOR USD 3 Month + 1.38%), 1.57%, 11/15/2021 (c) | | | 30,000 | | | | 30,073 | |
| | |
3.45%, 7/1/2025 | | | 17,000 | | | | 18,265 | |
| | |
2.95%, 3/1/2026 | | | 10,000 | | | | 10,486 | |
| | |
3.30%, 3/15/2027 | | | 120,000 | | | | 127,762 | |
| | |
4.65%, 8/1/2028 | | | 100,000 | | | | 111,769 | |
| | |
4.25%, 3/15/2046 | | | 78,000 | | | | 78,326 | |
| | |
PG&E Corp. 5.00%, 7/1/2028 | | | 40,000 | | | | 42,050 | |
| | |
Public Service Electric and Gas Co. 3.00%, 5/15/2027 | | | 50,000 | | | | 54,621 | |
| | |
Southern California Edison Co. | | | | | | | | |
| | |
Series C, 3.60%, 2/1/2045 | | | 35,000 | | | | 35,509 | |
| | |
Series C, 4.13%, 3/1/2048 | | | 88,000 | | | | 96,757 | |
| | |
Series 20A, 2.95%, 2/1/2051 | | | 80,000 | | | | 73,291 | |
| | |
Southwestern Public Service Co. | | | | | | | | |
| | |
3.30%, 6/15/2024 | | | 29,000 | | | | 31,097 | |
| | |
4.50%, 8/15/2041 | | | 74,000 | | | | 89,574 | |
| | |
Tucson Electric Power Co. 4.85%, 12/1/2048 | | | 72,000 | | | | 89,474 | |
| | |
Vistra Operations Co. LLC | | | | | | | | |
| | |
5.50%, 9/1/2026 (a) | | | 65,000 | | | | 67,437 | |
| | |
5.00%, 7/31/2027 (a) | | | 55,000 | | | | 57,544 | |
| | |
4.30%, 7/15/2029 (a) | | | 90,000 | | | | 100,254 | |
| | |
Wisconsin Public Service Corp. 4.75%, 11/1/2044 | | | 69,000 | | | | 87,245 | |
| | | | | | | | |
| | |
| | | | | | | 2,612,244 | |
| | | | | | | | |
| | |
Electrical Equipment — 0.1% | | | | | | | | |
| | |
Eaton Corp. 4.00%, 11/2/2032 | | | 50,000 | | | | 58,711 | |
| | |
EnerSys 5.00%, 4/30/2023 (a) | | | 26,000 | | | | 27,253 | |
| | |
Sensata Technologies BV 5.00%, 10/1/2025 (a) | | | 40,000 | | | | 43,888 | |
| | | | | | | | |
| | |
| | | | | | | 129,852 | |
| | | | | | | | |
|
Electronic Equipment, Instruments & Components — 0.0% (b) | |
| | |
CDW LLC 4.25%, 4/1/2028 | | | 30,000 | | | | 31,131 | |
| | |
Sensata Technologies, Inc. 4.38%, 2/15/2030 (a) | | | 40,000 | | | | 42,650 | |
| | | | | | | | |
| | |
| | | | | | | 73,781 | |
| | | | | | | | |
| | |
Energy Equipment & Services — 0.3% | | | | | | | | |
| | |
Baker Hughes a GE Co. LLC | | | | | | | | |
| | |
4.49%, 5/1/2030 | | | 66,000 | | | | 77,642 | |
| | |
4.08%, 12/15/2047 | | | 30,000 | | | | 32,901 | |
| | |
Nabors Industries, Inc. 5.75%, 2/1/2025 | | | 15,000 | | | | 11,906 | |
SEE NOTES TO FINANCIAL STATEMENTS.
| | | | | | | | |
| | | |
| FEBRUARY 28, 2021 | | J.P. MORGAN EXCHANGE-TRADED FUNDS | | | | | 49 | |
JPMorgan Core Plus Bond ETF
SCHEDULE OF PORTFOLIO INVESTMENTS
AS OF FEBRUARY 28, 2021 (continued)
| | | | | | | | |
| INVESTMENTS | | PRINCIPAL
AMOUNT ($) | | | VALUE ($) | |
Corporate Bonds — continued | | | | | | | | |
| |
Energy Equipment & Services — continued | | | | | |
| | |
Oceaneering International, Inc. 4.65%, 11/15/2024 | | | 40,000 | | | | 39,850 | |
| | |
Schlumberger Finance Canada Ltd. 1.40%, 9/17/2025 | | | 110,000 | | | | 110,840 | |
| | |
Schlumberger Holdings Corp. 3.90%, 5/17/2028 (a) | | | 103,000 | | | | 115,237 | |
| | |
Transocean Pontus Ltd. 6.13%, 8/1/2025 (a) | | | 15,950 | | | | 15,232 | |
| | | | | | | | |
| | |
| | | | | | | 403,608 | |
| | | | | | | | |
| | |
Entertainment — 0.4% | | | | | | | | |
| | |
Cinemark USA, Inc. 4.88%, 6/1/2023 | | | 15,000 | | | | 14,846 | |
| | |
Live Nation Entertainment, Inc. | | | | | | | | |
| | |
5.63%, 3/15/2026 (a) | | | 2,000 | | | | 2,050 | |
| | |
6.50%, 5/15/2027 (a) | | | 10,000 | | | | 11,038 | |
| | |
4.75%, 10/15/2027 (a) | | | 40,000 | | | | 40,408 | |
| | |
Netflix, Inc. | | | | | | | | |
| | |
4.88%, 4/15/2028 | | | 100,000 | | | | 113,845 | |
| | |
5.88%, 11/15/2028 | | | 35,000 | | | | 41,989 | |
| | |
4.88%, 6/15/2030 (a) | | | 55,000 | | | | 63,250 | |
| | |
Walt Disney Co. (The) | | | | | | | | |
| | |
2.00%, 9/1/2029 | | | 50,000 | | | | 50,629 | |
| | |
3.80%, 3/22/2030 | | | 90,000 | | | | 103,060 | |
| | |
WMG Acquisition Corp. 3.88%, 7/15/2030 (a) | | | 100,000 | | | | 102,258 | |
| | | | | | | | |
| | |
| | | | | | | 543,373 | |
| | | | | | | | |
| |
Equity Real Estate Investment Trusts (REITs) — 1.0% | | | | | |
| | |
Alexandria Real Estate Equities, Inc. 1.88%, 2/1/2033 | | | 53,000 | | | | 49,957 | |
| | |
American Tower Corp. 2.10%, 6/15/2030 | | | 255,000 | | | | 250,068 | |
| | |
AvalonBay Communities, Inc. 3.35%, 5/15/2027 | | | 32,000 | | | | 35,346 | |
| | |
Corporate Office Properties LP 2.25%, 3/15/2026 | | | 94,000 | | | | 96,393 | |
| | |
Crown Castle International Corp. 3.25%, 1/15/2051 | | | 50,000 | | | | 47,904 | |
| | |
Duke Realty LP 1.75%, 7/1/2030 | | | 49,000 | | | | 47,707 | |
| | |
ERP Operating LP 3.25%, 8/1/2027 | | | 31,000 | | | | 34,064 | |
| | |
ESH Hospitality, Inc. 4.63%, 10/1/2027 (a) | | | 25,000 | | | | 25,391 | |
| | |
GLP Capital LP 4.00%, 1/15/2030 | | | 10,000 | | | | 10,633 | |
| | |
Healthcare Trust of America Holdings LP 3.75%, 7/1/2027 | | | 48,000 | | | | 54,256 | |
| | |
Healthpeak Properties, Inc. 3.00%, 1/15/2030 | | | 37,000 | | | | 39,292 | |
| | |
Life Storage LP 2.20%, 10/15/2030 | | | 88,000 | | | | 86,520 | |
| | | | | | | | |
| INVESTMENTS | | PRINCIPAL
AMOUNT ($) | | | VALUE ($) | |
| | | | | | | | |
|
Equity Real Estate Investment Trusts (REITs) — continued | |
| | |
MGM Growth Properties Operating Partnership LP | | | | | | | | |
| | |
5.63%, 5/1/2024 | | | 67,000 | | | | 72,360 | |
| | |
4.50%, 9/1/2026 | | | 35,000 | | | | 37,100 | |
| | |
National Retail Properties, Inc. 3.60%, 12/15/2026 | | | 39,000 | | | | 42,917 | |
| | |
Prologis LP 2.13%, 10/15/2050 | | | 95,000 | | | | 80,186 | |
| | |
Realty Income Corp. | | | | | | | | |
| | |
4.13%, 10/15/2026 | | | 44,000 | | | | 50,507 | |
| | |
3.25%, 1/15/2031 | | | 9,000 | | | | 9,790 | |
| | |
RHP Hotel Properties LP 4.75%, 10/15/2027 | | | 25,000 | | | | 25,353 | |
| | |
SBA Communications Corp. 3.13%, 2/1/2029 (a) | | | 75,000 | | | | 72,955 | |
| | |
Simon Property Group LP | | | | | | | | |
| | |
3.50%, 9/1/2025 | | | 73,000 | | | | 79,558 | |
| | |
3.25%, 9/13/2049 | | | 31,000 | | | | 29,761 | |
| | |
VICI Properties LP | | | | | | | | |
| | |
3.50%, 2/15/2025 (a) | | | 90,000 | | | | 91,238 | |
| | |
4.25%, 12/1/2026 (a) | | | 30,000 | | | | 30,942 | |
| | |
4.63%, 12/1/2029 (a) | | | 20,000 | | | | 20,994 | |
| | |
WP Carey, Inc. 2.25%, 4/1/2033 | | | 45,000 | | | | 43,815 | |
| | | | | | | | |
| | |
| | | | | | | 1,465,007 | |
| | | | | | | | |
| | |
Food & Staples Retailing — 0.3% | | | | | | | | |
| | |
7-Eleven, Inc. | | | | | | | | |
| | |
0.95%, 2/10/2026 (a) | | | 15,000 | | | | 14,772 | |
| | |
1.30%, 2/10/2028 (a) | | | 12,000 | | | | 11,692 | |
| | |
2.50%, 2/10/2041 (a) | | | 14,000 | | | | 12,913 | |
| | |
Albertsons Cos., Inc. | | | | | | | | |
| | |
5.75%, 3/15/2025 | | | 10,000 | | | | 10,313 | |
| | |
4.63%, 1/15/2027 (a) | | | 160,000 | | | | 165,634 | |
| | |
4.88%, 2/15/2030 (a) | | | 20,000 | | | | 20,704 | |
| | |
Sysco Corp. | | | | | | | | |
| | |
2.40%, 2/15/2030 | | | 30,000 | | | | 30,563 | |
| | |
5.95%, 4/1/2030 | | | 90,000 | | | | 115,306 | |
| | |
3.30%, 2/15/2050 | | | 110,000 | | | | 108,653 | |
| | |
Walmart, Inc. 3.63%, 12/15/2047 | | | 15,000 | | | | 17,280 | |
| | | | | | | | |
| | |
| | | | | | | 507,830 | |
| | | | | | | | |
| | |
Food Products — 0.4% | | | | | | | | |
| | |
Darling Ingredients, Inc. 5.25%, 4/15/2027 (a) | | | 50,000 | | | | 52,625 | |
| | |
Kraft Heinz Foods Co. | | | | | | | | |
| | |
3.00%, 6/1/2026 | | | 25,000 | | | | 26,532 | |
| | |
4.63%, 1/30/2029 | | | 35,000 | | | | 40,549 | |
| | |
5.00%, 6/4/2042 | | | 50,000 | | | | 58,812 | |
SEE NOTES TO FINANCIAL STATEMENTS.
| | | | | | |
| | | |
| 50 | | | | J.P. MORGAN EXCHANGE-TRADED FUNDS | | FEBRUARY 28, 2021 |
| | | | | | | | |
| INVESTMENTS | | PRINCIPAL
AMOUNT ($) | | | VALUE ($) | |
Corporate Bonds — continued | | | | | | | | |
| | |
Food Products — continued | | | | | | | | |
| | |
Lamb Weston Holdings, Inc. 4.88%, 11/1/2026 (a) | | | 65,000 | | | | 67,356 | |
| | |
Mead Johnson Nutrition Co. (United Kingdom) 4.13%, 11/15/2025 | | | 64,000 | | | | 72,306 | |
| | |
Pilgrim’s Pride Corp. 5.75%, 3/15/2025 (a) | | | 16,000 | | | | 16,317 | |
| | |
Post Holdings, Inc. | | | | | | | | |
| | |
5.75%, 3/1/2027 (a) | | | 75,000 | | | | 78,536 | |
| | |
5.50%, 12/15/2029 (a) | | | 25,000 | | | | 26,907 | |
| | |
4.63%, 4/15/2030 (a) | | | 30,000 | | | | 30,450 | |
| | |
Tyson Foods, Inc. 4.35%, 3/1/2029 | | | 59,000 | | | | 68,698 | |
| | | | | | | | |
| | |
| | | | | | | 539,088 | |
| | | | | | | | |
| | |
Gas Utilities — 0.1% | | | | | | | | |
| | |
AmeriGas Partners LP | | | | | | | | |
| | |
5.50%, 5/20/2025 | | | 23,000 | | | | 25,178 | |
| | |
5.88%, 8/20/2026 | | | 10,000 | | | | 11,275 | |
| | |
Atmos Energy Corp. 5.50%, 6/15/2041 | | | 52,000 | | | | 69,923 | |
| | |
Boston Gas Co. 3.00%, 8/1/2029 (a) | | | 37,000 | | | | 39,721 | |
| | |
Brooklyn Union Gas Co. (The) 3.87%, 3/4/2029 (a) | | | 10,000 | | | | 11,265 | |
| | |
Southern California Gas Co. Series XX, 2.55%, 2/1/2030 | | | 33,000 | | | | 34,337 | |
| | | | | | | | |
| | |
| | | | | | | 191,699 | |
| | | | | | | | |
| |
Health Care Equipment & Supplies — 0.3% | | | | | |
| | |
Abbott Laboratories 1.15%, 1/30/2028 | | | 20,000 | | | | 19,495 | |
| | |
Avantor Funding, Inc. 4.63%, 7/15/2028 (a) | | | 110,000 | | | | 114,677 | |
| | |
Becton Dickinson and Co. 3.70%, 6/6/2027 | | | 110,000 | | | | 123,321 | |
| | |
Boston Scientific Corp. 4.70%, 3/1/2049 | | | 63,000 | | | | 79,332 | |
| | |
Hologic, Inc. 3.25%, 2/15/2029 (a) | | | 30,000 | | | | 29,942 | |
| | |
Teleflex, Inc. 4.63%, 11/15/2027 | | | 20,000 | | | | 21,075 | |
| | | | | | | | |
| | |
| | | | | | | 387,842 | |
| | | | | | | | |
| | |
Health Care Providers & Services — 1.9% | | | | | | | | |
| | |
Centene Corp. | | | | | | | | |
| | |
5.38%, 6/1/2026 (a) | | | 54,000 | | | | 56,424 | |
| | |
4.63%, 12/15/2029 | | | 240,000 | | | | 258,960 | |
| | |
Cigna Corp. 3.40%, 3/15/2050 | | | 60,000 | | | | 61,149 | |
| | |
CommonSpirit Health | | | | | | | | |
| | |
1.55%, 10/1/2025 | | | 13,000 | | | | 13,156 | |
| | |
2.78%, 10/1/2030 | | | 13,000 | | | | 13,544 | |
| | |
3.91%, 10/1/2050 | | | 15,000 | | | | 15,833 | |
| | |
Community Health Systems, Inc. 5.63%, 3/15/2027 (a) | | | 75,000 | | | | 78,989 | |
| | | | | | | | |
| INVESTMENTS | | PRINCIPAL
AMOUNT ($) | | | VALUE ($) | |
| | | | | | | | |
| |
Health Care Providers & Services — continued | | | | | |
| | |
CVS Health Corp. | | | | | | | | |
| | |
2.88%, 6/1/2026 | | | 10,000 | | | | 10,771 | |
| | |
4.30%, 3/25/2028 | | | 235,000 | | | | 270,508 | |
| | |
1.88%, 2/28/2031 | | | 75,000 | | | | 72,488 | |
| | |
4.78%, 3/25/2038 | | | 50,000 | | | | 60,941 | |
| | |
2.70%, 8/21/2040 | | | 50,000 | | | | 47,472 | |
| | |
DaVita, Inc. 4.63%, 6/1/2030 (a) | | | 125,000 | | | | 127,187 | |
| | |
Encompass Health Corp. 4.50%, 2/1/2028 | | | 85,000 | | | | 88,367 | |
| | |
Envision Healthcare Corp. 8.75%, 10/15/2026 (a) | | | 20,000 | | | | 14,300 | |
| | |
HCA, Inc. | | | | | | | | |
| | |
5.38%, 9/1/2026 | | | 155,000 | | | | 176,908 | |
| | |
4.50%, 2/15/2027 | | | 210,000 | | | | 240,043 | |
| | |
5.63%, 9/1/2028 | | | 245,000 | | | | 284,813 | |
| | |
5.88%, 2/1/2029 | | | 25,000 | | | | 29,471 | |
| | |
3.50%, 9/1/2030 | | | 25,000 | | | | 26,012 | |
| | |
5.50%, 6/15/2047 | | | 25,000 | | | | 31,945 | |
| | |
MidMichigan Health Series 2020, 3.41%, 6/1/2050 | | | 10,000 | | | | 10,362 | |
| | |
MultiCare Health System 2.80%, 8/15/2050 | | | 10,000 | | | | 9,468 | |
| | |
New York and Presbyterian Hospital (The) 2.61%, 8/1/2060 | | | 5,000 | | | | 4,517 | |
| | |
Rush Obligated Group Series 2020, 3.92%, 11/15/2029 | | | 50,000 | | | | 57,264 | |
| | |
Tenet Healthcare Corp. | | | | | | | | |
| | |
4.63%, 9/1/2024 (a) | | | 140,000 | | | | 143,500 | |
| | |
4.88%, 1/1/2026 (a) | | | 125,000 | | | | 129,211 | |
| | |
5.13%, 11/1/2027 (a) | | | 10,000 | | | | 10,482 | |
| | |
UnitedHealth Group, Inc. | | | | | | | | |
| | |
3.38%, 4/15/2027 | | | 91,000 | | | | 101,762 | |
| | |
2.75%, 5/15/2040 | | | 82,000 | | | | 82,353 | |
| | |
4.63%, 11/15/2041 | | | 132,000 | | | | 166,358 | |
| | |
Universal Health Services, Inc. 2.65%, 10/15/2030 (a) | | | 75,000 | | | | 74,157 | |
| | | | | | | | |
| | |
| | | | | | | 2,768,715 | |
| | | | | | | | |
| | |
Hotels, Restaurants & Leisure — 0.6% | | | | | | | | |
| | |
1011778 BC ULC (Canada) | | | | | | | | |
| | |
5.75%, 4/15/2025 (a) | | | 50,000 | | | | 53,312 | |
| | |
3.88%, 1/15/2028 (a) | | | 17,000 | | | | 17,257 | |
| | |
Boyne USA, Inc. 7.25%, 5/1/2025 (a) | | | 19,000 | | | | 19,764 | |
| | |
Caesars Resort Collection LLC 5.75%, 7/1/2025 (a) | | | 75,000 | | | | 78,750 | |
| | |
Downstream Development Authority of the Quapaw Tribe of Oklahoma 10.50%, 2/15/2023 (a) | | | 14,000 | | | | 14,280 | |
SEE NOTES TO FINANCIAL STATEMENTS.
| | | | | | | | |
| | | |
| FEBRUARY 28, 2021 | | J.P. MORGAN EXCHANGE-TRADED FUNDS | | | | | 51 | |
JPMorgan Core Plus Bond ETF
SCHEDULE OF PORTFOLIO INVESTMENTS
AS OF FEBRUARY 28, 2021 (continued)
| | | | | | | | |
| INVESTMENTS | | PRINCIPAL
AMOUNT ($) | | | VALUE ($) | |
Corporate Bonds — continued | | | | | | | | |
|
Hotels, Restaurants & Leisure — continued | |
| | |
Enterprise Development Authority (The) 12.00%, 7/15/2024 (a) | | | 7,000 | | | | 7,903 | |
| | |
Hilton Domestic Operating Co., Inc. 5.38%, 5/1/2025 (a) | | | 25,000 | | | | 26,294 | |
| | |
Hilton Grand Vacations Borrower LLC 6.13%, 12/1/2024 | | | 20,000 | | | | 20,850 | |
| | |
Marriott Ownership Resorts, Inc. 6.50%, 9/15/2026 | | | 20,000 | | | | 20,809 | |
| | |
McDonald’s Corp. 3.63%, 9/1/2049 | | | 35,000 | | | | 37,511 | |
| | |
MGM Resorts International 5.50%, 4/15/2027 | | | 41,000 | | | | 44,473 | |
| | |
Scientific Games International, Inc. 5.00%, 10/15/2025 (a) | | | 26,000 | | | | 26,740 | |
| | |
Six Flags Theme Parks, Inc. 7.00%, 7/1/2025 (a) | | | 90,000 | | | | 97,023 | |
| | |
Starbucks Corp. 3.35%, 3/12/2050 | | | 50,000 | | | | 50,293 | |
| | |
Stars Group Holdings BV (Canada) 7.00%, 7/15/2026 (a) | | | 85,000 | | | | 89,159 | |
| | |
Station Casinos LLC 5.00%, 10/1/2025 (a) | | | 13,000 | | | | 13,107 | |
| | |
Travel + Leisure Co. 5.65%, 4/1/2024 (f) | | | 25,000 | | | | 26,625 | |
| | |
Vail Resorts, Inc. 6.25%, 5/15/2025 (a) | | | 70,000 | | | | 74,753 | |
| | |
Wynn Las Vegas LLC 5.50%, 3/1/2025 (a) | | | 75,000 | | | | 79,500 | |
| | |
Wynn Resorts Finance LLC 5.13%, 10/1/2029 (a) | | | 15,000 | | | | 15,787 | |
| | |
Yum! Brands, Inc. 7.75%, 4/1/2025 (a) | | | 35,000 | | | | 38,405 | |
| | | | | | | | |
| | |
| | | | | | | 852,595 | |
| | | | | | | | |
| | |
Household Durables — 0.2% | | | | | | | | |
| | |
Lennar Corp. | | | | | | | | |
| | |
4.75%, 11/15/2022 (f) | | | 20,000 | | | | 21,000 | |
| | |
4.88%, 12/15/2023 | | | 25,000 | | | | 27,400 | |
| | |
4.50%, 4/30/2024 | | | 6,000 | | | | 6,575 | |
| | |
4.75%, 5/30/2025 | | | 30,000 | | | | 33,675 | |
| | |
5.25%, 6/1/2026 | | | 20,000 | | | | 23,274 | |
| | |
Newell Brands, Inc. | | | | | | | | |
| | |
4.70%, 4/1/2026 (f) | | | 55,000 | | | | 60,991 | |
| | |
5.87%, 4/1/2036 (f) | | | 50,000 | | | | 62,250 | |
| | |
Tempur Sealy International, Inc. 5.50%, 6/15/2026 | | | 80,000 | | | | 82,751 | |
| | |
Toll Brothers Finance Corp. 4.88%, 11/15/2025 | | | 13,000 | | | | 14,658 | |
| | | | | | | | |
| | |
| | | | | | | 332,574 | |
| | | | | | | | |
| | |
Household Products — 0.2% | | | | | | | | |
| | |
Central Garden & Pet Co. 5.13%, 2/1/2028 | | | 95,000 | | | | 100,581 | |
| | | | | | | | |
| INVESTMENTS | | PRINCIPAL
AMOUNT ($) | | | VALUE ($) | |
| | | | | | | | |
| | |
Household Products — continued | | | | | | | | |
| | |
Energizer Holdings, Inc. 4.38%, 3/31/2029 (a) | | | 105,000 | | | | 104,738 | |
| | |
Kimberly-Clark Corp. 3.20%, 4/25/2029 | | | 39,000 | | | | 43,463 | |
| | |
Spectrum Brands, Inc. 5.75%, 7/15/2025 | | | 70,000 | | | | 72,100 | |
| | | | | | | | |
| | |
| | | | | | | 320,882 | |
| | | | | | | | |
|
Independent Power and Renewable Electricity Producers — 0.1% | |
| | |
Calpine Corp. | | | | | | | | |
| | |
5.25%, 6/1/2026 (a) | | | 47,000 | | | | 48,351 | |
| | |
5.13%, 3/15/2028 (a) | | | 55,000 | | | | 55,275 | |
| | |
Exelon Generation Co. LLC 3.25%, 6/1/2025 | | | 37,000 | | | | 39,707 | |
| | | | | | | | |
| | |
| | | | | | | 143,333 | |
| | | | | | | | |
| | |
Industrial Conglomerates — 0.0% (b) | | | | | | | | |
| | |
General Electric Co. 4.13%, 10/9/2042 | | | 40,000 | | | | 44,141 | |
| | | | | | | | |
| | |
Insurance — 0.6% | | | | | | | | |
| | |
Aflac, Inc. 3.25%, 3/17/2025 | | | 21,000 | | | | 22,810 | |
| | |
Allstate Corp. (The) 5.35%, 6/1/2033 | | | 23,000 | | | | 30,438 | |
| | |
Athene Global Funding | | | | | | | | |
| | |
0.95%, 1/8/2024 (a) | | | 30,000 | | | | 30,058 | |
| | |
1.45%, 1/8/2026 (a) | | | 20,000 | | | | 19,915 | |
| | |
2.95%, 11/12/2026 (a) | | | 44,000 | | | | 46,821 | |
| | |
Berkshire Hathaway Finance Corp. | | | | | | | | |
| | |
4.25%, 1/15/2049 | | | 29,000 | | | | 35,156 | |
| | |
2.85%, 10/15/2050 | | | 60,000 | | | | 58,324 | |
| | |
Jackson National Life Global Funding 2.50%, 6/27/2022 (a) | | | 47,000 | | | | 48,309 | |
| | |
Lincoln National Corp. 3.35%, 3/9/2025 | | | 30,000 | | | | 32,830 | |
| | |
Manulife Financial Corp. (Canada) 4.15%, 3/4/2026 | | | 42,000 | | | | 48,001 | |
| | |
MetLife, Inc. 4.13%, 8/13/2042 | | | 79,000 | | | | 94,725 | |
| | |
New York Life Global Funding 3.00%, 1/10/2028 (a) | | | 51,000 | | | | 55,370 | |
| | |
New York Life Insurance Co. 3.75%, 5/15/2050 (a) | | | 60,000 | | | | 66,689 | |
| | |
Pacific Life Insurance Co. (ICE LIBOR USD 3 Month + 2.80%), 4.30%, 10/24/2067 (a) (c) | | | 27,000 | | | | 30,510 | |
| | |
Principal Financial Group, Inc. 3.70%, 5/15/2029 | | | 45,000 | | | | 50,743 | |
| | |
Progressive Corp. (The) 4.35%, 4/25/2044 | | | 42,000 | | | | 51,863 | |
| | |
Prudential Financial, Inc. | | | | | | | | |
| | |
3.88%, 3/27/2028 | | | 50,000 | | | | 57,941 | |
| | |
3.91%, 12/7/2047 | | | 20,000 | | | | 22,797 | |
SEE NOTES TO FINANCIAL STATEMENTS.
| | | | | | |
| | | |
| 52 | | | | J.P. MORGAN EXCHANGE-TRADED FUNDS | | FEBRUARY 28, 2021 |
| | | | | | | | |
| INVESTMENTS | | PRINCIPAL
AMOUNT ($) | | | VALUE ($) | |
Corporate Bonds — continued | | | | | | | | |
| | |
Insurance — continued | | | | | | | | |
| | |
Travelers Cos., Inc. (The) 5.35%, 11/1/2040 | | | 46,000 | | | | 63,084 | |
| | | | | | | | |
| | |
| | | | | | | 866,384 | |
| | | | | | | | |
| |
Internet & Direct Marketing Retail — 0.2% | | | | | |
| | |
Amazon.com, Inc. | | | | | | | | |
| | |
3.15%, 8/22/2027 | | | 201,000 | | | | 222,791 | |
| | |
2.70%, 6/3/2060 | | | 40,000 | | | | 36,907 | |
| | |
Photo Holdings Merger Sub, Inc. 8.50%, 10/1/2026 (a) | | | 13,000 | | | | 13,945 | |
| | | | | | | | |
| | |
| | | | | | | 273,643 | |
| | | | | | | | |
| | |
IT Services — 0.1% | | | | | | | | |
| | |
Gartner, Inc. 3.75%, 10/1/2030 (a) | | | 40,000 | | | | 40,500 | |
| | |
Global Payments, Inc. 2.90%, 5/15/2030 | | | 40,000 | | | | 41,774 | |
| | |
International Business Machines Corp. 5.60%, 11/30/2039 | | | 66,000 | | | | 90,938 | |
| | |
Presidio Holdings, Inc. 4.88%, 2/1/2027 (a) | | | 20,000 | | | | 20,850 | |
| | | | | | | | |
| | |
| | | | | | | 194,062 | |
| | | | | | | | |
| | |
Leisure Products — 0.1% | | | | | | | | |
| | |
Mattel, Inc. | | | | | | | | |
| | |
6.75%, 12/31/2025 (a) | | | 53,000 | | | | 55,692 | |
| | |
5.88%, 12/15/2027 (a) | | | 65,000 | | | | 70,761 | |
| | | | | | | | |
| | |
| | | | | | | 126,453 | |
| | | | | | | | |
| | |
Life Sciences Tools & Services — 0.1% | | | | | | | | |
| | |
Thermo Fisher Scientific, Inc. 2.60%, 10/1/2029 | | | 91,000 | | | | 95,608 | |
| | | | | | | | |
| | |
Machinery — 0.3% | | | | | | | | |
| | |
Amsted Industries, Inc. 5.63%, 7/1/2027 (a) | | | 65,000 | | | | 68,900 | |
| | |
Caterpillar, Inc. 4.30%, 5/15/2044 | | | 78,000 | | | | 96,877 | |
| | |
Colfax Corp. 6.00%, 2/15/2024 (a) | | | 5,000 | | | | 5,156 | |
| | |
Parker-Hannifin Corp. 3.25%, 3/1/2027 | | | 92,000 | | | | 101,892 | |
| | |
Tennant Co. 5.63%, 5/1/2025 | | | 10,000 | | | | 10,325 | |
| | |
Vertical US Newco, Inc. (Germany) 5.25%, 7/15/2027 (a) | | | 200,000 | | | | 208,500 | |
| | | | | | | | |
| | |
| | | | | | | 491,650 | |
| | | | | | | | |
| | |
Media — 2.4% | | | | | | | | |
| | |
Altice Financing SA (Luxembourg) 7.50%, 5/15/2026 (a) | | | 200,000 | | | | 209,020 | |
| | |
AMC Networks, Inc. 5.00%, 4/1/2024 | | | 4,000 | | | | 4,050 | |
| | |
Charter Communications Operating LLC | | | | | | | | |
| | |
6.38%, 10/23/2035 | | | 50,000 | | | | 66,375 | |
| | |
3.50%, 6/1/2041 | | | 75,000 | | | | 72,525 | |
| | | | | | | | |
| INVESTMENTS | | PRINCIPAL
AMOUNT ($) | | | VALUE ($) | |
| | | | | | | | |
| | |
Media — continued | | | | | | | | |
| | |
4.80%, 3/1/2050 | | | 85,000 | | | | 93,473 | |
| | |
3.70%, 4/1/2051 | | | 56,000 | | | | 53,262 | |
| | |
Clear Channel Worldwide Holdings, Inc. | | | | | | | | |
| | |
9.25%, 2/15/2024 | | | 30,000 | | | | 31,238 | |
| | |
5.13%, 8/15/2027 (a) | | | 97,000 | | | | 98,552 | |
| | |
Comcast Corp. | | | | | | | | |
| | |
2.35%, 1/15/2027 | | | 130,000 | | | | 136,684 | |
| | |
4.25%, 10/15/2030 | | | 94,000 | | | | 110,762 | |
| | |
1.95%, 1/15/2031 | | | 207,000 | | | | 203,800 | |
| | |
3.90%, 3/1/2038 | | | 95,000 | | | | 109,855 | |
| | |
3.25%, 11/1/2039 | | | 133,000 | | | | 141,621 | |
| | |
4.75%, 3/1/2044 | | | 222,000 | | | | 282,172 | |
| | |
3.40%, 7/15/2046 | | | 15,000 | | | | 15,788 | |
| | |
4.00%, 3/1/2048 | | | 45,000 | | | | 51,346 | |
| | |
2.45%, 8/15/2052 | | | 105,000 | | | | 91,732 | |
| | |
2.65%, 8/15/2062 | | | 65,000 | | | | 57,374 | |
| | |
Cox Communications, Inc. | | | | | | | | |
| | |
1.80%, 10/1/2030 (a) | | | 65,000 | | | | 62,148 | |
| | |
2.95%, 10/1/2050 (a) | | | 25,000 | | | | 23,069 | |
| | |
CSC Holdings LLC 5.50%, 4/15/2027 (a) | | | 200,000 | | | | 210,440 | |
| | |
Diamond Sports Group LLC 5.38%, 8/15/2026 (a) | | | 35,000 | | | | 24,752 | |
| | |
Discovery Communications LLC 4.00%, 9/15/2055 (a) | | | 35,000 | | | | 35,848 | |
| | |
DISH DBS Corp. | | | | | | | | |
| | |
6.75%, 6/1/2021 | | | 20,000 | | | | 20,225 | |
| | |
5.88%, 11/15/2024 | | | 146,000 | | | | 152,775 | |
| | |
7.75%, 7/1/2026 | | | 115,000 | | | | 126,558 | |
| | |
iHeartCommunications, Inc. | | | | | | | | |
| | |
6.38%, 5/1/2026 | | | 25,000 | | | | 26,452 | |
| | |
8.38%, 5/1/2027 | | | 25,000 | | | | 26,510 | |
| | |
5.25%, 8/15/2027 (a) | | | 75,000 | | | | 76,875 | |
| | |
Lamar Media Corp. | | | | | | | | |
| | |
3.75%, 2/15/2028 | | | 40,000 | | | | 40,500 | |
| | |
4.00%, 2/15/2030 | | | 35,000 | | | | 35,700 | |
| | |
Meredith Corp. 6.50%, 7/1/2025 (a) | | | 85,000 | | | | 90,525 | |
| | |
Midcontinent Communications 5.38%, 8/15/2027 (a) | | | 15,000 | | | | 15,825 | |
| | |
Nexstar Broadcasting, Inc. 5.63%, 7/15/2027 (a) | | | 40,000 | | | | 42,250 | |
| | |
Outfront Media Capital LLC 5.00%, 8/15/2027 (a) | | | 21,000 | | | | 21,341 | |
| | |
Scripps Escrow II, Inc. 3.88%, 1/15/2029 (a) | | | 70,000 | | | | 68,749 | |
| | |
Sinclair Television Group, Inc. 4.13%, 12/1/2030 (a) | | | 65,000 | | | | 63,476 | |
SEE NOTES TO FINANCIAL STATEMENTS.
| | | | | | | | |
| | | |
| FEBRUARY 28, 2021 | | J.P. MORGAN EXCHANGE-TRADED FUNDS | | | | | 53 | |
JPMorgan Core Plus Bond ETF
SCHEDULE OF PORTFOLIO INVESTMENTS
AS OF FEBRUARY 28, 2021 (continued)
| | | | | | | | |
| INVESTMENTS | | PRINCIPAL
AMOUNT ($) | | | VALUE ($) | |
Corporate Bonds — continued | | | | | | | | |
| | |
Media — continued | | | | | | | | |
| | |
Sirius XM Radio, Inc. | | | | | | | | |
| | |
5.38%, 7/15/2026 (a) | | | 30,000 | | | | 30,984 | |
| | |
5.00%, 8/1/2027 (a) | | | 110,000 | | | | 114,540 | |
| | |
5.50%, 7/1/2029 (a) | | | 65,000 | | | | 70,343 | |
| | |
TEGNA, Inc. 5.00%, 9/15/2029 | | | 25,000 | | | | 26,051 | |
| | |
ViacomCBS, Inc. | | | | | | | | |
| | |
4.20%, 5/19/2032 | | | 137,000 | | | | 157,598 | |
| | |
5.85%, 9/1/2043 | | | 5,000 | | | | 6,633 | |
| | |
(ICE LIBOR USD 3 Month + 3.90%), 5.87%, 2/28/2057 (c) | | | 18,000 | | | | 18,360 | |
| | |
Videotron Ltd. (Canada) | | | | | | | | |
| | |
5.38%, 6/15/2024 (a) | | | 37,000 | | | | 40,330 | |
| | |
5.13%, 4/15/2027 (a) | | | 25,000 | | | | 26,094 | |
| | | | | | | | |
| | |
| | | | | | | 3,484,580 | |
| | | | | | | | |
| | |
Metals & Mining — 0.6% | | | | | | | | |
| | |
Alcoa Nederland Holding BV 5.50%, 12/15/2027 (a) | | | 200,000 | | | | 212,000 | |
| | |
Allegheny Technologies, Inc. 5.88%, 12/1/2027 | | | 60,000 | | | | 63,375 | |
| | |
Arconic Corp. | | | | | | | | |
| | |
6.00%, 5/15/2025 (a) | | | 40,000 | | | | 42,500 | |
| | |
6.13%, 2/15/2028 (a) | | | 35,000 | | | | 36,937 | |
| | |
Cleveland-Cliffs, Inc. 6.75%, 3/15/2026 (a) | | | 90,000 | | | | 96,412 | |
| | |
Commercial Metals Co. 4.88%, 5/15/2023 | | | 28,000 | | | | 29,470 | |
| | |
Freeport-McMoRan, Inc. | | | | | | | | |
| | |
5.00%, 9/1/2027 | | | 45,000 | | | | 48,128 | |
| | |
5.45%, 3/15/2043 | | | 95,000 | | | | 118,038 | |
| | |
Glencore Funding LLC (Australia) | | | | | | | | |
| | |
1.63%, 9/1/2025 (a) | | | 24,000 | | | | 24,321 | |
| | |
2.50%, 9/1/2030 (a) | | | 37,000 | | | | 36,637 | |
| | |
Kaiser Aluminum Corp. 4.63%, 3/1/2028 (a) | | | 85,000 | | | | 88,734 | |
| | |
Rio Tinto Finance USA Ltd. (Australia) 7.13%, 7/15/2028 | | | 59,000 | | | | 81,452 | |
| | |
United States Steel Corp. 12.00%, 6/1/2025 (a) | | | 20,000 | | | | 24,021 | |
| | | | | | | | |
| | |
| | | | | | | 902,025 | |
| | | | | | | | |
| | |
Multiline Retail — 0.0% (b) | | | | | | | | |
| | |
Kohl’s Corp. 9.50%, 5/15/2025 | | | 7,000 | | | | 9,040 | |
| | | | | | | | |
| | |
Multi-Utilities — 0.3% | | | | | | | | |
| | |
Ameren Corp. 3.50%, 1/15/2031 | | | 26,000 | | | | 28,895 | |
| | |
Berkshire Hathaway Energy Co. | | | | | | | | |
| | |
1.65%, 5/15/2031 (a) | | | 80,000 | | | | 76,763 | |
| | |
5.15%, 11/15/2043 | | | 94,000 | | | | 122,614 | |
| | |
2.85%, 5/15/2051 (a) | | | 40,000 | | | | 37,515 | |
| | | | | | | | |
| INVESTMENTS | | PRINCIPAL
AMOUNT ($) | | | VALUE ($) | |
| | | | | | | | |
| | |
Multi-Utilities — continued | | | | | | | | |
| | |
Consolidated Edison Co. of New York, Inc. Series A, 4.13%, 5/15/2049 | | | 41,000 | | | | 46,683 | |
| | |
Puget Sound Energy, Inc. 5.76%, 7/15/2040 | | | 90,000 | | | | 122,486 | |
| | | | | | | | |
| | |
| | | | | | | 434,956 | |
| | | | | | | | |
| | |
Oil, Gas & Consumable Fuels — 2.7% | | | | | | | | |
| | |
Antero Midstream Partners LP 7.88%, 5/15/2026 (a) | | | 80,000 | | | | 87,050 | |
| | |
Antero Resources Corp. 5.63%, 6/1/2023 | | | 35,000 | | | | 35,042 | |
| | |
Apache Corp. 3.25%, 4/15/2022 | | | 65,000 | | | | 65,162 | |
| | |
BP Capital Markets America, Inc. | | | | | | | | |
| | |
3.02%, 1/16/2027 | | | 106,000 | | | | 114,144 | |
| | |
3.94%, 9/21/2028 | | | 20,000 | | | | 22,741 | |
| | |
4.23%, 11/6/2028 | | | 265,000 | | | | 307,739 | |
| | |
3.00%, 2/24/2050 | | | 99,000 | | | | 92,014 | |
| | |
2.77%, 11/10/2050 | | | 55,000 | | | | 48,631 | |
| | |
2.94%, 6/4/2051 | | | 15,000 | | | | 13,710 | |
| | |
BP Capital Markets plc (United Kingdom) | | | | | | | | |
| | |
(US Treasury Yield Curve Rate T Note Constant Maturity 5 Year + 4.04%), 4.38%, 6/22/2025 (c) (d) (e) | | | 85,000 | | | | 89,613 | |
| | |
(US Treasury Yield Curve Rate T Note Constant Maturity 5 Year + 4.40%), 4.88%, 3/22/2030 (c) (d) (e) | | | 155,000 | | | | 166,392 | |
| | |
Buckeye Partners LP | | | | | | | | |
| | |
3.95%, 12/1/2026 | | | 10,000 | | | | 9,925 | |
| | |
4.13%, 12/1/2027 | | | 45,000 | | | | 45,183 | |
| | |
Cenovus Energy, Inc. (Canada) 5.38%, 7/15/2025 | | | 50,000 | | | | 56,612 | |
| | |
Cheniere Corpus Christi Holdings LLC | | | | | | | | |
| | |
5.88%, 3/31/2025 | | | 65,000 | | | | 74,893 | |
| | |
5.13%, 6/30/2027 | | | 75,000 | | | | 87,556 | |
| | |
Cheniere Energy Partners LP | | | | | | | | |
| | |
5.25%, 10/1/2025 | | | 22,000 | | | | 22,612 | |
| | |
5.63%, 10/1/2026 | | | 55,000 | | | | 57,150 | |
| | |
Chevron Corp. | | | | | | | | |
| | |
2.00%, 5/11/2027 | | | 21,000 | | | | 21,785 | |
| | |
2.24%, 5/11/2030 | | | 23,000 | | | | 23,533 | |
| | |
2.98%, 5/11/2040 | | | 21,000 | | | | 21,573 | |
| | |
Chevron USA, Inc. 3.85%, 1/15/2028 | | | 120,000 | | | | 137,006 | |
| | |
2.34%, 8/12/2050 | | | 70,000 | | | | 60,584 | |
| | |
Cimarex Energy Co. 3.90%, 5/15/2027 | | | 30,000 | | | | 33,094 | |
| | |
Comstock Resources, Inc. 7.50%, 5/15/2025 (a) | | | 20,000 | | | | 20,850 | |
SEE NOTES TO FINANCIAL STATEMENTS.
| | | | | | |
| | | |
| 54 | | | | J.P. MORGAN EXCHANGE-TRADED FUNDS | | FEBRUARY 28, 2021 |
| | | | | | | | |
| INVESTMENTS | | PRINCIPAL
AMOUNT ($) | | | VALUE ($) | |
Corporate Bonds — continued | | | | | | | | |
|
Oil, Gas & Consumable Fuels — continued | |
| | |
Continental Resources, Inc. | | | | | | | | |
| | |
5.00%, 9/15/2022 | | | 30,000 | | | | 30,000 | |
| | |
5.75%, 1/15/2031 (a) | | | 75,000 | | | | 84,541 | |
| | |
DCP Midstream Operating LP 5.38%, 7/15/2025 | | | 85,000 | | | | 90,613 | |
| | |
Diamondback Energy, Inc. 3.25%, 12/1/2026 | | | 18,000 | | | | 19,129 | |
| | |
Energy Transfer Operating LP 4.25%, 3/15/2023 | | | 40,000 | | | | 42,385 | |
| | |
EnLink Midstream Partners LP | | | | | | | | |
| | |
4.40%, 4/1/2024 | | | 8,000 | | | | 8,060 | |
| | |
5.60%, 4/1/2044 | | | 9,000 | | | | 7,627 | |
| | |
Enterprise Products Operating LLC | | | | | | | | |
| | |
2.80%, 1/31/2030 | | | 37,000 | | | | 38,876 | |
| | |
3.20%, 2/15/2052 | | | 63,000 | | | | 58,640 | |
| | |
EOG Resources, Inc. 4.38%, 4/15/2030 | | | 20,000 | | | | 23,467 | |
| | |
EQM Midstream Partners LP 4.00%, 8/1/2024 | | | 85,000 | | | | 85,850 | |
| | |
EQT Corp. 7.63%, 2/1/2025 (f) | | | 80,000 | | | | 93,058 | |
| | |
Exxon Mobil Corp. | | | | | | | | |
| | |
2.99%, 3/19/2025 | | | 18,000 | | | | 19,411 | |
| | |
3.00%, 8/16/2039 | | | 65,000 | | | | 65,302 | |
| | |
3.10%, 8/16/2049 | | | 75,000 | | | | 72,658 | |
| | |
Gray Oak Pipeline LLC | | | | | | | | |
| | |
2.00%, 9/15/2023 (a) | | | 44,000 | | | | 44,676 | |
| | |
2.60%, 10/15/2025 (a) | | | 22,000 | | | | 22,499 | |
| | |
Gulfport Energy Corp. | | | | | | | | |
| | |
6.63%, 5/1/2023 (g) | | | 5,000 | | | | 4,550 | |
| | |
6.00%, 10/15/2024 (g) | | | 10,000 | | | | 9,162 | |
| | |
HollyFrontier Corp. | | | | | | | | |
| | |
2.63%, 10/1/2023 | | | 10,000 | | | | 10,301 | |
| | |
5.88%, 4/1/2026 | | | 5,000 | | | | 5,632 | |
| | |
MEG Energy Corp. (Canada) | | | | | | | | |
| | |
6.50%, 1/15/2025 (a) | | | 8,000 | | | | 8,250 | |
| | |
7.13%, 2/1/2027 (a) | | | 5,000 | | | | 5,249 | |
| | |
MPLX LP 1.75%, 3/1/2026 | | | 50,000 | | | | 50,385 | |
| | |
NGPL PipeCo LLC 4.38%, 8/15/2022 (a) | | | 5,000 | | | | 5,206 | |
| | |
NuStar Logistics LP 5.63%, 4/28/2027 | | | 20,000 | | | | 20,900 | |
| | |
Occidental Petroleum Corp. | | | | | | | | |
| | |
2.70%, 8/15/2022 | | | 37,000 | | | | 36,586 | |
| | |
2.90%, 8/15/2024 | | | 225,000 | | | | 218,966 | |
| | |
PBF Holding Co. LLC 6.00%, 2/15/2028 | | | 20,000 | | | | 12,700 | |
| | |
Range Resources Corp. 4.88%, 5/15/2025 | | | 45,000 | | | | 44,528 | |
| | |
Sabine Pass Liquefaction LLC 4.50%, 5/15/2030 | | | 69,000 | | | | 78,921 | |
| | | | | | | | |
| INVESTMENTS | | PRINCIPAL
AMOUNT ($) | | | VALUE ($) | |
| | | | | | | | |
|
Oil, Gas & Consumable Fuels — continued | |
| | |
Southwestern Energy Co. | | | | | | | | |
| | |
6.45%, 1/23/2025 (f) | | | 10,000 | | | | 10,500 | |
| | |
7.50%, 4/1/2026 | | | 15,000 | | | | 15,791 | |
| | |
Spectra Energy Partners LP 4.50%, 3/15/2045 | | | 15,000 | | | | 16,595 | |
| | |
Suncor Energy, Inc. (Canada) 6.80%, 5/15/2038 | | | 83,000 | | | | 116,564 | |
| | |
Sunoco Logistics Partners Operations LP 5.35%, 5/15/2045 | | | 45,000 | | | | 48,386 | |
| | |
Sunoco LP 5.50%, 2/15/2026 | | | 22,000 | | | | 22,635 | |
| | |
Tallgrass Energy Partners LP 5.50%, 9/15/2024 (a) | | | 8,000 | | | | 8,040 | |
| | |
Targa Resources Partners LP | | | | | | | | |
| | |
5.88%, 4/15/2026 | | | 100,000 | | | | 104,130 | |
| | |
6.88%, 1/15/2029 | | | 25,000 | | | | 27,719 | |
| | |
Total Capital International SA (France) | | | | | | | | |
| | |
3.46%, 2/19/2029 | | | 135,000 | | | | 150,323 | |
| | |
3.46%, 7/12/2049 | | | 104,000 | | | | 108,116 | |
| | |
3.13%, 5/29/2050 | | | 30,000 | | | | 29,319 | |
| | |
TransCanada PipeLines Ltd. (Canada) | | | | | | | | |
| | |
3.75%, 10/16/2023 | | | 90,000 | | | | 96,760 | |
| | |
5.10%, 3/15/2049 | | | 48,000 | | | | 59,538 | |
| | |
Western Midstream Operating LP 4.75%, 8/15/2028 | | | 30,000 | | | | 31,426 | |
| | |
WPX Energy, Inc. 5.75%, 6/1/2026 | | | 85,000 | | | | 89,356 | |
| | | | | | | | |
| | |
| | | | | | | 3,967,920 | |
| | | | | | | | |
| | |
Personal Products — 0.1% | | | | | | | | |
| | |
Edgewell Personal Care Co. 5.50%, 6/1/2028 (a) | | | 70,000 | | | | 74,299 | |
| | |
Estee Lauder Cos., Inc. (The) 2.60%, 4/15/2030 | | | 83,000 | | | | 87,944 | |
| | |
Prestige Brands, Inc. 6.38%, 3/1/2024 (a) | | | 30,000 | | | | 30,478 | |
| | | | | | | | |
| | |
| | | | | | | 192,721 | |
| | | | | | | | |
| | |
Pharmaceuticals — 1.1% | | | | | | | | |
| | |
Advanz Pharma Corp. Ltd. (Canada) 8.00%, 9/6/2024 | | | 23,000 | | | | 23,489 | |
| | |
AstraZeneca plc (United Kingdom) | | | | | | | | |
| | |
1.38%, 8/6/2030 | | | 60,000 | | | | 56,650 | |
| | |
2.13%, 8/6/2050 | | | 110,000 | | | | 88,186 | |
| | |
Bausch Health Americas, Inc. | | | | | | | | |
| | |
9.25%, 4/1/2026 (a) | | | 263,000 | | | | 291,522 | |
| | |
8.50%, 1/31/2027 (a) | | | 8,000 | | | | 8,850 | |
| | |
Bausch Health Cos., Inc. | | | | | | | | |
| | |
7.00%, 3/15/2024 (a) | | | 55,000 | | | | 56,193 | |
| | |
5.50%, 11/1/2025 (a) | | | 55,000 | | | | 56,606 | |
SEE NOTES TO FINANCIAL STATEMENTS.
| | | | | | | | |
| | | |
| FEBRUARY 28, 2021 | | J.P. MORGAN EXCHANGE-TRADED FUNDS | | | | | 55 | |
JPMorgan Core Plus Bond ETF
SCHEDULE OF PORTFOLIO INVESTMENTS
AS OF FEBRUARY 28, 2021 (continued)
| | | | | | | | |
| INVESTMENTS | | PRINCIPAL
AMOUNT ($) | | | VALUE ($) | |
Corporate Bonds — continued | | | | | | | | |
| | |
Pharmaceuticals — continued | | | | | | | | |
| | |
5.75%, 8/15/2027 (a) | | | 30,000 | | | | 32,325 | |
| | |
5.00%, 1/30/2028 (a) | | | 30,000 | | | | 30,600 | |
| | |
5.00%, 2/15/2029 (a) | | | 175,000 | | | | 176,969 | |
| | |
Bristol-Myers Squibb Co. | | | | | | | | |
| | |
1.13%, 11/13/2027 | | | 25,000 | | | | 24,532 | |
| | |
3.40%, 7/26/2029 | | | 40,000 | | | | 44,769 | |
| | |
1.45%, 11/13/2030 | | | 15,000 | | | | 14,396 | |
| | |
4.13%, 6/15/2039 | | | 164,000 | | | | 197,558 | |
| | |
2.35%, 11/13/2040 | | | 20,000 | | | | 19,178 | |
| | |
5.00%, 8/15/2045 | | | 33,000 | | | | 44,071 | |
| | |
Par Pharmaceutical, Inc. 7.50%, 4/1/2027 (a) | | | 10,000 | | | | 10,750 | |
| | |
Pfizer, Inc. 3.60%, 9/15/2028 | | | 186,000 | | | | 210,643 | |
| | |
Royalty Pharma plc | | | | | | | | |
| | |
1.20%, 9/2/2025 (a) | | | 16,000 | | | | 15,920 | |
| | |
1.75%, 9/2/2027 (a) | | | 15,000 | | | | 15,022 | |
| | |
Takeda Pharmaceutical Co. Ltd. (Japan) 3.18%, 7/9/2050 | | | 200,000 | | | | 195,009 | |
| | | | | | | | |
| | |
| | | | | | | 1,613,238 | |
| | | | | | | | |
| | |
Road & Rail — 0.3% | | | | | | | | |
| | |
Avis Budget Car Rental LLC 5.25%, 3/15/2025 (a) | | | 81,000 | | | | 81,485 | |
| | |
Burlington Northern Santa Fe LLC | | | | | | | | |
| | |
4.70%, 9/1/2045 | | | 45,000 | | | | 57,237 | |
| | |
3.55%, 2/15/2050 | | | 48,000 | | | | 53,002 | |
| | |
3.05%, 2/15/2051 | | | 15,000 | | | | 15,188 | |
| | |
CSX Corp. | | | | | | | | |
| | |
3.25%, 6/1/2027 | | | 20,000 | | | | 22,089 | |
| | |
3.35%, 9/15/2049 | | | 50,000 | | | | 51,576 | |
| | |
Norfolk Southern Corp. | | | | | | | | |
| | |
3.95%, 10/1/2042 | | | 20,000 | | | | 23,052 | |
| | |
3.05%, 5/15/2050 | | | 55,000 | | | | 54,478 | |
| | |
Penske Truck Leasing Co. LP 1.20%, 11/15/2025 (a) | | | 46,000 | | | | 45,662 | |
| | |
Union Pacific Corp. 3.25%, 2/5/2050 | | | 25,000 | | | | 25,814 | |
| | | | | | | | |
| | |
| | | | | | | 429,583 | |
| | | | | | | | |
|
Semiconductors & Semiconductor Equipment — 0.3% | |
| | |
Amkor Technology, Inc. 6.63%, 9/15/2027 (a) | | | 7,000 | | | | 7,595 | |
| | |
Analog Devices, Inc. 3.50%, 12/5/2026 | | | 25,000 | | | | 27,847 | |
| | |
Broadcom Corp. 3.88%, 1/15/2027 | | | 120,000 | | | | 131,565 | |
| | |
Broadcom, Inc. | | | | | | | | |
| | |
4.11%, 9/15/2028 | | | 40,000 | | | | 44,364 | |
| | |
3.50%, 2/15/2041 (a) | | | 61,000 | | | | 60,790 | |
| | |
3.75%, 2/15/2051 (a) | | | 52,000 | | | | 51,274 | |
| | | | | | | | |
| INVESTMENTS | | PRINCIPAL
AMOUNT ($) | | | VALUE ($) | |
| | | | | | | | |
|
Semiconductors & Semiconductor Equipment — continued | |
| | |
Microchip Technology, Inc. 0.97%, 2/15/2024 (a) | | | 25,000 | | | | 25,090 | |
| | |
ON Semiconductor Corp. 3.88%, 9/1/2028 (a) | | | 75,000 | | | | 78,375 | |
| | |
Qorvo, Inc. 4.38%, 10/15/2029 | | | 50,000 | | | | 53,828 | |
| | | | | | | | |
| | |
| | | | | | | 480,728 | |
| | | | | | | | |
| | |
Software — 0.4% | | | | | | | | |
| | |
CDK Global, Inc. 5.88%, 6/15/2026 | | | 80,000 | | | | 83,290 | |
| | |
Microsoft Corp. 3.50%, 2/12/2035 | | | 20,000 | | | | 23,394 | |
| | |
Nuance Communications, Inc. 5.63%, 12/15/2026 | | | 33,000 | | | | 34,567 | |
| | |
Open Text Corp. (Canada) 5.88%, 6/1/2026 (a) | | | 14,000 | | | | 14,493 | |
| | |
Oracle Corp. | | | | | | | | |
| | |
2.65%, 7/15/2026 | | | 233,000 | | | | 249,478 | |
| | |
2.95%, 4/1/2030 | | | 100,000 | | | | 107,616 | |
| | |
4.38%, 5/15/2055 | | | 55,000 | | | | 65,171 | |
| | |
SS&C Technologies, Inc. 5.50%, 9/30/2027 (a) | | | 40,000 | | | | 42,255 | |
| | | | | | | | |
| | |
| | | | | | | 620,264 | |
| | | | | | | | |
| | |
Specialty Retail — 0.6% | | | | | | | | |
| | |
Gap, Inc. (The) 8.63%, 5/15/2025 (a) | | | 60,000 | | | | 66,898 | |
| | |
Group 1 Automotive, Inc. 4.00%, 8/15/2028 (a) | | | 45,000 | | | | 45,450 | |
| | |
Home Depot, Inc. (The) | | | | | | | | |
| | |
3.90%, 12/6/2028 | | | 112,000 | | | | 129,945 | |
| | |
4.25%, 4/1/2046 | | | 151,000 | | | | 182,363 | |
| | |
3.13%, 12/15/2049 | | | 35,000 | | | | 35,827 | |
| | |
2.38%, 3/15/2051 | | | 80,000 | | | | 71,289 | |
| | |
L Brands, Inc. | | | | | | | | |
| | |
5.63%, 10/15/2023 | | | 10,000 | | | | 10,825 | |
| | |
6.88%, 11/1/2035 | | | 60,000 | | | | 72,791 | |
| | |
Lowe’s Cos., Inc. | | | | | | | | |
| | |
1.70%, 10/15/2030 | | | 75,000 | | | | 72,125 | |
| | |
4.05%, 5/3/2047 | | | 50,000 | | | | 56,921 | |
| | |
O’Reilly Automotive, Inc. 1.75%, 3/15/2031 | | | 23,000 | | | | 21,984 | |
| | |
Penske Automotive Group, Inc. 5.50%, 5/15/2026 | | | 80,000 | | | | 82,400 | |
| | |
PetSmart, Inc. 7.13%, 3/15/2023 (a) | | | 24,000 | | | | 24,043 | |
| | |
Staples, Inc. | | | | | | | | |
| | |
7.50%, 4/15/2026 (a) | | | 35,000 | | | | 35,077 | |
| | |
10.75%, 4/15/2027 (a) | | | 23,000 | | | | 21,965 | |
| | | | | | | | |
| | |
| | | | | | | 929,903 | |
| | | | | | | | |
SEE NOTES TO FINANCIAL STATEMENTS.
| | | | | | |
| | | |
| 56 | | | | J.P. MORGAN EXCHANGE-TRADED FUNDS | | FEBRUARY 28, 2021 |
| | | | | | | | |
| INVESTMENTS | | PRINCIPAL
AMOUNT ($) | | | VALUE ($) | |
Corporate Bonds — continued | | | | | | | | |
|
Technology Hardware, Storage & Peripherals — 0.5% | |
| | |
Apple, Inc. | | | | | | | | |
| | |
3.35%, 2/9/2027 | | | 35,000 | | | | 38,939 | |
| | |
2.20%, 9/11/2029 | | | 46,000 | | | | 47,445 | |
| | |
3.45%, 2/9/2045 | | | 65,000 | | | | 70,898 | |
| | |
4.38%, 5/13/2045 | | | 129,000 | | | | 160,180 | |
| | |
2.65%, 2/8/2051 | | | 45,000 | | | | 41,874 | |
| | |
2.80%, 2/8/2061 | | | 35,000 | | | | 32,514 | |
| | |
Dell International LLC | | | | | | | | |
| | |
6.10%, 7/15/2027 (a) | | | 22,000 | | | | 26,974 | |
| | |
5.30%, 10/1/2029 (a) | | | 25,000 | | | | 29,712 | |
| | |
EMC Corp. 3.38%, 6/1/2023 | | | 56,000 | | | | 58,033 | |
| | |
Hewlett Packard Enterprise Co. 1.45%, 4/1/2024 | | | 34,000 | | | | 34,756 | |
| | |
NCR Corp. | | | | | | | | |
| | |
5.75%, 9/1/2027 (a) | | | 50,000 | | | | 52,201 | |
| | |
6.13%, 9/1/2029 (a) | | | 66,000 | | | | 70,620 | |
| | |
Western Digital Corp. 4.75%, 2/15/2026 | | | 71,000 | | | | 78,523 | |
| | |
Xerox Corp. 4.38%, 3/15/2023 (f) | | | 13,000 | | | | 13,603 | |
| | | | | | | | |
| | |
| | | | | | | 756,272 | |
| | | | | | | | |
|
Textiles, Apparel & Luxury Goods — 0.0% (b) | |
| | |
Hanesbrands, Inc. | | | | | | | | |
| | |
4.63%, 5/15/2024 (a) | | | 13,000 | | | | 13,618 | |
| | |
4.88%, 5/15/2026 (a) | | | 20,000 | | | | 21,544 | |
| | | | | | | | |
| | |
| | | | | | | 35,162 | |
| | | | | | | | |
| | |
Thrifts & Mortgage Finance — 0.1% | | | | | | | | |
| | |
Ladder Capital Finance Holdings LLLP REIT, 5.25%, 10/1/2025 (a) | | | 13,000 | | | | 12,919 | |
| | |
Nationstar Mortgage Holdings, Inc. 6.00%, 1/15/2027 (a) | | | 35,000 | | | | 36,750 | |
| | |
Quicken Loans LLC 3.63%, 3/1/2029 (a) | | | 120,000 | | | | 118,800 | |
| | | | | | | | |
| | |
| | | | | | | 168,469 | |
| | | | | | | | |
| | |
Tobacco — 0.9% | | | | | | | | |
| | |
Altria Group, Inc. | | | | | | | | |
| | |
3.40%, 5/6/2030 | | | 162,000 | | | | 173,514 | |
| | |
2.45%, 2/4/2032 | | | 80,000 | | | | 77,672 | |
| | |
3.40%, 2/4/2041 | | | 55,000 | | | | 51,614 | |
| | |
3.88%, 9/16/2046 | | | 95,000 | | | | 92,679 | |
| | |
BAT Capital Corp. (United Kingdom) | | | | | | | | |
| | |
3.56%, 8/15/2027 | | | 315,000 | | | | 342,094 | |
| | |
4.39%, 8/15/2037 | | | 278,000 | | | | 296,831 | |
| | |
Philip Morris International, Inc. | | | | | | | | |
| | |
3.13%, 3/2/2028 | | | 49,000 | | | | 53,634 | |
| | |
2.10%, 5/1/2030 | | | 175,000 | | | | 174,316 | |
| | |
4.38%, 11/15/2041 | | | 10,000 | | | | 11,804 | |
| | | | | | | | |
| | |
| | | | | | | 1,274,158 | |
| | | | | | | | |
| | | | | | | | |
| INVESTMENTS | | PRINCIPAL
AMOUNT ($) | | | VALUE ($) | |
| | | | | | | | |
|
Trading Companies & Distributors — 0.3% | |
| | |
Air Lease Corp. 3.38%, 7/1/2025 | | | 142,000 | | | | 150,955 | |
| | |
Aviation Capital Group LLC 1.95%, 1/30/2026 (a) | | | 50,000 | | | | 49,195 | |
| | |
United Rentals North America, Inc. 5.25%, 1/15/2030 | | | 155,000 | | | | 170,500 | |
| | |
WESCO Distribution, Inc. | | | | | | | | |
| | |
5.38%, 6/15/2024 | | | 13,000 | | | | 13,293 | |
| | |
7.13%, 6/15/2025 (a) | | | 105,000 | | | | 113,623 | |
| | | | | | | | |
| | |
| | | | | | | 497,566 | |
| | | | | | | | |
|
Transportation Infrastructure — 0.0% (b) | |
| | |
Transurban Finance Co. Pty. Ltd. (Australia) 2.45%, 3/16/2031 (a) | | | 21,000 | | | | 21,279 | |
| | | | | | | | |
|
Wireless Telecommunication Services — 0.6% | |
| | |
Hughes Satellite Systems Corp. | | | | | | | | |
| | |
5.25%, 8/1/2026 | | | 45,000 | | | | 49,950 | |
| | |
6.63%, 8/1/2026 | | | 15,000 | | | | 16,746 | |
| | |
Sprint Corp. | | | | | | | | |
| | |
7.88%, 9/15/2023 | | | 8,000 | | | | 9,236 | |
| | |
7.13%, 6/15/2024 | | | 30,000 | | | | 34,544 | |
| | |
7.63%, 3/1/2026 | | | 155,000 | | | | 190,321 | |
| | |
T-Mobile USA, Inc. | | | | | | | | |
| | |
5.13%, 4/15/2025 | | | 59,000 | | | | 60,113 | |
| | |
4.75%, 2/1/2028 | | | 10,000 | | | | 10,576 | |
| | |
2.05%, 2/15/2028 (a) | | | 80,000 | | | | 79,230 | |
| | |
3.88%, 4/15/2030 (a) | | | 165,000 | | | | 181,404 | |
| | |
2.55%, 2/15/2031 (a) | | | 75,000 | | | | 74,583 | |
| | |
4.38%, 4/15/2040 (a) | | | 75,000 | | | | 84,450 | |
| | |
4.50%, 4/15/2050 (a) | | | 45,000 | | | | 50,011 | |
| | | | | | | | |
| | |
| | | | | | | 841,164 | |
| | | | | | | | |
| | |
Total Corporate Bonds
(Cost $54,675,451) | | | | | | | 55,351,532 | |
| | | | | | | | |
Mortgage-Backed Securities — 20.5% | | | | | | | | |
| | |
FHLMC Gold Pools, 30 Year Pool # G60855, 4.50%, 12/1/2045 | | | 130,429 | | | | 146,689 | |
| | |
FHLMC Gold Pools, Other Pool # N31271, 4.50%, 1/1/2036 | | | 23,892 | | | | 25,962 | |
| | |
FHLMC UMBS, 30 Year Pool # QA5045, 4.00%, 11/1/2049 | | | 133,085 | | | | 142,995 | |
| | |
FNMA UMBS, 20 Year Pool # MA3004, 4.00%, 5/1/2037 | | | 673,248 | | | | 732,629 | |
| | |
FNMA UMBS, 30 Year | | | | | | | | |
| | |
Pool # AL2374, 4.00%, 12/1/2041 | | | 161,343 | | | | 181,574 | |
| | |
Pool # AL4244, 4.00%, 7/1/2042 | | | 173,915 | | | | 197,375 | |
| | |
Pool # BM1164, 3.50%, 12/1/2045 | | | 163,947 | | | | 176,266 | |
| | |
Pool # MA3073, 4.50%, 7/1/2047 | | | 45,901 | | | | 50,394 | |
SEE NOTES TO FINANCIAL STATEMENTS.
| | | | | | | | |
| | | |
| FEBRUARY 28, 2021 | | J.P. MORGAN EXCHANGE-TRADED FUNDS | | | | | 57 | |
JPMorgan Core Plus Bond ETF
SCHEDULE OF PORTFOLIO INVESTMENTS
AS OF FEBRUARY 28, 2021 (continued)
| | | | | | | | |
| INVESTMENTS | | PRINCIPAL
AMOUNT ($) | | | VALUE ($) | |
Mortgage-Backed Securities — continued | | | | | | | | |
| | |
Pool # BK4769, 5.00%, 8/1/2048 | | | 812,633 | | | | 903,670 | |
| | |
Pool # BN5013, 5.00%, 1/1/2049 | | | 194,563 | | | | 221,573 | |
| | |
Pool # BO1073, 4.50%, 6/1/2049 | | | 89,270 | | | | 97,254 | |
| | |
Pool # BO3039, 3.00%, 7/1/2049 | | | 271,759 | | | | 290,561 | |
| | |
Pool # BN6475, 4.00%, 7/1/2049 | | | 90,373 | | | | 97,328 | |
| | |
Pool # BO2562, 4.00%, 7/1/2049 | | | 143,584 | | | | 154,689 | |
| | |
Pool # BO4519, 4.00%, 8/1/2049 | | | 15,685 | | | | 16,898 | |
| | |
Pool # BO2203, 3.50%, 9/1/2049 | | | 562,563 | | | | 596,279 | |
| | |
FNMA, Other | | | | | | | | |
| | |
Pool # AM8846, 2.68%, 5/1/2025 | | | 147,816 | | | | 158,342 | |
| | |
Pool # AN7560, 2.90%, 12/1/2027 | | | 189,509 | | | | 207,455 | |
| | |
Pool # BL9645, 1.50%, 1/1/2031 | | | 100,000 | | | | 98,809 | |
| | |
Pool # BL9627, 1.56%, 1/1/2031 | | | 500,000 | | | | 496,809 | |
| | |
Pool # BL6367, 1.82%, 4/1/2032 | | | 330,000 | | | | 335,070 | |
| | |
Pool # AN9725, 3.76%, 7/1/2033 | | | 105,793 | | | | 122,328 | |
| | |
Pool # MA1072, 3.50%, 5/1/2042 | | | 18,046 | | | | 19,545 | |
| | |
FNMA/FHLMC UMBS, Single Family, 15 Year TBA, 2.00%, 4/25/2036 (h) | | | 1,410,000 | | | | 1,457,102 | |
| | |
FNMA/FHLMC UMBS, Single Family, 30 Year TBA, 2.00%, 4/25/2051 (h) | | | 16,073,000 | | | | 16,201,396 | |
| | |
GNMA II, 30 Year | | | | | | | | |
| | |
Pool # AJ9020, 4.50%, 10/20/2044 | | | 71,810 | | | | 77,091 | |
| | |
Pool # BB3525, 4.00%, 9/20/2047 | | | 44,111 | | | | 47,872 | |
| | |
Pool # BM2418, 4.00%, 8/20/2049 | | | 40,254 | | | | 44,061 | |
| | |
Pool # BN7049, 4.50%, 8/20/2049 | | | 229,557 | | | | 256,982 | |
| | |
Pool # BP7160, 4.50%, 9/20/2049 | | | 90,151 | | | | 101,077 | |
| | |
Pool # MA7136, 2.50%, 1/20/2051 | | | 6,144,162 | | | | 6,381,775 | |
| | | | | | | | |
| | |
Total Mortgage-backed Securities
(Cost $30,192,418) | | | | | | | 30,037,850 | |
| | | | | | | | |
Asset-Backed Securities — 14.8% | | | | | | | | |
| | |
Affirm Asset Securitization Trust Series 2021-A, Class C, 1.66%, 8/15/2025 (a) | | | 500,000 | | | | 502,446 | |
| | |
Ajax Mortgage Loan Trust Series 2021-B, Class A, 2.24%, 6/25/2066 (a) (f) | | | 285,000 | | | | 284,574 | |
| | |
American Credit Acceptance Receivables Trust Series 2020-2, Class C, 3.88%, 4/13/2026 (a) | | | 280,000 | | | | 297,025 | |
| | |
American Homes 4 Rent | | | | | | | | |
| | |
Series 2015-SFR1, Class E, 5.64%, 4/17/2052 ‡ (a) | | | 150,000 | | | | 163,251 | |
| | |
Series 2015-SFR1, Class F, 5.89%, 4/17/2052 ‡ (a) | | | 400,000 | | | | 435,262 | |
| | |
American Homes 4 Rent Trust | | | | | | | | |
| | |
Series 2014-SFR3, Class B, 4.20%, 12/17/2036 ‡ (a) | | | 125,000 | | | | 133,460 | |
| | |
Series 2015-SFR2, Class A, 3.73%, 10/17/2052 ‡ (a) | | | 93,479 | | | | 101,580 | |
| | | | | | | | |
| INVESTMENTS | | PRINCIPAL
AMOUNT ($) | | | VALUE ($) | |
| | | | | | | | |
| | |
AmeriCredit Automobile Receivables Trust Series 2017-2, Class D, 3.42%, 4/18/2023 | | | 250,000 | | | | 255,963 | |
| | |
AMSR Trust | | | | | | | | |
| | |
Series 2020-SFR1, Class E, 3.22%, 4/17/2037 (a) | | | 500,000 | | | | 511,443 | |
| | |
Series 2020-SFR2, Class E2, 4.28%, 7/17/2037 ‡ (a) | | | 375,000 | | | | 394,859 | |
| | |
Series 2020-SFR3, Class E2, 2.76%, 9/17/2037 ‡ (a) | | | 350,000 | | | | 351,007 | |
| | |
Series 2020-SFR4, Class E2, 2.46%, 11/17/2037 ‡ (a) | | | 425,000 | | | | 423,793 | |
| | |
Aqua Finance Trust Series 2019-A, Class B, 3.47%, 7/16/2040 ‡ (a) | | | 246,000 | | | | 259,202 | |
| | |
Avid Automobile Receivables Trust Series 2019-1, Class D, 4.03%, 7/15/2026 (a) | | | 300,000 | | | | 305,652 | |
| | |
B2R Mortgage Trust Series 2016-1, Class B, 3.87%, 6/15/2049 ‡ (a) | | | 79,151 | | | | 79,121 | |
| | |
Carvana Auto Receivables Trust | | | | | | | | |
| | |
Series 2020-N1A, Class B, 2.01%, 3/17/2025 (a) | | | 500,000 | | | | 509,264 | |
| | |
Series 2019-4A, Class D, 3.07%, 7/15/2025 (a) | | | 110,000 | | | | 114,703 | |
| | |
CPS Auto Receivables Trust | | | | | | | | |
| | |
Series 2017-C, Class D, 3.79%, 6/15/2023 (a) | | | 67,008 | | | | 67,980 | |
| | |
Series 2020-B, Class C, 3.30%, 4/15/2026 (a) | | | 400,000 | | | | 416,541 | |
| | |
Credit Acceptance Auto Loan Trust Series 2020-1A, Class C, 2.59%, 6/15/2029 (a) | | | 750,000 | | | | 773,390 | |
| | |
DataBank Issuer Series 2021-1A, Class A2, 2.06%, 2/27/2051 (a) (h) | | | 250,000 | | | | 250,000 | |
| | |
Delta Air Lines Pass-Through Trust | | | | | | | | |
| | |
Series 2007-1, Class A, 6.82%, 8/10/2022 | | | 674 | | | | 703 | |
| | |
Series 2019-1, Class AA, 3.20%, 4/25/2024 | | | 15,000 | | | | 15,492 | |
| | |
Drive Auto Receivables Trust Series 2020-2, Class D, 3.05%, 5/15/2028 | | | 750,000 | | | | 789,818 | |
| | |
DT Auto Owner Trust | | | | | | | | |
| | |
Series 2017-3A, Class D, 3.58%, 5/15/2023 (a) | | | 16,205 | | | | 16,258 | |
| | |
Series 2020-2A, Class D, 4.73%, 3/16/2026 (a) | | | 500,000 | | | | 549,367 | |
SEE NOTES TO FINANCIAL STATEMENTS.
| | | | | | |
| | | |
| 58 | | | | J.P. MORGAN EXCHANGE-TRADED FUNDS | | FEBRUARY 28, 2021 |
| | | | | | | | |
| INVESTMENTS | | PRINCIPAL
AMOUNT ($) | | | VALUE ($) | |
Asset-Backed Securities — continued | | | | | | | | |
| | |
Exeter Automobile Receivables Trust | | | | | | | | |
| | |
Series 2020-2A, Class C, 3.28%, 5/15/2025 (a) | | | 250,000 | | | | 260,555 | |
| | |
Series 2020-2A, Class D, 4.73%, 4/15/2026 (a) | | | 400,000 | | | | 431,200 | |
| | |
Finance of America HECM Buyout | | | | | | | | |
| | |
Series 2021-HB1, Class A, 0.88%, 2/25/2031 (a) (i) | | | 450,000 | | | | 450,450 | |
| | |
Series 2021-HB1, Class M2, 2.08%, 2/25/2031 (a) (i) | | | 150,000 | | | | 150,150 | |
| | |
First Investors Auto Owner Trust | | | | | | | | |
| | |
Series 2016-2A, Class D, 3.35%, 11/15/2022 (a) | | | 88,821 | | | | 89,262 | |
| | |
Series 2017-1A, Class D, 3.60%, 4/17/2023 (a) | | | 81,000 | | | | 82,403 | |
| | |
FirstKey Homes Trust Series 2020-SFR1, Class F1, 3.64%, 9/17/2025 ‡ (a) | | | 500,000 | | | | 516,055 | |
| | |
Flagship Credit Auto Trust | | | | | | | | |
| | |
Series 2017-2, Class C, 2.96%, 7/15/2023 (a) | | | 39,877 | | | | 40,088 | |
| | |
Series 2020-4, Class D, 2.18%, 2/16/2027 (a) | | | 280,000 | | | | 286,064 | |
| | |
FNMA, Grantor Trust Series 2017-T1, Class A, 2.90%, 6/25/2027 | | | 598,143 | | | | 650,517 | |
| | |
Foundation Finance Trust | | | | | | | | |
| | |
Series 2020-1A, Class B, 4.62%, 7/16/2040 ‡ (a) | | | 300,000 | | | | 307,780 | |
| | |
Series 2020-1A, Class C, 5.75%, 7/16/2040 ‡ (a) | | | 150,000 | | | | 153,818 | |
| | |
Genesis Private Label Amortizing Trust Series 2020-1, Class B, 2.83%, 7/20/2030 (a) | | | 220,000 | | | | 221,218 | |
| | |
Genesis Sales Finance Master Trust Series 2020-AA, Class C, 2.99%, 9/22/2025 (a) | | | 300,000 | | | | 301,515 | |
| | |
GLS Auto Receivables Trust Series 2018-3A, Class B, 3.78%, 8/15/2023 (a) | | | 111,367 | | | | 112,917 | |
| | |
Hertz Vehicle Financing II LP Series 2019-3A, Class B, 3.03%, 12/26/2025 (a) | | | 101,000 | | | | 101,293 | |
| | |
Hilton Grand Vacations Trust Series 2020-AA, Class C, 6.42%, 2/25/2039 ‡ (a) | | | 389,737 | | | | 435,094 | |
| | |
HIN Timeshare Trust Series 2020-A, Class D, 5.50%, 10/9/2039 ‡ (a) | | | 176,506 | | | | 183,848 | |
| | |
Lendmark Funding Trust | | | | | | | | |
| | |
Series 2018-2A, Class A, 4.23%, 4/20/2027 (a) | | | 118,000 | | | | 120,713 | |
| | | | | | | | |
| INVESTMENTS | | PRINCIPAL
AMOUNT ($) | | | VALUE ($) | |
| | | | | | | | |
| | |
Series 2019-2A, Class C, 3.72%, 4/20/2028 ‡ (a) | | | 100,000 | | | | 101,876 | |
| | |
LL ABS Trust Series 2020-1A, Class B, 3.79%, 1/17/2028 ‡ (a) | | | 350,000 | | | | 362,309 | |
| | |
MVW LLC | | | | | | | | |
| | |
Series 2020-1A, Class C, 4.21%, 10/20/2037 ‡ (a) | | | 300,990 | | | | 316,612 | |
| | |
Series 2019-2A, Class B, 2.44%, 10/20/2038 ‡ (a) | | | 139,763 | | | | 142,903 | |
| | |
MVW Owner Trust Series 2019-1A, Class C, 3.33%, 11/20/2036 ‡ (a) | | | 82,452 | | | | 83,598 | |
| | |
Nationstar HECM Loan Trust Series 2020-1A, Class A1, 1.27%, 9/25/2030 (a) (i) | | | 272,706 | | | | 273,197 | |
| | |
NRZ Excess Spread-Collateralized Notes Series 2020-PLS1, Class A, 3.84%, 12/25/2025 (a) | | | 374,095 | | | | 375,832 | |
| | |
NRZ FHT Excess LLC Series 2020-FHT1, Class A, 4.21%, 11/25/2025 (a) | | | 368,873 | | | | 370,864 | |
| | |
Octane Receivables Trust Series 2020-1A, Class C, 2.89%, 3/20/2026 ‡ (a) | | | 350,000 | | | | 358,744 | |
| | |
Oportun Funding IX LLC Series 2018-B, Class A, 3.91%, 7/8/2024 (a) | | | 300,000 | | | | 301,016 | |
| | |
Oportun Funding LLC Series 2020-1, Class A, 2.20%, 5/15/2024 (a) | | | 422,764 | | | | 424,105 | |
| | |
Prestige Auto Receivables Trust Series 2018-1A, Class D, 4.14%, 10/15/2024 (a) | | | 115,000 | | | | 119,428 | |
| | |
Pretium Mortgage Credit Partners I LLC | | | | | | | | |
| | |
Series 2019-CFL1, Class A1, 3.72%, 1/25/2059 ‡ (a) (f) | | | 216,757 | | | | 217,077 | |
| | |
Series 2020-NPL3, Class A1, 3.10%, 6/27/2060 ‡ (a) (f) | | | 230,165 | | | | 232,455 | |
| | |
Progress Residential Trust | | | | | | | | |
| | |
Series 2020-SFR3, Class E, 2.30%, 10/17/2027 ‡ (a) | | | 300,000 | | | | 300,549 | |
| | |
Series 2017-SFR1, Class A, 2.77%, 8/17/2034 (a) | | | 99,356 | | | | 100,347 | |
| | |
Series 2017-SFR1, Class D, 3.57%, 8/17/2034 ‡ (a) | | | 150,000 | | | | 151,659 | |
| | |
Series 2017-SFR1, Class E, 4.26%, 8/17/2034 ‡ (a) | | | 375,000 | | | | 380,105 | |
| | |
Series 2018-SFR2, Class D, 4.34%, 8/17/2035 ‡ (a) | | | 100,000 | | | | 101,162 | |
| | |
Series 2018-SFR3, Class E, 4.87%, 10/17/2035 ‡ (a) | | | 100,000 | | | | 102,098 | |
| | |
Series 2020-SFR2, Class D, 3.87%, 6/17/2037 ‡ (a) | | | 750,000 | | | | 782,011 | |
SEE NOTES TO FINANCIAL STATEMENTS.
| | | | | | | | |
| | | |
| FEBRUARY 28, 2021 | | J.P. MORGAN EXCHANGE-TRADED FUNDS | | | | | 59 | |
JPMorgan Core Plus Bond ETF
SCHEDULE OF PORTFOLIO INVESTMENTS
AS OF FEBRUARY 28, 2021 (continued)
| | | | | | | | |
| INVESTMENTS | | PRINCIPAL
AMOUNT ($) | | | VALUE ($) | |
Asset-Backed Securities — continued | | | | | | | | |
| | |
ReadyCap Lending Small Business Loan Trust Series 2019-2, Class A, 2.75%, 12/27/2044 (a) (i) | | | 152,262 | | | | 145,222 | |
| | |
Regional Management Issuance Trust | | | | | | | | |
| | |
Series 2020-1, Class C, 3.80%, 10/15/2030 ‡ (a) | | | 300,000 | | | | 307,625 | |
| | |
Series 2021-1, Class D, 5.07%, 3/17/2031 ‡ (a) | | | 500,000 | | | | 497,396 | |
| | |
Santander Drive Auto Receivables Trust Series 2019-1, Class C, 3.42%, 4/15/2025 | | | 90,000 | | | | 91,310 | |
| | |
Santander Revolving Auto Loan Trust Series 2019-A, Class D, 3.45%, 1/26/2032 (a) | | | 150,000 | | | | 157,725 | |
| | |
Small Business Lending Trust Series 2020-A, Class A, 2.62%, 12/15/2026 (a) | | | 152,027 | | | | 152,677 | |
| | |
Tricon American Homes Series 2020-SFR1, Class E, 3.54%, 7/17/2038 ‡ (a) | | | 300,000 | | | | 314,690 | |
| | |
United Airlines Pass-Through Trust | | | | | | | | |
| | |
Series 2016-2, Class A, 3.10%, 10/7/2028 | | | 8,414 | | | | 8,311 | |
| | |
Series 2018-1, Class A, 3.70%, 3/1/2030 | | | 8,835 | | | | 8,999 | |
| | |
US Airways Pass-Through Trust Series 2011-1, Class A, 7.13%, 10/22/2023 | | | 16,408 | | | | 16,759 | |
| | |
USASF Receivables LLC Series 2020-1A, Class B, 3.22%, 5/15/2024 (a) | | | 500,000 | | | | 511,791 | |
| | |
VCAT LLC Series 2021-NPL1, Class A1, 2.29%, 12/26/2050 ‡ (a) (f) | | | 449,219 | | | | 449,318 | |
| | |
VOLT XCI LLC Series 2020-NPL7, Class A1, 3.10%, 11/25/2050 ‡ (a) (f) | | | 292,045 | | | | 293,176 | |
| | |
Westgate Resorts LLC Series 2020-1A, Class C, 6.21%, 3/20/2034 ‡ (a) | | | 253,608 | | | | 268,013 | |
| | | | | | | | |
| | |
Total Asset-Backed Securities
(Cost $21,132,741) | | | | | | | 21,718,053 | |
| | | | | | | | |
U.S. Treasury Obligations — 10.2% | | | | | | | | |
| | |
U.S. Treasury Bonds | | | | | | | | |
| | |
5.00%, 5/15/2037 | | | 192,000 | | | | 280,478 | |
| | |
1.13%, 5/15/2040 | | | 240,000 | | | | 206,175 | |
| | |
4.38%, 5/15/2040 | | | 370,000 | | | | 517,812 | |
| | |
3.75%, 11/15/2043 | | | 668,000 | | | | 876,020 | |
| | |
3.00%, 11/15/2045 | | | 673,000 | | | | 791,169 | |
| | |
3.00%, 2/15/2047 | | | 338,000 | | | | 399,381 | |
| | |
3.38%, 11/15/2048 | | | 1,774,000 | | | | 2,253,742 | |
| | |
2.38%, 11/15/2049 | | | 147,000 | | | | 155,349 | |
| | |
2.00%, 2/15/2050 | | | 1,097,000 | | | | 1,068,590 | |
| | |
1.63%, 11/15/2050 | | | 700,000 | | | | 622,453 | |
| | | | | | | | |
| INVESTMENTS | | PRINCIPAL
AMOUNT ($) | | | VALUE ($) | |
| | | | | | | | |
| | |
U.S. Treasury Notes | | | | | | | | |
| | |
2.13%, 2/29/2024 | | | 156,000 | | | | 164,556 | |
| | |
1.13%, 2/28/2025 | | | 565,000 | | | | 578,728 | |
| | |
1.50%, 8/15/2026 | | | 434,000 | | | | 449,478 | |
| | |
2.88%, 5/15/2028 | | | 1,108,000 | | | | 1,242,042 | |
| | |
1.50%, 2/15/2030 | | | 392,000 | | | | 397,941 | |
| | |
0.88%, 11/15/2030 | | | 430,000 | | | | 409,978 | |
| | |
U.S. Treasury STRIPS Bonds | | | | | | | | |
| | |
1.04%, 5/15/2033 (j) | | | 1,467,000 | | | | 1,182,485 | |
| | |
1.16%, 8/15/2039 (j) | | | 1,297,000 | | | | 905,099 | |
| | |
2.23%, 8/15/2041 (j) | | | 207,000 | | | | 132,532 | |
| | |
2.18%, 11/15/2041 (j) | | | 845,000 | | | | 551,042 | |
| | |
2.46%, 2/15/2042 (j) | | | 718,000 | | | | 454,471 | |
| | |
1.38%, 2/15/2045 (j) | | | 649,000 | | | | 384,529 | |
| | |
3.33%, 8/15/2048 (j) | | | 1,558,000 | | | | 854,678 | |
| | | | | | | | |
| | |
Total U.S. Treasury Obligations
(Cost $15,733,959) | | | | | | | 14,878,728 | |
| | | | | | | | |
Collateralized Mortgage Obligations — 3.3% | |
| | |
FHLMC, REMIC | | | | | | | | |
| | |
Series 2708, Class ZD, 5.50%, 11/15/2033 | | | 143,050 | | | | 163,172 | |
| | |
Series 4302, Class PA, 4.00%, 12/15/2043 | | | 119,397 | | | | 131,762 | |
| | |
Series 4281, Class BC, 4.50%, 12/15/2043 (i) | | | 156,301 | | | | 175,751 | |
| | |
FNMA, REMIC | | | | | | | | |
| | |
Series 2003-7, Class FA, 0.87%, 2/25/2033 (i) | | | 136,634 | | | | 138,636 | |
| | |
Series 2013-108, Class GU, 3.00%, 10/25/2033 | | | 545,000 | | | | 591,680 | |
| | |
Series 2005-110, Class TY, 5.50%, 12/25/2035 | | | 77,101 | | | | 89,608 | |
| | |
Series 2007-89, Class F, 0.70%, 9/25/2037 (i) | | | 151,855 | | | | 153,733 | |
| | |
Series 2011-112, Class PB, 4.00%, 11/25/2041 | | | 200,000 | | | | 217,555 | |
| | |
GNMA | | | | | | | | |
| | |
Series 2010-H24, Class FA, 0.49%, 10/20/2060 (i) | | | 93,452 | | | | 93,325 | |
| | |
Series 2014-H03, Class FA, 0.74%, 1/20/2064 (i) | | | 92,005 | | | | 92,348 | |
| | |
Series 2015-H05, Class FC, 0.62%, 2/20/2065 (i) | | | 321,505 | | | | 320,807 | |
| | |
New Residential Mortgage Loan Trust Series 2020-RPL2, Class A1, 3.58%, 8/25/2025 (a) (i) | | | 95,498 | | | | 97,461 | |
SEE NOTES TO FINANCIAL STATEMENTS.
| | | | | | |
| | | |
| 60 | | | | J.P. MORGAN EXCHANGE-TRADED FUNDS | | FEBRUARY 28, 2021 |
| | | | | | | | |
| INVESTMENTS | | PRINCIPAL
AMOUNT ($) | | | VALUE ($) | |
Collateralized Mortgage Obligations — continued | |
| | |
Seasoned Credit Risk Transfer Trust | | | | | | | | |
| | |
Series 2018-3, Class MA, 3.50%, 8/25/2057 ‡ | | | 109,184 | | | | 117,359 | |
| | |
Series 2019-1, Class MA, 3.50%, 7/25/2058 ‡ | | | 201,605 | | | | 217,139 | |
| | |
Series 2019-2, Class MA, 3.50%, 8/25/2058 ‡ | | | 222,777 | | | | 240,368 | |
| | |
Series 2020-3, Class M5TW, 3.00%, 5/25/2060 ‡ | | | 743,786 | | | | 785,681 | |
| | |
Series 2020-3, Class TTW, 3.00%, 5/25/2060 ‡ | | | 820,261 | | | | 863,469 | |
| | |
VOLT XCIV LLC Series 2021-NPL3, Class A1, 2.24%, 2/27/2051 (a) (f) | | | 324,515 | | | | 324,416 | |
| | | | | | | | |
| | |
Total Collateralized Mortgage Obligations (Cost $4,708,535) | | | | | | | 4,814,270 | |
| | | | | | | | |
Commercial Mortgage-Backed Securities — 2.9% | |
| | |
ACRE Commercial Mortgage Ltd. (Cayman Islands) Series 2021-FL4, Class B, 1.51%, 12/18/2037 (a) (i) | | | 250,000 | | | | 249,700 | |
| | |
BAMLL Re-REMIC Trust Series 2014-FRR5, Class AK37, 2.50%, 1/27/2047 (a) (i) | | | 600,000 | | | | 589,519 | |
| | |
Bancorp Commercial Mortgage Trust Series 2019-CRE6, Class D, 2.41%, 9/15/2036 ‡ (a) (i) | | | 150,000 | | | | 148,523 | |
| | |
FHLMC, Multi-Family Structured Pass-Through Certificates | | | | | | | | |
| | |
Series KJ08, Class A2, 2.36%, 8/25/2022 | | | 42,338 | | | | 42,937 | |
| | |
Series K088, Class A2, 3.69%, 1/25/2029 | | | 350,000 | | | | 407,042 | |
| | |
Series Q014, Class X, IO, 2.80%, 10/25/2055 (i) | | | 1,989,487 | | | | 423,172 | |
| | |
FNMA ACES | | | | | | | | |
| | |
Series 2017-M3, Class A2, 2.48%, 12/25/2026 (i) | | | 350,000 | | | | 372,649 | |
| | |
Series 2021-M3, Class 1A1, 1.00%, 11/25/2033 | | | 139,535 | | | | 138,290 | |
| | |
Series 2021-M3, Class X1, IO, 2.01%, 11/25/2033 (i) | | | 619,532 | | | | 88,928 | |
| | |
FREMF Mortgage Trust | | | | | | | | |
| | |
Series 2015-K720, Class B, 3.39%, 7/25/2022 (a) (i) | | | 180,000 | | | | 185,616 | |
| | |
Series 2015-K44, Class B, 3.68%, 1/25/2048 (a) (i) | | | 200,000 | | | | 216,769 | |
| | |
Series 2015-K45, Class B, 3.59%, 4/25/2048 (a) (i) | | | 100,000 | | | | 108,181 | |
| | |
Series 2015-K48, Class B, 3.64%, 8/25/2048 (a) (i) | | | 200,000 | | | | 216,065 | |
| | |
Series 2015-K50, Class B, 3.78%, 10/25/2048 (a) (i) | | | 200,000 | | | | 217,954 | |
| | | | | | | | |
| INVESTMENTS | | PRINCIPAL
AMOUNT ($) | | | VALUE ($) | |
| | | | | | | | |
| | |
Series 2015-K51, Class B, 3.95%, 10/25/2048 (a) (i) | | | 175,000 | | | | 192,211 | |
| | |
Series 2016-K52, Class B, 3.92%, 1/25/2049 (a) (i) | | | 250,000 | | | | 274,889 | |
| | |
Series 2016-K53, Class C, 4.02%, 3/25/2049 (a) (i) | | | 70,000 | | | | 75,369 | |
| | |
Series 2017-K729, Class B, 3.68%, 11/25/2049 (a) (i) | | | 300,000 | | | | 322,429 | |
| | | | | | | | |
| | |
Total Commercial Mortgage-Backed Securities
(Cost $4,069,392) | | | | | | | 4,270,243 | |
| | | | | | | | |
Municipal Bonds — 0.0% (b) (k) | | | | | | | | |
| | |
Ohio — 0.0% (b) | | | | | | | | |
| | |
Ohio State University (The), General Receipts Rev., 5.59%, 12/1/2114
(Cost $32,787) | | | 25,000 | | | | 33,256 | |
| | | | | | | | |
| | |
| | | SHARES | | | | |
Common Stocks — 0.0% (b) | | | | | | | | |
| | |
Oil, Gas & Consumable Fuels — 0.0% (b) | | | | | | | | |
| | |
Chesapeake Energy Corp.* | | | 23 | | | | 1,016 | |
| | |
EP Energy Corp.* | | | 275 | | | | 15,400 | |
| | |
Oasis Petroleum, Inc.* | | | 109 | | | | 6,198 | |
| | | | | | | | |
| | |
| | | | | | | 22,614 | |
| | | | | | | | |
| | |
Professional Services — 0.0% (b) | | | | | | | | |
| | |
NMG, Inc.* | | | 1 | | | | 62 | |
| | | | | | | | |
| | |
Total Common Stocks
(Cost $9,711) | | | | | | | 22,676 | |
| | | | | | | | |
Preferred Stocks — 0.0% (b) | | | | | | | | |
| |
Internet & Direct Marketing Retail — 0.0% (b) | | | | | |
| | |
MYT Holding LLC, Series A, 10.00%, 6/6/2029 ‡
(Cost $3,247) | | | 3,382 | | | | 4,467 | |
| | | | | | | | |
| | |
| | | NO. OF
WARRANTS | | | | |
| | |
Warrants — 0.0% (b) | | | | | | | | |
| |
Diversified Telecommunication Services — 0.0% (b) | | | | | |
| | |
Windstream Holdings, Inc. expiring 12/31/2049, price 10.75 USD* ‡ | | | 16 | | | | 222 | |
| | | | | | | | |
| | |
Media — 0.0% (b) | | | | | | | | |
| | |
Nmg Research Ltd. expiring 9/24/2027, price 1.00 USD (United Kingdom)* ‡ | | | 78 | | | | 1 | |
| | | | | | | | |
| | |
Oil, Gas & Consumable Fuels — 0.0% (b) | | | | | | | | |
| | |
Chesapeake Energy Corp. | | | | | | | | |
| | |
expiring 2/9/2026, price 27.63 USD* | | | 71 | | | | 1,568 | |
| | |
expiring 2/9/2026, price 32.13 USD* | | | 79 | | | | 1,508 | |
SEE NOTES TO FINANCIAL STATEMENTS.
| | | | | | | | |
| | | |
| FEBRUARY 28, 2021 | | J.P. MORGAN EXCHANGE-TRADED FUNDS | | | | | 61 | |
JPMorgan Core Plus Bond ETF
SCHEDULE OF PORTFOLIO INVESTMENTS
AS OF FEBRUARY 28, 2021 (continued)
| | | | | | | | |
| | |
| INVESTMENTS | | NO. OF
WARRANTS | | | VALUE ($) | |
Warrants — continued | | | | | | | | |
|
Oil, Gas & Consumable Fuels — continued | |
| | |
expiring 2/9/2026, price 36.18 USD* | | | 44 | | | | 768 | |
| | | | | | | | |
| | |
| | | | | | | 3,844 | |
| | | | | | | | |
| | |
Total Warrants
(Cost $1) | | | | | | | 4,067 | |
| | | | | | | | |
| | |
| | | SHARES | | | | |
| | |
Short-Term Investments — 22.4% | | | | | | | | |
| | |
Investment Companies — 22.4% | | | | | | | | |
| | |
JPMorgan U.S. Government Money Market Fund Class Institutional Shares, 0.03% (l) (m)
(Cost $32,839,275) | | | 32,839,275 | | | | 32,839,275 | |
| | | | | | | | |
| | |
Total Investments — 111.8%
(Cost $163,397,517) | | | | | | | 163,974,417 | |
| | |
Liabilities in Excess of
Other Assets — (11.8)% | | | | | | | (17,326,307) | |
| | | | | |
| | |
NET ASSETS — 100.0% | | | | | | | 146,648,110 | |
| | | | | |
Percentages indicated are based on net assets.
Abbreviations
| | |
ABS | | Asset-Backed Securities |
ACES | | Alternative Credit Enhancement Securities |
FHLMC | | Federal Home Loan Mortgage Corp. |
FNMA | | Federal National Mortgage Association |
GNMA | | Government National Mortgage Association |
ICE | | Intercontinental Exchange |
IO | | Interest Only represents the right to receive the monthly interest payments on an underlying pool of mortgage loans. The principal amount shown represents the par value on the underlying pool. The yields on these securities are subject to accelerated principal paydowns as a result of prepayment or refinancing of the underlying pool of mortgage instruments. As a result, interest income may be reduced considerably. |
LIBOR | | London Interbank Offered Rate |
OYJ | | Public Limited Company |
REIT | | Real Estate Investment Trust |
REMIC | | Real Estate Mortgage Investment Conduit |
Re-REMIC | | Combined Real Estate Mortgage Investment Conduit |
Rev. | | Revenue |
SCA | | Limited partnership with share capital |
SOFR | | Secured Overnight Financing Rate |
STRIPS | | Separate Trading of Registered Interest and Principal of Securities. The STRIPS Program lets investors hold and trade individual interest and principal components of eligible notes and bonds as separate securities. |
TBA | | To Be Announced; Security is subject to delayed delivery. |
UMBS | | Uniform Mortgage-Backed Securities |
USD | | United States Dollar |
| | |
(a) | | Securities exempt from registration under Rule 144A or section 4(a)(2), of the Securities Act of 1933, as amended. |
(b) | | Amount rounds to less than 0.1% of net assets. |
(c) | | Variable or floating rate security, linked to the referenced benchmark. The interest rate shown is the current rate as of February 28, 2021. |
(d) | | Security is perpetual and thus, does not have a predetermined maturity date. The coupon rate for this security is fixed for a period of time and may be structured to adjust thereafter. The date shown, if applicable, reflects the next call date. The coupon rate shown is the rate in effect as of February 28, 2021. |
(e) | | Security is an interest bearing note with preferred security characteristics. |
(f) | | Step bond. Interest rate is a fixed rate for an initial period that either resets at a specific date or may reset in the future contingent upon a predetermined trigger. The interest rate shown is the current rate as of February 28, 2021. |
(g) | | Defaulted security. |
(h) | | All or a portion of the security is a when-issued security, delayed delivery security, or forward commitment. |
(i) | | Variable or floating rate security, the interest rate of which adjusts periodically based on changes in current interest rates and prepayments on the underlying pool of assets. The interest rate shown is the current rate as of February 28, 2021. |
(j) | | The rate shown is the effective yield as of February 28, 2021. |
(k) | | The date shown represents the earliest of the prerefunded date, next put date or final maturity date. |
(l) | | Investment in an affiliated fund, which is registered under the Investment Company Act of 1940, as amended, and is advised by J.P. Morgan Investment Management Inc. |
(m) | | The rate shown is the current yield as of February 28, 2021. |
* | | Non-income producing security. |
‡ | | Value determined using significant unobservable inputs. |
SEE NOTES TO FINANCIAL STATEMENTS.
| | | | | | |
| | | |
| 62 | | | | J.P. MORGAN EXCHANGE-TRADED FUNDS | | FEBRUARY 28, 2021 |
| | | | | | | | | | | | | | | | | | | | |
| Futures contracts outstanding as of February 28, 2021: | |
| DESCRIPTION | | NUMBER OF
CONTRACTS | | | EXPIRATION
DATE | | | TRADING
CURRENCY | | | NOTIONAL
AMOUNT ($) | | | VALUE AND
UNREALIZED
APPRECIATION
(DEPRECIATION) ($) | |
Long Contracts | | | | | | | | | | | | | | | | | | | | |
U.S. Treasury 2 Year Note | | | 28 | | | | 06/2021 | | | | USD | | | | 6,184,281 | | | | (2,242 | ) |
U.S. Treasury 5 Year Note | | | 28 | | | | 06/2021 | | | | USD | | | | 3,479,000 | | | | (18,431 | ) |
U.S. Treasury Ultra Bond | | | 1 | | | | 06/2021 | | | | USD | | | | 191,687 | | | | 1,794 | |
| | | | | | | | | | | | | | | | | | | | |
| | | | | | | | | | | | | | | | | | | (18,879 | ) |
| | | | | | | | | | | | | | | | | | | | |
Short Contracts | | | | | | | | | | | | | |
U.S. Treasury 10 Year Note | | | (10 | ) | | | 06/2021 | | | | USD | | | | (1,331,406 | ) | | | 2,700 | |
U.S. Treasury 10 Year Ultra Note | | | (13 | ) | | | 06/2021 | | | | USD | | | | (1,926,031 | ) | | | 8,896 | |
U.S. Treasury Long Bond | | | (6 | ) | | | 06/2021 | | | | USD | | | | (963,750 | ) | | | 1,159 | |
| | | | | | | | | | | | | | | | | | | | |
| | | | | | | | | | | | | | | | | | | 12,755 | |
| | | | | | | | | | | | | | | | | | | | |
| | | | | | | | | | | | | | | | | | | (6,124 | ) |
| | | | | | | | | | | | | | | | | | | | |
| | |
| Abbreviations |
| |
| USD | | United States Dollar |
| | | | | | | | | | | | | | | | | | | | |
| Forward foreign currency exchange contracts outstanding as of February 28, 2021: | |
| CURRENCY PURCHASED | | | CURRENCY SOLD | | | COUNTERPARTY | | SETTLEMENT
DATE | | | UNREALIZED
APPRECIATION
(DEPRECIATION) ($) | |
| CLP | | | 316,615,311 | | | USD | | | 430,289 | | | Citibank, NA** | | | 3/15/2021 | | | | 7,211 | |
| USD | | | 207,080 | | | BRL | | | 1,130,352 | | | Citibank, NA** | | | 3/15/2021 | | | | 5,492 | |
| USD | | | 219,888 | | | ZAR | | | 3,257,599 | | | Goldman Sachs International | | | 3/15/2021 | | | | 4,985 | |
| USD | | | 206,293 | | | MXN | | | 4,271,907 | | | Goldman Sachs International | | | 3/16/2021 | | | | 2,432 | |
| | | | | | | | | | | | | | | | | | | | |
| Total unrealized appreciation | | | | 20,120 | |
| | | | | | | | | | | | | | | | | | | | |
| BRL | | | 2,324,455 | | | USD | | | 433,481 | | | Citibank, NA** | | | 3/15/2021 | | | | (18,936 | ) |
| CNY | | | 2,776,386 | | | USD | | | 428,541 | | | BNP Paribas** | | | 3/15/2021 | | | | (897 | ) |
| ZAR | | | 6,470,396 | | | USD | | | 432,788 | | | Citibank, NA | | | 3/15/2021 | | | | (5,936 | ) |
| MXN | | | 8,776,244 | | | USD | | | 434,113 | | | Barclays Bank plc | | | 3/16/2021 | | | | (15,300 | ) |
| | | | | | | | | | | | | | | | | | | | |
| Total unrealized depreciation | | | | (41,069 | ) |
| | | | | | | | | | | | | | | | | | | | |
| Net unrealized depreciation | | | | (20,949 | ) |
| | | | | | | | | | | | | | | | | | | | |
| | |
Abbreviations |
| |
| BRL | | Brazilian Real |
| CLP | | Chile Peso |
| CNY | | China Yuan |
| MXN | | Mexican Peso |
| USD | | United States Dollar |
| ZAR | | South African Rand |
| ** | | Non-deliverable forward. |
SEE NOTES TO FINANCIAL STATEMENTS.
| | | | | | | | |
| | | |
| FEBRUARY 28, 2021 | | J.P. MORGAN EXCHANGE-TRADED FUNDS | | | | | 63 | |
JPMorgan Corporate Bond Research Enhanced ETF
SCHEDULE OF PORTFOLIO INVESTMENTS
AS OF FEBRUARY 28, 2021
| | | | | | | | |
| INVESTMENTS | | PRINCIPAL AMOUNT ($) | | | VALUE ($) | |
Corporate Bonds — 98.2% | | | | | | | | |
| | |
Aerospace & Defense — 4.3% | | | | | | | | |
| | |
BAE Systems plc (United Kingdom) 3.40%, 4/15/2030 (a) | | | 35,000 | | | | 38,188 | |
| | |
Boeing Co. (The) | | | | | | | | |
| | |
4.51%, 5/1/2023 | | | 190,000 | | | | 203,792 | |
| | |
4.88%, 5/1/2025 | | | 189,000 | | | | 211,302 | |
| | |
5.04%, 5/1/2027 | | | 181,000 | | | | 208,608 | |
| | |
5.15%, 5/1/2030 | | | 126,000 | | | | 146,823 | |
| | |
3.60%, 5/1/2034 | | | 159,000 | | | | 163,316 | |
| | |
5.71%, 5/1/2040 | | | 35,000 | | | | 44,099 | |
| | |
3.75%, 2/1/2050 | | | 30,000 | | | | 29,246 | |
| | |
5.81%, 5/1/2050 | | | 20,000 | | | | 25,799 | |
| | |
L3Harris Technologies, Inc. 4.40%, 6/15/2028 | | | 174,000 | | | | 202,754 | |
| | |
Leidos, Inc. 4.38%, 5/15/2030 (a) | | | 238,000 | | | | 270,266 | |
| | |
Lockheed Martin Corp. | | | | | | | | |
| | |
3.55%, 1/15/2026 | | | 34,000 | | | | 37,874 | |
| | |
4.09%, 9/15/2052 | | | 141,000 | | | | 168,778 | |
| | |
Northrop Grumman Corp. | | | | | | | | |
| | |
3.25%, 1/15/2028 | | | 90,000 | | | | 98,071 | |
| | |
4.03%, 10/15/2047 | | | 41,000 | | | | 46,754 | |
| | |
Precision Castparts Corp. 3.25%, 6/15/2025 | | | 24,000 | | | | 26,179 | |
| | |
Raytheon Technologies Corp. | | | | | | | | |
| | |
3.50%, 3/15/2027 | | | 63,000 | | | | 70,038 | |
| | |
3.13%, 5/4/2027 | | | 146,000 | | | | 160,042 | |
| | |
4.45%, 11/16/2038 | | | 107,000 | | | | 128,807 | |
| | |
3.75%, 11/1/2046 | | | 88,000 | | | | 96,345 | |
| | | | | | | | |
| | |
| | | | | | | 2,377,081 | |
| | | | | | | | |
| | |
Automobiles — 0.7% | | | | | | | | |
| | |
General Motors Co. 6.13%, 10/1/2025 | | | 314,000 | | | | 373,808 | |
| | | | | | | | |
| | |
Banks — 17.0% | | | | | | | | |
| | |
Bank of America Corp. | | | | | | | | |
| | |
(ICE LIBOR USD 3 Month + 0.79%), 3.00%, 12/20/2023 (b) | | | 527,000 | | | | 550,799 | |
| | |
(ICE LIBOR USD 3 Month + 0.78%), 3.55%, 3/5/2024 (b) | | | 146,000 | | | | 154,793 | |
| | |
(ICE LIBOR USD 3 Month + 0.87%), 2.46%, 10/22/2025 (b) | | | 30,000 | | | | 31,729 | |
| | |
(SOFR + 1.15%), 1.32%, 6/19/2026 (b) | | | 60,000 | | | | 60,431 | |
| | |
(ICE LIBOR USD 3 Month + 1.06%), 3.56%, 4/23/2027 (b) | | | 154,000 | | | | 170,391 | |
| | |
(ICE LIBOR USD 3 Month + 1.58%), 3.82%, 1/20/2028 (b) | | | 146,000 | | | | 164,280 | |
| | |
(ICE LIBOR USD 3 Month + 1.04%), 3.42%, 12/20/2028 (b) | | | 275,000 | | | | 303,300 | |
| | | | | | | | |
| INVESTMENTS | | PRINCIPAL AMOUNT ($) | | | VALUE ($) | |
| | | | | | | | |
|
Banks — continued | |
| | |
(ICE LIBOR USD 3 Month + 0.99%), 2.50%, 2/13/2031 (b) | | | 237,000 | | | | 242,781 | |
| | |
(ICE LIBOR USD 3 Month + 1.81%), 4.24%, 4/24/2038 (b) | | | 156,000 | | | | 184,349 | |
| | |
(ICE LIBOR USD 3 Month + 1.19%), 3.95%, 1/23/2049 (b) | | | 50,000 | | | | 57,876 | |
| | |
(ICE LIBOR USD 3 Month + 3.15%), 4.08%, 3/20/2051 (b) | | | 78,000 | | | | 90,667 | |
| | |
Citigroup, Inc. | | | | | | | | |
| | |
(ICE LIBOR USD 3 Month + 0.95%), 2.88%, 7/24/2023 (b) | | | 297,000 | | | | 306,840 | |
| | |
(ICE LIBOR USD 3 Month + 0.90%), 3.35%, 4/24/2025 (b) | | | 68,000 | | | | 73,434 | |
| | |
(SOFR + 2.84%), 3.11%, 4/8/2026 (b) | | | 78,000 | | | | 83,867 | |
| | |
3.20%, 10/21/2026 | | | 297,000 | | | | 323,791 | |
| | |
(ICE LIBOR USD 3 Month + 1.39%), 3.67%, 7/24/2028 (b) | | | 76,000 | | | | 84,603 | |
| | |
(SOFR + 1.15%), 2.67%, 1/29/2031 (b) | | | 107,000 | | | | 110,587 | |
| | |
(SOFR + 3.91%), 4.41%, 3/31/2031 (b) | | | 156,000 | | | | 181,474 | |
| | |
(ICE LIBOR USD 3 Month + 1.17%), 3.88%, 1/24/2039 (b) | | | 87,000 | | | | 98,485 | |
| | |
4.65%, 7/23/2048 | | | 78,000 | | | | 99,444 | |
| | |
Citizens Financial Group, Inc. 4.30%, 12/3/2025 | | | 160,000 | | | | 180,332 | |
| | |
HSBC Holdings plc (United Kingdom) | | | | | | | | |
| | |
4.00%, 3/30/2022 | | | 167,000 | | | | 173,733 | |
| | |
(ICE LIBOR USD 3 Month + 1.61%), 3.97%, 5/22/2030 (b) | | | 200,000 | | | | 223,503 | |
| | |
Huntington Bancshares, Inc. 2.63%, 8/6/2024 | | | 63,000 | | | | 66,994 | |
| | |
Mitsubishi UFJ Financial Group, Inc. (Japan) | | | | | | | | |
| | |
2.67%, 7/25/2022 | | | 127,000 | | | | 131,105 | |
| | |
3.76%, 7/26/2023 | | | 388,000 | | | | 417,845 | |
| | |
3.68%, 2/22/2027 | | | 31,000 | | | | 34,951 | |
| | |
3.96%, 3/2/2028 | | | 119,000 | | | | 135,948 | |
| | |
3.74%, 3/7/2029 | | | 231,000 | | | | 261,055 | |
| | |
Natwest Group plc (United Kingdom) | | | | | | | | |
| | |
6.13%, 12/15/2022 | | | 649,000 | | | | 707,998 | |
| | |
6.00%, 12/19/2023 | | | 229,000 | | | | 259,790 | |
| | |
5.13%, 5/28/2024 | | | 351,000 | | | | 392,773 | |
| | |
PNC Financial Services Group, Inc. (The) | | | | | | | | |
| | |
3.90%, 4/29/2024 | | | 13,000 | | | | 14,264 | |
| | |
2.60%, 7/23/2026 | | | 253,000 | | | | 271,738 | |
| | |
3.15%, 5/19/2027 | | | 23,000 | | | | 25,431 | |
SEE NOTES TO FINANCIAL STATEMENTS.
| | | | | | |
| | | |
| 64 | | | | J.P. MORGAN EXCHANGE-TRADED FUNDS | | FEBRUARY 28, 2021 |
| | | | | | | | |
| INVESTMENTS | | PRINCIPAL AMOUNT ($) | | | VALUE ($) | |
Corporate Bonds — continued | |
| | |
Banks — continued | | | | | | | | |
| | |
Sumitomo Mitsui Financial Group, Inc. (Japan) | | | | | | | | |
| | |
2.78%, 7/12/2022 | | | 107,000 | | | | 110,571 | |
| | |
2.63%, 7/14/2026 | | | 288,000 | | | | 306,521 | |
| | |
3.36%, 7/12/2027 | | | 77,000 | | | | 85,280 | |
| | |
US Bancorp Series V, 2.38%, 7/22/2026 | | | 129,000 | | | | 136,688 | |
| | |
Wells Fargo & Co. | | | | | | | | |
| | |
2.63%, 7/22/2022 | | | 312,000 | | | | 321,949 | |
| | |
3.75%, 1/24/2024 | | | 146,000 | | | | 158,672 | |
| | |
(ICE LIBOR USD 3 Month + 0.83%), 2.41%, 10/30/2025 (b) | | | 88,000 | | | | 92,754 | |
| | |
(SOFR + 2.00%), 2.19%, 4/30/2026 (b) | | | 107,000 | | | | 111,432 | |
| | |
3.00%, 10/23/2026 | | | 188,000 | | | | 203,982 | |
| | |
4.30%, 7/22/2027 | | | 88,000 | | | | 101,583 | |
| | |
(ICE LIBOR USD 3 Month + 1.31%), 3.58%, 5/22/2028 (b) | | | 276,000 | | | | 305,620 | |
| | |
(ICE LIBOR USD 3 Month + 1.17%), 2.88%, 10/30/2030 (b) | | | 202,000 | | | | 213,778 | |
| | |
3.90%, 5/1/2045 | | | 117,000 | | | | 135,440 | |
| | |
4.75%, 12/7/2046 | | | 68,000 | | | | 83,656 | |
| | |
Westpac Banking Corp. (Australia) | | | | | | | | |
| | |
2.85%, 5/13/2026 | | | 241,000 | | | | 261,450 | |
| | |
(US Treasury Yield Curve Rate T Note Constant Maturity 5 Year + 2.00%), 4.11%, 7/24/2034 (b) | | | 107,000 | | | | 117,933 | |
| | | | | | | | |
| | |
| | | | | | | 9,418,690 | |
| | | | | | | | |
| | |
Beverages — 2.7% | | | | | | | | |
| | |
Anheuser-Busch Cos. LLC (Belgium) | | | | | | | | |
| | |
3.65%, 2/1/2026 | | | 107,000 | | | | 118,690 | |
| | |
4.70%, 2/1/2036 | | | 77,000 | | | | 92,443 | |
| | |
4.90%, 2/1/2046 | | | 160,000 | | | | 192,446 | |
| | |
Anheuser-Busch InBev Worldwide, Inc. (Belgium) | | | | | | | | |
| | |
4.00%, 4/13/2028 | | | 49,000 | | | | 55,704 | |
| | |
4.90%, 1/23/2031 | | | 34,000 | | | | 41,602 | |
| | |
4.60%, 4/15/2048 | | | 218,000 | | | | 252,919 | |
| | |
4.44%, 10/6/2048 | | | 39,000 | | | | 44,283 | |
| | |
Coca-Cola Co. (The) 2.60%, 6/1/2050 | | | 76,000 | | | | 71,876 | |
| | |
Constellation Brands, Inc. 3.15%, 8/1/2029 | | | 66,000 | | | | 70,779 | |
| | |
Keurig Dr Pepper, Inc. | | | | | | | | |
| | |
4.06%, 5/25/2023 | | | 177,000 | | | | 190,545 | |
| | |
3.80%, 5/1/2050 | | | 20,000 | | | | 21,818 | |
| | |
Molson Coors Beverage Co. 4.20%, 7/15/2046 | | | 30,000 | | | | 32,127 | |
| | | | | | | | |
| INVESTMENTS | | PRINCIPAL AMOUNT ($) | | | VALUE ($) | |
| | | | | | | | |
|
Beverages — continued | |
| | |
PepsiCo, Inc. | | | | | | | | |
| | |
2.75%, 3/19/2030 | | | 107,000 | | | | 114,562 | |
| | |
3.50%, 3/19/2040 | | | 66,000 | | | | 74,114 | |
| | |
3.45%, 10/6/2046 | | | 68,000 | | | | 74,484 | |
| | |
3.63%, 3/19/2050 | | | 20,000 | | | | 22,611 | |
| | | | | | | | |
| | |
| | | | | | | 1,471,003 | |
| | | | | | | | |
| | |
Biotechnology — 3.3% | | | | | | | | |
| | |
AbbVie, Inc. | | | | | | | | |
| | |
3.45%, 3/15/2022 | | | 68,000 | | | | 69,802 | |
| | |
2.90%, 11/6/2022 | | | 205,000 | | | | 213,522 | |
| | |
3.60%, 5/14/2025 | | | 68,000 | | | | 74,590 | |
| | |
2.95%, 11/21/2026 | | | 122,000 | | | | 131,898 | |
| | |
4.25%, 11/14/2028 | | | 192,000 | | | | 223,217 | |
| | |
4.05%, 11/21/2039 | | | 161,000 | | | | 184,899 | |
| | |
4.70%, 5/14/2045 | | | 68,000 | | | | 82,355 | |
| | |
4.25%, 11/21/2049 | | | 73,000 | | | | 84,276 | |
| | |
Amgen, Inc. | | | | | | | | |
| | |
2.20%, 2/21/2027 | | | 68,000 | | | | 70,974 | |
| | |
2.45%, 2/21/2030 | | | 63,000 | | | | 64,839 | |
| | |
3.15%, 2/21/2040 | | | 40,000 | | | | 41,299 | |
| | |
4.40%, 5/1/2045 | | | 20,000 | | | | 23,855 | |
| | |
3.38%, 2/21/2050 | | | 20,000 | | | | 20,537 | |
| | |
Biogen, Inc. 3.15%, 5/1/2050 | | | 180,000 | | | | 170,825 | |
| | |
Gilead Sciences, Inc. | | | | | | | | |
| | |
3.65%, 3/1/2026 | | | 88,000 | | | | 97,726 | |
| | |
4.15%, 3/1/2047 | | | 247,000 | | | | 281,958 | |
| | | | | | | | |
| | |
| | | | | | | 1,836,572 | |
| | | | | | | | |
| | |
Building Products — 0.0% (c) | | | | | | | | |
| | |
Carrier Global Corp. 3.58%, 4/5/2050 | | | 20,000 | | | | 20,581 | |
| | | | | | | | |
| | |
Capital Markets — 5.8% | | | | | | | | |
| | |
CME Group, Inc. 3.00%, 3/15/2025 | | | 109,000 | | | | 117,686 | |
| | |
Credit Suisse Group AG (Switzerland) (ICE LIBOR USD 3 Month + 1.24%), 4.21%, 6/12/2024 (a) (b) | | | 250,000 | | | | 269,750 | |
| | |
Goldman Sachs Group, Inc. (The) | | | | | | | | |
| | |
5.75%, 1/24/2022 | | | 266,000 | | | | 278,941 | |
| | |
4.00%, 3/3/2024 | | | 242,000 | | | | 266,079 | |
| | |
3.50%, 4/1/2025 | | | 130,000 | | | | 142,181 | |
| | |
3.85%, 1/26/2027 | | | 91,000 | | | | 101,614 | |
| | |
(ICE LIBOR USD 3 Month + 1.30%), 4.22%, 5/1/2029 (b) | | | 249,000 | | | | 287,002 | |
| | |
3.80%, 3/15/2030 | | | 156,000 | | | | 177,114 | |
| | |
(ICE LIBOR USD 3 Month + 1.37%), 4.02%, 10/31/2038 (b) | | | 193,000 | | | | 223,204 | |
SEE NOTES TO FINANCIAL STATEMENTS.
| | | | | | | | |
| | | |
| FEBRUARY 28, 2021 | | J.P. MORGAN EXCHANGE-TRADED FUNDS | | | | | 65 | |
JPMorgan Corporate Bond Research Enhanced ETF
SCHEDULE OF PORTFOLIO INVESTMENTS
AS OF FEBRUARY 28, 2021 (continued)
| | | | | | | | |
| INVESTMENTS | | PRINCIPAL AMOUNT ($) | | | VALUE ($) | |
Corporate Bonds — continued | |
| | |
Capital Markets — continued | | | | | | | | |
| | |
Morgan Stanley | | | | | | | | |
| | |
2.75%, 5/19/2022 | | | 346,000 | | | | 356,218 | |
| | |
3.70%, 10/23/2024 | | | 68,000 | | | | 75,052 | |
| | |
(SOFR + 1.99%), 2.19%, 4/28/2026 (b) | | | 178,000 | | | | 185,351 | |
| | |
3.63%, 1/20/2027 | | | 88,000 | | | | 98,726 | |
| | |
(ICE LIBOR USD 3 Month + 1.14%), 3.77%, 1/24/2029 (b) | | | 205,000 | | | | 230,097 | |
| | |
(SOFR + 1.14%), 2.70%, 1/22/2031 (b) | | | 117,000 | | | | 121,601 | |
| | |
(SOFR + 3.12%), 3.62%, 4/1/2031 (b) | | | 78,000 | | | | 86,904 | |
| | |
(ICE LIBOR USD 3 Month + 1.46%), 3.97%, 7/22/2038 (b) | | | 146,000 | | | | 170,429 | |
| | |
4.30%, 1/27/2045 | | | 29,000 | | | | 35,587 | |
| | | | | | | | |
| | |
| | | | | | | 3,223,536 | |
| | | | | | | | |
| | |
Chemicals — 1.3% | | | | | | | | |
| | |
Air Products and Chemicals, Inc. 2.80%, 5/15/2050 | | | 40,000 | | | | 39,092 | |
| | |
Dow Chemical Co. (The) 3.60%, 11/15/2050 | | | 60,000 | | | | 61,927 | |
| | |
Huntsman International LLC 4.50%, 5/1/2029 | | | 78,000 | | | | 88,286 | |
| | |
LYB International Finance III LLC 3.38%, 10/1/2040 | | | 40,000 | | | | 40,778 | |
| | |
Nutrien Ltd. (Canada) 4.20%, 4/1/2029 | | | 124,000 | | | | 143,994 | |
| | |
Sherwin-Williams Co. (The) | | | | | | | | |
| | |
2.75%, 6/1/2022 | | | 4,000 | | | | 4,108 | |
| | |
3.45%, 6/1/2027 | | | 76,000 | | | | 83,729 | |
| | |
2.95%, 8/15/2029 | | | 254,000 | | | | 270,187 | |
| | | | | | | | |
| | |
| | | | | | | 732,101 | |
| | | | | | | | |
| | |
Commercial Services & Supplies — 0.1% | | | | | | | | |
| | |
Waste Management, Inc. 4.15%, 7/15/2049 | | | 32,000 | | | | 38,187 | |
| | | | | | | | |
| | |
Consumer Finance — 1.8% | | | | | | | | |
| | |
American Express Co. 3.70%, 8/3/2023 | | | 78,000 | | | | 83,988 | |
| | |
Capital One Financial Corp. | | | | | | | | |
| | |
3.30%, 10/30/2024 | | | 182,000 | | | | 197,592 | |
| | |
3.80%, 1/31/2028 | | | 156,000 | | | | 175,338 | |
| | |
General Motors Financial Co., Inc. | | | | | | | | |
| | |
5.20%, 3/20/2023 | | | 228,000 | | | | 248,613 | |
| | |
5.10%, 1/17/2024 | | | 162,000 | | | | 180,441 | |
| | |
4.35%, 1/17/2027 | | | 86,000 | | | | 96,865 | |
| | | | | | | | |
| | |
| | | | | | | 982,837 | |
| | | | | | | | |
| | |
Containers & Packaging — 0.1% | | | | | | | | |
| | |
WRKCo, Inc. 4.65%, 3/15/2026 | | | 72,000 | | | | 83,009 | |
| | | | | | | | |
| | | | | | | | |
| INVESTMENTS | | PRINCIPAL AMOUNT ($) | | | VALUE ($) | |
| | | | | | | | |
| | |
Diversified Consumer Services — 0.1% | | | | | | | | |
| | |
University of Chicago (The) Series 20B, 2.76%, 4/1/2045 | | | 29,000 | | | | 29,056 | |
| | |
William Marsh Rice University 2.60%, 5/15/2050 | | | 28,000 | | | | 26,335 | |
| | | | | | | | |
| | |
| | | | | | | 55,391 | |
| | | | | | | | |
| | |
Diversified Financial Services — 0.8% | | | | | | | | |
| | |
Shell International Finance BV (Netherlands) | | | | | | | | |
| | |
2.38%, 4/6/2025 | | | 49,000 | | | | 51,755 | |
| | |
3.25%, 5/11/2025 | | | 31,000 | | | | 33,791 | |
| | |
4.13%, 5/11/2035 | | | 243,000 | | | | 285,807 | |
| | |
4.38%, 5/11/2045 | | | 43,000 | | | | 51,484 | |
| | |
4.00%, 5/10/2046 | | | 29,000 | | | | 32,759 | |
| | | | | | | | |
| | |
| | | | | | | 455,596 | |
| | | | | | | | |
|
Diversified Telecommunication Services — 3.4% | |
| | |
AT&T, Inc. | | | | | | | | |
| | |
3.00%, 6/30/2022 | | | 194,000 | | | | 199,952 | |
| | |
4.30%, 2/15/2030 | | | 182,000 | | | | 208,724 | |
| | |
2.25%, 2/1/2032 | | | 162,000 | | | | 155,543 | |
| | |
4.50%, 5/15/2035 | | | 124,000 | | | | 142,805 | |
| | |
4.50%, 3/9/2048 | | | 236,000 | | | | 258,949 | |
| | |
3.50%, 9/15/2053 (a) | | | 105,000 | | | | 96,319 | |
| | |
3.55%, 9/15/2055 (a) | | | 60,000 | | | | 55,088 | |
| | |
3.65%, 9/15/2059 (a) | | | 30,000 | | | | 27,660 | |
| | |
Verizon Communications, Inc. | | | | | | | | |
| | |
3.38%, 2/15/2025 | | | 114,000 | | | | 124,446 | |
| | |
4.33%, 9/21/2028 | | | 45,000 | | | | 52,365 | |
| | |
1.68%, 10/30/2030 (a) | | | 70,000 | | | | 66,592 | |
| | |
4.40%, 11/1/2034 | | | 20,000 | | | | 23,726 | |
| | |
4.27%, 1/15/2036 | | | 258,000 | | | | 300,316 | |
| | |
2.99%, 10/30/2056 (a) | | | 180,000 | | | | 162,223 | |
| | | | | | | | |
| | |
| | | | | | | 1,874,708 | |
| | | | | | | | |
| | |
Electric Utilities — 5.1% | | | | | | | | |
| | |
Baltimore Gas and Electric Co. 2.90%, 6/15/2050 | | | 76,000 | | | | 73,362 | |
| | |
Commonwealth Edison Co. 3.00%, 3/1/2050 | | | 76,000 | | | | 75,415 | |
| | |
Duke Energy Corp. | | | | | | | | |
| | |
3.75%, 4/15/2024 | | | 273,000 | | | | 296,718 | |
| | |
2.65%, 9/1/2026 | | | 18,000 | | | | 19,125 | |
| | |
3.75%, 9/1/2046 | | | 117,000 | | | | 124,255 | |
| | |
Duke Energy Indiana LLC | | | | | | | | |
| | |
Series YYY, 3.25%, 10/1/2049 | | | 20,000 | | | | 20,530 | |
| | |
2.75%, 4/1/2050 | | | 20,000 | | | | 18,670 | |
SEE NOTES TO FINANCIAL STATEMENTS.
| | | | | | |
| | | |
| 66 | | | | J.P. MORGAN EXCHANGE-TRADED FUNDS | | FEBRUARY 28, 2021 |
| | | | | | | | |
| INVESTMENTS | | PRINCIPAL AMOUNT ($) | | | VALUE ($) | |
Corporate Bonds — continued | |
|
Electric Utilities — continued | |
| | |
Edison International | | | | | | | | |
| | |
3.13%, 11/15/2022 | | | 73,000 | | | | 75,753 | |
| | |
2.95%, 3/15/2023 | | | 195,000 | | | | 202,432 | |
| | |
4.13%, 3/15/2028 | | | 34,000 | | | | 37,105 | |
| | |
Emera US Finance LP (Canada) 4.75%, 6/15/2046 | | | 155,000 | | | | 181,241 | |
| | |
Entergy Louisiana LLC | | | | | | | | |
| | |
4.00%, 3/15/2033 | | | 227,000 | | | | 269,360 | |
| | |
2.90%, 3/15/2051 | | | 7,000 | | | | 6,882 | |
| | |
Entergy Texas, Inc. 3.55%, 9/30/2049 | | | 44,000 | | | | 46,440 | |
| | |
Evergy, Inc. | | | | | | | | |
| | |
2.45%, 9/15/2024 | | | 127,000 | | | | 133,926 | |
| | |
2.90%, 9/15/2029 | | | 102,000 | | | | 108,164 | |
| | |
Exelon Corp. 4.45%, 4/15/2046 | | | 20,000 | | | | 23,511 | |
| | |
Florida Power & Light Co. | | | | | | | | |
| | |
3.95%, 3/1/2048 | | | 30,000 | | | | 35,559 | |
| | |
3.15%, 10/1/2049 | | | 88,000 | | | | 92,400 | |
| | |
Fortis, Inc. (Canada) 3.06%, 10/4/2026 | | | 148,000 | | | | 160,227 | |
| | |
Pacific Gas and Electric Co. | | | | | | | | |
| | |
4.50%, 7/1/2040 | | | 306,000 | | | | 327,099 | |
| | |
4.95%, 7/1/2050 | | | 30,000 | | | | 32,504 | |
| | |
PPL Electric Utilities Corp. 3.00%, 10/1/2049 | | | 20,000 | | | | 19,689 | |
| | |
Southern California Edison Co. | | | | | | | | |
| | |
2.25%, 6/1/2030 | | | 10,000 | | | | 10,043 | |
| | |
Series 13-A, 3.90%, 3/15/2043 | | | 6,000 | | | | 6,351 | |
| | |
Series C, 3.60%, 2/1/2045 | | | 111,000 | | | | 112,616 | |
| | |
4.00%, 4/1/2047 | | | 68,000 | | | | 73,592 | |
| | |
3.65%, 2/1/2050 | | | 14,000 | | | | 14,384 | |
| | |
Southern Co. (The) 4.40%, 7/1/2046 | | | 72,000 | | | | 82,838 | |
| | |
Virginia Electric and Power Co. | | | | | | | | |
| | |
Series A, 3.15%, 1/15/2026 | | | 17,000 | | | | 18,542 | |
| | |
Series A, 3.50%, 3/15/2027 | | | 43,000 | | | | 47,974 | |
| | |
4.60%, 12/1/2048 | | | 30,000 | | | | 38,158 | |
| | |
2.45%, 12/15/2050 | | | 60,000 | | | | 53,931 | |
| | | | | | | | |
| | |
| | | | | | | 2,838,796 | |
| | | | | | | | |
|
Electronic Equipment, Instruments & Components — 0.2% | |
| | |
Corning, Inc. | | | | | | | | |
| | |
4.38%, 11/15/2057 | | | 20,000 | | | | 22,930 | |
| | |
5.45%, 11/15/2079 | | | 78,000 | | | | 101,256 | |
| | | | | | | | |
| | |
| | | | | | | 124,186 | |
| | | | | | | | |
|
Energy Equipment & Services — 0.1% | |
| | |
Baker Hughes a GE Co. LLC 4.08%, 12/15/2047 | | | 30,000 | | | | 32,901 | |
| | | | | | | | |
| | | | | | | | |
| INVESTMENTS | | PRINCIPAL AMOUNT ($) | | | VALUE ($) | |
| | | | | | | | |
|
Entertainment — 0.3% | |
| | |
Walt Disney Co. (The) | | | | | | | | |
| | |
3.50%, 5/13/2040 | | | 104,000 | | | | 113,591 | |
| | |
2.75%, 9/1/2049 | | | 76,000 | | | | 71,704 | |
| | | | | | | | |
| | |
| | | | | | | 185,295 | |
| | | | | | | | |
|
Equity Real Estate Investment Trusts (REITs) — 3.1% | |
| | |
Alexandria Real Estate Equities, Inc. | | | | | | | | |
| | |
2.75%, 12/15/2029 | | | 102,000 | | | | 107,266 | |
| | |
3.00%, 5/18/2051 | | | 140,000 | | | | 133,801 | |
| | |
American Tower Corp. 3.10%, 6/15/2050 | | | 50,000 | | | | 47,317 | |
| | |
Boston Properties LP | | | | | | | | |
| | |
4.50%, 12/1/2028 | | | 39,000 | | | | 45,611 | |
| | |
3.25%, 1/30/2031 | | | 120,000 | | | | 127,301 | |
| | |
Healthcare Trust of America Holdings LP 2.00%, 3/15/2031 | | | 180,000 | | | | 173,736 | |
| | |
Healthpeak Properties, Inc. | | | | | | | | |
| | |
4.00%, 6/1/2025 | | | 429,000 | | | | 478,402 | |
| | |
2.88%, 1/15/2031 | | | 66,000 | | | | 69,146 | |
| | |
Prologis LP 3.75%, 11/1/2025 | | | 195,000 | | | | 219,394 | |
| | |
Simon Property Group LP | | | | | | | | |
| | |
2.45%, 9/13/2029 | | | 78,000 | | | | 79,216 | |
| | |
3.25%, 9/13/2049 | | | 40,000 | | | | 38,402 | |
| | |
UDR, Inc. 3.00%, 8/15/2031 | | | 20,000 | | | | 21,072 | |
| | |
Welltower, Inc. 3.63%, 3/15/2024 | | | 185,000 | | | | 200,656 | |
| | | | | | | | |
| | |
| | | | | | | 1,741,320 | |
| | | | | | | | |
|
Food & Staples Retailing — 0.8% | |
| | |
Costco Wholesale Corp. 1.60%, 4/20/2030 | | | 146,000 | | | | 142,738 | |
| | |
Kroger Co. (The) | | | | | | | | |
| | |
4.45%, 2/1/2047 | | | 45,000 | | | | 52,756 | |
| | |
3.95%, 1/15/2050 | | | 76,000 | | | | 84,354 | |
| | |
Sysco Corp. | | | | | | | | |
| | |
3.30%, 7/15/2026 | | | 40,000 | | | | 43,774 | |
| | |
3.25%, 7/15/2027 | | | 40,000 | | | | 43,970 | |
| | |
Walmart, Inc. | | | | | | | | |
| | |
3.70%, 6/26/2028 | | | 25,000 | | | | 28,655 | |
| | |
4.05%, 6/29/2048 | | | 17,000 | | | | 20,813 | |
| | | | | | | | |
| | |
| | | | | | | 417,060 | |
| | | | | | | | |
|
Gas Utilities — 0.1% | |
| | |
Atmos Energy Corp. 4.13%, 10/15/2044 | | | 31,000 | | | | 36,047 | |
| | | | | | | | |
|
Health Care Equipment & Supplies — 0.5% | |
| | |
Becton Dickinson and Co. | | | | | | | | |
| | |
3.70%, 6/6/2027 | | | 66,000 | | | | 73,992 | |
| | |
4.69%, 12/15/2044 | | | 73,000 | | | | 90,663 | |
| | |
4.67%, 6/6/2047 | | | 49,000 | | | | 60,674 | |
| | |
3.79%, 5/20/2050 | | | 29,000 | | | | 32,082 | |
SEE NOTES TO FINANCIAL STATEMENTS.
| | | | | | | | |
| | | |
| FEBRUARY 28, 2021 | | J.P. MORGAN EXCHANGE-TRADED FUNDS | | | | | 67 | |
JPMorgan Corporate Bond Research Enhanced ETF
SCHEDULE OF PORTFOLIO INVESTMENTS
AS OF FEBRUARY 28, 2021 (continued)
| | | | | | | | |
| INVESTMENTS | | PRINCIPAL AMOUNT ($) | | | VALUE ($) | |
Corporate Bonds — continued | |
|
Health Care Equipment & Supplies — continued | |
| | |
Medtronic, Inc. 3.50%, 3/15/2025 | | | 36,000 | | | | 39,659 | |
| | | | | | | | |
| | |
| | | | | | | 297,070 | |
| | | | | | | | |
|
Health Care Providers & Services — 5.5% | |
| | |
Aetna, Inc. | | | | | | | | |
| | |
2.80%, 6/15/2023 | | | 278,000 | | | | 291,397 | |
| | |
3.88%, 8/15/2047 | | | 70,000 | | | | 75,876 | |
| | |
Anthem, Inc. 4.65%, 8/15/2044 | | | 123,000 | | | | 151,434 | |
| | |
Cigna Corp. | | | | | | | | |
| | |
3.25%, 4/15/2025 | | | 166,000 | | | | 179,869 | |
| | |
2.40%, 3/15/2030 | | | 30,000 | | | | 30,468 | |
| | |
4.80%, 8/15/2038 | | | 86,000 | | | | 106,384 | |
| | |
CVS Health Corp. | | | | | | | | |
| | |
3.70%, 3/9/2023 | | | 22,000 | | | | 23,407 | |
| | |
2.63%, 8/15/2024 | | | 10,000 | | | | 10,634 | |
| | |
4.30%, 3/25/2028 | | | 118,000 | | | | 135,830 | |
| | |
2.70%, 8/21/2040 | | | 256,000 | | | | 243,056 | |
| | |
5.05%, 3/25/2048 | | | 66,000 | | | | 83,357 | |
| | |
HCA, Inc. | | | | | | | | |
| | |
5.00%, 3/15/2024 | | | 510,000 | | | | 571,166 | |
| | |
4.13%, 6/15/2029 | | | 280,000 | | | | 316,067 | |
| | |
UnitedHealth Group, Inc. | | | | | | | | |
| | |
3.75%, 7/15/2025 | | | 86,000 | | | | 96,021 | |
| | |
3.50%, 8/15/2039 | | | 122,000 | | | | 134,892 | |
| | |
2.75%, 5/15/2040 | | | 261,000 | | | | 262,125 | |
| | |
Universal Health Services, Inc. 2.65%, 10/15/2030 (a) | | | 320,000 | | | | 316,403 | |
| | | | | | | | |
| | |
| | | | | | | 3,028,386 | |
| | | | | | | | |
|
Hotels, Restaurants & Leisure — 1.4% | |
| | |
McDonald’s Corp. | | | | | | | | |
| | |
3.70%, 1/30/2026 | | | 214,000 | | | | 238,945 | |
| | |
3.80%, 4/1/2028 | | | 76,000 | | | | 86,063 | |
| | |
2.13%, 3/1/2030 | | | 85,000 | | | | 85,617 | |
| | |
3.63%, 9/1/2049 | | | 176,000 | | | | 188,625 | |
| | |
Starbucks Corp. 3.50%, 11/15/2050 | | | 162,000 | | | | 169,098 | |
| | | | | | | | |
| | |
| | | | | | | 768,348 | |
| | | | | | | | |
|
Industrial Conglomerates — 1.1% | |
| | |
General Electric Co. | | | | | | | | |
| | |
2.70%, 10/9/2022 | | | 205,000 | | | | 212,780 | |
| | |
6.75%, 3/15/2032 | | | 40,000 | | | | 54,054 | |
| | |
5.88%, 1/14/2038 | | | 186,000 | | | | 244,171 | |
| | |
4.13%, 10/9/2042 | | | 8,000 | | | | 8,828 | |
| | |
4.35%, 5/1/2050 | | | 40,000 | | | | 44,485 | |
| | | | | | | | |
| INVESTMENTS | | PRINCIPAL AMOUNT ($) | | | VALUE ($) | |
| | | | | | | | |
|
Industrial Conglomerates — continued | |
| | |
Roper Technologies, Inc. 1.75%, 2/15/2031 | | | 66,000 | | | | 63,232 | |
| | | | | | | | |
| | |
| | | | | | | 627,550 | |
| | | | | | | | |
|
Insurance — 2.0% | |
| | |
Aflac, Inc. 3.60%, 4/1/2030 | | | 160,000 | | | | 180,326 | |
| | |
American International Group, Inc. | | | | | | | | |
| | |
2.50%, 6/30/2025 | | | 120,000 | | | | 126,866 | |
| | |
3.90%, 4/1/2026 | | | 28,000 | | | | 31,375 | |
| | |
3.40%, 6/30/2030 | | | 180,000 | | | | 197,355 | |
| | |
4.50%, 7/16/2044 | | | 86,000 | | | | 103,136 | |
| | |
Arch Capital Group Ltd. 3.64%, 6/30/2050 | | | 140,000 | | | | 147,234 | |
| | |
Berkshire Hathaway Finance Corp. | | | | | | | | |
| | |
4.20%, 8/15/2048 | | | 146,000 | | | | 175,847 | |
| | |
4.25%, 1/15/2049 | | | 20,000 | | | | 24,245 | |
| | |
Northwestern Mutual Life Insurance Co. (The) 3.85%, 9/30/2047 (a) | | | 20,000 | | | | 22,462 | |
| | |
Prudential Financial, Inc. | | | | | | | | |
| | |
3.91%, 12/7/2047 | | | 29,000 | | | | 33,056 | |
| | |
3.70%, 3/13/2051 | | | 68,000 | | | | 75,158 | |
| | | | | | | | |
| | |
| | | | | | | 1,117,060 | |
| | | | | | | | |
|
Internet & Direct Marketing Retail — 0.7% | |
| | |
Amazon.com, Inc. | | | | | | | | |
| | |
3.88%, 8/22/2037 | | | 292,000 | | | | 345,275 | |
| | |
4.05%, 8/22/2047 | | | 10,000 | | | | 11,927 | |
| | |
2.50%, 6/3/2050 | | | 60,000 | | | | 55,468 | |
| | | | | | | | |
| | |
| | | | | | | 412,670 | |
| | | | | | | | |
|
IT Services — 1.7% | |
| | |
Fidelity National Information Services, Inc. 3.00%, 8/15/2026 | | | 253,000 | | | | 277,384 | |
| | |
Global Payments, Inc. | | | | | | | | |
| | |
3.20%, 8/15/2029 | | | 146,000 | | | | 155,917 | |
| | |
4.15%, 8/15/2049 | | | 12,000 | | | | 13,406 | |
| | |
International Business Machines Corp. | | | | | | | | |
| | |
3.00%, 5/15/2024 | | | 100,000 | | | | 107,554 | |
| | |
3.30%, 5/15/2026 | | | 150,000 | | | | 165,693 | |
| | |
Mastercard, Inc. | | | | | | | | |
| | |
2.95%, 6/1/2029 | | | 35,000 | | | | 38,129 | |
| | |
3.35%, 3/26/2030 | | | 70,000 | | | | 78,498 | |
| | |
3.85%, 3/26/2050 | | | 80,000 | | | | 93,893 | |
| | | | | | | | |
| | |
| | | | | | | 930,474 | |
| | | | | | | | |
|
Life Sciences Tools & Services — 0.1% | |
| | |
Thermo Fisher Scientific, Inc. 4.10%, 8/15/2047 | | | 23,000 | | | | 27,860 | |
| | | | | | | | |
SEE NOTES TO FINANCIAL STATEMENTS.
| | | | | | |
| | | |
| 68 | | | | J.P. MORGAN EXCHANGE-TRADED FUNDS | | FEBRUARY 28, 2021 |
| | | | | | | | |
| INVESTMENTS | | PRINCIPAL AMOUNT ($) | | | VALUE ($) | |
Corporate Bonds — continued | |
|
Machinery — 0.4% | |
| | |
Caterpillar, Inc. | | | | | | | | |
| | |
3.80%, 8/15/2042 | | | 20,000 | | | | 23,301 | |
| | |
3.25%, 4/9/2050 | | | 20,000 | | | | 21,356 | |
| | |
Deere & Co. | | | | | | | | |
| | |
2.75%, 4/15/2025 | | | 20,000 | | | | 21,482 | |
| | |
3.75%, 4/15/2050 | | | 64,000 | | | | 75,187 | |
| | |
Otis Worldwide Corp. | | | | | | | | |
| | |
2.06%, 4/5/2025 | | | 40,000 | | | | 41,719 | |
| | |
2.57%, 2/15/2030 | | | 40,000 | | | | 41,179 | |
| | |
3.36%, 2/15/2050 | | | 20,000 | | | | 20,801 | |
| | | | | | | | |
| | |
| | | | | | | 245,025 | |
| | | | | | | | |
|
Media — 4.2% | |
| | |
Charter Communications Operating LLC | | | | | | | | |
| | |
4.46%, 7/23/2022 | | | 242,000 | | | | 253,223 | |
| | |
2.80%, 4/1/2031 | | | 40,000 | | | | 40,503 | |
| | |
6.48%, 10/23/2045 | | | 21,000 | | | | 28,150 | |
| | |
5.38%, 5/1/2047 | | | 30,000 | | | | 35,265 | |
| | |
4.80%, 3/1/2050 | | | 107,000 | | | | 117,666 | |
| | |
3.70%, 4/1/2051 | | | 25,000 | | | | 23,778 | |
| | |
Comcast Corp. | | | | | | | | |
| | |
3.70%, 4/15/2024 | | | 221,000 | | | | 242,315 | |
| | |
3.95%, 10/15/2025 | | | 105,000 | | | | 118,238 | |
| | |
3.15%, 3/1/2026 | | | 88,000 | | | | 96,305 | |
| | |
4.15%, 10/15/2028 | | | 101,000 | | | | 117,475 | |
| | |
3.40%, 4/1/2030 | | | 40,000 | | | | 44,469 | |
| | |
3.90%, 3/1/2038 | | | 150,000 | | | | 173,455 | |
| | |
4.60%, 10/15/2038 | | | 232,000 | | | | 288,994 | |
| | |
3.75%, 4/1/2040 | | | 100,000 | | | | 112,877 | |
| | |
4.00%, 11/1/2049 | | | 30,000 | | | | 34,510 | |
| | |
3.45%, 2/1/2050 | | | 20,000 | | | | 21,189 | |
| | |
2.45%, 8/15/2052 | | | 20,000 | | | | 17,473 | |
| | |
Discovery Communications LLC | | | | | | | | |
| | |
3.95%, 3/20/2028 | | | 76,000 | | | | 84,857 | |
| | |
5.00%, 9/20/2037 | | | 30,000 | | | | 36,189 | |
| | |
4.65%, 5/15/2050 | | | 91,000 | | | | 105,483 | |
| | |
ViacomCBS, Inc. | | | | | | | | |
| | |
4.20%, 5/19/2032 | | | 200,000 | | | | 230,070 | |
| | |
4.95%, 5/19/2050 | | | 76,000 | | | | 91,712 | |
| | | | | | | | |
| | |
| | | | | | | 2,314,196 | |
| | | | | | | | |
|
Metals & Mining — 1.0% | |
| | |
Glencore Funding LLC (Australia) 4.13%, 5/30/2023 (a) | | | 127,000 | | | | 136,564 | |
| | | | | | | | |
| INVESTMENTS | | PRINCIPAL AMOUNT ($) | | | VALUE ($) | |
| | | | | | | | |
|
Metals & Mining — continued | |
| | |
Vale Overseas Ltd. (Brazil) | | | | | | | | |
| | |
6.25%, 8/10/2026 | | | 192,000 | | | | 231,600 | |
| | |
3.75%, 7/8/2030 | | | 190,000 | | | | 201,219 | |
| | | | | | | | |
| | |
| | | | | | | 569,383 | |
| | | | | | | | |
|
Multiline Retail — 0.3% | |
| | |
Dollar General Corp. 3.50%, 4/3/2030 | | | 135,000 | | | | 148,685 | |
| | | | | | | | |
|
Multi-Utilities — 2.4% | |
| | |
Ameren Corp. | | | | | | | | |
| | |
2.50%, 9/15/2024 | | | 141,000 | | | | 149,082 | |
| | |
3.50%, 1/15/2031 | | | 60,000 | | | | 66,681 | |
| | |
Berkshire Hathaway Energy Co. | | | | | | | | |
| | |
4.50%, 2/1/2045 | | | 107,000 | | | | 127,970 | |
| | |
3.80%, 7/15/2048 | | | 76,000 | | | | 84,490 | |
| | |
4.45%, 1/15/2049 | | | 31,000 | | | | 37,414 | |
| | |
2.85%, 5/15/2051 (a) | | | 106,000 | | | | 99,415 | |
| | |
Consolidated Edison Co. of New York, Inc. Series 20B, 3.95%, 4/1/2050 | | | 76,000 | | | | 86,158 | |
| | |
Dominion Energy, Inc. 3.90%, 10/1/2025 | | | 17,000 | | | | 18,971 | |
| | |
NiSource, Inc. | | | | | | | | |
| | |
2.95%, 9/1/2029 | | | 35,000 | | | | 37,055 | |
| | |
3.60%, 5/1/2030 | | | 40,000 | | | | 44,519 | |
| | |
Sempra Energy | | | | | | | | |
| | |
3.25%, 6/15/2027 | | | 40,000 | | | | 44,012 | |
| | |
3.80%, 2/1/2038 | | | 38,000 | | | | 42,004 | |
| | |
4.00%, 2/1/2048 | | | 98,000 | | | | 108,317 | |
| | |
Southern Co. Gas Capital Corp. | | | | | | | | |
| | |
2.45%, 10/1/2023 | | | 205,000 | | | | 214,657 | |
| | |
Series 20-A, 1.75%, 1/15/2031 | | | 152,000 | | | | 146,261 | |
| | | | | | | | |
| | |
| | | | | | | 1,307,006 | |
| | | | | | | | |
|
Oil, Gas & Consumable Fuels — 6.7% | |
| | |
BP Capital Markets America, Inc. | | | | | | | | |
| | |
4.23%, 11/6/2028 | | | 39,000 | | | | 45,290 | |
| | |
3.00%, 2/24/2050 | | | 173,000 | | | | 160,793 | |
| | |
BP Capital Markets plc (United Kingdom) 3.28%, 9/19/2027 | | | 187,000 | | | | 205,318 | |
| | |
Cameron LNG LLC | | | | | | | | |
| | |
2.90%, 7/15/2031 (a) | | | 30,000 | | | | 31,783 | |
| | |
3.30%, 1/15/2035 (a) | | | 25,000 | | | | 26,881 | |
| | |
3.70%, 1/15/2039 (a) | | | 5,000 | | | | 5,460 | |
| | |
Canadian Natural Resources Ltd. (Canada) 4.95%, 6/1/2047 | | | 30,000 | | | | 36,195 | |
| | |
Cheniere Corpus Christi Holdings LLC 5.13%, 6/30/2027 | | | 90,000 | | | | 105,066 | |
SEE NOTES TO FINANCIAL STATEMENTS.
| | | | | | | | |
| | | |
| FEBRUARY 28, 2021 | | J.P. MORGAN EXCHANGE-TRADED FUNDS | | | | | 69 | |
JPMorgan Corporate Bond Research Enhanced ETF
SCHEDULE OF PORTFOLIO INVESTMENTS
AS OF FEBRUARY 28, 2021 (continued)
| | | | | | | | |
| INVESTMENTS | | PRINCIPAL AMOUNT ($) | | | VALUE ($) | |
Corporate Bonds — continued | |
|
Oil, Gas & Consumable Fuels — continued | |
| | |
Chevron Corp. | | | | | | | | |
| | |
1.55%, 5/11/2025 | | | 107,000 | | | | 109,676 | |
| | |
2.95%, 5/16/2026 | | | 88,000 | | | | 95,413 | |
| | |
Columbia Pipeline Group, Inc. 4.50%, 6/1/2025 | | | 192,000 | | | | 217,249 | |
| | |
ConocoPhillips 4.30%, 8/15/2028 (a) | | | 190,000 | | | | 220,912 | |
| | |
Energy Transfer Operating LP 4.95%, 6/15/2028 | | | 32,000 | | | | 36,477 | |
| | |
Exxon Mobil Corp. | | | | | | | | |
| | |
2.99%, 3/19/2025 | | | 78,000 | | | | 84,113 | |
| | |
2.61%, 10/15/2030 | | | 205,000 | | | | 214,639 | |
| | |
3.00%, 8/16/2039 | | | 185,000 | | | | 185,860 | |
| | |
4.33%, 3/19/2050 | | | 20,000 | | | | 23,582 | |
| | |
3.45%, 4/15/2051 | | | 30,000 | | | | 30,785 | |
| | |
Kinder Morgan, Inc. | | | | | | | | |
| | |
4.30%, 6/1/2025 | | | 110,000 | | | | 123,248 | |
| | |
2.00%, 2/15/2031 | | | 66,000 | | | | 63,081 | |
| | |
5.55%, 6/1/2045 | | | 81,000 | | | | 99,543 | |
| | |
Marathon Oil Corp. 4.40%, 7/15/2027 | | | 90,000 | | | | 101,765 | |
| | |
Marathon Petroleum Corp. | | | | | | | | |
| | |
4.50%, 5/1/2023 | | | 320,000 | | | | 345,341 | |
| | |
4.75%, 9/15/2044 | | | 17,000 | | | | 19,260 | |
| | |
MPLX LP | | | | | | | | |
| | |
4.25%, 12/1/2027 | | | 28,000 | | | | 31,912 | |
| | |
4.00%, 3/15/2028 | | | 34,000 | | | | 37,992 | |
| | |
4.50%, 4/15/2038 | | | 78,000 | | | | 86,226 | |
| | |
5.50%, 2/15/2049 | | | 20,000 | | | | 24,301 | |
| | |
Pioneer Natural Resources Co. 1.90%, 8/15/2030 | | | 66,000 | | | | 63,471 | |
| | |
Plains All American Pipeline LP 3.55%, 12/15/2029 | | | 146,000 | | | | 149,897 | |
| | |
Sabine Pass Liquefaction LLC 5.63%, 3/1/2025 | | | 140,000 | | | | 161,401 | |
| | |
Sunoco Logistics Partners Operations LP 5.40%, 10/1/2047 | | | 149,000 | | | | 163,582 | |
| | |
Total Capital International SA (France) | | | | | | | | |
| | |
2.43%, 1/10/2025 | | | 88,000 | | | | 92,706 | |
| | |
2.83%, 1/10/2030 | | | 166,000 | | | | 176,947 | |
| | |
3.46%, 7/12/2049 | | | 20,000 | | | | 20,791 | |
| | |
3.13%, 5/29/2050 | | | 90,000 | | | | 87,958 | |
| | | | | | | | |
| | |
| | | | | | | 3,684,914 | |
| | | | | | | | |
|
Pharmaceuticals — 3.7% | |
| | |
AstraZeneca plc (United Kingdom) | | | | | | | | |
| | |
3.38%, 11/16/2025 | | | 60,000 | | | | 65,944 | |
| | |
4.38%, 11/16/2045 | | | 68,000 | | | | 82,811 | |
| | | | | | | | |
| INVESTMENTS | | PRINCIPAL AMOUNT ($) | | | VALUE ($) | |
| | | | | | | | |
|
Pharmaceuticals — continued | |
| | |
Bristol-Myers Squibb Co. | | | | | | | | |
| | |
3.40%, 7/26/2029 | | | 68,000 | | | | 76,107 | |
| | |
4.13%, 6/15/2039 | | | 110,000 | | | | 132,508 | |
| | |
4.35%, 11/15/2047 | | | 32,000 | | | | 38,981 | |
| | |
4.25%, 10/26/2049 | | | 88,000 | | | | 107,116 | |
| | |
2.55%, 11/13/2050 | | | 80,000 | | | | 73,591 | |
| | |
Eli Lilly and Co. 2.25%, 5/15/2050 | | | 204,000 | | | | 179,293 | |
| | |
Johnson & Johnson 3.70%, 3/1/2046 | | | 80,000 | | | | 92,441 | |
| | |
Pfizer, Inc. 2.70%, 5/28/2050 | | | 174,000 | | | | 165,887 | |
| | |
Royalty Pharma plc | | | | | | | | |
| | |
0.75%, 9/2/2023 (a) | | | 220,000 | | | | 220,645 | |
| | |
3.30%, 9/2/2040 (a) | | | 150,000 | | | | 151,035 | |
| | |
Shire Acquisitions Investments Ireland DAC | | | | | | | | |
| | |
2.88%, 9/23/2023 | | | 156,000 | | | | 164,719 | |
| | |
3.20%, 9/23/2026 | | | 332,000 | | | | 363,344 | |
| | |
Utah Acquisition Sub, Inc. 3.95%, 6/15/2026 | | | 90,000 | | | | 100,522 | |
| | |
Zoetis, Inc. 4.70%, 2/1/2043 | | | 40,000 | | | | 50,915 | |
| | | | | | | | |
| | |
| | | | | | | 2,065,859 | |
| | | | | | | | |
|
Road & Rail — 2.1% | |
| | |
Burlington Northern Santa Fe LLC | | | | | | | | |
| | |
4.55%, 9/1/2044 | | | 25,000 | | | | 31,327 | |
| | |
4.15%, 4/1/2045 | | | 89,000 | | | | 105,725 | |
| | |
CSX Corp. | | | | | | | | |
| | |
3.25%, 6/1/2027 | | | 238,000 | | | | 262,865 | |
| | |
4.25%, 3/15/2029 | | | 40,000 | | | | 46,737 | |
| | |
4.10%, 3/15/2044 | | | 20,000 | | | | 22,924 | |
| | |
4.30%, 3/1/2048 | | | 75,000 | | | | 88,816 | |
| | |
3.80%, 4/15/2050 | | | 10,000 | | | | 11,225 | |
| | |
Norfolk Southern Corp. | | | | | | | | |
| | |
4.15%, 2/28/2048 | | | 166,000 | | | | 193,648 | |
| | |
3.16%, 5/15/2055 | | | 40,000 | | | | 39,283 | |
| | |
Union Pacific Corp. | | | | | | | | |
| | |
3.95%, 9/10/2028 | | | 154,000 | | | | 176,714 | |
| | |
3.70%, 3/1/2029 | | | 88,000 | | | | 99,231 | |
| | |
4.38%, 9/10/2038 | | | 50,000 | | | | 60,186 | |
| | |
3.25%, 2/5/2050 | | | 34,000 | | | | 35,107 | |
| | | | | | | | |
| | |
| | | | | | | 1,173,788 | |
| | | | | | | | |
|
Semiconductors & Semiconductor Equipment — 2.0% | |
| | |
Analog Devices, Inc. 3.50%, 12/5/2026 | | | 108,000 | | | | 120,297 | |
| | |
Broadcom Corp. 3.88%, 1/15/2027 | | | 241,000 | | | | 264,227 | |
| | |
Broadcom, Inc. | | | | | | | | |
| | |
4.75%, 4/15/2029 | | | 68,000 | | | | 77,930 | |
| | |
3.50%, 2/15/2041 (a) | | | 240,000 | | | | 239,172 | |
SEE NOTES TO FINANCIAL STATEMENTS.
| | | | | | |
| | | |
| 70 | | | | J.P. MORGAN EXCHANGE-TRADED FUNDS | | FEBRUARY 28, 2021 |
| | | | | | | | |
| INVESTMENTS | | PRINCIPAL AMOUNT ($) | | | VALUE ($) | |
Corporate Bonds — continued | |
|
Semiconductors & Semiconductor Equipment — continued | |
| | |
Intel Corp. 3.25%, 11/15/2049 | | | 154,000 | | | | 159,220 | |
| | |
NVIDIA Corp. 3.50%, 4/1/2050 | | | 156,000 | | | | 169,273 | |
| | |
NXP BV (Netherlands) 4.30%, 6/18/2029 (a) | | | 40,000 | | | | 45,946 | |
| | |
QUALCOMM, Inc. 3.25%, 5/20/2050 | | | 20,000 | | | | 20,921 | |
| | | | | | | | |
| | |
| | | | | | | 1,096,986 | |
| | | | | | | | |
|
Software — 2.0% | |
| | |
Microsoft Corp. | | | | | | | | |
| | |
3.30%, 2/6/2027 | | | 30,000 | | | | 33,483 | |
| | |
3.45%, 8/8/2036 | | | 88,000 | | | | 102,138 | |
| | |
4.10%, 2/6/2037 | | | 88,000 | | | | 108,914 | |
| | |
3.70%, 8/8/2046 | | | 77,000 | | | | 90,866 | |
| | |
2.53%, 6/1/2050 | | | 76,000 | | | | 71,415 | |
| | |
Oracle Corp. | | | | | | | | |
| | |
2.50%, 4/1/2025 | | | 107,000 | | | | 113,416 | |
| | |
3.25%, 11/15/2027 | | | 71,000 | | | | 78,430 | |
| | |
2.95%, 4/1/2030 | | | 83,000 | | | | 89,321 | |
| | |
3.80%, 11/15/2037 | | | 68,000 | | | | 76,454 | |
| | |
3.60%, 4/1/2040 | | | 138,000 | | | | 149,408 | |
| | |
4.00%, 7/15/2046 | | | 31,000 | | | | 34,777 | |
| | |
3.60%, 4/1/2050 | | | 156,000 | | | | 163,458 | |
| | | | | | | | |
| | |
| | | | | | | 1,112,080 | |
| | | | | | | | |
|
Specialty Retail — 1.6% | |
| | |
AutoZone, Inc. 1.65%, 1/15/2031 | | | 174,000 | | | | 164,575 | |
| | |
Home Depot, Inc. (The) | | | | | | | | |
| | |
2.70%, 4/15/2030 | | | 78,000 | | | | 83,263 | |
| | |
4.20%, 4/1/2043 | | | 30,000 | | | | 35,936 | |
| | |
3.13%, 12/15/2049 | | | 63,000 | | | | 64,489 | |
| | |
3.35%, 4/15/2050 | | | 20,000 | | | | 21,312 | |
| | |
3.50%, 9/15/2056 | | | 20,000 | | | | 21,864 | |
| | |
Lowe’s Cos., Inc. | | | | | | | | |
| | |
3.10%, 5/3/2027 | | | 40,000 | | | | 44,111 | |
| | |
3.70%, 4/15/2046 | | | 107,000 | | | | 116,074 | |
| | |
4.05%, 5/3/2047 | | | 40,000 | | | | 45,537 | |
| | |
O’Reilly Automotive, Inc. 3.60%, 9/1/2027 | | | 239,000 | | | | 267,413 | |
| | | | | | | | |
| | |
| | | | | | | 864,574 | |
| | | | | | | | |
|
Technology Hardware, Storage & Peripherals — 2.3% | |
| | |
Apple, Inc. | | | | | | | | |
| | |
2.40%, 5/3/2023 | | | 104,000 | | | | 108,698 | |
| | |
3.25%, 2/23/2026 | | | 80,000 | | | | 87,992 | |
| | |
2.90%, 9/12/2027 | | | 89,000 | | | | 97,030 | |
| | |
1.65%, 5/11/2030 | | | 40,000 | | | | 39,226 | |
| | |
3.85%, 5/4/2043 | | | 20,000 | | | | 23,342 | |
| | |
3.45%, 2/9/2045 | | | 107,000 | | | | 116,709 | |
| | | | | | | | |
| INVESTMENTS | | PRINCIPAL AMOUNT ($) | | | VALUE ($) | |
| | | | | | | | |
|
Technology Hardware, Storage & Peripherals — continued | |
| | |
4.65%, 2/23/2046 | | | 153,000 | | | | 196,190 | |
| | |
2.65%, 5/11/2050 | | | 20,000 | | | | 18,805 | |
| | |
2.65%, 2/8/2051 | | | 90,000 | | | | 83,748 | |
| | |
Dell International LLC | | | | | | | | |
| | |
5.45%, 6/15/2023 (a) | | | 224,000 | | | | 245,714 | |
| | |
6.02%, 6/15/2026 (a) | | | 152,000 | | | | 182,197 | |
| | |
5.30%, 10/1/2029 (a) | | | 40,000 | | | | 47,538 | |
| | | | | | | | |
| | |
| | | | | | | 1,247,189 | |
| | | | | | | | |
|
Textiles, Apparel & Luxury Goods — 0.1% | |
| | |
NIKE, Inc. 3.38%, 3/27/2050 | | | 64,000 | | | | 70,065 | |
| | | | | | | | |
|
Thrifts & Mortgage Finance — 0.4% | |
|
Nationwide Building Society (United Kingdom) | |
| | |
(ICE LIBOR USD 3 Month + 1.18%), 3.62%, 4/26/2023 (a) (b) | | | 200,000 | | | | 206,876 | |
| | | | | | | | |
|
Tobacco — 1.6% | |
| | |
Altria Group, Inc. | | | | | | | | |
| | |
2.85%, 8/9/2022 | | | 127,000 | | | | 131,231 | |
| | |
4.80%, 2/14/2029 | | | 146,000 | | | | 171,208 | |
| | |
5.38%, 1/31/2044 | | | 79,000 | | | | 95,583 | |
| | |
5.95%, 2/14/2049 | | | 20,000 | | | | 25,553 | |
| | |
BAT Capital Corp. (United Kingdom) | | | | | | | | |
| | |
4.39%, 8/15/2037 | | | 234,000 | | | | 249,851 | |
| | |
4.54%, 8/15/2047 | | | 98,000 | | | | 100,527 | |
| | |
Reynolds American, Inc. (United Kingdom) 4.45%, 6/12/2025 | | | 76,000 | | | | 84,854 | |
| | | | | | | | |
| | |
| | | | | | | 858,807 | |
| | | | | | | | |
|
Trading Companies & Distributors — 1.5% | |
| | |
Air Lease Corp. | | | | | | | | |
| | |
3.00%, 9/15/2023 | | | 338,000 | | | | 354,584 | |
| | |
2.30%, 2/1/2025 | | | 146,000 | | | | 149,187 | |
| | |
2.88%, 1/15/2026 | | | 120,000 | | | | 124,894 | |
| | |
3.75%, 6/1/2026 | | | 78,000 | | | | 84,469 | |
| | |
3.25%, 10/1/2029 | | | 68,000 | | | | 70,133 | |
| | |
3.13%, 12/1/2030 | | | 60,000 | | | | 60,259 | |
| | | | | | | | |
| | |
| | | | | | | 843,526 | |
| | | | | | | | |
|
Water Utilities — 0.1% | |
| | |
American Water Capital Corp. 2.80%, 5/1/2030 | | | 63,000 | | | | 66,881 | |
| | | | | | | | |
|
Wireless Telecommunication Services — 1.7% | |
| | |
Rogers Communications, Inc. (Canada) 3.70%, 11/15/2049 | | | 47,000 | | | | 50,506 | |
| | |
T-Mobile USA, Inc. | | | | | | | | |
| | |
3.50%, 4/15/2025 (a) | | | 195,000 | | | | 210,840 | |
| | |
3.75%, 4/15/2027 (a) | | | 117,000 | | | | 128,878 | |
SEE NOTES TO FINANCIAL STATEMENTS.
| | | | | | | | |
| | | |
| FEBRUARY 28, 2021 | | J.P. MORGAN EXCHANGE-TRADED FUNDS | | | | | 71 | |
JPMorgan Corporate Bond Research Enhanced ETF
SCHEDULE OF PORTFOLIO INVESTMENTS
AS OF FEBRUARY 28, 2021 (continued)
| | | | | | | | |
| INVESTMENTS | | PRINCIPAL AMOUNT ($) | | | VALUE ($) | |
Corporate Bonds — continued | |
|
Wireless Telecommunication Services — continued | |
| | |
3.88%, 4/15/2030 (a) | | | 100,000 | | | | 109,942 | |
| | |
4.38%, 4/15/2040 (a) | | | 25,000 | | | | 28,150 | |
| | |
4.50%, 4/15/2050 (a) | | | 141,000 | | | | 156,702 | |
| | |
Vodafone Group plc (United Kingdom) | | | | | | | | |
| | |
4.38%, 5/30/2028 | | | 68,000 | | | | 79,678 | |
| | |
4.25%, 9/17/2050 | | | 146,000 | | | | 163,739 | |
| | | | | | | | |
| | |
| | | | | | | 928,435 | |
| | | | | | | | |
| | |
Total Corporate Bonds
(Cost $52,636,926) | | | | | | | 54,332,398 | |
| | | | | | | | |
| | |
U.S. Treasury Obligations — 0.7% | | | | | | | | |
| | |
U.S. Treasury Bonds | | | | | | | | |
| | |
2.38%, 11/15/2049 | | | 162,700 | | | | 171,941 | |
| | |
1.25%, 5/15/2050 | | | 110,000 | | | | 88,834 | |
| | |
1.38%, 8/15/2050 | | | 170,400 | | | | 142,257 | |
| | | | | | | | |
| | |
Total U.S. Treasury Obligations
(Cost $447,162) | | | | | | | 403,032 | |
| | | | | | | | |
| | |
Asset-Backed Securities — 0.1% | | | | | | | | |
| | |
Air Canada Pass-Through Trust (Canada) Series 2017-1, Class AA, 3.30%, 1/15/2030 (a) | | | 26,160 | | | | 25,545 | |
| | |
United Airlines Pass-Through Trust Series 2019-2, Class AA, 2.70%, 5/1/2032 | | | 19,705 | | | | 19,557 | |
| | | | | | | | |
| | |
Total Asset-Backed Securities
(Cost $45,135) | | | | | | | 45,102 | |
| | | | | | | | |
| | | | | | | | |
| INVESTMENTS | |
SHARES | | | VALUE ($) | |
| | |
Short-Term Investments — 0.4% | | | | | | | | |
Investment Companies — 0.4% | |
| | |
JPMorgan U.S. Government Money Market Fund Class Institutional Shares, 0.03% (d) (e)
(Cost $194,411) | | | 194,411 | | | | 194,411 | |
| | | | | | | | |
| | |
Total Investments — 99.4%
(Cost $53,323,634) | | | | | | | 54,974,943 | |
| | |
Other Assets Less
Liabilities — 0.6% | | | | | | | 357,695 | |
| | | | | |
| |
Net Assets — 100.0% | | | | 55,332,638 | |
| | | | | |
Percentages indicated are based on net assets.
Abbreviations
| | |
ICE | | Intercontinental Exchange |
LIBOR | | London Interbank Offered Rate |
SOFR | | Secured Overnight Financing Rate |
USD | | United States Dollar |
| |
(a) | | Securities exempt from registration under Rule 144A or section 4(a)(2), of the Securities Act of 1933, as amended. |
(b) | | Variable or floating rate security, linked to the referenced benchmark. The interest rate shown is the current rate as of February 28, 2021. |
(c) | | Amount rounds to less than 0.1% of net assets. |
(d) | | Investment in an affiliated fund, which is registered under the Investment Company Act of 1940, as amended, and is advised by J.P. Morgan Investment Management Inc. |
(e) | | The rate shown is the current yield as of February 28, 2021. |
| | | | | | | | | | | | | | | | | | | | |
| Futures contracts outstanding as of February 28, 2021: | |
| DESCRIPTION | | NUMBER OF
CONTRACTS | | | EXPIRATION
DATE | | | TRADING
CURRENCY | | | NOTIONAL
AMOUNT ($) | | | VALUE AND
UNREALIZED
APPRECIATION
(DEPRECIATION) ($) | |
Long Contracts | | | | | | | | | | | | | | | | | | | | |
U.S. Treasury 5 Year Note | | | 3 | | | | 06/2021 | | | | USD | | | | 372,750 | | | | (1,975 | ) |
U.S. Treasury Long Bond | | | 20 | | | | 06/2021 | | | | USD | | | | 3,212,500 | | | | (3,848 | ) |
| | | | | | | | | | | | | | | | | | | | |
| | | | | | | | | | | | | | | | | | | (5,823 | ) |
| | | | | | | | | | | | | | | | | | | | |
Short Contracts | | | | | | | | | | | | | |
U.S. Treasury 2 Year Note | | | (2 | ) | | | 06/2021 | | �� | | USD | | | | (441,734 | ) | | | 90 | |
U.S. Treasury 10 Year Note | | | (6 | ) | | | 06/2021 | | | | USD | | | | (798,844 | ) | | | 7,019 | |
U.S. Treasury 10 Year Ultra Note | | | (10 | ) | | | 06/2021 | | | | USD | | | | (1,481,562 | ) | | | 4,839 | |
U.S. Treasury Ultra Bond | | | (7 | ) | | | 06/2021 | | | | USD | | | | (1,341,813 | ) | | | (12,703 | ) |
| | | | | | | | | | | | | | | | | | | | |
| | | | | | | | | | | | | | | | | | | (755 | ) |
| | | | | | | | | | | | | | | | | | | | |
| | | | | | | | | | | | | | | | | | | (6,578 | ) |
| | | | | | | | | | | | | | | | | | | | |
| | |
| Abbreviations |
| |
| USD | | United States Dollar |
SEE NOTES TO FINANCIAL STATEMENTS.
| | | | | | |
| | | |
| 72 | | | | J.P. MORGAN EXCHANGE-TRADED FUNDS | | FEBRUARY 28, 2021 |
JPMorgan High Yield Research Enhanced ETF
SCHEDULE OF PORTFOLIO INVESTMENTS
AS OF FEBRUARY 28, 2021
| | | | | | | | |
| INVESTMENTS | | PRINCIPAL AMOUNT ($) | | | VALUE ($) | |
Corporate Bonds — 97.8% | | | | | | | | |
| | |
Aerospace & Defense — 3.2% | | | | | | | | |
| | |
Bombardier, Inc. (Canada) | | | | | | | | |
| | |
6.13%, 1/15/2023 (a) | | | 1,525,000 | | | | 1,508,606 | |
| | |
7.88%, 4/15/2027 (a) | | | 1,525,000 | | | | 1,368,993 | |
| | |
BWX Technologies, Inc. | | | | | | | | |
| | |
5.38%, 7/15/2026 (a) | | | 584,000 | | | | 604,440 | |
| | |
4.13%, 6/30/2028 (a) | | | 623,000 | | | | 647,141 | |
| | |
Howmet Aerospace, Inc. | | | | | | | | |
| | |
6.88%, 5/1/2025 | | | 5,842,000 | | | | 6,788,112 | |
| | |
5.95%, 2/1/2037 | | | 4,802,000 | | | | 5,774,165 | |
| | |
Rolls-Royce plc (United Kingdom) 5.75%, 10/15/2027 (a) | | | 975,000 | | | | 1,054,219 | |
| | |
Spirit AeroSystems, Inc. | | | | | | | | |
| | |
7.50%, 4/15/2025 (a) | | | 1,006,000 | | | | 1,064,147 | |
| | |
4.60%, 6/15/2028 | | | 754,000 | | | | 728,846 | |
| | |
TransDigm, Inc. | | | | | | | | |
| | |
6.25%, 3/15/2026 (a) | | | 18,030,000 | | | | 19,001,637 | |
| | |
5.50%, 11/15/2027 | | | 4,781,000 | | | | 4,911,521 | |
| | |
4.63%, 1/15/2029 (a) | | | 1,006,000 | | | | 989,652 | |
| | |
Triumph Group, Inc. | | | | | | | | |
| | |
8.88%, 6/1/2024 (a) | | | 2,710,000 | | | | 2,994,550 | |
| | |
7.75%, 8/15/2025 | | | 2,014,000 | | | | 1,953,580 | |
| | | | | | | | |
| | |
| | | | | | | 49,389,609 | |
| | | | | | | | |
| | |
Air Freight & Logistics — 0.4% | | | | | | | | |
| | |
XPO Logistics, Inc. | | | | | | | | |
| | |
6.75%, 8/15/2024 (a) | | | 1,510,000 | | | | 1,585,500 | |
| | |
6.25%, 5/1/2025 (a) | | | 4,475,000 | | | | 4,806,374 | |
| | | | | | | | |
| | |
| | | | | | | 6,391,874 | |
| | | | | | | | |
| | |
Airlines — 0.2% | | | | | | | | |
| | |
Delta Air Lines, Inc. 7.38%, 1/15/2026 | | | 2,135,000 | | | | 2,500,544 | |
| | | | | | | | |
| | |
Auto Components — 2.3% | | | | | | | | |
| | |
Adient Global Holdings Ltd. 4.88%, 8/15/2026 (a) | | | 1,225,000 | | | | 1,237,250 | |
| | |
Adient US LLC 7.00%, 5/15/2026 (a) | | | 1,006,000 | | | | 1,082,823 | |
| | |
Allison Transmission, Inc. 5.88%, 6/1/2029 (a) | | | 706,000 | | | | 762,480 | |
| | |
American Axle & Manufacturing, Inc. | | | | | | | | |
| | |
6.25%, 4/1/2025 | | | 4,230,000 | | | | 4,357,323 | |
| | |
6.50%, 4/1/2027 | | | 3,052,000 | | | | 3,186,715 | |
| | |
Clarios Global LP | | | | | | | | |
| | |
6.25%, 5/15/2026 (a) | | | 2,988,000 | | | | 3,182,220 | |
| | |
8.50%, 5/15/2027 (a) | | | 1,830,000 | | | | 1,974,570 | |
| | |
Cooper-Standard Automotive, Inc. | | | | | | | | |
| | |
13.00%, 6/1/2024 (a) | | | 627,000 | | | | 719,483 | |
| | |
5.63%, 11/15/2026 (a) | | | 1,773,000 | | | | 1,541,269 | |
| | | | | | | | |
| INVESTMENTS | | PRINCIPAL AMOUNT ($) | | | VALUE ($) | |
| | | | | | | | |
| | |
Auto Components — continued | | | | | | | | |
| | |
Dana, Inc. | | | | | | | | |
| | |
5.50%, 12/15/2024 | | | 931,000 | | | | 947,292 | |
| | |
5.63%, 6/15/2028 | | | 630,000 | | | | 668,588 | |
| | |
Goodyear Tire & Rubber Co. (The) 5.00%, 5/31/2026 | | | 1,800,000 | | | | 1,838,916 | |
| | |
Icahn Enterprises LP | | | | | | | | |
| | |
4.75%, 9/15/2024 | | | 599,000 | | | | 629,699 | |
| | |
6.25%, 5/15/2026 | | | 2,990,000 | | | | 3,142,370 | |
| | |
5.25%, 5/15/2027 | | | 4,036,000 | | | | 4,237,800 | |
| | |
IHO Verwaltungs GmbH (Germany) 6.38% (cash), 5/15/2029 (a) (b) | | | 1,250,000 | | | | 1,389,375 | |
| | |
Tenneco, Inc. | | | | | | | | |
| | |
5.00%, 7/15/2026 | | | 1,913,000 | | | | 1,795,829 | |
| | |
7.88%, 1/15/2029 (a) | | | 1,000,000 | | | | 1,120,905 | |
| | |
ZF North America Capital, Inc. (Germany) 4.75%, 4/29/2025 (a) | | | 2,580,000 | | | | 2,786,400 | |
| | | | | | | | |
| | |
| | | | | | | 36,601,307 | |
| | | | | | | | |
| | |
Automobiles — 0.4% | | | | | | | | |
| | |
Ford Motor Co. | | | | | | | | |
| | |
8.50%, 4/21/2023 | | | 1,496,000 | | | | 1,671,780 | |
| | |
7.45%, 7/16/2031 | | | 1,793,000 | | | | 2,324,176 | |
| | |
PM General Purchaser LLC | | | | | | | | |
| | |
9.50%, 10/1/2028 (a) | | | 1,525,000 | | | | 1,678,949 | |
| | | | | | | | |
| | |
| | | | | | | 5,674,905 | |
| | | | | | | | |
| | |
Banks — 0.2% | | | | | | | | |
| | |
CIT Group, Inc. 6.13%, 3/9/2028 | | | 2,760,000 | | | | 3,415,500 | |
| | | | | | | | |
| | |
Building Products — 1.8% | | | | | | | | |
| | |
Builders FirstSource, Inc. 6.75%, 6/1/2027 (a) | | | 2,961,000 | | | | 3,175,672 | |
| | |
Forterra Finance LLC 6.50%, 7/15/2025 (a) | | | 1,236,000 | | | | 1,328,700 | |
| | |
Griffon Corp. 5.75%, 3/1/2028 | | | 2,421,000 | | | | 2,542,050 | |
| | |
James Hardie International Finance DAC 5.00%, 1/15/2028 (a) | | | 1,900,000 | | | | 2,023,500 | |
| | |
JELD-WEN, Inc. 4.88%, 12/15/2027 (a) | | | 2,976,000 | | | | 3,089,386 | |
| | |
Masonite International Corp. 5.38%, 2/1/2028 (a) | | | 1,482,000 | | | | 1,563,510 | |
| | |
PGT Innovations, Inc. 6.75%, 8/1/2026 (a) | | | 867,000 | | | | 919,020 | |
| | |
Standard Industries, Inc. | | | | | | | | |
| | |
5.00%, 2/15/2027 (a) | | | 575,000 | | | | 593,687 | |
| | |
4.75%, 1/15/2028 (a) | | | 7,534,000 | | | | 7,816,525 | |
| | |
Summit Materials LLC | | | | | | | | |
| | |
6.50%, 3/15/2027 (a) | | | 2,143,000 | | | | 2,266,790 | |
| | |
5.25%, 1/15/2029 (a) | | | 3,025,000 | | | | 3,210,281 | |
| | | | | | | | |
| | |
| | | | | | | 28,529,121 | |
| | | | | | | | |
SEE NOTES TO FINANCIAL STATEMENTS.
| | | | | | | | |
| | | |
| FEBRUARY 28, 2021 | | J.P. MORGAN EXCHANGE-TRADED FUNDS | | | | | 73 | |
JPMorgan High Yield Research Enhanced ETF
SCHEDULE OF PORTFOLIO INVESTMENTS
AS OF FEBRUARY 28, 2021 (continued)
| | | | | | | | |
| INVESTMENTS | | PRINCIPAL AMOUNT ($) | | | VALUE ($) | |
Corporate Bonds — continued | | | | | | | | |
| | |
Capital Markets — 0.9% | | | | | | | | |
| | |
LPL Holdings, Inc. | | | | | | | | |
| | |
5.75%, 9/15/2025 (a) | | | 2,079,000 | | | | 2,141,786 | |
| | |
4.63%, 11/15/2027 (a) | | | 3,050,000 | | | | 3,119,540 | |
| | |
MSCI, Inc. | | | | | | | | |
| | |
5.38%, 5/15/2027 (a) | | | 1,479,000 | | | | 1,575,135 | |
| | |
4.00%, 11/15/2029 (a) | | | 3,484,000 | | | | 3,693,423 | |
| | |
3.88%, 2/15/2031 (a) | | | 3,010,000 | | | | 3,160,500 | |
| | | | | | | | |
| | |
| | | | | | | 13,690,384 | |
| | | | | | | | |
| | |
Chemicals — 2.8% | | | | | | | | |
| | |
Avient Corp. 5.75%, 5/15/2025 (a) | | | 1,169,000 | | | | 1,239,374 | |
| | |
Axalta Coating Systems LLC 4.75%, 6/15/2027 (a) | | | 2,650,000 | | | | 2,769,594 | |
| | |
CF Industries, Inc. | | | | | | | | |
| | |
5.15%, 3/15/2034 | | | 1,010,000 | | | | 1,220,858 | |
| | |
5.38%, 3/15/2044 | | | 1,186,000 | | | | 1,481,017 | |
| | |
Chemours Co. (The) | | | | | | | | |
| | |
7.00%, 5/15/2025 | | | 883,000 | | | | 910,267 | |
| | |
5.38%, 5/15/2027 | | | 1,487,000 | | | | 1,565,068 | |
| | |
5.75%, 11/15/2028 (a) | | | 3,005,000 | | | | 3,080,125 | |
| | |
CVR Partners LP 9.25%, 6/15/2023 (a) | | | 2,089,000 | | | | 2,121,087 | |
| | |
Element Solutions, Inc. 3.88%, 9/1/2028 (a) | | | 2,676,000 | | | | 2,672,923 | |
| | |
Hexion, Inc. 7.88%, 7/15/2027 (a) | | | 2,705,000 | | | | 2,867,300 | |
| | |
INEOS Group Holdings SA (Luxembourg) 5.63%, 8/1/2024 (a) | | | 200,000 | | | | 203,042 | |
| | |
Ingevity Corp. 3.88%, 11/1/2028 (a) | | | 1,510,000 | | | | 1,494,908 | |
| | |
Methanex Corp. (Canada) 5.25%, 12/15/2029 | | | 1,234,000 | | | | 1,265,621 | |
| | |
OCI NV (Netherlands) 5.25%, 11/1/2024 (a) | | | 2,105,000 | | | | 2,176,044 | |
| | |
Olin Corp. | | | | | | | | |
| | |
9.50%, 6/1/2025 (a) | | | 612,000 | | | | 757,262 | |
| | |
5.13%, 9/15/2027 | | | 865,000 | | | | 896,940 | |
| | |
5.63%, 8/1/2029 | | | 1,475,000 | | | | 1,591,156 | |
| | |
Rain CII Carbon LLC 7.25%, 4/1/2025 (a) | | | 2,403,000 | | | | 2,459,182 | |
| | |
Scotts Miracle-Gro Co. (The) 4.50%, 10/15/2029 | | | 935,000 | | | | 991,427 | |
| | |
Trinseo Materials Operating SCA 5.38%, 9/1/2025 (a) | | | 1,525,000 | | | | 1,546,502 | |
| | |
Tronox, Inc. | | | | | | | | |
| | |
6.50%, 5/1/2025 (a) | | | 3,327,000 | | | | 3,559,890 | |
| | |
6.50%, 4/15/2026 (a) | | | 1,531,000 | | | | 1,582,702 | |
| | |
Valvoline, Inc. 4.25%, 2/15/2030 (a) | | | 3,023,000 | | | | 3,113,690 | |
| | |
Venator Finance SARL 9.50%, 7/1/2025 (a) | | | 797,000 | | | | 900,610 | |
| | | | | | | | |
| INVESTMENTS | | PRINCIPAL AMOUNT ($) | | | VALUE ($) | |
| | | | | | | | |
| | |
Chemicals — continued | | | | | | | | |
| | |
W.R. Grace & Co.-Conn. 4.88%, 6/15/2027 (a) | | | 865,000 | | | | 896,832 | |
| | | | | | | | |
| | |
| | | | | | | 43,363,421 | |
| | | | | | | | |
|
Commercial Services & Supplies — 2.6% | |
| | |
ACCO Brands Corp. 5.25%, 12/15/2024 (a) | | | 927,000 | | | | 950,175 | |
| | |
ADT Security Corp. (The) | | | | | | | | |
| | |
3.50%, 7/15/2022 | | | 1,194,000 | | | | 1,202,955 | |
| | |
4.13%, 6/15/2023 | | | 1,215,000 | | | | 1,265,970 | |
| | |
4.88%, 7/15/2032 (a) | | | 2,080,000 | | | | 2,202,200 | |
| | |
Allied Universal Holdco LLC | | | | | | | | |
| | |
6.63%, 7/15/2026 (a) | | | 3,044,000 | | | | 3,223,687 | |
| | |
9.75%, 7/15/2027 (a) | | | 2,121,000 | | | | 2,340,609 | |
| | |
Aramark Services, Inc. | | | | | | | | |
| | |
6.38%, 5/1/2025 (a) | | | 610,000 | | | | 644,312 | |
| | |
5.00%, 2/1/2028 (a) | | | 610,000 | | | | 625,250 | |
| | |
Brink’s Co. (The) 4.63%, 10/15/2027 (a) | | | 1,794,000 | | | | 1,848,789 | |
| | |
CoreCivic, Inc. 4.63%, 5/1/2023 | | | 1,480,000 | | | | 1,431,900 | |
| | |
Covanta Holding Corp. 6.00%, 1/1/2027 | | | 610,000 | | | | 634,400 | |
| | |
Garda World Security Corp. (Canada) | | | | | | | | |
| | |
4.63%, 2/15/2027 (a) | | | 1,826,000 | | | | 1,812,305 | |
| | |
9.50%, 11/1/2027 (a) | | | 2,100,000 | | | | 2,268,000 | |
| | |
GFL Environmental, Inc. (Canada) | | | | | | | | |
| | |
4.25%, 6/1/2025 (a) | | | 2,981,000 | | | | 3,056,151 | |
| | |
8.50%, 5/1/2027 (a) | | | 1,846,000 | | | | 2,030,600 | |
| | |
Nielsen Co. Luxembourg SARL (The) 5.00%, 2/1/2025 (a) | | | 1,526,000 | | | | 1,563,959 | |
| | |
Nielsen Finance LLC 5.63%, 10/1/2028 (a) | | | 5,209,000 | | | | 5,488,202 | |
| | |
Prime Security Services Borrower LLC | | | | | | | | |
| | |
5.25%, 4/15/2024 (a) | | | 2,710,000 | | | | 2,889,538 | |
| | |
5.75%, 4/15/2026 (a) | | | 4,534,000 | | | | 4,885,385 | |
| | |
Stericycle, Inc. 3.88%, 1/15/2029 (a) | | | 610,000 | | | | 614,362 | |
| | | | | | | | |
| | |
| | | | | | | 40,978,749 | |
| | | | | | | | |
| | |
Communications Equipment — 1.2% | | | | | | | | |
| | |
CommScope Technologies LLC | | | | | | | | |
| | |
6.00%, 6/15/2025 (a) | | | 2,430,000 | | | | 2,470,946 | |
| | |
5.00%, 3/15/2027 (a) | | | 5,449,000 | | | | 5,337,731 | |
| | |
CommScope, Inc. | | | | | | | | |
| | |
5.50%, 3/1/2024 (a) | | | 642,000 | | | | 658,853 | |
| | |
6.00%, 3/1/2026 (a) | | | 3,001,000 | | | | 3,154,801 | |
| | |
8.25%, 3/1/2027 (a) | | | 4,191,000 | | | | 4,416,224 | |
| | |
Nokia OYJ (Finland) | | | | | | | | |
| | |
4.38%, 6/12/2027 | | | 610,000 | | | | 658,800 | |
| | |
6.63%, 5/15/2039 | | | 610,000 | | | | 779,580 | |
SEE NOTES TO FINANCIAL STATEMENTS.
| | | | | | |
| | | |
| 74 | | | | J.P. MORGAN EXCHANGE-TRADED FUNDS | | FEBRUARY 28, 2021 |
| | | | | | | | |
| INVESTMENTS | | PRINCIPAL AMOUNT ($) | | | VALUE ($) | |
Corporate Bonds — continued | | | | | | | | |
|
Communications Equipment — continued | |
| | |
Viasat, Inc. 6.50%, 7/15/2028 (a) | | | 610,000 | | | | 651,419 | |
| | | | | | | | |
| | |
| | | | | | | 18,128,354 | |
| | | | | | | | |
| | |
Construction & Engineering — 0.4% | | | | | | | | |
| | |
AECOM | | | | | | | | |
| | |
5.88%, 10/15/2024 | | | 2,135,000 | | | | 2,369,850 | |
| | |
5.13%, 3/15/2027 | | | 1,475,000 | | | | 1,611,437 | |
| | |
MasTec, Inc. 4.50%, 8/15/2028 (a) | | | 3,000,000 | | | | 3,135,600 | |
| | | | | | | | |
| | |
| | | | | | | 7,116,887 | |
| | | | | | | | |
| | |
Consumer Finance — 4.4% | | | | | | | | |
| | |
Curo Group Holdings Corp. 8.25%, 9/1/2025 (a) | | | 860,000 | | | | 866,450 | |
| | |
Ford Motor Credit Co. LLC | | | | | | | | |
| | |
5.58%, 3/18/2024 | | | 7,950,000 | | | | 8,576,063 | |
| | |
5.13%, 6/16/2025 | | | 6,225,000 | | | | 6,723,000 | |
| | |
4.13%, 8/17/2027 | | | 17,950,000 | | | | 18,892,375 | |
| | |
4.00%, 11/13/2030 | | | 2,050,000 | | | | 2,096,125 | |
| | |
Global Aircraft Leasing Co. Ltd. (Cayman Islands) 7.25% (PIK), 9/15/2024 (a) (b) | | | 1,410,803 | | | | 1,261,918 | |
| | |
Navient Corp. | | | | | | | | |
| | |
7.25%, 9/25/2023 | | | 3,289,000 | | | | 3,568,565 | |
| | |
5.88%, 10/25/2024 | | | 3,524,000 | | | | 3,709,010 | |
| | |
OneMain Finance Corp. | | | | | | | | |
| | |
6.13%, 5/15/2022 | | | 2,379,000 | | | | 2,483,081 | |
| | |
6.13%, 3/15/2024 | | | 7,183,000 | | | | 7,708,293 | |
| | |
7.13%, 3/15/2026 | | | 11,764,000 | | | | 13,587,420 | |
| | | | | | | | |
| | |
| | | | | | | 69,472,300 | |
| | | | | | | | |
| | |
Containers & Packaging — 1.5% | | | | | | | | |
| | |
Ardagh Packaging Finance plc | | | | | | | | |
| | |
5.25%, 4/30/2025 (a) | | | 410,000 | | | | 432,550 | |
| | |
4.13%, 8/15/2026 (a) | | | 1,425,000 | | | | 1,474,744 | |
| | |
5.25%, 8/15/2027 (a) | | | 1,225,000 | | | | 1,269,038 | |
| | |
Ball Corp. | | | | | | | | |
| | |
5.25%, 7/1/2025 | | | 610,000 | | | | 686,250 | |
| | |
4.88%, 3/15/2026 | | | 1,636,000 | | | | 1,819,919 | |
| | |
Graham Packaging Co., Inc. 7.13%, 8/15/2028 (a) | | | 2,426,000 | | | | 2,622,603 | |
| | |
Graphic Packaging International LLC | | | | | | | | |
| | |
4.88%, 11/15/2022 | | | 231,000 | | | | 240,529 | |
| | |
4.75%, 7/15/2027 (a) | | | 939,000 | | | | 1,038,064 | |
| | |
3.50%, 3/1/2029 (a) | | | 120,000 | | | | 120,600 | |
| | |
LABL Escrow Issuer LLC 6.75%, 7/15/2026 (a) | | | 1,222,000 | | | | 1,310,595 | |
| | |
Mauser Packaging Solutions Holding Co. | | | | | | | | |
| | |
5.50%, 4/15/2024 (a) | | | 2,708,000 | | | | 2,721,540 | |
| | |
7.25%, 4/15/2025 (a) | | | 3,632,000 | | | | 3,588,915 | |
| | | | | | | | |
| INVESTMENTS | | PRINCIPAL AMOUNT ($) | | | VALUE ($) | |
| | | | | | | | |
| | |
Containers & Packaging — continued | | | | | | | | |
| | |
Owens-Brockway Glass Container, Inc. 6.63%, 5/13/2027 (a) | | | 1,167,000 | | | | 1,251,608 | |
| | |
Reynolds Group Issuer, Inc. 4.00%, 10/15/2027 (a) | | | 1,822,000 | | | | 1,816,297 | |
| | |
Sealed Air Corp. 6.88%, 7/15/2033 (a) | | | 1,495,000 | | | | 1,943,500 | |
| | |
Trivium Packaging Finance BV (Netherlands) 5.50%, 8/15/2026 (a) (c) | | | 1,275,000 | | | | 1,333,969 | |
| | | | | | | | |
| | |
| | | | | | | 23,670,721 | |
| | | | | | | | |
| | |
Distributors — 0.7% | | | | | | | | |
| | |
American Builders & Contractors Supply Co., Inc. 4.00%, 1/15/2028 (a) | | | 754,000 | | | | 761,540 | |
| | |
Performance Food Group, Inc. 5.50%, 10/15/2027 (a) | | | 5,144,000 | | | | 5,401,663 | |
| | |
Wolverine Escrow LLC | | | | | | | | |
| | |
8.50%, 11/15/2024 (a) | | | 2,057,000 | | | | 2,010,717 | |
| | |
9.00%, 11/15/2026 (a) | | | 3,072,000 | | | | 3,025,920 | |
| | | | | | | | |
| | |
| | | | | | | 11,199,840 | |
| | | | | | | | |
|
Diversified Consumer Services — 0.0% (d) | |
| | |
Service Corp. International 5.13%, 6/1/2029 | | | 583,000 | | | | 630,007 | |
| | | | | | | | |
| | |
Diversified Financial Services — 0.4% | | | | | | | | |
| | |
Sabre GLBL, Inc. 9.25%, 4/15/2025 (a) | | | 4,862,000 | | | | 5,767,548 | |
| | | | | | | | |
|
Diversified Telecommunication Services — 5.7% | |
| | |
Altice France Holding SA (Luxembourg) | | | | | | | | |
| | |
10.50%, 5/15/2027 (a) | | | 2,500,000 | | | | 2,810,750 | |
| | |
6.00%, 2/15/2028 (a) | | | 1,750,000 | | | | 1,712,813 | |
| | |
Altice France SA (France) | | | | | | | | |
| | |
7.38%, 5/1/2026 (a) | | | 630,000 | | | | 656,901 | |
| | |
5.50%, 1/15/2028 (a) | | | 4,110,000 | | | | 4,192,200 | |
| | |
5.13%, 1/15/2029 (a) | | | 4,100,000 | | | | 4,122,611 | |
| | |
CCO Holdings LLC | | | | | | | | |
| | |
5.75%, 2/15/2026 (a) | | | 6,305,000 | | | | 6,516,533 | |
| | |
5.13%, 5/1/2027 (a) | | | 4,530,000 | | | | 4,745,628 | |
| | |
5.38%, 6/1/2029 (a) | | | 9,631,000 | | | | 10,379,521 | |
| | |
4.75%, 3/1/2030 (a) | | | 13,228,000 | | | | 13,806,064 | |
| | |
Cincinnati Bell, Inc. 7.00%, 7/15/2024 (a) | | | 1,227,000 | | | | 1,276,080 | |
| | |
Embarq Corp. 8.00%, 6/1/2036 | | | 2,385,000 | | | | 2,835,169 | |
| | |
Frontier Communications Corp. | | | | | | | | |
| | |
5.88%, 10/15/2027 (a) | | | 3,905,000 | | | | 4,178,350 | |
| | |
5.00%, 5/1/2028 (a) | | | 3,050,000 | | | | 3,140,585 | |
| | |
Level 3 Financing, Inc. 4.63%, 9/15/2027 (a) | | | 1,521,000 | | | | 1,573,779 | |
| | |
Lumen Technologies, Inc. Series Y, 7.50%, 4/1/2024 | | | 590,000 | | | | 662,275 | |
SEE NOTES TO FINANCIAL STATEMENTS.
| | | | | | | | |
| | | |
| FEBRUARY 28, 2021 | | J.P. MORGAN EXCHANGE-TRADED FUNDS | | | | | 75 | |
JPMorgan High Yield Research Enhanced ETF
SCHEDULE OF PORTFOLIO INVESTMENTS
AS OF FEBRUARY 28, 2021 (continued)
| | | | | | | | |
| INVESTMENTS | | PRINCIPAL AMOUNT ($) | | | VALUE ($) | |
Corporate Bonds — continued | | | | | | | | |
| |
Diversified Telecommunication Services — continued | | | | | |
| | |
Sprint Capital Corp. | | | | | | | | |
| | |
6.88%, 11/15/2028 | | | 6,023,000 | | | | 7,619,095 | |
| | |
8.75%, 3/15/2032 | | | 3,050,000 | | | | 4,538,400 | |
| | |
Telecom Italia Capital SA (Italy) 7.72%, 6/4/2038 | | | 5,691,000 | | | | 7,619,111 | |
| | |
Telecom Italia SpA (Italy) 5.30%, 5/30/2024 (a) | | | 2,251,000 | | | | 2,437,090 | |
| | |
Virgin Media Secured Finance plc (United Kingdom) | | | | | | | | |
| | |
5.50%, 8/15/2026 (a) | | | 612,000 | | | | 637,168 | |
| | |
5.50%, 5/15/2029 (a) | | | 1,120,000 | | | | 1,200,438 | |
| | |
4.50%, 8/15/2030 (a) | | | 1,465,000 | | | | 1,497,963 | |
| | |
Zayo Group Holdings, Inc. 4.00%, 3/1/2027 (a) | | | 890,000 | | | | 886,333 | |
| | | | | | | | |
| | |
| | | | | | | 89,044,857 | |
| | | | | | | | |
| | |
Electric Utilities — 2.2% | | | | | | | | |
| | |
FirstEnergy Corp. | | | | | | | | |
| | |
Series B, 4.25%, 3/15/2023 (c) | | | 1,525,000 | | | | 1,614,563 | |
| | |
Series C, 7.38%, 11/15/2031 | | | 1,525,000 | | | | 2,097,455 | |
| | |
Series C, 5.35%, 7/15/2047 (c) | | | 1,525,000 | | | | 1,814,750 | |
| | |
NextEra Energy Operating Partners LP 4.50%, 9/15/2027 (a) | | | 1,220,000 | | | | 1,358,714 | |
| | |
NRG Energy, Inc. | | | | | | | | |
| | |
6.63%, 1/15/2027 | | | 1,815,000 | | | | 1,887,382 | |
| | |
5.75%, 1/15/2028 | | | 1,201,000 | | | | 1,276,062 | |
| | |
5.25%, 6/15/2029 (a) | | | 4,859,000 | | | | 5,128,043 | |
| | |
3.63%, 2/15/2031 (a) | | | 3,020,000 | | | | 2,974,700 | |
| | |
PG&E Corp. 5.25%, 7/1/2030 | | | 6,331,000 | | | | 6,772,271 | |
| | |
Vistra Operations Co. LLC | | | | | | | | |
| | |
5.50%, 9/1/2026 (a) | | | 915,000 | | | | 949,312 | |
| | |
5.63%, 2/15/2027 (a) | | | 8,137,000 | | | | 8,503,165 | |
| | | | | | | | |
| | |
| | | | | | | 34,376,417 | |
| | | | | | | | |
| | |
Electrical Equipment — 0.1% | | | | | | | | |
| | |
EnerSys 5.00%, 4/30/2023 (a) | | | 1,164,000 | | | | 1,220,082 | |
| | | | | | | | |
|
Electronic Equipment, Instruments & Components — 0.6% | |
| | |
CDW LLC 3.25%, 2/15/2029 | | | 2,145,000 | | | | 2,110,680 | |
| | |
MTS Systems Corp. 5.75%, 8/15/2027 (a) | | | 863,000 | | | | 938,944 | |
| | |
Sensata Technologies, Inc. | | | | | | | | |
| | |
4.38%, 2/15/2030 (a) | | | 3,946,000 | | | | 4,207,422 | |
| | |
3.75%, 2/15/2031 (a) | | | 2,990,000 | | | | 3,001,213 | |
| | | | | | | | |
| | |
| | | | | | | 10,258,259 | |
| | | | | | | | |
| | |
Energy Equipment & Services — 0.9% | | | | | | | | |
| | |
Archrock Partners LP 6.88%, 4/1/2027 (a) | | | 1,826,000 | | | | 1,926,832 | |
| | | | | | | | |
| INVESTMENTS | | PRINCIPAL AMOUNT ($) | | | VALUE ($) | |
| | | | | | | | |
| |
Energy Equipment & Services — continued | | | | | |
| | |
Nabors Industries Ltd. 7.25%, 1/15/2026 (a) | | | 1,220,000 | | | | 1,083,146 | |
| | |
Nabors Industries, Inc. 5.75%, 2/1/2025 | | | 1,525,000 | | | | 1,210,469 | |
| | |
Oceaneering International, Inc. 4.65%, 11/15/2024 | | | 1,212,000 | | | | 1,207,455 | |
| | |
Precision Drilling Corp. (Canada) | | | | | | | | |
| | |
5.25%, 11/15/2024 | | | 1,525,000 | | | | 1,425,875 | |
| | |
7.13%, 1/15/2026 (a) | | | 1,175,000 | | | | 1,139,750 | |
| | |
TechnipFMC plc (United Kingdom) 6.50%, 2/1/2026 (a) | | | 2,118,000 | | | | 2,217,909 | |
| | |
Transocean Guardian Ltd. 5.88%, 1/15/2024 (a) | | | 959,177 | | | | 868,055 | |
| | |
Transocean Pontus Ltd. 6.13%, 8/1/2025 (a) | | | 733,700 | | | | 700,683 | |
| | |
USA Compression Partners LP 6.88%, 4/1/2026 | | | 865,000 | | | | 893,113 | |
| | |
Weatherford International Ltd. | | | | | | | | |
| | |
8.75%, 9/1/2024 (a) | | | 1,212,026 | | | | 1,272,264 | |
| | |
11.00%, 12/1/2024 (a) | | | 608,000 | | | | 597,177 | |
| | | | | | | | |
| | |
| | | | | | | 14,542,728 | |
| | | | | | | | |
| | |
Entertainment — 2.3% | | | | | | | | |
| | |
Cinemark USA, Inc. | | | | | | | | |
| | |
4.88%, 6/1/2023 | | | 2,078,000 | | | | 2,056,617 | |
| | |
8.75%, 5/1/2025 (a) | | | 915,000 | | | | 995,063 | |
| | |
Live Nation Entertainment, Inc. | | | | | | | | |
| | |
4.88%, 11/1/2024 (a) | | | 3,175,000 | | | | 3,211,131 | |
| | |
6.50%, 5/15/2027 (a) | | | 5,686,000 | | | | 6,276,207 | |
| | |
4.75%, 10/15/2027 (a) | | | 2,639,000 | | | | 2,665,918 | |
| | |
Netflix, Inc. | | | | | | | | |
| | |
5.88%, 2/15/2025 | | | 4,828,000 | | | | 5,536,726 | |
| | |
5.88%, 11/15/2028 | | | 10,570,000 | | | | 12,680,829 | |
| | |
WMG Acquisition Corp. | | | | | | | | |
| | |
5.50%, 4/15/2026 (a) | | | 864,000 | | | | 886,983 | |
| | |
3.88%, 7/15/2030 (a) | | | 1,197,000 | | | | 1,224,034 | |
| | |
3.00%, 2/15/2031 (a) | | | 895,000 | | | | 860,319 | |
| | | | | | | | |
| | |
| | | | | | | 36,393,827 | |
| | | | | | | | |
|
Equity Real Estate Investment Trusts (REITs) — 3.4% | |
| | |
ESH Hospitality, Inc. | | | | | | | | |
| | |
5.25%, 5/1/2025 (a) | | | 2,081,000 | | | | 2,121,330 | |
| | |
4.63%, 10/1/2027 (a) | | | 4,570,000 | | | | 4,641,383 | |
| | |
HAT Holdings I LLC | | | | | | | | |
| | |
3.75%, 9/15/2030 (a) | | | 1,228,000 | | | | 1,218,790 | |
| | |
Iron Mountain, Inc. | | | | | | | | |
| | |
4.88%, 9/15/2027 (a) | | | 2,412,000 | | | | 2,514,510 | |
SEE NOTES TO FINANCIAL STATEMENTS.
| | | | | | |
| | | |
| 76 | | | | J.P. MORGAN EXCHANGE-TRADED FUNDS | | FEBRUARY 28, 2021 |
| | | | | | | | |
| INVESTMENTS | | PRINCIPAL AMOUNT ($) | | | VALUE ($) | |
Corporate Bonds — continued | | | | | | | | |
|
Equity Real Estate Investment Trusts (REITs) — continued | |
| | |
iStar, Inc. | | | | | | | | |
| | |
4.75%, 10/1/2024 | | | 3,293,000 | | | | 3,379,441 | |
| | |
MGM Growth Properties Operating Partnership LP | | | | | | | | |
| | |
5.63%, 5/1/2024 | | | 3,653,000 | | | | 3,945,240 | |
| | |
5.75%, 2/1/2027 | | | 3,357,000 | | | | 3,793,410 | |
| | |
3.88%, 2/15/2029 (a) | | | 3,050,000 | | | | 3,088,125 | |
| | |
MPT Operating Partnership LP 4.63%, 8/1/2029 | | | 4,056,000 | | | | 4,360,829 | |
| | |
RHP Hotel Properties LP 4.75%, 10/15/2027 | | | 3,614,000 | | | | 3,665,030 | |
| | |
SBA Communications Corp. 3.88%, 2/15/2027 | | | 2,455,000 | | | | 2,544,681 | |
| | |
Uniti Group LP | | | | | | | | |
| | |
6.00%, 4/15/2023 (a) | | | 610,000 | | | | 619,150 | |
| | |
7.88%, 2/15/2025 (a) | | | 3,087,000 | | | | 3,306,378 | |
| | |
6.50%, 2/15/2029 (a) | | | 4,134,000 | | | | 4,165,005 | |
| | |
VICI Properties LP | | | | | | | | |
| | |
3.50%, 2/15/2025 (a) | | | 890,000 | | | | 902,238 | |
| | |
4.25%, 12/1/2026 (a) | | | 4,261,000 | | | | 4,394,795 | |
| | |
4.63%, 12/1/2029 (a) | | | 3,629,000 | | | | 3,809,361 | |
| | | | | | | | |
| | |
| | | | | | | 52,469,696 | |
| | | | | | | | |
| | |
Food & Staples Retailing — 1.1% | | | | | | | | |
| | |
Albertsons Cos., Inc. | | | | | | | | |
| | |
4.63%, 1/15/2027 (a) | | | 4,833,000 | | | | 5,003,170 | |
| | |
5.88%, 2/15/2028 (a) | | | 3,314,000 | | | | 3,529,410 | |
| | |
4.88%, 2/15/2030 (a) | | | 2,703,000 | | | | 2,798,200 | |
| | |
Rite Aid Corp. | | | | | | | | |
| | |
7.50%, 7/1/2025 (a) | | | 633,000 | | | | 663,093 | |
| | |
8.00%, 11/15/2026 (a) | | | 4,564,000 | | | | 4,806,462 | |
| | |
US Foods, Inc. 6.25%, 4/15/2025 (a) | | | 846,000 | | | | 899,932 | |
| | | | | | | | |
| | |
| | | | | | | 17,700,267 | |
| | | | | | | | |
| | |
Food Products — 2.8% | | | | | | | | |
| | |
B&G Foods, Inc. | | | | | | | | |
| | |
5.25%, 4/1/2025 | | | 933,000 | | | | 956,698 | |
| | |
5.25%, 9/15/2027 | | | 3,876,000 | | | | 4,066,971 | |
| | |
Dole Food Co., Inc. 7.25%, 6/15/2025 (a) | | | 102,000 | | | | 104,295 | |
| | |
JBS USA LUX SA 6.50%, 4/15/2029 (a) | | | 2,969,000 | | | | 3,341,966 | |
| | |
Kraft Heinz Foods Co. | | | | | | | | |
| | |
3.88%, 5/15/2027 | | | 2,006,000 | | | | 2,192,694 | |
| | |
5.00%, 7/15/2035 | | | 3,050,000 | | | | 3,689,982 | |
| | |
4.38%, 6/1/2046 | | | 3,050,000 | | | | 3,322,891 | |
| | |
Lamb Weston Holdings, Inc. | | | | | | | | |
| | |
4.63%, 11/1/2024 (a) | | | 584,000 | | | | 606,192 | |
| | | | | | | | |
| INVESTMENTS | | PRINCIPAL AMOUNT ($) | | | VALUE ($) | |
| | | | | | | | |
| | |
Food Products — continued | | | | | | | | |
| | |
4.88%, 11/1/2026 (a) | | | 575,000 | | | | 595,844 | |
| | |
4.88%, 5/15/2028 (a) | | | 4,172,000 | | | | 4,547,480 | |
| | |
Pilgrim’s Pride Corp. | | | | | | | | |
| | |
5.75%, 3/15/2025 (a) | | | 933,000 | | | | 951,473 | |
| | |
5.88%, 9/30/2027 (a) | | | 863,000 | | | | 925,870 | |
| | |
Post Holdings, Inc. | | | | | | | | |
| | |
5.00%, 8/15/2026 (a) | | | 3,283,000 | | | | 3,425,810 | |
| | |
5.75%, 3/1/2027 (a) | | | 3,021,000 | | | | 3,163,440 | |
| | |
5.50%, 12/15/2029 (a) | | | 10,861,000 | | | | 11,689,260 | |
| | | | | | | | |
| | |
| | | | | | | 43,580,866 | |
| | | | | | | | |
| | |
Gas Utilities — 0.4% | | | | | | | | |
| | |
AmeriGas Partners LP | | | | | | | | |
| | |
5.50%, 5/20/2025 | | | 400,000 | | | | 437,880 | |
| | |
5.88%, 8/20/2026 | | | 5,126,000 | | | | 5,779,565 | |
| | | | | | | | |
| | |
| | | | | | | 6,217,445 | |
| | | | | | | | |
|
Health Care Equipment & Supplies — 0.5% | |
| | |
Avantor Funding, Inc. 4.63%, 7/15/2028 (a) | | | 2,670,000 | | | | 2,783,528 | |
| | |
Hill-Rom Holdings, Inc. 4.38%, 9/15/2027 (a) | | | 626,000 | | | | 652,605 | |
| | |
Hologic, Inc. 3.25%, 2/15/2029 (a) | | | 2,105,000 | | | | 2,100,927 | |
| | |
Teleflex, Inc. | | | | | | | | |
| | |
4.63%, 11/15/2027 | | | 622,000 | | | | 655,432 | |
| | |
4.25%, 6/1/2028 (a) | | | 1,765,000 | | | | 1,824,569 | |
| | | | | | | | |
| | |
| | | | | | | 8,017,061 | |
| | | | | | | | |
| | |
Health Care Providers & Services — 6.2% | | | | | | | | |
| | |
Acadia Healthcare Co., Inc. | | | | | | | | |
| | |
5.63%, 2/15/2023 | | | 1,817,000 | | | | 1,817,000 | |
| | |
5.50%, 7/1/2028 (a) | | | 1,230,000 | | | | 1,297,650 | |
| | |
Centene Corp. | | | | | | | | |
| | |
5.38%, 6/1/2026 (a) | | | 8,444,000 | | | | 8,823,051 | |
| | |
5.38%, 8/15/2026 (a) | | | 1,465,000 | | | | 1,541,912 | |
| | |
4.25%, 12/15/2027 | | | 5,087,000 | | | | 5,296,839 | |
| | |
4.63%, 12/15/2029 | | | 7,557,000 | | | | 8,154,003 | |
| | |
3.38%, 2/15/2030 | | | 3,050,000 | | | | 3,134,485 | |
| | |
Community Health Systems, Inc. | | | | | | | | |
| | |
8.00%, 3/15/2026 (a) | | | 2,413,000 | | | | 2,576,360 | |
| | |
5.63%, 3/15/2027 (a) | | | 1,525,000 | | | | 1,606,108 | |
| | |
DaVita, Inc. | | | | | | | | |
| | |
4.63%, 6/1/2030 (a) | | | 3,881,000 | | | | 3,948,918 | |
| | |
3.75%, 2/15/2031 (a) | | | 1,525,000 | | | | 1,453,241 | |
| | |
Encompass Health Corp. | | | | | | | | |
| | |
4.50%, 2/1/2028 | | | 1,525,000 | | | | 1,585,405 | |
| | |
4.75%, 2/1/2030 | | | 2,690,000 | | | | 2,845,671 | |
SEE NOTES TO FINANCIAL STATEMENTS.
| | | | | | | | |
| | | |
| FEBRUARY 28, 2021 | | J.P. MORGAN EXCHANGE-TRADED FUNDS | | | | | 77 | |
JPMorgan High Yield Research Enhanced ETF
SCHEDULE OF PORTFOLIO INVESTMENTS
AS OF FEBRUARY 28, 2021 (continued)
| | | | | | | | |
| INVESTMENTS | | PRINCIPAL AMOUNT ($) | | | VALUE ($) | |
Corporate Bonds — continued | | | | | | | | |
|
Health Care Providers & Services — continued | |
| | |
Envision Healthcare Corp. | | | | | | | | |
| | |
8.75%, 10/15/2026 (a) | | | 1,803,000 | | | | 1,289,145 | |
| | |
HCA, Inc. | | | | | | | | |
| | |
5.38%, 2/1/2025 | | | 3,050,000 | | | | 3,419,812 | |
| | |
5.38%, 9/1/2026 | | | 3,046,000 | | | | 3,476,526 | |
| | |
5.63%, 9/1/2028 | | | 7,508,000 | | | | 8,728,050 | |
| | |
5.88%, 2/1/2029 | | | 5,389,000 | | | | 6,352,823 | |
| | |
Legacy LifePoint Health LLC 4.38%, 2/15/2027 (a) | | | 606,000 | | | | 602,412 | |
| | |
MEDNAX, Inc. 6.25%, 1/15/2027 (a) | | | 891,000 | | | | 941,083 | |
| | |
Molina Healthcare, Inc. 4.38%, 6/15/2028 (a) | | | 1,800,000 | | | | 1,872,000 | |
| | |
Radiology Partners, Inc. 9.25%, 2/1/2028 (a) | | | 1,200,000 | | | | 1,299,000 | |
| | |
RegionalCare Hospital Partners Holdings, Inc. 9.75%, 12/1/2026 (a) | | | 583,000 | | | | 628,311 | |
| | |
Select Medical Corp. 6.25%, 8/15/2026 (a) | | | 913,000 | | | | 976,910 | |
| | |
Tenet Healthcare Corp. | | | | | | | | |
| | |
6.75%, 6/15/2023 | | | 1,528,000 | | | | 1,649,598 | |
| | |
4.88%, 1/1/2026 (a) | | | 1,525,000 | | | | 1,576,377 | |
| | |
6.25%, 2/1/2027 (a) | | | 3,629,000 | | | | 3,830,410 | |
| | |
5.13%, 11/1/2027 (a) | | | 11,440,000 | | | | 11,991,522 | |
| | |
4.63%, 6/15/2028 (a) | | | 1,525,000 | | | | 1,586,488 | |
| | |
6.13%, 10/1/2028 (a) | | | 1,525,000 | | | | 1,605,368 | |
| | |
6.88%, 11/15/2031 | | | 1,502,000 | | | | 1,640,935 | |
| | | | | | | | |
| | |
| | | | | | | 97,547,413 | |
| | | | | | | | |
| | |
Health Care Technology — 0.2% | | | | | | | | |
| | |
IQVIA, Inc. 5.00%, 5/15/2027 (a) | | | 3,176,000 | | | | 3,322,890 | |
| | | | | | | | |
| | |
Hotels, Restaurants & Leisure — 7.5% | | | | | | | | |
| | |
1011778 BC ULC (Canada) | | | | | | | | |
| | |
4.25%, 5/15/2024 (a) | | | 1,807,000 | | | | 1,825,070 | |
| | |
3.88%, 1/15/2028 (a) | | | 4,520,000 | | | | 4,588,252 | |
| | |
4.00%, 10/15/2030 (a) | | | 3,290,000 | | | | 3,208,408 | |
| | |
Boyd Gaming Corp. | | | | | | | | |
| | |
6.38%, 4/1/2026 | | | 1,816,000 | | | | 1,876,164 | |
| | |
4.75%, 12/1/2027 | | | 4,514,000 | | | | 4,588,842 | |
| | |
Boyne USA, Inc. 7.25%, 5/1/2025 (a) | | | 880,000 | | | | 915,394 | |
| | |
Caesars Resort Collection LLC | | | | | | | | |
| | |
5.75%, 7/1/2025 (a) | | | 3,346,000 | | | | 3,513,300 | |
| | |
5.25%, 10/15/2025 (a) | | | 3,342,000 | | | | 3,321,280 | |
| | |
Carnival Corp. | | | | | | | | |
| | |
11.50%, 4/1/2023 (a) | | | 3,042,000 | | | | 3,468,488 | |
| | |
9.88%, 8/1/2027 (a) | | | 1,500,000 | | | | 1,725,120 | |
| | | | | | | | |
| INVESTMENTS | | PRINCIPAL AMOUNT ($) | | | VALUE ($) | |
| | | | | | | | |
|
Hotels, Restaurants & Leisure — continued | |
| | |
Cedar Fair LP | | | | | | | | |
| | |
5.50%, 5/1/2025 (a) | | | 3,325,000 | | | | 3,485,016 | |
| | |
5.25%, 7/15/2029 | | | 876,000 | | | | 878,190 | |
| | |
Churchill Downs, Inc. 5.50%, 4/1/2027 (a) | | | 1,170,000 | | | | 1,219,035 | |
| | |
Enterprise Development Authority (The) 12.00%, 7/15/2024 (a) | | | 130,000 | | | | 146,770 | |
| | |
Hilton Domestic Operating Co., Inc. | | | | | | | | |
| | |
4.88%, 1/15/2030 | | | 4,829,000 | | | | 5,203,344 | |
| | |
3.63%, 2/15/2032 (a) | | | 504,000 | | | | 496,359 | |
| | |
Hilton Worldwide Finance LLC 4.88%, 4/1/2027 | | | 3,477,000 | | | | 3,616,080 | |
| | |
International Game Technology plc | | | | | | | | |
| | |
6.50%, 2/15/2025 (a) | | | 3,230,000 | | | | 3,569,150 | |
| | |
5.25%, 1/15/2029 (a) | | | 3,170,000 | | | | 3,356,237 | |
| | |
IRB Holding Corp. 7.00%, 6/15/2025 (a) | | | 2,698,000 | | | | 2,928,166 | |
| | |
KFC Holding Co. 5.25%, 6/1/2026 (a) | | | 3,016,000 | | | | 3,116,885 | |
| | |
Marriott Ownership Resorts, Inc. | | | | | | | | |
| | |
6.13%, 9/15/2025 (a) | | | 627,000 | | | | 666,187 | |
| | |
6.50%, 9/15/2026 | | | 628,000 | | | | 653,403 | |
| | |
4.75%, 1/15/2028 | | | 1,526,000 | | | | 1,537,048 | |
| | |
Melco Resorts Finance Ltd. (Hong Kong) | | | | | | | | |
| | |
5.75%, 7/21/2028 (a) | | | 750,000 | | | | 802,875 | |
| | |
5.38%, 12/4/2029 (a) | | | 750,000 | | | | 789,960 | |
| | |
MGM China Holdings Ltd. (Macau) | | | | | | | | |
| | |
5.88%, 5/15/2026 (a) | | | 750,000 | | | | 789,465 | |
| | |
MGM Resorts International | | | | | | | | |
| | |
6.00%, 3/15/2023 | | | 1,167,000 | | | | 1,244,314 | |
| | |
5.50%, 4/15/2027 | | | 3,326,000 | | | | 3,607,712 | |
| | |
NCL Corp. Ltd. 12.25%, 5/15/2024 (a) | | | 915,000 | | | | 1,087,706 | |
| | |
Royal Caribbean Cruises Ltd. 11.50%, 6/1/2025 (a) | | | 3,631,000 | | | | 4,248,270 | |
| | |
Scientific Games International, Inc. | | | | | | | | |
| | |
5.00%, 10/15/2025 (a) | | | 4,492,000 | | | | 4,619,798 | |
| | |
8.25%, 3/15/2026 (a) | | | 1,475,000 | | | | 1,563,544 | |
| | |
Six Flags Entertainment Corp. 5.50%, 4/15/2027 (a) | | | 1,797,000 | | | | 1,834,984 | |
| | |
Six Flags Theme Parks, Inc. 7.00%, 7/1/2025 (a) | | | 2,386,000 | | | | 2,572,180 | |
| | |
Stars Group Holdings BV (Canada) 7.00%, 7/15/2026 (a) | | | 1,205,000 | | | | 1,263,961 | |
| | |
Station Casinos LLC 4.50%, 2/15/2028 (a) | | | 913,000 | | | | 909,576 | |
| | |
Travel + Leisure Co. | | | | | | | | |
| | |
6.63%, 7/31/2026 (a) | | | 1,523,000 | | | | 1,719,162 | |
| | |
6.00%, 4/1/2027 (c) | | | 886,000 | | | | 985,675 | |
| | |
Vail Resorts, Inc. 6.25%, 5/15/2025 (a) | | | 913,000 | | | | 974,993 | |
SEE NOTES TO FINANCIAL STATEMENTS.
| | | | | | |
| | | |
| 78 | | | | J.P. MORGAN EXCHANGE-TRADED FUNDS | | FEBRUARY 28, 2021 |
| | | | | | | | |
| INVESTMENTS | | PRINCIPAL AMOUNT ($) | | | VALUE ($) | |
Corporate Bonds — continued | | | | | | | | |
|
Hotels, Restaurants & Leisure — continued | |
| | |
VOC Escrow Ltd. 5.00%, 2/15/2028 (a) | | | 915,000 | | | | 904,112 | |
| | |
Wynn Las Vegas LLC | | | | | | | | |
| | |
4.25%, 5/30/2023 (a) | | | 622,000 | | | | 628,220 | |
| | |
5.50%, 3/1/2025 (a) | | | 3,660,000 | | | | 3,879,600 | |
| | |
5.25%, 5/15/2027 (a) | | | 1,170,000 | | | | 1,241,826 | |
| | |
Wynn Macau Ltd. (Macau) | | | | | | | | |
| | |
4.88%, 10/1/2024 (a) | | | 1,000,000 | | | | 1,005,800 | |
| | |
5.63%, 8/26/2028 (a) | | | 4,500,000 | | | | 4,680,000 | |
| | |
5.13%, 12/15/2029 (a) | | | 1,000,000 | | | | 1,012,500 | |
| | |
Wynn Resorts Finance LLC 5.13%, 10/1/2029 (a) | | | 2,389,000 | | | | 2,514,423 | |
| | |
Yum! Brands, Inc. | | | | | | | | |
| | |
4.75%, 1/15/2030 (a) | | | 10,161,000 | | | | 10,601,987 | |
| | |
6.88%, 11/15/2037 | | | 874,000 | | | | 1,092,500 | |
| | | | | | | | |
| | |
| | | | | | | 116,477,331 | |
| | | | | | | | |
| | |
Household Durables — 0.5% | | | | | | | | |
| | |
Brookfield Residential Properties, Inc. (Canada) 6.25%, 9/15/2027 (a) | | | 610,000 | | | | 643,556 | |
| | |
KB Home 4.80%, 11/15/2029 | | | 1,485,000 | | | | 1,596,375 | |
| | |
Meritage Homes Corp. 5.13%, 6/6/2027 | | | 865,000 | | | | 970,962 | |
| | |
Newell Brands, Inc. 4.70%, 4/1/2026 (c) | | | 1,803,000 | | | | 1,999,401 | |
| | |
Taylor Morrison Communities, Inc. 5.88%, 6/15/2027 (a) | | | 1,167,000 | | | | 1,301,205 | |
| | |
Toll Brothers Finance Corp. 4.88%, 3/15/2027 | | | 865,000 | | | | 988,263 | |
| | | | | | | | |
| | |
| | | | | | | 7,499,762 | |
| | | | | | | | |
| | |
Household Products — 0.8% | | | | | | | | |
| | |
Central Garden & Pet Co. | | | | | | | | |
| | |
5.13%, 2/1/2028 | | | 588,000 | | | | 622,545 | |
| | |
4.13%, 10/15/2030 | | | 623,000 | | | | 646,914 | |
| | |
Energizer Holdings, Inc. 4.75%, 6/15/2028 (a) | | | 4,780,000 | | | | 4,886,116 | |
| | |
Kronos Acquisition Holdings, Inc. (Canada) | | | | | | | | |
| | |
5.00%, 12/31/2026 (a) | | | 610,000 | | | | 628,117 | |
| | |
7.00%, 12/31/2027 (a) | | | 610,000 | | | | 603,747 | |
| | |
Spectrum Brands, Inc. | | | | | | | | |
| | |
5.75%, 7/15/2025 | | | 1,522,000 | | | | 1,567,660 | |
| | |
5.50%, 7/15/2030 (a) | | | 2,685,000 | | | | 2,893,383 | |
| | | | | | | | |
| | |
| | | | | | | 11,848,482 | |
| | | | | | | | |
|
Independent Power and Renewable Electricity Producers — 0.4% | |
| | |
Calpine Corp. | | | | | | | | |
| | |
5.25%, 6/1/2026 (a) | | | 634,000 | | | | 652,227 | |
| | |
4.50%, 2/15/2028 (a) | | | 4,815,000 | | | | 4,947,413 | |
| | | | | | | | |
| INVESTMENTS | | PRINCIPAL AMOUNT ($) | | | VALUE ($) | |
| | | | | | | | |
|
Independent Power and Renewable Electricity Producers — continued | |
| | |
Clearway Energy Operating LLC 4.75%, 3/15/2028 (a) | | | 877,000 | | | | 937,294 | |
| | | | | | | | |
| | |
| | | | | | | 6,536,934 | |
| | | | | | | | |
| | |
Insurance — 0.3% | | | | | | | | |
| | |
HUB International Ltd. 7.00%, 5/1/2026 (a) | | | 2,137,000 | | | | 2,226,840 | |
| | |
NFP Corp. 6.88%, 8/15/2028 (a) | | | 2,281,000 | | | | 2,355,543 | |
| | | | | | | | |
| | |
| | | | | | | 4,582,383 | |
| | | | | | | | |
|
Internet & Direct Marketing Retail — 0.4% | |
| | |
Go Daddy Operating Co. LLC 5.25%, 12/1/2027 (a) | | | 911,000 | | | | 956,550 | |
| | |
Match Group Holdings II LLC 4.63%, 6/1/2028 (a) | | | 610,000 | | | | 633,290 | |
| | |
Photo Holdings Merger Sub, Inc. 8.50%, 10/1/2026 (a) | | | 1,499,000 | | | | 1,608,007 | |
| | |
QVC, Inc. | | | | | | | | |
| | |
4.38%, 3/15/2023 | | | 1,513,000 | | | | 1,584,565 | |
| | |
4.75%, 2/15/2027 | | | 1,165,000 | | | | 1,228,353 | |
| | | | | | | | |
| | |
| | | | | | | 6,010,765 | |
| | | | | | | | |
| | |
IT Services — 1.1% | | | | | | | | |
| | |
Arches Buyer, Inc. | | | | | | | | |
| | |
4.25%, 6/1/2028 (a) | | | 2,135,000 | | | | 2,152,774 | |
| | |
6.13%, 12/1/2028 (a) | | | 2,135,000 | | | | 2,207,024 | |
| | |
Black Knight InfoServ LLC 3.63%, 9/1/2028 (a) | | | 915,000 | | | | 909,602 | |
| | |
Booz Allen Hamilton, Inc. 3.88%, 9/1/2028 (a) | | | 3,276,000 | | | | 3,355,459 | |
| | |
Gartner, Inc. 4.50%, 7/1/2028 (a) | | | 4,780,000 | | | | 5,019,000 | |
| | |
Presidio Holdings, Inc. | | | | | | | | |
| | |
4.88%, 2/1/2027 (a) | | | 2,072,000 | | | | 2,160,060 | |
| | |
8.25%, 2/1/2028 (a) | | | 1,205,000 | | | | 1,330,778 | |
| | |
Science Applications International Corp. 4.88%, 4/1/2028 (a) | | | 890,000 | | | | 927,825 | |
| | | | | | | | |
| | |
| | | | | | | 18,062,522 | |
| | | | | | | | |
| | |
Leisure Products — 0.1% | | | | | | | | |
| | |
Mattel, Inc. | | | | | | | | |
| | |
5.88%, 12/15/2027 (a) | | | 1,006,000 | | | | 1,095,157 | |
| | |
6.20%, 10/1/2040 | | | 630,000 | | | | 743,400 | |
| | | | | | | | |
| | |
| | | | | | | 1,838,557 | |
| | | | | | | | |
| | |
Machinery — 0.4% | | | | | | | | |
| | |
Hillman Group, Inc. (The) 6.38%, 7/15/2022 (a) | | | 645,000 | | | | 647,032 | |
| | |
Mueller Water Products, Inc. 5.50%, 6/15/2026 (a) | | | 1,174,000 | | | | 1,211,133 | |
SEE NOTES TO FINANCIAL STATEMENTS.
| | | | | | | | |
| | | |
| FEBRUARY 28, 2021 | | J.P. MORGAN EXCHANGE-TRADED FUNDS | | | | | 79 | |
JPMorgan High Yield Research Enhanced ETF
SCHEDULE OF PORTFOLIO INVESTMENTS
AS OF FEBRUARY 28, 2021 (continued)
| | | | | | | | |
| INVESTMENTS | | PRINCIPAL AMOUNT ($) | | | VALUE ($) | |
Corporate Bonds — continued | | | | | | | | |
| | |
Machinery — continued | | | | | | | | |
| | |
Navistar International Corp. 9.50%, 5/1/2025 (a) | | | 865,000 | | | | 967,719 | |
| | |
RBS Global, Inc. 4.88%, 12/15/2025 (a) | | | 876,000 | | | | 898,995 | |
| | |
TriMas Corp. 4.88%, 10/15/2025 (a) | | | 130,000 | | | | 132,600 | |
| | |
Vertical US Newco, Inc. (Germany) 5.25%, 7/15/2027 (a) | | | 2,000,000 | | | | 2,085,000 | |
| | | | | | | | |
| | |
| | | | | | | 5,942,479 | |
| | | | | | | | |
| | |
Media — 6.3% | | | | | | | | |
| | |
Altice Financing SA (Luxembourg) 5.00%, 1/15/2028 (a) | | | 1,250,000 | | | | 1,250,137 | |
| | |
AMC Networks, Inc. | | | | | | | | |
| | |
5.00%, 4/1/2024 | | | 313,000 | | | | 316,913 | |
| | |
4.75%, 8/1/2025 | | | 885,000 | | | | 910,218 | |
| | |
4.25%, 2/15/2029 | | | 425,000 | | | | 415,994 | |
| | |
Clear Channel Worldwide Holdings, Inc. | | | | | | | | |
| | |
9.25%, 2/15/2024 | | | 6,210,000 | | | | 6,466,162 | |
| | |
5.13%, 8/15/2027 (a) | | | 4,829,000 | | | | 4,906,264 | |
| | |
CSC Holdings LLC | | | | | | | | |
| | |
5.50%, 4/15/2027 (a) | | | 3,775,000 | | | | 3,972,055 | |
| | |
6.50%, 2/1/2029 (a) | | | 7,000,000 | | | | 7,741,650 | |
| | |
3.38%, 2/15/2031 (a) | | | 3,050,000 | | | | 2,928,000 | |
| | |
DISH DBS Corp. | | | | | | | | |
| | |
5.00%, 3/15/2023 | | | 2,729,000 | | | | 2,810,870 | |
| | |
5.88%, 11/15/2024 | | | 8,718,000 | | | | 9,122,559 | |
| | |
7.75%, 7/1/2026 | | | 2,405,000 | | | | 2,646,702 | |
| | |
Gray Television, Inc. | | | | | | | | |
| | |
7.00%, 5/15/2027 (a) | | | 620,000 | | | | 677,350 | |
| | |
4.75%, 10/15/2030 (a) | | | 580,000 | | | | 580,000 | |
| | |
iHeartCommunications, Inc. | | | | | | | | |
| | |
6.38%, 5/1/2026 | | | 4,232,591 | | | | 4,478,504 | |
| | |
8.38%, 5/1/2027 | | | 6,231,763 | | | | 6,608,037 | |
| | |
Lamar Media Corp. 3.75%, 2/15/2028 | | | 1,006,000 | | | | 1,018,575 | |
| | |
LCPR Senior Secured Financing DAC 6.75%, 10/15/2027 (a) | | | 1,405,000 | | | | 1,504,896 | |
| | |
Meredith Corp. | | | | | | | | |
| | |
6.50%, 7/1/2025 (a) | | | 895,000 | | | | 953,175 | |
| | |
6.88%, 2/1/2026 | | | 3,930,000 | | | | 4,009,936 | |
| | |
National CineMedia LLC 5.88%, 4/15/2028 (a) | | | 1,185,000 | | | | 1,090,200 | |
| | |
Nexstar Broadcasting, Inc. | | | | | | | | |
| | |
5.63%, 7/15/2027 (a) | | | 4,521,000 | | | | 4,775,306 | |
| | |
4.75%, 11/1/2028 (a) | | | 3,895,000 | | | | 3,977,769 | |
| | |
Outfront Media Capital LLC 5.00%, 8/15/2027 (a) | | | 631,000 | | | | 641,254 | |
| | | | | | | | |
| INVESTMENTS | | PRINCIPAL AMOUNT ($) | | | VALUE ($) | |
| | | | | | | | |
| | |
Media — continued | | | | | | | | |
| | |
Radiate Holdco LLC | | | | | | | | |
| | |
4.50%, 9/15/2026 (a) | | | 504,000 | | | | 510,300 | |
| | |
6.50%, 9/15/2028 (a) | | | 504,000 | | | | 529,200 | |
| | |
Scripps Escrow II, Inc. 3.88%, 1/15/2029 (a) | | | 1,220,000 | | | | 1,198,193 | |
| | |
Scripps Escrow, Inc. 5.88%, 7/15/2027 (a) | | | 1,791,000 | | | | 1,866,222 | |
| | |
Sinclair Television Group, Inc. 5.50%, 3/1/2030 (a) | | | 880,000 | | | | 883,485 | |
| | |
Sirius XM Radio, Inc. | | | | | | | | |
| | |
4.63%, 7/15/2024 (a) | | | 2,419,000 | | | | 2,491,304 | |
| | |
5.00%, 8/1/2027 (a) | | | 1,522,000 | | | | 1,584,813 | |
| | |
5.50%, 7/1/2029 (a) | | | 3,284,000 | | | | 3,553,945 | |
| | |
4.13%, 7/1/2030 (a) | | | 3,580,000 | | | | 3,615,800 | |
| | |
TEGNA, Inc. 5.00%, 9/15/2029 | | | 902,000 | | | | 939,938 | |
| | |
Univision Communications, Inc. 5.13%, 2/15/2025 (a) | | | 915,000 | | | | 915,869 | |
| | |
Videotron Ltd. (Canada) 5.38%, 6/15/2024 (a) | | | 806,000 | | | | 878,540 | |
| | |
Ziggo Bond Co. BV (Netherlands) 5.13%, 2/28/2030 (a) | | | 3,000,000 | | | | 3,127,860 | |
| | |
Ziggo BV (Netherlands) 5.50%, 1/15/2027 (a) | | | 2,815,000 | | | | 2,924,813 | |
| | | | | | | | |
| | |
| | | | | | | 98,822,808 | |
| | | | | | | | |
| | |
Metals & Mining — 3.3% | | | | | | | | |
| | |
Alcoa Nederland Holding BV | | | | | | | | |
| | |
6.75%, 9/30/2024 (a) | | | 624,000 | | | | 647,400 | |
| | |
6.13%, 5/15/2028 (a) | | | 5,925,000 | | | | 6,428,625 | |
| | |
Allegheny Technologies, Inc. | | | | | | | | |
| | |
7.88%, 8/15/2023 (c) | | | 819,000 | | | | 892,931 | |
| | |
5.88%, 12/1/2027 | | | 3,030,000 | | | | 3,200,438 | |
| | |
ArcelorMittal SA (Luxembourg) | | | | | | | | |
| | |
4.55%, 3/11/2026 | | | 865,000 | | | | 966,335 | |
| | |
7.25%, 10/15/2039 (c) | | | 865,000 | | | | 1,245,600 | |
| | |
Arconic Corp. 6.13%, 2/15/2028 (a) | | | 2,436,000 | | | | 2,570,784 | |
| | |
Carpenter Technology Corp. 6.38%, 7/15/2028 | | | 1,525,000 | | | | 1,679,596 | |
| | |
Cleveland-Cliffs, Inc. | | | | | | | | |
| | |
9.88%, 10/17/2025 (a) | | | 1,192,000 | | | | 1,393,150 | |
| | |
4.63%, 3/1/2029 (a) | | | 2,014,000 | | | | 1,971,202 | |
| | |
Commercial Metals Co. 5.38%, 7/15/2027 | | | 865,000 | | | | 916,900 | |
| | |
Constellium SE | | | | | | | | |
| | |
6.63%, 3/1/2025 (a) | | | 266,000 | | | | 270,708 | |
| | |
5.63%, 6/15/2028 (a) | | | 1,000,000 | | | | 1,056,250 | |
SEE NOTES TO FINANCIAL STATEMENTS.
| | | | | | |
| | | |
| 80 | | | | J.P. MORGAN EXCHANGE-TRADED FUNDS | | FEBRUARY 28, 2021 |
| | | | | | | | |
| INVESTMENTS | | PRINCIPAL AMOUNT ($) | | | VALUE ($) | |
Corporate Bonds — continued | | | | | | | | |
| | |
Metals & Mining — continued | | | | | | | | |
| | |
FMG Resources August 2006 Pty. Ltd. (Australia) | | | | | | | | |
| | |
5.13%, 5/15/2024 (a) | | | 865,000 | | | | 935,281 | |
| | |
4.50%, 9/15/2027 (a) | | | 865,000 | | | | 950,419 | |
| | |
Freeport-McMoRan, Inc. | | | | | | | | |
| | |
4.55%, 11/14/2024 | | | 1,507,000 | | | | 1,659,584 | |
| | |
4.38%, 8/1/2028 | | | 3,050,000 | | | | 3,250,964 | |
| | |
4.63%, 8/1/2030 | | | 5,103,000 | | | | 5,640,142 | |
| | |
5.40%, 11/14/2034 | | | 2,735,000 | | | | 3,387,981 | |
| | |
5.45%, 3/15/2043 | | | 4,178,000 | | | | 5,191,165 | |
| | |
Kaiser Aluminum Corp. 4.63%, 3/1/2028 (a) | | | 2,421,000 | | | | 2,527,354 | |
| | |
Novelis Corp. 5.88%, 9/30/2026 (a) | | | 1,520,000 | | | | 1,583,658 | |
| | |
United States Steel Corp. 12.00%, 6/1/2025 (a) | | | 2,051,000 | | | | 2,463,405 | |
| | | | | | | | |
| | |
| | | | | | | 50,829,872 | |
| | | | | | | | |
| | |
Multiline Retail — 0.5% | | | | | | | | |
| | |
Macy’s, Inc. 8.38%, 6/15/2025 (a) | | | 3,913,000 | | | | 4,323,865 | |
| | |
Nordstrom, Inc. 5.00%, 1/15/2044 | | | 3,020,000 | | | | 2,900,016 | |
| | | | | | | | |
| | |
| | | | | | | 7,223,881 | |
| | | | | | | | |
| | |
Oil, Gas & Consumable Fuels — 11.7% | | | | | | | | |
| | |
Antero Midstream Partners LP | | | | | | | | |
| | |
5.38%, 9/15/2024 | | | 1,006,000 | | | | 1,013,545 | |
| | |
5.75%, 3/1/2027 (a) | | | 1,006,000 | | | | 1,009,772 | |
| | |
Antero Resources Corp. | | | | | | | | |
| | |
8.38%, 7/15/2026 (a) | | | 3,944,000 | | | | 4,313,750 | |
| | |
7.63%, 2/1/2029 (a) | | | 1,316,000 | | | | 1,403,185 | |
| | |
Apache Corp. | | | | | | | | |
| | |
3.25%, 4/15/2022 | | | 564,000 | | | | 565,410 | |
| | |
4.38%, 10/15/2028 | | | 1,220,000 | | | | 1,238,300 | |
| | |
5.10%, 9/1/2040 | | | 4,780,000 | | | | 4,877,177 | |
| | |
Baytex Energy Corp. (Canada) 8.75%, 4/1/2027 (a) | | | 1,220,000 | | | | 1,075,296 | |
| | |
Buckeye Partners LP | | | | | | | | |
| | |
4.15%, 7/1/2023 | | | 1,465,000 | | | | 1,483,510 | |
| | |
3.95%, 12/1/2026 | | | 1,463,000 | | | | 1,452,057 | |
| | |
4.50%, 3/1/2028 (a) | | | 6,332,000 | | | | 6,411,150 | |
| | |
California Resources Corp. 7.13%, 2/1/2026 (a) | | | 1,510,000 | | | | 1,510,944 | |
| | |
Cenovus Energy, Inc. (Canada) | | | | | | | | |
| | |
3.00%, 8/15/2022 | | | 575,000 | | | | 589,754 | |
| | |
3.80%, 9/15/2023 | | | 1,538,000 | | | | 1,625,023 | |
| | |
6.75%, 11/15/2039 | | | 1,528,000 | | | | 1,984,679 | |
| | |
Cheniere Energy Partners LP | | | | | | | | |
| | |
5.25%, 10/1/2025 | | | 3,585,000 | | | | 3,684,663 | |
| | |
4.50%, 10/1/2029 | | | 9,531,000 | | | | 10,031,377 | |
| | | | | | | | |
| INVESTMENTS | | PRINCIPAL AMOUNT ($) | | | VALUE ($) | |
| | | | | | | | |
|
Oil, Gas & Consumable Fuels — continued | |
| | |
Comstock Resources, Inc. | | | | | | | | |
| | |
9.75%, 8/15/2026 | | | 7,262,000 | | | | 7,927,127 | |
| | |
6.75%, 3/1/2029 (a) | | | 1,500,000 | | | | 1,556,250 | |
| | |
Continental Resources, Inc. | | | | | | | | |
| | |
4.50%, 4/15/2023 | | | 2,093,000 | | | | 2,148,548 | |
| | |
3.80%, 6/1/2024 | | | 575,000 | | | | 588,863 | |
| | |
5.75%, 1/15/2031 (a) | | | 1,800,000 | | | | 2,028,978 | |
| | |
Crestwood Midstream Partners LP 5.63%, 5/1/2027 (a) | | | 1,476,000 | | | | 1,463,085 | |
| | |
DCP Midstream Operating LP | | | | | | | | |
| | |
5.38%, 7/15/2025 | | | 1,522,000 | | | | 1,622,513 | |
| | |
5.13%, 5/15/2029 | | | 1,818,000 | | | | 1,926,571 | |
| | |
Endeavor Energy Resources LP 6.63%, 7/15/2025 (a) | | | 708,000 | | | | 744,165 | |
| | |
EnLink Midstream Partners LP | | | | | | | | |
| | |
4.15%, 6/1/2025 | | | 1,220,000 | | | | 1,210,850 | |
| | |
5.45%, 6/1/2047 | | | 1,220,000 | | | | 1,009,550 | |
| | |
EQM Midstream Partners LP | | | | | | | | |
| | |
4.75%, 7/15/2023 | | | 336,000 | | | | 346,403 | |
| | |
4.00%, 8/1/2024 | | | 2,449,000 | | | | 2,473,490 | |
| | |
6.00%, 7/1/2025 (a) | | | 3,337,000 | | | | 3,525,407 | |
| | |
5.50%, 7/15/2028 | | | 6,072,000 | | | | 6,254,160 | |
| | |
4.50%, 1/15/2029 (a) | | | 1,510,000 | | | | 1,463,756 | |
| | |
6.50%, 7/15/2048 | | | 1,812,000 | | | | 1,712,340 | |
| | |
EQT Corp. | | | | | | | | |
| | |
3.00%, 10/1/2022 | | | 3,308,000 | | | | 3,327,699 | |
| | |
7.63%, 2/1/2025 (c) | | | 5,679,000 | | | | 6,605,927 | |
| | |
Genesis Energy LP 6.50%, 10/1/2025 | | | 2,693,000 | | | | 2,613,018 | |
| | |
Hess Infrastructure Partners LP 5.63%, 2/15/2026 (a) | | | 25,000 | | | | 25,897 | |
| | |
Hess Midstream Operations LP | | | | | | | | |
| | |
5.63%, 2/15/2026 (a) | | | 621,000 | | | | 643,281 | |
| | |
5.13%, 6/15/2028 (a) | | | 620,000 | | | | 638,600 | |
| | |
Hilcorp Energy I LP 6.25%, 11/1/2028 (a) | | | 984,000 | | | | 1,027,050 | |
| | |
Matador Resources Co. 5.88%, 9/15/2026 | | | 610,000 | | | | 594,750 | |
| | |
Murphy Oil Corp. | | | | | | | | |
| | |
5.75%, 8/15/2025 | | | 1,504,000 | | | | 1,488,960 | |
| | |
5.88%, 12/1/2027 | | | 620,000 | | | | 610,700 | |
| | |
6.37%, 12/1/2042 (c) | | | 667,000 | | | | 618,642 | |
| | |
NGL Energy Operating LLC 7.50%, 2/1/2026 (a) | | | 6,544,000 | | | | 6,746,962 | |
| | |
NuStar Logistics LP | | | | | | | | |
| | |
6.00%, 6/1/2026 | | | 1,820,000 | | | | 1,941,157 | |
| | |
5.63%, 4/28/2027 | | | 3,410,000 | | | | 3,563,450 | |
SEE NOTES TO FINANCIAL STATEMENTS.
| | | | | | | | |
| | | |
| FEBRUARY 28, 2021 | | J.P. MORGAN EXCHANGE-TRADED FUNDS | | | | | 81 | |
JPMorgan High Yield Research Enhanced ETF
SCHEDULE OF PORTFOLIO INVESTMENTS
AS OF FEBRUARY 28, 2021 (continued)
| | | | | | | | |
| INVESTMENTS | | PRINCIPAL AMOUNT ($) | | | VALUE ($) | |
Corporate Bonds — continued | | | | | | | | |
|
Oil, Gas & Consumable Fuels — continued | |
| | |
Occidental Petroleum Corp. | | | | | | | | |
| | |
2.70%, 8/15/2022 | | | 3,283,000 | | | | 3,246,280 | |
| | |
2.90%, 8/15/2024 | | | 4,815,000 | | | | 4,685,862 | |
| | |
6.45%, 9/15/2036 | | | 5,235,000 | | | | 5,967,900 | |
| | |
4.20%, 3/15/2048 | | | 1,785,000 | | | | 1,521,712 | |
| | |
Ovintiv Exploration, Inc. | | | | | | | | |
| | |
5.63%, 7/1/2024 | | | 812,000 | | | | 890,098 | |
| | |
5.38%, 1/1/2026 | | | 4,840,000 | | | | 5,368,031 | |
| | |
Ovintiv, Inc. 6.50%, 8/15/2034 | | | 6,404,000 | | | | 7,988,912 | |
| | |
PBF Holding Co. LLC 9.25%, 5/15/2025 (a) | | | 1,515,000 | | | | 1,476,670 | |
| | |
Range Resources Corp. | | | | | | | | |
| | |
5.00%, 8/15/2022 | | | 440,000 | | | | 444,400 | |
| | |
9.25%, 2/1/2026 | | | 560,000 | | | | 609,398 | |
| | |
Rockies Express Pipeline LLC | | | | | | | | |
| | |
4.95%, 7/15/2029 (a) | | | 610,000 | | | | 651,938 | |
| | |
6.88%, 4/15/2040 (a) | | | 610,000 | | | | 675,575 | |
| | |
SM Energy Co. | | | | | | | | |
| | |
5.63%, 6/1/2025 | | | 649,000 | | | | 618,172 | |
| | |
6.75%, 9/15/2026 | | | 666,000 | | | | 631,368 | |
| | |
6.63%, 1/15/2027 | | | 669,000 | | | | 630,533 | |
| | |
Southwestern Energy Co. | | | | | | | | |
| | |
6.45%, 1/23/2025 (c) | | | 1,232,000 | | | | 1,293,600 | |
| | |
7.75%, 10/1/2027 | | | 588,000 | | | | 629,160 | |
| | |
Sunoco LP 6.00%, 4/15/2027 | | | 1,230,000 | | | | 1,280,369 | |
| | |
Tallgrass Energy Partners LP | | | | | | | | |
| | |
5.50%, 9/15/2024 (a) | | | 3,223,000 | | | | 3,239,115 | |
| | |
5.50%, 1/15/2028 (a) | | | 4,045,000 | | | | 3,974,213 | |
| | |
Targa Resources Partners LP | | | | | | | | |
| | |
5.88%, 4/15/2026 | | | 4,564,000 | | | | 4,752,493 | |
| | |
6.88%, 1/15/2029 | | | 8,172,000 | | | | 9,060,705 | |
| | |
5.50%, 3/1/2030 | | | 4,246,000 | | | | 4,540,545 | |
| | |
TerraForm Power Operating LLC 4.75%, 1/15/2030 (a) | | | 1,512,000 | | | | 1,592,015 | |
| | |
Western Midstream Operating LP | | | | | | | | |
| | |
4.35%, 2/1/2025 (c) | | | 890,000 | | | | 911,022 | |
| | |
5.30%, 2/1/2030 (c) | | | 3,050,000 | | | | 3,305,498 | |
| | |
WPX Energy, Inc. 5.25%, 9/15/2024 | | | 34,000 | | | | 37,783 | |
| | | | | | | | |
| | |
| | | | | | | 182,741,108 | |
| | | | | | | | |
| | |
Personal Products — 0.3% | | | | | | | | |
| | |
Edgewell Personal Care Co. 5.50%, 6/1/2028 (a) | | | 2,699,000 | | | | 2,864,746 | |
| | |
Prestige Brands, Inc. | | | | | | | | |
| | |
6.38%, 3/1/2024 (a) | | | 928,000 | | | | 942,792 | |
| | |
5.13%, 1/15/2028 (a) | | | 630,000 | | | | 659,185 | |
| | | | | | | | |
| | |
| | | | | | | 4,466,723 | |
| | | | | | | | |
| | | | | | | | |
| INVESTMENTS | | PRINCIPAL AMOUNT ($) | | | VALUE ($) | |
| | | | | | | | |
| | |
Pharmaceuticals — 2.5% | | | | | | | | |
| | |
Bausch Health Americas, Inc. 8.50%, 1/31/2027 (a) | | | 6,674,000 | | | | 7,383,113 | |
| | |
Bausch Health Cos., Inc. | | | | | | | | |
| | |
6.13%, 4/15/2025 (a) | | | 6,305,000 | | | | 6,456,068 | |
| | |
5.00%, 1/30/2028 (a) | | | 7,786,000 | | | | 7,941,720 | |
| | |
7.25%, 5/30/2029 (a) | | | 8,573,000 | | | | 9,497,855 | |
| | |
Catalent Pharma Solutions, Inc. 5.00%, 7/15/2027 (a) | | | 1,511,000 | | | | 1,590,327 | |
| | |
Endo Dac 9.50%, 7/31/2027 (a) | | | 1,236,000 | | | | 1,392,045 | |
| | |
Par Pharmaceutical, Inc. 7.50%, 4/1/2027 (a) | | | 4,800,000 | | | | 5,160,000 | |
| | | | | | | | |
| | |
| | | | | | | 39,421,128 | |
| | | | | | | | |
| | |
Professional Services — 0.1% | | | | | | | | |
| | |
Dun & Bradstreet Corp. (The) | | | | | | | | |
| | |
6.88%, 8/15/2026 (a) | | | 875,000 | | | | 936,250 | |
| | |
10.25%, 2/15/2027 (a) | | | 926,000 | | | | 1,035,963 | |
| | | | | | | | |
| | |
| | | | | | | 1,972,213 | |
| | | | | | | | |
| |
Real Estate Management & Development — 0.2% | | | | | |
| | |
Kennedy-Wilson, Inc. | | | | | | | | |
| | |
5.88%, 4/1/2024 | | | 1,486,000 | | | | 1,503,089 | |
| | |
4.75%, 3/1/2029 | | | 508,000 | | | | 523,875 | |
| | |
5.00%, 3/1/2031 | | | 508,000 | | | | 524,510 | |
| | | | | | | | |
| | |
| | | | | | | 2,551,474 | |
| | | | | | | | |
| | |
Road & Rail — 0.4% | | | | | | | | |
| | |
Avis Budget Car Rental LLC | | | | | | | | |
| | |
5.25%, 3/15/2025 (a) | | | 1,504,000 | | | | 1,512,994 | |
| | |
10.50%, 5/15/2025 (a) | | | 2,380,000 | | | | 2,838,864 | |
| | |
5.75%, 7/15/2027 (a) | | | 1,770,000 | | | | 1,829,737 | |
| | | | | | | | |
| | |
| | | | | | | 6,181,595 | |
| | | | | | | | |
| |
Semiconductors & Semiconductor Equipment — 0.5% | | | | | |
| | |
Entegris, Inc. | | | | | | | | |
| | |
4.63%, 2/10/2026 (a) | | | 1,233,000 | | | | 1,273,233 | |
| | |
4.38%, 4/15/2028 (a) | | | 905,000 | | | | 949,553 | |
| | |
Microchip Technology, Inc. 4.25%, 9/1/2025 (a) | | | 2,386,000 | | | | 2,503,597 | |
| | |
ON Semiconductor Corp. 3.88%, 9/1/2028 (a) | | | 1,226,000 | | | | 1,281,170 | |
| | |
Qorvo, Inc. | | | | | | | | |
| | |
4.38%, 10/15/2029 | | | 610,000 | | | | 656,702 | |
| | |
3.38%, 4/1/2031 (a) | | | 610,000 | | | | 610,000 | |
| | | | | | | | |
| | |
| | | | | | | 7,274,255 | |
| | | | | | | | |
SEE NOTES TO FINANCIAL STATEMENTS.
| | | | | | |
| | | |
| 82 | | | | J.P. MORGAN EXCHANGE-TRADED FUNDS | | FEBRUARY 28, 2021 |
| | | | | | | | |
| INVESTMENTS | | PRINCIPAL AMOUNT ($) | | | VALUE ($) | |
Corporate Bonds — continued | | | | | | | | |
| | |
Software — 1.0% | | | | | | | | |
| | |
Ascend Learning LLC 6.88%, 8/1/2025 (a) | | | 925,000 | | | | 950,438 | |
| | |
BY Crown Parent LLC 4.25%, 1/31/2026 (a) | | | 865,000 | | | | 890,950 | |
| | |
CDK Global, Inc. | | | | | | | | |
| | |
4.88%, 6/1/2027 | | | 1,192,000 | | | | 1,247,130 | |
| | |
5.25%, 5/15/2029 (a) | | | 917,000 | | | | 987,031 | |
| | |
Fair Isaac Corp. | | | | | | | | |
| | |
5.25%, 5/15/2026 (a) | | | 881,000 | | | | 997,732 | |
| | |
4.00%, 6/15/2028 (a) | | | 595,000 | | | | 615,647 | |
| | |
Nuance Communications, Inc. 5.63%, 12/15/2026 | | | 1,200,000 | | | | 1,257,000 | |
| | |
Open Text Corp. (Canada) 3.88%, 2/15/2028 (a) | | | 865,000 | | | | 879,056 | |
| | |
Open Text Holdings, Inc. (Canada) 4.13%, 2/15/2030 (a) | | | 865,000 | | | | 899,600 | |
| | |
PTC, Inc. 4.00%, 2/15/2028 (a) | | | 1,220,000 | | | | 1,255,075 | |
| | |
SS&C Technologies, Inc. 5.50%, 9/30/2027 (a) | | | 4,842,000 | | | | 5,114,944 | |
| | | | | | | | |
| | |
| | | | | | | 15,094,603 | |
| | | | | | | | |
| | |
Specialty Retail — 1.8% | | | | | | | | |
| | |
Gap, Inc. (The) | | | | | | | | |
| | |
8.63%, 5/15/2025 (a) | | | 2,419,000 | | | | 2,697,089 | |
| | |
8.88%, 5/15/2027 (a) | | | 2,695,000 | | | | 3,156,330 | |
| | |
L Brands, Inc. | | | | | | | | |
| | |
7.50%, 6/15/2029 | | | 3,018,000 | | | | 3,407,684 | |
| | |
6.88%, 11/1/2035 | | | 5,951,000 | | | | 7,219,634 | |
| | |
Penske Automotive Group, Inc. 3.50%, 9/1/2025 | | | 656,000 | | | | 669,120 | |
| | |
PetSmart, Inc. | | | | | | | | |
| | |
4.75%, 2/15/2028 (a) | | | 3,000,000 | | | | 3,102,480 | |
| | |
7.75%, 2/15/2029 (a) | | | 3,000,000 | | | | 3,217,500 | |
| | |
Staples, Inc. | | | | | | | | |
| | |
7.50%, 4/15/2026 (a) | | | 3,355,000 | | | | 3,362,381 | |
| | |
10.75%, 4/15/2027 (a) | | | 1,805,000 | | | | 1,723,775 | |
| | | | | | | | |
| | |
| | | | | | | 28,555,993 | |
| | | | | | | | |
| |
Technology Hardware, Storage & Peripherals — 1.3% | | | | | |
| | |
Dell, Inc. 6.50%, 4/15/2038 | | | 1,793,000 | | | | 2,236,427 | |
| | |
Diebold Nixdorf, Inc. 9.38%, 7/15/2025 (a) | | | 2,411,000 | | | | 2,694,292 | |
| | |
NCR Corp. | | | | | | | | |
| | |
5.75%, 9/1/2027 (a) | | | 4,259,000 | | | | 4,446,524 | |
| | |
6.13%, 9/1/2029 (a) | | | 5,390,000 | | | | 5,767,300 | |
| | |
Seagate HDD Cayman 4.88%, 6/1/2027 | | | 2,390,000 | | | | 2,659,126 | |
| | |
Xerox Corp. 6.75%, 12/15/2039 | | | 610,000 | | | | 672,525 | |
| | | | | | | | |
| INVESTMENTS | | PRINCIPAL AMOUNT ($) | | | VALUE ($) | |
| | | | | | | | |
|
Technology Hardware, Storage & Peripherals — continued | |
| | |
Xerox Holdings Corp. | | | | | | | | |
| | |
5.00%, 8/15/2025 (a) | | | 610,000 | | | | 644,312 | |
| | |
5.50%, 8/15/2028 (a) | | | 610,000 | | | | 651,175 | |
| | | | | | | | |
| | |
| | | | | | | 19,771,681 | |
| | | | | | | | |
|
Textiles, Apparel & Luxury Goods — 0.2% | |
| | |
Hanesbrands, Inc. | | | | | | | | |
| | |
4.63%, 5/15/2024 (a) | | | 595,000 | | | | 623,263 | |
| | |
4.88%, 5/15/2026 (a) | | | 565,000 | | | | 608,629 | |
| | |
William Carter Co. (The) 5.63%, 3/15/2027 (a) | | | 1,180,000 | | | | 1,242,687 | |
| | | | | | | | |
| | |
| | | | | | | 2,474,579 | |
| | | | | | | | |
| | |
Thrifts & Mortgage Finance — 2.1% | | | | | | | | |
| | |
Ladder Capital Finance Holdings LLLP | | | | | | | | |
| | |
REIT, 5.25%, 3/15/2022 (a) | | | 885,000 | | | | 889,425 | |
| | |
REIT, 4.25%, 2/1/2027 (a) | | | 2,123,000 | | | | 2,048,695 | |
| | |
Nationstar Mortgage Holdings, Inc. 5.50%, 8/15/2028 (a) | | | 7,724,000 | | | | 7,936,410 | |
| | |
Quicken Loans LLC | | | | | | | | |
| | |
5.25%, 1/15/2028 (a) | | | 7,837,000 | | | | 8,268,427 | |
| | |
3.88%, 3/1/2031 (a) | | | 6,646,000 | | | | 6,596,155 | |
| | |
Radian Group, Inc. | | | | | | | | |
| | |
6.63%, 3/15/2025 | | | 2,445,000 | | | | 2,728,498 | |
| | |
4.88%, 3/15/2027 | | | 3,621,000 | | | | 3,838,260 | |
| | | | | | | | |
| | |
| | | | | | | 32,305,870 | |
| | | | | | | | |
|
Trading Companies & Distributors — 2.5% | |
| | |
AerCap Holdings NV (Ireland) | | | | | | | | |
| | |
(US Treasury Yield Curve Rate T Note Constant Maturity 5 Year + 4.54%), 5.87%, 10/10/2079 (e) | | | 1,180,000 | | | | 1,206,550 | |
| | |
Beacon Roofing Supply, Inc. 4.88%, 11/1/2025 (a) | | | 865,000 | | | | 872,673 | |
| | |
H&E Equipment Services, Inc. 3.88%, 12/15/2028 (a) | | | 2,420,000 | | | | 2,329,250 | |
| | |
Herc Holdings, Inc. 5.50%, 7/15/2027 (a) | | | 3,275,000 | | | | 3,446,937 | |
| | |
United Rentals North America, Inc. | | | | | | | | |
| | |
4.88%, 1/15/2028 | | | 8,160,000 | | | | 8,629,200 | |
| | |
5.25%, 1/15/2030 | | | 6,884,000 | | | | 7,572,400 | |
| | |
WESCO Distribution, Inc. | | | | | | | | |
| | |
5.38%, 6/15/2024 | | | 938,000 | | | | 959,105 | |
| | |
7.13%, 6/15/2025 (a) | | | 3,915,000 | | | | 4,236,519 | |
| | |
7.25%, 6/15/2028 (a) | | | 8,480,000 | | | | 9,423,400 | |
| | | | | | | | |
| | |
| | | | | | | 38,676,034 | |
| | | | | | | | |
SEE NOTES TO FINANCIAL STATEMENTS.
| | | | | | | | |
| | | |
| FEBRUARY 28, 2021 | | J.P. MORGAN EXCHANGE-TRADED FUNDS | | | | | 83 | |
JPMorgan High Yield Research Enhanced ETF
SCHEDULE OF PORTFOLIO INVESTMENTS
AS OF FEBRUARY 28, 2021 (continued)
| | | | | | | | |
| INVESTMENTS | | PRINCIPAL AMOUNT ($) | | | VALUE ($) | |
Corporate Bonds — continued | | | | | | | | |
| |
Wireless Telecommunication Services — 1.8% | | | | | |
| | |
Connect Finco SARL (United Kingdom) 6.75%, 10/1/2026 (a) | | | 612,000 | | | | 634,384 | |
| | |
Hughes Satellite Systems Corp. 6.63%, 8/1/2026 | | | 874,000 | | | | 975,734 | |
| | |
Ligado Networks LLC 15.50% (PIK), 11/1/2023 (a) (b) | | | 915,000 | | | | 872,300 | |
| | |
Sprint Communications, Inc. 6.00%, 11/15/2022 | | | 895,000 | | | | 956,630 | |
| | |
Sprint Corp. | | | | | | | | |
| | |
7.88%, 9/15/2023 | | | 9,061,000 | | | | 10,461,377 | |
| | |
7.13%, 6/15/2024 | | | 2,980,000 | | | | 3,431,321 | |
| | |
T-Mobile USA, Inc. | | | | | | | | |
| | |
4.50%, 2/1/2026 | | | 906,000 | | | | 926,276 | |
| | |
4.75%, 2/1/2028 | | | 7,537,000 | | | | 7,970,939 | |
| | |
United States Cellular Corp. 6.70%, 12/15/2033 | | | 624,000 | | | | 773,255 | |
| | |
Vodafone Group plc (United Kingdom) (USD Swap Semi 5 Year + 4.87%), 7.00%, 4/4/2079 (e) | | | 602,000 | | | | 721,520 | |
| | | | | | | | |
| | |
| | | | | | | 27,723,736 | |
| | | | | | | | |
| | |
Total Corporate Bonds
(Cost $1,524,543,890) | | | | | | | 1,526,099,647 | |
| | | | | | | | |
| | |
SHARES | | | | |
Short-Term Investments — 0.9% | | | | | | | | |
| | |
Investment Companies — 0.9% | | | | | | | | |
| | |
JPMorgan U.S. Government Money Market Fund Class Institutional Shares, 0.03% (g) (h)
(Cost $13,965,910) | | | 13,965,910 | | | | 13,965,910 | |
| | | | | | | | |
| | |
Total Investments — 98.7%
(Cost $1,538,509,800) | | | | | | | 1,540,065,557 | |
| | |
Other Assets Less
Liabilities — 1.3% | | | | | | | 19,568,498 | |
| | | | | | | | |
| | |
Net Assets — 100.0% | | | | | | | 1,559,634,055 | |
| | | | | | | | |
Percentages indicated are based on net assets.
Abbreviations
| | |
OYJ | | Public Limited Company |
REIT | | Real Estate Investment Trust |
SCA | | Limited partnership with share capital |
USD | | United States Dollar |
| |
(a) | | Securities exempt from registration under Rule 144A or section 4(a)(2), of the Securities Act of 1933, as amended. |
(b) | | Security has the ability to pay in kind (“PIK”) or pay income in cash. When applicable, separate rates of such payments are disclosed. |
(c) | | Step bond. Interest rate is a fixed rate for an initial period that either resets at a specific date or may reset in the future contingent upon a predetermined trigger. The interest rate shown is the current rate as of February 28, 2021. |
(d) | | Amount rounds to less than 0.1% of net assets. |
(e) | | Variable or floating rate security, linked to the referenced benchmark. The interest rate shown is the current rate as of February 28, 2021. |
(f) | | Variable or floating rate security, the interest rate of which adjusts periodically based on changes in current interest rates and prepayments on the underlying pool of assets. The interest rate shown is the current rate as of February 28, 2021. |
(g) | | Investment in an affiliated fund, which is registered under the Investment Company Act of 1940, as amended, and is advised by J.P. Morgan Investment Management Inc. |
(h) | | The rate shown is the current yield as of February 28, 2021. |
SEE NOTES TO FINANCIAL STATEMENTS.
| | | | | | |
| | | |
| 84 | | | | J.P. MORGAN EXCHANGE-TRADED FUNDS | | FEBRUARY 28, 2021 |
JPMorgan International Bond Opportunities ETF
(formerly known as JPMorgan Global Bond Opportunities ETF)
SCHEDULE OF PORTFOLIO INVESTMENTS
AS OF FEBRUARY 28, 2021
| | | | | | | | |
| INVESTMENTS | | PRINCIPAL
AMOUNT ($) | | | VALUE ($) | |
Corporate Bonds — 54.4% | | | | | | | | |
| | |
Australia — 0.4% | | | | | | | | |
| | |
APT Pipelines Ltd. 2.00%, 7/15/2030 (a) | | EUR | 150,000 | | | | 200,505 | |
| | |
Glencore Finance Europe Ltd. 6.00%, 4/3/2022 (a) (b) | | GBP | 100,000 | | | | 147,367 | |
| | |
Glencore Funding LLC 2.50%, 9/1/2030 (c) | | | 462,000 | | | | 457,467 | |
| | |
Transurban Finance Co. Pty. Ltd. 2.00%, 8/28/2025 (a) | | EUR | 150,000 | | | | 194,542 | |
| | |
Westpac Banking Corp. (US Treasury Yield Curve Rate T Note Constant Maturity 5 Year + 2.00%), 4.11%, 7/24/2034 (d) | | | 75,000 | | | | 82,663 | |
| | | | | | | | |
| | |
| | | | | | | 1,082,544 | |
| | | | | | | | |
| | |
Austria — 0.2% | | | | | | | | |
| | |
ams AG 6.00%, 7/31/2025 (a) | | EUR | 400,000 | | | | 515,800 | |
| | | | | | | | |
| | |
Azerbaijan — 0.1% | | | | | | | | |
| | |
State Oil Co. of the Azerbaijan Republic 4.75%, 3/13/2023 (a) | | | 260,000 | | | | 273,894 | |
| | | | | | | | |
| | |
Belgium — 1.4% | | | | | | | | |
| | |
Anheuser-Busch Cos. LLC | | | | | | | | |
| | |
4.70%, 2/1/2036 | | | 170,000 | | | | 204,096 | |
| | |
4.90%, 2/1/2046 | | | 85,000 | | | | 102,237 | |
| | |
Anheuser-Busch InBev SA/NV 2.00%, 3/17/2028 (a) | | EUR | 800,000 | | | | 1,079,304 | |
| | |
Anheuser-Busch InBev Worldwide, Inc. | | | | | | | | |
| | |
4.75%, 1/23/2029 | | | 120,000 | | | | 141,940 | |
| | |
4.44%, 10/6/2048 | | | 114,000 | | | | 129,443 | |
| | |
KBC Group NV | | | | | | | | |
| | |
(EUR Swap Annual 5 Year + 4.69%), 4.75%, 3/5/2024 (a) (d) (e) (f) | | EUR | 400,000 | | | | 508,585 | |
| | |
(EUR Swap Annual 5 Year + 1.25%), 1.62%, 9/18/2029 (a) (d) | | EUR | 300,000 | | | | 375,640 | |
| | |
Solvay Finance SACA (EUR Swap Annual 5 Year + 3.70%), 5.42%, 11/12/2023 (a) (d) (e) (f) | | EUR | 100,000 | | | | 132,853 | |
| | |
Solvay SA (EUR Swap Annual 5 Year + 3.92%), 4.25%,
12/4/2023 (a) (d) (e) (f) | | EUR | 500,000 | | | | 645,541 | |
| | |
Telenet Finance Luxembourg Notes SARL 3.50%, 3/1/2028 (a) | | EUR | 200,000 | | | | 250,359 | |
| | | | | | | | |
| | |
| | | | | | | 3,569,998 | |
| | | | | | | | |
| | | | | | | | |
| INVESTMENTS | | PRINCIPAL
AMOUNT ($) | | | VALUE ($) | |
| | | | | | | | |
| | |
Brazil — 0.6% | | | | | | | | |
| | |
Gerdau Trade, Inc. 4.88%, 10/24/2027 (a) | | | 200,000 | | | | 226,800 | |
| | |
Guara Norte SARL 5.20%, 6/15/2034 (c) | | | 325,000 | | | | 333,028 | |
| | |
Klabin Austria GmbH 7.00%, 4/3/2049 (a) | | | 200,000 | | | | 249,505 | |
| | |
Petrobras Global Finance BV 6.90%, 3/19/2049 | | | 250,000 | | | | 278,912 | |
| | |
Suzano Austria GmbH | | | | | | | | |
| | |
3.75%, 1/15/2031 | | | 48,000 | | | | 50,518 | |
| | |
7.00%, 3/16/2047 (a) | | | 200,000 | | | | 261,700 | |
| | |
Vale Overseas Ltd. 3.75%, 7/8/2030 | | | 142,000 | | | | 150,385 | |
| | | | | | | | |
| | |
| | | | | | | 1,550,848 | |
| | | | | | | | |
| | |
Canada — 0.3% | | | | | | | | |
| | |
Emera US Finance LP 4.75%, 6/15/2046 | | | 160,000 | | | | 187,087 | |
| | |
Emera, Inc. Series 16-A, (ICE LIBOR USD 3 Month + 5.44%), 6.75%, 6/15/2076 (d) | | | 236,000 | | | | 274,777 | |
| | |
Enbridge, Inc. 3.13%, 11/15/2029 | | | 150,000 | | | | 160,043 | |
| | |
Transcanada Trust Series 16-A, (ICE LIBOR USD 3 Month + 4.64%), 5.87%, 8/15/2076 (d) | | | 57,000 | | | | 62,938 | |
| | | | | | | | |
| | |
| | | | | | | 684,845 | |
| | | | | | | | |
| | |
Chile — 0.2% | | | | | | | | |
| | |
Empresa de Transporte de Pasajeros Metro SA 4.70%, 5/7/2050 (c) | | | 200,000 | | | | 236,500 | |
| | |
Kenbourne Invest SA 6.88%, 11/26/2024 (c) | | | 200,000 | | | | 215,063 | |
| | | | | | | | |
| | |
| | | | | | | 451,563 | |
| | | | | | | | |
| | |
China — 0.3% | | | | | | | | |
| | |
Alibaba Group Holding Ltd. 3.40%, 12/6/2027 | | | 200,000 | | | | 217,856 | |
| | |
Huarong Finance 2017 Co. Ltd. 4.25%, 11/7/2027 (a) | | | 200,000 | | | | 217,375 | |
| | |
Tencent Holdings Ltd. 3.98%, 4/11/2029 (a) | | | 200,000 | | | | 221,375 | |
| | |
Yuzhou Group Holdings Co. Ltd. 8.38%, 10/30/2024 (a) | | | 200,000 | | | | 214,500 | |
| | | | | | | | |
| | |
| | | | | | | 871,106 | |
| | | | | | | | |
| | |
Colombia — 0.2% | | | | | | | | |
| | |
Ecopetrol SA 5.88%, 5/28/2045 | | | 400,000 | | | | 429,832 | |
| | | | | | | | |
| | |
Denmark — 0.4% | | | | | | | | |
| | |
Danske Bank A/S (US Treasury Yield Curve Rate T Note Constant Maturity 1 Year + 1.73%), 5.00%, 1/12/2023 (c) (d) | | | 200,000 | | | | 207,067 | |
SEE NOTES TO FINANCIAL STATEMENTS.
| | | | | | | | |
| | | |
| FEBRUARY 28, 2021 | | J.P. MORGAN EXCHANGE-TRADED FUNDS | | | | | 85 | |
JPMorgan International Bond Opportunities ETF
(formerly known as JPMorgan Global Bond Opportunities ETF)
SCHEDULE OF PORTFOLIO INVESTMENTS
AS OF FEBRUARY 28, 2021 (continued)
| | | | | | | | |
| INVESTMENTS | | PRINCIPAL
AMOUNT ($) | | | VALUE ($) | |
Corporate Bonds — continued | |
| | |
Denmark — continued | | | | | | | | |
| | |
DKT Finance ApS 7.00%, 6/17/2023 (a) | | EUR | 300,000 | | | | 370,931 | |
| | |
Nykredit Realkredit A/S Series CCE, 1.00%, 10/1/2050 (a) | | DKK | 628,101 | | | | 99,438 | |
| | |
TDC A/S 5.00%, 3/2/2022 (b) | | EUR | 200,000 | | | | 250,806 | |
| | | | | | | | |
| | |
| | | | | | | 928,242 | |
| | | | | | | | |
| | |
European Union — 0.1% | | | | | | | | |
| | |
Ardagh Metal Packaging Finance USA LLC 3.00%, 9/1/2029 (c) (g) | | EUR | 129,000 | | | | 155,645 | |
| | | | | | | | |
| | |
Finland — 0.3% | | | | | | | | |
| | |
Nokia OYJ 2.00%, 3/15/2024 (a) | | EUR | 425,000 | | | | 534,190 | |
| | |
Nordea Bank Abp (EUR Swap Annual 5 Year + 1.30%), 1.00%,
6/27/2029 (a) (d) | | EUR | 100,000 | | | | 122,375 | |
| | | | | | | | |
| | |
| | | | | | | 656,565 | |
| | | | | | | | |
| | |
France — 8.7% | | | | | | | | |
| | |
Accor SA 3.62%, 9/17/2023 (a) (b) | | EUR | 300,000 | | | | 384,322 | |
| | |
Airbus SE | | | | | | | | |
| | |
1.38%, 6/9/2026 (a) | | EUR | 200,000 | | | | 253,813 | |
| | |
1.63%, 6/9/2030 (a) | | EUR | 200,000 | | | | 259,424 | |
| | |
Altice France SA | | | | | | | | |
| | |
3.38%, 1/15/2028 (a) | | EUR | 900,000 | | | | 1,061,875 | |
| | |
3.38%, 1/15/2028 (c) | | EUR | 100,000 | | | | 117,986 | |
| | |
Banijay Entertainment SASU 3.50%, 3/1/2025 (a) | | EUR | 275,000 | | | | 329,313 | |
| | |
Banijay Group SAS 6.50%, 3/1/2026 (a) | | EUR | 200,000 | | | | 237,087 | |
| | |
BPCE SA | | | | | | | | |
| | |
3.00%, 5/22/2022 (c) | | | 250,000 | | | | 258,066 | |
| | |
5.15%, 7/21/2024 (c) | | | 600,000 | | | | 679,477 | |
| | |
0.63%, 9/26/2024 (a) | | EUR | 400,000 | | | | 490,631 | |
| | |
(EURIBOR 3 Month + 1.00%), 0.50%, 9/15/2027 (a) (d) | | EUR | 400,000 | | | | 483,986 | |
| | |
(EUR Swap Annual 5 Year + 2.37%), 2.75%, 11/30/2027 (a) (d) | | EUR | 400,000 | | | | 503,686 | |
| | |
Burger King France SAS 6.00%,
5/1/2024 (a) | | EUR | 100,000 | | | | 122,077 | |
| | |
Casino Guichard Perrachon SA 4.56%, 1/25/2023 (a) (b) | | EUR | 500,000 | | | | 633,469 | |
| | |
CMA CGM SA 5.25%, 1/15/2025 (a) | | EUR | 250,000 | | | | 303,281 | |
| | | | | | | | |
| INVESTMENTS | | PRINCIPAL
AMOUNT ($) | | | VALUE ($) | |
| | | | | | | | |
| | |
France — continued | | | | | | | | |
| | |
Credit Agricole SA | | | | | | | | |
| | |
(EUR Swap Annual 5 Year + 5.12%), 6.50%, 6/23/2021 (a) (d) (e) (f) | | EUR | 800,000 | | | | 979,690 | |
| | |
3.25%, 10/4/2024 (c) | | | 376,000 | | | | 407,281 | |
| | |
(USD Swap Semi 5 Year + 6.19%), 8.12%, 12/23/2025 (c) (d) (e) (f) | | | 400,000 | | | | 483,281 | |
| | |
2.00%, 3/25/2029 (a) | | EUR | 200,000 | | | | 259,313 | |
| | |
(EUR Swap Annual 5 Year + 1.90%), 1.62%, 6/5/2030 (a) (d) | | EUR | 500,000 | | | | 622,761 | |
| | |
Credit Mutuel Arkea SA (EURIBOR ICE Swap Rate 5 Year + 1.45%), 1.87%, 10/25/2029 (a) (d) | | EUR | 300,000 | | | | 375,272 | |
| | |
Electricite de France SA | | | | | | | | |
| | |
(EUR Swap Annual 6 Year + 3.44%), 4.00%, 7/4/2024 (a) (d) (e) (f) | | EUR | 300,000 | | | | 386,130 | |
| | |
(EUR Swap Annual 5 Year + 4.00%), 3.37%, 6/15/2030 (a) (d) (e) (f) | | EUR | 600,000 | | | | 748,775 | |
| | |
Elis SA 1.63%, 4/3/2028 (a) | | EUR | 400,000 | | | | 465,125 | |
| | |
Engie SA (EUR Swap Annual 5 Year + 1.15%), 1.37%, 1/16/2023 (a) (d) (e) (f) | | EUR | 300,000 | | | | 365,816 | |
| | |
Faurecia SE | | | | | | | | |
| | |
3.13%, 6/15/2026 (a) | | EUR | 600,000 | | | | 743,838 | |
| | |
2.38%, 6/15/2027 (a) | | EUR | 200,000 | | | | 243,723 | |
| | |
La Financiere Atalian SASU | | | | | | | | |
| | |
4.00%, 5/15/2024 (a) | | EUR | 250,000 | | | | 286,810 | |
| | |
5.13%, 5/15/2025 (a) | | EUR | 100,000 | | | | 117,373 | |
| | |
Loxam SAS 2.88%, 4/15/2026 (a) | | EUR | 200,000 | | | | 235,880 | |
| | |
Orange SA | | | | | | | | |
| | |
(EUR Swap Annual 5 Year + 2.36%), 2.37%, 1/15/2025 (a) (d) (e) (f) | | EUR | 200,000 | | | | 251,868 | |
| | |
(EUR Swap Annual 5 Year + 3.99%), 5.00%, 10/1/2026 (a) (d) (e) (f) | | EUR | 400,000 | | | | 577,180 | |
| | |
(EURIBOR ICE Swap Rate 5 Year + 2.18%), 1.75%,
12/19/2026 (a) (d) (e) (f) | | EUR | 200,000 | | | | 245,568 | |
| | |
Orano SA 3.13%, 3/20/2023 (a) | | EUR | 600,000 | | | | 752,026 | |
| | |
Parts Europe SA 6.50%, 7/16/2025 (a) | | EUR | 200,000 | | | | 251,988 | |
| | |
Quatrim SASU 5.88%, 1/15/2024 (a) | | EUR | 500,000 | | | | 633,422 | |
SEE NOTES TO FINANCIAL STATEMENTS.
| | | | | | |
| | | |
| 86 | | | | J.P. MORGAN EXCHANGE-TRADED FUNDS | | FEBRUARY 28, 2021 |
| | | | | | | | |
| INVESTMENTS | | PRINCIPAL
AMOUNT ($) | | | VALUE ($) | |
Corporate Bonds — continued | |
| | |
France — continued | | | | | | | | |
| | |
Renault SA 2.00%, 9/28/2026 (a) | | EUR | 700,000 | | | | 839,771 | |
| | |
Rexel SA 2.75%, 6/15/2026 (a) | | EUR | 500,000 | | | | 615,401 | |
| | |
Societe Generale SA | | | | | | | | |
| | |
(USD ICE Swap Rate 5 Year + 5.87%), 8.00%, 9/29/2025 (c) (d) (e) (f) | | | 200,000 | | | | 235,066 | |
| | |
(US Treasury Yield Curve Rate T Note Constant Maturity 5 Year + 4.51%), 5.38%,
11/18/2030 (c) (d) (e) (f) | | | 1,325,000 | | | | 1,354,826 | |
| | |
(US Treasury Yield Curve Rate T Note Constant Maturity 5 Year + 3.00%), 3.65%, 7/8/2035 (c) (d) | | | 200,000 | | | | 206,865 | |
| | |
SPIE SA | | | | | | | | |
| | |
3.13%, 3/22/2024 (a) | | EUR | 200,000 | | | | 252,169 | |
| | |
2.63%, 6/18/2026 (a) | | EUR | 400,000 | | | | 495,892 | |
| | |
Tereos Finance Groupe I SA 4.13%, 6/16/2023 (a) | | EUR | 100,000 | | | | 121,718 | |
| | |
Total Capital International SA 3.13%, 5/29/2050 | | | 50,000 | | | | 48,866 | |
| | |
TOTAL SE | | | | | | | | |
| | |
(EUR Swap Annual 5 Year + 3.78%), 3.87%, 5/18/2022 (a) (d) (e) (f) | | EUR | 100,000 | | | | 125,213 | |
| | |
(EUR Swap Annual 5 Year + 1.77%), 1.75%,
4/4/2024 (a) (d) (e) (f) | | EUR | 850,000 | | | | 1,043,515 | |
| | |
Valeo SA 3.25%, 1/22/2024 (a) | | EUR | 700,000 | | | | 914,846 | |
| | | | | | | | |
| | |
| | | | | | | 21,805,761 | |
| | | | | | | | |
| | |
Germany — 6.4% | | | | | | | | |
| | |
Adler Pelzer Holding GmbH 4.13%, 4/1/2024 (a) | | EUR | 150,000 | | | | 170,371 | |
| | |
ADLER Real Estate AG | | | | | | | | |
| | |
1.88%, 4/27/2023 (a) | | EUR | 500,000 | | | | 605,537 | |
| | |
2.13%, 2/6/2024 (a) | | EUR | 150,000 | | | | 181,688 | |
| | |
Bayer AG | | | | | | | | |
| | |
1.13%, 1/6/2030 (a) | | EUR | 400,000 | | | | 494,629 | |
| | |
(EURIBOR ICE Swap Rate 5 Year + 2.65%), 2.37%,
11/12/2079 (a) (d) | | EUR | 700,000 | | | | 849,245 | |
| | |
Bayer Capital Corp. BV 2.13%, 12/15/2029 (a) | | EUR | 100,000 | | | | 134,615 | |
| | |
Bertelsmann SE & Co. KGaA | | | | | | | | |
| | |
(EUR Swap Annual 5 Year + 2.64%), 3.00%, 4/23/2075 (a) (d) | | EUR | 200,000 | | | | 247,878 | |
| | | | | | | | |
| INVESTMENTS | | PRINCIPAL
AMOUNT ($) | | | VALUE ($) | |
| | | | | | | | |
| | |
Germany — continued | | | | | | | | |
| | |
CeramTec BondCo GmbH 5.25%, 12/15/2025 (a) | | EUR | 100,000 | | | | 122,694 | |
| | |
Cheplapharm Arzneimittel GmbH 4.38%, 1/15/2028 (a) | | EUR | 450,000 | | | | 559,421 | |
| | |
Commerzbank AG (EUR Swap Annual 5 Year + 6.74%), 6.50%, 10/9/2029 (a) (d) (e) (f) | | EUR | 200,000 | | | | 269,664 | |
| | |
Daimler AG 2.00%, 8/22/2026 (a) | | EUR | 700,000 | | | | 923,231 | |
| | |
Deutsche Bank AG | | | | | | | | |
| | |
4.25%, 10/14/2021 | | | 100,000 | | | | 102,208 | |
| | |
(SOFR + 2.16%), 2.22%, 9/18/2024 (d) | | | 1,075,000 | | | | 1,106,242 | |
| | |
Douglas GmbH 6.25%, 7/15/2022 (a) | | EUR | 200,000 | | | | 238,280 | |
| | |
IHO Verwaltungs GmbH | | | | | | | | |
| | |
3.75% (cash), 9/15/2026 (a) (h) | | EUR | 125,000 | | | | 153,452 | |
| | |
3.88% (cash), 5/15/2027 (a) (h) (i) | | EUR | 400,000 | | | | 498,112 | |
| | |
K+S AG 2.63%, 4/6/2023 (a) | | EUR | 300,000 | | | | 350,009 | |
| | |
Nidda BondCo GmbH 5.00%,
9/30/2025 (a) | | EUR | 475,000 | | | | 580,227 | |
| | |
Nidda Healthcare Holding GmbH 3.50%, 9/30/2024 (a) | | EUR | 225,000 | | | | 273,811 | |
| | |
ProGroup AG 3.00%, 3/31/2026 (a) | | EUR | 200,000 | | | | 243,153 | |
| | |
Rebecca Bidco GmbH | | | | | | | | |
| | |
5.75%, 7/15/2025 (c) | | EUR | 100,000 | | | | 125,638 | |
| | |
5.75%, 7/15/2025 (a) | | EUR | 100,000 | | | | 125,638 | |
| | |
Schaeffler AG | | | | | | | | |
| | |
2.88%, 3/26/2027 (a) | | EUR | 250,000 | | | | 322,375 | |
| | |
3.38%, 10/12/2028 (a) | | EUR | 300,000 | | | | 400,431 | |
| | |
Techem Verwaltungsgesellschaft 674 mbH 6.00%, 7/30/2026 (a) | | EUR | 250,000 | | | | 312,659 | |
| | |
Techem Verwaltungsgesellschaft 675 mbH 2.00%, 7/15/2025 (a) | | EUR | 500,000 | | | | 595,070 | |
| | |
thyssenkrupp AG | | | | | | | | |
| | |
1.38%, 3/3/2022 (a) | | EUR | 450,000 | | | | 542,948 | |
| | |
2.50%, 2/25/2025 (a) | | EUR | 100,000 | | | | 123,128 | |
| | |
Vertical Holdco GmbH | | | | | | | | |
| | |
6.63%, 7/15/2028 (a) | | EUR | 300,000 | | | | 384,611 | |
| | |
Vertical Midco GmbH 4.38%, 7/15/2027 (a) | | EUR | 400,000 | | | | 504,697 | |
| | |
Volkswagen Bank GmbH 2.50%, 7/31/2026 (a) | | EUR | 200,000 | | | | 266,548 | |
SEE NOTES TO FINANCIAL STATEMENTS.
| | | | | | | | |
| | | |
| FEBRUARY 28, 2021 | | J.P. MORGAN EXCHANGE-TRADED FUNDS | | | | | 87 | |
JPMorgan International Bond Opportunities ETF
(formerly known as JPMorgan Global Bond Opportunities ETF)
SCHEDULE OF PORTFOLIO INVESTMENTS
AS OF FEBRUARY 28, 2021 (continued)
| | | | | | | | |
| INVESTMENTS | | PRINCIPAL
AMOUNT ($) | | | VALUE ($) | |
Corporate Bonds — continued | |
| | |
Germany — continued | | | | | | | | |
| | |
Volkswagen International Finance NV | | | | | | | | |
| | |
(EUR Swap Annual 10 Year + 3.35%), 5.12%,
9/4/2023 (a) (d) (e) (f) | | EUR | 53,000 | | | | 69,223 | |
| | |
(EUR Swap Annual 5 Year + 3.75%), 3.50%, 6/17/2025 (a) (d) (e) (f) | | EUR | 200,000 | | | | 251,562 | |
| | |
(EUR Swap Annual 12 Year + 2.97%), 4.62%,
3/24/2026 (a) (d) (e) (f) | | EUR | 600,000 | | | | 791,798 | |
| | |
(EUR Swap Annual 10 Year + 3.98%), 4.62%,
6/27/2028 (a) (d) (e) (f) | | EUR | 200,000 | | | | 267,854 | |
| | |
3.25%, 11/18/2030 (a) | | EUR | 600,000 | | | | 880,719 | |
| | |
Vonovia Finance BV 2.25%, 4/7/2030 (a) | | EUR | 300,000 | | | | 413,661 | |
| | |
WEPA Hygieneprodukte GmbH 2.88%, 12/15/2027 (a) | | EUR | 250,000 | | | | 305,408 | |
| | |
ZF Europe Finance BV 2.00%,
2/23/2026 (a) | | EUR | 500,000 | | | | 597,192 | |
| | |
ZF Finance GmbH 3.75%, 9/21/2028 (a) | | EUR | 500,000 | | | | 645,743 | |
| | | | | | | | |
| | |
| | | | | | | 16,031,370 | |
| | | | | | | | |
| | |
Greece — 0.4% | | | | | | | | |
| | |
Alpha Bank AE 2.50%, 2/5/2023 (a) | | EUR | 780,000 | | | | 980,156 | |
| | | | | | | | |
| | |
India — 0.1% | | | | | | | | |
| | |
NTPC Ltd. 3.75%, 4/3/2024 (a) | | | 200,000 | | | | 211,875 | |
| | | | | | | | |
| | |
Indonesia — 0.3% | | | | | | | | |
| | |
Indonesia Asahan Aluminium Persero PT 5.45%, 5/15/2030 (c) | | | 200,000 | | | | 229,125 | |
| | |
Pertamina Persero PT 3.65%,
7/30/2029 (c) | | | 400,000 | | | | 423,500 | |
| | |
Perusahaan Perseroan Persero PT Perusahaan Listrik Negara 4.13%, 5/15/2027 (a) | | | 200,000 | | | | 216,187 | |
| | | | | | | | |
| | |
| | | | | | | 868,812 | |
| | | | | | | | |
| | |
Ireland — 1.7% | | | | | | | | |
| | |
AerCap Ireland Capital DAC 4.63%, 7/1/2022 | | | 330,000 | | | | 345,526 | |
| | |
AIB Group plc (EUR Swap Annual 5 Year + 2.15%), 1.87%, 11/19/2029 (a) (d) | | EUR | 750,000 | | | | 910,469 | |
| | |
Avolon Holdings Funding Ltd. | | | | | | | | |
| | |
3.95%, 7/1/2024 (c) | | | 126,000 | | | | 131,946 | |
| | |
2.13%, 2/21/2026 (c) | | | 440,000 | | | | 424,208 | |
| | | | | | | | |
| INVESTMENTS | | PRINCIPAL
AMOUNT ($) | | | VALUE ($) | |
| | | | | | | | |
| | |
Ireland — continued | | | | | | | | |
| | |
4.25%, 4/15/2026 (c) | | | 140,000 | | | | 147,968 | |
| | |
4.38%, 5/1/2026 (c) | | | 60,000 | | | | 63,655 | |
| | |
CRH SMW Finance DAC 1.25%, 11/5/2026 (a) | | EUR | 200,000 | | | | 254,783 | |
| | |
eircom Finance DAC 3.50%, 5/15/2026 (a) | | EUR | 700,000 | | | | 857,037 | |
| | |
Smurfit Kappa Acquisitions ULC | | | | | | | | |
| | |
2.38%, 2/1/2024 (a) | | EUR | 500,000 | | | | 635,898 | |
| | |
2.88%, 1/15/2026 (a) | | EUR | 400,000 | | | | 533,295 | |
| | | | | | | | |
| | |
| | | | | | | 4,304,785 | |
| | | | | | | | |
| | |
Israel — 0.2% | | | | | | | | |
| | |
Leviathan Bond Ltd. | | | | | | | | |
| | |
6.13%, 6/30/2025 (a) | | | 200,000 | | | | 218,250 | |
| | |
6.50%, 6/30/2027 (a) | | | 200,000 | | | | 219,750 | |
| | | | | | | | |
| | |
| | | | | | | 438,000 | |
| | | | | | | | |
| | |
Italy — 3.2% | | | | | | | | |
| | |
Assicurazioni Generali SpA 2.43%, 7/14/2031 (a) | | EUR | 200,000 | | | | 257,965 | |
| | |
Atlantia SpA | | | | | | | | |
| | |
1.63%, 2/3/2025 (a) | | EUR | 300,000 | | | | 362,899 | |
| | |
1.88%, 7/13/2027 (a) | | EUR | 100,000 | | | | 120,858 | |
| | |
Autostrade per l’Italia SpA | | | | | | | | |
| | |
1.63%, 6/12/2023 | | EUR | 200,000 | | | | 243,631 | |
| | |
1.75%, 2/1/2027 (a) | | EUR | 950,000 | | | | 1,164,425 | |
| | |
Enel Finance International NV 3.50%, 4/6/2028 (c) | | | 200,000 | | | | 220,191 | |
| | |
Enel SpA Series 63.5, (EUR Swap Annual 5 Year + 2.58%), 3.37%, 8/24/2026 (a) (d) (e) (f) | | EUR | 800,000 | | | | 1,062,876 | |
| | |
Eni SpA 4.25%, 5/9/2029 (c) | | | 250,000 | | | | 285,382 | |
| | |
Intesa Sanpaolo SpA 3.93%, 9/15/2026 (a) | | EUR | 150,000 | | | | 203,543 | |
| | |
Leonardo SpA 4.88%, 3/24/2025 | | EUR | 700,000 | | | | 965,668 | |
| | |
Pro-Gest SpA 3.25%, 12/15/2024 (a) | | EUR | 100,000 | | | | 114,369 | |
| | |
Rossini SARL 6.75%, 10/30/2025 (a) | | EUR | 200,000 | | | | 256,090 | |
| | |
Saipem Finance International BV 2.63%, 1/7/2025 (a) | | EUR | 250,000 | | | | 310,283 | |
| | |
Telecom Italia SpA | | | | | | | | |
| | |
3.63%, 1/19/2024 (a) | | EUR | 100,000 | | | | 129,577 | |
| | |
3.63%, 5/25/2026 (a) | | EUR | 825,000 | | | | 1,099,105 | |
| | |
2.38%, 10/12/2027 (a) | | EUR | 1,000,000 | | | | 1,254,812 | |
| | | | | | | | |
| | |
| | | | | | | 8,051,674 | |
| | | | | | | | |
SEE NOTES TO FINANCIAL STATEMENTS.
| | | | | | |
| | | |
| 88 | | | | J.P. MORGAN EXCHANGE-TRADED FUNDS | | FEBRUARY 28, 2021 |
| | | | | | | | |
| INVESTMENTS | | PRINCIPAL
AMOUNT ($) | | | VALUE ($) | |
Corporate Bonds — continued | |
| | |
Japan — 0.7% | | | | | | | | |
| | |
Sumitomo Mitsui Financial Group, Inc. 1.47%, 7/8/2025 | | | 460,000 | | | | 467,187 | |
| | |
Takeda Pharmaceutical Co. Ltd. | | | | | | | | |
| | |
1.00%, 7/9/2029 | | EUR | 600,000 | | | | 744,535 | |
| | |
3.03%, 7/9/2040 | | | 270,000 | | | | 271,212 | |
| | |
3.18%, 7/9/2050 | | | 200,000 | | | | 195,009 | |
| | | | | | | | |
| | |
| | | | | | | 1,677,943 | |
| | | | | | | | |
| | |
Kazakhstan — 0.2% | | | | | | | | |
| | |
KazMunayGas National Co. JSC 5.75%, 4/19/2047 (a) | | | 380,000 | | | | 448,970 | |
| | | | | | | | |
| | |
Kuwait — 0.1% | �� | | | | | | | |
| | |
MEGlobal Canada ULC 5.00%,
5/18/2025 (c) | | | 200,000 | | | | 221,375 | |
| | | | | | | | |
| | |
Luxembourg — 2.2% | | | | | | | | |
| | |
Altice Finco SA 4.75%, 1/15/2028 (a) | | EUR | 400,000 | | | | 464,410 | |
| | |
Altice France Holding SA | | | | | | | | |
| | |
8.00%, 5/15/2027 (a) | | EUR | 150,000 | | | | 197,271 | |
| | |
8.00%, 5/15/2027 (c) | | EUR | 123,000 | | | | 161,762 | |
| | |
ArcelorMittal SA 1.75%, 11/19/2025 (a) | | EUR | 525,000 | | | | 660,087 | |
| | |
ARD Finance SA | | | | | | | | |
| | |
5.00% (cash), 6/30/2027 (a) (h) (i) | | EUR | 100,000 | | | | 124,768 | |
| | |
5.00% (cash), 6/30/2027 (c) (h) | | EUR | 100,000 | | | | 124,769 | |
| | |
INEOS Finance plc | | | | | | | | |
| | |
3.38%, 3/31/2026 (a) | | EUR | 300,000 | | | | 372,814 | |
| | |
3.38%, 3/31/2026 (c) | | EUR | 147,000 | | | | 182,679 | |
| | |
Matterhorn Telecom SA | | | | | | | | |
| | |
3.13%, 9/15/2026 (a) | | EUR | 225,000 | | | | 268,310 | |
| | |
3.13%, 9/15/2026 (c) | | EUR | 100,000 | | | | 119,249 | |
| | |
Monitchem HoldCo 3 SA 5.25%, 3/15/2025 (a) | | EUR | 200,000 | | | | 247,343 | |
| | |
PLT VII Finance SARL 4.63%,
1/5/2026 (a) | | EUR | 250,000 | | | | 312,647 | |
| | |
SES SA | | | | | | | | |
| | |
(EUR Swap Annual 5 Year + 4.66%), 4.62%, 1/2/2022 (a) (d) (e) (f) | | EUR | 525,000 | | | | 649,409 | |
| | |
(EUR Swap Annual 5 Year + 5.40%), 5.63%, 1/29/2024 (a) (d) (e) (f) | | EUR | 200,000 | | | | 264,114 | |
| | |
1.63%, 3/22/2026 (a) | | EUR | 200,000 | | | | 256,006 | |
| | |
0.88%, 11/4/2027 (a) | | EUR | 450,000 | | | | 555,274 | |
| | |
Summer BC Holdco A SARL 9.25%, 10/31/2027 (a) | | EUR | 90,105 | | | | 117,142 | |
| | | | | | | | |
| INVESTMENTS | | PRINCIPAL
AMOUNT ($) | | | VALUE ($) | |
| | | | | | | | |
| | |
Luxembourg — continued | | | | | | | | |
| | |
Summer BC Holdco B SARL 5.75%, 10/31/2026 (a) | | EUR | 400,000 | | | | 508,440 | |
| | | | | | | | |
| | |
| | | | | | | 5,586,494 | |
| | | | | | | | |
| | |
Mexico — 0.8% | | | | | | | | |
| | |
Banco Mercantil del Norte SA (US Treasury Yield Curve Rate T Note Constant Maturity 5 Year + 5.04%), 6.87%, 7/6/2022 (c) (d) (e) (f) | | | 200,000 | | | | 206,500 | |
| | |
BBVA Bancomer SA (US Treasury Yield Curve Rate T Note Constant Maturity 5 Year + 2.65%), 5.12%,
1/18/2033 (c) (d) | | | 200,000 | | | | 210,125 | |
| | |
Cemex SAB de CV 3.88%, 7/11/2031 (c) | | | 377,000 | | | | 376,253 | |
| | |
Fomento Economico Mexicano SAB de CV 3.50%, 1/16/2050 | | | 150,000 | | | | 152,700 | |
| | |
Grupo Bimbo SAB de CV 4.00%,
9/6/2049 (c) | | | 200,000 | | | | 204,750 | |
| | |
Petroleos Mexicanos | | | | | | | | |
| | |
6.75%, 9/21/2047 | | | 525,000 | | | | 459,506 | |
| | |
6.95%, 1/28/2060 | | | 510,000 | | | | 448,622 | |
| | | | | | | | |
| | |
| | | | | | | 2,058,456 | |
| | | | | | | | |
| | |
Morocco — 0.1% | | | | | | | | |
| | |
OCP SA 6.88%, 4/25/2044 (a) | | | 200,000 | | | | 244,938 | |
| | | | | | | | |
| | |
Netherlands — 3.1% | | | | | | | | |
| | |
ABN AMRO Bank NV | | | | | | | | |
| | |
4.75%, 7/28/2025 (c) | | | 200,000 | | | | 226,302 | |
| | |
(EUR Swap Annual 5 Year + 4.67%), 4.37%, 9/22/2025 (a) (d) (e) (f) | | EUR | 800,000 | | | | 1,017,170 | |
| | |
Cooperatieve Rabobank UA | | | | | | | | |
| | |
(EUR Swap Annual 5 Year + 3.70%), 3.25%, 12/29/2026 (a) (d) (e) (f) | | EUR | 200,000 | | | | 244,628 | |
| | |
(EUR Swap Annual 5 Year + 4.68%), 4.37%, 6/29/2027 (a) (d) (e) (f) | | EUR | 600,000 | | | | 796,245 | |
| | |
ING Groep NV | | | | | | | | |
| | |
(EUR Swap Annual 5 Year + 2.85%), 3.00%, 4/11/2028 (d) | | EUR | 400,000 | | | | 508,692 | |
| | |
(EUR Swap Annual 5 Year + 1.20%), 1.00%, 11/13/2030 (a) (d) | | EUR | 300,000 | | | | 363,123 | |
| | |
Nouryon Holding BV 6.50%, 10/1/2026 (a) | | EUR | 275,000 | | | | 345,604 | |
SEE NOTES TO FINANCIAL STATEMENTS.
| | | | | | | | |
| | | |
| FEBRUARY 28, 2021 | | J.P. MORGAN EXCHANGE-TRADED FUNDS | | | | | 89 | |
JPMorgan International Bond Opportunities ETF
(formerly known as JPMorgan Global Bond Opportunities ETF)
SCHEDULE OF PORTFOLIO INVESTMENTS
AS OF FEBRUARY 28, 2021 (continued)
| | | | | | | | |
| INVESTMENTS | | PRINCIPAL
AMOUNT ($) | | | VALUE ($) | |
Corporate Bonds — continued | |
| | |
Netherlands — continued | | | | | | | | |
| | |
OCI NV | | | | | | | | |
| | |
3.13%, 11/1/2024 (a) | | EUR | 200,000 | | | | 245,533 | |
| | |
3.63%, 10/15/2025 (c) | | EUR | 118,000 | | | | 148,246 | |
| | |
Q-Park Holding I BV 2.00%, 3/1/2027 (a) | | EUR | 250,000 | | | | 283,780 | |
| | |
Sigma Holdco BV 5.75%, 5/15/2026 (a) | | EUR | 375,000 | | | | 439,889 | |
| | |
Sunshine Mid BV 6.50%, 5/15/2026 (a) | | EUR | 400,000 | | | | 497,099 | |
| | |
Trivium Packaging Finance BV 3.75%, 8/15/2026 (a) (b) | | EUR | 300,000 | | | | 370,109 | |
| | |
United Group BV 4.88%, 7/1/2024 (a) | | EUR | 200,000 | | | | 245,533 | |
| | |
UPC Holding BV 3.88%, 6/15/2029 (a) | | EUR | 400,000 | | | | 490,463 | |
| | |
UPCB Finance IV Ltd. 4.00%,
1/15/2027 (a) | | EUR | 180,000 | | | | 221,269 | |
| | |
Ziggo Bond Co. BV 3.38%, 2/28/2030 (a) | | EUR | 900,000 | | | | 1,079,162 | |
| | |
Ziggo BV 4.25%, 1/15/2027 (a) | | EUR | 160,000 | | | | 200,384 | |
| | | | | | | | |
| | |
| | | | | | | 7,723,231 | |
| | | | | | | | |
| | |
Peru — 0.1% | | | | | | | | |
| | |
Southern Copper Corp. 5.88%, 4/23/2045 | | | 140,000 | | | | 187,950 | |
| | | | | | | | |
| | |
Portugal — 0.9% | | | | | | | | |
| | |
EDP — Energias de Portugal SA | | | | | | | | |
| | |
1.63%, 4/15/2027 (a) | | EUR | 500,000 | | | | 648,153 | |
| | |
(EUR Swap Annual 5 Year + 1.84%), 1.70%, 7/20/2080 (a) (d) | | EUR | 1,200,000 | | | | 1,433,381 | |
| | |
EDP Finance BV 2.38%, 3/23/2023 (a) | | EUR | 200,000 | | | | 253,656 | |
| | | | | | | | |
| | |
| | | | | | | 2,335,190 | |
| | | | | | | | |
| | |
Qatar — 0.1% | | | | | | | | |
| | |
ABQ Finance Ltd. 3.50%, 2/22/2022 (a) | | | 200,000 | | | | 204,687 | |
| | | | | | | | |
| | |
Saudi Arabia — 0.2% | | | | | | | | |
| | |
Saudi Arabian Oil Co. | | | | | | | | |
| | |
3.25%, 11/24/2050 (c) | | | 223,000 | | | | 204,547 | |
| | |
3.50%, 11/24/2070 (c) | | | 353,000 | | | | 316,817 | |
| | | | | | | | |
| | |
| | | | | | | 521,364 | |
| | | | | | | | |
| | |
Spain — 5.7% | | | | | | | | |
| | |
Abertis Infraestructuras Finance BV (EUR Swap Annual 5 Year + 3.69%), 3.25%, 11/24/2025 (a) (d) (e) (f) | | EUR | 600,000 | | | | 738,440 | |
| | | | | | | | |
| INVESTMENTS | | PRINCIPAL
AMOUNT ($) | | | VALUE ($) | |
| | | | | | | | |
| | |
Spain — continued | | | | | | | | |
| | |
AI Candelaria Spain SLU 7.50%, 12/15/2028 (a) | | | 250,000 | | | | 284,375 | |
| | |
Banco Bilbao Vizcaya Argentaria SA | | | | | | | | |
| | |
(EUR Swap Annual 5 Year + 6.04%), 6.00%, 3/29/2024 (a) (d) (e) (f) | | EUR | 400,000 | | | | 516,355 | |
| | |
0.38%, 11/15/2026 (a) | | EUR | 300,000 | | | | 364,031 | |
| | |
Banco de Sabadell SA | | | | | | | | |
| | |
1.13%, 3/27/2025 (a) | | EUR | 300,000 | | | | 361,378 | |
| | |
(EUR Swap Annual 1 Year + 0.97%), 0.62%, 11/7/2025 (a) (d) | | EUR | 300,000 | | | | 362,652 | |
| | |
Banco Santander SA 2.13%, 2/8/2028 (a) | | EUR | 200,000 | | | | 257,540 | |
| | |
Bankia SA (EUR Swap Annual 5 Year + 6.22%), 6.37%, 9/19/2023 (a) (d) (e) (f) | | EUR | 400,000 | | | | 513,160 | |
| | |
CaixaBank SA | | | | | | | | |
| | |
(EUR Swap Annual 5 Year + 6.50%), 6.75%, 6/13/2024 (a) (d) (e) (f) | | EUR | 200,000 | | | | 263,329 | |
| | |
(EUR Swap Annual 5 Year + 3.35%), 3.50%, 2/15/2027 (a) (d) | | EUR | 1,100,000 | | | | 1,363,531 | |
| | |
Cellnex Telecom SA 2.88%, 4/18/2025 (a) | | EUR | 900,000 | | | | 1,174,241 | |
| | |
Cirsa Finance International SARL 4.75%, 5/22/2025 (a) | | EUR | 150,000 | | | | 172,974 | |
| | |
ContourGlobal Power Holdings SA | | | | | | | | |
| | |
4.13%, 8/1/2025 (a) | | EUR | 400,000 | | | | 495,262 | |
| | |
3.13%, 1/1/2028 (c) | | EUR | 100,000 | | | | 122,621 | |
| | |
eDreams ODIGEO SA 5.50%, 9/1/2023 (a) | | EUR | 100,000 | | | | 116,939 | |
| | |
Ferrovial Emisiones SA 2.50%,
7/15/2024 (a) | | EUR | 200,000 | | | | 260,721 | |
| | |
Grifols SA | | | | | | | | |
| | |
1.63%, 2/15/2025 (c) | | EUR | 100,000 | | | | 120,655 | |
| | |
2.25%, 11/15/2027 (c) | | EUR | 100,000 | | | | 121,741 | |
| | |
2.25%, 11/15/2027 (a) | | EUR | 600,000 | | | | 730,445 | |
| | |
Grupo Antolin-Irausa SA 3.25%,
4/30/2024 (a) | | EUR | 200,000 | | | | 234,602 | |
| | |
Iberdrola International BV | | | | | | | | |
| | |
(EUR Swap Annual 5 Year + 2.06%), 2.62%, 3/26/2024 (a) (d) (e) (f) | | EUR | 800,000 | | | | 1,014,614 | |
| | |
(EUR Swap Annual 5 Year + 2.97%), 3.25%, 11/12/2024 (a) (d) (e) (f) | | EUR | 300,000 | | | | 393,090 | |
SEE NOTES TO FINANCIAL STATEMENTS.
| | | | | | |
| | | |
| 90 | | | | J.P. MORGAN EXCHANGE-TRADED FUNDS | | FEBRUARY 28, 2021 |
| | | | | | | | |
| INVESTMENTS | | PRINCIPAL
AMOUNT ($) | | | VALUE ($) | |
Corporate Bonds — continued | |
| | |
Spain — continued | | | | | | | | |
| | |
Lorca Telecom Bondco SA | | | | | | | | |
| | |
4.00%, 9/18/2027 (a) | | EUR | 300,000 | | | | 378,253 | |
| | |
4.00%, 9/18/2027 (c) | | EUR | 116,000 | | | | 146,258 | |
| | |
Naturgy Finance BV | | | | | | | | |
| | |
(EUR Swap Annual 9 Year + 3.08%), 3.37%, 4/24/2024 (a) (d) (e) (f) | | EUR | 200,000 | | | | 253,376 | |
| | |
Repsol International Finance BV | | | | | | | | |
| | |
(EUR Swap Annual 10 Year + 4.20%), 4.50%, 3/25/2075 (a) (d) | | EUR | 700,000 | | | | 920,581 | |
| | |
Telefonica Emisiones SA 5.21%, 3/8/2047 | | | 150,000 | | | | 181,404 | |
| | |
Telefonica Europe BV | | | | | | | | |
| | |
(EUR Swap Annual 5 Year + 2.33%), 2.62%, 3/7/2023 (a) (d) (e) (f) | | EUR | 200,000 | | | | 245,361 | |
| | |
Series NC5, (EUR Swap Annual 5 Year + 2.45%), 3.00%, 9/4/2023 (a) (d) (e) (f) | | EUR | 1,300,000 | | | | 1,613,553 | |
| | |
(EUR Swap Annual 8 Year + 2.97%), 3.87%, 6/22/2026 (a) (d) (e) (f) | | EUR | 400,000 | | | | 514,954 | |
| | | | | | | | |
| | |
| | | | | | | 14,236,436 | |
| | | | | | | | |
| | |
Sweden — 0.7% | | | | | | | | |
| | |
Dometic Group AB 3.00%, 5/8/2026 (a) | | EUR | 150,000 | | | | 189,098 | |
| | |
Verisure Holding AB 3.88%,
7/15/2026 (a) | | EUR | 525,000 | | | | 649,275 | |
| | |
Verisure Midholding AB 5.25%, 2/15/2029 (c) | | EUR | 219,000 | | | | 271,910 | |
| | |
Volvo Car AB 2.00%, 1/24/2025 (a) | | EUR | 600,000 | | | | 747,603 | |
| | | | | | | | |
| | |
| | | | | | | 1,857,886 | |
| | | | | | | | |
| | |
Switzerland — 2.0% | | | | | | | | |
| | |
Credit Suisse AG 2.95%, 4/9/2025 | | | 260,000 | | | | 281,095 | |
| | |
Credit Suisse Group AG | | | | | | | | |
| | |
(USD Swap Semi 5 Year + 4.60%), 7.50%, 12/11/2023 (c) (d) (e) (f) | | | 450,000 | | | | 498,381 | |
| | |
(EURIBOR ICE Swap Rate 1 Year + 3.50%), 3.25%, 4/2/2026 (a) (d) | | EUR | 200,000 | | | | 269,990 | |
| | |
(US Treasury Yield Curve Rate T Note Constant Maturity 5 Year + 4.89%), 5.25%,
2/11/2027 (c) (d) (e) (f) | | | 200,000 | | | | 212,500 | |
| | | | | | | | |
| INVESTMENTS | | PRINCIPAL
AMOUNT ($) | | | VALUE ($) | |
| | | | | | | | |
| | |
Switzerland — continued | | | | | | | | |
| | |
(US Treasury Yield Curve Rate T Note Constant Maturity 5 Year + 3.55%), 4.50%,
9/3/2030 (c) (d) (e) (f) | | | 450,000 | | | | 439,313 | |
| | |
(SOFR + 3.73%), 4.19%,
4/1/2031 (c) (d) | | | 540,000 | | | | 615,463 | |
| | |
Dufry One BV 2.50%, 10/15/2024 (a) | | EUR | 100,000 | | | | 115,973 | |
| | |
Kongsberg Actuation Systems BV 5.00%, 7/15/2025 (a) | | EUR | 100,000 | | | | 117,638 | |
| | |
Swiss Re Finance UK plc (EUR Swap Annual 1 Year + 3.75%), 2.71%, 6/4/2052 (a) (d) | | EUR | 100,000 | | | | 130,137 | |
| | |
UBS Group AG | | | | | | | | |
| | |
(EUR Swap Annual 5 Year + 5.29%), 5.75%, 2/19/2022 (a) (d) (e) (f) | | EUR | 600,000 | | | | 750,394 | |
| | |
(USD Swap Semi 5 Year + 4.87%), 7.00%, 2/19/2025 (a) (d) (e) (f) | | | 200,000 | | | | 229,000 | |
| | |
(USD Swap Semi 5 Year + 4.59%), 6.87%, 8/7/2025 (a) (d) (e) (f) | | | 200,000 | | | | 226,000 | |
| | |
(EUR Swap Annual 1 Year + 0.55%), 0.25%, 1/29/2026 (a) (d) | | EUR | 300,000 | | | | 362,997 | |
| | |
(EUR Swap Annual 1 Year + 0.77%), 0.25%, 11/5/2028 (a) (d) | | EUR | 300,000 | | | | 356,999 | |
| | |
(US Treasury Yield Curve Rate T Note Constant Maturity 1 Year + 1.00%), 2.09%, 2/11/2032 (c) (d) | | | 280,000 | | | | 274,510 | |
| | | | | | | | |
| | |
| | | | | | | 4,880,390 | |
| | | | | | | | |
| | |
Taiwan — 0.1% | | | | | | | | |
| | |
Competition Team Technologies Ltd. 3.75%, 3/12/2024 (a) | | | 200,000 | | | | 215,625 | |
| | | | | | | | |
| | |
United Kingdom — 7.7% | | | | | | | | |
| | |
Barclays plc | | | | | | | | |
| | |
(EUR Swap Annual 1 Year + 3.70%), 3.37%, 4/2/2025 (a) (d) | | EUR | 250,000 | | | | 330,110 | |
| | |
(U.K. Government Bonds 5 Year Note Generic Bid Yield + 6.02%), 6.37%, 12/15/2025 (a) (d) (e) (f) | | GBP | 200,000 | | | | 300,854 | |
| | |
BAT Capital Corp. | | | | | | | | |
| | |
4.70%, 4/2/2027 | | | 50,000 | | | | 57,266 | |
| | |
3.56%, 8/15/2027 | | | 520,000 | | | | 564,726 | |
SEE NOTES TO FINANCIAL STATEMENTS.
| | | | | | | | |
| | | |
| FEBRUARY 28, 2021 | | J.P. MORGAN EXCHANGE-TRADED FUNDS | | | | | 91 | |
JPMorgan International Bond Opportunities ETF
(formerly known as JPMorgan Global Bond Opportunities ETF)
SCHEDULE OF PORTFOLIO INVESTMENTS
AS OF FEBRUARY 28, 2021 (continued)
| | | | | | | | |
| INVESTMENTS | | PRINCIPAL
AMOUNT ($) | | | VALUE ($) | |
Corporate bonds — continued | |
| | |
United Kingdom — continued | | | | | | | | |
| | |
2.26%, 3/25/2028 | | | 440,000 | | | | 440,069 | |
| | |
4.39%, 8/15/2037 | | | 309,000 | | | | 329,932 | |
| | |
4.54%, 8/15/2047 | | | 90,000 | | | | 92,321 | |
| | |
Boparan Finance plc 7.63%,
11/30/2025 (c) | | GBP | 104,000 | | | | 145,601 | |
| | |
BP Capital Markets plc | | | | | | | | |
| | |
(US Treasury Yield Curve Rate T Note Constant Maturity 5 Year + 4.04%), 4.38%,
6/22/2025 (d) (e) (f) | | | 204,000 | | | | 215,071 | |
| | |
(EUR Swap Annual 5 Year + 3.88%), 3.25%, 3/22/2026 (a) (d) (e) (f) | | EUR | 600,000 | | | | 763,746 | |
| | |
1.64%, 6/26/2029 (a) | | EUR | 200,000 | | | | 261,580 | |
| | |
(US Treasury Yield Curve Rate T Note Constant Maturity 5 Year + 4.40%), 4.88%,
3/22/2030 (d) (e) (f) | | | 94,000 | | | | 100,909 | |
| | |
British Telecommunications plc (EURIBOR ICE Swap Rate 5 Year + 2.13%), 1.87%, 8/18/2080 (a) (d) | | EUR | 100,000 | | | | 119,030 | |
| | |
Centrica plc 4.38%, 3/13/2029 (a) | | GBP | 200,000 | | | | 331,493 | |
| | |
CK Hutchison Group Telecom Finance SA 1.13%, 10/17/2028 (a) | | EUR | 850,000 | | | | 1,059,616 | |
| | |
EC Finance plc 2.38%, 11/15/2022 (a) | | EUR | 200,000 | | | | 231,658 | |
| | |
eG Global Finance plc 4.38%, 2/7/2025 (a) | | EUR | 400,000 | | | | 474,147 | |
| | |
FCE Bank plc 1.13%, 2/10/2022 (a) | | EUR | 300,000 | | | | 362,573 | |
| | |
Heathrow Funding Ltd. | | | | | | | | |
| | |
6.75%, 12/3/2026 (a) | | GBP | 200,000 | | | | 349,645 | |
| | |
1.50%, 2/11/2030 (a) | | EUR | 300,000 | | | | 370,130 | |
| | |
1.88%, 3/14/2034 (a) | | EUR | 250,000 | | | | 311,859 | |
| | |
HSBC Holdings plc | | | | | | | | |
| | |
(SOFR + 1.54%), 1.64%,
4/18/2026 (d) | | | 490,000 | | | | 495,515 | |
| | |
5.75%, 12/20/2027 (a) | | GBP | 200,000 | | | | 342,265 | |
| | |
(ICE LIBOR USD 3 Month + 1.61%), 3.97%, 5/22/2030 (d) | | | 250,000 | | | | 279,379 | |
| | |
Iceland Bondco plc 4.63%, 3/15/2025 (a) | | GBP | 300,000 | | | | 415,600 | |
| | |
INEOS Quattro Finance 2 plc 2.50%, 1/15/2026 (c) | | EUR | 200,000 | | | | 240,827 | |
| | | | | | | | |
| INVESTMENTS | | PRINCIPAL
AMOUNT ($) | | | VALUE ($) | |
| | | | | | | | |
| | |
United Kingdom — continued | | | | | | | | |
| | |
Jaguar Land Rover Automotive plc 4.50%, 1/15/2026 (a) | | EUR | 200,000 | | | | 243,892 | |
| | |
Lloyds Banking Group plc 4.58%, 12/10/2025 | | | 200,000 | | | | 226,379 | |
| | |
Motion Finco SARL 7.00%, 5/15/2025 (a) | | EUR | 150,000 | | | | 191,125 | |
| | |
Nationwide Building Society (U.K. Government Bonds 5 Year Note Generic Bid Yield + 5.63%), 5.75%, 6/20/2027 (a) (d) (e) (f) | | GBP | 750,000 | | | | 1,159,672 | |
| | |
Natwest Group plc | | | | | | | | |
| | |
(USD Swap Semi 5 Year + 7.60%), 8.62%, 8/15/2021 (d) (e) (f) | | | 200,000 | | | | 206,500 | |
| | |
(ICE LIBOR USD 3 Month + 1.48%), 3.50%, 5/15/2023 (d) | | | 235,000 | | | | 243,203 | |
| | |
(ICE LIBOR USD 3 Month + 1.76%), 4.27%, 3/22/2025 (d) | | | 780,000 | | | | 855,216 | |
| | |
(EURIBOR 3 Month + 1.08%), 0.75%, 11/15/2025 (a) (d) | | EUR | 400,000 | | | | 490,599 | |
| | |
(US Treasury Yield Curve Rate T Note Constant Maturity 5 Year + 5.63%), 6.00%,
12/29/2025 (d) (e) (f) | | | 322,000 | | | | 356,615 | |
| | |
(U.K. Government Bonds 5 Year Note Generic Bid Yield + 4.99%), 5.12%, 5/12/2027 (d) (e) (f) | | GBP | 449,000 | | | | 655,260 | |
| | |
Pinnacle Bidco plc 5.50%, 2/15/2025 (a) | | EUR | 200,000 | | | | 244,869 | |
| | |
Rolls-Royce plc 0.88%, 5/9/2024 (a) | | EUR | 400,000 | | | | 457,242 | |
| | |
Sky Ltd. | | | | | | | | |
| | |
1.50%, 9/15/2021 (a) | | EUR | 200,000 | | | | 243,734 | |
| | |
2.25%, 11/17/2025 (a) | | EUR | 200,000 | | | | 266,615 | |
| | |
Standard Chartered plc | | | | | | | | |
| | |
(US Treasury Yield Curve Rate T Note Constant Maturity 5 Year + 5.66%), 6.00%,
7/26/2025 (c) (d) (e) (f) | | | 200,000 | | | | 217,560 | |
| | |
(US Treasury Yield Curve Rate T Note Constant Maturity 1 Year + 3.85%), 4.64%, 4/1/2031 (c) (d) | | | 680,000 | | | | 792,614 | |
| | |
Synthomer plc 3.88%, 7/1/2025 (a) | | EUR | 200,000 | | | | 249,997 | |
SEE NOTES TO FINANCIAL STATEMENTS.
| | | | | | |
| | | |
| 92 | | | | J.P. MORGAN EXCHANGE-TRADED FUNDS | | FEBRUARY 28, 2021 |
| | | | | | | | |
| INVESTMENTS | | PRINCIPAL
AMOUNT ($) | | | VALUE ($) | |
Corporate Bonds — continued | |
| | |
United Kingdom — continued | | | | | | | | |
| | |
Virgin Media Finance plc 3.75%, 7/15/2030 (a) | | EUR | 525,000 | | | | 636,431 | |
| | |
Vodafone Group plc | | | | | | | | |
| | |
5.25%, 5/30/2048 | | | 180,000 | | | | 233,374 | |
| | |
4.88%, 6/19/2049 | | | 121,000 | | | | 148,569 | |
| | |
4.25%, 9/17/2050 | | | 90,000 | | | | 100,935 | |
| | |
(EUR Swap Annual 5 Year + 3.43%), 4.20%, 10/3/2078 (a) (d) | | EUR | 700,000 | | | | 951,425 | |
| | |
(EUR Swap Annual 5 Year + 2.67%), 3.10%, 1/3/2079 (a) (d) | | EUR | 300,000 | | | | 375,991 | |
| | |
Series NC10, (EUR Swap Annual 5 Year + 3.23%), 3.00%,
8/27/2080 (a) (d) | | EUR | 625,000 | | | | 771,061 | |
| | | | | | | | |
| | |
| | | | | | | 19,304,800 | |
| | | | | | | | |
| | |
United States — 4.2% | | | | | | | | |
| | |
Adient Global Holdings Ltd. 3.50%, 8/15/2024 (a) | | EUR | 200,000 | | | | 245,557 | |
| | |
AES Corp. (The) 2.45%, 1/15/2031 (c) | | | 110,000 | | | | 108,052 | |
| | |
Albertsons Cos., Inc. 5.75%, 3/15/2025 | | | 4,000 | | | | 4,125 | |
| | |
Alexander Funding Trust 1.84%, 11/15/2023 (c) | | | 70,000 | | | | 71,158 | |
| | |
Ardagh Packaging Finance plc 2.13%, 8/15/2026 (c) | | EUR | 100,000 | | | | 121,596 | |
| | |
AT&T, Inc. 3.55%, 9/15/2055 (c) | | | 88,000 | | | | 80,796 | |
| | |
Berry Global, Inc. 5.13%, 7/15/2023 | | | 6,000 | | | | 6,098 | |
| | |
Broadcom, Inc. | | | | | | | | |
| | |
2.45%, 2/15/2031 (c) | | | 760,000 | | | | 738,070 | |
| | |
3.50%, 2/15/2041 (c) | | | 105,000 | | | | 104,638 | |
| | |
3.75%, 2/15/2051 (c) | | | 233,000 | | | | 229,748 | |
| | |
CCO Holdings LLC 5.13%, 5/1/2027 (c) | | | 140,000 | | | | 146,664 | |
| | |
CenterPoint Energy, Inc. 2.95%, 3/1/2030 | | | 280,000 | | | | 293,716 | |
| | |
Charles Schwab Corp. (The) Series H, (US Treasury Yield Curve Rate T Note Constant Maturity 10 Year + 3.08%), 4.00%, 12/1/2030 (d) (e) (f) | | | 320,000 | | | | 321,200 | |
| | |
Citigroup, Inc. | | | | | | | | |
| | |
Series M, (ICE LIBOR USD 3 Month + 3.42%), 6.30%, 5/15/2024 (d) (e) (f) | | | 18,000 | | | | 19,013 | |
| | | | | | | | |
| INVESTMENTS | | PRINCIPAL
AMOUNT ($) | | | VALUE ($) | |
| | | | | | | | |
| | |
United States — continued | | | | | | | | |
| | |
Series V, (SOFR + 3.23%), 4.70%, 1/30/2025 (d) (e) (f) | | | 170,000 | | | | 171,734 | |
| | |
Series P, (ICE LIBOR USD 3 Month + 3.91%), 5.95%,
5/15/2025 (d) (e) (f) | | | 155,000 | | | | 168,175 | |
| | |
Series W, (US Treasury Yield Curve Rate T Note Constant Maturity 5 Year + 3.60%), 4.00%, 12/10/2025 (d) (e) (f) | | | 160,000 | | | | 161,597 | |
| | |
(US Treasury Yield Curve Rate T Note Constant Maturity 5 Year + 3.42%), 3.88%,
2/18/2026 (d) (e) (f) | | | 550,000 | | | | 547,250 | |
| | |
Series T, (ICE LIBOR USD 3 Month + 4.52%), 6.25%,
8/15/2026 (d) (e) (f) | | | 200,000 | | | | 228,060 | |
| | |
Constellium SE 4.25%, 2/15/2026 (a) | | EUR | 100,000 | | | | 122,947 | |
| | |
Diebold Nixdorf Dutch Holding BV 9.00%, 7/15/2025 (a) | | EUR | 250,000 | | | | 333,324 | |
| | |
Ford Motor Credit Co. LLC 3.25%, 9/15/2025 | | EUR | 150,000 | | | | 191,663 | |
| | |
GE Capital International Funding Co. Unlimited Co. 4.42%, 11/15/2035 | | | 245,000 | | | | 279,799 | |
| | |
General Electric Co. 1.50%, 5/17/2029 | | EUR | 100,000 | | | | 127,351 | |
| | |
General Motors Co. 6.13%, 10/1/2025 | | | 21,000 | | | | 25,000 | |
| | |
General Motors Financial Co., Inc. | | | | | | | | |
| | |
3.95%, 4/13/2024 | | | 40,000 | | | | 43,468 | |
| | |
2.75%, 6/20/2025 | | | 39,000 | | | | 41,044 | |
| | |
Gilead Sciences, Inc. | | | | | | | | |
| | |
1.65%, 10/1/2030 | | | 110,000 | | | | 105,771 | |
| | |
2.60%, 10/1/2040 | | | 160,000 | | | | 151,586 | |
| | |
2.80%, 10/1/2050 | | | 85,000 | | | | 78,478 | |
| | |
Gray Oak Pipeline LLC 2.60%,
10/15/2025 (c) | | | 50,000 | | | | 51,133 | |
| | |
Gulfport Energy Corp. 6.00%,
10/15/2024 (j) | | | 78,000 | | | | 71,468 | |
| | |
HCA, Inc. 5.25%, 6/15/2049 | | | 240,000 | | | | 300,975 | |
| | |
Hyundai Capital America 3.50%,
11/2/2026 (a) | | | 150,000 | | | | 162,469 | |
| | |
International Game Technology plc | | | | | | | | |
| | |
3.50%, 6/15/2026 (a) | | EUR | 300,000 | | | | 367,394 | |
| | |
2.38%, 4/15/2028 (a) | | EUR | 250,000 | | | | 292,242 | |
| | |
IQVIA, Inc. 2.25%, 1/15/2028 (a) | | EUR | 150,000 | | | | 181,453 | |
SEE NOTES TO FINANCIAL STATEMENTS.
| | | | | | | | |
| | | |
| FEBRUARY 28, 2021 | | J.P. MORGAN EXCHANGE-TRADED FUNDS | | | | | 93 | |
JPMorgan International Bond Opportunities ETF
(formerly known as JPMorgan Global Bond Opportunities ETF)
SCHEDULE OF PORTFOLIO INVESTMENTS
AS OF FEBRUARY 28, 2021 (continued)
| | | | | | | | |
| INVESTMENTS | | PRINCIPAL
AMOUNT ($) | | | VALUE ($) | |
Corporate Bonds — continued | |
| | |
United States — continued | | | | | | | | |
| | |
LKQ European Holdings BV 3.63%, 4/1/2026 (a) | | EUR | 200,000 | | | | 244,930 | |
| | |
Lkq Italia Bondco Di Lkq Italia Bondco Gp SRL E C SAPA 3.88%, 4/1/2024 (a) | | EUR | 200,000 | | | | 259,086 | |
| | |
Morgan Stanley | | | | | | | | |
| | |
Series J, (ICE LIBOR USD 3 Month + 3.81%), 4.05%,
4/15/2021 (d) (e) (f) | | | 321,000 | | | | 321,193 | |
| | |
(EURIBOR 3 Month + 0.83%), 1.34%, 10/23/2026 (d) | | EUR | 200,000 | | | | 253,265 | |
| | |
(SOFR + 1.43%), 2.80%,
1/25/2052 (d) | | | 100,000 | | | | 95,203 | |
| | |
Netflix, Inc. | | | | | | | | |
| | |
3.63%, 5/15/2027 | | EUR | 100,000 | | | | 137,698 | |
| | |
3.88%, 11/15/2029 (a) | | EUR | 450,000 | | | | 646,433 | |
| | |
Nielsen Finance LLC 5.00%,
4/15/2022 (c) | | | 14,000 | | | | 14,036 | |
| | |
Pacific Gas and Electric Co. 3.30%, 3/15/2027 | | | 366,000 | | | | 389,674 | |
| | |
Par Pharmaceutical, Inc. 7.50%, 4/1/2027 (c) | | | 9,000 | | | | 9,675 | |
| | |
Silgan Holdings, Inc. 3.25%, 3/15/2025 | | EUR | 300,000 | | | | 363,956 | |
| | |
Stellantis NV 4.50%, 7/7/2028 (a) | | EUR | 100,000 | | | | 149,100 | |
| | |
Transocean, Inc. 11.50%, 1/30/2027 (c) | | | 25,000 | | | | 20,493 | |
| | |
UGI International LLC 3.25%,
11/1/2025 (a) | | EUR | 250,000 | | | | 307,791 | |
| | |
Upjohn Finance BV 1.91%, 6/23/2032 (a) | | EUR | 150,000 | | | | 193,579 | |
| | |
Wells Fargo & Co. (US Treasury Yield Curve Rate T Note Constant Maturity 5 Year + 3.45%), 3.90%,
3/15/2026 (d) (e) (f) | | | 340,000 | | | | 338,691 | |
| | | | | | | | |
| | |
| | | | | | | 10,439,615 | |
| | | | | | | | |
| | |
Total Corporate Bonds (Cost $132,517,521) | | | | | | | 136,008,665 | |
| | | | | | | | |
Foreign Government Securities — 31.6% | | | | | |
| | |
Angola — 0.1% | | | | | | | | |
| | |
Republic of Angola 8.00%,
11/26/2029 (a) | | | 210,000 | | | | 204,488 | |
| | | | | | | | |
| | |
Australia — 5.2% | | | | | | | | |
| | |
Commonwealth of Australia | | | | | | | | |
| | |
5.50%, 4/21/2023 (a) | | AUD | 13,142,000 | | | | 11,274,623 | |
| | |
3.00%, 3/21/2047 (a) | | AUD | 2,140,000 | | | | 1,697,184 | |
| | | | | | | | |
| | |
| | | | | | | 12,971,807 | |
| | | | | | | | |
| | | | | | | | |
| INVESTMENTS | | PRINCIPAL
AMOUNT ($) | | | VALUE ($) | |
| | | | | | | | |
| | |
Bahrain — 0.4% | | | | | | | | |
| | |
Kingdom of Bahrain | | | | | | | | |
| | |
5.45%, 9/16/2032 (c) | | | 289,000 | | | | 287,194 | |
| | |
6.00%, 9/19/2044 (a) | | | 335,000 | | | | 320,658 | |
| | |
7.50%, 9/20/2047 (a) | | | 260,000 | | | | 279,500 | |
| | | | | | | | |
| | |
| | | | | | | 887,352 | |
| | | | | | | | |
| | |
Canada — 2.1% | | | | | | | | |
| | |
Canada Government Bond 0.50%, 9/1/2025 | | CAD | 6,758,000 | | | | 5,217,669 | |
| | | | | | | | |
| | |
China — 2.0% | | | | | | | | |
| | |
People’s Republic of China 3.27%, 11/19/2030 | | CNY | 32,000,000 | | | | 4,928,172 | |
| | | | | | | | |
| | |
Colombia — 0.6% | | | | | | | | |
| | |
Republic of Colombia | | | | | | | | |
| | |
3.13%, 4/15/2031 | | | 210,000 | | | | 208,031 | |
| | |
5.00%, 6/15/2045 | | | 200,000 | | | | 215,313 | |
| | |
4.13%, 5/15/2051 | | | 200,000 | | | | 191,625 | |
| | |
Titulos de Tesoreria 7.00%, 6/30/2032 | | COP | 3,125,400,000 | | | | 899,236 | |
| | | | | | | | |
| | |
| | | | | | | 1,514,205 | |
| | | | | | | | |
| | |
Czech Republic — 0.3% | | | | | | | | |
| | |
Czech Republic 2.00%, 10/13/2033 | | CZK | 18,250,000 | | | | 865,562 | |
| | | | | | | | |
| | |
Dominican Republic — 0.5% | | | | | | | | |
| | |
Dominican Republic Government Bond | | | | | | | | |
| | |
9.75%, 6/5/2026 (c) | | DOP | 14,000,000 | | | | 259,908 | |
| | |
4.88%, 9/23/2032 (c) | | | 240,000 | | | | 243,300 | |
| | |
5.30%, 1/21/2041 (c) | | | 165,000 | | | | 161,391 | |
| | |
6.40%, 6/5/2049 (a) | | | 184,000 | | | | 194,005 | |
| | |
5.88%, 1/30/2060 (c) | | | 414,000 | | | | 400,545 | |
| | | | | | | | |
| | |
| | | | | | | 1,259,149 | |
| | | | | | | | |
| | |
Egypt — 0.6% | | | | | | | | |
| | |
Arab Republic of Egypt | | | | | | | | |
| | |
5.75%, 5/29/2024 (c) | | | 200,000 | | | | 211,313 | |
| | |
7.60%, 3/1/2029 (c) | | | 280,000 | | | | 308,175 | |
| | |
5.88%, 2/16/2031 (c) | | | 386,000 | | | | 369,595 | |
| | |
7.05%, 1/15/2032 (c) | | | 230,000 | | | | 238,438 | |
| | |
8.70%, 3/1/2049 (a) | | | 300,000 | | | | 316,031 | |
| | | | | | | | |
| | |
| | | | | | | 1,443,552 | |
| | | | | | | | |
| | |
El Salvador — 0.2% | | | | | | | | |
| | |
Republic of El Salvador | | | | | | | | |
| | |
7.75%, 1/24/2023 (a) | | | 22,000 | | | | 22,247 | |
| | |
5.88%, 1/30/2025 (a) | | | 195,000 | | | | 189,394 | |
SEE NOTES TO FINANCIAL STATEMENTS.
| | | | | | |
| | | |
| 94 | | | | J.P. MORGAN EXCHANGE-TRADED FUNDS | | FEBRUARY 28, 2021 |
| | | | | | | | |
| INVESTMENTS | | PRINCIPAL
AMOUNT ($) | | | VALUE ($) | |
Foreign Government Securities — continued | | | | | |
| | |
El Salvador — continued | | | | | | | | |
| | |
6.38%, 1/18/2027 (a) | | | 195,000 | | | | 190,369 | |
| | |
7.12%, 1/20/2050 (c) | | | 227,000 | | | | 209,975 | |
| | | | | | | | |
| | |
| | | | | | | 611,985 | |
| | | | | | | | |
| | | | | | | | |
| | |
Ethiopia — 0.2% | | | | | | | | |
| | |
Federal Democratic Republic of Ethiopia 6.63%, 12/11/2024 (a) | | | 400,000 | | | | 371,500 | |
| | | | | | | | |
| | |
Ghana — 0.2% | | | | | | | | |
| | |
Republic of Ghana | | | | | | | | |
| | |
7.63%, 5/16/2029 (a) | | | 320,000 | | | | 333,600 | |
| | |
8.63%, 6/16/2049 (a) | | | 220,000 | | | | 212,506 | |
| | | | | | | | |
| | |
| | | | | | | 546,106 | |
| | | | | | | | |
| | |
Hungary — 0.4% | | | | | | | | |
| | |
Hungary Government Bond | | | | | | | | |
| | |
1.00%, 11/26/2025 | | HUF | 72,850,000 | | | | 233,409 | |
| | |
2.25%, 4/20/2033 | | HUF | 173,440,000 | | | | 552,411 | |
| | |
7.63%, 3/29/2041 | | | 150,000 | | | | 249,187 | |
| | | | | | | | |
| | |
| | | | | | | 1,035,007 | |
| | | | | | | | |
| | |
Indonesia — 1.2% | | | | | | | | |
| | |
Republic of Indonesia | | | | | | | | |
| | |
7.00%, 9/15/2030 | | IDR | 4,152,000,000 | | | | 295,933 | |
| | |
6.50%, 2/15/2031 | | IDR | 13,887,000,000 | | | | 959,515 | |
| | |
8.38%, 3/15/2034 | | IDR | 720,000,000 | | | | 54,762 | |
| | |
7.50%, 4/15/2040 | | IDR | 24,102,000,000 | | | | 1,722,176 | |
| | | | | | | | |
| | |
| | | | | | | 3,032,386 | |
| | | | | | | | |
| | |
Israel — 0.2% | | | | | | | | |
| | |
State of Israel Government Bond 3.38%, 1/15/2050 | | | 570,000 | | | | 571,781 | |
| | | | | | | | |
| | |
Italy — 3.4% | | | | | | | | |
| | |
Buoni Poliennali del Tesoro | | | | | | | | |
| | |
1.45%, 3/1/2036 (a) | | EUR | 2,300,000 | | | | 2,902,607 | |
| | |
1.80%, 3/1/2041 (a) | | EUR | 250,000 | | | | 322,212 | |
| | |
2.45%, 9/1/2050 (a) | | EUR | 480,000 | | | | 688,850 | |
| | |
Italian Republic Government Bond | | | | | | | | |
| | |
2.38%, 10/17/2024 | | | 3,295,000 | | | | 3,448,160 | |
| | |
2.88%, 10/17/2029 | | | 1,135,000 | | | | 1,164,414 | |
| | | | | | | | |
| | |
| | | | | | | 8,526,243 | |
| | | | | | | | |
| | |
Ivory Coast — 0.4% | | | | | | | | |
| | |
Republic of Cote d’Ivoire | | | | | | | | |
| | |
6.38%, 3/3/2028 (a) | | | 270,000 | | | | 299,531 | |
| | |
6.88%, 10/17/2040 (c) | | EUR | 460,000 | | | | 603,057 | |
| | | | | | | | |
| | |
| | | | | | | 902,588 | |
| | | | | | | | |
| | | | | | | | |
| INVESTMENTS | | PRINCIPAL
AMOUNT ($) | | | VALUE ($) | |
| | | | | | | | |
| | |
Jamaica — 0.1% | | | | | | | | |
| | |
Jamaica Government Bond 7.88%, 7/28/2045 | | | 200,000 | | | | 277,000 | |
| | | | | | | | |
| | |
Jordan — 0.4% | | | | | | | | |
| | |
Hashemite Kingdom of Jordan | | | | | | | | |
| | |
6.13%, 1/29/2026 (a) | | | 200,000 | | | | 217,875 | |
| | |
5.85%, 7/7/2030 (c) | | | 440,000 | | | | 466,400 | |
| | |
7.38%, 10/10/2047 (a) | | | 210,000 | | | | 229,359 | |
| | | | | | | | |
| | |
| | | | | | | 913,634 | |
| | | | | | | | |
| | |
Kazakhstan — 0.2% | | | | | | | | |
| | |
Republic of Kazakhstan 1.50%,
9/30/2034 (c) | | EUR | 370,000 | | | | 445,307 | |
| | | | | | | | |
| | |
Kenya — 0.2% | | | | | | | | |
| | |
Republic of Kenya 6.88%, 6/24/2024 (a) | | | 400,000 | | | | 442,875 | |
| | | | | | | | |
| | |
Lebanon — 0.0% (k) | | | | | | | | |
| | |
Lebanese Republic | | | | | | | | |
| | |
6.65%, 4/22/2024 (a) (j) | | | 227,000 | | | | 29,013 | |
| | |
6.65%, 11/3/2028 (a) (j) | | | 226,000 | | | | 28,815 | |
| | | | | | | | |
| | |
| | | | | | | 57,828 | |
| | | | | | | | |
| | |
Malaysia — 0.4% | | | | | | | | |
| | |
Malaysia Government Bond 3.83%, 7/5/2034 | | MYR | 3,920,000 | | | | 967,044 | |
| | | | | | | | |
| | |
Mexico — 1.4% | | | | | | | | |
| | |
Mex Bonos Desarr Fix Rt | | | | | | | | |
| | |
Series M 20, 8.50%, 5/31/2029 | | MXN | 17,000,000 | | | | 948,942 | |
| | |
7.75%, 5/29/2031 | | MXN | 8,780,000 | | | | 467,543 | |
| | |
7.75%, 11/23/2034 | | MXN | 19,800,000 | | | | 1,041,946 | |
| | |
United Mexican States | | | | | | | | |
| | |
3.77%, 5/24/2061 | | | 392,000 | | | | 343,368 | |
| | |
3.75%, 4/19/2071 | | | 853,000 | | | | 727,982 | |
| | | | | | | | |
| | |
| | | | | | | 3,529,781 | |
| | | | | | | | |
| | |
Morocco — 0.4% | | | | | | | | |
| | |
Kingdom of Morocco | | | | | | | | |
| | |
1.50%, 11/27/2031 (c) | | EUR | 180,000 | | | | 208,085 | |
| | |
3.00%, 12/15/2032 (c) | | | 200,000 | | | | 193,250 | |
| | |
5.50%, 12/11/2042 (a) | | | 320,000 | | | | 367,800 | |
| | |
4.00%, 12/15/2050 (c) | | | 200,000 | | | | 186,500 | |
| | | | | | | | |
| | |
| | | | | | | 955,635 | |
| | | | | | | | |
| | |
New Zealand — 1.3% | | | | | | | | |
| | |
New Zealand Government Bond | | | | | | | | |
| | |
4.50%, 4/15/2027 (a) | | NZD | 952,000 | | | | 818,012 | |
| | |
2.75%, 4/15/2037 (a) | | NZD | 3,201,000 | | | | 2,395,846 | |
| | | | | | | | |
| | |
| | | | | | | 3,213,858 | |
| | | | | | | | |
SEE NOTES TO FINANCIAL STATEMENTS.
| | | | | | | | |
| | | |
| FEBRUARY 28, 2021 | | J.P. MORGAN EXCHANGE-TRADED FUNDS | | | | | 95 | |
JPMorgan International Bond Opportunities ETF
(formerly known as JPMorgan Global Bond Opportunities ETF)
SCHEDULE OF PORTFOLIO INVESTMENTS
AS OF FEBRUARY 28, 2021 (continued)
| | | | | | | | |
| INVESTMENTS | | PRINCIPAL
AMOUNT ($) | | | VALUE ($) | |
Foreign Government Securities — continued | | | | | |
| | |
Nigeria — 0.3% | | | | | | | | |
| | |
Federal Republic of Nigeria | | | | | | | | |
| | |
7.63%, 11/21/2025 (a) | | | 300,000 | | | | 343,688 | |
| | |
7.63%, 11/28/2047 (a) | | | 400,000 | | | | 407,500 | |
| | | | | | | | |
| | |
| | | | | | | 751,188 | |
| | | | | | | | |
| | |
Panama — 0.2% | | | | | | | | |
| | |
Republic of Panama | | | | | | | | |
| | |
4.50%, 4/1/2056 | | | 200,000 | | | | 219,937 | |
| | |
3.87%, 7/23/2060 | | | 400,000 | | | | 394,250 | |
| | | | | | | | |
| | |
| | | | | | | 614,187 | |
| | | | | | | | |
| | |
Paraguay — 0.2% | | | | | | | | |
| | |
Republic of Paraguay 5.00%, 4/15/2026 (a) | | | 420,000 | | | | 471,319 | |
| | | | | | | | |
| | |
Peru — 0.1% | | | | | | | | |
| | |
Bonos de la Tesoreria 5.40%, 8/12/2034 | | PEN | 842,000 | | | | 239,685 | |
| | | | | | | | |
| | |
Philippines — 0.1% | | | | | | | | |
| | |
Republic of Philippines 2.95%, 5/5/2045 | | | 330,000 | | | | 313,294 | |
| | | | | | | | |
| | |
Poland — 0.8% | | | | | | | | |
| | |
Republic of Poland 1.25%, 10/25/2030 | | PLN | 7,595,000 | | | | 1,962,418 | |
| | | | | | | | |
| | |
Portugal — 1.4% | | | | | | | | |
| | |
Portuguese Republic 5.13%,
10/15/2024 (a) | | | 2,980,000 | | | | 3,424,854 | |
| | | | | | | | |
| | |
Qatar — 0.2% | | | | | | | | |
| | |
State of Qatar | | | | | | | | |
| | |
5.10%, 4/23/2048 (a) | | | 245,000 | | | | 310,920 | |
| | |
4.40%, 4/16/2050 (c) | | | 200,000 | | | | 234,250 | |
| | | | | | | | |
| | |
| | | | | | | 545,170 | |
| | | | | | | | |
| | |
Romania — 0.7% | | | | | | | | |
| | |
Romania Government Bond | | | | | | | | |
| | |
4.15%, 10/24/2030 | | RON | 4,250,000 | | | | 1,101,076 | |
| | |
2.63%, 12/2/2040 (c) | | EUR | 148,000 | | | | 176,114 | |
| | |
4.63%, 4/3/2049 (c) | | EUR | 276,000 | | | | 421,463 | |
| | | | | | | | |
| | |
| | | | | | | 1,698,653 | |
| | | | | | | | |
| | |
Russia — 0.8% | | | | | | | | |
| | |
Russian Federation | | | | | | | | |
| | |
6.00%, 10/6/2027 | | RUB | 13,330,000 | | | | 174,580 | |
| | |
7.65%, 4/10/2030 | | RUB | 65,710,000 | | | | 939,100 | |
| | |
7.25%, 5/10/2034 | | RUB | 21,393,000 | | | | 293,991 | |
| | |
7.70%, 3/16/2039 | | RUB | 11,860,000 | | | | 169,846 | |
| | |
5.88%, 9/16/2043 (a) | | | 400,000 | | | | 523,000 | |
| | | | | | | | |
| | |
| | | | | | | 2,100,517 | |
| | | | | | | | |
| | | | | | | | |
| INVESTMENTS | | PRINCIPAL
AMOUNT ($) | | | VALUE ($) | |
| | | | | | | | |
| | |
Saudi Arabia — 0.1% | | | | | | | | |
| | |
Kingdom of Saudi Arabia 3.45%,
2/2/2061 (c) | | | 259,000 | | | | 240,384 | |
| | | | | | | | |
| | |
Senegal — 0.3% | | | | | | | | |
| | |
Republic of Senegal | | | | | | | | |
| | |
6.25%, 5/23/2033 (a) | | | 400,000 | | | | 424,375 | |
| | |
6.75%, 3/13/2048 (a) | | | 260,000 | | | | 265,038 | |
| | | | | | | | |
| | |
| | | | | | | 689,413 | |
| | | | | | | | |
| | |
Serbia — 0.3% | | | | | | | | |
| | |
Republic of Serbia | | | | | | | | |
| | |
1.50%, 6/26/2029 (c) | | EUR | 410,000 | | | | 494,067 | |
| | |
1.65%, 3/3/2033 (c) | | EUR | 316,000 | | | | 368,497 | |
| | | | | | | | |
| | |
| | | | | | | 862,564 | |
| | | | | | | | |
| | |
South Africa — 1.4% | | | | | | | | |
| | |
Republic of South Africa | | | | | | | | |
| | |
Series R213, 7.00%, 2/28/2031 | | ZAR | 21,130,000 | | | | 1,177,816 | |
| | |
8.88%, 2/28/2035 | | ZAR | 33,080,000 | | | | 1,947,088 | |
| | |
Series 2037, 8.50%, 1/31/2037 | | ZAR | 3,273,449 | | | | 181,723 | |
| | |
6.25%, 3/8/2041 | | | 100,000 | | | | 100,938 | |
| | |
5.75%, 9/30/2049 | | | 200,000 | | | | 183,375 | |
| | | | | | | | |
| | |
| | | | | | | 3,590,940 | |
| | | | | | | | |
| | |
Ukraine — 0.3% | | | | | | | | |
| | |
Ukraine Government Bond | | | | | | | | |
| | |
7.75%, 9/1/2026 (a) | | | 560,000 | | | | 604,975 | |
| | |
7.38%, 9/25/2032 (a) | | | 230,000 | | | | 235,463 | |
| | | | | | | | |
| | |
| | | | | | | 840,438 | |
| | | | | | | | |
| | |
United Arab Emirates — 0.2% | | | | | | | | |
| | |
United Arab Emirates Government Bond 4.00%, 7/28/2050 (c) | | | 400,000 | | | | 368,000 | |
| | | | | | | | |
| | |
United Kingdom — 1.7% | | | | | | | | |
| | |
United Kingdom of Great Britain and Northern Ireland 3.75%, 9/7/2021 (a) | | GBP | 2,938,092 | | | | 4,173,637 | |
| | | | | | | | |
| | |
Uruguay — 0.1% | | | | | | | | |
| | |
Oriental Republic of Uruguay 5.10%, 6/18/2050 | | | 250,000 | | | | 308,438 | |
| | | | | | | | |
| | |
Total Foreign Government Securities
(Cost $79,990,528) | | | | | | | 78,887,613 | |
| | | | | | | | |
SEE NOTES TO FINANCIAL STATEMENTS.
| | | | | | |
| | | |
| 96 | | | | J.P. MORGAN EXCHANGE-TRADED FUNDS | | FEBRUARY 28, 2021 |
| | | | | | | | |
| INVESTMENTS | | PRINCIPAL
AMOUNT ($) | | | VALUE ($) | |
Asset-Backed Securities — 2.6% | | | | | |
| | |
United States — 2.6% | | | | | | | | |
| | |
Accelerated Assets LLC Series 2018-1, Class C, 6.65%, 12/2/2033 ‡ (c) | | | 166,886 | | | | 176,092 | |
| | |
Business Jet Securities LLC Series 2018-2, Class C, 6.66%, 6/15/2033 (c) | | | 77,949 | | | | 78,320 | |
| | |
Chase Funding Trust Series 2003-6, Class 1A7, 5.28%, 11/25/2034 ‡ (b) | | | 96,039 | | | | 101,093 | |
| | |
Conn’s Receivables Funding LLC Series 2019-A, Class B, 4.36%, 10/16/2023 ‡ (c) | | | 36,989 | | | | 37,170 | |
| | |
Credit Acceptance Auto Loan Trust | | | | | | | | |
| | |
Series 2018-1A, Class C, 3.77%, 6/15/2027 (c) | | | 250,000 | | | | 252,754 | |
| | |
Series 2018-3A, Class B, 3.89%, 10/15/2027 (c) | | | 250,000 | | | | 255,967 | |
| | |
Credit-Based Asset Servicing & Securitization LLC Series 2004-CB5, Class M1, 0.73%, 1/25/2034 ‡ (i) | | | 101,306 | | | | 98,865 | |
| | |
Drive Auto Receivables Trust | | | | | | | | |
| | |
Series 2018-3, Class D, 4.30%, 9/16/2024 | | | 256,000 | | | | 263,663 | |
| | |
Series 2018-4, Class C, 3.66%, 11/15/2024 | | | 74,542 | | | | 74,982 | |
| | |
DT Auto Owner Trust | | | | | | | | |
| | |
Series 2018-3A, Class C, 3.79%, 7/15/2024 (c) | | | 211,220 | | | | 213,346 | |
| | |
Series 2019-1A, Class D, 3.87%, 11/15/2024 (c) | | | 65,000 | | | | 67,428 | |
| | |
Series 2019-1A, Class E, 4.94%, 2/17/2026 (c) | | | 100,000 | | | | 105,292 | |
| | |
Exeter Automobile Receivables Trust | | | | | | | | |
| | |
Series 2016-3A, Class D, 6.40%, 7/17/2023 (c) | | | 350,000 | | | | 355,512 | |
| | |
Series 2018-3A, Class D, 4.35%, 6/17/2024 (c) | | | 210,000 | | | | 218,024 | |
| | |
Flagship Credit Auto Trust | | | | | | | | |
| | |
Series 2018-3, Class A, 3.07%,
2/15/2023 (c) | | | 12,235 | | | | 12,262 | |
| | |
Series 2017-4, Class D, 3.58%, 1/15/2024 (c) | | | 280,000 | | | | 287,993 | |
| | |
Series 2017-2, Class E, 5.55%, 7/15/2024 (c) | | | 380,000 | | | | 393,780 | |
| | |
GLS Auto Receivables Issuer Trust Series 2019-2A, Class B, 3.32%, 3/15/2024 (c) | | | 200,000 | | | | 204,339 | |
| | |
Lendmark Funding Trust Series 2019-2A, Class C, 3.72%, 4/20/2028 ‡ (c) | | | 580,000 | | | | 590,882 | |
| | | | | | | | |
| INVESTMENTS | | PRINCIPAL
AMOUNT ($) | | | VALUE ($) | |
| | | | | |
| | |
United States — continued | | | | | | | | |
| | |
Marlette Funding Trust | | | | | | | | |
| | |
Series 2018-1A, Class C, 3.69%, 3/15/2028 (c) | | | 6,248 | | | | 6,255 | |
| | |
Series 2018-2A, Class C, 4.37%, 7/17/2028 (c) | | | 214,271 | | | | 216,989 | |
| | |
MFA LLC Series 2018-NPL2, Class A1, 4.16%, 7/25/2048 ‡ (b) (c) | | | 87,273 | | | | 87,503 | |
| | |
Morgan Stanley ABS Capital I, Inc. Trust Series 2004-NC8, Class B1, 2.74%, 9/25/2034 ‡ (i) | | | 103,909 | | | | 106,456 | |
| | |
OneMain Direct Auto Receivables Trust | | | | | | | | |
| | |
Series 2018-1A, Class B, 3.71%, 4/14/2025 (c) | | | 100,000 | | | | 101,819 | |
| | |
Series 2018-1A, Class D, 4.40%, 1/14/2028 (c) | | | 160,000 | | | | 163,419 | |
| | |
Onemain Financial Issuance Trust Series 2018-1A, Class D, 4.08%, 3/14/2029 ‡ (c) | | | 100,000 | | | | 103,424 | |
| | |
PNMAC GMSR Issuer Trust Series 2018-GT2, Class A, 2.77%, 8/25/2025 (c) (i) | | | 210,000 | | | | 208,952 | |
| | |
Progress Residential Trust Series 2018-SFR3, Class E, 4.87%, 10/17/2035 ‡ (c) | | | 262,000 | | | | 267,497 | |
| | |
Santander Revolving Auto Loan Trust | | | | | | | | |
| | |
Series 2019-A, Class C, 3.00%,
1/26/2032 (c) | | | 150,000 | | | | 157,940 | |
| | |
Series 2019-A, Class D, 3.45%,
1/26/2032 (c) | | | 650,000 | | | | 683,476 | |
| | |
Structured Asset Investment Loan Trust | | | | | | | | |
| | |
Series 2004-8, Class M3, 1.09%, 9/25/2034 ‡ (i) | | | 65,768 | | | | 65,419 | |
| | |
Series 2005-HE3, Class M1, 0.84%, 9/25/2035 ‡ (i) | | | 65,689 | | | | 65,477 | |
| | |
Tricolor Auto Securitization Trust Series 2018-2A, Class C, 5.75%, 5/16/2022 (c) | | | 191,135 | | | | 191,281 | |
| | |
Westlake Automobile Receivables Trust Series 2018-2A, Class E, 4.86%, 1/16/2024 (c) | | | 310,000 | | | | 321,872 | |
| | | | | | | | |
| | |
Total Asset-Backed Securities (Cost $6,370,085) | | | | | | | 6,535,543 | |
| | | | | | | | |
| |
Commercial Mortgage-Backed Securities — 2.5% | | | | | |
| | |
United States — 2.5% | | | | | | | | |
| | |
BAMLL Re-REMIC Trust Series 2014-FRR4, Class BK29, PO, 4/27/2023 (c) | | | 400,000 | | | | 372,346 | |
SEE NOTES TO FINANCIAL STATEMENTS.
| | | | | | | | |
| | | |
| FEBRUARY 28, 2021 | | J.P. MORGAN EXCHANGE-TRADED FUNDS | | | | | 97 | |
JPMorgan International Bond Opportunities ETF
(formerly known as JPMorgan Global Bond Opportunities ETF)
SCHEDULE OF PORTFOLIO INVESTMENTS
AS OF FEBRUARY 28, 2021 (continued)
| | | | | | | | |
| INVESTMENTS | | PRINCIPAL
AMOUNT ($) | | | VALUE ($) | |
Commercial Mortgage-Backed Securities — continued | |
| | |
United States — continued | | | | | | | | |
| | |
Banc of America Commercial Mortgage Trust Series 2007-5, Class AJ, 5.82%, 2/10/2051 (i) | | | 333,325 | | | | 348,198 | |
| | |
BANK | | | | | | | | |
| | |
Series 2019-BN16, Class C, 4.79%, 2/15/2052 ‡ (i) | | | 23,000 | | | | 25,661 | |
| | |
Series 2018-BN10, Class C, 4.16%, 2/15/2061 ‡ (i) | | | 70,000 | | | | 74,812 | |
| | |
Series 2018-BN13, Class C, 4.56%, 8/15/2061 ‡ (i) | | | 118,000 | | | | 129,907 | |
| | |
Benchmark Mortgage Trust Series 2019-B11, Class C, 3.75%, 5/15/2052 ‡ (i) | | | 315,000 | | | | 326,597 | |
| | |
CCUBS Commercial Mortgage Trust Series 2017-C1, Class C, 4.39%, 11/15/2050 ‡ (i) | | | 28,000 | | | | 30,342 | |
| | |
CD Mortgage Trust Series 2016-CD2, Class C, 4.02%, 11/10/2049 ‡ (i) | | | 21,000 | | | | 21,656 | |
| | |
Citigroup Commercial Mortgage Trust | | | | | | | | |
| | |
Series 2014-GC23, Class C, 4.43%, 7/10/2047 ‡ (i) | | | 21,000 | | | | 22,680 | |
| | |
Series 2015-P1, Class D, 3.23%, 9/15/2048 ‡ (c) | | | 205,000 | | | | 173,838 | |
| | |
FHLMC, Multi-Family Structured Pass-Through Certificates | | | | | | | | |
| | |
Series K033, Class X1, IO, 0.29%, 7/25/2023 (i) | | | 3,828,613 | | | | 23,930 | |
| | |
Series K739, Class X1, IO, 1.29%, 9/25/2027 (i) | | | 2,199,752 | | | | 156,971 | |
| | |
Series K078, Class X3, IO, 2.21%, 10/25/2028 (i) | | | 1,820,000 | | | | 257,499 | |
| | |
Series K153, Class X3, IO, 3.77%, 4/25/2035 (i) | | | 340,000 | | | | 109,150 | |
| | |
Series K036, Class X3, IO, 2.11%, 12/25/2041 (i) | | | 2,640,000 | | | | 143,514 | |
| | |
Series K720, Class X3, IO, 1.33%, 8/25/2042 (i) | | | 6,800,000 | | | | 101,657 | |
| | |
Series K041, Class X3, IO, 1.64%, 11/25/2042 (i) | | | 3,470,000 | | | | 191,309 | |
| | |
Series K718, Class X3, IO, 1.43%, 2/25/2043 (i) | | | 10,025,000 | | | | 98,995 | |
| | |
Series K054, Class X3, IO, 1.60%, 4/25/2043 (i) | | | 1,365,000 | | | | 97,531 | |
| | |
Series K050, Class X3, IO, 1.55%, 10/25/2043 (i) | | | 1,010,000 | | | | 64,925 | |
| | |
Series K051, Class X3, IO, 1.61%, 10/25/2043 (i) | | | 1,395,000 | | | | 93,984 | |
| | |
Series K052, Class X3, IO, 1.61%, 1/25/2044 (i) | | | 750,000 | | | | 52,560 | |
| | | | | | | | |
| INVESTMENTS | | PRINCIPAL
AMOUNT ($) | | | VALUE ($) | |
| | | | | | | | |
| | |
United States — continued | | | | | | | | |
| | |
Series K726, Class X3, IO, 2.13%, 7/25/2044 (i) | | | 2,890,000 | | | | 175,829 | |
| | |
Series K067, Class X3, IO, 2.11%, 9/25/2044 (i) | | | 1,385,000 | | | | 167,096 | |
| | |
Series K072, Class X3, IO, 2.14%, 12/25/2045 (i) | | | 400,000 | | | | 50,960 | |
| | |
Series K089, Class X3, IO, 2.30%, 1/25/2046 (i) | | | 850,000 | | | | 135,225 | |
| | |
Series K088, Class X3, IO, 2.35%, 2/25/2047 (i) | | | 980,000 | | | | 159,426 | |
| | |
FREMF Series 2018-KF46, Class B, 2.07%, 3/25/2028 (c) (i) | | | 440,653 | | | | 433,897 | |
| | |
FREMF Mortgage Trust | | | | | | | | |
| | |
Series 2017-KF31, Class B, 3.02%, 4/25/2024 (c) (i) | | | 38,243 | | | | 37,804 | |
| | |
Series 2017-KF36, Class B, 2.77%, 8/25/2024 (c) (i) | | | 43,878 | | | | 43,878 | |
| | |
Series 2017-KF38, Class B, 2.62%, 9/25/2024 (c) (i) | | | 43,640 | | | | 43,640 | |
| | |
Series 2018-KF47, Class B, 2.12%, 5/25/2025 (c) (i) | | | 21,693 | | | | 21,268 | |
| | |
Series 2018-KF49, Class B, 2.02%, 6/25/2025 (c) (i) | | | 224,335 | | | | 222,546 | |
| | |
Series 2017-K728, Class B, 3.65%, 11/25/2050 (c) (i) | | | 190,000 | | | | 203,738 | |
| | |
Series 2017-K728, Class C, 3.65%, 11/25/2050 (c) (i) | | | 105,000 | | | | 111,122 | |
| | |
GNMA Series 2017-23, IO, 0.68%, 5/16/2059 (i) | | | 456,385 | | | | 21,132 | |
| | |
GS Mortgage Securities Trust | | | | | | | | |
| | |
Series 2012-GCJ9, Class D, 4.74%, 11/10/2045 ‡ (c) (i) | | | 320,000 | | | | 311,699 | |
| | |
Series 2015-GC30, Class C, 4.08%, 5/10/2050 ‡ (i) | | | 36,000 | | | | 37,557 | |
| | |
JPMBB Commercial Mortgage Securities Trust | | | | | | | | |
| | |
Series 2015-C30, Class C, 4.27%, 7/15/2048 (i) | | | 62,000 | | | | 66,449 | |
| | |
Series 2015-C31, Class C, 4.62%, 8/15/2048 ‡ (i) | | | 23,000 | | | | 24,476 | |
| | |
JPMDB Commercial Mortgage Securities Trust Series 2017-C7, Class C, 4.18%, 10/15/2050 ‡ (i) | | | 39,000 | | | | 42,007 | |
| | |
JPMorgan Chase Commercial Mortgage Securities Trust Series 2016-JP4, Class C, 3.42%, 12/15/2049 ‡ (i) | | | 28,000 | | | | 27,764 | |
| | |
LB Commercial Mortgage Trust Series 2007-C3, Class AJ, 6.06%, 7/15/2044 (i) | | | 18,848 | | | | 18,611 | |
SEE NOTES TO FINANCIAL STATEMENTS.
| | | | | | |
| | | |
| 98 | | | | J.P. MORGAN EXCHANGE-TRADED FUNDS | | FEBRUARY 28, 2021 |
| | | | | | | | |
| INVESTMENTS | | PRINCIPAL
AMOUNT ($) | | | VALUE ($) | |
Commercial Mortgage-Backed Securities — continued | |
| | |
United States — continued | | | | | | | | |
| | |
LB-UBS Commercial Mortgage Trust Series 2006-C6, Class AJ, 5.45%, 9/15/2039 ‡ (i) | | | 228,659 | | | | 132,258 | |
| | |
Morgan Stanley Bank of America Merrill Lynch Trust | | | | | | | | |
| | |
Series 2014-C14, Class C, 5.05%, 2/15/2047 ‡ (i) | | | 21,000 | | | | 22,700 | |
| | |
Series 2015-C24, Class C, 4.34%, 5/15/2048 ‡ (i) | | | 36,000 | | | | 37,290 | |
| | |
Morgan Stanley Capital I Trust | | | | | | | | |
| | |
Series 2005-HQ7, Class E, (8.71)%, 11/14/2042 ‡ (i) | | | 44,417 | | | | 43,898 | |
| | |
Series 2015-MS1, Class B, 4.03%, 5/15/2048 ‡ (i) | | | 28,000 | | | | 30,239 | |
| | |
Series 2020-L4, Class C, 3.54%, 2/15/2053 ‡ (i) | | | 113,000 | | | | 115,662 | |
| | |
UBS Commercial Mortgage Trust Series 2017-C7, Class B, 4.29%, 12/15/2050 ‡ (i) | | | 106,000 | | | | 117,723 | |
| | |
Velocity Commercial Capital Loan Trust | | | | | | | | |
| | |
Series 2018-2, Class A, 4.05%, 10/26/2048 (c) (i) | | | 176,171 | | | | 184,986 | |
| | |
Series 2019-1, Class M1, 3.94%, 3/25/2049 ‡ (c) (i) | | | 194,216 | | | | 202,036 | |
| | |
Wells Fargo Commercial Mortgage Trust | | | | | | | | |
| | |
Series 2016-C35, Class C, 4.18%, 7/15/2048 ‡ (i) | | | 23,000 | | | | 22,682 | |
| | |
Series 2019-C49, Class C, 4.87%, 3/15/2052 ‡ (i) | | | 59,000 | | | | 66,656 | |
| | | | | | | | |
| | |
Total Commercial Mortgage-Backed Securities
(Cost $6,222,136) | | | | | | | 6,250,316 | |
| | | | | | | | |
Collateralized Mortgage Obligations — 2.1% | | | | | |
| | |
European Union — 0.1% | | | | | | | | |
| | |
Ampbev 2.00%, 9/30/2028 (g) | | EUR | 175,000 | | | | 211,146 | |
| | | | | | | | |
| | |
United Kingdom — 0.1% | | | | | | | | |
| | |
Brass NO 8 plc Series 8A, Class A1, 0.89%, 11/16/2066 (c) (i) | | | 133,732 | | | | 134,461 | |
| | |
Lanark Master Issuer plc Series 2019-1A, Class 1A1, 0.95%, 12/22/2069 (c) (i) | | | 113,333 | | | | 113,554 | |
| | | | | | | | |
| | |
| | | | | | | 248,015 | |
| | | | | | | | |
| | |
United States — 1.9% | | | | | | | | |
| | |
Alternative Loan Trust | | | | | | | | |
| | |
Series 2004-25CB, Class A1, 6.00%, 12/25/2034 | | | 131,396 | | | | 132,983 | |
| | | | | | | | |
| INVESTMENTS | | PRINCIPAL
AMOUNT ($) | | | VALUE ($) | |
| | | | | |
| | |
United States — continued | | | | | | | | |
| | |
Series 2005-6CB, Class 1A6, 5.50%, 4/25/2035 | | | 80,095 | | | | 80,170 | |
| | |
Series 2005-80CB, Class 5A1, 6.00%, 2/25/2036 | | | 104,546 | | | | 106,561 | |
| | |
Series 2007-2CB, Class 1A6, 5.75%, 3/25/2037 | | | 147,573 | | | | 114,970 | |
| | |
Antler Mortgage Trust Series 2019-RTL1, Class A2, 4.95%, 8/25/2022 (c) (i) | | | 600,000 | | | | 611,495 | |
| | |
Chase Mortgage Finance Trust Series 2007-A1, Class 1A5, 2.87%, 2/25/2037 (i) | | | 22,377 | | | | 22,585 | |
| | |
CHL Mortgage Pass-Through Trust Series 2007-16, Class A1, 6.50%, 10/25/2037 | | | 55,991 | | | | 41,107 | |
| | |
COLT Mortgage Loan Trust Series 2019-4, Class A1, 2.58%, 11/25/2049 (c) (i) | | | 100,715 | | | | 101,756 | |
| | |
Deephaven Residential Mortgage Trust Series 2020-1, Class A1, 2.34%,
1/25/2060 (c) (i) | | | 116,818 | | | | 118,283 | |
| | |
FHLMC Structured Agency Credit Risk Debt Notes Series 2018-HQA1, Class M2, 2.42%, 9/25/2030 (i) | | | 47,104 | | | | 47,219 | |
| | |
FHLMC, REMIC | | | | | | | | |
| | |
Series 2916, Class S, IF, IO, 7.14%, 1/15/2035 (i) | | | 1,856,288 | | | | 380,641 | |
| | |
Series 4305, Class SK, IF, IO, 6.49%, 2/15/2044 (i) | | | 631,527 | | | | 127,297 | |
| | |
Series 4689, Class SD, IF, IO, 6.04%, 6/15/2047 (i) | | | 468,678 | | | | 100,122 | |
| | |
Series 4714, Class SA, IF, IO, 6.04%, 8/15/2047 (i) | | | 370,707 | | | | 78,869 | |
| | |
Series 5022, IO, 3.00%, 9/25/2050 | | | 582,893 | | | | 90,026 | |
| | |
Series 5023, Class MI, IO, 3.00%, 10/25/2050 | | | 967,030 | | | | 168,385 | |
| | |
Series 4839, Class WS, IF, IO, 5.99%, 8/15/2056 (i) | | | 2,588,393 | | | | 610,993 | |
| | |
FNMA, Connecticut Avenue Securities | | | | | | | | |
| | |
Series 2015-C03, Class 2M2, 5.13%, 7/25/2025 (i) | | | 66,147 | | | | 67,460 | |
| | |
Series 2016-C06, Class 1M2, 4.37%, 4/25/2029 (i) | | | 44,347 | | | | 46,154 | |
| | |
Series 2018-C05, Class 1M2, 2.47%, 1/25/2031 (i) | | | 7,831 | | | | 7,831 | |
| | |
Series 2018-C06, Class 1M2, 2.12%, 3/25/2031 (i) | | | 72,896 | | | | 73,021 | |
| | |
Series 2018-C06, Class 2M2, 2.22%, 3/25/2031 (i) | | | 20,595 | | | | 20,550 | |
SEE NOTES TO FINANCIAL STATEMENTS.
| | | | | | | | |
| | | |
| FEBRUARY 28, 2021 | | J.P. MORGAN EXCHANGE-TRADED FUNDS | | | | | 99 | |
JPMorgan International Bond Opportunities ETF
(formerly known as JPMorgan Global Bond Opportunities ETF)
SCHEDULE OF PORTFOLIO INVESTMENTS
AS OF FEBRUARY 28, 2021 (continued)
| | | | | | | | |
| INVESTMENTS | | PRINCIPAL
AMOUNT ($) | | | VALUE ($) | |
Collateralized Mortgage Obligations — continued | | | | | |
| | |
United States — continued | | | | | | | | |
| | |
FNMA, REMIC | | | | | | | | |
| | |
Series 2010-57, Class ID, IO, 4.00%, 6/25/2025 | | | 170,900 | | | | 4,560 | |
| | |
Series 2012-146, Class AI, IO, 3.00%, 1/25/2028 | | | 1,313,944 | | | | 80,630 | |
| | |
Series 2016-68, Class BI, IO, 3.00%, 10/25/2031 | | | 835,798 | | | | 73,018 | |
| | |
Series 2012-93, Class SE, IF, IO, 5.98%, 9/25/2042 (i) | | | 124,310 | | | | 26,242 | |
| | |
Series 2012-124, Class UI, IO, 4.00%, 11/25/2042 | | | 139,074 | | | | 18,418 | |
| | |
Series 2012-133, Class NS, IF, IO, 6.03%, 12/25/2042 (i) | | | 227,529 | | | | 48,246 | |
| | |
Series 2015-40, Class LS, IF, IO, 6.05%, 6/25/2045 (i) | | | 330,688 | | | | 62,184 | |
| | |
Series 2016-75, Class SC, IF, IO, 5.98%, 10/25/2046 (i) | | | 755,470 | | | | 153,736 | |
| | |
Series 2017-31, Class SG, IF, IO, 5.98%, 5/25/2047 (i) | | | 1,212,265 | | | | 231,263 | |
| | |
Series 2017-39, Class ST, IF, IO, 5.98%, 5/25/2047 (i) | | | 353,969 | | | | 72,087 | |
| | |
Series 2017-69, Class SH, IF, IO, 6.08%, 9/25/2047 (i) | | | 527,343 | | | | 115,436 | |
| | |
Series 2019-42, Class SK, IF, IO, 5.93%, 8/25/2049 (i) | | | 930,062 | | | | 185,243 | |
| | |
FNMA, STRIPS Series 409, Class 27, IO, 4.00%, 4/25/2027 (i) | | | 181,665 | | | | 12,289 | |
| | |
GNMA | | | | | | | | |
| | |
Series 2017-107, Class KS, IF, IO, 6.09%, 7/20/2047 (i) | | | 365,945 | | | | 66,291 | |
| | |
Series 2019-42, Class SJ, IF, IO, 5.94%, 4/20/2049 (i) | | | 927,698 | | | | 143,388 | |
| | |
Series 2015-H13, Class GI, IO, 1.60%, 4/20/2065 (i) | | | 206,946 | | | | 8,381 | |
| | |
Homeward Opportunities Fund I Trust Series 2019-1, Class M1, 3.95%, 1/25/2059 ‡ (c) (i) | | | 150,000 | | | | 154,490 | |
| | |
Merrill Lynch Mortgage Investors Trust Series 2004-C, Class A1, 0.68%, 7/25/2029 (i) | | | 70,719 | | | | 69,473 | |
| | |
Structured Adjustable Rate Mortgage Loan Trust Series 2004-8, Class 3A, 2.66%, 7/25/2034 (i) | | | 17,493 | | | | 18,701 | |
| | |
Toorak Mortgage Corp. Ltd. Series 2018-1, Class A1, 4.34%, 8/25/2021 (b) (c) | | | 67,591 | | | | 67,724 | |
| | | | | | | | |
| INVESTMENTS | | PRINCIPAL
AMOUNT ($) | | | VALUE ($) | |
| | | | | | | | |
| | |
United States — continued | | | | | | | | |
| | |
Verus Securitization Trust Series 2019-1, Class A1, 3.84%, 2/25/2059 (c) (i) | | | 108,889 | | | | 109,559 | |
| | | | | | | | |
| | |
| | | | | | | 4,869,837 | |
| | | | | | | | |
| | |
Total Collateralized Mortgage Obligations
(Cost $5,212,602) | | | | | | | 5,328,998 | |
| | | | | | | | |
Supranational — 0.1% | | | | | | | | |
| | |
African Export-Import Bank (The) 5.25%, 10/11/2023 (a) (Cost $209,576) | | | 200,000 | | | | 218,063 | |
| | | | | | | | |
| | |
| | | SHARES | | | | |
Common Stocks — 0.0% (k) | | | | | | | | |
| | |
United States — 0.0% (k) | | | | | | | | |
| | |
Oasis Petroleum, Inc.*
(Cost $46,455) | | | 1,711 | | | | 97,287 | |
| | | | | | | | |
| | |
| | | NO. OF
WARRANTS | | | | |
Warrants — 0.0% (k) | | | | | | | | |
| | |
United States — 0.0% (k) | | | | | | | | |
| | |
Windstream Holdings, Inc. expiring 12/31/2049, price
10.75 USD * ‡
(Cost $—) | | | 16 | | | | 222 | |
| | | | | | | | |
| | |
| | | SHARES | | | | |
Short-term Investments — 4.9% | | | | | | | | |
| | |
Investment Companies — 4.9% | | | | | | | | |
| | |
JPMorgan U.S. Government Money Market Fund Class Institutional Shares, 0.03% (l) (m)
(Cost $12,234,929) | | | 12,234,929 | | | | 12,234,929 | |
| | | | | | | | |
Total Investments — 98.2%
(Cost $242,803,832) | | | | 245,561,636 | |
Other Assets Less Liabilities — 1.8% | | | | 4,535,647 | |
| | | | | | | | |
Net Assets — 100.0% | | | | 250,097,283 | |
| | | | | | | | |
Percentages indicated are based on net assets.
Abbreviations
| | |
| ABS | | Asset-Backed Securities |
| AUD | | Australian Dollar |
| CAD | | Canadian Dollar |
| CNY | | China Yuan |
| COP | | Colombian Peso |
| CZK | | Czech Republic Koruna |
| DKK | | Danish Krone |
SEE NOTES TO FINANCIAL STATEMENTS.
| | | | | | |
| | | |
| 100 | | | | J.P. MORGAN EXCHANGE-TRADED FUNDS | | FEBRUARY 28, 2021 |
| | |
DOP | | Dominican Republic Peso |
EUR | | Euro |
EURIBOR | | Euro Interbank Offered Rate |
FHLMC | | Federal Home Loan Mortgage Corp. |
FNMA | | Federal National Mortgage Association |
GBP | | British Pound |
GNMA | | Government National Mortgage Association |
HUF | | Hungarian Forint |
ICE | | Intercontinental Exchange |
IDR | | Indonesian Rupiah |
IF | | Inverse Floaters represent securities that pay interest at a rate that increases (decreases) with a decline (incline) in a specified index or have an interest rate that adjusts periodically based on changes in current interest rates and prepayments on the underlying pool of assets. The interest rate shown is the rate in effect as of February 28, 2021. The rate may be subject to a cap and floor. |
IO | | Interest Only represents the right to receive the monthly interest payments on an underlying pool of mortgage loans. The principal amount shown represents the par value on the underlying pool. The yields on these securities are subject to accelerated principal paydowns as a result of prepayment or refinancing of the underlying pool of mortgage instruments. As a result, interest income may be reduced considerably. |
JSC | | Joint Stock Company |
LIBOR | | London Interbank Offered Rate |
MXN | | Mexican Peso |
MYR | | Malaysian Ringgit |
NZD | | New Zealand Dollar |
OYJ | | Public Limited Company |
PEN | | Peruvian Nuevo Sol |
PLN | | Polish Zloty |
PO | | Principal Only represents the right to receive the principal portion only on an underlying pool of mortgage loans. The market value of these securities is extremely volatile in response to changes in market interest rates. As prepayments on the underlying mortgages of these securities increase, the yield on these securities increases. |
PT | | Limited liability company |
REMIC | | Real Estate Mortgage Investment Conduit |
Re-REMIC | | Combined Real Estate Mortgage Investment Conduit |
RUB | | Russian Ruble |
SOFR | | Secured Overnight Financing Rate |
STRIPS | | Separate Trading of Registered Interest and Principal of Securities. The STRIPS Program lets investors hold and trade individual interest and principal components of eligible notes and bonds as separate securities. |
| | |
USD | | United States Dollar |
ZAR | | South African Rand |
RON | | Romanian Leu |
| |
(a) | | Security exempt from registration pursuant to Regulation S under the Securities Act of 1933, as amended. Regulation S applies to securities offerings that are made outside of the United States and do not involve direct selling efforts in the United States and as such may have restrictions on resale. |
(b) | | Step bond. Interest rate is a fixed rate for an initial period that either resets at a specific date or may reset in the future contingent upon a predetermined trigger. The interest rate shown is the current rate as of February 28, 2021. |
(c) | | Securities exempt from registration under Rule 144A or section 4(a)(2), of the Securities Act of 1933, as amended. |
(d) | | Variable or floating rate security, linked to the referenced benchmark. The interest rate shown is the current rate as of February 28, 2021. |
(e) | | Security is perpetual and thus, does not have a predetermined maturity date. The coupon rate for this security is fixed for a period of time and may be structured to adjust thereafter. The date shown, if applicable, reflects the next call date. The coupon rate shown is the rate in effect as of February 28, 2021. |
(f) | | Security is an interest bearing note with preferred security characteristics. |
(g) | | All or a portion of the security is a when-issued security, delayed delivery security, or forward commitment. |
(h) | | Security has the ability to pay in kind (“PIK”) or pay income in cash. When applicable, separate rates of such payments are disclosed. |
(i) | | Variable or floating rate security, the interest rate of which adjusts periodically based on changes in current interest rates and prepayments on the underlying pool of assets. The interest rate shown is the current rate as of February 28, 2021. |
(j) | | Defaulted security. |
(k) | | Amount rounds to less than 0.1% of net assets. |
(l) | | Investment in an affiliated fund, which is registered under the Investment Company Act of 1940, as amended, and is advised by J.P. Morgan Investment Management Inc. |
(m) | | The rate shown is the current yield as of February 28, 2021. |
* | | Non-income producing security. |
‡ | | Value determined using significant unobservable inputs. |
| | | | | | | | | | | | | | | | | | | | |
| Futures contracts outstanding as of February 28, 2021: | |
| DESCRIPTION | | NUMBER OF
CONTRACTS | | | EXPIRATION
DATE | | | TRADING
CURRENCY | | | NOTIONAL
AMOUNT ($) | | | VALUE AND
UNREALIZED
APPRECIATION
(DEPRECIATION) ($) | |
| | | | | |
Long Contracts | | | | | | | | | | | | | | | | | | | | |
Australia 10 Year Bond | | | 71 | | | | 03/2021 | | | | AUD | | | | 7,488,313 | | | | (40,523 | ) |
Euro-Bund | | | 8 | | | | 03/2021 | | | | EUR | | | | 1,678,552 | | | | (4,230 | ) |
U.S. Treasury 5 Year Note | | | 40 | | | | 06/2021 | | | | USD | | | | 4,970,000 | | | | (26,330 | ) |
| | | | | | | | | | | | | | | | | | | | |
| | | | | | | | | | | | | | | | | | | (71,083 | ) |
| | | | | | | | | | | | | | | | | | | | |
SEE NOTES TO FINANCIAL STATEMENTS.
| | | | | | | | |
| | | |
| FEBRUARY 28, 2021 | | J.P. MORGAN EXCHANGE-TRADED FUNDS | | | | | 101 | |
JPMorgan International Bond Opportunities ETF
(formerly known as JPMorgan Global Bond Opportunities ETF)
SCHEDULE OF PORTFOLIO INVESTMENTS
AS OF FEBRUARY 28, 2021 (continued)
| | | | | | | | | | | | | | | | | | | | |
| DESCRIPTION | | NUMBER OF
CONTRACTS | | | EXPIRATION
DATE | | | TRADING
CURRENCY | | | NOTIONAL
AMOUNT ($) | | | VALUE AND
UNREALIZED
APPRECIATION
(DEPRECIATION) ($) | |
| | | | | |
Short Contracts | | | | | | | | | | | | | | | | | | | | |
Euro-Bobl | | | (9 | ) | | | 03/2021 | | | | EUR | | | | (1,459,226 | ) | | | 6,268 | |
Euro-Buxl | | | (23 | ) | | | 03/2021 | | | | EUR | | | | (5,852,057 | ) | | | 353,918 | |
Long Gilt | | | (85 | ) | | | 06/2021 | | | | GBP | | | | (15,130,779 | ) | | | 112,288 | |
U.S. Treasury 5 Year Note | | | (8 | ) | | | 06/2021 | | | | USD | | | | (994,000 | ) | | | 5,171 | |
U.S. Treasury 10 Year Ultra Note | | | (88 | ) | | | 06/2021 | | | | USD | | | | (13,037,750 | ) | | | (65,919 | ) |
U.S. Treasury Long Bond | | | (7 | ) | | | 06/2021 | | | | USD | | | | (1,124,375 | ) | | | 1,352 | |
U.S. Treasury Ultra Bond | | | (30 | ) | | | 06/2021 | | | | USD | | | | (5,750,625 | ) | | | (56,714 | ) |
| | | | | | | | | | | | | | | | | | | | |
| | | | | | | | | | | | | | | | | | | 356,364 | |
| | | | | | | | | | | | | | | | | | | | |
| | | | | | | | | | | | | | | | | | | 285,281 | |
| | | | | | | | | | | | | | | | | | | | |
| | |
| Abbreviations |
| AUD | | Australian Dollar |
| EUR | | Euro |
| GBP | | British Pound |
| USD | | United States Dollar |
| | | | | | | | | | | | | | | | | | | | |
| Forward foreign currency exchange contracts outstanding as of February 28, 2021: | |
| CURRENCY PURCHASED | | | CURRENCY SOLD | | | COUNTERPARTY | | SETTLEMENT
DATE | | | UNREALIZED
APPRECIATION
(DEPRECIATION) ($) | |
| EUR | | | 106,252 | | | USD | | | 127,522 | | | Barclays Bank plc | | | 3/3/2021 | | | | 680 | |
| EUR | | | 245,309 | | | USD | | | 295,602 | | | Merrill Lynch International | | | 3/3/2021 | | | | 382 | |
| EUR | | | 586,087 | | | USD | | | 705,240 | | | TD Bank Financial Group | | | 3/3/2021 | | | | 1,918 | |
| GBP | | | 2,684,220 | | | USD | | | 3,737,925 | | | BNP Paribas | | | 3/3/2021 | | | | 1,745 | |
| USD | | | 1,730,628 | | | EUR | | | 1,432,255 | | | Barclays Bank plc | | | 3/3/2021 | | | | 2,504 | |
| USD | | | 3,187,165 | | | EUR | | | 2,637,926 | | | HSBC Bank, NA | | | 3/3/2021 | | | | 4,307 | |
| USD | | | 5,095,844 | | | EUR | | | 4,209,916 | | | Merrill Lynch International | | | 3/3/2021 | | | | 16,262 | |
| USD | | | 89,035,925 | | | EUR | | | 73,483,266 | | | TD Bank Financial Group | | | 3/3/2021 | | | | 372,801 | |
| CAD | | | 14,669,439 | | | USD | | | 11,488,288 | | | Barclays Bank plc | | | 3/23/2021 | | | | 39,566 | |
| CAD | | | 124,092 | | | USD | | | 97,489 | | | TD Bank Financial Group | | | 3/23/2021 | | | | 28 | |
| CLP | | | 3,547,185,924 | | | USD | | | 4,889,306 | | | BNP Paribas** | | | 3/23/2021 | | | | 12,869 | |
| EUR | | | 840,945 | | | USD | | | 1,013,030 | | | Royal Bank of Canada | | | 3/23/2021 | | | | 2,183 | |
| NZD | | | 1,753,161 | | | EUR | | | 1,045,172 | | | State Street Corp. | | | 3/23/2021 | | | | 4,992 | |
| TRY | | | 14,852,492 | | | USD | | | 1,852,545 | | | BNP Paribas | | | 3/23/2021 | | | | 128,518 | |
| USD | | | 4,477,423 | | | AUD | | | 5,788,987 | | | State Street Corp. | | | 3/23/2021 | | | | 22,653 | |
| USD | | | 2,471,157 | | | CLP | | | 1,755,880,786 | | | Citibank, NA** | | | 3/23/2021 | | | | 44,548 | |
| USD | | | 2,761,545 | | | CNY | | | 17,795,228 | | | Goldman Sachs International** | | | 3/23/2021 | | | | 22,791 | |
| USD | | | 1,068,263 | | | CZK | | | 23,096,059 | | | State Street Corp. | | | 3/23/2021 | | | | 3,395 | |
| USD | | | 17,274,690 | | | EUR | | | 14,259,106 | | | Merrill Lynch International | | | 3/23/2021 | | | | 60,682 | |
| USD | | | 830,815 | | | HUF | | | 247,075,439 | | | State Street Corp. | | | 3/23/2021 | | | | 8,708 | |
| USD | | | 3,271,010 | | | IDR | | | 45,795,776,853 | | | Barclays Bank plc** | | | 3/23/2021 | | | | 98,050 | |
| USD | | | 925,677 | | | MYR | | | 3,732,608 | | | BNP Paribas** | | | 3/23/2021 | | | | 4,138 | |
| USD | | | 2,057,486 | | | PLN | | | 7,644,656 | | | State Street Corp. | | | 3/23/2021 | | | | 17,130 | |
| USD | | | 1,271,787 | | | RUB | | | 94,531,949 | | | Citibank, NA** | | | 3/23/2021 | | | | 8,096 | |
| USD | | | 1,217,988 | | | TRY | | | 8,913,355 | | | Barclays Bank plc | | | 3/23/2021 | | | | 29,102 | |
| USD | | | 1,143,738 | | | ZAR | | | 16,837,804 | | | Citibank, NA | | | 3/23/2021 | | | | 34,340 | |
| USD | | | 2,446,243 | | | ZAR | | | 35,791,437 | | | Goldman Sachs International | | | 3/23/2021 | | | | 88,039 | |
| USD | | | 439,290 | | | ILS | | | 1,428,000 | | | Merrill Lynch International | | | 3/24/2021 | | | | 7,747 | |
| USD | | | 99,127,687 | | | EUR | | | 81,799,724 | | | BNP Paribas | | | 4/6/2021 | | | | 341,022 | |
| | | | | | | | | | | | | | | | | | | | |
| Total unrealized appreciation | | | | 1,379,196 | |
| | | | | | | | | | | | | | | | | | | | |
SEE NOTES TO FINANCIAL STATEMENTS.
| | | | | | |
| | | |
| 102 | | | | J.P. MORGAN EXCHANGE-TRADED FUNDS | | FEBRUARY 28, 2021 |
| | | | | | | | | | | | | | | | | | | | |
| CURRENCY PURCHASED | | | CURRENCY SOLD | | | COUNTERPARTY | | SETTLEMENT
DATE | | | UNREALIZED
APPRECIATION
(DEPRECIATION) ($) | |
| EUR | | | 81,799,724 | | | USD | | | 99,049,650 | | | BNP Paribas | | | 3/3/2021 | | | | (352,088 | ) |
| USD | | | 757,460 | | | EUR | | | 631,747 | | | Royal Bank of Canada | | | 3/3/2021 | | | | (4,790 | ) |
| USD | | | 410,258 | | | EUR | | | 342,264 | | | TD Bank Financial Group | | | 3/3/2021 | | | | (2,709 | ) |
| USD | | | 3,676,288 | | | GBP | | | 2,684,220 | | | Barclays Bank plc | | | 3/3/2021 | | | | (63,381 | ) |
| AUD | | | 1,469,699 | | | EUR | | | 962,538 | | | Goldman Sachs International | | | 3/23/2021 | | | | (31,034 | ) |
| AUD | | | 360,506 | | | USD | | | 284,507 | | | Barclays Bank plc | | | 3/23/2021 | | | | (7,089 | ) |
| AUD | | | 1,588,980 | | | USD | | | 1,229,699 | | | Royal Bank of Canada | | | 3/23/2021 | | | | (6,939 | ) |
| BRL | | | 19,859,973 | | | USD | | | 3,675,210 | | | Citibank, NA** | | | 3/23/2021 | | | | (134,407 | ) |
| COP | | | 9,521,710,341 | | | USD | | | 2,693,707 | | | BNP Paribas** | | | 3/23/2021 | | | | (84,749 | ) |
| CZK | | | 4,180,668 | | | USD | | | 196,514 | | | BNP Paribas | | | 3/23/2021 | | | | (3,760 | ) |
| EUR | | | 1,155,918 | | | USD | | | 1,397,857 | | | Citibank, NA | | | 3/23/2021 | | | | (2,400 | ) |
| INR | | | 264,550,079 | | | USD | | | 3,622,217 | | | BNP Paribas** | | | 3/23/2021 | | | | (54,816 | ) |
| KRW | | | 1,949,167,340 | | | USD | | | 1,768,995 | | | Goldman Sachs International** | | | 3/23/2021 | | | | (40,035 | ) |
| MXN | | | 5,148,749 | | | EUR | | | 211,271 | | | Barclays Bank plc | | | 3/23/2021 | | | | (9,562 | ) |
| MXN | | | 16,439,945 | | | USD | | | 816,038 | | | BNP Paribas | | | 3/23/2021 | | | | (32,188 | ) |
| MXN | | | 24,827,101 | | | USD | | | 1,222,221 | | | Goldman Sachs International | | | 3/23/2021 | | | | (38,476 | ) |
| NZD | | | 1,707,542 | | | EUR | | | 1,036,935 | | | Citibank, NA | | | 3/23/2021 | | | | (18,027 | ) |
| NZD | | | 1,622,498 | | | EUR | | | 990,609 | | | Goldman Sachs International | | | 3/23/2021 | | | | (23,549 | ) |
| PEN | | | 8,326,913 | | | USD | | | 2,287,299 | | | Citibank, NA** | | | 3/23/2021 | | | | (5,157 | ) |
| RUB | | | 93,113,964 | | | USD | | | 1,258,984 | | | Barclays Bank plc** | | | 3/23/2021 | | | | (14,248 | ) |
| RUB | | | 47,898,487 | | | USD | | | 641,980 | | | Goldman Sachs International** | | | 3/23/2021 | | | | (1,679 | ) |
| TRY | | | 11,277,053 | | | USD | | | 1,582,013 | | | BNP Paribas | | | 3/23/2021 | | | | (77,852 | ) |
| USD | | | 11,428,195 | | | AUD | | | 14,916,925 | | | TD Bank Financial Group | | | 3/23/2021 | | | | (50,749 | ) |
| USD | | | 19,125,976 | | | CAD | | | 24,394,354 | | | Barclays Bank plc | | | 3/23/2021 | | | | (44,119 | ) |
| USD | | | 4,149,126 | | | GBP | | | 3,009,033 | | | Citibank, NA | | | 3/23/2021 | | | | (43,673 | ) |
| USD | | | 7,089,251 | | | NZD | | | 9,869,759 | | | TD Bank Financial Group | | | 3/23/2021 | | | | (42,182 | ) |
| USD | | | 3,738,681 | | | GBP | | | 2,684,220 | | | BNP Paribas | | | 4/6/2021 | | | | (1,851 | ) |
| | | | | | | | | | | | | | | | | | | | |
| Total unrealized depreciation | | | | (1,191,509 | ) |
| | | | | | | | | | | | | | | | | | | | |
| Net unrealized appreciation | | | | 187,687 | |
| | | | | | | | | | | | | | | | | | | | |
| | |
| Abbreviations |
| |
| AUD | | Australian Dollar |
| BRL | | Brazilian Real |
| CAD | | Canadian Dollar |
| CLP | | Chile Peso |
| CNY | | China Yuan |
| COP | | Colombian Peso |
| CZK | | Czech Republic Koruna |
| EUR | | Euro |
| GBP | | British Pound |
| HUF | | Hungarian Forint |
| IDR | | Indonesian Rupiah |
| ILS | | Israeli Shekel |
| INR | | Indian Rupee |
| KRW | | Korean Republic Won |
| MXN | | Mexican Peso |
| MYR | | Malaysian Ringgit |
| NZD | | New Zealand Dollar |
| PEN | | Peruvian Nuevo Sol |
| PLN | | Polish Zloty |
| RUB | | Russian Ruble |
| TRY | | Turkish Lira |
| USD | | United States Dollar |
| ZAR | | South African Rand |
| |
| ** | | Non-deliverable forward. |
SEE NOTES TO FINANCIAL STATEMENTS.
| | | | | | | | |
| | | |
| FEBRUARY 28, 2021 | | J.P. MORGAN EXCHANGE-TRADED FUNDS | | | | | 103 | |
JPMorgan International Bond Opportunities ETF
(formerly known as JPMorgan Global Bond Opportunities ETF)
SCHEDULE OF PORTFOLIO INVESTMENTS
AS OF FEBRUARY 28, 2021 (continued)
| | | | | | | | | | | | | | | | | | | | | | | | | | | | | | | | | | |
| Over-the-Counter (“OTC”) Credit default swap contracts outstanding — buy protection (a) as of February 28, 2021: | |
REFERENCE
OBLIGATION/
INDEX | | FINANCING RATE
PAID BY THE
FUND (%) | | PAYMENT
FREQUENCY | | | COUNTERPARTY | | | MATURITY
DATE | | | IMPLIED
CREDIT
SPREAD
(%) (b) | | | NOTIONAL
AMOUNT (c) | | | UPFRONT
PAYMENTS
(RECEIPTS)
($) (d) | | | UNREALIZED
APPRECIATION
(DEPRECIATION)
($) | | | VALUE
($) | |
CDX.NA.EM.34-V1 | | 1.00 | | | Quarterly | | | | Morgan Stanley | | | | 12/20/2025 | | | | 1.93 | | | | USD 3,700,000 | | | | 218,485 | | | | (68,421 | ) | | | 150,064 | |
| | | | | | | | | | | | | | | | | | | | | | | | | | | | | | | | | | |
| | | | | | | | | | | | | | | | | | | | | | | | | | | | | | |
| Centrally Cleared Credit default swap contracts outstanding — buy protection (a) as of February 28, 2021: | |
REFERENCE
OBLIGATION/INDEX | | FINANCING RATE PAID BY THE FUND (%) | | PAYMENT
FREQUENCY | | | MATURITY
DATE | | | IMPLIED
CREDIT
SPREAD
(%) (b) | | | NOTIONAL
AMOUNT (C) | | | UPFRONT
PAYMENTS
(RECEIPTS)
($) (d) | | | UNREALIZED
APPRECIATION
(DEPRECIATION)
($) | | | VALUE
($) | |
iTraxx.Europe.Main.34-V1 | | 1.00 | | | Quarterly | | | | 12/20/2025 | | | | 0.51 | | | | EUR 3,560,000 | | | | (84,463 | ) | | | (25,164 | ) | | | (109,627 | ) |
| | | | | | | | | | | | | | | | | | | | | | | | | | | | | | |
| (a) | The Fund, as a buyer of credit protection, is generally obligated to make periodic payments and may also pay or receive an upfront premium to or from the protection seller, in exchange for the right to receive a contingent payment, upon occurrence of a credit event with respect to an underlying reference obligation, as defined under the terms of individual swap contracts. |
| (b) | Implied credit spreads are an indication of the seller’s performance risk, related to the likelihood of a credit event occurring that would require a seller to make payment to a buyer. Implied credit spreads are used to determine the value of swap contracts and reflect the cost of buying/selling protection, which may include upfront payments made to enter into the contract. Therefore, higher spreads would indicate a greater likelihood that a seller will be obligated to perform (i.e. make payment) under the swap contract. Increasing values, in absolute terms and relative to notional amounts, are also indicative of greater performance risk. Implied credit spreads for credit default swaps on credit indices are linked to the weighted average spread across the underlying reference obligations included in a particular index. |
| (c) | The notional amount is the maximum amount that a seller of credit protection would be obligated to pay and a buyer of credit protection would receive, upon occurrence of a credit event. |
| (d) | Upfront payments and receipts generally represent premiums paid or received at the initiation of the agreement to compensate the differences between the stated terms of the swap agreement and current market conditions (credit spreads, interest rates and other relevant factors). |
| | | | | | | | | | | | | | | | | | | | | | |
| Centrally Cleared Interest rate swap contracts outstanding as of February 28, 2021: | |
| FLOATING RATE INDEX (a) | | FIXED RATE | | | PAY/ RECEIVE
FLOATING RATE | | MATURITY
DATE | | | NOTIONAL
AMOUNT | | | UPFRONT
PAYMENTS
(RECEIPTS)
($) | | | VALUE AND
UNREALIZED
APPRECIATION
(DEPRECIATION)
($) | |
3 month BA semi-annually | | | 1.38 semi-annually | | | Receive | | | 3/17/2031 | | | | CAD 7,800,000 | | | | — | | | | 272,634 | |
| | | | | | | | | | | | | | | | | | | | | | |
| | |
| Abbreviations |
| |
| BA | | Banker’s Acceptance Rate |
| CAD | | Canadian Dollar |
| CDX | | Credit Default Swap Index |
| EUR | | Euro |
| USD | | United States Dollar |
| (a) | Value of floating rate index at February 28, 2021 was 0.56%. |
| | | | | | |
| Summary of total OTC swap contracts outstanding as of February 28, 2021: | | | | | |
| | | NET UPFRONT
PAYMENTS
(RECEIPTS)
($) | | VALUE
($) | |
Assets | |
| | |
| OTC Credit default swap contracts outstanding — buy protection | | 218,485 | | | 150,064 | |
| | | | | | |
SEE NOTES TO FINANCIAL STATEMENTS.
| | | | | | |
| | | |
| 104 | | | | J.P. MORGAN EXCHANGE-TRADED FUNDS | | FEBRUARY 28, 2021 |
JPMorgan Municipal ETF
SCHEDULE OF PORTFOLIO INVESTMENTS
AS OF FEBRUARY 28, 2021
| | | | | | | | |
| INVESTMENTS | | PRINCIPAL
AMOUNT ($) | | | VALUE ($) | |
Municipal Bonds — 98.4% (a) | | | | | | | | |
| | |
Alabama — 1.3% | | | | | | | | |
| | |
Black Belt Energy Gas District, Gas Prepay Project No. 5 Series 2020A-1, Rev., 4.00%, 10/1/2026 (b) | | | 250,000 | | | | 288,733 | |
| | |
Black Belt Energy Gas District, Gas Supply Series 2017A, Rev., LIQ: Royal Bank of Canada, 4.00%, 7/1/2022 (b) | | | 30,000 | | | | 31,303 | |
| | |
City of Pell City Series A, GO, 5.00%, 2/1/2025 | | | 100,000 | | | | 116,385 | |
| | |
Selma Industrial Development Board, International Paper Co. Project Series 2020A, Rev., 1.37%, 6/16/2025 (b) | | | 100,000 | | | | 102,036 | |
| | |
Southeast Alabama Gas Supply District (The), Project No. 1 Series 2018A, Rev., 4.00%, 4/1/2024 (b) | | | 25,000 | | | | 27,251 | |
| | |
University of Alabama (The), Huntsville General Fee Series B-2, Rev., 5.00%, 9/1/2031 | | | 95,000 | | | | 118,386 | |
| | |
University of South Alabama, University Facility Rev., AGM, 5.00%, 4/1/2030 | | | 250,000 | | | | 323,110 | |
| | | | | | | | |
| | |
Total Alabama | | | | | | | 1,007,204 | |
| | | | | | | | |
|
Alaska — 0.7% | |
| | |
Alaska Industrial Development and Export Authority, Tanana Chiefs Conference Project Series 2019A, Rev., 5.00%, 10/1/2024 | | | 200,000 | | | | 229,124 | |
| | |
Alaska Municipal Bond Bank Authority | | | | | | | | |
| | |
Series 3, Rev., 5.00%, 10/1/2025 | | | 20,000 | | | | 22,974 | |
| | |
Series 3, Rev., 5.00%, 12/1/2028 | | | 225,000 | | | | 272,254 | |
| | | | | | | | |
| | |
Total Alaska | | | | | | | 524,352 | |
| | | | | | | | |
|
Arizona — 4.5% | |
| | |
Arizona Industrial Development Authority, Cadence Campus Project | | | | | | | | |
| | |
Series 2020A, Rev., 4.00%, 7/15/2030 (c) | | | 125,000 | | | | 134,745 | |
| | |
Series 2020A, Rev., 4.00%, 7/15/2040 (c) | | | 125,000 | | | | 130,097 | |
| | |
Arizona Industrial Development Authority, Equitable School Revolving Fund Series A, Rev., 5.00%, 11/1/2044 | | | 250,000 | | | | 298,078 | |
| | |
Arizona Industrial Development Authority, Great Lakes Senior Living Communities LLC Project Series 2019A, Rev., 5.00%, 1/1/2036 | | | 250,000 | | | | 243,095 | |
| | |
Arizona Industrial Development Authority, Phoenix Children’s Hospital | | | | | | | | |
| | |
Series 2020A, Rev., 5.00%, 2/1/2024 | | | 55,000 | | | | 62,227 | |
| | |
Series 2020A, Rev., 5.00%, 2/1/2025 | | | 70,000 | | | | 81,913 | |
| | | | | | | | |
| INVESTMENTS | | PRINCIPAL
AMOUNT ($) | | | VALUE ($) | |
| | | | | | | | |
|
Arizona — continued | |
| | |
Series 2020A, Rev., 5.00%, 2/1/2031 | | | 150,000 | | | | 195,057 | |
| | |
Series 2020A, Rev., 5.00%, 2/1/2032 | | | 200,000 | | | | 258,704 | |
| | |
City of Mesa GO, 5.00%, 7/1/2030 | | | 285,000 | | | | 380,210 | |
| | |
City of Mesa, Excise Tax | | | | | | | | |
| | |
Rev., 5.00%, 7/1/2030 | | | 95,000 | | | | 125,948 | |
| | |
Rev., 5.00%, 7/1/2031 | | | 75,000 | | | | 98,903 | |
| | |
Rev., 5.00%, 7/1/2032 | | | 185,000 | | | | 242,687 | |
| | |
City of Mesa, Utility System | | | | | | | | |
| | |
Rev., 5.00%, 7/1/2028 | | | 300,000 | | | | 384,504 | |
| | |
Rev., 5.00%, 7/1/2032 | | | 125,000 | | | | 163,978 | |
| | |
City of Phoenix Civic Improvement Corp., Junior Lien Airport Series 2017D, Rev., 5.00%, 7/1/2026 | | | 160,000 | | | | 194,571 | |
| | |
Maricopa County School District No. 3 Tempe Elementary, School Improvement, Project of 2016 Series A, GO, 5.00%, 7/1/2027 | | | 30,000 | | | | 37,504 | |
| | |
Maricopa County Unified School District No. 95, Queen Creek, School Improvement | | | | | | | | |
| | |
GO, 4.00%, 7/1/2026 | | | 160,000 | | | | 186,704 | |
| | |
GO, 4.00%, 7/1/2027 | | | 40,000 | | | | 47,687 | |
| | |
GO, 4.00%, 7/1/2028 | | | 50,000 | | | | 60,167 | |
| | |
Salt Verde Financial Corp. Rev., 5.25%, 12/1/2026 | | | 100,000 | | | | 121,518 | |
| | | | | | | | |
| | |
Total Arizona | | | | | | | 3,448,297 | |
| | | | | | | | |
|
Arkansas — 0.2% | |
| | |
City of Fort Smith, Water and Sewer Construction Rev., 5.00%, 10/1/2024 | | | 75,000 | | | | 86,151 | |
| | |
University of Arkansas, Various Facility UAMS Campus Rev., 5.00%, 11/1/2021 | | | 40,000 | | | | 41,284 | |
| | | | | | | | |
| | |
Total Arkansas | | | | | | | 127,435 | |
| | | | | | | | |
|
California — 9.0% | |
| | |
Baldwin Park Financing Authority, Rail Crossings Safety Improvements Project Rev., 5.00%, 6/1/2024 | | | 100,000 | | | | 115,149 | |
| | |
Brentwood Infrastructure Financing Authority, Civic Center Project Rev., 5.00%, 10/1/2025 | | | 45,000 | | | | 53,543 | |
| | |
California Health Facilities Financing Authority, Kaiser Permanente Series 2006C, Rev., 5.00%, 11/1/2029 (b) | | | 300,000 | | | | 393,846 | |
| | |
California Health Facilities Financing Authority, On Lok Senior Health Service | | | | | | | | |
| | |
Rev., 3.00%, 8/1/2023 | | | 100,000 | | | | 104,855 | |
| | |
Rev., 5.00%, 8/1/2040 | | | 100,000 | | | | 122,275 | |
| | |
California Municipal Finance Authority, San Antonio Gardens Project Rev., 5.00%, 11/15/2039 | | | 150,000 | | | | 171,202 | |
SEE NOTES TO FINANCIAL STATEMENTS.
| | | | | | | | |
| | | |
| FEBRUARY 28, 2021 | | J.P. MORGAN EXCHANGE-TRADED FUNDS | | | | | 105 | |
JPMorgan Municipal ETF
SCHEDULE OF PORTFOLIO INVESTMENTS
AS OF FEBRUARY 28, 2021 (continued)
| | | | | | | | |
| INVESTMENTS | | PRINCIPAL
AMOUNT ($) | | | VALUE ($) | |
Municipal Bonds — continued | | | | | | | | |
|
California — continued | |
| | |
California State Public Works Board, California State University, Various Capital Projects Series 2020D, Rev., 5.00%, 11/1/2028 | | | 355,000 | | | | 458,486 | |
| | |
California Statewide Communities Development Authority, Emanate Health, Tax-Exempt Series 2020A, Rev., 5.00%, 4/1/2030 | | | 150,000 | | | | 194,899 | |
| | |
Chula Vista Municipal Financing Authority Rev., 4.00%, 5/1/2026 | | | 60,000 | | | | 69,576 | |
| | |
Chula Vista Municipal Financing Authority, Green Bond Series 2017B, Rev., 4.00%, 12/1/2028 | | | 45,000 | | | | 55,403 | |
| | |
City of Livermore Series 2020B, COP, 4.00%, 10/1/2030 | | | 200,000 | | | | 246,454 | |
| | |
City of Los Angeles Department of Airports, International Airport Senior | | | | | | | | |
| | |
Series A, Rev., AMT, 5.00%, 5/15/2022 | | | 125,000 | | | | 132,033 | |
| | |
Series A, Rev., AMT, 5.00%, 5/15/2033 | | | 100,000 | | | | 115,592 | |
| | |
City of Los Angeles, Department of Airports, International Airport Subordinate Series 2019E, Rev., AMT, 5.00%, 5/15/2026 | | | 10,000 | | | | 12,239 | |
| | |
City of Roseville, 316 Vernon Street Project COP, 5.00%, 8/1/2025 | | | 70,000 | | | | 83,746 | |
| | |
City of Santa Rosa, Courthouse Square Project and Lease COP, 4.00%, 10/1/2024 | | | 90,000 | | | | 100,990 | |
| | |
Conejo Valley Unified School District, Election 2014 Series C, GO, 4.00%, 8/1/2027 | | | 200,000 | | | | 238,630 | |
| | |
County of Santa Clara Series 2017C, GO, 5.00%, 8/1/2033 | | | 40,000 | | | | 49,736 | |
| | |
CSCDA Community Improvement Authority, Essential Housing, Jefferson-Anaheim Rev., 2.88%, 8/1/2041 (c) | | | 255,000 | | | | 245,241 | |
| | |
El Monte City School District, Election of 2004 Series A, GO, 5.00%, 8/1/2025 | | | 55,000 | | | | 65,270 | |
| | |
Golden State Tobacco Securitization Corp., Enhanced Tobacco Settlement Series A-1, Rev., 5.00%, 6/1/2032 | | | 250,000 | | | | 306,412 | |
| | |
Hermosa Beach City School District, Election of 2016 Series A, GO, 4.00%, 8/1/2023 | | | 15,000 | | | | 16,338 | |
| | |
Lodi Public Financing Authority Rev., AGM, 5.00%, 9/1/2027 | | | 350,000 | | | | 439,208 | |
| | |
Los Angeles Community College District Series 2015C, GO, 5.00%, 8/1/2021 | | | 30,000 | | | | 30,601 | |
| | |
Los Angeles County Metropolitan Transportation Authority, Sales Tax Series 2020A, Rev., 5.00%, 6/1/2032 | | | 1,000,000 | | | | 1,326,010 | |
| | | | | | | | |
| INVESTMENTS | | PRINCIPAL
AMOUNT ($) | | | VALUE ($) | |
| | | | | | | | |
|
California — continued | |
| | |
Metropolitan Water District of Southern California, Waterworks Series 2019A, Rev., 5.00%, 7/1/2034 | | | 25,000 | | | | 32,039 | |
| | |
Municipal Improvement Corp. of Los Angeles, Real Property Series 2014-A, Rev., 5.00%, 5/1/2023 | | | 20,000 | | | | 21,988 | |
| | |
Napa Valley Community College District Series 2014A, GO, 5.00%, 8/1/2021 | | | 15,000 | | | | 15,301 | |
| | |
Northern California Power Agency, Hydroelectric Project Series 2019A, Rev., 5.00%, 7/1/2022 | | | 20,000 | | | | 21,278 | |
| | |
Salinas Facilities Financing Authority Series 2020A-1, Rev., AGM, 4.00%, 11/1/2027 | | | 100,000 | | | | 118,872 | |
| | |
San Diego Community College District GO, 5.00%, 8/1/2022 (d) | | | 50,000 | | | | 53,461 | |
| | |
San Dieguito Union High School District, Election of 2012 Series A-2, GO, 5.00%, 8/1/2024 | | | 150,000 | | | | 167,175 | |
| | |
San Francisco City and County Airport Commission, San Francisco International Airport | | | | | | | | |
| | |
Series 2016A, Rev., 5.00%, 5/1/2023 | | | 105,000 | | | | 115,727 | |
| | |
Series 2016A, Rev., 5.00%, 5/1/2026 | | | 95,000 | | | | 116,137 | |
| | |
San Jose Evergreen Community College District Series A, GO, 5.00%, 9/1/2022 | | | 100,000 | | | | 107,266 | |
| | |
San Jose Evergreen Community College District, Election of 2010 Series C, GO, 5.00%, 9/1/2024 (d) | | | 105,000 | | | | 121,996 | |
| | |
San Ramon Valley Fire Protection District, Public Safety Complex and Fire Training Facility Projects | | | | | | | | |
| | |
COP, 4.00%, 8/1/2023 | | | 55,000 | | | | 59,543 | |
| | |
COP, 4.00%, 8/1/2032 | | | 125,000 | | | | 147,944 | |
| | |
Santa Cruz County Capital Financing Authority Series 2020A, Rev., 4.00%, 6/1/2025 | | | 100,000 | | | | 113,876 | |
| | |
Sequoia Union High School District GO, 5.00%, 7/1/2027 | | | 25,000 | | | | 30,798 | |
| | |
Sierra View Local Health Care District | | | | | | | | |
| | |
Rev., 4.00%, 7/1/2021 | | | 150,000 | | | | 151,620 | |
| | |
Rev., 4.00%, 7/1/2023 | | | 165,000 | | | | 176,687 | |
| | |
Southern California Public Power Authority, Transmission Project Series 2015A, Rev., 4.00%, 7/1/2021 | | | 20,000 | | | | 20,255 | |
| | |
Yosemite Community College District GO, 5.00%, 8/1/2022 (d) | | | 100,000 | | | | 106,774 | |
| | | | | | | | |
| | |
Total California | | | | | | | 6,846,471 | |
| | | | | | | | |
SEE NOTES TO FINANCIAL STATEMENTS.
| | | | | | |
| | | |
| 106 | | | | J.P. MORGAN EXCHANGE-TRADED FUNDS | | FEBRUARY 28, 2021 |
| | | | | | | | |
| INVESTMENTS | | PRINCIPAL
AMOUNT ($) | | | VALUE ($) | |
Municipal Bonds — continued | | | | | | | | |
|
Colorado — 3.9% | |
| | |
Colorado Educational and Cultural Facilities Authority, Vega Collegiate Academy Project Rev., 5.00%, 2/1/2051 (c) | | | 150,000 | | | | 162,175 | |
| | |
Colorado Health Facilities Authority, Boulder Community Health Project | | | | | | | | |
| | |
Rev., 5.00%, 10/1/2021 | | | 100,000 | | | | 102,641 | |
| | |
Rev., 5.00%, 10/1/2022 | | | 225,000 | | | | 241,068 | |
| | |
Rev., 5.00%, 10/1/2023 | | | 175,000 | | | | 194,360 | |
| | |
Crystal Valley Metropolitan District No. 2, Limited Tax | | | | | | | | |
| | |
Series 2020A, GO, AGM, 5.00%, 12/1/2022 | | | 50,000 | | | | 54,073 | |
| | |
Series 2020A, GO, AGM, 5.00%, 12/1/2023 | | | 135,000 | | | | 151,565 | |
| | |
Series 2020A, GO, AGM, 5.00%, 12/1/2024 | | | 175,000 | | | | 202,974 | |
| | |
Regional Transportation District, Denver Transit Partners | | | | | | | | |
| | |
Rev., 5.00%, 7/15/2026 | | | 100,000 | | | | 119,468 | |
| | |
Rev., 5.00%, 7/15/2029 | | | 130,000 | | | | 164,011 | |
| | |
Rev., 5.00%, 1/15/2030 | | | 170,000 | | | | 215,908 | |
| | |
Rev., 5.00%, 7/15/2030 | | | 115,000 | | | | 147,206 | |
| | |
Rev., 5.00%, 1/15/2031 | | | 250,000 | | | | 322,555 | |
| | |
Rev., 4.00%, 7/15/2036 | | | 185,000 | | | | 215,980 | |
| | |
Southlands Metropolitan District No. 1 Series A-1, GO, 5.00%, 12/1/2037 | | | 250,000 | | | | 281,810 | |
| | |
State of Colorado, Higher Education Capital Construction, Lease Purchase Financing Program Series 2014A, COP, 5.00%, 11/1/2025 | | | 10,000 | | | | 11,933 | |
| | |
STC Metropolitan District No. 2, Limited Tax Improvement Series 2019A, GO, 5.00%, 12/1/2038 | | | 300,000 | | | | 323,784 | |
| | |
University of Colorado, Enterprise System Series A-2, Rev., 5.00%, 6/1/2026 | | | 40,000 | | | | 48,856 | |
| | | | | | | | |
| | |
Total Colorado | | | | | | | 2,960,367 | |
| | | | | | | | |
|
Connecticut — 1.1% | |
| | |
Connecticut State Health & Educational Facilities Authority, Sacred Heart University Series K, Rev., 5.00%, 7/1/2022 | | | 250,000 | | | | 265,037 | |
| | |
Connecticut State Health & Educational Facilities Authority, Yale University Series A-2, Rev., 5.00%, 7/1/2022 (b) | | | 100,000 | | | | 106,486 | |
| | |
State of Connecticut Series A, GO, 5.00%, 4/15/2033 | | | 135,000 | | | | 162,813 | |
| | | | | | | | |
| INVESTMENTS | | PRINCIPAL
AMOUNT ($) | | | VALUE ($) | |
| | | | | | | | |
|
Connecticut — continued | |
| | |
State of Connecticut, Special Tax Transportation Infrastructure Purposes | | | | | | | | |
| | |
Series 2020A, Rev., 5.00%, 5/1/2023 | | | 200,000 | | | | 220,110 | |
| | |
Series B, Rev., 5.00%, 8/1/2023 | | | 75,000 | | | | 83,356 | |
| | | | | | | | |
| | |
Total Connecticut | | | | | | | 837,802 | |
| | | | | | | | |
| | |
Delaware — 0.1% | | | | | | | | |
| | |
Delaware Transportation Authority Rev., 5.00%, 7/1/2022 | | | 40,000 | | | | 42,594 | |
| | | | | | | | |
| | |
District of Columbia — 2.5% | | | | | | | | |
| | |
District of Columbia, Income Tax | | | | | | | | |
| | |
Series C, Rev., 5.00%, 12/1/2021 | | | 25,000 | | | | 25,913 | |
| | |
Series F, Rev., 5.00%, 12/1/2021 | | | 50,000 | | | | 51,825 | |
| | |
Series 2020C, Rev., 5.00%, 5/1/2033 | | | 1,000,000 | | | | 1,315,650 | |
| | |
District of Columbia, International School | | | | | | | | |
| | |
Rev., 5.00%, 7/1/2028 | | | 115,000 | | | | 136,649 | |
| | |
Rev., 5.00%, 7/1/2039 | | | 125,000 | | | | 145,077 | |
| | |
District of Columbia, Kipp DC Project Rev., 4.00%, 7/1/2039 | | | 100,000 | | | | 110,641 | |
| | |
District of Columbia, Water and Sewer Authority, Public Utility, Senior Lien Series B, Rev., 5.00%, 10/1/2025 | | | 65,000 | | | | 78,153 | |
| | | | | | | | |
| | |
Total District of Columbia | | | | | | | 1,863,908 | |
| | | | | | | | |
|
Florida — 3.8% | |
| | |
City of Cape Coral, Water and Sewer Rev., 5.00%, 10/1/2022 | | | 25,000 | | | | 26,839 | |
| | |
City of Miami Beach, Water and Sewer Rev., 5.00%, 9/1/2033 | | | 25,000 | | | | 30,870 | |
| | |
City of Orlando, Capital Improvement | | | | | | | | |
| | |
Series D, Rev., 5.00%, 10/1/2022 | | | 75,000 | | | | 80,728 | |
| | |
Series B, Rev., 5.00%, 10/1/2024 | | | 60,000 | | | | 69,613 | |
| | |
City of Tampa, H. Lee Moffitt Cancer Center Project | | | | | | | | |
| | |
Series 2020B, Rev., 5.00%, 7/1/2022 | | | 50,000 | | | | 53,042 | |
| | |
Series 2020B, Rev., 5.00%, 7/1/2023 | | | 50,000 | | | | 55,082 | |
| | |
Series 2020B, Rev., 5.00%, 7/1/2024 | | | 50,000 | | | | 57,032 | |
| | |
County of Broward, Port Facilities Series 2019A, Rev., 5.00%, 9/1/2030 | | | 50,000 | | | | 64,488 | |
| | |
County of Hillsborough, Communications Services Tax Rev., 5.00%, 10/1/2024 | | | 40,000 | | | | 46,456 | |
| | |
County of Okaloosa, Sales Tax Rev., 5.00%, 10/1/2024 | | | 30,000 | | | | 34,807 | |
| | |
County of Osceola, Sales Tax Series 2016A, Rev., 4.00%, 10/1/2023 | | | 10,000 | | | | 10,894 | |
| | |
County of Palm Beach, Atlantic University | | | | | | | | |
| | |
Rev., 5.00%, 4/1/2029 (c) | | | 100,000 | | | | 109,730 | |
| | |
Rev., 5.00%, 4/1/2039 (c) | | | 100,000 | | | | 108,207 | |
SEE NOTES TO FINANCIAL STATEMENTS.
| | | | | | | | |
| | | |
| FEBRUARY 28, 2021 | | J.P. MORGAN EXCHANGE-TRADED FUNDS | | | | | 107 | |
JPMorgan Municipal ETF
SCHEDULE OF PORTFOLIO INVESTMENTS
AS OF FEBRUARY 28, 2021 (continued)
| | | | | | | | |
| INVESTMENTS | | PRINCIPAL
AMOUNT ($) | | | VALUE ($) | |
Municipal Bonds — continued | |
|
Florida — continued | |
| | |
County of Seminole Rev., 4.00%, 10/1/2024 | | | 90,000 | | | | 100,820 | |
| | |
East Central Regional Wastewater Treatment Facilities Operation Board Rev., 5.00%, 10/1/2024 | | | 30,000 | | | | 34,807 | |
| | |
Florida Atlantic University Finance Corp., Student Housing Project Series 2019B, Rev., 5.00%, 7/1/2032 | | | 250,000 | | | | 314,492 | |
| | |
Florida Development Finance Corp., Educational Facilities, River City Science Academy Projects Rev., 4.00%, 7/1/2035 | | | 325,000 | | | | 354,747 | |
| | |
Monroe County School District Series 2018A, COP, 4.00%, 6/1/2025 | | | 45,000 | | | | 51,062 | |
| | |
Orange County School Board Series 2015D, COP, 5.00%, 8/1/2025 | | | 25,000 | | | | 29,525 | |
| | |
Palm Beach County Health Facilities Authority, Acts Retirement Life Communities, Inc., Obligated Group Rev., 5.00%, 11/15/2032 | | | 240,000 | | | | 283,296 | |
| | |
Palm Beach County School District Series 2015B, COP, 5.00%, 8/1/2021 | | | 10,000 | | | | 10,200 | |
| | |
Pinellas County Industrial Development Authority, Drs. Kiran & Pallavi Patel 2017 Foundation for Global Understanding, Inc., Project Rev., 5.00%, 7/1/2029 | | | 125,000 | | | | 142,304 | |
| | |
Pinellas County School Board, Master Lease Program Series 2021A, COP, 5.00%, 7/1/2031 | | | 250,000 | | | | 333,375 | |
| | |
Reedy Creek Improvement District, Ad Valorem Tax Series 2016-A, GO, 5.00%, 6/1/2026 | | | 50,000 | | | | 60,839 | |
| | |
State of Florida Board of Education, Public Education Capital Outlay | | | | | | | | |
| | |
Series B, GO, 5.00%, 6/1/2024 | | | 30,000 | | | | 34,482 | |
| | |
Series B, GO, 5.00%, 6/1/2026 | | | 20,000 | | | | 24,439 | |
| | |
Series B, GO, 5.00%, 6/1/2031 | | | 75,000 | | | | 93,398 | |
| | |
State of Florida, State Board of Education, Lottery | | | | | | | | |
| | |
Series 2016B, Rev., 5.00%, 7/1/2023 | | | 40,000 | | | | 44,401 | |
| | |
Series A, Rev., 5.00%, 7/1/2026 | | | 75,000 | | | | 92,305 | |
| | |
Tampa Bay Water, Regional Water Supply Authority, Utility System Series C, Rev., 5.00%, 10/1/2025 | | | 55,000 | | | | 65,964 | |
| | |
Tampa-Hillsborough County Expressway Authority Series B, Rev., 5.00%, 7/1/2031 | | | 40,000 | | | | 50,086 | |
| | |
Tohopekaliga Water Authority, Utility System Rev., 5.00%, 10/1/2025 | | | 10,000 | | | | 12,008 | |
| | | | | | | | |
| | |
Total Florida | | | | | | | 2,880,338 | |
| | | | | | | | |
| | | | | | | | |
| INVESTMENTS | | PRINCIPAL
AMOUNT ($) | | | VALUE ($) | |
| | | | | | | | |
|
Georgia — 2.1% | |
| | |
Albany-Dougherty Inner City Authority, State University Projects Rev., 5.00%, 7/1/2023 | | | 410,000 | | | | 449,167 | |
| | |
Carroll City-County Hospital Authority, Tanner Medical Center Project Rev., GTD, 4.00%, 7/1/2024 | | | 200,000 | | | | 223,454 | |
| | |
Cobb County, Kennestone Hospital Authority, Wellstar Health System, Inc., Project | | | | | | | | |
| | |
Series 2020B, Rev., 5.00%, 4/1/2022 | | | 150,000 | | | | 157,515 | |
| | |
Series 2020A, Rev., 5.00%, 4/1/2050 | | | 200,000 | | | | 245,434 | |
| | |
County of DeKalb, Water and Sewerage Series 2006B, Rev., 5.25%, 10/1/2026 | | | 25,000 | | | | 31,174 | |
| | |
Forsyth County Water and Sewerage Authority Rev., 5.00%, 4/1/2032 | | | 145,000 | | | | 187,381 | |
| | |
Glynn-Brunswick Memorial Hospital Authority, Southeast Georgia Health System Project Rev., 4.00%, 8/1/2037 | | | 255,000 | | | | 287,143 | |
| | |
Richmond County Hospital Authority, University Health Services, Inc., Project Rev., 5.00%, 1/1/2022 | | | 20,000 | | | | 20,771 | |
| | |
State of Georgia Series 2011J-1, GO, 4.50%, 7/1/2022 | | | 25,000 | | | | 25,359 | |
| | | | | | | | |
| | |
Total Georgia | | | | | | | 1,627,398 | |
| | | | | | | | |
|
Hawaii — 0.2% | |
| | |
City and County of Honolulu, Tax-Exempt Series D, GO, 5.00%, 9/1/2032 | | | 45,000 | | | | 55,563 | |
| | |
State of Hawaii | | | | | | | | |
| | |
Series EE, GO, 5.00%, 11/1/2022 (d) | | | 15,000 | | | | 16,206 | |
| | |
Series EP, GO, 5.00%, 8/1/2023 | | | 40,000 | | | | 44,528 | |
| | |
Series FK, GO, 5.00%, 5/1/2033 | | | 30,000 | | | | 36,614 | |
| | |
State of Hawaii, Highway Fund Series B, Rev., 5.00%, 1/1/2027 | | | 25,000 | | | | 30,563 | |
| | | | | | | | |
| | |
Total Hawaii | | | | | | | 183,474 | |
| | | | | | | | |
|
Illinois — 3.1% | |
| | |
Champaign County Community Unit School District No. 4 Champaign, School Building GO, 5.00%, 1/1/2027 | | | 45,000 | | | | 54,226 | |
| | |
Chicago O’Hare International Airport, General Airport, Senior Lien Series 2017B, Rev., 5.00%, 1/1/2034 | | | 40,000 | | | | 47,399 | |
| | |
City of Decatur, Green Bond GO, 5.00%, 3/1/2027 | | | 130,000 | | | | 156,303 | |
| | |
Cook and DuPage Counties, Village of Elk Grove GO, 5.00%, 1/1/2029 | | | 25,000 | | | | 30,772 | |
| | |
Illinois Finance Authority, Clean Water Initiative Revolving Fund Rev., 5.00%, 7/1/2032 | | | 35,000 | | | | 42,888 | |
SEE NOTES TO FINANCIAL STATEMENTS.
| | | | | | |
| | | |
| 108 | | | | J.P. MORGAN EXCHANGE-TRADED FUNDS | | FEBRUARY 28, 2021 |
| | | | | | | | |
| INVESTMENTS | | PRINCIPAL
AMOUNT ($) | | | VALUE ($) | |
Municipal Bonds — continued | | | | | | | | |
|
Illinois — continued | |
| | |
Illinois State Toll Highway Authority | | | | | | | | |
| | |
Series D, Rev., 5.00%, 1/1/2024 | | | 25,000 | | | | 28,160 | |
| | |
Series A, Rev., 5.00%, 1/1/2036 | | | 250,000 | | | | 316,400 | |
| | |
Kane McHenry Cook and De Kalb Counties Unit School District No. 300 GO, 5.00%, 1/1/2024 | | | 35,000 | | | | 39,383 | |
| | |
Kendall and Kane Counties Community Unit School District No. 115 Series 2017B, GO, 5.00%, 1/1/2027 | | | 25,000 | | | | 30,497 | |
| | |
Lake and McHenry Counties Community Unit, School District No. 118 GO, 5.00%, 1/1/2022 | | | 50,000 | | | | 51,947 | |
| | |
Lake County Forest Preserve District GO, 5.00%, 12/15/2028 | | | 165,000 | | | | 211,081 | |
| | |
McLean and Woodford Counties Community Unit School District No. 5 Normal Series 2017A, GO, 4.00%, 12/1/2023 | | | 80,000 | | | | 87,086 | |
| | |
Northern Illinois University, Auxiliary Facilities System Series 2020B, Rev., 5.00%, 4/1/2034 | | | 200,000 | | | | 250,158 | |
| | |
Southwestern Illinois Development Authority, Flood Prevention District Council Project Rev., 5.00%, 4/15/2030 | | | 625,000 | | | | 805,256 | |
| | |
State of Illinois | | | | | | | | |
| | |
GO, 5.00%, 4/1/2024 | | | 30,000 | | | | 33,200 | |
| | |
Series A, GO, 5.00%, 10/1/2024 | | | 30,000 | | | | 33,519 | |
| | |
Village of Bolingbrook Series A, GO, AGM, 5.00%, 1/1/2033 | | | 125,000 | | | | 153,300 | |
| | |
Will and Kendall Counties Community Consolidated School District 202 Plainfield GO, 4.00%, 1/1/2023 | | | 10,000 | | | | 10,641 | |
| | | | | | | | |
| | |
Total Illinois | | | | | | | 2,382,216 | |
| | | | | | | | |
|
Indiana — 1.1% | |
| | |
Adams Central Elementary School Building Corp., Valorem Property Tax First Mortgage Rev., 5.00%, 1/15/2027 | | | 20,000 | | | | 24,522 | |
| | |
Ball State University, Student Fee Series R, Rev., 5.00%, 7/1/2024 | | | 35,000 | | | | 40,010 | |
| | |
Decatur County, Jail Building Corp. Rev., 5.00%, 7/15/2028 | | | 250,000 | | | | 306,010 | |
| | |
Hamilton Southeastern Consolidated School Building Corp., Ad Valorem Property Tax First Mortgage Rev., 5.00%, 7/15/2026 | | | 25,000 | | | | 30,506 | |
| | |
Indiana Finance Authority, Highway Series C, Rev., 5.00%, 12/1/2025 | | | 35,000 | | | | 42,124 | |
| | |
Indiana Finance Authority, Indiana University Health Obligated Group Series 2016A, Rev., 5.00%, 12/1/2022 | | | 10,000 | | | | 10,833 | |
| | | | | | | | |
| INVESTMENTS | | PRINCIPAL
AMOUNT ($) | | | VALUE ($) | |
| | | | | | | | |
|
Indiana — continued | |
| | |
Indiana State University, Housing and Dining System Rev., 5.00%, 4/1/2031 | | | 75,000 | | | | 89,791 | |
| | |
Indiana State University, Student Fee Series R, Rev., 5.00%, 10/1/2022 | | | 10,000 | | | | 10,731 | |
| | |
IPS Multi-School Building Corp., Indiana Unlimited Ad Valorem Property Tax First Mortgage Rev., 5.00%, 7/15/2029 | | | 50,000 | | | | 64,344 | |
| | |
Perry Township Multi School Building Corp., Ad Valorem Property Tax First Mortgage Rev., 5.00%, 7/15/2025 | | | 35,000 | | | | 41,065 | |
| | |
Portage Township Multi-School Building Corp., Ad Valorem Property Tax First Mortgage Refunding Rev., 5.00%, 7/15/2028 | | | 75,000 | | | | 94,754 | |
| | |
The Trustees of Indiana University | | | | | | | | |
| | |
Series A, Rev., 5.00%, 6/1/2022 | | | 25,000 | | | | 26,507 | |
| | |
Series Y, Rev., 5.00%, 8/1/2028 | | | 25,000 | | | | 31,349 | |
| | | | | | | | |
| | |
Total Indiana | | | | | | | 812,546 | |
| | | | | | | | |
|
Iowa — 0.2% | |
| | |
City of Cedar Rapids, Sewer Series 2018D, Rev., 5.00%, 6/1/2022 | | | 70,000 | | | | 74,119 | |
| | |
City of West Des Moines, Urban Renewal Series 2016B, GO, 5.00%, 6/1/2024 | | | 35,000 | | | | 40,204 | |
| | |
Iowa Finance Authority, State Revolving Fund Rev., 5.00%, 8/1/2027 | | | 30,000 | | | | 37,917 | |
| | | | | | | | |
| | |
Total Iowa | | | | | | | 152,240 | |
| | | | | | | | |
|
Kansas — 0.1% | |
| | |
Johnson County Water District No. 1 Series 2017A, Rev., 5.00%, 1/1/2025 | | | 50,000 | | | | 58,665 | |
| | | | | | | | |
| | |
Kentucky — 1.8% | | | | | | | | |
| | |
Kentucky Economic Development Finance Authority, Baptist Healthcare System Obligated Group Series B, Rev., 5.00%, 8/15/2029 | | | 165,000 | | | | 202,186 | |
| | |
Kentucky Public Energy Authority, Gas Supply | | | | | | | | |
| | |
Series 2018C-1, Rev., 4.00%, 6/1/2025 (b) | | | 605,000 | | | | 677,800 | |
| | |
Series 2019C, Rev., 4.00%, 2/1/2028 (b) | | | 300,000 | | | | 350,712 | |
| | |
Louisville and Jefferson County Metropolitan Government, Norton Healthcare, Inc. Series 2016-A, Rev., 4.00%, 10/1/2036 | | | 65,000 | | | | 71,572 | |
| | |
Louisville and Jefferson County Metropolitan Sewer District, Sewer and Drainage System | | | | | | | | |
| | |
Series B, Rev., 5.00%, 5/15/2024 | | | 25,000 | | | | 28,620 | |
| | |
Series 2017A, Rev., 5.00%, 5/15/2027 | | | 40,000 | | | | 49,408 | |
| | | | | | | | |
| | |
Total Kentucky | | | | | | | 1,380,298 | |
| | | | | | | | |
SEE NOTES TO FINANCIAL STATEMENTS.
| | | | | | | | |
| | | |
| FEBRUARY 28, 2021 | | J.P. MORGAN EXCHANGE-TRADED FUNDS | | | | | 109 | |
JPMorgan Municipal ETF
SCHEDULE OF PORTFOLIO INVESTMENTS
AS OF FEBRUARY 28, 2021 (continued)
| | | | | | | | |
| INVESTMENTS | | PRINCIPAL
AMOUNT ($) | | | VALUE ($) | |
Municipal Bonds — continued | |
|
Louisiana — 1.5% | |
| | |
City of Shreveport, Water and Sewer, Junior Lien Series 2019B, Rev., AGM, 5.00%, 12/1/2032 | | | 200,000 | | | | 248,614 | |
| | |
Louisiana Local Government Environmental Facilities and Community Development Authority, Calcasieu Parish Projects Rev., 5.00%, 12/1/2030 | | | 250,000 | | | | 320,247 | |
| | |
Louisiana Public Facilities Authority, Tulane University Project | | | | | | | | |
| | |
Series 2020A, Rev., 5.00%, 4/1/2029 | | | 220,000 | | | | 281,200 | |
| | |
Series 2020A, Rev., 5.00%, 4/1/2030 | | | 135,000 | | | | 174,744 | |
| | |
State of Louisiana Series 2016-B, GO, 4.00%, 8/1/2026 | | | 30,000 | | | | 35,153 | |
| | |
State of Louisiana Gasoline and Fuels Tax Series 2012A-1, Rev., 5.00%, 5/1/2022 (d) | | | 55,000 | | | | 58,074 | |
| | | | | | | | |
| | |
Total Louisiana | | | | | | | 1,118,032 | |
| | | | | | | | |
|
Maine — 1.4% | |
| | |
Maine Health and Higher Educational Facilities Authority, Birch Bay Retirement Village | | | | | | | | |
| | |
Series 2020A, Rev., 4.00%, 7/1/2021 | | | 150,000 | | | | 151,812 | |
| | |
Series 2020A, Rev., 4.00%, 7/1/2022 | | | 225,000 | | | | 235,860 | |
| | |
Series 2020A, Rev., 5.00%, 7/1/2023 | | | 125,000 | | | | 137,829 | |
| | |
Maine Health and Higher Educational Facilities Authority, Mainehealth Series 2020A, Rev., 5.00%, 7/1/2027 | | | 300,000 | | | | 373,368 | |
| | |
Maine Municipal Bond Bank Series C, Rev., 5.00%, 11/1/2024 | | | 75,000 | | | | 87,321 | |
| | |
Maine Municipal Bond Bank, Maine Department of Transportation Series 2018A, Rev., GAN, 5.00%, 9/1/2026 | | | 45,000 | | | | 54,885 | |
| | | | | | | | |
| | |
Total Maine | | | | | | | 1,041,075 | |
| | | | | | | | |
|
Maryland — 1.5% | |
| | |
County of Baltimore, Consolidated Public Improvement GO, 5.00%, 8/1/2023 | | | 100,000 | | | | 106,700 | |
| | |
County of Spotsylvania, Commissioners of St. Mary’s, Public Improvement GO, 4.00%, 7/15/2027 | | | 70,000 | | | | 83,745 | |
| | |
Maryland Economic Development Corp., Bowie State University Project Rev., 4.00%, 7/1/2040 | | | 200,000 | | | | 216,538 | |
| | |
Maryland Health and Higher Educational Facilities Authority, Stevenson University Project | | | | | | | | |
| | |
Rev., 5.00%, 6/1/2033 | | | 200,000 | | | | 250,192 | |
| | |
Rev., 4.00%, 6/1/2046 | | | 250,000 | | | | 274,055 | |
| | | | | | | | |
| INVESTMENTS | | PRINCIPAL
AMOUNT ($) | | | VALUE ($) | |
| | | | | | | | |
|
Maryland — continued | |
| | |
State of Maryland Department of Transportation Rev., 5.00%, 9/1/2026 | | | 75,000 | | | | 92,517 | |
| | |
State of Maryland, State and Local Facilities Loan of 2017 Series A, GO, 5.00%, 8/1/2025 | | | 45,000 | | | | 53,837 | |
| | |
Washington Suburban Sanitary District, Consolidated Public Improvement Rev., GTD, 5.00%, 6/15/2030 | | | 40,000 | | | | 49,666 | |
| | | | | | | | |
| | |
Total Maryland | | | | | | | 1,127,250 | |
| | | | | | | | |
| | |
Massachusetts — 2.4% | | | | | | | | |
| | |
City of Boston Series 2017A, GO, 5.00%, 4/1/2025 | | | 10,000 | | | | 11,832 | |
| | |
Commonwealth of Massachusetts Series C, GO, 5.00%, 10/1/2026 | | | 25,000 | | | | 30,895 | |
| | |
Massachusetts Bay Transportation Authority, Mass Sales Tax Series A, Rev., 5.00%, 7/1/2022 | | | 20,000 | | | | 21,286 | |
| | |
Massachusetts Development Finance Agency, Mass General Brigham Issue Series 2020A-1, Rev., 5.00%, 1/31/2030 (b) | | | 500,000 | | | | 648,335 | |
| | |
Massachusetts Development Finance Agency, Milford Regional Medical Center Series G, Rev., 5.00%, 7/15/2037 (c) | | | 245,000 | | | | 281,995 | |
| | |
Massachusetts Development Finance Agency, Southcoast Health System Obligated Group Issue Series 2021G, Rev., 5.00%, 7/1/2035 | | | 200,000 | | | | 256,408 | |
| | |
Massachusetts Development Finance Agency, Wellforce Issue | | | | | | | | |
| | |
Series 2020C, Rev., AGM, 5.00%, 10/1/2030 | | | 175,000 | | | | 228,184 | |
| | |
Series 2020C, Rev., AGM, 5.00%, 10/1/2031 | | | 215,000 | | | | 277,036 | |
| | |
Massachusetts State College Building Authority Series D, Rev., 5.00%, 5/1/2027 | | | 45,000 | | | | 56,283 | |
| | |
Town of Hopkinton, Municipal Purpose Loan GO, 5.00%, 11/15/2024 | | | 30,000 | | | | 35,046 | |
| | | | | | | | |
| | |
Total Massachusetts | | | | | | | 1,847,300 | |
| | | | | | | | |
| | |
Michigan — 1.0% | | | | | | | | |
| | |
Berrien Springs Public Schools, School Building and Site GO, Q-SBLF, 5.00%, 5/1/2030 | | | 250,000 | | | | 327,460 | |
| | |
City of Grand Rapids, Sanitary Sewer System Rev., 5.00%, 1/1/2030 | | | 30,000 | | | | 39,493 | |
| | |
Marquette Board of Light and Power, Electric Utility System Series 2016A, Rev., 5.00%, 7/1/2026 | | | 185,000 | | | | 223,256 | |
SEE NOTES TO FINANCIAL STATEMENTS.
| | | | | | |
| | | |
| 110 | | | | J.P. MORGAN EXCHANGE-TRADED FUNDS | | FEBRUARY 28, 2021 |
| | | | | | | | |
| INVESTMENTS | | PRINCIPAL
AMOUNT ($) | | | VALUE ($) | |
Municipal Bonds — continued | |
| | |
Michigan — continued | | | | | | | | |
| | |
Michigan State Hospital Finance Authority, Trinity Health Credit Group Series C, Rev., 5.00%, 12/1/2025 | | | 25,000 | | | | 30,062 | |
| | |
Western Michigan University, Tax Exempt Series 2021A, Rev., AGM, 5.00%, 11/15/2031 | | | 125,000 | | | | 163,772 | |
| | | | | | | | |
| | |
Total Michigan | | | | | | | 784,043 | |
| | | | | | | | |
| | |
Minnesota — 0.6% | | | | | | | | |
| | |
Alexandria Lake Area Sanitation District, Sanitary Sewer Board Series 2015A, GO, 5.00%, 2/1/2022 | | | 30,000 | | | | 31,328 | |
| | |
Bloomington Independent School District No. 271, Bloomington Public Schools Series 2019A, GO, 5.00%, 2/1/2028 | | | 25,000 | | | | 30,917 | |
| | |
City of Apple Valley, Senior Housing, Orchard Path Project Rev., 4.25%, 9/1/2038 | | | 250,000 | | | | 254,508 | |
| | |
City of Hopkins Series 2017B, GO, 4.00%, 2/1/2025 | | | 20,000 | | | | 22,656 | |
| | |
State of Minnesota Series 2012B, Rev., 5.00%, 3/1/2024 | | | 130,000 | | | | 136,172 | |
| | |
University of Minnesota Series B, Rev., 5.00%, 12/1/2025 | | | 15,000 | | | | 18,115 | |
| | | | | | | | |
| | |
Total Minnesota | | | | | | | 493,696 | |
| | | | | | | | |
| | |
Mississippi — 0.3% | | | | | | | | |
| | |
Mississippi State University Educational Building Corp., New Facilities and Refinancing Project Rev., 5.00%, 8/1/2025 | | | 35,000 | | | | 41,452 | |
| | |
State of Mississippi | | | | | | | | |
| | |
Series B, GO, 5.00%, 12/1/2025 | | | 20,000 | | | | 24,123 | |
| | |
Series 2015F, GO, 5.00%, 11/1/2028 | | | 35,000 | | | | 41,639 | |
| | |
Series A, GO, 5.00%, 11/1/2031 | | | 60,000 | | | | 72,865 | |
| | |
University of Mississippi Educational Building Corp., Refinancing Project Series 2016A, Rev., 5.00%, 10/1/2030 | | | 40,000 | | | | 47,442 | |
| | | | | | | | |
| | |
Total Mississippi | | | | | | | 227,521 | |
| | | | | | | | |
| | |
Missouri — 1.8% | | | | | | | | |
| | |
Bi-State Development Agency of the Missouri-Illinois Metropolitan District, St. Clair County Metrolink Project Rev., AGM, 5.25%, 7/1/2024 | | | 40,000 | | | | 46,226 | |
| | |
City of Kansas, Sanitary Sewer System | | | | | | | | |
| | |
Series 2018A, Rev., 5.00%, 1/1/2022 | | | 25,000 | | | | 26,006 | |
| | |
Series B, Rev., 5.00%, 1/1/2033 | | | 25,000 | | | | 31,045 | |
| | |
Health and Educational Facilities Authority of the State of Missouri, City Art Institute Rev., 5.00%, 9/1/2030 | | | 200,000 | | | | 234,064 | |
| | | | | | | | |
| INVESTMENTS | | PRINCIPAL
AMOUNT ($) | | | VALUE ($) | |
| | | | | | | | |
| | |
Missouri — continued | | | | | | | | |
| | |
Health and Educational Facilities Authority of the State of Missouri, St. Luke’s Episcopal-Presbyterian Hospitals Series 2015B, Rev., 5.00%, 12/1/2026 | | | 165,000 | | | | 191,209 | |
| | |
Health and Educational Facilities Authority of the State of Missouri, St. Luke’s Health System, Inc. Rev., 5.00%, 11/15/2029 | | | 300,000 | | | | 357,918 | |
| | |
Health and Educational Facilities Authority of the State of Missouri, Wright Memorial Hospital Rev., 5.00%, 9/1/2026 | | | 200,000 | | | | 232,490 | |
| | |
Metropolitan St. Louis Sewer District, Wastewater System Improvement | | | | | | | | |
| | |
Series 2012A, Rev., 5.00%, 5/1/2022 (d) | | | 125,000 | | | | 132,062 | |
| | |
Series 2017A, Rev., 5.00%, 5/1/2027 | | | 45,000 | | | | 56,592 | |
| | |
Missouri Development Finance Board, Fulton State Hospital Project Rev., 5.00%, 10/1/2025 | | | 25,000 | | | | 28,936 | |
| | | | | | | | |
| | |
Total Missouri | | | | | | | 1,336,548 | |
| | | | | | | | |
| | |
Montana — 0.1% | | | | | | | | |
| | |
County of Missoula GO, 4.00%, 7/1/2025 | | | 50,000 | | | | 57,284 | |
| | | | | | | | |
| | |
Nebraska — 1.5% | | | | | | | | |
| | |
Central Plains Energy Project, Gas Project No. 3 Series 2017A, Rev., 5.00%, 9/1/2030 | | | 320,000 | | | | 410,150 | |
| | |
City of Lincoln, Electric System | | | | | | | | |
| | |
Rev., 5.00%, 9/1/2026 | | | 85,000 | | | | 104,491 | |
| | |
Rev., 5.00%, 9/1/2028 | | | 50,000 | | | | 62,061 | |
| | |
City of Omaha, Sewer Rev., 5.00%, 4/1/2027 | | | 50,000 | | | | 60,634 | |
| | |
Nebraska Educational Health Cultural and Social Services Finance Authority, Immanuel Retirement Communities Obligated Group Series 2019A, Rev., 4.00%, 1/1/2033 | | | 250,000 | | | | 279,545 | |
| | |
Omaha Public Power District, Electric System | | | | | | | | |
| | |
Series B, Rev., 5.00%, 2/1/2025 | | | 20,000 | | | | 23,047 | |
| | |
Series 2016A, Rev., 5.00%, 2/1/2026 | | | 40,000 | | | | 48,430 | |
| | |
Series A, Rev., 5.00%, 2/1/2027 | | | 30,000 | | | | 36,194 | |
| | |
Omaha School District, Elkhorn Public Schools GO, 5.00%, 12/15/2026 | | | 30,000 | | | | 37,300 | |
| | |
University of Nebraska Facilities Corp., UNMC Global Center Project Rev., 5.00%, 12/15/2025 | | | 35,000 | | | | 42,302 | |
| | | | | | | | |
| | |
Total Nebraska | | | | | | | 1,104,154 | |
| | | | | | | | |
SEE NOTES TO FINANCIAL STATEMENTS.
| | | | | | | | |
| | | |
| FEBRUARY 28, 2021 | | J.P. MORGAN EXCHANGE-TRADED FUNDS | | | | | 111 | |
JPMorgan Municipal ETF
SCHEDULE OF PORTFOLIO INVESTMENTS
AS OF FEBRUARY 28, 2021 (continued)
| | | | | | | | |
| INVESTMENTS | | PRINCIPAL
AMOUNT ($) | | | VALUE ($) | |
Municipal Bonds — continued | |
| | |
Nevada — 0.8% | | | | | | | | |
| | |
City of Sparks, Senior Sales Tax Series 2019A, Rev., 2.50%, 6/15/2024 (c) | | | 90,000 | | | | 90,748 | |
| | |
Clark County School District, Limited Tax | | | | | | | | |
| | |
Series A, GO, 5.00%, 6/15/2032 | | | 95,000 | | | | 116,635 | |
| | |
Series A, GO, 4.00%, 6/15/2035 | | | 90,000 | | | | 103,019 | |
| | |
County of Clark, Indexed Fuel Tax and Subordinate Motor Vehicle Fuel Tax Rev., 5.00%, 7/1/2028 | | | 25,000 | | | | 31,198 | |
| | |
County of Clark, Passenger Facility Charge, Las Vegas-McCarran International Airport Passenger Facility Series 2019E, Rev., 5.00%, 7/1/2033 | | | 155,000 | | | | 194,993 | |
| | |
Truckee Meadows Water Authority Rev., 5.00%, 7/1/2029 | | | 50,000 | | | | 61,802 | |
| | | | | | | | |
| | |
Total Nevada | | | | | | | 598,395 | |
| | | | | | | | |
| | |
New Hampshire — 0.4% | | | | | | | | |
| | |
New Hampshire Business Finance Authority, Springpoint Senior Living Project Rev., 4.00%, 1/1/2025 | | | 290,000 | | | | 322,613 | |
| | | | | | | | |
| | |
New Jersey — 3.6% | | | | | | | | |
| | |
City of New Brunswick GO, 4.00%, 3/15/2024 | | | 10,000 | | | | 11,076 | |
| | |
City of North Wildwood GO, 5.00%, 8/1/2022 | | | 10,000 | | | | 10,661 | |
| | |
New Jersey Economic Development Authority, Biomedical Research Facilities Series 2016A, Rev., 5.00%, 7/15/2028 | | | 260,000 | | | | 305,269 | |
| | |
New Jersey Economic Development Authority, School Facilities Construction Series II, Rev., 5.00%, 3/1/2022 (d) | | | 115,000 | | | | 120,567 | |
| | |
New Jersey Transportation Trust Fund Authority Series 2020AA, Rev., 4.00%, 6/15/2035 | | | 130,000 | | | | 146,940 | |
| | |
New Jersey Transportation Trust Fund Authority, Transportation System Series A, Rev., 4.00%, 12/15/2031 | | | 250,000 | | | | 282,200 | |
| | |
New Jersey Turnpike Authority Series D, Rev., 5.00%, 1/1/2028 | | | 200,000 | | | | 241,354 | |
| | |
Passaic County Improvement Authority (The), City of Paterson Project Rev., 5.00%, 6/15/2025 | | | 10,000 | | | | 11,843 | |
| | |
State of New Jersey, COVID-19 Emergency Bonds GO, 5.00%, 6/1/2028 | | | 1,000,000 | | | | 1,246,900 | |
| | |
Tobacco Settlement Financing Corp. Series 2018A, Rev., 5.00%, 6/1/2027 | | | 265,000 | | | | 326,655 | |
| | | | | | | | |
| | |
Total New Jersey | | | | | | | 2,703,465 | |
| | | | | | | | |
| | | | | | | | |
| INVESTMENTS | | PRINCIPAL
AMOUNT ($) | | | VALUE ($) | |
| | | | | | | | |
| | |
New Mexico — 1.1% | | | | | | | | |
| | |
City of Albuquerque, General Purpose Series 2016A, GO, 5.00%, 7/1/2023 | | | 75,000 | | | | 83,179 | |
| | |
City of Albuquerque, Gross Receipts Tax Series 2015A, Rev., 5.00%, 7/1/2026 | | | 240,000 | | | | 284,640 | |
| | |
New Mexico Finance Authority, Senior Lien Public Project Revolving Fund | | | | | | | | |
| | |
Series 2016C, Rev., 5.00%, 6/1/2022 | | | 30,000 | | | | 31,804 | |
| | |
Series 2016E, Rev., 5.00%, 6/1/2024 | | | 25,000 | | | | 28,656 | |
| | |
New Mexico Finance Authority, State Transportation, Subordinate Lien Series 2108A, Rev., 5.00%, 6/15/2027 | | | 100,000 | | | | 125,229 | |
| | |
New Mexico Hospital Equipment Loan Council, Presbyterian Healthcare Services Series 2015A, Rev., 5.00%, 8/1/2025 | | | 25,000 | | | | 29,561 | |
| | |
State of New Mexico, Severance Tax Permanent Fund Series 2016B, Rev., 4.00%, 7/1/2021 | | | 80,000 | | | | 81,020 | |
| | |
University of New Mexico, Subordinate Lien Rev., 5.00%, 6/1/2028 | | | 140,000 | | | | 172,450 | |
| | | | | | | | |
| | |
Total New Mexico | | | | | | | 836,539 | |
| | | | | | | | |
| | |
New York — 9.6% | | | | | | | | |
| | |
City of New York, Fiscal Year 2013 | | | | | | | | |
| | |
Series 2013J, GO, 5.00%, 8/1/2023 | | | 40,000 | | | | 44,477 | |
| | |
Series I, GO, 5.00%, 8/1/2023 | | | 25,000 | | | | 27,798 | |
| | |
City of New York, Fiscal Year 2014 Series 2014E, GO, 5.00%, 8/1/2027 | | | 35,000 | | | | 38,828 | |
| | |
City of New York, Fiscal Year 2017 Series C, GO, 4.00%, 8/1/2022 | | | 10,000 | | | | 10,535 | |
| | |
County of Onondaga GO, 5.00%, 3/15/2026 | | | 20,000 | | | | 22,884 | |
| | |
County of Suffolk, Longwood Central School District GO, 5.00%, 6/15/2025 | | | 175,000 | | | | 209,058 | |
| | |
Erie County Water Authority Rev., 5.00%, 12/1/2027 | | | 30,000 | | | | 37,166 | |
| | |
Metropolitan Transportation Authority | | | | | | | | |
| | |
Series 2018B, Subseries 2018B-2B, Rev., BAN, 5.00%, 5/15/2021 | | | 250,000 | | | | 252,182 | |
| | |
Series 2018C, Subseries 2018C-2, Rev., BAN, 5.00%, 9/1/2021 | | | 350,000 | | | | 357,494 | |
| | |
Metropolitan Transportation Authority, Dedicated Tax Fund Series 2016A, Rev., 5.00%, 11/15/2023 | | | 315,000 | | | | 353,140 | |
| | |
Monroe County Industrial Development Corp., Highland Hospital of Rochester Project | | | | | | | | |
| | |
Rev., 5.00%, 7/1/2021 | | | 185,000 | | | | 187,814 | |
| | |
Rev., 5.00%, 7/1/2022 | | | 195,000 | | | | 206,864 | |
| | |
Monroe County Industrial Development Corp., Rochester Schools Modernization Project Rev., 5.00%, 5/1/2030 | | | 80,000 | | | | 92,906 | |
SEE NOTES TO FINANCIAL STATEMENTS.
| | | | | | |
| | | |
| 112 | | | | J.P. MORGAN EXCHANGE-TRADED FUNDS | | FEBRUARY 28, 2021 |
| | | | | | | | |
| INVESTMENTS | | PRINCIPAL
AMOUNT ($) | | | VALUE ($) | |
Municipal Bonds — continued | |
|
New York — continued | |
| | |
New York City Transitional Finance Authority, Building Aid, Fiscal Year 2019 Series S-2A, Rev., 5.00%, 7/15/2025 | | | 50,000 | | | | 59,478 | |
| | |
New York City Transitional Finance Authority, Future Tax Secured, Fiscal Year 2015 | | | | | | | | |
| | |
Series C, Rev., 5.00%, 11/1/2022 | | | 25,000 | | | | 26,984 | |
| | |
Series 2015A-1, Rev., 5.00%, 8/1/2029 | | | 50,000 | | | | 57,387 | |
| | |
New York City Transitional Finance Authority, Future Tax Secured, Fiscal Year 2017 Series 2017E1, Rev., 5.00%, 2/1/2030 | | | 150,000 | | | | 183,486 | |
| | |
New York City Transitional Finance Authority, Future Tax Secured, Fiscal Year 2018 Series 1, Rev., 5.00%, 11/1/2026 | | | 25,000 | | | | 30,871 | |
| | |
New York City Transitional Finance Authority, Future Tax Secured, Fiscal Year 2019 Series 2019C-1, Rev., 5.00%, 11/1/2034 | | | 110,000 | | | | 138,797 | |
| | |
New York City Transitional Finance Authority, Future Tax Secured, Tax-Exempt, Fiscal Year 2013 | | | | | | | | |
| | |
Series 2013H, Rev., 5.00%, 11/1/2023 | | | 50,000 | | | | 55,097 | |
| | |
Series 2013G, Rev., 5.00%, 11/1/2026 | | | 30,000 | | | | 33,044 | |
| | |
New York City Transitional Finance Authority, Future Tax Secured, Tax-Exempt, Fiscal Year 2014 Series D, Subseries D-1, Rev., 5.00%, 2/1/2026 | | | 30,000 | | | | 33,979 | |
| | |
New York City Transitional Finance Authority, Future Tax Secured, Tax-Exempt, Fiscal Year 2016 Subseries B-1, Rev., 5.00%, 11/1/2029 | | | 125,000 | | | | 148,470 | |
| | |
New York City Transitional Finance Authority, Future Tax Secured, Tax-Exempt, Fiscal Year 2017 | | | | | | | | |
| | |
Series C, Rev., 4.00%, 11/1/2024 | | | 45,000 | | | | 50,725 | |
| | |
Subseries A-1, Rev., 5.00%, 5/1/2029 | | | 65,000 | | | | 78,433 | |
| | |
Series B, Subseries B-1, Rev., 5.00%, 8/1/2030 | | | 195,000 | | | | 236,051 | |
| | |
New York State Dormitory Authority, Columbia University Series B, Rev., 5.00%, 10/1/2038 | | | 25,000 | | | | 31,016 | |
| | |
New York State Dormitory Authority, Cornell University Series 2019D, Rev., 5.00%, 7/1/2033 | | | 135,000 | | | | 189,131 | |
| | |
New York State Dormitory Authority, Maimonides Medical Center, FHA-Insured Mortgage Hospital Rev., FHA, 5.00%, 8/1/2024 | | | 275,000 | | | | 318,464 | |
| | |
New York State Dormitory Authority, Montefiore Obligated Group Series 2020A, Rev., 4.00%, 9/1/2050 | | | 100,000 | | | | 110,954 | |
| | | | | | | | |
| INVESTMENTS | | PRINCIPAL
AMOUNT ($) | | | VALUE ($) | |
| | | | | | | | |
|
New York — continued | |
| | |
New York State Dormitory Authority, State Personal Income Tax, General Purpose | | | | | | | | |
| | |
Series 2015E, Rev., 5.00%, 3/15/2022 | | | 25,000 | | | | 26,255 | |
| | |
Series 2015A, Rev., 4.00%, 3/15/2023 | | | 25,000 | | | | 26,887 | |
| | |
Series 2018A, Rev., 5.00%, 3/15/2031 | | | 25,000 | | | | 31,657 | |
| | |
New York State Dormitory Authority, State University Dormitory Facilities Series 2018A, Rev., 5.00%, 7/1/2024 | | | 300,000 | | | | 341,874 | |
| | |
New York State Environmental Facilities Corp., State Clean Water and Drinking Water Revolving Funds, Municipal Water Finance Authority Projects — Second Resolution Series 2019B, Rev., 5.00%, 6/15/2031 | | | 100,000 | | | | 131,086 | |
| | |
New York State Urban Development Corp., State Personal Income Tax, General Purpose | | | | | | | | |
| | |
Series 2016A, Rev., 5.00%, 3/15/2026 | | | 45,000 | | | | 54,620 | |
| | |
Series 2017A, Rev., 5.00%, 3/15/2026 | | | 125,000 | | | | 151,721 | |
| | |
Series 2020C, Rev., 5.00%, 3/15/2026 | | | 45,000 | | | | 54,620 | |
| | |
Series 2016A, Rev., 5.00%, 3/15/2027 | | | 30,000 | | | | 36,174 | |
| | |
Series 2013A-1, Rev., 5.00%, 3/15/2028 | | | 25,000 | | | | 27,325 | |
| | |
Series 2016A, Rev., 5.00%, 3/15/2028 | | | 75,000 | | | | 90,187 | |
| | |
Series 2017-A, Rev., 5.00%, 3/15/2028 | | | 150,000 | | | | 185,955 | |
| | |
Series 2020C, Rev., 5.00%, 3/15/2029 | | | 1,275,000 | | | | 1,645,872 | |
| | |
New York Transportation Development Corp., Delta Air Lines, Inc., LaGuardia Airport Terminals C&D Redevelopment Project Rev., AMT, 5.00%, 1/1/2022 | | | 200,000 | | | | 206,428 | |
| | |
Orange County Funding Corp., Mount Saint Mary College Project Series 2012B, Rev., 4.00%, 7/1/2023 | | | 200,000 | | | | 205,356 | |
| | |
Port Authority of New York and New Jersey, Consolidated Series 205, Rev., 5.00%, 11/15/2028 | | | 30,000 | | | | 37,741 | |
| | |
Smithtown Central School District GO, 5.00%, 8/1/2022 | | | 70,000 | | | | 74,793 | |
| | |
Suffolk County Economic Development Corp., St. Johnland Assisted Living Inc., Project Rev., 5.13%, 11/1/2041 (c) | | | 340,000 | | | | 338,902 | |
| | | | | | | | |
| | |
Total New York | | | | | | | 7,290,966 | |
| | | | | | | | |
| | |
North Carolina — 3.4% | | | | | | | | |
| | |
County of Davidson GO, 5.00%, 6/1/2027 | | | 35,000 | | | | 43,912 | |
| | |
County of Onslow Rev., 5.00%, 12/1/2027 | | | 25,000 | | | | 29,410 | |
| | |
County of Wayne Rev., 5.00%, 6/1/2024 | | | 25,000 | | | | 28,665 | |
| | |
North Carolina Medical Care Commission, Caromont Health Series 2021B, Rev., 5.00%, 2/1/2026 (b) | | | 300,000 | | | | 362,256 | |
SEE NOTES TO FINANCIAL STATEMENTS.
| | | | | | | | |
| | | |
| FEBRUARY 28, 2021 | | J.P. MORGAN EXCHANGE-TRADED FUNDS | | | | | 113 | |
JPMorgan Municipal ETF
SCHEDULE OF PORTFOLIO INVESTMENTS
AS OF FEBRUARY 28, 2021 (continued)
| | | | | | | | |
| INVESTMENTS | | PRINCIPAL
AMOUNT ($) | | | VALUE ($) | |
Municipal Bonds — continued | |
| | |
North Carolina — continued | | | | | | | | |
| | |
North Carolina Turnpike Authority, Triangle Expressway System Rev., BAN, 5.00%, 2/1/2024 | | | 400,000 | | | | 451,436 | |
| | |
State of North Carolina, Build NC Programs, Limited Obligation | | | | | | | | |
| | |
Series C, Rev., 5.00%, 5/1/2024 | | | 25,000 | | | | 28,623 | |
| | |
Series 2020B, Rev., 5.00%, 5/1/2031 | | | 1,250,000 | | | | 1,655,850 | |
| | | | | | | | |
| | |
Total North Carolina | | | | | | | 2,600,152 | |
| | | | | | | | |
| | |
North Dakota — 0.0% (e) | | | | | | | | |
| | |
North Dakota Public Finance Authority, State Revolving Fund Program Series 2011A, Rev., 5.00%, 10/1/2021 | | | 25,000 | | | | 25,702 | |
| | | | | | | | |
| | |
Ohio — 4.5% | | | | | | | | |
| | |
American Municipal Power, Inc., Greenup Hydro-Electric Project Series 2016A, Rev., 5.00%, 2/15/2030 | | | 25,000 | | | | 29,779 | |
| | |
Bowling Green State University, General Receipts Series 2016A, Rev., 5.00%, 6/1/2024 | | | 25,000 | | | | 28,395 | |
| | |
Buckeye Tobacco Settlement Financing Authority Series 2020A-2, Class I, Rev., 4.00%, 6/1/2048 | | | 250,000 | | | | 279,250 | |
| | |
City of Middleburg Heights, General Health Center Project | | | | | | | | |
| | |
Series 2020A, Rev., 4.00%, 8/1/2021 | | | 125,000 | | | | 126,864 | |
| | |
Series 2020A, Rev., 4.00%, 8/1/2022 | | | 150,000 | | | | 157,584 | |
| | |
City of Reynoldsburg, Limited Tax GO, 5.00%, 12/1/2026 | | | 15,000 | | | | 18,535 | |
| | |
County of Hamilton, Sewer System, The Metropolitan Sewer District of Greater Cincinnati Series 2020A, Rev., 5.00%, 12/1/2032 | | | 750,000 | | | | 995,588 | |
| | |
County of Warren, Healthcare Facilities, Otterbein Homes Obligated Group Series A, Rev., 4.00%, 7/1/2033 | | | 205,000 | | | | 233,458 | |
| | |
Ohio Higher Educational Facility Commission, Denison University Project Series A, Rev., 5.00%, 11/1/2025 | | | 75,000 | | | | 89,309 | |
| | |
Ohio Higher Educational Facility Commission, Tiffin University 2019 Project Rev., 5.00%, 11/1/2034 | | | 125,000 | | | | 144,041 | |
| | |
Ohio Higher Educational Facility Commission, University of Findlay 2019 Project | | | | | | | | |
| | |
Rev., 5.00%, 3/1/2027 | | | 55,000 | | | | 63,043 | |
| | |
Rev., 5.00%, 3/1/2034 | | | 160,000 | | | | 182,848 | |
| | |
Ohio Higher Educational Facility Commission, Xavier University 2020 Project | | | | | | | | |
| | |
Rev., 5.00%, 5/1/2023 | | | 195,000 | | | | 213,186 | |
| | |
Rev., 5.00%, 5/1/2024 | | | 245,000 | | | | 277,190 | |
| | | | | | | | |
| INVESTMENTS | | PRINCIPAL
AMOUNT ($) | | | VALUE ($) | |
| | | | | | | | |
| | |
Ohio — continued | | | | | | | | |
| | |
Ohio Turnpike and Infrastructure Commission, Junior Lien Series A, Rev., 5.00%, 2/15/2027 | | | 135,000 | | | | 167,701 | |
| | |
Ohio Water Development Authority, Drinking Water Assistance Rev., 5.25%, 12/1/2021 | | | 20,000 | | | | 20,510 | |
| | |
Ohio Water Development Authority, Fresh Water Series 2016B, Rev., 5.00%, 6/1/2026 | | | 30,000 | | | | 36,798 | |
| | |
Ohio Water Development Authority, Water Pollution Control Loan Fund Series A, Rev., 5.00%, 12/1/2026 | | | 45,000 | | | | 56,035 | |
| | |
South-Western City School District, School Facilities Construction and Improvement GO, 5.00%,
6/1/2022 (d) | | | 160,000 | | | | 169,686 | |
| | |
State of Ohio, Capital Facilities Lease Appropriation Mental Health Facilities Improvement Fund Projects Series 2018A, Rev., 5.00%, 6/1/2025 | | | 25,000 | | | | 29,629 | |
| | |
State of Ohio, Cleveland Clinic Health System Obligated Group Series 2017A, Rev., 5.00%, 1/1/2028 | | | 25,000 | | | | 31,809 | |
| | |
State of Ohio, Highway Capital Improvements Full Faith and Credit/Highway User Receipts Series R, GO, 5.00%, 5/1/2021 | | | 20,000 | | | | 20,161 | |
| | |
State of Ohio, Infrastructure Improvement Series A, GO, 5.00%, 9/1/2028 | | | 25,000 | | | | 32,260 | |
| | |
State of Ohio, Natural Resources Series V, GO, 5.00%, 10/1/2027 | | | 35,000 | | | | 44,257 | |
| | | | | | | | |
| | |
Total Ohio | | | | | | | 3,447,916 | |
| | | | | | | | |
| | |
Oklahoma — 0.6% | | | | | | | | |
| | |
Cleveland County Educational Facilities Authority, Norman Public Schools Project Rev., 5.00%, 6/1/2025 | | | 150,000 | | | | 174,343 | |
| | |
Edmond Public Works Authority, Sales Tax and Utility System Rev., 4.00%, 7/1/2021 | | | 10,000 | | | | 10,126 | |
| | |
Oklahoma Capitol Improvement Authority, Capitol Repair Project | | | | | | | | |
| | |
Series C, Rev., 5.00%, 1/1/2030 | | | 10,000 | | | | 12,248 | |
| | |
Series 2018C, Rev., 5.00%, 1/1/2036 | | | 45,000 | | | | 54,344 | |
| | |
Oklahoma Capitol Improvement Authority, State Highway, Capital Improvement | | | | | | | | |
| | |
Rev., 5.00%, 10/1/2021 | | | 50,000 | | | | 51,383 | |
| | |
Rev., 5.00%, 7/1/2024 | | | 100,000 | | | | 114,706 | |
| | |
Oklahoma Water Resources Board, Clean Water Program Rev., 5.00%, 4/1/2023 | | | 35,000 | | | | 38,461 | |
| | | | | | | | |
| | |
Total Oklahoma | | | | | | | 455,611 | |
| | | | | | | | |
SEE NOTES TO FINANCIAL STATEMENTS.
| | | | | | |
| | | |
| 114 | | | | J.P. MORGAN EXCHANGE-TRADED FUNDS | | FEBRUARY 28, 2021 |
| | | | | | | | |
| INVESTMENTS | | PRINCIPAL
AMOUNT ($) | | | VALUE ($) | |
Municipal Bonds — continued | |
| | |
Oregon — 0.1% | | | | | | | | |
| | |
Hillsboro School District No. 1J GO, 5.00%, 6/15/2028 | | | 25,000 | | | | 31,199 | |
| | |
Tri-County Metropolitan Transportation District of Oregon Series A, Rev., 5.00%, 9/1/2030 | | | 45,000 | | | | 55,991 | |
| | | | | | | | |
| | |
Total Oregon | | | | | | | 87,190 | |
| | | | | | | | |
| | |
Pennsylvania — 6.3% | | | | | | | | |
| | |
Aliquippa School District, Limited Tax GO, 3.88%, 12/1/2037 | | | 200,000 | | | | 221,998 | |
| | |
Berks County Industrial Development Authority, The Highlands at Wyomissing Series 2017A, Rev., 5.00%, 5/15/2037 | | | 250,000 | | | | 282,475 | |
| | |
Bucks County Community College Authority Series 2019A, Rev., GTD, 5.00%, 6/15/2033 | | | 35,000 | | | | 43,734 | |
| | |
Chester County Industrial Development Authority, Longwood Gardens Project Rev., 4.00%, 12/1/2024 | | | 35,000 | | | | 39,566 | |
| | |
Commonwealth Financing Authority, Tobacco Master Settlement Payment Rev., 5.00%, 6/1/2035 | | | 225,000 | | | | 273,625 | |
| | |
County of Chester GO, 5.00%, 11/15/2027 | | | 30,000 | | | | 38,308 | |
| | |
County of Lehigh, Lehigh Valley Health Network Hospital Series A, Rev., 4.00%, 7/1/2035 | | | 175,000 | | | | 194,303 | |
| | |
Delaware Valley Regional Finance Authority Series 2021A, Rev., 2.00%, 10/1/2029 | | | 300,000 | | | | 310,599 | |
| | |
Erie City Water Authority Series 2019D, Rev., 5.00%, 12/1/2027 | | | 65,000 | | | | 81,293 | |
| | |
Geisinger Authority, Health System | | | | | | | | |
| | |
Series 2020B, Rev., 5.00%, 2/15/2027 (b) | | | 250,000 | | | | 305,452 | |
| | |
Series 2020A, Rev., 4.00%, 4/1/2039 | | | 335,000 | | | | 386,617 | |
| | |
Lancaster County Hospital Authority, St. Anne’s Retirement Community, Inc., Project Rev., 5.00%, 3/1/2040 | | | 250,000 | | | | 270,505 | |
| | |
Montgomery County Higher Education and Health Authority, Arcadia University | | | | | | | | |
| | |
Rev., 5.00%, 4/1/2034 | | | 250,000 | | | | 300,938 | |
| | |
Rev., 4.00%, 4/1/2035 | | | 205,000 | | | | 227,552 | |
| | |
Montgomery County Higher Education and Health Authority, Thomas Jefferson University Series 2018A, Rev., 4.00%, 9/1/2038 | | | 135,000 | | | | 151,583 | |
| | |
Northampton County General Purpose Authority, Moravian College Project Rev., 5.00%, 10/1/2027 | | | 185,000 | | | | 212,689 | |
| | | | | | | | |
| INVESTMENTS | | PRINCIPAL
AMOUNT ($) | | | VALUE ($) | |
| | | | | | | | |
| | |
Pennsylvania — continued | | | | | | | | |
| | |
Pennsylvania Higher Educational Facilities Authority, State System of Higher Education Series 2017AU-1, Rev., 5.00%, 6/15/2026 | | | 70,000 | | | | 84,900 | |
| | |
Pennsylvania Turnpike Commission | | | | | | | | |
| | |
Series A-1, Rev., 5.00%, 12/1/2029 | | | 105,000 | | | | 132,180 | |
| | |
Series A-1, Rev., 5.00%, 12/1/2031 | | | 60,000 | | | | 74,857 | |
| | |
Series 2020B, Rev., 5.00%, 12/1/2033 | | | 280,000 | | | | 367,276 | |
| | |
Seneca Valley School District Series 2015C, GO, 5.00%, 3/1/2028 | | | 30,000 | | | | 35,122 | |
| | |
State Public School Building Authority, Delaware County Community College Project Rev., 5.00%, 10/1/2027 | | | 25,000 | | | | 30,252 | |
| | |
Township of Palmer | | | | | | | | |
| | |
Series 2020C, GO, 4.00%, 11/15/2031 | | | 300,000 | | | | 355,992 | |
| | |
Series 2020C, GO, 4.00%, 11/15/2032 | | | 275,000 | | | | 324,387 | |
| | |
Township of Upper St. Clair Series A, GO, 4.00%, 6/1/2025 | | | 20,000 | | | | 22,829 | |
| | | | | | | | |
| | |
Total Pennsylvania | | | | | | | 4,769,032 | |
| | | | | | | | |
| | |
Rhode Island — 0.1% | | | | | | | | |
| | |
State of Rhode Island and Providence Plantations Consolidated Capital Development Loan Series 2018A, GO, 5.00%, 4/1/2029 | | | 75,000 | | | | 95,082 | |
| | | | | | | | |
| | |
South Carolina — 0.6% | | | | | | | | |
| | |
Charleston County Airport District Rev., 5.00%, 7/1/2035 | | | 250,000 | | | | 306,228 | |
| | |
South Carolina Jobs-Economic Development Authority, Episcopal Home At Still Hopes Series 2018A, Rev., 5.00%, 4/1/2033 | | | 125,000 | | | | 135,296 | |
| | |
South Carolina Jobs-Economic Development Authority, Wofford College Project Rev., 5.00%, 4/1/2029 | | | 10,000 | | | | 12,359 | |
| | | | | | | | |
| | |
Total South Carolina | | | | | | | 453,883 | |
| | | | | | | | |
| | |
South Dakota — 0.1% | | | | | | | | |
| | |
City of Rapid City, Sales Tax Rev., 5.00%, 12/1/2023 | | | 25,000 | | | | 28,141 | |
| | |
South Dakota Board of Regents, Housing and Auxiliary Facility System Rev., 5.00%, 4/1/2027 | | | 35,000 | | | | 42,456 | |
| | |
South Dakota Conservancy District, State Revolving Fund Program Rev., 5.00%, 8/1/2025 | | | 35,000 | | | | 41,755 | |
| | | | | | | | |
| | |
Total South Dakota | | | | | | | 112,352 | |
| | | | | | | | |
| | |
Tennessee — 2.1% | | | | | | | | |
| | |
City of Johnson City Series 2016A, GO, 5.00%, 6/1/2023 | | | 15,000 | | | | 16,592 | |
SEE NOTES TO FINANCIAL STATEMENTS.
| | | | | | | | |
| | | |
| FEBRUARY 28, 2021 | | J.P. MORGAN EXCHANGE-TRADED FUNDS | | | | | 115 | |
JPMorgan Municipal ETF
SCHEDULE OF PORTFOLIO INVESTMENTS
AS OF FEBRUARY 28, 2021 (continued)
| | | | | | | | |
| INVESTMENTS | | PRINCIPAL
AMOUNT ($) | | | VALUE ($) | |
Municipal Bonds — continued | |
| | |
Tennessee — continued | | | | | | | | |
| | |
City of Memphis, Sanitary Sewerage System Series 2020B, Rev., 5.00%, 10/1/2033 | | | 685,000 | | | | 902,241 | |
| | |
City of Murfreesboro GO, 4.00%, 4/1/2025 | | | 25,000 | | | | 27,701 | |
| | |
County of Maury, School Building GO, 5.00%, 4/1/2027 | | | 40,000 | | | | 49,983 | |
| | |
County of Montgomery, Public Improvement GO, 5.00%, 4/1/2027 | | | 25,000 | | | | 31,155 | |
| | |
County of Robertson GO, 5.00%, 6/1/2025 | | | 25,000 | | | | 29,560 | |
| | |
County of Sullivan, School GO, 5.00%, 5/1/2026 | | | 30,000 | | | | 36,572 | |
| | |
County of Washington Series 2016A, GO, 4.00%, 6/1/2027 | | | 50,000 | | | | 58,313 | |
| | |
County of Williamson GO, 5.00%, 4/1/2024 | | | 20,000 | | | | 22,836 | |
| | |
County of Wilson GO, 4.00%, 4/1/2021 | | | 20,000 | | | | 20,062 | |
| | |
Metropolitan Government of Nashville and Davidson County | | | | | | | | |
| | |
GO, 5.00%, 7/1/2022 (d) | | | 20,000 | | | | 21,278 | |
| | |
Series 2014A, Rev., 5.00%, 5/15/2024 | | | 10,000 | | | | 11,469 | |
| | |
Series 2015A, GO, 5.00%, 7/1/2025 | | | 10,000 | | | | 11,907 | |
| | |
Shelby County Health Educational and Housing Facilities Board, The Farms at Bailey Station Project | | | | | | | | |
| | |
Series 2019A, Rev., 5.00%, 10/1/2029 | | | 150,000 | | | | 152,394 | |
| | |
Series 2019A, Rev., 5.50%, 10/1/2034 | | | 150,000 | | | | 154,121 | |
| | |
State of Tennessee Series A, GO, 5.00%, 9/1/2025 | | | 25,000 | | | | 28,990 | |
| | |
Tennessee Energy Acquisition Corp., Gas Project Series 2017A, Rev., 4.00%, 5/1/2023 (b) | | | 20,000 | | | | 21,351 | |
| | | | | | | | |
| | |
Total Tennessee | | | | | | | 1,596,525 | |
| | | | | | | | |
| | |
Texas — 7.0% | | | | | | | | |
| | |
Alamo Community College District, Limited Tax GO, 5.00%, 2/15/2024 | | | 75,000 | | | | 85,163 | |
| | |
Arlington Higher Education Finance Corp., Uplift Education | | | | | | | | |
| | |
Series 2020A, Rev., PSF-GTD, 4.00%, 12/1/2023 | | | 200,000 | | | | 218,976 | |
| | |
Series 2020A, Rev., PSF-GTD, 4.00%, 12/1/2024 | | | 325,000 | | | | 365,332 | |
| | |
Board of Regents of the University of Texas System, Financing System | | | | | | | | |
| | |
Series 2016D, Rev., 5.00%, 8/15/2024 | | | 50,000 | | | | 57,795 | |
| | |
Series 2020A, Rev., 5.00%, 8/15/2030 | | | 250,000 | | | | 334,598 | |
| | |
Brushy Creek Regional Utility Authority, Inc., Brushy Creek Regional Water Treatment and Distribution Project Rev., 5.00%, 8/1/2026 | | | 85,000 | | | | 103,445 | |
| | | | | | | | |
| INVESTMENTS | | PRINCIPAL
AMOUNT ($) | | | VALUE ($) | |
| | | | | | | | |
| | |
Texas — continued | | | | | | | | |
| | |
City of Austin, Airport System Series 2019B, Rev., AMT, 5.00%, 11/15/2029 | | | 240,000 | | | | 306,833 | |
| | |
City of Austin, Public Improvement Series 2012A, GO, 4.00%, 9/1/2026 | | | 25,000 | | | | 26,359 | |
| | |
City of Corpus Christi, Certificates of Obligation Series 2016A, GO, 4.00%, 3/1/2026 | | | 200,000 | | | | 233,048 | |
| | |
City of Houston, Combined Utility System, First Lien Series 2018D, Rev., 5.00%, 11/15/2030 | | | 45,000 | | | | 57,892 | |
| | |
City of Hutto, Waterworks and Sewer System GO, 5.00%, 8/1/2026 | | | 80,000 | | | | 97,502 | |
| | |
City of League City, Combination Tax, Certificates of Obligation GO, 5.00%, 2/15/2027 | | | 20,000 | | | | 24,123 | |
| | |
City of Pflugerville, Limited Tax GO, 5.00%, 8/1/2026 | | | 25,000 | | | | 30,722 | |
| | |
City of San Angelo GO, 5.00%, 2/15/2027 | | | 20,000 | | | | 24,753 | |
| | |
City of San Antonio, General Improvement GO, 5.00%, 2/1/2022 (d) | | | 75,000 | | | | 78,335 | |
| | |
City of San Marcos, Combination Tax GO, 5.00%, 8/15/2031 | | | 170,000 | | | | 208,559 | |
| | |
Clifton Higher Education Finance Corp., Yes Prep Public Schools, Inc. | | | | | | | | |
| | |
Rev., PSF-GTD, 5.00%, 4/1/2029 | | | 100,000 | | | | 127,906 | |
| | |
Rev., PSF-GTD, 5.00%, 4/1/2030 | | | 185,000 | | | | 240,557 | |
| | |
Rev., PSF-GTD, 4.00%, 4/1/2031 | | | 175,000 | | | | 209,960 | |
| | |
Clint Independent School District, Unlimited Tax Series A, GO, PSF-GTD, 5.00%, 2/15/2024 | | | 25,000 | | | | 28,332 | |
| | |
County of Fort Bend, Unlimited Tax Series 2016B, GO, 5.00%, 3/1/2022 | | | 35,000 | | | | 36,687 | |
| | |
County of Harris, Unlimited Tax Series 2017A, GO, 5.00%, 10/1/2026 | | | 25,000 | | | | 30,895 | |
| | |
County of Hays, Limited Tax GO, 5.00%, 2/15/2026 | | | 20,000 | | | | 24,113 | |
| | |
County of Montgomery, Unlimited Tax GO, 5.00%, 3/1/2025 | | | 25,000 | | | | 29,246 | |
| | |
County of Williamson, Limited Tax GO, 5.00%, 2/15/2026 | | | 40,000 | | | | 48,508 | |
| | |
Cypress-Fairbanks Independent School District, Unlimited Tax Series 2015A, GO, PSF-GTD, 5.00%, 2/15/2025 | | | 20,000 | | | | 23,527 | |
| | |
Dallas Fort Worth International Airport Rev., 5.00%, 11/1/2022 | | | 100,000 | | | | 107,864 | |
| | |
Laredo Independent School District, Unlimited Tax GO, PSF-GTD, 5.00%, 8/1/2024 | | | 25,000 | | | | 28,859 | |
SEE NOTES TO FINANCIAL STATEMENTS.
| | | | | | |
| | | |
| 116 | | | | J.P. MORGAN EXCHANGE-TRADED FUNDS | | FEBRUARY 28, 2021 |
| | | | | | | | |
| INVESTMENTS | | PRINCIPAL
AMOUNT ($) | | | VALUE ($) | |
Municipal Bonds — continued | |
|
Texas — continued | |
| | |
Lower Colorado River Authority, LCRA Transmission Services Corp. Project Rev., 5.00%, 5/15/2035 | | | 155,000 | | | | 192,110 | |
| | |
Metropolitan Transit Authority of Harris County, Sales and Use Tax | | | | | | | | |
| | |
Series 2017A, Rev., 5.00%, 11/1/2025 | | | 45,000 | | | | 53,974 | |
| | |
Series B, Rev., 5.00%, 11/1/2029 | | | 25,000 | | | | 31,086 | |
| | |
North East Independent School District, Unlimited Tax GO, PSF-GTD, 5.00%, 8/1/2025 | | | 20,000 | | | | 23,860 | |
| | |
North Texas Municipal Water District, Wastewater System Rev., 5.00%, 6/1/2027 | | | 20,000 | | | | 25,120 | |
| | |
Northside Independent School District, Unlimited Tax GO, PSF-GTD, 5.00%, 8/15/2024 | | | 65,000 | | | | 75,183 | |
| | |
Old Spanish Trail-Alemda Corridors Redevelopment Authority Rev., 5.00%, 9/1/2028 | | | 125,000 | | | | 155,974 | |
| | |
Pearland Independent School District, Unlimited Tax Series A, GO, PSF-GTD, 5.00%, 2/15/2023 | | | 25,000 | | | | 27,291 | |
| | |
Permanent University Fund — University of Texas System Series A, Rev., 5.00%, 7/1/2024 | | | 85,000 | | | | 97,897 | |
| | |
Prosper Independent School District, Unlimited Tax School Building GO, PSF-GTD, 5.00%, 2/15/2037 | | | 25,000 | | | | 30,811 | |
| | |
San Antonio Water System, Junior Lien Series A, Rev., 5.00%, 5/15/2025 | | | 25,000 | | | | 29,529 | |
| | |
Sheldon Independent School District, Unlimited Tax Series 2016A, GO, PSF-GTD, 5.00%, 2/15/2027 | | | 100,000 | | | | 120,024 | |
| | |
Sherman Independent School District, Unlimited Tax Series A, GO, PSF-GTD, 5.00%, 2/15/2030 | | | 25,000 | | | | 31,458 | |
| | |
Socorro Independent School District, Unlimited Tax Series 2017A, GO, PSF-GTD, 5.00%, 8/15/2028 | | | 50,000 | | | | 62,791 | |
| | |
State of Texas, Transportation Commission Mobility Fund Series 2015-A, GO, 5.00%, 10/1/2024 | | | 50,000 | | | | 58,147 | |
| | |
Stephen F Austin State University, Financing System Series 2019A, Rev., 5.00%, 10/15/2026 | | | 60,000 | | | | 72,786 | |
| | |
Tarrant Regional, Water Control and Improvement District, Water System Rev., 5.00%, 3/1/2025 | | | 25,000 | | | | 29,529 | |
| | |
Texas A&M University, Financing System Series E, Rev., 5.00%, 5/15/2030 | | | 155,000 | | | | 191,405 | |
| | | | | | | | |
| INVESTMENTS | | PRINCIPAL
AMOUNT ($) | | | VALUE ($) | |
| | | | | | | | |
|
Texas — continued | |
| | |
Texas Tech University System Series A, Rev., 5.00%, 2/15/2024 | | | 35,000 | | | | 39,732 | |
| | |
Texas Water Development Board, Water Implementation Fund | | | | | | | | |
| | |
Rev., 5.00%, 8/1/2027 | | | 150,000 | | | | 189,583 | |
| | |
Series 2017A, Rev., 5.00%, 4/15/2028 | | | 40,000 | | | | 50,781 | |
| | |
Series 2018A, Rev., 5.00%, 10/15/2028 | | | 235,000 | | | | 301,136 | |
| | |
Trinity River Authority, Central Regional Wastewater System Rev., 5.00%, 8/1/2034 | | | 145,000 | | | | 177,194 | |
| | |
Trinity River Authority, Water Project Rev., 5.00%, 2/1/2026 | | | 60,000 | | | | 72,386 | |
| | | | | | | | |
| | |
Total Texas | | | | | | | 5,329,676 | |
| | | | | | | | |
| | |
Utah — 2.8% | | | | | | | | |
| | |
City of Park City, Sales Tax Rev., 5.00%, 6/15/2022 | | | 30,000 | | | | 31,845 | |
| | |
City of South Jordan, Sales Tax Rev., 5.00%, 8/15/2029 | | | 45,000 | | | | 59,162 | |
| | |
County of Summit, Sales Tax Rev., 5.00%, 12/15/2023 | | | 70,000 | | | | 79,223 | |
| | |
Jordan Valley Water Conservancy District Series 2019A, Rev., 5.00%, 10/1/2029 | | | 25,000 | | | | 30,572 | |
| | |
Snyderville Basin Special Recreation District GO, 4.00%, 12/15/2025 | | | 100,000 | | | | 116,047 | |
| | |
University of Utah (The) | | | | | | | | |
| | |
Series B, Rev., 5.00%, 8/1/2023 (d) | | | 25,000 | | | | 27,824 | |
| | |
Series 2020A, Rev., 5.00%, 8/1/2031 | | | 830,000 | | | | 1,105,751 | |
| | |
Utah Charter School Finance Authority, Summit Academy Incorporated Series A, Rev., 5.00%, 4/15/2030 | | | 110,000 | | | | 135,358 | |
| | |
Utah Charter School Finance Authority, The Freedom Academy Foundation, St. George Campus Project Series 2021A, Rev., 5.00%, 6/15/2041 (c) | | | 150,000 | | | | 163,596 | |
| | |
Utah Transit Authority, Subordinate Sales Tax Series A, Rev., BHAC-CR, MBIA, 5.00%, 6/15/2035 | | | 295,000 | | | | 403,536 | |
| | |
Washington County Water Conservancy District Series 2017A, Rev., 5.00%, 10/1/2021 | | | 10,000 | | | | 10,282 | |
| | | | | | | | |
| | |
Total Utah | | | | | | | 2,163,196 | |
| | | | | | | | |
| | |
Vermont — 0.0% (e) | | | | | | | | |
| | |
Vermont Municipal Bond Bank, Local Investment Bonds Series 2019-2, Rev., 5.00%, 12/1/2025 | | | 25,000 | | | | 30,219 | |
| | | | | | | | |
SEE NOTES TO FINANCIAL STATEMENTS.
| | | | | | | | |
| | | |
| FEBRUARY 28, 2021 | | J.P. MORGAN EXCHANGE-TRADED FUNDS | | | | | 117 | |
JPMorgan Municipal ETF
SCHEDULE OF PORTFOLIO INVESTMENTS
AS OF FEBRUARY 28, 2021 (continued)
| | | | | | | | |
| INVESTMENTS | | PRINCIPAL
AMOUNT ($) | | | VALUE ($) | |
Municipal Bonds — continued | |
| | |
Virginia — 1.4% | | | | | | | | |
| | |
City of Richmond, Public Improvement Series B, GO, 5.00%, 7/15/2027 | | | 175,000 | | | | 221,315 | |
| | |
Commonwealth of Virginia Series A, GO, 5.00%, 6/1/2030 | | | 25,000 | | | | 32,058 | |
| | |
County of Spotsylvania, Public Improvement GO, 5.00%, 7/15/2029 | | | 85,000 | | | | 109,226 | |
| | |
Hampton Roads Sanitation District, Wastewater Series 2014A, Rev., 5.00%, 7/1/2021 | | | 15,000 | | | | 15,241 | |
| | |
Roanoke Economic Development Authority, Carilion Clinic Obligated Group Series 2010D, Rev., 5.00%, 7/1/2030 (b) | | | 200,000 | | | | 259,786 | |
| | |
Virginia College Building Authority, Educational Facilities, 21st Century College and Equipment Programs Series 2017B, Rev., 5.00%, 2/1/2024 | | | 75,000 | | | | 85,065 | |
| | |
Virginia College Building Authority, Educational Facilities, Public Higher Education Financing Program Series 2014A, Rev., 5.00%, 9/1/2024 (d) | | | 100,000 | | | | 115,846 | |
| | |
Virginia Commonwealth Transportation Board, Capital Projects Rev., 5.00%, 5/15/2023 | | | 35,000 | | | | 38,628 | |
| | |
Virginia Public Building Authority, Public Facilities Series A, Rev., 5.00%, 8/1/2022 | | | 25,000 | | | | 26,712 | |
| | |
Virginia Public School Authority, School Financing 1997 Resolution Series 2018B, Rev., 5.00%, 8/1/2021 | | | 125,000 | | | | 127,486 | |
| | |
Virginia Resources Authority, Infrastructure Pooled Financing Program Series 2013-C, Rev., 5.00%, 11/1/2023 | | | 35,000 | | | | 39,373 | |
| | | | | | | | |
| | |
Total Virginia | | | | | | | 1,070,736 | |
| | | | | | | | |
| | |
Washington — 3.2% | | | | | | | | |
| | |
Benton County School District No. 17 Kennewick, Unlimited Tax GO, 5.00%, 12/1/2024 | | | 45,000 | | | | 52,521 | |
| | |
Central Puget Sound Regional Transit Authority, Sales and Use Tax Series 2015S-1, Rev., 5.00%, 11/1/2024 | | | 30,000 | | | | 34,964 | |
| | |
City of Bonney Lake, Water and Sewer System Rev., 4.00%, 12/1/2030 | | | 10,000 | | | | 11,359 | |
| | |
City of Richland, Waterworks Utility Rev., 4.00%, 11/1/2022 | | | 10,000 | | | | 10,636 | |
| | |
City of Seattle, Drainage and Wastewater System Improvement Rev., 4.00%, 4/1/2026 | | | 20,000 | | | | 23,381 | |
| | | | | | | | |
| INVESTMENTS | | PRINCIPAL
AMOUNT ($) | | | VALUE ($) | |
| | | | | | | | |
| | |
Washington — continued | | | | | | | | |
| | |
City of Seattle, Wastewater System Improvement Rev., 5.00%, 8/1/2024 | | | 35,000 | | | | 40,429 | |
| | |
City of University Place, Limited Tax GO, 5.00%, 12/1/2026 | | | 85,000 | | | | 103,182 | |
| | |
Clark County School District No. 101 La Center, Unlimited Tax GO, 5.00%, 12/1/2029 | | | 50,000 | | | | 63,228 | |
| | |
County of King, Limited Tax | | | | | | | | |
| | |
Series A, GO, 5.00%, 7/1/2025 | | | 50,000 | | | | 58,467 | |
| | |
Series B, GO, 5.00%, 12/1/2025 | | | 20,000 | | | | 22,571 | |
| | |
County of Snohomish, Limited Tax GO, 5.00%, 12/1/2025 | | | 10,000 | | | | 11,847 | |
| | |
Energy Northwest Series 2017A, Rev., 5.00%, 7/1/2028 | | | 55,000 | | | | 68,867 | |
| | |
Energy Northwest, Bonneville Power Administrator Series 2016-A, Rev., 5.00%, 7/1/2028 | | | 25,000 | | | | 30,460 | |
| | |
Franklin County School District No. 1 Pasco, Unlimited Tax GO, 5.00%, 12/1/2030 | | | 175,000 | | | | 218,463 | |
| | |
King County Public Hospital District No. 2, Evergreen Healthcare GO, 5.00%, 12/1/2031 | | | 105,000 | | | | 121,151 | |
| | |
King County School District No. 403 Renton, Unlimited Tax GO, 5.00%, 12/1/2022 | | | 100,000 | | | | 106,002 | |
| | |
King County School District No. 405 Bellevue, Unlimited Tax | | | | | | | | |
| | |
GO, 5.00%, 12/1/2021 | | | 30,000 | | | | 31,091 | |
| | |
GO, 5.00%, 12/1/2026 | | | 20,000 | | | | 24,815 | |
| | |
King County School District No. 411 Issaquah, Unlimited Tax GO, 5.00%, 12/1/2024 | | | 35,000 | | | | 40,907 | |
| | |
Mason County School District No. 309 Shelton, Unlimited Tax GO, 5.00%, 12/1/2029 | | | 45,000 | | | | 55,231 | |
| | |
Pend Oreille County, Public Utility District No. 1, Box Canyon Production System Rev., 5.00%, 1/1/2027 | | | 65,000 | | | | 74,652 | |
| | |
Pierce County, Puyallup School District No. 3, Unlimited Tax GO, 5.00%, 12/1/2031 | | | 305,000 | | | | 375,955 | |
| | |
Pierce County, White River School District No. 416, Unlimited Tax GO, 5.00%, 12/1/2025 | | | 50,000 | | | | 60,307 | |
| | |
Snohomish County School District No. 15 Edmonds, Unlimited Tax | | | | | | | | |
| | |
GO, 5.00%, 12/1/2025 | | | 25,000 | | | | 30,167 | |
| | |
GO, 5.00%, 12/1/2027 | | | 25,000 | | | | 29,984 | |
| | |
Snohomish County School District No. 4 Lake Stevens, Unlimited Tax GO, 5.00%, 12/1/2024 | | | 25,000 | | | | 29,128 | |
SEE NOTES TO FINANCIAL STATEMENTS.
| | | | | | |
| | | |
| 118 | | | | J.P. MORGAN EXCHANGE-TRADED FUNDS | | FEBRUARY 28, 2021 |
| | | | | | | | |
| INVESTMENTS | | PRINCIPAL
AMOUNT ($) | | | VALUE ($) | |
Municipal Bonds — continued | | | | | | | | |
| | |
Washington — continued | | | | | | | | |
| | |
Spokane County School District No. 354, Unlimited Tax GO, 5.00%, 12/1/2024 | | | 20,000 | | | | 23,359 | |
| | |
State of Washington, Motor Vehicle Fuel Tax Series 2016C, GO, 5.00%, 7/1/2026 | | | 100,000 | | | | 120,979 | |
| | |
State of Washington, State and Local Agency Real and Personal Property Series 2015-C, COP, 5.00%, 1/1/2029 | | | 55,000 | | | | 65,669 | |
| | |
State of Washington, Various Purpose Series 2015G, GO, 5.00%, 7/1/2026 | | | 125,000 | | | | 146,245 | |
| | |
Washington Health Care Facilities Authority, Providence St. Joseph Health Series 2018B, Rev., 5.00%, 10/1/2028 | | | 30,000 | | | | 38,377 | |
| | |
Washington Higher Education Facilities Authority, Seattle University Project | | | | | | | | |
| | |
Rev., 5.00%, 5/1/2022 | | | 200,000 | | | | 210,526 | |
| | |
Rev., 5.00%, 5/1/2023 | | | 125,000 | | | | 136,289 | |
| | | | | | | | |
| | |
Total Washington | | | | | | | 2,471,209 | |
| | | | | | | | |
| | |
Wisconsin — 2.9% | | | | | | | | |
| | |
City of Milwaukee, Promissory Notes Series N4 & B5, GO, 5.00%, 4/1/2023 | | | 85,000 | | | | 92,827 | |
| | |
Hamilton School District, School Building Improvement GO, 5.00%, 4/1/2025 | | | 60,000 | | | | 70,911 | |
| | |
Public Finance Authority, Acts Retirement Life Communities, Inc., Obligated Group Series 2020A, Rev., 4.00%, 11/15/2037 | | | 300,000 | | | | 345,126 | |
| | |
Public Finance Authority, Blue Ridge Healthcare Facilities | | | | | | | | |
| | |
Series 2020A, Rev., 5.00%, 1/1/2022 | | | 175,000 | | | | 181,592 | |
| | |
Series 2020A, Rev., 5.00%, 1/1/2023 | | | 300,000 | | | | 324,396 | |
| | |
Public Finance Authority, Piedmont Community Charter School Rev., 5.00%, 6/15/2039 | | | 200,000 | | | | 232,150 | |
| | |
Public Finance Authority, Ultimate Medical Academy Project Series 2019A, Rev., 5.00%, 10/1/2029 (c) | | | 150,000 | | | | 179,307 | |
| | |
State of Wisconsin | | | | | | | | |
| | |
Series B, GO, 4.00%, 5/1/2023 | | | 40,000 | | | | 43,242 | |
| | |
Series 1, GO, 5.00%, 11/1/2024 | | | 40,000 | | | | 46,651 | |
| | |
Series 2, GO, 5.00%, 11/1/2026 | | | 50,000 | | | | 60,982 | |
| | |
State of Wisconsin, Clean Water Fund Leveraged Loan Portfolio | | | | | | | | |
| | |
Series 1, Rev., 5.00%, 6/1/2023 (d) | | | 25,000 | | | | 27,635 | |
| | |
Rev., 5.00%, 6/1/2024 (d) | | | 65,000 | | | | 74,591 | |
| | |
State of Wisconsin, Environmental Improvement Fund | | | | | | | | |
| | |
Series A, Rev., 5.00%, 6/1/2025 | | | 35,000 | | | | 41,627 | |
| | |
Series A, Rev., 5.00%, 6/1/2026 | | | 20,000 | | | | 24,544 | |
| | | | | | | | |
| INVESTMENTS | | PRINCIPAL
AMOUNT ($) | | | VALUE ($) | |
| | | | | | | | |
| | |
Wisconsin — continued | | | | | | | | |
| | |
Village of Pleasant Prairie GO, 4.00%, 8/1/2024 | | | 10,000 | | | | 11,158 | |
| | |
Wisconsin Department of Transportation | | | | | | | | |
| | |
Series 2, Rev., 5.00%, 7/1/2031 | | | 180,000 | | | | 222,907 | |
| | |
Series 2, Rev., 5.00%, 7/1/2032 | | | 50,000 | | | | 61,720 | |
| | |
Wisconsin Health and Educational Facilities Authority, St. Camillus Health System Series 2019A, Rev., 5.00%, 11/1/2029 | | | 150,000 | | | | 164,996 | |
| | | | | | | | |
| | |
Total Wisconsin | | | | | | | 2,206,362 | |
| | | | | | | | |
| |
Total Municipal Bonds
(Cost $73,046,678) | | | | 74,939,329 | |
| | | | | |
| |
Total Investments — 98.4%
(Cost $73,046,678) | | | | 74,939,329 | |
| |
Other Assets Less Liabilities — 1.6% | | | | 1,180,976 | |
| | | | | |
| |
NET ASSETS — 100.0% | | | | 76,120,305 | |
| | | | | |
Percentages indicated are based on net assets.
| | |
Abbreviations |
AGM | | Insured by Assured Guaranty Municipal Corp. |
AMT | | Alternative Minimum Tax |
BAN | | Bond Anticipation Note |
BHAC | | Insured by Berkshire Hathaway Assurance Corp. |
COP | | Certificate of Participation |
CR | | Custodial Receipts |
FHA | | Federal Housing Administration |
GAN | | Grant Anticipation Note |
GO | | General Obligation |
GTD | | Guaranteed |
LIQ | | Liquidity Agreement |
PSF-GTD | | Permanent School Fund Guaranteed |
Q-SBLF | | Qualified School Bond Loan Fund |
Rev. | | Revenue |
| |
(a) | | The date shown represents the earliest of the prerefunded date, next put date or final maturity date. |
(b) | | Variable or floating rate security, the interest rate of which adjusts periodically based on changes in current interest rates and prepayments on the underlying pool of assets. The interest rate shown is the current rate as of February 28, 2021. |
(c) | | Securities exempt from registration under Rule 144A or section 4(a)(2), of the Securities Act of 1933, as amended. |
(d) | | Security is prerefunded or escrowed to maturity. |
(e) | | Amount rounds to less than 0.1% of net assets. |
SEE NOTES TO FINANCIAL STATEMENTS.
| | | | | | | | |
| | | |
| FEBRUARY 28, 2021 | | J.P. MORGAN EXCHANGE-TRADED FUNDS | | | | | 119 | |
JPMorgan U.S. Aggregate Bond ETF
SCHEDULE OF PORTFOLIO INVESTMENTS
AS OF FEBRUARY 28, 2021
| | | | | | | | |
| INVESTMENTS | | PRINCIPAL
AMOUNT ($) | | | VALUE ($) | |
U.S. Treasury Obligations — 37.0% | | | | | | | | |
| | |
U.S. Treasury Bonds | | | | | | | | |
| | |
7.63%, 11/15/2022 | | | 7,489,000 | | | | 8,442,385 | |
| | |
6.88%, 8/15/2025 | | | 1,960,000 | | | | 2,494,100 | |
| | |
6.75%, 8/15/2026 | | | 1,391,000 | | | | 1,830,904 | |
| | |
6.63%, 2/15/2027 | | | 2,750,000 | | | | 3,665,879 | |
| | |
6.38%, 8/15/2027 | | | 4,380,000 | | | | 5,860,303 | |
| | |
6.13%, 11/15/2027 | | | 3,495,000 | | | | 4,649,442 | |
| | |
5.50%, 8/15/2028 | | | 160,000 | | | | 209,875 | |
| | |
5.25%, 11/15/2028 | | | 2,210,000 | | | | 2,875,072 | |
| | |
6.13%, 8/15/2029 | | | 2,250,000 | | | | 3,137,344 | |
| | |
6.25%, 5/15/2030 | | | 40,000 | | | | 57,294 | |
| | |
5.38%, 2/15/2031 | | | 3,600,000 | | | | 4,948,312 | |
| | |
4.50%, 2/15/2036 | | | 436,000 | | | | 599,500 | |
| | |
4.75%, 2/15/2037 | | | 256,000 | | | | 364,120 | |
| | |
5.00%, 5/15/2037 | | | 5,184,000 | | | | 7,575,120 | |
| | |
4.50%, 5/15/2038 | | | 2,140,000 | | | | 2,994,997 | |
| | |
3.50%, 2/15/2039 | | | 5,083,000 | | | | 6,365,663 | |
| | |
4.25%, 5/15/2039 | | | 30,000 | | | | 41,142 | |
| | |
4.50%, 8/15/2039 | | | 1,283,000 | | | | 1,811,436 | |
| | |
4.38%, 11/15/2039 | | | 356,000 | | | | 496,231 | |
| | |
4.63%, 2/15/2040 | | | 2,660,000 | | | | 3,826,659 | |
| | |
1.13%, 5/15/2040 | | | 1,594,000 | | | | 1,371,338 | |
| | |
1.13%, 8/15/2040 | | | 224,000 | | | | 191,905 | |
| | |
1.38%, 11/15/2040 | | | 97,400 | | | | 87,264 | |
| | |
3.13%, 2/15/2042 | | | 1,049,000 | | | | 1,254,047 | |
| | |
2.50%, 2/15/2045 | | | 3,415,000 | | | | 3,678,062 | |
| | |
3.00%, 5/15/2045 | | | 1,904,000 | | | | 2,238,985 | |
| | |
3.00%, 11/15/2045 | | | 26,000 | | | | 30,611 | |
| | |
2.50%, 5/15/2046 | | | 11,654,000 | | | | 12,553,543 | |
| | |
2.25%, 8/15/2046 | | | 3,461,000 | | | | 3,554,555 | |
| | |
3.00%, 2/15/2047 | | | 1,424,000 | | | | 1,683,880 | |
| | |
3.38%, 11/15/2048 | | | 40,000 | | | | 50,850 | |
| | |
3.00%, 2/15/2049 | | | 1,936,000 | | | | 2,306,260 | |
| | |
2.25%, 8/15/2049 | | | 3,753,000 | | | | 3,863,831 | |
| | |
2.38%, 11/15/2049 | | | 3,863,000 | | | | 4,083,915 | |
| | |
1.25%, 5/15/2050 | | | 4,536,400 | | | | 3,663,852 | |
| | |
1.38%, 8/15/2050 | | | 5,091,000 | | | | 4,250,985 | |
| | |
U.S. Treasury Notes | | | | | | | | |
| | |
2.50%, 1/15/2022 | | | 19,781,000 | | | | 20,196,710 | |
| | |
1.38%, 1/31/2022 | | | 251,000 | | | | 253,951 | |
| | |
1.50%, 1/31/2022 | | | 5,305,000 | | | | 5,373,385 | |
| | |
1.88%, 1/31/2022 | | | 457,000 | | | | 464,462 | |
| | |
1.13%, 2/28/2022 | | | 1,559,000 | | | | 1,574,894 | |
| | |
1.88%, 2/28/2022 | | | 112,000 | | | | 113,978 | |
| | |
0.13%, 7/31/2022 | | | 1,644,000 | | | | 1,644,385 | |
| | |
0.13%, 9/30/2022 | | | 9,133,000 | | | | 9,134,427 | |
| | | | | | | | |
| INVESTMENTS | | PRINCIPAL
AMOUNT ($) | | | VALUE ($) | |
| | | | | | | | |
| | |
1.38%, 10/15/2022 | | | 50,000 | | | | 51,010 | |
| | |
0.13%, 5/15/2023 | | | 1,174,000 | | | | 1,172,899 | |
| | |
1.63%, 5/31/2023 | | | 600,000 | | | | 619,453 | |
| | |
0.25%, 6/15/2023 | | | 12,000,000 | | | | 12,019,688 | |
| | |
1.25%, 7/31/2023 | | | 5,200,000 | | | | 5,333,250 | |
| | |
0.13%, 8/15/2023 | | | 1,000,000 | | | | 998,203 | |
| | |
1.38%, 8/31/2023 | | | 360,000 | | | | 370,575 | |
| | |
1.38%, 9/30/2023 | | | 15,431,000 | | | | 15,895,136 | |
| | |
2.88%, 9/30/2023 | | | 700,000 | | | | 748,070 | |
| | |
0.13%, 10/15/2023 | | | 2,200,000 | | | | 2,194,672 | |
| | |
2.88%, 11/30/2023 | | | 2,077,000 | | | | 2,227,258 | |
| | |
2.25%, 12/31/2023 | | | 267,000 | | | | 282,081 | |
| | |
2.63%, 12/31/2023 | | | 621,000 | | | | 662,626 | |
| | |
2.25%, 1/31/2024 | | | 653,000 | | | | 690,650 | |
| | |
2.50%, 1/31/2024 | | | 3,854,000 | | | | 4,104,209 | |
| | |
2.13%, 2/29/2024 | | | 500,000 | | | | 527,461 | |
| | |
2.38%, 2/29/2024 | | | 10,212,000 | | | | 10,849,452 | |
| | |
2.13%, 3/31/2024 | | | 1,397,000 | | | | 1,475,036 | |
| | |
2.50%, 5/15/2024 | | | 100,000 | | | | 107,008 | |
| | |
2.00%, 5/31/2024 | | | 3,850,000 | | | | 4,056,938 | |
| | |
1.75%, 6/30/2024 | | | 1,967,000 | | | | 2,057,820 | |
| | |
1.75%, 7/31/2024 | | | 410,000 | | | | 429,155 | |
| | |
2.38%, 8/15/2024 | | | 2,800,000 | | | | 2,992,500 | |
| | |
1.25%, 8/31/2024 | | | 1,617,000 | | | | 1,664,878 | |
| | |
1.88%, 8/31/2024 | | | 1,509,000 | | | | 1,586,690 | |
| | |
1.50%, 9/30/2024 | | | 100,000 | | | | 103,875 | |
| | |
1.50%, 10/31/2024 | | | 993,000 | | | | 1,031,479 | |
| | |
1.50%, 11/30/2024 | | | 9,437,000 | | | | 9,804,158 | |
| | |
1.75%, 12/31/2024 | | | 142,000 | | | | 148,900 | |
| | |
1.38%, 1/31/2025 | | | 1,860,000 | | | | 1,923,647 | |
| | |
2.50%, 1/31/2025 | | | 450,000 | | | | 485,297 | |
| | |
2.00%, 2/15/2025 | | | 530,000 | | | | 561,345 | |
| | |
1.13%, 2/28/2025 | | | 1,153,000 | | | | 1,181,104 | |
| | |
0.50%, 3/31/2025 | | | 58,000 | | | | 57,937 | |
| | |
2.13%, 5/15/2025 | | | 163,000 | | | | 173,748 | |
| | |
0.25%, 5/31/2025 | | | 103,300 | | | | 101,920 | |
| | |
2.88%, 5/31/2025 | | | 12,000,000 | | | | 13,170,000 | |
| | |
0.25%, 6/30/2025 | | | 1,802,000 | | | | 1,776,096 | |
| | |
2.00%, 8/15/2025 | | | 600,000 | | | | 637,031 | |
| | |
0.25%, 9/30/2025 | | | 400,000 | | | | 392,938 | |
| | |
0.25%, 10/31/2025 | | | 6,200,000 | | | | 6,085,203 | |
| | |
2.25%, 11/15/2025 | | | 104,000 | | | | 111,711 | |
| | |
0.38%, 12/31/2025 | | | 89,000 | | | | 87,672 | |
| | |
2.63%, 12/31/2025 | | | 3,339,000 | | | | 3,647,857 | |
| | |
1.63%, 2/15/2026 | | | 4,739,000 | | | | 4,951,515 | |
| | |
2.50%, 2/28/2026 | | | 136,000 | | | | 147,953 | |
SEE NOTES TO FINANCIAL STATEMENTS.
| | | | | | |
| | | |
| 120 | | | | J.P. MORGAN EXCHANGE-TRADED FUNDS | | FEBRUARY 28, 2021 |
| | | | | | | | |
| INVESTMENTS | | PRINCIPAL
AMOUNT ($) | | | VALUE ($) | |
U.S. Treasury Obligations — continued | | | | | | | | |
| | |
2.25%, 3/31/2026 | | | 10,000 | | | | 10,759 | |
| | |
2.13%, 5/31/2026 | | | 200,000 | | | | 213,969 | |
| | |
1.88%, 7/31/2026 | | | 383,000 | | | | 404,753 | |
| | |
1.50%, 8/15/2026 | | | 507,000 | | | | 525,458 | |
| | |
1.38%, 8/31/2026 | | | 398,000 | | | | 409,722 | |
| | |
1.63%, 9/30/2026 | | | 150,000 | | | | 156,398 | |
| | |
1.63%, 10/31/2026 | | | 7,371,000 | | | | 7,680,812 | |
| | |
1.63%, 11/30/2026 | | | 1,639,000 | | | | 1,707,505 | |
| | |
1.75%, 12/31/2026 | | | 2,300,000 | | | | 2,412,664 | |
| | |
2.25%, 2/15/2027 | | | 1,800,000 | | | | 1,939,359 | |
| | |
0.50%, 4/30/2027 | | | 413,800 | | | | 402,259 | |
| | |
2.38%, 5/15/2027 | | | 1,900,000 | | | | 2,062,539 | |
| | |
0.38%, 7/31/2027 | | | 2,417,000 | | | | 2,321,264 | |
| | |
2.25%, 8/15/2027 | | | 2,000,000 | | | | 2,155,469 | |
| | |
0.50%, 10/31/2027 | | | 4,633,000 | | | | 4,465,778 | |
| | |
2.25%, 11/15/2027 | | | 400,000 | | | | 430,937 | |
| | |
0.63%, 11/30/2027 | | | 3,680,000 | | | | 3,571,900 | |
| | |
1.13%, 2/29/2028 | | | 2,001,000 | | | | 2,003,460 | |
| | |
2.88%, 5/15/2028 | | | 400,000 | | | | 448,562 | |
| | |
3.13%, 11/15/2028 | | | 303,000 | | | | 346,272 | |
| | |
2.63%, 2/15/2029 | | | 1,589,000 | | | | 1,759,818 | |
| | |
1.63%, 8/15/2029 | | | 1,218,000 | | | | 1,253,968 | |
| | |
1.75%, 11/15/2029 | | | 856,000 | | | | 889,571 | |
| | |
0.63%, 5/15/2030 | | | 881,000 | | | | 826,075 | |
| | |
0.63%, 8/15/2030 | | | 12,000 | | | | 11,214 | |
| | |
0.88%, 11/15/2030 | | | 1,854,000 | | | | 1,769,701 | |
| | | | | | | | |
| | |
Total U.S. Treasury Obligations
(Cost $305,744,848) | | | | | | | 305,744,143 | |
| | | | | | | | |
Mortgage-Backed Securities — 27.2% | | | | | | | | |
| | |
FHLMC Gold Pools, 15 Year | | | | | | | | |
| | |
Pool # G14541, 2.50%, 8/1/2022 | | | 9,055 | | | | 9,118 | |
| | |
Pool # J10548, 4.00%, 8/1/2024 | | | 34,781 | | | | 37,051 | |
| | |
Pool # J15449, 4.00%, 5/1/2026 | | | 133,532 | | | | 142,454 | |
| | |
Pool # G14781, 3.50%, 3/1/2027 | | | 76,901 | | | | 82,202 | |
| | |
Pool # G15201, 4.00%, 5/1/2027 | | | 32,312 | | | | 34,421 | |
| | |
Pool # J20129, 2.50%, 8/1/2027 | | | 120,479 | | | | 126,121 | |
| | |
Pool # G15438, 4.00%, 9/1/2027 | | | 24,011 | | | | 25,620 | |
| | |
Pool # G15602, 2.50%, 11/1/2027 | | | 88,481 | | | | 92,812 | |
| | |
Pool # E09028, 2.00%, 3/1/2028 | | | 131,819 | | | | 136,495 | |
| | |
Pool # J23362, 2.00%, 4/1/2028 | | | 128,481 | | | | 133,039 | |
| | |
Pool # G18466, 2.00%, 5/1/2028 | | | 18,886 | | | | 19,555 | |
| | |
Pool # G18465, 2.50%, 5/1/2028 | | | 36,473 | | | | 38,172 | |
| | |
Pool # G16762, 3.50%, 12/1/2028 | | | 29,098 | | | | 31,136 | |
| | |
Pool # G15601, 2.50%, 1/1/2029 | | | 80,459 | | | | 84,607 | |
| | |
Pool # G14957, 3.50%, 1/1/2029 | | | 167,778 | | | | 181,324 | |
| | | | | | | | |
| INVESTMENTS | | PRINCIPAL
AMOUNT ($) | | | VALUE ($) | |
| | | | | | | | |
| | |
Pool # G15093, 3.00%, 4/1/2029 | | | 206,095 | | | | 219,488 | |
| | |
Pool # G16570, 4.00%, 7/1/2029 | | | 22,522 | | | | 23,991 | |
| | |
Pool # G18540, 2.50%, 2/1/2030 | | | 48,331 | | | | 50,666 | |
| | |
Pool # G18556, 2.50%, 6/1/2030 | | | 59,505 | | | | 62,380 | |
| | |
Pool # V60840, 3.00%, 6/1/2030 | | | 15,185 | | | | 16,282 | |
| | |
Pool # G16622, 3.00%, 11/1/2030 | | | 60,516 | | | | 64,347 | |
| | |
Pool # G16019, 3.50%, 12/1/2030 | | | 30,391 | | | | 32,454 | |
| | |
Pool # J33545, 3.00%, 1/1/2031 | | | 158,318 | | | | 171,250 | |
| | |
Pool # G16044, 2.50%, 1/1/2032 | | | 158,411 | | | | 166,139 | |
| | |
Pool # J36524, 3.00%, 3/1/2032 | | | 161,743 | | | | 171,256 | |
| | |
Pool # J36660, 3.00%, 3/1/2032 | | | 110,389 | | | | 119,110 | |
| | |
Pool # J38270, 2.50%, 1/1/2033 | | | 530,855 | | | | 556,065 | |
| | |
Pool # G16568, 2.50%, 4/1/2033 | | | 218,539 | | | | 228,916 | |
| | |
Pool # G18706, 3.00%, 9/1/2033 | | | 16,408 | | | | 17,352 | |
| | |
FHLMC Gold Pools, 20 Year Pool # K90941, 3.50%, 8/1/2033 | | | 29,464 | | | | 31,882 | |
| | |
FHLMC Gold Pools, 30 Year | | | | | | | | |
| | |
Pool # V81680, 4.50%, 12/1/2034 | | | 118,649 | | | | 133,277 | |
| | |
Pool # A30892, 5.00%, 1/1/2035 | | | 113,987 | | | | 130,714 | |
| | |
Pool # A39210, 5.50%, 10/1/2035 | | | 39,110 | | | | 44,800 | |
| | |
Pool # V83754, 5.50%, 1/1/2036 | | | 51,388 | | | | 58,869 | |
| | |
Pool # A82255, 5.50%, 9/1/2036 | | | 121,259 | | | | 132,143 | |
| | |
Pool # G03381, 5.50%, 9/1/2037 | | | 34,123 | | | | 39,207 | |
| | |
Pool # A89760, 4.50%, 12/1/2039 | | | 34,817 | | | | 39,109 | |
| | |
Pool # A92197, 5.00%, 5/1/2040 | | | 99,698 | | | | 113,262 | |
| | |
Pool # G06856, 6.00%, 5/1/2040 | | | 6,044 | | | | 7,043 | |
| | |
Pool # A93359, 4.00%, 8/1/2040 | | | 9,292 | | | | 10,271 | |
| | |
Pool # G06222, 4.00%, 1/1/2041 | | | 339,514 | | | | 375,298 | |
| | |
Pool # G07794, 5.50%, 6/1/2041 | | | 16,030 | | | | 18,520 | |
| | |
Pool # Q03514, 4.50%, 9/1/2041 | | | 113,755 | | | | 127,562 | |
| | |
Pool # Q03516, 4.50%, 9/1/2041 | | | 37,653 | | | | 42,223 | |
| | |
Pool # Q04088, 3.50%, 10/1/2041 | | | 37,006 | | | | 40,188 | |
| | |
Pool # Q04688, 4.00%, 11/1/2041 | | | 4,946 | | | | 5,470 | |
| | |
Pool # G08477, 3.50%, 2/1/2042 | | | 13,482 | | | | 14,641 | |
| | |
Pool # Q06771, 3.00%, 3/1/2042 | | | 52,348 | | | | 56,034 | |
| | |
Pool # C03858, 3.50%, 4/1/2042 | | | 129,942 | | | | 141,297 | |
| | |
Pool # Q08646, 3.50%, 6/1/2042 | | | 39,392 | | | | 42,597 | |
| | |
Pool # G60737, 4.50%, 8/1/2042 | | | 161,506 | | | | 181,220 | |
| | |
Pool # Q11220, 3.50%, 9/1/2042 | | | 145,403 | | | | 157,236 | |
| | |
Pool # Q13477, 3.00%, 12/1/2042 | | | 167,991 | | | | 179,821 | |
| | |
Pool # Q14321, 3.00%, 12/1/2042 | | | 44,873 | | | | 48,033 | |
| | |
Pool # C04420, 3.00%, 1/1/2043 | | | 247,047 | | | | 264,463 | |
| | |
Pool # Q14694, 3.00%, 1/1/2043 | | | 1,859,135 | | | | 2,002,783 | |
| | |
Pool # G61723, 3.50%, 1/1/2043 | | | 97,214 | | | | 108,276 | |
| | |
Pool # Q15020, 4.00%, 1/1/2043 | | | 32,639 | | | | 36,165 | |
| | |
Pool # C09031, 2.50%, 2/1/2043 | | | 147,479 | | | | 154,312 | |
SEE NOTES TO FINANCIAL STATEMENTS.
| | | | | | | | |
| | | |
| FEBRUARY 28, 2021 | | J.P. MORGAN EXCHANGE-TRADED FUNDS | | | | | 121 | |
JPMorgan U.S. Aggregate Bond ETF
SCHEDULE OF PORTFOLIO INVESTMENTS
AS OF FEBRUARY 28, 2021 (continued)
| | | | | | | | |
| INVESTMENTS | | PRINCIPAL
AMOUNT ($) | | | VALUE ($) | |
Mortgage-Backed Securities — continued | | | | | | | | |
| | |
Pool # V80026, 3.00%, 4/1/2043 | | | 74,226 | | | | 79,301 | |
| | |
Pool # Q17374, 4.00%, 4/1/2043 | | | 122,922 | | | | 139,097 | |
| | |
Pool # Q20542, 3.00%, 7/1/2043 | | | 61,915 | | | | 66,149 | |
| | |
Pool # C09044, 3.50%, 7/1/2043 | | | 28,887 | | | | 31,419 | |
| | |
Pool # G62033, 4.00%, 11/1/2043 | | | 203,496 | | | | 224,903 | |
| | |
Pool # G08599, 3.50%, 8/1/2044 | | | 67,696 | | | | 72,949 | |
| | |
Pool # Q27903, 4.00%, 8/1/2044 | | | 122,199 | | | | 133,941 | |
| | |
Pool # Z40090, 4.50%, 9/1/2044 | | | 50,894 | | | | 56,818 | |
| | |
Pool # G60183, 4.00%, 12/1/2044 | | | 49,157 | | | | 54,317 | |
| | |
Pool # G61769, 4.50%, 12/1/2044 | | | 107,118 | | | | 120,194 | |
| | |
Pool # Q30868, 3.50%, 1/1/2045 | | | 71,302 | | | | 76,834 | |
| | |
Pool # G61617, 4.50%, 1/1/2045 | | | 32,991 | | | | 37,562 | |
| | |
Pool # Q33006, 3.50%, 4/1/2045 | | | 38,197 | | | | 41,080 | |
| | |
Pool # V81760, 4.00%, 5/1/2045 | | | 30,394 | | | | 33,268 | |
| | |
Pool # Q34508, 3.50%, 6/1/2045 | | | 612,508 | | | | 659,607 | |
| | |
Pool # G08651, 4.00%, 6/1/2045 | | | 184,685 | | | | 202,162 | |
| | |
Pool # Q33685, 4.00%, 6/1/2045 | | | 418,657 | | | | 458,269 | |
| | |
Pool # G08653, 3.00%, 7/1/2045 | | | 84,677 | | | | 89,725 | |
| | |
Pool # Q35223, 4.00%, 8/1/2045 | | | 18,929 | | | | 20,521 | |
| | |
Pool # G08669, 4.00%, 9/1/2045 | | | 57,763 | | | | 63,230 | |
| | |
Pool # G60238, 3.50%, 10/1/2045 | | | 1,085,773 | | | | 1,180,076 | |
| | |
Pool # G60480, 4.50%, 11/1/2045 | | | 126,196 | | | | 140,892 | |
| | |
Pool # G08697, 3.00%, 3/1/2046 | | | 672,996 | | | | 712,580 | |
| | |
Pool # G08693, 3.50%, 3/1/2046 | | | 549,924 | | | | 591,435 | |
| | |
Pool # G60506, 3.50%, 4/1/2046 | | | 65,402 | | | | 70,848 | |
| | |
Pool # Q39844, 3.50%, 4/1/2046 | | | 201,426 | | | | 216,075 | |
| | |
Pool # G61260, 4.50%, 4/1/2046 | | | 40,154 | | | | 44,920 | |
| | |
Pool # G08710, 3.00%, 6/1/2046 | | | 59,978 | | | | 63,506 | |
| | |
Pool # Q41024, 3.00%, 6/1/2046 | | | 726,526 | | | | 777,512 | |
| | |
Pool # Q42045, 3.50%, 7/1/2046 | | | 35,266 | | | | 37,943 | |
| | |
Pool # G08724, 2.50%, 9/1/2046 | | | 19,556 | | | | 20,309 | |
| | |
Pool # G61070, 3.00%, 9/1/2046 | | | 638,041 | | | | 681,617 | |
| | |
Pool # G61730, 3.00%, 9/1/2046 | | | 201,687 | | | | 215,461 | |
| | |
Pool # Q42921, 3.50%, 9/1/2046 | | | 136,411 | | | | 146,766 | |
| | |
Pool # G61235, 4.50%, 9/1/2046 | | | 40,058 | | | | 45,031 | |
| | |
Pool # Q43892, 4.50%, 10/1/2046 | | | 121,695 | | | | 137,246 | |
| | |
Pool # G08736, 2.50%, 12/1/2046 | | | 19,620 | | | | 20,375 | |
| | |
Pool # Q45872, 3.00%, 1/1/2047 | | | 943,191 | | | | 998,667 | |
| | |
Pool # G08747, 3.00%, 2/1/2047 | | | 276,315 | | | | 292,567 | |
| | |
Pool # G61623, 3.00%, 4/1/2047 | | | 40,561 | | | | 42,976 | |
| | |
Pool # G60985, 3.00%, 5/1/2047 | | | 132,593 | | | | 141,898 | |
| | |
Pool # G60996, 3.50%, 5/1/2047 | | | 12,427 | | | | 13,443 | |
| | |
Pool # Q47884, 4.00%, 5/1/2047 | | | 40,295 | | | | 43,540 | |
| | |
Pool # V83233, 4.00%, 6/1/2047 | | | 181,265 | | | | 198,554 | |
| | |
Pool # Q49796, 3.50%, 8/1/2047 | | | 172,515 | | | | 187,365 | |
| | | | | | | | |
| INVESTMENTS | | PRINCIPAL
AMOUNT ($) | | | VALUE ($) | |
| | | | | | | | |
| | |
Pool # Q50029, 3.50%, 8/1/2047 | | | 379,420 | | | | 404,038 | |
| | |
Pool # G08775, 4.00%, 8/1/2047 | | | 69,697 | | | | 75,308 | |
| | |
Pool # Q50152, 4.00%, 8/1/2047 | | | 161,401 | | | | 174,400 | |
| | |
Pool # Q51268, 3.50%, 10/1/2047 | | | 88,986 | | | | 94,527 | |
| | |
Pool # G08787, 3.00%, 11/1/2047 | | | 544,702 | | | | 573,844 | |
| | |
Pool # G61681, 3.00%, 12/1/2047 | | | 12,646 | | | | 13,322 | |
| | |
Pool # Q52866, 3.00%, 12/1/2047 | | | 29,740 | | | | 31,942 | |
| | |
Pool # G08793, 4.00%, 12/1/2047 | | | 64,073 | | | | 69,233 | |
| | |
Pool # Q53670, 3.50%, 1/1/2048 | | | 399,438 | | | | 424,315 | |
| | |
Pool # Q53751, 3.50%, 1/1/2048 | | | 171,342 | | | | 182,013 | |
| | |
Pool # G08799, 3.00%, 2/1/2048 | | | 263,409 | | | | 277,501 | |
| | |
Pool # G08800, 3.50%, 2/1/2048 | | | 197,572 | | | | 209,876 | |
| | |
Pool # Q54813, 3.50%, 3/1/2048 | | | 340,742 | | | | 362,691 | |
| | |
Pool # G08812, 3.00%, 4/1/2048 | | | 18,626 | | | | 19,530 | |
| | |
Pool # Q55484, 3.50%, 4/1/2048 | | | 559,821 | | | | 593,690 | |
| | |
Pool # G61866, 4.00%, 6/1/2048 | | | 42,148 | | | | 46,528 | |
| | |
Pool # Q57420, 4.50%, 7/1/2048 | | | 70,642 | | | | 77,000 | |
| | |
Pool # Q58587, 3.50%, 9/1/2048 | | | 8,617 | | | | 9,138 | |
| | |
Pool # G08837, 4.50%, 9/1/2048 | | | 9,860 | | | | 10,727 | |
| | |
Pool # G61607, 4.50%, 9/1/2048 | | | 192,474 | | | | 214,716 | |
| | |
Pool # G08841, 3.50%, 10/1/2048 | | | 28,626 | | | | 30,357 | |
| | |
Pool # G08842, 4.00%, 10/1/2048 | | | 31,343 | | | | 33,654 | |
| | |
Pool # G61737, 3.50%, 11/1/2048 | | | 362,186 | | | | 391,502 | |
| | |
Pool # V84897, 4.00%, 11/1/2048 | | | 59,756 | | | | 64,454 | |
| | |
Pool # G61885, 4.50%, 11/1/2048 | | | 58,096 | | | | 63,201 | |
| | |
Pool # Q59805, 4.50%, 11/1/2048 | | | 109,155 | | | | 118,746 | |
| | |
Pool # G08853, 4.50%, 12/1/2048 | | | 32,986 | | | | 35,885 | |
| | |
Pool # Q62234, 4.50%, 12/1/2048 | | | 220,049 | | | | 244,566 | |
| | |
Pool # G67718, 4.00%, 1/1/2049 | | | 19,429 | | | | 21,258 | |
| | |
Pool # G08862, 4.00%, 2/1/2049 | | | 49,616 | | | | 53,274 | |
| | |
Pool # Q61487, 4.00%, 2/1/2049 | | | 58,364 | | | | 63,300 | |
| | |
Pool # V85252, 3.50%, 3/1/2049 | | | 133,476 | | | | 143,090 | |
| | |
Pool # Q62004, 4.00%, 3/1/2049 | | | 68,949 | | | | 75,362 | |
| | |
Pool # Q63195, 3.00%, 4/1/2049 | | | 78,548 | | | | 82,412 | |
| | |
Pool # G08874, 5.00%, 4/1/2049 | | | 24,501 | | | | 27,292 | |
| | |
Pool # Q63756, 3.00%, 5/1/2049 | | | 161,375 | | | | 172,346 | |
| | |
Pool # G08876, 3.50%, 5/1/2049 | | | 97,403 | | | | 103,306 | |
| | |
Pool # G08887, 3.00%, 6/1/2049 | | | 70,333 | | | | 73,453 | |
| | |
FHLMC UMBS, 15 Year | | | | | | | | |
| | |
Pool # ZS5890, 4.00%, 7/1/2024 | | | 216,844 | | | | 230,994 | |
| | |
Pool # ZK2080, 4.00%, 1/1/2025 | | | 70,653 | | | | 75,308 | |
| | |
Pool # ZA2587, 4.00%, 9/1/2025 | | | 18,151 | | | | 19,377 | |
| | |
Pool # ZK2723, 3.50%, 11/1/2025 | | | 31,978 | | | | 34,201 | |
| | |
Pool # ZK3540, 3.00%, 9/1/2026 | | | 137,721 | | | | 145,719 | |
| | |
Pool # ZS8460, 3.00%, 4/1/2027 | | | 31,834 | | | | 33,686 | |
| | |
Pool # SB0031, 3.50%, 10/1/2027 | | | 58,981 | | | | 62,982 | |
SEE NOTES TO FINANCIAL STATEMENTS.
| | | | | | |
| | | |
| 122 | | | | J.P. MORGAN EXCHANGE-TRADED FUNDS | | FEBRUARY 28, 2021 |
| | | | | | | | |
| INVESTMENTS | | PRINCIPAL
AMOUNT ($) | | | VALUE ($) | |
Mortgage-Backed Securities — continued | | | | | | | | |
| | |
Pool # ZS7751, 3.00%, 1/1/2029 | | | 195,128 | | | | 207,599 | |
| | |
Pool # SB0071, 2.50%, 5/1/2030 | | | 49,782 | | | | 52,103 | |
| | |
Pool # ZS7331, 3.00%, 12/1/2030 | | | 40,357 | | | | 43,273 | |
| | |
Pool # ZS7938, 2.50%, 1/1/2033 | | | 110,208 | | | | 117,137 | |
| | |
Pool # SB0256, 4.00%, 11/1/2033 | | | 191,563 | | | | 204,063 | |
| | |
Pool # SB0077, 3.50%, 10/1/2034 | | | 112,376 | | | | 120,008 | |
| | |
Pool # QN1148, 2.50%, 12/1/2034 | | | 103,821 | | | | 110,115 | |
| | |
Pool # SB8031, 2.50%, 2/1/2035 | | | 289,825 | | | | 302,753 | |
| | |
Pool # QN2407, 2.00%, 6/1/2035 | | | 213,604 | | | | 220,959 | |
| | |
Pool # SB8500, 2.50%, 7/1/2035 | | | 551,762 | | | | 587,494 | |
| | |
Pool # SB8501, 2.00%, 8/1/2035 | | | 386,484 | | | | 402,130 | |
| | |
Pool # SB8068, 1.50%, 10/1/2035 | | | 293,710 | | | | 297,154 | |
| | |
Pool # SB0424, 2.00%, 10/1/2035 | | | 1,386,286 | | | | 1,441,633 | |
| | |
Pool # RC1712, 1.50%, 12/1/2035 | | | 1,565,137 | | | | 1,586,272 | |
| | |
FHLMC UMBS, 20 Year | | | | | | | | |
| | |
Pool # ZA2277, 3.00%, 9/1/2032 | | | 118,381 | | | | 125,573 | |
| | |
Pool # ZJ9491, 3.50%, 12/1/2032 | | | 26,582 | | | | 28,778 | |
| | |
Pool # ZS9164, 3.00%, 9/1/2033 | | | 660,563 | | | | 713,553 | |
| | |
Pool # ZA2463, 3.50%, 6/1/2037 | | | 61,995 | | | | 66,173 | |
| | |
Pool # RB5001, 3.50%, 7/1/2039 | | | 36,728 | | | | 38,953 | |
| | |
Pool # RB5026, 2.50%, 11/1/2039 | | | 76,868 | | | | 79,568 | |
| | |
Pool # QK0157, 2.50%, 1/1/2040 | | | 80,992 | | | | 83,836 | |
| | |
Pool # RB5032, 2.50%, 2/1/2040 | | | 63,178 | | | | 65,397 | |
| | |
Pool # RB5037, 2.50%, 3/1/2040 | | | 206,186 | | | | 213,427 | |
| | |
Pool # RB5043, 2.50%, 4/1/2040 | | | 150,263 | | | | 156,320 | |
| | |
Pool # RB5048, 2.50%, 5/1/2040 | | | 164,362 | | | | 170,987 | |
| | |
Pool # RB5066, 2.50%, 8/1/2040 | | | 500,263 | | | | 520,424 | |
| | |
FHLMC UMBS, 30 Year | | | | | | | | |
| | |
Pool # ZI3765, 5.50%, 11/1/2035 | | | 47,240 | | | | 54,661 | |
| | |
Pool # ZS2546, 5.00%, 2/1/2039 | | | 25,736 | | | | 29,599 | |
| | |
Pool # ZJ0449, 4.00%, 9/1/2040 | | | 36,859 | | | | 40,740 | |
| | |
Pool # ZL3548, 3.50%, 8/1/2042 | | | 159,597 | | | | 172,597 | |
| | |
Pool # ZS3712, 3.50%, 4/1/2043 | | | 221,568 | | | | 246,834 | |
| | |
Pool # ZS4077, 3.50%, 1/1/2044 | | | 32,062 | | | | 35,076 | |
| | |
Pool # ZL8869, 3.50%, 12/1/2044 | | | 41,085 | | | | 44,501 | |
| | |
Pool # ZS4596, 3.50%, 12/1/2044 | | | 14,659 | | | | 15,797 | |
| | |
Pool # ZS4598, 3.00%, 1/1/2045 | | | 18,006 | | | | 19,151 | |
| | |
Pool # ZL9010, 3.50%, 1/1/2045 | | | 23,034 | | | | 24,949 | |
| | |
Pool # ZS4609, 3.00%, 4/1/2045 | | | 69,055 | | | | 73,151 | |
| | |
Pool # ZM0037, 3.50%, 8/1/2045 | | | 226,704 | | | | 243,761 | |
| | |
Pool # ZS9809, 4.50%, 9/1/2045 | | | 43,346 | | | | 48,386 | |
| | |
Pool # ZS9589, 4.50%, 12/1/2045 | | | 69,948 | | | | 78,080 | |
| | |
Pool # ZA4628, 4.00%, 3/1/2046 | | | 62,923 | | | | 69,541 | |
| | |
Pool # ZS9743, 4.00%, 5/1/2046 | | | 1,313,918 | | | | 1,437,899 | |
| | |
Pool # SD0073, 4.50%, 6/1/2046 | | | 99,568 | | | | 111,335 | |
| | | | | | | | |
| INVESTMENTS | | PRINCIPAL
AMOUNT ($) | | | VALUE ($) | |
| | | | | | | | |
| | |
Pool # ZM1621, 4.50%, 9/1/2046 | | | 170,778 | | | | 195,137 | |
| | |
Pool # SD0146, 3.00%, 11/1/2046 | | | 240,413 | | | | 254,463 | |
| | |
Pool # ZM2209, 3.50%, 12/1/2046 | | | 415,266 | | | | 446,492 | |
| | |
Pool # ZM3134, 3.50%, 5/1/2047 | | | 123,770 | | | | 133,771 | |
| | |
Pool # ZS4729, 3.00%, 8/1/2047 | | | 554,790 | | | | 584,184 | |
| | |
Pool # ZM4635, 4.00%, 11/1/2047 | | | 816,528 | | | | 882,461 | |
| | |
Pool # SD0225, 3.00%, 12/1/2047 | | | 921,398 | | | | 976,973 | |
| | |
Pool # ZT0534, 3.50%, 12/1/2047 | | | 501,967 | | | | 545,114 | |
| | |
Pool # ZS4750, 3.00%, 1/1/2048 | | | 46,440 | | | | 48,900 | |
| | |
Pool # ZT0536, 3.50%, 3/1/2048 | | | 555,542 | | | | 600,432 | |
| | |
Pool # ZM6887, 3.00%, 5/1/2048 | | | 103,926 | | | | 108,864 | |
| | |
Pool # ZS4777, 3.50%, 7/1/2048 | | | 10,466 | | | | 11,096 | |
| | |
Pool # ZM7669, 3.50%, 8/1/2048 | | | 121,720 | | | | 131,953 | |
| | |
Pool # ZA5677, 4.00%, 9/1/2048 | | | 47,479 | | | | 51,212 | |
| | |
Pool # ZT1597, 3.00%, 12/1/2048 | | | 37,889 | | | | 39,689 | |
| | |
Pool # ZA6286, 4.00%, 2/1/2049 | | | 287,077 | | | | 310,640 | |
| | |
Pool # ZT1776, 3.50%, 3/1/2049 | | | 57,944 | | | | 61,470 | |
| | |
Pool # ZN5087, 4.00%, 4/1/2049 | | | 250,823 | | | | 271,744 | |
| | |
Pool # ZT1864, 4.00%, 4/1/2049 | | | 8,279 | | | | 8,897 | |
| | |
Pool # ZT1951, 3.50%, 5/1/2049 | | | 19,423 | | | | 20,605 | |
| | |
Pool # ZT1952, 4.00%, 5/1/2049 | | | 131,148 | | | | 140,930 | |
| | |
Pool # QA4907, 3.00%, 6/1/2049 | | | 267,318 | | | | 281,482 | |
| | |
Pool # ZT2086, 3.50%, 6/1/2049 | | | 107,107 | | | | 113,625 | |
| | |
Pool # ZT2087, 4.00%, 6/1/2049 | | | 54,928 | | | | 59,025 | |
| | |
Pool # SD0040, 3.00%, 7/1/2049 | | | 64,124 | | | | 67,008 | |
| | |
Pool # SD7502, 3.50%, 7/1/2049 | | | 250,790 | | | | 269,459 | |
| | |
Pool # SD8001, 3.50%, 7/1/2049 | | | 37,676 | | | | 39,969 | |
| | |
Pool # SD7501, 4.00%, 7/1/2049 | | | 144,675 | | | | 159,443 | |
| | |
Pool # QA1790, 3.00%, 8/1/2049 | | | 119,853 | | | | 125,244 | |
| | |
Pool # QA1997, 3.00%, 8/1/2049 | | | 38,687 | | | | 40,428 | |
| | |
Pool # SD8005, 3.50%, 8/1/2049 | | | 133,500 | | | | 141,623 | |
| | |
Pool # SD8006, 4.00%, 8/1/2049 | | | 84,489 | | | | 90,791 | |
| | |
Pool # SD8014, 5.00%, 8/1/2049 | | | 280,133 | | | | 311,555 | |
| | |
Pool # SD8016, 3.00%, 10/1/2049 | | | 42,711 | | | | 44,633 | |
| | |
Pool # SD8023, 2.50%, 11/1/2049 | | | 16,007 | | | | 16,570 | |
| | |
Pool # SD8025, 3.50%, 11/1/2049 | | | 382,571 | | | | 405,851 | |
| | |
Pool # SD8029, 2.50%, 12/1/2049 | | | 293,038 | | | | 303,330 | |
| | |
Pool # RA1878, 3.50%, 12/1/2049 | | | 287,642 | | | | 306,362 | |
| | |
Pool # SD8037, 2.50%, 1/1/2050 | | | 772,037 | | | | 799,151 | |
| | |
Pool # QA7416, 3.00%, 2/1/2050 | | | 1,250,711 | | | | 1,307,687 | |
| | |
Pool # QA7554, 3.00%, 2/1/2050 | | | 2,369,038 | | | | 2,532,612 | |
| | |
Pool # RA2116, 3.00%, 2/1/2050 | | | 993,640 | | | | 1,052,931 | |
| | |
Pool # SD0303, 2.50%, 4/1/2050 | | | 1,088,743 | | | | 1,139,394 | |
| | |
Pool # RA2471, 3.50%, 4/1/2050 | | | 156,023 | | | | 167,961 | |
| | |
Pool # SD8080, 2.00%, 6/1/2050 | | | 87,190 | | | | 88,100 | |
| | |
Pool # QB1691, 2.00%, 7/1/2050 | | | 1,147,537 | | | | 1,159,518 | |
SEE NOTES TO FINANCIAL STATEMENTS.
| | | | | | | | |
| | | |
| FEBRUARY 28, 2021 | | J.P. MORGAN EXCHANGE-TRADED FUNDS | | | | | 123 | |
JPMorgan U.S. Aggregate Bond ETF
SCHEDULE OF PORTFOLIO INVESTMENTS
AS OF FEBRUARY 28, 2021 (continued)
| | | | | | | | |
| INVESTMENTS | | PRINCIPAL
AMOUNT ($) | | | VALUE ($) | |
Mortgage-Backed Securities — continued | | | | | | | | |
| | |
Pool # SD8089, 2.50%, 7/1/2050 | | | 3,776,328 | | | | 3,912,671 | |
| | |
Pool # SD8083, 2.50%, 8/1/2050 | | | 2,025,911 | | | | 2,099,056 | |
| | |
Pool # RA3727, 2.00%, 10/1/2050 | | | 2,565,379 | | | | 2,605,318 | |
| | |
Pool # SD8104, 1.50%, 11/1/2050 | | | 158,294 | | | | 155,252 | |
| | |
Pool # QB5222, 2.00%, 11/1/2050 | | | 2,759,225 | | | | 2,792,037 | |
| | |
Pool # RA4197, 2.50%, 12/1/2050 | | | 771,377 | | | | 801,074 | |
| | |
Pool # QB8583, 1.50%, 2/1/2051 | | | 1,423,000 | | | | 1,396,290 | |
| | |
FNMA UMBS, 15 Year | | | | | | | | |
| | |
Pool # AC8711, 4.00%, 12/1/2024 | | | 345,316 | | | | 367,804 | |
| | |
Pool # AC7007, 4.50%, 1/1/2025 | | | 35,508 | | | | 37,131 | |
| | |
Pool # AL9580, 4.00%, 3/1/2025 | | | 28,141 | | | | 29,974 | |
| | |
Pool # 932724, 4.00%, 4/1/2025 | | | 12,826 | | | | 13,685 | |
| | |
Pool # AE0971, 4.00%, 5/1/2025 | | | 58,001 | | | | 61,778 | |
| | |
Pool # AE0939, 3.50%, 2/1/2026 | | | 70,256 | | | | 75,135 | |
| | |
Pool # FM2968, 4.00%, 5/1/2026 | | | 20,665 | | | | 22,049 | |
| | |
Pool # AJ6632, 3.00%, 11/1/2026 | | | 78,622 | | | | 83,183 | |
| | |
Pool # AJ9357, 3.50%, 1/1/2027 | | | 163,743 | | | | 175,222 | |
| | |
Pool # AK4047, 3.00%, 2/1/2027 | | | 32,400 | | | | 34,276 | |
| | |
Pool # AL4586, 4.00%, 2/1/2027 | | | 74,717 | | | | 79,717 | |
| | |
Pool # AB5095, 3.00%, 5/1/2027 | | | 31,843 | | | | 33,764 | |
| | |
Pool # AO0527, 3.00%, 5/1/2027 | | | 43,603 | | | | 46,199 | |
| | |
Pool # AO4400, 2.50%, 7/1/2027 | | | 90,919 | | | | 95,300 | |
| | |
Pool # AB5823, 3.50%, 8/1/2027 | | | 141,139 | | | | 151,184 | |
| | |
Pool # AL8138, 4.00%, 9/1/2027 | | | 43,578 | | | | 46,494 | |
| | |
Pool # AB6811, 2.50%, 10/1/2027 | | | 22,877 | | | | 23,944 | |
| | |
Pool # AQ9442, 2.00%, 12/1/2027 | | | 47,015 | | | | 48,622 | |
| | |
Pool # AB8447, 2.50%, 2/1/2028 | | | 40,812 | | | | 42,715 | |
| | |
Pool # AR4180, 2.50%, 2/1/2028 | | | 21,278 | | | | 22,362 | |
| | |
Pool # AL3802, 3.00%, 2/1/2028 | | | 127,216 | | | | 134,619 | |
| | |
Pool # AB8787, 2.00%, 3/1/2028 | | | 131,566 | | | | 136,210 | |
| | |
Pool # AP6059, 2.00%, 6/1/2028 | | | 16,227 | | | | 16,799 | |
| | |
Pool # BM5381, 3.00%, 6/1/2028 | | | 135,814 | | | | 143,717 | |
| | |
Pool # BM1892, 2.50%, 9/1/2028 | | | 40,716 | | | | 42,691 | |
| | |
Pool # AU6682, 3.00%, 9/1/2028 | | | 23,469 | | | | 24,894 | |
| | |
Pool # AS0761, 3.00%, 10/1/2028 | | | 50,115 | | | | 53,158 | |
| | |
Pool # AU6961, 3.00%, 10/1/2028 | | | 94,820 | | | | 100,578 | |
| | |
Pool # AL6132, 4.50%, 3/1/2029 | | | 17,770 | | | | 18,649 | |
| | |
Pool # FM1105, 2.50%, 6/1/2029 | | | 83,212 | | | | 87,093 | |
| | |
Pool # AS3345, 2.00%, 7/1/2029 | | | 17,160 | | | | 17,765 | |
| | |
Pool # MA2061, 3.00%, 10/1/2029 | | | 106,671 | | | | 113,328 | |
| | |
Pool # AL7205, 3.50%, 12/1/2029 | | | 196,504 | | | | 212,346 | |
| | |
Pool # BM4202, 3.50%, 12/1/2029 | | | 122,934 | | | | 132,845 | |
| | |
Pool # FM1465, 3.00%, 5/1/2030 | | | 245,395 | | | | 261,276 | |
| | |
Pool # 890666, 2.00%, 6/1/2030 | | | 45,720 | | | | 47,334 | |
| | |
Pool # MA2684, 3.00%, 7/1/2031 | | | 196,037 | | | | 207,561 | |
| | |
Pool # AL9418, 3.50%, 8/1/2031 | | | 69,169 | | | | 74,962 | |
| | | | | | | | |
| INVESTMENTS | | PRINCIPAL
AMOUNT ($) | | | VALUE ($) | |
| | | | | | | | |
| | |
Pool # BD5647, 2.00%, 11/1/2031 | | | 25,916 | | | | 26,819 | |
| | |
Pool # 890776, 3.50%, 11/1/2031 | | | 50,196 | | | | 54,237 | |
| | |
Pool # BM5490, 3.50%, 11/1/2031 | | | 35,035 | | | | 37,856 | |
| | |
Pool # BM4993, 3.50%, 3/1/2032 | | | 77,905 | | | | 83,085 | |
| | |
Pool # BM4741, 3.00%, 4/1/2032 | | | 23,688 | | | | 25,126 | |
| | |
Pool # FM1645, 3.00%, 4/1/2032 | | | 262,177 | | | | 278,096 | |
| | |
Pool # BE8694, 3.50%, 7/1/2032 | | | 70,645 | | | | 76,837 | |
| | |
Pool # MA3124, 2.50%, 9/1/2032 | | | 71,466 | | | | 74,841 | |
| | |
Pool # FM3099, 3.50%, 9/1/2032 | | | 101,515 | | | | 108,375 | |
| | |
Pool # CA0775, 2.50%, 11/1/2032 | | | 48,119 | | | | 50,941 | |
| | |
Pool # MA3188, 3.00%, 11/1/2032 | | | 39,077 | | | | 41,336 | |
| | |
Pool # BH7081, 2.50%, 12/1/2032 | | | 81,173 | | | | 85,006 | |
| | |
Pool # BH8720, 3.50%, 12/1/2032 | | | 63,745 | | | | 69,641 | |
| | |
Pool # FM1161, 2.50%, 1/1/2033 | | | 70,871 | | | | 75,035 | |
| | |
Pool # FM1691, 2.50%, 1/1/2033 | | | 28,762 | | | | 30,112 | |
| | |
Pool # FM2549, 2.50%, 1/1/2033 | | | 144,165 | | | | 152,073 | |
| | |
Pool # MA3353, 4.00%, 4/1/2033 | | | 30,318 | | | | 32,291 | |
| | |
Pool # BM5716, 4.00%, 6/1/2033 | | | 125,644 | | | | 135,060 | |
| | |
Pool # MA3393, 4.00%, 6/1/2033 | | | 193,588 | | | | 206,187 | |
| | |
Pool # FM1123, 4.00%, 9/1/2033 | | | 236,334 | | | | 254,832 | |
| | |
Pool # FM2153, 4.00%, 11/1/2033 | | | 386,859 | | | | 412,054 | |
| | |
Pool # MA3547, 3.00%, 12/1/2033 | | | 13,616 | | | | 14,394 | |
| | |
Pool # BD9105, 4.00%, 1/1/2034 | | | 75,469 | | | | 81,353 | |
| | |
Pool # BM5306, 4.00%, 1/1/2034 | | | 11,212 | | | | 12,143 | |
| | |
Pool # FM1842, 3.50%, 6/1/2034 | | | 341,134 | | | | 365,565 | |
| | |
Pool # BO1822, 3.50%, 7/1/2034 | | | 140,631 | | | | 151,009 | |
| | |
Pool # MA3764, 2.50%, 9/1/2034 | | | 19,335 | | | | 20,198 | |
| | |
Pool # MA3910, 2.00%, 1/1/2035 | | | 44,583 | | | | 46,098 | |
| | |
Pool # FM3569, 3.00%, 1/1/2035 | | | 210,202 | | | | 227,291 | |
| | |
Pool # FM2708, 3.00%, 3/1/2035 | | | 121,648 | | | | 130,404 | |
| | |
Pool # MA3985, 3.00%, 4/1/2035 | | | 324,298 | | | | 344,725 | |
| | |
Pool # MA4014, 3.00%, 5/1/2035 | | | 205,902 | | | | 218,878 | |
| | |
Pool # MA4075, Class 177, 2.50%, 7/1/2035 | | | 721,042 | | | | 754,293 | |
| | |
Pool # MA4076, 3.00%, 7/1/2035 | | | 252,120 | | | | 268,013 | |
| | |
Pool # FM4035, 2.50%, 8/1/2035 | | | 115,184 | | | | 121,330 | |
| | |
Pool # MA4122, 1.50%, 9/1/2035 | | | 196,919 | | | | 199,231 | |
| | |
Pool # MA4123, 2.00%, 9/1/2035 | | | 206,837 | | | | 213,944 | |
| | |
Pool # CA7497, 2.50%, 10/1/2035 | | | 1,832,630 | | | | 1,940,813 | |
| | |
Pool # FM5797, 2.00%, 1/1/2036 | | | 1,059,199 | | | | 1,101,400 | |
| | |
Pool # FM5367, 1.50%, 2/1/2036 | | | 2,036,466 | | | | 2,060,372 | |
| | |
FNMA UMBS, 20 Year | | | | | | | | |
| | |
Pool # AE6799, 4.50%, 11/1/2030 | | | 3,443 | | | | 3,786 | |
| | |
Pool # MA0885, 3.50%, 10/1/2031 | | | 49,755 | | | | 53,303 | |
| | |
Pool # AB4853, 3.00%, 4/1/2032 | | | 48,916 | | | | 51,863 | |
| | |
Pool # MA1058, 3.00%, 5/1/2032 | | | 21,462 | | | | 22,755 | |
SEE NOTES TO FINANCIAL STATEMENTS.
| | | | | | |
| | | |
| 124 | | | | J.P. MORGAN EXCHANGE-TRADED FUNDS | | FEBRUARY 28, 2021 |
| | | | | | | | |
| INVESTMENTS | | PRINCIPAL
AMOUNT ($) | | | VALUE ($) | |
Mortgage-Backed Securities — continued | | | | | | | | |
| | |
Pool # MA1165, 3.00%, 9/1/2032 | | | 118,181 | | | | 125,303 | |
| | |
Pool # MA2079, 4.00%, 11/1/2034 | | | 25,333 | | | | 27,744 | |
| | |
Pool # AL8620, 3.00%, 2/1/2035 | | | 32,310 | | | | 34,286 | |
| | |
Pool # AS4442, 3.00%, 2/1/2035 | | | 88,854 | | | | 94,287 | |
| | |
Pool # MA2287, 3.00%, 6/1/2035 | | | 61,962 | | | | 65,630 | |
| | |
Pool # AL6970, 3.50%, 7/1/2035 | | | 35,193 | | | | 37,927 | |
| | |
Pool # AL7654, 3.00%, 9/1/2035 | | | 104,378 | | | | 110,556 | |
| | |
Pool # MA2472, 3.00%, 12/1/2035 | | | 21,111 | | | | 22,361 | |
| | |
Pool # FM1133, 4.00%, 6/1/2036 | | | 50,566 | | | | 55,378 | |
| | |
Pool # MA3099, 4.00%, 8/1/2037 | | | 173,784 | | | | 187,681 | |
| | |
Pool # BM5330, 2.50%, 12/1/2037 | | | 72,240 | | | | 75,080 | |
| | |
Pool # FM3204, 4.00%, 10/1/2038 | | | 60,757 | | | | 66,602 | |
| | |
Pool # MA3519, 4.00%, 11/1/2038 | | | 24,677 | | | | 26,612 | |
| | |
Pool # MA3958, 3.00%, 3/1/2040 | | | 68,338 | | | | 71,596 | |
| | |
Pool # MA4046, 3.00%, 6/1/2040 | | | 20,515 | | | | 21,493 | |
| | |
Pool # MA4072, 2.50%, 7/1/2040 | | | 264,193 | | | | 274,769 | |
| | |
Pool # MA4128, 2.00%, 9/1/2040 | | | 2,272,174 | | | | 2,317,239 | |
| | |
Pool # MA4204, 2.00%, 12/1/2040 | | | 1,124,639 | | | | 1,146,622 | |
| | |
Pool # CA9019, 2.00%, 2/1/2041 | | | 466,712 | | | | 480,554 | |
| | |
FNMA UMBS, 30 Year | | | | | | | | |
| | |
Pool # 254447, 6.00%, 9/1/2032 | | | 33,303 | | | | 38,406 | |
| | |
Pool # 708506, 5.50%, 5/1/2033 | | | 57,636 | | | | 60,713 | |
| | |
Pool # 711215, 5.50%, 6/1/2033 | | | 24,032 | | | | 27,474 | |
| | |
Pool # AA1005, 5.00%, 12/1/2033 | | | 18,694 | | | | 21,309 | |
| | |
Pool # 725232, 5.00%, 3/1/2034 | | | 16,050 | | | | 18,295 | |
| | |
Pool # 725228, 6.00%, 3/1/2034 | | | 82,631 | | | | 95,635 | |
| | |
Pool # 790003, 6.00%, 8/1/2034 | | | 18,034 | | | | 20,750 | |
| | |
Pool # 735503, 6.00%, 4/1/2035 | | | 57,229 | | | | 66,584 | |
| | |
Pool # 190360, 5.00%, 8/1/2035 | | | 44,772 | | | | 51,304 | |
| | |
Pool # 904601, 6.00%, 11/1/2036 | | | 53,244 | | | | 62,087 | |
| | |
Pool # 888538, 5.50%, 1/1/2037 | | | 31,953 | | | | 36,828 | |
| | |
Pool # AB0284, 6.00%, 2/1/2037 | | | 62,534 | | | | 72,775 | |
| | |
Pool # AL2627, 5.00%, 7/1/2037 | | | 28,981 | | | | 33,037 | |
| | |
Pool # 956965, 6.50%, 12/1/2037 | | | 20,142 | | | | 22,382 | |
| | |
Pool # BH7907, 6.50%, 12/1/2037 | | | 28,220 | | | | 33,427 | |
| | |
Pool # 961793, 5.00%, 3/1/2038 | | | 114,005 | | | | 131,243 | |
| | |
Pool # 985661, 5.50%, 6/1/2038 | | | 21,258 | | | | 24,391 | |
| | |
Pool # AU7519, 3.50%, 9/1/2038 | | | 57,927 | | | | 62,994 | |
| | |
Pool # AA7402, 4.50%, 6/1/2039 | | | 182,572 | | | | 205,071 | |
| | |
Pool # AC2638, 5.00%, 10/1/2039 | | | 231,231 | | | | 269,117 | |
| | |
Pool # AL0100, 6.00%, 10/1/2039 | | | 76,782 | | | | 89,457 | |
| | |
Pool # AC4886, 5.00%, 11/1/2039 | | | 44,932 | | | | 51,342 | |
| | |
Pool # 190399, 5.50%, 11/1/2039 | | | 130,993 | | | | 151,582 | |
| | |
Pool # AS4787, 3.00%, 4/1/2040 | | | 170,922 | | | | 181,058 | |
| | |
Pool # AB1143, 4.50%, 6/1/2040 | | | 129,914 | | | | 148,382 | |
| | | | | | | | |
| INVESTMENTS | | PRINCIPAL
AMOUNT ($) | | | VALUE ($) | |
| | | | | | | | |
| | |
Pool # AD6938, 4.50%, 6/1/2040 | | | 169,591 | | | | 190,244 | |
| | |
Pool # AD5479, 5.00%, 6/1/2040 | | | 46,788 | | | | 53,124 | |
| | |
Pool # AB1259, 5.00%, 7/1/2040 | | | 61,160 | | | | 69,442 | |
| | |
Pool # AB1292, 5.00%, 8/1/2040 | | | 23,843 | | | | 27,072 | |
| | |
Pool # AL5437, 5.00%, 8/1/2040 | | | 155,665 | | | | 177,454 | |
| | |
Pool # AB1421, 5.00%, 9/1/2040 | | | 61,017 | | | | 71,225 | |
| | |
Pool # AE4142, 5.00%, 9/1/2040 | | | 33,791 | | | | 38,367 | |
| | |
Pool # AE8289, 4.00%, 12/1/2040 | | | 165,170 | | | | 182,534 | |
| | |
Pool # MA0622, 3.50%, 1/1/2041 | | | 47,149 | | | | 50,937 | |
| | |
Pool # AH2312, 5.00%, 1/1/2041 | | | 121,106 | | | | 137,506 | |
| | |
Pool # AE0828, 3.50%, 2/1/2041 | | | 30,739 | | | | 33,209 | |
| | |
Pool # BM3090, 3.50%, 2/1/2041 | | | 189,299 | | | | 203,522 | |
| | |
Pool # AH3804, 4.00%, 2/1/2041 | | | 32,822 | | | | 36,273 | |
| | |
Pool # MA0639, 4.00%, 2/1/2041 | | | 59,550 | | | | 65,811 | |
| | |
Pool # AB2676, 3.50%, 4/1/2041 | | | 142,204 | | | | 154,814 | |
| | |
Pool # AL0241, 4.00%, 4/1/2041 | | | 95,043 | | | | 105,034 | |
| | |
Pool # AI1887, 4.50%, 5/1/2041 | | | 341,232 | | | | 382,561 | |
| | |
Pool # BM3118, 6.00%, 7/1/2041 | | | 122,358 | | | | 142,652 | |
| | |
Pool # AJ2293, 4.00%, 9/1/2041 | | | 32,161 | | | | 35,556 | |
| | |
Pool # AL0933, 5.00%, 10/1/2041 | | | 141,809 | | | | 161,047 | |
| | |
Pool # AW8154, 3.50%, 1/1/2042 | | | 32,544 | | | | 35,342 | |
| | |
Pool # AX5318, 4.50%, 1/1/2042 | | | 111,973 | | | | 125,534 | |
| | |
Pool # BD4480, 4.50%, 1/1/2042 | | | 437,558 | | | | 490,553 | |
| | |
Pool # AB4698, 4.00%, 3/1/2042 | | | 114,659 | | | | 129,840 | |
| | |
Pool # AL1998, 4.00%, 3/1/2042 | | | 152,274 | | | | 168,344 | |
| | |
Pool # AK7028, 4.00%, 4/1/2042 | | | 110,301 | | | | 122,191 | |
| | |
Pool # AO4134, 3.50%, 6/1/2042 | | | 19,288 | | | | 20,965 | |
| | |
Pool # AO8694, 4.50%, 7/1/2042 | | | 37,854 | | | | 41,797 | |
| | |
Pool # AP4258, 3.00%, 8/1/2042 | | | 148,603 | | | | 159,019 | |
| | |
Pool # AO9798, 3.50%, 8/1/2042 | | | 40,571 | | | | 43,856 | |
| | |
Pool # AP2424, 4.00%, 8/1/2042 | | | 158,263 | | | | 175,323 | |
| | |
Pool # AP3958, 3.00%, 9/1/2042 | | | 358,930 | | | | 384,088 | |
| | |
Pool # AB6632, 3.50%, 10/1/2042 | | | 201,469 | | | | 217,782 | |
| | |
Pool # AB6633, 3.50%, 10/1/2042 | | | 39,446 | | | | 42,640 | |
| | |
Pool # AL3344, 4.50%, 10/1/2042 | | | 202,505 | | | | 229,466 | |
| | |
Pool # AB6828, 3.50%, 11/1/2042 | | | 175,517 | | | | 190,777 | |
| | |
Pool # AL3182, 3.50%, 12/1/2042 | | | 27,570 | | | | 30,590 | |
| | |
Pool # AQ9316, 2.50%, 1/1/2043 | | | 81,433 | | | | 85,169 | |
| | |
Pool # AB7580, 3.00%, 1/1/2043 | | | 193,676 | | | | 207,251 | |
| | |
Pool # AQ1104, 3.00%, 1/1/2043 | | | 48,059 | | | | 51,428 | |
| | |
Pool # AR0168, 3.00%, 2/1/2043 | | | 77,104 | | | | 82,665 | |
| | |
Pool # AR4239, 3.00%, 2/1/2043 | | | 51,790 | | | | 55,314 | |
| | |
Pool # AB7964, 3.50%, 2/1/2043 | | | 101,989 | | | | 113,549 | |
| | |
Pool # BM4751, 3.50%, 3/1/2043 | | | 52,077 | | | | 56,293 | |
| | |
Pool # AB8742, 4.00%, 3/1/2043 | | | 22,974 | | | | 26,015 | |
| | |
Pool # AR6770, 4.00%, 3/1/2043 | | | 25,418 | | | | 28,088 | |
SEE NOTES TO FINANCIAL STATEMENTS.
| | | | | | | | |
| | | |
| FEBRUARY 28, 2021 | | J.P. MORGAN EXCHANGE-TRADED FUNDS | | | | | 125 | |
JPMorgan U.S. Aggregate Bond ETF
SCHEDULE OF PORTFOLIO INVESTMENTS
AS OF FEBRUARY 28, 2021 (continued)
| | | | | | | | |
| INVESTMENTS | | PRINCIPAL
AMOUNT ($) | | | VALUE ($) | |
Mortgage-Backed Securities — continued | | | | | | | | |
| | |
Pool # AT2015, 3.00%, 4/1/2043 | | | 55,848 | | | | 59,648 | |
| | |
Pool # AT2016, 3.00%, 4/1/2043 | | | 854,484 | | | | 912,628 | |
| | |
Pool # AT2035, 3.50%, 4/1/2043 | | | 76,205 | | | | 82,870 | |
| | |
Pool # AR8293, 3.00%, 5/1/2043 | | | 390,067 | | | | 416,609 | |
| | |
Pool # AT2723, 3.00%, 5/1/2043 | | | 84,788 | | | | 90,557 | |
| | |
Pool # AB9194, 3.50%, 5/1/2043 | | | 179,968 | | | | 195,709 | |
| | |
Pool # AS0021, 3.00%, 7/1/2043 | | | 96,137 | | | | 102,679 | |
| | |
Pool # AT8912, 3.00%, 7/1/2043 | | | 52,760 | | | | 56,351 | |
| | |
Pool # AU1629, 3.00%, 7/1/2043 | | | 132,113 | | | | 141,102 | |
| | |
Pool # BM3785, 3.50%, 7/1/2043 | | | 190,485 | | | | 207,474 | |
| | |
Pool # BM3704, 3.00%, 9/1/2043 | | | 56,851 | | | | 60,720 | |
| | |
Pool # AT2612, 3.50%, 9/1/2043 | | | 130,804 | | | | 142,244 | |
| | |
Pool # AU4256, 3.50%, 9/1/2043 | | | 46,736 | | | | 51,473 | |
| | |
Pool # AU4283, 3.50%, 9/1/2043 | | | 29,831 | | | | 32,501 | |
| | |
Pool # AL4062, 4.00%, 9/1/2043 | | | 43,119 | | | | 48,275 | |
| | |
Pool # AS0560, 4.50%, 9/1/2043 | | | 25,093 | | | | 28,069 | |
| | |
Pool # BM4635, 2.50%, 10/1/2043 | | | 232,276 | | | | 242,819 | |
| | |
Pool # AS1121, 4.00%, 11/1/2043 | | | 62,283 | | | | 68,751 | |
| | |
Pool # AV0022, 4.00%, 11/1/2043 | | | 1,049,943 | | | | 1,158,971 | |
| | |
Pool # AL7696, 3.00%, 12/1/2043 | | | 88,416 | | | | 94,433 | |
| | |
Pool # AS1557, 4.00%, 1/1/2044 | | | 76,179 | | | | 84,089 | |
| | |
Pool # AV6103, 4.00%, 1/1/2044 | | | 308,403 | | | | 340,428 | |
| | |
Pool # BC1737, 4.00%, 1/1/2044 | | | 125,268 | | | | 138,438 | |
| | |
Pool # BM5365, 4.00%, 3/1/2044 | | | 113,018 | | | | 124,899 | |
| | |
Pool # FM1744, 3.50%, 5/1/2044 | | | 45,810 | | | | 51,003 | |
| | |
Pool # AS2700, 4.00%, 6/1/2044 | | | 68,577 | | | | 75,769 | |
| | |
Pool # AW6233, 4.50%, 6/1/2044 | | | 865,223 | | | | 971,781 | |
| | |
Pool # AS2947, 4.00%, 7/1/2044 | | | 65,937 | | | | 72,377 | |
| | |
Pool # AL9072, 5.00%, 7/1/2044 | | | 114,649 | | | | 130,202 | |
| | |
Pool # AS3133, 3.50%, 8/1/2044 | | | 32,097 | | | | 34,869 | |
| | |
Pool # AL9569, 5.00%, 8/1/2044 | | | 179,683 | | | | 204,193 | |
| | |
Pool # AX0152, 4.50%, 9/1/2044 | | | 42,175 | | | | 46,654 | |
| | |
Pool # BM4620, 3.00%, 10/1/2044 | | | 144,103 | | | | 154,204 | |
| | |
Pool # AL5926, 3.50%, 10/1/2044 | | | 140,402 | | | | 153,706 | |
| | |
Pool # AS3611, 3.50%, 10/1/2044 | | | 20,297 | | | | 22,050 | |
| | |
Pool # AS3470, 4.00%, 10/1/2044 | | | 32,086 | | | | 35,167 | |
| | |
Pool # AX2491, 4.00%, 10/1/2044 | | | 12,359 | | | | 13,545 | |
| | |
Pool # AS3710, 4.00%, 11/1/2044 | | | 44,330 | | | | 48,660 | |
| | |
Pool # AS3867, 4.00%, 11/1/2044 | | | 18,280 | | | | 20,065 | |
| | |
Pool # AX4855, 4.00%, 11/1/2044 | | | 171,009 | | | | 187,427 | |
| | |
Pool # AS3935, 3.50%, 12/1/2044 | | | 697,788 | | | | 758,049 | |
| | |
Pool # AS4012, 3.50%, 12/1/2044 | | | 89,534 | | | | 98,024 | |
| | |
Pool # FM1746, 3.50%, 1/1/2045 | | | 147,458 | | | | 162,352 | |
| | |
Pool # AS4402, 3.50%, 2/1/2045 | | | 97,958 | | | | 106,746 | |
| | |
Pool # AS4457, 3.50%, 2/1/2045 | | | 211,857 | | | | 228,224 | |
| | | | | | | | |
| INVESTMENTS | | PRINCIPAL
AMOUNT ($) | | | VALUE ($) | |
| | | | | | | | |
| | |
Pool # AX7699, 3.50%, 2/1/2045 | | | 66,237 | | | | 71,354 | |
| | |
Pool # AY3671, 3.50%, 2/1/2045 | | | 84,333 | | | | 93,257 | |
| | |
Pool # FM0015, 4.00%, 2/1/2045 | | | 149,171 | | | | 167,133 | |
| | |
Pool # MA2193, 4.50%, 2/1/2045 | | | 29,719 | | | | 33,165 | |
| | |
Pool # AS4541, 3.00%, 3/1/2045 | | | 114,962 | | | | 122,754 | |
| | |
Pool # AS4571, 3.50%, 3/1/2045 | | | 81,786 | | | | 88,246 | |
| | |
Pool # FM3414, 4.00%, 3/1/2045 | | | 151,561 | | | | 166,366 | |
| | |
Pool # AZ1682, 3.50%, 4/1/2045 | | | 32,009 | | | | 34,413 | |
| | |
Pool # BM3398, 3.50%, 4/1/2045 | | | 20,968 | | | | 22,906 | |
| | |
Pool # AY8617, 3.00%, 5/1/2045 | | | 17,581 | | | | 18,624 | |
| | |
Pool # BM5471, 3.50%, 6/1/2045 | | | 475,146 | | | | 517,670 | |
| | |
Pool # AZ5985, 3.00%, 7/1/2045 | | | 124,943 | | | | 133,967 | |
| | |
Pool # AS5570, 3.50%, 8/1/2045 | | | 68,944 | | | | 74,227 | |
| | |
Pool # AS5806, 3.00%, 9/1/2045 | | | 226,861 | | | | 240,314 | |
| | |
Pool # AS5778, 3.50%, 9/1/2045 | | | 26,462 | | | | 28,451 | |
| | |
Pool # AZ2947, 4.00%, 9/1/2045 | | | 31,084 | | | | 34,014 | |
| | |
Pool # CA2709, 4.00%, 9/1/2045 | | | 1,824,693 | | | | 2,021,384 | |
| | |
Pool # AS5851, 4.50%, 9/1/2045 | | | 25,891 | | | | 28,946 | |
| | |
Pool # AS6184, 3.50%, 11/1/2045 | | | 206,983 | | | | 226,635 | |
| | |
Pool # AS6196, 3.50%, 11/1/2045 | | | 30,294 | | | | 32,571 | |
| | |
Pool # FM1869, 4.00%, 11/1/2045 | | | 119,572 | | | | 131,052 | |
| | |
Pool # FM1708, 3.00%, 12/1/2045 | | | 58,413 | | | | 62,626 | |
| | |
Pool # BA3077, 3.50%, 12/1/2045 | | | 32,834 | | | | 35,557 | |
| | |
Pool # BC0066, 3.50%, 12/1/2045 | | | 46,350 | | | | 49,901 | |
| | |
Pool # BC0676, 3.50%, 12/1/2045 | | | 56,004 | | | | 60,212 | |
| | |
Pool # FM1923, 3.50%, 1/1/2046 | | | 62,637 | | | | 67,343 | |
| | |
Pool # FM3413, 4.00%, 1/1/2046 | | | 131,142 | | | | 144,897 | |
| | |
Pool # MA2512, 4.00%, 1/1/2046 | | | 28,986 | | | | 31,718 | |
| | |
Pool # AS6654, 3.50%, 2/1/2046 | | | 29,815 | | | | 32,055 | |
| | |
Pool # FM2323, 4.00%, 2/1/2046 | | | 68,409 | | | | 75,628 | |
| | |
Pool # AL9128, 4.50%, 2/1/2046 | | | 34,219 | | | | 38,363 | |
| | |
Pool # AS6811, 3.00%, 3/1/2046 | | | 57,485 | | | | 60,850 | |
| | |
Pool # BM4834, 3.00%, 3/1/2046 | | | 41,057 | | | | 44,105 | |
| | |
Pool # AL8387, 4.00%, 3/1/2046 | | | 236,634 | | | | 258,945 | |
| | |
Pool # FM1782, 4.00%, 3/1/2046 | | | 20,650 | | | | 22,668 | |
| | |
Pool # FM2195, 4.00%, 3/1/2046 | | | 53,840 | | | | 59,522 | |
| | |
Pool # AS7003, 3.00%, 4/1/2046 | | | 73,108 | | | | 77,387 | |
| | |
Pool # FM1370, 3.00%, 4/1/2046 | | | 24,187 | | | | 25,622 | |
| | |
Pool # FM1224, 3.50%, 4/1/2046 | | | 180,866 | | | | 194,454 | |
| | |
Pool # AL8936, 4.50%, 5/1/2046 | | | 26,583 | | | | 29,665 | |
| | |
Pool # AS7198, 4.50%, 5/1/2046 | | | 194,796 | | | | 216,343 | |
| | |
Pool # BD0166, 2.50%, 6/1/2046 | | | 186,424 | | | | 193,577 | |
| | |
Pool # BM5168, 2.50%, 6/1/2046 | | | 37,336 | | | | 39,049 | |
| | |
Pool # AS7343, 3.00%, 6/1/2046 | | | 226,925 | | | | 240,207 | |
| | |
Pool # AS7376, 3.00%, 6/1/2046 | | | 327,678 | | | | 346,857 | |
| | |
Pool # AS7386, 3.50%, 6/1/2046 | | | 20,892 | | | | 22,407 | |
SEE NOTES TO FINANCIAL STATEMENTS.
| | | | | | |
| | | |
| 126 | | | | J.P. MORGAN EXCHANGE-TRADED FUNDS | | FEBRUARY 28, 2021 |
| | | | | | | | |
| INVESTMENTS | | PRINCIPAL
AMOUNT ($) | | | VALUE ($) | |
Mortgage-Backed Securities — continued | | | | | | | | |
| | |
Pool # BM5587, 4.00%, 6/1/2046 | | | 78,760 | | | | 86,938 | |
| | |
Pool # AS7660, 2.50%, 8/1/2046 | | | 394,684 | | | | 409,829 | |
| | |
Pool # MA2730, 2.50%, 8/1/2046 | | | 60,771 | | | | 63,103 | |
| | |
Pool # BD7968, 3.50%, 9/1/2046 | | | 475,783 | | | | 517,076 | |
| | |
Pool # FM3810, 3.00%, 10/1/2046 | | | 155,743 | | | | 166,300 | |
| | |
Pool # AL9385, 3.00%, 11/1/2046 | | | 81,142 | | | | 86,427 | |
| | |
Pool # MA2806, 3.00%, 11/1/2046 | | | 285,546 | | | | 302,259 | |
| | |
Pool # BM3288, 3.50%, 12/1/2046 | | | 36,257 | | | | 39,215 | |
| | |
Pool # FM2321, 3.50%, 12/1/2046 | | | 160,689 | | | | 172,761 | |
| | |
Pool # BM4990, 2.50%, 1/1/2047 | | | 17,668 | | | | 18,470 | |
| | |
Pool # FM2807, 3.00%, 1/1/2047 | | | 123,328 | | | | 131,927 | |
| | |
Pool # 890856, 3.50%, 1/1/2047 | | | 196,553 | | | | 214,484 | |
| | |
Pool # FM3374, 3.50%, 1/1/2047 | | | 269,521 | | | | 291,345 | |
| | |
Pool # FM0041, 3.00%, 2/1/2047 | | | 889,297 | | | | 962,209 | |
| | |
Pool # BD5046, 3.50%, 2/1/2047 | | | 532,366 | | | | 570,971 | |
| | |
Pool # BM5955, 4.00%, 2/1/2047 | | | 63,656 | | | | 69,874 | |
| | |
Pool # BM5270, 4.50%, 2/1/2047 | | | 28,663 | | | | 32,134 | |
| | |
Pool # MA2920, 3.00%, 3/1/2047 | | | 13,146 | | | | 13,916 | |
| | |
Pool # FM3107, 3.50%, 3/1/2047 | | | 505,609 | | | | 543,596 | |
| | |
Pool # AS9313, 4.00%, 3/1/2047 | | | 30,519 | | | | 33,423 | |
| | |
Pool # FM1511, 3.00%, 4/1/2047 | | | 158,058 | | | | 167,432 | |
| | |
Pool # FM4735, 3.00%, 4/1/2047 | | | 233,278 | | | | 252,404 | |
| | |
Pool # AS9480, 4.50%, 4/1/2047 | | | 64,182 | | | | 71,902 | |
| | |
Pool # BM2000, 3.50%, 5/1/2047 | | | 1,372,898 | | | | 1,472,456 | |
| | |
Pool # BM5220, 3.50%, 5/1/2047 | | | 49,943 | | | | 53,565 | |
| | |
Pool # BE0628, 4.50%, 5/1/2047 | | | 70,014 | | | | 76,651 | |
| | |
Pool # FM1772, 4.50%, 5/1/2047 | | | 28,293 | | | | 31,720 | |
| | |
Pool # AS9937, 3.00%, 7/1/2047 | | | 934,195 | | | | 988,873 | |
| | |
Pool # AS9946, 3.50%, 7/1/2047 | | | 76,221 | | | | 82,371 | |
| | |
Pool # BM1568, 3.50%, 7/1/2047 | | | 100,060 | | | | 110,670 | |
| | |
Pool # AS9988, 4.50%, 7/1/2047 | | | 40,478 | | | | 44,315 | |
| | |
Pool # BH7375, 3.50%, 8/1/2047 | | | 93,899 | | | | 99,722 | |
| | |
Pool # CA0110, 3.50%, 8/1/2047 | | | 24,343 | | | | 25,918 | |
| | |
Pool # CA0148, 4.50%, 8/1/2047 | | | 34,284 | | | | 37,534 | |
| | |
Pool # CA0850, 3.00%, 9/1/2047 | | | 72,826 | | | | 76,710 | |
| | |
Pool # BH9317, 3.50%, 9/1/2047 | | | 166,669 | | | | 178,568 | |
| | |
Pool # CA0407, 3.50%, 9/1/2047 | | | 135,307 | | | | 144,060 | |
| | |
Pool # MA3147, 3.00%, 10/1/2047 | | | 79,187 | | | | 83,410 | |
| | |
Pool # BH9394, 3.50%, 10/1/2047 | | | 227,235 | | | | 243,458 | |
| | |
Pool # BM2003, 4.00%, 10/1/2047 | | | 354,181 | | | | 382,633 | |
| | |
Pool # BH9392, 3.50%, 11/1/2047 | | | 32,492 | | | | 34,507 | |
| | |
Pool # CA0681, 3.50%, 11/1/2047 | | | 337,088 | | | | 369,690 | |
| | |
Pool # FM0028, 3.00%, 12/1/2047 | | | 70,768 | | | | 75,564 | |
| | |
Pool # MA3209, 3.00%, 12/1/2047 | | | 519,155 | | | | 546,842 | |
| | |
Pool # FM1420, 3.50%, 12/1/2047 | | | 358,478 | | | | 389,498 | |
| | |
Pool # BJ5376, 4.50%, 12/1/2047 | | | 52,883 | | | | 57,896 | |
| | | | | | | | |
| INVESTMENTS | | PRINCIPAL
AMOUNT ($) | | | VALUE ($) | |
| | | | | | | | |
| | |
Pool # CA4015, 3.00%, 1/1/2048 | | | 16,539 | | | | 17,421 | |
| | |
Pool # MA3238, 3.50%, 1/1/2048 | | | 103,728 | | | | 110,160 | |
| | |
Pool # BJ5910, 3.50%, 2/1/2048 | | | 263,800 | | | | 291,870 | |
| | |
Pool # CA4155, 3.50%, 2/1/2048 | | | 27,337 | | | | 29,032 | |
| | |
Pool # MA3304, 3.00%, 3/1/2048 | | | 84,485 | | | | 88,991 | |
| | |
Pool # BM3990, 4.00%, 3/1/2048 | | | 43,820 | | | | 47,340 | |
| | |
Pool # FM3494, 2.50%, 4/1/2048 | | | 19,353 | | | | 20,095 | |
| | |
Pool # BM3899, 4.00%, 4/1/2048 | | | 592,028 | | | | 639,588 | |
| | |
Pool # CA1574, 5.00%, 4/1/2048 | | | 93,498 | | | | 103,750 | |
| | |
Pool # CA2687, 3.00%, 5/1/2048 | | | 33,424 | | | | 35,747 | |
| | |
Pool # FM2177, 3.50%, 5/1/2048 | | | 562,705 | | | | 608,615 | |
| | |
Pool # BM4054, 4.00%, 5/1/2048 | | | 180,002 | | | | 196,923 | |
| | |
Pool # MA3425, 3.00%, 6/1/2048 | | | 68,062 | | | | 71,368 | |
| | |
Pool # BM4757, 3.50%, 7/1/2048 | | | 76,861 | | | | 82,435 | |
| | |
Pool # FM1911, 3.50%, 7/1/2048 | | | 159,431 | | | | 171,410 | |
| | |
Pool # MA3443, 4.00%, 8/1/2048 | | | 31,072 | | | | 33,360 | |
| | |
Pool # BK4769, 5.00%, 8/1/2048 | | | 23,566 | | | | 26,086 | |
| | |
Pool # BM2007, 4.00%, 9/1/2048 | | | 10,910 | | | | 11,713 | |
| | |
Pool # CA2368, 4.00%, 9/1/2048 | | | 65,558 | | | | 71,092 | |
| | |
Pool # MA3472, 5.00%, 9/1/2048 | | | 24,217 | | | | 26,806 | |
| | |
Pool # CA4655, 3.50%, 10/1/2048 | | | 151,280 | | | | 163,485 | |
| | |
Pool # MA3495, 4.00%, 10/1/2048 | | | 75,593 | | | | 81,159 | |
| | |
Pool # CA2432, 4.50%, 10/1/2048 | | | 105,552 | | | | 116,767 | |
| | |
Pool # BM4678, 4.00%, 11/1/2048 | | | 255,189 | | | | 276,730 | |
| | |
Pool # FM1248, 4.50%, 11/1/2048 | | | 45,937 | | | | 50,291 | |
| | |
Pool # FM2275, 4.50%, 11/1/2048 | | | 55,935 | | | | 62,123 | |
| | |
Pool # FM1148, 3.50%, 12/1/2048 | | | 68,399 | | | | 72,523 | |
| | |
Pool # FM1866, 4.00%, 12/1/2048 | | | 235,944 | | | | 253,316 | |
| | |
Pool # MA3536, 4.00%, 12/1/2048 | | | 99,813 | | | | 107,162 | |
| | |
Pool # MA3577, 3.00%, 1/1/2049 | | | 29,321 | | | | 30,746 | |
| | |
Pool # BM5256, 4.50%, 1/1/2049 | | | 78,933 | | | | 86,593 | |
| | |
Pool # BM5152, 5.50%, 1/1/2049 | | | 205,584 | | | | 233,340 | |
| | |
Pool # FM0030, 3.00%, 2/1/2049 | | | 88,540 | | | | 93,722 | |
| | |
Pool # FM1527, 3.00%, 2/1/2049 | | | 121,155 | | | | 128,246 | |
| | |
Pool # MA3603, 3.00%, 2/1/2049 | | | 13,953 | | | | 14,631 | |
| | |
Pool # BM5446, 3.50%, 2/1/2049 | | | 19,650 | | | | 20,834 | |
| | |
Pool # MA3592, 4.00%, 2/1/2049 | | | 5,441 | | | | 5,841 | |
| | |
Pool # MA3593, 4.50%, 2/1/2049 | | | 134,575 | | | | 146,380 | |
| | |
Pool # BN4380, 3.00%, 3/1/2049 | | | 14,144 | | | | 14,780 | |
| | |
Pool # MA3614, 3.50%, 3/1/2049 | | | 11,006 | | | | 11,676 | |
| | |
Pool # FM0017, 4.00%, 3/1/2049 | | | 97,076 | | | | 104,224 | |
| | |
Pool # MA3637, 3.50%, 4/1/2049 | | | 48,165 | | | | 51,098 | |
| | |
Pool # MA3638, 4.00%, 4/1/2049 | | | 43,151 | | | | 46,364 | |
| | |
Pool # BN5418, 4.50%, 4/1/2049 | | | 39,833 | | | | 43,973 | |
| | |
Pool # MA3639, 4.50%, 4/1/2049 | | | 11,449 | | | | 12,461 | |
| | |
Pool # MA3664, 4.00%, 5/1/2049 | | | 23,939 | | | | 25,721 | |
SEE NOTES TO FINANCIAL STATEMENTS.
| | | | | | | | |
| | | |
| FEBRUARY 28, 2021 | | J.P. MORGAN EXCHANGE-TRADED FUNDS | | | | | 127 | |
JPMorgan U.S. Aggregate Bond ETF
SCHEDULE OF PORTFOLIO INVESTMENTS
AS OF FEBRUARY 28, 2021 (continued)
| | | | | | | | |
| INVESTMENTS | | PRINCIPAL
AMOUNT ($) | | | VALUE ($) | |
Mortgage-Backed Securities — continued | | | | | | | | |
| | |
Pool # FM4074, 4.50%, 5/1/2049 | | | 598,671 | | | | 662,278 | |
| | |
Pool # MA3665, 4.50%, 5/1/2049 | | | 36,895 | | | | 40,157 | |
| | |
Pool # CA3528, 5.00%, 5/1/2049 | | | 20,290 | | | | 22,572 | |
| | |
Pool # MA3687, 4.00%, 6/1/2049 | | | 257,161 | | | | 276,307 | |
| | |
Pool # FM1389, 4.50%, 6/1/2049 | | | 16,490 | | | | 17,937 | |
| | |
Pool # MA3688, 4.50%, 6/1/2049 | | | 10,056 | | | | 10,945 | |
| | |
Pool # FM1198, 3.00%, 7/1/2049 | | | 60,578 | | | | 64,185 | |
| | |
Pool # BO1169, 3.50%, 7/1/2049 | | | 89,049 | | | | 94,470 | |
| | |
Pool # CA4358, 3.50%, 7/1/2049 | | | 36,139 | | | | 38,339 | |
| | |
Pool # BO1766, 4.50%, 7/1/2049 | | | 161,439 | | | | 175,710 | |
| | |
Pool # FM1672, 4.50%, 7/1/2049 | | | 220,930 | | | | 247,688 | |
| | |
Pool # FM1241, 3.50%, 8/1/2049 | | | 105,273 | | | | 113,114 | |
| | |
Pool # MA3745, 3.50%, 8/1/2049 | | | 215,912 | | | | 229,058 | |
| | |
Pool # MA3746, 4.00%, 8/1/2049 | | | 35,200 | | | | 37,821 | |
| | |
Pool # MA3747, 4.50%, 8/1/2049 | | | 21,007 | | | | 22,863 | |
| | |
Pool # BO4012, 3.00%, 9/1/2049 | | | 144,034 | | | | 154,134 | |
| | |
Pool # MA3774, 3.00%, 9/1/2049 | | | 665,960 | | | | 695,925 | |
| | |
Pool # BO2200, 3.50%, 9/1/2049 | | | 372,704 | | | | 395,395 | |
| | |
Pool # FM1449, 3.50%, 9/1/2049 | | | 467,520 | | | | 496,180 | |
| | |
Pool # FM4430, 3.50%, 9/1/2049 | | | 1,222,803 | | | | 1,312,193 | |
| | |
Pool # MA3775, 3.50%, 9/1/2049 | | | 21,321 | | | | 22,619 | |
| | |
Pool # FM3572, 4.50%, 9/1/2049 | | | 158,312 | | | | 175,132 | |
| | |
Pool # BO2820, 3.00%, 10/1/2049 | | | 108,977 | | | | 114,169 | |
| | |
Pool # MA3803, 3.50%, 10/1/2049 | | | 106,813 | | | | 113,316 | |
| | |
Pool # MA3818, 5.00%, 10/1/2049 | | | 32,618 | | | | 36,287 | |
| | |
Pool # MA3833, 2.50%, 11/1/2049 | | | 246,891 | | | | 255,548 | |
| | |
Pool # MA3870, 2.50%, 12/1/2049 | | | 363,925 | | | | 376,685 | |
| | |
Pool # CA4977, 3.00%, 1/1/2050 | | | 448,774 | | | | 470,155 | |
| | |
Pool # MA3905, 3.00%, 1/1/2050 | | | 2,111,347 | | | | 2,206,347 | |
| | |
Pool # CA5021, 3.50%, 1/1/2050 | | | 90,701 | | | | 96,607 | |
| | |
Pool # MA3906, 3.50%, 1/1/2050 | | | 102,012 | | | | 108,223 | |
| | |
Pool # CA5135, 2.50%, 2/1/2050 | | | 177,154 | | | | 185,589 | |
| | |
Pool # MA3936, 2.50%, 2/1/2050 | | | 278,641 | | | | 288,411 | |
| | |
Pool # FM2733, 2.50%, 3/1/2050 | | | 162,363 | | | | 169,571 | |
| | |
Pool # BP4015, 3.00%, 3/1/2050 | | | 216,156 | | | | 227,265 | |
| | |
Pool # FM4461, 3.00%, 3/1/2050 | | | 1,616,068 | | | | 1,693,059 | |
| | |
Pool # FM4372, 3.50%, 3/1/2050 | | | 1,305,028 | | | | 1,398,386 | |
| | |
Pool # MA3972, 4.50%, 3/1/2050 | | | 188,720 | | | | 205,402 | |
| | |
Pool # BP5001, 2.50%, 5/1/2050 | | | 1,012,213 | | | | 1,048,758 | |
| | |
Pool # FM3257, 3.00%, 5/1/2050 | | | 348,740 | | | | 374,749 | |
| | |
Pool # MA4049, 3.50%, 6/1/2050 | | | 225,139 | | | | 240,771 | |
| | |
Pool # BK2753, 2.50%, 7/1/2050 | | | 1,658,124 | | | | 1,717,990 | |
| | |
Pool # MA4078, 2.50%, 7/1/2050 | | | 599,357 | | | | 620,997 | |
| | |
Pool # BP7217, 3.00%, 7/1/2050 | | | 729,279 | | | | 785,426 | |
| | |
Pool # MA4079, 3.00%, 7/1/2050 | | | 248,905 | | | | 260,910 | |
| | |
Pool # BP6626, 2.00%, 8/1/2050 | | | 2,999,045 | | | | 3,030,358 | |
| | | | | | | | |
| INVESTMENTS | | PRINCIPAL
AMOUNT ($) | | | VALUE ($) | |
| | | | | | | | |
| | |
Pool # MA4100, 2.00%, 8/1/2050 | | | 1,529,773 | | | | 1,545,746 | |
| | |
Pool # BP9500, 2.50%, 8/1/2050 | | | 136,063 | | | | 140,976 | |
| | |
Pool # FM5371, 3.00%, 8/1/2050 | | | 482,783 | | | | 510,012 | |
| | |
Pool # MA4097, 3.00%, 8/1/2050 | | | 239,089 | | | | 250,800 | |
| | |
Pool # MA4119, 2.00%, 9/1/2050 | | | 201,401 | | | | 203,504 | |
| | |
Pool # BK3044, 2.50%, 9/1/2050 | | | 1,939,365 | | | | 2,009,384 | |
| | |
Pool # MA4158, 2.00%, 10/1/2050 | | | 2,266,121 | | | | 2,289,782 | |
| | |
Pool # MA4159, 2.50%, 10/1/2050 | | | 900,437 | | | | 932,947 | |
| | |
Pool # CA8222, 1.50%, 12/1/2050 | | | 1,732,775 | | | | 1,700,235 | |
| | |
Pool # MA4209, 1.50%, 12/1/2050 | | | 202,636 | | | | 198,741 | |
| | |
Pool # BQ5160, 2.00%, 12/1/2050 | | | 3,175,885 | | | | 3,213,654 | |
| | |
Pool # MA4208, 2.00%, 12/1/2050 | | | 594,244 | | | | 600,448 | |
| | |
Pool # BR2807, 2.50%, 12/1/2050 | | | 1,693,041 | | | | 1,758,271 | |
| | |
Pool # MA4210, 2.50%, 12/1/2050 | | | 1,283,868 | | | | 1,330,222 | |
| | |
Pool # FM6241, 2.00%, 1/1/2051 | | | 4,663,000 | | | | 4,718,443 | |
| | |
Pool # MA4255, 2.00%, 2/1/2051 | | | 5,118,420 | | | | 5,171,862 | |
| | |
GNMA I, 30 Year | | | | | | | | |
| | |
Pool # 704155, 5.50%, 1/15/2039 | | | 25,768 | | | | 29,214 | |
| | |
Pool # 726769, 5.00%, 9/15/2039 | | | 24,159 | | | | 26,439 | |
| | |
Pool # 721340, 5.00%, 12/15/2039 | | | 50,420 | | | | 54,032 | |
| | |
Pool # 754439, 3.50%, 12/15/2041 | | | 158,995 | | | | 172,437 | |
| | |
Pool # 711674, 3.00%, 9/15/2042 | | | 53,215 | | | | 56,948 | |
| | |
Pool # AD7257, 3.50%, 3/15/2043 | | | 132,332 | | | | 145,798 | |
| | |
Pool # 783748, 3.50%, 4/15/2043 | | | 92,244 | | | | 100,060 | |
| | |
Pool # 784660, 4.00%, 4/15/2043 | | | 9,367 | | | | 10,310 | |
| | |
Pool # AC2224, 3.50%, 6/15/2043 | | | 73,347 | | | | 78,520 | |
| | |
Pool # 785088, 3.50%, 7/15/2043 | | | 80,869 | | | | 89,427 | |
| | |
Pool # AJ4151, 4.00%, 9/15/2044 | | | 354,114 | | | | 397,552 | |
| | |
Pool # AL2280, 3.00%, 3/15/2045 | | | 40,188 | | | | 41,898 | |
| | |
Pool # AL9314, 3.00%, 3/15/2045 | | | 69,656 | | | | 72,619 | |
| | |
Pool # 784664, 4.00%, 4/15/2045 | | | 37,365 | | | | 41,130 | |
| | |
Pool # 670030, 3.00%, 7/15/2045 | | | 67,375 | | | | 70,242 | |
| | |
Pool # AM8960, 4.00%, 7/15/2045 | | | 20,014 | | | | 21,882 | |
| | |
Pool # AO0544, 3.00%, 8/15/2045 | | | 35,940 | | | | 37,470 | |
| | |
Pool # 784371, 4.00%, 8/15/2045 | | | 89,939 | | | | 100,851 | |
| | |
Pool # 627030, 3.00%, 12/15/2045 | | | 27,032 | | | | 29,061 | |
| | |
Pool # 784429, 3.00%, 8/15/2046 | | | 127,316 | | | | 132,642 | |
| | |
Pool # BB4046, 4.00%, 12/15/2047 | | | 285,313 | | | | 311,143 | |
| | |
Pool # 784766, 3.50%, 3/15/2048 | | | 981,648 | | | | 1,061,643 | |
| | |
Pool # AF8266, 3.50%, 10/15/2048 | | | 96,737 | | | | 106,013 | |
| | |
GNMA II, 15 Year | | | | | | | | |
| | |
Pool # MA0513, 2.50%, 11/20/2027 | | | 112,267 | | | | 117,374 | |
| | |
Pool # MA4625, 3.50%, 8/20/2032 | | | 41,440 | | | | 44,220 | |
| | |
Pool # MA6906, 2.50%, 10/20/2035 | | | 1,330,306 | | | | 1,395,764 | |
| | |
GNMA II, 30 Year | | | | | | | | |
| | |
Pool # 711773, 3.50%, 6/20/2033 | | | 68,875 | | | | 74,415 | |
SEE NOTES TO FINANCIAL STATEMENTS.
| | | | | | |
| | | |
| 128 | | | | J.P. MORGAN EXCHANGE-TRADED FUNDS | | FEBRUARY 28, 2021 |
| | | | | | | | |
| INVESTMENTS | | PRINCIPAL
AMOUNT ($) | | | VALUE ($) | |
Mortgage-Backed Securities — continued | | | | | | | | |
| | |
Pool # 3459, 5.50%, 10/20/2033 | | | 70,625 | | | | 79,786 | |
| | |
Pool # AQ5932, 3.50%, 1/20/2036 | | | 97,140 | | | | 104,809 | |
| | |
Pool # 4222, 6.00%, 8/20/2038 | | | 14,055 | | | | 16,122 | |
| | |
Pool # 709148, 4.50%, 2/20/2039 | | | 30,753 | | | | 34,525 | |
| | |
Pool # 4446, 4.50%, 5/20/2039 | | | 4,595 | | | | 5,159 | |
| | |
Pool # 4467, 4.00%, 6/20/2039 | | | 20,528 | | | | 22,794 | |
| | |
Pool # 4468, 4.50%, 6/20/2039 | | | 4,062 | | | | 4,561 | |
| | |
Pool # 4494, 4.00%, 7/20/2039 | | | 23,119 | | | | 25,671 | |
| | |
Pool # 4495, 4.50%, 7/20/2039 | | | 17,659 | | | | 19,824 | |
| | |
Pool # 4519, 4.50%, 8/20/2039 | | | 6,664 | | | | 7,481 | |
| | |
Pool # 4558, 4.50%, 10/20/2039 | | | 5,392 | | | | 6,054 | |
| | |
Pool # 4576, 4.00%, 11/20/2039 | | | 10,203 | | | | 11,329 | |
| | |
Pool # 4598, 4.50%, 12/20/2039 | | | 10,833 | | | | 12,161 | |
| | |
Pool # 4617, 4.50%, 1/20/2040 | | | 5,913 | | | | 6,638 | |
| | |
Pool # 4636, 4.50%, 2/20/2040 | | | 8,216 | | | | 9,223 | |
| | |
Pool # 4656, 4.00%, 3/20/2040 | | | 15,456 | | | | 17,113 | |
| | |
Pool # 4677, 4.00%, 4/20/2040 | | | 44,170 | | | | 48,906 | |
| | |
Pool # 4678, 4.50%, 4/20/2040 | | | 1,988 | | | | 2,233 | |
| | |
Pool # 4695, 4.00%, 5/20/2040 | | | 5,300 | | | | 5,868 | |
| | |
Pool # 4696, 4.50%, 5/20/2040 | | | 2,052 | | | | 2,305 | |
| | |
Pool # 4712, 4.00%, 6/20/2040 | | | 7,208 | | | | 7,981 | |
| | |
Pool # 4800, 4.00%, 9/20/2040 | | | 8,261 | | | | 9,147 | |
| | |
Pool # 737727, 4.00%, 12/20/2040 | | | 59,667 | | | | 66,421 | |
| | |
Pool # 4945, 4.00%, 2/20/2041 | | | 17,128 | | | | 18,964 | |
| | |
Pool # 759342, 4.50%, 2/20/2041 | | | 722,206 | | | | 811,315 | |
| | |
Pool # 4950, 5.50%, 2/20/2041 | | | 31,309 | | | | 35,459 | |
| | |
Pool # 4976, 3.50%, 3/20/2041 | | | 18,286 | | | | 19,866 | |
| | |
Pool # 4977, 4.00%, 3/20/2041 | | | 31,343 | | | | 34,711 | |
| | |
Pool # 5016, 4.00%, 4/20/2041 | | | 12,097 | | | | 13,397 | |
| | |
Pool # 5054, 4.00%, 5/20/2041 | | | 19,019 | | | | 21,063 | |
| | |
Pool # 5114, 4.00%, 7/20/2041 | | | 2,531 | | | | 2,803 | |
| | |
Pool # 779497, 3.50%, 10/20/2041 | | | 14,355 | | | | 15,647 | |
| | |
Pool # 5233, 4.00%, 11/20/2041 | | | 3,037 | | | | 3,363 | |
| | |
Pool # 5258, 3.50%, 12/20/2041 | | | 182,423 | | | | 198,381 | |
| | |
Pool # 5259, 4.00%, 12/20/2041 | | | 11,458 | | | | 12,689 | |
| | |
Pool # 5279, 3.50%, 1/20/2042 | | | 34,235 | | | | 37,229 | |
| | |
Pool # 5330, 3.00%, 3/20/2042 | | | 21,787 | | | | 23,223 | |
| | |
Pool # 754406, 3.50%, 5/20/2042 | | | 67,352 | | | | 73,244 | |
| | |
Pool # MA0220, 3.50%, 7/20/2042 | | | 14,547 | | | | 15,831 | |
| | |
Pool # MA0318, 3.50%, 8/20/2042 | | | 204,878 | | | | 222,973 | |
| | |
Pool # 796468, 4.00%, 9/20/2042 | | | 37,895 | | | | 41,971 | |
| | |
Pool # AA6040, 3.00%, 1/20/2043 | | | 119,102 | | | | 126,950 | |
| | |
Pool # AD1584, 3.00%, 1/20/2043 | | | 219,734 | | | | 234,214 | |
| | |
Pool # AA6054, 3.00%, 2/20/2043 | | | 271,400 | | | | 297,053 | |
| | |
Pool # AD1744, 3.00%, 2/20/2043 | | | 22,436 | | | | 24,557 | |
| | |
Pool # 783755, 3.00%, 4/20/2043 | | | 202,454 | | | | 215,712 | |
| | | | | | | | |
| INVESTMENTS | | PRINCIPAL
AMOUNT ($) | | | VALUE ($) | |
| | | | | | | | |
| | |
Pool # 783976, 3.50%, 4/20/2043 | | | 33,579 | | | | 36,545 | |
| | |
Pool # MA1012, 3.50%, 5/20/2043 | | | 170,262 | | | | 185,042 | |
| | |
Pool # MA1157, 3.50%, 7/20/2043 | | | 34,157 | | | | 37,122 | |
| | |
Pool # AE7804, 3.00%, 8/20/2043 | | | 18,516 | | | | 19,729 | |
| | |
Pool # MA1284, 3.00%, 9/20/2043 | | | 27,058 | | | | 28,830 | |
| | |
Pool # 785065, 3.50%, 10/20/2043 | | | 365,655 | | | | 397,396 | |
| | |
Pool # MA1376, 4.00%, 10/20/2043 | | | 175,158 | | | | 193,943 | |
| | |
Pool # MA1995, 3.50%, 6/20/2044 | | | 128,749 | | | | 139,673 | |
| | |
Pool # AI7106, 4.00%, 6/20/2044 | | | 69,092 | | | | 76,796 | |
| | |
Pool # MA2223, 3.50%, 9/20/2044 | | | 102,227 | | | | 110,900 | |
| | |
Pool # MA2444, 3.00%, 12/20/2044 | | | 25,492 | | | | 27,101 | |
| | |
Pool # 784026, 3.50%, 12/20/2044 | | | 223,145 | | | | 246,430 | |
| | |
Pool # AK6860, 3.00%, 1/20/2045 | | | 61,586 | | | | 66,617 | |
| | |
Pool # MA2677, 3.00%, 3/20/2045 | | | 36,043 | | | | 38,182 | |
| | |
Pool # MA2678, 3.50%, 3/20/2045 | | | 251,009 | | | | 270,879 | |
| | |
Pool # MA2679, 4.00%, 3/20/2045 | | | 75,591 | | | | 83,624 | |
| | |
Pool # MA2753, 3.00%, 4/20/2045 | | | 296,539 | | | | 314,136 | |
| | |
Pool # MA2754, 3.50%, 4/20/2045 | | | 11,944 | | | | 12,890 | |
| | |
Pool # 626942, 3.00%, 5/20/2045 | | | 179,260 | | | | 193,548 | |
| | |
Pool # MA2825, 3.00%, 5/20/2045 | | | 329,359 | | | | 348,903 | |
| | |
Pool # MA2829, 5.00%, 5/20/2045 | | | 42,105 | | | | 48,212 | |
| | |
Pool # 784800, 3.00%, 6/20/2045 | | | 45,939 | | | | 48,948 | |
| | |
Pool # AM9881, 3.00%, 6/20/2045 | | | 26,734 | | | | 28,460 | |
| | |
Pool # MA2891, 3.00%, 6/20/2045 | | | 13,397 | | | | 14,192 | |
| | |
Pool # AN2972, 4.00%, 9/20/2045 | | | 75,163 | | | | 82,939 | |
| | |
Pool # 784623, 3.50%, 10/20/2045 | | | 88,266 | | | | 95,928 | |
| | |
Pool # AO8403, 3.50%, 10/20/2045 | | | 33,467 | | | | 36,426 | |
| | |
Pool # MA3247, 5.00%, 11/20/2045 | | | 38,581 | | | | 44,178 | |
| | |
Pool # AO9442, 3.50%, 12/20/2045 | | | 29,927 | | | | 32,696 | |
| | |
Pool # MA3375, 3.00%, 1/20/2046 | | | 74,736 | | | | 79,171 | |
| | |
Pool # 784119, 3.00%, 2/20/2046 | | | 283,159 | | | | 299,962 | |
| | |
Pool # MA3458, 5.50%, 2/20/2046 | | | 51,978 | | | | 58,908 | |
| | |
Pool # MA3523, 4.50%, 3/20/2046 | | | 19,194 | | | | 21,474 | |
| | |
Pool # MA3596, 3.00%, 4/20/2046 | | | 542,026 | | | | 572,527 | |
| | |
Pool # MA3662, 3.00%, 5/20/2046 | | | 187,819 | | | | 198,388 | |
| | |
Pool # MA3735, 3.00%, 6/20/2046 | | | 552,076 | | | | 583,143 | |
| | |
Pool # AS5902, 3.50%, 6/20/2046 | | | 86,873 | | | | 94,160 | |
| | |
Pool # AT7138, 3.50%, 6/20/2046 | | | 37,510 | | | | 41,263 | |
| | |
Pool # MA3935, 2.50%, 9/20/2046 | | | 137,047 | | | | 142,878 | |
| | |
Pool # 784768, 3.00%, 9/20/2046 | | | 120,297 | | | | 128,837 | |
| | |
Pool # AT8215, 3.00%, 9/20/2046 | | | 35,548 | | | | 38,072 | |
| | |
Pool # AX8668, 3.50%, 9/20/2046 | | | 120,817 | | | | 130,524 | |
| | |
Pool # MA4002, 2.50%, 10/20/2046 | | | 733,743 | | | | 764,960 | |
| | |
Pool # AV8383, 3.00%, 10/20/2046 | | | 38,724 | | | | 41,188 | |
| | |
Pool # AW0199, 3.00%, 10/20/2046 | | | 97,609 | | | | 105,594 | |
| | |
Pool # MA4003, 3.00%, 10/20/2046 | | | 117,310 | | | | 123,911 | |
SEE NOTES TO FINANCIAL STATEMENTS.
| | | | | | | | |
| | | |
| FEBRUARY 28, 2021 | | J.P. MORGAN EXCHANGE-TRADED FUNDS | | | | | 129 | |
JPMorgan U.S. Aggregate Bond ETF
SCHEDULE OF PORTFOLIO INVESTMENTS
AS OF FEBRUARY 28, 2021 (continued)
| | | | | | | | |
| INVESTMENTS | | PRINCIPAL
AMOUNT ($) | | | VALUE ($) | |
Mortgage-Backed Securities — continued | | | | | | | | |
| | |
Pool # MA4068, 3.00%, 11/20/2046 | | | 22,991 | | | | 24,284 | |
| | |
Pool # MA4072, 5.00%, 11/20/2046 | | | 40,430 | | | | 44,928 | |
| | |
Pool # MA4125, 2.50%, 12/20/2046 | | | 648,083 | | | | 675,656 | |
| | |
Pool # MA4126, 3.00%, 12/20/2046 | | | 106,396 | | | | 112,383 | |
| | |
Pool # MA4127, 3.50%, 12/20/2046 | | | 50,799 | | | | 54,440 | |
| | |
Pool # MA4260, 2.50%, 2/20/2047 | | | 105,754 | | | | 110,254 | |
| | |
Pool # AZ3119, 3.50%, 3/20/2047 | | | 42,766 | | | | 46,226 | |
| | |
Pool # 675725, 3.50%, 6/20/2047 | | | 8,506 | | | | 8,905 | |
| | |
Pool # 784801, 3.50%, 6/20/2047 | | | 83,512 | | | | 90,761 | |
| | |
Pool # MA4511, 4.00%, 6/20/2047 | | | 384,843 | | | | 416,119 | |
| | |
Pool # BA5041, 5.00%, 6/20/2047 | | | 131,437 | | | | 145,111 | |
| | |
Pool # MA4584, 2.50%, 7/20/2047 | | | 128,644 | | | | 134,117 | |
| | |
Pool # MA4718, 3.00%, 9/20/2047 | | | 15,308 | | | | 16,166 | |
| | |
Pool # MA4721, 4.50%, 9/20/2047 | | | 71,965 | | | | 78,664 | |
| | |
Pool # MA4836, 3.00%, 11/20/2047 | | | 1,370,065 | | | | 1,446,828 | |
| | |
Pool # BD6940, 3.50%, 12/20/2047 | | | 485 | | | | 519 | |
| | |
Pool # MA4900, 3.50%, 12/20/2047 | | | 201,225 | | | | 214,975 | |
| | |
Pool # MA4961, 3.00%, 1/20/2048 | | | 94,966 | | | | 100,287 | |
| | |
Pool # 784899, 4.00%, 2/20/2048 | | | 59,624 | | | | 64,469 | |
| | |
Pool # BF6382, 3.00%, 3/20/2048 | | | 61,248 | | | | 63,483 | |
| | |
Pool # MA5077, 3.50%, 3/20/2048 | | | 78,399 | | | | 83,756 | |
| | |
Pool # MA5138, 4.50%, 4/20/2048 | | | 35,661 | | | | 38,981 | |
| | |
Pool # 785033, 3.50%, 5/20/2048 | | | 317,526 | | | | 352,429 | |
| | |
Pool # MA5194, 5.00%, 5/20/2048 | | | 222,230 | | | | 244,872 | |
| | |
Pool # MA5264, 4.00%, 6/20/2048 | | | 64,105 | | | | 68,906 | |
| | |
Pool # MA5329, 3.50%, 7/20/2048 | | | 18,609 | | | | 19,748 | |
| | |
Pool # MA5330, 4.00%, 7/20/2048 | | | 53,374 | | | | 57,371 | |
| | |
Pool # BK1677, 4.50%, 9/20/2048 | | | 210,979 | | | | 234,808 | |
| | |
Pool # MA5468, 5.00%, 9/20/2048 | | | 17,650 | | | | 19,278 | |
| | |
Pool # MA5527, 3.50%, 10/20/2048 | | | 71,047 | | | | 75,396 | |
| | |
Pool # MA5528, 4.00%, 10/20/2048 | | | 39,124 | | | | 42,054 | |
| | |
Pool # BJ6774, 4.00%, 11/20/2048 | | | 24,167 | | | | 25,988 | |
| | |
Pool # MA5595, 4.00%, 11/20/2048 | | | 94,488 | | | | 101,565 | |
| | |
Pool # BJ6759, 4.50%, 11/20/2048 | | | 720,013 | | | | 784,764 | |
| | |
Pool # MA5650, 3.50%, 12/20/2048 | | | 28,318 | | | | 30,052 | |
| | |
Pool # MA5651, 4.00%, 12/20/2048 | | | 443,513 | | | | 476,729 | |
| | |
Pool # MA5709, 3.50%, 1/20/2049 | | | 192,948 | | | | 206,132 | |
| | |
Pool # BI6473, 4.00%, 1/20/2049 | | | 1,451,120 | | | | 1,591,045 | |
| | |
Pool # BJ9901, 3.00%, 2/20/2049 | | | 58,852 | | | | 63,652 | |
| | |
Pool # MA5763, 4.00%, 2/20/2049 | | | 130,456 | | | | 140,226 | |
| | |
Pool # MA5815, 3.00%, 3/20/2049 | | | 170,271 | | | | 177,781 | |
| | |
Pool # MA5816, 3.50%, 3/20/2049 | | | 264,763 | | | | 280,971 | |
| | |
Pool # 784900, 4.00%, 4/20/2049 | | | 378,143 | | | | 406,463 | |
| | |
Pool # MA5876, 4.00%, 4/20/2049 | | | 81,775 | | | | 87,346 | |
| | |
Pool # MA5930, 3.50%, 5/20/2049 | | | 29,570 | | | | 31,288 | |
| | |
Pool # MA5931, 4.00%, 5/20/2049 | | | 265,745 | | | | 283,849 | |
| | | | | | | | |
| INVESTMENTS | | PRINCIPAL
AMOUNT ($) | | | VALUE ($) | |
| | | | | | | | |
| | |
Pool # MA5983, 2.50%, 6/20/2049 | | | 224,810 | | | | 234,375 | |
| | |
Pool # MA5985, 3.50%, 6/20/2049 | | | 117,281 | | | | 124,095 | |
| | |
Pool # MA5986, 4.00%, 6/20/2049 | | | 67,855 | | | | 72,478 | |
| | |
Pool # MA5987, 4.50%, 6/20/2049 | | | 105,156 | | | | 113,281 | |
| | |
Pool # MA5988, 5.00%, 6/20/2049 | | | 22,835 | | | | 24,941 | |
| | |
Pool # MA6039, 3.50%, 7/20/2049 | | | 198,721 | | | | 210,267 | |
| | |
Pool # MA6040, 4.00%, 7/20/2049 | | | 42,824 | | | | 45,741 | |
| | |
Pool # BM5450, 4.50%, 7/20/2049 | | | 104,032 | | | | 115,276 | |
| | |
Pool # MA6089, 3.00%, 8/20/2049 | | | 49,443 | | | | 51,596 | |
| | |
Pool # MA6090, 3.50%, 8/20/2049 | | | 197,924 | | | | 209,423 | |
| | |
Pool # BP4603, 3.50%, 9/20/2049 | | | 34,983 | | | | 37,895 | |
| | |
Pool # BP8717, 3.50%, 9/20/2049 | | | 203,130 | | | | 220,039 | |
| | |
Pool # MA6154, 3.50%, 9/20/2049 | | | 60,373 | | | | 63,881 | |
| | |
Pool # MA6155, 4.00%, 9/20/2049 | | | 620,665 | | | | 662,947 | |
| | |
Pool # 785122, 3.50%, 10/20/2049 | | | 421,674 | | | | 453,862 | |
| | |
Pool # BQ7205, 3.50%, 10/20/2049 | | | 513,666 | | | | 569,334 | |
| | |
Pool # MA6220, 4.00%, 10/20/2049 | | | 563,303 | | | | 601,678 | |
| | |
Pool # MA6221, 4.50%, 10/20/2049 | | | 175,579 | | | | 189,408 | |
| | |
Pool # BR4627, 3.00%, 11/20/2049 | | | 637,967 | | | | 684,821 | |
| | |
Pool # MA6283, 3.00%, 11/20/2049 | | | 249,931 | | | | 260,817 | |
| | |
Pool # MA6284, 3.50%, 11/20/2049 | | | 81,339 | | | | 86,065 | |
| | |
Pool # BR2455, 3.00%, 12/20/2049 | | | 553,809 | | | | 570,272 | |
| | |
Pool # MA6339, 3.50%, 12/20/2049 | | | 485,634 | | | | 513,849 | |
| | |
Pool # BS1714, 4.00%, 12/20/2049 | | | 396,973 | | | | 435,121 | |
| | |
Pool # MA6341, 4.50%, 12/20/2049 | | | 384,261 | | | | 413,949 | |
| | |
Pool # MA6409, 3.00%, 1/20/2050 | | | 626,720 | | | | 654,017 | |
| | |
Pool # MA6410, 3.50%, 1/20/2050 | | | 243,119 | | | | 257,244 | |
| | |
Pool # MA6474, 3.00%, 2/20/2050 | | | 154,252 | | | | 160,971 | |
| | |
Pool # MA6478, 5.00%, 2/20/2050 | | | 73,912 | | | | 81,443 | |
| | |
Pool # BT3619, 3.00%, 3/20/2050 | | | 86,640 | | | | 91,672 | |
| | |
Pool # MA6542, 3.50%, 3/20/2050 | | | 401,121 | | | | 424,426 | |
| | |
Pool # MA6545, 5.00%, 3/20/2050 | | | 95,642 | | | | 105,386 | |
| | |
Pool # BU6116, 2.50%, 4/20/2050 | | | 297,189 | | | | 304,048 | |
| | |
Pool # BT6608, 3.00%, 4/20/2050 | | | 158,337 | | | | 162,541 | |
| | |
Pool # MA6599, Class 357, 3.00%, 4/20/2050 | | | 263,012 | | | | 273,972 | |
| | |
Pool # MA6656, 3.00%, 5/20/2050 | | | 356,856 | | | | 371,727 | |
| | |
Pool # BT5564, 2.50%, 6/20/2050 | | | 1,124,440 | | | | 1,150,392 | |
| | |
Pool # BV1348, 2.50%, 6/20/2050 | | | 348,021 | | | | 355,975 | |
| | |
Pool # MA6709, 2.50%, 6/20/2050 | | | 1,077,136 | | | | 1,117,803 | |
| | |
Pool # MA6710, 3.00%, 6/20/2050 | | | 1,437,563 | | | | 1,497,469 | |
| | |
Pool # MA6766, 3.00%, 7/20/2050 | | | 1,258,997 | | | | 1,311,462 | |
| | |
Pool # MA6767, 3.50%, 7/20/2050 | | | 1,542,179 | | | | 1,657,806 | |
| | |
Pool # MA6769, 4.50%, 7/20/2050 | | | 227,259 | | | | 245,158 | |
| | |
Pool # MA6819, 2.50%, 8/20/2050 | | | 1,871,852 | | | | 1,942,523 | |
| | |
Pool # MA6820, 3.00%, 8/20/2050 | | | 340,255 | | | | 354,435 | |
SEE NOTES TO FINANCIAL STATEMENTS.
| | | | | | |
| | | |
| 130 | | | | J.P. MORGAN EXCHANGE-TRADED FUNDS | | FEBRUARY 28, 2021 |
| | | | | | | | |
| INVESTMENTS | | PRINCIPAL
AMOUNT ($) | | | VALUE ($) | |
Mortgage-Backed Securities — continued | | | | | | | | |
| | |
Pool # MA6866, 3.00%, 9/20/2050 | | | 521,086 | | | | 542,801 | |
| | |
Pool # BY8818, 2.00%, 10/20/2050 | | | 650,094 | | | | 661,770 | |
| | |
Pool # MA6931, 2.50%, 10/20/2050 | | | 1,968,488 | | | | 2,042,808 | |
| | |
Pool # MA6994, 2.00%, 11/20/2050 | | | 1,981,434 | | | | 2,012,404 | |
| | |
Pool # BY8832, 2.50%, 11/20/2050 | | | 648,500 | | | | 676,275 | |
| | |
Pool # MA7051, 2.00%, 12/20/2050 | | | 596,507 | | | | 605,830 | |
| | |
Pool # MA7052, 2.50%, 12/20/2050 | | | 1,491,193 | | | | 1,547,493 | |
| | |
Pool # MA7135, 2.00%, 1/20/2051 | | | 2,393,625 | | | | 2,431,039 | |
| | | | | | | | |
| | |
Total Mortgage-backed Securities
(Cost $223,953,254) | | | | | | | 225,101,992 | |
| | | | | | | | |
Corporate Bonds — 26.5% | | | | | | | | |
| | |
Aerospace & Defense — 0.1% | | | | | | | | |
| | |
Huntington Ingalls Industries, Inc. | | | | | | | | |
| | |
3.48%, 12/1/2027 | | | 436,000 | | | | 481,621 | |
| | |
4.20%, 5/1/2030 | | | 120,000 | | | | 137,868 | |
| | | | | | | | |
| | |
| | | | | | | 619,489 | |
| | | | | | | | |
| | |
Auto Components — 0.3% | | | | | | | | |
| | |
Aptiv Corp. 4.15%, 3/15/2024 | | | 227,000 | | | | 248,609 | |
| | |
Lear Corp. | | | | | | | | |
| | |
3.80%, 9/15/2027 | | | 459,000 | | | | 507,204 | |
| | |
5.25%, 5/15/2049 | | | 1,151,000 | | | | 1,398,868 | |
| | | | | | | | |
| | |
| | | | | | | 2,154,681 | |
| | | | | | | | |
| | |
Automobiles — 0.0%(a) | | | | | | | | |
| | |
Stellantis NV 5.25%, 4/15/2023 | | | 200,000 | | | | 217,398 | |
| | | | | | | | |
| | |
Banks — 1.6% | | | | | | | | |
| | |
Canadian Imperial Bank of Commerce (Canada) 2.25%, 1/28/2025 | | | 719,000 | | | | 751,244 | |
| | |
Capital One NA | | | | | | | | |
| | |
2.95%, 7/23/2021 | | | 200,000 | | | | 201,630 | |
| | |
2.25%, 9/13/2021 | | | 200,000 | | | | 201,703 | |
| | |
2.15%, 9/6/2022 | | | 250,000 | | | | 256,506 | |
| | |
Discover Bank | | | | | | | | |
| | |
4.20%, 8/8/2023 | | | 250,000 | | | | 271,742 | |
| | |
4.25%, 3/13/2026 | | | 636,000 | | | | 722,264 | |
| | |
3.45%, 7/27/2026 | | | 90,000 | | | | 99,163 | |
| | |
4.65%, 9/13/2028 | | | 660,000 | | | | 770,913 | |
| | |
First Republic Bank | | | | | | | | |
| | |
2.50%, 6/6/2022 | | | 250,000 | | | | 256,165 | |
| | |
(SOFR + 0.62%), 1.91%, 2/12/2024 (b) | | | 300,000 | | | | 307,975 | |
| | |
Huntington Bancshares, Inc.
2.63%, 8/6/2024 | | | 180,000 | | | | 191,253 | |
| | |
Intesa Sanpaolo SpA (Italy)
5.25%, 1/12/2024 (c) | | | 400,000 | | | | 447,066 | |
| | | | | | | | |
| INVESTMENTS | | PRINCIPAL
AMOUNT ($) | | | VALUE ($) | |
| | | | | | | | |
| | |
Banks — continued | | | | | | | | |
| | |
Kreditanstalt fuer Wiederaufbau (Germany) | | | | | | | | |
| | |
2.13%, 3/7/2022 | | | 115,000 | | | | 117,279 | |
| | |
2.13%, 6/15/2022 | | | 158,000 | | | | 161,979 | |
| | |
2.38%, 12/29/2022 | | | 190,000 | | | | 197,550 | |
| | |
2.13%, 1/17/2023 | | | 200,000 | | | | 207,218 | |
| | |
1.63%, 2/15/2023 | | | 83,000 | | | | 85,297 | |
| | |
0.25%, 10/19/2023 | | | 139,000 | | | | 138,801 | |
| | |
2.63%, 2/28/2024 | | | 36,000 | | | | 38,425 | |
| | |
2.50%, 11/20/2024 | | | 60,000 | | | | 64,373 | |
| | |
2.00%, 5/2/2025 | | | 183,000 | | | | 193,412 | |
| | |
0.38%, 7/18/2025 | | | 50,000 | | | | 49,259 | |
| | |
2.88%, 4/3/2028 | | | 111,000 | | | | 123,481 | |
| | |
1.75%, 9/14/2029 | | | 95,000 | | | | 97,763 | |
| | |
Zero Coupon, 4/18/2036 | | | 141,000 | | | | 104,413 | |
| | |
Zero Coupon, 6/29/2037 | | | 587,000 | | | | 424,809 | |
| | |
Landwirtschaftliche Rentenbank (Germany) | | | | | | | | |
| | |
3.13%, 11/14/2023 | | | 31,000 | | | | 33,325 | |
| | |
2.00%, 1/13/2025 | | | 229,000 | | | | 241,588 | |
| | |
2.38%, 6/10/2025 | | | 75,000 | | | | 80,448 | |
| | |
Oesterreichische Kontrollbank AG (Austria) | | | | | | | | |
| | |
2.88%, 3/13/2023 | | | 120,000 | | | | 126,435 | |
| | |
1.50%, 2/12/2025 (c) | | | 150,000 | | | | 155,680 | |
| | |
Royal Bank of Canada (Canada) | | | | | | | | |
| | |
2.80%, 4/29/2022 | | | 759,000 | | | | 781,385 | |
| | |
0.50%, 10/26/2023 | | | 10,000 | | | | 10,032 | |
| | |
2.55%, 7/16/2024 | | | 272,000 | | | | 289,414 | |
| | |
2.25%, 11/1/2024 | | | 1,522,000 | | | | 1,607,146 | |
| | |
1.15%, 6/10/2025 | | | 64,000 | | | | 64,353 | |
| | |
SVB Financial Group | | | | | | | | |
| | |
3.50%, 1/29/2025 | | | 681,000 | | | | 744,232 | |
| | |
3.13%, 6/5/2030 (c) | | | 907,000 | | | | 976,871 | |
| | |
Synovus Financial Corp.
3.13%, 11/1/2022 | | | 1,177,000 | | | | 1,218,269 | |
| | | | | | | | |
| | |
| | | | | | | 12,810,861 | |
| | | | | | | | |
| | |
Beverages — 0.1% | | | | | | | | |
| | |
Brown-Forman Corp. | | | | | | | | |
| | |
3.50%, 4/15/2025 | | | 56,000 | | | | 61,107 | |
| | |
4.00%, 4/15/2038 | | | 93,000 | | | | 110,258 | |
| | |
4.50%, 7/15/2045 | | | 269,000 | | | | 339,936 | |
| | | | | | | | |
| | |
| | | | | | | 511,301 | |
| | | | | | | | |
| | |
Biotechnology — 0.8% | | | | | | | | |
| | |
Biogen, Inc. | | | | | | | | |
| | |
3.63%, 9/15/2022 | | | 236,000 | | | | 247,611 | |
| | |
2.25%, 5/1/2030 | | | 10,000 | | | | 10,012 | |
SEE NOTES TO FINANCIAL STATEMENTS.
| | | | | | | | |
| | | |
| FEBRUARY 28, 2021 | | J.P. MORGAN EXCHANGE-TRADED FUNDS | | | | | 131 | |
JPMorgan U.S. Aggregate Bond ETF
SCHEDULE OF PORTFOLIO INVESTMENTS
AS OF FEBRUARY 28, 2021 (continued)
| | | | | | | | |
| INVESTMENTS | | PRINCIPAL
AMOUNT ($) | | | VALUE ($) | |
Corporate Bonds — continued | | | | | | | | |
| | |
Biotechnology — continued | | | | | | | | |
| | |
5.20%, 9/15/2045 (c) | | | 1,429,000 | | | | 1,829,548 | |
| | |
3.15%, 5/1/2050 | | | 562,000 | | | | 536,293 | |
| | |
Gilead Sciences, Inc. | | | | | | | | |
| | |
2.50%, 9/1/2023 | | | 1,640,000 | | | | 1,718,262 | |
| | |
3.70%, 4/1/2024 | | | 10,000 | | | | 10,845 | |
| | |
1.65%, 10/1/2030 | | | 344,000 | | | | 330,788 | |
| | |
4.00%, 9/1/2036 | | | 38,000 | | | | 43,827 | |
| | |
4.50%, 2/1/2045 | | | 25,000 | | | | 29,834 | |
| | |
4.75%, 3/1/2046 | | | 67,000 | | | | 82,628 | |
| | |
2.80%, 10/1/2050 | | | 100,000 | | | | 92,243 | |
| | |
Regeneron Pharmaceuticals, Inc. | | | | | | | | |
| | |
1.75%, 9/15/2030 | | | 25,000 | | | | 23,728 | |
| | |
2.80%, 9/15/2050 | | | 1,533,000 | | | | 1,374,167 | |
| | | | | | | | |
| | |
| | | | | | | 6,329,786 | |
| | | | | | | | |
| | |
Building Products — 0.3% | | | | | | | | |
| | |
Allegion plc 3.50%, 10/1/2029 | | | 138,000 | | | | 148,638 | |
| | |
Johnson Controls International plc | | | | | | | | |
| | |
1.75%, 9/15/2030 | | | 740,000 | | | | 722,172 | |
| | |
4.63%, 7/2/2044 (d) | | | 1,000,000 | | | | 1,231,843 | |
| | |
Lennox International, Inc. | | | | | | | | |
| | |
3.00%, 11/15/2023 | | | 170,000 | | | | 179,683 | |
| | |
1.35%, 8/1/2025 | | | 150,000 | | | | 150,751 | |
| | | | | | | | |
| | |
| | | | | | | 2,433,087 | |
| | | | | | | | |
| | |
Capital Markets — 3.9% | | | | | | | | |
| | |
Affiliated Managers Group, Inc. | | | | | | | | |
| | |
4.25%, 2/15/2024 | | | 410,000 | | | | 451,498 | |
| | |
3.30%, 6/15/2030 | | | 207,000 | | | | 219,161 | |
| | |
Ameriprise Financial, Inc. | | | | | | | | |
| | |
3.00%, 3/22/2022 (c) | | | 636,000 | | | | 654,356 | |
| | |
4.00%, 10/15/2023 | | | 331,000 | | | | 361,887 | |
| | |
3.70%, 10/15/2024 | | | 86,000 | | | | 95,111 | |
| | |
2.88%, 9/15/2026 | | | 541,000 | | | | 587,451 | |
| | |
BGC Partners, Inc.
3.75%, 10/1/2024 | | | 332,000 | | | | 348,252 | |
| | |
BlackRock, Inc. | | | | | | | | |
| | |
3.38%, 6/1/2022 (e) | | | 252,000 | | | | 261,843 | |
| | |
3.20%, 3/15/2027 (e) | | | 100,000 | | | | 111,518 | |
| | |
3.25%, 4/30/2029 (e) | | | 150,000 | | | | 166,926 | |
| | |
2.40%, 4/30/2030 (e) | | | 1,063,000 | | | | 1,109,673 | |
| | |
1.90%, 1/28/2031 | | | 992,000 | | | | 985,320 | |
| | |
Charles Schwab Corp. (The) | | | | | | | | |
| | |
4.20%, 3/24/2025 | | | 200,000 | | | | 225,024 | |
| | |
3.85%, 5/21/2025 (c) | | | 300,000 | | | | 335,335 | |
| | |
3.25%, 5/22/2029 | | | 1,887,000 | | | | 2,088,451 | |
| | |
4.63%, 3/22/2030 | | | 560,000 | | | | 679,724 | |
| | | | | | | | |
| INVESTMENTS | | PRINCIPAL
AMOUNT ($) | | | VALUE ($) | |
| | | | | | | | |
| | |
Capital Markets — continued | | | | | | | | |
| | |
CME Group, Inc. | | | | | | | | |
| | |
3.00%, 3/15/2025 | | | 140,000 | | | | 151,054 | |
| | |
3.75%, 6/15/2028 | | | 362,000 | | | | 413,858 | |
| | |
5.30%, 9/15/2043 | | | 87,000 | | | | 122,699 | |
| | |
4.15%, 6/15/2048 | | | 303,000 | | | | 379,819 | |
| | |
Deutsche Bank AG (Germany) | | | | | | | | |
| | |
Series D, 5.00%, 2/14/2022 | | | 604,000 | | | | 628,959 | |
| | |
3.30%, 11/16/2022 | | | 545,000 | | | | 568,387 | |
| | |
3.95%, 2/27/2023 | | | 100,000 | | | | 106,091 | |
| | |
3.70%, 5/30/2024 | | | 400,000 | | | | 431,365 | |
| | |
(SOFR + 2.58%), 3.96%, 11/26/2025 (b) | | | 150,000 | | | | 163,800 | |
| | |
4.10%, 1/13/2026 (c) | | | 2,178,000 | | | | 2,390,830 | |
| | |
(SOFR + 3.04%), 3.55%, 9/18/2031 (b) (c) | | | 150,000 | | | | 158,389 | |
| | |
Eaton Vance Corp. | | | | | | | | |
| | |
3.63%, 6/15/2023 | | | 95,000 | | | | 101,642 | |
| | |
3.50%, 4/6/2027 | | | 142,000 | | | | 156,253 | |
| | |
Franklin Resources, Inc. | | | | | | | | |
| | |
2.80%, 9/15/2022 | | | 25,000 | | | | 25,935 | |
| | |
2.85%, 3/30/2025 | | | 194,000 | | | | 208,243 | |
| | |
1.60%, 10/30/2030 | | | 1,040,000 | | | | 990,541 | |
| | |
Goldman Sachs Group, Inc. (The) | | | | | | | | |
| | |
5.75%, 1/24/2022 | | | 10,000 | | | | 10,486 | |
| | |
3.00%, 4/26/2022 | | | 153,000 | | | | 153,597 | |
| | |
3.63%, 1/22/2023 | | | 10,000 | | | | 10,596 | |
| | |
(ICE LIBOR USD 3 Month + 1.05%), 2.91%, 6/5/2023 (b) | | | 10,000 | | | | 10,305 | |
| | |
3.85%, 7/8/2024 | | | 10,000 | | | | 10,954 | |
| | |
(ICE LIBOR USD 3 Month + 1.30%), 4.22%, 5/1/2029 (b) | | | 1,024,000 | | | | 1,180,047 | |
| | |
4.80%, 7/8/2044 | | | 400,000 | | | | 518,813 | |
| | |
4.75%, 10/21/2045 | | | 10,000 | | | | 12,905 | |
| | |
Intercontinental Exchange, Inc. | | | | | | | | |
| | |
2.35%, 9/15/2022 | | | 448,000 | | | | 460,790 | |
| | |
3.45%, 9/21/2023 | | | 139,000 | | | | 149,205 | |
| | |
4.00%, 10/15/2023 | | | 125,000 | | | | 136,275 | |
| | |
3.75%, 12/1/2025 | | | 50,000 | | | | 55,585 | |
| | |
3.75%, 9/21/2028 | | | 761,000 | | | | 855,420 | |
| | |
2.10%, 6/15/2030 | | | 146,000 | | | | 145,325 | |
| | |
4.25%, 9/21/2048 | | | 719,000 | | | | 849,924 | |
| | |
3.00%, 6/15/2050 | | | 178,000 | | | | 172,053 | |
| | |
Janus Capital Group, Inc. 4.88%, 8/1/2025 | | | 562,000 | | | | 640,847 | |
| | |
Jefferies Group LLC | | | | | | | | |
| | |
5.13%, 1/20/2023 | | | 10,000 | | | | 10,837 | |
SEE NOTES TO FINANCIAL STATEMENTS.
| | | | | | |
| | | |
| 132 | | | | J.P. MORGAN EXCHANGE-TRADED FUNDS | | FEBRUARY 28, 2021 |
| | | | | | | | |
| INVESTMENTS | | PRINCIPAL
AMOUNT ($) | | | VALUE ($) | |
Corporate Bonds — continued | | | | | | | | |
| | |
Capital Markets — continued | | | | | | | | |
| | |
2.75%, 10/15/2032 | | | 389,000 | | | | 395,076 | |
| | |
6.25%, 1/15/2036 | | | 1,418,000 | | | | 1,877,776 | |
| | |
6.50%, 1/20/2043 | | | 50,000 | | | | 66,024 | |
| | |
Lazard Group LLC | | | | | | | | |
| | |
3.75%, 2/13/2025 | | | 1,109,000 | | | | 1,209,304 | |
| | |
3.63%, 3/1/2027 | | | 539,000 | | | | 587,607 | |
| | |
4.50%, 9/19/2028 | | | 280,000 | | | | 326,063 | |
| | |
4.38%, 3/11/2029 | | | 750,000 | | | | 858,279 | |
| | |
Legg Mason, Inc. | | | | | | | | |
| | |
4.75%, 3/15/2026 | | | 400,000 | | | | 466,354 | |
| | |
5.63%, 1/15/2044 | | | 61,000 | | | | 83,436 | |
| | |
Nasdaq, Inc. | | | | | | | | |
| | |
4.25%, 6/1/2024 | | | 423,000 | | | | 466,242 | |
| | |
3.85%, 6/30/2026 | | | 365,000 | | | | 410,223 | |
| | |
1.65%, 1/15/2031 | | | 120,000 | | | | 112,754 | |
| | |
Raymond James Financial, Inc. | | | | | | | | |
| | |
3.63%, 9/15/2026 | | | 533,000 | | | | 603,095 | |
| | |
4.65%, 4/1/2030 (c) | | | 90,000 | | | | 108,127 | |
| | |
4.95%, 7/15/2046 | | | 110,000 | | | | 139,347 | |
| | |
S&P Global, Inc. | | | | | | | | |
| | |
4.00%, 6/15/2025 | | | 510,000 | | | | 570,311 | |
| | |
2.95%, 1/22/2027 | | | 282,000 | | | | 305,624 | |
| | |
2.50%, 12/1/2029 | | | 462,000 | | | | 484,431 | |
| | |
3.25%, 12/1/2049 | | | 402,000 | | | | 419,512 | |
| | |
Stifel Financial Corp. | | | | | | | | |
| | |
4.25%, 7/18/2024 | | | 275,000 | | | | 306,200 | |
| | |
4.00%, 5/15/2030 | | | 100,000 | | | | 111,053 | |
| | |
TD Ameritrade Holding Corp. | | | | | | | | |
| | |
2.95%, 4/1/2022 | | | 765,000 | | | | 783,760 | |
| | |
3.75%, 4/1/2024 | | | 94,000 | | | | 102,738 | |
| | |
3.63%, 4/1/2025 (c) | | | 417,000 | | | | 458,969 | |
| | |
3.30%, 4/1/2027 | | | 139,000 | | | | 154,033 | |
| | |
2.75%, 10/1/2029 (c) | | | 100,000 | | | | 106,370 | |
| | | | | | | | |
| | |
| | | | | | | 32,576,067 | |
| | | | | | | | |
| | |
Chemicals — 0.2% | | | | | | | | |
| | |
EI du Pont de Nemours and Co. | | | | | | | | |
| | |
1.70%, 7/15/2025 | | | 90,000 | | | | 92,225 | |
| | |
2.30%, 7/15/2030 | | | 139,000 | | | | 142,543 | |
| | |
Huntsman International LLC
4.50%, 5/1/2029 | | | 508,000 | | | | 572,709 | |
| | |
NewMarket Corp. 4.10%, 12/15/2022 (c) | | | 109,000 | | | | 115,416 | |
| | |
Syngenta Finance NV (Switzerland) 3.13%, 3/28/2022 | | | 6,000 | | | | 6,078 | |
| | | | | | | | |
| INVESTMENTS | | PRINCIPAL
AMOUNT ($) | | | VALUE ($) | |
| | | | | | | | |
| | |
Westlake Chemical Corp. 5.00%, 8/15/2046 | | | 462,000 | | | | 553,029 | |
| | | | | | | | |
| | |
| | | | | | | 1,482,000 | |
| | | | | | | | |
| | |
Communications Equipment — 0.1% | | | | | | | | |
| | |
Juniper Networks, Inc. 5.95%, 3/15/2041 | | | 728,000 | | | | 914,664 | |
| | | | | | | | |
| | |
Consumer Finance — 2.1% | | | | | | | | |
| | |
Ally Financial, Inc. | | | | | | | | |
| | |
3.88%, 5/21/2024 | | | 1,608,000 | | | | 1,749,559 | |
| | |
5.13%, 9/30/2024 | | | 2,097,000 | | | | 2,388,249 | |
| | |
4.63%, 3/30/2025 | | | 55,000 | | | | 61,819 | |
| | |
8.00%, 11/1/2031 | | | 405,000 | | | | 575,007 | |
| | |
American Express Co. | | | | | | | | |
| | |
2.75%, 5/20/2022 | | | 262,000 | | | | 269,264 | |
| | |
2.50%, 8/1/2022 | | | 162,000 | | | | 166,830 | |
| | |
2.65%, 12/2/2022 | | | 178,000 | | | | 185,136 | |
| | |
3.40%, 2/27/2023 | | | 63,000 | | | | 66,624 | |
| | |
3.70%, 8/3/2023 | | | 310,000 | | | | 333,715 | |
| | |
3.40%, 2/22/2024 | | | 34,000 | | | | 36,815 | |
| | |
3.00%, 10/30/2024 | | | 208,000 | | | | 224,905 | |
| | |
4.20%, 11/6/2025 | | | 100,000 | | | | 114,420 | |
| | |
3.13%, 5/20/2026 | | | 240,000 | | | | 263,695 | |
| | |
4.05%, 12/3/2042 (c) | | | 1,166,000 | | | | 1,373,867 | |
| | |
American Express Credit Corp. | | | | | | | | |
| | |
2.70%, 3/3/2022 | | | 112,000 | | | | 114,526 | |
| | |
3.30%, 5/3/2027 | | | 336,000 | | | | 373,989 | |
| | |
Capital One Financial Corp. | | | | | | | | |
| | |
3.05%, 3/9/2022 | | | 643,000 | | | | 659,418 | |
| | |
2.60%, 5/11/2023 | | | 10,000 | | | | 10,444 | |
| | |
3.50%, 6/15/2023 | | | 229,000 | | | | 244,573 | |
| | |
3.30%, 10/30/2024 | | | 10,000 | | | | 10,846 | |
| | |
3.20%, 2/5/2025 | | | 270,000 | | | | 290,548 | |
| | |
3.80%, 1/31/2028 (c) | | | 60,000 | | | | 67,452 | |
| | |
Discover Financial Services | | | | | | | | |
| | |
5.20%, 4/27/2022 | | | 314,000 | | | | 330,813 | |
| | |
3.85%, 11/21/2022 | | | 789,000 | | | | 834,075 | |
| | |
3.95%, 11/6/2024 | | | 1,192,000 | | | | 1,313,235 | |
| | |
3.75%, 3/4/2025 | | | 44,000 | | | | 48,115 | |
| | |
4.50%, 1/30/2026 | | | 20,000 | | | | 22,782 | |
| | |
4.10%, 2/9/2027 | | | 418,000 | | | | 472,131 | |
| | |
Navient Solutions LLC Zero Coupon, 10/3/2022 | | | 50,000 | | | | 49,355 | |
| | |
Synchrony Financial | | | | | | | | |
| | |
2.85%, 7/25/2022 | | | 1,320,000 | | | | 1,359,871 | |
| | |
4.38%, 3/19/2024 | | | 487,000 | | | | 534,316 | |
| | |
4.50%, 7/23/2025 (c) | | | 142,000 | | | | 158,465 | |
SEE NOTES TO FINANCIAL STATEMENTS.
| | | | | | | | |
| | | |
| FEBRUARY 28, 2021 | | J.P. MORGAN EXCHANGE-TRADED FUNDS | | | | | 133 | |
JPMorgan U.S. Aggregate Bond ETF
SCHEDULE OF PORTFOLIO INVESTMENTS
AS OF FEBRUARY 28, 2021 (continued)
| | | | | | | | |
| INVESTMENTS | | PRINCIPAL
AMOUNT ($) | | | VALUE ($) | |
Corporate Bonds — continued | | | | | | | | |
| | |
Consumer Finance — continued | | | | | | | | |
| | |
3.70%, 8/4/2026 | | | 378,000 | | | | 412,845 | |
| | |
5.15%, 3/19/2029 | | | 1,873,000 | | | | 2,216,622 | |
| | | | | | | | |
| | |
| | | | | | | 17,334,326 | |
| | | | | | | | |
| | |
Containers & Packaging — 0.1% | | | | | | | | |
| | |
Avery Dennison Corp. | | | | | | | | |
| | |
4.88%, 12/6/2028 | | | 432,000 | | | | 515,499 | |
| | |
2.65%, 4/30/2030 | | | 24,000 | | | | 24,896 | |
| | | | | | | | |
| | |
| | | | | | | 540,395 | |
| | | | | | | | |
| | |
Diversified Financial Services — 0.1% | | | | | | | | |
| | |
Jefferies Financial Group, Inc. | | | | | | | | |
| | |
5.50%, 10/18/2023 | | | 10,000 | | | | 10,903 | |
| | |
Synchrony Bank 3.00%, 6/15/2022 | | | 450,000 | | | | 463,363 | |
| | | | | | | | |
| | |
| | | | | | | 474,266 | |
| | | | | | | | |
| |
Diversified Telecommunication Services — 0.5% | | | | | |
| | |
Verizon Communications, Inc. | | | | | | | | |
| | |
2.95%, 3/15/2022 | | | 232,000 | | | | 238,463 | |
| | |
5.15%, 9/15/2023 | | | 10,000 | | | | 11,159 | |
| | |
3.38%, 2/15/2025 | | | 50,000 | | | | 54,613 | |
| | |
4.13%, 3/16/2027 | | | 310,000 | | | | 357,671 | |
| | |
3.00%, 3/22/2027 | | | 20,000 | | | | 21,683 | |
| | |
4.33%, 9/21/2028 | | | 50,000 | | | | 58,187 | |
| | |
3.88%, 2/8/2029 | | | 411,000 | | | | 466,844 | |
| | |
1.68%, 10/30/2030 (e) | | | 796,000 | | | | 756,943 | |
| | |
7.75%, 12/1/2030 (c) | | | 55,000 | | | | 80,529 | |
| | |
1.75%, 1/20/2031 | | | 125,000 | | | | 119,108 | |
| | |
4.40%, 11/1/2034 | | | 80,000 | | | | 95,011 | |
| | |
4.27%, 1/15/2036 | | | 155,000 | | | | 180,271 | |
| | |
4.81%, 3/15/2039 | | | 265,000 | | | | 327,018 | |
| | |
2.65%, 11/20/2040 | | | 1,000 | | | | 934 | |
| | |
3.85%, 11/1/2042 | | | 80,000 | | | | 88,253 | |
| | |
5.01%, 4/15/2049 | | | 9,000 | | | | 11,429 | |
| | |
4.00%, 3/22/2050 (c) | | | 214,000 | | | | 235,266 | |
| | |
2.88%, 11/20/2050 | | | 50,000 | | | | 45,519 | |
| | |
4.67%, 3/15/2055 | | | 412,000 | | | | 500,818 | |
| | |
2.99%, 10/30/2056 (e) | | | 727,000 | | | | 658,382 | |
| | |
3.00%, 11/20/2060 | | | 175,000 | | | | 157,214 | |
| | | | | | | | |
| | |
| | | | | | | 4,465,315 | |
| | | | | | | | |
| | |
Electric Utilities — 1.5% | | | | | | | | |
| | |
Avangrid, Inc. | | | | | | | | |
| | |
3.15%, 12/1/2024 | | | 216,000 | | | | 234,092 | |
| | |
3.20%, 4/15/2025 | | | 136,000 | | | | 147,026 | |
| | |
3.80%, 6/1/2029 | | | 175,000 | | | | 197,709 | |
| | | | | | | | |
| INVESTMENTS | | PRINCIPAL
AMOUNT ($) | | | VALUE ($) | |
| | | | | | | | |
| | |
Electric Utilities — continued | | | | | | | | |
| | |
Enel Americas SA (Chile) | | | | | | | | |
| | |
4.00%, 10/25/2026 | | | 761,000 | | | | 844,724 | |
| | |
Enel Chile SA (Chile) | | | | | | | | |
| | |
4.88%, 6/12/2028 | | | 401,000 | | | | 470,460 | |
| | |
Gulf Power Co. | | | | | | | | |
| | |
Series A, 3.30%, 5/30/2027 | | | 291,000 | | | | 323,183 | |
| | |
Hydro-Quebec (Canada) | | | | | | | | |
| | |
Series IO, 8.05%, 7/7/2024 | | | 35,000 | | | | 43,417 | |
| | |
8.50%, 12/1/2029 | | | 50,000 | | | | 75,969 | |
| | |
Iberdrola International BV (Spain) | | | | | | | | |
| | |
5.81%, 3/15/2025 | | | 30,000 | | | | 35,360 | |
| | |
6.75%, 7/15/2036 | | | 178,000 | | | | 266,265 | |
| | |
Interstate Power and Light Co. | | | | | | | | |
| | |
2.30%, 6/1/2030 | | | 650,000 | | | | 665,062 | |
| | |
6.25%, 7/15/2039 | | | 202,000 | | | | 284,965 | |
| | |
NextEra Energy Capital Holdings, Inc. | | | | | | | | |
| | |
2.90%, 4/1/2022 | | | 268,000 | | | | 275,460 | |
| | |
2.80%, 1/15/2023 | | | 328,000 | | | | 342,424 | |
| | |
3.15%, 4/1/2024 | | | 1,105,000 | | | | 1,186,625 | |
| | |
3.25%, 4/1/2026 | | | 610,000 | | | | 669,114 | |
| | |
3.55%, 5/1/2027 | | | 224,000 | | | | 251,413 | |
| | |
3.50%, 4/1/2029 | | | 150,000 | | | | 165,859 | |
| | |
2.75%, 11/1/2029 | | | 1,206,000 | | | | 1,269,192 | |
| | |
2.25%, 6/1/2030 | | | 210,000 | | | | 211,981 | |
| | |
Public Service Electric and Gas Co. | | | | | | | | |
| | |
3.65%, 9/1/2042 | | | 195,000 | | | | 218,438 | |
| | |
Union Electric Co. | | | | | | | | |
| | |
8.45%, 3/15/2039 | | | 60,000 | | | | 102,277 | |
| | |
3.90%, 9/15/2042 | | | 800,000 | | | | 912,455 | |
| | |
Wisconsin Power and Light Co. | | | | | | | | |
| | |
3.65%, 4/1/2050 | | | 900,000 | | | | 1,001,918 | |
| | |
Xcel Energy, Inc. | | | | | | | | |
| | |
0.50%, 10/15/2023 (c) | | | 435,000 | | | | 435,721 | |
| | |
2.60%, 12/1/2029 | | | 1,402,000 | | | | 1,461,196 | |
| | |
3.40%, 6/1/2030 | | | 350,000 | | | | 384,972 | |
| | |
3.50%, 12/1/2049 | | | 50,000 | | | | 52,645 | |
| | | | | | | | |
| | |
| | | | | | | 12,529,922 | |
| | | | | | | | |
| | |
Electrical Equipment — 0.1% | | | | | | | | |
| | |
Rockwell Automation, Inc. | | | | | | | | |
| | |
4.20%, 3/1/2049 | | | 964,000 | | | | 1,192,207 | |
| | | | | | | | |
|
Electronic Equipment, Instruments & Components — 0.2% | |
| | |
Allegion US Holding Co., Inc. | | | | | | | | |
| | |
3.20%, 10/1/2024 | | | 214,000 | | | | 227,896 | |
| | |
3.55%, 10/1/2027 | | | 126,000 | | | | 136,777 | |
SEE NOTES TO FINANCIAL STATEMENTS.
| | | | | | |
| | | |
| 134 | | | | J.P. MORGAN EXCHANGE-TRADED FUNDS | | FEBRUARY 28, 2021 |
| | | | | | | | |
| INVESTMENTS | | PRINCIPAL
AMOUNT ($) | | | VALUE ($) | |
Corporate Bonds — continued | | | | | | | | |
|
Electronic Equipment, Instruments & Components — continued | |
| | |
Amphenol Corp. | | | | | | | | |
| | |
3.20%, 4/1/2024 | | | 56,000 | | | | 59,840 | |
| | |
2.05%, 3/1/2025 | | | 724,000 | | | | 752,306 | |
| | |
2.80%, 2/15/2030 | | | 187,000 | | | | 196,954 | |
| | | | | | | | |
| | |
| | | | | | | 1,373,773 | |
| | | | | | | | |
| |
Energy Equipment & Services — 0.0% (a) | | | | | |
| | |
Helmerich & Payne, Inc. | | | | | | | | |
| | |
4.65%, 3/15/2025 | | | 176,000 | | | | 194,416 | |
| | |
4.65%, 3/15/2025 (e) | | | 30,000 | | | | 33,139 | |
| | | | | | | | |
| | |
| | | | | | | 227,555 | |
| | | | | | | | |
| | |
Entertainment — 0.3% | | | | | | | | |
| | |
Activision Blizzard, Inc. | | | | | | | | |
| | |
3.40%, 9/15/2026 | | | 310,000 | | | | 345,079 | |
| | |
3.40%, 6/15/2027 | | | 200,000 | | | | 222,783 | |
| | |
1.35%, 9/15/2030 | | | 10,000 | | | | 9,348 | |
| | |
4.50%, 6/15/2047 | | | 371,000 | | | | 457,529 | |
| | |
2.50%, 9/15/2050 (c) | | | 1,278,000 | | | | 1,122,992 | |
| | |
Electronic Arts, Inc. | | | | | | | | |
| | |
4.80%, 3/1/2026 (c) | | | 400,000 | | | | 465,718 | |
| | | | | | | | |
| | |
| | | | | | | 2,623,449 | |
| | | | | | | | |
| | |
Food & Staples Retailing — 0.1% | | | | | | | | |
| | |
Ahold Finance USA LLC (Netherlands) 6.88%, 5/1/2029 (c) | | | 124,000 | | | | 166,796 | |
| | |
Koninklijke Ahold Delhaize NV (Netherlands)
5.70%, 10/1/2040 | | | 491,000 | | | | 667,122 | |
| | | | | | | | |
| | |
| | | | | | | 833,918 | |
| | | | | | | | |
| | |
Food Products — 0.1% | | | | | | | | |
| | |
Flowers Foods, Inc. | | | | | | | | |
| | |
4.38%, 4/1/2022 (c) | | | 137,000 | | | | 140,934 | |
| | |
3.50%, 10/1/2026 | | | 101,000 | | | | 110,544 | |
| | |
Hormel Foods Corp. 1.80%, 6/11/2030 | | | 398,000 | | | | 393,324 | |
| | | | | | | | |
| | |
| | | | | | | 644,802 | |
| | | | | | | | |
| | |
Gas Utilities — 0.2% | | | | | | | | |
| | |
National Fuel Gas Co. | | | | | | | | |
| | |
3.75%, 3/1/2023 | | | 244,000 | | | | 256,260 | |
| | |
5.50%, 1/15/2026 | | | 578,000 | | | | 667,718 | |
| | |
3.95%, 9/15/2027 | | | 320,000 | | | | 344,138 | |
| | |
4.75%, 9/1/2028 (c) | | | 250,000 | | | | 281,201 | |
| | | | | | | | |
| | |
| | | | | | | 1,549,317 | |
| | | | | | | | |
| | | | | | | | |
| INVESTMENTS | | PRINCIPAL
AMOUNT ($) | | | VALUE ($) | |
| | | | | | | | |
|
Health Care Equipment & Supplies — 0.6% | |
| | |
Baxter International, Inc. | | | | | | | | |
| | |
2.60%, 8/15/2026 | | | 663,000 | | | | 712,087 | |
| | |
3.95%, 4/1/2030 (e) | | | 10,000 | | | | 11,508 | |
| | |
3.50%, 8/15/2046 | | | 120,000 | | | | 129,318 | |
| | |
Danaher Corp. 3.35%, 9/15/2025 | | | 50,000 | | | | 54,972 | |
| | |
DENTSPLY SIRONA, Inc. 3.25%, 6/1/2030 | | | 983,000 | | | | 1,051,001 | |
| | |
DH Europe Finance II SARL | | | | | | | | |
| | |
2.05%, 11/15/2022 | | | 142,000 | | | | 146,073 | |
| | |
2.20%, 11/15/2024 | | | 35,000 | | | | 36,875 | |
| | |
2.60%, 11/15/2029 | | | 277,000 | | | | 289,496 | |
| | |
Edwards Lifesciences Corp. 4.30%, 6/15/2028 | | | 803,000 | | | | 921,435 | |
| | |
Koninklijke Philips NV (Netherlands) | | | | | | | | |
| | |
6.88%, 3/11/2038 | | | 263,000 | | | | 396,917 | |
| | |
5.00%, 3/15/2042 | | | 982,000 | | | | 1,275,538 | |
| | | | | | | | |
| | |
| | | | | | | 5,025,220 | |
| | | | | | | | |
| | |
Health Care Providers & Services — 0.4% | | | | | | | | |
| | |
AmerisourceBergen Corp. | | | | | | | | |
| | |
3.40%, 5/15/2024 | | | 500,000 | | | | 539,523 | |
| | |
3.25%, 3/1/2025 | | | 255,000 | | | | 276,302 | |
| | |
3.45%, 12/15/2027 | | | 429,000 | | | | 476,221 | |
| | |
4.25%, 3/1/2045 | | | 350,000 | | | | 395,415 | |
| | |
4.30%, 12/15/2047 | | | 175,000 | | | | 200,644 | |
| | |
McKesson Corp. | | | | | | | | |
| | |
2.70%, 12/15/2022 | | | 899,000 | | | | 930,158 | |
| | |
3.95%, 2/16/2028 (c) | | | 55,000 | | | | 62,573 | |
| | |
4.88%, 3/15/2044 | | | 70,000 | | | | 85,105 | |
| | | | | | | | |
| | |
| | | | | | | 2,965,941 | |
| | | | | | | | |
| | |
Household Durables — 0.1% | | | | | | | | |
| | |
Harman International Industries, Inc. 4.15%, 5/15/2025 | | | 100,000 | | | | 110,648 | |
| | |
Whirlpool Corp. 4.60%, 5/15/2050 | | | 671,000 | | | | 800,771 | |
| | | | | | | | |
| | |
| | | | | | | 911,419 | |
| | | | | | | | |
| | |
Household Products — 0.2% | | | | | | | | |
| | |
Church & Dwight Co., Inc. | | | | | | | | |
| | |
3.15%, 8/1/2027 | | | 61,000 | | | | 66,975 | |
| | |
3.95%, 8/1/2047 | | | 1,159,000 | | | | 1,331,926 | |
| | |
Clorox Co. (The) | | | | | | | | |
| | |
3.05%, 9/15/2022 | | | 134,000 | | | | 138,639 | |
| | |
3.50%, 12/15/2024 | | | 10,000 | | | | 11,016 | |
| | |
3.90%, 5/15/2028 (c) | | | 252,000 | | | | 287,690 | |
| | | | | | | | |
| | |
| | | | | | | 1,836,246 | |
| | | | | | | | |
SEE NOTES TO FINANCIAL STATEMENTS.
| | | | | | | | |
| | | |
| FEBRUARY 28, 2021 | | J.P. MORGAN EXCHANGE-TRADED FUNDS | | | | | 135 | |
JPMorgan U.S. Aggregate Bond ETF
SCHEDULE OF PORTFOLIO INVESTMENTS
AS OF FEBRUARY 28, 2021 (continued)
| | | | | | | | |
| INVESTMENTS | | PRINCIPAL
AMOUNT ($) | | | VALUE ($) | |
Corporate Bonds — continued | | | | | | | | |
|
Independent Power and Renewable Electricity Producers — 0.3% | |
| | |
Enel Generacion Chile SA (Chile)
4.25%, 4/15/2024 | | | 399,000 | | | | 431,240 | |
| | |
PSEG Power LLC
3.85%, 6/1/2023 | | | 1,905,000 | | | | 2,042,884 | |
| | | | | | | | |
| | |
| | | | | | | 2,474,124 | |
| | | | | | | | |
| | |
Industrial Conglomerates — 0.0% (a) | | | | | | | | |
| | |
Pentair Finance SARL
4.50%, 7/1/2029 (c) | | | 129,000 | | | | 149,028 | |
| | | | | | | | |
| | |
Insurance — 0.1% | | | | | | | | |
| | |
Loews Corp. 4.13%, 5/15/2043 | | | 515,000 | | | | 583,197 | |
| | | | | | | | |
| | |
Interactive Media & Services — 0.5% | | | | | | | | |
| | |
Alphabet, Inc. | | | | | | | | |
| | |
3.38%, 2/25/2024 (c) | | | 2,358,000 | | | | 2,564,256 | |
| | |
2.00%, 8/15/2026 (c) | | | 1,274,000 | | | | 1,340,791 | |
| | |
1.10%, 8/15/2030 | | | 409,000 | | | | 386,885 | |
| | | | | | | | |
| | |
| | | | | | | 4,291,932 | |
| | | | | | | | |
| |
Internet & Direct Marketing Retail — 0.8% | | | | | |
| | |
Alibaba Group Holding Ltd. (China) | | | | | | | | |
| | |
2.80%, 6/6/2023 | | | 200,000 | | | | 209,439 | |
| | |
3.60%, 11/28/2024 | | | 600,000 | | | | 656,790 | |
| | |
4.50%, 11/28/2034 | | | 200,000 | | | | 236,679 | |
| | |
4.00%, 12/6/2037 | | | 835,000 | | | | 943,232 | |
| | |
4.20%, 12/6/2047 | | | 435,000 | | | | 496,224 | |
| | |
4.40%, 12/6/2057 | | | 1,600,000 | | | | 1,908,278 | |
| | |
Booking Holdings, Inc. | | | | | | | | |
| | |
2.75%, 3/15/2023 | | | 693,000 | | | | 723,590 | |
| | |
3.65%, 3/15/2025 (c) | | | 126,000 | | | | 137,960 | |
| | |
3.60%, 6/1/2026 | | | 10,000 | | | | 11,072 | |
| | |
4.63%, 4/13/2030 | | | 70,000 | | | | 83,533 | |
| | |
JD.com, Inc. (China) | | | | | | | | |
| | |
3.88%, 4/29/2026 | | | 420,000 | | | | 462,049 | |
| | |
4.13%, 1/14/2050 | | | 1,020,000 | | | | 1,071,220 | |
| | | | | | | | |
| | |
| | | | | | | 6,940,066 | |
| | | | | | | | |
| | |
IT Services — 0.1% | | | | | | | | |
| | |
Broadridge Financial Solutions, Inc. | | | | | | | | |
| | |
3.40%, 6/27/2026 | | | 284,000 | | | | 312,688 | |
| | |
2.90%, 12/1/2029 | | | 126,000 | | | | 132,753 | |
| | | | | | | | |
| | |
| | | | | | | 445,441 | |
| | | | | | | | |
| | |
Leisure Products — 0.2% | | | | | | | | |
| | |
Hasbro, Inc. | | | | | | | | |
| | |
3.00%, 11/19/2024 | | | 137,000 | | | | 147,006 | |
| | |
3.55%, 11/19/2026 | | | 141,000 | | | | 154,322 | |
| | |
3.50%, 9/15/2027 | | | 133,000 | | | | 144,547 | |
| | | | | | | | |
| INVESTMENTS | | PRINCIPAL
AMOUNT ($) | | | VALUE ($) | |
| | | | | | | | |
| | |
Leisure Products — continued | | | | | | | | |
| | |
6.35%, 3/15/2040 | | | 585,000 | | | | 767,698 | |
| | |
5.10%, 5/15/2044 | | | 245,000 | | | | 281,084 | |
| | | | | | | | |
| | |
| | | | | | | 1,494,657 | |
| | | | | | | | |
| | |
Life Sciences Tools & Services — 0.1% | | | | | | | | |
| | |
Agilent Technologies, Inc. | | | | | | | | |
| | |
3.20%, 10/1/2022 | | | 134,000 | | | | 138,918 | |
| | |
3.88%, 7/15/2023 | | | 309,000 | | | | 330,719 | |
| | |
3.05%, 9/22/2026 | | | 40,000 | | | | 43,501 | |
| | |
2.75%, 9/15/2029 | | | 470,000 | | | | 494,529 | |
| | | | | | | | |
| | |
| | | | | | | 1,007,667 | |
| | | | | | | | |
| | |
Machinery — 0.2% | | | | | | | | |
| | |
IDEX Corp. 3.00%, 5/1/2030 | | | 545,000 | | | | 578,365 | |
| | |
Otis Worldwide Corp. 3.11%, 2/15/2040 | | | 1,157,000 | | | | 1,192,970 | |
| | | | | | | | |
| | |
| | | | | | | 1,771,335 | |
| | | | | | | | |
| | |
Metals & Mining — 1.9% | | | | | | | | |
| | |
Kinross Gold Corp. (Canada) | | | | | | | | |
| | |
5.95%, 3/15/2024 | | | 726,000 | | | | 823,694 | |
| | |
4.50%, 7/15/2027 | | | 430,000 | | | | 492,244 | |
| | |
Newmont Corp. | | | | | | | | |
| | |
3.50%, 3/15/2022 | | | 290,000 | | | | 296,345 | |
| | |
3.70%, 3/15/2023 | | | 302,000 | | | | 318,238 | |
| | |
2.80%, 10/1/2029 | | | 338,000 | | | | 354,293 | |
| | |
2.25%, 10/1/2030 | | | 950,000 | | | | 947,389 | |
| | |
5.88%, 4/1/2035 | | | 283,000 | | | | 386,602 | |
| | |
6.25%, 10/1/2039 | | | 101,000 | | | | 145,537 | |
| | |
4.88%, 3/15/2042 | | | 453,000 | | | | 575,896 | |
| | |
5.45%, 6/9/2044 | | | 400,000 | | | | 535,643 | |
| | |
Rio Tinto Alcan, Inc. (Canada) | | | | | | | | |
| | |
7.25%, 3/15/2031 | | | 476,000 | | | | 680,547 | |
| | |
6.13%, 12/15/2033 | | | 90,000 | | | | 131,027 | |
| | |
5.75%, 6/1/2035 | | | 71,000 | | | | 99,380 | |
| | |
Rio Tinto Finance USA plc (Australia) | | | | | | | | |
| | |
4.75%, 3/22/2042 | | | 61,000 | | | | 79,226 | |
| | |
4.13%, 8/21/2042 | | | 1,547,000 | | | | 1,869,528 | |
| | |
Southern Copper Corp. (Peru) | | | | | | | | |
| | |
3.50%, 11/8/2022 | | | 139,000 | | | | 145,294 | |
| | |
3.88%, 4/23/2025 | | | 1,017,000 | | | | 1,122,818 | |
| | |
6.75%, 4/16/2040 | | | 100,000 | | | | 140,967 | |
| | |
5.25%, 11/8/2042 | | | 228,000 | | | | 286,298 | |
| | |
5.88%, 4/23/2045 | | | 1,214,000 | | | | 1,649,784 | |
| | |
Vale Overseas Ltd. (Brazil) | | | | | | | | |
| | |
6.25%, 8/10/2026 | | | 719,000 | | | | 873,455 | |
| | |
3.75%, 7/8/2030 | | | 754,000 | | | | 805,729 | |
SEE NOTES TO FINANCIAL STATEMENTS.
| | | | | | |
| | | |
| 136 | | | | J.P. MORGAN EXCHANGE-TRADED FUNDS | | FEBRUARY 28, 2021 |
| | | | | | | | |
| INVESTMENTS | | PRINCIPAL
AMOUNT ($) | | | VALUE ($) | |
Corporate Bonds — continued | | | | | | | | |
| | |
Metals & Mining — continued | | | | | | | | |
| | |
6.88%, 11/21/2036 | | | 125,000 | | | | 171,533 | |
| | |
6.88%, 11/10/2039 | | | 426,000 | | | | 587,761 | |
| | |
Vale SA (Brazil) 5.63%, 9/11/2042 (c) | | | 1,987,000 | | | | 2,499,508 | |
| | | | | | | | |
| | |
| | | | | | | 16,018,736 | |
| | | | | | | | |
| | |
Multiline Retail — 0.3% | | | | | | | | |
| | |
Dollar General Corp. | | | | | | | | |
| | |
3.25%, 4/15/2023 | | | 214,000 | | | | 225,173 | |
| | |
4.15%, 11/1/2025 | | | 259,000 | | | | 292,572 | |
| | |
3.88%, 4/15/2027 | | | 120,000 | | | | 135,756 | |
| | |
4.13%, 5/1/2028 | | | 230,000 | | | | 264,104 | |
| | |
3.50%, 4/3/2030 | | | 325,000 | | | | 358,116 | |
| | |
4.13%, 4/3/2050 | | | 1,084,000 | | | | 1,255,352 | |
| | | | | | | | |
| | |
| | | | | | | 2,531,073 | |
| | | | | | | | |
| | |
Multi-Utilities — 0.1% | | | | | | | | |
| | |
Ameren Corp. | | | | | | | | |
| | |
2.50%, 9/15/2024 | | | 349,000 | | | | 369,789 | |
| | |
3.50%, 1/15/2031 | | | 661,000 | | | | 731,926 | |
| | |
Public Service Enterprise Group, Inc. 2.65%, 11/15/2022 | | | 10,000 | | | | 10,368 | |
| | | | | | | | |
| | |
| | | | | | | 1,112,083 | |
| | | | | | | | |
| | |
Oil, Gas & Consumable Fuels — 3.0% | | | | | | | | |
| | |
Boardwalk Pipelines LP
3.40%, 2/15/2031 | | | 400,000 | | | | 412,998 | |
| | |
Burlington Resources LLC | | | | | | | | |
| | |
7.20%, 8/15/2031 | | | 179,000 | | | | 259,223 | |
| | |
5.95%, 10/15/2036 | | | 376,000 | | | | 521,540 | |
| | |
Cimarex Energy Co. 4.38%, 3/15/2029 (c) | | | 454,000 | | | | 508,050 | |
| | |
Conoco Funding Co. 7.25%, 10/15/2031 | | | 151,000 | | | | 221,333 | |
| | |
ConocoPhillips | | | | | | | | |
| | |
5.90%, 10/15/2032 | | | 131,000 | | | | 178,040 | |
| | |
6.50%, 2/1/2039 | | | 60,000 | | | | 87,987 | |
| | |
ConocoPhillips Co. | | | | | | | | |
| | |
2.40%, 12/15/2022 | | | 353,000 | | | | 363,807 | |
| | |
3.35%, 11/15/2024 (c) | | | 197,000 | | | | 214,237 | |
| | |
4.95%, 3/15/2026 (c) | | | 818,000 | | | | 959,863 | |
| | |
6.95%, 4/15/2029 | | | 132,000 | | | | 179,945 | |
| | |
4.30%, 11/15/2044 | | | 358,000 | | | | 426,325 | |
| | |
5.95%, 3/15/2046 (c) | | | 33,000 | | | | 47,565 | |
| | |
Ecopetrol SA (Colombia) | | | | | | | | |
| | |
5.88%, 9/18/2023 | | | 109,000 | | | | 120,954 | |
| | |
4.13%, 1/16/2025 | | | 119,000 | | | | 127,622 | |
| | |
6.88%, 4/29/2030 | | | 99,000 | | | | 121,481 | |
| | |
7.38%, 9/18/2043 | | | 68,000 | | | | 85,493 | |
| | |
5.88%, 5/28/2045 | | | 168,000 | | | | 183,037 | |
| | | | | | | | |
| INVESTMENTS | | PRINCIPAL
AMOUNT ($) | | | VALUE ($) | |
| | | | | | | | |
| |
Oil, Gas & Consumable Fuels — continued | | | | | |
| | |
Eni USA, Inc. (Italy)
7.30%, 11/15/2027 | | | 104,000 | | | | 136,795 | |
| | |
EOG Resources, Inc. | | | | | | | | |
| | |
2.63%, 3/15/2023 | | | 206,000 | | | | 214,414 | |
| | |
4.15%, 1/15/2026 (c) | | | 600,000 | | | | 681,305 | |
| | |
4.38%, 4/15/2030 | | | 710,000 | | | | 834,051 | |
| | |
4.95%, 4/15/2050 | | | 283,000 | | | | 358,490 | |
| | |
Equinor ASA (Norway) | | | | | | | | |
| | |
2.65%, 1/15/2024 | | | 97,000 | | | | 102,785 | |
| | |
3.70%, 3/1/2024 | | | 91,000 | | | | 99,670 | |
| | |
1.75%, 1/22/2026 | | | 38,000 | | | | 39,091 | |
| | |
3.63%, 9/10/2028 | | | 40,000 | | | | 45,122 | |
| | |
2.38%, 5/22/2030 | | | 162,000 | | | | 165,711 | |
| | |
3.25%, 11/18/2049 | | | 230,000 | | | | 233,846 | |
| | |
Hess Corp. | | | | | | | | |
| | |
7.30%, 8/15/2031 | | | 1,272,000 | | | | 1,658,841 | |
| | |
5.60%, 2/15/2041 (c) | | | 1,772,000 | | | | 2,103,072 | |
| | |
HollyFrontier Corp. | | | | | | | | |
| | |
2.63%, 10/1/2023 (c) | | | 250,000 | | | | 257,023 | |
| | |
5.88%, 4/1/2026 | | | 1,022,000 | | | | 1,163,239 | |
| | |
4.50%, 10/1/2030 | | | 254,000 | | | | 267,728 | |
| | |
Magellan Midstream Partners LP | | | | | | | | |
| | |
5.00%, 3/1/2026 | | | 10,000 | | | | 11,661 | |
| | |
3.25%, 6/1/2030 (c) | | | 600,000 | | | | 644,930 | |
| | |
5.15%, 10/15/2043 | | | 26,000 | | | | 31,031 | |
| | |
4.25%, 9/15/2046 | | | 72,000 | | | | 76,217 | |
| | |
4.20%, 10/3/2047 | | | 50,000 | | | | 52,333 | |
| | |
3.95%, 3/1/2050 | | | 1,000,000 | | | | 1,022,956 | |
| | |
Pioneer Natural Resources Co. | | | | | | | | |
| | |
0.75%, 1/15/2024 | | | 1,591,000 | | | | 1,591,264 | |
| | |
1.13%, 1/15/2026 | | | 393,000 | | | | 389,246 | |
| | |
4.45%, 1/15/2026 | | | 368,000 | | | | 418,445 | |
| | |
Suncor Energy, Inc. (Canada) | | | | | | | | |
| | |
3.10%, 5/15/2025 | | | 190,000 | | | | 204,087 | |
| | |
7.15%, 2/1/2032 | | | 64,000 | | | | 87,573 | |
| | |
4.00%, 11/15/2047 | | | 2,211,000 | | | | 2,374,274 | |
| | |
Tosco Corp. 8.13%, 2/15/2030 | | | 65,000 | | | | 95,249 | |
| | |
Valero Energy Corp. | | | | | | | | |
| | |
2.70%, 4/15/2023 | | | 175,000 | | | | 182,446 | |
| | |
1.20%, 3/15/2024 | | | 388,000 | | | | 391,207 | |
| | |
3.65%, 3/15/2025 (c) | | | 505,000 | | | | 547,130 | |
| | |
2.85%, 4/15/2025 | | | 360,000 | | | | 379,793 | |
| | |
3.40%, 9/15/2026 | | | 1,124,000 | | | | 1,207,728 | |
| | |
2.15%, 9/15/2027 | | | 100,000 | | | | 100,135 | |
| | |
4.35%, 6/1/2028 | | | 324,000 | | | | 364,242 | |
SEE NOTES TO FINANCIAL STATEMENTS.
| | | | | | | | |
| | | |
| FEBRUARY 28, 2021 | | J.P. MORGAN EXCHANGE-TRADED FUNDS | | | | | 137 | |
JPMorgan U.S. Aggregate Bond ETF
SCHEDULE OF PORTFOLIO INVESTMENTS
AS OF FEBRUARY 28, 2021 (continued)
| | | | | | | | |
| INVESTMENTS | | PRINCIPAL
AMOUNT ($) | | | VALUE ($) | |
Corporate Bonds — continued | | | | | | | | |
| | |
Oil, Gas & Consumable Fuels — continued | | | | | | | | |
| | |
4.00%, 4/1/2029 | | | 250,000 | | | | 275,630 | |
| | |
7.50%, 4/15/2032 | | | 147,000 | | | | 203,704 | |
| | |
4.90%, 3/15/2045 | | | 136,000 | | | | 156,624 | |
| | |
Valero Energy Partners LP | | | | | | | | |
| | |
4.38%, 12/15/2026 | | | 287,000 | | | | 325,316 | |
| | |
4.50%, 3/15/2028 | | | 302,000 | | | | 341,052 | |
| | | | | | | | |
| | |
| | | | | | | 24,854,956 | |
| | | | | | | | |
| | |
Personal Products — 0.2% | | | | | | | | |
| | |
Estee Lauder Cos., Inc. (The) | | | | | | | | |
| | |
2.00%, 12/1/2024 | | | 75,000 | | | | 78,828 | |
| | |
3.15%, 3/15/2027 | | | 160,000 | | | | 176,870 | |
| | |
2.38%, 12/1/2029 | | | 27,000 | | | | 28,141 | |
| | |
2.60%, 4/15/2030 | | | 58,000 | | | | 61,480 | |
| | |
6.00%, 5/15/2037 (c) | | | 130,000 | | | | 182,214 | |
| | |
4.38%, 6/15/2045 | | | 191,000 | | | | 235,740 | |
| | |
4.15%, 3/15/2047 | | | 125,000 | | | | 152,386 | |
| | |
3.13%, 12/1/2049 | | | 681,000 | | | | 717,652 | |
| | | | | | | | |
| | |
| | | | | | | 1,633,311 | |
| | | | | | | | |
| | |
Pharmaceuticals — 0.9% | | | | | | | | |
| | |
Johnson & Johnson | | | | | | | | |
| | |
2.25%, 3/3/2022 | | | 83,000 | | | | 84,566 | |
| | |
2.45%, 3/1/2026 | | | 43,000 | | | | 46,102 | |
| | |
2.90%, 1/15/2028 | | | 220,000 | | | | 241,647 | |
| | |
6.95%, 9/1/2029 | | | 50,000 | | | | 71,090 | |
| | |
4.38%, 12/5/2033 | | | 227,000 | | | | 283,075 | |
| | |
3.55%, 3/1/2036 | | | 192,000 | | | | 224,142 | |
| | |
3.63%, 3/3/2037 | | | 170,000 | | | | 198,656 | |
| | |
5.95%, 8/15/2037 | | | 25,000 | | | | 36,425 | |
| | |
3.40%, 1/15/2038 | | | 286,000 | | | | 321,540 | |
| | |
2.10%, 9/1/2040 | | | 250,000 | | | | 234,353 | |
| | |
4.50%, 9/1/2040 | | | 73,000 | | | | 93,068 | |
| | |
4.50%, 12/5/2043 | | | 25,000 | | | | 32,327 | |
| | |
3.70%, 3/1/2046 | | | 699,000 | | | | 809,630 | |
| | |
3.75%, 3/3/2047 | | | 87,000 | | | | 101,692 | |
| | |
3.50%, 1/15/2048 | | | 719,000 | | | | 812,192 | |
| | |
2.25%, 9/1/2050 | | | 770,000 | | | | 698,806 | |
| | |
2.45%, 9/1/2060 | | | 264,000 | | | | 239,950 | |
| | |
Zoetis, Inc. | | | | | | | | |
| | |
3.25%, 2/1/2023 | | | 467,000 | | | | 488,555 | |
| | |
4.50%, 11/13/2025 | | | 56,000 | | | | 64,171 | |
| | |
3.00%, 9/12/2027 | | | 625,000 | | | | 682,039 | |
| | |
3.90%, 8/20/2028 | | | 497,000 | | | | 563,106 | |
| | |
2.00%, 5/15/2030 | | | 272,000 | | | | 268,492 | |
| | |
4.70%, 2/1/2043 | | | 469,000 | | | | 592,447 | |
| | | | | | | | |
| INVESTMENTS | | PRINCIPAL
AMOUNT ($) | | | VALUE ($) | |
| | | | | | | | |
| | |
Pharmaceuticals — continued | | | | | | | | |
| | |
3.95%, 9/12/2047 | | | 154,000 | | | | 176,717 | |
| | |
4.45%, 8/20/2048 | | | 135,000 | | | | 165,118 | |
| | |
3.00%, 5/15/2050 | | | 173,000 | | | | 172,097 | |
| | | | | | | | |
| | |
| | | | | | | 7,702,003 | |
| | | | | | | | |
| | |
Professional Services — 0.6% | | | | | | | | |
| | |
Thomson Reuters Corp. (Canada) | | | | | | | | |
| | |
4.30%, 11/23/2023 | | | 419,000 | | | | 456,941 | |
| | |
3.35%, 5/15/2026 | | | 1,540,000 | | | | 1,687,512 | |
| | |
5.50%, 8/15/2035 | | | 100,000 | | | | 128,598 | |
| | |
5.85%, 4/15/2040 | | | 25,000 | | | | 32,873 | |
| | |
5.65%, 11/23/2043 (c) | | | 1,318,000 | | | | 1,698,133 | |
| | |
Verisk Analytics, Inc. | | | | | | | | |
| | |
4.13%, 9/12/2022 | | | 10,000 | | | | 10,542 | |
| | |
5.50%, 6/15/2045 | | | 47,000 | | | | 61,676 | |
| | |
3.63%, 5/15/2050 | | | 562,000 | | | | 580,466 | |
| | | | | | | | |
| | |
| | | | | | | 4,656,741 | |
| | | | | | | | |
|
Semiconductors & Semiconductor Equipment — 1.0% | |
| | |
Maxim Integrated Products, Inc. | | | | | | | | |
| | |
3.38%, 3/15/2023 | | | 48,000 | | | | 50,342 | |
| | |
3.45%, 6/15/2027 (c) | | | 160,000 | | | | 178,228 | |
| | |
Micron Technology, Inc. | | | | | | | | |
| | |
2.50%, 4/24/2023 | | | 507,000 | | | | 528,118 | |
| | |
4.64%, 2/6/2024 | | | 431,000 | | | | 476,265 | |
| | |
4.98%, 2/6/2026 | | | 698,000 | | | | 809,194 | |
| | |
4.19%, 2/15/2027 | | | 125,000 | | | | 142,465 | |
| | |
5.33%, 2/6/2029 | | | 110,000 | | | | 132,720 | |
| | |
4.66%, 2/15/2030 | | | 220,000 | | | | 257,647 | |
| | |
NVIDIA Corp. | | | | | | | | |
| | |
3.20%, 9/16/2026 | | | 175,000 | | | | 192,937 | |
| | |
2.85%, 4/1/2030 | | | 856,000 | | | | 920,431 | |
| | |
3.50%, 4/1/2040 | | | 334,000 | | | | 369,229 | |
| | |
3.50%, 4/1/2050 | | | 318,000 | | | | 345,057 | |
| | |
3.70%, 4/1/2060 | | | 1,280,000 | | | | 1,432,472 | |
| | |
Texas Instruments, Inc. | | | | | | | | |
| | |
2.25%, 5/1/2023 | | | 90,000 | | | | 93,339 | |
| | |
2.63%, 5/15/2024 | | | 40,000 | | | | 42,571 | |
| | |
2.90%, 11/3/2027 | | | 230,000 | | | | 252,092 | |
| | |
2.25%, 9/4/2029 | | | 50,000 | | | | 51,522 | |
| | |
3.88%, 3/15/2039 | | | 754,000 | | | | 886,784 | |
| | |
4.15%, 5/15/2048 | | | 1,145,000 | | | | 1,399,456 | |
| | | | | | | | |
| | |
| | | | | | | 8,560,869 | |
| | | | | | | | |
SEE NOTES TO FINANCIAL STATEMENTS.
| | | | | | |
| | | |
| 138 | | | | J.P. MORGAN EXCHANGE-TRADED FUNDS | | FEBRUARY 28, 2021 |
| | | | | | | | |
| INVESTMENTS | | PRINCIPAL
AMOUNT ($) | | | VALUE ($) | |
Corporate Bonds — continued | | | | | | | | |
| | |
Software — 0.4% | | | | | | | | |
| | |
Cadence Design Systems, Inc. 4.38%, 10/15/2024 | | | 865,000 | | | | 962,525 | |
| | |
Citrix Systems, Inc. | | | | | | | | |
| | |
4.50%, 12/1/2027 (c) | | | 577,000 | | | | 668,960 | |
| | |
3.30%, 3/1/2030 | | | 208,000 | | | | 219,619 | |
| | |
Intuit, Inc. 0.65%, 7/15/2023 | | | 557,000 | | | | 560,865 | |
| | |
ServiceNow, Inc. 1.40%, 9/1/2030 | | | 850,000 | | | | 790,995 | |
| | | | | | | | |
| | |
| | | | | | | 3,202,964 | |
| | | | | | | | |
| | |
Specialty Retail — 0.6% | | | | | | | | |
| | |
Best Buy Co., Inc. | | | | | | | | |
| | |
4.45%, 10/1/2028 | | | 800,000 | | | | 928,971 | |
| | |
1.95%, 10/1/2030 | | | 359,000 | | | | 347,215 | |
| | |
Ross Stores, Inc. | | | | | | | | |
| | |
4.60%, 4/15/2025 | | | 707,000 | | | | 803,500 | |
| | |
0.88%, 4/15/2026 | | | 14,000 | | | | 13,745 | |
| | |
TJX Cos., Inc. (The) | | | | | | | | |
| | |
2.50%, 5/15/2023 | | | 445,000 | | | | 463,302 | |
| | |
3.50%, 4/15/2025 | | | 10,000 | | | | 10,966 | |
| | |
2.25%, 9/15/2026 | | | 1,196,000 | | | | 1,263,552 | |
| | |
3.75%, 4/15/2027 | | | 100,000 | | | | 113,282 | |
| | |
1.15%, 5/15/2028 | | | 165,000 | | | | 159,902 | |
| | |
Tractor Supply Co. 1.75%, 11/1/2030 | | | 677,000 | | | | 649,284 | |
| | | | | | | | |
| | |
| | | | | | | 4,753,719 | |
| | | | | | | | |
|
Technology Hardware, Storage & Peripherals — 0.4% | |
| | |
HP, Inc. | | | | | | | | |
| | |
2.20%, 6/17/2025 | | | 10,000 | | | | 10,438 | |
| | |
3.00%, 6/17/2027 | | | 2,010,000 | | | | 2,175,408 | |
| | |
3.40%, 6/17/2030 | | | 10,000 | | | | 10,794 | |
| | |
6.00%, 9/15/2041 | | | 720,000 | | | | 924,566 | |
| | | | | | | | |
| | |
| | | | | | | 3,121,206 | |
| | | | | | | | |
| |
Trading Companies & Distributors — 0.2% | | | | | |
| | |
WW Grainger, Inc. | | | | | | | | |
| | |
1.85%, 2/15/2025 | | | 1,009,000 | | | | 1,047,706 | |
| | |
4.60%, 6/15/2045 | | | 499,000 | | | | 624,300 | |
| | | | | | | | |
| | |
| | | | | | | 1,672,006 | |
| | | | | | | | |
|
Wireless Telecommunication Services — 0.6% | |
| | |
T-Mobile USA, Inc. | | | | | | | | |
| | |
3.50%, 4/15/2025 (e) | | | 10,000 | | | | 10,859 | |
| | |
3.75%, 4/15/2027 (e) | | | 10,000 | | | | 11,044 | |
| | |
2.05%, 2/15/2028 (e) | | | 10,000 | | | | 9,980 | |
| | |
3.88%, 4/15/2030 (e) | | | 1,089,000 | | | | 1,202,724 | |
| | |
4.38%, 4/15/2040 (e) | | | 770,000 | | | | 872,395 | |
| | |
3.00%, 2/15/2041 (c) (e) | | | 620,000 | | | | 588,795 | |
| | | | | | | | |
| INVESTMENTS | | PRINCIPAL
AMOUNT ($) | | | VALUE ($) | |
| | | | | | | | |
|
Wireless Telecommunication Services — continued | |
| | |
4.50%, 4/15/2050 (e) | | | 1,031,000 | | | | 1,160,207 | |
| | |
3.30%, 2/15/2051 (e) | | | 1,296,000 | | | | 1,214,713 | |
| | | | | | | | |
| | |
| | | | | | | 5,070,717 | |
| | | | | | | | |
| | |
Total Corporate Bonds
(Cost $217,448,323) | | | | | | | 218,625,236 | |
| | | | | | | | |
Commercial Mortgage-Backed Securities — 2.2% | |
| | |
Banc of America Commercial Mortgage Trust Series 2017-BNK3, Class A4, 3.57%, 2/15/2050 | | | 20,000 | | | | 22,255 | |
| | |
BANK | | | | | | | | |
| | |
Series 2017-BNK4, Class ASB, 3.42%, 5/15/2050 | | | 30,000 | | | | 32,487 | |
| | |
Series 2019-BN16, Class A4, 4.01%, 2/15/2052 | | | 60,000 | | | | 68,973 | |
| | |
Series 2019-BN21, Class A5, 2.85%, 10/17/2052 | | | 60,000 | | | | 64,146 | |
| | |
Series 2019-BN23, Class A3, 2.92%, 12/15/2052 | | | 142,000 | | | | 152,460 | |
| | |
Series 2018-BN10, Class A5, 3.69%, 2/15/2061 | | | 20,000 | | | | 22,469 | |
| | |
Series 2018-BN10, Class AS, 3.90%, 2/15/2061 (f) | | | 180,000 | | | | 201,626 | |
| | |
Series 2019-BN19, Class A3, 3.18%, 8/15/2061 | | | 100,000 | | | | 109,140 | |
| | |
Series 2019-BN22, Class A4, 2.98%, 11/15/2062 | | | 260,000 | | | | 280,309 | |
| | |
BBCMS Mortgage Trust Series 2018-C2, Class A5, 4.31%, 12/15/2051 | | | 40,000 | | | | 46,587 | |
| | |
Benchmark Mortgage Trust | | | | | | | | |
| | |
Series 2018-B1, Class A5, 3.67%, 1/15/2051 (f) | | | 50,000 | | | | 56,095 | |
| | |
Series 2018-B2, Class B, 4.20%, 2/15/2051 ‡ (f) | | | 20,000 | | | | 22,775 | |
| | |
Series 2018-B5, Class A4, 4.21%, 7/15/2051 | | | 110,000 | | | | 127,614 | |
| | |
Series 2018-B6, Class A2, 4.20%, 10/10/2051 | | | 50,000 | | | | 53,651 | |
| | |
Series 2018-B8, Class A5, 4.23%, 1/15/2052 | | | 40,000 | | | | 46,636 | |
| | |
Series 2020-B16, Class AM, 2.94%, 2/15/2053 ‡ (f) | | | 180,000 | | | | 189,829 | |
| | |
Cantor Commercial Real Estate Lending Series 2019-CF2, Class AS, 3.12%, 11/15/2052 | | | 75,000 | | | | 79,997 | |
| | |
CD Mortgage Trust | | | | | | | | |
| | |
Series 2017-CD3, Class A4, 3.63%, 2/10/2050 | | | 330,000 | | | | 368,157 | |
SEE NOTES TO FINANCIAL STATEMENTS.
| | | | | | | | |
| | | |
| FEBRUARY 28, 2021 | | J.P. MORGAN EXCHANGE-TRADED FUNDS | | | | | 139 | |
JPMorgan U.S. Aggregate Bond ETF
SCHEDULE OF PORTFOLIO INVESTMENTS
AS OF FEBRUARY 28, 2021 (continued)
| | | | | | | | |
| INVESTMENTS | | PRINCIPAL
AMOUNT ($) | | | VALUE ($) | |
Commercial Mortgage-Backed Securities — continued | |
| | |
Series 2017-CD6, Class ASB, 3.33%, 11/13/2050 | | | 20,000 | | | | 21,831 | |
| | |
Series 2017-CD6, Class AM, 3.71%,
11/13/2050 (f) | | | 30,000 | | | | 33,202 | |
| | |
CFCRE Commercial Mortgage Trust | | | | | | | | |
| | |
Series 2017-C8, Class A4, REIT, 3.57%, 6/15/2050 | | | 30,000 | | | | 33,164 | |
| | |
Series 2016-C7, Class ASB, 3.64%, 12/10/2054 | | | 20,000 | | | | 21,693 | |
| | |
Citigroup Commercial Mortgage Trust | | | | | | | | |
| | |
Series 2014-GC21, Class AAB, 3.48%, 5/10/2047 | | | 12,840 | | | | 13,421 | |
| | |
Series 2014-GC23, Class B, 4.17%, 7/10/2047 ‡ (f) | | | 30,000 | | | | 32,571 | |
| | |
Series 2014-GC25, Class AAB, 3.37%, 10/10/2047 | | | 21,517 | | | | 22,541 | |
| | |
Series 2015-GC29, Class C, 4.15%, 4/10/2048 ‡ (f) | | | 40,000 | | | | 42,593 | |
| | |
Series 2016-C1, Class AAB, 3.00%, 5/10/2049 | | | 100,000 | | | | 106,074 | |
| | |
Series 2019-GC43, Class A4, 3.04%, 11/10/2052 | | | 850,000 | | | | 918,641 | |
| | |
Commercial Mortgage Trust | | | | | | | | |
| | |
Series 2013-CR9, Class A4, 4.22%,
7/10/2045 (f) | | | 120,000 | | | | 129,583 | |
| | |
Series 2012-CR3, Class A3, 2.82%, 10/15/2045 | | | 159,394 | | | | 163,037 | |
| | |
Series 2012-CR4, Class A3, 2.85%, 10/15/2045 | | | 24,848 | | | | 25,720 | |
| | |
Series 2013-CR6, Class A4, 3.10%, 3/10/2046 | | | 20,000 | | | | 20,896 | |
| | |
Series 2013-CR7, Class A4, 3.21%, 3/10/2046 | | | 48,255 | | | | 50,694 | |
| | |
Series 2013-CR13, Class B, 4.89%,
11/10/2046 (f) | | | 364,000 | | | | 402,100 | |
| | |
Series 2014-UBS5, Class AM, 4.19%,
9/10/2047 (f) | | | 40,000 | | | | 43,803 | |
| | |
Series 2014-CR20, Class A3, 3.33%,
11/10/2047 | | | 45,000 | | | | 48,188 | |
| | |
Series 2014-UBS6, Class A4, 3.38%, 12/10/2047 | | | 140,000 | | | | 150,640 | |
| | |
Series 2015-LC19, Class A4, 3.18%,
2/10/2048 | | | 750,000 | | | | 810,291 | |
| | |
Series 2015-LC21, Class AM, 4.04%,
7/10/2048 (f) | | | 30,000 | | | | 32,549 | |
| | |
Series 2015-CR25, Class A4, 3.76%, 8/10/2048 | | | 30,000 | | | | 33,289 | |
| | |
CSAIL Commercial Mortgage Trust | | | | | | | | |
| | |
Series 2015-C3, Class A4, 3.72%, 8/15/2048 | | | 30,000 | | | | 33,203 | |
| | | | | | | | |
| INVESTMENTS | | PRINCIPAL
AMOUNT ($) | | | VALUE ($) | |
| | | | | | | | |
| | |
Series 2016-C5, Class A5, 3.76%, 11/15/2048 | | | 27,000 | | | | 30,055 | |
| | |
Series 2019-C15, Class A4, 4.05%, 3/15/2052 | | | 210,000 | | | | 239,885 | |
| | |
DBGS Mortgage Trust Series 2018-C1, Class A4, 4.47%, 10/15/2051 | | | 20,000 | | | | 23,468 | |
| | |
DBJPM Mortgage Trust Series 2017-C6, Class A5, 3.33%, 6/10/2050 | | | 20,000 | | | | 22,080 | |
| | |
FHLMC, Multi-Family Structured Pass-Through Certificates | | | | | | | | |
| | |
Series K027, Class A2, 2.64%, 1/25/2023 | | | 267,000 | | | | 274,855 | |
| | |
Series K028, Class A2, 3.11%, 2/25/2023 | | | 100,000 | | | | 103,949 | |
| | |
Series K029, Class A2, 3.32%, 2/25/2023 (f) | | | 150,000 | | | | 156,838 | |
| | |
Series K033, Class A2, 3.06%, 7/25/2023 (f) | | | 220,000 | | | | 232,091 | |
| | |
Series K036, Class A2, 3.53%, 10/25/2023 (f) | | | 162,000 | | | | 173,918 | |
| | |
Series K725, Class AM, 3.10%, 2/25/2024 (f) | | | 50,000 | | | | 53,194 | |
| | |
Series K728, Class A2, 3.06%, 8/25/2024 (f) | | | 50,000 | | | | 53,601 | |
| | |
Series K040, Class A2, 3.24%, 9/25/2024 | | | 70,000 | | | | 75,765 | |
| | |
Series K731, Class A2, 3.60%, 2/25/2025 (f) | | | 50,000 | | | | 54,385 | |
| | |
Series K051, Class A2, 3.31%, 9/25/2025 | | | 40,000 | | | | 44,274 | |
| | |
Series K734, Class A2, 3.21%, 2/25/2026 | | | 370,000 | | | | 406,137 | |
| | |
Series K735, Class A2, 2.86%, 5/25/2026 | | | 50,000 | | | | 54,602 | |
| | |
Series K057, Class A2, 2.57%, 7/25/2026 | | | 63,000 | | | | 67,999 | |
| | |
Series K063, Class A1, 3.05%, 8/25/2026 | | | 43,459 | | | | 46,305 | |
| | |
Series K084, Class A2, 3.78%, 10/25/2028 (f) | | | 500,000 | | | | 583,830 | |
| | |
Series K085, Class A2, 4.06%, 10/25/2028 (f) | | | 840,000 | | | | 995,933 | |
| | |
Series K096, Class A2, 2.52%, 7/25/2029 | | | 295,000 | | | | 316,837 | |
| | |
Series K099, Class A2, 2.60%, 9/25/2029 | | | 100,000 | | | | 108,043 | |
| | |
Series K100, Class A2, 2.67%, 9/25/2029 | | | 400,000 | | | | 434,503 | |
| | |
Series K-1512, Class A2, 2.99%, 5/25/2031 | | | 75,000 | | | | 82,476 | |
SEE NOTES TO FINANCIAL STATEMENTS.
| | | | | | |
| | | |
| 140 | | | | J.P. MORGAN EXCHANGE-TRADED FUNDS | | FEBRUARY 28, 2021 |
| | | | | | | | |
| INVESTMENTS | | PRINCIPAL
AMOUNT ($) | | | VALUE ($) | |
Commercial Mortgage-Backed Securities — continued | |
| | |
Series K156, Class A3, 3.70%, 6/25/2033 (f) | | | 91,000 | | | | 107,110 | |
| | |
Series K-1512, Class A3, 3.06%, 4/25/2034 | | | 150,000 | | | | 168,055 | |
| | |
Series K-1513, Class A3, 2.80%, 8/25/2034 | | | 325,000 | | | | 354,509 | |
| | |
Series K-1514, Class A2, 2.86%, 10/25/2034 | | | 400,000 | | | | 439,994 | |
| | |
Series K-1518, Class A2, 1.86%, 10/25/2035 | | | 848,000 | | | | 837,645 | |
| | |
FNMA ACES | | | | | | | | |
| | |
Series 2014-M2, Class A2, 3.51%,
12/25/2023 (f) | | | 35,111 | | | | 37,792 | |
| | |
Series 2014-M3, Class A2, 3.49%,
1/25/2024 (f) | | | 30,035 | | | | 32,352 | |
| | |
Series 2017-M10, Class AV2, 2.56%,
7/25/2024 (f) | | | 49,630 | | | | 52,168 | |
| | |
Series 2016-M6, Class A1, 2.14%, 5/25/2026 | | | 41,403 | | | | 42,719 | |
| | |
Series 2016-M11, Class A1, 2.08%, 7/25/2026 | | | 44,938 | | | | 46,266 | |
| | |
Series 2017-M1, Class A2, 2.42%,
10/25/2026 (f) | | | 200,000 | | | | 212,209 | |
| | |
Series 2017-M7, Class A2, 2.96%,
2/25/2027 (f) | | | 730,000 | | | | 795,740 | |
| | |
Series 2017-M12, Class A1, 2.75%, 6/25/2027 | | | 1,933 | | | | 1,933 | |
| | |
Series 2017-M12, Class A2, 3.08%,
6/25/2027 (f) | | | 202,756 | | | | 223,366 | |
| | |
Series 2018-M10, Class A2, 3.37%,
7/25/2028 (f) | | | 40,000 | | | | 45,565 | |
| | |
Series 2018-M14, Class A2, 3.58%,
8/25/2028 (f) | | | 450,000 | | | | 519,560 | |
| | |
Series 2019-M1, Class A2, 3.55%,
9/25/2028 (f) | | | 85,000 | | | | 98,205 | |
| | |
Series 2018-M13, Class A1, 3.70%,
3/25/2030 (f) | | | 34,250 | | | | 38,846 | |
| | |
GS Mortgage Securities Trust | | | | | | | | |
| | |
Series 2012-GCJ9, Class A3, 2.77%, 11/10/2045 | | | 77,671 | | | | 79,787 | |
| | |
Series 2014-GC24, Class AAB, 3.65%, 9/10/2047 | | | 17,674 | | | | 18,614 | |
| | |
Series 2014-GC24, Class AS, 4.16%,
9/10/2047 (f) | | | 170,000 | | | | 184,998 | |
| | |
Series 2015-GC28, Class A4, 3.14%, 2/10/2048 | | | 38,765 | | | | 41,284 | |
| | |
Series 2015-GC30, Class A4, 3.38%, 5/10/2050 | | | 25,000 | | | | 27,300 | |
| | |
Series 2019-GSA1, Class A4, 3.05%, 11/10/2052 | | | 260,000 | | | | 279,938 | |
| | | | | | | | |
| INVESTMENTS | | PRINCIPAL
AMOUNT ($) | | | VALUE ($) | |
| | | | | | | | |
| | |
JPMBB Commercial Mortgage Securities Trust | | | | | | | | |
| | |
Series 2013-C12, Class C, 4.10%, 7/15/2045 (f) | | | 26,000 | | | | 26,833 | |
| | |
Series 2015-C29, Class B, 4.12%, 5/15/2048 ‡ (f) | | | 40,000 | | | | 42,921 | |
| | |
Series 2015-C31, Class A3, 3.80%, 8/15/2048 | | | 40,000 | | | | 44,277 | |
| | |
JPMDB Commercial Mortgage Securities Trust | | | | | | | | |
| | |
Series 2016-C2, Class B, 3.99%, 6/15/2049 (f) | | | 20,000 | | | | 21,052 | |
| | |
Series 2017-C5, Class B, 4.01%, 3/15/2050 ‡ (f) | | | 20,000 | | | | 21,750 | |
| | |
JPMorgan Chase Commercial Mortgage Securities Trust | | | | | | | | |
| | |
Series 2012-C8, Class A3, 2.83%, 10/15/2045 | | | 7,260 | | | | 7,481 | |
| | |
Series 2012-LC9, Class A5, 2.84%, 12/15/2047 | | | 19,879 | | | | 20,441 | |
| | |
Morgan Stanley Bank of America Merrill Lynch Trust | | | | | | | | |
| | |
Series 2012-C5, Class A4, 3.18%, 8/15/2045 | | | 20,000 | | | | 20,603 | |
| | |
Series 2013-C9, Class A4, 3.10%, 5/15/2046 | | | 30,000 | | | | 31,501 | |
| | |
Series 2015-C22, Class AS, 3.56%, 4/15/2048 ‡ | | | 40,000 | | | | 42,091 | |
| | |
Series 2015-C25, Class ASB, 3.38%, 10/15/2048 | | | 46,583 | | | | 49,351 | |
| | |
Series 2015-C25, Class A5, 3.64%, 10/15/2048 | | | 40,000 | | | | 44,204 | |
| | |
Series 2016-C32, Class A4, 3.72%, 12/15/2049 | | | 295,000 | | | | 329,253 | |
| | |
Morgan Stanley Capital I Trust | | | | | | | | |
| | |
Series 2016-UB12, Class A3, 3.34%, 12/15/2049 | | | 850,000 | | | | 919,465 | |
| | |
Series 2017-H1, Class C, 4.28%, 6/15/2050 ‡ (f) | | | 25,000 | | | | 25,864 | |
| | |
Series 2019-L2, Class A4, 4.07%, 3/15/2052 | | | 50,000 | | | | 57,329 | |
| | |
Series 2019-L3, Class A4, 3.13%, 11/15/2052 | | | 100,000 | | | | 108,658 | |
| | |
UBS Commercial Mortgage Trust | | | | | | | | |
| | |
Series 2012-C1, Class A3, 3.40%, 5/10/2045 | | | 122,004 | | | | 124,962 | |
| | |
Series 2017-C4, Class ASB, 3.37%, 10/15/2050 | | | 40,000 | | | | 43,494 | |
| | |
Series 2017-C5, Class AS, 3.78%, 11/15/2050 (f) | | | 70,000 | | | | 77,351 | |
SEE NOTES TO FINANCIAL STATEMENTS.
| | | | | | | | |
| | | |
| FEBRUARY 28, 2021 | | J.P. MORGAN EXCHANGE-TRADED FUNDS | | | | | 141 | |
JPMorgan U.S. Aggregate Bond ETF
SCHEDULE OF PORTFOLIO INVESTMENTS
AS OF FEBRUARY 28, 2021 (continued)
| | | | | | | | |
| INVESTMENTS | | PRINCIPAL
AMOUNT ($) | | | VALUE ($) | |
Commercial Mortgage-Backed securities — continued | |
| | |
Series 2017-C7, Class AS, 4.06%,
12/15/2050 (f) | | | 50,000 | | | | 56,377 | |
| | |
UBS-Barclays Commercial Mortgage Trust | | | | | | | | |
| | |
Series 2013-C5, Class A4, 3.18%, 3/10/2046 | | | 40,000 | | | | 41,692 | |
| | |
Series 2012-C2, Class A4, 3.53%, 5/10/2063 | | | 20,000 | | | | 20,634 | |
| | |
Wells Fargo Commercial Mortgage Trust | | | | | | | | |
| | |
Series 2012-LC5, Class A3, 2.92%, 10/15/2045 | | | 72,342 | | | | 74,620 | |
| | |
Series 2013-LC12, Class A4, 4.22%,
7/15/2046 (f) | | | 300,000 | | | | 321,526 | |
| | |
Series 2015-C27, Class A4, 3.19%, 2/15/2048 | | | 42,549 | | | | 45,451 | |
| | |
Series 2015-C28, Class A4, 3.54%, 5/15/2048 | | | 20,000 | | | | 21,925 | |
| | |
Series 2015-C29, Class A4, 3.64%, 6/15/2048 | | | 120,000 | | | | 132,442 | |
| | |
Series 2018-C45, Class A3, 3.92%, 6/15/2051 | | | 45,000 | | | | 51,007 | |
| | |
Series 2019-C53, Class A4, 3.04%, 10/15/2052 | | | 125,000 | | | | 135,167 | |
| | |
Series 2020-C55, Class A5, 2.73%, 2/15/2053 | | | 240,000 | | | | 253,294 | |
| | |
WFRBS Commercial Mortgage Trust | | | | | | | | |
| | |
Series 2012-C9, Class AS, 3.39%, 11/15/2045 | | | 60,000 | | | | 62,404 | |
| | |
Series 2012-C10, Class A3, 2.88%, 12/15/2045 | | | 40,000 | | | | 41,476 | |
| | |
Series 2013-C15, Class AS, 4.36%,
8/15/2046 (f) | | | 190,000 | | | | 201,295 | |
| | |
Series 2014-C22, Class A4, 3.49%, 9/15/2057 | | | 40,000 | | | | 43,031 | |
| | |
Series 2014-C22, Class A5, 3.75%, 9/15/2057 | | | 25,000 | | | | 27,349 | |
| | | | | | | | |
| |
Total Commercial Mortgage-backed Securities
(Cost $17,807,560) | | | | 18,044,479 | |
| | | | | | | | |
Foreign Government Securities — 1.9% | | | | | |
| | |
Canada Government Bond (Canada) | | | | | | | | |
| | |
2.63%, 1/25/2022 | | | 255,000 | | | | 260,616 | |
| | |
1.63%, 1/22/2025 (c) | | | 35,000 | | | | 36,483 | |
| | |
Export Development Canada (Canada) | | | | | | | | |
| | |
2.00%, 5/17/2022 | | | 25,000 | | | | 25,547 | |
| | |
1.75%, 7/18/2022 | | | 60,000 | | | | 61,291 | |
| | |
2.50%, 1/24/2023 | | | 120,000 | | | | 125,220 | |
| | |
2.63%, 2/21/2024 | | | 55,000 | | | | 58,660 | |
| | |
FMS Wertmanagement AoeR (Germany) | | | | | | | | |
| | |
2.00%, 8/1/2022 | | | 405,000 | | | | 415,291 | |
| | |
2.75%, 1/30/2024 | | | 200,000 | | | | 213,731 | |
| | | | | | | | |
| INVESTMENTS | | PRINCIPAL
AMOUNT ($) | | | VALUE ($) | |
| | | | | | | | |
| | |
Hungary Government Bond (Hungary) | | | | | | | | |
| | |
5.38%, 2/21/2023 | | | 142,000 | | | | 155,493 | |
| | |
5.38%, 3/25/2024 | | | 186,000 | | | | 211,629 | |
| | |
Italian Republic Government Bond (Italy) 5.38%, 6/15/2033 | | | 427,000 | | | | 531,764 | |
| | |
Japan Bank for International Cooperation (Japan) | | | | | | | | |
| | |
1.63%, 10/17/2022 | | | 200,000 | | | | 204,336 | |
| | |
1.75%, 1/23/2023 | | | 200,000 | | | | 205,461 | |
| | |
3.00%, 5/29/2024 | | | 201,000 | | | | 217,053 | |
| | |
2.50%, 5/28/2025 | | | 220,000 | | | | 236,380 | |
| | |
2.88%, 6/1/2027 | | | 202,000 | | | | 222,372 | |
| | |
2.88%, 7/21/2027 | | | 218,000 | | | | 239,384 | |
| | |
Oriental Republic of Uruguay (Uruguay) | | | | | | | | |
| | |
8.00%, 11/18/2022 | | | 50,000 | | | | 54,287 | |
| | |
4.50%, 8/14/2024 | | | 140,000 | | | | 152,554 | |
| | |
4.38%, 10/27/2027 | | | 80,000 | | | | 91,232 | |
| | |
5.10%, 6/18/2050 | | | 159,000 | | | | 197,791 | |
| | |
4.98%, 4/20/2055 | | | 55,000 | | | | 67,694 | |
| | |
Province of Alberta (Canada) | | | | | | | | |
| | |
2.20%, 7/26/2022 | | | 90,000 | | | | 92,437 | |
| | |
3.35%, 11/1/2023 | | | 100,000 | | | | 107,712 | |
| | |
2.95%, 1/23/2024 | | | 50,000 | | | | 53,570 | |
| | |
1.00%, 5/20/2025 | | | 100,000 | | | | 101,051 | |
| | |
3.30%, 3/15/2028 | | | 25,000 | | | | 28,017 | |
| | |
Province of British Columbia (Canada) | | | | | | | | |
| | |
2.00%, 10/23/2022 | | | 344,000 | | | | 354,094 | |
| | |
1.75%, 9/27/2024 | | | 100,000 | | | | 104,456 | |
| | |
2.25%, 6/2/2026 | | | 49,000 | | | | 52,330 | |
| | |
Province of Manitoba (Canada) 2.13%, 5/4/2022 | | | 33,000 | | | | 33,724 | |
| | |
Province of Ontario (Canada) | | | | | | | | |
| | |
2.40%, 2/8/2022 | | | 95,000 | | | | 96,898 | |
| | |
2.55%, 4/25/2022 | | | 331,000 | | | | 339,774 | |
| | |
2.20%, 10/3/2022 | | | 24,000 | | | | 24,739 | |
| | |
1.75%, 1/24/2023 | | | 346,000 | | | | 355,596 | |
| | |
3.40%, 10/17/2023 (c) | | | 267,000 | | | | 287,865 | |
| | |
3.05%, 1/29/2024 | | | 155,000 | | | | 166,695 | |
| | |
2.50%, 4/27/2026 | | | 129,000 | | | | 138,945 | |
| | |
2.30%, 6/15/2026 | | | 30,000 | | | | 32,012 | |
| | |
2.00%, 10/2/2029 | | | 25,000 | | | | 25,831 | |
| | |
Province of Quebec (Canada) | | | | | | | | |
| | |
2.38%, 1/31/2022 | | | 198,000 | | | | 201,895 | |
| | |
1.50%, 2/11/2025 | | | 220,000 | | | | 227,233 | |
| | |
2.50%, 4/20/2026 | | | 550,000 | | | | 592,982 | |
SEE NOTES TO FINANCIAL STATEMENTS.
| | | | | | |
| | | |
| 142 | | | | J.P. MORGAN EXCHANGE-TRADED FUNDS | | FEBRUARY 28, 2021 |
| | | | | | | | |
| INVESTMENTS | | PRINCIPAL
AMOUNT ($) | | | VALUE ($) | |
Foreign Government Securities — continued | |
| | |
Republic of Chile (Chile) 2.55%, 1/27/2032 (c) | | | 150,000 | | | | 152,914 | |
| | |
Republic of Colombia (Colombia) | | | | | | | | |
| | |
8.13%, 5/21/2024 | | | 93,000 | | | | 111,471 | |
| | |
4.50%, 1/28/2026 | | | 200,000 | | | | 221,385 | |
| | |
4.50%, 3/15/2029 | | | 90,000 | | | | 99,628 | |
| | |
10.38%, 1/28/2033 | | | 76,000 | | | | 117,948 | |
| | |
5.00%, 6/15/2045 | | | 200,000 | | | | 216,983 | |
| | |
Republic of Indonesia (Indonesia) | | | | | | | | |
| | |
5.35%, 2/11/2049 (c) | | | 200,000 | | | | 252,346 | |
| | |
3.50%, 2/14/2050 | | | 200,000 | | | | 199,504 | |
| | |
3.35%, 3/12/2071 (c) | | | 200,000 | | | | 189,576 | |
| | |
Republic of Korea (South Korea) | | | | | | | | |
| | |
5.63%, 11/3/2025 | | | 200,000 | | | | 242,465 | |
| | |
2.75%, 1/19/2027 | | | 207,000 | | | | 225,692 | |
| | |
1.00%, 9/16/2030 | | | 306,000 | | | | 290,130 | |
| | |
Republic of Panama (Panama) | | | | | | | | |
| | |
7.13%, 1/29/2026 | | | 100,000 | | | | 124,591 | |
| | |
8.88%, 9/30/2027 | | | 33,000 | | | | 45,923 | |
| | |
9.38%, 4/1/2029 | | | 152,000 | | | | 224,519 | |
| | |
6.70%, 1/26/2036 | | | 96,000 | | | | 129,702 | |
| | |
4.50%, 4/1/2056 | | | 200,000 | | | | 220,698 | |
| | |
Republic of Peru (Peru) | | | | | | | | |
| | |
7.35%, 7/21/2025 | | | 80,000 | | | | 100,492 | |
| | |
8.75%, 11/21/2033 | | | 246,000 | | | | 389,199 | |
| | |
6.55%, 3/14/2037 | | | 25,000 | | | | 34,727 | |
| | |
3.23%, 7/28/2121 | | | 257,000 | | | | 217,636 | |
| | |
Republic of Philippines (Philippines) | | | | | | | | |
| | |
7.50%, 9/25/2024 | | | 250,000 | | | | 292,310 | |
| | |
9.50%, 10/21/2024 | | | 125,000 | | | | 163,812 | |
| | |
10.63%, 3/16/2025 | | | 72,000 | | | | 100,079 | |
| | |
9.50%, 2/2/2030 | | | 47,000 | | | | 74,980 | |
| | |
2.95%, 5/5/2045 | | | 400,000 | | | | 385,205 | |
| | |
Republic of Poland (Poland) | | | | | | | | |
| | |
5.00%, 3/23/2022 | | | 151,000 | | | | 158,669 | |
| | |
3.25%, 4/6/2026 | | | 225,000 | | | | 252,173 | |
| | |
State of Israel Government Bond (Israel) | | | | | | | | |
| | |
3.15%, 6/30/2023 | | | 200,000 | | | | 212,083 | |
| | |
2.88%, 3/16/2026 | | | 200,000 | | | | 218,130 | |
| | |
4.50%, 4/3/2120 | | | 201,000 | | | | 248,456 | |
| | |
Svensk Exportkredit AB (Sweden) | | | | | | | | |
| | |
0.75%, 4/6/2023 | | | 292,000 | | | | 294,964 | |
| | |
0.50%, 8/26/2025 | | | 201,000 | | | | 197,945 | |
| | |
United Mexican States (Mexico) | | | | | | | | |
| | |
8.00%, 9/24/2022 | | | 51,000 | | | | 56,820 | |
| | |
4.00%, 10/2/2023 | | | 240,000 | | | | 260,759 | |
| | | | | | | | |
| INVESTMENTS | | PRINCIPAL
AMOUNT ($) | | | VALUE ($) | |
| | | | | | | | |
| | |
4.50%, 4/22/2029 | | | 280,000 | | | | 314,667 | |
| | |
6.75%, 9/27/2034 | | | 265,000 | | | | 347,828 | |
| | |
5.55%, 1/21/2045 | | | 200,000 | | | | 234,252 | |
| | |
4.60%, 1/23/2046 | | | 200,000 | | | | 205,982 | |
| | |
5.75%, 10/12/2110 | | | 394,000 | | | | 448,521 | |
| | | | | | | | |
| | |
Total Foreign Government Securities
(Cost $15,651,655) | | | | | | | 15,677,289 | |
| | | | | | | | |
U.S. Government Agency Securities — 1.6% | | | | | |
| | |
FFCB | | | | | | | | |
| | |
0.53%, 1/18/2022 | | | 309,000 | | | | 310,166 | |
| | |
0.38%, 4/8/2022 | | | 290,000 | | | | 290,811 | |
| | |
0.25%, 6/2/2022 | | | 140,000 | | | | 140,208 | |
| | |
1.85%, 8/5/2022 | | | 34,000 | | | | 34,721 | |
| | |
0.13%, 11/23/2022 | | | 867,000 | | | | 866,751 | |
| | |
0.57%, 7/2/2024 | | | 45,000 | | | | 44,890 | |
| | |
FHLB | | | | | | | | |
| | |
2.25%, 3/11/2022 | | | 30,000 | | | | 30,643 | |
| | |
2.38%, 6/10/2022 | | | 25,000 | | | | 25,706 | |
| | |
0.13%, 10/21/2022 | | | 50,000 | | | | 49,996 | |
| | |
1.88%, 12/9/2022 | | | 10,000 | | | | 10,307 | |
| | |
3.00%, 12/9/2022 | | | 70,000 | | | | 73,523 | |
| | |
1.38%, 2/17/2023 | | | 95,000 | | | | 97,270 | |
| | |
2.13%, 3/10/2023 | | | 75,000 | | | | 77,920 | |
| | |
3.38%, 12/8/2023 | | | 100,000 | | | | 108,464 | |
| | |
2.50%, 2/13/2024 | | | 180,000 | | | | 191,707 | |
| | |
1.50%, 8/15/2024 | | | 10,000 | | | | 10,386 | |
| | |
2.88%, 9/13/2024 | | | 130,000 | | | | 141,214 | |
| | |
2.75%, 12/13/2024 | | | 100,000 | | | | 108,521 | |
| | |
2.38%, 3/14/2025 | | | 35,000 | | | | 37,482 | |
| | |
3.25%, 11/16/2028 | | | 860,000 | | | | 985,019 | |
| | |
2.13%, 9/14/2029 | | | 100,000 | | | | 105,765 | |
| | |
5.63%, 3/14/2036 | | | 50,000 | | | | 74,075 | |
| | |
5.50%, 7/15/2036 | | | 35,000 | | | | 51,966 | |
| | |
FHLMC | | | | | | | | |
| | |
2.38%, 1/13/2022 | | | 216,000 | | | | 220,260 | |
| | |
0.25%, 6/8/2022 | | | 679,000 | | | | 680,169 | |
| | |
0.13%, 7/25/2022 | | | 500,000 | | | | 499,968 | |
| | |
0.38%, 4/20/2023 | | | 10,000 | | | | 10,048 | |
| | |
0.38%, 5/5/2023 | | | 600,000 | | | | 602,836 | |
| | |
2.75%, 6/19/2023 | | | 282,000 | | | | 298,601 | |
| | |
0.25%, 6/26/2023 | | | 210,000 | | | | 210,313 | |
| | |
0.25%, 8/24/2023 | | | 650,000 | | | | 650,773 | |
| | |
0.30%, 9/28/2023 | | | 10,000 | | | | 9,992 | |
| | |
0.30%, 12/29/2023 | | | 10,000 | | | | 9,993 | |
| | |
1.50%, 2/12/2025 | | | 379,000 | | | | 393,968 | |
SEE NOTES TO FINANCIAL STATEMENTS.
| | | | | | | | |
| | | |
| FEBRUARY 28, 2021 | | J.P. MORGAN EXCHANGE-TRADED FUNDS | | | | | 143 | |
JPMorgan U.S. Aggregate Bond ETF
SCHEDULE OF PORTFOLIO INVESTMENTS
AS OF FEBRUARY 28, 2021 (continued)
| | | | | | | | |
| INVESTMENTS | | PRINCIPAL
AMOUNT ($) | | | VALUE ($) | |
U.S. Government Agency Securities — continued | | | | | |
| | |
0.38%, 7/21/2025 | | | 73,000 | | | | 72,191 | |
| | |
0.38%, 9/23/2025 | | | 10,000 | | | | 9,850 | |
| | |
2.60%, 12/14/2029 (g) | | | 80,000 | | | | 69,818 | |
| | |
6.25%, 7/15/2032 | | | 120,000 | | | | 178,202 | |
| | |
FNMA | | | | | | | | |
| | |
2.25%, 4/12/2022 | | | 118,000 | | | | 120,771 | |
| | |
1.38%, 9/6/2022 | | | 72,000 | | | | 73,348 | |
| | |
2.38%, 1/19/2023 | | | 121,000 | | | | 126,093 | |
| | |
0.25%, 7/10/2023 | | | 10,000 | | | | 10,003 | |
| | |
0.30%, 8/3/2023 | | | 140,000 | | | | 140,101 | |
| | |
2.88%, 9/12/2023 | | | 400,000 | | | | 426,483 | |
| | |
2.50%, 2/5/2024 | | | 161,000 | | | | 171,291 | |
| | |
2.63%, 9/6/2024 | | | 65,000 | | | | 70,099 | |
| | |
1.63%, 10/15/2024 | | | 10,000 | | | | 10,441 | |
| | |
0.63%, 4/22/2025 | | | 120,000 | | | | 120,204 | |
| | |
0.50%, 6/17/2025 | | | 455,000 | | | | 452,781 | |
| | |
2.13%, 4/24/2026 | | | 175,000 | | | | 186,900 | |
| | |
1.88%, 9/24/2026 | | | 503,000 | | | | 530,018 | |
| | |
6.25%, 5/15/2029 | | | 310,000 | | | | 427,302 | |
| | |
7.13%, 1/15/2030 | | | 31,000 | | | | 45,716 | |
| | |
0.88%, 8/5/2030 | | | 10,000 | | | | 9,451 | |
| | |
6.63%, 11/15/2030 | | | 108,000 | | | | 157,744 | |
| | |
6.21%, 8/6/2038 | | | 45,000 | | | | 72,758 | |
| | |
Israel Government AID Bond (Israel) 5.50%, 12/4/2023 | | | 388,000 | | | | 442,288 | |
| | |
Tennessee Valley Authority | | | | | | | | |
| | |
1.88%, 8/15/2022 | | | 129,000 | | | | 132,180 | |
| | |
0.75%, 5/15/2025 | | | 50,000 | | | | 50,076 | |
| | |
7.13%, 5/1/2030 | | | 166,000 | | | | 246,829 | |
| | |
Series B, 4.70%, 7/15/2033 | | | 612,000 | | | | 800,743 | |
| | |
6.15%, 1/15/2038 | | | 35,000 | | | | 53,722 | |
| | |
3.50%, 12/15/2042 | | | 50,000 | | | | 57,968 | |
| | |
5.38%, 4/1/2056 | | | 55,000 | | | | 87,468 | |
| | |
4.25%, 9/15/2065 | | | 395,000 | | | | 534,177 | |
| | | | | | | | |
| |
Total U.S. Government Agency Securities
(Cost $13,255,152) | | | | 13,341,448 | |
| | | | | | | | |
| | |
Supranational — 1.5% | | | | | | | | |
| | |
African Development Bank (Supranational) | | | | | | | | |
| | |
0.50%, 4/22/2022 | | | 37,000 | | | | 37,138 | |
| | |
0.75%, 4/3/2023 | | | 240,000 | | | | 242,656 | |
| | |
3.00%, 9/20/2023 | | | 100,000 | | | | 106,810 | |
| | |
Asian Development Bank (Supranational) | | | | | | | | |
| | |
1.88%, 2/18/2022 | | | 640,000 | | | | 650,414 | |
| | |
0.63%, 4/7/2022 | | | 360,000 | | | | 361,840 | |
| | |
1.75%, 9/13/2022 | | | 273,000 | | | | 279,549 | |
| | | | | | | | |
| INVESTMENTS | | PRINCIPAL
AMOUNT ($) | | | VALUE ($) | |
| | |
| | | | | | | | |
| | |
1.63%, 1/24/2023 | | | 100,000 | | | | 102,696 | |
| | |
2.75%, 3/17/2023 | | | 25,000 | | | | 26,295 | |
| | |
2.63%, 1/30/2024 | | | 150,000 | | | | 159,898 | |
| | |
1.50%, 10/18/2024 | | | 60,000 | | | | 62,141 | |
| | |
2.00%, 1/22/2025 | | | 100,000 | | | | 105,517 | |
| | |
0.63%, 4/29/2025 | | | 100,000 | | | | 100,023 | |
| | |
2.50%, 11/2/2027 | | | 164,000 | | | | 177,791 | |
| | |
2.75%, 1/19/2028 | | | 100,000 | | | | 110,089 | |
| | |
3.13%, 9/26/2028 | | | 80,000 | | | | 90,527 | |
| | |
1.88%, 1/24/2030 | | | 93,000 | | | | 96,331 | |
| | |
0.75%, 10/8/2030 | | | 181,000 | | | | 168,677 | |
| | |
Asian Infrastructure Investment Bank (The) (Supranational) | | | | | | | | |
| | |
2.25%, 5/16/2024 | | | 30,000 | | | | 31,752 | |
| | |
0.50%, 5/28/2025 | | | 84,000 | | | | 83,475 | |
| | |
0.50%, 1/27/2026 | | | 400,000 | | | | 393,270 | |
| | |
Corp. Andina de Fomento (Supranational) | | | | | | | | |
| | |
4.38%, 6/15/2022 | | | 320,000 | | | | 335,197 | |
| | |
2.75%, 1/6/2023 (c) | | | 300,000 | | | | 311,594 | |
| | |
3.75%, 11/23/2023 | | | 25,000 | | | | 26,888 | |
| | |
Council of Europe Development Bank (Supranational) | | | | | | | | |
| | |
2.63%, 2/13/2023 | | | 49,000 | | | | 51,297 | |
| | |
1.38%, 2/27/2025 | | | 291,000 | | | | 300,125 | |
| | |
European Bank for Reconstruction & Development (Supranational) | | | | | | | | |
| | |
2.13%, 3/7/2022 | | | 25,000 | | | | 25,490 | |
| | |
0.50%, 5/19/2025 (c) | | | 639,000 | | | | 635,633 | |
| | |
European Investment Bank (Supranational) | | | | | | | | |
| | |
2.25%, 3/15/2022 | | | 30,000 | | | | 30,644 | |
| | |
2.63%, 5/20/2022 | | | 26,000 | | | | 26,779 | |
| | |
2.38%, 6/15/2022 | | | 67,000 | | | | 68,898 | |
| | |
1.38%, 9/6/2022 | | | 85,000 | | | | 86,542 | |
| | |
2.00%, 12/15/2022 | | | 200,000 | | | | 206,475 | |
| | |
2.50%, 3/15/2023 | | | 1,100,000 | | | | 1,151,388 | |
| | |
3.25%, 1/29/2024 (c) | | | 420,000 | | | | 455,227 | |
| | |
2.63%, 3/15/2024 | | | 40,000 | | | | 42,731 | |
| | |
1.88%, 2/10/2025 | | | 200,000 | | | | 210,152 | |
| | |
0.63%, 7/25/2025 | | | 86,000 | | | | 85,649 | |
| | |
0.38%, 12/15/2025 | | | 75,000 | | | | 73,537 | |
| | |
2.38%, 5/24/2027 | | | 41,000 | | | | 44,332 | |
| | |
1.63%, 10/9/2029 | | | 130,000 | | | | 132,179 | |
| | |
0.75%, 9/23/2030 | | | 10,000 | | | | 9,347 | |
| | |
Inter-American Development Bank (Supranational) | | | | | | | | |
| | |
2.13%, 1/18/2022 | | | 116,000 | | | | 117,984 | |
SEE NOTES TO FINANCIAL STATEMENTS.
| | | | | | |
| | | |
| 144 | | | | J.P. MORGAN EXCHANGE-TRADED FUNDS | | FEBRUARY 28, 2021 |
| | | | | | | | |
| INVESTMENTS | | PRINCIPAL
AMOUNT ($) | | | VALUE ($) | |
Supranational — continued | | | | | | | | |
| | |
1.75%, 4/14/2022 | | | 50,000 | | | | 50,889 | |
| | |
2.50%, 1/18/2023 | | | 314,000 | | | | 327,589 | |
| | |
0.88%, 4/3/2025 | | | 50,000 | | | | 50,584 | |
| | |
7.00%, 6/15/2025 | | | 91,000 | | | | 114,608 | |
| | |
0.63%, 7/15/2025 | | | 100,000 | | | | 99,535 | |
| | |
2.00%, 6/2/2026 | | | 100,000 | | | | 105,684 | |
| | |
2.38%, 7/7/2027 | | | 26,000 | | | | 27,927 | |
| | |
3.13%, 9/18/2028 | | | 109,000 | | | | 123,289 | |
| | |
2.25%, 6/18/2029 | | | 167,000 | | | | 177,962 | |
| | |
3.20%, 8/7/2042 | | | 53,000 | | | | 60,933 | |
| | |
4.38%, 1/24/2044 | | | 300,000 | | | | 407,238 | |
| | |
International Bank for Reconstruction & Development (Supranational) | | | | | | | | |
| | |
2.00%, 1/26/2022 | | | 440,000 | | | | 447,227 | |
| | |
2.13%, 2/13/2023 | | | 25,000 | | | | 25,932 | |
| | |
3.00%, 9/27/2023 | | | 240,000 | | | | 256,546 | |
| | |
2.50%, 3/19/2024 | | | 110,000 | | | | 117,099 | |
| | |
2.50%, 11/25/2024 | | | 50,000 | | | | 53,661 | |
| | |
1.63%, 1/15/2025 | | | 100,000 | | | | 104,107 | |
| | |
0.63%, 4/22/2025 | | | 350,000 | | | | 350,215 | |
| | |
2.50%, 7/29/2025 | | | 70,000 | | | | 75,377 | |
| | |
3.13%, 11/20/2025 | | | 70,000 | | | | 77,594 | |
| | |
1.88%, 10/27/2026 | | | 89,000 | | | | 93,557 | |
| | |
2.50%, 11/22/2027 | | | 30,000 | | | | 32,526 | |
| | |
1.75%, 10/23/2029 | | | 331,000 | | | | 340,452 | |
| | |
0.88%, 5/14/2030 | | | 50,000 | | | | 47,487 | |
| | |
4.75%, 2/15/2035 | | | 240,000 | | | | 320,931 | |
| | |
International Finance Corp. (Supranational) 2.00%, 10/24/2022 | | | 60,000 | | | | 61,790 | |
| | |
Nordic Investment Bank (Supranational) 2.13%, 2/1/2022 | | | 200,000 | | | | 203,540 | |
| | | | | | | | |
| | |
Total Supranational
(Cost $11,864,107) | | | | | | | 11,969,256 | |
| | | | | | | | |
Municipal Bonds — 0.6% (h) | | | | | | | | |
| | |
California — 0.2% | | | | | | | | |
| | |
Bay Area Toll Authority, Toll Bridge | | | | | | | | |
| | |
Series 2010S-1, Rev., 6.92%, 4/1/2040 | | | 40,000 | | | | 59,428 | |
| | |
Series 2009F-2, Rev., 6.26%, 4/1/2049 | | | 100,000 | | | | 159,607 | |
| | |
East Bay Municipal Utility District, Wastewater System Series 2010B, Rev., 5.87%, 6/1/2040 | | | 155,000 | | | | 218,225 | |
| | |
Los Angeles Unified School District, Build America Bonds | | | | | | | | |
| | |
GO, 5.75%, 7/1/2034 | | | 20,000 | | | | 27,208 | |
| | |
Series 2010RY, GO, 6.76%, 7/1/2034 | | | 105,000 | | | | 152,316 | |
| | | | | | | | |
| INVESTMENTS | | PRINCIPAL
AMOUNT ($) | | | VALUE ($) | |
| | | | | | | | |
| | |
California — continued | | | | | | | | |
| | |
Regents of the University of California Medical Center Pooled | | | | | | | | |
| | |
Series H, Rev., 6.55%, 5/15/2048 | | | 40,000 | | | | 59,964 | |
| | |
Series 2020N, Rev., 3.71%, 5/15/2120 | | | 165,000 | | | | 168,806 | |
| | |
Santa Clara Valley Transportation Authority, Sales Tax Series 2010A, Rev., 5.88%, 4/1/2032 | | | 215,000 | | | | 269,905 | |
| | |
State of California, Various Purpose | | | | | | | | |
| | |
GO, 7.50%, 4/1/2034 | | | 245,000 | | | | 389,935 | |
| | |
GO, 7.55%, 4/1/2039 (c) | | | 100,000 | | | | 165,128 | |
| | |
GO, 7.60%, 11/1/2040 | | | 25,000 | | | | 42,591 | |
| | | | | | | | |
| | |
Total California | | | | | | | 1,713,113 | |
| | | | | | | | |
| | |
Connecticut — 0.0% (a) | | | | | | | | |
| | |
State of Connecticut, Teachers Retirement FD Series A, GO, 5.85%, 3/15/2032 | | | 75,000 | | | | 101,099 | |
| | | | | | | | |
| | |
Florida — 0.1% | | | | | | | | |
| | |
State Board of Administration Finance Corp. Series 2020A, Rev., 1.26%, 7/1/2025 | | | 775,000 | | | | 782,014 | |
| | | | | | | | |
| | |
Illinois — 0.1% | | | | | | | | |
| | |
Chicago O’Hare International Airport, General Airport, Senior Lien Series 2018C, Rev., 4.47%, 1/1/2049 | | | 25,000 | | | | 31,926 | |
| | |
Metropolitan Water Reclamation District of Greater Chicago, Build America GO, 5.72%, 12/1/2038 | | | 55,000 | | | | 74,191 | |
| | |
Sales Tax Securitization Corp. Series 2019A, Rev., 4.64%, 1/1/2040 | | | 60,000 | | | | 68,644 | |
| | |
State of Illinois, Taxable Pension | | | | | | | | |
| | |
GO, 4.95%, 6/1/2023 | | | 53,182 | | | | 55,077 | |
| | |
GO, 5.10%, 6/1/2033 | | | 410,000 | | | | 456,404 | |
| | | | | | | | |
| | |
Total Illinois | | | | | | | 686,242 | |
| | | | | | | | |
| | |
Massachusetts — 0.0% (a) | | | | | | | | |
| | |
Commonwealth of Massachusetts, Consolidated Loan, Build America Series 2010E, GO, 4.20%, 12/1/2021 | | | 20,000 | | | | 20,610 | |
| | | | | | | | |
| | |
Missouri — 0.0% (a) | | | | | | | | |
| | |
Health and Educational Facilities Authority of the State of Missouri, The Washington University Series 2017A, Rev., 3.65%, 8/15/2057 | | | 45,000 | | | | 53,644 | |
| | | | | | | | |
| | |
Nebraska — 0.0% (a) | | | | | | | | |
| | |
University of Nebraska Facilities Corp., Taxable Series 2019A, Rev., 3.04%, 10/1/2049 | | | 50,000 | | | | 52,271 | |
| | | | | | | | |
SEE NOTES TO FINANCIAL STATEMENTS.
| | | | | | | | |
| | | |
| FEBRUARY 28, 2021 | | J.P. MORGAN EXCHANGE-TRADED FUNDS | | | | | 145 | |
JPMorgan U.S. Aggregate Bond ETF
SCHEDULE OF PORTFOLIO INVESTMENTS
AS OF FEBRUARY 28, 2021 (continued)
| | | | | | | | |
| INVESTMENTS | | PRINCIPAL
AMOUNT ($) | | | VALUE ($) | |
Municipal Bonds — continued | | | | | | | | |
| | |
New Jersey — 0.0% (a) | | | | | | | | |
| | |
New Jersey Economic Development Authority, Pension Funding Series 1997A, Rev., NATL-RE, 7.43%, 2/15/2029 | | | 35,000 | | | | 45,438 | |
| | |
New Jersey Transportation Trust Fund Authority, Transportation System Series 2010C, Rev., 5.75%, 12/15/2028 | | | 25,000 | | | | 29,185 | |
| | |
New Jersey Turnpike Authority Series F, Rev., 7.41%, 1/1/2040 | | | 10,000 | | | | 16,397 | |
| | |
Rutgers The State University of New Jersey Series 2019P, Rev., 3.92%, 5/1/2119 | | | 55,000 | | | | 58,848 | |
| | | | | | | | |
| | |
Total New Jersey | | | | | | | 149,868 | |
| | | | | | | | |
| | |
New York — 0.1% | | | | | | | | |
| | |
City of New York, Fiscal Year 2010 Subseries A-2, GO, 5.21%, 10/1/2031 | | | 25,000 | | | | 30,724 | |
| | |
New York City Water and Sewer System, Second General Resolution, Fiscal Year 2010 Series GG, Rev., 5.72%, 6/15/2042 | | | 40,000 | | | | 57,611 | |
| | |
New York State Urban Development Corp., State Personal Income Tax Series 2009E, Rev., 5.77%, 3/15/2039 | | | 25,000 | | | | 31,097 | |
| | |
New York State Urban Development Corp., State Personal Income Tax, General Purpose Series 2019B, Rev., 3.90%, 3/15/2033 | | | 65,000 | | | | 73,032 | |
| | |
Port Authority of New York and New Jersey, Consolidated | | | | | | | | |
| | |
Series 182, Rev., 5.31%, 8/1/2046 | | | 60,000 | | | | 68,291 | |
| | |
Series 192, Rev., 4.81%, 10/15/2065 | | | 120,000 | | | | 160,594 | |
| | | | | | | | |
| | |
Total New York | | | | | | | 421,349 | |
| | | | | | | | |
| | |
Ohio — 0.0% (a) | | | | | | | | |
| | |
American Municipal Power, Inc., Combined Hydroelectric Projects Series 2010B, Rev., 7.83%, 2/15/2041 | | | 25,000 | | | | 39,139 | |
| | | | | | | | |
| | |
Oregon — 0.0% (a) | | | | | | | | |
| | |
State of Oregon | | | | | | | | |
| | |
GO, 5.76%, 6/1/2023 | | | 26,806 | | | | 28,783 | |
| | |
GO, 5.89%, 6/1/2027 | | | 55,000 | | | | 68,131 | |
| | | | | | | | |
| | |
Total Oregon | | | | | | | 96,914 | |
| | | | | | | | |
| | |
Texas — 0.1% | | | | | | | | |
| | |
City of Houston GO, 3.96%, 3/1/2047 | | | 40,000 | | | | 47,121 | |
| | |
Grand Parkway Transportation Corp., System Toll Series 2020B, Rev., 3.24%, 10/1/2052 | | | 100,000 | | | | 102,776 | |
| | | | | | | | |
| INVESTMENTS | | PRINCIPAL
AMOUNT ($) | | | VALUE ($) | |
| | | | | | | | |
| | |
Texas — continued | | | | | | | | |
| | |
Permanent University Fund — Texas A&M University System Series B, Rev., 3.66%, 7/1/2047 | | | 20,000 | | | | 22,155 | |
| | |
State of Texas, Transportation Commission Highway Improvement Series 2010A, GO, 4.68%, 4/1/2040 | | | 45,000 | | | | 59,382 | |
| | |
State of Texas, Transportation Commission Mobility Fund Series 2009A, GO, 5.52%, 4/1/2039 | | | 120,000 | | | | 172,007 | |
| | |
Texas Transportation Commission State Highway Fund, First Tier Series 2010B, Rev., 5.18%, 4/1/2030 | | | 125,000 | | | | 157,842 | |
| | | | | | | | |
| | |
Total Texas | | | | | | | 561,283 | |
| | | | | | | | |
| | |
Virginia — 0.0% (a) | | | | | | | | |
| | |
University of Virginia, Federally Taxable Rev., 2.26%, 9/1/2050 | | | 340,000 | | | | 312,909 | |
| | | | | | | | |
| | |
Total Municipal Bonds
(Cost $4,942,036) | | | | | | | 4,990,455 | |
| | | | | | | | |
Asset-Backed Securities — 0.3% | | | | | | | | |
| | |
AmeriCredit Automobile Receivables Trust Series 2018-1, Class C, 3.50%, 1/18/2024 | | | 15,000 | | | | 15,478 | |
| | |
Capital One Multi-Asset Execution Trust | | | | | | | | |
| | |
Series 2019-A1, Class A1, 2.84%, 12/15/2024 | | | 50,000 | | | | 51,251 | |
| | |
Series 2017-A6, Class A6, 2.29%, 7/15/2025 | | | 10,000 | | | | 10,318 | |
| | |
Series 2019-A3, Class A3, 2.06%, 8/15/2028 | | | 400,000 | | | | 420,228 | |
| | |
CarMax Auto Owner Trust Series 2018-1, Class A4, 2.64%, 6/15/2023 | | | 25,000 | | | | 25,507 | |
| | |
Citibank Credit Card Issuance Trust | | | | | | | | |
| | |
Series 2018-A6, Class A6, 3.21%, 12/7/2024 | | | 50,000 | | | | 52,604 | |
| | |
Series 2018-A7, Class A7, 3.96%, 10/13/2030 | | | 100,000 | | | | 118,362 | |
| | |
Discover Card Execution Note Trust Series 2018-A1, Class A1, 3.03%, 8/15/2025 | | | 18,000 | | | | 18,953 | |
| | |
Ford Credit Floorplan Master Owner Trust A | | | | | | | | |
| | |
Series 2019-1, Class A, 2.84%, 3/15/2024 | | | 600,000 | | | | 615,888 | |
| | |
Series 2019-3, Class A1, 2.23%, 9/15/2024 | | | 75,000 | | | | 77,197 | |
| | |
Honda Auto Receivables Owner Trust Series 2019-4, Class A3, 1.83%, 1/18/2024 | | | 500,000 | | | | 508,965 | |
SEE NOTES TO FINANCIAL STATEMENTS.
| | | | | | |
| | | |
| 146 | | | | J.P. MORGAN EXCHANGE-TRADED FUNDS | | FEBRUARY 28, 2021 |
| | | | | | | | |
| INVESTMENTS | | PRINCIPAL
AMOUNT ($) | | | VALUE ($) | |
Asset-Backed Securities — continued | | | | | | | | |
| | |
Mercedes-Benz Auto Lease Trust Series 2020-A, Class A3, 1.84%, 12/15/2022 | | | 370,000 | | | | 374,506 | |
| | |
Santander Drive Auto Receivables Trust Series 2018-4, Class D, 3.98%, 12/15/2025 | | | 95,000 | | | | 98,852 | |
| | |
Synchrony Credit Card Master Note Trust Series 2018-2, Class A, 3.47%, 5/15/2026 | | | 50,000 | | | | 53,375 | |
| | |
Toyota Auto Receivables Owner Trust Series 2019-D, Class A3, 1.92%, 1/16/2024 | | | 50,000 | | | | 50,907 | |
| | |
World Omni Select Auto Trust Series 2019-A, Class D, 2.59%, 12/15/2025 | | | 182,000 | | | | 186,803 | |
| | | | | | | | |
| | |
Total Asset-backed Securities
(Cost $2,644,492) | | | | | | | 2,679,194 | |
| | | | | | | | |
| | | SHARES | | | | |
Short-Term Investments — 3.0% | | | | | | | | |
| | |
Investment Companies — 0.7% | | | | | | | | |
| | |
JPMorgan U.S. Government Money Market Fund Class Institutional Shares, 0.03% (i) (j)
(Cost $5,811,837) | | | 5,811,837 | | | | 5,811,837 | |
| | | | | | | | |
|
Investment of Cash Collateral from Securities Loaned — 2.3% | |
| | |
JPMorgan Securities Lending Money Market Fund Agency SL Class Shares, 0.14% (i) (j) | | | 18,497,450 | | | | 18,499,300 | |
| | |
JPMorgan U.S. Government Money Market Fund Class IM Shares, 0.04% (i) (j) | | | 866,055 | | | | 866,055 | |
| | | | | | | | |
| |
Total Investment Of Cash Collateral From Securities Loaned
(Cost $19,365,355) | | | | 19,365,355 | |
| | | | | | | | |
| | |
Total Short-Term Investments
(Cost $25,177,192) | | | | | | | 25,177,192 | |
| | | | | | | | |
| | |
Total Investments — 101.8%
(Cost $838,488,619) | | | | | | | 841,350,684 | |
| | |
Liabilities in Excess of Other Assets — (1.8)% | | | | | | | (14,561,354) | |
| | | | | | | | |
| |
NET ASSETS — 100.0% | | | | 826,789,330 | |
| | | | | | | | |
Percentages indicated are based on net assets.
| | |
Abbreviations |
ACES | | Alternative Credit Enhancement Securities |
FFCB | | Federal Farm Credit Bank |
FHLB | | Federal Home Loan Bank |
FHLMC | | Federal Home Loan Mortgage Corp. |
FNMA | | Federal National Mortgage Association |
GNMA | | Government National Mortgage Association |
GO | | General Obligation |
ICE | | Intercontinental Exchange |
LIBOR | | London Interbank Offered Rate |
NATL | | Insured by National Public Finance Guarantee Corp. |
RE | | Reinsured |
REIT | | Real Estate Investment Trust |
Rev. | | Revenue |
SOFR | | Secured Overnight Financing Rate |
UMBS | | Uniform Mortgage-Backed Securities |
USD | | United States Dollar |
| |
(a) | | Amount rounds to less than 0.1% of net assets. |
(b) | | Variable or floating rate security, linked to the referenced benchmark. The interest rate shown is the current rate as of February 28, 2021. |
(c) | | The security or a portion of this security is on loan at February 28, 2021. The total value of securities on loan at February 28, 2021 is $14,606,292. |
(d) | | Step bond. Interest rate is a fixed rate for an initial period that either resets at a specific date or may reset in the future contingent upon a predetermined trigger. The interest rate shown is the current rate as of February 28, 2021. |
(e) | | Securities exempt from registration under Rule 144A or section 4(a)(2), of the Securities Act of 1933, as amended. |
(f) | | Variable or floating rate security, the interest rate of which adjusts periodically based on changes in current interest rates and prepayments on the underlying pool of assets. The interest rate shown is the current rate as of February 28, 2021. |
(g) | | The rate shown is the effective yield as of February 28, 2021. |
(h) | | The date shown represents the earliest of the prerefunded date, next put date or final maturity date. |
(i) | | Investment in an affiliated fund, which is registered under the Investment Company Act of 1940, as amended, and is advised by J.P. Morgan Investment Management Inc. |
(j) | | The rate shown is the current yield as of February 28, 2021. |
‡ | | Value determined using significant unobservable inputs. |
SEE NOTES TO FINANCIAL STATEMENTS.
| | | | | | | | |
| | | |
| FEBRUARY 28, 2021 | | J.P. MORGAN EXCHANGE-TRADED FUNDS | | | | | 147 | |
JPMorgan Ultra-Short Income ETF
SCHEDULE OF PORTFOLIO INVESTMENTS
AS OF FEBRUARY 28, 2021
| | | | | | | | |
| INVESTMENTS | | PRINCIPAL
AMOUNT ($) | | | VALUE ($) | |
Corporate Bonds — 59.7% | |
|
Aerospace & Defense — 0.6% | |
| | |
Boeing Co. (The) 4.51%, 5/1/2023 | | | 31,519,000 | | | | 33,806,904 | |
| | |
General Dynamics Corp.
(ICE LIBOR USD 3 Month + 0.38%), 0.58%, 5/11/2021 (a) | | | 7,055,000 | | | | 7,060,306 | |
| | |
Leidos, Inc. 2.95%, 5/15/2023 (b) | | | 46,063,000 | | | | 48,305,347 | |
| | |
Northrop Grumman Corp. 2.55%, 10/15/2022 | | | 5,000,000 | | | | 5,165,154 | |
| | |
Raytheon Technologies Corp. | | | | | | | | |
| | |
2.50%, 12/15/2022 | | | 3,131,000 | | | | 3,230,014 | |
| | |
3.20%, 3/15/2024 | | | 5,792,000 | | | | 6,222,596 | |
| | | | | | | | |
| | |
| | | | | | | 103,790,321 | |
| | | | | | | | |
| | |
Automobiles — 2.7% | | | | | | | | |
| | |
BMW US Capital LLC (Germany) | | | | | | | | |
| | |
(ICE LIBOR USD 3 Month + 0.41%), 0.63%, 4/12/2021 (a) (b) | | | 12,300,000 | | | | 12,307,424 | |
| | |
3.10%, 4/12/2021 (b) | | | 6,383,000 | | | | 6,402,660 | |
| | |
(ICE LIBOR USD 3 Month + 0.50%), 0.70%, 8/13/2021 (a) (b) | | | 979,000 | | | | 981,041 | |
| | |
2.95%, 4/14/2022 (b) | | | 18,360,000 | | | | 18,898,680 | |
| | |
3.80%, 4/6/2023 (b) | | | 55,742,000 | | | | 59,523,324 | |
| | |
2.25%, 9/15/2023 (b) | | | 18,130,000 | | | | 18,900,508 | |
| | |
Daimler Finance North America LLC (Germany) | | | | | | | | |
| | |
(ICE LIBOR USD 3 Month + 0.55%), 0.74%, 5/4/2021 (a) (b) | | | 1,658,000 | | | | 1,659,652 | |
| | |
2.00%, 7/6/2021 (b) | | | 5,160,000 | | | | 5,188,437 | |
| | |
(ICE LIBOR USD 3 Month + 0.90%), 1.09%, 2/15/2022 (a) (b) | | | 35,447,000 | | | | 35,716,841 | |
| | |
(ICE LIBOR USD 3 Month + 0.88%), 1.06%, 2/22/2022 (a) (b) | | | 28,500,000 | | | | 28,714,660 | |
| | |
2.55%, 8/15/2022 (b) | | | 9,996,000 | | | | 10,287,163 | |
| | |
0.75%, 3/1/2024 (b) | | | 22,758,000 | | | | 22,795,685 | |
| | |
Hyundai Capital America | | | | | | | | |
| | |
3.45%, 3/12/2021 (b) | | | 14,976,000 | | | | 14,989,329 | |
| | |
3.00%, 3/18/2021 (b) | | | 5,245,000 | | | | 5,248,147 | |
| | |
2.45%, 6/15/2021 (b) | | | 10,000,000 | | | | 10,037,500 | |
| | |
(ICE LIBOR USD 3 Month + 0.94%), 1.17%, 7/8/2021 (a) (b) | | | 8,250,000 | | | | 8,264,026 | |
| | |
3.10%, 4/5/2022 (b) | | | 2,303,000 | | | | 2,357,696 | |
| | |
2.85%, 11/1/2022 (b) (c) | | | 10,000,000 | | | | 10,311,300 | |
| | |
1.15%, 11/10/2022 (b) | | | 27,058,000 | | | | 27,252,479 | |
| | |
5.75%, 4/6/2023 (b) | | | 10,021,000 | | | | 11,035,626 | |
| | |
Volkswagen Group of America Finance LLC (Germany) | | | | | | | | |
| | |
(ICE LIBOR USD 3 Month + 0.86%), 1.10%, 9/24/2021 (a) (b) | | | 20,965,000 | | | | 21,058,825 | |
| | | | | | | | |
| INVESTMENTS | | PRINCIPAL
AMOUNT ($) | | | VALUE ($) | |
| | | | | | | | |
|
Automobiles — continued | |
| | |
(ICE LIBOR USD 3 Month + 0.94%), 1.14%, 11/12/2021 (a) (b) | | | 9,806,000 | | | | 9,864,535 | |
| | |
4.00%, 11/12/2021 (b) | | | 12,228,000 | | | | 12,538,089 | |
| | |
2.90%, 5/13/2022 (b) | | | 29,836,000 | | | | 30,710,304 | |
| | |
2.70%, 9/26/2022 (b) | | | 9,928,000 | | | | 10,268,285 | |
| | |
0.75%, 11/23/2022 (b) (c) | | | 7,436,000 | | | | 7,469,097 | |
| | |
3.13%, 5/12/2023 (b) | | | 22,136,000 | | | | 23,328,842 | |
| | |
4.25%, 11/13/2023 (b) | | | 9,666,000 | | | | 10,577,512 | |
| | | | | | | | |
| | |
| | | | | | | 436,687,667 | |
| | | | | | | | |
| | |
Banks — 24.9% | | | | | | | | |
| | |
ABN AMRO Bank NV (Netherlands) | | | | | | | | |
| | |
(ICE LIBOR USD 3 Month + 0.57%), 0.76%, 8/27/2021 (a) (b) | | | 24,527,000 | | | | 24,589,053 | |
| | |
3.40%, 8/27/2021 (b) | | | 28,298,000 | | | | 28,730,960 | |
| | |
ANZ New Zealand Int’l Ltd. (New Zealand) | | | | | | | | |
| | |
(ICE LIBOR USD 3 Month + 1.01%), 1.23%, 7/28/2021 (a) (b) | | | 13,356,000 | | | | 13,408,795 | |
| | |
2.13%, 7/28/2021 (b) (c) | | | 8,095,000 | | | | 8,155,421 | |
| | |
2.88%, 1/25/2022 (b) | | | 2,585,000 | | | | 2,645,892 | |
| | |
1.90%, 2/13/2023 (b) | | | 3,630,000 | | | | 3,739,553 | |
| | |
Australia & New Zealand Banking Group Ltd. (Australia) | | | | | | | | |
| | |
(ICE LIBOR USD 3 Month + 0.46%), 0.65%, 5/17/2021 (a) (b) | | | 2,300,000 | | | | 2,302,243 | |
| | |
(ICE LIBOR USD 3 Month + 0.99%), 1.22%, 6/1/2021 (a) (b) | | | 2,850,000 | | | | 2,856,744 | |
| | |
2.30%, 6/1/2021 | | | 1,150,000 | | | | 1,155,984 | |
| | |
(ICE LIBOR USD 3 Month + 0.87%), 1.05%, 11/23/2021 (a) (b) | | | 1,470,000 | | | | 1,479,172 | |
| | |
2.55%, 11/23/2021 | | | 375,000 | | | | 381,412 | |
| | |
2.63%, 5/19/2022 | | | 11,522,000 | | | | 11,854,367 | |
| | |
2.63%, 11/9/2022 | | | 16,021,000 | | | | 16,662,088 | |
| | |
2.05%, 11/21/2022 | | | 12,527,000 | | | | 12,905,850 | |
| | |
Banco Santander SA (Spain) | | | | | | | | |
| | |
3.50%, 4/11/2022 | | | 7,600,000 | | | | 7,856,053 | |
| | |
3.85%, 4/12/2023 | | | 6,400,000 | | | | 6,848,196 | |
| | |
2.75%, 5/28/2025 (c) | | | 10,000,000 | | | | 10,597,356 | |
| | |
Bank of America Corp. | | | | | | | | |
| | |
5.00%, 5/13/2021 | | | 3,000,000 | | | | 3,028,348 | |
| | |
(ICE LIBOR USD 3 Month + 0.63%), 3.50%, 5/17/2022 (a) | | | 8,560,000 | | | | 8,617,102 | |
| | |
2.50%, 10/21/2022 | | | 1,006,000 | | | | 1,019,906 | |
| | |
3.30%, 1/11/2023 | | | 1,473,000 | | | | 1,555,447 | |
| | |
(ICE LIBOR USD 3 Month + 1.16%), 3.12%, 1/20/2023 (a) | | | 25,222,000 | | | | 25,823,749 | |
SEE NOTES TO FINANCIAL STATEMENTS.
| | | | | | |
| | | |
| 148 | | | | J.P. MORGAN EXCHANGE-TRADED FUNDS | | FEBRUARY 28, 2021 |
| | | | | | | | |
| INVESTMENTS | | PRINCIPAL
AMOUNT ($) | | | VALUE ($) | |
Corporate Bonds — continued | |
| | |
Banks — continued | | | | | | | | |
| | |
(ICE LIBOR USD 3 Month + 1.02%), 2.88%, 4/24/2023 (a) | | | 8,532,000 | | | | 8,775,745 | |
| | |
(ICE LIBOR USD 3 Month + 0.93%), 2.82%, 7/21/2023 (a) | | | 2,515,000 | | | | 2,597,911 | |
| | |
4.10%, 7/24/2023 | | | 1,101,000 | | | | 1,197,993 | |
| | |
(ICE LIBOR USD 3 Month + 0.79%), 3.00%, 12/20/2023 (a) (c) | | | 4,611,000 | | | | 4,819,233 | |
| | |
(SOFR + 0.73%), 0.76%, 10/24/2024 (a) | | | 37,500,000 | | | | 37,841,250 | |
| | |
(ICE LIBOR USD 3 Month + 0.97%), 3.46%, 3/15/2025 (a) | | | 2,392,000 | | | | 2,585,467 | |
| | |
Bank of Montreal (Canada) | | | | | | | | |
| | |
Series D, (ICE LIBOR USD 3 Month + 0.46%), 0.68%, 4/13/2021 (a) | | | 3,635,000 | | | | 3,637,111 | |
| | |
Series D, 3.10%, 4/13/2021 (c) | | | 2,099,000 | | | | 2,106,005 | |
| | |
(ICE LIBOR USD 3 Month + 0.79%), 0.98%, 8/27/2021 (a) | | | 525,000 | | | | 526,927 | |
| | |
1.90%, 8/27/2021 | | | 5,975,000 | | | | 6,024,436 | |
| | |
(ICE LIBOR USD 3 Month + 0.40%), 0.63%, 9/10/2021 (a) (c) | | | 25,665,000 | | | | 25,716,258 | |
| | |
(ICE LIBOR USD 3 Month + 0.57%), 0.82%, 3/26/2022 (a) | | | 30,500,000 | | | | 30,686,972 | |
| | |
2.90%, 3/26/2022 | | | 8,690,000 | | | | 8,936,220 | |
| | |
2.35%, 9/11/2022 (c) | | | 5,511,000 | | | | 5,689,516 | |
| | |
2.05%, 11/1/2022 (c) | | | 5,930,000 | | | | 6,098,393 | |
| | |
Bank of Nova Scotia (The) (Canada) | | | | | | | | |
| | |
2.45%, 3/22/2021 | | | 1,909,000 | | | | 1,911,291 | |
| | |
(ICE LIBOR USD 3 Month + 0.44%), 0.66%, 4/20/2021 (a) | | | 221,000 | | | | 221,159 | |
| | |
3.13%, 4/20/2021 | | | 3,243,000 | | | | 3,255,625 | |
| | |
2.80%, 7/21/2021 | | | 315,000 | | | | 318,168 | |
| | |
(ICE LIBOR USD 3 Month + 0.64%), 0.87%, 3/7/2022 (a) | | | 10,108,000 | | | | 10,170,366 | |
| | |
2.70%, 3/7/2022 | | | 11,850,000 | | | | 12,143,627 | |
| | |
2.45%, 9/19/2022 | | | 5,887,000 | | | | 6,084,741 | |
| | |
1.95%, 2/1/2023 | | | 11,814,000 | | | | 12,183,973 | |
| | |
1.63%, 5/1/2023 (c) | | | 2,850,000 | | | | 2,927,119 | |
| | |
0.80%, 6/15/2023 (c) | | | 5,025,000 | | | | 5,073,761 | |
| | |
Banque Federative du Credit Mutuel SA (France) | | | | | | | | |
| | |
2.50%, 4/13/2021 (b) | | | 4,724,000 | | | | 4,736,237 | |
| | |
1.96%, 7/21/2021 (b) | | | 55,575,000 | | | | 55,916,321 | |
| | |
2.70%, 7/20/2022 (b) | | | 10,055,000 | | | | 10,383,819 | |
| | |
2.13%, 11/21/2022 (b) | | | 17,217,000 | | | | 17,748,716 | |
| | |
3.75%, 7/20/2023 (b) | | | 4,865,000 | | | | 5,245,762 | |
| | |
Barclays Bank plc (United Kingdom) 1.70%, 5/12/2022 | | | 23,728,000 | | | | 24,089,102 | |
| | | | | | | | |
| INVESTMENTS | | PRINCIPAL
AMOUNT ($) | | | VALUE ($) | |
| | | | | | | | |
| | |
Banks — continued | | | | | | | | |
| | |
Barclays plc (United Kingdom) | | | | | | | | |
| | |
3.20%, 8/10/2021 | | | 42,609,000 | | | | 43,152,411 | |
| | |
(ICE LIBOR USD 3 Month + 1.63%), 1.85%, 1/10/2023 (a) (c) | | | 27,550,000 | | | | 27,863,712 | |
| | |
3.68%, 1/10/2023 | | | 1,800,000 | | | | 1,848,298 | |
| | |
(ICE LIBOR USD 3 Month + 1.40%), 4.61%, 2/15/2023 (a) | | | 45,000,000 | | | | 46,718,083 | |
| | |
(US Treasury Yield Curve Rate T Note Constant Maturity 1 Year + 0.80%), 1.01%, 12/10/2024 (a) | | | 29,647,000 | | | | 29,798,768 | |
| | |
BBVA USA | | | | | | | | |
| | |
(ICE LIBOR USD 3 Month + 0.73%), 0.95%, 6/11/2021 (a) (c) | | | 9,511,000 | | | | 9,522,718 | |
| | |
3.50%, 6/11/2021 | | | 44,885,000 | | | | 45,160,943 | |
| | |
BNP Paribas SA (France) | | | | | | | | |
| | |
(ICE LIBOR USD 3 Month + 0.39%), 0.58%, 8/7/2021 (a) (b) | | | 34,808,000 | | | | 34,860,312 | |
| | |
2.95%, 5/23/2022 (b) | | | 8,058,000 | | | | 8,316,837 | |
| | |
3.50%, 3/1/2023 (b) | | | 39,176,000 | | | | 41,510,014 | |
| | |
3.80%, 1/10/2024 (b) | | | 11,005,000 | | | | 11,927,821 | |
| | |
BNZ International Funding Ltd. (New Zealand) | | | | | | | | |
| | |
2.75%, 3/2/2021 (b) | | | 750,000 | | | | 750,000 | |
| | |
(ICE LIBOR USD 3 Month + 0.98%), 1.20%, 9/14/2021 (a) (b) | | | 21,969,000 | | | | 22,072,990 | |
| | |
2.10%, 9/14/2021 (b) | | | 7,705,000 | | | | 7,782,549 | |
| | |
2.65%, 11/3/2022 (b) (c) | | | 4,855,000 | | | | 5,042,446 | |
| | |
3.38%, 3/1/2023 (b) | | | 13,260,000 | | | | 14,035,147 | |
| | |
Canadian Imperial Bank of Commerce (Canada) | | | | | | | | |
| | |
2.55%, 6/16/2022 | | | 740,000 | | | | 762,200 | |
| | |
0.95%, 6/23/2023 | | | 57,416,000 | | | | 58,074,271 | |
| | |
(ICE LIBOR USD 3 Month + 0.79%), 2.61%, 7/22/2023 (a) | | | 12,898,000 | | | | 13,298,487 | |
| | |
(SOFR + 0.40%), 0.43%, 12/14/2023 (a) | | | 50,032,000 | | | | 50,184,324 | |
| | |
Capital One Bank USA NA (SOFR + 0.62%), 2.01%, 1/27/2023 (a) | | | 2,246,000 | | | | 2,278,631 | |
| | |
Capital One NA | | | | | | | | |
| | |
2.95%, 7/23/2021 | | | 4,410,000 | | | | 4,446,735 | |
| | |
2.25%, 9/13/2021 | | | 9,212,000 | | | | 9,296,493 | |
| | |
2.15%, 9/6/2022 | | | 24,273,000 | | | | 24,902,853 | |
| | |
Citibank NA | | | | | | | | |
| | |
(ICE LIBOR USD 3 Month + 0.57%), 0.79%, 7/23/2021 (a) | | | 4,545,000 | | | | 4,553,111 | |
| | |
3.40%, 7/23/2021 | | | 850,000 | | | | 858,342 | |
SEE NOTES TO FINANCIAL STATEMENTS.
| | | | | | | | |
| | | |
| FEBRUARY 28, 2021 | | J.P. MORGAN EXCHANGE-TRADED FUNDS | | | | | 149 | |
JPMorgan Ultra-Short Income ETF
SCHEDULE OF PORTFOLIO INVESTMENTS
AS OF FEBRUARY 28, 2021 (continued)
| | | | | | | | |
| INVESTMENTS | | PRINCIPAL
AMOUNT ($) | | | VALUE ($) | |
Corporate Bonds — continued | |
| | |
Banks — continued | | | | | | | | |
| | |
Citigroup, Inc. | | | | | | | | |
| | |
(ICE LIBOR USD 3 Month + 1.38%), 1.62%, 3/30/2021 (a) | | | 9,735,000 | | | | 9,746,223 | |
| | |
2.70%, 3/30/2021 | | | 3,754,000 | | | | 3,761,433 | |
| | |
(ICE LIBOR USD 3 Month + 1.19%), 1.39%, 8/2/2021 (a) | | | 7,950,000 | | | | 7,988,255 | |
| | |
(ICE LIBOR USD 3 Month + 1.07%), 1.30%, 12/8/2021 (a) | | | 7,645,000 | | | | 7,696,986 | |
| | |
2.90%, 12/8/2021 | | | 4,511,000 | | | | 4,593,572 | |
| | |
2.75%, 4/25/2022 | | | 7,335,000 | | | | 7,523,558 | |
| | |
(SOFR + 0.87%), 2.31%, 11/4/2022 (a) | | | 6,152,000 | | | | 6,227,104 | |
| | |
(ICE LIBOR USD 3 Month + 0.72%), 3.14%, 1/24/2023 (a) | | | 91,206,000 | | | | 93,432,556 | |
| | |
(ICE LIBOR USD 3 Month + 0.95%), 2.88%, 7/24/2023 (a) | | | 2,097,000 | | | | 2,166,479 | |
| | |
(SOFR + 1.67%), 1.68%, 5/15/2024 (a) | | | 500,000 | | | | 512,359 | |
| | |
(ICE LIBOR USD 3 Month + 1.02%), 4.04%, 6/1/2024 (a) | | | 1,937,000 | | | | 2,088,892 | |
| | |
Citizens Bank NA | | | | | | | | |
| | |
2.55%, 5/13/2021 | | | 16,676,000 | | | | 16,720,141 | |
| | |
(ICE LIBOR USD 3 Month + 0.72%), 0.92%, 2/14/2022 (a) | | | 13,543,000 | | | | 13,604,293 | |
| | |
3.25%, 2/14/2022 | | | 21,626,000 | | | | 22,177,989 | |
| | |
2.65%, 5/26/2022 | | | 5,954,000 | | | | 6,108,858 | |
| | |
Commonwealth Bank of Australia (Australia) | | | | | | | | |
| | |
(ICE LIBOR USD 3 Month + 0.70%), 0.93%, 3/10/2022 (a) (b) | | | 2,348,000 | | | | 2,363,731 | |
| | |
2.75%, 3/10/2022 (b) | | | 1,452,000 | | | | 1,489,072 | |
| | |
2.50%, 9/18/2022 (b) | | | 13,980,000 | | | | 14,477,317 | |
| | |
1.63%, 10/17/2022 (b) | | | 25,290,000 | | | | 25,830,909 | |
| | |
Cooperatieve Rabobank UA (Netherlands) | | | | | | | | |
| | |
(ICE LIBOR USD 3 Month + 0.43%), 0.65%, 4/26/2021 (a) | | | 7,490,000 | | | | 7,495,251 | |
| | |
3.13%, 4/26/2021 | | | 13,515,000 | | | | 13,574,978 | |
| | |
(ICE LIBOR USD 3 Month + 0.83%), 1.05%, 1/10/2022 (a) | | | 3,700,000 | | | | 3,727,256 | |
| | |
2.75%, 1/10/2022 | | | 420,000 | | | | 429,084 | |
| | |
3.88%, 2/8/2022 | | | 18,176,000 | | | | 18,791,125 | |
| | |
2.75%, 1/10/2023 | | | 2,089,000 | | | | 2,182,536 | |
| | |
3.88%, 9/26/2023 (b) | | | 6,490,000 | | | | 7,046,071 | |
| | |
(SOFR + 0.30%), 0.39%, 1/12/2024 (a) (c) | | | 62,834,000 | | | | 62,896,206 | |
| | | | | | | | |
| INVESTMENTS | | PRINCIPAL
AMOUNT ($) | | | VALUE ($) | |
| | | | | | | | |
| | |
Banks — continued | | | | | | | | |
| | |
Credit Agricole SA (France) | | | | | | | | |
| | |
3.38%, 1/10/2022 (b) | | | 3,801,000 | | | | 3,902,312 | |
| | |
3.75%, 4/24/2023 (b) | | | 75,556,000 | | | | 80,764,284 | |
| | |
Credit Suisse Group Funding Guernsey Ltd. (Switzerland) | | | | | | | | |
| | |
(ICE LIBOR USD 3 Month + 2.29%), 2.51%, 4/16/2021 (a) | | | 6,956,000 | | | | 6,975,548 | |
| | |
3.45%, 4/16/2021 | | | 17,850,000 | | | | 17,917,473 | |
| | |
3.80%, 9/15/2022 | | | 1,536,000 | | | | 1,612,938 | |
| | |
DBS Group Holdings Ltd. (Singapore) 2.85%, 4/16/2022 (b) | | | 44,859,000 | | | | 46,056,735 | |
| | |
DNB Bank ASA (Norway) | | | | | | | | |
| | |
2.38%, 6/2/2021 (b) | | | 7,871,000 | | | | 7,913,990 | |
| | |
2.15%, 12/2/2022 (b) | | | 35,121,000 | | | | 36,244,837 | |
| | |
Federation des Caisses Desjardins du Quebec (Canada) 1.95%, 9/26/2022 (b) | | | 25,000,000 | | | | 25,655,708 | |
| | |
Fifth Third Bancorp | | | | | | | | |
| | |
1.63%, 5/5/2023 | | | 18,545,000 | | | | 19,011,175 | |
| | |
3.65%, 1/25/2024 | | | 23,511,000 | | | | 25,495,215 | |
| | |
Fifth Third Bank NA | | | | | | | | |
| | |
(ICE LIBOR USD 3 Month + 0.44%), 0.66%, 7/26/2021 (a) | | | 14,045,000 | | | | 14,064,008 | |
| | |
2.88%, 10/1/2021 | | | 20,518,000 | | | | 20,788,935 | |
| | |
First Republic Bank (SOFR + 0.62%), 1.91%, 2/12/2024 (a) | | | 592,000 | | | | 608,044 | |
| | |
Huntington National Bank (The) | | | | | | | | |
| | |
3.25%, 5/14/2021 | | | 24,737,000 | | | | 24,825,468 | |
| | |
3.13%, 4/1/2022 | | | 2,128,000 | | | | 2,187,583 | |
| | |
2.50%, 8/7/2022 | | | 16,029,000 | | | | 16,502,166 | |
| | |
1.80%, 2/3/2023 | | | 500,000 | | | | 513,368 | |
| | |
3.55%, 10/6/2023 | | | 1,640,000 | | | | 1,771,129 | |
| | |
ING Groep NV (Netherlands) | | | | | | | | |
| | |
(ICE LIBOR USD 3 Month + 1.15%), 1.40%, 3/29/2022 (a) | | | 21,325,000 | | | | 21,558,936 | |
| | |
3.15%, 3/29/2022 | | | 58,170,000 | | | | 59,973,734 | |
| | |
4.10%, 10/2/2023 | | | 3,730,000 | | | | 4,070,926 | |
| | |
KeyBank NA | | | | | | | | |
| | |
2.40%, 6/9/2022 | | | 965,000 | | | | 991,401 | |
| | |
2.30%, 9/14/2022 | | | 5,119,000 | | | | 5,280,710 | |
| | |
1.25%, 3/10/2023 | | | 500,000 | | | | 509,251 | |
| | |
KeyCorp 5.10%, 3/24/2021 | | | 12,301,000 | | | | 12,337,818 | |
| | |
Lloyds Bank plc (United Kingdom)
(ICE LIBOR USD 3 Month + 0.49%), 0.68%, 5/7/2021 (a) | | | 2,101,000 | | | | 2,102,744 | |
SEE NOTES TO FINANCIAL STATEMENTS.
| | | | | | |
| | | |
| 150 | | | | J.P. MORGAN EXCHANGE-TRADED FUNDS | | FEBRUARY 28, 2021 |
| | | | | | | | |
| INVESTMENTS | | PRINCIPAL
AMOUNT ($) | | | VALUE ($) | |
Corporate Bonds — continued | |
| | |
Banks — continued | | | | | | | | |
| | |
Lloyds Banking Group plc (United Kingdom) | | | | | | | | |
| | |
(ICE LIBOR USD 3 Month + 0.80%), 1.04%, 6/21/2021 (a) | | | 300,000 | | | | 300,696 | |
| | |
3.10%, 7/6/2021 | | | 1,445,000 | | | | 1,459,268 | |
| | |
3.00%, 1/11/2022 | | | 7,896,000 | | | | 8,076,355 | |
| | |
(ICE LIBOR USD 3 Month + 1.25%), 2.86%, 3/17/2023 (a) | | | 78,163,000 | | | | 80,080,275 | |
| | |
4.05%, 8/16/2023 | | | 22,633,000 | | | | 24,554,966 | |
| | |
(ICE LIBOR USD 3 Month + 0.81%), 2.91%, 11/7/2023 (a) (c) | | | 3,334,000 | | | | 3,462,194 | |
| | |
Mitsubishi UFJ Financial Group, Inc. (Japan) | | | | | | | | |
| | |
(ICE LIBOR USD 3 Month + 0.65%), 0.87%, 7/26/2021 (a) | | | 9,060,000 | | | | 9,082,219 | |
| | |
3.54%, 7/26/2021 | | | 17,367,000 | | | | 17,594,309 | |
| | |
(ICE LIBOR USD 3 Month + 1.06%), 1.28%, 9/13/2021 (a) | | | 6,387,000 | | | | 6,421,024 | |
| | |
2.19%, 9/13/2021 | | | 1,877,000 | | | | 1,895,582 | |
| | |
(ICE LIBOR USD 3 Month + 0.92%), 1.10%, 2/22/2022 (a) | | | 4,789,000 | | | | 4,827,858 | |
| | |
3.00%, 2/22/2022 | | | 42,869,000 | | | | 43,986,375 | |
| | |
(ICE LIBOR USD 3 Month + 0.70%), 0.93%, 3/7/2022 (a) | | | 22,890,000 | | | | 23,032,542 | |
| | |
3.22%, 3/7/2022 | | | 3,842,000 | | | | 3,954,017 | |
| | |
2.62%, 7/18/2022 | | | 20,517,000 | | | | 21,153,590 | |
| | |
2.67%, 7/25/2022 | | | 10,807,000 | | | | 11,156,331 | |
| | |
3.46%, 3/2/2023 | | | 351,000 | | | | 371,928 | |
| | |
(ICE LIBOR USD 3 Month + 0.86%), 1.08%, 7/26/2023 (a) | | | 1,594,000 | | | | 1,616,320 | |
| | |
3.76%, 7/26/2023 | | | 2,493,000 | | | | 2,684,759 | |
| | |
Mizuho Financial Group, Inc. (Japan) | | | | | | | | |
| | |
(ICE LIBOR USD 3 Month + 1.14%), 1.36%, 9/13/2021 (a) | | | 15,690,000 | | | | 15,781,065 | |
| | |
2.27%, 9/13/2021 | | | 17,600,000 | | | | 17,787,571 | |
| | |
(ICE LIBOR USD 3 Month + 0.94%), 1.13%, 2/28/2022 (a) | | | 11,765,000 | | | | 11,865,642 | |
| | |
2.60%, 9/11/2022 | | | 14,686,000 | | | | 15,194,091 | |
| | |
3.55%, 3/5/2023 | | | 3,942,000 | | | | 4,191,487 | |
| | |
(ICE LIBOR USD 3 Month + 0.84%), 1.06%, 7/16/2023 (a) | | | 9,601,000 | | | | 9,676,729 | |
| | |
(ICE LIBOR USD 3 Month + 0.84%), 2.72%, 7/16/2023 (a) | | | 4,363,000 | | | | 4,500,153 | |
| | |
(ICE LIBOR USD 3 Month + 0.85%), 1.07%, 9/13/2023 (a) | | | 66,214,000 | | | | 66,792,342 | |
| | |
(ICE LIBOR USD 3 Month + 0.99%), 1.24%, 7/10/2024 (a) | | | 15,000,000 | | | | 15,231,951 | |
| | | | | | | | |
| INVESTMENTS | | PRINCIPAL
AMOUNT ($) | | | VALUE ($) | |
| | | | | | | | |
| | |
Banks — continued | | | | | | | | |
| | |
(ICE LIBOR USD 3 Month + 0.61%), 0.85%, 9/8/2024 (a) | | | 29,700,000 | | | | 29,890,883 | |
| | |
(ICE LIBOR USD 3 Month + 1.00%), 3.92%, 9/11/2024 (a) | | | 8,066,000 | | | | 8,729,545 | |
| | |
MUFG Americas Holdings Corp. 3.50%, 6/18/2022 | | | 9,413,000 | | | | 9,794,423 | |
| | |
MUFG Bank Ltd. (Japan) 4.10%, 9/9/2023 (b) | | | 200,000 | | | | 217,794 | |
| | |
MUFG Union Bank NA | | | | | | | | |
| | |
3.15%, 4/1/2022 | | | 1,220,000 | | | | 1,254,066 | |
| | |
(SOFR + 0.71%), 0.73%, 12/9/2022 (a) | | | 24,750,000 | | | | 24,920,694 | |
| | |
National Australia Bank Ltd. (Australia) | | | | | | | | |
| | |
(ICE LIBOR USD 3 Month + 1.00%), 1.22%, 7/12/2021 (a) (b) | | | 4,750,000 | | | | 4,768,439 | |
| | |
1.88%, 7/12/2021 | | | 3,895,000 | | | | 3,917,565 | |
| | |
3.38%, 9/20/2021 | | | 6,250,000 | | | | 6,353,375 | |
| | |
(ICE LIBOR USD 3 Month + 0.71%), 0.90%, 11/4/2021 (a) (b) | | | 18,111,000 | | | | 18,195,165 | |
| | |
3.70%, 11/4/2021 | | | 250,000 | | | | 255,490 | |
| | |
2.50%, 5/22/2022 (c) | | | 8,967,000 | | | | 9,219,699 | |
| | |
1.88%, 12/13/2022 | | | 7,765,000 | | | | 7,988,042 | |
| | |
3.00%, 1/20/2023 | | | 5,600,000 | | | | 5,882,078 | |
| | |
2.88%, 4/12/2023 (c) | | | 3,345,000 | | | | 3,521,860 | |
| | |
National Bank of Canada (Canada) | | | | | | | | |
| | |
(ICE LIBOR USD 3 Month + 0.40%), 0.64%, 3/21/2021 (a) (b) | | | 60,000,000 | | | | 60,014,778 | |
| | |
2.15%, 10/7/2022 (b) | | | 13,125,000 | | | | 13,501,918 | |
| | |
2.10%, 2/1/2023 (c) | | | 43,700,000 | | | | 45,116,013 | |
| | |
(US Treasury Yield Curve Rate T Note Constant Maturity 1 Year + 0.77%), 0.90%, 8/15/2023 (a) (c) | | | 15,000,000 | | | | 15,109,447 | |
| | |
Natwest Group plc (United Kingdom) | | | | | | | | |
| | |
(ICE LIBOR USD 3 Month + 1.47%), 1.66%, 5/15/2023 (a) | | | 17,744,000 | | | | 17,985,247 | |
| | |
(US Treasury Yield Curve Rate T Note Constant Maturity 1 Year + 2.15%), 2.36%, 5/22/2024 (a) | | | 133,000 | | | | 137,686 | |
| | |
(ICE LIBOR USD 3 Month + 1.76%), 4.27%, 3/22/2025 (a) | | | 10,045,000 | | | | 11,013,654 | |
| | |
NatWest Markets plc (United Kingdom) 3.63%, 9/29/2022 (b) | | | 25,670,000 | | | | 26,947,012 | |
| | |
Nordea Bank Abp (Finland) | | | | | | | | |
| | |
(ICE LIBOR USD 3 Month + 0.99%), 1.18%, 5/27/2021 (a) (b) | | | 4,600,000 | | | | 4,610,808 | |
| | |
2.25%, 5/27/2021 (b) (c) | | | 46,490,000 | | | | 46,717,687 | |
SEE NOTES TO FINANCIAL STATEMENTS.
| | | | | | | | |
| | | |
| FEBRUARY 28, 2021 | | J.P. MORGAN EXCHANGE-TRADED FUNDS | | | | | 151 | |
JPMorgan Ultra-Short Income ETF
SCHEDULE OF PORTFOLIO INVESTMENTS
AS OF FEBRUARY 28, 2021 (continued)
| | | | | | | | |
| INVESTMENTS | | PRINCIPAL
AMOUNT ($) | | | VALUE ($) | |
Corporate Bonds — continued | |
| | |
Banks — continued | | | | | | | | |
| | |
1.00%, 6/9/2023 (b) | | | 15,826,000 | | | | 16,054,776 | |
| | |
PNC Bank NA | | | | | | | | |
| | |
(ICE LIBOR USD 3 Month + 0.44%), 2.23%, 7/22/2022 (a) | | | 6,211,000 | | | | 6,259,564 | |
| | |
(ICE LIBOR USD 3 Month + 0.42%), 2.03%, 12/9/2022 (a) | | | 3,610,000 | | | | 3,657,598 | |
| | |
(ICE LIBOR USD 3 Month + 0.32%), 1.74%, 2/24/2023 (a) | | | 2,405,000 | | | | 2,436,769 | |
| | |
PNC Financial Services Group, Inc. (The) 2.85%, 11/9/2022 (d) | | | 1,465,000 | | | | 1,529,247 | |
| | |
QNB Finance Ltd. (Qatar) (ICE LIBOR USD 3 Month + 1.35%), 1.54%, 5/31/2021 (a) (e) | | | 7,000,000 | | | | 7,010,938 | |
| | |
Royal Bank of Canada (Canada) | | | | | | | | |
| | |
(ICE LIBOR USD 3 Month + 0.39%), 0.60%, 4/30/2021 (a) | | | 8,135,000 | | | | 8,140,263 | |
| | |
(ICE LIBOR USD 3 Month + 0.73%), 0.93%, 2/1/2022 (a) | | | 1,333,000 | | | | 1,341,345 | |
| | |
2.75%, 2/1/2022 | | | 12,939,000 | | | | 13,237,910 | |
| | |
1.95%, 1/17/2023 | | | 479,000 | | | | 493,383 | |
| | |
1.60%, 4/17/2023 | | | 26,338,000 | | | | 27,013,215 | |
| | |
3.70%, 10/5/2023 | | | 7,562,000 | | | | 8,200,985 | |
| | |
(SOFR + 0.45%), 0.48%, 10/26/2023 (a) | | | 62,070,000 | | | | 62,381,172 | |
| | |
Santander UK Group Holdings plc (United Kingdom) 2.88%, 8/5/2021 | | | 12,592,000 | | | | 12,729,507 | |
| | |
Santander UK plc (United Kingdom) | | | | | | | | |
| | |
(ICE LIBOR USD 3 Month + 0.62%), 0.85%, 6/1/2021 (a) | | | 3,000,000 | | | | 3,004,511 | |
| | |
3.40%, 6/1/2021 | | | 6,638,000 | | | | 6,688,654 | |
| | |
(ICE LIBOR USD 3 Month + 0.66%), 0.85%, 11/15/2021 (a) (c) | | | 20,219,000 | | | | 20,308,122 | |
| | |
2.10%, 1/13/2023 | | | 26,835,000 | | | | 27,694,110 | |
| | |
Skandinaviska Enskilda Banken AB (Sweden) | | | | | | | | |
| | |
(ICE LIBOR USD 3 Month + 0.43%), 0.62%, 5/17/2021 (a) (b) | | | 200,000 | | | | 200,177 | |
| | |
3.25%, 5/17/2021 (b) | | | 41,540,000 | | | | 41,796,302 | |
| | |
1.88%, 9/13/2021 | | | 22,200,000 | | | | 22,386,092 | |
| | |
3.05%, 3/25/2022 (b) | | | 13,760,000 | | | | 14,158,214 | |
| | |
2.20%, 12/12/2022 (b) | | | 10,957,000 | | | | 11,308,117 | |
| | |
Societe Generale SA (France) | | | | | | | | |
| | |
(ICE LIBOR USD 3 Month + 1.33%), 1.56%, 4/8/2021 (a) (b) | | | 5,150,000 | | | | 5,156,875 | |
| | |
2.50%, 4/8/2021 (b) | | | 20,365,000 | | | | 20,411,079 | |
| | |
5.20%, 4/15/2021 (b) | | | 60,174,000 | | | | 60,526,018 | |
| | | | | | | | |
| INVESTMENTS | | PRINCIPAL
AMOUNT ($) | | | VALUE ($) | |
| | | | | | | | |
| | |
Banks — continued | | | | | | | | |
| | |
4.25%, 9/14/2023 (b) | | | 16,840,000 | | | | 18,327,267 | |
| | |
3.88%, 3/28/2024 (b) | | | 5,300,000 | | | | 5,763,676 | |
| | |
2.63%, 1/22/2025 (b) | | | 5,000,000 | | | | 5,237,111 | |
| | |
Standard Chartered plc (United Kingdom) | | | | | | | | |
| | |
(ICE LIBOR USD 3 Month + 1.20%), 1.43%, 9/10/2022 (a) (b) | | | 40,825,000 | | | | 41,031,287 | |
| | |
(ICE LIBOR USD 3 Month + 1.20%), 2.74%, 9/10/2022 (a) (b) | | | 50,600,000 | | | | 51,161,755 | |
| | |
(ICE LIBOR USD 3 Month + 1.15%), 1.37%, 1/20/2023 (a) (b) | | | 9,712,000 | | | | 9,817,846 | |
| | |
(ICE LIBOR USD 3 Month + 1.15%), 4.25%, 1/20/2023 (a) (b) | | | 41,232,000 | | | | 42,544,133 | |
| | |
(US Treasury Yield Curve Rate T Note Constant Maturity 1 Year + 1.17%), 1.32%, 10/14/2023 (a) (b) | | | 12,742,000 | | | | 12,858,717 | |
| | |
Sumitomo Mitsui Banking Corp. (Japan) 3.20%, 7/18/2022 | | | 24,653,000 | | | | 25,601,766 | |
| | |
Sumitomo Mitsui Financial Group, Inc. (Japan) | | | | | | | | |
| | |
(ICE LIBOR USD 3 Month + 1.68%), 1.91%, 3/9/2021 (a) | | | 6,353,000 | | | | 6,355,198 | |
| | |
2.93%, 3/9/2021 | | | 6,815,000 | | | | 6,818,670 | |
| | |
(ICE LIBOR USD 3 Month + 1.11%), 1.34%, 7/14/2021 (a) (c) | | | 5,404,000 | | | | 5,425,454 | |
| | |
2.06%, 7/14/2021 | | | 1,582,000 | | | | 1,592,837 | |
| | |
(ICE LIBOR USD 3 Month + 1.14%), 1.36%, 10/19/2021 (a) | | | 5,067,000 | | | | 5,102,361 | |
| | |
2.44%, 10/19/2021 | | | 29,688,000 | | | | 30,096,870 | |
| | |
(ICE LIBOR USD 3 Month + 0.97%), 1.19%, 1/11/2022 (a) | | | 19,000,000 | | | | 19,146,390 | |
| | |
2.85%, 1/11/2022 | | | 262,000 | | | | 267,737 | |
| | |
2.78%, 7/12/2022 | | | 34,567,000 | | | | 35,720,659 | |
| | |
2.78%, 10/18/2022 | | | 6,875,000 | | | | 7,139,846 | |
| | |
3.10%, 1/17/2023 | | | 184,000 | | | | 193,352 | |
| | |
Svenska Handelsbanken AB (Sweden) | | | | | | | | |
| | |
2.45%, 3/30/2021 | | | 12,529,000 | | | | 12,551,070 | |
| | |
(ICE LIBOR USD 3 Month + 0.47%), 0.65%, 5/24/2021 (a) | | | 45,347,000 | | | | 45,395,107 | |
| | |
3.35%, 5/24/2021 | | | 68,161,000 | | | | 68,649,505 | |
| | |
1.88%, 9/7/2021 | | | 4,537,000 | | | | 4,575,176 | |
| | |
Toronto-Dominion Bank (The) (Canada) | | | | | | | | |
| | |
(ICE LIBOR USD 3 Month + 0.27%), 0.50%, 3/17/2021 (a) | | | 4,905,000 | | | | 4,905,842 | |
| | |
(ICE LIBOR USD 3 Month + 1.00%), 1.24%, 4/7/2021 (a) | | | 52,000 | | | | 52,055 | |
SEE NOTES TO FINANCIAL STATEMENTS.
| | | | | | |
| | | |
| 152 | | | | J.P. MORGAN EXCHANGE-TRADED FUNDS | | FEBRUARY 28, 2021 |
| | | | | | | | |
| INVESTMENTS | | PRINCIPAL
AMOUNT ($) | | | VALUE ($) | |
Corporate Bonds — continued | |
| | |
Banks — continued | | | | | | | | |
| | |
(ICE LIBOR USD 3 Month + 0.43%), 0.65%, 6/11/2021 (a) | | | 2,435,000 | | | | 2,437,949 | |
| | |
3.25%, 6/11/2021 | | | 11,301,000 | | | | 11,394,093 | |
| | |
(ICE LIBOR USD 3 Month + 0.90%), 1.12%, 7/13/2021 (a) | | | 5,890,000 | | | | 5,907,973 | |
| | |
1.80%, 7/13/2021 | | | 980,000 | | | | 985,620 | |
| | |
1.90%, 12/1/2022 | | | 3,189,000 | | | | 3,281,074 | |
| | |
0.25%, 1/6/2023 (c) | | | 78,100,000 | | | | 78,036,668 | |
| | |
(SOFR + 0.24%), 0.35%, 1/6/2023 (a) | | | 73,141,000 | | | | 73,189,273 | |
| | |
(SOFR + 0.48%), 0.51%, 1/27/2023 (a) | | | 29,380,000 | | | | 29,536,595 | |
| | |
0.75%, 6/12/2023 | | | 33,955,000 | | | | 34,279,499 | |
| | |
0.45%, 9/11/2023 | | | 48,000 | | | | 48,094 | |
| | |
Truist Bank 2.85%, 4/1/2021 | | | 4,492,000 | | | | 4,492,000 | |
| | |
Truist Financial Corp. | | | | | | | | |
| | |
3.20%, 9/3/2021 | | | 1,300,000 | | | | 1,316,368 | |
| | |
2.70%, 1/27/2022 | | | 271,000 | | | | 276,460 | |
| | |
3.05%, 6/20/2022 | | | 17,689,000 | | | | 18,288,637 | |
| | |
3.75%, 12/6/2023 | | | 8,520,000 | | | | 9,279,369 | |
| | |
US Bancorp (ICE LIBOR USD 3 Month + 0.64%), 0.86%, 1/24/2022 (a) | | | 54,000 | | | | 54,271 | |
| | |
US Bank NA | | | | | | | | |
| | |
(ICE LIBOR USD 3 Month + 0.32%), 0.54%, 4/26/2021 (a) | | | 1,831,000 | | | | 1,831,475 | |
| | |
(ICE LIBOR USD 3 Month + 0.38%), 0.57%, 11/16/2021 (a) | | | 9,732,000 | | | | 9,753,138 | |
| | |
3.45%, 11/16/2021 | | | 279,000 | | | | 284,636 | |
| | |
(ICE LIBOR USD 3 Month + 0.18%), 0.40%, 1/21/2022 (a) | | | 82,771,000 | | | | 82,874,664 | |
| | |
1.80%, 1/21/2022 | | | 500,000 | | | | 506,372 | |
| | |
2.65%, 5/23/2022 | | | 2,081,000 | | | | 2,138,996 | |
| | |
Wells Fargo & Co. | | | | | | | | |
| | |
(ICE LIBOR USD 3 Month + 1.34%), 1.57%, 3/4/2021 (a) | | | 5,595,000 | | | | 5,595,448 | |
| | |
(ICE LIBOR USD 3 Month + 1.03%), 1.24%, 7/26/2021 (a) | | | 260,000 | | | | 261,023 | |
| | |
2.63%, 7/22/2022 | | | 32,300,000 | | | | 33,330,014 | |
| | |
3.75%, 1/24/2024 | | | 4,790,000 | | | | 5,205,751 | |
| | |
(SOFR + 1.60%), 1.65%, 6/2/2024 (a) (c) | | | 24,600,000 | | | | 25,215,474 | |
| | |
Wells Fargo Bank NA | | | | | | | | |
| | |
(ICE LIBOR USD 3 Month + 0.51%), 0.73%, 10/22/2021 (a) | | | 445,000 | | | | 446,193 | |
| | |
(ICE LIBOR USD 3 Month + 0.61%), 2.90%, 5/27/2022 (a) | | | 1,900,000 | | | | 1,911,765 | |
| | | | | | | | |
| INVESTMENTS | | PRINCIPAL
AMOUNT ($) | | | VALUE ($) | |
| | | | | | | | |
| | |
Banks — continued | | | | | | | | |
| | |
(ICE LIBOR USD 3 Month + 0.65%), 2.08%, 9/9/2022 (a) (c) | | | 14,699,000 | | | | 14,834,560 | |
| | |
3.55%, 8/14/2023 | | | 16,330,000 | | | | 17,581,258 | |
| | |
Westpac Banking Corp. (Australia) | | | | | | | | |
| | |
(ICE LIBOR USD 3 Month + 1.00%), 1.19%, 5/13/2021 (a) | | | 430,000 | | | | 430,843 | |
| | |
(ICE LIBOR USD 3 Month + 0.85%), 1.03%, 8/19/2021 (a) | | | 1,750,000 | | | | 1,756,631 | |
| | |
(ICE LIBOR USD 3 Month + 0.85%), 1.07%, 1/11/2022 (a) (c) | | | 4,524,000 | | | | 4,555,016 | |
| | |
2.50%, 6/28/2022 | | | 8,763,000 | | | | 9,022,247 | |
| | |
2.00%, 1/13/2023 | | | 1,140,000 | | | | 1,176,284 | |
| | | | | | | | |
| | |
| | | | | | | 4,023,937,449 | |
| | | | | | | | |
|
Beverages — 0.4% | |
| | |
Heineken NV (Netherlands) 2.75%, 4/1/2023 (b) | | | 6,250,000 | | | | 6,522,166 | |
| | |
Keurig Dr Pepper, Inc. | | | | | | | | |
| | |
3.55%, 5/25/2021 | | | 43,023,000 | | | | 43,346,911 | |
| | |
3.20%, 11/15/2021 | | | 2,505,000 | | | | 2,535,608 | |
| | |
PepsiCo, Inc. 3.10%, 7/17/2022 (c) | | | 7,570,000 | | | | 7,830,025 | |
| | | | | | | | |
| | |
| | | | | | | 60,234,710 | |
| | | | | | | | |
|
Biotechnology — 0.8% | |
| | |
AbbVie, Inc. | | | | | | | | |
| | |
(ICE LIBOR USD 3 Month + 0.35%), 0.53%, 5/21/2021 (a) | | | 100,000 | | | | 100,063 | |
| | |
3.38%, 11/14/2021 | | | 8,000,000 | | | | 8,167,273 | |
| | |
(ICE LIBOR USD 3 Month + 0.46%), 0.64%, 11/19/2021 (a) | | | 19,800,000 | | | | 19,848,964 | |
| | |
2.15%, 11/19/2021 | | | 38,122,000 | | | | 38,597,593 | |
| | |
5.00%, 12/15/2021 | | | 7,500,000 | | | | 7,683,789 | |
| | |
3.45%, 3/15/2022 | | | 9,930,000 | | | | 10,193,172 | |
| | |
Gilead Sciences, Inc. | | | | | | | | |
| | |
(ICE LIBOR USD 3 Month + 0.15%), 0.38%, 9/17/2021 (a) | | | 29,439,000 | | | | 29,457,188 | |
| | |
3.25%, 9/1/2022 | | | 11,140,000 | | | | 11,563,962 | |
| | | | | | | | |
| | |
| | | | | | | 125,612,004 | |
| | | | | | | | |
|
Capital Markets — 5.5% | |
| | |
Ameriprise Financial, Inc. 4.00%, 10/15/2023 | | | 1,606,000 | | | | 1,756,405 | |
| | |
Bank of New York Mellon Corp. (The) | | | | | | | | |
| | |
2.50%, 4/15/2021 | | | 798,000 | | | | 798,671 | |
| | |
2.05%, 5/3/2021 | | | 3,892,000 | | | | 3,898,266 | |
| | |
2.60%, 2/7/2022 | | | 383,000 | | | | 390,791 | |
| | |
1.85%, 1/27/2023 (c) | | | 1,210,000 | | | | 1,243,451 | |
| | |
2.95%, 1/29/2023 (c) | | | 396,000 | | | | 415,018 | |
SEE NOTES TO FINANCIAL STATEMENTS.
| | | | | | | | |
| | | |
| FEBRUARY 28, 2021 | | J.P. MORGAN EXCHANGE-TRADED FUNDS | | | | | 153 | |
JPMorgan Ultra-Short Income ETF
SCHEDULE OF PORTFOLIO INVESTMENTS
AS OF FEBRUARY 28, 2021 (continued)
| | | | | | | | |
| INVESTMENTS | | PRINCIPAL
AMOUNT ($) | | | VALUE ($) | |
Corporate Bonds — continued | | | | | | | | |
|
Capital Markets — continued | |
| | |
3.50%, 4/28/2023 (c) | | | 818,000 | | | | 873,753 | |
| | |
(ICE LIBOR USD 3 Month + 0.63%), 2.66%, 5/16/2023 (a) | | | 5,401,000 | | | | 5,551,526 | |
| | |
Charles Schwab Corp. (The) | | | | | | | | |
| | |
(ICE LIBOR USD 3 Month + 0.32%), 0.50%, 5/21/2021 (a) | | | 11,272,000 | | | | 11,277,326 | |
| | |
3.23%, 9/1/2022 | | | 300,000 | | | | 313,189 | |
| | |
2.65%, 1/25/2023 | | | 3,499,000 | | | | 3,647,684 | |
| | |
Credit Suisse AG (Switzerland) | | | | | | | | |
| | |
2.80%, 4/8/2022 | | | 67,624,000 | | | | 69,487,297 | |
| | |
1.00%, 5/5/2023 (c) | | | 18,143,000 | | | | 18,383,319 | |
| | |
(SOFR + 0.39%), 0.46%, 2/2/2024 (a) | | | 40,999,000 | | | | 41,093,298 | |
| | |
Credit Suisse Group AG (Switzerland) 3.57%, 1/9/2023 (b) | | | 22,740,000 | | | | 23,330,978 | |
| | |
Daiwa Securities Group, Inc. (Japan) 3.13%, 4/19/2022 (b) | | | 2,583,000 | | | | 2,662,423 | |
| | |
Goldman Sachs Group, Inc. (The) | | | | | | | | |
| | |
5.75%, 1/24/2022 | | | 21,568,000 | | | | 22,617,317 | |
| | |
(ICE LIBOR USD 3 Month + 0.82%), 2.88%, 10/31/2022 (a) | | | 19,722,000 | | | | 20,041,074 | |
| | |
(SOFR + 0.41%), 0.44%, 1/27/2023 (a) | | | 25,368,000 | | | | 25,394,890 | |
| | |
(ICE LIBOR USD 3 Month + 1.00%), 1.22%, 7/24/2023 (a) | | | 1,343,000 | | | | 1,357,410 | |
| | |
(SOFR + 0.54%), 0.63%, 11/17/2023 (a) | | | 33,389,000 | | | | 33,491,998 | |
| | |
ING Bank NV (Netherlands) | | | | | | | | |
| | |
2.75%, 3/22/2021 (b) | | | 24,459,000 | | | | 24,493,877 | |
| | |
5.00%, 6/9/2021 (b) | | | 15,208,000 | | | | 15,403,574 | |
| | |
Intercontinental Exchange, Inc. 2.35%, 9/15/2022 | | | 2,115,000 | | | | 2,177,350 | |
| | |
Macquarie Bank Ltd. (Australia) | | | | | | | | |
| | |
(ICE LIBOR USD 3 Month + 0.45%), 0.64%, 8/6/2021 (a) (b) (c) | | | 40,914,000 | | | | 40,986,285 | |
| | |
(ICE LIBOR USD 3 Month + 0.45%), 0.63%, 11/24/2021 (a) (b) | | | 47,038,000 | | | | 47,164,889 | |
| | |
2.10%, 10/17/2022 (b) | | | 4,920,000 | | | | 5,057,560 | |
| | |
0.44%, 12/16/2022 (b) (c) | | | 85,955,000 | | | | 86,112,119 | |
| | |
Moody’s Corp. 4.50%, 9/1/2022 | | | 2,048,000 | | | | 2,148,030 | |
| | |
Morgan Stanley | | | | | | | | |
| | |
5.50%, 7/28/2021 | | | 7,295,000 | | | | 7,447,825 | |
| | |
2.63%, 11/17/2021 | | | 24,860,000 | | | | 25,273,660 | |
| | |
2.75%, 5/19/2022 | | | 36,682,000 | | | | 37,765,295 | |
| | |
(SOFR + 0.70%), 0.73%, 1/20/2023 (a) | | | 18,323,000 | | | | 18,396,979 | |
| | |
3.13%, 1/23/2023 | | | 18,075,000 | | | | 18,996,229 | |
| | | | | | | | |
| INVESTMENTS | | PRINCIPAL
AMOUNT ($) | | | VALUE ($) | |
| | | | | | | | |
|
Capital Markets — continued | |
| | |
(SOFR + 0.47%), 0.56%, 11/10/2023 (a) | | | 21,754,000 | | | | 21,784,235 | |
| | |
(SOFR + 0.46%), 0.53%, 1/25/2024 (a) | | | 8,363,000 | | | | 8,367,261 | |
| | |
Nomura Holdings, Inc. (Japan) | | | | | | | | |
| | |
2.65%, 1/16/2025 | | | 1,000,000 | | | | 1,053,448 | |
| | |
1.85%, 7/16/2025 | | | 22,000,000 | | | | 22,469,637 | |
| | |
State Street Corp. | | | | | | | | |
| | |
1.95%, 5/19/2021 | | | 315,000 | | | | 316,178 | |
| | |
(SOFR + 2.69%), 2.82%, 3/30/2023 (a) | | | 15,059,000 | | | | 15,478,221 | |
| | |
UBS AG (Switzerland) | | | | | | | | |
| | |
1.75%, 4/21/2022 (b) | | | 83,557,000 | | | | 84,889,373 | |
| | |
(SOFR + 0.36%), 0.38%, 2/9/2024 (a) (b) | | | 23,894,000 | | | | 23,955,647 | |
| | |
UBS Group AG (Switzerland) | | | | | | | | |
| | |
(ICE LIBOR USD 3 Month + 1.53%), 1.73%, 2/1/2022 (a) (b) | | | 5,805,000 | | | | 5,885,815 | |
| | |
2.65%, 2/1/2022 (b) | | | 17,966,000 | | | | 18,347,642 | |
| | |
3.49%, 5/23/2023 (b) (c) | | | 290,000 | | | | 300,662 | |
| | |
(ICE LIBOR USD 3 Month + 0.95%), 2.86%, 8/15/2023 (a) (b) | | | 25,000,000 | | | | 25,860,036 | |
| | |
(US Treasury Yield Curve Rate T Note Constant Maturity 1 Year + 0.83%), 1.01%, 7/30/2024 (a) (b) | | | 36,500,000 | | | | 36,811,044 | |
| | | | | | | | |
| | |
| | | | | | | 884,968,955 | |
| | | | | | | | |
|
Chemicals — 0.4% | |
| | |
Air Liquide Finance SA (France) 1.75%, 9/27/2021 (b) | | | 20,860,000 | | | | 21,016,236 | |
| | |
Chevron Phillips Chemical Co. LLC 3.30%, 5/1/2023 (b) | | | 4,703,000 | | | | 4,976,105 | |
| | |
Nutrien Ltd. (Canada) 1.90%, 5/13/2023 | | | 22,880,000 | | | | 23,602,497 | |
| | |
Nutrition & Biosciences, Inc. 0.70%, 9/15/2022 (b) | | | 15,000,000 | | | | 15,064,386 | |
| | | | | | | | |
| | |
| | | | | | | 64,659,224 | |
| | | | | | | | |
|
Consumer Finance — 4.7% | |
| | |
American Express Co. | | | | | | | | |
| | |
(ICE LIBOR USD 3 Month + 0.53%), 0.72%, 5/17/2021 (a) | | | 7,803,000 | | | | 7,807,705 | |
| | |
3.38%, 5/17/2021 (c) | | | 1,500,000 | | | | 1,505,768 | |
| | |
(ICE LIBOR USD 3 Month + 0.60%), 0.80%, 11/5/2021 (a) | | | 12,004,000 | | | | 12,043,361 | |
| | |
2.75%, 5/20/2022 | | | 117,000 | | | | 120,269 | |
| | |
2.50%, 8/1/2022 | | | 8,699,000 | | | | 8,954,382 | |
| | |
2.65%, 12/2/2022 | | | 885,000 | | | | 920,838 | |
SEE NOTES TO FINANCIAL STATEMENTS.
| | | | | | |
| | | |
| 154 | | | | J.P. MORGAN EXCHANGE-TRADED FUNDS | | FEBRUARY 28, 2021 |
| | | | | | | | |
| INVESTMENTS | | PRINCIPAL
AMOUNT ($) | | | VALUE ($) | |
Corporate Bonds — continued | | | | | | | | |
|
Consumer Finance — continued | |
| | |
3.40%, 2/27/2023 | | | 4,933,000 | | | | 5,217,250 | |
| | |
3.70%, 8/3/2023 | | | 3,130,000 | | | | 3,370,279 | |
| | |
American Express Credit Corp. (ICE LIBOR USD 3 Month + 0.70%), 0.93%, 3/3/2022 (a) | | | 235,000 | | | | 236,445 | |
| | |
American Honda Finance Corp. | | | | | | | | |
| | |
(ICE LIBOR USD 3 Month + 0.12%), 0.34%, 1/21/2022 (a) | | | 59,724,000 | | | | 59,753,285 | |
| | |
(ICE LIBOR USD 3 Month + 0.15%), 0.33%, 2/22/2023 (a) | | | 99,001,000 | | | | 99,050,303 | |
| | |
0.88%, 7/7/2023 (c) | | | 9,506,000 | | | | 9,605,067 | |
| | |
0.65%, 9/8/2023 | | | 31,889,000 | | | | 32,054,187 | |
| | |
Avolon Holdings Funding Ltd. (Ireland) 3.63%, 5/1/2022 (b) | | | 26,415,000 | | | | 26,908,271 | |
| | |
Capital One Financial Corp. | | | | | | | | |
| | |
3.45%, 4/30/2021 | | | 41,973,000 | | | | 42,082,727 | |
| | |
(ICE LIBOR USD 3 Month + 0.95%), 1.18%, 3/9/2022 (a) | | | 8,214,000 | | | | 8,278,751 | |
| | |
2.60%, 5/11/2023 | | | 25,000,000 | | | | 26,112,780 | |
| | |
Caterpillar Financial Services Corp. | | | | | | | | |
| | |
(ICE LIBOR USD 3 Month + 0.30%), 0.53%, 3/8/2021 (a) | | | 40,629,000 | | | | 40,631,580 | |
| | |
(ICE LIBOR USD 3 Month + 0.23%), 0.45%, 3/15/2021 (a) | | | 60,425,000 | | | | 60,431,078 | |
| | |
Series I, (ICE LIBOR USD 3 Month + 0.39%), 0.58%, 5/17/2021 (a) | | | 402,000 | | | | 402,300 | |
| | |
(ICE LIBOR USD 3 Month + 0.28%), 0.51%, 9/7/2021 (a) | | | 5,838,000 | | | | 5,846,130 | |
| | |
(ICE LIBOR USD 3 Month + 0.22%), 0.46%, 1/6/2022 (a) | | | 1,730,000 | | | | 1,732,880 | |
| | |
0.95%, 5/13/2022 | | | 25,206,000 | | | | 25,407,918 | |
| | |
1.95%, 11/18/2022 | | | 7,500,000 | | | | 7,710,131 | |
| | |
2.55%, 11/29/2022 | | | 9,656,000 | | | | 10,036,319 | |
| | |
General Motors Financial Co., Inc. | | | | | | | | |
| | |
4.20%, 11/6/2021 | | | 16,978,000 | | | | 17,414,741 | |
| | |
(SOFR + 1.20%), 1.26%, 11/17/2023 (a) | | | 23,000,000 | | | | 23,281,353 | |
| | |
John Deere Capital Corp. | | | | | | | | |
| | |
2.80%, 3/4/2021 | | | 6,778,000 | | | | 6,779,017 | |
| | |
(ICE LIBOR USD 3 Month + 0.26%), 0.49%, 9/10/2021 (a) | | | 300,000 | | | | 300,378 | |
| | |
3.15%, 10/15/2021 | | | 7,600,000 | | | | 7,722,234 | |
| | |
3.20%, 1/10/2022 | | | 189,000 | | | | 193,716 | |
| | |
(ICE LIBOR USD 3 Month + 0.38%), 0.61%, 3/7/2022 (a) | | | 145,000 | | | | 145,508 | |
| | |
2.75%, 3/15/2022 | | | 1,000,000 | | | | 1,025,496 | |
| | |
2.80%, 1/27/2023 | | | 573,000 | | | | 600,412 | |
| | | | | | | | |
| INVESTMENTS | | PRINCIPAL
AMOUNT ($) | | | VALUE ($) | |
| | | | | | | | |
|
Consumer Finance — continued | |
| | |
PACCAR Financial Corp. | | | | | | | | |
| | |
(ICE LIBOR USD 3 Month + 0.26%), 0.46%, 5/10/2021 (a) | | | 1,099,000 | | | | 1,099,576 | |
| | |
0.80%, 6/8/2023 | | | 7,324,000 | | | | 7,395,189 | |
| | |
0.35%, 8/11/2023 | | | 16,872,000 | | | | 16,886,519 | |
| | |
Toyota Motor Credit Corp. | | | | | | | | |
| | |
(ICE LIBOR USD 3 Month + 0.13%), 0.32%, 8/13/2021 (a) | | | 14,319,000 | | | | 14,324,342 | |
| | |
(ICE LIBOR USD 3 Month + 0.15%), 0.35%, 2/14/2022 (a) | | | 30,437,000 | | | | 30,479,324 | |
| | |
0.45%, 7/22/2022 | | | 13,171,000 | | | | 13,213,847 | |
| | |
0.35%, 10/14/2022 | | | 65,417,000 | | | | 65,557,403 | |
| | |
(SOFR + 0.33%), 0.42%, 1/11/2024 (a) | | | 61,779,000 | | | | 61,842,632 | |
| | | | | | | | |
| | |
| | | | | | | 764,481,691 | |
| | | | | | | | |
|
Diversified Financial Services — 1.4% | |
| | |
AIG Global Funding | | | | | | | | |
| | |
1.90%, 10/6/2021 (b) | | | 11,007,000 | | | | 11,115,110 | |
| | |
2.70%, 12/15/2021 (b) | | | 412,000 | | | | 419,864 | |
| | |
2.30%, 7/1/2022 (b) | | | 2,125,000 | | | | 2,180,308 | |
| | |
0.80%, 7/7/2023 (b) | | | 8,310,000 | | | | 8,386,514 | |
| | |
(SOFR + 0.38%), 0.41%, 12/15/2023 (a) (b) | | | 48,943,000 | | | | 48,998,572 | |
| | |
Berkshire Hathaway, Inc. 2.20%, 3/15/2021 | | | 1,898,000 | | | | 1,899,348 | |
| | |
CK Hutchison International 16 Ltd. (United Kingdom) 1.88%, 10/3/2021 (b) | | | 38,819,000 | | | | 39,122,273 | |
| | |
CK Hutchison International 17 Ltd. (United Kingdom) 2.88%, 4/5/2022 (b) | | | 3,245,000 | | | | 3,326,514 | |
| | |
National Rural Utilities Cooperative Finance Corp. | | | | | | | | |
| | |
2.30%, 9/15/2022 | | | 2,070,000 | | | | 2,128,240 | |
| | |
Series D, (ICE LIBOR USD 3 Month + 0.07%), 0.26%, 2/16/2023 (a) | | | 65,911,000 | | | | 65,894,545 | |
| | |
NTT Finance Corp. (Japan) 0.37%, 3/3/2023 (b) | | | 40,004,000 | | | | 40,009,970 | |
| | |
ORIX Corp. (Japan) 2.90%, 7/18/2022 | | | 147,000 | | | | 151,855 | |
| | |
Siemens Financieringsmaatschappij NV (Germany) | | | | | | | | |
| | |
1.70%, 9/15/2021 (b) | | | 1,805,000 | | | | 1,819,155 | |
| | |
(ICE LIBOR USD 3 Month + 0.61%), 0.83%, 3/16/2022 (a) (b) | | | 1,227,000 | | | | 1,233,945 | |
| | | | | | | | |
| | |
| | | | | | | 226,686,213 | |
| | | | | | | | |
SEE NOTES TO FINANCIAL STATEMENTS.
| | | | | | | | |
| | | |
| FEBRUARY 28, 2021 | | J.P. MORGAN EXCHANGE-TRADED FUNDS | | | | | 155 | |
JPMorgan Ultra-Short Income ETF
SCHEDULE OF PORTFOLIO INVESTMENTS
AS OF FEBRUARY 28, 2021 (continued)
| | | | | | | | |
| INVESTMENTS | | PRINCIPAL
AMOUNT ($) | | | VALUE ($) | |
Corporate Bonds — continued | | | | | | | | |
|
Diversified Telecommunication Services — 0.2% | |
| | |
Telstra Corp. Ltd. (Australia) 4.80%, 10/12/2021 (b) (c) | | | 700,000 | | | | 719,256 | |
| | |
Verizon Communications, Inc. (ICE LIBOR USD 3 Month + 1.00%), 1.22%, 3/16/2022 (a) | | | 28,319,000 | | | | 28,600,705 | |
| | | | | | | | |
| | |
| | | | | | | 29,319,961 | |
| | | | | | | | |
|
Electric Utilities — 2.4% | |
| | |
American Electric Power Co., Inc. Series M, 0.75%, 11/1/2023 | | | 7,821,000 | | | | 7,833,541 | |
| | |
Appalachian Power Co. 4.60%, 3/30/2021 | | | 16,917,000 | | | | 16,968,204 | |
| | |
Duke Energy Corp. | | | | | | | | |
| | |
(ICE LIBOR USD 3 Month + 0.50%), 0.70%, 5/14/2021 (a) (b) | | | 17,301,000 | | | | 17,317,269 | |
| | |
3.55%, 9/15/2021 | | | 5,959,000 | | | | 6,014,454 | |
| | |
2.40%, 8/15/2022 | | | 1,279,000 | | | | 1,313,952 | |
| | |
Duke Energy Progress LLC Series A, (ICE LIBOR USD 3 Month + 0.18%), 0.37%, 2/18/2022 (a) | | | 15,373,000 | | | | 15,373,061 | |
| | |
Enel Finance International NV (Italy) 2.88%, 5/25/2022 (b) | | | 4,400,000 | | | | 4,526,469 | |
| | |
Entergy Louisiana LLC 0.62%, 11/17/2023 | | | 34,117,000 | | | | 34,191,753 | |
| | |
Eversource Energy Series N, 3.80%, 12/1/2023 (c) | | | 174,000 | | | | 188,467 | |
| | |
Exelon Corp. 2.45%, 4/15/2021 | | | 7,911,000 | | | | 7,915,159 | |
| | |
Florida Power & Light Co. (ICE LIBOR USD 3 Month + 0.38%), 0.60%, 7/28/2023 (a) (c) | | | 76,259,000 | | | | 76,262,206 | |
| | |
NextEra Energy Capital Holdings, Inc. | | | | | | | | |
| | |
(ICE LIBOR USD 3 Month + 0.48%), 0.67%, 5/4/2021 (a) | | | 485,000 | | | | 485,393 | |
| | |
(ICE LIBOR USD 3 Month + 0.72%), 0.91%, 2/25/2022 (a) | | | 42,944,000 | | | | 43,210,658 | |
| | |
2.90%, 4/1/2022 | | | 4,780,000 | | | | 4,913,129 | |
| | |
1.95%, 9/1/2022 | | | 30,000,000 | | | | 30,747,901 | |
| | |
(ICE LIBOR USD 3 Month + 0.27%), 0.45%, 2/22/2023 (a) | | | 29,947,000 | | | | 29,957,482 | |
| | |
PECO Energy Co. 1.70%, 9/15/2021 | | | 1,250,000 | | | | 1,258,117 | |
| | |
PPL Capital Funding, Inc. 3.95%, 3/15/2024 | | | 1,449,000 | | | | 1,574,188 | |
| | |
Southern Co. (The) | | | | | | | | |
| | |
2.35%, 7/1/2021 | | | 33,111,000 | | | | 33,273,228 | |
| | |
Series 21-A, 0.60%, 2/26/2024 | | | 34,448,000 | | | | 34,406,560 | |
| | |
Tampa Electric Co. 5.40%, 5/15/2021 | | | 5,014,000 | | | | 5,064,045 | |
| | | | | | | | |
| INVESTMENTS | | PRINCIPAL
AMOUNT ($) | | | VALUE ($) | |
| | | | | | | | |
|
Electric Utilities — continued | |
| | |
Wisconsin Electric Power Co. 2.95%, 9/15/2021 | | | 11,716,000 | | | | 11,807,417 | |
| | | | | | | | |
| | |
| | | | | | | 384,602,653 | |
| | | | | | | | |
|
Electrical Equipment — 0.0% (f) | |
| | |
ABB Finance USA, Inc. (Switzerland) 2.88%, 5/8/2022 | | | 1,400,000 | | | | 1,442,234 | |
| | |
Eaton Corp. 2.75%, 11/2/2022 | | | 4,062,000 | | | | 4,223,191 | |
| | | | | | | | |
| | |
| | | | | | | 5,665,425 | |
| | | | | | | | |
|
Electronic Equipment, Instruments & Components — 0.0% (f) | |
| | |
ABB Treasury Center USA, Inc. (Switzerland) 4.00%, 6/15/2021 (b) | | | 1,000,000 | | | | 1,010,591 | |
| | | | | | | | |
|
Energy Equipment & Services — 0.1% | |
| | |
Schlumberger Investment SA 3.30%, 9/14/2021 (b) | | | 7,324,000 | | | | 7,389,273 | |
| | | | | | | | |
|
Entertainment — 0.3% | |
| | |
TWDC Enterprises 18 Corp. | | | | | | | | |
| | |
3.75%, 6/1/2021 | | | 1,475,000 | | | | 1,487,747 | |
| | |
2.75%, 8/16/2021 | | | 484,000 | | | | 489,580 | |
| | |
2.55%, 2/15/2022 | | | 3,453,000 | | | | 3,527,251 | |
| | |
2.35%, 12/1/2022 | | | 5,400,000 | | | | 5,589,550 | |
| | |
Walt Disney Co. (The) | | | | | | | | |
| | |
(ICE LIBOR USD 3 Month + 0.25%), 0.48%, 9/1/2021 (a) | | | 6,678,000 | | | | 6,684,812 | |
| | |
1.65%, 9/1/2022 | | | 19,999,000 | | | | 20,400,149 | |
| | |
3.00%, 9/15/2022 | | | 5,500,000 | | | | 5,724,239 | |
| | | | | | | | |
| | |
| | | | | | | 43,903,328 | |
| | | | | | | | |
|
Equity Real Estate Investment Trusts (REITs) — 0.1% | |
| | |
Scentre Group Trust 1 (Australia) 2.38%, 4/28/2021 (b) | | | 7,774,000 | | | | 7,785,366 | |
| | | | | | | | |
|
Food & Staples Retailing — 0.5% | |
| | |
7-Eleven, Inc. | | | | | | | | |
| | |
(ICE LIBOR USD 3 Month + 0.45%), 0.65%, 8/10/2022 (a) (b) | | | 35,862,000 | | | | 35,904,228 | |
| | |
0.63%, 2/10/2023 (b) | | | 32,098,000 | | | | 32,154,895 | |
| | |
Kroger Co. (The) 2.95%, 11/1/2021 | | | 9,610,000 | | | | 9,760,618 | |
| | | | | | | | |
| | |
| | | | | | | 77,819,741 | |
| | | | | | | | |
|
Food Products — 0.6% | |
| | |
Cargill, Inc. | | | | | | | | |
| | |
3.05%, 4/19/2021 (b) | | | 3,285,000 | | | | 3,297,305 | |
| | |
4.31%, 5/14/2021 (b) | | | 2,700,000 | | | | 2,722,215 | |
| | |
3.30%, 3/1/2022 (b) | | | 3,075,000 | | | | 3,143,628 | |
SEE NOTES TO FINANCIAL STATEMENTS.
| | | | | | |
| | | |
| 156 | | | | J.P. MORGAN EXCHANGE-TRADED FUNDS | | FEBRUARY 28, 2021 |
| | | | | | | | |
| INVESTMENTS | | PRINCIPAL
AMOUNT ($) | | | VALUE ($) | |
Corporate Bonds — continued | | | | | | | | |
|
Food Products — continued | |
| | |
General Mills, Inc. | | | | | | | | |
| | |
(ICE LIBOR USD 3 Month + 0.54%), 0.76%, 4/16/2021 (a) | | | 18,608,000 | | | | 18,620,327 | |
| | |
3.20%, 4/16/2021 | | | 7,098,000 | | | | 7,122,701 | |
| | |
Mondelez International Holdings Netherlands BV | | | | | | | | |
| | |
2.00%, 10/28/2021 (b) | | | 36,765,000 | | | | 37,119,234 | |
| | |
2.13%, 9/19/2022 (b) | | | 18,605,000 | | | | 19,108,556 | |
| | |
Mondelez International, Inc. 0.63%, 7/1/2022 | | | 7,039,000 | | | | 7,066,215 | |
| | |
Nestle Holdings, Inc. 3.10%, 9/24/2021 (b) | | | 451,000 | | | | 457,250 | |
| | |
Unilever Capital Corp. (United Kingdom) 3.00%, 3/7/2022 | | | 1,541,000 | | | | 1,583,767 | |
| | | | | | | | |
| | |
| | | | | | | 100,241,198 | |
| | | | | | | | |
| | |
Gas Utilities — 0.3% | | | | | | | | |
| | |
CenterPoint Energy Resources Corp. | | | | | | | | |
| | |
(ICE LIBOR USD 3 Month + 0.50%), 0.68%, 3/2/2023 (a) | | | 27,945,000 | | | | 27,945,000 | |
| | |
0.70%, 3/2/2023 | | | 25,216,000 | | | | 25,191,540 | |
| | | | | | | | |
| | |
| | | | | | | 53,136,540 | |
| | | | | | | | |
|
Health Care Equipment & Supplies — 0.0% (f) | |
| | |
Abbott Laboratories 2.55%, 3/15/2022 | | | 143,000 | | | | 146,316 | |
| | |
DH Europe Finance II SARL 2.05%, 11/15/2022 | | | 1,000,000 | | | | 1,028,987 | |
| | | | | | | | |
| | |
| | | | | | | 1,175,303 | |
| | | | | | | | |
|
Health Care Providers & Services — 0.5% | |
| | |
Anthem, Inc. | | | | | | | | |
| | |
3.13%, 5/15/2022 | | | 22,700,000 | | | | 23,454,198 | |
| | |
3.30%, 1/15/2023 | | | 2,946,000 | | | | 3,096,723 | |
| | |
CVS Health Corp. | | | | | | | | |
| | |
(ICE LIBOR USD 3 Month + 0.72%), 0.95%, 3/9/2021 (a) | | | 1,858,000 | | | | 1,858,279 | |
| | |
3.35%, 3/9/2021 | | | 26,406,000 | | | | 26,420,788 | |
| | |
2.13%, 6/1/2021 | | | 8,193,000 | | | | 8,216,085 | |
| | |
UnitedHealth Group, Inc. | | | | | | | | |
| | |
3.38%, 11/15/2021 | | | 1,051,000 | | | | 1,065,648 | |
| | |
2.88%, 12/15/2021 | | | 1,265,000 | | | | 1,289,886 | |
| | |
2.88%, 3/15/2022 | | | 6,495,000 | | | | 6,629,407 | |
| | |
3.35%, 7/15/2022 | | | 2,251,000 | | | | 2,344,084 | |
| | | | | | | | |
| | |
| | | | | | | 74,375,098 | |
| | | | | | | | |
| | | | | | | | |
| INVESTMENTS | | PRINCIPAL
AMOUNT ($) | | | VALUE ($) | |
| | | | | | | | |
|
Hotels, Restaurants & Leisure — 0.4% | |
| | |
McDonald’s Corp. 2.63%, 1/15/2022 | | | 52,053,000 | | | | 53,114,245 | |
| | |
Starbucks Corp. 1.30%, 5/7/2022 | | | 10,231,000 | | | | 10,344,617 | |
| | | | | | | | |
| | |
| | | | | | | 63,458,862 | |
| | | | | | | | |
|
Household Products — 0.2% | |
| | |
Church & Dwight Co., Inc. 2.45%, 8/1/2022 | | | 5,800,000 | | | | 5,950,541 | |
| | |
Kimberly-Clark Corp. 3.88%, 3/1/2021 | | | 247,000 | | | | 247,000 | |
| | |
Reckitt Benckiser Treasury Services plc (United Kingdom) 2.38%, 6/24/2022 (b) | | | 30,205,000 | | | | 30,974,258 | |
| | | | | | | | |
| | |
| | | | | | | 37,171,799 | |
| | | | | | | | |
|
Industrial Conglomerates — 0.3% | |
| | |
3M Co. | | | | | | | | |
| | |
1.75%, 2/14/2023 | | | 205,000 | | | | 210,704 | |
| | |
2.25%, 3/15/2023 (c) | | | 5,202,000 | | | | 5,415,028 | |
| | |
Honeywell International, Inc. | | | | | | | | |
| | |
2.15%, 8/8/2022 | | | 3,051,000 | | | | 3,130,322 | |
| | |
0.48%, 8/19/2022 | | | 21,813,000 | | | | 21,840,099 | |
| | |
Roper Technologies, Inc. | | | | | | | | |
| | |
2.80%, 12/15/2021 | | | 9,603,000 | | | | 9,767,794 | |
| | |
0.45%, 8/15/2022 | | | 5,216,000 | | | | 5,224,223 | |
| | | | | | | | |
| | |
| | | | | | | 45,588,170 | |
| | | | | | | | |
| | |
Insurance — 4.9% | | | | | | | | |
| | |
AIA Group Ltd. (Hong Kong) (ICE LIBOR USD 3 Month + 0.52%), 0.76%, 9/20/2021 (a) (b) | | | 10,683,000 | | | | 10,687,173 | |
| | |
American International Group, Inc. 4.88%, 6/1/2022 | | | 291,000 | | | | 307,155 | |
| | |
Athene Global Funding | | | | | | | | |
| | |
4.00%, 1/25/2022 (b) | | | 21,796,000 | | | | 22,501,603 | |
| | |
1.20%, 10/13/2023 (b) | | | 51,300,000 | | | | 51,907,566 | |
| | |
0.95%, 1/8/2024 (b) | | | 33,070,000 | | | | 33,134,378 | |
| | |
Equitable Financial Life Global Funding 0.50%, 11/17/2023 (b) (c) | | | 26,647,000 | | | | 26,673,381 | |
| | |
Guardian Life Global Funding | | | | | | | | |
| | |
2.00%, 4/26/2021 (b) | | | 800,000 | | | | 802,153 | |
| | |
2.50%, 5/8/2022 (b) | | | 5,994,000 | | | | 6,151,957 | |
| | |
3.40%, 4/25/2023 (b) | | | 500,000 | | | | 532,367 | |
| | |
Jackson National Life Global Funding | | | | | | | | |
| | |
(ICE LIBOR USD 3 Month + 0.31%), 0.53%, 3/16/2021 (a) (b) | | | 40,046,000 | | | | 40,051,695 | |
| | |
2.25%, 4/29/2021 (b) | | | 23,984,000 | | | | 24,067,860 | |
| | |
(ICE LIBOR USD 3 Month + 0.48%), 0.70%, 6/11/2021 (a) (b) | | | 837,000 | | | | 838,023 | |
SEE NOTES TO FINANCIAL STATEMENTS.
| | | | | | | | |
| | | |
| FEBRUARY 28, 2021 | | J.P. MORGAN EXCHANGE-TRADED FUNDS | | | | | 157 | |
JPMorgan Ultra-Short Income ETF
SCHEDULE OF PORTFOLIO INVESTMENTS
AS OF FEBRUARY 28, 2021 (continued)
| | | | | | | | |
| INVESTMENTS | | PRINCIPAL
AMOUNT ($) | | | VALUE ($) | |
Corporate Bonds — continued | |
|
Insurance — continued | |
| | |
3.30%, 2/1/2022 (b) | | | 4,970,000 | | | | 5,108,440 | |
| | |
2.50%, 6/27/2022 (b) | | | 2,091,000 | | | | 2,149,251 | |
| | |
2.38%, 9/15/2022 (b) | | | 900,000 | | | | 927,278 | |
| | |
(SOFR + 0.60%), 0.62%, 1/6/2023 (a) (b) | | | 28,665,000 | | | | 28,843,108 | |
| | |
3.25%, 1/30/2024 (b) | | | 46,148,000 | | | | 49,643,694 | |
| | |
MassMutual Global Funding II | | | | | | | | |
| | |
2.00%, 4/15/2021 (b) | | | 200,000 | | | | 200,434 | |
| | |
0.85%, 6/9/2023 (b) | | | 39,446,000 | | | | 39,884,414 | |
| | |
0.48%, 8/28/2023 (b) | | | 17,560,000 | | | | 17,594,198 | |
| | |
Met Tower Global Funding 0.55%, 7/13/2022 (b) | | | 35,928,000 | | | | 36,063,736 | |
| | |
Metropolitan Life Global Funding I | | | | | | | | |
| | |
(SOFR + 0.50%), 0.52%, 5/28/2021 (a) (b) | | | 1,460,000 | | | | 1,461,551 | |
| | |
1.95%, 9/15/2021 (b) | | | 7,177,000 | | | | 7,244,207 | |
| | |
3.45%, 10/9/2021 (b) | | | 7,975,000 | | | | 8,130,965 | |
| | |
3.38%, 1/11/2022 (b) | | | 850,000 | | | | 872,752 | |
| | |
3.00%, 1/10/2023 (b) | | | 243,000 | | | | 255,118 | |
| | |
0.90%, 6/8/2023 (b) | | | 16,933,000 | | | | 17,124,258 | |
| | |
0.45%, 9/1/2023 (b) | | | 30,993,000 | | | | 31,015,389 | |
| | |
New York Life Global Funding | | | | | | | | |
| | |
2.00%, 4/13/2021 (b) | | | 450,000 | | | | 450,934 | |
| | |
(ICE LIBOR USD 3 Month + 0.32%), 0.51%, 8/6/2021 (a) (b) | | | 2,417,000 | | | | 2,420,100 | |
| | |
3.25%, 8/6/2021 (b) | | | 335,000 | | | | 339,343 | |
| | |
(ICE LIBOR USD 3 Month + 0.28%), 0.50%, 1/21/2022 (a) (b) | | | 19,500,000 | | | | 19,548,387 | |
| | |
2.30%, 6/10/2022 (b) | | | 1,650,000 | | | | 1,696,285 | |
| | |
0.40%, 9/20/2022 (b) | | | 52,840,000 | | | | 52,952,380 | |
| | |
1.10%, 5/5/2023 (b) | | | 15,873,000 | | | | 16,120,827 | |
| | |
Pricoa Global Funding I 2.20%, 6/3/2021 (b) | | | 6,025,000 | | | | 6,058,139 | |
| | |
Principal Life Global Funding II | | | | | | | | |
| | |
(ICE LIBOR USD 3 Month + 0.33%), 0.56%, 3/2/2021 (a) (b) | | | 9,572,000 | | | | 9,572,000 | |
| | |
(ICE LIBOR USD 3 Month + 0.40%), 0.64%, 10/6/2021 (a) (b) (c) | | | 40,392,000 | | | | 40,475,812 | |
| | |
2.38%, 11/21/2021 (b) | | | 485,000 | | | | 491,868 | |
| | |
1.25%, 5/11/2023 (b) (c) | | | 84,951,000 | | | | 86,639,177 | |
| | |
Protective Life Global Funding | | | | | | | | |
| | |
(ICE LIBOR USD 3 Month + 0.52%), 0.77%, 6/28/2021 (a) (b) | | | 6,490,000 | | | | 6,500,951 | |
| | |
3.40%, 6/28/2021 (b) | | | 15,246,000 | | | | 15,399,441 | |
| | |
1.08%, 6/9/2023 (b) | | | 20,009,000 | | | | 20,333,126 | |
| | |
Reliance Standard Life Global Funding II 2.15%, 1/21/2023 (b) | | | 9,976,000 | | | | 10,253,482 | |
| | | | | | | | |
| INVESTMENTS | | PRINCIPAL
AMOUNT ($) | | | VALUE ($) | |
| | | | | | | | |
|
Insurance — continued | |
| | |
Suncorp-Metway Ltd. (Australia) 2.80%, 5/4/2022 (b) | | | 145,000 | | | | 149,342 | |
| | |
Swiss Re Treasury U.S. Corp. (Switzerland) 2.88%, 12/6/2022 (b) | | | 35,796,000 | | | | 36,769,115 | |
| | | | | | | | |
| | |
| | | | | | | 790,344,813 | |
| | | | | | | | |
| | |
IT Services — 0.4% | | | | | | | | |
| | |
Fidelity National Information Services, Inc. 0.60%, 3/1/2024 | | | 19,200,000 | | | | 19,179,906 | |
| | |
IBM Credit LLC | | | | | | | | |
| | |
3.60%, 11/30/2021 | | | 300,000 | | | | 307,342 | |
| | |
2.20%, 9/8/2022 | | | 9,193,000 | | | | 9,456,291 | |
| | |
International Business Machines Corp. | | | | | | | | |
| | |
(ICE LIBOR USD 3 Month + 0.40%), 0.59%, 5/13/2021 (a) | | | 37,803,000 | | | | 37,832,864 | |
| | |
1.88%, 8/1/2022 | | | 1,775,000 | | | | 1,821,976 | |
| | |
2.88%, 11/9/2022 | | | 2,215,000 | | | | 2,315,545 | |
| | | | | | | | |
| | |
| | | | | | | 70,913,924 | |
| | | | | | | | |
| | |
Machinery — 0.0% (f) | | | | | | | | |
| | |
Caterpillar, Inc. 3.90%, 5/27/2021 | | | 2,746,000 | | | | 2,769,835 | |
| | | | | | | | |
| | |
Media — 0.1% | | | | | | | | |
| | |
Omnicom Group, Inc. 3.63%, 5/1/2022 | | | 9,683,000 | | | | 10,037,659 | |
| | | | | | | | |
| | |
Metals & Mining — 0.2% | | | | | | | | |
| | |
Newmont Corp. | | | | | | | | |
| | |
3.63%, 6/9/2021 | | | 16,929,000 | | | | 16,987,312 | |
| | |
3.50%, 3/15/2022 (c) | | | 13,848,000 | | | | 14,176,912 | |
| | | | | | | | |
| | |
| | | | | | | 31,164,224 | |
| | | | | | | | |
| | |
Multi-Utilities — 0.4% | | | | | | | | |
| | |
Berkshire Hathaway Energy Co. 3.75%, 11/15/2023 | | | 2,000,000 | | | | 2,164,449 | |
| | |
CenterPoint Energy, Inc. 3.60%, 11/1/2021 | | | 9,921,000 | | | | 10,137,778 | |
| | |
Consolidated Edison Co. of New York, Inc. Series C, (ICE LIBOR USD 3 Month + 0.40%), 0.65%, 6/25/2021 (a) | | | 2,631,000 | | | | 2,634,245 | |
| | |
Dominion Energy, Inc. | | | | | | | | |
| | |
2.72%, 8/15/2021 (d) | | | 20,166,000 | | | | 20,376,984 | |
| | |
Series D, (ICE LIBOR USD 3 Month + 0.53%), 0.75%, 9/15/2023 (a) | | | 31,071,000 | | | | 31,137,523 | |
| | |
Sempra Energy (ICE LIBOR USD 3 Month + 0.45%), 0.67%, 3/15/2021 (a) | | | 4,488,000 | | | | 4,488,853 | |
| | | | | | | | |
| | |
| | | | | | | 70,939,832 | |
| | | | | | | | |
SEE NOTES TO FINANCIAL STATEMENTS.
| | | | | | |
| | | |
| 158 | | | | J.P. MORGAN EXCHANGE-TRADED FUNDS | | FEBRUARY 28, 2021 |
| | | | | | | | |
| INVESTMENTS | | PRINCIPAL
AMOUNT ($) | | | VALUE ($) | |
Corporate Bonds — continued | |
| | |
Oil, Gas & Consumable Fuels — 1.2% | | | | | | | | |
| | |
APT Pipelines Ltd. (Australia) 3.88%, 10/11/2022 (b) | | | 3,655,000 | | | | 3,829,787 | |
| | |
BP Capital Markets America, Inc. 4.74%, 3/11/2021 | | | 7,072,000 | | | | 7,079,514 | |
| | |
Chevron USA, Inc. | | | | | | | | |
| | |
0.33%, 8/12/2022 | | | 16,407,000 | | | | 16,429,111 | |
| | |
0.43%, 8/11/2023 (c) | | | 10,348,000 | | | | 10,363,261 | |
| | |
Enbridge Energy Partners LP 4.20%, 9/15/2021 | | | 2,363,000 | | | | 2,388,438 | |
| | |
Enbridge, Inc. (Canada) (SOFR + 0.40%), 0.43%, 2/17/2023 (a) | | | 13,879,000 | | | | 13,908,659 | |
| | |
Equinor ASA (Norway) 2.45%, 1/17/2023 | | | 1,130,000 | | | | 1,174,513 | |
| | |
Exxon Mobil Corp. | | | | | | | | |
| | |
1.90%, 8/16/2022 | | | 10,747,000 | | | | 11,012,455 | |
| | |
1.57%, 4/15/2023 | | | 48,100,000 | | | | 49,298,652 | |
| | |
Marathon Petroleum Corp. 5.13%, 3/1/2021 | | | 2,704,000 | | | | 2,704,000 | |
| | |
Pioneer Natural Resources Co. 0.75%, 1/15/2024 | | | 13,563,000 | | | | 13,527,703 | |
| | |
Saudi Arabian Oil Co. (Saudi Arabia) | | | | | | | | |
| | |
2.75%, 4/16/2022 (b) (c) | | | 4,800,000 | | | | 4,896,000 | |
| | |
1.25%, 11/24/2023 (b) | | | 8,000,000 | | | | 8,060,000 | |
| | |
Spectra Energy Partners LP 4.60%, 6/15/2021 | | | 2,700,000 | | | | 2,700,945 | |
| | |
Total Capital International SA (France) 2.22%, 7/12/2021 (c) | | | 16,284,000 | | | | 16,370,715 | |
| | |
TransCanada PipeLines Ltd. (Canada) 3.75%, 10/16/2023 (c) | | | 25,013,000 | | | | 26,891,801 | |
| | | | | | | | |
| | |
| | | | | | | 190,635,554 | |
| | | | | | | | |
| | |
Personal Products — 0.0% (f) | | | | | | | | |
| | |
Estee Lauder Cos., Inc. (The) 1.70%, 5/10/2021 | | | 300,000 | | | | 300,340 | |
| | | | | | | | |
| | |
Pharmaceuticals — 0.5% | | | | | | | | |
| | |
Bristol-Myers Squibb Co. | | | | | | | | |
| | |
2.55%, 5/14/2021 | | | 3,968,000 | | | | 3,985,770 | |
| | |
2.25%, 8/15/2021 | | | 1,530,000 | | | | 1,544,147 | |
| | |
2.60%, 5/16/2022 | | | 6,770,000 | | | | 6,960,366 | |
| | |
3.55%, 8/15/2022 | | | 503,000 | | | | 526,489 | |
| | |
0.54%, 11/13/2023 | | | 1,180,000 | | | | 1,182,756 | |
| | |
GlaxoSmithKline Capital plc (United Kingdom) | | | | | | | | |
| | |
(ICE LIBOR USD 3 Month + 0.35%), 0.54%, 5/14/2021 (a) | | | 3,393,000 | | | | 3,395,444 | |
| | |
2.85%, 5/8/2022 | | | 15,098,000 | | | | 15,559,619 | |
| | |
2.88%, 6/1/2022 | | | 4,285,000 | | | | 4,412,973 | |
| | | | | | | | |
| INVESTMENTS | | PRINCIPAL
AMOUNT ($) | | | VALUE ($) | |
| | | | | | | | |
|
Pharmaceuticals — continued | |
| | |
Pfizer, Inc. | | | | | | | | |
| | |
3.00%, 9/15/2021 | | | 221,000 | | | | 224,195 | |
| | |
2.80%, 3/11/2022 | | | 247,000 | | | | 253,584 | |
| | |
Sanofi (France) 4.00%, 3/29/2021 | | | 1,014,000 | | | | 1,016,890 | |
| | |
Takeda Pharmaceutical Co. Ltd. (Japan) 2.45%, 1/18/2022 (b) | | | 2,216,000 | | | | 2,252,472 | |
| | |
Viatris, Inc. 1.13%, 6/22/2022 (b) | | | 17,844,000 | | | | 17,999,547 | |
| | |
Zoetis, Inc. (ICE LIBOR USD 3 Month + 0.44%), 0.62%, 8/20/2021 (a) | | | 22,902,000 | | | | 22,944,897 | |
| | | | | | | | |
| | |
| | | | | | | 82,259,149 | |
| | | | | | | | |
| | |
Road & Rail — 0.4% | | | | | | | | |
| | |
ERAC USA Finance LLC | | | | | | | | |
| | |
4.50%, 8/16/2021 (b) | | | 250,000 | | | | 254,807 | |
| | |
2.60%, 12/1/2021 (b) | | | 2,225,000 | | | | 2,257,715 | |
| | |
Penske Truck Leasing Co. LP | | | | | | | | |
| | |
3.30%, 4/1/2021 (b) | | | 2,160,000 | | | | 2,160,000 | |
| | |
3.65%, 7/29/2021 (b) | | | 15,088,000 | | | | 15,241,374 | |
| | |
3.38%, 2/1/2022 (b) | | | 10,521,000 | | | | 10,751,272 | |
| | |
4.88%, 7/11/2022 (b) | | | 11,895,000 | | | | 12,588,579 | |
| | |
2.70%, 3/14/2023 (b) | | | 5,895,000 | | | | 6,138,027 | |
| | |
4.13%, 8/1/2023 (b) | | | 2,500,000 | | | | 2,702,364 | |
| | |
Ryder System, Inc. | | | | | | | | |
| | |
3.45%, 11/15/2021 | | | 12,913,000 | | | | 13,164,726 | |
| | |
2.88%, 6/1/2022 | | | 6,291,000 | | | | 6,469,291 | |
| | | | | | | | |
| | |
| | | | | | | 71,728,155 | |
| | | | | | | | |
|
Semiconductors & Semiconductor Equipment — 0.1% | |
| | |
Analog Devices, Inc. 2.50%, 12/5/2021 | | | 7,784,000 | | | | 7,893,962 | |
| | |
Intel Corp. | | | | | | | | |
| | |
1.70%, 5/19/2021 | | | 1,426,000 | | | | 1,428,721 | |
| | |
3.30%, 10/1/2021 | | | 1,011,000 | | | | 1,028,628 | |
| | | | | | | | |
| | |
| | | | | | | 10,351,311 | |
| | | | | | | | |
| | |
Software — 0.1% | | | | | | | | |
| | |
Oracle Corp. | | | | | | | | |
| | |
1.90%, 9/15/2021 | | | 2,136,000 | | | | 2,151,848 | |
| | |
2.50%, 5/15/2022 | | | 6,980,000 | | | | 7,141,129 | |
| | |
2.50%, 10/15/2022 | | | 12,679,000 | | | | 13,135,706 | |
| | | | | | | | |
| | |
| | | | | | | 22,428,683 | |
| | | | | | | | |
|
Technology Hardware, Storage & Peripherals — 0.2% | |
| | |
Apple, Inc. | | | | | | | | |
| | |
2.85%, 5/6/2021 | | | 6,679,000 | | | | 6,710,527 | |
| | |
1.55%, 8/4/2021 | | | 400,000 | | | | 401,425 | |
| | |
1.70%, 9/11/2022 (c) | | | 21,091,000 | | | | 21,572,401 | |
| | | | | | | | |
| | |
| | | | | | | 28,684,353 | |
| | | | | | | | |
SEE NOTES TO FINANCIAL STATEMENTS.
| | | | | | | | |
| | | |
| FEBRUARY 28, 2021 | | J.P. MORGAN EXCHANGE-TRADED FUNDS | | | | | 159 | |
JPMorgan Ultra-Short Income ETF
SCHEDULE OF PORTFOLIO INVESTMENTS
AS OF FEBRUARY 28, 2021 (continued)
| | | | | | | | |
| INVESTMENTS | | PRINCIPAL
AMOUNT ($) | | | VALUE ($) | |
Corporate Bonds — continued | |
| | |
Thrifts & Mortgage Finance — 2.4% | | | | | | | | |
| | |
BPCE SA (France) | | | | | | | | |
| | |
2.75%, 12/2/2021 | | | 10,782,000 | | | | 10,981,493 | |
| | |
(ICE LIBOR USD 3 Month + 0.30%), 0.53%, 1/14/2022 (a) (b) (c) | | | 86,643,000 | | | | 86,844,647 | |
| | |
(SOFR + 0.44%), 0.47%, 2/17/2022 (a) (b) | | | 53,697,000 | | | | 53,815,772 | |
| | |
(ICE LIBOR USD 3 Month + 1.22%), 1.40%, 5/22/2022 (a) (b) | | | 2,490,000 | | | | 2,519,058 | |
| | |
3.00%, 5/22/2022 (b) | | | 11,561,000 | | | | 11,933,992 | |
| | |
(ICE LIBOR USD 3 Month + 0.88%), 1.11%, 5/31/2022 (a) | | | 27,250,000 | | | | 27,510,649 | |
| | |
2.75%, 1/11/2023 (b) | | | 5,000,000 | | | | 5,214,436 | |
| | |
Nationwide Building Society (United Kingdom) | | | | | | | | |
| | |
2.45%, 7/27/2021 (b) | | | 6,750,000 | | | | 6,808,012 | |
| | |
2.00%, 1/27/2023 (b) | | | 55,589,000 | | | | 57,311,480 | |
| | |
(ICE LIBOR USD 3 Month + 1.18%), 3.62%, 4/26/2023 (a) (b) | | | 55,942,000 | | | | 57,865,383 | |
| | |
0.55%, 1/22/2024 (b) (c) | | | 60,158,000 | | | | 60,051,162 | |
| | | | | | | | |
| | |
| | | | | | | 380,856,084 | |
| | | | | | | | |
| | |
Tobacco — 0.7% | | | | | | | | |
| | |
Altria Group, Inc. 4.75%, 5/5/2021 | | | 53,175,000 | | | | 53,579,817 | |
| | |
Philip Morris International, Inc. | | | | | | | | |
| | |
4.13%, 5/17/2021 | | | 1,060,000 | | | | 1,068,782 | |
| | |
2.38%, 8/17/2022 | | | 11,000,000 | | | | 11,307,798 | |
| | |
2.50%, 8/22/2022 | | | 160,000 | | | | 165,117 | |
| | |
2.50%, 11/2/2022 | | | 2,620,000 | | | | 2,709,637 | |
| | |
Reynolds American, Inc. (United Kingdom) 4.85%, 9/15/2023 | | | 45,368,000 | | | | 50,196,080 | |
| | | | | | | | |
| | |
| | | | | | | 119,027,231 | |
| | | | | | | | |
|
Trading Companies & Distributors — 0.2% | |
| | |
Aviation Capital Group LLC | | | | | | | | |
| | |
(ICE LIBOR USD 3 Month + 0.95%), 1.18%, 6/1/2021 (a) (b) | | | 15,273,000 | | | | 15,261,885 | |
| | |
(ICE LIBOR USD 3 Month + 0.67%), 0.88%, 7/30/2021 (a) (b) | | | 6,254,000 | | | | 6,247,096 | |
| | |
2.88%, 1/20/2022 (b) | | | 2,986,000 | | | | 3,035,413 | |
| | |
BOC Aviation Ltd. (Singapore) | | | | | | | | |
| | |
(ICE LIBOR USD 3 Month + 1.05%), 1.25%, 5/4/2021 (a) (b) | | | 5,737,000 | | | | 5,738,793 | |
| | |
2.38%, 9/15/2021 (b) | | | 6,200,000 | | | | 6,240,687 | |
| | | | | | | | |
| | |
| | | | | | | 36,523,874 | |
| | | | | | | | |
| | | | | | | | |
| INVESTMENTS | | PRINCIPAL
AMOUNT ($) | | | VALUE ($) | |
| | | | | | | | |
|
Wireless Telecommunication Services — 0.6% | |
| | |
Rogers Communications, Inc. (Canada) | | | | | | | | |
| | |
(ICE LIBOR USD 3 Month + 0.60%), 0.84%, 3/22/2022 (a) (c) | | | 66,444,000 | | | | 66,832,464 | |
| | |
3.00%, 3/15/2023 | | | 8,874,000 | | | | 9,277,572 | |
| | |
Vodafone Group plc (United Kingdom) 3.75%, 1/16/2024 (c) | | | 12,160,000 | | | | 13,263,848 | |
| | | | | | | | |
| | |
| | | | | | | 89,373,884 | |
| | | | | | | | |
| | |
Total Corporate Bonds
(Cost $9,567,827,191) | | | | | | | 9,632,040,447 | |
| | | | | | | | |
Asset-Backed Securities — 11.6% | | | | | | | | |
| | |
522 Funding CLO Ltd. (Cayman Islands) Series 2019-4A, Class AR, 1.30%, 4/20/2030 (b) (g) | | | 50,000,000 | | | | 50,005,750 | |
| | |
AIMCO CLO (Cayman Islands) Series 2015-AA, Class AR, 1.09%, 1/15/2028 (b) (g) | | | 32,159,504 | | | | 32,080,938 | |
| | |
Apidos CLO (Cayman Islands) | | | | | | | | |
| | |
Series 2015-21A, Class A1R, 1.15%, 7/18/2027 (b) (g) | | | 22,760,314 | | | | 22,747,660 | |
| | |
Series 2016-24A, Class A1AL, 1.07%, 10/20/2030 (b) (g) (h) | | | 60,000,000 | | | | 60,000,000 | |
| | |
Avery Point CLO Ltd. (Cayman Islands) | | | | | | | | |
| | |
Series 2015-6A, Class AR2, 1.06%, 8/5/2027 (b) (g) | | | 53,874,920 | | | | 53,874,920 | |
| | |
Series 2015-7A, Class AR2, 1.20%, 1/15/2028 (b) (g) | | | 30,850,000 | | | | 30,868,387 | |
| | |
Bain Capital Credit CLO Ltd. (Cayman Islands) Series 2016-2A, Class ARR, 1.16%, 1/15/2029 (b) (g) | | | 80,000,000 | | | | 79,980,000 | |
| | |
Barings CLO Ltd. (Cayman Islands) Series 2013-IA, Class AR, 1.02%, 1/20/2028 (b) (g) | | | 57,917,480 | | | | 57,910,935 | |
| | |
Benefit Street Partners CLO Ltd. (Cayman Islands) | | | | | | | | |
| | |
Series 2013-IIA, Class A1R2, 1.11%, 7/15/2029 (b) (g) | | | 24,939,203 | | | | 24,939,203 | |
| | |
Series 2013-IIA, Class X, 1.94%, 7/15/2029‡(b) (g) | | | 34,375 | | | | 34,366 | |
| | |
BlueMountain CLO Ltd. (Cayman Islands) | | | | | | | | |
| | |
Series 2012-2A, Class AR2, 1.23%, 11/20/2028 (b) (g) | | | 10,416,163 | | | | 10,428,225 | |
| | |
Series 2013-1A, Class A1R2, 1.45%, 1/20/2029 (b) (g) | | | 2,733,704 | | | | 2,733,682 | |
| | |
Capital One Prime Auto Receivables Trust Series 2020-1, Class A3, 1.60%, 11/15/2024 | | | 16,100,000 | | | | 16,359,648 | |
SEE NOTES TO FINANCIAL STATEMENTS.
| | | | | | |
| | | |
| 160 | | | | J.P. MORGAN EXCHANGE-TRADED FUNDS | | FEBRUARY 28, 2021 |
| | | | | | | | |
| INVESTMENTS | | PRINCIPAL
AMOUNT ($) | | | VALUE ($) | |
Asset-Backed Securities — continued | |
| | |
Carlyle Global Market Strategies CLO Ltd. Series 2012-4A, Class XRR, 0.97%, 4/22/2032 (b) (g) | | | 319,434 | | | | 319,417 | |
| | |
CarMax Auto Owner Trust | | | | | | | | |
| | |
Series 2020-4, Class A2, 0.31%, 1/16/2024 | | | 40,247,000 | | | | 40,276,557 | |
| | |
Series 2018-3, Class A4, 3.27%, 3/15/2024 | | | 15,600,000 | | | | 16,232,518 | |
| | |
CBAM Ltd. (Cayman Islands) Series 2017-3A, Class A, 1.45%, 10/17/2029 (b) (g) | | | 6,100,000 | | | | 6,101,549 | |
| | |
CIFC Funding Ltd. (Cayman Islands) | | | | | | | | |
| | |
Series 2012-2RA, Class A1, 1.02%, 1/20/2028 (b) (g) | | | 4,550,467 | | | | 4,542,317 | |
| | |
Series 2017-5A, Class A1, 1.40%, 11/16/2030 (b) (g) | | | 35,900,000 | | | | 35,924,699 | |
| | |
Clear Creek CLO (Cayman Islands) Series 2015-1A, Class X, 1.22%, 10/20/2030‡(b) (g) | | | 51,563 | | | | 51,550 | |
| | |
Cloud Pass-Through Trust Series 2019-1A, Class CLOU, 3.55%, 12/5/2022 (b) (g) | | | 12,474,603 | | | | 12,611,490 | |
| | |
Cole Park CLO Ltd. (Cayman Islands) Series 2015-1A, Class AR, 1.27%, 10/20/2028 (b) (g) | | | 8,210,322 | | | | 8,210,487 | |
| | |
Dorchester Park CLO DAC Series 2015-1A, Class AR, 1.12%, 4/20/2028 (b) (g) | | | 6,544,386 | | | | 6,545,636 | |
| | |
Dryden Senior Loan Fund (Cayman Islands) | | | | | | | | |
| | |
Series 2013-30A, Class AR, 1.01%, 11/15/2028 (b) (g) | | | 56,577,552 | | | | 56,610,820 | |
| | |
Series 2014-36A, Class XR2, 0.89%, 4/15/2029‡(b) (g) | | | 200,000 | | | | 200,005 | |
| | |
Series 2014-36A, Class AR3, 1.26%, 4/15/2029 (b) (g) | | | 71,656,000 | | | | 71,691,183 | |
| | |
Exeter Automobile Receivables Trust | | | | | | | | |
| | |
Series 2021-1A, Class A2, 0.30%, 6/15/2023 | | | 16,147,000 | | | | 16,148,540 | |
| | |
Series 2021-1A, Class A3, 0.34%, 3/15/2024 | | | 4,283,000 | | | | 4,282,625 | |
| | |
Ford Credit Auto Owner Trust | | | | | | | | |
| | |
Series 2020-C, Class A2, 0.25%, 10/15/2023 | | | 41,898,000 | | | | 41,902,190 | |
| | |
Series 2017-2, Class A, 2.36%, 3/15/2029 (b) | | | 72,206,000 | | | | 74,376,895 | |
| | |
Galaxy CLO Ltd. (Cayman Islands) Series 2013-15A, Class AR, 1.44%, 10/15/2030 (b) (g) | | | 17,920,000 | | | | 17,921,021 | |
| | | | | | | | |
| INVESTMENTS | | PRINCIPAL
AMOUNT ($) | | | VALUE ($) | |
| | | | | | | | |
| | |
GM Financial Automobile Leasing Trust Series 2020-3, Class A2A, 0.35%, 11/21/2022 | | | 26,206,000 | | | | 26,226,747 | |
| | |
GM Financial Consumer Automobile Receivables Trust Series 2020-4, Class A2, 0.26%, 11/16/2023 | | | 6,465,000 | | | | 6,466,885 | |
| | |
Goldentree Loan Management US CLO Ltd. (Cayman Islands) Series 2017-1A, Class AR, 1.17%, 4/20/2029 (b) (g) | | | 8,923,000 | | | | 8,918,824 | |
| | |
GoldentTree Loan Management US CLO Ltd. (Cayman Islands) Series 2020-7A, Class A, 2.12%, 4/20/2031 (b) (g) | | | 5,000,000 | | | | 5,005,930 | |
| | |
Hyundai Auto Receivables Trust Series 2020-C, Class A2, 0.26%, 9/15/2023 | | | 60,582,000 | | | | 60,599,878 | |
| | |
KKR CLO Ltd. (Cayman Islands) | | | | | | | | |
| | |
Series 13, Class A1R, 1.02%, 1/16/2028 (b) (g) | | | 10,127,329 | | | | 10,095,580 | |
| | |
Series 17, Class A, 1.58%, 4/15/2029 (b) (g) | | | 40,000,000 | | | | 40,024,080 | |
| | |
Series 32A, Class A1, 1.56%, 1/15/2032 (b) (g) | | | 18,000,000 | | | | 18,068,526 | |
| | |
KREF Ltd. Series 2018-FL1, Class A, 1.21%, 6/15/2036 (b) (g) | | | 4,972,350 | | | | 4,973,897 | |
| | |
LCM Ltd. (Cayman Islands) Series 24A, Class AR, 3/20/2030 (b) (g) | | | 51,444,000 | | | | 51,444,000 | |
| | |
LCM XVII LP (Cayman Islands) Series 17A, Class XR, 0.84%, 10/15/2031 (b) (g) | | | 270,000 | | | | 270,000 | |
| | |
LCM XX LP (Cayman Islands) Series 20A, Class AR, 1.26%, 10/20/2027 (b) (g) | | | 20,951,137 | | | | 20,955,432 | |
| | |
Magnetite Ltd. (Cayman Islands) | | | | | | | | |
| | |
Series 2012-7A, Class A1R2, 1.04%, 1/15/2028 (b) (g) | | | 5,220,000 | | | | 5,222,500 | |
| | |
Series 2016-18A, Class AR, 1.27%, 11/15/2028 (b) (g) | | | 6,600,000 | | | | 6,601,538 | |
| | |
Series 2020-25A, Class A, 1.45%, 1/25/2032 (b) (g) | | | 20,000,000 | | | | 20,029,100 | |
| | |
Series 2020-27A, Class A1, 1.77%, 7/20/2033 (b) (g) | | | 22,058,000 | | | | 22,117,424 | |
| | |
Neuberger Berman CLO Ltd. (Cayman Islands) | | | | | | | | |
| | |
Series 2015-19A, Class A1R2, 1.04%, 7/15/2027 (b) (g) | | | 7,523,599 | | | | 7,503,082 | |
| | |
Series 2017-16SA, Class A, 1.09%, 1/15/2028 (b) (g) | | | 29,967,448 | | | | 29,940,867 | |
| | |
Series 2013-14A, Class AR2, 1.25%, 1/28/2030 (b) (g) | | | 16,000,000 | | | | 16,004,512 | |
SEE NOTES TO FINANCIAL STATEMENTS.
| | | | | | | | |
| | | |
| FEBRUARY 28, 2021 | | J.P. MORGAN EXCHANGE-TRADED FUNDS | | | | | 161 | |
JPMorgan Ultra-Short Income ETF
SCHEDULE OF PORTFOLIO INVESTMENTS
AS OF FEBRUARY 28, 2021 (continued)
| | | | | | | | |
| INVESTMENTS | | PRINCIPAL
AMOUNT ($) | | | VALUE ($) | |
Asset-Backed Securities — continued | |
| | |
Newark BSL CLO 2 Ltd. (Cayman Islands) | | | | | | | | |
| | |
Series 2017-1A, Class A1R, 1.15%, 7/25/2030 (b) (g) | | | 50,619,000 | | | | 50,619,000 | |
| | |
Series 2017-1A, Class A1, 1.49%, 7/25/2030 (b) (g) | | | 4,500,000 | | | | 4,501,057 | |
| | |
Newark BSL CLO Ltd. (Cayman Islands) Series 2016-1A, Class A1R, 1.31%, 12/21/2029 (b) (g) | | | 29,000,000 | | | | 29,038,396 | |
| | |
OCP CLO Ltd. (Cayman Islands) | | | | | | | | |
| | |
Series 2015-9A, Class A1R, 1.04%, 7/15/2027 (b) (g) | | | 15,647,921 | | | | 15,652,240 | |
| | |
Series 2016-12A, Class A1R, 1.34%, 10/18/2028 (b) (g) | | | 926,390 | | | | 926,439 | |
| | |
Series 2020-8RA, Class A1, 1.44%, 1/17/2032 (b) (g) | | | 35,000,000 | | | | 34,990,935 | |
| | |
Octagon Investment Partners 30 Ltd. (Cayman Islands) Series 2017-1A, Class A1R, 1.20%, 3/17/2030 (b) (g) | | | 70,000,000 | | | | 69,982,430 | |
| | |
Octagon Investment Partners 35 Ltd. (Cayman Islands) Series 2018-1A, Class A1A, 1.28%, 1/20/2031 (b) (g) | | | 35,000,000 | | | | 35,002,520 | |
| | |
Palmer Square Loan Funding Ltd. (Cayman Islands) | | | | | | | | |
| | |
Series 2018-4A, Class A1, 1.09%, 11/15/2026 (b) (g) | | | 854,951 | | | | 854,166 | |
| | |
Series 2019-2A, Class A1, 1.19%, 4/20/2027 (b) (g) | | | 7,998,239 | | | | 7,998,407 | |
| | |
Series 2019-4A, Class A1, 1.12%, 10/24/2027 (b) (g) | | | 24,071,735 | | | | 24,020,510 | |
| | |
Series 2020-1A, Class A1, 0.98%, 2/20/2028 (b) (g) | | | 16,140,407 | | | | 16,070,922 | |
| | |
Series 2020-2A, Class A1, 1.22%, 4/20/2028 (b) (g) | | | 16,924,448 | | | | 16,934,045 | |
| | |
Series 2020-4A, Class A1, 1.19%, 11/25/2028 (b) (g) | | | 63,608,912 | | | | 63,687,660 | |
| | |
Series 2021-1A, Class A1, 1.09%, 4/20/2029 (b) (g) | | | 48,806,000 | | | | 48,793,701 | |
| | |
Santander Drive Auto Receivables Trust Series 2020-3, Class A2, 0.46%, 9/15/2023 | | | 37,335,636 | | | | 37,368,973 | |
| | |
Shackleton CLO Ltd. (Cayman Islands) | | | | | | | | |
| | |
Series 2015-8A, Class A1R, 1.14%, 10/20/2027 (b) (g) | | | 19,000,553 | | | | 18,974,903 | |
| | |
Series 2015-8A, Class A2R, 1.14%, 10/20/2027 (b) (g) | | | 7,799,716 | | | | 7,789,186 | |
| | |
Stratus CLO Ltd. (Cayman Islands) Series 2020-2A, Class A, 1.57%, 10/15/2028 (b) (g) | | | 46,316,000 | | | | 46,322,206 | |
| | | | | | | | |
| INVESTMENTS | | PRINCIPAL
AMOUNT ($) | | | VALUE ($) | |
| | | | | | | | |
| | |
Symphony CLO Ltd. (Cayman Islands) | | | | | | | | |
| | |
Series 2014-14A, Class AR, 1.18%, 7/14/2026 (b) (g) | | | 26,351,704 | | | | 26,379,979 | |
| | |
Series 2018-20A, Class X, 1.22%, 1/16/2032 (b) (g) | | | 1,500,000 | | | | 1,500,000 | |
| | |
Series 2014-15A, Class XR2, 0.92%, 1/17/2032 (b) (g) | | | 1,333,333 | | | | 1,333,333 | |
| | |
Series 2020-24A, Class A, 1.42%, 1/23/2032 (b) (g) | | | 28,200,000 | | | | 28,192,696 | |
| | |
Tesla Auto Lease Trust Series 2020-A, Class A3, 0.68%, 12/20/2023 (b) | | | 5,184,000 | | | | 5,220,925 | |
| | |
Treman Park CLO Ltd. (Cayman Islands) Series 2015-1A, Class ARR, 1.29%, 10/20/2028 (b) (g) | | | 10,346,775 | | | | 10,347,396 | |
| | |
Venture CLO Ltd. (Cayman Islands) Series 2018-33A, Class A1LR, 1.40%, 7/15/2031 (b) (g) | | | 31,836,000 | | | | 31,836,000 | |
| | |
Verizon Owner Trust Series 2018-1A, Class A1A, 2.82%, 9/20/2022 (b) | | | 4,851,161 | | | | 4,865,924 | |
| | |
Voya CLO Ltd. (Cayman Islands) Series 2014-3A, Class A1R, 0.94%, 7/25/2026 (b) (g) | | | 548,310 | | | | 547,685 | |
| | |
Wind River CLO Ltd. (Cayman Islands) Series 2016-1A, Class AR, 1.29%, 7/15/2028 (b) (g) | | | 16,151,109 | | | | 16,147,022 | |
| | | | | | | | |
| | |
Total Asset-Backed Securities
(Cost $1,869,172,109) | | | | | | | 1,872,280,671 | |
| | | | | | | | |
Commercial Mortgage-Backed Securities — 2.3% | |
| | |
ACRE Commercial Mortgage Ltd. (Cayman Islands) Series 2021-FL4, Class A, 0.94%, 12/18/2037 (b) (g) | | | 12,000,000 | | | | 12,000,012 | |
| | |
Benchmark Mortgage Trust | | | | | | | | |
| | |
Series 2018-B3, Class A2, 3.85%, 4/10/2051 | | | 5,500,000 | | | | 5,799,896 | |
| | |
Series 2018-B5, Class A2, 4.08%, 7/15/2051 | | | 5,000,000 | | | | 5,347,366 | |
| | |
BX Commercial Mortgage Trust | | | | | | | | |
| | |
Series 2020-BXLP, Class A, 0.91%, 12/15/2036 (b) (g) | | | 22,943,493 | | | | 22,960,765 | |
| | |
Series 2020-VKNG, Class A, 1.04%, 10/15/2037 (b) (g) | | | 31,775,700 | | | | 31,862,340 | |
| | |
BX Trust Series 2021-LBA, Class AJV, 0.91%, 2/15/2036 (b) (g) | | | 39,712,098 | | | | 39,722,022 | |
| | |
BXMT Ltd. (Cayman Islands) | | | | | | | | |
| | |
Series 2017-FL1, Class A, 0.98%, 6/15/2035 (b) (g) | | | 370,441 | | | | 370,555 | |
| | |
Series 2020-FL3, Class A, 1.51%, 3/15/2037 (b) (g) | | | 45,000,000 | | | | 45,069,975 | |
SEE NOTES TO FINANCIAL STATEMENTS.
| | | | | | |
| | | |
| 162 | | | | J.P. MORGAN EXCHANGE-TRADED FUNDS | | FEBRUARY 28, 2021 |
| | | | | | | | |
| INVESTMENTS | | PRINCIPAL
AMOUNT ($) | | | VALUE ($) | |
Commercial Mortgage-Backed Securities — continued | |
| | |
CGDBB Commercial Mortgage Trust Series 2017-BIOC, Class A, 0.90%, 7/15/2032 (b) (g) | | | 822,189 | | | | 822,967 | |
| | |
Citigroup Commercial Mortgage Trust | | | | | | | | |
| | |
Series 2014-GC25, Class B, 4.34%, 10/10/2047‡(g) | | | 8,626,000 | | | | 9,442,948 | |
| | |
Series 2018-B2, Class A2, 3.79%, 3/10/2051 | | | 6,000,000 | | | | 6,288,660 | |
| | |
Commercial Mortgage Trust Series 2014-LC15, Class AM, 4.20%, 4/10/2047 | | | 3,145,000 | | | | 3,426,185 | |
| | |
Credit Suisse Mortgage Capital Certificates Series 2019-ICE4, Class A, 1.09%, 5/15/2036 (b) (g) | | | 28,000,000 | | | | 28,044,677 | |
| | |
CSAIL Commercial Mortgage Trust Series 2017-CX9, Class A2, 3.05%, 9/15/2050 | | | 2,500,000 | | | | 2,574,128 | |
| | |
DBGS Mortgage Trust Series 2018-BIOD, Class A, 0.92%, 5/15/2035 (b) (g) | | | 26,753,605 | | | | 26,769,732 | |
| | |
GS Mortgage Securities Corp. Trust Series 2021-RENT, Class A, 0.95%, 11/21/2023 (b) (g) | | | 5,000,052 | | | | 5,000,052 | |
| | |
Independence Plaza Trust Series 2018-INDP, Class A, 3.76%, 7/10/2035 (b) | | | 10,000,000 | | | | 10,650,968 | |
| | |
KNDL Mortgage Trust Series 2019-KNSQ, Class A, 0.91%, 5/15/2036 (b) (g) | | | 5,600,000 | | | | 5,608,942 | |
| | |
Morgan Stanley Bank of America Merrill Lynch Trust Series 2013-C8, Class A3, 2.86%, 12/15/2048 | | | 7,730,939 | | | | 7,925,593 | |
| | |
Morgan Stanley Capital I Trust Series 2018-H3, Class A2, 4.00%, 7/15/2051 | | | 6,250,000 | | | | 6,667,016 | |
| | |
ONE Mortgage Trust Series 2021-PARK, Class A, 0.95%, 3/15/2036 (b) (g) | | | 24,000,000 | | | | 23,917,464 | |
| | |
UBS Commercial Mortgage Trust | | | | | | | | |
| | |
Series 2018-C8, Class A2, 3.71%, 2/15/2051 | | | 6,569,000 | | | | 6,871,028 | |
| | |
Series 2018-C11, Class A2, 3.99%, 6/15/2051 | | | 4,647,000 | | | | 4,885,322 | |
| | |
Wells Fargo Commercial Mortgage Trust | | | | | | | | |
| | |
Series 2021-SAVE, Class A, 1.30%, 2/15/2040 (b) (g) | | | 34,642,716 | | | | 34,705,589 | |
| | |
Series 2018-C46, Class A2, 4.06%, 8/15/2051 | | | 11,750,000 | | | | 12,519,690 | |
| | | | | | | | |
| INVESTMENTS | | PRINCIPAL
AMOUNT ($) | | | VALUE ($) | |
| | | | | | | | |
| | |
WFRBS Commercial Mortgage Trust | | | | | | | | |
| | |
Series 2013-UBS1, Class AS, 4.31%, 3/15/2046 (g) | | | 6,584,641 | | | | 7,156,954 | |
| | |
Series 2014-C22, Class AS, 4.07%, 9/15/2057 (g) | | | 6,901,000 | | | | 7,544,338 | |
| | | | | | | | |
| | |
Total Commercial Mortgage-Backed Securities
(Cost $373,677,497) | | | | | | | 373,955,184 | |
| | | | | | | | |
U.S. Treasury Obligations — 1.3% | | | | | | | | |
| | |
U.S. Treasury Notes | | | | | | | | |
| | |
1.13%, 9/30/2021 | | | 72,000,000 | | | | 72,450,000 | |
| | |
2.88%, 10/15/2021 | | | 139,200,000 | | | | 141,641,437 | |
| | | | | | | | |
| | |
Total U.S. Treasury Obligations
(Cost $214,008,892) | | | | | | | 214,091,437 | |
| | | | | | | | |
| | |
Certificates Of Deposit — 0.2% | | | | | | | | |
| | |
UBS AG (Switzerland) 0.46%, 12/2/2022
(Cost $40,092,000) | | | 40,092,000 | | | | 40,324,378 | |
| | | | | | | | |
|
Foreign Government Securities — 0.2% | |
| | |
Svensk Exportkredit AB (Sweden) (SOFR + 1.00%), 1.03%, 5/25/2023 (a)
(Cost $28,889,504) | | | 28,420,000 | | | | 28,959,134 | |
| | | | | | | | |
|
Short-Term Investments — 26.6% | |
| | |
Certificates of Deposit — 7.5% | | | | | | | | |
| | |
Bank of Nova Scotia (The) (Canada) | | | | | | | | |
| | |
(SOFR + 0.17%), 0.20%, 2/25/2022 (a) | | | 47,281,000 | | | | 47,293,584 | |
| | |
(SOFR + 0.16%), 0.19%, 2/28/2022 (a) | | | 27,241,000 | | | | 27,246,176 | |
| | |
Barclays Bank plc (United Kingdom) 0.70%, 7/29/2021 | | | 6,500,000 | | | | 6,513,195 | |
| | |
Canadian Imperial Bank of Commerce (Canada) 0.42%, 6/22/2021 | | | 90,500,000 | | | | 90,590,275 | |
| | |
Credit Agricole Corporate and Investment Bank (France) | | | | | | | | |
| | |
(ICE LIBOR USD 3 Month + 0.21%), 0.40%, 8/9/2021 (a) | | | 36,098,000 | | | | 36,133,272 | |
| | |
(ICE LIBOR USD 3 Month + 0.48%), 0.71%, 9/17/2021 (a) | | | 33,446,000 | | | | 33,532,893 | |
| | |
Credit Suisse AG (Switzerland) 0.31%, 9/16/2021 | | | 50,000,000 | | | | 50,033,559 | |
| | |
Deutsche Bank AG (Germany) 0.63%, 7/26/2021 | | | 150,000,000 | | | | 150,030,972 | |
| | |
DZ Bank AG (Germany) (ICE LIBOR USD 3 Month + 0.20%), 0.39%, 2/17/2022 (a) | | | 24,025,000 | | | | 24,036,521 | |
SEE NOTES TO FINANCIAL STATEMENTS.
| | | | | | | | |
| | | |
| FEBRUARY 28, 2021 | | J.P. MORGAN EXCHANGE-TRADED FUNDS | | | | | 163 | |
JPMorgan Ultra-Short Income ETF
SCHEDULE OF PORTFOLIO INVESTMENTS
AS OF FEBRUARY 28, 2021 (continued)
| | | | | | | | |
| INVESTMENTS | | PRINCIPAL
AMOUNT ($) | | | VALUE ($) | |
Short-Term Investments — continued | |
|
Certificates of Deposit — continued | |
| | |
First Abu Dhabi Bank USA NV (ICE LIBOR USD 3 Month + 0.17%), 0.39%, 12/14/2021 (a) | | | 53,300,000 | | | | 53,329,284 | |
| | |
Kookmin Bank (South Korea) | | | | | | | | |
| | |
(ICE LIBOR USD 3 Month + 0.27%), 0.48%, 10/29/2021 (a) | | | 17,452,000 | | | | 17,469,281 | |
| | |
(ICE LIBOR USD 1 Month + 0.29%), 0.40%, 12/20/2021 (a) | | | 49,869,000 | | | | 49,898,968 | |
| | |
Lloyds Bank Corporate Markets plc (United Kingdom) 0.24%, 2/22/2022 | | | 63,514,000 | | | | 63,514,633 | |
| | |
Lloyds Bank plc (United Kingdom) (SOFR + 0.30%), 0.36%, 11/16/2021 (a) | | | 27,890,000 | | | | 27,914,011 | |
| | |
MUFG Bank Ltd. (Japan) 0.32%, 10/15/2021 | | | 3,600,000 | | | | 3,602,832 | |
| | |
Norinchukin Bank (The) (Japan) | | | | | | | | |
| | |
0.37%, 12/1/2021 | | | 132,661,000 | | | | 132,791,667 | |
| | |
0.37%, 12/3/2021 | | | 108,726,000 | | | | 108,833,863 | |
| | |
Shinhan Bank (South Korea) | | | | | | | | |
| | |
0.47%, 11/3/2021 | | | 29,452,000 | | | | 29,488,040 | |
| | |
0.44%, 1/10/2022 | | | 32,416,000 | | | | 32,455,931 | |
| | |
Societe Generale SA (France) 0.32%, 9/17/2021 | | | 28,300,000 | | | | 28,319,882 | |
| | |
Sumitomo Mitsui Banking Corp. (Japan) (ICE LIBOR USD 3 Month + 0.32%), 0.50%, 11/22/2021 (a) | | | 47,564,000 | | | | 47,661,184 | |
| | |
Westpac Banking Corp. (Australia) (ICE LIBOR USD 3 Month + 0.01%), 0.23%, 1/24/2022 (a) | | | 148,409,000 | | | | 148,395,612 | |
| | | | | | | | |
| | |
Total Certificates of Deposit
(Cost $1,208,264,353) | | | | | | | 1,209,085,635 | |
| | | | | | | | |
|
Commercial Paper — 13.6% | |
| | |
ABN AMRO Funding USA LLC (Netherlands) 0.18%, 10/8/2021 (b) (i) | | | 3,100,000 | | | | 3,093,075 | |
| | |
American Honda Finance Corp. | | | | | | | | |
| | |
0.45%, 3/22/2021 (i) | | | 23,805,000 | | | | 23,801,985 | |
| | |
0.32%, 3/26/2021 (i) | | | 9,881,000 | | | | 9,879,440 | |
| | |
AT&T, Inc. | | | | | | | | |
| | |
0.38%, 11/16/2021 (b) (i) | | | 16,021,000 | | | | 15,984,366 | |
| | |
0.40%, 12/14/2021 (b) (i) | | | 64,420,000 | | | | 64,253,366 | |
| | |
Banco del Estado de Chile (Chile) 0.41%, 11/26/2021 (b) (i) | | | 50,000,000 | | | | 49,901,416 | |
| | |
Banco Santander SA (Spain) 0.47%, 9/2/2021 (b) (i) | | | 17,673,000 | | | | 17,657,218 | |
| | | | | | | | |
| INVESTMENTS | | PRINCIPAL
AMOUNT ($) | | | VALUE ($) | |
| | | | | | | | |
|
Commercial Paper — continued | |
| | |
Barclays Bank plc (United Kingdom) | | | | | | | | |
| | |
0.30%, 2/9/2022 (b) (i) | | | 9,892,000 | | | | 9,871,919 | |
| | |
0.30%, 2/10/2022 (b) (i) | | | 10,901,000 | | | | 10,878,702 | |
| | |
BASF SE (Germany) | | | | | | | | |
| | |
0.23%, 3/23/2021 (b) (i) | | | 17,000,000 | | | | 16,998,796 | |
| | |
0.24%, 3/25/2021 (b) (i) | | | 28,590,000 | | | | 28,587,577 | |
| | |
0.24%, 3/30/2021 (b) (i) | | | 30,000,000 | | | | 29,996,507 | |
| | |
0.24%, 3/31/2021 (b) (i) | | | 80,000,000 | | | | 79,990,393 | |
| | |
BP Capital Markets plc (United Kingdom) | | | | | | | | |
| | |
0.30%, 1/11/2022 (b) (i) | | | 15,302,000 | | | | 15,264,034 | |
| | |
0.29%, 1/28/2022 (b) (i) | | | 4,450,000 | | | | 4,438,246 | |
| | |
BPCE SA (France) | | | | | | | | |
| | |
0.30%, 7/1/2021 (b) (i) | | | 3,000,000 | | | | 2,998,417 | |
| | |
0.29%, 9/1/2021 (b) (i) | | | 35,000,000 | | | | 34,968,911 | |
| | |
Campbell Soup Co. 2.04%, 3/1/2021 (b) (i) | | | 29,450,000 | | | | 29,449,632 | |
| | |
Conagra Brands, Inc. 0.90%, 4/8/2021 (b) (i) | | | 35,250,000 | | | | 35,227,639 | |
| | |
Electricite de France SA (France) 0.48%, 6/28/2021 (b) (i) | | | 120,000,000 | | | | 119,898,334 | |
| | |
Enel Finance America LLC | | | | | | | | |
| | |
0.40%, 4/15/2021 (b) (i) | | | 16,439,000 | | | | 16,434,397 | |
| | |
0.41%, 4/22/2021 (b) (i) | | | 12,431,000 | | | | 12,426,784 | |
| | |
0.40%, 7/12/2021 (b) (i) | | | 39,000,000 | | | | 38,957,126 | |
| | |
0.40%, 10/20/2021 (b) (i) | | | 23,700,000 | | | | 23,646,709 | |
| | |
Eni Finance USA, Inc. (Italy) | | | | | | | | |
| | |
0.41%, 3/15/2021 (b) (i) | | | 25,818,000 | | | | 25,816,159 | |
| | |
0.58%, 7/30/2021 (b) (i) | | | 21,075,000 | | | | 21,046,691 | |
| | |
0.58%, 10/18/2021 (b) (i) | | | 23,300,000 | | | | 23,246,387 | |
| | |
0.58%, 10/20/2021 (b) (i) | | | 22,600,000 | | | | 22,547,553 | |
| | |
0.57%, 10/29/2021 (b) (i) | | | 19,500,000 | | | | 19,452,756 | |
| | |
Entergy Corp. | | | | | | | | |
| | |
0.25%, 4/19/2021 (b) (i) | | | 30,000,000 | | | | 29,989,383 | |
| | |
0.24%, 5/4/2021 (b) (i) | | | 15,500,000 | | | | 15,492,731 | |
| | |
ERP Operating LP 0.24%, 3/19/2021 (b) (i) | | | 10,000,000 | | | | 9,999,020 | |
| | |
First Abu Dhabi Bank PJSC (United Arab Emirates) 0.40%, 8/27/2021 (b) (i) | | | 174,311,000 | | | | 174,160,308 | |
| | |
Glencore Funding LLC (Australia) | | | | | | | | |
| | |
0.59%, 3/19/2021 (b) (i) | | | 35,000,000 | | | | 34,994,079 | |
| | |
0.35%, 7/12/2021 (b) (i) | | | 24,500,000 | | | | 24,467,791 | |
| | |
0.40%, 8/5/2021 (b) (i) | | | 20,500,000 | | | | 20,468,111 | |
| | |
Goldman Sachs International 0.33%, 1/12/2022 (b) (i) | | | 54,901,000 | | | | 54,767,773 | |
SEE NOTES TO FINANCIAL STATEMENTS.
| | | | | | |
| | | |
| 164 | | | | J.P. MORGAN EXCHANGE-TRADED FUNDS | | FEBRUARY 28, 2021 |
| | | | | | | | |
| INVESTMENTS | | PRINCIPAL
AMOUNT ($) | | | VALUE ($) | |
Short-Term Investments — continued | |
|
Commercial Paper — continued | |
| | |
HSBC USA, Inc. | | | | | | | | |
| | |
0.30%, 11/3/2021 (b) (i) | | | 29,000,000 | | | | 28,930,118 | |
| | |
0.30%, 11/9/2021 (b) (i) | | | 50,000,000 | | | | 49,876,267 | |
| | |
Hyundai Capital America 0.32%, 6/21/2021 (b) (i) | | | 9,200,000 | | | | 9,191,918 | |
| | |
KEB Hana Bank (South Korea) 0.40%, 7/23/2021 (b) (i) | | | 18,776,000 | | | | 18,763,886 | |
| | |
LVMH Moet Hennessy Louis Vuitton SE (France) | | | | | | | | |
| | |
0.22%, 7/16/2021 (b) (i) | | | 85,000,000 | | | | 84,951,408 | |
| | |
0.28%, 9/23/2021 (b) (i) | | | 84,120,000 | | | | 84,036,979 | |
| | |
Marathon Petroleum Corp. 0.45%, 3/31/2021 (b) (i) | | | 56,948,000 | | | | 56,937,298 | |
| | |
National Bank of Canada (Canada) 0.20%, 2/11/2022 (b) (i) | | | 51,482,000 | | | | 51,373,387 | |
| | |
National Grid North America, Inc. 0.27%, 3/30/2021 (b) (i) | | | 69,045,000 | | | | 69,033,768 | |
| | |
NatWest Markets plc (United Kingdom) | | | | | | | | |
| | |
0.61%, 4/29/2021 (b) (i) | | | 16,590,000 | | | | 16,584,800 | |
| | |
0.66%, 7/26/2021 (b) (i) | | | 27,281,000 | | | | 27,253,719 | |
| | |
0.38%, 1/4/2022 (b) (i) | | | 11,680,000 | | | | 11,648,012 | |
| | |
Procter & Gamble Co. (The) 0.13%, 3/31/2021 (b) (i) | | | 3,600,000 | | | | 3,599,852 | |
| | |
Public Service Enterprise Group, Inc. 0.33%, 3/8/2021 (b) (i) | | | 54,193,000 | | | | 54,190,682 | |
| | |
Rogers Communications, Inc. (Canada) 0.55%, 8/26/2021 (b) (i) | | | 39,167,000 | | | | 39,103,985 | |
| | |
Schlumberger Holdings Corp. | | | | | | | | |
| | |
0.47%, 7/29/2021 (b) (i) | | | 15,300,000 | | | | 15,290,962 | |
| | |
0.49%, 8/16/2021 (b) (i) | | | 42,000,000 | | | | 41,961,496 | |
| | |
Shell International Finance BV (Netherlands) | | | | | | | | |
| | |
3.25%, 3/29/2021 (b) (i) | | | 34,360,000 | | | | 34,356,745 | |
| | |
0.16%, 5/25/2021 (b) (i) | | | 3,600,000 | | | | 3,598,865 | |
| | |
0.17%, 8/17/2021 (b) (i) | | | 15,000,000 | | | | 14,988,032 | |
| | |
Societe Generale SA (France) 0.31%, 12/2/2021 (b) (i) | | | 29,850,000 | | | | 29,803,501 | |
| | |
Suncor Energy, Inc. (Canada) 0.33%, 4/21/2021 (b) (i) | | | 5,253,000 | | | | 5,251,267 | |
| | |
Telstra Corp Ltd. (Australia) 0.30%, 2/7/2022 (b) (i) | | | 21,244,000 | | | | 21,189,688 | |
| | |
Telstra Corp. Ltd. (Australia) 0.40%, 10/27/2021 (b) (i) | | | 45,743,000 | | | | 45,667,044 | |
| | |
UnitedHealth Group, Inc. 0.23%, 3/26/2021 (b) (i) | | | 70,000,000 | | | | 69,993,521 | |
| | |
Waste Management, Inc. | | | | | | | | |
| | |
0.35%, 7/6/2021 (b) (i) | | | 67,820,000 | | | | 67,761,957 | |
| | |
0.45%, 9/17/2021 (b) (i) | | | 42,068,000 | | | | 42,012,017 | |
| | | | | | | | |
| INVESTMENTS | | PRINCIPAL
AMOUNT ($) | | | VALUE ($) | |
| | | | | | | | |
|
Commercial Paper — continued | |
| | |
Westpac Banking Corp. (Australia) 0.16%, 4/12/2021 (b) (i) | | | 10,000,000 | | | | 9,998,375 | |
| | | | | | | | |
| | |
Total Commercial Paper
(Cost $2,177,250,418) | | | | | | | 2,178,403,280 | |
| | | | | | | | |
| | |
| | | SHARES | | | | |
| | |
Investment Companies — 4.7% | | | | | | | | |
| | |
JPMorgan U.S. Government Money Market Fund Class Institutional Shares, 0.03% (j) (k)
(Cost $763,604,992) | | | 763,604,992 | | | | 763,604,992 | |
| | | | | | | | |
|
Investment of Cash Collateral From Securities Loaned — 0.2% | |
| | |
JPMorgan Securities Lending Money Market Fund Agency SL Class Shares, 0.14% (j) (k) | | | 32,732,182 | | | | 32,735,455 | |
| | |
JPMorgan U.S. Government Money Market Fund Class IM Shares, 0.04% (j) (k) | | | 5,643,500 | | | | 5,643,500 | |
| | | | | | | | |
| | |
Total Investment of Cash Collateral From Securities Loaned
(Cost $38,378,955) | | | | | | | 38,378,955 | |
| | | | | | | | |
| | |
Repurchase Agreements — 0.6% | | | | | | | | |
| | |
Wells Fargo Securities LLC, 0.74%, dated 2/26/2021, due 6/25/2021, repurchase price $100,244,611, collateralized by Collateralized Mortgage Obligations, 0.58% — 5.79%, due 11/18/2021 — 11/17/2054, with the value of $108,397,380.
(Cost $100,000,000) | | | 100,000,000 | | | | 100,000,000 | |
| | | | | | | | |
| | |
Total Short-Term Investments
(Cost $4,287,498,718) | | | | | | | 4,289,472,862 | |
| | | | | | | | |
| | |
Total Investments — 101.9%
(Cost $16,381,165,911) | | | | | | | 16,451,124,113 | |
| | |
Liabilities in Excess of
Other Assets — (1.9)% | | | | | | | (307,086,400) | |
| | | | | | | | |
| |
Net Assets — 100.0% | | | | 16,144,037,713 | |
| | | | | | | | |
Percentages indicated are based on net assets.
SEE NOTES TO FINANCIAL STATEMENTS.
| | | | | | | | |
| | | |
| FEBRUARY 28, 2021 | | J.P. MORGAN EXCHANGE-TRADED FUNDS | | | | | 165 | |
JPMorgan Ultra-Short Income ETF
SCHEDULE OF PORTFOLIO INVESTMENTS
AS OF FEBRUARY 28, 2021 (continued)
Abbreviations
| | |
| CIFC | | Commercial Industrial Finance Corp. |
| CLO | | Collateralized Loan Obligations |
| ICE | | Intercontinental Exchange |
| LIBOR | | London Interbank Offered Rate |
| PJSC | | Public Joint Stock Company |
| SOFR | | Secured Overnight Financing Rate |
| USD | | United States Dollar |
| |
| (a) | | Variable or floating rate security, linked to the referenced benchmark. The interest rate shown is the current rate as of February 28, 2021. |
| (b) | | Securities exempt from registration under Rule 144A or section 4(a)(2), of the Securities Act of 1933, as amended. |
| (c) | | The security or a portion of this security is on loan at February 28, 2021. The total value of securities on loan at February 28, 2021 is $37,357,448. |
| (d) | | Step bond. Interest rate is a fixed rate for an initial period that either resets at a specific date or may reset in the future contingent upon a predetermined trigger. The interest rate shown is the current rate as of February 28, 2021. |
| | |
| |
| (e) | | Security exempt from registration pursuant to Regulation S under the Securities Act of 1933, as amended. Regulation S applies to securities offerings that are made outside of the United States and do not involve direct selling efforts in the United States and as such may have restrictions on resale. |
| (f) | | Amount rounds to less than 0.1% of net assets. |
| (g) | | Variable or floating rate security, the interest rate of which adjusts periodically based on changes in current interest rates and prepayments on the underlying pool of assets. The interest rate shown is the current rate as of February 28, 2021. |
| (h) | | All or a portion of the security is a when-issued security, delayed delivery security, or forward commitment. |
| (i) | | The rate shown is the effective yield as of February 28, 2021. |
| (j) | | Investment in an affiliated fund, which is registered under the Investment Company Act of 1940, as amended, and is advised by J.P. Morgan Investment Management Inc. |
| (k) | | The rate shown is the current yield as of February 28, 2021. |
| ‡ | | Value determined using significant unobservable inputs. |
| | | | | | | | | | | | | | | | | | | | |
| Futures contracts outstanding as of February 28, 2021: | | | | | | | | | | | | | | | |
| DESCRIPTION | | NUMBER OF
CONTRACTS | | | EXPIRATION
DATE | | | TRADING
CURRENCY | | | NOTIONAL
AMOUNT ($) | | | VALUE AND
UNREALIZED
APPRECIATION
(DEPRECIATION) ($) | |
Short Contracts | | | | | | | | | | | | | | | | | | | | |
| U.S. Treasury 5 Year Note | | | (359) | | | | 06/2021 | | | | USD | | | | (44,605,750 | ) | | | 232,095 | |
| | | | | | | | | | | | | | | | | | | | |
Abbreviations
SEE NOTES TO FINANCIAL STATEMENTS.
| | | | | | |
| | | |
| 166 | | | | J.P. MORGAN EXCHANGE-TRADED FUNDS | | FEBRUARY 28, 2021 |
JPMorgan Ultra-Short Municipal Income ETF
SCHEDULE OF PORTFOLIO INVESTMENTS
AS OF FEBRUARY 28, 2021
| | | | | | | | |
| INVESTMENTS | | PRINCIPAL
AMOUNT ($) | | | VALUE ($) | |
Municipal Bonds — 88.5% (a) | |
|
Alabama — 0.5% | |
| | |
Alabama 21st Century Authority Series 2012A, Rev., 5.00%, 6/1/2021 | | | 55,000 | | | | 55,640 | |
| | |
Alabama Drinking Water Finance Authority, Revolving Fund Loan Series 2015A, Rev., 5.00%, 8/15/2022 | | | 25,000 | | | | 26,755 | |
| | |
Alabama Federal Aid Highway Finance Authority | | | | | | | | |
| | |
Rev., GAN, 4.00%, 9/1/2021 | | | 25,000 | | | | 25,472 | |
| | |
Series 2012A, Rev., GAN, 5.00%, 9/1/2021 | | | 250,000 | | | | 255,960 | |
| | |
Series A, Rev., 5.00%, 9/1/2023 | | | 25,000 | | | | 27,908 | |
| | |
Alabama Highway Finance Corp., Special Obligation Series 2020A, Rev., 4.00%, 8/1/2021 | | | 340,000 | | | | 345,372 | |
| | |
Alabama Municipal Electric Authority, Power Supply System Series 2013A, Rev., 4.50%, 9/1/2021 (b) | | | 20,000 | | | | 20,429 | |
| | |
Alabama Public School and College Authority, Capital Improvement | | | | | | | | |
| | |
Series 2013B, Rev., 5.00%, 6/1/2021 | | | 50,000 | | | | 50,604 | |
| | |
Series 2013-C, Rev., 5.00%, 9/1/2021 | | | 30,000 | | | | 30,729 | |
| | |
Series 2014B, Rev., 5.00%, 1/1/2022 | | | 80,000 | | | | 83,240 | |
| | |
Series 2014-A, Rev., 5.00%, 2/1/2022 | | | 20,000 | | | | 20,891 | |
| | |
Series 2015A, Rev., 5.00%, 5/1/2022 | | | 100,000 | | | | 105,662 | |
| | |
Series 2015B, Rev., 5.00%, 5/1/2022 | | | 20,000 | | | | 21,132 | |
| | |
Series 2015C, Rev., 5.00%, 6/1/2022 | | | 30,000 | | | | 31,820 | |
| | |
Series C, Rev., 5.00%, 9/1/2022 | | | 40,000 | | | | 42,913 | |
| | |
Series 2020A, Rev., 5.00%, 11/1/2022 | | | 75,000 | | | | 81,056 | |
| | |
Series 2014-B, Rev., 5.00%, 1/1/2023 | | | 50,000 | | | | 54,383 | |
| | |
Alabama Public School and College Authority, Capital Improvement Economic Development and Training | | | | | | | | |
| | |
Series 2012B, Rev., 5.00%, 3/1/2021 | | | 100,000 | | | | 100,000 | |
| | |
Rev., 5.00%, 3/1/2022 | | | 225,000 | | | | 235,939 | |
| | |
Alabama Public School and College Authority, Tax-Exempt Series 2012A, Rev., 5.00%, 3/1/2022 | | | 30,000 | | | | 31,459 | |
| | | | | | | | |
| INVESTMENTS | | PRINCIPAL
AMOUNT ($) | | | VALUE ($) | |
| | | | | | | | |
|
Alabama — continued | |
| | |
Alabama Special Care Facilities Financing Authority-Birmingham, Children’s Hospital Health Care Facility Rev., 5.00%, 6/1/2023 | | | 145,000 | | | | 159,557 | |
| | |
Auburn University, General Fee | | | | | | | | |
| | |
Series 2011A, Rev., 5.00%, 6/1/2021 (b) | | | 30,000 | | | | 30,361 | |
| | |
Series 2011-A, Rev., 5.00%, 6/1/2021 (b) | | | 50,000 | | | | 50,602 | |
| | |
Series 2018A, Rev., 5.00%, 6/1/2021 | | | 40,000 | | | | 40,480 | |
| | |
Series 2015B, Rev., 4.00%, 6/1/2022 | | | 25,000 | | | | 26,189 | |
| | |
Series 2012A, Rev., 5.00%, 6/1/2022 (b) | | | 30,000 | | | | 31,816 | |
| | |
Series 2020A, Rev., 5.00%, 6/1/2022 | | | 25,000 | | | | 26,501 | |
| | |
Auburn Water Works Board Series 2020A, Rev., 3.00%, 9/1/2021 | | | 225,000 | | | | 228,029 | |
| | |
Black Belt Energy Gas District, Gas Prepay Series 2018A, Rev., 4.00%, 12/1/2023 (c) | | | 170,000 | | | | 184,494 | |
| | |
Black Belt Energy Gas District, Gas Supply Series 2016A, Rev., LIQ: Royal Bank of Canada, 4.00%, 6/1/2021 (c) | | | 1,130,000 | | | | 1,138,577 | |
| | |
City of Auburn, Warrants GO, 3.00%, 5/1/2022 | | | 20,000 | | | | 20,660 | |
| | |
City of Daphne, Warrants GO, 3.00%, 4/1/2022 | | | 35,000 | | | | 36,038 | |
| | |
City of Decatur, Sewer | | | | | | | | |
| | |
Rev., 3.50%, 5/1/2022 (b) | | | 110,000 | | | | 114,191 | |
| | |
Rev., 3.00%, 8/15/2022 (b) | | | 20,000 | | | | 20,821 | |
| | |
City of Huntsville, Capital Improvement, Warrants | | | | | | | | |
| | |
Series 2011A, GO, 5.00%, 3/1/2021 | | | 25,000 | | | | 25,000 | |
| | |
Series 2011B, GO, 5.00%, 5/1/2021 (b) | | | 110,000 | | | | 110,859 | |
| | |
Series 2015A, GO, 5.00%, 5/1/2021 | | | 60,000 | | | | 60,478 | |
| | |
GO, 5.00%, 9/1/2021 (b) | | | 115,000 | | | | 117,724 | |
| | |
Series 2020B, GO, 5.00%, 9/1/2023 | | | 30,000 | | | | 33,490 | |
| | |
City of Huntsville, Electric System, Warrants Rev., 5.00%, 12/1/2021 (b) | | | 20,000 | | | | 20,727 | |
| | |
City of Madison, Warrants Series 2011B, GO, 3.45%, 8/1/2021 (b) | | | 25,000 | | | | 25,341 | |
SEE NOTES TO FINANCIAL STATEMENTS.
| | | | | | | | |
| | | |
| FEBRUARY 28, 2021 | | J.P. MORGAN EXCHANGE-TRADED FUNDS | | | | | 167 | |
JPMorgan Ultra-Short Municipal Income ETF
SCHEDULE OF PORTFOLIO INVESTMENTS
AS OF FEBRUARY 28, 2021 (continued)
| | | | | | | | |
| INVESTMENTS | | PRINCIPAL
AMOUNT ($) | | | VALUE ($) | |
Municipal Bonds — continued | | | | | | | | |
|
Alabama — continued | |
| | |
City of Opelika | | | | | | | | |
| | |
GO, 4.00%, 11/1/2021 (b) | | | 100,000 | | | | 102,567 | |
| | |
GO, 4.13%, 11/1/2021 (b) | | | 35,000 | | | | 35,928 | |
| | |
GO, 5.00%, 11/1/2021 (b) | | | 50,000 | | | | 51,615 | |
| | |
City of Orange Beach, Warrants | | | | | | | | |
| | |
GO, 5.00%, 2/1/2022 | | | 25,000 | | | | 26,081 | |
| | |
GO, 5.00%, 8/1/2022 (b) | | | 60,000 | | | | 64,117 | |
| | |
City of Oxford GO, 3.25%, 10/1/2022 (b) | | | 25,000 | | | | 26,211 | |
| | |
City of Trussville | | | | | | | | |
| | |
Series 2014A, GO, 5.00%, 10/1/2021 | | | 100,000 | | | | 102,819 | |
| | |
Series 2014A, GO, 5.00%, 10/1/2023 (b) | | | 25,000 | | | | 28,053 | |
| | |
City of Tuscaloosa | | | | | | | | |
| | |
Series 2014A, GO, 5.00%, 7/1/2022 | | | 25,000 | | | | 26,573 | |
| | |
Series 2020A, GO, 3.00%, 10/1/2022 | | | 20,000 | | | | 20,847 | |
| | |
County of Baldwin GO, 5.00%, 6/1/2021 | | | 20,000 | | | | 20,240 | |
| | |
County of Lee Series 2013A, GO, 5.00%, 8/1/2021 | | | 40,000 | | | | 40,804 | |
| | |
County of Mobile | | | | | | | | |
| | |
Series 2014A, GO, 5.00%, 6/1/2022 | | | 40,000 | | | | 42,411 | |
| | |
Series 2020B, GO, 4.00%, 8/1/2023 | | | 25,000 | | | | 27,185 | |
| | |
County of Montgomery GO, 5.00%, 3/1/2021 | | | 30,000 | | | | 30,000 | |
| | |
Foley Utilities Board Rev., 5.00%, 5/1/2022 (b) | | | 105,000 | | | | 110,805 | |
| | |
Hoover City Board of Education | | | | | | | | |
| | |
4.00%, 2/15/2022 | | | 30,000 | | | | 31,099 | |
| | |
5.00%, 2/15/2023 | | | 50,000 | | | | 53,404 | |
| | |
Limestone County Water & Sewer Authority Rev., 5.00%, 12/1/2022 | | | 115,000 | | | | 124,369 | |
| | |
Madison County Board of Education | | | | | | | | |
| | |
Series 2019C, 5.00%, 3/1/2021 | | | 25,000 | | | | 25,000 | |
| | |
Rev., AGM, 4.50%, 9/1/2021 (b) | | | 40,000 | | | | 40,868 | |
| | |
Madison Water and Wastewater Board Rev., 5.00%, 12/1/2022 | | | 55,000 | | | | 59,592 | |
| | |
Montgomery County Public Education Cooperative District, Public Schools Project | | | | | | | | |
| | |
Rev., 5.00%, 4/1/2021 | | | 100,000 | | | | 100,391 | |
| | |
Rev., 5.00%, 4/1/2023 | | | 200,000 | | | | 218,722 | |
| | |
Oxford Public Building Authority, Oxford Project Series 2015A, Rev., 5.00%, 10/1/2022 | | | 25,000 | | | | 26,889 | |
| | | | | | | | |
| INVESTMENTS | | PRINCIPAL
AMOUNT ($) | | | VALUE ($) | |
| | | | | | | | |
|
Alabama — continued | |
| | |
State of Alabama | | | | | | | | |
| | |
Series 2013-A, GO, 5.00%, 8/1/2021 | | | 25,000 | | | | 25,502 | |
| | |
Series 2014-A, GO, 5.00%, 8/1/2021 | | | 105,000 | | | | 107,111 | |
| | |
Series 2016C, GO, 5.00%, 8/1/2022 | | | 30,000 | | | | 32,050 | |
| | |
Series 2016A, GO, 5.00%, 11/1/2022 | | | 50,000 | | | | 54,011 | |
| | |
State of Alabama, Capital Improvement | | | | | | | | |
| | |
Series 2013B, GO, 5.00%, 8/1/2021 | | | 50,000 | | | | 51,005 | |
| | |
Series 2013B, GO, 5.00%, 8/1/2022 | | | 45,000 | | | | 48,075 | |
| | |
UAB Medicine Finance Authority Series 2016B, Rev., 5.00%, 9/1/2023 | | | 135,000 | | | | 149,703 | |
| | |
University of Alabama (The) | | | | | | | | |
| | |
Rev., 5.00%, 7/1/2021 | | | 20,000 | | | | 20,318 | |
| | |
Series 2019B, Rev., 4.00%, 7/1/2022 | | | 35,000 | | | | 36,761 | |
| | |
Series 2019A, Rev., 5.00%, 7/1/2022 | | | 30,000 | | | | 31,908 | |
| | |
University of Alabama at Birmingham | | | | | | | | |
| | |
Series 2013-A2, Rev., 5.00%, 10/1/2021 | | | 50,000 | | | | 51,394 | |
| | |
Series 2019A, Rev., 4.00%, 10/1/2022 | | | 165,000 | | | | 174,862 | |
| | |
Series 2015A, Rev., 5.00%, 10/1/2022 | | | 25,000 | | | | 26,889 | |
| | |
Water Works Board of the City of Birmingham (The) | | | | | | | | |
| | |
Series 2015A, Rev., 5.00%, 1/1/2022 | | | 45,000 | | | | 46,811 | |
| | |
Series 2015B, Rev., 5.00%, 1/1/2022 | | | 30,000 | | | | 31,207 | |
| | | | | | | | |
| | |
Total Alabama | | | | | | | 6,473,496 | |
| | | | | | | | |
| | |
Alaska — 0.6% | | | | | | | | |
| | |
Alaska Housing Finance Corp., General Mortgage Series A, Rev., 1.50%, 6/1/2024 | | | 305,000 | | | | 313,140 | |
| | |
Alaska Housing Finance Corp., State Capital Project | | | | | | | | |
| | |
Series 2017A, Rev., 5.00%, 6/1/2021 | | | 25,000 | | | | 25,292 | |
| | |
Rev., 5.00%, 12/1/2021 | | | 100,000 | | | | 103,528 | |
| | |
Series 2013A, Rev., 5.00%, 12/1/2021 | | | 45,000 | | | | 46,588 | |
| | |
Series 2014D, Rev., 5.00%, 12/1/2021 | | | 100,000 | | | | 103,528 | |
SEE NOTES TO FINANCIAL STATEMENTS.
| | | | | | |
| | | |
| 168 | | | | J.P. MORGAN EXCHANGE-TRADED FUNDS | | FEBRUARY 28, 2021 |
| | | | | | | | |
| INVESTMENTS | | PRINCIPAL
AMOUNT ($) | | | VALUE ($) | |
Municipal Bonds — continued | | | | | | | | |
|
Alaska — continued | |
| | |
Rev., 5.00%, 6/1/2022 (b) | | | 55,000 | | | | 58,235 | |
| | |
Series 2013A, Rev., 5.00%, 6/1/2022 | | | 100,000 | | | | 105,794 | |
| | |
Alaska Industrial Development and Export Authority, Greater Fairbanks Community Hospital Foundation Project | | | | | | | | |
| | |
Rev., 5.00%, 4/1/2021 | | | 1,125,000 | | | | 1,129,174 | |
| | |
Rev., 5.00%, 4/1/2022 | | | 200,000 | | | | 209,910 | |
| | |
Alaska Municipal Bond Bank Authority | | | | | | | | |
| | |
Series 2015A-2, Rev., 5.00%, 3/1/2021 | | | 125,000 | | | | 125,000 | |
| | |
Series 2013-3, Rev., 4.00%, 8/1/2021 | | | 25,000 | | | | 25,373 | |
| | |
Series 2012-2, Rev., 4.00%, 9/1/2021 | | | 280,000 | | | | 285,015 | |
| | |
Series 2014-3, Rev., 5.00%, 10/1/2021 | | | 305,000 | | | | 313,143 | |
| | |
Series 2016-3, Rev., 4.00%, 12/1/2021 | | | 165,000 | | | | 169,439 | |
| | |
Series 1, Rev., 5.00%, 12/1/2021 | | | 450,000 | | | | 465,462 | |
| | |
Series 2012-3, Rev., 5.00%, 7/1/2022 | | | 200,000 | | | | 212,168 | |
| | |
Alaska Railroad Corp. Series 2015A, Rev., 5.00%, 8/1/2021 | | | 550,000 | | | | 560,566 | |
| | |
Borough of Fairbanks North Star Series 2011-Q, GO, 5.00%, 9/1/2021 | | | 40,000 | | | | 40,964 | |
| | |
Borough of Matanuska-Susitna | | | | | | | | |
| | |
Series 2007A, GO, NATL-RE, 5.00%, 4/1/2021 | | | 35,000 | | | | 35,135 | |
| | |
Series 2014B, GO, 5.00%, 11/1/2021 | | | 170,000 | | | | 175,399 | |
| | |
Series 2016A, GO, 5.00%, 7/1/2022 | | | 20,000 | | | | 21,267 | |
| | |
Borough of Matanuska-Susitna, Goose Creek Correctional Center Project | | | | | | | | |
| | |
Rev., 5.00%, 9/1/2021 | | | 195,000 | | | | 199,600 | |
| | |
Rev., 5.00%, 9/1/2024 | | | 260,000 | | | | 294,310 | |
| | |
Borough of Matanuska-Susitna, Transportation System | | | | | | | | |
| | |
Series 2014A, GO, 5.00%, 8/1/2021 | | | 20,000 | | | | 20,396 | |
| | |
Series 2015C, GO, 5.00%, 11/1/2021 | | | 35,000 | | | | 36,111 | |
| | |
Series 2012D, GO, 4.50%, 4/1/2022 (b) | | | 30,000 | | | | 31,412 | |
| | |
Borough of North Slope | | | | | | | | |
| | |
Series 2012A, GO, 5.00%, 6/30/2021 | | | 20,000 | | | | 20,310 | |
| | | | | | | | |
| INVESTMENTS | | PRINCIPAL
AMOUNT ($) | | | VALUE ($) | |
| | | | | | | | |
|
Alaska — continued | |
| | |
Series 2016B, GO, 5.00%, 6/30/2021 (b) | | | 240,000 | | | | 243,828 | |
| | |
Series 2018A, GO, 5.00%, 6/30/2021 | | | 120,000 | | | | 121,863 | |
| | |
Series 2018B, GO, 5.00%, 6/30/2021 | | | 90,000 | | | | 91,397 | |
| | |
Series 2014B, GO, 5.00%, 10/30/2021 | | | 35,000 | | | | 36,095 | |
| | |
Series 2012A, GO, 5.00%, 6/30/2022 | | | 20,000 | | | | 21,250 | |
| | |
Series 2016A, GO, 5.00%, 6/30/2022 | | | 175,000 | | | | 185,939 | |
| | |
Series 2015B, GO, 5.00%, 6/30/2025 | | | 100,000 | | | | 101,495 | |
| | |
Municipality of Anchorage | | | | | | | | |
| | |
Series 2007B, GO, NATL-RE, 5.00%, 9/1/2021 | | | 65,000 | | | | 66,556 | |
| | |
Series 2018B, GO, 5.00%, 9/1/2021 | | | 400,000 | | | | 409,576 | |
| | |
Series B, GO, 5.00%, 9/1/2021 | | | 100,000 | | | | 102,394 | |
| | |
Series C, GO, 5.00%, 9/1/2021 | | | 280,000 | | | | 286,703 | |
| | |
Series D, GO, 5.00%, 9/1/2021 | | | 75,000 | | | | 76,795 | |
| | |
Series A, GO, 5.00%, 8/1/2022 | | | 20,000 | | | | 21,355 | |
| | |
Series 2018D, GO, 4.00%, 9/1/2022 | | | 25,000 | | | | 26,420 | |
| | |
Series 2018A, GO, 5.00%, 9/1/2022 | | | 50,000 | | | | 53,586 | |
| | |
Series 2108B, GO, 5.00%, 9/1/2022 | | | 55,000 | | | | 58,945 | |
| | |
Series B, GO, 5.00%, 9/1/2022 | | | 125,000 | | | | 133,965 | |
| | |
Series D, GO, 5.00%, 9/1/2022 | | | 70,000 | | | | 75,020 | |
| | |
State of Alaska, Native Tribal Health Consortium | | | | | | | | |
| | |
COP, 5.00%, 6/1/2021 | | | 225,000 | | | | 227,587 | |
| | |
COP, 4.00%, 6/1/2022 | | | 295,000 | | | | 308,349 | |
| | |
University of Alaska Series 2011Q, Rev., 4.00%, 10/1/2021 (b) | | | 135,000 | | | | 137,990 | |
| | | | | | | | |
| | |
Total Alaska | | | | | | | 7,913,367 | |
| | | | | | | | |
| | |
Arizona — 1.1% | | | | | | | | |
| | |
Arizona Department of Transportation State Highway Fund | | | | | | | | |
| | |
Series 2011A, Rev., 5.00%, 7/1/2021 (b) | | | 125,000 | | | | 127,013 | |
| | |
Series 2013A, Rev., 5.00%, 7/1/2021 | | | 70,000 | | | | 71,128 | |
| | |
Series 2013A, Rev., 5.00%, 7/1/2022 (b) | | | 160,000 | | | | 170,316 | |
| | |
Arizona Health Facilities Authority, Banner Health Series 2015A, Rev., 5.00%, 1/1/2022 | | | 150,000 | | | | 155,907 | |
SEE NOTES TO FINANCIAL STATEMENTS.
| | | | | | | | |
| | | |
| FEBRUARY 28, 2021 | | J.P. MORGAN EXCHANGE-TRADED FUNDS | | | | | 169 | |
JPMorgan Ultra-Short Municipal Income ETF
SCHEDULE OF PORTFOLIO INVESTMENTS
AS OF FEBRUARY 28, 2021 (continued)
| | | | | | | | |
| INVESTMENTS | | PRINCIPAL
AMOUNT ($) | | | VALUE ($) | |
Municipal Bonds — continued | | | | | | | | |
| | |
Arizona — continued | | | | | | | | |
| | |
Arizona Health Facilities Authority, Common Spirit Health Series B-1, Rev., 5.25%, 3/1/2021 (b) | | | 95,000 | | | | 95,000 | |
| | |
Arizona Health Facilities Authority, Scottsdale Lincoln Hospitals Rev., 5.00%, 12/1/2023 | | | 120,000 | | | | 135,252 | |
| | |
Arizona Industrial Development Authority, Equitable School Revolving Fund | | | | | | | | |
| | |
Series 2019A, Rev., 5.00%, 11/1/2021 | | | 190,000 | | | | 195,607 | |
| | |
Series 2019A, Rev., 5.00%, 11/1/2022 | | | 450,000 | | | | 482,963 | |
| | |
Series 2019A, Rev., 5.00%, 11/1/2024 | | | 75,000 | | | | 86,345 | |
| | |
Arizona School Facilities Board Series 2015A, COP, 5.00%, 9/1/2021 | | | 120,000 | | | | 122,886 | |
| | |
Arizona State University | | | | | | | | |
| | |
Series 2012A, Rev., 3.00%, 7/1/2022 | | | 25,000 | | | | 25,926 | |
| | |
Series 2016A, Rev., 5.00%, 7/1/2022 | | | 25,000 | | | | 26,590 | |
| | |
Series 2017A, Rev., 5.00%, 7/1/2022 | | | 45,000 | | | | 47,863 | |
| | |
Arizona State University, Green Bond | | | | | | | | |
| | |
Series 2015A, Rev., 5.00%, 7/1/2022 | | | 30,000 | | | | 31,909 | |
| | |
Series 2016B, Rev., 5.00%, 7/1/2022 | | | 25,000 | | | | 26,590 | |
| | |
Arizona State University, Maricopa County Regional Area Road Fund | | | | | | | | |
| | |
Rev., 5.00%, 7/1/2021 | | | 340,000 | | | | 345,481 | |
| | |
Rev., 5.00%, 7/1/2022 | | | 130,000 | | | | 138,395 | |
| | |
Rev., 5.00%, 7/1/2025 | | | 40,000 | | | | 47,686 | |
| | |
Arizona Transportation Board Series 2019A, Rev., GAN, 5.00%, 7/1/2021 | | | 65,000 | | | | 66,048 | |
| | |
Arizona Transportation Board, Excise Tax, Maricopa County Regional Area Road Fund Rev., 5.00%, 7/1/2022 | | | 25,000 | | | | 26,614 | |
| | |
Arizona Water Infrastructure Finance Authority, Water Quality Series 2014A, Rev., 5.00%, 10/1/2021 | | | 225,000 | | | | 231,275 | |
| | |
Central Arizona Water Conservation District, Central Arizona Project Rev., 5.00%, 1/1/2022 | | | 25,000 | | | | 26,006 | |
| | | | | | | | |
| INVESTMENTS | | PRINCIPAL
AMOUNT ($) | | | VALUE ($) | |
| | | | | | | | |
| | |
Arizona — continued | | | | | | | | |
| | |
Chandler Industrial Development Authority, Intel Corp. Project Rev., 2.40%, 8/14/2023 (c) | | | 2,170,000 | | | | 2,270,037 | |
| | |
City of Avondale GO, 5.00%, 7/1/2022 | | | 80,000 | | | | 85,144 | |
| | |
City of Buckeye, Excise Tax | | | | | | | | |
| | |
Rev., 5.00%, 7/1/2022 | | | 20,000 | | | | 21,286 | |
| | |
Rev., 5.00%, 7/1/2023 | | | 25,000 | | | | 27,695 | |
| | |
City of Bullhead, Excise Taxes Rev., 4.00%, 7/1/2022 | | | 25,000 | | | | 26,203 | |
| | |
City of Flagstaff | | | | | | | | |
| | |
GO, 5.00%, 7/1/2021 | | | 30,000 | | | | 30,482 | |
| | |
Series 2014B, GO, 5.00%, 7/1/2021 | | | 20,000 | | | | 20,321 | |
| | |
City of Flagstaff, Road Repair, Street Improvement Project | | | | | | | | |
| | |
Rev., 4.00%, 7/1/2021 | | | 25,000 | | | | 25,319 | |
| | |
Rev., 4.00%, 7/1/2023 | | | 20,000 | | | | 21,692 | |
| | |
City of Glendale, Excise Tax Rev., 5.00%, 7/1/2021 | | | 90,000 | | | | 91,400 | |
| | |
City of Glendale, Water and Sewer, Senior Lien Rev., 5.00%, 7/1/2021 | | | 140,000 | | | | 142,223 | |
| | |
City of Goodyear GO, 3.00%, 7/1/2021 | | | 20,000 | | | | 20,186 | |
| | |
City of Mesa | | | | | | | | |
| | |
Rev., 5.00%, 7/1/2021 | | | 25,000 | | | | 25,389 | |
| | |
GO, 2.00%, 7/1/2022 | | | 30,000 | | | | 30,733 | |
| | |
City of Mesa, Utility System Rev., 5.00%, 7/1/2022 | | | 50,000 | | | | 53,215 | |
| | |
City of Phoenix Series 2012C, GO, 4.00%, 7/1/2022 | | | 185,000 | | | | 194,439 | |
| | |
City of Phoenix Civic Improvement Corp., Excise Tax Series 2017B, Rev., 5.00%, 7/1/2022 | | | 135,000 | | | | 143,625 | |
| | |
City of Phoenix Civic Improvement Corp., Junior Lien Airport | | | | | | | | |
| | |
Rev., 5.00%, 7/1/2022 | | | 25,000 | | | | 26,604 | |
| | |
Series 2017D, Rev., 5.00%, 7/1/2024 | | | 400,000 | | | | 458,684 | |
| | |
City of Phoenix Civic Improvement Corp., Wastewater System, Junior Lien | | | | | | | | |
| | |
Rev., 4.00%, 7/1/2021 | | | 65,000 | | | | 65,827 | |
| | |
Rev., 5.00%, 7/1/2021 | | | 75,000 | | | | 76,202 | |
| | |
Rev., 5.00%, 7/1/2022 | | | 20,000 | | | | 21,283 | |
| | |
Series 2018B, Rev., 5.00%, 7/1/2022 | | | 25,000 | | | | 26,597 | |
| | |
City of Phoenix Civic Improvement Corp., Water System | | | | | | | | |
| | |
Series 2014A, Rev., 4.00%, 7/1/2021 | | | 25,000 | | | | 25,318 | |
SEE NOTES TO FINANCIAL STATEMENTS.
| | | | | | |
| | | |
| 170 | | | | J.P. MORGAN EXCHANGE-TRADED FUNDS | | FEBRUARY 28, 2021 |
| | | | | | | | |
| INVESTMENTS | | PRINCIPAL
AMOUNT ($) | | | VALUE ($) | |
Municipal Bonds — continued | | | | | | | | |
| | |
Arizona — continued | | | | | | | | |
| | |
Rev., 5.00%, 7/1/2021 | | | 75,000 | | | | 76,201 | |
| | |
Series 2014B, Rev., 5.00%, 7/1/2021 | | | 50,000 | | | | 50,801 | |
| | |
City of Phoenix Civic Improvement Corp., Water System, Junior Lien | | | | | | | | |
| | |
Rev., NATL-RE, 5.50%, 7/1/2021 | | | 75,000 | | | | 76,320 | |
| | |
Rev., 5.00%, 7/1/2022 | | | 25,000 | | | | 26,597 | |
| | |
City of Scottsdale | | | | | | | | |
| | |
GO, 3.00%, 7/1/2021 | | | 115,000 | | | | 116,093 | |
| | |
GO, 3.00%, 7/1/2022 | | | 25,000 | | | | 25,950 | |
| | |
GO, 5.00%, 7/1/2022 | | | 65,000 | | | | 69,198 | |
| | |
City of Surprise, Utility System | | | | | | | | |
| | |
Rev., 5.00%, 7/1/2021 | | | 30,000 | | | | 30,476 | |
| | |
Rev., 5.00%, 7/1/2022 | | | 110,000 | | | | 116,997 | |
| | |
City of Tempe | | | | | | | | |
| | |
Series 2016B, GO, 2.00%, 7/1/2021 | | | 50,000 | | | | 50,307 | |
| | |
Series 2013B, GO, 4.00%, 7/1/2021 | | | 25,000 | | | | 25,319 | |
| | |
Series 2014C, GO, 4.00%, 7/1/2022 | | | 25,000 | | | | 26,275 | |
| | |
City of Tempe, Excise Tax | | | | | | | | |
| | |
Rev., 5.00%, 7/1/2021 | | | 90,000 | | | | 91,445 | |
| | |
Series 2011A, Rev., 5.00%, 7/1/2021 | | | 25,000 | | | | 25,401 | |
| | |
City of Tucson, Water System | | | | | | | | |
| | |
Series 2013A, Rev., 3.00%, 7/1/2021 | | | 25,000 | | | | 25,236 | |
| | |
Rev., 5.00%, 7/1/2021 | | | 25,000 | | | | 25,401 | |
| | |
Rev., 5.00%, 7/1/2022 | | | 25,000 | | | | 26,608 | |
| | |
County of Maricopa | | | | | | | | |
| | |
Series 2018A, COP, 5.00%, 7/1/2021 | | | 100,000 | | | | 101,609 | |
| | |
COP, 5.00%, 7/1/2022 | | | 370,000 | | | | 393,843 | |
| | |
County of Pima, Sewer System | | | | | | | | |
| | |
Series 2012A, Rev., 3.00%, 7/1/2021 | | | 20,000 | | | | 20,189 | |
| | |
Rev., 5.00%, 7/1/2021 | | | 145,000 | | | | 147,333 | |
| | |
Series 2011B, Rev., 5.00%, 7/1/2021 (b) | | | 185,000 | | | | 187,977 | |
| | |
Series B, Rev., 5.00%, 7/1/2021 (b) | | | 175,000 | | | | 177,816 | |
| | |
Rev., 5.00%, 7/1/2022 | | | 85,000 | | | | 90,477 | |
| | |
County of Pima, Street and Highway | | | | | | | | |
| | |
Rev., 5.00%, 7/1/2021 | | | 35,000 | | | | 35,557 | |
| | |
Rev., 3.00%, 7/1/2022 | | | 45,000 | | | | 46,674 | |
| | |
County of Pinal | | | | | | | | |
| | |
Rev., 5.00%, 8/1/2022 | | | 25,000 | | | | 26,690 | |
| | |
Rev., 5.00%, 8/1/2023 | | | 35,000 | | | | 38,676 | |
| | | | | | | | |
| INVESTMENTS | | PRINCIPAL
AMOUNT ($) | | | VALUE ($) | |
| | | | | | | | |
| | |
Arizona — continued | | | | | | | | |
| | |
Gila County Unified School District No. 10-Payson GO, 5.00%, 7/1/2023 | | | 20,000 | | | | 22,107 | |
| | |
Gilbert Public Facilities Municipal Property Corp. | | | | | | | | |
| | |
Rev., 4.75%, 7/1/2021 | | | 65,000 | | | | 65,990 | |
| | |
Rev., 5.00%, 7/1/2021 | | | 25,000 | | | | 25,401 | |
| | |
Gilbert Water Resource Municipal Property Corp., Senior Lien Rev., 5.00%, 7/1/2022 | | | 45,000 | | | | 47,894 | |
| | |
Glendale Union High School District No. 205 Series 2019C, GO, 5.00%, 7/1/2021 | | | 180,000 | | | | 182,830 | |
| | |
Goodyear Public Improvement Corp. Series 2011A, Rev., 5.00%, 7/1/2025 | | | 350,000 | | | | 371,802 | |
| | |
Industrial Development Authority of the County of Yavapai (The), Regional Medical Center Series 2013A, Rev., 4.00%, 8/1/2021 | | | 135,000 | | | | 137,013 | |
| | |
Kyrene Elementary School District No. 28 | | | | | | | | |
| | |
GO, 4.00%, 7/1/2022 | | | 20,000 | | | | 21,021 | |
| | |
GO, 4.00%, 7/1/2023 | | | 20,000 | | | | 21,702 | |
| | |
Kyrene Elementary School District No. 28, School Improvement Project | | | | | | | | |
| | |
Series 2020B, GO, 5.00%, 7/1/2021 | | | 40,000 | | | | 40,635 | |
| | |
Series 2016A, GO, 5.00%, 7/1/2022 | | | 20,000 | | | | 21,286 | |
| | |
Series 2020B, GO, 5.00%, 7/1/2022 | | | 30,000 | | | | 31,929 | |
| | |
Madison Elementary School District No. 38, School Improvement, Project of 2014 | | | | | | | | |
| | |
Series 2017B, GO, 5.00%, 7/1/2021 | | | 40,000 | | | | 40,641 | |
| | |
Series 2019C, GO, 5.00%, 7/1/2023 | | | 25,000 | | | | 27,726 | |
| | |
Madison Elementary School District No. 38, School Improvement, Project of 2019 | | | | | | | | |
| | |
Series 2020A, GO, 5.00%, 7/1/2021 | | | 40,000 | | | | 40,641 | |
| | |
Series 2020A, GO, 5.00%, 7/1/2023 | | | 45,000 | | | | 49,907 | |
| | |
Maricopa County Community College District, Project of 2004 | | | | | | | | |
| | |
Series 2011D, GO, 4.00%, 7/1/2021 | | | 20,000 | | | | 20,255 | |
| | |
Series 2011D, GO, 4.00%, 7/1/2022 | | | 155,000 | | | | 156,965 | |
| | |
Maricopa County Elementary School District No. 14 Creighton, School Improvement, Project of 2016 Series 2017A, GO, 5.00%, 7/1/2021 | | | 200,000 | | | | 203,110 | |
SEE NOTES TO FINANCIAL STATEMENTS.
| | | | | | | | |
| | | |
| FEBRUARY 28, 2021 | | J.P. MORGAN EXCHANGE-TRADED FUNDS | | | | | 171 | |
JPMorgan Ultra-Short Municipal Income ETF
SCHEDULE OF PORTFOLIO INVESTMENTS
AS OF FEBRUARY 28, 2021 (continued)
| | | | | | | | |
| INVESTMENTS | | PRINCIPAL
AMOUNT ($) | | | VALUE ($) | |
Municipal Bonds — continued | | | | | | | | |
| | |
Arizona — continued | | | | | | | | |
| | |
Maricopa County Elementary School District No. 92 Pendergast Elementary, School Improvement, Project of 2016 Series 2017A, GO, 5.00%, 7/1/2021 | | | 50,000 | | | | 50,780 | |
| | |
Maricopa County Industrial Development Authority, Banner Health Series C, Rev., 5.00%, 10/18/2024 (c) | | | 165,000 | | | | 190,902 | |
| | |
Maricopa County Industrial Development Authority, HonorHealth | | | | | | | | |
| | |
Series 2019A, Rev., 5.00%, 9/1/2021 | | | 150,000 | | | | 153,432 | |
| | |
Series 2019A, Rev., 5.00%, 9/1/2023 | | | 135,000 | | | | 150,705 | |
| | |
Maricopa County School District No. 3 Tempe Elementary | | | | | | | | |
| | |
GO, 3.00%, 7/1/2021 | | | 45,000 | | | | 45,425 | |
| | |
GO, 4.00%, 7/1/2022 | | | 25,000 | | | | 26,275 | |
| | |
GO, 4.00%, 7/1/2023 | | | 35,000 | | | | 37,962 | |
| | |
Maricopa County Special Health Care District, Integrated Health Services Series 2018C, GO, 5.00%, 7/1/2021 | | | 50,000 | | | | 50,786 | |
| | |
Maricopa County Unified School District No. 48 Scottsdale, School Improvement, Project of 2016 GO, 5.00%, 7/1/2021 | | | 220,000 | | | | 223,524 | |
| | |
Maricopa County Unified School District No. 69 Paradise Valley, School Improvement, Project of 2015 | | | | | | | | |
| | |
Series 2018D, GO, 5.00%, 7/1/2021 | | | 25,000 | | | | 25,401 | |
| | |
Series 2017B, GO, 5.00%, 7/1/2022 | | | 35,000 | | | | 37,250 | |
| | |
Series 2018D, GO, 5.00%, 7/1/2022 | | | 25,000 | | | | 26,608 | |
| | |
Maricopa County Unified School District No. 80 Chandler | | | | | | | | |
| | |
Series 2017B, GO, 3.50%, 7/1/2022 | | | 25,000 | | | | 26,116 | |
| | |
GO, 5.00%, 7/1/2022 | | | 20,000 | | | | 21,292 | |
| | |
Maricopa County Unified School District No. 95, Queen Creek, School Improvement | | | | | | | | |
| | |
GO, 5.00%, 7/1/2021 | | | 50,000 | | | | 50,782 | |
| | |
GO, 5.00%, 7/1/2022 | | | 45,000 | | | | 47,788 | |
| | |
Maricopa County Unified School District No. 97 Deer Valley, School Improvement, Project of 2013 | | | | | | | | |
| | |
Series 2017C, GO, 5.00%, 7/1/2021 | | | 40,000 | | | | 40,639 | |
| | |
Series 2017C, GO, 5.00%, 7/1/2022 | | | 30,000 | | | | 31,921 | |
| | |
Maricopa County Union High School District No. 210 Phoenix, School Improvement | | | | | | | | |
| | |
Series 2017E, GO, 5.00%, 7/1/2021 | | | 60,000 | | | | 60,959 | |
| | | | | | | | |
| INVESTMENTS | | PRINCIPAL
AMOUNT ($) | | | VALUE ($) | |
| | | | | | | | |
| | |
Arizona — continued | | | | | | | | |
| | |
GO, 3.00%, 7/1/2022 | | | 30,000 | | | | 31,124 | |
| | |
Series 2014C, GO, 3.00%, 7/1/2022 | | | 25,000 | | | | 25,936 | |
| | |
GO, 5.00%, 7/1/2022 | | | 80,000 | | | | 85,122 | |
| | |
Maricopa County Union High School District No. 216 Agua Fria, School Improvement | | | | | | | | |
| | |
Series 2012A, GO, 3.00%, 7/1/2022 | | | 25,000 | | | | 25,936 | |
| | |
Series 2017B, GO, 5.00%, 7/1/2022 | | | 25,000 | | | | 26,601 | |
| | |
Series 2014B, GO, 3.00%, 7/1/2023 | | | 30,000 | | | | 31,843 | |
| | |
Mohave County Unified School District No. 1 Lake Havasu, School Improvement, Project of 2016 Series 2017A, GO, 4.00%, 7/1/2023 | | | 45,000 | | | | 48,808 | |
| | |
Pima County Community College District Rev., 5.00%, 7/1/2021 | | | 295,000 | | | | 299,685 | |
| | |
Pima County Elementary School District No. 39 Continental, School Improvement, Project of 2010 Series 2012B, GO, AGM, 4.00%, 7/1/2021 | | | 50,000 | | | | 50,604 | |
| | |
Pima County Regional Transportation Authority, Excise Tax | | | | | | | | |
| | |
Rev., 5.00%, 6/1/2021 (b) | | | 370,000 | | | | 374,377 | |
| | |
Rev., 5.00%, 6/1/2022 | | | 60,000 | | | | 63,586 | |
| | |
Rev., 5.00%, 6/1/2024 | | | 60,000 | | | | 68,879 | |
| | |
Pima County Unified School District No. 1 Tucson GO, 5.00%, 7/1/2021 | | | 95,000 | | | | 96,477 | |
| | |
Pima County Unified School District No. 20 Vail, School Improvement GO, AGM, 4.00%, 7/1/2021 | | | 50,000 | | | | 50,614 | |
| | |
Pinal County Community College District, Central Arizona College Rev., 5.00%, 7/1/2021 | | | 65,000 | | | | 66,011 | |
| | |
Pinal County School District No. 2 Oracle Elementary, Project 2019 Series 2020A, GO, 3.00%, 7/1/2021 | | | 60,000 | | | | 60,527 | |
| | |
Pinal County School District No. 20 Maricopa GO, 3.00%, 7/1/2021 | | | 25,000 | | | | 25,224 | |
| | |
Regional Public Transportation Authority, Transportation Excise Tax, Maricopa County Public Transportation Fund | | | | | | | | |
| | |
Rev., 5.00%, 7/1/2021 | | | 80,000 | | | | 81,282 | |
| | |
Rev., 5.25%, 7/1/2021 | | | 90,000 | | | | 91,516 | |
| | |
Rev., 5.25%, 7/1/2022 | | | 150,000 | | | | 160,143 | |
| | |
Rev., 5.25%, 7/1/2023 | | | 25,000 | | | | 27,890 | |
SEE NOTES TO FINANCIAL STATEMENTS.
| | | | | | |
| | | |
| 172 | | | | J.P. MORGAN EXCHANGE-TRADED FUNDS | | FEBRUARY 28, 2021 |
| | | | | | | | |
| INVESTMENTS | | PRINCIPAL
AMOUNT ($) | | | VALUE ($) | |
Municipal Bonds — continued | | | | | | | | |
| | |
Arizona — continued | | | | | | | | |
| | |
Salt River Project Agricultural Improvement and Power District, Arizona Salt River Project | | | | | | | | |
| | |
Series 2015A, Rev., 5.00%, 12/1/2021 | | | 175,000 | | | | 181,349 | |
| | |
Series 2011A, Rev., 5.00%, 12/1/2022 | | | 150,000 | | | | 155,396 | |
| | |
Series 2015A, Rev., 5.00%, 12/1/2022 | | | 25,000 | | | | 27,106 | |
| | |
Series 2016A, Rev., 5.00%, 1/1/2023 | | | 30,000 | | | | 32,612 | |
| | |
Series 2011A, Rev., 5.00%, 12/1/2023 | | | 50,000 | | | | 51,798 | |
| | |
Series 2011A, Rev., 5.00%, 12/1/2024 | | | 270,000 | | | | 279,712 | |
| | |
Scottsdale Municipal Property Corp., Excise Tax | | | | | | | | |
| | |
Rev., 5.00%, 7/1/2021 | | | 155,000 | | | | 157,499 | |
| | |
Rev., 5.00%, 7/1/2022 | | | 30,000 | | | | 31,929 | |
| | |
Scottsdale Preserve Authority, Excise Tax Rev., 5.00%, 7/1/2021 | | | 20,000 | | | | 20,321 | |
| | |
Sedona-Oak Creek Joint Unified School District No. 9 | | | | | | | | |
| | |
GO, 4.00%, 7/1/2021 | | | 20,000 | | | | 20,255 | |
| | |
GO, 5.00%, 7/1/2021 | | | 65,000 | | | | 66,043 | |
| | |
State of Arizona COP, 5.00%, 10/1/2021 | | | 25,000 | | | | 25,708 | |
| | |
State of Arizona Lottery Rev., 5.00%, 7/1/2022 | | | 25,000 | | | | 26,614 | |
| | |
Town of Queen Creek, Excise Tax | | | | | | | | |
| | |
Series 2018B, Rev., 4.00%, 8/1/2021 | | | 25,000 | | | | 25,383 | |
| | |
Rev., 4.00%, 8/1/2022 | | | 40,000 | | | | 42,075 | |
| | |
Rev., 5.00%, 8/1/2022 | | | 45,000 | | | | 47,969 | |
| | |
University of Arizona (The), Stimulus Plan for Economic and Educational Development Rev., 5.00%, 8/1/2023 | | | 150,000 | | | | 152,989 | |
| | |
Yavapai County Union High School District No. 4 Mingus GO, 4.00%, 7/1/2021 | | | 25,000 | | | | 25,306 | |
| | | | | | | | |
| | |
Total Arizona | | | | | | | 14,753,821 | |
| | | | | | | | |
| | |
Arkansas — 0.3% | | | | | | | | |
| | |
Arkansas Development Finance Authority, Cancer Research Project Rev., AMBAC, Zero Coupon, 7/1/2023 | | | 75,000 | | | | 73,804 | |
| | | | | | | | |
| INVESTMENTS | | PRINCIPAL
AMOUNT ($) | | | VALUE ($) | |
| | | | | | | | |
| | |
Arkansas — continued | | | | | | | | |
| | |
Arkansas Development Finance Authority, Capital Improvement Series 2011C, Rev., 5.00%, 6/1/2021 | | | 35,000 | | | | 35,420 | |
| | |
Blytheville School District No. 5 Series A, GO, 3.50%, 3/15/2021 | | | 745,000 | | | | 745,887 | |
| | |
City of Fort Smith, Water and Sewer Construction Rev., 5.00%, 10/1/2021 | | | 50,000 | | | | 51,386 | |
| | |
City of Little Rock, Capital Improvement GO, 5.00%, 4/1/2021 | | | 315,000 | | | | 316,232 | |
| | |
City of Rogers, Sewer Rev., 4.00%, 11/1/2021 | | | 50,000 | | | | 51,246 | |
| | |
Greenwood School District No. 25 GO, 2.00%, 12/1/2021 | | | 425,000 | | | | 430,708 | |
| | |
North Little Rock School District No. 1 | | | | | | | | |
| | |
Series B, GO, 4.00%, 2/1/2030 | | | 100,000 | | | | 100,424 | |
| | |
Series B, GO, 4.00%, 2/1/2032 | | | 145,000 | | | | 145,615 | |
| | |
Series B, GO, 4.50%, 2/1/2043 | | | 250,000 | | | | 251,200 | |
| | |
Northwest Arkansas Community College, Capital Improvement, Tax-Exempt GO, 4.13%, 5/15/2021 (b) | | | 30,000 | | | | 30,243 | |
| | |
Rogers School District No. 30 GO, 5.00%, 2/1/2022 | | | 45,000 | | | | 46,967 | |
| | |
Springdale School District No. 50 GO, 5.00%, 6/1/2022 | | | 45,000 | | | | 47,677 | |
| | |
State of Arkansas, Federal Highway | | | | | | | | |
| | |
GO, 5.00%, 10/1/2021 | | | 25,000 | | | | 25,706 | |
| | |
GO, 5.00%, 4/1/2022 | | | 25,000 | | | | 26,311 | |
| | |
GO, 5.00%, 10/1/2023 | | | 45,000 | | | | 50,385 | |
| | |
State of Arkansas, Four-Lane Highway Construction and Improvement GO, 5.00%, 6/15/2021 | | | 425,000 | | | | 430,916 | |
| | |
State of Arkansas, Waste Disposal and Pollution Abatement Facilities | | | | | | | | |
| | |
GO, 5.00%, 7/1/2021 | | | 50,000 | | | | 50,804 | |
| | |
GO, 5.00%, 7/1/2023 | | | 30,000 | | | | 33,264 | |
| | |
University of Arkansas Student Fee, UALR Campus Rev., 5.00%, 10/1/2022 | | | 20,000 | | | | 21,511 | |
| | |
University of Arkansas, Capital Improvement, UALR Energy Conservation Series 2013C, Rev., 5.00%, 10/1/2021 | | | 50,000 | | | | 51,404 | |
| | |
University of Arkansas, Refunding and Improvement Series 2016A, Rev., 5.00%, 11/1/2021 | | | 25,000 | | | | 25,797 | |
SEE NOTES TO FINANCIAL STATEMENTS.
| | | | | | | | |
| | | |
| FEBRUARY 28, 2021 | | J.P. MORGAN EXCHANGE-TRADED FUNDS | | | | | 173 | |
JPMorgan Ultra-Short Municipal Income ETF
SCHEDULE OF PORTFOLIO INVESTMENTS
AS OF FEBRUARY 28, 2021 (continued)
| | | | | | | | |
| INVESTMENTS | | PRINCIPAL
AMOUNT ($) | | | VALUE ($) | |
Municipal Bonds — continued | | | | | | | | |
| | |
Arkansas — continued | | | | | | | | |
| | |
University of Arkansas, Student Fee, Community College | | | | | | | | |
| | |
Rev., 4.00%, 5/1/2022 | | | 30,000 | | | | 31,321 | |
| | |
Rev., 4.00%, 5/1/2023 | | | 60,000 | | | | 64,714 | |
| | |
University of Arkansas, Student Fee, UALR Project Series 2013A, Rev., 5.00%, 12/1/2021 | | | 20,000 | | | | 20,723 | |
| | |
University of Arkansas, Various Facility Fayetteville Campus | | | | | | | | |
| | |
Rev., 4.13%, 11/1/2021 (b) | | | 25,000 | | | | 25,662 | |
| | |
Rev., 5.00%, 11/1/2021 | | | 220,000 | | | | 227,054 | |
| | |
Series 2011A, Rev., 5.00%, 11/1/2021 (b) | | | 95,000 | | | | 98,069 | |
| | |
Series 2013A, Rev., 5.00%, 9/15/2022 | | | 25,000 | | | | 26,848 | |
| | |
Rev., 5.00%, 11/1/2022 | | | 50,000 | | | | 53,993 | |
| | |
Series 2012A, Rev., 5.00%, 11/1/2022 | | | 25,000 | | | | 26,997 | |
| | |
Series 2016A, Rev., 5.00%, 11/1/2022 | | | 70,000 | | | | 75,554 | |
| | |
University of Arkansas, Various Facility Pine Bluff Campus Rev., 4.00%, 12/1/2022 | | | 35,000 | | | | 37,325 | |
| | |
University of Arkansas, Various Facility UAMS Campus | | | | | | | | |
| | |
Rev., 5.00%, 11/1/2021 | | | 25,000 | | | | 25,803 | |
| | |
Series 2020A, Rev., 5.00%, 12/1/2021 | | | 235,000 | | | | 243,326 | |
| | | | | | | | |
| | |
Total Arkansas | | | | | | | 4,000,296 | |
| | | | | | | | |
| | |
California — 5.4% | | | | | | | | |
| | |
Abag Finance Authority for Nonprofit Corp., Sharp Healthcare Series 2014A, Rev., 5.00%, 8/1/2021 | | | 20,000 | | | | 20,398 | |
| | |
ABC Unified School District, Election of 2018 Series A, GO, 5.00%, 8/1/2021 | | | 85,000 | | | | 86,716 | |
| | |
Acalanes Union High School District GO, 4.00%, 8/1/2022 | | | 30,000 | | | | 31,635 | |
| | |
Adelanto Public Utility Authority, Utility System Project Series 2017A, Rev., AGM, 5.00%, 7/1/2021 | | | 50,000 | | | | 50,806 | |
| | |
Alameda County Joint Powers Authority, Multiple Capital Projects | | | | | | | | |
| | |
Series 2013A, Rev., 5.00%, 12/1/2021 | | | 25,000 | | | | 25,911 | |
| | |
Series 2013A, Rev., 5.00%, 12/1/2022 | | | 125,000 | | | | 135,367 | |
| | | | | | | | |
| INVESTMENTS | | PRINCIPAL
AMOUNT ($) | | | VALUE ($) | |
| | | | | | | | |
| | |
California — continued | | | | | | | | |
| | |
Alameda County Transportation Commission, Sales Tax | | | | | | | | |
| | |
Rev., 5.00%, 3/1/2021 | | | 130,000 | | | | 130,000 | |
| | |
Rev., 4.00%, 3/1/2022 | | | 60,000 | | | | 62,313 | |
| | |
Alameda Unified School District-Alameda County, Election of 2014 Series C, GO, 4.00%, 8/1/2022 | | | 25,000 | | | | 26,362 | |
| | |
Alhambra Unified School District | | | | | | | | |
| | |
Series 2016B, GO, 5.00%, 8/1/2021 | | | 20,000 | | | | 20,404 | |
| | |
Series A, GO, 5.00%, 8/1/2021 | | | 20,000 | | | | 20,404 | |
| | |
Series 2016B, GO, 5.00%, 8/1/2022 | | | 30,000 | | | | 32,058 | |
| | |
Alhambra Unified School District, Election of 2016 Series 2016A, GO, 4.00%, 8/1/2021 | | | 25,000 | | | | 25,401 | |
| | |
Alta Loma School District, Capital Appreciation Series 1999A, GO, NATL-RE, Zero Coupon, 8/1/2022 | | | 125,000 | | | | 124,364 | |
| | |
Alvord Unified School District, Election of 2012 Series A, GO, AGM, Zero Coupon, 8/1/2022 | | | 200,000 | | | | 199,066 | |
| | |
Anaheim Housing and Public Improvements Authority, Electric Utility Distribution System Series 2020A, Rev., 5.00%, 10/1/2024 | | | 160,000 | | | | 185,389 | |
| | |
Anaheim Public Financing Authority, Electric Distribution System | | | | | | | | |
| | |
Series 2011A, Rev., 5.00%, 4/1/2021 (b) | | | 50,000 | | | | 50,197 | |
| | |
Series 2012A, Rev., 5.00%, 10/1/2021 | | | 20,000 | | | | 20,563 | |
| | |
Bay Area Toll Authority, Toll Bridge | | | | | | | | |
| | |
Series 2014 F-2, Rev., 4.00%, 4/1/2021 | | | 100,000 | | | | 100,312 | |
| | |
Rev., 5.00%, 4/1/2022 | | | 115,000 | | | | 121,067 | |
| | |
Series 2012F-1, Rev., 5.00%, 4/1/2022 (b) | | | 40,000 | | | | 42,116 | |
| | |
Series F-1, Rev., 5.00%, 4/1/2022 (b) | | | 190,000 | | | | 200,051 | |
| | |
Belmont Joint Powers Financing Authority Rev., 4.00%, 8/1/2022 | | | 50,000 | | | | 52,725 | |
| | |
Belmont-Redwood Shores School District | | | | | | | | |
| | |
Series 2015A, GO, 5.00%, 8/1/2021 | | | 35,000 | | | | 35,706 | |
| | |
GO, 5.00%, 8/1/2022 | | | 90,000 | | | | 96,176 | |
| | |
Berkeley Unified School District GO, 5.00%, 8/1/2021 | | | 25,000 | | | | 25,505 | |
SEE NOTES TO FINANCIAL STATEMENTS.
| | | | | | |
| | | |
| 174 | | | | J.P. MORGAN EXCHANGE-TRADED FUNDS | | FEBRUARY 28, 2021 |
| | | | | | | | |
| INVESTMENTS | | PRINCIPAL
AMOUNT ($) | | | VALUE ($) | |
Municipal Bonds — continued | | | | | | | | |
| | |
California — continued | | | | | | | | |
| | |
Brea Redevelopment Agency, Redevelopment Project AB Series 2011A, 5.00%, 8/1/2021 (b) | | | 30,000 | | | | 30,588 | |
| | |
Brentwood Infrastructure Financing Authority | | | | | | | | |
| | |
Rev., 5.00%, 7/1/2022 | | | 20,000 | | | | 21,297 | |
| | |
Series 2012A, Rev., AGM, 3.50%, 9/2/2023 | | | 50,000 | | | | 52,355 | |
| | |
Brentwood Infrastructure Financing Authority, Civic Center Project Rev., 5.00%, 10/1/2024 | | | 40,000 | | | | 46,162 | |
| | |
Buena Park Public Financing Authority, Fire Station Headquarters Project Rev., 4.00%, 5/1/2021 | | | 110,000 | | | | 110,695 | |
| | |
Buena Park School District, Election of 2014 GO, 4.00%, 8/1/2021 | | | 75,000 | | | | 76,165 | |
| | |
Burbank Redevelopment Agency Successor Agency 5.00%, 12/1/2023 | | | 50,000 | | | | 56,326 | |
| | |
Burlingame School District, Election of 2012 Series 2013A, GO, 4.00%, 8/1/2023 (b) | | | 20,000 | | | | 21,824 | |
| | |
Burlingame School District, Election of 2020 Series A, GO, 3.00%, 8/1/2022 | | | 20,000 | | | | 20,808 | |
| | |
Cabrillo Community College District GO, 5.00%, 8/1/2022 | | | 30,000 | | | | 32,059 | |
| | |
California County Tobacco Securitization Agency, Los Angeles County Securitization Corp. | | | | | | | | |
| | |
Series 2020A, Rev., 3.00%, 6/1/2021 | | | 550,000 | | | | 553,608 | |
| | |
Series 2020A, Rev., 4.00%, 6/1/2022 | | | 350,000 | | | | 365,799 | |
| | |
Series 2020A, Rev., 4.00%, 6/1/2023 | | | 350,000 | | | | 377,664 | |
| | |
California County Tobacco Securitization Agency, Merced County Tobacco Funding Corp. | | | | | | | | |
| | |
Rev., 3.00%, 6/1/2021 | | | 100,000 | | | | 100,656 | |
| | |
Rev., 4.00%, 6/1/2022 | | | 150,000 | | | | 156,771 | |
| | |
Rev., 4.00%, 6/1/2023 | | | 460,000 | | | | 496,354 | |
| | |
Rev., 5.00%, 6/1/2025 | | | 240,000 | | | | 282,917 | |
| | |
California County Tobacco Securitization Agency, Sonoma County Securitization Corp. | | | | | | | | |
| | |
Rev., 4.00%, 6/1/2022 | | | 375,000 | | | | 391,942 | |
| | |
Rev., 4.00%, 6/1/2023 | | | 530,000 | | | | 571,881 | |
| | | | | | | | |
| INVESTMENTS | | PRINCIPAL
AMOUNT ($) | | | VALUE ($) | |
| | | | | | | | |
| | |
California — continued | | | | | | | | |
| | |
California Educational Facilities Authority, Loyola Marymount University Rev., 4.00%, 10/1/2021 | | | 140,000 | | | | 142,969 | |
| | |
California Educational Facilities Authority, Stanford University Series U-5, Rev., 5.00%, 5/1/2021 | | | 125,000 | | | | 125,999 | |
| | |
California Enterprise Development Authority, Riverside County, Library Facility Rev., 4.00%, 11/1/2023 | | | 200,000 | | | | 218,568 | |
| | |
California Enterprise Development Authority, The Thatcher School Project Rev., 4.00%, 9/1/2021 | | | 65,000 | | | | 66,247 | |
| | |
California Health Facilities Financing Authority, Adventist Health System Series 2011A, Rev., 3.00%, 3/1/2024 (c) | | | 310,000 | | | | 327,149 | |
| | |
California Health Facilities Financing Authority, Cedars-Sinai Medical Center Rev., 5.00%, 11/15/2024 | | | 250,000 | | | | 292,353 | |
| | |
California Health Facilities Financing Authority, Children’s Hospital | | | | | | | | |
| | |
Rev., 5.00%, 8/15/2021 | | | 30,000 | | | | 30,646 | |
| | |
Rev., 5.00%, 11/1/2021 | | | 300,000 | | | | 309,465 | |
| | |
California Health Facilities Financing Authority, Common Spirit Health 2011 Series 2011A, Rev., 5.25%, 3/1/2021 (b) | | | 275,000 | | | | 275,000 | |
| | |
California Health Facilities Financing Authority, Kaiser Permanente | | | | | | | | |
| | |
Series 2017B, Rev., 5.00%, 11/1/2022 (c) | | | 100,000 | | | | 107,952 | |
| | |
Series C, Rev., 5.00%, 11/1/2022 (c) | | | 670,000 | | | | 723,278 | |
| | |
California Health Facilities Financing Authority, Lucile Salter Packard Children’s Hospital at Stanford Rev., 5.00%, 8/15/2021 | | | 40,000 | | | | 40,852 | |
| | |
California Health Facilities Financing Authority, Memorial Health Service | | | | | | | | |
| | |
Series 2012A, Rev., 4.00%, 10/1/2021 | | | 270,000 | | | | 275,981 | |
| | |
Series 2012A, Rev., 5.00%, 10/1/2023 | | | 350,000 | | | | 375,809 | |
| | |
Series 2012A, Rev., 5.00%, 10/1/2026 | | | 250,000 | | | | 266,965 | |
| | |
California Health Facilities Financing Authority, Providence Health and Services Series 2014A, Rev., 5.00%, 10/1/2022 | | | 20,000 | | | | 21,521 | |
SEE NOTES TO FINANCIAL STATEMENTS.
| | | | | | | | |
| | | |
| FEBRUARY 28, 2021 | | J.P. MORGAN EXCHANGE-TRADED FUNDS | | | | | 175 | |
JPMorgan Ultra-Short Municipal Income ETF
SCHEDULE OF PORTFOLIO INVESTMENTS
AS OF FEBRUARY 28, 2021 (continued)
| | | | | | | | |
| INVESTMENTS | | PRINCIPAL
AMOUNT ($) | | | VALUE ($) | |
Municipal Bonds — continued | | | | | | | | |
| | |
California — continued | | | | | | | | |
| | |
California Health Facilities Financing Authority, St. Joseph Health System | | | | | | | | |
| | |
Series 2009D, Rev., 1.70%, 10/18/2022 (c) | | | 280,000 | | | | 286,129 | |
| | |
Series 2009C, Rev., 5.00%, 10/18/2022 (c) | | | 290,000 | | | | 311,869 | |
| | |
Rev., 2.00%, 10/1/2025 (c) | | | 125,000 | | | | 132,410 | |
| | |
California Health Facilities Financing Authority, Sutter Health | | | | | | | | |
| | |
Series 2011D, Rev., 5.25%, 8/15/2021 (b) | | | 180,000 | | | | 184,145 | |
| | |
Series 2018A, Rev., 5.00%, 11/15/2021 | | | 50,000 | | | | 51,663 | |
| | |
California Infrastructure and Economic Development Bank, Academy of Motion Picture Arts and Sciences Obligated Group Series 2015A, Rev., 5.00%, 11/1/2022 | | | 100,000 | | | | 107,934 | |
| | |
California Infrastructure and Economic Development Bank, State Revolving Fund | | | | | | | | |
| | |
Rev., 5.00%, 10/1/2021 | | | 30,000 | | | | 30,845 | |
| | |
Rev., 4.00%, 10/1/2022 | | | 25,000 | | | | 26,515 | |
| | |
California Infrastructure and Economic Development Bank, The Broad Collection Series 2011A, Rev., 5.00%, 6/1/2021 | | | 105,000 | | | | 106,253 | |
| | |
California Municipal Finance Authority, City of Anaheim Electric Utility Distribution System Rev., 5.00%, 10/1/2021 | | | 20,000 | | | | 20,563 | |
| | |
California Municipal Finance Authority, Civic Center Infrastructure Improvement Program Rev., 5.00%, 6/1/2023 | | | 75,000 | | | | 82,707 | |
| | |
California Municipal Finance Authority, Community Medical Center | | | | | | | | |
| | |
Series 2017A, Rev., 5.00%, 2/1/2022 | | | 120,000 | | | | 124,974 | |
| | |
Series 2017A, Rev., 5.00%, 2/1/2026 | | | 1,000,000 | | | | 1,186,220 | |
| | |
California Municipal Finance Authority, Hollywood El Centro Apartments Series 2019A, Rev., 1.40%, 5/1/2021 (c) | | | 425,000 | | | | 425,833 | |
| | |
California Municipal Finance Authority, Pacific Meadows Apartments Series 2010A, Rev., VRDO, LIQ: FHLMC, 0.03%, 3/9/2021 (c) | | | 5,595,000 | | | | 5,595,000 | |
| | | | | | | | |
| INVESTMENTS | | PRINCIPAL
AMOUNT ($) | | | VALUE ($) | |
| | | | | | | | |
| | |
California — continued | | | | | | | | |
| | |
California Municipal Finance Authority, University of San Diego Series 2011A, Rev., 5.00%, 10/1/2021 (b) | | | 140,000 | | | | 143,930 | |
| | |
California Public Finance Authority, Henry Mayo Newhall Hospital | | | | | | | | |
| | |
Rev., 4.00%, 10/15/2021 (d) | | | 210,000 | | | | 214,110 | |
| | |
Rev., 4.00%, 10/15/2022 (d) | | | 240,000 | | | | 252,297 | |
| | |
Rev., 4.00%, 10/15/2023 (d) | | | 290,000 | | | | 313,313 | |
| | |
Rev., 4.00%, 10/15/2024 (d) | | | 380,000 | | | | 420,231 | |
| | |
California Public Finance Authority, ORO Loma Sanitary District Rev., 3.00%, 10/1/2021 | | | 25,000 | | | | 25,418 | |
| | |
California State Public Works Board | | | | | | | | |
| | |
Series 2007A, Rev., NATL-RE, 5.25%, 6/1/2021 (b) | | | 250,000 | | | | 253,175 | |
| | |
Series 2015F, Rev., 5.00%, 5/1/2022 | | | 75,000 | | | | 79,192 | |
| | |
Series 2007A, Rev., NATL-RE, 5.25%, 6/1/2022 (b) | | | 25,000 | | | | 26,604 | |
| | |
California State Public Works Board, California State University, Various Capital Projects | | | | | | | | |
| | |
Series 2019B, Rev., 5.00%, 5/1/2021 | | | 25,000 | | | | 25,199 | |
| | |
Series 2014E, Rev., 5.00%, 9/1/2021 | | | 100,000 | | | | 102,400 | |
| | |
Series 2013-I, Rev., 4.00%, 11/1/2021 | | | 45,000 | | | | 46,143 | |
| | |
Series 2012A, Rev., 5.00%, 4/1/2022 | | | 100,000 | | | | 105,201 | |
| | |
Series 2017B, Rev., 5.00%, 10/1/2022 | | | 100,000 | | | | 107,587 | |
| | |
Series 2021A, Rev., 5.00%, 2/1/2023 (d) | | | 5,000,000 | | | | 5,291,900 | |
| | |
Series 2013-I, Rev., 5.00%, 11/1/2025 | | | 200,000 | | | | 224,024 | |
| | |
Series 2011A, Rev., 5.25%, 10/1/2026 | | | 825,000 | | | | 849,115 | |
| | |
California State Public Works Board, California State University, Various University Projects Series 2011G, Rev., 5.00%, 12/1/2021 (b) | | | 25,000 | | | | 25,913 | |
| | |
California State Public Works Board, Coalinga State Hospital Rev., 5.00%, 6/1/2021 | | | 20,000 | | | | 20,240 | |
| | |
California State Public Works Board, Davidson Library at Santa Barbara Series 2013C, Rev., 4.00%, 3/1/2021 (b) | | | 75,000 | | | | 75,000 | |
SEE NOTES TO FINANCIAL STATEMENTS.
| | | | | | |
| | | |
| 176 | | | | J.P. MORGAN EXCHANGE-TRADED FUNDS | | FEBRUARY 28, 2021 |
| | | | | | | | |
| INVESTMENTS | | PRINCIPAL
AMOUNT ($) | | | VALUE ($) | |
Municipal Bonds — continued | | | | | | | | |
| | |
California — continued | | | | | | | | |
| | |
California State Public Works Board, Department of Corrections and Rehabilitation | | | | | | | | |
| | |
Series 2014A, Rev., 2.50%, 9/1/2021 | | | 25,000 | | | | 25,290 | |
| | |
Series 2013G, Rev., 5.00%, 9/1/2021 | | | 75,000 | | | | 76,800 | |
| | |
Series 2011C, Rev., 5.00%, 10/1/2021 | | | 115,000 | | | | 118,221 | |
| | |
Series 2015H, Rev., 5.00%, 12/1/2021 | | | 35,000 | | | | 36,262 | |
| | |
Series 2015A, Rev., 5.00%, 6/1/2022 | | | 30,000 | | | | 31,797 | |
| | |
Series 2011C, Rev., 5.25%, 10/1/2024 | | | 100,000 | | | | 102,923 | |
| | |
Series 2016E, Rev., 5.00%, 10/1/2025 | | | 175,000 | | | | 209,709 | |
| | |
California State Public Works Board, Trustees of The California State University Series 2011B, Rev., 5.00%, 10/1/2021 (b) | | | 100,000 | | | | 102,837 | |
| | |
California State University, Systemwide | | | | | | | | |
| | |
Series 2018A, Rev., 5.00%, 11/1/2021 | | | 25,000 | | | | 25,813 | |
| | |
Series 2012A, Rev., 3.25%, 11/1/2022 (b) | | | 20,000 | | | | 21,030 | |
| | |
Series A, Rev., 5.00%, 11/1/2023 | | | 35,000 | | | | 39,403 | |
| | |
California Statewide Communities Development Authority, Multi-Family Housing, Ethel Arnold Bradley Apartments Series S-1, Rev., 1.25%, 6/1/2021 (c) | | | 845,000 | | | | 847,341 | |
| | |
California Statewide Communities Development Authority, Multi-Family Housing, Robert Farrell Manor and Western Gardens Apartments Series T-1, Rev., 1.25%, 6/1/2021 (c) | | | 165,000 | | | | 165,427 | |
| | |
California Statewide Communities Development Authority, Rady Children’s Hospital | | | | | | | | |
| | |
Series 2016A, Rev., 5.00%, 8/15/2021 | | | 100,000 | | | | 102,153 | |
| | |
Series 2016A, Rev., 5.00%, 8/15/2023 | | | 50,000 | | | | 55,576 | |
| | |
Series 2016B, Rev., 5.00%, 8/15/2025 | | | 125,000 | | | | 148,763 | |
| | |
California Statewide Communities Development Authority, The Terraces at San Joaquin Gardens Project Rev., 5.63%, 10/1/2022 (b) | | | 1,000,000 | | | | 1,085,400 | |
| | | | | | | | |
| INVESTMENTS | | PRINCIPAL
AMOUNT ($) | | | VALUE ($) | |
| | | | | | | | |
| | |
California — continued | | | | | | | | |
| | |
California Statewide Communities Development Authority, Trinity Health Credit Group Rev., 5.00%, 12/1/2021 (b) | | | 80,000 | | | | 82,921 | |
| | |
Campbell Union High School District, Election of 2016 | | | | | | | | |
| | |
Series A-1, GO, 4.00%, 8/1/2021 | | | 25,000 | | | | 25,401 | |
| | |
Series B, GO, 4.00%, 8/1/2021 | | | 50,000 | | | | 50,803 | |
| | |
Campbell Union School District | | | | | | | | |
| | |
GO, 4.00%, 8/1/2021 | | | 80,000 | | | | 81,284 | |
| | |
Series 2010H & 2016C, GO, 5.00%, 8/1/2021 | | | 25,000 | | | | 25,505 | |
| | |
Carlsbad Unified School District GO, 5.00%, 8/1/2022 | | | 20,000 | | | | 21,372 | |
| | |
Carlsbad Unified School District, Election of 2006 | | | | | | | | |
| | |
Series 2011C, GO, 4.75%, 8/1/2021 (b) | | | 25,000 | | | | 25,480 | |
| | |
Series 2011C, GO, 5.00%, 8/1/2021 | | | 235,000 | | | | 239,744 | |
| | |
Carlsbad Unified School District, Election of 2018 | | | | | | | | |
| | |
Series A, GO, 5.00%, 8/1/2021 | | | 50,000 | | | | 51,010 | |
| | |
Series 2018A, GO, 5.00%, 8/1/2022 | | | 20,000 | | | | 21,372 | |
| | |
Carmel Unified School District GO, 4.00%, 8/1/2021 | | | 50,000 | | | | 50,803 | |
| | |
Castaic Lake Water Agency, Capital Appreciation, Water System Improvement Project Series 1999A, COP, AMBAC, Zero Coupon, 8/1/2023 | | | 45,000 | | | | 44,354 | |
| | |
Castro Valley Unified School District GO, 4.00%, 8/1/2021 | | | 65,000 | | | | 66,043 | |
| | |
Cerritos Community College District | | | | | | | | |
| | |
Series 2019C, GO, 4.00%, 8/1/2021 | | | 25,000 | | | | 25,401 | |
| | |
Series 2018B, GO, 5.00%, 8/1/2021 | | | 35,000 | | | | 35,707 | |
| | |
Series A, GO, 5.00%, 8/1/2022 | | | 90,000 | | | | 96,176 | |
| | |
Chabot-Las Positas Community College District GO, 4.00%, 8/1/2021 | | | 50,000 | | | | 50,803 | |
| | |
Chaffey Joint Union High School District GO, 5.00%, 8/1/2021 (b) | | | 25,000 | | | | 25,506 | |
| | |
Chula Vista Elementary School District Series 2013A, COP, AGM, 5.00%, 9/1/2021 | | | 25,000 | | | | 25,585 | |
| | |
Chula Vista Municipal Financing Authority Rev., 5.00%, 5/1/2024 | | | 10,000 | | | | 11,378 | |
| | |
Citrus Community College District Series 2015A, GO, 5.00%, 8/1/2022 | | | 55,000 | | | | 58,774 | |
SEE NOTES TO FINANCIAL STATEMENTS.
| | | | | | | | |
| | | |
| FEBRUARY 28, 2021 | | J.P. MORGAN EXCHANGE-TRADED FUNDS | | | | | 177 | |
JPMorgan Ultra-Short Municipal Income ETF
SCHEDULE OF PORTFOLIO INVESTMENTS
AS OF FEBRUARY 28, 2021 (continued)
| | | | | | | | |
| INVESTMENTS | | PRINCIPAL
AMOUNT ($) | | | VALUE ($) | |
Municipal Bonds — continued | | | | | | | | |
| | |
California — continued | | | | | | | | |
| | |
City and County of San Francisco | | | | | | | | |
| | |
Series 2011-R1, GO, 5.00%, 6/15/2021 | | | 30,000 | | | | 30,418 | |
| | |
Series 2014A, GO, 5.00%, 6/15/2021 | | | 45,000 | | | | 45,628 | |
| | |
City and County of San Francisco Finance Corp., Emergency Communication Series 2010-R1, Rev., 3.50%, 4/1/2021 | | | 25,000 | | | | 25,063 | |
| | |
City and County of San Francisco, City Office Buildings — Multiple Properties Project Series 2015-R1, COP, 5.00%, 9/1/2022 | | | 25,000 | | | | 26,797 | |
| | |
City and County of San Francisco, Clean and Safe Neighborhood Parks GO, 5.00%, 6/15/2023 | | | 510,000 | | | | 517,058 | |
| | |
City and County of San Francisco, Green Bond COP, 5.00%, 4/1/2021 | | | 250,000 | | | | 250,973 | |
| | |
City and County of San Francisco, Juvenile Hall Project Series 2014-R2, COP, 5.00%, 4/1/2022 | | | 90,000 | | | | 94,681 | |
| | |
City and County of San Francisco, Moscone Center South Project Series 2011A, COP, 5.00%, 9/1/2021 | | | 30,000 | | | | 30,714 | |
| | |
City and County of San Francisco, Multiple Capital Improvement Projects COP, 5.00%, 4/1/2022 | | | 25,000 | | | | 26,300 | |
| | |
City and County of San Francisco, Tax-Exempt Series 2017A, GO, 5.00%, 6/15/2021 | | | 30,000 | | | | 30,419 | |
| | |
City of Azusa, Water System Series 2012A, Rev., 5.00%, 7/1/2022 | | | 25,000 | | | | 26,614 | |
| | |
City of Bakersfield, Wastewater Series 2015A, Rev., 5.00%, 9/15/2021 | | | 25,000 | | | | 25,654 | |
| | |
City of Brea, Water Utility | | | | | | | | |
| | |
Rev., 4.00%, 7/1/2021 | | | 25,000 | | | | 25,320 | |
| | |
Rev., 4.00%, 7/1/2022 | | | 75,000 | | | | 78,847 | |
| | |
City of Burbank, Wastewater Treatment Rev., 5.00%, 6/1/2022 | | | 35,000 | | | | 37,119 | |
| | |
City of Glendora, Waterworks Series 2016A, Rev., 5.00%, 10/1/2022 | | | 25,000 | | | | 26,918 | |
| | |
City of Long Beach Harbor | | | | | | | | |
| | |
Series 2014B, Rev., 5.00%, 5/15/2023 | | | 50,000 | | | | 54,880 | |
| | |
Series 2020A, Rev., 4.00%, 5/15/2024 | | | 20,000 | | | | 22,152 | |
| | | | | | | | |
| INVESTMENTS | | PRINCIPAL
AMOUNT ($) | | | VALUE ($) | |
| | | | | | | | |
| | |
California — continued | | | | | | | | |
| | |
Rev., 4.00%, 5/15/2025 | | | 100,000 | | | | 113,529 | |
| | |
Rev., 5.00%, 5/15/2025 | | | 50,000 | | | | 58,831 | |
| | |
City of Los Angeles | | | | | | | | |
| | |
Series 2000-A, GO, 5.00%, 9/1/2021 (b) | | | 80,000 | | | | 81,944 | |
| | |
Series 2011-B, GO, 5.00%, 9/1/2021 | | | 40,000 | | | | 40,970 | |
| | |
City of Los Angeles, Department of Airports Series 2015C, Rev., 5.00%, 5/15/2021 (b) | | | 35,000 | | | | 35,343 | |
| | |
City of Los Angeles, Solid Waste Resources Series 2015-A, Rev., 5.00%, 2/1/2022 | | | 20,000 | | | | 20,893 | |
| | |
City of Los Angeles, Wastewater System | | | | | | | | |
| | |
Series 2012C, Rev., 5.00%, 6/1/2021 | | | 120,000 | | | | 121,438 | |
| | |
Series 2013-A, Rev., 5.00%, 6/1/2021 | | | 25,000 | | | | 25,299 | |
| | |
Series 2015-D, Rev., 5.00%, 6/1/2021 | | | 25,000 | | | | 25,302 | |
| | |
Series 2013B, Rev., 4.00%, 6/1/2022 | | | 25,000 | | | | 26,202 | |
| | |
Series 2013-B, Rev., 5.00%, 6/1/2022 | | | 130,000 | | | | 137,870 | |
| | |
City of Malibu Series 2016A, COP, 4.00%, 11/1/2021 | | | 40,000 | | | | 41,002 | |
| | |
City of Manhattan Beach COP, 3.00%, 1/1/2023 | | | 25,000 | | | | 26,226 | |
| | |
City of Napa Rev., 5.00%, 5/1/2022 | | | 25,000 | | | | 26,413 | |
| | |
City of Newark COP, 5.00%, 6/1/2023 | | | 45,000 | | | | 49,560 | |
| | |
City of Oakland, Sewer Series 2014A, Rev., 5.00%, 6/15/2023 | | | 35,000 | | | | 38,808 | |
| | |
City of Pacifica COP, 5.00%, 1/1/2022 | | | 80,000 | | | | 83,164 | |
| | |
City of Pasadena | | | | | | | | |
| | |
Series 2011A, Rev., 4.00%, 6/1/2022 | | | 40,000 | | | | 41,913 | |
| | |
Series 2012A, Rev., 4.00%, 6/1/2022 | | | 20,000 | | | | 20,956 | |
| | |
City of Redding, Electric System Rev., 5.00%, 6/1/2022 | | | 55,000 | | | | 58,323 | |
| | |
City of Richmond Rev., FGIC, Zero Coupon, 8/1/2023 (b) | | | 200,000 | | | | 197,746 | |
| | |
City of Riverside Series 2019A, Rev., 5.00%, 10/1/2022 | | | 40,000 | | | | 43,062 | |
| | |
City of Roseville, 316 Vernon Street Project COP, 5.00%, 8/1/2022 | | | 40,000 | | | | 42,686 | |
| | |
City of Sacramento, Wastewater Rev., 5.00%, 9/1/2021 | | | 50,000 | | | | 51,213 | |
SEE NOTES TO FINANCIAL STATEMENTS.
| | | | | | |
| | | |
| 178 | | | | J.P. MORGAN EXCHANGE-TRADED FUNDS | | FEBRUARY 28, 2021 |
| | | | | | | | |
| INVESTMENTS | | PRINCIPAL
AMOUNT ($) | | | VALUE ($) | |
Municipal Bonds — continued | | | | | | | | |
| | |
California — continued | | | | | | | | |
| | |
City of Salinas, Sanitary Sewer System Rev., 4.00%, 8/1/2021 (b) | | | 25,000 | | | | 25,402 | |
| | |
City of San Mateo, Library Improvement Project | | | | | | | | |
| | |
GO, 4.00%, 8/1/2021 | | | 20,000 | | | | 20,321 | |
| | |
GO, 4.00%, 8/1/2022 | | | 20,000 | | | | 21,090 | |
| | |
City of San Ramon COP, 3.50%, 6/1/2021 | | | 30,000 | | | | 30,243 | |
| | |
City of Santa Barbara COP, 4.00%, 10/1/2021 | | | 35,000 | | | | 35,761 | |
| | |
City of Santa Clara, Electric Power Supply | | | | | | | | |
| | |
Series 2013A, Rev., 5.00%, 7/1/2021 | | | 70,000 | | | | 71,124 | |
| | |
Series 2018A, Rev., 5.00%, 7/1/2021 | | | 125,000 | | | | 127,006 | |
| | |
City of Santa Rosa, Wastewater Series 2014A, Rev., 5.00%, 9/1/2022 | | | 20,000 | | | | 21,453 | |
| | |
City of Sausalito COP, 4.00%, 5/1/2023 | | | 50,000 | | | | 54,064 | |
| | |
City of Torrance COP, 4.00%, 11/1/2021 | | | 45,000 | | | | 46,128 | |
| | |
Clovis Unified School District | | | | | | | | |
| | |
GO, 4.00%, 8/1/2021 | | | 50,000 | | | | 50,800 | |
| | |
GO, 5.00%, 8/1/2021 | | | 50,000 | | | | 51,007 | |
| | |
Clovis Unified School District, Election 2012 | | | | | | | | |
| | |
Series 2012A, GO, 4.00%, 8/1/2021 | | | 25,000 | | | | 25,400 | |
| | |
Series 2012C, GO, 5.00%, 8/1/2021 | | | 20,000 | | | | 20,403 | |
| | |
Coast Community College District | | | | | | | | |
| | |
Series 2019F, GO, 3.00%, 8/1/2021 | | | 60,000 | | | | 60,715 | |
| | |
Series A, GO, 5.00%, 8/1/2021 | | | 75,000 | | | | 76,514 | |
| | |
Series A, GO, 5.00%, 8/1/2022 | | | 75,000 | | | | 80,146 | |
| | |
College of the Sequoias Visalia Area Improvement District No. 2 Series 2011C, GO, AGM, Zero Coupon, 8/1/2021 (b) | | | 370,000 | | | | 137,777 | |
| | |
Contra Costa Community College District, Election 2014 | | | | | | | | |
| | |
Series 2019B-2, GO, 4.00%, 8/1/2021 | | | 80,000 | | | | 81,284 | |
| | |
Series 2019B-2, GO, 4.00%, 8/1/2022 | | | 40,000 | | | | 42,180 | |
| | |
Contra Costa County Public Financing Authority, Capital Projects Series 2015B, Rev., 5.00%, 6/1/2021 | | | 75,000 | | | | 75,893 | |
| | | | | | | | |
| INVESTMENTS | | PRINCIPAL
AMOUNT ($) | | | VALUE ($) | |
| | | | | | | | |
| | |
California — continued | | | | | | | | |
| | |
Contra Costa County Transportation Authority, Sales Tax Series 2017A, Rev., 5.00%, 3/1/2021 | | | 30,000 | | | | 30,000 | |
| | |
Contra Costa Water District Series T, Rev., 5.00%, 10/1/2021 | | | 35,000 | | | | 35,991 | |
| | |
Corona Utility Authority Water Rev., 5.00%, 9/1/2022 | | | 30,000 | | | | 32,180 | |
| | |
Coronado Community Development Agency Successor Agency Series 2018A, 5.00%, 9/1/2021 | | | 130,000 | | | | 133,152 | |
| | |
Corona-Norco Unified School District, Election 2014 | | | | | | | | |
| | |
Series B, GO, 4.00%, 8/1/2021 | | | 200,000 | | | | 203,184 | |
| | |
Series B, GO, 4.00%, 8/1/2022 | | | 25,000 | | | | 26,351 | |
| | |
County of Los Angeles, Disney Concert Hall Parking Garage | | | | | | | | |
| | |
COP, 5.00%, 3/1/2022 | | | 445,000 | | | | 465,354 | |
| | |
COP, 5.00%, 3/1/2023 | | | 250,000 | | | | 272,520 | |
| | |
County of Monterey, Public Facilities Refinancing COP, 5.00%, 10/1/2022 | | | 25,000 | | | | 26,876 | |
| | |
County of Napa | | | | | | | | |
| | |
COP, 3.00%, 6/1/2021 | | | 50,000 | | | | 50,343 | |
| | |
COP, 5.00%, 6/1/2022 | | | 80,000 | | | | 84,739 | |
| | |
County of San Bernardino, Arrowhead Project | | | | | | | | |
| | |
Series 2019A, COP, 5.00%, 10/1/2021 | | | 395,000 | | | | 405,665 | |
| | |
Series 2019A, COP, 5.00%, 10/1/2022 | | | 25,000 | | | | 26,794 | |
| | |
County of Santa Cruz Rev., TRAN, 3.00%, 7/9/2021 | | | 35,000 | | | | 35,357 | |
| | |
County of Sonoma, Measure F Sales Tax, Limited Tax, Agricultural Preservation and Open Space | | | | | | | | |
| | |
Rev., 5.00%, 9/1/2021 | | | 55,000 | | | | 56,328 | |
| | |
Rev., 5.00%, 9/1/2022 | | | 20,000 | | | | 21,435 | |
| | |
County of Yuba, Community Facilities District No. 2004-1, Edgewater, Special Tax AGM, 3.00%, 9/1/2021 | | | 100,000 | | | | 101,295 | |
| | |
Cucamonga Valley Water District Financing Authority Rev., 5.00%, 9/1/2021 | | | 30,000 | | | | 30,727 | |
| | |
Cupertino Union School District | | | | | | | | |
| | |
Series 2013B, GO, 4.00%, 8/1/2021 | | | 50,000 | | | | 50,802 | |
| | |
Series 2012A, GO, 4.00%, 8/1/2022 | | | 25,000 | | | | 26,363 | |
| | |
GO, 5.00%, 8/1/2022 | | | 25,000 | | | | 26,715 | |
| | |
Davis Joint Unified School District GO, 5.00%, 8/1/2021 | | | 25,000 | | | | 25,489 | |
SEE NOTES TO FINANCIAL STATEMENTS.
| | | | | | | | |
| | | |
| FEBRUARY 28, 2021 | | J.P. MORGAN EXCHANGE-TRADED FUNDS | | | | | 179 | |
JPMorgan Ultra-Short Municipal Income ETF
SCHEDULE OF PORTFOLIO INVESTMENTS
AS OF FEBRUARY 28, 2021 (continued)
| | | | | | | | |
| INVESTMENTS | | PRINCIPAL
AMOUNT ($) | | | VALUE ($) | |
Municipal Bonds — continued | | | | | | | | |
| | |
California — continued | | | | | | | | |
| | |
Desert Community College District GO, 5.00%, 8/1/2022 | | | 85,000 | | | | 90,833 | |
| | |
Desert Sands Unified School District | | | | | | | | |
| | |
GO, 5.00%, 8/1/2021 | | | 20,000 | | | | 20,404 | |
| | |
Series 2013A, GO, 5.00%, 6/1/2022 | | | 45,000 | | | | 47,724 | |
| | |
Desert Sands Unified School District, Election of 2014 GO, 5.00%, 8/1/2021 | | | 35,000 | | | | 35,707 | |
| | |
Desert Water Agency Rev., 4.00%, 5/1/2022 | | | 40,000 | | | | 41,795 | |
| | |
Dublin Unified School District | | | | | | | | |
| | |
GO, 4.00%, 8/1/2021 | | | 35,000 | | | | 35,562 | |
| | |
GO, 4.00%, 8/1/2022 | | | 25,000 | | | | 26,362 | |
| | |
GO, 5.00%, 8/1/2022 | | | 90,000 | | | | 96,176 | |
| | |
Dublin Unified School District, Election of 2016 | | | | | | | | |
| | |
GO, 5.00%, 8/1/2021 | | | 20,000 | | | | 20,404 | |
| | |
GO, 5.00%, 8/1/2022 | | | 25,000 | | | | 26,715 | |
| | |
East Bay Municipal Utility District, Wastewater System | | | | | | | | |
| | |
Series 2012B, Rev., 5.00%, 6/1/2021 | | | 70,000 | | | | 70,844 | |
| | |
Series 2014B, Rev., 5.00%, 6/1/2021 | | | 125,000 | | | | 126,508 | |
| | |
Series 2012B, Rev., 5.00%, 6/1/2022 | | | 65,000 | | | | 68,935 | |
| | |
East Bay Regional Park District Series A-1, GO, 5.00%, 9/1/2021 | | | 30,000 | | | | 30,727 | |
| | |
East Side Union High School District | | | | | | | | |
| | |
Series A, GO, 3.00%, 8/1/2021 | | | 45,000 | | | | 45,531 | |
| | |
Series D, GO, 5.00%, 8/1/2022 (b) | | | 20,000 | | | | 21,384 | |
| | |
Eastern Municipal Water District, Water and Wastewater System | | | | | | | | |
| | |
Series 2016A, Rev., 5.00%, 7/1/2021 | | | 60,000 | | | | 60,967 | |
| | |
Series C, Rev., 5.00%, 7/1/2021 | | | 125,000 | | | | 127,015 | |
| | |
Series 2016A, Rev., 5.00%, 7/1/2022 | | | 20,000 | | | | 21,292 | |
| | |
El Camino Community College District Foundation (The) | | | | | | | | |
| | |
GO, 5.00%, 8/1/2021 | | | 90,000 | | | | 91,817 | |
| | |
GO, 5.00%, 8/1/2022 | | | 50,000 | | | | 53,431 | |
| | |
El Monte City School District, Election of 2004 Series 2008C, GO, AGC, Zero Coupon, 8/1/2023 | | | 600,000 | | | | 577,398 | |
| | |
Elk Grove Unified School District, Election 2016 GO, 5.00%, 8/1/2021 | | | 40,000 | | | | 40,799 | |
| | | | | | | | |
| INVESTMENTS | | PRINCIPAL
AMOUNT ($) | | | VALUE ($) | |
| | | | | | | | |
| | |
California — continued | | | | | | | | |
| | |
Elsinore Valley Municipal Water District Financing Authority Series 2016A, Rev., 5.00%, 7/1/2022 | | | 25,000 | | | | 26,615 | |
| | |
Emery Unified School District, Election 2010 Series 2011A, GO, AGM, 5.50%, 8/1/2021 (b) | | | 50,000 | | | | 51,115 | |
| | |
Etiwanda School District Public Financing Authority Series 2018A, Rev., 5.00%, 9/1/2022 | | | 35,000 | | | | 37,543 | |
| | |
Fairfield-Suisun Unified School District, Election of 2016 GO, 5.00%, 8/1/2021 | | | 45,000 | | | | 45,909 | |
| | |
Fontana Redevelopment Agency, Successor Agency | | | | | | | | |
| | |
Series 2017A, 5.00%, 10/1/2021 | | | 50,000 | | | | 51,326 | |
| | |
Series 2017A, 5.00%, 10/1/2023 | | | 30,000 | | | | 33,221 | |
| | |
Fontana Unified School District GO, 3.13%, 8/1/2022 (b) | | | 20,000 | | | | 20,846 | |
| | |
Foothill-De Anza Community College District | | | | | | | | |
| | |
GO, 5.00%, 8/1/2021 | | | 120,000 | | | | 122,423 | |
| | |
Series C, GO, 5.00%, 8/1/2021 (b) | | | 30,000 | | | | 30,607 | |
| | |
Fountain Valley School District GO, 5.00%, 8/1/2021 | | | 35,000 | | | | 35,707 | |
| | |
Fremont Public Financing Authority Series 2017B, Rev., 5.00%, 10/1/2023 | | | 25,000 | | | | 28,033 | |
| | |
Fremont Union High School District | | | | | | | | |
| | |
GO, 5.00%, 8/1/2021 | | | 20,000 | | | | 20,404 | |
| | |
GO, 5.00%, 8/1/2022 | | | 30,000 | | | | 32,058 | |
| | |
Fresno Unified School District, Election of 2001 Series G, GO, Zero Coupon, 8/1/2041 | | | 605,000 | | | | 152,563 | |
| | |
Fresno Unified School District, Election of 2010 Series E, GO, 5.00%, 8/1/2021 | | | 35,000 | | | | 35,702 | |
| | |
Fullerton Joint Union High School District | | | | | | | | |
| | |
GO, 5.00%, 8/1/2021 | | | 75,000 | | | | 76,514 | |
| | |
GO, 5.00%, 8/1/2022 | | | 25,000 | | | | 26,716 | |
| | |
Gavilan Joint Community College District, Election of 2004 Series 2011D, GO, 4.00%, 8/1/2021 (b) | | | 50,000 | | | | 50,800 | |
| | |
Gilroy Unified School District, Election 2008 & 2016 GO, 4.00%, 8/1/2021 | | | 315,000 | | | | 320,015 | |
| | |
Glendale Unified School District | | | | | | | | |
| | |
Series 2015A, GO, 5.00%, 9/1/2021 | | | 35,000 | | | | 35,849 | |
| | |
GO, 4.25%, 9/1/2022 (b) | | | 30,000 | | | | 31,857 | |
SEE NOTES TO FINANCIAL STATEMENTS.
| | | | | | |
| | | |
| 180 | | | | J.P. MORGAN EXCHANGE-TRADED FUNDS | | FEBRUARY 28, 2021 |
| | | | | | | | |
| INVESTMENTS | | PRINCIPAL
AMOUNT ($) | | | VALUE ($) | |
Municipal Bonds — continued | | | | | | | | |
| | |
California — continued | | | | | | | | |
| | |
Golden State Tobacco Securitization Corp., Enhanced Tobacco Settlement | | | | | | | | |
| | |
Series 2013A, Rev., 4.00%, 6/1/2021 | | | 100,000 | | | | 100,941 | |
| | |
Series 2015A, Rev., 5.00%, 6/1/2021 | | | 1,600,000 | | | | 1,619,008 | |
| | |
Series 2017A-1, Rev., 5.00%, 6/1/2021 | | | 230,000 | | | | 232,627 | |
| | |
Series 2018A, Rev., 5.00%, 6/1/2021 | | | 200,000 | | | | 202,376 | |
| | |
Series 2018A, Rev., 3.00%, 6/1/2022 | | | 100,000 | | | | 103,423 | |
| | |
Series 2018A, Rev., 5.00%, 6/1/2022 | | | 125,000 | | | | 132,390 | |
| | |
Golden West Schools Financing Authority, Beverly Hills Unified School District Rev., NATL-RE, 5.25%, 8/1/2021 | | | 25,000 | | | | 25,528 | |
| | |
Grossmont Healthcare District | | | | | | | | |
| | |
Series D, GO, 5.00%, 7/15/2021 | | | 25,000 | | | | 25,447 | |
| | |
Series D, GO, 5.00%, 7/15/2022 | | | 20,000 | | | | 21,318 | |
| | |
Series C, GO, 5.00%, 7/15/2024 | | | 25,000 | | | | 28,687 | |
| | |
Grossmont Union High School District | | | | | | | | |
| | |
GO, 5.00%, 8/1/2021 | | | 50,000 | | | | 51,009 | |
| | |
GO, 5.00%, 8/1/2022 | | | 45,000 | | | | 48,088 | |
| | |
Grossmont Union High School District, Election of 2008 | | | | | | | | |
| | |
GO, 5.00%, 8/1/2021 (b) | | | 50,000 | | | | 51,011 | |
| | |
Series G-2, GO, 5.00%, 8/1/2022 | | | 30,000 | | | | 32,059 | |
| | |
Grossmont-Cuyamaca Community College District GO, 5.00%, 8/1/2022 | | | 75,000 | | | | 80,146 | |
| | |
Grossmont-Cuyamaca Community College District, Election of 2012 Series 2013A, GO, 5.00%, 8/1/2021 | | | 20,000 | | | | 20,404 | |
| | |
Hayward Unified School District GO, AGM, 5.00%, 8/1/2021 | | | 25,000 | | | | 25,496 | |
| | |
Hermosa Beach Public Financing Authority Rev., 4.00%, 11/1/2024 | | | 25,000 | | | | 28,151 | |
| | |
Imperial Community College District GO, AGM, 5.00%, 8/1/2022 (b) | | | 25,000 | | | | 26,712 | |
| | |
Inglewood Public Financing Authority Rev., Zero Coupon, 8/1/2022 (b) | | | 150,000 | | | | 79,324 | |
| | |
Irvine Ranch Water District COP, 5.00%, 3/1/2022 | | | 30,000 | | | | 31,443 | |
| | |
Irvine Unified School District, School Facilities Improvement District No. 1 Series 2016A, GO, 5.00%, 9/1/2022 | | | 25,000 | | | | 26,816 | |
| | | | | | | | |
| INVESTMENTS | | PRINCIPAL
AMOUNT ($) | | | VALUE ($) | |
| | | | | | | | |
| | |
California — continued | | | | | | | | |
| | |
Jefferson Union High School District, Election of 2006 Series D, GO, Zero Coupon, 8/1/2021 (b) | | | 150,000 | | | | 52,495 | |
| | |
Kern County Water Agency, Improvement District No. 4 Series 2016A, Rev., AGM, 5.00%, 5/1/2021 | | | 20,000 | | | | 20,159 | |
| | |
Kern High School District | | | | | | | | |
| | |
GO, 3.50%, 8/1/2021 | | | 40,000 | | | | 40,559 | |
| | |
GO, 5.00%, 8/1/2022 | | | 50,000 | | | | 53,431 | |
| | |
La Mirada Public Financing Authority Rev., 5.00%, 5/1/2022 | | | 25,000 | | | | 26,397 | |
| | |
Lake Elsinore Recreation Authority, Public Facilities Project Rev., 4.00%, 2/1/2022 | | | 35,000 | | | | 36,220 | |
| | |
Liberty Union High School District | | | | | | | | |
| | |
GO, 4.00%, 8/1/2021 (b) | | | 90,000 | | | | 91,448 | |
| | |
Series B, GO, 4.00%, 8/1/2021 | | | 30,000 | | | | 30,481 | |
| | |
Series B, GO, 4.00%, 8/1/2022 | | | 25,000 | | | | 26,363 | |
| | |
Lodi Public Financing Authority Series 2020A, Rev., 4.00%, 6/1/2022 | | | 40,000 | | | | 41,887 | |
| | |
Lodi Unified School District | | | | | | | | |
| | |
GO, AGM, 5.00%, 8/1/2021 (b) | | | 20,000 | | | | 20,405 | |
| | |
GO, AGM, 5.00%, 8/1/2023 | | | 240,000 | | | | 255,228 | |
| | |
Long Beach Community College District | | | | | | | | |
| | |
Series 2017G, GO, 4.00%, 8/1/2021 | | | 35,000 | | | | 35,562 | |
| | |
Series 2017G, GO, 5.00%, 8/1/2022 | | | 25,000 | | | | 26,715 | |
| | |
Long Beach Community College District, Election of 2002 Series A, GO, 5.00%, 5/1/2022 (b) | | | 40,000 | | | | 42,279 | |
| | |
Long Beach Community College District, Election of 2008 Series 2012B, GO, 4.00%, 8/1/2021 | | | 20,000 | | | | 20,321 | |
| | |
Long Beach Unified School District, Election of 2016 Series B, GO, 5.00%, 8/1/2021 | | | 30,000 | | | | 30,606 | |
| | |
Los Alamitos Unified School District GO, 5.00%, 8/1/2021 | | | 80,000 | | | | 81,615 | |
| | |
Los Alamitos Unified School District, Election of 2018 GO, 5.00%, 8/1/2022 | | | 30,000 | | | | 32,059 | |
| | |
Los Altos Elementary School District | | | | | | | | |
| | |
GO, 4.00%, 8/1/2021 | | | 255,000 | | | | 259,093 | |
| | |
GO, 4.00%, 8/1/2022 | | | 20,000 | | | | 21,090 | |
| | |
Los Angeles Community College District | | | | | | | | |
| | |
Series G, GO, 4.00%, 8/1/2021 | | | 105,000 | | | | 106,667 | |
| | |
Series I, GO, 4.00%, 8/1/2021 | | | 45,000 | | | | 45,715 | |
SEE NOTES TO FINANCIAL STATEMENTS.
| | | | | | | | |
| | | |
| FEBRUARY 28, 2021 | | J.P. MORGAN EXCHANGE-TRADED FUNDS | | | | | 181 | |
JPMorgan Ultra-Short Municipal Income ETF
SCHEDULE OF PORTFOLIO INVESTMENTS
AS OF FEBRUARY 28, 2021 (continued)
| | | | | | | | |
| INVESTMENTS | | PRINCIPAL
AMOUNT ($) | | | VALUE ($) | |
Municipal Bonds — continued | | | | | | | | |
| | |
California — continued | | | | | | | | |
| | |
Series 2015A, GO, 5.00%, 8/1/2021 | | | 165,000 | | | | 168,303 | |
| | |
Series 2015C, GO, 5.00%, 8/1/2021 | | | 25,000 | | | | 25,501 | |
| | |
Los Angeles Community College District, Election of 2008 Series J, GO, 3.00%, 8/1/2022 | | | 65,000 | | | | 67,587 | |
| | |
Los Angeles Community College District, Election of 2016 Series B-1, GO, 5.00%, 8/1/2021 | | | 180,000 | | | | 183,604 | |
| | |
Los Angeles County Metropolitan Transportation Authority, Sales Tax | | | | | | | | |
| | |
Series 2016A, Rev., 5.00%, 6/1/2021 | | | 25,000 | | | | 25,302 | |
| | |
Rev., 5.00%, 7/1/2021 | | | 265,000 | | | | 269,265 | |
| | |
Series 2012-B, Rev., 5.00%, 7/1/2021 | | | 25,000 | | | | 25,403 | |
| | |
Series 2013B, Rev., 5.00%, 7/1/2021 | | | 110,000 | | | | 111,773 | |
| | |
Series 2016A, Rev., 5.00%, 7/1/2021 | | | 35,000 | | | | 35,564 | |
| | |
Series 2017A, Rev., 5.00%, 7/1/2021 | | | 55,000 | | | | 55,887 | |
| | |
Series 2018-A, Rev., 5.00%, 7/1/2021 | | | 65,000 | | | | 66,048 | |
| | |
Series A, Rev., 5.00%, 7/1/2021 | | | 115,000 | | | | 116,854 | |
| | |
Series 2016A, Rev., 5.00%, 6/1/2022 | | | 30,000 | | | | 31,816 | |
| | |
Series 2016A, Rev., 5.00%, 7/1/2022 | | | 75,000 | | | | 79,844 | |
| | |
Series 2017A, Rev., 5.00%, 7/1/2022 | | | 40,000 | | | | 42,583 | |
| | |
Series 2017-B, Rev., 5.00%, 7/1/2022 | | | 20,000 | | | | 21,292 | |
| | |
Series 2018A, Rev., 5.00%, 7/1/2022 | | | 180,000 | | | | 191,624 | |
| | |
Series 2019A, Rev., 5.00%, 7/1/2022 | | | 35,000 | | | | 37,260 | |
| | |
Los Angeles County Public Works Financing Authority | | | | | | | | |
| | |
Series 2015B, Rev., 5.00%, 12/1/2021 | | | 50,000 | | | | 51,818 | |
| | |
Series 2019E1, Rev., 4.00%, 12/1/2023 | | | 85,000 | | | | 93,433 | |
| | |
Los Angeles County Public Works Financing Authority, MLK Hospital Project Series 2016D, Rev., 5.00%, 12/1/2022 | | | 75,000 | | | | 81,331 | |
| | |
Los Angeles County Public Works Financing Authority, Multiple Capital Projects II | | | | | | | | |
| | |
Rev., 5.00%, 8/1/2021 | | | 50,000 | | | | 51,007 | |
| | | | | | | | |
| INVESTMENTS | | PRINCIPAL
AMOUNT ($) | | | VALUE ($) | |
| | | | | | | | |
| | |
California — continued | | | | | | | | |
| | |
Rev., 5.00%, 8/1/2022 | | | 135,000 | | | | 144,243 | |
| | |
Rev., 5.00%, 8/1/2023 | | | 25,000 | | | | 26,675 | |
| | |
Los Angeles County Redevelopment Authority Redev Agency Successor Agency Rev., 5.00%, 12/1/2022 | | | 50,000 | | | | 53,918 | |
| | |
Los Angeles Department of Water and Power, Power System | | | | | | | | |
| | |
Series 2011A, Rev., 5.00%, 7/1/2021 | | | 50,000 | | | | 50,806 | |
| | |
Series 2013A, Rev., 5.00%, 7/1/2021 | | | 75,000 | | | | 76,209 | |
| | |
Series 2016A, Rev., 4.00%, 7/1/2022 | | | 65,000 | | | | 68,334 | |
| | |
Los Angeles Department of Water and Power, Water System Series 2013B, Rev., 5.00%, 7/1/2022 | | | 30,000 | | | | 31,937 | |
| | |
Los Angeles Unified School District | | | | | | | | |
| | |
Series 2017A, GO, 4.00%, 7/1/2021 | | | 25,000 | | | | 25,319 | |
| | |
Series A, GO, 5.00%, 7/1/2021 | | | 25,000 | | | | 25,402 | |
| | |
Series A-1, GO, 5.00%, 7/1/2021 | | | 40,000 | | | | 40,644 | |
| | |
Series A-2, GO, 5.00%, 7/1/2021 | | | 25,000 | | | | 25,402 | |
| | |
Series D, GO, 5.00%, 7/1/2021 | | | 130,000 | | | | 132,092 | |
| | |
Los Gatos Union School District GO, 4.00%, 8/1/2022 | | | 30,000 | | | | 31,635 | |
| | |
Los Rios Community College District | | | | | | | | |
| | |
GO, 5.00%, 8/1/2021 | | | 20,000 | | | | 20,404 | |
| | |
GO, 5.00%, 8/1/2023 | | | 40,000 | | | | 42,732 | |
| | |
Los Rios Community College District, Election of 2002 Series F, GO, 4.00%, 8/1/2022 | | | 30,000 | | | | 31,635 | |
| | |
Los Rios Community College District, Election of 2008 | | | | | | | | |
| | |
Series C, GO, 4.00%, 8/1/2021 | | | 75,000 | | | | 76,204 | |
| | |
Series B, GO, 5.00%, 8/1/2021 | | | 25,000 | | | | 25,505 | |
| | |
Lowell Joint School District GO, 5.00%, 8/1/2021 | | | 30,000 | | | | 30,597 | |
| | |
Lucia Mar Unified School District GO, NATL-RE, 5.25%, 8/1/2022 | | | 35,000 | | | | 37,525 | |
| | |
Lucia Mar Unified School District, Election of 2016 Series 2016B, GO, 5.00%, 8/1/2021 | | | 95,000 | | | | 96,918 | |
| | |
Manteca Unified School District, Election of 2014 Series C, GO, 3.00%, 8/1/2021 | | | 50,000 | | | | 50,595 | |
| | |
Marin Community College District | | | | | | | | |
| | |
GO, 4.00%, 8/1/2021 | | | 50,000 | | | | 50,803 | |
| | |
GO, 5.00%, 8/1/2022 | | | 20,000 | | | | 21,372 | |
SEE NOTES TO FINANCIAL STATEMENTS.
| | | | | | |
| | | |
| 182 | | | | J.P. MORGAN EXCHANGE-TRADED FUNDS | | FEBRUARY 28, 2021 |
| | | | | | | | |
| INVESTMENTS | | PRINCIPAL
AMOUNT ($) | | | VALUE ($) | |
Municipal Bonds — continued | | | | | | | | |
| | |
California — continued | | | | | | | | |
| | |
Marin Emergency Radio Authority Rev., 2.00%, 8/1/2021 | | | 25,000 | | | | 25,194 | |
| | |
Marin Water District Financing Authority, Subordinate Lien Series 2012A, Rev., 4.00%, 7/1/2021 | | | 70,000 | | | | 70,897 | |
| | |
Marysville Joint Unified School District COP, AGM, Zero Coupon, 6/1/2033 | | | 300,000 | | | | 154,884 | |
| | |
Menlo Park City School District, Crossover Capital Appreciation GO, 5.00%, 7/1/2022 (b) | | | 25,000 | | | | 26,628 | |
| | |
Merced Union High School District GO, AGM, Zero Coupon, 2/18/2025 (b) | | | 250,000 | | | | 78,955 | |
| | |
Metropolitan Water District of Southern California, Waterworks | | | | | | | | |
| | |
Series 2017A, Rev., 2.00%, 7/1/2021 | | | 100,000 | | | | 100,614 | |
| | |
Series 2012G, Rev., 4.00%, 7/1/2021 | | | 20,000 | | | | 20,256 | |
| | |
Series 2018A, Rev., 5.00%, 7/1/2021 | | | 70,000 | | | | 71,124 | |
| | |
Series 2017B, Rev., 5.00%, 8/1/2021 | | | 25,000 | | | | 25,401 | |
| | |
Series 2011C, Rev., 5.00%, 10/1/2021 | | | 25,000 | | | | 25,708 | |
| | |
Rev., 5.00%, 1/1/2022 | | | 20,000 | | | | 20,808 | |
| | |
Series 2018A, Rev., 5.00%, 7/1/2022 | | | 25,000 | | | | 26,608 | |
| | |
Midpeninsula Regional Open Space District Series A, GO, 4.00%, 9/1/2021 | | | 30,000 | | | | 30,578 | |
| | |
Milpitas Unified School District | | | | | | | | |
| | |
GO, 5.00%, 8/1/2021 | | | 20,000 | | | | 20,404 | |
| | |
Series 2018A, GO, 5.00%, 8/1/2021 | | | 55,000 | | | | 56,110 | |
| | |
GO, 5.00%, 8/1/2022 | | | 60,000 | | | | 64,117 | |
| | |
Modesto Irrigation District, Domestic Water Project Series 2013G, Rev., AGM, 5.00%, 9/1/2021 | | | 25,000 | | | | 25,606 | |
| | |
Modesto Irrigation District, Electrical System Rev., 5.00%, 10/1/2021 | | | 200,000 | | | | 205,638 | |
| | |
Mojave Unified School District School Facilities Improvement District No. 1 GO, AGM, 4.00%, 8/1/2021 (b) | | | 45,000 | | | | 45,724 | |
| | |
Mojave Water Agency Public Facilities Corp. Series 2017A, Rev., 5.00%, 6/1/2022 | | | 35,000 | | | | 37,119 | |
| | |
Monterey Peninsula Community College District, Tax-Exempt Series A, GO, 4.00%, 8/1/2021 | | | 45,000 | | | | 45,722 | |
| | | | | | | | |
| INVESTMENTS | | PRINCIPAL
AMOUNT ($) | | | VALUE ($) | |
| | | | | | | | |
| | |
California — continued | | | | | | | | |
| | |
Moraga Elementary School District Series B, GO, 4.00%, 8/1/2021 | | | 50,000 | | | | 50,803 | |
| | |
Morongo Unified School District Series 2018A, GO, 4.00%, 8/1/2022 | | | 20,000 | | | | 21,081 | |
| | |
Morongo Unified School District, Election of 2005 Series 2012C, GO, Zero Coupon, 8/15/2022 (b) | | | 95,000 | | | | 36,145 | |
| | |
Mount San Antonio Community College District Series 2013A, GO, 5.00%, 9/1/2022 | | | 20,000 | | | | 21,453 | |
| | |
Mount San Antonio Community College District, Election of 2018 Series 2019A, GO, 4.00%, 8/1/2021 | | | 75,000 | | | | 76,204 | |
| | |
Mountain View Los Altos Union High School District, Election of 2018 Series A, GO, 4.00%, 8/1/2021 | | | 25,000 | | | | 25,401 | |
| | |
M-S-R Public Power Agency Series 2018R, Rev., 5.00%, 7/1/2021 | | | 25,000 | | | | 25,396 | |
| | |
Municipal Improvement Corp. of Los Angeles, Capital Equipment | | | | | | | | |
| | |
Series 2016A, Rev., 5.00%, 11/1/2021 | | | 25,000 | | | | 25,785 | |
| | |
Series 2018A, Rev., 5.00%, 11/1/2023 | | | 50,000 | | | | 56,035 | |
| | |
Municipal Improvement Corp. of Los Angeles, Capital Improvement Series 2012-A, Rev., 5.00%, 3/1/2021 (b) | | | 35,000 | | | | 35,000 | |
| | |
Municipal Improvement Corp. of Los Angeles, Real Property Series 2016B, Rev., 5.00%, 11/1/2021 | | | 100,000 | | | | 103,142 | |
| | |
Napa Sanitation District Series 2012A, COP, 4.00%, 8/1/2022 | | | 40,000 | | | | 42,186 | |
| | |
New Haven Unified School District Series A, GO, 3.00%, 8/1/2021 | | | 100,000 | | | | 101,179 | |
| | |
Newport Mesa Unified School District, Election of 2005 GO, Zero Coupon, 8/1/2021 (b) | | | 200,000 | | | | 48,944 | |
| | |
North Lake Tahoe Public Financing Authority Rev., 5.00%, 12/1/2021 | | | 25,000 | | | | 25,911 | |
| | |
North Orange County Community College District, Election of 2014 | | | | | | | | |
| | |
Series 2014B, GO, 4.00%, 8/1/2021 | | | 30,000 | | | | 30,482 | |
| | |
Series 2014B, GO, 4.00%, 8/1/2022 | | | 30,000 | | | | 31,635 | |
| | |
Northern California Power Agency, Hydroelectric Project | | | | | | | | |
| | |
Series 2019A, Rev., 5.00%, 7/1/2021 | | | 100,000 | | | | 101,595 | |
| | |
Series 1986A, Rev., AMBAC, 7.50%, 7/1/2021 (b) | | | 360,000 | | | | 368,752 | |
SEE NOTES TO FINANCIAL STATEMENTS.
| | | | | | | | |
| | | |
| FEBRUARY 28, 2021 | | J.P. MORGAN EXCHANGE-TRADED FUNDS | | | | | 183 | |
JPMorgan Ultra-Short Municipal Income ETF
SCHEDULE OF PORTFOLIO INVESTMENTS
AS OF FEBRUARY 28, 2021 (continued)
| | | | | | | | |
| INVESTMENTS | | PRINCIPAL
AMOUNT ($) | | | VALUE ($) | |
Municipal Bonds — continued | | | | | | | | |
| | |
California — continued | | | | | | | | |
| | |
Novato Unified School District GO, 5.00%, 8/1/2021 (b) | | | 20,000 | | | | 20,405 | |
| | |
Oakland Joint Powers Financing Authority Rev., 5.00%, 11/1/2021 | | | 25,000 | | | | 25,806 | |
| | |
Ohlone Community College District | | | | | | | | |
| | |
GO, 4.00%, 8/1/2021 | | | 135,000 | | | | 137,167 | |
| | |
GO, 5.00%, 8/1/2022 | | | 135,000 | | | | 144,275 | |
| | |
Ohlone Community College District, Election of 2010 | | | | | | | | |
| | |
Series A, GO, 5.00%, 8/1/2021 (b) | | | 50,000 | | | | 51,011 | |
| | |
Series A-1, GO, 5.00%, 8/1/2021 (b) | | | 25,000 | | | | 25,506 | |
| | |
Series 2011A, GO, 5.25%, 8/1/2021 (b) | | | 20,000 | | | | 20,425 | |
| | |
Olivenhain Municipal Water District Series 2016A, Rev., 5.00%, 6/1/2022 | | | 25,000 | | | | 26,514 | |
| | |
Ontario Public Financing Authority | | | | | | | | |
| | |
Rev., 5.00%, 7/1/2021 | | | 35,000 | | | | 35,564 | |
| | |
Rev., AGM, 5.00%, 11/1/2023 | | | 100,000 | | | | 111,644 | |
| | |
Orange County Sanitation District Series 2018A, COP, 5.00%, 8/15/2021 | | | 70,000 | | | | 71,404 | |
| | |
Orange County Sanitation District, Wastewater Series 2014A, Rev., 5.00%, 2/1/2022 | | | 25,000 | | | | 26,114 | |
| | |
Orchard School District GO, 5.00%, 8/1/2023 | | | 25,000 | | | | 27,863 | |
| | |
Orinda Union School District, Election of 2018 Series A, GO, 3.00%, 8/1/2021 | | | 125,000 | | | | 126,489 | |
| | |
Oxnard Union High School District, Election of 2018 | | | | | | | | |
| | |
Series A, GO, 4.00%, 8/1/2021 | | | 25,000 | | | | 25,401 | |
| | |
Series 2018A, GO, 4.00%, 8/1/2022 | | | 20,000 | | | | 21,090 | |
| | |
Series B, GO, 4.00%, 8/1/2022 | | | 25,000 | | | | 26,363 | |
| | |
Pacific Grove Unified School District | | | | | | | | |
| | |
GO, 4.00%, 8/1/2021 | | | 25,000 | | | | 25,401 | |
| | |
Series 2015A, GO, 5.00%, 8/1/2022 | | | 55,000 | | | | 58,774 | |
| | |
Padre Dam Municipal Water District Series 2017A, COP, 5.00%, 10/1/2024 | | | 50,000 | | | | 58,166 | |
| | |
Pajaro Valley Water Management Agency Rev., AGM, 5.00%, 3/1/2022 | | | 50,000 | | | | 52,312 | |
| | |
Palm Springs Community Redevelopment Agency Successor Agency 5.00%, 9/1/2021 | | | 85,000 | | | | 87,048 | |
| | | | | | | | |
| INVESTMENTS | | PRINCIPAL
AMOUNT ($) | | | VALUE ($) | |
| | | | | | | | |
| | |
California — continued | | | | | | | | |
| | |
Palm Springs Financing Authority, Convention Center Project | | | | | | | | |
| | |
Series 2012A, Rev., 3.00%, 11/1/2021 | | | 150,000 | | | | 152,623 | |
| | |
Series 2012A, Rev., 3.13%, 11/1/2022 | | | 25,000 | | | | 26,129 | |
| | |
Series 2012A, Rev., 3.25%, 11/1/2023 | | | 55,000 | | | | 57,495 | |
| | |
Palm Springs Financing Authority, Downtown Revitalization Project Series 2012B, Rev., 4.00%, 6/1/2022 | | | 100,000 | | | | 104,808 | |
| | |
Palm Springs Unified School District GO, 4.00%, 8/1/2021 | | | 25,000 | | | | 25,391 | |
| | |
Palomar Community College District | | | | | | | | |
| | |
GO, 5.00%, 5/1/2021 | | | 20,000 | | | | 20,160 | |
| | |
GO, 5.00%, 5/1/2022 | | | 25,000 | | | | 26,406 | |
| | |
GO, 5.00%, 5/1/2024 | | | 50,000 | | | | 57,246 | |
| | |
Palomar Community College District, Election of 2006 Series 2010B, GO, Zero Coupon, 8/1/2021 | | | 250,000 | | | | 249,825 | |
| | |
Paramount Unified School District, Election of 2006 GO, Zero Coupon, 8/1/2023 (b) | | | 165,000 | | | | 22,471 | |
| | |
Pasadena Public Financing Authority, Rose Bowl Renovation Project | | | | | | | | |
| | |
Series 2016A, Rev., 5.00%, 4/1/2022 | | | 25,000 | | | | 26,308 | |
| | |
Series 2016A, Rev., 5.00%, 4/1/2023 | | | 75,000 | | | | 82,021 | |
| | |
Pasadena Unified School District, Election of 2008 GO, 5.00%, 5/1/2022 (b) | | | 40,000 | | | | 42,279 | |
| | |
Peralta Community College District Series 2020A, GO, 5.00%, 8/1/2022 | | | 25,000 | | | | 26,693 | |
| | |
Pismo Beach Public Financing Agency, Beach Municipal Pier Project Rev., 5.00%, 12/1/2023 | | | 30,000 | | | | 33,857 | |
| | |
Pismo Beach Public Financing Authority, Wastewater Project Rev., 5.00%, 12/1/2021 | | | 30,000 | | | | 31,086 | |
| | |
Pittsburg Successor Agency Redevelopment Agency, Los Medanos Community Development District AGM, 5.00%, 8/1/2021 | | | 25,000 | | | | 25,502 | |
| | |
Pittsburg Unified School District Rev., AGM, Zero Coupon, 9/1/2021 (b) | | | 175,000 | | | | 48,561 | |
| | |
Placer Union High School District School Facilities Improvement District No. 2, Election of 2018 Series A, GO, 5.00%, 8/1/2021 | | | 50,000 | | | | 51,009 | |
SEE NOTES TO FINANCIAL STATEMENTS.
| | | | | | |
| | | |
| 184 | | | | J.P. MORGAN EXCHANGE-TRADED FUNDS | | FEBRUARY 28, 2021 |
| | | | | | | | |
| INVESTMENTS | | PRINCIPAL
AMOUNT ($) | | | VALUE ($) | |
Municipal Bonds — continued | | | | | | | | |
| | |
California — continued | | | | | | | | |
| | |
Placer Union High School District, Capital Appreciation Series 2000A, GO, NATL-RE, Zero Coupon, 8/1/2022 | | | 20,000 | | | | 19,834 | |
| | |
Pleasanton Unified School District | | | | | | | | |
| | |
GO, 3.00%, 8/1/2021 | | | 45,000 | | | | 45,536 | |
| | |
Series 2013A, GO, 5.00%, 8/1/2021 | | | 65,000 | | | | 66,312 | |
| | |
GO, 4.00%, 8/1/2022 | | | 25,000 | | | | 26,363 | |
| | |
Pomona Unified School District, Election of 2008 Series C, GO, 5.13%, 8/1/2021 (b) | | | 50,000 | | | | 51,026 | |
| | |
Port of Los Angeles, Harbor Department | | | | | | | | |
| | |
Series 2014B, Rev., 5.00%, 8/1/2021 | | | 30,000 | | | | 30,584 | |
| | |
Series 2015A, Rev., 5.00%, 8/1/2021 | | | 25,000 | | | | 25,487 | |
| | |
Series 2014C, Rev., 3.00%, 8/1/2022 | | | 25,000 | | | | 25,948 | |
| | |
Poway Unified School District GO, 5.00%, 8/1/2021 (b) | | | 160,000 | | | | 163,237 | |
| | |
Poway Unified School District Public Financing Authority, Community Facility District, Special Tax Series 2017A, Rev., 4.00%, 9/1/2021 | | | 30,000 | | | | 30,575 | |
| | |
Puente Basin Water Agency, Walnut Valley Water District Project Series 2013A, Rev., 5.00%, 6/1/2023 | | | 25,000 | | | | 27,676 | |
| | |
Rancho Santa Fe School District GO, 5.00%, 8/1/2021 | | | 25,000 | | | | 25,505 | |
| | |
Rancho Santiago Community College District | | | | | | | | |
| | |
GO, 4.00%, 9/1/2021 | | | 20,000 | | | | 20,385 | |
| | |
GO, 4.00%, 9/1/2022 | | | 25,000 | | | | 26,443 | |
| | |
Rancho Water District Financing Authority Series 2016B, Rev., 5.00%, 8/1/2021 | | | 35,000 | | | | 35,707 | |
| | |
Reed Union School District GO, 4.00%, 8/1/2021 | | | 50,000 | | | | 50,802 | |
| | |
Regents of the University of California Medical Center Pooled | | | | | | | | |
| | |
Series 2016L, Rev., 5.00%, 5/15/2021 | | | 30,000 | | | | 30,297 | |
| | |
Series 2016L, Rev., 5.00%, 5/15/2022 | | | 65,000 | | | | 68,779 | |
| | |
Rio Hondo Community College District, Election of 2019 Series 2019B, GO, 5.00%, 8/1/2021 | | | 50,000 | | | | 51,009 | |
| | | | | | | | |
| INVESTMENTS | | PRINCIPAL
AMOUNT ($) | | | VALUE ($) | |
| | | | | | | | |
| | |
California — continued | | | | | | | | |
| | |
Riverside County Asset Leasing Corp., County Administrative Center Rev., 5.00%, 11/1/2021 | | | 50,000 | | | | 51,585 | |
| | |
Riverside County Transportation Commission, Sales Tax | | | | | | | | |
| | |
Series 2013A, Rev., 5.00%, 6/1/2021 | | | 20,000 | | | | 20,239 | |
| | |
Series 2018A, Rev., 5.00%, 6/1/2021 | | | 40,000 | | | | 40,478 | |
| | |
Series 2017A, Rev., 4.00%, 6/1/2022 | | | 20,000 | | | | 20,951 | |
| | |
Series 2013A, Rev., 5.00%, 6/1/2022 | | | 25,000 | | | | 26,501 | |
| | |
Series 2018A, Rev., 5.00%, 6/1/2022 | | | 40,000 | | | | 42,401 | |
| | |
Series 2013A, Rev., 5.00%, 6/1/2023 | | | 40,000 | | | | 44,187 | |
| | |
Series 2017A, Rev., 5.00%, 6/1/2023 | | | 25,000 | | | | 27,617 | |
| | |
Riverside Public Financing Authority, Riverside Pavement Rehabilitation Project COP, AGM, 5.00%, 6/1/2021 | | | 100,000 | | | | 101,180 | |
| | |
Rocklin Public Financing Authority Rev., 5.00%, 11/1/2022 | | | 25,000 | | | | 27,014 | |
| | |
Roseville Joint Union High School District GO, 5.00%, 8/1/2021 | | | 25,000 | | | | 25,505 | |
| | |
Rowland Unified School District GO, 4.00%, 8/1/2021 | | | 110,000 | | | | 111,766 | |
| | |
Sacramento Area Flood Control Agency, Natomas Basin Local Assessment 5.00%, 10/1/2021 | | | 25,000 | | | | 25,705 | |
| | |
Sacramento County Sanitation Districts Financing Authority Series 2011A, Rev., 5.00%, 12/1/2021 (b) | | | 100,000 | | | | 103,651 | |
| | |
Sacramento Municipal Utility District, Electric | | | | | | | | |
| | |
Series 2011X, Rev., 5.00%, 8/15/2021 | | | 100,000 | | | | 102,204 | |
| | |
Series 2018F, Rev., 5.00%, 8/15/2021 | | | 40,000 | | | | 40,882 | |
| | |
Series 2018F, Rev., 5.00%, 8/15/2022 | | | 50,000 | | | | 53,518 | |
| | |
Series E, Rev., 5.00%, 8/15/2022 | | | 20,000 | | | | 21,407 | |
| | |
Series 2019A, Rev., 5.00%, 10/17/2023 (c) | | | 245,000 | | | | 268,976 | |
| | |
Sacramento Municipal Utility District, Financing Authority, Cosumnes Project | | | | | | | | |
| | |
Rev., 5.00%, 7/1/2021 | | | 40,000 | | | | 40,642 | |
| | |
Rev., 5.00%, 7/1/2022 | | | 40,000 | | | | 42,594 | |
SEE NOTES TO FINANCIAL STATEMENTS.
| | | | | | | | |
| | | |
| FEBRUARY 28, 2021 | | J.P. MORGAN EXCHANGE-TRADED FUNDS | | | | | 185 | |
JPMorgan Ultra-Short Municipal Income ETF
SCHEDULE OF PORTFOLIO INVESTMENTS
AS OF FEBRUARY 28, 2021 (continued)
| | | | | | | | |
| INVESTMENTS | | PRINCIPAL
AMOUNT ($) | | | VALUE ($) | |
Municipal Bonds — continued | | | | | | | | |
| | |
California — continued | | | | | | | | |
| | |
Saddleback Valley Unified School District GO, 4.00%, 8/1/2021 | | | 25,000 | | | | 25,401 | |
| | |
San Bernardino Community College District Series A, GO, 5.00%, 8/1/2021 | | | 75,000 | | | | 76,508 | |
| | |
San Bernardino Community College District, Election of 2018 Series 2019A, GO, 4.00%, 8/1/2021 | | | 25,000 | | | | 25,399 | |
| | |
San Bernardino County Transportation Authority | | | | | | | | |
| | |
Series 2014A, Rev., 4.00%, 3/1/2021 | | | 25,000 | | | | 25,000 | |
| | |
Series 2012A, Rev., 5.00%, 3/1/2021 | | | 75,000 | | | | 75,000 | |
| | |
San Diego Community College District | | | | | | | | |
| | |
GO, 4.00%, 8/1/2021 | | | 40,000 | | | | 40,642 | |
| | |
GO, 5.00%, 8/1/2021 | | | 25,000 | | | | 25,505 | |
| | |
GO, 5.00%, 8/1/2022 | | | 105,000 | | | | 112,252 | |
| | |
San Diego Community College District, Election of 2002 GO, 5.00%, 8/1/2021 (b) | | | 140,000 | | | | 142,832 | |
| | |
San Diego Community College District, Election of 2006 | | | | | | | | |
| | |
GO, 4.00%, 8/1/2021 | | | 55,000 | | | | 55,883 | |
| | |
GO, 5.00%, 8/1/2021 | | | 105,000 | | | | 107,122 | |
| | |
GO, 4.00%, 8/1/2022 | | | 30,000 | | | | 31,635 | |
| | |
San Diego County Regional Airport Authority, Subordinate Airport Series 2019A, Rev., 5.00%, 7/1/2021 | | | 30,000 | | | | 30,472 | |
| | |
San Diego County Regional Transportation Commission, Sales Tax | | | | | | | | |
| | |
Series 2018A, Rev., 3.00%, 4/1/2021 (b) | | | 100,000 | | | | 100,232 | |
| | |
Series 2018A, Rev., 4.00%, 4/1/2021 (b) | | | 35,000 | | | | 35,109 | |
| | |
Series 2012A, Rev., 5.00%, 4/1/2021 | | | 130,000 | | | | 130,511 | |
| | |
Series 2016A, Rev., 5.00%, 4/1/2021 | | | 125,000 | | | | 125,491 | |
| | |
Series 2020A, Rev., 5.00%, 4/1/2021 | | | 25,000 | | | | 25,098 | |
| | |
Series A, Rev., 5.00%, 4/1/2021 | | | 75,000 | | | | 75,295 | |
| | |
Series 2012A, Rev., 5.00%, 4/1/2022 | | | 20,000 | | | | 21,052 | |
| | |
San Diego County Water Authority | | | | | | | | |
| | |
Series 2011A, Rev., 5.00%, 5/1/2021 | | | 465,000 | | | | 468,725 | |
| | | | | | | | |
| INVESTMENTS | | PRINCIPAL
AMOUNT ($) | | | VALUE ($) | |
| | | | | | | | |
| | |
California — continued | | | | | | | | |
| | |
Series 2011B, Rev., 5.00%, 5/1/2021 | | | 170,000 | | | | 171,358 | |
| | |
Series 2016S-1, Rev., 5.00%, 5/1/2021 | | | 40,000 | | | | 40,092 | |
| | |
Rev., 5.00%, 5/1/2022 | | | 50,000 | | | | 52,825 | |
| | |
San Diego Housing Authority, Multi-Family Housing, Hillside Views Apartments Series 2018G-1, Rev., 0.22%, 6/1/2021 (c) | | | 30,000 | | | | 30,006 | |
| | |
San Diego Public Facilities Financing Authority | | | | | | | | |
| | |
Series 2016B, Rev., 5.00%, 8/1/2021 | | | 100,000 | | | | 102,010 | |
| | |
Rev., 5.00%, 5/15/2022 | | | 65,000 | | | | 68,787 | |
| | |
Series 2012A, Rev., 5.00%, 8/1/2022 (b) | | | 40,000 | | | | 42,739 | |
| | |
Series 2020A, Rev., 5.00%, 8/1/2022 | | | 30,000 | | | | 32,067 | |
| | |
San Diego Public Facilities Financing Authority, Ballpark Refunding Rev., 5.00%, 10/15/2022 | | | 125,000 | | | | 134,230 | |
| | |
San Diego Public Facilities Financing Authority, Capital Improvement Projects Series 2012A, Rev., 5.00%, 4/15/2022 (b) | | | 50,000 | | | | 52,741 | |
| | |
San Diego Public Facilities Financing Authority, Sewer Utility Series 2016A, Rev., 4.00%, 5/15/2021 | | | 200,000 | | | | 201,564 | |
| | |
San Diego Regional Building Authority, County Operations Center Series 2016A, Rev., 5.00%, 10/15/2022 | | | 25,000 | | | | 26,795 | |
| | |
San Diego Unified School District, Election of 2008 Series 2020D-2, GO, 5.00%, 7/1/2022 | | | 20,000 | | | | 21,300 | |
| | |
San Dieguito Union High School District, Election of 2012 | | | | | | | | |
| | |
Series 2018D-2, GO, 4.00%, 8/1/2021 | | | 80,000 | | | | 81,284 | |
| | |
Series A-2, GO, 4.00%, 8/1/2021 | | | 50,000 | | | | 50,803 | |
| | |
San Elijo Joint Powers Authority, Clean Water Projects Rev., 3.00%, 3/1/2022 | | | 85,000 | | | | 87,430 | |
| | |
San Francisco Bay Area Rapid Transit District, Election of 2004 | | | | | | | | |
| | |
Series 2013C, GO, 4.00%, 8/1/2021 | | | 175,000 | | | | 177,809 | |
| | |
Series D, GO, 3.00%, 8/1/2022 | | | 20,000 | | | | 20,807 | |
SEE NOTES TO FINANCIAL STATEMENTS.
| | | | | | |
| | | |
| 186 | | | | J.P. MORGAN EXCHANGE-TRADED FUNDS | | FEBRUARY 28, 2021 |
| | | | | | | | |
| INVESTMENTS | | PRINCIPAL
AMOUNT ($) | | | VALUE ($) | |
Municipal Bonds — continued | | | | | | | | |
| | |
California — continued | | | | | | | | |
| | |
San Francisco Bay Area Rapid Transit District, Sales Tax | | | | | | | | |
| | |
Series 2012A, Rev., 4.00%, 7/1/2021 | | | 30,000 | | | | 30,385 | |
| | |
Rev., 5.00%, 7/1/2021 | | | 20,000 | | | | 20,322 | |
| | |
Series 2012A, Rev., 5.00%, 7/1/2022 (b) | | | 55,000 | | | | 58,544 | |
| | |
Series 2015A, Rev., 5.00%, 7/1/2022 | | | 20,000 | | | | 21,292 | |
| | |
San Francisco City and County Airport Commission, San Francisco International Airport | | | | | | | | |
| | |
Series 2016A, Rev., 5.00%, 5/1/2021 (b) | | | 150,000 | | | | 151,164 | |
| | |
Series 2011B, Rev., 5.50%, 5/1/2021 (b) | | | 200,000 | | | | 201,716 | |
| | |
Series 2011D, Rev., 5.00%, 5/3/2021 (b) | | | 25,000 | | | | 25,207 | |
| | |
Series 2016A, Rev., 5.00%, 5/1/2022 | | | 80,000 | | | | 84,501 | |
| | |
San Francisco City and County Public Utilities Commission | | | | | | | | |
| | |
Series 2010A, Rev., 5.00%, 10/1/2021 | | | 30,000 | | | | 30,851 | |
| | |
Subseries 2011-A, Rev., 5.00%, 11/1/2021 (b) | | | 60,000 | | | | 61,946 | |
| | |
Subseries A, Rev., 5.00%, 11/1/2021 (b) | | | 25,000 | | | | 25,811 | |
| | |
Subseries C, Rev., 5.00%, 11/1/2021 (b) | | | 45,000 | | | | 46,460 | |
| | |
Series 2012A, Rev., 4.00%, 5/1/2022 (b) | | | 175,000 | | | | 182,936 | |
| | |
Series 2012A, Rev., 5.00%, 5/1/2022 (b) | | | 25,000 | | | | 26,425 | |
| | |
San Francisco County Transportation Authority, Sales Tax Rev., 3.00%, 2/1/2022 | | | 160,000 | | | | 164,192 | |
| | |
San Francisco Municipal Transportation Agency Rev., 5.00%, 3/1/2021 | | | 135,000 | | | | 135,000 | |
| | |
San Francisco Unified School District, Election of 2016 Series A, GO, 3.00%, 6/15/2021 | | | 55,000 | | | | 55,448 | |
| | |
San Francisco Unified School District, Proposition A, Election of 2011 | | | | | | | | |
| | |
Series 2014B, GO, 5.00%, 6/15/2021 | | | 50,000 | | | | 50,693 | |
| | |
Series 2015F&C, GO, 5.00%, 6/15/2021 | | | 55,000 | | | | 55,763 | |
| | |
Series 2014B, GO, 5.00%, 6/15/2022 | | | 55,000 | | | | 58,411 | |
| | | | | | | | |
| INVESTMENTS | | PRINCIPAL
AMOUNT ($) | | | VALUE ($) | |
| | | | | | | | |
| | |
California — continued | | | | | | | | |
| | |
San Joaquin County Transportation Authority, Measure K Sales Tax | | | | | | | | |
| | |
Rev., 5.00%, 3/1/2022 | | | 20,000 | | | | 20,970 | |
| | |
Rev., 5.00%, 3/1/2023 | | | 20,000 | | | | 21,875 | |
| | |
San Joaquin Hills Transportation Corridor Agency, Toll Road, Senior Lien Rev., Zero Coupon, 1/1/2025 (b) | | | 120,000 | | | | 117,502 | |
| | |
San Jose Evergreen Community College District GO, 5.00%, 9/1/2021 | | | 50,000 | | | | 51,213 | |
| | |
San Jose Evergreen Community College District, Election of 2010 Series B, GO, 5.00%, 8/1/2022 (b) | | | 35,000 | | | | 37,422 | |
| | |
San Jose Evergreen Community College District, Election of 2016 | | | | | | | | |
| | |
Series A, GO, 4.00%, 9/1/2022 | | | 20,000 | | | | 21,154 | |
| | |
Series B, GO, 4.00%, 9/1/2022 | | | 25,000 | | | | 26,443 | |
| | |
San Jose Financing Authority, Civic Center Project | | | | | | | | |
| | |
Series 2013A, Rev., 4.00%, 6/1/2021 (b) | | | 25,000 | | | | 25,234 | |
| | |
Series 2013A, Rev., 5.00%, 6/1/2022 (b) | | | 90,000 | | | | 95,379 | |
| | |
Series 2013A, Rev., 5.00%, 6/1/2023 (b) | | | 30,000 | | | | 33,155 | |
| | |
San Jose Redevelopment Agency Successor Agency Series B, 5.00%, 8/1/2021 | | | 25,000 | | | | 25,496 | |
| | |
San Jose Unified School District | | | | | | | | |
| | |
GO, 4.00%, 8/1/2021 | | | 40,000 | | | | 40,642 | |
| | |
GO, 4.25%, 8/1/2021 (b) | | | 35,000 | | | | 35,599 | |
| | |
GO, 5.00%, 8/1/2021 (b) | | | 320,000 | | | | 326,469 | |
| | |
San Juan Unified School District Series 2012C, GO, 4.00%, 8/1/2021 (b) | | | 25,000 | | | | 25,402 | |
| | |
San Juan Unified School District, Election of 2002 | | | | | | | | |
| | |
GO, 3.00%, 8/1/2021 | | | 80,000 | | | | 80,953 | |
| | |
GO, 3.00%, 8/1/2022 | | | 25,000 | | | | 26,009 | |
| | |
GO, 3.00%, 8/1/2023 | | | 25,000 | | | | 26,635 | |
| | |
San Juan Unified School District, Election of 2012 Series 2019N, GO, 4.00%, 8/1/2021 | | | 25,000 | | | | 25,401 | |
| | |
San Juan Unified School District, Election of 2016 Series 2019P, GO, 4.00%, 8/1/2021 | | | 100,000 | | | | 101,605 | |
| | |
San Juan Water District Rev., 5.00%, 2/1/2025 | | | 45,000 | | | | 53,042 | |
SEE NOTES TO FINANCIAL STATEMENTS.
| | | | | | | | |
| | | |
| FEBRUARY 28, 2021 | | J.P. MORGAN EXCHANGE-TRADED FUNDS | | | | | 187 | |
JPMorgan Ultra-Short Municipal Income ETF
SCHEDULE OF PORTFOLIO INVESTMENTS
AS OF FEBRUARY 28, 2021 (continued)
| | | | | | | | |
| INVESTMENTS | | PRINCIPAL
AMOUNT ($) | | | VALUE ($) | |
Municipal Bonds — continued | | | | | | | | |
| | |
California — continued | | | | | | | | |
| | |
San Marcos Public Financing Authority Series 1994A, Rev., 6.25%, 9/2/2022 (b) | | | 25,000 | | | | 27,264 | |
| | |
San Marcos Unified School District, Election of 2010 Series A, GO, 5.00%, 8/1/2021 (b) | | | 65,000 | | | | 66,307 | |
| | |
San Marcos Unified School, District No. 4, Community Facilities, Special Tax 4.00%, 9/1/2023 | | | 25,000 | | | | 27,300 | |
| | |
San Mateo County Transit District | | | | | | | | |
| | |
Series 2015A, Rev., 5.00%, 6/1/2021 | | | 55,000 | | | | 55,663 | |
| | |
Series 2015A, Rev., 5.00%, 6/1/2022 | | | 50,000 | | | | 53,027 | |
| | |
San Mateo Foster City School District GO, 5.00%, 8/15/2022 | | | 50,000 | | | | 53,526 | |
| | |
San Mateo Foster City School District, Election of 2008 Series 2012C, GO, 5.00%, 8/1/2022 | | | 40,000 | | | | 42,745 | |
| | |
San Mateo Joint Powers Financing Authority, Maple Street Correctional Center | | | | | | | | |
| | |
Series 2014A, Rev., 4.00%, 6/15/2021 | | | 65,000 | | | | 65,708 | |
| | |
Series 2014A, Rev., 5.00%, 6/15/2022 | | | 25,000 | | | | 26,537 | |
| | |
San Mateo Redevelopment Agency Successor Agency Series 2017A, 5.00%, 8/1/2021 | | | 50,000 | | | | 51,003 | |
| | |
San Mateo Union High School District Series 2016C, GO, 5.00%, 9/1/2022 | | | 20,000 | | | | 21,453 | |
| | |
San Rafael City Elementary School District | | | | | | | | |
| | |
GO, 4.00%, 8/1/2021 | | | 20,000 | | | | 20,321 | |
| | |
GO, 5.00%, 8/1/2021 (b) | | | 25,000 | | | | 25,506 | |
| | |
San Rafael City Elementary School District, Election of 2011 Series 2015C, GO, 5.00%, 8/1/2021 | | | 35,000 | | | | 35,707 | |
| | |
San Rafael City High School District GO, 5.00%, 8/1/2021 | | | 55,000 | | | | 56,112 | |
| | |
San Rafael City High School District, Election of 2015 Series C, GO, 4.00%, 8/1/2021 | | | 25,000 | | | | 25,401 | |
| | |
San Rafael Joint Powers Financing Authority, Public Safety Facilities Project Rev., 4.00%, 6/1/2022 | | | 70,000 | | | | 73,366 | |
| | |
San Ramon Valley Unified School District | | | | | | | | |
| | |
GO, 4.00%, 8/1/2021 | | | 30,000 | | | | 30,481 | |
| | |
GO, 5.00%, 8/1/2022 | | | 110,000 | | | | 117,569 | |
| | | | | | | | |
| INVESTMENTS | | PRINCIPAL
AMOUNT ($) | | | VALUE ($) | |
| | | | | | | | |
| | |
California — continued | | | | | | | | |
| | |
Santa Ana College Improvement District #1 Rancho Santiago Community College District, Election of 2012 | | | | | | | | |
| | |
Series 2014A, GO, 5.00%, 8/1/2021 | | | 20,000 | | | | 20,404 | |
| | |
Series 2014A, GO, 5.00%, 8/1/2022 | | | 20,000 | | | | 21,372 | |
| | |
Santa Barbara Community College District GO, 5.00%, 8/1/2021 | | | 25,000 | | | | 25,505 | |
| | |
Santa Barbara Unified School District | | | | | | | | |
| | |
GO, 5.00%, 8/1/2021 | | | 20,000 | | | | 20,404 | |
| | |
Series A, GO, 5.00%, 8/1/2022 | | | 30,000 | | | | 32,058 | |
| | |
Santa Clara Unified School District GO, 5.00%, 7/1/2021 | | | 20,000 | | | | 20,322 | |
| | |
Santa Clara Valley Transportation Authority, Sales Tax Series 2017B, Rev., 5.00%, 6/1/2021 | | | 25,000 | | | | 25,302 | |
| | |
Santa Clara Valley Water District, Water Utility System Improvement Projects Series 2016C, COP, 5.00%, 6/1/2021 | | | 20,000 | | | | 20,240 | |
| | |
Santa Clarita Community College District | | | | | | | | |
| | |
GO, 5.00%, 8/1/2021 | | | 75,000 | | | | 76,514 | |
| | |
GO, 4.00%, 8/1/2022 | | | 35,000 | | | | 36,908 | |
| | |
Santa Cruz City Elementary School District GO, 4.00%, 8/1/2021 | | | 25,000 | | | | 25,401 | |
| | |
Santa Margarita-Dana Point Authority Series 2020A, Rev., 5.00%, 6/1/2022 | | | 45,000 | | | | 47,724 | |
| | |
Santa Margarita-Dana Point Authority, Water District Improvement Rev., 4.00%, 8/1/2021 | | | 90,000 | | | | 91,445 | |
| | |
Santa Monica Community College District, Election of 2008 | | | | | | | | |
| | |
Series 2014B, GO, 5.00%, 8/1/2021 | | | 30,000 | | | | 30,605 | |
| | |
Series 2014B, GO, 5.00%, 8/1/2022 | | | 35,000 | | | | 37,402 | |
| | |
Santa Monica Public Financing Authority, City Services Building Project Series 2011A, Rev., 5.00%, 6/1/2023 | | | 25,000 | | | | 25,296 | |
| | |
Santa Monica Public Financing Authority, Downtown Fire Station Project Rev., 5.00%, 7/1/2021 | | | 35,000 | | | | 35,564 | |
| | |
Santa Monica-Malibu Unified School District Series 2016A, GO, 4.00%, 7/1/2022 | | | 65,000 | | | | 68,334 | |
| | |
Santa Rosa High School District | | | | | | | | |
| | |
GO, 4.00%, 8/1/2021 | | | 20,000 | | | | 20,321 | |
| | |
GO, 4.00%, 8/1/2022 | | | 45,000 | | | | 47,453 | |
| | |
Savanna School District, Election of 2012 Series 2012A, GO, AGM, 5.00%, 8/1/2021 | | | 35,000 | | | | 35,684 | |
SEE NOTES TO FINANCIAL STATEMENTS.
| | | | | | |
| | | |
| 188 | | | | J.P. MORGAN EXCHANGE-TRADED FUNDS | | FEBRUARY 28, 2021 |
| | | | | | | | |
| INVESTMENTS | | PRINCIPAL
AMOUNT ($) | | | VALUE ($) | |
Municipal Bonds — continued | | | | | | | | |
| | |
California — continued | | | | | | | | |
| | |
Shasta-Tehama-Trinity Joint Community College District | | | | | | | | |
| | |
Series B, GO, 3.00%, 8/1/2021 | | | 70,000 | | | | 70,811 | |
| | |
GO, 5.00%, 8/1/2022 | | | 50,000 | | | | 53,372 | |
| | |
Silicon Valley Clean Water, Wastewater | | | | | | | | |
| | |
Rev., 5.00%, 2/1/2022 | | | 25,000 | | | | 26,112 | |
| | |
Rev., 5.00%, 8/1/2022 | | | 100,000 | | | | 106,862 | |
| | |
Series A, Rev., 3.00%, 3/1/2024 | | | 145,000 | | | | 154,264 | |
| | |
Simi Valley Public Financing Authority, Public Facilities Series 2014A, Rev., 5.00%, 10/1/2022 | | | 110,000 | | | | 118,437 | |
| | |
Simi Valley Unified School District Series 2016B, GO, 4.00%, 8/1/2021 | | | 75,000 | | | | 76,204 | |
| | |
Siskiyou Community College District GO, 4.00%, 8/1/2021 | | | 25,000 | | | | 25,383 | |
| | |
Solano County Community College District Series 2014A, GO, 5.00%, 8/1/2023 | | | 40,000 | | | | 44,559 | |
| | |
Sonoma County Junior College District | | | | | | | | |
| | |
Series B, GO, 4.00%, 8/1/2021 | | | 80,000 | | | | 81,284 | |
| | |
Series B, GO, 4.00%, 8/1/2023 | | | 55,000 | | | | 59,974 | |
| | |
Sonoma County Transportation Authority, Limited Tax | | | | | | | | |
| | |
Rev., 5.00%, 12/1/2021 | | | 20,000 | | | | 20,729 | |
| | |
Rev., 5.00%, 12/1/2022 | | | 25,000 | | | | 27,115 | |
| | |
Sonoma-Marin Area Rail Transit District, Sales Tax Series 2011A, Rev., 5.00%, 3/1/2022 (b) | | | 40,000 | | | | 41,953 | |
| | |
Soquel Creek Water District, Capital Projects COP, 4.00%, 3/1/2021 (b) | | | 30,000 | | | | 30,000 | |
| | |
South Placer Wastewater Authority Rev., 5.00%, 11/1/2021 | | | 35,000 | | | | 36,126 | |
| | |
South San Francisco Unified School District, Measure J, Dedicated Unlimited Ad Valorem Property Tax Rev., NATL-RE, 5.25%, 9/15/2022 | | | 35,000 | | | | 37,743 | |
| | |
Southern California Public Power Authority, Canyon Power Project Series 2016A, Rev., 5.00%, 7/1/2021 (b) | | | 50,000 | | | | 50,808 | |
| | |
Southern California Public Power Authority, Milford Wind Corridor Phase-1 Project Rev., 5.00%, 7/1/2022 | | | 40,000 | | | | 42,572 | |
| | |
Southern California Public Power Authority, Transmission Project Rev., 5.00%, 7/1/2021 | | | 155,000 | | | | 157,488 | |
| | |
Southern California Water Replenishment District Rev., 5.00%, 8/1/2021 | | | 75,000 | | | | 76,514 | |
| | | | | | | | |
| INVESTMENTS | | PRINCIPAL
AMOUNT ($) | | | VALUE ($) | |
| | | | | | | | |
| | |
California — continued | | | | | | | | |
| | |
Southwestern Community College District, Election of 2008 Series C, GO, 5.00%, 8/1/2021 (b) | | | 100,000 | | | | 102,023 | |
| | |
State Center Community College District | | | | | | | | |
| | |
GO, 5.00%, 8/1/2021 | | | 25,000 | | | | 25,505 | |
| | |
GO, 5.00%, 8/1/2022 | | | 30,000 | | | | 32,058 | |
| | |
State of California GO, 5.00%, 9/1/2021 | | | 65,000 | | | | 66,576 | |
| | |
State of California Department of Water Resources, Central Valley Project, Water System | | | | | | | | |
| | |
Series AJ, Rev., 5.00%, 12/1/2021 | | | 115,000 | | | | 119,183 | |
| | |
Series AM, Rev., 5.00%, 12/1/2021 | | | 85,000 | | | | 88,104 | |
| | |
Series AQ, Rev., 5.00%, 12/1/2021 | | | 20,000 | | | | 20,730 | |
| | |
Series AS, Rev., 5.00%, 12/1/2021 | | | 85,000 | | �� | | 88,103 | |
| | |
Series AW, Rev., 5.00%, 12/1/2021 | | | 40,000 | | | | 41,461 | |
| | |
Series BA, Rev., 5.00%, 12/1/2021 | | | 65,000 | | | | 67,373 | |
| | |
State of California Department of Water Resources, Power Supply | | | | | | | | |
| | |
Series 2011N, Rev., 5.00%, 5/1/2021 (b) | | | 125,000 | | | | 126,001 | |
| | |
Series 2015O, Rev., 5.00%, 5/1/2021 (b) | | | 230,000 | | | | 231,843 | |
| | |
Series 2015O, Rev., 5.00%, 5/1/2022 (b) | | | 50,000 | | | | 52,849 | |
| | |
State of California, Various Purpose | | | | | | | | |
| | |
GO, 2.00%, 3/1/2021 | | | 50,000 | | | | 50,000 | |
| | |
GO, 5.00%, 3/1/2021 | | | 35,000 | | | | 35,000 | |
| | |
GO, 5.00%, 4/1/2021 | | | 70,000 | | | | 70,275 | |
| | |
GO, 5.00%, 8/1/2021 | | | 75,000 | | | | 76,514 | |
| | |
GO, 5.00%, 9/1/2021 | | | 220,000 | | | | 225,335 | |
| | |
GO, 5.00%, 10/1/2021 | | | 150,000 | | | | 154,247 | |
| | |
GO, 5.00%, 11/1/2021 | | | 190,000 | | | | 196,150 | |
| | |
GO, 3.00%, 12/1/2021 | | | 35,000 | | | | 35,752 | |
| | |
GO, 3.00%, 3/1/2022 | | | 30,000 | | | | 30,858 | |
| | |
Stockton Public Financing Authority Rev., BAN, 1.40%, 6/1/2022 | | | 3,335,000 | | | | 3,343,071 | |
| | |
Sunnyvale School District, Election of 2013 Series 2019C, GO, 4.00%, 9/1/2021 | | | 25,000 | | | | 25,482 | |
| | |
Sylvan Union School District GO, 5.00%, 8/1/2021 | | | 35,000 | | | | 35,702 | |
| | |
Tahoe-Truckee Sanitation Agency, Wastewater Rev., 5.00%, 7/1/2024 | | | 30,000 | | | | 34,649 | |
| | |
Tahoe-Truckee Unified School District, Election of 2014, School Facilities Improvement District No. 2 Series B, GO, 5.00%, 8/1/2022 | | | 45,000 | | | | 48,088 | |
SEE NOTES TO FINANCIAL STATEMENTS.
| | | | | | | | |
| | | |
| FEBRUARY 28, 2021 | | J.P. MORGAN EXCHANGE-TRADED FUNDS | | | | | 189 | |
JPMorgan Ultra-Short Municipal Income ETF
SCHEDULE OF PORTFOLIO INVESTMENTS
AS OF FEBRUARY 28, 2021 (continued)
| | | | | | | | |
| INVESTMENTS | | PRINCIPAL
AMOUNT ($) | | | VALUE ($) | |
Municipal Bonds — continued | | | | | | | | |
| | |
California — continued | | | | | | | | |
| | |
The Tracy Joint Unified School District, Election of 2008, School Facilities Improvement District No. 3 Series 2011B, GO, Zero Coupon, 8/1/2021 (b) | | | 100,000 | | | | 38,590 | |
| | |
Tobacco Securitization Authority of Northern California Rev., 5.00%, 6/1/2025 | | | 105,000 | | | | 123,776 | |
| | |
Tustin Public Financing Authority Series 2011A, Rev., 5.00%, 4/1/2021 (b) | | | 25,000 | | | | 25,098 | |
| | |
Tustin Unified School District GO, 6.00%, 8/1/2028 | | | 250,000 | | | | 255,995 | |
| | |
Tustin Unified School District, School Facilities Improvement Districts No. 2002-1 and 2008-1 GO, 5.00%, 8/1/2025 | | | 30,000 | | | | 35,833 | |
| | |
Tustin Unified School District, School Facilities Improvement Project | | | | | | | | |
| | |
GO, 5.25%, 8/1/2021 (b) | | | 35,000 | | | | 35,744 | |
| | |
GO, 5.00%, 6/1/2022 | | | 35,000 | | | | 37,119 | |
| | |
Twin Rivers Unified School District Series 2014A, GO, Zero Coupon, 2/1/2024 (b) | | | 350,000 | | | | 168,584 | |
| | |
Union City Community Redevelopment Project, Tax Allocation Series 2017B, 5.00%, 10/1/2021 | | | 170,000 | | | | 174,782 | |
| | |
University of California | | | | | | | | |
| | |
Series 2016AT, Rev., 1.40%, 3/10/2021 (c) | | | 2,250,000 | | | | 2,256,007 | |
| | |
Series 2017AV, Rev., 4.00%, 5/15/2021 | | | 75,000 | | | | 75,590 | |
| | |
Series 2013AF, Rev., 5.00%, 5/15/2021 | | | 20,000 | | | | 20,198 | |
| | |
Series 2014AM, Rev., 5.00%, 5/15/2021 | | | 35,000 | | | | 35,346 | |
| | |
Series 2015AO, Rev., 5.00%, 5/15/2021 | | | 50,000 | | | | 50,495 | |
| | |
Series AB, Rev., 5.00%, 5/15/2021 | | | 35,000 | | | | 35,346 | |
| | |
Series 2015AO, Rev., 4.00%, 5/15/2022 | | | 20,000 | | | | 20,927 | |
| | |
Series 2015AO, Rev., 5.00%, 5/15/2022 | | | 110,000 | | | | 116,422 | |
| | |
Series 2018AZ, Rev., 5.00%, 5/15/2022 | | | 50,000 | | | | 52,919 | |
| | |
Series 2020BE, Rev., 5.00%, 5/15/2022 | | | 40,000 | | | | 42,335 | |
| | |
Series 2015AO, Rev., 5.00%, 5/15/2023 | | | 20,000 | | | | 22,096 | |
| | |
Series AK, Rev., 5.00%, 5/15/2023 (c) | | | 455,000 | | | | 501,310 | |
| | | | | | | | |
| INVESTMENTS | | PRINCIPAL
AMOUNT ($) | | | VALUE ($) | |
| | | | | | | | |
| | |
California — continued | | | | | | | | |
| | |
University of California, Limited Project | | | | | | | | |
| | |
Series 2015-I, Rev., 5.00%, 5/15/2021 | | | 45,000 | | | | 45,441 | |
| | |
Series 2015-I, Rev., 5.00%, 5/15/2024 | | | 135,000 | | | | 154,686 | |
| | |
Upper Santa Clara Valley Joint Powers Authority Series 2015A, Rev., 5.00%, 8/1/2022 (b) | | | 25,000 | | | | 26,730 | |
| | |
Vacaville Unified School District Series C, GO, 5.00%, 8/1/2021 | | | 30,000 | | | | 30,606 | |
| | |
Ventura County Community College District | | | | | | | | |
| | |
Series 2008C, GO, Zero Coupon, 8/1/2021 | | | 100,000 | | | | 99,872 | |
| | |
GO, 5.00%, 8/1/2021 | | | 225,000 | | | | 229,548 | |
| | |
Ventura County Public Financing Authority Series 2013B, Rev., 5.00%, 11/1/2022 | | | 25,000 | | | | 27,006 | |
| | |
Ventura Unified School District GO, 5.00%, 8/1/2021 | | | 45,000 | | | | 45,903 | |
| | |
Victor Elementary School District GO, 5.00%, 8/1/2021 | | | 25,000 | | | | 25,502 | |
| | |
Victor Valley Union High School District Series 2016B, GO, AGM, 3.00%, 8/1/2021 | | | 25,000 | | | | 25,287 | |
| | |
Walnut Valley Unified School District | | | | | | | | |
| | |
GO, 5.00%, 8/1/2021 (b) | | | 135,000 | | | | 137,731 | |
| | |
GO, 5.00%, 8/1/2022 | | | 20,000 | | | | 21,372 | |
| | |
Washington Township Health Care District Series 2015A, Rev., 5.00%, 7/1/2021 | | | 275,000 | | | | 278,913 | |
| | |
West Basin Municipal Water District | | | | | | | | |
| | |
Series 2011A, Rev., 5.00%, 8/1/2021 | | | 25,000 | | | | 25,505 | |
| | |
Series 2012A, Rev., 5.00%, 8/1/2023 | | | 40,000 | | | | 41,748 | |
| | |
West Contra Costa Healthcare District, Financing Program COP, 5.00%, 7/1/2021 (b) | | | 165,000 | | | | 167,610 | |
| | |
West Contra Costa Unified School District, Election of 2010 | | | | | | | | |
| | |
Series 2011A, GO, 5.00%, 8/1/2021 (b) | | | 25,000 | | | | 25,506 | |
| | |
Series 2011A, GO, AGM, 5.25%, 8/1/2021 (b) | | | 215,000 | | | | 219,571 | |
| | |
West Hollywood Public Financing Authority, Hollywood Park Phase II Rev., 5.00%, 4/1/2024 | | | 75,000 | | | | 85,463 | |
SEE NOTES TO FINANCIAL STATEMENTS.
| | | | | | |
| | | |
| 190 | | | | J.P. MORGAN EXCHANGE-TRADED FUNDS | | FEBRUARY 28, 2021 |
| | | | | | | | |
| INVESTMENTS | | PRINCIPAL
AMOUNT ($) | | | VALUE ($) | |
Municipal Bonds — continued | | | | | | | | |
| | |
California — continued | | | | | | | | |
| | |
West Valley-Mission Community College District | | | | | | | | |
| | |
Series 2019A, GO, 4.00%, 8/1/2021 | | | 75,000 | | | | 76,204 | |
| | |
GO, 5.00%, 8/1/2021 | | | 55,000 | | | | 56,110 | |
| | |
Series B, GO, 5.00%, 8/1/2021 | | | 50,000 | | | | 51,009 | |
| | |
Series 2017C, GO, 4.00%, 8/1/2022 | | | 25,000 | | | | 26,363 | |
| | |
Series B, GO, 5.00%, 8/1/2022 | | | 25,000 | | | | 26,716 | |
| | |
West Valley-Mission Community College District, Election of 2012 Series 2012A, GO, 5.00%, 8/1/2021 | | | 85,000 | | | | 86,716 | |
| | |
Western Placer Unified School District, Election of 2014 Series 2015A, GO, AGM, 5.00%, 8/1/2021 | | | 25,000 | | | | 25,501 | |
| | |
Whittier Union High School District Series 2015C, GO, 4.00%, 8/1/2022 | | | 75,000 | | | | 79,087 | |
| | |
William S Hart Union High School District GO, 4.00%, 9/1/2021 | | | 30,000 | | | | 30,578 | |
| | |
William S Hart Union High School District, 2008 Election | | | | | | | | |
| | |
Series 2013C, GO, 4.00%, 8/1/2021 | | | 50,000 | | | | 50,803 | |
| | |
Series B, GO, AGM, 5.00%, 8/1/2021 (b) | | | 35,000 | | | | 35,708 | |
| | |
Windsor Unified School District, Election of 2016 GO, 5.00%, 8/1/2021 | | | 325,000 | | | | 331,519 | |
| | |
Yorba Linda Redevelopment Agency, Tax Allocation Series 2017A, 5.00%, 9/1/2021 | | | 75,000 | | | | 76,807 | |
| | |
Yosemite Community College District | | | | | | | | |
| | |
GO, 3.00%, 8/1/2022 (b) | | | 30,000 | | | | 31,172 | |
| | |
GO, 5.00%, 8/1/2022 (b) | | | 40,000 | | | | 42,710 | |
| | |
Yountville Finance Authority Rev., 5.00%, 12/1/2021 | | | 25,000 | | | | 25,907 | |
| | |
Yuba Community College District | | | | | | | | |
| | |
Series 2016A, GO, 5.00%, 8/1/2021 | | | 50,000 | | | | 51,009 | |
| | |
Series 2015B, GO, 4.00%, 8/1/2022 | | | 50,000 | | | | 52,725 | |
| | | | | | | | |
| | |
Total California | | | | | | | 75,492,306 | |
| | | | | | | | |
| | |
Colorado — 2.8% | | | | | | | | |
| | |
Adams 12 Five Star Schools, The City and County of Broomfield GO, 4.00%, 12/15/2022 | | | 75,000 | | | | 80,120 | |
| | |
Adams and Arapahoe Joint School District 28J Aurora GO, 5.00%, 12/1/2024 | | | 25,000 | | | | 27,071 | |
| | |
Adams County, Improvement COP, 5.00%, 12/1/2023 | | | 705,000 | | | | 793,365 | |
| | |
Apex Park and Recreation District | | | | | | | | |
| | |
GO, 2.00%, 12/1/2021 | | | 25,000 | | | | 25,343 | |
| | |
GO, 3.00%, 12/1/2024 | | | 50,000 | | | | 54,590 | |
| | | | | | | | |
| INVESTMENTS | | PRINCIPAL
AMOUNT ($) | | | VALUE ($) | |
| | | | | | | | |
| | |
Colorado — continued | | | | | | | | |
| | |
Arapahoe County School District No. 5 Cherry Creek Series 2012B, GO, 3.00%, 12/15/2021 | | | 25,000 | | | | 25,562 | |
| | |
Arapahoe County School District No. 6 Littleton GO, 5.00%, 12/1/2021 | | | 60,000 | | | | 62,177 | |
| | |
Boulder Larimer and Weld Counties St. Vrain Valley School District Re1J | | | | | | | | |
| | |
Series 2016C, GO, 4.00%, 12/15/2021 | | | 30,000 | | | | 30,909 | |
| | |
Series 2011-B, GO, 5.00%, 12/15/2022 | | | 90,000 | | | | 97,749 | |
| | |
Boulder Valley School District No. Re-2 Boulder Series 2019A, GO, 6.00%, 12/1/2022 | | | 30,000 | | | | 33,044 | |
| | |
City and County of Denver | | | | | | | | |
| | |
Series 2011A, GO, 3.00%, 8/1/2021 (b) | | | 25,000 | | | | 25,294 | |
| | |
Series 2011-A, GO, 3.00%, 8/1/2021 (b) | | | 25,000 | | | | 25,295 | |
| | |
Series 2018A, GO, 5.00%, 8/1/2021 | | | 30,000 | | | | 30,607 | |
| | |
Series 2019C, GO, 5.00%, 8/1/2022 | | | 40,000 | | | | 42,751 | |
| | |
City and County of Denver, Airport System | | | | | | | | |
| | |
Series 2012B, Rev., 5.00%, 11/15/2022 (b) | | | 300,000 | | | | 324,411 | |
| | |
Series 2016A, Rev., 5.00%, 11/15/2023 | | | 95,000 | | | | 106,865 | |
| | |
Series B, Rev., 5.00%, 11/15/2024 | | | 125,000 | | | | 145,624 | |
| | |
City of Aurora, First Lien Water, Green Bonds Rev., 5.00%, 8/1/2021 | | | 25,000 | | | | 25,503 | |
| | |
City of Boulder, Capital Improvement Projects Rev., 4.00%, 10/1/2021 | | | 25,000 | | | | 25,560 | |
| | |
City of Colorado Springs, Utilities System Improvement | | | | | | | | |
| | |
Series 2007A, Rev., VRDO, LIQ: TD Bank NA, 0.02%, 3/9/2021 (c) | | | 10,000,000 | | | | 10,000,000 | |
| | |
Series 2012A, Rev., VRDO, LIQ: U.S. Bank NA, 0.02%, 3/9/2021 (c) | | | 15,530,000 | | | | 15,530,000 | |
| | |
Series 2012C-2, Rev., 4.00%, 11/15/2021 | | | 70,000 | | | | 71,897 | |
| | |
Series 2011-A, Rev., 5.00%, 11/15/2021 | | | 110,000 | | | | 113,753 | |
| | |
Series 2012B, Rev., 5.00%, 11/15/2021 | | | 90,000 | | | | 93,071 | |
| | |
Series 2013B-2, Rev., 5.00%, 11/15/2021 | | | 100,000 | | | | 103,412 | |
| | |
Series 2020B, Rev., 5.00%, 11/15/2021 | | | 35,000 | | | | 36,194 | |
SEE NOTES TO FINANCIAL STATEMENTS.
| | | | | | | | |
| | | |
| FEBRUARY 28, 2021 | | J.P. MORGAN EXCHANGE-TRADED FUNDS | | | | | 191 | |
JPMorgan Ultra-Short Municipal Income ETF
SCHEDULE OF PORTFOLIO INVESTMENTS
AS OF FEBRUARY 28, 2021 (continued)
| | | | | | | | |
| INVESTMENTS | | PRINCIPAL
AMOUNT ($) | | | VALUE ($) | |
Municipal Bonds — continued | | | | | | | | |
| | |
Colorado — continued | | | | | | | | |
| | |
Series 2011-A, Rev., 5.00%, 11/15/2022 | | | 25,000 | | | | 25,848 | |
| | |
Series A-3, Rev., 5.00%, 11/15/2022 | | | 50,000 | | | | 54,105 | |
| | |
City of Greeley Rev., 4.00%, 8/1/2021 | | | 125,000 | | | | 126,995 | |
| | |
City of Longmon Series A, COP, 4.00%, 12/1/2023 | | | 100,000 | | | | 109,401 | |
| | |
City of Longmont, Sales and Use Tax Rev., AGM, 4.25%, 11/15/2021 | | | 1,075,000 | | | | 1,104,552 | |
| | |
City of Longmont, Waterworks Rev., 5.00%, 11/1/2023 | | | 25,000 | | | | 27,946 | |
| | |
City of Northglenn COP, 5.00%, 12/1/2022 | | | 100,000 | | | | 108,221 | |
| | |
City of Thornton COP, AMBAC, 4.00%, 12/1/2022 | | | 30,000 | | | | 31,949 | |
| | |
City of Westminster, Sales and Use Tax Rev., 5.00%, 12/1/2021 | | | 130,000 | | | | 134,716 | |
| | |
Colorado Educational and Cultural Facilities Authority, Stargate Charter School Project Rev., 7.25%, 6/1/2023 (b) | | | 180,000 | | | | 204,417 | |
| | |
Colorado Educational and Cultural Facilities Authority, University of Denver Project Rev., 4.00%, 3/1/2021 | | | 110,000 | | | | 110,000 | |
| | |
Colorado Health Facilities Authority, Adventist Health System/Sunbelt Obligated Group | | | | | | | | |
| | |
Rev., 5.00%, 11/15/2021 | | | 100,000 | | | | 103,355 | |
| | |
Rev., 5.00%, 11/15/2022 | | | 450,000 | | | | 486,135 | |
| | |
Rev., 5.00%, 11/20/2025 (c) | | | 25,000 | | | | 29,995 | |
| | |
Colorado Health Facilities Authority, Catholic Health Initiatives | | | | | | | | |
| | |
Series 2009B-1, Rev., 4.00%, 11/9/2022 (b) | | | 180,000 | | | | 191,160 | |
| | |
Series 2009B-1, Rev., 5.00%, 11/9/2022 (b) | | | 40,000 | | | | 43,152 | |
| | |
Series 2013A, Rev., 5.25%, 1/1/2023 (b) | | | 525,000 | | | | 572,288 | |
| | |
Colorado Health Facilities Authority, Covenant Retirement Communities, Inc. | | | | | | | | |
| | |
Series 2012C, Rev., 5.00%, 12/1/2021 (b) | | | 75,000 | | | | 77,698 | |
| | |
Rev., 4.00%, 12/1/2022 (b) | | | 130,000 | | | | 138,564 | |
| | |
Colorado Health Facilities Authority, Parkview Medical Center, Inc., Project | | | | | | | | |
| | |
Series 2015A, Rev., 4.00%, 9/1/2022 | | | 80,000 | | | | 83,729 | |
| | | | | | | | |
| INVESTMENTS | | PRINCIPAL
AMOUNT ($) | | | VALUE ($) | |
| | | | | | | | |
| | |
Colorado — continued | | | | | | | | |
| | |
Rev., 5.00%, 9/1/2022 | | | 170,000 | | | | 180,448 | |
| | |
Rev., 5.00%, 9/1/2023 | | | 270,000 | | | | 298,412 | |
| | |
Colorado Health Facilities Authority, School Health System | | | | | | | | |
| | |
Series 2019A, Rev., 5.00%, 1/1/2022 | | | 585,000 | | | | 608,189 | |
| | |
Series 2019A, Rev., 5.00%, 1/1/2023 | | | 145,000 | | | | 157,431 | |
| | |
Colorado Health Facilities Authority, The Evangelical Lutheran Good Samaritan Society Project Rev., 5.00%, 6/1/2022 (b) | | | 140,000 | | | | 148,385 | |
| | |
Colorado Housing and Finance Authority, Multi-Family | | | | | | | | |
| | |
Series 2019B-2, Class I, Rev., 1.35%, 2/1/2022 | | | 110,000 | | | | 110,418 | |
| | |
Series 2020A-2, Class I, Rev., 1.55%, 4/1/2023 | | | 100,000 | | | | 100,802 | |
| | |
Colorado State Education Loan Program | | | | | | | | |
| | |
Series 2020A, Rev., TRAN, 3.00%, 6/29/2021 | | | 95,000 | | | | 95,900 | |
| | |
Series 2020A, Rev., TRAN, 4.00%, 6/29/2021 | | | 285,000 | | | | 288,631 | |
| | |
Colorado Water Resources & Power Development Authority State Revolving Fund | | | | | | | | |
| | |
Series 2019A, Rev., 5.00%, 9/1/2021 | | | 150,000 | | | | 153,637 | |
| | |
Series 2019A, Rev., 5.00%, 9/1/2022 | | | 35,000 | | | | 37,538 | |
| | |
Colorado Water Resources & Power Development Authority, Clean Water | | | | | | | | |
| | |
Series 2019A, Rev., 5.00%, 9/1/2021 | | | 30,000 | | | | 30,728 | |
| | |
Series 2010A, Rev., 4.00%, 9/1/2024 | | | 25,000 | | | | 25,071 | |
| | |
Counties of Gunnison, Watershed School District No. 1 Series 2014A, GO, 3.00%, 12/1/2021 | | | 25,000 | | | | 25,534 | |
| | |
County of Boulder, Flood Reconstruction Projects COP, 5.00%, 12/1/2021 | | | 160,000 | | | | 160,571 | |
| | |
County of Boulder, Open Space Capital Improvement | | | | | | | | |
| | |
Series 2011-A, Rev., 4.00%, 7/15/2021 | | | 125,000 | | | | 126,781 | |
| | |
Series 2011-B, Rev., 5.25%, 7/15/2021 (b) | | | 100,000 | | | | 101,890 | |
| | |
County of Eagle COP, 5.00%, 12/1/2021 | | | 245,000 | | | | 253,619 | |
SEE NOTES TO FINANCIAL STATEMENTS.
| | | | | | |
| | | |
| 192 | | | | J.P. MORGAN EXCHANGE-TRADED FUNDS | | FEBRUARY 28, 2021 |
| | | | | | | | |
| INVESTMENTS | | PRINCIPAL
AMOUNT ($) | | | VALUE ($) | |
Municipal Bonds — continued | | | | | | | | |
| | |
Colorado — continued | | | | | | | | |
| | |
County of Larimer, Jail Facilities Project COP, 5.00%, 12/1/2021 | | | 40,000 | | | | 41,420 | |
| | |
County of Pueblo, Building Acquisition Project | | | | | | | | |
| | |
Series 2021B, COP, 4.00%, 9/15/2021 | | | 120,000 | | | | 122,266 | |
| | |
Series 2021B, COP, 4.00%, 9/15/2022 | | | 100,000 | | | | 105,349 | |
| | |
Series 2021B, COP, 4.00%, 9/15/2024 | | | 220,000 | | | | 244,532 | |
| | |
Dawson Ridge Metropolitan District No. 1 Series A, GO, Zero Coupon, 10/1/2022 (b) | | | 155,000 | | | | 154,437 | |
| | |
Denver City & County School District No. 1 | | | | | | | | |
| | |
Series 2012B, GO, 4.00%, 12/1/2021 | | | 25,000 | | | | 25,728 | |
| | |
GO, 5.00%, 12/1/2021 | | | 35,000 | | | | 36,281 | |
| | |
Series 2010C, GO, 5.00%, 12/1/2021 | | | 50,000 | | | | 51,829 | |
| | |
Series 2005A, GO, NATL-RE, 5.25%, 12/1/2021 | | | 25,000 | | | | 25,961 | |
| | |
Series 2012B, GO, 4.00%, 12/1/2022 | | | 50,000 | | | | 53,394 | |
| | |
GO, 5.00%, 12/1/2022 | | | 20,000 | | | | 21,707 | |
| | |
Denver Wastewater Management Division Department of Public Works | | | | | | | | |
| | |
Rev., 4.00%, 11/1/2021 | | | 20,000 | | | | 20,516 | |
| | |
Rev., 5.00%, 11/1/2021 | | | 40,000 | | | | 41,298 | |
| | |
Douglas County School District No. Re-1 Douglas and Elbert Counties | | | | | | | | |
| | |
GO, 4.50%, 12/15/2021 | | | 295,000 | | | | 305,101 | |
| | |
GO, 5.00%, 12/15/2021 | | | 30,000 | | | | 31,145 | |
| | |
GO, 5.25%, 12/15/2021 | | | 265,000 | | | | 275,634 | |
| | |
El Paso County School District No. 20 Academy | | | | | | | | |
| | |
GO, 4.00%, 12/15/2021 | | | 25,000 | | | | 25,758 | |
| | |
GO, 5.00%, 12/15/2022 | | | 25,000 | | | | 27,101 | |
| | |
Garfield Pitkin & Eagle Counties School District No. Re-1 Roaring Fork GO, 5.00%, 12/15/2021 (b) | | | 25,000 | | | | 25,956 | |
| | |
Grand County School District No. 2 East Grand GO, 5.00%, 12/1/2021 | | | 60,000 | | | | 62,177 | |
| | |
Jefferson County School District R-1 | | | | | | | | |
| | |
GO, 5.00%, 12/15/2021 | | | 75,000 | | | | 77,863 | |
| | |
GO, 5.00%, 12/15/2022 | | | 65,000 | | | | 70,596 | |
| | | | | | | | |
| INVESTMENTS | | PRINCIPAL
AMOUNT ($) | | | VALUE ($) | |
| | | | | | | | |
| | |
Colorado — continued | | | | | | | | |
| | |
Larimer County School District No. R-1 Poudre | | | | | | | | |
| | |
GO, 5.00%, 12/15/2021 | | | 25,000 | | | | 25,954 | |
| | |
GO, 4.00%, 12/15/2022 | | | 35,000 | | | | 37,390 | |
| | |
GO, 5.00%, 12/15/2022 | | | 30,000 | | | | 32,583 | |
| | |
Larimer Weld & Boulder County School District, R-2J Thompson GO, 3.25%, 12/15/2022 | | | 25,000 | | | | 26,373 | |
| | |
Mesa County Valley School District No. 51 Grand Junction GO, 4.00%, 12/1/2021 | | | 40,000 | | | | 41,153 | |
| | |
Metro Wastewater Reclamation District | | | | | | | | |
| | |
Series 2019A, Rev., 5.00%, 4/1/2021 | | | 45,000 | | | | 45,176 | |
| | |
Series 2012A, Rev., 5.00%, 4/1/2022 (b) | | | 25,000 | | | | 26,312 | |
| | |
Parker Water and Sanitation District GO, 4.00%, 8/1/2022 | | | 25,000 | | | | 26,355 | |
| | |
Platte River Power Authority | | | | | | | | |
| | |
Series JJ, Rev., 5.00%, 6/1/2021 | | | 85,000 | | | | 86,021 | |
| | |
Series JJ, Rev., 5.00%, 6/1/2022 | | | 25,000 | | | | 26,510 | |
| | |
Regional Transportation District Series 2013A, COP, 5.00%, 6/1/2022 | | | 200,000 | | | | 211,536 | |
| | |
State of Colorado | | | | | | | | |
| | |
Series 2011G, COP, 5.00%, 3/15/2021 (b) | | | 100,000 | | | | 100,176 | |
| | |
Rev., TRAN, 4.00%, 6/25/2021 | | | 60,000 | | | | 60,739 | |
| | |
Series 2018A, COP, 5.00%, 12/15/2021 | | | 110,000 | | | | 114,162 | |
| | |
State of Colorado, Higher Education Capital Construction, Lease Purchase Financing Program | | | | | | | | |
| | |
Series 2014A, COP, 5.00%, 11/1/2021 | | | 400,000 | | | | 412,620 | |
| | |
Series 2014A, COP, 5.00%, 11/1/2022 | | | 100,000 | | | | 107,847 | |
| | |
University of Colorado Hospital Authority | | | | | | | | |
| | |
Series 2012A, Rev., 4.00%, 11/15/2021 | | | 50,000 | | | | 51,319 | |
| | |
Series 2017C-2, Rev., 5.00%, 3/1/2022 (c) | | | 975,000 | | | | 996,869 | |
| | |
University of Colorado Hospital Authority, Health System Series 2019C, Rev., 5.00%, 11/15/2024 (c) | | | 300,000 | | | | 341,991 | |
SEE NOTES TO FINANCIAL STATEMENTS.
| | | | | | | | |
| | | |
| FEBRUARY 28, 2021 | | J.P. MORGAN EXCHANGE-TRADED FUNDS | | | | | 193 | |
JPMorgan Ultra-Short Municipal Income ETF
SCHEDULE OF PORTFOLIO INVESTMENTS
AS OF FEBRUARY 28, 2021 (continued)
| | | | | | | | |
| INVESTMENTS | | PRINCIPAL
AMOUNT ($) | | | VALUE ($) | |
Municipal Bonds — continued | | | | | | | | |
| | |
Colorado — continued | | | | | | | | |
| | |
University of Colorado, Enterprise System | | | | | | | | |
| | |
Series 2011A, Rev., 4.13%, 6/1/2021 (b) | | | 25,000 | | | | 25,247 | |
| | |
Series 2011B, Rev., 4.25%, 6/1/2021 | | | 210,000 | | | | 212,106 | |
| | |
Series 2016B-1, Rev., 5.00%, 6/1/2021 | | | 75,000 | | | | 75,891 | |
| | |
Series 2017A-1, Rev., 5.00%, 6/1/2021 | | | 75,000 | | | | 75,891 | |
| | |
Series A-3, Rev., 5.00%, 6/1/2021 | | | 30,000 | | | | 30,356 | |
| | |
Series 2012A-1, Rev., 4.00%, 6/1/2022 | | | 75,000 | | | | 78,516 | |
| | |
Series 2011B, Rev., 5.00%, 6/1/2022 | | | 70,000 | | | | 74,156 | |
| | |
Series 2012A-2, Rev., 5.00%, 6/1/2022 (b) | | | 25,000 | | | | 26,497 | |
| | |
Series 2016B-1, Rev., 5.00%, 6/1/2022 | | | 40,000 | | | | 42,375 | |
| | |
Series A, Rev., 5.00%, 6/1/2023 | | | 50,000 | | | | 55,245 | |
| | |
West Metro Fire Protection District GO, 3.00%, 12/1/2021 | | | 30,000 | | | | 30,641 | |
| | | | | | | | |
| | |
Total Colorado | | | | | | | 39,942,434 | |
| | | | | | | | |
| | |
Connecticut — 3.6% | | | | | | | | |
| | |
City of Bridgeport | | | | | | | | |
| | |
Series 2012B, GO, AGM, 2.50%, 8/15/2021 (b) | | | 25,000 | | | | 25,256 | |
| | |
GO, GAN, 1.50%, 12/9/2021 | | | 4,200,000 | | | | 4,227,132 | |
| | |
City of Bristol GO, 4.00%, 7/15/2021 | | | 35,000 | | | | 35,499 | |
| | |
City of Danbury GO, 5.00%, 7/15/2025 | | | 120,000 | | | | 122,076 | |
| | |
City of Hartford | | | | | | | | |
| | |
Series 2011A, GO, GTD, 5.00%, 4/1/2021 (b) | | | 105,000 | | | | 105,407 | |
| | |
Series 2014C, GO, GTD, 5.00%, 8/15/2021 | | | 50,000 | | | | 51,065 | |
| | |
City of Meriden | | | | | | | | |
| | |
Series 2016B, GO, 4.00%, 5/15/2021 | | | 40,000 | | | | 40,310 | |
| | |
Series 2020B, GO, 5.00%, 7/1/2021 | | | 425,000 | | | | 431,766 | |
| | |
GO, 5.00%, 3/1/2022 | | | 25,000 | | | | 26,195 | |
| | |
City of New Haven | | | | | | | | |
| | |
GO, AGM-CR, 4.50%, 3/1/2021 (b) | | | 100,000 | | | | 100,000 | |
| | |
Series 2016A, GO, AGM, 5.00%, 8/15/2021 (b) | | | 30,000 | | | | 30,661 | |
| | |
City of New London GO, 2.50%, 8/15/2021 | | | 100,000 | | | | 100,999 | |
| | |
City of Norwich GO, 5.00%, 8/1/2021 | | | 45,000 | | | | 45,905 | |
| | | | | | | | |
| INVESTMENTS | | PRINCIPAL
AMOUNT ($) | | | VALUE ($) | |
| | | | | | | | |
| | |
Connecticut — continued | | | | | | | | |
| | |
City of Stamford GO, 4.00%, 7/1/2021 | | | 20,000 | | | | 20,254 | |
| | |
City of Waterbury GO, AGM, 3.38%, 9/1/2021 (b) | | | 50,000 | | | | 50,801 | |
| | |
Connecticut Housing Finance Authority, Housing Mortgage Finance Program | | | | | | | | |
| | |
Subseries 2018C-3, Rev., VRDO, LIQ: TD Bank NA, 0.03%, 3/9/2021 (c) | | | 5,040,000 | | | | 5,040,000 | |
| | |
Series 2016E-3, Rev., VRDO, LIQ: | | | | | | | | |
| | |
Landesbank Hessen-Thueringen, | | | | | | | | |
| | |
0.03%, 3/9/2021 (c) | | | 9,570,000 | | | | 9,570,000 | |
| | |
Subseries A-4, Rev., 1.85%, 11/15/2021 | | | 70,000 | | | | 70,771 | |
| | |
Series 2012G-1, Rev., 2.10%, 11/15/2021 | | | 145,000 | | | | 146,799 | |
| | |
Subseries A-4, Rev., 2.10%, 11/15/2022 | | | 90,000 | | | | 92,435 | |
| | |
Connecticut State Health & Educational Facilities Authority, Bridgeport Hospital Series D, Rev., 5.00%, 7/1/2023 | | | 20,000 | | | | 21,239 | |
| | |
Connecticut State Health & Educational Facilities Authority, Connecticut State University System | | | | | | | | |
| | |
Series L, Rev., 4.00%, 11/1/2021 | | | 125,000 | | | | 128,031 | |
| | |
Series M, Rev., 5.00%, 11/1/2021 | | | 350,000 | | | | 360,805 | |
| | |
Connecticut State Health & Educational Facilities Authority, Hartford Healthcare | | | | | | | | |
| | |
Series 2011A, Rev., 4.00%, 7/1/2021 (b) | | | 25,000 | | | | 25,319 | |
| | |
Rev., AGM-CR, 5.00%, 7/1/2021 (b) | | | 175,000 | | | | 177,816 | |
| | |
Connecticut State Health & Educational Facilities Authority, Nuvance Health Series 2019A, Rev., 5.00%, 7/1/2021 | | | 125,000 | | | | 126,761 | |
| | |
Connecticut State Health & Educational Facilities Authority, Quinnipiac University Series L, Rev., 5.00%, 7/1/2021 | | | 60,000 | | | | 60,957 | |
| | |
Connecticut State Health & Educational Facilities Authority, Supported Child Care Rev., 5.00%, 7/1/2021 | | | 150,000 | | | | 152,332 | |
| | |
Connecticut State Health & Educational Facilities Authority, Trinity Health Credit Group Rev., 3.00%, 12/1/2023 | | | 100,000 | | | | 107,047 | |
| | |
Connecticut State Health & Educational Facilities Authority, Yale New Haven Health Series E, Rev., 5.00%, 7/1/2022 | | | 240,000 | | | | 255,266 | |
SEE NOTES TO FINANCIAL STATEMENTS.
| | | | | | |
| | | |
| 194 | | | | J.P. MORGAN EXCHANGE-TRADED FUNDS | | FEBRUARY 28, 2021 |
| | | | | | | | |
| INVESTMENTS | | PRINCIPAL
AMOUNT ($) | | | VALUE ($) | |
Municipal Bonds — continued | | | | | | | | |
| | |
Connecticut — continued | | | | | | | | |
| | |
Connecticut State Health & Educational Facilities Authority, Yale University | | | | | | | | |
| | |
Series 2015A, Rev., 2.05%, 7/12/2021 (c) | | | 120,000 | | | | 120,845 | |
| | |
Series U-1, Rev., 2.00%, 2/8/2022 (c) | | | 455,000 | | | | 462,803 | |
| | |
Series 2014A, Rev., 1.10%, 2/7/2023 (c) | | | 180,000 | | | | 182,770 | |
| | |
Series X-2, Rev., 0.25%, 2/9/2024 (c) | | | 30,000 | | | | 29,647 | |
| | |
Metropolitan District (The) | | | | | | | | |
| | |
Series 2019B, GO, 5.00%, 7/15/2021 | | | 100,000 | | | | 101,734 | |
| | |
Series 2016C, GO, AGM, 5.00%, 11/1/2021 | | | 100,000 | | | | 103,114 | |
| | |
Metropolitan District (The), Clean Water Project | | | | | | | | |
| | |
Series 2020A, Rev., 5.00%, 10/1/2021 | | | 195,000 | | | | 200,382 | |
| | |
Series 2013A, Rev., 5.00%, 4/1/2022 (b) | | | 100,000 | | | | 105,246 | |
| | |
South Central Connecticut Regional Water Authority, Water System Series B, Rev., 5.00%, 8/1/2022 | | | 75,000 | | | | 80,069 | |
| | |
State of Connecticut | | | | | | | | |
| | |
Series 2013A, GO, (SIFMA Municipal Swap Index Yield + 0.75%), 0.78%, 3/1/2021 (e) | | | 200,000 | | | | 200,000 | |
| | |
Series 2019A, GO, 5.00%, 4/15/2021 | | | 330,000 | | | | 331,914 | |
| | |
Series 2016B, GO, 5.00%, 5/15/2021 | | | 100,000 | | | | 100,985 | |
| | |
Series 2020C, GO, 3.00%, 6/1/2021 | | | 30,000 | | | | 30,212 | |
| | |
Series 2013E, GO, 5.00%, 8/15/2021 | | | 100,000 | | | | 102,199 | |
| | |
Series 2018E, GO, 5.00%, 9/15/2021 | | | 150,000 | | | | 153,906 | |
| | |
Series 2016E, GO, 5.00%, 10/15/2021 | | | 50,000 | | | | 51,504 | |
| | |
Series 2011D, GO, 4.00%, 11/1/2021 | | | 270,000 | | | | 276,912 | |
| | |
Series G, GO, 5.00%, 11/1/2021 | | | 340,000 | | | | 350,962 | |
| | |
Series 2021A, GO, 3.00%, 1/15/2022 | | | 1,250,000 | | | | 1,280,500 | |
| | |
Series 2015A, GO, 4.00%, 3/15/2022 | | | 25,000 | | | | 25,986 | |
| | |
Series 2017B, GO, 3.00%, 4/15/2022 | | | 100,000 | | | | 103,141 | |
| | | | | | | | |
| INVESTMENTS | | PRINCIPAL
AMOUNT ($) | | | VALUE ($) | |
| | | | | | | | |
| | |
Connecticut — continued | | | | | | | | |
| | |
Series 2019A, GO, 5.00%, 4/15/2022 | | | 150,000 | | | | 158,064 | |
| | |
Series 2011B, GO, 5.00%, 5/15/2022 | | | 225,000 | | | | 227,187 | |
| | |
Series 2016B, GO, 5.00%, 5/15/2022 | | | 40,000 | | | | 42,305 | |
| | |
Series 2011D, GO, 5.00%, 11/1/2022 | | | 425,000 | | | | 438,498 | |
| | |
Series 2021A, GO, 3.00%, 1/15/2023 | | | 1,180,000 | | | | 1,238,670 | |
| | |
Series 2017A, GO, 5.00%, 4/15/2023 | | | 150,000 | | | | 164,790 | |
| | |
Series 2012C, GO, 5.00%, 6/1/2023 | | | 100,000 | | | | 105,766 | |
| | |
Series 2014E, GO, 5.00%, 9/1/2023 | | | 350,000 | | | | 390,250 | |
| | |
Series 2013A, GO, 5.00%, 10/15/2023 | | | 330,000 | | | | 369,669 | |
| | |
Series 2011D, GO, 5.00%, 11/1/2023 | | | 150,000 | | | | 154,753 | |
| | |
Series 2014D, GO, 5.00%, 6/15/2024 | | | 100,000 | | | | 114,566 | |
| | |
Series 2011D, GO, 5.00%, 11/1/2024 | | | 330,000 | | | | 340,411 | |
| | |
Series 2012B, GO, AGM-CR, 5.00%, 4/15/2025 | | | 875,000 | | | | 922,346 | |
| | |
Series 2012B, GO, 5.00%, 4/15/2025 | | | 810,000 | | | | 850,476 | |
| | |
Series 2017A, GO, 5.00%, 4/15/2025 | | | 1,325,000 | | | | 1,557,882 | |
| | |
Series 2016B, GO, 5.00%, 5/15/2025 | | | 200,000 | | | | 235,776 | |
| | |
State of Connecticut Clean Water Fund, State Revolving Fund Series 2015A, Rev., 5.00%, 3/1/2023 | | | 25,000 | | | | 27,380 | |
| | |
State of Connecticut, Special Tax Transportation Infrastructure Purposes | | | | | | | | |
| | |
Series 2015A, Rev., 5.00%, 8/1/2021 | | | 175,000 | | | | 178,517 | |
| | |
Series 2015B, Rev., 5.00%, 8/1/2021 | | | 75,000 | | | | 76,508 | |
| | |
Series 2014A, Rev., 5.00%, 9/1/2021 | | | 65,000 | | | | 66,570 | |
| | |
Series 2016A, Rev., 5.00%, 9/1/2021 | | | 75,000 | | | | 76,811 | |
| | |
Series 2013A, Rev., 5.00%, 10/1/2021 | | | 210,000 | | | | 215,920 | |
| | |
Series 2011A, Rev., 5.00%, 12/1/2021 | | | 40,000 | | | | 41,451 | |
| | |
Rev., 5.00%, 1/1/2022 | | | 90,000 | | | | 93,591 | |
SEE NOTES TO FINANCIAL STATEMENTS.
| | | | | | | | |
| | | |
| FEBRUARY 28, 2021 | | J.P. MORGAN EXCHANGE-TRADED FUNDS | | | | | 195 | |
JPMorgan Ultra-Short Municipal Income ETF
SCHEDULE OF PORTFOLIO INVESTMENTS
AS OF FEBRUARY 28, 2021 (continued)
| | | | | | | | |
| INVESTMENTS | | PRINCIPAL
AMOUNT ($) | | | VALUE ($) | |
Municipal Bonds — continued | | | | | | | | |
| | |
Connecticut — continued | | | | | | | | |
| | |
Rev., 5.00%, 1/1/2024 | | | 300,000 | | | | 325,596 | |
| | |
Series 2016A, Rev., 5.00%, 9/1/2024 | | | 135,000 | | | | 155,678 | |
| | |
Town of Cromwell Series 2016A, GO, 4.00%, 8/1/2022 | | | 25,000 | | | | 26,355 | |
| | |
Town of East Lyme | | | | | | | | |
| | |
GO, 5.00%, 7/15/2021 | | | 90,000 | | | | 91,615 | |
| | |
GO, BAN, 2.00%, 8/12/2021 | | | 295,000 | | | | 297,292 | |
| | |
Town of Enfield GO, BAN, 2.00%, 8/5/2021 | | | 40,000 | | | | 40,302 | |
| | |
Town of Griswold GO, BAN, 1.25%, 7/19/2021 | | | 7,160,000 | | | | 7,183,270 | |
| | |
Town of New Milford GO, BAN, 2.00%, 7/23/2021 | | | 280,000 | | | | 281,974 | |
| | |
Town of Newtown GO, 4.00%, 8/15/2021 | | | 20,000 | | | | 20,349 | |
| | |
Town of Southington GO, 3.38%, 1/15/2022 (b) | | | 40,000 | | | | 41,117 | |
| | |
Town of Stratford GO, 5.00%, 12/15/2022 (b) | | | 125,000 | | | | 135,645 | |
| | |
Town of Trumbull | | | | | | | | |
| | |
Series 2020A, GO, 4.00%, 9/1/2021 | | | 25,000 | | | | 25,479 | |
| | |
GO, 4.00%, 9/1/2022 | | | 25,000 | | | | 26,435 | |
| | |
Town of Waterford GO, 4.00%, 3/15/2021 | | | 20,000 | | | | 20,028 | |
| | |
Town of Wethersfield GO, 4.00%, 3/1/2022 | | | 20,000 | | | | 20,767 | |
| | |
Town of Windham | | | | | | | | |
| | |
Series B, GO, BAN, 2.00%, 9/30/2021 | | | 7,240,000 | | | | 7,313,486 | |
| | |
Series A, GO, 5.00%, 8/15/2023 | | | 355,000 | | | | 393,574 | |
| | |
University of Connecticut | | | | | | | | |
| | |
Series 2016A, Rev., 5.00%, 3/15/2021 | | | 175,000 | | | | 175,300 | |
| | |
Series 2018A, Rev., 5.00%, 4/15/2021 | | | 125,000 | | | | 125,706 | |
| | |
Series 2014A, Rev., 5.00%, 2/15/2022 | | | 100,000 | | | | 104,498 | |
| | |
University of Connecticut, Special Obligation Student Fee Series 2012A, Rev., 5.00%, 11/15/2021 | | | 35,000 | | | | 36,164 | |
| | | | | | | | |
| | |
Total Connecticut | | | | | | | 51,072,522 | |
| | | | | | | | |
| | |
Delaware — 0.2% | | | | | | | | |
| | |
City of Newark GO, 3.00%, 9/15/2022 | | | 30,000 | | | | 31,311 | |
| | |
City of Wilmington | | | | | | | | |
| | |
GO, 4.00%, 6/1/2021 | | | 80,000 | | | | 80,765 | |
| | |
Series 2013A, GO, 4.00%, 10/1/2021 | | | 30,000 | | | | 30,673 | |
| | | | | | | | |
| INVESTMENTS | | PRINCIPAL
AMOUNT ($) | | | VALUE ($) | |
| | | | | | | | |
| | |
Delaware — continued | | | | | | | | |
| | |
County of New Castle GO, 5.00%, 4/1/2024 | | | 25,000 | | | | 28,595 | |
| | |
County of Sussex Series 2020A, GO, 5.00%, 3/15/2022 | | | 30,000 | | | | 31,509 | |
| | |
Delaware Economic Development Authority, Delmarva Power and Light Co. Project Series 2020A, Rev., 1.05%, 7/1/2025 (c) | | | 715,000 | | | | 724,810 | |
| | |
Delaware Health Facilities Authority, Bayhealth Medical Center Project Series 2017A, Rev., 5.00%, 7/1/2021 | | | 115,000 | | | | 116,846 | |
| | |
Delaware Municipal Electric Corp. (The) Rev., 5.00%, 7/1/2024 | | | 605,000 | | | | 614,323 | |
| | |
Delaware Transportation Authority | | | | | | | | |
| | |
Rev., 5.00%, 7/1/2021 | | | 205,000 | | | | 208,319 | |
| | |
Rev., 5.00%, 7/1/2022 | | | 150,000 | | | | 159,729 | |
| | |
Rev., 5.00%, 9/1/2025 | | | 100,000 | | | | 118,980 | |
| | |
State of Delaware | | | | | | | | |
| | |
GO, 5.00%, 3/1/2021 | | | 45,000 | | | | 45,000 | |
| | |
Series 2010B, GO, 5.00%, 7/1/2021 | | | 30,000 | | | | 30,483 | |
| | |
Series 2009C, GO, 5.00%, 10/1/2021 | | | 70,000 | | | | 71,978 | |
| | |
GO, 5.00%, 3/1/2022 | | | 40,000 | | | | 41,936 | |
| | |
University of Delaware | | | | | | | | |
| | |
Rev., 5.00%, 11/1/2021 | | | 755,000 | | | | 779,288 | |
| | |
Series 2013A, Rev., 5.00%, 5/1/2023 (b) | | | 25,000 | | | | 27,567 | |
| | |
Wilmington Parking Authority (The) | | | | | | | | |
| | |
Rev., GTD, 5.00%, 3/15/2021 | | | 25,000 | | | | 25,044 | |
| | |
Rev., GTD, 5.00%, 3/15/2022 | | | 75,000 | | | | 78,773 | |
| | | | | | | | |
| | |
Total Delaware | | | | | | | 3,245,929 | |
| | | | | | | | |
| | |
District of Columbia — 0.5% | | | | | | | | |
| | |
District of Columbia | | | | | | | | |
| | |
Series 2013A, GO, 5.00%, 6/1/2021 | | | 150,000 | | | | 151,809 | |
| | |
Series 2015A, GO, 5.00%, 6/1/2021 | | | 30,000 | | | | 30,362 | |
| | |
Series 2016D, GO, 5.00%, 6/1/2021 | | | 25,000 | | | | 25,301 | |
| | |
Series 2011A, Rev., 5.00%, 12/1/2021 (b) | | | 75,000 | | | | 77,727 | |
| | |
Series 2013A, GO, 5.00%, 6/1/2022 | | | 115,000 | | | | 121,962 | |
| | |
Series 2014D, GO, 5.00%, 6/1/2022 | | | 40,000 | | | | 42,422 | |
| | |
Series 2015A, GO, 5.00%, 6/1/2022 | | | 20,000 | | | | 21,211 | |
| | |
Series 2016D, GO, 5.00%, 6/1/2022 | | | 30,000 | | | | 31,816 | |
| | |
Series 2017A, GO, 5.00%, 6/1/2022 | | | 25,000 | | | | 26,513 | |
| | |
Series 2018A, GO, 5.00%, 6/1/2022 | | | 25,000 | | | | 26,514 | |
SEE NOTES TO FINANCIAL STATEMENTS.
| | | | | | |
| | | |
| 196 | | | | J.P. MORGAN EXCHANGE-TRADED FUNDS | | FEBRUARY 28, 2021 |
| | | | | | | | |
| INVESTMENTS | | PRINCIPAL
AMOUNT ($) | | | VALUE ($) | |
Municipal Bonds — continued | | | | | | | | |
| | |
District of Columbia — continued | | | | | | | | |
| | |
District of Columbia Housing Finance Agency, Multi-Family Development Program Series 2019B-2, Rev., FHA, 1.70%, 3/1/2023 | | | 165,000 | | | | 168,122 | |
| | |
District of Columbia Housing Finance Agency, Strand Residence Project Rev., 1.45%, 8/1/2022 (c) | | | 1,025,000 | | | | 1,040,724 | |
| | |
District of Columbia, Children’s Hospital Obligated Group | | | | | | | | |
| | |
Rev., 5.00%, 7/15/2021 | | | 115,000 | | | | 116,999 | |
| | |
Rev., 5.00%, 7/15/2022 | | | 180,000 | | | | 191,527 | |
| | |
Rev., 5.00%, 7/15/2023 | | | 500,000 | | | | 554,115 | |
| | |
District of Columbia, Federal Highway Rev., GAN, 5.00%, 12/1/2024 | | | 175,000 | | | | 203,327 | |
| | |
District of Columbia, Gallery Place Project | | | | | | | | |
| | |
5.00%, 6/1/2021 | | | 25,000 | | | | 25,300 | |
| | |
5.00%, 6/1/2024 | | | 100,000 | | | | 101,188 | |
| | |
District of Columbia, Howard University | | | | | | | | |
| | |
Series 2011A, Rev., 6.25%, 4/1/2021 (b) | | | 585,000 | | | | 587,802 | |
| | |
Series 2011A, Rev., 6.50%, 4/1/2021 (b) | | | 750,000 | | | | 753,743 | |
| | |
District of Columbia, Income Tax | | | | | | | | |
| | |
Series 2019C, Rev., 5.00%, 10/1/2021 | | | 115,000 | | | | 118,263 | |
| | |
Series 2011A, Rev., 4.00%, 12/1/2021 | | | 60,000 | | | | 61,743 | |
| | |
Series 2012C, Rev., 4.00%, 12/1/2021 | | | 25,000 | | | | 25,726 | |
| | |
Series F, Rev., 4.00%, 12/1/2021 | | | 105,000 | | | | 108,050 | |
| | |
Series 2012A, Rev., 5.00%, 12/1/2021 | | | 195,000 | | | | 202,119 | |
| | |
Series 2014A, Rev., 5.00%, 12/1/2021 | | | 130,000 | | | | 134,746 | |
| | |
Series C, Rev., 5.00%, 12/1/2021 | | | 50,000 | | | | 51,826 | |
| | |
Series F, Rev., 5.00%, 12/1/2021 | | | 60,000 | | | | 62,191 | |
| | |
Series 2014A, Rev., 5.00%, 12/1/2022 | | | 20,000 | | | | 21,688 | |
| | |
Series 2014A, Rev., 5.00%, 12/1/2023 | | | 25,000 | | | | 28,207 | |
| | |
Series 2012A, Rev., 5.00%, 12/1/2026 | | | 200,000 | | | | 216,348 | |
| | |
District of Columbia, Water and Sewer Authority, Public Utility, Senior Lien | | | | | | | | |
| | |
Series 2017B, Rev., 5.00%, 10/1/2022 | | | 50,000 | | | | 53,818 | |
| | |
Rev., AGM, 5.50%, 10/1/2023 | | | 180,000 | | | | 195,149 | |
| | | | | | | | |
| INVESTMENTS | | PRINCIPAL
AMOUNT ($) | | | VALUE ($) | |
| | | | | | | | |
| | |
District of Columbia — continued | | | | | | | | |
| | |
District of Columbia, Water and Sewer Authority, Public Utility, Subordinate Lien | | | | | | | | |
| | |
Series 2015A, Rev., 4.00%, 10/1/2021 | | | 70,000 | | | | 71,567 | |
| | |
Series 2014C, Rev., 5.00%, 10/1/2021 | | | 70,000 | | | | 71,973 | |
| | |
Series 2014C, Rev., 5.00%, 10/1/2024 | | | 25,000 | | | | 29,064 | |
| | |
Metropolitan Washington Airports Authority | | | | | | | | |
| | |
Series 2010F-1, Rev., 5.00%, 10/1/2021 | | | 40,000 | | | | 41,118 | |
| | |
Series 2016B, Rev., 5.00%, 10/1/2021 | | | 100,000 | | | | 102,795 | |
| | |
Washington Convention and Sports Authority, Senior Lien Dedicated Tax Refunding Series 2018A, Rev., 5.00%, 10/1/2021 | | | 400,000 | | | | 408,056 | |
| | | | | | | | |
| | |
Total District of Columbia | | | | | | | 6,302,931 | |
| | | | | | | | |
| | |
Florida — 4.6% | | | | | | | | |
| | |
Board of Governors State University System of Florida, University System Improvement | | | | | | | | |
| | |
Series 2014A, Rev., 5.00%, 7/1/2021 | | | 20,000 | | | | 20,318 | |
| | |
Series 2017B, Rev., 5.00%, 7/1/2021 | | | 50,000 | | | | 50,796 | |
| | |
Series 2014A, Rev., 5.00%, 7/1/2022 | | | 165,000 | | | | 175,519 | |
| | |
Series 2014A, Rev., 5.00%, 7/1/2023 | | | 40,000 | | | | 44,115 | |
| | |
Brevard County Health Facilities Authority, Health First, Inc., Project Rev., 5.00%, 4/1/2021 | | | 310,000 | | | | 311,150 | |
| | |
Brevard County School District | | | | | | | | |
| | |
COP, 5.00%, 7/1/2021 | | | 125,000 | | | | 126,981 | |
| | |
Series 2013A, COP, 5.00%, 7/1/2021 | | | 110,000 | | | | 111,743 | |
| | |
Series 2015C, COP, 5.00%, 7/1/2021 | | | 35,000 | | | | 35,555 | |
| | |
COP, 5.00%, 7/1/2022 | | | 25,000 | | | | 26,587 | |
| | |
Broward County Housing Finance Authority, Prospect Park Apartments Series 2019C, Rev., 1.40%, 5/1/2021 (c) | | | 100,000 | | | | 100,196 | |
| | |
Capital Trust Agency, Inc., Alexander Apartments Project | | | | | | | | |
| | |
Series 2011A, Rev., 6.00%, 7/1/2021 (b) | | | 335,000 | | | | 341,244 | |
SEE NOTES TO FINANCIAL STATEMENTS.
| | | | | | | | |
| | | |
| FEBRUARY 28, 2021 | | J.P. MORGAN EXCHANGE-TRADED FUNDS | | | | | 197 | |
JPMorgan Ultra-Short Municipal Income ETF
SCHEDULE OF PORTFOLIO INVESTMENTS
AS OF FEBRUARY 28, 2021 (continued)
| | | | | | | | |
| INVESTMENTS | | PRINCIPAL
AMOUNT ($) | | | VALUE ($) | |
Municipal Bonds — continued | | | | | | | | |
| | |
Florida — continued | | | | | | | | |
| | |
Series 2011A, Rev., 6.75%, 7/1/2021 (b) | | | 300,000 | | | | 306,324 | |
| | |
Capital Trust Agency, Inc., Council Towers Apartments Project Series 2020A, Rev., 0.80%, 3/1/2022 (c) | | | 10,450,000 | | | | 10,498,802 | |
| | |
Capital Trust Agency, Inc., Mission Springs Apartments Project Series A, Rev., 4.25%, 12/1/2022 (b) | | | 595,000 | | | | 664,157 | |
| | |
Citizens Property Insurance, Inc., Senior Secured Series A-1, Rev., 5.00%, 6/1/2021 | | | 75,000 | | | | 75,889 | |
| | |
City of Apopka, Utility System | | | | | | | | |
| | |
Rev., 4.00%, 10/1/2021 | | | 20,000 | | | | 20,442 | |
| | |
Rev., 5.00%, 10/1/2023 | | | 30,000 | | | | 32,235 | |
| | |
City of Bradenton, Special Obligation Rev., 4.00%, 9/1/2022 | | | 25,000 | | | | 26,396 | |
| | |
City of Cape Coral, Water and Sewer | | | | | | | | |
| | |
Rev., AGM, 5.00%, 10/1/2021 (b) | | | 135,000 | | | | 138,774 | |
| | |
Series 2011A, Rev., AGM, 5.00%, 10/1/2021 (b) | | | 105,000 | | | | 107,966 | |
| | |
City of Clearwater, Stormwater System | | | | | | | | |
| | |
Rev., 4.00%, 11/1/2021 | | | 30,000 | | | | 30,768 | |
| | |
Rev., 4.75%, 11/1/2022 | | | 35,000 | | | | 37,662 | |
| | |
City of Clearwater, Water and Sewer | | | | | | | | |
| | |
Rev., 5.00%, 12/1/2021 | | | 110,000 | | | | 113,996 | |
| | |
Rev., 5.00%, 12/1/2022 | | | 50,000 | | | | 54,212 | |
| | |
City of Cocoa, Water and Sewer System Series 2018A, Rev., 3.00%, 10/1/2021 | | | 50,000 | | | | 50,829 | |
| | |
City of Fort Myers, Utility System Series 2019A, Rev., 4.00%, 10/1/2023 | | | 100,000 | | | | 109,155 | |
| | |
City of Hallandale Beach, Capital Improvement Rev., 5.00%, 10/1/2023 | | | 25,000 | | | | 27,888 | |
| | |
City of Jacksonville | | | | | | | | |
| | |
Series 2010B, Rev., 5.00%, 10/1/2021 | | | 300,000 | | | | 308,316 | |
| | |
Series 2012C, Rev., 5.00%, 10/1/2021 | | | 150,000 | | | | 154,158 | |
| | |
Series 2012A, Rev., 4.25%, 10/1/2022 (b) | | | 45,000 | | | | 47,875 | |
| | |
Series 2012A, Rev., 5.00%, 10/1/2022 (b) | | | 240,000 | | | | 258,170 | |
| | |
Series 2020A, Rev., 5.00%, 10/1/2022 | | | 250,000 | | | | 268,762 | |
| | |
Series 2012C, Rev., 5.00%, 10/1/2025 | | | 150,000 | | | | 160,926 | |
| | | | | | | | |
| INVESTMENTS | | PRINCIPAL
AMOUNT ($) | | | VALUE ($) | |
| | | | | | | | |
| | |
Florida — continued | | | | | | | | |
| | |
City of Jacksonville, Health Care Facilities | | | | | | | | |
| | |
Series 2012B, Rev., 5.00%, 10/1/2021 | | | 225,000 | | | | 231,143 | |
| | |
Series 2012B, Rev., 5.00%, 10/1/2022 | | | 145,000 | | | | 155,714 | |
| | |
City of Jacksonville, Health Care Facilities, Brooks Rehabilitation Project Series 2019A, Rev., 4.00%, 8/15/2023 | | | 265,000 | | | | 286,062 | |
| | |
City of Jacksonville, Sales Tax Rev., 5.00%, 10/1/2024 | | | 100,000 | | | | 107,417 | |
| | |
City of Kissimmee, Capital Improvement, Sales Tax Rev., 5.00%, 10/1/2021 | | | 50,000 | | | | 51,410 | |
| | |
City of Lakeland, Department of Electric Utilities Rev., 5.00%, 10/1/2021 | | | 315,000 | | | | 323,861 | |
| | |
City of Lakeland, Water and Wastewater Series 2012A, Rev., 5.00%, 10/1/2023 | | | 25,000 | | | | 25,692 | |
| | |
City of Miami Beach, Stormwater | | | | | | | | |
| | |
Series 2011A, Rev., 4.13%, 9/1/2021 (b) | | | 100,000 | | | | 101,960 | |
| | |
Series 2011A, Rev., 4.75%, 9/1/2021 (b) | | | 110,000 | | | | 112,497 | |
| | |
Series 2011A, Rev., 5.00%, 9/1/2021 | | | 125,000 | | | | 127,986 | |
| | |
Series 2011A, Rev., 5.25%, 9/1/2021 (b) | | | 100,000 | | | | 102,519 | |
| | |
City of Miramar, Utility System Rev., 5.00%, 10/1/2021 | | | 40,000 | | | | 41,128 | |
| | |
City of Mount Dora, Capital Improvement Rev., 4.00%, 11/1/2021 | | | 100,000 | | | | 102,391 | |
| | |
City of Oakland Park, Water and Sewer Rev., 5.00%, 9/1/2022 | | | 30,000 | | | | 32,147 | |
| | |
City of Ocoee Rev., 4.00%, 10/1/2021 | | | 20,000 | | | | 20,430 | |
| | |
City of Orlando, Capital Improvement | | | | | | | | |
| | |
Series 2018B, Rev., 5.00%, 10/1/2023 | | | 50,000 | | | | 55,956 | |
| | |
Series 2016B, Rev., 5.00%, 10/1/2024 | | | 25,000 | | | | 29,005 | |
| | |
City of Orlando, Development Tax | | | | | | | | |
| | |
Series 2014A, Rev., 5.00%, 11/1/2021 (b) | | | 35,000 | | | | 36,118 | |
| | |
Series 2014A, Rev., 5.00%, 5/1/2024 (b) | | | 20,000 | | | | 22,842 | |
| | |
City of Orlando, Waste Water System Rev., 5.00%, 10/1/2021 | | | 50,000 | | | | 51,410 | |
SEE NOTES TO FINANCIAL STATEMENTS.
| | | | | | |
| | | |
| 198 | | | | J.P. MORGAN EXCHANGE-TRADED FUNDS | | FEBRUARY 28, 2021 |
| | | | | | | | |
| INVESTMENTS | | PRINCIPAL
AMOUNT ($) | | | VALUE ($) | |
Municipal Bonds — continued | | | | | | | | |
| | |
Florida — continued | | | | | | | | |
| | |
City of Palm Beach Gardens Series 2011A, Rev., 3.38%, 5/1/2021 | | | 125,000 | | | | 125,600 | |
| | |
City of Palm Coast Rev., 5.00%, 10/1/2021 | | | 75,000 | | | | 77,070 | |
| | |
City of Pembroke Pines, Capital Improvement Rev., AGM, 5.00%, 12/1/2021 | | | 100,000 | | | | 103,590 | |
| | |
City of Sarasota, St. Armands Paid Parking Area Improvements Series 2017A, Rev., 4.00%, 10/1/2023 | | | 25,000 | | | | 27,289 | |
| | |
City of Sarasota, Water and Sewer System Rev., 5.00%, 10/1/2021 | | | 50,000 | | | | 51,410 | |
| | |
City of St. Petersburg | | | | | | | | |
| | |
Rev., 3.00%, 10/1/2021 | | | 25,000 | | | | 25,407 | |
| | |
Series 2013A, Rev., 3.00%, 10/1/2022 | | | 30,000 | | | | 31,320 | |
| | |
City of St. Petersburg, Public Utility Series 2014B, Rev., 5.00%, 10/1/2021 | | | 50,000 | | | | 51,395 | |
| | |
City of Sunrise GO, 5.00%, 7/1/2021 | | | 50,000 | | | | 50,802 | |
| | |
City of Tallahassee | | | | | | | | |
| | |
Rev., 5.00%, 10/1/2021 | | | 45,000 | | | | 46,269 | |
| | |
Rev., 5.00%, 10/1/2022 | | | 25,000 | | | | 26,909 | |
| | |
City of Tallahassee, Energy System Rev., 5.00%, 10/1/2021 | | | 35,000 | | | | 35,976 | |
| | |
City of Tallahassee, Utility System Rev., 5.00%, 10/1/2021 | | | 225,000 | | | | 231,343 | |
| | |
City of Tampa | | | | | | | | |
| | |
Rev., 5.00%, 9/1/2021 | | | 140,000 | | | | 143,238 | |
| | |
Series 2012B, Rev., 5.00%, 10/1/2021 (b) | | | 140,000 | | | | 143,955 | |
| | |
Series 2012A, Rev., 5.00%, 11/15/2025 | | | 215,000 | | | | 226,090 | |
| | |
City of Tampa, Sales Tax Rev., 5.00%, 10/1/2022 | | | 200,000 | | | | 215,108 | |
| | |
City of Tampa, Water and Sewer Improvement System Rev., 5.00%, 10/1/2021 (b) | | | 210,000 | | | | 215,931 | |
| | |
City of Venice GO, 5.00%, 2/1/2022 | | | 35,000 | | | | 36,550 | |
| | |
City of West Palm Beach, Utility System | | | | | | | | |
| | |
Series 2012A, Rev., 4.00%, 10/1/2021 | | | 50,000 | | | | 51,120 | |
| | |
Series 2011A, Rev., 5.00%, 10/1/2021 | | | 110,000 | | | | 113,101 | |
| | |
Series 2017C, Rev., 5.00%, 10/1/2022 | | | 25,000 | | | | 26,909 | |
| | | | | | | | |
| INVESTMENTS | | PRINCIPAL
AMOUNT ($) | | | VALUE ($) | |
| | | | | | | | |
| | |
Florida — continued | | | | | | | | |
| | |
County of Brevard, Water and Wastewater Utility Rev., 5.00%, 9/1/2022 | | | 80,000 | | | | 85,788 | |
| | |
County of Citrus, Non-Ad Valorem Rev., 4.00%, 10/1/2021 | | | 50,000 | | | | 51,120 | |
| | |
County of Citrus, Water & Wastewater System Rev., 5.00%, 10/1/2021 | | | 40,000 | | | | 41,116 | |
| | |
County of Collier | | | | | | | | |
| | |
Rev., 5.00%, 10/1/2021 | | | 220,000 | | | | 226,202 | |
| | |
Series 2010B, Rev., 5.00%, 10/1/2021 | | | 30,000 | | | | 30,845 | |
| | |
Rev., 5.00%, 10/1/2023 | | | 65,000 | | | | 66,813 | |
| | |
County of Hillsborough, Capital Improvement Program Rev., 5.00%, 8/1/2021 | | | 70,000 | | | | 71,407 | |
| | |
County of Hillsborough, Communications Services Tax Rev., 5.00%, 10/1/2024 | | | 35,000 | | | | 40,649 | |
| | |
County of Hillsborough, Community Investment Rev., 5.00%, 11/1/2023 | | | 135,000 | | | | 150,719 | |
| | |
County of Hillsborough, Utility Rev., 5.00%, 8/1/2021 | | | 45,000 | | | | 45,904 | |
| | |
County of Lee County, Water and Sewer | | | | | | | | |
| | |
Series 2013A, Rev., 5.00%, 10/1/2021 | | | 40,000 | | | | 41,128 | |
| | |
Series 2013B, Rev., 5.00%, 10/1/2021 | | | 70,000 | | | | 71,973 | |
| | |
Series 2013B, Rev., 5.00%, 10/1/2022 | | | 55,000 | | | | 58,792 | |
| | |
County of Lee, Tourist Development Tax | | | | | | | | |
| | |
Series 2019A, Rev., 3.00%, 10/1/2021 | | | 50,000 | | | | 50,829 | |
| | |
Series 2019A, Rev., 5.00%, 10/1/2024 | | | 25,000 | | | | 28,546 | |
| | |
County of Lee, Transportation Facilities Rev., AGM, 5.00%, 10/1/2024 | | | 200,000 | | | | 229,124 | |
| | |
County of Manatee, Improvement Rev., 5.00%, 10/1/2021 | | | 55,000 | | | | 56,550 | |
| | |
County of Manatee, Public Utilities | | | | | | | | |
| | |
Rev., 5.00%, 10/1/2021 | | | 90,000 | | | | 92,537 | |
| | |
Rev., 5.00%, 10/1/2022 | | | 50,000 | | | | 53,819 | |
| | |
County of Martin, Consolidated Utilities System Series 2016A, Rev., 5.00%, 10/1/2021 | | | 40,000 | | | | 41,128 | |
| | |
County of Martin, Half-Cent Sales Tax Rev., 5.00%, 7/1/2022 | | | 30,000 | | | | 31,929 | |
| | |
County of Miami-Dade Series 2012B, Rev., 5.00%, 10/1/2022 (b) | | | 455,000 | | | | 489,826 | |
SEE NOTES TO FINANCIAL STATEMENTS.
| | | | | | | | |
| | | |
| FEBRUARY 28, 2021 | | J.P. MORGAN EXCHANGE-TRADED FUNDS | | | | | 199 | |
JPMorgan Ultra-Short Municipal Income ETF
SCHEDULE OF PORTFOLIO INVESTMENTS
AS OF FEBRUARY 28, 2021 (continued)
| | | | | | | | |
| INVESTMENTS | | PRINCIPAL
AMOUNT ($) | | | VALUE ($) | |
Municipal Bonds — continued | | | | | | | | |
| | |
Florida — continued | | | | | | | | |
| | |
County of Miami-Dade, Aviation Series 2012B, Rev., 5.00%, 10/1/2024 | | | 280,000 | | | | 301,277 | |
| | |
County of Miami-Dade, Building Better Communities Program | | | | | | | | |
| | |
GO, 4.00%, 7/1/2021 (b) | | | 160,000 | | | | 162,045 | |
| | |
Series 2011A, GO, 4.00%, 7/1/2021 (b) | | | 25,000 | | | | 25,319 | |
| | |
Series 2016A, GO, 5.00%, 7/1/2021 | | | 90,000 | | | | 91,451 | |
| | |
Series 2013A, GO, 5.00%, 7/1/2022 | | | 45,000 | | | | 47,894 | |
| | |
Series 2015-D, GO, 5.00%, 7/1/2022 | | | 40,000 | | | | 42,572 | |
| | |
Series 2016A, GO, 5.00%, 7/1/2024 | | | 30,000 | | | | 34,476 | |
| | |
County of Miami-Dade, Capital Asset Acquisition | | | | | | | | |
| | |
Series 2016A, Rev., 3.00%, 4/1/2021 | | | 20,000 | | | | 20,045 | |
| | |
Series 2011A, Rev., 4.38%, 4/1/2021 (b) | | | 190,000 | | | | 190,650 | |
| | |
Series 2016B, Rev., 5.00%, 4/1/2021 | | | 20,000 | | | | 20,077 | |
| | |
Series A, Rev., 5.00%, 4/1/2021 | | | 125,000 | | | | 125,484 | |
| | |
Series 2016B, Rev., 5.00%, 4/1/2022 | | | 50,000 | | | | 52,589 | |
| | |
Series 2017A, Rev., 5.00%, 4/1/2022 | | | 120,000 | | | | 126,214 | |
| | |
County of Miami-Dade, Parks Program | | | | | | | | |
| | |
Series 2011B, GO, 4.00%, 11/1/2021 | | | 30,000 | | | | 30,772 | |
| | |
Series 2015A, GO, 5.00%, 11/1/2021 | | | 20,000 | | | | 20,647 | |
| | |
Series 2011B, GO, 3.50%, 11/1/2022 | | | 30,000 | | | | 30,662 | |
| | |
Series 2015A, GO, 5.00%, 11/1/2022 | | | 25,000 | | | | 27,006 | |
| | |
County of Miami-Dade, Public Facilities, Jackson Healthcare Corp. Series 2005B, Rev., NATL-RE, 5.00%, 6/1/2021 | | | 100,000 | | | | 101,175 | |
| | |
County of Miami-Dade, Public Health Trust Program | | | | | | | | |
| | |
Series 2016A, GO, 5.00%, 7/1/2021 | | | 30,000 | | | | 30,481 | |
| | |
Series 2016A, GO, 5.00%, 7/1/2022 | | | 30,000 | | | | 31,929 | |
| | |
County of Miami-Dade, Seaport Department Series 2011C, GO, 4.75%, 10/1/2021 | | | 25,000 | | | | 25,671 | |
| | |
County of Miami-Dade, Transit System, Sales Surtax | | | | | | | | |
| | |
Rev., 5.00%, 7/1/2021 | | | 100,000 | | | | 101,555 | |
| | | | | | | | |
| INVESTMENTS | | PRINCIPAL
AMOUNT ($) | | | VALUE ($) | |
| | | | | | | | |
| | |
Florida — continued | | | | | | | | |
| | |
Rev., 5.00%, 7/1/2022 (b) | | | 150,000 | | | | 159,616 | |
| | |
Rev., 5.00%, 7/1/2023 | | | 215,000 | | | | 237,119 | |
| | |
County of Miami-Dade, Water and Sewer System | | | | | | | | |
| | |
Series 2008B, Rev., AGM, 5.25%, 10/1/2021 | | | 165,000 | | | | 169,841 | |
| | |
Series 2013A, Rev., 5.00%, 10/1/2022 (b) | | | 45,000 | | | | 48,444 | |
| | |
Series 2013B, Rev., 5.00%, 10/1/2023 (b) | | | 50,000 | | | | 56,105 | |
| | |
County of Okaloosa, Sales Tax Rev., 5.00%, 10/1/2022 | | | 40,000 | | | | 43,055 | |
| | |
County of Okaloosa, Sales Tax, Improvement Rev., 5.00%, 10/1/2021 | | | 100,000 | | | | 102,819 | |
| | |
County of Okeechobee, Solid Waste Disposal, Waste Management, Inc., Okeechobee Landfill Project Rev., 1.55%, 7/1/2021 (c) | | | 75,000 | | | | 75,342 | |
| | |
County of Orange, Capital Improvement Rev., 5.00%, 10/1/2021 | | | 25,000 | | | | 25,705 | |
| | |
County of Orange, Sales Tax | | | | | | | | |
| | |
Series 2012B, Rev., 5.00%, 1/1/2022 (b) | | | 50,000 | | | | 52,021 | |
| | |
Series 2012C, Rev., 5.00%, 1/1/2022 | | | 110,000 | | | | 114,426 | |
| | |
County of Osceola, Infrastructure Sales Surtax Rev., 5.00%, 10/1/2021 | | | 250,000 | | | | 256,618 | |
| | |
County of Osceola, Sales Tax Series 2016A, Rev., 4.00%, 10/1/2021 | | | 165,000 | | | | 168,490 | |
| | |
County of Palm Beach, Public Improvement | | | | | | | | |
| | |
Rev., 4.00%, 6/1/2021 | | | 85,000 | | | | 85,811 | |
| | |
Rev., 5.00%, 6/1/2022 | | | 25,000 | | | | 26,507 | |
| | |
Rev., 5.00%, 6/1/2024 | | | 30,000 | | | | 31,766 | |
| | |
County of Palm Beach, Public Improvement Bonds, Convention Center Project Rev., 5.00%, 11/1/2021 (b) | | | 385,000 | | | | 397,439 | |
| | |
County of Palm Beach, Recreational and Cultural Facilities GO, 5.00%, 7/1/2022 | | | 70,000 | | | | 74,501 | |
| | |
County of Palm Beach, Water and Sewer | | | | | | | | |
| | |
Rev., 4.00%, 10/1/2021 | | | 230,000 | | | | 235,150 | |
| | |
Rev., 5.00%, 10/1/2023 (b) | | | 25,000 | | | | 28,052 | |
| | |
County of Palm Beach, Water and Sewer, FPL Reclaimed Water Project Rev., 5.00%, 10/1/2022 | | | 35,000 | | | | 37,673 | |
SEE NOTES TO FINANCIAL STATEMENTS.
| | | | | | |
| | | |
| 200 | | | | J.P. MORGAN EXCHANGE-TRADED FUNDS | | FEBRUARY 28, 2021 |
| | | | | | | | |
| INVESTMENTS | | PRINCIPAL
AMOUNT ($) | | | VALUE ($) | |
Municipal Bonds — continued | | | | | | | | |
| | |
Florida — continued | | | | | | | | |
| | |
County of Pasco, Half-Cent Sales Tax and Improvement Series 2013A, Rev., 5.00%, 12/1/2022 | | | 55,000 | | | | 59,602 | |
| | |
County of Pasco, Water & Sewer Series 2014A, Rev., 5.00%, 10/1/2022 | | | 25,000 | | | | 26,897 | |
| | |
County of Pinellas, Sewer Rev., 5.00%, 10/1/2022 (b) | | | 40,000 | | | | 43,028 | |
| | |
County of Polk, Utility System Rev., 5.00%, 10/1/2022 | | | 55,000 | | | | 59,200 | |
| | |
County of Sarasota, Infrastructure Sales Surtax | | | | | | | | |
| | |
Rev., 4.00%, 10/1/2021 | | | 145,000 | | | | 148,247 | |
| | |
Rev., 5.00%, 10/1/2021 | | | 50,000 | | | | 51,409 | |
| | |
Rev., 5.00%, 10/1/2022 | | | 45,000 | | | | 48,437 | |
| | |
County of Sarasota, Utility System Rev., 5.00%, 10/1/2022 | | | 40,000 | | | | 43,055 | |
| | |
County of Seminole, Water and Sewer Series 2015B, Rev., 5.00%, 10/1/2021 | | | 25,000 | | | | 25,700 | |
| | |
County of St. Johns, Water & Sewer Rev., 5.00%, 6/1/2022 | | | 20,000 | | | | 21,206 | |
| | |
Escambia County Housing Finance Authority, Multi County Program Series 2019B, Rev., GNMA COLL, 1.65%, 4/1/2023 | | | 95,000 | | | | 96,993 | |
| | |
Escambia County School Board | | | | | | | | |
| | |
Rev., 5.00%, 9/1/2022 | | | 115,000 | | | | 123,176 | |
| | |
Rev., 5.00%, 9/1/2023 | | | 125,000 | | | | 138,978 | |
| | |
Florida Atlantic University Finance Corp., Student Housing Project Series 2012A, Rev., 4.00%, 7/1/2021 | | | 75,000 | | | | 75,667 | |
| | |
Florida Department of Children & Families, Civil Commitment COP, 5.00%, 10/1/2021 | | | 75,000 | | | | 77,101 | |
| | |
Florida Department of Environmental Protection | | | | | | | | |
| | |
Series 2011B, Rev., 5.00%, 7/1/2021 | | | 155,000 | | | | 157,468 | |
| | |
Series 2012A, Rev., 5.00%, 7/1/2021 | | | 100,000 | | | | 101,592 | |
| | |
Series 2014-A, Rev., 5.00%, 7/1/2021 | | | 20,000 | | | | 20,318 | |
| | |
Series 2015A, Rev., 5.00%, 7/1/2021 | | | 30,000 | | | | 30,478 | |
| | |
Series 2016A, Rev., 5.00%, 7/1/2022 | | | 75,000 | | | | 79,781 | |
| | |
Series 2018A, Rev., 5.00%, 7/1/2022 | | | 125,000 | | | | 132,969 | |
| | | | | | | | |
| INVESTMENTS | | PRINCIPAL
AMOUNT ($) | | | VALUE ($) | |
| | | | | | | | |
| | |
Florida — continued | | | | | | | | |
| | |
Florida Department of Management Services | | | | | | | | |
| | |
Series 2015A, COP, 5.00%, 8/1/2021 | | | 1,345,000 | | | | 1,372,035 | |
| | |
Series 2015A, COP, 5.00%, 8/1/2022 | | | 165,000 | | | | 176,200 | |
| | |
Series 2018A, COP, 5.00%, 11/1/2022 | | | 50,000 | | | | 53,758 | |
| | |
Florida Development Finance Corp., Nova Southeastern University Project Series 2020A, Rev., 5.00%, 4/1/2021 | | | 185,000 | | | | 185,640 | |
| | |
Florida Gulf Coast University Financing Corp., Housing Project | | | | | | | | |
| | |
Rev., 5.00%, 2/1/2022 | | | 215,000 | | | | 223,912 | |
| | |
Series 2020A, Rev., 5.00%, 2/1/2022 | | | 150,000 | | | | 156,217 | |
| | |
Series 2017A, Rev., 5.00%, 8/1/2022 | | | 100,000 | | | | 106,390 | |
| | |
Series 2020A, Rev., 5.00%, 2/1/2023 | | | 120,000 | | | | 130,200 | |
| | |
Series 2020A, Rev., 5.00%, 2/1/2024 | | | 125,000 | | | | 140,609 | |
| | |
Series 2020A, Rev., 5.00%, 2/1/2025 | | | 115,000 | | | | 133,601 | |
| | |
Florida Higher Educational Facilities Financial Authority, University of Tampa Project Series 2012A, Rev., AGM, 4.50%, 4/1/2022 (b) | | | 100,000 | | | | 104,650 | |
| | |
Florida Housing Finance Corp., Emerald Villas Phase 2 Series 2019A, Rev., 2.00%, 8/1/2021 | | | 125,000 | | | | 125,983 | |
| | |
Florida Housing Finance Corp., Multi-Family Housing, Azure Estates Series 2019J, Rev., 1.45%, 3/1/2022 (c) | | | 100,000 | | | | 101,113 | |
| | |
Florida Housing Finance Corp., Multi-Family Mortgage, Parrish Oaks Series 2020A, Rev., 1.25%, 2/1/2022 (c) | | | 375,000 | | | | 378,664 | |
| | |
Florida Municipal Loan Council, Lighthouse Point Series 2019A, Rev., 5.00%, 8/1/2022 | | | 30,000 | | | | 32,010 | |
| | |
Florida Municipal Power Agency | | | | | | | | |
| | |
Series 2016A, Rev., 5.00%, 10/1/2021 | | | 95,000 | | | | 97,588 | |
| | |
Series 2016A, Rev., 5.00%, 10/1/2023 | | | 65,000 | | | | 72,599 | |
| | |
Series 2016A, Rev., 5.00%, 10/1/2024 | | | 100,000 | | | | 115,713 | |
SEE NOTES TO FINANCIAL STATEMENTS.
| | | | | | | | |
| | | |
| FEBRUARY 28, 2021 | | J.P. MORGAN EXCHANGE-TRADED FUNDS | | | | | 201 | |
JPMorgan Ultra-Short Municipal Income ETF
SCHEDULE OF PORTFOLIO INVESTMENTS
AS OF FEBRUARY 28, 2021 (continued)
| | | | | | | | |
| INVESTMENTS | | PRINCIPAL
AMOUNT ($) | | | VALUE ($) | |
Municipal Bonds — continued | | | | | | | | |
| | |
Florida — continued | | | | | | | | |
| | |
Florida Municipal Power Agency, Stanton II Project | | | | | | | | |
| | |
Series 2012A, Rev., 5.00%, 10/1/2021 | | | 220,000 | | | | 225,940 | |
| | |
Series 2012A, Rev., 5.00%, 10/1/2023 | | | 390,000 | | | | 418,150 | |
| | |
Florida Ports Financing Commission, State Transportation Trust Fund | | | | | | | | |
| | |
Series 2011A, Rev., 5.00%, 10/1/2022 | | | 30,000 | | | | 30,817 | |
| | |
Series 2011A, Rev., 5.00%, 10/1/2023 | | | 100,000 | | | | 102,742 | |
| | |
Series 2011A, Rev., 5.00%, 10/1/2025 | | | 100,000 | | | | 102,724 | |
| | |
Florida State Board of Governors, International University Dormitory | | | | | | | | |
| | |
Series 2013A, Rev., 5.00%, 5/1/2021 | | | 20,000 | | | | 20,158 | |
| | |
Series 2011A, Rev., 3.00%, 7/1/2021 | | | 20,000 | | | | 20,182 | |
| | |
Florida State Board of Governors, State University Mandatory School Fee Series 2010A, Rev., 5.00%, 7/1/2024 | | | 500,000 | | | | 506,695 | |
| | |
FSU Financial Assistance, Inc. Series 2012A, Rev., 3.00%, 10/1/2021 | | | 25,000 | | | | 25,385 | |
| | |
Hillsborough County School Board, Master Lease Program | | | | | | | | |
| | |
Series 2015A, COP, 5.00%, 7/1/2021 | | | 35,000 | | | | 35,561 | |
| | |
Series 2012A, COP, 5.00%, 7/1/2022 (b) | | | 150,000 | | | | 159,687 | |
| | |
Inland Protection Financing Corp. | | | | | | | | |
| | |
Series 2019A, Rev., 5.00%, 7/1/2022 | | | 50,000 | | | | 53,215 | |
| | |
Series 2019A, Rev., 5.00%, 7/1/2023 | | | 30,000 | | | | 33,279 | |
| | |
Jacksonville Transportation Authority, Senior Lien Gas Tax Rev., 5.00%, 8/1/2024 | | | 25,000 | | | | 28,712 | |
| | |
JEA Electric System | | | | | | | | |
| | |
Series 2012A, Rev., 5.00%, 4/1/2021 (b) | | | 35,000 | | | | 35,136 | |
| | |
Series 2014A, Rev., 5.00%, 10/1/2021 | | | 100,000 | | | | 102,778 | |
| | |
JEA Water and Sewer System | | | | | | | | |
| | |
Series 2008A-1, Rev., VRDO, LIQ: U.S. Bank NA, 0.02%, 3/1/2021 (c) | | | 15,000,000 | | | | 15,000,000 | |
| | | | | | | | |
| INVESTMENTS | | PRINCIPAL
AMOUNT ($) | | | VALUE ($) | |
| | | | | | | | |
| | |
Florida — continued | | | | | | | | |
| | |
Series 2017A, Rev., 5.00%, 10/1/2021 (b) | | | 635,000 | | | | 652,564 | |
| | |
Lakeland Educational Facilities, Southern College Project Rev., 5.00%, 11/15/2021 | | | 125,000 | | | | 129,040 | |
| | |
Lee County School Board (The) | | | | | | | | |
| | |
Series 2012B, COP, 3.00%, 8/1/2021 | | | 150,000 | | | | 151,737 | |
| | |
Series 2020A, COP, 5.00%, 8/1/2021 | | | 125,000 | | | | 127,481 | |
| | |
Series 2012B, COP, 3.00%, 8/1/2022 | | | 255,000 | | | | 261,470 | |
| | |
Series 2012B, COP, 4.00%, 8/1/2022 | | | 100,000 | | | | 105,333 | |
| | |
Lee Memorial Health System | | | | | | | | |
| | |
Series 2019A-1, Rev., 5.00%, 4/1/2022 | | | 200,000 | | | | 210,020 | |
| | |
Series A-1, Rev., 5.00%, 4/1/2025 | | | 120,000 | | | | 140,071 | |
| | |
Martin County Health Facilities Authority, Martin Memorial Medical Center | | | | | | | | |
| | |
Rev., 5.00%, 11/15/2022 (b) | | | 25,000 | | | | 27,034 | |
| | |
Rev., 4.25%, 11/15/2024 (b) | | | 105,000 | | | | 119,676 | |
| | |
Miami Beach Health Facilities Authority, Mount Sinai Medical Center Rev., 5.00%, 11/15/2021 | | | 175,000 | | | | 180,213 | |
| | |
Miami-Dade County Housing Finance Authority | | | | | | | | |
| | |
Rev., 0.60%, 12/1/2021 (c) | | | 325,000 | | | | 325,218 | |
| | |
Rev., 1.40%, 4/1/2022 (c) | | | 485,000 | | | | 487,900 | |
| | |
Miami-Dade County Housing Finance Authority, Liberty Square Phase Two Project Rev., 1.42%, 5/1/2022 (c) | | | 325,000 | | | | 329,062 | |
| | |
Monroe County School District Series 2018A, COP, 4.00%, 6/1/2021 | | | 105,000 | | | | 105,985 | |
| | |
New Smyrna Beach Utilities Commission Rev., 5.00%, 10/1/2022 | | | 65,000 | | | | 69,964 | |
| | |
Orange County Health Facilities Authority, Orlando Health, Inc. Series 2016A, Rev., 5.00%, 10/1/2023 | | | 95,000 | | | | 105,976 | |
| | |
Orange County Housing Finance Authority, Willow Key Apartments Series 2019A, Rev., 1.90%, 4/1/2021 (c) | | | 975,000 | | | | 976,297 | |
| | |
Orange County School Board | | | | | | | | |
| | |
Series 2013A, COP, 5.00%, 8/1/2021 | | | 250,000 | | | | 254,973 | |
SEE NOTES TO FINANCIAL STATEMENTS.
| | | | | | |
| | | |
| 202 | | | | J.P. MORGAN EXCHANGE-TRADED FUNDS | | FEBRUARY 28, 2021 |
| | | | | | | | |
| INVESTMENTS | | PRINCIPAL
AMOUNT ($) | | | VALUE ($) | |
Municipal Bonds — continued | | | | | | | | |
| | |
Florida — continued | | | | | | | | |
| | |
Series 2015D, COP, 5.00%, 8/1/2021 | | | 125,000 | | | | 127,486 | |
| | |
Series 2015D, COP, 5.00%, 8/1/2023 | | | 200,000 | | | | 221,770 | |
| | |
Orlando Utilities Commission | | | | | | | | |
| | |
Series 2011C, Rev., 4.00%, 10/1/2021 | | | 50,000 | | | | 51,122 | |
| | |
Series 2011B, Rev., 5.00%, 10/1/2021 | | | 145,000 | | | | 149,096 | |
| | |
Series 2011C, Rev., 5.00%, 10/1/2021 | | | 185,000 | | | | 190,226 | |
| | |
Series 2013A, Rev., 5.00%, 10/1/2021 | | | 70,000 | | | | 71,977 | |
| | |
Series 2016A, Rev., 5.00%, 10/1/2021 | | | 70,000 | | | | 71,978 | |
| | |
Series 2011C, Rev., 4.00%, 10/1/2022 | | | 55,000 | | | | 58,342 | |
| | |
Series 2011C, Rev., 5.00%, 10/1/2022 | | | 100,000 | | | | 107,654 | |
| | |
Series 2013A, Rev., 5.00%, 10/1/2022 | | | 50,000 | | | | 53,827 | |
| | |
Series 2010C, Rev., 5.25%, 10/1/2022 | | | 95,000 | | | | 102,646 | |
| | |
Series 2011B, Rev., 5.00%, 10/1/2023 | | | 50,000 | | | | 51,383 | |
| | |
Series 2016A, Rev., 5.00%, 10/1/2023 | | | 25,000 | | | | 28,019 | |
| | |
Orlando-Orange County Expressway Authority Rev., AGM, 5.00%, 7/1/2025 | | | 110,000 | | | | 116,422 | |
| | |
Palm Beach County Health Facilities Authority, Baptist Health South Florida Obligated Group | | | | | | | | |
| | |
Rev., 5.00%, 8/15/2021 | | | 160,000 | | | | 163,333 | |
| | |
Rev., 5.00%, 8/15/2022 | | | 240,000 | | | | 255,938 | |
| | |
Rev., 5.00%, 8/15/2024 | | | 495,000 | | | | 568,681 | |
| | |
Palm Beach County School District | | | | | | | | |
| | |
Series 2015B, COP, 5.00%, 8/1/2021 | | | 150,000 | | | | 152,996 | |
| | |
Series 2018A, COP, 5.00%, 8/1/2021 | | | 35,000 | | | | 35,699 | |
| | |
Series 2012A, COP, 5.00%, 8/1/2022 (b) | | | 25,000 | | | | 26,715 | |
| | |
Series 2018B, COP, 5.00%, 8/1/2023 | | | 20,000 | | | | 22,264 | |
| | |
Series 2017B, COP, 5.00%, 8/1/2025 | | | 25,000 | | | | 29,752 | |
| | | | | | | | |
| INVESTMENTS | | PRINCIPAL
AMOUNT ($) | | | VALUE ($) | |
| | | | | | | | |
| | |
Florida — continued | | | | | | | | |
| | |
Palm Beach County Solid Waste Authority | | | | | | | | |
| | |
Rev., 4.00%, 10/1/2021 | | | 25,000 | | | | 25,534 | |
| | |
Rev., 5.00%, 10/1/2021 | | | 60,000 | | | | 61,631 | |
| | |
Rev., 5.00%, 10/1/2022 | | | 375,000 | | | | 385,350 | |
| | |
Rev., 5.00%, 10/1/2023 | | | 100,000 | | | | 102,766 | |
| | |
Pasco County School Board | | | | | | | | |
| | |
Series 2018A, COP, 4.00%, 8/1/2021 | | | 145,000 | | | | 147,205 | |
| | |
Series 2013A, COP, 5.00%, 8/1/2021 | | | 675,000 | | | | 688,055 | |
| | |
Rev., 5.00%, 10/1/2021 | | | 100,000 | | | | 102,463 | |
| | |
Peace River Manasota Regional Water Supply Authority Rev., 5.00%, 10/1/2021 | | | 100,000 | | | | 102,789 | |
| | |
Polk County School District Rev., 5.00%, 10/1/2023 | | | 25,000 | | | | 27,943 | |
| | |
Reedy Creek Improvement District, Ad Valorem Tax | | | | | | | | |
| | |
Series 2013A, GO, 5.00%, 6/1/2021 | | | 25,000 | | | | 25,297 | |
| | |
Series A, GO, 5.00%, 6/1/2022 | | | 65,000 | | | | 68,876 | |
| | |
Riviera Beach Utility Special District Rev., 5.00%, 10/1/2021 | | | 25,000 | | | | 25,690 | |
| | |
Sarasota County Public Hospital District, Sarasota Memorial Hospital Series 1998B, Rev., NATL-RE, 5.25%, 7/1/2024 | | | 435,000 | | | | 490,054 | |
| | |
School Board of Miami-Dade County (The) | | | | | | | | |
| | |
GO, 5.00%, 3/15/2021 | | | 20,000 | | | | 20,035 | |
| | |
Series 2015A, COP, 5.00%, 5/1/2021 | | | 135,000 | | | | 136,061 | |
| | |
Series 2006C, COP, AMBAC, 5.00%, 10/1/2021 | | | 100,000 | | | | 102,783 | |
| | |
Series 2014D, COP, 5.00%, 11/1/2021 | | | 70,000 | | | | 72,228 | |
| | |
Series 2015D, COP, 5.00%, 2/1/2024 | | | 300,000 | | | | 338,391 | |
| | |
School District of Broward County | | | | | | | | |
| | |
Rev., TAN, 2.00%, 6/30/2021 | | | 170,000 | | | | 171,056 | |
| | |
Series 2015A, COP, 5.00%, 7/1/2021 | | | 80,000 | | | | 81,268 | |
| | |
Series A, COP, 5.00%, 7/1/2021 | | | 235,000 | | | | 238,725 | |
| | |
GO, 5.00%, 7/1/2022 | | | 25,000 | | | | 26,604 | |
| | |
Series 2012A, COP, 5.00%, 7/1/2024 | | | 125,000 | | | | 132,510 | |
| | |
Series 2015B, COP, 5.00%, 7/1/2024 | | | 115,000 | | | | 132,036 | |
SEE NOTES TO FINANCIAL STATEMENTS.
| | | | | | | | |
| | | |
| FEBRUARY 28, 2021 | | J.P. MORGAN EXCHANGE-TRADED FUNDS | | | | | 203 | |
JPMorgan Ultra-Short Municipal Income ETF
SCHEDULE OF PORTFOLIO INVESTMENTS
AS OF FEBRUARY 28, 2021 (continued)
| | | | | | | | |
| INVESTMENTS | | PRINCIPAL
AMOUNT ($) | | | VALUE ($) | |
Municipal Bonds — continued | | | | | | | | |
| | |
Florida — continued | | | | | | | | |
| | |
Seminole County School Board | | | | | | | | |
| | |
Series 2012B, COP, 5.00%, 7/1/2021 | | | 100,000 | | | | 101,585 | |
| | |
Series 2012B, COP, 5.00%, 7/1/2024 | | | 195,000 | | | | 206,716 | |
| | |
South Broward Hospital District, Memorial Healthcare System | | | | | | | | |
| | |
Rev., 5.00%, 5/1/2021 | | | 120,000 | | | | 120,935 | |
| | |
Rev., 5.00%, 5/1/2024 | | | 170,000 | | | | 193,424 | |
| | |
South Florida Water Management District COP, 5.00%, 10/1/2022 | | | 300,000 | | | | 322,464 | |
| | |
St. Johns County School Board Series 2020A, COP, 5.00%, 7/1/2023 | | | 20,000 | | | | 22,141 | |
| | |
St. Lucie County School Board Series 2015A, COP, 5.00%, 7/1/2021 | | | 30,000 | | | | 30,463 | |
| | |
State of Florida Board of Education, Public Education Capital Outlay Series 2011D, GO, 5.00%, 6/1/2021 | | | 325,000 | | | | 328,910 | |
| | |
State of Florida Department of Transportation | | | | | | | | |
| | |
Rev., 5.00%, 7/1/2021 | | | 80,000 | | | | 81,284 | |
| | |
Rev., 5.00%, 7/1/2024 | | | 35,000 | | | | 40,323 | |
| | |
State of Florida Department of Transportation Turnpike System | | | | | | | | |
| | |
Series 2011A, Rev., 5.00%, 7/1/2021 | | | 70,000 | | | | 71,126 | |
| | |
Series 2012A, Rev., 5.00%, 7/1/2021 | | | 50,000 | | | | 50,804 | |
| | |
Series 2013A, Rev., 5.00%, 7/1/2021 | | | 90,000 | | | | 91,448 | |
| | |
Series 2014A, Rev., 5.00%, 7/1/2021 | | | 25,000 | | | | 25,402 | |
| | |
Series 2016B, Rev., 5.00%, 7/1/2021 | | | 135,000 | | | | 137,172 | |
| | |
Series 2017A, Rev., 5.00%, 7/1/2021 | | | 510,000 | | | | 518,206 | |
| | |
Series 2019B, Rev., 5.00%, 7/1/2021 | | | 35,000 | | | | 35,563 | |
| | |
Series 2012A, Rev., 5.00%, 7/1/2022 | | | 325,000 | | | | 345,898 | |
| | |
Series 2014A, Rev., 5.00%, 7/1/2022 | | | 30,000 | | | | 31,929 | |
| | |
Series 2016A, Rev., 5.00%, 7/1/2022 | | | 80,000 | | | | 85,144 | |
| | |
Series 2016B, Rev., 5.00%, 7/1/2022 | | | 100,000 | | | | 106,430 | |
| | | | | | | | |
| INVESTMENTS | | PRINCIPAL
AMOUNT ($) | | | VALUE ($) | |
| | | | | | | | |
| | |
Florida — continued | | | | | | | | |
| | |
Series 2019A, Rev., 5.00%, 7/1/2022 | | | 85,000 | | | | 90,466 | |
| | |
Series 2016C, Rev., 5.00%, 7/1/2023 | | | 25,000 | | | | 27,745 | |
| | |
State of Florida, Capital Outlay | | | | | | | | |
| | |
Series 2012A, GO, 4.00%, 6/1/2021 | | | 185,000 | | | | 186,759 | |
| | |
Series 2012B, GO, 4.00%, 6/1/2021 | | | 150,000 | | | | 151,434 | |
| | |
Series 2008F, GO, 4.50%, 6/1/2021 | | | 25,000 | | | | 25,269 | |
| | |
Series 2008F, GO, 5.00%, 6/1/2021 | | | 30,000 | | | | 30,361 | |
| | |
Series 2011D, GO, 5.00%, 6/1/2021 | | | 150,000 | | | | 151,804 | |
| | |
Series 2011F, GO, 5.00%, 6/1/2021 | | | 25,000 | | | | 25,301 | |
| | |
Series 2012B, GO, 5.00%, 6/1/2021 | | | 60,000 | | | | 60,719 | |
| | |
Series 2013A, GO, 5.00%, 6/1/2021 | | | 80,000 | | | | 80,958 | |
| | |
Series 2013C, GO, 5.00%, 6/1/2021 | | | 70,000 | | | | 70,839 | |
| | |
Series 2015E, GO, 5.00%, 6/1/2021 | | | 50,000 | | | | 50,599 | |
| | |
Series 2016B, GO, 5.00%, 6/1/2021 | | | 25,000 | | | | 25,299 | |
| | |
Series 2017A, GO, GTD, 5.00%, 6/1/2021 | | | 40,000 | | | | 40,479 | |
| | |
Series 2017C, GO, 5.00%, 6/1/2021 | | | 25,000 | | | | 25,300 | |
| | |
Series 2019A, GO, 5.00%, 6/1/2021 | | | 65,000 | | | | 65,779 | |
| | |
Series 2013A, GO, 5.00%, 6/1/2022 | | | 25,000 | | | | 26,504 | |
| | |
Series 2015A, GO, 5.00%, 6/1/2022 | | | 25,000 | | | | 26,504 | |
| | |
Series 2015B, GO, 5.00%, 6/1/2022 | | | 210,000 | | | | 222,631 | |
| | |
Series 2016E, GO, 5.00%, 6/1/2022 | | | 20,000 | | | | 21,203 | |
| | |
Series 2017A, GO, GTD, 5.00%, 6/1/2022 | | | 25,000 | | | | 26,504 | |
| | |
Series 2014A, GO, 5.00%, 6/1/2023 | | | 25,000 | | | | 27,658 | |
| | |
State of Florida, Department of Transportation, Right-of- Way Acquisition and Bridge Construction | | | | | | | | |
| | |
GO, 5.00%, 7/1/2022 | | | 90,000 | | | | 95,774 | |
| | |
Series 2011B, GO, 5.00%, 7/1/2023 | | | 55,000 | | | | 55,881 | |
| | |
GO, 5.00%, 7/1/2024 | | | 150,000 | | | | 152,399 | |
| | |
State of Florida, State Board of Education, Lottery | | | | | | | | |
| | |
Series 2010F, Rev., 5.00%, 7/1/2021 | | | 160,000 | | | | 160,587 | |
| | |
Series 2011A, Rev., 5.00%, 7/1/2021 | | | 365,000 | | | | 370,848 | |
| | |
Sunshine State Governmental Financing Commission, Coral Gables Program Series 2018B, Rev., 5.00%, 10/1/2022 | | | 35,000 | | | | 37,673 | |
| | |
Tampa Bay Water, Regional Water Supply Authority, Utility System | | | | | | | | |
| | |
Rev., 5.00%, 10/1/2021 | | | 30,000 | | | | 30,840 | |
| | |
Rev., NATL-RE, 5.50%, 10/1/2021 | | | 405,000 | | | | 417,519 | |
| | |
Rev., NATL-RE, 5.50%, 10/1/2022 | | | 50,000 | | | | 54,171 | |
SEE NOTES TO FINANCIAL STATEMENTS.
| | | | | | |
| | | |
| 204 | | | | J.P. MORGAN EXCHANGE-TRADED FUNDS | | FEBRUARY 28, 2021 |
| | | | | | | | |
| INVESTMENTS | | PRINCIPAL
AMOUNT ($) | | | VALUE ($) | |
Municipal Bonds — continued | | | | | | | | |
| | |
Florida — continued | | | | | | | | |
| | |
Tampa-Hillsborough County Expressway Authority Series 2012A, Rev., 4.00%, 7/1/2022 (b) | | | 100,000 | | | | 105,060 | |
| | |
Tohopekaliga Water Authority, Utility System Rev., 4.00%, 10/1/2021 | | | 175,000 | | | | 178,918 | |
| | |
Town of Palm Beach, Public Improvement Series 2016A, Rev., 5.00%, 1/1/2023 | | | 25,000 | | | | 27,177 | |
| | |
University of Central Florida | | | | | | | | |
| | |
Series 2012A, Rev., 5.00%, 10/1/2021 | | | 50,000 | | | | 51,380 | |
| | |
Series 2018A, Rev., 5.00%, 10/1/2021 | | | 90,000 | | | | 92,484 | |
| | |
University of Florida Dormitory Series 2012A, Rev., 4.00%, 7/1/2022 | | | 55,000 | | | | 55,690 | |
| | |
USF Financing Corp., Capital Improvement, Marshall Center Project | | | | | | | | |
| | |
Rev., 5.00%, 7/1/2021 | | | 20,000 | | | | 20,314 | |
| | |
Rev., 5.00%, 7/1/2024 | | | 20,000 | | | | 22,813 | |
| | |
Volusia County School Board COP, 5.00%, 8/1/2022 | | | 115,000 | | | | 122,756 | |
| | |
Volusia County School Board, Master Lease Program Series 2015A, COP, 5.00%, 8/1/2021 | | | 95,000 | | | | 96,886 | |
| | |
Walton County District School Board COP, 5.00%, 7/1/2022 | | | 60,000 | | | | 63,808 | |
| | | | | | | | |
| | |
Total Florida | | | | | | | 64,947,706 | |
| | | | | | | | |
| | |
Georgia — 1.2% | | | | | | | | |
| | |
Albany-Dougherty Inner City Authority, State University Projects | | | | | | | | |
| | |
Rev., 5.00%, 7/1/2021 | | | 375,000 | | | | 380,767 | |
| | |
Rev., 5.00%, 7/1/2022 | | | 375,000 | | | | 398,074 | |
| | |
Athens-Clarke County Unified Government Development Authority, UGAREF CCRC Building Project | | | | | | | | |
| | |
Rev., 5.00%, 6/15/2022 | | | 35,000 | | | | 37,152 | |
| | |
Rev., 5.00%, 12/15/2022 | | | 25,000 | | | | 25,938 | |
| | |
Athens-Clarke County Unified Government Development Authority, UGAREF Central Precincts LLC Project Rev., 5.00%, 6/15/2023 | | | 125,000 | | | | 137,901 | |
| | |
Athens-Clarke County Unified Government Development Authority, UGAREF Pac Parking Dec LLC Project Rev., 4.00%, 6/15/2022 | | | 175,000 | | | | 183,514 | |
| | | | | | | | |
| INVESTMENTS | | PRINCIPAL
AMOUNT ($) | | | VALUE ($) | |
| | | | | | | | |
| | |
Georgia — continued | | | | | | | | |
| | |
Athens-Clarke County Unified Government Development Authority, University of Georgia Athletic Association Project Rev., 5.25%, 7/1/2021 (b) | | | 90,000 | | | | 91,522 | |
| | |
Athens-Clarke County Unified Government, Sales Tax GO, 5.00%, 12/1/2022 | | | 30,000 | | | | 32,527 | |
| | |
Atlanta and Fulton County Recreation Authority, Park Improvement | | | | | | | | |
| | |
Series 2014A, Rev., 5.00%, 12/1/2021 | | | 125,000 | | | | 129,535 | |
| | |
Series 2014A, Rev., 5.00%, 12/1/2022 | | | 20,000 | | | | 21,659 | |
| | |
Series A, Rev., 5.00%, 12/1/2023 | | | 25,000 | | | | 28,177 | |
| | |
Atlanta Development Authority, Panther Place, LLC Project Located on The Campus of Georgia State University Series 2017A, Rev., 5.00%, 7/1/2023 | | | 275,000 | | | | 303,157 | |
| | |
Barrow County School District GO, 4.00%, 2/1/2022 | | | 20,000 | | | | 20,699 | |
| | |
Bartow County Development Authority Rev., 2.05%, 11/19/2021 (c) | | | 120,000 | | | | 121,470 | |
| | |
Bartow County School District GO, 5.00%, 10/1/2021 | | | 100,000 | | | | 102,789 | |
| | |
Braselton Urban Redevelopment Agency, Municipal Facilities Project Rev., GTD, 4.00%, 7/1/2024 | | | 30,000 | | | | 33,370 | |
| | |
Brookhaven Development Authority, Children’s Health care | | | | | | | | |
| | |
Series 2019A, Rev., 5.00%, 7/1/2021 | | | 500,000 | | | | 507,995 | |
| | |
Series 2019A, Rev., 5.00%, 7/1/2022 | | | 25,000 | | | | 26,601 | |
| | |
Butts County School District, Sales Tax GO, 4.00%, 9/1/2021 | | | 100,000 | | | | 101,893 | |
| | |
Carroll City-County Hospital Authority, Tanner Medical Center Project Rev., GTD, 5.00%, 7/1/2023 | | | 20,000 | | | | 22,171 | |
| | |
Cherokee County Board of Education, School System | | | | | | | | |
| | |
Series 2014A, GO, 5.00%, 8/1/2021 | | | 20,000 | | | | 20,402 | |
| | |
GO, 5.00%, 8/1/2022 | | | 55,000 | | | | 58,758 | |
| | |
Cherokee County Water and Sewer Authority | | | | | | | | |
| | |
Rev., 4.00%, 8/1/2021 (b) | | | 50,000 | | | | 50,800 | |
| | |
Series 2020A, Rev., 5.00%, 8/1/2021 | | | 25,000 | | | | 25,495 | |
| | |
Rev., 5.00%, 8/1/2022 | | | 45,000 | | | | 48,035 | |
SEE NOTES TO FINANCIAL STATEMENTS.
| | | | | | | | |
| | | |
| FEBRUARY 28, 2021 | | J.P. MORGAN EXCHANGE-TRADED FUNDS | | | | | 205 | |
JPMorgan Ultra-Short Municipal Income ETF
SCHEDULE OF PORTFOLIO INVESTMENTS
AS OF FEBRUARY 28, 2021 (continued)
| | | | | | | | |
| INVESTMENTS | | PRINCIPAL
AMOUNT ($) | | | VALUE ($) | |
Municipal Bonds — continued | | | | | | | | |
| | |
Georgia — continued | | | | | | | | |
| | |
City of Alpharetta GO, 3.00%, 5/1/2021 | | | 40,000 | | | | 40,187 | |
| | |
City of Atlanta Series 2014A, GO, 5.00%, 12/1/2021 | | | 125,000 | | | | 129,535 | |
| | |
City of Barnesville, Tax-Exempt Series 2011A, Rev., 4.25%, 9/1/2021 (b) | | | 300,000 | | | | 305,991 | |
| | |
City of Cartersville, Water and Sewer Rev., 5.00%, 6/1/2022 | | | 175,000 | | | | 185,435 | |
| | |
City of Columbus, Water and Sewerage | | | | | | | | |
| | |
Series 2012A, Rev., 3.00%, 5/1/2021 | | | 20,000 | | | | 20,094 | |
| | |
Series 2014A, Rev., 5.00%, 5/1/2021 | | | 25,000 | | | | 25,199 | |
| | |
Clarke County School District, Sales Tax | | | | | | | | |
| | |
GO, 3.00%, 9/1/2021 | | | 25,000 | | | | 25,353 | |
| | |
GO, 5.00%, 9/1/2021 | | | 185,000 | | | | 189,449 | |
| | |
Clayton County Urban Redevelopment Agency, Georgia Project Rev., GTD, 5.00%, 2/1/2022 | | | 35,000 | | | | 36,523 | |
| | |
Cobb County, Kennestone Hospital Authority, Wellstar Health System, Inc., Project | | | | | | | | |
| | |
Rev., 5.25%, 4/1/2021 (b) | | | 760,000 | | | | 763,040 | |
| | |
Rev., 4.00%, 4/1/2022 | | | 175,000 | | | | 181,883 | |
| | |
Rev., 5.00%, 4/1/2022 | | | 260,000 | | | | 273,026 | |
| | |
Series 2020B, Rev., 5.00%, 4/1/2022 | | | 150,000 | | | | 157,515 | |
| | |
Series 2020B, Rev., 5.00%, 4/1/2023 | | | 175,000 | | | | 191,497 | |
| | |
Series 2020B, Rev., 5.00%, 4/1/2024 | | | 120,000 | | | | 136,186 | |
| | |
Cobb-Marietta Coliseum and Exhibit Hall Authority, Performing Arts Center Project | | | | | | | | |
| | |
Rev., GTD, 5.00%, 1/1/2022 | | | 50,000 | | | | 52,012 | |
| | |
Rev., GTD, 4.00%, 1/1/2024 | | | 25,000 | | | | 26,675 | |
| | |
Columbia County School District | | | | | | | | |
| | |
GO, 5.00%, 4/1/2021 | | | 25,000 | | | | 25,098 | |
| | |
GO, 3.00%, 10/1/2021 | | | 65,000 | | | | 66,074 | |
| | |
County of Barrow GO, 5.00%, 10/1/2021 | | | 25,000 | | | | 25,705 | |
| | |
County of Butts, Sales Tax GO, 3.00%, 4/1/2021 | | | 300,000 | | | | 300,678 | |
| | |
County of Clayton, Water and Sewerage | | | | | | | | |
| | |
Rev., 3.00%, 5/1/2021 | | | 50,000 | | | | 50,234 | |
| | |
Rev., 5.00%, 5/1/2021 | | | 35,000 | | | | 35,279 | |
| | | | | | | | |
| INVESTMENTS | | PRINCIPAL
AMOUNT ($) | | | VALUE ($) | |
| | | | | | | | |
| | |
Georgia — continued | | | | | | | | |
| | |
County of Douglas, Sales Tax GO, 5.00%, 4/1/2021 | | | 220,000 | | | | 220,860 | |
| | |
County of Henry, Sales Tax GO, 5.00%, 5/1/2022 | | | 35,000 | | | | 36,969 | |
| | |
County of Rockdale, Water & Sewer Rev., 4.00%, 7/1/2021 | | | 20,000 | | | | 20,250 | |
| | |
Development Authority for Fulton County, Georgia Tech Athletic Association Project Rev., 5.50%, 4/1/2021 (b) | | | 40,000 | | | | 40,171 | |
| | |
Development Authority for Fulton County, Piedmont Healthcare, Inc. Project Series 2016A, Rev., 5.00%, 7/1/2021 | | | 100,000 | | | | 101,538 | |
| | |
Development Authority for Fulton County, Tech Facilities Series A, Rev., 4.00%, 5/1/2021 | | | 200,000 | | | | 201,248 | |
| | |
Development Authority for Fulton County, Tech Foundation Campus Recreation Center Project Series 2011A, Rev., 5.00%, 11/1/2021 | | | 50,000 | | | | 51,612 | |
| | |
Development Authority for Fulton County, Tech Foundation Technology Square Project Series 2012A, Rev., 5.00%, 11/1/2021 | | | 25,000 | | | | 25,806 | |
| | |
Development Authority of Gwinnett County, Public School Project COP, NATL-RE, 5.25%, 1/1/2022 | | | 160,000 | | | | 166,757 | |
| | |
Downtown Savannah Authority, City of Savannah Projects Series 2018A, Rev., 5.00%, 8/1/2022 | | | 25,000 | | | | 26,708 | |
| | |
Dublin School District GO, 3.00%, 4/1/2022 | | | 20,000 | | | | 20,615 | |
| | |
Floyd County Hospital Authority, Medical Center Project Rev., GTD, 5.00%, 7/1/2022 | | | 25,000 | | | | 26,556 | |
| | |
Forsyth County Water and Sewerage Authority | | | | | | | | |
| | |
Rev., 5.00%, 4/1/2021 | | | 25,000 | | | | 25,098 | |
| | |
Rev., GTD, 4.00%, 4/1/2023 | | | 25,000 | | | | 25,076 | |
| | |
Fulton County Urban Redevelopment Agency Rev., 3.00%, 8/1/2022 | | | 50,000 | | | | 52,005 | |
| | |
Gainesville & Hall County Hospital Authority Rev., GTD, 5.00%, 2/15/2022 | | | 50,000 | | | | 52,234 | |
| | |
Georgia Higher Education Facilities Authority, USG Real Estate Foundation II LLC Projects Rev., 5.00%, 6/15/2021 | | | 150,000 | | | | 151,908 | |
SEE NOTES TO FINANCIAL STATEMENTS.
| | | | | | |
| | | |
| 206 | | | | J.P. MORGAN EXCHANGE-TRADED FUNDS | | FEBRUARY 28, 2021 |
| | | | | | | | |
| INVESTMENTS | | PRINCIPAL
AMOUNT ($) | | | VALUE ($) | |
Municipal Bonds — continued | | | | | | | | |
| | |
Georgia — continued | | | | | | | | |
| | |
Georgia Housing and Finance Authority, Single Family Mortgage Series A-4, Rev., 2.60%, 12/1/2021 | | | 175,000 | | | | 178,068 | |
| | |
Georgia Municipal Association, Inc. COP, 5.00%, 12/1/2021 | | | 45,000 | | | | 46,598 | |
| | |
Georgia State Road and Tollway Authority | | | | | | | | |
| | |
Series 2011A, Rev., GTD, 5.00%, 3/1/2021 | | | 185,000 | | | | 185,000 | |
| | |
Series 2011B, Rev., GTD, 5.00%, 10/1/2021 | | | 40,000 | | | | 41,132 | |
| | |
Gilmer County Building Authority, Court House Project Rev., 5.00%, 4/1/2021 | | | 100,000 | | | | 100,380 | |
| | |
Glynn-Brunswick Memorial Hospital Authority, Southeast Georgia Health System Project Rev., 5.00%, 8/1/2021 | | | 50,000 | | | | 50,878 | |
| | |
Gwinnett County School District | | | | | | | | |
| | |
GO, 5.00%, 8/1/2021 | | | 50,000 | | | | 51,001 | |
| | |
GO, 5.00%, 2/1/2022 | | | 20,000 | | | | 20,882 | |
| | |
GO, 5.00%, 8/1/2022 | | | 30,000 | | | | 32,041 | |
| | |
Gwinnett County Water & Sewerage Authority Rev., 5.00%, 8/1/2021 | | | 25,000 | | | | 25,501 | |
| | |
Hall County School District GO, 5.00%, 11/1/2021 | | | 25,000 | | | | 25,802 | |
| | |
Henry County Development Authority Rev., GTD, 3.00%, 8/1/2021 | | | 145,000 | | | | 146,715 | |
| | |
Houston County School District GO, 5.00%, 9/1/2022 | | | 50,000 | | | | 53,602 | |
| | |
Jackson County Industrial Development Authority, Economic Development Project Rev., GTD, 5.00%, 7/1/2023 | | | 55,000 | | | | 60,943 | |
| | |
Jones County School District GO, 4.00%, 8/1/2021 | | | 200,000 | | | | 203,150 | |
| | |
LaGrange-Troup County Hospital Authority Rev., 5.00%, 4/1/2023 | | | 325,000 | | | | 355,638 | |
| | |
Lowndes County Board of Education GO, 5.00%, 2/1/2022 | | | 25,000 | | | | 26,102 | |
| | |
Main Street Natural Gas, Inc., Gas Supply | | | | | | | | |
| | |
Series 2018A, Rev., LIQ: Royal Bank of Canada, 4.00%, 3/1/2021 | | | 75,000 | | | | 75,000 | |
| | |
Series 2019B, Rev., 4.00%, 6/1/2022 | | | 450,000 | | | | 470,713 | |
| | |
Series 2019B, Rev., 4.00%, 12/1/2022 | | | 345,000 | | | | 367,008 | |
| | |
Series 2019B, Rev., 4.00%, 6/1/2023 | | | 240,000 | | | | 259,356 | |
| | | | | | | | |
| INVESTMENTS | | PRINCIPAL
AMOUNT ($) | | | VALUE ($) | |
| | | | | | | | |
| | |
Georgia — continued | | | | | | | | |
| | |
Series A, Rev., LIQ: Royal Bank of Canada, 4.00%, 9/1/2023 (c) | | | 400,000 | | | | 432,200 | |
| | |
Series 2018C, Rev., LIQ: Royal Bank of Canada, 4.00%, 12/1/2023 (c) | | | 245,000 | | | | 266,496 | |
| | |
Metropolitan Atlanta Rapid Transit Authority, Sales Tax | | | | | | | | |
| | |
Series 2007A, Rev., NATL-RE, 5.25%, 7/1/2021 | | | 125,000 | | | | 127,098 | |
| | |
Series 2007A, Rev., NATL-RE, 5.25%, 7/1/2023 | | | 40,000 | | | | 44,594 | |
| | |
Metropolitan Atlanta Rapid Transit Authority, Sales Tax, Third Indenture | | | | | | | | |
| | |
Series 2012A, Rev., 5.00%, 7/1/2022 (b) | | | 25,000 | | | | 26,615 | |
| | |
Series 2014A, Rev., 5.00%, 7/1/2022 | | | 125,000 | | | | 132,986 | |
| | |
Milton Public Buildings and Facilities Authority Rev., 5.00%, 12/1/2021 | | | 20,000 | | | | 20,726 | |
| | |
Oconee County School District, Sales Tax GO, 2.50%, 3/1/2022 | | | 25,000 | | | | 25,580 | |
| | |
Private Colleges and Universities Authority, Emory University Series 2020B, Rev., 5.00%, 9/1/2025 | | | 980,000 | | | | 1,168,885 | |
| | |
Sandy Springs Public Facilities Authority, City of Sandy Springs City Center Project Rev., 5.00%, 5/1/2022 | | | 350,000 | | | | 369,691 | |
| | |
Savannah Economic Development Authority, Southern Care Corp. Rev., Zero Coupon, 12/1/2021 (b) | | | 95,000 | | | | 94,837 | |
| | |
South Regional Joint Development Authority, Valdosta State University Parking and Student Service Center Project Rev., 5.00%, 8/1/2025 | | | 1,095,000 | | | | 1,272,499 | |
| | |
State of Georgia | | | | | | | | |
| | |
Series 2011J-1, GO, 4.00%, 7/1/2021 | | | 50,000 | | | | 50,639 | |
| | |
Series 2011C, GO, 4.50%, 7/1/2021 (b) | | | 250,000 | | | | 253,610 | |
| | |
Series 2011C, GO, 5.00%, 7/1/2021 | | | 35,000 | | | | 35,563 | |
| | |
Series 2012A, GO, 5.00%, 7/1/2021 | | | 55,000 | | | | 55,885 | |
| | |
Series 2016F, GO, 5.00%, 7/1/2021 | | | 50,000 | | | | 50,804 | |
| | |
Series 2017C, GO, 5.00%, 7/1/2021 | | | 280,000 | | | | 284,505 | |
| | |
Series 2019A, GO, 5.00%, 7/1/2021 | | | 105,000 | | | | 106,689 | |
| | |
Series I, GO, 5.00%, 7/1/2021 | | | 135,000 | | | | 137,172 | |
| | |
Series 2012C, GO, 4.00%, 9/1/2021 | | | 325,000 | | | | 331,250 | |
| | |
Series 2011E-2, GO, 5.00%, 9/1/2021 | | | 25,000 | | | | 25,605 | |
SEE NOTES TO FINANCIAL STATEMENTS.
| | | | | | | | |
| | | |
| FEBRUARY 28, 2021 | | J.P. MORGAN EXCHANGE-TRADED FUNDS | | | | | 207 | |
JPMorgan Ultra-Short Municipal Income ETF
SCHEDULE OF PORTFOLIO INVESTMENTS
AS OF FEBRUARY 28, 2021 (continued)
| | | | | | | | |
| INVESTMENTS | | PRINCIPAL
AMOUNT ($) | | | VALUE ($) | |
Municipal Bonds — continued | | | | | | | | |
| | |
Georgia — continued | | | | | | | | |
| | |
Series 2013C, GO, 5.00%, 10/1/2021 | | | 50,000 | | | | 51,413 | |
| | |
Series 2018A, GO, 5.00%, 7/1/2022 | | | 45,000 | | | | 47,900 | |
| | |
Series 2012C, GO, 4.00%, 9/1/2022 | | | 60,000 | | | | 63,454 | |
| | |
Series 2011-I, GO, 4.00%, 11/1/2022 | | | 25,000 | | | | 25,637 | |
| | |
Series 2011J-2, GO, 4.50%, 11/1/2022 | | | 30,000 | | | | 30,863 | |
| | |
Tift County Hospital Authority Rev., GTD, 5.00%, 12/1/2022 | | | 25,000 | | | | 27,083 | |
| | |
Valdosta and Lowndes County Hospital Authority Series 2019A, Rev., 5.00%, 10/1/2021 | | | 75,000 | | | | 77,070 | |
| | |
Valdosta and Lowndes County Hospital Authority, South Georgia Medical Center Project | | | | | | | | |
| | |
Series 2011B, Rev., GTD, 4.50%, 10/1/2021 (b) | | | 125,000 | | | | 128,169 | |
| | |
Series 2011B, Rev., GTD, 5.00%, 10/1/2021 (b) | | | 310,000 | | | | 318,757 | |
| | |
Warner Robins Public Facilities Authority, City of Warner Robins Projects Rev., 5.00%, 7/1/2022 | | | 25,000 | | | | 26,608 | |
| | | | | | | | |
| | |
Total Georgia | | | | | | | 16,284,873 | |
| | | | | | | | |
| | |
Hawaii — 0.1% | | | | | | | | |
| | |
City and County Honolulu, Wastewater System | | | | | | | | |
| | |
Series 2016A, Rev., 5.00%, 7/1/2022 | | | 20,000 | | | | 21,286 | |
| | |
Series 2016B, Rev., 5.00%, 7/1/2022 | | | 25,000 | | | | 26,608 | |
| | |
City and County of Honolulu | | | | | | | | |
| | |
Series 2011B, GO, 5.00%, 8/1/2021 | | | 25,000 | | | | 25,502 | |
| | |
Series A, GO, 5.00%, 10/1/2021 | | | 25,000 | | | | 25,705 | |
| | |
Series A, GO, 5.00%, 10/1/2022 | | | 25,000 | | | | 26,909 | |
| | |
Series B, GO, 5.00%, 10/1/2022 | | | 35,000 | | | | 37,673 | |
| | |
City and County of Honolulu, Tax-Exempt | | | | | | | | |
| | |
Series 2012C, GO, 4.00%, 11/1/2021 | | | 30,000 | | | | 30,768 | |
| | |
Series 2017B, GO, 5.00%, 9/1/2022 | | | 40,000 | | | | 42,894 | |
| | |
Series 2016C, GO, 5.00%, 10/1/2022 | | | 45,000 | | | | 48,437 | |
| | |
Series 2012A, GO, 5.00%, 11/1/2022 (b) | | | 20,000 | | | | 21,608 | |
| | |
City and County of Honolulu, Wastewater System | | | | | | | | |
| | |
Series B, Rev., 4.00%, 7/1/2021 | | | 25,000 | | | | 25,319 | |
| | |
Series 2011A, Rev., 5.00%, 7/1/2021 (b) | | | 175,000 | | | | 177,816 | |
| | | | | | | | |
| INVESTMENTS | | PRINCIPAL
AMOUNT ($) | | | VALUE ($) | |
| | | | | | | | |
| | |
Hawaii — continued | | | | | | | | |
| | |
Rev., 4.00%, 7/1/2022 (b) | | | 65,000 | | | | 68,306 | |
| | |
Series 2012B, Rev., 4.00%, 7/1/2022 (b) | | | 25,000 | | | | 26,265 | |
| | |
Rev., 5.00%, 7/1/2022 | | | 25,000 | | | | 26,607 | |
| | |
Series B, Rev., 5.00%, 7/1/2022 | | | 25,000 | | | | 26,607 | |
| | |
Series B, Rev., 5.00%, 7/1/2023 | | | 75,000 | | | | 83,179 | |
| | |
Series B, Rev., 5.00%, 7/1/2024 | | | 25,000 | | | | 28,784 | |
| | |
County of Hawaii | | | | | | | | |
| | |
Series 2017D, GO, 5.00%, 9/1/2021 | | | 30,000 | | | | 30,724 | |
| | |
Series A, GO, 5.00%, 9/1/2022 | | | 65,000 | | | | 69,703 | |
| | |
Honolulu City & County Board of Water Supply | | | | | | | | |
| | |
Series 2012A, Rev., 5.00%, 7/1/2021 | | | 50,000 | | | | 50,803 | |
| | |
Series 2012A, Rev., 5.00%, 7/1/2022 (b) | | | 45,000 | | | | 47,906 | |
| | |
State of Hawaii | | | | | | | | |
| | |
Series EO, GO, 3.00%, 8/1/2021 (b) | | | 35,000 | | | | 35,413 | |
| | |
Series EL, GO, 5.00%, 8/1/2021 | | | 20,000 | | | | 20,404 | |
| | |
Series EO, GO, 5.00%, 8/1/2021 | | | 95,000 | | | | 96,922 | |
| | |
Series 2020GA, GO, 5.00%, 10/1/2021 | | | 45,000 | | | | 46,277 | |
| | |
Series EE, GO, 5.00%, 11/1/2021 | | | 60,000 | | | | 61,946 | |
| | |
Series DZ, GO, 3.75%, 12/1/2021 (b) | | | 25,000 | | | | 25,672 | |
| | |
Series 2017-DZ, GO, 5.00%, 12/1/2021 | | | 30,000 | | | | 31,095 | |
| | |
Series 2018FT, GO, 5.00%, 1/1/2022 | | | 40,000 | | | | 41,613 | |
| | |
Series FH, GO, 5.00%, 10/1/2022 | | | 20,000 | | | | 21,531 | |
| | |
Series 2012EE, GO, 4.00%, 11/1/2022 (b) | | | 40,000 | | | | 42,551 | |
| | |
Series EL, GO, 3.00%, 8/1/2023 | | | 50,000 | | | | 53,257 | |
| | |
State of Hawaii, Department of Hawaiian Home Lands Rev., 5.00%, 4/1/2021 | | | 340,000 | | | | 341,309 | |
| | |
State of Hawaii, Department of Hawaiian Home Lands, Kapolei Office Facility Series 2017A, COP, 4.00%, 11/1/2022 | | | 25,000 | | | | 26,560 | |
| | | | | | | | |
| | |
Total Hawaii | | | | | | | 1,813,959 | |
| | | | | | | | |
| | |
Idaho — 0.3% | | | | | | | | |
| | |
Ada and Boise Counties Independent School District Boise City | | | | | | | | |
| | |
GO, 4.00%, 8/1/2022 | | | 175,000 | | | | 184,487 | |
| | |
Series 2012B, GO, 5.00%, 8/1/2022 | | | 20,000 | | | | 21,367 | |
SEE NOTES TO FINANCIAL STATEMENTS.
| | | | | | |
| | | |
| 208 | | | | J.P. MORGAN EXCHANGE-TRADED FUNDS | | FEBRUARY 28, 2021 |
| | | | | | | | |
| INVESTMENTS | | PRINCIPAL
AMOUNT ($) | | | VALUE ($) | |
Municipal Bonds — continued | | | | | | | | |
| | |
Idaho — continued | | | | | | | | |
| | |
Ada and Canyon Counties Joint School District No. 2 Meridian, Sales Tax Guaranty Program Series 2018A, GO, 5.00%, 9/15/2021 | | | 25,000 | | | | 25,648 | |
| | |
County of Blaine GO, 4.00%, 8/1/2022 | | | 20,000 | | | | 21,055 | |
| | |
Idaho Bond Bank Authority | | | | | | | | |
| | |
Series 2012B, Rev., 5.00%, 9/15/2021 | | | 25,000 | | | | 25,651 | |
| | |
Series A, Rev., 5.00%, 9/15/2022 | | | 25,000 | | | | 26,856 | |
| | |
Idaho Health Facilities Authority, Ada County Coroner Project Rev., 5.00%, 9/1/2021 | | | 70,000 | | | | 71,672 | |
| | |
Idaho Health Facilities Authority, Trinity Health Credit Group Series 2015D, Rev., 5.00%, 12/1/2022 | | | 100,000 | | | | 108,331 | |
| | |
Idaho Housing and Finance Association, Single Family Mortgage | | | | | | | | |
| | |
Series 2009A, Class I, Rev., VRDO, 0.14%, 3/9/2021 (c) | | | 3,500,000 | | | | 3,500,000 | |
| | |
Series 2019A, Rev., GNMA COLL, 1.60%, 7/1/2022 | | | 170,000 | | | | 172,533 | |
| | |
Idaho State Building Authority Rev., 5.00%, 9/1/2022 (b) | | | 30,000 | | | | 32,175 | |
| | |
Idaho State Building Authority, Eastern Idaho Technical College Project Rev., 4.00%, 9/1/2022 | | | 400,000 | | | | 422,652 | |
| | |
Kootenai County School District No. 271, Coeur d’Alene Sales Tax & Enhancement Guaranty Series 2012B, GO, 4.00%, 9/15/2021 | | | 25,000 | | | | 25,516 | |
| | |
University of Idaho Rev., 5.25%, 4/1/2021 (c) | | | 115,000 | | | | 115,469 | |
| | | | | | | | |
| | |
Total Idaho | | | | | | | 4,753,412 | |
| | | | | | | | |
| | |
Illinois — 3.4% | | | | | | | | |
| | |
Boone McHenry and Dekalb Counties Community Unit School District 100, School Building Series 2005B, GO, BHAC-CR, NATL-RE, Zero Coupon, 12/1/2021 | | | 25,000 | | | | 24,957 | |
| | |
Chicago Board of Education Series 2010-F, GO, AGM-CR, 5.00%, 3/1/2021 | | | 135,000 | | | | 135,000 | |
| | |
Chicago O’Hare International Airport, General Airport, Senior Lien | | | | | | | | |
| | |
Rev., 5.00%, 1/1/2022 (b) | | | 435,000 | | | | 452,391 | |
| | |
Series 2013B, Rev., 5.00%, 1/1/2022 (b) | | | 100,000 | | | | 103,998 | |
| | | | | | | | |
| INVESTMENTS | | PRINCIPAL
AMOUNT ($) | | | VALUE ($) | |
| | | | | | | | |
| | |
Illinois — continued | | | | | | | | |
| | |
Series 2013D, Rev., 5.00%, 1/1/2022 (b) | | | 250,000 | | | | 259,995 | |
| | |
Series 2016C, Rev., 5.00%, 1/1/2022 | | | 240,000 | | | | 249,432 | |
| | |
Chicago Transit Authority Sales Tax Receipts Fund Rev., 5.25%, 12/1/2021 (b) | | | 680,000 | | | | 705,990 | |
| | |
City of Chicago Series 2015C, GO, 5.00%, 1/1/2023 (b) | | | 165,000 | | | | 179,114 | |
| | |
City of Chicago, Sales Tax Series 2011-A, Rev., 5.25%, 1/1/2022 (b) | | | 80,000 | | | | 83,399 | |
| | |
City of Fairview Heights GO, 3.00%, 12/1/2021 | | | 25,000 | | | | 25,496 | |
| | |
City of Rock Island GO, 4.00%, 12/1/2021 | | | 200,000 | | | | 205,534 | |
| | |
City of Springfield, Senior Lien Electric Rev., 5.00%, 3/1/2021 | | | 135,000 | | | | 135,000 | |
| | |
City of St. Charles GO, 5.00%, 12/1/2021 | | | 25,000 | | | | 25,878 | |
| | |
Cook and DuPage Counties, Village of Elk Grove GO, 4.00%, 1/1/2022 | | | 25,000 | | | | 25,777 | |
| | |
Cook County Community High School District No. 218, Oak Lawn, Limited Tax Series 2016B, GO, 5.00%, 12/1/2021 | | | 25,000 | | | | 25,884 | |
| | |
Cook County Community Unit School District No. 401, Elmwood Park | | | | | | | | |
| | |
GO, 3.00%, 12/1/2021 | | | 715,000 | | | | 729,450 | |
| | |
GO, 3.00%, 12/1/2022 | | | 500,000 | | | | 522,430 | |
| | |
Cook County Forest Preserve District, Unlimited Tax Series 2012A, GO, 5.00%, 11/15/2021 | | | 20,000 | | | | 20,560 | |
| | |
Cook County School District No. 163, Park Forest | | | | | | | | |
| | |
Series 2011A, GO, AGM, 4.50%, 12/15/2021 (b) | | | 20,000 | | | | 20,678 | |
| | |
Series 2011A, GO, AGM, 5.00%, 12/15/2021 (b) | | | 25,000 | | | | 25,946 | |
| | |
Cook County School District No. 81, Schiller Park, School GO, 4.00%, 12/1/2021 | | | 80,000 | | | | 82,214 | |
| | |
Cook County School District No. 83, Mannheim Series 2011D, GO, 5.25%, 12/1/2021 (b) | | | 20,000 | | | | 20,757 | |
| | |
Cook County Township High School District No. 227, Rich Township GO, 4.00%, 12/1/2021 | | | 50,000 | | | | 51,193 | |
| | |
County of Cook Series A, GO, 5.00%, 11/15/2021 | | | 25,000 | | | | 25,840 | |
SEE NOTES TO FINANCIAL STATEMENTS.
| | | | | | | | |
| | | |
| FEBRUARY 28, 2021 | | J.P. MORGAN EXCHANGE-TRADED FUNDS | | | | | 209 | |
JPMorgan Ultra-Short Municipal Income ETF
SCHEDULE OF PORTFOLIO INVESTMENTS
AS OF FEBRUARY 28, 2021 (continued)
| | | | | | | | |
| INVESTMENTS | | PRINCIPAL
AMOUNT ($) | | | VALUE ($) | |
Municipal Bonds — continued | | | | | | | | |
| | |
Illinois — continued | | | | | | | | |
| | |
County of Kendall GO, 5.00%, 12/15/2022 | | | 55,000 | | | | 59,529 | |
| | |
De Witt Ford & Livingston ETC Counties Community College District No. 540 Heartland GO, 4.00%, 12/1/2021 (b) | | | 30,000 | | | | 30,867 | |
| | |
Du Page and Will Counties Community School District No. 204 Indian Prairie Series 2007A, GO, NATL-RE, 6.25%, 12/30/2021 | | | 35,000 | | | | 36,735 | |
| | |
DuPage and Cook Counties Community Consolidated School District No. 181 Hinsdale GO, 2.00%, 5/1/2022 | | | 125,000 | | | | 125,327 | |
| | |
DuPage and Cook Counties Community Unit School District No. 205 Elmhurst | | | | | | | | |
| | |
GO, NATL-RE, Zero Coupon, 1/1/2022 | | | 65,000 | | | | 64,742 | |
| | |
GO, 5.00%, 1/1/2023 | | | 290,000 | | | | 314,638 | |
| | |
DuPage County Community High School District No. 94 West Chicago GO, 4.00%, 1/1/2022 | | | 50,000 | | | | 51,546 | |
| | |
DuPage County School District No. 2 Bensenville GO, 5.00%, 5/1/2025 | | | 75,000 | | | | 88,206 | |
| | |
Fox Valley Park District Series 2015B, GO, 4.00%, 12/15/2021 | | | 55,000 | | | | 56,645 | |
| | |
Illinois Finance Authority, Advocate Health Care Network | | | | | | | | |
| | |
Rev., 5.00%, 8/1/2021 | | | 305,000 | | | | 310,807 | |
| | |
Rev., 5.00%, 5/1/2022 | | | 320,000 | | | | 337,693 | |
| | |
Rev., 5.00%, 6/1/2022 (b) | | | 205,000 | | | | 217,288 | |
| | |
Rev., 5.00%, 8/1/2022 | | | 505,000 | | | | 537,643 | |
| | |
Illinois Finance Authority, Ann and Robert H Lurie Children’s Hospital Obligated Group | | | | | | | | |
| | |
Rev., 5.00%, 8/15/2023 | | | 20,000 | | | | 22,184 | |
| | |
Rev., 5.00%, 8/15/2025 | | | 230,000 | | | | 272,720 | |
| | |
Illinois Finance Authority, Ascension Health Alliance Senior Credit Group Series E-2, Rev., 1.75%, 4/1/2021 (c) | | | 120,000 | | | | 120,151 | |
| | |
Illinois Finance Authority, Chicago Symphony Orchestra Rev., VRDO, LOC: PNC Bank NA, 0.04%, 3/9/2021 (c) | | | 10,000,000 | | | | 10,000,000 | |
| | |
Illinois Finance Authority, Clean Water Initiative Revolving Fund | | | | | | | | |
| | |
Rev., 5.00%, 7/1/2021 | | | 975,000 | | | | 990,648 | |
| | |
Rev., 5.00%, 7/1/2022 | | | 25,000 | | | | 26,604 | |
| | |
Rev., 5.00%, 7/1/2023 | | | 75,000 | | | | 83,086 | |
| | | | | | | | |
| INVESTMENTS | | PRINCIPAL
AMOUNT ($) | | | VALUE ($) | |
| | | | | | | | |
| | |
Illinois — continued | | | | | | | | |
| | |
Illinois Finance Authority, Community Unit District, Local Government Project Rev., 2.00%, 12/1/2021 | | | 120,000 | | | | 121,657 | |
| | |
Illinois Finance Authority, DePaul University Series 2011A, Rev., 6.13%, 4/1/2021 (b) | | | 680,000 | | | | 683,278 | |
| | |
Illinois Finance Authority, Downers Grove Community High School District Number 99 Project Rev., 3.00%, 12/15/2021 | | | 45,000 | | | | 45,993 | |
| | |
Illinois Finance Authority, Memorial Health System Series 2014A, Rev., 5.00%, 7/1/2023 | | | 320,000 | | | | 353,078 | |
| | |
Illinois Finance Authority, NorthWestern Memorial Healthcare | | | | | | | | |
| | |
Rev., 5.00%, 7/15/2021 | | | 75,000 | | | | 76,317 | |
| | |
Rev., 5.00%, 7/15/2022 | | | 80,000 | | | | 85,180 | |
| | |
Illinois Finance Authority, OSF Healthcare System | | | | | | | | |
| | |
Rev., 5.00%, 5/15/2021 | | | 150,000 | | | | 151,385 | |
| | |
Series 2012A, Rev., 4.25%, 5/15/2022 (b) | | | 270,000 | | | | 283,162 | |
| | |
Series 2012A, Rev., 5.00%, 5/15/2022 (b) | | | 370,000 | | | | 391,371 | |
| | |
Series 2015A, Rev., 5.00%, 11/15/2024 | | | 100,000 | | | | 114,632 | |
| | |
Illinois Finance Authority, Presence Health Network Series 2016C, Rev., 5.00%, 2/15/2022 | | | 110,000 | | | | 115,024 | |
| | |
Illinois Finance Authority, Riverside Health System Rev., 5.00%, 11/15/2023 | | | 155,000 | | | | 173,467 | |
| | |
Illinois Finance Authority, Silver Cross Hospital and Medical Centers Series C, Rev., 5.00%, 8/15/2021 | | | 60,000 | | | | 61,167 | |
| | |
Illinois Finance Authority, Trinity Health Credit Group Series 2011-L, Rev., 5.00%, 12/1/2021 (b) | | | 270,000 | | | | 279,712 | |
| | |
Illinois Finance Authority, Unitypoint Health | | | | | | | | |
| | |
Series 2016D, Rev., 5.00%, 2/15/2023 | | | 160,000 | | | | 174,368 | |
| | |
Series 2016D, Rev., 5.00%, 2/15/2024 | | | 230,000 | | | | 259,787 | |
| | |
Illinois Finance Authority, University of Chicago (The) | | | | | | | | |
| | |
Rev., VRDO, 0.03%, 3/9/2021 (c) | | | 10,203,000 | | | | 10,203,000 | |
| | |
Series 2012A, Rev., 4.00%, 10/1/2021 | | | 75,000 | | | | 76,644 | |
| | |
Series 2012A, Rev., 5.00%, 10/1/2021 | | | 25,000 | | | | 25,693 | |
SEE NOTES TO FINANCIAL STATEMENTS.
| | | | | | |
| | | |
| 210 | | | | J.P. MORGAN EXCHANGE-TRADED FUNDS | | FEBRUARY 28, 2021 |
| | | | | | | | |
| INVESTMENTS | | PRINCIPAL
AMOUNT ($) | | | VALUE ($) | |
Municipal Bonds — continued | | | | | | | | |
| | |
Illinois — continued | | | | | | | | |
| | |
Illinois Finance Authority, University of Chicago Medical Center (The) | | | | | | | | |
| | |
Series 2009E-1, Rev., VRDO, LOC: Wells Fargo Bank NA, 0.01%, 3/1/2021 (c) | | | 1,350,000 | | | | 1,350,000 | |
| | |
Series 2016B, Rev., 5.00%, 8/15/2023 | | | 740,000 | | | | 819,646 | |
| | |
Series 2016A, Rev., 5.00%, 8/15/2024 | | | 200,000 | | | | 228,958 | |
| | |
Illinois Housing Development Authority Rev., 1.90%, 10/1/2021 (c) | | | 135,000 | | | | 136,307 | |
| | |
Illinois Municipal Electric Agency Series 2015A, Rev., 5.00%, 2/1/2022 | | | 70,000 | | | | 72,921 | |
| | |
Illinois State Toll Highway Authority Series 2014D, Rev., 5.00%, 1/1/2022 | | | 55,000 | | | | 57,180 | |
| | |
Joliet Regional Port District GO, 4.00%, 12/30/2021 | | | 135,000 | | | | 139,012 | |
| | |
Kane County Community Unit School District No. 101 Batavia GO, 5.00%, 1/1/2022 | | | 95,000 | | | | 98,725 | |
| | |
Kane County Forest Preserve District Series 2016C, GO, 5.00%, 12/15/2021 | | | 25,000 | | | | 25,944 | |
| | |
Kane County School District No. 131 Aurora East Side | | | | | | | | |
| | |
Series 2020C, GO, 5.00%, 12/1/2021 | | | 140,000 | | | | 144,649 | |
| | |
Series 2020C, GO, 5.00%, 12/1/2022 | | | 160,000 | | | | 171,954 | |
| | |
Lake and McHenry Counties Community Unit, School District No. 118 GO, 5.00%, 1/1/2022 | | | 65,000 | | | | 67,532 | |
| | |
Lake County Community High School District No. 115 Lake Forest GO, 4.00%, 11/1/2021 | | | 25,000 | | | | 25,623 | |
| | |
Lake County Township High School District No. 121 Warren Series 2016A, GO, 3.00%, 1/1/2024 (b) | | | 370,000 | | | | 397,373 | |
| | |
Lincoln Land Community College District No. 526 GO, 4.00%, 12/15/2021 (b) | | | 185,000 | | | | 190,624 | |
| | |
Macoupin County Community Unit School District No. 7 Gillespie, School Building GO, AGC, 6.00%, 12/1/2021 (b) | | | 50,000 | | | | 52,164 | |
| | | | | | | | |
| INVESTMENTS | | PRINCIPAL
AMOUNT ($) | | | VALUE ($) | |
| | | | | | | | |
| | |
Illinois — continued | | | | | | | | |
| | |
McLean and Woodford Counties Community Unit School District No. 5 Normal | | | | | | | | |
| | |
Series 2017A, GO, 4.00%, 12/1/2021 | | | 30,000 | | | | 30,855 | |
| | |
Series 2017A, GO, 4.00%, 12/1/2023 | | | 30,000 | | | | 32,657 | |
| | |
Metropolitan Water Reclamation District of Greater Chicago | | | | | | | | |
| | |
Series 2014B, GO, 4.00%, 12/1/2021 | | | 25,000 | | | | 25,692 | |
| | |
Series 2014D, GO, 5.00%, 12/1/2021 | | | 85,000 | | | | 87,986 | |
| | |
Northwest Suburban Municipal Joint Action Water Agency Rev., 5.00%, 5/1/2021 | | | 350,000 | | | | 352,538 | |
| | |
Peoria County Community Unit School District No. 323 Series 2014B, GO, 5.00%, 4/1/2021 | | | 100,000 | | | | 100,381 | |
| | |
Peoria Metropolitan Airport Authority Series 2017D, GO, 5.00%, 12/1/2023 | | | 75,000 | | | | 83,656 | |
| | |
Plainfield Township Park District GO, 3.00%, 12/30/2021 | | | 45,000 | | | | 46,008 | |
| | |
Railsplitter Tobacco Settlement Authority | | | | | | | | |
| | |
Rev., 5.25%, 6/1/2021 | | | 265,000 | | | | 268,185 | |
| | |
Rev., 5.38%, 6/1/2021 | | | 740,000 | | | | 749,117 | |
| | |
Rev., 5.50%, 6/1/2021 (b) | | | 250,000 | | | | 253,318 | |
| | |
Rev., 6.00%, 6/1/2021 (b) | | | 180,000 | | | | 182,601 | |
| | |
Rev., 5.00%, 6/1/2022 | | | 155,000 | | | | 163,682 | |
| | |
Rev., 5.00%, 6/1/2024 | | | 120,000 | | | | 136,172 | |
| | |
Regional Transportation Authority | | | | | | | | |
| | |
Series 2016A, Rev., 5.00%, 6/1/2021 | | | 25,000 | | | | 25,296 | |
| | |
Series 2001A, Rev., NATL-RE, 5.50%, 7/1/2021 | | | 25,000 | | | | 25,437 | |
| | |
Series 2003A, Rev., NATL-RE, 5.50%, 7/1/2021 | | | 50,000 | | | | 50,873 | |
| | |
Southwestern Illinois Development Authority, Memorial Group Inc. Rev., 7.13%, 11/1/2023 (b) | | | 100,000 | | | | 117,625 | |
| | |
Tender Option Bond Trust Receipts/Certificates Series 2017-XF2500, Rev., VRDO, LIQ: | | | | | | | | |
| | |
Citibank NA, 0.08%, 3/9/2021 (c) (f) | | | 7,580,000 | | | | 7,580,000 | |
| | |
Village of Glendale Heights GO, 5.00%, 12/15/2021 | | | 45,000 | | | | 46,681 | |
SEE NOTES TO FINANCIAL STATEMENTS.
| | | | | | | | |
| | | |
| FEBRUARY 28, 2021 | | J.P. MORGAN EXCHANGE-TRADED FUNDS | | | | | 211 | |
JPMorgan Ultra-Short Municipal Income ETF
SCHEDULE OF PORTFOLIO INVESTMENTS
AS OF FEBRUARY 28, 2021 (continued)
| | | | | | | | |
| INVESTMENTS | | PRINCIPAL
AMOUNT ($) | | | VALUE ($) | |
Municipal Bonds — continued | | | | | | | | |
| | |
Illinois — continued | | | | | | | | |
| | |
Village of Glenview Series 2012A, GO, 4.00%, 12/1/2021 | | | 100,000 | | | | 102,843 | |
| | |
Village of McCook Series 2019A, GO, AGM, 4.00%, 12/1/2021 | | | 135,000 | | | | 138,231 | |
| | |
Village of Midlothian | | | | | | | | |
| | |
GO, AGM, 4.00%, 1/1/2022 | | | 15,000 | | | | 15,409 | |
| | |
GO, AGM, 4.00%, 1/1/2023 | | | 15,000 | | | | 15,864 | |
| | |
GO, AGM, 4.00%, 1/1/2024 | | | 70,000 | | | | 76,408 | |
| | |
GO, AGM, 4.00%, 1/1/2025 | | | 40,000 | | | | 44,701 | |
| | |
Village of Oak Park, Corporate Purpose Series 2020B, GO, 5.00%, 1/1/2023 | | | 660,000 | | | | 714,556 | |
| | |
Village of Rantoul GO, 4.00%, 1/1/2025 | | | 350,000 | | | | 390,572 | |
| | |
Village of Sauk Village Series 2019C, GO, 4.00%, 12/1/2021 | | | 150,000 | | | | 154,151 | |
| | |
Village of Schaumburg Series 2020B, GO, 2.00%, 12/1/2023 | | | 325,000 | | | | 336,590 | |
| | |
Village of Wheeling GO, 5.00%, 12/1/2021 | | | 25,000 | | | | 25,878 | |
| | |
Wheaton Park District Series 2019A, GO, 5.00%, 12/15/2021 | | | 25,000 | | | | 25,924 | |
| | |
Will and Kendall Counties Community Consolidated School District 202, Limited Tax Series 2019B, Rev., 5.00%, 7/1/2021 | | | 25,000 | | | | 25,389 | |
| | |
Will County Community High School District No. 210 Lincoln-Way GO, AGM, Zero Coupon, 1/1/2022 (b) | | | 50,000 | | | | 49,830 | |
| | |
Will County Elementary School District No. 122 Series B, GO, AGM, Zero Coupon, 11/1/2021 (b) | | | 85,000 | | | | 84,899 | |
| | |
Will County Forest Preserve District, Unlimited Tax GO, 5.00%, 12/15/2021 | | | 35,000 | | | | 36,322 | |
| | |
Will County School District No. 88 Chaney-Monge, School Building GO, 5.00%, 12/1/2023 (b) | | | 135,000 | | | | 151,910 | |
| | |
Will County, Community Unit School District No. 365-U GO, AGM, Zero Coupon, 11/1/2021 (b) | | | 40,000 | | | | 39,952 | |
| | |
Winnebago and Boone Counties School District No. 205 Rockford GO, Zero Coupon, 2/1/2022 | | | 50,000 | | | | 49,704 | |
| | | | | | | | |
| | |
Total Illinois | | | | | | | 48,375,392 | |
| | | | | | | | |
| | |
Indiana — 1.6% | | | | | | | | |
| | |
Allen County War Memorial Coliseum Additions Building Corp. | | | | | | | | |
| | |
Series 2016A, Rev., 4.00%, 5/1/2021 | | | 25,000 | | | | 25,151 | |
| | | | | | | | |
| INVESTMENTS | | PRINCIPAL
AMOUNT ($) | | | VALUE ($) | |
| | | | | | | | |
| | |
Indiana — continued | | | | | | | | |
| | |
Series 2016A, Rev., 4.00%, 11/1/2021 | | | 75,000 | | | | 76,768 | |
| | |
Series 2016A, Rev., 4.00%, 11/1/2022 | | | 50,000 | | | | 52,913 | |
| | |
Anderson School Building Corp. Rev., 5.00%, 7/20/2023 | | | 20,000 | | | | 22,101 | |
| | |
Avon Community School Building Corp., Ad Valorem Property Tax First Mortgage | | | | | | | | |
| | |
Rev., 4.00%, 7/15/2024 | | | 25,000 | | | | 27,704 | |
| | |
Rev., 5.00%, 7/15/2024 | | | 110,000 | | | | 125,629 | |
| | |
Ball State University, Housing and Dining System | | | | | | | | |
| | |
Rev., 5.00%, 7/1/2021 | | | 40,000 | | | | 40,635 | |
| | |
Rev., 5.00%, 7/1/2024 | | | 25,000 | | | | 27,529 | |
| | |
Carmel Clay Public Library GO, 3.00%, 1/15/2023 | | | 615,000 | | | | 645,578 | |
| | |
Carmel Clay Schools GO, 2.00%, 7/15/2021 | | | 45,000 | | | | 45,291 | |
| | |
Carmel Local Public Improvement Bond Bank | | | | | | | | |
| | |
Rev., 5.00%, 6/1/2021 | | | 40,000 | | | | 40,470 | |
| | |
Series 2016, Rev., 2.00%, 7/15/2021 | | | 200,000 | | | | 201,374 | |
| | |
Carmel Redevelopment Authority, Option Income Tax Lease Rental | | | | | | | | |
| | |
Series 2014B, Rev., 5.00%, 7/1/2021 | | | 70,000 | | | | 71,124 | |
| | |
Series 2014B, Rev., 5.00%, 1/1/2024 | | | 35,000 | | | | 39,319 | |
| | |
Series 2014B, Rev., 5.00%, 7/1/2024 | | | 20,000 | | | | 22,784 | |
| | |
City of Fort Wayne, Sewage Works Series 2020B, Rev., 4.00%, 8/1/2024 | | | 150,000 | | | | 164,804 | |
| | |
City of Indianapolis Department of Public Utilities Gas Utility Series 2020A, Rev., 5.00%, 8/15/2022 | | | 180,000 | | | | 192,582 | |
| | |
City of Indianapolis, Energy System, First Lien Series 2016A, Rev., 5.00%, 10/1/2021 | | | 125,000 | | | | 128,435 | |
| | |
City of Lafayette, Sewage Works Rev., 5.00%, 7/1/2022 | | | 25,000 | | | | 26,556 | |
| | |
City of Rockport, Michigan Power Company Project Series D, Rev., 2.05%, 6/1/2021 (c) | | | 2,375,000 | | | | 2,381,864 | |
| | |
Clark Pleasant Middle School Corp. Rev., 4.00%, 1/15/2022 | | | 80,000 | | | | 82,568 | |
SEE NOTES TO FINANCIAL STATEMENTS.
| | | | | | |
| | | |
| 212 | | | | J.P. MORGAN EXCHANGE-TRADED FUNDS | | FEBRUARY 28, 2021 |
| | | | | | | | |
| INVESTMENTS | | PRINCIPAL
AMOUNT ($) | | | VALUE ($) | |
Municipal Bonds — continued | | | | | | | | |
| | |
Indiana — continued | | | | | | | | |
| | |
County of Johnson, Local Income Tax Series 2020A, Rev., 4.00%, 7/15/2023 | | | 25,000 | | | | 27,098 | |
| | |
County of Warrick, Multifamily Housing Bonds, Newburgh Assisted Living Project Rev., 1.63%, 6/1/2021 (c) | | | 300,000 | | | | 301,032 | |
| | |
Crothersville 2000 School Building Corp., First Mortgage Rev., AMBAC, 5.00%, 7/15/2021 | | | 80,000 | | | | 81,294 | |
| | |
Eagle-Union Middle School Building Corp., Ind Lease Rental Rev., AMBAC, Zero Coupon, 7/15/2021 | | | 150,000 | | | | 149,734 | |
| | |
Fishers Industrial Redevelopment District Rev., 4.00%, 1/15/2024 | | | 25,000 | | | | 27,369 | |
| | |
Fishers Redevelopment District Series 2017A1, 4.00%, 7/15/2022 | | | 50,000 | | | | 52,554 | |
| | |
Fishers Town Hall Building Corp. Rev., 4.00%, 7/15/2022 | | | 100,000 | | | | 104,968 | |
| | |
Fort Wayne Redevelopment Authority Lease Rental Rev., 4.00%, 2/1/2022 | | | 50,000 | | | | 51,758 | |
| | |
Fort Wayne Redevelopment Authority Lease Rental, Harrison Square Project Rev., 5.00%, 8/1/2021 | | | 100,000 | | | | 102,010 | |
| | |
Franklin Township School Building Corp., Valorem Property Project Rev., 5.00%, 7/15/2021 | | | 150,000 | | | | 152,663 | |
| | |
Franklin Township-Marion County Multiple School Building Corp., Property Tax Mortgage Rev., 5.00%, 7/10/2021 | | | 30,000 | | | | 30,513 | |
| | |
Hamilton County Public Building Corp. Rev., 5.00%, 2/1/2023 | | | 75,000 | | | | 79,870 | |
| | |
Hamilton Southeastern Consolidated School Building Corp., Ad Valorem Property Tax First Mortgage | | | | | | | | |
| | |
Rev., 5.00%, 7/15/2021 | | | 25,000 | | | | 25,447 | |
| | |
Series 2015B, Rev., 4.00%, 1/15/2022 | | | 25,000 | | | | 25,831 | |
| | |
Series B, Rev., 5.00%, 7/15/2022 | | | 35,000 | | | | 37,306 | |
| | |
Rev., 4.00%, 1/15/2024 | | | 25,000 | | | | 27,497 | |
| | |
Hammond Multi-School Building Corp., Ad Valorem Property Tax First Mortgage Rev., 5.00%, 7/15/2024 | | | 100,000 | | | | 111,818 | |
| | |
Highland Sanitation District 4.00%, 2/1/2022 | | | 250,000 | | | | 258,200 | |
| | |
Indiana Bond Bank, Special Program, Adams County Memorial Hospital Project | | | | | | | | |
| | |
Series 2012D, Rev., 5.00%, 2/1/2023 | | | 40,000 | | | | 41,714 | |
| | | | | | | | |
| INVESTMENTS | | PRINCIPAL
AMOUNT ($) | | | VALUE ($) | |
| | | | | | | | |
| | |
Indiana — continued | | | | | | | | |
| | |
Series 2012D, Rev., 3.00%, 2/1/2025 | | | 140,000 | | | | 143,013 | |
| | |
Indiana Finance Authority | | | | | | | | |
| | |
Series 2012M, Rev., 4.00%, 7/1/2021 | | | 70,000 | | | | 70,874 | |
| | |
Series 2011B, Rev., 5.00%, 7/1/2021 (b) | | | 100,000 | | | | 101,609 | |
| | |
Series 2012C, Rev., 5.00%, 7/1/2021 | | | 50,000 | | | | 50,801 | |
| | |
Rev., 5.00%, 2/1/2022 | | | 50,000 | | | | 52,218 | |
| | |
Series 2011A, Rev., 3.00%, 7/1/2022 | | | 50,000 | | | | 50,467 | |
| | |
Series 2012M, Rev., 5.00%, 7/1/2022 (b) | | | 175,000 | | | | 186,302 | |
| | |
Series A, Rev., 5.00%, 7/1/2022 | | | 75,000 | | | | 76,204 | |
| | |
Indiana Finance Authority, Beacon Health System Obligation Group Series 2013A, Rev., 5.00%, 8/15/2023 | | | 250,000 | | | | 278,075 | |
| | |
Indiana Finance Authority, Community Foundation of Northwest Indiana Obligated Group Rev., 4.00%, 9/1/2021 | | | 200,000 | | | | 203,684 | |
| | |
Indiana Finance Authority, Community Health Network Project Series 2012A, Rev., 5.00%, 5/1/2021 | | | 900,000 | | | | 906,786 | |
| | |
Indiana Finance Authority, Deaconess Health System Obligated Group Series 2015A, Rev., 4.00%, 3/1/2021 | | | 65,000 | | | | 65,000 | |
| | |
Indiana Finance Authority, First Lien Wastewater, CWA Authority Project, | | | | | | | | |
| | |
Rev., 4.00%, 10/1/2021 | | | 40,000 | | | | 40,891 | |
| | |
Series 2011A, Rev., 5.00%, 10/1/2021 | | | 290,000 | | | | 298,140 | |
| | |
Series 2014A, Rev., 5.00%, 10/1/2021 | | | 85,000 | | | | 87,386 | |
| | |
Series 2015A, Rev., 5.00%, 10/1/2021 | | | 80,000 | | | | 82,246 | |
| | |
Series 2016A, Rev., 5.00%, 10/1/2022 | | | 50,000 | | | | 53,802 | |
| | |
Series 2011A, Rev., 5.25%, 10/1/2022 | | | 100,000 | | | | 102,940 | |
| | |
Series 2011B, Rev., 5.25%, 10/1/2022 | | | 200,000 | | | | 205,880 | |
| | |
Series 2011A, Rev., 5.25%, 10/1/2024 | | | 560,000 | | | | 576,100 | |
SEE NOTES TO FINANCIAL STATEMENTS.
| | | | | | | | |
| | | |
| FEBRUARY 28, 2021 | | J.P. MORGAN EXCHANGE-TRADED FUNDS | | | | | 213 | |
JPMorgan Ultra-Short Municipal Income ETF
SCHEDULE OF PORTFOLIO INVESTMENTS
AS OF FEBRUARY 28, 2021 (continued)
| | | | | | | | |
| INVESTMENTS | | PRINCIPAL
AMOUNT ($) | | | VALUE ($) | |
Municipal Bonds — continued | | | | | | | | |
| | |
Indiana — continued | | | | | | | | |
| | |
Indiana Finance Authority, Franciscan Alliance, Inc., Obligated Group | | | | | | | | |
| | |
Rev., 5.00%, 11/1/2022 | | | 150,000 | | | | 161,640 | |
| | |
Series 2016B, Rev., 5.00%, 11/1/2024 | | | 345,000 | | | | 399,631 | |
| | |
Indiana Finance Authority, Health Obligated Group Series B, Rev., 2.25%, 7/1/2025 (c) | | | 100,000 | | | | 105,353 | |
| | |
Indiana Finance Authority, Highway | | | | | | | | |
| | |
Series 2016C, Rev., 5.00%, 12/1/2021 | | | 245,000 | | | | 253,869 | |
| | |
Series 2010A, Rev., 5.00%, 12/1/2022 | | | 50,000 | | | | 54,165 | |
| | |
Indiana Finance Authority, Indiana University Health Obligated Group | | | | | | | | |
| | |
Series 2016A, Rev., 5.00%, 12/1/2021 | | | 20,000 | | | | 20,718 | |
| | |
Series 2011 I, Rev., 1.65%, 1/1/2022 (b) (c) | | | 250,000 | | | | 253,027 | |
| | |
Series H, Rev., 1.65%, 1/1/2022 (b) (c) | | | 1,000,000 | | | | 1,012,110 | |
| | |
Series 2016A, Rev., 5.00%, 12/1/2022 | | | 45,000 | | | | 48,749 | |
| | |
Indiana Finance Authority, Lease Appropriation, Convention Center Expansion Project Series 2019B, Rev., 5.00%, 2/1/2025 | | | 90,000 | | | | 105,508 | |
| | |
Indiana Finance Authority, National Collegiate Athletic Association Project Rev., 5.00%, 5/1/2022 | | | 75,000 | | | | 79,219 | |
| | |
Indiana Finance Authority, Parkview Health System, Inc. | | | | | | | | |
| | |
Series 2017A, Rev., 5.00%, 11/1/2021 | | | 250,000 | | | | 257,888 | |
| | |
Series 2012A, Rev., 5.00%, 5/1/2022 | | | 25,000 | | | | 26,397 | |
| | |
Series 2017A, Rev., 5.00%, 11/1/2023 | | | 100,000 | | | | 112,125 | |
| | |
Series 2017A, Rev., 5.00%, 11/1/2024 | | | 30,000 | | | | 34,845 | |
| | |
Indiana Finance Authority, Stadium Project Series 2015A, Rev., 5.00%, 2/1/2022 | | | 1,000,000 | | | | 1,043,330 | |
| | |
Indiana Finance Authority, State Revolving Fund Program | | | | | | | | |
| | |
Series 2011A, Rev., 5.00%, 2/1/2022 (b) | | | 50,000 | | | | 52,223 | |
| | |
Series 2013A, Rev., 5.00%, 2/1/2022 | | | 55,000 | | | | 57,440 | |
| | | | | | | | |
| INVESTMENTS | | PRINCIPAL
AMOUNT ($) | | | VALUE ($) | |
| | | | | | | | |
| | |
Indiana — continued | | | | | | | | |
| | |
Series 2016B, Rev., 5.00%, 2/1/2022 | | | 20,000 | | | | 20,888 | |
| | |
Series 2017B, Rev., 5.00%, 2/1/2022 | | | 25,000 | | | | 26,109 | |
| | |
Indiana Finance Authority, University Health, Inc. Rev., 5.00%, 12/1/2022 | | | 180,000 | | | | 194,996 | |
| | |
Indiana Health and Educational Facilities Financing Authority, Ascension Senior Credit Group Series 2006B-3, Rev., 1.75%, 11/2/2021 (c) | | | 135,000 | | | | 136,411 | |
| | |
Indiana Health and Educational Facilities Financing Authority, Ascension Sub Credit Group | | | | | | | | |
| | |
Rev., 4.00%, 10/1/2021 | | | 160,000 | | | | 163,498 | |
| | |
Rev., 4.00%, 10/1/2025 | | | 30,000 | | | | 34,421 | |
| | |
Indiana Municipal Power Agency, Power Supply System | | | | | | | | |
| | |
Series 2014A, Rev., 5.00%, 1/1/2022 | | | 55,000 | | | | 57,147 | |
| | |
Series 2016C, Rev., 5.00%, 1/1/2022 | | | 50,000 | | | | 51,952 | |
| | |
Series 2017A, Rev., 5.00%, 1/1/2022 | | | 200,000 | | | | 207,808 | |
| | |
Series 2014A, Rev., 5.00%, 1/1/2023 | | | 200,000 | | | | 216,724 | |
| | |
Indiana State University, Student Fee Series S, Rev., 5.00%, 10/1/2021 | | | 25,000 | | | | 25,675 | |
| | |
Indiana Transportation Finance Authority | | | | | | | | |
| | |
Series 2004B, Rev., NATL-RE, 5.75%, 12/1/2021 | | | 315,000 | | | | 328,192 | |
| | |
Series 2004B, Rev., NATL-RE, 5.75%, 12/1/2022 | | | 25,000 | | | | 27,433 | |
| | |
Indiana University, Lease Purchase | | | | | | | | |
| | |
Series 2017A, Rev., 4.00%, 6/1/2021 | | | 220,000 | | | | 222,103 | |
| | |
Series 2020A, Rev., 5.00%, 6/1/2021 | | | 60,000 | | | | 60,722 | |
| | |
Series 2020A, Rev., 5.00%, 6/1/2022 | | | 30,000 | | | | 31,808 | |
| | |
Indiana University, Student Fee | | | | | | | | |
| | |
Series U, Rev., 5.00%, 8/1/2021 (b) | | | 135,000 | | | | 137,719 | |
| | |
Series W-2, Rev., 5.00%, 8/1/2021 | | | 40,000 | | | | 40,805 | |
| | |
Series Z-1, Rev., 3.00%, 8/1/2022 | | | 60,000 | | | | 62,405 | |
| | |
Series U, Rev., 3.20%, 8/1/2022 | | | 200,000 | | | | 202,514 | |
| | |
Series X, Rev., 4.00%, 8/1/2022 | | | 60,000 | | | | 63,253 | |
| | |
Series W-2, Rev., 5.00%, 8/1/2022 | | | 20,000 | | | | 21,367 | |
SEE NOTES TO FINANCIAL STATEMENTS.
| | | | | | |
| | | |
| 214 | | | | J.P. MORGAN EXCHANGE-TRADED FUNDS | | FEBRUARY 28, 2021 |
| | | | | | | | |
| INVESTMENTS | | PRINCIPAL
AMOUNT ($) | | | VALUE ($) | |
Municipal Bonds — continued | | | | | | | | |
| | |
Indiana — continued | | | | | | | | |
| | |
Indianapolis Local Public Improvement Bond Bank Series 2014C, Rev., 4.00%, 2/1/2022 | | | 25,000 | | | | 25,867 | |
| | |
Indianapolis Local Public Improvement Bond Bank, Courthouse and Jail Project Series 2019A, Rev., 5.00%, 2/1/2023 | | | 65,000 | | | | 70,839 | |
| | |
Indianapolis Local Public Improvement Bond Bank, Indyroads Series 2019E, Rev., 5.00%, 1/1/2022 | | | 30,000 | | | | 31,207 | |
| | |
Indianapolis Local Public Improvement Bond Bank, Stormwater Project Series 2013D, Rev., 5.00%, 1/1/2022 | | | 40,000 | | | | 41,610 | |
| | |
Indianapolis-Marion County Public Library GO, 5.00%, 1/1/2023 | | | 40,000 | | | | 41,572 | |
| | |
Ivy Tech Community College of Indiana, Student Fee | | | | | | | | |
| | |
Series W, Rev., 4.00%, 7/1/2021 | | | 60,000 | | | | 60,759 | |
| | |
Series V, Rev., 5.00%, 7/1/2021 | | | 25,000 | | | | 25,399 | |
| | |
Series R-1, Rev., 5.00%, 7/1/2022 | | | 40,000 | | | | 42,545 | |
| | |
Series T, Rev., 5.00%, 7/1/2022 | | | 25,000 | | | | 26,590 | |
| | |
Series V, Rev., 5.00%, 7/1/2022 | | | 110,000 | | | | 116,997 | |
| | |
Series W, Rev., 5.00%, 7/1/2022 | | | 20,000 | | | | 21,272 | |
| | |
Series 2004J, Rev., AMBAC, 5.00%, 7/1/2023 | | | 75,000 | | | | 82,845 | |
| | |
Series R-1, Rev., 5.00%, 7/1/2023 | | | 35,000 | | | | 38,782 | |
| | |
Jackson County Building Corp. | | | | | | | | |
| | |
Rev., 2.00%, 1/15/2023 | | | 120,000 | | | | 123,028 | |
| | |
Rev., 2.00%, 7/15/2023 | | | 125,000 | | | | 128,885 | |
| | |
Rev., 2.00%, 1/15/2024 | | | 125,000 | | | | 129,460 | |
| | |
Rev., 2.00%, 7/15/2024 | | | 125,000 | | | | 129,875 | |
| | |
Rev., 2.00%, 1/15/2025 | | | 125,000 | | | | 130,126 | |
| | |
Jennings County School Building Corp., First Mortgage | | | | | | | | |
| | |
Series 2019B, Rev., 3.00%, 7/15/2021 | | | 50,000 | | | | 50,500 | |
| | |
Series 2019A, Rev., 2.00%, 1/15/2022 | | | 90,000 | | | | 91,327 | |
| | |
Series 2019B, Rev., 3.00%, 1/15/2022 | | | 40,000 | | | | 40,937 | |
| | |
Series 2019A, Rev., 2.00%, 1/15/2023 | | | 60,000 | | | | 61,809 | |
| | |
La Porte County Public Library Leasing Corp. GO, 3.00%, 1/15/2022 | | | 25,000 | | | | 25,585 | |
| | |
Lake Central Multi-District School Building Corp., First Mortgage | | | | | | | | |
| | |
Series 2012B, Rev., 5.00%, 7/15/2021 | | | 250,000 | | | | 254,298 | |
| | | | | | | | |
| INVESTMENTS | | PRINCIPAL
AMOUNT ($) | | | VALUE ($) | |
| | | | | | | | |
| | |
Indiana — continued | | | | | | | | |
| | |
Series 2012B, Rev., 5.00%, 1/15/2023 (b) | | | 100,000 | | | | 108,834 | |
| | |
Lincoln Center Building Corp. Rev., 4.00%, 8/1/2022 | | | 285,000 | | | | 299,367 | |
| | |
Maconaquah School Building Corp. Series 2016A, Rev., 3.00%, 7/15/2021 | | | 125,000 | | | | 126,226 | |
| | |
Metropolitan School District Washington Township GO, 3.00%, 1/15/2022 | | | 30,000 | | | | 30,729 | |
| | |
Mishawaka School Building Corp., Indiana First Mortgage Refunding Rev., 3.00%, 1/15/2022 | | | 45,000 | | | | 46,034 | |
| | |
Mishawaka School City Multi-School Building Corp., First Mortgage Rev., 5.00%, 7/15/2021 | | | 100,000 | | | | 101,722 | |
| | |
Mount Vernon of Posey County Multi-School Building Corp. Rev., 5.00%, 7/15/2021 | | | 20,000 | | | | 20,344 | |
| | |
MSD of Wabash County Multi-School Building Corp., First Mortgage Rev., 3.40%, 7/15/2022 | | | 25,000 | | | | 25,263 | |
| | |
New Albany-Floyd County School Building Corp., First Mortgage Rev., 5.00%, 1/15/2023 | | | 25,000 | | | | 27,150 | |
| | |
New Palestine Multi-School Building Corp. | | | | | | | | |
| | |
Rev., 4.00%, 7/15/2022 | | | 25,000 | | | | 26,295 | |
| | |
Rev., 4.00%, 1/15/2023 | | | 20,000 | | | | 21,386 | |
| | |
North Webster Community Public Library GO, 4.00%, 1/15/2022 | | | 75,000 | | | | 77,347 | |
| | |
Northern Indiana Commuter Transportation District Rev., 5.00%, 7/1/2021 | | | 270,000 | | | | 274,080 | |
| | |
Pike Township Multi-School Building Corp., First Mortgage | | | | | | | | |
| | |
Rev., 5.00%, 1/15/2024 | | | 320,000 | | | | 360,278 | |
| | |
Rev., 5.00%, 7/15/2024 | | | 350,000 | | | | 400,736 | |
| | |
Rev., 5.00%, 1/15/2025 | | | 335,000 | | | | 389,632 | |
| | |
Purdue University, Student Facilities System Series 2015A, Rev., 5.00%, 7/1/2022 | | | 25,000 | | | | 26,607 | |
| | |
Purdue University, Student Fee | | | | | | | | |
| | |
Series 2016CC, Rev., 5.00%, 7/1/2021 | | | 20,000 | | | | 20,321 | |
| | |
Series AA, Rev., 5.00%, 7/1/2022 | | | 20,000 | | | | 21,286 | |
| | |
South Bend Community School Corp., School Building, First Mortgage Rev., 4.00%, 7/15/2022 | | | 30,000 | | | | 31,554 | |
SEE NOTES TO FINANCIAL STATEMENTS.
| | | | | | | | |
| | | |
| FEBRUARY 28, 2021 | | J.P. MORGAN EXCHANGE-TRADED FUNDS | | | | | 215 | |
JPMorgan Ultra-Short Municipal Income ETF
SCHEDULE OF PORTFOLIO INVESTMENTS
AS OF FEBRUARY 28, 2021 (continued)
| | | | | | | | |
| INVESTMENTS | | PRINCIPAL
AMOUNT ($) | | | VALUE ($) | |
Municipal Bonds — continued | | | | | | | | |
| | |
Indiana — continued | | | | | | | | |
| | |
South Vermillion Middle School Building Corp., First Mortgage Series 2016A, Rev., 3.00%, 1/15/2024 | | | 50,000 | | | | 53,392 | |
| | |
Southeast Dubois County School Building Corp., First Mortgage Series 2012A, Rev., 3.00%, 7/15/2022 | | | 640,000 | | | | 658,541 | |
| | |
The Trustees of Indiana University | | | | | | | | |
| | |
Series 2012A, Rev., 5.00%, 6/1/2021 | | | 50,000 | | | | 50,602 | |
| | |
Series Y, Rev., 5.00%, 8/1/2021 | | | 30,000 | | | | 30,604 | |
| | |
Series A, Rev., 5.00%, 6/1/2022 | | | 25,000 | | | | 26,507 | |
| | |
Valparaiso Middle School Building Corp., AD Valorem Property Tax First Mortgage Series 2012A, Rev., 3.00%, 7/15/2022 | | | 100,000 | | | | 102,342 | |
| | |
Wa-Nee Community Schools GO, 3.00%, 1/15/2023 | | | 125,000 | | | | 130,045 | |
| | |
Washington Township of Hendriks County, Building Corp., Indiana Lease Rental Bonds Rev., 4.00%, 7/15/2024 | | | 100,000 | | | | 110,850 | |
| | |
Wayne Township School Building Corp., Ad Valorem Property Tax First Mortgage Refunding Series 2015A, Rev., 4.00%, 1/15/2022 | | | 200,000 | | | | 206,332 | |
| | |
West Lafayette School Building Corp., Ad Valorem Property Tax First Mortgage Rev., 5.00%, 7/15/2022 | | | 30,000 | | | | 31,964 | |
| | |
Whitestown Redevelopment Authority Rev., 3.00%, 1/15/2024 | | | 25,000 | | | | 26,703 | |
| | |
Winfield Building Corp., Indiana Lease Rental, Sewage Works Treatment Plant Project | | | | | | | | |
| | |
Rev., 4.00%, 1/15/2022 | | | 35,000 | | | | 36,033 | |
| | |
Rev., 4.00%, 7/15/2022 | | | 35,000 | | | | 36,605 | |
| | |
Rev., 4.00%, 1/15/2023 | | | 130,000 | | | | 137,953 | |
| | |
Rev., 4.00%, 7/15/2023 | | | 85,000 | | | | 91,778 | |
| | |
Rev., 4.00%, 1/15/2024 | | | 85,000 | | | | 92,977 | |
| | |
Rev., 4.00%, 7/15/2024 | | | 35,000 | | | | 38,773 | |
| | |
Rev., 4.00%, 1/15/2025 | | | 145,000 | | | | 162,399 | |
| | |
Rev., 4.00%, 7/15/2025 | | | 145,000 | | | | 164,268 | |
| | |
Rev., 4.00%, 1/15/2026 | | | 150,000 | | | | 171,546 | |
| | |
Zionsville Community Schools Building Corp., Capital Appreciation Series 2003Z, Rev., NATL-RE, Zero Coupon, 1/15/2025 | | | 25,000 | | | | 24,119 | |
| | | | | | | | |
| | |
Total Indiana | | | | | | | 22,786,098 | |
| | | | | | | | |
| | | | | | | | |
| INVESTMENTS | | PRINCIPAL
AMOUNT ($) | | | VALUE ($) | |
| | | | | | | | |
| | |
Iowa — 0.8% | | | | | | | | |
| | |
Ankeny Community School District | | | | | | | | |
| | |
Series 2015A, GO, 4.00%, 6/1/2021 | | | 240,000 | | | | 242,278 | |
| | |
GO, 5.00%, 6/1/2021 | | | 305,000 | | | | 308,648 | |
| | |
Series 2015A, GO, 4.00%, 6/1/2022 | | | 60,000 | | | | 62,854 | |
| | |
City of Ames Series 2017A, GO, 5.00%, 6/1/2021 | | | 20,000 | | | | 20,240 | |
| | |
City of Ankeny | | | | | | | | |
| | |
Series 2017A, GO, 5.00%, 6/1/2021 | | | 75,000 | | | | 75,901 | |
| | |
Series 2020A, GO, 5.00%, 6/1/2021 | | | 90,000 | | | | 91,081 | |
| | |
Series 2017A, GO, 5.00%, 6/1/2022 | | | 40,000 | | | | 42,411 | |
| | |
City of Ankeny, Capital Loan | | | | | | | | |
| | |
Series 2014G, GO, 5.00%, 6/1/2021 | | | 75,000 | | | | 75,901 | |
| | |
Series 2014G, GO, 5.00%, 6/1/2022 | | | 20,000 | | | | 21,205 | |
| | |
City of Bettendorf | | | | | | | | |
| | |
Series 20109A, GO, 5.00%, 6/1/2021 | | | 45,000 | | | | 45,530 | |
| | |
Series 2019A, GO, 5.00%, 6/1/2021 | | | 50,000 | | | | 50,589 | |
| | |
Series 2017D, GO, 5.00%, 6/1/2022 | | | 55,000 | | | | 58,215 | |
| | |
Series 2013A, GO, 4.00%, 6/1/2023 | | | 50,000 | | | | 54,009 | |
| | |
City of Cedar Rapids | | | | | | | | |
| | |
Series 2016A, GO, 5.00%, 6/1/2021 | | | 75,000 | | | | 75,901 | |
| | |
Series 2017A, GO, 5.00%, 6/1/2021 | | | 25,000 | | | | 25,300 | |
| | |
Series 2019A, GO, 5.00%, 6/1/2021 | | | 20,000 | | | | 20,240 | |
| | |
Series 2020A, GO, 5.00%, 6/1/2021 | | | 40,000 | | | | 40,480 | |
| | |
Series 2017A, GO, 5.00%, 6/1/2022 | | | 45,000 | | | | 47,713 | |
| | |
City of Cedar Rapids, Sewer | | | | | | | | |
| | |
Series 2017D, Rev., 5.00%, 6/1/2021 | | | 25,000 | | | | 25,293 | |
| | |
Series 2018C, Rev., 5.00%, 6/1/2022 | | | 20,000 | | | | 21,177 | |
| | |
City of Council Bluffs Series 2018A, GO, 5.00%, 6/1/2021 | | | 20,000 | | | | 20,230 | |
| | |
City of Des Moines | | | | | | | | |
| | |
Series 2014C, GO, 5.00%, 6/1/2021 | | | 20,000 | | | | 20,241 | |
| | |
Series 2018B, GO, 5.00%, 6/1/2021 | | | 80,000 | | | | 80,962 | |
| | |
Series 2016B, GO, 4.00%, 6/1/2023 | | | 25,000 | | | | 27,045 | |
| | |
City of Des Moines Polk County, Water Works Series 2012B, Rev., 3.00%, 12/1/2021 | | | 50,000 | | | | 51,071 | |
| | |
City of Des Moines, Capital Loan Notes Series 2014E, GO, 5.00%, 6/1/2021 | | | 20,000 | | | | 20,241 | |
| | |
City of Des Moines, Stormwater Management Utility Series 2016C, Rev., 5.00%, 6/1/2022 | | | 25,000 | | | | 26,510 | |
| | |
City of North Liberty, Urban Renewal Series 2017B, GO, 2.00%, 6/1/2022 | | | 50,000 | | | | 51,114 | |
SEE NOTES TO FINANCIAL STATEMENTS.
| | | | | | |
| | | |
| 216 | | | | J.P. MORGAN EXCHANGE-TRADED FUNDS | | FEBRUARY 28, 2021 |
| | | | | | | | |
| INVESTMENTS | | PRINCIPAL
AMOUNT ($) | | | VALUE ($) | |
Municipal Bonds — continued | | | | | | | | |
| | |
Iowa — continued | | | | | | | | |
| | |
City of Urbandale, Urban Renewal | | | | | | | | |
| | |
Series 2019B, GO, 4.00%, 6/1/2021 | | | 65,000 | | | | 65,620 | |
| | |
Series 2019B, GO, 4.00%, 6/1/2022 | | | 100,000 | | | | 104,782 | |
| | |
City of Waterloo Series 2017A, GO, 3.00%, 6/1/2021 | | | 100,000 | | | | 100,694 | |
| | |
City of Waukee Series 2018A, GO, 5.00%, 6/1/2021 | | | 80,000 | | | | 80,936 | |
| | |
City of West Des Moines Series 2016D, GO, 5.00%, 6/1/2021 | | | 105,000 | | | | 106,237 | |
| | |
County of Audubon, Urban Renewal Purpose GO, 3.00%, 6/1/2021 | | | 215,000 | | | | 216,438 | |
| | |
County of Linn, Land and Water Legacy Series 2019A, GO, 3.00%, 6/1/2021 | | | 50,000 | | | | 50,347 | |
| | |
County of Polk GO, 5.00%, 6/1/2021 | | | 70,000 | | | | 70,841 | |
| | |
Des Moines Metropolitan Wastewater Reclamation Authority, Sewer Series 2013B, Rev., 3.00%, 6/1/2021 | | | 35,000 | | | | 35,243 | |
| | |
Iowa City Community School District | | | | | | | | |
| | |
Series 2017C, GO, 5.00%, 6/1/2021 | | | 30,000 | | | | 30,359 | |
| | |
Rev., 5.00%, 6/1/2022 | | | 95,000 | | | | 100,541 | |
| | |
GO, 5.00%, 6/1/2022 | | | 190,000 | | | | 201,429 | |
| | |
Iowa Finance Authority, Single Family Mortgage-Backed Securities Program | | | | | | | | |
| | |
Series 2019E, Rev., VRDO, GNMA/FNMA/FHLMC, LIQ: TD Bank NA, 0.03%, 3/9/2021 (c) | | | 4,015,000 | | | | 4,015,000 | |
| | |
Series 2017C, Rev., GNMA/FNMA/FHLMC, 1.70%, 1/1/2023 | | | 165,000 | | | | 168,721 | |
| | |
Iowa Finance Authority, State Revolving Fund | | | | | | | | |
| | |
Rev., 5.00%, 8/1/2021 (b) | | | 40,000 | | | | 40,806 | |
| | |
Rev., 5.00%, 8/1/2022 | | | 20,000 | | | | 21,366 | |
| | |
Series 2019A, Rev., 5.00%, 8/1/2022 | | | 25,000 | | | | 26,708 | |
| | |
Iowa Finance Authority, Unitypoint Health | | | | | | | | |
| | |
Series 2016E, Rev., 5.00%, 8/15/2022 | | | 200,000 | | | | 213,586 | |
| | |
Series 2018B, Rev., 5.00%, 2/15/2025 | | | 170,000 | | | | 198,232 | |
| | |
Iowa State University of Science and Technology, Academic Building Series 2016ISU, Rev., 3.00%, 7/1/2022 | | | 25,000 | | | | 25,937 | |
| | |
Iowa State University of Science and Technology, Recreational System Facilities Series 2017A, Rev., 3.00%, 7/1/2023 | | | 50,000 | | | | 52,988 | |
| | | | | | | | |
| INVESTMENTS | | PRINCIPAL
AMOUNT ($) | | | VALUE ($) | |
| | | | | | | | |
| | |
Iowa — continued | | | | | | | | |
| | |
Iowa State University of Science and Technology, Utility System Series ISU, Rev., 4.00%, 11/1/2021 | | | 50,000 | | | | 51,253 | |
| | |
Kirkwood Community College | | | | | | | | |
| | |
Series 2020A, GO, 4.00%, 6/1/2022 | | | 20,000 | | | | 20,931 | |
| | |
Series 2020A, GO, 4.00%, 6/1/2023 | | | 70,000 | | | | 75,711 | |
| | |
Linn-Mar Community School District GO, 5.00%, 5/1/2021 | | | 320,000 | | | | 322,522 | |
| | |
Pella Community School District GO, 2.10%, 6/1/2022 | | | 395,000 | | | | 395,498 | |
| | |
State of Iowa Board of Regents, University of Iowa, Hospitals and Clinics | | | | | | | | |
| | |
Rev., 4.00%, 9/1/2021 | | | 40,000 | | | | 40,757 | |
| | |
Series 2016SUI, Rev., 5.00%, 9/1/2023 | | | 65,000 | | | | 72,493 | |
| | |
Series 2019SUI, Rev., 5.00%, 9/1/2025 | | | 25,000 | | | | 29,831 | |
| | |
State of Iowa, IJOBS Program, Special Obligation | | | | | | | | |
| | |
Series 2020A, GO, 5.00%, 6/1/2021 | | | 30,000 | | | | 30,360 | |
| | |
Series A, Rev., 5.00%, 6/1/2021 | | | 165,000 | | | | 166,982 | |
| | |
Series 2016A, Rev., 5.00%, 6/1/2022 | | | 130,000 | | | | 137,836 | |
| | |
Series 2020A, GO, 5.00%, 6/1/2022 | | | 25,000 | | | | 26,507 | |
| | |
State of Iowa, Special Obligation | | | | | | | | |
| | |
Rev., 5.00%, 6/15/2021 | | | 20,000 | | | | 20,278 | |
| | |
Rev., 5.00%, 6/15/2022 | | | 35,000 | | | | 37,176 | |
| | |
Rev., 5.00%, 6/15/2023 | | | 25,000 | | | | 27,677 | |
| | |
University of Iowa (The), Academic Building | | | | | | | | |
| | |
Series 2016A, Rev., 3.00%, 7/1/2021 | | | 135,000 | | | | 136,266 | |
| | |
Series 2013SUI, Rev., 5.00%, 7/1/2021 | | | 30,000 | | | | 30,482 | |
| | |
Series 2016SUI, Rev., 3.00%, 7/1/2023 | | | 135,000 | | | | 143,390 | |
| | |
University of Iowa (The), Recreational Facilities | | | | | | | | |
| | |
Series 2017SUI, Rev., 5.00%, 7/1/2022 | | | 25,000 | | | | 26,607 | |
| | |
Series 2017B, Rev., 4.00%, 7/1/2023 | | | 20,000 | | | | 21,707 | |
| | |
University of Iowa Facilities Corp., Museum of Art Project Rev., 5.00%, 6/1/2021 | | | 595,000 | | | | 602,146 | |
| | |
Waukee Community School District | | | | | | | | |
| | |
GO, 5.00%, 6/1/2021 | | | 25,000 | | | | 25,299 | |
SEE NOTES TO FINANCIAL STATEMENTS.
| | | | | | | | |
| | | |
| FEBRUARY 28, 2021 | | J.P. MORGAN EXCHANGE-TRADED FUNDS | | | | | 217 | |
JPMorgan Ultra-Short Municipal Income ETF
SCHEDULE OF PORTFOLIO INVESTMENTS
AS OF FEBRUARY 28, 2021 (continued)
| | | | | | | | |
| INVESTMENTS | | PRINCIPAL
AMOUNT ($) | | | VALUE ($) | |
Municipal Bonds — continued | | | | | | | | |
| | |
Iowa — continued | | | | | | | | |
| | |
Series 2014C, GO, 5.00%, 6/1/2021 | | | 40,000 | | | | 40,478 | |
| | |
Series 2014C, GO, 5.00%, 6/1/2022 | | | 45,000 | | | | 47,701 | |
| | |
Series 2016B, GO, 5.00%, 6/1/2022 | | | 125,000 | | | | 132,503 | |
| | |
Series 2019A, GO, 5.00%, 6/1/2022 | | | 20,000 | | | | 21,200 | |
| | |
Waukee Community School District, Capital Loan Notes | | | | | | | | |
| | |
Series 2016A, GO, 5.00%, 6/1/2021 | | | 180,000 | | | | 182,153 | |
| | |
Series 2016A, GO, 4.00%, 6/1/2022 | | | 40,000 | | | | 41,903 | |
| | | | | | | | |
| | |
Total Iowa | | | | | | | 10,536,838 | |
| | | | | | | | |
| | |
Kansas — 0.4% | | | | | | | | |
| | |
Blue Valley Recreation Commission Series A, COP, AGM, 5.00%, 10/1/2022 | | | 25,000 | | | | 26,868 | |
| | |
City of Lawrence Series 2016-A, GO, 5.00%, 11/1/2021 | | | 25,000 | | | | 25,806 | |
| | |
City of Lawrence, Improvement | | | | | | | | |
| | |
Series 2017D, GO, 5.00%, 9/1/2021 | | | 20,000 | | | | 20,483 | |
| | |
Series 2015-A, GO, 3.00%, 9/1/2022 | | | 30,000 | | | | 31,273 | |
| | |
Series 2017D, GO, 5.00%, 9/1/2022 | | | 60,000 | | | | 64,341 | |
| | |
City of Lawrence, Temporary Notes Series I, GO, 2.00%, 5/1/2021 | | | 310,000 | | | | 310,257 | |
| | |
City of Manhattan Series B, GO, 3.00%, 11/1/2021 | | | 20,000 | | | | 20,373 | |
| | |
City of Manhattan, Temporary Notes Series 2020-03, GO, 0.75%, 6/15/2024 | | | 250,000 | | | | 250,217 | |
| | |
City of Olathe | | | | | | | | |
| | |
Series 2020A, GO, 3.00%, 8/1/2021 | | | 365,000 | | | | 369,117 | |
| | |
Series 233, GO, 3.00%, 10/1/2021 | | | 60,000 | | | | 60,995 | |
| | |
Series 228, GO, 4.00%, 10/1/2021 | | | 70,000 | | | | 71,567 | |
| | |
Series 230, GO, 5.00%, 10/1/2021 | | | 55,000 | | | | 56,551 | |
| | |
Series 233, GO, 3.00%, 10/1/2022 | | | 20,000 | | | | 20,896 | |
| | |
Series 230, GO, 5.00%, 10/1/2022 | | | 80,000 | | | | 86,110 | |
| | |
Series 230, GO, 5.00%, 10/1/2023 | | | 40,000 | | | | 44,820 | |
| | |
City of Topeka Series 2017A, GO, 5.00%, 8/15/2021 | | | 90,000 | | | | 91,979 | |
| | |
City of Topeka, Combined Utility Series 2018A, Rev., 5.00%, 8/1/2021 | | | 100,000 | | | | 101,989 | |
| | |
City of Wichita | | | | | | | | |
| | |
Series 807, GO, 2.00%, 6/1/2021 | | | 20,000 | | | | 20,092 | |
| | |
Series 962, GO, 3.00%, 6/1/2021 | | | 100,000 | | | | 100,707 | |
| | |
Series 814, GO, 5.00%, 6/1/2021 | | | 45,000 | | | | 45,540 | |
| | |
Series 2012A, GO, 5.00%, 9/1/2021 | | | 165,000 | | | | 168,985 | |
| | |
Rev., 5.00%, 11/15/2021 (b) | | | 25,000 | | | | 25,837 | |
| | | | | | | | |
| INVESTMENTS | | PRINCIPAL
AMOUNT ($) | | | VALUE ($) | |
| | | | | | | | |
| | |
Kansas — continued | | | | | | | | |
| | |
Series 2017A, GO, 5.00%, 12/1/2021 | | | 110,000 | | | | 113,991 | |
| | |
Series 811, GO, 5.00%, 6/1/2022 | | | 35,000 | | | | 37,110 | |
| | |
GO, 5.00%, 10/1/2022 | | | 110,000 | | | | 118,401 | |
| | |
GO, 5.00%, 12/1/2022 | | | 55,000 | | | | 59,632 | |
| | |
County of Johnson, Internal Improvement | | | | | | | | |
| | |
Series 2012A, GO, 4.00%, 9/1/2021 | | | 50,000 | | | | 50,959 | |
| | |
Series 2018A, GO, 5.00%, 9/1/2022 | | | 20,000 | | | | 21,447 | |
| | |
County of Shawnee COP, 3.00%, 9/1/2024 | | | 35,000 | | | | 37,789 | |
| | |
County of Shawnee, Public Building Commission, Kansas Expocentre Project Rev., 4.00%, 9/1/2022 | | | 25,000 | | | | 26,377 | |
| | |
Douglas County Unified School District No. 491, Eudora School Building Series 2011A, GO, AGC, 5.00%, 9/1/2021 (b) | | | 25,000 | | | | 25,598 | |
| | |
Douglas County Unified School District No. 497, Lawrence Improvement Series 2016-A, GO, 5.00%, 9/1/2021 | | | 40,000 | | | | 40,956 | |
| | |
Johnson County Community College Foundation, Inc., Student Common & Parking System Rev., 4.00%, 11/15/2022 | | | 100,000 | | | | 106,279 | |
| | |
Johnson County Park and Recreation District Series 2019A, COP, 5.00%, 9/1/2021 | | | 245,000 | | | | 250,731 | |
| | |
Johnson County Public Building Commission, Court House & Medical Examiners Facilities Rev., 5.00%, 9/1/2021 | | | 175,000 | | | | 179,181 | |
| | |
Johnson County Unified School District No. 229 Blue Valley Series 2020A, GO, 3.00%, 10/1/2021 | | | 90,000 | | | | 91,488 | |
| | |
Johnson County Unified School District No. 232 De Soto Series 2015-A, GO, 5.00%, 9/1/2021 | | | 25,000 | | | | 25,601 | |
| | |
Johnson County Unified School District No. 233 Olathe | | | | | | | | |
| | |
Series 2017B, GO, 3.00%, 9/1/2022 | | | 30,000 | | | | 31,265 | |
| | |
Series 2017A, GO, 4.00%, 9/1/2022 | | | 40,000 | | | | 42,284 | |
| | |
Series 2016C, GO, 5.00%, 9/1/2023 | | | 50,000 | | | | 55,816 | |
| | |
Johnson County Unified School District No. 512 Shawnee Mission | | | | | | | | |
| | |
Series 2017A, GO, 5.00%, 4/1/2021 | | | 55,000 | | | | 55,215 | |
| | |
Series 2016B, GO, 2.00%, 10/1/2021 | | | 145,000 | | | | 146,564 | |
SEE NOTES TO FINANCIAL STATEMENTS.
| | | | | | |
| | | |
| 218 | | | | J.P. MORGAN EXCHANGE-TRADED FUNDS | | FEBRUARY 28, 2021 |
| | | | | | | | |
| INVESTMENTS | | PRINCIPAL
AMOUNT ($) | | | VALUE ($) | |
Municipal Bonds — continued | | | | | | | | |
| | |
Kansas — continued | | | | | | | | |
| | |
Series 2016B, GO, 4.00%, 10/1/2021 | | | 25,000 | | | | 25,560 | |
| | |
Kansas Development Finance Authority, Department of Health and Environment Project Series 2020SRF, Rev., 5.00%, 5/1/2021 | | | 25,000 | | | | 25,199 | |
| | |
Kansas Development Finance Authority, School Engineering Project Rev., 5.00%, 5/1/2021 | | | 125,000 | | | | 125,985 | |
| | |
Kansas Development Finance Authority, State of Kansas Project | | | | | | | | |
| | |
Series 2019F, Rev., 5.00%, 11/1/2021 | | | 250,000 | | | | 257,958 | |
| | |
Series 2020R, Rev., 5.00%, 11/1/2021 | | | 105,000 | | | | 108,342 | |
| | |
Kansas Development Finance Authority, University Housing Projects Rev., 5.00%, 4/1/2022 | | | 250,000 | | | | 262,917 | |
| | |
Kansas Development Finance Authority, University Project | | | | | | | | |
| | |
Series 2014C, Rev., 5.00%, 5/1/2021 | | | 20,000 | | | | 20,158 | |
| | |
Series 2014C, Rev., 5.00%, 5/1/2022 | | | 100,000 | | | | 105,565 | |
| | |
Series 2017A, Rev., 5.00%, 5/1/2022 | | | 105,000 | | | | 110,843 | |
| | |
Kansas Turnpike Authority | | | | | | | | |
| | |
Series 2020A, Rev., 3.00%, 9/1/2021 | | | 180,000 | | | | 182,558 | |
| | |
Series 2020A, Rev., 3.00%, 9/1/2022 | | | 50,000 | | | | 52,092 | |
| | |
Sedgwick County Public Building Commission, Exploration Place Project Series 2015-1, Rev., 5.00%, 8/1/2021 | | | 25,000 | | | | 25,502 | |
| | |
Sedgwick County Unified School District No. 259 Wichita Series 2017-A, GO, 3.00%, 10/1/2022 | | | 45,000 | | | | 47,002 | |
| | |
Sedgwick County Unified School District No. 266 Maize | | | | | | | | |
| | |
Series 2019-B, GO, 3.00%, 9/1/2021 | | | 25,000 | | | | 25,353 | |
| | |
Series 2015B, GO, 5.00%, 9/1/2021 | | | 85,000 | | | | 87,044 | |
| | |
Seward County Unified School District No. 480 Liberal GO, 5.00%, 9/1/2022 (b) | | | 25,000 | | | | 26,813 | |
| | |
State of Kansas Department of Transportation | | | | | | | | |
| | |
Series 2015A, Rev., 5.00%, 9/1/2021 | | | 190,000 | | | | 194,598 | |
| | | | | | | | |
| INVESTMENTS | | PRINCIPAL
AMOUNT ($) | | | VALUE ($) | |
| | | | | | | | |
| | |
Kansas — continued | | | | | | | | |
| | |
Series 2018A, Rev., 5.00%, 9/1/2021 | | | 50,000 | | | | 51,210 | |
| | |
Series 2015A, Rev., 5.00%, 9/1/2022 | | | 125,000 | | | | 134,064 | |
| | |
University of Kansas Hospital Authority, Health System Rev., 5.00%, 3/1/2021 | | | 160,000 | | | | 160,000 | |
| | |
Wyandotte County City Unified Government Utility System Series 2014A, Rev., 5.00%, 9/1/2021 | | | 500,000 | | | | 511,665 | |
| | |
Wyandotte County Unified Government Public Utility System Refunding Series 2012A, Rev., 5.00%, 9/1/2022 (b) | | | 25,000 | | | | 26,793 | |
| | |
Wyandotte County Unified Government Utility System Improvement and Refunding Series 2011-A, Rev., 5.00%, 9/1/2021 (b) | | | 50,000 | | | | 51,197 | |
| | | | | | | | |
| | |
Total Kansas | | | | | | | 6,149,905 | |
| | | | | | | | |
| | |
Kentucky — 0.6% | | | | | | | | |
| | |
Campbell Kenton and Boone Counties Sanitation District No. 1 | | | | | | | | |
| | |
Rev., 5.00%, 8/1/2021 | | | 70,000 | | | | 71,404 | |
| | |
Rev., 5.00%, 8/1/2022 | | | 25,000 | | | | 26,705 | |
| | |
City of Bowling Green Series 2016C, GO, 4.00%, 6/1/2021 | | | 50,000 | | | | 50,461 | |
| | |
County of Kenton, Limited Tax | | | | | | | | |
| | |
Series B, GO, 5.00%, 10/1/2021 | | | 215,000 | | | | 221,048 | |
| | |
Series 2017A, GO, 5.00%, 4/1/2022 | | | 25,000 | | | | 26,306 | |
| | |
Fayette County School District Finance Corp. | | | | | | | | |
| | |
Series 2011A, Rev., 4.00%, 6/1/2021 | | | 150,000 | | | | 151,374 | |
| | |
Series 2013A, Rev., 5.00%, 10/1/2021 | | | 25,000 | | | | 25,683 | |
| | |
Kenton County Public Properties Corp., Court Facilities Project Rev., 3.00%, 3/1/2023 | | | 150,000 | | | | 157,381 | |
| | |
Kenton County School District Finance Corp., School Building Project Rev., 4.50%, 5/1/2021 (b) | | | 200,000 | | | | 201,414 | |
| | |
Kentucky Asset Liability Commission, Federal Highway Trust Fund | | | | | | | | |
| | |
Rev., 5.00%, 9/1/2021 | | | 155,000 | | | | 158,672 | |
| | |
Series 2013A, Rev., 5.00%, 9/1/2021 | | | 85,000 | | | | 87,014 | |
SEE NOTES TO FINANCIAL STATEMENTS.
| | | | | | | | |
| | | |
| FEBRUARY 28, 2021 | | J.P. MORGAN EXCHANGE-TRADED FUNDS | | | | | 219 | |
JPMorgan Ultra-Short Municipal Income ETF
SCHEDULE OF PORTFOLIO INVESTMENTS
AS OF FEBRUARY 28, 2021 (continued)
| | | | | | | | |
| INVESTMENTS | | PRINCIPAL
AMOUNT ($) | | | VALUE ($) | |
Municipal Bonds — continued | | | | | | | | |
| | |
Kentucky — continued | | | | | | | | |
| | |
Kentucky Bond Development Corp., Hospital Facilities, St. Elizabeth Medical Center, Inc. Rev., 5.00%, 5/1/2021 | | | 250,000 | | | | 251,947 | |
| | |
Kentucky Economic Development Finance Authority, Baptist Healthcare System Obligated Group | | | | | | | | |
| | |
Rev., 5.00%, 8/15/2021 (b) | | | 130,000 | | | | 132,804 | |
| | |
Rev., 5.25%, 8/15/2021 (b) | | | 955,000 | | | | 976,679 | |
| | |
Kentucky Economic Development Finance Authority, Catholic Health Initiatives Series 2013A, Rev., 5.25%, 1/1/2023 (b) | | | 100,000 | | | | 109,010 | |
| | |
Kentucky Housing Corp., Westminster Village Project Rev., 2.00%, 4/1/2021 (c) | | | 900,000 | | | | 901,278 | |
| | |
Kentucky Infrastructure Authority, Governmental Agencies Program Rev., 3.00%, 8/1/2021 | | | 50,000 | | | | 50,592 | |
| | |
Kentucky Infrastructure Authority, Wastewater and Drinking Water Revolving Fund Series 2018A, Rev., 3.00%, 2/1/2024 | | | 25,000 | | | | 26,884 | |
| | |
Kentucky Public Energy Authority, Gas Supply Series 2018B, Rev., 4.00%, 1/1/2025 (c) | | | 615,000 | | | | 680,584 | |
| | |
Kentucky State Property and Buildings Commission, Project No. 106 Series 2013A, Rev., 5.00%, 10/1/2021 | | | 45,000 | | | | 46,231 | |
| | |
Kentucky State Property and Buildings Commission, Project No. 110 Rev., 5.00%, 8/1/2021 | | | 25,000 | | | | 25,488 | |
| | |
Kentucky State Property and Buildings Commission, Project No. 112 Series B, Rev., 5.00%, 11/1/2021 | | | 125,000 | | | | 128,910 | |
| | |
Kentucky State Property and Buildings Commission, Project No. 117 Series D, Rev., 5.00%, 5/1/2021 | | | 100,000 | | | | 100,772 | |
| | |
Kentucky State Property and Buildings Commission, Project No. 84 Rev., NATL-RE, 5.00%, 8/1/2021 | | | 30,000 | | | | 30,585 | |
| | |
Kentucky Turnpike Authority, Economic Development Road, Revitalization Projects | | | | | | | | |
| | |
Series 2013A, Rev., 5.00%, 7/1/2021 | | | 275,000 | | | | 279,034 | |
| | |
Series 2014A, Rev., 5.00%, 7/1/2021 | | | 150,000 | | | | 152,201 | |
| | | | | | | | |
| INVESTMENTS | | PRINCIPAL
AMOUNT ($) | | | VALUE ($) | |
| | | | | | | | |
| | |
Kentucky — continued | | | | | | | | |
| | |
Lexington-Fayette Urban County Government | | | | | | | | |
| | |
Series 2017A, GO, 5.00%, 9/1/2021 | | | 90,000 | | | | 92,169 | |
| | |
Series 2013C, GO, 4.00%, 10/1/2021 | | | 25,000 | | | | 25,558 | |
| | |
Series 2012B, GO, 3.00%, 7/1/2024 | | | 100,000 | | | | 100,811 | |
| | |
Louisville and Jefferson County Metropolitan Government | | | | | | | | |
| | |
Series 2016A, GO, 5.00%, 12/1/2021 | | | 55,000 | | | | 56,957 | |
| | |
Series 2017A, GO, 5.00%, 12/1/2021 | | | 20,000 | | | | 20,712 | |
| | |
Series 2020B, Rev., 5.00%, 10/1/2023 (c) | | | 400,000 | | | | 445,228 | |
| | |
Louisville and Jefferson County Metropolitan Government, Catholic Health Initiatives | | | | | | | | |
| | |
Series 2012A, Rev., 4.00%, 6/1/2022 (b) | | | 75,000 | | | | 78,509 | |
| | |
Series 2012A, Rev., 4.25%, 6/1/2022 | | | 5,000 | | | | 5,249 | |
| | |
Series 2012A, Rev., 5.00%, 6/1/2022 (b) | | | 40,000 | | | | 42,370 | |
| | |
Louisville and Jefferson County Metropolitan Government, Louisville Gas and Electric Co. Project Series 2003A, Rev., 1.85%, 4/1/2021 (c) | | | 200,000 | | | | 200,248 | |
| | |
Louisville and Jefferson County Metropolitan Government, Norton Healthcare, Inc. | | | | | | | | |
| | |
Series 2016A, Rev., 5.00%, 10/1/2023 | | | 165,000 | | | | 184,336 | |
| | |
Series 2016A, Rev., 5.00%, 10/1/2024 | | | 660,000 | | | | 763,198 | |
| | |
Louisville and Jefferson County Metropolitan Sewer District, Sewer and Drainage System | | | | | | | | |
| | |
Series 2013B, Rev., 5.00%, 5/15/2021 | | | 25,000 | | | | 25,245 | |
| | |
Rev., 5.00%, 5/15/2022 | | | 125,000 | | | | 132,189 | |
| | |
Series 2016C, Rev., 5.00%, 5/15/2022 | | | 50,000 | | | | 52,875 | |
| | |
Series 2011A, Rev., 5.00%, 5/15/2025 | | | 110,000 | | | | 113,659 | |
| | |
Murray State University Series 2011B, Rev., 3.75%, 9/1/2021 | | | 60,000 | | | | 61,031 | |
| | |
Northern Kentucky Water District Rev., 5.00%, 2/1/2022 | | | 90,000 | | | | 93,848 | |
SEE NOTES TO FINANCIAL STATEMENTS.
| | | | | | |
| | | |
| 220 | | | | J.P. MORGAN EXCHANGE-TRADED FUNDS | | FEBRUARY 28, 2021 |
| | | | | | | | |
| INVESTMENTS | | PRINCIPAL
AMOUNT ($) | | | VALUE ($) | |
Municipal Bonds — continued | | | | | | | | |
| | |
Kentucky — continued | | | | | | | | |
| | |
Scott County School District Finance Corp. Rev., 5.00%, 6/1/2025 | | | 20,000 | | | | 23,519 | |
| | |
Spencer County School District Finance Corp. Rev., 3.00%, 8/1/2021 | | | 80,000 | | | | 80,879 | |
| | |
University of Kentucky, General Receipt | | | | | | | | |
| | |
Series 2014A, Rev., 5.00%, 4/1/2021 | | | 20,000 | | | | 20,077 | |
| | |
Series 2014B, Rev., 5.00%, 4/1/2021 | | | 25,000 | | | | 25,097 | |
| | |
Series 2014D, Rev., 5.00%, 10/1/2021 | | | 40,000 | | | | 41,116 | |
| | | | | | | | |
| | |
Total Kentucky | | | | | | | 7,755,341 | |
| | | | | | | | |
| | |
Louisiana — 0.6% | | | | | | | | |
| | |
Central Community School System, Sales Tax Rev., 5.00%, 1/1/2022 | | | 100,000 | | | | 103,895 | |
| | |
City of Alexandria, Utilities Series 2013A, Rev., 5.00%, 5/1/2023 (b) | | | 25,000 | | | | 27,538 | |
| | |
City of Lafayette, Publica Improvement, Sales and Use Tax | | | | | | | | |
| | |
Rev., 5.00%, 3/1/2021 (b) | | | 200,000 | | | | 200,000 | |
| | |
Series 2011ST-D, Rev., 5.00%, 5/1/2021 | | | 55,000 | | | | 55,431 | |
| | |
Series 2011ST-D, Rev., 5.00%, 5/1/2022 | | | 25,000 | | | | 26,385 | |
| | |
Iberia Parishwide School District Series 2014A, GO, 5.00%, 3/1/2021 | | | 100,000 | | | | 100,000 | |
| | |
Jefferson Parish School Board | | | | | | | | |
| | |
GO, 3.00%, 3/1/2021 | | | 100,000 | | | | 100,000 | |
| | |
Rev., 4.00%, 2/1/2022 | | | 125,000 | | | | 129,311 | |
| | |
Lafourche Parish School Board GO, 4.00%, 3/1/2022 | | | 25,000 | | | | 25,882 | |
| | |
Louisiana Local Government Environmental Facilities and Community Development Authority, Bossier City Public | | | | | | | | |
| | |
Series 2015A, Rev., 5.00%, 11/1/2021 | | | 55,000 | | | | 56,698 | |
| | |
Rev., 5.00%, 11/1/2023 | | | 100,000 | | | | 111,984 | |
| | |
Louisiana Local Government Environmental Facilities and Community Development Authority, Jefferson CPZ Beautification Rev., 4.00%, 10/1/2025 | | | 130,000 | | | | 147,648 | |
| | |
Louisiana Local Government Environmental Facilities and Community Development Authority, Jefferson Parish Projects Rev., 5.00%, 4/1/2023 | | | 100,000 | | | | 109,646 | |
| | | | | | | | |
| INVESTMENTS | | PRINCIPAL
AMOUNT ($) | | | VALUE ($) | |
| | | | | | | | |
| | |
Louisiana — continued | | | | | | | | |
| | |
Louisiana Public Facilities Authority, Franciscan Missionaries of Our Lady, Health System Rev., 5.00%, 7/1/2022 (b) | | | 380,000 | | | | 404,012 | |
| | |
Louisiana Public Facilities Authority, Hurricane Recovery Program Rev., 5.00%, 6/1/2021 | | | 25,000 | | | | 25,288 | |
| | |
Louisiana Public Facilities Authority, Lafayette General Health System Project | | | | | | | | |
| | |
Rev., 4.00%, 11/1/2025 (b) | | | 605,000 | | | | 700,977 | |
| | |
Rev., 5.00%, 11/1/2025 (b) | | | 160,000 | | | | 192,739 | |
| | |
Louisiana Public Facilities Authority, Ochsner Clinic Foundation Project | | | | | | | | |
| | |
Rev., 5.25%, 5/15/2021 (b) | | | 100,000 | | | | 101,038 | |
| | |
Rev., 6.38%, 5/15/2021 (b) | | | 155,000 | | | | 156,958 | |
| | |
Rev., 6.50%, 5/15/2021 (b) | | | 150,000 | | | | 151,930 | |
| | |
Series 2002B, Rev., 5.50%, 5/15/2022 (b) | | | 75,000 | | | | 79,735 | |
| | |
Rev., 5.00%, 5/15/2023 | | | 185,000 | | | | 202,669 | |
| | |
Louisiana State Citizens Property Insurance Corp. Rev., AGM, 5.00%, 6/1/2022 (b) | | | 30,000 | | | | 31,797 | |
| | |
St. Charles Parish School District No. 1 GO, 5.00%, 3/1/2022 | | | 50,000 | | | | 52,379 | |
| | |
St. Tammany Parish Hospital Service District No. 2 GO, 3.00%, 3/1/2022 | | | 25,000 | | | | 25,659 | |
| | |
State of Louisiana | | | | | | | | |
| | |
Series 2019-A, GO, 5.00%, 3/1/2021 | | | 300,000 | | | | 300,000 | |
| | |
Series 2012-C, GO, 5.00%, 7/15/2021 | | | 75,000 | | | | 76,345 | |
| | |
Series 2012-C, GO, 5.00%, 7/15/2022 (b) | | | 25,000 | | | | 26,662 | |
| | |
Series 2013-C, GO, 5.00%, 7/15/2022 | | | 25,000 | | | | 26,655 | |
| | |
Series 2012-A, GO, 5.00%, 8/1/2022 (b) | | | 40,000 | | | | 42,745 | |
| | |
State of Louisiana Gasoline and Fuels Tax | | | | | | | | |
| | |
Series 2012A-1, Rev., 5.00%, 5/1/2021 | | | 130,000 | | | | 131,035 | |
| | |
Series 2012A-1, Rev., 5.00%, 5/1/2023 | | | 25,000 | | | | 26,454 | |
| | |
State of Louisiana Gasoline and Fuels Tax, Second Lien | | | | | | | | |
| | |
Series 2017D, Rev., 0.55%, 5/1/2022 (c) | | | 4,290,000 | | | | 4,290,558 | |
| | |
Series 2017A, Rev., 0.60%, 5/1/2023 (c) | | | 200,000 | | | | 199,710 | |
SEE NOTES TO FINANCIAL STATEMENTS.
| | | | | | | | |
| | | |
| FEBRUARY 28, 2021 | | J.P. MORGAN EXCHANGE-TRADED FUNDS | | | | | 221 | |
JPMorgan Ultra-Short Municipal Income ETF
SCHEDULE OF PORTFOLIO INVESTMENTS
AS OF FEBRUARY 28, 2021 (continued)
| | | | | | | | |
| INVESTMENTS | | PRINCIPAL
AMOUNT ($) | | | VALUE ($) | |
Municipal Bonds — continued | | | | | | | | |
|
Louisiana — continued | |
| | |
Terrebonne Parish La Sales and Use Tax Morganza Levee Improvement Series 2011-ST, Rev., AGM, 4.75%, 4/1/2021 (b) | | | 620,000 | | | | 622,282 | |
| | |
Zachary Community School District No. 1 GO, 4.00%, 3/1/2021 (b) | | | 25,000 | | | | 25,000 | |
| | | | | | | | |
| | |
Total Louisiana | | | | | | | 9,087,045 | |
| | | | | | | | |
| | |
Maine — 0.3% | | | | | | | | |
| | |
City of Augusta Series 2015B, GO, 3.00%, 5/1/2022 | | | 25,000 | | | | 25,825 | |
| | |
City of Lewiston, Public Improvement GO, 4.00%, 4/15/2023 | | | 25,000 | | | | 26,965 | |
| | |
City of Portland GO, 5.00%, 4/1/2022 | | | 25,000 | | | | 26,308 | |
| | |
Maine Governmental Facilities Authority Series 2015B, Rev., 5.00%, 10/1/2022 | | | 30,000 | | | | 32,266 | |
| | |
Maine Health and Higher Educational Facilities Authority | | | | | | | | |
| | |
Series 2014A, Rev., 5.00%, 7/1/2021 | | | 140,000 | | | | 142,148 | |
| | |
Series 2014A, Rev., 5.00%, 7/1/2023 | | | 135,000 | | | | 148,989 | |
| | |
Series 2017A, Rev., 5.00%, 7/1/2023 | | | 80,000 | | | | 88,349 | |
| | |
Series 2020B, Rev., 4.00%, 7/1/2024 | | | 150,000 | | | | 165,385 | |
| | |
Maine Health and Higher Educational Facilities Authority, Birch Bay Retirement Village Series 2020A, Rev., 5.00%, 7/1/2023 | | | 600,000 | | | | 661,578 | |
| | |
Maine Health and Higher Educational Facilities Authority, Central Maine Medical Center Series 2019A, Rev., 5.00%, 7/1/2021 | | | 65,000 | | | | 66,000 | |
| | |
Maine Health and Higher Educational Facilities Authority, University of New England Rev., 4.00%, 7/1/2021 | | | 175,000 | | | | 176,995 | |
| | |
Maine Municipal Bond Bank | | | | | | | | |
| | |
Series 2011C, Rev., 4.88%, 11/1/2021 (b) | | | 25,000 | | | | 25,787 | |
| | |
Series 2015A, Rev., 5.00%, 11/1/2021 | | | 25,000 | | | | 25,806 | �� |
| | |
Series 2017A, Rev., 5.00%, 11/1/2021 | | | 120,000 | | | | 123,869 | |
| | |
Series 2018B, Rev., 5.00%, 11/1/2021 | | | 150,000 | | | | 154,836 | |
| | |
Series 2020A, Rev., 5.00%, 11/1/2021 | | | 50,000 | | | | 51,612 | |
| | | | | | | | |
| INVESTMENTS | | PRINCIPAL
AMOUNT ($) | | | VALUE ($) | |
| | | | | | | | |
| | |
Maine — continued | | | | | | | | |
| | |
Series D, Rev., 5.00%, 11/1/2021 | | | 80,000 | | | | 82,579 | |
| | |
Series 2010C, Rev., 5.00%, 11/1/2022 | | | 25,000 | | | | 27,005 | |
| | |
Series 2012B, Rev., 5.00%, 11/1/2022 | | | 30,000 | | | | 32,406 | |
| | |
Series 2015A, Rev., 5.00%, 11/1/2022 | | | 30,000 | | | | 32,407 | |
| | |
Series 2016B, Rev., 5.00%, 11/1/2022 | | | 30,000 | | | | 32,407 | |
| | |
Series 2019A, Rev., 5.00%, 11/1/2022 | | | 50,000 | | | | 54,011 | |
| | |
Series D, Rev., 5.00%, 11/1/2022 | | | 70,000 | | | | 75,615 | |
| | |
Series 2016C, Rev., 4.00%, 11/1/2023 | | | 25,000 | | | | 27,454 | |
| | |
Maine Municipal Bond Bank, Transcap Program | | | | | | | | |
| | |
Series 2015A, Rev., 5.00%, 9/1/2022 | | | 25,000 | | | | 26,809 | |
| | |
Series 2011A, Rev., 5.00%, 9/1/2025 | | | 1,150,000 | | | | 1,177,013 | |
| | |
Maine School Administrative District No. 51 GO, 4.00%, 8/1/2025 | | | 50,000 | | | | 57,449 | |
| | |
Maine State Housing Authority, Mortgage Purchase Series 2011-D, Rev., AMT, 3.15%, 11/15/2021 | | | 35,000 | | | | 35,190 | |
| | |
State of Maine | | | | | | | | |
| | |
Series 2014B, GO, 5.00%, 6/1/2021 | | | 75,000 | | | | 75,901 | |
| | |
Series 2016B, GO, 5.00%, 6/1/2021 | | | 35,000 | | | | 35,420 | |
| | |
Series 2018D, GO, 5.00%, 6/1/2021 | | | 50,000 | | | | 50,601 | |
| | |
Series 2014B, GO, 5.00%, 6/1/2022 | | | 25,000 | | | | 26,507 | |
| | |
Series 2017B, GO, 5.00%, 6/1/2022 | | | 25,000 | | | | 26,507 | |
| | |
Town of Gorham Series 2016B, GO, 5.00%, 10/1/2021 | | | 25,000 | | | | 25,695 | |
| | |
Town of Scarborough GO, 5.00%, 11/1/2022 | | | 25,000 | | | | 26,936 | |
| | | | | | | | |
| | |
Total Maine | | | | | | | 3,870,630 | |
| | | | | | | | |
| | |
Maryland — 0.9% | | | | | | | | |
| | |
City of Annapolis, Public Improvement | | | | | | | | |
| | |
GO, 4.00%, 8/1/2021 | | | 35,000 | | | | 35,559 | |
| | |
Series 2017B, GO, 5.00%, 8/1/2022 | | | 25,000 | | | | 26,708 | |
| | |
City of Baltimore, Consolidated Public Improvement | | | | | | | | |
| | |
Series 2013A, GO, 4.00%, 10/15/2022 (b) | | | 35,000 | | | | 37,179 | |
| | |
Series 2013A, GO, 5.00%, 10/15/2022 | | | 40,000 | | | | 43,137 | |
| | |
City of Baltimore, Wastewater Projects | | | | | | | | |
| | |
Series 2017B, Rev., 3.00%, 7/1/2021 | | | 25,000 | | | | 25,237 | |
SEE NOTES TO FINANCIAL STATEMENTS.
| | | | | | |
| | | |
| 222 | | | | J.P. MORGAN EXCHANGE-TRADED FUNDS | | FEBRUARY 28, 2021 |
| | | | | | | | |
| INVESTMENTS | | PRINCIPAL
AMOUNT ($) | | | VALUE ($) | |
Municipal Bonds — continued | | | | | | | | |
|
Maryland — continued | |
| | |
Series 2014C, Rev., 5.00%, 7/1/2021 | | | 35,000 | | | | 35,563 | |
| | |
Series 2013C, Rev., 5.00%, 7/1/2023 | | | 30,000 | | | | 33,279 | |
| | |
City of Baltimore, Water Projects | | | | | | | | |
| | |
Series 2011A, Rev., 5.00%, 7/1/2021 | | | 25,000 | | | | 25,402 | |
| | |
Series 2017C, Rev., 5.00%, 7/1/2021 | | | 25,000 | | | | 25,397 | |
| | |
Series 2013A, Rev., 5.00%, 7/1/2022 | | | 25,000 | | | | 26,611 | |
| | |
County of Anne Arundel, Arundel Mills Project GTD, 5.00%, 7/1/2023 | | | 50,000 | | | | 55,502 | |
| | |
County of Anne Arundel, Consolidated General Improvements | | | | | | | | |
| | |
GO, 5.00%, 4/1/2021 | | | 355,000 | | | | 356,388 | |
| | |
GO, 5.00%, 10/1/2021 | | | 30,000 | | | | 30,846 | |
| | |
GO, 5.00%, 4/1/2022 | | | 40,000 | | | | 42,093 | |
| | |
County of Anne Arundel, Consolidated Water and Sewer GO, 5.00%, 4/1/2021 | | | 50,000 | | | | 50,195 | |
| | |
County of Baltimore, Consolidated Public Improvement | | | | | | | | |
| | |
GO, 5.00%, 3/1/2021 | | | 25,000 | | | | 25,000 | |
| | |
GO, 5.00%, 8/1/2021 | | | 105,000 | | | | 107,111 | |
| | |
GO, 5.00%, 2/1/2022 | | | 35,000 | | | | 36,550 | |
| | |
Series 2014B, GO, 5.00%, 8/1/2022 | | | 25,000 | | | | 26,708 | |
| | |
GO, 5.00%, 3/1/2023 | | | 70,000 | | | | 76,649 | |
| | |
County of Baltimore, Equipment Acquisition Program | | | | | | | | |
| | |
COP, 5.00%, 3/1/2021 | | | 45,000 | | | | 45,000 | |
| | |
COP, 5.00%, 10/1/2021 | | | 165,000 | | | | 169,554 | |
| | |
COP, 5.00%, 3/1/2022 | | | 420,000 | | | | 439,857 | |
| | |
COP, 5.00%, 10/1/2022 | | | 125,000 | | | | 134,339 | |
| | |
County of Baltimore, Health and Social Services Building Project COP, 3.00%, 10/1/2021 | | | 50,000 | | | | 50,800 | |
| | |
County of Baltimore, Metropolitan District | | | | | | | | |
| | |
GO, 4.00%, 2/1/2022 | | | 30,000 | | | | 31,054 | |
| | |
Series 2014C, GO, 4.00%, 9/1/2022 | | | 25,000 | | | | 26,435 | |
| | |
County of Calvert, Consolidated Public Improvement GO, 4.00%, 4/1/2021 | | | 30,000 | | | | 30,093 | |
| | |
County of Carroll, Consolidated Public Improvement | | | | | | | | |
| | |
GO, 4.00%, 11/1/2021 | | | 25,000 | | | | 25,642 | |
| | |
GO, 5.00%, 11/1/2021 | | | 65,000 | | | | 67,100 | |
| | |
GO, 5.00%, 11/1/2022 | | | 30,000 | | | | 32,412 | |
| | | | | | | | |
| INVESTMENTS | | PRINCIPAL
AMOUNT ($) | | | VALUE ($) | |
| | | | | | | | |
|
Maryland — continued | |
| | |
County of Cecil, Consolidated Public Improvement GO, 4.00%, 2/1/2022 | | | 75,000 | | | | 77,636 | |
| | |
County of Charles, Consolidated Public Improvement | | | | | | | | |
| | |
GO, 5.00%, 3/1/2021 | | | 170,000 | | | | 170,000 | |
| | |
GO, 5.00%, 10/1/2021 | | | 20,000 | | | | 20,564 | |
| | |
GO, 5.00%, 11/1/2021 | | | 20,000 | | | | 20,645 | |
| | |
GO, 5.00%, 10/1/2022 | | | 50,000 | | | | 53,818 | |
| | |
County of Charles, Tax Exempt GO, 4.00%, 2/1/2022 | | | 25,000 | | | | 25,879 | |
| | |
County of Frederick, Public Facilities | | | | | | | | |
| | |
GO, 5.00%, 5/1/2021 | | | 25,000 | | | | 25,199 | |
| | |
GO, 4.00%, 8/1/2021 | | | 65,000 | | | | 66,041 | |
| | |
Series 2016A, GO, 5.00%, 8/1/2022 | | | 25,000 | | | | 26,712 | |
| | |
County of Harford, Consolidated Public Improvement GO, 5.00%, 9/15/2022 | | | 150,000 | | | | 161,134 | |
| | |
County of Montgomery, Consolidated Public Improvement | | | | | | | | |
| | |
Series 2011A, GO, 5.00%, 7/1/2021 | | | 25,000 | | | | 25,405 | |
| | |
Series 2017D, GO, 3.00%, 11/1/2021 | | | 45,000 | | | | 45,866 | |
| | |
Series 2017C, GO, 5.00%, 10/1/2022 | | | 25,000 | | | | 26,914 | |
| | |
Series 2017D, GO, 3.00%, 11/1/2022 | | | 50,000 | | | | 52,358 | |
| | |
Series 2016A, GO, 5.00%, 12/1/2022 | | | 25,000 | | | | 27,110 | |
| | |
Series 2015B, GO, 5.00%, 12/1/2023 | | | 35,000 | | | | 39,500 | |
| | |
County of Montgomery, Consolidated Public Improvement Bonds Series 2013A, GO, 5.00%, 11/1/2021 | | | 100,000 | | | | 103,251 | |
| | |
County of Montgomery, Department of Liquor Control Series 2011A, Rev., 5.00%, 4/1/2024 | | | 45,000 | | | | 45,174 | |
| | |
County of Montgomery, Metrorail Garage Project Rev., 5.00%, 6/1/2022 | | | 75,000 | | | | 75,861 | |
| | |
County of Montgomery, Montgomery College | | | | | | | | |
| | |
Series 2016A, COP, 5.00%, 11/1/2021 | | | 25,000 | | | | 25,809 | |
| | |
Series 2016A, COP, 5.00%, 11/1/2022 | | | 30,000 | | | | 32,417 | |
| | |
County of Montgomery, Parking System Rev., 5.00%, 6/1/2021 | | | 25,000 | | | | 25,301 | |
SEE NOTES TO FINANCIAL STATEMENTS.
| | | | | | | | |
| | | |
| FEBRUARY 28, 2021 | | J.P. MORGAN EXCHANGE-TRADED FUNDS | | | | | 223 | |
JPMorgan Ultra-Short Municipal Income ETF
SCHEDULE OF PORTFOLIO INVESTMENTS
AS OF FEBRUARY 28, 2021 (continued)
| | | | | | | | |
| INVESTMENTS | | PRINCIPAL
AMOUNT ($) | | | VALUE ($) | |
Municipal Bonds — continued | | | | | | | | |
|
Maryland — continued | |
| | |
County of Montgomery, Water Quality Protection Charge | | | | | | | | |
| | |
Rev., 3.00%, 4/1/2021 | | | 25,000 | | | | 25,058 | |
| | |
Series 2012A, Rev., 5.00%, 4/1/2021 | | | 100,000 | | | | 100,365 | |
| | |
County of Prince George’s, Consolidated Public Improvement | | | | | | | | |
| | |
Series 2013B, GO, 4.00%, 3/1/2021 | | | 30,000 | | | | 30,000 | |
| | |
Series 2011A, GO, 5.00%, 9/15/2021 (b) | | | 180,000 | | | | 184,696 | |
| | |
Series 2011B, GO, 5.00%, 9/15/2021 (b) | | | 25,000 | | | | 25,653 | |
| | |
Series 2013B, GO, 4.00%, 3/1/2022 | | | 45,000 | | | | 46,744 | |
| | |
Series 2019A, GO, 5.00%, 7/15/2022 | | | 40,000 | | | | 42,670 | |
| | |
County of Prince George’s, Public Safety Communications COP, 5.00%, 10/1/2023 | | | 25,000 | | | | 25,089 | |
| | |
County of Queen Anne’s, Public Facilities | | | | | | | | |
| | |
GO, 4.00%, 4/1/2021 | | | 50,000 | | | | 50,155 | |
| | |
GO, 4.00%, 7/1/2021 | | | 25,000 | | | | 25,319 | |
| | |
GO, 5.00%, 1/15/2023 | | | 50,000 | | | | 54,447 | |
| | |
County of Spotsylvania, Commissioners of St. Mary’s, Public Improvement GO, 4.00%, 7/15/2021 | | | 30,000 | | | | 30,428 | |
| | |
County of Washington GO, 4.00%, 1/1/2023 | | | 40,000 | | | | 42,753 | |
| | |
County of Washington, Public Improvement GO, 3.00%, 7/1/2022 (b) | | | 40,000 | | | | 41,504 | |
| | |
County of Wicomico, Public Improvement GO, 5.00%, 10/1/2022 | | | 25,000 | | | | 26,909 | |
| | |
Maryland Community Development Administration, Housing and Community Development | | | | | | | | |
| | |
Series 2014C, Rev., 2.15%, 3/1/2021 | | | 165,000 | | | | 165,000 | |
| | |
Series 2018A, Rev., 2.55%, 3/1/2022 | | | 20,000 | | | | 20,446 | |
| | |
Series 2019A, Rev., 2.10%, 3/1/2024 | | | 25,000 | | | | 26,002 | |
| | |
Maryland Community Development Administration, Local Government Infrastructure | | | | | | | | |
| | |
Series 2017A-1, Rev., 2.00%, 6/1/2021 | | | 75,000 | | | | 75,330 | |
| | |
Series A-2, Rev., 3.00%, 6/1/2021 | | | 25,000 | | | | 25,168 | |
| | |
Series 2011A, Rev., 4.00%, 6/1/2021 | | | 115,000 | | | | 116,010 | |
| | | | | | | | |
| INVESTMENTS | | PRINCIPAL
AMOUNT ($) | | | VALUE ($) | |
| | | | | | | | |
|
Maryland — continued | |
| | |
Maryland Economic Development Corp., Department of Transportation Headquarters Rev., 4.00%, 6/1/2021 | | | 150,000 | | | | 151,431 | |
| | |
Maryland Economic Development Corp., Howard Hughes Medical Institute Series 2008A, Rev., VRDO, 0.03%, 3/9/2021 (c) | | | 2,690,000 | | | | 2,690,000 | |
| | |
Maryland Economic Development Corp., Maryland Public Health Laboratory Project Rev., 4.00%, 6/1/2023 | | | 50,000 | | | | 50,466 | |
| | |
Maryland Health and Higher Educational Facilities Authority, John Hopkins Health System | | | | | | | | |
| | |
Rev., 5.00%, 5/15/2021 | | | 25,000 | | | | 25,246 | |
| | |
Series 2013B, Rev., 5.00%, 7/1/2022 | | | 125,000 | | | | 133,037 | |
| | |
Maryland Health and Higher Educational Facilities Authority, Lifebridge Health Issue | | | | | | | | |
| | |
Rev., 4.00%, 7/1/2021 | | | 180,000 | | | | 182,234 | |
| | |
Rev., 5.00%, 7/1/2021 | | | 250,000 | | | | 253,930 | |
| | |
Rev., 5.00%, 7/1/2023 | | | 160,000 | | | | 176,618 | |
| | |
Rev., 5.00%, 7/1/2025 | | | 45,000 | | | | 53,095 | |
| | |
Maryland Health and Higher Educational Facilities Authority, Peninsula Medical Center Rev., 5.00%, 7/1/2021 | | | 70,000 | | | | 71,058 | |
| | |
Maryland Health and Higher Educational Facilities Authority, University of Pittsburgh Medical Center Series 2020B, Rev., 5.00%, 4/15/2022 | | | 255,000 | | | | 268,530 | |
| | |
Maryland National Capital Park and Planning Commission, Park Development Project Series PGC-2015A, GO, 5.00%, 1/15/2022 | | | 35,000 | | | | 36,474 | |
| | |
Maryland Stadium Authority, Baltimore City Public Schools Rev., 5.00%, 5/1/2022 | | | 80,000 | | | | 84,394 | |
| | |
Maryland Stadium Authority, Montgomery County Conference Center | | | | | | | | |
| | |
Rev., 5.00%, 6/15/2022 | | | 30,000 | | | | 31,845 | |
| | |
Rev., 5.00%, 6/15/2023 | | | 65,000 | | | | 71,913 | |
| | |
Maryland Water Quality Financing Administration Revolving Loan Fund | | | | | | | | |
| | |
Rev., 5.00%, 3/1/2021 | | | 115,000 | | | | 115,000 | |
| | |
Rev., 5.00%, 3/1/2022 | | | 20,000 | | | | 20,966 | |
SEE NOTES TO FINANCIAL STATEMENTS.
| | | | | | |
| | | |
| 224 | | | | J.P. MORGAN EXCHANGE-TRADED FUNDS | | FEBRUARY 28, 2021 |
| | | | | | | | |
| INVESTMENTS | | PRINCIPAL
AMOUNT ($) | | | VALUE ($) | |
Municipal Bonds — continued | | | | | | | | |
|
Maryland — continued | |
| | |
Montgomery County Housing Opportunities Commission, Multi-Family Housing Series 2011A, Rev., VRDO, GNMA/FNMA/FHLMC, LOC: TD Bank NA, 0.04%, 3/9/2021 (c) | | | 1,150,000 | | | | 1,150,000 | |
| | |
State of Maryland Department of Transportation | | | | | | | | |
| | |
Rev., 4.00%, 5/15/2021 | | | 50,000 | | | | 50,391 | |
| | |
Rev., 5.00%, 6/1/2021 | | | 30,000 | | | | 30,359 | |
| | |
Rev., 5.00%, 10/1/2021 | | | 75,000 | | | | 77,110 | |
| | |
Rev., 5.00%, 11/1/2021 | | | 145,000 | | | | 149,665 | |
| | |
Rev., 5.00%, 12/1/2021 | | | 95,000 | | | | 98,439 | |
| | |
Rev., 5.00%, 12/15/2021 | | | 50,000 | | | | 51,904 | |
| | |
Rev., 5.00%, 6/1/2022 | | | 25,000 | | | | 26,504 | |
| | |
Rev., 5.00%, 10/1/2022 | | | 70,000 | | | | 75,334 | |
| | |
State of Maryland, State and Local Facilities Loan of 2013 | | | | | | | | |
| | |
GO, 4.00%, 3/1/2021 (b) | | | 30,000 | | | | 30,000 | |
| | |
GO, 5.00%, 3/1/2021 (b) | | | 190,000 | | | | 190,000 | |
| | |
Series 2013B, GO, 4.50%, 8/1/2021 | | | 210,000 | | | | 213,797 | |
| | |
State of Maryland, State and Local Facilities Loan of 2014 | | | | | | | | |
| | |
GO, 5.00%, 8/1/2021 | | | 140,000 | | | | 142,819 | |
| | |
Series 2014-2-C, GO, 5.00%, 8/1/2021 | | | 250,000 | | | | 255,035 | |
| | |
Series 2014B, GO, 5.00%, 8/1/2021 | | | 20,000 | | | | 20,403 | |
| | |
Series 2014-2-C, GO, 5.00%, 8/1/2022 | | | 70,000 | | | | 74,783 | |
| | |
Series 2014B, GO, 5.00%, 8/1/2022 (b) | | | 35,000 | | | | 37,402 | |
| | |
State of Maryland, State and Local Facilities Loan of 2015 | | | | | | | | |
| | |
Series 2015A, GO, 5.00%, 8/1/2021 | | | 70,000 | | | | 71,410 | |
| | |
Series 2015A, GO, 5.00%, 3/1/2022 | | | 35,000 | | | | 36,691 | |
| | |
State of Maryland, State and Local Facilities Loan of 2017 | | | | | | | | |
| | |
Series 2014A, GO, 5.00%, 3/1/2022 (b) | | | 65,000 | | | | 68,147 | |
| | |
Series 2017A, GO, 5.00%, 8/1/2022 | | | 100,000 | | | | 106,833 | |
| | |
Series 2017B, GO, 5.00%, 8/1/2022 | | | 25,000 | | | | 26,708 | |
| | |
State of Maryland, State and Local Facilities Loan of 2018 Series 2018B, GO, 5.00%, 8/1/2022 | | | 60,000 | | | | 64,100 | |
| | |
Town of Ocean City GO, 4.00%, 10/1/2022 | | | 50,000 | | | | 53,030 | |
| | |
Town of Ocean City, Mayor and City Council, Municipal Purpose Loan GO, 5.00%, 12/1/2021 | | | 50,000 | | | | 51,814 | |
| | | | | | | | |
| INVESTMENTS | | PRINCIPAL
AMOUNT ($) | | | VALUE ($) | |
| | | | | | | | |
|
Maryland — continued | |
| | |
University System of Maryland, Auxiliary Facility and Tuition | | | | | | | | |
| | |
Series 2011A, Rev., 3.00%, 4/1/2021 | | | 25,000 | | | | 25,057 | |
| | |
Series 2010C, Rev., 4.00%, 4/1/2021 | | | 110,000 | | | | 110,343 | |
| | |
Series 2011A, Rev., 5.00%, 4/1/2021 (b) | | | 160,000 | | | | 160,627 | |
| | |
Series 2014A, Rev., 5.00%, 4/1/2021 | | | 25,000 | | | | 25,098 | |
| | |
Series 2016A, Rev., 5.00%, 4/1/2021 | | | 140,000 | | | | 140,550 | |
| | |
Series 2019A, Rev., 5.00%, 4/1/2021 | | | 50,000 | | | | 50,197 | |
| | |
Series 2012D, Rev., 5.00%, 10/1/2021 | | | 120,000 | | | | 123,397 | |
| | |
Series 2017B, Rev., 5.00%, 4/1/2022 | | | 85,000 | | | | 89,469 | |
| | |
Washington Suburban Sanitary District, Consolidated Public Improvement | | | | | | | | |
| | |
Rev., GTD, 4.00%, 6/1/2021 (b) | | | 25,000 | | | | 25,239 | |
| | |
Rev., GTD, 5.00%, 6/1/2021 | | | 165,000 | | | | 166,993 | |
| | |
Rev., GTD, 3.00%, 6/1/2022 | | | 100,000 | | | | 103,537 | |
| | |
Rev., GTD, 5.00%, 6/1/2023 | | | 35,000 | | | | 38,730 | |
| | | | | | | | |
| | |
Total Maryland | | | | | | | 13,153,892 | |
| | | | | | | | |
| | |
Massachusetts — 4.2% | | | | | | | | |
| | |
Berkshire Hills Regional School District | | | | | | | | |
| | |
GO, 5.00%, 10/15/2021 | | | 20,000 | | | | 20,599 | |
| | |
GO, 5.00%, 10/15/2022 | | | 55,000 | | | | 59,285 | |
| | |
Berkshire Regional Transit Authority Series B, Rev., RAN, 1.25%, 7/29/2021 | | | 5,300,000 | | | | 5,318,020 | |
| | |
Boston Water and Sewer Commission | | | | | | | | |
| | |
Series 2012A, Rev., 4.00%, 11/1/2021 | | | 70,000 | | | | 71,807 | |
| | |
Series 2016A, Rev., 5.00%, 11/1/2021 | | | 125,000 | | | | 129,055 | |
| | |
Brockton Area Transit Authority Rev., RAN, 1.50%, 7/30/2021 | | | 3,050,000 | | | | 3,061,834 | |
| | |
Cape Cod Regional Transit Authority Rev., RAN, 1.50%, 7/23/2021 | | | 3,000,000 | | | | 3,010,980 | |
| | |
City of Beverly GO, 5.00%, 1/15/2023 | | | 50,000 | | | | 54,456 | |
| | |
City of Boston | | | | | | | | |
| | |
Series 2019A, GO, 5.00%, 3/1/2021 | | | 60,000 | | | | 60,000 | |
| | |
Series 2010B, GO, 4.00%, 4/1/2021 | | | 45,000 | | | | 45,140 | |
| | |
Series 2011A, GO, 4.00%, 4/1/2021 (b) | | | 175,000 | | | | 175,546 | |
SEE NOTES TO FINANCIAL STATEMENTS.
| | | | | | | | |
| | | |
| FEBRUARY 28, 2021 | | J.P. MORGAN EXCHANGE-TRADED FUNDS | | | | | 225 | |
JPMorgan Ultra-Short Municipal Income ETF
SCHEDULE OF PORTFOLIO INVESTMENTS
AS OF FEBRUARY 28, 2021 (continued)
| | | | | | | | |
| INVESTMENTS | | PRINCIPAL
AMOUNT ($) | | | VALUE ($) | |
Municipal Bonds — continued | | | | | | | | |
|
Massachusetts — continued | |
| | |
Series 2011B, GO, 5.00%, 4/1/2021 | | | 25,000 | | | | 25,098 | |
| | |
Series 2015B, GO, 5.00%, 4/1/2021 | | | 50,000 | | | | 50,197 | |
| | |
Series 2018A, GO, 5.00%, 5/1/2021 | | | 50,000 | | | | 50,400 | |
| | |
Series 2012D, GO, 4.00%, 10/1/2021 | | | 55,000 | | | | 56,238 | |
| | |
Series 2014A, GO, 5.00%, 3/1/2022 | | | 40,000 | | | | 41,941 | |
| | |
Series 2012A, GO, 5.00%, 4/1/2022 | | | 25,000 | | | | 26,314 | |
| | |
Series 2010B, GO, 3.00%, 4/1/2023 | | | 40,000 | | | | 42,261 | |
| | |
City of Fall River GO, 4.00%, 3/1/2022 | | | 100,000 | | | | 103,835 | |
| | |
City of Framingham, Municipal Purpose Loan | | | | | | | | |
| | |
GO, 5.00%, 12/1/2021 | | | 65,000 | | | | 67,338 | |
| | |
GO, 5.00%, 11/1/2022 | | | 45,000 | | | | 48,586 | |
| | |
GO, 5.00%, 12/1/2022 | | | 20,000 | | | | 21,674 | |
| | |
City of Marlborough, Municipal Purpose Loan | | | | | | | | |
| | |
GO, 4.00%, 6/15/2021 | | | 95,000 | | | | 96,052 | |
| | |
GO, 5.00%, 6/15/2021 | | | 25,000 | | | | 25,348 | |
| | |
GO, 4.00%, 6/15/2022 | | | 25,000 | | | | 26,236 | |
| | |
GO, 5.00%, 6/15/2022 | | | 20,000 | | | | 21,246 | |
| | |
City of Medford, Municipal Purpose Loan GO, 5.00%, 7/15/2021 | | | 130,000 | | | | 132,337 | |
| | |
City of Methuen GO, BAN, 2.00%, 9/1/2021 | | | 3,235,000 | | | | 3,261,139 | |
| | |
City of Newton GO, 4.00%, 4/1/2021 | | | 105,000 | | | | 105,328 | |
| | |
City of Peabody GO, 2.25%, 3/15/2021 | | | 25,000 | | | | 25,019 | |
| | |
City of Peabody, Municipal Purpose Loan | | | | | | | | |
| | |
GO, 5.00%, 3/15/2021 | | | 45,000 | | | | 45,078 | |
| | |
GO, 4.00%, 10/1/2021 | | | 35,000 | | | | 35,778 | |
| | |
Series 2015A, GO, 5.00%, 11/15/2021 | | | 75,000 | | | | 77,543 | |
| | |
City of Revere | | | | | | | | |
| | |
GO, 5.00%, 9/1/2021 | | | 500,000 | | | | 511,945 | |
| | |
GO, 4.00%, 12/1/2021 | | | 50,000 | | | | 51,422 | |
| | |
City of Salem, Municipal Purpose Loan GO, 5.00%, 9/15/2022 | | | 25,000 | | | | 26,836 | |
| | |
City of Somerville | | | | | | | | |
| | |
Series 2018B, GO, 4.00%, 6/1/2021 | | | 100,000 | | | | 100,956 | |
| | |
GO, 5.00%, 5/15/2022 | | | 25,000 | | | | 26,456 | |
| | |
GO, 5.00%, 10/1/2022 | | | 35,000 | | | | 37,679 | |
| | |
City of Somerville, Municipal Purpose Loan GO, 5.00%, 6/1/2021 | | | 45,000 | | | | 45,541 | |
| | |
City of Waltham, Municipal Purpose Loan | | | | | | | | |
| | |
GO, 4.00%, 6/15/2021 | | | 100,000 | | | | 101,107 | |
| | |
GO, 4.10%, 2/1/2023 | | | 35,000 | | | | 35,100 | |
| | | | | | | | |
| INVESTMENTS | | PRINCIPAL
AMOUNT ($) | | | VALUE ($) | |
| | | | | | | | |
|
Massachusetts — continued | |
| | |
City of Westfield, Municipal Purpose Loan GO, 5.00%, 3/1/2021 | | | 50,000 | | | | 50,000 | |
| | |
City of Woburn GO, 4.00%, 11/15/2022 | | | 20,000 | | | | 21,305 | |
| | |
Commonwealth of Massachusetts | | | | | | | | |
| | |
Series 2019C, GO, 5.00%, 5/1/2021 | | | 165,000 | | | | 166,318 | |
| | |
Series 2016A, GO, 5.00%, 7/1/2021 | | | 20,000 | | | | 20,322 | |
| | |
Series 2019A, GO, 5.00%, 7/1/2021 | | | 85,000 | | | | 86,370 | |
| | |
Series 2013B, GO, 5.00%, 8/1/2021 | | | 160,000 | | | | 163,230 | |
| | |
Series 2014C, GO, 5.00%, 8/1/2021 | | | 30,000 | | | | 30,606 | |
| | |
Series 2004A, GO, 5.25%, 8/1/2021 | | | 80,000 | | | | 81,698 | |
| | |
Series 2004A, GO, AMBAC, 5.25%, 8/1/2021 | | | 215,000 | | | | 219,562 | |
| | |
Series B, GO, NATL-RE-IBC, 5.25%, 8/1/2021 | | | 115,000 | | | | 117,440 | |
| | |
Series B, GO, 5.25%, 8/1/2021 | | | 310,000 | | | | 316,578 | |
| | |
Series B, GO, AGM, 5.25%, 8/1/2021 | | | 170,000 | | | | 173,608 | |
| | |
Series 2006B, GO, AGM, 5.25%, 9/1/2021 | | | 25,000 | | | | 25,637 | |
| | |
Series 2016C, GO, 5.00%, 10/1/2021 | | | 295,000 | | | | 303,352 | |
| | |
Series 2004C, GO, AGM, 5.50%, 12/1/2021 | | | 35,000 | | | | 36,406 | |
| | |
Series 2019C, GO, 5.00%, 5/1/2022 | | | 30,000 | | | | 31,695 | |
| | |
Series 2016B, GO, 5.00%, 7/1/2022 | | | 100,000 | | | | 106,458 | |
| | |
Series 2019A, GO, 5.00%, 7/1/2022 | | | 40,000 | | | | 42,583 | |
| | |
Series 2017E, GO, 5.00%, 11/1/2022 | | | 25,000 | | | | 27,010 | |
| | |
Series 2004C, GO, AGM, 5.50%, 12/1/2022 | | | 40,000 | | | | 43,733 | |
| | |
Series 2020A, GO, 5.00%, 6/1/2023 (c) | | | 50,000 | | | | 55,222 | |
| | |
Series C, GO, 5.00%, 10/1/2023 | | | 25,000 | | | | 28,019 | |
| | |
Commonwealth of Massachusetts Federal Highway, Accelerated Bridge Program | | | | | | | | |
| | |
Series 2013A, Rev., GAN, 4.00%, 6/15/2021 | | | 20,000 | | | | 20,222 | |
| | |
Series 2013A, Rev., GAN, 5.00%, 6/15/2021 | | | 220,000 | | | | 223,062 | |
| | |
Series 2014A, Rev., GAN, 5.00%, 6/15/2021 | | | 75,000 | | | | 76,044 | |
| | |
Rev., GAN, 5.00%, 6/15/2022 | | | 85,000 | | | | 90,297 | |
| | |
Series 2014A, Rev., GAN, 5.00%, 6/15/2022 | | | 60,000 | | | | 63,737 | |
SEE NOTES TO FINANCIAL STATEMENTS.
| | | | | | |
| | | |
| 226 | | | | J.P. MORGAN EXCHANGE-TRADED FUNDS | | FEBRUARY 28, 2021 |
| | | | | | | | |
| INVESTMENTS | | PRINCIPAL
AMOUNT ($) | | | VALUE ($) | |
Municipal Bonds — continued | | | | | | | | |
|
Massachusetts — continued | |
| | |
Commonwealth of Massachusetts Transportation Fund, Accelerated Bridge Program | | | | | | | | |
| | |
Series 2012A, Rev., 5.00%, 6/1/2021 (b) | | | 120,000 | | | | 121,444 | |
| | |
Series 2012A, Rev., 5.00%, 6/1/2022 | | | 50,000 | | | | 50,599 | |
| | |
Commonwealth of Massachusetts Transportation Fund, Rail Enhancement Series 2015A, Rev., 5.00%, 6/1/2022 | | | 95,000 | | | | 100,615 | |
| | |
Commonwealth of Massachusetts Transportation Fund, Rail Enhancement & Accelerated Bridge Programs Rev., 5.00%, 6/1/2021 | | | 25,000 | | | | 25,298 | |
| | |
Commonwealth of Massachusetts, Consolidated Loan | | | | | | | | |
| | |
Series 2016A, GO, 5.00%, 3/1/2021 | | | 80,000 | | | | 80,000 | |
| | |
Series 2013A, GO, 4.00%, 4/1/2021 (b) | | | 620,000 | | | | 621,934 | |
| | |
Series 2011A, GO, 5.00%, 4/1/2021 (b) | | | 565,000 | | | | 567,215 | |
| | |
Series 2005A, Rev., AGM, 5.50%, 6/1/2021 | | | 25,000 | | | | 25,332 | |
| | |
Series 2013C, GO, 4.00%, 8/1/2021 (b) | | | 175,000 | | | | 177,802 | |
| | |
Series E, GO, 4.50%, 8/1/2021 (b) | | | 20,000 | | | | 20,362 | |
| | |
Series E, GO, 5.00%, 8/1/2021 (b) | | | 490,000 | | | | 499,868 | |
| | |
Series 2011D, GO, 3.00%, 10/1/2021 (b) | | | 200,000 | | | | 203,306 | |
| | |
Series 2011D, GO, 4.25%, 10/1/2021 (b) | | | 25,000 | | | | 25,597 | |
| | |
Series 2011D, GO, 5.00%, 10/1/2021 (b) | | | 155,000 | | | | 159,379 | |
| | |
Series 2014A, GO, 4.00%, 12/1/2021 (b) | | | 50,000 | | | | 51,444 | |
| | |
Series 2014A, GO, 4.50%, 12/1/2021 (b) | | | 195,000 | | | | 201,363 | |
| | |
Series 2014A, GO, 5.00%, 12/1/2021 (b) | | | 480,000 | | | | 497,453 | |
| | |
Series 2016A, GO, 5.00%, 3/1/2022 | | | 55,000 | | | | 57,669 | |
| | |
Series 2015A, GO, 5.00%, 5/1/2022 | | | 30,000 | | | | 31,695 | |
| | |
Series C, GO, 5.00%, 7/1/2022 (b) | | | 140,000 | | | | 149,041 | |
| | |
Subseries D-2, GO, 1.70%, 8/1/2022 (c) | | | 110,000 | | | | 112,092 | |
| | |
Series F, GO, 5.00%, 11/1/2022 (b) | | | 30,000 | | | | 32,412 | |
| | |
Series 2016H, GO, 5.00%, 12/1/2022 | | | 20,000 | | | | 21,692 | |
| | | | | | | | |
| INVESTMENTS | | PRINCIPAL
AMOUNT ($) | | | VALUE ($) | |
| | | | | | | | |
|
Massachusetts — continued | |
| | |
Commonwealth of Massachusetts, Consolidated Loan, Green Bonds | | | | | | | | |
| | |
Series 2013D, GO, 3.75%, 8/1/2021 (b) | | | 150,000 | | | | 152,234 | |
| | |
Series 2013D, GO, 4.00%, 8/1/2021 (b) | | | 40,000 | | | | 40,640 | |
| | |
Series 2013D, GO, 5.00%, 8/1/2021 (b) | | | 35,000 | | | | 35,705 | |
| | |
Series E, GO, 4.00%, 9/1/2021 | | | 25,000 | | | | 25,482 | |
| | |
Series E, GO, 5.00%, 9/1/2022 (b) | | | 25,000 | | | | 26,813 | |
| | |
Concord & Carlisle Regional School District GO, 5.00%, 6/15/2021 | | | 75,000 | | | | 76,044 | |
| | |
County of Collin Series 2016A, GO, 5.00%, 3/1/2021 | | | 110,000 | | | | 110,000 | |
| | |
Hyannis Fire District GO, 5.00%, 4/15/2021 | | | 100,000 | | | | 100,574 | |
| | |
Lowell Regional Transit Authority Rev., RAN, 1.25%, 8/19/2021 | | | 6,000,000 | | | | 6,022,080 | |
| | |
Massachusetts Bay Transportation Authority | | | | | | | | |
| | |
Series A, Rev., 5.00%, 7/1/2021 | | | 165,000 | | | | 167,648 | |
| | |
Series 2012A, Rev., 5.00%, 7/1/2022 | | | 55,000 | | | | 58,537 | |
| | |
Massachusetts Bay Transportation Authority, Mass Sales Tax | | | | | | | | |
| | |
Series 2008B, Rev., 5.00%, 7/1/2021 | | | 25,000 | | | | 25,401 | |
| | |
Series 2014A, Rev., 5.00%, 7/1/2021 | | | 50,000 | | | | 50,803 | |
| | |
Series 2003A, Rev., 5.25%, 7/1/2021 | | | 120,000 | | | | 122,026 | |
| | |
Series 2003C, Rev., 5.25%, 7/1/2021 | | | 125,000 | | | | 127,110 | |
| | |
Series 2004B, Rev., 5.25%, 7/1/2021 | | | 80,000 | | | | 81,350 | |
| | |
Series 2006B, Rev., 5.25%, 7/1/2021 | | | 55,000 | | | | 55,928 | |
| | |
Series C, Rev., 5.50%, 7/1/2021 | | | 50,000 | | | | 50,886 | |
| | |
Rev., BAN, 4.00%, 12/1/2021 | | | 270,000 | | | | 277,781 | |
| | |
Series 2015A, Rev., 5.00%, 7/1/2022 | | | 60,000 | | | | 63,858 | |
| | |
Series 2006A, Rev., 5.25%, 7/1/2022 | | | 90,000 | | | | 96,086 | |
| | |
Series 2006B, Rev., 5.25%, 7/1/2022 | | | 20,000 | | | | 21,352 | |
| | |
Series 2004C, Rev., 5.50%, 7/1/2022 | | | 35,000 | | | | 37,483 | |
SEE NOTES TO FINANCIAL STATEMENTS.
| | | | | | | | |
| | | |
| FEBRUARY 28, 2021 | | J.P. MORGAN EXCHANGE-TRADED FUNDS | | | | | 227 | |
JPMorgan Ultra-Short Municipal Income ETF
SCHEDULE OF PORTFOLIO INVESTMENTS
AS OF FEBRUARY 28, 2021 (continued)
| | | | | | | | |
| INVESTMENTS | | PRINCIPAL
AMOUNT ($) | | | VALUE ($) | |
Municipal Bonds — continued | | | | | | | | |
|
Massachusetts — continued | |
| | |
Massachusetts Clean Water Trust (The) | | | | | | | | |
| | |
Rev., 5.00%, 8/1/2021 | | | 320,000 | | | | 326,474 | |
| | |
Series 2012B, Rev., 5.00%, 8/1/2021 | | | 80,000 | | | | 81,618 | |
| | |
Series 2017, Rev., 5.00%, 8/1/2021 | | | 210,000 | | | | 214,204 | |
| | |
Rev., 5.00%, 8/1/2022 | | | 25,000 | | | | 26,716 | |
| | |
Series 2012B, Rev., 5.00%, 8/1/2022 | | | 25,000 | | | | 26,715 | |
| | |
Massachusetts Development Finance Agency, Boston University Issue Series 2019DD-1, Rev., 5.00%, 4/1/2024 (c) | | | 475,000 | | | | 528,713 | |
| | |
Massachusetts Development Finance Agency, Broad Institute | | | | | | | | |
| | |
Rev., 5.00%, 4/1/2021 | | | 805,000 | | | | 808,148 | |
| | |
Series 2011A, Rev., 5.00%, 4/1/2021 (b) | | | 245,000 | | | | 245,960 | |
| | |
Series 2011A, Rev., 5.25%, 4/1/2021 (b) | | | 75,000 | | | | 75,309 | |
| | |
Massachusetts Development Finance Agency, Caregroup Series 2016-I, Rev., 5.00%, 7/1/2021 | | | 165,000 | | | | 167,543 | |
| | |
Massachusetts Development Finance Agency, College of the Holy Cross Series 2016A, Rev., 5.00%, 9/1/2021 | | | 20,000 | | | | 20,479 | |
| | |
Massachusetts Development Finance Agency, Harvard University | | | | | | | | |
| | |
Series 2016A, Rev., 5.00%, 7/15/2021 | | | 45,000 | | | | 45,814 | |
| | |
Series A, Rev., 5.00%, 12/15/2021 | | | 240,000 | | | | 249,238 | |
| | |
Series 2016A, Rev., 5.00%, 7/15/2022 | | | 30,000 | | | | 32,002 | |
| | |
Massachusetts Development Finance Agency, Mount Holyoke College Issue Series 2011B, Rev., 5.00%, 7/1/2021 (b) | | | 420,000 | | | | 426,615 | |
| | |
Massachusetts Development Finance Agency, Multi-Family, Lyman Terrace Phase II Issue Rev., 1.39%, 2/1/2022 (c) | | | 459,000 | | | | 463,434 | |
| | |
Massachusetts Development Finance Agency, Partners Healthcare System Issue | | | | | | | | |
| | |
Rev., 5.00%, 7/1/2021 (b) | | | 125,000 | | | | 126,969 | |
| | |
Series 2011K-6, Rev., 5.00%, 7/1/2021 | | | 150,000 | | | | 152,358 | |
| | |
Series 2012L, Rev., 5.00%, 7/1/2021 | | | 75,000 | | | | 76,179 | |
| | | | | | | | |
| INVESTMENTS | | PRINCIPAL
AMOUNT ($) | | | VALUE ($) | |
| | | | | | | | |
|
Massachusetts — continued | |
| | |
Series 2014M-4, Rev., 5.00%, 7/1/2021 | | | 25,000 | | | | 25,393 | |
| | |
Rev., 5.00%, 7/1/2022 | | | 25,000 | | | | 26,572 | |
| | |
Series 2017S, Rev., (SIFMA Municipal Swap Index Yield + 0.50%), 0.53%, 1/26/2023 (e) | | | 250,000 | | | | 250,320 | |
| | |
Series 2017S-4, Rev., 5.00%, 1/25/2024 (c) | | | 200,000 | | | | 226,326 | |
| | |
Massachusetts Development Finance Agency, Umass Memorial Health Care Obligated Group Issue | | | | | | | | |
| | |
Series 2016-I, Rev., 5.00%, 7/1/2021 | | | 100,000 | | | | 101,436 | |
| | |
Series I, Rev., 5.00%, 7/1/2022 | | | 245,000 | | | | 259,061 | |
| | |
Massachusetts Development Finance Agency, Whitehead Institute for Biomedical Research Issue Series 2011A, Rev., 5.00%, 6/1/2021 (b) | | | 785,000 | | | | 794,051 | |
| | |
Massachusetts Development Finance Agency, Williams College | | | | | | | | |
| | |
Series 2011N, Rev., 1.45%, 7/1/2021 (c) | | | 95,000 | | | | 95,370 | |
| | |
Series 2013P, Rev., 5.00%, 7/1/2022 | | | 100,000 | | | | 106,402 | |
| | |
Massachusetts Health and Educational Facilities Authority, Massachusetts Institute of Technology Series M, Rev., 5.25%, 7/1/2021 | | | 35,000 | | | | 35,597 | |
| | |
Massachusetts Housing Finance Agency Series C2, Rev., FHA, 0.40%, 12/1/2022 | | | 100,000 | | | | 100,130 | |
| | |
Massachusetts Housing Finance Agency, Multi-Family Conduit, Chestnut Park Project Series 2018A, Rev., 2.40%, 12/1/2021 (c) | | | 100,000 | | | | 101,680 | |
| | |
Massachusetts Housing Finance Agency, Single Family Housing Series 215, Rev., GNMA/FNMA/FHLMC, 0.75%, 12/1/2021 | | | 100,000 | | | | 100,425 | |
| | |
Massachusetts School Building Authority, Sales Tax | | | | | | | | |
| | |
Series 2013A, Rev., 5.00%, 5/15/2021 (b) | | | 45,000 | | | | 45,444 | |
| | |
Series 2012A, Rev., 5.00%, 8/15/2021 | | | 235,000 | | | | 240,168 | |
| | |
Series 2011B, Rev., 4.00%, 10/15/2021 | | | 150,000 | | | | 153,583 | |
| | |
Series 2011B, Rev., 5.00%, 10/15/2021 (b) | | | 835,000 | | | | 860,153 | |
SEE NOTES TO FINANCIAL STATEMENTS.
| | | | | | |
| | | |
| 228 | | | | J.P. MORGAN EXCHANGE-TRADED FUNDS | | FEBRUARY 28, 2021 |
| | | | | | | | |
| INVESTMENTS | | PRINCIPAL
AMOUNT ($) | | | VALUE ($) | |
Municipal Bonds — continued | | | | | | | | |
|
Massachusetts — continued | |
| | |
Series 2012A, Rev., 5.00%, 8/15/2022 (b) | | | 290,000 | | | | 310,330 | |
| | |
Series 2012B, Rev., 5.00%, 8/15/2022 (b) | | | 65,000 | | | | 69,583 | |
| | |
Massachusetts State College Building Authority | | | | | | | | |
| | |
Series 2003B, Rev., AGC, Zero Coupon, 5/1/2021 | | | 200,000 | | | | 199,892 | |
| | |
Series 2012A, Rev., 4.00%, 5/1/2021 (b) | | | 25,000 | | | | 25,158 | |
| | |
Series 2011A, Rev., 5.00%, 5/1/2021 (b) | | | 105,000 | | | | 105,838 | |
| | |
Series 2014A, Rev., 5.00%, 5/1/2021 (b) | | | 25,000 | | | | 25,200 | |
| | |
Series 2014B, Rev., 5.00%, 5/1/2021 (b) | | | 55,000 | | | | 55,439 | |
| | |
Series 2012A, Rev., 5.00%, 5/1/2022 (b) | | | 75,000 | | | | 79,237 | |
| | |
Series 2012B, Rev., 5.00%, 5/1/2022 (b) | | | 20,000 | | | | 21,130 | |
| | |
Massachusetts Water Resources Authority | | | | | | | | |
| | |
Series 2011B, Rev., 5.00%, 8/1/2021 (b) | | | 125,000 | | | | 127,518 | |
| | |
Series 2011C, Rev., 5.00%, 8/1/2021 (b) | | | 310,000 | | | | 316,243 | |
| | |
Series 2014F, Rev., 5.00%, 8/1/2021 | | | 220,000 | | | | 224,422 | |
| | |
Series 2002J, Rev., AGM, 5.50%, 8/1/2021 | | | 105,000 | | | | 107,328 | |
| | |
Series 2017C, Rev., 5.00%, 8/1/2022 | | | 30,000 | | | | 32,050 | |
| | |
Metrowest Regional Transit Authority Rev., RAN, 1.50%, 9/17/2021 | | | 4,770,000 | | | | 4,798,525 | |
| | |
Minuteman Regional Vocational Technical School District GO, 5.00%, 10/15/2022 | | | 25,000 | | | | 26,961 | |
| | |
Onset Fire District GO, 5.00%, 10/15/2022 | | | 55,000 | | | | 59,201 | |
| | |
Southeastern Regional Transit Authority Rev., RAN, 1.25%, 8/20/2021 | | | 2,850,000 | | | | 2,860,944 | |
| | |
Springfield Water and Sewer Commission | | | | | | | | |
| | |
Series 2017B, Rev., 3.00%, 4/15/2021 | | | 25,000 | | | | 25,085 | |
| | |
Series 2017B, Rev., 5.00%, 4/15/2022 | | | 50,000 | | | | 52,653 | |
| | |
Series 2014C, Rev., 5.00%, 7/15/2022 | | | 35,000 | | | | 37,282 | |
| | | | | | | | |
| INVESTMENTS | | PRINCIPAL
AMOUNT ($) | | | VALUE ($) | |
| | | | | | | | |
|
Massachusetts — continued | |
| | |
Town of Andover, Municipal Purpose Loan GO, 3.00%, 9/15/2021 | | | 20,000 | | | | 20,308 | |
| | |
Town of Arlington, Municipal Purpose Loan GO, 4.00%, 11/1/2021 | | | 30,000 | | | | 30,766 | |
| | |
Town of Ashland, Municipal Purpose Loan GO, 5.00%, 5/15/2021 | | | 20,000 | | | | 20,197 | |
| | |
Town of Bedford GO, 5.00%, 8/15/2022 | | | 25,000 | | | | 26,759 | |
| | |
Town of Bellingham GO, 4.00%, 3/15/2021 | | | 20,000 | | | | 20,028 | |
| | |
Town of Belmont, Municipal Purpose Loan GO, 3.00%, 3/15/2021 | | | 95,000 | | | | 95,099 | |
| | |
Town of Belmont, Unlimited Tax GO, 5.00%, 8/15/2022 | | | 25,000 | | | | 26,759 | |
| | |
Town of Billerica, Municipal Purpose Loan GO, 5.00%, 5/15/2021 | | | 45,000 | | | | 45,444 | |
| | |
Town of Bolton, Unlimited Tax GO, 4.00%, 4/1/2021 | | | 20,000 | | | | 20,062 | |
| | |
Town of Bourne, Municipal Purpose Loan | | | | | | | | |
| | |
GO, 5.00%, 11/15/2021 | | | 20,000 | | | | 20,684 | |
| | |
GO, 5.00%, 12/1/2021 | | | 45,000 | | | | 46,636 | |
| | |
Town of Braintree, Municipal Purpose Loan GO, 3.50%, 10/15/2021 | | | 45,000 | | | | 45,939 | |
| | |
Town of Burlington, Municipal Purpose Loan GO, 5.00%, 7/15/2021 | | | 70,000 | | | | 71,259 | |
| | |
Town of Charlton GO, BAN, 1.13%, 5/28/2021 | | | 3,007,000 | | | | 3,011,029 | |
| | |
Town of Chelmsford | | | | | | | | |
| | |
GO, 5.00%, 4/1/2021 | | | 65,000 | | | | 65,255 | |
| | |
GO, 5.00%, 4/1/2022 | | | 20,000 | | | | 21,049 | |
| | |
Town of Chelmsford, Municipal Purpose Loan | | | | | | | | |
| | |
GO, 4.00%, 4/15/2021 | | | 20,000 | | | | 20,092 | |
| | |
GO, 5.00%, 6/15/2021 | | | 140,000 | | | | 141,949 | |
| | |
Town of Concord, Municipal Purpose Loan GO, 5.00%, 6/15/2021 | | | 30,000 | | | | 30,418 | |
| | |
Town of Dedham GO, BAN, 1.13%, 5/12/2021 | | | 1,000,000 | | | | 1,001,150 | |
| | |
Town of Dedham, Municipal Purpose Loan GO, 5.00%, 6/1/2021 | | | 45,000 | | | | 45,541 | |
| | |
Town of Dracut Series A, GO, 5.00%, 7/15/2021 | | | 25,000 | | | | 25,447 | |
| | |
Town of Dracut, Municipal Purpose Loan GO, 5.00%, 9/15/2021 | | | 25,000 | | | | 25,649 | |
| | |
Town of Eastham, Municipal Purpose Loan GO, 5.00%, 11/1/2021 | | | 30,000 | | | | 30,957 | |
| | |
Town of Easton, Municipal Purpose Loan GO, 4.00%, 8/1/2021 | | | 25,000 | | | | 25,393 | |
SEE NOTES TO FINANCIAL STATEMENTS.
| | | | | | | | |
| | | |
| FEBRUARY 28, 2021 | | J.P. MORGAN EXCHANGE-TRADED FUNDS | | | | | 229 | |
JPMorgan Ultra-Short Municipal Income ETF
SCHEDULE OF PORTFOLIO INVESTMENTS
AS OF FEBRUARY 28, 2021 (continued)
| | | | | | | | |
| INVESTMENTS | | PRINCIPAL
AMOUNT ($) | | | VALUE ($) | |
Municipal Bonds — continued | | | | | | | | |
|
Massachusetts — continued | |
| | |
Town of Falmouth, Municipal Purpose Loan Series 2014A, GO, 4.00%, 7/15/2021 | | | 30,000 | | | | 30,429 | |
| | |
Town of Foxborough, Municipal Purpose Loan GO, 5.00%, 3/15/2021 | | | 100,000 | | | | 100,176 | |
| | |
Town of Franklin | | | | | | | | |
| | |
GO, 4.00%, 3/1/2021 | | | 45,000 | | | | 45,000 | |
| | |
GO, 4.00%, 3/1/2022 | | | 30,000 | | | | 31,154 | |
| | |
Town of Franklin, Municipal Purpose Loan GO, 5.00%, 8/15/2021 | | | 135,000 | | | | 137,975 | |
| | |
Town of Grafton, Municipal Purpose Loan GO, 5.00%, 4/1/2021 | | | 80,000 | | | | 80,313 | |
| | |
Town of Grafton, School Unlimited Tax GO, 4.00%, 4/1/2021 | | | 45,000 | | | | 45,140 | |
| | |
Town of Great Barrington, Municipal Purpose GO, 4.00%, 6/15/2022 | | | 25,000 | | | | 26,223 | |
| | |
Town of Hamilton GO, BAN, 1.25%, 8/27/2021 | | | 667,767 | | | | 670,505 | |
| | |
Town of Hanover GO, 4.00%, 5/15/2021 | | | 105,000 | | | | 105,815 | |
| | |
Town of Hanover, Municipal Purpose Loan | | | | | | | | |
| | |
GO, 5.00%, 5/15/2021 | | | 35,000 | | | | 35,343 | |
| | |
GO, 4.00%, 9/1/2021 | | | 45,000 | | | | 45,856 | |
| | |
Town of Harwich, Municipal Purpose Loan GO, 4.00%, 10/1/2021 | | | 25,000 | | | | 25,561 | |
| | |
Town of Holden, Municipal Purpose Loan GO, 5.00%, 6/15/2021 | | | 35,000 | | | | 35,484 | |
| | |
Town of Holliston, Municipal Purpose Loan | | | | | | | | |
| | |
GO, 5.00%, 4/1/2021 | | | 50,000 | | | | 50,196 | |
| | |
GO, 5.00%, 4/1/2022 | | | 20,000 | | | | 21,049 | |
| | |
Town of Hull, Municipal Purpose Loan GO, 2.00%, 8/15/2021 | | | 25,000 | | | | 25,211 | |
| | |
Town of Lexington GO, 4.00%, 2/1/2022 | | | 40,000 | | | | 41,406 | |
| | |
Town of Lexington, Municipal Purpose Loan | | | | | | | | |
| | |
GO, 4.00%, 2/15/2022 | | | 25,000 | | | | 25,916 | |
| | |
GO, 4.00%, 6/15/2022 | | | 20,000 | | | | 20,986 | |
| | |
Town of Littleton, Municipal Purpose Loan GO, 4.00%, 3/15/2021 | | | 25,000 | | | | 25,035 | |
| | |
Town of Longmeadow GO, 5.00%, 6/1/2021 | | | 20,000 | | | | 20,241 | |
| | |
Town of Lunenburg, Municipal Purpose Loan GO, 4.00%, 6/1/2021 | | | 150,000 | | | | 150,435 | |
| | |
Town of Mansfield, Municipal Purpose Loan GO, 5.00%, 5/15/2021 | | | 20,000 | | | | 20,194 | |
| | | | | | | | |
| INVESTMENTS | | PRINCIPAL
AMOUNT ($) | | | VALUE ($) | |
| | | | | | | | |
|
Massachusetts — continued | |
| | |
Town of Marblehead GO, 4.00%, 8/15/2023 | | | 50,000 | | | | 50,856 | |
| | |
Town of Marblehead, Municipal Purpose Loan | | | | | | | | |
| | |
GO, 5.00%, 7/15/2021 | | | 75,000 | | | | 76,349 | |
| | |
GO, 5.00%, 8/1/2021 | | | 30,000 | | | | 30,604 | |
| | |
GO, 5.00%, 7/15/2022 | | | 35,000 | | | | 37,321 | |
| | |
Town of Marshfield, Municipal Purpose Loan | | | | | | | | |
| | |
GO, 5.00%, 7/15/2021 | | | 20,000 | | | | 20,360 | |
| | |
GO, 5.25%, 7/15/2021 | | | 20,000 | | | | 20,378 | |
| | |
Town of Mendon, Municipal Purpose Loan GO, 3.00%, 2/15/2022 | | | 50,000 | | | | 51,342 | |
| | |
Town of Merrimac, Municipal Purpose Loan GO, 5.00%, 9/15/2021 | | | 25,000 | | | | 25,647 | |
| | |
Town of Nantucket, Municipal Purpose Loan GO, 5.00%, 12/1/2021 | | | 35,000 | | | | 36,273 | |
| | |
Town of North Attleborough, Municipal Purpose Loan GO, 4.00%, 5/15/2021 | | | 50,000 | | | | 50,392 | |
| | |
Town of North Reading, Municipal Purpose Loan | | | | | | | | |
| | |
GO, 5.00%, 5/15/2021 | | | 50,000 | | | | 50,494 | |
| | |
GO, 5.00%, 5/15/2022 | | | 75,000 | | | | 79,369 | |
| | |
Town of Norwood GO, 4.00%, 8/15/2021 | | | 20,000 | | | | 20,350 | |
| | |
Town of Oak Bluffs, Municipal Purpose Loan GO, 5.00%, 9/1/2021 | | | 25,000 | | | | 25,600 | |
| | |
Town of Orleans, Municipal Purpose Loan | | | | | | | | |
| | |
GO, 5.00%, 9/15/2021 | | | 90,000 | | | | 92,348 | |
| | |
GO, 5.00%, 2/1/2022 | | | 30,000 | | | | 31,331 | |
| | |
Town of Pembroke GO, 5.00%, 8/1/2021 | | | 50,000 | | | | 51,007 | |
| | |
Town of Plymouth GO, 4.00%, 5/15/2021 | | | 20,000 | | | | 20,157 | |
| | |
Town of Plymouth, Municipal Purpose Loan GO, 5.00%, 5/1/2021 | | | 25,000 | | | | 25,199 | |
| | |
Town of Randolph, Municipal Purpose Loan GO, 3.00%, 4/15/2021 | | | 45,000 | | | | 45,154 | |
| | |
Town of Reading, Municipal Purpose Loan | | | | | | | | |
| | |
GO, 3.00%, 4/15/2021 | | | 25,000 | | | | 25,087 | |
| | |
GO, 4.00%, 6/15/2022 | | | 20,000 | | | | 20,989 | |
| | |
Town of Salisbury, Municipal Purpose Loan GO, 4.00%, 8/1/2022 | | | 25,000 | | | | 26,359 | |
| | |
Town of Scituate, Municipal Purpose Loan GO, 5.00%, 9/15/2021 | | | 20,000 | | | | 20,524 | |
SEE NOTES TO FINANCIAL STATEMENTS.
| | | | | | |
| | | |
| 230 | | | | J.P. MORGAN EXCHANGE-TRADED FUNDS | | FEBRUARY 28, 2021 |
| | | | | | | | |
| INVESTMENTS | | PRINCIPAL
AMOUNT ($) | | | VALUE ($) | |
Municipal Bonds — continued | | | | | | | | |
|
Massachusetts — continued | |
| | |
Town of Shrewsbury, Municipal Purpose Loan | | | | | | | | |
| | |
GO, 5.00%, 7/1/2021 | | | 60,000 | | | | 60,965 | |
| | |
GO, 5.00%, 7/15/2021 | | | 30,000 | | | | 30,540 | |
| | |
Town of South Hadley, Municipal Purpose Loan Series 2013A, GO, 3.00%, 5/15/2021 | | | 150,000 | | | | 150,859 | |
| | |
Town of Stockbridge, Highway Garage GO, 3.00%, 6/1/2022 | | | 40,000 | | | | 41,394 | |
| | |
Town of Stoughton, Municipal Purpose Loan GO, 5.00%, 10/15/2022 | | | 35,000 | | | | 37,667 | |
| | |
Town of Stow GO, 3.00%, 5/15/2021 | | | 50,000 | | | | 50,286 | |
| | |
Town of Tewksbury, Unlimited Tax GO, 5.00%, 6/1/2022 | | | 35,000 | | | | 37,114 | |
| | |
Town of Topsfield, Municipal Purpose Loan GO, 5.00%, 3/1/2022 | | | 35,000 | | | | 36,694 | |
| | |
Town of Walpole, Municipal Purpose Loan GO, 5.00%, 4/15/2021 | | | 25,000 | | | | 25,145 | |
| | |
Town of Watertown, Municipal Purpose Loan | | | | | | | | |
| | |
GO, 5.00%, 6/15/2021 | | | 30,000 | | | | 30,416 | |
| | |
GO, 4.00%, 1/15/2022 | | | 20,000 | | | | 20,667 | |
| | |
GO, 3.00%, 5/15/2022 | | | 30,000 | | | | 31,020 | |
| | |
Town of Wellesley, Municipal Purpose Loan | | | | | | | | |
| | |
GO, 4.00%, 12/1/2021 | | | 85,000 | | | | 87,456 | |
| | |
GO, 4.00%, 6/1/2022 | | | 35,000 | | | | 36,678 | |
| | |
Town of West Bridgewater GO, BAN, 2.00%, 11/26/2021 | | | 1,713,832 | | | | 1,734,089 | |
| | |
Town of Westborough, Municipal Purpose Loan GO, 5.00%, 8/1/2021 | | | 60,000 | | | | 61,208 | |
| | |
Town of Weston GO, 4.00%, 12/1/2022 | | | 25,000 | | | | 26,674 | |
| | |
Town of Wilmington, School GO, 5.00%, 3/15/2022 | | | 75,000 | | | | 78,772 | |
| | |
Town of Winchester, Municipal Purpose Loan GO, 5.00%, 7/1/2022 | | | 35,000 | | | | 37,255 | |
| | |
Town of Winthrop GO, 4.00%, 9/1/2021 | | | 25,000 | | | | 25,481 | |
| | |
Town of Winthrop, Municipal Purpose Loan GO, 4.00%, 3/15/2021 | | | 45,000 | | | | 45,063 | |
| | |
Town of Yarmouth, Municipal Purpose Loan GO, 5.00%, 12/15/2021 | | | 55,000 | | | | 57,095 | |
| | |
Woods Hole, Martha’s Vineyard and Nantucket Steamship Authority | | | | | | | | |
| | |
Series 2018A, Rev., GTD, 5.00%, 3/1/2021 | | | 50,000 | | | | 50,000 | |
| | |
Series 2015A, Rev., GTD, 5.00%, 3/1/2022 | | | 100,000 | | | | 104,841 | |
| | | | | | | | |
| | |
Total Massachusetts | | | | | | | 59,365,696 | |
| | | | | | | | |
| | | | | | | | |
| INVESTMENTS | | PRINCIPAL
AMOUNT ($) | | | VALUE ($) | |
| | | | | | | | |
|
Michigan — 2.8% | |
| | |
Anchor Bay School District | | | | | | | | |
| | |
GO, Q-SBLF, 5.00%, 5/1/2021 | | | 30,000 | | | | 30,231 | |
| | |
Series 2016A, GO, Q-SBLF, 5.00%, 5/1/2021 | | | 100,000 | | | | 100,771 | |
| | |
Ann Arbor School District, Unlimited Tax | | | | | | | | |
| | |
GO, Q-SBLF, 5.00%, 5/1/2021 | | | 185,000 | | | | 186,460 | |
| | |
GO, 5.00%, 5/1/2021 | | | 50,000 | | | | 50,394 | |
| | |
GO, 5.00%, 5/1/2022 | | | 45,000 | | | | 47,510 | |
| | |
GO, Q-SBLF, 5.00%, 5/1/2022 | | | 40,000 | | | | 42,231 | |
| | |
Avondale School District, Unlimited Tax GO, Q-SBLF, 5.00%, 11/1/2021 | | | 175,000 | | | | 180,642 | |
| | |
Birmingham City School District GO, 5.00%, 5/1/2022 | | | 40,000 | | | | 42,245 | |
| | |
Brighton Area School District, School Building and Site Series 2013-II, GO, Q-SBLF, 5.00%, 5/1/2022 | | | 300,000 | | | | 315,429 | |
| | |
Central Michigan University Rev., 5.00%, 10/1/2021 | | | 150,000 | | | | 154,050 | |
| | |
Charlotte Public School District GO, Q-SBLF, 5.00%, 5/1/2022 | | | 45,000 | | | | 47,423 | |
| | |
Charter Township of Canton, Limited Tax GO, 5.00%, 10/1/2022 | | | 65,000 | | | | 69,803 | |
| | |
Charter Township of Commerce, Limited Tax | | | | | | | | |
| | |
Series 2016A, GO, 4.00%, 4/1/2021 | | | 45,000 | | | | 45,134 | |
| | |
Series 2016A, GO, 5.00%, 4/1/2023 | | | 95,000 | | | | 104,143 | |
| | |
Charter Township of Lyon Series 2006-A, GO, XLCA, 4.13%, 11/1/2023 | | | 45,000 | | | | 45,286 | |
| | |
City of Ann Arbor, Sewage Disposal System Rev., 3.00%, 7/1/2022 | | | 20,000 | | | | 20,749 | |
| | |
City of Farmington Hills, Capital Improvement GO, 3.00%, 10/1/2021 | | | 20,000 | | | | 20,329 | |
| | |
City of Ferndale, Unlimited Tax GO, 3.00%, 4/1/2021 | | | 100,000 | | | | 100,225 | |
| | |
City of Grand Rapids, Capital Improvement, Limited Tax GO, 5.00%, 4/1/2024 | | | 50,000 | | | | 56,975 | |
| | |
City of Grand Rapids, Limited Tax GO, 5.00%, 5/1/2021 | | | 20,000 | | | | 20,159 | |
| | |
City of Grand Rapids, Sanitary Sewer System Rev., 5.00%, 1/1/2022 | | | 115,000 | | | | 119,608 | |
| | |
City of Grand Rapids, Water Supply System Rev., 5.00%, 1/1/2023 | | | 30,000 | | | | 32,601 | |
| | |
City of Kalamazoo, Wastewater System Rev., 3.15%, 10/1/2022 | | | 25,000 | | | | 25,376 | |
| | |
City of Lansing, Sewage Disposal System Rev., 5.00%, 5/1/2022 | | | 30,000 | | | | 31,644 | |
SEE NOTES TO FINANCIAL STATEMENTS.
| | | | | | | | |
| | | |
| FEBRUARY 28, 2021 | | J.P. MORGAN EXCHANGE-TRADED FUNDS | | | | | 231 | |
JPMorgan Ultra-Short Municipal Income ETF
SCHEDULE OF PORTFOLIO INVESTMENTS
AS OF FEBRUARY 28, 2021 (continued)
| | | | | | | | |
| INVESTMENTS | | PRINCIPAL
AMOUNT ($) | | | VALUE ($) | |
Municipal Bonds — continued | | | | | | | | |
|
Michigan — continued | |
| | |
City of Marquette, Capital Improvement | | | | | | | | |
| | |
GO, 4.00%, 5/1/2023 | | | 200,000 | | | | 214,900 | |
| | |
GO, 4.00%, 5/1/2024 | | | 210,000 | | | | 231,806 | |
| | |
GO, 4.00%, 5/1/2025 | | | 290,000 | | | | 327,909 | |
| | |
City of Marquette, Limited Tax | | | | | | | | |
| | |
GO, 4.00%, 10/1/2022 | | | 40,000 | | | | 40,843 | |
| | |
GO, 4.00%, 5/1/2023 | | | 170,000 | | | | 182,665 | |
| | |
GO, 4.00%, 5/1/2024 | | | 125,000 | | | | 137,980 | |
| | |
GO, 4.00%, 5/1/2025 | | | 105,000 | | | | 118,726 | |
| | |
City of Novi GO, 4.00%, 10/1/2021 | | | 60,000 | | | | 61,290 | |
| | |
City of Royal Oak, Capital Improvement | | | | | | | | |
| | |
GO, 4.00%, 4/1/2021 | | | 50,000 | | | | 50,149 | |
| | |
GO, 3.00%, 10/1/2021 | | | 110,000 | | | | 111,728 | |
| | |
City of Southfield, Water and Sewer Capital Improvement Limited Tax GO, 3.00%, 5/1/2023 | | | 85,000 | | | | 89,752 | |
| | |
City of Sterling Heights, Capital Improvement GO, 5.00%, 4/1/2022 | | | 45,000 | | | | 47,300 | |
| | |
City of Warren, Capital Improvement GO, AGM, 3.00%, 5/1/2022 | | | 25,000 | | | | 25,739 | |
| | |
Clarkston Community Schools | | | | | | | | |
| | |
GO, Q-SBLF, 5.00%, 5/1/2021 | | | 25,000 | | | | 25,193 | |
| | |
Series 2016A, GO, Q-SBLF, 5.00%, 5/1/2021 | | | 215,000 | | | | 216,657 | |
| | |
Cook & Thorburn Drain District GO, GTD, 3.00%, 5/1/2021 | | | 80,000 | | | | 80,354 | |
| | |
County of Barry, Medical Care Facility GO, 4.00%, 4/1/2021 | | | 50,000 | | | | 50,148 | |
| | |
County of Jackson, Transportation | | | | | | | | |
| | |
GO, 2.00%, 5/1/2022 | | | 115,000 | | | | 117,188 | |
| | |
GO, 2.00%, 5/1/2024 | | | 250,000 | | | | 261,863 | |
| | |
County of Lenawee GO, 5.00%, 5/1/2021 | | | 25,000 | | | | 25,193 | |
| | |
County of Monroe, Sewage Disposal System, Village Of Dundee, Limited Tax GO, 4.00%, 5/1/2021 | | | 105,000 | | | | 105,637 | |
| | |
County of Muskegon, Wastewater Management System No. 2 GO, 5.00%, 7/1/2022 | | | 25,000 | | | | 25,087 | |
| | |
County of Ottawa GO, 5.00%, 11/1/2021 | | | 100,000 | | | | 103,210 | |
| | |
County of Saginaw, Limited Tax GO, 4.00%, 11/1/2021 | | | 50,000 | | | | 51,230 | |
| | |
De Witt Public Schools, Unlimited Tax GO, Q-SBLF, 5.00%, 5/1/2023 | | | 50,000 | | | | 54,993 | |
| | |
Dearborn School District, Limited Tax | | | | | | | | |
| | |
GO, 3.00%, 5/1/2021 | | | 915,000 | | | | 919,054 | |
| | |
GO, 3.00%, 5/1/2022 | | | 915,000 | | | | 943,575 | |
| | | | | | | | |
| INVESTMENTS | | PRINCIPAL
AMOUNT ($) | | | VALUE ($) | |
| | | | | | | | |
|
Michigan — continued | |
| | |
Detroit City School District, School Building & Site Improvement Series 2002A, GO, FGIC, Q-SBLF, 6.00%, 5/1/2021 | | | 115,000 | | | | 116,071 | |
| | |
Dexter Community Schools GO, Q-SBLF, 4.00%, 5/1/2022 | | | 100,000 | | | | 104,439 | |
| | |
Dundee Community Schools, Unlimited Tax GO, Q-SBLF, 3.00%, 5/1/2023 | | | 50,000 | | | | 52,751 | |
| | |
East Grand Rapids Public School District Series 2018-II, GO, Q-SBLF, 4.00%, 5/1/2021 | | | 25,000 | | | | 25,157 | |
| | |
East Jordan Public Schools, Unlimited Tax Series 2017-I, GO, Q-SBLF, 3.00%, 5/1/2021 | | | 25,000 | | | | 25,117 | |
| | |
East Lansing School District Series 2020-II, GO, Q-SBLF, 4.00%, 5/1/2023 | | | 180,000 | | | | 193,815 | |
| | |
Forest Hills Public Schools, Unlimited Tax | | | | | | | | |
| | |
GO, 4.00%, 5/1/2021 | | | 20,000 | | | | 20,126 | |
| | |
GO, 5.00%, 5/1/2021 | | | 340,000 | | | | 342,696 | |
| | |
Series I, GO, 3.00%, 5/1/2022 | | | 50,000 | | | | 51,639 | |
| | |
Fraser Public School District, Schoold Building & Site GO, Q-SBLF, 2.00%, 5/1/2021 | | | 150,000 | | | | 150,408 | |
| | |
Glen Lake Community Schools GO, AGM, Q-SBLF, 4.00%, 5/1/2021 | | | 150,000 | | | | 150,434 | |
| | |
Grand Haven Area Public Schools GO, Q-SBLF, 3.00%, 5/1/2021 | | | 225,000 | | | | 226,035 | |
| | |
Grand Rapids Community College, Limited Tax GO, 3.00%, 5/1/2022 | | | 30,000 | | | | 30,919 | |
| | |
Grand Rapids Public Schools GO, AGM, 5.00%, 5/1/2022 | | | 25,000 | | | | 26,388 | |
| | |
Grand Traverse County Hospital Finance Authority, Munson Healthcare Obligated Group Series 2019A, Rev., 5.00%, 7/1/2024 | | | 130,000 | | | | 148,238 | |
| | |
Grand Valley State University | | | | | | | | |
| | |
Series 2014B, Rev., 5.00%, 12/1/2021 | | | 110,000 | | | | 113,822 | |
| | |
Series 2015A, Rev., 5.00%, 12/1/2021 | | | 200,000 | | | | 206,212 | |
| | |
Series 2016A, Rev., 5.00%, 12/1/2021 | | | 415,000 | | | | 429,417 | |
| | |
Series 2014B, Rev., 5.00%, 12/1/2023 | | | 310,000 | | | | 343,809 | |
| | |
Series 2016A, Rev., 5.00%, 12/1/2024 | | | 670,000 | | | | 770,647 | |
SEE NOTES TO FINANCIAL STATEMENTS.
| | | | | | |
| | | |
| 232 | | | | J.P. MORGAN EXCHANGE-TRADED FUNDS | | FEBRUARY 28, 2021 |
| | | | | | | | |
| INVESTMENTS | | PRINCIPAL
AMOUNT ($) | | | VALUE ($) | |
Municipal Bonds — continued | | | | | | | | |
|
Michigan — continued | |
| | |
Greenville Public Schools GO, Q-SBLF, 4.75%, 5/1/2021 (b) | | | 100,000 | | | | 100,740 | |
| | |
Grosse Ile Township School District GO, Q-SBLF, 5.00%, 5/1/2022 | | | 50,000 | | | | 52,662 | |
| | |
Grosse Pointe Public Library GO, 5.00%, 4/1/2021 | | | 50,000 | | | | 50,195 | |
| | |
Healthsource Saginaw, Inc., Unlimited Tax GO, 4.00%, 5/1/2023 | | | 50,000 | | | | 52,146 | |
| | |
Houghton-Portage Township School District Series 2016A, GO, Q-SBLF, 3.00%, 5/1/2021 | | | 25,000 | | | | 25,117 | |
| | |
Hudsonville Public Schools GO, Q-SBLF, 5.00%, 5/1/2021 (b) | | | 95,000 | | | | 95,758 | |
| | |
Huron School District, Unlimited Tax GO, Q-SBLF, 5.00%, 5/1/2022 | | | 50,000 | | | | 52,722 | |
| | |
Jenison Public Schools, State of School Building & Site GO, 5.00%, 5/1/2021 | | | 25,000 | | | | 25,197 | |
| | |
Kalamazoo Hospital Finance Authority, Bronson Healthcare Group | | | | | | | | |
| | |
Rev., 5.00%, 5/15/2023 | | | 100,000 | | | | 109,621 | |
| | |
Rev., 5.00%, 5/15/2024 | | | 100,000 | | | | 113,212 | |
| | |
Kenowa Hills Public Schools Series 2018-II, GO, Q-SBLF, 4.00%, 11/1/2022 | | | 65,000 | | | | 69,033 | |
| | |
Kent Hospital Finance Authority Series 2011A, Rev., 5.00%, 11/15/2021 (b) | | | 100,000 | | | | 103,420 | |
| | |
Kent Hospital Finance Authority, Spectrum Health System Series 2011A, Rev., 5.00%, 11/15/2021 | | | 500,000 | | | | 516,700 | |
| | |
L’Anse Creuse Public Schools | | | | | | | | |
| | |
GO, VRDO, Q-SBLF, LOC: TD Bank NA, 0.03%, 3/9/2021 (c) | | | 725,000 | | | | 725,000 | |
| | |
GO, Q-SBLF, 5.00%, 5/1/2021 | | | 125,000 | | | | 125,953 | |
| | |
Lansing Community College, Building and Site | | | | | | | | |
| | |
GO, 4.00%, 5/1/2021 | | | 25,000 | | | | 25,157 | |
| | |
GO, 5.00%, 5/1/2022 | | | 40,000 | | | | 42,217 | |
| | |
Linden Community School District GO, Q-SBLF, 5.00%, 5/1/2022 | | | 25,000 | | | | 26,391 | |
| | |
Livonia Municipal Building Authority Rev., 4.00%, 5/1/2024 | | | 40,000 | | | | 44,220 | |
| | |
Ludington Area School District GO, Q-SBLF, 5.00%, 11/1/2021 | | | 115,000 | | | | 118,550 | |
| | |
Macomb County Building Authority Rev., 2.50%, 5/1/2021 | | | 50,000 | | | | 50,191 | |
| | | | | | | | |
| INVESTMENTS | | PRINCIPAL
AMOUNT ($) | | | VALUE ($) | |
| | | | | | | | |
|
Michigan — continued | |
| | |
Macomb Interceptor Drain Drainage District, Limited Tax Series 2017A, GTD, 5.00%, 5/1/2022 | | | 25,000 | | | | 26,400 | |
| | |
Macomb Township Building Authority Rev., 5.00%, 4/1/2022 | | | 25,000 | | | | 26,252 | |
| | |
Manchester Community Schools, Unlimited Tax Series 2016A, GO, Q-SBLF, 4.00%, 5/1/2022 | | | 50,000 | | | | 52,082 | |
| | |
Meridian Public School District GO, Q-SBLF, 5.00%, 5/1/2021 | | | 75,000 | | | | 75,578 | |
| | |
Michigan Finance Authority | | | | | | | | |
| | |
Series 2016C-3, Rev., 5.00%, 4/1/2021 | | | 700,000 | | | | 702,450 | |
| | |
Rev., 5.00%, 10/1/2021 (b) | | | 25,000 | | | | 25,706 | |
| | |
Rev., 5.00%, 11/15/2021 | | | 30,000 | | | | 30,970 | |
| | |
Rev., 5.00%, 10/1/2022 (b) | | | 25,000 | | | | 26,913 | |
| | |
Series 2016C-3, Rev., 5.00%, 4/1/2023 | | | 100,000 | | | | 108,881 | |
| | |
Michigan Finance Authority, Beaumont Health | | | | | | | | |
| | |
Rev., 5.00%, 11/1/2023 | | | 225,000 | | | | 241,958 | |
| | |
Rev., 5.00%, 11/1/2026 | | | 100,000 | | | | 107,107 | |
| | |
Michigan Finance Authority, Bronson Healthcare Group, Inc. Series B, Rev., 3.50%, 11/15/2022 (c) | | | 370,000 | | | | 388,149 | |
| | |
Michigan Finance Authority, Clean Water Revolving Fund | | | | | | | | |
| | |
Rev., 5.00%, 10/1/2021 | | | 45,000 | | | | 46,266 | |
| | |
Series 2016B, Rev., 5.00%, 10/1/2024 | | | 150,000 | | | | 174,441 | |
| | |
Michigan Finance Authority, Critenton Hospital Medical Center | | | | | | | | |
| | |
Series 2012A, Rev., 5.00%, 6/1/2022 (b) | | | 25,000 | | | | 26,497 | |
| | |
Michigan Finance Authority, Detroit School District | | | | | | | | |
| | |
Series 2015A, Rev., Q-SBLF, 5.00%, 5/1/2021 | | | 50,000 | | | | 50,383 | |
| | |
Series 2015A, Rev., Q-SBLF, 5.00%, 5/1/2022 | | | 90,000 | | | | 94,878 | |
| | |
Michigan Finance Authority, Henry Ford Health System | | | | | | | | |
| | |
Rev., 5.00%, 11/15/2021 | | | 245,000 | | | | 252,918 | |
| | |
Rev., 5.00%, 11/15/2022 | | | 950,000 | | | | 1,023,739 | |
| | |
Rev., 5.00%, 11/15/2024 | | | 395,000 | | | | 458,749 | |
| | |
Michigan Finance Authority, Local Government Loan Program Rev., AGM, 5.00%, 7/1/2024 | | | 250,000 | | | | 286,408 | |
SEE NOTES TO FINANCIAL STATEMENTS.
| | | | | | | | |
| | | |
| FEBRUARY 28, 2021 | | J.P. MORGAN EXCHANGE-TRADED FUNDS | | | | | 233 | |
JPMorgan Ultra-Short Municipal Income ETF
SCHEDULE OF PORTFOLIO INVESTMENTS
AS OF FEBRUARY 28, 2021 (continued)
| | | | | | | | |
| INVESTMENTS | | PRINCIPAL
AMOUNT ($) | | | VALUE ($) | |
Municipal Bonds — continued | | | | | | | | |
|
Michigan — continued | |
| | |
Michigan Finance Authority, McLaren Health Care Corp. | | | | | | | | |
| | |
Series 20105A, Rev., 5.00%, 5/15/2022 | | | 400,000 | | | | 422,252 | |
| | |
Series 2012A, Rev., 5.00%, 6/1/2025 | | | 100,000 | | | | 105,433 | |
| | |
Michigan Finance Authority, Mid Michigan Health Rev., 4.00%, 6/1/2024 (b) | | | 540,000 | | | | 599,503 | |
| | |
Michigan Finance Authority, Sparrow Obligated Group Rev., 4.00%, 11/15/2021 | | | 25,000 | | | | 25,633 | |
| | |
Michigan Finance Authority, Trinity Health Credit Group | | | | | | | | |
| | |
Rev., 5.00%, 12/1/2021 | | | 570,000 | | | | 590,463 | |
| | |
Series 2015MI, Rev., 5.00%, 12/1/2021 | | | 355,000 | | | | 367,744 | |
| | |
Series 2016MI-2, Rev., (SIFMA Municipal Swap Index Yield + 0.48%), 0.51%, 2/1/2022 (e) | | | 145,000 | | | | 145,139 | |
| | |
Rev., 5.00%, 12/1/2022 (b) | | | 150,000 | | | | 162,497 | |
| | |
Series 2017A-MI, Rev., 5.00%, 12/1/2022 | | | 615,000 | | | | 666,236 | |
| | |
Series 2017A, Rev., 5.00%, 12/1/2023 | | | 295,000 | | | | 331,890 | |
| | |
Series 2019MI-1, Rev., 5.00%, 12/1/2023 | | | 100,000 | | | | 112,505 | |
| | |
Series 2017A, Rev., 5.00%, 12/1/2024 | | | 240,000 | | | | 279,626 | |
| | |
Series 2019MI-2, Rev., 5.00%, 2/1/2025 (c) | | | 660,000 | | | | 767,309 | |
| | |
Michigan State Building Authority, Facilities Program | | | | | | | | |
| | |
Series I, Rev., 5.00%, 4/15/2021 | | | 150,000 | | | | 150,870 | |
| | |
Rev., 5.00%, 10/15/2021 | | | 100,000 | | | | 103,008 | |
| | |
Series 2011II-A, Rev., 5.00%, 10/15/2021 (b) | | | 100,000 | | | | 103,014 | |
| | |
Series 2016-I, Rev., 5.00%, 10/15/2021 | | | 50,000 | | | | 51,504 | |
| | |
Series 2011I-A, Rev., 5.13%, 10/15/2021 (b) | | | 1,500,000 | | | | 1,546,380 | |
| | |
Series 2011I-A, Rev., 5.20%, 10/15/2021 (b) | | | 150,000 | | | | 154,707 | |
| | |
Series 2011I-A, Rev., 5.50%, 10/15/2021 (b) | | | 170,000 | | | | 175,651 | |
| | |
Michigan State Building Authority, Multi Modal Program Rev., VRDO, 0.10%, 3/9/2021 (c) | | | 5,235,000 | | | | 5,235,000 | |
| | | | | | | | |
| INVESTMENTS | | PRINCIPAL
AMOUNT ($) | | | VALUE ($) | |
| | | | | | | | |
|
Michigan — continued | |
| | |
Michigan State Hospital Finance Authority, Ascension Health Credit Group | | | | | | | | |
| | |
Series 2010F-2, Rev., 1.90%, 4/1/2021 (c) | | | 750,000 | | | | 751,035 | |
| | |
Series 2005A-3, Rev., 4.00%, 11/1/2021 | | | 875,000 | | | | 896,866 | |
| | |
Series F-5, Rev., 2.40%, 3/15/2023 (c) | | | 305,000 | | | | 317,420 | |
| | |
Series 2010 F-1, Rev., 4.00%, 6/1/2023 (c) | | | 50,000 | | | | 54,009 | |
| | |
Series 2005A-3, Rev., 4.00%, 11/1/2023 | | | 100,000 | | | | 109,423 | |
| | |
Series 2005A-3, Rev., 4.00%, 11/1/2024 | | | 50,000 | | | | 56,167 | |
| | |
Michigan State Hospital Finance Authority, Trinity Health Credit Group | | | | | | | | |
| | |
Rev., 4.00%, 6/1/2022 (b) | | | 100,000 | | | | 104,744 | |
| | |
Rev., 5.00%, 6/1/2022 (b) | | | 185,000 | | | | 196,080 | |
| | |
Series 2008C, Rev., 5.00%, 12/1/2024 | | | 255,000 | | | | 297,103 | |
| | |
Series C, Rev., 5.00%, 12/1/2025 | | | 150,000 | | | | 180,373 | |
| | |
Michigan State Housing Development Authority, Single Family Mortgage | | | | | | | | |
| | |
Series 2019B, Rev., 1.40%, 6/1/2021 | | | 160,000 | | | | 160,422 | |
| | |
Series 2018A, Rev., 2.20%, 6/1/2022 | | | 25,000 | | | | 25,538 | |
| | |
Michigan State University | | | | | | | | |
| | |
Series 2019C, Rev., 5.00%, 8/15/2021 | | | 125,000 | | | | 127,720 | |
| | |
Series 2019C, Rev., 5.00%, 8/15/2022 | | | 155,000 | | | | 165,763 | |
| | |
Series 2020A, Rev., 5.00%, 8/15/2022 | | | 25,000 | | | | 26,736 | |
| | |
Michigan Strategic Fund, Rare isotope Beams Project | | | | | | | | |
| | |
Rev., 5.00%, 3/1/2021 | | | 50,000 | | | | 50,000 | |
| | |
Rev., 5.00%, 3/1/2022 | | | 150,000 | | | | 157,170 | |
| | |
Michigan Strategic Fund, The Detroit Edison Co. | | | | | | | | |
| | |
Series 2008ET-2, Rev., 1.45%, 9/1/2021 (c) | | | 290,000 | | | | 291,641 | |
| | |
Series CC, Rev., 1.45%, 9/1/2021 (c) | | | 300,000 | | | | 301,698 | |
| | |
Midland Public Schools, Unlimited Tax Series 2019-II, GO, Q-SBLF, 4.00%, 5/1/2021 | | | 20,000 | | | | 20,121 | |
SEE NOTES TO FINANCIAL STATEMENTS.
| | | | | | |
| | | |
| 234 | | | | J.P. MORGAN EXCHANGE-TRADED FUNDS | | FEBRUARY 28, 2021 |
| | | | | | | | |
| INVESTMENTS | | PRINCIPAL
AMOUNT ($) | | | VALUE ($) | |
Municipal Bonds — continued | | | | | | | | |
|
Michigan — continued | |
| | |
Milan Area Schools GO, Q-SBLF, 5.00%, 5/1/2022 | | | 20,000 | | | | 21,065 | |
| | |
Mount Clemens Community School District Series 2017A, GO, Q-SBLF, 5.00%, 5/1/2022 | | | 50,000 | | | | 52,801 | |
| | |
Mount Pleasant School District Series 2016-I, GO, 4.00%, 5/1/2022 | | | 50,000 | | | | 52,202 | |
| | |
Muskegon Local Development Finance Authority Rev., AGM, GTD, 3.00%, 11/1/2022 | | | 50,000 | | | | 50,687 | |
| | |
New Buffalo Area Schools GO, 2.50%, 11/1/2021 | | | 100,000 | | | | 101,431 | |
| | |
New Haven Community Schools, Unlimited Tax GO, Q-SBLF, 5.00%, 5/1/2022 | | | 25,000 | | | | 26,406 | |
| | |
North Gratiot Interceptor-Lenox Local Drain Drainage District GO, GTD, 5.00%, 5/1/2021 | | | 60,000 | | | | 60,476 | |
| | |
North Kent Sewer Authority, State of Michigan, Sanitary Sewer System, Limited Tax of Constituent Municipalities Rev., 4.00%, 11/1/2022 | | | 50,000 | | | | 53,163 | |
| | |
Northville Public Schools, School Building and Site Series 2020-III, GO, 4.00%, 5/1/2025 | | | 30,000 | | | | 34,001 | |
| | |
Northwestern Michigan College, Community College Facilities, Limited Tax GO, 3.25%, 5/1/2021 | | | 35,000 | | | | 35,177 | |
| | |
Novi Community School District, School Building and Site Series I, GO, 4.00%, 5/1/2021 | | | 25,000 | | | | 25,157 | |
| | |
Novi Community School District, School Building and Site, Unlimited Tax Series II, GO, 4.00%, 5/1/2021 | | | 25,000 | | | | 25,157 | |
| | |
Oakland County Building Authority, Limited Tax Series 2020A, Rev., 5.00%, 11/1/2022 | | | 35,000 | | | | 37,795 | |
| | |
Plymouth-Canton Community School District GO, Q-SBLF, 5.00%, 5/1/2023 | | | 45,000 | | | | 49,525 | |
| | |
Port Huron Area School District, School Building and Site GO, Q-SBLF, 5.00%, 5/1/2021 (b) | | | 40,000 | | | | 40,316 | |
| | |
Royal Oak Hospital Finance Authority, William Beaumont Hospital Obligated Group | | | | | | | | |
| | |
Series 2014D, Rev., 5.00%, 9/1/2021 | | | 260,000 | | | | 266,014 | |
| | |
Rev., 5.00%, 9/1/2023 | | | 410,000 | | | | 456,170 | |
| | | | | | | | |
| INVESTMENTS | | PRINCIPAL
AMOUNT ($) | | | VALUE ($) | |
| | | | | | | | |
|
Michigan — continued | |
| | |
Royal Oak School District, School Building and Site, Unlimited Tax | | | | | | | | |
| | |
GO, 4.00%, 5/1/2022 | | | 55,000 | | | | 57,441 | |
| | |
GO, 5.00%, 5/1/2022 | | | 75,000 | | | | 79,201 | |
| | |
Saginaw Township Community School District, Unlimited Tax GO, Q-SBLF, 4.00%, 5/1/2021 | | | 50,000 | | | | 50,315 | |
| | |
Saginaw Valley State University Series 2016A, Rev., 5.00%, 7/1/2021 | | | 570,000 | | | | 578,767 | |
| | |
Sault Ste Marie Area Public Schools, School Building and Site, Unlimited Tax GO, Q-SBLF, 3.00%, 5/1/2022 | | | 55,000 | | | | 56,718 | |
| | |
Schoolcraft Community College District, Limited Tax GO, 3.00%, 5/1/2024 | | | 115,000 | | | | 123,799 | |
| | |
South Lake Schools, School Building and Site GO, Q-SBLF, 4.00%, 11/1/2024 | | | 25,000 | | | | 27,443 | |
| | |
South Redford School District GO, Q-SBLF, 5.00%, 5/1/2021 | | | 25,000 | | | | 25,193 | |
| | |
State of Michigan Rev., GAN, 5.00%, 3/15/2021 | | | 415,000 | | | | 415,706 | |
| | |
State of Michigan Comprehensive Transportation Rev., AGM, 5.25%, 5/15/2021 | | | 20,000 | | | | 20,201 | |
| | |
State of Michigan, Environmental Program | | | | | | | | |
| | |
Series 2016B, GO, 5.00%, 11/1/2021 | | | 150,000 | | | | 154,815 | |
| | |
Series 2011A, GO, 5.00%, 12/1/2021 | | | 45,000 | | | | 46,626 | |
| | |
Series 2015A, GO, 5.00%, 12/1/2021 | | | 55,000 | | | | 56,987 | |
| | |
Series 2016A, GO, 5.00%, 12/1/2021 | | | 125,000 | | | | 129,516 | |
| | |
State of Michigan, Trunk Line Fund | | | | | | | | |
| | |
Rev., 5.00%, 11/15/2021 | | | 585,000 | | | | 604,878 | |
| | |
Rev., 5.00%, 11/15/2022 | | | 400,000 | | | | 432,692 | |
| | |
Township of Scio, Limited Tax GO, 3.00%, 11/1/2021 | | | 20,000 | | | | 20,359 | |
| | |
Township of Spring Arbor, Unlimited Tax GO, 3.00%, 5/1/2021 | | | 100,000 | | | | 100,452 | |
| | |
Troy School District, School Building and Site | | | | | | | | |
| | |
GO, Q-SBLF, 5.00%, 5/1/2021 | | | 220,000 | | | | 221,745 | |
| | |
GO, Q-SBLF, 5.00%, 5/1/2022 | | | 45,000 | | | | 47,520 | |
| | |
Troy School District, Unlimited Tax GO, Q-SBLF, 5.00%, 5/1/2021 | | | 90,000 | | | | 90,714 | |
SEE NOTES TO FINANCIAL STATEMENTS.
| | | | | | | | |
| | | |
| FEBRUARY 28, 2021 | | J.P. MORGAN EXCHANGE-TRADED FUNDS | | | | | 235 | |
JPMorgan Ultra-Short Municipal Income ETF
SCHEDULE OF PORTFOLIO INVESTMENTS
AS OF FEBRUARY 28, 2021 (continued)
| | | | | | | | |
| INVESTMENTS | | PRINCIPAL
AMOUNT ($) | | | VALUE ($) | |
Municipal Bonds — continued | | | | | | | | |
|
Michigan — continued | |
| | |
University of Michigan | | | | | | | | |
| | |
Rev., 5.00%, 4/1/2021 | | | 25,000 | | | | 25,098 | |
| | |
Series 2014A, Rev., 5.00%, 4/1/2021 | | | 25,000 | | | | 25,098 | |
| | |
Utica Community Schools, School Building and Site GO, Q-SBLF, 4.00%, 5/1/2021 | | | 35,000 | | | | 35,217 | |
| | |
Walled Lake Consolidated School District GO, Q-SBLF, 5.00%, 11/1/2023 (b) | | | 45,000 | | | | 50,607 | |
| | |
Warren Consolidated Schools, Unlimited Tax GO, Q-SBLF, 4.00%, 5/1/2022 | | | 100,000 | | | | 104,164 | |
| | |
Wayne State University Series 2019A, Rev., 5.00%, 11/15/2024 | | | 210,000 | | | | 243,054 | |
| | |
West Bloomfield School District, Unlimited Tax School Building and Site GO, AGM, 5.00%, 5/1/2022 | | | 25,000 | | | | 26,361 | |
| | |
West Ottawa Public Schools, School Building and Site | | | | | | | | |
| | |
Series 2018-II, GO, 5.00%, 11/1/2021 | | | 50,000 | | | | 51,605 | |
| | |
Series 2014-1, GO, 5.00%, 5/1/2022 | | | 40,000 | | | | 42,240 | |
| | |
West Ottawa Public Schools, School Building and Site, Unlimited Tax | | | | | | | | |
| | |
GO, 4.00%, 5/1/2021 | | | 50,000 | | | | 50,315 | |
| | |
GO, 4.00%, 5/1/2023 | | | 20,000 | | | | 21,589 | |
| | |
Western Michigan University, Tax Exempt Rev., 5.00%, 11/15/2021 | | | 95,000 | | | | 98,105 | |
| | |
Western Township Utilities Authority, Sewage Disposal System, Limited Tax Rev., GTD, 5.00%, 1/1/2022 | | | 60,000 | | | | 62,270 | |
| | |
Westwood Heights Schools, 2018 School Improvement, Limited Tax GO, 3.00%, 5/1/2021 | | | 100,000 | | | | 100,362 | |
| | |
Wyandotte City School District, School Building and Site, Unlimited Tax GO, Q-SBLF, 5.00%, 5/1/2022 | | | 45,000 | | | | 47,450 | |
| | |
Ypsilanti Community Utilities Authority, Charter Township of Ypsilanti, Limited Tax Rev., 4.00%, 5/1/2022 | | | 25,000 | | | | 26,041 | |
| | |
Ypsilanti Community Utilities Authority, Water Supply System No. 7, Charter Township Ypsilanti, Limited Tax Rev., 4.00%, 4/1/2023 | | | 175,000 | | | | 187,915 | |
| | |
Zeeland Public Schools, Unlimited Tax GO, Q-SBLF, 4.00%, 5/1/2022 | | | 50,000 | | | | 52,112 | |
| | | | | | | | |
| | |
Total Michigan | | | | | | | 39,153,281 | |
| | | | | | | | |
| | | | | | | | |
| INVESTMENTS | | PRINCIPAL
AMOUNT ($) | | | VALUE ($) | |
| | | | | | | | |
|
Minnesota — 0.8% | |
| | |
Alexandria Lake Area Sanitation District, Sanitary Sewer Board Series 2015A, GO, 5.00%, 2/1/2023 | | | 25,000 | | | | 27,225 | |
| | |
Anoka County Regional Railroad Authority, Limited Tax Series 2015A, GO, 2.50%, 2/1/2022 | | | 50,000 | | | | 51,072 | |
| | |
Buffalo-Hanover-Montrose Independent School District No. 877 Series 2012A, GO, 4.00%, 2/1/2022 | | | 45,000 | | | | 46,577 | |
| | |
Centennial Independent School District No. 12 Series 2017A, GO, 3.00%, 2/1/2022 | | | 20,000 | | | | 20,518 | |
| | |
City of Cambridge Series 2016A, GO, 3.00%, 2/1/2022 | | | 30,000 | | | | 30,767 | |
| | |
City of Carver Series 2015B, GO, 4.00%, 2/1/2022 | | | 25,000 | | | | 25,867 | |
| | |
City of Columbia Heights | | | | | | | | |
| | |
Series 2015A, GO, 3.00%, 2/1/2022 | | | 25,000 | | | | 25,639 | |
| | |
Series 2017B, GO, 3.00%, 2/1/2023 | | | 35,000 | | | | 36,712 | |
| | |
City of Crystal, General Improvement Series 2017A, GO, 3.00%, 2/1/2022 | | | 25,000 | | | | 25,639 | |
| | |
City of Duluth, Capital Equipment Notes Series 2018C, GO, 3.00%, 2/1/2022 | | | 25,000 | | | | 25,639 | |
| | |
City of Duluth, State Aid Street Improvement Series 2020C, GO, 1.50%, 2/1/2022 | | | 755,000 | | | | 763,954 | |
| | |
City of Mankato | | | | | | | | |
| | |
Series 2012A, GO, 3.00%, 2/1/2022 | | | 75,000 | | | | 76,979 | |
| | |
Series 2014A, GO, 5.00%, 2/1/2022 | | | 25,000 | | | | 26,116 | |
| | |
City of Minneapolis, Health Care System, Fairview Health Services | | | | | | | | |
| | |
Series 2015A, Rev., 5.00%, 11/15/2021 | | | 70,000 | | | | 72,237 | |
| | |
Rev., 5.00%, 11/15/2022 | | | 100,000 | | | | 107,941 | |
| | |
Rev., 5.00%, 11/15/2023 | | | 100,000 | | | | 112,346 | |
| | |
Rev., 5.00%, 11/15/2025 | | | 20,000 | | | | 23,997 | |
| | |
City of Mound Series 2018A, GO, 4.00%, 2/1/2022 | | | 75,000 | | | | 77,566 | |
| | |
City of Prior Lake Series 2016A, GO, 2.00%, 12/15/2021 | | | 250,000 | | | | 253,552 | |
| | |
City of Red Wing Series 2017A, GO, 3.00%, 2/1/2023 | | | 35,000 | | | | 36,713 | |
| | |
City of Rochester, Health Care Facilities, Mayo Clinic Series 2011C, Rev., 4.50%, 11/15/2021 (c) | | | 1,260,000 | | | | 1,296,931 | |
| | |
City of Roseville Series 2012A, GO, 4.00%, 3/1/2022 | | | 25,000 | | | | 25,959 | |
SEE NOTES TO FINANCIAL STATEMENTS.
| | | | | | |
| | | |
| 236 | | | | J.P. MORGAN EXCHANGE-TRADED FUNDS | | FEBRUARY 28, 2021 |
| | | | | | | | |
| INVESTMENTS | | PRINCIPAL
AMOUNT ($) | | | VALUE ($) | |
Municipal Bonds — continued | | | | | | | | |
|
Minnesota — continued | |
| | |
City of Sauk Centre GO, 2.00%, 9/1/2022 | | | 45,000 | | | | 46,203 | |
| | |
City of St. Cloud Series 2016A, Rev., 5.00%, 5/1/2021 | | | 125,000 | | | | 125,942 | |
| | |
City of St. Cloud, Infrastructure Management Fund Series 2013A, GO, 3.00%, 2/1/2025 | | | 45,000 | | | | 45,083 | |
| | |
City of St. Paul | | | | | | | | |
| | |
Series 2017A, GO, 5.00%, 3/1/2021 | | | 70,000 | | | | 70,000 | |
| | |
Series 2014B, GO, 5.00%, 11/1/2021 | | | 25,000 | | | | 25,806 | |
| | |
Series 2016A, GO, 5.00%, 9/1/2022 | | | 25,000 | | | | 26,809 | |
| | |
City of St. Paul Minnesota, Housing and Redevelopment Authority, Fairview Health Services Series 2017A, Rev., 5.00%, 11/15/2022 | | | 200,000 | | | | 215,346 | |
| | |
City of St. Paul Minnesota, Housing and Redevelopment Authority, Health Partners Obligated Group Rev., 5.00%, 7/1/2021 | | | 250,000 | | | | 253,803 | |
| | |
City of St. Paul, Street Improvement Series 2016F, GO, 5.00%, 5/1/2022 | | | 25,000 | | | | 26,407 | |
| | |
County of Anoka, Capital Improvement Bonds Series 2017A, GO, 5.00%, 2/1/2022 | | | 50,000 | | | | 52,214 | |
| | |
County of Clay Series 2017A, GO, 5.00%, 2/1/2025 | | | 50,000 | | | | 58,637 | |
| | |
County of Hennepin | | | | | | | | |
| | |
Series 2014B, GO, 5.00%, 12/1/2022 | | | 50,000 | | | | 54,211 | |
| | |
Series 2016A, GO, 5.00%, 12/1/2022 | | | 30,000 | | | | 32,527 | |
| | |
Series 2017C, GO, 5.00%, 12/1/2022 | | | 30,000 | | | | 32,527 | |
| | |
County of Kandiyohi, Water and Sewer Series 2019A, GO, 4.00%, 2/1/2022 | | | 25,000 | | | | 25,864 | |
| | |
County of Mille Lacs, Drainage Series 2019B, GO, 3.00%, 2/1/2024 | | | 45,000 | | | | 48,175 | |
| | |
County of Olmsted Series 2012A, GO, 4.00%, 2/1/2022 | | | 75,000 | | | | 77,601 | |
| | |
County of Otter Tail, Capital Improvement Series 2019A, GO, 5.00%, 2/1/2023 | | | 55,000 | | | | 59,930 | |
| | |
County of Ramsey, Library Series 2014A, GO, 5.00%, 2/1/2022 | | | 20,000 | | | | 20,878 | |
| | |
County of Sherburne, Capital Improvement Series 2017A, GO, 3.00%, 2/1/2023 | | | 25,000 | | | | 26,248 | |
| | | | | | | | |
| INVESTMENTS | | PRINCIPAL
AMOUNT ($) | | | VALUE ($) | |
| | | | | | | | |
|
Minnesota — continued | |
| | |
County of St. Louis, Capital Improvement | | | | | | | | |
| | |
Series 2015C, GO, 3.00%, 12/1/2022 | | | 25,000 | | | | 26,234 | |
| | |
Series 2016B, GO, 5.00%, 12/1/2023 | | | 35,000 | | | | 39,458 | |
| | |
County of Stearns, Capital Improvement Crossover Series 2014A, GO, 4.00%, 12/1/2021 | | | 30,000 | | | | 30,853 | |
| | |
County of Washington, Capital Improvement Plan Series 2014A, GO, 5.00%, 2/1/2022 | | | 50,000 | | | | 52,214 | |
| | |
County of Wright, Jail Series 2017A, GO, 4.00%, 12/1/2022 | | | 115,000 | | | | 122,576 | |
| | |
Deer River Independent School District No. 317, Deer River, Facilities Maintenance Series 2019A, GO, 5.00%, 2/1/2022 | | | 100,000 | | | | 104,418 | |
| | |
Duluth Independent School District No. 709 | | | | | | | | |
| | |
Series 2019C, COP, 5.00%, 2/1/2022 | | | 130,000 | | | | 135,047 | |
| | |
Series A, COP, 5.00%, 2/1/2022 | | | 200,000 | | | | 207,764 | |
| | |
Series 2016A, COP, 5.00%, 2/1/2023 | | | 100,000 | | | | 107,941 | |
| | |
Series 2016A, COP, 5.00%, 2/1/2025 | | | 200,000 | | | | 230,426 | |
| | |
Edina Independent School District No. 273 Series 2011C, COP, 3.00%, 4/1/2021 | | | 25,000 | | | | 25,055 | |
| | |
Hennepin County Regional Railroad Authority Series 2019A, GO, 5.00%, 12/1/2021 | | | 25,000 | | | | 25,907 | |
| | |
Hopkins Independent School District No. 270, Alternative Facilities Series 2015A, GO, 3.00%, 2/1/2022 | | | 25,000 | | | | 25,648 | |
| | |
Hoyt Lakes Economic Development Authority Series 2013A, Rev., 5.20%, 3/1/2021 (b) | | | 30,000 | | | | 30,000 | |
| | |
Lakeville Independent School District No. 194 Series 2016A, GO, 5.00%, 2/1/2022 | | | 40,000 | | | | 41,767 | |
| | |
Metropolitan Council | | | | | | | | |
| | |
Series 2012C, GO, 4.00%, 3/1/2021 | | | 25,000 | | | | 25,000 | |
| | |
Series 2016A, GO, 5.00%, 3/1/2021 | | | 25,000 | | | | 25,000 | |
| | |
Metropolitan Council, Wastewater Series 2012-I, GO, 4.00%, 3/1/2022 | | | 45,000 | | | | 46,726 | |
| | |
Minneapolis Special School District No. 1 | | | | | | | | |
| | |
Series 2020A, COP, 5.00%, 4/1/2023 | | | 125,000 | | | | 136,865 | |
SEE NOTES TO FINANCIAL STATEMENTS.
| | | | | | | | |
| | | |
| FEBRUARY 28, 2021 | | J.P. MORGAN EXCHANGE-TRADED FUNDS | | | | | 237 | |
JPMorgan Ultra-Short Municipal Income ETF
SCHEDULE OF PORTFOLIO INVESTMENTS
AS OF FEBRUARY 28, 2021 (continued)
| | | | | | | | |
| INVESTMENTS | | PRINCIPAL
AMOUNT ($) | | | VALUE ($) | |
Municipal Bonds — continued | | | | | | | | |
|
Minnesota — continued | |
| | |
Series 2014D, COP, 5.00%, 2/1/2025 | | | 30,000 | | | | 32,684 | |
| | |
Minneapolis-St. Paul Metropolitan Airports Commission | | | | | | | | |
| | |
Series 2016B, Rev., 5.00%, 1/1/2022 | | | 775,000 | | | | 805,186 | |
| | |
Series 2019C, Rev., 5.00%, 1/1/2023 | | | 150,000 | | | | 162,629 | |
| | |
Minnesota Higher Education Facilities Authority, Carleton College | | | | | | | | |
| | |
Rev., 5.00%, 3/1/2021 | | | 25,000 | | | | 25,000 | |
| | |
Rev., 5.00%, 3/1/2023 | | | 195,000 | | | | 212,499 | |
| | |
Minnesota Higher Education Facilities Authority, Hamline University Series 7-K2, Rev., 6.00%, 10/1/2021 (b) | | | 375,000 | | | | 387,499 | |
| | |
Minnesota Higher Education Facilities Authority, Macalester College | | | | | | | | |
| | |
Series 20158-J, Rev., 5.00%, 3/1/2021 | | | 30,000 | | | | 30,000 | |
| | |
Series 7-S, Rev., 3.00%, 5/1/2021 | | | 100,000 | | | | 100,460 | |
| | |
Minnesota Housing Finance Agency, Housing Infrastructure, State Appropriation Series 2018C, Rev., 5.00%, 8/1/2021 | | | 20,000 | | | | 20,394 | |
| | |
Minnesota Housing Finance Agency, Residential Housing Finance | | | | | | | | |
| | |
Series 2015C, Rev., AMT, GNMA/FNMA/FHLMC, 2.10%, 7/1/2021 | | | 60,000 | | | | 60,344 | |
| | |
Series 2013C, Rev., AMT, GNMA/FNMA/FHLMC, 2.55%, 1/1/2022 | | | 130,000 | | | | 132,261 | |
| | |
Series C, Rev., AMT, GNMA/FNMA/FHLMC, 2.55%, 1/1/2023 | | | 65,000 | | | | 67,157 | |
| | |
Minnesota Municipal Power Agency Rev., 5.00%, 10/1/2021 | | | 75,000 | | | | 77,070 | |
| | |
Minnesota Public Facilities Authority | | | | | | | | |
| | |
Series 2005B, Rev., 5.00%, 3/1/2021 | | | 35,000 | | | | 35,000 | |
| | |
Series 2010A, Rev., 5.00%, 3/1/2021 | | | 30,000 | | | | 30,000 | |
| | |
Series 2010A, Rev., 5.00%, 3/1/2023 | | | 50,000 | | | | 54,761 | |
| | |
Minnesota State Colleges and Universities Foundation Rev., 4.00%, 10/1/2022 | | | 125,000 | | | | 132,471 | |
| | |
Minnetonka Independent School District No. 276 | | | | | | | | |
| | |
Series E, COP, 3.00%, 10/1/2021 | | | 155,000 | | | | 157,435 | |
| | |
Series E, COP, 3.00%, 10/1/2022 | | | 85,000 | | | | 88,602 | |
| | |
Series E, COP, 4.00%, 10/1/2023 | | | 115,000 | | | | 125,435 | |
| | | | | | | | |
| INVESTMENTS | | PRINCIPAL
AMOUNT ($) | | | VALUE ($) | |
| | | | | | | | |
|
Minnesota — continued | |
| | |
Orono Independent School District No. 278 Series 2017A, GO, 4.00%, 2/1/2022 | | | 50,000 | | | | 51,753 | |
| | |
Rochester Independent School District No. 535 | | | | | | | | |
| | |
Series 2020A, GO, 4.00%, 2/1/2022 | | | 20,000 | | | | 20,701 | |
| | |
Series 2016C, GO, 5.00%, 2/1/2022 | | | 25,000 | | | | 26,104 | |
| | |
Series 2014A, COP, 3.00%, 2/1/2024 | | | 25,000 | | | | 26,206 | |
| | |
Rosemount-Apple Valley-Eagan Independent School District No. 196 | | | | | | | | |
| | |
Series 2013A, GO, 3.00%, 2/1/2022 | | | 75,000 | | | | 76,944 | |
| | |
Series 2016A, GO, 5.00%, 2/1/2025 | | | 35,000 | | | | 41,061 | |
| | |
Shakopee Independent School District No. 720 Series 2020D, GO, 5.00%, 2/1/2022 | | | 400,000 | | | | 417,144 | |
| | |
St. Louis Park Independent School District No. 283, School Building Series 2014A, GO, 3.00%, 2/1/2022 | | | 25,000 | | | | 25,636 | |
| | |
St. Michael-Albertville Independent School District No. 885, School Building Series 2016A, GO, 5.00%, 2/1/2023 | | | 25,000 | | | | 27,236 | |
| | |
St. Paul Independent School District No. 625 Series 2017C, COP, 5.00%, 2/1/2022 | | | 25,000 | | | | 26,081 | |
| | |
St. Paul Port Authority, State of Minnesota Freeman Office Building | | | | | | | | |
| | |
Series 2013-2, Rev., 5.00%, 12/1/2021 | | | 90,000 | | | | 93,265 | |
| | |
Series 2013-2, Rev., 5.00%, 12/1/2022 | | | 150,000 | | | | 162,635 | |
| | |
State of Minnesota | | | | | | | | |
| | |
Series 2012B, Rev., 5.00%, 3/1/2021 | | | 280,000 | | | | 280,000 | |
| | |
Series 2014A, Rev., 5.00%, 6/1/2021 | | | 75,000 | | | | 75,906 | |
| | |
Series 2012B, Rev., 5.00%, 3/1/2022 | | | 370,000 | | | | 387,989 | |
| | |
Series 2014A, Rev., 5.00%, 6/1/2023 | | | 25,000 | | | | 27,605 | |
| | |
State of Minnesota, Trunk Highway | | | | | | | | |
| | |
Series 2014E, GO, 3.00%, 8/1/2021 | | | 70,000 | | | | 70,840 | |
| | |
Series 2019B, GO, 5.00%, 8/1/2021 | | | 70,000 | | | | 71,419 | |
| | |
Series B, GO, 5.00%, 8/1/2021 | | | 25,000 | | | | 25,506 | |
| | |
GO, 5.00%, 10/1/2021 (b) | | | 75,000 | | | | 77,119 | |
| | |
Series 2011B, GO, 5.00%, 10/1/2021 (b) | | | 240,000 | | | | 246,780 | |
| | |
Series 2018B, GO, 5.00%, 8/1/2023 | | | 25,000 | | | | 27,869 | |
SEE NOTES TO FINANCIAL STATEMENTS.
| | | | | | |
| | | |
| 238 | | | | J.P. MORGAN EXCHANGE-TRADED FUNDS | | FEBRUARY 28, 2021 |
| | | | | | | | |
| INVESTMENTS | | PRINCIPAL
AMOUNT ($) | | | VALUE ($) | |
Municipal Bonds — continued | | | | | | | | |
|
Minnesota — continued | |
| | |
State of Minnesota, Various Purpose | | | | | | | | |
| | |
GO, 5.00%, 8/1/2021 | | | 30,000 | | | | 30,608 | |
| | |
Series 2009F, GO, 5.00%, 8/1/2021 | | | 30,000 | | | | 30,608 | |
| | |
Series 2016A, GO, 5.00%, 8/1/2021 | | | 215,000 | | | | 219,358 | |
| | |
Series 2018A, GO, 5.00%, 8/1/2021 | | | 85,000 | | | | 86,723 | |
| | |
Series 2011A, GO, 5.00%, 10/1/2021 (b) | | | 40,000 | | | | 41,130 | |
| | |
Series 2013F, GO, 5.00%, 10/1/2021 | | | 45,000 | | | | 46,279 | |
| | |
Series 2014A, GO, 5.00%, 8/1/2022 | | | 25,000 | | | | 26,723 | |
| | |
Series 2015A, GO, 5.00%, 8/1/2022 | | | 20,000 | | | | 21,379 | |
| | |
Series 2019D, GO, 5.00%, 8/1/2022 | | | 25,000 | | | | 26,723 | |
| | |
Series 2013D, GO, 5.00%, 10/1/2022 | | | 35,000 | | | | 37,696 | |
| | |
Series 2017D, GO, 5.00%, 10/1/2022 | | | 30,000 | | | | 32,311 | |
| | |
Three Rivers Park District Series 2015B, GO, 3.00%, 2/1/2023 | | | 20,000 | | | | 21,018 | |
| | |
University of Minnesota | | | | | | | | |
| | |
Series 2017B, Rev., 5.00%, 12/1/2021 | | | 75,000 | | | | 77,721 | |
| | |
Series 2013A, Rev., 5.00%, 2/1/2022 | | | 25,000 | | | | 26,107 | |
| | |
University of Minnesota, Special Purpose Rev., 5.00%, 8/1/2021 | | | 20,000 | | | | 20,402 | |
| | | | | | | | |
| | |
Total Minnesota | | | | | | | 11,720,528 | |
| | | | | | | | |
|
Mississippi — 0.4% | |
| | |
Alcorn State University Educational Building Corp. (The) Rev., 3.00%, 9/1/2022 | | | 30,000 | | | | 31,204 | |
| | |
City of Ridgeland | | | | | | | | |
| | |
GO, 4.00%, 8/1/2021 | | | 100,000 | | | | 101,554 | |
| | |
GO, 4.00%, 8/1/2024 | | | 25,000 | | | | 27,977 | |
| | |
City of Starkville, Water and Sewer System Rev., 4.00%, 5/1/2023 | | | 55,000 | | | | 59,147 | |
| | |
County of DeSoto GO, 5.00%, 7/1/2022 | | | 95,000 | | | | 101,109 | |
| | |
County of Madison, Road and Bridge GO, 4.00%, 11/1/2023 | | | 50,000 | | | | 54,781 | |
| | |
Harrison County School District GO, 4.00%, 6/1/2021 | | | 115,000 | | | | 116,053 | |
| | |
Jackson State University Educational Building Corp. | | | | | | | | |
| | |
Series 2015A, Rev., 5.00%, 3/1/2021 | | | 55,000 | | | | 55,000 | |
| | |
Series 2015A, Rev., 5.00%, 3/1/2023 | | | 100,000 | | | | 108,974 | |
| | | | | | | | |
| INVESTMENTS | | PRINCIPAL
AMOUNT ($) | | | VALUE ($) | |
| | | | | | | | |
|
Mississippi — continued | |
| | |
Madison County School District | | | | | | | | |
| | |
GO, 5.00%, 3/1/2021 | | | 25,000 | | | | 25,000 | |
| | |
GO, 5.00%, 3/1/2024 | | | 25,000 | | | | 28,226 | |
| | |
Mississippi Business Finance Corp., Power Company Project Rev., 2.75%, 12/9/2021 (c) | | | 100,000 | | | | 101,561 | |
| | |
Mississippi Development Bank, Department of Corrections Walnut Grove Correctional Facility Refunding Bonds Project Rev., 5.00%, 8/1/2025 | | | 110,000 | | | | 128,140 | |
| | |
Mississippi Development Bank, East Mississippi Community College District Capital Improvement Project Rev., 5.00%, 1/1/2022 | | | 50,000 | | | | 51,948 | |
| | |
Mississippi Development Bank, Hinds Community College | | | | | | | | |
| | |
Rev., AGM, 5.13%, 4/1/2021 (b) | | | 250,000 | | | | 251,005 | |
| | |
Rev., AGM, 3.00%, 10/1/2021 | | | 250,000 | | | | 253,853 | |
| | |
Mississippi Development Bank, Marshall County Industrial Development Authority Rev., 5.00%, 1/1/2022 (b) | | | 75,000 | | | | 78,031 | |
| | |
Mississippi Development Bank, Rankin County School District General Obligation Bond Project Rev., 5.00%, 6/1/2021 | | | 545,000 | | | | 551,420 | |
| | |
Mississippi Development Bank, Rankin County School District Project | | | | | | | | |
| | |
Rev., 5.00%, 6/1/2022 | | | 315,000 | | | | 333,415 | |
| | |
Rev., 5.00%, 11/1/2022 | | | 30,000 | | | | 32,354 | |
| | |
Rev., 5.00%, 6/1/2023 | | | 60,000 | | | | 66,251 | |
| | |
Rev., 5.00%, 6/1/2024 | | | 30,000 | | | | 34,387 | |
| | |
Mississippi Hospital Equipment and Facilities Authority, North Mississippi Health Services | | | | | | | | |
| | |
Series 2020-I, Rev., 5.00%, 10/1/2021 | | | 620,000 | | | | 636,740 | |
| | |
Rev., 5.00%, 10/1/2023 | | | 155,000 | | | | 172,696 | |
| | |
Mississippi State University Educational Building Corp., Campus Improvement Project Rev., 5.00%, 11/1/2021 | | | 25,000 | | | | 25,806 | |
| | |
Mississippi State University Educational Building Corp., New Facilities and Refinancing Project | | | | | | | | |
| | |
Series 2014A, Rev., 5.00%, 8/1/2021 | | | 135,000 | | | | 137,713 | |
| | |
Series 2014A, Rev., 5.00%, 8/1/2023 | | | 50,000 | | | | 55,571 | |
SEE NOTES TO FINANCIAL STATEMENTS.
| | | | | | | | |
| | | |
| FEBRUARY 28, 2021 | | J.P. MORGAN EXCHANGE-TRADED FUNDS | | | | | 239 | |
JPMorgan Ultra-Short Municipal Income ETF
SCHEDULE OF PORTFOLIO INVESTMENTS
AS OF FEBRUARY 28, 2021 (continued)
| | | | | | | | |
| INVESTMENTS | | PRINCIPAL
AMOUNT ($) | | | VALUE ($) | |
Municipal Bonds — continued | |
|
Mississippi — continued | |
| | |
Rankin County School District, Limited Tax GO, 3.00%, 8/1/2023 | | | 75,000 | | | | 75,128 | |
| | |
State of Mississippi | | | | | | | | |
| | |
Series 2009F, GO, 5.25%, 10/1/2021 | | | 75,000 | | | | 77,223 | |
| | |
Series A, GO, 5.25%, 11/1/2021 | | | 165,000 | | | | 170,594 | |
| | |
Series 2012H, GO, 4.00%, 12/1/2021 | | | 250,000 | | | | 257,205 | |
| | |
Series 2015C, GO, 5.00%, 10/1/2022 | | | 65,000 | | | | 69,964 | |
| | |
Series 2012F, GO, 4.00%, 11/1/2022 | | | 45,000 | | | | 47,862 | |
| | |
State of Mississippi, Nissan North America Project Series 2012B, GO, 5.00%, 11/1/2021 | | | 35,000 | | | | 36,128 | |
| | |
University of Mississippi Educational Building Corp., Refinancing Project | | | | | | | | |
| | |
Rev., 3.00%, 10/1/2022 | | | 195,000 | | | | 203,580 | |
| | |
Series 2016A, Rev., 5.00%, 10/1/2022 | | | 30,000 | | | | 32,266 | |
| | |
Rev., 5.00%, 10/1/2023 | | | 270,000 | | | | 300,753 | |
| | |
Rev., 5.00%, 10/1/2024 | | | 195,000 | | | | 224,816 | |
| | |
University of Southern Mississippi Educational Building Corp., Facilities Refinancing Project Rev., 3.00%, 3/1/2023 | | | 50,000 | | | | 52,440 | |
| | | | | | | | |
| | |
Total Mississippi | | | | | | | 5,167,875 | |
| | | | | | | | |
|
Missouri — 0.7% | |
| | |
Bi-State Development Agency of the Missouri-Illinois Metropolitan District, Combine Lien Mass Transit Sales Tax | | | | | | | | |
| | |
Series 2013A, Rev., 5.00%, 10/1/2021 | | | 215,000 | | | | 220,857 | |
| | |
Series 2013A, Rev., 5.00%, 10/1/2022 | | | 145,000 | | | | 155,689 | |
| | |
Cape Girardeau School District No. 63 GO, 4.00%, 3/1/2025 | | | 25,000 | | | | 28,400 | |
| | |
City of Chesterfield COP, 5.00%, 12/1/2023 | | | 25,000 | | | | 28,156 | |
| | |
City of Columbia, Water and Electric System Rev., 5.00%, 10/1/2021 | | | 170,000 | | | | 174,692 | |
| | |
City of Grain Valley GO, Zero Coupon, 3/1/2021 | | | 150,000 | | | | 126,776 | |
| | |
City of Kansas City | | | | | | | | |
| | |
Series 2019A, Rev., 5.00%, 12/1/2021 | | | 20,000 | | | | 20,725 | |
| | |
Series 2014A, Rev., 4.00%, 12/1/2022 | | | 35,000 | | | | 37,338 | |
| | |
Series 2012A, GO, 4.50%, 2/1/2024 | | | 25,000 | | | | 25,937 | |
| | | | | | | | |
| INVESTMENTS | | PRINCIPAL
AMOUNT ($) | | | VALUE ($) | |
| | | | | | | | |
|
Missouri — continued | |
| | |
City of Kansas City, Special Obligation Series E, Rev., Zero Coupon, 2/1/2024 | | | 275,000 | | | | 261,797 | |
| | |
City of Kansas, Sanitary Sewer System | | | | | | | | |
| | |
Series 2016A, Rev., 4.00%, 1/1/2022 | | | 25,000 | | | | 25,798 | |
| | |
Series 2011A, Rev., 5.00%, 1/1/2022 | | | 225,000 | | | | 225,817 | |
| | |
Series 2018A, Rev., 5.00%, 1/1/2022 | | | 25,000 | | | | 26,006 | |
| | |
City of O’Fallon GO, 5.00%, 3/1/2021 | | | 25,000 | | | | 25,000 | |
| | |
City of Springfield, Public Utility | | | | | | | | |
| | |
Rev., 5.00%, 8/1/2021 | | | 20,000 | | | | 20,402 | |
| | |
COP, 5.00%, 12/1/2021 | | | 105,000 | | | | 108,809 | |
| | |
Rev., 5.00%, 8/1/2022 | | | 65,000 | | | | 69,442 | |
| | |
City of St. Charles COP, 5.00%, 4/1/2023 | | | 35,000 | | | | 38,338 | |
| | |
City of St. Peters COP, 4.00%, 5/1/2023 | | | 170,000 | | | | 183,087 | |
| | |
County of Clay | | | | | | | | |
| | |
Series 2018A, COP, 4.00%, 5/1/2021 | | | 100,000 | | | | 100,615 | |
| | |
Series 2018A, COP, 4.00%, 5/1/2022 | | | 40,000 | | | | 41,737 | |
| | |
Series 2018A, COP, 4.00%, 5/1/2024 | | | 30,000 | | | | 33,215 | |
| | |
County of Greene, Neighborhood Improvement District Project GO, 3.00%, 4/1/2021 | | | 165,000 | | | | 165,380 | |
| | |
County of Jackson, Harry S. Truman Sports Complex Project Rev., 5.00%, 12/1/2024 | | | 180,000 | | | | 203,976 | |
| | |
County of Jackson, Truman Medical Center Project Series 2011B, Rev., 4.50%, 12/1/2025 | | | 100,000 | | | | 102,757 | |
| | |
Curators of the University of Missouri (The), System Facilities Bonds | | | | | | | | |
| | |
Rev., 5.00%, 11/1/2021 (b) | | | 25,000 | | | | 25,807 | |
| | |
Series 2014A, Rev., 5.00%, 11/1/2022 (b) | | | 25,000 | | | | 27,010 | |
| | |
Eureka Fire Protection District GO, 4.00%, 3/1/2022 | | | 70,000 | | | | 72,649 | |
| | |
Florissant Valley Fire Protection District GO, 3.00%, 3/1/2022 | | | 25,000 | | | | 25,697 | |
| | |
Fort Zumwalt School District, Missouri Direct Deposit Program GO, Zero Coupon, 3/1/2022 | | | 200,000 | | | | 199,242 | |
SEE NOTES TO FINANCIAL STATEMENTS.
| | | | | | |
| | | |
| 240 | | | | J.P. MORGAN EXCHANGE-TRADED FUNDS | | FEBRUARY 28, 2021 |
| | | | | | | | |
| INVESTMENTS | | PRINCIPAL
AMOUNT ($) | | | VALUE ($) | |
Municipal Bonds — continued | |
|
Missouri — continued | |
| | |
Greene County Reorganized School District No. R-4 GO, 1.40%, 3/1/2021 | | | 100,000 | | | | 100,000 | |
| | |
Health and Educational Facilities Authority of the State of Missouri, BJC Health System | | | | | | | | |
| | |
Series C, Rev., VRDO, LIQ: BJC Health System, 0.02%, 3/9/2021 (c) | | | 810,000 | | | | 810,000 | |
| | |
Rev., 5.00%, 1/1/2022 | | | 125,000 | | | | 129,869 | |
| | |
Health and Educational Facilities Authority of the State of Missouri, Coxhealth and Obligated Group Series 2013A, Rev., 5.00%, 11/15/2022 | | | 75,000 | | | | 80,821 | |
| | |
Health and Educational Facilities Authority of the State of Missouri, Mosaic Health System Series 2019A, Rev., 5.00%, 2/15/2022 | | | 50,000 | | | | 52,244 | |
| | |
Health and Educational Facilities Authority of the State of Missouri, SSM Health System Series 2014A, Rev., 5.00%, 6/1/2021 | | | 50,000 | | | | 50,575 | |
| | |
Health and Educational Facilities Authority of the State of Missouri, St. Luke’s Health System, Inc. | | | | | | | | |
| | |
Rev., 5.00%, 11/15/2021 | | | 180,000 | | | | 185,972 | |
| | |
Rev., 5.00%, 11/15/2023 | | | 175,000 | | | | 196,504 | |
| | |
Health and Educational Facilities Authority of the State of Missouri, The Chidern’s Mercy Hospital Rev., 5.00%, 5/15/2021 | | | 30,000 | | | | 30,285 | |
| | |
Health and Educational Facilities Authority of the State of Missouri, Wright Memorial Hospital Rev., 5.00%, 9/1/2021 | | | 230,000 | | | | 234,158 | |
| | |
Hickman Mills C-1 School District Series 2020C-1, GO, 4.00%, 3/1/2023 | | | 25,000 | | | | 26,742 | |
| | |
Jackson County Reorganized School District No. 7 GO, 3.00%, 3/1/2021 | | | 125,000 | | | | 125,000 | |
| | |
Jackson County School District No. R-VI Oak Grove, Missouri Direct Deposit Program GO, 1.80%, 3/1/2021 | | | 150,000 | | | | 150,000 | |
| | |
Kirkwood School District Educational Facilities Authority, Leasehold Rev., 3.00%, 2/15/2022 | | | 25,000 | | | | 25,678 | |
| | |
Ladue School District GO, 4.00%, 3/1/2022 | | | 25,000 | | | | 25,959 | |
| | |
Lindbergh School District GO, 4.00%, 3/1/2021 | | | 50,000 | | | | 50,000 | |
| | | | | | | | |
| INVESTMENTS | | PRINCIPAL
AMOUNT ($) | | | VALUE ($) | |
| |
|
Missouri — continued | |
| | |
Metropolitan St. Louis Sewer District, Wastewater System Improvement | | | | | | | | |
| | |
Series 2011B, Rev., 5.00%, 5/1/2021 | | | 45,000 | | | | 45,359 | |
| | |
Series 2012A, Rev., 5.00%, 5/1/2022 (b) | | | 35,000 | | | | 36,978 | |
| | |
Series 2012B, Rev., 5.00%, 5/1/2022 (b) | | | 30,000 | | | | 31,695 | |
| | |
Missouri Highway and Transportation Commission Series 2019A, Rev., 5.00%, 5/1/2021 | | | 170,000 | | | | 171,350 | |
| | |
Missouri Highway and Transportation Commission, First Lien | | | | | | | | |
| | |
Series 2014A, Rev., 5.00%, 5/1/2021 | | | 40,000 | | | | 40,318 | |
| | |
Series 2014A, Rev., 5.00%, 5/1/2022 | | | 95,000 | | | | 100,332 | |
| | |
Missouri Highway and Transportation Commission, Second Lien Series 2014B, Rev., 5.00%, 5/1/2021 | | | 95,000 | | | | 95,754 | |
| | |
Missouri Highway and Transportation Commission, Third Lien Series 2019B, Rev., 5.00%, 11/1/2021 | | | 240,000 | | | | 247,721 | |
| | |
Missouri Joint Municipal Electric Utility Commission, IATAN 2 Project Series 2014A, Rev., 5.00%, 1/1/2022 | | | 600,000 | | | | 623,370 | |
| | |
Missouri Joint Municipal Electric Utility Commission, Prairie State Project | | | | | | | | |
| | |
Series 2015A, Rev., 5.00%, 12/1/2021 | | | 560,000 | | | | 579,628 | |
| | |
Series 2015A, Rev., 5.00%, 12/1/2023 | | | 100,000 | | | | 112,387 | |
| | |
Series 2015A, Rev., 5.00%, 6/1/2024 | | | 100,000 | | | | 114,344 | |
| | |
Missouri School Boards Association, The School District of the City of Independence Project COP, 2.50%, 4/1/2021 | | | 100,000 | | | | 100,148 | |
| | |
Missouri State Board of Public Buildings | | | | | | | | |
| | |
Series 2016A, Rev., 4.00%, 4/1/2021 | | | 250,000 | | | | 250,777 | |
| | |
Series 2017A, Rev., 5.00%, 4/1/2021 | | | 50,000 | | | | 50,195 | |
| | |
Series 2018A, Rev., 5.00%, 4/1/2021 | | | 100,000 | | | | 100,391 | |
| | |
Series 2014A, Rev., 5.00%, 10/1/2021 | | | 25,000 | | | | 25,705 | |
SEE NOTES TO FINANCIAL STATEMENTS.
| | | | | | | | |
| | | |
| FEBRUARY 28, 2021 | | J.P. MORGAN EXCHANGE-TRADED FUNDS | | | | | 241 | |
JPMorgan Ultra-Short Municipal Income ETF
SCHEDULE OF PORTFOLIO INVESTMENTS
AS OF FEBRUARY 28, 2021 (continued)
| | | | | | | | |
| INVESTMENTS | | PRINCIPAL
AMOUNT ($) | | | VALUE ($) | |
Municipal Bonds — continued | |
|
Missouri — continued | |
| | |
Series 2015B, Rev., 5.00%, 4/1/2022 | | | 55,000 | | | | 57,879 | |
| | |
Series 2014A, Rev., 5.00%, 10/1/2022 | | | 110,000 | | | | 118,401 | |
| | |
Series 2015B, Rev., 5.00%, 4/1/2024 | | | 100,000 | | | | 114,215 | |
| | |
Missouri State Environmental Improvement and Energy Resources Authority, Water Pollution Control and Drinking Water | | | | | | | | |
| | |
Rev., 5.00%, 7/1/2021 | | | 20,000 | | | | 20,324 | |
| | |
Rev., 4.00%, 1/1/2022 | | | 25,000 | | | | 25,807 | |
| | |
Rev., 5.00%, 1/1/2022 (b) | | | 50,000 | | | | 52,020 | |
| | |
Series 2020A, Rev., 5.00%, 1/1/2023 | | | 25,000 | | | | 27,196 | |
| | |
Series 2013A, Rev., 5.00%, 7/1/2024 | | | 60,000 | | | | 66,632 | |
| | |
North Kansas City School District 74, Improvement Bonds, Missouri Direct Deposit Program GO, 4.00%, 3/1/2021 | | | 25,000 | | | | 25,000 | |
| | |
OTC Public Building Corp., Ozarks Technical Community College Project Rev., 5.00%, 5/1/2021 (b) | | | 105,000 | | | | 105,828 | |
| | |
Park Hill School District of Platte County, Missouri Direct Deposit Program | | | | | | | | |
| | |
GO, 5.00%, 3/1/2022 | | | 50,000 | | | | 52,415 | |
| | |
GO, 5.00%, 3/1/2023 | | | 40,000 | | | | 43,716 | |
| | |
Platte County Reorganized School District No. R-3 GO, 2.00%, 3/1/2021 | | | 50,000 | | | | 50,000 | |
| | |
Republic School District No. R-3, Missouri Direct Deposit Program GO, 4.00%, 3/1/2022 | | | 25,000 | | | | 25,959 | |
| | |
Rock Township Ambulance District GO, 4.00%, 3/1/2022 | | | 25,000 | | | | 25,959 | |
| | |
Springfield School District No. R-12, Missouri Direct Deposit Program Series 2014B, GO, 5.00%, 3/1/2021 | | | 70,000 | | | | 70,000 | |
| | |
St Louis County School District C-2 Parkway Series 2012-A, GO, 5.00%, 3/1/2021 | | | 20,000 | | | | 20,000 | |
| | |
St. Charles County Public Water Supply District No. 2 Series 2016B, COP, 5.00%, 12/1/2021 | | | 205,000 | | | | 212,249 | |
| | |
St. Louis Junior College District Building Corp. Rev., 3.00%, 4/1/2022 | | | 50,000 | | | | 50,095 | |
| | |
St. Louis Regional Convention and Sports Complex Authority, Convention and Sports Facilities Series 2013B, Rev., 5.00%, 8/15/2021 | | | 60,000 | | | | 61,314 | |
| | | | | | | | |
| INVESTMENTS | | PRINCIPAL
AMOUNT ($) | | | VALUE ($) | |
| |
|
Missouri — continued | |
| | |
St. Louis School District, Direct Deposit Program | | | | | | | | |
| | |
Series 2011B, GO, 4.00%, 4/1/2021 (b) | | | 500,000 | | | | 501,535 | |
| | |
GO, 5.00%, 4/1/2021 | | | 95,000 | | | | 95,371 | |
| | |
Series 2011B, GO, 5.00%, 4/1/2021 (b) | | | 20,000 | | | | 20,078 | |
| | | | | | | | |
| | |
Total Missouri | | | | | | | 9,643,403 | |
| | | | | | | | |
| | |
Montana — 0.4% | | | | | | | | |
| | |
Cascade County Elementary School District No. 1 Great Falls, School Building GO, 4.00%, 7/1/2021 | | | 25,000 | | | | 25,306 | |
| | |
City of Billings Series 2012A, GO, 3.00%, 7/1/2023 | | | 35,000 | | | | 35,312 | |
| | |
City of Missoula, Limited Tax Series 2016A, GO, 4.00%, 7/1/2021 | | | 50,000 | | | | 50,637 | |
| | |
Gallatin County High School District No. 44 Belgrade GO, 4.00%, 6/1/2021 | | | 50,000 | | | | 50,458 | |
| | |
Gallatin County High School District No. 7 Bozeman GO, 4.00%, 6/1/2022 | | | 25,000 | | | | 26,180 | |
| | |
Gallatin County School District No. 44 Belgrade, School Building GO, 4.00%, 6/1/2021 | | | 50,000 | | | | 50,458 | |
| | |
Lewis & Clark County K-12 School District No. 9 East Helena GO, 3.00%, 7/1/2021 | | | 25,000 | | | | 25,224 | |
| | |
Montana Facility Finance Authority, Billings Clinic Obligated Group Series 2018C, Rev., (SIFMA Municipal Swap Index Yield + 0.55%), 0.58%, 8/15/2023 (e) | | | 5,135,000 | | | | 5,144,140 | |
| | |
State of Montana Series 2020C, GO, 5.00%, 8/1/2021 | | | 40,000 | | | | 40,804 | |
| | |
Yellowstone County School District No. 2 Billings, School Building GO, 5.00%, 6/15/2022 | | | 45,000 | | | | 47,737 | |
| | | | | | | | |
| | |
Total Montana | | | | | | | 5,496,256 | |
| | | | | | | | |
| | |
Nebraska — 0.7% | | | | | | | | |
| | |
Central Plains Energy Project, Gas Project No. 4 Series 2018A, Rev., 5.00%, 1/1/2024 (c) | | | 255,000 | | | | 283,639 | |
| | |
City of Columbus, Sales Tax Rev., 5.00%, 9/15/2021 | | | 25,000 | | | | 25,616 | |
| | |
City of Fremont, Combined Utility System Rev., 3.00%, 10/15/2021 | | | 65,000 | | | | 66,130 | |
| | |
City of Lincoln Rev., 3.00%, 8/15/2022 | | | 25,000 | | | | 26,030 | |
SEE NOTES TO FINANCIAL STATEMENTS.
| | | | | | |
| | | |
| 242 | | | | J.P. MORGAN EXCHANGE-TRADED FUNDS | | FEBRUARY 28, 2021 |
| | | | | | | | |
| INVESTMENTS | | PRINCIPAL
AMOUNT ($) | | | VALUE ($) | |
Municipal Bonds — continued | | | | | | | | |
| | |
Nebraska — continued | | | | | | | | |
| | |
City of Lincoln NE Electric System | | | | | | | | |
| | |
Rev., 5.00%, 9/1/2021 | | | 230,000 | | | | 235,554 | |
| | |
Rev., 5.00%, 9/1/2022 | | | 90,000 | | | | 96,512 | |
| | |
City of Lincoln, Sanitary Sewer | | | | | | | | |
| | |
Rev., 4.00%, 6/15/2021 | | | 30,000 | | | | 30,331 | |
| | |
Rev., 4.00%, 8/1/2021 | | | 40,000 | | | | 40,638 | |
| | |
Rev., 4.00%, 6/15/2022 | | | 35,000 | | | | 36,726 | |
| | |
City of Omaha | | | | | | | | |
| | |
Series A, GO, 4.00%, 5/1/2021 | | | 50,000 | | | | 50,316 | |
| | |
Series 2012B, GO, 3.00%, 11/15/2021 | | | 40,000 | | | | 40,803 | |
| | |
Series 2011A, GO, 5.00%, 11/15/2021 (b) | | | 100,000 | | | | 103,420 | |
| | |
Series 2014B, GO, 5.00%, 11/15/2022 | | | 75,000 | | | | 81,157 | |
| | |
City of Omaha, Convention Center | | | | | | | | |
| | |
GO, 5.25%, 4/1/2021 | | | 25,000 | | | | 25,104 | |
| | |
GO, 5.25%, 4/1/2022 | | | 35,000 | | | | 36,926 | |
| | |
City of Omaha, Sewer | | | | | | | | |
| | |
Rev., 4.00%, 4/1/2021 | | | 95,000 | | | | 95,297 | |
| | |
Rev., 5.00%, 11/15/2021 (b) | | | 200,000 | | | | 206,836 | |
| | |
Series 2020A, Rev., 4.00%, 4/1/2022 | | | 20,000 | | | | 20,831 | |
| | |
Rev., 3.25%, 11/15/2022 (b) | | | 25,000 | | | | 26,300 | |
| | |
City of Omaha, Various Purpose | | | | | | | | |
| | |
Series 2017A, GO, 5.00%, 4/15/2021 | | | 170,000 | | | | 170,993 | |
| | |
Series A, GO, 4.00%, 11/15/2021 | | | 85,000 | | | | 87,303 | |
| | |
Series 2018A, GO, 5.00%, 1/15/2022 | | | 50,000 | | | | 52,106 | |
| | |
Douglas County Hospital Authority No. 2, Children’s Hospital Obligated Group Series 2020A, Rev., 5.00%, 11/15/2021 | | | 50,000 | | | | 51,645 | |
| | |
Douglas County Hospital Authority No. 2, Health Facilities Rev., 5.00%, 5/15/2021 | | | 25,000 | | | | 25,238 | |
| | |
Douglas County School District No. 17, Millard Public School | | | | | | | | |
| | |
Series 2015B, GO, 5.00%, 6/15/2021 | | | 80,000 | | | | 81,110 | |
| | |
Series 2015B, GO, 5.00%, 6/15/2022 | | | 165,000 | | | | 175,233 | |
| | |
Lincoln County Hospital Authority No. 1 Rev., 4.00%, 11/1/2021 (b) | | | 150,000 | | | | 153,647 | |
| | |
Metropolitan Community College Area, Fort Omaha Campus Project COP, 5.00%, 3/1/2022 | | | 25,000 | | | | 26,182 | |
| | | | | | | | |
| INVESTMENTS | | PRINCIPAL
AMOUNT ($) | | | VALUE ($) | |
| | | | | | | | |
| | |
Nebraska — continued | | | | | | | | |
| | |
Nebraska Cooperative Republican Platte Enhancement Project | | | | | | | | |
| | |
Rev., AGM, 4.00%, 5/1/2022 (b) | | | 110,000 | | | | 114,804 | |
| | |
Series 2020A, Rev., 2.00%, 12/15/2022 | | | 445,000 | | | | 456,290 | |
| | |
Series 2020A, Rev., 2.00%, 12/15/2023 | | | 905,000 | | | | 938,376 | |
| | |
Nebraska Investment Finance Authority, Single Family Housing | | | | | | | | |
| | |
Series 2019D, Rev., GNMA/FNMA/FHLMC, 1.45%, 9/1/2021 | | | 155,000 | | | | 155,862 | |
| | |
Series 2016A, Rev., 1.60%, 9/1/2021 | | | 35,000 | | | | 35,229 | |
| | |
Series 2019A, Rev., GNMA/FNMA/FHLMC, 1.80%, 3/1/2022 | | | 35,000 | | | | 35,487 | |
| | |
Series 2018C, Rev., 2.13%, 9/1/2022 | | | 55,000 | | | | 56,301 | |
| | |
Nebraska Public Power District | | | | | | | | |
| | |
Series 2014C, Rev., 5.00%, 7/1/2021 | | | 150,000 | | | | 152,297 | |
| | |
Series 2014A, Rev., 5.00%, 1/1/2022 | | | 135,000 | | | | 140,260 | |
| | |
Series 2017B, Rev., 5.00%, 1/1/2022 | | | 40,000 | | | | 41,534 | |
| | |
Series 2019A, Rev., 5.00%, 1/1/2022 | | | 175,000 | | | | 181,713 | |
| | |
Rev., 5.00%, 7/1/2022 | | | 100,000 | | | | 103,827 | |
| | |
Series 2021A, Rev., 5.00%, 1/1/2023 (d) | | | 1,500,000 | | | | 1,581,915 | |
| | |
Series 2021B, Rev., 5.00%, 1/1/2023 (d) | | | 450,000 | | | | 474,575 | |
| | |
Series A-2, Rev., 5.00%, 1/1/2023 | | | 125,000 | | | | 129,602 | |
| | |
Series 2020A, Rev., 0.60%, 7/1/2023 (c) | | | 565,000 | | | | 562,051 | |
| | |
Series 2021A, Rev., 5.00%, 1/1/2025 (d) | | | 525,000 | | | | 593,554 | |
| | |
Series 2021A, Rev., 5.00%, 1/1/2027 (d) | | | 400,000 | | | | 478,072 | |
| | |
Omaha Public Facilities Corp., Omaha Baseball Stadium Project Series 2016A, Rev., 5.00%, 6/1/2023 | | | 25,000 | | | | 27,599 | |
| | |
Omaha Public Power District, Electric System | | | | | | | | |
| | |
Series 2015B, Rev., 4.00%, 2/1/2022 | | | 25,000 | | | | 25,867 | |
| | |
Series 2012A, Rev., 5.00%, 2/1/2022 (b) | | | 25,000 | | | | 26,112 | |
| | |
Series A, Rev., 5.00%, 2/1/2022 (b) | | | 25,000 | | | | 26,111 | |
SEE NOTES TO FINANCIAL STATEMENTS.
| | | | | | | | |
| | �� | |
| FEBRUARY 28, 2021 | | J.P. MORGAN EXCHANGE-TRADED FUNDS | | | | | 243 | |
JPMorgan Ultra-Short Municipal Income ETF
SCHEDULE OF PORTFOLIO INVESTMENTS
AS OF FEBRUARY 28, 2021 (continued)
| | | | | | | | |
| INVESTMENTS | | PRINCIPAL
AMOUNT ($) | | | VALUE ($) | |
Municipal Bonds — continued | | | | | | | | |
| | |
Nebraska — continued | | | | | | | | |
| | |
Papillion-La Vista School District No. 27 Series 2019B, GO, 3.00%, 12/1/2022 | | | 25,000 | | | | 26,180 | |
| | |
Public Power Generation Agency, Whelan Energy Center Unit 2 Rev., 5.00%, 1/1/2022 | | | 50,000 | | | | 51,900 | |
| | |
State of Nebraska | | | | | | | | |
| | |
Series 2020A, COP, 2.00%, 9/1/2021 | | | 400,000 | | | | 403,496 | |
| | |
Series 2017C, COP, 4.00%, 11/1/2021 | | | 25,000 | | | | 25,623 | |
| | |
University of Nebraska Facilities Corp., UNMC Global Center Project Rev., 5.00%, 12/15/2021 | | | 130,000 | | | | 134,931 | |
| | |
University of Nebraska, Lincoln Student Fees and Facilities Rev., 5.00%, 1/1/2022 (b) | | | 210,000 | | | | 218,486 | |
| | |
University of Nebraska, OMAHA Student Health and Recreation Project Rev., 1.50%, 5/15/2021 (b) | | | 75,000 | | | | 75,199 | |
| | |
University of Nebraska, OMAHA Student Housing Project Rev., 3.25%, 5/15/2024 (b) | | | 60,000 | | | | 65,436 | |
| | | | | | | | |
| | |
Total Nebraska | | | | | | | 9,690,312 | |
| | | | | | | | |
| | |
Nevada — 0.6% | | | | | | | | |
| | |
City of Henderson, Sewer | | | | | | | | |
| | |
GO, 5.00%, 6/1/2021 | | | 30,000 | | | | 30,360 | |
| | |
Series 2012A, GO, 5.00%, 6/1/2023 | | | 25,000 | | | | 27,053 | |
| | |
City of Las Vegas, City Hall Series 2015C, GO, 5.00%, 9/1/2024 | | | 125,000 | | | | 144,522 | |
| | |
City of Las Vegas, Limited Tax | | | | | | | | |
| | |
Series 2014A, GO, 5.00%, 5/1/2021 | | | 50,000 | | | | 50,398 | |
| | |
Series 2014A, GO, 5.00%, 5/1/2022 | | | 50,000 | | | | 52,813 | |
| | |
Series 2019C, GO, 5.00%, 6/1/2022 | | | 50,000 | | | | 53,014 | |
| | |
Clark County School District | | | | | | | | |
| | |
Series 2012A, GO, 5.00%, 6/15/2021 | | | 165,000 | | | | 167,221 | |
| | |
Series 2015D, GO, 5.00%, 6/15/2021 | | | 25,000 | | | | 25,336 | |
| | |
Clark County Water Reclamation District, Limited Tax GO, 5.00%, 7/1/2023 | | | 20,000 | | | | 22,181 | |
| | |
County of Clark, Department of Aviation, Nevada Airport System, Junior Subordinate Lien Series A, Rev., 5.00%, 7/1/2021 | | | 75,000 | | | | 76,179 | |
| | |
County of Clark, Department of Aviation, Nevada Airport System, Las Vegas-McCarran International Airport Passenger Facility Charge Series 2012B, Rev., 5.00%, 7/1/2022 | | | 270,000 | | | | 287,285 | |
| | | | | | | | |
| INVESTMENTS | | PRINCIPAL
AMOUNT ($) | | | VALUE ($) | |
| | | | | | | | |
| | |
Nevada — continued | | | | | | | | |
| | |
County of Clark, Department of Aviation, Nevada Airport System, Subordinate Lien | | | | | | | | |
| | |
Rev., 5.00%, 7/1/2021 | | | 125,000 | | | | 126,999 | |
| | |
Series 2019D, Rev., 5.00%, 7/1/2023 | | | 670,000 | | | | 741,737 | |
| | |
Series 2019D, Rev., 5.00%, 7/1/2024 | | | 300,000 | | | | 344,226 | |
| | |
County of Clark, Department of Aviation, Nevada Airport System, Subordinate Lien, McCarran International Airport Series 2019A, Rev., 5.00%, 7/1/2023 | | | 140,000 | | | | 154,990 | |
| | |
County of Clark, Flood Control | | | | | | | | |
| | |
GO, 5.00%, 11/1/2021 | | | 50,000 | | | | 51,609 | |
| | |
GO, 5.00%, 11/1/2022 | | | 200,000 | | | | 216,008 | |
| | |
GO, 5.00%, 11/1/2023 | | | 25,000 | | | | 28,088 | |
| | |
County of Clark, Indexed Fuel Tax and Subordinate Motor Vehicle Fuel Tax Rev., 5.00%, 7/1/2025 | | | 710,000 | | | | 843,068 | |
| | |
County of Clark, Las Vegas Convention and Visitors Authority | | | | | | | | |
| | |
GO, 4.00%, 7/1/2021 | | | 80,000 | | | | 81,018 | |
| | |
GO, 5.00%, 7/1/2023 | | | 20,000 | | | | 22,181 | |
| | |
County of Clark, Limited Tax | | | | | | | | |
| | |
Series 2016A, GO, 5.00%, 11/1/2021 | | | 245,000 | | | | 252,882 | |
| | |
Series 2016B, GO, 5.00%, 11/1/2021 | | | 115,000 | | | | 118,700 | |
| | |
Series 2016B, GO, 5.00%, 11/1/2022 | | | 310,000 | | | | 334,812 | |
| | |
Series 2016B, GO, 5.00%, 11/1/2023 | | | 25,000 | | | | 28,088 | |
| | |
Series 2016B, GO, 5.00%, 11/1/2024 | | | 45,000 | | | | 52,357 | |
| | |
County of Clark, Park Improvement, Limited Tax GO, 5.00%, 12/1/2024 | | | 25,000 | | | | 29,168 | |
| | |
County of Clark, Passenger Facility Charge, Las Vegas-McCarran International Airport Passenger Facility Rev., 5.00%, 7/1/2021 | | | 400,000 | | | | 406,396 | |
| | |
County of Clark, Stadium Improvement, Limited Tax Series 2018A, GO, 5.00%, 6/1/2021 | | | 100,000 | | | | 101,198 | |
| | |
County of Clark, Transportation, Limited Tax Series 2019B, GO, 5.00%, 6/1/2026 | | | 300,000 | | | | 366,246 | |
| | |
County of Washoe, Limited Tax, Various Purpose Series 2012A, GO, 3.00%, 3/1/2024 | | | 50,000 | | | | 51,279 | |
SEE NOTES TO FINANCIAL STATEMENTS.
| | | | | | |
| | | |
| 244 | | | | J.P. MORGAN EXCHANGE-TRADED FUNDS | | FEBRUARY 28, 2021 |
| | | | | | | | |
| INVESTMENTS | | PRINCIPAL
AMOUNT ($) | | | VALUE ($) | |
Municipal Bonds — continued | | | | | | | | |
| | |
Nevada — continued | | | | | | | | |
| | |
County of Washoe, Reno-Sparks Convention & Visitors Authority, Limited Tax GO, 5.00%, 7/1/2021 (b) | | | 110,000 | | | | 111,751 | |
| | |
Las Vegas Valley Water District | | | | | | | | |
| | |
Series 2011D, GO, 5.00%, 6/1/2021 | | | 20,000 | | | | 20,239 | |
| | |
Series 2015A, GO, 5.00%, 6/1/2021 | | | 95,000 | | | | 96,146 | |
| | |
Series 2016A, GO, 5.00%, 6/1/2021 | | | 200,000 | | | | 202,412 | |
| | |
Series 2017B, GO, 5.00%, 6/1/2021 | | | 40,000 | | | | 40,482 | |
| | |
Series 2018A, GO, 5.00%, 6/1/2021 | | | 190,000 | | | | 192,291 | |
| | |
Series 2019A, GO, 5.00%, 6/1/2021 | | | 150,000 | | | | 151,809 | |
| | |
Series 2015B, GO, 5.00%, 12/1/2021 | | | 40,000 | | | | 41,458 | |
| | |
Series 2012B, GO, 5.00%, 6/1/2022 | | | 50,000 | | | | 53,027 | |
| | |
Series 2015A, GO, 5.00%, 6/1/2022 | | | 225,000 | | | | 238,621 | |
| | |
Series 2017A, GO, 5.00%, 6/1/2022 | | | 75,000 | | | | 79,540 | |
| | |
Series 2018B, GO, 5.00%, 6/1/2022 | | | 25,000 | | | | 26,514 | |
| | |
Series 2016A, GO, 5.00%, 6/1/2023 | | | 25,000 | | | | 27,664 | |
| | |
Series 2012B, GO, 5.00%, 6/1/2025 | | | 240,000 | | | | 254,345 | |
| | |
Nevada System of Higher Education | | | | | | | | |
| | |
Series 2013A, Rev., 5.00%, 7/1/2021 | | | 85,000 | | | | 86,336 | |
| | |
Rev., 4.00%, 7/1/2022 | | | 100,000 | | | | 104,964 | |
| | |
Series 2013B, Rev., 5.00%, 7/1/2022 | | | 20,000 | | | | 21,258 | |
| | |
Rev., 5.00%, 7/1/2023 | | | 25,000 | | | | 27,560 | |
| | |
State of Nevada Highway Improvement | | | | | | | | |
| | |
Rev., 5.00%, 12/1/2021 | | | 60,000 | | | | 62,187 | |
| | |
Series 2020B, Rev., 5.00%, 12/1/2021 | | | 30,000 | | | | 31,093 | |
| | |
State of Nevada Highway Improvement, Motor Vehicle Fuel Tax | | | | | | | | |
| | |
Rev., 5.00%, 12/1/2021 | | | 370,000 | | | | 383,483 | |
| | |
Series 2020A, Rev., 5.00%, 12/1/2022 | | | 35,000 | | | | 37,948 | |
| | |
State of Nevada, Capital Improvement and Cultural Affairs | | | | | | | | |
| | |
Series 2014A, GO, 5.00%, 4/1/2021 | | | 90,000 | | | | 90,354 | |
| | |
Series 2011A, GO, 5.00%, 8/1/2021 | | | 60,000 | | | | 61,211 | |
| | |
Series 2012B, GO, 5.00%, 8/1/2021 | | | 30,000 | | | | 30,606 | |
| | |
Series 2013D-1, GO, 5.00%, 3/1/2022 | | | 65,000 | | | | 68,140 | |
| | |
Series 2014A, GO, 5.00%, 4/1/2022 | | | 40,000 | | | | 42,094 | |
| | |
GO, 5.00%, 8/1/2022 | | | 25,000 | | | | 26,708 | |
| | |
Series 2015B, GO, 5.00%, 11/1/2022 | | | 65,000 | | | | 70,214 | |
| | |
Series 2015B, GO, 5.00%, 11/1/2024 | | | 25,000 | | | | 29,048 | |
| | | | | | | | |
| INVESTMENTS | | PRINCIPAL
AMOUNT ($) | | | VALUE ($) | |
| | | | | | | | |
| | |
Nevada — continued | | | | | | | | |
| | |
State of Nevada, Casa Grande Project COP, 4.00%, 4/1/2021 | | | 30,000 | | | | 30,091 | |
| | |
State of Nevada, College Project COP, 5.00%, 6/1/2021 | | | 20,000 | | | | 20,236 | |
| | |
State of Nevada, Historic Preservation | | | | | | | | |
| | |
Series 2018A, GO, 5.00%, 4/1/2021 | | | 20,000 | | | | 20,078 | |
| | |
Series 2018A, GO, 5.00%, 4/1/2022 | | | 40,000 | | | | 42,094 | |
| | |
State of Nevada, Limited Tax | | | | | | | | |
| | |
Series 2016D, GO, 5.00%, 5/1/2021 | | | 60,000 | | | | 60,480 | |
| | |
Series 2015D, GO, 5.00%, 4/1/2022 | | | 45,000 | | | | 47,355 | |
| | |
State of Nevada, Natural Resources, Limited Tax Series 2012C, GO, 5.00%, 8/1/2022 | | | 20,000 | | | | 21,367 | |
| | |
State of Nevada, Parks and Natural Resources GO, 5.00%, 6/1/2021 | | | 25,000 | | | | 25,302 | |
| | |
State of Nevada, Water Pollution Control GO, 5.00%, 8/1/2022 | | | 25,000 | | | | 26,708 | |
| | |
Truckee Meadows Water Authority | | | | | | | | |
| | |
Rev., 5.00%, 7/1/2021 | | | 20,000 | | | | 20,321 | |
| | |
Series 2015A, Rev., 5.00%, 7/1/2021 | | | 20,000 | | | | 20,321 | |
| | |
Rev., 5.00%, 7/1/2022 | | | 40,000 | | | | 42,572 | |
| | |
Washoe County School District, Limited Tax, School Improvement Series 2011-A, GO, 5.00%, 6/1/2021 (b) | | | 40,000 | | | | 40,481 | |
| | | | | | | | |
| | |
Total Nevada | | | | | | | 8,414,321 | |
| | | | | | | | |
| | |
New Hampshire — 0.1% | | | | | | | | |
| | |
City of Concord GO, 4.00%, 7/15/2022 | | | 40,000 | | | | 42,100 | |
| | |
City of Dover GO, 3.00%, 6/15/2021 | | | 100,000 | | | | 100,803 | |
| | |
City of Keene GO, 4.00%, 11/1/2022 | | | 30,000 | | | | 31,841 | |
| | |
City of Manchester Series 2011C, GO, 3.50%, 12/1/2021 (b) | | | 55,000 | | | | 56,375 | |
| | |
City of Nashua | | | | | | | | |
| | |
GO, 3.00%, 5/1/2021 | | | 50,000 | | | | 50,234 | |
| | |
GO, 5.00%, 9/15/2022 | | | 25,000 | | | | 26,856 | |
| | |
City of Portsmouth Series B, GO, 3.00%, 8/1/2021 | | | 50,000 | | | | 50,591 | |
| | |
County of Merrimack GO, 5.00%, 11/15/2021 | | | 25,000 | | | | 25,853 | |
| | |
New Hampshire Health and Education Facilities Authority Act, Concord Hospital | | | | | | | | |
| | |
Rev., 5.25%, 10/1/2021 (b) | | | 150,000 | | | | 154,367 | |
| | |
Series 2013A, Rev., 4.00%, 10/1/2022 (b) | | | 410,000 | | | | 434,239 | |
SEE NOTES TO FINANCIAL STATEMENTS.
| | | | | | | | |
| | | |
| FEBRUARY 28, 2021 | | J.P. MORGAN EXCHANGE-TRADED FUNDS | | | | | 245 | |
JPMorgan Ultra-Short Municipal Income ETF
SCHEDULE OF PORTFOLIO INVESTMENTS
AS OF FEBRUARY 28, 2021 (continued)
| | | | | | | | |
| INVESTMENTS | | PRINCIPAL
AMOUNT ($) | | | VALUE ($) | |
Municipal Bonds — continued | | | | | | | | |
| | |
New Hampshire — continued | | | | | | | | |
| | |
New Hampshire Health and Education Facilities Authority Act, Southern New Hampshire University Rev., 5.00%, 1/1/2023 (b) | | | 40,000 | | | | 43,460 | |
| | |
New Hampshire Health and Education Facilities Authority, University System Rev., 5.00%, 7/1/2021 | | | 25,000 | | | | 25,397 | |
| | |
New Hampshire Municipal Bond Bank | | | | | | | | |
| | |
Series 2016D, Rev., 4.00%, 8/15/2021 | | | 25,000 | | | | 25,436 | |
| | |
Series 2011D, Rev., 5.00%, 8/15/2021 | | | 25,000 | | | | 25,549 | |
| | |
Series 2013A, Rev., 5.00%, 8/15/2021 | | | 70,000 | | | | 71,536 | |
| | |
Series 2017B, Rev., 5.00%, 8/15/2021 | | | 75,000 | | | | 76,645 | |
| | |
Series 2013C, Rev., 5.25%, 8/15/2021 | | | 35,000 | | | | 35,807 | |
| | |
Series 2011E, Rev., 3.00%, 1/15/2022 | | | 20,000 | | | | 20,493 | |
| | |
Series 2011E, Rev., 4.13%, 1/15/2022 (b) | | | 20,000 | | | | 20,694 | |
| | |
Series 2017A, Rev., 5.00%, 2/15/2022 | | | 20,000 | | | | 20,921 | |
| | |
Series 2019A, Rev., 5.00%, 2/15/2022 | | | 75,000 | | | | 78,455 | |
| | |
Series 2012C, Rev., 4.00%, 8/15/2022 | | | 35,000 | | | | 36,944 | |
| | |
Series 2016D, Rev., 4.00%, 8/15/2022 | | | 25,000 | | | | 26,389 | |
| | |
State of New Hampshire | | | | | | | | |
| | |
Series 2014A, GO, 4.00%, 3/1/2021 | | | 20,000 | | | | 20,000 | |
| | |
Series 2016B, GO, 5.00%, 6/1/2021 | | | 30,000 | | | | 30,360 | |
| | |
Series 2011B, GO, 3.50%, 2/1/2022 (b) | | | 25,000 | | | | 25,762 | |
| | |
Series 2011B, GO, 4.00%, 2/1/2022 | | | 25,000 | | | | 25,879 | |
| | |
Series 2014A, GO, 5.00%, 3/1/2022 | | | 25,000 | | | | 26,208 | |
| | |
Series 2018A, GO, 5.00%, 12/1/2022 | | | 25,000 | | | | 27,106 | |
| | | | | | | | |
| | |
Total New Hampshire | | | | | | | 1,636,300 | |
| | | | | | | | |
| | |
New Jersey — 7.1% | | | | | | | | |
| | |
Bergen County Improvement Authority (The), Englewood Board of Education Project Rev., GTD, 5.00%, 4/1/2021 | | | 20,000 | | | | 20,078 | |
| | |
Bergen County Improvement Authority (The), Guaranteed Governmental Loan | | | | | | | | |
| | |
Rev., GTD, 5.00%, 8/15/2021 | | | 20,000 | | | | 20,440 | |
| | | | | | | | |
| INVESTMENTS | | PRINCIPAL
AMOUNT ($) | | | VALUE ($) | |
| | | | | | | | |
| | |
New Jersey — continued | | | | | | | | |
| | |
Rev., GTD, 5.00%, 9/1/2022 | | | 35,000 | | | | 37,532 | |
| | |
Rev., GTD, 5.00%, 10/15/2022 | | | 30,000 | | | | 32,348 | |
| | |
Borough of Carlstadt GO, BAN, 2.00%, 6/25/2021 | | | 8,675,000 | | | | 8,712,216 | |
| | |
Borough of Edgewater, General Improvement and Marina Utility GO, 4.00%, 2/15/2022 | | | 40,000 | | | | 41,466 | |
| | |
Borough of Florham Park, Water and Sewer Utility GO, BAN, 1.50%, 11/12/2021 | | | 2,621,000 | | | | 2,641,418 | |
| | |
Borough of Hightstown GO, 5.00%, 4/1/2022 | | | 50,000 | | | | 52,505 | |
| | |
Borough of Lebanon, General Improvement GO, 4.00%, 2/1/2022 | | | 30,000 | | | | 30,962 | |
| | |
Borough of Oakland, General Improvement GO, 3.00%, 12/1/2022 | | | 25,000 | | | | 26,175 | |
| | |
Borough of Old Tappan GO, BAN, 2.00%, 10/8/2021 | | | 1,149,100 | | | | 1,160,717 | |
| | |
Borough of Point Pleasant, General Improvement GO, 4.00%, 7/15/2022 | | | 20,000 | | | | 21,022 | |
| | |
Borough of Runnemede Series A, GO, BAN, 1.25%, 6/30/2021 | | | 2,363,125 | | | | 2,368,253 | |
| | |
Borough of Saddle River GO, BAN, 1.25%, 4/23/2021 | | | 2,494,000 | | | | 2,496,594 | |
| | |
Borough of South Plainfield, General Improvement GO, 4.00%, 4/1/2022 | | | 100,000 | | | | 104,044 | |
| | |
Borough of South River, General Improvement | | | | | | | | |
| | |
GO, 3.00%, 12/1/2022 | | | 25,000 | | | | 26,189 | |
| | |
GO, 4.00%, 12/1/2022 | | | 40,000 | | | | 42,599 | |
| | |
Borough of Westwood GO, BAN, 1.50%, 12/17/2021 | | | 1,074,000 | | | | 1,083,784 | |
| | |
Bridgewater-Raritan Regional School District | | | | | | | | |
| | |
GO, 4.50%, 5/1/2021 | | | 50,000 | | | | 50,348 | |
| | |
GO, 4.50%, 5/1/2022 | | | 70,000 | | | | 73,447 | |
| | |
Burlington County Bridge Commission | | | | | | | | |
| | |
Rev., GTD, 5.00%, 10/1/2021 | | | 20,000 | | | | 20,550 | |
| | |
Rev., GTD, 5.00%, 10/1/2022 | | | 50,000 | | | | 53,719 | |
| | |
Burlington County Bridge Commission, Governmental Leasing Program | | | | | | | | |
| | |
Series 2020AB, Rev., 3.50%, 4/15/2021 | | | 330,000 | | | | 331,353 | |
| | |
Rev., 5.00%, 10/1/2021 | | | 25,000 | | | | 25,687 | |
| | |
Rev., 5.00%, 4/15/2022 | | | 25,000 | | | | 26,321 | |
SEE NOTES TO FINANCIAL STATEMENTS.
| | | | | | |
| | | |
| 246 | | | | J.P. MORGAN EXCHANGE-TRADED FUNDS | | FEBRUARY 28, 2021 |
| | | | | | | | |
| INVESTMENTS | | PRINCIPAL
AMOUNT ($) | | | VALUE ($) | |
Municipal Bonds — continued | | | | | | | | |
| | |
New Jersey — continued | | | | | | | | |
| | |
Burlington County Bridge Commission, Governmental Loan Program | | | | | | | | |
| | |
Rev., GTD, 5.00%, 8/1/2021 | | | 30,000 | | | | 30,588 | |
| | |
Rev., GTD, 4.00%, 10/15/2021 | | | 35,000 | | | | 35,809 | |
| | |
Rev., GTD, 5.00%, 12/1/2021 | | | 25,000 | | | | 25,884 | |
| | |
Rev., GTD, 5.00%, 8/1/2022 | | | 25,000 | | | | 26,664 | |
| | |
Rev., GTD, 5.00%, 12/1/2022 | | | 20,000 | | | | 21,637 | |
| | |
Camden County Improvement Authority (The) | | | | | | | | |
| | |
Series 2011A, Rev., GTD, 4.00%, 9/1/2021 | | | 75,000 | | | | 76,400 | |
| | |
Series 2012A, Rev., GTD, 5.00%, 9/1/2021 | | | 50,000 | | | | 51,182 | |
| | |
Series 2015A, Rev., GTD, 5.00%, 9/1/2021 | | | 55,000 | | | | 56,300 | |
| | |
Series 2014A, Rev., GTD, 4.00%, 12/15/2021 | | | 195,000 | | | | 200,754 | |
| | |
Series 2017B, Rev., GTD, 4.00%, 1/15/2024 | | | 25,000 | | | | 27,497 | |
| | |
Series 2015A, Rev., GTD, 5.00%, 9/1/2024 | | | 25,000 | | | | 28,867 | |
| | |
Camden County Improvement Authority (The), Camden County College Project Rev., GTD, 5.00%, 1/15/2023 | | | 50,000 | | | | 54,348 | |
| | |
Camden County Improvement Authority (The), City Hall Project Rev., GTD, 5.00%, 12/1/2022 | | | 75,000 | | | | 81,179 | |
| | |
Camden County Improvement Authority (The), County Capital Program Rev., GTD, 5.00%, 1/15/2022 | | | 315,000 | | | | 327,987 | |
| | |
Camden County Improvement Authority (The), Open Space Preservation Trust Fund | | | | | | | | |
| | |
Rev., GTD, 2.25%, 6/1/2021 | | | 40,000 | | | | 40,198 | |
| | |
Rev., GTD, 5.00%, 6/1/2023 | | | 50,000 | | | | 52,937 | |
| | |
Chathams District Board of Education Series 2014A, GO, 5.00%, 7/15/2022 | | | 25,000 | | | | 26,655 | |
| | |
City of Brigantine GO, 4.00%, 10/15/2022 | | | 25,000 | | | | 26,443 | |
| | |
City of Cape May GO, 3.00%, 7/15/2021 | | | 30,000 | | | | 30,317 | |
| | |
City of East Orange, Water Utilities Series B, GO, AGM, 5.00%, 7/15/2021 | | | 35,000 | | | | 35,602 | |
| | |
City of Elizabeth, General Improvement | | | | | | | | |
| | |
GO, AGM, 3.00%, 4/1/2022 | | | 25,000 | | | | 25,769 | |
| | |
GO, 4.00%, 8/15/2022 | | | 50,000 | | | | 52,785 | |
| | | | | | | | |
| INVESTMENTS | | PRINCIPAL
AMOUNT ($) | | | VALUE ($) | |
| | | | | | | | |
| | |
New Jersey — continued | | | | | | | | |
| | |
City of Elizabeth, Improvement and Sewer Utility GO, 3.00%, 4/1/2022 | | | 50,000 | | | | 51,538 | |
| | |
City of Hoboken, Packaging Utility GO, 5.00%, 1/1/2023 | | | 25,000 | | | | 27,177 | |
| | |
City of Jersey, General Improvement Series 2012A-B, GO, AGM, 3.00%, 9/1/2021 | | | 25,000 | | | | 25,325 | |
| | |
City of Ocean City GO, 4.00%, 9/15/2023 | | | 75,000 | | | | 81,858 | |
| | |
City of Rahway | | | | | | | | |
| | |
GO, 4.00%, 4/15/2022 | | | 25,000 | | | | 26,004 | |
| | |
GO, 4.00%, 8/1/2023 | | | 25,000 | | | | 27,091 | |
| | |
City of Ventnor GO, BAN, 2.00%, 7/15/2021 | | | 12,679,000 | | | | 12,757,737 | |
| | |
Collingswood School District GO, 4.00%, 6/1/2021 | | | 25,000 | | | | 25,232 | |
| | |
County of Bergen GO, 5.00%, 10/15/2022 | | | 35,000 | | | | 37,751 | |
| | |
County of Burlington, General Improvement | | | | | | | | |
| | |
Series 2016A-1, GO, 4.00%, 9/1/2021 | | | 185,000 | | | | 188,435 | |
| | |
Series 2016A-1, GO, 4.00%, 9/1/2022 | | | 50,000 | | | | 52,777 | |
| | |
County of Camden, College GO, 3.00%, 2/1/2022 | | | 25,000 | | | | 25,627 | |
| | |
County of Cumberland GO, BAN, 2.00%, 10/7/2021 | | | 85,000 | | | | 85,897 | |
| | |
County of Essex, Vocational School Bonds Series 2017B, GO, 5.00%, 9/1/2022 | | | 35,000 | | | | 37,532 | |
| | |
County of Gloucester | | | | | | | | |
| | |
Series 2017B, GO, 3.00%, 10/15/2021 | | | 30,000 | | | | 30,531 | |
| | |
GO, 4.00%, 1/15/2022 | | | 100,000 | | | | 103,344 | |
| | |
County of Hudson | | | | | | | | |
| | |
GO, 5.00%, 9/1/2021 | | | 30,000 | | | | 30,718 | |
| | |
GO, 5.00%, 12/1/2021 | | | 60,000 | | | | 62,158 | |
| | |
GO, 5.00%, 12/1/2022 | | | 25,000 | | | | 27,046 | |
| | |
GO, 5.00%, 12/1/2023 | | | 25,000 | | | | 28,105 | |
| | |
County of Mercer, Capital Improvement, Open Space Farmland Preservation Series 2020A, GO, BAN, 2.00%, 6/10/2021 | | | 820,000 | | | | 824,100 | |
| | |
County of Mercer, County College GO, 4.00%, 6/1/2022 | | | 25,000 | | | | 26,195 | |
| | |
County of Middlesex, Civic Square II Redevelopment Associates LLC | | | | | | | | |
| | |
COP, 4.00%, 6/15/2021 | | | 60,000 | | | | 60,644 | |
SEE NOTES TO FINANCIAL STATEMENTS.
| | | | | | | | |
| | | |
| FEBRUARY 28, 2021 | | J.P. MORGAN EXCHANGE-TRADED FUNDS | | | | | 247 | |
JPMorgan Ultra-Short Municipal Income ETF
SCHEDULE OF PORTFOLIO INVESTMENTS
AS OF FEBRUARY 28, 2021 (continued)
| | | | | | | | |
| INVESTMENTS | | PRINCIPAL
AMOUNT ($) | | | VALUE ($) | |
Municipal Bonds — continued | | | | | | | | |
| | |
New Jersey — continued | | | | | | | | |
| | |
COP, 4.00%, 6/15/2023 | | | 25,000 | | | | 27,019 | |
| | |
County of Middlesex, Civic Square III Redevelopment Associates LLC COP, 4.00%, 6/15/2023 | | | 100,000 | | | | 108,074 | |
| | |
County of Middlesex, Civic Square IV Redevelopment Associates LLC | | | | | | | | |
| | |
COP, 5.00%, 10/15/2021 | | | 45,000 | | | | 46,325 | |
| | |
COP, 5.00%, 10/15/2022 | | | 50,000 | | | | 53,827 | |
| | |
County of Monmouth, Various Purpose Series 2015C, GO, 5.00%, 7/15/2022 | | | 30,000 | | | | 31,985 | |
| | |
County of Ocean | | | | | | | | |
| | |
Series 2015A, GO, 4.00%, 8/1/2022 | | | 25,000 | | | | 26,356 | |
| | |
GO, 5.00%, 8/1/2022 | | | 25,000 | | | | 26,708 | |
| | |
County of Ocean, General Improvement GO, 5.00%, 11/1/2021 | | | 45,000 | | | | 46,420 | |
| | |
County of Passaic, Consisting of General Improvement and College | | | | | | | | |
| | |
GO, 5.00%, 6/15/2021 | | | 20,000 | | | | 20,278 | |
| | |
GO, 5.00%, 4/1/2023 | | | 25,000 | | | | 27,422 | |
| | |
County of Passaic, Vocational School Series 2018B, GO, 4.00%, 12/1/2024 | | | 165,000 | | | | 185,607 | |
| | |
County of Somerset | | | | | | | | |
| | |
GO, 3.00%, 8/1/2021 | | | 35,000 | | | | 35,414 | |
| | |
GO, 3.00%, 8/1/2022 | | | 25,000 | | | | 26,002 | |
| | |
County of Union GO, 3.00%, 3/1/2022 | | | 45,000 | | | | 46,278 | |
| | |
East Rutherford Board of Education GO, 1.25%, 7/15/2021 | | | 8,000,000 | | | | 8,021,040 | |
| | |
Essex County Improvement Authority | | | | | | | | |
| | |
Rev., AMBAC, GTD, 5.25%, 12/15/2021 | | | 25,000 | | | | 26,009 | |
| | |
Series 2006, Rev., AMBAC, GTD, 5.25%, 12/15/2021 | | | 20,000 | | | | 20,808 | |
| | |
Rev., AMBAC, GTD, 5.25%, 12/15/2022 | | | 20,000 | | | | 21,822 | |
| | |
Essex County Improvement Authority, County Guaranteed Project Rev., GTD, 5.00%, 10/1/2022 | | | 50,000 | | | | 53,844 | |
| | |
Flemington Raritan Regional Board of Education GO, 4.00%, 6/15/2021 | | | 20,000 | | | | 20,221 | |
| | |
Franklin Township Board of Education GO, 3.00%, 2/1/2022 | | | 40,000 | | | | 41,033 | |
| | |
Freehold Township Board of Education GO, 5.00%, 7/15/2023 | | | 25,000 | | | | 26,616 | |
| | |
Gloucester County Improvement Authority (The), GCSSSD/GCVTSD Project Rev., 4.00%, 5/15/2023 | | | 35,000 | | | | 37,787 | |
| | | | | | | | |
| INVESTMENTS | | PRINCIPAL
AMOUNT ($) | | | VALUE ($) | |
| | | | | | | | |
| | |
New Jersey — continued | | | | | | | | |
| | |
Gloucester County Improvement Authority (The), Shady Lane Nursing Home Project Rev., GTD, 4.00%, 12/1/2022 | | | 480,000 | | | | 508,838 | |
| | |
Green Brook Township School District GO, 3.50%, 5/15/2023 | | | 80,000 | | | | 83,114 | |
| | |
Hainesport Township School District GO, 5.00%, 1/15/2024 | | | 35,000 | | | | 39,469 | |
| | |
Hopewell Valley Regional School District GO, 3.25%, 1/15/2025 | | | 25,000 | | | | 27,270 | |
| | |
Hudson County Improvement Authority, Guttenberg Project Rev., GTD, 5.00%, 8/1/2023 | | | 50,000 | | | | 55,558 | |
| | |
Hudson County Improvement Authority, Vocational — Technical School Project | | | | | | | | |
| | |
Rev., 5.00%, 5/1/2021 | | | 30,000 | | | | 30,234 | |
| | |
Rev., 5.00%, 5/1/2023 | | | 25,000 | | | | 27,508 | |
| | |
Jackson Township School District GO, 5.00%, 6/15/2025 | | | 50,000 | | | | 58,960 | |
| | |
Lenape Regional High School District GO, 5.00%, 3/15/2023 | | | 20,000 | | | | 21,864 | |
| | |
Leonia Board of Education GO, 4.00%, 7/15/2022 | | | 140,000 | | | | 147,252 | |
| | |
Lindenwold Boro School District GO, 4.00%, 6/1/2021 | | | 75,000 | | | | 75,677 | |
| | |
Livingston Township School District GO, 5.00%, 7/15/2021 | | | 25,000 | | | | 25,448 | |
| | |
Lyndhurst Township School District GO, 4.00%, 7/1/2021 | | | 100,000 | | | | 101,191 | |
| | |
Medford Township Board of Education | | | | | | | | |
| | |
GO, 5.00%, 3/1/2021 | | | 50,000 | | | | 50,000 | |
| | |
GO, 5.00%, 3/1/2022 | | | 120,000 | | | | 125,772 | |
| | |
Middlesex County Improvement Authority, Capital Equipment and Improvement | | | | | | | | |
| | |
Rev., GTD, 3.00%, 9/1/2021 | | | 20,000 | | | | 20,284 | |
| | |
Rev., GTD, 4.00%, 9/15/2021 | | | 175,000 | | | | 178,619 | |
| | |
Rev., GTD, 4.00%, 10/15/2021 | | | 20,000 | | | | 20,478 | |
| | |
Middlesex County Improvement Authority, Educational Services Commission of New Jersey Project Rev., GTD, 5.00%, 7/15/2022 | | | 25,000 | | | | 26,655 | |
| | |
Monmouth County Improvement Authority (The), Governmental Pooled Loan Project | | | | | | | | |
| | |
Series 2018B, Rev., 5.00%, 7/15/2021 | | | 20,000 | | | | 20,359 | |
| | |
Series 2017B, Rev., GTD, 5.00%, 7/15/2022 | | | 30,000 | | | | 31,985 | |
| | |
Rev., GTD, 5.00%, 12/1/2022 | | | 95,000 | | | | 103,002 | |
SEE NOTES TO FINANCIAL STATEMENTS.
| | | | | | |
| | | |
| 248 | | | | J.P. MORGAN EXCHANGE-TRADED FUNDS | | FEBRUARY 28, 2021 |
| | | | | | | | |
| INVESTMENTS | | PRINCIPAL
AMOUNT ($) | | | VALUE ($) | |
Municipal Bonds — continued | | | | | | | | |
| | |
New Jersey — continued | | | | | | | | |
| | |
Monroe Township Board of Education GO, 5.00%, 3/1/2022 | | | 35,000 | | | | 36,673 | |
| | |
Montgomery Township Board of Education GO, 5.00%, 4/1/2022 | | | 60,000 | | | | 63,134 | |
| | |
Morris County Improvement Authority Rev., GTD, 5.00%, 8/15/2021 (b) | | | 25,000 | | | | 25,551 | |
| | |
Morris County Improvement Authority, Morris Hills Regional District Project Rev., GTD, 5.00%, 10/1/2022 (b) | | | 35,000 | | | | 37,679 | |
| | |
Mount Olive Township Board of Education GO, 4.00%, 7/15/2021 | | | 25,000 | | | | 25,355 | |
| | |
Mountain Lakes School District GO, 5.00%, 1/15/2022 | | | 25,000 | | | | 26,051 | |
| | |
New Brunswick Parking Authority, Tax-Exempt | | | | | | | | |
| | |
Series 2020B, Rev., GTD, 5.00%, 9/1/2021 | | | 70,000 | | | | 71,552 | |
| | |
Series 2020B, Rev., GTD, 5.00%, 9/1/2022 | | | 350,000 | | | | 372,918 | |
| | |
Series 2020B, Rev., GTD, 5.00%, 9/1/2023 | | | 335,000 | | | | 370,165 | |
| | |
New Jersey Building Authority Series 2013A, Rev., 5.00%, 6/15/2021 | | | 240,000 | | | | 243,209 | |
| | |
New Jersey Economic Development Authority, Motor Vehicle Surcharge Series 2004A, Rev., NATL-RE, Zero Coupon, 7/1/2021 | | | 350,000 | | | | 349,055 | |
| | |
New Jersey Economic Development Authority, School Facilities Construction | | | | | | | | |
| | |
Series 2012-II, Rev., 5.00%, 3/1/2021 (b) | | | 40,000 | | | | 40,000 | |
| | |
Series 2013NN, Rev., 5.00%, 3/1/2021 | | | 245,000 | | | | 245,000 | |
| | |
Series GG, Rev., 5.00%, 3/1/2021 | | | 100,000 | | | | 100,000 | |
| | |
Series 2011EE, Rev., 5.25%, 3/1/2021 | | | 1,300,000 | | | | 1,300,000 | |
| | |
Series 2011GG, Rev., 5.25%, 3/1/2021 | | | 200,000 | | | | 200,000 | |
| | |
Rev., 5.50%, 3/1/2021 (b) | | | 80,000 | | | | 80,000 | |
| | |
Series 2011GG, Rev., 5.75%, 3/1/2021 (b) | | | 975,000 | | | | 975,000 | |
| | |
Series XX, Rev., 5.00%, 6/15/2021 | | | 560,000 | | | | 567,487 | |
| | |
Series 2011GG, Rev., 5.00%, 9/1/2021 | | | 125,000 | | | | 125,357 | |
| | |
Series 2012-II, Rev., 5.00%, 3/1/2022 | | | 275,000 | | | | 287,661 | |
| | |
Series 2013NN, Rev., 5.00%, 3/1/2022 | | | 50,000 | | | | 52,302 | |
| | | | | | | | |
| INVESTMENTS | | PRINCIPAL
AMOUNT ($) | | | VALUE ($) | |
| | | | | | | | |
| | |
New Jersey — continued | | | | | | | | |
| | |
Rev., 5.00%, 6/15/2022 | | | 100,000 | | | | 105,921 | |
| | |
Rev., 5.00%, 6/15/2023 | | | 110,000 | | | | 120,743 | |
| | |
Series 2012-II, Rev., 3.00%, 3/1/2024 | | | 110,000 | | | | 112,287 | |
| | |
Series 2005N1, Rev., AMBAC, 5.50%, 9/1/2024 | | | 1,375,000 | | | | 1,593,336 | |
| | |
Series 2012-II, Rev., 5.00%, 3/1/2025 | | | 150,000 | | | | 156,318 | |
| | |
New Jersey Educational Facilities Authority, College of New Jersey Rev., 5.00%, 7/1/2022 (b) | | | 100,000 | | | | 106,458 | |
| | |
New Jersey Educational Facilities Authority, Montclair State University Series 2014A, Rev., 5.00%, 7/1/2021 | | | 270,000 | | | | 274,061 | |
| | |
New Jersey Educational Facilities Authority, Princeton University | | | | | | | | |
| | |
Series 2015D, Rev., 5.00%, 7/1/2021 | | | 30,000 | | | | 30,481 | |
| | |
Series 2011B, Rev., 3.10%, 7/1/2023 | | | 50,000 | | | | 50,467 | |
| | |
New Jersey Health Care Facilities Financing Authority, AHS Hospital Corp. Rev., 5.00%, 7/1/2022 | | | 120,000 | | | | 127,384 | |
| | |
New Jersey Health Care Facilities Financing Authority, Barnabas Health Obligated Group | | | | | | | | |
| | |
Series 2019B-1, Rev., 5.00%, 7/1/2024 (c) | | | 800,000 | | | | 912,616 | |
| | |
Rev., 5.00%, 7/1/2026 (c) | | | 100,000 | | | | 120,852 | |
| | |
New Jersey Health Care Facilities Financing Authority, Hackensack Meridian Health | | | | | | | | |
| | |
Series 2017A, Rev., 5.00%, 7/1/2021 | | | 100,000 | | | | 101,572 | |
| | |
Rev., 5.00%, 7/1/2022 | | | 295,000 | | | | 313,559 | |
| | |
Series 2017A, Rev., 5.00%, 7/1/2025 | | | 175,000 | | | | 207,303 | |
| | |
New Jersey Health Care Facilities Financing Authority, Inspira Health Obligated Group Rev., 2.00%, 7/1/2022 | | | 350,000 | | | | 357,374 | |
| | |
New Jersey Health Care Facilities Financing Authority, Meridian Health System Rev., 5.00%, 7/1/2024 | | | 305,000 | | | | 323,605 | |
| | |
New Jersey Health Care Facilities Financing Authority, Robert Wood Johnson University Hospital Rev., 5.00%, 7/1/2021 | | | 225,000 | | | | 228,537 | |
SEE NOTES TO FINANCIAL STATEMENTS.
| | | | | | | | |
| | | |
| FEBRUARY 28, 2021 | | J.P. MORGAN EXCHANGE-TRADED FUNDS | | | | | 249 | |
JPMorgan Ultra-Short Municipal Income ETF
SCHEDULE OF PORTFOLIO INVESTMENTS
AS OF FEBRUARY 28, 2021 (continued)
| | | | | | | | |
| INVESTMENTS | | PRINCIPAL
AMOUNT ($) | | | VALUE ($) | |
Municipal Bonds — continued | | | | | | | | |
| | |
New Jersey — continued | | | | | | | | |
| | |
New Jersey Health Care Facilities Financing Authority, Valley Health System | | | | | | | | |
| | |
Rev., 4.00%, 7/1/2021 | | | 305,000 | | | | 308,632 | |
| | |
Rev., 5.00%, 7/1/2023 | | | 85,000 | | | | 94,143 | |
| | |
Rev., 5.00%, 7/1/2024 | | | 200,000 | | | | 227,774 | |
| | |
New Jersey Higher Education Student Assistance Authority, Senior Student Loan Series A, Rev., 5.00%, 12/1/2024 | | | 40,000 | | | | 46,394 | |
| | |
New Jersey Housing and Mortgage Finance Agency, Riverside Senior Apartments Project Series 2019D, Rev., 1.35%, 6/1/2022 (c) | | | 300,000 | | | | 303,732 | |
| | |
New Jersey Infrastructure Bank, Environmental Infrastructure | | | | | | | | |
| | |
Series 2017A-R2, Rev., GTD, 4.00%, 9/1/2021 | | | 25,000 | | | | 25,481 | |
| | |
Series 2007-C, Rev., 5.00%, 9/1/2021 | | | 35,000 | | | | 35,847 | |
| | |
Series 2020A-1, Rev., 5.00%, 9/1/2021 | | | 25,000 | | | | 25,595 | |
| | |
Series 2020A-R1, Rev., 3.00%, 9/1/2022 | | | 60,000 | | | | 62,455 | |
| | |
Series 2012A-R, Rev., GTD, 4.00%, 9/1/2022 | | | 60,000 | | | | 63,453 | |
| | |
Series 2017A-R2, Rev., GTD, 4.00%, 9/1/2022 | | | 60,000 | | | | 63,453 | |
| | |
Series 2007A, Rev., GTD, 5.00%, 9/1/2022 | | | 35,000 | | | | 37,538 | |
| | |
Series 2014A, Rev., GTD, 5.00%, 9/1/2022 | | | 25,000 | | | | 26,813 | |
| | |
Series 2020A-R1, Rev., 3.00%, 9/1/2023 | | | 40,000 | | | | 42,624 | |
| | |
Series 2012A-R, Rev., GTD, 4.00%, 9/1/2023 | | | 30,000 | | | | 32,752 | |
| | |
Rev., GTD, 5.00%, 9/1/2024 | | | 35,000 | | | | 40,546 | |
| | |
New Jersey Sports and Exposition Authority, Convention Center Rev., NATL-RE, 5.50%, 3/1/2022 (b) | | | 35,000 | | | | 36,833 | |
| | |
New Jersey Transportation Trust Fund Authority, Federal Highway Reimbursement Series 2016A-1, Rev., 5.00%, 6/15/2021 | | | 30,000 | | | | 30,412 | |
| | |
New Jersey Transportation Trust Fund Authority, Transportation Program Series 2013AA, Rev., 5.00%, 6/15/2022 | | | 100,000 | | | | 105,921 | |
| | | | | | | | |
| INVESTMENTS | | PRINCIPAL
AMOUNT ($) | | | VALUE ($) | |
| | | | | | | | |
| | |
New Jersey — continued | | | | | | | | |
| | |
New Jersey Transportation Trust Fund Authority, Transportation System | | | | | | | | |
| | |
Series 2011B, Rev., 5.00%, 6/15/2021 (b) | | | 470,000 | | | | 476,478 | |
| | |
Series 2006A, Rev., 5.25%, 12/15/2021 | | | 80,000 | | | | 83,094 | |
| | |
Series 2006A, Rev., 5.50%, 12/15/2021 | | | 540,000 | | | | 561,940 | |
| | |
Series 2006A, Rev., AGM-CR, 5.50%, 12/15/2022 | | | 125,000 | | | | 136,499 | |
| | |
Series 2008A, Rev., Zero Coupon, 12/15/2023 | | | 120,000 | | | | 116,609 | |
| | |
New Jersey Turnpike Authority | | | | | | | | |
| | |
Series 2012A, Rev., 5.00%, 1/1/2022 (b) | | | 65,000 | | | | 67,627 | |
| | |
Series 2013A, Rev., 3.00%, 7/1/2022 (b) | | | 100,000 | | | | 103,759 | |
| | |
Series 2013A, Rev., 5.00%, 7/1/2022 (b) | | | 350,000 | | | | 372,603 | |
| | |
New Jersey Water Supply Authority Rev., 5.00%, 8/1/2022 | | | 20,000 | | | | 21,337 | |
| | |
Ocean Township Board of Education, Monmouth County GO, 4.00%, 3/1/2021 | | | 25,000 | | | | 25,000 | |
| | |
Old Bridge Township Board of Education GO, 5.00%, 7/15/2021 | | | 70,000 | | | | 71,217 | |
| | |
Paramus School District GO, 5.00%, 4/1/2022 | | | 50,000 | | | | 52,611 | |
| | |
Passaic County Improvement Authority (The), City of Paterson Project Rev., 4.00%, 6/15/2022 | | | 25,000 | | | | 26,209 | |
| | |
Passaic County Improvement Authority (The), DPW Building Project Rev., 5.00%, 5/1/2021 | | | 25,000 | | | | 25,198 | |
| | |
Passaic County Improvement Authority (The), Preakness Healthcare Center Expansion Project | | | | | | | | |
| | |
Rev., GTD, 5.00%, 5/1/2021 | | | 20,000 | | | | 20,158 | |
| | |
Rev., GTD, 2.63%, 5/1/2023 | | | 100,000 | | | | 102,366 | |
| | |
Passaic County Utilities Authority, Solid Waste Disposal Rev., GTD, 4.50%, 3/1/2024 | | | 75,000 | | | | 83,521 | |
| | |
Pequannock Township Board of Education | | | | | | | | |
| | |
GO, 4.00%, 1/15/2024 | | | 65,000 | | | | 71,315 | |
| | |
GO, 4.00%, 1/15/2025 | | | 50,000 | | | | 56,208 | |
| | |
Ramsey School District GO, 3.13%, 1/15/2023 | | | 25,000 | | | | 26,349 | |
SEE NOTES TO FINANCIAL STATEMENTS.
| | | | | | |
| | | |
| 250 | | | | J.P. MORGAN EXCHANGE-TRADED FUNDS | | FEBRUARY 28, 2021 |
| | | | | | | | |
| INVESTMENTS | | PRINCIPAL
AMOUNT ($) | | | VALUE ($) | |
Municipal Bonds — continued | | | | | | | | |
| | |
New Jersey — continued | | | | | | | | |
| | |
Rancocas Valley Regional High School District GO, 5.00%, 2/1/2023 | | | 40,000 | | | | 43,496 | |
| | |
Readington Township Board of Education GO, 4.00%, 7/15/2021 | | | 100,000 | | | | 101,418 | |
| | |
Ridgewood Board of Education Series 2016A, GO, 4.00%, 3/15/2022 | | | 80,000 | | | | 83,179 | |
| | |
River Dell Regional School District GO, 4.00%, 3/1/2022 | | | 20,000 | | | | 20,763 | |
| | |
Rumson-Fair Haven Regional High School District GO, 3.25%, 2/1/2022 | | | 40,000 | | | | 41,128 | |
| | |
Rutgers The State University of New Jersey | | | | | | | | |
| | |
Series 2013J, Rev., 5.00%, 5/1/2021 (b) | | | 230,000 | | | | 231,835 | |
| | |
Series 2013L, Rev., 5.00%, 5/1/2021 (b) | | | 45,000 | | | | 45,359 | |
| | |
Somerset County Improvement Authority, Bridgewater, Hillsborough and Bernards Property Acquisition Project Rev., GTD, 4.00%, 10/1/2022 | | | 25,000 | | | | 26,515 | |
| | |
Somerset Hills School District GO, 5.00%, 3/15/2022 | | | 30,000 | | | | 31,503 | |
| | |
South Brunswick Township Board of Education | | | | | | | | |
| | |
GO, 5.00%, 8/1/2021 | | | 75,000 | | | | 76,507 | |
| | |
GO, 3.00%, 12/1/2021 | | | 195,000 | | | | 199,148 | |
| | |
GO, 4.00%, 8/1/2022 | | | 25,000 | | | | 26,351 | |
| | |
GO, 5.00%, 8/1/2024 | | | 45,000 | | | | 50,745 | |
| | |
South Harrison Township School District GO, 4.00%, 1/15/2023 | | | 25,000 | | | | 26,607 | |
| | |
South Orange and Maplewood School District | | | | | | | | |
| | |
GO, 4.00%, 1/15/2023 | | | 25,000 | | | | 26,708 | |
| | |
GO, 5.00%, 1/15/2023 | | | 25,000 | | | | 27,174 | |
| | |
State of New Jersey | | | | | | | | |
| | |
GO, 5.00%, 6/1/2021 | | | 40,000 | | | | 40,459 | |
| | |
Series 2016T, GO, 5.00%, 6/1/2021 | | | 125,000 | | | | 126,435 | |
| | |
GO, 5.25%, 8/1/2021 | | | 185,000 | | | | 188,744 | |
| | |
GO, 5.00%, 6/1/2022 | | | 200,000 | | | | 211,510 | |
| | |
Series 2016T, GO, 5.00%, 6/1/2022 | | | 30,000 | | | | 31,727 | |
| | |
State of New Jersey, COVID-19 Emergency Bonds GO, 4.00%, 6/1/2023 | | | 1,440,000 | | | | 1,553,098 | |
| | |
Tobacco Settlement Financing Corp. | | | | | | | | |
| | |
Series A, Rev., 5.00%, 6/1/2021 | | | 520,000 | | | | 525,808 | |
| | |
Series A, Rev., 5.00%, 6/1/2022 | | | 540,000 | | | | 570,175 | |
| | | | | | | | |
| INVESTMENTS | | PRINCIPAL
AMOUNT ($) | | | VALUE ($) | |
| | | | | | | | |
| | |
New Jersey — continued | | | | | | | | |
| | |
Series A, Rev., 5.00%, 6/1/2023 | | | 1,665,000 | | | | 1,828,570 | |
| | |
Series A, Rev., 5.00%, 6/1/2024 | | | 125,000 | | | | 142,154 | |
| | |
Series A, Rev., 5.00%, 6/1/2025 | | | 125,000 | | | | 146,605 | |
| | |
Toms River Board of Education, Regional School District GO, 2.00%, 7/15/2021 | | | 195,000 | | | | 196,238 | |
| | |
Town of Boonton GO, BAN, 2.00%, 6/25/2021 | | | 2,809,265 | | | | 2,824,266 | |
| | |
Town of Guttenberg GO, BAN, 2.00%, 10/21/2021 | | | 7,450,000 | | | | 7,527,852 | |
| | |
Town of Newton GO, 5.00%, 4/1/2024 | | | 50,000 | | | | 56,892 | |
| | |
Town of Phillipsburg GO, BAN, 2.00%, 6/1/2021 | | | 2,455,000 | | | | 2,462,881 | |
| | |
Township of Berkeley GO, 5.00%, 5/15/2021 | | | 50,000 | | | | 50,471 | |
| | |
Township of Bloomfield, General Improvement and Water Utility GO, 5.00%, 2/1/2024 | | | 40,000 | | | | 45,218 | |
| | |
Township of Bordentown GO, 3.00%, 8/1/2021 | | | 275,000 | | | | 278,138 | |
| | |
Township of Brick | | | | | | | | |
| | |
GO, 4.00%, 11/1/2021 | | | 35,000 | | | | 35,896 | |
| | |
GO, 4.00%, 11/1/2022 | | | 25,000 | | | | 26,590 | |
| | |
Township of Bridgewater | | | | | | | | |
| | |
GO, 5.00%, 8/1/2021 | | | 45,000 | | | | 45,905 | |
| | |
GO, 3.00%, 9/1/2021 | | | 25,000 | | | | 25,355 | |
| | |
Township of Cherry Hill, General Improvement and Sewer Utility | | | | | | | | |
| | |
GO, 2.00%, 8/15/2021 | | | 35,000 | | | | 35,295 | |
| | |
GO, 4.00%, 5/1/2022 | | | 30,000 | | | | 31,339 | |
| | |
Township of East Amwell GO, 4.00%, 2/15/2023 | | | 25,000 | | | | 26,739 | |
| | |
Township of East Brunswick | | | | | | | | |
| | |
GO, 2.00%, 3/15/2021 | | | 100,000 | | | | 100,065 | |
| | |
GO, 3.00%, 3/15/2023 | | | 25,000 | | | | 26,369 | |
| | |
Township of East Greenwich GO, BAN, 2.00%, 12/9/2021 | | | 2,505,000 | | | | 2,534,684 | |
| | |
Township of Edison, General Improvement and Sewer Utility GO, 4.00%, 6/1/2022 | | | 90,000 | | | | 94,304 | |
| | |
Township of Evesham, General Improvement and Golf Utility GO, 4.00%, 5/1/2023 | | | 25,000 | | | | 26,953 | |
| | |
Township of Florence, General Improvement Water Sewer Utility Series 2020B, GO, BAN, 2.00%, 6/10/2021 | | | 150,000 | | | | 150,755 | |
SEE NOTES TO FINANCIAL STATEMENTS.
| | | | | | | | |
| | | |
| FEBRUARY 28, 2021 | | J.P. MORGAN EXCHANGE-TRADED FUNDS | | | | | 251 | |
JPMorgan Ultra-Short Municipal Income ETF
SCHEDULE OF PORTFOLIO INVESTMENTS
AS OF FEBRUARY 28, 2021 (continued)
| | | | | | | | |
| INVESTMENTS | | PRINCIPAL
AMOUNT ($) | | | VALUE ($) | |
Municipal Bonds — continued | | | | | | | | |
| | |
New Jersey — continued | | | | | | | | |
| | |
Township of Franklin, Open Space Trust GO, 4.00%, 1/15/2022 | | | 25,000 | | | | 25,836 | |
| | |
Township of Hamilton, Sewer Utility GO, 5.00%, 8/1/2022 | | | 20,000 | | | | 21,337 | |
| | |
Township of Harding GO, BAN, 1.25%, 8/20/2021 | | | 1,677,850 | | | | 1,684,461 | |
| | |
Township of Lebanon GO, BAN, 1.25%, 7/23/2021 | | | 1,035,138 | | | | 1,039,092 | |
| | |
Township of Livingston GO, 3.00%, 7/15/2022 | | | 30,000 | | | | 31,144 | |
| | |
Township of Lopatcong GO, 4.00%, 9/1/2023 | | | 30,000 | | | | 32,588 | |
| | |
Township of Maplewood, General Improvement GO, 5.00%, 2/15/2023 | | | 40,000 | | | | 43,691 | |
| | |
Township of Medford GO, 4.00%, 7/15/2022 | | | 25,000 | | | | 26,277 | |
| | |
Township of Montclair | | | | | | | | |
| | |
GO, 5.00%, 3/1/2022 | | | 25,000 | | | | 26,208 | |
| | |
Series 2016B, GO, 4.00%, 10/1/2022 | | | 50,000 | | | | 53,029 | |
| | |
Township of Montclair, General Improvement Series 2017A, GO, 3.00%, 3/1/2022 | | | 25,000 | | | | 25,710 | |
| | |
Township of Moorestown, General Improvement and Water Sewer Utility | | | | | | | | |
| | |
GO, 5.00%, 9/1/2021 | | | 45,000 | | | | 46,087 | |
| | |
GO, 5.00%, 2/1/2023 | | | 25,000 | | | | 27,271 | |
| | |
Township of Mount Laurel Series 2011A, GO, 4.00%, 4/15/2021 | | | 40,000 | | | | 40,184 | |
| | |
Township of Mount Olive, General Improvement and Water Sewer Utility GO, 4.00%, 8/15/2022 | | | 35,000 | | | | 36,897 | |
| | |
Township of North Brunswick GO, 2.75%, 7/15/2021 | | | 65,000 | | | | 65,602 | |
| | |
Township of Parsippany-Troy Hills, Golf Recreation Utility GO, 3.00%, 6/1/2023 | | | 35,000 | | | | 37,016 | |
| | |
Township of Pennsauken GO, AGM, 3.00%, 8/15/2021 (b) | | | 100,000 | | | | 101,289 | |
| | |
Township of Pequannock, Recreation Utility GO, BAN, 2.00%, 7/15/2021 | | | 250,000 | | | | 251,597 | |
| | |
Township of Pequannock, Sewer Utility GO, 4.00%, 4/1/2022 | | | 25,000 | | | | 26,039 | |
| | |
Township of Randolph, Various Purpose GO, 3.00%, 10/15/2022 | | | 45,000 | | | | 47,036 | |
| | |
Township of Readington, General Improvement GO, 5.00%, 1/15/2025 | | | 25,000 | | | | 29,087 | |
| | | | | | | | |
| INVESTMENTS | | PRINCIPAL
AMOUNT ($) | | | VALUE ($) | |
| | | | | | | | |
| | |
New Jersey — continued | | | | | | | | |
| | |
Township of River Vale GO, 4.00%, 6/15/2023 | | | 35,000 | | | | 37,734 | |
| | |
Township of Robbinsville, Tax Exempt Open Space Series 2015A, GO, 4.00%, 7/15/2021 | | | 40,000 | | | | 40,548 | |
| | |
Township of South Brunswick GO, 4.00%, 3/1/2022 | | | 20,000 | | | | 20,767 | |
| | |
Township of South Hackensack GO, BAN, 1.50%, 12/16/2021 | | | 1,461,500 | | | | 1,475,706 | |
| | |
Township of Toms River | | | | | | | | |
| | |
GO, 5.00%, 3/1/2021 | | | 25,000 | | | | 25,000 | |
| | |
GO, 5.00%, 3/1/2022 | | | 45,000 | | | | 47,174 | |
| | |
Township of Toms River, General Improvement GO, 4.00%, 6/15/2023 | | | 40,000 | | | | 43,315 | |
| | |
Township of Toms River, General Improvement, Golf Utility Improvement Series 2011A, GO, 3.00%, 12/15/2023 | | | 45,000 | | | | 48,223 | |
| | |
Township of Union, General Improvement GO, 4.00%, 2/1/2023 | | | 25,000 | | | | 26,764 | |
| | |
Township of Washington, Gloucester County Series 2020A, GO, BAN, 1.75%, 6/22/2021 | | | 571,940 | | | | 574,371 | |
| | |
Township of West Orange, Tax Appeal Refunding GO, BAN, 1.50%, 12/15/2021 | | | 9,608,441 | | | | 9,690,785 | |
| | |
Township of Woodbridge, General Sewer Utility GO, BAN, 2.00%, 10/15/2021 | | | 60,000 | | | | 60,675 | |
| | |
Union County Improvement Authority | | | | | | | | |
| | |
Rev., AGM, GTD, 4.00%, 11/1/2021 | | | 20,000 | | | | 20,512 | |
| | |
Rev., 3.00%, 12/1/2022 | | | 50,000 | | | | 52,467 | |
| | |
West Essex Regional School District GO, 5.00%, 11/1/2022 | | | 40,000 | | | | 43,209 | |
| | |
West Windsor-Plainsboro Regional School District GO, 4.00%, 9/15/2021 | | | 20,000 | | | | 20,414 | |
| | |
Woodbridge Township Board of Education GO, 4.00%, 7/15/2021 | | | 30,000 | | | | 30,427 | |
| | | | | | | | |
| | |
Total New Jersey | | | | | | | 100,183,837 | |
| | | | | | | | |
| | |
New Mexico — 0.4% | | | | | | | | |
| | |
Albuquerque Bernalillo County Water Utility Authority, Joint Water and Sewer System Improvement | | | | | | | | |
| | |
Rev., 5.00%, 7/1/2021 | | | 175,000 | | | | 177,798 | |
| | |
Series 2013A, Rev., 5.00%, 7/1/2021 | | | 25,000 | | | | 25,400 | |
| | |
Rev., 5.00%, 7/1/2022 | | | 50,000 | | | | 53,201 | |
SEE NOTES TO FINANCIAL STATEMENTS.
| | | | | | |
| | | |
| 252 | | | | J.P. MORGAN EXCHANGE-TRADED FUNDS | | FEBRUARY 28, 2021 |
| | | | | | | | |
| INVESTMENTS | | PRINCIPAL
AMOUNT ($) | | | VALUE ($) | |
Municipal Bonds — continued | | | | | | | | |
| | |
New Mexico — continued | | | | | | | | |
| | |
Albuquerque Metropolitan Arroyo Flood Control Authority GO, 4.00%, 8/1/2021 | | | 100,000 | | | | 101,596 | |
| | |
Albuquerque Municipal School District No. 12 Series 2014B, GO, 5.00%, 8/1/2022 | | | 50,000 | | | | 53,380 | |
| | |
Central New Mexico Community College, Limited Tax GO, 5.00%, 8/15/2021 | | | 85,000 | | | | 86,869 | |
| | |
City of Albuquerque, General Purpose | | | | | | | | |
| | |
Series 2017A, GO, 5.00%, 7/1/2021 | | | 25,000 | | | | 25,399 | |
| | |
Series 2014A, GO, 5.00%, 7/1/2022 | | | 200,000 | | | | 212,778 | |
| | |
Series 2019A, GO, 5.00%, 7/1/2022 | | | 30,000 | | | | 31,916 | |
| | |
City of Albuquerque, Gross Receipts Tax Series 1999B, Rev., 5.00%, 7/1/2021 (b) | | | 20,000 | | | | 20,318 | |
| | |
City of Roswell Rev., 4.00%, 8/1/2022 | | | 50,000 | | | | 52,565 | |
| | |
City of Santa Fe GO, 4.00%, 8/1/2022 | | | 25,000 | | | | 26,355 | |
| | |
County of Bernalillo GO, 4.00%, 6/15/2021 | | | 70,000 | | | | 70,773 | |
| | |
County of Dona Ana, Gross Receipt Tax Rev., 2.00%, 5/1/2021 | | | 315,000 | | | | 315,907 | |
| | |
County of San Juan, Gross Receipts Tax Improvement Series 2015B, Rev., 5.00%, 6/15/2021 | | | 25,000 | | | | 25,340 | |
| | |
Las Cruces School District No. 2 Series 2016C, GO, 5.00%, 8/1/2021 | | | 30,000 | | | | 30,584 | |
| | |
New Mexico Finance Authority, Senior Lien | | | | | | | | |
| | |
Rev., 4.00%, 6/15/2021 | | | 25,000 | | | | 25,275 | |
| | |
Rev., 4.00%, 6/15/2022 | | | 90,000 | | | | 94,426 | |
| | |
Rev., 5.00%, 6/15/2022 | | | 250,000 | | | | 265,505 | |
| | |
New Mexico Finance Authority, Senior Lien Public Project Revolving Fund | | | | | | | | |
| | |
Series 2015C, Rev., 3.00%, 6/1/2021 | | | 50,000 | | | | 50,351 | |
| | |
Series 2013A, Rev., 4.00%, 6/1/2021 | | | 20,000 | | | | 20,190 | |
| | |
Rev., 5.00%, 6/1/2021 | | | 300,000 | | | | 303,588 | |
| | |
Series 2016C, Rev., 5.00%, 6/1/2021 | | | 45,000 | | | | 45,538 | |
| | |
Series 2017A, Rev., 5.00%, 6/1/2021 | | | 25,000 | | | | 25,299 | |
| | |
Series 2019B, Rev., 5.00%, 6/1/2021 | | | 40,000 | | | | 40,478 | |
| | |
Rev., 5.00%, 6/1/2022 | | | 40,000 | | | | 42,406 | |
| | |
Series 2016D, Rev., 5.00%, 6/1/2022 | | | 30,000 | | | | 31,804 | |
| | |
Series 2016F, Rev., 5.00%, 6/1/2022 | | | 50,000 | | | | 53,008 | |
| | | | | | | | |
| INVESTMENTS | | PRINCIPAL
AMOUNT ($) | | | VALUE ($) | |
| | | | | | | | |
| | |
New Mexico — continued | | | | | | | | |
| | |
Series 2017A, Rev., 5.00%, 6/1/2022 | | | 65,000 | | | | 68,910 | |
| | |
Series 2017E, Rev., 5.00%, 6/1/2022 | | | 195,000 | | | | 206,729 | |
| | |
Series 2020A, Rev., 5.00%, 6/1/2022 | | | 135,000 | | | | 143,120 | |
| | |
Series 2017A, Rev., 5.00%, 6/1/2023 | | | 55,000 | | | | 60,796 | |
| | |
Series 2016C, Rev., 5.00%, 6/1/2024 | | | 25,000 | | | | 28,656 | |
| | |
New Mexico Finance Authority, State Transportation, Senior Lien, Tax-Exempt Series 2010-B, Rev., 5.00%, 6/15/2021 | | | 310,000 | | | | 314,290 | |
| | |
New Mexico Finance Authority, State Transportation, Subordinate Lien | | | | | | | | |
| | |
Series B-2, Rev., 5.00%, 6/15/2022 | | | 25,000 | | | | 26,550 | |
| | |
Series 2018A, Rev., 5.00%, 6/15/2023 | | | 240,000 | | | | 265,702 | |
| | |
New Mexico Finance Authority, Subordinate Lien Public Project Revolving Fund, Tax-Exempt | | | | | | | | |
| | |
Series 2015A, Rev., 5.00%, 6/15/2021 | | | 25,000 | | | | 25,346 | |
| | |
Series 2017B, Rev., 5.00%, 6/15/2021 | | | 40,000 | | | | 40,554 | |
| | |
Rev., 5.00%, 6/15/2022 | | | 155,000 | | | | 164,613 | |
| | |
Series 2017D, Rev., 5.00%, 6/15/2022 | | | 25,000 | | | | 26,550 | |
| | |
Series 2017D, Rev., 5.00%, 6/15/2023 | | | 100,000 | | | | 110,709 | |
| | |
Series 2019C-1, Rev., 5.00%, 6/15/2023 | | | 40,000 | | | | 44,284 | |
| | |
Series 2017B, Rev., 3.50%, 6/15/2024 | | | 50,000 | | | | 54,946 | |
| | |
Series 2018C-1, Rev., 4.00%, 6/15/2024 | | | 30,000 | | | | 33,456 | |
| | |
New Mexico Hospital Equipment Loan Council, Presbyterian Healthcare Services | | | | | | | | |
| | |
Series 2015A, Rev., 5.00%, 8/1/2021 | | | 110,000 | | | | 112,165 | |
| | |
Series 2012A, Rev., 5.00%, 8/1/2022 (b) | | | 110,000 | | | | 117,548 | |
| | |
Series 2015A, Rev., 5.00%, 8/1/2022 | | | 520,000 | | | | 554,762 | |
| | |
Series 2015A, Rev., 5.00%, 8/1/2024 | | | 185,000 | | | | 212,199 | |
SEE NOTES TO FINANCIAL STATEMENTS.
| | | | | | | | |
| | | |
| FEBRUARY 28, 2021 | | J.P. MORGAN EXCHANGE-TRADED FUNDS | | | | | 253 | |
JPMorgan Ultra-Short Municipal Income ETF
SCHEDULE OF PORTFOLIO INVESTMENTS
AS OF FEBRUARY 28, 2021 (continued)
| | | | | | | | |
| INVESTMENTS | | PRINCIPAL
AMOUNT ($) | | | VALUE ($) | |
Municipal Bonds — continued | | | | | | | | |
| | |
New Mexico — continued | | | | | | | | |
| | |
New Mexico Municipal Energy Acquisition Authority Series 2019A, Rev., LIQ: Royal Bank of Canada, 4.00%, 5/1/2021 | | | 50,000 | | | | 50,307 | |
| | |
Santa Fe Public School District GO, 5.00%, 8/1/2022 | | | 260,000 | | | | 277,688 | |
| | |
Southern Sandoval County Arroyo Flood Control Authority Series 2019B, GO, 4.00%, 8/1/2021 | | | 300,000 | | | | 304,725 | |
| | |
State of New Mexico Series 2017B, GO, 5.00%, 3/1/2022 | | | 75,000 | | | | 78,623 | |
| | |
State of New Mexico, Capital Projects | | | | | | | | |
| | |
GO, 5.00%, 3/1/2021 | | | 30,000 | | | | 30,000 | |
| | |
Series 2017A, GO, 5.00%, 3/1/2021 | | | 60,000 | | | | 60,000 | |
| | |
State of New Mexico, Severance Tax Permanent Fund | | | | | | | | |
| | |
Series A-1, Rev., 3.00%, 7/1/2021 | | | 100,000 | | | | 100,214 | |
| | |
Series 2016B, Rev., 4.00%, 7/1/2021 | | | 40,000 | | | | 40,510 | |
| | |
Series 2016A, Rev., 5.00%, 7/1/2021 | | | 100,000 | | | | 101,605 | |
| | |
Series 2016B, Rev., 4.00%, 7/1/2022 | | | 80,000 | | | | 84,082 | |
| | |
University of New Mexico, Subordinate Lien Series 2014C, Rev., 5.00%, 6/1/2022 | | | 25,000 | | | | 26,491 | |
| | | | | | | | |
| | |
Total New Mexico | | | | | | | 6,074,177 | |
| | | | | | | | |
| | |
New York — 12.2% | | | | | | | | |
| | |
Albany City School District GO, 4.00%, 6/15/2021 | | | 25,000 | | | | 25,271 | |
| | |
Albany Municipal Water Finance Authority, Second Resolution Series 2011A, Rev., 5.00%, 12/1/2021 (b) | | | 175,000 | | | | 181,309 | |
| | |
Ardsley Union Free School District | | | | | | | | |
| | |
GO, 5.00%, 6/1/2021 | | | 100,000 | | | | 101,203 | |
| | |
GO, 4.00%, 1/15/2022 | | | 30,000 | | | | 31,006 | |
| | |
Arlington Central School District | | | | | | | | |
| | |
GO, 4.00%, 12/15/2021 | | | 25,000 | | | | 25,760 | |
| | |
GO, 5.00%, 5/15/2022 | | | 25,000 | | | | 26,456 | |
| | |
Ballston Spa Central School District Series 2020B, GO, BAN, 1.50%, 9/17/2021 | | | 1,888,000 | | | | 1,898,969 | |
| | |
Battery Park City Authority | | | | | | | | |
| | |
Series 2019D-2, Rev., VRDO, LIQ: TD Bank NA, 0.03%, 3/9/2021 (c) | | | 2,485,000 | | | | 2,485,000 | |
| | |
Series 2013A, Rev., 4.00%, 11/1/2022 | | | 30,000 | | | | 31,898 | |
| | | | | | | | |
| INVESTMENTS | | PRINCIPAL
AMOUNT ($) | | | VALUE ($) | |
| | | | | | | | |
| | |
New York — continued | | | | | | | | |
| | |
Battery Park City Authority, Tax-Exempt Series 2013A, Rev., 5.00%, 11/1/2021 | | | 85,000 | | | | 87,740 | |
| | |
Bethlehem Central School District | | | | | | | | |
| | |
GO, 5.00%, 6/15/2021 | | | 130,000 | | | | 131,809 | |
| | |
GO, 5.00%, 7/15/2021 | | | 105,000 | | | | 106,888 | |
| | |
Brentwood Union Free School District GO, 4.50%, 11/15/2021 | | | 30,000 | | | | 30,921 | |
| | |
Brighton Central School District GO, 4.00%, 6/1/2022 | | | 40,000 | | | | 41,918 | |
| | |
Broadalbin-Perth Central School District GO, 2.00%, 6/15/2022 | | | 340,000 | | | | 347,235 | |
| | |
Brookhaven-Comsewogue Union Free School District | | | | | | | | |
| | |
GO, 4.00%, 7/15/2021 | | | 110,000 | | | | 111,572 | |
| | |
GO, 4.00%, 7/15/2022 | | | 25,000 | | | | 26,316 | |
| | |
Buffalo Municipal Water Finance Authority, Water System Series 2015-A, Rev., 5.00%, 7/1/2021 | | | 125,000 | | | | 126,923 | |
| | |
Build NYC Resource Corp., Manhattan College Project Rev., 5.00%, 8/1/2021 | | | 25,000 | | | | 25,460 | |
| | |
Build NYC Resource Corp., The New York Methodist Hospital Project Rev., 5.00%, 7/1/2023 (b) | | | 55,000 | | | | 60,958 | |
| | |
Build NYC Resource Corp., United Jewish Appeal-Federation of Jewish Philanthropies of New York, Inc., Project Rev., 5.00%, 7/1/2022 | | | 50,000 | | | | 53,222 | |
| | |
Byram Hills Central School District GO, 4.00%, 11/15/2021 | | | 40,000 | | | | 41,087 | |
| | |
Cambridge Central School District GO, 3.00%, 6/15/2021 | | | 55,000 | | | | 55,436 | |
| | |
Carmel Central School District GO, 4.00%, 6/15/2021 | | | 50,000 | | | | 50,546 | |
| | |
Central Islip Union Free School District GO, 4.00%, 7/15/2021 | | | 30,000 | | | | 30,417 | |
| | |
Central Square Central School District GO, 3.00%, 6/15/2021 | | | 75,000 | | | | 75,570 | |
| | |
Chappaqua Central School District GO, 3.00%, 6/15/2021 | | | 50,000 | | | | 50,411 | |
| | |
Cheektowaga Central School District GO, 5.00%, 4/15/2021 | | | 100,000 | | | | 100,575 | |
| | |
Cheektowaga-Sloan Union Free School District GO, 4.00%, 7/15/2021 | | | 30,000 | | | | 30,417 | |
| | |
City of Albany Series 2011A, GO, 3.00%, 7/1/2021 | | | 20,000 | | | | 20,182 | |
| | |
City of Binghamton, Public Improvement GO, 2.13%, 1/15/2022 | | | 25,000 | | | | 25,407 | |
SEE NOTES TO FINANCIAL STATEMENTS.
| | | | | | |
| | | |
| 254 | | | | J.P. MORGAN EXCHANGE-TRADED FUNDS | | FEBRUARY 28, 2021 |
| | | | | | | | |
| INVESTMENTS | | PRINCIPAL
AMOUNT ($) | | | VALUE ($) | |
Municipal Bonds — continued | | | | | | | | |
| | |
New York — continued | | | | | | | | |
| | |
City of Buffalo, General Improvement | | | | | | | | |
| | |
GO, 5.00%, 4/1/2021 | | | 25,000 | | | | 25,097 | |
| | |
Series 2018A, GO, 5.00%, 10/1/2021 | | | 45,000 | | | | 46,258 | |
| | |
City of Ithaca, Public Improvement GO, 4.00%, 1/15/2023 | | | 25,000 | | | | 26,703 | |
| | |
City of Jamestown, Public Improvement GO, 5.00%, 6/1/2021 | | | 260,000 | | | | 262,956 | |
| | |
City of New York | | | | | | | | |
| | |
Series 2013-I, GO, 4.00%, 8/1/2021 (b) | | | 25,000 | | | | 25,401 | |
| | |
Series I, GO, 4.00%, 8/1/2021 (b) | | | 25,000 | | | | 25,401 | |
| | |
Series 1994A, GO, 5.00%, 8/1/2021 | | | 180,000 | | | | 183,611 | |
| | |
Series 2014B, GO, 5.00%, 8/1/2021 | | | 50,000 | | | | 51,003 | |
| | |
Series 2014H, GO, 5.00%, 8/1/2021 | | | 100,000 | | | | 102,006 | |
| | |
Series 2016C, GO, 5.00%, 8/1/2021 | | | 40,000 | | | | 40,802 | |
| | |
Series B, GO, 5.00%, 8/1/2021 | | | 125,000 | | | | 127,507 | |
| | |
Series H, GO, 5.00%, 8/1/2021 | | | 25,000 | | | | 25,502 | |
| | |
Series I, GO, 5.00%, 8/1/2021 | | | 50,000 | | | | 51,003 | |
| | |
Series 2012G, GO, 5.00%, 4/1/2022 (b) | | | 45,000 | | | | 47,366 | |
| | |
Series G, Subseries G-1, GO, 5.00%, 4/1/2022 (b) | | | 190,000 | | | | 199,988 | |
| | |
Series B, GO, 5.00%, 8/1/2022 | | | 55,000 | | | | 58,717 | |
| | |
Series C, GO, 5.00%, 8/1/2022 | | | 100,000 | | | | 106,759 | |
| | |
Series H, GO, 5.00%, 8/1/2022 | | | 110,000 | | | | 117,435 | |
| | |
Series B, Subseries B-5, GO, NATL-RE, 5.00%, 8/15/2022 | | | 25,000 | | | | 26,736 | |
| | |
Subseries A-1, GO, 5.00%, 10/1/2022 (b) | | | 30,000 | | | | 32,301 | |
| | |
Series 1994A, GO, 5.00%, 8/1/2023 | | | 150,000 | | | | 152,996 | |
| | |
Series C, GO, 5.00%, 8/1/2023 | | | 25,000 | | | | 26,671 | |
| | |
Series 2012F, GO, 5.00%, 8/1/2024 | | | 20,000 | | | | 20,867 | |
| | |
Series 2013J, GO, 5.00%, 8/1/2024 | | | 295,000 | | | | 328,019 | |
| | |
Series B, GO, 5.00%, 8/1/2025 | | | 140,000 | | | | 149,274 | |
| | |
Series C, GO, 5.00%, 8/1/2025 | | | 105,000 | | | | 111,955 | |
| | |
City of New York, Fiscal Year 2006 Series H, Subseries 2006 HH-A, GO, 4.00%, 1/1/2022 | | | 195,000 | | | | 201,146 | |
| | |
City of New York, Fiscal Year 2012 | | | | | | | | |
| | |
Subseries D-1, GO, 4.00%, 10/1/2021 | | | 25,000 | | | | 25,557 | |
| | |
Series 2012F, GO, 5.00%, 8/1/2023 | | | 50,000 | | | | 52,176 | |
| | |
Series 2012-I, GO, 5.00%, 8/1/2023 | | | 280,000 | | | | 298,712 | |
| | |
City of New York, Fiscal Year 2013 | | | | | | | | |
| | |
Series 2013E, GO, 4.00%, 8/1/2021 (b) | | | 190,000 | | | | 193,010 | |
| | | | | | | | |
| INVESTMENTS | | PRINCIPAL
AMOUNT ($) | | | VALUE ($) | |
| | | | | | | | |
| | |
New York — continued | | | | | | | | |
| | |
Series 2013J, GO, 5.00%, 8/1/2021 | | | 225,000 | | | | 229,513 | |
| | |
Series 2013D, GO, 5.00%, 8/1/2022 | | | 25,000 | | | | 26,690 | |
| | |
Series 2013J, GO, 5.00%, 8/1/2022 | | | 180,000 | | | | 192,166 | |
| | |
Series 2013E, GO, 4.50%, 8/1/2023 | | | 55,000 | | | | 59,427 | |
| | |
Series H, GO, 5.00%, 8/1/2023 | | | 75,000 | | | | 83,395 | |
| | |
City of New York, Fiscal Year 2014 | | | | | | | | |
| | |
Series I, Subseries 2014I-1, GO, 5.00%, 3/1/2021 (b) | | | 25,000 | | | | 25,000 | |
| | |
Series 2013G, GO, 5.00%, 8/1/2021 | | | 105,000 | | | | 107,106 | |
| | |
Series 2014J, GO, 5.00%, 8/1/2021 | | | 75,000 | | | | 76,505 | |
| | |
Subseries D-1, GO, 5.00%, 8/1/2021 | | | 280,000 | | | | 285,617 | |
| | |
Series 2014J, GO, 5.00%, 8/1/2022 | | | 50,000 | | | | 53,380 | |
| | |
Series 2014E, GO, 5.25%, 8/1/2022 | | | 365,000 | | | | 390,959 | |
| | |
Series I, Subseries 2014I-1, GO, 5.00%, 3/1/2023 | | | 25,000 | | | | 27,346 | |
| | |
Series 2013G, GO, 5.00%, 8/1/2023 | | | 230,000 | | | | 255,744 | |
| | |
Series 2014E, GO, 5.00%, 8/1/2023 | | | 70,000 | | | | 77,835 | |
| | |
Series 2014J, GO, 5.00%, 8/1/2023 | | | 140,000 | | | | 155,670 | |
| | |
Series 2014I-1, GO, 5.00%, 3/1/2024 | | | 75,000 | | | | 85,135 | |
| | |
City of New York, Fiscal Year 2015 | | | | | | | | |
| | |
Series 2015A, GO, 5.00%, 8/1/2021 | | | 125,000 | | | | 127,507 | |
| | |
Series 2015B, GO, 5.00%, 8/1/2021 | | | 85,000 | | | | 86,705 | |
| | |
Series 2015-1, GO, 5.00%, 8/1/2022 | | | 50,000 | | | | 53,380 | |
| | |
Series 1, GO, 5.00%, 8/1/2023 | | | 240,000 | | | | 266,863 | |
| | |
Series 2015A, GO, 5.00%, 8/1/2024 | | | 215,000 | | | | 247,633 | |
| | |
City of New York, Fiscal Year 2016 | | | | | | | | |
| | |
Series A, GO, 5.00%, 8/1/2024 | | | 210,000 | | | | 241,874 | |
| | |
Series E, GO, 5.00%, 8/1/2024 | | | 90,000 | | | | 103,660 | |
| | |
City of New York, Fiscal Year 2017 | | | | | | | | |
| | |
Series 2017C, GO, 3.00%, 8/1/2021 | | | 100,000 | | | | 101,179 | |
| | |
Subseries A-1, GO, 4.00%, 8/1/2021 | | | 35,000 | | | | 35,557 | |
| | |
Series C, GO, 5.00%, 8/1/2021 | | | 135,000 | | | | 137,708 | |
| | |
Subseries A-1, GO, 5.00%, 8/1/2021 | | | 75,000 | | | | 76,505 | |
| | |
Series C, GO, 5.00%, 8/1/2022 | | | 285,000 | | | | 304,263 | |
| | |
City of New York, Fiscal Year 2018 | | | | | | | | |
| | |
Series 2018C, GO, 5.00%, 8/1/2021 | | | 80,000 | | | | 81,605 | |
| | |
Series 2018-1, GO, 4.00%, 8/1/2022 | | | 70,000 | | | | 73,744 | |
| | |
Series 2018-1, GO, 5.00%, 8/1/2022 | | | 20,000 | | | | 21,352 | |
| | |
Series 2018A, GO, 5.00%, 8/1/2022 | | | 40,000 | | | | 42,704 | |
| | |
Series 2018C, GO, 5.00%, 8/1/2023 | | | 35,000 | | | | 38,917 | |
| | |
Series 2018D, GO, 5.00%, 8/1/2023 | | | 800,000 | | | | 889,544 | |
| | |
Series 2018F-1, GO, 4.00%, 4/1/2025 | | | 30,000 | | | | 34,036 | |
SEE NOTES TO FINANCIAL STATEMENTS.
| | | | | | | | |
| | | |
| FEBRUARY 28, 2021 | | J.P. MORGAN EXCHANGE-TRADED FUNDS | | | | | 255 | |
JPMorgan Ultra-Short Municipal Income ETF
SCHEDULE OF PORTFOLIO INVESTMENTS
AS OF FEBRUARY 28, 2021 (continued)
| | | | | | | | |
| INVESTMENTS | | PRINCIPAL
AMOUNT ($) | | | VALUE ($) | |
Municipal Bonds — continued | | | | | | | | |
| | |
New York — continued | | | | | | | | |
| | |
City of New York, Fiscal Year 2019 | | | | | | | | |
| | |
Series D, Subseries D-4, GO, VRDO, LIQ: | | | | | | | | |
| | |
Barclays Bank plc, 0.01%, 3/1/2021 (c) | | | 5,000,000 | | | | 5,000,000 | |
| | |
GO, 5.00%, 8/1/2021 (b) | | | 35,000 | | | | 35,699 | |
| | |
Series 2019A, GO, 5.00%, 8/1/2021 | | | 295,000 | | | | 300,918 | |
| | |
City of New York, Fiscal Year 2020 Series 2020C-1, GO, 5.00%, 8/1/2023 | | | 25,000 | | | | 27,798 | |
| | |
City of White Plains, Public Improvement | | | | | | | | |
| | |
Series 2017C, GO, 3.00%, 3/1/2021 | | | 30,000 | | | | 30,000 | |
| | |
Series 2017A, GO, 3.00%, 5/15/2021 | | | 40,000 | | | | 40,233 | |
| | |
Clarence Central School District | | | | | | | | |
| | |
GO, 4.00%, 5/15/2021 | | | 50,000 | | | | 50,392 | |
| | |
GO, 5.00%, 6/15/2021 | | | 75,000 | | | | 76,044 | |
| | |
GO, 5.00%, 6/15/2022 | | | 25,000 | | | | 26,557 | |
| | |
Clifton-Fine Central School District GO, BAN, 2.00%, 6/30/2021 | | | 3,980,000 | | | | 3,999,940 | |
| | |
Commack Union Free School District GO, 4.00%, 11/15/2021 | | | 100,000 | | | | 102,717 | |
| | |
Connetquot Central School District of Islip | | | | | | | | |
| | |
GO, 5.00%, 6/1/2021 | | | 290,000 | | | | 293,489 | |
| | |
GO, 4.25%, 1/15/2022 | | | 45,000 | | | | 46,606 | |
| | |
GO, 5.00%, 7/15/2022 | | | 40,000 | | | | 42,653 | |
| | |
Cornwall Central School District GO, 5.00%, 10/15/2021 | | | 25,000 | | | | 25,746 | |
| | |
County of Albany, Various Purpose Series 2019A, GO, 5.00%, 9/15/2022 | | | 20,000 | | | | 21,488 | |
| | |
County of Broome Series 2020A, GO, BAN, 2.00%, 4/30/2021 | | | 625,000 | | | | 626,750 | |
| | |
County of Dutchess, Public Improvement Bonds | | | | | | | | |
| | |
GO, 5.00%, 5/1/2021 | | | 25,000 | | | | 25,194 | |
| | |
Series 2018A, GO, 3.00%, 3/1/2022 | | | 25,000 | | | | 25,682 | |
| | |
Series 2018B, GO, 3.25%, 3/1/2022 | | | 55,000 | | | | 56,637 | |
| | |
GO, 5.00%, 5/1/2022 | | | 40,000 | | | | 42,197 | |
| | |
County of Erie GO, RAN, 3.00%, 6/24/2021 | | | 90,000 | | | | 90,742 | |
| | |
County of Livingston, Public Improvement | | | | | | | | |
| | |
GO, 4.00%, 5/1/2021 | | | 20,000 | | | | 20,127 | |
| | |
GO, 4.00%, 5/15/2021 | | | 200,000 | | | | 201,568 | |
| | |
GO, 4.00%, 5/15/2022 | | | 25,000 | | | | 26,156 | |
| | | | | | | | |
| INVESTMENTS | | PRINCIPAL
AMOUNT ($) | | | VALUE ($) | |
| | | | | | | | |
| | |
New York — continued | | | | | | | | |
| | |
GO, 3.00%, 5/15/2023 | | | 50,000 | | | | 52,863 | |
| | |
GO, 4.00%, 2/1/2024 | | | 35,000 | | | | 38,490 | |
| | |
County of Monroe GO, 4.00%, 6/1/2021 | | | 130,000 | | | | 131,204 | |
| | |
County of Monroe, Public Improvement GO, 5.00%, 6/1/2021 | | | 25,000 | | | | 25,293 | |
| | |
County of Nassau Series 2015B, GO, 5.00%, 4/1/2021 | | | 350,000 | | | | 351,288 | |
| | |
County of Nassau, General Improvement | | | | | | | | |
| | |
Series 2017C, GO, 5.00%, 10/1/2021 | | | 50,000 | | | | 51,327 | |
| | |
Series C, GO, 5.00%, 10/1/2022 | | | 230,000 | | | | 245,290 | |
| | |
County of Oneida, Public Improvement GO, 3.00%, 4/15/2022 | | | 200,000 | | | | 205,232 | |
| | |
County of Onondaga | | | | | | | | |
| | |
GO, 5.00%, 4/15/2021 | | | 25,000 | | | | 25,144 | |
| | |
GO, 5.00%, 5/1/2021 | | | 310,000 | | | | 312,477 | |
| | |
GO, 5.00%, 5/15/2021 | | | 25,000 | | | | 25,243 | |
| | |
GO, 5.00%, 2/1/2022 | | | 25,000 | | | | 26,095 | |
| | |
County of Orange, Various Purpose Series 2015A, GO, AGM, 5.00%, 3/1/2021 | | | 25,000 | | | | 25,000 | |
| | |
County of Rensselaer, Public Improvement GO, 5.00%, 6/1/2021 | | | 75,000 | | | | 75,902 | |
| | |
County of Rockland GO, TAN, 2.00%, 4/1/2021 | | | 170,000 | | | | 170,255 | |
| | |
County of Suffolk | | | | | | | | |
| | |
Series 2015C, GO, 5.00%, 5/1/2021 | | | 300,000 | | | | 302,067 | |
| | |
Series 2020B, GO, AGM, 5.00%, 5/15/2021 | | | 5,150,000 | | | | 5,197,946 | |
| | |
Series 2020B, GO, AGM, 5.00%, 5/15/2022 | | | 3,000,000 | | | | 3,162,780 | |
| | |
County of Suffolk, Longwood Central School District GO, 5.00%, 6/1/2021 | | | 40,000 | | | | 40,481 | |
| | |
County of Sullivan, Public Improvement | | | | | | | | |
| | |
GO, 3.00%, 5/15/2021 | | | 45,000 | | | | 45,262 | |
| | |
GO, 3.00%, 11/15/2021 | | | 50,000 | | | | 51,007 | |
| | |
GO, 3.00%, 5/15/2022 | | | 60,000 | | | | 62,054 | |
| | |
GO, 5.00%, 7/15/2022 | | | 25,000 | | | | 26,640 | |
| | |
County of Ulster, Public Improvement GO, 5.00%, 11/15/2021 | | | 60,000 | | | | 62,000 | |
| | |
County of Wake, Public Improvement | | | | | | | | |
| | |
GO, AGM, 5.00%, 7/15/2021 | | | 30,000 | | | | 30,539 | |
| | |
GO, 4.00%, 12/1/2021 | | | 30,000 | | | | 30,867 | |
| | |
County of Wayne GO, 5.00%, 12/1/2022 | | | 125,000 | | | | 135,551 | |
SEE NOTES TO FINANCIAL STATEMENTS.
| | | | | | |
| | | |
| 256 | | | | J.P. MORGAN EXCHANGE-TRADED FUNDS | | FEBRUARY 28, 2021 |
| | | | | | | | |
| INVESTMENTS | | PRINCIPAL
AMOUNT ($) | | | VALUE ($) | |
Municipal Bonds — continued | | | | | | | | |
| | |
New York — continued | | | | | | | | |
| | |
County of Wayne, Public Improvement GO, 4.50%, 6/1/2022 | | | 25,000 | | | | 26,355 | |
| | |
County of Westchester | | | | | | | | |
| | |
Series 2011B, GO, 4.00%, 7/1/2021 | | | 100,000 | | | | 101,248 | |
| | |
Series 2018A, GO, 5.00%, 12/1/2021 | | | 200,000 | | | | 207,272 | |
| | |
Series 2016A, GO, 5.00%, 1/1/2022 | | | 35,000 | | | | 36,412 | |
| | |
Croton-Harmon Union Free School District | | | | | | | | |
| | |
GO, 5.00%, 6/1/2021 | | | 105,000 | | | | 106,263 | |
| | |
GO, BAN, 1.25%, 8/20/2021 | | | 755,000 | | | | 757,975 | |
| | |
Dutchess County Local Development Corp., Marist Collage Project Series 2015A, Rev., 5.00%, 7/1/2021 | | | 125,000 | | | | 126,880 | |
| | |
Dutchess County Local Development Corp., Vassar Collage Project Rev., 5.00%, 7/1/2021 | | | 100,000 | | | | 101,588 | |
| | |
East Islip Union Free School District GO, 5.00%, 6/15/2021 | | | 30,000 | | | | 30,418 | |
| | |
Enlarged City School District of the City of Troy GO, 5.00%, 7/1/2021 | | | 100,000 | | | | 101,605 | |
| | |
Erie County Fiscal Stability Authority, Sales Tax and State Aid Secured | | | | | | | | |
| | |
Series 2013A, Rev., 5.00%, 3/15/2021 | | | 20,000 | | | | 20,035 | |
| | |
Series 2016A, Rev., 5.00%, 5/15/2021 | | | 75,000 | | | | 75,740 | |
| | |
Series 2013C, Rev., 5.00%, 8/15/2021 | | | 20,000 | | | | 20,440 | |
| | |
Series 2017D, Rev., 5.00%, 9/1/2021 | | | 20,000 | | | | 20,483 | |
| | |
Series 2011C, Rev., 5.00%, 12/1/2021 (b) | | | 195,000 | | | | 202,106 | |
| | |
Series 2013A, Rev., 5.00%, 3/15/2022 | | | 20,000 | | | | 21,004 | |
| | |
Series 2016A, Rev., 5.00%, 5/15/2022 | | | 30,000 | | | | 31,748 | |
| | |
Rev., 5.00%, 9/1/2022 | | | 25,000 | | | | 26,816 | |
| | |
Erie County Industrial Development Agency (The) Rev., 5.00%, 5/1/2021 | | | 430,000 | | | | 433,315 | |
| | |
Erie County Industrial Development Agency (The), City School District of the City of Buffalo Project | | | | | | | | |
| | |
Rev., 5.00%, 5/1/2021 | | | 455,000 | | | | 458,508 | |
| | |
Series 2016A, Rev., 5.00%, 5/1/2021 | | | 40,000 | | | | 40,308 | |
| | | | | | | | |
| INVESTMENTS | | PRINCIPAL
AMOUNT ($) | | | VALUE ($) | |
| | | | | | | | |
| | |
New York — continued | | | | | | | | |
| | |
Series 2012A, Rev., 5.00%, 5/1/2022 | | | 100,000 | | | | 105,444 | |
| | |
Series 2015A, Rev., 5.00%, 5/1/2022 | | | 160,000 | | | | 168,711 | |
| | |
Rev., 5.00%, 5/1/2023 | | | 150,000 | | | | 164,706 | |
| | |
Rev., 5.00%, 5/1/2024 | | | 50,000 | | | | 56,957 | |
| | |
Erie County Water Authority Rev., 5.00%, 12/1/2022 | | | 55,000 | | | | 59,643 | |
| | |
Fairport Central School District GO, 4.00%, 6/15/2021 | | | 175,000 | | | | 176,937 | |
| | |
Fayetteville-Manlius Central School District Series 2020A, GO, BAN, 1.25%, 7/29/2021 | | | 500,000 | | | | 502,095 | |
| | |
Freeport Union Free School District | | | | | | | | |
| | |
GO, 5.00%, 4/1/2022 | | | 60,000 | | | | 63,148 | |
| | |
GO, 5.00%, 12/1/2022 | | | 50,000 | | | | 54,220 | |
| | |
Geneva City School District GO, AGM, 5.00%, 6/15/2021 | | | 25,000 | | | | 25,341 | |
| | |
Grand Island Central School District GO, 5.00%, 12/1/2021 | | | 75,000 | | | | 77,727 | |
| | |
Great Neck Union Free School District GO, 5.00%, 6/15/2021 | | | 25,000 | | | | 25,348 | |
| | |
Half Hollow Hills Central School District | | | | | | | | |
| | |
GO, XLCA, 5.00%, 6/15/2021 | | | 100,000 | | | | 101,392 | |
| | |
Series 2013B, GO, 4.00%, 8/15/2022 | | | 20,000 | | | | 21,117 | |
| | |
Hamburg Central School District GO, 2.00%, 6/1/2021 | | | 35,000 | | | | 35,162 | |
| | |
Harborfields Central School District GO, 5.00%, 3/1/2022 | | | 45,000 | | | | 47,178 | |
| | |
Hempstead Town Local Development Corp., Hofstra University Project Rev., 5.00%, 7/1/2021 | | | 375,000 | | | | 380,640 | |
| | |
Herricks Union Free School District Series 2014A, GO, 2.00%, 5/1/2021 | | | 45,000 | | | | 45,138 | |
| | |
Hicksville Water District GO, 5.00%, 12/15/2021 | | | 25,000 | | | | 25,956 | |
| | |
Homer Central School District GO, 3.00%, 3/15/2021 | | | 350,000 | | | | 350,357 | |
| | |
Island Trees Union Free School District GO, 4.00%, 8/1/2023 | | | 25,000 | | | | 26,326 | |
| | |
Jamestown City School District GO, AGM, 4.00%, 5/15/2021 | | | 150,000 | | | | 151,146 | |
| | |
Katonah-Lewisboro Union Free School District Series 2016A, GO, 5.00%, 11/15/2021 | | | 25,000 | | | | 25,855 | |
| | |
Kendall Central School District GO, 2.00%, 6/15/2021 | | | 65,000 | | | | 65,348 | |
SEE NOTES TO FINANCIAL STATEMENTS.
| | | | | | | | |
| | | |
| FEBRUARY 28, 2021 | | J.P. MORGAN EXCHANGE-TRADED FUNDS | | | | | 257 | |
JPMorgan Ultra-Short Municipal Income ETF
SCHEDULE OF PORTFOLIO INVESTMENTS
AS OF FEBRUARY 28, 2021 (continued)
| | | | | | | | |
| INVESTMENTS | | PRINCIPAL
AMOUNT ($) | | | VALUE ($) | |
Municipal Bonds — continued | | | | | | | | |
| | |
New York — continued | | | | | | | | |
| | |
Kings Park Central School District GO, 2.25%, 8/1/2022 | | | 70,000 | | | | 72,076 | |
| | |
Lafayette Central School District GO, RAN, 1.25%, 6/18/2021 | | | 4,500,000 | | | | 4,513,635 | |
| | |
Lakeland Central School District | | | | | | | | |
| | |
GO, BAN, 1.25%, 8/20/2021 | | | 2,321,785 | | | | 2,330,933 | |
| | |
GO, 5.00%, 10/15/2021 | | | 35,000 | | | | 36,053 | |
| | |
Lancaster Central School District | | | | | | | | |
| | |
GO, 4.00%, 6/1/2021 | | | 55,000 | | | | 55,526 | |
| | |
GO, 5.00%, 6/1/2022 | | | 35,000 | | | | 37,114 | |
| | |
Lansing Central School District GO, BAN, 1.25%, 7/23/2021 | | | 4,817,400 | | | | 4,831,611 | |
| | |
Le Roy Central School District GO, 4.00%, 6/15/2021 | | | 65,000 | | | | 65,720 | |
| | |
Liverpool Central School District GO, 4.00%, 6/15/2021 | | | 25,000 | | | | 25,272 | |
| | |
Long Island Power Authority, Electric System | | | | | | | | |
| | |
Series 2011A, Rev., 5.00%, 5/1/2021 (b) | | | 350,000 | | | | 352,796 | |
| | |
Series A, Rev., AGM, Zero Coupon, 6/1/2021 | | | 235,000 | | | | 234,732 | |
| | |
Rev., AGM, Zero Coupon, 6/1/2022 | | | 120,000 | | | | 119,137 | |
| | |
Series 2016B, Rev., 5.00%, 9/1/2023 | | | 200,000 | | | | 223,266 | |
| | |
Rev., 1.00%, 9/1/2025 | | | 120,000 | | | | 121,174 | |
| | |
Maine-Endwell Central School District GO, BAN, 2.00%, 10/1/2021 | | | 1,487,680 | | | | 1,502,587 | |
| | |
Manhasset Union Free School District Series 2016B, GO, 5.00%, 1/15/2022 | | | 25,000 | | | | 26,055 | |
| | |
Marlboro Central School District GO, 5.00%, 12/15/2021 | | | 40,000 | | | | 41,498 | |
| | |
Massapequa Union Free School District Series 2016A, GO, 4.00%, 7/15/2021 | | | 45,000 | | | | 45,643 | |
| | |
Metropolitan Transportation Authority | | | | | | | | |
| | |
Series 2018B, Subseries 2018B-2A, Rev., BAN, 5.00%, 5/15/2021 | | | 2,555,000 | | | | 2,577,305 | |
| | |
Series 2018B, Subseries 2018B-2B, Rev., BAN, 5.00%, 5/15/2021 | | | 2,975,000 | | | | 3,000,972 | |
| | |
Series 2018B, Subseries 2018B-2D, Rev., BAN, 5.00%, 5/15/2021 | | | 525,000 | | | | 529,583 | |
| | |
Series 2011A, Rev., 5.00%, 11/15/2021 (b) | | | 30,000 | | | | 31,028 | |
| | |
Series 2011C, Rev., AGM, 5.00%, 11/15/2021 (b) | | | 20,000 | | | | 20,686 | |
| | |
Series 2011D, Rev., 5.00%, 11/15/2021 (b) | | | 155,000 | | | | 160,312 | |
| | | | | | | | |
| INVESTMENTS | | PRINCIPAL
AMOUNT ($) | | | VALUE ($) | |
| | | | | | | | |
| | |
New York — continued | | | | | | | | |
| | |
Metropolitan Transportation Authority, Dedicated Tax Fund | | | | | | | | |
| | |
Series 2011A, Rev., 5.00%, 11/15/2021 | | | 65,000 | | | | 67,120 | |
| | |
Series 2012A, Rev., 5.00%, 11/15/2021 | | | 50,000 | | | | 51,631 | |
| | |
Subseries 2008B-4, Rev., 5.00%, 11/15/2021 | | | 45,000 | | | | 46,467 | |
| | |
Subseries B-4, Rev., 5.00%, 11/15/2021 (b) | | | 70,000 | | | | 72,399 | |
| | |
Series 2019A, Rev., BAN, 5.00%, 3/1/2022 | | | 715,000 | | | | 747,997 | |
| | |
Series B-1, Rev., 4.00%, 11/15/2022 | | | 70,000 | | | | 74,267 | |
| | |
Series 2016A, Rev., 5.00%, 11/15/2023 | | | 100,000 | | | | 112,108 | |
| | |
Series 2012A, Rev., 5.00%, 11/15/2024 | | | 510,000 | | | | 549,352 | |
| | |
Series 2013B-1, Rev., 5.00%, 11/15/2024 | | | 125,000 | | | | 139,810 | |
| | |
Middle Country Central School District at Centereach GO, 2.00%, 8/15/2021 | | | 75,000 | | | | 75,635 | |
| | |
Middletown City School District GO, 4.00%, 6/15/2022 | | | 25,000 | | | | 26,213 | |
| | |
Minisink Valley Central School District | | | | | | | | |
| | |
GO, 4.00%, 4/15/2021 | | | 120,000 | | | | 120,554 | |
| | |
GO, 4.00%, 6/15/2021 | | | 50,000 | | | | 50,554 | |
| | |
GO, 5.00%, 12/1/2021 | | | 20,000 | | | | 20,727 | |
| | |
GO, 4.00%, 4/15/2022 | | | 55,000 | | | | 57,374 | |
| | |
GO, 4.00%, 6/15/2022 | | | 45,000 | | | | 47,225 | |
| | |
Monroe County Industrial Development Corp., Rochester Schools Modernization Project | | | | | | | | |
| | |
Rev., 5.00%, 5/1/2021 | | | 705,000 | | | | 710,245 | |
| | |
Series 2012A, Rev., 5.00%, 5/1/2021 | | | 80,000 | | | | 80,595 | |
| | |
Rev., 5.00%, 5/1/2022 | | | 25,000 | | | | 26,343 | |
| | |
Monroe County Industrial Development Corp., University of Rochester Project | | | | | | | | |
| | |
Series 2013B, Rev., 5.00%, 7/1/2021 | | | 100,000 | | | | 101,588 | |
| | |
Series 2017B, Rev., 5.00%, 7/1/2021 | | | 50,000 | | | | 50,794 | |
| | |
Series 2013B, Rev., 5.00%, 7/1/2022 | | | 25,000 | | | | 26,590 | |
| | |
Montauk Union Free School District GO, TAN, 1.50%, 6/24/2021 | | | 2,300,000 | | | | 2,308,004 | |
SEE NOTES TO FINANCIAL STATEMENTS.
| | | | | | |
| | | |
| 258 | | | | J.P. MORGAN EXCHANGE-TRADED FUNDS | | FEBRUARY 28, 2021 |
| | | | | | | | |
| INVESTMENTS | | PRINCIPAL
AMOUNT ($) | | | VALUE ($) | |
Municipal Bonds — continued | | | | | | | | |
| | |
New York — continued | | | | | | | | |
| | |
Morrisville-Eaton Central School District GO, BAN, 1.75%, 5/28/2021 | | | 1,750,000 | | | | 1,756,423 | |
| | |
Mount Sinai Union Free School District GO, 5.00%, 1/15/2022 | | | 20,000 | | | | 20,844 | |
| | |
Mount Vernon City School District GO, AGM, 5.00%, 8/15/2021 | | | 25,000 | | | | 25,552 | |
| | |
Nassau County Interim Finance Authority, Sales Tax | | | | | | | | |
| | |
Series 2012A, Rev., 4.00%, 11/15/2021 | | | 110,000 | | | | 112,949 | |
| | |
Series 2015A, Rev., 5.00%, 11/15/2021 (b) | | | 490,000 | | | | 506,792 | |
| | |
Series 2012A, Rev., 4.00%, 11/15/2022 | | | 35,000 | | | | 37,254 | |
| | |
New Hyde Park-Garden City Park Union Free School District GO, 5.00%, 11/15/2021 | | | 45,000 | | | | 46,539 | |
| | |
New Rochelle City School District | | | | | | | | |
| | |
GO, 5.00%, 9/1/2021 | | | 45,000 | | | | 46,089 | |
| | |
GO, 5.00%, 9/1/2022 | | | 25,000 | | | | 26,813 | |
| | |
New York City Health and Hospitals Corp. Series 2013A, Rev., 5.00%, 2/15/2023 | | | 200,000 | | | | 218,042 | |
| | |
New York City Housing Development Corp., New York City Housing Authority Program Series 2013B-1, Rev., 5.00%, 7/1/2021 | | | 340,000 | | | | 345,171 | |
| | |
New York City Industrial Development Agency, Queens Baseball Stadium Project Rev., AMBAC, 5.00%, 3/15/2021 | | | 200,000 | | | | 200,344 | |
| | |
New York City Transitional Finance Authority Future Tax Secured, Tax Exempt Subordinate Bonds Subseries E, Rev., 5.00%, 11/1/2021 | | | 30,000 | | | | 30,967 | |
| | |
New York City Transitional Finance Authority Future Tax Secured, Tax-Exempt, Fiscal Year 2013 Series B, Rev., 5.00%, 11/1/2021 | | | 385,000 | | | | 397,412 | |
| | |
New York City Transitional Finance Authority, Building Aid, Fiscal Year 2012 Series 2012S-1A, Rev., 5.00%, 7/15/2022 | | | 200,000 | | | | 203,506 | |
| | |
New York City Transitional Finance Authority, Building Aid, Fiscal Year 2013 Series 2013S-1, Rev., 4.00%, 7/15/2022 | | | 25,000 | | | | 26,281 | |
| | |
New York City Transitional Finance Authority, Building Aid, Fiscal Year 2015 Series 2015S-1, Rev., 5.00%, 7/15/2021 (b) | | | 30,000 | | | | 30,529 | |
| | | | | | | | |
| INVESTMENTS | | PRINCIPAL
AMOUNT ($) | | | VALUE ($) | |
| | | | | | | | |
| | |
New York — continued | | | | | | | | |
| | |
New York City Transitional Finance Authority, Building Aid, Fiscal Year 2018 | | | | | | | | |
| | |
Series 2018S-3, Rev., 5.00%, 7/15/2021 | | | 70,000 | | | | 71,232 | |
| | |
Series 2018S-4A, Rev., 3.00%, 7/15/2022 | | | 100,000 | | | | 103,757 | |
| | |
Series 2018S-3, Rev., 5.00%, 7/15/2022 | | | 500,000 | | | | 508,765 | |
| | |
New York City Transitional Finance Authority, Building Aid, Fiscal Year 2019 Series 2019S-1, Rev., 5.00%, 7/15/2022 | | | 25,000 | | | | 26,622 | |
| | |
New York City Transitional Finance Authority, Future Tax Secured, Fiscal Year 2003 | | | | | | | | |
| | |
Subseries 13, Rev., 5.00%, 11/1/2021 | | | 90,000 | | | | 92,902 | |
| | |
Subseries A-1, Rev., 5.00%, 11/1/2021 | | | 100,000 | | | | 103,224 | |
| | |
Series 2003B, Rev., 5.00%, 2/1/2022 | | | 150,000 | | | | 150,544 | |
| | |
Subseries A-1, Rev., 5.00%, 11/1/2022 | | | 150,000 | | | | 154,754 | |
| | |
Subseries 2003A-1, Rev., 5.00%, 11/1/2023 | | | 100,000 | | | | 103,210 | |
| | |
Series 2003B, Rev., 5.00%, 2/1/2026 | | | 100,000 | | | | 100,357 | |
| | |
New York City Transitional Finance Authority, Future Tax Secured, Fiscal Year 2011 | | | | | | | | |
| | |
Series 2011E, Rev., 5.00%, 11/1/2021 | | | 195,000 | | | | 196,552 | |
| | |
Series 2011E, Rev., 5.00%, 11/1/2022 | | | 300,000 | | | | 302,349 | |
| | |
New York City Transitional Finance Authority, Future Tax Secured, Fiscal Year 2012 | | | | | | | | |
| | |
Series 2012F-1, Rev., 5.00%, 5/1/2021 | | | 90,000 | | | | 90,716 | |
| | |
Series 2012C, Rev., 3.00%, 11/1/2021 | | | 250,000 | | | | 254,742 | |
| | |
Series 2012A, Rev., 5.00%, 11/1/2021 | | | 20,000 | | | | 20,645 | |
| | |
Series 2012E-1, Rev., 5.00%, 2/1/2022 | | | 25,000 | | | | 26,105 | |
| | |
Subseries 2012D-1, Rev., 5.00%, 11/1/2023 | | | 120,000 | | | | 123,852 | |
| | |
Series 2012A, Rev., 5.00%, 11/1/2024 | | | 255,000 | | | | 263,134 | |
SEE NOTES TO FINANCIAL STATEMENTS.
| | | | | | | | |
| | | |
| FEBRUARY 28, 2021 | | J.P. MORGAN EXCHANGE-TRADED FUNDS | | | | | 259 | |
JPMorgan Ultra-Short Municipal Income ETF
SCHEDULE OF PORTFOLIO INVESTMENTS
AS OF FEBRUARY 28, 2021 (continued)
| | | | | | | | |
| INVESTMENTS | | PRINCIPAL
AMOUNT ($) | | | VALUE ($) | |
Municipal Bonds — continued | | | | | | | | |
| | |
New York — continued | | | | | | | | |
| | |
Series E, Subseries 2012E-1, Rev., 5.00%, 2/1/2025 | | | 425,000 | | | | 443,658 | |
| | |
New York City Transitional Finance Authority, Future Tax Secured, Fiscal Year 2013 | | | | | | | | |
| | |
Subseries C-5, Rev., VRDO, LOC: Sumitomo Mitsui Banking Corp., 0.04%, 3/9/2021 (c) | | | 1,955,000 | | | | 1,955,000 | |
| | |
Series 2013I, Rev., 5.00%, 5/1/2022 | | | 60,000 | | | | 63,368 | |
| | |
Series 2013D, Rev., 5.00%, 11/1/2022 | | | 60,000 | | | | 64,760 | |
| | |
New York City Transitional Finance Authority, Future Tax Secured, Fiscal Year 2014 | | | | | | | | |
| | |
Subseries 2014C, Rev., 5.00%, 11/1/2021 | | | 35,000 | | | | 36,128 | |
| | |
Series 2014A-1, Rev., 5.00%, 11/1/2022 | | | 75,000 | | | | 80,950 | |
| | |
Subseries 2014C, Rev., 5.00%, 11/1/2022 | | | 140,000 | | | | 151,108 | |
| | |
Series 2014C, Rev., 5.00%, 11/1/2023 | | | 40,000 | | | | 44,930 | |
| | |
New York City Transitional Finance Authority, Future Tax Secured, Fiscal Year 2015 | | | | | | | | |
| | |
Subseries A-4, Rev., VRDO, LIQ: Mizuho Bank Ltd., 0.03%, 3/1/2021 (c) | | | 725,000 | | | | 725,000 | |
| | |
Series 2015A-1, Rev., 5.00%, 8/1/2021 (b) | | | 25,000 | | | | 25,505 | |
| | |
Series 2015C, Rev., 5.00%, 11/1/2021 | | | 180,000 | | | | 185,803 | |
| | |
Series 2015E-1, Rev., 5.00%, 2/1/2022 | | | 30,000 | | | | 31,325 | |
| | |
Series B, Subseries B-1, Rev., 5.00%, 8/1/2022 | | | 20,000 | | | | 21,352 | |
| | |
Subseries 2015A-1, Rev., 5.00%, 8/1/2022 | | | 20,000 | | | | 21,352 | |
| | |
New York City Transitional Finance Authority, Future Tax Secured, Fiscal Year 2016 Series 2016A-1, Rev., 4.00%, 8/1/2023 | | | 25,000 | | | | 27,210 | |
| | |
New York City Transitional Finance Authority, Future Tax Secured, Fiscal Year 2017 Subseries F-1, Rev., 5.00%, 5/1/2023 | | | 20,000 | | | | 22,029 | |
| | |
New York City Transitional Finance Authority, Future Tax Secured, Fiscal Year 2018 Series 2018A-1, Rev., 5.00%, 8/1/2022 | | | 115,000 | | | | 122,773 | |
| | | | | | | | |
| INVESTMENTS | | PRINCIPAL
AMOUNT ($) | | | VALUE ($) | |
| | | | | | | | |
| | |
New York — continued | | | | | | | | |
| | |
New York City Transitional Finance Authority, Future Tax Secured, Fiscal Year 2019 Subseries B-1, Rev., 5.00%, 8/1/2022 | | | 65,000 | | | | 69,393 | |
| | |
New York City Transitional Finance Authority, Future Tax Secured, Fiscal Year 2020 Series C, Subseries C-1, Rev., 5.00%, 5/1/2022 | | | 30,000 | | | | 31,684 | |
| | |
New York City Transitional Finance Authority, Future Tax Secured, Fiscal Year 2021 | | | | | | | | |
| | |
Series 2021A, Rev., 5.00%, 11/1/2021 | | | 670,000 | | | | 691,601 | |
| | |
Series 2021A, Rev., 3.00%, 11/1/2022 | | | 105,000 | | | | 109,845 | |
| | |
Series 2021-1, Rev., 5.00%, 11/1/2025 | | | 40,000 | | | | 48,017 | |
| | |
New York City Transitional Finance Authority, Future Tax Secured, Tax-Exempt | | | | | | | | |
| | |
Subseries F-1, Rev., 5.00%, 2/1/2022 | | | 115,000 | | | | 120,081 | |
| | |
Subseries F-1, Rev., 5.00%, 5/1/2022 | | | 25,000 | | | | 26,403 | |
| | |
Series 2013B, Rev., 5.00%, 11/1/2022 | | | 105,000 | | | | 113,331 | |
| | |
Subseries F-1, Rev., 5.00%, 2/1/2023 | | | 150,000 | | | | 163,504 | |
| | |
New York City Transitional Finance Authority, Future Tax Secured, Tax-Exempt, Fiscal Year 2013 | | | | | | | | |
| | |
Rev., 2.00%, 11/1/2021 | | | 25,000 | | | | 25,308 | |
| | |
Series 2013H, Rev., 5.00%, 11/1/2021 | | | 30,000 | | | | 30,967 | |
| | |
Series 2013G, Rev., 4.00%, 11/1/2022 | | | 25,000 | | | | 26,569 | |
| | |
New York City Transitional Finance Authority, Future Tax Secured, Tax-Exempt, Fiscal Year 2016 | | | | | | | | |
| | |
Series 2016C, Rev., 5.00%, 11/1/2021 | | | 85,000 | | | | 87,740 | |
| | |
Series 2016C, Rev., 5.00%, 11/1/2022 | | | 20,000 | | | | 21,587 | |
| | |
Series 2016E-1, Rev., 5.00%, 2/1/2025 | | | 25,000 | | | | 29,297 | |
| | |
New York City Transitional Finance Authority, Future Tax Secured, Tax-Exempt, Fiscal Year 2017 Series C, Rev., 5.00%, 11/1/2021 | | | 50,000 | | | | 51,612 | |
SEE NOTES TO FINANCIAL STATEMENTS.
| | | | | | |
| | | |
| 260 | | | | J.P. MORGAN EXCHANGE-TRADED FUNDS | | FEBRUARY 28, 2021 |
| | | | | | | | |
| INVESTMENTS | | PRINCIPAL
AMOUNT ($) | | | VALUE ($) | |
Municipal Bonds — continued | | | | | | | | |
| | |
New York — continued | | | | | | | | |
| | |
New York City Transitional Finance Authority, Future Tax Secured, Tax-Exempt, Fiscal Year 2018 Series 2018C-1, Rev., 5.00%, 5/1/2021 | | | 20,000 | | | | 20,159 | |
| | |
New York City Transitional Finance Authority, Future Tax Secured, Tax-Exempt, Fiscal Year 2020 | | | | | | | | |
| | |
Series A, Subseries A-1, Rev., 5.00%, 5/1/2021 | | | 225,000 | | | | 226,791 | |
| | |
Series 2020B-1, Rev., 5.00%, 11/1/2021 | | | 70,000 | | | | 72,257 | |
| | |
New York City Trust for Cultural Resources, Museum of Natural History Rev., 5.00%, 4/1/2021 | | | 25,000 | | | | 25,095 | |
| | |
New York City Trust for Cultural Resources, The Museum of Modern Art | | | | | | | | |
| | |
Series 2016-1-E, Rev., 4.00%, 2/1/2023 | | | 150,000 | | | | 160,225 | |
| | |
Series 2012A, Rev., 5.00%, 4/1/2023 | | | 125,000 | | | | 136,865 | |
| | |
New York City Water and Sewer System, Fiscal Year 2012 | | | | | | | | |
| | |
Subseries A-1, Rev., VRDO, LIQ: Mizuho Bank Ltd., 0.01%, 3/1/2021 (c) | | | 3,500,000 | | | | 3,500,000 | |
| | |
Subseries A-2, Rev., VRDO, LIQ: | | | | | | | | |
| | |
Mizuho Bank Ltd., 0.01%, 3/1/2021 (c) | | | 655,000 | | | | 655,000 | |
| | |
New York City Water and Sewer System, Second General Resolution, Fiscal Year 2009 Series 2009BB-1, Rev., VRDO, LIQ: | | | | | | | | |
| | |
Landesbank Hessen-Thueringen, 0.03%, 3/1/2021 (c) | | | 4,485,000 | | | | 4,485,000 | |
| | |
New York City Water and Sewer System, Second General Resolution, Fiscal Year 2011 Series 2011GG, Rev., 5.00%, 6/15/2021 (b) | | | 65,000 | | | | 65,907 | |
| | |
New York City Water and Sewer System, Second General Resolution, Fiscal Year 2012 | | | | | | | | |
| | |
Series 2012AA, Rev., 5.00%, 6/15/2021 (b) | | | 30,000 | | | | 30,418 | |
| | |
Series 2012EE, Rev., 5.00%, 6/15/2022 | | | 20,000 | | | | 21,230 | |
| | |
Series 2012EE, Rev., 4.00%, 6/15/2023 | | | 50,000 | | | | 52,449 | |
| | | | | | | | |
| INVESTMENTS | | PRINCIPAL
AMOUNT ($) | | | VALUE ($) | |
| | | | | | | | |
| | |
New York — continued | | | | | | | | |
| | |
New York City Water and Sewer System, Second General Resolution, Fiscal Year 2013 Series AA, Subseries AA-1, Rev., VRDO, LIQ: PNC Bank NA, 0.05%, 3/9/2021 (c) | | | 8,815,000 | | | | 8,815,000 | |
| | |
New York City Water and Sewer System, Second General Resolution, Fiscal Year 2014 Series 2014DD, Rev., 5.00%, 6/15/2022 | | | 75,000 | | | | 79,612 | |
| | |
New York City Water and Sewer System, Second General Resolution, Fiscal Year 2016 Subseries 2016CC-1, Rev., 4.00%, 6/15/2021 (b) | | | 45,000 | | | | 45,499 | |
| | |
New York City Water and Sewer System, Second General Resolution, Fiscal Year 2018 | | | | | | | | |
| | |
Rev., 4.00%, 6/15/2021 (b) | | | 100,000 | | | | 101,109 | |
| | |
Series 2018FF, Rev., 5.00%, 6/15/2021 (b) | | | 25,000 | | | | 25,349 | |
| | |
New York City Water and Sewer System, Second General Resolution, Fiscal Year 2019 | | | | | | | | |
| | |
Rev., VRDO, LIQ: Industrial & Commercial Bank of China, 0.08%, 3/9/2021 (c) | | | 7,000,000 | | | | 7,000,000 | |
| | |
Series 2019DD-2, Rev., 5.00%, 6/15/2024 | | | 35,000 | | | | 37,969 | |
| | |
New York City Water and Sewer System, Second General Resolution, Fiscal Year 2020 | | | | | | | | |
| | |
Series 2020AA, Rev., 4.00%, 6/15/2021 (b) | | | 25,000 | | | | 25,277 | |
| | |
Series 2020CC-2, Rev., 5.00%, 6/15/2022 | | | 100,000 | | | | 106,149 | |
| | |
New York Local Government Assistance Corp. Series 2011A, Rev., 4.00%, 4/1/2021 | | | 125,000 | | | | 125,392 | |
| | |
New York Municipal Bond Bank Agency, Prior Year Claims Series 2012A, Rev., 5.00%, 12/1/2021 | | | 120,000 | | | | 124,363 | |
| | |
New York State Dormitory Authority Rev., NATL-RE, 5.50%, 7/1/2021 | | | 180,000 | | | | 183,004 | |
| | |
New York State Dormitory Authority, Albany Public Library Rev., 4.00%, 7/1/2021 | | | 50,000 | | | | 50,637 | |
| | |
New York State Dormitory Authority, Columbia University | | | | | | | | |
| | |
Series 2011A, Rev., 5.00%, 10/1/2021 | | | 45,000 | | | | 46,274 | |
| | |
Series 2012A, Rev., 5.00%, 10/1/2021 | | | 85,000 | | | | 87,406 | |
SEE NOTES TO FINANCIAL STATEMENTS.
| | | | | | | | |
| | | |
| FEBRUARY 28, 2021 | | J.P. MORGAN EXCHANGE-TRADED FUNDS | | | | | 261 | |
JPMorgan Ultra-Short Municipal Income ETF
SCHEDULE OF PORTFOLIO INVESTMENTS
AS OF FEBRUARY 28, 2021 (continued)
| | | | | | | | |
| INVESTMENTS | | PRINCIPAL
AMOUNT ($) | | | VALUE ($) | |
Municipal Bonds — continued | | | | | | | | |
| | |
New York — continued | | | | | | | | |
| | |
Series 2016B, Rev., 5.00%, 10/1/2021 | | | 75,000 | | | | 77,123 | |
| | |
Series 2011A, Rev., 5.00%, 10/1/2022 | | | 50,000 | | | | 50,196 | |
| | |
New York State Dormitory Authority, Cornell University | | | | | | | | |
| | |
Series 1990B, Rev., 5.00%, 3/30/2021 | | | 55,000 | | | | 55,206 | |
| | |
Series 2016A, Rev., 5.00%, 7/1/2021 | | | 50,000 | | | | 50,803 | |
| | |
New York State Dormitory Authority, Court Facility Lease | | | | | | | | |
| | |
Rev., AMBAC, 5.50%, 5/15/2021 | | | 185,000 | | | | 186,970 | |
| | |
Rev., 5.00%, 8/1/2021 | | | 25,000 | | | | 25,492 | |
| | |
Rev., AMBAC, 5.50%, 5/15/2022 | | | 40,000 | | | | 42,515 | |
| | |
Rev., 5.00%, 8/1/2022 | | | 75,000 | | | | 80,014 | |
| | |
New York State Dormitory Authority, Department of Health | | | | | | | | |
| | |
Series 2016A, Rev., 5.00%, 7/1/2022 | | | 35,000 | | | | 37,270 | |
| | |
Series 2016A, Rev., 5.00%, 7/1/2023 | | | 25,000 | | | | 27,689 | |
| | |
New York State Dormitory Authority, Fifth General Resolution Series 2005A, Rev., NATL-RE, 5.50%, 7/1/2021 | | | 115,000 | | | | 117,037 | |
| | |
New York State Dormitory Authority, Fordham University Series 2011A, Rev., 5.00%, 7/1/2021 (b) | | | 150,000 | | | | 152,347 | |
| | |
Rev., 5.00%, 7/1/2023 | | | 200,000 | | | | 220,674 | |
| | |
New York State Dormitory Authority, Harborfields Public Library Rev., 4.00%, 7/1/2022 | | | 40,000 | | | | 42,052 | |
| | |
New York State Dormitory Authority, Icahn School of Medicine at Mount Sinai Rev., 5.00%, 7/1/2023 | | | 200,000 | | | | 220,330 | |
| | |
New York State Dormitory Authority, Memorial Sloan-Kettering Cancer Center | | | | | | | | |
| | |
Series 2012-1, Rev., 4.38%, 1/1/2022 (b) | | | 85,000 | | | | 87,965 | |
| | |
Rev., 5.00%, 1/1/2022 (b) | | | 25,000 | | | | 26,013 | |
| | |
Series 2012-1, Rev., 5.00%, 1/1/2022 (b) | | | 250,000 | | | | 260,017 | |
| | |
Rev., NATL-RE, 5.50%, 7/1/2023 | | | 955,000 | | | | 1,023,903 | |
| | |
New York State Dormitory Authority, Mount Sinai School of Medical Series 1994A, Rev., NATL-RE, 5.15%, 7/1/2024 | | | 100,000 | | | | 110,070 | |
| | | | | | | | |
| INVESTMENTS | | PRINCIPAL
AMOUNT ($) | | | VALUE ($) | |
| | | | | | | | |
| | |
New York — continued | | | | | | | | |
| | |
New York State Dormitory Authority, New York University Series 2015A, Rev., 5.00%, 7/1/2021 | | | 180,000 | | | | 182,889 | |
| | |
New York State Dormitory Authority, New York University Hospitals Center, Langone Hospitals Obligated Group | | | | | | | | |
| | |
Rev., 3.00%, 7/1/2021 | | | 200,000 | | | | 201,722 | |
| | |
Rev., 5.00%, 7/1/2021 | | | 270,000 | | | | 274,107 | |
| | |
Rev., 5.00%, 7/1/2023 | | | 150,000 | | | | 165,359 | |
| | |
Rev., 5.00%, 7/1/2024 | | | 720,000 | | | | 822,031 | |
| | |
Rev., 5.00%, 7/1/2026 | | | 465,000 | | | | 526,496 | |
| | |
New York State Dormitory Authority, Northwell Health Obligated Group | | | | | | | | |
| | |
Rev., 5.00%, 5/1/2021 | | | 165,000 | | | | 166,257 | |
| | |
Series 2011A, Rev., 5.00%, 5/1/2021 (b) | | | 35,000 | | | | 35,277 | |
| | |
Series 2019A, Rev., 5.00%, 5/1/2021 | | | 300,000 | | | | 302,286 | |
| | |
Series 2011A, Rev., 5.25%, 5/1/2021 (b) | | | 155,000 | | | | 156,290 | |
| | |
Series 2019B-1, Rev., 5.00%, 5/1/2022 (c) | | | 6,525,000 | | | | 6,726,883 | |
| | |
Rev., 5.00%, 5/1/2023 | | | 200,000 | | | | 219,562 | |
| | |
Series 2015A, Rev., 5.00%, 5/1/2023 | | | 530,000 | | | | 581,839 | |
| | |
Rev., 5.00%, 5/1/2025 | | | 105,000 | | | | 123,158 | |
| | |
New York State Dormitory Authority, NYSARC Inc. | | | | | | | | |
| | |
Series 2012A, Rev., 2.25%, 7/1/2021 | | | 225,000 | | | | 226,561 | |
| | |
Rev., 5.00%, 7/1/2022 | | | 145,000 | | | | 154,405 | |
| | |
New York State Dormitory Authority, Personal Income Tax Refunding, General Purpose Series 2012A, Rev., 4.00%, 12/15/2021 | | | 50,000 | | | | 51,515 | |
| | |
New York State Dormitory Authority, Rochester Institute of Technology Rev., 4.00%, 7/1/2022 (b) | | | 75,000 | | | | 78,805 | |
| | |
New York State Dormitory Authority, School Districts Financing Program | | | | | | | | |
| | |
Series 2012H, Rev., 3.00%, 4/1/2021 | | | 130,000 | | | | 130,261 | |
| | |
Series 2016H, Rev., 1.25%, 10/1/2021 | | | 25,000 | | | | 25,108 | |
| | |
Series 2017A, Rev., 4.00%, 10/1/2021 | | | 25,000 | | | | 25,558 | |
| | |
Series 2018C-1, Rev., 4.00%, 10/1/2021 | | | 25,000 | | | | 25,560 | |
SEE NOTES TO FINANCIAL STATEMENTS.
| | | | | | |
| | | |
| 262 | | | | J.P. MORGAN EXCHANGE-TRADED FUNDS | | FEBRUARY 28, 2021 |
| | | | | | | | |
| INVESTMENTS | | PRINCIPAL
AMOUNT ($) | | | VALUE ($) | |
Municipal Bonds — continued | | | | | | | | |
| | |
New York — continued | | | | | | | | |
| | |
Series 2011A, Rev., 5.00%, 10/1/2021 | | | 105,000 | | | | 107,960 | |
| | |
Series 2014A, Rev., AGM, 5.00%, 10/1/2021 | | | 70,000 | | | | 71,990 | |
| | |
Series 2017F, Rev., 5.00%, 10/1/2021 | | | 750,000 | | | | 771,098 | |
| | |
Series 2018A, Rev., 5.00%, 10/1/2021 | | | 175,000 | | | | 179,559 | |
| | |
Series 2019A, Rev., 5.00%, 10/1/2021 | | | 215,000 | | | | 220,678 | |
| | |
Rev., 4.00%, 10/1/2022 | | | 125,000 | | | | 131,695 | |
| | |
Series 2012D, Rev., AGM, 5.00%, 10/1/2023 | | | 300,000 | | | | 321,753 | |
| | |
Series 2016G, Rev., 5.00%, 10/1/2023 | | | 40,000 | | | | 44,633 | |
| | |
Series 2015D, Rev., 5.00%, 10/1/2024 | | | 165,000 | | | | 189,722 | |
| | |
Series 2017G, Rev., 5.00%, 10/1/2025 | | | 1,375,000 | | | | 1,632,634 | |
| | |
New York State Dormitory Authority, Skidmore College Series 2011A, Rev., 5.50%, 7/1/2041 | | | 400,000 | | | | 407,040 | |
| | |
New York State Dormitory Authority, State Personal Income Tax | | | | | | | | |
| | |
Series 2005B, Rev., AMBAC, 5.50%, 3/15/2022 | | | 35,000 | | | | 36,938 | |
| | |
Series 2005B, Rev., AMBAC, 5.50%, 3/15/2023 | | | 30,000 | | | | 33,132 | |
| | |
Series B, Rev., AMBAC, 5.50%, 3/15/2024 | | | 100,000 | | | | 115,161 | |
| | |
New York State Dormitory Authority, State Personal Income Tax, General Purpose | | | | | | | | |
| | |
Series 2015A, Rev., 3.00%, 3/15/2021 | | | 75,000 | | | | 75,079 | |
| | |
Series 2011C, Rev., 5.00%, 3/15/2021 | | | 100,000 | | | | 100,177 | |
| | |
Series 2012B, Rev., 5.00%, 3/15/2021 | | | 170,000 | | | | 170,301 | |
| | |
Series 2015A, Rev., 5.00%, 3/15/2021 | | | 50,000 | | | | 50,089 | |
| | |
Series 2015E, Rev., 5.00%, 3/15/2021 | | | 700,000 | | | | 701,239 | |
| | |
Series 2018A, Rev., 5.00%, 3/15/2021 | | | 200,000 | | | | 200,354 | |
| | |
Series 2020B, Rev., RAN, 5.00%, 3/31/2021 | | | 850,000 | | | | 853,468 | |
| | |
Series 2011E, Rev., 5.00%, 8/15/2021 | | | 70,000 | | | | 71,539 | |
| | | | | | | | |
| INVESTMENTS | | PRINCIPAL
AMOUNT ($) | | | VALUE ($) | |
| | | | | | | | |
| | |
New York — continued | | | | | | | | |
| | |
Series 2020A, Rev., 5.00%, 9/15/2021 | | | 115,000 | | | | 117,995 | |
| | |
Series 2012A, Rev., 5.00%, 12/15/2021 | | | 580,000 | | | | 602,139 | |
| | |
Series 2012D, Rev., 2.00%, 2/15/2022 | | | 40,000 | | | | 40,704 | |
| | |
Series 2014E, Rev., 4.00%, 2/15/2022 | | | 20,000 | | | | 20,733 | |
| | |
Series 2014A, Rev., 5.00%, 2/15/2022 | | | 230,000 | | | | 240,617 | |
| | |
Series 2014E, Rev., 5.00%, 2/15/2022 | | | 110,000 | | | | 115,078 | |
| | |
Series 2016D, Rev., 5.00%, 2/15/2022 | | | 80,000 | | | | 83,693 | |
| | |
Series 2017A, Rev., 5.00%, 2/15/2022 | | | 280,000 | | | | 292,925 | |
| | |
Series 2011A, Rev., 5.00%, 3/15/2022 | | | 250,000 | | | | 250,907 | |
| | |
Series 2011C, Rev., 5.00%, 3/15/2022 | | | 50,000 | | | | 50,181 | |
| | |
Series 2012B, Rev., 5.00%, 3/15/2022 | | | 95,000 | | | | 99,768 | |
| | |
Series 2014C, Rev., 5.00%, 3/15/2022 | | | 270,000 | | | | 283,551 | |
| | |
Series 2015A, Rev., 5.00%, 3/15/2022 | | | 215,000 | | | | 225,791 | |
| | |
Series 2015E, Rev., 5.00%, 3/15/2022 | | | 95,000 | | | | 99,768 | |
| | |
Series 2012A, Rev., 4.00%, 12/15/2022 | | | 60,000 | | | | 64,108 | |
| | |
Series 2012A, Rev., 5.00%, 12/15/2022 | | | 275,000 | | | | 298,730 | |
| | |
Series 2013A, Rev., 5.00%, 2/15/2023 | | | 50,000 | | | | 54,582 | |
| | |
Series 2015B, Rev., 5.00%, 2/15/2023 | | | 95,000 | | | | 103,707 | |
| | |
Series 2016D, Rev., 5.00%, 2/15/2023 | | | 105,000 | | | | 114,623 | |
| | |
Series 2017B, Rev., 5.00%, 2/15/2023 | | | 330,000 | | | | 360,245 | |
| | |
Series 2011C, Rev., 5.00%, 3/15/2023 | | | 270,000 | | | | 270,977 | |
| | |
Series 2015A, Rev., 5.00%, 3/15/2023 | | | 75,000 | | | | 82,182 | |
| | |
Series 2015E, Rev., 5.00%, 3/15/2023 | | | 190,000 | | | | 208,194 | |
| | |
Series A, Rev., 5.00%, 3/15/2023 | | | 25,000 | | | | 27,394 | |
| | |
Series 2012A, Rev., 5.00%, 12/15/2023 | | | 100,000 | | | | 108,482 | |
SEE NOTES TO FINANCIAL STATEMENTS.
| | | | | | | | |
| | | |
| FEBRUARY 28, 2021 | | J.P. MORGAN EXCHANGE-TRADED FUNDS | | | | | 263 | |
JPMorgan Ultra-Short Municipal Income ETF
SCHEDULE OF PORTFOLIO INVESTMENTS
AS OF FEBRUARY 28, 2021 (continued)
| | | | | | | | |
| INVESTMENTS | | PRINCIPAL
AMOUNT ($) | | | VALUE ($) | |
Municipal Bonds — continued | | | | | | | | |
| | |
New York — continued | | | | | | | | |
| | |
Series 2014A, Rev., 4.00%, 2/15/2024 | | | 35,000 | | | | 38,710 | |
| | |
Series 2012E, Rev., 5.00%, 2/15/2024 | | | 400,000 | | | | 417,948 | |
| | |
Series 2019D, Rev., 5.00%, 2/15/2024 | | | 40,000 | | | | 45,414 | |
| | |
Series 2011C, Rev., 5.00%, 3/15/2024 | | | 835,000 | | | | 838,014 | |
| | |
Series 2018A, Rev., 5.00%, 3/15/2024 | | | 525,000 | | | | 597,886 | |
| | |
Series 2012A, Rev., 5.00%, 12/15/2025 | | | 100,000 | | | | 108,294 | |
| | |
New York State Dormitory Authority, State Sales Tax | | | | | | | | |
| | |
Series 2013A, Rev., 5.00%, 3/15/2021 (b) | | | 220,000 | | | | 220,379 | |
| | |
Series 2018C, Rev., 5.00%, 3/15/2021 | | | 150,000 | | | | 150,266 | |
| | |
Series 2018E, Rev., 5.00%, 3/15/2021 | | | 20,000 | | | | 20,035 | |
| | |
Series A, Rev., 5.00%, 3/15/2021 | | | 230,000 | | | | 230,407 | |
| | |
Series 2013A, Rev., 5.00%, 3/15/2022 | | | 55,000 | | | | 57,760 | |
| | |
Series 2014A, Rev., 5.00%, 3/15/2022 | | | 150,000 | | | | 157,528 | |
| | |
Series 2015A, Rev., 5.00%, 3/15/2022 | | | 25,000 | | | | 26,255 | |
| | |
Series 2018A, Rev., 5.00%, 3/15/2022 | | | 50,000 | | | | 52,510 | |
| | |
Series 2013A, Rev., 5.00%, 3/15/2023 | | | 60,000 | | | | 65,771 | |
| | |
Series 2015A, Rev., 5.00%, 3/15/2023 | | | 75,000 | | | | 82,214 | |
| | |
Series 2015B, Rev., 5.00%, 3/15/2023 | | | 25,000 | | | | 27,405 | |
| | |
Series 2017A, Rev., 5.00%, 3/15/2023 | | | 25,000 | | | | 27,405 | |
| | |
Series 2013A, Rev., 5.00%, 3/15/2024 | | | 340,000 | | | | 372,501 | |
| | |
Series 2016A, Rev., 5.00%, 3/15/2024 | | | 50,000 | | | | 56,975 | |
| | |
New York State Dormitory Authority, State University Dormitory Facilities | | | | | | | | |
| | |
Series 2011A, Rev., 5.00%, 7/1/2021 (b) | | | 45,000 | | | | 45,725 | |
| | |
Series 2017A, Rev., 5.00%, 7/1/2021 (b) | | | 65,000 | | | | 66,037 | |
| | |
Series 2012A, Rev., 5.00%, 7/1/2022 (b) | | | 35,000 | | | | 37,265 | |
| | | | | | | | |
| INVESTMENTS | | PRINCIPAL
AMOUNT ($) | | | VALUE ($) | |
| | | | | | | | |
| | |
New York — continued | | | | | | | | |
| | |
New York State Dormitory Authority, State University Educational Facilities Series 1994A, Rev., NATL-RE, Zero Coupon, 5/15/2022 | | | 30,000 | | | | 29,840 | |
| | |
New York State Dormitory Authority, State University Facilities Series 2013A, Rev., 5.00%, 7/1/2021 (b) | | | 40,000 | | | | 40,638 | |
| | |
New York State Dormitory Authority, The New School Project Series 2016A, Rev., 5.00%, 7/1/2021 | | | 100,000 | | | | 101,521 | |
| | |
New York State Dormitory Authority, Third General Resolution, State University Educational Facilities | | | | | | | | |
| | |
Rev., 5.00%, 5/15/2021 | | | 75,000 | | | | 75,739 | |
| | |
Series 2012A, Rev., 4.00%, 5/15/2022 | | | 125,000 | | | | 130,734 | |
| | |
Series 2012A, Rev., 5.00%, 5/15/2022 | | | 40,000 | | | | 42,315 | |
| | |
Series 2012A, Rev., 5.00%, 5/15/2023 | | | 675,000 | | | | 713,347 | |
| | |
Series 2005A, Rev., NATL-RE, 5.50%, 5/15/2023 | | | 30,000 | | | | 33,291 | |
| | |
Rev., 5.00%, 5/15/2024 | | | 535,000 | | | | 565,056 | |
| | |
New York State Environmental Facilities Corp., Master Financing Program | | | | | | | | |
| | |
Series 2011C, Rev., 5.00%, 5/15/2021 | | | 110,000 | | | | 111,085 | |
| | |
Series 2016B, Rev., 4.00%, 8/15/2021 | | | 25,000 | | | | 25,437 | |
| | |
Series 2016B, Rev., 5.00%, 2/15/2022 | | | 25,000 | | | | 26,154 | |
| | |
Series 2015B, Rev., 5.00%, 3/15/2022 | | | 20,000 | | | | 21,004 | |
| | |
New York State Environmental Facilities Corp., State Clean Water and Drinking Water Revolving Funds, Municipal Water Finance Authority Projects — Second Resolution | | | | | | | | |
| | |
Series 2012A, Rev., 3.00%, 6/15/2021 | | | 25,000 | | | | 25,205 | |
| | |
Series 2016A, Rev., 4.00%, 6/15/2021 | | | 50,000 | | | | 50,552 | |
| | |
Rev., 5.00%, 6/15/2021 | | | 25,000 | | | | 25,347 | |
| | |
Series 2014A, Rev., 5.00%, 6/15/2021 | | | 30,000 | | | | 30,417 | |
| | |
Series 2015A, Rev., 5.00%, 6/15/2021 | | | 40,000 | | | | 40,556 | |
SEE NOTES TO FINANCIAL STATEMENTS.
| | | | | | |
| | | |
| 264 | | | | J.P. MORGAN EXCHANGE-TRADED FUNDS | | FEBRUARY 28, 2021 |
| | | | | | | | |
| INVESTMENTS | | PRINCIPAL
AMOUNT ($) | | | VALUE ($) | |
Municipal Bonds — continued | | | | | | | | |
| | |
New York — continued | | | | | | | | |
| | |
Series 2017E, Rev., 5.00%, 6/15/2021 | | | 25,000 | | | | 25,348 | |
| | |
Series 2017E, Rev., 4.00%, 6/15/2022 | | | 30,000 | | | | 31,479 | |
| | |
Rev., 5.00%, 6/15/2022 | | | 150,000 | | | | 152,076 | |
| | |
Series 2015A, Rev., 5.00%, 6/15/2023 | | | 20,000 | | | | 22,161 | |
| | |
New York State Thruway Authority | | | | | | | | |
| | |
Series I, Rev., 5.00%, 1/1/2022 (b) | | | 75,000 | | | | 78,037 | |
| | |
Series J, Rev., 5.00%, 1/1/2022 | | | 80,000 | | | | 83,158 | |
| | |
New York State Thruway Authority, Highway and Bridge Trust Fund | | | | | | | | |
| | |
Series 2011A-1, Rev., 5.00%, 4/1/2021 | | | 50,000 | | | | 50,195 | |
| | |
Series 2012A, Rev., 5.00%, 4/1/2021 | | | 25,000 | | | | 25,098 | |
| | |
Series 2012A, Rev., 4.00%, 4/1/2022 | | | 25,000 | | | | 26,025 | |
| | |
Series A-1, Rev., 4.00%, 4/1/2022 | | | 100,000 | | | | 100,293 | |
| | |
Series 2012A, Rev., 5.00%, 4/1/2022 | | | 320,000 | | | | 336,678 | |
| | |
Series A-1, Rev., 5.00%, 4/1/2022 | | | 25,000 | | | | 25,097 | |
| | |
Series A-1, Rev., 5.00%, 4/1/2023 | | | 300,000 | | | | 301,143 | |
| | |
New York State Thruway Authority, State Personal Income Tax, Transportation | | | | | | | | |
| | |
Series 2011A, Rev., 4.00%, 3/15/2021 (b) | | | 150,000 | | | | 150,207 | |
| | |
Series 2011A, Rev., 5.00%, 3/15/2021 | | | 245,000 | | | | 245,426 | |
| | |
Series 2012A, Rev., 5.00%, 3/15/2021 | | | 75,000 | | | | 75,133 | |
| | |
Series 2013A, Rev., 5.00%, 3/15/2021 | | | 95,000 | | | | 95,168 | |
| | |
Series 2012A, Rev., 5.00%, 3/15/2022 | | | 165,000 | | | | 173,282 | |
| | |
Series 2013A, Rev., 5.00%, 3/15/2022 | | | 75,000 | | | | 78,764 | |
| | |
Series 2012A, Rev., 5.00%, 3/15/2023 | | | 40,000 | | | | 41,039 | |
| | |
Series A, Rev., 5.00%, 3/15/2023 | | | 25,000 | | | | 27,394 | |
| | |
New York State Urban Development Corp., State Personal Income Tax, General Purpose | | | | | | | | |
| | |
Series 2011A, Rev., 3.50%, 3/15/2021 | | | 110,000 | | | | 110,131 | |
| | |
Series 2011A, Rev., 4.00%, 3/15/2021 | | | 275,000 | | | | 275,379 | |
| | | | | | | | |
| INVESTMENTS | | PRINCIPAL
AMOUNT ($) | | | VALUE ($) | |
| | | | | | | | |
| | |
New York — continued | | | | | | | | |
| | |
Series 2011A, Rev., 5.00%, 3/15/2021 | | | 325,000 | | | | 325,565 | |
| | |
Series 2013C, Rev., 5.00%, 3/15/2021 | | | 25,000 | | | | 25,044 | |
| | |
Series 2013D, Rev., 5.00%, 3/15/2021 | | | 55,000 | | | | 55,097 | |
| | |
Series 2016A, Rev., 5.00%, 3/15/2021 | | | 115,000 | | | | 115,204 | |
| | |
Series 2017C, Rev., 5.00%, 3/15/2021 | | | 100,000 | | | | 100,177 | |
| | |
Series 2019A, Rev., 5.00%, 3/15/2021 | | | 105,000 | | | | 105,186 | |
| | |
Series 2013C, Rev., 5.00%, 3/15/2022 | | | 25,000 | | | | 26,255 | |
| | |
Series 2013D, Rev., 5.00%, 3/15/2022 | | | 175,000 | | | | 183,783 | |
| | |
Series 2013E-A, Rev., 5.00%, 3/15/2022 | | | 90,000 | | | | 94,517 | |
| | |
Series 2014A-A, Rev., 5.00%, 3/15/2022 | | | 150,000 | | | | 157,528 | |
| | |
Series 2015A, Rev., 5.00%, 3/15/2022 | | | 75,000 | | | | 78,764 | |
| | |
Series A, Rev., 5.00%, 3/15/2022 | | | 240,000 | | | | 252,046 | |
| | |
Series A-1, Rev., 5.00%, 3/15/2022 | | | 90,000 | | | | 94,517 | |
| | |
Series A-2, Rev., NATL-RE, 5.50%, 3/15/2022 | | | 40,000 | | | | 42,215 | |
| | |
Series 2013C, Rev., 5.00%, 3/15/2023 | | | 25,000 | | | | 27,394 | |
| | |
Series 2013D, Rev., 5.00%, 3/15/2023 | | | 25,000 | | | | 27,394 | |
| | |
Series 2016A, Rev., 5.00%, 3/15/2023 | | | 110,000 | | | | 120,534 | |
| | |
Series 2020C, Rev., 5.00%, 3/15/2023 | | | 25,000 | | | | 27,394 | |
| | |
Series A-1, Rev., 5.00%, 3/15/2023 | | | 30,000 | | | | 32,873 | |
| | |
Series 2014A, Rev., 5.00%, 3/15/2024 | | | 60,000 | | | | 68,330 | |
| | |
New York State Urban Development Corp., State Personal Income Tax, State Facilities and Equipment Series A-2, Rev., NATL-RE, 5.50%, 3/15/2021 | | | 285,000 | | | | 285,556 | |
| | |
New York State Urban Development Corp., State Sales Tax | | | | | | | | |
| | |
Series 2019A, Rev., 5.00%, 3/15/2021 | | | 820,000 | | | | 821,451 | |
| | |
Series 2019A, Rev., 5.00%, 3/15/2022 | | | 40,000 | | | | 42,008 | |
SEE NOTES TO FINANCIAL STATEMENTS.
| | | | | | | | |
| | | |
| FEBRUARY 28, 2021 | | J.P. MORGAN EXCHANGE-TRADED FUNDS | | | | | 265 | |
JPMorgan Ultra-Short Municipal Income ETF
SCHEDULE OF PORTFOLIO INVESTMENTS
AS OF FEBRUARY 28, 2021 (continued)
| | | | | | | | |
| INVESTMENTS | | PRINCIPAL
AMOUNT ($) | | | VALUE ($) | |
Municipal Bonds — continued | | | | | | | | |
| | |
New York — continued | | | | | | | | |
| | |
Niskayuna Central School District | | | | | | | | |
| | |
GO, 4.00%, 4/15/2021 | | | 295,000 | | | | 296,369 | |
| | |
GO, 4.00%, 6/15/2021 | | | 40,000 | | | | 40,445 | |
| | |
GO, 4.00%, 4/15/2022 | | | 55,000 | | | | 57,380 | |
| | |
North Salem Central School District | | | | | | | | |
| | |
GO, BAN, 1.50%, 6/25/2021 | | | 2,250,000 | | | | 2,255,603 | |
| | |
GO, 3.00%, 6/15/2022 | | | 45,000 | | | | 46,647 | |
| | |
North Syracuse Central School District GO, BAN, 1.50%, 8/6/2021 | | | 1,100,000 | | | | 1,104,488 | |
| | |
Northport-East Northport Union Free School District Series 2013A, GO, 4.00%, 4/1/2021 | | | 45,000 | | | | 45,140 | |
| | |
Ossining Union Free School District GO, 3.00%, 8/15/2021 | | | 50,000 | | | | 50,650 | |
| | |
Owego Apalachin Central School District GO, RAN, 1.00%, 6/25/2021 | | | 500,000 | | | | 500,160 | |
| | |
Peekskill City School District GO, BAN, 2.00%, 6/29/2021 | | | 500,000 | | | | 502,635 | |
| | |
Pelham Union Free School District GO, 5.00%, 8/15/2021 | | | 80,000 | | | | 81,763 | |
| | |
Penn Yan Central School District GO, 2.00%, 12/15/2021 | | | 75,000 | | | | 76,042 | |
| | |
Pittsford Central School District GO, | | | | | | | | |
| | |
4.00%, 10/1/2021 | | | 105,000 | | | | 107,357 | |
| | |
Series 2012B, GO, 4.00%, 12/15/2021 | | | 25,000 | | | | 25,760 | |
| | |
GO, 4.00%, 10/1/2022 | | | 25,000 | | | | 26,519 | |
| | |
Plainedge Union Free School District Series 2012B, GO, 4.00%, 6/15/2021 | | | 20,000 | | | | 20,221 | |
| | |
Port Authority of New York and New Jersey, Consolidated | | | | | | | | |
| | |
Series 180, Rev., 5.00%, 6/1/2021 | | | 25,000 | | | | 25,300 | |
| | |
Rev., 5.00%, 9/1/2021 | | | 65,000 | | | | 66,570 | |
| | |
Series 194, Rev., 5.00%, 10/15/2021 | | | 25,000 | | | | 25,752 | |
| | |
Series 173, Rev., 4.00%, 12/1/2021 | | | 25,000 | | | | 25,720 | |
| | |
Series 179, Rev., 5.00%, 12/1/2021 | | | 45,000 | | | | 46,633 | |
| | |
Port Washington Union Free School District GO, BAN, 1.50%, 8/5/2021 | | | 1,215,000 | | | | 1,221,172 | |
| | |
Putnam Valley Central School District GO, 4.00%, 6/15/2021 | | | 85,000 | | | | 85,941 | |
| | |
Riverhead Central School District GO, 3.00%, 3/15/2022 | | | 25,000 | | | | 25,740 | |
| | |
Rockville Centre Union Free School District GO, 3.00%, 6/15/2021 | | | 25,000 | | | | 25,205 | |
| | |
Roslyn Union Free School District GO, BAN, 2.00%, 9/3/2021 | | | 1,174,407 | | | | 1,184,307 | |
| | | | | | | | |
| INVESTMENTS | | PRINCIPAL
AMOUNT ($) | | | VALUE ($) | |
| | | | | | | | |
| | |
New York — continued | | | | | | | | |
| | |
Sachem Central School District | | | | | | | | |
| | |
GO, 5.00%, 8/15/2021 | | | 20,000 | | | | 20,441 | |
| | |
GO, 5.00%, 10/15/2021 | | | 65,000 | | | | 66,959 | |
| | |
Sales Tax Asset Receivable Corp., Fiscal Year 2015 | | | | | | | | |
| | |
Series 2015A, Rev., 4.00%, 10/15/2021 | | | 120,000 | | | | 122,890 | |
| | |
Series 2015A, Rev., 5.00%, 10/15/2021 | | | 245,000 | | | | 252,416 | |
| | |
Series 2015A, Rev., 4.00%, 10/15/2022 | | | 80,000 | | | | 85,007 | |
| | |
Series 2015A, Rev., 5.00%, 10/15/2022 | | | 45,000 | | | | 48,544 | |
| | |
Saratoga County Water Authority Rev., 5.00%, 9/1/2021 | | | 75,000 | | | | 76,815 | |
| | |
Sayville Union Free School District | | | | | | | | |
| | |
GO, 3.00%, 6/15/2021 | | | 25,000 | | | | 25,205 | |
| | |
GO, 4.00%, 6/15/2021 | | | 35,000 | | | | 35,388 | |
| | |
Schenectady County Capital Resource Corp., Union College Project Rev., 5.00%, 1/1/2022 | | | 100,000 | | | | 103,853 | |
| | |
Shenendehowa Central School District, Clifton Park GO, 3.00%, 6/15/2021 | | | 25,000 | | | | 25,205 | |
| | |
Smithtown Central School District | | | | | | | | |
| | |
GO, 5.00%, 8/1/2021 | | | 20,000 | | | | 20,403 | |
| | |
GO, 5.00%, 10/15/2021 | | | 20,000 | | | | 20,603 | |
| | |
GO, 5.00%, 10/15/2022 | | | 25,000 | | | | 26,960 | |
| | |
Somers Central School District GO, 5.00%, 9/15/2021 | | | 20,000 | | | | 20,522 | |
| | |
South Country Central School District at Brookhaven | | | | | | | | |
| | |
GO, 4.00%, 7/15/2021 | | | 110,000 | | | | 111,572 | |
| | |
GO, 5.00%, 10/15/2021 | | | 45,000 | | | | 46,356 | |
| | |
GO, 4.00%, 10/15/2022 | | | 25,000 | | | | 26,556 | |
| | |
South Orangetown Central School District GO, 5.00%, 12/1/2021 | | | 50,000 | | | | 51,818 | |
| | |
Spencerport Central School District GO, 4.00%, 6/15/2021 | | | 100,000 | | | | 101,092 | |
| | |
State of New York | | | | | | | | |
| | |
Series 2015A, GO, 5.00%, 3/15/2021 | | | 25,000 | | | | 25,044 | |
| | |
Series 2013A, GO, 4.00%, 3/1/2023 | | | 35,000 | | | | 37,613 | |
| | |
Suffern Central School District | | | | | | | | |
| | |
GO, 5.00%, 10/15/2021 | | | 55,000 | | | | 56,657 | |
| | |
GO, 5.00%, 10/15/2022 | | | 40,000 | | | | 43,137 | |
| | |
Suffolk County Water Authority, Water System | | | | | | | | |
| | |
Rev., 4.00%, 12/1/2021 (b) | | | 45,000 | | | | 46,304 | |
SEE NOTES TO FINANCIAL STATEMENTS.
| | | | | | |
| | | |
| 266 | | | | J.P. MORGAN EXCHANGE-TRADED FUNDS | | FEBRUARY 28, 2021 |
| | | | | | | | |
| INVESTMENTS | | PRINCIPAL
AMOUNT ($) | | | VALUE ($) | |
Municipal Bonds — continued | | | | | | | | |
| | |
New York — continued | | | | | | | | |
| | |
Rev., 5.00%, 12/1/2021 (b) | | | 100,000 | | | | 103,644 | |
| | |
Syracuse Industrial Development Agency School Facility, Syracuse City School District Project Rev., 4.00%, 5/1/2021 | | | 20,000 | | | | 20,125 | |
| | |
Three Village Central School District Brookhaven and Smithtown GO, 5.00%, 5/15/2022 | | | 40,000 | | | | 42,330 | |
| | |
Tompkins County Development Corp., Tax Exempt Ithaca College Project Rev., 5.00%, 7/1/2021 | | | 200,000 | | | | 203,008 | |
| | |
Tonawanda City School District GO, 5.00%, 8/15/2021 | | | 60,000 | | | | 61,292 | |
| | |
Town of Amherst, Public Improvement | | | | | | | | |
| | |
Series 2019A, GO, 3.00%, 11/1/2021 | | | 100,000 | | | | 101,870 | |
| | |
GO, 5.00%, 11/1/2021 | | | 25,000 | | | | 25,799 | |
| | |
Town of Brookhaven GO, 5.00%, 3/15/2022 | | | 35,000 | | | | 36,761 | |
| | |
Town of Clarkstown, Public Improvement | | | | | | | | |
| | |
GO, 4.00%, 10/15/2021 | | | 50,000 | | | | 51,169 | |
| | |
GO, 3.00%, 6/15/2022 | | | 100,000 | | | | 103,542 | |
| | |
Town of Cornwall GO, BAN, 1.25%, 7/23/2021 | | | 2,100,000 | | | | 2,105,523 | |
| | |
Town of Cornwall, Public Improvement GO, 3.50%, 3/1/2023 | | | 40,000 | | | | 40,095 | |
| | |
Town of Greenburgh, Public Improvement | | | | | | | | |
| | |
Series 2013A, GO, 5.00%, 4/15/2021 | | | 20,000 | | | | 20,116 | |
| | |
GO, 4.00%, 6/1/2021 | | | 65,000 | | | | 65,621 | |
| | |
GO, 5.00%, 4/15/2022 | | | 25,000 | | | | 26,359 | |
| | |
Town of Hempstead, Public Improvement GO, 5.00%, 4/15/2022 | | | 25,000 | | | | 26,358 | |
| | |
Town of Henrietta, Public Improvement GO, 3.13%, 12/15/2021 | | | 45,000 | | | | 46,019 | |
| | |
Town of Huntington, Public Improvement GO, 3.00%, 9/1/2021 | | | 50,000 | | | | 50,713 | |
| | |
Town of Islip, Public Improvement Series 2016B, GO, 4.00%, 10/15/2021 | | | 55,000 | | | | 56,317 | |
| | |
Town of North Hempstead, Public Improvement | | | | | | | | |
| | |
Series 2016A, GO, 2.00%, 4/1/2021 | | | 125,000 | | | | 125,189 | |
| | |
Series 2016B, GO, 2.00%, 9/15/2021 | | | 25,000 | | | | 25,250 | |
| | | | | | | | |
| INVESTMENTS | | PRINCIPAL
AMOUNT ($) | | | VALUE ($) | |
| | | | | | | | |
| | |
New York — continued | | | | | | | | |
| | |
Town of Oyster Bay, Public Improvement | | | | | | | | |
| | |
Series 2014A, GO, AGM, 4.00%, 3/5/2021 | | | 115,000 | | | | 115,037 | |
| | |
GO, 2.00%, 11/1/2021 | | | 420,000 | | | | 424,452 | |
| | |
GO, 4.00%, 11/1/2022 | | | 410,000 | | | | 432,484 | |
| | |
Town of Riverhead | | | | | | | | |
| | |
GO, 4.00%, 6/1/2021 | | | 25,000 | | | | 25,236 | |
| | |
GO, 4.00%, 6/1/2022 | | | 25,000 | | | | 26,183 | |
| | |
Town of Southampton, Erosion Control District GO, 4.00%, 9/1/2021 | | | 20,000 | | | | 20,388 | |
| | |
Triborough Bridge and Tunnel Authority Series 1997A, Rev., 5.25%, 1/1/2022 (b) | | | 30,000 | | | | 31,277 | |
| | |
Triborough Bridge and Tunnel Authority, General Purpose Series 1999-B, Rev., 5.50%, 1/1/2022 (b) | | | 140,000 | | | | 146,251 | |
| | |
Triborough Bridge and Tunnel Authority, MTA Bridges and Tunnels | | | | | | | | |
| | |
Series 2012B, Rev., 4.00%, 11/15/2021 | | | 100,000 | | | | 102,717 | |
| | |
Series 2014A, Rev., 4.00%, 11/15/2021 | | | 50,000 | | | | 51,358 | |
| | |
Series 2013B, Rev., 5.00%, 11/15/2021 | | | 100,000 | | | | 103,420 | |
| | |
Series 2011A, Rev., 5.00%, 1/1/2022 | | | 200,000 | | | | 207,980 | |
| | |
Utility Debt Securitization Authority Series 2016B, Rev., 5.00%, 6/15/2023 | | | 275,000 | | | | 278,823 | |
| | |
Valley Stream Union Free School District No. 13 GO, 5.00%, 9/1/2022 | | | 200,000 | | | | 214,502 | |
| | |
Victor Central School District GO, 5.00%, 6/15/2021 | | | 110,000 | | | | 111,531 | |
| | |
Village of Lake Success GO, BAN, 1.50%, 6/18/2021 | | | 1,029,313 | | | | 1,031,598 | |
| | |
Village of Northport GO, 2.00%, 5/15/2021 | | | 350,000 | | | | 351,327 | |
| | |
Village of Ossining GO, BAN, 1.25%, 9/24/2021 | | | 7,107,446 | | | | 7,145,044 | |
| | |
Village of Tarrytown, Public Improvement GO, 3.13%, 10/15/2021 (b) | | | 100,000 | | | | 101,847 | |
| | |
Wallkill Central School District GO, 3.00%, 6/15/2021 | | | 35,000 | | | | 35,287 | |
| | |
Wappingers Central School District GO, 3.00%, 12/1/2021 | | | 40,000 | | | | 40,827 | |
| | |
Warwick Valley Central School District | | | | | | | | |
| | |
GO, 4.00%, 5/15/2021 | | | 20,000 | | | | 20,157 | |
| | |
GO, 5.00%, 6/15/2021 | | | 45,000 | | | | 45,626 | |
SEE NOTES TO FINANCIAL STATEMENTS.
| | | | | | | | |
| | | |
| FEBRUARY 28, 2021 | | J.P. MORGAN EXCHANGE-TRADED FUNDS | | | | | 267 | |
JPMorgan Ultra-Short Municipal Income ETF
SCHEDULE OF PORTFOLIO INVESTMENTS
AS OF FEBRUARY 28, 2021 (continued)
| | | | | | | | |
| INVESTMENTS | | PRINCIPAL
AMOUNT ($) | | | VALUE ($) | |
Municipal Bonds — continued | | | | | | | | |
| | |
New York — continued | | | | | | | | |
| | |
Washingtonville Central School District, Orange City GO, 5.00%, 6/15/2021 | | | 40,000 | | | | 40,557 | |
| | |
Webster Central School District | | | | | | | | |
| | |
GO, 5.00%, 6/15/2021 | | | 65,000 | | | | 65,905 | |
| | |
GO, 4.00%, 10/1/2021 | | | 20,000 | | | | 20,449 | |
| | |
West Babylon Union Free School District | | | | | | | | |
| | |
Series 2011A, GO, 5.00%, 5/1/2021 | | | 50,000 | | | | 50,399 | |
| | |
GO, 5.00%, 6/15/2021 | | | 50,000 | | | | 50,696 | |
| | |
GO, 4.00%, 8/1/2021 | | | 55,000 | | | | 55,881 | |
| | |
West Islip Fire District GO, BAN, 2.00%, 7/9/2021 | | | 3,590,000 | | | | 3,607,053 | |
| | |
Westchester Tobacco Asset Securitization Corp., Tobacco Settlement Series B, Rev., 5.00%, 6/1/2021 | | | 260,000 | | | | 262,951 | |
| | |
White Plains City School District | | | | | | | | |
| | |
GO, 5.00%, 5/15/2021 | | | 60,000 | | | | 60,592 | |
| | |
GO, 5.00%, 6/15/2021 | | | 35,000 | | | | 35,487 | |
| | |
Williamsville Central School District GO, 5.00%, 6/1/2022 | | | 20,000 | | | | 21,208 | |
| | |
Yorkshire-Pioneer Central School District | | | | | | | | |
| | |
GO, 2.00%, 6/1/2021 | | | 50,000 | | | | 50,219 | |
| | |
GO, 4.00%, 7/15/2021 | | | 30,000 | | | | 30,406 | |
| | |
Yorktown Central School District GO, 2.00%, 10/1/2022 | | | 110,000 | | | | 113,211 | |
| | | | | | | | |
| | |
Total New York | | | | | | | 172,339,741 | |
| | | | | | | | |
| | |
North Carolina — 1.7% | | | | | | | | |
| | |
Appalachian State University | | | | | | | | |
| | |
Rev., 4.00%, 10/1/2021 (b) | | | 35,000 | | | | 35,775 | |
| | |
Rev., 4.25%, 10/1/2021 (b) | | | 55,000 | | | | 56,298 | |
| | |
Series A, Rev., 5.00%, 10/1/2022 | | | 40,000 | | | | 42,989 | |
| | |
Cape Fear Public Utility Authority, Water and Sewer System Rev., 5.00%, 8/1/2021 | | | 100,000 | | | | 102,010 | |
| | |
Charlotte-Mecklenburg Hospital Authority (The), Carolinas Healthcare System | | | | | | | | |
| | |
Series 2013A, Rev., 4.00%, 1/15/2022 | | | 25,000 | | | | 25,825 | |
| | |
Series 2016A, Rev., 5.00%, 1/15/2025 | | | 290,000 | | | | 339,596 | |
| | |
Charlotte-Mecklenburg Hospital Authority (The), Healthcare System, Atrium Health Series 2018C, Rev., 5.00%, 3/1/2023 (c) | | | 490,000 | | | | 534,178 | |
| | | | | | | | |
| INVESTMENTS | | PRINCIPAL
AMOUNT ($) | | | VALUE ($) | |
| | | | | | | | |
| | |
North Carolina — continued | | | | | | | | |
| | |
City of Asheville, Limited Obligation | | | | | | | | |
| | |
Rev., 5.00%, 4/1/2021 | | | 30,000 | | | | 30,117 | |
| | |
Rev., 5.00%, 4/1/2022 | | | 40,000 | | | | 42,094 | |
| | |
City of Asheville, Special Obligation Rev., 4.00%, 10/1/2021 | | | 30,000 | | | | 30,672 | |
| | |
City of Burlington, Combined Enterprise System Series 2011, Rev., 4.00%, 2/1/2022 | | | 25,000 | | | | 25,879 | |
| | |
City of Charlotte | | | | | | | | |
| | |
Series 2019A, GO, 4.00%, 6/1/2021 | | | 50,000 | | | | 50,477 | |
| | |
Series 2012A, GO, 5.00%, 7/1/2021 | | | 25,000 | | | | 25,401 | |
| | |
Series 2020A, GO, 4.00%, 6/1/2022 | | | 50,000 | | | | 52,391 | |
| | |
Series 2012A, GO, 5.00%, 7/1/2022 (b) | | | 20,000 | | | | 21,292 | |
| | |
Series 2010A, COP, 5.00%, 10/1/2022 | | | 50,000 | | | | 50,179 | |
| | |
GO, 5.00%, 12/1/2022 | | | 30,000 | | | | 32,527 | |
| | |
City of Charlotte, Airport Special Facilities | | | | | | | | |
| | |
Series 2011A, Rev., 5.00%, 7/1/2021 | | | 60,000 | | | | 60,963 | |
| | |
Series 2017A, Rev., 5.00%, 7/1/2024 | | | 35,000 | | | | 40,260 | |
| | |
City of Charlotte, Convention Facility Project | | | | | | | | |
| | |
COP, 5.00%, 12/1/2021 | | | 35,000 | | | | 36,256 | |
| | |
Series 2016A, COP, 5.00%, 12/1/2021 | | | 50,000 | | | | 51,795 | |
| | |
Series 2019A, COP, 5.00%, 6/1/2024 | | | 60,000 | | | | 68,879 | |
| | |
City of Charlotte, Equipment Acquisition and Public Facilities | | | | | | | | |
| | |
Series 2012A, COP, 4.00%, 12/1/2021 | | | 40,000 | | | | 41,137 | |
| | |
COP, 5.00%, 12/1/2021 | | | 40,000 | | | | 41,436 | |
| | |
Series 2016A, COP, 5.00%, 12/1/2023 | | | 30,000 | | | | 33,813 | |
| | |
City of Charlotte, Storm Water | | | | | | | | |
| | |
Rev., 4.00%, 12/1/2021 | | | 50,000 | | | | 51,441 | |
| | |
Rev., 5.00%, 12/1/2021 | | | 25,000 | | | | 25,907 | |
| | |
City of Charlotte, Water and Sewer System Rev., 5.00%, 12/1/2021 | | | 35,000 | | | | 36,270 | |
| | |
City of Durham | | | | | | | | |
| | |
GO, 5.00%, 9/1/2021 | | | 50,000 | | | | 51,207 | |
| | |
GO, 5.00%, 9/1/2022 | | | 20,000 | | | | 21,447 | |
| | |
City of Goldsboro, Public Improvement GO, 5.00%, 5/1/2023 | | | 25,000 | | | | 27,542 | |
SEE NOTES TO FINANCIAL STATEMENTS.
| | | | | | |
| | | |
| 268 | | | | J.P. MORGAN EXCHANGE-TRADED FUNDS | | FEBRUARY 28, 2021 |
| | | | | | | | |
| INVESTMENTS | | PRINCIPAL
AMOUNT ($) | | | VALUE ($) | |
Municipal Bonds — continued | | | | | | | | |
| | |
North Carolina — continued | | | | | | | | |
| | |
City of Greensboro, Limited Obligation Rev., 4.00%, 4/1/2021 | | | 25,000 | | | | 25,078 | |
| | |
City of Greensboro, Water and Sewer System | | | | | | | | |
| | |
Rev., 5.00%, 6/1/2021 | | | 125,000 | | | | 126,501 | |
| | |
Rev., 5.25%, 6/1/2022 | | | 35,000 | | | | 37,219 | |
| | |
City of High Point GO, 5.00%, 3/1/2021 | | | 50,000 | | | | 50,000 | |
| | |
City of Jacksonville, Enterprise System Rev., 4.00%, 5/1/2022 | | | 35,000 | | | | 36,541 | |
| | |
City of Raleigh | | | | | | | | |
| | |
Series 2020A, Rev., 5.00%, 6/1/2021 | | | 40,000 | | | | 40,480 | |
| | |
Series 2011A, GO, 4.00%, 9/1/2021 | | | 25,000 | | | | 25,480 | |
| | |
Series A, Rev., 4.00%, 10/1/2022 | | | 25,000 | | | | 26,515 | |
| | |
Rev., 5.00%, 2/1/2024 | | | 50,000 | | | | 56,710 | |
| | |
City of Raleigh, Combined Enterprise System | | | | | | | | |
| | |
Series 2010-A, Rev., 4.00%, 3/1/2021 | | | 25,000 | | | | 25,000 | |
| | |
Series 2012A, Rev., 5.00%, 3/1/2022 (b) | | | 25,000 | | | | 26,210 | |
| | |
City of Sanford GO, 4.00%, 2/1/2022 | | | 50,000 | | | | 51,757 | |
| | |
City of Winston-Salem | | | | | | | | |
| | |
Series 2012B, GO, 4.00%, 6/1/2021 | | | 20,000 | | | | 20,191 | |
| | |
Series 2014C, Rev., 5.00%, 6/1/2021 | | | 25,000 | | | | 25,300 | |
| | |
City of Winston-Salem, Water and Sewer System Rev., 5.00%, 6/1/2021 | | | 75,000 | | | | 75,901 | |
| | |
County of Brunswick | | | | | | | | |
| | |
Rev., 4.00%, 4/1/2021 | | | 45,000 | | | | 45,140 | |
| | |
Rev., 5.00%, 4/1/2021 | | | 45,000 | | | | 45,176 | |
| | |
GO, 3.50%, 5/1/2021 | | | 25,000 | | | | 25,137 | |
| | |
County of Brunswick, Enterprise Systems Rev., 5.00%, 4/1/2021 | | | 25,000 | | | | 25,097 | |
| | |
County of Buncombe | | | | | | | | |
| | |
Rev., 5.00%, 6/1/2021 | | | 50,000 | | | | 50,600 | |
| | |
Series 2014A, Rev., 5.00%, 6/1/2021 | | | 55,000 | | | | 55,661 | |
| | |
Rev., 5.00%, 6/1/2022 (b) | | | 75,000 | | | | 79,540 | |
| | |
Series 2014A, Rev., 5.00%, 6/1/2022 | | | 170,000 | | | | 180,248 | |
| | |
Series 2020A, Rev., 5.00%, 6/1/2022 | | | 20,000 | | | | 21,206 | |
| | |
County of Cabarrus, Installment Financing Contract | | | | | | | | |
| | |
Rev., 5.00%, 6/1/2021 | | | 125,000 | | | | 126,501 | |
| | |
Rev., 5.00%, 6/1/2022 | | | 50,000 | | | | 53,014 | |
| | | | | | | | |
| INVESTMENTS | | PRINCIPAL
AMOUNT ($) | | | VALUE ($) | |
| | | | | | | | |
| | |
North Carolina — continued | | | | | | | | |
| | |
County of Carteret GO, 5.00%, 4/1/2021 | | | 75,000 | | | | 75,293 | |
| | |
County of Chatham | | | | | | | | |
| | |
Rev., 4.00%, 11/1/2021 | | | 25,000 | | | | 25,640 | |
| | |
Rev., 5.00%, 11/1/2021 | | | 65,000 | | | | 67,096 | |
| | |
Rev., 5.00%, 11/1/2022 | | | 25,000 | | | | 27,005 | |
| | |
County of Chatham, Public Facility Corp. Rev., GTD, 5.00%, 12/1/2022 | | | 20,000 | | | | 21,685 | |
| | |
County of Cumberland GO, 4.00%, 8/1/2021 | | | 25,000 | | | | 25,394 | |
| | |
County of Dare Series 2013A, Rev., 4.00%, 6/1/2022 | | | 25,000 | | | | 26,179 | |
| | |
County of Durham | | | | | | | | |
| | |
GO, 5.00%, 4/1/2021 | | | 25,000 | | | | 25,098 | |
| | |
GO, 5.00%, 10/1/2021 | | | 50,000 | | | | 51,416 | |
| | |
GO, 4.00%, 11/1/2021 | | | 25,000 | | | | 25,643 | |
| | |
GO, 5.00%, 4/1/2022 | | | 25,000 | | | | 26,317 | |
| | |
County of Gaston | | | | | | | | |
| | |
GO, 5.00%, 3/1/2021 | | | 115,000 | | | | 115,000 | |
| | |
GO, 5.00%, 2/1/2022 | | | 25,000 | | | | 26,107 | |
| | |
GO, 5.00%, 3/1/2022 | | | 25,000 | | | | 26,208 | |
| | |
County of Guilford | | | | | | | | |
| | |
GO, 4.00%, 3/1/2021 | | | 60,000 | | | | 60,000 | |
| | |
Series 2016A, GO, 5.00%, 2/1/2022 | | | 20,000 | | | | 20,886 | |
| | |
County of Guilford, Public Improvement Bonds | | | | | | | | |
| | |
Series 2012A, GO, 5.00%, 3/1/2021 | | | 75,000 | | | | 75,000 | |
| | |
Series 2012A, GO, 5.00%, 3/1/2022 | | | 50,000 | | | | 52,416 | |
| | |
Series 2017A, GO, 5.00%, 5/1/2022 | | | 40,000 | | | | 42,250 | |
| | |
County of Henderson Series 2018A, Rev., 4.00%, 6/1/2021 | | | 90,000 | | | | 90,847 | |
| | |
County of Iredell Rev., 5.00%, 6/1/2022 | | | 25,000 | | | | 26,507 | |
| | |
County of Lincoln Series 2012A, GO, 3.00%, 6/1/2021 | | | 25,000 | | | | 25,177 | |
| | |
County of Mecklenburg | | | | | | | | |
| | |
Series 2016A, GO, 5.00%, 9/1/2021 | | | 105,000 | | | | 107,546 | |
| | |
Series 2013A, GO, 5.00%, 12/1/2021 | | | 135,000 | | | | 139,919 | |
| | |
Series 2016A, GO, 5.00%, 9/1/2022 | | | 25,000 | | | | 26,817 | |
| | |
Series 2015A, Rev., 5.00%, 10/1/2022 | | | 120,000 | | | | 129,204 | |
| | |
County of Mecklenburg, Public Improvement Series 2016B, GO, 5.00%, 12/1/2021 | | | 30,000 | | | | 31,093 | |
| | |
County of New Hanover, Community College Bonds Series 2013A, GO, 5.00%, 6/1/2022 | | | 25,000 | | | | 26,507 | |
SEE NOTES TO FINANCIAL STATEMENTS.
| | | | | | | | |
| | | |
| FEBRUARY 28, 2021 | | J.P. MORGAN EXCHANGE-TRADED FUNDS | | | | | 269 | |
JPMorgan Ultra-Short Municipal Income ETF
SCHEDULE OF PORTFOLIO INVESTMENTS
AS OF FEBRUARY 28, 2021 (continued)
| | | | | | | | |
| INVESTMENTS | | PRINCIPAL
AMOUNT ($) | | | VALUE ($) | |
Municipal Bonds — continued | | | | | | | | |
| | |
North Carolina — continued | | | | | | | | |
| | |
County of New Hanover, Regional Medical Center Rev., 5.00%, 10/1/2021 (b) | | | 120,000 | | | | 123,247 | |
| | |
County of New Hanover, School GO, 5.00%, 9/1/2021 | | | 30,000 | | | | 30,724 | |
| | |
County of Orange, School GO, 5.00%, 8/1/2022 | | | 30,000 | | | | 32,050 | |
| | |
County of Pender Rev., 4.50%, 6/1/2022 (b) | | | 30,000 | | | | 31,610 | |
| | |
County of Pitt Series 2016B, Rev., 5.00%, 4/1/2022 | | | 35,000 | | | | 36,832 | |
| | |
County of Randolph Series 2019B, Rev., 5.00%, 10/1/2021 | | | 150,000 | | | | 154,183 | |
| | |
County of Union Rev., 4.00%, 12/1/2021 | | | 100,000 | | | | 102,882 | |
| | |
County of Wake | | | | | | | | |
| | |
Series 2010-C, GO, 5.00%, 3/1/2021 | | | 175,000 | | | | 175,000 | |
| | |
Series 2018A, Rev., 5.00%, 8/1/2021 | | | 55,000 | | | | 56,113 | |
| | |
Rev., 5.00%, 9/1/2022 | | | 25,000 | | | | 26,820 | |
| | |
County of Wake, Hospital System Rev., NATL-RE, 5.13%, 10/1/2026 (b) | | | 145,000 | | | | 164,893 | |
| | |
County of Wake, Public Improvement | | | | | | | | |
| | |
Series 2017A, GO, 5.00%, 3/1/2021 | | | 100,000 | | | | 100,000 | |
| | |
GO, 5.00%, 4/1/2021 | | | 50,000 | | | | 50,197 | |
| | |
GO, 3.25%, 4/1/2023 | | | 125,000 | | | | 125,305 | |
| | |
County of Watauga, North Carolina Limited Obligation Bonds | | | | | | | | |
| | |
Rev., 5.00%, 6/1/2021 | | | 50,000 | | | | 50,601 | |
| | |
Rev., 5.00%, 6/1/2022 | | | 30,000 | | | | 31,808 | |
| | |
Durham Capital Financing Corp. | | | | | | | | |
| | |
Rev., 5.00%, 12/1/2021 | | | 65,000 | | | | 67,358 | |
| | |
Rev., GTD, 4.00%, 6/1/2022 | | | 30,000 | | | | 31,435 | |
| | |
Rev., GTD, 5.00%, 6/1/2022 (b) | | | 80,000 | | | | 84,843 | |
| | |
Durham Housing Authority, JFK Towers Project Series 2012A, Rev., 5.00%, 12/1/2022 (b) | | | 435,000 | | | | 465,459 | |
| | |
Jacksonville Public Facilities Corp. Rev., 5.00%, 4/1/2023 | | | 20,000 | | | | 21,942 | |
| | |
Mecklenburg County Public Facilities Corp. Rev., 3.00%, 2/1/2022 | | | 50,000 | | | | 51,301 | |
| | |
North Carolina Capital Facilities Finance Agency, Davidson College Rev., 5.00%, 3/1/2021 | | | 35,000 | | | | 35,000 | |
| | |
North Carolina Eastern Municipal Power Agency Series 2012D, Rev., 5.00%, 7/1/2022 (b) | | | 50,000 | | | | 53,229 | |
| | | | | | | | |
| INVESTMENTS | | PRINCIPAL
AMOUNT ($) | | | VALUE ($) | |
| | | | | | | | |
| | |
North Carolina — continued | | | | | | | | |
| | |
North Carolina Medical Care Commission, Duke University Health System | | | | | | | | |
| | |
Rev., 5.00%, 6/1/2021 | | | 50,000 | | | | 50,588 | |
| | |
Series 2012A, Rev., 5.00%, 6/1/2022 | | | 25,000 | | | | 26,474 | |
| | |
Rev., 5.00%, 6/1/2025 | | | 100,000 | | | | 118,239 | |
| | |
North Carolina Medical Care Commission, Wake Forest Baptist Obligated Group Series 2019B, Rev., 2.20%, 12/1/2022 (c) | | | 6,090,000 | | | | 6,220,204 | |
| | |
North Carolina Municipal Power Agency No. 1, Catawba Electric Series 2015E, Rev., 5.00%, 1/1/2022 | | | 65,000 | | | | 67,543 | |
| | |
North Carolina State University at Raleigh | | | | | | | | |
| | |
Rev., 5.00%, 10/1/2022 | | | 20,000 | | | | 21,524 | |
| | |
Series 2020A, Rev., 5.00%, 10/1/2022 | | | 25,000 | | | | 26,905 | |
| | |
North Carolina Turnpike Authority, Monroe Connector System Rev., 3.00%, 7/1/2022 | | | 60,000 | | | | 60,555 | |
| | |
North Carolina Turnpike Authority, Triangle Expressway System Rev., BAN, 5.00%, 2/1/2024 | | | 625,000 | | | | 705,369 | |
| | |
Orange County Public Facilities Co. | | | | | | | | |
| | |
Rev., 5.00%, 10/1/2021 | | | 50,000 | | | | 51,403 | |
| | |
Rev., 4.75%, 10/1/2022 (b) | | | 25,000 | | | | 26,815 | |
| | |
Rev., 5.00%, 10/1/2022 | | | 25,000 | | | | 26,889 | |
| | |
Orange Water and Sewer Authority | | | | | | | | |
| | |
Rev., 2.00%, 7/1/2021 | | | 100,000 | | | | 100,614 | |
| | |
Rev., 5.00%, 6/1/2022 | | | 75,000 | | | | 79,521 | |
| | |
State of North Carolina | | | | | | | | |
| | |
Rev., GAN, 5.00%, 3/1/2021 | | | 225,000 | | | | 225,000 | |
| | |
Series 2013C, GO, 4.00%, 5/1/2021 | | | 25,000 | | | | 25,160 | |
| | |
Series 2010-C, GO, 5.00%, 5/1/2021 | | | 240,000 | | | | 241,927 | |
| | |
Series D, GO, 4.00%, 6/1/2021 | | | 60,000 | | | | 60,578 | |
| | |
Series 2013B, GO, 5.00%, 6/1/2022 | | | 35,000 | | | | 37,128 | |
| | |
Series 2015A, GO, 5.00%, 6/1/2022 | | | 25,000 | | | | 26,520 | |
| | |
State of North Carolina, Build NC Programs, Limited Obligation | | | | | | | | |
| | |
Series 2014B, Rev., 5.00%, 6/1/2021 | | | 110,000 | | | | 111,332 | |
| | |
Series 2017B, Rev., 5.00%, 5/1/2022 | | | 25,000 | | | | 26,419 | |
SEE NOTES TO FINANCIAL STATEMENTS.
| | | | | | |
| | | |
| 270 | | | | J.P. MORGAN EXCHANGE-TRADED FUNDS | | FEBRUARY 28, 2021 |
| | | | | | | | |
| INVESTMENTS | | PRINCIPAL
AMOUNT ($) | | | VALUE ($) | |
Municipal Bonds — continued | | | | | | | | |
| | |
North Carolina — continued | | | | | | | | |
| | |
State of North Carolina, Limited Obligation | | | | | | | | |
| | |
Series 2011C, Rev., 3.50%, 5/1/2021 (b) | | | 90,000 | | | | 90,494 | |
| | |
Series 2011C, Rev., 5.00%, 5/1/2021 (b) | | | 60,000 | | | | 60,481 | |
| | |
Series 2013A, Rev., 5.00%, 5/1/2021 | | | 50,000 | | | | 50,401 | |
| | |
Series 2014C, Rev., 5.00%, 5/1/2021 | | | 165,000 | | | | 166,325 | |
| | |
Series 2017B, Rev., 5.00%, 5/1/2021 | | | 50,000 | | | | 50,402 | |
| | |
Series 2011B, Rev., 5.00%, 11/1/2021 | | | 50,000 | | | | 51,625 | |
| | |
Series 2019A, Rev., 5.00%, 5/1/2022 | | | 35,000 | | | | 36,986 | |
| | |
State of North Carolina, Public Improvement Series 2018A, GO, 5.00%, 6/1/2022 | | | 55,000 | | | | 58,344 | |
| | |
Town of Cary, Enterprise System Rev., 5.00%, 12/1/2021 | | | 20,000 | | | | 20,726 | |
| | |
Town of Cary, Public Improvement Series 2019A, GO, 5.00%, 9/1/2021 | | | 25,000 | | | | 25,604 | |
| | |
Town of Chapel Hill, Limited Obligation | | | | | | | | |
| | |
Rev., 5.00%, 6/1/2021 | | | 20,000 | | | | 20,240 | |
| | |
Rev., 5.00%, 6/1/2022 | | | 30,000 | | | | 31,809 | |
| | |
Town of Mooresville, Enterprise System | | | | | | | | |
| | |
Rev., 5.00%, 5/1/2021 | | | 20,000 | | | | 20,159 | |
| | |
Rev., 5.00%, 5/1/2022 | | | 25,000 | | | | 26,407 | |
| | |
University of North Carolina Series 2011C, Rev., 4.00%, 10/1/2021 (b) | | | 50,000 | | | | 51,107 | |
| | |
University of North Carolina at Asheville Rev., 5.00%, 6/1/2021 | | | 50,000 | | | | 50,575 | |
| | |
University of North Carolina at Greensboro | | | | | | | | |
| | |
Rev., 5.00%, 4/1/2021 | | | 100,000 | | | | 100,383 | |
| | |
Series 2012A, Rev., 5.00%, 4/1/2022 (b) | | | 75,000 | | | | 78,892 | |
| | |
University of North Carolina at Wilmington Series 2019B, Rev., 5.00%, 10/1/2022 | | | 150,000 | | | | 161,331 | |
| | |
University of North Carolina, Hospital at Chapel Hill | | | | | | | | |
| | |
Series 2003 B, Rev., VRDO, LIQ: TD Bank NA, 0.03%, 3/9/2021 (c) | | | 6,115,000 | | | | 6,115,000 | |
| | |
Series 2009-A, Rev., VRDO, LIQ: TD Bank NA, 0.03%, 3/9/2021 (c) | | | 425,000 | | | | 425,000 | |
| | | | | | | | |
| INVESTMENTS | | PRINCIPAL
AMOUNT ($) | | | VALUE ($) | |
| | | | | | | | |
|
North Carolina — continued | |
| | |
University of North Carolina, School of the Arts | | | | | | | | |
| | |
Rev., 5.00%, 2/1/2023 | | | 185,000 | | | | 200,725 | |
| | |
Rev., 5.00%, 2/1/2024 | | | 150,000 | | | | 168,731 | |
| | |
Rev., 5.00%, 2/1/2025 | | | 295,000 | | | | 342,716 | |
| | |
Watauga Public Facilities Corp. Series 2012A, Rev., 4.00%, 6/1/2022 (b) | | | 20,000 | | | | 20,962 | |
| | | | | | | | |
| | |
Total North Carolina | | | | | | | 23,725,470 | |
| | | | | | | | |
|
North Dakota — 0.2% | |
| | |
City of Bismarck | | | | | | | | |
| | |
Series 2015K, GO, 2.00%, 5/1/2021 | | | 50,000 | | | | 50,151 | |
| | |
Series 2108N, GO, 5.00%, 5/1/2023 | | | 50,000 | | | | 55,073 | |
| | |
City of Bismarck, Sanitary Sewer Rev., 5.00%, 5/1/2021 | | | 200,000 | | | | 201,586 | |
| | |
City of Fargo | | | | | | | | |
| | |
Series 2015D, GO, 2.00%, 5/1/2021 | | | 25,000 | | | | 25,035 | |
| | |
Series 2011A, GO, 4.00%, 5/1/2021 (b) | | | 150,000 | | | | 150,915 | |
| | |
Series 2015A, GO, 5.00%, 5/1/2021 | | | 25,000 | | | | 25,198 | |
| | |
Series 2015B, GO, 5.00%, 5/1/2021 | | | 50,000 | | | | 50,396 | |
| | |
Series 2014E, GO, 4.00%, 5/1/2022 | | | 100,000 | | | | 104,415 | |
| | |
Series 2016A, GO, 5.00%, 7/1/2022 | | | 25,000 | | | | 26,594 | |
| | |
City of Fargo, NSDU Development Foundation Project Series 2012A, Rev., 3.00%, 12/1/2021 | | | 50,000 | | | | 50,345 | |
| | |
City of West Fargo Series 2019A, GO, 4.00%, 5/1/2021 | | | 200,000 | | | | 201,214 | |
| | |
County of Burleigh, St. Alexius Medical Center Project Series 2012A, Rev., 5.00%, 7/1/2022 (b) | | | 270,000 | | | | 285,941 | |
| | |
Fargo Public School District No. 1 GO, 5.00%, 8/1/2021 | | | 35,000 | | | | 35,689 | |
| | |
North Dakota Building Authority Series 2020A, Rev., 5.00%, 12/1/2022 | | | 35,000 | | | | 37,922 | |
| | |
North Dakota Housing Finance Agency, Home Mortgage Finance Program Series C, Rev., 1.75%, 7/1/2021 | | | 900,000 | | | | 903,978 | |
| | |
North Dakota Public Finance Authority, Capital Financing Program Series A, Rev., 1.75%, 11/1/2023 | | | 430,000 | | | | 438,247 | |
| | |
North Dakota Public Finance Authority, State Revolving Fund Program Series 2018A, Rev., 5.00%, 10/1/2021 | | | 50,000 | | | | 51,403 | |
SEE NOTES TO FINANCIAL STATEMENTS.
| | | | | | | | |
| | | |
| FEBRUARY 28, 2021 | | J.P. MORGAN EXCHANGE-TRADED FUNDS | | | | | 271 | |
JPMorgan Ultra-Short Municipal Income ETF
SCHEDULE OF PORTFOLIO INVESTMENTS
AS OF FEBRUARY 28, 2021 (continued)
| | | | | | | | |
| INVESTMENTS | | PRINCIPAL
AMOUNT ($) | | | VALUE ($) | |
Municipal Bonds — continued | | | | | | | | |
|
North Dakota — continued | |
| | |
State Board of Higher Education of the State of North Dakota, State University Housing and Auxiliary Facilities Series 2017B, Rev., 5.00%, 4/1/2021 | | | 100,000 | | | | 100,387 | |
| | |
West Fargo Public School District No. 6, School Building | | | | | | | | |
| | |
Series 2016A, GO, 3.00%, 5/1/2021 | | | 100,000 | | | | 100,452 | |
| | |
GO, 4.00%, 8/1/2024 | | | 40,000 | | | | 44,763 | |
| | | | | | | | |
| | |
Total North Dakota | | | | | | | 2,939,704 | |
| | | | | | | | |
| | |
Ohio — 4.4% | | | | | | | | |
| | |
Akron Bath Copley Joint Township Hospital District, Akron General Health System Rev., 3.80%, 1/1/2022 (b) | | | 445,000 | | | | 458,061 | |
| | |
American Municipal Power, Inc., Combined Hydroelectric Projects Series 2016A, Rev., 5.00%, 2/15/2022 | | | 335,000 | | | | 349,968 | |
| | |
American Municipal Power, Inc., Electric System Improvement, City of Hubbard Project Rev., BAN, 2.25%, 3/4/2021 | | | 325,000 | | | | 325,055 | |
| | |
American Municipal Power, Inc., Electric System Improvement, Village of Jackson Center Project Rev., BAN, 1.50%, 8/12/2021 | | | 645,000 | | | | 648,483 | |
| | |
American Municipal Power, Inc., Green Bond Series 2019A, Rev., 5.00%, 2/15/2023 | | | 225,000 | | | | 245,065 | |
| | |
American Municipal Power, Inc., State Energy Campus | | | | | | | | |
| | |
Rev., 5.25%, 2/15/2022 (b) | | | 70,000 | | | | 73,412 | |
| | |
Series 2015A, Rev., 5.25%, 2/15/2022 (b) | | | 75,000 | | | | 78,655 | |
| | |
Apollo Joint Vocational School District, Various Purpose GO, 5.00%, 12/1/2021 (b) | | | 25,000 | | | | 25,909 | |
| | |
Beavercreek City School District, Unlimited Tax GO, 3.00%, 12/1/2021 | | | 50,000 | | | | 51,063 | |
| | |
Bellbrook-Sugarcreek Local School District, School Improvement GO, 4.00%, 12/1/2021 | | | 30,000 | | | | 30,860 | |
| | |
Bowling Green State University, General Receipts | | | | | | | | |
| | |
Series 2020A, Rev., 5.00%, 6/1/2021 | | | 30,000 | | | | 30,345 | |
| | |
Series 2016A, Rev., 5.00%, 6/1/2022 | | | 100,000 | | | | 105,768 | |
| | | | | | | | |
| INVESTMENTS | | PRINCIPAL
AMOUNT ($) | | | VALUE ($) | |
| | | | | | | | |
|
Ohio — continued | |
| | |
Buckeye Tobacco Settlement Financing Authority Series A-3, Rev., 6.25%, 6/1/2022 (b) | | | 445,000 | | | | 478,633 | |
| | |
Buckeye Valley Local School District, Unlimited Tax Series 2016B, GO, 5.00%, 12/1/2021 | | | 25,000 | | | | 25,903 | |
| | |
Carey Exempted Village School District GO, 5.38%, 11/1/2021 (b) | | | 100,000 | | | | 103,445 | |
| | |
Central Ohio Solid Waste Authority, Limited Tax GO, 5.00%, 12/1/2023 | | | 45,000 | | | | 50,720 | |
| | |
City of Akron, Community Learning Centers | | | | | | | | |
| | |
Series 2012A, Rev., 5.00%, 12/1/2021 | | | 30,000 | | | | 31,033 | |
| | |
Rev., 5.00%, 12/1/2022 | | | 35,000 | | | | 37,762 | |
| | |
Series 2012A, Rev., 5.00%, 12/1/2022 | | | 25,000 | | | | 26,409 | |
| | |
City of Akron, Income Tax Rev., 5.00%, 12/1/2021 | | | 150,000 | | | | 155,164 | |
| | |
City of Akron, Various Purpose | | | | | | | | |
| | |
GO, 2.00%, 12/1/2021 | | | 425,000 | | | | 430,227 | |
| | |
GO, 2.00%, 12/1/2022 | | | 565,000 | | | | 580,425 | |
| | |
City of Avon, Street Improvement, Limited Tax GO, 2.00%, 12/1/2021 | | | 100,000 | | | | 101,313 | |
| | |
City of Cincinnati, Baldwin 300 Project Series 2016D, Rev., 4.00%, 11/1/2021 | | | 110,000 | | | | 112,682 | |
| | |
City of Cincinnati, Unlimited Tax | | | | | | | | |
| | |
Series 2012D, GO, 4.00%, 12/1/2021 | | | 25,000 | | | | 25,709 | |
| | |
Series 2014A, GO, 5.00%, 12/1/2021 | | | 25,000 | | | | 25,896 | |
| | |
City of Cincinnati, Unlimited Tax, Various Purpose | | | | | | | | |
| | |
Series 2016A, GO, 4.00%, 12/1/2021 | | | 50,000 | | | | 51,418 | |
| | |
Series 2016C, GO, 5.00%, 12/1/2021 | | | 20,000 | | | | 20,716 | |
| | |
City of Cincinnati, Water System | | | | | | | | |
| | |
Series 2011A, Rev., 5.00%, 12/1/2021 | | | 40,000 | | | | 41,448 | |
| | |
Series 2012A, Rev., 5.00%, 12/1/2021 (b) | | | 60,000 | | | | 62,182 | |
| | |
City of Cleveland, Airport System Series 2016A, Rev., AGM, 5.00%, 1/1/2022 | | | 275,000 | | | | 285,359 | |
| | |
City of Cleveland, Income Tax, Subordinate Lien, Public Facilities Improvements Rev., 5.00%, 5/15/2021 | | | 185,000 | | | | 186,802 | |
SEE NOTES TO FINANCIAL STATEMENTS.
| | | | | | |
| | | |
| 272 | | | | J.P. MORGAN EXCHANGE-TRADED FUNDS | | FEBRUARY 28, 2021 |
| | | | | | | | |
| INVESTMENTS | | PRINCIPAL
AMOUNT ($) | | | VALUE ($) | |
Municipal Bonds — continued | | | | | | | | |
|
Ohio — continued | |
| | |
City of Cleveland, Various Purpose GO, 5.00%, 12/1/2026 | | | 200,000 | | | | 247,136 | |
| | |
City of Columbus, Various Purpose, Limited Tax | | | | | | | | |
| | |
Series 2011B, GO, 5.00%, 7/1/2021 | | | 25,000 | | | | 25,402 | |
| | |
Series 2013-2, GO, 5.00%, 7/1/2021 | | | 195,000 | | | | 198,138 | |
| | |
GO, 4.00%, 8/15/2021 | | | 50,000 | | | | 50,876 | |
| | |
Series 2019B, GO, 5.00%, 4/1/2022 | | | 30,000 | | | | 31,574 | |
| | |
Series 2015A, GO, 3.00%, 7/1/2022 | | | 20,000 | | | | 20,757 | |
| | |
Series 2012-4, GO, 5.00%, 8/15/2022 | | | 45,000 | | | | 48,166 | |
| | |
City of Columbus, Various Purpose, Unlimited Tax | | | | | | | | |
| | |
Series 2017A, GO, 4.00%, 4/1/2021 | | | 30,000 | | | | 30,094 | |
| | |
Series 2012-1, GO, 3.00%, 7/1/2021 | | | 65,000 | | | | 65,616 | |
| | |
Series 2011A, GO, 5.00%, 7/1/2021 (b) | | | 95,000 | | | | 96,529 | |
| | |
Series 2013-1, GO, 5.00%, 7/1/2021 | | | 25,000 | | | | 25,402 | |
| | |
Series 2016A, GO, 4.00%, 8/15/2021 | | | 25,000 | | | | 25,438 | |
| | |
Series 2019A, GO, 5.00%, 4/1/2022 | | | 25,000 | | | | 26,311 | |
| | |
GO, 4.00%, 7/1/2022 | | | 25,000 | | | | 26,279 | |
| | |
Series 2013A, GO, 5.00%, 8/15/2022 | | | 50,000 | | | | 53,518 | |
| | |
City of Dayton, Various Purpose GO, 4.00%, 12/1/2021 | | | 50,000 | | | | 51,402 | |
| | |
City of Dublin, Limited Tax, Capital Facilities Improvement GO, 3.00%, 12/1/2022 | | | 210,000 | | | | 214,435 | |
| | |
City of Hilliard, Limited Tax Series 2019A, GO, 5.00%, 12/1/2022 | | | 20,000 | | | | 21,644 | |
| | |
City of Lakewood, Limited Tax GO, 5.00%, 12/1/2021 | | | 40,000 | | | | 41,451 | |
| | |
City of Lakewood, Purpose Tax GO, 5.00%, 12/1/2021 | | | 20,000 | | | | 20,726 | |
| | |
City of Lima, Various Improvement, Limited Tax GO, AGM, 3.00%, 12/1/2021 | | | 125,000 | | | | 127,479 | |
| | |
City of North Olmsted, Unlimited Tax GO, 3.00%, 12/1/2022 | | | 20,000 | | | | 20,969 | |
| | |
City of Westerville | | | | | | | | |
| | |
Series 2012A, GO, 4.00%, 12/1/2021 | | | 30,000 | | | | 30,853 | |
| | |
Rev., 5.00%, 12/1/2022 | | | 65,000 | | | | 70,415 | |
| | | | | | | | |
| INVESTMENTS | | PRINCIPAL
AMOUNT ($) | | | VALUE ($) | |
| | | | | | | | |
|
Ohio — continued | |
| | |
City of Whitehall Rev., 1.00%, 12/8/2021 | | | 1,000,000 | | | | 1,004,680 | |
| | |
Cleveland Department of Public Utilities Division of Public Power Rev., AGM, 5.00%, 11/15/2023 | | | 100,000 | | | | 112,230 | |
| | |
Cleveland Department of Public Utilities Division of Water Series 2017CC, Rev., 5.00%, 1/1/2022 | | | 20,000 | | | | 20,805 | |
| | |
Coldwater Exempted Village School District GO, 3.00%, 12/1/2023 | | | 380,000 | | | | 404,411 | |
| | |
Columbus City School District, Various Purpose Series 2014A, GO, 5.00%, 12/1/2021 | | | 85,000 | | | | 88,071 | |
| | |
County of Allen, Hospital Facilities and Improvement Bonds, Catholic Health Partners | | | | | | | | |
| | |
Series 2012A, Rev., 5.00%, 5/1/2021 | | | 235,000 | | | | 236,791 | |
| | |
Series 2012A, Rev., 4.00%, 5/1/2022 (b) | | | 145,000 | | | | 151,506 | |
| | |
Series 2012A, Rev., 5.00%, 5/1/2022 | | | 310,000 | | | | 326,690 | |
| | |
County of Allen, Hospital Facilities, Mercy Health | | | | | | | | |
| | |
Series 2017A, Rev., 5.00%, 8/1/2021 | | | 845,000 | | | | 861,266 | |
| | |
Series 2017A, Rev., 5.00%, 8/1/2024 | | | 425,000 | | | | 489,039 | |
| | |
County of Butler, Hospital Facilities | | | | | | | | |
| | |
Rev., 5.00%, 11/15/2021 | | | 200,000 | | | | 206,392 | |
| | |
Rev., 4.00%, 11/15/2022 | | | 160,000 | | | | 169,566 | |
| | |
County of Cuyahoga, Capital Improvement | | | | | | | | |
| | |
Series 2020A, GO, 4.00%, 12/1/2021 | | | 25,000 | | | | 25,711 | |
| | |
Series 2020A, GO, 4.00%, 12/1/2022 | | | 55,000 | | | | 58,623 | |
| | |
County of Cuyahoga, Sales Tax Rev., 5.00%, 12/1/2021 | | | 25,000 | | | | 25,897 | |
| | |
County of Cuyahoga, Sports Facilities Improvement Project, Excise Tax Rev., 5.00%, 12/1/2022 (b) | | | 50,000 | | | | 54,165 | |
| | |
County of Delaware, Sanitary Sewer System Improvement Rev., 4.00%, 12/1/2022 | | | 25,000 | | | | 26,670 | |
| | |
County of Franklin, Nationwide Children’s Hospital Project Series 2012A, Rev., 5.00%, 11/1/2022 | | | 115,000 | | | | 121,316 | |
SEE NOTES TO FINANCIAL STATEMENTS.
| | | | | | | | |
| | | |
| FEBRUARY 28, 2021 | | J.P. MORGAN EXCHANGE-TRADED FUNDS | | | | | 273 | |
JPMorgan Ultra-Short Municipal Income ETF
SCHEDULE OF PORTFOLIO INVESTMENTS
AS OF FEBRUARY 28, 2021 (continued)
| | | | | | | | |
| INVESTMENTS | | PRINCIPAL
AMOUNT ($) | | | VALUE ($) | |
Municipal Bonds — continued | | | | | | | | |
|
Ohio — continued | |
| | |
County of Franklin, Various Purpose, Limited Tax | | | | | | | | |
| | |
GO, 5.00%, 6/1/2021 | | | 80,000 | | | | 80,961 | |
| | |
GO, 5.00%, 12/1/2021 | | | 40,000 | | | | 41,451 | |
| | |
County of Geauga, South Franklin Circle Project Rev., 8.00%, 12/31/2022 (b) (c) | | | 4,945,000 | | | | 5,710,486 | |
| | |
County of Greene, Sewer System, Limited Tax GO, 5.00%, 12/1/2021 | | | 100,000 | | | | 103,628 | |
| | |
County of Hamilton, Healthcare Facilities, Christ Hospital Project Rev., 5.00%, 6/1/2021 | | | 170,000 | | | | 171,890 | |
| | |
County of Hamilton, Riverfront Infrastructure Improvement, Limited Tax GO, 5.00%, 12/1/2021 (b) | | | 115,000 | | | | 119,181 | |
| | |
County of Hamilton, Sales Tax Series 2016A, Rev., 4.00%, 12/1/2021 | | | 110,000 | | | | 113,051 | |
| | |
County of Hamilton, Sewer System, The Metropolitan Sewer District of Greater Cincinnati | | | | | | | | |
| | |
Series 2014A, Rev., 5.00%, 12/1/2021 | | | 65,000 | | | | 67,358 | |
| | |
Series A, Rev., 5.00%, 12/1/2021 | | | 20,000 | | | | 20,725 | |
| | |
Series 2013A, Rev., 5.00%, 12/1/2022 | | | 55,000 | | | | 59,633 | |
| | |
Series 2014A, Rev., 5.00%, 12/1/2022 | | | 20,000 | | | | 21,685 | |
| | |
County of Hancock, Hospital Facilities, Blanchard Valley Health Center Rev., 5.00%, 6/1/2021 (b) | | | 250,000 | | | | 252,945 | |
| | |
County of Lake, Various Purpose GO, 3.50%, 12/1/2022 | | | 50,000 | | | | 52,849 | |
| | |
County of Lorain, Various Purpose GO, 3.00%, 12/1/2022 | | | 55,000 | | | | 57,615 | |
| | |
County of Lucas, Promedica Health Rev., 5.00%, 11/15/2021 (b) | | | 100,000 | | | | 103,347 | |
| | |
County of Montgomery, Health Initiatives Series 2008D-2, Rev., 5.45%, 11/13/2023 (b) | | | 140,000 | | | | 159,151 | |
| | |
County of Summit, Various Purpose GO, 4.00%, 12/1/2021 | | | 75,000 | | | | 77,161 | |
| | |
County of Union, Memorial Hospital, Various Purpose GO, 4.00%, 12/1/2022 | | | 55,000 | | | | 58,673 | |
| | |
County of Warren, Jail Construction and Improvement | | | | | | | | |
| | |
GO, 3.00%, 12/1/2021 | | | 180,000 | | | | 183,843 | |
| | |
GO, 3.00%, 6/1/2023 | | | 25,000 | | | | 26,527 | |
| | | | | | | | |
| INVESTMENTS | | PRINCIPAL
AMOUNT ($) | | | VALUE ($) | |
| | | | | | | | |
|
Ohio — continued | |
| | |
Cuyahoga Community College District, Facilities Construction and Improvement GO, 3.00%, 12/1/2021 | | | 20,000 | | | | 20,427 | |
| | |
Cuyahoga Community College District, General Receipts Series 2016E, Rev., 5.00%, 8/1/2021 | | | 25,000 | | | | 25,502 | |
| | |
Cuyahoga Metropolitan Housing Authority, Riverside Park Phase II Project Rev., 2.00%, 4/1/2021 (c) | | | 3,800,000 | | | | 3,805,472 | |
| | |
Dayton Metro Library, Improvement Series 2013A, GO, 4.00%, 12/1/2022 | | | 25,000 | | | | 25,692 | |
| | |
Defiance City School District, Various Purpose GO, 5.00%, 12/1/2022 (b) | | | 45,000 | | | | 48,708 | |
| | |
Dublin City School District, Construction & Improvement | | | | | | | | |
| | |
GO, 4.00%, 12/1/2022 | | | 35,000 | | | | 37,331 | |
| | |
GO, 4.00%, 12/1/2024 | | | 20,000 | | | | 22,625 | |
| | |
Dublin City School District, Various Purpose Series 2013A, GO, 5.00%, 12/1/2022 | | | 20,000 | | | | 21,681 | |
| | |
Eastwood Local School District COP, 3.00%, 6/1/2023 | | | 30,000 | | | | 31,610 | |
| | |
Forest Hills Local School District, School Improvement GO, 4.00%, 12/1/2022 | | | 40,000 | | | | 42,657 | |
| | |
Franklin County Convention Facilities Authority | | | | | | | | |
| | |
Rev., 5.00%, 12/1/2023 (b) | | | 50,000 | | | | 56,484 | |
| | |
Rev., 5.00%, 12/1/2024 (b) | | | 75,000 | | | | 87,849 | |
| | |
Franklin County, Hospital Facilities, OhioHealth Corp. Series 2011A, Rev., 5.00%, 11/15/2021 (b) | | | 110,000 | | | | 113,762 | |
| | |
Gahanna-Jefferson City School District GO, 3.00%, 12/1/2022 | | | 75,000 | | | | 78,701 | |
| | |
Greater Cleveland Regional Transit Authority | | | | | | | | |
| | |
Rev., 5.00%, 12/1/2021 | | | 125,000 | | | | 129,535 | |
| | |
Series A, Rev., 5.00%, 12/1/2022 | | | 55,000 | | | | 59,633 | |
| | |
Greene County Vocational School District GO, 5.00%, 12/1/2021 | | | 220,000 | | | | 227,949 | |
| | |
Highland Local School District GO, 5.00%, 12/1/2022 | | | 20,000 | | | | 21,677 | |
| | |
Johnstown-Monroe Local School District GO, Zero Coupon, 12/1/2021 | | | 200,000 | | | | 199,582 | |
| | |
Kent State University | | | | | | | | |
| | |
Series 2012A, Rev., 5.00%, 5/1/2022 (b) | | | 80,000 | | | | 84,520 | |
| | |
Series 2014A, Rev., 5.00%, 5/1/2022 (b) | | | 55,000 | | | | 58,107 | |
SEE NOTES TO FINANCIAL STATEMENTS.
| | | | | | |
| | | |
| 274 | | | | J.P. MORGAN EXCHANGE-TRADED FUNDS | | FEBRUARY 28, 2021 |
| | | | | | | | |
| INVESTMENTS | | PRINCIPAL
AMOUNT ($) | | | VALUE ($) | |
Municipal Bonds — continued | | | | | | | | |
|
Ohio — continued | |
| | |
Lakewood City School District, School Facilities Improvement | | | | | | | | |
| | |
GO, 4.00%, 12/1/2021 | | | 110,000 | | | | 113,153 | |
| | |
Series 2014A, GO, 5.00%, 11/1/2022 (b) | | | 45,000 | | | | 48,617 | |
| | |
Lakota Local School District/Butler County GO, 5.00%, 12/1/2022 | | | 45,000 | | | | 48,782 | |
| | |
Lancaster City School District GO, 3.75%, 10/1/2022 (b) | | | 25,000 | | | | 26,408 | |
| | |
Lancaster Port Authority, Gas Supply | | | | | | | | |
| | |
Series 2019A, Rev., LIQ: Royal Bank of Canada, 5.00%, 8/1/2021 | | | 300,000 | | | | 305,877 | |
| | |
Series 2019A, Rev., LIQ: Royal Bank of Canada, 5.00%, 2/1/2022 | | | 190,000 | | | | 198,143 | |
| | |
Licking County Career & Technology Education Centers GO, 3.13%, 12/1/2023 | | | 50,000 | | | | 50,971 | |
| | |
Lucas-Plaza Housing Development Corp. Rev., FHA, Zero Coupon, 6/1/2024 (b) | | | 710,000 | | | | 695,196 | |
| | |
Mason City School District GO, 5.00%, 12/1/2022 | | | 25,000 | | | | 27,101 | |
| | |
Miami Trace Local School District GO, 4.00%, 12/1/2023 | | | 85,000 | | | | 93,260 | |
| | |
Miami Valley Career Technology Center, Various Purpose School Improvement, Unlimited Tax GO, 4.00%, 12/1/2021 | | | 25,000 | | | | 25,716 | |
| | |
New Boston Local School District, Unlimited Tax GO, 3.00%, 11/1/2021 | | | 45,000 | | | | 45,854 | |
| | |
North Ridgeville City School District, School Facilities Improvement | | | | | | | | |
| | |
GO, Zero Coupon, 12/1/2021 | | | 150,000 | | | | 149,676 | |
| | |
Series 2014A, GO, 3.00%, 12/1/2021 | | | 50,000 | | | | 51,060 | |
| | |
Northeast Ohio Regional Sewer District, Wastewater Improvement | | | | | | | | |
| | |
Rev., 5.00%, 11/15/2021 | | | 175,000 | | | | 180,971 | |
| | |
Rev., 5.00%, 5/15/2023 (b) | | | 25,000 | | | | 27,584 | |
| | |
Northmont City School District Series 2012A, GO, 4.00%, 11/1/2021 (b) | | | 60,000 | | | | 61,540 | |
| | |
Northwest Local School District, Unlimited Tax GO, 5.00%, 12/1/2022 | | | 30,000 | | | | 32,516 | |
| | |
Ohio Higher Educational Facility Commission, Case Western University Project Series 2012A, Rev., 5.00%, 12/1/2021 | | | 200,000 | | | | 207,118 | |
| | | | | | | | |
| INVESTMENTS | | PRINCIPAL
AMOUNT ($) | | | VALUE ($) | |
| | | | | | | | |
|
Ohio — continued | |
| | |
Ohio Higher Educational Facility Commission, Cleveland Clinic Health System Obligated Group | | | | | | | | |
| | |
Rev., 5.00%, 1/1/2022 | | | 235,000 | | | | 244,355 | |
| | |
Rev., 5.00%, 1/1/2024 | | | 150,000 | | | | 155,810 | |
| | |
Ohio Higher Educational Facility Commission, Denison University Project | | | | | | | | |
| | |
Rev., 5.00%, 11/1/2021 | | | 25,000 | | | | 25,803 | |
| | |
Series 2017A, Rev., 5.00%, 11/1/2021 | | | 100,000 | | | | 103,210 | |
| | |
Ohio Higher Educational Facility Commission, Kenyon College 2017 Project Rev., 4.00%, 7/1/2021 | | | 85,000 | | | | 85,998 | |
| | |
Ohio Higher Educational Facility Commission, University of Dayton 2013 Project Rev., 5.00%, 12/1/2021 | | | 25,000 | | | | 25,849 | |
| | |
Ohio Housing Finance Agency, Mortgage — Backed Securities Program | | | | | | | | |
| | |
Series 2017A, Rev., GNMA/FNMA/FHLMC, 1.75%, 3/1/2021 | | | 195,000 | | | | 195,000 | |
| | |
Series 2019B, Rev., 1.45%, 9/1/2021 | | | 135,000 | | | | 135,784 | |
| | |
Ohio Housing Finance Agency, Multi-Family Housing Nelle Park Apartment Rev., 1.75%, 6/1/2021 (c) | | | 1,175,000 | | | | 1,179,442 | |
| | |
Ohio Housing Finance Agency, Multi-Family Housing Wesley Tower Apartments Project Rev., 1.40%, 6/1/2021 (c) | | | 10,500,000 | | | | 10,530,345 | |
| | |
Ohio Housing Finance Agency, Park Eden Apartments Series 2020A, Rev., GNMA/FHA, 0.40%, 9/1/2022 (c) | | | 150,000 | | | | 150,297 | |
| | |
Ohio State Building Authority, Juenville Correctional Building Fund Projects Series 2011A, Rev., 4.00%, 4/1/2021 | | | 30,000 | | | | 30,094 | |
| | |
Ohio State University (The), General Receipts | | | | | | | | |
| | |
Series 2012A, Rev., 4.00%, 6/1/2021 | | | 25,000 | | | | 25,238 | |
| | |
Series 2012A, Rev., 5.00%, 6/1/2021 | | | 50,000 | | | | 50,600 | |
| | |
Series 2010D, Rev., 5.00%, 12/1/2021 | | | 220,000 | | | | 227,982 | |
| | |
Series 2020A, Rev., 5.00%, 12/1/2022 | | | 55,000 | | | | 59,633 | |
SEE NOTES TO FINANCIAL STATEMENTS.
| | | | | | | | |
| | | |
| FEBRUARY 28, 2021 | | J.P. MORGAN EXCHANGE-TRADED FUNDS | | | | | 275 | |
JPMorgan Ultra-Short Municipal Income ETF
SCHEDULE OF PORTFOLIO INVESTMENTS
AS OF FEBRUARY 28, 2021 (continued)
| | | | | | | | |
| INVESTMENTS | | PRINCIPAL
AMOUNT ($) | | | VALUE ($) | |
Municipal Bonds — continued | | | | | | | | |
|
Ohio — continued | |
| | |
Ohio State University (The), Multiyear Debt Issuance Program | | | | | | | | |
| | |
Rev., 5.00%, 12/1/2021 | | | 75,000 | | | | 77,721 | |
| | |
Rev., 5.00%, 12/1/2022 | | | 55,000 | | | | 59,633 | |
| | |
Ohio Turnpike and Infrastructure Commission Series 2017A, Rev., 5.00%, 2/15/2023 | | | 40,000 | | | | 43,674 | |
| | |
Ohio Turnpike and Infrastructure Commission, Junior Lien | | | | | | | | |
| | |
Series A-1, Rev., 5.00%, 2/15/2023 (b) | | | 40,000 | | | | 43,691 | |
| | |
Series 2013A-1, Rev., 5.00%, 2/15/2025 | | | 100,000 | | | | 108,937 | |
| | |
Ohio University, General Receipts Rev., 4.00%, 12/1/2022 (b) | | | 40,000 | | | | 42,672 | |
| | |
Ohio Water Development Authority, Drinking Water Assistance | | | | | | | | |
| | |
Rev., 4.00%, 6/1/2021 | | | 45,000 | | | | 45,432 | |
| | |
Rev., 5.00%, 12/1/2021 | | | 60,000 | | | | 62,186 | |
| | |
Rev., 5.00%, 12/1/2022 | | | 145,000 | | | | 157,267 | |
| | |
Ohio Water Development Authority, Fresh Water Series 2013A, Rev., 5.00%, 6/1/2021 | | | 45,000 | | | | 45,543 | |
| | |
Ohio Water Development Authority, Water Pollution Control Loan Fund | | | | | | | | |
| | |
Rev., 5.00%, 6/1/2021 | | | 100,000 | | | | 101,206 | |
| | |
Rev., 5.50%, 6/1/2021 | | | 35,000 | | | | 35,465 | |
| | |
Rev., 5.00%, 12/1/2021 | | | 65,000 | | | | 67,369 | |
| | |
Series 2014B, Rev., 5.00%, 12/1/2021 | | | 145,000 | | | | 150,284 | |
| | |
Rev., 5.50%, 12/1/2022 | | | 50,000 | | | | 54,666 | |
| | |
Olentangy Local School District Series 2013B, GO, 4.00%, 12/1/2021 | | | 20,000 | | | | 20,575 | |
| | |
Penta Career Center COP, 5.00%, 4/1/2022 | | | 50,000 | | | | 52,533 | |
| | |
Perry Local School District, Lake County COP, 4.00%, 12/1/2021 | | | 100,000 | | | | 102,729 | |
| | |
Perrysburg Exempted Village School District GO, 5.00%, 12/1/2023 | | | 30,000 | | | | 33,628 | |
| | |
Port of Greater Cincinnati Development Authority, Mariemont City School District Project, Tax-Exempt | | | | | | | | |
| | |
Rev., 5.00%, 12/1/2022 | | | 50,000 | | | | 54,193 | |
| | |
Rev., 5.00%, 12/1/2024 | | | 200,000 | | | | 232,778 | |
| | |
Revere Local School District, School Facilities Improvement Series 2017A, GO, 5.00%, 6/1/2022 (b) | | | 150,000 | | | | 159,081 | |
| | | | | | | | |
| INVESTMENTS | | PRINCIPAL
AMOUNT ($) | | | VALUE ($) | |
| | | | | | | | |
|
Ohio — continued | |
| | |
Reynoldsburg City School District, Unlimited Tax | | | | | | | | |
| | |
GO, 5.00%, 12/1/2021 | | | 90,000 | | | | 93,252 | |
| | |
GO, 5.00%, 12/1/2022 | | | 20,000 | | | | 21,677 | |
| | |
South-Western City School District, School Facilities Construction and Improvement | | | | | | | | |
| | |
Series 2019A, GO, 4.00%, 12/1/2021 | | | 135,000 | | | | 138,869 | |
| | |
GO, 4.50%, 6/1/2022 (b) | | | 35,000 | | | | 36,901 | |
| | |
South-Western City School District, Unlimited Tax GO, 5.00%, 12/1/2021 | | | 100,000 | | | | 103,613 | |
| | |
State of Ohio Series R, GO, 5.00%, 5/1/2022 | | | 35,000 | | | | 36,986 | |
| | |
State of Ohio, Bureau of Criminal Investigation Records System Project COP, 4.00%, 3/1/2022 | | | 30,000 | | | | 31,129 | |
| | |
State of Ohio, Capital Facilities Lease Appropriation Administrative Building Fund Projects | | | | | | | | |
| | |
Rev., 5.00%, 4/1/2021 (b) | | | 55,000 | | | | 55,217 | |
| | |
Series 2013B, Rev., 5.00%, 4/1/2021 (b) | | | 25,000 | | | | 25,098 | |
| | |
State of Ohio, Capital Facilities Lease Appropriation Adult Correctional Building Fund Projects | | | | | | | | |
| | |
Series 2014A, Rev., 5.00%, 4/1/2021 (b) | | | 45,000 | | | | 45,176 | |
| | |
Rev., 5.00%, 10/1/2021 | | | 50,000 | | | | 51,422 | |
| | |
Series 2016A, Rev., 5.00%, 10/1/2021 | | | 35,000 | | | | 35,995 | |
| | |
Series 2019A, Rev., 5.00%, 10/1/2021 | | | 75,000 | | | | 77,132 | |
| | |
Series 2012A, Rev., 5.00%, 4/1/2022 | | | 85,000 | | | | 89,468 | |
| | |
Series 2015B, Rev., 5.00%, 10/1/2022 (b) | | | 75,000 | | | | 80,741 | |
| | |
Rev., 5.00%, 10/1/2023 | | | 35,000 | | | | 39,198 | |
| | |
Series 2017B, Rev., 5.00%, 10/1/2023 | | | 40,000 | | | | 44,798 | |
| | |
State of Ohio, Capital Facilities Lease Appropriation Cultural and Sports Facilities Building Fund Projects | | | | | | | | |
| | |
Rev., 5.00%, 4/1/2021 | | | 100,000 | | | | 100,395 | |
| | |
Series 2013A, Rev., 5.00%, 4/1/2022 | | | 25,000 | | | | 26,314 | |
| | |
Series 2019A, Rev., 5.00%, 4/1/2022 | | | 85,000 | | | | 89,469 | |
| | |
Series 2016A, Rev., 5.00%, 10/1/2023 | | | 30,000 | | | | 33,598 | |
SEE NOTES TO FINANCIAL STATEMENTS.
| | | | | | |
| | | |
| 276 | | | | J.P. MORGAN EXCHANGE-TRADED FUNDS | | FEBRUARY 28, 2021 |
| | | | | | | | |
| INVESTMENTS | | PRINCIPAL
AMOUNT ($) | | | VALUE ($) | |
Municipal Bonds — continued | | | | | | | | |
|
Ohio — continued | |
| | |
State of Ohio, Capital Facilities Lease Appropriation Mental Health Facilities Improvement Fund Projects | | | | | | | | |
| | |
Rev., 5.00%, 6/1/2021 | | | 45,000 | | | | 45,545 | |
| | |
Rev., 5.00%, 2/1/2022 | | | 130,000 | | | | 135,780 | |
| | |
Series 2016A, Rev., 5.00%, 6/1/2022 | | | 25,000 | | | | 26,513 | |
| | |
Rev., 5.00%, 6/1/2023 | | | 50,000 | | | | 55,269 | |
| | |
Series 2016A, Rev., 5.00%, 6/1/2023 | | | 50,000 | | | | 55,269 | |
| | |
Series 2015A, Rev., 5.00%, 2/1/2024 | | | 170,000 | | | | 192,814 | |
| | |
State of Ohio, Capital Facilities Lease Appropriation Park and Recreation Improvement Fund Projects | | | | | | | | |
| | |
Series 2015A, Rev., 5.00%, 2/1/2022 | | | 35,000 | | | | 36,556 | |
| | |
Series 2016B, Rev., 4.00%, 8/1/2022 | | | 140,000 | | | | 147,630 | |
| | |
Series 2020A, Rev., 5.00%, 12/1/2022 | | | 135,000 | | | | 146,421 | |
| | |
State of Ohio, Capital Facilities Lease Appropriation Transportation Building Fund Projects | | | | | | | | |
| | |
Series 2015A, Rev., 5.00%, 4/1/2021 | | | 60,000 | | | | 60,237 | |
| | |
Series 2013A, Rev., 5.00%, 1/15/2022 | | | 155,000 | | | | 161,391 | |
| | |
Series 2018A, Rev., 5.00%, 4/1/2022 | | | 25,000 | | | | 26,314 | |
| | |
State of Ohio, Common Schools | | | | | | | | |
| | |
Series 2011B, GO, 5.00%, 3/15/2021 (b) | | | 140,000 | | | | 140,246 | |
| | |
Series 2012B, GO, 5.00%, 3/15/2021 | | | 25,000 | | | | 25,044 | |
| | |
Series 2019A, GO, 5.00%, 6/15/2021 | | | 90,000 | | | | 91,261 | |
| | |
Series 2011B, GO, 4.00%, 9/15/2021 | | | 130,000 | | | | 132,717 | |
| | |
Series 2010A, GO, 5.00%, 9/15/2021 | | | 110,000 | | | | 112,889 | |
| | |
Series 2011A, GO, 5.00%, 9/15/2021 | | | 70,000 | | | | 71,838 | |
| | |
Series 2011C, GO, 5.00%, 9/15/2021 | | | 20,000 | | | | 20,525 | |
| | |
Series 2012B, GO, 5.00%, 9/15/2021 (b) | | | 25,000 | | | | 25,652 | |
| | |
Series 2012C, GO, 5.00%, 9/15/2021 | | | 25,000 | | | | 25,657 | |
| | | | | | | | |
| INVESTMENTS | | PRINCIPAL
AMOUNT ($) | | | VALUE ($) | |
| | | | | | | | |
|
Ohio — continued | |
| | |
Series 2013A, GO, 5.00%, 9/15/2021 | | | 205,000 | | | | 210,383 | |
| | |
Series 2014A, GO, 5.00%, 9/15/2021 | | | 175,000 | | | | 179,595 | |
| | |
Series 2013B, GO, 5.00%, 6/15/2022 | | | 50,000 | | | | 53,135 | |
| | |
Series 2015B, GO, 5.00%, 6/15/2022 (b) | | | 25,000 | | | | 26,561 | |
| | |
Series 2010C, GO, 4.25%, 9/15/2022 | | | 25,000 | | | | 26,584 | |
| | |
Series 2012A, GO, 5.00%, 9/15/2022 | | | 40,000 | | | | 42,995 | |
| | |
Series 2012C, GO, 5.00%, 9/15/2022 | | | 30,000 | | | | 32,246 | |
| | |
Series 2013A, GO, 5.00%, 9/15/2022 | | | 75,000 | | | | 80,615 | |
| | |
State of Ohio, Conservation Project | | | | | | | | |
| | |
Series 2018A, GO, 2.00%, 3/1/2021 | | | 50,000 | | | | 50,000 | |
| | |
Series 2019A, GO, 3.00%, 3/1/2021 | | | 150,000 | | | | 150,000 | |
| | |
Series 2011A, GO, 5.00%, 9/1/2021 | | | 60,000 | | | | 61,461 | |
| | |
Series 2015A, GO, 5.00%, 9/1/2022 | | | 40,000 | | | | 42,919 | |
| | |
State of Ohio, Department of Administrative Services Enterprise Data Center Solutions Project | | | | | | | | |
| | |
COP, 5.00%, 9/1/2021 | | | 75,000 | | | | 76,785 | |
| | |
COP, 5.00%, 9/1/2022 | | | 125,000 | | | | 133,906 | |
| | |
COP, 5.00%, 9/1/2023 | | | 100,000 | | | | 111,633 | |
| | |
State of Ohio, Department of Administrative Services, Administrative Knowledge System and Enterprise Data Center Solutions Project COP, 5.00%, 9/1/2022 | | | 200,000 | | | | 214,250 | |
| | |
State of Ohio, Department of Administrative Services, Multi-Agency Radio Communication System Project COP, 5.00%, 9/1/2021 (b) | | | 225,000 | | | | 230,387 | |
| | |
State of Ohio, Higher Education | | | | | | | | |
| | |
Series 2014A, GO, 5.00%, 5/1/2021 | | | 55,000 | | | | 55,442 | |
| | |
Series 2011A, GO, 5.00%, 8/1/2021 | | | 20,000 | | | | 20,405 | |
| | |
Series 2011B, GO, 5.00%, 8/1/2021 | | | 50,000 | | | | 51,014 | |
| | |
Series 2013A, GO, 5.00%, 8/1/2021 | | | 35,000 | | | | 35,709 | |
| | |
Series 2014B, GO, 5.00%, 8/1/2021 | | | 30,000 | | | | 30,608 | |
| | |
Series 2016A, GO, 5.00%, 8/1/2021 | | | 20,000 | | | | 20,405 | |
| | |
Series 2014A, GO, 5.00%, 5/1/2022 (b) | | | 25,000 | | | | 26,413 | |
| | |
Series 2011B, GO, 5.00%, 8/1/2022 | | | 30,000 | | | | 32,068 | |
| | |
Series 2014A, GO, 4.00%, 5/1/2024 | | | 50,000 | | | | 55,709 | |
SEE NOTES TO FINANCIAL STATEMENTS.
| | | | | | | | |
| | | |
| FEBRUARY 28, 2021 | | J.P. MORGAN EXCHANGE-TRADED FUNDS | | | | | 277 | |
JPMorgan Ultra-Short Municipal Income ETF
SCHEDULE OF PORTFOLIO INVESTMENTS
AS OF FEBRUARY 28, 2021 (continued)
| | | | | | | | |
| INVESTMENTS | | PRINCIPAL
AMOUNT ($) | | | VALUE ($) | |
Municipal Bonds — continued | | | | | | | | |
|
Ohio — continued | |
| | |
State of Ohio, Highway Capital Improvements Series T, GO, 5.00%, 11/1/2021 | | | 50,000 | | | | 51,626 | |
| | |
State of Ohio, Highway Capital Improvements Full Faith and Credit/Highway User Receipts | | | | | | | | |
| | |
Series Q, GO, 5.00%, 5/1/2021 | | | 50,000 | | | | 50,402 | |
| | |
Series 2010A, GO, 5.00%, 8/1/2021 | | | 100,000 | | | | 102,027 | |
| | |
State of Ohio, Infrastructure Improvement | | | | | | | | |
| | |
Series 2011B, GO, 5.00%, 8/1/2021 | | | 25,000 | | | | 25,507 | |
| | |
Series 2020C, GO, 4.00%, 3/1/2022 | | | 30,000 | | | | 31,163 | |
| | |
Series 2014A, GO, 5.00%, 3/1/2022 (b) | | | 120,000 | | | | 125,809 | |
| | |
Series 2015A, GO, 5.00%, 9/1/2022 | | | 25,000 | | | | 26,824 | |
| | |
Series 2015B, GO, 5.00%, 9/1/2022 | | | 25,000 | | | | 26,825 | |
| | |
Series 2015B, GO, 5.00%, 9/1/2023 | | | 25,000 | | | | 27,948 | |
| | |
Series 2017B, GO, 5.00%, 9/1/2025 | | | 30,000 | | | | 35,945 | |
| | |
State of Ohio, Major New Infrastructure Project | | | | | | | | |
| | |
Series 2019-1, Rev., 4.00%, 12/15/2021 | | | 65,000 | | | | 66,992 | |
| | |
Rev., 5.00%, 12/15/2021 | | | 50,000 | | | | 51,924 | |
| | |
Series 2012-1, Rev., 5.00%, 12/15/2021 | | | 25,000 | | | | 25,962 | |
| | |
Series 2016-1, Rev., 5.00%, 12/15/2021 | | | 50,000 | | | | 51,924 | |
| | |
Rev., 5.00%, 12/15/2022 | | | 40,000 | | | | 43,459 | |
| | |
Series 2016-1, Rev., 5.00%, 12/15/2022 | | | 50,000 | | | | 54,324 | |
| | |
Series 2018-1, Rev., 5.00%, 12/15/2022 | | | 40,000 | | | | 43,459 | |
| | |
Series 2019-1, Rev., 5.00%, 12/15/2022 | | | 125,000 | | | | 135,810 | |
| | |
Series 2016-1, Rev., 5.00%, 12/15/2023 | | | 25,000 | | | | 28,219 | |
| | |
Series 2018-1, Rev., 5.00%, 12/15/2023 | | | 35,000 | | | | 39,507 | |
| | |
Series 2012-1, Rev., 5.00%, 12/15/2024 | | | 55,000 | | | | 58,351 | |
| | |
State of Ohio, Natural Resources Series P, GO, 3.00%, 10/1/2021 | | | 50,000 | | | | 50,842 | |
| | |
State of Ohio, Third Frontier Research and Development, Tax-Exempt | | | | | | | | |
| | |
Series 2013A, GO, 4.00%, 5/1/2021 | | | 20,000 | | | | 20,128 | |
| | |
GO, 4.00%, 11/1/2022 | | | 35,000 | | | | 37,250 | |
| | |
State of Ohio, Treasury Management System Project Series 2014A, COP, 5.00%, 9/1/2021 | | | 30,000 | | | | 30,714 | |
| | | | | | | | |
| INVESTMENTS | | PRINCIPAL
AMOUNT ($) | | | VALUE ($) | |
| | | | | | | | |
|
Ohio — continued | |
| | |
State of Ohio, University Hospitals Health System, Inc. Series B, Rev., VRDO, 0.17%, 3/9/2021 (c) | | | 5,500,000 | | | | 5,500,000 | |
| | |
Strongsville City School District GO, 4.00%, 12/1/2022 | | | 45,000 | | | | 47,989 | |
| | |
Tender Option Bond Trust Receipts/Certificates | | | | | | | | |
| | |
Series C, Rev., VRDO, LIQ: Citibank NA, 0.13%, 3/9/2021 (c) (f) | | | 4,000,000 | | | | 4,000,000 | |
| | |
Series 2018-XF2703, GO, VRDO, LIQ: Barclays Bank plc, 0.21%, 3/9/2021 (c) (f) | | | 4,000,000 | | | | 4,000,000 | |
| | |
University of Cincinnati, General Receipts | | | | | | | | |
| | |
Series 2011A, Rev., 5.00%, 6/1/2021 | | | 25,000 | | | | 25,297 | |
| | |
Series 2014D, Rev., 5.00%, 6/1/2021 | | | 25,000 | | | | 25,297 | |
| | |
Series 2012A, Rev., 5.00%, 6/1/2022 (b) | | | 70,000 | | | | 74,238 | |
| | |
Series 2013C, Rev., 5.00%, 12/1/2023��(b) | | | 235,000 | | | | 265,472 | |
| | |
University of Toledo, General Receipt Series 2011B, Rev., 4.50%, 6/1/2021 (b) | | | 100,000 | | | | 101,067 | |
| | |
Village of Bluffton, Ohio Hospital Facilities, Blanchard Valley Health System Rev., 5.00%, 12/1/2021 | | | 185,000 | | | | 191,357 | |
| | |
Westlake City School District, Unlimited Tax GO, 4.00%, 12/1/2022 | | | 30,000 | | | | 30,855 | |
| | |
Willoughby-Eastlake City School District, School Improvement, Unlimited Tax GO, 2.00%, 12/1/2021 | | | 25,000 | | | | 25,309 | |
| | |
Worthington City School District, School Facilities Construction and Improvement, Unlimited Tax | | | | | | | | |
| | |
Series 2019A, GO, 4.00%, 12/1/2021 | | | 25,000 | | | | 25,718 | |
| | |
GO, 4.00%, 12/1/2022 | | | 60,000 | | | | 63,997 | |
| | | | | | | | |
| | |
Total Ohio | | | | | | | 61,921,020 | |
| | | | | | | | |
|
Oklahoma — 0.9% | |
| | |
Beaver County Independent School District No. 75, Balko Board of Education GO, 3.00%, 6/1/2021 | | | 25,000 | | | | 25,177 | |
| | |
Canadian County Educational Facilities Authority, Mustang Public Schools Project | | | | | | | | |
| | |
Rev., 4.00%, 9/1/2023 | | | 420,000 | | | | 427,631 | |
| | |
Rev., 4.00%, 9/1/2024 | | | 1,100,000 | | | | 1,234,112 | |
SEE NOTES TO FINANCIAL STATEMENTS.
| | | | | | |
| | | |
| 278 | | | | J.P. MORGAN EXCHANGE-TRADED FUNDS | | FEBRUARY 28, 2021 |
| | | | | | | | |
| INVESTMENTS | | PRINCIPAL
AMOUNT ($) | | | VALUE ($) | |
Municipal Bonds — continued | | | | | | | | |
|
Oklahoma — continued | |
| | |
Rev., 4.00%, 9/1/2025 | | | 1,175,000 | | | | 1,350,592 | |
| | |
Canadian County Independent School District No. 69 Mustang | | | | | | | | |
| | |
GO, 3.00%, 4/1/2022 | | | 45,000 | | | | 46,360 | |
| | |
GO, 2.00%, 6/1/2023 | | | 45,000 | | | | 46,700 | |
| | |
City of Broken Arrow Series 2018E, GO, 5.00%, 4/1/2021 | | | 100,000 | | | | 100,380 | |
| | |
City of Norman | | | | | | | | |
| | |
Series 2016A, GO, 5.00%, 6/1/2021 | | | 25,000 | | | | 25,294 | |
| | |
GO, 4.00%, 6/1/2022 | | | 100,000 | | | | 104,654 | |
| | |
Series 2016A, GO, 5.00%, 6/1/2022 | | | 100,000 | | | | 105,898 | |
| | |
GO, 4.00%, 6/1/2023 | | | 60,000 | | | | 64,909 | |
| | |
City of Oklahoma City | | | | | | | | |
| | |
GO, 5.00%, 3/1/2021 | | | 25,000 | | | | 25,000 | |
| | |
GO, 3.00%, 3/1/2022 | | | 50,000 | | | | 51,420 | |
| | |
GO, 5.00%, 3/1/2022 | | | 65,000 | | | | 68,140 | |
| | |
City of Tulsa | | | | | | | | |
| | |
GO, 3.00%, 3/1/2021 | | | 50,000 | | | | 50,000 | |
| | |
Series 2011A, GO, 4.00%, 3/1/2021 | | | 50,000 | | | | 50,000 | |
| | |
Cleveland County Educational Facilities Authority, Norman Public Schools Project | | | | | | | | |
| | |
Rev., 5.00%, 6/1/2021 | | | 515,000 | | | | 520,660 | |
| | |
Rev., 5.00%, 6/1/2024 | | | 310,000 | | | | 349,965 | |
| | |
Cleveland County Independent School District No. 2 Moore | | | | | | | | |
| | |
GO, 3.00%, 3/1/2021 | | | 30,000 | | | | 30,000 | |
| | |
GO, 3.50%, 3/1/2023 | | | 25,000 | | | | 26,612 | |
| | |
Edmond Public Works Authority, Sales Tax and Utility System Rev., 5.00%, 7/1/2021 | | | 25,000 | | | | 25,397 | |
| | |
McClain County Economic Development Authority, Educational Facilities, Blanchard Public Schools Project Rev., 4.00%, 9/1/2022 | | | 285,000 | | | | 299,598 | |
| | |
Midwest City Municipal Authority | | | | | | | | |
| | |
Series 2011A, Rev., 3.00%, 3/1/2021 | | | 100,000 | | | | 100,000 | |
| | |
Series 2011A, Rev., 5.00%, 3/1/2021 (b) | | | 50,000 | | | | 50,000 | |
| | |
Oklahoma Capitol Improvement Authority, Oklahoma Department of Transportation Project | | | | | | | | |
| | |
Series 2014C, Rev., 5.00%, 7/1/2021 | | | 25,000 | | | | 25,394 | |
| | |
Rev., 5.00%, 7/1/2022 | | | 220,000 | | | | 233,719 | |
| | |
Rev., 5.00%, 7/1/2025 | | | 110,000 | | | | 130,253 | |
| | | | | | | | |
| INVESTMENTS | | PRINCIPAL
AMOUNT ($) | | | VALUE ($) | |
| | | | | | | | |
|
Oklahoma — continued | |
| | |
Oklahoma City Water Utilities Trust, Water and Sewer System | | | | | | | | |
| | |
Rev., 4.38%, 7/1/2021 (b) | | | 250,000 | | | | 253,505 | |
| | |
Rev., 5.00%, 7/1/2021 | | | 50,000 | | | | 50,802 | |
| | |
Oklahoma County Finance Authority, Educational Facilities, Bethany Public Schools Project Rev., 4.00%, 9/1/2021 | | | 25,000 | | | | 25,454 | |
| | |
Oklahoma County Independent School District No. 12 Edmond GO, 2.00%, 3/1/2021 | | | 100,000 | | | | 100,000 | |
| | |
Oklahoma County Independent School District No. 12 Edmond, Combined Purpose | | | | | | | | |
| | |
GO, 3.00%, 3/1/2021 | | | 100,000 | | | | 100,000 | |
| | |
GO, 2.00%, 3/1/2022 | | | 55,000 | | | | 56,019 | |
| | |
GO, 3.00%, 3/1/2022 | | | 40,000 | | | | 41,140 | |
| | |
Oklahoma County Independent School District No. 52 Midwest City-Del City, Combined Purpose Series 2018B, GO, 3.00%, 7/1/2021 | | | 50,000 | | | | 50,464 | |
| | |
Oklahoma County Independent School District No. 89 Oklahoma City, Combined Purpose | | | | | | | | |
| | |
Series 2017C, GO, 3.00%, 7/1/2022 | | | 55,000 | | | | 57,060 | |
| | |
Series 2019A, GO, 3.00%, 7/1/2023 | | | 95,000 | | | | 100,951 | |
| | |
Oklahoma Department of Transportation | | | | | | | | |
| | |
Series 2018A, Rev., GAN, 5.00%, 9/1/2021 | | | 110,000 | | | | 112,617 | |
| | |
Series 2018A, Rev., GAN, 5.00%, 9/1/2022 | | | 20,000 | | | | 21,416 | |
| | |
Oklahoma Development Finance Authority, Baptist Medical Center, Inc. Series 2015A, Rev., 5.00%, 8/15/2021 | | | 50,000 | | | | 51,030 | |
| | |
Oklahoma Development Finance Authority, Pontotoc County Health Department Rev., 3.00%, 4/1/2021 | | | 190,000 | | | | 190,429 | |
| | |
Oklahoma Development Finance Authority, St. John Health System Rev., 5.00%, 2/15/2022 (b) | | | 100,000 | | | | 104,586 | |
| | |
Oklahoma Development Finance Authority, System of Higher Education, Master Equipment Lease Series 2014A, Rev., 3.00%, 6/1/2022 | | | 25,000 | | | | 25,852 | |
| | |
Oklahoma Development Finance Authority, System of Higher Education, Master Real Property | | | | | | | | |
| | |
Rev., 3.00%, 6/1/2021 | | | 485,000 | | | | 488,303 | |
SEE NOTES TO FINANCIAL STATEMENTS.
| | | | | | | | |
| | | |
| FEBRUARY 28, 2021 | | J.P. MORGAN EXCHANGE-TRADED FUNDS | | | | | 279 | |
JPMorgan Ultra-Short Municipal Income ETF
SCHEDULE OF PORTFOLIO INVESTMENTS
AS OF FEBRUARY 28, 2021 (continued)
| | | | | | | | |
| INVESTMENTS | | PRINCIPAL
AMOUNT ($) | | | VALUE ($) | |
Municipal Bonds — continued | | | | | | | | |
|
Oklahoma — continued | |
| | |
Series 2020A, Rev., 4.00%, 6/1/2021 | | | 220,000 | | | | 222,042 | |
| | |
Rev., 5.00%, 6/1/2021 | | | 650,000 | | | | 657,638 | |
| | |
Series 2013A, Rev., 3.00%, 6/1/2022 | | | 25,000 | | | | 25,852 | |
| | |
Series 2020A, Rev., 4.00%, 6/1/2022 | | | 500,000 | | | | 523,270 | |
| | |
Series 2020A, Rev., 4.00%, 6/1/2023 | | | 260,000 | | | | 279,510 | |
| | |
Series 2020A, Rev., 4.00%, 6/1/2024 | | | 445,000 | | | | 490,888 | |
| | |
Oklahoma Housing Finance Agency, Deer Park and Apple Run Apartments Rev., 1.60%, 1/1/2022 (c) | | | 475,000 | | | | 476,724 | |
| | |
Oklahoma Municipal Power Authority | | | | | | | | |
| | |
Series 2014B, Rev., 5.00%, 1/1/2022 | | | 110,000 | | | | 114,285 | |
| | |
Series 2019A, Rev., 5.00%, 1/1/2022 | | | 135,000 | | | | 140,258 | |
| | |
Oklahoma Turnpike Authority, Second Senior Series 2017C, Rev., 5.00%, 1/3/2022 (b) | | | 350,000 | | | | 364,238 | |
| | |
Oklahoma Water Resources Board, Master Trust | | | | | | | | |
| | |
Rev., 5.00%, 4/1/2022 | | | 25,000 | | | | 26,309 | |
| | |
Series 2012B, Rev., 5.00%, 4/1/2022 (b) | | | 25,000 | | | | 26,311 | |
| | |
Oklahoma Water Resources Board, Master Trust, Drinking Water Program Rev., 5.00%, 4/1/2021 | | | 50,000 | | | | 50,196 | |
| | |
Oklahoma Water Resources Board, Student Loan Program Series 2020A, Rev., 4.00%, 10/1/2023 | | | 60,000 | | | | 65,656 | |
| | |
Sapulpa Municipal Authority Rev., AGM, 4.00%, 7/1/2022 (b) | | | 200,000 | | | | 210,120 | |
| | |
Tulsa County Independent School District No. 1, Combined Purpose | | | | | | | | |
| | |
Series 2019B, GO, 2.00%, 8/1/2021 | | | 40,000 | | | | 40,286 | |
| | |
Series 2018B, GO, 2.75%, 8/1/2021 | | | 30,000 | | | | 30,307 | |
| | |
Series 2017A, GO, 3.00%, 3/1/2022 | | | 25,000 | | | | 25,677 | |
| | |
Series 2019B, GO, 2.00%, 8/1/2022 | | | 180,000 | | | | 184,340 | |
| | |
Series 2018B, GO, 3.00%, 8/1/2023 | | | 35,000 | | | | 37,254 | |
| | |
Tulsa County Independent School District No. 3 Broken Arrow, Combined Purpose GO, 3.00%, 4/1/2022 | | | 35,000 | | | | 36,069 | |
| | |
Tulsa County Independent School District No. 4 Bixby, Combined Purpose GO, 2.00%, 6/1/2021 | | | 85,000 | | | | 85,387 | |
| | | | | | | | |
| INVESTMENTS | | PRINCIPAL
AMOUNT ($) | | | VALUE ($) | |
| | | | | | | | |
|
Oklahoma — continued | |
| | |
Tulsa County Independent School District No. 5, Jenks Public Schools, Combined Purpose GO, 4.00%, 6/1/2021 | | | 50,000 | | | | 50,474 | |
| | |
Tulsa County Independent School District No. 9, Union Board of Education Building | | | | | | | | |
| | |
GO, 2.00%, 4/1/2021 | | | 50,000 | | | | 50,074 | |
| | |
GO, 2.00%, 4/1/2022 | | | 25,000 | | | | 25,497 | |
| | |
Tulsa County Independent School District No. 9, Union Board of Education, Combined Purpose GO, 3.00%, 4/1/2021 | | | 260,000 | | | | 260,595 | |
| | |
Tulsa County Industrial Authority, Capital Improvement Rev., 1.85%, 3/1/2021 | | | 100,000 | | | | 100,000 | |
| | |
Tulsa Metropolitan Utility Authority Series 2016C, Rev., 5.00%, 10/1/2021 | | | 40,000 | | | | 41,128 | |
| | |
Tulsa Public Facilities Authority, Capital Improvement | | | | | | | | |
| | |
Rev., 3.00%, 6/1/2021 | | | 25,000 | | | | 25,169 | |
| | |
Rev., 3.00%, 6/1/2023 | | | 110,000 | | | | 116,285 | |
| | |
Rev., 5.00%, 6/1/2024 | | | 100,000 | | | | 114,554 | |
| | |
University of Oklahoma (The) | | | | | | | | |
| | |
Series 2014C, Rev., 5.00%, 7/1/2021 | | | 50,000 | | | | 50,769 | |
| | |
Series 2016A, Rev., 5.00%, 7/1/2021 | | | 25,000 | | | | 25,384 | |
| | |
Series 2016A, Rev., 5.00%, 7/1/2023 | | | 250,000 | | | | 275,905 | |
| | |
University of Oklahoma, Tax Exempt | | | | | | | | |
| | |
Series 2012A, Rev., 3.00%, 7/1/2021 (b) | | | 130,000 | | | | 131,223 | |
| | |
Rev., 4.00%, 7/1/2021 | | | 200,000 | | | | 202,416 | |
| | |
Washington County Independent School District No. 30 GO, 2.00%, 6/1/2021 | | | 150,000 | | | | 150,626 | |
| | | | | | | | |
| | |
Total Oklahoma | | | | | | | 13,130,209 | |
| | | | | | | | |
|
Oregon — 1.0% | |
| | |
City of Bend, Bridge Creek Project | | | | | | | | |
| | |
Rev., 5.00%, 12/1/2021 | | | 50,000 | | | | 51,814 | |
| | |
Rev., 5.00%, 12/1/2022 | | | 45,000 | | | | 48,790 | |
| | |
City of Eugene, Electric Utility System Series 2011A, Rev., 5.00%, 8/1/2021 (b) | | | 95,000 | | | | 96,913 | |
| | |
City of Hermiston, Water and Sewer System Rev., AGM, 4.00%, 11/1/2021 | | | 25,000 | | | | 25,623 | |
SEE NOTES TO FINANCIAL STATEMENTS.
| | | | | | |
| | | |
| 280 | | | | J.P. MORGAN EXCHANGE-TRADED FUNDS | | FEBRUARY 28, 2021 |
| | | | | | | | |
| INVESTMENTS | | PRINCIPAL
AMOUNT ($) | | | VALUE ($) | |
Municipal Bonds — continued | | | | | | | | |
|
Oregon — continued | |
| | |
City of Hillsboro, Full Faith and Credit Project GO, 5.00%, 6/1/2021 | | | 25,000 | | | | 25,300 | |
| | |
City of Lake Oswego Series 2015A, GO, 5.00%, 6/1/2022 | | | 35,000 | | | | 37,110 | |
| | |
City of Portland Sewer System, Second Lien | | | | | | | | |
| | |
Series 2019A, Rev., 5.00%, 3/1/2021 | | | 35,000 | | | | 35,000 | |
| | |
Series 2019A, Rev., 5.00%, 3/1/2022 | | | 25,000 | | | | 26,208 | |
| | |
City of Portland, 4th and Montgomery and Streetcar Projects GO, 5.00%, 2/1/2022 | | | 50,000 | | | | 52,214 | |
| | |
City of Portland, Limited Tax GO, 5.00%, 4/1/2022 | | | 60,000 | | | | 63,140 | |
| | |
City of Portland, Sewer System | | | | | | | | |
| | |
Series 2016B, Rev., 5.00%, 6/15/2021 | | | 40,000 | | | | 40,556 | |
| | |
Series 2016B, Rev., 5.00%, 6/15/2022 | | | 200,000 | | | | 212,432 | |
| | |
City of Portland, Sewer System, First Lien | | | | | | | | |
| | |
Series 2015A, Rev., 5.00%, 6/1/2021 | | | 190,000 | | | | 192,282 | |
| | |
Series 2016A, Rev., 5.00%, 6/15/2021 | | | 125,000 | | | | 126,738 | |
| | |
Series A, Rev., 5.00%, 10/1/2021 | | | 100,000 | | | | 102,819 | |
| | |
Series 2014A, Rev., 5.00%, 10/1/2022 | | | 25,000 | | | | 26,909 | |
| | |
City of Portland, Water System Series 2019A, Rev., 5.00%, 5/1/2022 | | | 75,000 | | | | 79,220 | |
| | |
City of Portland, Water System, First Lien | | | | | | | | |
| | |
Series 2012A, Rev., 5.00%, 4/1/2021 | | | 100,000 | | | | 100,391 | |
| | |
Series 2012A, Rev., 3.00%, 4/1/2022 | | | 25,000 | | | | 25,769 | |
| | |
City of Portland, Water System, Second Lien | | | | | | | | |
| | |
Series 2013A, Rev., 4.00%, 10/1/2021 | | | 50,000 | | | | 51,120 | |
| | |
Rev., 5.00%, 10/1/2022 | | | 25,000 | | | | 26,909 | |
| | |
City of Wilsonville | | | | | | | | |
| | |
GO, 4.00%, 6/1/2021 | | | 20,000 | | | | 20,191 | |
| | |
GO, 4.00%, 6/1/2022 | | | 25,000 | | | | 25,221 | |
| | |
Clackamas County School District No. 108 Estacada GO, AGM, 5.50%, 6/15/2021 | | | 50,000 | | | | 50,766 | |
| | | | | | | | |
| INVESTMENTS | | PRINCIPAL
AMOUNT ($) | | | VALUE ($) | |
| | | | | | | | |
|
Oregon — continued | |
| | |
Clackamas County School District No. 12 North Clackamas GO, 4.00%, 6/15/2021 | | | 40,000 | | | | 40,442 | |
| | |
Clackamas County School District No. 7J, Lake Oswego | | | | | | | | |
| | |
GO, AGM, 4.25%, 6/1/2021 | | | 90,000 | | | | 90,913 | |
| | |
GO, AGM, 5.25%, 6/1/2022 | | | 25,000 | | | | 26,585 | |
| | |
Clackamas County Service District No. 1 | | | | | | | | |
| | |
Rev., 5.00%, 12/1/2021 | | | 20,000 | | | | 20,726 | |
| | |
Rev., 5.00%, 12/1/2022 | | | 35,000 | | | | 37,948 | |
| | |
County of Lane, Full Faith and Credit GO, 4.00%, 6/1/2021 | | | 35,000 | | | | 35,334 | |
| | |
County of Multnomah, Full Faith and Credit GO, 5.00%, 6/1/2022 | | | 25,000 | | | | 26,507 | |
| | |
County of Washington, Full Faith and Credit GO, 5.00%, 3/1/2021 | | | 20,000 | | | | 20,000 | |
| | |
County of Yamhill, Linfield University Project | | | | | | | | |
| | |
Rev., 4.00%, 10/1/2021 | | | 165,000 | | | | 167,577 | |
| | |
Rev., 4.00%, 10/1/2022 | | | 250,000 | | | | 260,485 | |
| | |
Deschutes County Administrative School District No. 1, Bend-La Pine GO, 4.00%, 6/15/2021 | | | 50,000 | | | | 50,552 | |
| | |
Hillsboro School District No. 1J GO, 4.00%, 6/15/2022 (b) | | | 25,000 | | | | 26,240 | |
| | |
Hospital Facilities Authority of Multnomah County Oregon, Adventist Health System Rev., 5.00%, 3/1/2025 (c) | | | 175,000 | | | | 199,322 | |
| | |
Lane County School District No. 4J Eugene | | | | | | | | |
| | |
Series 2011A, GO, 3.00%, 6/15/2021 | | | 30,000 | | | | 30,245 | |
| | |
GO, 5.00%, 6/15/2021 | | | 100,000 | | | | 101,390 | |
| | |
GO, 5.00%, 6/15/2022 | | | 25,000 | | | | 26,554 | |
| | |
Metro Series 2012A, GO, 5.00%, 6/1/2022 | | | 25,000 | | | | 26,507 | |
| | |
Multnomah County School District No. 1 Portland Series 2013B, GO, 5.00%, 6/15/2022 | | | 35,000 | | | | 37,180 | |
| | |
Oregon Health and Science University | | | | | | | | |
| | |
Series 2012A, Rev., 3.00%, 7/1/2021 | | | 100,000 | | | | 100,911 | |
| | |
Series 2012E, Rev., 4.00%, 7/1/2022 (b) | | | 225,000 | | | | 236,540 | |
| | |
Series 2012E, Rev., 5.00%, 7/1/2022 (b) | | | 200,000 | | | | 212,916 | |
SEE NOTES TO FINANCIAL STATEMENTS.
| | | | | | | | |
| | | |
| FEBRUARY 28, 2021 | | J.P. MORGAN EXCHANGE-TRADED FUNDS | | | | | 281 | |
JPMorgan Ultra-Short Municipal Income ETF
SCHEDULE OF PORTFOLIO INVESTMENTS
AS OF FEBRUARY 28, 2021 (continued)
| | | | | | | | |
| INVESTMENTS | | PRINCIPAL
AMOUNT ($) | | | VALUE ($) | |
Municipal Bonds — continued | | | | | | | | |
|
Oregon — continued | |
| | |
Oregon State Facilities Authority, Legacy Health Project | | | | | | | | |
| | |
Series 2011A, Rev., 4.63%, 5/1/2021 | | | 150,000 | | | | 151,052 | |
| | |
Series 2011A, Rev., 5.25%, 5/1/2021 | | | 40,000 | | | | 40,321 | |
| | |
Oregon State Facilities Authority, Providence Health and Services | | | | | | | | |
| | |
Series 2013A, Rev., 5.00%, 10/1/2021 | | | 25,000 | | | | 25,702 | |
| | |
Series 2013A, Rev., 5.00%, 10/1/2022 | | | 50,000 | | | | 53,802 | |
|
Oregon State Lottery | |
| | |
Series 2016-XF2290, Rev., VRDO, LIQ: Citibank NA, 0.09%, 3/9/2021 (c) (f) | | | 4,000,000 | | | | 4,000,000 | |
| | |
Series C, Rev., 4.00%, 4/1/2021 | | | 50,000 | | | | 50,155 | |
| | |
Series 2014B, Rev., 5.00%, 4/1/2021 | | | 215,000 | | | | 215,841 | |
| | |
Series A, Rev., 5.00%, 4/1/2021 | | | 25,000 | | | | 25,098 | |
| | |
Series 2011A, Rev., 5.25%, 4/1/2021 (b) | | | 225,000 | | | | 225,909 | |
| | |
Series 2013A, Rev., 5.00%, 4/1/2022 | | | 40,000 | | | | 42,093 | |
| | |
Series 2014B, Rev., 5.00%, 4/1/2022 | | | 85,000 | | | | 89,449 | |
| | |
Series 2014C, Rev., 5.00%, 4/1/2022 | | | 35,000 | | | | 36,832 | |
| | |
Series 2015C, Rev., 5.00%, 4/1/2022 | | | 25,000 | | | | 26,308 | |
| | |
Series C, Rev., 5.00%, 4/1/2022 | | | 40,000 | | | | 42,094 | |
| | |
Portland Community College District GO, 5.00%, 6/15/2022 | | | 40,000 | | | | 42,486 | |
| | |
Salem Hospital Facility Authority, Salem Health Project Rev., 5.00%, 5/15/2021 | | | 200,000 | | | | 201,912 | |
| | |
Seaside School District No. 10 Series 2017B, GO, 4.00%, 6/15/2021 | | | 25,000 | | | | 25,272 | |
| | |
State of Oregon | | | | | | | | |
| | |
Series 2014A, GO, 5.00%, 5/1/2021 | | | 100,000 | | | | 100,798 | |
| | |
Series 2015H, GO, 5.00%, 5/1/2021 | | | 25,000 | | | | 25,200 | |
| | |
Series 2018A, GO, 5.00%, 5/1/2021 | | | 25,000 | | | | 25,200 | |
| | |
Series 2015J, GO, 5.00%, 8/1/2021 | | | 25,000 | | | | 25,504 | |
| | |
Series 2011N, GO, 5.00%, 12/1/2021 | | | 20,000 | | | | 20,727 | |
| | |
Series 2012K, GO, 5.00%, 5/1/2022 | | | 25,000 | | | | 26,409 | |
| | |
Series 2015F, GO, 5.00%, 5/1/2022 | | | 25,000 | | | | 26,409 | |
| | | | | | | | |
| INVESTMENTS | | PRINCIPAL
AMOUNT ($) | | | VALUE ($) | |
| | | | | | | | |
|
Oregon — continued | |
| | |
State of Oregon, Article XI-M and XI-N Seismic Projects Series 2020E, GO, 5.00%, 6/1/2021 | | | 40,000 | | | | 40,481 | |
| | |
State of Oregon, Article XI-M Seismic Projects Series 2017C, GO, 5.00%, 6/1/2022 | | | 20,000 | | | | 21,208 | |
| | |
State of Oregon, Article XI-N Seismic Projects, Tax-Exempt Series D, GO, 3.00%, 6/1/2021 | | | 25,000 | | | | 25,177 | |
| | |
State of Oregon, Article XI-Q State Projects | | | | | | | | |
| | |
Series 2019A, GO, 5.00%, 5/1/2021 | | | 20,000 | | | | 20,160 | |
| | |
Series 2019M, GO, 5.00%, 11/1/2021 | | | 45,000 | | | | 46,454 | |
| | |
Series 2017A, GO, 5.00%, 5/1/2023 | | | 25,000 | | | | 27,560 | |
| | |
Series 2019A, GO, 5.00%, 5/1/2023 | | | 45,000 | | | | 49,607 | |
| | |
State of Oregon, Department of Transportation Highway User Senior Lien | | | | | | | | |
| | |
Series 2013A, Rev., 5.00%, 11/15/2021 | | | 135,000 | | | | 139,606 | |
| | |
Series 2014A, Rev., 5.00%, 11/15/2021 | | | 60,000 | | | | 62,047 | |
| | |
Series 2017A, Rev., 5.00%, 11/15/2021 | | | 35,000 | | | | 36,194 | |
| | |
Series 2014A, Rev., 4.00%, 11/15/2022 | | | 25,000 | | | | 26,628 | |
| | |
Series 2012A, Rev., 5.00%, 11/15/2022 (b) | | | 30,000 | | | | 32,468 | |
| | |
State of Oregon, Housing and Community Services Department Sha Rad Group II Apartment Projects Rev., 1.45%, 6/1/2022 (c) | | | 260,000 | | | | 264,212 | |
| | |
State of Oregon, Housing and Community Services Department, Single-Family Mortgage Program | | | | | | | | |
| | |
Series 2018C, Rev., 1.95%, 7/1/2021 | | | 420,000 | | | | 422,314 | |
| | |
Series 2020A, Rev., 0.88%, 1/1/2024 | | | 425,000 | | | | 426,883 | |
| | |
Series 2014A, Rev., 3.00%, 1/1/2024 | | | 235,000 | | | | 248,040 | |
| | |
Series 2020A, Rev., 0.90%, 7/1/2024 | | | 570,000 | | | | 572,269 | |
| | |
State of Oregon, Housing and Community Services Department, Ya-Po-Ah Terrace Project Series 2018-I, Rev., 2.20%, 5/1/2021 (c) | | | 600,000 | | | | 601,962 | |
| | |
State of Oregon, State Property-ODOT Building Series 2011K, GO, 5.00%, 5/1/2021 (b) | | | 200,000 | | | | 201,596 | |
SEE NOTES TO FINANCIAL STATEMENTS.
| | | | | | |
| | | |
| 282 | | | | J.P. MORGAN EXCHANGE-TRADED FUNDS | | FEBRUARY 28, 2021 |
| | | | | | | | |
| INVESTMENTS | | PRINCIPAL
AMOUNT ($) | | | VALUE ($) | |
Municipal Bonds — continued | | | | | | | | |
|
Oregon — continued | |
| | |
State of Oregon, University Systems Projects | | | | | | | | |
| | |
Series 2011E, GO, 5.00%, 8/1/2021 (b) | | | 200,000 | | | | 204,028 | |
| | |
Series G, GO, 5.25%, 8/2/2021 (b) | | | 220,000 | | | | 224,690 | |
| | |
Tri-County Metropolitan Transportation District of Oregon | | | | | | | | |
| | |
Series 2011A, Rev., 5.00%, 10/1/2021 (b) | | | 215,000 | | | | 220,994 | |
| | |
Series 2017A, Rev., 5.00%, 10/1/2022 | | | 375,000 | | | | 403,016 | |
| | |
Tualatin Hills Park and Recreation District GO, 5.00%, 6/1/2022 | | | 25,000 | | | | 26,507 | |
| | |
Washington and Clackamas Counties School District No. 23J Tigard GO, NATL-RE, 5.00%, 6/15/2022 | | | 25,000 | | | | 26,554 | |
| | |
Washington and Multnomah Counties School District No. 48J Beaverton | | | | | | | | |
| | |
Series 2012B, GO, 4.00%, 6/15/2021 | | | 80,000 | | | | 80,883 | |
| | |
GO, 5.00%, 6/15/2022 | | | 85,000 | | | | 90,284 | |
| | |
Washington County Clean Water Services, Senior Lien Sewer | | | | | | | | |
| | |
Series 2011A, Rev., 5.00%, 10/1/2021 | | | 95,000 | | | | 97,678 | |
| | |
Series 2011B, Rev., 5.00%, 10/1/2021 | | | 25,000 | | | | 25,705 | |
| | | | | | | | |
| | |
Total Oregon | | | | | | | 13,528,087 | |
| | | | | | | | |
| | |
Pennsylvania — 2.6% | | | | | | | | |
| | |
Adams County | | | | | | | | |
| | |
Series 2017B, GO, 4.00%, 11/15/2021 | | | 40,000 | | | | 41,084 | |
| | |
Allegheny County Higher Education Building Authority, Carnegie Mellon University Rev., 5.00%, 3/1/2021 | | | 45,000 | | | | 45,000 | |
| | |
Allegheny County Hospital Development Authority, Pittsburgh Medical Center | | | | | | | | |
| | |
Rev., 5.00%, 7/15/2021 | | | 30,000 | | | | 30,527 | |
| | |
Series 2011A, Rev., 5.00%, 10/15/2021 | | | 170,000 | | | | 175,005 | |
| | |
Series 2019A, Rev., 5.00%, 7/15/2022 | | | 350,000 | | | | 372,662 | |
| | |
Series 1997B, Rev., NATL-RE, 6.00%, 7/1/2023 | | | 190,000 | | | | 213,799 | |
| | |
Rev., 5.00%, 7/15/2025 | | | 110,000 | | | | 130,203 | |
| | |
Allegheny County Sanitary Authority, Sewer Rev., 5.00%, 12/1/2022 | | | 170,000 | | | | 183,976 | |
| | | | | | | | |
| INVESTMENTS | | PRINCIPAL
AMOUNT ($) | | | VALUE ($) | |
| | | | | | | | |
|
Pennsylvania — continued | |
| | |
Beaver County Hospital Authority, Heritage Valley Health System, Inc. Rev., 5.00%, 5/15/2021 (b) | | | 125,000 | | | | 126,207 | |
| | |
Borough of Columbia GO, 3.00%, 6/15/2022 (b) | | | 50,000 | | | | 51,817 | |
| | |
Borough of West Chester GO, 4.00%, 11/15/2022 | | | 25,000 | | | | 26,521 | |
| | |
Bristol Township School District GO, 5.00%, 6/1/2022 | | | 25,000 | | | | 26,426 | |
| | |
Bucks County Water and Sewer Authority, Water System Rev., AGM, 5.00%, 12/1/2021 (b) | | | 30,000 | | | | 31,091 | |
| | |
Butler Area Sewer Authority Series 2020A, Rev., 5.00%, 7/1/2022 | | | 505,000 | | | | 536,770 | |
| | |
Capital Region Water Series 2016A, Rev., 5.00%, 7/15/2021 | | | 25,000 | | | | 25,439 | |
| | |
Carlisle Area School District, Limited Tax GO, 3.00%, 9/1/2024 | | | 25,000 | | | | 27,119 | |
| | |
Central Bradford Progress Authority, Guthrie Healthcare System Rev., 4.00%, 12/1/2021 | | | 380,000 | | | | 390,370 | |
| | |
Centre County Hospital Authority, Mount Nittany Medical Center Project Rev., 6.00%, 11/15/2021 (b) | | | 200,000 | | | | 208,214 | |
| | |
Chambersburg Area School District Series A, GO, 5.00%, 3/1/2021 | | | 25,000 | | | | 25,000 | |
| | |
Chartiers Valley School District Series 2015A, GO, 5.00%, 10/15/2021 | | | 25,000 | | | | 25,736 | |
| | |
Cheltenham Township School District Series 2021A, GO, 2.00%, 9/15/2022 | | | 20,000 | | | | 20,518 | |
| | |
City of Philadelphia | | | | | | | | |
| | |
Series 2020-2021A, Rev., TRAN, 4.00%, 6/30/2021 | | | 60,000 | | | | 60,755 | |
| | |
Series 2019A, GO, 5.00%, 8/1/2021 | | | 125,000 | | | | 127,322 | |
| | |
City of Philadelphia, Airport System Series 2017A, Rev., 5.00%, 7/1/2021 | | | 100,000 | | | | 101,555 | |
| | |
City of Pittsburgh | | | | | | | | |
| | |
GO, 3.00%, 9/1/2021 | | | 110,000 | | | | 111,497 | |
| | |
Series 2012A, GO, 5.00%, 9/1/2022 (b) | | | 110,000 | | | | 117,976 | |
| | |
Series 2012B, GO, 5.00%, 9/1/2022 (b) | | | 25,000 | | | | 26,813 | |
| | |
GO, 4.00%, 9/1/2023 | | | 100,000 | | | | 108,807 | |
| | |
Colonial School District Series 2017B, GO, 4.00%, 5/15/2022 | | | 45,000 | | | | 46,986 | |
SEE NOTES TO FINANCIAL STATEMENTS.
| | | | | | | | |
| | | |
| FEBRUARY 28, 2021 | | J.P. MORGAN EXCHANGE-TRADED FUNDS | | | | | 283 | |
JPMorgan Ultra-Short Municipal Income ETF
SCHEDULE OF PORTFOLIO INVESTMENTS
AS OF FEBRUARY 28, 2021 (continued)
| | | | | | | | |
| INVESTMENTS | | PRINCIPAL
AMOUNT ($) | | | VALUE ($) | |
Municipal Bonds — continued | | | | | | | | |
|
Pennsylvania — continued | |
| | |
Commonwealth Financing Authority, Tobacco Master Settlement Payment | | | | | | | | |
| | |
Rev., 5.00%, 6/1/2021 | | | 100,000 | | | | 101,122 | |
| | |
Rev., 5.00%, 6/1/2023 | | | 365,000 | | | | 401,208 | |
| | |
Rev., 5.00%, 6/1/2024 | | | 395,000 | | | | 449,877 | |
| | |
Rev., 5.00%, 6/1/2026 | | | 150,000 | | | | 181,316 | |
| | |
Commonwealth of Pennsylvania | | | | | | | | |
| | |
Series 2014-1, GO, 5.00%, 6/15/2021 | | | 40,000 | | | | 40,557 | |
| | |
GO, 5.00%, 7/1/2021 | | | 25,000 | | | | 25,402 | |
| | |
Series 2014-1, GO, 5.00%, 7/1/2021 | | | 50,000 | | | | 50,805 | |
| | |
Series 2016-2, GO, 5.00%, 9/15/2021 | | | 125,000 | | | | 128,261 | |
| | |
Series 2011, GO, 5.00%, 11/15/2021 (b) | | | 100,000 | | | | 103,420 | |
| | |
Series 2012-1, GO, 5.00%, 6/1/2022 (b) | | | 170,000 | | | | 180,292 | |
| | |
Series 2016-2, GO, 5.00%, 1/15/2023 | | | 150,000 | | | | 163,251 | |
| | |
Conestoga Valley School District GO, 4.00%, 2/1/2022 | | | 25,000 | | | | 25,843 | |
| | |
Conewago Valley School District GO, 2.00%, 9/1/2021 | | | 25,000 | | | | 25,031 | |
| | |
Cornwall Lebanon School District GO, 4.00%, 2/15/2022 | | | 45,000 | | | | 46,561 | |
| | |
Council Rock School District | | | | | | | | |
| | |
GO, 4.00%, 11/15/2021 | | | 45,000 | | | | 46,213 | |
| | |
Series 2017A, GO, 5.00%, 8/15/2022 | | | 20,000 | | | | 21,398 | |
| | |
GO, 4.00%, 11/15/2022 | | | 120,000 | | | | 127,769 | |
| | |
County of Allegheny | | | | | | | | |
| | |
Series C-65, GO, 5.00%, 5/1/2021 (b) | | | 25,000 | | | | 25,199 | |
| | |
Series C-67, GO, 5.00%, 11/1/2021 (b) | | | 20,000 | | | | 20,646 | |
| | |
Series C-68, GO, 5.00%, 11/1/2021 (b) | | | 20,000 | | | | 20,646 | |
| | |
Series C-69, GO, 5.00%, 12/1/2021 (b) | | | 75,000 | | | | 77,727 | |
| | |
Series C-69, GO, 5.00%, 12/1/2022 (b) | | | 50,000 | | | | 54,120 | |
| | |
Series C-70, GO, 5.00%, 12/1/2022 (b) | | | 25,000 | | | | 27,106 | |
| | |
County of Bucks | | | | | | | | |
| | |
GO, 5.00%, 6/1/2021 | | | 30,000 | | | | 30,360 | |
| | |
GO, 5.00%, 12/1/2022 | | | 45,000 | | | | 48,791 | |
| | | | | | | | |
| INVESTMENTS | | PRINCIPAL
AMOUNT ($) | | | VALUE ($) | |
| | | | | | | | |
|
Pennsylvania — continued | |
| | |
County of Chester | | | | | | | | |
| | |
GO, 4.00%, 11/15/2021 (b) | | | 20,000 | | | | 20,543 | |
| | |
GO, 5.00%, 11/15/2021 (b) | | | 55,000 | | | | 56,881 | |
| | |
County of Dauphin | | | | | | | | |
| | |
GO, 5.00%, 11/15/2021 | | | 70,000 | | | | 72,388 | |
| | |
Series 2016A, GO, 4.00%, 11/15/2022 | | | 40,000 | | | | 42,604 | |
| | |
Series 2016C, GO, 4.00%, 10/1/2023 | | | 25,000 | | | | 27,309 | |
| | |
GO, 4.00%, 11/15/2023 | | | 35,000 | | | | 38,371 | |
| | |
County of Lancaster | | | | | | | | |
| | |
Series 2016A, GO, 4.00%, 5/1/2021 | | | 75,000 | | | | 75,449 | |
| | |
Series 2016A, GO, 5.00%, 5/1/2022 | | | 125,000 | | | | 131,730 | |
| | |
Series 2016B, GO, 3.00%, 11/1/2022 | | | 105,000 | | | | 109,684 | |
| | |
Series 2017C, GO, 4.00%, 11/1/2022 | | | 20,000 | | | | 21,169 | |
| | |
GO, 5.00%, 5/1/2023 | | | 25,000 | | | | 27,445 | |
| | |
Series 2020C, GO, 4.00%, 11/1/2023 | | | 50,000 | | | | 54,475 | |
| | |
County of Montgomery | | | | | | | | |
| | |
GO, 5.00%, 5/1/2022 | | | 50,000 | | | | 52,819 | |
| | |
Series 2009C, GO, 5.00%, 12/15/2023 | | | 25,000 | | | | 25,089 | |
| | |
County of Westmoreland Series 2013A, GO, 5.00%, 12/1/2021 | | | 25,000 | | | | 25,859 | |
| | |
County of York | | | | | | | | |
| | |
Series A, GO, 4.00%, 6/1/2022 | | | 205,000 | | | | 214,541 | |
| | |
GO, 4.00%, 12/1/2022 | | | 30,000 | | | | 31,949 | |
| | |
Series 2016A, GO, 3.00%, 12/1/2023 | | | 30,000 | | | | 32,046 | |
| | |
Crawford Central School District GO, 4.00%, 2/1/2022 | | | 35,000 | | | | 36,164 | |
| | |
Crestwood School District GO, 4.00%, 3/1/2021 | | | 25,000 | | | | 25,000 | |
| | |
Cumberland Valley School District Series 2015A, GO, 4.00%, 11/15/2021 | | | 30,000 | | | | 30,791 | |
| | |
Dauphin County General Authority, Pinnacle Health System Project | | | | | | | | |
| | |
Series 2016A, Rev., 5.00%, 6/1/2021 | | | 210,000 | | | | 212,388 | |
| | |
Series 2016A, Rev., 5.00%, 6/1/2022 | | | 140,000 | | | | 147,985 | |
| | |
Delaware County Authority, Neumann University Rev., 4.00%, 10/1/2021 | | | 180,000 | | | | 183,181 | |
| | |
Delaware County Authority, Villanova University Rev., 5.00%, 12/1/2021 | | | 125,000 | | | | 129,342 | |
SEE NOTES TO FINANCIAL STATEMENTS.
| | | | | | |
| | | |
| 284 | | | | J.P. MORGAN EXCHANGE-TRADED FUNDS | | FEBRUARY 28, 2021 |
| | | | | | | | |
| INVESTMENTS | | PRINCIPAL
AMOUNT ($) | | | VALUE ($) | |
Municipal Bonds — continued | | | | | | | | |
|
Pennsylvania — continued | |
| | |
Delaware County Regional Water Quality Control Authority Rev., NATL-RE, 5.25%, 5/1/2022 | | | 100,000 | | | | 105,855 | |
| | |
Derry Township Industrial & Commercial Development Authority, Derry Township Municipal Center Project Rev., 1.00%, 11/15/2023 | | | 160,000 | | | | 161,099 | |
| | |
Easton Area School District Series 2013A, GO, 5.00%, 4/1/2022 | | | 30,000 | | | | 30,835 | |
| | |
Fleetwood Area School District GO, 5.00%, 6/1/2021 | | | 20,000 | | | | 20,230 | |
| | |
Fox Chapel Area School District GO, 4.00%, 8/1/2021 | | | 90,000 | | | | 91,380 | |
| | |
Garnet Valley School District GO, 4.00%, 4/1/2023 | | | 20,000 | | | | 21,498 | |
| | |
Geisinger Authority, Health System | | | | | | | | |
| | |
Rev., 5.00%, 4/1/2022 | | | 80,000 | | | | 84,080 | |
| | |
Series A-1, Rev., 5.00%, 6/1/2023 | | | 430,000 | | | | 434,902 | |
| | |
Series A-2, Rev., 5.00%, 6/1/2024 | | | 250,000 | | | | 252,770 | |
| | |
Gettysburg Area School District GO, 5.00%, 1/15/2024 | | | 20,000 | | | | 22,481 | |
| | |
Hamburg Area School District | | | | | | | | |
| | |
GO, 5.00%, 4/1/2022 | | | 85,000 | | | | 89,354 | |
| | |
GO, 5.00%, 4/1/2023 | | | 20,000 | | | | 21,911 | |
| | |
Hampton Township School District GO, 2.00%, 11/15/2021 | | | 25,000 | | | | 25,247 | |
| | |
Hempfield Area School District GO, AGM, 5.00%, 3/15/2021 (b) | | | 280,000 | | | | 280,487 | |
| | |
Hempfield School District Series 2019A, GO, 4.00%, 8/1/2022 | | | 85,000 | | | | 89,360 | |
| | |
Hollidaysburg Area School District GO, 4.00%, 3/15/2021 | | | 100,000 | | | | 100,132 | |
| | |
Lancaster Area Sewer Authority Rev., 5.00%, 4/1/2021 | | | 215,000 | | | | 215,815 | |
| | |
Lancaster County Hospital Authority, Health Center, Masonic Villages Project Rev., 2.13%, 11/1/2021 | | | 180,000 | | | | 181,742 | |
| | |
Lancaster Higher Education Authority Series 2016A, Rev., 5.00%, 10/1/2021 | | | 65,000 | | | | 66,802 | |
| | |
Lancaster Industrial Development Authority, Garden Spot Village Project Rev., 5.38%, 5/1/2023 (b) | | | 20,000 | | | | 22,192 | |
| | |
Lancaster School District Series 2019B, GO, AGM, 4.00%, 6/1/2021 | | | 25,000 | | | | 25,226 | |
| | |
Ligonier Valley School District Series 2016A, GO, 5.00%, 3/1/2022 | | | 25,000 | | | | 26,169 | |
| | |
Marple Newtown School District GO, 5.00%, 6/1/2022 | | | 20,000 | | | | 21,206 | |
| | | | | | | | |
| INVESTMENTS | | PRINCIPAL
AMOUNT ($) | | | VALUE ($) | |
| | | | | | | | |
|
Pennsylvania — continued | |
| | |
Mars Area School District GO, AGM, 4.13%, 3/1/2022 (b) | | | 25,000 | | | | 25,979 | |
| | |
Methacton School District | | | | | | | | |
| | |
Series 2019AA, GO, 4.00%, 8/1/2021 | | | 25,000 | | | | 25,383 | |
| | |
GO, 4.00%, 3/1/2022 | | | 25,000 | | | | 25,920 | |
| | |
Monroeville Finance Authority, University of Pittsburg Medical Center | | | | | | | | |
| | |
Rev., 5.00%, 2/15/2022 | | | 45,000 | | | | 47,033 | |
| | |
Series 2013B, Rev., 5.00%, 7/1/2022 | | | 100,000 | | | | 106,291 | |
| | |
Series 2013B, Rev., 3.50%, 7/1/2023 | | | 130,000 | | | | 139,179 | |
| | |
Montgomery County Higher Education and Health Authority, Abington Memorial Hospital Rev., 5.00%, 6/1/2022 (b) | | | 100,000 | | | | 105,924 | |
| | |
Montgomery County Industrial Development Authority, Waverly Heights Ltd. Project | | | | | | | | |
| | |
Rev., 4.00%, 12/1/2021 | | | 100,000 | | | | 102,355 | |
| | |
Rev., 4.00%, 12/1/2022 | | | 100,000 | | | | 105,316 | |
| | |
Rev., 4.00%, 12/1/2023 | | | 125,000 | | | | 134,826 | |
| | |
Mount Lebanon School District GO, 5.00%, 2/15/2022 | | | 20,000 | | | | 20,913 | |
| | |
Muhlenberg School District | | | | | | | | |
| | |
GO, 1.50%, 5/15/2022 | | | 70,000 | | | | 70,999 | |
| | |
GO, 4.00%, 5/15/2022 | | | 20,000 | | | | 20,885 | |
| | |
Newtown Township Sewer Authority Rev., GTD, 4.00%, 9/1/2021 | | | 65,000 | | | | 66,247 | |
| | |
North Hills School District | | | | | | | | |
| | |
GO, 4.00%, 10/15/2021 | | | 275,000 | | | | 281,223 | |
| | |
Series 2016B, GO, 5.00%, 12/15/2021 | | | 100,000 | | | | 103,655 | |
| | |
North Penn School District Series 2019A, GO, 3.00%, 1/15/2025 | | | 30,000 | | | | 32,763 | |
| | |
Northampton County General Purpose Authority, St. Luke’s University Health Network Project Series 2016A, Rev., 5.00%, 8/15/2022 | | | 130,000 | | | | 138,536 | |
| | |
Owen J Roberts School District Series 2016A, GO, 3.00%, 8/15/2021 | | | 25,000 | | | | 25,312 | |
| | |
Oxford Area School District Series 2014A, GO, 5.00%, 2/15/2022 | | | 40,000 | | | | 41,827 | |
| | |
Parkland School District | | | | | | | | |
| | |
GO, 4.00%, 4/15/2021 | | | 30,000 | | | | 30,133 | |
| | |
GO, 5.00%, 4/15/2022 | | | 100,000 | | | | 105,248 | |
SEE NOTES TO FINANCIAL STATEMENTS.
| | | | | | | | |
| | | |
| FEBRUARY 28, 2021 | | J.P. MORGAN EXCHANGE-TRADED FUNDS | | | | | 285 | |
JPMorgan Ultra-Short Municipal Income ETF
SCHEDULE OF PORTFOLIO INVESTMENTS
AS OF FEBRUARY 28, 2021 (continued)
| | | | | | | | |
| INVESTMENTS | | PRINCIPAL
AMOUNT ($) | | | VALUE ($) | |
Municipal Bonds — continued | | | | | | | | |
|
Pennsylvania — continued | |
| | |
Pennridge School District | | | | | | | | |
| | |
Series 2014A, GO, 3.00%, 2/15/2022 (b) | | | 90,000 | | | | 92,389 | |
| | |
Series 2014B, GO, 5.00%, 2/15/2022 (b) | | | 150,000 | | | | 156,879 | |
| | |
Pennsbury School District GO, 5.00%, 1/15/2022 | | | 25,000 | | | | 26,031 | |
| | |
Pennsylvania Economic Development Financing Authority, University of Pittsburgh Medical Center | | | | | | | | |
| | |
Series 2013A, Rev., 5.00%, 7/1/2021 | | | 100,000 | | | | 101,572 | |
| | |
Series 2017A, Rev., 4.00%, 11/15/2021 | | | 415,000 | | | | 425,948 | |
| | |
Series 2014A, Rev., 5.00%, 2/1/2022 | | | 150,000 | | | | 156,499 | |
| | |
Rev., 5.00%, 3/15/2022 | | | 105,000 | | | | 110,158 | |
| | |
Series 2017A, Rev., 4.00%, 11/15/2022 | | | 145,000 | | | | 154,181 | |
| | |
Series 2014A, Rev., 5.00%, 2/1/2023 | | | 140,000 | | | | 152,463 | |
| | |
Pennsylvania Economic Development Financing Authority, Waste Management, Inc., Project Rev., 2.80%, 12/1/2021 (c) | | | 440,000 | | | | 448,536 | |
| | |
Pennsylvania Higher Educational Facilities Authority, BRYN MAWR College | | | | | | | | |
| | |
Series 2012A, Rev., 4.00%, 12/1/2022 | | | 55,000 | | | | 58,653 | |
| | |
Rev., 5.00%, 12/1/2023 | | | 25,000 | | | | 28,016 | |
| | |
Rev., 5.00%, 12/1/2024 | | | 70,000 | | | | 81,134 | |
| | |
Pennsylvania Higher Educational Facilities Authority, State System of Higher Education Series AM, Rev., 5.00%, 6/15/2021 (b) | | | 125,000 | | | | 126,736 | |
| | |
Pennsylvania Higher Educational Facilities Authority, Temple University | | | | | | | | |
| | |
Series 2012, Rev., 5.00%, 4/1/2021 | | | 150,000 | | | | 150,580 | |
| | |
Series 2012-1, Rev., 5.00%, 4/1/2022 (b) | | | 160,000 | | | | 168,394 | |
| | |
Pennsylvania Higher Educational Facilities Authority, Thomas Jefferson University Rev., 5.00%, 3/1/2022 | | | 25,000 | | | | 26,143 | |
| | |
Pennsylvania Higher Educational Facilities Authority, Trustees of the University | | | | | | | | |
| | |
Series 2011A, Rev., 5.00%, 3/1/2021 (b) | | | 250,000 | | | | 250,000 | |
| | | | | | | | |
| INVESTMENTS | | PRINCIPAL
AMOUNT ($) | | | VALUE ($) | |
| | | | | | | | |
|
Pennsylvania — continued | |
| | |
Series 2016A, Rev., 2.25%, 8/15/2021 (b) (c) | | | 115,000 | | | | 116,045 | |
| | |
Series 2016A, Rev., 5.00%, 8/15/2021 | | | 100,000 | | | | 102,199 | |
| | |
Pennsylvania Higher Educational Facilities Authority, University of Pennsylvania Health System | | | | | | | | |
| | |
Rev., 5.00%, 8/15/2021 | | | 275,000 | | | | 280,946 | |
| | |
Series 2016C, Rev., 5.00%, 8/15/2022 | | | 185,000 | | | | 197,763 | |
| | |
Pennsylvania Housing Finance Agency, Multi-Family Housing Development Rev., 2.45%, 7/1/2021 (c) | | | 125,000 | | | | 125,916 | |
| | |
Pennsylvania Housing Finance Agency, Single Family Mortgage Series 2019-130A, Rev., 1.40%, 4/1/2024 | | | 260,000 | | | | 265,489 | |
| | |
Pennsylvania Intergovernmental Cooperation Authority, City of Philadelphia Funding Program | | | | | | | | |
| | |
5.00%, 6/15/2021 | | | 175,000 | | | | 177,364 | |
| | |
5.00%, 6/15/2022 | | | 25,000 | | | | 26,510 | |
| | |
Pennsylvania State University (The) | | | | | | | | |
| | |
Series 2020E, Rev., 5.00%, 3/1/2022 | | | 35,000 | | | | 36,691 | |
| | |
Series 2015B, Rev., 5.00%, 9/1/2022 | | | 50,000 | | | | 53,618 | |
| | |
Series 2019A, Rev., 5.00%, 9/1/2022 | | | 175,000 | | | | 187,661 | |
| | |
Series 2016B, Rev., 5.00%, 9/1/2023 | | | 35,000 | | | | 39,062 | |
| | |
Pennsylvania Turnpike Commission | | | | | | | | |
| | |
Series 2019-2, Rev., VRDO, LOC: TD Bank NA, 0.03%, 3/9/2021 (c) | | | 14,095,000 | | | | 14,095,000 | |
| | |
Series 2011B, Rev., 4.00%, 12/1/2021 (b) | | | 25,000 | | | | 25,722 | |
| | |
Series 2012A, Rev., 4.25%, 12/1/2021 (b) | | | 55,000 | | | | 56,692 | |
| | |
Rev., 5.00%, 12/1/2021 | | | 110,000 | | | | 113,923 | |
| | |
Series 2011E, Rev., 5.00%, 12/1/2021 (b) | | | 30,000 | | | | 31,068 | |
| | |
Series 2013A, Rev., 5.00%, 12/1/2021 | | | 125,000 | | | | 129,487 | |
| | |
Series 2013C, Rev., 5.00%, 12/1/2021 | | | 90,000 | | | | 93,209 | |
| | |
Series 2014C, Rev., 5.00%, 12/1/2021 | | | 50,000 | | | | 51,783 | |
| | |
Series 2016A, Rev., 5.00%, 12/1/2023 | | | 50,000 | | | | 56,355 | |
SEE NOTES TO FINANCIAL STATEMENTS.
| | | | | | |
| | | |
| 286 | | | | J.P. MORGAN EXCHANGE-TRADED FUNDS | | FEBRUARY 28, 2021 |
| | | | | | | | |
| INVESTMENTS | | PRINCIPAL
AMOUNT ($) | | | VALUE ($) | |
Municipal Bonds — continued | | | | | | | | |
|
Pennsylvania — continued | |
| | |
Pennsylvania Turnpike Commission, Motor License Fund-Enhanced Turnpike | | | | | | | | |
| | |
Rev., 5.00%, 12/1/2021 (b) | | | 255,000 | | | | 264,272 | |
| | |
Series B, Rev., 5.00%, 12/1/2021 (b) | | | 50,000 | | | | 51,818 | |
| | |
Rev., 5.00%, 12/1/2022 (b) | | | 75,000 | | | | 81,248 | |
| | |
Rev., 5.00%, 12/1/2023 | | | 290,000 | | | | 323,892 | |
| | |
Pennsylvania Turnpike Commission, Senior Lien | | | | | | | | |
| | |
Series 2012A, Rev., 5.00%, 12/1/2022 (b) | | | 70,000 | | | | 75,896 | |
| | |
Series 2012A, Rev., 5.00%, 12/1/2023 | | | 150,000 | | | | 162,339 | |
| | |
Perkiomen Valley School District GO, 5.00%, 3/1/2024 | | | 25,000 | | | | 28,435 | |
| | |
Philadelphia Authority for Industrial Development, Gift of Life Donor Program Project Rev., VRDO, LOC: TD Bank NA, 0.03%, 3/9/2021 (c) | | | 700,000 | | | | 700,000 | |
| | |
Philadelphia Authority for Industrial Development, National Board of Medical Examiners Project Rev., 5.00%, 5/1/2025 | | | 160,000 | | | | 187,741 | |
| | |
Pittsburgh School District Series 2017A, GO, 5.00%, 9/1/2022 | | | 35,000 | | | | 37,488 | |
| | |
Port Authority of Allegheny County Rev., 5.25%, 3/1/2021 | | | 225,000 | | | | 225,000 | |
| | |
Quaker Valley School District GO, 5.00%, 10/1/2023 | | | 25,000 | | | | 27,868 | |
| | |
Robinson Township Municipal Authority Rev., AGM, 3.00%, 5/15/2022 | | | 35,000 | | | | 36,194 | |
| | |
Rose Tree Media School District GO, 4.00%, 2/1/2022 | | | 20,000 | | | | 20,675 | |
| | |
School District of Philadelphia (The) | | | | | | | | |
| | |
Series 2020-2021A, Rev., TRAN, 4.00%, 6/30/2021 | | | 1,055,000 | | | | 1,068,483 | |
| | |
Series 2015A, GO, 5.00%, 9/1/2021 | | | 40,000 | | | | 40,915 | |
| | |
Somerset Area School District GO, 2.00%, 2/15/2022 | | | 160,000 | | | | 162,339 | |
| | |
South Fayette Township School District Series 2014A, GO, AGM, 4.00%, 9/15/2022 | | | 50,000 | | | | 51,859 | |
| | |
Southcentral General Authority, Wellspan Health Obligated Group Series 2014A, Rev., 5.00%, 6/1/2024 | | | 185,000 | | | | 211,666 | |
| | |
Southeastern Pennsylvania Transportation Authority Rev., 5.00%, 6/1/2021 (b) | | | 60,000 | | | | 60,715 | |
| | | | | | | | |
| INVESTMENTS | | PRINCIPAL
AMOUNT ($) | | | VALUE ($) | |
| | | | | | | | |
|
Pennsylvania — continued | |
| | |
Southern Fulton School District GO, 3.00%, 9/15/2021 | | | 50,000 | | | | 50,684 | |
| | |
Springfield School District GO, 4.00%, 9/1/2021 | | | 50,000 | | | | 50,933 | |
| | |
Spring-Ford Area School District Series 2016A, GO, 4.00%, 3/1/2022 | | | 25,000 | | | | 25,946 | |
| | |
State College Area School District GO, 5.00%, 3/15/2023 | | | 50,000 | | | | 54,820 | |
| | |
Susquehanna Township School District | | | | | | | | |
| | |
GO, 4.00%, 5/15/2021 | | | 80,000 | | | | 80,618 | |
| | |
GO, 4.00%, 5/15/2022 | | | 130,000 | | | | 135,915 | |
| | |
Swarthmore Borough Authority, Swarthmore College Series 2016B, Rev., 5.00%, 9/15/2022 | | | 25,000 | | | | 26,856 | |
| | |
Township of Dover GO, 3.00%, 9/1/2021 | | | 25,000 | | | | 25,325 | |
| | |
Township of East Lampeter GO, 5.00%, 11/15/2021 | | | 195,000 | | | | 201,287 | |
| | |
Township of Hampden GO, 4.00%, 5/15/2022 | | | 25,000 | | | | 26,066 | |
| | |
Township of Lower Paxton | | | | | | | | |
| | |
Series 2020B, GO, 1.00%, 4/1/2021 | | | 200,000 | | | | 200,102 | |
| | |
GO, 4.00%, 4/1/2021 | | | 35,000 | | | | 35,103 | |
| | |
GO, 4.00%, 4/1/2024 | | | 30,000 | | | | 32,948 | |
| | |
Township of Milford GO, 5.00%, 3/1/2022 | | | 50,000 | | | | 52,416 | |
| | |
Township of Palmer | | | | | | | | |
| | |
Series 2020D, GO, 3.00%, 11/15/2021 | | | 50,000 | | | | 50,969 | |
| | |
Series 2020A, GO, 5.00%, 11/15/2023 | | | 30,000 | | | | 33,574 | |
| | |
Township of Radnor GO, 3.63%, 11/1/2022 (b) | | | 40,000 | | | | 42,282 | |
| | |
Township of Susquehanna GO, 3.00%, 10/1/2021 | | | 25,000 | | | | 25,415 | |
| | |
Tuscarora School District GO, 2.00%, 4/1/2021 | | | 50,000 | | | | 50,069 | |
| | |
Union County Higher Educational Facilities Financing Authority Series 2013A, Rev., 5.00%, 4/1/2021 | | | 90,000 | | | | 90,352 | |
| | |
Unionville-Chadds Ford School District | | | | | | | | |
| | |
GO, 4.00%, 6/1/2022 | | | 25,000 | | | | 26,179 | |
| | |
Series 2019A, GO, 4.00%, 6/1/2022 | | | 20,000 | | | | 20,944 | |
| | |
Upper Moreland Township School District | | | | | | | | |
| | |
GO, 4.00%, 8/15/2021 | | | 60,000 | | | | 61,006 | |
| | |
GO, 2.00%, 8/15/2022 | | | 140,000 | | | | 143,427 | |
SEE NOTES TO FINANCIAL STATEMENTS.
| | | | | | | | |
| | | |
| FEBRUARY 28, 2021 | | J.P. MORGAN EXCHANGE-TRADED FUNDS | | | | | 287 | |
JPMorgan Ultra-Short Municipal Income ETF
SCHEDULE OF PORTFOLIO INVESTMENTS
AS OF FEBRUARY 28, 2021 (continued)
| | | | | | | | |
| INVESTMENTS | | PRINCIPAL
AMOUNT ($) | | | VALUE ($) | |
Municipal Bonds — continued | | | | | | | | |
|
Pennsylvania — continued | |
| | |
West Chester Area School District | | | | | | | | |
| | |
Series 2012AA, GO, 4.00%, 5/15/2021 | | | 50,000 | | | | 50,386 | |
| | |
GO, 5.00%, 3/15/2022 | | | 85,000 | | | | 89,221 | |
| | |
Series 2012AA, GO, 4.00%, 5/15/2022 | | | 25,000 | | | | 26,138 | |
| | |
West Jefferson Hills School District GO, 3.00%, 8/1/2024 | | | 25,000 | | | | 26,963 | |
| | |
West View Municipal Authority, Water Rev., 4.00%, 11/15/2021 | | | 25,000 | | | | 25,660 | |
| | |
Westmoreland County Industrial Development Authority Health System, Tax Exempt | | | | | | | | |
| | |
Series 2020A, Rev., 4.00%, 7/1/2021 | | | 250,000 | | | | 252,475 | |
| | |
Series 2020A, Rev., 4.00%, 7/1/2022 | | | 300,000 | | | | 311,802 | |
| | | | | | | | |
| | |
Total Pennsylvania | | | | | | | 36,931,577 | |
| | | | | | | | |
| | |
Rhode Island — 0.9% | | | | | | | | |
| | |
Narragansett Bay Commission, Wastewater System Series C, Rev., 5.00%, 9/1/2022 | | | 25,000 | | | | 26,789 | |
| | |
Rhode Island Commerce Corp., Department of Transportation | | | | | | | | |
| | |
Rev., GAN, 5.00%, 6/15/2021 | | | 515,000 | | | | 522,050 | |
| | |
Series 2016-A, Rev., GAN, 5.00%, 6/15/2022 | | | 885,000 | | | | 939,180 | |
| | |
Series 2017A, Rev., 5.00%, 6/15/2023 | | | 85,000 | | | | 93,180 | |
| | |
Series 2016B, Rev., 5.00%, 6/15/2025 | | | 135,000 | | | | 159,505 | |
| | |
Rhode Island Convention Center Authority Series 2015A, Rev., 5.00%, 5/15/2022 | | | 1,000,000 | | | | 1,049,300 | |
| | |
Rhode Island Health and Educational Building Corp. Series 2016A, Rev., 4.00%, 5/15/2022 | | | 25,000 | | | | 26,094 | |
| | |
Rhode Island Health and Educational Building Corp., Higher Education Facilities, Brown University | | | | | | | | |
| | |
Series A, Rev., 4.50%, 9/1/2021 | | | 50,000 | | | | 51,080 | |
| | |
Rev., 5.00%, 9/1/2021 | | | 370,000 | | | | 378,917 | |
| | |
Rev., 5.00%, 9/1/2022 | | | 30,000 | | | | 32,166 | |
| | |
Rhode Island Health and Educational Building Corp., Higher Education Facilities, Bryant University Rev., VRDO, LOC: TD Bank NA, 0.05%, 3/9/2021 (c) | | | 6,510,000 | | | | 6,510,000 | |
| | | | | | | | |
| INVESTMENTS | | PRINCIPAL
AMOUNT ($) | | | VALUE ($) | |
| | | | | | | | |
|
Rhode Island — continued | |
| | |
Rhode Island Health and Educational Building Corp., Lifespan Obligated Group Series 2016A, Rev., 5.00%, 5/15/2021 | | | 275,000 | | | | 277,109 | |
| | |
Rhode Island Health and Educational Building Corp., Public School Financing Program | | | | | | | | |
| | |
Series 2017B, Rev., GTD, 4.00%, 5/15/2021 | | | 125,000 | | | | 125,942 | |
| | |
Series 2017C, Rev., 5.00%, 5/15/2021 | | | 25,000 | | | | 25,245 | |
| | |
Series 2019A, Rev., 5.00%, 5/15/2021 | | | 25,000 | | | | 25,236 | |
| | |
Series 2016A, Rev., 5.00%, 9/15/2021 | | | 25,000 | | | | 25,637 | |
| | |
Rev., 5.00%, 5/15/2022 | | | 375,000 | | | | 395,865 | |
| | |
Rhode Island Infrastructure Bank Water Pollution Control Revolving Fund | | | | | | | | |
| | |
Series 2012A, Rev., 4.00%, 10/1/2022 | | | 35,000 | | | | 37,115 | |
| | |
Series 2013A, Rev., 5.00%, 10/1/2022 (b) | | | 30,000 | | | | 32,296 | |
| | |
Rhode Island Infrastructure Bank, Municipal Road and Bridge Series 2019A, Rev., 5.00%, 10/1/2022 | | | 150,000 | | | | 161,034 | |
| | |
Rhode Island Infrastructure Bank, Safe Drinking Water Series 2012A, Rev., 5.00%, 10/1/2022 (b) | | | 25,000 | | | | 26,914 | |
| | |
Rhode Island Turnpike and Bridge Authority, Motor Fuel Tax | | | | | | | | |
| | |
Series 2019A, Rev., 5.00%, 10/1/2021 | | | 25,000 | | | | 25,645 | |
| | |
Series 2016A, Rev., 4.00%, 10/1/2022 | | | 180,000 | | | | 189,729 | |
| | |
State of Rhode Island and Providence Plantations Consolidated Capital Development Loan | | | | | | | | |
| | |
Series 2017A, GO, 5.00%, 5/1/2021 | | | 45,000 | | | | 45,358 | |
| | |
Series 2019A, GO, 5.00%, 5/1/2021 | | | 315,000 | | | | 317,507 | |
| | |
Series 2014D, GO, 5.00%, 8/1/2021 | | | 190,000 | | | | 193,819 | |
| | |
Series A, GO, 5.00%, 8/1/2021 | | | 25,000 | | | | 25,503 | |
| | |
Series A, GO, 5.50%, 8/1/2021 (b) | | | 50,000 | | | | 51,111 | |
| | |
Series 2013A, GO, 5.00%, 10/15/2021 | | | 50,000 | | | | 51,504 | |
| | |
Series 2014B, GO, 5.00%, 11/1/2021 | | | 50,000 | | | | 51,612 | |
| | |
Series 2012A, GO, 5.00%, 8/1/2022 | | | 90,000 | | | | 96,150 | |
SEE NOTES TO FINANCIAL STATEMENTS.
| | | | | | |
| | | |
| 288 | | | | J.P. MORGAN EXCHANGE-TRADED FUNDS | | FEBRUARY 28, 2021 |
| | | | | | | | |
| INVESTMENTS | | PRINCIPAL
AMOUNT ($) | | | VALUE ($) | |
Municipal Bonds — continued | | | | | | | | |
|
Rhode Island — continued | |
| | |
Series 2013A, GO, 5.00%, 10/15/2022 | | | 25,000 | | | | 26,956 | |
| | |
Series 2014B, GO, 5.00%, 11/1/2022 | | | 45,000 | | | | 48,610 | |
| | |
Town of Lincoln Series 2015A, GO, 5.00%, 8/1/2022 | | | 180,000 | | | | 192,218 | |
| | |
Town of North Kingstown Series 2015A, GO, 5.00%, 7/15/2021 | | | 45,000 | | | | 45,807 | |
| | | | | | | | |
| | |
Total Rhode Island | | | | | | | 12,282,183 | |
| | | | | | | | |
|
South Carolina — 0.8% | |
| | |
Aiken County Consolidated School District | | | | | | | | |
| | |
Series 2016A, GO, SCSDE, 5.00%, 3/1/2021 | | | 35,000 | | | | 35,000 | |
| | |
Series 2018A, GO, SCSDE, 5.00%, 3/1/2021 | | | 50,000 | | | | 50,000 | |
| | |
Series 2016B, GO, SCSDE, 5.00%, 4/1/2021 | | | 20,000 | | | | 20,078 | |
| | |
Series 2017A, GO, SCSDE, 5.00%, 4/1/2021 | | | 20,000 | | | | 20,078 | |
| | |
Series 2017A, GO, SCSDE, 4.00%, 4/1/2022 | | | 35,000 | | | | 36,455 | |
| | |
Series 2018B, GO, SCSDE, 5.00%, 4/1/2022 | | | 30,000 | | | | 31,570 | |
| | |
Anderson County School District No. 1 GO, SCSDE, 5.00%, 3/1/2022 | | | 55,000 | | | | 57,657 | |
| | |
Anderson County School District No. 4 Series 2018A, GO, SCSDE, 5.00%, 3/1/2022 | | | 80,000 | | | | 83,882 | |
| | |
Beaufort County School District | | | | | | | | |
| | |
Series 2017B, GO, SCSDE, 5.00%, 3/1/2021 | | | 20,000 | | | | 20,000 | |
| | |
Series 2018B, GO, SCSDE, 5.00%, 3/1/2021 | | | 50,000 | | | | 50,000 | |
| | |
GO, SCSDE, 5.00%, 3/1/2024 | | | 30,000 | | | | 34,131 | |
| | |
Beaufort-Jasper Water and Sewer Authority Series 2010B, Rev., 5.00%, 3/1/2021 | | | 40,000 | | | | 40,000 | |
| | |
Berkeley County School District | | | | | | | | |
| | |
Series 2014A, GO, SCSDE, 5.00%, 3/1/2021 | | | 65,000 | | | | 65,000 | |
| | |
Series 2020A, GO, 5.00%, 6/1/2021 | | | 30,000 | | | | 30,360 | |
| | |
Charleston Public Facilities Corp., City of Charleston Project Series 2017A, Rev., 5.00%, 9/1/2021 | | | 35,000 | | | | 35,845 | |
| | |
City of Anderson, Water and Sewer Rev., AGM, 4.00%, 7/1/2021 | | | 25,000 | | | | 25,315 | |
| | |
City of Charleston, Stormwater System Rev., 5.00%, 1/1/2022 | | | 40,000 | | | | 41,610 | |
| | | | | | | | |
| INVESTMENTS | | PRINCIPAL
AMOUNT ($) | | | VALUE ($) | |
| | | | | | | | |
|
South Carolina — continued | |
| | |
City of Columbia, City Stormwater Improvements Rev., 5.00%, 2/1/2022 | | | 40,000 | | | | 41,771 | |
| | |
City of Greenville, Limited Obligation Rev., 4.00%, 6/1/2021 | | | 30,000 | | | | 30,086 | |
| | |
City of North Charleston, Limited Obligation, Tax Increment Pledge Rev., 5.00%, 10/1/2021 | | | 175,000 | | | | 179,778 | |
| | |
Clemson University | | | | | | | | |
| | |
Series 2015B, Rev., 5.00%, 5/1/2021 | | | 50,000 | | | | 50,394 | |
| | |
Series 2015B, Rev., 5.00%, 5/1/2023 | | | 40,000 | | | | 43,894 | |
| | |
Clemson University, Higher Education Bonds | | | | | | | | |
| | |
Rev., 5.00%, 5/1/2021 | | | 25,000 | | | | 25,197 | |
| | |
Rev., 5.00%, 5/1/2023 | | | 110,000 | | | | 120,708 | |
| | |
County of Charleston Series 2013A, GO, 5.00%, 11/1/2021 | | | 25,000 | | | | 25,806 | |
| | |
County of Charleston, Capital Improvement Transportation Sales Tax GO, 4.00%, 11/1/2021 (b) | | | 30,000 | | | | 30,770 | |
| | |
County of Charleston, Transportation Sales Tax GO, 5.00%, 11/1/2021 | | | 25,000 | | | | 25,806 | |
| | |
County of Dorchester | | | | | | | | |
| | |
Series 2013B, GO, 4.00%, 4/1/2021 | | | 45,000 | | | | 45,140 | |
| | |
Series 2013B, GO, 5.00%, 4/1/2022 | | | 25,000 | | | | 26,308 | |
| | |
County of Dorchester, Waterworks & Sewer System Rev., 5.00%, 10/1/2022 | | | 25,000 | | | | 26,909 | |
| | |
County of Florence, McLeod Medical Center Project | | | | | | | | |
| | |
Rev., 5.00%, 11/1/2021 | | | 25,000 | | | | 25,780 | |
| | |
Rev., 5.00%, 11/1/2022 | | | 245,000 | | | | 264,012 | |
| | |
County of Horry GO, 4.00%, 3/1/2021 | | | 20,000 | | | | 20,000 | |
| | |
County of Richland, Library Projects Series 2016B, GO, 5.00%, 3/1/2022 | | | 25,000 | | | | 26,210 | |
| | |
County of Spartanburg GO, 5.00%, 4/1/2021 | | | 50,000 | | | | 50,195 | |
| | |
County of Spartanburg, Public Works Project Rev., 3.00%, 4/1/2021 | | | 95,000 | | | | 95,218 | |
| | |
County of York GO, 5.00%, 4/1/2022 | | | 25,000 | | | | 26,309 | |
| | |
Dorchester County School District No. 2 Series 2014A, GO, SCSDE, 5.00%, 3/1/2021 | | | 60,000 | | | | 60,000 | |
| | |
Fort Mill School District No. 4 | | | | | | | | |
| | |
Series 2012A, GO, SCSDE, 4.00%, 3/1/2021 | | | 50,000 | | | | 50,000 | |
SEE NOTES TO FINANCIAL STATEMENTS.
| | | | | | | | |
| | | |
| FEBRUARY 28, 2021 | | J.P. MORGAN EXCHANGE-TRADED FUNDS | | | | | 289 | |
JPMorgan Ultra-Short Municipal Income ETF
SCHEDULE OF PORTFOLIO INVESTMENTS
AS OF FEBRUARY 28, 2021 (continued)
| | | | | | | | |
| INVESTMENTS | | PRINCIPAL
AMOUNT ($) | | | VALUE ($) | |
Municipal Bonds — continued | | | | | | | | |
|
South Carolina — continued | |
| | |
Series 2013B, GO, SCSDE, 5.00%, 3/1/2021 | | | 55,000 | | | | 55,000 | |
| | |
Series 2013D, GO, SCSDE, 5.00%, 3/1/2021 | | | 140,000 | | | | 140,000 | |
| | |
Series 2016D, GO, SCSDE, 5.00%, 3/1/2021 | | | 55,000 | | | | 55,000 | |
| | |
Series 2018A, GO, SCSDE, 5.00%, 3/1/2021 | | | 235,000 | | | | 235,000 | |
| | |
Series 2016D, GO, SCSDE, 5.00%, 3/1/2022 | | | 20,000 | | | | 20,970 | |
| | |
Grand Strand Water and Sewer Authority, Water work & Sewer System Series 2011B, Rev., 5.00%, 6/1/2021 | | | 80,000 | | | | 80,961 | |
| | |
Greenville County School District | | | | | | | | |
| | |
Series 2020C, GO, SCSDE, 3.00%, 6/1/2021 | | | 185,000 | | | | 186,312 | |
| | |
Rev., 5.00%, 12/1/2021 | | | 200,000 | | | | 207,318 | |
| | |
Rev., 5.00%, 12/1/2022 | | | 60,000 | | | | 65,076 | |
| | |
Greenville Health System Rev., 5.00%, 5/1/2023 | | | 120,000 | | | | 126,428 | |
| | |
Horry County School District | | | | | | | | |
| | |
GO, SCSDE, 5.00%, 3/1/2021 | | | 230,000 | | | | 230,000 | |
| | |
Rev., 5.00%, 3/1/2021 | | | 130,000 | | | | 130,000 | |
| | |
Lexington County Health Services District, Inc., LexMed Obligated Group | | | | | | | | |
| | |
Rev., 5.00%, 11/1/2021 | | | 345,000 | | | | 355,650 | |
| | |
Rev., 5.00%, 11/1/2022 | | | 200,000 | | | | 215,346 | |
| | |
Lexington County School District No. 1 | | | | | | | | |
| | |
Series 2011C, GO, SCSDE, 4.00%, 2/1/2022 (b) | | | 30,000 | | | | 31,060 | |
| | |
Series 2015A, GO, SCSDE, 5.00%, 2/1/2022 | | | 25,000 | | | | 26,111 | |
| | |
Lexington School District No. 2 Educational Facilities Corp. Series 2015B, Rev., 5.00%, 12/1/2021 | | | 170,000 | | | | 176,037 | |
| | |
Piedmont Municipal Power Agency | | | | | | | | |
| | |
Series 2010A-5, Rev., 5.00%, 1/1/2022 | | | 200,000 | | | | 200,720 | |
| | |
Series 2012B, Rev., 4.00%, 1/1/2023 | | | 200,000 | | | | 205,506 | |
| | |
Series 2017B, Rev., 5.00%, 1/1/2024 | | | 100,000 | | | | 111,861 | |
| | |
Series 2015A, Rev., 5.00%, 1/1/2025 | | | 350,000 | | | | 403,858 | |
| | |
Richland County School District No. 1 Series 2011A, GO, SCSDE, 4.00%, 9/1/2021 (b) | | | 100,000 | | | | 101,923 | |
| | | | | | | | |
| INVESTMENTS | | PRINCIPAL
AMOUNT ($) | | | VALUE ($) | |
| | | | | | | | |
|
South Carolina — continued | |
| | |
Richland County School District No. 2 | | | | | | | | |
| | |
GO, SCSDE, 5.00%, 5/1/2021 | | | 20,000 | | | | 20,160 | |
| | |
Series 2011B, GO, SCSDE, 5.00%, 5/1/2021 (b) | | | 90,000 | | | | 90,718 | |
| | |
Series 2015A, GO, SCSDE, 5.00%, 2/1/2022 | | | 25,000 | | | | 26,107 | |
| | |
GO, SCSDE, 5.00%, 3/1/2022 | | | 20,000 | | | | 20,966 | |
| | |
SCAGO Educational Facilities Corp. for Colleton School District Rev., 5.00%, 12/1/2021 | | | 65,000 | | | | 67,163 | |
| | |
SCAGO Educational Facilities Corp. for Pickens School District Rev., 5.00%, 12/1/2021 | | | 425,000 | | | | 439,765 | |
| | |
South Carolina Association of Governmental Organizations Series 2020C, COP, SCSDE, 2.00%, 3/1/2021 | | | 1,080,000 | | | | 1,080,000 | |
| | |
South Carolina Jobs-Economic Development Authority, Anmed Health Project Rev., 5.00%, 2/1/2023 | | | 125,000 | | | | 135,725 | |
| | |
South Carolina Jobs-Economic Development Authority, Bon Secours Mercy Health, Inc. Rev., 5.00%, 10/1/2025 (c) | | | 200,000 | | | | 234,912 | |
| | |
South Carolina Jobs-Economic Development Authority, Hospital Refunding and Improvement, Mcleod Health Projects Rev., 5.00%, 11/1/2022 | | | 390,000 | | | | 420,264 | |
| | |
South Carolina Public Service Authority, Santee Cooper | | | | | | | | |
| | |
Series 2011B, Rev., 4.00%, 12/1/2021 (b) | | | 25,000 | | | | 25,713 | |
| | |
Series 2011B, Rev., 5.00%, 12/1/2021 (b) | | | 80,000 | | | | 82,847 | |
| | |
Series 2012-D, Rev., 5.00%, 6/1/2022 (b) | | | 170,000 | | | | 180,181 | |
| | |
South Carolina Transportation Infrastructure Bank Series 2012A, Rev., 5.00%, 10/1/2021 (b) | | | 385,000 | | | | 395,690 | |
| | |
State of South Carolina, Clemson University | | | | | | | | |
| | |
Series 2011B, GO, 5.00%, 3/1/2021 (b) | | | 40,000 | | | | 40,000 | |
| | |
Series 2017A, GO, 5.00%, 4/1/2021 | | | 25,000 | | | | 25,099 | |
| | |
State of South Carolina, Lander University Series 2016G, GO, 5.00%, 6/1/2021 | | | 75,000 | | | | 75,906 | |
SEE NOTES TO FINANCIAL STATEMENTS.
| | | | | | |
| | | |
| 290 | | | | J.P. MORGAN EXCHANGE-TRADED FUNDS | | FEBRUARY 28, 2021 |
| | | | | | | | |
| INVESTMENTS | | PRINCIPAL
AMOUNT ($) | | | VALUE ($) | |
Municipal Bonds — continued | | | | | | | | |
|
South Carolina — continued | |
| | |
State of South Carolina, University of South Carolina Series 2017B, GO, 5.00%, 4/1/2021 | | | 25,000 | | | | 25,099 | |
| | |
Town of Summerville, Hospitality Fee Pledge Series 2015B, Rev., 5.00%, 10/1/2023 | | | 300,000 | | | | 332,127 | |
| | |
University of South Carolina, Athletic Facilities | | | | | | | | |
| | |
Series 2017A, Rev., 5.00%, 5/1/2021 | | | 150,000 | | | | 151,182 | |
| | |
Series 2017B, Rev., 5.00%, 5/1/2024 | | | 410,000 | | | | 462,492 | |
| | |
Series 2017B, Rev., 5.00%, 5/1/2025 | | | 530,000 | | | | 615,267 | |
| | |
University of South Carolina, Higher Education | | | | | | | | |
| | |
Rev., 5.00%, 5/1/2021 | | | 80,000 | | | | 80,631 | |
| | |
Rev., 5.00%, 5/1/2022 | | | 20,000 | | | | 21,113 | |
| | |
Rev., 5.00%, 5/1/2023 | | | 30,000 | | | | 32,900 | |
| | |
University of South Carolina, Higher Education Facilities | | | | | | | | |
| | |
Rev., 5.00%, 5/1/2021 | | | 85,000 | | | | 85,670 | |
| | |
Rev., 5.00%, 5/1/2022 | | | 125,000 | | | | 131,956 | |
| | |
Rev., 5.00%, 5/1/2023 | | | 45,000 | | | | 49,350 | |
| | |
Rev., 5.00%, 5/1/2024 | | | 25,000 | | | | 26,254 | |
| | |
Rev., 5.00%, 5/1/2025 | | | 20,000 | | | | 23,459 | |
| | | | | | | | |
| | |
Total South Carolina | | | | | | | 10,726,125 | |
| | | | | | | | |
| | |
South Dakota — 0.4% | | | | | | | | |
| | |
City of Rapid City, Sales Tax Rev., 4.00%, 12/1/2021 (b) | | | 35,000 | | | | 35,998 | |
| | |
City of Sioux Falls, Sales Tax | | | | | | | | |
| | |
Series 2012A, Rev., 4.00%, 11/15/2021 | | | 180,000 | | | | 184,826 | |
| | |
Series 2017A, Rev., 5.00%, 11/15/2021 | | | 45,000 | | | | 46,522 | |
| | |
Series 2020A, Rev., 5.00%, 11/15/2022 | | | 25,000 | | | | 27,034 | |
| | |
County of Minnehaha, Limited Tax Series 2014A, COP, 5.00%, 12/1/2021 | | | 125,000 | | | | 129,400 | |
| | |
County of Pennington, Limited Tax | | | | | | | | |
| | |
Series 2017A, COP, 3.00%, 6/1/2021 | | | 25,000 | | | | 25,161 | |
| | |
Series 2017A, COP, 3.00%, 12/1/2021 | | | 225,000 | | | | 229,376 | |
| | |
Rapid City Area School District No. 51-4, Limited Tax, Capital Outlay GO, 4.00%, 8/1/2023 | | | 630,000 | | | | 685,062 | |
| | | | | | | | |
| INVESTMENTS | | PRINCIPAL
AMOUNT ($) | | | VALUE ($) | |
| | | | | | | | |
|
South Dakota — continued | |
| | |
Sioux Falls School District No. 49-5, Limited Tax Series 2011A, GO, 5.00%, 7/1/2021 | | | 45,000 | | | | 45,716 | |
| | |
South Dakota Board of Regents, Housing and Auxiliary Facility System Series 2013A, Rev., 5.00%, 4/1/2021 | | | 70,000 | | | | 70,265 | |
| | |
South Dakota Building Authority Series 2019A, Rev., 4.00%, 6/1/2022 | | | 50,000 | | | | 52,289 | |
| | |
South Dakota Conservancy District, State Revolving Fund Program Series 2012B, Rev., 4.00%, 8/1/2021 | | | 20,000 | | | | 20,316 | |
| | |
South Dakota Health and Educational Facilities Authority, Avera Health Series 2012A, Rev., 5.00%, 7/1/2021 (b) | | | 100,000 | | | | 101,507 | |
| | |
South Dakota Health and Educational Facilities Authority, Regional Health | | | | | | | | |
| | |
Rev., 5.00%, 9/1/2021 | | | 35,000 | | | | 35,821 | |
| | |
Rev., 5.00%, 9/1/2022 | | | 140,000 | | | | 149,713 | |
| | |
South Dakota Health and Educational Facilities Authority, Vocational Education Program | | | | | | | | |
| | |
Series 2015C, Rev., 5.00%, 8/1/2021 | | | 25,000 | | | | 25,492 | |
| | |
Rev., 5.00%, 8/1/2022 | | | 20,000 | | | | 21,337 | |
| | |
South Dakota Housing Development Authority, Homeownership Mortgage Series B, Rev., 2.70%, 11/1/2021 | | | 15,000 | | | | 15,232 | |
| | |
South Dakota State Building Authority | | | | | | | | |
| | |
Series 2011A, Rev., 5.00%, 9/1/2021 | | | 60,000 | | | | 61,406 | |
| | |
Series 2017A, Rev., 4.00%, 6/1/2022 | | | 50,000 | | | | 52,289 | |
| | |
Series 2018A, Rev., 4.00%, 6/1/2022 | | | 25,000 | | | | 26,144 | |
| | |
Series 2013B, Rev., 5.00%, 6/1/2022 | | | 80,000 | | | | 84,656 | |
| | |
Series 2015B, Rev., 5.00%, 6/1/2022 | | | 35,000 | | | | 37,037 | |
| | |
Series A, Rev., 5.00%, 6/1/2022 | | | 50,000 | | | | 52,910 | |
| | |
Series 2014D, Rev., 5.00%, 9/1/2022 | | | 80,000 | | | | 85,588 | |
| | |
Series 2019A, Rev., 4.00%, 6/1/2024 | | | 30,000 | | | | 33,318 | |
| | |
Series 2014D, Rev., 5.00%, 9/1/2024 | | | 25,000 | | | | 28,811 | |
SEE NOTES TO FINANCIAL STATEMENTS.
| | | | | | | | |
| | | |
| FEBRUARY 28, 2021 | | J.P. MORGAN EXCHANGE-TRADED FUNDS | | | | | 291 | |
JPMorgan Ultra-Short Municipal Income ETF
SCHEDULE OF PORTFOLIO INVESTMENTS
AS OF FEBRUARY 28, 2021 (continued)
| | | | | | | | |
| INVESTMENTS | | PRINCIPAL
AMOUNT ($) | | | VALUE ($) | |
Municipal Bonds — continued | | | | | | | | |
|
South Dakota — continued | |
| | |
Tender Option Bond Trust Receipts/Certificates Series 2020-XG0302, Rev., VRDO, LIQ: Barclays Bank plc, 0.17%, 3/9/2021 (c) (f) | | | 3,680,000 | | | | 3,680,000 | |
| | | | | | | | |
| | |
Total South Dakota | | | | | | | 6,043,226 | |
| | | | | | | | |
| | |
Tennessee — 1.7% | | | | | | | | |
| | |
Chattanooga Health Educational and Housing Facility Board, Catholic Health Initiatives Series 2013A, Rev., 5.25%, 1/1/2023 (b) | | | 1,615,000 | | | | 1,758,945 | |
| | |
City of Chattanooga Series 2017B, GO, 5.00%, 3/1/2021 | | | 25,000 | | | | 25,000 | |
| | |
City of Chattanooga, Electric System | | | | | | | | |
| | |
Series 2015A, Rev., 5.00%, 9/1/2021 | | | 75,000 | | | | 76,811 | |
| | |
Series A, Rev., 5.00%, 9/1/2022 | | | 50,000 | | | | 53,618 | |
| | |
City of Clarksville, Water Sewer and Gas Rev., 5.00%, 2/1/2022 | | | 25,000 | | | | 26,107 | |
| | |
City of Franklin, Public Improvement GO, 5.00%, 4/1/2022 | | | 50,000 | | | | 52,617 | |
| | |
City of Franklin, Water and Sewer GO, 5.00%, 4/1/2021 | | | 25,000 | | | | 25,098 | |
| | |
City of Johnson City GO, 5.00%, 6/1/2021 | | | 20,000 | | | | 20,240 | |
| | |
City of Kingsport Series 2017A, GO, 5.00%, 3/1/2022 | | | 115,000 | | | | 120,556 | |
| | |
City of Knoxville, Electric System | | | | | | | | |
| | |
GO, 5.00%, 5/1/2021 | | | 55,000 | | | | 55,438 | |
| | |
Series 2017HH, Rev., 5.00%, 7/1/2021 | | | 50,000 | | | | 50,802 | |
| | |
Series 2017-II, Rev., 5.00%, 7/1/2021 | | | 20,000 | | | | 20,321 | |
| | |
Series 2012-AA, Rev., 3.00%, 7/1/2023 | | | 100,000 | | | | 100,877 | |
| | |
City of Knoxville, Gas System Series 2013-T, Rev., 4.00%, 3/1/2021 | | | 50,000 | | | | 50,000 | |
| | |
City of Knoxville, Waterworks System | | | | | | | | |
| | |
Series 2015A, Rev., 5.00%, 4/1/2021 | | | 75,000 | | | | 75,293 | |
| | |
Series 2015A, Rev., 5.00%, 4/1/2022 | | | 25,000 | | | | 26,309 | |
| | |
City of Memphis Series 2012A, GO, 5.00%, 4/1/2021 | | | 55,000 | | | | 55,215 | |
| | |
City of Memphis, General Improvement | | | | | | | | |
| | |
GO, 5.00%, 6/1/2021 | | | 50,000 | | | | 50,600 | |
| | |
GO, 5.00%, 5/1/2022 | | | 155,000 | | | | 156,214 | |
| | | | | | | | |
| INVESTMENTS | | PRINCIPAL
AMOUNT ($) | | | VALUE ($) | |
| | | | | | | | |
|
Tennessee — continued | |
| | |
City of Memphis, Sanitary Sewerage System | | | | | | | | |
| | |
Rev., 5.00%, 10/1/2021 | | | 265,000 | | | | 272,470 | |
| | |
Rev., 5.00%, 10/1/2022 | | | 45,000 | | | | 48,437 | |
| | |
City of Morristown GO, 4.00%, 10/1/2024 | | | 100,000 | | | | 102,109 | |
| | |
City of Murfreesboro | | | | | | | | |
| | |
GO, 5.00%, 6/1/2021 | | | 100,000 | | | | 101,203 | |
| | |
Series 2020C, GO, 3.00%, 2/1/2022 | | | 35,000 | | | | 35,914 | |
| | |
GO, 5.00%, 6/1/2022 | | | 50,000 | | | | 53,020 | |
| | |
City of Oak Ridge | | | | | | | | |
| | |
GO, 5.00%, 6/1/2021 | | | 25,000 | | | | 25,300 | |
| | |
Series 2015A, GO, 5.00%, 6/1/2021 | | | 45,000 | | | | 45,541 | |
| | |
City of Pigeon Forge GO, 5.00%, 6/1/2021 | | | 40,000 | | | | 40,475 | |
| | |
Columbia Housing & Redevelopment Corp., Northridge Project Rev., 2.40%, 9/1/2021 (c) | | | 150,000 | | | | 151,566 | |
| | |
County of Bradley GO, 5.00%, 6/1/2021 | | | 20,000 | | | | 20,236 | |
| | |
County of Hamilton GO, 3.00%, 3/1/2022 | | | 25,000 | | | | 25,710 | |
| | |
County of Knox | | | | | | | | |
| | |
Series 2005A, GO, 5.00%, 5/1/2021 | | | 100,000 | | | | 100,796 | |
| | |
GO, 5.00%, 6/1/2021 | | | 45,000 | | | | 45,540 | |
| | |
Series 2020A, GO, 5.00%, 8/1/2022 | | | 30,000 | | | | 32,050 | |
| | |
County of Madison | | | | | | | | |
| | |
GO, 5.00%, 4/1/2021 | | | 25,000 | | | | 25,097 | |
| | |
GO, 5.00%, 5/1/2021 | | | 20,000 | | | | 20,159 | |
| | |
GO, 5.00%, 4/1/2022 | | | 20,000 | | | | 21,029 | |
| | |
County of Montgomery GO, 5.00%, 4/1/2021 | | | 40,000 | | | | 40,156 | |
| | |
County of Montgomery, Public Improvement GO, 4.00%, 4/1/2022 | | | 20,000 | | | | 20,829 | |
| | |
County of Montgomery, School And Public Improvement GO, 5.00%, 4/1/2021 | | | 20,000 | | | | 20,078 | |
| | |
County of Putnam GO, 5.00%, 4/1/2022 | | | 25,000 | | | | 26,309 | |
| | |
County of Robertson | | | | | | | | |
| | |
GO, 5.00%, 5/1/2021 | | | 100,000 | | | | 100,796 | |
| | |
Series 2014B, GO, 4.00%, 6/1/2021 | | | 100,000 | | | | 100,954 | |
| | |
County of Rutherford | | | | | | | | |
| | |
GO, 4.00%, 4/1/2021 | | | 25,000 | | | | 25,078 | |
| | |
GO, 5.00%, 4/1/2021 | | | 190,000 | | | | 190,747 | |
| | |
GO, 3.00%, 4/1/2022 (b) | | | 20,000 | | | | 20,611 | |
| | |
GO, 5.00%, 4/1/2022 | | | 45,000 | | | | 47,355 | |
SEE NOTES TO FINANCIAL STATEMENTS.
| | | | | | |
| | | |
| 292 | | | | J.P. MORGAN EXCHANGE-TRADED FUNDS | | FEBRUARY 28, 2021 |
| | | | | | | | |
| INVESTMENTS | | PRINCIPAL
AMOUNT ($) | | | VALUE ($) | |
Municipal Bonds — continued | | | | | | | | |
|
Tennessee — continued | |
| | |
County of Shelby | | | | | | | | |
| | |
Series 2012A, GO, 4.00%, 3/1/2021 | | | 55,000 | | | | 55,000 | |
| | |
Series 2012A, GO, 5.00%, 3/1/2021 | | | 50,000 | | | | 50,000 | |
| | |
Series 2015A, GO, 5.00%, 4/1/2021 | | | 75,000 | | | | 75,293 | |
| | |
Series 2012A, GO, 4.00%, 3/1/2022 | | | 120,000 | | | | 124,602 | |
| | |
Series A, GO, 5.00%, 3/1/2022 | | | 50,000 | | | | 52,416 | |
| | |
Series 2015A, GO, 5.00%, 4/1/2022 | | | 30,000 | | | | 31,570 | |
| | |
Series 2017A, GO, 5.00%, 4/1/2022 | | | 30,000 | | | | 31,570 | |
| | |
Series 2019B, GO, 5.00%, 4/1/2022 | | | 50,000 | | | | 52,617 | |
| | |
County of Sullivan, Improvement | | | | | | | | |
| | |
Series 2015A, GO, 5.00%, 4/1/2021 | | | 100,000 | | | | 100,390 | |
| | |
Series 2015A, GO, 5.00%, 4/1/2022 | | | 25,000 | | | | 26,303 | |
| | |
County of Sumner, School and Public Improvement | | | | | | | | |
| | |
GO, 5.00%, 12/1/2021 | | | 20,000 | | | | 20,724 | |
| | |
GO, 5.00%, 12/1/2022 | | | 125,000 | | | | 135,505 | |
| | |
County of Williamson GO, 4.00%, 4/1/2021 | | | 30,000 | | | | 30,093 | |
| | |
County of Williamson, Public Improvement and School Series 2016B, GO, 5.00%, 4/1/2021 | | | 30,000 | | | | 30,117 | |
| | |
County of Wilson, School Series 2017A, GO, 5.00%, 4/1/2021 | | | 25,000 | | | | 25,098 | |
| | |
County of Wilson, School and Public Improvement GO, 3.00%, 4/1/2021 | | | 50,000 | | | | 50,115 | |
| | |
Highlands Residential Services, Walnut Village Project Rev., GNMA COLL, 1.80%, 4/1/2021 (c) | | | 50,000 | | | | 50,064 | |
| | |
Johnson City Energy Authority, Electric System Rev., 5.00%, 5/1/2022 | | | 25,000 | | | | 26,407 | |
| | |
Knox County Health Educational and Housing Facility Board, Clear Springs Apartments Project Rev., 1.80%, 5/1/2021 (c) | | | 150,000 | | | | 150,393 | |
| | |
Memphis and Shelby County Port Commission Rev., 4.00%, 4/1/2021 | | | 300,000 | | | | 300,921 | |
| | |
Memphis Center City Revenue Finance Corp. Rev., AGM, 4.50%, 11/1/2021 (b) | | | 100,000 | | | | 102,899 | |
| | |
Metropolitan Government Nashville and Davidson County Health and Educational Facilities Bonds, Volunteer Healthcare Rev., Zero Coupon, 6/1/2021 (b) | | | 815,000 | | | | 814,641 | |
| | |
Metropolitan Government of Nashville and Davidson County | | | | | | | | |
| | |
Series 2015A, Rev., 5.00%, 5/15/2021 | | | 45,000 | | | | 45,447 | |
| | |
GO, 5.00%, 7/1/2021 | | | 85,000 | | | | 86,376 | |
| | | | | | | | |
| INVESTMENTS | | PRINCIPAL
AMOUNT ($) | | | VALUE ($) | |
| | | | | | | | |
|
Tennessee — continued | |
| | |
Series 2015A, Rev., 5.00%, 5/15/2022 | | | 20,000 | | | | 21,173 | |
| | |
GO, 5.00%, 7/1/2022 | | | 25,000 | | | | 26,621 | |
| | |
Series 2015A, GO, 5.00%, 7/1/2022 | | | 25,000 | | | | 26,622 | |
| | |
Series 2015C, GO, 5.00%, 7/1/2022 | | | 150,000 | | | | 159,729 | |
| | |
Metropolitan Government of Nashville and Davidson County, Electrical System Series 2011A, Rev., 5.00%, 5/15/2021 (b) | | | 35,000 | | | | 35,345 | |
| | |
Metropolitan Government of Nashville and Davidson County, Water and Sewer | | | | | | | | |
| | |
Series 2017A, Rev., 4.00%, 7/1/2022 | | | 50,000 | | | | 52,578 | |
| | |
Rev., 5.00%, 7/1/2022 | | | 20,000 | | | | 21,297 | |
| | |
Series 2017B, Rev., 5.00%, 7/1/2023 | | | 25,000 | | | | 27,739 | |
| | |
Series 2020B, Rev., 5.00%, 7/1/2023 | | | 35,000 | | | | 38,834 | |
| | |
Pigeon Forge Industrial Development Board, Public Facility Rev., 5.00%, 6/1/2022 | | | 50,000 | | | | 50,533 | |
| | |
Public Building Authority of Sevier County, Local Government Public Improvement Rev., VRDO, GTD, LOC: Bank of America NA, 0.04%, 3/9/2021 (c) | | | 14,370,000 | | | | 14,370,000 | |
| | |
Rutherford County Consolidated Utility District Rev., 4.00%, 2/1/2022 | | | 75,000 | | | | 77,636 | |
| | |
State of Tennessee | | | | | | | | |
| | |
Series 2011A, GO, 5.00%, 10/1/2021 | | | 125,000 | | | | 128,524 | |
| | |
Series 2009B, GO, 5.00%, 11/1/2021 | | | 200,000 | | | | 206,448 | |
| | |
Tennergy Corp. | | | | | | | | |
| | |
Series 2019A, Rev., LIQ: Royal Bank of Canada, 4.00%, 3/1/2021 | | | 200,000 | | | | 200,000 | |
| | |
Series 2019A, Rev., LIQ: Royal Bank of Canada, 5.00%, 10/1/2024 (c) | | | 50,000 | | | | 57,415 | |
| | |
Tennessee Energy Acquisition Corp., Gas Project Series 2006A, Rev., 5.25%, 9/1/2021 | | | 395,000 | | | | 404,646 | |
| | |
Tennessee State School Bond Authority, Higher Educational Facility Second Program | | | | | | | | |
| | |
Rev., 5.00%, 11/1/2021 | | | 100,000 | | | | 103,224 | |
| | |
Series 2014B, Rev., 5.00%, 11/1/2021 | | | 165,000 | | | | 170,320 | |
| | |
Series 2015B, Rev., 5.00%, 11/1/2021 | | | 110,000 | | | | 113,546 | |
SEE NOTES TO FINANCIAL STATEMENTS.
| | | | | | | | |
| | | |
| FEBRUARY 28, 2021 | | J.P. MORGAN EXCHANGE-TRADED FUNDS | | | | | 293 | |
JPMorgan Ultra-Short Municipal Income ETF
SCHEDULE OF PORTFOLIO INVESTMENTS
AS OF FEBRUARY 28, 2021 (continued)
| | | | | | | | |
| INVESTMENTS | | PRINCIPAL
AMOUNT ($) | | | VALUE ($) | |
Municipal Bonds — continued | | | | | | | | |
|
Tennessee — continued | |
| | |
Rev., 5.00%, 11/1/2022 | | | 50,000 | | | | 53,998 | |
| | |
Series 2013A, Rev., 5.00%, 11/1/2022 | | | 25,000 | | | | 26,992 | |
| | |
Series B, Rev., 5.00%, 11/1/2022 | | | 20,000 | | | | 21,594 | |
| | |
Tenth Special School District, Limited Obligation School GO, 4.00%, 4/1/2022 | | | 40,000 | | | | 41,640 | |
| | |
Town of Collierville Series 2015A, GO, 5.00%, 1/1/2022 | | | 75,000 | | | | 78,018 | |
| | |
Town of Collierville, Water and Sewer System GO, 4.00%, 11/1/2021 | | | 30,000 | | | | 30,768 | |
| | |
Town of Smyrna, Water and Sewer System GO, 4.00%, 6/1/2021 | | | 20,000 | | | | 20,191 | |
| | |
West Wilson Utility District, Water Rev., 4.50%, 6/1/2021 (b) | | | 130,000 | | | | 131,355 | |
| | | | | | | | |
| | |
Total Tennessee | | | | | | | 23,724,973 | |
| | | | | | | | |
|
Texas — 6.2% | |
| | |
Abilene Independent School District, Unlimited Tax School Building | | | | | | | | |
| | |
GO, PSF-GTD, 5.00%, 2/15/2022 | | | 55,000 | | | | 57,544 | |
| | |
Alamo Community College District, Financing System Senior Lien Series 2012A, Rev., 5.00%, 11/1/2021 | | | 30,000 | | | | 30,967 | |
| | |
Alamo Community College District, Maintenance Tax | | | | | | | | |
| | |
GO, 4.00%, 2/15/2022 | | | 95,000 | | | | 98,481 | |
| | |
GO, 5.00%, 2/15/2022 | | | 25,000 | | | | 25,091 | |
| | |
GO, 5.50%, 2/15/2022 | | | 85,000 | | | | 89,328 | |
| | |
Alamo Regional Mobility Authority, Vehicle Registration Fee Senior Lien | | | | | | | | |
| | |
Rev., 5.00%, 6/15/2021 | | | 25,000 | | | | 25,347 | |
| | |
Rev., 5.00%, 6/15/2023 | | | 50,000 | | | | 55,246 | |
| | |
Aledo Independent School District, Unlimited Tax GO, PSF-GTD, Zero Coupon, 2/15/2022 | | | 85,000 | | | | 84,733 | |
| | |
Alief Independent School District, School Building GO, PSF-GTD, 5.00%, 2/15/2022 | | | 20,000 | | | | 20,925 | |
| | |
Allen Economic Development Corp., Sales Tax Series 2017A, Rev., 4.00%, 9/1/2021 | | | 135,000 | | | | 137,589 | |
| | |
Allen Independent School District, School Building GO, PSF-GTD, 5.00%, 2/15/2022 (b) | | | 20,000 | | | | 20,927 | |
| | |
Alvin Independent School District, Unlimited Tax Series 2014A, GO, PSF-GTD, 5.00%, 2/15/2022 | | | 100,000 | | | | 104,557 | |
| | | | | | | | |
| INVESTMENTS | | PRINCIPAL
AMOUNT ($) | | | VALUE ($) | |
| | | | | | | | |
|
Texas — continued | |
| | |
Arlington Independent School District, Unlimited Tax GO, PSF-GTD, 5.00%, 2/15/2022 | | | 20,000 | | | | 20,923 | |
| | |
Austin Community College District Public Facility Corp., Hays New Campus Project Rev., 4.00%, 8/1/2022 (b) | | | 25,000 | | | | 26,362 | |
| | |
Austin Community College District Public Facility Corp., Highland Campus — Building 3000 Project Rev., 5.00%, 8/1/2023 | | | 25,000 | | | | 27,798 | |
| | |
Austin Community College District Public Facility Corp., Round Rock Campus Rev., 5.00%, 8/1/2022 | | | 25,000 | | | | 26,690 | |
| | |
Austin Community College District, Combined Fee Series 2016A, Rev., 4.00%, 2/1/2023 | | | 125,000 | | | | 133,595 | |
| | |
Austin Community College District, Limited Tax | | | | | | | | |
| | |
GO, 5.00%, 8/1/2021 | | | 105,000 | | | | 107,115 | |
| | |
GO, 5.00%, 8/1/2022 | | | 20,000 | | | | 21,369 | |
| | |
GO, 5.00%, 8/1/2023 | | | 35,000 | | | | 38,899 | |
| | |
Austin Independent School District, Unlimited Tax | | | | | | | | |
| | |
GO, PSF-GTD, 5.00%, 8/1/2021 | | | 65,000 | | | | 66,309 | |
| | |
Series 2015B, GO, 5.00%, 8/1/2021 | | | 45,000 | | | | 45,904 | |
| | |
Series 2014B, GO, 5.00%, 8/1/2022 | | | 20,000 | | | | 21,367 | |
| | |
Barbers Hill Independent School District, Unlimited Tax GO, 5.00%, 2/15/2022 | | | 90,000 | | | | 94,154 | |
| | |
Bastrop Independent School District, Unlimited Tax Series 2013A, GO, PSF-GTD, 3.00%, 2/15/2023 | | | 140,000 | | | | 145,412 | |
| | |
Belton Independent School District, Unlimited Tax GO, PSF-GTD, 5.00%, 2/15/2022 (b) | | | 85,000 | | | | 88,941 | |
| | |
Benavides Independent School District, Unlimited Tax GO, PSF-GTD, Zero Coupon, 8/15/2021 | | | 140,000 | | | | 139,691 | |
| | |
Bexar County Hospital District GO, 5.00%, 2/15/2022 | | | 50,000 | | | | 52,293 | |
| | |
Bexar County Hospital District, Limited Tax | | | | | | | | |
| | |
GO, 5.00%, 2/15/2022 | | | 25,000 | | | | 26,146 | |
| | |
GO, 5.00%, 2/15/2023 | | | 200,000 | | | | 218,166 | |
| | |
Board of Regents of the University of Texas System, Financing System | | | | | | | | |
| | |
Series 2012A, Rev., 4.00%, 8/15/2021 | | | 25,000 | | | | 25,439 | |
| | |
Series 2006C, Rev., 5.00%, 8/15/2021 | | | 35,000 | | | | 35,773 | |
SEE NOTES TO FINANCIAL STATEMENTS.
| | | | | | |
| | | |
| 294 | | | | J.P. MORGAN EXCHANGE-TRADED FUNDS | | FEBRUARY 28, 2021 |
| | | | | | | | |
| INVESTMENTS | | PRINCIPAL
AMOUNT ($) | | | VALUE ($) | |
Municipal Bonds — continued | | | | | | | | |
|
Texas — continued | |
| | |
Series 2010B, Rev., 5.00%, 8/15/2021 | | | 315,000 | | | | 321,955 | |
| | |
Series 2012A, Rev., 5.00%, 8/15/2021 | | | 25,000 | | | | 25,552 | |
| | |
Series 2014A, Rev., 5.00%, 8/15/2021 | | | 35,000 | | | | 35,773 | |
| | |
Series 2016C, Rev., 5.00%, 8/15/2021 | | | 30,000 | | | | 30,663 | |
| | |
Series 2016D, Rev., 5.00%, 8/15/2021 | | | 20,000 | | | | 20,442 | |
| | |
Series 2016I, Rev., 5.00%, 8/15/2021 | | | 105,000 | | | | 107,318 | |
| | |
Series 2010B, Rev., 5.00%, 8/15/2022 | | | 30,000 | | | | 32,115 | |
| | |
Series 2012B, Rev., 5.00%, 8/15/2022 (b) | | | 175,000 | | | | 187,339 | |
| | |
Series 2016C, Rev., 5.00%, 8/15/2022 | | | 30,000 | | | | 32,115 | |
| | |
Series 2016E, Rev., 5.00%, 8/15/2022 | | | 30,000 | | | | 32,115 | |
| | |
Series 2016J, Rev., 5.00%, 8/15/2022 | | | 80,000 | | | | 85,641 | |
| | |
Boerne Public Facilities Corp., Liv at Boerne Senior Apartments Rev., 2.75%, 11/1/2021 (c) | | | 100,000 | | | | 101,684 | |
| | |
Brazosport Independent School District, Unlimited Tax GO, PSF-GTD, 5.00%, 2/15/2022 | | | 50,000 | | | | 52,313 | |
| | |
Buna Independent School District, School Building GO, PSF-GTD, 2.25%, 8/15/2023 | | | 120,000 | | | | 122,605 | |
| | |
Calhoun County Independent School District, Unlimited Tax GO, PSF-GTD, 5.00%, 2/15/2022 | | | 20,000 | | | | 20,925 | |
| | |
Canadian River Municipal Water Authority Corp., Conjunctive Use Groundwater Supply Project Rev., 5.00%, 2/15/2023 | | | 150,000 | | | | 156,510 | |
| | |
Canyon Regional Water Authority, Wells Ranch I Project | | | | | | | | |
| | |
Rev., 4.00%, 8/1/2021 | | | 45,000 | | | | 45,718 | |
| | |
Rev., 5.00%, 8/1/2022 | | | 30,000 | | | | 32,050 | |
| | |
Capital Area Housing Finance Corp., Mission Trail at El Camino Real Apartments Rev., 2.10%, 9/1/2022 (c) | | | 125,000 | | | | 125,823 | |
| | |
Carroll Independent School District, Unlimited Tax GO, PSF-GTD, 5.00%, 2/15/2022 | | | 20,000 | | | | 20,925 | |
| | | | | | | | |
| INVESTMENTS | | PRINCIPAL
AMOUNT ($) | | | VALUE ($) | |
| | | | | | | | |
|
Texas — continued | |
| | |
Carrollton-Farmers Branch Independent School District, Unlimited Tax | | | | | | | | |
| | |
GO, PSF-GTD, 5.00%, 2/15/2022 | | | 105,000 | | | | 109,857 | |
| | |
GO, PSF-GTD, 5.00%, 2/15/2023 | | | 25,000 | | | | 27,271 | |
| | |
Centerville Independent School District, Unlimited Tax GO, PSF-GTD, 4.00%, 8/15/2021 (b) | | | 75,000 | | | | 76,313 | |
| | |
Central Texas Regional Mobility Authority, Subordinated Lien | | | | | | | | |
| | |
Rev., 5.00%, 1/1/2023 (b) | | | 25,000 | | | | 27,162 | |
| | |
Series 2020F, Rev., BAN, 5.00%, 1/1/2025 | | | 570,000 | | | | 648,854 | |
| | |
Central Texas Turnpike System Series C, Rev., 5.00%, 8/15/2022 | | | 150,000 | | | | 158,161 | |
| | |
Cinco Southwest Municipal Utility District No. 1 Rev., GTD, 3.00%, 12/1/2021 | | | 100,000 | | | | 102,021 | |
| | |
City of Abilene | | | | | | | | |
| | |
GO, 4.00%, 2/15/2022 | | | 250,000 | | | | 259,037 | |
| | |
GO, 4.00%, 2/15/2023 | | | 25,000 | | | | 26,764 | |
| | |
GO, 5.00%, 2/15/2024 | | | 25,000 | | | | 28,309 | |
| | |
City of Abilene, Combination Tax | | | | | | | | |
| | |
GO, 4.00%, 2/15/2022 | | | 85,000 | | | | 88,073 | |
| | |
GO, 5.00%, 2/15/2022 | | | 100,000 | | | | 104,567 | |
| | |
City of Amarillo, Waterworks and Sewer System | | | | | | | | |
| | |
Rev., 5.00%, 4/1/2021 | | | 80,000 | | | | 80,313 | |
| | |
Rev., 5.00%, 4/1/2022 | | | 20,000 | | | | 21,047 | |
| | |
City of Arlington, Permanent Improvement | | | | | | | | |
| | |
GO, 4.00%, 8/15/2021 | | | 30,000 | | | | 30,524 | |
| | |
Series 2015B, GO, 4.00%, 8/15/2021 | | | 20,000 | | | | 20,350 | |
| | |
GO, 5.00%, 8/15/2023 | | | 25,000 | | | | 27,879 | |
| | |
City of Arlington, Water and Wastewater System | | | | | | | | |
| | |
Series 2019B, Rev., 3.00%, 6/1/2021 | | | 30,000 | | | | 30,212 | |
| | |
Series 2017A, Rev., 4.00%, 6/1/2021 | | | 210,000 | | | | 212,003 | |
| | |
Series 2015A, Rev., 5.00%, 6/1/2021 | | | 35,000 | | | | 35,420 | |
| | |
Series 2015B, Rev., 5.00%, 6/1/2021 | | | 50,000 | | | | 50,601 | |
| | |
Series 2013B, Rev., 3.00%, 6/1/2022 | | | 50,000 | | | | 51,769 | |
| | |
City of Austin, Electric Utility System | | | | | | | | |
| | |
Series 2015A, Rev., 5.00%, 11/15/2021 | | | 150,000 | | | | 155,130 | |
SEE NOTES TO FINANCIAL STATEMENTS.
| | | | | | | | |
| | | |
| FEBRUARY 28, 2021 | | J.P. MORGAN EXCHANGE-TRADED FUNDS | | | | | 295 | |
JPMorgan Ultra-Short Municipal Income ETF
SCHEDULE OF PORTFOLIO INVESTMENTS
AS OF FEBRUARY 28, 2021 (continued)
| | | | | | | | |
| INVESTMENTS | | PRINCIPAL
AMOUNT ($) | | | VALUE ($) | |
Municipal Bonds — continued | | | | | | | | |
|
Texas — continued | |
| | |
Series 2015A, Rev., 5.00%, 11/15/2022 | | | 20,000 | | | | 21,645 | |
| | |
City of Austin, Public Improvement | | | | | | | | |
| | |
GO, 5.00%, 9/1/2021 | | | 595,000 | | | | 609,399 | |
| | |
Series 2013A, GO, 5.00%, 9/1/2021 | | | 70,000 | | | | 71,694 | |
| | |
GO, 5.00%, 9/1/2022 | | | 65,000 | | | | 69,713 | |
| | |
GO, 5.00%, 9/1/2023 | | | 70,000 | | | | 78,161 | |
| | |
City of Austin, Public Property Finance Contractual Obligations | | | | | | | | |
| | |
GO, 5.00%, 5/1/2021 | | | 30,000 | | | | 30,239 | |
| | |
GO, 5.00%, 11/1/2021 | | | 170,000 | | | | 175,493 | |
| | |
City of Austin, Water and Wastewater System | | | | | | | | |
| | |
Rev., 5.00%, 11/15/2022 | | | 65,000 | | | | 70,348 | |
| | |
Rev., 5.00%, 11/15/2024 | | | 50,000 | | | | 51,720 | |
| | |
Rev., 5.00%, 11/15/2026 | | | 280,000 | | | | 289,635 | |
| | |
City of Baytown | | | | | | | | |
| | |
GO, 5.00%, 2/1/2022 | | | 60,000 | | | | 62,600 | |
| | |
GO, 5.00%, 2/1/2023 | | | 35,000 | | | | 38,073 | |
| | |
City of Beaumont Series 2020A, GO, 5.00%, 3/1/2022 | | | 65,000 | | | | 68,107 | |
| | |
City of Beaumont, Waterworks and Sewer System Series 2014A, Rev., AGM, 5.00%, 9/1/2021 | | | 200,000 | | | | 204,678 | |
| | |
City of Boerne GO, 4.00%, 3/1/2022 | | | 100,000 | | | | 103,784 | |
| | |
City of Brownsville GO, 4.00%, 2/15/2022 | | | 265,000 | | | | 273,986 | |
| | |
City of Brownsville, Utilities System Series 2013A, Rev., 5.00%, 9/1/2024 | | | 100,000 | | | | 110,786 | |
| | |
City of Bryan | | | | | | | | |
| | |
GO, 3.00%, 8/15/2021 | | | 25,000 | | | | 25,318 | |
| | |
GO, 3.00%, 8/15/2022 | | | 30,000 | | | | 31,213 | |
| | |
City of Bryan, Electric System Rev., 5.00%, 7/1/2021 | | | 115,000 | | | | 116,764 | |
| | |
City of Buda, Combination Tax GO, 5.00%, 8/15/2022 | | | 105,000 | | | | 112,291 | |
| | |
City of Burleson GO, 4.00%, 3/1/2022 | | | 35,000 | | | | 36,307 | |
| | |
City of Cedar Hill GO, 5.00%, 2/15/2022 | | | 90,000 | | | | 94,110 | |
| | |
City of Cedar Park GO, 5.00%, 2/15/2022 | | | 30,000 | | | | 31,370 | |
| | |
City of Cedar Park, Utility System Rev., 3.00%, 8/15/2022 | | | 25,000 | | | | 26,011 | |
| | |
City of College Station | | | | | | | | |
| | |
GO, 5.00%, 2/15/2022 | | | 45,000 | | | | 47,049 | |
| | |
GO, 5.00%, 2/15/2023 | | | 30,000 | | | | 32,743 | |
| | | | | | | | |
| INVESTMENTS | | PRINCIPAL
AMOUNT ($) | | | VALUE ($) | |
| | | | | | | | |
|
Texas — continued | |
| | |
City of Conroe, Certificates of Obligation Series 2020C, GO, 5.00%, 11/15/2021 | | | 165,000 | | | | 170,570 | |
| | |
City of Conroe, Water and Sewer System Series 2011, Rev., 3.00%, 11/15/2021 | | | 40,000 | | | | 40,775 | |
| | |
City of Corpus Christi, General Improvement | | | | | | | | |
| | |
GO, 5.00%, 3/1/2021 | | | 30,000 | | | | 30,000 | |
| | |
GO, 5.00%, 3/1/2022 | | | 245,000 | | | | 256,711 | |
| | |
GO, 5.00%, 3/1/2023 | | | 40,000 | | | | 43,791 | |
| | |
Series 2020A, GO, 5.00%, 3/1/2023 | | | 35,000 | | | | 38,317 | |
| | |
City of Corpus Christi, Junior Lien Utility System Series C, Rev., 5.00%, 7/15/2021 | | | 50,000 | | | | 50,887 | |
| | |
City of Dallas | | | | | | | | |
| | |
GO, 5.00%, 2/15/2022 | | | 150,000 | | | | 156,864 | |
| | |
GO, 5.00%, 2/15/2023 | | | 495,000 | | | | 517,117 | |
| | |
GO, 5.00%, 2/15/2025 | | | 100,000 | | | | 104,477 | |
| | |
City of Dallas Housing Finance Corp., Multi-Family, Palladium Redbird Rev., 1.50%, 4/1/2022 (c) | | | 1,440,000 | | | | 1,460,405 | |
| | |
City of Dallas, Waterworks and Sewer System | | | | | | | | |
| | |
Series 2012A, Rev., 5.00%, 10/1/2021 | | | 60,000 | | | | 61,699 | |
| | |
Rev., 5.00%, 10/1/2022 | | | 75,000 | | | | 77,047 | |
| | |
Series 2020C, Rev., 5.00%, 10/1/2022 | | | 30,000 | | | | 32,266 | |
| | |
City of Deer Park, Certificates of Obligation | | | | | | | | |
| | |
GO, 3.00%, 3/15/2021 | | | 25,000 | | | | 25,025 | |
| | |
GO, 4.00%, 3/15/2021 | | | 180,000 | | | | 180,245 | |
| | |
GO, 3.00%, 3/15/2022 | | | 50,000 | | | | 51,422 | |
| | |
GO, 3.00%, 3/15/2024 | | | 25,000 | | | | 26,896 | |
| | |
City of Del Rio, Certificates of Obligation GO, AGM, 3.00%, 6/1/2021 | | | 50,000 | | | | 50,340 | |
| | |
City of Denton | | | | | | | | |
| | |
GO, 4.00%, 2/15/2022 | | | 65,000 | | | | 67,388 | |
| | |
GO, 5.00%, 2/15/2022 | | | 45,000 | | | | 47,082 | |
| | |
GO, 5.00%, 2/15/2023 | | | 25,000 | | | | 27,271 | |
| | |
City of Denton, Certificates of Obligation GO, 5.00%, 2/15/2022 | | | 165,000 | | | | 172,633 | |
| | |
City of Eagle Pass, Limited Tax GO, 4.00%, 3/1/2022 | | | 75,000 | | | | 77,692 | |
| | |
City of Edinburg GO, 5.00%, 3/1/2022 | | | 20,000 | | | | 20,946 | |
| | |
City of El Campo, Certificates of Obligation Series 2015A, GO, 4.00%, 2/1/2022 | | | 100,000 | | | | 103,421 | |
SEE NOTES TO FINANCIAL STATEMENTS.
| | | | | | |
| | | |
| 296 | | | | J.P. MORGAN EXCHANGE-TRADED FUNDS | | FEBRUARY 28, 2021 |
| | | | | | | | |
| INVESTMENTS | | PRINCIPAL
AMOUNT ($) | | | VALUE ($) | |
Municipal Bonds — continued | | | | | | | | |
|
Texas — continued | |
| | |
City of El Paso | | | | | | | | |
| | |
GO, 5.00%, 8/15/2021 | | | 80,000 | | | | 81,763 | |
| | |
GO, 5.00%, 8/15/2022 | | | 60,000 | | | | 64,222 | |
| | |
Series 2014A, GO, 5.00%, 8/15/2023 | | | 50,000 | | | | 55,732 | |
| | |
City of El Paso Municipal Drainage Utility System Rev., 5.00%, 3/1/2022 | | | 135,000 | | | | 141,535 | |
| | |
City of El Paso, Certificates of Obligations GO, 5.00%, 8/15/2022 | | | 85,000 | | | | 90,981 | |
| | |
City of El Paso, Improvement Bond Series 2019A, GO, 5.00%, 8/15/2022 | | | 80,000 | | | | 85,629 | |
| | |
City of El Paso, Water and Sewer Rev., 5.00%, 3/1/2023 | | | 25,000 | | | | 27,301 | |
| | |
City of El Paso, Water and Sewer System | | | | | | | | |
| | |
Rev., 4.00%, 3/1/2021 | | | 200,000 | | | | 200,000 | |
| | |
Series 2012A, Rev., 4.00%, 3/1/2021 | | | 25,000 | | | | 25,000 | |
| | |
Rev., 4.00%, 3/1/2022 | | | 25,000 | | | | 25,961 | |
| | |
Series 2012A, Rev., 4.00%, 3/1/2022 (b) | | | 40,000 | | | | 41,538 | |
| | |
Rev., 5.00%, 3/1/2022 | | | 150,000 | | | | 157,262 | |
| | |
Series 2012A, Rev., 5.00%, 3/1/2022 (b) | | | 25,000 | | | | 26,210 | |
| | |
Rev., 5.00%, 3/1/2023 | | | 25,000 | | | | 27,301 | |
| | |
City of Farmers Branch GO, 4.00%, 2/15/2025 | | | 35,000 | | | | 39,701 | |
| | |
City of Farmers Branch, Combination Tax GO, 5.00%, 2/15/2023 | | | 30,000 | | | | 32,731 | |
| | |
City of Fort Worth, General Purpose Series 2015A, GO, 5.00%, 3/1/2022 | | | 250,000 | | | | 261,950 | |
| | |
City of Fort Worth, Water and Sewer System Improvement | | | | | | | | |
| | |
Rev., 5.00%, 2/15/2022 | | | 25,000 | | | | 26,154 | |
| | |
Series 2020A, Rev., 5.00%, 2/15/2022 | | | 155,000 | | | | 162,155 | |
| | |
City of Frisco | | | | | | | | |
| | |
GO, 5.00%, 2/15/2022 | | | 195,000 | | | | 203,982 | |
| | |
Series 2015A, GO, 5.00%, 2/15/2022 | | | 80,000 | | | | 83,685 | |
| | |
GO, 5.00%, 2/15/2023 | | | 45,000 | | | | 45,159 | |
| | |
City of Frisco, Certificates of Obligation GO, 3.00%, 2/15/2022 | | | 20,000 | | | | 20,541 | |
| | |
City of Garland | | | | | | | | |
| | |
GO, 5.00%, 2/15/2022 | | | 80,000 | | | | 83,693 | |
| | |
GO, 5.00%, 2/15/2023 | | | 35,000 | | | | 38,251 | |
| | |
Series 2015A, GO, 5.00%, 2/15/2023 | | | 25,000 | | | | 27,322 | |
| | | | | | | | |
| INVESTMENTS | | PRINCIPAL
AMOUNT ($) | | | VALUE ($) | |
| | | | | | | | |
|
Texas — continued | |
| | |
City of Garland, Combination Tax GO, 5.00%, 2/15/2022 | | | 30,000 | | | | 31,385 | |
| | |
City of Garland, Electric Utility System | | | | | | | | |
| | |
Series 2019A, Rev., 5.00%, 3/1/2022 | | | 585,000 | | | | 612,354 | |
| | |
Series 2016B, Rev., 5.00%, 3/1/2023 | | | 220,000 | | | | 240,205 | |
| | |
City of Georgetown | | | | | | | | |
| | |
GO, 5.00%, 8/15/2021 | | | 20,000 | | | | 20,435 | |
| | |
GO, 5.00%, 8/15/2022 | | | 40,000 | | | | 42,778 | |
| | |
City of Grand Prairie, Combination Tax GO, 4.00%, 2/15/2022 | | | 55,000 | | | | 57,010 | |
| | |
City of Grapevine | | | | | | | | |
| | |
GO, 5.00%, 2/15/2022 | | | 20,000 | | | | 20,923 | |
| | |
GO, 5.00%, 2/15/2023 | | | 40,000 | | | | 43,674 | |
| | |
City of Grapevine, Combination Tax | | | | | | | | |
| | |
GO, 3.00%, 2/15/2022 | | | 25,000 | | | | 25,678 | |
| | |
GO, 5.00%, 2/15/2022 | | | 40,000 | | | | 41,846 | |
| | |
Series 2015A, GO, 5.00%, 8/15/2022 | | | 170,000 | | | | 181,934 | |
| | |
City of Heath, Certificates of Obligation GO, 4.00%, 2/15/2022 | | | 35,000 | | | | 36,265 | |
| | |
City of Houston, Airport System, Subordinate Lien | | | | | | | | |
| | |
Series 2011B, Rev., 5.00%, 7/1/2021 | | | 25,000 | | | | 25,394 | |
| | |
Series 2018B, Rev., 5.00%, 7/1/2021 | | | 335,000 | | | | 340,276 | |
| | |
Series 2018D, Rev., 5.00%, 7/1/2021 | | | 55,000 | | | | 55,866 | |
| | |
City of Houston, Combined Utility System, Capital Appreciation Series A, Rev., AGM, Zero Coupon, 12/1/2024 | | | 85,000 | | | | 82,610 | |
| | |
City of Houston, Public Improvement | | | | | | | | |
| | |
GO, 5.00%, 3/1/2021 (b) | | | 100,000 | | | | 100,000 | |
| | |
Series 2012A, GO, 5.00%, 3/1/2021 | | | 30,000 | | | | 30,000 | |
| | |
Series 2012A, GO, 5.00%, 3/1/2022 (b) | | | 160,000 | | | | 167,757 | |
| | |
Series 2014A, GO, 5.00%, 3/1/2022 | | | 25,000 | | | | 26,213 | |
| | |
City of Houston, Utility System, First Lien | | | | | | | | |
| | |
Series 2014C, Rev., 5.00%, 5/15/2021 | | | 165,000 | | | | 166,632 | |
| | |
Series 2011D, Rev., 4.00%, 11/15/2021 | | | 25,000 | | | | 25,681 | |
| | |
Series 2012F, Rev., 4.00%, 11/15/2021 (b) | | | 150,000 | | | | 154,076 | |
| | |
Series 2013B, Rev., 4.00%, 11/15/2021 | | | 70,000 | | | | 71,907 | |
SEE NOTES TO FINANCIAL STATEMENTS.
| | | | | | | | |
| | | |
| FEBRUARY 28, 2021 | | J.P. MORGAN EXCHANGE-TRADED FUNDS | | | | | 297 | |
JPMorgan Ultra-Short Municipal Income ETF
SCHEDULE OF PORTFOLIO INVESTMENTS
AS OF FEBRUARY 28, 2021 (continued)
| | | | | | | | |
| INVESTMENTS | | PRINCIPAL
AMOUNT ($) | | | VALUE ($) | |
Municipal Bonds — continued | | | | | | | | |
|
Texas — continued | |
| | |
Series 2017B, Rev., 4.00%, 11/15/2021 | | | 35,000 | | | | 35,954 | |
| | |
Series 2019B, Rev., 4.00%, 11/15/2021 | | | 145,000 | | | | 148,951 | |
| | |
Series 2011D, Rev., 5.00%, 11/15/2021 (b) | | | 350,000 | | | | 361,974 | |
| | |
Series 2011F, Rev., 5.00%, 11/15/2021 (b) | | | 75,000 | | | | 77,565 | |
| | |
Series 2012D, Rev., 5.00%, 11/15/2021 | | | 95,000 | | | | 98,256 | |
| | |
Series 2012F, Rev., 5.00%, 11/15/2021 (b) | | | 75,000 | | | | 77,565 | |
| | |
Series 2014D, Rev., 5.00%, 11/15/2021 | | | 75,000 | | | | 77,570 | |
| | |
Series 2016B, Rev., 5.00%, 11/15/2021 | | | 230,000 | | | | 237,882 | |
| | |
Series 2014C, Rev., 5.00%, 5/15/2022 | | | 75,000 | | | | 79,378 | |
| | |
Series 2012D, Rev., 5.00%, 11/15/2022 (b) | | | 40,000 | | | | 43,291 | |
| | |
Series 2014D, Rev., 5.00%, 11/15/2022 | | | 20,000 | | | | 21,649 | |
| | |
Series 2016B, Rev., 5.00%, 11/15/2022 | | | 95,000 | | | | 102,833 | |
| | |
Series 2018D, Rev., 5.00%, 11/15/2022 | | | 105,000 | | | | 113,657 | |
| | |
City of Hutto Series 2019A, GO, 5.00%, 8/1/2025 | | | 20,000 | | | | 23,687 | |
| | |
City of Irving, Waterworks and Sewer System | | | | | | | | |
| | |
Rev., 5.00%, 8/15/2022 | | | 25,000 | | | | 26,747 | |
| | |
Series 2017B, Rev., 5.00%, 8/15/2022 | | | 20,000 | | | | 21,398 | |
| | |
City of Kenedy, Certificates of Obligation GO, 4.00%, 5/1/2025 | | | 25,000 | | | | 28,290 | |
| | |
City of Killeen, Waterworks and Sewerage Improvement Rev., 4.00%, 8/15/2021 | | | 115,000 | | | | 117,009 | |
| | |
City of Lakeway GO, 4.00%, 2/1/2024 | | | 45,000 | | | | 49,529 | |
| | |
City of Laredo | | | | | | | | |
| | |
GO, 4.00%, 2/15/2022 | | | 70,000 | | | | 72,531 | |
| | |
GO, 5.00%, 2/15/2022 | | | 70,000 | | | | 73,197 | |
| | |
GO, 5.00%, 2/15/2023 | | | 45,000 | | | | 48,939 | |
| | |
GO, 5.00%, 2/15/2024 | | | 25,000 | | | | 28,167 | |
| | |
City of Laredo, Waterworks and Sewer System | | | | | | | | |
| | |
Rev., AGM, 3.50%, 3/1/2022 (b) | | | 300,000 | | | | 309,951 | |
| | |
Rev., AGM, 3.63%, 3/1/2022 (b) | | | 100,000 | | | | 103,441 | |
| | | | | | | | |
| INVESTMENTS | | PRINCIPAL
AMOUNT ($) | | | VALUE ($) | |
| | | | | | | | |
|
Texas — continued | |
| | |
City of League City Series 2011A, GO, 5.00%, 2/15/2022 | | | 25,000 | | | | 26,142 | |
| | |
City of Lewisville GO, 5.00%, 2/15/2022 | | | 50,000 | | | | 52,308 | |
| | |
City of Lubbock | | | | | | | | |
| | |
GO, 4.00%, 2/15/2022 | | | 20,000 | | | | 20,727 | |
| | |
GO, 5.00%, 2/15/2022 | | | 225,000 | | | | 235,318 | |
| | |
City of Lubbock, Certificates of Obligation GO, 5.00%, 2/15/2022 | | | 75,000 | | | | 78,439 | |
| | |
City of Lubbock, Electric Light and Power System Rev., 5.00%, 4/15/2022 | | | 120,000 | | | | 126,466 | |
| | |
City of Lubbock, Tax and Waterworks System GO, 5.00%, 2/15/2022 | | | 20,000 | | | | 20,917 | |
| | |
City of Mansfield, Combination Tax GO, 4.00%, 2/15/2022 | | | 20,000 | | | | 20,733 | |
| | |
City of McAllen | | | | | | | | |
| | |
GO, 5.00%, 2/15/2022 | | | 50,000 | | | | 52,308 | |
| | |
GO, 5.00%, 2/15/2023 | | | 25,000 | | | | 27,271 | |
| | |
City of McAllen, Water and Sewer Rev., 5.00%, 2/1/2023 | | | 25,000 | | | | 27,215 | |
| | |
City of McKinney | | | | | | | | |
| | |
GO, 5.00%, 8/15/2021 | | | 295,000 | | | | 301,487 | |
| | |
GO, 5.00%, 8/15/2022 | | | 70,000 | | | | 74,914 | |
| | |
GO, 5.00%, 8/15/2025 | | | 25,000 | | | | 29,898 | |
| | |
City of McKinney, Waterworks and Sewer System | | | | | | | | |
| | |
Rev., 5.00%, 3/15/2021 | | | 175,000 | | | | 175,306 | |
| | |
Rev., 5.00%, 3/15/2022 | | | 25,000 | | | | 26,255 | |
| | |
City of Mesquite | | | | | | | | |
| | |
GO, 4.00%, 2/15/2022 | | | 45,000 | | | | 46,627 | |
| | |
GO, 5.00%, 2/15/2023 | | | 30,000 | | | | 32,743 | |
| | |
City of Mesquite, Combination Tax GO, 3.00%, 2/15/2022 | | | 55,000 | | | | 56,465 | |
| | |
City of Mesquite, Waterworks and Sewer System | | | | | | | | |
| | |
Rev., 4.00%, 3/1/2021 | | | 110,000 | | | | 110,000 | |
| | |
Rev., 3.00%, 3/1/2023 | | | 45,000 | | | | 47,316 | |
| | |
City of Midland GO, 5.00%, 3/1/2022 | | | 25,000 | | | | 26,195 | |
| | |
City of Midland, Certificates of Obligation | | | | | | | | |
| | |
GO, 4.00%, 3/1/2021 | | | 50,000 | | | | 50,000 | |
| | |
GO, 5.00%, 3/1/2025 | | | 40,000 | | | | 46,968 | |
| | |
City of Midlothian GO, 5.00%, 2/1/2022 | | | 20,000 | | | | 20,886 | |
| | |
City of Midlothian, Combination Tax GO, 3.00%, 8/15/2024 | | | 25,000 | | | | 27,070 | |
| | |
City of Missouri GO, 5.00%, 6/15/2023 | | | 35,000 | | | | 38,705 | |
SEE NOTES TO FINANCIAL STATEMENTS.
| | | | | | |
| | | |
| 298 | | | | J.P. MORGAN EXCHANGE-TRADED FUNDS | | FEBRUARY 28, 2021 |
| | | | | | | | |
| INVESTMENTS | | PRINCIPAL
AMOUNT ($) | | | VALUE ($) | |
Municipal Bonds — continued | | | | | | | | |
|
Texas — continued | |
| | |
City of Missouri City GO, 5.00%, 6/15/2021 | | | 30,000 | | | | 30,411 | |
| | |
City of Missouri City, Certificates of Combination | | | | | | | | |
| | |
Series 2018A, GO, 5.00%, 6/15/2022 | | | 20,000 | | | | 21,222 | |
| | |
GO, 4.00%, 8/15/2022 | | | 100,000 | | | | 105,495 | |
| | |
City of New Braunfels GO, 5.00%, 2/1/2022 | | | 70,000 | | | | 72,974 | |
| | |
City of New Braunfels, Certificates of Obligation | | | | | | | | |
| | |
GO, 3.00%, 2/1/2022 | | | 30,000 | | | | 30,728 | |
| | |
Series 2014A, GO, 3.00%, 2/1/2022 | | | 50,000 | | | | 51,212 | |
| | |
GO, 4.00%, 2/1/2022 | | | 35,000 | | | | 36,168 | |
| | |
City of New Braunfels, Utility System Rev., 5.00%, 7/1/2022 | | | 25,000 | | | | 26,542 | |
| | |
City of Odessa GO, 4.00%, 3/1/2023 | | | 100,000 | | | | 106,926 | |
| | |
City of Pasadena | | | | | | | | |
| | |
Series 2016A, GO, 5.00%, 2/15/2022 | | | 25,000 | | | | 26,154 | |
| | |
Series 2012A, GO, 5.00%, 2/15/2024 | | | 55,000 | | | | 55,196 | |
| | |
City of Pearland | | | | | | | | |
| | |
Series 2020A, GO, 3.00%, 3/1/2021 | | | 20,000 | | | | 20,000 | |
| | |
GO, 3.00%, 3/1/2022 | | | 25,000 | | | | 25,697 | |
| | |
GO, 4.00%, 3/1/2022 | | | 25,000 | | | | 25,946 | |
| | |
GO, 5.00%, 3/1/2024 | | | 40,000 | | | | 45,418 | |
| | |
Series 2016B, GO, 5.00%, 3/1/2024 | | | 25,000 | | | | 28,387 | |
| | |
City of Pflugerville, Limited Tax | | | | | | | | |
| | |
GO, 3.00%, 8/1/2021 (b) | | | 100,000 | | | | 101,179 | |
| | |
GO, 5.00%, 8/1/2022 | | | 35,000 | | | | 37,366 | |
| | |
City of Plano | | | | | | | | |
| | |
GO, 4.38%, 3/1/2021 (b) | | | 100,000 | | | | 100,000 | |
| | |
GO, 5.00%, 9/1/2021 | | | 75,000 | | | | 76,811 | |
| | |
GO, 5.00%, 9/1/2022 | | | 95,000 | | | | 101,873 | |
| | |
GO, 5.00%, 9/1/2023 | | | 30,000 | | | | 33,482 | |
| | |
City of Plano, Municipal Drainage Utility System Rev., 3.00%, 5/15/2021 | | | 50,000 | | | | 50,290 | |
| | |
City of Portland GO, 4.00%, 8/15/2023 | | | 25,000 | | | | 27,217 | |
| | |
City of Richardson | | | | | | | | |
| | |
Series 2016A, GO, 5.00%, 2/15/2022 | | | 40,000 | | | | 41,847 | |
| | |
GO, 3.00%, 2/15/2023 | | | 25,000 | | | | 26,298 | |
| | |
City of Richland Hills, Combination Tax GO, 4.00%, 8/15/2022 | | | 25,000 | | | | 26,374 | |
| | |
City of Round Rock GO, 5.00%, 8/15/2022 | | | 20,000 | | | | 21,404 | |
| | | | | | | | |
| INVESTMENTS | | PRINCIPAL
AMOUNT ($) | | | VALUE ($) | |
| | | | | | | | |
|
Texas — continued | |
| | |
City of Round Rock, Utility System Rev., 5.00%, 8/1/2022 | | | 40,000 | | | | 42,733 | |
| | |
City of Rowlett GO, 5.00%, 2/15/2022 | | | 110,000 | | | | 114,991 | |
| | |
City of Sachse Series 2017A, GO, 4.00%, 2/15/2025 | | | 65,000 | | | | 73,078 | |
| | |
City of San Antonio | | | | | | | | |
| | |
GO, 4.50%, 8/1/2021 | | | 75,000 | | | | 76,362 | |
| | |
GO, 5.00%, 8/1/2021 (b) | | | 165,000 | | | | 168,331 | |
| | |
GO, 5.00%, 8/1/2022 | | | 65,000 | | | | 69,412 | |
| | |
City of San Antonio, Electric and Gas Systems | | | | | | | | |
| | |
Series B, Rev., 2.00%, 12/1/2021 (c) | | | 100,000 | | | | 100,442 | |
| | |
Rev., 5.00%, 2/1/2022 | | | 600,000 | | | | 626,568 | |
| | |
Rev., 5.00%, 2/1/2023 | | | 50,000 | | | | 53,350 | |
| | |
Rev., 3.00%, 2/1/2024 | | | 175,000 | | | | 181,545 | |
| | |
City of San Antonio, Municipal Drainage Utility System Rev., 5.00%, 2/1/2022 | | | 40,000 | | | | 41,771 | |
| | |
City of San Marcos GO, 3.00%, 8/15/2021 | | | 25,000 | | | | 25,316 | |
| | |
City of San Marcos, Combination Tax | | | | | | | | |
| | |
GO, 5.00%, 8/15/2023 | | | 40,000 | | | | 44,586 | |
| | |
GO, 5.00%, 8/15/2024 | | | 35,000 | | | | 40,405 | |
| | |
City of Sherman GO, 5.00%, 8/15/2021 | | | 195,000 | | | | 199,243 | |
| | |
City of Sugar Land | | | | | | | | |
| | |
GO, 5.00%, 2/15/2022 | | | 30,000 | | | | 31,364 | |
| | |
GO, 5.00%, 2/15/2023 | | | 45,000 | | | | 49,115 | |
| | |
City of Sugar Land, Waterworks and Sewer System | | | | | | | | |
| | |
Series 2012A, Rev., 4.00%, 8/15/2021 | | | 125,000 | | | | 127,143 | |
| | |
Rev., 5.00%, 8/15/2021 | | | 45,000 | | | | 45,975 | |
| | |
Rev., 4.00%, 8/15/2022 | | | 50,000 | | | | 52,733 | |
| | |
Rev., 5.00%, 8/15/2022 | | | 60,000 | | | | 64,148 | |
| | |
Series 2012A, Rev., 4.00%, 8/15/2023 | | | 215,000 | | | | 218,655 | |
| | |
City of Temple | | | | | | | | |
| | |
GO, 4.00%, 8/1/2022 | | | 35,000 | | | | 36,897 | |
| | |
GO, 5.00%, 8/1/2022 | | | 120,000 | | | | 128,200 | |
| | |
City of Temple, Utility System Rev., 4.00%, 8/1/2021 | | | 25,000 | | | | 25,398 | |
| | |
City of Tyler, Water and Sewer System Series 2015B, Rev., 2.75%, 9/1/2021 | | | 25,000 | | | | 25,323 | |
| | |
City of Victoria GO, 5.00%, 8/15/2022 | | | 35,000 | | | | 37,457 | |
SEE NOTES TO FINANCIAL STATEMENTS.
| | | | | | | | |
| | | |
| FEBRUARY 28, 2021 | | J.P. MORGAN EXCHANGE-TRADED FUNDS | | | | | 299 | |
JPMorgan Ultra-Short Municipal Income ETF
SCHEDULE OF PORTFOLIO INVESTMENTS
AS OF FEBRUARY 28, 2021 (continued)
| | | | | | | | |
| INVESTMENTS | | PRINCIPAL
AMOUNT ($) | | | VALUE ($) | |
Municipal Bonds — continued | | | | | | | | |
|
Texas — continued | |
| | |
City of Victoria, Utility System Rev., 5.00%, 12/1/2022 | | | 25,000 | | | | 27,083 | |
| | |
City of Waco | | | | | | | | |
| | |
GO, 5.00%, 2/1/2022 | | | 330,000 | | | | 344,454 | |
| | |
GO, 5.00%, 2/1/2023 | | | 30,000 | | | | 32,677 | |
| | |
City of Waco, Combination Tax | | | | | | | | |
| | |
GO, 5.00%, 2/1/2022 | | | 75,000 | | | | 78,285 | |
| | |
GO, 5.00%, 2/1/2023 | | | 45,000 | | | | 49,015 | |
| | |
GO, 5.00%, 2/1/2024 | | | 20,000 | | | | 22,653 | |
| | |
City of Waxahachie Series 2016A, GO, 2.00%, 8/1/2021 | | | 125,000 | | | | 125,935 | |
| | |
City of Weatherford GO, 3.00%, 3/1/2022 | | | 25,000 | | | | 25,677 | |
| | |
City of Weslaco GO, AGM, 5.00%, 8/15/2021 (b) | | | 25,000 | | | | 25,551 | |
| | |
City of Wichita Falls | | | | | | | | |
| | |
Series 2015A, GO, 4.00%, 9/1/2021 | | | 25,000 | | | | 25,477 | |
| | |
Series 2018A, GO, 4.00%, 9/1/2021 | | | 70,000 | | | | 71,336 | |
| | |
City of Windcrest Series 2019B, GO, 5.00%, 2/15/2023 | | | 75,000 | | | | 81,673 | |
| | |
City of Wylie | | | | | | | | |
| | |
GO, 4.00%, 2/15/2022 | | | 50,000 | | | | 51,807 | |
| | |
GO, 5.00%, 2/15/2023 | | | 50,000 | | | | 54,593 | |
| | |
Clear Creek Independent School District, Unlimited Tax | | | | | | | | |
| | |
GO, PSF-GTD, 5.00%, 2/15/2022 | | | 60,000 | | | | 62,775 | |
| | |
Series 2012B, GO, 5.00%, 2/15/2022 (b) | | | 1,105,000 | | | | 1,156,223 | |
| | |
Clear Lake City Water Authority | | | | | | | | |
| | |
GO, 4.00%, 3/1/2021 | | | 125,000 | | | | 125,000 | |
| | |
GO, 4.00%, 3/1/2022 | | | 105,000 | | | | 108,299 | |
| | |
GO, 4.00%, 3/1/2023 | | | 145,000 | | | | 155,043 | |
| | |
Clifton Higher Education Finance Corp. Rev., 5.00%, 3/1/2021 (b) | | | 80,000 | | | | 80,000 | |
| | |
Clifton Higher Education Finance Corp., Idea Public Schools | | | | | | | | |
| | |
Rev., PSF-GTD, 4.00%, 8/15/2021 | | | 90,000 | | | | 91,534 | |
| | |
Rev., 4.80%, 8/15/2021 (b) | | | 155,000 | | | | 158,204 | |
| | |
Rev., PSF-GTD, 4.00%, 8/15/2023 | | | 25,000 | | | | 27,192 | |
| | |
Columbia-Brazoria Independent School District GO, PSF-GTD, 3.00%, 2/1/2025 | | | 200,000 | | | | 216,966 | |
| | |
Comal Independent School District, Unlimited Tax | | | | | | | | |
| | |
GO, PSF-GTD, 5.00%, 2/1/2025 | | | 25,000 | | | | 29,361 | |
| | |
Series B, GO, PSF-GTD, 5.00%, 2/1/2025 | | | 25,000 | | | | 28,292 | |
| | | | | | | | |
| INVESTMENTS | | PRINCIPAL
AMOUNT ($) | | | VALUE ($) | |
| | | | | | | | |
|
Texas — continued | |
| | |
Conroe Independent School District, School Building, Unlimited Tax | | | | | | | | |
| | |
GO, PSF-GTD, 5.00%, 2/15/2022 | | | 40,000 | | | | 41,850 | |
| | |
Series 2014A, GO, PSF-GTD, 5.00%, 2/15/2022 | | | 50,000 | | | | 52,313 | |
| | |
Series 2016A, GO, PSF-GTD, 5.00%, 2/15/2022 | | | 50,000 | | | | 52,313 | |
| | |
Series 2016A, GO, PSF-GTD, 5.00%, 2/15/2023 | | | 35,000 | | | | 38,230 | |
| | |
Conroe Independent School District, Unlimited Tax GO, PSF-GTD, 5.00%, 2/15/2022 | | | 60,000 | | | | 62,776 | |
| | |
Coppell Independent School District, Unlimited Tax GO, PSF-GTD, 5.00%, 8/15/2022 | | | 20,000 | | | | 21,407 | |
| | |
Corpus Christi Independent School District, Unlimited Tax GO, PSF-GTD, 5.00%, 8/15/2021 | | | 30,000 | | | | 30,661 | |
| | |
County of Bell, Combination Tax GO, 5.00%, 8/15/2021 | | | 160,000 | | | | 163,488 | |
| | |
County of Bexar, Combination Tax | | | | | | | | |
| | |
GO, 5.00%, 6/15/2021 | | | 90,000 | | | | 91,251 | |
| | |
Series B, GO, 5.00%, 6/15/2021 | | | 20,000 | | | | 20,278 | |
| | |
Series 2016B, GO, 5.00%, 6/15/2022 | | | 30,000 | | | | 31,865 | |
| | |
County of Bexar, Flood Control | | | | | | | | |
| | |
GO, 5.00%, 6/15/2022 | | | 20,000 | | | | 21,243 | |
| | |
GO, 5.00%, 6/15/2024 | | | 45,000 | | | | 51,698 | |
| | |
County of Brazoria, Unlimited Tax GO, 4.00%, 3/1/2022 | | | 50,000 | | | | 51,917 | |
| | |
County of Brazos, Limited Tax | | | | | | | | |
| | |
GO, 5.00%, 9/1/2021 | | | 105,000 | | | | 107,509 | |
| | |
GO, 5.00%, 9/1/2022 | | | 20,000 | | | | 21,431 | |
| | |
County of Cameron, State Highway 550 Project GO, 5.00%, 2/15/2022 (b) | | | 25,000 | | | | 26,159 | |
| | |
County of Collin GO, 5.00%, 2/15/2022 | | | 85,000 | | | | 88,924 | |
| | |
County of Comal, Combination Tax | | | | | | | | |
| | |
GO, 5.00%, 2/1/2022 | | | 50,000 | | | | 52,190 | |
| | |
Series 2017A, GO, 3.00%, 2/1/2023 | | | 25,000 | | | | 26,223 | |
| | |
County of Crane GO, AGM, 3.00%, 2/15/2022 | | | 85,000 | | | | 87,116 | |
| | |
County of Dallas, Limited Tax GO, 5.00%, 8/15/2021 | | | 25,000 | | | | 25,550 | |
| | |
County of Denton, Permanent Improvement | | | | | | | | |
| | |
GO, 5.00%, 7/15/2021 | | | 20,000 | | | | 20,356 | |
| | |
GO, 5.00%, 7/15/2022 | | | 65,000 | | | | 69,264 | |
| | |
County of Ector GO, 5.00%, 2/15/2022 | | | 400,000 | | | | 417,872 | |
SEE NOTES TO FINANCIAL STATEMENTS.
| | | | | | |
| | | |
| 300 | | | | J.P. MORGAN EXCHANGE-TRADED FUNDS | | FEBRUARY 28, 2021 |
| | | | | | | | |
| INVESTMENTS | | PRINCIPAL
AMOUNT ($) | | | VALUE ($) | |
Municipal Bonds — continued | | | | | | | | |
|
Texas — continued | |
| | |
County of El Paso GO, 5.00%, 2/15/2022 | | | 20,000 | | | | 20,923 | |
| | |
County of Ellis GO, 5.00%, 2/1/2022 | | | 70,000 | | | | 73,066 | |
| | |
County of Fort Bend, Limited Tax GO, 4.00%, 3/1/2021 | | | 175,000 | | | | 175,000 | |
| | |
County of Fort Bend, Unlimited Tax | | | | | | | | |
| | |
GO, 5.00%, 3/1/2022 | | | 50,000 | | | | 52,410 | |
| | |
GO, 5.00%, 3/1/2023 | | | 25,000 | | | | 27,354 | |
| | |
County of Fort Bend, Unlimited Tax and Subordinate Lien Toll Road GO, 5.00%, 3/1/2022 | | | 140,000 | | | | 146,742 | |
| | |
County of Galveston, Limited Tax | | | | | | | | |
| | |
GO, 4.00%, 2/1/2022 | | | 90,000 | | | | 93,164 | |
| | |
GO, 5.00%, 2/1/2024 | | | 50,000 | | | | 56,507 | |
| | |
County of Grayson, Limited Tax GO, 4.50%, 1/1/2023 | | | 35,000 | | | | 37,561 | |
| | |
County of Grayson, Pass-Through Toll, Limited Tax GO, 5.00%, 1/1/2022 | | | 20,000 | | | | 20,805 | |
| | |
County of Harris, Permanent Improvement | | | | | | | | |
| | |
GO, 5.00%, 10/1/2021 (b) | | | 120,000 | | | | 123,319 | |
| | |
Series 2011A, GO, 5.00%, 10/1/2021 | | | 50,000 | | | | 51,410 | |
| | |
Series 2017A, GO, 5.00%, 10/1/2021 | | | 75,000 | | | | 77,114 | |
| | |
Series 2020A, GO, 5.00%, 10/1/2021 | | | 35,000 | | | | 35,987 | |
| | |
County of Harris, Subordinated Lien | | | | | | | | |
| | |
GO, 5.00%, 8/15/2022 | | | 85,000 | | | | 90,967 | |
| | |
Series 2007C, GO, 5.25%, 8/15/2024 | | | 280,000 | | | | 326,365 | |
| | |
County of Harris, Toll Road, Senior Lien | | | | | | | | |
| | |
Series 2015B, Rev., 5.00%, 8/15/2021 | | | 45,000 | | | | 45,989 | |
| | |
Series 2016A, Rev., 5.00%, 8/15/2021 | | | 100,000 | | | | 102,199 | |
| | |
Series 2015B, Rev., 5.00%, 8/15/2022 | | | 230,000 | | | | 246,146 | |
| | |
Series 2016A, Rev., 5.00%, 8/15/2022 | | | 170,000 | | | | 181,934 | |
| | |
Series 2016A, Rev., 5.00%, 8/15/2024 | | | 60,000 | | | | 69,422 | |
| | |
Series 2012C, Rev., 5.00%, 8/15/2025 | | | 30,000 | | | | 31,977 | |
| | |
County of Harris, Unlimited Tax | | | | | | | | |
| | |
Series 2014A, GO, 5.00%, 10/1/2021 | | | 25,000 | | | | 25,705 | |
| | |
Series 2019A, GO, 5.00%, 10/1/2021 | | | 35,000 | | | | 35,986 | |
| | | | | | | | |
| INVESTMENTS | | PRINCIPAL
AMOUNT ($) | | | VALUE ($) | |
| | | | | | | | |
|
Texas — continued | |
| | |
County of Hays, Limited Tax GO, 5.00%, 2/15/2022 | | | 45,000 | | | | 47,077 | |
| | |
County of Hays, Pass-Through, Unlimited Tax GO, 3.00%, 2/15/2022 | | | 35,000 | | | | 35,949 | |
| | |
County of Hidalgo GO, 5.00%, 8/15/2021 | | | 45,000 | | | | 45,979 | |
| | |
County of Jefferson GO, 5.00%, 8/1/2022 | | | 50,000 | | | | 53,342 | |
| | |
County of Kendall, Limited Tax | | | | | | | | |
| | |
GO, 4.00%, 3/1/2021 | | | 50,000 | | | | 50,000 | |
| | |
GO, 4.00%, 3/1/2023 | | | 25,000 | | | | 26,778 | |
| | |
County of Lubbock GO, 5.00%, 2/15/2022 | | | 20,000 | | | | 20,923 | |
| | |
County of McLennan, Combination Tax and Limited Pledge GO, 3.00%, 6/1/2021 | | | 35,000 | | | | 35,246 | |
| | |
County of Montgomery, Limited Tax GO, 5.00%, 3/1/2021 | | | 25,000 | | | | 25,000 | |
| | |
County of Montgomery, Pass-Through Toll, Limited Tax GO, 5.00%, 3/1/2022 (b) | | | 50,000 | | | | 52,369 | |
| | |
County of Montgomery, Unlimited Tax GO, 5.00%, 3/1/2022 | | | 25,000 | | | | 26,195 | |
| | |
County of Montgomery, Unlimited Tax Road, Limited Tax | | | | | | | | |
| | |
Series 2016A, GO, 5.00%, 3/1/2022 | | | 20,000 | | | | 20,956 | |
| | |
Series 2016A, GO, 5.00%, 3/1/2023 | | | 40,000 | | | | 43,707 | |
| | |
County of Nueces, Limited Tax GO, 4.00%, 2/15/2022 | | | 25,000 | | | | 25,904 | |
| | |
County of Parker, Unlimited Tax GO, 4.00%, 2/15/2022 (b) | | | 50,000 | | | | 51,842 | |
| | |
County of Taylor, Limited Tax | | | | | | | | |
| | |
GO, 5.00%, 2/15/2022 | | | 90,000 | | | | 94,110 | |
| | |
GO, 5.00%, 2/15/2025 | | | 30,000 | | | | 35,110 | |
| | |
County of Tom Green, Combination Tax and Limited Surplus GO, 5.00%, 2/1/2022 | | | 30,000 | | | | 31,300 | |
| | |
County of Travis, Limited Tax | | | | | | | | |
| | |
GO, 5.00%, 3/1/2021 | | | 105,000 | | | | 105,000 | |
| | |
Series 2019A, GO, 5.00%, 3/1/2021 | | | 105,000 | | | | 105,000 | |
| | |
GO, 3.50%, 3/1/2022 | | | 30,000 | | | | 31,001 | |
| | |
GO, 5.00%, 3/1/2022 | | | 105,000 | | | | 110,073 | |
| | |
GO, 5.00%, 3/1/2024 | | | 100,000 | | | | 113,610 | |
| | |
County of Travis, State Highway System Series 2014-A, GO, 5.00%, 3/1/2021 | | | 20,000 | | | | 20,000 | |
| | |
County of Travis, Unlimited Tax Road | | | | | | | | |
| | |
GO, 3.00%, 3/1/2022 | | | 70,000 | | | | 71,987 | |
| | |
GO, 5.00%, 3/1/2022 | | | 100,000 | | | | 104,831 | |
SEE NOTES TO FINANCIAL STATEMENTS.
| | | | | | | | |
| | | |
| FEBRUARY 28, 2021 | | J.P. MORGAN EXCHANGE-TRADED FUNDS | | | | | 301 | |
JPMorgan Ultra-Short Municipal Income ETF
SCHEDULE OF PORTFOLIO INVESTMENTS
AS OF FEBRUARY 28, 2021 (continued)
| | | | | | | | |
| INVESTMENTS | | PRINCIPAL
AMOUNT ($) | | | VALUE ($) | |
Municipal Bonds — continued | | | | | | | | |
|
Texas — continued | |
| | |
County of Williamson, Limited Tax GO, 5.00%, 2/15/2022 | | | 20,000 | | | | 20,915 | |
| | |
County of Williamson, Unlimited Tax GO, 4.00%, 2/15/2022 | | | 45,000 | | | | 46,631 | |
| | |
Crandall Independent School District, Unlimited Tax Series 2017B, GO, PSF-GTD, 3.00%, 8/15/2022 | | | 30,000 | | | | 31,240 | |
| | |
Dallas Area Rapid Transit, Sales Tax, Senior Lien | | | | | | | | |
| | |
Series 2016B, Rev., 4.00%, 12/1/2021 | | | 50,000 | | | | 51,421 | |
| | |
Series 2014A, Rev., 5.00%, 12/1/2021 | | | 265,000 | | | | 274,513 | |
| | |
Series 2016B, Rev., 5.00%, 12/1/2021 | | | 110,000 | | | | 113,949 | |
| | |
Rev., 5.00%, 12/1/2022 (b) | | | 155,000 | | | | 168,056 | |
| | |
Series 2014A, Rev., 5.00%, 12/1/2022 | | | 125,000 | | | | 135,414 | |
| | |
Series 2016B, Rev., 5.00%, 12/1/2022 | | | 70,000 | | | | 75,832 | |
| | |
Dallas County Hospital District, Limited Tax GO, 5.00%, 8/15/2022 | | | 100,000 | | | | 106,793 | |
| | |
Dallas County Utility & Reclamation District, Unlimited Tax | | | | | | | | |
| | |
GO, 5.00%, 2/15/2022 | | | 110,000 | | | | 114,774 | |
| | |
GO, 5.00%, 2/15/2024 | | | 115,000 | | | | 129,533 | |
| | |
Dallas Fort Worth International Airport | | | | | | | | |
| | |
Series 2013D, Rev., 5.00%, 11/1/2021 | | | 175,000 | | | | 180,533 | |
| | |
Series 2013G, Rev., 5.00%, 11/1/2021 | | | 380,000 | | | | 392,016 | |
| | |
Series 2014E, Rev., 5.00%, 11/1/2021 | | | 205,000 | | | | 211,482 | |
| | |
Series 2014C, Rev., 5.00%, 11/1/2024 | | | 175,000 | | | | 196,817 | |
| | |
Series F, Rev., 5.00%, 11/1/2024 | | | 370,000 | | | | 416,128 | |
| | |
Dallas Independent School District, Unlimited Tax | | | | | | | | |
| | |
GO, PSF-GTD, 5.00%, 2/15/2022 (b) | | | 25,000 | | | | 26,146 | |
| | |
Series 2019B, GO, PSF-GTD, 5.00%, 2/15/2023 | | | 45,000 | | | | 49,171 | |
| | |
GO, PSF-GTD, 5.00%, 2/15/2025 | | | 100,000 | | | | 100,364 | |
| | |
Decatur Independent School District, Capital Appreciation GO, PSF-GTD, Zero Coupon, 8/15/2021 | | | 385,000 | | | | 384,704 | |
| | |
Deer Park Independent School District, Limited Tax School Building GO, PSF-GTD, 5.00%, 2/15/2022 | | | 20,000 | | | | 20,925 | |
| | | | | | | | |
| INVESTMENTS | | PRINCIPAL
AMOUNT ($) | | | VALUE ($) | |
| | | | | | | | |
|
Texas — continued | |
| | |
Del Mar College District, Combined Fee Rev., 5.00%, 8/15/2021 | | | 200,000 | | | | 204,306 | |
| | |
Del Mar College District, Limited Tax | | | | | | | | |
| | |
GO, 4.00%, 8/15/2021 | | | 30,000 | | | | 30,517 | |
| | |
GO, 3.50%, 8/15/2022 | | | 45,000 | | | | 47,147 | |
| | |
GO, 4.00%, 8/15/2023 | | | 20,000 | | | | 21,738 | |
| | |
GO, 5.00%, 8/15/2023 | | | 50,000 | | | | 51,068 | |
| | |
Denton County Fresh Water Supply District No. 6, Unlimited Tax GO, 4.00%, 2/15/2022 | | | 160,000 | | | | 165,550 | |
| | |
Denton Independent School District | | | | | | | | |
| | |
Series 2014A, GO, PSF-GTD, 5.00%, 8/15/2021 | | | 75,000 | | | | 76,653 | |
| | |
GO, PSF-GTD, 5.00%, 8/15/2022 | | | 30,000 | | | | 32,111 | |
| | |
Dripping Springs Independent School District, Unlimited Tax School Building GO, PSF-GTD, 5.00%, 2/15/2022 | | | 35,000 | | | | 36,619 | |
| | |
Eagle Pass Independent School District GO, PSF-GTD, 4.00%, 8/15/2021 | | | 100,000 | | | | 101,751 | |
| | |
Eanes Independent School District Series B, GO, 4.00%, 8/1/2021 | | | 135,000 | | | | 137,155 | |
| | |
Edgewood Independent School District GO, PSF-GTD, 5.00%, 8/15/2023 | | | 100,000 | | | | 102,139 | |
| | |
El Paso Downtown Development Corp, Downtown Ballpark Venue Project Rev., 5.00%, 8/15/2021 | | | 250,000 | | | | 253,770 | |
| | |
El Paso Independent School District GO, PSF-GTD, 5.00%, 8/15/2023 | | | 75,000 | | | | 83,599 | |
| | |
Flour Bluff Independent School District GO, PSF-GTD, 5.00%, 8/15/2022 (b) | | | 150,000 | | | | 160,577 | |
| | |
Fort Bend County Water Control & Improvement District No. 2 GO, 4.00%, 9/1/2021 | | | 100,000 | | | | 101,908 | |
| | |
Fort Bend Grand Parkway Toll Road Authority Rev., 5.00%, 3/1/2022 | | | 65,000 | | | | 68,107 | |
| | |
Fort Bend Independent School District | | | | | | | | |
| | |
GO, PSF-GTD, 5.00%, 8/15/2021 | | | 45,000 | | | | 45,992 | |
| | |
Series 2019C, GO, PSF-GTD, 5.00%, 8/15/2021 | | | 30,000 | | | | 30,661 | |
| | |
Series 2015C, GO, PSF-GTD, 5.00%, 2/15/2022 | | | 25,000 | | | | 26,157 | |
| | |
Fort Worth Independent School District, Unlimited Tax GO, PSF-GTD, 5.00%, 2/15/2022 | | | 35,000 | | | | 36,619 | |
| | |
Frenship Independent School District, Unlimited Tax GO, PSF-GTD, 5.00%, 2/15/2022 (b) | | | 25,000 | | | | 26,159 | |
| | |
Friendswood Independent School District, Unlimited Tax GO, PSF-GTD, 5.00%, 2/15/2022 | | | 100,000 | | | | 104,626 | |
SEE NOTES TO FINANCIAL STATEMENTS.
| | | | | | |
| | | |
| 302 | | | | J.P. MORGAN EXCHANGE-TRADED FUNDS | | FEBRUARY 28, 2021 |
| | | | | | | | |
| INVESTMENTS | | PRINCIPAL
AMOUNT ($) | | | VALUE ($) | |
Municipal Bonds — continued | | | | | | | | |
|
Texas — continued | |
| | |
Frisco Independent School District, School Building | | | | | | | | |
| | |
GO, PSF-GTD, 5.00%, 8/15/2021 (b) | | | 495,000 | | | | 505,914 | |
| | |
GO, PSF-GTD, 5.00%, 8/15/2022 | | | 20,000 | | | | 21,407 | |
| | |
Galena Park Independent School District | | | | | | | | |
| | |
GO, PSF-GTD, 4.00%, 8/15/2021 | | | 30,000 | | | | 30,525 | |
| | |
GO, PSF-GTD, 5.00%, 8/15/2021 | | | 100,000 | | | | 102,204 | |
| | |
GO, PSF-GTD, 5.00%, 8/15/2022 | | | 50,000 | | | | 53,518 | |
| | |
Garland Independent School District, School Building GO, PSF-GTD, 5.00%, 2/15/2022 | | | 25,000 | | | | 26,152 | |
| | |
Grapevine-Colleyville Independent School District, Unlimited Tax, School Building Series 2013B, GO, 5.00%, 8/15/2022 | | | 25,000 | | | | 26,755 | |
| | |
Grayson County Junior College District GO, 4.00%, 2/15/2022 | | | 25,000 | | | | 25,916 | |
| | |
Gregory-Portland Independent School District Series 2021A, GO, PSF-GTD, 5.00%, 2/15/2023 | | | 35,000 | | | | 38,244 | |
| | |
Harris County Cultural Education Facilities Finance Corp., Baylor Medical Project Rev., 5.00%, 11/15/2021 | | | 600,000 | | | | 619,176 | |
| | |
Harris County Cultural Education Facilities Finance Corp., Children’s Hospital | | | | | | | | |
| | |
Series 2015-1, Rev., 5.00%, 10/1/2021 | | | 200,000 | | | | 205,544 | |
| | |
Rev., 5.00%, 10/1/2023 | | | 20,000 | | | | 22,333 | |
| | |
Harris County Cultural Education Facilities Finance Corp., Memorial Hermann Health System | | | | | | | | |
| | |
Rev., 5.00%, 12/1/2021 | | | 150,000 | | | | 155,327 | |
| | |
Rev., 5.00%, 12/1/2022 | | | 155,000 | | | | 167,793 | |
| | |
Series 2013A, Rev., 5.00%, 12/1/2023 | | | 220,000 | | | | 237,290 | |
| | |
Rev., 5.00%, 12/1/2024 (c) | | | 185,000 | | | | 214,722 | |
| | |
Series 2019C-2, Rev., (SIFMA Municipal Swap Index Yield + 0.57%), 0.60%, 12/4/2024 (e) | | | 490,000 | | | | 487,736 | |
| | |
Harris County Cultural Education Facilities Finance Corp., Teco Project Rev., 5.00%, 11/15/2022 | | | 100,000 | | | | 107,905 | |
| | |
Harris County Flood Control District Series 2008A, Rev., 5.25%, 10/1/2021 | | | 65,000 | | | | 66,930 | |
| | |
Harris County Municipal Utility District No. 530 GO, 5.50%, 9/1/2021 | | | 25,000 | | | | 25,666 | |
| | | | | | | | |
| INVESTMENTS | | PRINCIPAL
AMOUNT ($) | | | VALUE ($) | |
| | | | | | | | |
|
Texas — continued | |
| | |
Harris County Toll Road Authority (The), Senior Lien | | | | | | | | |
| | |
Series A, Rev., 5.00%, 8/15/2021 | | | 45,000 | | | | 45,990 | |
| | |
Series 2018A, Rev., 5.00%, 8/15/2022 | | | 250,000 | | | | 267,550 | |
| | |
Hays Consolidated Independent School District GO, PSF-GTD, 3.00%, 2/15/2022 | | | 25,000 | | | | 25,680 | |
| | |
Hays Consolidated Independent School District, School Building Series 2018B, GO, PSF-GTD, 2.70%, 8/15/2023 (c) | | | 100,000 | | | | 103,071 | |
| | |
Hidalgo County Drain District No. 1 Unlimited Tax GO, 5.00%, 9/1/2022 | | | 100,000 | | | | 107,157 | |
| | |
Houston Community College System | | | | | | | | |
| | |
GO, 4.00%, 3/15/2021 | | | 50,000 | | | | 50,070 | |
| | |
Rev., 5.00%, 4/15/2021 | | | 60,000 | | | | 60,346 | |
| | |
GO, 5.00%, 2/15/2022 | | | 175,000 | | | | 183,025 | |
| | |
Rev., 5.00%, 4/15/2022 | | | 65,000 | | | | 68,502 | |
| | |
GO, 5.00%, 2/15/2023 | | | 55,000 | | | | 60,041 | |
| | |
Houston Independent School District | | | | | | | | |
| | |
GO, 5.00%, 7/15/2021 | | | 25,000 | | | | 25,449 | |
| | |
GO, PSF-GTD, 5.00%, 2/15/2022 | | | 20,000 | | | | 20,925 | |
| | |
Series 2016A, GO, PSF-GTD, 5.00%, 2/15/2022 | | | 40,000 | | | | 41,850 | |
| | |
GO, PSF-GTD, 5.00%, 2/15/2025 | | | 25,000 | | | | 29,419 | |
| | |
Hudson Independent School District, Unlimited Tax GO, PSF-GTD, 4.00%, 2/15/2022 | | | 200,000 | | | | 207,230 | |
| | |
Humble Independent School District | | | | | | | | |
| | |
Series 2015A, GO, PSF-GTD, 5.00%, 2/15/2022 | | | 25,000 | | | | 26,157 | |
| | |
Series 2016B, GO, PSF-GTD, 5.00%, 2/15/2022 | | | 120,000 | | | | 125,551 | |
| | |
Hurst-Euless-Bedford Independent School District GO, PSF-GTD, 5.00%, 8/15/2022 | | | 45,000 | | | | 48,166 | |
| | |
Jefferson County Drain District No. 7, Maintenance Tax Notes Rev., 4.00%, 3/1/2022 | | | 100,000 | | | | 103,784 | |
| | |
Katy Independent School District, School Building | | | | | | | | |
| | |
Series 2012A, GO, PSF-GTD, 3.00%, 2/15/2022 | | | 50,000 | | | | 51,361 | |
| | |
Series 2012A, GO, PSF-GTD, 5.00%, 2/15/2022 (b) | | | 30,000 | | | | 31,391 | |
| | |
Series 2014B, GO, PSF-GTD, 5.00%, 2/15/2022 | | | 30,000 | | | | 31,388 | |
SEE NOTES TO FINANCIAL STATEMENTS.
| | | | | | | | |
| | | |
| FEBRUARY 28, 2021 | | J.P. MORGAN EXCHANGE-TRADED FUNDS | | | | | 303 | |
JPMorgan Ultra-Short Municipal Income ETF
SCHEDULE OF PORTFOLIO INVESTMENTS
AS OF FEBRUARY 28, 2021 (continued)
| | | | | | | | |
| INVESTMENTS | | PRINCIPAL
AMOUNT ($) | | | VALUE ($) | |
Municipal Bonds — continued | | | | | | | | |
|
Texas — continued | |
| | |
Series 2015A, GO, PSF-GTD, 3.00%, 2/15/2023 | | | 50,000 | | | | 52,636 | |
| | |
Series 2016-D, GO, PSF-GTD, 5.00%, 2/15/2023 | | | 20,000 | | | | 21,833 | |
| | |
Keller Independent School District, Unlimited Tax | | | | | | | | |
| | |
Series A, GO, PSF-GTD, 5.00%, 8/15/2021 | | | 20,000 | | | | 20,441 | |
| | |
GO, PSF-GTD, 5.00%, 8/15/2022 | | | 45,000 | | | | 48,166 | |
| | |
Series 2014A, GO, PSF-GTD, 5.00%, 8/15/2022 | | | 75,000 | | | | 80,277 | |
| | |
Klein Independent School District, Unlimited Tax | | | | | | | | |
| | |
GO, PSF-GTD, 5.00%, 2/1/2022 | | | 110,000 | | | | 114,881 | |
| | |
Series 2015A, GO, PSF-GTD, 5.00%, 8/1/2024 | | | 65,000 | | | | 74,985 | |
| | |
La Porte Independent School District | | | | | | | | |
| | |
GO, 5.00%, 2/15/2022 | | | 30,000 | | | | 31,385 | |
| | |
GO, 5.00%, 2/15/2023 | | | 60,000 | | | | 65,351 | |
| | |
Lamar Consolidated Independent School District | | | | | | | | |
| | |
GO, PSF-GTD, 5.00%, 2/15/2022 | | | 35,000 | | | | 36,619 | |
| | |
Series 2012B, GO, PSF-GTD, 5.00%, 2/15/2022 | | | 25,000 | | | | 26,157 | |
| | |
Laredo Independent School District, Unlimited Tax GO, 5.00%, 8/1/2021 | | | 30,000 | | | | 30,590 | |
| | |
Lasara Independent School District GO, PSF-GTD, 3.00%, 2/15/2022 | | | 30,000 | | | | 30,755 | |
| | |
Leander Independent School District, Unlimited Tax | | | | | | | | |
| | |
Series 2017A, GO, PSF-GTD, 5.00%, 8/15/2021 | | | 20,000 | | | | 20,441 | |
| | |
Series 2013A, GO, PSF-GTD, 5.00%, 8/15/2023 (b) | | | 40,000 | | | | 44,486 | |
| | |
Series 2013B, GO, 5.00%, 8/15/2023 | | | 60,000 | | | | 66,676 | |
| | |
Lewisville Independent School District, Unlimited Tax | | | | | | | | |
| | |
Series 2013B, GO, 4.00%, 8/15/2021 | | | 30,000 | | | | 30,524 | |
| | |
Series 2016B, GO, 4.00%, 8/15/2021 | | | 30,000 | | | | 30,524 | |
| | |
GO, PSF-GTD, 5.00%, 8/15/2021 | | | 90,000 | | | | 91,984 | |
| | |
Series 2013A, GO, PSF-GTD, 5.00%, 8/15/2021 | | | 25,000 | | | | 25,551 | |
| | |
Series 2013A, GO, PSF-GTD, 3.00%, 8/15/2022 | | | 20,000 | | | | 20,827 | |
| | |
Series 2013E, GO, PSF-GTD, 3.00%, 8/15/2022 | | | 50,000 | | | | 52,067 | |
| | | | | | | | |
| INVESTMENTS | | PRINCIPAL
AMOUNT ($) | | | VALUE ($) | |
| | | | | | | | |
|
Texas — continued | |
| | |
GO, PSF-GTD, 5.00%, 8/15/2022 | | | 50,000 | | | | 53,518 | |
| | |
Series 2016B, GO, 5.00%, 8/15/2022 | | | 30,000 | | | | 32,106 | |
| | |
GO, PSF-GTD, 5.00%, 8/15/2023 | | | 25,000 | | | | 27,866 | |
| | |
London Independent School District, Unlimited Tax GO, PSF-GTD, 5.00%, 8/15/2021 (b) | | | 250,000 | | | | 255,450 | |
| | |
Lone Star College System Rev., 5.00%, 8/15/2021 | | | 50,000 | | | | 51,100 | |
| | |
Lone Star College System, Limited Tax | | | | | | | | |
| | |
Series 2015B, GO, 5.00%, 2/15/2022 | | | 20,000 | | | | 20,923 | |
| | |
GO, 5.00%, 2/15/2024 | | | 40,000 | | | | 41,823 | |
| | |
Lower Colorado River Authority | | | | | | | | |
| | |
Rev., 5.00%, 5/15/2021 | | | 35,000 | | | | 35,346 | |
| | |
Rev., 5.00%, 5/15/2024 | | | 125,000 | | | | 142,969 | |
| | |
Rev., 5.13%, 5/15/2024 | | | 100,000 | | | | 110,080 | |
| | |
Lower Colorado River Authority, LCRA Transmission Services Corp. Project | | | | | | | | |
| | |
Rev., 5.00%, 5/15/2021 | | | 490,000 | | | | 494,846 | |
| | |
Series 2011A, Rev., 5.00%, 5/15/2021 (b) | | | 140,000 | | | | 141,367 | |
| | |
Series 2011B, Rev., 5.00%, 5/15/2021 (b) | | | 530,000 | | | | 535,173 | |
| | |
Rev., 5.00%, 5/15/2022 | | | 185,000 | | | | 195,800 | |
| | |
Rev., 5.00%, 5/15/2023 | | | 250,000 | | | | 275,855 | |
| | |
Rev., 5.00%, 5/15/2024 | | | 100,000 | | | | 114,375 | |
| | |
Lufkin Independent School District, Unlimited Tax | | | | | | | | |
| | |
GO, PSF-GTD, 3.00%, 8/15/2021 | | | 60,000 | | | | 60,779 | |
| | |
GO, PSF-GTD, 3.00%, 8/15/2022 | | | 60,000 | | | | 62,481 | |
| | |
Magnolia Independent School District, Unlimited Tax | | | | | | | | |
| | |
GO, PSF-GTD, 3.25%, 8/15/2021 (b) | | | 40,000 | | | | 40,561 | |
| | |
GO, 5.00%, 8/15/2021 | | | 60,000 | | | | 61,320 | |
| | |
GO, PSF-GTD, 5.00%, 8/15/2021 | | | 35,000 | | | | 35,771 | |
| | |
GO, 5.00%, 8/15/2022 | | | 50,000 | | | | 53,510 | |
| | |
GO, PSF-GTD, 5.00%, 8/15/2022 | | | 20,000 | | | | 21,407 | |
| | |
Mansfield Independent School District Series 2013B, GO, PSF-GTD, 5.00%, 2/15/2022 | | | 20,000 | | | | 20,925 | |
| | |
McAllen Independent School District, Maintenance Tax Series 2020, GO, 5.00%, 2/15/2022 | | | 50,000 | | | | 52,308 | |
| | |
McLennan County Junior College District, Limited Tax | | | | | | | | |
| | |
GO, 5.00%, 8/15/2021 | | | 210,000 | | | | 214,599 | |
| | |
GO, 5.00%, 8/15/2022 | | | 170,000 | | | | 181,883 | |
SEE NOTES TO FINANCIAL STATEMENTS.
| | | | | | |
| | | |
| 304 | | | | J.P. MORGAN EXCHANGE-TRADED FUNDS | | FEBRUARY 28, 2021 |
| | | | | | | | |
| INVESTMENTS | | PRINCIPAL
AMOUNT ($) | | | VALUE ($) | |
Municipal Bonds — continued | | | | | | | | |
|
Texas — continued | |
| | |
Mesquite Independent School District GO, PSF-GTD, 5.00%, 8/15/2022 (b) | | | 35,000 | | | | 37,468 | |
| | |
Metropolitan Transit Authority of Harris County, Sales and Use Tax | | | | | | | | |
| | |
Series 2011A, Rev., 5.00%, 11/1/2021 (b) | | | 1,135,000 | | | | 1,171,480 | |
| | |
Series 2015B, Rev., 5.00%, 11/1/2021 | | | 20,000 | | | | 20,634 | |
| | |
Series 2016A, Rev., 5.00%, 11/1/2021 | | | 85,000 | | | | 87,694 | |
| | |
Series 2017A, Rev., 5.00%, 11/1/2021 | | | 25,000 | | | | 25,792 | |
| | |
Rev., 5.00%, 11/1/2022 | | | 195,000 | | | | 210,302 | |
| | |
Series 2015B, Rev., 5.00%, 11/1/2022 | | | 20,000 | | | | 21,569 | |
| | |
Series 2016A, Rev., 5.00%, 11/1/2022 | | | 50,000 | | | | 53,923 | |
| | |
Series 2017A, Rev., 5.00%, 11/1/2022 | | | 30,000 | | | | 32,354 | |
| | |
Series 2015B, Rev., 5.00%, 11/1/2023 | | | 25,000 | | | | 28,067 | |
| | |
Series 2017A, Rev., 5.00%, 11/1/2023 | | | 35,000 | | | | 39,293 | |
| | |
Midland College District | | | | | | | | |
| | |
GO, 5.00%, 2/15/2022 | | | 55,000 | | | | 57,539 | |
| | |
GO, 5.00%, 2/15/2023 | | | 85,000 | | | | 88,756 | |
| | |
Midland County Fresh Water Supply District No. 1 Rev., 5.00%, 9/15/2022 (b) | | | 25,000 | | | | 26,860 | |
| | |
Midway Independent School District, McLennan County | | | | | | | | |
| | |
GO, PSF-GTD, 5.00%, 8/1/2021 | | | 100,000 | | | | 102,014 | |
| | |
GO, PSF-GTD, 5.00%, 8/1/2022 | | | 90,000 | | | | 96,162 | |
| | |
GO, PSF-GTD, 5.00%, 8/15/2022 (b) | | | 25,000 | | | | 26,763 | |
| | |
Montgomery County Health Facilities Development Co. Rev., AGM-CR, Zero Coupon, 7/15/2023 (b) | | | 235,000 | | | | 232,511 | |
| | |
Mustang Special Utility District | | | | | | | | |
| | |
Series 2018A, Rev., 5.00%, 9/1/2021 | | | 45,000 | | | | 46,075 | |
| | |
Rev., 3.00%, 9/1/2022 | | | 25,000 | | | | 26,061 | |
| | |
New Hope Cultural Education Facilities Finance Corp., Children’s Health System Series 2017A, Rev., 5.00%, 8/15/2022 | | | 55,000 | | | | 58,736 | |
| | |
North Central Texas Health Facility Development Corp., Children’s Medical Center of Dallas Project | | | | | | | | |
| | |
Rev., 5.00%, 8/15/2021 | | | 360,000 | | | | 367,751 | |
| | |
Rev., 4.13%, 8/15/2022 (b) | | | 100,000 | | | | 105,706 | |
| | | | | | | | |
| INVESTMENTS | | PRINCIPAL
AMOUNT ($) | | | VALUE ($) | |
| | | | | | | | |
|
Texas — continued | |
| | |
North East Independent School District, Unlimited Tax | | | | | | | | |
| | |
GO, PSF-GTD, 5.00%, 8/1/2021 | | | 230,000 | | | | 234,632 | |
| | |
GO, PSF-GTD, 2.50%, 8/1/2022 (b) | | | 30,000 | | | | 30,974 | |
| | |
GO, PSF-GTD, 4.00%, 8/1/2022 (b) | | | 75,000 | | | | 79,087 | |
| | |
North Fort Bend Water Authority Rev., AGM, 5.00%, 12/15/2021 | | | 315,000 | | | | 326,743 | |
| | |
North Harris County Regional Water Authority, Senior Lien Rev., 5.00%, 12/15/2021 | | | 105,000 | | | | 108,871 | |
| | |
North Texas Education Finance Corp., Uplift Education Series 2012A, Rev., 5.25%, 6/1/2022 (b) | | | 150,000 | | | | 159,353 | |
| | |
North Texas Municipal Water District Water System | | | | | | | | |
| | |
Rev., 5.00%, 9/1/2021 | | | 20,000 | | | | 20,474 | |
| | |
Series 2019A, Rev., 3.00%, 9/1/2024 | | | 40,000 | | | | 43,564 | |
| | |
North Texas Municipal Water District Water System, Refunding and Improvement | | | | | | | | |
| | |
Rev., 5.00%, 9/1/2021 | | | 30,000 | | | | 30,711 | |
| | |
Rev., 5.25%, 9/1/2022 | | | 30,000 | | | | 31,493 | |
| | |
Rev., 5.00%, 9/1/2024 | | | 30,000 | | | | 34,753 | |
| | |
North Texas Municipal Water District, Regional Solid Waste Disposal System Rev., 5.00%, 9/1/2022 | | | 25,000 | | | | 26,777 | |
| | |
North Texas Municipal Water District, Upper East Fork Wastewater Interceptor System | | | | | | | | |
| | |
Rev., 5.00%, 6/1/2021 | | | 85,000 | | | | 86,001 | |
| | |
Rev., 5.00%, 6/1/2023 | | | 25,000 | | | | 27,653 | |
| | |
North Texas Municipal Water District, Wastewater System | | | | | | | | |
| | |
Rev., 5.00%, 6/1/2021 | | | 75,000 | | | | 75,884 | |
| | |
Rev., 5.00%, 6/1/2022 | | | 30,000 | | | | 31,773 | |
| | |
North Texas Tollway Authority System, First Tier | | | | | | | | |
| | |
Series 2012B, Rev., 5.00%, 1/1/2022 (b) | | | 455,000 | | | | 473,191 | |
| | |
Series 2017A, Rev., 5.00%, 1/1/2023 | | | 100,000 | | | | 108,381 | |
| | |
Series 2017A, Rev., 5.00%, 1/1/2024 | | | 200,000 | | | | 217,064 | |
| | |
Series 2017A, Rev., 5.00%, 1/1/2025 | | | 190,000 | | | | 205,992 | |
SEE NOTES TO FINANCIAL STATEMENTS.
| | | | | | | | |
| | | |
| FEBRUARY 28, 2021 | | J.P. MORGAN EXCHANGE-TRADED FUNDS | | | | | 305 | |
JPMorgan Ultra-Short Municipal Income ETF
SCHEDULE OF PORTFOLIO INVESTMENTS
AS OF FEBRUARY 28, 2021 (continued)
| | | | | | | | |
| INVESTMENTS | | PRINCIPAL
AMOUNT ($) | | | VALUE ($) | |
Municipal Bonds — continued | | | | | | | | |
|
Texas — continued | |
| | |
North Texas Tollway Authority System, Special Projects System | | | | | | | | |
| | |
Series 2011A, Rev., 5.00%, 9/1/2021 (b) | | | 100,000 | | | | 102,394 | |
| | |
Series 2011D, Rev., 5.25%, 9/1/2021 (b) | | | 400,000 | | | | 410,076 | |
| | |
Series 2011A, Rev., 5.50%, 9/1/2021 (b) | | | 300,000 | | | | 307,929 | |
| | |
Northside Independent School District, Unlimited Tax | | | | | | | | |
| | |
Series 2016A, GO, PSF-GTD, 4.00%, 8/15/2021 | | | 35,000 | | | | 35,613 | |
| | |
Series 2019A, GO, PSF-GTD, 5.00%, 8/15/2021 | | | 45,000 | | | | 45,992 | |
| | |
Northwest Independent School District, Unlimited Tax GO, PSF-GTD, 5.00%, 2/15/2022 (b) | | | 25,000 | | | | 26,122 | |
| | |
Nueces River Authority Rev., 5.00%, 7/15/2021 | | | 25,000 | | | | 25,444 | |
| | |
Palestine Independent School District, Unlimited Tax GO, PSF-GTD, 5.00%, 2/15/2022 | | | 25,000 | | | | 26,144 | |
| | |
Permanent University Fund — Texas A&M University System Series 2009A, Rev., 5.00%, 7/1/2022 | | | 20,000 | | | | 21,294 | |
| | |
Permanent University Fund — University of Texas System | | | | | | | | |
| | |
Series 2015B, Rev., 5.00%, 7/1/2021 | | | 25,000 | | | | 25,401 | |
| | |
Series 2016A, Rev., 5.00%, 7/1/2021 | | | 55,000 | | | | 55,883 | |
| | |
Series 2006B, Rev., 5.25%, 7/1/2021 | | | 75,000 | | | | 76,266 | |
| | |
Series 2015B, Rev., 5.00%, 7/1/2022 | | | 30,000 | | | | 31,929 | |
| | |
Series 2016A, Rev., 5.00%, 7/1/2022 | | | 55,000 | | | | 58,536 | |
| | |
Series 2016B, Rev., 5.00%, 7/1/2022 | | | 25,000 | | | | 26,608 | |
| | |
Series 2006B, Rev., 5.25%, 7/1/2022 | | | 20,000 | | | | 21,352 | |
| | |
Pflugerville Independent School District | | | | | | | | |
| | |
Series 2019A, GO, PSF-GTD, 5.00%, 2/15/2022 | | | 25,000 | | | | 26,156 | |
| | |
Series 2020A, GO, PSF-GTD, 5.00%, 2/15/2023 | | | 30,000 | | | | 32,756 | |
| | |
Plano Independent School District, Unlimited Tax School Building | | | | | | | | |
| | |
GO, PSF-GTD, 5.00%, 2/15/2022 | | | 125,000 | | | | 130,783 | |
| | |
Series 2016B, GO, PSF-GTD, 5.00%, 2/15/2022 | | | 35,000 | | | | 36,619 | |
| | | | | | | | |
| INVESTMENTS | | PRINCIPAL
AMOUNT ($) | | | VALUE ($) | |
| | | | | | | | |
|
Texas — continued | |
| | |
Rockwall Independent School District, Unlimited Tax | | | | | | | | |
| | |
GO, PSF-GTD, 5.00%, 2/15/2023 | | | 25,000 | | | | 27,291 | |
| | |
GO, PSF-GTD, Zero Coupon, 2/15/2025 | | | 25,000 | | | | 24,176 | |
| | |
Round Rock Independent School District, Unlimited Tax | | | | | | | | |
| | |
GO, PSF-GTD, 5.00%, 8/1/2021 | | | 45,000 | | | | 45,906 | |
| | |
GO, PSF-GTD, 5.00%, 8/1/2022 | | | 40,000 | | | | 42,739 | |
| | |
Series 2019A, GO, PSF-GTD, 5.00%, 8/1/2022 | | | 25,000 | | | | 26,712 | |
| | |
Sam Rayburn Municipal Power Agency, Texas Power Supply System Rev., 5.00%, 10/1/2021 | | | 300,000 | | | | 308,244 | |
| | |
San Antonio Education Facilities Corp., Trinity University Project Rev., 5.00%, 6/1/2023 (b) | | | 50,000 | | | | 55,331 | |
| | |
San Antonio Housing Trust Finance Corp., Multi-Family Housing, Alsbury Park Apartments Rev., FHA, 1.37%, 9/1/2021 (c) | | | 40,000 | | | | 40,234 | |
| | |
San Antonio Independent School District, Unlimited Tax GO, PSF-GTD, 5.00%, 2/15/2022 | | | 55,000 | | | | 57,533 | |
| | |
San Antonio Public Facilities Corp., Convention Center Refinancing and Expansion Project Rev., 5.00%, 9/15/2024 | | | 35,000 | | | | 37,385 | |
| | |
San Antonio Water System | | | | | | | | |
| | |
Rev., 5.00%, 5/15/2021 | | | 30,000 | | | | 30,298 | |
| | |
Series 2012A, Rev., 5.00%, 5/15/2021 | | | 45,000 | | | | 45,447 | |
| | |
San Antonio Water System, Junior Lien | | | | | | | | |
| | |
Rev., 4.50%, 5/15/2021 | | | 25,000 | | | | 25,223 | |
| | |
Series 2013E, Rev., 5.00%, 5/15/2021 | | | 155,000 | | | | 156,539 | |
| | |
Series 2016A, Rev., 5.00%, 5/15/2021 | | | 200,000 | | | | 201,986 | |
| | |
Series 2016C, Rev., 5.00%, 5/15/2021 | | | 50,000 | | | | 50,497 | |
| | |
Series 2017A, Rev., 5.00%, 5/15/2021 | | | 45,000 | | | | 45,447 | |
| | |
Series 2019C, Rev., 5.00%, 5/15/2021 | | | 25,000 | | | | 25,248 | |
| | |
Series 2013E, Rev., 5.00%, 5/15/2022 | | | 20,000 | | | | 21,163 | |
| | |
Series 2015B, Rev., 5.00%, 5/15/2022 | | | 45,000 | | | | 47,616 | |
| | |
Series 2016A, Rev., 5.00%, 5/15/2022 | | | 25,000 | | | | 26,453 | |
SEE NOTES TO FINANCIAL STATEMENTS.
| | | | | | |
| | | |
| 306 | | | | J.P. MORGAN EXCHANGE-TRADED FUNDS | | FEBRUARY 28, 2021 |
| | | | | | | | |
| INVESTMENTS | | PRINCIPAL
AMOUNT ($) | | | VALUE ($) | |
Municipal Bonds — continued | | | | | | | | |
|
Texas — continued | |
| | |
Series 2017A, Rev., 5.00%, 5/15/2022 | | | 25,000 | | | | 26,453 | |
| | |
Series 2018A, Rev., 5.00%, 5/15/2022 | | | 80,000 | | | | 84,650 | |
| | |
Series 2020A, Rev., 5.00%, 5/15/2022 | | | 30,000 | | | | 31,744 | |
| | |
Series 2019C, Rev., 5.00%, 5/15/2023 | | | 25,000 | | | | 27,574 | |
| | |
Series 2016A, Rev., 5.00%, 5/15/2024 | | | 25,000 | | | | 28,594 | |
| | |
San Jacinto Community College District, Limited Tax | | | | | | | | |
| | |
GO, 5.00%, 2/15/2022 | | | 85,000 | | | | 88,924 | |
| | |
Series 2016A, GO, 5.00%, 2/15/2022 | | | 55,000 | | | | 57,539 | |
| | |
Series 2016B, GO, 5.00%, 2/15/2022 (b) | | | 40,000 | | | | 41,846 | |
| | |
Series 2019A, GO, 5.00%, 2/15/2022 | | | 165,000 | | | | 172,616 | |
| | |
Series 2019B, GO, 5.00%, 2/15/2023 | | | 25,000 | | | | 27,209 | |
| | |
San Marcos Consolidated Independent School District, Unlimited Tax GO, PSF-GTD, 5.00%, 8/1/2021 | | | 55,000 | | | | 56,108 | |
| | |
Seguin Independent School District, Unlimited Tax Series 2016A, GO, PSF-GTD, 5.00%, 8/1/2022 | | | 50,000 | | | | 53,424 | |
| | |
Sienna Plantation Levee Improvement District, Limited Tax Series 2015A, GO, 5.00%, 9/1/2021 | | | 30,000 | | | | 30,702 | |
| | |
South Texas College, Limited Tax GO, 3.00%, 8/15/2021 | | | 95,000 | | | | 96,229 | |
| | |
Southwest Higher Education Authority, Inc., Southern Methodist University Project Rev., 5.00%, 10/1/2022 | | | 110,000 | | | | 118,218 | |
| | |
Spring Branch Independent School District, Unlimited Tax GO, PSF-GTD, 5.00%, 2/1/2022 | | | 40,000 | | | | 41,775 | |
| | |
State of Texas Rev., TRAN, 4.00%, 8/26/2021 | | | 585,000 | | | | 596,027 | |
| | |
State of Texas, Public Finance Authority | | | | | | | | |
| | |
GO, 5.00%, 10/1/2021 | | | 115,000 | | | | 118,249 | |
| | |
Series 2018A, GO, 5.00%, 10/1/2021 | | | 90,000 | | | | 92,542 | |
| | |
State of Texas, Transportation Commission Highway Improvement | | | | | | | | |
| | |
GO, 5.00%, 4/1/2021 | | | 50,000 | | | | 50,196 | |
| | |
Series 2012A, GO, 5.00%, 4/1/2021 | | | 75,000 | | | | 75,294 | |
| | |
GO, 5.00%, 4/1/2022 (b) | | | 75,000 | | | | 78,935 | |
| | |
Series 2012A, GO, 5.00%, 4/1/2022 | | | 20,000 | | | | 21,049 | |
| | | | | | | | |
| INVESTMENTS | | PRINCIPAL
AMOUNT ($) | | | VALUE ($) | |
| | | | | | | | |
|
Texas — continued | |
| | |
State of Texas, Transportation Commission Mobility Fund | | | | | | | | |
| | |
Series 2014-A, GO, 5.00%, 10/1/2021 | | | 150,000 | | | | 154,237 | |
| | |
Series 2015A, GO, 5.00%, 10/1/2021 | | | 70,000 | | | | 71,978 | |
| | |
Series A, GO, 5.00%, 10/1/2022 | | | 85,000 | | | | 91,506 | |
| | |
State of Texas, Veterans | | | | | | | | |
| | |
Series 2011B, GO, VRDO, LIQ: State Street Bank & Trust, 0.06%, 3/9/2021 (c) | | | 2,760,000 | | | | 2,760,000 | |
| | |
Series 2015 A, GO, VRDO, LIQ: State Street Bank & Trust, 0.06%, 3/9/2021 (c) | | | 3,830,000 | | | | 3,830,000 | |
| | |
State of Texas, Veterans Housing Assistance Program | | | | | | | | |
| | |
GO, VRDO, LIQ: FHLB, 0.06%, 3/9/2021 (c) | | | 8,000,000 | | | | 8,000,000 | |
| | |
Series 2010C, GO, VRDO, LIQ: State Street Bank & Trust, 0.06%, 3/9/2021 (c) | | | 3,535,000 | | | | 3,535,000 | |
| | |
State of Texas, Water Financial Assistance | | | | | | | | |
| | |
GO, 5.00%, 8/1/2021 | | | 100,000 | | | | 102,014 | |
| | |
Series 2012F, GO, 5.00%, 8/1/2021 | | | 35,000 | | | | 35,705 | |
| | |
Series 2013C, GO, 5.00%, 8/1/2021 | | | 40,000 | | | | 40,806 | |
| | |
Series 2015D, GO, 5.00%, 5/15/2022 | | | 25,000 | | | | 26,456 | |
| | |
Series 2013A, GO, 4.00%, 8/1/2022 | | | 20,000 | | | | 21,087 | |
| | |
Series 2011B, GO, 5.00%, 8/1/2022 | | | 60,000 | | | | 61,204 | |
| | |
Series 2012G, GO, 5.00%, 8/1/2023 | | | 50,000 | | | | 53,423 | |
| | |
Stephen F Austin State University, Financing System Series 2019A, Rev., 5.00%, 10/15/2021 | | | 50,000 | | | | 51,440 | |
| | |
Sugar Land 4B Corp., Sales Tax Rev., 3.00%, 2/15/2022 | | | 225,000 | | | | 230,557 | |
| | |
Tarrant County Cultural Education Facilities Finance Corp., Baylor Healthcare System Project Series 2013A, Rev., 4.00%, 5/15/2023 (b) | | | 55,000 | | | | 59,477 | |
| | |
Tarrant County Cultural Education Facilities Finance Corp., Hospital, Cook Children’s Medical Center Rev., 4.00%, 12/1/2021 | | | 285,000 | | | | 292,994 | |
| | |
Tarrant County Cultural Education Facilities Finance Corp., Methodist Hospitals of Dallas Rev., 5.00%, 10/1/2023 | | | 195,000 | | | | 217,530 | |
SEE NOTES TO FINANCIAL STATEMENTS.
| | | | | | | | |
| | | |
| FEBRUARY 28, 2021 | | J.P. MORGAN EXCHANGE-TRADED FUNDS | | | | | 307 | |
JPMorgan Ultra-Short Municipal Income ETF
SCHEDULE OF PORTFOLIO INVESTMENTS
AS OF FEBRUARY 28, 2021 (continued)
| | | | | | | | |
| INVESTMENTS | | PRINCIPAL
AMOUNT ($) | | | VALUE ($) | |
Municipal Bonds — continued | | | | | | | | |
|
Texas — continued | |
| | |
Tarrant County Cultural Education Facilities Finance Corp., Texas Health Resources System Rev., 5.00%, 2/15/2024 | | | 330,000 | | | | 372,633 | |
| | |
Tarrant Regional, Water Control and Improvement District, Water System | | | | | | | | |
| | |
Rev., 5.00%, 3/1/2022 (b) | | | 465,000 | | | | 487,077 | |
| | |
Series 2016A, Rev., 5.00%, 3/1/2022 | | | 20,000 | | | | 20,970 | |
| | |
Rev., 4.00%, 9/1/2022 (b) | | | 160,000 | | | | 169,210 | |
| | |
Tatum Independent School District, Unlimited Tax GO, PSF-GTD, 3.00%, 2/15/2022 | | | 25,000 | | | | 25,666 | |
| | |
Temple Independent School District, Unlimited Tax | | | | | | | | |
| | |
GO, PSF-GTD, 3.00%, 2/1/2022 | | | 30,000 | | | | 30,784 | |
| | |
GO, PSF-GTD, 5.00%, 2/1/2022 | | | 25,000 | | | | 26,109 | |
| | |
Texas A&M University, Financing System | | | | | | | | |
| | |
Series 2013B, Rev., 5.00%, 5/15/2021 | | | 60,000 | | | | 60,595 | |
| | |
Series 2013D, Rev., 5.00%, 5/15/2021 | | | 25,000 | | | | 25,248 | |
| | |
Series 2016E, Rev., 5.00%, 5/15/2021 | | | 90,000 | | | | 90,892 | |
| | |
Series 2013A, Rev., 5.00%, 5/15/2022 | | | 145,000 | | | | 153,484 | |
| | |
Series 2015A, Rev., 5.00%, 5/15/2022 | | | 65,000 | | | | 68,803 | |
| | |
Series 2016C, Rev., 5.00%, 5/15/2022 | | | 20,000 | | | | 21,170 | |
| | |
Texas Southmost College District | | | | | | | | |
| | |
Series 2014A, GO, 5.00%, 2/15/2022 | | | 35,000 | | | | 36,581 | |
| | |
Series 2014B, GO, 5.00%, 2/15/2023 | | | 20,000 | | | | 21,739 | |
| | |
Texas State University System | | | | | | | | |
| | |
Series 2019A, Rev., 4.00%, 3/15/2021 | | | 50,000 | | | | 50,069 | |
| | |
Rev., 5.00%, 3/15/2021 (b) | | | 450,000 | | | | 450,783 | |
| | |
Rev., 5.00%, 3/15/2022 | | | 20,000 | | | | 20,997 | |
| | |
Series 2015A, Rev., 5.00%, 3/15/2022 | | | 140,000 | | | | 146,982 | |
| | |
Series 2017A, Rev., 5.00%, 3/15/2022 | | | 85,000 | | | | 89,239 | |
| | |
Series 2015A, Rev., 5.00%, 3/15/2023 | | | 20,000 | | | | 21,924 | |
| | |
Series 2017A, Rev., 5.00%, 3/15/2023 | | | 50,000 | | | | 54,809 | |
| | |
Series 2017A, Rev., 5.00%, 3/15/2025 | | | 50,000 | | | | 58,850 | |
| | | | | | | | |
| INVESTMENTS | | PRINCIPAL
AMOUNT ($) | | | VALUE ($) | |
| | | | | | | | |
|
Texas — continued | |
| | |
Texas Tech University System | | | | | | | | |
| | |
Series 2012A, Rev., 4.25%, 8/15/2021 | | | 165,000 | | | | 168,069 | |
| | |
Series 2012A, Rev., 5.00%, 8/15/2021 (b) | | | 195,000 | | | | 199,298 | |
| | |
Texas Transportation Commission State Highway Fund | | | | | | | | |
| | |
Series 2016-A, Rev., 3.00%, 10/1/2021 | | | 30,000 | | | | 30,500 | |
| | |
Series 2016-B, Rev., 4.00%, 10/1/2021 (c) | | | 1,300,000 | | | | 1,328,951 | |
| | |
Rev., 5.00%, 10/1/2021 | | | 30,000 | | | | 30,847 | |
| | |
Series 2016-A, Rev., 5.00%, 10/1/2021 | | | 55,000 | | | | 56,554 | |
| | |
Rev., 5.00%, 10/1/2022 | | | 75,000 | | | | 80,740 | |
| | |
Rev., 5.00%, 10/1/2023 | | | 40,000 | | | | 44,820 | |
| | |
Texas Transportation Commission State Highway Fund, First Tier | | | | | | | | |
| | |
Series 2014A, Rev., 5.00%, 4/1/2021 | | | 230,000 | | | | 230,901 | |
| | |
Series 2014A, Rev., 5.00%, 4/1/2022 | | | 95,000 | | | | 99,984 | |
| | |
Texas Water Development Board, Water Implementation Fund | | | | | | | | |
| | |
Rev., 5.00%, 4/15/2021 | | | 55,000 | | | | 55,321 | |
| | |
Series 2015A, Rev., 5.00%, 4/15/2021 | | | 25,000 | | | | 25,146 | |
| | |
Series 2017A, Rev., 5.00%, 4/15/2021 | | | 25,000 | | | | 25,146 | |
| | |
Series 2018B, Rev., 5.00%, 10/15/2021 | | | 55,000 | | | | 56,661 | |
| | |
Series 2019A, Rev., 5.00%, 10/15/2021 | | | 50,000 | | | | 51,510 | |
| | |
Series 2017A, Rev., 5.00%, 4/15/2022 | | | 35,000 | | | | 36,898 | |
| | |
Series 2018B, Rev., 4.00%, 10/15/2022 | | | 45,000 | | | | 47,794 | |
| | |
Series 2018B, Rev., 5.00%, 10/15/2022 | | | 25,000 | | | | 26,956 | |
| | |
Texas Woman’s University, Financing System | | | | | | | | |
| | |
Rev., 4.00%, 7/1/2021 | | | 100,000 | | | | 101,241 | |
| | |
Series 2017A, Rev., 4.00%, 7/1/2021 | | | 30,000 | | | | 30,372 | |
| | |
Rev., 4.00%, 7/1/2022 | | | 25,000 | | | | 25,309 | |
| | |
Tomball Independent School District, Unlimited Tax School Building GO, PSF-GTD, 5.00%, 2/15/2025 | | | 35,000 | | | | 41,052 | |
SEE NOTES TO FINANCIAL STATEMENTS.
| | | | | | |
| | | |
| 308 | | | | J.P. MORGAN EXCHANGE-TRADED FUNDS | | FEBRUARY 28, 2021 |
| | | | | | | | |
| INVESTMENTS | | PRINCIPAL
AMOUNT ($) | | | VALUE ($) | |
Municipal Bonds — continued | | | | | | | | |
|
Texas — continued | |
| | |
Town of Addison GO, 4.00%, 2/15/2023 | | | 20,000 | | | | 21,468 | |
| | |
Town of Prosper | | | | | | | | |
| | |
GO, 5.00%, 8/15/2021 | | | 25,000 | | | | 25,544 | |
| | |
GO, 5.00%, 2/15/2022 | | | 30,000 | | | | 31,370 | |
| | |
Town of Prosper, Combination Tax and Surplus GO, 4.00%, 2/15/2022 | | | 50,000 | | | | 51,807 | |
| | |
Trinity River Authority, Central Regional Wastewater System | | | | | | | | |
| | |
Rev., 3.00%, 8/1/2021 | | | 130,000 | | | | 131,538 | |
| | |
Rev., 5.00%, 8/1/2021 | | | 235,000 | | | | 239,723 | |
| | |
Rev., 5.00%, 8/1/2022 | | | 185,000 | | | | 197,641 | |
| | |
Trinity River Authority, Denton Creek Wastewater Treatment System | | | | | | | | |
| | |
Rev., 5.00%, 2/1/2022 | | | 30,000 | | | | 31,294 | |
| | |
Rev., 5.00%, 2/1/2024 | | | 40,000 | | | | 45,243 | |
| | |
Trinity River Authority, Water Project | | | | | | | | |
| | |
Rev., 3.00%, 2/1/2022 | | | 110,000 | | | | 112,739 | |
| | |
Rev., 5.00%, 2/1/2024 | | | 25,000 | | | | 28,277 | |
| | |
Rev., 5.00%, 2/1/2025 | | | 40,000 | | | | 46,790 | |
| | |
Tyler Independent School District, Unlimited Tax | | | | | | | | |
| | |
GO, 5.00%, 2/15/2022 | | | 40,000 | | | | 41,846 | |
| | |
GO, PSF-GTD, 5.00%, 2/15/2023 (b) | | | 25,000 | | | | 27,333 | |
| | |
University of Houston | | | | | | | | |
| | |
Series 2011A, Rev., 5.00%, 2/15/2022 | | | 50,000 | | | | 50,181 | |
| | |
Series 2016A, Rev., 5.00%, 2/15/2022 | | | 100,000 | | | | 104,616 | |
| | |
Series 2020A, Rev., 5.00%, 2/15/2022 | | | 125,000 | | | | 130,770 | |
| | |
Series 2017A, Rev., 5.00%, 2/15/2025 | | | 45,000 | | | | 52,781 | |
| | |
University of North Texas System | | | | | | | | |
| | |
Series 2017A, Rev., 5.00%, 4/15/2021 | | | 25,000 | | | | 25,144 | |
| | |
Rev., 5.00%, 4/15/2022 | | | 30,000 | | | | 31,609 | |
| | |
Series 2015A, Rev., 5.00%, 4/15/2022 | | | 30,000 | | | | 31,609 | |
| | |
Series 2017A, Rev., 5.00%, 4/15/2022 | | | 60,000 | | | | 63,218 | |
| | |
Series 2017A, Rev., 5.00%, 4/15/2023 | | | 70,000 | | | | 76,839 | |
| | |
Series 2018A, Rev., 5.00%, 4/15/2023 | | | 55,000 | | | | 60,374 | |
| | |
Upper Trinity Regional Water District Rev., 5.00%, 8/1/2022 | | | 320,000 | | | | 341,110 | |
| | | | | | | | |
| INVESTMENTS | | PRINCIPAL
AMOUNT ($) | | | VALUE ($) | |
| | | | | | | | |
|
Texas — continued | |
| | |
Via Metropolitan Transit, Sales Tax Rev., 5.00%, 7/15/2024 | | | 110,000 | | | | 126,025 | |
| | |
Vidor Independent School District GO, PSF-GTD, Zero Coupon, 2/15/2022 | | | 100,000 | | | | 99,525 | |
| | |
Waco Independent School District, Unlimited Tax GO, PSF-GTD, 5.00%, 8/15/2022 | | | 25,000 | | | | 26,767 | |
| | |
Weatherford Independent School District, Unlimited Tax GO, PSF-GTD, Zero Coupon, 2/15/2025 | | | 50,000 | | | | 48,485 | |
| | |
Weslaco Housing Opportunities Corp., Primrose Village Apartments Rev., 1.42%, 1/1/2022 (c) | | | 460,000 | | | | 464,154 | |
| | |
West Harris County Municipal Utility District No. 2, Unlimited Tax GO, 3.00%, 8/1/2022 | | | 105,000 | | | | 108,829 | |
| | |
West Harris County Regional Water Authority Rev., 4.00%, 12/15/2022 | | | 500,000 | | | | 514,190 | |
| | |
West Travis County Public Utility Agency | | | | | | | | |
| | |
Rev., 5.00%, 8/15/2021 (b) | | | 285,000 | | | | 291,213 | |
| | |
Rev., 5.50%, 8/15/2021 (b) | | | 100,000 | | | | 102,407 | |
| | |
Wylie Independent School District, Unlimited Tax Series 2015C, GO, PSF-GTD, 6.75%, 8/15/2021 | | | 25,000 | | | | 25,749 | |
| | | | | | | | |
| | |
Total Texas | | | | | | | 87,555,651 | |
| | | | | | | | |
|
Utah — 0.5% | |
| | |
Alpine School District, School Building | | | | | | | | |
| | |
GO, 5.00%, 3/15/2021 | | | 55,000 | | | | 55,096 | |
| | |
GO, 5.00%, 3/15/2022 | | | 45,000 | | | | 47,259 | |
| | |
Central Utah Water Conservancy District Series 2017B, Rev., 5.00%, 10/1/2022 | | | 30,000 | | | | 32,286 | |
| | |
Central Utah Water Conservancy District, Limited Tax | | | | | | | | |
| | |
Series 2011A, GO, 5.00%, 4/1/2021 | | | 210,000 | | | | 210,815 | |
| | |
Series 2011C, GO, 5.00%, 4/1/2021 | | | 50,000 | | | | 50,195 | |
| | |
Series 2011C, GO, 5.00%, 4/1/2022 | | | 70,000 | | | | 73,656 | |
| | |
City of American Fork GO, 4.00%, 5/1/2021 | | | 115,000 | | | | 115,677 | |
| | |
City of Lehi, Sales Tax Rev., 5.00%, 6/1/2021 | | | 135,000 | | | | 136,593 | |
| | |
City of Ogden City Rev., 3.00%, 1/15/2022 | | | 270,000 | | | | 276,683 | |
| | |
City of Park City GO, 5.00%, 5/1/2022 | | | 25,000 | | | | 26,406 | |
| | |
City of Provo, Wastewater Series 2015A, Rev., 5.00%, 2/1/2023 | | | 25,000 | | | | 27,261 | |
| | |
City of Riverton Rev., 3.00%, 9/1/2022 | | | 35,000 | | | | 35,467 | |
SEE NOTES TO FINANCIAL STATEMENTS.
| | | | | | | | |
| | | |
| FEBRUARY 28, 2021 | | J.P. MORGAN EXCHANGE-TRADED FUNDS | | | | | 309 | |
JPMorgan Ultra-Short Municipal Income ETF
SCHEDULE OF PORTFOLIO INVESTMENTS
AS OF FEBRUARY 28, 2021 (continued)
| | | | | | | | |
| INVESTMENTS | | PRINCIPAL
AMOUNT ($) | | | VALUE ($) | |
Municipal Bonds — continued | | | | | | | | |
|
Utah — continued | |
| | |
City of Sandy City Rev., 5.00%, 3/1/2024 | | | 25,000 | | | | 28,459 | |
| | |
City of South Jordan Rev., 5.00%, 8/15/2021 | | | 25,000 | | | | 25,550 | |
| | |
City of South Jordan, Daybreak Assessment Area No. 1 | | | | | | | | |
| | |
4.00%, 11/1/2021 | | | 730,000 | | | | 748,688 | |
| | |
3.00%, 11/1/2022 | | | 40,000 | | | | 41,880 | |
| | |
City of St. George | | | | | | | | |
| | |
Rev., 3.00%, 6/1/2021 | | | 25,000 | | | | 25,165 | |
| | |
Rev., 5.00%, 12/1/2021 | | | 20,000 | | | | 20,726 | |
| | |
Rev., 5.00%, 12/1/2022 | | | 20,000 | | | | 21,685 | |
| | |
GO, 4.00%, 8/1/2023 | | | 75,000 | | | | 75,214 | |
| | |
Rev., AGM, 5.00%, 6/1/2024 | | | 150,000 | | | | 171,412 | |
| | |
County of Salt Lake, Crossover GO, 4.00%, 12/15/2022 | | | 75,000 | | | | 80,120 | |
| | |
County of Salt Lake, Sales Tax Series 2012A, Rev., 5.00%, 2/1/2022 | | | 55,000 | | | | 57,435 | |
| | |
County of Utah, IHC Health Services, Inc. | | | | | | | | |
| | |
Rev., 2.75%, 5/15/2021 | | | 135,000 | | | | 135,700 | |
| | |
Series 2016B, Rev., 5.00%, 5/15/2022 | | | 145,000 | | | | 153,339 | |
| | |
Series 2018B-1, Rev., 5.00%, 8/1/2022 (c) | | | 250,000 | | | | 263,490 | |
| | |
Series 2018B-2, Rev., 5.00%, 8/1/2024 (c) | | | 235,000 | | | | 265,804 | |
| | |
Series 2020B-1, Rev., 5.00%, 8/1/2024 (c) | | | 100,000 | | | | 115,226 | |
| | |
Series 2020B-2, Rev., 5.00%, 8/1/2026 (c) | | | 250,000 | | | | 305,270 | |
| | |
County of Weber GO, 5.00%, 1/15/2022 | | | 70,000 | | | | 72,948 | |
| | |
Davis School District, School District Bond Guaranty Program | | | | | | | | |
| | |
GO, 5.00%, 6/1/2021 | | | 50,000 | | | | 50,600 | |
| | |
GO, 5.00%, 6/1/2022 | | | 20,000 | | | | 21,206 | |
| | |
Jordan Valley Water Conservancy District Series 2013A, Rev., 4.00%, 10/1/2021 | | | 20,000 | | | | 20,448 | |
| | |
Magna Water District GO, 5.00%, 6/1/2023 | | | 50,000 | | | | 55,150 | |
| | |
Metropolitan Water District of Salt Lake and Sandy Series 2012A, Rev., 4.00%, 7/1/2022 | | | 85,000 | | | | 89,337 | |
| | |
Mountain Regional Water Special Service District Series 2014A, Rev., AGM, 3.00%, 12/15/2022 | | | 75,000 | | | | 78,646 | |
| | | | | | | | |
| INVESTMENTS | | PRINCIPAL
AMOUNT ($) | | | VALUE ($) | |
| | | | | | | | |
|
Utah — continued | |
| | |
Nebo School District Series 2017B, GO, 5.00%, 7/1/2022 | | | 30,000 | | | | 31,929 | |
| | |
North Davis County Sewer District Rev., 5.00%, 3/1/2021 | | | 50,000 | | | | 50,000 | |
| | |
Ogden City School District Municipal Building Authority Rev., 5.00%, 1/15/2022 | | | 210,000 | | | | 218,658 | |
| | |
Salt Lake City Corp., Sales and Excise Tax Series 2016A, Rev., 4.00%, 10/1/2023 | | | 30,000 | | | | 32,828 | |
| | |
Salt Lake City School District, Utah School Bond Guaranty Program GO, 5.00%, 3/1/2021 | | | 25,000 | | | | 25,000 | |
| | |
Southern Utah University, Auxiliary System and Student Building Rev., 4.00%, 5/1/2022 | | | 50,000 | | | | 52,159 | |
| | |
State of Utah GO, 5.00%, 7/1/2024 | | | 75,000 | | | | 86,488 | |
| | |
Summit County, Transportation Sales Tax Rev., 5.00%, 12/15/2021 | | | 75,000 | | | | 77,863 | |
| | |
Tooele County School District Series 2014B, GO, 5.00%, 6/1/2021 | | | 25,000 | | | | 25,300 | |
| | |
Unified Fire Service Area, Local Building Authority Rev., 2.00%, 4/1/2021 | | | 100,000 | | | | 100,142 | |
| | |
University of Utah (The) | | | | | | | | |
| | |
Series B-2, Rev., 4.00%, 8/1/2021 | | | 75,000 | | | | 76,207 | |
| | |
Series 2013A, Rev., 5.00%, 8/1/2021 | | | 200,000 | | | | 204,046 | |
| | |
Series 2014B, Rev., 5.00%, 8/1/2021 (b) | | | 25,000 | | | | 25,503 | |
| | |
Series 2015B, Rev., 5.00%, 8/1/2021 (b) | | | 200,000 | | | | 204,028 | |
| | |
Series A-1, Rev., 5.00%, 8/1/2021 (b) | | | 20,000 | | | | 20,403 | |
| | |
Series 2014B, Rev., 5.00%, 8/1/2022 (b) | | | 50,000 | | | | 53,431 | |
| | |
Series 2015B, Rev., 5.00%, 8/1/2022 (b) | | | 265,000 | | | | 283,184 | |
| | |
Series 2016B-1, Rev., 5.00%, 8/1/2022 | | | 30,000 | | | | 32,050 | |
| | |
Series 2017A, Rev., 5.00%, 8/1/2022 | | | 25,000 | | | | 26,708 | |
| | |
Series 2017B-2, Rev., 5.00%, 8/1/2022 | | | 20,000 | | | | 21,367 | |
| | |
University of Utah, Auxiliary and Campus Facilities Rev., 5.00%, 4/1/2022 (b) | | | 25,000 | | | | 26,312 | |
| | |
Utah Associated Municipal Power Systems, Power Systems Payson Power Project Rev., 5.00%, 10/1/2021 (b) | | | 585,000 | | | | 601,526 | |
SEE NOTES TO FINANCIAL STATEMENTS.
| | | | | | |
| | | |
| 310 | | | | J.P. MORGAN EXCHANGE-TRADED FUNDS | | FEBRUARY 28, 2021 |
| | | | | | | | |
| INVESTMENTS | | PRINCIPAL
AMOUNT ($) | | | VALUE ($) | |
Municipal Bonds — continued | | | | | | | | |
|
Utah — continued | |
| | |
Utah Associated Municipal Power Systems, San Juan Project Series 2011A, Rev., 5.50%, 6/1/2021 | | | 300,000 | | | | 303,819 | |
| | |
Utah Charter School Finance Authority, Summit Academy Incorporated | | | | | | | | |
| | |
Series A, Rev., 5.00%, 4/15/2021 | | | 35,000 | | | | 35,186 | |
| | |
Series A, Rev., 5.00%, 4/15/2022 | | | 130,000 | | | | 136,446 | |
| | |
Series A, Rev., 5.00%, 4/15/2023 | | | 80,000 | | | | 86,909 | |
| | |
Utah State Building Ownership Authority, Facilities Master Lease Program | | | | | | | | |
| | |
Series 2011, Rev., 2.75%, 5/15/2021 | | | 75,000 | | | | 75,391 | |
| | |
Rev., 5.00%, 5/15/2021 | | | 60,000 | | | | 60,586 | |
| | |
Rev., 5.00%, 5/15/2022 | | | 170,000 | | | | 179,797 | |
| | |
Rev., 5.00%, 5/15/2023 | | | 30,000 | | | | 33,067 | |
| | |
Utah Transit Authority, Subordinate Sales Tax Series 2015A, Rev., 5.00%, 6/15/2021 | | | 165,000 | | | | 167,252 | |
| | |
Wasatch County School District Board of Education, Utah School Bond Guaranty Program GO, 5.00%, 6/1/2021 | | | 30,000 | | | | 30,360 | |
| | |
Washington County School District, School Building and Refunding, Utah School Bond Guaranty Program | | | | | | | | |
| | |
GO, 5.00%, 3/1/2021 | | | 20,000 | | | | 20,000 | |
| | |
Series 2016B, GO, 5.00%, 3/1/2021 | | | 50,000 | | | | 50,000 | |
| | |
Series 2016B, GO, 5.00%, 3/1/2023 | | | 30,000 | | | | 32,863 | |
| | |
Washington County Water Conservancy District Rev., 5.00%, 10/1/2022 | | | 25,000 | | | | 26,292 | |
| | |
Washington County, St. George Interlocal Agency Series 2012A, Rev., 2.00%, 12/1/2021 | | | 25,000 | | | | 25,319 | |
| | |
Weber Basin Water Conservancy District Series 2015A, Rev., 5.00%, 10/1/2021 | | | 30,000 | | | | 30,842 | |
| | |
Weber School District, School Building | | | | | | | | |
| | |
GO, 5.00%, 6/15/2021 | | | 50,000 | | | | 50,695 | |
| | |
GO, 5.00%, 6/15/2022 | | | 40,000 | | | | 42,486 | |
| | | | | | | | |
| | |
Total Utah | | | | | | | 7,673,334 | |
| | | | | | | | |
|
Vermont — 0.0% (g) | |
| | |
State of Vermont | | | | | | | | |
| | |
Series 2019B, GO, 3.00%, 8/15/2021 | | | 25,000 | | | | 25,323 | |
| | |
Series 2012E, GO, 4.00%, 8/15/2021 | | | 55,000 | | | | 55,961 | |
| | | | | | | | |
| INVESTMENTS | | PRINCIPAL
AMOUNT ($) | | | VALUE ($) | |
| | | | | | | | |
|
Vermont — continued | |
| | |
Series 2015A, GO, 5.00%, 8/15/2022 | | | 25,000 | | | | 26,755 | |
| | |
State of Vermont, Transportation Infrastructure Series 2013A, Rev., 4.00%, 6/15/2022 | | | 45,000 | | | | 47,219 | |
| | |
Vermont Municipal Bond Bank | | | | | | | | |
| | |
Series 2012-4, Rev., 4.00%, 12/1/2021 | | | 25,000 | | | | 25,721 | |
| | |
Series 2018-1, Rev., 4.00%, 12/1/2021 | | | 25,000 | | | | 25,720 | |
| | |
Series 2011-4, Rev., 5.00%, 12/1/2022 | | | 40,000 | | | | 41,442 | |
| | |
Series 2011-6, Rev., 5.00%, 12/1/2022 | | | 25,000 | | | | 25,901 | |
| | |
Series 2016-2, Rev., 5.00%, 12/1/2022 | | | 25,000 | | | | 27,106 | |
| | |
Vermont Municipal Bond Bank, State Colleges System Bonds Series 2017A, Rev., 5.00%, 10/1/2022 | | | 55,000 | | | | 59,201 | |
| | | | | | | | |
| | |
Total Vermont | | | | | | | 360,349 | |
| | | | | | | | |
|
Virginia — 0.9% | |
| | |
Arlington County Industrial Development Authority Rev., 5.00%, 2/15/2023 | | | 35,000 | | | | 38,193 | |
| | |
Chesapeake Hospital Authority, Regional Medical Center Rev., 4.00%, 7/1/2021 | | | 200,000 | | | | 202,382 | |
| | |
City of Alexandria Series 2012A, GO, 4.50%, 6/15/2021 | | | 30,000 | | | | 30,374 | |
| | |
City of Alexandria, Capital Improvement | | | | | | | | |
| | |
GO, 4.00%, 7/15/2021 (b) | | | 250,000 | | | | 253,572 | |
| | |
Series 2016A, GO, 5.00%, 7/15/2021 | | | 40,000 | | | | 40,718 | |
| | |
Series 2018C, GO, 5.00%, 7/15/2021 | | | 45,000 | | | | 45,807 | |
| | |
City of Bristol Rev., AGM, 5.00%, 7/15/2021 (b) | | | 50,000 | | | | 50,890 | |
| | |
City of Fairfax GO, 5.00%, 7/15/2022 | | | 25,000 | | | | 26,655 | |
| | |
City of Hampton, Public Improvement | | | | | | | | |
| | |
Series 2019A, GO, 5.00%, 3/1/2022 | | | 50,000 | | | | 52,416 | |
| | |
Series 2012A, GO, 5.00%, 4/1/2022 (b) | | | 30,000 | | | | 31,574 | |
| | |
Series 2015B, GO, 5.00%, 9/1/2022 | | | 30,000 | | | | 32,170 | |
| | |
City of Harrisonburg, Public Improvement GO, 3.00%, 8/1/2022 | | | 25,000 | | | | 25,294 | |
| | |
City of Lynchburg, Publica Improvement GO, 3.00%, 8/1/2021 | | | 25,000 | | | | 25,296 | |
SEE NOTES TO FINANCIAL STATEMENTS.
| | | | | | | | |
| | | |
| FEBRUARY 28, 2021 | | J.P. MORGAN EXCHANGE-TRADED FUNDS | | | | | 311 | |
JPMorgan Ultra-Short Municipal Income ETF
SCHEDULE OF PORTFOLIO INVESTMENTS
AS OF FEBRUARY 28, 2021 (continued)
| | | | | | | | |
| INVESTMENTS | | PRINCIPAL
AMOUNT ($) | | | VALUE ($) | |
Municipal Bonds — continued | | | | | | | | |
|
Virginia — continued | |
| | |
City of Manassas, Public Improvement GO, 5.00%, 7/1/2021 | | | 55,000 | | | | 55,883 | |
| | |
City of Newport News Rev., 5.00%, 7/15/2021 | | | 35,000 | | | | 35,632 | |
| | |
Series 2014A, GO, 5.00%, 7/15/2021 | | | 20,000 | | | | 20,361 | |
| | |
Series 2017A, GO, 5.00%, 8/1/2021 | | | 25,000 | | | | 25,506 | |
| | |
City of Norfolk | | | | | | | | |
| | |
GO, 5.00%, 8/1/2021 | | | 60,000 | | | | 61,214 | |
| | |
Series 2013A, GO, 5.00%, 8/1/2021 | | | 25,000 | | | | 25,506 | |
| | |
Series 2016A, GO, 5.00%, 10/1/2021 | | | 45,000 | | | | 46,276 | |
| | |
Series A, GO, 5.00%, 10/1/2021 | | | 40,000 | | | | 41,135 | |
| | |
Rev., 5.00%, 11/1/2021 | | | 110,000 | | | | 113,568 | |
| | |
City of Poquoson GO, 5.00%, 2/15/2022 | | | 45,000 | | | | 47,077 | |
| | |
City of Portsmouth | | | | | | | | |
| | |
Series 2016A, GO, 3.00%, 8/1/2021 | | | 25,000 | | | | 25,296 | |
| | |
Series 2015A, GO, 5.00%, 8/1/2021 | | | 25,000 | | | | 25,502 | |
| | |
Series 2013A, GO, 5.00%, 2/1/2022 | | | 55,000 | | | | 57,435 | |
| | |
Series 2015A, GO, 4.00%, 8/1/2022 | | | 25,000 | | | | 26,355 | |
| | |
Series 2016A, GO, 5.00%, 8/1/2022 | | | 50,000 | | | | 53,417 | |
| | |
City of Richmond | | | | | | | | |
| | |
Series 2015B, GO, 3.00%, 3/1/2021 | | | 50,000 | | | | 50,000 | |
| | |
Series 2012A, GO, 5.00%, 3/1/2021 | | | 25,000 | | | | 25,000 | |
| | |
Series 2013A, GO, 5.00%, 3/1/2021 | | | 35,000 | | | | 35,000 | |
| | |
Series 2017B, GO, 5.00%, 7/15/2021 | | | 90,000 | | | | 91,625 | |
| | |
City of Richmond, Public Improvement Series 2012A, GO, 5.00%, 3/1/2022 | | | 45,000 | | | | 47,188 | |
| | |
City of Richmond, Public Utility Rev., 5.00%, 1/15/2022 | | | 150,000 | | | | 156,359 | |
| | |
City of Suffolk | | | | | | | | |
| | |
GO, 3.00%, 6/1/2021 | | | 30,000 | | | | 30,212 | |
| | |
GO, 5.00%, 2/1/2022 | | | 35,000 | | | | 36,550 | |
| | |
City of Virginia Beach | | | | | | | | |
| | |
Series 2018A, GO, 5.00%, 3/1/2021 | | | 25,000 | | | | 25,000 | |
| | |
Series 2014-A, GO, 5.00%, 5/1/2021 | | | 25,000 | | | | 25,197 | |
| | |
Series 2019A, GO, 5.00%, 7/15/2021 | | | 65,000 | | | | 66,157 | |
| | |
Series 2013A, GO, 4.00%, 8/1/2021 | | | 50,000 | | | | 50,790 | |
| | |
Series 2015B, GO, 5.00%, 9/15/2021 | | | 50,000 | | | | 51,291 | |
| | |
City of Winchester GO, 5.00%, 8/1/2021 | | | 45,000 | | | | 45,904 | |
| | | | | | | | |
| INVESTMENTS | | PRINCIPAL
AMOUNT ($) | | | VALUE ($) | |
| | | | | | | | |
|
Virginia — continued | |
| | |
Commonwealth of Virginia | | | | | | | | |
| | |
Series 2011A-1, GO, 4.00%, 6/1/2021 | | | 25,000 | | | | 25,238 | |
| | |
Series 2011A-2, GO, 5.00%, 6/1/2021 (b) | | | 75,000 | | | | 75,902 | |
| | |
Series 2013B, GO, 4.00%, 6/1/2022 | | | 80,000 | | | | 83,816 | |
| | |
Series 2015B, GO, 5.00%, 6/1/2022 | | | 35,000 | | | | 37,105 | |
| | |
County of Arlington, Public Improvement Series 2013A, GO, 4.00%, 8/1/2021 (b) | | | 45,000 | | | | 45,720 | |
| | |
County of Chesterfield, Public Improvement Series 2015A, GO, 5.00%, 1/1/2022 | | | 20,000 | | | | 20,805 | |
| | |
County of Fairfax, Public Improvement | | | | | | | | |
| | |
Series 2011A, GO, 4.13%, 4/1/2021 (b) | | | 30,000 | | | | 30,097 | |
| | |
Series 2012B, GO, 5.00%, 4/1/2021 | | | 50,000 | | | | 50,197 | |
| | |
Series 2013A, GO, 5.00%, 10/1/2021 (b) | | | 75,000 | | | | 77,119 | |
| | |
Series 2015A, GO, 5.00%, 10/1/2021 | | | 25,000 | | | | 25,709 | |
| | |
Series 2015C, GO, 5.00%, 10/1/2021 | | | 50,000 | | | | 51,418 | |
| | |
County of Fairfax, Sewer Series 2016A, Rev., 5.00%, 7/15/2022 | | | 25,000 | | | | 26,665 | |
| | |
County of Hanover, Public Improvement Series 2011A, GO, 4.13%, 1/15/2023 | | | 50,000 | | | | 50,146 | |
| | |
County of Henrico, Public Improvement | | | | | | | | |
| | |
GO, 5.00%, 7/15/2021 | | | 25,000 | | | | 25,452 | |
| | |
GO, 5.00%, 8/1/2021 (b) | | | 30,000 | | | | 30,604 | |
| | |
GO, 4.00%, 8/1/2022 | | | 25,000 | | | | 26,370 | |
| | |
County of Henrico, Water and Sewer | | | | | | | | |
| | |
Rev., 4.00%, 5/1/2021 | | | 100,000 | | | | 100,639 | |
| | |
Rev., 5.00%, 5/1/2022 | | | 20,000 | | | | 21,135 | |
| | |
County of Loudoun, Public Improvement | | | | | | | | |
| | |
Series 2013A, GO, 4.00%, 12/1/2021 | | | 25,000 | | | | 25,724 | |
| | |
Series 2012A, GO, 5.00%, 12/1/2021 | | | 35,000 | | | | 36,275 | |
| | |
Series 2013A, GO, 5.00%, 12/1/2021 | | | 40,000 | | | | 41,458 | |
| | |
Series 2014B, GO, 5.00%, 12/1/2021 | | | 30,000 | | | | 31,093 | |
| | |
Series 2015A, GO, 5.00%, 12/1/2021 | | | 50,000 | | | | 51,822 | |
| | |
Series 2016A, GO, 5.00%, 12/1/2021 | | | 50,000 | | | | 51,822 | |
SEE NOTES TO FINANCIAL STATEMENTS.
| | | | | | |
| | | |
| 312 | | | | J.P. MORGAN EXCHANGE-TRADED FUNDS | | FEBRUARY 28, 2021 |
| | | | | | | | |
| INVESTMENTS | | PRINCIPAL
AMOUNT ($) | | | VALUE ($) | |
Municipal Bonds — continued | | | | | | | | |
|
Virginia — continued | |
| | |
County of Pittsylvania, School Bonds GO, 5.00%, 6/15/2021 | | | 50,000 | | | | 50,688 | |
| | |
County of Prince George GO, 5.00%, 8/1/2021 | | | 65,000 | | | | 66,307 | |
| | |
County of Prince William COP, 5.00%, 10/1/2022 | | | 100,000 | | | | 107,471 | |
| | |
County of Pulaski GO, 5.00%, 2/1/2024 | | | 40,000 | | | | 45,306 | |
| | |
County of Spotsylvania, Public Improvement | | | | | | | | |
| | |
GO, 3.00%, 6/1/2021 | | | 55,000 | | | | 55,389 | |
| | |
GO, 5.00%, 6/1/2021 | | | 45,000 | | | | 45,540 | |
| | |
GO, 5.00%, 7/15/2021 | | | 35,000 | | | | 35,628 | |
| | |
GO, 5.00%, 1/15/2022 | | | 50,000 | | | | 52,106 | |
| | |
Series 2011B, GO, 4.00%, 1/15/2024 | | | 30,000 | | | | 30,083 | |
| | |
County of Spotsylvania, Water & Sewer System Rev., 5.00%, 6/1/2021 | | | 20,000 | | | | 20,240 | |
| | |
Culpeper County Economic Development Authority, Capital Projects Rev., 5.00%, 6/1/2024 | | | 30,000 | | | | 34,282 | |
| | |
Economic Development Authority, Capital Project Rev., 4.00%, 7/15/2023 | | | 55,000 | | | | 59,603 | |
| | |
Fairfax County Economic Development Authority, Community Service Project Series 2012A, Rev., 4.50%, 3/1/2021 (b) | | | 275,000 | | | | 275,000 | |
| | |
Fairfax County Economic Development Authority, County Facilities Project Series 2014A, Rev., 5.00%, 10/1/2021 | | | 30,000 | | | | 30,846 | |
| | |
Fairfax County Economic Development Authority, Joint Public Uses Complex Project | | | | | | | | |
| | |
Rev., 5.00%, 5/15/2021 | | | 75,000 | | | | 75,739 | |
| | |
Rev., 5.00%, 5/15/2022 | | | 35,000 | | | | 37,034 | |
| | |
Fairfax County Economic Development Authority, Route 28 Project | | | | | | | | |
| | |
Rev., 4.00%, 4/1/2021 | | | 140,000 | | | | 140,435 | |
| | |
Series 2016B, 3.00%, 4/1/2022 | | | 25,000 | | | | 25,769 | |
| | |
Fairfax County Industrial Development Authority, Virginia Health Care, Inova Health System Project Rev., 4.00%, 5/15/2022 | | | 150,000 | | | | 156,825 | |
| | |
Fairfax County Water Authority | | | | | | | | |
| | |
Rev., 5.00%, 4/1/2021 | | | 100,000 | | | | 100,391 | |
| | |
Rev., 5.00%, 4/1/2022 (b) | | | 65,000 | | | | 68,410 | |
| | | | | | | | |
| INVESTMENTS | | PRINCIPAL
AMOUNT ($) | | | VALUE ($) | |
| | | | | | | | |
|
Virginia — continued | |
| | |
Hampton Roads Sanitation District, Wastewater | | | | | | | | |
| | |
Series 2014A, Rev., 5.00%, 7/1/2021 | | | 30,000 | | | | 30,481 | |
| | |
Series 2018A, Rev., 5.00%, 10/1/2021 | | | 40,000 | | | | 41,128 | |
| | |
Series 2016A, Rev., 5.00%, 8/1/2022 | | | 20,000 | | | | 21,369 | |
| | |
Loudoun County Economic Development Authority, Public Facilities Project | | | | | | | | |
| | |
Rev., 5.00%, 12/1/2021 | | | 25,000 | | | | 25,907 | |
| | |
Series 2016A, Rev., 5.00%, 12/1/2021 | | | 25,000 | | | | 25,907 | |
| | |
Series 2016B, Rev., 5.00%, 12/1/2021 | | | 40,000 | | | | 41,451 | |
| | |
Prince William County Industrial Development Authority, County Facilities Project Series 2020A, Rev., 5.00%, 4/1/2021 | | | 80,000 | | | | 80,313 | |
| | |
Riverside Regional Jail Authority | | | | | | | | |
| | |
Rev., 5.00%, 7/1/2021 | | | 50,000 | | | | 50,803 | |
| | |
Rev., 4.00%, 7/1/2022 | | | 100,000 | | | | 105,102 | |
| | |
Roanoke Economic Development Authority, Carilion Clinic Obligated Group Series 2020A, Rev., 5.00%, 7/1/2021 | | | 175,000 | | | | 177,721 | |
| | |
Spotsylvania County Economic Development Authority, Spotsylvania School Facilities Projects Rev., 5.00%, 6/1/2021 | | | 50,000 | | | | 50,600 | |
| | |
University of Virginia Series 2015B, Rev., 2.00%, 8/1/2021 | | | 30,000 | | | | 30,235 | |
| | |
Virginia Beach Development Authority, Public Facilities | | | | | | | | |
| | |
Series 2015A, Rev., 5.00%, 3/1/2021 | | | 200,000 | | | | 200,000 | |
| | |
Series 2014A, Rev., 5.00%, 5/1/2021 | | | 25,000 | | | | 25,199 | |
| | |
Series 2015B, Rev., 5.00%, 7/15/2021 | | | 30,000 | | | | 30,538 | |
| | |
Series 2020A, Rev., 5.00%, 4/15/2022 | | | 50,000 | | | | 52,712 | |
| | |
Virginia Biotechnology Research Partnership Authority, Consolidated Laboratories Project Rev., 5.00%, 9/1/2021 | | | 20,000 | | | | 20,483 | |
| | |
Virginia College Building Authority, Educational Facilities, 21st Century College and Equipment Programs | | | | | | | | |
| | |
Rev., 5.00%, 2/1/2022 (b) | | | 325,000 | | | | 339,449 | |
SEE NOTES TO FINANCIAL STATEMENTS.
| | | | | | | | |
| | | |
| FEBRUARY 28, 2021 | | J.P. MORGAN EXCHANGE-TRADED FUNDS | | | | | 313 | |
JPMorgan Ultra-Short Municipal Income ETF
SCHEDULE OF PORTFOLIO INVESTMENTS
AS OF FEBRUARY 28, 2021 (continued)
| | | | | | | | |
| INVESTMENTS | | PRINCIPAL
AMOUNT ($) | | | VALUE ($) | |
Municipal Bonds — continued | | | | | | | | |
|
Virginia — continued | |
| | |
Series 2009E-1, Rev., 5.00%, 2/1/2022 | | | 30,000 | | | | 31,334 | |
| | |
Series 2009E-2, Rev., 5.00%, 2/1/2022 | | | 30,000 | | | | 31,334 | |
| | |
Series 2014A, Rev., 5.00%, 2/1/2022 | | | 90,000 | | | | 94,001 | |
| | |
Series 2015D, Rev., 5.00%, 2/1/2022 | | | 25,000 | | | | 26,112 | |
| | |
Series 2016A, Rev., 5.00%, 2/1/2022 | | | 170,000 | | | | 177,558 | |
| | |
Series 2018A, Rev., 5.00%, 2/1/2022 | | | 80,000 | | | | 83,557 | |
| | |
Series 2019A, Rev., 5.00%, 2/1/2022 | | | 45,000 | | | | 47,001 | |
| | |
Virginia College Building Authority, Educational Facilities, Public Higher Education Financing Program | | | | | | | | |
| | |
Rev., 3.00%, 3/11/2021 | | | 50,000 | | | | 50,035 | |
| | |
Rev., 5.00%, 9/1/2021 (b) | | | 95,000 | | | | 97,250 | |
| | |
Series 2012A, Rev., 5.00%, 9/1/2021 (b) | | | 115,000 | | | | 117,696 | |
| | |
Series 2012-A, Rev., 5.00%, 9/1/2021 | | | 35,000 | | | | 35,849 | |
| | |
Series 2015A, Rev., 5.00%, 9/1/2021 | | | 25,000 | | | | 25,606 | |
| | |
Series 2012-A, Rev., 5.00%, 9/1/2022 (b) | | | 50,000 | | | | 53,508 | |
| | |
Series 2015A, Rev., 5.00%, 9/1/2022 | | | 25,000 | | | | 26,816 | |
| | |
Series 2016A, Rev., 5.00%, 9/1/2022 | | | 45,000 | | | | 48,270 | |
| | |
Virginia College Building Authority, Educational Facilities, University of Richmond Project Rev., 5.00%, 3/1/2021 | | | 110,000 | | | | 110,000 | |
| | |
Virginia Commonwealth Transportation Board, Capital Projects | | | | | | | | |
| | |
Rev., 5.00%, 5/15/2021 | | | 175,000 | | | | 176,731 | |
| | |
Rev., 5.00%, 5/15/2022 | | | 90,000 | | | | 95,254 | |
| | |
Rev., 5.00%, 5/15/2023 | | | 25,000 | | | | 27,591 | |
| | |
Rev., 5.00%, 5/15/2024 | | | 35,000 | | | | 40,104 | |
| | |
Series 2017A, Rev., 5.00%, 5/15/2025 | | | 40,000 | | | | 47,393 | |
| | |
Virginia Commonwealth Transportation Board, Federal Transportation | | | | | | | | |
| | |
Rev., GAN, 5.00%, 3/15/2021 | | | 270,000 | | | | 270,475 | |
| | |
Series B-G, Rev., GAN, 5.00%, 3/15/2021 | | | 25,000 | | | | 25,044 | |
| | |
Rev., GAN, 5.00%, 9/15/2021 | | | 155,000 | | | | 159,053 | |
| | | | | | | | |
| INVESTMENTS | | PRINCIPAL
AMOUNT ($) | | | VALUE ($) | |
| | | | | | | | |
|
Virginia — continued | |
| | |
Series 2012B-G, Rev., GAN, 5.00%, 9/15/2021 | | | 40,000 | | | | 41,046 | |
| | |
Series 2012A, Rev., GAN, 4.50%, 3/15/2022 | | | 20,000 | | | | 20,905 | |
| | |
Rev., GAN, 5.00%, 3/15/2022 | | | 50,000 | | | | 52,518 | |
| | |
Series 2012B-G, Rev., GAN, 5.00%, 3/15/2022 | | | 30,000 | | | | 31,512 | |
| | |
Rev., GAN, 5.00%, 9/15/2022 | | | 45,000 | | | | 48,355 | |
| | |
Series 2012B, Rev., GAN, 5.00%, 9/15/2022 | | | 25,000 | | | | 26,864 | |
| | |
Rev., GAN, 5.00%, 3/15/2023 | | | 25,000 | | | | 27,405 | |
| | |
Series 2013A, Rev., GAN, 5.00%, 3/15/2023 (b) | | | 140,000 | | | | 153,618 | |
| | |
Rev., GAN, 5.00%, 3/15/2025 | | | 30,000 | | | | 35,349 | |
| | |
Virginia Commonwealth Transportation Board, Transportation District Program | | | | | | | | |
| | |
Rev., 5.00%, 5/15/2021 | | | 40,000 | | | | 40,395 | |
| | |
Rev., 5.00%, 5/15/2022 | | | 20,000 | | | | 21,168 | |
| | |
Virginia Commonwealth Transportation Board, U.S. Route 58 Corridor Development Program Series 2014B, Rev., 5.00%, 5/15/2021 | | | 80,000 | | | | 80,791 | |
| | |
Virginia Commonwealth University Health System Authority Rev., 5.00%, 7/1/2025 | | | 45,000 | | | | 52,948 | |
| | |
Virginia Housing Development Authority, Commonwealth Mortgage Series 2012C-4, Rev., 2.49%, 1/1/2022 | | | 200,000 | | | | 203,462 | |
| | |
Virginia Housing Development Authority, Rental Housing | | | | | | | | |
| | |
Series 2018A, Rev., 1.85%, 3/1/2021 | | | 125,000 | | | | 125,000 | |
| | |
Series 2012A, Rev., 3.88%, 3/1/2021 | | | 110,000 | | | | 110,000 | |
| | |
Virginia Polytechnic Institute and State University Series 2015A, Rev., 5.00%, 6/1/2021 | | | 50,000 | | | | 50,601 | |
| | |
Virginia Public Building Authority, Public Facilities | | | | | | | | |
| | |
Series 2011A, Rev., 5.00%, 8/1/2021 (b) | | | 175,000 | | | | 178,524 | |
| | |
Series 2013A, Rev., 5.00%, 8/1/2021 | | | 100,000 | | | | 102,014 | |
| | |
Series 2014A, Rev., 5.00%, 8/1/2021 | | | 20,000 | | | | 20,403 | |
| | |
Series 2014C, Rev., 5.00%, 8/1/2021 | | | 140,000 | | | | 142,819 | |
SEE NOTES TO FINANCIAL STATEMENTS.
| | | | | | |
| | | |
| 314 | | | | J.P. MORGAN EXCHANGE-TRADED FUNDS | | FEBRUARY 28, 2021 |
| | | | | | | | |
| INVESTMENTS | | PRINCIPAL
AMOUNT ($) | | | VALUE ($) | |
Municipal Bonds — continued | | | | | | | | |
|
Virginia — continued | |
| | |
Series B, Rev., 5.00%, 8/1/2021 | | | 205,000 | | | | 209,129 | |
| | |
Series 2014A, Rev., 5.00%, 8/1/2022 | | | 55,000 | | | | 58,766 | |
| | |
Series A, Rev., 5.00%, 8/1/2022 | | | 110,000 | | | | 117,532 | |
| | |
Virginia Public School Authority, School Financing 1997 Resolution | | | | | | | | |
| | |
Series 2011B, Rev., 4.00%, 8/1/2021 (b) | | | 35,000 | | | | 35,560 | |
| | |
Series 2012A, Rev., 4.00%, 8/1/2021 | | | 70,000 | | | | 71,103 | |
| | |
Series 2011A, Rev., 4.13%, 8/1/2021 (b) | | | 30,000 | | | | 30,496 | |
| | |
Rev., 5.00%, 8/1/2021 | | | 20,000 | | | | 20,398 | |
| | |
Series 2013A, Rev., 5.00%, 8/1/2021 | | | 25,000 | | | | 25,497 | |
| | |
Series 2016A, Rev., 5.00%, 8/1/2021 | | | 25,000 | | | | 25,497 | |
| | |
Series 2016B, Rev., 5.00%, 8/1/2021 | | | 50,000 | | | | 50,995 | |
| | |
Series 2018B, Rev., 5.00%, 8/1/2021 | | | 25,000 | | | | 25,497 | |
| | |
Series 2019B, Rev., 5.00%, 8/1/2021 | | | 40,000 | | | | 40,796 | |
| | |
Series 2020B, Rev., 5.00%, 8/1/2021 | | | 25,000 | | | | 25,497 | |
| | |
Rev., 3.00%, 8/1/2022 (b) | | | 20,000 | | | | 20,799 | |
| | |
Series 2012C, Rev., 3.25%, 8/1/2022 (b) | | | 80,000 | | | | 83,478 | |
| | |
Rev., 5.00%, 8/1/2022 (b) | | | 35,000 | | | | 37,402 | |
| | |
Series 2014B, Rev., 5.00%, 8/1/2022 | | | 50,000 | | | | 53,379 | |
| | |
Rev., 5.00%, 8/1/2023 | | | 50,000 | | | | 55,635 | |
| | |
Virginia Public School Authority, School Technology and Security Notes | | | | | | | | |
| | |
Series VI, Rev., 5.00%, 4/15/2022 | | | 110,000 | | | | 115,900 | |
| | |
Series VIII, Rev., 5.00%, 4/15/2022 | | | 55,000 | | | | 57,950 | |
| | |
Series VI, Rev., 5.00%, 4/15/2023 | | | 80,000 | | | | 87,978 | |
| | |
Virginia Public School Authority, Special Obligation School Montgomery County Rev., 5.00%, 2/1/2022 | | | 75,000 | | | | 78,285 | |
| | |
Virginia Resources Authority Clean Water State Revolving Fund Rev., 5.00%, 10/1/2021 | | | 25,000 | | | | 25,708 | |
| | |
Virginia Resources Authority, Infrastructure Moral Obligation | | | | | | | | |
| | |
Rev., 5.00%, 11/1/2021 | | | 50,000 | | | | 51,595 | |
| | |
Series A, Rev., 5.00%, 11/1/2021 | | | 20,000 | | | | 20,648 | |
| | |
Rev., 4.00%, 11/1/2022 | | | 25,000 | | | | 26,564 | |
| | | | | | | | |
| INVESTMENTS | | PRINCIPAL
AMOUNT ($) | | | VALUE ($) | |
| | | | | | | | |
|
Virginia — continued | |
| | |
Virginia Resources Authority, Infrastructure Moral Obligation, Pooled Financing Program | | | | | | | | |
| | |
Rev., 4.00%, 11/1/2021 | | | 105,000 | | | | 107,653 | |
| | |
Series 2014B, Rev., 5.00%, 11/1/2021 | | | 40,000 | | | | 41,276 | |
| | |
Series 2019C, Rev., 5.00%, 11/1/2021 | | | 90,000 | | | | 92,871 | |
| | |
Rev., 5.00%, 11/1/2022 | | | 60,000 | | | | 64,785 | |
| | |
Virginia Resources Authority, Infrastructure Pooled Financing Program Series 2012B, Rev., 5.00%, 11/1/2022 | | | 25,000 | | | | 27,014 | |
| | |
Virginia Resources Authority, Pooled Financing Program Series 2010A, Rev., 5.00%, 11/1/2023 | | | 5,000 | | | | 5,018 | |
| | |
Virginia Resources Authority, Virginia Pooled Financing Program | | | | | | | | |
| | |
Rev., 3.00%, 11/1/2021 | | | 25,000 | | | | 25,478 | |
| | |
Series 2015C, Rev., 4.00%, 11/1/2021 | | | 40,000 | | | | 41,030 | |
| | |
Rev., 5.00%, 11/1/2022 | | | 25,000 | | | | 27,014 | |
| | |
Western Regional Jail Authority Rev., 4.00%, 12/1/2022 | | | 50,000 | | | | 53,230 | |
| | |
Wise County Industrial Development Authority, Electric and Power Co. Project Series 2010A, Rev., 1.20%, 5/31/2024 (c) | | | 1,670,000 | | | | 1,688,220 | |
| | | | | | | | |
| | |
Total Virginia | | | | | | | 13,245,540 | |
| | | | | | | | |
|
Washington — 2.5% | |
| | |
Adams County Joint Consolidated School District No. 147 & 163 & 55 GO, 2.50%, 12/1/2021 | | | 25,000 | | | | 25,416 | |
| | |
Auburn School District No. 408 of King and Pierce Counties GO, 4.00%, 12/1/2021 | | | 25,000 | | | | 25,720 | |
| | |
Benton County School District No. 400 Richland | | | | | | | | |
| | |
GO, 3.00%, 12/1/2021 | | | 50,000 | | | | 51,067 | |
| | |
GO, 5.00%, 12/1/2021 | | | 120,000 | | | | 124,354 | |
| | |
Central Puget Sound Regional Transit Authority, Sales and Motor Vehicle Excise Tax Series 2016S-1, Rev., 5.00%, 11/1/2021 | | | 50,000 | | | | 51,612 | |
| | |
Central Puget Sound Regional Transit Authority, Sales and Use Tax | | | | | | | | |
| | |
Series 2012S-1, Rev., 5.00%, 11/1/2021 | | | 25,000 | | | | 25,806 | |
| | |
Series 2012S-1, Rev., 5.00%, 11/1/2022 | | | 20,000 | | | | 21,604 | |
SEE NOTES TO FINANCIAL STATEMENTS.
| | | | | | | | |
| | | |
| FEBRUARY 28, 2021 | | J.P. MORGAN EXCHANGE-TRADED FUNDS | | | | | 315 | |
JPMorgan Ultra-Short Municipal Income ETF
SCHEDULE OF PORTFOLIO INVESTMENTS
AS OF FEBRUARY 28, 2021 (continued)
| | | | | | | | |
| INVESTMENTS | | PRINCIPAL
AMOUNT ($) | | | VALUE ($) | |
Municipal Bonds — continued | | | | | | | | |
|
Washington — continued | |
| | |
Central Washington University Rev., AGM, 5.00%, 5/1/2024 | | | 360,000 | | | | 408,874 | |
| | |
City of Auburn, Utility System Rev., 5.00%, 12/1/2021 | | | 70,000 | | | | 72,540 | |
| | |
City of Bellevue, Limited Tax GO, 5.00%, 12/1/2022 | | | 30,000 | | | | 32,521 | |
| | |
City of Bellingham, Water and Sewer System Series 2016-ZF2389, Rev., VRDO, LIQ: | | | | | | | | |
| | |
Citibank NA, 0.13%, 3/9/2021 (c) (f) | | | 5,480,000 | | | | 5,480,000 | |
| | |
City of Bonney Lake, Water and Sewer System Rev., 4.00%, 12/1/2022 | | | 25,000 | | | | 26,670 | |
| | |
City of Edmonds, Water and Sewer Rev., 5.00%, 12/1/2023 | | | 25,000 | | | | 27,628 | |
| | |
City of Everett, Water & Sewer Rev., 5.00%, 12/1/2022 | | | 85,000 | | | | 92,160 | |
| | |
City of Gig Harbor, Water and Sewer Rev., 4.00%, 10/1/2022 | | | 50,000 | | | | 52,890 | |
| | |
City of Kent, Limited Tax GO, 5.00%, 12/1/2021 | | | 65,000 | | | | 67,358 | |
| | |
City of Lynnwood, Limited Tax GO, AGM, 4.00%, 12/1/2021 | | | 25,000 | | | | 25,720 | |
| | |
City of Marysville, Water and Sewer Rev., 5.00%, 4/1/2022 | | | 135,000 | | | | 142,066 | |
| | |
City of Olympia, Limited Tax | | | | | | | | |
| | |
GO, 5.00%, 12/1/2021 | | | 35,000 | | | | 36,270 | |
| | |
GO, 5.00%, 12/1/2024 | | | 25,000 | | | | 29,178 | |
| | |
City of Olympia, Unlimited Tax GO, 5.00%, 12/1/2022 | | | 45,000 | | | | 48,790 | |
| | |
City of Puyallup GO, 4.00%, 12/1/2021 | | | 250,000 | | | | 257,012 | |
| | |
City of Redmond GO, 5.00%, 12/1/2021 | | | 20,000 | | | | 20,726 | |
| | |
City of Renton, Limited Tax GO, 5.00%, 12/1/2022 | | | 30,000 | | | | 32,527 | |
| | |
City of Richland Series 2013A, GO, 4.00%, 12/1/2021 | | | 40,000 | | | | 41,153 | |
| | |
City of Richland, Waterworks Utility Rev., 4.00%, 11/1/2021 | | | 20,000 | | | | 20,512 | |
| | |
City of Seattle | | | | | | | | |
| | |
Series 2015A, GO, 5.00%, 6/1/2021 | | | 25,000 | | | | 25,300 | |
| | |
Series 2013A, GO, 4.00%, 10/1/2021 | | | 30,000 | | | | 30,672 | |
| | |
GO, 5.00%, 5/1/2022 | | | 20,000 | | | | 21,123 | |
| | |
City of Seattle, Drainage and Wastewater System Improvement | | | | | | | | |
| | |
Rev., 5.00%, 5/1/2021 | | | 65,000 | | | | 65,517 | |
| | |
Rev., 5.00%, 9/1/2021 | | | 125,000 | | | | 128,019 | |
| | |
Rev., 5.00%, 4/1/2022 | | | 45,000 | | | | 47,355 | |
| | |
Rev., 5.00%, 9/1/2024 | | | 25,000 | | | | 26,195 | |
| | | | | | | | |
| INVESTMENTS | | PRINCIPAL
AMOUNT ($) | | | VALUE ($) | |
| | | | | | | | |
|
Washington — continued | |
| | |
City of Seattle, Municipal Light and Power | | | | | | | | |
| | |
Rev., 5.00%, 7/1/2022 | | | 65,000 | | | | 69,170 | |
| | |
Series 2012A, Rev., 5.00%, 6/1/2024 | | | 25,000 | | | | 26,478 | |
| | |
City of Seattle, Municipal Light and Power Improvement | | | | | | | | |
| | |
Rev., 5.00%, 9/1/2021 | | | 75,000 | | | | 76,812 | |
| | |
Series 2018A, Rev., 5.00%, 1/1/2022 | | | 40,000 | | | | 41,606 | |
| | |
Rev., 5.00%, 9/1/2022 | | | 55,000 | | | | 58,979 | |
| | |
City of Seattle, Water System | | | | | | | | |
| | |
Rev., 5.00%, 9/1/2021 | | | 70,000 | | | | 71,690 | |
| | |
Rev., 5.00%, 9/1/2022 | | | 50,000 | | | | 53,618 | |
| | |
City of Shelton, Limited Tax | | | | | | | | |
| | |
GO, 4.00%, 12/1/2021 | | | 150,000 | | | | 153,990 | |
| | |
GO, 4.00%, 12/1/2022 | | | 150,000 | | | | 159,093 | |
| | |
City of Spokane, Unlimited Tax GO, 5.00%, 12/1/2022 | | | 85,000 | | | | 92,160 | |
| | |
City of Spokane, Water and Wastewater System Rev., 5.00%, 12/1/2021 | | | 25,000 | | | | 25,907 | |
| | |
City of Tacoma Series 2015A, Rev., 5.00%, 12/1/2022 | | | 20,000 | | | | 21,685 | |
| | |
City of University Place, Limited Tax GO, 4.00%, 12/1/2023 | | | 35,000 | | | | 38,492 | |
| | |
City of Vancouver Downtown Redevelopment Authority, Conference Center Project Rev., GTD, 5.00%, 1/1/2023 | | | 100,000 | | | | 108,708 | |
| | |
City of Yakima, Water and Sewer Rev., 4.00%, 11/1/2021 | | | 25,000 | | | | 25,615 | |
| | |
Clark County Public Utility District No. 1 Rev., 5.00%, 1/1/2024 | | | 15,000 | | | | 16,914 | |
| | |
Clark County School District No. 117 Camas, Unlimited Tax GO, 4.00%, 12/1/2021 | | | 190,000 | | | | 195,476 | |
| | |
Clark County School District No. 37 Vancouver, Unlimited Tax | | | | | | | | |
| | |
GO, 5.00%, 12/1/2021 | | | 85,000 | | | | 88,103 | |
| | |
GO, 3.00%, 12/1/2022 | | | 30,000 | | | | 31,497 | |
| | |
GO, 5.00%, 12/1/2023 | | | 30,000 | | | | 33,857 | |
| | |
Clark County, Vancouver School District No. 37 GO, 3.00%, 12/1/2023 | | | 25,000 | | | | 26,847 | |
| | |
Clark Regional Wastewater District Rev., 5.00%, 12/1/2022 | | | 25,000 | | | | 27,060 | |
| | |
COB Properties Rev., 5.00%, 12/1/2021 | | | 25,000 | | | | 25,907 | |
| | |
County of Clark, Limited Tax GO, 5.00%, 12/1/2021 | | | 75,000 | | | | 77,721 | |
SEE NOTES TO FINANCIAL STATEMENTS.
| | | | | | |
| | | |
| 316 | | | | J.P. MORGAN EXCHANGE-TRADED FUNDS | | FEBRUARY 28, 2021 |
| | | | | | | | |
| INVESTMENTS | | PRINCIPAL
AMOUNT ($) | | | VALUE ($) | |
Municipal Bonds — continued | | | | | | | | |
|
Washington — continued | |
| | |
County of King, Limited Tax | | | | | | | | |
| | |
GO, 5.00%, 7/1/2021 | | | 50,000 | | | | 50,808 | |
| | |
Series 2019B, GO, 5.00%, 7/1/2021 | | | 25,000 | | | | 25,404 | |
| | |
GO, 5.00%, 1/1/2022 | | | 25,000 | | | | 26,012 | |
| | |
Series 2019B, GO, 5.00%, 7/1/2022 | | | 30,000 | | | | 31,942 | |
| | |
Series 2012E, GO, 3.00%, 12/1/2022 | | | 30,000 | | | | 31,497 | |
| | |
Series 2014C, GO, 5.00%, 12/1/2022 | | | 35,000 | | | | 37,967 | |
| | |
County of King, Sewer | | | | | | | | |
| | |
Series 2014B, Rev., 5.00%, 7/1/2021 | | | 80,000 | | | | 81,293 | |
| | |
Series 2016A, Rev., 5.00%, 7/1/2021 | | | 25,000 | | | | 25,404 | |
| | |
Series 2011C, Rev., 4.00%, 1/1/2022 | | | 35,000 | | | | 36,127 | |
| | |
Series 2012C, Rev., 5.00%, 1/1/2022 | | | 50,000 | | | | 52,025 | |
| | |
Series 2020A, Rev., 0.62%, 1/1/2024 (c) | | | 1,175,000 | | | | 1,175,928 | |
| | |
County of King, Unlimited Tax GO, 5.00%, 12/1/2021 | | | 50,000 | | | | 51,825 | |
| | |
County of Pierce, Limited Tax Series 2013A, GO, 5.00%, 7/1/2021 | | | 35,000 | | | | 35,562 | |
| | |
County of Pierce, Sewer | | | | | | | | |
| | |
Rev., 5.00%, 8/1/2021 | | | 20,000 | | | | 20,402 | |
| | |
Rev., 4.00%, 8/1/2022 (b) | | | 135,000 | | | | 142,259 | |
| | |
County of Skagit, Limited Tax | | | | | | | | |
| | |
GO, 5.00%, 12/1/2021 | | | 110,000 | | | | 113,991 | |
| | |
GO, 5.00%, 12/1/2024 | | | 60,000 | | | | 70,077 | |
| | |
County of Snohomish, Limited Tax Series 2011B, GO, 4.00%, 12/1/2021 | | | 25,000 | | | | 25,721 | |
| | |
County of Spokane, Limited Tax GO, 5.00%, 12/1/2021 | | | 60,000 | | | | 62,177 | |
| | |
Douglas County School District No. 206, Eastmont Ltd. GO, 2.00%, 12/1/2021 | | | 60,000 | | | | 60,833 | |
| | |
East Columbia Basin Irrigation District Rev., 5.00%, 6/1/2022 | | | 50,000 | | | | 52,949 | |
| | |
East Wenatchee Water District Rev., 4.00%, 8/1/2023 | | | 25,000 | | | | 27,103 | |
| | |
Energy Northwest, Columbia Generating Station | | | | | | | | |
| | |
Series A, Rev., 5.00%, 7/1/2021 | | | 110,000 | | | | 111,770 | |
| | |
Series 2018A, Rev., 5.00%, 7/1/2022 | | | 20,000 | | | | 21,289 | |
| | | | | | | | |
| INVESTMENTS | | PRINCIPAL
AMOUNT ($) | | | VALUE ($) | |
| | | | | | | | |
|
Washington — continued | |
| | |
FYI Properties, State of Washington District Project — Green Bonds | | | | | | | | |
| | |
Rev., 5.00%, 6/1/2021 | | | 110,000 | | | | 111,265 | |
| | |
Rev., 5.00%, 6/1/2023 | | | 45,000 | | | | 49,369 | |
| | |
Grant County Public Utility District No. 2, Priest Rapids Hydroelectric Project Series 2012A, Rev., 5.00%, 1/1/2022 (b) | | | 50,000 | | | | 52,021 | |
| | |
Grays Harbor County Public Utility District No. 1 Series 2015A, Rev., 5.00%, 1/1/2025 | | | 100,000 | | | | 116,292 | |
| | |
King & Snohomish Counties School District No. 417 Northshore GO, 5.00%, 12/1/2022 | | | 30,000 | | | | 32,521 | |
| | |
King County Fire Protection District No. 39 Series 2015A, GO, 5.00%, 12/1/2024 | | | 40,000 | | | | 46,702 | |
| | |
King County Housing Authority Rev., 3.00%, 6/1/2022 | | | 55,000 | | | | 56,778 | |
| | |
King County Public Hospital District No. 2, Evergreen Health GO, 5.00%, 12/1/2021 | | | 60,000 | | | | 62,177 | |
| | |
King County Rural Library District, Unlimited Tax | | | | | | | | |
| | |
GO, 4.00%, 12/1/2021 | | | 120,000 | | | | 123,459 | |
| | |
GO, 4.00%, 12/1/2022 | | | 65,000 | | | | 69,341 | |
| | |
King County School District No. 401 Highline GO, 5.00%, 6/1/2022 | | | 25,000 | | | | 26,494 | |
| | |
King County School District No. 403 Renton, Unlimited Tax GO, 4.00%, 12/1/2021 | | | 25,000 | | | | 25,720 | |
| | |
King County School District No. 405 Bellevue, Unlimited Tax | | | | | | | | |
| | |
GO, 4.38%, 6/1/2021 (b) | | | 100,000 | | | | 101,049 | |
| | |
GO, 5.00%, 6/1/2021 (b) | | | 100,000 | | | | 101,203 | |
| | |
GO, 5.00%, 12/1/2021 | | | 120,000 | | | | 124,363 | |
| | |
GO, 5.00%, 12/1/2022 | | | 60,000 | | | | 65,043 | |
| | |
GO, 5.00%, 12/1/2024 | | | 160,000 | | | | 186,872 | |
| | |
King County School District No. 410 Snoqualmie Valley GO, 4.00%, 12/1/2022 | | | 75,000 | | | | 79,996 | |
| | |
King County School District No. 411 Issaquah, Unlimited Tax | | | | | | | | |
| | |
GO, 4.00%, 12/1/2021 | | | 50,000 | | | | 51,449 | |
| | |
GO, 3.00%, 12/1/2022 | | | 35,000 | | | | 36,727 | |
| | |
King County School District No. 414 Lake Washington | | | | | | | | |
| | |
GO, 4.00%, 12/1/2021 | | | 25,000 | | | | 25,721 | |
| | |
GO, 5.00%, 12/1/2021 | | | 80,000 | | | | 82,902 | |
SEE NOTES TO FINANCIAL STATEMENTS.
| | | | | | | | |
| | | |
| FEBRUARY 28, 2021 | | J.P. MORGAN EXCHANGE-TRADED FUNDS | | | | | 317 | |
JPMorgan Ultra-Short Municipal Income ETF
SCHEDULE OF PORTFOLIO INVESTMENTS
AS OF FEBRUARY 28, 2021 (continued)
| | | | | | | | |
| INVESTMENTS | | PRINCIPAL
AMOUNT ($) | | | VALUE ($) | |
Municipal Bonds — continued | | | | | | | | |
|
Washington — continued | |
| | |
GO, 5.00%, 12/1/2022 | | | 35,000 | | | | 37,948 | |
| | |
Kitsap County School District No. 401 Central Kitsap, Unlimited Tax GO, 5.00%, 12/1/2022 | | | 35,000 | | | | 37,935 | |
| | |
Lewis County Public Utility District No. 1 | | | | | | | | |
| | |
Rev., 5.00%, 10/1/2021 | | | 150,000 | | | | 154,228 | |
| | |
Rev., 5.00%, 10/1/2023 | | | 100,000 | | | | 111,856 | |
| | |
North Thurston Public Schools GO, 5.00%, 12/1/2021 | | | 25,000 | | | | 25,907 | |
| | |
Pierce County School District No. 320 Sumner, Unlimited Tax | | | | | | | | |
| | |
GO, 5.00%, 12/1/2021 | | | 50,000 | | | | 51,814 | |
| | |
GO, 5.00%, 12/1/2022 | | | 25,000 | | | | 27,096 | |
| | |
Pierce County School District No. 403 Bethel, Unlimited Tax | | | | | | | | |
| | |
GO, 4.00%, 12/1/2021 | | | 75,000 | | | | 77,162 | |
| | |
GO, 4.00%, 12/1/2022 | | | 70,000 | | | | 74,675 | |
| | |
Pierce County, Peninsula School District No. 401, Unlimited Tax GO, 5.00%, 12/1/2021 | | | 45,000 | | | | 46,633 | |
| | |
Pierce County, Puyallup School District No. 3, Unlimited Tax | | | | | | | | |
| | |
Series 2012A, GO, 4.00%, 12/1/2021 | | | 20,000 | | | | 20,576 | |
| | |
GO, 5.00%, 12/1/2021 | | | 60,000 | | | | 62,177 | |
| | |
Series 2012A, GO, 4.00%, 12/1/2022 | | | 95,000 | | | | 101,310 | |
| | |
GO, 5.00%, 12/1/2022 | | | 25,000 | | | | 26,497 | |
| | |
Port of Seattle, Intermediate Lien | | | | | | | | |
| | |
Series 2012A, Rev., 4.00%, 8/1/2021 | | | 25,000 | | | | 25,368 | |
| | |
Series 2015B, Rev., 5.00%, 3/1/2022 | | | 60,000 | | | | 62,824 | |
| | |
Port of Tacoma, Limited Tax Series 2016A, GO, 4.00%, 12/1/2022 | | | 30,000 | | | | 32,004 | |
| | |
Public Utility District No. 1 of Cowlitz County, Distribution System Rev., 5.00%, 9/1/2021 | | | 75,000 | | | | 76,773 | |
| | |
Public Utility District No. 1 of Cowlitz County, Production System Rev., 5.00%, 9/1/2021 | | | 100,000 | | | | 102,364 | |
| | |
Snohomish County Public Transportation Benefit Area Corp., Limited Sales Tax Rev., 5.00%, 8/1/2022 | | | 70,000 | | | | 74,783 | |
| | |
Snohomish County Public Utility District No. 1, Electric System Rev., 5.00%, 12/1/2022 | | | 25,000 | | | | 27,106 | |
| | | | | | | | |
| INVESTMENTS | | PRINCIPAL
AMOUNT ($) | | | VALUE ($) | |
| | | | | | | | |
|
Washington — continued | |
| | |
Snohomish County School District No. 2 Everett, Unlimited Tax | | | | | | | | |
| | |
GO, 4.00%, 12/1/2021 | | | 25,000 | | | | 25,723 | |
| | |
GO, 5.00%, 12/1/2021 | | | 25,000 | | | | 25,909 | |
| | |
GO, 3.00%, 12/1/2022 | | | 25,000 | | | | 26,229 | |
| | |
Snohomish County School District No. 25 Marysville GO, 5.00%, 12/1/2021 | | | 25,000 | | | | 25,901 | |
| | |
South Correctional Entity Facility Public Development Authority Rev., 4.00%, 12/1/2023 | | | 70,000 | | | | 76,782 | |
| | |
Southwest Suburban Sewer District Rev., 5.00%, 5/1/2022 | | | 20,000 | | | | 21,089 | |
| | |
Spokane and Whitman Counties School District No. 360 Cheney, Unlimited Tax GO, 5.00%, 12/1/2022 | | | 25,000 | | | | 27,087 | |
| | |
State of Washington Series 2020D, COP, 5.00%, 7/1/2021 | | | 90,000 | | | | 91,444 | |
| | |
State of Washington, Motor Vehicle Fuel Tax | | | | | | | | |
| | |
Series 2003C, GO, NATL-RE, Zero Coupon, 6/1/2021 | | | 40,000 | | | | 39,979 | |
| | |
Series R-2014B, GO, 5.00%, 7/1/2021 | | | 20,000 | | | | 20,322 | |
| | |
Series R-2020D, GO, 5.00%, 7/1/2021 | | | 175,000 | | | | 177,821 | |
| | |
Series 2017B, GO, 5.00%, 8/1/2021 | | | 50,000 | | | | 51,010 | |
| | |
Series R-2017B, GO, 5.00%, 8/1/2021 | | | 110,000 | | | | 112,221 | |
| | |
Series R-2017D, GO, 5.00%, 8/1/2021 | | | 95,000 | | | | 96,918 | |
| | |
Series R-2018B, GO, 5.00%, 8/1/2021 | | | 60,000 | | | | 61,211 | |
| | |
Series 2019D, GO, 5.00%, 6/1/2022 | | | 45,000 | | | | 47,724 | |
| | |
Series 2021B, GO, 5.00%, 6/1/2022 | | | 85,000 | | | | 90,146 | |
| | |
GO, 5.00%, 7/1/2022 | | | 65,000 | | | | 69,198 | |
| | |
Series B, GO, 5.00%, 7/1/2022 | | | 70,000 | | | | 74,521 | |
| | |
Series R-2012D, GO, 5.00%, 7/1/2022 | | | 25,000 | | | | 26,614 | |
| | |
Series R-2015F, GO, 5.00%, 7/1/2022 | | | 170,000 | | | | 180,979 | |
| | |
Series R-2020D, GO, 5.00%, 7/1/2022 | | | 60,000 | | | | 63,875 | |
| | |
Series 2013B-2, GO, 4.00%, 8/1/2022 | | | 25,000 | | | | 26,362 | |
| | |
Series R-2013D, GO, 5.00%, 7/1/2023 | | | 20,000 | | | | 22,206 | |
| | |
Series 2012B-1, GO, 5.00%, 8/1/2023 | | | 200,000 | | | | 203,994 | |
SEE NOTES TO FINANCIAL STATEMENTS.
| | | | | | |
| | | |
| 318 | | | | J.P. MORGAN EXCHANGE-TRADED FUNDS | | FEBRUARY 28, 2021 |
| | | | | | | | |
| INVESTMENTS | | PRINCIPAL
AMOUNT ($) | | | VALUE ($) | |
Municipal Bonds — continued | | | | | | | | |
|
Washington — continued | |
| | |
Series R-2021A, GO, 5.00%, 6/1/2024 | | | 500,000 | | | | 574,805 | |
| | |
GO, 5.00%, 7/1/2025 | | | 250,000 | | | | 265,850 | |
| | |
Series R-2012D, GO, 5.00%, 7/1/2025 | | | 240,000 | | | | 255,216 | |
| | |
State of Washington, Motor Vehicle Fuel Tax, Senior 520 Corridor Program-Toll Revenue | | | | | | | | |
| | |
Series 2012C, GO, 5.00%, 6/1/2022 | | | 65,000 | | | | 65,766 | |
| | |
Series 2017C, GO, 5.00%, 6/1/2022 | | | 20,000 | | | | 21,211 | |
| | |
Series 2012C, GO, 5.25%, 6/1/2026 | | | 500,000 | | | | 506,200 | |
| | |
Series 2012C, GO, 5.25%, 6/1/2027 | | | 110,000 | | | | 111,364 | |
| | |
Series 2012C, GO, 5.00%, 6/1/2028 | | | 230,000 | | | | 232,709 | |
| | |
Series 2012C, GO, 5.00%, 6/1/2031 | | | 100,000 | | | | 101,178 | |
| | |
Series 2012C, GO, 5.00%, 6/1/2033 | | | 25,000 | | | | 25,294 | |
| | |
Series 2012C, GO, 5.00%, 6/1/2041 | | | 110,000 | | | | 111,296 | |
| | |
State of Washington, Senior 520 Corridor Program | | | | | | | | |
| | |
Rev., 5.00%, 9/1/2021 | | | 615,000 | | | | 629,693 | |
| | |
Series 2012F, Rev., 5.00%, 9/1/2022 | | | 535,000 | | | | 572,867 | |
| | |
Series 2012F, Rev., 5.00%, 9/1/2024 | | | 565,000 | | | | 604,578 | |
| | |
State of Washington, State and Local Agency Personal Property | | | | | | | | |
| | |
COP, 5.00%, 7/1/2021 | | | 50,000 | | | | 50,802 | |
| | |
Series 2013A, COP, 5.00%, 7/1/2021 | | | 25,000 | | | | 25,401 | |
| | |
Series 2014A, COP, 4.00%, 7/1/2022 | | | 50,000 | | | | 52,537 | |
| | |
Series 2013A, COP, 5.00%, 7/1/2022 | | | 110,000 | | | | 117,042 | |
| | |
Series 2014B, COP, 5.00%, 7/1/2024 | | | 50,000 | | | | 57,551 | |
| | |
State of Washington, State and Local Agency Real and Personal Property | | | | | | | | |
| | |
Series 2015C, COP, 5.00%, 7/1/2021 | | | 70,000 | | | | 71,123 | |
| | |
Series 2016A, COP, 5.00%, 7/1/2021 | | | 50,000 | | | | 50,803 | |
| | |
Series 2017A, COP, 5.00%, 7/1/2021 | | | 60,000 | | | | 60,963 | |
| | |
Series 2018B, COP, 5.00%, 7/1/2021 | | | 50,000 | | | | 50,803 | |
| | |
Series 2018C, COP, 5.00%, 7/1/2021 | | | 80,000 | | | | 81,284 | |
| | |
Series 2013B, COP, 4.00%, 7/1/2022 | | | 125,000 | | | | 131,342 | |
| | | | | | | | |
| INVESTMENTS | | PRINCIPAL
AMOUNT ($) | | | VALUE ($) | |
| | | | | | | | |
|
Washington — continued | |
| | |
COP, 5.00%, 7/1/2022 | | | 100,000 | | | | 106,402 | |
| | |
Series 2017A, COP, 5.00%, 7/1/2022 | | | 215,000 | | | | 228,764 | |
| | |
Series 2018C, COP, 5.00%, 7/1/2022 | | | 25,000 | | | | 26,601 | |
| | |
Series 2019A, COP, 5.00%, 7/1/2022 | | | 110,000 | | | | 117,042 | |
| | |
Series 2019D, COP, 5.00%, 7/1/2022 | | | 135,000 | | | | 143,643 | |
| | |
Series 2015C, COP, 5.00%, 7/1/2023 | | | 55,000 | | | | 61,011 | |
| | |
Series 2016A, COP, 5.00%, 7/1/2023 | | | 35,000 | | | | 38,826 | |
| | |
Series 2017A, COP, 5.00%, 7/1/2023 | | | 45,000 | | | | 49,919 | |
| | |
Series 2019B, COP, 5.00%, 7/1/2023 | | | 30,000 | | | | 33,279 | |
| | |
Series 2019D, COP, 5.00%, 7/1/2023 | | | 40,000 | | �� | | 44,372 | |
| | |
Series 2018C, COP, 5.00%, 7/1/2024 | | | 35,000 | | | | 40,285 | |
| | |
Series 2011D, COP, 4.50%, 1/1/2025 | | | 50,000 | | | | 51,757 | |
| | |
State of Washington, Various Purpose | | | | | | | | |
| | |
Series R-2012C, GO, 4.00%, 7/1/2021 | | | 25,000 | | | | 25,320 | |
| | |
Series R-2015G, GO, 4.00%, 7/1/2021 | | | 85,000 | | | | 86,090 | |
| | |
Series R-2013C, GO, 5.00%, 7/1/2021 | | | 100,000 | | | | 101,612 | |
| | |
Series R-2015C, GO, 5.00%, 7/1/2021 | | | 20,000 | | | | 20,322 | |
| | |
Series R-2016A, GO, 5.00%, 7/1/2021 | | | 80,000 | | | | 81,290 | |
| | |
Series 2012A, GO, 5.00%, 8/1/2021 | | | 240,000 | | | | 244,840 | |
| | |
Series 2013A, GO, 5.00%, 8/1/2021 | | | 35,000 | | | | 35,707 | |
| | |
Series R-2017A, GO, 5.00%, 8/1/2021 | | | 145,000 | | | | 147,928 | |
| | |
Series 2017D, GO, 5.00%, 2/1/2022 | | | 25,000 | | | | 26,111 | |
| | |
Series R-2012C, GO, 4.00%, 7/1/2022 | | | 130,000 | | | | 136,668 | |
| | |
Series R-2015E, GO, 5.00%, 7/1/2022 | | | 50,000 | | | | 53,229 | |
| | |
Series R-2016B, GO, 5.00%, 7/1/2022 | | | 45,000 | | | | 47,906 | |
| | |
Series 2014A, GO, 5.00%, 8/1/2022 | | | 35,000 | | | | 37,402 | |
| | |
Series R-2017C, GO, 5.00%, 8/1/2022 | | | 25,000 | | | | 26,715 | |
SEE NOTES TO FINANCIAL STATEMENTS.
| | | | | | | | |
| | | |
| FEBRUARY 28, 2021 | | J.P. MORGAN EXCHANGE-TRADED FUNDS | | | | | 319 | |
JPMorgan Ultra-Short Municipal Income ETF
SCHEDULE OF PORTFOLIO INVESTMENTS
AS OF FEBRUARY 28, 2021 (continued)
| | | | | | | | |
| INVESTMENTS | | PRINCIPAL
AMOUNT ($) | | | VALUE ($) | |
Municipal Bonds — continued | | | | | | | | |
|
Washington — continued | |
| | |
Series 2014D, GO, 5.00%, 2/1/2023 | | | 55,000 | | | | 60,029 | |
| | |
Series R-2015C, GO, 5.00%, 7/1/2023 | | | 20,000 | | | | 22,206 | |
| | |
Series 2015E, GO, 5.00%, 7/1/2024 | | | 25,000 | | | | 28,829 | |
| | |
Tacoma Metropolitan Park District, Unlimited Tax GO, 5.00%, 12/1/2021 | | | 200,000 | | | | 207,256 | |
| | |
Thurston County School District No. 111 Olympia, Unlimited Tax, Washington State School District Credit Enhancement Program GO, 5.00%, 12/1/2021 | | | 120,000 | | | | 124,354 | |
| | |
Thurston County School District No. 33 Tumwater, Unlimited Tax GO, 5.00%, 12/1/2021 | | | 35,000 | | | | 36,270 | |
| | |
Tobacco Settlement Authority Rev., 5.00%, 6/1/2024 | | | 100,000 | | | | 110,082 | |
| | |
University of Washington | | | | | | | | |
| | |
Series 2011A, Rev., 5.00%, 4/1/2021 | | | 100,000 | | | | 100,380 | |
| | |
Series 2015C, Rev., 5.00%, 12/1/2021 | | | 25,000 | | | | 25,903 | |
| | |
Vancouver Wash Housing Authority Rev., VRDO, LIQ: FHLMC, 0.04%, 3/9/2021 (c) | | | 10,000,000 | | | | 10,000,000 | |
| | |
Washington Biomedical Research Properties | | | | | | | | |
| | |
Series 2015A, Rev., 5.00%, 1/1/2022 | | | 30,000 | | | | 31,207 | |
| | |
Series 2015A, Rev., 5.00%, 1/1/2023 | | | 20,000 | | | | 21,742 | |
| | |
Washington Economic Development Finance Authority, Washington Biomedical Research Properties II | | | | | | | | |
| | |
Rev., 5.00%, 6/1/2021 | | | 30,000 | | | | 30,360 | |
| | |
Series A, Rev., 5.00%, 6/1/2022 | | | 50,000 | | | | 53,014 | |
| | |
Washington Health Care Facilities Authority, Catholic Health Initiatives Series 2013A, Rev., 5.25%, 1/1/2023 (b) | | | 155,000 | | | | 168,965 | |
| | |
Washington Health Care Facilities Authority, Multicare Health System | | | | | | | | |
| | |
Series 2015A, Rev., 5.00%, 8/15/2021 | | | 55,000 | | | | 56,184 | |
| | |
Series 2017B, Rev., 5.00%, 8/15/2021 | | | 135,000 | | | | 137,907 | |
| | |
Washington Health Care Facilities Authority, Providence Health and Services Series B, Rev., 5.00%, 10/1/2021 (c) | | | 275,000 | | | | 282,573 | |
| | | | | | | | |
| INVESTMENTS | | PRINCIPAL
AMOUNT ($) | | | VALUE ($) | |
| | | | | | | | |
|
Washington — continued | |
| | |
Washington Health Care Facilities Authority, Seattle Children’s Hospital | | | | | | | | |
| | |
Series 2010B, Rev., 5.00%, 10/1/2021 | | | 225,000 | | | | 225,797 | |
| | |
Series 2017A, Rev., 5.00%, 10/1/2022 | | | 170,000 | | | | 182,617 | |
| | |
Washington State Housing Finance Commission, SAG Portfolio Projects Rev., 2.55%, 7/1/2021 (c) | | | 500,000 | | | | 503,830 | |
| | | | | | | | |
| | |
Total Washington | | | | | | | 35,322,094 | |
| | | | | | | | |
|
West Virginia — 0.7% | |
| | |
Marshall University Rev., 5.00%, 5/3/2021 (b) | | | 200,000 | | | | 201,650 | |
| | |
Monongalia County Building Commission, Justice Center Project Series 2014A, Rev., 4.00%, 2/1/2022 | | | 250,000 | | | | 250,675 | |
| | |
Putnam County Board of Education GO, 4.00%, 5/1/2021 (b) | | | 150,000 | | | | 150,937 | |
| | |
West Virginia Commissioner of Highways, Surface Transportation Improvements Notes Series 2017A, Rev., 5.00%, 9/1/2021 | | | 115,000 | | | | 117,742 | |
| | |
West Virginia Economic Development Authority, Correctional Juvenile and Public Safety Facilities | | | | | | | | |
| | |
Rev., 5.00%, 6/1/2022 | | | 1,000,000 | | | | 1,057,430 | |
| | |
Rev., 5.00%, 6/1/2025 | | | 125,000 | | | | 132,147 | |
| | |
West Virginia Economic Development Authority, Solid Waste Disposal Facilities, Appalachian Power Company — Amos Project | | | | | | | | |
| | |
Series 2009-B, Rev., 2.63%, 6/1/2022 (c) | | | 500,000 | | | | 512,215 | |
| | |
Rev., 0.62%, 12/15/2025 (c) | | | 100,000 | | | | 98,841 | |
| | |
West Virginia Hospital Finance Authority, United Health System | | | | | | | | |
| | |
Series 2016A, Rev., 5.00%, 6/1/2021 | | | 5,670,000 | | | | 5,735,205 | |
| | |
Series 2016A, Rev., 5.00%, 6/1/2022 | | | 20,000 | | | | 21,154 | |
| | |
West Virginia State School Building Authority, Lottery Capital Improvement Series 2012A, Rev., 5.00%, 7/1/2023 | | | 100,000 | | | | 106,284 | |
| | |
West Virginia University | | | | | | | | |
| | |
Series 2011B, Rev., 4.50%, 10/1/2021 (b) | | | 25,000 | | | | 25,634 | |
SEE NOTES TO FINANCIAL STATEMENTS.
| | | | | | |
| | | |
| 320 | | | | J.P. MORGAN EXCHANGE-TRADED FUNDS | | FEBRUARY 28, 2021 |
| | | | | | | | |
| INVESTMENTS | | PRINCIPAL
AMOUNT ($) | | | VALUE ($) | |
Municipal Bonds — continued | | | | | | | | |
|
West Virginia — continued | |
| | |
Series 2011B, Rev., 5.00%, 10/1/2021 (b) | | | 80,000 | | | | 82,260 | |
| | |
Series 2013A, Rev., 5.00%, 10/1/2022 (b) | | | 50,000 | | | | 53,827 | |
| | |
Series 2019A, Rev., 5.00%, 10/1/2022 | | | 275,000 | | | | 295,545 | |
| | |
West Virginia Water Development Authority, Infrastructure and Jobs Development Council Program Rev., 5.00%, 10/1/2021 | | | 520,000 | | | | 534,196 | |
| | |
West Virginia Water Development Authority, Loan Program II | | | | | | | | |
| | |
Series 2013A-II, Rev., 5.00%, 11/1/2021 | | | 30,000 | | | | 30,936 | |
| | |
Series 2016A-II, Rev., 5.00%, 11/1/2023 | | | 250,000 | | | | 279,818 | |
| | | | | | | | |
| | |
Total West Virginia | | | | | | | 9,686,496 | |
| | | | | | | | |
|
Wisconsin — 2.9% | |
| | |
Appleton Area School District GO, 4.00%, 3/1/2021 | | | 125,000 | | | | 125,000 | |
| | |
City of Appleton | | | | | | | | |
| | |
GO, 3.00%, 4/1/2021 | | | 25,000 | | | | 25,056 | |
| | |
Series 2018A, GO, 4.00%, 4/1/2021 | | | 25,000 | | | | 25,077 | |
| | |
Series 2019A, GO, 3.00%, 4/1/2022 | | | 25,000 | | | | 25,755 | |
| | |
City of Appleton, Water System Rev., 4.00%, 1/1/2022 | | | 45,000 | | | | 46,418 | |
| | |
City of De Pere, Promissory Notes Series 2019A, GO, 3.00%, 9/1/2021 | | | 25,000 | | | | 25,349 | |
| | |
City of Eau Claire, Corporate Purpose Series 2016A, GO, 3.00%, 4/1/2021 | | | 150,000 | | | | 150,339 | |
| | |
City of Eau Claire, Promissory Notes Series 2019B, GO, 4.00%, 4/1/2021 | | | 45,000 | | | | 45,138 | |
| | |
City of Flagstaff, Road Repair, Street Improvement Project Series 2020A, GO, 2.00%, 3/1/2022 | | | 50,000 | | | | 50,871 | |
| | |
City of Green Bay, Corporate Purpose GO, 3.00%, 4/1/2021 | | | 100,000 | | | | 100,226 | |
| | |
City of Green Bay, Water System Rev., 3.00%, 11/1/2021 | | | 80,000 | | | | 81,518 | |
| | |
City of Janesville, Promissory Notes GO, 3.00%, 2/1/2022 | | | 35,000 | | | | 35,894 | |
| | |
City of Kaukauna, Promissory Note GO, 4.00%, 9/1/2022 | | | 100,000 | | | | 101,857 | |
| | |
City of Kenosha, Promissory Notes | | | | | | | | |
| | |
Series 2018B, GO, 3.00%, 4/1/2021 | | | 75,000 | | | | 75,169 | |
| | |
Series 2012B, GO, 4.00%, 4/1/2021 | | | 25,000 | | | | 25,077 | |
| | | | | | | | |
| INVESTMENTS | | PRINCIPAL
AMOUNT ($) | | | VALUE ($) | |
| | | | | | | | |
|
Wisconsin — continued | |
| | |
City of La Crosse/Wisconsin Series 2011-C, GO, 3.00%, 10/1/2024 | | | 100,000 | | | | 101,547 | |
| | |
City of Lake Mills, Capital Purpose Bond Series 2014B, GO, 4.00%, 9/1/2022 | | | 140,000 | | | | 147,602 | |
| | |
City of Lake Mills, Promissory Notes Series 2017B, GO, 1.65%, 4/1/2021 | | | 200,000 | | | | 200,210 | |
| | |
City of Madison, Corporate Purpose Series 2020B, GO, 2.00%, 10/1/2021 | | | 30,000 | | | | 30,324 | |
| | |
City of Madison, Promissory Notes | | | | | | | | |
| | |
Series 2013-A, GO, 4.00%, 10/1/2021 | | | 30,000 | | | | 30,672 | |
| | |
Series 2013-A, GO, 4.00%, 10/1/2022 | | | 30,000 | | | | 30,636 | |
| | |
Series 2017A, GO, 4.00%, 10/1/2022 | | | 25,000 | | | | 26,515 | |
| | |
Series 2018A, GO, 4.00%, 10/1/2022 | | | 20,000 | | | | 21,212 | |
| | |
Series 2014A, GO, 3.00%, 10/1/2024 | | | 100,000 | | | | 101,524 | |
| | |
City of Madison, Sewer System Series 2018E, Rev., 4.00%, 12/1/2021 | | | 30,000 | | | | 30,846 | |
| | |
City of Madison, Water Utility | | | | | | | | |
| | |
Series 2019A, Rev., 5.00%, 1/1/2022 | | | 25,000 | | | | 25,989 | |
| | |
Rev., 5.00%, 1/1/2023 | | | 50,000 | | | | 54,277 | |
| | |
Rev., BAN, 1.50%, 11/1/2024 | | | 1,075,000 | | | | 1,075,387 | |
| | |
City of Manitowoc | | | | | | | | |
| | |
Rev., 2.00%, 6/1/2022 | | | 775,000 | | | | 785,098 | |
| | |
GO, 2.00%, 2/1/2023 | | | 320,000 | | | | 329,875 | |
| | |
City of Merrill | | | | | | | | |
| | |
Series 2019A, GO, 3.00%, 10/1/2021 | | | 60,000 | | | | 60,907 | |
| | |
Series 2019A, GO, 3.00%, 10/1/2022 | | | 60,000 | | | | 62,397 | |
| | |
City of Milwaukee, Promissory Notes | | | | | | | | |
| | |
Series 2017N4, GO, 5.00%, 4/1/2021 | | | 3,675,000 | | | | 3,688,818 | |
| | |
Series 2018N4, GO, 5.00%, 4/1/2021 | | | 620,000 | | | | 622,331 | |
| | |
Series 2011N3, GO, 5.00%, 5/15/2021 | | | 705,000 | | | | 711,662 | |
| | |
Series 2017N4, GO, 5.00%, 4/1/2022 | | | 45,000 | | | | 47,260 | |
| | |
Series 2012N2, GO, 5.00%, 5/1/2022 | | | 30,000 | | | | 31,619 | |
SEE NOTES TO FINANCIAL STATEMENTS.
| | | | | | | | |
| | | |
| FEBRUARY 28, 2021 | | J.P. MORGAN EXCHANGE-TRADED FUNDS | | | | | 321 | |
JPMorgan Ultra-Short Municipal Income ETF
SCHEDULE OF PORTFOLIO INVESTMENTS
AS OF FEBRUARY 28, 2021 (continued)
| | | | | | | | |
| INVESTMENTS | | PRINCIPAL
AMOUNT ($) | | | VALUE ($) | |
Municipal Bonds — continued | |
|
Wisconsin — continued | |
| | |
City of Oshkosh | | | | | | | | |
| | |
Series A, GO, 0.05%, 12/1/2022 | | | 70,000 | | | | 69,732 | |
| | |
Series A, GO, 2.00%, 12/1/2023 | | | 200,000 | | | | 208,190 | |
| | |
City of Racine Series 2020B, GO, 3.00%, 6/1/2021 | | | 100,000 | | | | 100,702 | |
| | |
City of Shawano, Promissory Notes GO, 3.00%, 4/1/2022 | | | 140,000 | | | | 144,229 | |
| | |
City of Sun Prairie Series 2019D, GO, 3.00%, 4/1/2021 | | | 65,000 | | | | 65,147 | |
| | |
City of Superior | | | | | | | | |
| | |
Rev., NATL-RE, 6.90%, 8/1/2021 | | | 785,000 | | | | 806,446 | |
| | |
GO, 4.00%, 12/1/2021 | | | 55,000 | | | | 56,598 | |
| | |
City of Waukesha Series 2020A, GO, 3.00%, 10/1/2021 | | | 110,000 | | | | 111,793 | |
| | |
City of Waukesha, Promissory Notes Series 2019C, GO, 3.00%, 10/1/2022 | | | 20,000 | | | | 20,880 | |
| | |
City of Waukesha, Sewer System Rev., 3.00%, 5/1/2021 | | | 25,000 | | | | 25,115 | |
| | |
City of Wauwatosa, Waterworks System Rev., 3.00%, 1/1/2022 | | | 100,000 | | | | 102,322 | |
| | |
City of West Allis Series 2016A, GO, 2.00%, 4/1/2021 | | | 100,000 | | | | 100,142 | |
| | |
County of Dane, Corporate Purpose GO, 2.00%, 6/1/2021 | | | 125,000 | | | | 125,538 | |
| | |
County of Fond Du Lac | | | | | | | | |
| | |
Series 2017A, GO, 2.00%, 3/1/2021 | | | 200,000 | | | | 200,000 | |
| | |
Series 2019A, GO, 3.00%, 3/1/2021 | | | 95,000 | | | | 95,000 | |
| | |
County of La Crosse, Corporate Purpose | | | | | | | | |
| | |
Series 2017A, GO, 5.00%, 4/1/2021 | | | 50,000 | | | | 50,195 | |
| | |
GO, 3.00%, 10/1/2021 | | | 25,000 | | | | 25,415 | |
| | |
County of Milwaukee, Corporate Purpose | | | | | | | | |
| | |
Series 2017A, GO, 2.00%, 9/1/2021 | | | 300,000 | | | | 302,487 | |
| | |
Series 2018D, GO, 3.00%, 8/1/2024 | | | 100,000 | | | | 108,241 | |
| | |
County of St. Croix, Highway Maintenance Facility Series 2018A, GO, 4.00%, 3/1/2021 | | | 25,000 | | | | 25,000 | |
| | |
County of Winnebago GO, 4.00%, 4/1/2022 | | | 25,000 | | | | 26,008 | |
| | |
DeForest Area School District GO, 5.00%, 4/1/2023 | | | 60,000 | | | | 65,788 | |
| | |
East Troy Community School District GO, 3.00%, 3/1/2021 | | | 25,000 | | | | 25,000 | |
| | |
Fox Valley Technical College District | | | | | | | | |
| | |
Series 2019A, GO, 3.00%, 12/1/2021 | | | 155,000 | | | | 158,322 | |
| | |
Series 2018A, GO, 4.00%, 12/1/2022 | | | 60,000 | | | | 63,963 | |
| | | | | | | | |
| INVESTMENTS | | PRINCIPAL
AMOUNT ($) | | | VALUE ($) | |
| |
|
Wisconsin — continued | |
| | |
Grafton School District, School Building & Improvement GO, 5.00%, 4/1/2023 | | | 20,000 | | | | 21,934 | |
| | |
Green Bay Area Public School District | | | | | | | | |
| | |
GO, 4.00%, 4/1/2021 | | | 95,000 | | | | 95,292 | |
| | |
GO, 4.00%, 4/1/2022 | | | 20,000 | | | | 20,815 | |
| | |
Ithaca School District, School Improvement GO, 3.00%, 3/1/2021 | | | 175,000 | | | | 175,000 | |
| | |
Kenosha Unified School District No. 1 | | | | | | | | |
| | |
GO, 5.00%, 4/1/2021 | | | 110,000 | | | | 110,427 | |
| | |
GO, 4.00%, 4/1/2022 | | | 55,000 | | | | 57,242 | |
| | |
Madison Area Technical College | | | | | | | | |
| | |
Series 2010-11B, GO, 4.00%, 3/1/2021 (b) | | | 125,000 | | | | 125,000 | |
| | |
Series 2011-12A, GO, 4.00%, 3/1/2021 | | | 30,000 | | | | 30,000 | |
| | |
Series 2018-19B, GO, 4.00%, 3/1/2021 | | | 60,000 | | | | 60,000 | |
| | |
Series 2011-12A, GO, 4.50%, 3/1/2021 (b) | | | 50,000 | | | | 50,000 | |
| | |
Madison Metropolitan School District GO, 4.00%, 3/1/2021 | | | 25,000 | | | | 25,000 | |
| | |
Mequon and Thiensville School District, School Improvement GO, 4.00%, 3/1/2021 | | | 35,000 | | | | 35,000 | |
| | |
Middleton-Cross Plains Area School District, School Building and Improvement Series 2019A, GO, 5.00%, 3/1/2022 | | | 40,000 | | | | 41,908 | |
| | |
Milwaukee Area Technical College District | | | | | | | | |
| | |
Series 2017-2018L, GO, 3.00%, 6/1/2021 | | | 25,000 | | | | 25,170 | |
| | |
Series 2019-20-C, GO, 4.00%, 6/1/2021 | | | 50,000 | | | | 50,464 | |
| | |
Series 2018-2019C, GO, 4.00%, 6/1/2022 | | | 100,000 | | | | 104,654 | |
| | |
Milwaukee Metropolitan Sewerage District GO, 4.00%, 10/1/2021 | | | 20,000 | | | | 20,448 | |
| | |
Milwaukee Redevelopment Authority, Milwaukee Public Schools | | | | | | | | |
| | |
Rev., 4.00%, 8/1/2021 | | | 350,000 | | | | 355,439 | |
| | |
Rev., 5.00%, 11/15/2022 | | | 365,000 | | | | 394,309 | |
| | |
Rev., NATL-RE, 4.00%, 8/1/2023 | | | 400,000 | | | | 433,044 | |
| | |
Rev., 5.00%, 11/15/2023 | | | 130,000 | | | | 145,451 | |
| | |
Northcentral Technical College District, Promissory Notes | | | | | | | | |
| | |
Series 2016B, GO, 2.00%, 3/1/2021 | | | 115,000 | | | | 115,000 | |
| | |
GO, 3.00%, 3/1/2021 | | | 335,000 | | | | 335,000 | |
SEE NOTES TO FINANCIAL STATEMENTS.
| | | | | | |
| | | |
| 322 | | | | J.P. MORGAN EXCHANGE-TRADED FUNDS | | FEBRUARY 28, 2021 |
| | | | | | | | |
| INVESTMENTS | | PRINCIPAL
AMOUNT ($) | | | VALUE ($) | |
Municipal Bonds — continued | |
|
Wisconsin — continued | |
| | |
Northeast Wisconsin Technical College District Series 2017B, GO, 4.00%, 4/1/2022 | | | 45,000 | | | | 46,845 | |
| | |
Oak Creek-Franklin Joint School District GO, 5.00%, 4/1/2022 | | | 40,000 | | | | 42,062 | |
| | |
Oconomowoc Area School District, Corporate Purpose GO, 4.00%, 4/1/2022 | | | 40,000 | | | | 41,631 | |
| | |
Public Finance Authority, KU Campus Development Corp. — Central District Development Project | | | | | | | | |
| | |
Rev., 5.00%, 3/1/2021 | | | 100,000 | | | | 100,000 | |
| | |
Rev., 5.00%, 3/1/2023 | | | 25,000 | | | | 27,202 | |
| | |
Rev., 5.00%, 3/1/2025 | | | 160,000 | | | | 185,872 | |
| | |
Public Finance Authority, Renown Regional Medical Center Project Rev., 5.00%, 6/1/2021 | | | 110,000 | | | | 111,251 | |
| | |
Public Finance Authority, Searstone CCRC Project Series 2020A, Rev., 8.63%, 6/1/2022 (b) | | | 400,000 | | | | 439,080 | |
| | |
Public Finance Authority, Voyager Foundation Inc., Project Series 2012A, Rev., 6.20%, 10/1/2022 (b) | | | 325,000 | | | | 355,267 | |
| | |
Sevastopol School District, Promissory Notes | | | | | | | | |
| | |
GO, 4.00%, 3/1/2024 | | | 985,000 | | | | 1,084,170 | |
| | |
GO, 4.00%, 3/1/2025 | | | 625,000 | | | | 704,450 | |
| | |
Sheboygan Area School District GO, 2.00%, 3/1/2021 | | | 50,000 | | | | 50,000 | |
| | |
State of Wisconsin | | | | | | | | |
| | |
Series 2011C, GO, 4.00%, 5/1/2021 (b) | | | 85,000 | | | | 85,539 | |
| | |
Series 2012A, GO, 4.00%, 5/1/2021 (b) | | | 220,000 | | | | 221,395 | |
| | |
Series 2011B, GO, 4.50%, 5/1/2021 (b) | | | 100,000 | | | | 100,716 | |
| | |
Series 2011-1, GO, 5.00%, 5/1/2021 | | | 350,000 | | | | 352,781 | |
| | |
Series 2011A, GO, 5.00%, 5/1/2021 | | | 305,000 | | | | 307,422 | |
| | |
Series 2011B, GO, 5.00%, 5/1/2021 (b) | | | 1,150,000 | | | | 1,159,177 | |
| | |
Series 2011C, GO, 5.00%, 5/1/2021 (b) | | | 165,000 | | | | 166,317 | |
| | |
Series 2012-2, GO, 5.00%, 5/1/2021 | | | 50,000 | | | | 50,397 | |
| | |
Series 2012A, GO, 5.00%, 5/1/2021 (b) | | | 170,000 | | | | 171,356 | |
| | |
Series 2016-B, GO, 5.00%, 5/1/2021 | | | 55,000 | | | | 55,437 | |
| | | | | | | | |
| INVESTMENTS | | PRINCIPAL
AMOUNT ($) | | | VALUE ($) | |
Municipal Bonds — continued | |
|
Wisconsin — continued | |
| | |
Series 2016D, GO, 5.00%, 5/1/2021 | | | 205,000 | | | | 206,628 | |
| | |
Series 2019A, Rev., 5.00%, 5/1/2021 | | | 125,000 | | | | 125,995 | |
| | |
Series 2011-2, GO, 4.00%, 11/1/2021 | | | 100,000 | | | | 102,554 | |
| | |
Series 2016-1, GO, 5.00%, 11/1/2021 | | | 55,000 | | | | 56,769 | |
| | |
Series 2016-2, GO, 5.00%, 11/1/2021 | | | 30,000 | | | | 30,965 | |
| | |
Series 3, GO, 5.00%, 11/1/2021 | | | 280,000 | | | | 289,007 | |
| | |
Series 2013-1, GO, 5.00%, 5/1/2022 | | | 50,000 | | | | 52,806 | |
| | |
Series 2013A, GO, 5.00%, 5/1/2022 (b) | | | 20,000 | | | | 21,130 | |
| | |
Series 2016D, GO, 5.00%, 5/1/2022 | | | 50,000 | | | | 52,806 | |
| | |
Series 2016-2, GO, 4.00%, 11/1/2022 | | | 20,000 | | | | 21,269 | |
| | |
GO, 5.00%, 11/1/2022 | | | 215,000 | | | | 232,209 | |
| | |
Series 2014-3, GO, 5.00%, 11/1/2022 | | | 20,000 | | | | 21,601 | |
| | |
Series 2016-1, GO, 5.00%, 11/1/2022 | | | 40,000 | | | | 43,202 | |
| | |
Series 2016-2, GO, 5.00%, 11/1/2022 | | | 50,000 | | | | 54,002 | |
| | |
Series 2013-1, GO, 5.00%, 5/1/2023 | | | 25,000 | | | | 27,565 | |
| | |
State of Wisconsin, Clean Water Fund Leveraged Loan Portfolio | | | | | | | | |
| | |
Series 2012-1, Rev., 4.00%, 6/1/2021 (b) | | | 125,000 | | | | 126,180 | |
| | |
Series 2012-2, Rev., 5.00%, 6/1/2022 (b) | | | 20,000 | | | | 21,198 | |
| | |
State of Wisconsin, Environmental Improvement Fund Series 2017A, Rev., 5.00%, 6/1/2022 | | | 20,000 | | | | 21,213 | |
| | |
State of Wisconsin, Master Lease | | | | | | | | |
| | |
Series 2018A, COP, 5.00%, 9/1/2021 | | | 100,000 | | | | 102,384 | |
| | |
Series 2018A, COP, 3.00%, 9/1/2022 | | | 25,000 | | | | 25,343 | |
| | |
Series 2018A, COP, 3.00%, 3/1/2023 | | | 100,000 | | | | 101,310 | |
| | |
Sun Prairie Area School District GO, 5.00%, 3/1/2021 | | | 45,000 | | | | 45,000 | |
| | |
Tender Option Bond Trust Receipts/Certificates | | | | | | | | |
| | |
Series 2020-XL0147, Rev., VRDO, AGM, LOC: Barclays Bank plc, 0.07%, 3/9/2021 (c) (f) | | | 5,320,000 | | | | 5,320,000 | |
SEE NOTES TO FINANCIAL STATEMENTS.
| | | | | | | | |
| | | |
| FEBRUARY 28, 2021 | | J.P. MORGAN EXCHANGE-TRADED FUNDS | | | | | 323 | |
JPMorgan Ultra-Short Municipal Income ETF
SCHEDULE OF PORTFOLIO INVESTMENTS
AS OF FEBRUARY 28, 2021 (continued)
| | | | | | | | |
| INVESTMENTS | | PRINCIPAL
AMOUNT ($) | | | VALUE ($) | |
Municipal Bonds — continued | |
|
Wisconsin — continued | |
| | |
Series 2020-XL0148, Rev., VRDO, AGM, LOC: Barclays Bank plc, 0.07%, 3/9/2021 (c) (f) | | | 2,250,000 | | | | 2,250,000 | |
| | |
University of Wisconsin Hospitals and Clinics | | | | | | | | |
| | |
Series 2013A, Rev., 5.00%, 4/1/2021 | | | 275,000 | | | | 276,064 | |
| | |
Series 2013A, Rev., 5.00%, 4/1/2025 | | | 430,000 | | | | 466,787 | |
| | |
Village of DeForest Series 2019A, GO, 0.05%, 5/1/2021 | | | 95,000 | | | | 94,978 | |
| | |
Village of Ephraim, Street Improvement Series 2018A, GO, 5.00%, 3/1/2022 | | | 30,000 | | | | 31,434 | |
| | |
Village of Fox Crossing, Corporate Purpose GO, 3.00%, 4/1/2024 | | | 185,000 | | | | 198,555 | |
| | |
Village of Howard Rev., 4.00%, 12/1/2022 | | | 135,000 | | | | 138,766 | |
| | |
Village of Menomonee Falls, Corporate Purpose | | | | | | | | |
| | |
Series B, GO, 3.50%, 2/1/2022 | | | 150,000 | | | | 154,517 | |
| | |
Series B, GO, 3.50%, 2/1/2023 | | | 155,000 | | | | 164,244 | |
| | |
Series B, GO, 3.50%, 2/1/2024 | | | 245,000 | | | | 266,266 | |
| | |
Village of Pleasant Prairie Series 2014A, GO, 5.00%, 9/1/2021 | | | 190,000 | | | | 194,454 | |
| | |
Village of Waunakee, Corporate Purpose | | | | | | | | |
| | |
Series 2012A, GO, 4.00%, 4/1/2021 | | | 80,000 | | | | 80,231 | |
| | |
GO, 4.00%, 6/1/2021 | | | 35,000 | | | | 35,330 | |
| | |
Waukesha School District, Promissory Notes GO, 3.00%, 4/1/2021 | | | 25,000 | | | | 25,057 | |
| | |
Wauwatosa School District, School Building and Improvement | | | | | | | | |
| | |
Series 2019A, GO, 4.00%, 3/1/2021 | | | 460,000 | | | | 460,000 | |
| | |
Series 2019B, GO, 5.00%, 9/1/2022 | | | 65,000 | | | | 69,692 | |
| | |
West De Pere School District, Corporate Purpose Series 2020A, GO, 5.00%, 4/1/2021 | | | 100,000 | | | | 100,385 | |
| | |
West Salem School District GO, 1.25%, 4/1/2022 | | | 200,000 | | | | 200,148 | |
| | |
Western Technical College District Series 2017B, GO, 3.00%, 4/1/2022 | | | 50,000 | | | | 51,510 | |
| | |
Whitnall School District, Promissory Notes GO, 4.00%, 3/1/2022 | | | 25,000 | | | | 25,941 | |
| | |
Wisconsin Department of Transportation | | | | | | | | |
| | |
Series 2013-1, Rev., 4.00%, 7/1/2021 | | | 80,000 | | | | 81,020 | |
| | |
Series 2012-2, Rev., 5.00%, 7/1/2021 | | | 125,000 | | | | 127,006 | |
| | |
Series 2013-1, Rev., 5.00%, 7/1/2021 | | | 40,000 | | | | 40,642 | |
| | | | | | | | |
| INVESTMENTS | | PRINCIPAL
AMOUNT ($) | | | VALUE ($) | |
| |
|
Wisconsin — continued | |
| | |
Series 2015-1, Rev., 5.00%, 7/1/2021 | | | 140,000 | | | | 142,247 | |
| | |
Series 2017-1, Rev., 5.00%, 7/1/2021 | | | 40,000 | | | | 40,642 | |
| | |
Series 2019A, Rev., 5.00%, 7/1/2021 | | | 55,000 | | | | 55,881 | |
| | |
Series 2012-1, Rev., 5.00%, 7/1/2022 | | | 115,000 | | | | 122,395 | |
| | |
Series 2012-2, Rev., 5.00%, 7/1/2022 | | | 30,000 | | | | 31,929 | |
| | |
Series 2014-1, Rev., 5.00%, 7/1/2022 (b) | | | 35,000 | | | | 37,260 | |
| | |
Series 2017-1, Rev., 5.00%, 7/1/2022 | | | 245,000 | | | | 260,753 | |
| | |
Series 2014-2, Rev., 5.00%, 7/1/2023 | | | 20,000 | | | | 22,201 | |
| | |
Wisconsin Health and Educational Facilities Authority, Advocate Aurora Health Credit Group | | | | | | | | |
| | |
Series 2018B-1, Rev., 5.00%, 1/26/2022 (c) | | | 225,000 | | | | 234,257 | |
| | |
Series 2018B-2, Rev., 5.00%, 1/25/2023 (c) | | | 270,000 | | | | 293,128 | |
| | |
Series 2018B-3, Rev., 5.00%, 1/31/2024 (c) | | | 1,000,000 | | | | 1,129,210 | |
| | |
Wisconsin Health and Educational Facilities Authority, Agnesian Healthcare, Inc. Rev., 5.00%, 7/1/2023 | | | 300,000 | | | | 331,158 | |
| | |
Wisconsin Health and Educational Facilities Authority, Ascension Health Alliance Senior Credit Group Series 2013A, Rev., 5.00%, 11/15/2021 | | | 70,000 | | | | 72,374 | |
| | |
Wisconsin Health and Educational Facilities Authority, Ascension Senior Credit Group Series 2019A, Rev., 5.00%, 11/15/2024 | | | 250,000 | | | | 290,847 | |
| | |
Wisconsin Health and Educational Facilities Authority, Aspirus, Inc., Obligated Group | | | | | | | | |
| | |
Rev., 5.00%, 8/15/2021 | | | 175,000 | | | | 178,685 | |
| | |
Rev., 5.00%, 8/15/2023 | | | 100,000 | | | | 110,892 | |
| | |
Rev., 5.00%, 8/15/2024 | | | 100,000 | | | | 114,479 | |
| | |
Rev., 5.00%, 8/15/2025 | | | 100,000 | | | | 118,045 | |
| | |
Wisconsin Health and Educational Facilities Authority, Aurora Health Care Incorporated | | | | | | | | |
| | |
Series 2012A, Rev., AGM, 5.00%, 7/15/2021 (b) | | | 100,000 | | | | 101,779 | |
SEE NOTES TO FINANCIAL STATEMENTS.
| | | | | | |
| | | |
| 324 | | | | J.P. MORGAN EXCHANGE-TRADED FUNDS | | FEBRUARY 28, 2021 |
| | | | | | | | |
| INVESTMENTS | | PRINCIPAL
AMOUNT ($) | | | VALUE ($) | |
Municipal Bonds — continued | |
|
Wisconsin — continued | |
| | |
Series 2012A, Rev., 5.00%, 7/15/2021 (b) | | | 100,000 | | | | 101,779 | |
| | |
Wisconsin Health and Educational Facilities Authority, Froedtert Health Inc., Obligated Group Series 2017A, Rev., 5.00%, 4/1/2021 | | | 1,015,000 | | | | 1,018,847 | |
| | |
Wisconsin Health and Educational Facilities Authority, Hospital Sisters Services, Inc. Obligated Group | | | | | | | | |
| | |
Rev., 5.00%, 11/15/2021 | | | 145,000 | | | | 149,759 | |
| | |
Rev., 5.00%, 11/15/2022 | | | 100,000 | | | | 107,887 | |
| | |
Rev., 5.00%, 11/15/2025 | | | 355,000 | | | | 408,083 | |
| | |
Wisconsin Health and Educational Facilities Authority, Thedacare, Inc. Rev., 5.00%, 12/15/2023 | | | 120,000 | | | | 134,808 | |
| | |
Wisconsin Health and Educational Facilities Authority, Unity Point Health | | | | | | | | |
| | |
Series 2014A, Rev., 5.00%, 12/1/2021 | | | 555,000 | | | | 574,497 | |
| | |
Series 2014A, Rev., 5.00%, 12/1/2024 | | | 100,000 | | | | 115,595 | |
| | |
Series 2014A, Rev., 5.00%, 12/1/2025 | | | 145,000 | | | | 167,001 | |
| | |
Wisconsin Housing and Economic Development Authority Series 2019A, Rev., 1.55%, 11/1/2021 (c) | | | 100,000 | | | | 100,218 | |
| | |
Wisconsin Housing and Economic Development Authority, Home Ownership Series 2018D, Rev., 3.10%, 3/1/2021 | | | 100,000 | | | | 100,000 | |
| | |
WPPI Energy Power Supply System | | | | | | | | |
| | |
Series 2013A, Rev., 5.00%, 7/1/2021 | | | 50,000 | | | | 50,754 | |
| | |
Series 2013A, Rev., 5.00%, 7/1/2024 | | | 300,000 | | | | 332,418 | |
| | |
Series 2018A, Rev., 5.00%, 7/1/2024 | | | 90,000 | | | | 102,626 | |
| | |
Wrightstown Community School District GO, 5.00%, 3/1/2022 | | | 25,000 | | | | 26,182 | |
| | | | | | | | |
| | |
Total Wisconsin | | | | | | | 40,735,448 | |
| | | | | | | | |
| | |
Wyoming — 0.0% (g) | | | | | | | | |
| | |
County of Laramie, Hospital, Regional Medical Center Project Rev., 5.00%, 5/1/2021 | | | 190,000 | | | | 191,499 | |
| | |
County of Natrona, Wyoming Medical Center Rev., 6.00%, 3/15/2021 (b) | | | 125,000 | | | | 125,260 | |
| | | | | | | | |
| INVESTMENTS | | PRINCIPAL
AMOUNT ($) | | | VALUE ($) | |
| |
|
Wyoming — continued | |
| | |
University of Wyoming, Facilities Improvement | | | | | | | | |
| | |
Series 2011B, Rev., 3.50%, 6/1/2022 | | | 45,000 | | | | 45,365 | |
| | |
Series 2012A, Rev., 5.00%, 6/1/2023 | | | 75,000 | | | | 79,337 | |
| | |
Series 2012B, Rev., 5.00%, 6/1/2023 | | | 25,000 | | | | 26,446 | |
| | |
Wyoming State Loan and Investment Board Series 2012A, Rev., 5.00%, 10/1/2023 | | | 30,000 | | | | 32,220 | |
| | | | | | | | |
| | |
Total Wyoming | | | | | | | 500,127 | |
| | | | | | | | |
| | |
Total Municipal Bonds
(Cost $1,245,040,021) | | | | | | | 1,247,629,533 | |
| | | | | | | | |
| | |
| | | SHARES | | | | |
Short-Term Investments — 9.8% | | | | | | | | |
|
Investment Companies — 9.8% | |
| | |
JPMorgan Institutional Tax Free Money Market Fund Class IM Shares, 0.03% (h) (i)
(Cost $139,100,415) | | | 139,020,341 | | | | 139,089,852 | |
| | | | | | | | |
| |
Total Investments — 98.3%
(Cost $1,384,140,436) | | | | 1,386,719,385 | |
| |
Other Assets Less Liabilities — 1.7% | | | | 23,591,773 | |
| | | | | | | | |
| |
Net Assets — 100.0% | | | | 1,410,311,158 | |
| | | | | | | | |
Percentages indicated are based on net assets.
| | |
Abbreviations |
| |
AGC | | Insured by Assured Guaranty Corp. |
AGM | | Insured by Assured Guaranty Municipal Corp. |
AMBAC | | Insured by American Municipal Bond Assurance Corp. |
BAN | | Bond Anticipation Note |
BHAC | | Insured by Berkshire Hathaway Assurance Corp. |
COLL | | Collateral |
COP | | Certificate of Participation |
CR | | Custodial Receipts |
FGIC | | Insured by Financial Guaranty Insurance Co. |
FHA | | Federal Housing Administration |
FHLB | | Federal Home Loan Bank |
FHLMC | | Federal Home Loan Mortgage Corp. |
FNMA | | Federal National Mortgage Association |
GAN | | Grant Anticipation Note |
GNMA | | Government National Mortgage Association |
GO | | General Obligation |
GTD | | Guaranteed |
IBC | | Insured Bond Certificates |
LIQ | | Liquidity Agreement |
LOC | | Letter of Credit |
SEE NOTES TO FINANCIAL STATEMENTS.
| | | | | | | | |
| | | |
| FEBRUARY 28, 2021 | | J.P. MORGAN EXCHANGE-TRADED FUNDS | | | | | 325 | |
JPMorgan Ultra-Short Municipal Income ETF
SCHEDULE OF PORTFOLIO INVESTMENTS
AS OF FEBRUARY 28, 2021 (continued)
| | |
MTA | | Metropolitan Transportation Authority |
NATL | | Insured by National Public Finance Guarantee Corp. |
PSF-GTD | | Permanent School Fund Guaranteed |
Q-SBLF | | Qualified School Bond Loan Fund |
RAN | | Revenue Anticipation Note |
RE | | Reinsured |
Rev. | | Revenue |
SCSDE | | South Carolina School District Enhancement |
SIFMA | | The Securities Industry and Financial Markets Association |
TAN | | Tax Anticipation Note |
TRAN | | Tax & Revenue Anticipation Note |
VRDO | | Variable Rate Demand Obligation |
XLCA | | Insured by XL Capital Assurance |
| |
(a) | | The date shown represents the earliest of the prerefunded date, next put date or final maturity date. |
(b) | | Security is prerefunded or escrowed to maturity. |
(c) | | Variable or floating rate security, the interest rate of which adjusts periodically based on changes in current interest rates and prepayments on the underlying pool of assets. The interest rate shown is the current rate as of February 28, 2021. |
(d) | | All or a portion of the security is a when-issued security, delayed delivery security, or forward commitment. |
(e) | | Variable or floating rate security, linked to the referenced benchmark. The interest rate shown is the current rate as of February 28, 2021. |
(f) | | Securities exempt from registration under Rule 144A or section 4(a)(2), of the Securities Act of 1933, as amended. |
(g) | | Amount rounds to less than 0.1% of net assets. |
(h) | | Investment in an affiliated fund, which is registered under the Investment Company Act of 1940, as amended, and is advised by J.P. Morgan Investment Management Inc. |
(i) | | The rate shown is the current yield as of February 28, 2021. |
SEE NOTES TO FINANCIAL STATEMENTS.
| | | | | | |
| | | |
| 326 | | | | J.P. MORGAN EXCHANGE-TRADED FUNDS | | FEBRUARY 28, 2021 |
JPMorgan USD Emerging Markets Sovereign Bond ETF
SCHEDULE OF PORTFOLIO INVESTMENTS
AS OF FEBRUARY 28, 2021
| | | | | | | | |
| INVESTMENTS | | PRINCIPAL
AMOUNT ($) | | | VALUE ($) | |
Foreign Government Securities — 87.7% | | | | | | | | |
| | |
Azerbaijan — 1.0% | | | | | | | | |
| | |
Republic of Azerbaijan | | | | | | | | |
| | |
4.75%, 3/18/2024 (a) | | | 400,000 | | | | 431,250 | |
| | |
3.50%, 9/1/2032 (b) | | | 215,000 | | | | 220,576 | |
| | |
3.50%, 9/1/2032 (a) | | | 150,000 | | | | 153,891 | |
| | | | | | | | |
| | |
| | | | | | | 805,717 | |
| | | | | | | | |
| | |
Bahrain — 4.3% | | | | | | | | |
| | |
CBB International Sukuk Programme Co. SPC | | | | | | | | |
| | |
6.25%, 11/14/2024 (a) | | | 270,000 | | | | 297,169 | |
| | |
4.50%, 3/30/2027 (b) (c) | | | 389,000 | | | | 404,925 | |
| | |
Kingdom of Bahrain | | | | | | | | |
| | |
6.13%, 8/1/2023 (a) | | | 280,000 | | | | 301,000 | |
| | |
7.00%, 1/26/2026 (b) | | | 321,000 | | | | 368,147 | |
| | |
7.00%, 1/26/2026 (a) | | | 189,000 | | | | 216,759 | |
| | |
7.00%, 10/12/2028 (b) | | | 680,000 | | | | 768,981 | |
| | |
6.75%, 9/20/2029 (a) | | | 200,000 | | | | 220,438 | |
| | |
7.38%, 5/14/2030 (a) | | | 200,000 | | | | 227,000 | |
| | |
5.63%, 9/30/2031 (a) | | | 533,000 | | | | 537,497 | |
| | |
6.00%, 9/19/2044 (a) | | | 228,000 | | | | 218,239 | |
| | | | | | | | |
| | |
| | | | | | | 3,560,155 | |
| | | | | | | | |
| | |
Bolivia, Plurinational State of — 0.4% | | | | | | | | |
| | |
Plurinational State of Bolivia | | | | | | | | |
| | |
4.50%, 3/20/2028 (b) (c) | | | 200,000 | | | | 178,875 | |
| | |
4.50%, 3/20/2028 (a) | | | 200,000 | | | | 178,875 | |
| | | | | | | | |
| | |
| | | | | | | 357,750 | |
| | | | | | | | |
| | |
Brazil — 7.2% | | | | | | | | |
| | |
Federative Republic of Brazil | | | | | | | | |
| | |
2.63%, 1/5/2023 | | | 408,000 | | | | 421,897 | |
| | |
8.88%, 4/15/2024 | | | 121,000 | | | | 149,284 | |
| | |
4.25%, 1/7/2025 | | | 427,000 | | | | 460,626 | |
| | |
6.00%, 4/7/2026 | | | 181,000 | | | | 210,243 | |
| | |
4.63%, 1/13/2028 | | | 905,000 | | | | 976,834 | |
| | |
4.50%, 5/30/2029 | | | 510,000 | | | | 541,397 | |
| | |
8.25%, 1/20/2034 | | | 500,000 | | | | 665,625 | |
| | |
7.13%, 1/20/2037 | | | 380,000 | | | | 468,825 | |
| | |
5.63%, 1/7/2041 | | | 336,000 | | | | 352,170 | |
| | |
5.00%, 1/27/2045 | | | 465,000 | | | | 454,538 | |
| | |
5.63%, 2/21/2047 | | | 542,000 | | | | 569,269 | |
| | |
4.75%, 1/14/2050 | | | 591,000 | | | | 553,324 | |
| | |
State of Minas Gerais | | | | | | | | |
| | |
5.33%, 2/15/2028 (a) | | | 167,300 | | | | 181,207 | |
| | | | | | | | |
| | |
| | | | | | | 6,005,239 | |
| | | | | | | | |
| | | | | | | | |
| INVESTMENTS | | PRINCIPAL
AMOUNT ($) | | | VALUE ($) | |
| | | | | | | | |
| | |
Chile — 0.9% | | | | | | | | |
| | |
Republic of Chile | | | | | | | | |
| | |
2.45%, 1/31/2031 | | | 6,000 | | | | 6,071 | |
| | |
2.55%, 1/27/2032 (c) | | | 272,000 | | | | 275,315 | |
| | |
3.86%, 6/21/2047 | | | 200,000 | | | | 214,437 | |
| | |
3.50%, 1/25/2050 | | | 270,000 | | | | 271,013 | |
| | | | | | | | |
| | |
| | | | | | | 766,836 | |
| | | | | | | | |
| | |
China — 0.8% | | | | | | | | |
| | |
People’s Republic of China | | | | | | | | |
| | |
1.88%, 12/3/2022 (a) | | | 220,000 | | | | 225,775 | |
| | |
3.50%, 10/19/2028 (a) | | | 200,000 | | | | 225,562 | |
| | |
2.13%, 12/3/2029 (a) | | | 200,000 | | | | 206,813 | |
| | | | | | | | |
| | |
| | | | | | | 658,150 | |
| | | | | | | | |
| | |
Colombia — 1.9% | | | | | | | | |
| | |
Republic of Colombia | | | | | | | | |
| | |
3.88%, 4/25/2027 | | | 216,000 | | | | 232,807 | |
| | |
3.00%, 1/30/2030 | | | 422,000 | | | | 418,176 | |
| | |
7.38%, 9/18/2037 | | | 100,000 | | | | 132,656 | |
| | |
6.13%, 1/18/2041 | | | 120,000 | | | | 144,075 | |
| | |
5.63%, 2/26/2044 | | | 205,000 | | | | 235,686 | |
| | |
5.00%, 6/15/2045 | | | 437,000 | | | | 470,458 | |
| | | | | | | | |
| | |
| | | | | | | 1,633,858 | |
| | | | | | | | |
| | |
Croatia — 0.4% | | | | | | | | |
| | |
Republic of Croatia 6.00%, 1/26/2024 (b) (c) | | | 265,000 | | | | 304,253 | |
| | | | | | | | |
| | |
Dominican Republic — 6.3% | | | | | | | | |
| | |
Dominican Republic Government Bond | | | | | | | | |
| | |
6.88%, 1/29/2026 (a) | | | 298,000 | | | | 347,170 | |
| | |
5.95%, 1/25/2027 (a) | | | 673,000 | | | | 752,078 | |
| | |
5.95%, 1/25/2027 (b) | | | 198,000 | | | | 221,265 | |
| | |
6.00%, 7/19/2028 (b) | | | 360,000 | | | | 406,237 | |
| | |
6.00%, 7/19/2028 (a) | | | 49,000 | | | | 55,293 | |
| | |
4.50%, 1/30/2030 (a) | | | 510,000 | | | | 513,347 | |
| | |
4.88%, 9/23/2032 (a) | | | 272,000 | | | | 275,740 | |
| | |
7.45%, 4/30/2044 (b) | | | 302,000 | | | | 359,097 | |
| | |
7.45%, 4/30/2044 (a) | | | 168,000 | | | | 199,763 | |
| | |
6.85%, 1/27/2045 (b) | | | 860,000 | | | | 952,719 | |
| | |
6.40%, 6/5/2049 (a) | | | 672,000 | | | | 708,540 | |
| | |
6.40%, 6/5/2049 (b) | | | 305,000 | | | | 321,584 | |
| | |
5.88%, 1/30/2060 (a) | | | 191,000 | | | | 184,792 | |
| | | | | | | | |
| | |
| | | | | | | 5,297,625 | |
| | | | | | | | |
SEE NOTES TO FINANCIAL STATEMENTS.
| | | | | | | | |
| | | |
| FEBRUARY 28, 2021 | | J.P. MORGAN EXCHANGE-TRADED FUNDS | | | | | 327 | |
JPMorgan USD Emerging Markets Sovereign Bond ETF
SCHEDULE OF PORTFOLIO INVESTMENTS
AS OF FEBRUARY 28, 2021 (continued)
| | | | | | | | |
| INVESTMENTS | | PRINCIPAL
AMOUNT ($) | | | VALUE ($) | |
Foreign Government Securities — continued | |
| | |
Egypt — 6.3% | | | | | | | | |
| | |
Arab Republic of Egypt | | | | | | | | |
| | |
5.58%, 2/21/2023 (a) | | | 201,000 | | | | 208,977 | |
| | |
5.75%, 5/29/2024 (a) | | | 241,000 | | | | 254,632 | |
| | |
5.88%, 6/11/2025 (a) | | | 319,000 | | | | 340,632 | |
| | |
7.50%, 1/31/2027 (b) | | | 330,000 | | | | 370,528 | |
| | |
7.50%, 1/31/2027 (a) | | | 25,000 | | | | 28,070 | |
| | |
6.59%, 2/21/2028 (a) | | | 200,000 | | | | 211,563 | |
| | |
7.60%, 3/1/2029 (a) | | | 400,000 | | | | 440,250 | |
| | |
7.60%, 3/1/2029 (b) | | | 200,000 | | | | 220,125 | |
| | |
7.05%, 1/15/2032 (b) | | | 575,000 | | | | 596,096 | |
| | |
7.63%, 5/29/2032 (a) | | | 250,000 | | | | 266,172 | |
| | |
8.50%, 1/31/2047 (b) | | | 500,000 | | | | 519,531 | |
| | |
8.50%, 1/31/2047 (a) | | | 400,000 | | | | 415,625 | |
| | |
7.90%, 2/21/2048 (a) | | | 400,000 | | | | 395,000 | |
| | |
8.70%, 3/1/2049 (a) | | | 332,000 | | | | 349,741 | |
| | |
8.88%, 5/29/2050 (a) | | | 640,000 | | | | 683,600 | |
| | | | | | | | |
| | |
| | | | | | | 5,300,542 | |
| | | | | | | | |
| | |
Ethiopia — 0.4% | | | | | | | | |
| | |
Federal Democratic Republic of Ethiopia 6.63%, 12/11/2024 (b) (c) | | | 400,000 | | | | 371,500 | |
| | | | | | | | |
| | |
Gabon — 0.2% | | | | | | | | |
| | |
Gabonese Republic 6.63%, 2/6/2031 (a) | | | 200,000 | | | | 195,562 | |
| | | | | | | | |
| | |
Hungary — 0.7% | | | | | | | | |
| | |
Hungary Government Bond | | | | | | | | |
| | |
5.75%, 11/22/2023 | | | 300,000 | | | | 340,594 | |
| | |
7.63%, 3/29/2041 | | | 150,000 | | | | 249,187 | |
| | | | | | | | |
| | |
| | | | | | | 589,781 | |
| | | | | | | | |
| | |
India — 0.3% | | | | | | | | |
| | |
Export-Import Bank of India 3.25%, 1/15/2030 (a) | | | 249,000 | | | | 253,694 | |
| | | | | | | | |
| | |
Indonesia — 2.4% | | | | | | | | |
| | |
Perusahaan Penerbit SBSN Indonesia III | | | | | | | | |
| | |
4.55%, 3/29/2026 (b) | | | 200,000 | | | | 226,375 | |
| | |
4.15%, 3/29/2027 (b) | | | 200,000 | | | | 221,812 | |
| | |
Republic of Indonesia | | | | | | | | |
| | |
5.38%, 10/17/2023 (a) | | | 200,000 | | | | 223,625 | |
| | |
3.50%, 1/11/2028 | | | 200,000 | | | | 214,938 | |
| | |
4.10%, 4/24/2028 | | | 200,000 | | | | 223,188 | |
| | |
8.50%, 10/12/2035 (a) | | | 142,000 | | | | 223,339 | |
| | |
6.63%, 2/17/2037 (b) | | | 145,000 | | | | 194,980 | |
| | |
6.75%, 1/15/2044 (b) | | | 200,000 | | | | 285,812 | |
| | |
3.70%, 10/30/2049 | | | 200,000 | | | | 200,500 | |
| | | | | | | | |
| | |
| | | | | | | 2,014,569 | |
| | | | | | | | |
| | | | | | | | |
| INVESTMENTS | | PRINCIPAL
AMOUNT ($) | | | VALUE ($) | |
| | | | | | | | |
| | |
Iraq — 1.1% | | | | | | | | |
| | |
Republic of Iraq | | | | | | | | |
| | |
6.75%, 3/9/2023 (b) | | | 559,000 | | | | 547,121 | |
| | |
5.80%, 1/15/2028 (a) | | | 218,750 | | | | 202,415 | |
| | |
5.80%, 1/15/2028 (b) | | | 204,563 | | | | 189,287 | |
| | |
5.80%, 1/15/2028 (b) | | | 14,188 | | | | 13,128 | |
| | | | | | | | |
| | |
| | | | | | | 951,951 | |
| | | | | | | | |
| | |
Ivory Coast — 1.2% | | | | | | | | |
| | |
Republic of Cote d’Ivoire | | | | | | | | |
| | |
5.75%, 12/31/2032 (b) (d) | | | 94,731 | | | | 94,642 | |
| | |
6.13%, 6/15/2033 (b) | | | 410,000 | | | | 441,775 | |
| | |
6.13%, 6/15/2033 (a) | | | 430,000 | | | | 463,325 | |
| | | | | | | | |
| | |
| | | | | | | 999,742 | |
| | | | | | | | |
| | |
Jamaica — 2.0% | | | | | | | | |
| | |
Jamaica Government Bond | | | | | | | | |
| | |
6.75%, 4/28/2028 | | | 550,000 | | | | 642,641 | |
| | |
8.00%, 3/15/2039 | | | 116,000 | | | | 159,355 | |
| | |
7.88%, 7/28/2045 | | | 641,000 | | | | 887,785 | |
| | | | | | | | |
| | |
| | | | | | | 1,689,781 | |
| | | | | | | | |
| | |
Jordan — 1.6% | | | | | | | | |
| | |
Hashemite Kingdom of Jordan | | | | | | | | |
| | |
6.13%, 1/29/2026 (b) | | | 546,000 | | | | 594,799 | |
| | |
5.75%, 1/31/2027 (b) | | | 202,000 | | | | 217,213 | |
| | |
5.75%, 1/31/2027 (a) | | | 20,000 | | | | 21,506 | |
| | |
7.38%, 10/10/2047 (b) | | | 225,000 | | | | 245,742 | |
| | |
7.38%, 10/10/2047 (a) | | | 220,000 | | | | 240,282 | |
| | | | | | | | |
| | |
| | | | | | | 1,319,542 | |
| | | | | | | | |
| | |
Kazakhstan — 0.8% | | | | | | | | |
| | |
Republic of Kazakhstan | | | | | | | | |
| | |
3.88%, 10/14/2024 (b) | | | 350,000 | | | | 385,525 | |
| | |
6.50%, 7/21/2045 (b) | | | 200,000 | | | | 290,625 | |
| | | | | | | | |
| | |
| | | | | | | 676,150 | |
| | | | | | | | |
| | |
Kenya — 2.0% | | | | | | | | |
| | |
Republic of Kenya | | | | | | | | |
| | |
6.88%, 6/24/2024 (a) | | | 283,000 | | | | 313,334 | |
| | |
7.25%, 2/28/2028 (b) | | | 835,000 | | | | 924,763 | |
| | |
8.00%, 5/22/2032 (a) | | | 200,000 | | | | 224,500 | |
| | |
8.25%, 2/28/2048 (a) | | | 203,000 | | | | 223,934 | |
| | | | | | | | |
| | |
| | | | | | | 1,686,531 | |
| | | | | | | | |
| | |
Kuwait — 0.5% | | | | | | | | |
| | |
State of Kuwait 3.50%, 3/20/2027 (b) | | | 400,000 | | | | 446,500 | |
| | | | | | | | |
SEE NOTES TO FINANCIAL STATEMENTS.
| | | | | | |
| | | |
| 328 | | | | J.P. MORGAN EXCHANGE-TRADED FUNDS | | FEBRUARY 28, 2021 |
| | | | | | | | |
| INVESTMENTS | | PRINCIPAL
AMOUNT ($) | | | VALUE ($) | |
Foreign Government Securities — continued | |
| | |
Malaysia — 0.4% | | | | | | | | |
| | |
Malaysia Sovereign Sukuk Bhd. 3.04%, 4/22/2025 (a) | | | 302,000 | | | | 325,311 | |
| | | | | | | | |
| | |
Mexico — 1.8% | | | | | | | | |
| | |
United Mexican States | | | | | | | | |
| | |
4.00%, 10/2/2023 | | | 40,000 | | | | 43,463 | |
| | |
4.13%, 1/21/2026 (c) | | | 461,000 | | | | 515,398 | |
| | |
2.66%, 5/24/2031 | | | 212,000 | | | | 202,195 | |
| | |
6.05%, 1/11/2040 | | | 140,000 | | | | 170,844 | |
| | |
4.75%, 3/8/2044 | | | 76,000 | | | | 79,990 | |
| | |
5.55%, 1/21/2045 | | | 140,000 | | | | 163,100 | |
| | |
4.35%, 1/15/2047 | | | 200,000 | | | | 199,187 | |
| | |
5.75%, 10/12/2110 | | | 110,000 | | | | 124,403 | |
| | | | | | | | |
| | |
| | | | | | | 1,498,580 | |
| | | | | | | | |
| | |
Oman — 6.0% | | | | | | | | |
| | |
Oman Sovereign Sukuk SAOC | | | | | | | | |
| | |
4.40%, 6/1/2024 (a) | | | 276,000 | | | | 285,688 | |
| | |
5.93%, 10/31/2025 (a) | | | 533,000 | | | | 586,036 | |
| | |
Sultanate of Oman Government Bond | | | | | | | | |
| | |
4.13%, 1/17/2023 (a) | | | 727,000 | | | | 741,086 | |
| | |
4.75%, 6/15/2026 (b) | | | 268,000 | | | | 270,094 | |
| | |
5.38%, 3/8/2027 (b) | | | 581,000 | | | | 597,159 | |
| | |
5.38%, 3/8/2027 (a) | | | 200,000 | | | | 205,562 | |
| | |
5.63%, 1/17/2028 (b) | | | 200,000 | | | | 206,000 | |
| | |
6.00%, 8/1/2029 (b) | | | 501,000 | | | | 522,292 | |
| | |
6.50%, 3/8/2047 (a) | | | 348,000 | | | | 328,751 | |
| | |
6.50%, 3/8/2047 (b) | | | 254,000 | | | | 239,951 | |
| | |
6.75%, 1/17/2048 (a) | | | 790,000 | | | | 760,375 | |
| | |
7.00%, 1/25/2051 (b) | | | 288,000 | | | | 284,400 | |
| | | | | | | | |
| | |
| | | | | | | 5,027,394 | |
| | | | | | | | |
| | |
Pakistan — 1.3% | | | | | | | | |
| | |
Islamic Republic of Pakistan | | | | | | | | |
| | |
8.25%, 4/15/2024 (b) | | | 471,000 | | | | 520,455 | |
| | |
6.88%, 12/5/2027 (b) | | | 350,000 | | | | 372,203 | |
| | |
6.88%, 12/5/2027 (a) | | | 200,000 | | | | 212,688 | |
| | | | | | | | |
| | |
| | | | | | | 1,105,346 | |
| | | | | | | | |
| | |
Panama — 1.8% | | | | | | | | |
| | |
Republic of Panama | | | | | | | | |
| | |
3.88%, 3/17/2028 | | | 200,000 | | | | 218,937 | |
| | |
3.16%, 1/23/2030 | | | 200,000 | | | | 207,812 | |
| | |
6.70%, 1/26/2036 | | | 177,000 | | | | 238,010 | |
| | |
4.50%, 5/15/2047 | | | 206,000 | | | | 229,111 | |
| | |
4.30%, 4/29/2053 | | | 296,000 | | | | 320,050 | |
| | |
4.50%, 4/1/2056 | | | 237,000 | | | | 260,626 | |
| | | | | | | | |
| | |
| | | | | | | 1,474,546 | |
| | | | | | | | |
| | | | | | | | |
| INVESTMENTS | | PRINCIPAL
AMOUNT ($) | | | VALUE ($) | |
| | | | | | | | |
| | |
Paraguay — 0.7% | | | | | | | | |
| | |
Republic of Paraguay | | | | | | | | |
| | |
4.95%, 4/28/2031 (a) | | | 208,000 | | | | 235,105 | |
| | |
6.10%, 8/11/2044 (a) | | | 262,000 | | | | 320,213 | |
| | | | | | | | |
| | |
| | | | | | | 555,318 | |
| | | | | | | | |
| | |
Peru — 1.3% | | | | | | | | |
| | |
Republic of Peru | | | | | | | | |
| | |
7.35%, 7/21/2025 | | | 117,000 | | | | 146,213 | |
| | |
7.35%, 7/21/2025 | | | 100,000 | | | | 124,969 | |
| | |
2.39%, 1/23/2026 | | | 30,000 | | | | 31,163 | |
| | |
4.13%, 8/25/2027 | | | 184,000 | | | | 208,437 | |
| | |
2.78%, 1/23/2031 | | | 50,000 | | | | 50,813 | |
| | |
6.55%, 3/14/2037 | | | 54,000 | | | | 74,773 | |
| | |
5.63%, 11/18/2050 | | | 234,000 | | | | 320,214 | |
| | |
3.23%, 7/28/2121 | | | 140,000 | | | | 115,281 | |
| | | | | | | | |
| | |
| | | | | | | 1,071,863 | |
| | | | | | | | |
| | |
Philippines — 2.1% | | | | | | | | |
| | |
Republic of Philippines | | | | | | | | |
| | |
10.63%, 3/16/2025 | | | 163,000 | | | | 225,347 | |
| | |
5.50%, 3/30/2026 | | | 200,000 | | | | 243,750 | |
| | |
9.50%, 2/2/2030 | | | 20,000 | | | | 31,775 | |
| | |
2.46%, 5/5/2030 | | | 201,000 | | | | 203,764 | |
| | |
6.38%, 1/15/2032 | | | 278,000 | | | | 378,949 | |
| | |
6.38%, 10/23/2034 | | | 196,000 | | | | 272,134 | |
| | |
3.70%, 3/1/2041 | | | 214,000 | | | | 226,706 | |
| | |
3.70%, 2/2/2042 | | | 200,000 | | | | 211,688 | |
| | | | | | | | |
| | |
| | | | | | | 1,794,113 | |
| | | | | | | | |
| | |
Poland — 0.6% | | | | | | | | |
| | |
Republic of Poland | | | | | | | | |
| | |
3.00%, 3/17/2023 | | | 274,000 | | | | 288,728 | |
| | |
4.00%, 1/22/2024 | | | 70,000 | | | | 76,949 | |
| | |
3.25%, 4/6/2026 | | | 119,000 | | | | 133,131 | |
| | | | | | | | |
| | |
| | | | | | | 498,808 | |
| | | | | | | | |
| | |
Qatar — 2.5% | | | | | | | | |
| | |
State of Qatar | | | | | | | | |
| | |
3.88%, 4/23/2023 (b) | | | 215,000 | | | | 229,512 | |
| | |
3.38%, 3/14/2024 (a) | | | 250,000 | | | | 269,297 | |
| | |
4.00%, 3/14/2029 (b) | | | 214,000 | | | | 244,495 | |
| | |
9.75%, 6/15/2030 (b) | | | 154,000 | | | | 250,202 | |
| | |
4.63%, 6/2/2046 (b) | | | 708,000 | | | | 848,272 | |
| | |
5.10%, 4/23/2048 (a) | | | 200,000 | | | | 253,813 | |
| | | | | | | | |
| | |
| | | | | | | 2,095,591 | |
| | | | | | | | |
SEE NOTES TO FINANCIAL STATEMENTS.
| | | | | | | | |
| | | |
| FEBRUARY 28, 2021 | | J.P. MORGAN EXCHANGE-TRADED FUNDS | | | | | 329 | |
JPMorgan USD Emerging Markets Sovereign Bond ETF
SCHEDULE OF PORTFOLIO INVESTMENTS
AS OF FEBRUARY 28, 2021 (continued)
| | | | | | | | |
| INVESTMENTS | | PRINCIPAL
AMOUNT ($) | | | VALUE ($) | |
Foreign Government Securities — continued | |
| | |
Romania — 0.8% | | | | | | | | |
| | |
Romania Government Bond | | | | | | | | |
| | |
4.38%, 8/22/2023 (a) | | | 50,000 | | | | 54,437 | |
| | |
4.88%, 1/22/2024 (a) | | | 64,000 | | | | 71,400 | |
| | |
3.00%, 2/14/2031 (a) | | | 300,000 | | | | 303,563 | |
| | |
5.13%, 6/15/2048 (b) | | | 130,000 | | | | 147,875 | |
| | |
4.00%, 2/14/2051 (a) | | | 108,000 | | | | 104,220 | |
| | | | | | | | |
| | |
| | | | | | | 681,495 | |
| | | | | | | | |
| | |
Russia — 2.1% | | | | | | | | |
| | |
Russian Federation | | | | | | | | |
| | |
4.88%, 9/16/2023 (a) | | | 200,000 | | | | 219,527 | |
| | |
4.25%, 6/23/2027 (b) | | | 200,000 | | | | 225,100 | |
| | |
4.38%, 3/21/2029 (a) | | | 200,000 | | | | 225,000 | |
| | |
7.50%, 3/31/2030 (a) (d) | | | 113,475 | | | | 130,610 | |
| | |
5.10%, 3/28/2035 (b) | | | 400,000 | | | | 469,750 | |
| | |
5.63%, 4/4/2042 (a) | | | 200,000 | | | | 251,437 | |
| | |
5.25%, 6/23/2047 (b) | | | 200,000 | | | | 248,563 | |
| | | | | | | | |
| | |
| | | | | | | 1,769,987 | |
| | | | | | | | |
| | |
Saudi Arabia — 2.7% | | | | | | | | |
| | |
Kingdom of Saudi Arabia | | | | | | | | |
| | |
2.88%, 3/4/2023 (b) | | | 320,000 | | | | 332,800 | |
| | |
2.88%, 3/4/2023 (a) | | | 28,000 | | | | 29,120 | |
| | |
3.63%, 3/4/2028 (a) | | | 510,000 | | | | 560,522 | |
| | |
4.50%, 4/17/2030 (b) | | | 282,000 | | | | 329,411 | |
| | |
2.75%, 2/3/2032 (a) | | | 200,000 | | | | 203,250 | |
| | |
4.63%, 10/4/2047 (b) | | | 247,000 | | | | 281,889 | |
| | |
5.00%, 4/17/2049 (a) | | | 200,000 | | | | 240,750 | |
| | |
4.50%, 4/22/2060 (a) | | | 270,000 | | | | 307,378 | |
| | | | | | | | |
| | |
| | | | | | | 2,285,120 | |
| | | | | | | | |
| | |
South Africa — 4.4% | | | | | | | | |
| | |
Republic of South Africa | | | | | | | | |
| | |
4.67%, 1/17/2024 | | | 275,000 | | | | 291,414 | |
| | |
5.88%, 9/16/2025 | | | 262,000 | | | | 291,475 | |
| | |
4.88%, 4/14/2026 | | | 388,000 | | | | 408,855 | |
| | |
4.85%, 9/27/2027 | | | 284,000 | | | | 295,360 | |
| | |
4.30%, 10/12/2028 | | | 737,000 | | | | 729,630 | |
| | |
4.85%, 9/30/2029 | | | 200,000 | | | | 201,437 | |
| | |
5.88%, 6/22/2030 | | | 256,000 | | | | 274,480 | |
| | |
5.00%, 10/12/2046 | | | 528,000 | | | | 457,380 | |
| | |
5.65%, 9/27/2047 | | | 221,000 | | | | 203,251 | |
| | |
5.75%, 9/30/2049 | | | 592,000 | | | | 542,790 | |
| | | | | | | | |
| | |
| | | | | | | 3,696,072 | |
| | | | | | | | |
| | |
Trinidad and Tobago — 0.3% | | | | | | | | |
| | |
Republic of Trinidad and Tobago 4.50%, 8/4/2026 (b) | | | 200,000 | | | | 215,250 | |
| | | | | | | | |
| | | | | | | | |
| INVESTMENTS | | PRINCIPAL
AMOUNT ($) | | | VALUE ($) | |
| | | | | | | | |
| | |
Turkey — 8.5% | | | | | | | | |
| | |
Hazine Mustesarligi Varlik Kiralama A/S 4.49%, 11/25/2024 (b) | | | 203,000 | | | | 207,377 | |
| | |
Republic of Turkey | | | | | | | | |
| | |
3.25%, 3/23/2023 | | | 546,000 | | | | 543,611 | |
| | |
7.25%, 12/23/2023 | | | 200,000 | | | | 217,000 | |
| | |
5.75%, 3/22/2024 | | | 275,000 | | | | 287,461 | |
| | |
7.38%, 2/5/2025 | | | 347,000 | | | | 383,543 | |
| | |
4.25%, 4/14/2026 | | | 768,000 | | | | 750,480 | |
| | |
4.88%, 10/9/2026 | | | 226,000 | | | | 224,658 | |
| | |
6.00%, 3/25/2027 | | | 870,000 | | | | 907,519 | |
| | |
6.13%, 10/24/2028 | | | 290,000 | | | | 301,691 | |
| | |
7.63%, 4/26/2029 | | | 200,000 | | | | 224,312 | |
| | |
11.88%, 1/15/2030 | | | 423,000 | | | | 600,792 | |
| | |
8.00%, 2/14/2034 | | | 438,000 | | | | 501,784 | |
| | |
6.88%, 3/17/2036 | | | 301,000 | | | | 310,406 | |
| | |
7.25%, 3/5/2038 | | | 63,000 | | | | 66,938 | |
| | |
6.75%, 5/30/2040 | | | 397,000 | | | | 395,387 | |
| | |
4.88%, 4/16/2043 | | | 450,000 | | | | 363,516 | |
| | |
6.63%, 2/17/2045 | | | 455,000 | | | | 436,516 | |
| | |
5.75%, 5/11/2047 | | | 419,000 | | | | 366,494 | |
| | | | | | | | |
| | |
| | | | | | | 7,089,485 | |
| | | | | | | | |
| | |
Ukraine — 4.5% | | | | | | | | |
| | |
Ukraine Government Bond | | | | | | | | |
| | |
7.75%, 9/1/2023 (b) | | | 350,000 | | | | 377,125 | |
| | |
7.75%, 9/1/2024 (b) | | | 683,000 | | | | 735,292 | |
| | |
7.75%, 9/1/2025 (a) | | | 104,000 | | | | 112,684 | |
| | |
7.75%, 9/1/2026 (b) | | | 5,000 | | | | 5,402 | |
| | |
7.75%, 9/1/2027 (b) | | | 615,000 | | | | 665,161 | |
| | |
7.75%, 9/1/2027 (a) | | | 100,000 | | | | 108,156 | |
| | |
9.75%, 11/1/2028 (a) | | | 200,000 | | | | 235,687 | |
| | |
7.38%, 9/25/2032 (b) | | | 385,000 | | | | 394,144 | |
| | |
7.38%, 9/25/2032 (a) | | | 208,000 | | | | 212,940 | |
| | |
7.25%, 3/15/2033 (a) | | | 932,000 | | | | 944,815 | |
| | | | | | | | |
| | |
| | | | | | | 3,791,406 | |
| | | | | | | | |
| | |
United Arab Emirates — 1.5% | | | | | | | | |
| | |
Sharjah Sukuk Program Ltd. 4.23%, 3/14/2028 (a) | | | 200,000 | | | | 217,625 | |
| | |
United Arab Emirates Government Bond | | | | | | | | |
| | |
3.13%, 10/11/2027 (a) | | | 300,000 | | | | 328,406 | |
| | |
3.13%, 4/16/2030 (a) | | | 200,000 | | | | 216,700 | |
| | |
4.13%, 10/11/2047 (b) | | | 200,000 | | | | 228,500 | |
| | |
3.13%, 9/30/2049 (b) | | | 265,000 | | | | 256,802 | |
| | | | | | | | |
| | |
| | | | | | | 1,248,033 | |
| | | | | | | | |
SEE NOTES TO FINANCIAL STATEMENTS.
| | | | | | |
| | | |
| 330 | | | | J.P. MORGAN EXCHANGE-TRADED FUNDS | | FEBRUARY 28, 2021 |
| | | | | | | | |
| INVESTMENTS | | PRINCIPAL
AMOUNT ($) | | | VALUE ($) | |
Foreign Government Securities — continued | |
| | |
Uruguay — 1.4% | | | | | | | | |
| | |
Oriental Republic of Uruguay | | | | | | | | |
| | |
4.38%, 10/27/2027 | | | 207,000 | | | | 235,398 | |
| | |
4.38%, 1/23/2031 | | | 82,000 | | | | 94,812 | |
| | |
7.63%, 3/21/2036 | | | 192,000 | | | | 296,580 | |
| | |
4.98%, 4/20/2055 | | | 431,000 | | | | 524,473 | |
| | | | | | | | |
| | |
| | | | | | | 1,151,263 | |
| | | | | | | | |
| | |
Vietnam — 0.3% | | | | | | | | |
| | |
Socialist Republic of Vietnam 4.80%, 11/19/2024 (b) | | | 200,000 | | | | 224,250 | |
| | | | | | | | |
| | |
Total Foreign Government Securities
(Cost $71,481,937) | | | | | | | 73,484,659 | |
| | | | | | | | |
| | |
Corporate Bonds — 10.2% | | | | | | | | |
| | |
Azerbaijan — 1.0% | | | | | | | | |
| | |
Southern Gas Corridor CJSC 6.88%, 3/24/2026 (b) | | | 393,000 | | | | 469,478 | |
| | |
State Oil Co. of the Azerbaijan Republic 4.75%, 3/13/2023 (a) | | | 350,000 | | | | 368,703 | |
| | | | | | | | |
| | |
| | | | | | | 838,181 | |
| | | | | | | | |
| | |
Bahrain — 0.5% | | | | | | | | |
| | |
Oil and Gas Holding Co. BSCC (The) | | | | | | | | |
| | |
7.50%, 10/25/2027 (b) | | | 203,000 | | | | 231,103 | |
| | |
7.50%, 10/25/2027 (a) | | | 200,000 | | | | 227,687 | |
| | | | | | | | |
| | |
| | | | | | | 458,790 | |
| | | | | | | | |
| | |
Brazil — 0.4% | | | | | | | | |
| | |
Banco Nacional de Desenvolvimento Economico e Social 5.75%, 9/26/2023 (b) | | | 280,000 | | | | 312,112 | |
| | | | | | | | |
| | |
Chile — 0.8% | | | | | | | | |
| | |
Corp. Nacional del Cobre de Chile | | | | | | | | |
| | |
4.50%, 9/16/2025 (a) | | | 300,000 | | | | 338,438 | |
| | |
3.70%, 1/30/2050 (a) | | | 320,000 | | | | 315,800 | |
| | | | | | | | |
| | |
| | | | | | | 654,238 | |
| | | | | | | | |
| | |
China — 1.1% | | | | | | | | |
| | |
Sinopec Group Overseas Development 2012 Ltd. 4.88%, 5/17/2042 (a) | | | 200,000 | | | | 240,512 | |
| | |
Sinopec Group Overseas Development 2017 Ltd. 3.63%, 4/12/2027 (b) | | | 200,000 | | | | 218,982 | |
| | |
Sinopec Group Overseas Development Ltd. 2.70%, 5/13/2030 (a) | | | 240,000 | | | | 242,700 | |
| | |
State Grid Overseas Investment 2016 Ltd. | | | | | | | | |
| | |
3.50%, 5/4/2027 (b) | | | 2,000 | | | | 2,205 | |
| | |
1.63%, 8/5/2030 (a) | | | 200,000 | | | | 188,063 | |
| | | | | | | | |
| | |
| | | | | | | 892,462 | |
| | | | | | | | |
| | | | | | | | |
| INVESTMENTS | | PRINCIPAL
AMOUNT ($) | | | VALUE ($) | |
| | | | | | | | |
| | |
Indonesia — 0.6% | | | | | | | | |
| | |
Indonesia Asahan Aluminium Persero PT 5.45%, 5/15/2030 (a) | | | 200,000 | | | | 229,125 | |
| | |
Perusahaan Perseroan Persero PT Perusahaan Listrik Negara 6.15%, 5/21/2048 (a) | | | 201,000 | | | | 245,534 | |
| | | | | | | | |
| | |
| | | | | | | 474,659 | |
| | | | | | | | |
| | |
Kazakhstan — 0.6% | | | | | | | | |
| | |
KazMunayGas National Co. JSC | | | | | | | | |
| | |
5.38%, 4/24/2030 (a) | | | 222,000 | | | | 263,348 | |
| | |
6.38%, 10/24/2048 (b) | | | 200,000 | | | | 256,125 | |
| | | | | | | | |
| | |
| | | | | | | 519,473 | |
| | | | | | | | |
| | |
Malaysia — 1.1% | | | | | | | | |
| | |
Petronas Capital Ltd. | | | | | | | | |
| | |
3.50%, 3/18/2025 (b) | | | 253,000 | | | | 274,907 | |
| | |
4.55%, 4/21/2050 (a) | | | 520,000 | | | | 624,122 | |
| | | | | | | | |
| | |
| | | | | | | 899,029 | |
| | | | | | | | |
| | |
Mexico — 1.5% | | | | | | | | |
| | |
Comision Federal de Electricidad 4.75%, 2/23/2027 (b) | | | 100,000 | | | | 110,625 | |
| | |
Mexico City Airport Trust 5.50%, 7/31/2047 (a) | | | 209,000 | | | | 195,415 | |
| | |
Petroleos Mexicanos | | | | | | | | |
| | |
4.88%, 1/18/2024 | | | 50,000 | | | | 51,788 | |
| | |
6.50%, 3/13/2027 | | | 148,000 | | | | 153,550 | |
| | |
5.95%, 1/28/2031 | | | 51,000 | | | | 49,215 | |
| | |
6.63%, 6/15/2035 | | | 386,000 | | | | 367,549 | |
| | |
6.35%, 2/12/2048 | | | 174,000 | | | | 146,812 | |
| | |
6.95%, 1/28/2060 | | | 245,000 | | | | 215,514 | |
| | | | | | | | |
| | |
| | | | | | | 1,290,468 | |
| | | | | | | | |
| | |
Peru — 0.2% | | | | | | | | |
| | |
Petroleos del Peru SA 5.63%, 6/19/2047 (b) | | | 200,000 | | | | 220,480 | |
| | | | | | | | |
| | |
Russia — 0.2% | | | | | | | | |
| | |
Vnesheconombank Via VEB Finance plc 6.80%, 11/22/2025 (b) | | | 140,000 | | | | 167,081 | |
| | | | | | | | |
| | |
South Africa — 1.0% | | | | | | | | |
| | |
Eskom Holdings SOC Ltd. | | | | | | | | |
| | |
6.75%, 8/6/2023 (b) | | | 2,000 | | | | 2,089 | |
| | |
7.13%, 2/11/2025 (b) | | | 527,000 | | | | 549,727 | |
| | |
6.35%, 8/10/2028 (b) | | | 240,000 | | | | 256,950 | |
| | | | | | | | |
| | |
| | | | | | | 808,766 | |
| | | | | | | | |
SEE NOTES TO FINANCIAL STATEMENTS.
| | | | | | | | |
| | | |
| FEBRUARY 28, 2021 | | J.P. MORGAN EXCHANGE-TRADED FUNDS | | | | | 331 | |
JPMorgan USD Emerging Markets Sovereign Bond ETF
SCHEDULE OF PORTFOLIO INVESTMENTS
AS OF FEBRUARY 28, 2021 (continued)
| | | | | | | | |
| INVESTMENTS | | PRINCIPAL
AMOUNT ($) | | | VALUE ($) | |
| | |
Corporate Bonds — continued | | | | | | | | |
| | |
Tunisia — 0.2% | | | | | | | | |
| | |
Banque Centrale de Tunisie International Bond 5.75%, 1/30/2025 (b) | | | 200,000 | | | | 177,875 | |
| | | | | | | | |
| | |
United Arab Emirates — 1.0% | | | | | | | | |
| | |
Abu Dhabi Crude Oil Pipeline LLC
4.60%, 11/2/2047 (a) | | | 222,000 | | | | 256,132 | |
| | |
DP World plc 6.85%, 7/2/2037 (a) | | | 260,000 | | | | 339,950 | |
| | |
MDGH — GMTN BV 2.88%, 5/21/2030 (a) | | | 201,000 | | | | 210,799 | |
| | | | | | | | |
| | |
| | | | | | | 806,881 | |
| | | | | | | | |
| |
Total Corporate Bonds
(Cost $8,368,744) | | | | 8,520,495 | |
| | | | | | | | |
| | |
| | | SHARES | | | | |
| | |
Short-Term Investments — 3.2% | | | | | | | | |
| | |
Investment Companies — 0.9% | | | | | | | | |
| | |
JPMorgan U.S. Government Money Market Fund Class Institutional Shares,
0.03% (e) (f)
(Cost $776,784) | | | 776,784 | | | | 776,784 | |
| | | | | | | | |
| | |
Investment of Cash Collateral from Securities Loaned — 2.3% | | | | | | | | |
| | |
JPMorgan U.S. Government Money Market Fund Class IM Shares, 0.04% (e) (f)
(Cost $1,878,630) | | | 1,878,630 | | | | 1,878,630 | |
| | | | | | | | |
| | |
Total Short-Term Investments
(Cost $2,655,414) | | | | | | | 2,655,414 | |
| | | | | | | | |
Total Investments — 101.1%
(Cost $82,506,095) | | | | | | | 84,660,568 | |
Liabilities in Excess of
Other Assets — (1.1)% | | | | (909,905) | |
| | | | | | | | |
Net Assets — 100.0% | | | | | | | 83,750,663 | |
| | | | | | | | |
Percentages indicated are based on net assets.
Abbreviations
| | |
CJSC | | Closed Joint Stock Company |
GMTN | | Global medium term note |
JSC | | Joint Stock Company |
PT | | Limited liability company |
SPC | | Special purpose company |
| |
(a) | | Security exempt from registration pursuant to Regulation S under the Securities Act of 1933, as amended. Regulation S applies to securities offerings that are made outside of the United States and do not involve direct selling efforts in the United States and as such may have restrictions on resale. |
(b) | | Securities exempt from registration under Rule 144A or section 4(a)(2), of the Securities Act of 1933, as amended. |
| | |
(c) | | The security or a portion of this security is on loan at February 28, 2021. The total value of securities on loan at February 28, 2021 is $1,815,183. |
(d) | | Step bond. Interest rate is a fixed rate for an initial period that either resets at a specific date or may reset in the future contingent upon a predetermined trigger. The interest rate shown is the current rate as of February 28, 2021. |
(e) | | Investment in an affiliated fund, which is registered under the Investment Company Act of 1940, as amended, and is advised by J.P. Morgan Investment Management Inc. |
(f) | | The rate shown is the current yield as of February 28, 2021. |
SEE NOTES TO FINANCIAL STATEMENTS.
| | | | | | |
| | | |
| 332 | | | | J.P. MORGAN EXCHANGE-TRADED FUNDS | | FEBRUARY 28, 2021 |
STATEMENTS OF ASSETS AND LIABILITIES
AS OF FEBRUARY 28, 2021
| | | | | | | | | | | | |
| | |
JPMorgan
BetaBuilders
1-5 Year U.S.
Aggregate
Bond ETF | | | JPMorgan
Core Plus
Bond ETF | | | JPMorgan
Corporate Bond
Research
Enhanced ETF | |
ASSETS: | |
Investments in non-affiliates, at value | | $ | 59,084,819 | | | $ | 131,135,142 | | | $ | 54,780,532 | |
Investments in affiliates, at value | | | 514,056 | | | | 32,839,275 | | | | 194,411 | |
Investments of cash collateral received from securities loaned, at value (See Note 2.E.) | | | 104,878 | | | | — | | | | — | |
Cash | | | 1,320 | | | | 5,640 | | | | 3,444 | |
Deposits at broker for futures contracts | | | — | | | | 246,000 | | | | 56,000 | |
Segregated cash balance with Authorized Participant for deposit securities | | | 52,497 | | | | — | | | | — | |
Receivables: | | | | | | | | | | | | |
Investment securities sold | | | 1,040,371 | | | | 155 | | | | 201,452 | |
Investment securities sold — delayed delivery securities | | | — | | | | 9,277,103 | | | | — | |
Interest from non-affiliates | | | 250,697 | | | | 716,142 | | | | 502,519 | |
Dividends from affiliates | | | 7 | | | | 630 | | | | 3 | |
Securities lending income (See Note 2.E.) | | | 14 | | | | — | | | | — | |
Unrealized appreciation on forward foreign currency exchange contracts | | | — | | | | 20,120 | | | | — | |
| | | | | | | | | | | | |
Total Assets | | | 61,048,659 | | | | 174,240,207 | | | | 55,738,361 | |
| | | | | | | | | | | | |
|
LIABILITIES: | |
Payables: | | | | | | | | | | | | |
Investment securities purchased | | | 1,234,686 | | | | 263,656 | | | | 387,515 | |
Investment securities purchased — delayed delivery securities | | | — | | | | 27,244,827 | | | | — | |
Collateral received on securities loaned (See Note 2.E.) | | | 104,878 | | | | — | | | | — | |
Variation margin on futures contracts | | | — | | | | 450 | | | | 12,248 | |
Unrealized depreciation on forward foreign currency exchange contracts | | | — | | | | 41,069 | | | | — | |
Collateral upon return of deposit securities | | | 52,497 | | | | — | | | | — | |
Accrued liabilities: | | | | | | | | | | | | |
Management fees (See Note 3.A.) | | | 2,192 | | | | 42,095 | | | | 5,960 | |
| | | | | | | | | | | | |
Total Liabilities | | | 1,394,253 | | | | 27,592,097 | | | | 405,723 | |
| | | | | | | | | | | | |
Net Assets | | $ | 59,654,406 | | | $ | 146,648,110 | | | $ | 55,332,638 | |
| | | | | | | | | | | | |
|
NET ASSETS: | |
Paid-in-Capital | | $ | 58,678,896 | | | $ | 145,467,800 | | | $ | 53,275,690 | |
Total distributable earnings (loss) | | | 975,510 | | | | 1,180,310 | | | | 2,056,948 | |
| | | | | | | | | | | | |
Total Net Assets | | $ | 59,654,406 | | | $ | 146,648,110 | | | $ | 55,332,638 | |
| | | | | | | | | | | | |
| | | |
Outstanding number of shares
(unlimited number of shares authorized — par value $0.0001) | | | 2,300,000 | | | | 2,700,000 | | | | 1,000,000 | |
| | | | | | | | | | | | |
Net asset value, per share | | $ | 25.94 | | | $ | 54.31 | | | $ | 55.33 | |
| | | | | | | | | | | | |
| | | |
Cost of investments in non-affiliates | | $ | 58,236,781 | | | $ | 130,558,242 | | | $ | 53,129,223 | |
Cost of investments in affiliates | | | 514,056 | | | | 32,839,275 | | | | 194,411 | |
Investment securities on loan, at value (See Note 2.E.) | | | 102,693 | | | | — | | | | — | |
Cost of investment of cash collateral (See Note 2.E.) | | | 104,878 | | | | — | | | | — | |
SEE NOTES TO FINANCIAL STATEMENTS.
| | | | | | | | |
| | | |
| FEBRUARY 28, 2021 | | J.P. MORGAN EXCHANGE-TRADED FUNDS | | | | | 333 | |
STATEMENTS OF ASSETS AND LIABILITIES
AS OF FEBRUARY 28, 2021 (continued)
| | | | | | | | | | | | |
| | | JPMorgan High
Yield Research
Enhanced ETF | | | JPMorgan
International
Bond
Opportunities ETF
(formerly known
as JPMorgan
Global Bond
Opportunities ETF) | | | JPMorgan
Municipal ETF | |
ASSETS: | | | | | | | | | |
Investments in non-affiliates, at value | | $ | 1,526,099,647 | | | $ | 233,326,707 | | | $ | 74,939,329 | |
Investments in affiliates, at value | | | 13,965,910 | | | | 12,234,929 | | | | — | |
Cash | | | — | | | | — | | | | 401,433 | |
Foreign currency, at value | | | — | | | | 616,907 | | | | — | |
Deposits at broker for futures contracts | | | — | | | | 1,044,000 | | | | — | |
Deposits at broker for centrally cleared swaps | | | — | | | | 286,000 | | | | — | |
Segregated cash balance with Authorized Participant for deposit securities | | | 52,496 | | | | — | | | | — | |
Receivables: | | | | | | | | | | | | |
Due from custodian | | | 2,151,459 | | | | — | | | | — | |
Investment securities sold | | | — | | | | 213,888 | | | | 363 | |
Investment securities sold — delayed delivery securities | | | — | | | | — | | | | 825,131 | |
Interest from non-affiliates | | | 21,387,351 | | | | 2,866,340 | | | | 792,832 | |
Dividends from affiliates | | | 1,071 | | | | 173 | | | | 25 | |
Tax reclaims | | | — | | | | 13,752 | | | | — | |
Variation margin on futures contracts | | | — | | | | 118,027 | | | | — | |
Variation margin on centrally cleared swaps (net upfront receipts of $0, $84,463 and $0, respectively) | | | — | | | | 69,338 | | | | — | |
Unrealized appreciation on forward foreign currency exchange contracts | | | — | | | | 1,379,196 | | | | — | |
Outstanding OTC swap contracts, at value (net upfront payments of $0, $218,485 and $0, respectively) | | | — | | | | 150,064 | | | | — | |
| | | | | | | | | | | | |
Total Assets | | | 1,563,657,934 | | | | 252,319,321 | | | | 76,959,113 | |
| | | | | | | | | | | | |
| | | |
LIABILITIES: | | | | | | | | | | | | |
Payables: | | | | | | | | | | | | |
Due to custodian | | | — | | | | 3,354 | | | | — | |
Investment securities purchased | | | 3,694,585 | | | | 564,360 | | | | 362 | |
Investment securities purchased — delayed delivery securities | | | — | | | | 366,791 | | | | 824,435 | |
Unrealized depreciation on forward foreign currency exchange contracts | | | — | | | | 1,191,509 | | | | — | |
Collateral upon return of deposit securities | | | 52,496 | | | | — | | | | — | |
Accrued liabilities: | | | | | | | | | | | | |
Management fees (See Note 3.A.) | | | 276,798 | | | | 95,580 | | | | 14,011 | |
Deferred foreign capital gains tax | | | — | | | | 444 | | | | — | |
| | | | | | | | | | | | |
Total Liabilities | | | 4,023,879 | | | | 2,222,038 | | | | 838,808 | |
| | | | | | | | | | | | |
Net Assets | | $ | 1,559,634,055 | | | $ | 250,097,283 | | | $ | 76,120,305 | |
| | | | | | | | | | | | |
|
NET ASSETS: | |
Paid-in-Capital | | $ | 1,557,059,616 | | | $ | 252,816,016 | | | $ | 73,927,790 | |
Total distributable earnings (loss) | | | 2,574,439 | | | | (2,718,733 | ) | | | 2,192,515 | |
| | | | | | | | | | | | |
Total Net Assets | | $ | 1,559,634,055 | | | $ | 250,097,283 | | | $ | 76,120,305 | |
| | | | | | | | | | | | |
| | | |
Outstanding number of shares
(unlimited number of shares authorized — par value $0.0001) | | | 30,200,000 | | | | 4,900,000 | | | | 1,400,000 | |
| | | | | | | | | | | | |
Net asset value, per share | | $ | 51.64 | | | $ | 51.04 | | | $ | 54.37 | |
| | | | | | | | | | | | |
| | | |
Cost of investments in non-affiliates | | $ | 1,524,543,890 | | | $ | 230,568,903 | | | $ | 73,046,678 | |
Cost of investments in affiliates | | | 13,965,910 | | | | 12,234,929 | | | | — | |
Cost of foreign currency | | | — | | | | 688,244 | | | | — | |
SEE NOTES TO FINANCIAL STATEMENTS.
| | | | | | |
| | | |
| 334 | | | | J.P. MORGAN EXCHANGE-TRADED FUNDS | | FEBRUARY 28, 2021 |
| | | | | | | | | | | | | | | | |
| | | JPMorgan U.S.
Aggregate
Bond ETF | | | JPMorgan
Ultra-Short
Income ETF | | | JPMorgan
Ultra-Short
Municipal
Income ETF | | |
JPMorgan USD
Emerging
Markets
Sovereign
Bond ETF | |
ASSETS: | |
Investments in non-affiliates, at value | | $ | 816,173,492 | | | $ | 15,549,140,166 | | | $ | 1,247,629,533 | | | $ | 82,005,154 | |
Investments in affiliates, at value | | | 5,811,837 | | | | 763,604,992 | | | | 139,089,852 | | | | 776,784 | |
Investments of cash collateral received from securities loaned, at value (See Note 2.E.) | | | 19,365,355 | | | | 38,378,955 | | | | — | | | | 1,878,630 | |
Repurchase agreements, at value | | | — | | | | 100,000,000 | | | | — | | | | — | |
Cash | | | 131,966 | | | | 1,037,731 | | | | 8,869 | | | | 38,644 | |
Deposits at broker for futures contracts | | | — | | | | 409,000 | | | | — | | | | — | |
Segregated cash balance with Authorized Participant for deposit securities | | | 31,428 | | | | — | | | | — | | | | — | |
Receivables: | | | | | | | | | | | | | | | | |
Investment securities sold | | | 28,042,749 | | | | 48,546,927 | | | | 22,360,037 | | | | 2,606,189 | |
Fund shares sold | | | — | | | | — | | | | 12,759,135 | | | | — | |
Interest from non-affiliates | | | 4,274,367 | | | | 51,773,630 | | | | 10,665,285 | | | | 1,131,692 | |
Dividends from affiliates | | | 55 | | | | 25,079 | | | | 3,540 | | | | 14 | |
Tax reclaims | | | — | | | | — | | | | — | | | | 318 | |
Securities lending income (See Note 2.E.) | | | 1,330 | | | | 3,707 | | | | — | | | | 518 | |
Due from Authorized Participant | | | 521,801 | | | | — | | | | — | | | | — | |
| | | | | | | | | | | | | | | | |
Total Assets | | | 874,354,380 | | | | 16,552,920,187 | | | | 1,432,516,251 | | | | 88,437,943 | |
| | | | | | | | | | | | | | | | |
|
LIABILITIES: | |
Payables: | | | | | | | | | | | | | | | | |
Investment securities purchased | | | 28,122,850 | | | | 308,318,633 | | | | 12,444,265 | | | | 2,783,048 | |
Investment securities purchased — delayed delivery securities | | | — | | | | 60,000,000 | | | | 9,595,016 | | | | — | |
Collateral received on securities loaned (See Note 2.E.) | | | 19,365,355 | | | | 38,378,955 | | | | — | | | | 1,878,630 | |
Variation margin on futures contracts | | | — | | | | 117,722 | | | | — | | | | — | |
Collateral upon return of deposit securities | | | 31,428 | | | | — | | | | — | | | | — | |
Accrued liabilities: | | | | | | | | | | | | | | | | |
Management fees (See Note 3.A.) | | | 45,417 | | | | 2,067,164 | | | | 165,812 | | | | 25,602 | |
| | | | | | | | | | | | | | | | |
Total Liabilities | | | 47,565,050 | | | | 408,882,474 | | | | 22,205,093 | | | | 4,687,280 | |
| | | | | | | | | | | | | | | | |
Net Assets | | $ | 826,789,330 | | | $ | 16,144,037,713 | | | $ | 1,410,311,158 | | | $ | 83,750,663 | |
| | | | | | | | | | | | | | | | |
|
NET ASSETS: | |
Paid-in-Capital | | $ | 821,889,174 | | | $ | 16,060,524,046 | | | $ | 1,407,170,648 | | | $ | 85,502,389 | |
Total distributable earnings (loss) | | | 4,900,156 | | | | 83,513,667 | | | | 3,140,510 | | | | (1,751,726 | ) |
| | | | | | | | | | | | | | | | |
Total Net Assets | | $ | 826,789,330 | | | $ | 16,144,037,713 | | | $ | 1,410,311,158 | | | $ | 83,750,663 | |
| | | | | | | | | | | | | | | | |
| | | | |
Outstanding number of shares (unlimited number of shares authorized — par value $0.0001) | | | 30,400,000 | | | | 317,950,000 | | | | 27,650,000 | | | | 1,700,000 | |
| | | | | | | | | | | | | | | | |
Net asset value, per share | | $ | 27.20 | | | $ | 50.78 | | | $ | 51.01 | | | $ | 49.27 | |
| | | | | | | | | | | | | | | | |
| | | | |
Cost of investments in non-affiliates | | $ | 813,311,427 | | | $ | 15,479,181,964 | | | $ | 1,245,040,021 | | | $ | 79,850,681 | |
Cost of investments in affiliates | | | 5,811,837 | | | | 763,604,992 | | | | 139,100,415 | | | | 776,784 | |
Cost of repurchase agreements | | | — | | | | 100,000,000 | | | | — | | | | — | |
Investment securities on loan, at value (See Note 2.E.) | | | 14,606,292 | | | | 37,357,448 | | | | — | | | | 1,815,183 | |
Cost of investment of cash collateral (See Note 2.E.) | | | 19,365,355 | | | | 38,378,955 | | | | — | | | | 1,878,630 | |
SEE NOTES TO FINANCIAL STATEMENTS.
| | | | | | | | |
| | | |
| FEBRUARY 28, 2021 | | J.P. MORGAN EXCHANGE-TRADED FUNDS | | | | | 335 | |
STATEMENTS OF OPERATIONS
FOR THE YEAR ENDED FEBRUARY 28, 2021
| | | | | | | | | | | | |
| | |
JPMorgan
BetaBuilders
1-5 Year U.S.
Aggregate
Bond ETF | | | JPMorgan
Core Plus
Bond ETF | | | JPMorgan
Corporate Bond
Research
Enhanced ETF | |
INVESTMENT INCOME: | |
Interest income from non-affiliates | | $ | 737,970 | | | $ | 2,157,137 | | | $ | 1,293,536 | |
Interest income from affiliates | | | 7 | | | | — | | | | — | |
Dividend income from affiliates | | | 176 | | | | 19,517 | | | | 661 | |
Income from securities lending (net) (See Note 2.E.) | | | 434 | | | | 5 | | | | — | |
| | | | | | | | | | | | |
Total investment income | | | 738,587 | | | | 2,176,659 | | | | 1,294,197 | |
| | | | | | | | | | | | |
|
EXPENSES: | |
Management fees (See Note 3.A.) | | | 21,720 | | | | 368,866 | | | | 60,753 | |
Interest expense to non-affiliates | | | — | | | | 24 | | | | 1 | |
| | | | | | | | | | | | |
Total expenses | | | 21,720 | | | | 368,890 | | | | 60,754 | |
| | | | | | | | | | | | |
Net investment income (loss) | | | 716,867 | | | | 1,807,769 | | | | 1,233,443 | |
| | | | | | | | | | | | |
| | | |
REALIZED/UNREALIZED GAINS (LOSSES): | | | | | | | | | | | | |
Net realized gain (loss) on transactions from: | |
Investments in non-affiliates | | | 231,940 | | | | 1,239,131 | | | | 730,020 | |
Options purchased | | | — | | | | (9,788 | ) | | | — | |
Futures contracts | | | — | | | | 302,138 | | | | (16,679 | ) |
Swaps | | | — | | | | 44,067 | | | | — | |
| | | | | | | | | | | | |
Net realized gain (loss) | | | 231,940 | | | | 1,575,548 | | | | 713,341 | |
| | | | | | | | | | | | |
Change in net unrealized appreciation/depreciation on: | | | | | | | | | | | | |
Investments in non-affiliates | | | (139,324 | ) | | | (1,512,341 | ) | | | (1,304,980 | ) |
Futures contracts | | | — | | | | (75,508 | ) | | | (9,098 | ) |
Forward foreign currency exchange contracts | | | — | | | | (20,949 | ) | | | — | |
| | | | | | | | | | | | |
Change in net unrealized appreciation/depreciation | | | (139,324 | ) | | | (1,608,798 | ) | | | (1,314,078 | ) |
| | | | | | | | | | | | |
Net realized/unrealized gains (losses) | | | 92,616 | | | | (33,250 | ) | | | (600,737 | ) |
| | | | | | | | | | | | |
Change in net assets resulting from operations | | $ | 809,483 | | | $ | 1,774,519 | | | $ | 632,706 | |
| | | | | | | | | | | | |
SEE NOTES TO FINANCIAL STATEMENTS.
| | | | | | |
| | | |
| 336 | | | | J.P. MORGAN EXCHANGE-TRADED FUNDS | | FEBRUARY 28, 2021 |
| | | | | | | | | | | | |
| | | JPMorgan High
Yield Research
Enhanced ETF | | | JPMorgan
International
Bond
Opportunities ETF
(formerly known
as JPMorgan
Global Bond
Opportunities ETF) | | | JPMorgan
Municipal ETF | |
INVESTMENT INCOME: | |
Interest income from non-affiliates | | $ | 15,258,858 | | | $ | 5,975,964 | | | $ | 1,221,765 | |
Interest income from affiliates | | | — | | | | 187 | | | | — | |
Dividend income from non-affiliates | | | — | | | | 349 | | | | 18 | |
Dividend income from affiliates | | | 4,813 | | | | 10,744 | | | | 5,944 | |
Income from securities lending (net) (See Note 2.E.) | | | 1,854 | | | | — | | | | — | |
Foreign taxes withheld (net) | | | — | | | | (19,168 | ) | | | — | |
| | | | | | | | | | | | |
Total investment income | | | 15,265,525 | | | | 5,968,076 | | | | 1,227,727 | |
| | | | | | | | | | | | |
|
EXPENSES: | |
Management fees (See Note 3.A.) | | | 811,073 | | | | 869,744 | | | | 138,012 | |
Interest expense to non-affiliates | | | — | | | | 1,041 | | | | — | |
Interest expense to affiliates | | | — | | | | 6,511 | | | | — | |
| | | | | | | | | | | | |
Total expenses | | | 811,073 | | | | 877,296 | | | | 138,012 | |
| | | | | | | | | | | | |
Net investment income (loss) | | | 14,454,452 | | | | 5,090,780 | | | | 1,089,715 | |
| | | | | | | | | | | | |
| | | |
REALIZED/UNREALIZED GAINS (LOSSES): | | | | | | | | | | | | |
Net realized gain (loss) on transactions from: | |
Investments in non-affiliates | | | (2,690,435 | ) | | | (228,659 | )(a) | | | 238,804 | |
Investments in affiliates | | | — | | | | — | | | | (1,560 | ) |
In-kind redemptions of investments in non-affiliates | | | (5,409,895 | ) | | | — | | | | — | |
Futures contracts | | | — | | | | 1,635,300 | | | | — | |
Foreign currency transactions | | | — | | | | (264,636 | ) | | | — | |
Forward foreign currency exchange contracts | | | — | | | | (3,697,713 | ) | | | — | |
Swaps | | | — | | | | 825,794 | | | | — | |
| | | | | | | | | | | | |
Net realized gain (loss) | | | (8,100,330 | ) | | | (1,729,914 | ) | | | 237,244 | |
| | | | | | | | | | | | |
Distributions of capital gains received from investment company affiliates | | | — | | | | — | | | | 3 | |
| | | | | | | | | | | | |
Change in net unrealized appreciation/depreciation on: | | | | | | | | | | | | |
Investments in non-affiliates | | | 2,918,296 | | | | 436,066 | (b) | | | (1,230,669 | ) |
Investments in affiliates | | | — | | | | — | | | | (14 | ) |
Futures contracts | | | — | | | | 244,227 | | | | — | |
Foreign currency translations | | | — | | | | 247,078 | | | | — | |
Forward foreign currency exchange contracts | | | — | | | | 267,938 | | | | — | |
Swaps | | | — | | | | 130,883 | | | | — | |
| | | | | | | | | | | | |
Change in net unrealized appreciation/depreciation | | | 2,918,296 | | | | 1,326,192 | | | | (1,230,683 | ) |
| | | | | | | | | | | | |
Net realized/unrealized gains (losses) | | | (5,182,034 | ) | | | (403,722 | ) | | | (993,436 | ) |
| | | | | | | | | | | | |
Change in net assets resulting from operations | | $ | 9,272,418 | | | $ | 4,687,058 | | | $ | 96,279 | |
| | | | | | | | | | | | |
| (a) | Net of foreign capital gains tax of $(29,246). |
| (b) | Net of change in foreign capital gains tax of $9,702. |
SEE NOTES TO FINANCIAL STATEMENTS.
| | | | | | | | |
| | | |
| FEBRUARY 28, 2021 | | J.P. MORGAN EXCHANGE-TRADED FUNDS | | | | | 337 | |
STATEMENTS OF OPERATIONS
FOR THE YEAR ENDED FEBRUARY 28, 2021 (continued)
| | | | | | | | | | | | | | | | |
| | | JPMorgan U.S.
Aggregate
Bond ETF | | | JPMorgan
Ultra-Short
Income ETF | | | JPMorgan
Ultra-Short
Municipal
Income ETF | | |
JPMorgan USD
Emerging
Markets
Sovereign
Bond ETF | |
INVESTMENT INCOME: | |
Interest income from non-affiliates | | $ | 11,425,719 | | | $ | 173,481,765 | | | $ | 5,097,507 | | | $ | 4,112,269 | |
Interest income from affiliates | | | 10 | | | | — | | | | — | | | | — | |
Dividend income from affiliates | | | 2,552 | | | | 1,283,035 | | | | 76,628 | | | | 621 | |
Income from securities lending (net) (See Note 2.E.) | | | 13,953 | | | | 115,663 | | | | — | | | | 9,556 | |
| | | | | | | | | | | | | | | | |
Total investment income | | | 11,442,234 | | | | 174,880,463 | | | | 5,174,135 | | | | 4,122,446 | |
| | | | | | | | | | | | | | | | |
|
EXPENSES: | |
Management fees (See Note 3.A.) | | | 476,422 | | | | 22,121,701 | | | | 1,066,035 | | | | 328,421 | |
Interest expense to non-affiliates | | | — | | | | 1,849 | | | | — | | | | — | |
Interest expense to affiliates | | | — | | | | 10,022 | | | | — | | | | — | |
| | | | | | | | | | | | | | | | |
Total expenses | | | 476,422 | | | | 22,133,572 | | | | 1,066,035 | | | | 328,421 | |
| | | | | | | | | | | | | | | | |
Net investment income (loss) | | | 10,965,812 | | | | 152,746,891 | | | | 4,108,100 | | | | 3,794,025 | |
| | | | | | | | | | | | | | | | |
| | | | |
REALIZED/UNREALIZED GAINS (LOSSES): | | | | | | | | | | | | | | | | |
Net realized gain (loss) on transactions from: | |
Investments in non-affiliates | | | 3,507,191 | | | | 120,637 | | | | (27,009 | ) | | | (3,806,548 | ) |
Investments in affiliates | | | — | | | | — | | | | (7,802 | ) | | | — | |
In-kind redemptions of investments in non-affiliates | | | 2,586,176 | | | | — | | | | — | | | | 150,800 | |
Futures contracts | | | — | | | | 6,682,948 | | | | — | | | | — | |
| | | | | | | | | | | | | | | | |
Net realized gain (loss) | | | 6,093,367 | | | | 6,803,585 | | | | (34,811 | ) | | | (3,655,748 | ) |
| | | | | | | | | | | | | | | | |
Distributions of capital gains received from investment company affiliates | | | — | | | | — | | | | 178 | | | | — | |
| | | | | | | | | | | | | | | | |
Change in net unrealized appreciation/depreciation on: | |
Investments in non-affiliates | | | (17,084,303 | ) | | | 25,780,691 | | | | 1,928,681 | | | | (131,088 | ) |
Investments in affiliates | | | — | | | | — | | | | (10,563 | ) | | | — | |
Futures contracts | | | — | | | | 427,077 | | | | — | | | | — | |
| | | | | | | | | | | | | | | | |
Change in net unrealized appreciation/depreciation | | | (17,084,303 | ) | | | 26,207,768 | | | | 1,918,118 | | | | (131,088 | ) |
| | | | | | | | | | | | | | | | |
Net realized/unrealized gains (losses) | | | (10,990,936 | ) | | | 33,011,353 | | | | 1,883,485 | | | | (3,786,836 | ) |
| | | | | | | | | | | | | | | | |
Change in net assets resulting from operations | | $ | (25,124 | ) | | $ | 185,758,244 | | | $ | 5,991,585 | | | $ | 7,189 | |
| | | | | | | | | | | | | | | | |
SEE NOTES TO FINANCIAL STATEMENTS.
| | | | | | |
| | | |
| 338 | | | | J.P. MORGAN EXCHANGE-TRADED FUNDS | | FEBRUARY 28, 2021 |
STATEMENTS OF CHANGES IN NET ASSETS
FOR THE PERIODS INDICATED
| | | | | | | | | | | | | | | | |
| | |
| | |
JPMorgan BetaBuilders 1-5 Year U.S.
Aggregate Bond ETF | | | JPMorgan Core Plus Bond ETF | |
| | | Year Ended
February 28, 2021 | | | Period Ended
February 29, 2020 (a) | | | Year Ended
February 28, 2021 | | | Year Ended
February 29, 2020 | |
CHANGE IN NET ASSETS RESULTING FROM OPERATIONS: | |
Net investment income (loss) | | $ | 716,867 | | | $ | 750,051 | | | $ | 1,807,769 | | | $ | 927,088 | |
Net realized gain (loss) | | | 231,940 | | | | 91,623 | | | | 1,575,548 | | | | 620,050 | |
Change in net unrealized appreciation/depreciation | | | (139,324 | ) | | | 987,362 | | | | (1,608,798 | ) | | | 2,065,672 | |
| | | | | | | | | | | | | | | | |
Change in net assets resulting from operations | | | 809,483 | | | | 1,829,036 | | | | 1,774,519 | | | | 3,612,810 | |
| | | | | | | | | | | | | | | | |
|
DISTRIBUTIONS TO SHAREHOLDERS: | |
Total distributions to shareholders | | | (876,578 | ) | | | (786,431 | ) | | | (3,118,840 | ) | | | (1,191,282 | ) |
| | | | | | | | | | | | | | | | |
|
CAPITAL TRANSACTIONS: | |
Change in net assets resulting from capital transactions | | | 22,226,417 | | | | 36,452,479 | | | | 93,823,607 | | | | 26,569,194 | |
| | | | | | | | | | | | | | | | |
|
NET ASSETS: | |
Change in net assets | | | 22,159,322 | | | | 37,495,084 | | | | 92,479,286 | | | | 28,990,722 | |
Beginning of period | | | 37,495,084 | | | | — | | | | 54,168,824 | | | | 25,178,102 | |
| | | | | | | | | | | | | | | | |
End of period | | $ | 59,654,406 | | | $ | 37,495,084 | | | $ | 146,648,110 | | | $ | 54,168,824 | |
| | | | | | | | | | | | | | | | |
| | | | |
CAPITAL TRANSACTIONS: | | | | | | | | | | | | | | | | |
Proceeds from shares issued | | $ | 23,516,563 | | | $ | 36,452,479 | | | $ | 121,700,097 | | | $ | 26,569,194 | |
Cost of shares redeemed | | | (1,290,146 | ) | | | — | | | | (27,876,490 | ) | | | — | |
| | | | | | | | | | | | | | | | |
Total change in net assets resulting from capital transactions | | $ | 22,226,417 | | | $ | 36,452,479 | | | $ | 93,823,607 | | | $ | 26,569,194 | |
| | | | | | | | | | | | | | | | |
|
SHARE TRANSACTIONS: | |
Issued | | | 900,000 | | | | 1,450,000 | | | | 2,200,000 | | | | 500,000 | |
Redeemed | | | (50,000 | ) | | | — | | | | (500,000 | ) | | | — | |
| | | | | | | | | | | | | | | | |
Net increase in shares from share transactions | | | 850,000 | | | | 1,450,000 | | | | 1,700,000 | | | | 500,000 | |
| | | | | | | | | | | | | | | | |
| (a) | Commencement of operations was March 12, 2019. |
SEE NOTES TO FINANCIAL STATEMENTS.
| | | | | | | | |
| | | |
| FEBRUARY 28, 2021 | | J.P. MORGAN EXCHANGE-TRADED FUNDS | | | | | 339 | |
STATEMENTS OF CHANGES IN NET ASSETS
FOR THE PERIODS INDICATED (continued)
| | | | | | | | | | | | | | | | |
| | |
| | |
JPMorgan Corporate Bond Research
Enhanced ETF | | | JPMorgan High Yield Research
Enhanced ETF | |
| | | Year Ended
February 28, 2021 | | | Year Ended
February 29, 2020 | | | Year Ended
February 28, 2021 | | | Year Ended
February 29, 2020 | |
CHANGE IN NET ASSETS RESULTING FROM OPERATIONS: | |
Net investment income (loss) | | $ | 1,233,443 | | | $ | 1,051,195 | | | $ | 14,454,452 | | | $ | 8,026,465 | |
Net realized gain (loss) | | | 713,341 | | | | 780,622 | | | | (8,100,330 | ) | | | 1,508,193 | |
Change in net unrealized appreciation/depreciation | | | (1,314,078 | ) | | | 2,449,608 | | | | 2,918,296 | | | | (189,354 | ) |
| | | | | | | | | | | | | | | | |
Change in net assets resulting from operations | | | 632,706 | | | | 4,281,425 | | | | 9,272,418 | | | | 9,345,304 | |
| | | | | | | | | | | | | | | | |
|
DISTRIBUTIONS TO SHAREHOLDERS: | |
Total distributions to shareholders | | | (1,836,138 | ) | | | (1,566,538 | ) | | | (10,833,216 | ) | | | (8,310,507 | ) |
| | | | | | | | | | | | | | | | |
|
CAPITAL TRANSACTIONS: | |
Change in net assets resulting from capital transactions | | | 21,365,676 | | | | 6,860,014 | | | | 1,390,157,529 | | | | 15,432,142 | |
| | | | | | | | | | | | | | | | |
|
NET ASSETS: | |
Change in net assets | | | 20,162,244 | | | | 9,574,901 | | | | 1,388,596,731 | | | | 16,466,939 | |
Beginning of period | | | 35,170,394 | | | | 25,595,493 | | | | 171,037,324 | | | | 154,570,385 | |
| | | | | | | | | | | | | | | | |
End of period | | $ | 55,332,638 | | | $ | 35,170,394 | | | $ | 1,559,634,055 | | | $ | 171,037,324 | |
| | | | | | | | | | | | | | | | |
| | | | |
CAPITAL TRANSACTIONS: | | | | | | | | | | | | | | | | |
Proceeds from shares issued | | $ | 21,365,676 | | | $ | 6,860,014 | | | $ | 1,434,265,618 | | | $ | 15,432,142 | |
Cost of shares redeemed | | | — | | | | — | | | | (44,108,089 | ) | | | — | |
| | | | | | | | | | | | | | | | |
Total change in net assets resulting from capital transactions | | $ | 21,365,676 | | | $ | 6,860,014 | | | $ | 1,390,157,529 | | | $ | 15,432,142 | |
| | | | | | | | | | | | | | | | |
|
SHARE TRANSACTIONS: | |
Issued | | | 375,000 | | | | 125,000 | | | | 27,800,000 | | | | 300,000 | |
Redeemed | | | — | | | | — | | | | (1,000,000 | ) | | | — | |
| | | | | | | | | | | | | | | | |
Net increase in shares from share transactions | | | 375,000 | | | | 125,000 | | | | 26,800,000 | | | | 300,000 | |
| | | | | | | | | | | | | | | | |
SEE NOTES TO FINANCIAL STATEMENTS.
| | | | | | |
| | | |
| 340 | | | | J.P. MORGAN EXCHANGE-TRADED FUNDS | | FEBRUARY 28, 2021 |
| | | | | | | | | | | | | | | | |
| | |
| | |
JPMorgan International Bond
Opportunities ETF (formerly known as
JPMorgan Global Bond Opportunities ETF) | | | JPMorgan Municipal ETF | |
| | | Year Ended
February 28, 2021 | | | Year Ended
February 29, 2020 | | | Year Ended
February 28, 2021 | | | Year Ended
February 29, 2020 | |
CHANGE IN NET ASSETS RESULTING FROM OPERATIONS: | |
Net investment income (loss) | | $ | 5,090,780 | | | $ | 6,285,285 | | | $ | 1,089,715 | | | $ | 860,167 | |
Net realized gain (loss) | | | (1,729,914 | ) | | | 2,702,947 | | | | 237,244 | | | | 575,968 | |
Distributions of capital gains received from investment company affiliates | | | — | | | | — | | | | 3 | | | | — | |
Change in net unrealized appreciation/depreciation | | | 1,326,192 | | | | 4,105,639 | | | | (1,230,683 | ) | | | 2,214,073 | |
| | | | | | | | | | | | | | | | |
Change in net assets resulting from operations | | | 4,687,058 | | | | 13,093,871 | | | | 96,279 | | | | 3,650,208 | |
| | | | | | | | | | | | | | | | |
|
DISTRIBUTIONS TO SHAREHOLDERS: | |
Total distributions to shareholders | | | (4,888,166 | ) | | | (8,337,390 | ) | | | (1,149,619 | ) | | | (1,413,794 | ) |
| | | | | | | | | | | | | | | | |
|
CAPITAL TRANSACTIONS: | |
Change in net assets resulting from capital transactions | | | 80,369,552 | | | | (15,184,873 | ) | | | 24,782,763 | | | | 19,000,910 | |
| | | | | | | | | | | | | | | | |
|
NET ASSETS: | |
Change in net assets | | | 80,168,444 | | | | (10,428,392 | ) | | | 23,729,423 | | | | 21,237,324 | |
Beginning of period | | | 169,928,839 | | | | 180,357,231 | | | | 52,390,882 | | | | 31,153,558 | |
| | | | | | | | | | | | | | | | |
End of period | | $ | 250,097,283 | | | $ | 169,928,839 | | | $ | 76,120,305 | | | $ | 52,390,882 | |
| | | | | | | | | | | | | | | | |
| | | | |
CAPITAL TRANSACTIONS: | | | | | | | | | | | | | | | | |
Proceeds from shares issued | | $ | 107,768,383 | | | $ | 5,073,164 | | | $ | 35,363,968 | | | $ | 29,682,599 | |
Cost of shares redeemed | | | (27,398,831 | ) | | | (20,258,037 | ) | | | (10,581,205 | ) | | | (10,681,689 | ) |
| | | | | | | | | | | | | | | | |
Total change in net assets resulting from capital transactions | | $ | 80,369,552 | | | $ | (15,184,873 | ) | | $ | 24,782,763 | | | $ | 19,000,910 | |
| | | | | | | | | | | | | | | | |
|
SHARE TRANSACTIONS: | |
Issued | | | 2,100,000 | | | | 100,000 | | | | 650,000 | | | | 550,000 | |
Redeemed | | | (600,000 | ) | | | (400,000 | ) | | | (200,000 | ) | | | (200,000 | ) |
| | | | | | | | | | | | | | | | |
Net increase (decrease) in shares from share transactions | | | 1,500,000 | | | | (300,000 | ) | | | 450,000 | | | | 350,000 | |
| | | | | | | | | | | | | | | | |
SEE NOTES TO FINANCIAL STATEMENTS.
| | | | | | | | |
| | | |
| FEBRUARY 28, 2021 | | J.P. MORGAN EXCHANGE-TRADED FUNDS | | | | | 341 | |
STATEMENTS OF CHANGES IN NET ASSETS
FOR THE PERIODS INDICATED (continued)
| | | | | | | | | | | | | | | | |
| | |
| | |
JPMorgan U.S. Aggregate Bond ETF | | | JPMorgan Ultra-Short Income ETF | |
| | | Year Ended
February 28, 2021 | | | Year Ended
February 29, 2020 | | | Year Ended
February 28, 2021 | | | Year Ended
February 29, 2020 | |
CHANGE IN NET ASSETS RESULTING FROM OPERATIONS: | |
Net investment income (loss) | | $ | 10,965,812 | | | $ | 6,135,910 | | | $ | 152,746,891 | | | $ | 215,229,392 | |
Net realized gain (loss) | | | 6,093,367 | | | | 1,526,368 | | | | 6,803,585 | | | | 4,869,131 | |
Change in net unrealized appreciation/depreciation | | | (17,084,303 | ) | | | 19,826,834 | | | | 26,207,768 | | | | 41,300,189 | |
| | | | | | | | | | | | | | | | |
Change in net assets resulting from operations | | | (25,124 | ) | | | 27,489,112 | | | | 185,758,244 | | | | 261,398,712 | |
| | | | | | | | | | | | | | | | |
|
DISTRIBUTIONS TO SHAREHOLDERS: | |
Total distributions to shareholders | | | (13,077,795 | ) | | | (7,057,507 | ) | | | (148,089,858 | ) | | | (218,564,137 | ) |
| | | | | | | | | | | | | | | | |
|
CAPITAL TRANSACTIONS: | |
Change in net assets resulting from capital transactions | | | 296,821,303 | | | | 423,909,259 | | | | 4,514,879,823 | | | | 5,845,592,654 | |
| | | | | | | | | | | | | | | | |
|
NET ASSETS: | |
Change in net assets | | | 283,718,384 | | | | 444,340,864 | | | | 4,552,548,209 | | | | 5,888,427,229 | |
Beginning of period | | | 543,070,946 | | | | 98,730,082 | | | | 11,591,489,504 | | | | 5,703,062,275 | |
| | | | | | | | | | | | | | | | |
End of period | | $ | 826,789,330 | | | $ | 543,070,946 | | | $ | 16,144,037,713 | | | $ | 11,591,489,504 | |
| | | | | | | | | | | | | | | | |
| | | | |
CAPITAL TRANSACTIONS: | | | | | | | | | | | | | | | | |
Proceeds from shares issued | | $ | 364,516,514 | | | $ | 445,988,689 | | | $ | 6,937,280,585 | | | $ | 6,133,315,027 | |
Cost of shares redeemed | | | (67,695,211 | ) | | | (22,079,430 | ) | | | (2,422,400,762 | ) | | | (287,722,373 | ) |
| | | | | | | | | | | | | | | | |
Total change in net assets resulting from capital transactions | | $ | 296,821,303 | | | $ | 423,909,259 | | | $ | 4,514,879,823 | | | $ | 5,845,592,654 | |
| | | | | | | | | | | | | | | | |
|
SHARE TRANSACTIONS: | |
Issued | | | 13,100,000 | | | | 16,750,000 | | | | 136,900,000 | | | | 121,600,000 | |
Redeemed | | | (2,500,000 | ) | | | (850,000 | ) | | | (48,450,000 | ) | | | (5,700,000 | ) |
| | | | | | | | | | | | | | | | |
Net increase in shares from share transactions | | | 10,600,000 | | | | 15,900,000 | | | | 88,450,000 | | | | 115,900,000 | |
| | | | | | | | | | | | | | | | |
SEE NOTES TO FINANCIAL STATEMENTS.
| | | | | | |
| | | |
| 342 | | | | J.P. MORGAN EXCHANGE-TRADED FUNDS | | FEBRUARY 28, 2021 |
| | | | | | | | | | | | | | | | |
| | |
| | | JPMorgan Ultra-Short Municipal
Income ETF | | |
JPMorgan USD Emerging Markets
Sovereign Bond ETF | |
| | | Year Ended
February 28, 2021 | | | Year Ended
February 29, 2020 | | | Year Ended
February 28, 2021 | | | Year Ended
February 29, 2020 | |
CHANGE IN NET ASSETS RESULTING FROM OPERATIONS: | |
Net investment income (loss) | | $ | 4,108,100 | | | $ | 1,852,136 | | | $ | 3,794,025 | | | $ | 3,299,525 | |
Net realized gain (loss) | | | (34,811 | ) | | | (20,822 | ) | | | (3,655,748 | ) | | | 380,895 | |
Distributions of capital gains received from investment company affiliates | | | 178 | | | | — | | | | — | | | | — | |
Change in net unrealized appreciation/depreciation | | | 1,918,118 | | | | 526,419 | | | | (131,088 | ) | | | 3,946,502 | |
| | | | | | | | | | | | | | | | |
Change in net assets resulting from operations | | | 5,991,585 | | | | 2,357,733 | | | | 7,189 | | | | 7,626,922 | |
| | | | | | | | | | | | | | | | |
|
DISTRIBUTIONS TO SHAREHOLDERS: | |
Total distributions to shareholders | | | (3,476,451 | ) | | | (1,868,857 | ) | | | (3,496,716 | ) | | | (3,288,107 | ) |
| | | | | | | | | | | | | | | | |
|
CAPITAL TRANSACTIONS: | |
Change in net assets resulting from capital transactions | | | 1,200,610,442 | | | | 148,897,115 | | | | (4,473,264 | ) | | | 25,597,892 | |
| | | | | | | | | | | | | | | | |
|
NET ASSETS: | |
Change in net assets | | | 1,203,125,576 | | | | 149,385,991 | | | | (7,962,791 | ) | | | 29,936,707 | |
Beginning of period | | | 207,185,582 | | | | 57,799,591 | | | | 91,713,454 | | | | 61,776,747 | |
| | | | | | | | | | | | | | | | |
End of period | | $ | 1,410,311,158 | | | $ | 207,185,582 | | | $ | 83,750,663 | | | $ | 91,713,454 | |
| | | | | | | | | | | | | | | | |
| | | | |
CAPITAL TRANSACTIONS: | | | | | | | | | | | | | | | | |
Proceeds from shares issued | | $ | 1,200,610,442 | | | $ | 151,415,332 | | | $ | 19,156,204 | | | $ | 25,597,892 | |
Cost of shares redeemed | | | — | | | | (2,518,217 | ) | | | (23,629,468 | ) | | | — | |
| | | | | | | | | | | | | | | | |
Total change in net assets resulting from capital transactions | | $ | 1,200,610,442 | | | $ | 148,897,115 | | | $ | (4,473,264 | ) | | $ | 25,597,892 | |
| | | | | | | | | | | | | | | | |
|
SHARE TRANSACTIONS: | |
Issued | | | 23,550,000 | | | | 3,000,000 | | | | 400,000 | | | | 500,000 | |
Redeemed | | | — | | | | (50,000 | ) | | | (500,000 | ) | | | — | |
| | | | | | | | | | | | | | | | |
Net increase (decrease) in shares from share transactions | | | 23,550,000 | | | | 2,950,000 | | | | (100,000 | ) | | | 500,000 | |
| | | | | | | | | | | | | | | | |
SEE NOTES TO FINANCIAL STATEMENTS.
| | | | | | | | |
| | | |
| FEBRUARY 28, 2021 | | J.P. MORGAN EXCHANGE-TRADED FUNDS | | | | | 343 | |
FINANCIAL HIGHLIGHTS
FOR THE PERIODS INDICATED
| | | | | | | | | | | | | | | | | | | | | | | | | | | | |
| | | Per share operating performance | |
| | | | | | Investment operations | | | Distributions | |
| | | Net asset
value,
beginning
of period | | | Net
investment
income
(loss) (b) | | | Net realized
and unrealized
gains (losses)
on investments | | | Total from
investment
operations | | | Net
investment
income | | | Net
realized
gain | | | Total
distributions | |
|
JPMorgan BetaBuilders 1-5 Year U.S. Aggregate Bond ETF | |
Year Ended February 28, 2021 | | $ | 25.86 | | | $ | 0.42 | | | $ | 0.17 | | | $ | 0.59 | | | $ | (0.41 | ) | | $ | (0.10 | ) | | $ | (0.51 | ) |
March 12, 2019 (f) through February 29, 2020 | | | 25.00 | | | | 0.59 | | | | 0.88 | | | | 1.47 | | | | (0.61 | ) | | | — | | | | (0.61 | ) |
|
JPMorgan Core Plus Bond ETF | |
Year Ended February 28, 2021 | | | 54.17 | | | | 0.97 | | | | 0.70 | (h) | | | 1.67 | | | | (0.88 | ) | | | (0.65 | ) | | | (1.53 | ) |
Year Ended February 29, 2020 | | | 50.36 | | | | 1.45 | | | | 4.13 | | | | 5.58 | | | | (1.44 | ) | | | (0.33 | ) | | | (1.77 | ) |
January 28, 2019 (f) through February 28, 2019 | | | 50.00 | | | | 0.13 | | | | 0.36 | | | | 0.49 | | | | (0.13 | ) | | | — | | | | (0.13 | ) |
|
JPMorgan Corporate Bond Research Enhanced ETF | |
Year Ended February 28, 2021 | | | 56.27 | | | | 1.58 | | | | (0.31 | ) | | | 1.27 | | | | (1.46 | ) | | | (0.75 | ) | | | (2.21 | ) |
Year Ended February 29, 2020 | | | 51.19 | | | | 1.95 | | | | 5.96 | | | | 7.91 | | | | (1.93 | ) | | | (0.90 | ) | | | (2.83 | ) |
December 12, 2018 (f) through February 28, 2019 | | | 50.00 | | | | 0.44 | | | | 1.19 | | | | 1.63 | | | | (0.44 | ) | | | — | | | | (0.44 | ) |
|
JPMorgan High Yield Research Enhanced ETF | |
Year Ended February 28, 2021 | | | 50.31 | | | | 2.12 | | | | 1.31 | (h) | | | 3.43 | | | | (2.07 | ) | | | (0.03 | ) | | | (2.10 | ) |
Year Ended February 29, 2020 | | | 49.86 | | | | 2.50 | | | | 0.53 | | | | 3.03 | | | | (2.58 | ) | | | — | | | | (2.58 | ) |
Year Ended February 28, 2019 | | | 50.09 | | | | 2.47 | | | | (0.23 | ) | | | 2.24 | | | | (2.47 | ) | | | — | | | | (2.47 | ) |
Year Ended February 28, 2018 | | | 50.96 | | | | 2.44 | | | | (0.92 | ) | | | 1.52 | | | | (2.39 | ) | | | — | | | | (2.39 | ) |
September 14, 2016 (f) through February 28, 2017 | | | 50.00 | | | | 1.14 | | | | 0.96 | | | | 2.10 | | | | (1.14 | ) | | | — | (l) | | | (1.14 | ) |
| | | | | | | |
JPMorgan International Bond Opportunities ETF (formerly
known as JPMorgan Global Bond Opportunities ETF) | | | | | | | | | | | | | | | | | | | | | | | | | | | | |
Year Ended February 28, 2021 | | | 49.98 | | | | 1.45 | | | | 1.00 | (h) | | | 2.45 | | | | (1.39 | ) | | | — | | | | (1.39 | ) |
Year Ended February 29, 2020 | | | 48.75 | | | | 1.71 | | | | 1.86 | | | | 3.57 | | | | (2.34 | ) | | | — | | | | (2.34 | ) |
Year Ended February 28, 2019 | | | 50.54 | | | | 1.94 | | | | (0.97 | ) | | | 0.97 | | | | (2.56 | ) | | | (0.20 | ) | | | (2.76 | ) |
April 5, 2017 (f) through February 28, 2018 | | | 50.00 | | | | 1.83 | | | | 0.05 | (h) | | | 1.88 | | | | (1.34 | ) | | | — | | | | (1.34 | ) |
|
JPMorgan Municipal ETF | |
Year Ended February 28, 2021 | | | 55.15 | | | | 1.00 | | | | (0.71 | ) | | | 0.29 | | | | (0.94 | ) | | | (0.13 | ) | | | (1.07 | ) |
Year Ended February 29, 2020 | | | 51.92 | | | | 1.24 | | | | 3.91 | | | | 5.15 | | | | (1.22 | ) | | | (0.70 | ) | | | (1.92 | ) |
October 29, 2018 (f) through February 28, 2019 | | | 50.00 | | | | 0.46 | | | | 1.90 | | | | 2.36 | | | | (0.44 | ) | | | — | | | | (0.44 | ) |
|
JPMorgan U.S. Aggregate Bond ETF | |
Year Ended February 28, 2021 | | | 27.43 | | | | 0.44 | | | | (0.15 | ) | | | 0.29 | | | | (0.42 | ) | | | (0.10 | ) | | | (0.52 | ) |
Year Ended February 29, 2020 | | | 25.32 | | | | 0.69 | | | | 2.18 | | | | 2.87 | | | | (0.72 | ) | | | (0.04 | ) | | | (0.76 | ) |
December 12, 2018 (f) through February 28, 2019 | | | 25.00 | | | | 0.18 | | | | 0.29 | | | | 0.47 | | | | (0.15 | ) | | | — | | | | (0.15 | ) |
|
JPMorgan Ultra-Short Income ETF | |
Year Ended February 28, 2021 | | | 50.51 | | | | 0.58 | | | | 0.28 | | | | 0.86 | | | | (0.59 | ) | | | — | (l) | | | (0.59 | ) |
Year Ended February 29, 2020 | | | 50.20 | | | | 1.28 | | | | 0.32 | | | | 1.60 | | | | (1.29 | ) | | | — | | | | (1.29 | ) |
Year Ended February 28, 2019 | | | 50.01 | | | | 1.37 | | | | (0.04 | )(h) | | | 1.33 | | | | (1.14 | ) | | | — | | | | (1.14 | ) |
May 17, 2017 (f) through February 28, 2018 | | | 50.00 | | | | 0.70 | | | | (0.08 | ) | | | 0.62 | | | | (0.61 | ) | | | — | | | | (0.61 | ) |
|
JPMorgan Ultra-Short Municipal Income ETF | |
Year Ended February 28, 2021 | | | 50.53 | | | | 0.32 | | | | 0.52 | | | | 0.84 | | | | (0.36 | ) | | | — | | | | (0.36 | ) |
Year Ended February 29, 2020 | | | 50.26 | | | | 0.78 | | | | 0.26 | | | | 1.04 | | | | (0.77 | ) | | | — | | | | (0.77 | ) |
October 16, 2018 (f) through February 28, 2019 | | | 50.00 | | | | 0.35 | | | | 0.23 | | | | 0.58 | | | | (0.32 | ) | | | — | | | | (0.32 | ) |
|
JPMorgan USD Emerging Markets Sovereign Bond ETF | |
Year Ended February 28, 2021 | | | 50.95 | | | | 2.17 | | | | (1.83 | ) | | | 0.34 | | | | (2.02 | ) | | | — | | | | (2.02 | ) |
Year Ended February 29, 2020 | | | 47.52 | | | | 2.32 | | | | 3.40 | | | | 5.72 | | | | (2.29 | ) | | | — | | | | (2.29 | ) |
Year Ended February 28, 2019 | | | 48.83 | | | | 2.31 | | | | (1.30 | ) | | | 1.01 | | | | (2.32 | ) | | | — | | | | (2.32 | ) |
January 29, 2018 (f) through February 28, 2018 | | | 50.00 | | | | 0.19 | | | | (1.21 | ) | | | (1.02 | ) | | | (0.15 | ) | | | — | | | | (0.15 | ) |
| (a) | Annualized for periods less than one year, unless otherwise indicated. |
| (b) | Calculated based upon average shares outstanding. |
| (c) | Not annualized for periods less than one year. |
| (d) | Includes adjustments in accordance with accounting principles generally accepted in the United States of America and as such, the net asset values for financial reporting purposes and the returns based upon those net asset values may differ from the net asset values and returns for shareholder transactions. |
| (e) | Prior to December 9, 2019, market price return was calculated assuming an initial investment made at the market price at the beginning of the reporting period, reinvestment of all dividends and distributions at market price during the period, and sale at the market price on the last day of the period. The price used to calculate the market price return was the midpoint of the bid/ask spread at the close of business on the listing exchange of the fund. Effective December 9, 2019, the closing price was used to calculate the market price return; however, any prices used in the calculation for market price return prior to December 9, 2019, would have used the midpoint of the bid/ask spread at the close of business on the exchange. |
| (f) | Commencement of operations. |
| (g) | Since the Shares of the Fund did not trade in the secondary market until the day after the Fund’s inception, for the period from the inception to the first day of secondary market trading, the NAV is used as a proxy for the secondary market trading price to calculate the market returns. |
| (h) | Calculation of the net realized and unrealized gains (losses) per share do not correlate with the Fund’s net realized and unrealized gains (losses) presented in the Statement of Operations due to the timing of capital transactions in relation to the fluctuating market values of the Fund’s investments. |
| (i) | Prior to November 1, 2019, the Fund may have waived fees if expenses exceeded the expense cap. On November 1, 2019, the Fund adopted a unitary fee structure where a management fee is accrued by the fund based on prior day net assets and other expenses are paid by the Advisor. |
| (j) | Certain non-recurring expenses incurred by the Fund were not annualized for the period indicated. |
| (k) | Amount rounds to less than 0.5% |
| (l) | Amount rounds to less than $0.005. |
SEE NOTES TO FINANCIAL STATEMENTS.
| | | | | | |
| | | |
| 344 | | | | J.P. MORGAN EXCHANGE-TRADED FUNDS | | FEBRUARY 28, 2021 |
| | | | | | | | | | | | | | | | | | | | | | | | | | | | | | | | | | |
| Ratios/Supplemental data | |
| | | | | | | | | | | | | | | | Ratios to average net assets (a) | | | | |
Net asset
value,
end of
period | | | Market
price,
end of
period | | | Total
return (c)(d) | | | Market
price
total
return (c)(e) | | | Net assets,
end of
period | | | Net
expenses | | | Net
investment
income
(loss) | | | Expenses without
waivers and
reimbursements | | | Portfolio
turnover
rate (c) | |
| | | | | | | | |
| | | | | | | | | | | | | | | | | | | | | | | | | | | | | | | | | | |
| $ | 25.94 | | | $ | 25.98 | | | | 2.32 | % | | | 2.55 | % | | $ | 59,654,406 | | | | 0.05 | % | | | 1.62 | % | | | 0.05 | % | | | 40 | % |
| | 25.86 | | | | 25.84 | | | | 5.93 | | | | 5.85 | (g) | | | 37,495,084 | | | | 0.05 | | | | 2.38 | | | | 0.05 | | | | 56 | |
| | | | | | | | |
| | | | | | | | | | | | | | | | | | | | | | | | | | | | | | | | | | |
| | 54.31 | | | | 54.48 | | | | 3.08 | | | | 2.87 | | | | 146,648,110 | | | | 0.36 | | | | 1.76 | | | | 0.36 | | | | 272 | |
| | 54.17 | | | | 54.44 | | | | 11.24 | | | | 11.52 | | | | 54,168,824 | | | | 0.38 | | | | 2.76 | | | | 0.69 | (i) | | | 91 | |
| | 50.36 | | | | 50.48 | | | | 0.97 | | | | 1.21 | (g) | | | 25,178,102 | | | | 0.38 | (j) | | | 2.96 | | | | 5.38 | (i)(j) | | | — | (k) |
| | | | | | | | |
| | | | | | | | | | | | | | | | | | | | | | | | | | | | | | | | | | |
| | 55.33 | | | | 55.48 | | | | 2.24 | | | | 2.09 | | | | 55,332,638 | | | | 0.14 | | | | 2.81 | | | | 0.14 | | | | 41 | |
| | 56.27 | | | | 56.50 | | | | 15.74 | | | | 15.95 | | | | 35,170,394 | | | | 0.14 | | | | 3.58 | | | | 0.65 | (i) | | | 67 | |
| | 51.19 | | | | 51.30 | | | | 3.26 | | | | 3.48 | (g) | | | 25,595,493 | | | | 0.14 | (j) | | | 3.98 | | | | 2.13 | (i)(j) | | | 12 | |
| | | | | | | | |
| | | | | | | | | | | | | | | | | | | | | | | | | | | | | | | | | | |
| | 51.64 | | | | 51.61 | | | | 7.16 | | | | 6.43 | | | | 1,559,634,055 | | | | 0.23 | | | | 4.18 | | | | 0.23 | | | | 50 | |
| | 50.31 | | | | 50.62 | | | | 6.15 | | | | 6.88 | | | | 171,037,324 | | | | 0.32 | | | | 4.90 | | | | 0.44 | (i) | | | 128 | |
| | 49.86 | | | | 49.82 | | | | 4.66 | | | | 4.00 | | | | 154,570,385 | | | | 0.40 | | | | 5.01 | | | | 0.57 | (i) | | | 23 | |
| | 50.09 | | | | 50.36 | | | | 3.00 | | | | 3.12 | | | | 105,191,308 | | | | 0.40 | | | | 4.78 | | | | 0.98 | (i) | | | 23 | |
| | 50.96 | | | | 51.16 | | | | 4.24 | | | | 4.64 | (g) | | | 30,574,068 | | | | 0.39 | (j) | | | 4.99 | | | | 1.74 | (i)(j) | | | 8 | |
| | | | | | | | |
|
|
| | | | | | | | | | | | | | | | | | | | | | | | | | | | | | | | |
| | 51.04 | | | | 51.34 | | | | 5.02 | | | | 5.95 | | | | 250,097,283 | | | | 0.50 | | | | 2.90 | | | | 0.50 | | | | 136 | |
| | 49.98 | | | | 49.83 | | | | 7.39 | | | | 6.89 | | | | 169,928,839 | | | | 0.53 | | | | 3.40 | | | | 0.69 | (i) | | | 88 | |
| | 48.75 | | | | 48.83 | | | | 2.09 | | | | 2.13 | | | | 180,357,231 | | | | 0.54 | | | | 3.92 | | | | 0.82 | (i) | | | 73 | |
| | 50.54 | | | | 50.60 | | | | 3.76 | | | | 3.88 | (g) | | | 151,634,232 | | | | 0.53 | (j) | | | 3.98 | | | | 1.10 | (i)(j) | | | 52 | |
| | | | | | | | |
| | | | | | | | | | | | | | | | | | | | | | | | | | | | | | | | | | |
| | 54.37 | | | | 54.35 | | | | 0.54 | | | | 0.67 | | | | 76,120,305 | | | | 0.23 | | | | 1.84 | | | | 0.23 | | | | 56 | |
| | 55.15 | | | | 55.06 | | | | 10.09 | | | | 9.71 | | | | 52,390,882 | | | | 0.23 | | | | 2.31 | | | | 0.67 | (i) | | | 51 | |
| | 51.92 | | | | 52.01 | | | | 4.74 | | | | 4.92 | (g) | | | 31,153,558 | | | | 0.23 | (j) | | | 2.65 | | | | 1.06 | (i)(j) | | | 15 | |
| | | | | | | | |
| | | | | | | | | | | | | | | | | | | | | | | | | | | | | | | | | | |
| | 27.20 | | | | 27.18 | | | | 1.04 | | | | 0.85 | | | | 826,789,330 | | | | 0.07 | | | | 1.60 | | | | 0.07 | | | | 64 | |
| | 27.43 | | | | 27.46 | | | | 11.46 | | | | 11.49 | | | | 543,070,946 | | | | 0.07 | | | | 2.61 | | | | 0.20 | (i) | | | 57 | |
| | 25.32 | | | | 25.34 | | | | 1.90 | | | | 1.98 | (g) | | | 98,730,082 | | | | 0.07 | (j) | | | 3.26 | | | | 1.14 | (i)(j) | | | 53 | |
| | | | | | | | |
| | | | | | | | | | | | | | | | | | | | | | | | | | | | | | | | | | |
| | 50.78 | | | | 50.79 | | | | 1.72 | | | | 1.67 | | | | 16,144,037,713 | | | | 0.17 | | | | 1.14 | | | | 0.17 | | | | 94 | |
| | 50.51 | | | | 50.54 | | | | 3.22 | | | | 3.22 | | | | 11,591,489,504 | | | | 0.18 | | | | 2.53 | | | | 0.22 | (i) | | | 46 | |
| | 50.20 | | | | 50.23 | | | | 2.68 | | | | 2.66 | | | | 5,703,062,275 | | | | 0.17 | | | | 2.74 | | | | 0.28 | (i) | | | 43 | |
| | 50.01 | | | | 50.05 | | | | 1.25 | | | | 1.33 | (g) | | | 200,051,266 | | | | 0.16 | (j) | | | 1.77 | | | | 0.55 | (i)(j) | | | 25 | |
| | | | | | | | |
| | | | | | | | | | | | | | | | | | | | | | | | | | | | | | | | | | |
| | 51.01 | | | | 51.03 | | | | 1.66 | | | | 1.64 | | | | 1,410,311,158 | | | | 0.16 | | | | 0.63 | | | | 0.16 | | | | 67 | |
| | 50.53 | | | | 50.56 | | | | 2.09 | | | | 2.09 | | | | 207,185,582 | | | | 0.18 | | | | 1.55 | | | | 0.34 | (i) | | | 153 | |
| | 50.26 | | | | 50.29 | | | | 1.16 | | | | 1.22 | (g) | | | 57,799,591 | | | | 0.17 | (j) | | | 1.88 | | | | 0.79 | (i)(j) | | | 61 | |
| | | | | | | | |
| | | | | | | | | | | | | | | | | | | | | | | | | | | | | | | | | | |
| | 49.27 | | | | 49.30 | | | | 0.85 | | | | 0.50 | | | | 83,750,663 | | | | 0.39 | | | | 4.50 | | | | 0.39 | | | | 59 | |
| | 50.95 | | | | 51.15 | | | | 12.25 | | | | 12.44 | | | | 91,713,454 | | | | 0.39 | | | | 4.64 | | | | 0.58 | (i) | | | 53 | |
| | 47.52 | | | | 47.62 | | | | 2.29 | | | | 2.23 | | | | 61,776,747 | | | | 0.39 | | | | 4.96 | | | | 0.87 | (i) | | | 28 | |
| | 48.83 | | | | 48.95 | | | | (2.03 | ) | | | (1.79 | )(g) | | | 53,713,929 | | | | 0.35 | (j) | | | 4.79 | | | | 2.74 | (i)(j) | | | 2 | |
SEE NOTES TO FINANCIAL STATEMENTS.
| | | | | | | | |
| | | |
| FEBRUARY 28, 2021 | | J.P. MORGAN EXCHANGE-TRADED FUNDS | | | | | 345 | |
NOTES TO FINANCIAL STATEMENTS
AS OF FEBRUARY 28, 2021
1. Organization
J.P. Morgan Exchange-Traded Fund Trust (the “Trust”) was formed on February 25, 2010, and is governed by a Declaration of Trust as amended and restated February 19, 2014, and is registered under the Investment Company Act of 1940, as amended (the “1940 Act”), as an open-end management investment company.
The following are 10 separate funds of the Trust (each, a “Fund” and collectively, the “Funds”) covered by this report:
| | |
| | | Diversification Classification |
| JPMorgan BetaBuilders 1-5 Year U.S. Aggregate Bond ETF(1) | | Diversified |
| JPMorgan Core Plus Bond ETF | | Diversified |
| JPMorgan Corporate Bond Research Enhanced ETF | | Diversified |
| JPMorgan High Yield Research Enhanced ETF | | Diversified |
| JPMorgan International Bond Opportunities ETF(2) | | Diversified |
| JPMorgan Municipal ETF | | Diversified |
| JPMorgan U.S. Aggregate Bond ETF | | Diversified |
| JPMorgan Ultra-Short Income ETF | | Diversified |
| JPMorgan Ultra-Short Municipal Income ETF | | Diversified |
| JPMorgan USD Emerging Markets Sovereign Bond ETF | | Diversified |
| (1) | Commenced operations on March 12, 2019. |
| (2) | Effective September 14, 2020, JPMorgan Global Bond Opportunities ETF changed its name to JPMorgan International Bond Opportunities ETF. |
The investment objective of JPMorgan BetaBuilders 1-5 Year U.S. Aggregate Bond ETF (“BetaBuilders 1-5 Year U.S. Aggregate Bond ETF”) is to seek investment results that closely correspond, before fees and expenses, to the performance of the Bloomberg Barclays Short-Term U.S. Aggregate Bond Index.
The investment objective of JPMorgan Core Plus Bond ETF (“Core Plus Bond ETF”) is to seek a high level of current income by investing primarily in a diversified portfolio of high-, medium- and low-grade debt securities.
The investment objective of JPMorgan Corporate Bond Research Enhanced ETF (“Corporate Bond Research Enhanced ETF”) is to seek to provide total return from a portfolio of investment grade corporate bonds.
The investment objective of JPMorgan High Yield Research Enhanced ETF (“High Yield Research Enhanced ETF”) is to seek to provide a high level of income with capital appreciation as a secondary objective.
The investment objective of JPMorgan International Bond Opportunities ETF (formerly JPMorgan Global Bond Opportunities ETF) (“International Bond Opportunities ETF”) is to seek to provide total return.
The investment objective of JPMorgan Municipal ETF (“Municipal ETF”) is to seek to provide monthly dividends, which are excluded from gross income, and to protect the value of your investment by investing primarily in municipal obligations. For purposes of the Fund’s investment objective, “gross income” means gross income for federal income tax purposes.
The investment objective of JPMorgan U.S. Aggregate Bond ETF (“U.S. Aggregate Bond ETF”) is to seek long-term total return.
The investment objective of JPMorgan Ultra-Short Income ETF (“Ultra-Short Income ETF”) is to seek to provide current income while seeking to maintain a low volatility of principal.
The investment objective of JPMorgan Ultra-Short Municipal Income ETF (“Ultra-Short Municipal Income ETF”) is to seek to provide as high a level of current income exempt from federal income tax as is consistent with relative stability of principal.
The investment objective of JPMorgan USD Emerging Markets Sovereign Bond ETF (“USD Emerging Markets Sovereign Bond ETF”) is to seek investment results that closely correspond, before fees and expenses, to the performance of the JPMorgan Emerging Markets Risk-Aware Bond Index.
J.P. Morgan Investment Management Inc. (“JPMIM”), an indirect, wholly-owned subsidiary of JPMorgan Chase & Co. (“JPMorgan”), acts as Adviser (the “Adviser”) and Administrator (the “Administrator”) to the Funds.
| | | | | | |
| | | |
| 346 | | | | J.P. MORGAN EXCHANGE-TRADED FUNDS | | FEBRUARY 28, 2021 |
Shares of each Fund are listed and traded at market price on an exchange as follows:
| | |
| | | Listing Exchange |
| BetaBuilders 1-5 Year U.S. Aggregate Bond ETF | | Cboe BZX Exchange, Inc. |
| Core Plus Bond ETF | | Cboe BZX Exchange, Inc. |
| Corporate Bond Research Enhanced ETF | | NYSE Arca, Inc. |
| High Yield Research Enhanced ETF | | Cboe BZX Exchange, Inc. |
| International Bond Opportunities ETF | | Cboe BZX Exchange, Inc. |
| Municipal ETF | | Cboe BZX Exchange, Inc. |
| U.S. Aggregate Bond ETF | | NYSE Arca, Inc. |
| Ultra-Short Income ETF | | Cboe BZX Exchange, Inc. |
| Ultra-Short Municipal Income ETF | | Cboe BZX Exchange, Inc. |
| USD Emerging Markets Sovereign Bond ETF | | NYSE Arca, Inc. |
Market prices for the Funds’ shares may be different from their net asset value (“NAV”).
The Funds issue and redeem their shares on a continuous basis, through JPMorgan Distribution Services, Inc. (the “Distributor” or “JPMDS”), an indirect, wholly-owned subsidiary of JPMorgan, at NAV in large blocks of shares, referred to as “Creation Units” as shown in the table below:
| | | | |
| | | Shares per Creation Unit | |
BetaBuilders 1-5 Year U.S. Aggregate Bond ETF | | | 50,000 | |
Core Plus Bond ETF | | | 100,000 | |
Corporate Bond Research Enhanced ETF | | | 25,000 | |
High Yield Research Enhanced ETF | | | 100,000 | |
International Bond Opportunities ETF | | | 100,000 | |
Municipal ETF | | | 50,000 | |
U.S. Aggregate Bond ETF | | | 50,000 | |
Ultra-Short Income ETF | | | 50,000 | |
Ultra-Short Municipal Income ETF | | | 50,000 | |
USD Emerging Markets Sovereign Bond ETF | | | 100,000 | |
The Funds may elect creations and redemptions in cash or partially in cash. Shares are generally traded in the secondary market in amounts less than a Creation Unit at market prices that change throughout the day. Only individuals or institutions that have entered into an authorized participant agreement with the Distributor may do business directly with the Funds (each, an “Authorized Participant”).
2. Significant Accounting Policies
The following is a summary of significant accounting policies followed by the Funds in the preparation of their financial statements. The Funds are investment companies and, accordingly, follow the investment company accounting and reporting guidance of the Financial Accounting Standards Board (“FASB”) Accounting Standards Codification Topic 946 — Investment Companies, which is part of U.S. generally accepted accounting principles (“GAAP”). The preparation of financial statements in conformity with GAAP requires management to make estimates and assumptions that affect (i) the reported amounts of assets and liabilities, (ii) disclosure of contingent assets and liabilities at the date of the financial statements, and (iii) the reported amounts of increases and decreases in net assets from operations during the reporting period. Actual results could differ from those estimates.
A. Valuation of Investments — Investments are valued in accordance with GAAP and the Funds’ valuation policies set forth by, and under the supervision and responsibility of, the Board of Trustees of the Trust (the “Board”), which established the following approach to valuation, as described more fully below: (i) investments for which market quotations are readily available shall be valued at their market value and (ii) all other investments for which market quotations are not readily available shall be valued at their fair value as determined in good faith by the Board.
The Administrator has established the J.P. Morgan Asset Management Americas Valuation Committee (“AVC”) to assist the Board with the oversight and monitoring of the valuation of the Funds’ investments. The Administrator implements the valuation policies of the Funds’ investments, as directed by the Board. The AVC oversees and carries out the policies for the valuation of investments held in the Funds. This includes monitoring the appropriateness of fair values based on results of ongoing valuation oversight including, but not limited to, consideration of macro or security specific events, market events, and pricing vendor and broker due diligence. The Administrator is responsible for discussing and assessing the potential impacts to the fair values on an ongoing basis, and, at least on a quarterly basis, with the AVC and the Board.
A market-based approach is primarily used to value the Funds’ investments. Investments for which market quotations are not readily available are fair valued by approved affiliated and/or unaffiliated pricing vendors or third party broker-dealers (collectively referred to as “Pricing Services”) or may be internally fair valued using methods set forth by the valuation policies approved by the Board. This may include the use of related or comparable assets or liabilities, recent transactions, market multiples, book values and other relevant information for the investment. An income-based valuation approach may be used in which the anticipated future cash flows of the investment are discounted to calculate the fair value. Discounts may also be applied due to the nature or duration of any restrictions on the disposition of the investments. Valuations may be based upon current
| | | | | | | | |
| | | |
| FEBRUARY 28, 2021 | | J.P. MORGAN EXCHANGE-TRADED FUNDS | | | | | 347 | |
NOTES TO FINANCIAL STATEMENTS
AS OF FEBRUARY 28, 2021 (continued)
market prices of securities that are comparable in coupon, rating, maturity and industry. It is possible that the estimated values may differ significantly from the values that would have been used had a ready market for the investments existed, and such differences could be material.
Fixed income instruments are valued based on prices received from Pricing Services. The Pricing Services use multiple valuation techniques to determine the valuation of fixed income instruments. In instances where sufficient market activity exists, the Pricing Services may utilize a market-based approach through which trades or quotes from market makers are used to determine the valuation of these instruments. In instances where sufficient market activity may not exist, the Pricing Services also utilize proprietary valuation models which may consider market transactions in comparable securities and the various relationships between securities in determining fair value and/or market characteristics in order to estimate the relevant cash flows, which are then discounted to calculate the fair values.
Equities and other exchange-traded instruments are valued at the last sale price or official market closing price on the primary exchange on which the instrument is traded before the NAVs of the Funds are calculated on a valuation date. Certain foreign equity instruments are valued by applying international fair value factors provided by approved Pricing Services. The factors seek to adjust the local closing price for movements of local markets post-closing, but prior to the time the NAVs are calculated.
Certain short term investments may be valued using the amortized cost method, provided it approximates the fair market value of the investment. The amortized cost method of valuation involves valuing a security at its cost initially and thereafter assuming a constant amortization to maturity of any discount or premium, regardless of the impact of fluctuating interest rates on the market value of the security. This method may result in periods during which value, as determined by amortized cost, is higher or lower than the price each Fund would receive if it sold the security. The market value of securities in the Funds can generally be expected to vary inversely with changes in prevailing interest rates.
Investments in open-end investment companies (“Underlying Funds”) are valued at each Underlying Fund’s NAV per share as of the report date.
Futures contracts and options are generally valued on the basis of available market quotations. Swaps and forward foreign currency exchange contracts are valued utilizing market quotations from approved Pricing Services.
See the tables on “Quantitative Information about Level 3 Fair Value Measurements” for information on the valuation techniques and inputs used to value level 3 securities held by Core Plus Bond ETF and International Bond Opportunities ETF at February 28, 2021.
Valuations reflected in this report are as of the report date. As a result, changes in valuation due to market events and/or issuer-related events after the report date and prior to issuance of the report are not reflected herein.
The various inputs that are used in determining the valuation of the Funds’ investments are summarized into the three broad levels listed below.
| • | | Level 1 — Unadjusted inputs using quoted prices in active markets for identical investments. |
| • | | Level 2 — Other significant observable inputs including, but not limited to, quoted prices for similar investments, inputs other than quoted prices that are observable for investments (such as interest rates, prepayment speeds, credit risk, etc.) or other market corroborated inputs. |
| • | | Level 3 — Significant inputs based on the best information available in the circumstances, to the extent observable inputs are not available (including the Funds’ assumptions in determining the fair value of investments). |
A financial instrument’s level within the fair value hierarchy is based on the lowest level of any input, both individually and in the aggregate, that is significant to the fair value measurement. The inputs or methodology used for valuing instruments are not necessarily an indication of the risk associated with investing in those instruments.
| | | | | | |
| | | |
| 348 | | | | J.P. MORGAN EXCHANGE-TRADED FUNDS | | FEBRUARY 28, 2021 |
The following tables represent each valuation input as presented on the Schedules of Portfolio Investments (“SOIs”):
BetaBuilders 1-5 Year U.S. Aggregate Bond ETF
| | | | | | | | | | | | | | | | |
| | | Level 1
Quoted prices | | | Level 2
Other significant
observable inputs | | | Level 3
Significant
unobservable inputs | | | Total | |
Investments in Securities | | | | | | | | | |
Asset-Backed Securities | | $ | — | | | $ | 468,806 | | | $ | — | | | $ | 468,806 | |
Commercial Mortgage-Backed Securities | | | — | | | | 1,321,504 | | | | 155,591 | | | | 1,477,095 | |
Corporate Bonds | | | — | | | | 14,771,329 | | | | — | | | | 14,771,329 | |
Foreign Government Securities | | | — | | | | 939,769 | | | | — | | | | 939,769 | |
Mortgage-Backed Securities | | | — | | | | 4,878,625 | | | | — | | | | 4,878,625 | |
Municipal Bonds | | | — | | | | 127,636 | | | | — | | | | 127,636 | |
Supranational | | | — | | | | 1,822,858 | | | | — | | | | 1,822,858 | |
U.S. Government Agency Securities | | | — | | | | 1,611,003 | | | | — | | | | 1,611,003 | |
U.S. Treasury Obligations | | | — | | | | 32,987,698 | | | | — | | | | 32,987,698 | |
Short-Term Investments | | | | | | | | | |
Investment Companies | | | 514,056 | | | | — | | | | — | | | | 514,056 | |
Investment of Cash Collateral from Securities Loaned | | | 104,878 | | | | — | | | | — | | | | 104,878 | |
| | | | | | | | | | | | | | | | |
Total Short-Term Investments | | | 618,934 | | | | — | | | | — | | | | 618,934 | |
| | | | | | | | | | | | | | | | |
Total Investments in Securities | | $ | 618,934 | | | $ | 58,929,228 | | | $ | 155,591 | | | $ | 59,703,753 | |
| | | | | | | | | | | | | | | | |
| | | | |
| Core Plus Bond ETF | | | | | | | | | | | | | | | | |
| | | Level 1
Quoted prices | | | Level 2
Other significant
observable inputs | | | Level 3
Significant
unobservable inputs | | | Total | |
Investments in Securities | | | | | | | | | |
Asset-Backed Securities | | $ | — | | | $ | 12,016,547 | | | $ | 9,701,506 | | | $ | 21,718,053 | |
Collateralized Mortgage Obligations | | | — | | | | 2,590,254 | | | | 2,224,016 | | | | 4,814,270 | |
Commercial Mortgage-Backed Securities | | | — | | | | 4,121,720 | | | | 148,523 | | | | 4,270,243 | |
Common Stocks | | | | | | | | | |
Oil, Gas & Consumable Fuels | | | 7,214 | | | | 15,400 | | | | — | | | | 22,614 | |
Professional Services | | | 62 | | | | — | | | | — | | | | 62 | |
| | | | | | | | | | | | | | | | |
Total Common Stocks | | | 7,276 | | | | 15,400 | | | | — | | | | 22,676 | |
| | | | | | | | | | | | | | | | |
Corporate Bonds | | | — | | | | 55,351,532 | | | | — | | | | 55,351,532 | |
Mortgage-Backed Securities | | | — | | | | 30,037,850 | | | | — | | | | 30,037,850 | |
Municipal Bonds | | | — | | | | 33,256 | | | | — | | | | 33,256 | |
Preferred Stocks | | | — | | | | — | | | | 4,467 | | | | 4,467 | |
U.S. Treasury Obligations | | | — | | | | 14,878,728 | | | | — | | | | 14,878,728 | |
Warrants | | | | | | | | | |
Diversified Telecommunication Services | | | — | | | | — | | | | 222 | | | | 222 | |
Media | | | — | | | | — | | | | 1 | | | | 1 | |
Oil, Gas & Consumable Fuels | | | 3,844 | | | | — | | | | — | | | | 3,844 | |
| | | | | | | | | | | | | | | | |
Total Warrants | | | 3,844 | | | | — | | | | 223 | | | | 4,067 | |
| | | | | | | | | | | | | | | | |
Short-Term Investments | | | | | | | | | |
Investment Companies | | | 32,839,275 | | | | — | | | | — | | | | 32,839,275 | |
| | | | | | | | | | | | | | | | |
Total Investments in Securities | | $ | 32,850,395 | | | $ | 119,045,287 | | | $ | 12,078,735 | | | $ | 163,974,417 | |
| | | | | | | | | | | | | | | | |
Appreciation in Other Financial Instruments | | | | | | | | | |
Forward Foreign Currency Exchange Contracts | | $ | — | | | $ | 20,120 | | | $ | — | | | $ | 20,120 | |
Futures Contracts | | | 14,549 | | | | — | | | | — | | | | 14,549 | |
Depreciation in Other Financial Instruments | | | | | | | | | |
Forward Foreign Currency Exchange Contracts | | | — | | | | (41,069 | ) | | | — | | | | (41,069 | ) |
Futures Contracts | | | (20,673 | ) | | | — | | | | — | | | | (20,673 | ) |
| | | | | | | | | | | | | | | | |
Total Net Appreciation/Depreciation in Other Financial Instruments | | $ | (6,124 | ) | | $ | (20,949 | ) | | $ | — | | | $ | (27,073 | ) |
| | | | | | | | | | | | | | | | |
| | | | | | | | |
| | | |
| FEBRUARY 28, 2021 | | J.P. MORGAN EXCHANGE-TRADED FUNDS | | | | | 349 | |
NOTES TO FINANCIAL STATEMENTS
AS OF FEBRUARY 28, 2021 (continued)
| | | | | | | | | | | | | | | | |
| Corporate Bond Research Enhanced ETF | | | | | | | | | | | | | | | | |
| | | Level 1
Quoted prices | | | Level 2
Other significant
observable inputs | | | Level 3
Significant
unobservable inputs | | | Total | |
Investments in Securities | | | | | | | | | |
Asset-Backed Securities | | $ | — | | | $ | 45,102 | | | $ | — | | | $ | 45,102 | |
Corporate Bonds | | | — | | | | 54,332,398 | | | | — | | | | 54,332,398 | |
U.S. Treasury Obligations | | | — | | | | 403,032 | | | | — | | | | 403,032 | |
Short-Term Investments | | | | | | | | | |
Investment Companies | | | 194,411 | | | | — | | | | — | | | | 194,411 | |
| | | | | | | | | | | | | | | | |
Total Investments in Securities | | $ | 194,411 | | | $ | 54,780,532 | | | $ | — | | | $ | 54,974,943 | |
| | | | | | | | | | | | | | | | |
Appreciation in Other Financial Instruments | | | | | | | | | |
Futures Contracts | | $ | 11,948 | | | $ | — | | | $ | — | | | $ | 11,948 | |
Depreciation in Other Financial Instruments | | | | | | | | | |
Futures Contracts | | | (18,526 | ) | | | — | | | | — | | | | (18,526 | ) |
| | | | | | | | | | | | | | | | |
Total Net Appreciation/Depreciation in Other Financial Instruments | | $ | (6,578 | ) | | $ | — | | | $ | — | | | $ | (6,578 | ) |
| | | | | | | | | | | | | | | | |
| | | | |
| High Yield Research Enhanced ETF | | | | | | | | | | | | | | | | |
| | | Level 1
Quoted prices | | | Level 2
Other significant
observable inputs | | | Level 3
Significant
unobservable inputs | | | Total | |
Investments in Securities | | | | | | | | | |
Corporate Bonds | | $ | — | | | $ | 1,526,099,647 | | | $ | — | | | $ | 1,526,099,647 | |
Short-Term Investments | | | | | | | | | |
Investment Companies | | | 13,965,910 | | | | — | | | | — | | | | 13,965,910 | |
| | | | | | | | | | | | | | | | |
Total Investments in Securities | | $ | 13,965,910 | | | $ | 1,526,099,647 | | | $ | — | | | $ | 1,540,065,557 | |
| | | | | | | | | | | | | | | | |
| | | | |
| International Bond Opportunities ETF | | | | | | | | | | | | | | | | |
| | | Level 1
Quoted prices | | | Level 2
Other significant
observable inputs | | | Level 3
Significant
unobservable inputs | | | Total | |
Investments in Securities | |
Asset-Backed Securities | |
United States | | $ | — | | | $ | 4,835,665 | | | $ | 1,699,878 | | | $ | 6,535,543 | |
Collateralized Mortgage Obligations | |
European Union | | | — | | | | 211,146 | | | | — | | | | 211,146 | |
United States | | | — | | | | 4,715,347 | | | | 154,490 | | | | 4,869,837 | |
United Kingdom | | | — | | | | 248,015 | | | | — | | | | 248,015 | |
| | | | | | | | | | | | | | | | |
Total Collateralized Mortgage Obligations | | | — | | | | 5,174,508 | | | | 154,490 | | | | 5,328,998 | |
| | | | | | | | | | | | | | | | |
Commercial Mortgage-Backed Securities | |
United States | | | — | | | | 4,210,176 | | | | 2,040,140 | | | | 6,250,316 | |
Common Stocks | | | 97,287 | | | | — | | | | — | | | | 97,287 | |
Corporate Bonds | | | — | | | | 136,008,665 | | | | — | | | | 136,008,665 | |
Foreign Government Securities | | | — | | | | 78,887,613 | | | | — | | | | 78,887,613 | |
Supranational | | | — | | | | 218,063 | | | | — | | | | 218,063 | |
Warrants | | | — | | | | — | | | | 222 | | | | 222 | |
Short-Term Investments | |
Investment Companies | | | 12,234,929 | | | | — | | | | — | | | | 12,234,929 | |
| | | | | | | | | | | | | | | | |
Total Investments in Securities | | $ | 12,332,216 | | | $ | 229,334,690 | | | $ | 3,894,730 | | | $ | 245,561,636 | |
| | | | | | | | | | | | | | | | |
Appreciation in Other Financial Instruments | |
Forward Foreign Currency Exchange Contracts | | $ | — | | | $ | 1,379,196 | | | $ | — | | | $ | 1,379,196 | |
Futures Contracts | | | 478,997 | | | | — | | | | — | | | | 478,997 | |
Swaps | | | — | | | | 272,634 | | | | — | | | | 272,634 | |
Depreciation in Other Financial Instruments | |
Forward Foreign Currency Exchange Contracts | | | — | | | | (1,191,509 | ) | | | — | | | | (1,191,509 | ) |
Futures Contracts | | | (193,716 | ) | | | — | | | | — | | | | (193,716 | ) |
Swaps | | | — | | | | (93,585 | ) | | | — | | | | (93,585 | ) |
| | | | | | | | | | | | | | | | |
Total Net Appreciation/Depreciation in Other Financial Instruments | | $ | 285,281 | | | $ | 366,736 | | | $ | — | | | $ | 652,017 | |
| | | | | | | | | | | | | | | | |
| | | | | | |
| | | |
| 350 | | | | J.P. MORGAN EXCHANGE-TRADED FUNDS | | FEBRUARY 28, 2021 |
| | | | | | | | | | | | | | | | |
| Municipal ETF | | | | | | | | | | | | | | | | |
| | | Level 1
Quoted prices | | | Level 2
Other significant
observable inputs | | | Level 3
Significant
unobservable inputs | | | Total | |
Total Investments in Securities (a) | | $ | — | | | $ | 74,939,329 | | | $ | — | | | $ | 74,939,329 | |
| | | | | | | | | | | | | | | | |
| | | | |
| U.S. Aggregate Bond ETF | | | | | | | | | | | | | | | | |
| | | Level 1
Quoted prices | | | Level 2
Other significant
observable inputs | | | Level 3
Significant
unobservable inputs | | | Total | |
Investments in Securities | | | | | | | | | |
Asset-Backed Securities | | $ | — | | | $ | 2,679,194 | | | $ | — | | | $ | 2,679,194 | |
Commercial Mortgage-Backed Securities | | | — | | | | 17,624,085 | | | | 420,394 | | | | 18,044,479 | |
Corporate Bonds | | | — | | | | 218,625,236 | | | | — | | | | 218,625,236 | |
Foreign Government Securities | | | — | | | | 15,677,289 | | | | — | | | | 15,677,289 | |
Mortgage-Backed Securities | | | — | | | | 225,101,992 | | | | — | | | | 225,101,992 | |
Municipal Bonds | | | — | | | | 4,990,455 | | | | — | | | | 4,990,455 | |
Supranational | | | — | | | | 11,969,256 | | | | — | | | | 11,969,256 | |
U.S. Government Agency Securities | | | — | | | | 13,341,448 | | | | — | | | | 13,341,448 | |
U.S. Treasury Obligations | | | — | | | | 305,744,143 | | | | — | | | | 305,744,143 | |
Short-Term Investments | | | | | | | | | |
Investment Companies | | | 5,811,837 | | | | — | | | | — | | | | 5,811,837 | |
Investment of Cash Collateral from Securities Loaned | | | 19,365,355 | | | | — | | | | — | | | | 19,365,355 | |
| | | | | | | | | | | | | | | | |
Total Short-Term Investments | | | 25,177,192 | | | | — | | | | — | | | | 25,177,192 | |
| | | | | | | | | | | | | | | | |
Total Investments in Securities | | $ | 25,177,192 | | | $ | 815,753,098 | | | $ | 420,394 | | | $ | 841,350,684 | |
| | | | | | | | | | | | | | | | |
| | | | |
| Ultra-Short Income ETF | | | | | | | | | | | | | | | | |
| | | Level 1
Quoted prices | | | Level 2
Other significant
observable inputs | | | Level 3
Significant
unobservable inputs | | | Total | |
Investments in Securities | | | | | | | | | |
Asset-Backed Securities | | $ | — | | | $ | 1,871,994,750 | | | $ | 285,921 | | | $ | 1,872,280,671 | |
Certificates of Deposit | | | — | | | | 40,324,378 | | | | — | | | | 40,324,378 | |
Commercial Mortgage-Backed Securities | | | — | | | | 364,512,236 | | | | 9,442,948 | | | | 373,955,184 | |
Corporate Bonds | | | — | | | | 9,632,040,447 | | | | — | | | | 9,632,040,447 | |
Foreign Government Securities | | | — | | | | 28,959,134 | | | | — | | | | 28,959,134 | |
U.S. Treasury Obligations | | | — | | | | 214,091,437 | | | | — | | | | 214,091,437 | |
Short-Term Investments | | | | | | | | | |
Certificates of Deposit | | | — | | | | 1,209,085,635 | | | | — | | | | 1,209,085,635 | |
Commercial Paper | | | — | | | | 2,178,403,280 | | | | — | | | | 2,178,403,280 | |
Investment Companies | | | 763,604,992 | | | | — | | | | — | | | | 763,604,992 | |
Investment of Cash Collateral from Securities Loaned | | | 38,378,955 | | | | — | | | | — | | | | 38,378,955 | |
Repurchase Agreements | | | — | | | | 100,000,000 | | | | — | | | | 100,000,000 | |
| | | | | | | | | | | | | | | | |
Total Short-Term Investments | | | 801,983,947 | | | | 3,487,488,915 | | | | — | | | | 4,289,472,862 | |
| | | | | | | | | | | | | | | | |
Total Investments in Securities | | $ | 801,983,947 | | | $ | 15,639,411,297 | | | $ | 9,728,869 | | | $ | 16,451,124,113 | |
| | | | | | | | | | | | | | | | |
Appreciation in Other Financial Instruments | | | | | | | | | | | | | | | | |
Futures Contracts | | $ | 232,095 | | | $ | — | | | $ | — | | | $ | 232,095 | |
| | | | | | �� | | | | | | | | | | |
| | | | | | | | |
| | | |
| FEBRUARY 28, 2021 | | J.P. MORGAN EXCHANGE-TRADED FUNDS | | | | | 351 | |
NOTES TO FINANCIAL STATEMENTS
AS OF FEBRUARY 28, 2021 (continued)
| | | | | | | | | | | | | | | | |
| Ultra-Short Municipal Income ETF | | | | | | | | | | | | | | | | |
| | | Level 1
Quoted prices | | | Level 2
Other significant
observable inputs | | | Level 3
Significant
unobservable inputs | | | Total | |
Investments in Securities | |
Municipal Bonds | | $ | — | | | $ | 1,247,629,533 | | | $ | — | | | $ | 1,247,629,533 | |
Short-Term Investments | |
Investment Companies | | | 139,089,852 | | | | — | | | | — | | | | 139,089,852 | |
| | | | | | | | | | | | | | | | |
Total Investments in Securities | | $ | 139,089,852 | | | $ | 1,247,629,533 | | | $ | — | | | $ | 1,386,719,385 | |
| | | | | | | | | | | | | | | | |
|
| USD Emerging Markets Sovereign Bond ETF | |
| | | Level 1
Quoted prices | | | Level 2
Other significant
observable inputs | | | Level 3
Significant
unobservable inputs | | | Total | |
Investments in Securities | | | | | | | | | |
Corporate Bonds | | $ | — | | | $ | 8,520,495 | | | $ | — | | | $ | 8,520,495 | |
Foreign Government Securities | | | — | | | | 73,484,659 | | | | — | | | | 73,484,659 | |
Short-Term Investments | | | | | | | | | |
Investment Companies | | | 776,784 | | | | — | | | | — | | | | 776,784 | |
Investment of Cash Collateral from Securities Loaned | | | 1,878,630 | | | | — | | | | — | | | | 1,878,630 | |
| | | | | | | | | | | | | | | | |
Total Short-Term Investments | | | 2,655,414 | | | | — | | | | — | | | | 2,655,414 | |
| | | | | | | | | | | | | | | | |
Total Investments in Securities | | $ | 2,655,414 | | | $ | 82,005,154 | | | $ | — | | | $ | 84,660,568 | |
| | | | | | | | | | | | | | | | |
| (a) | Please refer to the SOI for specifics of portfolio holdings. |
There were no significant transfers into or out of level 3 for the year ended February 28, 2021 for BetaBuilders 1-5 Year U.S. Aggregate Bond ETF.
The following is a summary of investments for which significant unobservable inputs (level 3) were used in determining fair value:
| | | | | | | | | | | | | | | | | | | | | | | | | | | | | | | | | | | | |
| Core Plus Bond ETF | | Balance as of
February 29,
2020 | | | Realized
gain (loss) | | | Change in net
unrealized
appreciation
(depreciation) | | | Net accretion
(amortization) | | | Purchases1 | | | Sales2 | | | Transfers into Level 3 | | | Transfers
out
of Level 3 | | | Balance as of
February 28,
2021 | |
Investments in Securities: | | | | | | | | | | | | | | | | | | | | | | | | | | | | | | | | | | | | |
Asset-Backed Securities | | $ | 2,033,177 | | | $ | (24 | ) | | $ | 189,134 | | | $ | (465 | ) | | $ | 8,370,117 | | | $ | (890,433 | ) | | $ | — | | | $ | — | | | $ | 9,701,506 | |
Collateralized Mortgage Obligations | | | 691,915 | | | | — | | | | (15,296 | ) | | | (783 | ) | | | 1,791,524 | | | | (243,344 | ) | | | — | | | | — | | | | 2,224,016 | |
Commercial Mortgage-Backed Securities | | | 150,000 | | | | — | | | | (1,477 | ) | | | — | | | | — | | | | — | | | | — | | | | — | | | | 148,523 | |
Preferred Stocks — Internet & Direct Marketing Retail | | | — | | | | — | | | | 1,220 | | | | — | | | | 3,247 | | | | — | | | | — | | | | — | | | | 4,467 | |
Warrants — Diversified Telecommunication Services | | | — | | | | — | | | | 222 | | | | — | | | | — | | | | — | | | | — | | | | — | | | | 222 | |
Warrants — Media | | | — | | | | — | | | | — | | | | — | | | | 1 | | | | — | | | | — | | | | — | | | | 1 | |
| | | | | | | | | | | | | | | | | | | | | | | | | | | | | | | | | | | | |
Total | | $ | 2,875,092 | | | $ | (24 | ) | | $ | 173,803 | | | $ | (1,248 | ) | | $ | 10,164,889 | | | $ | (1,133,777 | ) | | $ | — | | | $ | — | | | $ | 12,078,735 | |
| | | | | | | | | | | | | | | | | | | | | | | | | | | | | | | | | | | | |
| | | | | | |
| | | |
| 352 | | | | J.P. MORGAN EXCHANGE-TRADED FUNDS | | FEBRUARY 28, 2021 |
| | | | | | | | | | | | | | | | | | | | | | | | | | | | | | | | | | | | |
International Bond
Opportunities ETF | | Balance as of
February 29,
2020 | | | Realized
gain (loss) | | | Change in net
unrealized
appreciation
(depreciation) | | | Net accretion
(amortization) | | | Purchases1 | | | Sales2 | | | Transfers
into Level 3 | | | Transfers
out
of Level 3 | | | Balance as of
February 28,
2021 | |
Investments in Securities: | | | | | | | | | | | | | | | | | | | | | | | | | | | | | | | | | | | | |
Asset-Backed Securities — Cayman Islands | | $ | 348,565 | | | $ | (24,080 | ) | | $ | 1,435 | | | $ | — | | | $ | — | | | $ | (325,920 | ) | | $ | — | | | $ | — | | | $ | — | |
Asset-Backed Securities — United States | | | 4,749,667 | | | | (1,230 | ) | | | (50,704 | ) | | | 492 | | | | — | | | | (2,998,347 | ) | | | — | | | | — | | | | 1,699,878 | |
Collateralized Mortgage Obligations — United States | | | 153,617 | | | | — | | | | 873 | | | | — | | | | — | | | | — | | | | — | | | | — | | | | 154,490 | |
Commercial Mortgage-Backed Securities — United States | | | 1,776,971 | | | | (20,339 | ) | | | (66,292 | ) | | | 1,774 | | | | 1,187,272 | | | | (982,886 | ) | | | 143,640 | | | | — | | | | 2,040,140 | |
Corporate Bonds — Luxembourg | | | 336,188 | | | | — | | | | (12,682 | ) | | | 127 | | | | — | | | | (323,633 | ) | | | — | | | | — | | | | — | |
Corporate Bonds — United States | | | — | (a) | | | 7,488 | | | | — | | | | — | | | | — | | | | (7,488 | ) | | | — | | | | — | | | | — | |
Warrants — United States | | | — | | | | — | | | | 222 | | | | — | | | | — | | | | — | | | | — | | | | — | | | | 222 | |
| | | | | | | | | | | | | | | | | | | | | | | | | | | | | | | | | | | | |
Total | | $ | 7,365,008 | | | $ | (38,161 | ) | | $ | (127,148 | ) | | $ | 2,393 | | | $ | 1,187,272 | | | $ | (4,638,274 | ) | | $ | 143,640 | | | $ | — | | | $ | 3,894,730 | |
| | | | | | | | | | | | | | | | | | | | | | | | | | | | | | | | | | | | |
| 1 | Purchases include all purchases of securities and securities received in corporate actions. |
| 2 | Sales include all sales of securities, maturities, paydowns and securities tendered in corporate actions. |
The changes in net unrealized appreciation (depreciation) attributable to securities owned at February 28, 2021, which were valued using significant unobservable inputs (level 3) were as follows:
| | | | |
| | | | |
Core Plus Bond ETF | | $ | 179,540 | |
International Bond Opportunities ETF | | | (84,138 | ) |
These amounts are included in Change in net unrealized appreciation/depreciation on investments in non-affiliates on the Statements of Operations.
There were no significant transfers into or out of level 3 for the year ended February 28, 2021 for International Bond Opportunities ETF.
The significant unobservable inputs used in the fair value measurement of the Funds’ investments are listed below. Generally, a change in the assumptions used in any input in isolation may be accompanied by a change in another input. Significant changes in any of the unobservable inputs may significantly impact the fair value measurement. The impact is based on the relationship between each unobservable input and the fair value measurement. Significant increases (decreases) in enterprise multiples may increase (decrease) the fair value measurement. Significant increases (decreases) in the discount for lack of marketability, liquidity discount, probability of default, yield and default rate may decrease (increase) the fair value measurement. A significant change in the discount rate or prepayment rate (Constant Prepayment Rate or PSA Prepayment Model) may decrease or increase the fair value measurement.
Core Plus Bond ETF
Quantitative Information about Level 3 Fair Value Measurements #
| | | | | | | | | | | | |
| | | Fair Value at
February 28, 2021 | | | Valuation Technique(s) | | Unobservable Input | | Range (Weighted Average) (a) | |
| | $ | 9,701,506 | | | Discounted Cash Flow | | Constant Prepayment Rate | | | 0.00% - 35.00% (10.81%) | |
| | | | | | | | Yield (Discount Rate of Cash Flows) | | | 1.67% - 5.24% (2.89%) | |
| | | | | | | | | | | | |
Asset-Backed Securities | | | 9,701,506 | | | | | | | | | |
| | | | | | | | | | | | |
| | | 2,224,016 | | | Discounted Cash Flow | | Constant Prepayment Rate | | | 100.00% (100.00%) | |
| | | | | | | | Constant Default Rate | | | 0.00% - 0.50% (0.19%) | |
| | | | | | | | Yield (Discount Rate of Cash Flows) | | | 1.29% - 1.57% (1.41%) | |
| | | | | | | | | | | | |
Collateralized Mortgage Obligations | | | 2,224,016 | | | | | | | | | |
| | | | | | | | | | | | |
| | | 148,523 | | | Discounted Cash Flow | | Yield (Discount Rate of Cash Flows) | | | 3.21% (3.21%) | |
| | | | | | | | | | | | |
Commercial Mortgage-Backed Securities | | | 148,523 | | | | | | | | | |
| | | | | | | | | | | | |
| | | 222 | | | Market Comparable Companies | | EBITDA Multiple (b) | | | 4.8x (4.8x) | |
| | | 1 | | | Pending Distribution Amount | | Expected Recovery | | | $0.01 ($0.01) | |
| | | | | | | | | | | | |
Warrants | | | 223 | | | | | | | | | |
| | | | | | | | | | | | |
Total | | $ | 12,074,268 | | | | | | | | | |
| | | | | | | | | | | | |
| | | | | | | | |
| | | |
| FEBRUARY 28, 2021 | | J.P. MORGAN EXCHANGE-TRADED FUNDS | | | | | 353 | |
NOTES TO FINANCIAL STATEMENTS
AS OF FEBRUARY 28, 2021 (continued)
| # | The table above does not include certain level 3 securities that are valued by brokers and Pricing Services. At February 28, 2021, the value of these investments was $4,467.The inputs for these securities are not readily available or cannot be reasonably estimated and are generally those inputs described in Note 2.A. |
| (a) | Unobservable inputs were weighted by the relative fair value of the instruments. |
| (b) | Represents amounts used when the reporting entity has determined that market participants would take into account such multiples when pricing the investments. |
International Bond Opportunities ETF
Quantitative Information about Level 3 Fair Value Measurements
| | | | | | | | | | | | |
| | | Fair Value at
February 28, 2021 | | | Valuation Technique(s) | | Unobservable Input | | Range (Weighted Average) (a) | |
| | $ | 1,699,878 | | | Discounted Cash Flow | | Constant Prepayment Rate | | | 0.00% - 35.00% (16.82%) | |
| | | | | | | | Constant Default Rate | | | 0.00% - 3.40% (0.76%) | |
| | | | | | | | Yield (Discount Rate of Cash Flows) | | | 1.30% - 4.11% (3.06%) | |
| | | | | | | | | | | | |
Asset-Backed Securities | | | 1,699,878 | | | | | | | | | |
| | | | | | | | | | | | |
| | | 154,490 | | | Discounted Cash Flow | | Constant Prepayment Rate | | | 20.00% (20.00%) | |
| | | | | | | | Constant Default Rate | | | 0.50% (0.50%) | |
| | | | | | | | Yield (Discount Rate of Cash Flows) | | | 3.35% (3.35%) | |
| | | | | | | | | | | | |
Collateralized Mortgage Obligations | | | 154,490 | | | | | | | | | |
| | | | | | | | | | | | |
| | | 2,040,140 | | | Discounted Cash Flow | | Constant Prepayment Rate | | | 0.00% - 100.00% (9.90%) | |
| | | | | | | | Constant Default Rate | | | 0.00% - 2.00% (0.20%) | |
| | | | | | | | Yield (Discount Rate of Cash Flows) | | | 2.01% - 199% (17.04%) | |
| | | | | | | | | | | | |
Commercial Mortgage-Backed Securities | | | 2,040,140 | | | | | | | | | |
| | | | | | | | | | | | |
| | | 222 | | | Market Comparable Companies | | EBITDA Multiple (b) | | | 4.8x (4.8x) | |
| | | | | | | | | | | | |
Warrants | | | 222 | | | | | | | | | |
| | | | | | | | | | | | |
Total | | $ | 3,894,730 | | | | | | | | | |
| | | | | | | | | | | | |
| (a) | Unobservable inputs were weighted by the relative fair value of the instruments. |
| (b) | Represents amounts used when the reporting entity has determined that market participants would take into account such multiples when pricing the investments. |
B. Restricted Securities — Certain securities held by the Funds may be subject to legal or contractual restrictions on resale. Restricted securities generally are resold in transactions exempt from registration under the Securities Act of 1933, as amended (the “Securities Act”). Disposal of these securities may involve time-consuming negotiations and expense. Prompt sale at the current valuation may be difficult and could adversely affect the NAVs of the Funds.
As of February 28, 2021, the Funds had no investments in restricted securities other than securities sold to the Funds under Rule 144A and/or Regulation S under the Securities Act.
C. Repurchase Agreements — Ultra-Short Income ETF may enter into repurchase agreement transactions that meet the credit guidelines of JPMIM. Repurchase agreements involve the purchase of securities subject to the seller’s agreement to repurchase the securities at a mutually agreed upon date and price. The Fund requires that the collateral received in a repurchase agreement transaction be transferred to a custodian in a manner sufficient to enable the Fund to obtain collateral in the event of a counterparty default. If the counterparty defaults and the fair value of the collateral declines, realization of the collateral by the Fund may be delayed or limited. Repurchase agreement collateral may be held in segregated accounts maintained by JPMorgan Chase Bank, N.A. (“JPMCB”), a wholly-owned subsidiary of JPMorgan.
The Fund’s repurchase agreements are not subject to master netting arrangements.
D. When-Issued Securities, Delayed Delivery Securities and Forward Commitments — Core Plus Bond ETF, International Bond Opportunities ETF, Municipal ETF, Ultra-Short Income ETF and Ultra-Short Municipal Income ETF purchased when-issued securities, including To Be Announced (“TBA”) securities, and entered into contracts to purchase or sell securities for a fixed price that may be settled a month or more after the trade date, or purchased delayed delivery securities which generally settle seven days after the trade date. When-issued securities are securities that have been authorized, but not issued in the market. A forward commitment involves entering into a contract to purchase or sell securities for a fixed price at a future date that may be settled a month or more after the trade date. A delayed delivery security is agreed upon in advance between the buyer and the seller of the security and is generally delivered beyond seven days of the agreed upon date. The purchase of securities on a when-issued, delayed delivery or forward commitment basis involves the risk that the value of the security to be purchased declines before the settlement date. The sale of securities on a forward commitment basis involves the risk that the value of the securities sold may increase before the settlement date.
| | | | | | |
| | | |
| 354 | | | | J.P. MORGAN EXCHANGE-TRADED FUNDS | | FEBRUARY 28, 2021 |
The Funds may be exposed to credit risk if the counterparty fails to perform under the terms of the transaction. Interest income for securities purchased on a when-issued, delayed delivery or forward commitment basis is not accrued until the settlement date.
International Bond Opportunities ETF may be required to post or receive collateral for delayed delivery securities in the form of cash or securities under a Master Securities Forward Transaction Agreement with the counterparties (each, an “MSFTA”). The collateral requirements are generally calculated by netting the mark-to-market amount for a Fund’s transactions under the MSFTA and comparing that amount to the value of the collateral pledged by a fund and the counterparty. Daily movement of cash collateral is subject to minimum threshold amounts. Collateral posted by a Fund is held in a segregated account at the Fund’s custodian bank and is included on the Statements of Assets and Liabilities as Restricted cash. Collateral received by the Funds is held in a separate segregated account maintained by JPMCB. These amounts are not reflected on the Funds’ Statements of Assets and Liabilities.
Core Plus Bond ETF, International Bond Opportunities ETF, Municipal ETF, Ultra-Short Income ETF and Ultra-Short Municipal Income ETF had when-issued securities, delayed delivery securities or forward commitments outstanding as of February 28, 2021, which are shown as a Receivable for Investment securities sold — delayed delivery securities and a Payable for Investment securities purchased — delayed delivery securities, respectively, on the Statements of Assets and Liabilities. The values of these securities held at February 28, 2021 are detailed on the SOIs.
E. Securities Lending — The Funds, except International Bond Opportunities ETF, are authorized to engage in securities lending in order to generate additional income. The Funds are able to lend to approved borrowers. Citibank N.A. (“Citibank”) serves as lending agent for the Funds, pursuant to a Securities Lending Agency Agreement (the “Securities Lending Agency Agreement”). Securities loaned are collateralized by cash equal to at least 100% of the market value plus accrued interest on the securities lent, which is invested in the Class IM Shares of the JPMorgan U.S. Government Money Market Fund and the Agency SL Class Shares of the JPMorgan Securities Lending Money Market Fund. The Funds retain loan fees and the interest on cash collateral investments but are required to pay the borrower a rebate for the use of cash collateral. In cases where the lent security is of high value to borrowers, there may be a negative rebate (i.e., a net payment from the borrower to the Funds). Upon termination of a loan, the Funds are required to return to the borrower an amount equal to the cash collateral, plus any rebate owed to the borrowers. The remaining maturities of the securities lending transactions are considered overnight and continuous. Loans are subject to termination by the Funds or the borrower at any time.
The net income earned on the securities lending (after payment of rebates and Citibank’s fee) is included on the Statements of Operations as Income from securities lending (net). The Funds also receive payments from the borrower during the period of the loan, equivalent to dividends and interest earned on the securities loaned, which are recorded as Dividend or Interest income, respectively, on the Statements of Operations.
Under the Securities Lending Agency Agreement, Citibank marks to market the loaned securities on a daily basis. In the event the cash received from the borrower is less than 102% of the value of the loaned securities (105% for loans of non-U.S. securities), Citibank requests additional cash from the borrower so as to maintain a collateralization level of at least 102% of the value of the loaned securities plus accrued interest (105% for loans of non-U.S. securities), subject to certain de minimis amounts.
The value of securities out on loan is recorded as an asset on the Statements of Assets and Liabilities. The value of the cash collateral received is recorded as a liability on the Statements of Assets and Liabilities and details of collateral investments are disclosed on the SOIs.
The Funds bear the risk of loss associated with the collateral investments and are not entitled to additional collateral from the borrower to cover any such losses. To the extent that the value of the collateral investments declines below the amount owed to a borrower, the Funds may incur losses that exceed the amount they earned on lending the security. Upon termination of a loan, the Funds may use leverage (borrow money) to repay the borrower for cash collateral posted if the Adviser does not believe that it is prudent to sell the collateral investments to fund the payment of this liability. Securities lending activity is subject to master netting arrangements.
The following table presents for each lending Fund, the value of the securities on loan with Citibank, net of amounts available for offset under the master netting arrangements and any related collateral received or posted by the Funds as of February 28, 2021.
| | | | | | | | | | | | |
| | | Investment Securities
on Loan, at Value,
Presented on the
Statements of Assets
and Liabilities | | | Cash Collateral
Posted by Borrower* | | | Net Amount Due
to Counterparty
(not less than zero) | |
BetaBuilders 1-5 Year U.S. Aggregate Bond ETF | | $ | 102,693 | | | $ | (102,693 | ) | | $ | — | |
U.S. Aggregate Bond ETF | | | 14,606,292 | | | | (14,606,292 | ) | | | — | |
Ultra-Short Income ETF | | | 37,357,448 | | | | (37,357,448 | ) | | | — | |
USD Emerging Markets Sovereign Bond ETF | | | 1,815,183 | | | | (1,815,183 | ) | | | — | |
| * | Collateral posted reflects the value of securities on loan and does not include any additional amounts received from the borrower. |
Securities lending also involves counterparty risks, including the risk that the loaned securities may not be returned in a timely manner or at all. Subject to certain conditions, Citibank has agreed to indemnify the Funds from losses resulting from a borrower’s failure to return a loaned security.
| | | | | | | | |
| | | |
| FEBRUARY 28, 2021 | | J.P. MORGAN EXCHANGE-TRADED FUNDS | | | | | 355 | |
NOTES TO FINANCIAL STATEMENTS
AS OF FEBRUARY 28, 2021 (continued)
JPMIM voluntarily waived management fees charged to the Funds to reduce the impact of the cash collateral investment in the JPMorgan U.S. Government Money Market Fund from 0.15% to 0.06%. For the year ended February 28, 2021, JPMIM waived fees associated with the Funds’ investment in the JPMorgan U.S. Government Money Market Fund as follows:
| | | | |
BetaBuilders 1-5 Year U.S. Aggregate Bond ETF | | $ | 83 | |
Core Plus Bond ETF | | | 3 | |
High Yield Research Enhanced ETF | | | 1,394 | |
U.S. Aggregate Bond ETF | | | 2,093 | |
Ultra-Short Income ETF | | | 5,043 | |
USD Emerging Markets Sovereign Bond ETF | | | 1,248 | |
The above waiver is included in the determination of earnings on cash collateral investment and in the calculation of Citibank’s compensation and is included on the Statements of Operations as Income from securities lending (net).
Corporate Bond Research Enhanced ETF, Municipal ETF and Ultra-Short Municipal Income ETF did not lend out any securities during the year ended February 28, 2021. Core Plus Bond ETF and High Yield Research Enhanced ETF did not have any securities out on loan at February 28, 2021.
F. Investment Transactions with Affiliates — The Funds invested in Underlying Funds which are advised by the Adviser. An issuer which is under common control with a Fund may be considered an affiliate. For the purposes of the financial statements, the Funds assume the issuers listed in the tables below to be affiliated issuers. Underlying Funds’ distributions may be reinvested into such Underlying Funds. Reinvestment amounts are included in the purchase cost amounts in the tables below.
BetaBuilders 1-5 Year U.S. Aggregate Bond ETF
| | | | | | | | | | | | | | | | | | | | | | | | | | | | | | | | | | | | |
| For the year ended February 28, 2021 | |
| Security Description | | Value at
February 29, 2020 | | | Purchases at Cost | | | Proceeds from Sales | | | Net
Realized
Gain
(Loss) | | | Change in
Unrealized
Appreciation/
(Depreciation) | | | Value at
February 28, 2021 | | | Shares at
February 28,
2021 | | | Dividend
Income | | | Capital Gain
Distributions | |
JPMorgan Securities Lending Money Market Fund Agency SL Class Shares (a) | | $ | — | | | $ | 60,000 | | | $ | 59,992 | | | $ | (8 | )* | | $ | — | | | $ | — | | | | — | | | $ | 15 | * | | $ | — | |
JPMorgan U.S. Government Money Market Fund Class IM Shares, 0.04% (a) (b) | | | — | | | | 3,307,213 | | | | 3,202,335 | | | | — | | | | — | | | | 104,878 | | | | 104,878 | | | | 252 | * | | | — | |
JPMorgan U.S. Government Money Market Fund Class Institutional Shares, 0.03% (a) (b) | | | 95,622 | | | | 15,591,629 | | | | 15,173,195 | | | | — | | | | — | | | | 514,056 | | | | 514,056 | | | | 176 | | | | — | |
| | | | | | | | | | | | | | | | | | | | | | | | | | | | | | | | | | | | |
Total | | $ | 95,622 | | | $ | 18,958,842 | | | $ | 18,435,522 | | | $ | (8 | ) | | $ | — | | | $ | 618,934 | | | | | | | $ | 443 | | | $ | — | |
| | | | | | | | | | | | | | | | | | | | | | | | | | | | | | | | | | | | |
|
| Core Plus Bond ETF | |
| For the year ended February 28, 2021 | |
| Security Description | | Value at
February 29, 2020 | | | Purchases at Cost | | | Proceeds from Sales | | | Net
Realized
Gain
(Loss) | | | Change in
Unrealized
Appreciation/
(Depreciation) | | | Value at
February 28, 2021 | | | Shares at
February 28,
2021 | | | Dividend
Income | | | Capital Gain
Distributions | |
JPMorgan U.S. Government Money Market Fund Class IM Shares (a) | | $ | — | | | $ | 111,875 | | | $ | 111,875 | | | $ | — | | | $ | — | | | $ | — | | | | — | | | $ | 8 | * | | $ | — | |
JPMorgan U.S. Government Money Market Fund Class Institutional Shares, 0.03% (a) (b) | | | 10,592,327 | | | | 119,929,182 | | | | 97,682,234 | | | | — | | | | — | | | | 32,839,275 | | | | 32,839,275 | | | | 19,517 | | | | — | |
| | | | | | | | | | | | | | | | | | | | | | | | | | | | | | | | | | | | |
Total | | $ | 10,592,327 | | | $ | 120,041,057 | | | $ | 97,794,109 | | | $ | — | | | $ | — | | | $ | 32,839,275 | | | | | | | $ | 19,525 | | | $ | — | |
| | | | | | | | | | | | | | | | | | | | | | | | | | | | | | | | | | | | |
| | | | | | |
| | | |
| 356 | | | | J.P. MORGAN EXCHANGE-TRADED FUNDS | | FEBRUARY 28, 2021 |
| | | | | | | | | | | | | | | | | | | | | | | | | | | | | | | | | | | | |
| Corporate Bond Research Enhanced ETF | |
| For the year ended February 28, 2021 | |
| Security Description | | Value at
February 29, 2020 | | | Purchases at Cost | | | Proceeds from Sales | | | Net
Realized
Gain
(Loss) | | | Change in
Unrealized
Appreciation/
(Depreciation) | | | Value at
February 28, 2021 | | | Shares at
February 28,
2021 | | | Dividend
Income | | | Capital Gain
Distributions | |
JPMorgan U.S. Government Money Market Fund Class Institutional Shares, 0.03% (a) (b) | | $ | 326,606 | | | $ | 12,179,600 | | | $ | 12,311,795 | | | $ | — | | | $ | — | | | $ | 194,411 | | | | 194,411 | | | $ | 661 | | | $ | — | |
| | | | | | | | | | | | | | | | | | | | | | | | | | | | | | | | | | | | |
|
| High Yield Research Enhanced ETF | |
| For the year ended February 28, 2021 | |
| Security Description | | Value at
February 29, 2020 | | | Purchases at Cost | | | Proceeds from Sales | | | Net
Realized
Gain
(Loss) | | | Change in
Unrealized
Appreciation/
(Depreciation) | | | Value at
February 28,
2021 | | | Shares at
February 28,
2021 | | | Dividend
Income | | | Capital Gain
Distributions | |
JPMorgan U.S. Government Money Market Fund Class IM Shares (a) | | $ | 2,675,130 | | | $ | 9,260,615 | | | $ | 11,935,745 | | | $ | — | | | $ | — | | | $ | — | | | | — | | | $ | 3,631 | * | | $ | — | |
JPMorgan U.S. Government Money Market Fund Class Institutional Shares, 0.03% (a) (b) | | | 1,006,572 | | | | 446,903,385 | | | | 433,944,047 | | | | — | | | | — | | | | 13,965,910 | | | | 13,965,910 | | | | 4,813 | | | | — | |
| | | | | | | | | | | | | | | | | | | | | | | | | | | | | | | | | | | | |
Total | | $ | 3,681,702 | | | $ | 456,164,000 | | | $ | 445,879,792 | | | $ | — | | | $ | — | | | $ | 13,965,910 | | | | | | | $ | 8,444 | | | $ | — | |
| | | | | | | | | | | | | | | | | | | | | | | | | | | | | | | | | | | | |
|
| International Bond Opportunities ETF | |
| For the year ended February 28, 2021 | |
| Security Description | | Value at
February 29, 2020 | | | Purchases at Cost | | | Proceeds from Sales | | | Net
Realized
Gain
(Loss) | | | Change in
Unrealized
Appreciation/
(Depreciation) | | | Value at
February 28,
2021 | | | Shares at
February 28,
2021 | | | Dividend
Income | | | Capital Gain
Distributions | |
JPMorgan U.S. Government Money Market Fund Class Institutional Shares, 0.03% (a) (b) | | $ | 2,920,684 | | | $ | 158,522,896 | | | $ | 149,208,651 | | | $ | — | | | $ | — | | | $ | 12,234,929 | | | | 12,234,929 | | | $ | 10,744 | | | $ | — | |
| | | | | | | | | | | | | | | | | | | | | | | | | | | | | | | | | | | | |
|
| Municipal ETF | |
| For the year ended February 28, 2021 | |
| Security Description | | Value at
February 29,
2020 | | | Purchases at Cost | | | Proceeds
from Sales | | | Net
Realized
Gain
(Loss) | | | Change in
Unrealized
Appreciation/
(Depreciation) | | | Value at
February 28,
2021 | | | Shares at
February 28,
2021 | | | Dividend
Income | | | Capital Gain
Distributions | |
JPMorgan Institutional Tax Free Money Market Fund Class IM Shares (a) | | $ | 5,501,376 | | | $ | 52,209,326 | | | $ | 57,709,128 | | | $ | (1,560 | ) | | $ | (14 | ) | | $ | — | | | | — | | | $ | 5,944 | | | $ | 3 | |
| | | | | | | | | | | | | | | | | | | | | | | | | | | | | | | | | | | | |
| | | | | | | | |
| | | |
| FEBRUARY 28, 2021 | | J.P. MORGAN EXCHANGE-TRADED FUNDS | | | | | 357 | |
NOTES TO FINANCIAL STATEMENTS
AS OF FEBRUARY 28, 2021 (continued)
| | | | | | | | | | | | | | | | | | | | | | | | | | | | | | | | | | | | |
| U.S. Aggregate Bond ETF | |
| For the year ended February 28, 2021 | |
| Security Description | | Value at
February 29,
2020 | | | Purchases at Cost | | | Proceeds
from Sales | | | Net
Realized
Gain
(Loss) | | | Change in
Unrealized
Appreciation/
(Depreciation) | | | Value at
February 28,
2021 | | | Shares at
February 28,
2021 | | | Dividend
Income | | | Capital Gain
Distributions | |
JPMorgan Securities Lending Money Market Fund Agency SL Class Shares, 0.14% (a) (b) | | $ | — | | | $ | 26,500,000 | | | $ | 8,000,000 | | | $ | (700 | ) | | $ | — | | | $ | 18,499,300 | | | | 18,497,450 | | | $ | 5,601 | * | | $ | — | |
JPMorgan U.S. Government Money Market Fund Class IM Shares, 0.04% (a) (b) | | | — | | | | 71,595,938 | | | | 70,729,883 | | | | — | | | | — | | | | 866,055 | | | | 866,055 | | | | 6,135 | * | | | — | |
JPMorgan U.S. Government Money Market Fund Class Institutional Shares, 0.03% (a) (b) | | | 1,208,867 | | | | 161,604,437 | | | | 157,001,467 | | | | — | | | | — | | | | 5,811,837 | | | | 5,811,837 | | | | 2,552 | | | | — | |
| | | | | | | | | | | | | | | | | | | | | | | | | | | | | | | | | | | | |
Total | | $ | 1,208,867 | | | $ | 259,700,375 | | | $ | 235,731,350 | | | $ | (700 | ) | | $ | — | | | $ | 25,177,192 | | | | | | | $ | 14,288 | | | $ | — | |
| | | | | | | | | | | | | | | | | | | | | | | | | | | | | | | | | | | | |
|
| Ultra-Short Income ETF | |
| For the year ended February 28, 2021 | |
| Security Description | | Value at
February 29,
2020 | | | Purchases at Cost | | | Proceeds from
Sales | | | Net
Realized
Gain
(Loss) | | | Change in
Unrealized
Appreciation/
(Depreciation) | | | Value at
February 28,
2021 | | | Shares at
February 28,
2021 | | | Dividend
Income | | | Capital Gain
Distributions | |
JPMorgan Securities Lending Money Market Fund Agency SL Class Shares, 0.14% (a) (b) | | $ | 1,000,000 | | | $ | 308,000,000 | | | $ | 276,250,000 | | | $ | (14,545 | )* | | $ | — | | | $ | 32,735,455 | | | | 32,732,182 | | | $ | 104,784 | * | | $ | — | |
JPMorgan U.S. Government Money Market Fund Class IM Shares, 0.04% (a) (b) | | | 1,286,200 | | | | 332,444,019 | | | | 328,086,719 | | | | — | | | | — | | | | 5,643,500 | | | | 5,643,500 | | | | 11,663 | * | | | — | |
JPMorgan U.S. Government Money Market Fund Class Institutional Shares, 0.03% (a) (b) | | | 667,817,128 | | | | 10,459,550,809 | | | | 10,363,762,945 | | | | — | | | | — | | | | 763,604,992 | | | | 763,604,992 | | | | 1,283,035 | | | | — | |
| | | | | | | | | | | | | | | | | | | | | | | | | | | | | | | | | | | | |
Total | | $ | 670,103,328 | | | $ | 11,099,994,828 | | | $ | 10,968,099,664 | | | $ | (14,545 | ) | | $ | — | | | $ | 801,983,947 | | | | | | | $ | 1,399,482 | | | $ | — | |
| | | | | | | | | | | | | | | | | | | | | | | | | | | | | | | | | | | | |
|
| Ultra-Short Municipal Income ETF | |
| For the year ended February 28, 2021 | |
| Security Description | | Value at
February 29,
2020 | | | Purchases at Cost | | | Proceeds
from Sales | | | Net
Realized
Gain
(Loss) | | | Change in
Unrealized
Appreciation/
(Depreciation) | | | Value at
February 28,
2021 | | | Shares at
February 28,
2021 | | | Dividend
Income | | | Capital Gain
Distributions | |
JPMorgan Institutional Tax Free Money Market Fund Class IM Shares, 0.03% (a) (b) | | $ | 8,637,248 | | | $ | 1,070,994,946 | | | $ | 940,523,977 | | | $ | (7,802 | ) | | $ | (10,563 | ) | | $ | 139,089,852 | | | | 139,020,341 | | | $ | 76,628 | | | $ | 178 | |
| | | | | | | | | | | | | | | | | | | | | | | | | | | | | | | | | | | | |
| | | | | | |
| | | |
| 358 | | | | J.P. MORGAN EXCHANGE-TRADED FUNDS | | FEBRUARY 28, 2021 |
| | | | | | | | | | | | | | | | | | | | | | | | | | | | | | | | | | | | |
| USD Emerging Markets Sovereign Bond ETF | |
| For the year ended February 28, 2021 | |
| Security Description | | Value at
February 29,
2020 | | | Purchases at Cost | | | Proceeds from Sales | | | Net
Realized
Gain
(Loss) | | | Change in
Unrealized
Appreciation/
(Depreciation) | | | Value at
February 28,
2021 | | | Shares at
February 28,
2021 | | | Dividend
Income | | | Capital Gain
Distributions | |
JPMorgan U.S. Government Money Market Fund Class IM Shares, 0.04% (a) (b) | | $ | — | | | $ | 27,190,547 | | | $ | 25,311,917 | | | $ | — | | | $ | — | | | $ | 1,878,630 | | | | 1,878,630 | | | $ | 2,893 | * | | $ | — | |
JPMorgan U.S. Government Money Market Fund Class Institutional Shares, 0.03% (a) (b) | | | 355,735 | | | | 16,063,054 | | | | 15,642,005 | | | | — | | | | — | | | | 776,784 | | | | 776,784 | | | | 621 | | | | — | |
| | | | | | | | | | | | | | | | | | | | | | | | | | | | | | | | | | | | |
Total | | $ | 355,735 | | | $ | 43,253,601 | | | $ | 40,953,922 | | | $ | — | | | $ | — | | | $ | 2,655,414 | | | | | | | $ | 3,514 | | | $ | — | |
| | | | | | | | | | | | | | | | | | | | | | | | | | | | | | | | | | | | |
| (a) | Investment in an affiliated fund, which is registered under the Investment Company Act of 1940, as amended, and is advised by J.P. Morgan Investment Management Inc. |
| (b) | The rate shown is the current yield as of February 28, 2021. |
| * | Amount is included on the Statements of Operations as Income from securities lending (net) (after payments of rebates and Citibank’s fee). |
G. Foreign Currency Translation — The books and records of the Funds are maintained in U.S. dollars. Foreign currency amounts are translated into U.S. dollars at the prevailing exchange rates of such currencies against the U.S. dollar. The market value of investment securities and other assets and liabilities are translated at the exchange rate as of the valuation date. Purchases and sales of investment securities, income and expenses are translated at the exchange rate prevailing on the respective dates of such transactions.
The Funds do not isolate the effect of changes in foreign exchange rates from changes in market prices on securities held. Accordingly, such changes are included within Change in net unrealized appreciation/depreciation on investments in non-affiliates on the Statements of Operations.
Reported realized foreign currency gains and losses arise from the disposition of foreign currency, currency gains or losses realized between the trade and settlement dates on securities transactions, and the difference between the amounts of dividends, interest and foreign withholding taxes recorded on each Fund’s books on the transaction date and the U.S. dollar equivalent of the amounts actually received or paid. These reported realized foreign currency gains and losses are included in Net realized gain (loss) on foreign currency transactions on the Statements of Operations. Unrealized foreign currency gains and losses arise from changes (due to changes in exchange rates) in the value of foreign currency and other assets and liabilities denominated in foreign currencies, which are held at year end and are included in Change in net unrealized appreciation/depreciation on foreign currency translations on the Statements of Operations.
H. Derivatives — The Funds used derivative instruments including options, futures contracts, forward foreign currency exchange contracts and swaps in connection with their respective investment strategies. Derivative instruments may be used as substitutes for securities in which the Funds can invest, to hedge portfolio investments or to generate income or gain to the Funds. Derivatives may also be used to manage duration, sector and yield curve exposures and credit and spread volatility.
The Funds may be subject to various risks from the use of derivatives, including the risk that changes in the value of a derivative may not correlate perfectly with the underlying asset, rate or index; counterparty credit risk related to derivatives counterparties’ failure to perform under contract terms; liquidity risk related to the potential lack of a liquid market for these contracts allowing a Fund to close out its position(s); and documentation risk relating to disagreement over contract terms. Investing in certain derivatives also results in a form of leverage and as such, the Funds’ risk of loss associated with these instruments may exceed their value, as recorded on the Statements of Assets and Liabilities.
The Funds are party to various derivative contracts governed by International Swaps and Derivatives Association master agreements (“ISDA agreements”). The Funds’ ISDA agreements, which are separately negotiated with each dealer counterparty, may contain provisions allowing, absent other considerations, a counterparty to exercise rights, to the extent not otherwise waived, against the Funds in the event the Funds’ net assets decline over time by a pre-determined percentage or fall below a pre-determined floor. The ISDA agreements may also contain provisions allowing, absent other conditions, the Funds to exercise rights, to the extent not otherwise waived, against a counterparty (e.g., decline in a counterparty’s credit rating below a specified level). Such rights for both a counterparty and the Funds often include the ability to terminate (i.e., close out) open contracts at prices which may favor a counterparty, which could have an adverse effect on the Funds. The ISDA agreements give the Funds and a counterparty the right, upon an event of default, to close out all transactions traded under such agreements and to net amounts owed or due across all transactions and offset such net payable or receivable against collateral posted to a segregated account by one party for the benefit of the other.
Counterparty credit risk may be mitigated to the extent a counterparty posts additional collateral for mark to market gains to the Funds.
Notes (1) — (4) below describe the various derivatives used by the Funds.
| | | | | | | | |
| | | |
| FEBRUARY 28, 2021 | | J.P. MORGAN EXCHANGE-TRADED FUNDS | | | | | 359 | |
NOTES TO FINANCIAL STATEMENTS
AS OF FEBRUARY 28, 2021 (continued)
(1). Options — Core Plus Bond ETF purchased and sold (“wrote”) put and call options on various instruments including futures and securities to manage and hedge interest rate risk within its portfolio and also to gain long or short exposure to the underlying instrument, index, currency or rate. A purchaser of a put option has the right, but not the obligation, to sell the underlying instrument at an agreed upon price (“strike price”) to the option seller. A purchaser of a call option has the right, but not the obligation, to purchase the underlying instrument at the strike price from the option seller.
Options Purchased — Premiums paid by the Fund for options purchased are included on the Statements of Assets and Liabilities as Options purchased. The option is adjusted daily to reflect the current market value of the option and the change is recorded as Change in net unrealized appreciation/depreciation on options purchased on the Statements of Operations. If the option is allowed to expire, the Fund will lose the entire premium they paid and record a realized loss for the premium amount. Premiums paid for options purchased which are exercised or closed are added to the amounts paid or offset against the proceeds on the underlying investment transaction to determine the realized gain (loss) or cost basis of the underlying investment.
(2). Futures Contracts — The Core Bond Plus ETF, Corporate Bond Research Enhanced ETF, International Bond Opportunities ETF and Ultra-Short Income ETF used treasury futures contracts to manage and hedge interest rate risk associated with portfolio investments. The Funds also purchased futures contracts to invest incoming cash in the market or sold futures in response to cash outflows, thereby simulating an invested position in the underlying index while maintaining a cash balance for liquidity.
Futures contracts provide for the delayed delivery of the underlying instrument at a fixed price or are settled for a cash amount based on the change in the value of the underlying instrument at a specific date in the future. Upon entering into a futures contract, the Funds are required to deposit with the broker, cash or securities in an amount equal to a certain percentage of the contract amount, which is referred to as the initial margin deposit. Subsequent payments, referred to as variation margin, are made or received by the Funds periodically and are based on changes in the market value of open futures contracts. Changes in the market value of open futures contracts are recorded as Change in net unrealized appreciation/depreciation on futures contracts on the Statements of Operations. Realized gains or losses, representing the difference between the value of the contract at the time it was opened and the value at the time it was closed, are reported on the Statements of Operations at the closing or expiration of the futures contract. Securities deposited as initial margin are designated on the SOIs, while cash deposited, which is considered restricted, is recorded on the Statements of Assets and Liabilities. A receivable from and/or a payable to brokers for the daily variation margin is also recorded on the Statements of Assets and Liabilities.
The use of futures contracts exposes the Funds to interest rate risk. The Funds may be subject to the risk that the change in the value of the futures contract may not correlate perfectly with the underlying instrument. Use of long futures contracts subjects the Funds to risk of loss in excess of the amounts shown on the Statements of Assets and Liabilities, up to the notional amount of the futures contracts. Use of short futures contracts subjects the Funds to unlimited risk of loss. The Funds may enter into futures contracts only on exchanges or boards of trade. The exchange or board of trade acts as the counterparty to each futures transaction; therefore, the Funds’ credit risk is limited to failure of the exchange or board of trade. Under some circumstances, futures exchanges may establish daily limits on the amount that the price of a futures contract can vary from the previous day’s settlement price, which could effectively prevent liquidation of positions.
The Funds’ futures contracts are not subject to master netting arrangements (the right to close out all transactions traded with a counterparty and net amounts owed or due across transactions).
(3). Forward Foreign Currency Exchange Contracts — Core Plus Bond ETF and International Bond Opportunities ETF are exposed to foreign currency risks associated with some or all of their portfolio investments and used forward foreign currency exchange contracts to hedge or manage certain of these exposures as part of an investment strategy. The Funds also bought forward foreign currency exchange contracts to gain exposure to currencies. Forward foreign currency exchange contracts represent obligations to purchase or sell foreign currency on a specified future date at a price fixed at the time the contracts are entered into. Non-deliverable forward foreign currency exchange contracts are settled with the counterparty in U.S. dollars without the delivery of the foreign currency.
The values of the forward foreign currency exchange contracts are adjusted daily based on the applicable exchange rate of the underlying currency. Changes in the value of these contracts are recorded as unrealized appreciation or depreciation until the contract settlement date. When the forward foreign currency exchange contract is closed, the Funds record a realized gain or loss equal to the difference between the value at the time the contract was opened and the value at the time it was closed. The Funds also record a realized gain or loss, upon settlement, when a forward foreign currency exchange contract offsets another forward foreign currency exchange contract with the same counterparty.
The Funds’ forward foreign currency exchange contracts are subject to master netting arrangements (the right to close out all transactions with a counterparty and net amounts owed or due across transactions).
The Funds may be required to post or receive collateral for non-deliverable forward foreign currency exchange contracts.
(4). Swaps — Core Plus Bond ETF and International Bond Opportunities ETF engaged in various swap transactions to manage credit and interest rate risks (e.g. duration, yield curve) within their respective portfolios. The Funds also used swaps as alternatives to direct investments. Swap transactions are contracts negotiated over-the-counter (“OTC swaps”) between a fund and a counterparty or are centrally cleared (“centrally cleared swaps”) through a central clearinghouse managed by a Futures Commission Merchant (“FCM”) that exchange investment cash flows, assets, foreign currencies or market-linked returns at specified, future intervals.
| | | | | | |
| | | |
| 360 | | | | J.P. MORGAN EXCHANGE-TRADED FUNDS | | FEBRUARY 28, 2021 |
Upfront payments made and/or received by a Fund are recorded as assets or liabilities, respectively, on the Statements of Assets and Liabilities and amortized over the term of the swap. The value of an OTC swap agreement is recorded as either an asset or a liability on the Statements of Assets and Liabilities at the beginning of the measurement period. Upon entering into a centrally cleared swap, the Funds are required to deposit with the FCM cash or securities, which is referred to as initial margin deposit. Securities deposited as initial margin are designated on the SOIs, while cash deposited, which is considered restricted, is recorded on the Statements of Assets and Liabilities. Daily changes in valuation of centrally cleared swaps, if any, are recorded as a variation margin receivable or payable on the Statements of Assets and Liabilities. The change in the value of swaps, including accruals of periodic amounts of interest to be paid or received on swaps, is reported as Change in net unrealized appreciation/depreciation on swaps on the Statements of Operations. A realized gain or loss is recorded upon payment or receipt of a periodic payment or payment made upon termination of a swap agreement.
The central clearinghouse acts as the counterparty to each centrally cleared swap transaction; therefore credit risk is limited to the failure of the clearinghouse.
The Funds’ OTC swap contracts are subject to master netting arrangements.
Credit Default Swaps
Core Plus Bond ETF and International Bond Opportunities ETF entered into credit default swaps to simulate long and/or short bond positions or to take an active long and/or short position with respect to the likelihood of a default or credit event by the issuer of the underlying reference obligation.
The underlying reference obligation may be a single issuer of corporate or sovereign debt, a basket of issuers or a credit index. A credit index is a list of credit instruments or exposures that reference a fixed number of obligors with shared characteristics that represents some part of the credit market as a whole. Index credit default swaps have standardized terms including a fixed spread and standard maturity dates. The composition of the obligations within a particular index changes periodically.
Credit default swaps involve one party, the protection buyer, making a stream of payments to another party, the protection seller, in exchange for the right to receive a contingent payment if there is a credit event related to the underlying reference obligation. In the event that the reference obligation matures prior to the termination date of the contract, a similar security will be substituted for the duration of the contract term. Credit events are defined under individual swap agreements and generally include bankruptcy, failure to pay, restructuring, repudiation/moratorium, obligation acceleration and obligation default.
If a credit event occurs, the Funds, as protection sellers, would be obligated to make a payment, which may be either: (i) a net cash settlement equal to the notional amount of the swap less the auction value of the reference obligation or (ii) the notional amount of the swap in exchange for the delivery of the reference obligation. Selling protection effectively adds leverage to a Fund’s portfolio up to the notional amount of swap agreements. The notional amount represents the maximum potential liability under a contract and is not reflected on the Statements of Assets and Liabilities. Potential liabilities under these contracts may be reduced by: the auction rates of the underlying reference obligations; upfront payments received at the inception of a swap; and net amounts received from credit default swaps purchased with the identical reference obligation.
Interest Rate Swaps
International Bond Opportunities ETF entered into interest rate swap contracts to manage fund exposure to interest rates or to either preserve or generate a return on a particular investment or portion of its portfolio. These are agreements between counterparties to exchange periodic interest payments based on interest rates. One cash flow stream will typically be a floating rate payment based upon a specified interest rate, while the other is typically based on a fixed interest rate.
| | | | | | | | |
| | | |
| FEBRUARY 28, 2021 | | J.P. MORGAN EXCHANGE-TRADED FUNDS | | | | | 361 | |
NOTES TO FINANCIAL STATEMENTS
AS OF FEBRUARY 28, 2021 (continued)
(5). Summary of Derivatives Information
The following tables present the value of derivatives held as of February 28, 2021 by their primary underlying risk exposure and respective location on the Statements of Assets and Liabilities:
| | | | | | | | | | | | | | | | |
| | | Core Plus
Bond ETF | | | Corporate
Bond Research
Enhanced ETF | | | International
Bond
Opportunities
ETF | | | Ultra-short
Income
ETF | |
Foreign Exchange Rate Risk Exposure: | | | | | | | | | | | | | | | | |
Unrealized Appreciation on Forward Foreign Currency Exchange Contracts | | $ | 20,120 | | | $ | — | | | $ | 1,379,196 | | | $ | — | |
Unrealized Depreciation on Forward Foreign Currency Exchange Contracts | | | (41,069 | ) | | | — | | | | (1,191,509 | ) | | | — | |
| | | | |
Interest Rate Risk Exposure: | | | | | | | | | | | | | | | | |
Unrealized Appreciation on Futures Contracts* | | | 14,549 | | | | 11,948 | | | | 478,997 | | | | 232,095 | |
Swaps at Value (Assets)** | | | — | | | | — | | | | 272,634 | | | | — | |
Unrealized Depreciation on Futures Contracts* | | | (20,673 | ) | | | (18,526 | ) | | | (193,716 | ) | | | — | |
| | | | |
Credit Risk Exposure: | | | | | | | | | | | | | | | | |
Swaps at Value (Assets)** | | | — | | | | — | | | | 150,064 | | | | — | |
Swaps at Value (Liabilities)** | | | — | | | | — | | | | (109,627 | ) | | | — | |
| | | | |
Net Fair Value of Derivative Contracts: | | | | | | | | | | | | | | | | |
Unrealized Appreciation (Depreciation) on Futures Contracts* | | | (6,124 | ) | | | (6,578 | ) | | | 285,281 | | | | 232,095 | |
Swaps at Value** | | | — | | | | — | | | | 313,071 | | | | — | |
Unrealized Appreciation (Depreciation) on Forward Foreign Currency Exchange Contracts | | | (20,949 | ) | | | — | | | | 187,687 | | | | — | |
| * | Includes cumulative appreciation/(depreciation) on futures contracts, if any, as reported on the SOIs. Only current day’s variation margin is reported within the Statements of Assets and Liabilities. |
| ** | Includes the fair value of centrally cleared swap contracts as reported on the SOIs. Only current day’s variation margin is reported within the Statements of Assets and Liabilities. |
| | | | | | |
| | | |
| 362 | | | | J.P. MORGAN EXCHANGE-TRADED FUNDS | | FEBRUARY 28, 2021 |
The following table presents the Fund’s gross derivative assets and liabilities by counterparty net of amounts available for offset under netting arrangements and any related collateral received or posted by the Fund as of February 28, 2021:
| | | | | | | | | | | | | | | | |
| | | International Bond Opportunities ETF | |
| Counterparty | | Gross Amount of
Derivative Assets Subject
to Netting Arrangements
Presented on the
Statements of Assets
and Liabilities (a) | | | Derivatives
Available
for offset | | | Collateral
Received | | | Net Amount
Due from
Counterparty
(not less
than zero) | |
Barclays Bank plc | | $ | 169,902 | | | $ | (138,399 | ) | | $ | — | | | $ | 31,503 | |
BNP Paribas | | | 488,292 | | | | (488,292 | ) | | | — | | | | — | |
Citibank, NA | | | 86,984 | | | | (86,984 | ) | | | — | | | | — | |
Goldman Sachs International | | | 110,830 | | | | (110,830 | ) | | | — | | | | — | |
HSBC Bank, NA | | | 4,307 | | | | — | | | | — | | | | 4,307 | |
Merrill Lynch International | | | 85,073 | | | | — | | | | — | | | | 85,073 | |
Morgan Stanley | | | 150,064 | | | | — | | | | — | | | | 150,064 | |
Royal Bank of Canada | | | 2,183 | | | | (2,183 | ) | | | — | | | | — | |
State Street Corp. | | | 56,878 | | | | — | | | | — | | | | 56,878 | |
TD Bank Financial Group | | | 374,747 | | | | (95,640 | ) | | | — | | | | 279,107 | |
| | | | | | | | | | | | | | | | |
Total | | $ | 1,529,260 | | | $ | (922,328 | ) | | $ | — | | | $ | 606,932 | |
| | | | | | | | | | | | | | | | |
| | | | | | | | | | | | | | | | |
| Counterparty | | Gross Amount of
Derivative Liabilities Subject
to Netting Arrangements
Presented on the
Statements of Assets
and Liabilities (a) | | | Derivatives
Available
for Offset | | | Collateral
Posted | | | Net Amount
Due to
Counterparty
(not less
than zero) | |
Barclays Bank plc | | $ | 138,399 | | | $ | (138,399 | ) | | $ | — | | | $ | — | |
BNP Paribas | | | 607,304 | | | | (488,292 | ) | | | — | | | | 119,012 | |
Citibank, NA | | | 203,664 | | | | (86,984 | ) | | | — | | | | 116,680 | |
Goldman Sachs International | | | 134,773 | | | | (110,830 | ) | | | — | | | | 23,943 | |
Royal Bank of Canada | | | 11,729 | | | | (2,183 | ) | | | — | | | | 9,546 | |
State Street Corp. | | | 95,640 | | | | (95,640 | ) | | | — | | | | — | |
| | | | | | | | | | | | | | | | |
Total | | $ | 1,191,509 | | | $ | (922,328 | ) | | $ | — | | | $ | 269,181 | |
| | | | | | | | | | | | | | | | |
| (a) | For financial reporting purposes, the Fund does not offset derivative assets and derivative liabilities subject to master netting arrangements on the Statements of Assets and Liabilities. |
| | | | | | | | |
| | | |
| FEBRUARY 28, 2021 | | J.P. MORGAN EXCHANGE-TRADED FUNDS | | | | | 363 | |
NOTES TO FINANCIAL STATEMENTS
AS OF FEBRUARY 28, 2021 (continued)
The following tables present the effect of derivatives on the Statements of Operations for the year ended February��28, 2021, by primary underlying risk exposure:
| | | | | | | | | | | | | | | | |
| | | Core Plus
Bond ETF | | | Corporate
Bond
Research
Enhanced
ETF | | | International
Bond
Opportunities
ETF | | | Ultra-Short
Income ETF | |
Realized Gain (Loss) on Derivatives Recognized as a Result From Operations: | |
Foreign Exchange Rate Risk Exposure: | | | | | | | | | | | | | | | | |
Forward Foreign Currency Exchange Contracts | | $ | — | | | $ | — | | | $ | (3,697,713 | ) | | $ | — | |
| | | | |
Interest Rate Risk Exposure: | | | | | | | | | | | | | | | | |
Futures Contracts | | | 302,138 | | | | (16,679 | ) | | | 1,635,300 | | | | 6,682,948 | |
Swap Contracts | | | — | | | | — | | | | (109,392 | ) | | | — | |
Options | | | (9,788 | ) | | | — | | | | — | | | | — | |
| | | | |
Credit Risk Exposure: | | | | | | | | | | | | | | | | |
Swap Contracts | | | 44,067 | | | | — | | | | 935,186 | | | | — | |
|
Net Change in Unrealized Appreciation (Depreciation) on Derivatives Recognized as a Result of Operations: | |
Foreign Exchange Rate Risk Exposure: | | | | | | | | | | | | | | | | |
Forward Foreign Currency Exchange Contracts | | | (20,949 | ) | | | — | | | | 267,938 | | | | — | |
| | | | |
Interest Rate Risk Exposure: | | | | | | | | | | | | | | | | |
Futures Contracts | | | (75,508 | ) | | | (9,098 | ) | | | 244,227 | | | | 427,077 | |
Swap Contracts | | | — | | | | — | | | | 322,121 | | | | — | |
| | | | |
Credit Risk Exposure: | | | | | | | | | | | | | | | | |
Swap Contracts | | | — | | | | — | | | | (191,238 | ) | | | — | |
Derivatives Volume
The table below discloses the volume of the Funds’ options, futures contracts, forward foreign currency exchange contracts and swaps activity during the year ended February 28, 2021. Please refer to the tables in the Summary of Derivatives Information for derivative-related gains and losses associated with volume activity:
| | | | | | | | | | | | | | | | |
| | | Core Plus
Bond ETF | | | Corporate Bond
Research
Enhanced ETF | | | International
Bond
Opportunities
ETF | | | Ultra-Short
Income ETF | |
Futures Contracts — Interest: | | | | | | | | | | | | | | | | |
Average Notional Balance Long | | $ | 8,687,232 | | | $ | 2,860,851 | | | $ | 22,155,861 | | | $ | 1,818,884,879 | (c) |
Average Notional Balance Short | | | 3,298,802 | | | | 2,830,207 | | | | 29,881,409 | | | | 495,386,110 | |
Ending Notional Balance Long | | | 9,854,968 | | | | 3,585,250 | | | | 14,136,865 | | | | — | |
Ending Notional Balance Short | | | 4,221,187 | | | | 4,063,953 | | | | 43,348,812 | | | | 44,605,750 | |
| | | | |
Forward Foreign Currency Exchange Contracts: | | | | | | | | | | | | | | | | |
Average Settlement Value Purchased | | | 2,159,212 | (a) | | | — | | | | 42,986,147 | | | | — | |
Average Settlement Value Sold | | | 633,261 | (a) | | | — | | | | 123,029,750 | | | | — | |
Ending Settlement Value Purchased | | | 2,159,212 | | | | — | | | | 151,060,365 | | | | — | |
Ending Settlement Value Sold | | | 633,261 | | | | — | | | | 290,209,596 | | | | — | |
| | | | |
Exchange-Traded Options: | | | | | | | | | | | | | | | | |
Average Number of Contracts Purchased | | | 122 | (b) | | | — | | | | — | | | | — | |
| | | | |
Credit Default Swaps: | | | | | | | | | | | | | | | | |
Average Notional Balance — Buy Protection | | | 11,550,000 | (b) | | | — | | | | 12,200,057 | | | | — | |
Ending Notional Balance — Buy Protection | | | — | | | | — | | | | 7,995,318 | | | | — | |
| | | | |
Interest Rate-Related Swaps: | | | | | | | | | | | | | | | | |
Average Notional Balance — Pays Fixed rate | | | — | | | | — | | | | 1,305,397 | | | | — | |
Average Notional Balance — Receives Fixed rate | | | — | | | | — | | | | 8,718,620 | (c) | | | — | |
Ending Notional Balance — Pays Fixed Rate | | | — | | | | — | | | | 6,129,184 | | | | — | |
| (a) | For the period February 1, 2021 through February 28, 2021. |
| (b) | For the period November 1, 2020 through November 30, 2020. |
| (c) | For the period March 1, 2020 through March 31, 2020. |
| | | | | | |
| | | |
| 364 | | | | J.P. MORGAN EXCHANGE-TRADED FUNDS | | FEBRUARY 28, 2021 |
The Funds may be required to post or receive collateral based on the net value of the Funds’ outstanding OTC swap contracts with the counterparty in the form of cash or securities. Daily movement of cash collateral is subject to minimum threshold amounts. Collateral posted by the Funds is held in a segregated account at the Funds’ custodian bank. The cash collateral is included on the Statements of Assets and Liabilities as Restricted cash for OTC derivatives. Collateral received by the Funds is held in a separate segregated account maintained by JPMCB, an affiliate of the Funds.
The Funds’ derivatives contracts held at February 28, 2021 are not accounted for as hedging instruments under GAAP.
I. Security Transactions and Investment Income — Investment transactions are accounted for on the trade date (the date the order to buy or sell is executed). Securities gains and losses are calculated on a specifically identified cost basis. Interest income is determined on the basis of coupon interest accrued using the effective interest method, which adjusts for amortization of premiums and accretion of discounts. Dividend income, net of foreign taxes withheld, if any, and distributions of net investment income and realized capital gains from the Underlying Funds, if any, are recorded on the ex-dividend date or when a Fund first learns of the dividend.
To the extent such information is publicly available, the Funds record distributions received in excess of income earned from underlying investments as a reduction of cost of investments and/or realized gain. Such amounts are based on estimates if actual amounts are not available and actual amounts of income, realized gain and return of capital may differ from the estimated amounts. The Funds adjust the estimated amounts of the components of distributions (and consequently their net investment income) as necessary, once the issuers provide information about the actual composition of the distributions.
J. Federal Income Taxes — Each Fund is treated as a separate taxable entity for Federal income tax purposes. Each Fund’s policy is to comply with the provisions of the Internal Revenue Code (the “Code”) applicable to regulated investment companies and to distribute to shareholders all of its distributable net investment income and net realized capital gains on investments. Accordingly, no provision for Federal income tax is necessary. Management has reviewed the Funds’ tax positions for all open tax years and has determined that as of February 28, 2021, no liability for Federal income tax is required in the Funds’ financial statements for net unrecognized tax benefits. However, management’s conclusions may be subject to future review based on changes in, or the interpretation of, the accounting standards or tax laws and regulations. Each Fund’s Federal tax returns for the prior three fiscal years, or since inception if shorter, remain subject to examination by the Internal Revenue Service.
K. Foreign Taxes — The Funds may be subject to foreign taxes on income, gains on investments or currency purchases/repatriation, a portion of which may be recoverable. The Funds will accrue such taxes and recoveries as applicable, based upon their current interpretation of tax rules and regulations that exist in the markets in which they invest. When a capital gains tax is determined to apply, the Funds record an estimated deferred tax liability in an amount that would be payable if the securities were disposed of on the valuation date.
L. Distributions to Shareholders — Distributions from net investment income, if any, are generally declared and paid at least monthly. Net realized capital gains, if any, are distributed by each Fund at least annually. The amount of distributions from net investment income and net realized capital gains is determined in accordance with Federal income tax regulations, which may differ from GAAP. To the extent these “book/tax” differences are permanent in nature (i.e., that they result from other than timing of recognition — “temporary differences”), such amounts are reclassified within the capital accounts based on their Federal tax basis treatment.
The following amounts were reclassified within the capital accounts:
| | | | | | | | | | | | |
| | | Paid-in-Capital | | | Accumulated
undistributed
(distributions
in excess of)
net investment
income | | | Accumulated
net realized
gains (losses) | |
BetaBuilders 1-5 Year U.S. Aggregate Bond ETF | | $ | — | | | $ | 37,575 | | | $ | (37,575) | |
Core Plus Bond ETF | | | (71 | ) | | | 7,573 | | | | (7,502 | ) |
Corporate Bond Research Enhanced ETF | | | (28 | ) | | | 1,152 | | | | (1,124 | ) |
High Yield Research Enhanced ETF | | | (5,664,504 | ) | | | 595,615 | | | | 5,068,889 | |
International Bond Opportunities ETF | | | (282,217 | ) | | | (2,155,987 | ) | | | 2,438,204 | |
Municipal ETF | | | 532 | | | | (1,237 | ) | | | 705 | |
U.S. Aggregate Bond ETF | | | 2,578,876 | | | | 546,682 | | | | (3,125,558 | ) |
Ultra-Short Income ETF | | | (74,493 | ) | | | 5,222,649 | | | | (5,148,156 | ) |
Ultra-Short Municipal Income ETF | | | 421 | | | | (7,051 | ) | | | 6,630 | |
USD Emerging Markets Sovereign Bond ETF | | | 93,457 | | | | 8,306 | | | | (101,763 | ) |
The reclassifications for the Funds relate primarily to callable bonds, foreign currency gains or losses, investments in swap contracts, redemptions in-kind and redesignation of distributions.
M. Recent Accounting Pronouncement — In March 2020, the FASB issued Accounting Standards Update No. 2020-04 (“ASU 2020-04”), Reference Rate Reform (Topic 848) – Facilitation of the Effects of Reference Rate Reform on Financial Reporting. ASU 2020-04 provides optional temporary financial reporting relief from the effect of certain types of contract modifications due to the planned discontinuation of the London Interbank Offered
| | | | | | | | |
| | | |
| FEBRUARY 28, 2021 | | J.P. MORGAN EXCHANGE-TRADED FUNDS | | | | | 365 | |
NOTES TO FINANCIAL STATEMENTS
AS OF FEBRUARY 28, 2021 (continued)
Rate (“LIBOR”) and other interbank-offered based reference rates as of the end of 2021. ASU 2020-04 became effective upon the issuance and its optional relief can be applied through December 31, 2022. Management is currently evaluating the impact, if any, to the Funds’ financial statements of applying ASU 2020-04.
3. Fees and Other Transactions with Affiliates
A. Management Fee - JPMIM manages the investments of each Fund pursuant to a Management Agreement. For such services, JPMIM is paid a fee which is accrued daily and paid no more frequently than monthly based on each Fund’s respective average daily net assets at the following rate:
| | | | |
BetaBuilders 1-5 Year U.S. Aggregate Bond ETF | | | 0.05 | % |
Core Plus Bond ETF | | | 0.40 | |
Corporate Bond Research Enhanced ETF | | | 0.14 | |
High Yield Research Enhanced ETF | | | 0.24 | |
International Bond Opportunities ETF | | | 0.50 | |
Municipal ETF | | | 0.24 | |
U.S. Aggregate Bond ETF | | | 0.07 | |
Ultra-Short Income ETF | | | 0.18 | |
Ultra-Short Municipal Income ETF | | | 0.18 | |
USD Emerging Markets Sovereign Bond ETF | | | 0.39 | |
Under each Management Agreement, JPMIM is responsible for substantially all expenses of each Fund, (including expenses of the Trust relating to each Fund), except for the management fees, payments under the Funds’ 12b-1 plan (if any), interest expenses, dividend and interest expenses related to short sales, taxes, acquired fund fees and expenses (other than fees for funds advised by the adviser and/or its affiliates), costs of holding shareholder meetings, and litigation and potential litigation and other extraordinary expenses not incurred in the ordinary course of each Fund’s business. Additionally, each Fund shall be responsible for its non-operating expenses, including brokerage commissions and fees and expenses associated with each Fund’s securities lending program, if applicable. For the avoidance of doubt, the Adviser’s payment of such expenses may be accomplished through a Fund’s payment of such expenses and a corresponding reduction in the fee payable to the Adviser, provided, however, that if the amount of expenses paid by a Fund exceeds the fee payable to the Adviser, the Adviser will reimburse that Fund for such amount.
B. Administration Fee — JPMIM provides administration services to the Funds. Pursuant to each Management Agreement, JPMIM is compensated as described in Note 3.A.
JPMCB serves as the Funds’ sub-administrator (the “Sub-administrator”). For its services as Sub-administrator, JPMCB receives a portion of the management fees payable to JPMIM.
C. Custodian, Accounting and Transfer Agent Fees — JPMCB provides custody, accounting and transfer agency services to the Funds. For performing these services, JPMIM pays JPMCB transaction and asset-based fees that vary according to the number of transactions and positions, plus out-of-pocket expenses.
Additionally, Authorized Participants generally pay transaction fees associated with the creation and redemption of Fund shares. These fees are paid to JPMIM to offset certain custodian charges that are covered by each Management Agreement.
Interest income earned on cash balances at the custodian, if any, is included in Interest income from affiliates on the Statements of Operations.
Interest expense paid to the custodian related to cash overdrafts, if any, is included in Interest expense to affiliates on the Statements of Operations.
D. Distribution Services — The Distributor or its agent distributes Creation Units for each Fund on an agency basis. The Distributor does not maintain a secondary market in shares of each Fund. JPMDS receives no fees for their distribution services under the distribution agreement with the Trust (the “Distribution Agreement”). Although the Trust does not pay any fees under the Distribution Agreement, JPMIM pays JPMDS for certain distribution related services.
E. Waivers and Reimbursements — The Funds may invest in one or more money market funds advised by the Adviser (affiliated money market funds). The fees for the affiliated money market funds are covered under each Management Agreement as described in Note 3.A.
F. Other — Certain officers of the Trust are affiliated with the Adviser, the Administrator and JPMDS. Such officers receive no compensation from the Funds for serving in their respective roles.
The Board designated and appointed a Chief Compliance Officer to the Funds pursuant to Rule 38a-1 under the 1940 Act. The fees associated with the office of the Chief Compliance Officer are paid for by JPMIM as described in Note 3.A.
During the year ended February 28, 2021, Core Plus Bond ETF, Corporate Bond Research Enhanced ETF, International Bond Opportunities ETF, Municipal ETF, Ultra-Short Income ETF and Ultra-Short Municipal Income ETF purchased securities from an underwriting syndicate in which the principal underwriter or members of the syndicate were affiliated with the Adviser.
The Securities and Exchange Commission (“SEC”) has granted an exemptive order permitting the Funds to engage in principal transactions with J.P. Morgan Securities LLC, an affiliated broker, involving taxable money market instruments, subject to certain conditions.
| | | | | | |
| | | |
| 366 | | | | J.P. MORGAN EXCHANGE-TRADED FUNDS | | FEBRUARY 28, 2021 |
4. Investment Transactions
During the year ended February 28, 2021, purchases and sales of investments (excluding short-term investments) were as follows:
| | | | | | | | | | | | | | | | |
| | | Purchases
(excluding
U.S. Government) | | | Sales
(excluding
U.S. Government) | | | Purchases
of U.S.
Government | | | Sales
of U.S.
Government | |
BetaBuilders 1-5 Year U.S. Aggregate Bond ETF | | $ | 18,060,961 | | | $ | 9,992,596 | | | $ | 13,675,718 | | | $ | 7,546,770 | |
Core Plus Bond ETF | | | 316,928,574 | | | | 240,065,081 | | | | 19,609,670 | | | | 12,320,521 | |
Corporate Bond Research Enhanced ETF | | | 27,401,530 | | | | 17,180,286 | | | | 895,961 | | | | 675,964 | |
High Yield Research Enhanced ETF | | | 556,799,149 | | | | 182,881,956 | | | | – | | | | – | |
International Bond Opportunities ETF | | | 293,839,424 | | | | 223,286,540 | | | | 6,610,555 | | | | 6,652,029 | |
Municipal ETF | | | 58,356,403 | | | | 31,428,445 | | | | – | | | | – | |
U.S. Aggregate Bond ETF | | | 453,380,729 | | | | 308,280,655 | | | | 159,776,923 | | | | 126,320,626 | |
Ultra-Short Income ETF | | | 12,644,744,436 | | | | 8,349,579,511 | | | | 427,203,059 | | | | 721,541,926 | |
Ultra-Short Municipal Income ETF | | | 1,097,350,821 | | | | 303,286,011 | | | | – | | | | – | |
USD Emerging Markets Sovereign Bond ETF | | | 68,110,295 | | | | 48,298,014 | | | | – | | | | – | |
For the year ended February 28, 2021, in-kind transactions associated with creations and redemptions were as follows:
| | | | | | | | |
| | | In-Kind
Creations | | | In-Kind
Redemptions | |
BetaBuilders 1-5 Year U.S. Aggregate Bond ETF | | $ | 7,733,111 | | | $ | — | |
Corporate Bond Research Enhanced ETF | | | 10,978,037 | | | | — | |
High Yield Research Enhanced ETF | | | 1,031,022,756 | | | | 38,219,470 | |
U.S. Aggregate Bond ETF | | | 155,255,074 | | | | 34,372,792 | |
USD Emerging Markets Sovereign Bond ETF | | | — | | | | 23,007,595 | |
5. Federal Income Tax Matters
For Federal income tax purposes, the estimated cost and unrealized appreciation (depreciation) in value of investments held at February 28, 2021 were as follows:
| | | | | | | | | | | | | | | | |
| | | Aggregate
Cost | | | Gross Unrealized
Appreciation | | | Gross
Unrealized
Depreciation | | | Net Unrealized
Appreciation
(Depreciation) | |
BetaBuilders 1-5 Year U.S. Aggregate Bond ETF | | $ | 58,867,378 | | | $ | 994,644 | | | $ | 158,269 | | | $ | 836,375 | |
Core Plus Bond ETF | | | 163,417,019 | | | | 2,606,369 | | | | 2,076,044 | | | | 530,325 | |
Corporate Bond Research Enhanced ETF | | | 53,325,638 | | | | 2,238,309 | | | | 595,582 | | | | 1,642,727 | |
High Yield Research Enhanced ETF | | | 1,540,057,719 | | | | 8,509,665 | | | | 8,501,827 | | | | 7,838 | |
International Bond Opportunities ETF | | | 246,514,919 | | | | 6,064,353 | | | | 6,231,597 | | | | (167,244 | ) |
Municipal ETF | | | 73,042,956 | | | | 2,264,497 | | | | 368,124 | | | | 1,896,373 | |
U.S. Aggregate Bond ETF | | | 838,808,427 | | | | 12,861,619 | | | | 10,319,362 | | | | 2,542,257 | |
Ultra-Short Income ETF | | | 16,388,379,715 | | | | 64,249,767 | | | | 1,273,274 | | | | 62,976,493 | |
Ultra-Short Municipal Income ETF | | | 1,384,140,148 | | | | 3,000,072 | | | | 420,835 | | | | 2,579,237 | |
USD Emerging Markets Sovereign Bond ETF | | | 82,570,721 | | | | 3,321,286 | | | | 1,231,439 | | | | 2,089,847 | |
The difference between book and tax basis appreciation (depreciation) on investments is primarily attributed to callable bonds, mark to market of futures contracts, mark to market of foreign currency gains and losses on assets and liabilities and wash sale loss deferrals.
| | | | | | | | |
| | | |
| FEBRUARY 28, 2021 | | J.P. MORGAN EXCHANGE-TRADED FUNDS | | | | | 367 | |
NOTES TO FINANCIAL STATEMENTS
AS OF FEBRUARY 28, 2021 (continued)
The tax character of distributions paid during the year ended February 28, 2021 was as follows:
| | | | | | | | | | | | | | | | |
| | | Ordinary
Income* | | | Net
Long-Term
Capital Gains | | | Tax
Exempt
Income | | | Total
Distributions
Paid | |
BetaBuilders 1-5 Year U.S. Aggregate Bond ETF | | $ | 743,237 | | | $ | 133,341 | | | $ | — | | | $ | 876,578 | |
Core Plus Bond ETF | | | 2,842,311 | | | | 276,529 | | | | — | | | | 3,118,840 | |
Corporate Bond Research Enhanced ETF | | | 1,373,612 | | | | 462,526 | | | | — | | | | 1,836,138 | |
High Yield Research Enhanced ETF | | | 10,520,966 | | | | 312,250 | | | | — | | | | 10,833,216 | |
International Bond Opportunities ETF | | | 4,888,166 | | | | — | | | | — | | | | 4,888,166 | |
Municipal ETF | | | 102,361 | | | | 70,457 | | | | 976,801 | | | | 1,149,619 | |
U.S. Aggregate Bond ETF | | | 11,822,079 | | | | 1,255,716 | | | | — | | | | 13,077,795 | |
Ultra-Short Income ETF | | | 148,089,858 | | �� | | — | | | | — | | | | 148,089,858 | |
Ultra-Short Municipal Income ETF | | | 11,550 | | | | — | | | | 3,464,901 | | | | 3,476,451 | |
USD Emerging Markets Sovereign Bond ETF | | | 3,496,716 | | | | — | | | | — | | | | 3,496,716 | |
| * | Short-term gain distributions are treated as ordinary income for income tax purposes. |
The tax character of distributions paid during the year ended February 29, 2020 was as follows:
| | | | | | | | | | | | | | | | |
| | | Ordinary
Income* | | | Net
Long-Term
Capital Gains | | | Tax Exempt
Income | | | Total
Distributions
Paid | |
BetaBuilders 1-5 Year U.S. Aggregate Bond ETF | | $ | 786,431 | | | $ | — | | | $ | — | | | $ | 786,431 | |
Core Plus Bond ETF | | | 1,106,186 | | | | 85,096 | | | | — | | | | 1,191,282 | |
Corporate Bond Research Enhanced ETF | | | 1,566,538 | | | | — | | | | — | | | | 1,566,538 | |
High Yield Research Enhanced ETF | | | 8,310,507 | | | | — | | | | — | | | | 8,310,507 | |
International Bond Opportunities ETF | | | 8,337,390 | | | | — | | | | — | | | | 8,337,390 | |
Municipal ETF | | | 561,565 | | | | — | | | | 852,229 | | | | 1,413,794 | |
U.S. Aggregate Bond ETF | | | 7,057,507 | | | | — | | | | — | | | | 7,057,507 | |
Ultra-Short Income ETF | | | 218,564,137 | | | | — | | | | — | | | | 218,564,137 | |
Ultra-Short Municipal Income ETF | | | 1,980 | | | | — | | | | 1,866,877 | | | | 1,868,857 | |
USD Emerging Markets Sovereign Bond ETF | | | 3,288,107 | | | | — | | | | — | | | | 3,288,107 | |
| * | Short-term gain distributions are treated as ordinary income for income tax purposes. |
As of February 28, 2021, the estimated components of net assets (excluding paid-in-capital) on a tax basis were as follows:
| | | | | | | | | | | | | | | | |
| | | Current
Distributable
Ordinary
Income | | | Current
Distributable
Long-Term
Capital Gain
(Tax Basis Capital
Loss Carryover) | | | Tax
Exempt
Income | | | Unrealized
Appreciation
(Depreciation) | |
BetaBuilders 1-5 Year U.S. Aggregate Bond ETF | | $ | 69,696 | | | $ | 69,436 | | | $ | — | | | $ | 836,375 | |
Core Plus Bond ETF | | | 384,952 | | | | 295,433 | | | | — | | | | 520,872 | |
Corporate Bond Research Enhanced ETF | | | 119,729 | | | | 294,488 | | | | — | | | | 1,642,727 | |
High Yield Research Enhanced ETF | | | 5,320,692 | | | | (2,754,087 | ) | | | — | | | | 7,838 | |
International Bond Opportunities ETF | | | 573,868 | | | | (2,713,878 | ) | | | — | | | | (366,648 | ) |
Municipal ETF | | | — | | | | 183,079 | | | | 113,062 | | | | 1,896,373 | |
U.S. Aggregate Bond ETF | | | 1,027,719 | | | | 1,330,184 | | | | — | | | | 2,542,257 | |
Ultra-Short Income ETF | | | 20,537,169 | | | | — | | | | — | | | | 62,976,493 | |
Ultra-Short Municipal Income ETF | | | — | | | | (17,596 | ) | | | 612,029 | | | | 2,579,237 | |
USD Emerging Markets Sovereign Bond ETF | | | 324,526 | | | | (4,166,103 | ) | | | — | | | | 2,089,847 | |
The cumulative timing differences primarily consist of callable bonds, mark to market of futures contracts, mark to market of foreign currency gains and losses on assets and liabilities, post-October capital loss deferrals, straddle loss deferrals and wash sale loss deferrals.
| | | | | | |
| | | |
| 368 | | | | J.P. MORGAN EXCHANGE-TRADED FUNDS | | FEBRUARY 28, 2021 |
As of February 28, 2021, the following Funds had net capital loss carryforwards which are available to offset future realized gains:
| | | | | | | | |
| | | Capital Loss Carryforward Character | |
| | | Short-Term | | | Long-Term | |
High Yield Research Enhanced ETF | | $ | 2,301,893 | | | $ | 452,194 | |
International Bond Opportunities ETF | | | 633,526 | | | | 2,080,352 | |
Ultra-Short Municipal Income ETF | | | 17,596 | | | | — | |
USD Emerging Markets Sovereign Bond ETF | | | 2,019,098 | | | | 2,147,005 | |
Specified ordinary losses and net capital losses incurred after October 31, and within the taxable year are deemed to arise on the first business day of the Funds’ next taxable year. For the year ended February 28, 2021, the Funds deferred to March 1, 2021 the following specified ordinary losses and net capital losses of:
| | | | | | | | | | | | |
| | | Net Capital Losses | | | Specified
Ordinary
Losses | |
| | | Short-Term | | | Long-Term | |
Core Plus Bond ETF | | $ | — | | | $ | — | | | $ | 20,949 | |
International Bond Opportunities ETF | | | — | | | | — | | | | 212,078 | |
Ultra-Short Municipal Income ETF | | | 30,945 | | | | 2,219 | | | | — | |
During the year ended February 28, 2021, the following Funds utilized capital loss carryforwards as follows:
| | | | | | | | |
| | | Capital Loss Utilized | |
| | | Short-Term | | | Long-Term | |
International Bond Opportunities ETF | | $ | 326,175 | | | $ | 102,355 | |
6. Capital Share Transactions
The Trust issues and redeems shares of the Funds only in Creation Units through the Distributor at NAV. Capital shares transactions detail can be found in the Statements of Changes in Net Assets.
Shares of the Funds may only be purchased or redeemed by Authorized Participants. Such Authorized Participants may from time to time hold, of record or beneficially, a substantial percentage of the Funds’ shares outstanding and act as executing or clearing broker for investment transactions on behalf of the Funds. An Authorized Participant is either (1) a “Participating Party” or other participant in the clearing process through the Continuous Net Settlement System of the National Securities Clearing Corporation (“NSCC”); or (2) a DTC Participant; which, in either case, must have executed an agreement with the Distributor.
Creation Units of a Fund may be created in advance of receipt by the Trust of all or a portion of the applicable basket of fixed income securities and other instruments (“Deposit Instruments”) and cash as described in the Funds’ registration statement. In these instances, the initial Deposit Instruments and cash must be deposited in an amount equal to the sum of the cash amount, plus at least 105%, for BetaBuilders 1-5 Year U.S. Aggregate Bond ETF, Corporate Bond Research Enhanced ETF, International Bond Opportunities ETF, High Yield Research Enhanced ETF, U.S. Aggregate Bond ETF, Ultra-Short Income ETF and USD Emerging Markets Sovereign Bond ETF, of the market value of undelivered Deposit Instruments. A transaction fee may be imposed to offset transfer and other transaction costs associated with the purchase or redemption of Creation Units.
Authorized Participants transacting in Creation Units for cash may also pay a variable fee to compensate the relevant fund for market impact expenses relating to investing in portfolio securities. Such variable fees, if any, are included in “Proceeds from shares issued” in the Statements of Changes in Net Assets.
7. Risks, Concentrations and Indemnifications
In the normal course of business, the Funds enter into contracts that contain a variety of representations which provide general indemnifications. Each Fund’s maximum exposure under these arrangements is unknown. The amount of exposure would depend on future claims that may be brought against each Fund. However, based on experience, the Funds expect the risk of loss to be remote.
As of February 28, 2021, JPMorgan SmartRetirement Funds and SmartRetirement Blend Funds, which are affiliated funds of funds, owned in the aggregate, shares representing more than 10% of the net assets of the Funds as follows:
| | | | | | | | |
| | | JPMorgan
SmartRetirement
Funds | | | JPMorgan
SmartRetirement
Blend Funds | |
High Yield Research Enhanced ETF | | | 50.1 | % | | | 30.5 | % |
U.S. Aggregate Bond ETF | | | — | | | | 19.8 | |
Significant shareholder transactions by these shareholders may impact the Funds’ performance and liquidity.
| | | | | | | | |
| | | |
| FEBRUARY 28, 2021 | | J.P. MORGAN EXCHANGE-TRADED FUNDS | | | | | 369 | |
NOTES TO FINANCIAL STATEMENTS
AS OF FEBRUARY 28, 2021 (continued)
As of February 28, 2021, the Adviser owns shares representing more than 10% of net assets of the following Funds:
| | | | |
| | | % of Ownership | |
BetaBuilders 1-5 Year U.S. Aggregate Bond ETF | | | 43 | % |
Corporate Bond Research Enhanced ETF | | | 49 | |
Municipal ETF | | | 33 | |
USD Emerging Markets Sovereign Bond ETF | | | 59 | |
Significant shareholder transactions by the Adviser may impact the Funds’ performance.
Core Plus Bond ETF, International Bond Opportunities ETF, U.S. Aggregate Bond ETF and Ultra-Short Income ETF are subject to risks associated with securities with contractual cash flows including asset-backed and mortgage-related securities such as collateralized mortgage obligations, mortgage pass-through securities and commercial mortgage-backed securities, including securities backed by sub-prime mortgage loans. The value, liquidity and related income of these securities are sensitive to changes in economic conditions, including real estate value, pre-payments, delinquencies and/or defaults, and may be adversely affected by shifts in the market’s perception of the issuers and changes in interest rates.
International Bond Opportunities ETF and USD Emerging Markets Sovereign Bond ETF’s investments in sovereign and corporate debt obligations within emerging market countries may be subject to potentially higher risks than investments in more developed markets and the prices of such investments may be volatile. The yields of emerging market debt obligations reflect, among other things, perceived credit risk. The consequences of political, social or economic instability in these markets may have disruptive effects on the market prices of the Funds’ investments and the income they generate, as well as the Funds’ ability to repatriate such amounts.
The Funds are subject to interest rate and credit risk. The value of debt securities may decline as interest rates increase. The Funds could lose money if the issuer of a fixed income security is unable to pay interest or repay principal when it is due. The Funds invest in floating rate loans and other floating rate debt securities. Although these investments are generally less sensitive to interest rate changes than other fixed rate instruments, the value of floating rate loans and other floating rate investments may decline if their interest rates do not rise as quickly, or as much, as general interest rates. Many factors can cause interest rates to rise. Some examples include central bank monetary policy, rising inflation rates and general economic conditions. The Funds may face a heightened level of interest rate risk due to certain changes in monetary policy. During periods when interest rates are low or there are negative interest rates, the Funds’ yield (and total return) also may be low or the Funds may be unable to maintain positive returns. The ability of the issuers of debt to meet their obligations may be affected by economic and political developments in a specific industry or region. The value of a Fund’s investments may be adversely affected if any of the issuers or counterparties it is invested in are subject to an actual or perceived deterioration in their credit quality.
High Yield Research Enhanced ETF invests in high yield securities that are not rated or rated below investment grade (commonly known as “junk bonds”). These securities are considered to be high risk investments. Investments in lower-rated securities or unrated securities of comparable quality tend to be more sensitive to economic conditions than higher rated securities. Junk bonds involve a greater risk of default by the issuer because such securities are generally unsecured and are often subordinated to other creditors’ claims. The market price of these securities can change suddenly and unexpectedly. As a result, the Funds are intended for investors who are able and willing to assume a high degree of risk.
The Funds may have elements of risk not typically associated with investments in the United States of America due to concentrated investments in a limited number of countries or regions, which may vary throughout the period. Such concentrations may subject the Funds to additional risks resulting from political or economic conditions in such countries or regions and the possible imposition of adverse governmental laws or currency exchange restrictions could cause the securities and their markets to be less liquid and their prices to be more volatile than those of comparable U.S. securities.
Derivatives may be riskier than other types of investments because they may be more sensitive to changes in economic and market conditions and could result in losses that significantly exceed the Funds’ original investment. Many derivatives create leverage thereby causing the Funds to be more volatile than they would have been if they had not used derivatives. Derivatives also expose the Funds to counterparty risk (the risk that the derivative counterparty will not fulfill its contractual obligations), including credit risk of the derivative counterparty. The possible lack of a liquid secondary market for derivatives and the resulting inability of the Funds to sell or otherwise close a derivatives position could expose the Funds to losses.
The Funds are also subject to counterparty credit risk, which is the risk that a counterparty fails to perform on agreements with the Funds such as swap and option contracts, forward foreign currency exchange contracts and TBA securities.
Disruptions to creations and redemptions, the existence of significant market volatility or potential lack of an active trading market for the Shares (including through a trading halt), as well as other factors, may result in Shares trading significantly above (at a premium) or below (at a discount) to the NAV or to the intraday value of the Funds’ holdings. During such periods, investors may incur significant losses if shares are sold.
BetaBuilders 1-5 Year U.S. Aggregate Bond ETF and USD Emerging Markets Sovereign Bond ETF may not track the return of their underlying index for a number of reasons and therefore may not achieve their investment objective. For example, the Funds incur a number of operating expenses not applicable to their underlying index, and incur costs in buying and selling securities, especially when rebalancing the Funds’ securities holdings to reflect changes in the composition of the underlying index. In addition, each Fund’s return may differ from the return of its underlying index as a result of, among other things, pricing differences and the inability to purchase certain securities included in the underlying index due to regulatory or other restrictions. To the extent of the previously outlined items, each Fund’s return may differ from the return of the underlying index.
| | | | | | |
| | | |
| 370 | | | | J.P. MORGAN EXCHANGE-TRADED FUNDS | | FEBRUARY 28, 2021 |
LIBOR is intended to represent the rate at which contributing banks may obtain short-term borrowings from each other in the London interbank market. On March 5, 2021, the U.K. Financial Conduct Authority (“FCA”) publicly announced that (i) immediately after December 31, 2021, publication of the 1-week and 2-month U.S. Dollar LIBOR settings will permanently cease; (ii) immediately after June 30, 2023, publication of the overnight and 12-month U.S. Dollar LIBOR settings will permanently cease; and (iii) immediately after June 30, 2023, the 1-month, 3-month and 6-month U.S. Dollar LIBOR settings will cease to be provided or, subject to the FCA’s consideration of the case, be provided on a synthetic basis and no longer be representative of the underlying market and economic reality they are intended to measure and that representativeness will not be restored. There is no assurance that the dates announced by the FCA will not change or that the administrator of LIBOR and/or regulators will not take further action that could impact the availability, composition or characteristics of LIBOR or the currencies and/or tenors for which LIBOR is published. Public and private sector industry initiatives are currently underway to implement new or alternative reference rates to be used in place of LIBOR. There is no assurance that any such alternative reference rate will be similar to or produce the same value or economic equivalence as LIBOR or that it will have the same volume or liquidity as did LIBOR prior to its discontinuance or unavailability, which may affect the value or liquidity or return on certain of a Fund’s loans, notes, derivatives and other instruments or investments comprising some or all of a Fund’s investments and result in costs incurred in connection with closing out positions and entering into new trades. These risks may also apply with respect to changes in connection with other interbank offering rates (e.g., Euribor) and a wide range of other index levels, rates and values that are treated as “benchmarks” and are the subject of recent regulatory reform.
The Funds are subject to infectious disease epidemics/pandemics risk. The worldwide outbreak of COVID-19, a novel coronavirus disease, has negatively affected economies, markets and individual companies throughout the world. The effects of this COVID-19 pandemic to public health, and business and market conditions, including exchange trading suspensions and closures may continue to have a significant negative impact on the performance of a Fund’s investments, increase a Fund’s volatility, negatively impact a Fund’s arbitrage and pricing mechanisms, exacerbate other pre-existing political, social and economic risks to the Funds and negatively impact broad segments of businesses and populations. The Funds’ operations may be interrupted as a result, which may have a significant negative impact on investment performance. In addition, governments, their regulatory agencies, or self-regulatory organizations may take actions in response to the pandemic that affect the instruments in which the Funds invest, or the issuers of such instruments, in ways that could also have a significant negative impact on a Fund’s investment performance. The full impact of this COVID-19 pandemic, or other future epidemics/pandemics, is currently unknown.
8. Subsequent Events
At its meeting held on March 9, 2021, the Board approved the following changes:
A reduction to the Municipal ETF’s management fee to 0.18% of the Fund’s average daily net assets, which became effective on March 31, 2021.
A one-for-two reverse stock split of the shares of BetaBuilders 1-5 Year U.S. Aggregate Bond ETF and U.S. Aggregate Bond ETF occurred on April 12, 2021, which resulted in a decrease to each Fund’s shares outstanding and an increase to each Fund’s NAV. In connection with the reverse stock split, both BetaBuilders 1-5 Year U.S. Aggregate Bond ETF and U.S. Aggregate Bond ETF reduced the creation size for each fund to 25,000.
| | | | | | | | |
| | | |
| FEBRUARY 28, 2021 | | J.P. MORGAN EXCHANGE-TRADED FUNDS | | | | | 371 | |
Report of Independent Registered Public Accounting Firm
To the Board of Trustees of J.P. Morgan Exchange-Traded Fund Trust and Shareholders of each of the ten funds listed in the table below
Opinions on the Financial Statements
We have audited the accompanying statements of assets and liabilities, including the schedules of portfolio investments, of each of the funds listed in the table below (ten of the funds constituting J.P. Morgan Exchange-Traded Fund Trust, hereafter collectively referred to as the “Funds”) as of February 28, 2021, the related statements of operations and of changes in net assets for each of the periods indicated in the table below, including the related notes, and the financial highlights for each of the periods indicated therein (collectively referred to as the “financial statements”). In our opinion, the financial statements present fairly, in all material respects, the financial position of each of the Funds as of February 28, 2021, the results of each of their operations and the changes in each of their net assets for each of the periods indicated in the table below, and each of the financial highlights for each of the periods indicated therein, in conformity with accounting principles generally accepted in the United States of America.
| | |
| JPMorgan BetaBuilders 1-5 Year U.S. Aggregate Bond ETF (1) | | JPMorgan Core Plus Bond ETF (2) |
| JPMorgan Corporate Bond Research Enhanced ETF (2) | | JPMorgan International Bond Opportunities ETF (2) |
| JPMorgan High Yield Research Enhanced ETF (2) | | JPMorgan Municipal ETF (2) |
| JPMorgan U.S. Aggregate Bond ETF (2) | | JPMorgan Ultra-Short Income ETF (2) |
| JPMorgan Ultra- Short Municipal Income ETF (2) | | JPMorgan USD Emerging Markets Sovereign Bond ETF (2) |
| | (1) | Statement of operations for the year ended February 28, 2021, and statement of changes in net assets for the year ended February 28, 2021 and the period March 12, 2019 (commencement of operations) through February 29, 2020 |
| | (2) | Statement of operations for the year ended February 28, 2021 and statement of changes in net assets for the years ended February 28, 2021 and February 29, 2020 |
Basis for Opinions
These financial statements are the responsibility of the Funds’ management. Our responsibility is to express an opinion on the Funds’ financial statements based on our audits. We are a public accounting firm registered with the Public Company Accounting Oversight Board (United States) (PCAOB) and are required to be independent with respect to the Funds in accordance with the U.S. federal securities laws and the applicable rules and regulations of the Securities and Exchange Commission and the PCAOB.
We conducted our audits of these financial statements in accordance with the standards of the PCAOB. Those standards require that we plan and perform the audit to obtain reasonable assurance about whether the financial statements are free of material misstatement, whether due to error or fraud.
Our audits included performing procedures to assess the risks of material misstatement of the financial statements, whether due to error or fraud, and performing procedures that respond to those risks. Such procedures included examining, on a test basis, evidence regarding the amounts and disclosures in the financial statements. Our audits also included evaluating the accounting principles used and significant estimates made by management, as well as evaluating the overall presentation of the financial statements. Our procedures included confirmation of securities owned as of February 28, 2021 by correspondence with the custodian, transfer agent and brokers; when replies were not received from brokers, we performed other auditing procedures. We believe that our audits provide a reasonable basis for our opinions.
/s/PricewaterhouseCoopers LLP
New York, New York
April 23, 2021
We have served as the auditor of one or more investment companies in the JPMorgan Funds complex since 1993.
| | | | | | |
| | | |
| 372 | | | | J.P. MORGAN EXCHANGE-TRADED FUNDS | | FEBRUARY 28, 2021 |
TRUSTEES
(Unaudited)
The Funds’ Statements of Additional Information includes additional information about the Funds’ Trustees and is available, without charge, upon request by calling 1-844-457-6383 or on the J.P. Morgan Funds’ website at www.jpmorganfunds.com.
| | | | | | | | |
Name (Year of Birth;
Positions With
the Funds since) | | Principal Occupation
During Past 5 Years | | Number of
Funds in Fund
Complex Overseen
by Trustee (1) | | | Other Directorships Held
During the Past 5 Years |
Independent Trustees | | | | | | | | |
| | | |
Gary L. French (1951);
Trustee of the Trust since 2014 | | Real Estate Investor (2011–present); Consultant to the Mutual Fund Industry (2011-present); Senior Consultant for The Regulatory Fundamentals Group LLC (2011–2017). | | | 36 | | | Independent Trustee, The China Fund, Inc. (2013-2019); Exchange Traded Concepts Trust II (2012-2014); Exchange Traded Concepts Trust I (2011-2014). |
| | | |
Robert J. Grassi (1957);
Trustee of the Trust since 2014 | | Sole Proprietor, Academy Hills Advisors LLC (2012-present); Pension Director, Corning Incorporated (2002-2012). | | | 36 | | | None. |
| | | |
Thomas P. Lemke (1954);
Trustee of the Trust since 2014 | | Retired; Executive Vice President and General Counsel, Legg Mason (2005-2013). | | | 36 | | | SEI family of funds — Independent Trustee of Advisors’ Inner Circle Fund III (20 portfolios) (from February 2014 to present); Independent Trustee of Winton Diversified Opportunities Fund (from December 2014 to 2018); Independent Trustee of Gallery Trust (from August 2015 to present); Independent Trustee of Schroder Series Trust (from February 2017 to present); Independent Trustee of Schroder Global Series Trust (from February 2017 to present); Independent Trustee of O’Connor EQUUS (May 2014-April 2016); Independent Trustee of Winton Series Trust (December 2014-March 2017); Independent Trustee of AXA Premier VIP Trust (2014-June 2017); Independent Director of The Victory Funds (or their predecessor funds) (35 portfolios) (2014-March 2015); Symmetry Panoramic Trust (16 portfolios) (2018-present). |
| | | |
Lawrence R. Maffia (1950);
Trustee of the Trust since 2014 | | Retired; Director and President, ICI Mutual Insurance Company (2006-2013). | | | 36 | | | Director, ICI Mutual Insurance Company (1999-2013). |
| | | |
Emily A. Youssouf (1951);
Trustee of the Trust since 2014 | | Clinical Professor, NYU Schack Institute of Real Estate (2009–present); Board Member and Member of the Audit Committee (2013–present), Chair of Finance Committee (2019–present), Member of Related Parties Committee (2013–2018) and Member of the Enterprise Risk Committee (2015–2018), PennyMac Financial Services, Inc.; Board Member (2005–2018), Chair of Capital Committee (2006–2016), Chair of Audit Committee (2005–2018), Member of Finance Committee (2005–2018) and Chair of IT Committee (2016–2018), NYC Health and Hospitals Corporation. | | | 36 | | | Trustee, NYC School Construction Authority (2009-present); Board Member, NYS Job Development Authority (2008-present); Trustee and Chair of the Audit Committee of the Transit Center Foundation (2015-2019). |
Interested Trustee | | | | | | | | |
| | | |
| Robert E. Deutsch (2) (1957); Chairman and Trustee of the Trust since 2014 | | Retired; Head of the Global ETF Business for JPMorgan Asset Management (2013-2017); Head of the Global Liquidity Business for JPMorgan Asset Management (2003-2013). | | | 36 | | | Board of Directors of the JUST Capital Foundation (2017–present). |
| (1) | A Fund Complex means two or more registered investment companies that hold themselves out to investors as related companies for purposes of investment and investor services or have a common investment adviser or have an investment adviser that is an affiliated person of the investment adviser of any of the other registered investment companies. Thirty one series of the Trust have commenced operations. |
| (2) | Mr. Deutsch is an interested trustee because he was an employee of the Adviser until August 2017. |
The contact address for each of the Trustees is 277 Park Avenue, New York, NY 10172.
| | | | | | | | |
| | | |
| FEBRUARY 28, 2021 | | J.P. MORGAN EXCHANGE-TRADED FUNDS | | | | | 373 | |
OFFICERS
(Unaudited)
| | |
Name (Year of Birth),
Positions Held with
the Trust (Since) | | Principal Occupations During Past 5 Years |
| |
Joanna Gallegos (1975), President and Principal Executive Officer (2017) | | Managing Director, Global Head of ETF Strategy. Previously, Head of J.P. Morgan Asset Management’s U.S. Exchange Traded Funds business from July 2017 to December 2019 and Head of J.P. Morgan Asset Management’s ETF Product Development team from August 2013 to July 2017. |
| |
Timothy J. Clemens (1975), Treasurer and Principal Financial Officer (2020), Assistant Treasurer (2019-2020) | | Executive Director, J.P. Morgan Investment Management Inc. (formerly JPMorgan Funds Management, Inc.) since February 2016. Mr. Clemens has been with J.P. Morgan Investment Management Inc. since 2013. |
| |
Brian S. Shlissel (1964), Vice President (2016)* | | Managing Director and Chief Administrative Officer for J.P. Morgan pooled vehicles, J.P. Morgan Investment Management Inc. (formerly JPMorgan Funds Management, Inc.) since 2014. |
| |
Paul Shield (1960), Vice President and Assistant Treasurer (2016) | | Managing Director and head of Business Management for JPMorgan Asset Management’s Exchange Traded Fund platform since 2013. |
| |
| Elizabeth A. Davin (1964), Secretary (2018)*** | | Executive Director and Assistant General Counsel, JPMorgan Chase. Ms. Davin has been with JPMorgan Chase (formerly Bank One Corporation) since 2004. |
| |
Stephen M. Ungerman (1953), Chief Compliance Officer (2014) | | Managing Director, JPMorgan Chase & Co.; Mr. Ungerman has been with JPMorgan Chase & Co. since 2000. |
| |
Jessica K. Ditullio (1962), Assistant Secretary (2014)*** | | Executive Director and Assistant General Counsel, JPMorgan Chase. Ms. Ditullio has been with JPMorgan Chase (formerly Bank One Corporation) since 1990. |
| |
Anthony Geron (1971), Assistant Secretary (2019)** | | Vice President and Assistant General Counsel, JPMorgan Chase since September 2018; Lead Director and Counsel, AXA Equitable Life Insurance Company from 2015 to 2018 and Senior Director and Counsel, AXA Equitable Life Insurance Company from 2014 to 2015. |
| |
Carmine Lekstutis (1980), Assistant Secretary (2014)** | | Executive Director and Assistant General Counsel, JPMorgan Chase. Mr. Lekstutis has been with JPMorgan Chase since 2011. |
| |
Gregory S. Samuels (1980), Assistant Secretary (2014)** | | Executive Director and Assistant General Counsel, JPMorgan Chase. Mr. Samuels has been with JPMorgan Chase since 2010. |
| |
| Zachary E. Vonnegut-Gabovitch (1986), Assistant Secretary (2017)** | | Vice President and Assistant General Counsel, JPMorgan Chase since September 2016; Associate, Morgan Lewis & Bockius (law firm) from 2012 to 2016. |
| |
| Frederick J. Cavaliere (1978), Assistant Treasurer (2015)* | | Executive Director, J.P. Morgan Investment Management Inc. since February 2016; formerly, Vice President, J.P. Morgan Investment Management Inc. (formerly JPMorgan Funds Management, Inc.) since September 2010 to February 2016. Mr. Cavaliere has been with JPMorgan since May 2006. |
| |
Michael M. D’Ambrosio (1969), Assistant Treasurer (2014) | | Managing Director, J.P. Morgan Investment Management Inc. (formerly JPMorgan Funds Management, Inc.) Mr. D’Ambrosio has been with J.P. Morgan Investment Management Inc. since 2012. |
| |
Shannon Gaines (1977), Assistant Treasurer (2019)*** | | Vice President, J.P. Morgan Investment Management Inc. (formerly JPMorgan Funds Management, Inc.) since January 2014. |
| |
Nektarios E. Manolakakis (1972), Assistant Treasurer (2020) | | Executive Director, J.P. Morgan Investment Management Inc. since February 2021; formerly Vice President, J.P. Morgan Investment Management Inc. (formerly JPMorgan Funds Management, Inc.) since 2014; Vice President, J.P. Morgan Corporate & Investment Bank 2010-2014. |
| |
Todd McEwen (1981), Assistant Treasurer (2020)*** | | Vice President, J.P. Morgan Investment Management Inc. (formerly JPMorgan Funds Management, Inc.) Mr. McEwen has been with J.P. Morgan Investment Management Inc. since 2010. |
The contact address for each of the officers, unless otherwise noted, is 277 Park Avenue, New York, NY 10172.
| * | | The contact address for the officer is 575 Washington Boulevard, Jersey City, NJ 07310. |
| ** | | The contact address for the officer is 4 New York Plaza, New York, NY 10004. |
| *** | | The contact address for the officer is 1111 Polaris Parkway, Columbus, OH 43240. |
| | | | | | |
| | | |
| 374 | | | | J.P. MORGAN EXCHANGE-TRADED FUNDS | | FEBRUARY 28, 2021 |
SCHEDULE OF SHAREHOLDER EXPENSES
(Unaudited)
Hypothetical $1,000 Investment
As a shareholder of the Funds, you incur two types of costs: (1) transaction costs, including brokerage commissions on your purchase and sales of Fund Shares and (2) ongoing costs, primarily management fees. The examples assume that you had a $1,000 investment at the beginning of the reporting period, September 1, 2020 and continued to hold your shares at the end of the reporting period, February 28, 2021.
Actual Expenses
For the Fund in the table below, the first line provides information about actual account values and actual expenses. You may use the information in this line, together with the amount you invested, to estimate the expenses that you paid over the period. Simply divide your account value by $1,000 (for example, an $8,600 account value divided by $1,000 = 8.6), then multiply the result by the number under the heading titled “Expenses Paid During the Period” to estimate the expenses you paid on your account during this period.
Hypothetical Example for Comparison Purposes
The second line in the table below provides information about hypothetical account values and hypothetical expenses based on the Fund’s actual expense ratio and an assumed rate of return of 5% per year before expenses, which is not the Fund’s actual return. The hypothetical account values and expenses may not be used to estimate the actual ending account balance or expenses you paid for the period. You may use this information to compare the ongoing costs of investing in the Fund and other Funds. To do so, compare this 5% hypothetical example with the 5% hypothetical examples that appear in the shareholder reports of other funds. The examples also assume all dividends and distributions have been reinvested. The examples do not take into account brokerage commissions that you pay when purchasing or selling shares of a Fund.
| | | | | | | | | | | | | | | | |
| | | Beginning
Account Value
September 1, 2020 | | | Ending
Account Value
February 28, 2021 | | | Annualized
Expense
Ratio (1) | | | Expenses
Paid During
the Period | |
JPMorgan BetaBuilders 1-5 Year U.S. Aggregate Bond ETF | |
Actual | | $ | 1,000.00 | | | $ | 1,000.50 | | | | 0.05 | % | | $ | 0.25 | |
Hypothetical | | | 1,000.00 | | | | 1,024.55 | | | | 0.05 | | | | 0.25 | |
JPMorgan Core Plus Bond ETF | |
Actual | | | 1,000.00 | | | | 994.90 | | | | 0.36 | | | | 1.78 | |
Hypothetical | | | 1,000.00 | | | | 1,023.01 | | | | 0.36 | | | | 1.81 | |
JPMorgan Corporate Bond Research Enhanced ETF | |
Actual | | | 1,000.00 | | | | 992.60 | | | | 0.14 | | | | 0.69 | |
Hypothetical | | | 1,000.00 | | | | 1,024.10 | | | | 0.14 | | | | 0.70 | |
JPMorgan High Yield Research Enhanced ETF | |
Actual | | | 1,000.00 | | | | 1,040.70 | | | | 0.23 | | | | 1.16 | |
Hypothetical | | | 1,000.00 | | | | 1,023.65 | | | | 0.23 | | | | 1.15 | |
JPMorgan International Bond Opportunities ETF
(formerly known as JPMorgan Global Bond Opportunities ETF) | |
Actual | | | 1,000.00 | | | | 1,024.90 | | | | 0.50 | | | | 2.51 | |
Hypothetical | | | 1,000.00 | | | | 1,022.32 | | | | 0.50 | | | | 2.51 | |
JPMorgan Municipal ETF | |
Actual | | | 1,000.00 | | | | 1,007.90 | | | | 0.23 | | | | 1.15 | |
Hypothetical | | | 1,000.00 | | | | 1,023.65 | | | | 0.23 | | | | 1.15 | |
JPMorgan U.S. Aggregate Bond ETF | |
Actual | | | 1,000.00 | | | | 981.80 | | | | 0.07 | | | | 0.34 | |
Hypothetical | | | 1,000.00 | | | | 1,024.45 | | | | 0.07 | | | | 0.35 | |
JPMorgan Ultra-Short Income ETF | |
Actual | | | 1,000.00 | | | | 1,004.20 | | | | 0.17 | | | | 0.84 | |
Hypothetical | | | 1,000.00 | | | | 1,023.95 | | | | 0.17 | | | | 0.85 | |
JPMorgan Ultra-Short Municipal Income ETF | |
Actual | | | 1,000.00 | | | | 1,003.00 | | | | 0.16 | | | | 0.79 | |
Hypothetical | | | 1,000.00 | | | | 1,024.00 | | | | 0.16 | | | | 0.80 | |
JPMorgan USD Emerging Markets Sovereign Bond ETF | |
Actual | | | 1,000.00 | | | | 1,021.70 | | | | 0.39 | | | | 1.95 | |
Hypothetical | | | 1,000.00 | | | | 1,022.86 | | | | 0.39 | | | | 1.96 | |
| (1) | Expenses are equal to each Fund’s annualized net expense ratio, multiplied by the average account value over the period, multiplied by 181/365 (to reflect the one-half year period). |
| | | | | | | | |
| | | |
| FEBRUARY 28, 2021 | | J.P. MORGAN EXCHANGE-TRADED FUNDS | | | | | 375 | |
BOARD APPROVAL OF MANAGEMENT AGREEMENTS
(Unaudited)
JPMorgan BetaBuilders 1-5 Year U.S. Aggregate Bond ETF, JPMorgan Core Plus Bond ETF, JPMorgan Corporate Bond Research Enhanced ETF, JPMorgan High Yield Research Enhanced ETF, JPMorgan International Bond Opportunities ETF, JPMorgan Municipal ETF, JPMorgan U.S. Aggregate Bond ETF, JPMorgan Ultra-Short Income ETF, JPMorgan Ultra-Short Municipal Income ETF and JPMorgan USD Emerging Markets Sovereign Bond ETF
The Board of Trustees meets regularly throughout the year and considers factors that are relevant to their annual consideration of management agreements at each meeting. The Board also meets specifically to consider management agreement annual renewals. The Board of Trustees held meetings on November 5, 2020 and December 7-8, 2020, at which the Trustees considered the continuation of management agreements (each an “Management Agreement” and collectively, the “Management Agreements”) for JPMorgan BetaBuilders 1-5 Year U.S. Aggregate Bond ETF, JPMorgan Core Plus Bond ETF, JPMorgan Corporate Bond Research Enhanced ETF, JPMorgan High Yield Research Enhanced ETF, JPMorgan International Bond Opportunities ETF, JPMorgan Municipal ETF, JPMorgan U.S. Aggregate Bond ETF, JPMorgan Ultra-Short Income ETF and JPMorgan Ultra-Short Municipal Income ETF and JPMorgan USD Emerging Markets Sovereign Bond ETF (the “Funds”). The meetings were held by videoconference in reliance upon the Division of Investment Management Staff Statement on Fund Board Meetings and Unforeseen or Emergency Circumstances Related to Coronavirus Disease 2019. In connection with these meetings, the Board reviewed and considered performance, expense and other information individually for each of the Funds. The Trustees, including a majority of the Trustees who are not “Interested Persons” (as defined in the 1940 Act) of any party to the Management Agreements or any of their affiliates, approved the continuation of each Management Agreement.
As part of their review of the Management Agreements, the Trustees considered and reviewed performance and other information about each Fund received from the Adviser. This information included each Fund’s performance as compared to the performance of its benchmark and analyses by the Adviser of each Fund’s performance. In addition, in preparation for the December meeting, the Trustees requested, received and evaluated extensive materials from the Adviser, including performance and expense information compiled by Broadridge Investor Communications Solutions Inc. (“Broadridge”), an independent provider of investment company data, and met with representatives of Broadridge. Before voting on the Management Agreements, the Trustees reviewed the Management Agreements with representatives of the Adviser, counsel to the Trust and independent legal counsel and received a memorandum from independent legal counsel to the Trustees discussing the legal standards for their consideration of the Management Agreements. The Trustees also discussed the
Management Agreements in executive sessions with independent legal counsel at which no representatives of the Adviser were present.
A summary of the material factors evaluated by the Trustees in determining whether to approve each Management Agreement is provided below. The Trustees considered information provided with respect to the Funds over the course of the year, as well as the materials furnished specifically in connection with this annual renewal process. Each Trustee attributed his or her own evaluation of the significance of the various factors and no factor alone was considered determinative. As part of their review process, the Trustees consider and place emphasis on relevant information in light of changing circumstances in market and economic conditions. The Trustees determined that the compensation received by the Adviser from each Fund under the Management Agreement was fair and reasonable and that the continuance of the Management Agreement was in the best interests of each Fund and its shareholders.
The factors summarized below were considered and discussed by the Trustees in reaching their conclusions:
Nature, Extent and Quality of Services Provided by the Adviser
The Trustees received and considered information regarding the nature, extent and quality of the services provided to each Fund under its respective Management Agreement. The Trustees took into account information furnished throughout the year at Trustee meetings, as well as the materials furnished specifically in connection with this annual review process. Among other things, the Trustees considered:
| | (i) | The background and experience of the Adviser’s senior management and investment personnel; |
| | (ii) | The qualifications, backgrounds and responsibilities of the portfolio management team primarily responsible for the day-to-day management of the Fund; |
| | (iii) | The investment strategy for each Fund, and the infrastructure supporting the portfolio management teams; |
| | (iv) | Information about the structure and distribution strategy of the Funds and how it fits within the Trust’s other fund offerings; |
| | (v) | The administration services provided by the Adviser under the Management Agreements; |
| | (vi) | Their knowledge of the nature and quality of the services provided by the Adviser and its affiliates gained from their experience as Trustees of the Trust and in the financial industry generally; |
| | (vii) | The overall reputation and capabilities of the Adviser and its affiliates; |
| | (viii) | The commitment of the Adviser to provide high quality service to the Funds; |
| | (ix) | Their overall confidence in the Adviser’s integrity; |
| | | | | | |
| | | |
| 376 | | | | J.P. MORGAN EXCHANGE-TRADED FUNDS | | FEBRUARY 28, 2021 |
| | (x) | The Adviser’s responsiveness to requests for additional information, questions or concerns raised by them; and |
| | (xi) | The Adviser’s business continuity plan and steps the Adviser and its affiliates were taking to provide ongoing services to the Fund during the COVID-19 pandemic, and the Adviser’s and its affiliates’ success in continuing to provide services to the Fund and its shareholders throughout this period. |
Based upon these considerations and other factors, the Trustees concluded that they were satisfied with the nature, extent and quality of services to be provided to the Funds by the Adviser.
Costs of Services Provided and Profitability to the Adviser and its Affiliates
The Trustees received, reviewed, considered and discussed information regarding the profitability to the Adviser and its affiliates in providing services to the Funds. The Trustees recognized that this information is not audited and represents the Adviser’s determination of its and its affiliates’ revenues from the contractual services provided to the Funds, less expenses of providing such services. Expenses include direct and indirect costs and are calculated using allocation methodologies developed by the Adviser. The Trustees recognized that it is difficult to make direct comparisons of profitability from fund management contracts because comparative information is not generally publicly available and is affected by numerous factors, including the structure of the particular adviser, the types of funds it manages, its business mix, numerous assumptions regarding allocations and the fact that publicly-traded fund managers’ operating profits and net income are net of distribution and marketing expenses. Based upon their review, the Trustees concluded that the profitability to the Adviser under each Management Agreement was not unreasonable in light of the services and benefits provided to each Fund.
The Trustees also considered that under the Management Agreements, the Adviser earns fees from the Funds for providing administrative services and considered fees paid to J.P. Morgan Chase Bank, N.A. (“JPMCB”), an affiliate of the Adviser, for custody, transfer agency and other related services for each Fund.
Fall-Out Benefits
The Trustees reviewed information regarding potential “fall-out” or ancillary benefits received by the Adviser and its affiliates as a result of their relationships with the Funds. Additionally, the Trustees considered that any fall-out or ancillary benefits would be comparable to those related to the other funds in the complex.
The Trustees also considered the benefits the Adviser receives as the result of JPMCB’s roles as custodian, fund accountant and transfer agent for the Fund.
Economies of Scale
The Trustees considered the extent to which each Fund will benefit from economies of scale. The Trustees noted that the management fee schedule for the Funds does not contain breakpoints. The Trustees considered that shareholders would benefit because expenses would be limited even when a Fund was new and not achieving economies of scale. The Trustees considered the fact that increases in assets would not lead to fee decreases even if economies of scale are achieved, but also that the Trustees would have the opportunity to further review the appropriateness of the fee payable to the Adviser under the Management Agreement in the future. After considering the factors identified above, the Trustees concluded that the Fund’s shareholders will receive the benefits of potential economies of scale.
Fees Relative to Adviser’s Other Clients
The Trustees requested and received and considered information about the nature and extent of investment advisory services and fee rates offered to other investment companies and/or institutional accounts advised by the Adviser in the same asset class as each Fund. The Trustees noted the Adviser’s view that it does not manage other accounts with substantially similar investment strategies as that of the Funds other than the JPMorgan Core Plus Bond ETF. The Trustees concluded that the fees charged to each Fund in comparison to those charged to such other clients were reasonable.
Investment Performance
The Trustees received and considered absolute and relative performance information for Funds with at least one-year of performance history in a report prepared by Broadridge, except for the JPMorgan BetaBuilders 1-5 Year U.S. Aggregate Bond ETF and JPMorgan USD Emerging Markets Sovereign Bond ETF for which performance information was compared against each Fund’s benchmark index. The Trustees considered the total return performance information, which included ranking the Funds within a performance universe made up of funds with the same Morningstar investment classification and objective (the “Universe”), as well as a subset of funds within the Universe (the “Peer Group”), by total return for applicable one- and three-year periods. The Trustees reviewed a description of Broadridge’s methodology for selecting exchange-traded funds in each Fund’s Peer Group and Universe and noted that Universe and Peer Group rankings were not calculated if the number of funds in the Universe and/or Peer Group did not meet a predetermined minimum. The Trustees also considered each Fund’s investment strategy and processes, portfolio management teams and competitive positioning
| | | | | | | | |
| | | |
| FEBRUARY 28, 2021 | | J.P. MORGAN EXCHANGE-TRADED FUNDS | | | | | 377 | |
BOARD APPROVAL OF MANAGEMENT AGREEMENTS
(Unaudited) (continued)
against peer funds, as identified by Broadridge and/or management. As part of this review, the Trustees reviewed each Fund’s performance against its benchmark and considered each Fund’s performance information provided at regular Board meetings by the Adviser. After consideration, the Trustees determined that each Fund’s performance was consistent with its investment objective. The Broadridge performance data noted by the Trustees as part of their review and the determinations made by the Trustees with respect to each Fund’s performance are summarized below:
The Trustees noted the performance of the JPMorgan BetaBuilders 1-5 Year U.S. Aggregate Bond ETF as compared with that of its benchmark index. The Trustees discussed the performance and investment strategy of the Fund with the Adviser and based upon these discussions and various other factors, the Trustees concluded that the Fund’s performance was satisfactory.
The Trustees noted that the JPMorgan Core Plus Bond ETF’s performance was in the third and second quintiles based upon the Peer Group and Universe, respectively, for the one-year period ended September 30, 2020. The Trustees discussed the performance and investment strategy of the Fund with the Adviser and based upon these discussions and various other factors, the Trustees concluded that the Fund’s performance was satisfactory.
The Trustees noted that the JPMorgan Corporate Bond Research Enhanced ETF’s performance was in the fourth quintile based upon the Universe for the one-year period ended September 30, 2020. (Broadridge did not calculate a Peer Group for this Fund.) The Trustees discussed the performance and investment strategy of the Fund with the Adviser and based upon these discussions and various other factors, the Trustees concluded that the Fund’s performance was satisfactory.
The Trustees noted that the JPMorgan High Yield Research Enhanced ETF’s performance was in the fourth quintile based upon the Peer Group for the one-year period ended September 30, 2020, and in the third and second quintiles based upon the Universe for the one- and three-year periods ended September 30, 2020, respectively. The Trustees discussed the performance and investment strategy of the Fund with the Adviser and based upon these discussions and various other factors, the Trustees concluded that the Fund’s performance was satisfactory.
The Trustees noted that the JPMorgan International Bond Opportunities ETF’s performance was in the third and first quintiles based upon the Universe, for the one- and three-year periods ended September 30, 2020, respectively. (Broadridge did not calculate a Peer Group for this Fund.) The Trustees discussed the performance and investment strategy of the
Fund with the Adviser and based upon these discussions and various other factors, the Trustees concluded that the Fund’s performance was satisfactory.
The Trustees noted that the JPMorgan Municipal ETF’s performance was in the third and fourth quintiles based upon the Peer Group and Universe, respectively, for the one-year period ended September 30, 2020. The Trustees discussed the performance and investment strategy of the Fund with the Adviser and based upon these discussions and various other factors, the Trustees concluded that the Fund’s performance was satisfactory.
The Trustees noted that the JPMorgan U.S. Aggregate Bond ETF’s performance was in the fourth quintile based upon the Universe for the one-year period ended September 30, 2020. (Broadridge did not calculate a Peer Group for this Fund.) The Trustees discussed the performance and investment strategy of the Fund with the Adviser and based upon these discussions and various other factors, the Trustees concluded that the Fund’s performance was satisfactory.
The Trustees noted that the JPMorgan Ultra-Short Income ETF’s performance was in the first quintile based upon both the Peer Group and Universe for the one- and three-year periods ended September 30, 2020. The Trustees discussed the performance and investment strategy of the Fund with the Adviser and based upon these discussions and various other factors, the Trustees concluded that the Fund’s performance was satisfactory.
The Trustees noted that the JPMorgan Ultra-Short Municipal Income ETF’s performance was in the fourth quintile based upon the Universe for the one-year period ended September 30, 2020. (Broadridge did not calculate a Peer Group for this Fund.) The Trustees discussed the performance and investment strategy of the Fund with the Adviser and based upon these discussions and various other factors, the Trustees concluded that the Fund’s performance was satisfactory.
The Trustees noted the performance of the JPMorgan USD Emerging Markets Sovereign Bond ETF as compared with that of its benchmark index. The Trustees discussed the performance and investment strategy of the Fund with the Adviser and based upon these discussions and various other factors, the Trustees concluded that the Fund’s performance was satisfactory.
Management Fees and Expense Ratios
The Trustees considered the contractual management fee rate paid by each Fund to the Adviser and compared the rate to the information prepared by Broadridge concerning management fee rates paid by other funds in the same Morningstar category as each Fund. This review included ranking of the Fund within an expense universe made up of funds with the same Morningstar investment classification and objective (the “Universe”), as
| | | | | | |
| | | |
| 378 | | | | J.P. MORGAN EXCHANGE-TRADED FUNDS | | FEBRUARY 28, 2021 |
well as a subset of funds within the Universe (the “Peer Group”). The Trustees reviewed a description of Broadridge’s methodology for selecting funds in the Peer Group and Universe, as applicable, and noted that Universe and Peer Group rankings were not calculated if the number of funds in the Universe and/or Peer Group did not meet a predetermined minimum. The Trustees also reviewed information about other expenses and the total expense ratio for each Fund. The Trustees compared the management fee for each Fund to fees charged to mutual funds and/or institutional accounts with similar investment objectives or in similar asset classes managed by the Adviser. The Trustees recognized that it is difficult to make comparisons of management fees because there are variations in the services that are included in the fees paid by other accounts. The Trustees considered how the Funds are positioned against peer funds, as identified by management and/or Broadridge and noted that each Fund’s management fee was appropriate as compared to identified peer funds. The Trustees’ determinations as a result of the review of each Fund’s management fees and expense ratios are summarized below:
The Trustees noted that the JPMorgan BetaBuilders 1-5 Year U.S. Aggregate Bond ETF’s net management fee and actual total expenses were in the first quintile of both the Peer Group and Universe. After considering the factors identified above, in light of this information, the Trustees concluded that the management fee was reasonable.
The Trustees noted that the JPMorgan Core Plus Bond ETF’s net management fee and actual total expenses were in the second and third quintiles, of the Peer Group and Universe, respectively. After considering the factors identified above, in light of this information, the Trustees concluded that the management fee was reasonable.
The Trustees noted that the JPMorgan Corporate Bond Research Enhanced ETF’s net management fee and actual total expenses were in the third and second quintiles, respectively, of the Universe. (Broadridge did not calculate a Peer Group for this Fund.) After considering the factors identified above, in light of this information, the Trustees concluded that the management fee was reasonable.
The Trustees noted that the JPMorgan High Yield Research Enhanced ETF’s net management fee and actual total expenses were in the first quintile of both the Peer Group and Universe. After considering the factors identified above, in light of this information, the Trustees concluded that the management fee was reasonable.
The Trustees noted that the JPMorgan International Bond Opportunities ETF’s net management fee and actual total expenses were in the fourth and second quintiles, respectively, of the Universe. (Broadridge did not calculate a Peer Group for this Fund.) After considering the factors identified above, in light of this information, the Trustees concluded that the management fee was reasonable.
The Trustees noted that the JPMorgan Municipal ETF’s net management fee was in the third and fourth quintiles of the Peer Group and Universe, respectively, and that the actual total expenses were in the first and second quintiles of the Peer Group and Universe, respectively. After considering the factors identified above, in light of this information, the Trustees concluded that the management fee was reasonable.
The Trustees noted that the JPMorgan U.S. Aggregate Bond ETF’s net management fee was in the first and second quintiles of the Peer Group and Universe, respectively; and that the actual total expenses were in the first and second quintiles of the Peer Group and Universe, respectively. After considering the factors identified above, in light of this information, the Trustees concluded that the management fee was reasonable.
The Trustees noted that the JPMorgan Ultra-Short Income ETF’s net management fee was in the first and third quintiles of the Peer Group and Universe, respectively, and that the actual total expenses were in the first and second quintiles of the Peer Group and Universe, respectively. After considering the factors identified above, in light of this information, the Trustees concluded that the management fee was reasonable.
The Trustees noted that the JPMorgan Ultra-Short Municipal Income ETF’s net management fee and actual total expenses were in the first quintile of the Universe. (Broadridge did not calculate a Peer Group for this Fund.) After considering the factors identified above, in light of this information, the Trustees concluded that the management fee was reasonable.
The Trustees noted that the JPMorgan USD Emerging Markets Sovereign Bond ETF’s net management fee was in the second and third quintiles of the Peer Group and Universe, respectively, and that the actual total expenses were in the second quintile of both the Peer Group and Universe. After considering the factors identified above, in light of this information, the Trustees concluded that the management fee was reasonable.
| | | | | | | | |
| | | |
| FEBRUARY 28, 2021 | | J.P. MORGAN EXCHANGE-TRADED FUNDS | | | | | 379 | |
TAX LETTER
(Unaudited)
Certain tax information for the J.P. Morgan Funds is required to be provided to shareholders based upon the Funds’ income and distributions for the taxable year ended February 28, 2021. The information and distributions reported in this letter may differ from the information and taxable distributions reported to the shareholders for the calendar year ending December 31, 2021. The information necessary to complete your income tax returns for the calendar year ending December 31, 2021 will be provided under separate cover.
Long Term Capital Gain
Each Fund listed below distributed the following amount, or maximum allowable amount, of long-term capital gain dividends for the fiscal year ended February 28, 2021:
| | | | |
| | | Long-Term Capital Gain Distribution | |
JPMorgan BetaBuilders 1-5 Year U.S. Aggregate Bond ETF | | $ | 133,341 | |
JPMorgan Core Plus Bond ETF | | | 276,529 | |
JPMorgan Corporate Bond Research Enhanced ETF | | | 462,526 | |
JPMorgan High Yield Research Enhanced ETF | | | 312,250 | |
JPMorgan Municipal ETF | | | 70,457 | |
JPMorgan U.S. Aggregate Bond ETF | | | 1,255,716 | |
Tax-Exempt Income
Each Fund listed below had the following amount, or maximum allowable amount, of dividends paid from investment income that are exempt from federal income tax for the fiscal year ended February 28, 2021:
| | | | |
| | | Exempt
Distributions
Paid | |
JPMorgan Municipal ETF | | $ | 976,801 | |
JPMorgan Ultra-Short Municipal Income ETF | | | 3,464,901 | |
Qualified Interest Income (QII) and Short-Term Capital Gain
Each Fund listed below paid the following amount, or maximum allowable amount, of ordinary distributions treated as qualified
interest income and short-term capital gain for the fiscal year ended February 28, 2021:
| | | | | | | | |
| | | Qualified
Interest
Income | | | Short-Term
Capital
Gain | |
JPMorgan BetaBuilders 1-5 Year U.S. Aggregate Bond ETF | | $ | 620,082 | | | $ | 70,590 | |
JPMorgan Core Plus Bond ETF | | | 1,514,355 | | | | 1,219,230 | |
JPMorgan Corporate Bond Research Enhanced ETF | | | 957,877 | | | | 248,178 | |
JPMorgan High Yield Research Enhanced ETF | | | 8,783,755 | | | | — | |
JPMorgan International Bond Opportunities ETF | | | 2,007,341 | | | | — | |
JPMorgan U.S. Aggregate Bond ETF | | | 9,051,742 | | | | 1,636,767 | |
JPMorgan Ultra-Short Income ETF | | | 73,321,170 | | | | 1,268,366 | |
Each Fund listed below had the following percentage, or the maximum allowable percentage, of income earned from direct U.S. Treasury Obligations for the fiscal year ended February 28, 2021:
| | | | |
| | | Income from U.S. Treasury Obligations | |
JPMorgan BetaBuilders 1-5 Year U.S. Aggregate Bond ETF | | | 46.4 | % |
JPMorgan Core Plus Bond ETF | | | 5.9 | |
JPMorgan Corporate Bond Research Enhanced ETF | | | 0.3 | |
JPMorgan International Bond Opportunities ETF | | | 0.1 | |
JPMorgan U.S. Aggregate Bond ETF | | | 26.7 | |
JPMorgan Ultra-Short Income ETF | | | 1.6 | |
| | | | | | |
| | | |
| 380 | | | | J.P. MORGAN EXCHANGE-TRADED FUNDS | | FEBRUARY 28, 2021 |
J.P. Morgan Exchange-Traded Funds are distributed by JPMorgan Distribution Services, Inc., an indirect, wholly-owned subsidiary of JPMorgan Chase & Co.
Contact J.P. Morgan Exchange-Traded Funds at 1-844-457-6383 (844-4JPM ETF) for a fund prospectus. You can also visit us at www.jpmorganfunds.com. Investors should carefully consider the investment objectives and risks as well as charges and expenses of the fund before investing. The prospectus contains this and other information about the fund. Read the prospectus carefully before investing.
Investors may obtain information about the Securities Investor Protection Corporation (SIPC), including the SIPC brochure, by visiting www.sipc.org or by calling SIPC at 202-371-8300.
Each Fund files a complete schedule of its fund holdings for the first and third quarters of its fiscal year with the SEC as an exhibit to its report on Form N-PORT. The Funds’ Form N-PORT reports are available on the SEC’s website at http://www.sec.gov. The Fund’s quarterly holdings can be found by visiting the J.P. Morgan Funds’ website at www.jpmorganfunds.com.
A description of each Fund’s policies and procedures with respect to the disclosure of each Fund’s holdings is available in the prospectus and Statement of Additional Information.
A copy of proxy policies and procedures is available without charge upon request by calling 1-844-457-6383 and on the Funds’ website at www.jpmorganfunds.com. A description of such policies and procedures is on the SEC’s website at www.sec.gov. The Trustees have delegated the authority to vote proxies for securities owned by the Fund to the Adviser. A copy of the Funds’ voting record for the most recent 12-month period ended June 30 is available on the SEC’s website at www.sec.gov or at the Funds’ website at www.jpmorganfunds.com no later than August 31 of each year. The Funds’ proxy voting record will include, among other things, a brief description of the matter voted on for each fund security, and will state how each vote was cast, for example, for or against the proposal.


J.P. Morgan Asset Management is the brand name for the asset management business of JPMorgan Chase & Co. and its affiliates worldwide.
| | | | |
| | © JPMorgan Chase & Co., 2021. All rights reserved. February 2021. | | AN-FIETF-221 |
Annual Report
J.P. Morgan Exchange-Traded Funds
February 28, 2021
JPMorgan BetaBuilders MSCI US REIT ETF
CONTENTS
Investments in the Fund are not bank deposits or obligations of, or guaranteed or endorsed by, any bank and are not insured or guaranteed by the FDIC, the Federal Reserve Board or any other government agency. You could lose money if you sell when the Fund’s share price is lower than when you invested.
Past performance is no guarantee of future performance. The general market views expressed in this report are opinions based on market and other conditions through the end of the reporting period and are subject to change without notice. These views are not intended to predict the future performance of the Fund or the securities markets. References to specific securities and their issuers are for illustrative purposes only and are not intended to be, and should not be interpreted as, recommendations to purchase or sell such securities. Such views are not meant as investment advice and may not be relied on as an indication of trading intent on behalf of the Fund.
Prospective investors should refer to the Fund’s prospectus for a discussion of the Fund’s investment objectives, strategies and risks. Call J.P. Morgan Exchange-Traded Funds at (844) 457-6383 for a prospectus containing more complete information about the Fund, including management fees and other expenses. Please read it carefully before investing.
Shares are bought and sold throughout the day on an exchange at market price (not at net asset value) through a brokerage account, and are not individually subscribed and redeemed from the Fund. Shares may only be subscribed and redeemed directly from the Fund by Authorized Participants, in large creation/redemption units. Brokerage commissions will reduce returns.
PRESIDENT’S LETTER
APRIL 13, 2021 (Unaudited)
Dear Shareholder,
Financial markets largely proved to be resilient over the past four quarters, thanks to continued support from monetary and fiscal policies, the distribution of the first vaccines against COVID-19 and the prospect for an expanded re-opening of local, national and global economies. At the end of the twelve months ended February 28, 2021, J.P. Morgan Exchange-Traded Funds had expanded in the U.S. to more than $50 billion in assets under management across 33 funds.
| | |
 | | “From the initial turmoil of the pandemic through the impressive rebound in financial markets, we have remained focused on providing investors with a diversified platform of solutions to help them build durable portfolios.” – Joanna M. Gallegos |
The investment environment has drastically changed since the World Health Organization declared the spread of the virus a pandemic in early March 2020. Though an outright financial crisis was headed off by the rapid response of leading central banks, the yields on both 10-year U.S. Treasury bonds and 30-year U.S. Treasury bonds fell to record lows and leading equity indexes lost 20% or more of their value in first quarter of 2020. Over the second half of 2020 and into the first months of 2021, financial markets recovered amid continued central bank support, additional government spending and the eventual development and distribution of vaccines.
Notably, the first months of 2021 were marked by the passage of the $1.9 trillion American Rescue Plan — signed into law
March 11 — and the initial debate over President Biden’s proposed $2 trillion American Jobs Act. The potential economic impact of massive government spending and an expanded vaccination effort has bolstered investor expectations for a surge of economic activity that will potentially lift corporate profits and job growth this year. This investor optimism has helped push the Standard & Poor’s 500 Index above 4,000 points for the first time. However, the path to a fully re-opened economy includes a range of uncertainties, from the threat of new strains of COVID-19 and a resurgence in infections — both in the U.S. and Europe — to the potential for accelerating inflation and rising long-term interest rates.
From the initial turmoil of the pandemic through the impressive rebound in financial markets, we have remained focused on providing investors with a diversified platform of solutions to help them build durable portfolios. Regardless of the market environment, we seek to deliver innovative, quality ETFs that meet the needs of investors and we are proud of our accomplishments and our ability to adapt to new global realities. Thank you for your belief in our Firm and our process.
Sincerely,

Joanna M. Gallegos
President, J.P. Morgan Exchange-Traded Funds
J.P Morgan Asset Management
1-844-4JPM-ETF or jpmorgan.com/etfs for more information
| | | | | | | | |
| | | |
| FEBRUARY 28, 2021 | | J.P. MORGAN EXCHANGE-TRADED FUNDS | | | | | 1 | |
JPMorgan BetaBuilders MSCI US REIT ETF
FUND COMMENTARY
TWELVE MONTHS ENDED FEBRUARY 28, 2021 (Unaudited)
| | | | |
| REPORTING PERIOD RETURN: | | | |
| Net Asset Value* | | | 3.37% | |
| Market Price** | | | 3.36% | |
| MSCI US REIT Custom Capped Index1*** | | | 3.36% | |
| MSCI US REIT Index | | | 3.36% | |
| |
| Net Assets as of 2/28/2021 | | $ | 944,122,915 | |
INVESTMENT OBJECTIVE****
The JPMorgan BetaBuilders MSCI US REIT ETF (the “Fund”) seeks investment results that closely correspond, before fees and expenses, to the performance of the MSCI US REIT Custom Capped Index (the “Underlying Index”).
INVESTMENT APPROACH
The Underlying Index is a free-float adjusted market-cap weighted index designed to measure the performance of U.S. equity real estate investment trusts (REIT) securities. Using a passive investment approach, the Fund attempts to replicate the Underlying Index as closely as possible and invests at least 80% of its assets in securities included in the Underlying Index. The Underlying Index includes a capping methodology, which is designed to prevent the weight of any single issuer, and the aggregate weight of issuers representing over 5% of the Underlying Index, from exceeding a maximum of 25% of the Underlying Index.
HOW DID THE MARKET PERFORM?
Overall, the real estate sector provided positive returns but underperformed the broader equity market during the period, which was marked by wide dispersion in share price performance within real estate subsectors. The pandemic forced the closure of retail, office, lodging and entertainment properties, which led to a steep sell-off in REITs operating in those subsectors. While new vaccines against COVID-19 bolstered investor expectations that the economy could fully reopen in 2021, uncertainty remained regarding the prospects for commercial real estate, shopping malls, retail outlets and stores.
Notably, demand for communications and technology led to market gains in REITs operating in the data center and communications infrastructure businesses. Shares of industrial property REITs also benefitted, as many of those properties serve as distribution hubs for e-commerce retailers. Demand for single-family homes and home renovations surged during the period, largely driven by the pandemic and ultra-low interest rates.
HOW DID THE FUND PERFORM?
For the twelve months ended February 28, 2021, the Fund performed in line with both the Underlying Index and the MSCI US REIT Index, before considering the effects of operating expenses, fees and tax management of the Fund’s portfolio.
The Fund’s and the Underlying Index’s exposures to the specialized and industrial REIT sectors were leading contributors to absolute performance. The Fund’s and the Underlying Index’s exposures to the retail REIT and office REIT sectors were leading detractors from absolute performance.
HOW WAS THE FUND POSITIONED?
At the end of the reporting period, the Fund’s and the Underlying Index’s largest allocations were to the apartments and diversified REIT sectors and the smallest allocations were to the hotels and regional malls REIT sectors.
| 1 | | Effective November 30, 2020, the MSCI US REIT Custom Capped Index replaced the MSCI US REIT Index as the Fund’s benchmark. The index history for MSCI REIT Custom Capped Index reflects a combination of the performance of the current index and the previous index. |
| | | | | | |
| | | |
| 2 | | | | J.P. MORGAN EXCHANGE-TRADED FUNDS | | FEBRUARY 28, 2021 |
| | | | | | | | |
| TOP TEN EQUITY HOLDINGS OF THE PORTFOLIO***** | |
| | 1. | | | Prologis, Inc. | | | 7.3 | % |
| | 2. | | | Equinix, Inc. | | | 5.7 | |
| | 3. | | | Digital Realty Trust, Inc. | | | 3.8 | |
| | 4. | | | Simon Property Group, Inc. | | | 3.7 | |
| | 5. | | | Public Storage | | | 3.7 | |
| | 6. | | | Welltower, Inc. | | | 2.8 | |
| | 7. | | | AvalonBay Communities, Inc. | | | 2.4 | |
| | 8. | | | Equity Residential | | | 2.4 | |
| | 9. | | | Alexandria Real Estate Equities, Inc. | | | 2.1 | |
| | 10. | | | Realty Income Corp. | | | 2.1 | |
| | | | |
PORTFOLIO COMPOSITION BY SECTOR**** | |
| Apartments | | | 22.0 | % |
| Diversified | | | 17.5 | |
| Industrial | | | 12.4 | |
| Health Care | | | 11.1 | |
| Office | | | 10.8 | |
| Storage | | | 7.9 | |
| Shopping Centers | | | 4.8 | |
| Hotels | | | 4.4 | |
| Regional Malls | | | 4.0 | |
| Short-Term Investments | | | 5.1 | |
| * | | The return shown is based on net asset value and may differ from the return shown in the financial highlights, which reflects adjustments made to the net asset value in accordance with accounting principles generally accepted in the United States of America. The net asset value was $82.46 as of February 28, 2021. |
| ** | | Market price return was calculated assuming an initial investment made at the market price at the beginning of the reporting period, reinvestment of all dividends and distributions at market price during the period, and sale at the market price on the last day of the period. The price used to calculate the market price return was the closing price on the Cboe BZX Exchange, Inc. As of February 28, 2021, the closing price was $82.56. |
| *** | | The MSCI US REIT Custom Capped Index was launched on September 30, 2020. |
| **** | | The adviser seeks to achieve the Fund’s objective. There can be no guarantee it will be achieved. |
| ***** | | Percentages indicated are based on total investments as of February 28, 2021. The Fund’s composition is subject to change. |
| | | | | | | | |
| | | |
| FEBRUARY 28, 2021 | | J.P. MORGAN EXCHANGE-TRADED FUNDS | | | | | 3 | |
JPMorgan BetaBuilders MSCI US REIT ETF
FUND COMMENTARY
TWELVE MONTHS ENDED FEBRUARY 28, 2021 (Unaudited) (continued)
| | | | | | | | | | | | |
AVERAGE ANNUAL TOTAL RETURNS AS OF FEBRUARY 28, 2021 (Unaudited) | |
| | | INCEPTION DATE | | | 1 YEAR | | | SINCE INCEPTION | |
JPMorgan BetaBuilders MSCI US REIT ETF | | | | | | | | | | | | |
Net Asset Value | | | June 15, 2018 | | | | 3.37% | | | | 6.20% | |
Market Price | | | | | | | 3.36% | | | | 6.24% | |
LIFE OF FUND PERFORMANCE (6/15/18 TO 2/28/21)
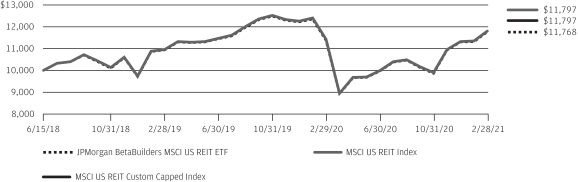
The performance quoted is past performance and is not a guarantee of future results. Exchange-traded funds are subject to certain market risks. Investment returns and principal value of an investment will fluctuate so that an investor’s shares, when sold or redeemed, may be worth more or less than their original cost. Current performance may be higher or lower than the performance data shown. For up-to-date, month-end performance information please call 1-844-457-6383.
Fund commenced operations on June 15, 2018.
The graph illustrates comparative performance for $10,000 invested in shares of the JPMorgan BetaBuilders MSCI US REIT ETF, the MSCI US REIT Index and the MSCI US REIT Custom Capped Index from June 15, 2018 to February 28, 2021. The performance of the Fund reflects the deduction of Fund expenses and assumes reinvestment of all dividends and capital gain distributions, if any. The performance of the MSCI US REIT Index and the MSCI US REIT Custom Capped Index does not reflect the deduction of expenses associated with an exchange-traded fund and has been adjusted to reflect reinvestment of all dividends and capital gain distributions of the securities included in the respective Index, if applicable. The MSCI US REIT Index is a free-float adjusted market-cap weighted index designed to measure the performance of U.S. equity real estate investment trust (REIT) securities. The MSCI US REIT Index is made up of the stocks of publicly traded U.S. equity REITs, as determined by MSCI Inc., the index provider. To be included initially in the MSCI US REIT Index, an equity REIT must meet certain criteria established by the index provider, including meeting a minimum market capitalization threshold as well as a liquidity threshold based on a number of factors, including trading volume and frequency of trading. Equity REITs in the MSCI US REIT Index tend to be small- and mid-cap stocks, and may include Health Care REITs, Hotel & Resort REITs, Industrial REITs, Office REITs, Residential REITs, Retail REITs, Diversified REITs and certain
Specialized REITs. Specialized REITs that may be included in the MSCI US REIT Index own and/or operate (i) storage and self-storage facilities, (ii) data centers, (iii) correctional facilities, (iv) theaters, (v) casinos and gaming facilities or (vi) restaurants.
The MSCI US REIT Custom Capped Index is designed to measure the performance of the US equity REIT market across all market capitalizations. It starts with the universe and weightings of stocks in the MSCI US REIT Index and applies certain investment limits designed to prevent the weight of any single issuer, and the aggregate weight of issuers representing over 5% of the MSCI US REIT Custom Capped Index, from exceeding a maximum of 25% of the MSCI US REIT Custom Capped Index.
Effective November 30, 2020, the Fund’s underlying index changed from the MSCI US REIT Index to the MSCI US REIT Custom Capped Index in order to allow the Fund to operate more effectively as a diversified fund. The index history for MSCI REIT Custom Capped Index reflects a combination of the performance of the current index and the previous index.
Fund performance reflects the waiver of the Fund’s fees and reimbursement of expenses for certain periods since the Fund’s inception date. Without these waivers and reimbursements, performance would have been lower. Also, performance shown in this section does not reflect the deduction of taxes that a shareholder may pay on Fund distributions or on gains resulting from redemption or sale of Fund shares.
The returns shown are based on net asset values calculated for shareholder transactions and may differ from the returns shown in the financial highlights, which reflect adjustments made to the net asset values in accordance with accounting principles generally accepted in the United States of America.
| | | | | | |
| | | |
| 4 | | | | J.P. MORGAN EXCHANGE-TRADED FUNDS | | FEBRUARY 28, 2021 |
JPMorgan BetaBuilders MSCI US REIT ETF
SCHEDULE OF PORTFOLIO INVESTMENTS
AS OF FEBRUARY 28, 2021
| | | | | | | | |
| INVESTMENTS | | SHARES | | | VALUE($) | |
Common Stocks — 99.4% | | | | | | | | |
|
Apartments — 23.0% | |
Agree Realty Corp., REIT (a) | | | 54,438 | | | | 3,514,517 | |
American Campus Communities, Inc., REIT (a) | | | 135,324 | | | | 5,542,871 | |
American Homes 4 Rent, Class A, REIT | | | 279,286 | | | | 8,696,966 | |
Apartment Income REIT Corp., REIT | | | 146,357 | | | | 5,983,074 | |
Apartment Investment and Management Co., Class A, REIT | | | 65,515 | | | | 311,851 | |
AvalonBay Communities, Inc., REIT | | | 137,257 | | | | 24,122,918 | |
Camden Property Trust, REIT | | | 95,759 | | | | 9,973,300 | |
Centerspace, REIT | | | 12,756 | | | | 875,444 | |
Equity LifeStyle Properties, Inc., REIT | | | 170,198 | | | | 10,492,707 | |
Equity Residential, REIT | | | 365,995 | | | | 23,939,733 | |
Essential Properties Realty Trust, Inc., REIT | | | 102,908 | | | | 2,387,466 | |
Essex Property Trust, Inc., REIT | | | 64,108 | | | | 16,334,077 | |
Four Corners Property Trust, Inc., REIT | | | 72,206 | | | | 1,956,061 | |
Getty Realty Corp., REIT | | | 35,775 | | | | 1,000,985 | |
Independence Realty Trust, Inc., REIT | | | 93,240 | | | | 1,309,090 | |
Invitation Homes, Inc., REIT | | | 551,111 | | | | 16,059,375 | |
Mid-America Apartment Communities, Inc., REIT | | | 112,453 | | | | 15,150,793 | |
National Retail Properties, Inc., REIT | | | 170,805 | | | | 7,488,091 | |
NexPoint Residential Trust, Inc., REIT | | | 19,358 | | | | 794,452 | |
Realty Income Corp., REIT | | | 345,094 | | | | 20,795,365 | |
Spirit Realty Capital, Inc., REIT | | | 106,957 | | | | 4,601,290 | |
STORE Capital Corp., REIT | | | 245,276 | | | | 8,202,029 | |
Sun Communities, Inc., REIT | | | 105,753 | | | | 16,069,168 | |
UDR, Inc., REIT | | | 289,532 | | | | 11,920,032 | |
| | | | | | | | |
| | |
| | | | | | | 217,521,655 | |
| | | | | | | | |
| | |
Diversified — 18.3% | | | | | | | | |
Alexander & Baldwin, Inc., REIT | | | 67,575 | | | | 1,180,535 | |
American Finance Trust, Inc., REIT | | | 107,002 | | | | 948,038 | |
Armada Hoffler Properties, Inc., REIT | | | 56,964 | | | | 735,405 | |
Colony Capital, Inc., REIT (a) | | | 473,528 | | | | 2,803,286 | |
CoreSite Realty Corp., REIT | | | 42,045 | | | | 5,117,297 | |
Digital Realty Trust, Inc., REIT | | | 275,460 | | | | 37,112,726 | |
Duke Realty Corp., REIT | | | 365,703 | | | | 14,353,843 | |
EPR Properties, REIT | | | 73,363 | | | | 3,314,540 | |
Equinix, Inc., REIT | | | 87,607 | | | | 56,799,122 | |
Gaming and Leisure Properties, Inc., REIT | | | 214,736 | | | | 9,534,278 | |
GEO Group, Inc. (The), REIT (a) | | | 119,281 | | | | 858,823 | |
Gladstone Commercial Corp., REIT | | | 33,686 | | | | 629,254 | |
Global Net Lease, Inc., REIT | | | 87,979 | | | | 1,634,650 | |
iStar, Inc., REIT (a) | | | 72,730 | | | | 1,288,776 | |
Lexington Realty Trust, REIT (a) | | | 272,302 | | | | 2,919,077 | |
One Liberty Properties, Inc., REIT | | | 16,192 | | | | 346,671 | |
PS Business Parks, Inc., REIT | | | 20,273 | | | | 2,936,747 | |
Safehold, Inc., REIT (a) | | | 13,055 | | | | 995,444 | |
UMH Properties, Inc., REIT | | | 36,902 | | | | 629,917 | |
VICI Properties, Inc., REIT | | | 527,646 | | | | 15,037,911 | |
Washington, REIT (a) | | | 80,985 | | | | 1,823,782 | |
WP Carey, Inc., REIT | | | 172,455 | | | | 11,820,066 | |
| | | | | | | | |
| | |
| | | | | | | 172,820,188 | |
| | | | | | | | |
| | | | | | | | |
| INVESTMENTS | | SHARES | | | VALUE($) | |
| | | | | | | | |
| | |
Health Care — 11.7% | | | | | | | | |
CareTrust REIT, Inc., REIT | | | 94,133 | | | | 2,087,870 | |
Community Healthcare Trust, Inc., REIT | | | 21,881 | | | | 959,044 | |
Diversified Healthcare Trust, REIT (a) | | | 234,268 | | | | 1,054,206 | |
Global Medical REIT, Inc., REIT | | | 45,013 | | | | 606,325 | |
Healthcare Realty Trust, Inc., REIT | | | 133,767 | | | | 3,860,516 | |
Healthcare Trust of America, Inc., Class A, REIT | | | 214,901 | | | | 5,836,711 | |
Healthpeak Properties, Inc., REIT | | | 529,304 | | | | 15,397,453 | |
LTC Properties, Inc., REIT | | | 38,586 | | | | 1,578,553 | |
Medical Properties Trust, Inc., REIT | | | 563,777 | | | | 12,171,945 | |
National Health Investors, Inc., REIT | | | 43,977 | | | | 3,002,310 | |
Omega Healthcare Investors, Inc., REIT | | | 223,191 | | | | 8,289,314 | |
Physicians Realty Trust, REIT | | | 204,728 | | | | 3,480,376 | |
Sabra Health Care REIT, Inc., REIT | | | 203,451 | | | | 3,503,426 | |
Universal Health Realty Income Trust, REIT | | | 12,862 | | | | 796,801 | |
Ventas, Inc., REIT | | | 368,273 | | | | 19,481,642 | |
Welltower, Inc., REIT | | | 410,285 | | | | 27,858,352 | |
| | | | | | | | |
| | |
| | | | | | | 109,964,844 | |
| | | | | | | | |
| | |
Hotels — 4.7% | | | | | | | | |
Apple Hospitality REIT, Inc., REIT | | | 208,540 | | | | 2,971,695 | |
Chatham Lodging Trust, REIT* | | | 46,180 | | | | 643,287 | |
DiamondRock Hospitality Co., REIT* | | | 196,168 | | | | 1,985,220 | |
Host Hotels & Resorts, Inc., REIT | | | 693,471 | | | | 11,504,684 | |
MGM Growth Properties LLC, Class A, REIT | | | 129,247 | | | | 4,267,736 | |
Park Hotels & Resorts, Inc., REIT | | | 231,648 | | | | 5,038,344 | |
Pebblebrook Hotel Trust, REIT (a) | | | 128,716 | | | | 2,916,705 | |
RLJ Lodging Trust, REIT | | | 162,251 | | | | 2,547,341 | |
Ryman Hospitality Properties, Inc., REIT | | | 51,356 | | | | 3,969,305 | |
Service Properties Trust, REIT | | | 162,050 | | | | 2,080,722 | |
Summit Hotel Properties, Inc., REIT* | | | 103,918 | | | | 1,075,551 | |
Sunstone Hotel Investors, Inc., REIT | | | 212,008 | | | | 2,800,626 | |
Xenia Hotels & Resorts, Inc., REIT | | | 111,820 | | | | 2,233,045 | |
| | | | | | | | |
| | |
| | | | | | | 44,034,261 | |
| | | | | | | | |
| | |
Industrial — 13.0% | | | | | | | | |
Americold Realty Trust, REIT | | | 201,412 | | | | 7,057,476 | |
CyrusOne, Inc., REIT | | | 118,404 | | | | 7,770,855 | |
EastGroup Properties, Inc., REIT | | | 38,891 | | | | 5,293,454 | |
First Industrial Realty Trust, Inc., REIT | | | 126,881 | | | | 5,419,088 | |
Industrial Logistics Properties Trust, REIT | | | 64,205 | | | | 1,365,640 | |
Innovative Industrial Properties, Inc., REIT (a) | | | 21,796 | | | | 4,250,220 | |
Monmouth Real Estate Investment Corp., REIT | | | 91,595 | | | | 1,586,425 | |
Prologis, Inc., REIT | | | 726,791 | | | | 72,003,184 | |
QTS Realty Trust, Inc., Class A, REIT (a) | | | 63,226 | | | | 3,927,599 | |
Rexford Industrial Realty, Inc., REIT | | | 121,704 | | | | 5,807,715 | |
STAG Industrial, Inc., REIT | | | 146,725 | | | | 4,629,174 | |
Terreno Realty Corp., REIT | | | 67,220 | | | | 3,767,009 | |
| | | | | | | | |
| | |
| | | | | | | 122,877,839 | |
| | | | | | | | |
SEE NOTES TO FINANCIAL STATEMENTS.
| | | | | | | | |
| | | |
| FEBRUARY 28, 2021 | | J.P. MORGAN EXCHANGE-TRADED FUNDS | | | | | 5 | |
JPMorgan BetaBuilders MSCI US REIT ETF
SCHEDULE OF PORTFOLIO INVESTMENTS
AS OF FEBRUARY 28, 2021 (continued)
| | | | | | | | |
| INVESTMENTS | | SHARES | | | VALUE($) | |
Common Stocks — continued | |
|
Office — 11.3% | |
Alexandria Real Estate Equities, Inc., REIT | | | 132,670 | | | | 21,186,072 | |
American Assets Trust, Inc., REIT | | | 50,379 | | | | 1,565,779 | |
Boston Properties, Inc., REIT | | | 145,396 | | | | 14,413,105 | |
Brandywine Realty Trust, REIT | | | 167,707 | | | | 2,051,057 | |
City Office REIT, Inc., REIT | | | 42,669 | | | | 433,517 | |
Columbia Property Trust, Inc., REIT | | | 112,536 | | | | 1,589,008 | |
Corporate Office Properties Trust, REIT | | | 110,286 | | | | 2,867,436 | |
Cousins Properties, Inc., REIT | | | 150,211 | | | | 5,038,077 | |
Douglas Emmett, Inc., REIT | | | 172,432 | | | | 5,647,148 | |
Easterly Government Properties, Inc., REIT | | | 79,870 | | | | 1,755,543 | |
Empire State Realty Trust, Inc., Class A, REIT (a) | | | 142,863 | | | | 1,572,922 | |
Equity Commonwealth, REIT | | | 119,479 | | | | 3,370,503 | |
Franklin Street Properties Corp., REIT | | | 105,529 | | | | 523,424 | |
Highwoods Properties, Inc., REIT | | | 102,162 | | | | 4,082,393 | |
Hudson Pacific Properties, Inc., REIT | | | 149,581 | | | | 3,827,778 | |
JBG SMITH Properties, REIT | | | 117,213 | | | | 3,721,513 | |
Kilroy Realty Corp., REIT | | | 101,977 | | | | 6,471,460 | |
Mack-Cali Realty Corp., REIT (a) | | | 89,183 | | | | 1,245,886 | |
Office Properties Income Trust, REIT | | | 47,502 | | | | 1,201,325 | |
Paramount Group, Inc., REIT | | | 173,169 | | | | 1,605,277 | |
Piedmont Office Realty Trust, Inc., Class A, REIT | | | 123,917 | | | | 2,114,024 | |
SL Green Realty Corp., REIT (a) | | | 71,554 | | | | 4,942,235 | |
VEREIT, Inc., REIT | | | 214,666 | | | | 8,371,974 | |
Vornado Realty Trust, REIT | | | 159,838 | | | | 6,863,444 | |
| | | | | | | | |
| | |
| | | | | | | 106,460,900 | |
| | | | | | | | |
|
Regional Malls — 4.2% | |
Macerich Co. (The), REIT (a) | | | 110,215 | | | | 1,423,978 | |
Simon Property Group, Inc., REIT | | | 322,615 | | | | 36,429,686 | |
Tanger Factory Outlet Centers, Inc., REIT (a) | | | 91,877 | | | | 1,446,144 | |
| | | | | | | | |
| | |
| | | | | | | 39,299,808 | |
| | | | | | | | |
| | |
Shopping Centers — 5.0% | | | | | | | | |
Acadia Realty Trust, REIT | | | 84,820 | | | | 1,603,946 | |
Alexander’s, Inc., REIT | | | 2,259 | | | | 612,438 | |
Brixmor Property Group, Inc., REIT | | | 291,502 | | | | 5,736,759 | |
Federal Realty Investment Trust, REIT (a) | | | 70,660 | | | | 7,148,672 | |
Kimco Realty Corp., REIT | | | 425,232 | | | | 7,794,503 | |
Kite Realty Group Trust, REIT | | | 82,784 | | | | 1,586,969 | |
Regency Centers Corp., REIT | | | 166,830 | | | | 9,138,948 | |
Retail Opportunity Investments Corp., REIT | | | 116,025 | | | | 1,834,355 | |
Retail Properties of America, Inc., Class A, REIT | | | 210,649 | | | | 2,218,134 | |
RPT Realty, REIT | | | 79,598 | | | | 873,190 | |
Saul Centers, Inc., REIT | | | 13,806 | | | | 489,009 | |
Seritage Growth Properties, Class A, REIT* (a) | | | 36,093 | | | | 728,718 | |
SITE Centers Corp., REIT | | | 151,974 | | | | 2,027,333 | |
Urban Edge Properties, REIT | | | 114,746 | | | | 1,893,309 | |
| | | | | | | | |
| INVESTMENTS | | SHARES | | | VALUE($) | |
| | | | | | | | |
| | |
Shopping Centers — continued | | | | | | | | |
Urstadt Biddle Properties, Inc., Class A, REIT | | | 29,495 | | | | 475,459 | |
Weingarten Realty Investors, REIT | | | 119,693 | | | | 3,039,005 | |
| | | | | | | | |
| | |
| | | | | | | 47,200,747 | |
| | | | | | | | |
| | |
Storage — 8.2% | | | | | | | | |
CubeSmart, REIT | | | 191,985 | | | | 7,095,766 | |
Extra Space Storage, Inc., REIT | | | 127,068 | | | | 15,972,448 | |
Iron Mountain, Inc., REIT (a) | | | 283,321 | | | | 9,856,738 | |
Life Storage, Inc., REIT | | | 71,677 | | | | 6,013,700 | |
National Storage Affiliates Trust, REIT | | | 68,041 | | | | 2,622,980 | |
Public Storage, REIT | | | 154,691 | | | | 36,188,412 | |
| | | | | | | | |
| | |
| | | | | | | 77,750,044 | |
| | | | | | | | |
Total Common Stocks
(Cost $1,022,665,566) | | | | 937,930,286 | |
| | | | | |
|
Short-Term Investments — 5.3% | |
| | |
Investment Companies — 1.0% | | | | | | | | |
JPMorgan U.S. Government Money Market Fund Class Institutional Shares, 0.03% (b) (c)
(Cost $9,743,503) | | | 9,743,503 | | | | 9,743,503 | |
| | | | | | | | |
|
Investment of Cash Collateral From Securities Loaned — 4.3% | |
JPMorgan Securities Lending Money Market Fund Agency SL Class Shares, 0.14% (b) (c) | | | 36,805,471 | | | | 36,809,152 | |
JPMorgan U.S. Government Money Market Fund Class IM Shares, 0.04% (b) (c) | | | 3,725,951 | | | | 3,725,951 | |
| | | | | | | | |
Total Investment of Cash Collateral From Securities Loaned
(Cost $40,535,103) | | | | 40,535,103 | |
| | | | | |
Total Short-Term Investments
(Cost $50,278,606) | | | | 50,278,606 | |
| | | | | |
Total Investments — 104.7%
(Cost $1,072,944,172) | | | | 988,208,892 | |
Liabilities in Excess of
Other Assets — (4.7)% | | | | (44,085,977 | ) |
| | | | | |
NET ASSETS — 100.0% | | | | 944,122,915 | |
| | | | | |
Percentages indicated are based on net assets.
Abbreviations
| | |
| REIT | | Real Estate Investment Trust |
| |
| (a) | | The security or a portion of this security is on loan at February 28, 2021. The total value of securities on loan at February 28, 2021 is $38,663,812. |
| (b) | | Investment in an affiliated fund, which is registered under the Investment Company Act of 1940, as amended, and is advised by J.P. Morgan Investment Management Inc. |
| (c) | | The rate shown is the current yield as of February 28, 2021. |
| * | | Non-income producing security. |
SEE NOTES TO FINANCIAL STATEMENTS.
| | | | | | |
| | | |
| 6 | | | | J.P. MORGAN EXCHANGE-TRADED FUNDS | | FEBRUARY 28, 2021 |
| | | | | | | | | | | | | | | | | | | | |
| Futures contracts outstanding as of February 28, 2021: | |
| DESCRIPTION | | NUMBER OF
CONTRACTS | | | EXPIRATION
DATE | | | TRADING
CURRENCY | | | NOTIONAL AMOUNT
($) | | | VALUE AND
UNREALIZED
APPRECIATION
(DEPRECIATION)($) | |
Long Contracts | |
DJ US Real Estate Index | | | 195 | | | | 03/2021 | | | | USD | | | | 6,653,400 | | | | 289,797 | |
| | | | | | | | | | | | | | | | | | | | |
Abbreviations
SEE NOTES TO FINANCIAL STATEMENTS.
| | | | | | | | |
| | | |
| FEBRUARY 28, 2021 | | J.P. MORGAN EXCHANGE-TRADED FUNDS | | | | | 7 | |
STATEMENT OF ASSETS AND LIABILITIES
AS OF FEBRUARY 28, 2021
| | | | |
| | | JPMorgan
BetaBuilders MSCI
US REIT ETF | |
ASSETS: | |
Investments in non-affiliates, at value | | $ | 937,930,286 | |
Investments in affiliates, at value | | | 9,743,503 | |
Investments of cash collateral received from securities loaned, at value (See Note 2.B.) | | | 40,535,103 | |
Cash | | | 27,904 | |
Deposits at broker for futures contracts | | | 802,000 | |
Receivables: | | | | |
Investment securities sold | | | 29,413,294 | |
Dividends from non-affiliates | | | 757,729 | |
Dividends from affiliates | | | 180 | |
Securities lending income (See Note 2.B.) | | | 7,653 | |
| | | | |
Total Assets | | | 1,019,217,652 | |
| | | | |
|
LIABILITIES: | |
Payables: | | | | |
Investment securities purchased | | | 7,520,337 | |
Collateral received on securities loaned (See Note 2.B.) | | | 40,535,103 | |
Fund shares redeemed | | | 26,798,382 | |
Variation margin on futures contracts | | | 159,293 | |
Accrued liabilities: | | | | |
Management fees (See Note 3.A.) | | | 81,622 | |
| | | | |
Total Liabilities | | | 75,094,737 | |
| | | | |
Net Assets | | $ | 944,122,915 | |
| | | | |
|
NET ASSETS: | |
Paid-in-Capital | | $ | 1,044,130,582 | |
Total distributable earnings (loss) | | | (100,007,667 | ) |
| | | | |
Total Net Assets | | $ | 944,122,915 | |
| | | | |
| |
Outstanding number of shares
(unlimited number of shares authorized — par value $0.0001) | | | 11,450,000 | |
| | | | |
Net asset value, per share | | $ | 82.46 | |
| | | | |
| |
Cost of investments in non-affiliates | | $ | 1,022,665,566 | |
Cost of investments in affiliates | | | 9,743,503 | |
Investment securities on loan, at value (See Note 2.B.) | | | 38,663,812 | |
Cost of investment of cash collateral (See Note 2.B.) | | | 40,535,103 | |
SEE NOTES TO FINANCIAL STATEMENTS.
| | | | | | |
| | | |
| 8 | | | | J.P. MORGAN EXCHANGE-TRADED FUNDS | | FEBRUARY 28, 2021 |
STATEMENT OF OPERATIONS
FOR THE YEAR ENDED FEBRUARY 28, 2021
| | | | |
| | | JPMorgan
BetaBuilders MSCI
US REIT ETF | |
INVESTMENT INCOME: | | | | |
Interest income from non-affiliates | | $ | 296 | |
Dividend income from non-affiliates | | | 26,880,095 | |
Dividend income from affiliates | | | 5,339 | |
Income from securities lending (net) (See Note 2.B.) | | | 297,824 | |
| | | | |
Total investment income | | | 27,183,554 | |
| | | | |
| |
EXPENSES: | | | | |
Management fees (See Note 3.A.) | | | 1,013,552 | |
Interest expense to non-affiliates | | | 1,516 | |
| | | | |
Total expenses | | | 1,015,068 | |
| | | | |
Net investment income (loss) | | | 26,168,486 | |
| | | | |
| |
REALIZED/UNREALIZED GAINS (LOSSES): | | | | |
Net realized gain (loss) on transactions from: | | | | |
Investments in non-affiliates | | | (19,137,932 | ) |
In-kind redemptions of investments in non-affiliates | | | (38,302,731 | ) |
Futures contracts | | | 490,100 | |
| | | | |
Net realized gain (loss) | | | (56,950,563 | ) |
| | | | |
Change in net unrealized appreciation/depreciation on: | | | | |
Investments in non-affiliates | | | (2,251,170 | ) |
Futures contracts | | | 520,696 | |
| | | | |
Change in net unrealized appreciation/depreciation | | | (1,730,474 | ) |
| | | | |
Net realized/unrealized gains (losses) | | | (58,681,037 | ) |
| | | | |
Change in net assets resulting from operations | | $ | (32,512,551 | ) |
| | | | |
SEE NOTES TO FINANCIAL STATEMENTS.
| | | | | | | | |
| | | |
| FEBRUARY 28, 2021 | | J.P. MORGAN EXCHANGE-TRADED FUNDS | | | | | 9 | |
STATEMENTS OF CHANGES IN NET ASSETS
FOR THE PERIODS INDICATED
| | | | | | | | |
| | | JPMorgan BetaBuilders MSCI US REIT ETF | |
| | | Year Ended
February 28, 2021 | | | Year Ended
February 29, 2020 | |
CHANGE IN NET ASSETS RESULTING FROM OPERATIONS: | |
Net investment income (loss) | | $ | 26,168,486 | | | $ | 18,248,268 | |
Net realized gain (loss) | | | (56,950,563 | ) | | | 21,867,375 | |
Change in net unrealized appreciation/depreciation | | | (1,730,474 | ) | | | (89,222,724 | ) |
| | | | | | | | |
Change in net assets resulting from operations | | | (32,512,551 | ) | | | (49,107,081 | ) |
| | | | | | | | |
|
DISTRIBUTIONS TO SHAREHOLDERS: | |
Total distributions to shareholders | | | (32,859,372 | ) | | | (15,092,951 | ) |
| | | | | | | | |
|
CAPITAL TRANSACTIONS: | |
Change in net assets resulting from capital transactions | | | (196,802,655 | ) | | | 1,134,468,601 | |
| | | | | | | | |
|
NET ASSETS: | |
Change in net assets | | | (262,174,578 | ) | | | 1,070,268,569 | |
Beginning of period | | | 1,206,297,493 | | | | 136,028,924 | |
| | | | | | | | |
End of period | | $ | 944,122,915 | | | $ | 1,206,297,493 | |
| | | | | | | | |
| | |
CAPITAL TRANSACTIONS: | | | | | | | | |
Proceeds from shares issued | | $ | 405,994,191 | | | $ | 1,284,582,953 | |
Cost of shares redeemed | | | (602,796,846 | ) | | | (150,114,352 | ) |
| | | | | | | | |
Total change in net assets resulting from capital transactions | | $ | (196,802,655 | ) | | $ | 1,134,468,601 | |
| | | | | | | | |
|
SHARE TRANSACTIONS: | |
Issued | | | 5,500,000 | | | | 14,625,000 | |
Redeemed | | | (8,650,000 | ) | | | (1,700,000 | ) |
| | | | | | | | |
Net increase (decrease) in shares from share transactions | | | (3,150,000 | ) | | | 12,925,000 | |
| | | | | | | | |
SEE NOTES TO FINANCIAL STATEMENTS.
| | | | | | |
| | | |
| 10 | | | | J.P. MORGAN EXCHANGE-TRADED FUNDS | | FEBRUARY 28, 2021 |
THIS PAGE IS INTENTIONALLY LEFT BLANK
| | | | | | | | |
| | | |
| FEBRUARY 28, 2021 | | J.P. MORGAN EXCHANGE-TRADED FUNDS | | | | | 11 | |
FINANCIAL HIGHLIGHTS
FOR THE PERIODS INDICATED
| | | | | | | | | | | | | | | | | | | | | | | | | | | | |
| | | Per share operating performance | |
| | | | | | Investment operations | | | Distributions | |
| | | Net asset
value,
beginning
of period | | | Net
investment
income
(loss) (b) | | | Net realized
and unrealized
gains
(losses) on
investments | | | Total from
investment
operations | | | Net
investment
income | | | Net
realized
gain | | | Total
distributions | |
| | | | | | | |
JPMorgan BetaBuilders MSCI US REIT ETF | | | | | | | | | | | | | | | | | | | | | | | | | | | | |
Year Ended February 28, 2021 | | $ | 82.62 | | | $ | 2.07 | | | $ | 0.28 | (f) | | $ | 2.35 | | | $ | (2.51 | ) | | $ | — | | | $ | (2.51 | ) |
Year Ended February 29, 2020 | | | 81.21 | | | | 2.55 | | | | 0.80 | (f) | | | 3.35 | | | | (1.85 | ) | | | (0.09 | ) | | | (1.94 | ) |
June 15, 2018 (h) through February 28, 2019 | | | 75.67 | | | | 1.85 | | | | 5.10 | | | | 6.95 | | | | (1.35 | ) | | | (0.06 | ) | | | (1.41 | ) |
| (a) | Annualized for periods less than one year, unless otherwise indicated. |
| (b) | Calculated based upon average shares outstanding. |
| (c) | Not annualized for periods less than one year. |
| (d) | Includes adjustments in accordance with accounting principles generally accepted in the United States of America and as such, the net asset values for financial reporting purposes and the returns based upon those net asset values may differ from the net asset values and returns for shareholder transactions. |
| (e) | Prior to December 9, 2019, market price return was calculated assuming an initial investment made at the market price at the beginning of the reporting period, reinvestment of all dividends and distributions at market price during the period, and sale at the market price on the last day of the period. The price used to calculate the market price return was the midpoint of the bid/ask spread at the close of business on the listing exchange of the fund. Effective December 9, 2019, the closing price was used to calculate the market price return; however, any prices used in the calculation for market price return prior to December 9, 2019, would have used the midpoint of the bid/ask spread at the close of business on the exchange. |
| (f) | Calculation of the net realized and unrealized gains (losses) per share do not correlate with the Fund’s net realized and unrealized gains (losses) presented in the Statement of Operations due to the timing of capital transactions in relation to the fluctuating market values of the Fund’s investments. |
| (g) | Prior to November 1, 2019, the Fund may have waived fees if expenses exceeded the expense cap. On November 1, 2019, the Fund adopted a unitary fee structure where a management fee is accrued by the fund based on prior day net assets and other expenses are paid by the Advisor. |
| (h) | Commencement of operations. |
| (i) | Since the Shares of the Fund did not trade in the secondary market until the day after the Fund’s inception, for the period from the inception to the first day of secondary market trading, the NAV is used as a proxy for the secondary market trading price to calculate the market returns. |
| (j) | Certain non-recurring expenses incurred by the Fund were not annualized for the period indicated. |
SEE NOTES TO FINANCIAL STATEMENTS.
| | | | | | |
| | | |
| 12 | | | | J.P. MORGAN EXCHANGE-TRADED FUNDS | | FEBRUARY 28, 2021 |
| | | | | | | | | | | | | | | | | | | | | | | | | | | | | | | | | | |
| Ratios/Supplemental data | |
| | | | | | | | | | | | | | | | Ratios to average net assets (a) | | | | |
Net asset
value,
end of
period | | | Market
price,
end of
period | | | Total
return (c)(d) | | | Market
price total
return (c)(e) | | | Net assets,
end of period | | | Net
expenses | | | Net
investment
income
(loss) | | | Expenses without
waivers
and reimbursements | | | Portfolio
turnover
rate (c) | |
| | | | | | | | |
| | | | | | | | | | | | | | | | | | | | | | | | | | | | | | | | | | |
| $ | 82.46 | | | $ | 82.56 | | | | 3.37 | % | | | 3.36 | % | | $ | 944,122,915 | | | | 0.11 | % | | | 2.82 | % | | | 0.11 | % | | | 7 | % |
| | 82.62 | | | | 82.73 | | | | 4.06 | | | | 4.18 | | | | 1,206,297,493 | | | | 0.11 | | | | 2.88 | | | | 0.16 | (g) | | | 5 | |
| | 81.21 | | | | 81.22 | | | | 9.40 | | | | 9.41 | (i) | | | 136,028,924 | | | | 0.11 | (j) | | | 3.37 | | | | 0.40 | (g)(j) | | | 5 | |
SEE NOTES TO FINANCIAL STATEMENTS.
| | | | | | | | |
| | | |
| FEBRUARY 28, 2021 | | J.P. MORGAN EXCHANGE-TRADED FUNDS | | | | | 13 | |
NOTES TO FINANCIAL STATEMENTS
AS OF FEBRUARY 28, 2021
1. Organization
J.P. Morgan Exchange-Traded Fund Trust (the “Trust”) was formed on February 25, 2010, and is governed by a Declaration of Trust as amended and restated February 19, 2014, and is registered under the Investment Company Act of 1940, as amended (the “1940 Act”), as an open-end management investment company. JPMorgan BetaBuilders MSCI US REIT ETF (the “Fund” or “MSCI US REIT ETF”) is a separate diversified series of the Trust covered in this report.
The investment objective of the Fund is to seek investment results that closely correspond, before fees and expenses, to the performance of the MSCI US REIT Custom Capped Index.
J.P. Morgan Investment Management Inc. (“JPMIM”), an indirect, wholly-owned subsidiary of JPMorgan Chase & Co. (“JPMorgan”), acts as Adviser (the “Adviser”) and Administrator (the “Administrator”) to the Fund.
Shares of the Fund are listed and traded at market price on the Cboe BZX Exchange, Inc. Market prices for the Fund’s shares may be different from its net asset value (“NAV”). The Fund issues and redeems its shares on a continuous basis, through JPMorgan Distribution Services, Inc. (the “Distributor” or “JPMDS”), an indirect, wholly-owned subsidiary of JPMorgan, at NAV in large blocks of shares, typically 25,000 shares, referred to as “Creation Units.”
Creation Units are issued and redeemed principally in-kind for a basket of securities. A cash amount may be substituted if the Fund has sizeable exposure to market or sponsor restricted securities. Shares are generally traded in the secondary market in amounts less than a Creation Unit at market prices that change throughout the day. Only individuals or institutions that have entered into an authorized participant agreement with the Distributor may do business directly with the Fund (each, an “Authorized Participant”).
2. Significant Accounting Policies
The following is a summary of significant accounting policies followed by the Fund in the preparation of its financial statements. The Fund is an investment company and, accordingly, follows the investment company accounting and reporting guidance of the Financial Accounting Standards Board (“FASB”) Accounting Standards Codification Topic 946 — Investment Companies, which is part of U.S. generally accepted accounting principles (“GAAP”). The preparation of financial statements in conformity with GAAP requires management to make estimates and assumptions that affect (i) the reported amounts of assets and liabilities, (ii) disclosure of contingent assets and liabilities at the date of the financial statements, and (iii) the reported amounts of increases and decreases in net assets from operations during the reporting period. Actual results could differ from those estimates.
A. Valuation of Investments — Investments are valued in accordance with GAAP and the Fund’s valuation policies set forth by, and under the supervision and responsibility of, the Board of Trustees of the Trust (the “Board”), which established the following approach to valuation, as described more fully below: (i) investments for which market quotations are readily available shall be valued at their market value and (ii) all other investments for which market quotations are not readily available shall be valued at their fair value as determined in good faith by the Board.
The Administrator has established the J.P. Morgan Asset Management Americas Valuation Committee (“AVC”) to assist the Board with the oversight and monitoring of the valuation of the Fund’s investments. The Administrator implements the valuation policies of the Fund’s investments, as directed by the Board. The AVC oversees and carries out the policies for the valuation of investments held in the Fund. This includes monitoring the appropriateness of fair values based on results of ongoing valuation oversight including, but not limited to, consideration of macro or security specific events, market events, and pricing vendor and broker due diligence. The Administrator is responsible for discussing and assessing the potential impacts to the fair values on an ongoing basis, and, at least on a quarterly basis, with the AVC and the Board.
Equities and other exchange-traded instruments are valued at the last sale price or official market closing price on the primary exchange on which the instrument is traded before the NAV of the Fund is calculated on a valuation date.
Investments in open-end investment companies (“Underlying Funds”) are valued at each Underlying Fund’s NAV per share as of the report date.
Futures contracts are generally valued on the basis of available market quotations.
Valuations reflected in this report are as of the report date. As a result, changes in valuation due to market events and/or issuer-related events after the report date and prior to issuance of the report are not reflected herein.
The various inputs that are used in determining the valuation of the Fund’s investments are summarized into the three broad levels listed below.
| • | | Level 1 — Unadjusted inputs using quoted prices in active markets for identical investments. |
| • | | Level 2 — Other significant observable inputs including, but not limited to, quoted prices for similar investments, inputs other than quoted prices that are observable for investments (such as interest rates, prepayment speeds, credit risk, etc.) or other market corroborated inputs. |
| • | | Level 3 — Significant inputs based on the best information available in the circumstances, to the extent observable inputs are not available (including the Fund’s assumptions in determining the fair value of investments). |
A financial instrument’s level within the fair value hierarchy is based on the lowest level of any input, both individually and in the aggregate, that is significant to the fair value measurement. The inputs or methodology used for valuing instruments are not necessarily an indication of the risk associated with investing in those instruments.
| | | | | | |
| | | |
| 14 | | | | J.P. MORGAN EXCHANGE-TRADED FUNDS | | FEBRUARY 28, 2021 |
The following table represents each valuation input as presented on the Schedule of Portfolio Investments (“SOI”):
| | | | | | | | | | | | | | | | |
| | | Level 1 Quoted prices | | | Level 2
Other significant
observable inputs | | | Level 3 Significant unobservable inputs | | | Total | |
Total Investments in Securities (a) | | $ | 988,208,892 | | | $ | — | | | $ | — | | | $ | 988,208,892 | |
| | | | | | | | | | | | | | | | |
Appreciation in Other Financial Instruments | |
Futures Contracts (a) | | $ | 289,797 | | | $ | — | | | $ | — | | | $ | 289,797 | |
| | | | | | | | | | | | | | | | |
| (a) | Please refer to the SOI for specifics of portfolio holdings. |
B. Securities Lending — The Fund is authorized to engage in securities lending in order to generate additional income. The Fund is able to lend to approved borrowers. Citibank N.A. (“Citibank”) serves as lending agent for the Fund, pursuant to a Securities Lending Agency Agreement (the “Securities Lending Agency Agreement”). Securities loaned are collateralized by cash equal to at least 100% of the market value plus accrued interest on the securities lent, which is invested in the Class IM Shares of the JPMorgan U.S. Government Money Market Fund and the Agency SL Class Shares of the JPMorgan Securities Lending Money Market Fund. The Fund retains loan fees and the interest on cash collateral investments but is required to pay the borrower a rebate for the use of cash collateral. In cases where the lent security is of high value to borrowers, there may be a negative rebate (i.e., a net payment from the borrower to the Fund). Upon termination of a loan, the Fund is required to return to the borrower an amount equal to the cash collateral, plus any rebate owed to the borrowers. The remaining maturities of the securities lending transactions are considered overnight and continuous. Loans are subject to termination by the Fund or the borrower at any time.
The net income earned on the securities lending (after payment of rebates and Citibank’s fee) is included on the Statement of Operations as Income from securities lending (net). The Fund also receives payments from the borrower during the period of the loan, equivalent to dividends and interest earned on the securities loaned, which are recorded as Dividend or Interest income, respectively, on the Statement of Operations.
Under the Securities Lending Agency Agreement, Citibank marks to market the loaned securities on a daily basis. In the event the cash received from the borrower is less than 102% of the value of the loaned securities (105% for loans of non-U.S. securities), Citibank requests additional cash from the borrower so as to maintain a collateralization level of at least 102% of the value of the loaned securities plus accrued interest (105% for loans of non-U.S. securities), subject to certain de minimis amounts.
The value of securities out on loan is recorded as an asset on the Statement of Assets and Liabilities. The value of the cash collateral received is recorded as a liability on the Statement of Assets and Liabilities and details of collateral investments are disclosed on the SOI.
The Fund bears the risk of loss associated with the collateral investments and is not entitled to additional collateral from the borrower to cover any such losses. To the extent that the value of the collateral investments declines below the amount owed to a borrower, the Fund may incur losses that exceed the amount it earned on lending the security. Upon termination of a loan, the Fund may use leverage (borrow money) to repay the borrower for cash collateral posted if the Adviser does not believe that it is prudent to sell the collateral investments to fund the payment of this liability. Securities lending activity is subject to master netting arrangements.
The following table presents the Fund’s value of the securities on loan with Citibank, net of amounts available for offset under the master netting arrangements and any related collateral received or posted by the Fund as of February 28, 2021.
| | | | | | | | | | | | |
| | | Investment Securities
On Loan, at value,
Presented in the
Statement of Assets
and Liabilities | | | Cash Collateral
Posted by Borrower* | | | Net Amount Due
to Counterparty
(not less than zero) | |
| | $ | 38,663,812 | | | $ | (38,663,812 | ) | | $ | — | |
| * | Collateral posted reflects the value of securities on loan and does not include any additional amounts received from the borrower. |
Securities lending also involves counterparty risks, including the risk that the loaned securities may not be returned in a timely manner or at all. Subject to certain conditions, Citibank has agreed to indemnify the Fund from losses resulting from a borrower’s failure to return a loaned security.
JPMIM voluntarily waived management fees charged to the Fund to reduce the impact of the cash collateral investment in the JPMorgan U.S. Government Money Market Fund from 0.15% to 0.06%. For the year ended February 28, 2021, JPMIM waived fees associated with the Fund’s investment in the JPMorgan U.S. Government Money Market Fund as follows:
The above waiver is included in the determination of earnings on cash collateral investment and in the calculation of Citibank’s compensation and is included on the Statement of Operations as Income from securities lending (net).
C. Investment Transactions with Affiliates — The Fund invested in Underlying Funds which are advised by the Adviser. An issuer which is under common control with the Fund may be considered an affiliate. For the purposes of the financial statements, the Fund assumes the issuers listed in
| | | | | | | | |
| | | |
| FEBRUARY 28, 2021 | | J.P. MORGAN EXCHANGE-TRADED FUNDS | | | | | 15 | |
NOTES TO FINANCIAL STATEMENTS
AS OF FEBRUARY 28, 2021 (continued)
the table below to be affiliated issuers. The Underlying Funds’ distributions may be reinvested into the Underlying Funds. Reinvestment amounts are included in the purchase cost amounts in the table below.
| | | | | | | | | | | | | | | | | | | | | | | | | | | | | | | | | | | | |
| For the year ended February 28, 2021 | |
| Security Description | | Value at
February 29,
2020 | | | Purchases
at Cost | | | Proceeds
from Sales | | | Net
Realized
Gain
(Loss) | | | Change in
Unrealized
Appreciation/
(Depreciation) | | | Value at
February 28,
2021 | | | Shares at
February 28,
2021 | | | Dividend
Income | | | Capital Gain
Distributions | |
JPMorgan Securities Lending Money Market Fund Agency SL Class Shares, 0.14% (a)(b) | | $ | 46,004,799 | | | $ | 362,000,000 | | | $ | 371,199,999 | | | $ | 4,352 | * | | $ | — | | | $ | 36,809,152 | | | | 36,805,471 | | | $ | 255,948 | * | | $ | — | |
JPMorgan U.S. Government Money Market Fund Class IM Shares, 0.04% (a)(b) | | | 4,817,421 | | | | 269,655,764 | | | | 270,747,234 | | | | — | | | | — | | | | 3,725,951 | | | | 3,725,951 | | | | 16,952 | * | | | — | |
JPMorgan U.S. Government Money Market Fund Class Institutional Shares, 0.03% (a)(b) | | | 10,488,851 | | | | 79,459,523 | | | | 80,204,871 | | | | — | | | | — | | | | 9,743,503 | | | | 9,743,503 | | | | 5,339 | | | | — | |
| | | | | | | | | | | | | | | | | | | | | | | | | | | | | | | | | | | | |
Total | | $ | 61,311,071 | | | $ | 711,115,287 | | | $ | 722,152,104 | | | $ | 4,352 | | | $ | — | | | $ | 50,278,606 | | | | | | | $ | 278,239 | | | $ | — | |
| | | | | | | | | | | | | | | | | | | | | | | | | | | | | | | | | | | | |
| (a) | Investment in an affiliated fund, which is registered under the Investment Company Act of 1940, as amended, and is advised by J.P. Morgan Investment Management Inc. |
| (b) | The rate shown is the current yield as of February 28, 2021. |
| * | Amount is included on the Statements of Operations as Income from securities lending (net) (after payments of rebates and Citibank’s fee). |
D. Futures Contracts — The Fund used index futures contracts to gain or reduce exposure to the stock market, or maintain liquidity or minimize transaction costs. The Fund also purchased futures contracts to invest incoming cash in the market or sold futures in response to cash outflows, thereby simulating an invested position in the underlying index while maintaining a cash balance for liquidity.
Futures contracts provide for the delayed delivery of the underlying instrument at a fixed price or are settled for a cash amount based on the change in the value of the underlying instrument at a specific date in the future. Upon entering into a futures contract, the Fund is required to deposit with the broker, cash or securities in an amount equal to a certain percentage of the contract amount, which is referred to as the initial margin deposit. Subsequent payments, referred to as variation margin, are made or received by the Fund periodically and are based on changes in the market value of open futures contracts. Changes in the market value of open futures contracts are recorded as Change in net unrealized appreciation/depreciation on futures contracts on the Statement of Operations. Realized gains or losses, representing the difference between the value of the contract at the time it was opened and the value at the time it was closed, are reported on the Statement of Operations at the closing or expiration of the futures contract. Securities deposited as initial margin are designated on the SOI, while cash deposited, which is considered restricted, is recorded on the Statement of Assets and Liabilities. A receivable from and/or a payable to brokers for the daily variation margin is also recorded on the Statement of Assets and Liabilities.
The use of futures contracts exposes the Fund to equity price risk. The Fund may be subject to the risk that the change in the value of the futures contract may not correlate perfectly with the underlying instrument. Use of long futures contracts subjects the Fund to risk of loss in excess of the amounts shown on the Statement of Assets and Liabilities, up to the notional amount of the futures contracts. Use of short futures contracts subjects the Fund to unlimited risk of loss. The Fund may enter into futures contracts only on exchanges or boards of trade. The exchange or board of trade acts as the counterparty to each futures transaction; therefore, the Fund’s credit risk is limited to failure of the exchange or board of trade. Under some circumstances, futures exchanges may establish daily limits on the amount that the price of a futures contract can vary from the previous day’s settlement price, which could effectively prevent liquidation of positions.
The Fund’s futures contracts are not subject to master netting arrangements (the right to close out all transactions traded with a counterparty and net amounts owed or due across transactions).
The table below discloses the volume of the Fund’s futures contracts activity during the year ended February 28, 2021:
| | | | |
Futures Contracts — Equity: | | | | |
Average Notional Balance Long | | $ | 6,915,950 | |
Ending Notional Balance Long | | | 6,653,400 | |
| | | | | | |
| | | |
| 16 | | | | J.P. MORGAN EXCHANGE-TRADED FUNDS | | FEBRUARY 28, 2021 |
E. Security Transactions and Investment Income — Investment transactions are accounted for on the trade date (the date the order to buy or sell is executed). Securities gains and losses are calculated on a specifically identified cost basis. Interest income is determined on the basis of coupon interest accrued using the effective interest method, which adjusts for amortization of premiums and accretion of discounts. Dividend income is recorded on the ex-dividend date or when the Fund first learns of the dividend.
To the extent such information is publicly available, the Fund records distributions received in excess of income earned from underlying investments as a reduction of cost of investments and/or realized gain. Such amounts are based on estimates if actual amounts are not available and actual amounts of income, realized gain and return of capital may differ from the estimated amounts. The Fund adjusts the estimated amounts of the components of distributions (and consequently its net investment income) as necessary, once the issuers provide information about the actual composition of the distributions.
F. Federal Income Taxes — The Fund is treated as a separate taxable entity for Federal income tax purposes. The Fund’s policy is to comply with the provisions of the Internal Revenue Code (the “Code”) applicable to regulated investment companies and to distribute to shareholders all of its distributable net investment income and net realized capital gains on investments. Accordingly, no provision for Federal income tax is necessary. Management has reviewed the Fund’s tax positions for all open tax years and has determined that as of February 28, 2021, no liability for Federal income tax is required in the Fund’s financial statements for net unrecognized tax benefits. However, management’s conclusions may be subject to future review based on changes in, or the interpretation of, the accounting standards or tax laws and regulations. The Fund’s Federal tax returns for the prior three fiscal years remain subject to examination by the Internal Revenue Service.
G. Distributions to Shareholders — Distributions from net investment income, if any, are generally declared and paid at least quarterly. Net realized capital gains, if any, are distributed at least annually. The amount of distributions from net investment income and net realized capital gains is determined in accordance with Federal income tax regulations, which may differ from GAAP. To the extent these “book/tax” differences are permanent in nature (i.e., that they result from other than timing of recognition — “temporary differences”), such amounts are reclassified within the capital accounts based on their Federal tax basis treatment.
The following amounts were reclassified within the capital accounts:
| | | | | | | | | | | | |
| | | Paid-in-Capital | | | Accumulated
undistributed
(distributions in
excess of)
net investment
income | | | Accumulated
net realized
gains (losses) | |
| | $ | (45,488,279 | ) | | $ | (25,953 | ) | | $ | 45,514,232 | |
The reclassifications for the Fund relate primarily to redemptions in-kind.
3. Fees and Other Transactions with Affiliates
A. Management Fee — JPMIM manages the investments of the Fund pursuant to the Management Agreement. For such services, JPMIM is paid a fee, which is accrued daily and paid no more frequently than monthly at an annual rate of 0.11% of the Fund’s average daily net assets. Under the Management Agreement, JPMIM is responsible for substantially all expenses of the Fund, (including expenses of the Trust relating to the Fund), except for the management fee, payments under the Fund’s 12b-1 plan (if any), interest expenses, dividend and interest expenses related to short sales, taxes, acquired fund fees and expenses (other than fees for funds advised by the adviser and/or its affiliates), costs of holding shareholder meetings, and litigation and potential litigation and other extraordinary expenses not incurred in the ordinary course of the Fund’s business. Additionally, the Fund shall be responsible for its non-operating expenses, including brokerage commissions and fees and expenses associated with the Fund’s securities lending program, if applicable. For the avoidance of doubt, the Adviser’s payment of such expenses may be accomplished through the Fund’s payment of such expenses and a corresponding reduction in the fee payable to the Adviser, provided, however, that if the amount of expenses paid by the Fund exceeds the fee payable to the Adviser, the Adviser will reimburse the Fund for such amount.
B. Administration Fee — JPMIM provides administration services to the Fund. Pursuant to the Management Agreement for the Fund, JPMIM is compensated as described in Note 3.A.
JPMorgan Chase Bank, N.A. (“JPMCB”), a wholly-owned subsidiary of JPMorgan, serves as the Fund’s sub-administrator (the “Sub-administrator”). For its services as Sub-administrator, JPMCB receives a portion of the management fees payable to JPMIM.
C. Custodian, Accounting and Transfer Agent Fees — JPMCB provides custody, accounting and transfer agency services to the Fund. For performing these services, JPMIM pays JPMCB transaction and asset-based fees that vary according to the number of transactions and positions, plus out-of-pocket expenses.
Additionally, Authorized Participants generally pay transaction fees associated with the creation and redemption of Fund shares. These fees are paid to JPMIM to offset certain custodian charges that are covered by the Management Agreement.
Interest income earned on cash balances at the custodian, if any, is included in Interest income from affiliates on the Statement of Operations.
Interest expense paid to the custodian related to cash overdrafts, if any, is included in Interest expense to affiliates on the Statement of Operations.
| | | | | | | | |
| | | |
| FEBRUARY 28, 2021 | | J.P. MORGAN EXCHANGE-TRADED FUNDS | | | | | 17 | |
NOTES TO FINANCIAL STATEMENTS
AS OF FEBRUARY 28, 2021 (continued)
D. Distribution Services — The Distributor or its agent distributes Creation Units for the Fund on an agency basis. The Distributor does not maintain a secondary market in shares of the Fund. JPMDS receives no fees for their distribution services under the distribution agreement with the Trust (the “Distribution Agreement”). Although the Trust does not pay any fees under the Distribution Agreement, JPMIM pays JPMDS for certain distribution related services.
E. Waivers and Reimbursements — The Fund may invest in one or more money market funds advised by the Adviser (affiliated money market funds). The fees for the affiliated money market funds are covered under the Management Agreement as described in Note 3.A.
F. Other — Certain officers of the Trust are affiliated with the Adviser, the Administrator and JPMDS. Such officers receive no compensation from the Fund for serving in their respective roles.
The Board designated and appointed a Chief Compliance Officer to the Fund pursuant to Rule 38a-1 under the 1940 Act. The fees associated with the office of the Chief Compliance Officer are paid for by JPMIM as described in Note 3.A.
The Securities and Exchange Commission (“SEC”) has granted an exemptive order permitting the Fund to engage in principal transactions with J.P. Morgan Securities LLC, an affiliated broker, involving taxable money market instruments, subject to certain conditions.
4. Investment Transactions
During the year ended February 28, 2021, purchases and sales of investments (excluding short-term investments) were as follows:
| | | | | | | | |
| | | Purchases
(excluding U.S.
Government) | | | Sales
(excluding U.S.
Government) | |
| | $ | 74,689,600 | | | $ | 65,633,204 | |
During the year ended February 28, 2021, there were no purchases or sales of U.S. Government securities.
For the year ended February 28, 2021, in-kind transactions associated with creations and redemptions were as follows:
| | | | | | | | |
| | | In-Kind
Creations | | | In-Kind
Redemptions | |
| | $ | 397,742,814 | | | $ | 593,249,998 | |
5. Federal Income Tax Matters
For Federal income tax purposes, the estimated cost and unrealized appreciation (depreciation) in value of investments held at February 28, 2021 were as follows:
| | | | | | | | | | | | | | | | |
| | | Aggregate
Cost | | | Gross
Unrealized
Appreciation | | | Gross
Unrealized
Depreciation | | | Net Unrealized
Appreciation
(Depreciation) | |
| | $ | 1,077,816,377 | | | $ | 26,267,132 | | | $ | 115,584,820 | | | $ | (89,317,688 | ) |
The difference between book and tax basis appreciation (depreciation) on investments is primarily attributed to wash sale loss deferrals.
The tax character of distributions paid during the year ended February 28, 2021 was as follows:
| | | | | | | | |
| | | Ordinary
Income* | | | Total
Distributions
Paid | |
| | $ | 32,859,372 | | | $ | 32,859,372 | |
| * | Short-term gain distributions are treated as ordinary income for income tax purposes. |
The tax character of distributions paid during the year ended February 29, 2020 was as follows:
| | | | | | | | | | | | |
| | | Ordinary
Income* | | | Net
Long-Term
Capital Gains | | | Total
Distributions Paid | |
| | $ | 13,846,312 | | | $ | 1,246,639 | | | $ | 15,092,951 | |
| * | Short-term gain distributions are treated as ordinary income for income tax purposes. |
As of February 28, 2021, the estimated components of net assets (excluding paid-in-capital) on a tax basis were as follows:
| | | | | | | | | | | | |
| | | Current
Distributable
Ordinary
Income | | | Current
Distributable
Long-Term
Capital Gain
(Tax Basis Capital
Loss Carryover) | | | Unrealized
Appreciation
(Depreciation) | |
| | $ | 566,889 | | | $ | (9,894,049 | ) | | $ | (89,317,688 | ) |
| | | | | | |
| | | |
| 18 | | | | J.P. MORGAN EXCHANGE-TRADED FUNDS | | FEBRUARY 28, 2021 |
The cumulative timing differences primarily consist of late year ordinary loss deferrals and wash sale loss deferrals.
As of February 28, 2021, the Fund had net capital loss carryforwards which are available to offset future realized gains:
| | | | | | | | |
| | | Capital Loss Carryforward Character | |
| | | Short-Term | | | Long-Term | |
| | $ | 9,894,049 | | | $ | — | |
Late year ordinary losses incurred after December 31, and within the taxable year are deemed to arise on the first business day of the Fund’s next taxable year. For the year ended February 28, 2021, the Fund deferred to March 1, 2021 the following net capital losses of:
| | | | |
| | | Late Year Ordinary
Loss Deferral | |
| | $ | 1,362,819 | |
6. Capital Share Transactions
The Trust issues and redeems shares of the Fund only in Creation Units through the Distributor at NAV. Capital shares transactions detail can be found in the Statement of Changes in Net Assets.
Shares of the Fund may only be purchased or redeemed by Authorized Participants. Such Authorized Participants may from time to time hold, of record or beneficially, a substantial percentage of the Fund’s shares outstanding and act as executing or clearing broker for investment transactions on behalf of the Fund. An Authorized Participant is either (1) a “Participating Party” or other participant in the clearing process through the Continuous Net Settlement System of the National Securities Clearing Corporation (“NSCC”); or (2) a DTC Participant; which, in either case, must have executed an agreement with the Distributor.
7. Risks, Concentrations and Indemnifications
In the normal course of business, the Fund enters into contracts that contain a variety of representations which provide general indemnifications. The Fund’s maximum exposure under these arrangements is unknown. The amount of exposure would depend on future claims that may be brought against the Fund. However, based on experience, the Fund expects the risk of loss to be remote.
As of February 28, 2021, JPMorgan SmartRetirement Funds and SmartRetirement Blend Funds, which are affiliated funds of funds, owned in the aggregate, shares representing more than 10% of the net assets of the Fund as follows:
| | | | | | | | |
| | | JPMorgan
SmartRetirement
Blend Funds | | | JPMorgan
SmartRetirement
Funds | |
| | | 52.4 | % | | | 17.7 | % |
Significant shareholder transactions by these shareholders may impact the Fund’s performance and liquidity.
Derivatives may be riskier than other types of investments because they may be more sensitive to changes in economic and market conditions and could result in losses that significantly exceed the Fund’s original investment. Many derivatives create leverage thereby causing the Fund to be more volatile than they would have been if they had not used derivatives. Derivatives also expose the Fund to counterparty risk (the risk that the derivative counterparty will not fulfill its contractual obligations), including credit risk of the derivative counterparty. The possible lack of a liquid secondary market for derivatives and the resulting inability of the Fund to sell or otherwise close a derivatives position could expose the Fund to losses.
Disruptions to creations and redemptions, the existence of significant market volatility or potential lack of an active trading market for the Shares (including through a trading halt), as well as other factors, may result in Shares trading significantly above (at a premium) or below (at a discount) to the NAV or to the intraday value of the Fund’s holdings. During such periods, investors may incur significant losses if shares are sold.
The Fund may not track the return of its underlying index for a number of reasons and therefore may not achieve its investment objective. For example, the Fund incurs a number of operating expenses not applicable to its underlying index, and incurs costs in buying and selling securities, especially when rebalancing the Fund’s securities holdings to reflect changes in the composition of the underlying index. In addition, the Fund’s return may differ from the return of its underlying index as a result of, among other things, pricing differences and the inability to purchase certain securities included in the underlying index due to regulatory or other restrictions. To the extent of the previously outlined items, the Fund’s return may differ from the return of the underlying index.
Because the Fund may invest a significant portion of its assets in real estate investment trusts (“REITs”), the Fund may be subject to certain risks similar to those associated with direct investments in real estate. REITs may be affected by changes in the value of their underlying properties and by defaults by tenants. REITs depend generally on their ability to generate cash flow to make distributions to shareholders, and certain REITs have self-liquidation provisions by which mortgages held may be paid in full and distributions of capital returns may be made at any time.
The Fund is subject to infectious disease epidemics/pandemics risk. The worldwide outbreak of COVID-19, a novel coronavirus disease, has negatively affected economies, markets and individual companies throughout the world. The effects of this COVID-19 pandemic to public health, and business and market conditions, including exchange trading suspensions and closures may continue to have a significant negative impact on the performance of the Fund’s investments, increase the Fund’s volatility, negatively impact the Fund’s arbitrage and pricing mechanisms, exacerbate other pre-existing political, social and economic risks to the Fund and negatively impact broad segments of businesses and populations. The Fund’s operations may be interrupted as a result, which may have a significant negative impact on investment performance. In addition, governments, their regulatory agencies, or self-regulatory organizations may take actions in response to the pandemic that affect the instruments in which the Fund invests, or the issuers of such instruments, in ways that could also have a significant negative impact on the Fund’s investment performance. The full impact of this COVID-19 pandemic, or other future epidemics/pandemics, is currently unknown.
| | | | | | | | |
| | | |
| FEBRUARY 28, 2021 | | J.P. MORGAN EXCHANGE-TRADED FUNDS | | | | | 19 | |
REPORT OF INDEPENDENT REGISTERED PUBLIC ACCOUNTING FIRM
To the Board of Trustees of J.P. Morgan Exchange-Traded Fund Trust and Shareholders of JPMorgan BetaBuilders MSCI US REIT ETF
Opinion on the Financial Statements
We have audited the accompanying statement of assets and liabilities, including the schedule of portfolio investments, of JPMorgan BetaBuilders MSCI US REIT ETF (one of the funds constituting J.P. Morgan Exchange-Traded Fund Trust, referred to hereafter as the “Fund”) as of February 28, 2021, the related statement of operations for the year ended February 28, 2021, the statements of changes in net assets for each of the two years in the period ended February 28, 2021, including the related notes, and the financial highlights for each of the two years in the period ended February 28, 2021 and for the period June 15, 2018 (commencement of operations) through February 28, 2019 (collectively referred to as the “financial statements”). In our opinion, the financial statements present fairly, in all material respects, the financial position of the Fund as of February 28, 2021, the results of its operations for the year then ended, the changes in its net assets for each of the two years in the period ended February 28, 2021 and the financial highlights for each of the two years in the period ended February 28, 2021 and for the period June 15, 2018 (commencement of operations) through February 28, 2019 in conformity with accounting principles generally accepted in the United States of America.
Basis for Opinion
These financial statements are the responsibility of the Fund’s management. Our responsibility is to express an opinion on the Fund’s financial statements based on our audits. We are a public accounting firm registered with the Public Company Accounting Oversight Board (United States) (PCAOB) and are required to be independent with respect to the Fund in accordance with the U.S. federal securities laws and the applicable rules and regulations of the Securities and Exchange Commission and the PCAOB.
We conducted our audits of these financial statements in accordance with the standards of the PCAOB. Those standards require that we plan and perform the audit to obtain reasonable assurance about whether the financial statements are free of material misstatement, whether due to error or fraud.
Our audits included performing procedures to assess the risks of material misstatement of the financial statements, whether due to error or fraud, and performing procedures that respond to those risks. Such procedures included examining, on a test basis, evidence regarding the amounts and disclosures in the financial statements. Our audits also included evaluating the accounting principles used and significant estimates made by management, as well as evaluating the overall presentation of the financial statements. Our procedures included confirmation of securities owned as of February 28, 2021 by correspondence with the custodian, transfer agent and brokers; when replies were not received from brokers, we performed other auditing procedures. We believe that our audits provide a reasonable basis for our opinion.
/s/PricewaterhouseCoopers LLP
New York, New York
April 23, 2021
We have served as the auditor of one or more investment companies in the JPMorgan Funds complex since 1993.
| | | | | | |
| | | |
| 20 | | | | J.P. MORGAN EXCHANGE-TRADED FUNDS | | FEBRUARY 28, 2021 |
TRUSTEES
(Unaudited)
The Funds’ Statements of Additional Information includes additional information about the Funds’ Trustees and is available, without charge, upon request by calling 1-844-457-6383 or on the J.P. Morgan Funds’ website at www.jpmorganfunds.com.
| | | | | | | | |
Name (Year of Birth;
Positions With
the Funds since) | | Principal Occupation
During Past 5 Years | | Number of
Funds in Fund
Complex Overseen
by Trustee (1) | | | Other Directorships Held
During the Past 5 Years |
Independent Trustees | | | | | | | | |
| | | |
Gary L. French (1951);
Trustee of the Trust since 2014 | | Real Estate Investor (2011–present); Consultant to the Mutual Fund Industry (2011-present); Senior Consultant for The Regulatory Fundamentals Group LLC (2011–2017). | | | 36 | | | Independent Trustee, The China Fund, Inc. (2013-2019); Exchange Traded Concepts Trust II (2012-2014); Exchange Traded Concepts Trust I (2011-2014). |
| | | |
| Robert J. Grassi (1957); Trustee of the Trust since 2014 | | Sole Proprietor, Academy Hills Advisors LLC (2012-present); Pension Director, Corning Incorporated (2002-2012). | | | 36 | | | None. |
| | | |
| Thomas P. Lemke (1954); Trustee of the Trust since 2014 | | Retired; Executive Vice President and General Counsel, Legg Mason (2005-2013). | | | 36 | | | SEI family of funds — Independent Trustee of Advisors’ Inner Circle Fund III (20 portfolios) (from February 2014 to present); Independent Trustee of Winton Diversified Opportunities Fund (from December 2014 to 2018); Independent Trustee of Gallery Trust (from August 2015 to present); Independent Trustee of Schroder Series Trust (from February 2017 to present); Independent Trustee of Schroder Global Series Trust (from February 2017 to present); Independent Trustee of O’Connor EQUUS (May 2014-April 2016); Independent Trustee of Winton Series Trust (December 2014-March 2017); Independent Trustee of AXA Premier VIP Trust (2014-June 2017); Independent Director of The Victory Funds (or their predecessor funds) (35 portfolios) (2014-March 2015); Symmetry Panoramic Trust (16 portfolios) (2018-present). |
| | | |
| Lawrence R. Maffia (1950); Trustee of the Trust since 2014 | | Retired; Director and President, ICI Mutual Insurance Company (2006-2013). | | | 36 | | | Director, ICI Mutual Insurance Company (1999-2013). |
| | | |
| Emily A. Youssouf (1951); Trustee of the Trust since 2014 | | Clinical Professor, NYU Schack Institute of Real Estate (2009–present); Board Member and Member of the Audit Committee (2013–present), Chair of Finance Committee (2019–present), Member of Related Parties Committee (2013–2018) and Member of the Enterprise Risk Committee (2015–2018), PennyMac Financial Services, Inc.; Board Member (2005–2018), Chair of Capital Committee (2006–2016), Chair of Audit Committee (2005–2018), Member of Finance Committee (2005–2018) and Chair of IT Committee (2016–2018), NYC Health and Hospitals Corporation. | | | 36 | | | Trustee, NYC School Construction Authority (2009-present); Board Member, NYS Job Development Authority (2008-present); Trustee and Chair of the Audit Committee of the Transit Center Foundation (2015-2019). |
Interested Trustee | | | | | | | | |
| | | |
| Robert E. Deutsch (2) (1957); Chairman and Trustee of the Trust since 2014 | | Retired; Head of the Global ETF Business for JPMorgan Asset Management (2013-2017); Head of the Global Liquidity Business for JPMorgan Asset Management (2003-2013). | | | 36 | | | Board of Directors of the JUST Capital Foundation (2017–present). |
| (1) | A Fund Complex means two or more registered investment companies that hold themselves out to investors as related companies for purposes of investment and investor services or have a common investment adviser or have an investment adviser that is an affiliated person of the investment adviser of any of the other registered investment companies. Thirty one series of the Trust have commenced operations. |
| (2) | Mr. Deutsch is an interested trustee because he was an employee of the Adviser until August 2017. |
The contact address for each of the Trustees is 277 Park Avenue, New York, NY 10172.
| | | | | | | | |
| | | |
| FEBRUARY 28, 2021 | | J.P. MORGAN EXCHANGE-TRADED FUNDS | | | | | 21 | |
OFFICERS
(Unaudited)
| | |
Name (Year of Birth),
Positions Held with
the Trust (Since) | | Principal Occupations During Past 5 Years |
| |
Joanna Gallegos (1975), President and Principal Executive Officer (2017) | | Managing Director, Global Head of ETF Strategy. Previously, Head of J.P. Morgan Asset Management’s U.S. Exchange Traded Funds business from July 2017 to December 2019 and Head of J.P. Morgan Asset Management’s ETF Product Development team from August 2013 to July 2017. |
| |
Timothy J. Clemens (1975), Treasurer and Principal Financial Officer (2020), Assistant Treasurer (2019-2020) | | Executive Director, J.P. Morgan Investment Management Inc. (formerly JPMorgan Funds Management, Inc.) since February 2016. Mr. Clemens has been with J.P. Morgan Investment Management Inc. since 2013. |
| |
Brian S. Shlissel (1964), Vice President (2016)* | | Managing Director and Chief Administrative Officer for J.P. Morgan pooled vehicles, J.P. Morgan Investment Management Inc. (formerly JPMorgan Funds Management, Inc.) since 2014. |
| |
Paul Shield (1960), Vice President and Assistant Treasurer (2016) | | Managing Director and head of Business Management for JPMorgan Asset Management’s Exchange Traded Fund platform since 2013. |
| |
| Elizabeth A. Davin (1964), Secretary (2018)*** | | Executive Director and Assistant General Counsel, JPMorgan Chase. Ms. Davin has been with JPMorgan Chase (formerly Bank One Corporation) since 2004. |
| |
Stephen M. Ungerman (1953), Chief Compliance Officer (2014) | | Managing Director, JPMorgan Chase & Co.; Mr. Ungerman has been with JPMorgan Chase & Co. since 2000. |
| |
Jessica K. Ditullio (1962), Assistant Secretary (2014)*** | | Executive Director and Assistant General Counsel, JPMorgan Chase. Ms. Ditullio has been with JPMorgan Chase (formerly Bank One Corporation) since 1990. |
| |
Anthony Geron (1971), Assistant Secretary (2019)** | | Vice President and Assistant General Counsel, JPMorgan Chase since September 2018; Lead Director and Counsel, AXA Equitable Life Insurance Company from 2015 to 2018 and Senior Director and Counsel, AXA Equitable Life Insurance Company from 2014 to 2015. |
| |
Carmine Lekstutis (1980), Assistant Secretary (2014)** | | Executive Director and Assistant General Counsel, JPMorgan Chase. Mr. Lekstutis has been with JPMorgan Chase since 2011. |
| |
Gregory S. Samuels (1980), Assistant Secretary (2014)** | | Executive Director and Assistant General Counsel, JPMorgan Chase. Mr. Samuels has been with JPMorgan Chase since 2010. |
| |
| Zachary E. Vonnegut-Gabovitch (1986), Assistant Secretary (2017)** | | Vice President and Assistant General Counsel, JPMorgan Chase since September 2016; Associate, Morgan Lewis & Bockius (law firm) from 2012 to 2016. |
| |
| Frederick J. Cavaliere (1978), Assistant Treasurer (2015)* | | Executive Director, J.P. Morgan Investment Management Inc. since February 2016; formerly, Vice President, J.P. Morgan Investment Management Inc. (formerly JPMorgan Funds Management, Inc.) since September 2010 to February 2016. Mr. Cavaliere has been with JPMorgan since May 2006. |
| |
Michael M. D’Ambrosio (1969), Assistant Treasurer (2014) | | Managing Director, J.P. Morgan Investment Management Inc. (formerly JPMorgan Funds Management, Inc.) Mr. D’Ambrosio has been with J.P. Morgan Investment Management Inc. since 2012. |
| |
Shannon Gaines (1977), Assistant Treasurer (2019)*** | | Vice President, J.P. Morgan Investment Management Inc. (formerly JPMorgan Funds Management, Inc.) since January 2014. |
| |
Nektarios E. Manolakakis (1972), Assistant Treasurer (2020) | | Executive Director, J.P. Morgan Investment Management Inc. since February 2021; formerly Vice President, J.P. Morgan Investment Management Inc. (formerly JPMorgan Funds Management, Inc.) since 2014; Vice President, J.P. Morgan Corporate & Investment Bank 2010-2014. |
| |
Todd McEwen (1981), Assistant Treasurer (2020)*** | | Vice President, J.P. Morgan Investment Management Inc. (formerly JPMorgan Funds Management, Inc.) Mr. McEwen has been with J.P. Morgan Investment Management Inc. since 2010. |
The contact address for each of the officers, unless otherwise noted, is 277 Park Avenue, New York, NY 10172.
| * | The contact address for the officer is 575 Washington Boulevard, Jersey City, NJ 07310. |
| ** | The contact address for the officer is 4 New York Plaza, New York, NY 10004. |
| *** | The contact address for the officer is 1111 Polaris Parkway, Columbus, OH 43240. |
| | | | | | |
| | | |
| 22 | | | | J.P. MORGAN EXCHANGE-TRADED FUNDS | | FEBRUARY 28, 2021 |
SCHEDULE OF SHAREHOLDER EXPENSES
(Unaudited)
Hypothetical $1,000 Investment
As a shareholder of the Fund, you incur two types of costs: (1) transaction costs, including brokerage commissions on your purchase and sales of Fund shares and (2) ongoing costs, primarily management fees. The examples below are intended to help you understand your ongoing costs (in dollars) of investing in the Fund and to compare these ongoing costs with the ongoing costs of investing in other funds. The examples assume that you had a $1,000 investment at the beginning of the reporting period September 1, 2020 and continued to hold your shares at the end of the reporting period, February 28, 2021.
Actual Expenses
For the Fund in the table below, the first line provides information about actual account values and actual expenses. You may use the information in this line, together with the amount you invested, to estimate the expenses that you paid over the period. Simply divide your account value by $1,000 (for example, an $8,600 account value divided by $1,000 = 8.6),
then multiply the result by the number under the heading entitled “Expenses Paid During the Period” to estimate the expenses you paid on your account during this period.
Hypothetical Example for Comparison Purposes
The second line in the table below provides information about hypothetical account values and hypothetical expenses based on the Fund’s actual expense ratio and an assumed rate of return of 5% per year before expenses, which is not the Fund’s actual return. The hypothetical account values and expenses may not be used to estimate the actual ending account balance or expenses you paid for the period. You may use this information to compare the ongoing costs of investing in the Fund and other Funds. To do so, compare this 5% hypothetical example with the 5% hypothetical examples that appear in the shareholder reports of other funds. The examples also assume all dividends and distributions have been reinvested.
| | | | | | | | | | | | | | | | |
| | | Beginning
Account Value
September 1, 2020 | | | Ending
Account Value
February 28, 2021 | | | Annualized
Expense
Ratio | | | Expenses
Paid During
the Period | |
JPMorgan BetaBuilders MSCI US REIT ETF | | | | | | | | | | | | | | | | |
Actual | | $ | 1,000.00 | | | $ | 1,123.80 | | | | 0.11 | % | | $ | 0.58 | |
Hypothetical | | | 1,000.00 | | | | 1,024.25 | | | | 0.11 | | | | 0.55 | |
| (1) | Expenses are equal to each Fund’s annualized net expense ratio, multiplied by the average account value over the period, multiplied by 181/365 (to reflect the one-half year period). |
| | | | | | | | |
| | | |
| FEBRUARY 28, 2021 | | J.P. MORGAN EXCHANGE-TRADED FUNDS | | | | | 23 | |
BOARD APPROVAL OF MANAGEMENT AGREEMENT
(Unaudited)
JPMorgan BetaBuilders MSCI US REIT ETF
The Board of Trustees meets regularly throughout the year and considers factors that are relevant to their annual consideration of management agreements at each meeting. The Board also meets specifically to consider management agreement annual renewals. The Board of Trustees held meetings on November 5, 2020 and December 7-8, 2020, at which the Trustees considered the continuation of the management agreement (the “Management Agreement”) for JPMorgan BetaBuilders MSCI US REIT ETF (the “Fund”). The meetings were held by videoconference in reliance upon the Division of Investment Management Staff Statement on Fund Board Meetings and Unforeseen or Emergency Circumstances Related to Coronavirus Disease 2019. In connection with the meetings, the Board reviewed and considered performance, expense and other information individually for the Fund. The Trustees, including a majority of the Trustees who are not “Interested Persons” (as defined in the 1940 Act) of any party to the Management Agreement or any of their affiliates, approved the continuation of the Management Agreement.
As part of their review of the Management Agreement, the Trustees considered and reviewed performance and other information about the Fund received from the Adviser. This information included the Fund’s performance as compared to the performance of its benchmark and analyses by the Adviser of the Fund’s performance. In addition, in preparation for the December meeting, the Trustees requested, received and evaluated extensive materials from the Adviser, including expense information compiled by Broadridge Investor Communications Solutions Inc. (“Broadridge”), an independent provider of investment company data, and met with representatives of Broadridge. Before voting on the Management Agreement, the Trustees reviewed the Management Agreement with representatives of the Adviser, counsel to the Trust and independent legal counsel and received a memorandum from independent legal counsel to the Trustees discussing the legal standards for their consideration of the Management Agreement. The Trustees also discussed the Management Agreement in executive sessions with independent legal counsel at which no representatives of the Adviser were present.
A summary of the material factors evaluated by the Trustees in determining whether to approve the Management Agreement is provided below. The Trustees considered information provided with respect to the Fund over the course of the year, as well as the materials furnished specifically in connection with this annual renewal process. Each Trustee attributed his or her own evaluation of the significance of the various factors and no factor alone was considered determinative. As part of their review process, the Trustees consider and place emphasis on relevant information in light of changing circumstances in market and economic conditions. The Trustees determined that the compensation received by the Adviser from the Fund under the Management Agreement was fair and reasonable and that
the continuance of the Management Agreement was in the best interests of the Fund and its shareholders.
The factors summarized below were considered and discussed by the Trustees in reaching their conclusions:
Nature, Extent and Quality of Services Provided by the Adviser
The Trustees received and considered information regarding the nature, extent and quality of the services provided to the Fund under its Management Agreement. The Trustees took into account information furnished throughout the year at Trustee meetings, as well as the materials furnished specifically in connection with this annual review process. Among other things, the Trustees considered:
| (i) | The background and experience of the Adviser’s senior management and investment personnel; |
| (ii) | The qualifications, backgrounds and responsibilities of the portfolio management team primarily responsible for the day-to-day management of the Fund; |
| (iii) | The investment strategy for the Fund, and the infrastructure supporting the portfolio management teams; |
| (iv) | Information about the structure and distribution strategy of the Fund and how it fits within the Trust’s other fund offerings; |
| (v) | The administration services provided by the Adviser under the Management Agreement; |
| (vi) | Their knowledge of the nature and quality of the services provided by the Adviser and its affiliates gained from their experience as Trustees of the Trust and in the financial industry generally; |
| (vii) | The overall reputation and capabilities of the Adviser and its affiliates; |
| (viii) | The commitment of the Adviser to provide high quality service to the Fund; |
| (ix) | Their overall confidence in the Adviser’s integrity; |
| (x) | The Adviser’s responsiveness to requests for additional information, questions or concerns raised by them; and |
| (xi) | The Adviser’s business continuity plan and steps the Adviser and its affiliates were taking to provide ongoing services to the Fund during the COVID-19 pandemic, and the Adviser’s and its affiliates’ success in continuing to provide services to the Fund and its shareholders throughout this period. |
Based upon these considerations and other factors, the Trustees concluded that they were satisfied with the nature, extent and quality of services to be provided to the Fund by the Adviser.
Costs of Services Provided and Profitability to the Adviser and its Affiliates
The Trustees received, reviewed, considered and discussed information regarding the profitability to the Adviser and its affiliates in providing services to the Fund. The Trustees recognized that this information is not audited and represents the Adviser’s determination of its and its affiliates’ revenues from the contractual services provided to the Fund, less expenses of
providing such services. Expenses include direct and indirect costs and are calculated using allocation methodologies developed by
| | | | | | |
| | | |
| 24 | | | | J.P. MORGAN EXCHANGE-TRADED FUNDS | | FEBRUARY 28, 2021 |
the Adviser. The Trustees also recognized that it is difficult to make direct comparisons of profitability from fund management contracts because comparative information is not generally publicly available and is affected by numerous factors, including the structure of the particular adviser, the types of funds it manages, its business mix, numerous assumptions regarding allocations and the fact that publicly-traded fund managers’ operating profits and net income are net of distribution and marketing expenses. Based upon their review, the Trustees concluded that the profitability to the Adviser under the Management Agreement was not unreasonable in light of the services and benefits provided to the Fund.
The Trustees also considered that under the Management Agreement, the Adviser earns fees from the Fund for providing administrative services and considered fees paid to J.P. Morgan Chase Bank, N.A. (“JPMCB”), an affiliate of the Adviser, for custody, transfer agency and other related services for the Fund.
Fall-Out Benefits
The Trustees reviewed information regarding potential “fall-out” or ancillary benefits received by the Adviser and its affiliates as a result of their relationships with the Fund. Additionally, the Trustees considered that any fall-out or ancillary benefits would be comparable to those related to the other funds in the complex.
The Trustees also considered the benefits the Adviser receives as the result of JPMCB’s roles as custodian, fund accountant and transfer agent for the Fund.
Economies of Scale
The Trustees considered the extent to which the Fund will benefit from economies of scale. The Trustees noted that the management fee schedule for the Fund does not contain breakpoints. The Trustees considered that shareholders would benefit because expenses would be limited even when a Fund was new and not achieving economies of scale. The Trustees considered the fact that increases in assets would not lead to fee decreases even if economies of scale are achieved, but also that the Trustees would have the opportunity to further review the appropriateness of the fee payable to the Adviser under the Management Agreement in the future. After considering the factors identified above, the Trustees concluded that the Fund’s shareholders will receive the benefits of potential economies of scale.
Fees Relative to Adviser’s Other Clients
The Trustees requested and received and considered information about the nature and extent of investment advisory services and fee rates offered to other investment companies and/or institutional accounts advised by the Adviser in the same asset class as the Fund. The Trustees noted the Adviser’s view that it does not manage other accounts with substantially similar investment strategies as that of the Fund. The Trustees
concluded that the fees charged to the Fund in comparison to those charged to such other clients were reasonable.
Investment Performance
The Trustees considered the Fund’s investment strategy and processes, portfolio management teams and competitive positioning against peer funds, as identified by Broadridge and/or management. As part of this review, the Trustees reviewed the Fund’s performance against its benchmark and considered the Fund’s performance information provided at regular Board meetings by the Adviser. After consideration, the Trustees determined that the Fund’s performance was consistent with its investment objective.
Management Fees and Expense Ratios
The Trustees considered the contractual management fee rate paid by the Fund to the Adviser and compared the rate to the information prepared by Broadridge concerning management fee rates paid by other funds in the same Morningstar category as the Fund. This review included ranking of the Fund within an expense universe made up of funds with the same Morningstar investment classification and objective (the “Universe”), as well as a subset of funds within the Universe (the “Peer Group”). The Trustees reviewed a description of Broadridge’s methodology for selecting funds in the Peer Group and Universe, as applicable. The Trustees also reviewed information about other expenses and the total expense ratio for the Fund. The Trustees compared the management fee for the Fund to fees charged to mutual funds and/or institutional accounts with similar investment objectives or in similar asset classes managed by the Adviser. The Trustees recognized that it is difficult to make comparisons of management fees because there are variations in the services that are included in the fees paid by other funds. The Trustees considered how the Fund is positioned against peer funds, as identified by management and/or Broadridge and noted that the Fund’s management fee was appropriate when compared to identify peer funds. The Trustees’ determinations as a result of the review of the Fund’s management fees and expense ratios are summarized below:
The Trustees noted that the Fund’s net management fee was in the third and first quintiles of the Peer Group and Universe, respectively, and that the actual total expenses were in the second and first quintiles of the Peer Group and Universe, respectively. After considering the factors identified above, in light of this information, the Trustees concluded that the management fee was reasonable.
| | | | | | | | |
| | | |
| FEBRUARY 28, 2021 | | J.P. MORGAN EXCHANGE-TRADED FUNDS | | | | | 25 | |
TAX LETTER
(Unaudited)
Certain tax information for the J.P. Morgan Funds is required to be provided to shareholders based upon the Fund’s income and distributions for the taxable year ended February 28, 2021. The information and distributions reported in this letter may differ from the information and taxable distributions reported to the shareholders for the calendar year ending December 31, 2021. The information necessary to complete your income tax returns for the calendar year ending December 31, 2021 will be provided under separate cover.
Section 199A Income
The Fund had the following amount, or maximum allowable amount, of ordinary income distributions treated as section 199A dividends for the period ended February 28, 2021:
| | | | | | |
| | | |
| 26 | | | | J.P. MORGAN EXCHANGE-TRADED FUNDS | | FEBRUARY 28, 2021 |
J.P. Morgan Exchange-Traded Funds are distributed by JPMorgan Distribution Services, Inc., an indirect, wholly-owned subsidiary of JPMorgan Chase & Co.
Contact J.P. Morgan Exchange-Traded Funds at 1-844-457-6383 (844-4JPM ETF) for a fund prospectus. You can also visit us at www.jpmorganfunds.com. Investors should carefully consider the investment objectives and risks as well as charges and expenses of the fund before investing. The prospectus contains this and other information about the fund. Read the prospectus carefully before investing.
Investors may obtain information about the Securities Investor Protection Corporation (SIPC), including the SIPC brochure, by visiting www.sipc.org or by calling SIPC at 202-371-8300.
The Fund files a complete schedule of its fund holdings for the first and third quarters of its fiscal year with the SEC as an exhibit to its report on Form N-PORT. The Fund’s Form N-PORT reports are available on the SEC’s website at http://www.sec.gov. The Fund’s quarterly holdings can be found by visiting the J.P. Morgan Funds’ website at www.jpmorganfunds.com.
A description of the Fund’s policies and procedures with respect to the disclosure of the Fund’s holdings is available in the prospectus and Statement of Additional Information.
A copy of proxy policies and procedures is available without charge upon request by calling 1-844-457-6383 and on the Fund’s website at www.jpmorganfunds.com. A description of such policies and procedures is on the SEC’s website at www.sec.gov. The Trustees have delegated the authority to vote proxies for securities owned by the Fund to the Adviser. A copy of the Fund’s voting record for the most recent 12-month period ended June 30 is available on the SEC’s website at www.sec.gov or at the Fund’s website at www.jpmorganfunds.com no later than August 31 of each year. The Fund’s proxy voting record will include, among other things, a brief description of the matter voted on for each fund security, and will state how each vote was cast, for example, for or against the proposal.

J.P. Morgan Asset Management is the brand name for the asset management businesses of JPMorgan Chase & Co. and its affiliates worldwide.
| | | | |
| | © JPMorgan Chase & Co., 2021. All rights reserved. February 2021. | | AN-RETF-221 |
ITEM 2. CODE OF ETHICS.
Disclose whether, as of the end of the period covered by the report, the registrant has adopted a code of ethics that applies to the registrant’s principal executive officer, principal financial officer, principal accounting officer or controller, or persons performing similar functions, regardless of whether these individuals are employed by the registrant or a third party. If the registrant has not adopted such a code of ethics, explain why it has not done so.
The registrant must briefly describe the nature of any amendment, during the period covered by the report, to a provision of its code of ethics that applies to the registrant’s principal executive officer, principal financial officer, principal accounting officer or controller, or persons performing similar functions, regardless of whether these individuals are employed by the registrant or a third party, and that relates to any element of the code of ethics definition enumerated in paragraph (b) of this Item. The registrant must file a copy of any such amendment as an exhibit pursuant to Item 13(a)(1), unless the registrant has elected to satisfy paragraph (f) of this Item by positing its code of ethics on its website pursuant to paragraph (f)(2) of this Item, or by undertaking to provide its code of ethics to any person without charge, upon request, pursuant to paragraph (f)(3) of this Item.
If the registrant has, during the period covered by the report, granted a waiver, including an implicit waiver, from a provision of the code of ethics that applies to the registrant’s principal executive officer, principal financial officer, principal accounting officer or controller, or persons performing similar functions, regardless of whether these individuals are employed by the registrant or third party, that relates to one or more items set forth in paragraph (b) of this Item, the registrant must briefly describe the nature of the waiver, the name of the person to whom the waiver was granted, and the date of the waiver.
The Registrant has adopted a code of ethics that applies to the Registrant’s principal executive officer and principal financial officer. There were no amendments to the code of ethics or waivers granted with respect to the code of ethics in the period covered by the report.
ITEM 3. AUDIT COMMITTEE FINANCIAL EXPERT.
(a) (1) Disclose that the registrant’s board of directors has determined that the registrant either:
| | (i) | Has at least one audit committee financial expert serving on its audit committee; or |
| | (ii) | Does not have an audit committee financial expert serving on its audit committee. |
The Registrant’s Board of Trustees has determined that the Registrant has at least one audit committee financial expert serving on its audit committee. The Securities and Exchange Commission has stated that the designation or identification of a person as an audit committee financial expert pursuant to this Item 3 of Form N-CSR does not impose on such person any duties, obligations or liabilities that are greater than the duties, obligations and liabilities imposed on such person as a member of the Audit Committee and the Board of Trustees in the absence of such designation or identification.
(2) If the registrant provides the disclosure required by paragraph (a)(1)(i) of this Item, it must disclose the name of the audit committee financial expert and whether that person is “independent.” In order to be considered “independent” for purposes of this Item, a member of an audit committee may not, other than in his or her capacity as a member of the audit committee, the board of directors, or any other board committee:
| | (i) | Accept directly or indirectly any consulting, advisory, or other compensatory fee from the issuer; or |
| | (ii) | Be an “interested person” of the investment company as defined in Section 2(a)(19) of the Act (15 U.S.C. 80a-2(a)(19)). |
The audit committee financial experts are Gary L. French, Robert J. Grassi, Thomas P. Lemke, Lawrence R. Maffia and EmilyA. Youssouf, each of which is not an “interested person” of the Registrant and is also “independent” as defined by the U.S. Securities and Exchange Commission for purposes of audit committee financial expert determinations.
(3) If the registrant provides the disclosure required by paragraph (a)(1)(ii) of this Item, it must explain why it does not have an audit committee financial expert.
Not applicable.
ITEM 4. PRINCIPAL ACCOUNTANT FEES AND SERVICES.
(a) Disclose, under the caption Audit Fees, the aggregate fees billed for each of the last two fiscal years for professional services rendered by the principal accountant for the audit of the registrant’s annual financial statements or services that are normally provided by the accountant in connection with statutory and regulatory filings or engagements for those fiscal years.
AUDIT FEES
2021 – $526,980
2020 – $646,000
(b) Disclose, under the caption Audit-Related Fees, the aggregate fees billed in each of the last two fiscal years for assurance and related services by the principal accountant that are reasonably related to the performance of the audit of the registrant’s financial statements and are not reported under paragraph (a) of this Item. Registrants shall describe the nature of the services comprising the fees disclosed under this category.
AUDIT-RELATED FEES
2021 – $59,892
2020 – $64,752
Audit-related fees consist of security count procedures performed as required under Rule 17f-2 of the Investment Company Act of 1940 during the Registrant’s fiscal year.
(c) Disclose, under the caption Tax Fees, the aggregate fees billed in each of the last two fiscal years for professional services rendered by the principal accountant for tax compliance, tax advice, and tax planning. Registrants shall describe the nature of the services comprising the fees disclosed under this category.
TAX FEES
2021 – $145,359
2020 – $156,012
The tax fees consist of fees billed in connection with preparing the federal regulated investment company income tax returns for the Registrant for the tax years ended February 28, 2021 and 2020, respectively.
For the last fiscal year, no tax fees were required to be approved pursuant to paragraph (c)(7)(ii) of Rule 2-01 of Regulation S-X.
(d) Disclose, under the caption All Other Fees, the aggregate fees billed in each of the last two fiscal years for products and services provided by the principal accountant, other than the services reported in paragraphs (a) through (c) of this Item. Registrants shall describe the nature of the services comprising the fees disclosed under this category.
ALL OTHER FEES
2021 – $0
2020 – $0
(e)(1) Disclose the audit committee’s pre-approval policies and procedures described in paragraph (c)(7) of Rule 2-01 of Regulation S-X.
Pursuant to the Registrant’s Audit Committee Charter and written policies and procedures for the pre-approval of audit and non-audit services (the “Pre-approval Policy”), the Audit Committee pre-approves all audit and non-audit services performed by the Registrant’s independent public registered accounting firm for the Registrant. In addition, the Audit Committee pre-approves the auditor’s engagement for non-audit services with the Registrant’s investment adviser (not including a sub-adviser whose role is primarily portfolio management and is sub-contracted or overseen by another investment adviser) and any Service Affiliate in accordance with paragraph (c)(7)(ii) of Rule 2-01 of Regulation S-X, if the engagement relates directly to the operations and financial reporting of the Registrant. Proposed services may be pre-approved either 1) without consideration of specific case-by- case services or 2) require the specific pre-approval of the Audit Committee. Therefore, initially the Pre-approval Policy listed a number of audit and non-audit services that have been approved by the Audit Committee, or which were not subject to pre-approval under the transition provisions of Sarbanes-Oxley Act of 2002 (the “Pre-approval List”). The Audit Committee annually reviews and pre-approves the services included on the Pre-approval List that may be provided by the independent public registered accounting firm without obtaining additional specific pre-approval of individual services from the Audit Committee. The Audit Committee adds to, or subtracts from, the list of general pre-approved services from time to time, based on subsequent determinations. All other audit and non-audit services not on the Pre-approval List must be specifically pre-approved by the Audit Committee.
One or more members of the Audit Committee may be appointed as the Committee’s delegate for the purposes of considering whether to approve such services. Any pre-approvals granted by the delegate will be reported, for informational purposes only, to the Audit Committee at its next scheduled meeting. The Audit Committee’s responsibilities to pre-approve services performed by the independent public registered accounting firm are not delegated to management.
(2) Disclose the percentage of services described in each of paragraphs (b) through (d) of this Item that were approved by the audit committee pursuant to paragraph (c)(7)(i)(C) of Rule 2-01 of Regulation S-X.
2021 – 0.0%
2020 – 0.0%
(f) If greater than 50 percent, disclose the percentage of hours expended on the principal accountant’s engagement to audit the registrant’s financial statements for the most recent fiscal year that were attributed to work performed by persons other than the principal accountant’s full-time, permanent employees.
Not applicable.
(g) Disclose the aggregate non-audit fees billed by the registrant’s accountant for services rendered to the registrant, and rendered to the registrant’s investment adviser (not including any sub-adviser whose role is primarily portfolio management and is subcontracted with or overseen by another investment adviser), and any entity controlling, controlled by, or under common control with the adviser that provides ongoing services to the registrant for each of the last two fiscal years of the registrant.
The aggregate non-audit fees billed by the independent registered public accounting firm for services rendered to the Registrant, and rendered to Service Affiliates, for the last two calendar year ends were:
2020 – $30.2 million
2019 – $27.9 million
(h) Disclose whether the registrant’s audit committee of the board of directors has considered whether the provision of non-audit services that were rendered to the registrant’s investment adviser (not including any subadviser whose role is primarily portfolio management and is subcontracted with or overseen by another investment adviser), and any entity controlling, controlled by, or under common control with the investment adviser that provides ongoing services to the registrant that were not pre-approved pursuant to paragraph (c)(7)(ii) of Rule 2-01 of Regulation S-X is compatible with maintaining the principal accountant’s independence.
The Registrant’s Audit Committee has considered whether the provision of the non-audit services that were rendered to Service Affiliates that were not pre-approved (not requiring pre-approval) is compatible with maintaining the independent public registered accounting firm’s independence. All services provided by the independent public registered accounting firm to the Registrant or to Service Affiliates that were required to be pre-approved were pre-approved as required.
ITEM 5. AUDIT COMMITTEE OF LISTED REGISTRANTS.
(a) If the registrant is a listed issuer as defined in Rule 10A-3 under the Exchange Act (17CFR 240.10A-3), state whether or not the registrant has a separately-designated standing audit committee established in accordance with Section 3(a)(58)(A) of the Exchange Act (15 U.S.C. 78c(a)(58)(A)). If the registrant has such a committee, however designated, identify each committee member. If the entire board of directors is acting as the registrant’s audit committee as specified in Section 3(a)(58)(B) of the Exchange Act (15 U.S.C. 78c(a)(58)(B)), so state.
The registrant has a separately designated Audit Committee established in accordance with Section 3(a)(58)(A) of the Exchange Act. The members of the Audit Committee are Gary L. French, Robert J. Grassi, Thomas P. Lemke, Lawrence R. Maffia and Emily A. Youssouf.
(b) If applicable, provide the disclosure required by Rule 10A-3(d) under the Exchange Act (17CFR 240.10A-3(d)) regarding an exemption from the listing standards for all audit committees.
Not applicable.
ITEM 6. SCHEDULE OF INVESTMENTS.
File Schedule I – Investments in securities of unaffiliated issuers as of the close of the reporting period as set forth in Section 210.12-12 of Regulation S-X, unless the schedule is included as part of the report to shareholders filed under Item 1 of this Form.
Included in Item 1.
ITEM 7. DISCLOSURE OF PROXY VOTING POLICIES AND PROCEDURES FOR CLOSED-END MANAGEMENT INVESTMENT COMPANIES.
A closed-end management investment company that is filing an annual report on this Form N-CSR must, unless it invests exclusively in non-voting securities, describe the policies and procedures that it uses to determine how to vote proxies relating to portfolio securities, including the procedures that the company uses when a vote presents a conflict between the interests of its shareholders, on the one hand, and those of the company’s investment adviser; principal underwriter; or any affiliated person (as defined in Section 2(a)(3) of the Investment Company Act of 1940 (15 U.S.C. 80a-2(a)(3)) and the rules thereunder) of the company, its investment adviser, or its principal underwriter, on the other. Include any policies and procedures of the company’s investment adviser, or any other third party, that the company uses, or that are used on the company’s behalf, to determine how to vote proxies relating to portfolio securities.
Not applicable.
ITEM 8. PORTFOLIO MANAGERS OF CLOSED-END MANAGEMENT INVESTMENT COMPANIES.
Not applicable.
ITEM 9. PURCHASE OF EQUITY SECURITIES BY CLOSED-END MANAGEMENT INVESTMENT COMPANY AND AFFILIATED PURCHASERS.
(a) If the registrant is a closed-end management investment company, provide the information specified in paragraph (b) of this Item with respect to any purchase made by or on behalf of the registrant or any “affiliated purchaser,” as defined in Rule 10b-18(a)(3) under the Exchange Act (17 CFR 240.10b-18(a)(3)), of shares or other units of any class of the registrant’s equity securities that is registered by the registrant pursuant to Section 12 of the Exchange Act (15 U.S.C. 781).
Not applicable.
ITEM 10. SUBMISSION OF MATTERS TO A VOTE OF SECURITY HOLDERS.
Describe any material changes to the procedures by which shareholders may recommend nominees to the registrant’s board of directors, where those changes were implemented after the registrant last provided disclosure in response to the requirements of Item 7(d)(2)(ii)(G) of Schedule 14A (17 CFR 240.14a-101), or this Item.
No material changes to report.
ITEM 11. CONTROLS AND PROCEDURES.
(a) Disclose the conclusions of the registrant’s principal executive and principal financial officers, or persons performing similar functions, regarding the effectiveness of the registrant’s disclosure controls and procedures (as defined in Rule 30a-3(c) under the Act (17 CFR 270.30a-3(c))) as of a date within 90 days of the filing date of the report that includes the disclosure required by this paragraph, based on the evaluation of these controls and procedures required by Rule 30a-3(b) under the Act (17 CFR 270.30a-3(b)) and Rules 13a-15(b) or 15d-15(b) under the Exchange Act (17 CFR 240.13a-15(b) or 240.15d-15(b)).
The Registrant’s principal executive and principal financial officers have concluded, based on their evaluation of the Registrant’s disclosure controls and procedures as of a date within 90 days of the filing date of this report, that the Registrant’s disclosure controls and procedures are reasonably designed to ensure that information required to be disclosed by the Registrant on Form N-CSR is recorded, processed, summarized and reported within the required time periods and that information required to be disclosed by the Registrant in the reports that it files or submits on Form N-CSR is accumulated and communicated to the Registrant’s management, including its principal executive and principal financial officers, as appropriate to allow timely decisions regarding required disclosure.
(b) Disclose any change in the registrant’s internal control over financial reporting (as defined in Rule 30a-3(d) under the Act (17 CFR 270.30a-3(d)) that occurred during the registrant’s second fiscal quarter of the period covered by this report that has materially affected, or is reasonably likely to materially affect, the registrant’s internal control over financial reporting.
There were no changes in the Registrant’s internal control over financial reporting that occurred during the last fiscal quarter covered by this report that have materially affected, or are reasonably likely to materially affect, the Registrant’s internal control over financial reporting.
ITEM 12. DISCLOSURE OF SECURITIES LENDING ACTIVITIES FOR CLOSED-END MANAGEMENT INVESTMENT COMPANIES.
Not applicable.
ITEM 13. EXHIBITS.
| | (a) | File the exhibits listed below as part of this Form. Letter or number the exhibits in the sequence indicated. |
(a)(1) Any code of ethics, or amendment thereto, that is the subject of the disclosure required by Item 2, to the extent that the registrant intends to satisfy the Item 2 requirements through filing of an exhibit.
Code of Ethics applicable to its Principal Executive and Principal Financial Officers pursuant to Section 406 of the Sarbanes-Oxley Act of 2002 attached hereto.
(a)(2) A separate certification for each principal executive officer and principal financial officer of the registrant as required by Rule 30a-2(a) under the Act (17 CFR 270.30a-2).
Certifications pursuant to Rule 30a-2(a) under the Investment Company Act of 1940 are attached hereto.
(a)(3) Any written solicitation to purchase securities under Rule 23c-1 under the Act (17 CFR 270.23c-1) sent or given during the period covered by the report by or on behalf of the registrant to 10 or more persons.
Not applicable.
(b) A separate or combined certification for each principal executive officer and principal officer of the registrant as required by Rule 30a-2(b) under the Act of 1940.
Certifications pursuant to Rule 30a-2(b) under the Investment Company Act of 1940 are attached hereto.
SIGNATURES
Pursuant to the requirements of the Securities Exchange Act of 1934 and the Investment Company Act of 1940, the registrant has duly caused this report to be signed on its behalf by the undersigned, thereunto duly authorized.
| | | | |
| J.P. Morgan Exchange-Traded Fund Trust |
| |
| By: | | /s/ Joanna M. Gallegos |
| | Joanna M. Gallegos |
| | President and Principal Executive Officer |
| | April 30, 2021 |
Pursuant to the requirements of the Securities Exchange Act of 1934 and the Investment Company Act of 1940, this report has been signed below by the following persons on behalf of the registrant and in the capacities and on the dates indicated.
| | | | |
| By: | | /s/ Joanna M. Gallegos |
| | Joanna M. Gallegos |
| | President and Principal Executive Officer |
| | April 30, 2021 |
| |
| By: | | /s/ Timothy J. Clemens |
| | Timothy J. Clemens |
| | Treasurer and Principal Financial Officer |
| | April 30, 2021 |