UNITED STATES
SECURITIES AND EXCHANGE COMMISSION
Washington, D.C. 20549
FORM N-CSR
CERTIFIED SHAREHOLDER REPORT OF REGISTERED
MANAGEMENT INVESTMENT COMPANIES
Investment Company Act file number: 811-22903
J.P. Morgan Exchange-Traded Fund Trust
(Exact name of registrant as specified in charter)
277 Park Avenue
New York, NY 10172
(Address of principal executive offices) (Zip code)
Gregory S. Samuels
J.P. Morgan Investment Management Inc.
277 Park Avenue
New York, NY 10172
(Name and Address of Agent for Service)
With copies to:
| Elizabeth A. Davin, Esq. | Jon S. Rand, Esq. | |
| JPMorgan Chase & Co. | Dechert LLP | |
| 1111 Polaris Parkway | 1095 Avenue of the Americas | |
| Columbus, OH 43240 | New York, NY 10036 |
Registrant’s telephone number, including area code: 1-844-457-6383
Date of fiscal year end: Last day of February
Date of reporting period: March 1, 2022 through August 31, 2022
Form N-CSR is to be used by management investment companies to file reports with the Commission not later than 10 days after the transmission to stockholders of any report that is required to be transmitted to stockholders under Rule 30e-1 under the Investment Company Act of 1940 (17 CFR 270.30e-1). The Commission may use the information provided on Form N-CSR in its regulatory, disclosure review, inspection, and policymaking roles.
A registrant is required to disclose the information specified by Form N-CSR, and the Commission will make this information public. A registrant is not required to respond to the collection of information contained in Form N-CSR unless the Form displays a currently valid Office of Management and Budget (“OMB”) control number. Please direct comments concerning the accuracy of the information collection burden estimate and any suggestions for reducing the burden to Secretary, Securities and Exchange Commission, 450 Fifth Street, NW, Washington, DC 20549-0609. The OMB has reviewed this collection of information under the clearance requirements of 44 U.S.C. Section 3507.
ITEM 1. REPORTS TO STOCKHOLDERS.
a.) The following is a copy of the report transmitted to shareholders pursuant to Rule 30e-1 under the Investment Company Act of 1940 (17 CFR 270.30e-1).
b.) A copy of the notice transmitted to shareholders in reliance on Rule 30e-3 under the 1940 Act that contains disclosures specified by paragraph (c)(3) of that rule is included in the Annual Report. Not Applicable. Notices do not incorporate disclosures from the shareholder reports.
Fund | Ticker | Listing Exchange |
JPMorgan BetaBuilders 1-5 Year U.S. Aggregate Bond ETF | BBSA | Cboe BZX Exchange, Inc. |
JPMorgan Core Plus Bond ETF | JCPB | Cboe BZX Exchange, Inc. |
JPMorgan Corporate Bond Research Enhanced ETF | JIGB | NYSE Arca |
JPMorgan High Yield Research Enhanced ETF | JPHY | Cboe BZX Exchange, Inc. |
JPMorgan Income ETF | JPIE | NYSE Arca |
JPMorgan International Bond Opportunities ETF | JPIB | Cboe BZX Exchange, Inc. |
JPMorgan Municipal ETF | JMUB | Cboe BZX Exchange, Inc. |
JPMorgan Short Duration Core Plus ETF | JSCP | NYSE Arca |
JPMorgan U.S. Aggregate Bond ETF | JAGG | NYSE Arca |
JPMorgan Ultra-Short Income ETF | JPST | NYSE Arca |
JPMorgan Ultra-Short Municipal Income ETF | JMST | Cboe BZX Exchange, Inc. |
JPMorgan USD Emerging Markets Sovereign Bond ETF | JPMB | NYSE Arca |

1 | |
2 | |
4 | |
6 | |
9 | |
11 | |
14 | |
16 | |
19 | |
21 | |
24 | |
26 | |
28 | |
30 | |
33 | |
358 | |
374 | |
380 | |
412 | |
416 |
Past performance is no guarantee of future performance. The general market views expressed in this report are opinions based on market and other conditions through the end of the reporting period and are subject to change without notice. These views are not intended to predict the future performance of a Fund or the securities markets.
Prospective investors should refer to the Funds’ prospectuses for a discussion of the Funds’ investment objectives, strategies and risks. Call J.P. Morgan Exchange-Traded Funds at (844) 457-6383 for a prospectus containing more complete information about a Fund, including management fees and other expenses. Please read it carefully before investing.
Shares are bought and sold throughout the day on an exchange at market price (not at net asset value) through a brokerage account, and are not individually subscribed and redeemed from a Fund. Shares may only be subscribed and redeemed directly from a Fund by Authorized Participants, in very large creation/redemption units. Brokerage commissions will reduce returns.
October 17, 2022 (Unaudited)
 | “Given the current circumstances in financial markets, we believe it is important that investors consider a long-term view and maintain a diversified portfolio.” — Brian S. Shlissel |

President, J.P. Morgan Exchange-Traded Funds
J.P. Morgan Asset Management
1-844-4JPM-ETF or jpmorgan.com/etfs for more information
August 31, 2022 | J.P. Morgan Exchange-Traded Funds | 1 |
SIX MONTHS ENDED August 31, 2022 (Unaudited)
2 | J.P. Morgan Exchange-Traded Funds | August 31, 2022 |
SIX MONTHS ENDED August 31, 2022 (Unaudited)
REPORTING PERIOD RETURN: | |
Net Asset Value * | (3.63)% |
Market Price ** | (3.71)% |
Bloomberg Short-Term U.S. Aggregate Bond Index | (3.54)% |
Net Assets as of 8/31/2022 | $38,192,695 |
Duration as of 8/31/2022 | 2.7 Years |
Fund Ticker | BBSA |
PORTFOLIO COMPOSITION AS OF August 31, 2022 | PERCENT OF TOTAL INVESTMENTS |
U.S. Treasury Obligations | 56.0% |
Corporate Bonds | 24.1 |
Mortgage-Backed Securities | 7.9 |
Supranational | 2.6 |
Commercial Mortgage-Backed Securities | 2.1 |
U.S. Government Agency Securities | 2.0 |
Foreign Government Securities | 1.6 |
Others (each less than 1.0%) | 0.9 |
Short-Term Investments | 2.8 |
4 | J.P. Morgan Exchange-Traded Funds | August 31, 2022 |
INCEPTION DATE | SIX MONTHS* | 1 YEAR | SINCE INCEPTION | |
JPMorgan BetaBuilders 1-5 Year U.S. Aggregate Bond ETF | ||||
Net Asset Value | March 12, 2019 | (3.63)% | (6.13)% | 0.58% |
Market Price | (3.71) | (6.21) | 0.57 |
* | Not annualized. |

August 31, 2022 | J.P. Morgan Exchange-Traded Funds | 5 |
SIX MONTHS ENDED August 31, 2022 (Unaudited)
REPORTING PERIOD RETURN: | |
Net Asset Value * | (7.52)% |
Market Price ** | (7.56)% |
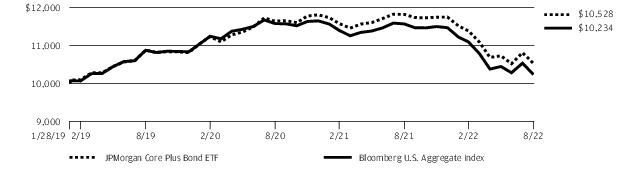
Bloomberg U.S. Aggregate Index | (7.76)% |
Net Assets as of 8/31/2022 | $410,277,100 |
Duration as of 8/31/2022 | 6.1 Years |
Fund Ticker | JCPB |
PORTFOLIO COMPOSITION AS OF August 31, 2022 | PERCENT OF TOTAL INVESTMENTS |
Corporate Bonds | 28.9% |
Asset-Backed Securities | 16.5 |
U.S. Treasury Obligations | 15.4 |
Mortgage-Backed Securities | 15.1 |
Commercial Mortgage-Backed Securities | 5.9 |
Collateralized Mortgage Obligations | 3.0 |
Others (each less than 1.0%) | 0.0 |
Short-Term Investments | 15.2 |
6 | J.P. Morgan Exchange-Traded Funds | August 31, 2022 |
August 31, 2022 | J.P. Morgan Exchange-Traded Funds | 7 |
SIX MONTHS ENDED August 31, 2022 (Unaudited) (continued)
INCEPTION DATE | SIX MONTHS* | 1 YEAR | SINCE INCEPTION | |
JPMorgan Core Plus Bond ETF | ||||
Net Asset Value | January 28, 2019 | (7.52)% | (10.91)% | 1.44% |
Market Price | (7.56) | (10.99) | 1.50 |
* | Not annualized. |
8 | J.P. Morgan Exchange-Traded Funds | August 31, 2022 |
SIX MONTHS ENDED August 31, 2022 (Unaudited)
REPORTING PERIOD RETURN: | |
Net Asset Value * | (9.29)% |
Market Price ** | (9.63)% |
Bloomberg U.S. Corporate Index | (9.41)% |
Net Assets as of 8/31/2022 | $39,079,416 |
Duration as of 8/31/2022 | 7.5 Years |
Fund Ticker | JIGB |
PORTFOLIO COMPOSITION AS OF August 31, 2022 | PERCENT OF TOTAL INVESTMENTS |
Corporate Bonds | 98.4% |
Short-Term Investments | 1.6 |
August 31, 2022 | J.P. Morgan Exchange-Traded Funds | 9 |
SIX MONTHS ENDED August 31, 2022 (Unaudited) (continued)
INCEPTION DATE | SIX MONTHS* | 1 YEAR | SINCE INCEPTION | |
JPMorgan Corporate Bond Research Enhanced ETF | ||||
Net Asset Value | December 12, 2018 | (9.29)% | (14.89)% | 1.77% |
Market Price | (9.63) | (15.54) | 1.70 |
* | Not annualized. |

10 | J.P. Morgan Exchange-Traded Funds | August 31, 2022 |
SIX MONTHS ENDED August 31, 2022 (Unaudited)
REPORTING PERIOD RETURN: | |
Net Asset Value * | (7.73)% |
Market Price ** | (8.15)% |
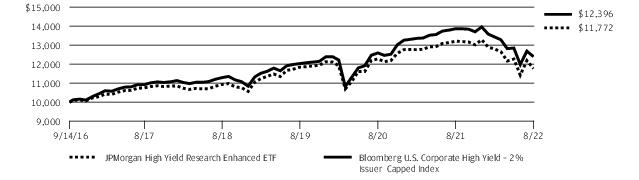
Bloomberg US Corporate High Yield – 2% Issuer Capped Index | (7.78)% |
Net Assets as of 8/31/2022 | $404,575,558 |
Duration as of 8/31/2022 | 4.4 Years |
Fund Ticker | JPHY |
PORTFOLIO COMPOSITION BY INDUSTRY AS OF August 31, 2022 | PERCENT OF TOTAL INVESTMENTS |
Oil, Gas & Consumable Fuels | 11.3% |
Hotels, Restaurants & Leisure | 9.8 |
Media | 7.4 |
Diversified Telecommunication Services | 6.6 |
Health Care Providers & Services | 5.4 |
Consumer Finance | 5.3 |
Commercial Services & Supplies | 3.2 |
Aerospace & Defense | 3.1 |
Chemicals | 2.8 |
Equity Real Estate Investment Trusts (REITs) | 2.5 |
Specialty Retail | 2.5 |
Auto Components | 2.4 |
Containers & Packaging | 2.4 |
Metals & Mining | 2.0 |
Pharmaceuticals | 2.0 |
Electric Utilities | 1.9 |
Airlines | 1.9 |
Software | 1.7 |
Entertainment | 1.6 |
Trading Companies & Distributors | 1.5 |
Capital Markets | 1.4 |
Thrifts & Mortgage Finance | 1.4 |
Building Products | 1.3 |
Household Durables | 1.1 |
Food & Staples Retailing | 1.1 |
Communications Equipment | 1.0 |
Food Products | 1.0 |
Energy Equipment & Services | 1.0 |
IT Services | 1.0 |
Others (each less than 1.0%) | 11.9 |
Short-Term Investments | 0.5 |
August 31, 2022 | J.P. Morgan Exchange-Traded Funds | 11 |
SIX MONTHS ENDED August 31, 2022 (Unaudited) (continued)
12 | J.P. Morgan Exchange-Traded Funds | August 31, 2022 |
INCEPTION DATE | SIX MONTHS* | 1 YEAR | 5 YEAR | SINCE INCEPTION | |
JPMorgan High Yield Research Enhanced ETF | |||||
Net Asset Value | September 14, 2016 | (7.73)% | (10.56)% | 1.91% | 2.85% |
Market Price | (8.15) | (11.09) | 1.68 | 2.77 |
* | Not annualized. |
August 31, 2022 | J.P. Morgan Exchange-Traded Funds | 13 |
SIX MONTHS ENDED August 31, 2022 (Unaudited)
REPORTING PERIOD RETURN: | |
Net Asset Value * | (4.66)% |
Market Price ** | (4.32)% |
Bloomberg U.S. Aggregate Index | (7.76)% |
Net Assets as of 8/31/2022 | $156,350,508 |
Duration as of 8/31/2022 | 3.4 Years |
Fund Ticker | JPIE |
PORTFOLIO COMPOSITION AS OF August 31, 2022 | PERCENT OF TOTAL INVESTMENTS |
Corporate Bonds | 36.8% |
Asset-Backed Securities | 26.5 |
Commercial Mortgage-Backed Securities | 16.4 |
Mortgage-Backed Securities | 8.7 |
Collateralized Mortgage Obligations | 7.2 |
Foreign Government Securities | 2.7 |
Exchange-Traded Funds | 1.6 |
Short-Term Investments | 0.1 |
14 | J.P. Morgan Exchange-Traded Funds | August 31, 2022 |
INCEPTION DATE | SIX MONTHS* | CUMULATIVE SINCE INCEPTION | |
JPMorgan Income ETF | |||
Net Asset Value | October 28, 2021 | (4.66)% | (5.96)% |
Market Price | (4.32) | (5.21) |
* | Not annualized. |

August 31, 2022 | J.P. Morgan Exchange-Traded Funds | 15 |
SIX MONTHS ENDED August 31, 2022 (Unaudited)
REPORTING PERIOD RETURN: | |
Net Asset Value * | (4.99)% |
Market Price ** | (4.63)% |
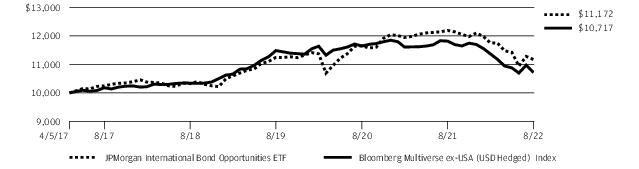
Bloomberg Multiverse ex-USA (USD Hedged) Index | (12.61)% |
Net Assets as of 8/31/2022 | $296,747,942 |
Duration as of 8/31/2022 | 3.3 Years |
Fund Ticker | JPIB |
PORTFOLIO COMPOSITION AS OF August 31, 2022 | PERCENT OF TOTAL INVESTMENTS |
Corporate Bonds | 59.7% |
Foreign Government Securities | 31.9 |
Commercial Mortgage-Backed Securities | 1.7 |
Asset-Backed Securities | 1.5 |
Collateralized Mortgage Obligations | 1.1 |
Others (each less than 1.0%) | 0.4 |
Short-Term Investments | 3.7 |
PORTFOLIO COMPOSTION BY COUNTRY AS OF August 31, 2022 | PERCENT OF TOTAL INVESTMENTS |
United States | 12.5 % |
Australia | 10.5 |
United Kingdom | 9.0 |
France | 8.3 |
Canada | 7.2 |
Italy | 7.0 |
Germany | 5.7 |
Spain | 5.5 |
Brazil | 3.6 |
Mexico | 2.4 |
Portugal | 2.3 |
Netherlands | 2.1 |
Luxembourg | 2.1 |
China | 2.0 |
Switzerland | 1.6 |
Japan | 1.5 |
Belgium | 1.3 |
South Africa | 1.3 |
Ireland | 1.2 |
Others (each less than 1.0%) | 9.2 |
Short-Term Investments | 3.7 |
16 | J.P. Morgan Exchange-Traded Funds | August 31, 2022 |
August 31, 2022 | J.P. Morgan Exchange-Traded Funds | 17 |
SIX MONTHS ENDED August 31, 2022 (Unaudited) (continued)
INCEPTION DATE | SIX MONTHS* | 1 YEAR | 5 YEAR | SINCE INCEPTION | |
JPMorgan International Bond Opportunities ETF | |||||
Net Asset Value | April 5, 2017 | (4.99)% | (8.37)% | 1.75% | 2.07% |
Market Price | (4.63) | (8.24) | 1.74 | 2.15 |
* | Not annualized. |
18 | J.P. Morgan Exchange-Traded Funds | August 31, 2022 |
SIX MONTHS ENDED August 31, 2022 (Unaudited)
REPORTING PERIOD RETURN: | |
Net Asset Value * | (4.79)% |
Market Price ** | (4.84)% |
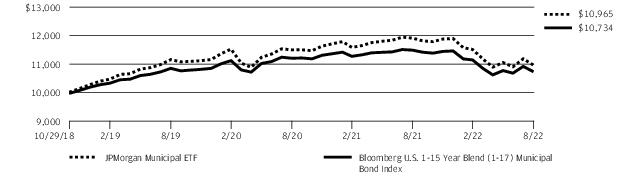
Bloomberg U.S. 1-15 Year Blend (1-17) Municipal Bond Index | (3.73)% |
Net Assets as of 8/31/2022 | $237,437,095 |
Duration as of 8/31/2022 | 5.3 Years |
Fund Ticker | JMUB |
PORTFOLIO COMPOSITION AS OF August 31, 2022 | PERCENT OF TOTAL INVESTMENTS |
Municipal Bonds | 85.6% |
Short-Term Investments | 14.4 |
August 31, 2022 | J.P. Morgan Exchange-Traded Funds | 19 |
SIX MONTHS ENDED August 31, 2022 (Unaudited) (continued)
INCEPTION DATE | SIX MONTHS* | 1 YEAR | SINCE INCEPTION | |
JPMorgan Municipal ETF | ||||
Net Asset Value | October 29, 2018 | (4.79)% | (7.97)% | 2.43% |
Market Price | (4.84) | (7.95) | 2.43 |
* | Not annualized. |
20 | J.P. Morgan Exchange-Traded Funds | August 31, 2022 |
SIX MONTHS ENDED August 31, 2022 (Unaudited)
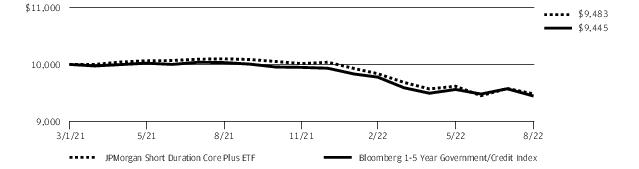
REPORTING PERIOD RETURN: | |
Net Asset Value * | (3.59)% |
Market Price ** | (3.55)% |
Bloomberg 1-5 Year Government/Credit Index | (3.39)% |
Net Assets as of 8/31/2022 | $213,744,542 |
Duration as of 8/31/2022 | 2.4 Years |
Fund Ticker | JSCP |
PORTFOLIO COMPOSITION AS OF August 31, 2022 | PERCENT OF TOTAL INVESTMENTS |
Corporate Bonds | 38.4% |
Asset-Backed Securities | 17.9 |
U.S. Treasury Obligations | 16.0 |
Mortgage-Backed Securities | 9.4 |
Commercial Mortgage-Backed Securities | 6.9 |
Collateralized Mortgage Obligations | 4.0 |
Others (each less than 1.0%) | 0.8 |
Short-Term Investments | 6.6 |
August 31, 2022 | J.P. Morgan Exchange-Traded Funds | 21 |
SIX MONTHS ENDED August 31, 2022 (Unaudited) (continued)
22 | J.P. Morgan Exchange-Traded Funds | August 31, 2022 |
INCEPTION DATE | SIX MONTHS* | 1 YEAR | SINCE INCEPTION | |
JPMorgan Short Duration Core Plus ETF | ||||
Net Asset Value | March 1, 2021 | (3.59)% | (6.09)% | (3.47)% |
Market Price | (3.55) | (6.18) | (3.43) |
* | Not annualized. |
August 31, 2022 | J.P. Morgan Exchange-Traded Funds | 23 |
SIX MONTHS ENDED August 31, 2022 (Unaudited)
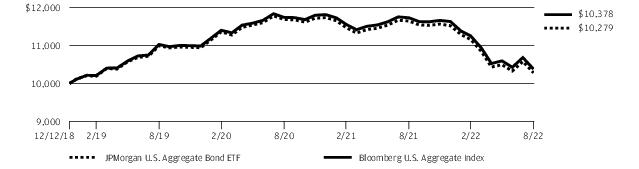
REPORTING PERIOD RETURN: | |
Net Asset Value * | (7.87)% |
Market Price ** | (7.81)% |
Bloomberg U.S. Aggregate Index | (7.76)% |
Net Assets as of 8/31/2022 | $1,127,230,543 |
Duration as of 8/31/2022 | 6.4 Years |
Fund Ticker | JAGG |
PORTFOLIO COMPOSITION AS OF August 31, 2022 | PERCENT OF TOTAL INVESTMENTS |
U.S. Treasury Obligations | 38.4% |
Mortgage-Backed Securities | 26.5 |
Corporate Bonds | 23.4 |
Commercial Mortgage-Backed Securities | 1.8 |
Foreign Government Securities | 1.5 |
Supranational | 1.3 |
U.S. Government Agency Securities | 1.2 |
Others (each less than 1.0%) | 0.7 |
Short-Term Investments | 5.2 |
24 | J.P. Morgan Exchange-Traded Funds | August 31, 2022 |
INCEPTION DATE | SIX MONTHS* | 1 YEAR | SINCE INCEPTION | |
JPMorgan U.S. Aggregate Bond ETF | ||||
Net Asset Value | December 12, 2018 | (7.87)% | (11.72)% | 0.74% |
Market Price | (7.81) | (11.69) | 0.76 |
* | Not annualized. |
August 31, 2022 | J.P. Morgan Exchange-Traded Funds | 25 |
SIX MONTHS ENDED August 31, 2022 (Unaudited)
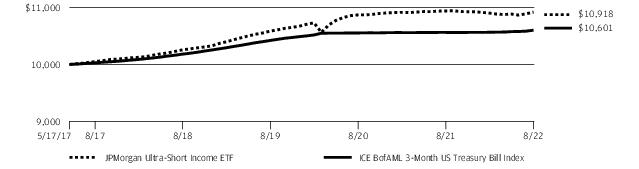
REPORTING PERIOD RETURN: | |
Net Asset Value * | 0.16% |
Market Price ** | 0.16% |
ICE BofAML 3-Month US Treasury Bill Index | 0.35% |
Net Assets as of 8/31/2022 | $21,608,362,786 |
Duration as of 8/31/2022 | 0.3 Years |
Fund Ticker | JPST |
PORTFOLIO COMPOSTION BY SECTOR AS OF August 31, 2022 | PERCENT OF TOTAL INVESTMENTS |
Financials | 30.1% |
Asset-Backed Securities | 8.8 |
Utilities | 3.1 |
Health Care | 2.8 |
Consumer Discretionary | 1.9 |
Commercial Mortgage-Backed Securities | 1.8 |
Industrials | 1.5 |
Consumer Staples | 1.2 |
Energy | 1.2 |
Information Technology | 1.0 |
Others (each less than 1.0%) | 1.4 |
Short-Term Investments | 45.2 |
26 | J.P. Morgan Exchange-Traded Funds | August 31, 2022 |
INCEPTION DATE | SIX MONTHS* | 1 YEAR | 5 YEAR | SINCE INCEPTION | |
JPMorgan Ultra-Short Income ETF | |||||
Net Asset Value | May 17, 2017 | 0.16% | (0.20)% | 1.67% | 1.67% |
Market Price | 0.16 | (0.22) | 1.66 | 1.68 |
* | Not annualized. |
August 31, 2022 | J.P. Morgan Exchange-Traded Funds | 27 |
SIX MONTHS ENDED August 31, 2022 (Unaudited)
REPORTING PERIOD RETURN: | |
Net Asset Value * | (0.05)% |
Market Price ** | (0.24)% |
Bloomberg 1 Year Municipal Bond Index | (0.71)% |
Net Assets as of 8/31/2022 | $3,117,744,864 |
Duration as of 8/31/2022 | 0.6 Years |
Fund Ticker | JMST |
PORTFOLIO COMPOSITION AS OF August 31, 2022 | PERCENT OF TOTAL INVESTMENTS |
Municipal Bonds | 87.1% |
Short-Term Investments | 12.9 |
28 | J.P. Morgan Exchange-Traded Funds | August 31, 2022 |
INCEPTION DATE | SIX MONTHS* | 1 YEAR | SINCE INCEPTION | |
JPMorgan Ultra-Short Municipal Income ETF | ||||
Net Asset Value | October 16, 2018 | (0.05)% | (0.51)% | 1.19% |
Market Price | (0.24) | (0.80) | 1.14 |
* | Not annualized. |

August 31, 2022 | J.P. Morgan Exchange-Traded Funds | 29 |
SIX MONTHS ENDED August 31, 2022 (Unaudited)
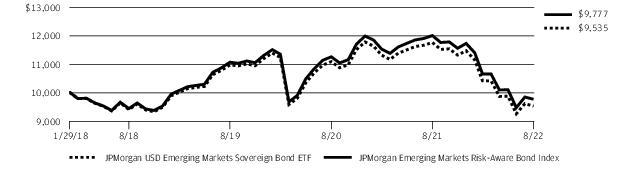
REPORTING PERIOD RETURN: | |
Net Asset Value * | (8.45)% |
Market Price ** | (9.84)% |
JPMorgan Emerging Markets Risk-Aware Bond Index | (8.31)% |
Net Assets as of 8/31/2022 | $69,866,551 |
Duration as of 8/31/2022 | 7.0 Years |
Fund Ticker | JPMB |
PORTFOLIO COMPOSTION BY COUNTRY AS OF August 31, 2022 | PERCENT OF TOTAL INVESTMENTS |
Turkey | 7.8 % |
Brazil | 6.6 |
Dominican Republic | 5.7 |
Oman | 5.7 |
Colombia | 5.5 |
South Africa | 5.1 |
Bahrain | 4.8 |
Mexico | 3.8 |
Indonesia | 3.6 |
Nigeria | 3.5 |
Saudi Arabia | 3.4 |
United Arab Emirates | 3.2 |
Qatar | 3.0 |
China | 2.9 |
Philippines | 2.7 |
Peru | 2.2 |
Angola | 2.1 |
Chile | 2.1 |
Panama | 2.1 |
Jamaica | 1.7 |
Malaysia | 1.7 |
Kenya | 1.6 |
Uruguay | 1.6 |
Pakistan | 1.4 |
Kazakhstan | 1.4 |
Azerbaijan | 1.4 |
Jordan | 1.1 |
Others (each less than 1.0%) | 9.0 |
Short-Term Investments | 3.3 |
30 | J.P. Morgan Exchange-Traded Funds | August 31, 2022 |
August 31, 2022 | J.P. Morgan Exchange-Traded Funds | 31 |
SIX MONTHS ENDED August 31, 2022 (Unaudited) (continued)
INCEPTION DATE | SIX MONTHS* | 1 YEAR | SINCE INCEPTION | |
JPMorgan USD Emerging Markets Sovereign Bond ETF | ||||
Net Asset Value | January 29, 2018 | (8.45)% | (18.91)% | (1.00)% |
Market Price | (9.84) | (19.31) | (1.03) |
* | Not annualized. |
32 | J.P. Morgan Exchange-Traded Funds | August 31, 2022 |
AS OF August 31, 2022 (Unaudited)
INVESTMENTS | PRINCIPAL AMOUNT($) | VALUE($) |
U.S. Treasury Obligations — 57.1% | ||
U.S. Treasury Bonds 7.50%, 11/15/2024 | 996,000 | 1,079,648 |
U.S. Treasury Notes | ||
0.25%, 6/15/2023 | 887,000 | 865,241 |
0.13%, 6/30/2023 | 256,000 | 249,090 |
0.13%, 8/15/2023 | 566,000 | 548,180 |
2.75%, 8/31/2023 | 507,000 | 503,198 |
0.25%, 11/15/2023 | 923,000 | 888,315 |
2.38%, 2/29/2024 | 2,066,000 | 2,032,831 |
2.00%, 4/30/2024 | 480,000 | 468,713 |
2.25%, 4/30/2024 | 15,000 | 14,704 |
2.00%, 5/31/2024 | 334,000 | 325,689 |
1.75%, 6/30/2024 | 282,000 | 273,419 |
1.75%, 7/31/2024 | 717,000 | 694,370 |
0.38%, 9/15/2024 | 354,000 | 332,483 |
1.50%, 9/30/2024 | 1,083,000 | 1,040,442 |
1.50%, 10/31/2024 | 258,000 | 247,539 |
0.50%, 3/31/2025 | 1,303,000 | 1,207,616 |
0.38%, 4/30/2025 | 46,000 | 42,370 |
0.25%, 5/31/2025 | 1,066,000 | 975,806 |
0.25%, 6/30/2025 | 340,000 | 310,648 |
0.25%, 7/31/2025 | 244,000 | 222,212 |
0.25%, 9/30/2025 | 93,000 | 84,274 |
0.25%, 10/31/2025 | 48,000 | 43,365 |
0.38%, 11/30/2025 | 2,440,000 | 2,207,628 |
0.38%, 12/31/2025 | 26,000 | 23,467 |
2.63%, 12/31/2025 | 5,000 | 4,868 |
0.38%, 1/31/2026 | 22,000 | 19,805 |
0.75%, 4/30/2026 | 1,865,000 | 1,691,905 |
0.75%, 5/31/2026 | 713,000 | 645,432 |
0.88%, 6/30/2026 | 109,000 | 98,960 |
1.88%, 6/30/2026 | 868,000 | 820,057 |
0.63%, 7/31/2026 | 823,000 | 738,450 |
0.75%, 8/31/2026 | 772,000 | 694,860 |
0.88%, 9/30/2026 | 140,000 | 126,459 |
1.63%, 9/30/2026 | 51,000 | 47,562 |
1.13%, 10/31/2026 | 247,000 | 225,059 |
1.63%, 10/31/2026 | 125,000 | 116,348 |
1.25%, 11/30/2026 | 139,000 | 127,185 |
1.25%, 12/31/2026 | 303,000 | 276,866 |
1.50%, 1/31/2027 | 488,000 | 450,294 |
1.13%, 2/28/2027 | 197,000 | 178,685 |
0.63%, 3/31/2027 | 123,000 | 108,749 |
2.50%, 3/31/2027 | 6,000 | 5,777 |
0.50%, 4/30/2027 | 138,000 | 121,020 |
0.50%, 5/31/2027 | 164,000 | 143,500 |
INVESTMENTS | PRINCIPAL AMOUNT($) | VALUE($) |
0.50%, 6/30/2027 | 437,000 | 381,624 |
0.38%, 7/31/2027 | 119,000 | 103,177 |
Total U.S. Treasury Obligations (Cost $22,851,599) | 21,807,890 | |
Corporate Bonds — 24.6% | ||
Aerospace & Defense — 0.3% | ||
Boeing Co. (The) | ||
1.95%, 2/1/2024 | 4,000 | 3,870 |
4.88%, 5/1/2025 | 5,000 | 5,017 |
2.75%, 2/1/2026 | 15,000 | 14,056 |
2.70%, 2/1/2027 | 2,000 | 1,814 |
General Dynamics Corp. | ||
2.38%, 11/15/2024 | 7,000 | 6,794 |
1.15%, 6/1/2026 | 51,000 | 45,980 |
Leidos, Inc. 3.63%, 5/15/2025 | 4,000 | 3,908 |
Lockheed Martin Corp. 3.55%, 1/15/2026 | 2,000 | 1,984 |
Precision Castparts Corp. 3.25%, 6/15/2025 | 16,000 | 15,793 |
Raytheon Technologies Corp. 3.20%, 3/15/2024 | 16,000 | 15,852 |
115,068 | ||
Air Freight & Logistics — 0.1% | ||
FedEx Corp. 3.25%, 4/1/2026 | 13,000 | 12,660 |
GXO Logistics, Inc. 1.65%, 7/15/2026 | 4,000 | 3,383 |
United Parcel Service, Inc. 2.20%, 9/1/2024 | 10,000 | 9,697 |
25,740 | ||
Airlines — 0.0% ^ | ||
Southwest Airlines Co. 5.25%, 5/4/2025 | 2,000 | 2,052 |
Banks — 6.5% | ||
Banco Bilbao Vizcaya Argentaria SA (Spain) 0.88%, 9/18/2023 | 200,000 | 193,129 |
Banco Santander SA (Spain) (US Treasury Yield Curve Rate T Note Constant Maturity 1 Year + 0.90%), 1.72%, 9/14/2027 (a) | 200,000 | 172,578 |
Bangko Sentral ng Pilipinas International Bond (Philippines) 8.60%, 6/15/2027 | 13,000 | 14,817 |
Bank of America Corp. | ||
(ICE LIBOR USD 3 Month + 0.64%), 2.01%, 2/13/2026 (a) | 35,000 | 32,734 |
3.50%, 4/19/2026 | 39,000 | 38,016 |
(SOFR + 1.15%), 1.32%, 6/19/2026 (a) | 154,000 | 139,917 |
(SOFR + 0.96%), 1.73%, 7/22/2027 (a) | 51,000 | 45,263 |
(SOFR + 1.58%), 4.38%, 4/27/2028 (a) | 6,000 | 5,855 |
Bank of Montreal (Canada) | ||
(SOFR + 0.60%), 0.95%, 1/22/2027 (a) | 9,000 | 8,021 |
2.65%, 3/8/2027 | 39,000 | 36,283 |
August 31, 2022 | J.P. Morgan Exchange-Traded Funds | 33 |
AS OF August 31, 2022 (Unaudited) (continued)
INVESTMENTS | PRINCIPAL AMOUNT($) | VALUE($) |
Corporate Bonds — continued | ||
Banks — continued | ||
Barclays plc (United Kingdom) 3.65%, 3/16/2025 | 40,000 | 38,860 |
Citigroup, Inc. | ||
3.70%, 1/12/2026 | 4,000 | 3,907 |
(SOFR + 0.77%), 1.12%, 1/28/2027 (a) | 63,000 | 55,561 |
(SOFR + 0.77%), 1.46%, 6/9/2027 (a) | 139,000 | 122,599 |
Comerica, Inc. 3.70%, 7/31/2023 | 15,000 | 14,951 |
Fifth Third Bancorp | ||
4.30%, 1/16/2024 | 12,000 | 12,013 |
3.65%, 1/25/2024 | 12,000 | 11,926 |
(SOFR + 0.69%), 1.71%, 11/1/2027 (a) | 12,000 | 10,757 |
First Citizens BancShares, Inc. (3-MONTH CME TERM SOFR + 2.47%), 3.38%, 3/15/2030 (a) | 20,000 | 18,930 |
HSBC Holdings plc (United Kingdom) (SOFR + 1.40%), 2.63%, 11/7/2025 (a) | 30,000 | 28,472 |
Huntington Bancshares, Inc. | ||
2.63%, 8/6/2024 | 17,000 | 16,513 |
4.00%, 5/15/2025 | 8,000 | 7,926 |
Korea Development Bank (The) (South Korea) 0.40%, 6/19/2024 | 200,000 | 188,051 |
Kreditanstalt fuer Wiederaufbau (Germany) | ||
2.63%, 2/28/2024 | 56,000 | 55,247 |
0.25%, 3/8/2024 | 22,000 | 20,933 |
1.38%, 8/5/2024 | 10,000 | 9,597 |
2.50%, 11/20/2024 | 13,000 | 12,710 |
0.38%, 7/18/2025 | 27,000 | 24,641 |
0.63%, 1/22/2026 | 22,000 | 19,954 |
1.00%, 10/1/2026 | 44,000 | 39,798 |
Landwirtschaftliche Rentenbank (Germany) | ||
3.13%, 11/14/2023 | 36,000 | 35,809 |
Series 40, 0.50%, 5/27/2025 | 13,000 | 11,957 |
0.88%, 3/30/2026 | 86,000 | 78,211 |
1.75%, 7/27/2026 | 1,000 | 935 |
Mitsubishi UFJ Financial Group, Inc. (Japan) 3.41%, 3/7/2024 | 8,000 | 7,921 |
Oesterreichische Kontrollbank AG (Austria) | ||
3.13%, 11/7/2023 | 4,000 | 3,979 |
0.50%, 2/2/2026 | 20,000 | 18,001 |
PNC Financial Services Group, Inc. (The) | ||
3.50%, 1/23/2024 | 76,000 | 75,752 |
1.15%, 8/13/2026 | 215,000 | 192,734 |
Royal Bank of Canada (Canada) | ||
0.50%, 10/26/2023 | 22,000 | 21,215 |
1.40%, 11/2/2026 | 35,000 | 31,140 |
INVESTMENTS | PRINCIPAL AMOUNT($) | VALUE($) |
Banks — continued | ||
Santander UK plc (United Kingdom) 4.00%, 3/13/2024 | 27,000 | 26,973 |
Sumitomo Mitsui Financial Group, Inc. (Japan) | ||
3.94%, 10/16/2023 | 27,000 | 26,990 |
3.01%, 10/19/2026 | 93,000 | 87,537 |
Toronto-Dominion Bank (The) (Canada) | ||
0.75%, 9/11/2025 | 5,000 | 4,516 |
1.25%, 9/10/2026 | 32,000 | 28,419 |
2.80%, 3/10/2027 | 16,000 | 15,005 |
Truist Financial Corp. | ||
3.70%, 6/5/2025 | 6,000 | 5,935 |
1.13%, 8/3/2027 | 53,000 | 45,502 |
(SOFR + 1.37%), 4.12%, 6/6/2028 (a) | 22,000 | 21,601 |
US Bancorp | ||
Series V, 2.38%, 7/22/2026 | 91,000 | 85,764 |
(SOFR + 0.73%), 2.22%, 1/27/2028 (a) | 20,000 | 18,280 |
Valley National Bancorp (3-MONTH CME TERM SOFR + 2.36%), 3.00%, 6/15/2031 (a) | 36,000 | 32,181 |
Wells Fargo & Co. | ||
3.30%, 9/9/2024 | 16,000 | 15,811 |
(SOFR + 0.51%), 0.80%, 5/19/2025 (a) | 10,000 | 9,382 |
3.55%, 9/29/2025 | 13,000 | 12,768 |
(ICE LIBOR USD 3 Month + 0.75%), 2.16%, 2/11/2026 (a) | 50,000 | 46,986 |
3.00%, 4/22/2026 | 8,000 | 7,609 |
(SOFR + 2.00%), 2.19%, 4/30/2026 (a) | 25,000 | 23,397 |
3.00%, 10/23/2026 | 2,000 | 1,887 |
(ICE LIBOR USD 3 Month + 1.17%), 3.20%, 6/17/2027 (a) | 5,000 | 4,709 |
(SOFR + 1.51%), 3.53%, 3/24/2028 (a) | 58,000 | 54,772 |
Westpac Banking Corp. (Australia) | ||
3.35%, 3/8/2027 | 2,000 | 1,930 |
(US Treasury Yield Curve Rate T Note Constant Maturity 5 Year + 1.35%), 2.89%, 2/4/2030 (a) | 10,000 | 9,403 |
2,464,970 | ||
Beverages — 0.4% | ||
Coca-Cola Co. (The) | ||
1.75%, 9/6/2024 | 81,000 | 78,545 |
1.45%, 6/1/2027 | 16,000 | 14,478 |
Keurig Dr Pepper, Inc. | ||
3.13%, 12/15/2023 | 14,000 | 13,865 |
3.40%, 11/15/2025 | 2,000 | 1,954 |
PepsiCo, Inc. | ||
3.60%, 3/1/2024 | 20,000 | 20,011 |
34 | J.P. Morgan Exchange-Traded Funds | August 31, 2022 |
INVESTMENTS | PRINCIPAL AMOUNT($) | VALUE($) |
Corporate Bonds — continued | ||
Beverages — continued | ||
2.85%, 2/24/2026 | 10,000 | 9,739 |
2.38%, 10/6/2026 | 2,000 | 1,898 |
140,490 | ||
Biotechnology — 0.3% | ||
AbbVie, Inc. | ||
3.85%, 6/15/2024 | 17,000 | 16,917 |
2.60%, 11/21/2024 | 10,000 | 9,665 |
3.80%, 3/15/2025 | 42,000 | 41,440 |
3.60%, 5/14/2025 | 15,000 | 14,739 |
Amgen, Inc. | ||
3.63%, 5/22/2024 | 15,000 | 14,938 |
1.90%, 2/21/2025 | 8,000 | 7,619 |
Baxalta, Inc. 4.00%, 6/23/2025 | 4,000 | 3,970 |
Gilead Sciences, Inc. 3.65%, 3/1/2026 | 13,000 | 12,767 |
122,055 | ||
Building Products — 0.0% ^ | ||
Lennox International, Inc. 1.35%, 8/1/2025 | 2,000 | 1,816 |
Capital Markets — 3.6% | ||
Ameriprise Financial, Inc. | ||
3.70%, 10/15/2024 | 5,000 | 4,961 |
2.88%, 9/15/2026 | 2,000 | 1,903 |
Bain Capital Specialty Finance, Inc. 2.55%, 10/13/2026 | 24,000 | 20,335 |
Bank of New York Mellon Corp. (The) | ||
2.20%, 8/16/2023 | 16,000 | 15,775 |
1.60%, 4/24/2025 | 10,000 | 9,416 |
1.05%, 10/15/2026 | 171,000 | 152,084 |
(SOFR + 1.15%), 3.99%, 6/13/2028 (a) | 18,000 | 17,629 |
BlackRock, Inc. 3.50%, 3/18/2024 | 10,000 | 9,969 |
Blackstone Secured Lending Fund 2.75%, 9/16/2026 | 5,000 | 4,423 |
Charles Schwab Corp. (The) | ||
0.90%, 3/11/2026 | 74,000 | 66,588 |
2.45%, 3/3/2027 | 18,000 | 16,797 |
CME Group, Inc. 3.00%, 3/15/2025 | 2,000 | 1,962 |
Deutsche Bank AG (Germany) 4.10%, 1/13/2026 | 373,000 | 362,996 |
Franklin Resources, Inc. 2.85%, 3/30/2025 | 2,000 | 1,936 |
Goldman Sachs Group, Inc. (The) | ||
3.63%, 2/20/2024 | 9,000 | 8,941 |
3.85%, 7/8/2024 | 15,000 | 14,944 |
3.50%, 4/1/2025 | 50,000 | 48,894 |
3.75%, 5/22/2025 | 15,000 | 14,739 |
INVESTMENTS | PRINCIPAL AMOUNT($) | VALUE($) |
Capital Markets — continued | ||
(ICE LIBOR USD 3 Month + 1.20%), 3.27%, 9/29/2025 (a) | 14,000 | 13,638 |
3.75%, 2/25/2026 | 5,000 | 4,897 |
(SOFR + 0.82%), 1.54%, 9/10/2027 (a) | 15,000 | 13,164 |
(SOFR + 0.91%), 1.95%, 10/21/2027 (a) | 62,000 | 55,006 |
(SOFR + 1.11%), 2.64%, 2/24/2028 (a) | 13,000 | 11,793 |
Golub Capital BDC, Inc. 2.05%, 2/15/2027 | 27,000 | 22,475 |
Intercontinental Exchange, Inc. 3.75%, 12/1/2025 | 15,000 | 14,856 |
Janus Henderson US Holdings, Inc. 4.88%, 8/1/2025 | 5,000 | 5,014 |
Jefferies Group LLC 4.85%, 1/15/2027 | 5,000 | 4,962 |
Moody's Corp. 4.88%, 2/15/2024 | 5,000 | 5,053 |
Morgan Stanley | ||
3.70%, 10/23/2024 | 29,000 | 28,819 |
Series I, (SOFR + 0.75%), 0.86%, 10/21/2025 (a) | 107,000 | 98,917 |
4.35%, 9/8/2026 | 4,000 | 3,954 |
(SOFR + 0.88%), 1.59%, 5/4/2027 (a) | 24,000 | 21,405 |
(SOFR + 0.86%), 1.51%, 7/20/2027 (a) | 15,000 | 13,291 |
S&P Global, Inc. 2.45%, 3/1/2027 (b) | 14,000 | 13,063 |
Sixth Street Specialty Lending, Inc. 2.50%, 8/1/2026 | 31,000 | 27,087 |
State Street Corp. | ||
3.70%, 11/20/2023 | 114,000 | 114,154 |
(ICE LIBOR USD 3 Month + 0.77%), 3.78%, 12/3/2024 (a) | 10,000 | 9,976 |
3.55%, 8/18/2025 | 24,000 | 23,789 |
(SOFR + 0.94%), 2.35%, 11/1/2025 (a) | 48,000 | 46,344 |
(SOFR + 0.56%), 1.68%, 11/18/2027 (a) | 25,000 | 22,519 |
(SOFR + 0.73%), 2.20%, 2/7/2028 (a) | 29,000 | 26,577 |
1,375,045 | ||
Chemicals — 0.3% | ||
Air Products and Chemicals, Inc. | ||
1.50%, 10/15/2025 | 21,000 | 19,558 |
1.85%, 5/15/2027 | 2,000 | 1,823 |
Celanese US Holdings LLC | ||
3.50%, 5/8/2024 | 19,000 | 18,500 |
1.40%, 8/05/2026 | 34,000 | 28,587 |
DuPont de Nemours, Inc. | ||
4.21%, 11/15/2023 | 10,000 | 10,025 |
4.49%, 11/15/2025 | 10,000 | 10,081 |
Linde, Inc. 3.20%, 1/30/2026 | 12,000 | 11,765 |
LYB International Finance II BV 3.50%, 3/2/2027 | 5,000 | 4,745 |
August 31, 2022 | J.P. Morgan Exchange-Traded Funds | 35 |
AS OF August 31, 2022 (Unaudited) (continued)
INVESTMENTS | PRINCIPAL AMOUNT($) | VALUE($) |
Corporate Bonds — continued | ||
Chemicals — continued | ||
Mosaic Co. (The) 4.25%, 11/15/2023 | 2,000 | 2,002 |
Nutrien Ltd. (Canada) 3.00%, 4/1/2025 | 6,000 | 5,821 |
112,907 | ||
Commercial Services & Supplies — 0.1% | ||
Waste Management, Inc. 0.75%, 11/15/2025 | 23,000 | 20,784 |
Communications Equipment — 0.0% ^ | ||
Cisco Systems, Inc. 2.20%, 9/20/2023 | 4,000 | 3,948 |
Consumer Finance — 1.9% | ||
AerCap Ireland Capital DAC (Ireland) 3.15%, 2/15/2024 | 150,000 | 145,326 |
Ally Financial, Inc. 3.88%, 5/21/2024 | 87,000 | 86,174 |
American Express Co. 1.65%, 11/4/2026 | 25,000 | 22,595 |
American Honda Finance Corp. | ||
3.63%, 10/10/2023 | 16,000 | 15,974 |
1.20%, 7/8/2025 | 15,000 | 13,897 |
Capital One Financial Corp. | ||
3.30%, 10/30/2024 | 51,000 | 50,027 |
(SOFR + 1.29%), 2.64%, 3/3/2026 (a) | 3,000 | 2,840 |
(SOFR + 0.86%), 1.88%, 11/2/2027 (a) | 14,000 | 12,318 |
(SOFR + 2.06%), 4.93%, 5/10/2028 (a) | 11,000 | 10,870 |
Caterpillar Financial Services Corp. | ||
3.65%, 12/7/2023 | 6,000 | 6,005 |
3.30%, 6/9/2024 | 12,000 | 11,919 |
3.25%, 12/1/2024 | 6,000 | 5,939 |
0.80%, 11/13/2025 | 12,000 | 10,870 |
1.15%, 9/14/2026 | 1,000 | 896 |
General Motors Financial Co., Inc. | ||
5.10%, 1/17/2024 | 45,000 | 45,400 |
4.00%, 10/6/2026 | 63,000 | 60,611 |
John Deere Capital Corp. | ||
0.40%, 10/10/2023 | 53,000 | 51,187 |
2.65%, 6/24/2024 | 15,000 | 14,754 |
1.70%, 1/11/2027 | 44,000 | 40,247 |
PACCAR Financial Corp. | ||
1.10%, 5/11/2026 | 1,000 | 905 |
2.00%, 2/4/2027 | 2,000 | 1,849 |
Synchrony Financial 3.70%, 8/4/2026 | 12,000 | 11,242 |
Toyota Motor Credit Corp. | ||
2.25%, 10/18/2023 | 23,000 | 22,658 |
0.45%, 1/11/2024 | 57,000 | 54,576 |
0.80%, 10/16/2025 | 5,000 | 4,548 |
INVESTMENTS | PRINCIPAL AMOUNT($) | VALUE($) |
Consumer Finance — continued | ||
3.05%, 3/22/2027 | 17,000 | 16,303 |
1.15%, 8/13/2027 | 10,000 | 8,709 |
728,639 | ||
Containers & Packaging — 0.0% ^ | ||
Berry Global, Inc. 1.57%, 1/15/2026 | 2,000 | 1,784 |
WRKCo, Inc. 4.65%, 3/15/2026 | 3,000 | 3,018 |
4,802 | ||
Diversified Consumer Services — 0.0% ^ | ||
Leland Stanford Junior University (The) 1.29%, 6/1/2027 | 2,000 | 1,776 |
Yale University Series 2020, 0.87%, 4/15/2025 | 9,000 | 8,362 |
10,138 | ||
Diversified Financial Services — 0.1% | ||
Berkshire Hathaway, Inc. 3.13%, 3/15/2026 | 19,000 | 18,599 |
National Rural Utilities Cooperative Finance Corp. 1.00%, 6/15/2026 | 35,000 | 31,345 |
49,944 | ||
Diversified Telecommunication Services — 0.2% | ||
AT&T, Inc. 2.95%, 7/15/2026 | 60,000 | 57,006 |
Verizon Communications, Inc. | ||
0.75%, 3/22/2024 | 5,000 | 4,772 |
0.85%, 11/20/2025 | 13,000 | 11,723 |
3.00%, 3/22/2027 | 13,000 | 12,318 |
85,819 | ||
Electric Utilities — 0.8% | ||
American Electric Power Co., Inc. Series N, 1.00%, 11/1/2025 | 2,000 | 1,794 |
Avangrid, Inc. 3.20%, 4/15/2025 | 5,000 | 4,841 |
Duke Energy Corp. | ||
0.90%, 9/15/2025 | 22,000 | 19,968 |
(US Treasury Yield Curve Rate T Note Constant Maturity 5 Year + 2.32%), 3.25%, 1/15/2082 (a) | 6,000 | 4,851 |
Eversource Energy | ||
Series Q, 0.80%, 8/15/2025 | 20,000 | 18,074 |
Series U, 1.40%, 8/15/2026 | 16,000 | 14,236 |
Florida Power & Light Co. | ||
3.25%, 6/1/2024 | 9,000 | 8,933 |
3.13%, 12/1/2025 | 8,000 | 7,888 |
Iberdrola International BV (Spain) 5.81%, 3/15/2025 | 2,000 | 2,084 |
ITC Holdings Corp. 3.25%, 6/30/2026 | 10,000 | 9,530 |
36 | J.P. Morgan Exchange-Traded Funds | August 31, 2022 |
INVESTMENTS | PRINCIPAL AMOUNT($) | VALUE($) |
Corporate Bonds — continued | ||
Electric Utilities — continued | ||
Oncor Electric Delivery Co. LLC 0.55%, 10/1/2025 | 101,000 | 90,750 |
Pacific Gas and Electric Co. | ||
3.15%, 1/1/2026 | 4,000 | 3,688 |
2.95%, 3/1/2026 | 6,000 | 5,450 |
Public Service Electric and Gas Co. 0.95%, 3/15/2026 | 49,000 | 44,137 |
Southern Co. (The) | ||
Series B, (US Treasury Yield Curve Rate T Note Constant Maturity 5 Year + 3.73%), 4.00%, 1/15/2051 (a) | 29,000 | 26,955 |
Series 21-A, (US Treasury Yield Curve Rate T Note Constant Maturity 5 Year + 2.92%), 3.75%, 9/15/2051 (a) | 6,000 | 5,209 |
Union Electric Co. 2.95%, 6/15/2027 | 24,000 | 22,775 |
Xcel Energy, Inc. 1.75%, 3/15/2027 | 13,000 | 11,637 |
302,800 | ||
Electronic Equipment, Instruments & Components — 0.7% | ||
CDW LLC 5.50%, 12/1/2024 | 14,000 | 14,321 |
TD SYNNEX Corp. 1.25%, 8/9/2024 | 201,000 | 186,485 |
Vontier Corp. 1.80%, 4/1/2026 | 67,000 | 58,610 |
259,416 | ||
Energy Equipment & Services — 0.1% | ||
Schlumberger Investment SA 3.65%, 12/1/2023 | 35,000 | 34,984 |
Entertainment — 0.3% | ||
TWDC Enterprises 18 Corp. | ||
1.85%, 7/30/2026 | 74,000 | 68,148 |
2.95%, 6/15/2027 | 15,000 | 14,399 |
Walt Disney Co. (The) | ||
1.75%, 1/13/2026 | 10,000 | 9,314 |
3.70%, 3/23/2027 | 35,000 | 34,551 |
126,412 | ||
Equity Real Estate Investment Trusts (REITs) — 0.7% | ||
American Tower Corp. | ||
2.95%, 1/15/2025 | 2,000 | 1,921 |
1.45%, 9/15/2026 | 32,000 | 28,123 |
AvalonBay Communities, Inc. | ||
4.20%, 12/15/2023 | 6,000 | 6,027 |
3.50%, 11/15/2024 | 10,000 | 9,869 |
3.45%, 6/1/2025 | 5,000 | 4,917 |
3.50%, 11/15/2025 | 2,000 | 1,953 |
Boston Properties LP | ||
3.13%, 9/1/2023 | 6,000 | 5,941 |
INVESTMENTS | PRINCIPAL AMOUNT($) | VALUE($) |
Equity Real Estate Investment Trusts (REITs) — continued | ||
3.65%, 2/1/2026 | 10,000 | 9,718 |
Brixmor Operating Partnership LP 3.65%, 6/15/2024 | 2,000 | 1,954 |
Corporate Office Properties LP 2.25%, 3/15/2026 | 32,000 | 28,630 |
Crown Castle, Inc. 1.05%, 7/15/2026 | 15,000 | 13,150 |
ERP Operating LP 2.85%, 11/1/2026 | 1,000 | 949 |
Essex Portfolio LP 3.50%, 4/1/2025 | 8,000 | 7,839 |
Healthpeak Properties, Inc. 1.35%, 2/1/2027 | 10,000 | 8,777 |
Mid-America Apartments LP 1.10%, 9/15/2026 | 16,000 | 13,997 |
Office Properties Income Trust 4.50%, 2/1/2025 | 46,000 | 43,136 |
Prologis LP 2.13%, 4/15/2027 | 4,000 | 3,685 |
Realty Income Corp. 3.88%, 4/15/2025 | 20,000 | 19,830 |
Simon Property Group LP 3.50%, 9/1/2025 | 48,000 | 47,352 |
Ventas Realty LP 3.25%, 10/15/2026 | 9,000 | 8,496 |
Welltower, Inc. | ||
4.00%, 6/1/2025 | 12,000 | 11,858 |
2.70%, 2/15/2027 | 2,000 | 1,856 |
279,978 | ||
Food & Staples Retailing — 0.1% | ||
Costco Wholesale Corp. 1.38%, 6/20/2027 | 3,000 | 2,694 |
Kroger Co. (The) | ||
3.50%, 2/1/2026 | 2,000 | 1,954 |
2.65%, 10/15/2026 | 5,000 | 4,722 |
Walmart, Inc. 1.05%, 9/17/2026 | 29,000 | 26,274 |
35,644 | ||
Food Products — 0.1% | ||
Bunge Ltd. Finance Corp. 1.63%, 8/17/2025 | 17,000 | 15,781 |
Kellogg Co. 3.25%, 4/1/2026 | 8,000 | 7,763 |
McCormick & Co., Inc. 3.40%, 8/15/2027 | 10,000 | 9,605 |
Tyson Foods, Inc. 3.90%, 9/28/2023 | 9,000 | 8,996 |
42,145 | ||
Gas Utilities — 0.1% | ||
Atmos Energy Corp. 3.00%, 6/15/2027 | 10,000 | 9,550 |
National Fuel Gas Co. 5.50%, 1/15/2026 | 17,000 | 17,168 |
Southern California Gas Co. Series TT, 2.60%, 6/15/2026 | 13,000 | 12,280 |
38,998 | ||
Health Care Equipment & Supplies — 0.0% ^ | ||
Baxter International, Inc. 1.92%, 2/1/2027 | 2,000 | 1,798 |
August 31, 2022 | J.P. Morgan Exchange-Traded Funds | 37 |
AS OF August 31, 2022 (Unaudited) (continued)
INVESTMENTS | PRINCIPAL AMOUNT($) | VALUE($) |
Corporate Bonds — continued | ||
Health Care Equipment & Supplies — continued | ||
Stryker Corp. 0.60%, 12/1/2023 | 4,000 | 3,842 |
Zimmer Biomet Holdings, Inc. 3.05%, 1/15/2026 | 11,000 | 10,527 |
16,167 | ||
Health Care Providers & Services — 1.1% | ||
AmerisourceBergen Corp. 0.74%, 3/15/2023 | 62,000 | 60,915 |
Cigna Corp. | ||
0.61%, 3/15/2024 | 97,000 | 92,298 |
1.25%, 3/15/2026 | 50,000 | 45,013 |
CommonSpirit Health 2.76%, 10/1/2024 | 5,000 | 4,844 |
CVS Health Corp. | ||
3.88%, 7/20/2025 | 25,000 | 24,822 |
1.30%, 8/21/2027 | 29,000 | 25,114 |
Elevance Health, Inc. | ||
3.50%, 8/15/2024 | 13,000 | 12,857 |
3.35%, 12/1/2024 | 14,000 | 13,770 |
1.50%, 3/15/2026 | 13,000 | 11,861 |
HCA, Inc. | ||
5.00%, 3/15/2024 | 50,000 | 50,275 |
5.25%, 4/15/2025 | 9,000 | 9,080 |
Humana, Inc. 1.35%, 2/3/2027 | 78,000 | 68,157 |
UnitedHealth Group, Inc. | ||
1.25%, 1/15/2026 | 10,000 | 9,165 |
1.15%, 5/15/2026 | 2,000 | 1,816 |
3.38%, 4/15/2027 | 3,000 | 2,933 |
432,920 | ||
Hotels, Restaurants & Leisure — 0.5% | ||
McDonald's Corp. 3.25%, 6/10/2024 | 5,000 | 4,958 |
Sands China Ltd. (Macau) 5.63%, 8/8/2025 (c) | 200,000 | 182,847 |
187,805 | ||
Household Durables — 0.0% ^ | ||
DR Horton, Inc. 2.50%, 10/15/2024 | 13,000 | 12,485 |
Household Products — 0.3% | ||
Kimberly-Clark Corp. 3.05%, 8/15/2025 | 16,000 | 15,681 |
Procter & Gamble Co. (The) | ||
1.00%, 4/23/2026 | 5,000 | 4,579 |
1.90%, 2/1/2027 | 26,000 | 24,331 |
2.80%, 3/25/2027 | 53,000 | 50,989 |
95,580 | ||
INVESTMENTS | PRINCIPAL AMOUNT($) | VALUE($) |
Industrial Conglomerates — 0.3% | ||
Honeywell International, Inc. | ||
2.30%, 8/15/2024 | 15,000 | 14,633 |
1.10%, 3/1/2027 | 100,000 | 89,227 |
103,860 | ||
Insurance — 0.3% | ||
Aflac, Inc. 1.13%, 3/15/2026 | 30,000 | 27,130 |
Allied World Assurance Co. Holdings Ltd. 4.35%, 10/29/2025 | 9,000 | 8,753 |
Kemper Corp. 4.35%, 2/15/2025 | 6,000 | 5,949 |
Manulife Financial Corp. (Canada) 2.48%, 5/19/2027 | 10,000 | 9,186 |
Old Republic International Corp. 3.88%, 8/26/2026 | 39,000 | 37,650 |
Prudential Financial, Inc. | ||
1.50%, 3/10/2026 | 18,000 | 16,492 |
(ICE LIBOR USD 3 Month + 3.03%), 5.38%, 5/15/2045 (a) | 2,000 | 1,966 |
107,126 | ||
Interactive Media & Services — 0.0% ^ | ||
Alphabet, Inc. 0.80%, 8/15/2027 | 15,000 | 13,108 |
Internet & Direct Marketing Retail — 0.2% | ||
Amazon.com, Inc. | ||
2.80%, 8/22/2024 | 7,000 | 6,913 |
0.80%, 6/03/2025 | 25,000 | 23,123 |
1.00%, 5/12/2026 | 37,000 | 33,515 |
eBay, Inc. 1.90%, 3/11/2025 | 2,000 | 1,888 |
65,439 | ||
IT Services — 0.4% | ||
Kyndryl Holdings, Inc. 2.05%, 10/15/2026 (b) | 7,000 | 5,801 |
Mastercard, Inc. 3.38%, 4/1/2024 | 7,000 | 6,977 |
PayPal Holdings, Inc. 2.40%, 10/1/2024 | 16,000 | 15,574 |
Visa, Inc. 1.90%, 4/15/2027 | 35,000 | 32,306 |
Western Union Co. (The) 1.35%, 3/15/2026 | 100,000 | 88,551 |
149,209 | ||
Leisure Products — 0.0% ^ | ||
Hasbro, Inc. | ||
3.00%, 11/19/2024 | 5,000 | 4,867 |
3.55%, 11/19/2026 | 3,000 | 2,857 |
7,724 | ||
38 | J.P. Morgan Exchange-Traded Funds | August 31, 2022 |
INVESTMENTS | PRINCIPAL AMOUNT($) | VALUE($) |
Corporate Bonds — continued | ||
Machinery — 0.1% | ||
CNH Industrial Capital LLC 1.45%, 7/15/2026 | 3,000 | 2,662 |
Cummins, Inc. 0.75%, 9/1/2025 | 26,000 | 23,834 |
26,496 | ||
Media — 0.5% | ||
Charter Communications Operating LLC 4.91%, 7/23/2025 | 10,000 | 9,977 |
Comcast Corp. | ||
3.38%, 8/15/2025 | 20,000 | 19,670 |
3.95%, 10/15/2025 | 67,000 | 66,881 |
2.35%, 1/15/2027 | 8,000 | 7,448 |
Fox Corp. 3.05%, 4/7/2025 | 14,000 | 13,536 |
Omnicom Group, Inc. 3.65%, 11/1/2024 | 9,000 | 8,905 |
Paramount Global 4.00%, 1/15/2026 | 16,000 | 15,738 |
TCI Communications, Inc. 7.88%, 2/15/2026 | 1,000 | 1,117 |
WPP Finance 2010 (United Kingdom) 3.75%, 9/19/2024 | 41,000 | 40,361 |
183,633 | ||
Metals & Mining — 0.0% ^ | ||
ArcelorMittal SA (Luxembourg) 4.55%, 3/11/2026 | 2,000 | 1,963 |
BHP Billiton Finance USA Ltd. (Australia) | ||
3.85%, 9/30/2023 | 3,000 | 3,002 |
6.42%, 3/1/2026 | 1,000 | 1,069 |
6,034 | ||
Multiline Retail — 0.0% ^ | ||
Target Corp. 2.25%, 4/15/2025 | 15,000 | 14,411 |
Multi-Utilities — 0.3% | ||
Ameren Corp. 3.65%, 2/15/2026 | 52,000 | 50,604 |
Delmarva Power & Light Co. 3.50%, 11/15/2023 | 10,000 | 9,977 |
Dominion Energy, Inc. | ||
3.07%, 8/15/2024 (c) | 24,000 | 23,291 |
(ICE LIBOR USD 3 Month + 3.06%), 5.75%, 10/1/2054 (a) | 12,000 | 11,484 |
DTE Energy Co. 2.85%, 10/1/2026 | 3,000 | 2,818 |
NiSource, Inc. 0.95%, 8/15/2025 | 10,000 | 9,098 |
Sempra Energy (US Treasury Yield Curve Rate T Note Constant Maturity 5 Year + 2.87%), 4.12%, 4/1/2052 (a) | 13,000 | 10,999 |
118,271 | ||
Oil, Gas & Consumable Fuels — 1.3% | ||
BP Capital Markets America, Inc. 3.41%, 2/11/2026 | 11,000 | 10,796 |
INVESTMENTS | PRINCIPAL AMOUNT($) | VALUE($) |
Oil, Gas & Consumable Fuels — continued | ||
Canadian Natural Resources Ltd. (Canada) | ||
3.90%, 2/1/2025 | 12,000 | 11,819 |
2.05%, 7/15/2025 | 3,000 | 2,799 |
Cheniere Corpus Christi Holdings LLC 5.88%, 3/31/2025 | 10,000 | 10,202 |
Chevron Corp. 2.00%, 5/11/2027 | 13,000 | 12,140 |
Chevron USA, Inc. | ||
0.69%, 8/12/2025 | 3,000 | 2,741 |
1.02%, 8/12/2027 | 17,000 | 14,825 |
ConocoPhillips Co. 3.35%, 11/15/2024 | 2,000 | 1,982 |
Energy Transfer LP | ||
4.25%, 4/1/2024 | 9,000 | 8,938 |
2.90%, 5/15/2025 | 13,000 | 12,328 |
4.75%, 1/15/2026 | 7,000 | 6,948 |
Enterprise Products Operating LLC 3.75%, 2/15/2025 | 45,000 | 44,694 |
Exxon Mobil Corp. | ||
3.18%, 3/15/2024 | 80,000 | 79,607 |
3.04%, 3/1/2026 | 9,000 | 8,765 |
2.28%, 8/16/2026 | 43,000 | 40,613 |
Kinder Morgan Energy Partners LP 4.15%, 2/1/2024 | 18,000 | 18,004 |
Kinder Morgan, Inc. 1.75%, 11/15/2026 | 6,000 | 5,364 |
Marathon Petroleum Corp. 4.70%, 5/1/2025 | 6,000 | 6,039 |
MPLX LP 4.88%, 12/1/2024 | 23,000 | 23,160 |
ONEOK, Inc. 2.20%, 9/15/2025 | 8,000 | 7,467 |
Ovintiv Exploration, Inc. 5.38%, 1/1/2026 | 5,000 | 5,077 |
Petroleos Mexicanos (Mexico) 6.84%, 1/23/2030 (d) | 1 | 1 |
Pioneer Natural Resources Co. 1.13%, 1/15/2026 | 15,000 | 13,404 |
Sabine Pass Liquefaction LLC 5.63%, 3/1/2025 | 23,000 | 23,435 |
Spectra Energy Partners LP 4.75%, 3/15/2024 | 4,000 | 4,021 |
TC PipeLines LP 4.38%, 3/13/2025 | 20,000 | 19,947 |
TransCanada PipeLines Ltd. (Canada) 3.75%, 10/16/2023 | 46,000 | 45,844 |
Williams Cos., Inc. (The) | ||
4.50%, 11/15/2023 | 34,000 | 34,102 |
3.90%, 1/15/2025 | 3,000 | 2,962 |
478,024 | ||
Paper & Forest Products — 0.1% | ||
Fibria Overseas Finance Ltd. (Brazil) | ||
4.00%, 1/14/2025 | 6,000 | 5,951 |
August 31, 2022 | J.P. Morgan Exchange-Traded Funds | 39 |
AS OF August 31, 2022 (Unaudited) (continued)
INVESTMENTS | PRINCIPAL AMOUNT($) | VALUE($) |
Corporate Bonds — continued | ||
Paper & Forest Products — continued | ||
5.50%, 1/17/2027 | 6,000 | 6,062 |
Georgia-Pacific LLC 8.00%, 1/15/2024 | 16,000 | 16,831 |
28,844 | ||
Personal Products — 0.0% ^ | ||
Estee Lauder Cos., Inc. (The) 2.00%, 12/1/2024 | 15,000 | 14,552 |
Pharmaceuticals — 0.6% | ||
Bristol-Myers Squibb Co. | ||
3.25%, 11/1/2023 | 15,000 | 14,951 |
2.90%, 7/26/2024 | 9,000 | 8,871 |
Eli Lilly & Co. 2.75%, 6/1/2025 | 15,000 | 14,700 |
GlaxoSmithKline Capital, Inc. (United Kingdom) 3.63%, 5/15/2025 | 2,000 | 1,990 |
Johnson & Johnson | ||
3.38%, 12/5/2023 | 9,000 | 8,985 |
0.55%, 9/1/2025 | 85,000 | 77,851 |
Merck & Co., Inc. | ||
2.75%, 2/10/2025 | 27,000 | 26,412 |
1.70%, 6/10/2027 | 41,000 | 37,245 |
Mylan, Inc. 4.20%, 11/29/2023 | 13,000 | 12,990 |
Novartis Capital Corp. (Switzerland) 1.75%, 2/14/2025 | 2,000 | 1,916 |
Pfizer, Inc. | ||
3.20%, 9/15/2023 | 7,000 | 6,970 |
3.40%, 5/15/2024 | 15,000 | 14,945 |
2.75%, 6/3/2026 | 5,000 | 4,848 |
232,674 | ||
Road & Rail — 0.3% | ||
Burlington Northern Santa Fe LLC | ||
3.75%, 4/1/2024 | 14,000 | 13,990 |
3.00%, 4/1/2025 | 22,000 | 21,606 |
3.65%, 9/1/2025 | 8,000 | 7,956 |
3.25%, 6/15/2027 | 11,000 | 10,739 |
Canadian Pacific Railway Co. (Canada) 1.75%, 12/2/2026 | 3,000 | 2,720 |
JB Hunt Transport Services, Inc. 3.88%, 3/1/2026 | 5,000 | 4,909 |
Ryder System, Inc. 4.63%, 6/1/2025 | 8,000 | 7,991 |
Union Pacific Corp. 3.25%, 1/15/2025 | 24,000 | 23,696 |
93,607 | ||
Semiconductors & Semiconductor Equipment — 0.6% | ||
Broadcom, Inc. 3.63%, 10/15/2024 | 10,000 | 9,889 |
Intel Corp. 3.40%, 3/25/2025 | 2,000 | 1,976 |
INVESTMENTS | PRINCIPAL AMOUNT($) | VALUE($) |
Semiconductors & Semiconductor Equipment — continued | ||
Texas Instruments, Inc. | ||
1.38%, 3/12/2025 | 6,000 | 5,657 |
1.13%, 9/15/2026 | 12,000 | 10,889 |
TSMC Arizona Corp. (Taiwan) 1.75%, 10/25/2026 | 200,000 | 180,699 |
209,110 | ||
Software — 0.3% | ||
Adobe, Inc. 1.90%, 2/1/2025 | 7,000 | 6,710 |
Intuit, Inc. 1.35%, 7/15/2027 | 10,000 | 8,787 |
Microsoft Corp. 2.70%, 2/12/2025 | 15,000 | 14,748 |
Oracle Corp. | ||
2.40%, 9/15/2023 | 93,000 | 91,367 |
1.65%, 3/25/2026 | 6,000 | 5,412 |
127,024 | ||
Specialty Retail — 0.1% | ||
Home Depot, Inc. (The) | ||
3.35%, 9/15/2025 | 5,000 | 4,949 |
2.50%, 4/15/2027 | 8,000 | 7,552 |
Lowe's Cos., Inc. | ||
3.13%, 9/15/2024 | 30,000 | 29,528 |
3.38%, 9/15/2025 | 6,000 | 5,878 |
47,907 | ||
Technology Hardware, Storage & Peripherals — 0.4% | ||
Apple, Inc. | ||
3.00%, 2/9/2024 | 32,000 | 31,741 |
3.45%, 5/6/2024 | 10,000 | 9,986 |
2.75%, 1/13/2025 | 10,000 | 9,806 |
2.50%, 2/9/2025 | 2,000 | 1,948 |
0.70%, 2/8/2026 | 36,000 | 32,528 |
Dell International LLC | ||
4.00%, 7/15/2024 | 15,000 | 14,944 |
5.85%, 7/15/2025 | 14,000 | 14,496 |
Hewlett Packard Enterprise Co. 1.45%, 4/1/2024 | 12,000 | 11,527 |
HP, Inc. | ||
2.20%, 6/17/2025 | 38,000 | 35,848 |
1.45%, 6/17/2026 | 2,000 | 1,782 |
164,606 | ||
Textiles, Apparel & Luxury Goods — 0.1% | ||
NIKE, Inc. 2.40%, 3/27/2025 | 20,000 | 19,364 |
40 | J.P. Morgan Exchange-Traded Funds | August 31, 2022 |
INVESTMENTS | PRINCIPAL AMOUNT($) | VALUE($) |
Corporate Bonds — continued | ||
Tobacco — 0.1% | ||
BAT Capital Corp. (United Kingdom) | ||
3.22%, 8/15/2024 | 18,000 | 17,583 |
2.79%, 9/6/2024 | 9,000 | 8,717 |
Philip Morris International, Inc. 1.50%, 5/1/2025 | 3,000 | 2,813 |
Reynolds American, Inc. (United Kingdom) 4.45%, 6/12/2025 | 5,000 | 4,955 |
34,068 | ||
Water Utilities — 0.0% ^ | ||
American Water Capital Corp. 3.40%, 3/1/2025 | 1,000 | 985 |
Wireless Telecommunication Services — 0.0% ^ | ||
T-Mobile USA, Inc. 1.50%, 2/15/2026 | 2,000 | 1,803 |
Vodafone Group plc (United Kingdom) 4.13%, 5/30/2025 | 4,000 | 3,986 |
5,789 | ||
Total Corporate Bonds (Cost $9,915,684) | 9,381,416 | |
Mortgage-Backed Securities — 8.0% | ||
FHLMC Gold Pools, 15 Year | ||
Pool # J14776, 3.00%, 3/1/2026 | 6,186 | 6,099 |
Pool # G18452, 2.50%, 12/1/2027 | 18,520 | 17,975 |
Pool # G18511, 2.50%, 5/1/2029 | 1,783 | 1,710 |
Pool # G18549, 2.50%, 4/1/2030 | 17,362 | 16,648 |
Pool # G15520, 3.00%, 7/1/2030 | 8,514 | 8,319 |
Pool # G18568, 2.50%, 9/1/2030 | 8,322 | 7,980 |
Pool # J33012, 3.00%, 10/1/2030 | 21,087 | 20,641 |
Pool # G18600, 2.50%, 5/1/2031 | 6,144 | 5,931 |
Pool # G16028, 3.00%, 8/1/2031 | 4,978 | 4,873 |
Pool # J35495, 2.50%, 10/1/2031 | 12,452 | 11,939 |
Pool # G18626, 2.50%, 1/1/2032 | 28,000 | 26,846 |
Pool # G18632, 3.00%, 2/1/2032 | 6,459 | 6,282 |
Pool # J37147, 3.00%, 6/1/2032 | 7,614 | 7,401 |
Pool # G16207, 3.50%, 7/1/2032 | 6,791 | 6,697 |
Pool # G18715, 3.00%, 12/1/2033 | 4,384 | 4,265 |
FHLMC UMBS, 15 Year | ||
Pool # ZS8617, 2.50%, 8/1/2031 | 13,571 | 13,000 |
Pool # ZS7938, 2.50%, 1/1/2033 | 1,871 | 1,792 |
Pool # ZS7988, 3.50%, 2/1/2033 | 9,667 | 9,518 |
Pool # ZK9341, 3.00%, 3/1/2033 | 2,469 | 2,399 |
Pool # ZT0716, 3.00%, 10/1/2033 | 2,377 | 2,310 |
Pool # SB0194, 2.50%, 12/1/2033 | 5,108 | 4,893 |
Pool # SB0109, 2.50%, 11/1/2034 | 22,977 | 21,866 |
Pool # SB8021, 3.00%, 12/1/2034 | 4,274 | 4,151 |
INVESTMENTS | PRINCIPAL AMOUNT($) | VALUE($) |
Pool # SB0264, 2.50%, 2/1/2035 | 11,210 | 10,627 |
Pool # QN2057, 3.00%, 5/1/2035 | 13,588 | 13,195 |
Pool # SB0345, 2.00%, 6/1/2035 | 71,085 | 65,590 |
Pool # SB0401, 2.00%, 7/1/2035 | 18,750 | 17,300 |
Pool # SB0394, 2.50%, 7/1/2035 | 10,219 | 9,687 |
Pool # SB8501, 2.00%, 8/1/2035 | 49,819 | 45,968 |
Pool # SB0406, 2.50%, 8/1/2035 | 19,302 | 18,297 |
Pool # SB8058, 2.50%, 8/1/2035 | 24,149 | 22,892 |
Pool # RC1591, 1.50%, 10/1/2035 | 59,879 | 53,855 |
Pool # QN4391, 1.50%, 11/1/2035 | 59,686 | 53,699 |
Pool # QN4278, 2.00%, 11/1/2035 | 6,947 | 6,410 |
Pool # QN4490, 1.50%, 12/1/2035 | 82,122 | 73,864 |
Pool # SB0450, 2.00%, 12/1/2035 | 43,545 | 40,181 |
Pool # QN4861, 1.50%, 1/1/2036 | 64,808 | 58,310 |
Pool # SB8088, 1.50%, 2/1/2036 | 15,343 | 13,804 |
Pool # SB8102, 1.50%, 5/1/2036 | 27,023 | 24,312 |
Pool # RC2089, 2.00%, 7/1/2036 | 72,693 | 67,070 |
Pool # SB8118, 1.50%, 9/1/2036 | 58,028 | 52,206 |
Pool # SB8127, 1.50%, 11/1/2036 | 73,541 | 66,162 |
FNMA UMBS, 15 Year | ||
Pool # AK3264, 3.00%, 2/1/2027 | 4,109 | 4,037 |
Pool # AV4793, 3.50%, 5/1/2029 | 7,859 | 7,727 |
Pool # AW3641, 3.00%, 6/1/2029 | 8,265 | 8,083 |
Pool # AS4489, 2.50%, 3/1/2030 | 1,953 | 1,871 |
Pool # AL6583, 3.00%, 3/1/2030 | 4,198 | 4,105 |
Pool # AS4860, 2.50%, 5/1/2030 | 14,604 | 13,991 |
Pool # AL9852, 3.00%, 9/1/2030 | 11,947 | 11,689 |
Pool # AS7467, 2.50%, 7/1/2031 | 6,606 | 6,328 |
Pool # AS7606, 2.50%, 7/1/2031 | 22,907 | 21,944 |
Pool # AS7620, 2.50%, 7/1/2031 | 33,735 | 32,316 |
Pool # AS7657, 2.50%, 8/1/2031 | 12,480 | 11,949 |
Pool # FM6169, 3.50%, 5/1/2032 | 56,723 | 55,862 |
Pool # 890822, 3.00%, 12/1/2032 | 38,412 | 37,328 |
Pool # BM3276, 3.50%, 12/1/2032 | 8,597 | 8,465 |
Pool # CA1089, 3.00%, 2/1/2033 | 7,340 | 7,133 |
Pool # FM3937, 3.00%, 4/1/2033 | 7,893 | 7,721 |
Pool # FM4036, 2.50%, 12/1/2033 | 8,889 | 8,516 |
Pool # BN3975, 3.00%, 1/1/2034 | 885 | 860 |
Pool # MA3631, 3.00%, 4/1/2034 | 7,822 | 7,596 |
Pool # MA3709, 2.50%, 6/1/2034 | 4,914 | 4,677 |
Pool # BJ5549, 3.00%, 8/1/2034 | 2,299 | 2,231 |
Pool # FM2403, 3.50%, 9/1/2034 | 8,136 | 8,012 |
Pool # FM5400, 2.50%, 10/1/2034 | 11,717 | 11,226 |
Pool # BO4944, 2.50%, 11/1/2034 | 28,655 | 27,268 |
Pool # MA3828, 3.00%, 11/1/2034 | 7,558 | 7,340 |
August 31, 2022 | J.P. Morgan Exchange-Traded Funds | 41 |
AS OF August 31, 2022 (Unaudited) (continued)
INVESTMENTS | PRINCIPAL AMOUNT($) | VALUE($) |
Mortgage-Backed Securities — continued | ||
Pool # FM4671, 3.50%, 1/1/2035 | 2,460 | 2,422 |
Pool # BP5762, 2.50%, 6/1/2035 | 36,277 | 34,389 |
Pool # FM3654, 3.00%, 6/1/2035 | 22,918 | 22,256 |
Pool # FM3936, 2.50%, 8/1/2035 | 5,281 | 5,059 |
Pool # MA4154, 1.50%, 10/1/2035 | 39,134 | 35,197 |
Pool # CA7497, 2.50%, 10/1/2035 | 9,710 | 9,204 |
Pool # FM4850, 2.00%, 11/1/2035 | 34,267 | 31,618 |
Pool # FM5396, 2.00%, 12/1/2035 | 52,119 | 48,105 |
Pool # CA8788, 2.00%, 1/1/2036 | 68,810 | 63,487 |
Pool # FM6510, 2.00%, 3/1/2036 | 34,647 | 31,978 |
Pool # FM6512, 2.00%, 3/1/2036 | 37,145 | 34,271 |
Pool # MA4298, 2.50%, 3/1/2036 | 20,051 | 19,057 |
Pool # CB0302, 1.50%, 5/1/2036 | 54,588 | 49,113 |
Pool # FM7113, 2.00%, 5/1/2036 | 42,256 | 38,988 |
Pool # MA4329, 2.00%, 5/1/2036 | 65,678 | 60,597 |
Pool # BP3507, 2.00%, 6/1/2036 | 64,774 | 59,764 |
Pool # CB0747, 2.50%, 6/1/2036 | 10,575 | 10,043 |
Pool # MA4361, 2.50%, 6/1/2036 | 14,340 | 13,576 |
Pool # MA4383, 2.00%, 7/1/2036 | 191,029 | 176,250 |
Pool # MA4384, 2.50%, 7/1/2036 | 14,805 | 14,018 |
Pool # FM9020, 2.00%, 9/1/2036 | 26,134 | 24,119 |
Pool # FM9367, 1.50%, 11/1/2036 | 50,531 | 45,445 |
Pool # MA4470, 2.00%, 11/1/2036 | 36,424 | 33,605 |
Pool # MA4497, 2.00%, 12/1/2036 | 35,033 | 32,321 |
FNMA/FHLMC UMBS, Single Family, 15 Year | ||
TBA, 1.50%, 9/25/2037 (e) | 226,000 | 203,073 |
TBA, 2.00%, 9/25/2037 (e) | 330,000 | 304,219 |
TBA, 2.50%, 9/25/2037 (e) | 180,000 | 170,269 |
TBA, 3.00%, 9/25/2037 (e) | 175,000 | 169,497 |
TBA, 3.50%, 9/25/2037 (e) | 50,000 | 49,100 |
GNMA II, 15 Year | ||
Pool # MA4559, 3.00%, 7/20/2032 | 5,973 | 5,786 |
Pool # MA7107, 2.50%, 1/20/2036 | 21,065 | 19,865 |
Total Mortgage-Backed Securities (Cost $3,310,107) | 3,061,930 | |
Supranational — 2.6% | ||
African Development Bank (Supranational) | ||
0.88%, 3/23/2026 | 30,000 | 27,266 |
0.88%, 7/22/2026 | 3,000 | 2,705 |
Asian Development Bank (Supranational) | ||
0.38%, 6/11/2024 | 194,000 | 183,489 |
1.50%, 10/18/2024 | 12,000 | 11,503 |
2.00%, 1/22/2025 | 23,000 | 22,175 |
0.38%, 9/3/2025 | 120,000 | 109,073 |
1.00%, 4/14/2026 | 52,000 | 47,506 |
INVESTMENTS | PRINCIPAL AMOUNT($) | VALUE($) |
1.50%, 1/20/2027 | 58,000 | 53,347 |
Asian Infrastructure Investment Bank (The) (Supranational) | ||
2.25%, 5/16/2024 | 84,000 | 82,039 |
0.50%, 5/28/2025 | 55,000 | 50,357 |
European Bank for Reconstruction & Development (Supranational) | ||
1.50%, 2/13/2025 | 5,000 | 4,756 |
0.50%, 11/25/2025 | 4,000 | 3,624 |
0.50%, 1/28/2026 | 8,000 | 7,208 |
European Investment Bank (Supranational) | ||
1.63%, 3/14/2025 | 61,000 | 58,150 |
0.38%, 12/15/2025 | 11,000 | 9,916 |
0.38%, 3/26/2026 | 41,000 | 36,681 |
1.38%, 3/15/2027 | 37,000 | 33,795 |
Inter-American Development Bank (Supranational) | ||
0.50%, 9/23/2024 | 43,000 | 40,418 |
0.50%, 9/23/2024 | 1,000 | 940 |
0.63%, 7/15/2025 | 27,000 | 24,816 |
0.88%, 4/20/2026 | 73,000 | 66,354 |
1.50%, 1/13/2027 | 1,000 | 921 |
International Bank for Reconstruction & Development (Supranational) | ||
2.50%, 11/25/2024 | 15,000 | 14,670 |
2.13%, 3/3/2025 | 5,000 | 4,829 |
0.63%, 4/22/2025 | 72,000 | 66,720 |
2.50%, 7/29/2025 | 34,000 | 32,967 |
International Finance Corp. (Supranational) 0.38%, 7/16/2025 | 15,000 | 13,698 |
Total Supranational (Cost $1,067,920) | 1,009,923 | |
Commercial Mortgage-Backed Securities — 2.2% | ||
Benchmark Mortgage Trust | ||
Series 2018-B3, Class A3, 3.75%, 4/10/2051 | 25,000 | 24,420 |
Series 2019-B12, Class A2, 3.00%, 8/15/2052 | 6,536 | 6,329 |
CGMS Commercial Mortgage Trust Series 2017-B1, Class AAB, 3.24%, 8/15/2050 | 16,000 | 15,445 |
Citigroup Commercial Mortgage Trust | ||
Series 2013-GC17, Class A4, 4.13%, 11/10/2046 | 20,000 | 19,889 |
Series 2016-C1, Class AAB, 3.00%, 5/10/2049 | 8,727 | 8,492 |
Series 2020-GC46, Class A2, 2.71%, 2/15/2053 | 20,000 | 19,036 |
42 | J.P. Morgan Exchange-Traded Funds | August 31, 2022 |
INVESTMENTS | PRINCIPAL AMOUNT($) | VALUE($) |
Commercial Mortgage-Backed Securities — continued | ||
Commercial Mortgage Trust | ||
Series 2014-CR16, Class A3, 3.78%, 4/10/2047 | 24,015 | 23,738 |
Series 2014-LC15, Class A4, 4.01%, 4/10/2047 | 20,000 | 19,828 |
Commercial Mortgage Trust, Series 2013-CR12, Class A4 Series 2013-CR12, Class A4, 4.05%, 10/10/2046 | 75,000 | 74,431 |
CSAIL Commercial Mortgage Trust Series 2015-C3, Class A4, 3.72%, 8/15/2048 | 20,000 | 19,497 |
FHLMC, Multi-Family Structured Pass-Through Certificates | ||
Series K028, Class A2, 3.11%, 2/25/2023 | 46,810 | 46,634 |
Series K046, Class A2, 3.21%, 3/25/2025 | 26,000 | 25,577 |
Series K733, Class A2, 3.75%, 8/25/2025 | 30,000 | 29,824 |
Series K063, Class A2, 3.43%, 1/25/2027 (f) | 100,000 | 98,417 |
FNMA ACES | ||
Series 2017-M10, Class AV2, 2.64%, 7/25/2024 (f) | 12,004 | 11,790 |
Series 2017-M1, Class A2, 2.50%, 10/25/2026 (f) | 39,923 | 37,796 |
Series 2015-M10, Class A2, 3.09%, 4/25/2027 (f) | 43,480 | 42,240 |
GS Mortgage Securities Trust | ||
Series 2014-GC18, Class A4, 4.07%, 1/10/2047 | 30,000 | 29,720 |
Series 2014-GC18, Class AS, 4.38%, 1/10/2047 | 17,000 | 16,618 |
JPMBB Commercial Mortgage Securities Trust | ||
Series 2013-C17, Class ASB, 3.71%, 1/15/2047 | 5,696 | 5,658 |
Series 2014-C19, Class C, 4.81%, 4/15/2047 ‡ (f) | 10,000 | 9,741 |
Series 2014-C23, Class C, 4.63%, 9/15/2047 ‡ (f) | 20,000 | 18,906 |
JPMorgan Chase Commercial Mortgage Securities Trust | ||
Series 2013-C10, Class AS, 3.37%, 12/15/2047 ‡ | 20,000 | 19,827 |
Series 2015-JP1, Class D, 4.38%, 1/15/2049 ‡ (f) | 10,000 | 8,529 |
Morgan Stanley Bank of America Merrill Lynch Trust | ||
Series 2014-C19, Class A3, 3.25%, 12/15/2047 | 5,552 | 5,424 |
Series 2015-C25, Class ASB, 3.38%, 10/15/2048 | 21,377 | 20,945 |
INVESTMENTS | PRINCIPAL AMOUNT($) | VALUE($) |
Series 2016-C31, Class A5, 3.10%, 11/15/2049 | 32,000 | 30,243 |
UBS Commercial Mortgage Trust Series 2018-C13, Class A2, 4.21%, 10/15/2051 | 5,670 | 5,629 |
UBS-Barclays Commercial Mortgage Trust Series 2013-C6, Class A4, 3.24%, 4/10/2046 | 23,000 | 22,843 |
Wells Fargo Commercial Mortgage Trust | ||
Series 2013-LC12, Class A4, 4.22%, 7/15/2046 (f) | 12,000 | 11,798 |
Series 2014-LC18, Class A5, 3.41%, 12/15/2047 | 15,000 | 14,601 |
Series 2015-C31, Class A4, 3.70%, 11/15/2048 | 24,000 | 23,369 |
Series 2019-C54, Class A2, 3.01%, 12/15/2052 | 35,000 | 33,715 |
WFRBS Commercial Mortgage Trust | ||
Series 2012-C10, Class A3, 2.88%, 12/15/2045 | 8,965 | 8,934 |
Series 2012-C10, Class B, 3.74%, 12/15/2045 ‡ | 15,000 | 14,720 |
Series 2014-C20, Class A5, 4.00%, 5/15/2047 | 12,000 | 11,872 |
Total Commercial Mortgage-Backed Securities (Cost $878,853) | 836,475 | |
U.S. Government Agency Securities — 2.0% | ||
FFCB Funding Corp. | ||
0.13%, 11/23/2022 | 18,000 | 17,878 |
0.13%, 5/10/2023 | 105,000 | 102,538 |
2.51%, 4/1/2025 | 4,000 | 3,888 |
1.00%, 10/7/2026 | 46,000 | 41,063 |
0.79%, 6/21/2027 | 2,000 | 1,739 |
FHLB | ||
0.75%, 11/22/2023 | 85,000 | 81,964 |
2.75%, 12/13/2024 | 25,000 | 24,516 |
0.50%, 4/14/2025 | 85,000 | 78,588 |
0.75%, 2/24/2026 | 70,000 | 63,262 |
1.25%, 12/21/2026 | 60,000 | 54,789 |
0.90%, 2/26/2027 | 15,000 | 13,280 |
FHLMC | ||
0.38%, 5/5/2023 | 129,000 | 126,309 |
0.25%, 8/24/2023 | 8,000 | 7,742 |
FNMA | ||
0.25%, 11/27/2023 | 82,000 | 78,824 |
0.63%, 4/22/2025 | 5,000 | 4,631 |
0.88%, 12/18/2026 | 10,000 | 8,844 |
August 31, 2022 | J.P. Morgan Exchange-Traded Funds | 43 |
AS OF August 31, 2022 (Unaudited) (continued)
INVESTMENTS | PRINCIPAL AMOUNT($) | VALUE($) |
U.S. Government Agency Securities — continued | ||
Israel Government AID Bond (Israel) | ||
5.50%, 9/18/2023 | 45,000 | 45,860 |
5.50%, 4/26/2024 | 15,000 | 15,416 |
Total U.S. Government Agency Securities (Cost $797,274) | 771,131 | |
Foreign Government Securities — 1.6% | ||
Canada Government Bond 0.75%, 5/19/2026 | 130,000 | 117,437 |
Export Development Canada | ||
2.63%, 2/21/2024 | 40,000 | 39,449 |
3.00%, 5/25/2027 | 15,000 | 14,664 |
Hungary Government Bond 5.75%, 11/22/2023 | 1,000 | 1,015 |
Italian Republic Government Bond 6.88%, 9/27/2023 | 39,000 | 39,812 |
Oriental Republic of Uruguay, 4.50%, 8/14/2024 | 16,333 | 16,541 |
Province of Alberta 1.00%, 5/20/2025 | 13,000 | 12,098 |
Province of British Columbia | ||
2.25%, 6/2/2026 | 9,000 | 8,530 |
0.90%, 7/20/2026 | 44,000 | 39,613 |
Province of Manitoba, 2.13%, 6/22/2026 | 3,000 | 2,819 |
Province of Ontario | ||
3.20%, 5/16/2024 | 10,000 | 9,921 |
0.63%, 1/21/2026 | 82,000 | 73,800 |
1.05%, 4/14/2026 | 8,000 | 7,266 |
Province of Quebec 1.50%, 2/11/2025 | 10,000 | 9,508 |
Republic of Peru 2.39%, 1/23/2026 | 15,000 | 14,037 |
Republic of Philippines, 10.63%, 3/16/2025 | 2,000 | 2,332 |
Republic of Poland 4.00%, 1/22/2024 | 12,000 | 11,990 |
Svensk Exportkredit AB 0.38%, 7/30/2024 | 200,000 | 187,980 |
Total Foreign Government Securities (Cost $642,667) | 608,812 | |
Asset-Backed Securities — 0.8% | ||
American Express Credit Account Master Trust Series 2017-7, Class A, 2.35%, 5/15/2025 | 30,000 | 29,968 |
AmeriCredit Automobile Receivables Trust Series 2020-3, Class B, 0.76%, 12/18/2025 | 30,000 | 28,948 |
Capital One Multi-Asset Execution Trust Series 2022-A2, Class A, 3.49%, 5/15/2027 | 30,000 | 29,694 |
CarMax Auto Owner Trust Series 2021-1, Class A3, 0.34%, 12/15/2025 | 23,448 | 22,836 |
Citibank Credit Card Issuance Trust Series 2018-A3, Class A3, 3.29%, 5/23/2025 | 33,000 | 32,878 |
INVESTMENTS | PRINCIPAL AMOUNT($) | VALUE($) |
Drive Auto Receivables Trust Series 2021-2, Class B, 0.58%, 12/15/2025 | 40,000 | 39,353 |
Exeter Automobile Receivables Trust Series 2021-3A, Class C, 0.96%, 10/15/2026 | 40,000 | 38,168 |
Ford Credit Floorplan Master Owner Trust A | ||
Series 2018-2, Class A, 3.17%, 3/15/2025 | 15,000 | 14,944 |
Series 2019-2, Class A, 3.06%, 4/15/2026 | 8,000 | 7,859 |
GM Financial Consumer Automobile Receivables Trust Series 2020-2, Class A4, 1.74%, 8/18/2025 | 22,000 | 21,421 |
Verizon Owner Trust Series 2020-A, Class A1A, 1.85%, 7/22/2024 | 8,071 | 8,034 |
World Omni Auto Receivables Trust Series 2021-C, Class A3, 0.44%, 8/17/2026 | 30,000 | 28,770 |
Total Asset-Backed Securities (Cost $308,609) | 302,873 | |
Municipal Bonds — 0.1% (g) | ||
California — 0.0% ^ | ||
University of California, Taxable Series 2020BG, Rev., 0.88%, 5/15/2025 | 5,000 | 4,618 |
University of California, Taxable Fixed Rate Notes Series 2017AX, Rev., 3.06%, 7/1/2025 | 5,000 | 4,911 |
Total California | 9,529 | |
Florida — 0.1% | ||
State Board of Administration Finance Corp. Series 2020A, Rev., 1.71%, 7/1/2027 | 50,000 | 44,717 |
New Jersey — 0.0% ^ | ||
New Jersey Economic Development Authority Series 1997B, Rev., AGM, Zero Coupon, 2/15/2023 | 1,000 | 982 |
Total Municipal Bonds (Cost $57,402) | 55,228 | |
44 | J.P. Morgan Exchange-Traded Funds | August 31, 2022 |
INVESTMENTS | SHARES | VALUE($) |
Short-Term Investments — 2.9% | ||
Investment Companies — 2.9% | ||
JPMorgan U.S. Government Money Market Fund Class IM Shares, 2.00% (h) (i) (Cost $1,095,512) | 1,095,512 | 1,095,512 |
Total Investments — 101.9% (Cost $40,925,627) | 38,931,190 | |
Liabilities in Excess of Other Assets — (1.9)% | (738,495) | |
NET ASSETS — 100.0% | 38,192,695 | |
Percentages indicated are based on net assets. |
Abbreviations | |
ACES | Alternative Credit Enhancement Securities |
AGM | Insured by Assured Guaranty Municipal Corp. |
CME | Chicago Mercantile Exchange |
FFCB | Federal Farm Credit Bank |
FHLB | Federal Home Loan Bank |
FHLMC | Federal Home Loan Mortgage Corp. |
FNMA | Federal National Mortgage Association |
GNMA | Government National Mortgage Association |
ICE | Intercontinental Exchange |
LIBOR | London Interbank Offered Rate |
Rev. | Revenue |
SOFR | Secured Overnight Financing Rate |
TBA | To Be Announced; Security is subject to delayed delivery. |
UMBS | Uniform Mortgage-Backed Securities |
USD | United States Dollar |
^ | Amount rounds to less than 0.1% of net assets. | |
‡ | Value determined using significant unobservable inputs. | |
(a) | Variable or floating rate security, linked to the referenced benchmark. The interest rate shown is the current rate as of August 31, 2022. | |
(b) | Securities exempt from registration under Rule 144A or section 4(a)(2), of the Securities Act of 1933, as amended. | |
(c) | Step bond. Interest rate is a fixed rate for an initial period that either resets at a specific date or may reset in the future contingent upon a predetermined trigger. The interest rate shown is the current rate as of August 31, 2022. | |
(d) | Security exempt from registration pursuant to Regulation S under the Securities Act of 1933, as amended. Regulation S applies to securities offerings that are made outside of the United States and do not involve direct selling efforts in the United States and as such may have restrictions on resale. | |
(e) | All or a portion of the security is a when-issued security, delayed delivery security, or forward commitment. | |
(f) | Variable or floating rate security, the interest rate of which adjusts periodically based on changes in current interest rates and prepayments on the underlying pool of assets. The interest rate shown is the current rate as of August 31, 2022. | |
(g) | The date shown represents the earliest of the prerefunded date, next put date or final maturity date. | |
(h) | Investment in an affiliated fund, which is registered under the Investment Company Act of 1940, as amended, and is advised by J.P. Morgan Investment Management Inc. | |
(i) | The rate shown is the current yield as of August 31, 2022. |
August 31, 2022 | J.P. Morgan Exchange-Traded Funds | 45 |
AS OF August 31, 2022 (Unaudited)
INVESTMENTS | PRINCIPAL AMOUNT($) | VALUE($) |
Corporate Bonds — 29.7% | ||
Aerospace & Defense — 0.6% | ||
Boeing Co. (The) | ||
1.17%, 2/4/2023 | 20,000 | 19,790 |
1.95%, 2/1/2024 | 18,000 | 17,416 |
1.43%, 2/4/2024 | 35,000 | 33,553 |
2.75%, 2/1/2026 | 14,000 | 13,098 |
2.20%, 2/4/2026 | 95,000 | 86,932 |
3.10%, 5/1/2026 | 35,000 | 33,046 |
2.70%, 2/1/2027 | 65,000 | 58,905 |
5.93%, 5/1/2060 | 40,000 | 38,199 |
Bombardier, Inc. (Canada) 6.00%, 2/15/2028 (a) | 85,000 | 75,145 |
BWX Technologies, Inc. 4.13%, 4/15/2029 (a) | 130,000 | 116,025 |
Howmet Aerospace, Inc. | ||
5.13%, 10/1/2024 | 142,000 | 141,135 |
5.95%, 2/1/2037 | 14,000 | 13,576 |
Lockheed Martin Corp. 4.50%, 5/15/2036 | 125,000 | 124,090 |
Precision Castparts Corp. 4.38%, 6/15/2045 | 54,000 | 49,784 |
Raytheon Technologies Corp. | ||
4.13%, 11/16/2028 | 735,000 | 719,756 |
2.38%, 3/15/2032 | 95,000 | 79,775 |
3.13%, 7/1/2050 | 125,000 | 93,061 |
3.03%, 3/15/2052 | 350,000 | 254,776 |
Spirit AeroSystems, Inc. 7.50%, 4/15/2025 (a) | 105,000 | 102,681 |
TransDigm, Inc. 6.25%, 3/15/2026 (a) | 190,000 | 186,675 |
Triumph Group, Inc. | ||
6.25%, 9/15/2024 (a) | 10,000 | 9,200 |
7.75%, 8/15/2025 | 16,000 | 13,475 |
Wesco Aircraft Holdings, Inc. 9.00%, 11/15/2026 (a) | 20,000 | 12,000 |
2,292,093 | ||
Airlines — 0.2% | ||
American Airlines, Inc. | ||
5.50%, 4/20/2026 (a) | 240,000 | 228,307 |
5.75%, 4/20/2029 (a) | 215,000 | 194,089 |
Continental Airlines Pass-Through Trust Series 2012-2, Class A Shares, 4.00%, 10/29/2024 | 29,390 | 27,964 |
Delta Air Lines, Inc. 7.38%, 1/15/2026 | 105,000 | 107,100 |
Mileage Plus Holdings LLC 6.50%, 6/20/2027 (a) | 190,000 | 190,475 |
INVESTMENTS | PRINCIPAL AMOUNT($) | VALUE($) |
Airlines — continued | ||
United Airlines Holdings, Inc. | ||
5.00%, 2/1/2024 | 20,000 | 19,442 |
4.88%, 1/15/2025 | 16,000 | 15,130 |
782,507 | ||
Auto Components — 0.3% | ||
Adient Global Holdings Ltd. 4.88%, 8/15/2026 (a) | 200,000 | 185,088 |
Allison Transmission, Inc. | ||
5.88%, 6/1/2029 (a) | 65,000 | 61,105 |
3.75%, 1/30/2031 (a) | 75,000 | 60,775 |
American Axle & Manufacturing, Inc. | ||
6.88%, 7/1/2028 | 120,000 | 113,951 |
5.00%, 10/1/2029 | 75,000 | 63,156 |
Aptiv plc 5.40%, 3/15/2049 | 25,000 | 22,029 |
Clarios Global LP 6.25%, 5/15/2026 (a) | 67,000 | 66,256 |
Cooper-Standard Automotive, Inc. | ||
13.00%, 6/1/2024 (a) | 5,000 | 5,227 |
5.63%, 11/15/2026 (a) | 30,000 | 14,646 |
Dana, Inc. | ||
5.38%, 11/15/2027 | 130,000 | 115,905 |
4.50%, 2/15/2032 | 40,000 | 31,934 |
Goodyear Tire & Rubber Co. (The) | ||
5.00%, 5/31/2026 | 19,000 | 18,334 |
5.00%, 7/15/2029 | 130,000 | 116,538 |
5.25%, 7/15/2031 | 225,000 | 193,914 |
Icahn Enterprises LP | ||
6.38%, 12/15/2025 | 22,000 | 21,468 |
5.25%, 5/15/2027 | 125,000 | 113,719 |
Lear Corp. 2.60%, 1/15/2032 | 10,000 | 7,710 |
1,211,755 | ||
Automobiles — 0.2% | ||
Ford Motor Co. 9.63%, 4/22/2030 | 120,000 | 140,343 |
General Motors Co. | ||
6.13%, 10/1/2025 | 50,000 | 51,463 |
5.15%, 4/1/2038 | 35,000 | 30,766 |
5.95%, 4/1/2049 | 25,000 | 23,213 |
Hyundai Capital America | ||
0.80%, 1/8/2024 (a) | 70,000 | 66,511 |
1.50%, 6/15/2026 (a) | 40,000 | 35,003 |
3.00%, 2/10/2027 (a) | 200,000 | 182,619 |
Nissan Motor Co. Ltd. (Japan) 4.35%, 9/17/2027 (a) | 200,000 | 185,170 |
715,088 | ||
46 | J.P. Morgan Exchange-Traded Funds | August 31, 2022 |
INVESTMENTS | PRINCIPAL AMOUNT($) | VALUE($) |
Corporate Bonds — continued | ||
Banks — 5.5% | ||
ABN AMRO Bank NV (Netherlands) | ||
(US Treasury Yield Curve Rate T Note Constant Maturity 1 Year + 1.10%), 2.47%, 12/13/2029 (a) (b) | 200,000 | 167,178 |
(US Treasury Yield Curve Rate T Note Constant Maturity 5 Year + 1.90%), 3.32%, 3/13/2037 (a) (b) | 200,000 | 155,502 |
AIB Group plc (Ireland) 4.75%, 10/12/2023 (a) | 200,000 | 198,336 |
ASB Bank Ltd. (New Zealand) 2.38%, 10/22/2031 (a) | 200,000 | 164,266 |
Banco Bilbao Vizcaya Argentaria SA (Spain) 0.88%, 9/18/2023 | 200,000 | 193,134 |
Banco Santander SA (Spain) | ||
5.29%, 8/18/2027 | 400,000 | 391,478 |
(US Treasury Yield Curve Rate T Note Constant Maturity 1 Year + 1.60%), 3.22%, 11/22/2032 (b) | 200,000 | 152,885 |
Bank of America Corp. | ||
(SOFR + 0.41%), 0.52%, 6/14/2024 (b) | 400,000 | 387,589 |
3.88%, 8/1/2025 | 203,000 | 201,701 |
(SOFR + 1.01%), 1.20%, 10/24/2026 (b) | 500,000 | 447,032 |
(ICE LIBOR USD 3 Month + 1.06%), 3.56%, 4/23/2027 (b) | 40,000 | 38,184 |
(ICE LIBOR USD 3 Month + 1.58%), 3.82%, 1/20/2028 (b) | 236,000 | 225,907 |
(ICE LIBOR USD 3 Month + 1.51%), 3.71%, 4/24/2028 (b) | 475,000 | 451,207 |
(ICE LIBOR USD 3 Month + 1.37%), 3.59%, 7/21/2028 (b) | 261,000 | 245,689 |
(SOFR + 2.04%), 4.95%, 7/22/2028 (b) | 390,000 | 389,644 |
(ICE LIBOR USD 3 Month + 1.04%), 3.42%, 12/20/2028 (b) | 454,000 | 420,522 |
(SOFR + 1.06%), 2.09%, 6/14/2029 (b) | 135,000 | 114,773 |
(SOFR + 1.53%), 1.90%, 7/23/2031 (b) | 510,000 | 401,680 |
(SOFR + 1.37%), 1.92%, 10/24/2031 (b) | 50,000 | 39,555 |
Series N, (SOFR + 1.22%), 2.65%, 3/11/2032 (b) | 480,000 | 397,960 |
(SOFR + 1.32%), 2.69%, 4/22/2032 (b) | 340,000 | 281,859 |
(SOFR + 1.22%), 2.30%, 7/21/2032 (b) | 550,000 | 439,038 |
INVESTMENTS | PRINCIPAL AMOUNT($) | VALUE($) |
Banks — continued | ||
(SOFR + 1.21%), 2.57%, 10/20/2032 (b) | 655,000 | 535,375 |
(SOFR + 2.16%), 5.02%, 7/22/2033 (b) | 225,000 | 222,900 |
(ICE LIBOR USD 3 Month + 1.32%), 4.08%, 4/23/2040 (b) | 112,000 | 97,712 |
(SOFR + 1.93%), 2.68%, 6/19/2041 (b) | 150,000 | 107,405 |
Bank of Montreal (Canada) 1.50%, 1/10/2025 | 220,000 | 207,015 |
Bank of New Zealand (New Zealand) 3.50%, 2/20/2024 (a) | 250,000 | 247,472 |
Bank of Nova Scotia (The) (Canada) | ||
(ICE LIBOR USD 3 Month + 2.65%), 4.65%, 10/12/2022 (b) (c) (d) | 50,000 | 44,250 |
2.20%, 2/3/2025 | 12,000 | 11,439 |
3.45%, 4/11/2025 | 150,000 | 146,650 |
Banque Federative du Credit Mutuel SA (France) | ||
3.75%, 7/20/2023 (a) | 250,000 | 249,611 |
4.52%, 7/13/2025 (a) | 320,000 | 318,466 |
Barclays plc (United Kingdom) | ||
5.20%, 5/12/2026 | 200,000 | 198,471 |
(US Treasury Yield Curve Rate T Note Constant Maturity 1 Year + 1.05%), 2.28%, 11/24/2027 (b) | 200,000 | 175,649 |
BNP Paribas SA (France) (SOFR + 1.61%), 1.90%, 9/30/2028 (a) (b) | 200,000 | 168,357 |
Canadian Imperial Bank of Commerce (Canada) | ||
3.10%, 4/2/2024 | 34,000 | 33,509 |
3.30%, 4/7/2025 | 105,000 | 102,285 |
Citigroup, Inc. | ||
(SOFR + 1.37%), 4.14%, 5/24/2025 (b) | 81,000 | 80,452 |
(SOFR + 0.69%), 2.01%, 1/25/2026 (b) | 444,000 | 417,188 |
(ICE LIBOR USD 3 Month + 1.56%), 3.89%, 1/10/2028 (b) | 350,000 | 335,102 |
Series VAR, (SOFR + 1.28%), 3.07%, 2/24/2028 (b) | 285,000 | 263,512 |
(SOFR + 1.89%), 4.66%, 5/24/2028 (b) | 60,000 | 59,157 |
(ICE LIBOR USD 3 Month + 1.39%), 3.67%, 7/24/2028 (b) | 300,000 | 282,541 |
(ICE LIBOR USD 3 Month + 1.19%), 4.07%, 4/23/2029 (b) | 345,000 | 328,152 |
August 31, 2022 | J.P. Morgan Exchange-Traded Funds | 47 |
AS OF August 31, 2022 (Unaudited) (continued)
INVESTMENTS | PRINCIPAL AMOUNT($) | VALUE($) |
Corporate Bonds — continued | ||
Banks — continued | ||
(SOFR + 1.42%), 2.98%, 11/5/2030 (b) | 25,000 | 21,787 |
(SOFR + 3.91%), 4.41%, 3/31/2031 (b) | 155,000 | 147,909 |
(SOFR + 2.11%), 2.57%, 6/3/2031 (b) | 120,000 | 100,263 |
(SOFR + 1.17%), 2.56%, 5/1/2032 (b) | 260,000 | 212,652 |
(SOFR + 1.18%), 2.52%, 11/3/2032 (b) | 365,000 | 294,997 |
(SOFR + 1.38%), 2.90%, 11/3/2042 (b) | 55,000 | 40,200 |
Citizens Financial Group, Inc. 2.50%, 2/6/2030 | 11,000 | 9,253 |
Cooperatieve Rabobank UA (Netherlands) (US Treasury Yield Curve Rate T Note Constant Maturity 1 Year + 1.22%), 3.65%, 4/6/2028 (a) (b) | 360,000 | 338,431 |
Credit Agricole SA (France) | ||
(SOFR + 1.68%), 1.91%, 6/16/2026 (a) (b) | 250,000 | 229,443 |
(SOFR + 0.89%), 1.25%, 1/26/2027 (a) (b) | 250,000 | 219,671 |
(USD Swap Semi 5 Year + 1.64%), 4.00%, 1/10/2033 (a) (b) | 250,000 | 225,515 |
Danske Bank A/S (Denmark) (US Treasury Yield Curve Rate T Note Constant Maturity 1 Year + 1.45%), 3.77%, 3/28/2025 (a) (b) | 200,000 | 195,012 |
Fifth Third Bancorp 3.65%, 1/25/2024 | 70,000 | 69,551 |
HSBC Holdings plc (United Kingdom) | ||
(SOFR + 1.43%), 3.00%, 3/10/2026 (b) | 290,000 | 274,760 |
(SOFR + 1.29%), 1.59%, 5/24/2027 (b) | 200,000 | 174,208 |
(SOFR + 2.61%), 5.21%, 8/11/2028 (b) | 305,000 | 297,696 |
(SOFR + 1.73%), 2.01%, 9/22/2028 (b) | 450,000 | 380,456 |
(SOFR + 1.29%), 2.21%, 8/17/2029 (b) | 200,000 | 165,520 |
7.63%, 5/17/2032 | 143,000 | 162,779 |
(SOFR + 1.41%), 2.87%, 11/22/2032 (b) | 250,000 | 198,662 |
(SOFR + 2.87%), 5.40%, 8/11/2033 (b) | 200,000 | 190,295 |
6.10%, 1/14/2042 | 230,000 | 248,943 |
INVESTMENTS | PRINCIPAL AMOUNT($) | VALUE($) |
Banks — continued | ||
ING Groep NV (Netherlands) | ||
(US Treasury Yield Curve Rate T Note Constant Maturity 1 Year + 1.10%), 1.40%, 7/1/2026 (a) (b) | 200,000 | 180,796 |
(US Treasury Yield Curve Rate T Note Constant Maturity 5 Year + 2.86%), 3.88%, 5/16/2027 (b) (c) (d) | 200,000 | 148,026 |
Intesa Sanpaolo SpA (Italy) (US Treasury Yield Curve Rate T Note Constant Maturity 1 Year + 2.75%), 4.95%, 6/1/2042 (a) (b) | 200,000 | 130,483 |
KeyCorp 2.25%, 4/6/2027 | 57,000 | 51,226 |
Lloyds Banking Group plc (United Kingdom) (US Treasury Yield Curve Rate T Note Constant Maturity 1 Year + 1.60%), 3.51%, 3/18/2026 (b) | 200,000 | 192,646 |
Mitsubishi UFJ Financial Group, Inc. (Japan) | ||
3.76%, 7/26/2023 | 100,000 | 99,858 |
(US Treasury Yield Curve Rate T Note Constant Maturity 1 Year + 0.68%), 0.85%, 9/15/2024 (b) | 200,000 | 192,826 |
3.78%, 3/2/2025 | 269,000 | 266,023 |
Mizuho Financial Group, Inc. (Japan) (US Treasury Yield Curve Rate T Note Constant Maturity 1 Year + 0.87%), 2.17%, 5/22/2032 (b) | 225,000 | 176,905 |
National Australia Bank Ltd. (Australia) 3.38%, 1/14/2026 | 250,000 | 242,944 |
NatWest Group plc (United Kingdom) (ICE LIBOR USD 3 Month + 1.91%), 5.08%, 1/27/2030 (b) | 200,000 | 194,327 |
NatWest Markets plc (United Kingdom) 0.80%, 8/12/2024 (a) | 200,000 | 186,117 |
PNC Financial Services Group, Inc. (The) 2.55%, 1/22/2030 | 99,000 | 86,818 |
Royal Bank of Canada (Canada) | ||
4.65%, 1/27/2026 | 45,000 | 45,340 |
4.24%, 8/3/2027 | 425,000 | 419,420 |
Santander UK Group Holdings plc (United Kingdom) | ||
(SOFR + 0.99%), 1.67%, 6/14/2027 (b) | 200,000 | 172,987 |
(ICE LIBOR USD 3 Month + 1.40%), 3.82%, 11/3/2028 (b) | 200,000 | 182,343 |
Societe Generale SA (France) | ||
4.25%, 4/14/2025 (a) | 200,000 | 195,833 |
4.75%, 11/24/2025 (a) | 200,000 | 195,397 |
48 | J.P. Morgan Exchange-Traded Funds | August 31, 2022 |
INVESTMENTS | PRINCIPAL AMOUNT($) | VALUE($) |
Corporate Bonds — continued | ||
Banks — continued | ||
(US Treasury Yield Curve Rate T Note Constant Maturity 1 Year + 1.10%), 1.49%, 12/14/2026 (a) (b) | 200,000 | 174,293 |
(US Treasury Yield Curve Rate T Note Constant Maturity 1 Year + 1.00%), 1.79%, 6/9/2027 (a) (b) | 200,000 | 173,105 |
(US Treasury Yield Curve Rate T Note Constant Maturity 1 Year + 1.30%), 2.80%, 1/19/2028 (a) (b) | 200,000 | 176,220 |
Standard Chartered plc (United Kingdom) (US Treasury Yield Curve Rate T Note Constant Maturity 1 Year + 0.78%), 0.99%, 1/12/2025 (a) (b) | 200,000 | 189,020 |
Sumitomo Mitsui Financial Group, Inc. (Japan) 3.75%, 7/19/2023 | 53,000 | 52,944 |
Sumitomo Mitsui Trust Bank Ltd. (Japan) 1.05%, 9/12/2025 (a) | 60,000 | 54,117 |
Toronto-Dominion Bank (The) (Canada) | ||
3.25%, 3/11/2024 | 33,000 | 32,606 |
2.65%, 6/12/2024 | 81,000 | 79,109 |
2.00%, 9/10/2031 | 235,000 | 190,145 |
Truist Bank 4.05%, 11/3/2025 | 60,000 | 59,953 |
UniCredit SpA (Italy) (US Treasury Yield Curve Rate T Note Constant Maturity 1 Year + 1.20%), 1.98%, 6/3/2027 (a) (b) | 200,000 | 169,227 |
US Bancorp 3.00%, 7/30/2029 | 97,000 | 87,514 |
Wells Fargo & Co. | ||
3.55%, 9/29/2025 | 77,000 | 75,672 |
(ICE LIBOR USD 3 Month + 0.75%), 2.16%, 2/11/2026 (b) | 363,000 | 341,539 |
(SOFR + 1.32%), 3.91%, 4/25/2026 (b) | 90,000 | 88,183 |
3.00%, 10/23/2026 | 360,000 | 340,139 |
(SOFR + 1.51%), 3.53%, 3/24/2028 (b) | 325,000 | 307,020 |
(ICE LIBOR USD 3 Month + 1.31%), 3.58%, 5/22/2028 (b) | 1,101,000 | 1,038,879 |
(SOFR + 1.98%), 4.81%, 7/25/2028 (b) | 320,000 | 317,651 |
(SOFR + 1.26%), 2.57%, 2/11/2031 (b) | 250,000 | 211,745 |
(SOFR + 2.10%), 4.90%, 7/25/2033 (b) | 180,000 | 177,113 |
4.90%, 11/17/2045 | 25,000 | 23,097 |
Westpac Banking Corp. (Australia) | ||
2.85%, 5/13/2026 | 25,000 | 23,930 |
INVESTMENTS | PRINCIPAL AMOUNT($) | VALUE($) |
Banks — continued | ||
1.95%, 11/20/2028 | 30,000 | 26,103 |
(USD ICE Swap Rate 5 Year + 2.24%), 4.32%, 11/23/2031 (b) | 275,000 | 261,740 |
22,767,171 | ||
Beverages — 0.3% | ||
Anheuser-Busch Cos. LLC (Belgium) | ||
4.70%, 2/1/2036 | 540,000 | 522,443 |
4.90%, 2/1/2046 | 65,000 | 61,708 |
Anheuser-Busch InBev Worldwide, Inc. (Belgium) | ||
4.38%, 4/15/2038 | 95,000 | 87,730 |
4.44%, 10/6/2048 | 40,000 | 35,557 |
4.60%, 6/1/2060 | 90,000 | 79,836 |
Coca-Cola Co. (The) 2.60%, 6/1/2050 | 50,000 | 36,396 |
Coca-Cola Femsa SAB de CV (Mexico) 2.75%, 1/22/2030 | 150,000 | 133,676 |
Constellation Brands, Inc. 4.65%, 11/15/2028 | 95,000 | 94,233 |
Diageo Capital plc (United Kingdom) 3.88%, 4/29/2043 | 30,000 | 26,496 |
Fomento Economico Mexicano SAB de CV (Mexico) 3.50%, 1/16/2050 | 150,000 | 116,717 |
Keurig Dr Pepper, Inc. 3.40%, 11/15/2025 | 38,000 | 37,192 |
Keurig Dr. Pepper, Inc. 4.05%, 4/15/2032 | 135,000 | 125,944 |
1,357,928 | ||
Biotechnology — 0.5% | ||
AbbVie, Inc. | ||
2.95%, 11/21/2026 | 73,000 | 68,861 |
3.20%, 11/21/2029 | 271,000 | 247,522 |
4.05%, 11/21/2039 | 444,000 | 391,379 |
4.63%, 10/1/2042 | 75,000 | 68,853 |
Amgen, Inc. | ||
1.65%, 8/15/2028 | 15,000 | 12,938 |
3.35%, 2/22/2032 | 610,000 | 551,529 |
3.15%, 2/21/2040 | 27,000 | 21,340 |
Biogen, Inc. 2.25%, 5/1/2030 | 65,000 | 53,097 |
Emergent BioSolutions, Inc. 3.88%, 8/15/2028 (a) | 100,000 | 70,000 |
Gilead Sciences, Inc. | ||
2.95%, 3/1/2027 | 195,000 | 184,709 |
1.65%, 10/1/2030 | 118,000 | 95,891 |
2.60%, 10/1/2040 | 220,000 | 159,823 |
August 31, 2022 | J.P. Morgan Exchange-Traded Funds | 49 |
AS OF August 31, 2022 (Unaudited) (continued)
INVESTMENTS | PRINCIPAL AMOUNT($) | VALUE($) |
Corporate Bonds — continued | ||
Biotechnology — continued | ||
Grifols Escrow Issuer SA (Spain) 4.75%, 10/15/2028 (a) | 200,000 | 166,711 |
Regeneron Pharmaceuticals, Inc. 1.75%, 9/15/2030 | 80,000 | 63,264 |
2,155,917 | ||
Building Products — 0.2% | ||
Builders FirstSource, Inc. 4.25%, 2/1/2032 (a) | 210,000 | 167,629 |
Griffon Corp. 5.75%, 3/1/2028 | 140,000 | 129,500 |
James Hardie International Finance DAC 5.00%, 1/15/2028 (a) | 200,000 | 183,997 |
Masco Corp. 1.50%, 2/15/2028 | 25,000 | 21,049 |
PGT Innovations, Inc. 4.38%, 10/1/2029 (a) | 70,000 | 59,209 |
Standard Industries, Inc. | ||
5.00%, 2/15/2027 (a) | 20,000 | 18,291 |
4.75%, 1/15/2028 (a) | 260,000 | 227,276 |
Summit Materials LLC 5.25%, 1/15/2029 (a) | 65,000 | 58,467 |
865,418 | ||
Capital Markets — 2.3% | ||
Ameriprise Financial, Inc. 4.00%, 10/15/2023 | 47,000 | 47,036 |
Bank of New York Mellon Corp. (The) | ||
2.10%, 10/24/2024 | 30,000 | 29,060 |
3.25%, 5/16/2027 | 160,000 | 154,666 |
Charles Schwab Corp. (The) | ||
0.90%, 3/11/2026 | 30,000 | 26,988 |
2.75%, 10/1/2029 | 46,000 | 41,395 |
Credit Suisse AG (Switzerland) 3.70%, 2/21/2025 | 310,000 | 299,806 |
Credit Suisse Group AG (Switzerland) | ||
(SOFR + 0.98%), 1.31%, 2/2/2027 (a) (b) | 250,000 | 210,364 |
(SOFR + 1.73%), 3.09%, 5/14/2032 (a) (b) | 250,000 | 188,951 |
Credit Suisse USA, Inc. (Switzerland) 7.13%, 7/15/2032 | 53,000 | 57,984 |
Deutsche Bank AG (Germany) (SOFR + 2.16%), 2.22%, 9/18/2024 (b) | 150,000 | 144,665 |
Goldman Sachs Group, Inc. (The) | ||
3.50%, 4/1/2025 | 280,000 | 273,779 |
(ICE LIBOR USD 3 Month + 1.20%), 3.27%, 9/29/2025 (b) | 201,000 | 195,771 |
3.50%, 11/16/2026 | 371,000 | 356,388 |
3.85%, 1/26/2027 | 135,000 | 130,793 |
INVESTMENTS | PRINCIPAL AMOUNT($) | VALUE($) |
Capital Markets — continued | ||
(SOFR + 0.80%), 1.43%, 3/9/2027 (b) | 1,085,000 | 965,297 |
(SOFR + 1.51%), 4.39%, 6/15/2027 (b) | 117,000 | 114,828 |
(SOFR + 1.11%), 2.64%, 2/24/2028 (b) | 150,000 | 136,026 |
(SOFR + 1.28%), 2.62%, 4/22/2032 (b) | 785,000 | 648,631 |
(SOFR + 1.25%), 2.38%, 7/21/2032 (b) | 170,000 | 137,611 |
(SOFR + 1.26%), 2.65%, 10/21/2032 (b) | 25,000 | 20,527 |
(SOFR + 1.41%), 3.10%, 2/24/2033 (b) | 190,000 | 161,641 |
(SOFR + 1.51%), 3.21%, 4/22/2042 (b) | 60,000 | 45,976 |
(SOFR + 1.63%), 3.44%, 2/24/2043 (b) | 18,000 | 14,183 |
LPL Holdings, Inc. 4.00%, 3/15/2029 (a) | 120,000 | 106,250 |
Morgan Stanley | ||
(SOFR + 1.16%), 3.62%, 4/17/2025 (b) | 90,000 | 88,675 |
3.88%, 1/27/2026 | 330,000 | 326,285 |
3.13%, 7/27/2026 | 130,000 | 123,853 |
3.63%, 1/20/2027 | 191,000 | 185,567 |
(SOFR + 0.88%), 1.59%, 5/4/2027 (b) | 210,000 | 187,180 |
(SOFR + 1.00%), 2.48%, 1/21/2028 (b) | 614,000 | 557,728 |
(SOFR + 1.61%), 4.21%, 4/20/2028 (b) | 303,000 | 295,248 |
(ICE LIBOR USD 3 Month + 1.34%), 3.59%, 7/22/2028 (b) | 330,000 | 311,525 |
(ICE LIBOR USD 3 Month + 1.63%), 4.43%, 1/23/2030 (b) | 373,000 | 363,354 |
(SOFR + 1.14%), 2.70%, 1/22/2031 (b) | 70,000 | 60,565 |
(SOFR + 1.18%), 2.24%, 7/21/2032 (b) | 80,000 | 64,441 |
(SOFR + 1.20%), 2.51%, 10/20/2032 (b) | 68,000 | 55,685 |
(SOFR + 1.29%), 2.94%, 1/21/2033 (b) | 25,000 | 21,271 |
(SOFR + 1.49%), 3.22%, 4/22/2042 (b) | 135,000 | 105,319 |
MSCI, Inc. 4.00%, 11/15/2029 (a) | 115,000 | 102,363 |
Northern Trust Corp. 3.95%, 10/30/2025 | 60,000 | 59,771 |
Nuveen LLC 4.00%, 11/1/2028 (a) | 60,000 | 57,893 |
50 | J.P. Morgan Exchange-Traded Funds | August 31, 2022 |
INVESTMENTS | PRINCIPAL AMOUNT($) | VALUE($) |
Corporate Bonds — continued | ||
Capital Markets — continued | ||
S&P Global, Inc. | ||
2.70%, 3/1/2029 (a) | 106,000 | 96,452 |
2.90%, 3/1/2032 (a) | 112,000 | 99,333 |
3.25%, 12/1/2049 | 73,000 | 57,414 |
UBS Group AG (Switzerland) | ||
(US Treasury Yield Curve Rate T Note Constant Maturity 1 Year + 0.85%), 1.49%, 8/10/2027 (a) (b) | 585,000 | 508,082 |
(US Treasury Yield Curve Rate T Note Constant Maturity 1 Year + 1.75%), 4.75%, 5/12/2028 (a) (b) | 200,000 | 196,152 |
(ICE LIBOR USD 3 Month + 1.47%), 3.13%, 8/13/2030 (a) (b) | 200,000 | 174,751 |
(US Treasury Yield Curve Rate T Note Constant Maturity 1 Year + 1.10%), 2.75%, 2/11/2033 (a) (b) | 720,000 | 576,864 |
(US Treasury Yield Curve Rate T Note Constant Maturity 1 Year + 2.40%), 4.99%, 8/5/2033 (a) (b) | 200,000 | 192,762 |
(US Treasury Yield Curve Rate T Note Constant Maturity 1 Year + 1.10%), 3.18%, 2/11/2043 (a) (b) | 200,000 | 146,783 |
9,523,932 | ||
Chemicals — 0.5% | ||
Avient Corp. 7.13%, 8/1/2030 (a) | 110,000 | 108,616 |
Axalta Coating Systems LLC 4.75%, 6/15/2027 (a) | 150,000 | 138,937 |
CF Industries, Inc. | ||
5.15%, 3/15/2034 | 60,000 | 57,856 |
4.95%, 6/1/2043 | 70,000 | 62,221 |
Chemours Co. (The) 5.75%, 11/15/2028 (a) | 215,000 | 192,425 |
CVR Partners LP 6.13%, 6/15/2028 (a) | 70,000 | 63,912 |
Ecolab, Inc. | ||
3.25%, 12/1/2027 | 52,000 | 50,705 |
2.13%, 2/1/2032 | 75,000 | 63,219 |
Element Solutions, Inc. 3.88%, 9/1/2028 (a) | 105,000 | 91,219 |
INEOS Quattro Finance 2 plc (United Kingdom) 3.38%, 1/15/2026 (a) | 200,000 | 173,000 |
International Flavors & Fragrances, Inc. | ||
1.83%, 10/15/2027 (a) | 116,000 | 99,380 |
3.27%, 11/15/2040 (a) | 25,000 | 19,032 |
3.47%, 12/1/2050 (a) | 13,000 | 9,535 |
LYB International Finance III LLC 3.38%, 10/1/2040 | 40,000 | 30,494 |
INVESTMENTS | PRINCIPAL AMOUNT($) | VALUE($) |
Chemicals — continued | ||
NOVA Chemicals Corp. (Canada) 5.25%, 6/1/2027 (a) | 140,000 | 123,605 |
Nutrien Ltd. (Canada) 2.95%, 5/13/2030 | 80,000 | 70,874 |
Scotts Miracle-Gro Co. (The) 4.50%, 10/15/2029 | 375,000 | 300,435 |
Sherwin-Williams Co. (The) 4.50%, 6/1/2047 | 15,000 | 13,364 |
Trinseo Materials Operating SCA 5.38%, 9/1/2025 (a) | 145,000 | 124,973 |
WR Grace Holdings LLC 5.63%, 10/1/2024 (a) | 85,000 | 83,937 |
1,877,739 | ||
Commercial Services & Supplies — 0.4% | ||
ACCO Brands Corp. 4.25%, 3/15/2029 (a) | 165,000 | 137,546 |
ADT Security Corp. (The) | ||
4.13%, 6/15/2023 | 26,000 | 25,675 |
4.88%, 7/15/2032 (a) | 20,000 | 16,731 |
Allied Universal Holdco LLC 4.63%, 6/1/2028 (a) | 200,000 | 168,525 |
Aramark Services, Inc. 5.00%, 2/1/2028 (a) | 155,000 | 142,650 |
Garda World Security Corp. (Canada) 4.63%, 2/15/2027 (a) | 140,000 | 123,046 |
GFL Environmental, Inc. (Canada) | ||
3.75%, 8/1/2025 (a) | 105,000 | 99,198 |
5.13%, 12/15/2026 (a) | 55,000 | 53,153 |
4.00%, 8/1/2028 (a) | 65,000 | 54,925 |
Madison IAQ LLC 4.13%, 6/30/2028 (a) | 195,000 | 167,212 |
Nielsen Finance LLC 5.63%, 10/1/2028 (a) | 170,000 | 170,388 |
Prime Security Services Borrower LLC | ||
5.75%, 4/15/2026 (a) | 282,000 | 271,332 |
3.38%, 8/31/2027 (a) | 120,000 | 103,275 |
Stericycle, Inc. | ||
5.38%, 7/15/2024 (a) | 85,000 | 83,177 |
3.88%, 1/15/2029 (a) | 120,000 | 103,950 |
Waste Management, Inc. 1.50%, 3/15/2031 | 20,000 | 15,827 |
1,736,610 | ||
Communications Equipment — 0.1% | ||
CommScope Technologies LLC 6.00%, 6/15/2025 (a) | 105,000 | 95,419 |
CommScope, Inc. 6.00%, 3/1/2026 (a) | 172,000 | 162,557 |
Plantronics, Inc. 4.75%, 3/1/2029 (a) | 70,000 | 69,825 |
327,801 | ||
August 31, 2022 | J.P. Morgan Exchange-Traded Funds | 51 |
AS OF August 31, 2022 (Unaudited) (continued)
INVESTMENTS | PRINCIPAL AMOUNT($) | VALUE($) |
Corporate Bonds — continued | ||
Construction & Engineering — 0.1% | ||
Dycom Industries, Inc. 4.50%, 4/15/2029 (a) | 115,000 | 102,652 |
Global Infrastructure Solutions, Inc. 5.63%, 6/1/2029 (a) | 130,000 | 103,957 |
Weekley Homes LLC 4.88%, 9/15/2028 (a) | 95,000 | 78,751 |
285,360 | ||
Construction Materials — 0.0% ^ | ||
Martin Marietta Materials, Inc. 2.40%, 7/15/2031 | 70,000 | 57,655 |
Consumer Finance — 1.0% | ||
AerCap Ireland Capital DAC (Ireland) | ||
1.15%, 10/29/2023 | 150,000 | 143,480 |
2.45%, 10/29/2026 | 150,000 | 132,263 |
3.00%, 10/29/2028 | 450,000 | 382,554 |
American Express Co. 2.55%, 3/4/2027 | 340,000 | 315,730 |
Avolon Holdings Funding Ltd. (Ireland) | ||
5.13%, 10/1/2023 (a) | 170,000 | 168,075 |
5.25%, 5/15/2024 (a) | 250,000 | 245,104 |
2.88%, 2/15/2025 (a) | 28,000 | 25,675 |
5.50%, 1/15/2026 (a) | 60,000 | 57,854 |
2.13%, 2/21/2026 (a) | 275,000 | 237,028 |
4.25%, 4/15/2026 (a) | 25,000 | 23,041 |
Capital One Financial Corp. (SOFR + 1.27%), 2.62%, 11/2/2032 (b) | 100,000 | 79,699 |
Ford Motor Credit Co. LLC | ||
4.39%, 1/8/2026 | 200,000 | 188,296 |
4.27%, 1/9/2027 | 200,000 | 182,681 |
4.13%, 8/17/2027 | 300,000 | 270,219 |
4.00%, 11/13/2030 | 250,000 | 208,845 |
3.63%, 6/17/2031 | 200,000 | 161,946 |
General Motors Financial Co., Inc. | ||
3.80%, 4/7/2025 | 35,000 | 34,126 |
3.60%, 6/21/2030 | 60,000 | 51,920 |
2.70%, 6/10/2031 | 25,000 | 19,619 |
John Deere Capital Corp. 2.65%, 6/10/2026 | 119,000 | 114,177 |
Navient Corp. | ||
6.13%, 3/25/2024 | 130,000 | 126,835 |
5.88%, 10/25/2024 | 20,000 | 19,204 |
OneMain Finance Corp. | ||
7.13%, 3/15/2026 | 219,000 | 203,996 |
6.63%, 1/15/2028 | 95,000 | 86,855 |
INVESTMENTS | PRINCIPAL AMOUNT($) | VALUE($) |
Consumer Finance — continued | ||
Park Aerospace Holdings Ltd. (Ireland) | ||
4.50%, 3/15/2023 (a) | 305,000 | 303,234 |
5.50%, 2/15/2024 (a) | 208,000 | 205,392 |
3,987,848 | ||
Containers & Packaging — 0.3% | ||
Ardagh Packaging Finance plc 5.25%, 4/30/2025 (a) | 200,000 | 189,157 |
Ball Corp. 3.13%, 9/15/2031 | 55,000 | 44,546 |
Canpack SA (Poland) 3.88%, 11/15/2029 (a) | 200,000 | 163,187 |
Crown Americas LLC 4.25%, 9/30/2026 | 13,000 | 12,187 |
LABL, Inc. 6.75%, 7/15/2026 (a) | 155,000 | 147,250 |
Mauser Packaging Solutions Holding Co. 5.50%, 4/15/2024 (a) | 215,000 | 208,137 |
Owens-Brockway Glass Container, Inc. 6.63%, 5/13/2027 (a) | 80,000 | 74,254 |
Packaging Corp. of America 3.05%, 10/1/2051 | 85,000 | 60,014 |
Pactiv Evergreen Group Issuer, Inc. 4.00%, 10/15/2027 (a) | 215,000 | 187,663 |
Sealed Air Corp. 4.00%, 12/1/2027 (a) | 115,000 | 104,650 |
TriMas Corp. 4.13%, 4/15/2029 (a) | 90,000 | 78,975 |
WRKCo, Inc. 4.65%, 3/15/2026 | 30,000 | 30,113 |
1,300,133 | ||
Diversified Consumer Services — 0.0% ^ | ||
Service Corp. International 5.13%, 6/1/2029 | 105,000 | 99,478 |
University of Miami Series 2022, 4.06%, 4/1/2052 | 40,000 | 35,324 |
134,802 | ||
Diversified Financial Services — 0.2% | ||
EDP Finance BV (Portugal) 1.71%, 1/24/2028 (a) | 250,000 | 211,571 |
LSEGA Financing plc (United Kingdom) 2.00%, 4/6/2028 (a) | 200,000 | 175,117 |
Shell International Finance BV (Netherlands) | ||
2.88%, 11/26/2041 | 200,000 | 154,827 |
3.63%, 8/21/2042 | 50,000 | 42,636 |
3.75%, 9/12/2046 | 41,000 | 35,139 |
3.13%, 11/7/2049 | 25,000 | 19,436 |
3.00%, 11/26/2051 | 200,000 | 150,197 |
788,923 | ||
52 | J.P. Morgan Exchange-Traded Funds | August 31, 2022 |
INVESTMENTS | PRINCIPAL AMOUNT($) | VALUE($) |
Corporate Bonds — continued | ||
Diversified Telecommunication Services — 1.1% | ||
Altice France Holding SA (Luxembourg) 10.50%, 5/15/2027 (a) | 200,000 | 172,544 |
Altice France SA (France) 5.13%, 7/15/2029 (a) | 200,000 | 151,932 |
AT&T, Inc. | ||
1.65%, 2/1/2028 | 150,000 | 128,857 |
2.55%, 12/1/2033 | 570,000 | 454,157 |
3.50%, 6/1/2041 | 60,000 | 47,294 |
3.65%, 6/1/2051 | 65,000 | 49,737 |
CCO Holdings LLC | ||
5.00%, 2/1/2028 (a) | 395,000 | 360,959 |
5.38%, 6/1/2029 (a) | 100,000 | 91,360 |
4.75%, 3/1/2030 (a) | 784,000 | 673,875 |
4.50%, 8/15/2030 (a) | 199,000 | 167,354 |
4.50%, 5/1/2032 | 70,000 | 56,804 |
4.50%, 6/1/2033 (a) | 135,000 | 105,975 |
Embarq Corp. 8.00%, 6/1/2036 | 13,000 | 10,108 |
ESC Co., Intelsat Jackson Holdings, Ltd. 8.50%, 10/15/2024 ‡ (a) (e) | 28,000 | 3 |
Frontier Communications Holdings LLC 5.88%, 10/15/2027 (a) | 115,000 | 107,266 |
Intelsat Jackson Holdings SA (Luxembourg) 6.50%, 3/15/2030 (a) | 74,000 | 67,080 |
Level 3 Financing, Inc. | ||
5.38%, 5/1/2025 | 20,000 | 20,003 |
5.25%, 3/15/2026 | 54,000 | 54,918 |
Lumen Technologies, Inc. | ||
5.13%, 12/15/2026 (a) | 130,000 | 112,331 |
4.00%, 2/15/2027 (a) | 575,000 | 499,810 |
Series G, 6.88%, 1/15/2028 | 3,000 | 2,701 |
Sprint Capital Corp. 8.75%, 3/15/2032 | 240,000 | 289,733 |
Telecom Italia Capital SA (Italy) 6.00%, 9/30/2034 | 134,000 | 105,801 |
Verizon Communications, Inc. | ||
2.10%, 3/22/2028 | 25,000 | 22,094 |
4.33%, 9/21/2028 | 75,000 | 74,015 |
4.02%, 12/3/2029 | 184,000 | 176,537 |
2.55%, 3/21/2031 | 105,000 | 88,746 |
2.36%, 3/15/2032 | 13,000 | 10,665 |
2.65%, 11/20/2040 | 295,000 | 212,931 |
3.40%, 3/22/2041 | 30,000 | 24,167 |
3.85%, 11/1/2042 | 125,000 | 106,082 |
2.88%, 11/20/2050 | 75,000 | 51,647 |
INVESTMENTS | PRINCIPAL AMOUNT($) | VALUE($) |
Diversified Telecommunication Services — continued | ||
3.70%, 3/22/2061 | 30,000 | 23,128 |
Zayo Group Holdings, Inc. 4.00%, 3/1/2027 (a) | 75,000 | 63,938 |
4,584,552 | ||
Electric Utilities — 1.6% | ||
AEP Transmission Co. LLC Series N, 2.75%, 8/15/2051 | 50,000 | 34,953 |
Alabama Power Co. 3.05%, 3/15/2032 | 200,000 | 181,967 |
American Electric Power Co., Inc. 2.03%, 3/15/2024 | 40,000 | 38,743 |
Baltimore Gas and Electric Co. | ||
3.20%, 9/15/2049 | 80,000 | 61,837 |
2.90%, 6/15/2050 | 50,000 | 36,642 |
Connecticut Light and Power Co. (The) 4.00%, 4/1/2048 | 46,000 | 41,638 |
DTE Electric Co. Series A, 4.00%, 4/1/2043 | 90,000 | 79,944 |
Duke Energy Carolinas LLC 3.20%, 8/15/2049 | 34,000 | 26,495 |
Duke Energy Indiana LLC | ||
Series YYY, 3.25%, 10/1/2049 | 125,000 | 95,908 |
2.75%, 4/1/2050 | 165,000 | 115,139 |
Duke Energy Progress LLC 4.00%, 4/1/2052 | 40,000 | 35,372 |
Duquesne Light Holdings, Inc. 2.53%, 10/1/2030 (a) | 48,000 | 39,164 |
Emera US Finance LP (Canada) | ||
2.64%, 6/15/2031 | 660,000 | 544,920 |
4.75%, 6/15/2046 | 50,000 | 43,536 |
Enel Finance International NV (Italy) 2.25%, 7/12/2031 (a) | 200,000 | 151,041 |
Entergy Arkansas LLC | ||
4.00%, 6/1/2028 | 13,000 | 12,603 |
2.65%, 6/15/2051 | 14,000 | 9,552 |
Entergy Louisiana LLC | ||
2.40%, 10/1/2026 | 69,000 | 63,922 |
1.60%, 12/15/2030 | 10,000 | 7,987 |
Entergy Mississippi LLC 3.50%, 6/1/2051 | 20,000 | 15,994 |
Entergy Texas Restoration Funding II LLC Series A-2, 3.70%, 12/15/2035 | 215,000 | 200,707 |
Entergy Texas, Inc. 1.75%, 3/15/2031 | 535,000 | 429,102 |
Eversource Energy 4.60%, 7/1/2027 | 31,000 | 31,091 |
FirstEnergy Transmission LLC 4.55%, 4/1/2049 (a) | 90,000 | 78,420 |
Florida Power & Light Co. 3.70%, 12/1/2047 | 60,000 | 52,419 |
August 31, 2022 | J.P. Morgan Exchange-Traded Funds | 53 |
AS OF August 31, 2022 (Unaudited) (continued)
INVESTMENTS | PRINCIPAL AMOUNT($) | VALUE($) |
Corporate Bonds — continued | ||
Electric Utilities — continued | ||
Indiana Michigan Power Co. Series K, 4.55%, 3/15/2046 | 50,000 | 45,843 |
ITC Holdings Corp. 2.95%, 5/14/2030 (a) | 305,000 | 266,482 |
Kentucky Utilities Co. 5.13%, 11/1/2040 | 74,000 | 73,936 |
MidAmerican Energy Co. 3.65%, 4/15/2029 | 46,000 | 44,580 |
Mid-Atlantic Interstate Transmission LLC 4.10%, 5/15/2028 (a) | 200,000 | 193,051 |
Monongahela Power Co. 4.10%, 4/15/2024 (a) | 100,000 | 99,131 |
NextEra Energy Capital Holdings, Inc. 5.00%, 7/15/2032 | 60,000 | 61,081 |
Northern States Power Co. | ||
2.60%, 6/1/2051 | 70,000 | 49,499 |
4.50%, 6/1/2052 | 50,000 | 48,546 |
NRG Energy, Inc. | ||
6.63%, 1/15/2027 | 21,000 | 20,834 |
2.45%, 12/2/2027 (a) | 60,000 | 51,371 |
5.75%, 1/15/2028 | 65,000 | 61,270 |
3.38%, 2/15/2029 (a) | 70,000 | 57,504 |
5.25%, 6/15/2029 (a) | 160,000 | 143,008 |
Ohio Power Co. | ||
Series P, 2.60%, 4/1/2030 | 50,000 | 43,793 |
Series R, 2.90%, 10/1/2051 | 65,000 | 46,490 |
Oncor Electric Delivery Co. LLC 3.10%, 9/15/2049 | 50,000 | 38,667 |
Pacific Gas and Electric Co. | ||
1.70%, 11/15/2023 | 30,000 | 28,979 |
3.25%, 2/16/2024 | 75,000 | 73,360 |
3.45%, 7/1/2025 | 17,000 | 16,205 |
2.95%, 3/1/2026 | 10,000 | 9,089 |
4.65%, 8/1/2028 | 100,000 | 91,289 |
4.50%, 7/1/2040 | 130,000 | 101,194 |
4.20%, 6/1/2041 | 30,000 | 22,302 |
4.25%, 3/15/2046 | 78,000 | 57,219 |
PacifiCorp | ||
4.15%, 2/15/2050 | 118,000 | 105,711 |
3.30%, 3/15/2051 | 120,000 | 92,838 |
PG&E Corp. | ||
5.00%, 7/1/2028 | 106,000 | 94,124 |
5.25%, 7/1/2030 | 70,000 | 60,515 |
PG&E Wildfire Recovery Funding LLC | ||
Series A-2, 4.26%, 6/1/2036 | 25,000 | 24,208 |
Series A-4, 5.21%, 12/1/2047 | 40,000 | 41,629 |
Series A-5, 5.10%, 6/1/2052 | 70,000 | 72,256 |
INVESTMENTS | PRINCIPAL AMOUNT($) | VALUE($) |
Electric Utilities — continued | ||
Public Service Co. of Colorado Series 36, 2.70%, 1/15/2051 | 45,000 | 31,896 |
Public Service Electric and Gas Co. | ||
3.00%, 5/15/2027 | 50,000 | 47,963 |
2.05%, 8/1/2050 | 68,000 | 41,988 |
Southern California Edison Co. | ||
Series G, 2.50%, 6/1/2031 | 400,000 | 334,058 |
Series C, 3.60%, 2/1/2045 | 35,000 | 26,613 |
Series C, 4.13%, 3/1/2048 | 88,000 | 73,175 |
Series 20A, 2.95%, 2/1/2051 | 80,000 | 53,951 |
Southwestern Electric Power Co. | ||
Series N, 1.65%, 3/15/2026 | 45,000 | 40,798 |
3.25%, 11/1/2051 | 160,000 | 115,878 |
Southwestern Public Service Co. | ||
3.30%, 6/15/2024 | 29,000 | 28,620 |
4.50%, 8/15/2041 | 74,000 | 69,544 |
Tucson Electric Power Co. | ||
1.50%, 8/1/2030 | 448,000 | 356,563 |
4.85%, 12/1/2048 | 72,000 | 69,298 |
Union Electric Co. 3.90%, 4/1/2052 | 45,000 | 39,580 |
Vistra Operations Co. LLC | ||
5.50%, 9/1/2026 (a) | 65,000 | 62,761 |
4.38%, 5/1/2029 (a) | 220,000 | 191,796 |
4.30%, 7/15/2029 (a) | 90,000 | 80,880 |
Wisconsin Public Service Corp. 4.75%, 11/1/2044 | 69,000 | 65,571 |
6,396,033 | ||
Electrical Equipment — 0.0% ^ | ||
Eaton Corp. 4.00%, 11/2/2032 | 50,000 | 47,789 |
EnerSys 4.38%, 12/15/2027 (a) | 65,000 | 59,150 |
Sensata Technologies BV 5.00%, 10/1/2025 (a) | 40,000 | 39,161 |
146,100 | ||
Electronic Equipment, Instruments & Components — 0.1% | ||
Arrow Electronics, Inc. 2.95%, 2/15/2032 | 20,000 | 16,241 |
Corning, Inc. 5.35%, 11/15/2048 | 75,000 | 74,182 |
II-VI, Inc. 5.00%, 12/15/2029 (a) | 85,000 | 75,681 |
Sensata Technologies, Inc. 4.38%, 2/15/2030 (a) | 145,000 | 129,193 |
295,297 | ||
Energy Equipment & Services — 0.1% | ||
Baker Hughes Holdings LLC | ||
2.06%, 12/15/2026 | 70,000 | 63,694 |
4.49%, 5/1/2030 | 86,000 | 83,770 |
54 | J.P. Morgan Exchange-Traded Funds | August 31, 2022 |
INVESTMENTS | PRINCIPAL AMOUNT($) | VALUE($) |
Corporate Bonds — continued | ||
Energy Equipment & Services — continued | ||
Halliburton Co. 3.80%, 11/15/2025 | 12,000 | 11,872 |
Oceaneering International, Inc. 4.65%, 11/15/2024 | 120,000 | 111,950 |
Schlumberger Holdings Corp. 3.75%, 5/1/2024 (a) | 70,000 | 69,498 |
Transocean Pontus Ltd. 6.13%, 8/1/2025 (a) | 12,320 | 11,797 |
352,581 | ||
Entertainment — 0.6% | ||
Activision Blizzard, Inc. | ||
1.35%, 9/15/2030 | 230,000 | 181,677 |
2.50%, 9/15/2050 | 259,000 | 175,210 |
Cinemark USA, Inc. | ||
5.88%, 3/15/2026 (a) | 75,000 | 66,540 |
5.25%, 7/15/2028 (a) | 40,000 | 32,403 |
Live Nation Entertainment, Inc. | ||
5.63%, 3/15/2026 (a) | 2,000 | 1,930 |
6.50%, 5/15/2027 (a) | 80,000 | 79,870 |
4.75%, 10/15/2027 (a) | 80,000 | 72,800 |
Magallanes, Inc. | ||
4.28%, 3/15/2032 (a) | 790,000 | 688,354 |
5.14%, 3/15/2052 (a) | 80,000 | 64,032 |
Netflix, Inc. | ||
4.88%, 4/15/2028 | 605,000 | 588,362 |
5.38%, 11/15/2029 (a) | 88,000 | 86,680 |
Take-Two Interactive Software, Inc. 3.70%, 4/14/2027 | 15,000 | 14,435 |
Walt Disney Co. (The) | ||
2.00%, 9/1/2029 | 50,000 | 43,192 |
3.80%, 3/22/2030 | 90,000 | 86,998 |
WMG Acquisition Corp. 3.88%, 7/15/2030 (a) | 100,000 | 86,000 |
2,268,483 | ||
Equity Real Estate Investment Trusts (REITs) — 0.5% | ||
Alexandria Real Estate Equities, Inc. 1.88%, 2/1/2033 | 53,000 | 39,890 |
American Tower Corp. | ||
1.45%, 9/15/2026 | 85,000 | 74,664 |
2.95%, 1/15/2051 | 25,000 | 16,830 |
AvalonBay Communities, Inc. 3.35%, 5/15/2027 | 32,000 | 30,461 |
Camden Property Trust 3.15%, 7/1/2029 | 30,000 | 27,482 |
Corporate Office Properties LP 2.25%, 3/15/2026 | 94,000 | 84,253 |
Crown Castle, Inc. 2.90%, 3/15/2027 | 120,000 | 111,175 |
INVESTMENTS | PRINCIPAL AMOUNT($) | VALUE($) |
Equity Real Estate Investment Trusts (REITs) — continued | ||
Duke Realty LP 1.75%, 7/1/2030 | 49,000 | 40,257 |
Equinix, Inc. 3.90%, 4/15/2032 | 80,000 | 72,618 |
ERP Operating LP 3.25%, 8/1/2027 | 31,000 | 29,191 |
Essex Portfolio LP 2.65%, 3/15/2032 | 45,000 | 36,896 |
Goodman US Finance Three LLC (Australia) 3.70%, 3/15/2028 (a) | 40,000 | 37,835 |
Healthpeak Properties, Inc. | ||
2.13%, 12/1/2028 | 64,000 | 55,020 |
3.00%, 1/15/2030 | 37,000 | 32,768 |
Iron Mountain, Inc. 4.88%, 9/15/2027 (a) | 230,000 | 211,106 |
Life Storage LP 2.20%, 10/15/2030 | 88,000 | 70,656 |
National Retail Properties, Inc. 3.60%, 12/15/2026 | 39,000 | 37,134 |
Office Properties Income Trust | ||
4.50%, 2/1/2025 | 88,000 | 82,323 |
3.45%, 10/15/2031 | 35,000 | 23,331 |
Realty Income Corp. | ||
4.13%, 10/15/2026 | 44,000 | 43,574 |
3.25%, 1/15/2031 | 9,000 | 8,068 |
Regency Centers LP 3.70%, 6/15/2030 | 85,000 | 77,206 |
RHP Hotel Properties LP 4.75%, 10/15/2027 | 140,000 | 127,306 |
Sabra Health Care LP 3.20%, 12/1/2031 | 70,000 | 55,660 |
SBA Communications Corp. 3.13%, 2/1/2029 | 175,000 | 144,187 |
Scentre Group Trust 1 (Australia) 3.50%, 2/12/2025 (a) | 100,000 | 96,804 |
Simon Property Group LP 3.25%, 9/13/2049 | 31,000 | 22,483 |
UDR, Inc. 2.10%, 8/1/2032 | 45,000 | 34,671 |
VICI Properties LP | ||
5.63%, 5/1/2024 (a) | 67,000 | 67,101 |
3.50%, 2/15/2025 (a) | 90,000 | 84,768 |
4.50%, 9/1/2026 (a) | 95,000 | 89,517 |
4.25%, 12/1/2026 (a) | 30,000 | 28,100 |
4.63%, 12/1/2029 (a) | 20,000 | 18,475 |
WP Carey, Inc. 2.25%, 4/1/2033 | 95,000 | 72,239 |
2,084,049 | ||
Food & Staples Retailing — 0.2% | ||
7-Eleven, Inc. | ||
0.95%, 2/10/2026 (a) | 65,000 | 57,703 |
1.30%, 2/10/2028 (a) | 62,000 | 51,751 |
2.50%, 2/10/2041 (a) | 14,000 | 9,535 |
2.80%, 2/10/2051 (a) | 50,000 | 32,678 |
August 31, 2022 | J.P. Morgan Exchange-Traded Funds | 55 |
AS OF August 31, 2022 (Unaudited) (continued)
INVESTMENTS | PRINCIPAL AMOUNT($) | VALUE($) |
Corporate Bonds — continued | ||
Food & Staples Retailing — continued | ||
Albertsons Cos., Inc. | ||
4.63%, 1/15/2027 (a) | 460,000 | 419,759 |
4.88%, 2/15/2030 (a) | 20,000 | 17,515 |
Alimentation Couche-Tard, Inc. (Canada) | ||
3.44%, 5/13/2041 (a) | 5,000 | 3,714 |
3.63%, 5/13/2051 (a) | 10,000 | 7,168 |
Performance Food Group, Inc. 5.50%, 10/15/2027 (a) | 111,000 | 104,632 |
Rite Aid Corp. 8.00%, 11/15/2026 (a) | 125,000 | 101,875 |
Sysco Corp. 2.40%, 2/15/2030 | 50,000 | 42,881 |
849,211 | ||
Food Products — 0.1% | ||
Bunge Ltd. Finance Corp. 2.75%, 5/14/2031 | 30,000 | 25,179 |
Campbell Soup Co. 4.15%, 3/15/2028 | 20,000 | 19,639 |
Cargill, Inc. 4.38%, 4/22/2052 (a) | 50,000 | 47,748 |
Darling Ingredients, Inc. 5.25%, 4/15/2027 (a) | 50,000 | 49,041 |
Lamb Weston Holdings, Inc. 4.13%, 1/31/2030 (a) | 155,000 | 139,694 |
Mead Johnson Nutrition Co. (United Kingdom) 4.13%, 11/15/2025 | 64,000 | 64,191 |
Post Holdings, Inc. | ||
5.75%, 3/1/2027 (a) | 82,000 | 80,110 |
5.50%, 12/15/2029 (a) | 85,000 | 77,894 |
503,496 | ||
Gas Utilities — 0.1% | ||
AmeriGas Partners LP | ||
5.50%, 5/20/2025 | 23,000 | 21,824 |
5.88%, 8/20/2026 | 10,000 | 9,518 |
5.75%, 5/20/2027 | 80,000 | 75,399 |
Atmos Energy Corp. 5.50%, 6/15/2041 | 52,000 | 54,464 |
Boston Gas Co. 3.00%, 8/1/2029 (a) | 37,000 | 32,500 |
Southern California Gas Co. Series XX, 2.55%, 2/1/2030 | 33,000 | 29,432 |
223,137 | ||
Health Care Equipment & Supplies — 0.2% | ||
Abbott Laboratories 1.15%, 1/30/2028 | 20,000 | 17,438 |
Avantor Funding, Inc. 4.63%, 7/15/2028 (a) | 176,000 | 160,139 |
Becton Dickinson and Co. 3.70%, 6/6/2027 | 45,000 | 43,705 |
DH Europe Finance II SARL 3.25%, 11/15/2039 | 40,000 | 33,030 |
INVESTMENTS | PRINCIPAL AMOUNT($) | VALUE($) |
Health Care Equipment & Supplies — continued | ||
Hologic, Inc. 3.25%, 2/15/2029 (a) | 115,000 | 98,032 |
Medline Borrower LP | ||
3.88%, 4/1/2029 (a) | 160,000 | 135,600 |
5.25%, 10/1/2029 (a) | 55,000 | 46,223 |
Teleflex, Inc. 4.25%, 6/1/2028 (a) | 85,000 | 77,226 |
Zimmer Biomet Holdings, Inc. 2.60%, 11/24/2031 | 58,000 | 48,403 |
659,796 | ||
Health Care Providers & Services — 1.2% | ||
Acadia Healthcare Co., Inc. 5.50%, 7/1/2028 (a) | 136,000 | 128,837 |
AdaptHealth LLC 4.63%, 8/1/2029 (a) | 85,000 | 70,781 |
Aetna, Inc. 2.80%, 6/15/2023 | 70,000 | 69,362 |
Centene Corp. 4.63%, 12/15/2029 | 916,000 | 862,909 |
Cigna Corp. 2.38%, 3/15/2031 | 35,000 | 29,408 |
CommonSpirit Health | ||
1.55%, 10/1/2025 | 13,000 | 11,838 |
2.78%, 10/1/2030 | 13,000 | 10,884 |
3.91%, 10/1/2050 | 15,000 | 11,808 |
Community Health Systems, Inc. | ||
5.63%, 3/15/2027 (a) | 230,000 | 195,039 |
4.75%, 2/15/2031 (a) | 85,000 | 62,764 |
CVS Health Corp. | ||
2.88%, 6/1/2026 | 10,000 | 9,544 |
4.30%, 3/25/2028 | 37,000 | 36,578 |
2.70%, 8/21/2040 | 50,000 | 36,134 |
DaVita, Inc. 4.63%, 6/1/2030 (a) | 210,000 | 169,058 |
Encompass Health Corp. | ||
4.50%, 2/1/2028 | 180,000 | 157,471 |
4.75%, 2/1/2030 | 65,000 | 55,590 |
Envision Healthcare Corp. 8.75%, 10/15/2026 (a) | 20,000 | 6,604 |
Hackensack Meridian Health, Inc. Series 2020, 2.68%, 9/1/2041 | 50,000 | 37,083 |
HCA, Inc. | ||
5.25%, 6/15/2026 | 120,000 | 120,593 |
5.38%, 9/1/2026 | 155,000 | 155,426 |
4.50%, 2/15/2027 | 210,000 | 205,012 |
5.63%, 9/1/2028 | 1,170,000 | 1,175,950 |
5.88%, 2/1/2029 | 25,000 | 25,483 |
3.50%, 9/1/2030 | 37,000 | 32,288 |
3.50%, 7/15/2051 | 35,000 | 24,025 |
4.63%, 3/15/2052 (a) | 35,000 | 28,963 |
MidMichigan Health Series 2020, 3.41%, 6/1/2050 | 10,000 | 7,501 |
56 | J.P. Morgan Exchange-Traded Funds | August 31, 2022 |
INVESTMENTS | PRINCIPAL AMOUNT($) | VALUE($) |
Corporate Bonds — continued | ||
Health Care Providers & Services — continued | ||
MultiCare Health System 2.80%, 8/15/2050 | 10,000 | 6,897 |
New York and Presbyterian Hospital (The) 2.61%, 8/1/2060 | 5,000 | 3,219 |
Northwell Healthcare, Inc. 4.26%, 11/1/2047 | 110,000 | 96,341 |
Owens & Minor, Inc. 4.50%, 3/31/2029 (a) | 110,000 | 93,751 |
Quest Diagnostics, Inc. 2.95%, 6/30/2030 | 55,000 | 48,589 |
Tenet Healthcare Corp. | ||
4.88%, 1/1/2026 (a) | 260,000 | 247,000 |
5.13%, 11/1/2027 (a) | 270,000 | 250,155 |
4.25%, 6/1/2029 (a) | 215,000 | 185,404 |
UnitedHealth Group, Inc. | ||
3.38%, 4/15/2027 | 91,000 | 88,956 |
4.63%, 11/15/2041 | 132,000 | 128,867 |
3.25%, 5/15/2051 | 55,000 | 43,189 |
4,929,301 | ||
Health Care Technology — 0.0% ^ | ||
IQVIA, Inc. 5.00%, 5/15/2027 (a) | 200,000 | 193,278 |
Hotels, Restaurants & Leisure — 0.7% | ||
1011778 BC ULC (Canada) | ||
5.75%, 4/15/2025 (a) | 50,000 | 50,250 |
3.88%, 1/15/2028 (a) | 92,000 | 81,780 |
Boyd Gaming Corp. 4.75%, 12/1/2027 | 122,000 | 113,883 |
Boyne USA, Inc. 4.75%, 5/15/2029 (a) | 142,000 | 126,297 |
Caesars Entertainment, Inc. 6.25%, 7/1/2025 (a) | 170,000 | 165,990 |
Carnival Corp. | ||
9.88%, 8/1/2027 (a) | 110,000 | 110,413 |
4.00%, 8/1/2028 (a) | 120,000 | 100,049 |
Cedar Fair LP 5.38%, 4/15/2027 | 85,000 | 80,197 |
Hilton Domestic Operating Co., Inc. | ||
5.38%, 5/1/2025 (a) | 25,000 | 24,784 |
4.88%, 1/15/2030 | 290,000 | 265,002 |
International Game Technology plc 6.25%, 1/15/2027 (a) | 200,000 | 195,862 |
Las Vegas Sands Corp. 2.90%, 6/25/2025 | 205,000 | 188,958 |
Marriott Ownership Resorts, Inc. 4.50%, 6/15/2029 (a) | 70,000 | 59,017 |
MGM Resorts International 5.50%, 4/15/2027 | 226,000 | 208,237 |
Royal Caribbean Cruises Ltd. | ||
9.13%, 6/15/2023 (a) | 250,000 | 252,027 |
11.50%, 6/1/2025 (a) | 10,000 | 10,613 |
INVESTMENTS | PRINCIPAL AMOUNT($) | VALUE($) |
Hotels, Restaurants & Leisure — continued | ||
Six Flags Entertainment Corp. 4.88%, 7/31/2024 (a) | 85,000 | 81,554 |
Six Flags Theme Parks, Inc. 7.00%, 7/1/2025 (a) | 63,000 | 63,672 |
Starbucks Corp. | ||
3.80%, 8/15/2025 | 70,000 | 69,702 |
3.35%, 3/12/2050 | 5,000 | 3,746 |
Station Casinos LLC 4.50%, 2/15/2028 (a) | 105,000 | 90,450 |
Travel + Leisure Co. 5.65%, 4/1/2024 (f) | 25,000 | 24,764 |
Vail Resorts, Inc. 6.25%, 5/15/2025 (a) | 70,000 | 70,066 |
Wynn Las Vegas LLC 5.50%, 3/1/2025 (a) | 75,000 | 71,821 |
Wynn Resorts Finance LLC | ||
7.75%, 4/15/2025 (a) | 70,000 | 69,766 |
5.13%, 10/1/2029 (a) | 100,000 | 83,898 |
Yum! Brands, Inc. 4.63%, 1/31/2032 | 240,000 | 212,033 |
2,874,831 | ||
Household Durables — 0.1% | ||
CD&R Smokey Buyer, Inc. 6.75%, 7/15/2025 (a) | 55,000 | 51,150 |
Lennar Corp. 4.50%, 4/30/2024 | 6,000 | 6,005 |
MDC Holdings, Inc. | ||
3.85%, 1/15/2030 | 30,000 | 24,550 |
2.50%, 1/15/2031 | 125,000 | 89,238 |
Newell Brands, Inc. 5.63%, 4/1/2036 (f) | 50,000 | 44,780 |
Tempur Sealy International, Inc. 4.00%, 4/15/2029 (a) | 150,000 | 123,242 |
338,965 | ||
Household Products — 0.1% | ||
Central Garden & Pet Co. 5.13%, 2/1/2028 | 145,000 | 133,742 |
Energizer Holdings, Inc. 4.38%, 3/31/2029 (a) | 210,000 | 170,818 |
Kimberly-Clark Corp. 3.20%, 4/25/2029 | 39,000 | 36,886 |
Spectrum Brands, Inc. | ||
5.75%, 7/15/2025 | 45,000 | 43,905 |
5.00%, 10/1/2029 (a) | 95,000 | 82,713 |
5.50%, 7/15/2030 (a) | 35,000 | 30,151 |
498,215 | ||
Independent Power and Renewable Electricity Producers — 0.1% | ||
Calpine Corp. | ||
5.25%, 6/1/2026 (a) | 143,000 | 138,760 |
5.13%, 3/15/2028 (a) | 55,000 | 48,846 |
August 31, 2022 | J.P. Morgan Exchange-Traded Funds | 57 |
AS OF August 31, 2022 (Unaudited) (continued)
INVESTMENTS | PRINCIPAL AMOUNT($) | VALUE($) |
Corporate Bonds — continued | ||
Independent Power and Renewable Electricity Producers — continued | ||
Constellation Energy Generation LLC | ||
3.25%, 6/1/2025 | 37,000 | 35,907 |
5.75%, 10/1/2041 | 20,000 | 19,871 |
5.60%, 6/15/2042 | 95,000 | 95,041 |
338,425 | ||
Industrial Conglomerates — 0.0% ^ | ||
GE Capital International Funding Co. Unlimited Co. 4.42%, 11/15/2035 | 200,000 | 189,107 |
Insurance — 0.3% | ||
Aflac, Inc. 3.25%, 3/17/2025 | 21,000 | 20,681 |
AIA Group Ltd. (Hong Kong) 3.20%, 3/11/2025 (a) | 200,000 | 194,975 |
Athene Global Funding | ||
1.45%, 1/8/2026 (a) | 20,000 | 17,753 |
2.95%, 11/12/2026 (a) | 44,000 | 39,951 |
Berkshire Hathaway Finance Corp. | ||
2.85%, 10/15/2050 | 60,000 | 43,763 |
2.50%, 1/15/2051 | 240,000 | 164,521 |
3.85%, 3/15/2052 | 175,000 | 150,977 |
Equitable Financial Life Global Funding 1.70%, 11/12/2026 (a) | 25,000 | 22,249 |
F&G Global Funding 1.75%, 6/30/2026 (a) | 10,000 | 8,921 |
Great-West Lifeco Finance 2018 LP (Canada) 4.58%, 5/17/2048 (a) | 20,000 | 18,265 |
Manulife Financial Corp. (Canada) 4.15%, 3/4/2026 | 42,000 | 41,597 |
MetLife, Inc. 4.13%, 8/13/2042 | 79,000 | 70,956 |
New York Life Global Funding 3.00%, 1/10/2028 (a) | 51,000 | 48,160 |
Pacific Life Insurance Co. (ICE LIBOR USD 3 Month + 2.80%), 4.30%, 10/24/2067 (a) (b) | 27,000 | 23,221 |
Principal Financial Group, Inc. 3.70%, 5/15/2029 | 45,000 | 42,325 |
Progressive Corp. (The) | ||
3.00%, 3/15/2032 | 200,000 | 180,623 |
4.35%, 4/25/2044 | 42,000 | 38,463 |
Prudential Financial, Inc. | ||
3.88%, 3/27/2028 | 32,000 | 31,387 |
3.91%, 12/7/2047 | 70,000 | 61,131 |
Teachers Insurance & Annuity Association of America 4.27%, 5/15/2047 (a) | 40,000 | 36,024 |
INVESTMENTS | PRINCIPAL AMOUNT($) | VALUE($) |
Insurance — continued | ||
Travelers Cos., Inc. (The) 5.35%, 11/1/2040 | 16,000 | 16,934 |
W R Berkley Corp. 3.55%, 3/30/2052 | 45,000 | 34,444 |
1,307,321 | ||
Interactive Media & Services — 0.1% | ||
Alphabet, Inc. 2.05%, 8/15/2050 | 100,000 | 65,899 |
Meta Platforms, Inc. 3.85%, 8/15/2032 (a) | 380,000 | 357,364 |
423,263 | ||
Internet & Direct Marketing Retail — 0.2% | ||
Amazon.com, Inc. | ||
3.15%, 8/22/2027 | 201,000 | 194,083 |
3.60%, 4/13/2032 | 200,000 | 191,711 |
3.10%, 5/12/2051 | 40,000 | 31,166 |
3.95%, 4/13/2052 | 215,000 | 195,505 |
Go Daddy Operating Co. LLC 5.25%, 12/1/2027 (a) | 110,000 | 103,400 |
Photo Holdings Merger Sub, Inc. 8.50%, 10/1/2026 (a) | 13,000 | 9,708 |
725,573 | ||
IT Services — 0.2% | ||
Arches Buyer, Inc. 4.25%, 6/1/2028 (a) | 85,000 | 68,425 |
Black Knight InfoServ LLC 3.63%, 9/1/2028 (a) | 90,000 | 78,570 |
Block, Inc. 3.50%, 6/1/2031 | 120,000 | 98,728 |
Fidelity National Information Services, Inc. 2.25%, 3/1/2031 | 80,000 | 65,192 |
Fiserv, Inc. 3.20%, 7/1/2026 | 70,000 | 66,607 |
Gartner, Inc. 3.75%, 10/1/2030 (a) | 130,000 | 111,475 |
Global Payments, Inc. | ||
3.20%, 8/15/2029 | 60,000 | 52,399 |
2.90%, 5/15/2030 | 40,000 | 33,661 |
2.90%, 11/15/2031 | 75,000 | 60,759 |
Presidio Holdings, Inc. 4.88%, 2/1/2027 (a) | 75,000 | 70,171 |
Twilio, Inc. 3.63%, 3/15/2029 | 115,000 | 95,996 |
801,983 | ||
Leisure Products — 0.0% ^ | ||
Hasbro, Inc. 3.90%, 11/19/2029 | 15,000 | 13,739 |
Mattel, Inc. | ||
3.38%, 4/1/2026 (a) | 70,000 | 63,600 |
5.88%, 12/15/2027 (a) | 65,000 | 64,723 |
142,062 | ||
58 | J.P. Morgan Exchange-Traded Funds | August 31, 2022 |
INVESTMENTS | PRINCIPAL AMOUNT($) | VALUE($) |
Corporate Bonds — continued | ||
Life Sciences Tools & Services — 0.0% ^ | ||
Charles River Laboratories International, Inc. 3.75%, 3/15/2029 (a) | 120,000 | 103,424 |
Thermo Fisher Scientific, Inc. | ||
1.75%, 10/15/2028 | 20,000 | 17,667 |
2.60%, 10/1/2029 | 91,000 | 83,005 |
204,096 | ||
Machinery — 0.1% | ||
Amsted Industries, Inc. 5.63%, 7/1/2027 (a) | 65,000 | 63,030 |
Caterpillar, Inc. 4.30%, 5/15/2044 | 78,000 | 75,171 |
Illinois Tool Works, Inc. 3.90%, 9/1/2042 | 15,000 | 13,302 |
Otis Worldwide Corp. 2.06%, 4/5/2025 | 90,000 | 84,982 |
Parker-Hannifin Corp. | ||
3.25%, 3/1/2027 | 92,000 | 88,225 |
4.25%, 9/15/2027 | 150,000 | 148,444 |
Stanley Black & Decker, Inc. 2.75%, 11/15/2050 | 10,000 | 6,787 |
Xylem, Inc. 1.95%, 1/30/2028 | 30,000 | 26,411 |
506,352 | ||
Media — 1.4% | ||
Charter Communications Operating LLC | ||
2.25%, 1/15/2029 | 265,000 | 217,646 |
3.50%, 6/1/2041 | 85,000 | 58,901 |
3.50%, 3/1/2042 | 90,000 | 62,168 |
3.70%, 4/1/2051 | 40,000 | 26,690 |
3.90%, 6/1/2052 | 95,000 | 64,367 |
Clear Channel Outdoor Holdings, Inc. 5.13%, 8/15/2027 (a) | 262,000 | 234,655 |
Comcast Corp. | ||
4.15%, 10/15/2028 | 110,000 | 109,040 |
4.25%, 10/15/2030 | 194,000 | 190,749 |
1.95%, 1/15/2031 | 80,000 | 66,410 |
1.50%, 2/15/2031 | 430,000 | 345,342 |
3.90%, 3/1/2038 | 95,000 | 85,402 |
3.25%, 11/1/2039 | 313,000 | 254,917 |
4.00%, 3/1/2048 | 45,000 | 38,594 |
2.89%, 11/1/2051 | 10,000 | 7,041 |
2.45%, 8/15/2052 | 110,000 | 71,284 |
2.94%, 11/1/2056 | 578,000 | 391,604 |
CSC Holdings LLC | ||
5.50%, 4/15/2027 (a) | 200,000 | 189,556 |
6.50%, 2/1/2029 (a) | 200,000 | 184,047 |
4.50%, 11/15/2031 (a) | 200,000 | 160,446 |
INVESTMENTS | PRINCIPAL AMOUNT($) | VALUE($) |
Media — continued | ||
Diamond Sports Group LLC 5.38%, 8/15/2026 (a) | 35,000 | 6,650 |
Directv Financing LLC 5.88%, 8/15/2027 (a) | 211,000 | 193,065 |
Discovery Communications LLC 4.00%, 9/15/2055 | 45,000 | 29,813 |
DISH DBS Corp. | ||
5.00%, 3/15/2023 | 215,000 | 210,406 |
5.88%, 11/15/2024 | 81,000 | 73,305 |
7.75%, 7/1/2026 | 290,000 | 228,642 |
5.25%, 12/1/2026 (a) | 175,000 | 144,484 |
Gannett Holdings LLC 6.00%, 11/1/2026 (a) | 110,000 | 85,800 |
Gray Escrow II, Inc. 5.38%, 11/15/2031 (a) | 135,000 | 114,099 |
Gray Television, Inc. 4.75%, 10/15/2030 (a) | 100,000 | 82,400 |
iHeartCommunications, Inc. | ||
6.38%, 5/1/2026 | 25,000 | 23,612 |
8.38%, 5/1/2027 | 25,000 | 22,019 |
5.25%, 8/15/2027 (a) | 155,000 | 139,057 |
Lamar Media Corp. | ||
3.75%, 2/15/2028 | 110,000 | 98,656 |
4.00%, 2/15/2030 | 35,000 | 30,472 |
News Corp. 3.88%, 5/15/2029 (a) | 130,000 | 113,100 |
Nexstar Media, Inc. | ||
5.63%, 7/15/2027 (a) | 100,000 | 95,217 |
4.75%, 11/1/2028 (a) | 95,000 | 85,975 |
Outfront Media Capital LLC | ||
6.25%, 6/15/2025 (a) | 25,000 | 24,788 |
5.00%, 8/15/2027 (a) | 76,000 | 69,560 |
Paramount Global 4.95%, 1/15/2031 | 50,000 | 47,324 |
Scripps Escrow II, Inc. 3.88%, 1/15/2029 (a) | 110,000 | 93,265 |
Scripps Escrow, Inc. 5.88%, 7/15/2027 (a) | 45,000 | 40,724 |
Sinclair Television Group, Inc. 4.13%, 12/1/2030 (a) | 65,000 | 52,909 |
Sirius XM Radio, Inc. | ||
5.00%, 8/1/2027 (a) | 110,000 | 103,552 |
4.00%, 7/15/2028 (a) | 350,000 | 304,946 |
5.50%, 7/1/2029 (a) | 160,000 | 149,613 |
Stagwell Global LLC 5.63%, 8/15/2029 (a) | 175,000 | 148,409 |
TEGNA, Inc. 5.00%, 9/15/2029 | 140,000 | 134,009 |
August 31, 2022 | J.P. Morgan Exchange-Traded Funds | 59 |
AS OF August 31, 2022 (Unaudited) (continued)
INVESTMENTS | PRINCIPAL AMOUNT($) | VALUE($) |
Corporate Bonds — continued | ||
Media — continued | ||
Univision Communications, Inc. 4.50%, 5/1/2029 (a) | 115,000 | 100,596 |
Videotron Ltd. (Canada) | ||
5.38%, 6/15/2024 (a) | 37,000 | 36,734 |
5.13%, 4/15/2027 (a) | 120,000 | 112,500 |
5,954,560 | ||
Metals & Mining — 0.6% | ||
Alcoa Nederland Holding BV 5.50%, 12/15/2027 (a) | 200,000 | 191,704 |
Arconic Corp. 6.13%, 2/15/2028 (a) | 135,000 | 126,722 |
ATI, Inc. 5.88%, 12/1/2027 | 100,000 | 95,035 |
Carpenter Technology Corp. 6.38%, 7/15/2028 | 100,000 | 95,613 |
Cleveland-Cliffs, Inc. | ||
6.75%, 3/15/2026 (a) | 125,000 | 126,384 |
5.88%, 6/1/2027 | 135,000 | 129,262 |
FMG Resources August 2006 Pty. Ltd. (Australia) 4.50%, 9/15/2027 (a) | 100,000 | 91,355 |
Freeport-McMoRan, Inc. | ||
5.00%, 9/1/2027 | 45,000 | 44,388 |
4.25%, 3/1/2030 | 97,000 | 87,847 |
4.63%, 8/1/2030 | 60,000 | 55,544 |
5.40%, 11/14/2034 | 183,000 | 173,533 |
5.45%, 3/15/2043 | 86,000 | 77,419 |
Glencore Funding LLC (Australia) | ||
4.63%, 4/29/2024 (a) | 90,000 | 90,137 |
3.88%, 10/27/2027 (a) | 40,000 | 37,767 |
2.50%, 9/1/2030 (a) | 37,000 | 30,084 |
2.85%, 4/27/2031 (a) | 435,000 | 358,850 |
2.63%, 9/23/2031 (a) | 102,000 | 81,118 |
Kaiser Aluminum Corp. 4.63%, 3/1/2028 (a) | 120,000 | 103,360 |
Novelis Corp. 4.75%, 1/30/2030 (a) | 105,000 | 91,350 |
Nucor Corp. 2.98%, 12/15/2055 | 50,000 | 33,415 |
Rio Tinto Finance USA Ltd. (Australia) | ||
7.13%, 7/15/2028 | 59,000 | 66,540 |
5.20%, 11/2/2040 | 20,000 | 20,883 |
Rio Tinto Finance USA plc (Australia) 4.13%, 8/21/2042 | 40,000 | 36,679 |
Teck Resources Ltd. (Canada) 5.40%, 2/1/2043 | 20,000 | 17,745 |
INVESTMENTS | PRINCIPAL AMOUNT($) | VALUE($) |
Metals & Mining — continued | ||
United States Steel Corp. 6.88%, 3/1/2029 | 100,000 | 97,750 |
Vale Overseas Ltd. (Brazil) 3.75%, 7/8/2030 | 20,000 | 17,435 |
2,377,919 | ||
Mortgage Real Estate Investment Trusts (REITs) — 0.2% | ||
Great Ajax Operating Partnership LP Series QIB, 8.88%, 9/1/2027 (a) | 1,000,000 | 988,089 |
Multiline Retail — 0.0% ^ | ||
Macy's Retail Holdings LLC 5.88%, 4/1/2029 (a) | 110,000 | 95,205 |
Multi-Utilities — 0.2% | ||
Ameren Corp. | ||
1.95%, 3/15/2027 | 20,000 | 17,887 |
3.50%, 1/15/2031 | 291,000 | 265,979 |
Berkshire Hathaway Energy Co. | ||
1.65%, 5/15/2031 | 230,000 | 184,170 |
5.15%, 11/15/2043 | 94,000 | 95,272 |
2.85%, 5/15/2051 | 40,000 | 28,533 |
4.60%, 5/1/2053 (a) | 20,000 | 19,050 |
Consolidated Edison Co. of New York, Inc. | ||
Series E, 4.65%, 12/1/2048 | 60,000 | 56,640 |
Series A, 4.13%, 5/15/2049 | 41,000 | 35,738 |
PG&E Energy Recovery Funding LLC Series A-3, 2.82%, 7/15/2046 | 70,000 | 51,887 |
Puget Sound Energy, Inc. 5.76%, 7/15/2040 | 90,000 | 93,874 |
San Diego Gas & Electric Co. 2.95%, 8/15/2051 | 170,000 | 125,693 |
Southern Co. Gas Capital Corp. Series 21A, 3.15%, 9/30/2051 | 50,000 | 34,815 |
1,009,538 | ||
Oil, Gas & Consumable Fuels — 2.9% | ||
Antero Midstream Partners LP 7.88%, 5/15/2026 (a) | 135,000 | 137,363 |
Antero Resources Corp. | ||
7.63%, 2/1/2029 (a) | 85,000 | 86,461 |
5.38%, 3/1/2030 (a) | 50,000 | 47,063 |
Apache Corp. 4.38%, 10/15/2028 | 179,000 | 163,797 |
Baytex Energy Corp. (Canada) 8.75%, 4/1/2027 (a) | 60,000 | 61,350 |
BP Capital Markets America, Inc. | ||
3.02%, 1/16/2027 | 106,000 | 101,390 |
3.94%, 9/21/2028 | 20,000 | 19,522 |
60 | J.P. Morgan Exchange-Traded Funds | August 31, 2022 |
INVESTMENTS | PRINCIPAL AMOUNT($) | VALUE($) |
Corporate Bonds — continued | ||
Oil, Gas & Consumable Fuels — continued | ||
1.75%, 8/10/2030 | 480,000 | 396,539 |
2.72%, 1/12/2032 | 557,000 | 485,700 |
3.06%, 6/17/2041 | 130,000 | 102,028 |
3.00%, 2/24/2050 | 74,000 | 54,027 |
2.77%, 11/10/2050 | 55,000 | 38,579 |
2.94%, 6/4/2051 | 67,000 | 48,015 |
3.00%, 3/17/2052 | 280,000 | 203,367 |
BP Capital Markets plc (United Kingdom) | ||
(US Treasury Yield Curve Rate T Note Constant Maturity 5 Year + 4.04%), 4.38%, 6/22/2025 (b) (c) (d) | 85,000 | 81,366 |
(US Treasury Yield Curve Rate T Note Constant Maturity 5 Year + 4.40%), 4.88%, 3/22/2030 (b) (c) (d) | 155,000 | 141,786 |
Buckeye Partners LP | ||
3.95%, 12/1/2026 | 10,000 | 8,880 |
4.13%, 12/1/2027 | 175,000 | 154,701 |
Cameron LNG LLC 3.70%, 1/15/2039 (a) | 20,000 | 16,875 |
Cheniere Corpus Christi Holdings LLC | ||
5.88%, 3/31/2025 | 200,000 | 204,067 |
5.13%, 6/30/2027 | 135,000 | 134,734 |
3.70%, 11/15/2029 | 200,000 | 183,796 |
Cheniere Energy Partners LP | ||
4.50%, 10/1/2029 | 264,000 | 243,098 |
4.00%, 3/1/2031 | 135,000 | 118,294 |
3.25%, 1/31/2032 | 25,000 | 20,013 |
Chesapeake Energy Corp. 6.75%, 4/15/2029 (a) | 115,000 | 112,274 |
Chevron Corp. 2.00%, 5/11/2027 | 21,000 | 19,413 |
CNX Resources Corp. 7.25%, 3/14/2027 (a) | 125,000 | 124,094 |
Comstock Resources, Inc. 6.75%, 3/1/2029 (a) | 155,000 | 147,944 |
ConocoPhillips Co. 4.03%, 3/15/2062 (a) | 233,000 | 198,364 |
Coterra Energy, Inc. 3.90%, 5/15/2027 (a) | 30,000 | 28,629 |
Crestwood Midstream Partners LP | ||
5.75%, 4/1/2025 | 100,000 | 96,378 |
8.00%, 4/1/2029 (a) | 90,000 | 89,229 |
DT Midstream, Inc. | ||
4.13%, 6/15/2029 (a) | 110,000 | 96,578 |
4.30%, 4/15/2032 (a) | 80,000 | 72,718 |
Energy Transfer LP | ||
3.60%, 2/1/2023 | 140,000 | 139,820 |
INVESTMENTS | PRINCIPAL AMOUNT($) | VALUE($) |
Oil, Gas & Consumable Fuels — continued | ||
4.25%, 3/15/2023 | 120,000 | 120,047 |
4.15%, 9/15/2029 | 150,000 | 138,077 |
5.80%, 6/15/2038 | 100,000 | 93,643 |
5.35%, 5/15/2045 | 45,000 | 39,657 |
EnLink Midstream Partners LP | ||
4.85%, 7/15/2026 | 175,000 | 171,937 |
5.60%, 4/1/2044 | 9,000 | 7,053 |
Enterprise Products Operating LLC | ||
2.80%, 1/31/2030 | 37,000 | 32,564 |
3.30%, 2/15/2053 | 30,000 | 22,253 |
EQM Midstream Partners LP | ||
6.50%, 7/1/2027 (a) | 160,000 | 154,440 |
4.75%, 1/15/2031 (a) | 195,000 | 168,648 |
Exxon Mobil Corp. | ||
2.99%, 3/19/2025 | 18,000 | 17,609 |
3.00%, 8/16/2039 | 65,000 | 53,221 |
4.23%, 3/19/2040 | 200,000 | 190,064 |
3.10%, 8/16/2049 | 200,000 | 156,681 |
Flex Intermediate Holdco LLC | ||
3.36%, 6/30/2031 (a) | 64,000 | 52,845 |
4.32%, 12/30/2039 (a) | 20,000 | 15,649 |
Genesis Energy LP 6.25%, 5/15/2026 | 80,000 | 72,243 |
Gray Oak Pipeline LLC | ||
2.00%, 9/15/2023 (a) | 44,000 | 42,868 |
2.60%, 10/15/2025 (a) | 112,000 | 103,053 |
Gulfport Energy Corp. 8.00%, 5/17/2026 (a) | 110,000 | 110,733 |
Hess Midstream Operations LP 5.63%, 2/15/2026 (a) | 105,000 | 102,382 |
Hilcorp Energy I LP 5.75%, 2/1/2029 (a) | 220,000 | 200,262 |
Holly Energy Partners LP 6.38%, 4/15/2027 (a) | 105,000 | 102,182 |
Kinder Morgan, Inc. 3.25%, 8/1/2050 | 75,000 | 52,234 |
Kinetik Holdings LP 5.88%, 6/15/2030 (a) | 105,000 | 99,888 |
Laredo Petroleum, Inc. 9.50%, 1/15/2025 | 55,000 | 55,199 |
MEG Energy Corp. (Canada) 7.13%, 2/1/2027 (a) | 150,000 | 151,575 |
MPLX LP 2.65%, 8/15/2030 | 70,000 | 58,352 |
NGL Energy Operating LLC 7.50%, 2/1/2026 (a) | 95,000 | 86,925 |
NGPL PipeCo LLC 3.25%, 7/15/2031 (a) | 10,000 | 8,350 |
NuStar Logistics LP | ||
5.75%, 10/1/2025 | 60,000 | 57,252 |
5.63%, 4/28/2027 | 90,000 | 81,939 |
August 31, 2022 | J.P. Morgan Exchange-Traded Funds | 61 |
AS OF August 31, 2022 (Unaudited) (continued)
INVESTMENTS | PRINCIPAL AMOUNT($) | VALUE($) |
Corporate Bonds — continued | ||
Oil, Gas & Consumable Fuels — continued | ||
Occidental Petroleum Corp. | ||
8.00%, 7/15/2025 | 105,000 | 114,056 |
8.88%, 7/15/2030 | 150,000 | 175,230 |
6.63%, 9/1/2030 | 385,000 | 411,295 |
Pioneer Natural Resources Co. 1.13%, 1/15/2026 | 50,000 | 44,670 |
Range Resources Corp. | ||
4.88%, 5/15/2025 | 45,000 | 43,650 |
8.25%, 1/15/2029 | 90,000 | 94,473 |
Sabine Pass Liquefaction LLC | ||
5.63%, 3/1/2025 | 40,000 | 40,743 |
5.88%, 6/30/2026 | 385,000 | 395,701 |
4.50%, 5/15/2030 | 584,000 | 559,082 |
SM Energy Co. 6.63%, 1/15/2027 | 115,000 | 112,125 |
Southwestern Energy Co. | ||
5.70%, 1/23/2025 (f) | 2,000 | 2,000 |
7.75%, 10/1/2027 | 110,000 | 113,988 |
5.38%, 3/15/2030 | 215,000 | 201,515 |
Spectra Energy Partners LP 4.50%, 3/15/2045 | 15,000 | 13,084 |
Suncor Energy, Inc. (Canada) 6.80%, 5/15/2038 | 83,000 | 91,483 |
Sunoco LP 6.00%, 4/15/2027 | 80,000 | 77,370 |
Tallgrass Energy Partners LP | ||
7.50%, 10/1/2025 (a) | 45,000 | 45,056 |
5.50%, 1/15/2028 (a) | 55,000 | 47,556 |
6.00%, 12/31/2030 (a) | 115,000 | 100,655 |
6.00%, 9/1/2031 (a) | 40,000 | 35,000 |
Targa Resources Corp. 5.20%, 7/1/2027 | 31,000 | 30,922 |
TotalEnergies Capital International SA (France) | ||
3.46%, 7/12/2049 | 84,000 | 68,895 |
3.13%, 5/29/2050 | 80,000 | 61,677 |
TransCanada PipeLines Ltd. (Canada) 5.10%, 3/15/2049 | 48,000 | 47,543 |
Valero Energy Corp. 2.15%, 9/15/2027 | 25,000 | 22,368 |
Venture Global Calcasieu Pass LLC 3.88%, 8/15/2029 (a) | 90,000 | 78,525 |
Western Midstream Operating LP | ||
4.50%, 3/1/2028 | 225,000 | 208,856 |
4.75%, 8/15/2028 | 30,000 | 28,241 |
Williams Cos., Inc. (The) | ||
2.60%, 3/15/2031 | 1,525,000 | 1,273,966 |
5.40%, 3/4/2044 | 50,000 | 47,763 |
11,785,565 | ||
INVESTMENTS | PRINCIPAL AMOUNT($) | VALUE($) |
Personal Products — 0.1% | ||
Edgewell Personal Care Co. | ||
5.50%, 6/1/2028 (a) | 100,000 | 92,351 |
4.13%, 4/1/2029 (a) | 70,000 | 60,164 |
Estee Lauder Cos., Inc. (The) 2.60%, 4/15/2030 | 158,000 | 141,178 |
Prestige Brands, Inc. 5.13%, 1/15/2028 (a) | 80,000 | 73,792 |
367,485 | ||
Pharmaceuticals — 0.7% | ||
Astrazeneca Finance LLC (United Kingdom) 2.25%, 5/28/2031 | 120,000 | 103,857 |
Bausch Health Americas, Inc. | ||
9.25%, 4/1/2026 (a) | 263,000 | 157,800 |
8.50%, 1/31/2027 (a) | 88,000 | 42,240 |
Bausch Health Cos., Inc. | ||
5.50%, 11/1/2025 (a) | 55,000 | 45,375 |
5.75%, 8/15/2027 (a) | 30,000 | 21,876 |
5.00%, 1/30/2028 (a) | 30,000 | 11,250 |
4.88%, 6/1/2028 (a) | 280,000 | 193,553 |
5.00%, 2/15/2029 (a) | 175,000 | 68,250 |
Bayer US Finance II LLC (Germany) 3.38%, 7/15/2024 (a) | 70,000 | 68,450 |
Bristol-Myers Squibb Co. | ||
4.13%, 6/15/2039 | 164,000 | 153,620 |
2.35%, 11/13/2040 | 80,000 | 58,485 |
2.55%, 11/13/2050 | 70,000 | 48,187 |
3.70%, 3/15/2052 | 220,000 | 186,400 |
Eli Lilly & Co. 2.25%, 5/15/2050 | 70,000 | 48,405 |
Jazz Securities DAC 4.38%, 1/15/2029 (a) | 200,000 | 180,348 |
Merck & Co., Inc. 2.75%, 12/10/2051 | 340,000 | 245,906 |
Organon & Co. 4.13%, 4/30/2028 (a) | 200,000 | 179,434 |
Par Pharmaceutical, Inc. 7.50%, 4/1/2027 (a) | 80,000 | 67,997 |
Pfizer, Inc. 2.63%, 4/1/2030 | 130,000 | 116,918 |
Roche Holdings, Inc. (Switzerland) 2.08%, 12/13/2031 (a) | 600,000 | 505,344 |
Royalty Pharma plc 1.20%, 9/2/2025 | 16,000 | 14,545 |
Shire Acquisitions Investments Ireland DAC 3.20%, 9/23/2026 | 145,000 | 138,597 |
Takeda Pharmaceutical Co. Ltd. (Japan) 3.03%, 7/9/2040 | 200,000 | 154,955 |
Zoetis, Inc. 2.00%, 5/15/2030 | 35,000 | 29,405 |
2,841,197 | ||
62 | J.P. Morgan Exchange-Traded Funds | August 31, 2022 |
INVESTMENTS | PRINCIPAL AMOUNT($) | VALUE($) |
Corporate Bonds — continued | ||
Real Estate Management & Development — 0.0% ^ | ||
Kennedy-Wilson, Inc. 4.75%, 3/1/2029 | 75,000 | 62,579 |
Realogy Group LLC 5.75%, 1/15/2029 (a) | 105,000 | 82,264 |
144,843 | ||
Road & Rail — 0.4% | ||
Avis Budget Car Rental LLC | ||
4.75%, 4/1/2028 (a) | 95,000 | 82,927 |
5.38%, 3/1/2029 (a) | 55,000 | 47,930 |
Burlington Northern Santa Fe LLC | ||
3.55%, 2/15/2050 | 78,000 | 65,151 |
3.05%, 2/15/2051 | 155,000 | 119,582 |
Canadian Pacific Railway Co. (Canada) 3.10%, 12/2/2051 | 90,000 | 66,455 |
CSX Corp. 3.25%, 6/1/2027 | 20,000 | 19,264 |
Hertz Corp. (The) 4.63%, 12/1/2026 (a) | 160,000 | 137,042 |
Kansas City Southern 2.88%, 11/15/2029 | 775,000 | 692,740 |
Norfolk Southern Corp. 3.95%, 10/1/2042 | 50,000 | 43,246 |
Penske Truck Leasing Co. LP 1.20%, 11/15/2025 (a) | 46,000 | 40,773 |
Triton Container International Ltd. (Bermuda) 1.15%, 6/7/2024 (a) | 200,000 | 185,850 |
Uber Technologies, Inc. 7.50%, 5/15/2025 (a) | 80,000 | 80,518 |
1,581,478 | ||
Semiconductors & Semiconductor Equipment — 0.5% | ||
Amkor Technology, Inc. 6.63%, 9/15/2027 (a) | 135,000 | 131,868 |
Analog Devices, Inc. | ||
3.50%, 12/5/2026 | 25,000 | 24,575 |
2.95%, 10/1/2051 | 107,000 | 80,960 |
Entegris Escrow Corp. 5.95%, 6/15/2030 (a) | 150,000 | 142,325 |
KLA Corp. | ||
4.65%, 7/15/2032 | 80,000 | 81,297 |
3.30%, 3/1/2050 | 30,000 | 23,445 |
Marvell Technology, Inc. 2.95%, 4/15/2031 | 85,000 | 69,689 |
Microchip Technology, Inc. 0.97%, 2/15/2024 | 25,000 | 23,800 |
NVIDIA Corp. 2.00%, 6/15/2031 | 80,000 | 67,479 |
NXP BV (China) | ||
3.25%, 5/11/2041 | 70,000 | 50,632 |
3.13%, 2/15/2042 | 30,000 | 21,174 |
ON Semiconductor Corp. 3.88%, 9/1/2028 (a) | 75,000 | 66,885 |
INVESTMENTS | PRINCIPAL AMOUNT($) | VALUE($) |
Semiconductors & Semiconductor Equipment — continued | ||
QUALCOMM, Inc. | ||
4.25%, 5/20/2032 | 55,000 | 55,427 |
4.50%, 5/20/2052 | 35,000 | 33,884 |
TSMC Arizona Corp. (Taiwan) | ||
2.50%, 10/25/2031 | 520,000 | 439,748 |
4.25%, 4/22/2032 | 240,000 | 235,008 |
TSMC Global Ltd. (Taiwan) 1.00%, 9/28/2027 (a) | 380,000 | 323,000 |
Xilinx, Inc. 2.38%, 6/1/2030 | 39,000 | 34,001 |
1,905,197 | ||
Software — 0.3% | ||
Clarivate Science Holdings Corp. 3.88%, 7/1/2028 (a) | 145,000 | 124,121 |
Microsoft Corp. 2.92%, 3/17/2052 | 90,000 | 70,797 |
NCR Corp. | ||
5.75%, 9/1/2027 (a) | 115,000 | 110,611 |
6.13%, 9/1/2029 (a) | 161,000 | 153,520 |
Oracle Corp. | ||
2.65%, 7/15/2026 | 233,000 | 214,851 |
2.30%, 3/25/2028 | 15,000 | 13,037 |
3.80%, 11/15/2037 | 150,000 | 116,474 |
3.65%, 3/25/2041 | 15,000 | 11,004 |
3.95%, 3/25/2051 | 15,000 | 10,774 |
4.38%, 5/15/2055 | 55,000 | 41,425 |
Roper Technologies, Inc. 1.75%, 2/15/2031 | 45,000 | 35,267 |
SS&C Technologies, Inc. 5.50%, 9/30/2027 (a) | 150,000 | 142,133 |
VMware, Inc. 4.65%, 5/15/2027 | 105,000 | 103,989 |
Workday, Inc. 3.70%, 4/1/2029 | 172,000 | 161,215 |
1,309,218 | ||
Specialty Retail — 0.5% | ||
Asbury Automotive Group, Inc. 4.50%, 3/1/2028 | 141,000 | 125,923 |
Bath & Body Works, Inc. | ||
7.50%, 6/15/2029 | 135,000 | 129,843 |
6.88%, 11/1/2035 | 135,000 | 117,849 |
Gap, Inc. (The) | ||
3.63%, 10/1/2029 (a) | 130,000 | 90,544 |
3.88%, 10/1/2031 (a) | 60,000 | 41,611 |
Group 1 Automotive, Inc. 4.00%, 8/15/2028 (a) | 115,000 | 98,254 |
Home Depot, Inc. (The) | ||
3.90%, 12/6/2028 | 112,000 | 111,023 |
August 31, 2022 | J.P. Morgan Exchange-Traded Funds | 63 |
AS OF August 31, 2022 (Unaudited) (continued)
INVESTMENTS | PRINCIPAL AMOUNT($) | VALUE($) |
Corporate Bonds — continued | ||
Specialty Retail — continued | ||
4.25%, 4/1/2046 | 201,000 | 186,299 |
Lithia Motors, Inc. 3.88%, 6/1/2029 (a) | 100,000 | 84,401 |
Lowe's Cos., Inc. | ||
1.70%, 10/15/2030 | 170,000 | 136,259 |
3.75%, 4/1/2032 | 155,000 | 142,743 |
O'Reilly Automotive, Inc. | ||
1.75%, 3/15/2031 | 73,000 | 57,934 |
4.70%, 6/15/2032 | 90,000 | 89,144 |
Penske Automotive Group, Inc. 3.75%, 6/15/2029 | 115,000 | 97,274 |
PetSmart, Inc. 4.75%, 2/15/2028 (a) | 250,000 | 222,771 |
SRS Distribution, Inc. 4.63%, 7/1/2028 (a) | 90,000 | 79,664 |
Staples, Inc. | ||
7.50%, 4/15/2026 (a) | 75,000 | 63,379 |
10.75%, 4/15/2027 (a) | 23,000 | 16,905 |
1,891,820 | ||
Technology Hardware, Storage & Peripherals — 0.3% | ||
Apple, Inc. | ||
2.20%, 9/11/2029 | 46,000 | 41,050 |
1.25%, 8/20/2030 | 100,000 | 81,555 |
3.35%, 8/8/2032 | 230,000 | 217,481 |
4.38%, 5/13/2045 | 129,000 | 126,355 |
2.65%, 2/8/2051 | 150,000 | 109,761 |
3.95%, 8/8/2052 | 120,000 | 110,737 |
2.85%, 8/5/2061 | 350,000 | 248,507 |
Dell International LLC | ||
4.90%, 10/1/2026 | 30,000 | 30,116 |
5.30%, 10/1/2029 | 100,000 | 99,093 |
Seagate HDD Cayman 3.13%, 7/15/2029 | 220,000 | 174,738 |
1,239,393 | ||
Textiles, Apparel & Luxury Goods — 0.0% ^ | ||
Hanesbrands, Inc. | ||
4.63%, 5/15/2024 (a) | 13,000 | 12,522 |
4.88%, 5/15/2026 (a) | 20,000 | 18,401 |
William Carter Co. (The) 5.63%, 3/15/2027 (a) | 100,000 | 96,563 |
127,486 | ||
Thrifts & Mortgage Finance — 0.2% | ||
BPCE SA (France) | ||
3.50%, 10/23/2027 (a) | 250,000 | 229,290 |
(SOFR + 1.73%), 3.12%, 10/19/2032 (a) (b) | 250,000 | 195,658 |
INVESTMENTS | PRINCIPAL AMOUNT($) | VALUE($) |
Thrifts & Mortgage Finance — continued | ||
Nationstar Mortgage Holdings, Inc. 6.00%, 1/15/2027 (a) | 115,000 | 102,283 |
Rocket Mortgage LLC | ||
2.88%, 10/15/2026 (a) | 60,000 | 50,400 |
3.63%, 3/1/2029 (a) | 120,000 | 96,600 |
674,231 | ||
Tobacco — 0.4% | ||
Altria Group, Inc. | ||
2.45%, 2/4/2032 | 80,000 | 60,464 |
3.40%, 2/4/2041 | 145,000 | 98,022 |
3.88%, 9/16/2046 | 95,000 | 65,882 |
BAT Capital Corp. (United Kingdom) | ||
3.56%, 8/15/2027 | 141,000 | 129,530 |
4.39%, 8/15/2037 | 600,000 | 474,575 |
Imperial Brands Finance plc (United Kingdom) 6.13%, 7/27/2027 (a) | 285,000 | 289,306 |
Philip Morris International, Inc. | ||
3.13%, 3/2/2028 | 49,000 | 44,984 |
4.38%, 11/15/2041 | 345,000 | 285,532 |
4.13%, 3/4/2043 | 100,000 | 78,648 |
1,526,943 | ||
Trading Companies & Distributors — 0.4% | ||
Air Lease Corp. | ||
3.38%, 7/1/2025 | 92,000 | 87,364 |
1.88%, 8/15/2026 | 50,000 | 43,738 |
Aviation Capital Group LLC | ||
4.13%, 8/1/2025 (a) | 110,000 | 103,217 |
1.95%, 1/30/2026 (a) | 50,000 | 43,139 |
Herc Holdings, Inc. 5.50%, 7/15/2027 (a) | 565,000 | 533,493 |
Imola Merger Corp. 4.75%, 5/15/2029 (a) | 170,000 | 144,324 |
United Rentals North America, Inc. 5.25%, 1/15/2030 | 240,000 | 227,040 |
WESCO Distribution, Inc. | ||
7.13%, 6/15/2025 (a) | 85,000 | 85,015 |
7.25%, 6/15/2028 (a) | 210,000 | 211,735 |
1,479,065 | ||
Transportation Infrastructure — 0.0% ^ | ||
Transurban Finance Co. Pty. Ltd. (Australia) 2.45%, 3/16/2031 (a) | 12,000 | 9,756 |
Wireless Telecommunication Services — 0.2% | ||
Hughes Satellite Systems Corp. 6.63%, 8/1/2026 | 105,000 | 99,356 |
64 | J.P. Morgan Exchange-Traded Funds | August 31, 2022 |
INVESTMENTS | PRINCIPAL AMOUNT($) | VALUE($) |
Corporate Bonds — continued | ||
Wireless Telecommunication Services — continued | ||
Rogers Communications, Inc. (Canada) 4.55%, 3/15/2052 (a) | 40,000 | 35,111 |
Sprint Corp. | ||
7.88%, 9/15/2023 | 8,000 | 8,242 |
7.13%, 6/15/2024 | 30,000 | 30,974 |
7.63%, 3/1/2026 | 225,000 | 237,966 |
T-Mobile USA, Inc. | ||
4.75%, 2/1/2028 | 195,000 | 190,729 |
2.55%, 2/15/2031 | 95,000 | 79,068 |
681,446 | ||
Total Corporate Bonds (Cost $135,774,472) | 121,994,621 | |
Asset-Backed Securities — 17.0% | ||
ACC Trust Series 2022-1, Class C, 3.24%, 10/20/2025 (a) | 1,000,000 | 949,437 |
Affirm Asset Securitization Trust Series 2021-A, Class C, 1.66%, 8/15/2025 ‡ (a) | 500,000 | 483,179 |
Air Canada Pass-Through Trust (Canada) Series 2017-1, Class AA, 3.30%, 1/15/2030 (a) | 397,600 | 354,427 |
American Airlines Pass-Through Trust Series 2015-2, Class A, 4.00%, 9/22/2027 | 193,263 | 165,501 |
American Credit Acceptance Receivables Trust | ||
Series 2020-2, Class C, 3.88%, 4/13/2026 (a) | 217,047 | 216,524 |
Series 2022-2, Class E, 6.57%, 6/13/2028 (a) | 300,000 | 290,666 |
Series 2022-3, Class D, 5.83%, 10/13/2028 (a) | 506,000 | 501,836 |
American Homes 4 Rent Trust | ||
Series 2014-SFR3, Class B, 4.20%, 12/17/2036 ‡ (a) | 125,000 | 123,444 |
Series 2015-SFR1, Class E, 5.64%, 4/17/2052 (a) | 150,000 | 150,654 |
Series 2015-SFR1, Class F, 5.89%, 4/17/2052 ‡ (a) | 400,000 | 391,620 |
Series 2015-SFR2, Class A, 3.73%, 10/17/2052 ‡ (a) | 90,648 | 88,539 |
AMSR Trust | ||
Series 2020-SFR1, Class E, 3.22%, 4/17/2037 (a) | 500,000 | 470,559 |
Series 2020-SFR2, Class E2, 4.28%, 7/17/2037 ‡ (a) | 375,000 | 358,702 |
Series 2020-SFR3, Class E2, 2.76%, 9/17/2037 ‡ (a) | 350,000 | 321,563 |
INVESTMENTS | PRINCIPAL AMOUNT($) | VALUE($) |
Series 2020-SFR4, Class A, 1.36%, 11/17/2037 (a) | 1,500,000 | 1,378,920 |
Series 2020-SFR4, Class E2, 2.46%, 11/17/2037 ‡ (a) | 425,000 | 384,098 |
Series 2022-SFR1, Class F, 6.02%, 3/17/2039 ‡ (a) | 750,000 | 697,997 |
Series 2022-SFR3, Class E2, 4.00%, 10/17/2039 (a) | 1,000,000 | 844,932 |
Aqua Finance Trust Series 2019-A, Class B, 3.47%, 7/16/2040 ‡ (a) | 246,000 | 233,253 |
Avid Automobile Receivables Trust Series 2019-1, Class D, 4.03%, 7/15/2026 (a) | 300,000 | 297,367 |
British Airways Pass-Through Trust (United Kingdom) Series 2013-1, Class A, 4.63%, 6/20/2024 (a) | 131,096 | 128,420 |
Business Jet Securities LLC | ||
Series 2020-1A, Class A, 2.98%, 11/15/2035 (a) | 947,259 | 885,905 |
Series 2021-1A, Class A, 2.16%, 4/15/2036 (a) | 251,500 | 226,239 |
Series 2021-1A, Class B, 2.92%, 4/15/2036 ‡ (a) | 541,342 | 480,699 |
Series 2021-1A, Class C, 5.07%, 4/15/2036 ‡ (a) | 266,688 | 251,591 |
CarNow Auto Receivables Trust Series 2021-1A, Class C, 2.16%, 2/17/2026 (a) | 200,000 | 194,515 |
Carvana Auto Receivables Trust | ||
Series 2020-N1A, Class B, 2.01%, 3/17/2025 (a) | 48,265 | 48,214 |
Series 2019-4A, Class D, 3.07%, 7/15/2025 (a) | 110,000 | 108,715 |
Cascade MH Asset Trust Series 2019-MH1, Class B, 5.00%, 11/25/2044 ‡ (a) (g) | 401,843 | 361,237 |
CoreVest American Finance Trust | ||
Series 2019-1, Class E, 5.49%, 3/15/2052 ‡ (a) (g) | 551,000 | 508,347 |
Series 2019-2, Class E, 5.42%, 6/15/2052 ‡ (a) (g) | 650,000 | 586,016 |
Series 2019-3, Class E, 4.92%, 10/15/2052 ‡ (a) (g) | 570,000 | 492,018 |
CPS Auto Receivables Trust | ||
Series 2020-B, Class C, 3.30%, 4/15/2026 (a) | 85,149 | 85,104 |
Series 2022-C, Class C, 5.28%, 4/15/2030 (a) | 1,000,000 | 993,648 |
Credit Acceptance Auto Loan Trust Series 2020-1A, Class C, 2.59%, 6/15/2029 (a) | 750,000 | 733,286 |
August 31, 2022 | J.P. Morgan Exchange-Traded Funds | 65 |
AS OF August 31, 2022 (Unaudited) (continued)
INVESTMENTS | PRINCIPAL AMOUNT($) | VALUE($) |
Asset-Backed Securities — continued | ||
DataBank Issuer Series 2021-1A, Class A2, 2.06%, 2/27/2051 (a) | 250,000 | 222,525 |
Delta Air Lines Pass-Through Trust Series 2019-1, Class AA, 3.20%, 4/25/2024 | 15,000 | 14,526 |
Diamond Resorts Owner Trust | ||
Series 2021-1A, Class A, 1.51%, 11/21/2033 (a) | 280,534 | 260,172 |
Series 2021-1A, Class D, 3.83%, 11/21/2033 ‡ (a) | 246,082 | 230,955 |
Drive Auto Receivables Trust Series 2020-2, Class D, 3.05%, 5/15/2028 | 750,000 | 737,036 |
DT Auto Owner Trust Series 2020-2A, Class D, 4.73%, 3/16/2026 (a) | 500,000 | 497,142 |
Elara HGV Timeshare Issuer LLC | ||
Series 2021-A, Class C, 2.09%, 8/27/2035 ‡ (a) | 569,535 | 507,022 |
Series 2021-A, Class D, 3.32%, 8/27/2035 ‡ (a) | 203,405 | 182,390 |
Exeter Automobile Receivables Trust | ||
Series 2020-2A, Class C, 3.28%, 5/15/2025 (a) | 162,207 | 161,861 |
Series 2020-2A, Class D, 4.73%, 4/15/2026 (a) | 400,000 | 400,007 |
Series 2022-3A, Class D, 6.76%, 9/15/2028 | 1,000,000 | 1,012,794 |
Series 2022-4A, Class E, 8.23%, 3/15/2030 (a) | 1,000,000 | 995,802 |
FHF Trust Series 2021-1A, Class A, 1.27%, 3/15/2027 (a) | 263,728 | 253,054 |
FirstKey Homes Trust | ||
Series 2020-SFR1, Class F1, 3.64%, 8/17/2037 ‡ (a) | 1,201,000 | 1,105,256 |
Series 2020-SFR2, Class E, 2.67%, 10/19/2037 ‡ (a) | 1,000,000 | 918,087 |
Series 2021-SFR1, Class E1, 2.39%, 8/17/2038 ‡ (a) | 500,000 | 432,216 |
Series 2021-SFR1, Class F1, 3.24%, 8/17/2038 ‡ (a) | 600,000 | 512,763 |
Series 2021-SFR2, Class E1, 2.26%, 9/17/2038 ‡ (a) | 635,000 | 543,530 |
Series 2021-SFR2, Class E2, 2.36%, 9/17/2038 ‡ (a) | 814,000 | 687,975 |
Series 2022-SFR2, Class E2, 4.50%, 7/17/2039 ‡ (a) | 492,000 | 430,031 |
Flagship Credit Auto Trust | ||
Series 2020-4, Class D, 2.18%, 2/16/2027 (a) | 280,000 | 267,666 |
Series 2021-4, Class C, 1.96%, 12/15/2027 (a) | 500,000 | 462,746 |
INVESTMENTS | PRINCIPAL AMOUNT($) | VALUE($) |
Series 2022-3, Class E, 7.95%, 10/15/2029 (a) | 1,000,000 | 988,248 |
FMC GMSR Issuer Trust | ||
Series 2021-GT1, Class B, 4.36%, 7/25/2026 ‡ (a) (g) | 400,000 | 357,307 |
Series 2022-GT1, Class B, 7.17%, 4/25/2027 ‡ (a) | 600,000 | 556,842 |
FNMA, Grantor Trust Series 2017-T1, Class A, 2.90%, 6/25/2027 | 1,093,640 | 1,051,088 |
Foundation Finance Trust | ||
Series 2020-1A, Class B, 4.62%, 7/16/2040 ‡ (a) | 300,000 | 294,138 |
Series 2020-1A, Class C, 5.75%, 7/16/2040 ‡ (a) | 150,000 | 148,253 |
Series 2021-1A, Class C, 2.99%, 5/15/2041 ‡ (a) | 536,000 | 461,695 |
FREED ABS Trust | ||
Series 2021-2, Class C, 1.94%, 6/19/2028 ‡ (a) | 200,000 | 193,965 |
Series 2022-1FP, Class D, 3.35%, 3/19/2029 ‡ (a) | 700,000 | 648,579 |
Series 2022-3FP, Class C, 7.05%, 8/20/2029 ‡ (a) | 500,000 | 496,479 |
Genesis Sales Finance Master Trust Series 2020-AA, Class C, 2.99%, 9/22/2025 (a) | 300,000 | 274,077 |
GLS Auto Receivables Issuer Trust Series 2022-1A, Class D, 3.97%, 1/18/2028 (a) | 1,000,000 | 935,866 |
HGI CRE CLO Ltd. (Cayman Islands) Series 2022-FL3, Class E, 6.28%, 4/20/2037 ‡ (a) (g) | 663,500 | 631,744 |
Hilton Grand Vacations Trust | ||
Series 2022-1D, Class D, 6.79%, 6/20/2034 ‡ (a) | 411,292 | 398,294 |
Series 2022-2A, Class D, 8.73%, 1/25/2037 (a) | 600,000 | 591,310 |
Series 2020-AA, Class C, 6.42%, 2/25/2039 ‡ (a) | 254,199 | 256,377 |
HIN Timeshare Trust | ||
Series 2020-A, Class D, 5.50%, 10/9/2039 ‡ (a) | 102,295 | 96,128 |
Series 2020-A, Class E, 6.50%, 10/9/2039 ‡ (a) | 460,328 | 433,859 |
HINNT LLC Series 2022-A, Class D, 6.50%, 5/15/2041 ‡ (a) | 899,013 | 834,801 |
Home Partners of America Trust Series 2022-1, Class D, 4.73%, 4/17/2039 ‡ (a) | 976,337 | 926,142 |
66 | J.P. Morgan Exchange-Traded Funds | August 31, 2022 |
INVESTMENTS | PRINCIPAL AMOUNT($) | VALUE($) |
Asset-Backed Securities — continued | ||
Lendingpoint Asset Securitization Trust Series 2022-A, Class D, 4.54%, 6/15/2029 (a) | 1,000,000 | 836,039 |
Lendmark Funding Trust | ||
Series 2019-2A, Class C, 3.72%, 4/20/2028 ‡ (a) | 100,000 | 93,182 |
Series 2019-2A, Class D, 5.24%, 4/20/2028 ‡ (a) | 700,000 | 650,978 |
Series 2021-1A, Class D, 5.05%, 11/20/2031 ‡ (a) | 870,000 | 666,881 |
Series 2021-2A, Class B, 2.37%, 4/20/2032 ‡ (a) | 1,000,000 | 790,469 |
LL ABS Trust Series 2020-1A, Class B, 3.79%, 1/17/2028 ‡ (a) | 193,735 | 193,134 |
LP LMS Asset Securitization Trust, 6.17%, 10/15/2028 | 550,000 | 529,045 |
Mariner Finance Issuance Trust Series 2021-AA, Class D, 3.83%, 3/20/2036 ‡ (a) | 351,000 | 299,961 |
Mercury Financial Credit Card Master Trust | ||
Series 2021-1A, Class A, 1.54%, 3/20/2026 (a) | 600,000 | 568,365 |
Series 2021-1A, Class B, 2.33%, 3/20/2026 (a) | 200,000 | 188,905 |
MVW LLC | ||
Series 2020-1A, Class C, 4.21%, 10/20/2037 ‡ (a) | 152,508 | 143,383 |
Series 2019-2A, Class B, 2.44%, 10/20/2038 ‡ (a) | 69,871 | 65,351 |
MVW Owner Trust Series 2019-1A, Class C, 3.33%, 11/20/2036 ‡ (a) | 43,063 | 40,689 |
New Residential Mortgage Loan Trust | ||
Series 2022-SFR1, Class D, 3.30%, 2/17/2039 ‡ (a) | 340,000 | 307,407 |
Series 2022-SFR1, Class E1, 3.55%, 2/17/2039 ‡ (a) | 420,000 | 376,985 |
NMEF Funding LLC Series 2021-A, Class C, 2.58%, 12/15/2027 ‡ (a) | 600,000 | 555,214 |
NRZ Excess Spread-Collateralized Notes | ||
Series 2020-PLS1, Class A, 3.84%, 12/25/2025 (a) | 226,497 | 213,259 |
Series 2021-FNT1, Class A, 2.98%, 3/25/2026 (a) | 802,181 | 725,385 |
Series 2021-FNT2, Class A, 3.23%, 5/25/2026 (a) | 220,392 | 200,625 |
Series 2021-GNT1, Class A, 3.47%, 11/25/2026 (a) | 328,712 | 302,605 |
NRZ FHT Excess LLC Series 2020-FHT1, Class A, 4.21%, 11/25/2025 (a) | 262,437 | 247,378 |
INVESTMENTS | PRINCIPAL AMOUNT($) | VALUE($) |
Octane Receivables Trust Series 2020-1A, Class C, 2.89%, 3/20/2026 ‡ (a) | 350,000 | 333,258 |
Oportun Funding XIV LLC | ||
Series 2021-A, Class A, 1.21%, 3/8/2028 (a) | 100,000 | 93,245 |
Series 2021-A, Class C, 3.44%, 3/8/2028 ‡ (a) | 380,000 | 350,463 |
Oportun Issuance Trust | ||
Series 2022-2, Class C, 9.36%, 10/9/2029 ‡ (a) | 750,000 | 744,844 |
Series 2021-B, Class B, 1.96%, 5/8/2031 ‡ (a) | 400,000 | 366,879 |
Series 2021-B, Class C, 3.65%, 5/8/2031 ‡ (a) | 100,000 | 93,417 |
Series 2022-A, Class C, 7.40%, 6/9/2031 ‡ (a) | 755,000 | 735,374 |
Pagaya AI Debt Selection Trust Series 2021-1, Class B, 2.13%, 11/15/2027 ‡ (a) | 499,794 | 457,843 |
Prestige Auto Receivables Trust Series 2018-1A, Class D, 4.14%, 10/15/2024 (a) | 107,047 | 106,910 |
PRET LLC | ||
Series 2021-NPL6, Class A1, 2.49%, 7/25/2051 (a) (f) | 701,787 | 660,400 |
Series 2021-RN3, Class A1, 1.84%, 9/25/2051 ‡ (a) (f) | 855,746 | 797,494 |
Pretium Mortgage Credit Partners I LLC Series 2021-NPL1, Class A1, 2.24%, 9/27/2060 (a) (f) | 362,406 | 345,371 |
Progress Residential | ||
Series 2021-SFR3, Class E1, 2.54%, 5/17/2026 ‡ (a) | 450,000 | 392,941 |
Series 2021-SFR3, Class E2, 2.69%, 5/17/2026 ‡ (a) | 645,000 | 561,547 |
Progress Residential Trust | ||
Series 2022-SFR2, Class E2, 4.80%, 4/17/2027 ‡ | 651,000 | 589,995 |
Series 2020-SFR3, Class E, 2.30%, 10/17/2027 ‡ (a) | 300,000 | 271,991 |
Series 2020-SFR3, Class G, 4.11%, 10/17/2027 ‡ (a) | 500,000 | 463,381 |
Series 2020-SFR1, Class E, 3.03%, 4/17/2037 ‡ (a) | 425,000 | 401,531 |
Series 2020-SFR1, Class F, 3.43%, 4/17/2037 ‡ (a) | 450,000 | 421,134 |
Series 2020-SFR2, Class D, 3.87%, 6/17/2037 ‡ (a) | 750,000 | 720,407 |
August 31, 2022 | J.P. Morgan Exchange-Traded Funds | 67 |
AS OF August 31, 2022 (Unaudited) (continued)
INVESTMENTS | PRINCIPAL AMOUNT($) | VALUE($) |
Asset-Backed Securities — continued | ||
Series 2021-SFR2, Class E2, 2.65%, 4/19/2038 ‡ (a) | 400,000 | 347,499 |
Series 2021-SFR5, Class E1, 2.21%, 7/17/2038 ‡ (a) | 950,000 | 817,579 |
Series 2021-SFR5, Class E2, 2.36%, 7/17/2038 (a) | 270,000 | 230,908 |
Series 2022-SFR3, Class F, 6.60%, 4/17/2039 ‡ (a) | 665,000 | 625,168 |
Series 2022-SFR5, Class E2, 6.86%, 6/17/2039 ‡ (a) | 388,000 | 383,302 |
Series 2021-SFR7, Class E1, 2.59%, 8/17/2040 ‡ (a) | 793,000 | 646,492 |
Series 2022-SFR1, Class E2, 3.99%, 2/17/2041 ‡ (a) | 750,000 | 645,743 |
ReadyCap Lending Small Business Loan Trust Series 2019-2, Class A, 5.00%, 12/27/2044 (a) (g) | 85,988 | 81,804 |
Regional Management Issuance Trust | ||
Series 2020-1, Class C, 3.80%, 10/15/2030 ‡ (a) | 300,000 | 273,217 |
Series 2021-1, Class D, 5.07%, 3/17/2031 ‡ (a) | 500,000 | 420,992 |
Santander Revolving Auto Loan Trust Series 2019-A, Class D, 3.45%, 1/26/2032 (a) | 150,000 | 142,738 |
Sierra Timeshare Receivables Funding LLC | ||
Series 2020-2A, Class D, 6.59%, 7/20/2037 ‡ (a) | 729,303 | 708,544 |
Series 2021-1A, Class D, 3.17%, 11/20/2037 ‡ (a) | 341,639 | 316,445 |
Series 2022-1A, Class D, 6.00%, 10/20/2038 ‡ (a) | 695,969 | 662,682 |
Series 2022-2A, Class D, 9.22%, 6/20/2040 ‡ (a) | 675,884 | 670,387 |
SpringCastle America Funding LLC Series 2020-AA, Class A, 1.97%, 9/25/2037 (a) | 743,030 | 686,031 |
Theorem Funding Trust Series 2022-2A, Class A, 6.06%, 12/15/2028 (a) | 530,000 | 531,691 |
Tricon American Homes Series 2020-SFR1, Class E, 3.54%, 7/17/2038 ‡ (a) | 300,000 | 277,564 |
United Airlines Pass-Through Trust | ||
Series 2014-1, Class A, 4.00%, 4/11/2026 | 123,108 | 114,054 |
Series 2016-2, Class A, 3.10%, 10/7/2028 | 7,621 | 6,177 |
Series 2018-1, Class A, 3.70%, 3/1/2030 | 12,508 | 10,519 |
United Auto Credit Securitization Trust Series 2022-2, Class C, 5.81%, 5/10/2027 (a) | 856,000 | 852,074 |
INVESTMENTS | PRINCIPAL AMOUNT($) | VALUE($) |
Upstart Securitization Trust Series 2022-4, Class A, 5.98%, 8/20/2032 (a) | 1,093,000 | 1,089,029 |
US Airways Pass-Through Trust Series 2011-1, Class A, 7.13%, 10/22/2023 | 13,189 | 13,168 |
US Auto Funding Trust Series 2022-1A, Class D, 9.14%, 7/15/2027 (a) | 1,000,000 | 957,535 |
USASF Receivables LLC | ||
Series 2020-1A, Class B, 3.22%, 5/15/2024 (a) | 264,195 | 262,919 |
Series 2020-1A, Class D, 9.35%, 3/15/2027 (a) | 750,000 | 751,919 |
VCAT LLC | ||
Series 2021-NPL1, Class A1, 2.29%, 12/26/2050 ‡ (a) (f) | 230,639 | 221,665 |
Series 2021-NPL5, Class A1, 1.87%, 8/25/2051 ‡ (a) (f) | 641,450 | 592,353 |
Veros Auto Receivables Trust Series 2021-1, Class B, 1.49%, 10/15/2026 (a) | 300,000 | 286,521 |
VOLT XCII LLC Series 2021-NPL1, Class A1, 1.89%, 2/27/2051 (a) (f) | 157,936 | 147,103 |
VOLT XCIII LLC Series 2021-NPL2, Class A1, 1.89%, 2/27/2051 (a) (f) | 702,169 | 663,626 |
VOLT XCIV LLC Series 2021-NPL3, Class A1, 2.24%, 2/27/2051 (a) (f) | 226,900 | 215,825 |
Westgate Resorts LLC | ||
Series 2020-1A, Class C, 6.21%, 3/20/2034 ‡ (a) | 124,242 | 123,794 |
Series 2022-1A, Class B, 2.29%, 8/20/2036 ‡ (a) | 209,805 | 199,531 |
Series 2022-1A, Class D, 3.84%, 8/20/2036 ‡ (a) | 839,220 | 785,977 |
Westlake Automobile Receivables Trust Series 2022-2A, Class D, 5.48%, 9/15/2027 (a) | 1,000,000 | 996,804 |
Total Asset-Backed Securities (Cost $73,647,942) | 69,860,964 | |
U.S. Treasury Obligations — 15.9% | ||
U.S. Treasury Bonds | ||
4.50%, 8/15/2039 | 715,000 | 825,769 |
1.13%, 5/15/2040 | 994,000 | 676,541 |
4.38%, 5/15/2040 | 370,000 | 419,329 |
1.13%, 8/15/2040 | 2,755,000 | 1,858,118 |
1.38%, 11/15/2040 | 800,000 | 562,813 |
4.75%, 2/15/2041 | 2,113,000 | 2,500,686 |
2.25%, 5/15/2041 | 3,076,000 | 2,508,382 |
3.75%, 11/15/2043 | 2,226,000 | 2,279,215 |
3.38%, 11/15/2048 | 1,144,000 | 1,133,052 |
68 | J.P. Morgan Exchange-Traded Funds | August 31, 2022 |
INVESTMENTS | PRINCIPAL AMOUNT($) | VALUE($) |
U.S. Treasury Obligations — continued | ||
2.38%, 11/15/2049 | 3,939,000 | 3,246,136 |
2.00%, 2/15/2050 | 358,000 | 270,793 |
1.88%, 2/15/2051 | 1,207,000 | 880,686 |
2.38%, 5/15/2051 | 3,954,000 | 3,255,254 |
2.25%, 2/15/2052 | 6,776,000 | 5,412,330 |
U.S. Treasury Notes | ||
2.13%, 2/29/2024 | 156,000 | 152,947 |
1.13%, 2/28/2025 | 565,000 | 533,373 |
1.13%, 10/31/2026 | 10,471,000 | 9,540,881 |
0.50%, 8/31/2027 | 2,381,000 | 2,071,191 |
0.63%, 11/30/2027 | 2,224,000 | 1,933,490 |
1.25%, 3/31/2028 | 180,000 | 160,664 |
1.25%, 4/30/2028 | 4,100,000 | 3,654,605 |
1.25%, 9/30/2028 | 8,045,000 | 7,115,740 |
0.88%, 11/15/2030 | 430,000 | 359,436 |
1.63%, 5/15/2031 | 443,000 | 391,346 |
1.38%, 11/15/2031 | 678,000 | 580,776 |
1.88%, 2/15/2032 | 5,701,000 | 5,097,050 |
U.S. Treasury STRIPS Bonds | ||
2.52%, 5/15/2032 (h) | 2,200,000 | 1,595,425 |
1.64%, 5/15/2033 (h) | 3,205,000 | 2,244,516 |
2.28%, 2/15/2034 (h) | 838,000 | 571,132 |
1.32%, 8/15/2039 (h) | 511,000 | 295,107 |
2.37%, 11/15/2040 (h) | 3,172,000 | 1,657,040 |
2.26%, 8/15/2041 (h) | 207,000 | 103,339 |
2.22%, 11/15/2041 (h) | 845,000 | 425,942 |
2.58%, 2/15/2042 (h) | 1,065,000 | 517,463 |
1.38%, 2/15/2045 (h) | 649,000 | 285,692 |
Total U.S. Treasury Obligations (Cost $73,448,146) | 65,116,259 | |
Mortgage-Backed Securities — 15.6% | ||
FHLMC Gold Pools, 30 Year Pool # G60855, 4.50%, 12/1/2045 | 75,686 | 77,300 |
FHLMC Gold Pools, Other Pool # N31271, 4.50%, 1/1/2036 | 14,049 | 14,008 |
FHLMC UMBS, 30 Year Pool # QA5045, 4.00%, 11/1/2049 | 76,580 | 75,449 |
FNMA , 3.97%, 8/1/2032 (i) | 908,000 | 913,108 |
FNMA UMBS, 20 Year Pool # MA3004, 4.00%, 5/1/2037 | 371,083 | 371,637 |
FNMA UMBS, 30 Year | ||
Pool # AL2374, 4.00%, 12/1/2041 | 107,850 | 107,946 |
Pool # AL4244, 4.00%, 7/1/2042 | 125,047 | 125,429 |
Pool # BM1164, 3.50%, 12/1/2045 | 85,546 | 82,713 |
Pool # MA3073, 4.50%, 7/1/2047 | 20,190 | 20,396 |
Pool # BK4769, 5.00%, 8/1/2048 | 365,926 | 375,453 |
INVESTMENTS | PRINCIPAL AMOUNT($) | VALUE($) |
Pool # BN5013, 5.00%, 1/1/2049 | 120,092 | 123,190 |
Pool # BO1073, 4.50%, 6/1/2049 | 41,204 | 41,121 |
Pool # BO3039, 3.00%, 7/1/2049 | 169,223 | 157,173 |
Pool # BN6475, 4.00%, 7/1/2049 | 7,868 | 7,765 |
Pool # BO2562, 4.00%, 7/1/2049 | 111,462 | 110,788 |
Pool # BO4519, 4.00%, 8/1/2049 | 3,551 | 3,497 |
Pool # BO2203, 3.50%, 9/1/2049 | 256,204 | 246,211 |
Pool # FM9961, 3.00%, 12/1/2051 | 493,501 | 457,492 |
Pool # CB2637, 2.50%, 1/1/2052 | 510,119 | 456,817 |
Pool # BV0273, 3.00%, 1/1/2052 | 315,289 | 293,549 |
Pool # CB2670, 3.00%, 1/1/2052 | 459,204 | 427,591 |
Pool # BV3930, 3.00%, 2/1/2052 | 593,659 | 550,728 |
Pool # BV0295, 3.50%, 2/1/2052 | 670,348 | 649,614 |
Pool # BW6017, 3.50%, 5/1/2052 | 599,139 | 574,950 |
FNMA, Other | ||
Pool # BS6339, 11.00%, 7/12/2024 (i) | 1,100,000 | 1,091,409 |
Pool # AM8846, 2.68%, 5/1/2025 | 142,550 | 138,075 |
Pool # AM0414, 2.87%, 9/1/2027 | 400,000 | 383,440 |
Pool # AN7560, 2.90%, 12/1/2027 | 184,660 | 176,016 |
Pool # BL2367, 3.48%, 5/1/2029 | 540,538 | 529,173 |
Pool # BS1577, 1.82%, 2/1/2030 | 862,252 | 755,733 |
Pool # BS4878, 2.44%, 6/1/2030 | 597,043 | 544,574 |
Pool # 387898, 3.71%, 8/1/2030 | 750,000 | 746,235 |
Pool # BS5171, 2.51%, 10/1/2030 | 1,925,000 | 1,745,408 |
Pool # BS5985, 3.99%, 11/1/2030 | 425,000 | 428,011 |
Pool # BL9645, 1.50%, 1/1/2031 | 100,000 | 83,031 |
Pool # BL9627, 1.56%, 1/1/2031 | 500,000 | 417,313 |
Pool # BS1731, 1.82%, 1/1/2031 | 980,265 | 846,979 |
Pool # BS2422, 1.67%, 7/1/2031 | 1,200,000 | 1,003,210 |
Pool # BS2898, 1.56%, 9/1/2031 | 1,000,000 | 825,487 |
Pool # BS4563, 2.01%, 1/1/2032 | 1,100,000 | 945,355 |
Pool # BM7037, 1.76%, 3/1/2032 (g) | 1,099,950 | 925,010 |
Pool # BL6367, 1.82%, 4/1/2032 | 330,000 | 280,418 |
Pool # BS5130, 2.55%, 4/1/2032 | 497,111 | 449,825 |
Pool # BS6301, 3.67%, 8/1/2032 | 945,000 | 929,898 |
Pool # BS6335, 3.75%, 9/1/2032 (i) | 1,030,000 | 1,023,241 |
Pool # BL8708, 1.40%, 11/1/2032 | 200,000 | 159,210 |
Pool # AN6000, 3.21%, 7/1/2033 | 972,464 | 921,216 |
Pool # AN9725, 3.76%, 7/1/2033 | 103,043 | 102,153 |
Pool # BS4197, 2.14%, 12/1/2033 | 500,000 | 427,251 |
Pool # BS6427, IO, 3.75%, 9/1/2034 (i) | 1,000,000 | 1,003,125 |
Pool # BS5018, 2.88%, 10/1/2035 | 750,000 | 639,737 |
Pool # AN7345, 3.21%, 11/1/2037 | 638,456 | 588,521 |
Pool # MA1072, 3.50%, 5/1/2042 | 11,128 | 10,833 |
Pool # BF0230, 5.50%, 1/1/2058 | 435,322 | 470,727 |
August 31, 2022 | J.P. Morgan Exchange-Traded Funds | 69 |
AS OF August 31, 2022 (Unaudited) (continued)
INVESTMENTS | PRINCIPAL AMOUNT($) | VALUE($) |
Mortgage-Backed Securities — continued | ||
Pool # BF0400, 4.00%, 8/1/2059 | 769,915 | 755,902 |
Pool # BF0497, 3.00%, 7/1/2060 | 77,344 | 71,658 |
Pool # BF0560, 2.50%, 9/1/2061 | 983,118 | 866,639 |
Pool # BF0562, 3.50%, 9/1/2061 | 963,431 | 910,140 |
FNMA/FHLMC UMBS, Single Family, 30 Year TBA, 3.50%, 9/25/2052 (i) | 11,405,000 | 10,865,935 |
GNMA II | ||
Pool # CJ7125, ARM, 4.49%, 10/20/2071 (g) | 458,825 | 474,468 |
Pool # CJ7141, ARM, 4.41%, 11/20/2071 (g) | 440,291 | 453,480 |
Pool # CE9384, ARM, 4.49%, 11/20/2071 (g) | 717,186 | 740,737 |
Pool # CE5557, ARM, 4.58%, 11/20/2071 (g) | 98,781 | 102,861 |
Pool # CK2792, ARM, 4.58%, 3/20/2072 (g) | 809,519 | 844,181 |
Pool # CO0363, ARM, 4.75%, 7/20/2072 (g) | 779,000 | 823,855 |
GNMA II, 30 Year | ||
Pool # AJ9020, 4.50%, 10/20/2044 | 34,029 | 34,002 |
Pool # BB3525, 4.00%, 9/20/2047 | 24,278 | 24,266 |
Pool # BM2418, 4.00%, 8/20/2049 | 18,432 | 18,642 |
Pool # BN7049, 4.50%, 8/20/2049 | 161,388 | 165,370 |
Pool # BP7160, 4.50%, 9/20/2049 | 87,434 | 90,771 |
Pool # CC9803, 4.00%, 4/20/2051 | 410,819 | 406,267 |
Pool # MA7534, 2.50%, 8/20/2051 | 4,798,843 | 4,396,124 |
Pool # MA7705, 2.50%, 11/20/2051 | 6,589,323 | 6,021,287 |
Pool # CH7863, 3.50%, 12/20/2051 | 707,377 | 686,320 |
Pool # CI2080, 3.50%, 12/20/2051 | 854,333 | 824,547 |
Pool # CH0876, 3.00%, 1/20/2052 | 111,970 | 105,640 |
Pool # CH0877, 3.00%, 1/20/2052 | 276,457 | 260,742 |
Pool # CH0878, 3.00%, 1/20/2052 | 326,224 | 307,476 |
Pool # CJ3916, 3.00%, 1/20/2052 | 751,823 | 722,583 |
Pool # CK2608, 3.00%, 1/20/2052 | 476,427 | 448,479 |
Pool # CK4909, 3.00%, 1/20/2052 | 98,841 | 93,046 |
Pool # CK4916, 3.00%, 1/20/2052 | 232,239 | 218,206 |
Pool # CJ8184, 3.50%, 1/20/2052 | 633,033 | 611,023 |
Pool # CK4918, 3.50%, 1/20/2052 | 79,091 | 76,723 |
Pool # CK7137, 4.00%, 1/20/2052 | 486,929 | 480,344 |
Pool # CK2667, 3.00%, 2/20/2052 | 632,187 | 593,898 |
Pool # CK2672, 3.50%, 2/20/2052 | 594,538 | 575,249 |
Pool # CM2154, 3.00%, 3/20/2052 | 792,676 | 736,818 |
Pool # CM2278, 3.50%, 4/20/2052 | 865,249 | 839,319 |
Pool # CO4826, 5.00%, 6/20/2052 | 591,117 | 599,574 |
INVESTMENTS | PRINCIPAL AMOUNT($) | VALUE($) |
Pool # CO4847, 5.00%, 7/20/2052 | 884,740 | 897,501 |
Pool # MA8200, 4.00%, 8/20/2052 | 1,975,000 | 1,950,504 |
Total Mortgage-Backed Securities (Cost $68,146,024) | 63,949,116 | |
Commercial Mortgage-Backed Securities — 6.0% | ||
ACRE Commercial Mortgage Ltd. Series 2021-FL4, Class B, 3.78%, 12/18/2037 ‡ (a) (g) | 250,000 | 241,029 |
BAMLL Re-REMIC Trust | ||
Series 2014-FRR4, Class BK29, PO, 4/27/2023 (a) | 836,170 | 796,273 |
Series 2014-FRR5, Class AK37, 2.40%, 1/27/2047 (a) (g) | 770,000 | 733,129 |
BB-UBS Trust Series 2012-SHOW, Class E, 4.16%, 11/5/2036 ‡ (a) (g) | 225,000 | 202,751 |
Cascade Funding Mortgage Trust | ||
Series 2021-FRR1, Class DK45, 0.00%, 2/28/2025 ‡ (a) | 380,000 | 306,209 |
Series 2021-FRR1, Class CK45, 1.41%, 2/28/2025 ‡ (a) (g) | 500,000 | 429,883 |
Series 2021-FRR1, Class BK45, 2.11%, 2/28/2025 ‡ (a) (g) | 600,000 | 539,487 |
Series 2021-FRR1, Class CK54, 0.00%, 2/28/2026 ‡ (a) | 480,000 | 356,316 |
Series 2021-FRR1, Class DKW1, 0.00%, 2/28/2026 ‡ (a) | 430,000 | 321,596 |
Series 2021-FRR1, Class BK98, 0.00%, 8/29/2029 ‡ (a) | 1,150,000 | 677,076 |
Series 2021-FRR1, Class BK99, 0.00%, 9/29/2029 ‡ (a) | 400,000 | 218,909 |
FHLMC, Multi-Family Structured Credit Risk | ||
Series 2021-MN1, Class M1, 4.18%, 1/25/2051 (a) (g) | 284,425 | 274,547 |
Series 2021-MN1, Class M2, 5.93%, 1/25/2051 (a) (g) | 685,000 | 633,820 |
Series 2021-MN3, Class M1, 4.48%, 11/25/2051 (a) (g) | 619,799 | 595,627 |
Series 2022-MN4, Class M1, 6.43%, 5/25/2052 (a) (g) | 997,956 | 1,031,785 |
FHLMC, Multi-Family Structured Pass-Through Certificates | ||
Series KW06, Class A2, 3.80%, 6/25/2028 (g) | 1,750,000 | 1,748,950 |
Series K088, Class A2, 3.69%, 1/25/2029 | 350,000 | 348,184 |
Series KLU3, Class X1, IO, 2.08%, 1/25/2031 (g) | 642 | 74 |
Series K128, Class X3, IO, 2.88%, 4/25/2031 (g) | 550,000 | 98,906 |
70 | J.P. Morgan Exchange-Traded Funds | August 31, 2022 |
INVESTMENTS | PRINCIPAL AMOUNT($) | VALUE($) |
Commercial Mortgage-Backed Securities — continued | ||
Series K142, Class A2, 2.40%, 3/25/2032 | 1,250,000 | 1,109,286 |
Series K-1520, Class X1, IO, 0.58%, 2/25/2036 ‡ (g) | 4,492,532 | 197,737 |
Series K-1520, Class X3, IO, 3.20%, 4/25/2039 (g) | 550,000 | 151,272 |
Series 2022-MN4, Class M2, 8.68%, 5/25/2052 (a) (g) | 750,000 | 757,017 |
Series K145, Class AM, 2.58%, 6/25/2055 | 1,100,000 | 983,330 |
Series Q014, Class X, IO, 2.80%, 10/25/2055 (g) | 1,924,629 | 382,349 |
FNMA ACES | ||
Series 2017-M3, Class A2, 2.55%, 12/25/2026 (g) | 269,311 | 255,858 |
Series 2021-M11, Class A2, 1.51%, 3/25/2031 (g) | 300,000 | 250,597 |
Series 2022-M1, Class A1, 1.73%, 10/25/2031 (g) | 485,544 | 437,905 |
Series 2022-M3, Class A2, 1.76%, 11/25/2031 (g) | 1,400,000 | ��� 1,174,544 |
Series 2020-M53, Class A2, 1.74%, 11/25/2032 (g) | 1,250,000 | 1,026,577 |
Series 2021-M3, Class 1A1, 1.00%, 11/25/2033 | 63,251 | 60,163 |
Series 2021-M3, Class X1, IO, 2.07%, 11/25/2033 (g) | 542,795 | 60,361 |
FNMA, Multi-Family REMIC Trust Series 2022-M1G, Class A2, 1.58%, 9/25/2031 (g) | 700,000 | 584,667 |
FREMF Mortgage Trust | ||
Series 2018-KL3W, Class CW, 4.23%, 8/25/2025 (a) (g) | 250,000 | 228,905 |
Series 2018-KBX1, Class B, 3.69%, 1/25/2026 (a) (g) | 500,000 | 465,011 |
Series 2021-KHG3, Class BFX, 2.48%, 9/25/2028 (a) (g) | 1,000,000 | 836,984 |
Series 2015-K44, Class B, 3.85%, 1/25/2048 (a) (g) | 200,000 | 195,461 |
Series 2015-K45, Class B, 3.73%, 4/25/2048 (a) (g) | 199,293 | 194,301 |
Series 2015-K48, Class B, 3.77%, 8/25/2048 (a) (g) | 200,000 | 192,663 |
Series 2015-K50, Class B, 3.91%, 10/25/2048 (a) (g) | 200,000 | 194,198 |
Series 2015-K51, Class B, 4.09%, 10/25/2048 (a) (g) | 381,860 | 368,270 |
Series 2016-K52, Class B, 4.06%, 1/25/2049 (a) (g) | 250,000 | 242,785 |
INVESTMENTS | PRINCIPAL AMOUNT($) | VALUE($) |
Series 2016-K53, Class C, 4.16%, 3/25/2049 (a) (g) | 70,000 | 66,708 |
Series 2017-K729, Class B, 3.80%, 11/25/2049 (a) (g) | 300,000 | 291,635 |
FRR Re-REMIC Trust Series 2018-C1, Class CK43, PO, 2/27/2048 ‡ (a) | 612,660 | 501,119 |
JPMCC Re-REMIC Trust Series 2015-FRR2, Class AK39, 2.76%, 8/27/2047 (a) (g) | 944,000 | 895,182 |
MHC Commercial Mortgage Trust Series 2021-MHC, Class F, 4.99%, 4/15/2038 ‡ (a) (g) | 600,000 | 570,238 |
Multi-Family Connecticut Avenue Securities Trust | ||
Series 2019-01, Class M10, 5.69%, 10/25/2049 ‡ (a) (g) | 988,702 | 944,672 |
Series 2020-01, Class M7, 4.39%, 3/25/2050 ‡ (a) (g) | 272,907 | 267,659 |
Series 2020-01, Class M10, 6.19%, 3/25/2050 (a) (g) | 1,000,000 | 950,519 |
PFP Ltd. (Cayman Islands) | ||
Series 2021-7, Class C, 4.04%, 4/14/2038 ‡ (a) (g) | 164,992 | 154,962 |
Series 2021-7, Class D, 4.79%, 4/14/2038 ‡ (a) (g) | 169,992 | 163,465 |
Total Commercial Mortgage-Backed Securities (Cost $26,237,272) | 24,710,951 | |
Collateralized Mortgage Obligations — 3.1% | ||
Ajax Mortgage Loan Trust Series 2021-B, Class A, 2.24%, 6/25/2066 ‡ (a) (f) | 281,334 | 261,187 |
Anchor Mortgage Trust Series 2021-1, Class A2, 3.65%, 10/25/2026 (a) (f) | 476,191 | 450,742 |
Bayview Financing Trust Series 2021-2F, Class M2, 3.76%, 1/10/2032 ‡ (a) (g) | 109,962 | 110,270 |
Cascade MH Asset Trust Series 2022-MH1, Class M, 4.25%, 8/25/2054 ‡ (a) (f) | 1,000,000 | 813,603 |
CSMC Trust | ||
Series 2021-JR1, Class A1, 2.46%, 9/27/2066 (a) (g) | 552,196 | 526,338 |
Series 2022-JR1, Class A1, 4.27%, 10/25/2066 (a) (f) | 828,091 | 799,166 |
FHLMC, REMIC | ||
Series 2708, Class ZD, 5.50%, 11/15/2033 | 91,793 | 96,054 |
Series 4302, Class PA, 4.00%, 12/15/2043 | 66,621 | 65,926 |
Series 4281, Class BC, 4.50%, 12/15/2043 (g) | 95,192 | 96,796 |
August 31, 2022 | J.P. Morgan Exchange-Traded Funds | 71 |
AS OF August 31, 2022 (Unaudited) (continued)
INVESTMENTS | PRINCIPAL AMOUNT($) | VALUE($) |
Collateralized Mortgage Obligations — continued | ||
FMC GMSR Issuer Trust Series 2022-GT2, Class B, 10.07%, 7/25/2027 (a) | 1,000,000 | 979,844 |
FNMA, REMIC | ||
Series 2003-7, Class FA, 3.19%, 2/25/2033 (g) | 91,403 | 92,351 |
Series 2013-108, Class GU, 3.00%, 10/25/2033 | 503,070 | 487,030 |
Series 2005-110, Class TY, 5.50%, 12/25/2035 | 57,238 | 60,221 |
Series 2007-89, Class F, 3.02%, 9/25/2037 (g) | 102,738 | 103,166 |
Series 2011-112, Class PB, 4.00%, 11/25/2041 | 119,045 | 117,601 |
GNMA | ||
Series 2010-H24, Class FA, 2.15%, 10/20/2060 (g) | 66,202 | 65,604 |
Series 2014-H03, Class FA, 2.40%, 1/20/2064 (g) | 48,957 | 48,763 |
Series 2015-H05, Class FC, 2.28%, 2/20/2065 (g) | 259,330 | 257,125 |
Home RE Ltd. (Bermuda) | ||
Series 2021-2, Class M1A, 3.43%, 1/25/2034 ‡ (a) (g) | 167,059 | 166,424 |
Series 2022-1, Class M1C, 7.68%, 10/25/2034 ‡ (a) (g) | 750,000 | 758,906 |
LHOME Mortgage Trust Series 2021-RTL1, Class A1, 2.09%, 9/25/2026 (a) (g) | 255,000 | 245,926 |
PMT Credit Risk Transfer Trust Series 2021-1R, Class A, 5.34%, 2/27/2024 (a) (g) | 241,527 | 236,047 |
PRPM LLC Series 2021-2, Class A1, 2.12%, 3/25/2026 (a) (g) | 170,126 | 161,543 |
RCO VI Mortgage LLC Series 2022-1, Class A1, 3.00%, 1/25/2027 (a) (f) | 497,511 | 471,163 |
Seasoned Credit Risk Transfer Trust | ||
Series 2018-1, Class M60C, 3.50%, 5/25/2057 | 160,562 | 155,885 |
Series 2018-3, Class MA, 3.50%, 8/25/2057 ‡ (g) | 65,112 | 63,732 |
Series 2018-3, Class M55D, 4.00%, 8/25/2057 ‡ (g) | 290,794 | 287,646 |
Series 2018-2, Class MT, 3.50%, 11/25/2057 | 633,090 | 605,714 |
Series 2018-2, Class M55D, 4.00%, 11/25/2057 | 322,992 | 318,038 |
Series 2019-1, Class MA, 3.50%, 7/25/2058 | 126,635 | 123,750 |
Series 2019-2, Class MA, 3.50%, 8/25/2058 ‡ | 148,522 | 145,024 |
INVESTMENTS | PRINCIPAL AMOUNT($) | VALUE($) |
Series 2020-3, Class M5TW, 3.00%, 5/25/2060 ‡ | 522,825 | 498,205 |
Series 2020-3, Class TTW, 3.00%, 5/25/2060 ‡ | 528,566 | 508,434 |
Series 2021-1, Class BXS, 11.45%, 9/25/2060 ‡ (a) (g) | 150,000 | 122,733 |
Series 2022-1, Class MTU, 3.25%, 11/25/2061 | 518,183 | 487,052 |
Towd Point Mortgage Trust Series 2021-R1, Class A2C, 3.31%, 11/30/2060 (a) | 754,000 | 715,061 |
VM Master Issuer LLC Series 2022-1, Class B, 6.88%, 5/24/2025 ‡ (a) (g) | 800,000 | 774,640 |
VOLT CV LLC Series 2021-CF2, Class A1, 2.49%, 11/27/2051 (a) (f) | 423,215 | 399,311 |
Total Collateralized Mortgage Obligations (Cost $13,195,856) | 12,677,021 | |
SHARES | ||
Common Stocks — 0.0% ^ | ||
Oil, Gas & Consumable Fuels — 0.0% ^ | ||
Chesapeake Energy Corp. | 23 | 2,311 |
Chord Energy Corp. | 109 | 15,429 |
EP Energy Corp. * | 275 | 2,338 |
20,078 | ||
Professional Services — 0.0% ^ | ||
NMG, Inc. * | 1 | 180 |
Wireless Telecommunication Services — 0.0% ^ | ||
Intelsat SA (Luxembourg) ‡ * | 270 | 7,425 |
Total Common Stocks (Cost $12,779) | 27,683 | |
PRINCIPAL AMOUNT($) | ||
Municipal Bonds — 0.0% (j) ^ | ||
Ohio — 0.0% ^ | ||
Ohio University, General Receipts, Federally Taxable Rev., 5.59%, 12/1/2114(Cost $32,776) | 25,000 | 24,387 |
NO. OF WARRANTS | ||
Warrants — 0.0% ^ | ||
Diversified Telecommunication Services — 0.0% ^ | ||
Windstream Holdings, Inc. expiring 12/31/2049, price 10.75 USD ‡ * | 16 | 216 |
72 | J.P. Morgan Exchange-Traded Funds | August 31, 2022 |
INVESTMENTS | NO. OF WARRANTS | VALUE($) |
Warrants — continued | ||
Media — 0.0% ^ | ||
Nmg Research Ltd. expiring 9/24/2027, price 1.00 USD (United Kingdom) ‡ * | 78 | 3,965 |
Oil, Gas & Consumable Fuels — 0.0% ^ | ||
Chesapeake Energy Corp. | ||
expiring 2/9/2026, price 25.10 USD* | 71 | 6,237 |
expiring 2/9/2026, price 29.18 USD* | 79 | 6,623 |
expiring 2/9/2026, price 32.86 USD* | 44 | 3,547 |
16,407 | ||
Total Warrants (Cost $1) | 20,588 | |
SHARES | ||
Preferred Stocks — 0.0% ^ | ||
Internet & Direct Marketing Retail — 0.0% ^ | ||
MYT Holding LLC Series A, 10.00%, 6/6/2029 ‡(Cost $2,753) | 2,868 | 3,140 |
NO. OF RIGHTS | ||
Rights — 0.0% ^ | ||
Diversified Telecommunication Services — 0.0% ^ | ||
Intelsat Jackson Holdings SA, expiring 12/5/2025 (Luxembourg) ‡ * (Cost $1 ) | 56 | 1 |
SHARES | ||
Short-Term Investments — 15.7% | ||
Investment Companies — 15.7% | ||
JPMorgan U.S. Government Money Market Fund Class IM Shares, 2.00% (k) (l) (Cost $64,292,445) | 64,292,445 | 64,292,445 |
Total Investments — 103.0% (Cost $454,790,467) | 422,677,176 | |
Liabilities in Excess of Other Assets — (3.0)% | (12,400,076) | |
NET ASSETS — 100.0% | 410,277,100 | |
Percentages indicated are based on net assets. |
Abbreviations | |
ABS | Asset-Backed Securities |
ACES | Alternative Credit Enhancement Securities |
ARM | Adjustable Rate Mortgage. The interest rate shown is the rate in effect as of August 31, 2022. |
CSMC | Credit Suisse Mortgage Trust |
FHLMC | Federal Home Loan Mortgage Corp. |
FNMA | Federal National Mortgage Association |
GNMA | Government National Mortgage Association |
ICE | Intercontinental Exchange |
IO | Interest Only represents the right to receive the monthly interest payments on an underlying pool of mortgage loans. The principal amount shown represents the par value on the underlying pool. The yields on these securities are subject to accelerated principal paydowns as a result of prepayment or refinancing of the underlying pool of mortgage instruments. As a result, interest income may be reduced considerably. |
LIBOR | London Interbank Offered Rate |
PO | Principal Only represents the right to receive the principal portion only on an underlying pool of mortgage loans. The market value of these securities is extremely volatile in response to changes in market interest rates. As prepayments on the underlying mortgages of these securities increase, the yield on these securities increases. |
RE | Reinsured |
REMIC | Real Estate Mortgage Investment Conduit |
Re-REMIC | Combined Real Estate Mortgage Investment Conduit |
Rev. | Revenue |
SCA | Limited partnership with share capital |
SOFR | Secured Overnight Financing Rate |
STRIPS | Separate Trading of Registered Interest and Principal of Securities. The STRIPS Program lets investors hold and trade individual interest and principal components of eligible notes and bonds as separate securities. |
TBA | To Be Announced; Security is subject to delayed delivery. |
UMBS | Uniform Mortgage-Backed Securities |
USD | United States Dollar |
^ | Amount rounds to less than 0.1% of net assets. | |
‡ | Value determined using significant unobservable inputs. | |
* | Non-income producing security. | |
(a) | Securities exempt from registration under Rule 144A or section 4(a)(2), of the Securities Act of 1933, as amended. | |
(b) | Variable or floating rate security, linked to the referenced benchmark. The interest rate shown is the current rate as of August 31, 2022. | |
(c) | Security is an interest bearing note with preferred security characteristics. | |
(d) | Security is perpetual and thus, does not have a predetermined maturity date. The coupon rate for this security is fixed for a period of time and may be structured to adjust thereafter. The date shown, if applicable, reflects the next call date. The coupon rate shown is the rate in effect as of August 31, 2022. | |
(e) | Defaulted security. | |
(f) | Step bond. Interest rate is a fixed rate for an initial period that either resets at a specific date or may reset in the future contingent upon a predetermined trigger. The interest rate shown is the current rate as of August 31, 2022. | |
August 31, 2022 | J.P. Morgan Exchange-Traded Funds | 73 |
AS OF August 31, 2022 (Unaudited) (continued)
(g) | Variable or floating rate security, the interest rate of which adjusts periodically based on changes in current interest rates and prepayments on the underlying pool of assets. The interest rate shown is the current rate as of August 31, 2022. | |
(h) | The rate shown is the effective yield as of August 31, 2022. | |
(i) | All or a portion of the security is a when-issued security, delayed delivery security, or forward commitment. |
(j) | The date shown represents the earliest of the prerefunded date, next put date or final maturity date. | |
(k) | Investment in an affiliated fund, which is registered under the Investment Company Act of 1940, as amended, and is advised by J.P. Morgan Investment Management Inc. | |
(l) | The rate shown is the current yield as of August 31, 2022. |
DESCRIPTION | NUMBER OF CONTRACTS | EXPIRATION DATE | TRADING CURRENCY | NOTIONAL AMOUNT ($) | VALUE AND UNREALIZED APPRECIATION (DEPRECIATION) ($) |
Long Contracts | |||||
U.S. Treasury 10 Year Note | 77 | 12/20/2022 | USD | 8,980,125 | (72,193) |
U.S. Treasury Long Bond | 38 | 12/20/2022 | USD | 5,147,813 | (42,832) |
U.S. Treasury Ultra Bond | 54 | 12/20/2022 | USD | 8,039,250 | (34,681) |
U.S. Treasury 2 Year Note | 133 | 12/30/2022 | USD | 27,697,250 | (54,666) |
U.S. Treasury 5 Year Note | 95 | 12/30/2022 | USD | 10,513,828 | (50,658) |
(255,030) | |||||
Short Contracts | |||||
U.S. Treasury 10 Year Note | (2) | 12/20/2022 | USD | (233,250) | 1,808 |
U.S. Treasury 10 Year Ultra Note | (35) | 12/20/2022 | USD | (4,370,078) | 37,505 |
U.S. Treasury 5 Year Note | (1) | 12/30/2022 | USD | (110,672) | 529 |
39,842 | |||||
(215,188) |
Abbreviations | |
USD | United States Dollar |
REFERENCE OBLIGATION/INDEX | FINANCING RATE PAID BY THE FUND (%) | PAYMENT FREQUENCY | MATURITY DATE | IMPLIED CREDIT SPREAD (%)(a) | NOTIONAL AMOUNT(b) | UPFRONT PAYMENTS (RECEIPTS) ($)(c) | UNREALIZED APPRECIATION (DEPRECIATION) ($) | VALUE ($) |
CDX.NA.HY.38-V2 | 5.00 | Quarterly | 6/20/2027 | 5.31 | USD 6,000,000 | (128,710) | 142,092 | 13,382 |
(*) | The Fund, as a buyer of credit protection, is generally obligated to make periodic payments and may also pay or receive an upfront premium to or from the protection seller, in exchange for the right to receive a contingent payment, upon occurrence of a credit event with respect to an underlying reference obligation, as defined under the terms of individual swap contracts. | ||||||||
(a) | Implied credit spreads are an indication of the seller's performance risk, related to the likelihood of a credit event occurring that would require a seller to make payment to a buyer. Implied credit spreads are used to determine the value of swap contracts and reflect the cost of buying/selling protection, which may include upfront payments made to enter into the contract. Therefore, higher spreads would indicate a greater likelihood that a seller will be obligated to perform (i.e. make payment) under the swap contract.Increasing values, in absolute terms and relative to notional amounts, are also indicative of greater performance risk. Implied credit spreads for credit default swaps on credit indices are linked to the weighted average spread across the underlying reference obligations included in a particular index. | ||||||||
74 | J.P. Morgan Exchange-Traded Funds | August 31, 2022 |
(b) | The notional amount is the maximum amount that a seller of credit protection would be obligated to pay and a buyer of credit protection would receive, upon occurrence of a credit event. | ||||||||
(c) | Upfront payments and receipts generally represent premiums paid or received at the initiation of the agreement to compensate the differences between the stated terms of the swap agreement and current market conditions (credit spreads, interest rates and other relevant factors). | ||||||||
Abbreviations | |
CDX | Credit Default Swap Index |
USD | United States Dollar |
REFERENCE OBLIGATION/INDEX | FINANCING RATE PAID BY THE FUND (%) | PAYMENT FREQUENCY | MATURITY DATE | IMPLIED CREDIT SPREAD (%)(a) | NOTIONAL AMOUNT(b) | UPFRONT PAYMENTS (RECEIPTS) ($)(c) | UNREALIZED APPRECIATION (DEPRECIATION) ($) | VALUE ($) |
CDX.NA.IG.38-V1 | 1.00 | Quarterly | 6/20/2027 | 0.92 | USD 11,000,000 | (5,524) | 64,459 | 58,935 |
CDX.NA.HY.38-V2 | 5.00 | Quarterly | 6/20/2027 | 5.31 | USD 3,700,000 | (102,952) | 94,700 | (8,252) |
(108,476) | 159,159 | 50,683 |
(**) | The Fund, as a seller of credit protection, receives periodic payments and may also receive or pay an upfront premium from or to the protection buyer, and is obligated to make a contingent payment, upon occurrence of a credit event with respect to an underlying reference obligation, as defined under the terms of individual swap contracts. | ||||||||
(a) | Implied credit spreads are an indication of the seller's performance risk, related to the likelihood of a credit event occurring that would require a seller to make payment to a buyer. Implied credit spreads are used to determine the value of swap contracts and reflect the cost of buying/selling protection, which may include upfront payments made to enter into the contract. Therefore, higher spreads would indicate a greater likelihood that a seller will be obligated to perform (i.e. make payment) under the swap contract.Increasing values, in absolute terms and relative to notional amounts, are also indicative of greater performance risk. Implied credit spreads for credit default swaps on credit indices are linked to the weighted average spread across the underlying reference obligations included in a particular index. | ||||||||
(b) | The notional amount is the maximum amount that a seller of credit protection would be obligated to pay and a buyer of credit protection would receive, upon occurrence of a credit event. | ||||||||
(c) | Upfront payments and receipts generally represent premiums paid or received at the initiation of the agreement to compensate the differences between the stated terms of the swap agreement and current market conditions (credit spreads, interest rates and other relevant factors). | ||||||||
Abbreviations | |
CDX | Credit Default Swap Index |
USD | United States Dollar |
August 31, 2022 | J.P. Morgan Exchange-Traded Funds | 75 |
AS OF August 31, 2022 (Unaudited)
INVESTMENTS | PRINCIPAL AMOUNT($) | VALUE($) |
Corporate Bonds — 98.4% | ||
Aerospace & Defense — 4.3% | ||
BAE Systems plc (United Kingdom) 3.40%, 4/15/2030 (a) | 35,000 | 31,864 |
Boeing Co. (The) | ||
4.51%, 5/1/2023 | 132,000 | 132,241 |
4.88%, 5/1/2025 | 189,000 | 189,528 |
5.04%, 5/1/2027 | 120,000 | 119,639 |
3.60%, 5/1/2034 | 159,000 | 129,364 |
5.71%, 5/1/2040 | 105,000 | 100,149 |
3.75%, 2/1/2050 | 30,000 | 21,530 |
L3Harris Technologies, Inc. 4.40%, 6/15/2028 | 174,000 | 171,038 |
Leidos, Inc. | ||
4.38%, 5/15/2030 | 238,000 | 219,718 |
2.30%, 2/15/2031 | 80,000 | 62,794 |
Northrop Grumman Corp. | ||
3.25%, 1/15/2028 | 90,000 | 85,402 |
4.03%, 10/15/2047 | 41,000 | 36,031 |
Precision Castparts Corp. 3.25%, 6/15/2025 | 24,000 | 23,721 |
Raytheon Technologies Corp. | ||
3.50%, 3/15/2027 | 63,000 | 61,012 |
3.13%, 5/4/2027 | 146,000 | 139,394 |
4.45%, 11/16/2038 | 107,000 | 100,368 |
3.75%, 11/1/2046 | 88,000 | 73,203 |
1,696,996 | ||
Air Freight & Logistics — 0.6% | ||
FedEx Corp. | ||
2.40%, 5/15/2031 | 60,000 | 50,500 |
3.25%, 5/15/2041 | 110,000 | 85,791 |
4.05%, 2/15/2048 | 90,000 | 76,003 |
212,294 | ||
Auto Components — 0.3% | ||
Lear Corp. 3.80%, 9/15/2027 | 140,000 | 132,236 |
Automobiles — 0.7% | ||
General Motors Co. 6.13%, 10/1/2025 | 273,000 | 280,990 |
Banks — 15.0% | ||
Bank of America Corp. | ||
(ICE LIBOR USD 3 Month + 0.79%), 3.00%, 12/20/2023 (b) | 300,000 | 298,892 |
(ICE LIBOR USD 3 Month + 0.78%), 3.55%, 3/5/2024 (b) | 146,000 | 145,409 |
(ICE LIBOR USD 3 Month + 0.87%), 2.46%, 10/22/2025 (b) | 30,000 | 28,626 |
(SOFR + 1.15%), 1.32%, 6/19/2026 (b) | 60,000 | 54,586 |
(ICE LIBOR USD 3 Month + 1.06%), 3.56%, 4/23/2027 (b) | 154,000 | 147,009 |
INVESTMENTS | PRINCIPAL AMOUNT($) | VALUE($) |
Banks — continued | ||
(ICE LIBOR USD 3 Month + 1.58%), 3.82%, 1/20/2028 (b) | 146,000 | 139,756 |
(ICE LIBOR USD 3 Month + 1.04%), 3.42%, 12/20/2028 (b) | 210,000 | 194,515 |
(ICE LIBOR USD 3 Month + 0.99%), 2.50%, 2/13/2031 (b) | 237,000 | 198,841 |
(SOFR + 1.32%), 2.69%, 4/22/2032 (b) | 60,000 | 49,740 |
(US Treasury Yield Curve Rate T Note Constant Maturity 5 Year + 1.20%), 2.48%, 9/21/2036 (b) | 53,000 | 41,086 |
(ICE LIBOR USD 3 Month + 1.81%), 4.24%, 4/24/2038 (b) | 59,000 | 53,079 |
(SOFR + 1.93%), 2.68%, 6/19/2041 (b) | 50,000 | 35,802 |
(ICE LIBOR USD 3 Month + 1.19%), 3.95%, 1/23/2049 (b) | 50,000 | 42,438 |
(ICE LIBOR USD 3 Month + 3.15%), 4.08%, 3/20/2051 (b) | 78,000 | 66,875 |
Barclays plc (United Kingdom) (US Treasury Yield Curve Rate T Note Constant Maturity 1 Year + 2.30%), 5.30%, 8/9/2026 (b) | 330,000 | 327,582 |
Citigroup, Inc. | ||
(ICE LIBOR USD 3 Month + 0.90%), 3.35%, 4/24/2025 (b) | 428,000 | 419,459 |
(SOFR + 2.84%), 3.11%, 4/8/2026 (b) | 78,000 | 74,921 |
3.20%, 10/21/2026 | 188,000 | 179,577 |
(SOFR + 1.15%), 2.67%, 1/29/2031 (b) | 107,000 | 90,212 |
(SOFR + 3.91%), 4.41%, 3/31/2031 (b) | 156,000 | 148,863 |
(ICE LIBOR USD 3 Month + 1.17%), 3.88%, 1/24/2039 (b) | 87,000 | 75,495 |
4.65%, 7/23/2048 | 78,000 | 73,527 |
Citizens Financial Group, Inc. 3.25%, 4/30/2030 | 150,000 | 132,298 |
HSBC Holdings plc (United Kingdom) | ||
(ICE LIBOR USD 3 Month + 1.61%), 3.97%, 5/22/2030 (b) | 200,000 | 180,568 |
6.10%, 1/14/2042 | 75,000 | 81,177 |
Mitsubishi UFJ Financial Group, Inc. (Japan) | ||
3.76%, 7/26/2023 | 177,000 | 176,749 |
3.68%, 2/22/2027 | 31,000 | 29,777 |
3.96%, 3/2/2028 | 177,000 | 170,643 |
3.74%, 3/7/2029 | 289,000 | 273,535 |
NatWest Group plc (United Kingdom) (US Treasury Yield Curve Rate T Note Constant Maturity 1 Year + 0.90%), 1.64%, 6/14/2027 (b) | 228,000 | 199,603 |
PNC Financial Services Group, Inc. (The) 2.60%, 7/23/2026 | 152,000 | 143,518 |
76 | J.P. Morgan Exchange-Traded Funds | August 31, 2022 |
INVESTMENTS | PRINCIPAL AMOUNT($) | VALUE($) |
Corporate Bonds — continued | ||
Banks — continued | ||
Sumitomo Mitsui Financial Group, Inc. (Japan) 2.93%, 9/17/2041 | 200,000 | 144,974 |
Toronto-Dominion Bank (The) (Canada) 2.45%, 1/12/2032 | 200,000 | 166,669 |
Truist Financial Corp. 1.13%, 8/3/2027 | 90,000 | 77,386 |
Wells Fargo & Co. | ||
(SOFR + 2.00%), 2.19%, 4/30/2026 (b) | 53,000 | 49,610 |
(ICE LIBOR USD 3 Month + 1.31%), 3.58%, 5/22/2028 (b) | 349,000 | 329,309 |
(SOFR + 1.43%), 2.88%, 10/30/2030 (b) | 202,000 | 177,182 |
5.38%, 11/2/2043 | 96,000 | 95,726 |
3.90%, 5/1/2045 | 117,000 | 98,952 |
4.75%, 12/7/2046 | 68,000 | 62,089 |
Westpac Banking Corp. (Australia) | ||
(US Treasury Yield Curve Rate T Note Constant Maturity 5 Year + 1.35%), 2.89%, 2/4/2030 (b) | 50,000 | 46,952 |
(USD ICE Swap Rate 5 Year + 2.24%), 4.32%, 11/23/2031 (b) | 160,000 | 152,285 |
(US Treasury Yield Curve Rate T Note Constant Maturity 5 Year + 2.00%), 4.11%, 7/24/2034 (b) | 107,000 | 96,245 |
(US Treasury Yield Curve Rate T Note Constant Maturity 5 Year + 1.53%), 3.02%, 11/18/2036 (b) | 53,000 | 41,815 |
2.96%, 11/16/2040 | 71,000 | 50,568 |
5,863,920 | ||
Beverages — 2.9% | ||
Anheuser-Busch Cos. LLC (Belgium) | ||
3.65%, 2/1/2026 | 51,000 | 50,128 |
4.70%, 2/1/2036 | 77,000 | 74,497 |
4.90%, 2/1/2046 | 160,000 | 151,897 |
Anheuser-Busch InBev Worldwide, Inc. (Belgium) | ||
4.00%, 4/13/2028 | 49,000 | 48,429 |
4.90%, 1/23/2031 | 34,000 | 34,930 |
4.60%, 4/15/2048 | 120,000 | 108,833 |
4.44%, 10/6/2048 | 39,000 | 34,668 |
Coca-Cola Co. (The) | ||
1.75%, 9/6/2024 | 217,000 | 210,370 |
2.88%, 5/5/2041 | 78,000 | 63,460 |
2.60%, 6/1/2050 | 55,000 | 40,036 |
2.75%, 6/1/2060 | 59,000 | 42,037 |
Constellation Brands, Inc. 3.15%, 8/1/2029 | 66,000 | 59,336 |
Keurig Dr Pepper, Inc. 3.80%, 5/1/2050 | 20,000 | 15,552 |
Molson Coors Beverage Co. 4.20%, 7/15/2046 | 30,000 | 24,694 |
INVESTMENTS | PRINCIPAL AMOUNT($) | VALUE($) |
Beverages — continued | ||
PepsiCo, Inc. | ||
2.75%, 3/19/2030 | 30,000 | 27,427 |
3.50%, 3/19/2040 | 66,000 | 58,204 |
2.75%, 10/21/2051 | 100,000 | 75,480 |
1,119,978 | ||
Biotechnology — 2.8% | ||
AbbVie, Inc. | ||
2.90%, 11/6/2022 | 105,000 | 104,921 |
3.60%, 5/14/2025 | 68,000 | 66,753 |
2.95%, 11/21/2026 | 122,000 | 115,083 |
4.25%, 11/14/2028 | 192,000 | 188,593 |
4.05%, 11/21/2039 | 161,000 | 141,919 |
4.70%, 5/14/2045 | 68,000 | 63,333 |
Amgen, Inc. | ||
2.20%, 2/21/2027 | 68,000 | 62,492 |
2.45%, 2/21/2030 | 63,000 | 55,127 |
3.15%, 2/21/2040 | 40,000 | 31,615 |
4.40%, 5/1/2045 | 20,000 | 17,993 |
3.38%, 2/21/2050 | 20,000 | 15,275 |
4.40%, 2/22/2062 | 138,000 | 119,595 |
Biogen, Inc. 3.15%, 5/1/2050 | 80,000 | 54,570 |
Gilead Sciences, Inc. 4.15%, 3/1/2047 | 47,000 | 40,858 |
Regeneron Pharmaceuticals, Inc. 1.75%, 9/15/2030 | 10,000 | 7,908 |
1,086,035 | ||
Building Products — 0.0% ^ | ||
Carrier Global Corp. 3.58%, 4/5/2050 | 20,000 | 15,267 |
Capital Markets — 6.8% | ||
Charles Schwab Corp. (The) 1.95%, 12/1/2031 | 146,000 | 118,990 |
CME Group, Inc. 3.00%, 3/15/2025 | 109,000 | 106,942 |
Credit Suisse Group AG (Switzerland) (ICE LIBOR USD 3 Month + 1.24%), 4.21%, 6/12/2024 (a) (b) | 250,000 | 246,078 |
Goldman Sachs Group, Inc. (The) | ||
1.22%, 12/6/2023 | 58,000 | 55,998 |
4.00%, 3/3/2024 | 242,000 | 241,920 |
3.50%, 4/1/2025 | 130,000 | 127,112 |
3.85%, 1/26/2027 | 91,000 | 88,164 |
(ICE LIBOR USD 3 Month + 1.30%), 4.22%, 5/1/2029 (b) | 249,000 | 238,085 |
3.80%, 3/15/2030 | 226,000 | 208,399 |
(SOFR + 1.25%), 2.38%, 7/21/2032 (b) | 53,000 | 42,902 |
(ICE LIBOR USD 3 Month + 1.37%), 4.02%, 10/31/2038 (b) | 161,000 | 140,338 |
August 31, 2022 | J.P. Morgan Exchange-Traded Funds | 77 |
AS OF August 31, 2022 (Unaudited) (continued)
INVESTMENTS | PRINCIPAL AMOUNT($) | VALUE($) |
Corporate Bonds — continued | ||
Capital Markets — continued | ||
Intercontinental Exchange, Inc. 5.20%, 6/15/2062 | 159,000 | 157,632 |
Morgan Stanley | ||
(SOFR + 1.99%), 2.19%, 4/28/2026 (b) | 128,000 | 120,231 |
3.63%, 1/20/2027 | 188,000 | 182,653 |
(ICE LIBOR USD 3 Month + 1.14%), 3.77%, 1/24/2029 (b) | 205,000 | 193,492 |
(SOFR + 1.14%), 2.70%, 1/22/2031 (b) | 117,000 | 101,229 |
(SOFR + 3.12%), 3.62%, 4/1/2031 (b) | 78,000 | 71,471 |
(SOFR + 1.36%), 2.48%, 9/16/2036 (b) | 70,000 | 53,885 |
(ICE LIBOR USD 3 Month + 1.46%), 3.97%, 7/22/2038 (b) | 96,000 | 85,520 |
4.30%, 1/27/2045 | 29,000 | 25,914 |
(SOFR + 1.43%), 2.80%, 1/25/2052 (b) | 50,000 | 34,044 |
2,640,999 | ||
Chemicals — 2.1% | ||
Celanese US Holdings LLC | ||
6.05%, 3/15/2025 | 136,000 | 136,346 |
6.38%, 7/15/2032 | 119,000 | 118,132 |
Ecolab, Inc. 2.70%, 12/15/2051 | 97,000 | 68,724 |
International Flavors & Fragrances, Inc. 5.00%, 9/26/2048 | 30,000 | 27,522 |
LYB International Finance III LLC | ||
3.38%, 10/1/2040 | 110,000 | 83,860 |
3.63%, 4/1/2051 | 86,000 | 63,349 |
Sherwin-Williams Co. (The) | ||
3.45%, 6/1/2027 | 76,000 | 72,702 |
2.95%, 8/15/2029 | 254,000 | 227,892 |
798,527 | ||
Commercial Services & Supplies — 0.2% | ||
RELX Capital, Inc. (United Kingdom) 4.00%, 3/18/2029 | 66,000 | 63,760 |
Construction & Engineering — 0.4% | ||
Quanta Services, Inc. | ||
2.90%, 10/1/2030 | 50,000 | 42,706 |
2.35%, 1/15/2032 | 120,000 | 94,815 |
137,521 | ||
Construction Materials — 0.3% | ||
Martin Marietta Materials, Inc. 3.20%, 7/15/2051 | 168,000 | 117,710 |
Consumer Finance — 3.1% | ||
AerCap Ireland Capital DAC (Ireland) | ||
6.50%, 7/15/2025 | 300,000 | 307,192 |
INVESTMENTS | PRINCIPAL AMOUNT($) | VALUE($) |
Consumer Finance — continued | ||
3.85%, 10/29/2041 | 165,000 | 121,480 |
American Express Co. | ||
0.75%, 11/3/2023 | 240,000 | 231,899 |
(SOFR + 2.26%), 4.99%, 5/26/2033 (b) | 155,000 | 154,079 |
Capital One Financial Corp. 3.30%, 10/30/2024 | 282,000 | 276,533 |
John Deere Capital Corp. 2.80%, 7/18/2029 | 138,000 | 127,546 |
1,218,729 | ||
Diversified Financial Services — 1.6% | ||
Berkshire Hathaway, Inc. 3.13%, 3/15/2026 | 362,000 | 353,824 |
Equitable Holdings, Inc. 4.35%, 4/20/2028 | 70,000 | 68,846 |
Shell International Finance BV (Netherlands) | ||
4.13%, 5/11/2035 | 147,000 | 139,567 |
4.38%, 5/11/2045 | 43,000 | 40,163 |
4.00%, 5/10/2046 | 29,000 | 25,833 |
628,233 | ||
Diversified Telecommunication Services — 1.4% | ||
AT&T, Inc. | ||
3.50%, 9/15/2053 | 155,000 | 114,268 |
3.55%, 9/15/2055 | 193,000 | 141,313 |
3.65%, 9/15/2059 | 30,000 | 21,746 |
Verizon Communications, Inc. | ||
3.40%, 3/22/2041 | 298,000 | 240,064 |
2.99%, 10/30/2056 | 50,000 | 33,610 |
551,001 | ||
Electric Utilities — 4.9% | ||
Baltimore Gas and Electric Co. | ||
3.20%, 9/15/2049 | 80,000 | 61,837 |
2.90%, 6/15/2050 | 76,000 | 55,695 |
Commonwealth Edison Co. 3.00%, 3/1/2050 | 76,000 | 57,269 |
Duke Energy Corp. | ||
3.75%, 4/15/2024 | 70,000 | 69,667 |
2.65%, 9/1/2026 | 118,000 | 110,299 |
3.75%, 9/1/2046 | 106,000 | 82,861 |
Duke Energy Indiana LLC | ||
Series YYY, 3.25%, 10/1/2049 | 20,000 | 15,345 |
2.75%, 4/1/2050 | 20,000 | 13,956 |
Emera US Finance LP (Canada) 4.75%, 6/15/2046 | 135,000 | 117,548 |
Entergy Louisiana LLC 4.00%, 3/15/2033 | 327,000 | 310,200 |
Evergy, Inc. | ||
2.45%, 9/15/2024 | 127,000 | 122,418 |
2.90%, 9/15/2029 | 102,000 | 89,494 |
Exelon Corp. 4.45%, 4/15/2046 | 20,000 | 17,926 |
78 | J.P. Morgan Exchange-Traded Funds | August 31, 2022 |
INVESTMENTS | PRINCIPAL AMOUNT($) | VALUE($) |
Corporate Bonds — continued | ||
Electric Utilities — continued | ||
Florida Power & Light Co. | ||
3.95%, 3/1/2048 | 30,000 | 27,286 |
3.15%, 10/1/2049 | 88,000 | 70,251 |
Fortis, Inc. (Canada) 3.06%, 10/4/2026 | 148,000 | 138,499 |
Pacific Gas and Electric Co. | ||
4.50%, 7/1/2040 | 116,000 | 90,297 |
3.30%, 8/1/2040 | 64,000 | 44,951 |
4.95%, 7/1/2050 | 30,000 | 23,943 |
3.50%, 8/1/2050 | 102,000 | 67,746 |
PPL Electric Utilities Corp. 3.00%, 10/1/2049 | 20,000 | 14,984 |
Southern California Edison Co. | ||
2.25%, 6/1/2030 | 10,000 | 8,381 |
Series 13-A, 3.90%, 3/15/2043 | 6,000 | 4,869 |
Series C, 3.60%, 2/1/2045 | 111,000 | 84,400 |
4.00%, 4/1/2047 | 98,000 | 79,353 |
3.65%, 2/1/2050 | 14,000 | 10,714 |
Southern Co. (The) Series 21-A, (US Treasury Yield Curve Rate T Note Constant Maturity 5 Year + 2.92%), 3.75%, 9/15/2051 (b) | 50,000 | 43,250 |
Virginia Electric and Power Co. | ||
Series A, 3.15%, 1/15/2026 | 17,000 | 16,501 |
Series A, 3.50%, 3/15/2027 | 43,000 | 41,866 |
4.60%, 12/1/2048 | 30,000 | 28,497 |
1,920,303 | ||
Electronic Equipment, Instruments & Components — 0.3% | ||
Teledyne Technologies, Inc. 2.75%, 4/1/2031 | 130,000 | 108,288 |
Entertainment — 1.5% | ||
Electronic Arts, Inc. 1.85%, 2/15/2031 | 241,000 | 197,546 |
Magallanes, Inc. 5.39%, 3/15/2062 (a) | 79,000 | 63,414 |
Walt Disney Co. (The) | ||
2.65%, 1/13/2031 | 121,000 | 106,665 |
3.50%, 5/13/2040 | 274,000 | 233,463 |
601,088 | ||
Equity Real Estate Investment Trusts (REITs) — 3.2% | ||
Alexandria Real Estate Equities, Inc. | ||
2.75%, 12/15/2029 | 102,000 | 88,890 |
2.00%, 5/18/2032 | 59,000 | 46,623 |
3.00%, 5/18/2051 | 102,000 | 69,263 |
Boston Properties LP | ||
4.50%, 12/1/2028 | 39,000 | 37,956 |
3.25%, 1/30/2031 | 120,000 | 103,361 |
Brixmor Operating Partnership LP 4.05%, 7/1/2030 | 270,000 | 240,000 |
Camden Property Trust 2.80%, 5/15/2030 | 121,000 | 107,179 |
INVESTMENTS | PRINCIPAL AMOUNT($) | VALUE($) |
Equity Real Estate Investment Trusts (REITs) — continued | ||
Equinix, Inc. 3.20%, 11/18/2029 | 140,000 | 125,375 |
Healthpeak Properties, Inc. 2.88%, 1/15/2031 | 136,000 | 117,339 |
Simon Property Group LP 2.45%, 9/13/2029 | 78,000 | 67,324 |
UDR, Inc. 3.00%, 8/15/2031 | 20,000 | 17,043 |
Ventas Realty LP 2.50%, 9/1/2031 | 59,000 | 48,142 |
Welltower, Inc. 3.63%, 3/15/2024 | 185,000 | 183,481 |
1,251,976 | ||
Food & Staples Retailing — 0.8% | ||
Sysco Corp. 3.30%, 7/15/2026 | 40,000 | 38,710 |
Walmart, Inc. | ||
2.85%, 7/8/2024 | 50,000 | 49,339 |
1.80%, 9/22/2031 | 195,000 | 163,954 |
4.05%, 6/29/2048 | 47,000 | 45,072 |
297,075 | ||
Food Products — 0.4% | ||
Bunge Ltd. Finance Corp. 2.75%, 5/14/2031 | 60,000 | 50,358 |
Kraft Heinz Foods Co. 5.50%, 6/1/2050 | 99,000 | 98,563 |
148,921 | ||
Health Care Equipment & Supplies — 1.0% | ||
Abbott Laboratories 4.90%, 11/30/2046 | 150,000 | 157,509 |
Becton Dickinson and Co. | ||
4.69%, 12/15/2044 | 73,000 | 69,198 |
4.67%, 6/6/2047 | 49,000 | 46,689 |
DH Europe Finance II Sarl 3.40%, 11/15/2049 | 62,000 | 50,123 |
Medtronic, Inc. 4.38%, 3/15/2035 | 68,000 | 67,490 |
391,009 | ||
Health Care Providers & Services — 3.7% | ||
Aetna, Inc. | ||
2.80%, 6/15/2023 | 149,000 | 147,642 |
3.88%, 8/15/2047 | 70,000 | 57,074 |
Cigna Corp. | ||
4.80%, 8/15/2038 | 86,000 | 82,893 |
3.40%, 3/15/2051 | 60,000 | 45,669 |
CVS Health Corp. | ||
2.70%, 8/21/2040 | 112,000 | 80,939 |
5.05%, 3/25/2048 | 66,000 | 63,546 |
HCA, Inc. | ||
5.00%, 3/15/2024 | 401,000 | 403,619 |
4.13%, 6/15/2029 | 90,000 | 82,848 |
3.50%, 7/15/2051 | 119,000 | 81,686 |
UnitedHealth Group, Inc. | ||
3.75%, 7/15/2025 | 86,000 | 85,736 |
August 31, 2022 | J.P. Morgan Exchange-Traded Funds | 79 |
AS OF August 31, 2022 (Unaudited) (continued)
INVESTMENTS | PRINCIPAL AMOUNT($) | VALUE($) |
Corporate Bonds — continued | ||
Health Care Providers & Services — continued | ||
3.50%, 8/15/2039 | 122,000 | 105,082 |
2.75%, 5/15/2040 | 211,000 | 162,960 |
3.25%, 5/15/2051 | 60,000 | 47,115 |
1,446,809 | ||
Hotels, Restaurants & Leisure — 0.9% | ||
Expedia Group, Inc. 3.25%, 2/15/2030 | 70,000 | 60,538 |
McDonald's Corp. 2.13%, 3/1/2030 | 185,000 | 158,701 |
Starbucks Corp. | ||
4.50%, 11/15/2048 | 75,000 | 68,003 |
3.50%, 11/15/2050 | 102,000 | 78,500 |
365,742 | ||
Household Durables — 0.2% | ||
Lennar Corp. 4.75%, 11/29/2027 | 75,000 | 72,988 |
Industrial Conglomerates — 0.5% | ||
GE Capital Funding LLC 4.55%, 5/15/2032 | 50,000 | 48,201 |
General Electric Co. 6.75%, 3/15/2032 | 122,000 | 138,091 |
186,292 | ||
Insurance — 1.9% | ||
Aflac, Inc. 3.60%, 4/1/2030 | 110,000 | 104,635 |
American International Group, Inc. | ||
2.50%, 6/30/2025 | 58,000 | 55,290 |
3.90%, 4/1/2026 | 28,000 | 27,540 |
Arch Capital Group Ltd. 3.64%, 6/30/2050 | 120,000 | 93,618 |
Berkshire Hathaway Finance Corp. | ||
2.30%, 3/15/2027 | 55,000 | 51,774 |
4.20%, 8/15/2048 | 95,000 | 88,349 |
4.25%, 1/15/2049 | 20,000 | 18,844 |
Corebridge Financial, Inc. 4.40%, 4/5/2052 (a) | 150,000 | 125,130 |
Marsh & McLennan Cos., Inc. 2.90%, 12/15/2051 | 150,000 | 107,449 |
Northwestern Mutual Life Insurance Co. (The) 3.85%, 9/30/2047 (a) | 20,000 | 16,752 |
Progressive Corp. (The) 4.13%, 4/15/2047 | 60,000 | 55,205 |
744,586 | ||
Internet & Direct Marketing Retail — 0.7% | ||
Amazon.com, Inc. | ||
1.00%, 5/12/2026 | 53,000 | 47,988 |
3.88%, 8/22/2037 | 252,000 | 236,466 |
284,454 | ||
IT Services — 0.8% | ||
Global Payments, Inc. | ||
3.20%, 8/15/2029 | 146,000 | 127,505 |
INVESTMENTS | PRINCIPAL AMOUNT($) | VALUE($) |
IT Services — continued | ||
4.15%, 8/15/2049 | 112,000 | 85,287 |
VeriSign, Inc. 2.70%, 6/15/2031 | 114,000 | 93,552 |
306,344 | ||
Leisure Products — 0.2% | ||
Hasbro, Inc. 3.90%, 11/19/2029 | 70,000 | 64,114 |
Life Sciences Tools & Services — 0.5% | ||
Danaher Corp. 2.60%, 10/1/2050 | 101,000 | 69,693 |
Thermo Fisher Scientific, Inc. | ||
2.80%, 10/15/2041 | 136,000 | 105,438 |
4.10%, 8/15/2047 | 23,000 | 21,443 |
196,574 | ||
Machinery — 0.3% | ||
Otis Worldwide Corp. | ||
2.06%, 4/5/2025 | 40,000 | 37,770 |
2.57%, 2/15/2030 | 40,000 | 34,417 |
3.36%, 2/15/2050 | 80,000 | 59,576 |
131,763 | ||
Media — 4.8% | ||
Charter Communications Operating LLC | ||
4.91%, 7/23/2025 | 270,000 | 269,074 |
2.80%, 4/1/2031 | 102,000 | 82,634 |
3.50%, 3/1/2042 | 177,000 | 122,263 |
5.38%, 5/1/2047 | 30,000 | 25,569 |
4.80%, 3/1/2050 | 54,000 | 42,386 |
5.50%, 4/1/2063 | 50,000 | 41,838 |
Comcast Corp. | ||
3.70%, 4/15/2024 | 199,000 | 198,332 |
3.95%, 10/15/2025 | 105,000 | 104,826 |
3.15%, 3/1/2026 | 88,000 | 85,643 |
4.15%, 10/15/2028 | 101,000 | 100,119 |
3.40%, 4/1/2030 | 40,000 | 37,343 |
3.90%, 3/1/2038 | 150,000 | 134,846 |
3.75%, 4/1/2040 | 50,000 | 43,393 |
4.00%, 11/1/2049 | 30,000 | 25,627 |
3.45%, 2/1/2050 | 20,000 | 15,769 |
Discovery Communications LLC | ||
3.95%, 3/20/2028 | 176,000 | 161,671 |
5.00%, 9/20/2037 | 30,000 | 26,173 |
4.65%, 5/15/2050 | 91,000 | 69,132 |
4.00%, 9/15/2055 | 90,000 | 59,625 |
80 | J.P. Morgan Exchange-Traded Funds | August 31, 2022 |
INVESTMENTS | PRINCIPAL AMOUNT($) | VALUE($) |
Corporate Bonds — continued | ||
Media — continued | ||
Time Warner Cable LLC | ||
6.55%, 5/1/2037 | 140,000 | 137,515 |
4.50%, 9/15/2042 | 100,000 | 75,585 |
1,859,363 | ||
Metals & Mining — 0.3% | ||
Glencore Funding LLC (Australia) 4.13%, 5/30/2023 (a) | 127,000 | 126,689 |
Multiline Retail — 0.6% | ||
Target Corp. 3.38%, 4/15/2029 | 242,000 | 232,103 |
Multi-Utilities — 3.1% | ||
Ameren Corp. | ||
2.50%, 9/15/2024 | 141,000 | 135,943 |
3.50%, 1/15/2031 | 60,000 | 54,841 |
Berkshire Hathaway Energy Co. | ||
4.45%, 1/15/2049 | 31,000 | 28,849 |
2.85%, 5/15/2051 | 106,000 | 75,612 |
CenterPoint Energy, Inc. 2.65%, 6/1/2031 | 345,000 | 294,362 |
Consolidated Edison Co. of New York, Inc. | ||
Series 20B, 3.95%, 4/1/2050 | 76,000 | 65,732 |
3.60%, 6/15/2061 | 50,000 | 39,259 |
Dominion Energy, Inc. 3.90%, 10/1/2025 | 17,000 | 16,774 |
San Diego Gas & Electric Co. | ||
Series VVV, 1.70%, 10/1/2030 | 53,000 | 43,535 |
2.95%, 8/15/2051 | 186,000 | 137,523 |
Southern Co. Gas Capital Corp. | ||
2.45%, 10/1/2023 | 205,000 | 201,626 |
Series 20-A, 1.75%, 1/15/2031 | 152,000 | 120,718 |
1,214,774 | ||
Oil, Gas & Consumable Fuels — 6.3% | ||
BP Capital Markets America, Inc. | ||
3.80%, 9/21/2025 | 72,000 | 71,704 |
4.23%, 11/6/2028 | 39,000 | 38,673 |
3.00%, 2/24/2050 | 146,000 | 106,594 |
BP Capital Markets plc (United Kingdom) 3.28%, 9/19/2027 | 187,000 | 179,062 |
Cameron LNG LLC | ||
3.30%, 1/15/2035 (a) | 25,000 | 21,221 |
3.70%, 1/15/2039 (a) | 5,000 | 4,219 |
Canadian Natural Resources Ltd. (Canada) 4.95%, 6/1/2047 | 30,000 | 28,372 |
Chevron Corp. 2.95%, 5/16/2026 | 88,000 | 85,235 |
Columbia Pipeline Group, Inc. 4.50%, 6/1/2025 | 192,000 | 191,220 |
ConocoPhillips 5.90%, 10/15/2032 | 50,000 | 55,490 |
INVESTMENTS | PRINCIPAL AMOUNT($) | VALUE($) |
Oil, Gas & Consumable Fuels — continued | ||
Diamondback Energy, Inc. 3.50%, 12/1/2029 | 70,000 | 63,502 |
Energy Transfer LP | ||
4.95%, 5/15/2028 | 80,000 | 78,210 |
4.95%, 6/15/2028 | 32,000 | 31,451 |
5.40%, 10/1/2047 | 96,000 | 85,526 |
5.00%, 5/15/2050 | 144,000 | 123,579 |
Enterprise Products Operating LLC 2.80%, 1/31/2030 | 80,000 | 70,408 |
EQT Corp. 7.00%, 2/1/2030 (c) | 60,000 | 64,205 |
Exxon Mobil Corp. | ||
2.99%, 3/19/2025 | 175,000 | 171,202 |
2.61%, 10/15/2030 | 205,000 | 183,055 |
3.00%, 8/16/2039 | 126,000 | 103,166 |
3.45%, 4/15/2051 | 30,000 | 24,756 |
Kinder Morgan, Inc. | ||
4.30%, 6/1/2025 | 110,000 | 109,608 |
5.45%, 8/1/2052 | 204,000 | 198,216 |
Marathon Oil Corp. 4.40%, 7/15/2027 | 90,000 | 87,392 |
Marathon Petroleum Corp. 4.75%, 9/15/2044 | 17,000 | 14,955 |
Phillips 66 4.88%, 11/15/2044 | 30,000 | 28,707 |
Pioneer Natural Resources Co. 1.90%, 8/15/2030 | 66,000 | 53,773 |
Sabine Pass Liquefaction LLC 5.63%, 3/1/2025 | 140,000 | 142,600 |
TotalEnergies Capital International SA (France) 2.83%, 1/10/2030 | 63,000 | 56,849 |
2,472,950 | ||
Paper & Forest Products — 0.5% | ||
Suzano Austria GmbH (Brazil) | ||
3.75%, 1/15/2031 | 95,000 | 80,056 |
Series DM3N, 3.13%, 1/15/2032 | 130,000 | 102,781 |
182,837 | ||
Pharmaceuticals — 2.7% | ||
Astrazeneca Finance LLC (United Kingdom) 0.70%, 5/28/2024 | 220,000 | 208,256 |
AstraZeneca plc (United Kingdom) | ||
3.38%, 11/16/2025 | 60,000 | 58,899 |
4.38%, 11/16/2045 | 68,000 | 65,314 |
3.00%, 5/28/2051 | 60,000 | 46,964 |
Bristol-Myers Squibb Co. | ||
3.40%, 7/26/2029 | 22,000 | 20,992 |
4.13%, 6/15/2039 | 70,000 | 65,570 |
4.35%, 11/15/2047 | 32,000 | 30,190 |
4.25%, 10/26/2049 | 88,000 | 81,505 |
2.55%, 11/13/2050 | 80,000 | 55,071 |
August 31, 2022 | J.P. Morgan Exchange-Traded Funds | 81 |
AS OF August 31, 2022 (Unaudited) (continued)
INVESTMENTS | PRINCIPAL AMOUNT($) | VALUE($) |
Corporate Bonds — continued | ||
Pharmaceuticals — continued | ||
Royalty Pharma plc 3.30%, 9/2/2040 | 63,000 | 47,406 |
Shire Acquisitions Investments Ireland DAC | ||
2.88%, 9/23/2023 | 62,000 | 61,171 |
3.20%, 9/23/2026 | 332,000 | 317,340 |
1,058,678 | ||
Road & Rail — 1.9% | ||
Canadian Pacific Railway Co. (Canada) | ||
1.35%, 12/2/2024 | 92,000 | 86,410 |
1.75%, 12/2/2026 | 321,000 | 291,144 |
2.45%, 12/2/2031 | 82,000 | 70,053 |
CSX Corp. 2.60%, 11/1/2026 | 80,000 | 75,749 |
Kansas City Southern 4.30%, 5/15/2043 | 30,000 | 26,367 |
Norfolk Southern Corp. | ||
4.15%, 2/28/2048 | 106,000 | 94,602 |
3.16%, 5/15/2055 | 50,000 | 36,234 |
Union Pacific Corp. | ||
2.89%, 4/6/2036 | 55,000 | 45,772 |
3.25%, 2/5/2050 | 34,000 | 26,765 |
753,096 | ||
Semiconductors & Semiconductor Equipment — 4.4% | ||
Analog Devices, Inc. 3.50%, 12/5/2026 | 108,000 | 106,164 |
Broadcom, Inc. 3.50%, 2/15/2041 (a) | 81,000 | 60,763 |
Intel Corp. | ||
3.25%, 11/15/2049 | 73,000 | 54,349 |
3.20%, 8/12/2061 | 53,000 | 37,194 |
KLA Corp. 4.10%, 3/15/2029 | 387,000 | 384,523 |
Marvell Technology, Inc. 2.95%, 4/15/2031 | 80,000 | 65,589 |
NVIDIA Corp. | ||
2.00%, 6/15/2031 | 59,000 | 49,765 |
3.50%, 4/1/2050 | 136,000 | 112,622 |
NXP BV (China) | ||
4.30%, 6/18/2029 | 40,000 | 37,875 |
3.25%, 5/11/2041 | 190,000 | 137,429 |
QUALCOMM, Inc. | ||
3.25%, 5/20/2027 | 233,000 | 227,357 |
1.30%, 5/20/2028 | 192,000 | 165,801 |
3.25%, 5/20/2050 | 20,000 | 16,141 |
Xilinx, Inc. | ||
2.95%, 6/1/2024 | 229,000 | 226,673 |
2.38%, 6/1/2030 | 51,000 | 44,463 |
1,726,708 | ||
INVESTMENTS | PRINCIPAL AMOUNT($) | VALUE($) |
Software — 1.7% | ||
Microsoft Corp. | ||
3.45%, 8/8/2036 | 119,000 | 111,981 |
4.10%, 2/6/2037 | 88,000 | 88,346 |
Oracle Corp. | ||
2.50%, 4/1/2025 | 50,000 | 47,464 |
3.60%, 4/1/2050 | 206,000 | 140,271 |
3.95%, 3/25/2051 | 83,000 | 59,615 |
Roper Technologies, Inc. 1.75%, 2/15/2031 | 136,000 | 106,585 |
VMware, Inc. 2.20%, 8/15/2031 | 148,000 | 115,384 |
669,646 | ||
Specialty Retail — 2.3% | ||
AutoZone, Inc. 1.65%, 1/15/2031 | 174,000 | 137,067 |
Home Depot, Inc. (The) | ||
2.50%, 4/15/2027 | 237,000 | 223,834 |
1.50%, 9/15/2028 | 133,000 | 115,448 |
2.70%, 4/15/2030 | 78,000 | 70,208 |
3.30%, 4/15/2040 | 56,000 | 46,861 |
4.20%, 4/1/2043 | 30,000 | 27,517 |
3.13%, 12/15/2049 | 63,000 | 48,333 |
Lowe's Cos., Inc. | ||
3.10%, 5/3/2027 | 40,000 | 37,969 |
2.80%, 9/15/2041 | 122,000 | 86,875 |
3.70%, 4/15/2046 | 107,000 | 85,007 |
4.05%, 5/3/2047 | 40,000 | 33,358 |
912,477 | ||
Technology Hardware, Storage & Peripherals — 1.9% | ||
Apple, Inc. | ||
2.90%, 9/12/2027 | 189,000 | 180,864 |
2.38%, 2/8/2041 | 69,000 | 51,892 |
3.85%, 5/4/2043 | 20,000 | 18,381 |
3.45%, 2/9/2045 | 56,000 | 48,607 |
4.65%, 2/23/2046 | 153,000 | 156,422 |
2.65%, 5/11/2050 | 20,000 | 14,642 |
2.65%, 2/8/2051 | 80,000 | 58,539 |
Dell International LLC | ||
6.02%, 6/15/2026 | 152,000 | 157,875 |
5.30%, 10/1/2029 | 40,000 | 39,637 |
726,859 | ||
Thrifts & Mortgage Finance — 0.6% | ||
BPCE SA (France) 4.00%, 4/15/2024 | 250,000 | 248,769 |
Tobacco — 1.1% | ||
Altria Group, Inc. 4.00%, 2/4/2061 | 55,000 | 36,768 |
82 | J.P. Morgan Exchange-Traded Funds | August 31, 2022 |
INVESTMENTS | PRINCIPAL AMOUNT($) | VALUE($) |
Corporate Bonds — continued | ||
Tobacco — continued | ||
BAT Capital Corp. (United Kingdom) | ||
3.22%, 8/15/2024 | 119,000 | 116,239 |
4.39%, 8/15/2037 | 274,000 | 216,722 |
Reynolds American, Inc. (United Kingdom) 4.45%, 6/12/2025 | 76,000 | 75,282 |
445,011 | ||
Water Utilities — 0.3% | ||
American Water Capital Corp. | ||
3.75%, 9/1/2047 | 50,000 | 42,007 |
3.45%, 5/1/2050 | 100,000 | 78,251 |
120,258 | ||
Wireless Telecommunication Services — 1.6% | ||
T-Mobile USA, Inc. | ||
3.50%, 4/15/2025 | 195,000 | 190,416 |
3.75%, 4/15/2027 | 117,000 | 112,191 |
3.88%, 4/15/2030 | 218,000 | 201,481 |
4.50%, 4/15/2050 | 141,000 | 123,038 |
627,126 | ||
Total Corporate Bonds (Cost $43,879,546) | 38,459,866 | |
SHARES | ||
Short-Term Investments — 1.6% | ||
Investment Companies — 1.6% | ||
JPMorgan U.S. Government Money Market Fund Class IM Shares, 2.00% (d) (e) (Cost $618,875) | 618,875 | 618,875 |
Total Investments — 100.0% (Cost $44,498,421) | 39,078,741 | |
Other Assets Less Liabilities — 0.0% ^ | 675 | |
NET ASSETS — 100.0% | 39,079,416 | |
Percentages indicated are based on net assets. |
Abbreviations | |
ICE | Intercontinental Exchange |
LIBOR | London Interbank Offered Rate |
SOFR | Secured Overnight Financing Rate |
USD | United States Dollar |
^ | Amount rounds to less than 0.1% of net assets. | |
(a) | Securities exempt from registration under Rule 144A or section 4(a)(2), of the Securities Act of 1933, as amended. | |
(b) | Variable or floating rate security, linked to the referenced benchmark. The interest rate shown is the current rate as of August 31, 2022. | |
(c) | Step bond. Interest rate is a fixed rate for an initial period that either resets at a specific date or may reset in the future contingent upon a predetermined trigger. The interest rate shown is the current rate as of August 31, 2022. | |
(d) | Investment in an affiliated fund, which is registered under the Investment Company Act of 1940, as amended, and is advised by J.P. Morgan Investment Management Inc. | |
(e) | The rate shown is the current yield as of August 31, 2022. | |
DESCRIPTION | NUMBER OF CONTRACTS | EXPIRATION DATE | TRADING CURRENCY | NOTIONAL AMOUNT ($) | VALUE AND UNREALIZED APPRECIATION (DEPRECIATION) ($) |
Long Contracts | |||||
U.S. Treasury Long Bond | 3 | 12/20/2022 | USD | 406,406 | (3,381) |
U.S. Treasury 5 Year Note | 15 | 12/30/2022 | USD | 1,660,078 | (7,999) |
(11,380) |
August 31, 2022 | J.P. Morgan Exchange-Traded Funds | 83 |
AS OF August 31, 2022 (Unaudited) (continued)
DESCRIPTION | NUMBER OF CONTRACTS | EXPIRATION DATE | TRADING CURRENCY | NOTIONAL AMOUNT ($) | VALUE AND UNREALIZED APPRECIATION (DEPRECIATION) ($) |
Short Contracts | |||||
U.S. Treasury 10 Year Note | (11) | 12/20/2022 | USD | (1,282,875) | 9,914 |
U.S. Treasury 10 Year Ultra Note | (1) | 12/20/2022 | USD | (124,859) | 1,060 |
U.S. Treasury Ultra Bond | (1) | 12/20/2022 | USD | (148,875) | 530 |
11,504 | |||||
124 |
Abbreviations | |
USD | United States Dollar |
84 | J.P. Morgan Exchange-Traded Funds | August 31, 2022 |
AS OF August 31, 2022 (Unaudited)
INVESTMENTS | PRINCIPAL AMOUNT ($000) | VALUE ($000) |
Corporate Bonds — 97.6% | ||
Aerospace & Defense — 3.1% | ||
Bombardier, Inc. (Canada) | ||
7.13%, 6/15/2026 (a) | 846,000 | 806,136 |
7.88%, 4/15/2027 (a) | 1,042,000 | 997,767 |
BWX Technologies, Inc. 4.13%, 6/30/2028 (a) | 329,000 | 302,680 |
Howmet Aerospace, Inc. | ||
6.88%, 5/1/2025 | 310,000 | 318,345 |
5.90%, 2/1/2027 | 495,000 | 497,574 |
5.95%, 2/1/2037 | 775,000 | 751,518 |
Moog, Inc. 4.25%, 12/15/2027 (a) | 205,000 | 187,647 |
Rolls-Royce plc (United Kingdom) 5.75%, 10/15/2027 (a) | 800,000 | 723,072 |
Spirit AeroSystems, Inc. | ||
7.50%, 4/15/2025 (a) | 840,000 | 821,444 |
4.60%, 6/15/2028 | 233,000 | 185,235 |
TransDigm, Inc. | ||
6.25%, 3/15/2026 (a) | 2,874,000 | 2,823,705 |
5.50%, 11/15/2027 | 1,501,000 | 1,350,750 |
Triumph Group, Inc. | ||
8.88%, 6/1/2024 (a) | 329,000 | 333,113 |
6.25%, 9/15/2024 (a) | 146,000 | 134,320 |
7.75%, 8/15/2025 | 328,000 | 276,235 |
Wesco Aircraft Holdings, Inc. | ||
8.50%, 11/15/2024 (a) | 1,588,000 | 857,520 |
9.00%, 11/15/2026 (a) | 1,791,000 | 1,074,600 |
12,441,661 | ||
Airlines — 1.9% | ||
Air Canada (Canada) 3.88%, 8/15/2026 (a) | 491,000 | 438,131 |
Allegiant Travel Co. 7.25%, 8/15/2027 (a) | 196,000 | 194,673 |
American Airlines, Inc. | ||
5.50%, 4/20/2026 (a) | 1,858,009 | 1,767,487 |
5.75%, 4/20/2029 (a) | 1,808,009 | 1,632,162 |
Delta Air Lines, Inc. | ||
7.38%, 1/15/2026 | 392,000 | 399,840 |
3.75%, 10/28/2029 | 332,000 | 271,410 |
Hawaiian Brand Intellectual Property Ltd. 5.75%, 1/20/2026 (a) | 432,111 | 394,424 |
Spirit Loyalty Cayman Ltd. 8.00%, 9/20/2025 (a) | 232,850 | 236,499 |
United Airlines, Inc. | ||
4.38%, 4/15/2026 (a) | 1,401,000 | 1,277,362 |
4.63%, 4/15/2029 (a) | 1,032,000 | 905,580 |
7,517,568 | ||
INVESTMENTS | PRINCIPAL AMOUNT ($000) | VALUE ($000) |
Auto Components — 2.4% | ||
Adient Global Holdings Ltd. 4.88%, 8/15/2026 (a) | 350,000 | 323,904 |
Allison Transmission, Inc. 5.88%, 6/1/2029 (a) | 570,000 | 535,845 |
American Axle & Manufacturing, Inc. 6.50%, 4/1/2027 | 720,000 | 673,200 |
Clarios Global LP | ||
6.25%, 5/15/2026 (a) | 506,000 | 500,378 |
8.50%, 5/15/2027 (a) | 906,000 | 890,236 |
Cooper-Standard Automotive, Inc. | ||
13.00%, 6/1/2024 (a) | 184,000 | 192,345 |
5.63%, 11/15/2026 (a) | 197,000 | 96,175 |
Dana, Inc. 5.38%, 11/15/2027 | 854,000 | 761,409 |
Dornoch Debt Merger Sub, Inc. 6.63%, 10/15/2029 (a) | 310,000 | 241,800 |
Goodyear Tire & Rubber Co. (The) | ||
5.00%, 5/31/2026 | 256,000 | 247,022 |
4.88%, 3/15/2027 | 1,072,000 | 1,007,734 |
5.25%, 4/30/2031 | 569,000 | 496,177 |
Icahn Enterprises LP | ||
6.25%, 5/15/2026 | 821,000 | 787,039 |
5.25%, 5/15/2027 | 794,000 | 722,341 |
IHO Verwaltungs GmbH (Germany) 6.38% (Cash), 5/15/2029 (a) (b) | 600,000 | 530,976 |
JB Poindexter & Co., Inc. 7.13%, 4/15/2026 (a) | 221,000 | 214,094 |
Real Hero Merger Sub 2, Inc. 6.25%, 2/1/2029 (a) | 232,000 | 188,580 |
Tenneco, Inc. | ||
5.00%, 7/15/2026 | 394,000 | 376,255 |
7.88%, 1/15/2029 (a) | 452,000 | 449,290 |
ZF North America Capital, Inc. (Germany) 4.75%, 4/29/2025 (a) | 500,000 | 463,115 |
9,697,915 | ||
Automobiles — 0.1% | ||
PM General Purchaser LLC 9.50%, 10/1/2028 (a) | 253,000 | 219,154 |
Banks — 0.6% | ||
Intesa Sanpaolo SpA (Italy) 5.71%, 1/15/2026 (a) | 1,600,000 | 1,500,804 |
UniCredit SpA (Italy) (USD ICE Swap Rate 5 Year + 3.70%), 5.86%, 6/19/2032 (a) (c) | 1,225,000 | 1,056,392 |
2,557,196 | ||
August 31, 2022 | J.P. Morgan Exchange-Traded Funds | 85 |
AS OF August 31, 2022 (Unaudited) (continued)
INVESTMENTS | PRINCIPAL AMOUNT ($000) | VALUE ($000) |
Corporate Bonds — continued | ||
Beverages — 0.1% | ||
Primo Water Holdings, Inc. (Canada) 4.38%, 4/30/2029 (a) | 293,000 | 250,455 |
Triton Water Holdings, Inc. 6.25%, 4/1/2029 (a) | 324,000 | 265,745 |
516,200 | ||
Biotechnology — 0.0% ^ | ||
Emergent BioSolutions, Inc. 3.88%, 8/15/2028 (a) | 186,000 | 130,200 |
Building Products — 1.2% | ||
Advanced Drainage Systems, Inc. 6.38%, 6/15/2030 (a) | 342,000 | 330,892 |
Builders FirstSource, Inc. 5.00%, 3/1/2030 (a) | 1,045,000 | 926,131 |
Griffon Corp. 5.75%, 3/1/2028 | 414,000 | 382,950 |
James Hardie International Finance DAC 5.00%, 1/15/2028 (a) | 300,000 | 275,996 |
JELD-WEN, Inc. 4.88%, 12/15/2027 (a) | 467,000 | 361,925 |
Masonite International Corp. 5.38%, 2/1/2028 (a) | 401,000 | 372,930 |
MIWD Holdco II LLC 5.50%, 2/1/2030 (a) | 251,000 | 206,141 |
PGT Innovations, Inc. 4.38%, 10/1/2029 (a) | 228,000 | 192,851 |
Standard Industries, Inc. 4.75%, 1/15/2028 (a) | 1,742,000 | 1,522,749 |
Summit Materials LLC 5.25%, 1/15/2029 (a) | 470,000 | 422,758 |
4,995,323 | ||
Capital Markets — 1.4% | ||
Coinbase Global, Inc. | ||
3.38%, 10/1/2028 (a) | 807,000 | 521,528 |
3.63%, 10/1/2031 (a) | 355,000 | 216,136 |
Deutsche Bank AG (Germany) (SOFR + 5.44%), 5.88%, 7/8/2031 (c) | 1,700,000 | 1,480,051 |
Dresdner Funding Trust I 8.15%, 6/30/2031 (a) | 600,000 | 656,700 |
LPL Holdings, Inc. 4.63%, 11/15/2027 (a) | 1,052,000 | 989,824 |
MSCI, Inc. | ||
4.00%, 11/15/2029 (a) | 1,560,000 | 1,388,572 |
3.88%, 2/15/2031 (a) | 492,000 | 421,616 |
5,674,427 | ||
Chemicals — 2.8% | ||
Ashland LLC 3.38%, 9/1/2031 (a) | 251,000 | 205,927 |
Avient Corp. | ||
5.75%, 5/15/2025 (a) | 226,000 | 222,886 |
7.13%, 8/1/2030 (a) | 832,000 | 821,533 |
INVESTMENTS | PRINCIPAL AMOUNT ($000) | VALUE ($000) |
Chemicals — continued | ||
Axalta Coating Systems LLC 4.75%, 6/15/2027 (a) | 825,000 | 764,156 |
Chemours Co. (The) 5.75%, 11/15/2028 (a) | 1,393,000 | 1,246,735 |
Consolidated Energy Finance SA (Switzerland) 6.50%, 5/15/2026 (a) | 300,000 | 273,990 |
CVR Partners LP 6.13%, 6/15/2028 (a) | 384,000 | 350,601 |
Element Solutions, Inc. 3.88%, 9/1/2028 (a) | 596,000 | 517,775 |
Gates Global LLC 6.25%, 1/15/2026 (a) | 221,000 | 209,398 |
INEOS Quattro Finance 2 plc (United Kingdom) 3.38%, 1/15/2026 (a) | 300,000 | 259,500 |
Ingevity Corp. 3.88%, 11/1/2028 (a) | 387,000 | 334,755 |
Koppers, Inc. 6.00%, 2/15/2025 (a) | 163,000 | 152,943 |
LSB Industries, Inc. 6.25%, 10/15/2028 (a) | 436,000 | 403,540 |
Methanex Corp. (Canada) 5.25%, 12/15/2029 | 599,000 | 503,211 |
Nufarm Australia Ltd. (Australia) 5.00%, 1/27/2030 (a) | 144,000 | 119,520 |
Olin Corp. | ||
5.13%, 9/15/2027 | 221,000 | 209,763 |
5.63%, 8/1/2029 | 297,000 | 282,973 |
Olympus Water US Holding Corp. 4.25%, 10/1/2028 (a) | 250,000 | 203,250 |
Rain CII Carbon LLC 7.25%, 4/1/2025 (a) | 356,000 | 332,904 |
SCIH Salt Holdings, Inc. | ||
4.88%, 5/1/2028 (a) | 304,000 | 260,774 |
6.63%, 5/1/2029 (a) | 184,000 | 151,487 |
Scotts Miracle-Gro Co. (The) | ||
4.50%, 10/15/2029 | 260,000 | 208,302 |
4.38%, 2/1/2032 | 324,000 | 244,620 |
Trinseo Materials Operating SCA | ||
5.38%, 9/1/2025 (a) | 409,000 | 352,509 |
5.13%, 4/1/2029 (a) | 282,000 | 200,135 |
Tronox, Inc. 4.63%, 3/15/2029 (a) | 790,000 | 657,122 |
Valvoline, Inc. 4.25%, 2/15/2030 (a) | 325,000 | 316,842 |
Venator Finance SARL | ||
9.50%, 7/1/2025 (a) | 144,000 | 141,840 |
5.75%, 7/15/2025 (a) | 156,000 | 114,660 |
WR Grace Holdings LLC | ||
4.88%, 6/15/2027 (a) | 542,000 | 501,285 |
5.63%, 8/15/2029 (a) | 904,000 | 714,160 |
11,279,096 | ||
Commercial Services & Supplies — 3.2% | ||
ACCO Brands Corp. 4.25%, 3/15/2029 (a) | 228,000 | 190,063 |
Allied Universal Holdco LLC | ||
6.63%, 7/15/2026 (a) | 1,411,000 | 1,321,105 |
86 | J.P. Morgan Exchange-Traded Funds | August 31, 2022 |
INVESTMENTS | PRINCIPAL AMOUNT ($000) | VALUE ($000) |
Corporate Bonds — continued | ||
Commercial Services & Supplies — continued | ||
9.75%, 7/15/2027 (a) | 394,000 | 354,780 |
APi Group DE, Inc. 4.13%, 7/15/2029 (a) | 332,000 | 269,750 |
Aramark Services, Inc. | ||
6.38%, 5/1/2025 (a) | 453,000 | 449,036 |
5.00%, 2/1/2028 (a) | 691,000 | 635,941 |
Brink's Co. (The) 4.63%, 10/15/2027 (a) | 453,000 | 407,700 |
Clean Harbors, Inc. 4.88%, 7/15/2027 (a) | 300,000 | 278,122 |
CoreCivic, Inc. 8.25%, 4/15/2026 | 436,000 | 431,026 |
Covanta Holding Corp. 4.88%, 12/1/2029 (a) | 310,000 | 261,563 |
Garda World Security Corp. (Canada) | ||
4.63%, 2/15/2027 (a) | 238,000 | 209,178 |
9.50%, 11/1/2027 (a) | 560,000 | 510,398 |
GFL Environmental, Inc. (Canada) | ||
5.13%, 12/15/2026 (a) | 772,000 | 746,074 |
4.75%, 6/15/2029 (a) | 822,000 | 713,085 |
Harsco Corp. 5.75%, 7/31/2027 (a) | 188,000 | 133,324 |
Interface, Inc. 5.50%, 12/1/2028 (a) | 186,000 | 162,462 |
KAR Auction Services, Inc. 5.13%, 6/1/2025 (a) | 60,000 | 58,917 |
Madison IAQ LLC | ||
4.13%, 6/30/2028 (a) | 182,000 | 156,065 |
5.88%, 6/30/2029 (a) | 677,000 | 556,927 |
Nielsen Finance LLC | ||
5.63%, 10/1/2028 (a) | 1,528,000 | 1,531,484 |
5.88%, 10/1/2030 (a) | 602,000 | 602,456 |
Prime Security Services Borrower LLC | ||
5.75%, 4/15/2026 (a) | 1,900,000 | 1,828,123 |
6.25%, 1/15/2028 (a) | 567,000 | 499,205 |
Stericycle, Inc. 3.88%, 1/15/2029 (a) | 382,000 | 330,907 |
Waste Pro USA, Inc. 5.50%, 2/15/2026 (a) | 186,000 | 166,703 |
12,804,394 | ||
Communications Equipment — 1.0% | ||
Ciena Corp. 4.00%, 1/31/2030 (a) | 188,000 | 162,385 |
CommScope Technologies LLC | ||
6.00%, 6/15/2025 (a) | 501,000 | 455,284 |
5.00%, 3/15/2027 (a) | 260,000 | 205,196 |
CommScope, Inc. | ||
6.00%, 3/1/2026 (a) | 1,061,000 | 1,002,751 |
8.25%, 3/1/2027 (a) | 1,233,000 | 1,056,699 |
Nokia OYJ (Finland) | ||
4.38%, 6/12/2027 | 188,000 | 179,215 |
6.63%, 5/15/2039 | 160,000 | 161,698 |
Plantronics, Inc. 4.75%, 3/1/2029 (a) | 212,000 | 211,470 |
INVESTMENTS | PRINCIPAL AMOUNT ($000) | VALUE ($000) |
Communications Equipment — continued | ||
Viasat, Inc. | ||
5.63%, 4/15/2027 (a) | 233,000 | 214,360 |
6.50%, 7/15/2028 (a) | 358,000 | 274,550 |
Viavi Solutions, Inc. 3.75%, 10/1/2029 (a) | 146,000 | 125,279 |
4,048,887 | ||
Construction & Engineering — 0.3% | ||
AECOM 5.13%, 3/15/2027 | 419,000 | 406,430 |
Dycom Industries, Inc. 4.50%, 4/15/2029 (a) | 251,000 | 224,050 |
Global Infrastructure Solutions, Inc. 5.63%, 6/1/2029 (a) | 332,000 | 265,490 |
Pike Corp. 5.50%, 9/1/2028 (a) | 426,000 | 352,179 |
Weekley Homes LLC 4.88%, 9/15/2028 (a) | 173,000 | 143,409 |
1,391,558 | ||
Consumer Finance — 5.2% | ||
Ally Financial, Inc. 5.75%, 11/20/2025 | 392,000 | 396,210 |
Credit Acceptance Corp. 6.63%, 3/15/2026 | 233,000 | 228,340 |
Curo Group Holdings Corp. 7.50%, 8/1/2028 (a) | 377,000 | 228,500 |
Enova International, Inc. 8.50%, 9/15/2025 (a) | 207,000 | 193,102 |
FirstCash, Inc. 5.63%, 1/1/2030 (a) | 311,000 | 278,345 |
Ford Motor Credit Co. LLC | ||
5.13%, 6/16/2025 | 4,300,000 | 4,200,412 |
4.13%, 8/17/2027 | 7,800,000 | 7,025,693 |
Global Aircraft Leasing Co. Ltd. (Cayman Islands) 6.50% (Cash), 9/15/2024 (a) (b) | 1,209,706 | 978,676 |
Navient Corp. | ||
7.25%, 9/25/2023 | 208,000 | 208,349 |
5.88%, 10/25/2024 | 1,045,000 | 1,003,404 |
5.00%, 3/15/2027 | 324,000 | 277,383 |
OneMain Finance Corp. | ||
6.13%, 3/15/2024 | 1,724,000 | 1,683,305 |
7.13%, 3/15/2026 | 3,266,000 | 3,042,246 |
3.88%, 9/15/2028 | 544,000 | 424,320 |
SLM Corp. 4.20%, 10/29/2025 | 401,000 | 367,693 |
VistaJet Malta Finance plc (Switzerland) 6.38%, 2/1/2030 (a) | 787,000 | 676,820 |
21,212,798 | ||
Containers & Packaging — 2.4% | ||
Ardagh Metal Packaging Finance USA LLC | ||
3.25%, 9/1/2028 (a) | 550,000 | 474,375 |
4.00%, 9/1/2029 (a) | 500,000 | 405,000 |
August 31, 2022 | J.P. Morgan Exchange-Traded Funds | 87 |
AS OF August 31, 2022 (Unaudited) (continued)
INVESTMENTS | PRINCIPAL AMOUNT ($000) | VALUE ($000) |
Corporate Bonds — continued | ||
Containers & Packaging — continued | ||
Ardagh Packaging Finance plc | ||
4.13%, 8/15/2026 (a) | 800,000 | 690,136 |
5.25%, 8/15/2027 (a) | 800,000 | 578,292 |
Ball Corp. | ||
4.88%, 3/15/2026 | 460,000 | 445,131 |
3.13%, 9/15/2031 | 938,000 | 759,711 |
Berry Global, Inc. 5.63%, 7/15/2027 (a) | 269,000 | 262,679 |
Crown Americas LLC | ||
4.75%, 2/1/2026 | 273,000 | 263,274 |
5.25%, 4/1/2030 (a) | 244,000 | 234,240 |
Graphic Packaging International LLC | ||
4.75%, 7/15/2027 (a) | 390,000 | 372,426 |
3.50%, 3/15/2028 (a) | 188,000 | 165,388 |
LABL, Inc. | ||
6.75%, 7/15/2026 (a) | 522,000 | 495,900 |
10.50%, 7/15/2027 (a) | 400,000 | 378,000 |
Mauser Packaging Solutions Holding Co. | ||
5.50%, 4/15/2024 (a) | 826,000 | 799,632 |
7.25%, 4/15/2025 (a) | 604,000 | 549,640 |
Owens-Brockway Glass Container, Inc. 6.63%, 5/13/2027 (a) | 668,000 | 620,021 |
Pactiv Evergreen Group Issuer, Inc. 4.00%, 10/15/2027 (a) | 737,000 | 643,290 |
Pactiv LLC 7.95%, 12/15/2025 | 141,000 | 131,246 |
Sealed Air Corp. 6.88%, 7/15/2033 (a) | 424,000 | 432,764 |
Silgan Holdings, Inc. 4.13%, 2/1/2028 | 219,000 | 200,475 |
TriMas Corp. 4.13%, 4/15/2029 (a) | 188,000 | 164,970 |
Trivium Packaging Finance BV (Netherlands) 5.50%, 8/15/2026 (a) (d) | 600,000 | 575,472 |
9,642,062 | ||
Distributors — 0.1% | ||
American Builders & Contractors Supply Co., Inc. 4.00%, 1/15/2028 (a) | 483,000 | 436,883 |
Diversified Consumer Services — 0.2% | ||
Metis Merger Sub LLC 6.50%, 5/15/2029 (a) | 232,000 | 199,525 |
Service Corp. International | ||
5.13%, 6/1/2029 | 143,000 | 135,480 |
3.38%, 8/15/2030 | 392,000 | 323,067 |
658,072 | ||
Diversified Financial Services — 0.4% | ||
MPH Acquisition Holdings LLC | ||
5.50%, 9/1/2028 (a) | 370,000 | 315,425 |
5.75%, 11/1/2028 (a) | 370,000 | 293,780 |
INVESTMENTS | PRINCIPAL AMOUNT ($000) | VALUE ($000) |
Diversified Financial Services — continued | ||
Oxford Finance LLC 6.38%, 2/1/2027 (a) | 231,000 | 221,760 |
Sabre GLBL, Inc. 9.25%, 4/15/2025 (a) | 453,000 | 446,337 |
Verscend Escrow Corp. 9.75%, 8/15/2026 (a) | 304,000 | 306,915 |
1,584,217 | ||
Diversified Telecommunication Services — 6.5% | ||
Altice France Holding SA (Luxembourg) 10.50%, 5/15/2027 (a) | 750,000 | 647,040 |
Altice France SA (France) 5.50%, 1/15/2028 (a) | 2,750,000 | 2,278,540 |
CCO Holdings LLC | ||
5.13%, 5/1/2027 (a) | 916,000 | 869,463 |
5.38%, 6/1/2029 (a) | 2,888,000 | 2,638,491 |
4.75%, 3/1/2030 (a) | 4,856,000 | 4,173,902 |
Consolidated Communications, Inc. 6.50%, 10/1/2028 (a) | 324,000 | 260,723 |
Embarq Corp. 8.00%, 6/1/2036 | 663,000 | 515,496 |
Frontier Communications Holdings LLC | ||
5.88%, 10/15/2027 (a) | 785,000 | 732,209 |
5.00%, 5/1/2028 (a) | 505,000 | 442,612 |
6.75%, 5/1/2029 (a) | 771,000 | 664,980 |
8.75%, 5/15/2030 (a) | 324,000 | 333,519 |
Iliad Holding SASU (France) 6.50%, 10/15/2026 (a) | 750,000 | 685,335 |
Intelsat Jackson Holdings SA (Luxembourg) 6.50%, 3/15/2030 (a) | 1,284,000 | 1,163,920 |
Level 3 Financing, Inc. | ||
4.63%, 9/15/2027 (a) | 1,052,000 | 929,358 |
4.25%, 7/1/2028 (a) | 602,000 | 500,413 |
Lumen Technologies, Inc. | ||
Series Y, 7.50%, 4/1/2024 | 510,000 | 513,468 |
4.00%, 2/15/2027 (a) | 1,264,000 | 1,098,713 |
5.38%, 6/15/2029 (a) | 456,000 | 356,081 |
Qwest Corp. 7.25%, 9/15/2025 | 142,000 | 147,008 |
Sprint Capital Corp. | ||
6.88%, 11/15/2028 | 1,939,000 | 2,047,477 |
8.75%, 3/15/2032 | 1,065,000 | 1,285,689 |
Telecom Italia Capital SA (Italy) 6.38%, 11/15/2033 | 596,000 | 503,620 |
Telecom Italia SpA (Italy) 5.30%, 5/30/2024 (a) | 926,000 | 891,386 |
Telesat Canada (Canada) 5.63%, 12/6/2026 (a) | 310,000 | 180,726 |
Virgin Media Secured Finance plc (United Kingdom) | ||
5.50%, 5/15/2029 (a) | 1,400,000 | 1,245,398 |
88 | J.P. Morgan Exchange-Traded Funds | August 31, 2022 |
INVESTMENTS | PRINCIPAL AMOUNT ($000) | VALUE ($000) |
Corporate Bonds — continued | ||
Diversified Telecommunication Services — continued | ||
4.50%, 8/15/2030 (a) | 300,000 | 249,810 |
Windstream Escrow LLC 7.75%, 8/15/2028 (a) | 424,000 | 364,462 |
Zayo Group Holdings, Inc. | ||
4.00%, 3/1/2027 (a) | 422,000 | 359,755 |
6.13%, 3/1/2028 (a) | 322,000 | 246,581 |
26,326,175 | ||
Electric Utilities — 1.9% | ||
FirstEnergy Corp. | ||
2.65%, 3/1/2030 | 1,192,000 | 1,016,883 |
Series C, 5.35%, 7/15/2047 (d) | 211,000 | 194,120 |
NextEra Energy Operating Partners LP 4.50%, 9/15/2027 (a) | 837,000 | 774,225 |
NRG Energy, Inc. | ||
5.75%, 1/15/2028 | 310,000 | 292,209 |
5.25%, 6/15/2029 (a) | 1,434,000 | 1,281,709 |
3.63%, 2/15/2031 (a) | 602,000 | 478,169 |
PG&E Corp. 5.25%, 7/1/2030 | 1,052,000 | 909,454 |
Terraform Global Operating LLC 6.13%, 3/1/2026 (a) | 182,000 | 171,444 |
Vistra Operations Co. LLC | ||
5.63%, 2/15/2027 (a) | 2,297,000 | 2,210,863 |
4.38%, 5/1/2029 (a) | 225,000 | 196,155 |
7,525,231 | ||
Electrical Equipment — 0.2% | ||
Atkore, Inc. 4.25%, 6/1/2031 (a) | 182,000 | 152,826 |
Sensata Technologies BV 5.00%, 10/1/2025 (a) | 475,000 | 465,034 |
Vertiv Group Corp. 4.13%, 11/15/2028 (a) | 353,000 | 305,345 |
923,205 | ||
Electronic Equipment, Instruments & Components — 0.4% | ||
II-VI, Inc. 5.00%, 12/15/2029 (a) | 489,000 | 435,391 |
Sensata Technologies, Inc. 4.38%, 2/15/2030 (a) | 1,467,000 | 1,307,075 |
1,742,466 | ||
Energy Equipment & Services — 0.9% | ||
Archrock Partners LP | ||
6.88%, 4/1/2027 (a) | 512,000 | 480,000 |
6.25%, 4/1/2028 (a) | 143,000 | 130,130 |
Nabors Industries Ltd. 7.25%, 1/15/2026 (a) | 239,000 | 217,306 |
Nabors Industries, Inc. | ||
5.75%, 2/1/2025 | 595,000 | 548,489 |
7.38%, 5/15/2027 (a) | 293,000 | 282,745 |
INVESTMENTS | PRINCIPAL AMOUNT ($000) | VALUE ($000) |
Energy Equipment & Services — continued | ||
Oceaneering International, Inc. 4.65%, 11/15/2024 | 223,000 | 208,041 |
Patterson-UTI Energy, Inc. 3.95%, 2/1/2028 | 282,000 | 238,563 |
Precision Drilling Corp. (Canada) | ||
7.13%, 1/15/2026 (a) | 242,000 | 231,296 |
6.88%, 1/15/2029 (a) | 162,000 | 148,844 |
Transocean Guardian Ltd. 5.88%, 1/15/2024 (a) | 278,997 | 264,349 |
Transocean Pontus Ltd. 6.13%, 8/1/2025 (a) | 237,440 | 227,349 |
Transocean, Inc. 11.50%, 1/30/2027 (a) | 313,000 | 301,702 |
USA Compression Partners LP 6.88%, 4/1/2026 | 411,000 | 385,456 |
Weatherford International Ltd. 6.50%, 9/15/2028 (a) | 159,000 | 149,858 |
3,814,128 | ||
Entertainment — 1.5% | ||
Banijay Entertainment SASU (France) 5.38%, 3/1/2025 (a) | 250,000 | 235,624 |
Cinemark USA, Inc. | ||
8.75%, 5/1/2025 (a) | 240,000 | 246,154 |
5.25%, 7/15/2028 (a) | 469,000 | 379,923 |
Lions Gate Capital Holdings LLC 5.50%, 4/15/2029 (a) | 293,000 | 232,068 |
Live Nation Entertainment, Inc. | ||
4.88%, 11/1/2024 (a) | 621,000 | 600,817 |
6.50%, 5/15/2027 (a) | 762,000 | 760,762 |
4.75%, 10/15/2027 (a) | 232,000 | 211,120 |
Netflix, Inc. 5.88%, 11/15/2028 | 2,678,000 | 2,708,020 |
ROBLOX Corp. 3.88%, 5/1/2030 (a) | 279,000 | 232,734 |
WMG Acquisition Corp. | ||
3.88%, 7/15/2030 (a) | 428,000 | 368,080 |
3.00%, 2/15/2031 (a) | 229,000 | 181,769 |
6,157,071 | ||
Equity Real Estate Investment Trusts (REITs) — 2.4% | ||
Brookfield Property REIT, Inc. 5.75%, 5/15/2026 (a) | 509,000 | 474,640 |
Global Net Lease, Inc. 3.75%, 12/15/2027 (a) | 144,000 | 123,929 |
HAT Holdings I LLC | ||
3.38%, 6/15/2026 (a) | 424,000 | 367,943 |
3.75%, 9/15/2030 (a) | 235,000 | 188,994 |
Iron Mountain, Inc. | ||
4.88%, 9/15/2027 (a) | 802,000 | 736,116 |
5.00%, 7/15/2028 (a) | 941,000 | 858,700 |
4.88%, 9/15/2029 (a) | 1,289,000 | 1,117,853 |
August 31, 2022 | J.P. Morgan Exchange-Traded Funds | 89 |
AS OF August 31, 2022 (Unaudited) (continued)
INVESTMENTS | PRINCIPAL AMOUNT ($000) | VALUE ($000) |
Corporate Bonds — continued | ||
Equity Real Estate Investment Trusts (REITs) — continued | ||
iStar, Inc. 4.75%, 10/1/2024 | 535,000 | 535,209 |
MPT Operating Partnership LP 4.63%, 8/1/2029 | 1,307,000 | 1,113,494 |
Park Intermediate Holdings LLC 5.88%, 10/1/2028 (a) | 1,452,000 | 1,333,807 |
RHP Hotel Properties LP 4.75%, 10/15/2027 | 815,000 | 741,104 |
SBA Communications Corp. | ||
3.88%, 2/15/2027 | 414,000 | 376,855 |
3.13%, 2/1/2029 | 518,000 | 426,793 |
Uniti Group LP | ||
7.88%, 2/15/2025 (a) | 895,000 | 884,166 |
6.50%, 2/15/2029 (a) | 680,000 | 518,078 |
9,797,681 | ||
Food & Staples Retailing — 1.1% | ||
Albertsons Cos., Inc. | ||
4.63%, 1/15/2027 (a) | 776,000 | 708,115 |
5.88%, 2/15/2028 (a) | 693,000 | 660,375 |
4.88%, 2/15/2030 (a) | 533,000 | 466,775 |
Performance Food Group, Inc. 5.50%, 10/15/2027 (a) | 961,000 | 905,868 |
Rite Aid Corp. 8.00%, 11/15/2026 (a) | 705,000 | 574,575 |
US Foods, Inc. | ||
6.25%, 4/15/2025 (a) | 427,000 | 429,080 |
4.75%, 2/15/2029 (a) | 592,000 | 527,599 |
4,272,387 | ||
Food Products — 1.0% | ||
B&G Foods, Inc. 5.25%, 9/15/2027 | 436,000 | 363,338 |
Darling Ingredients, Inc. | ||
5.25%, 4/15/2027 (a) | 186,000 | 182,431 |
6.00%, 6/15/2030 (a) | 334,000 | 334,421 |
Lamb Weston Holdings, Inc. 4.88%, 5/15/2028 (a) | 952,000 | 907,092 |
Post Holdings, Inc. 5.50%, 12/15/2029 (a) | 2,363,000 | 2,165,465 |
3,952,747 | ||
Gas Utilities — 0.3% | ||
AmeriGas Partners LP 5.88%, 8/20/2026 | 761,000 | 724,350 |
Suburban Propane Partners LP 5.00%, 6/1/2031 (a) | 325,000 | 286,996 |
Superior Plus LP (Canada) 4.50%, 3/15/2029 (a) | 291,000 | 256,607 |
1,267,953 | ||
Health Care Equipment & Supplies — 0.9% | ||
Avantor Funding, Inc. 4.63%, 7/15/2028 (a) | 776,000 | 706,067 |
INVESTMENTS | PRINCIPAL AMOUNT ($000) | VALUE ($000) |
Health Care Equipment & Supplies — continued | ||
Hologic, Inc. 3.25%, 2/15/2029 (a) | 506,000 | 431,342 |
Medline Borrower LP | ||
3.88%, 4/1/2029 (a) | 1,579,000 | 1,338,203 |
5.25%, 10/1/2029 (a) | 870,000 | 731,165 |
Teleflex, Inc. 4.25%, 6/1/2028 (a) | 329,000 | 298,910 |
3,505,687 | ||
Health Care Providers & Services — 5.3% | ||
Acadia Healthcare Co., Inc. 5.50%, 7/1/2028 (a) | 330,000 | 312,619 |
Centene Corp. | ||
4.25%, 12/15/2027 | 1,734,000 | 1,646,710 |
4.63%, 12/15/2029 | 3,415,000 | 3,217,067 |
3.38%, 2/15/2030 | 1,323,000 | 1,134,472 |
2.50%, 3/1/2031 | 1,805,000 | 1,440,246 |
Community Health Systems, Inc. | ||
8.00%, 3/15/2026 (a) | 687,000 | 642,345 |
5.63%, 3/15/2027 (a) | 1,844,000 | 1,563,703 |
6.00%, 1/15/2029 (a) | 415,000 | 340,615 |
6.88%, 4/15/2029 (a) | 850,000 | 531,250 |
DaVita, Inc. | ||
4.63%, 6/1/2030 (a) | 1,142,000 | 919,356 |
3.75%, 2/15/2031 (a) | 384,000 | 282,538 |
Encompass Health Corp. | ||
4.50%, 2/1/2028 | 409,000 | 357,810 |
4.75%, 2/1/2030 | 415,000 | 354,919 |
Envision Healthcare Corp. 8.75%, 10/15/2026 (a) | 227,000 | 74,958 |
Global Medical Response, Inc. 6.50%, 10/1/2025 (a) | 228,000 | 203,490 |
HealthEquity, Inc. 4.50%, 10/1/2029 (a) | 167,000 | 146,883 |
Legacy LifePoint Health LLC 4.38%, 2/15/2027 (a) | 395,000 | 343,338 |
Molina Healthcare, Inc. 4.38%, 6/15/2028 (a) | 688,000 | 634,680 |
Owens & Minor, Inc. 6.63%, 4/1/2030 (a) | 414,000 | 382,397 |
Pediatrix Medical Group, Inc. 5.38%, 2/15/2030 (a) | 130,000 | 110,821 |
Radiology Partners, Inc. 9.25%, 2/1/2028 (a) | 226,000 | 168,413 |
RegionalCare Hospital Partners Holdings, Inc. 9.75%, 12/1/2026 (a) | 548,000 | 522,165 |
RP Escrow Issuer LLC 5.25%, 12/15/2025 (a) | 272,000 | 242,803 |
Select Medical Corp. 6.25%, 8/15/2026 (a) | 329,000 | 314,741 |
Surgery Center Holdings, Inc. 6.75%, 7/1/2025 (a) | 279,000 | 269,179 |
90 | J.P. Morgan Exchange-Traded Funds | August 31, 2022 |
INVESTMENTS | PRINCIPAL AMOUNT ($000) | VALUE ($000) |
Corporate Bonds — continued | ||
Health Care Providers & Services — continued | ||
Tenet Healthcare Corp. | ||
6.25%, 2/1/2027 (a) | 1,007,000 | 971,045 |
5.13%, 11/1/2027 (a) | 3,219,000 | 2,982,403 |
4.63%, 6/15/2028 (a) | 648,000 | 589,029 |
6.13%, 10/1/2028 (a) | 409,000 | 375,257 |
6.88%, 11/15/2031 | 401,000 | 375,436 |
21,450,688 | ||
Health Care Technology — 0.2% | ||
IQVIA, Inc. 5.00%, 10/15/2026 (a) | 800,000 | 775,008 |
Hotels, Restaurants & Leisure — 9.6% | ||
1011778 BC ULC (Canada) | ||
3.88%, 1/15/2028 (a) | 1,166,000 | 1,036,469 |
4.38%, 1/15/2028 (a) | 990,000 | 885,023 |
Bloomin' Brands, Inc. 5.13%, 4/15/2029 (a) | 188,000 | 163,252 |
Boyd Gaming Corp. 4.75%, 12/1/2027 | 768,000 | 716,905 |
Boyne USA, Inc. 4.75%, 5/15/2029 (a) | 276,000 | 245,479 |
Caesars Entertainment, Inc. | ||
6.25%, 7/1/2025 (a) | 505,000 | 493,087 |
8.13%, 7/1/2027 (a) | 1,393,000 | 1,368,581 |
4.63%, 10/15/2029 (a) | 821,000 | 660,367 |
Caesars Resort Collection LLC 5.75%, 7/1/2025 (a) | 403,000 | 394,948 |
Carnival Corp. | ||
7.63%, 3/1/2026 (a) | 856,000 | 728,756 |
5.75%, 3/1/2027 (a) | 1,163,000 | 904,232 |
9.88%, 8/1/2027 (a) | 2,286,000 | 2,294,578 |
4.00%, 8/1/2028 (a) | 505,000 | 421,039 |
CCM Merger, Inc. 6.38%, 5/1/2026 (a) | 146,000 | 137,206 |
CDI Escrow Issuer, Inc. 5.75%, 4/1/2030 (a) | 466,000 | 431,744 |
Cedar Fair LP | ||
5.50%, 5/1/2025 (a) | 604,000 | 592,467 |
5.25%, 7/15/2029 | 406,000 | 369,590 |
Churchill Downs, Inc. 5.50%, 4/1/2027 (a) | 310,000 | 297,035 |
Everi Holdings, Inc. 5.00%, 7/15/2029 (a) | 146,000 | 131,133 |
Fertitta Entertainment LLC 4.63%, 1/15/2029 (a) | 300,000 | 261,429 |
Hilton Domestic Operating Co., Inc. 4.88%, 1/15/2030 | 1,416,000 | 1,293,941 |
Hilton Grand Vacations Borrower Escrow LLC 5.00%, 6/1/2029 (a) | 414,000 | 366,313 |
Hilton Worldwide Finance LLC 4.88%, 4/1/2027 | 1,002,000 | 956,910 |
International Game Technology plc | ||
6.50%, 2/15/2025 (a) | 1,200,000 | 1,191,000 |
INVESTMENTS | PRINCIPAL AMOUNT ($000) | VALUE ($000) |
Hotels, Restaurants & Leisure — continued | ||
5.25%, 1/15/2029 (a) | 250,000 | 233,748 |
IRB Holding Corp. 7.00%, 6/15/2025 (a) | 405,000 | 407,551 |
Jacobs Entertainment, Inc. 6.75%, 2/15/2029 (a) | 200,000 | 177,500 |
Las Vegas Sands Corp. 2.90%, 6/25/2025 | 1,001,000 | 922,666 |
Life Time, Inc. | ||
5.75%, 1/15/2026 (a) | 304,000 | 273,782 |
8.00%, 4/15/2026 (a) | 188,000 | 165,953 |
Marriott Ownership Resorts, Inc. | ||
6.13%, 9/15/2025 (a) | 159,000 | 158,472 |
4.75%, 1/15/2028 | 239,000 | 208,958 |
Melco Resorts Finance Ltd. (Hong Kong) | ||
4.88%, 6/6/2025 (a) | 500,000 | 380,094 |
5.75%, 7/21/2028 (a) | 750,000 | 504,375 |
MGM China Holdings Ltd. (Macau) 5.88%, 5/15/2026 (a) | 800,000 | 664,000 |
MGM Resorts International | ||
5.75%, 6/15/2025 | 728,000 | 706,160 |
4.63%, 9/1/2026 | 728,000 | 662,313 |
Midwest Gaming Borrower LLC 4.88%, 5/1/2029 (a) | 311,000 | 272,903 |
NCL Corp. Ltd. | ||
3.63%, 12/15/2024 (a) | 221,000 | 191,512 |
5.88%, 3/15/2026 (a) | 324,000 | 262,001 |
5.88%, 2/15/2027 (a) | 293,000 | 265,553 |
Papa John's International, Inc. 3.88%, 9/15/2029 (a) | 232,000 | 198,360 |
Peninsula Pacific Entertainment LLC 8.50%, 11/15/2027 (a) | 233,000 | 250,419 |
Penn Entertainment, Inc. 4.13%, 7/1/2029 (a) | 372,000 | 300,479 |
Premier Entertainment Sub LLC 5.63%, 9/1/2029 (a) | 424,000 | 313,175 |
Resorts World Las Vegas LLC 4.63%, 4/16/2029 (a) | 500,000 | 397,375 |
Royal Caribbean Cruises Ltd. | ||
11.50%, 6/1/2025 (a) | 1,316,000 | 1,396,684 |
5.50%, 8/31/2026 (a) | 1,274,000 | 1,018,359 |
11.63%, 8/15/2027 (a) | 392,000 | 384,223 |
Sands China Ltd. (Macau) | ||
5.63%, 8/8/2025 (d) | 1,000,000 | 910,000 |
5.90%, 8/8/2028 (d) | 1,000,000 | 847,500 |
Scientific Games International, Inc. | ||
8.63%, 7/1/2025 (a) | 414,000 | 426,151 |
7.25%, 11/15/2029 (a) | 304,000 | 298,963 |
August 31, 2022 | J.P. Morgan Exchange-Traded Funds | 91 |
AS OF August 31, 2022 (Unaudited) (continued)
INVESTMENTS | PRINCIPAL AMOUNT ($000) | VALUE ($000) |
Corporate Bonds — continued | ||
Hotels, Restaurants & Leisure — continued | ||
Six Flags Entertainment Corp. 5.50%, 4/15/2027 (a) | 412,000 | 377,802 |
Six Flags Theme Parks, Inc. 7.00%, 7/1/2025 (a) | 401,000 | 405,277 |
Station Casinos LLC 4.50%, 2/15/2028 (a) | 491,000 | 422,961 |
Studio City Finance Ltd. (Macau) 5.00%, 1/15/2029 (a) | 1,100,000 | 572,000 |
Travel + Leisure Co. | ||
6.63%, 7/31/2026 (a) | 304,000 | 294,597 |
6.00%, 4/1/2027 (d) | 511,000 | 485,207 |
Vail Resorts, Inc. 6.25%, 5/15/2025 (a) | 238,000 | 238,226 |
Viking Cruises Ltd. 5.88%, 9/15/2027 (a) | 515,000 | 415,358 |
VOC Escrow Ltd. 5.00%, 2/15/2028 (a) | 586,000 | 495,170 |
Wyndham Hotels & Resorts, Inc. 4.38%, 8/15/2028 (a) | 212,000 | 189,605 |
Wynn Las Vegas LLC 5.50%, 3/1/2025 (a) | 1,108,000 | 1,061,032 |
Wynn Macau Ltd. (Macau) 5.63%, 8/26/2028 (a) | 1,600,000 | 1,120,000 |
Wynn Resorts Finance LLC 5.13%, 10/1/2029 (a) | 652,000 | 547,015 |
Yum! Brands, Inc. | ||
4.75%, 1/15/2030 (a) | 2,313,000 | 2,107,721 |
6.88%, 11/15/2037 | 409,000 | 429,751 |
38,702,435 | ||
Household Durables — 1.1% | ||
Beazer Homes USA, Inc. 5.88%, 10/15/2027 | 279,000 | 229,477 |
Brookfield Residential Properties, Inc. (Canada) 6.25%, 9/15/2027 (a) | 414,000 | 367,899 |
CD&R Smokey Buyer, Inc. 6.75%, 7/15/2025 (a) | 270,000 | 251,100 |
Century Communities, Inc. 3.88%, 8/15/2029 (a) | 324,000 | 260,417 |
KB Home 4.80%, 11/15/2029 | 398,000 | 343,078 |
M/I Homes, Inc. 4.95%, 2/1/2028 | 233,000 | 205,654 |
Mattamy Group Corp. (Canada) 5.25%, 12/15/2027 (a) | 310,000 | 272,997 |
Meritage Homes Corp. 5.13%, 6/6/2027 | 328,000 | 307,242 |
Newell Brands, Inc. | ||
4.45%, 4/1/2026 (d) | 749,000 | 704,404 |
5.75%, 4/1/2046 (d) | 332,000 | 272,240 |
Taylor Morrison Communities, Inc. 5.88%, 6/15/2027 (a) | 548,000 | 529,431 |
INVESTMENTS | PRINCIPAL AMOUNT ($000) | VALUE ($000) |
Household Durables — continued | ||
Tempur Sealy International, Inc. 4.00%, 4/15/2029 (a) | 597,000 | 490,502 |
Tri Pointe Homes, Inc. 5.70%, 6/15/2028 | 322,000 | 291,730 |
4,526,171 | ||
Household Products — 0.3% | ||
Central Garden & Pet Co. | ||
5.13%, 2/1/2028 | 233,000 | 214,910 |
4.13%, 10/15/2030 | 173,000 | 144,006 |
Energizer Holdings, Inc. 4.75%, 6/15/2028 (a) | 590,000 | 490,845 |
Spectrum Brands, Inc. 5.50%, 7/15/2030 (a) | 510,000 | 439,347 |
1,289,108 | ||
Independent Power and Renewable Electricity Producers — 0.5% | ||
Calpine Corp. | ||
4.50%, 2/15/2028 (a) | 1,218,000 | 1,114,141 |
5.13%, 3/15/2028 (a) | 424,000 | 376,557 |
Clearway Energy Operating LLC | ||
4.75%, 3/15/2028 (a) | 242,000 | 226,573 |
3.75%, 2/15/2031 (a) | 424,000 | 354,050 |
2,071,321 | ||
Insurance — 0.9% | ||
Alliant Holdings Intermediate LLC | ||
4.25%, 10/15/2027 (a) | 322,000 | 290,048 |
6.75%, 10/15/2027 (a) | 602,000 | 546,797 |
AmWINS Group, Inc. 4.88%, 6/30/2029 (a) | 311,000 | 270,578 |
HUB International Ltd. | ||
7.00%, 5/1/2026 (a) | 602,000 | 589,812 |
5.63%, 12/1/2029 (a) | 159,000 | 139,070 |
Liberty Mutual Group, Inc. 4.30%, 2/1/2061 (a) | 652,000 | 449,880 |
NFP Corp. | ||
4.88%, 8/15/2028 (a) | 233,000 | 206,757 |
6.88%, 8/15/2028 (a) | 744,000 | 611,360 |
Ryan Specialty Group LLC 4.38%, 2/1/2030 (a) | 162,000 | 146,002 |
USI, Inc. 6.88%, 5/1/2025 (a) | 228,000 | 223,299 |
3,473,603 | ||
Interactive Media & Services — 0.1% | ||
TripAdvisor, Inc. 7.00%, 7/15/2025 (a) | 233,000 | 228,827 |
Twitter, Inc. 5.00%, 3/1/2030 (a) | 376,000 | 354,322 |
583,149 | ||
Internet & Direct Marketing Retail — 0.6% | ||
ANGI Group LLC 3.88%, 8/15/2028 (a) | 242,000 | 183,315 |
92 | J.P. Morgan Exchange-Traded Funds | August 31, 2022 |
INVESTMENTS | PRINCIPAL AMOUNT ($000) | VALUE ($000) |
Corporate Bonds — continued | ||
Internet & Direct Marketing Retail — continued | ||
Go Daddy Operating Co. LLC | ||
5.25%, 12/1/2027 (a) | 236,000 | 221,840 |
3.50%, 3/1/2029 (a) | 334,000 | 282,626 |
Match Group Holdings II LLC 4.63%, 6/1/2028 (a) | 660,000 | 587,400 |
Millennium Escrow Corp. 6.63%, 8/1/2026 (a) | 311,000 | 252,381 |
Photo Holdings Merger Sub, Inc. 8.50%, 10/1/2026 (a) | 226,000 | 168,769 |
QVC, Inc. 4.75%, 2/15/2027 | 898,000 | 741,685 |
2,438,016 | ||
IT Services — 0.9% | ||
Ahead DB Holdings LLC 6.63%, 5/1/2028 (a) | 223,000 | 200,141 |
Arches Buyer, Inc. | ||
4.25%, 6/1/2028 (a) | 370,000 | 297,850 |
6.13%, 12/1/2028 (a) | 232,000 | 181,470 |
Black Knight InfoServ LLC 3.63%, 9/1/2028 (a) | 315,000 | 274,995 |
Block, Inc. | ||
2.75%, 6/1/2026 | 324,000 | 287,929 |
3.50%, 6/1/2031 | 310,000 | 255,046 |
Booz Allen Hamilton, Inc. 3.88%, 9/1/2028 (a) | 551,000 | 490,114 |
Cablevision Lightpath LLC 3.88%, 9/15/2027 (a) | 250,000 | 218,183 |
Cogent Communications Group, Inc. 3.50%, 5/1/2026 (a) | 144,000 | 129,647 |
Conduent Business Services LLC 6.00%, 11/1/2029 (a) | 242,000 | 208,406 |
Gartner, Inc. 4.50%, 7/1/2028 (a) | 587,000 | 541,772 |
Northwest Fiber LLC | ||
4.75%, 4/30/2027 (a) | 129,000 | 112,506 |
10.75%, 6/1/2028 (a) | 142,000 | 131,021 |
Presidio Holdings, Inc. | ||
4.88%, 2/1/2027 (a) | 249,000 | 232,967 |
8.25%, 2/1/2028 (a) | 255,000 | 230,214 |
3,792,261 | ||
Leisure Products — 0.2% | ||
Mattel, Inc. | ||
5.88%, 12/15/2027 (a) | 324,000 | 322,620 |
3.75%, 4/1/2029 (a) | 188,000 | 167,508 |
5.45%, 11/1/2041 | 217,000 | 198,333 |
Vista Outdoor, Inc. 4.50%, 3/15/2029 (a) | 186,000 | 138,462 |
826,923 | ||
INVESTMENTS | PRINCIPAL AMOUNT ($000) | VALUE ($000) |
Life Sciences Tools & Services — 0.1% | ||
Charles River Laboratories International, Inc. 3.75%, 3/15/2029 (a) | 406,000 | 349,919 |
Syneos Health, Inc. 3.63%, 1/15/2029 (a) | 293,000 | 247,658 |
597,577 | ||
Machinery — 0.6% | ||
EnPro Industries, Inc. 5.75%, 10/15/2026 | 188,000 | 184,240 |
Hillenbrand, Inc. 3.75%, 3/1/2031 | 512,000 | 432,657 |
Mueller Water Products, Inc. 4.00%, 6/15/2029 (a) | 242,000 | 217,728 |
Roller Bearing Co. of America, Inc. 4.38%, 10/15/2029 (a) | 188,000 | 168,730 |
Stevens Holding Co., Inc. 6.13%, 10/1/2026 (a) | 188,000 | 186,590 |
Terex Corp. 5.00%, 5/15/2029 (a) | 233,000 | 208,465 |
TK Elevator US Newco, Inc. (Germany) 5.25%, 7/15/2027 (a) | 800,000 | 728,000 |
Wabash National Corp. 4.50%, 10/15/2028 (a) | 180,000 | 152,942 |
2,279,352 | ||
Media — 7.2% | ||
Altice Financing SA (Luxembourg) | ||
5.00%, 1/15/2028 (a) | 1,050,000 | 847,235 |
5.75%, 8/15/2029 (a) | 250,000 | 201,374 |
AMC Networks, Inc. | ||
5.00%, 4/1/2024 | 157,000 | 153,075 |
4.75%, 8/1/2025 | 322,000 | 298,046 |
4.25%, 2/15/2029 | 141,000 | 115,025 |
Audacy Capital Corp. 6.50%, 5/1/2027 (a) | 266,000 | 87,115 |
Block Communications, Inc. 4.88%, 3/1/2028 (a) | 143,000 | 130,130 |
Cable One, Inc. 4.00%, 11/15/2030 (a) | 251,000 | 208,990 |
Clear Channel Outdoor Holdings, Inc. | ||
5.13%, 8/15/2027 (a) | 598,000 | 535,587 |
7.50%, 6/1/2029 (a) | 924,000 | 742,873 |
CSC Holdings LLC | ||
7.50%, 4/1/2028 (a) | 1,100,000 | 977,779 |
6.50%, 2/1/2029 (a) | 2,200,000 | 2,024,517 |
5.75%, 1/15/2030 (a) | 1,350,000 | 1,045,494 |
Directv Financing LLC 5.88%, 8/15/2027 (a) | 1,282,000 | 1,173,030 |
DISH DBS Corp. | ||
5.88%, 11/15/2024 | 2,008,000 | 1,817,240 |
7.75%, 7/1/2026 | 683,000 | 538,491 |
5.25%, 12/1/2026 (a) | 596,000 | 492,072 |
5.75%, 12/1/2028 (a) | 414,000 | 317,897 |
Gannett Holdings LLC 6.00%, 11/1/2026 (a) | 188,000 | 146,640 |
August 31, 2022 | J.P. Morgan Exchange-Traded Funds | 93 |
AS OF August 31, 2022 (Unaudited) (continued)
INVESTMENTS | PRINCIPAL AMOUNT ($000) | VALUE ($000) |
Corporate Bonds — continued | ||
Media — continued | ||
GCI LLC 4.75%, 10/15/2028 (a) | 184,000 | 165,824 |
Gray Television, Inc. | ||
7.00%, 5/15/2027 (a) | 674,000 | 664,480 |
4.75%, 10/15/2030 (a) | 920,000 | 758,080 |
iHeartCommunications, Inc. | ||
6.38%, 5/1/2026 | 908,417 | 857,982 |
8.38%, 5/1/2027 | 567,864 | 500,163 |
Lamar Media Corp. | ||
3.75%, 2/15/2028 | 414,000 | 371,304 |
4.00%, 2/15/2030 | 229,000 | 199,372 |
LCPR Senior Secured Financing DAC 6.75%, 10/15/2027 (a) | 838,000 | 790,938 |
Liberty Interactive LLC 8.25%, 2/1/2030 | 304,000 | 232,560 |
McGraw-Hill Education, Inc. | ||
5.75%, 8/1/2028 (a) | 229,000 | 201,078 |
8.00%, 8/1/2029 (a) | 233,000 | 202,139 |
National CineMedia LLC 5.88%, 4/15/2028 (a) | 162,000 | 113,222 |
News Corp. 3.88%, 5/15/2029 (a) | 651,000 | 566,370 |
Nexstar Media, Inc. | ||
5.63%, 7/15/2027 (a) | 861,000 | 819,823 |
4.75%, 11/1/2028 (a) | 355,000 | 321,275 |
Outfront Media Capital LLC | ||
5.00%, 8/15/2027 (a) | 485,000 | 443,901 |
4.25%, 1/15/2029 (a) | 150,000 | 125,218 |
Paramount Global (US Treasury Yield Curve Rate T Note Constant Maturity 5 Year + 4.00%), 6.37%, 3/30/2062 (c) | 414,000 | 380,831 |
Radiate Holdco LLC | ||
4.50%, 9/15/2026 (a) | 311,000 | 268,082 |
6.50%, 9/15/2028 (a) | 310,000 | 230,869 |
Scripps Escrow II, Inc. 3.88%, 1/15/2029 (a) | 171,000 | 144,984 |
Scripps Escrow, Inc. 5.88%, 7/15/2027 (a) | 423,000 | 382,804 |
Sinclair Television Group, Inc. | ||
5.50%, 3/1/2030 (a) | 317,000 | 248,483 |
4.13%, 12/1/2030 (a) | 232,000 | 188,843 |
Sirius XM Radio, Inc. | ||
5.00%, 8/1/2027 (a) | 868,000 | 817,118 |
5.50%, 7/1/2029 (a) | 1,498,000 | 1,400,750 |
4.13%, 7/1/2030 (a) | 758,000 | 642,231 |
Stagwell Global LLC 5.63%, 8/15/2029 (a) | 422,000 | 357,877 |
Summer BC Bidco B LLC 5.50%, 10/31/2026 (a) | 350,000 | 304,276 |
TEGNA, Inc. 5.00%, 9/15/2029 | 1,120,000 | 1,072,075 |
INVESTMENTS | PRINCIPAL AMOUNT ($000) | VALUE ($000) |
Media — continued | ||
Univision Communications, Inc. | ||
5.13%, 2/15/2025 (a) | 718,000 | 693,534 |
6.63%, 6/1/2027 (a) | 408,000 | 393,728 |
4.50%, 5/1/2029 (a) | 378,000 | 330,655 |
UPC Broadband Finco BV (Netherlands) 4.88%, 7/15/2031 (a) | 500,000 | 432,485 |
Urban One, Inc. 7.38%, 2/1/2028 (a) | 228,000 | 204,630 |
Virgin Media Vendor Financing Notes IV DAC (United Kingdom) 5.00%, 7/15/2028 (a) | 550,000 | 469,725 |
Ziggo Bond Co. BV (Netherlands) 5.13%, 2/28/2030 (a) | 1,000,000 | 800,500 |
Ziggo BV (Netherlands) 4.88%, 1/15/2030 (a) | 250,000 | 211,050 |
29,161,869 | ||
Metals & Mining — 2.0% | ||
Arconic Corp. | ||
6.00%, 5/15/2025 (a) | 163,000 | 159,944 |
6.13%, 2/15/2028 (a) | 864,000 | 811,018 |
ATI, Inc. 5.88%, 12/1/2027 | 787,000 | 747,924 |
Big River Steel LLC 6.63%, 1/31/2029 (a) | 501,000 | 498,668 |
Carpenter Technology Corp. 6.38%, 7/15/2028 | 542,000 | 518,222 |
Cleveland-Cliffs, Inc. | ||
5.88%, 6/1/2027 | 386,000 | 369,595 |
4.63%, 3/1/2029 (a) | 92,000 | 81,671 |
4.88%, 3/1/2031 (a) | 322,000 | 281,111 |
Commercial Metals Co. 4.13%, 1/15/2030 | 283,000 | 247,510 |
Constellium SE 5.63%, 6/15/2028 (a) | 350,000 | 316,785 |
FMG Resources August 2006 Pty. Ltd. (Australia) | ||
5.13%, 5/15/2024 (a) | 221,000 | 218,684 |
4.50%, 9/15/2027 (a) | 1,038,000 | 948,260 |
Kaiser Aluminum Corp. | ||
4.63%, 3/1/2028 (a) | 505,000 | 434,974 |
4.50%, 6/1/2031 (a) | 323,000 | 254,308 |
Novelis Corp. | ||
3.25%, 11/15/2026 (a) | 182,000 | 161,980 |
4.75%, 1/30/2030 (a) | 1,947,000 | 1,693,890 |
United States Steel Corp. 6.88%, 3/1/2029 | 316,000 | 308,890 |
8,053,434 | ||
Mortgage Real Estate Investment Trusts (REITs) — 0.1% | ||
Starwood Property Trust, Inc. 3.63%, 7/15/2026 (a) | 687,000 | 607,995 |
94 | J.P. Morgan Exchange-Traded Funds | August 31, 2022 |
INVESTMENTS | PRINCIPAL AMOUNT ($000) | VALUE ($000) |
Corporate Bonds — continued | ||
Multiline Retail — 0.5% | ||
Macy's Retail Holdings LLC 5.88%, 4/1/2029 (a) | 666,000 | 576,423 |
NMG Holding Co., Inc. 7.13%, 4/1/2026 (a) | 615,000 | 575,375 |
Nordstrom, Inc. | ||
4.38%, 4/1/2030 | 612,000 | 466,228 |
5.00%, 1/15/2044 | 325,000 | 219,147 |
1,837,173 | ||
Oil, Gas & Consumable Fuels — 11.1% | ||
Aethon United BR LP 8.25%, 2/15/2026 (a) | 243,000 | 242,898 |
Antero Midstream Partners LP | ||
5.75%, 3/1/2027 (a) | 786,000 | 744,735 |
5.75%, 1/15/2028 (a) | 873,000 | 827,587 |
Antero Resources Corp. 8.38%, 7/15/2026 (a) | 914,000 | 980,674 |
Apache Corp. | ||
4.25%, 1/15/2030 | 728,000 | 657,471 |
5.10%, 9/1/2040 | 626,000 | 532,100 |
Ascent Resources Utica Holdings LLC 7.00%, 11/1/2026 (a) | 495,000 | 481,388 |
Baytex Energy Corp. (Canada) 8.75%, 4/1/2027 (a) | 168,000 | 171,780 |
Blue Racer Midstream LLC 7.63%, 12/15/2025 (a) | 459,000 | 456,705 |
Buckeye Partners LP 4.50%, 3/1/2028 (a) | 968,000 | 857,028 |
California Resources Corp. 7.13%, 2/1/2026 (a) | 322,000 | 316,542 |
Centennial Resource Production LLC 6.88%, 4/1/2027 (a) | 213,000 | 203,545 |
Cheniere Energy Partners LP 4.50%, 10/1/2029 | 1,894,000 | 1,744,043 |
Chesapeake Energy Corp. | ||
5.50%, 2/1/2026 (a) | 764,000 | 735,950 |
6.75%, 4/15/2029 (a) | 515,000 | 502,794 |
Chord Energy Corp. 6.38%, 6/1/2026 (a) | 182,000 | 176,540 |
CNX Resources Corp. 7.25%, 3/14/2027 (a) | 322,000 | 319,666 |
Colgate Energy Partners III LLC 7.75%, 2/15/2026 (a) | 273,000 | 272,762 |
Comstock Resources, Inc. 6.75%, 3/1/2029 (a) | 1,123,000 | 1,071,875 |
CQP Holdco LP 5.50%, 6/15/2031 (a) | 500,000 | 442,235 |
Crestwood Midstream Partners LP | ||
5.63%, 5/1/2027 (a) | 1,121,000 | 1,045,332 |
8.00%, 4/1/2029 (a) | 324,000 | 321,225 |
CrownRock LP | ||
5.63%, 10/15/2025 (a) | 159,000 | 156,567 |
5.00%, 5/1/2029 (a) | 322,000 | 295,740 |
INVESTMENTS | PRINCIPAL AMOUNT ($000) | VALUE ($000) |
Oil, Gas & Consumable Fuels — continued | ||
DT Midstream, Inc. 4.13%, 6/15/2029 (a) | 1,113,000 | 977,192 |
Encino Acquisition Partners Holdings LLC 8.50%, 5/1/2028 (a) | 421,000 | 400,812 |
Endeavor Energy Resources LP 5.75%, 1/30/2028 (a) | 328,000 | 323,539 |
EnLink Midstream Partners LP | ||
4.15%, 6/1/2025 | 164,000 | 159,826 |
4.85%, 7/15/2026 | 417,000 | 409,703 |
5.45%, 6/1/2047 | 403,000 | 307,791 |
EQM Midstream Partners LP | ||
4.00%, 8/1/2024 | 456,000 | 431,280 |
6.00%, 7/1/2025 (a) | 162,000 | 156,236 |
5.50%, 7/15/2028 | 1,858,000 | 1,698,695 |
4.50%, 1/15/2029 (a) | 423,000 | 364,282 |
6.50%, 7/15/2048 | 491,000 | 416,599 |
Genesis Energy LP | ||
6.50%, 10/1/2025 | 322,000 | 299,560 |
8.00%, 1/15/2027 | 607,000 | 575,133 |
Gulfport Energy Corp. 8.00%, 5/17/2026 | 286,999 | 288,910 |
Hess Infrastructure Partners LP 5.63%, 2/15/2026 (a) | 25,000 | 24,377 |
Hess Midstream Operations LP | ||
5.63%, 2/15/2026 (a) | 171,000 | 166,737 |
5.13%, 6/15/2028 (a) | 1,088,000 | 1,010,480 |
Hilcorp Energy I LP | ||
6.25%, 11/1/2028 (a) | 694,000 | 655,788 |
6.00%, 2/1/2031 (a) | 747,000 | 675,382 |
Holly Energy Partners LP | ||
6.38%, 4/15/2027 (a) | 188,000 | 182,955 |
5.00%, 2/1/2028 (a) | 262,000 | 243,967 |
ITT Holdings LLC 6.50%, 8/1/2029 (a) | 355,000 | 299,829 |
Kinetik Holdings LP 5.88%, 6/15/2030 (a) | 550,000 | 523,221 |
Laredo Petroleum, Inc. 10.13%, 1/15/2028 | 414,000 | 417,963 |
MEG Energy Corp. (Canada) | ||
7.13%, 2/1/2027 (a) | 607,000 | 613,374 |
5.88%, 2/1/2029 (a) | 324,000 | 301,320 |
Murphy Oil Corp. | ||
5.75%, 8/15/2025 | 194,000 | 192,154 |
5.88%, 12/1/2027 | 196,000 | 190,586 |
6.13%, 12/1/2042 (d) | 239,000 | 187,003 |
New Fortress Energy, Inc. 6.75%, 9/15/2025 (a) | 867,000 | 838,692 |
NuStar Logistics LP | ||
6.00%, 6/1/2026 | 284,000 | 268,077 |
August 31, 2022 | J.P. Morgan Exchange-Traded Funds | 95 |
AS OF August 31, 2022 (Unaudited) (continued)
INVESTMENTS | PRINCIPAL AMOUNT ($000) | VALUE ($000) |
Corporate Bonds — continued | ||
Oil, Gas & Consumable Fuels — continued | ||
5.63%, 4/28/2027 | 889,000 | 809,374 |
Occidental Petroleum Corp. | ||
5.88%, 9/1/2025 | 1,171,000 | 1,200,298 |
8.88%, 7/15/2030 | 709,000 | 828,254 |
6.45%, 9/15/2036 | 2,659,000 | 2,841,647 |
PDC Energy, Inc. | ||
6.13%, 9/15/2024 | 142,000 | 140,626 |
5.75%, 5/15/2026 | 188,000 | 180,027 |
Range Resources Corp. 8.25%, 1/15/2029 | 871,000 | 914,289 |
Rattler Midstream LP 5.63%, 7/15/2025 (a) | 144,000 | 146,933 |
Rockcliff Energy II LLC 5.50%, 10/15/2029 (a) | 229,000 | 211,621 |
Rockies Express Pipeline LLC | ||
4.95%, 7/15/2029 (a) | 405,000 | 365,298 |
4.80%, 5/15/2030 (a) | 576,000 | 483,120 |
6.88%, 4/15/2040 (a) | 160,000 | 133,170 |
SM Energy Co. | ||
5.63%, 6/1/2025 | 414,000 | 402,615 |
6.75%, 9/15/2026 | 436,000 | 428,780 |
Southwestern Energy Co. | ||
7.75%, 10/1/2027 | 148,000 | 153,365 |
8.38%, 9/15/2028 | 332,000 | 349,244 |
5.38%, 3/15/2030 | 1,686,000 | 1,580,254 |
Summit Midstream Holdings LLC 8.50%, 10/15/2026 (a) | 387,000 | 374,821 |
Sunoco LP | ||
6.00%, 4/15/2027 | 656,000 | 634,438 |
4.50%, 4/30/2030 | 718,000 | 612,454 |
Tallgrass Energy Partners LP 5.50%, 1/15/2028 (a) | 2,005,000 | 1,733,616 |
TerraForm Power Operating LLC 5.00%, 1/31/2028 (a) | 374,000 | 342,797 |
Venture Global Calcasieu Pass LLC 3.88%, 8/15/2029 (a) | 1,149,000 | 1,002,502 |
Viper Energy Partners LP 5.38%, 11/1/2027 (a) | 188,000 | 180,010 |
Western Midstream Operating LP | ||
4.75%, 8/15/2028 | 1,280,000 | 1,204,954 |
5.45%, 4/1/2044 | 687,000 | 601,751 |
45,014,903 | ||
Paper & Forest Products — 0.1% | ||
Glatfelter Corp. 4.75%, 11/15/2029 (a) | 188,000 | 116,560 |
Louisiana-Pacific Corp. 3.63%, 3/15/2029 (a) | 188,000 | 152,618 |
269,178 | ||
INVESTMENTS | PRINCIPAL AMOUNT ($000) | VALUE ($000) |
Personal Products — 0.4% | ||
BellRing Brands, Inc. 7.00%, 3/15/2030 (a) | 366,000 | 349,526 |
Coty, Inc. | ||
5.00%, 4/15/2026 (a) | 424,000 | 401,740 |
6.50%, 4/15/2026 (a) | 140,000 | 133,419 |
4.75%, 1/15/2029 (a) | 188,000 | 166,350 |
Edgewell Personal Care Co. 5.50%, 6/1/2028 (a) | 425,000 | 392,492 |
Prestige Brands, Inc. 5.13%, 1/15/2028 (a) | 290,000 | 267,496 |
1,711,023 | ||
Pharmaceuticals — 2.0% | ||
Bausch Health Cos., Inc. | ||
5.50%, 11/1/2025 (a) | 1,228,000 | 1,013,100 |
5.75%, 8/15/2027 (a) | 1,228,000 | 895,470 |
5.00%, 1/30/2028 (a) | 2,950,000 | 1,106,250 |
7.25%, 5/30/2029 (a) | 2,462,000 | 947,870 |
Catalent Pharma Solutions, Inc. | ||
5.00%, 7/15/2027 (a) | 336,000 | 316,959 |
3.13%, 2/15/2029 (a) | 220,000 | 182,389 |
Elanco Animal Health, Inc. 6.40%, 8/28/2028 (d) | 332,000 | 308,760 |
Herbalife Nutrition Ltd. 7.88%, 9/1/2025 (a) | 310,000 | 298,504 |
Jazz Securities DAC 4.38%, 1/15/2029 (a) | 650,000 | 586,131 |
Mallinckrodt International Finance SA 11.50%, 12/15/2028 (a) | 440,000 | 396,550 |
Organon & Co. | ||
4.13%, 4/30/2028 (a) | 825,000 | 740,165 |
5.13%, 4/30/2031 (a) | 625,000 | 546,875 |
Perrigo Finance Unlimited Co. 4.40%, 6/15/2030 (d) | 750,000 | 649,170 |
7,988,193 | ||
Professional Services — 0.2% | ||
AMN Healthcare, Inc. 4.63%, 10/1/2027 (a) | 276,000 | 254,212 |
Dun & Bradstreet Corp. (The) 5.00%, 12/15/2029 (a) | 212,000 | 188,150 |
Science Applications International Corp. 4.88%, 4/1/2028 (a) | 224,000 | 207,197 |
649,559 | ||
Real Estate Management & Development — 0.3% | ||
Forestar Group, Inc. 5.00%, 3/1/2028 (a) | 200,000 | 166,050 |
Kennedy-Wilson, Inc. 4.75%, 3/1/2029 | 602,000 | 502,297 |
Realogy Group LLC 5.75%, 1/15/2029 (a) | 580,000 | 454,412 |
1,122,759 | ||
96 | J.P. Morgan Exchange-Traded Funds | August 31, 2022 |
INVESTMENTS | PRINCIPAL AMOUNT ($000) | VALUE ($000) |
Corporate Bonds — continued | ||
Road & Rail — 0.8% | ||
AerCap Global Aviation Trust (Ireland) (ICE LIBOR USD 3 Month + 4.30%), 6.50%, 6/15/2045 (a) (c) | 300,000 | 285,474 |
Avis Budget Car Rental LLC | ||
5.75%, 7/15/2027 (a) | 671,000 | 635,772 |
5.38%, 3/1/2029 (a) | 242,000 | 210,893 |
First Student Bidco, Inc. 4.00%, 7/31/2029 (a) | 511,000 | 441,075 |
Hertz Corp. (The) | ||
4.63%, 12/1/2026 (a) | 320,000 | 274,083 |
5.00%, 12/1/2029 (a) | 423,000 | 340,257 |
NESCO Holdings II, Inc. 5.50%, 4/15/2029 (a) | 509,000 | 447,920 |
Williams Scotsman International, Inc. 4.63%, 8/15/2028 (a) | 322,000 | 289,414 |
XPO Logistics, Inc. 6.25%, 5/1/2025 (a) | 241,000 | 243,809 |
3,168,697 | ||
Semiconductors & Semiconductor Equipment — 0.4% | ||
Amkor Technology, Inc. 6.63%, 9/15/2027 (a) | 281,000 | 274,481 |
ams-OSRAM AG (Austria) 7.00%, 7/31/2025 (a) | 200,000 | 190,818 |
Entegris Escrow Corp. 5.95%, 6/15/2030 (a) | 596,000 | 565,503 |
Entegris, Inc. 4.38%, 4/15/2028 (a) | 232,000 | 204,785 |
ON Semiconductor Corp. 3.88%, 9/1/2028 (a) | 341,000 | 304,104 |
Synaptics, Inc. 4.00%, 6/15/2029 (a) | 188,000 | 161,565 |
1,701,256 | ||
Software — 1.7% | ||
ACI Worldwide, Inc. 5.75%, 8/15/2026 (a) | 212,000 | 209,880 |
Change Healthcare Holdings LLC 5.75%, 3/1/2025 (a) | 326,000 | 322,130 |
Clarivate Science Holdings Corp. | ||
3.88%, 7/1/2028 (a) | 578,000 | 494,770 |
4.88%, 7/1/2029 (a) | 487,000 | 402,554 |
Elastic NV 4.13%, 7/15/2029 (a) | 293,000 | 247,945 |
Fair Isaac Corp. | ||
5.25%, 5/15/2026 (a) | 418,000 | 404,369 |
4.00%, 6/15/2028 (a) | 236,000 | 208,476 |
GoTo Group, Inc. 5.50%, 9/1/2027 (a) | 242,000 | 178,003 |
Minerva Merger Sub, Inc. 6.50%, 2/15/2030 (a) | 714,000 | 606,211 |
NCR Corp. | ||
5.75%, 9/1/2027 (a) | 332,000 | 319,330 |
6.13%, 9/1/2029 (a) | 1,233,000 | 1,175,713 |
NortonLifeLock, Inc. 5.00%, 4/15/2025 (a) | 311,000 | 306,957 |
Open Text Corp. (Canada) 3.88%, 2/15/2028 (a) | 221,000 | 188,403 |
INVESTMENTS | PRINCIPAL AMOUNT ($000) | VALUE ($000) |
Software — continued | ||
Open Text Holdings, Inc. (Canada) 4.13%, 2/15/2030 (a) | 834,000 | 671,257 |
PTC, Inc. 4.00%, 2/15/2028 (a) | 322,000 | 294,450 |
SS&C Technologies, Inc. 5.50%, 9/30/2027 (a) | 661,000 | 626,331 |
ZoomInfo Technologies LLC 3.88%, 2/1/2029 (a) | 192,000 | 166,317 |
6,823,096 | ||
Specialty Retail — 2.4% | ||
Abercrombie & Fitch Management Co. 8.75%, 7/15/2025 (a) | 141,000 | 137,671 |
Asbury Automotive Group, Inc. | ||
4.50%, 3/1/2028 | 424,000 | 378,662 |
4.63%, 11/15/2029 (a) | 522,000 | 447,615 |
Bath & Body Works, Inc. | ||
7.50%, 6/15/2029 | 821,000 | 789,638 |
6.88%, 11/1/2035 | 1,253,000 | 1,093,813 |
Gap, Inc. (The) 3.63%, 10/1/2029 (a) | 721,000 | 502,169 |
Group 1 Automotive, Inc. 4.00%, 8/15/2028 (a) | 232,000 | 198,216 |
Ken Garff Automotive LLC 4.88%, 9/15/2028 (a) | 141,000 | 118,254 |
LCM Investments Holdings II LLC 4.88%, 5/1/2029 (a) | 331,000 | 276,320 |
Lithia Motors, Inc. | ||
4.63%, 12/15/2027 (a) | 218,000 | 201,857 |
3.88%, 6/1/2029 (a) | 322,000 | 271,771 |
LSF9 Atlantis Holdings LLC 7.75%, 2/15/2026 (a) | 300,000 | 277,501 |
Michaels Cos., Inc. (The) | ||
5.25%, 5/1/2028 (a) | 304,000 | 233,077 |
7.88%, 5/1/2029 (a) | 282,000 | 187,530 |
Murphy Oil USA, Inc. 5.63%, 5/1/2027 | 414,000 | 410,409 |
Park River Holdings, Inc. 5.63%, 2/1/2029 (a) | 233,000 | 168,970 |
Penske Automotive Group, Inc. 3.75%, 6/15/2029 | 521,000 | 440,696 |
PetSmart, Inc. | ||
4.75%, 2/15/2028 (a) | 450,000 | 400,988 |
7.75%, 2/15/2029 (a) | 650,000 | 612,618 |
Sonic Automotive, Inc. 4.63%, 11/15/2029 (a) | 506,000 | 432,463 |
SRS Distribution, Inc. | ||
4.63%, 7/1/2028 (a) | 324,000 | 286,791 |
6.13%, 7/1/2029 (a) | 496,000 | 411,477 |
Staples, Inc. | ||
7.50%, 4/15/2026 (a) | 1,052,000 | 889,003 |
August 31, 2022 | J.P. Morgan Exchange-Traded Funds | 97 |
AS OF August 31, 2022 (Unaudited) (continued)
INVESTMENTS | PRINCIPAL AMOUNT ($000) | VALUE ($000) |
Corporate Bonds — continued | ||
Specialty Retail — continued | ||
10.75%, 4/15/2027 (a) | 490,000 | 360,150 |
White Cap Buyer LLC 6.88%, 10/15/2028 (a) | 292,000 | 255,832 |
9,783,491 | ||
Technology Hardware, Storage & Peripherals — 0.4% | ||
Seagate HDD Cayman | ||
4.88%, 6/1/2027 | 668,000 | 630,151 |
4.13%, 1/15/2031 | 596,000 | 488,363 |
Xerox Corp. 6.75%, 12/15/2039 | 301,000 | 253,969 |
Xerox Holdings Corp. | ||
5.00%, 8/15/2025 (a) | 276,000 | 255,890 |
5.50%, 8/15/2028 (a) | 160,000 | 139,952 |
1,768,325 | ||
Textiles, Apparel & Luxury Goods — 0.3% | ||
G-III Apparel Group Ltd. 7.88%, 8/15/2025 (a) | 188,000 | 185,505 |
Hanesbrands, Inc. | ||
4.63%, 5/15/2024 (a) | 312,000 | 300,531 |
4.88%, 5/15/2026 (a) | 282,000 | 259,451 |
Kontoor Brands, Inc. 4.13%, 11/15/2029 (a) | 141,000 | 120,252 |
Under Armour, Inc. 3.25%, 6/15/2026 | 188,000 | 166,075 |
William Carter Co. (The) 5.63%, 3/15/2027 (a) | 218,000 | 210,507 |
Wolverine World Wide, Inc. 4.00%, 8/15/2029 (a) | 188,000 | 153,032 |
1,395,353 | ||
Thrifts & Mortgage Finance — 1.4% | ||
Ladder Capital Finance Holdings LLLP 4.25%, 2/1/2027 (a) | 1,142,000 | 998,974 |
MGIC Investment Corp. 5.25%, 8/15/2028 | 323,000 | 301,198 |
Nationstar Mortgage Holdings, Inc. 5.50%, 8/15/2028 (a) | 1,744,000 | 1,457,935 |
NMI Holdings, Inc. 7.38%, 6/1/2025 (a) | 162,000 | 163,659 |
PennyMac Financial Services, Inc. 5.75%, 9/15/2031 (a) | 630,000 | 510,646 |
Rocket Mortgage LLC | ||
2.88%, 10/15/2026 (a) | 1,190,000 | 999,600 |
3.88%, 3/1/2031 (a) | 875,000 | 682,712 |
4.00%, 10/15/2033 (a) | 596,000 | 444,084 |
5,558,808 | ||
Tobacco — 0.1% | ||
Vector Group Ltd. 5.75%, 2/1/2029 (a) | 406,000 | 351,921 |
Trading Companies & Distributors — 1.5% | ||
Beacon Roofing Supply, Inc. 4.50%, 11/15/2026 (a) | 289,000 | 271,152 |
INVESTMENTS | PRINCIPAL AMOUNT ($000) | VALUE ($000) |
Trading Companies & Distributors — continued | ||
Boise Cascade Co. 4.88%, 7/1/2030 (a) | 162,000 | 144,639 |
Fortress Transportation and Infrastructure Investors LLC | ||
6.50%, 10/1/2025 (a) | 252,000 | 234,778 |
5.50%, 5/1/2028 (a) | 460,000 | 391,400 |
H&E Equipment Services, Inc. 3.88%, 12/15/2028 (a) | 652,000 | 550,862 |
Herc Holdings, Inc. 5.50%, 7/15/2027 (a) | 587,000 | 554,266 |
Imola Merger Corp. 4.75%, 5/15/2029 (a) | 594,000 | 504,285 |
United Rentals North America, Inc. | ||
4.88%, 1/15/2028 | 1,045,000 | 976,667 |
5.25%, 1/15/2030 | 1,272,000 | 1,203,312 |
WESCO Distribution, Inc. | ||
7.13%, 6/15/2025 (a) | 401,000 | 401,072 |
7.25%, 6/15/2028 (a) | 687,000 | 692,675 |
5,925,108 | ||
Wireless Telecommunication Services — 0.8% | ||
Connect Finco SARL (United Kingdom) 6.75%, 10/1/2026 (a) | 700,000 | 641,886 |
Hughes Satellite Systems Corp. | ||
5.25%, 8/1/2026 | 157,000 | 149,543 |
6.63%, 8/1/2026 | 425,000 | 402,156 |
Sprint Corp. 7.13%, 6/15/2024 | 678,000 | 700,008 |
United States Cellular Corp. 6.70%, 12/15/2033 | 130,000 | 126,575 |
Vodafone Group plc (United Kingdom) | ||
(USD Swap Semi 5 Year + 4.87%), 7.00%, 4/4/2079 (c) | 870,000 | 898,145 |
(US Treasury Yield Curve Rate T Note Constant Maturity 5 Year + 3.07%), 5.12%, 6/4/2081 (c) | 246,000 | 179,142 |
3,097,455 | ||
Total Corporate Bonds (Cost $451,324,502) | 394,887,550 | |
98 | J.P. Morgan Exchange-Traded Funds | August 31, 2022 |
INVESTMENTS | SHARES ($000) | VALUE ($000) |
Short-Term Investments — 0.5% | ||
Investment Companies — 0.5% | ||
JPMorgan U.S. Government Money Market Fund Class IM Shares, 2.00% (e) (f) (Cost $1,852,115) | 1,852,115 | 1,852,115 |
Total Investments — 98.1% (Cost $453,176,617) | 396,739,665 | |
Other Assets Less Liabilities — 1.9% | 7,835,893 | |
NET ASSETS — 100.0% | 404,575,558 | |
Percentages indicated are based on net assets. |
Abbreviations | |
ICE | Intercontinental Exchange |
LIBOR | London Interbank Offered Rate |
OYJ | Public Limited Company |
REIT | Real Estate Investment Trust |
SCA | Limited partnership with share capital |
SOFR | Secured Overnight Financing Rate |
USD | United States Dollar |
^ | Amount rounds to less than 0.1% of net assets. | |
(a) | Securities exempt from registration under Rule 144A or section 4(a)(2), of the Securities Act of 1933, as amended. | |
(b) | Security has the ability to pay in kind (“PIK”) or pay income in cash. When applicable, separate rates of such payments are disclosed. | |
(c) | Variable or floating rate security, linked to the referenced benchmark. The interest rate shown is the current rate as of August 31, 2022. | |
(d) | Step bond. Interest rate is a fixed rate for an initial period that either resets at a specific date or may reset in the future contingent upon a predetermined trigger. The interest rate shown is the current rate as of August 31, 2022. | |
(e) | Investment in an affiliated fund, which is registered under the Investment Company Act of 1940, as amended, and is advised by J.P. Morgan Investment Management Inc. | |
(f) | The rate shown is the current yield as of August 31, 2022. | |
August 31, 2022 | J.P. Morgan Exchange-Traded Funds | 99 |
AS OF August 31, 2022 (Unaudited)
INVESTMENTS | PRINCIPAL AMOUNT($) | VALUE($) |
Corporate Bonds — 39.2% | ||
Aerospace & Defense — 0.2% | ||
Boeing Co. (The) 3.20%, 3/1/2029 | 200,000 | 176,703 |
Bombardier, Inc. (Canada) 7.50%, 3/15/2025 (a) | 25,000 | 24,454 |
BWX Technologies, Inc. 4.13%, 6/30/2028 (a) | 100,000 | 92,000 |
TransDigm, Inc. 6.25%, 3/15/2026 (a) | 70,000 | 68,775 |
361,932 | ||
Airlines — 0.2% | ||
American Airlines, Inc. | ||
5.50%, 4/20/2026 (a) | 260,000 | 247,333 |
5.75%, 4/20/2029 (a) | 25,000 | 22,568 |
Mileage Plus Holdings LLC 6.50%, 6/20/2027 (a) | 59,849 | 59,999 |
329,900 | ||
Auto Components — 1.1% | ||
Adient Global Holdings Ltd. 4.88%, 8/15/2026 (a) | 200,000 | 185,088 |
Allison Transmission, Inc. | ||
4.75%, 10/1/2027 (a) | 20,000 | 18,600 |
5.88%, 6/1/2029 (a) | 360,000 | 338,428 |
3.75%, 1/30/2031 (a) | 25,000 | 20,258 |
American Axle & Manufacturing, Inc. | ||
6.25%, 3/15/2026 | 20,000 | 19,283 |
6.50%, 4/1/2027 | 280,000 | 261,800 |
6.88%, 7/1/2028 | 20,000 | 18,992 |
5.00%, 10/1/2029 | 50,000 | 42,104 |
Clarios Global LP | ||
6.75%, 5/15/2025 (a) | 25,000 | 24,871 |
6.25%, 5/15/2026 (a) | 225,000 | 222,500 |
8.50%, 5/15/2027 (a) | 45,000 | 44,217 |
Dana, Inc. | ||
5.38%, 11/15/2027 | 100,000 | 89,158 |
5.63%, 6/15/2028 | 25,000 | 22,432 |
4.25%, 9/1/2030 | 25,000 | 20,179 |
Dornoch Debt Merger Sub, Inc. 6.63%, 10/15/2029 (a) | 80,000 | 62,400 |
Goodyear Tire & Rubber Co. (The) | ||
5.00%, 5/31/2026 | 20,000 | 19,299 |
5.00%, 7/15/2029 | 301,000 | 269,832 |
5.25%, 4/30/2031 | 73,000 | 63,657 |
1,743,098 | ||
Automobiles — 0.1% | ||
General Motors Co. 5.00%, 4/1/2035 | 85,000 | 76,042 |
INVESTMENTS | PRINCIPAL AMOUNT($) | VALUE($) |
Banks — 2.4% | ||
Bank of America Corp. | ||
Series DD, (ICE LIBOR USD 3 Month + 4.55%), 6.30%, 3/10/2026 (b) (c) (d) | 85,000 | 86,594 |
Series RR, (US Treasury Yield Curve Rate T Note Constant Maturity 5 Year + 2.76%), 4.38%, 1/27/2027 (b) (c) (d) | 250,000 | 214,267 |
(ICE LIBOR USD 3 Month + 1.06%), 3.56%, 4/23/2027 (d) | 225,000 | 214,785 |
Series TT, (US Treasury Yield Curve Rate T Note Constant Maturity 5 Year + 3.23%), 6.13%, 4/27/2027 (b) (c) (d) | 185,000 | 182,096 |
(SOFR + 1.32%), 2.69%, 4/22/2032 (d) | 115,000 | 95,335 |
Citigroup, Inc. | ||
Series U, (SOFR + 3.81%), 5.00%, 9/12/2024 (b) (c) (d) | 95,000 | 88,360 |
(SOFR + 1.37%), 4.14%, 5/24/2025 (d) | 340,000 | 337,699 |
Series W, (US Treasury Yield Curve Rate T Note Constant Maturity 5 Year + 3.60%), 4.00%, 12/10/2025 (b) (c) (d) | 145,000 | 127,238 |
(US Treasury Yield Curve Rate T Note Constant Maturity 5 Year + 3.42%), 3.88%, 2/18/2026 (b) (c) (d) | 100,000 | 86,500 |
(SOFR + 0.77%), 1.46%, 6/9/2027 (d) | 225,000 | 198,490 |
Credit Agricole SA (France) (USD Swap Semi 5 Year + 6.19%), 8.12%, 12/23/2025 (a) (b) (c) (d) | 250,000 | 255,937 |
HSBC Holdings plc (United Kingdom) (US Treasury Yield Curve Rate T Note Constant Maturity 5 Year + 3.65%), 4.60%, 12/17/2030 (b) (c) (d) | 200,000 | 157,103 |
ING Groep NV (Netherlands) (USD ICE Swap Rate 5 Year + 4.20%), 6.75%, 4/16/2024 (b) (c) (d) (e) | 200,000 | 195,580 |
Intesa Sanpaolo SpA (Italy) (US Treasury Yield Curve Rate T Note Constant Maturity 1 Year + 2.60%), 4.20%, 6/1/2032 (a) (d) | 200,000 | 145,525 |
Lloyds Banking Group plc (United Kingdom) (USD Swap Semi 5 Year + 4.50%), 7.50%, 9/27/2025 (b) (c) (d) | 200,000 | 193,888 |
100 | August 31, 2022 |
INVESTMENTS | PRINCIPAL AMOUNT($) | VALUE($) |
Corporate Bonds — continued | ||
Banks — continued | ||
National Australia Bank Ltd. (Australia) (US Treasury Yield Curve Rate T Note Constant Maturity 5 Year + 1.88%), 3.93%, 8/2/2034 (a) (d) | 250,000 | 223,044 |
NatWest Group plc (United Kingdom) (US Treasury Yield Curve Rate T Note Constant Maturity 5 Year + 5.63%), 6.00%, 12/29/2025 (b) (c) (d) | 200,000 | 187,959 |
Nordea Bank Abp (Finland) (US Treasury Yield Curve Rate T Note Constant Maturity 5 Year + 4.11%), 6.63%, 3/26/2026 (a) (b) (c) (d) | 200,000 | 196,014 |
Societe Generale SA (France) (USD ICE Swap Rate 5 Year + 5.87%), 8.00%, 9/29/2025 (a) (b) (c) (d) | 200,000 | 201,962 |
Truist Financial Corp. Series Q, (US Treasury Yield Curve Rate T Note Constant Maturity 10 Year + 4.35%), 5.10%, 3/1/2030 (b) (c) (d) | 50,000 | 47,375 |
UniCredit SpA (Italy) (US Treasury Yield Curve Rate T Note Constant Maturity 1 Year + 1.20%), 1.98%, 6/3/2027 (a) (d) | 200,000 | 169,226 |
Wells Fargo & Co. Series BB, (US Treasury Yield Curve Rate T Note Constant Maturity 5 Year + 3.45%), 3.90%, 3/15/2026 (b) (c) (d) | 250,000 | 220,312 |
3,825,289 | ||
Biotechnology — 0.2% | ||
AbbVie, Inc. 4.50%, 5/14/2035 | 80,000 | 76,088 |
Grifols Escrow Issuer SA (Spain) 4.75%, 10/15/2028 (a) | 200,000 | 166,710 |
242,798 | ||
Building Products — 0.4% | ||
Builders FirstSource, Inc. 6.38%, 6/15/2032 (a) | 75,000 | 69,562 |
Griffon Corp. 5.75%, 3/1/2028 | 25,000 | 23,125 |
JELD-WEN, Inc. | ||
6.25%, 5/15/2025 (a) | 45,000 | 43,875 |
4.88%, 12/15/2027 (a) | 90,000 | 69,750 |
Masonite International Corp. 5.38%, 2/1/2028 (a) | 100,000 | 93,000 |
MIWD Holdco II LLC 5.50%, 2/1/2030 (a) | 50,000 | 41,064 |
Standard Industries, Inc. | ||
4.75%, 1/15/2028 (a) | 350,000 | 305,948 |
4.38%, 7/15/2030 (a) | 20,000 | 15,881 |
662,205 | ||
INVESTMENTS | PRINCIPAL AMOUNT($) | VALUE($) |
Capital Markets — 0.7% | ||
Charles Schwab Corp. (The) Series I, (US Treasury Yield Curve Rate T Note Constant Maturity 5 Year + 3.17%), 4.00%, 6/1/2026 (b) (c) (d) | 200,000 | 172,000 |
Coinbase Global, Inc. 3.63%, 10/1/2031 (a) | 20,000 | 12,176 |
Credit Suisse Group AG (Switzerland) (USD Swap Semi 5 Year + 3.46%), 6.25%, 12/18/2024 (a) (b) (c) (d) | 200,000 | 179,500 |
Goldman Sachs Group, Inc. (The) | ||
Series R, (US Treasury Yield Curve Rate T Note Constant Maturity 5 Year + 3.22%), 4.95%, 2/10/2025 (b) (c) (d) | 95,000 | 89,326 |
Series U, (US Treasury Yield Curve Rate T Note Constant Maturity 5 Year + 2.92%), 3.65%, 8/10/2026 (b) (c) (d) | 100,000 | 81,050 |
(SOFR + 0.91%), 1.95%, 10/21/2027 (d) | 225,000 | 199,842 |
Morgan Stanley (SOFR + 0.86%), 1.51%, 7/20/2027 (d) | 225,000 | 199,238 |
UBS Group AG (Switzerland) (USD Swap Semi 5 Year + 4.59%), 6.87%, 8/7/2025 (b) (c) (d) (e) | 200,000 | 198,120 |
1,131,252 | ||
Chemicals — 1.4% | ||
Albemarle Corp. 4.65%, 6/1/2027 | 500,000 | 496,371 |
Axalta Coating Systems LLC 4.75%, 6/15/2027 (a) | 200,000 | 185,250 |
Braskem Idesa SAPI (Mexico) 6.99%, 2/20/2032 (a) | 200,000 | 155,000 |
Chemours Co. (The) | ||
5.75%, 11/15/2028 (a) | 250,000 | 223,750 |
4.63%, 11/15/2029 (a) | 50,000 | 41,250 |
Element Solutions, Inc. 3.88%, 9/1/2028 (a) | 140,000 | 121,625 |
NOVA Chemicals Corp. (Canada) | ||
5.25%, 6/1/2027 (a) | 340,000 | 300,184 |
4.25%, 5/15/2029 (a) | 20,000 | 16,450 |
Scotts Miracle-Gro Co. (The) | ||
5.25%, 12/15/2026 | 20,000 | 19,050 |
4.50%, 10/15/2029 | 285,000 | 228,330 |
4.00%, 4/1/2031 | 40,000 | 30,045 |
Trinseo Materials Operating SCA | ||
5.38%, 9/1/2025 (a) | 45,000 | 38,785 |
5.13%, 4/1/2029 (a) | 220,000 | 156,134 |
August 31, 2022 | 101 |
AS OF August 31, 2022 (Unaudited) (continued)
INVESTMENTS | PRINCIPAL AMOUNT($) | VALUE($) |
Corporate Bonds — continued | ||
Chemicals — continued | ||
WR Grace Holdings LLC | ||
4.88%, 6/15/2027 (a) | 140,000 | 129,483 |
5.63%, 8/15/2029 (a) | 140,000 | 110,600 |
2,252,307 | ||
Commercial Services & Supplies — 1.1% | ||
ACCO Brands Corp. 4.25%, 3/15/2029 (a) | 280,000 | 233,411 |
ADT Security Corp. (The) | ||
4.13%, 8/1/2029 (a) | 70,000 | 60,111 |
4.88%, 7/15/2032 (a) | 180,000 | 150,578 |
Allied Universal Holdco LLC 6.63%, 7/15/2026 (a) | 185,000 | 173,214 |
Aramark Services, Inc. 5.00%, 2/1/2028 (a) | 135,000 | 124,243 |
Atento Luxco 1 SA (Brazil) 8.00%, 2/10/2026 (e) | 100,000 | 47,500 |
Clean Harbors, Inc. 5.13%, 7/15/2029 (a) | 100,000 | 93,621 |
Garda World Security Corp. (Canada) 4.63%, 2/15/2027 (a) | 25,000 | 21,973 |
GFL Environmental, Inc. (Canada) | ||
3.75%, 8/1/2025 (a) | 160,000 | 151,158 |
5.13%, 12/15/2026 (a) | 20,000 | 19,328 |
4.38%, 8/15/2029 (a) | 45,000 | 38,138 |
Madison IAQ LLC 4.13%, 6/30/2028 (a) | 280,000 | 240,100 |
Nielsen Finance LLC 5.63%, 10/1/2028 (a) | 160,000 | 160,365 |
Prime Security Services Borrower LLC | ||
5.75%, 4/15/2026 (a) | 45,000 | 43,298 |
3.38%, 8/31/2027 (a) | 175,000 | 150,609 |
Stericycle, Inc. 3.88%, 1/15/2029 (a) | 80,000 | 69,300 |
1,776,947 | ||
Communications Equipment — 0.3% | ||
CommScope, Inc. | ||
6.00%, 3/1/2026 (a) | 330,000 | 311,883 |
8.25%, 3/1/2027 (a) | 135,000 | 115,697 |
4.75%, 9/1/2029 (a) | 50,000 | 42,547 |
470,127 | ||
Construction & Engineering — 0.2% | ||
Dycom Industries, Inc. 4.50%, 4/15/2029 (a) | 90,000 | 80,337 |
International Airport Finance SA (Ecuador) 12.00%, 3/15/2033 (e) | 200,000 | 191,244 |
MasTec, Inc. 4.50%, 8/15/2028 (a) | 75,000 | 68,831 |
340,412 | ||
INVESTMENTS | PRINCIPAL AMOUNT($) | VALUE($) |
Consumer Finance — 1.4% | ||
AerCap Ireland Capital DAC (Ireland) | ||
3.00%, 10/29/2028 | 420,000 | 357,050 |
3.85%, 10/29/2041 | 150,000 | 110,436 |
Ford Motor Credit Co. LLC | ||
3.66%, 9/8/2024 | 200,000 | 191,578 |
4.27%, 1/9/2027 | 275,000 | 251,186 |
4.13%, 8/17/2027 | 665,000 | 598,985 |
3.82%, 11/2/2027 | 400,000 | 352,080 |
OneMain Finance Corp. 3.88%, 9/15/2028 | 200,000 | 156,000 |
Park Aerospace Holdings Ltd. (Ireland) 4.50%, 3/15/2023 (a) | 100,000 | 99,421 |
2,116,736 | ||
Containers & Packaging — 1.0% | ||
Ardagh Packaging Finance plc 5.25%, 8/15/2027 (a) | 400,000 | 289,146 |
LABL, Inc. 6.75%, 7/15/2026 (a) | 210,000 | 199,500 |
Mauser Packaging Solutions Holding Co. 5.50%, 4/15/2024 (a) | 280,000 | 271,062 |
Owens-Brockway Glass Container, Inc. 6.63%, 5/13/2027 (a) | 25,000 | 23,204 |
Pactiv Evergreen Group Issuer, Inc. 4.00%, 10/15/2027 (a) | 340,000 | 296,769 |
TriMas Corp. 4.13%, 4/15/2029 (a) | 65,000 | 57,038 |
Trivium Packaging Finance BV (Netherlands) | ||
5.50%, 8/15/2026 (a) (f) | 200,000 | 191,824 |
8.50%, 8/15/2027 (a) (f) | 250,000 | 237,666 |
1,566,209 | ||
Diversified Consumer Services — 0.1% | ||
Service Corp. International 5.13%, 6/1/2029 | 175,000 | 165,797 |
Diversified Telecommunication Services — 3.0% | ||
Altice France Holding SA (Luxembourg) 10.50%, 5/15/2027 (a) | 200,000 | 172,544 |
Altice France SA (France) | ||
8.13%, 2/1/2027 (a) | 200,000 | 190,334 |
5.13%, 7/15/2029 (a) | 250,000 | 189,915 |
AT&T, Inc. | ||
4.30%, 2/15/2030 | 125,000 | 119,899 |
3.50%, 9/15/2053 | 50,000 | 36,861 |
CCO Holdings LLC | ||
5.00%, 2/1/2028 (a) | 575,000 | 525,446 |
5.38%, 6/1/2029 (a) | 387,000 | 353,565 |
4.75%, 3/1/2030 (a) | 705,000 | 605,972 |
102 | August 31, 2022 |
INVESTMENTS | PRINCIPAL AMOUNT($) | VALUE($) |
Corporate Bonds — continued | ||
Diversified Telecommunication Services — continued | ||
4.50%, 8/15/2030 (a) | 142,000 | 119,418 |
4.25%, 2/1/2031 (a) | 438,000 | 357,384 |
4.75%, 2/1/2032 (a) | 20,000 | 16,544 |
Frontier Communications Holdings LLC | ||
5.88%, 10/15/2027 (a) | 265,000 | 247,179 |
5.00%, 5/1/2028 (a) | 20,000 | 17,529 |
Intelsat Jackson Holdings SA (Luxembourg) 6.50%, 3/15/2030 (a) | 255,000 | 231,152 |
Level 3 Financing, Inc. | ||
5.38%, 5/1/2025 | 14,000 | 14,002 |
5.25%, 3/15/2026 | 6,000 | 6,102 |
4.63%, 9/15/2027 (a) | 380,000 | 335,700 |
Lumen Technologies, Inc. 4.00%, 2/15/2027 (a) | 440,000 | 382,463 |
Sprint Capital Corp. | ||
6.88%, 11/15/2028 | 125,000 | 131,993 |
8.75%, 3/15/2032 | 285,000 | 344,058 |
Switch Ltd. | ||
3.75%, 9/15/2028 (a) | 20,000 | 19,818 |
4.13%, 6/15/2029 (a) | 50,000 | 49,875 |
Telecom Italia Capital SA (Italy) 6.38%, 11/15/2033 | 60,000 | 50,700 |
Zayo Group Holdings, Inc. 4.00%, 3/1/2027 (a) | 135,000 | 115,088 |
4,633,541 | ||
Electric Utilities — 1.7% | ||
Duquesne Light Holdings, Inc. 2.78%, 1/7/2032 (a) | 115,000 | 93,773 |
Electricidad Firme de Mexico Holdings SA de CV (Mexico) 4.90%, 11/20/2026 (a) | 200,000 | 169,413 |
Energuate Trust (Guatemala) 5.88%, 5/3/2027 (e) | 200,000 | 187,500 |
Eskom Holdings SOC Ltd. (South Africa) 7.13%, 2/11/2025 (e) | 200,000 | 187,600 |
Instituto Costarricense de Electricidad (Costa Rica) 6.75%, 10/7/2031 (a) | 200,000 | 193,412 |
NRG Energy, Inc. | ||
6.63%, 1/15/2027 | 20,000 | 19,842 |
5.75%, 1/15/2028 | 350,000 | 329,913 |
3.38%, 2/15/2029 (a) | 265,000 | 217,693 |
5.25%, 6/15/2029 (a) | 25,000 | 22,345 |
Trinidad Generation UnLtd (Trinidad and Tobago) 5.25%, 11/4/2027 (e) | 200,000 | 193,850 |
INVESTMENTS | PRINCIPAL AMOUNT($) | VALUE($) |
Electric Utilities — continued | ||
Vistra Operations Co. LLC | ||
5.13%, 5/13/2025 (a) | 740,000 | 736,039 |
5.63%, 2/15/2027 (a) | 12,000 | 11,550 |
5.00%, 7/31/2027 (a) | 278,000 | 258,729 |
2,621,659 | ||
Electronic Equipment, Instruments & Components — 0.3% | ||
CDW LLC 3.25%, 2/15/2029 | 100,000 | 86,771 |
II-VI, Inc. 5.00%, 12/15/2029 (a) | 130,000 | 115,748 |
Sensata Technologies, Inc. 3.75%, 2/15/2031 (a) | 350,000 | 289,125 |
491,644 | ||
Energy Equipment & Services — 0.1% | ||
Guara Norte SARL (Brazil) 5.20%, 6/15/2034 (e) | 187,230 | 156,079 |
Nabors Industries, Inc. 5.75%, 2/1/2025 | 25,000 | 23,046 |
Transocean Guardian Ltd. 5.88%, 1/15/2024 (a) | 37,995 | 36,001 |
215,126 | ||
Entertainment — 0.7% | ||
Live Nation Entertainment, Inc. | ||
5.63%, 3/15/2026 (a) | 25,000 | 24,125 |
6.50%, 5/15/2027 (a) | 210,000 | 209,659 |
4.75%, 10/15/2027 (a) | 365,000 | 332,150 |
Netflix, Inc. | ||
5.88%, 11/15/2028 | 205,000 | 207,298 |
6.38%, 5/15/2029 | 125,000 | 129,412 |
WMG Acquisition Corp. | ||
3.75%, 12/1/2029 (a) | 23,000 | 19,659 |
3.88%, 7/15/2030 (a) | 217,000 | 186,620 |
1,108,923 | ||
Equity Real Estate Investment Trusts (REITs) — 0.7% | ||
American Tower Corp. 3.80%, 8/15/2029 | 100,000 | 92,575 |
Iron Mountain, Inc. | ||
4.88%, 9/15/2027 (a) | 45,000 | 41,303 |
5.25%, 3/15/2028 (a) | 45,000 | 41,288 |
5.00%, 7/15/2028 (a) | 25,000 | 22,814 |
5.25%, 7/15/2030 (a) | 125,000 | 110,625 |
RHP Hotel Properties LP | ||
4.75%, 10/15/2027 | 310,000 | 281,892 |
4.50%, 2/15/2029 (a) | 45,000 | 38,861 |
VICI Properties LP | ||
4.25%, 12/1/2026 (a) | 345,000 | 323,151 |
3.75%, 2/15/2027 (a) | 145,000 | 131,110 |
August 31, 2022 | 103 |
AS OF August 31, 2022 (Unaudited) (continued)
INVESTMENTS | PRINCIPAL AMOUNT($) | VALUE($) |
Corporate Bonds — continued | ||
Equity Real Estate Investment Trusts (REITs) — continued | ||
3.88%, 2/15/2029 (a) | 25,000 | 22,234 |
4.63%, 12/1/2029 (a) | 37,000 | 34,179 |
1,140,032 | ||
Food & Staples Retailing — 0.8% | ||
Albertsons Cos., Inc. | ||
4.63%, 1/15/2027 (a) | 310,000 | 282,881 |
5.88%, 2/15/2028 (a) | 195,000 | 185,820 |
3.50%, 3/15/2029 (a) | 70,000 | 57,526 |
Performance Food Group, Inc. | ||
5.50%, 10/15/2027 (a) | 195,000 | 183,813 |
4.25%, 8/1/2029 (a) | 95,000 | 81,347 |
Rite Aid Corp. | ||
7.50%, 7/01/2025 (a) | 173,000 | 147,282 |
8.00%, 11/15/2026 (a) | 120,000 | 97,800 |
US Foods, Inc. | ||
4.75%, 2/15/2029 (a) | 114,000 | 101,598 |
4.63%, 6/1/2030 (a) | 41,000 | 35,362 |
1,173,429 | ||
Food Products — 0.5% | ||
Lamb Weston Holdings, Inc. 4.13%, 1/31/2030 (a) | 320,000 | 288,400 |
Post Holdings, Inc. | ||
5.63%, 1/15/2028 (a) | 20,000 | 19,000 |
5.50%, 12/15/2029 (a) | 345,000 | 316,160 |
4.63%, 4/15/2030 (a) | 40,000 | 34,739 |
Sigma Holdco BV (Netherlands) 7.88%, 5/15/2026 (a) | 200,000 | 142,737 |
801,036 | ||
Health Care Equipment & Supplies — 0.6% | ||
Avantor Funding, Inc. 4.63%, 7/15/2028 (a) | 295,000 | 268,415 |
Hologic, Inc. 3.25%, 2/15/2029 (a) | 250,000 | 213,114 |
Medline Borrower LP | ||
3.88%, 4/1/2029 (a) | 400,000 | 339,000 |
5.25%, 10/1/2029 (a) | 70,000 | 58,829 |
Teleflex, Inc. 4.25%, 6/1/2028 (a) | 25,000 | 22,713 |
902,071 | ||
Health Care Providers & Services — 2.5% | ||
Acadia Healthcare Co., Inc. | ||
5.50%, 7/1/2028 (a) | 90,000 | 85,260 |
5.00%, 4/15/2029 (a) | 35,000 | 32,405 |
Centene Corp. | ||
4.25%, 12/15/2027 | 20,000 | 18,993 |
INVESTMENTS | PRINCIPAL AMOUNT($) | VALUE($) |
Health Care Providers & Services — continued | ||
4.63%, 12/15/2029 | 495,000 | 466,310 |
Community Health Systems, Inc. | ||
8.00%, 3/15/2026 (a) | 306,000 | 286,110 |
5.63%, 3/15/2027 (a) | 9,000 | 7,632 |
6.00%, 1/15/2029 (a) | 70,000 | 57,453 |
5.25%, 5/15/2030 (a) | 64,000 | 48,482 |
4.75%, 2/15/2031 (a) | 20,000 | 14,768 |
DaVita, Inc. | ||
4.63%, 6/1/2030 (a) | 25,000 | 20,126 |
3.75%, 2/15/2031 (a) | 375,000 | 275,916 |
Encompass Health Corp. | ||
4.50%, 2/1/2028 | 250,000 | 218,710 |
4.75%, 2/1/2030 | 70,000 | 59,866 |
HCA, Inc. | ||
5.88%, 2/15/2026 | 405,000 | 413,545 |
5.63%, 9/1/2028 | 250,000 | 251,271 |
5.88%, 2/1/2029 | 295,000 | 300,699 |
4.13%, 6/15/2029 | 140,000 | 128,875 |
Owens & Minor, Inc. 4.50%, 3/31/2029 (a) | 135,000 | 115,058 |
Tenet Healthcare Corp. | ||
4.88%, 1/1/2026 (a) | 20,000 | 19,000 |
6.25%, 2/1/2027 (a) | 20,000 | 19,286 |
5.13%, 11/1/2027 (a) | 560,000 | 518,840 |
4.63%, 6/15/2028 (a) | 485,000 | 440,863 |
4.38%, 1/15/2030 (a) | 25,000 | 21,875 |
6.13%, 6/15/2030 (a) | 68,000 | 65,287 |
3,886,630 | ||
Health Care Technology — 0.1% | ||
IQVIA, Inc. 5.00%, 5/15/2027 (a) | 200,000 | 193,278 |
Hotels, Restaurants & Leisure — 1.7% | ||
1011778 BC ULC (Canada) | ||
3.88%, 1/15/2028 (a) | 200,000 | 177,782 |
4.38%, 1/15/2028 (a) | 45,000 | 40,228 |
3.50%, 2/15/2029 (a) | 50,000 | 42,935 |
4.00%, 10/15/2030 (a) | 25,000 | 20,289 |
Boyne USA, Inc. 4.75%, 5/15/2029 (a) | 75,000 | 66,706 |
Caesars Entertainment, Inc. | ||
6.25%, 7/1/2025 (a) | 155,000 | 151,344 |
8.13%, 7/1/2027 (a) | 85,000 | 83,510 |
4.63%, 10/15/2029 (a) | 25,000 | 20,109 |
Carnival Corp. | ||
5.75%, 3/1/2027 (a) | 55,000 | 42,763 |
9.88%, 8/1/2027 (a) | 110,000 | 110,413 |
104 | August 31, 2022 |
INVESTMENTS | PRINCIPAL AMOUNT($) | VALUE($) |
Corporate Bonds — continued | ||
Hotels, Restaurants & Leisure — continued | ||
Cedar Fair LP | ||
5.50%, 5/1/2025 (a) | 20,000 | 19,618 |
5.38%, 4/15/2027 | 60,000 | 56,610 |
5.25%, 7/15/2029 | 75,000 | 68,274 |
Hilton Domestic Operating Co., Inc. 3.75%, 5/1/2029 (a) | 90,000 | 77,649 |
Hilton Worldwide Finance LLC 4.88%, 4/1/2027 | 260,000 | 248,300 |
MGM Resorts International | ||
6.75%, 5/1/2025 | 70,000 | 69,921 |
5.75%, 6/15/2025 | 50,000 | 48,500 |
4.63%, 9/1/2026 | 155,000 | 141,014 |
Royal Caribbean Cruises Ltd. | ||
11.50%, 6/1/2025 (a) | 25,000 | 26,533 |
11.63%, 8/15/2027 (a) | 109,000 | 106,837 |
Six Flags Entertainment Corp. | ||
4.88%, 7/31/2024 (a) | 270,000 | 259,054 |
5.50%, 4/15/2027 (a) | 135,000 | 123,794 |
Six Flags Theme Parks, Inc. 7.00%, 7/1/2025 (a) | 10,000 | 10,107 |
Station Casinos LLC 4.50%, 2/15/2028 (a) | 80,000 | 68,914 |
Vail Resorts, Inc. 6.25%, 5/15/2025 (a) | 25,000 | 25,024 |
Wynn Las Vegas LLC 5.50%, 3/1/2025 (a) | 25,000 | 23,940 |
Wynn Resorts Finance LLC | ||
7.75%, 4/15/2025 (a) | 70,000 | 69,767 |
5.13%, 10/1/2029 (a) | 325,000 | 272,668 |
Yum! Brands, Inc. 4.75%, 1/15/2030 (a) | 180,000 | 164,025 |
2,636,628 | ||
Household Durables — 0.3% | ||
CD&R Smokey Buyer, Inc. 6.75%, 7/15/2025 (a) | 85,000 | 79,050 |
Newell Brands, Inc. 4.45%, 4/1/2026 (f) | 160,000 | 150,474 |
Tempur Sealy International, Inc. 4.00%, 4/15/2029 (a) | 225,000 | 184,862 |
414,386 | ||
Household Products — 0.6% | ||
Central Garden & Pet Co. | ||
5.13%, 2/01/2028 | 225,000 | 207,531 |
4.13%, 10/15/2030 | 45,000 | 37,458 |
Energizer Holdings, Inc. | ||
4.75%, 6/15/2028 (a) | 97,000 | 80,698 |
4.38%, 3/31/2029 (a) | 307,000 | 249,720 |
INVESTMENTS | PRINCIPAL AMOUNT($) | VALUE($) |
Household Products — continued | ||
Spectrum Brands, Inc. | ||
5.00%, 10/1/2029 (a) | 270,000 | 235,078 |
5.50%, 7/15/2030 (a) | 45,000 | 38,766 |
3.88%, 3/15/2031 (a) | 50,000 | 38,786 |
888,037 | ||
Independent Power and Renewable Electricity Producers — 0.3% | ||
Alexander Funding Trust 1.84%, 11/15/2023 (a) | 310,000 | 294,549 |
Calpine Corp. 4.63%, 2/1/2029 (a) | 95,000 | 80,690 |
Termocandelaria Power Ltd. (Colombia) 7.88%, 1/30/2029 (e) | 170,000 | 158,238 |
533,477 | ||
Internet & Direct Marketing Retail — 0.1% | ||
Photo Holdings Merger Sub, Inc. 8.50%, 10/1/2026 (a) | 145,000 | 108,281 |
IT Services — 0.2% | ||
Block, Inc. 3.50%, 6/1/2031 | 165,000 | 135,750 |
Gartner, Inc. 4.50%, 7/1/2028 (a) | 260,000 | 239,967 |
375,717 | ||
Leisure Products — 0.2% | ||
Mattel, Inc. 5.88%, 12/15/2027 (a) | 175,000 | 174,254 |
Vista Outdoor, Inc. 4.50%, 3/15/2029 (a) | 185,000 | 137,718 |
311,972 | ||
Machinery — 0.2% | ||
Terex Corp. 5.00%, 5/15/2029 (a) | 80,000 | 71,576 |
TK Elevator US Newco, Inc. (Germany) 5.25%, 7/15/2027 (a) | 200,000 | 182,000 |
253,576 | ||
Media — 3.6% | ||
Charter Communications Operating LLC 5.38%, 4/1/2038 | 100,000 | 87,688 |
Clear Channel Outdoor Holdings, Inc. | ||
5.13%, 8/15/2027 (a) | 505,000 | 452,293 |
7.75%, 4/15/2028 (a) | 72,000 | 58,558 |
CSC Holdings LLC | ||
7.50%, 4/1/2028 (a) | 200,000 | 177,778 |
6.50%, 2/1/2029 (a) | 260,000 | 239,261 |
Directv Financing LLC 5.88%, 8/15/2027 (a) | 280,000 | 256,200 |
Discovery Communications LLC 4.95%, 5/15/2042 | 60,000 | 48,722 |
DISH DBS Corp. | ||
5.00%, 3/15/2023 | 150,000 | 146,795 |
August 31, 2022 | 105 |
AS OF August 31, 2022 (Unaudited) (continued)
INVESTMENTS | PRINCIPAL AMOUNT($) | VALUE($) |
Corporate Bonds — continued | ||
Media — continued | ||
5.88%, 11/15/2024 | 986,000 | 892,330 |
7.75%, 7/1/2026 | 125,000 | 98,553 |
5.25%, 12/1/2026 (a) | 164,000 | 135,403 |
GCI LLC 4.75%, 10/15/2028 (a) | 85,000 | 76,604 |
Gray Escrow II, Inc. 5.38%, 11/15/2031 (a) | 17,000 | 14,368 |
Gray Television, Inc. | ||
7.00%, 5/15/2027 (a) | 40,000 | 39,435 |
4.75%, 10/15/2030 (a) | 251,000 | 206,824 |
iHeartCommunications, Inc. | ||
6.38%, 5/1/2026 | 20,000 | 18,890 |
5.25%, 8/15/2027 (a) | 370,000 | 331,943 |
4.75%, 1/15/2028 (a) | 75,000 | 64,364 |
Lamar Media Corp. 4.88%, 1/15/2029 | 100,000 | 92,847 |
Midcontinent Communications 5.38%, 8/15/2027 (a) | 40,000 | 37,400 |
News Corp. 3.88%, 5/15/2029 (a) | 170,000 | 147,900 |
Nexstar Media, Inc. | ||
5.63%, 7/15/2027 (a) | 45,000 | 42,848 |
4.75%, 11/1/2028 (a) | 495,000 | 447,975 |
Paramount Global | ||
(ICE LIBOR USD 3 Month + 3.90%), 6.25%, 2/28/2057 (d) | 100,000 | 92,363 |
(US Treasury Yield Curve Rate T Note Constant Maturity 5 Year + 4.00%), 6.37%, 3/30/2062 (d) | 205,000 | 188,576 |
Sirius XM Radio, Inc. | ||
5.00%, 8/1/2027 (a) | 175,000 | 164,741 |
4.00%, 7/15/2028 (a) | 385,000 | 335,441 |
5.50%, 7/1/2029 (a) | 155,000 | 144,937 |
4.13%, 7/1/2030 (a) | 60,000 | 50,836 |
Stagwell Global LLC 5.63%, 8/15/2029 (a) | 100,000 | 84,805 |
Univision Communications, Inc. | ||
6.63%, 6/1/2027 (a) | 70,000 | 67,551 |
4.50%, 5/1/2029 (a) | 155,000 | 135,586 |
Videotron Ltd. (Canada) 5.13%, 4/15/2027 (a) | 185,000 | 173,437 |
5,553,252 | ||
Metals & Mining — 0.9% | ||
Alcoa Nederland Holding BV 6.13%, 5/15/2028 (a) | 200,000 | 194,376 |
Arconic Corp. | ||
6.00%, 5/15/2025 (a) | 20,000 | 19,625 |
6.13%, 2/15/2028 (a) | 210,000 | 197,122 |
INVESTMENTS | PRINCIPAL AMOUNT($) | VALUE($) |
Metals & Mining — continued | ||
ATI, Inc. | ||
5.88%, 12/1/2027 | 25,000 | 23,759 |
4.88%, 10/1/2029 | 25,000 | 22,365 |
Big River Steel LLC 6.63%, 1/31/2029 (a) | 55,000 | 54,744 |
Cleveland-Cliffs, Inc. 4.63%, 3/1/2029 (a) | 270,000 | 239,686 |
CSN Inova Ventures (Brazil) 6.75%, 1/28/2028 (e) | 200,000 | 188,870 |
Freeport-McMoRan, Inc. 4.38%, 8/1/2028 | 160,000 | 150,606 |
Glencore Funding LLC (Australia) 2.50%, 9/1/2030 (a) | 100,000 | 81,309 |
Kaiser Aluminum Corp. 4.63%, 3/1/2028 (a) | 80,000 | 68,907 |
Novelis Corp. | ||
4.75%, 1/30/2030 (a) | 179,000 | 155,730 |
3.88%, 8/15/2031 (a) | 66,000 | 53,272 |
1,450,371 | ||
Multiline Retail — 0.1% | ||
NMG Holding Co., Inc. 7.13%, 4/1/2026 (a) | 150,000 | 140,335 |
Oil, Gas & Consumable Fuels — 3.7% | ||
Antero Midstream Partners LP | ||
7.88%, 5/15/2026 (a) | 20,000 | 20,350 |
5.75%, 3/1/2027 (a) | 25,000 | 23,688 |
5.75%, 1/15/2028 (a) | 220,000 | 208,556 |
5.38%, 6/15/2029 (a) | 70,000 | 64,184 |
Antero Resources Corp. | ||
8.38%, 7/15/2026 (a) | 20,000 | 21,459 |
7.63%, 2/1/2029 (a) | 75,000 | 76,289 |
5.38%, 3/1/2030 (a) | 20,000 | 18,825 |
BP Capital Markets plc (United Kingdom) | ||
(US Treasury Yield Curve Rate T Note Constant Maturity 5 Year + 4.04%), 4.38%, 6/22/2025 (b) (c) (d) | 140,000 | 134,015 |
(US Treasury Yield Curve Rate T Note Constant Maturity 5 Year + 4.40%), 4.88%, 3/22/2030 (b) (c) (d) | 75,000 | 68,606 |
Buckeye Partners LP | ||
3.95%, 12/1/2026 | 170,000 | 150,954 |
4.13%, 12/1/2027 | 20,000 | 17,680 |
4.50%, 3/1/2028 (a) | 45,000 | 39,841 |
Cheniere Energy Partners LP | ||
4.50%, 10/1/2029 | 150,000 | 138,124 |
106 | August 31, 2022 |
INVESTMENTS | PRINCIPAL AMOUNT($) | VALUE($) |
Corporate Bonds — continued | ||
Oil, Gas & Consumable Fuels — continued | ||
4.00%, 3/1/2031 | 20,000 | 17,525 |
Cheniere Energy, Inc. 4.63%, 10/15/2028 | 80,000 | 77,085 |
Chesapeake Energy Corp. | ||
5.50%, 2/1/2026 (a) | 20,000 | 19,266 |
6.75%, 4/15/2029 (a) | 205,000 | 200,141 |
Chord Energy Corp. 6.38%, 6/1/2026 (a) | 100,000 | 97,000 |
Comstock Resources, Inc. | ||
6.75%, 3/1/2029 (a) | 180,000 | 171,805 |
5.88%, 1/15/2030 (a) | 25,000 | 22,873 |
Crestwood Midstream Partners LP | ||
5.75%, 4/01/2025 | 90,000 | 86,740 |
5.63%, 5/1/2027 (a) | 70,000 | 65,275 |
8.00%, 4/1/2029 (a) | 115,000 | 114,015 |
DT Midstream, Inc. 4.13%, 6/15/2029 (a) | 190,000 | 166,816 |
Encino Acquisition Partners Holdings LLC 8.50%, 5/1/2028 (a) | 25,000 | 23,801 |
Energean Israel Finance Ltd. (Israel) 5.38%, 3/30/2028 (e) | 50,000 | 44,875 |
Energy Transfer LP 5.35%, 5/15/2045 | 60,000 | 52,876 |
EnLink Midstream Partners LP 4.85%, 7/15/2026 | 20,000 | 19,650 |
EQM Midstream Partners LP | ||
6.00%, 7/1/2025 (a) | 68,000 | 65,581 |
4.50%, 1/15/2029 (a) | 95,000 | 81,813 |
Gulfport Energy Corp. 8.00%, 5/17/2026 (a) | 130,000 | 130,866 |
Hess Midstream Operations LP | ||
5.63%, 2/15/2026 (a) | 190,000 | 185,263 |
5.13%, 6/15/2028 (a) | 20,000 | 18,575 |
4.25%, 2/15/2030 (a) | 20,000 | 17,170 |
Kinetik Holdings LP 5.88%, 6/15/2030 (a) | 57,000 | 54,225 |
Leviathan Bond Ltd. (Israel) 6.75%, 6/30/2030 (e) | 50,000 | 47,687 |
Medco Bell Pte. Ltd. (Indonesia) 6.38%, 1/30/2027 (e) | 200,000 | 175,750 |
MEG Energy Corp. (Canada) 7.13%, 2/1/2027 (a) | 85,000 | 85,892 |
MPLX LP 4.50%, 4/15/2038 | 90,000 | 79,555 |
NuStar Logistics LP | ||
5.63%, 4/28/2027 | 210,000 | 191,191 |
6.38%, 10/1/2030 | 25,000 | 22,750 |
Occidental Petroleum Corp. | ||
8.50%, 7/15/2027 | 75,000 | 83,996 |
6.38%, 9/1/2028 | 60,000 | 62,666 |
8.88%, 7/15/2030 | 195,000 | 227,799 |
INVESTMENTS | PRINCIPAL AMOUNT($) | VALUE($) |
Oil, Gas & Consumable Fuels — continued | ||
Peru LNG Srl (Peru) 5.38%, 3/22/2030 (e) | 200,000 | 169,000 |
Petroleos Mexicanos (Mexico) | ||
6.88%, 8/4/2026 | 50,000 | 46,672 |
5.35%, 2/12/2028 | 300,000 | 243,780 |
5.95%, 1/28/2031 | 330,000 | 246,922 |
Range Resources Corp. | ||
8.25%, 1/15/2029 | 103,000 | 108,120 |
4.75%, 2/15/2030 (a) | 8,000 | 7,412 |
SM Energy Co. 6.75%, 9/15/2026 | 120,000 | 118,013 |
Southwestern Energy Co. | ||
8.38%, 9/15/2028 | 160,000 | 168,310 |
5.38%, 2/1/2029 | 20,000 | 18,905 |
5.38%, 3/15/2030 | 25,000 | 23,432 |
Sunoco LP | ||
4.50%, 5/15/2029 | 60,000 | 50,975 |
4.50%, 4/30/2030 | 25,000 | 21,325 |
Tallgrass Energy Partners LP | ||
7.50%, 10/1/2025 (a) | 170,000 | 170,212 |
6.00%, 3/1/2027 (a) | 45,000 | 41,062 |
5.50%, 1/15/2028 (a) | 50,000 | 43,232 |
6.00%, 12/31/2030 (a) | 20,000 | 17,505 |
Targa Resources Partners LP | ||
6.50%, 7/15/2027 | 285,000 | 293,194 |
5.50%, 3/1/2030 | 25,000 | 24,419 |
4.88%, 2/1/2031 | 70,000 | 64,889 |
4.00%, 1/15/2032 | 205,000 | 179,522 |
Transcanada Trust (Canada) (SOFR + 4.42%), 5.50%, 9/15/2079 (d) | 100,000 | 91,983 |
5,841,977 | ||
Personal Products — 0.3% | ||
Coty, Inc. | ||
5.00%, 4/15/2026 (a) | 80,000 | 75,800 |
4.75%, 1/15/2029 (a) | 45,000 | 39,818 |
Edgewell Personal Care Co. 5.50%, 6/1/2028 (a) | 255,000 | 235,495 |
Prestige Brands, Inc. 5.13%, 1/15/2028 (a) | 170,000 | 156,808 |
507,921 | ||
Pharmaceuticals — 1.1% | ||
Bausch Health Americas, Inc. 9.25%, 4/1/2026 (a) | 415,000 | 249,000 |
Bausch Health Cos., Inc. | ||
5.50%, 11/1/2025 (a) | 120,000 | 99,000 |
August 31, 2022 | 107 |
AS OF August 31, 2022 (Unaudited) (continued)
INVESTMENTS | PRINCIPAL AMOUNT($) | VALUE($) |
Corporate Bonds — continued | ||
Pharmaceuticals — continued | ||
9.00%, 12/15/2025 (a) | 135,000 | 83,785 |
5.75%, 8/15/2027 (a) | 225,000 | 164,072 |
5.00%, 1/30/2028 (a) | 230,000 | 86,250 |
4.88%, 6/1/2028 (a) | 275,000 | 190,097 |
5.00%, 2/15/2029 (a) | 20,000 | 7,800 |
7.25%, 5/30/2029 (a) | 130,000 | 50,050 |
Cheplapharm Arzneimittel GmbH (Germany) 5.50%, 1/15/2028 (a) | 250,000 | 214,277 |
Elanco Animal Health, Inc. 6.40%, 8/28/2028 (f) | 145,000 | 134,850 |
Jazz Securities DAC 4.38%, 1/15/2029 (a) | 200,000 | 180,348 |
Organon & Co. 4.13%, 4/30/2028 (a) | 205,000 | 183,920 |
Teva Pharmaceutical Finance Netherlands III BV (Israel) 3.15%, 10/1/2026 | 50,000 | 41,525 |
1,684,974 | ||
Real Estate Management & Development — 0.0% ^ | ||
Realogy Group LLC 5.75%, 1/15/2029 (a) | 25,000 | 19,587 |
Road & Rail — 0.6% | ||
Avis Budget Car Rental LLC | ||
4.75%, 4/1/2028 (a) | 90,000 | 78,563 |
5.38%, 3/01/2029 (a) | 300,000 | 261,439 |
First Student Bidco, Inc. 4.00%, 7/31/2029 (a) | 30,000 | 25,895 |
Hertz Corp. (The) | ||
4.63%, 12/1/2026 (a) | 45,000 | 38,543 |
5.00%, 12/1/2029 (a) | 165,000 | 132,724 |
NESCO Holdings II, Inc. 5.50%, 4/15/2029 (a) | 105,000 | 92,400 |
Uber Technologies, Inc. | ||
7.50%, 9/15/2027 (a) | 190,000 | 190,242 |
4.50%, 8/15/2029 (a) | 140,000 | 121,537 |
941,343 | ||
Semiconductors & Semiconductor Equipment — 0.4% | ||
Amkor Technology, Inc. 6.63%, 9/15/2027 (a) | 115,000 | 112,332 |
Broadcom Corp. 3.50%, 1/15/2028 | 100,000 | 92,827 |
Entegris Escrow Corp. 4.75%, 4/15/2029 (a) | 95,000 | 87,366 |
Entegris, Inc. 4.38%, 4/15/2028 (a) | 105,000 | 92,683 |
ON Semiconductor Corp. 3.88%, 9/1/2028 (a) | 190,000 | 169,442 |
554,650 | ||
INVESTMENTS | PRINCIPAL AMOUNT($) | VALUE($) |
Software — 0.5% | ||
ACI Worldwide, Inc. 5.75%, 8/15/2026 (a) | 25,000 | 24,750 |
Clarivate Science Holdings Corp. 3.88%, 7/1/2028 (a) | 215,000 | 184,041 |
Minerva Merger Sub, Inc. 6.50%, 2/15/2030 (a) | 50,000 | 42,452 |
NCR Corp. | ||
5.75%, 9/1/2027 (a) | 40,000 | 38,473 |
5.13%, 4/15/2029 (a) | 305,000 | 284,800 |
6.13%, 9/1/2029 (a) | 20,000 | 19,071 |
SS&C Technologies, Inc. 5.50%, 9/30/2027 (a) | 240,000 | 227,412 |
820,999 | ||
Specialty Retail — 0.8% | ||
Asbury Automotive Group, Inc. | ||
4.50%, 3/1/2028 | 45,000 | 40,188 |
4.63%, 11/15/2029 (a) | 155,000 | 132,912 |
4.75%, 3/1/2030 | 35,000 | 29,750 |
Bath & Body Works, Inc. | ||
7.50%, 6/15/2029 | 20,000 | 19,236 |
6.75%, 7/1/2036 | 115,000 | 99,238 |
Gap, Inc. (The) 3.63%, 10/1/2029 (a) | 55,000 | 38,307 |
Group 1 Automotive, Inc. 4.00%, 8/15/2028 (a) | 30,000 | 25,631 |
Lithia Motors, Inc. 4.63%, 12/15/2027 (a) | 90,000 | 83,336 |
Penske Automotive Group, Inc. 3.75%, 6/15/2029 | 100,000 | 84,587 |
PetSmart, Inc. 4.75%, 2/15/2028 (a) | 270,000 | 240,593 |
SRS Distribution, Inc. | ||
4.63%, 7/1/2028 (a) | 191,000 | 169,065 |
6.13%, 7/1/2029 (a) | 70,000 | 58,071 |
6.00%, 12/1/2029 (a) | 9,000 | 7,328 |
Staples, Inc. 7.50%, 4/15/2026 (a) | 225,000 | 190,138 |
1,218,380 | ||
Thrifts & Mortgage Finance — 0.1% | ||
Rocket Mortgage LLC 3.63%, 3/1/2029 (a) | 178,000 | 143,290 |
Tobacco — 0.2% | ||
BAT Capital Corp. (United Kingdom) 4.39%, 8/15/2037 | 80,000 | 63,276 |
BAT International Finance plc (United Kingdom) 4.45%, 3/16/2028 | 310,000 | 293,660 |
356,936 | ||
108 | August 31, 2022 |
INVESTMENTS | PRINCIPAL AMOUNT($) | VALUE($) |
Corporate Bonds — continued | ||
Trading Companies & Distributors — 0.9% | ||
Air Lease Corp. 2.20%, 1/15/2027 | 380,000 | 333,718 |
Imola Merger Corp. 4.75%, 5/15/2029 (a) | 385,000 | 326,851 |
United Rentals North America, Inc. | ||
4.88%, 1/15/2028 | 400,000 | 373,844 |
5.25%, 1/15/2030 | 20,000 | 18,920 |
WESCO Distribution, Inc. | ||
7.13%, 6/15/2025 (a) | 230,000 | 230,042 |
7.25%, 6/15/2028 (a) | 65,000 | 65,537 |
1,348,912 | ||
Wireless Telecommunication Services — 0.6% | ||
America Movil SAB de CV (Mexico) 5.38%, 4/4/2032 (a) | 200,000 | 183,690 |
Sprint Corp. 7.63%, 3/1/2026 | 310,000 | 327,864 |
T-Mobile USA, Inc. 4.75%, 2/1/2028 | 320,000 | 312,992 |
Vodafone Group plc (United Kingdom) | ||
(US Treasury Yield Curve Rate T Note Constant Maturity 5 Year + 2.45%), 3.25%, 6/4/2081 (d) | 100,000 | 86,430 |
(US Treasury Yield Curve Rate T Note Constant Maturity 5 Year + 2.77%), 4.12%, 6/4/2081 (d) | 100,000 | 78,450 |
989,426 | ||
Total Corporate Bonds (Cost $68,233,201) | 61,322,847 | |
Asset-Backed Securities — 28.2% | ||
ACC Trust Series 2019-2, Class C, 5.24%, 10/21/2024 (a) | 500,000 | 497,676 |
Affirm Asset Securitization Trust Series 2022-Z1, Class A, 4.55%, 6/15/2027 (a) | 385,902 | 380,246 |
Air Canada Pass-Through Trust (Canada) Series 2020-2, Class B, 9.00%, 10/1/2025 (a) | 7,341 | 7,426 |
American Airlines Pass-Through Trust Series 2021-1, Class B, 3.95%, 7/11/2030 | 50,000 | 41,610 |
American Credit Acceptance Receivables Trust | ||
Series 2022-3, Class B, 4.55%, 10/13/2026 (a) | 500,000 | 497,715 |
Series 2020-4, Class E, 3.65%, 12/14/2026 (a) | 600,000 | 580,480 |
Series 2021-2, Class E, 2.54%, 7/13/2027 (a) | 800,000 | 746,214 |
Series 2021-3, Class E, 2.56%, 11/15/2027 (a) | 800,000 | 742,359 |
INVESTMENTS | PRINCIPAL AMOUNT($) | VALUE($) |
Series 2022-2, Class D, 4.85%, 6/13/2028 (a) | 230,000 | 224,053 |
Series 2022-2, Class E, 6.57%, 6/13/2028 (a) | 190,000 | 184,088 |
Series 2022-3, Class C, 4.86%, 10/13/2028 (a) | 290,000 | 288,600 |
Series 2022-3, Class D, 5.83%, 10/13/2028 (a) | 267,000 | 264,803 |
AMSR Trust Series 2020-SFR1, Class H, 5.30%, 4/17/2037 ‡ (a) | 100,000 | 95,614 |
Applebee's Funding LLC | ||
Series 2019-1A, Class A2I, 4.19%, 6/5/2049 (a) | 1,633,500 | 1,568,678 |
Series 2019-1A, Class A2II, 4.72%, 6/5/2049 (a) | 495,000 | 462,139 |
Avis Budget Rental Car Funding AESOP LLC | ||
Series 2020-1A, Class C, 3.02%, 8/20/2026 (a) | 461,000 | 415,290 |
Series 2022-3A, Class A, 4.62%, 2/20/2027 (a) | 943,000 | 937,947 |
British Airways Pass-Through Trust (United Kingdom) Series 2020-1, Class B, 8.38%, 11/15/2028 (a) | 9,726 | 10,107 |
BSPRT Issuer Ltd. (Cayman Islands) | ||
Series 2021-FL7, Class A, 3.71%, 12/15/2038 (a) (g) | 428,500 | 415,645 |
Series 2021-FL7, Class D, 5.14%, 12/15/2038 ‡ (a) (g) | 275,000 | 258,022 |
Series 2021-FL7, Class E, 5.79%, 12/15/2038 ‡ (a) (g) | 265,000 | 245,344 |
Business Jet Securities LLC Series 2020-1A, Class A, 2.98%, 11/15/2035 (a) | 126,488 | 118,296 |
Conn's Receivables Funding LLC | ||
Series 2022-A, Class A, 5.87%, 12/15/2026 (a) | 638,952 | 637,991 |
Series 2022-A, Class B, 9.52%, 12/15/2026 ‡ (a) | 800,000 | 786,487 |
CoreVest American Finance Trust | ||
Series 2019-1, Class E, 5.49%, 3/15/2052 ‡ (a) (g) | 300,000 | 276,777 |
Series 2019-2, Class E, 5.42%, 6/15/2052 ‡ (a) (g) | 350,000 | 315,547 |
Series 2019-3, Class E, 4.92%, 10/15/2052 ‡ (a) (g) | 350,000 | 302,116 |
CPS Auto Receivables Trust Series 2022-C, Class D, 6.45%, 4/15/2030 (a) | 240,000 | 239,807 |
DB Master Finance LLC Series 2021-1A, Class A23, 2.79%, 11/20/2051 (a) | 297,750 | 241,480 |
August 31, 2022 | 109 |
AS OF August 31, 2022 (Unaudited) (continued)
INVESTMENTS | PRINCIPAL AMOUNT($) | VALUE($) |
Asset-Backed Securities — continued | ||
Diamond Resorts Owner Trust Series 2018-1, Class C, 4.53%, 1/21/2031 ‡ (a) | 81,236 | 80,871 |
Driven Brands Funding LLC Series 2021-1A, Class A2, 2.79%, 10/20/2051 (a) | 1,985,000 | 1,629,699 |
DT Auto Owner Trust | ||
Series 2019-2A, Class E, 4.46%, 5/15/2026 (a) | 750,000 | 741,420 |
Series 2021-3A, Class D, 1.31%, 5/17/2027 (a) | 800,000 | 725,870 |
Series 2021-4A, Class D, 1.99%, 9/15/2027 (a) | 1,929,000 | 1,733,090 |
Series 2021-2A, Class E, 2.97%, 7/17/2028 (a) | 1,080,000 | 991,135 |
Series 2021-4A, Class E, 3.34%, 7/17/2028 (a) | 1,600,000 | 1,433,157 |
Exeter Automobile Receivables Trust | ||
Series 2022-3A, Class D, 6.76%, 9/15/2028 | 400,000 | 405,117 |
Series 2022-4A, Class D, 5.98%, 12/15/2028 | 168,000 | 166,088 |
FirstKey Homes Trust Series 2020-SFR1, Class F1, 3.64%, 8/17/2037 ‡ (a) | 500,000 | 460,140 |
FMC GMSR Issuer Trust Series 2022-GT1, Class B, 7.17%, 4/25/2027 ‡ (a) | 300,000 | 278,421 |
FREED ABS Trust | ||
Series 2020-FP1, Class C, 4.37%, 3/18/2027 ‡ (a) | 711,495 | 710,243 |
Series 2022-1FP, Class D, 3.35%, 3/19/2029 ‡ (a) | 200,000 | 185,308 |
Series 2022-3FP, Class A, 4.50%, 8/20/2029 (a) | 373,647 | 372,302 |
Series 2022-3FP, Class C, 7.05%, 8/20/2029 ‡ (a) | 100,000 | 99,296 |
GLS Auto Receivables Issuer Trust | ||
Series 2021-4A, Class D, 2.48%, 10/15/2027 (a) | 250,000 | 229,288 |
Series 2021-1A, Class E, 3.14%, 1/18/2028 (a) | 650,000 | 605,097 |
Series 2022-1A, Class D, 3.97%, 1/18/2028 (a) | 250,000 | 233,967 |
Series 2022-2A, Class D, 6.15%, 4/17/2028 (a) | 420,000 | 415,936 |
Series 2021-3A, Class E, 3.20%, 10/16/2028 (a) | 1,000,000 | 875,909 |
Goldman Home Improvement Trust Issuer Trust Series 2022-GRN1, Class A, 4.50%, 6/25/2052 (a) | 505,861 | 497,494 |
INVESTMENTS | PRINCIPAL AMOUNT($) | VALUE($) |
Hertz Vehicle Financing III LLC Series 2022-3A, Class B, 3.86%, 3/25/2025 (a) | 500,000 | 490,561 |
Hertz Vehicle Financing LLC Series 2022-4A, Class D, 6.56%, 9/25/2026 (a) | 300,000 | 280,322 |
HGI CRE CLO Ltd. (Cayman Islands) Series 2022-FL3, Class E, 6.28%, 4/20/2037 ‡ (a) (g) | 195,500 | 186,143 |
Hilton Grand Vacations Trust Series 2022-1D, Class D, 6.79%, 6/20/2034 ‡ (a) | 411,292 | 398,294 |
HINNT LLC Series 2022-A, Class D, 6.50%, 5/15/2041 ‡ (a) | 766,460 | 711,716 |
LendingClub Loan Certificate Issuer Trust | ||
Series 2022-NP1, Class CERT, 0.00%, 3/16/2037 ‡ (a) | 50,000 | 1,066,685 |
Series 2022-P1, Class CERT, 0.00%, 3/16/2037 ‡ (a) | 50,000 | 981,670 |
Series 2022-P2, Class CERT, 0.00%, 4/15/2037 ‡ (a) | 50,000 | 1,027,210 |
Lendingpoint Asset Securitization Trust | ||
Series 2022-A, Class D, 4.54%, 6/15/2029 (a) | 1,000,000 | 836,039 |
Series 2022-B, Class A, 4.77%, 10/15/2029 (a) | 255,815 | 252,150 |
Lendmark Funding Trust Series 2021-1A, Class D, 5.05%, 11/20/2031 ‡ (a) | 500,000 | 383,265 |
ME Funding LLC Series 2019-1, Class A2, 6.45%, 7/30/2049 (a) | 583,500 | 577,674 |
New Residential Mortgage Loan Trust Series 2022-SFR1, Class E1, 3.55%, 2/17/2039 ‡ (a) | 168,000 | 150,794 |
NRZ Excess Spread-Collateralized Notes | ||
Series 2021-FNT1, Class A, 2.98%, 3/25/2026 (a) | 447,129 | 404,323 |
Series 2021-FNT2, Class A, 3.23%, 5/25/2026 (a) | 225,382 | 205,167 |
Series 2021-GNT1, Class A, 3.47%, 11/25/2026 (a) | 206,967 | 190,529 |
OneMain Direct Auto Receivables Trust Series 2022-1A, Class A1, 4.65%, 3/14/2029 (a) | 294,000 | 293,021 |
OneMain Financial Issuance Trust Series 2018-2A, Class A, 3.57%, 3/14/2033 (a) | 290,000 | 284,103 |
Oportun Issuance Trust | ||
Series 2022-2, Class A, 5.94%, 10/9/2029 (a) | 170,000 | 169,579 |
110 | August 31, 2022 |
INVESTMENTS | PRINCIPAL AMOUNT($) | VALUE($) |
Asset-Backed Securities — continued | ||
Series 2022-2, Class D, 11.34%, 10/9/2029 ‡ | 863,000 | 847,955 |
Pagaya AI Debt Selection Trust Series 2021-3, Class C, 3.27%, 5/15/2029 (a) | 1,499,918 | 1,276,865 |
Planet Fitness Master Issuer LLC Series 2022-1A, Class A2I, 3.25%, 12/5/2051 (a) | 64,837 | 58,239 |
PNMAC GMSR ISSUER TRUST Series 2022-GT1, Class A, 6.43%, 5/25/2027 (a) (g) | 343,000 | 342,295 |
Republic Finance Issuance Trust Series 2021-A, Class D, 5.23%, 12/22/2031 ‡ (a) | 800,000 | 650,707 |
Santander Drive Auto Receivables Trust | ||
Series 2022-2, Class B, 3.44%, 9/15/2027 | 210,000 | 205,589 |
Series 2022-2, Class C, 3.76%, 7/16/2029 | 400,000 | 387,907 |
Service Experts Issuer LLC Series 2021-1A, Class A, 2.67%, 2/2/2032 (a) | 328,099 | 301,723 |
Theorem Funding Trust Series 2022-2A, Class B, 9.27%, 12/15/2028 (a) | 400,000 | 416,608 |
Tricon Residential Trust Series 2022-SFR1, Class E2, 5.74%, 4/17/2039 ‡ (a) | 101,000 | 95,898 |
United Airlines Pass-Through Trust | ||
Series 2016-2, Class B, 3.65%, 10/7/2025 | 36,875 | 33,472 |
Series 2016-1, Class B, 3.65%, 1/7/2026 | 30,729 | 27,435 |
Upstart Pass-Through Trust | ||
Series 2021-ST10, Class A, 2.25%, 1/20/2030 (a) | 820,207 | 784,305 |
Series 2022-PT2, Class A, 16.81%, 2/20/2030 (a) (g) | 860,399 | 872,263 |
Series 2022-PT3, Class A, 18.66%, 4/20/2030 (a) (g) | 523,779 | 548,398 |
Upstart Securitization Trust | ||
Series 2020-3, Class C, 6.25%, 11/20/2030 ‡ (a) | 1,000,000 | 988,040 |
Series 2021-2, Class C, 3.61%, 6/20/2031 ‡ (a) | 1,500,000 | 1,373,290 |
Series 2022-2, Class B, 6.10%, 5/20/2032 ‡ (a) | 500,000 | 481,439 |
INVESTMENTS | PRINCIPAL AMOUNT($) | VALUE($) |
Westlake Automobile Receivables Trust | ||
Series 2022-2A, Class C, 4.85%, 9/15/2027 (a) | 504,000 | 500,220 |
Series 2022-2A, Class D, 5.48%, 9/15/2027 (a) | 432,000 | 430,619 |
Total Asset-Backed Securities (Cost $46,341,873) | 44,164,917 | |
Commercial Mortgage-Backed Securities — 17.5% | ||
BANK | ||
Series 2019-BN20, Class D, 2.50%, 9/15/2062 ‡ (a) | 700,000 | 495,292 |
Series 2020-BN26, Class E, 2.50%, 3/15/2063 ‡ (a) | 320,000 | 205,140 |
BX Commercial Mortgage Trust | ||
Series 2021-21M, Class A, 3.12%, 10/15/2036 (a) (g) | 500,000 | 480,599 |
Series 2020-VIVA, Class D, 3.67%, 3/11/2044 ‡ (a) (g) | 750,000 | 594,457 |
BX Trust | ||
Series 2022-LBA6, Class A, 3.31%, 1/15/2039 (a) (g) | 155,000 | 150,510 |
Series 2022-PSB, Class A, 4.76%, 8/15/2039 (a) (g) | 700,000 | 698,459 |
Series 2022-PSB, Class E, 8.64%, 8/15/2039 (a) (g) | 600,000 | 602,695 |
Citigroup Commercial Mortgage Trust | ||
Series 2013-GC17, Class B, 5.10%, 11/10/2046 ‡ (g) | 100,000 | 98,697 |
Series 2014-GC23, Class C, 4.58%, 7/10/2047 ‡ (g) | 100,000 | 96,112 |
Series 2018-C5, Class XA, IO, 0.69%, 6/10/2051 (g) | 1,506,011 | 49,073 |
Series 2018-C6, Class XA, IO, 0.94%, 11/10/2051 (g) | 2,157,014 | 80,679 |
Series 2015-GC33, Class B, 4.73%, 9/10/2058 ‡ (g) | 65,000 | 62,448 |
Commercial Mortgage Trust Series 2015-PC1, Class B, 4.43%, 7/10/2050 ‡ (g) | 65,000 | 61,667 |
FHLMC, Multi-Family Structured Pass-Through Certificates | ||
Series K741, Class X1, IO, 0.66%, 12/25/2027 (g) | 1,447,608 | 36,643 |
Series K742, Class X1, IO, 0.87%, 3/25/2028 (g) | 2,772,771 | 85,308 |
Series K742, Class X3, IO, 2.69%, 4/25/2028 (g) | 5,000,000 | 586,300 |
Series K743, Class X1, IO, 1.03%, 5/25/2028 (g) | 1,655,759 | 73,696 |
August 31, 2022 | 111 |
AS OF August 31, 2022 (Unaudited) (continued)
INVESTMENTS | PRINCIPAL AMOUNT($) | VALUE($) |
Commercial Mortgage-Backed Securities — continued | ||
Series K744, Class X1, IO, 0.96%, 7/25/2028 (g) | 2,154,248 | 90,196 |
Series K084, Class X3, IO, 2.31%, 11/25/2028 (g) | 751,485 | 84,102 |
Series K104, Class X1, IO, 1.25%, 1/25/2030 (g) | 9,368,036 | 609,439 |
Series K110, Class X1, IO, 1.81%, 4/25/2030 (g) | 8,871,447 | 882,437 |
Series K132, Class X1, IO, 0.61%, 8/25/2031 (g) | 16,897,547 | 618,443 |
Series K-1514, Class X1, IO, 0.70%, 10/25/2034 (g) | 1,189,503 | 60,326 |
Series K-1517, Class X1, IO, 1.44%, 7/25/2035 (g) | 392,589 | 47,186 |
Series K-1520, Class X1, IO, 0.58%, 2/25/2036 ‡ (g) | 413,353 | 18,194 |
Series K067, Class X3, IO, 2.19%, 9/25/2044 (g) | 1,575,428 | 136,570 |
Series K065, Class X3, IO, 2.26%, 7/25/2045 (g) | 1,304,230 | 110,739 |
Series K085, Class X3, IO, 2.39%, 12/25/2045 (g) | 1,100,000 | 124,703 |
Series K097, Class X3, IO, 2.09%, 9/25/2046 (g) | 3,000,000 | 333,508 |
Series K083, Class X3, IO, 2.37%, 11/25/2046 (g) | 621,062 | 70,011 |
Series K737, Class X3, IO, 1.83%, 1/25/2048 (g) | 900,000 | 56,377 |
Series K124, Class X3, IO, 2.71%, 2/25/2049 (g) | 5,000,000 | 833,467 |
Series K741, Class X3, IO, 2.53%, 3/25/2049 (g) | 13,766,615 | 1,459,113 |
Series K743, Class X3, IO, 3.06%, 6/25/2049 (g) | 13,000,000 | 1,783,656 |
FNMA ACES | ||
Series 2020-M3, Class X1, IO, 0.45%, 2/25/2030 (g) | 3,847,076 | 85,078 |
Series 2022-M2, Class X2, IO, 0.30%, 1/25/2032 (g) | 2,833,544 | 45,448 |
Series 2020-M31, Class AB, 0.50%, 10/25/2032 | 85,970 | 69,991 |
FREMF Mortgage Trust | ||
Series 2019-KW09, Class X2A, IO, 0.10%, 5/25/2029 (a) | 19,929,717 | 88,635 |
Series 2019-KW09, Class C, PO, 6/25/2029 (a) | 790,000 | 468,108 |
Series 2019-KW09, Class X2B, IO, 0.10%, 6/25/2029 (a) | 10,000,000 | 50,085 |
INVESTMENTS | PRINCIPAL AMOUNT($) | VALUE($) |
Series 2017-K724, Class D, PO, 12/25/2049 (a) | 500,000 | 444,032 |
Series 2017-K65, Class B, 4.22%, 7/25/2050 (a) (g) | 265,000 | 255,226 |
GNMA | ||
Series 2014-135, IO, 0.42%, 1/16/2056 (g) | 6,837,939 | 134,533 |
Series 2017-53, IO, 0.53%, 11/16/2056 (g) | 4,549,882 | 166,319 |
Series 2015-114, IO, 0.37%, 3/15/2057 (g) | 5,686,203 | 101,763 |
Series 2017-158, IO, 0.47%, 9/16/2057 (g) | 3,784,133 | 123,648 |
Series 2020-184, IO, 0.91%, 11/16/2060 (g) | 6,749,012 | 466,602 |
Series 2021-218, IO, 0.96%, 10/16/2061 (g) | 345,546 | 27,426 |
Series 2020-120, IO, 0.76%, 5/16/2062 (g) | 6,095,928 | 389,579 |
Series 2020-100, IO, 0.78%, 5/16/2062 (g) | 5,873,137 | 378,753 |
Series 2020-161, IO, 1.05%, 8/16/2062 (g) | 5,159,526 | 392,004 |
Series 2020-190, IO, 1.03%, 11/16/2062 (g) | 877,756 | 68,935 |
Series 2021-35, Class IX, IO, 1.16%, 12/16/2062 | 1,968,907 | 174,486 |
Series 2021-120, IO, 1.00%, 2/16/2063 (g) | 6,824,536 | 545,203 |
Series 2021-170, IO, 0.99%, 5/16/2063 (g) | 2,430,829 | 190,274 |
Series 2021-61, IO, 1.01%, 8/16/2063 (g) | 1,483,057 | 111,133 |
Series 2021-195, Class IX, IO, 1.20%, 8/16/2063 (g) | 1,978,743 | 180,126 |
Series 2021-110, IO, 0.87%, 11/16/2063 (g) | 5,883,288 | 432,346 |
Series 2021-200, IO, 0.87%, 11/16/2063 (g) | 2,072,641 | 156,718 |
Series 2021-180, IO, 0.90%, 11/16/2063 (g) | 4,720,828 | 362,913 |
Series 2021-150, IO, 1.03%, 11/16/2063 (g) | 4,888,606 | 399,834 |
Series 2021-185, IO, 1.10%, 11/16/2063 (g) | 1,522,940 | 130,240 |
Series 2022-7, Class SA, IF, IO, 1.74%, 2/16/2064 (g) | 1,390,273 | 116,315 |
Series 2021-224, IO, 0.78%, 4/16/2064 (g) | 1,974,522 | 143,394 |
112 | August 31, 2022 |
INVESTMENTS | PRINCIPAL AMOUNT($) | VALUE($) |
Commercial Mortgage-Backed Securities — continued | ||
Series 2022-134, IO, 0.51%, 6/16/2064 (g) | 2,997,179 | 158,982 |
Series 2022-80, IO, 0.59%, 6/16/2064 (g) | 1,194,882 | 67,802 |
Series 2022-62, IO, 0.62%, 6/16/2064 (g) | 1,987,587 | 120,049 |
GS Mortgage Securities Trust | ||
Series 2016-GS2, Class D, 2.75%, 5/10/2049 ‡ (a) | 750,000 | 603,269 |
Series 2019-GC40, Class E, 3.00%, 7/10/2052 ‡ (a) | 800,000 | 555,632 |
JPMBB Commercial Mortgage Securities Trust Series 2014-C26, Class D, 4.02%, 1/15/2048 ‡ (a) (g) | 250,000 | 221,461 |
JPMorgan Chase Commercial Mortgage Securities Trust Series 2013-C16, Class D, 5.17%, 12/15/2046 ‡ (a) (g) | 1,500,000 | 1,432,131 |
Morgan Stanley Bank of America Merrill Lynch Trust | ||
Series 2014-C15, Class D, 5.05%, 4/15/2047 ‡ (a) (g) | 1,337,000 | 1,262,826 |
Series 2014-C18, Class B, 4.61%, 10/15/2047 ‡ (g) | 100,000 | 96,702 |
Series 2016-C31, Class C, 4.41%, 11/15/2049 ‡ (g) | 100,000 | 86,482 |
MRCD MARK Mortgage Trust Series 2019-PARK, Class E, 2.72%, 12/15/2036 ‡ (a) | 400,000 | 356,627 |
MSC Trust Series 2021-ILP, Class A, 3.17%, 11/15/2023 (a) (g) | 239,209 | 230,167 |
Multi-Family Connecticut Avenue Securities Trust | ||
Series 2019-01, Class M10, 5.69%, 10/25/2049 ‡ (a) (g) | 395,481 | 377,869 |
Series 2020-01, Class M10, 6.19%, 3/25/2050 (a) (g) | 1,000,000 | 950,519 |
UBS-Barclays Commercial Mortgage Trust Series 2012-C4, Class C, 4.53%, 12/10/2045 ‡ (a) (g) | 1,000,000 | 987,351 |
Velocity Commercial Capital Loan Trust | ||
Series 2022-3, Class A, 5.22%, 6/25/2052 (a) (g) | 291,368 | 287,073 |
Series 2022-4, Class A, 5.63%, 8/25/2052 (a) (g) | 600,000 | 594,672 |
Wells Fargo Commercial Mortgage Trust | ||
Series 2018-C44, Class D, 3.00%, 5/15/2051 ‡ (a) | 250,000 | 182,883 |
Series 2022-C62, Class C, 4.50%, 4/15/2055 ‡ (g) | 150,000 | 128,741 |
INVESTMENTS | PRINCIPAL AMOUNT($) | VALUE($) |
WFRBS Commercial Mortgage Trust | ||
Series 2013-C13, Class C, 3.91%, 5/15/2045 ‡ (g) | 65,000 | 63,272 |
Series 2014-C22, Class C, 3.91%, 9/15/2057 (g) | 100,000 | 94,478 |
Series 2014-C22, Class B, 4.37%, 9/15/2057 ‡ (g) | 100,000 | 97,342 |
Total Commercial Mortgage-Backed Securities (Cost $29,858,683) | 27,431,719 | |
Mortgage-Backed Securities — 9.3% | ||
FNMA/FHLMC UMBS, Single Family, 30 Year TBA, 5.00%, 8/25/2052 (h) | 2,202,000 | 2,223,541 |
GNMA II, 30 Year | ||
Pool # MA8151, 4.50%, 7/20/2052 | 7,307 | 7,316 |
Pool # MA8152, 5.00%, 7/20/2052 | 235,483 | 238,894 |
Pool # MA8203, 5.50%, 8/20/2052 | 1,520,000 | 1,561,893 |
GNMA II, Single Family, 30 Year | ||
TBA, 4.50%, 9/15/2052 (h) | 2,523,576 | 2,523,970 |
TBA, 5.00%, 9/15/2052 (h) | 7,847,000 | 7,950,604 |
Total Mortgage-Backed Securities (Cost $14,775,024) | 14,506,218 | |
Collateralized Mortgage Obligations — 7.7% | ||
CHL Mortgage Pass-Through Trust Series 2006-OA5, Class 2A1, 2.84%, 4/25/2046 (g) | 162,130 | 138,357 |
Connecticut Avenue Securities Trust Series 2019-R01, Class 2B1, 6.79%, 7/25/2031 (a) (g) | 1,500,000 | 1,532,581 |
Deephaven Residential Mortgage Trust Series 2022-2, Class A1, 4.30%, 3/25/2067 (a) (g) | 130,263 | 127,030 |
FHLMC STACR REMIC Trust Series 2021-HQA1, Class M2, 4.43%, 8/25/2033 (a) (g) | 2,000,000 | 1,924,661 |
FHLMC Structured Agency Credit Risk Debt Notes Series 2017-DNA2, Class B1, 7.59%, 10/25/2029 (g) | 250,000 | 266,673 |
FNMA, Connecticut Avenue Securities | ||
Series 2017-C01, Class 1B1, 8.19%, 7/25/2029 (g) | 1,000,000 | 1,093,958 |
Series 2017-C02, Class 2B1, 7.94%, 9/25/2029 (g) | 1,000,000 | 1,099,816 |
Series 2017-C04, Class 2B1, 7.49%, 11/25/2029 (g) | 1,650,000 | 1,751,065 |
Series 2017-C05, Class 1B1, 6.04%, 1/25/2030 (g) | 150,000 | 151,463 |
August 31, 2022 | 113 |
AS OF August 31, 2022 (Unaudited) (continued)
INVESTMENTS | PRINCIPAL AMOUNT($) | VALUE($) |
Collateralized Mortgage Obligations — continued | ||
Series 2017-C06, Class 1B1, 6.59%, 2/25/2030 (g) | 150,000 | 154,500 |
Series 2021-R02, Class 2B1, 5.48%, 11/25/2041 (a) (g) | 64,000 | 60,453 |
Series 2021-R02, Class 2B2, 8.38%, 11/25/2041 (a) (g) | 26,000 | 23,497 |
GNMA | ||
Series 2014-181, Class SL, IF, IO, 3.23%, 12/20/2044 (g) | 576,128 | 66,864 |
Series 2017-134, Class SD, IF, IO, 3.83%, 9/20/2047 (g) | 575,133 | 69,602 |
Series 2019-52, Class SA, IF, IO, 3.73%, 4/20/2049 (g) | 847,333 | 92,293 |
Series 2021-78, Class IB, IO, 3.00%, 5/20/2051 | 1,095,130 | 159,604 |
Series 2021-107, Class XI, IO, 3.00%, 6/20/2051 | 1,611,170 | 232,975 |
Series 2021-117, Class ES, IF, IO, 3.93%, 7/20/2051 (g) | 1,859,240 | 256,125 |
Series 2021-142, Class XI, IO, 3.00%, 8/20/2051 | 164,710 | 24,542 |
Series 2021-154, Class SD, IF, IO, 3.93%, 9/20/2051 (g) | 572,185 | 85,196 |
Series 2021-188, Class IJ, IO, 3.00%, 10/20/2051 | 3,327,854 | 496,375 |
MFA Trust Series 2022-RTL1, Class A1, 5.07%, 4/26/2027 (a) (f) | 270,000 | 262,292 |
PRPM LLC Series 2021-11, Class A2, 4.58%, 11/25/2026 (a) (f) | 1,000,000 | 919,981 |
RCO VI Mortgage LLC Series 2022-1, Class A1, 3.00%, 1/25/2027 (a) (f) | 207,296 | 196,318 |
STACR Trust Series 2018-HRP2, Class M3, 4.84%, 2/25/2047 ‡ (a) (g) | 293,785 | 293,785 |
VM Master Issuer LLC Series 2022-1, Class B, 6.88%, 5/24/2025 ‡ (a) (g) | 500,000 | 484,150 |
Total Collateralized Mortgage Obligations (Cost $12,294,727) | 11,964,156 | |
Foreign Government Securities — 2.9% | ||
Dominican Republic Government Bond | ||
6.00%, 2/22/2033 (a) | 150,000 | 130,669 |
6.00%, 2/22/2033 (e) | 150,000 | 130,669 |
5.88%, 1/30/2060 (e) | 150,000 | 105,966 |
Federal Republic of Nigeria | ||
6.50%, 11/28/2027 (e) | 200,000 | 152,500 |
7.38%, 9/28/2033 (e) | 400,000 | 267,000 |
8.25%, 9/28/2051 (a) | 200,000 | 126,750 |
Federative Republic of Brazil 3.75%, 9/12/2031 | 200,000 | 170,300 |
INVESTMENTS | PRINCIPAL AMOUNT($) | VALUE($) |
Gabonese Republic 7.00%, 11/24/2031 (e) | 200,000 | 150,500 |
Hashemite Kingdom of Jordan 5.85%, 7/7/2030 (e) | 200,000 | 174,162 |
Islamic Republic of Pakistan 6.00%, 4/8/2026 (e) | 200,000 | 124,022 |
Kingdom of Bahrain 5.45%, 9/16/2032 (e) | 200,000 | 170,600 |
Republic of Angola 8.00%, 11/26/2029 (e) | 200,000 | 165,500 |
Republic of Colombia 3.00%, 1/30/2030 | 200,000 | 154,912 |
Republic of Costa Rica 6.13%, 2/19/2031 (e) | 200,000 | 186,475 |
Republic of Cote d'Ivoire | ||
5.75%, 12/31/2032 (e) (f) | 125,389 | 111,463 |
6.13%, 6/15/2033 (e) | 200,000 | 168,162 |
Republic of Ecuador | ||
5.50%, 7/31/2030 (e) (f) | 90,000 | 47,183 |
2.50%, 7/31/2035 (e) (f) | 30,000 | 11,490 |
Republic of El Salvador | ||
6.38%, 1/18/2027 (e) | 50,000 | 18,806 |
7.12%, 1/20/2050 (e) | 150,000 | 49,903 |
Republic of Ghana | ||
6.38%, 2/11/2027 (e) | 200,000 | 86,500 |
8.75%, 3/11/2061 (e) | 200,000 | 70,913 |
Republic of Iraq | ||
6.75%, 3/9/2023 (e) | 200,000 | 192,412 |
5.80%, 1/15/2028 (e) | 171,875 | 142,903 |
Republic of Kenya 8.00%, 5/22/2032 (e) | 200,000 | 148,000 |
Republic of Paraguay 5.40%, 3/30/2050 (a) | 200,000 | 166,975 |
Republic of Rwanda 5.50%, 8/9/2031 (a) | 200,000 | 151,538 |
Republic of Senegal | ||
6.25%, 5/23/2033 (e) | 200,000 | 161,037 |
6.75%, 3/13/2048 (e) | 200,000 | 139,038 |
Republic of South Africa 6.25%, 3/8/2041 | 100,000 | 81,519 |
State of Mongolia 4.45%, 7/7/2031 (e) | 200,000 | 154,022 |
Sultanate of Oman Government Bond | ||
6.25%, 1/25/2031 (e) | 200,000 | 201,500 |
6.50%, 3/8/2047 (e) | 200,000 | 174,500 |
Ukraine Government Bond 6.88%, 5/21/2031 (e) | 200,000 | 38,000 |
Total Foreign Government Securities (Cost $5,959,908) | 4,525,889 | |
114 | August 31, 2022 |
INVESTMENTS | SHARES | VALUE($) |
Exchange-Traded Funds — 1.7% | ||
U.S. Equity — 1.7% | ||
iShares iBoxx High Yield Corporate Bond ETF | 36,150 | 2,694,260 |
Short-Term Investments — 0.1% | ||
Investment Companies — 0.1% | ||
JPMorgan Prime Money Market Fund Class IM Shares, 2.30% (i) (j) (Cost $101,234) | 101,194 | 101,234 |
Total Investments — 106.6% (Cost $180,434,960) | 166,711,240 | |
Liabilities in Excess of Other Assets — (6.6)% | (10,360,732) | |
NET ASSETS — 100.0% | 156,350,508 | |
Percentages indicated are based on net assets. |
Abbreviations | |
ABS | Asset-Backed Securities |
ACES | Alternative Credit Enhancement Securities |
ETF | Exchange Traded Fund |
FHLMC | Federal Home Loan Mortgage Corp. |
FNMA | Federal National Mortgage Association |
GNMA | Government National Mortgage Association |
ICE | Intercontinental Exchange |
IF | Inverse Floaters represent securities that pay interest at a rate that increases (decreases) with a decline (incline) in a specified index or have an interest rate that adjusts periodically based on changes in current interest rates and prepayments on the underlying pool of assets. The interest rate shown is the rate in effect as of August 31, 2022. The rate may be subject to a cap and floor. |
IO | Interest Only represents the right to receive the monthly interest payments on an underlying pool of mortgage loans. The principal amount shown represents the par value on the underlying pool. The yields on these securities are subject to accelerated principal paydowns as a result of prepayment or refinancing of the underlying pool of mortgage instruments. As a result, interest income may be reduced considerably. |
LIBOR | London Interbank Offered Rate |
PO | Principal Only represents the right to receive the principal portion only on an underlying pool of mortgage loans. The market value of these securities is extremely volatile in response to changes in market interest rates. As prepayments on the underlying mortgages of these securities increase, the yield on these securities increases. |
REMIC | Real Estate Mortgage Investment Conduit |
SCA | Limited partnership with share capital |
SOFR | Secured Overnight Financing Rate |
TBA | To Be Announced; Security is subject to delayed delivery. |
UMBS | Uniform Mortgage-Backed Securities |
USD | United States Dollar |
^ | Amount rounds to less than 0.1% of net assets. | |
‡ | Value determined using significant unobservable inputs. | |
(a) | Securities exempt from registration under Rule 144A or section 4(a)(2), of the Securities Act of 1933, as amended. | |
(b) | Security is an interest bearing note with preferred security characteristics. | |
(c) | Security is perpetual and thus, does not have a predetermined maturity date. The coupon rate for this security is fixed for a period of time and may be structured to adjust thereafter. The date shown, if applicable, reflects the next call date. The coupon rate shown is the rate in effect as of August 31, 2022. | |
(d) | Variable or floating rate security, linked to the referenced benchmark. The interest rate shown is the current rate as of August 31, 2022. | |
(e) | Security exempt from registration pursuant to Regulation S under the Securities Act of 1933, as amended. Regulation S applies to securities offerings that are made outside of the United States and do not involve direct selling efforts in the United States and as such may have restrictions on resale. | |
(f) | Step bond. Interest rate is a fixed rate for an initial period that either resets at a specific date or may reset in the future contingent upon a predetermined trigger. The interest rate shown is the current rate as of August 31, 2022. | |
(g) | Variable or floating rate security, the interest rate of which adjusts periodically based on changes in current interest rates and prepayments on the underlying pool of assets. The interest rate shown is the current rate as of August 31, 2022. | |
(h) | All or a portion of the security is a when-issued security, delayed delivery security, or forward commitment. | |
(i) | Investment in an affiliated fund, which is registered under the Investment Company Act of 1940, as amended, and is advised by J.P. Morgan Investment Management Inc. | |
(j) | The rate shown is the current yield as of August 31, 2022. | |
SECURITY DESCRIPTION | PRINCIPAL AMOUNT($) | VALUE($) |
FNMA / FHLMC UMBS, Single Family, 30 Year | ||
TBA, 5.00%, 8/25/2052(a) | (2,202,000) | (2,224,229) |
TBA, 5.00%, 9/25/2052(a) | (8,300,000) | (8,381,055) |
(Proceeds received of $10,694,218) | (10,605,284) |
August 31, 2022 | 115 |
AS OF August 31, 2022 (Unaudited) (continued)
Abbreviations | |
FHLMC | Federal Home Loan Mortgage Corp. |
FNMA | Federal National Mortgage Association |
TBA | To Be Announced; Security is subject to delayed delivery. |
UMBS | Uniform Mortgage-Backed Securities |
(a) | All or a portion of the security is a when-issued security, delayed delivery security, or forward commitment. |
DESCRIPTION | NUMBER OF CONTRACTS | EXPIRATION DATE | TRADING CURRENCY | NOTIONAL AMOUNT ($) | VALUE AND UNREALIZED APPRECIATION (DEPRECIATION) ($) |
Long Contracts | |||||
U.S. Treasury 10 Year Ultra Note | 55 | 12/20/2022 | USD | 6,867,266 | (71,701) |
U.S. Treasury Long Bond | 4 | 12/20/2022 | USD | 541,875 | (4,509) |
U.S. Treasury Ultra Bond | 2 | 12/20/2022 | USD | 297,750 | (1,286) |
U.S. Treasury 2 Year Note | 46 | 12/30/2022 | USD | 9,579,500 | (18,902) |
U.S. Treasury 5 Year Note | 154 | 12/30/2022 | USD | 17,043,469 | (82,121) |
(178,519) | |||||
Short Contracts | |||||
U.S. Treasury 10 Year Note | (150) | 12/20/2022 | USD | (17,493,750) | 123,340 |
U.S. Treasury 10 Year Ultra Note | (16) | 12/20/2022 | USD | (1,997,750) | 17,146 |
U.S. Treasury Ultra Bond | (1) | 12/20/2022 | USD | (148,875) | 529 |
U.S. Treasury 2 Year Note | (39) | 12/30/2022 | USD | (8,121,750) | 15,158 |
156,173 | |||||
(22,346) |
Abbreviations | |
USD | United States Dollar |
REFERENCE OBLIGATION/INDEX | FINANCING RATE PAID BY THE FUND (%) | PAYMENT FREQUENCY | MATURITY DATE | IMPLIED CREDIT SPREAD (%)(a) | NOTIONAL AMOUNT(b) | UPFRONT PAYMENTS (RECEIPTS) ($)(c) | UNREALIZED APPRECIATION (DEPRECIATION) ($) | VALUE ($) |
CDX.NA.HY.38-V2 | 5.00 | Quarterly | 6/20/2027 | 5.31 | USD 2,700,000 | (16,098) | 22,120 | 6,022 |
(*) | The Fund, as a buyer of credit protection, is generally obligated to make periodic payments and may also pay or receive an upfront premium to or from the protection seller, in exchange for the right to receive a contingent payment, upon occurrence of a credit event with respect to an underlying reference obligation, as defined under the terms of individual swap contracts. | ||||||||
(a) | Implied credit spreads are an indication of the seller's performance risk, related to the likelihood of a credit event occurring that would require a seller to make payment to a buyer. Implied credit spreads are used to determine the value of swap contracts and reflect the cost of buying/selling protection, which may include upfront payments made to enter into the contract. Therefore, higher spreads would indicate a greater likelihood that a seller will be obligated to perform (i.e. make payment) under the swap contract.Increasing values, in absolute terms and relative to notional amounts, are also indicative of greater performance risk. Implied credit spreads for credit default swaps on credit indices are linked to the weighted average spread across the underlying reference obligations included in a particular index. | ||||||||
116 | August 31, 2022 |
(b) | The notional amount is the maximum amount that a seller of credit protection would be obligated to pay and a buyer of credit protection would receive, upon occurrence of a credit event. | ||||||||
(c) | Upfront payments and receipts generally represent premiums paid or received at the initiation of the agreement to compensate the differences between the stated terms of the swap agreement and current market conditions (credit spreads, interest rates and other relevant factors). | ||||||||
Abbreviations | |
CDX | Credit Default Swap Index |
USD | United States Dollar |
August 31, 2022 | 117 |
AS OF August 31, 2022 (Unaudited)
INVESTMENTS | PRINCIPAL AMOUNT($) | VALUE($) |
Corporate Bonds — 57.4% | ||
Australia — 0.7% | ||
APA Infrastructure Ltd. 2.00%, 7/15/2030 (a) | EUR 150,000 | 128,400 |
Commonwealth Bank of Australia | ||
2.69%, 3/11/2031 (b) | 650,000 | 520,989 |
3.78%, 3/14/2032 (b) | 200,000 | 171,861 |
Glencore Funding LLC | ||
2.50%, 9/1/2030 (b) | 462,000 | 375,649 |
2.85%, 4/27/2031 (b) | 450,000 | 371,224 |
2.63%, 9/23/2031 (b) | 608,000 | 483,524 |
Westpac Banking Corp. (US Treasury Yield Curve Rate T Note Constant Maturity 5 Year + 2.00%), 4.11%, 7/24/2034 (c) | 75,000 | 67,462 |
2,119,109 | ||
Austria — 0.2% | ||
ams-OSRAM AG 6.00%, 7/31/2025 (a) | EUR 700,000 | 654,222 |
Belgium — 1.1% | ||
Anheuser-Busch Cos. LLC 4.70%, 2/1/2036 | 170,000 | 164,473 |
Anheuser-Busch InBev SA/NV 3.70%, 4/2/2040 (a) | EUR 200,000 | 196,047 |
Anheuser-Busch InBev Worldwide, Inc. 4.75%, 1/23/2029 | 500,000 | 510,257 |
KBC Group NV (EUR Swap Annual 5 Year + 1.25%), 1.62%, 9/18/2029 (a) (c) | EUR 300,000 | 283,486 |
Ontex Group NV 3.50%, 7/15/2026 (a) | EUR 400,000 | 338,438 |
Sarens Finance Co. NV 5.75%, 2/21/2027 (a) | EUR 500,000 | 337,558 |
Solvay Finance SACA (EUR Swap Annual 5 Year + 3.70%), 5.42%, 11/12/2023 (a) (c) (d) (e) | EUR 100,000 | 99,582 |
Solvay SA (EUR Swap Annual 5 Year + 3.92%), 4.25%, 12/4/2023 (a) (c) (d) (e) | EUR 800,000 | 783,414 |
Telenet Finance Luxembourg Notes SARL 3.50%, 3/1/2028 (a) | EUR 500,000 | 442,178 |
3,155,433 | ||
Brazil — 0.3% | ||
Guara Norte SARL 5.20%, 6/15/2034 (b) | 304,249 | 253,630 |
Klabin Austria GmbH 7.00%, 4/3/2049 (a) | 200,000 | 189,100 |
INVESTMENTS | PRINCIPAL AMOUNT($) | VALUE($) |
Brazil — continued | ||
Suzano Austria GmbH | ||
3.75%, 1/15/2031 | 48,000 | 40,449 |
7.00%, 3/16/2047 (a) | 200,000 | 200,500 |
Vale Overseas Ltd. 3.75%, 7/8/2030 | 259,000 | 225,783 |
909,462 | ||
Canada — 0.8% | ||
Bank of Nova Scotia (The) | ||
2.45%, 2/2/2032 | 420,000 | 348,222 |
(US Treasury Yield Curve Rate T Note Constant Maturity 5 Year + 2.05%), 4.59%, 5/4/2037 (c) | 570,000 | 515,244 |
Emera US Finance LP 2.64%, 6/15/2031 | 272,000 | 224,573 |
Emera, Inc. Series 16-A, (ICE LIBOR USD 3 Month + 5.44%), 6.75%, 6/15/2076 (c) | 236,000 | 238,344 |
Toronto-Dominion Bank (The) 4.11%, 6/8/2027 | 955,000 | 944,764 |
Transcanada Trust Series 16-A, (ICE LIBOR USD 3 Month + 4.64%), 5.87%, 8/15/2076 (c) | 57,000 | 55,931 |
2,327,078 | ||
Cayman Islands — 0.0% ^ | ||
Avolon Holdings Funding Ltd. 4.38%, 5/1/2026 (b) | 60,000 | 55,465 |
Chile — 0.2% | ||
Alfa Desarrollo SpA 4.55%, 9/27/2051 (b) | 339,083 | 243,292 |
Empresa de Transporte de Pasajeros Metro SA 4.70%, 5/7/2050 (b) | 200,000 | 169,400 |
Kenbourne Invest SA 6.88%, 11/26/2024 (b) | 200,000 | 192,913 |
605,605 | ||
China — 0.8% | ||
Alibaba Group Holding Ltd. 3.40%, 12/6/2027 | 200,000 | 188,846 |
Country Garden Holdings Co. Ltd. 3.13%, 10/22/2025 (a) | 530,000 | 259,700 |
Huarong Finance 2017 Co. Ltd. 4.25%, 11/7/2027 (a) | 200,000 | 159,350 |
Huarong Finance 2019 Co. Ltd. | ||
(ICE LIBOR USD 3 Month + 1.13%), 4.10%, 2/24/2023 (a) (c) | 200,000 | 195,000 |
2.13%, 9/30/2023 (a) | 200,000 | 185,225 |
118 | J.P. Morgan Exchange-Traded Funds | August 31, 2022 |
INVESTMENTS | PRINCIPAL AMOUNT($) | VALUE($) |
Corporate Bonds — continued | ||
China — continued | ||
Longfor Group Holdings Ltd. 4.50%, 1/16/2028 (a) | 300,000 | 240,000 |
NXP BV | ||
5.55%, 12/1/2028 | 1,070,000 | 1,092,403 |
3.25%, 5/11/2041 | 300,000 | 216,994 |
2,537,518 | ||
Colombia — 0.1% | ||
AI Candelaria Spain SA 5.75%, 6/15/2033 (b) | 250,000 | 195,313 |
Denmark — 0.1% | ||
DKT Finance ApS 7.00%, 6/17/2023 (a) | EUR 200,000 | 194,960 |
Finland — 0.2% | ||
Nokia OYJ | ||
2.00%, 3/15/2024 (a) | EUR 300,000 | 298,949 |
2.00%, 3/11/2026 (a) | EUR 200,000 | 191,053 |
Nordea Bank Abp (EUR Swap Annual 5 Year + 1.30%), 1.00%, 6/27/2029 (a) (c) | EUR 100,000 | 94,914 |
584,916 | ||
France — 8.0% | ||
Accor SA 3.00%, 2/4/2026 (a) (f) | EUR 600,000 | 580,215 |
Airbus SE | ||
1.63%, 6/9/2030 (a) | EUR 1,100,000 | 1,004,297 |
1.38%, 5/13/2031 (a) | EUR 300,000 | 261,158 |
Altice France SA 3.38%, 1/15/2028 (a) | EUR 800,000 | 641,158 |
Autoroutes du Sud de la France SA 1.13%, 4/20/2026 (a) | EUR 800,000 | 765,169 |
AXA SA (EURIBOR 3 Month + 3.75%), 3.38%, 7/6/2047 (a) (c) | EUR 600,000 | 579,068 |
Banijay Entertainment SASU 3.50%, 3/1/2025 (a) | EUR 725,000 | 675,766 |
Banijay Group SAS 6.50%, 3/1/2026 (a) | EUR 200,000 | 180,891 |
Banque Federative du Credit Mutuel SA 3.75%, 7/20/2023 (b) | 715,000 | 713,889 |
BPCE SA | ||
5.15%, 7/21/2024 (b) | 600,000 | 596,748 |
4.88%, 4/1/2026 (b) | 450,000 | 438,490 |
(EURIBOR 3 Month + 1.00%), 0.50%, 9/15/2027 (a) (c) | EUR 400,000 | 355,386 |
(EUR Swap Annual 5 Year + 2.37%), 2.75%, 11/30/2027 (a) (c) | EUR 400,000 | 402,170 |
INVESTMENTS | PRINCIPAL AMOUNT($) | VALUE($) |
France — continued | ||
(SOFR + 1.31%), 2.28%, 1/20/2032 (b) (c) | 480,000 | 371,726 |
(SOFR + 1.73%), 3.12%, 10/19/2032 (b) (c) | 250,000 | 195,658 |
Burger King France SAS (EURIBOR 3 Month + 4.75%), 5.02%, 11/1/2026 (a) (c) | EUR 250,000 | 239,932 |
Casino Guichard Perrachon SA 4.50%, 3/7/2024 (a) (f) | EUR 400,000 | 285,182 |
CGG SA 7.75%, 4/1/2027 (a) | EUR 434,000 | 385,214 |
Chrome Bidco SASU 3.50%, 5/31/2028 (a) | EUR 439,000 | 382,920 |
Chrome Holdco SASU 5.00%, 5/31/2029 (a) | EUR 358,000 | 284,583 |
Credit Agricole SA | ||
(USD Swap Semi 5 Year + 6.19%), 8.12%, 12/23/2025 (b) (c) (d) (e) | 475,000 | 486,281 |
(SOFR + 0.89%), 1.25%, 1/26/2027 (b) (c) | 1,000,000 | 878,686 |
2.00%, 3/25/2029 (a) | EUR 200,000 | 175,803 |
(EUR Swap Annual 5 Year + 1.90%), 1.62%, 6/5/2030 (a) (c) | EUR 500,000 | 467,196 |
Credit Mutuel Arkea SA (EURIBOR ICE Swap Rate 5 Year + 1.45%), 1.88%, 10/25/2029 (a) (c) | EUR 300,000 | 286,803 |
Electricite de France SA | ||
(EUR Swap Annual 6 Year + 3.44%), 4.00%, 7/4/2024 (a) (c) (d) (e) | EUR 1,000,000 | 926,717 |
(EUR Swap Annual 5 Year + 3.97%), 3.38%, 6/15/2030 (a) (c) (d) (e) | EUR 600,000 | 446,198 |
Elis SA 1.63%, 4/3/2028 (a) | EUR 900,000 | 759,742 |
Faurecia SE | ||
2.38%, 6/15/2027 (a) | EUR 600,000 | 476,648 |
3.75%, 6/15/2028 (a) | EUR 800,000 | 653,581 |
Iliad Holding SASU | ||
5.13%, 10/15/2026 (a) | EUR 111,000 | 105,505 |
5.63%, 10/15/2028 (a) | EUR 584,000 | 541,296 |
La Financiere Atalian SASU | ||
4.00%, 5/15/2024 (a) | EUR 350,000 | 334,415 |
5.13%, 5/15/2025 (a) | EUR 100,000 | 95,721 |
Loxam SAS | ||
2.88%, 4/15/2026 (a) | EUR 600,000 | 531,593 |
4.50%, 2/15/2027 (b) | EUR 288,000 | 261,890 |
August 31, 2022 | J.P. Morgan Exchange-Traded Funds | 119 |
AS OF August 31, 2022 (Unaudited) (continued)
INVESTMENTS | PRINCIPAL AMOUNT($) | VALUE($) |
Corporate Bonds — continued | ||
France — continued | ||
Lune Holdings SARL 5.63%, 11/15/2028 (b) | EUR 375,000 | 320,033 |
Orange SA | ||
(EUR Swap Annual 5 Year + 2.36%), 2.38%, 1/15/2025 (a) (c) (d) (e) | EUR 200,000 | 190,470 |
(EUR Swap Annual 5 Year + 3.99%), 5.00%, 10/1/2026 (a) (c) (d) (e) | EUR 400,000 | 413,834 |
(EURIBOR ICE Swap Rate 5 Year + 2.18%), 1.75%, 12/19/2026 (a) (c) (d) (e) | EUR 200,000 | 177,537 |
Paprec Holding SA | ||
4.00%, 3/31/2025 (a) | EUR 100,000 | 93,460 |
3.50%, 7/1/2028 (a) | EUR 373,000 | 305,313 |
Parts Europe SA 6.50%, 7/16/2025 (a) | EUR 400,000 | 405,222 |
Quatrim SASU 5.88%, 1/15/2024 (a) | EUR 500,000 | 456,674 |
Renault SA | ||
1.25%, 6/24/2025 (a) | EUR 400,000 | 358,301 |
2.00%, 9/28/2026 (a) | EUR 600,000 | 508,690 |
1.13%, 10/4/2027 (a) | EUR 100,000 | 78,027 |
Rexel SA 2.13%, 6/15/2028 (a) | EUR 600,000 | 509,114 |
Societe Generale SA | ||
(US Treasury Yield Curve Rate T Note Constant Maturity 5 Year + 4.51%), 5.38%, 11/18/2030 (b) (c) (d) (e) | 525,000 | 425,250 |
(EUR Swap Annual 5 Year + 1.55%), 1.00%, 11/24/2030 (c) | EUR 1,100,000 | 970,209 |
SPIE SA 2.63%, 6/18/2026 (a) | EUR 500,000 | 472,367 |
TotalEnergies Capital International SA 3.13%, 5/29/2050 | 50,000 | 38,548 |
TotalEnergies SE (EUR Swap Annual 5 Year + 1.77%), 1.75%, 4/4/2024 (a) (c) (d) (e) | EUR 850,000 | 805,044 |
Vallourec SA 8.50%, 6/30/2026 (a) | EUR 500,000 | 474,296 |
23,770,084 | ||
Germany — 5.5% | ||
Adler Pelzer Holding GmbH 4.13%, 4/1/2024 (a) | EUR 100,000 | 83,351 |
Bertelsmann SE & Co. KGaA (EUR Swap Annual 5 Year + 2.64%), 3.00%, 4/23/2075 (a) (c) | EUR 200,000 | 197,221 |
BK LC Lux Finco1 SARL 5.25%, 4/30/2029 (a) | EUR 700,000 | 601,638 |
INVESTMENTS | PRINCIPAL AMOUNT($) | VALUE($) |
Germany — continued | ||
Cheplapharm Arzneimittel GmbH 4.38%, 1/15/2028 (a) | EUR 750,000 | 680,226 |
Commerzbank AG (EUR Swap Annual 5 Year + 4.35%), 4.00%, 12/5/2030 (a) (c) | EUR 500,000 | 473,583 |
CT Investment GmbH 5.50%, 4/15/2026 (a) | EUR 456,000 | 394,880 |
Deutsche Bank AG | ||
(SOFR + 2.16%), 2.22%, 9/18/2024 (c) | 1,075,000 | 1,036,768 |
(SOFR + 2.26%), 3.74%, 1/7/2033 (c) | 450,000 | 319,724 |
Deutsche Lufthansa AG | ||
2.00%, 7/14/2024 (a) | EUR 400,000 | 382,206 |
2.88%, 2/11/2025 (a) | EUR 1,400,000 | 1,280,306 |
3.00%, 5/29/2026 (a) | EUR 400,000 | 347,199 |
Deutsche Telekom International Finance BV 2.49%, 9/19/2023 (b) | 250,000 | 245,748 |
Douglas GmbH 6.00%, 4/8/2026 (a) | EUR 700,000 | 575,856 |
Hapag-Lloyd AG 2.50%, 4/15/2028 (a) | EUR 500,000 | 459,358 |
IHO Verwaltungs GmbH | ||
3.75% (Cash), 9/15/2026 (a) (g) | EUR 125,000 | 109,916 |
3.88% (Cash), 5/15/2027 (a) (g) (h) | EUR 500,000 | 414,702 |
Kirk Beauty SUN GmbH 8.25% (PIK), 10/1/2026 (a) (g) | EUR 273,462 | 167,508 |
Nidda BondCo GmbH 5.00%, 9/30/2025 (a) | EUR 500,000 | 439,428 |
Nidda Healthcare Holding GmbH 3.50%, 9/30/2024 (a) | EUR 625,000 | 577,897 |
Renk AG 5.75%, 7/15/2025 (a) | EUR 400,000 | 375,015 |
Schaeffler AG | ||
2.75%, 10/12/2025 (a) | EUR 200,000 | 187,154 |
2.88%, 3/26/2027 (a) | EUR 450,000 | 408,337 |
3.38%, 10/12/2028 (a) | EUR 500,000 | 436,332 |
Techem Verwaltungsgesellschaft 674 mbH 6.00%, 7/30/2026 (a) | EUR 219,799 | 205,602 |
Techem Verwaltungsgesellschaft 675 mbH 2.00%, 7/15/2025 (a) | EUR 1,100,000 | 1,008,719 |
thyssenkrupp AG | ||
2.88%, 2/22/2024 (a) | EUR 600,000 | 583,629 |
2.50%, 2/25/2025 (a) | EUR 200,000 | 188,888 |
TK Elevator Holdco GmbH 6.63%, 7/15/2028 (a) | EUR 270,000 | 231,173 |
TK Elevator Midco GmbH 4.38%, 7/15/2027 (a) | EUR 300,000 | 264,553 |
120 | J.P. Morgan Exchange-Traded Funds | August 31, 2022 |
INVESTMENTS | PRINCIPAL AMOUNT($) | VALUE($) |
Corporate Bonds — continued | ||
Germany — continued | ||
TUI Cruises GmbH 6.50%, 5/15/2026 (a) | EUR 350,000 | 286,486 |
Volkswagen International Finance NV 3.25%, 11/18/2030 (a) | EUR 600,000 | 568,870 |
Vonovia Finance BV 2.25%, 4/7/2030 (a) | EUR 1,100,000 | 973,645 |
WEPA Hygieneprodukte GmbH 2.88%, 12/15/2027 (a) | EUR 100,000 | 77,884 |
ZF Europe Finance BV | ||
2.00%, 2/23/2026 (a) | EUR 1,000,000 | 849,183 |
2.50%, 10/23/2027 (a) | EUR 300,000 | 238,482 |
ZF Finance GmbH | ||
2.25%, 5/3/2028 (a) | EUR 200,000 | 151,093 |
3.75%, 9/21/2028 (a) | EUR 600,000 | 487,200 |
16,309,760 | ||
Greece — 0.3% | ||
Alpha Bank SA 2.50%, 2/5/2023 (a) | EUR 780,000 | 786,559 |
India — 0.2% | ||
Greenko Dutch BV 3.85%, 3/29/2026 (b) | 194,000 | 163,406 |
Greenko Power II Ltd. 4.30%, 12/13/2028 (b) | 415,438 | 331,831 |
NTPC Ltd. 3.75%, 4/3/2024 (a) | 200,000 | 196,912 |
692,149 | ||
Indonesia — 0.3% | ||
Indonesia Asahan Aluminium Persero PT 5.45%, 5/15/2030 (b) | 200,000 | 195,420 |
Pertamina Persero PT 3.65%, 7/30/2029 (b) | 400,000 | 378,450 |
Perusahaan Perseroan Persero PT Perusahaan Listrik Negara 4.13%, 5/15/2027 (a) | 200,000 | 193,163 |
767,033 | ||
Ireland — 1.1% | ||
AerCap Ireland Capital DAC | ||
4.13%, 7/3/2023 | 420,000 | 418,966 |
3.00%, 10/29/2028 | 465,000 | 395,305 |
AIB Group plc (EUR Swap Annual 5 Year + 2.15%), 1.88%, 11/19/2029 (a) (c) | EUR 750,000 | 695,225 |
Avolon Holdings Funding Ltd. | ||
3.95%, 7/1/2024 (b) | 126,000 | 120,311 |
2.13%, 2/21/2026 (b) | 440,000 | 379,245 |
4.25%, 4/15/2026 (b) | 140,000 | 129,031 |
INVESTMENTS | PRINCIPAL AMOUNT($) | VALUE($) |
Ireland — continued | ||
Bank of Ireland Group plc (EUR Swap Annual 5 Year + 7.92%), 7.50%, 5/19/2025 (a) (c) (d) (e) | EUR 300,000 | 297,294 |
eircom Finance DAC 3.50%, 5/15/2026 (a) | EUR 1,000,000 | 922,544 |
3,357,921 | ||
Israel — 0.2% | ||
Energean Israel Finance Ltd. | ||
4.88%, 3/30/2026 (a) | 156,000 | 143,910 |
5.38%, 3/30/2028 (a) | 150,475 | 135,051 |
Leviathan Bond Ltd. | ||
6.13%, 6/30/2025 (a) | 200,000 | 196,288 |
6.50%, 6/30/2027 (a) | 165,554 | 161,084 |
636,333 | ||
Italy — 5.0% | ||
Assicurazioni Generali SpA | ||
2.43%, 7/14/2031 (a) | EUR 200,000 | 162,646 |
(EURIBOR 3 Month + 5.35%), 5.50%, 10/27/2047 (a) (c) | EUR 200,000 | 203,324 |
Atlantia SpA | ||
1.63%, 2/3/2025 (a) | EUR 300,000 | 280,670 |
1.88%, 7/13/2027 (a) | EUR 350,000 | 292,753 |
1.88%, 2/12/2028 (a) | EUR 400,000 | 323,594 |
Autostrade per l'Italia SpA | ||
1.75%, 2/1/2027 (a) | EUR 1,500,000 | 1,334,071 |
2.00%, 12/4/2028 (a) | EUR 900,000 | 752,080 |
1.88%, 9/26/2029 (a) | EUR 100,000 | 81,014 |
Enel Finance International NV | ||
1.38%, 7/12/2026 (b) | 1,460,000 | 1,271,915 |
3.50%, 4/6/2028 (b) | 200,000 | 181,607 |
1.88%, 7/12/2028 (b) | 425,000 | 348,780 |
5.00%, 6/15/2032 (b) | 200,000 | 185,108 |
Enel SpA Series 63.5, (EUR Swap Annual 5 Year + 2.58%), 3.38%, 8/24/2026 (a) (c) (d) (e) | EUR 800,000 | 716,529 |
Eni SpA 4.25%, 5/9/2029 (b) | 250,000 | 237,322 |
Gamma Bidco SpA 5.13%, 7/15/2025 (a) | EUR 582,000 | 549,788 |
Guala Closures SpA 3.25%, 6/15/2028 (a) | EUR 384,000 | 325,121 |
Infrastrutture Wireless Italiane SpA 1.88%, 7/8/2026 (a) | EUR 500,000 | 457,956 |
Intesa Sanpaolo SpA | ||
3.93%, 9/15/2026 (a) | EUR 150,000 | 147,781 |
August 31, 2022 | J.P. Morgan Exchange-Traded Funds | 121 |
AS OF August 31, 2022 (Unaudited) (continued)
INVESTMENTS | PRINCIPAL AMOUNT($) | VALUE($) |
Corporate Bonds — continued | ||
Italy — continued | ||
(EUR Swap Annual 5 Year + 7.19%), 7.75%, 1/11/2027 (a) (c) (d) (e) | EUR 676,000 | 656,418 |
(US Treasury Yield Curve Rate T Note Constant Maturity 1 Year + 2.75%), 4.95%, 6/1/2042 (b) (c) | 200,000 | 130,483 |
Kedrion SpA 3.38%, 5/15/2026 (a) | EUR 475,000 | 480,931 |
Leonardo SpA 4.88%, 3/24/2025 | EUR 600,000 | 613,177 |
Nexi SpA 1.63%, 4/30/2026 (a) | EUR 550,000 | 484,450 |
Pro-Gest SpA 3.25%, 12/15/2024 (a) | EUR 577,000 | 429,008 |
Rossini SARL 6.75%, 10/30/2025 (a) | EUR 400,000 | 400,983 |
Saipem Finance International BV | ||
3.75%, 9/8/2023 (a) | EUR 200,000 | 198,341 |
2.63%, 1/7/2025 (a) | EUR 300,000 | 269,778 |
Shiba Bidco SpA 4.50%, 10/31/2028 (a) | EUR 650,000 | 549,552 |
TeamSystem SpA 3.50%, 2/15/2028 (a) | EUR 300,000 | 261,642 |
Telecom Italia SpA | ||
2.88%, 1/28/2026 (a) | EUR 200,000 | 185,466 |
3.63%, 5/25/2026 (a) | EUR 400,000 | 383,730 |
2.38%, 10/12/2027 (a) | EUR 1,350,000 | 1,141,931 |
UniCredit SpA | ||
(EURIBOR ICE Swap Rate 5 Year + 7.33%), 7.50%, 6/3/2026 (a) (c) (d) (e) | EUR 300,000 | 289,056 |
(US Treasury Yield Curve Rate T Note Constant Maturity 1 Year + 1.20%), 1.98%, 6/3/2027 (b) (c) | 200,000 | 169,226 |
(EURIBOR ICE Swap Rate 5 Year + 4.74%), 4.87%, 2/20/2029 (a) (c) | EUR 200,000 | 198,759 |
(US Treasury Yield Curve Rate T Note Constant Maturity 1 Year + 1.55%), 3.13%, 6/3/2032 (b) (c) | 200,000 | 150,446 |
Verde Bidco SpA 4.63%, 10/1/2026 (a) | EUR 100,000 | 84,416 |
14,929,852 | ||
Japan — 1.4% | ||
Mitsubishi UFJ Financial Group, Inc. | ||
2.53%, 9/13/2023 | 580,000 | 571,345 |
INVESTMENTS | PRINCIPAL AMOUNT($) | VALUE($) |
Japan — continued | ||
(US Treasury Yield Curve Rate T Note Constant Maturity 1 Year + 0.83%), 2.34%, 1/19/2028 (c) | 1,575,000 | 1,413,306 |
Sumitomo Mitsui Financial Group, Inc. 3.75%, 7/19/2023 | 157,000 | 156,835 |
Takeda Pharmaceutical Co. Ltd. | ||
5.00%, 11/26/2028 | 1,110,000 | 1,124,949 |
1.00%, 7/9/2029 | EUR 363,000 | 314,935 |
2.05%, 3/31/2030 | 500,000 | 418,011 |
3.03%, 7/9/2040 | 270,000 | 209,189 |
4,208,570 | ||
Kazakhstan — 0.1% | ||
KazMunayGas National Co. JSC 5.75%, 4/19/2047 (a) | 380,000 | 311,410 |
Kuwait — 0.1% | ||
MEGlobal Canada ULC 5.00%, 5/18/2025 (b) | 200,000 | 201,000 |
Luxembourg — 2.0% | ||
Altice Finco SA 4.75%, 1/15/2028 (a) | EUR 500,000 | 396,843 |
Altice France Holding SA | ||
8.00%, 5/15/2027 (a) | EUR 350,000 | 286,662 |
8.00%, 5/15/2027 (b) | EUR 123,000 | 100,741 |
ARD Finance SA 5.00% (Cash), 6/30/2027 (a) (g) (h) | EUR 200,000 | 148,733 |
Herens Midco SARL 5.25%, 5/15/2029 (a) | EUR 603,000 | 442,369 |
INEOS Finance plc 3.38%, 3/31/2026 (a) | EUR 547,000 | 506,446 |
Matterhorn Telecom SA 3.13%, 9/15/2026 (a) | EUR 875,000 | 771,791 |
Monitchem HoldCo 3 SA 5.25%, 3/15/2025 (a) | EUR 400,000 | 377,861 |
PLT VII Finance SARL 4.63%, 1/5/2026 (a) | EUR 650,000 | 600,143 |
SELP Finance SARL, REIT 0.88%, 5/27/2029 (a) | EUR 900,000 | 711,038 |
SES SA | ||
(EUR Swap Annual 5 Year + 3.19%), 2.87%, 5/27/2026 (a) (c) (d) (e) | EUR 500,000 | 411,857 |
0.88%, 11/4/2027 (a) | EUR 450,000 | 384,239 |
122 | J.P. Morgan Exchange-Traded Funds | August 31, 2022 |
INVESTMENTS | PRINCIPAL AMOUNT($) | VALUE($) |
Corporate Bonds — continued | ||
Luxembourg — continued | ||
Summer BC Holdco A SARL 9.25%, 10/31/2027 (a) | EUR 360,421 | 311,859 |
Summer BC Holdco B SARL 5.75%, 10/31/2026 (a) | EUR 500,000 | 463,533 |
5,914,115 | ||
Malaysia — 0.1% | ||
Petronas Capital Ltd. 3.40%, 4/28/2061 (b) | 436,000 | 334,490 |
Mexico — 0.7% | ||
BBVA Bancomer SA (US Treasury Yield Curve Rate T Note Constant Maturity 5 Year + 2.65%), 5.12%, 1/18/2033 (b) (c) | 200,000 | 178,300 |
Cemex SAB de CV | ||
(US Treasury Yield Curve Rate T Note Constant Maturity 5 Year + 4.53%), 5.12%, 6/8/2026 (b) (c) (d) (e) | 488,000 | 404,430 |
3.88%, 7/11/2031 (b) | 377,000 | 315,690 |
Fomento Economico Mexicano SAB de CV 3.50%, 1/16/2050 | 150,000 | 116,717 |
Petroleos Mexicanos 5.95%, 1/28/2031 | 1,428,000 | 1,068,501 |
2,083,638 | ||
Morocco — 0.1% | ||
OCP SA 6.88%, 4/25/2044 (a) | 200,000 | 175,413 |
Netherlands — 2.1% | ||
ABN AMRO Bank NV | ||
4.75%, 7/28/2025 (b) | 200,000 | 197,251 |
(EUR Swap Annual 5 Year + 4.67%), 4.37%, 9/22/2025 (a) (c) (d) (e) | EUR 200,000 | 181,661 |
4.80%, 4/18/2026 (b) | 200,000 | 196,203 |
(US Treasury Yield Curve Rate T Note Constant Maturity 5 Year + 1.90%), 3.32%, 3/13/2037 (b) (c) | 400,000 | 311,004 |
Cooperatieve Rabobank UA | ||
3.88%, 9/26/2023 (b) | 250,000 | 249,436 |
(US Treasury Yield Curve Rate T Note Constant Maturity 1 Year + 0.73%), 1.00%, 9/24/2026 (b) (c) | 365,000 | 324,364 |
(EUR Swap Annual 5 Year + 4.68%), 4.37%, 6/29/2027 (a) (c) (d) (e) | EUR 400,000 | 360,275 |
INVESTMENTS | PRINCIPAL AMOUNT($) | VALUE($) |
Netherlands — continued | ||
ING Groep NV | ||
(SOFR + 1.83%), 4.02%, 3/28/2028 (c) | 710,000 | 673,116 |
(EUR Swap Annual 5 Year + 2.85%), 3.00%, 4/11/2028 (c) | EUR 400,000 | 400,995 |
(EUR Swap Annual 5 Year + 1.20%), 1.00%, 11/13/2030 (a) (c) | EUR 300,000 | 266,875 |
Nobel Bidco BV 3.13%, 6/15/2028 (a) | EUR 336,000 | 238,255 |
Q-Park Holding I BV | ||
1.50%, 3/1/2025 (a) | EUR 100,000 | 91,103 |
2.00%, 3/1/2027 (a) | EUR 500,000 | 415,231 |
Sigma Holdco BV 5.75%, 5/15/2026 (a) | EUR 400,000 | 289,526 |
Titan Holdings II BV 5.13%, 7/15/2029 (a) | EUR 468,000 | 399,769 |
Trivium Packaging Finance BV 3.75%, 8/15/2026 (a) (f) | EUR 500,000 | 474,839 |
UPC Holding BV 3.88%, 6/15/2029 (a) | EUR 500,000 | 428,131 |
Ziggo Bond Co. BV 3.38%, 2/28/2030 (a) | EUR 800,000 | 603,346 |
6,101,380 | ||
New Zealand — 0.1% | ||
ANZ New Zealand Int'l Ltd. 2.55%, 2/13/2030 (b) | 490,000 | 421,387 |
Norway — 0.4% | ||
DNB Bank ASA (GUKG1 + 1.35%), 2.62%, 6/10/2026 (a) (c) | GBP 1,000,000 | 1,099,665 |
Peru — 0.0% ^ | ||
Southern Copper Corp. 5.88%, 4/23/2045 | 140,000 | 145,364 |
Portugal — 0.8% | ||
EDP - Energias de Portugal SA (EUR Swap Annual 5 Year + 1.84%), 1.70%, 7/20/2080 (a) (c) | EUR 1,000,000 | 900,686 |
EDP Finance BV | ||
3.63%, 7/15/2024 (b) | 675,000 | 665,094 |
1.50%, 11/22/2027 (a) | EUR 750,000 | 697,157 |
2,262,937 | ||
August 31, 2022 | J.P. Morgan Exchange-Traded Funds | 123 |
AS OF August 31, 2022 (Unaudited) (continued)
INVESTMENTS | PRINCIPAL AMOUNT($) | VALUE($) |
Corporate Bonds — continued | ||
Spain — 5.3% | ||
Abertis Infraestructuras Finance BV | ||
(EUR Swap Annual 5 Year + 3.69%), 3.25%, 11/24/2025 (a) (c) (d) (e) | EUR 600,000 | 515,730 |
(EUR Swap Annual 5 Year + 3.27%), 2.62%, 1/26/2027 (a) (c) (d) (e) | EUR 100,000 | 79,819 |
Banco Bilbao Vizcaya Argentaria SA (EUR Swap Annual 5 Year + 6.46%), 6.00%, 1/15/2026 (a) (c) (d) (e) | EUR 400,000 | 376,864 |
Banco de Sabadell SA (EUR Swap Annual 1 Year + 0.97%), 0.63%, 11/7/2025 (a) (c) | EUR 300,000 | 281,525 |
Banco Santander SA | ||
(US Treasury Yield Curve Rate T Note Constant Maturity 1 Year + 0.45%), 0.70%, 6/30/2024 (c) | 600,000 | 580,726 |
5.15%, 8/18/2025 | 400,000 | 398,076 |
(US Treasury Yield Curve Rate T Note Constant Maturity 1 Year + 0.90%), 1.72%, 9/14/2027 (c) | 800,000 | 688,666 |
2.13%, 2/8/2028 (a) | EUR 200,000 | 181,976 |
CaixaBank SA | ||
(EUR Swap Annual 5 Year + 6.22%), 6.37%, 9/19/2023 (a) (c) (d) (e) | EUR 400,000 | 398,348 |
(EUR Swap Annual 5 Year + 6.50%), 6.75%, 6/13/2024 (a) (c) (d) (e) | EUR 400,000 | 387,151 |
1.13%, 3/27/2026 (a) | EUR 1,000,000 | 927,318 |
(EUR Swap Annual 5 Year + 3.62%), 3.75%, 2/15/2029 (a) (c) | EUR 800,000 | 794,132 |
Cellnex Telecom SA | ||
1.00%, 4/20/2027 (a) | EUR 500,000 | 426,707 |
1.88%, 6/26/2029 | EUR 400,000 | 323,594 |
Cirsa Finance International SARL 4.75%, 5/22/2025 (a) | EUR 950,000 | 880,112 |
ContourGlobal Power Holdings SA 4.13%, 8/1/2025 (a) | EUR 500,000 | 483,130 |
eDreams ODIGEO SA | ||
5.50%, 7/15/2027 (b) | EUR 307,000 | 264,512 |
5.50%, 7/15/2027 (a) | EUR 300,000 | 258,481 |
Grifols Escrow Issuer SA 3.88%, 10/15/2028 (a) | EUR 300,000 | 241,188 |
Grifols SA | ||
INVESTMENTS | PRINCIPAL AMOUNT($) | VALUE($) |
Spain — continued | ||
1.63%, 2/15/2025 (a) | EUR 550,000 | 507,123 |
2.25%, 11/15/2027 (a) | EUR 1,000,000 | 844,158 |
Grupo Antolin-Irausa SA | ||
3.38%, 4/30/2026 (a) | EUR 100,000 | 81,493 |
3.50%, 4/30/2028 (a) | EUR 225,000 | 163,243 |
Iberdrola International BV (EUR Swap Annual 5 Year + 2.06%), 2.62%, 12/26/2023 (a) (c) (d) (e) | EUR 800,000 | 782,052 |
Kaixo Bondco Telecom SA 5.13%, 9/30/2029 (a) | EUR 392,000 | 318,343 |
Lorca Telecom Bondco SA 4.00%, 9/18/2027 (a) | EUR 1,066,000 | 952,333 |
Naturgy Finance BV (EUR Swap Annual 9 Year + 3.08%), 3.38%, 4/24/2024 (a) (c) (d) (e) | EUR 200,000 | 187,565 |
Repsol International Finance BV (EUR Swap Annual 10 Year + 4.20%), 4.50%, 3/25/2075 (a) (c) | EUR 1,400,000 | 1,382,281 |
Telefonica Emisiones SA 5.21%, 3/8/2047 | 150,000 | 129,761 |
Telefonica Europe BV | ||
(EUR Swap Annual 5 Year + 2.33%), 2.62%, 3/7/2023 (a) (c) (d) (e) | EUR 100,000 | 98,242 |
Series NC5, (EUR Swap Annual 5 Year + 2.45%), 3.00%, 9/4/2023 (a) (c) (d) (e) | EUR 900,000 | 868,883 |
(EUR Swap Annual 8 Year + 2.97%), 3.88%, 6/22/2026 (a) (c) (d) (e) | EUR 900,000 | 814,281 |
15,617,813 | ||
Sweden — 0.8% | ||
Dometic Group AB 3.00%, 5/8/2026 (a) | EUR 650,000 | 576,791 |
Svenska Handelsbanken AB (US Treasury Yield Curve Rate T Note Constant Maturity 5 Year + 4.05%), 4.75%, 3/1/2031 (a) (c) (d) (e) | 200,000 | 164,183 |
Verisure Holding AB | ||
3.88%, 7/15/2026 (a) | EUR 275,000 | 246,230 |
3.25%, 2/15/2027 (a) | EUR 900,000 | 775,570 |
Verisure Midholding AB 5.25%, 2/15/2029 (a) | EUR 319,000 | 257,689 |
124 | J.P. Morgan Exchange-Traded Funds | August 31, 2022 |
INVESTMENTS | PRINCIPAL AMOUNT($) | VALUE($) |
Corporate Bonds — continued | ||
Sweden — continued | ||
Volvo Car AB | ||
2.00%, 1/24/2025 (a) | EUR 200,000 | 190,900 |
2.50%, 10/7/2027 (a) | EUR 300,000 | 268,162 |
2,479,525 | ||
Switzerland — 1.5% | ||
Argentum Netherlands for Zurich Insurance Co. Ltd. (EURIBOR 3 Month + 3.95%), 3.50%, 10/1/2046 (a) (c) | EUR 700,000 | 685,834 |
Credit Suisse Group AG | ||
4.28%, 1/9/2028 (b) | 550,000 | 493,738 |
(SOFR + 3.73%), 4.19%, 4/1/2031 (b) (c) | 274,000 | 230,221 |
(SOFR + 1.73%), 3.09%, 5/14/2032 (b) (c) | 561,000 | 424,006 |
Dufry One BV 2.50%, 10/15/2024 (a) | EUR 700,000 | 663,629 |
Holcim Sterling Finance Netherlands BV 2.25%, 4/4/2034 (a) | GBP 300,000 | 254,699 |
Kongsberg Actuation Systems BV 5.00%, 7/15/2025 (a) | EUR 218,182 | 185,039 |
Swiss Re Finance Luxembourg SA (US Treasury Yield Curve Rate T Note Constant Maturity 5 Year + 3.58%), 5.00%, 4/2/2049 (b) (c) | 200,000 | 190,000 |
UBS Group AG | ||
(US Treasury Yield Curve Rate T Note Constant Maturity 1 Year + 2.05%), 4.70%, 8/5/2027 (b) (c) | 322,000 | 316,058 |
(EUR Swap Annual 1 Year + 0.77%), 0.25%, 11/5/2028 (a) (c) | EUR 300,000 | 252,817 |
(US Treasury Yield Curve Rate T Note Constant Maturity 1 Year + 1.00%), 2.09%, 2/11/2032 (b) (c) | 280,000 | 218,948 |
(US Treasury Yield Curve Rate T Note Constant Maturity 1 Year + 1.10%), 2.75%, 2/11/2033 (b) (c) | 430,000 | 344,516 |
(US Treasury Yield Curve Rate T Note Constant Maturity 1 Year + 2.40%), 4.99%, 8/5/2033 (b) (c) | 200,000 | 192,762 |
4,452,267 | ||
INVESTMENTS | PRINCIPAL AMOUNT($) | VALUE($) |
Taiwan — 0.4% | ||
Competition Team Technologies Ltd. 3.75%, 3/12/2024 (a) | 200,000 | 197,850 |
TSMC Arizona Corp. 4.25%, 4/22/2032 | 380,000 | 372,096 |
TSMC Global Ltd. 2.25%, 4/23/2031 (b) | 700,000 | 584,969 |
1,154,915 | ||
United Kingdom — 8.6% | ||
888 Acquisitions Ltd. 7.56%, 7/15/2027 (b) | EUR 230,000 | 198,779 |
AstraZeneca plc | ||
0.38%, 6/3/2029 (a) | EUR 700,000 | 601,530 |
4.00%, 9/18/2042 | 490,000 | 448,729 |
Barclays plc | ||
(U.K. Government Bonds 5 Year Note Generic Bid Yield + 6.02%), 6.37%, 12/15/2025 (a) (c) (d) (e) | GBP 200,000 | 211,720 |
(US Treasury Yield Curve Rate T Note Constant Maturity 1 Year + 2.30%), 5.30%, 8/9/2026 (c) | 398,000 | 395,084 |
BP Capital Markets plc | ||
(US Treasury Yield Curve Rate T Note Constant Maturity 5 Year + 4.04%), 4.38%, 6/22/2025 (c) (d) (e) | 204,000 | 195,279 |
(EUR Swap Annual 5 Year + 3.88%), 3.25%, 3/22/2026 (a) (c) (d) (e) | EUR 600,000 | 551,199 |
(US Treasury Yield Curve Rate T Note Constant Maturity 5 Year + 4.40%), 4.88%, 3/22/2030 (c) (d) (e) | 94,000 | 85,987 |
British Telecommunications plc (EURIBOR ICE Swap Rate 5 Year + 2.13%), 1.87%, 8/18/2080 (a) (c) | EUR 100,000 | 86,426 |
Centrica plc 4.38%, 3/13/2029 (a) | GBP 200,000 | 224,717 |
Constellation Automotive Financing plc 4.88%, 7/15/2027 (a) | GBP 269,000 | 244,060 |
CPUK Finance Ltd. 4.50%, 8/28/2027 (a) | GBP 500,000 | 516,399 |
EC Finance plc 3.00%, 10/15/2026 (a) | EUR 799,000 | 739,955 |
eG Global Finance plc 4.38%, 2/7/2025 (a) | EUR 600,000 | 558,670 |
Eversholt Funding plc 2.74%, 6/30/2040 (a) | GBP 738,464 | 727,373 |
August 31, 2022 | J.P. Morgan Exchange-Traded Funds | 125 |
AS OF August 31, 2022 (Unaudited) (continued)
INVESTMENTS | PRINCIPAL AMOUNT($) | VALUE($) |
Corporate Bonds — continued | ||
United Kingdom — continued | ||
Gatwick Funding Ltd. 2.50%, 4/15/2030 (a) | GBP 700,000 | 676,711 |
Heathrow Funding Ltd. | ||
1.50%, 10/12/2025 (a) | EUR 800,000 | 764,588 |
6.75%, 12/3/2026 (a) | GBP 300,000 | 370,130 |
1.50%, 2/11/2030 (a) | EUR 300,000 | 260,113 |
1.88%, 3/14/2034 (a) | EUR 250,000 | 195,922 |
5.88%, 5/13/2041 (a) | GBP 100,000 | 119,815 |
HSBC Holdings plc | ||
(SOFR + 1.54%), 1.64%, 4/18/2026 (c) | 490,000 | 446,185 |
5.75%, 12/20/2027 (a) | GBP 200,000 | 230,924 |
(SOFR + 2.61%), 5.21%, 8/11/2028 (c) | 380,000 | 370,900 |
(SOFR + 1.73%), 2.01%, 9/22/2028 (c) | 1,270,000 | 1,073,732 |
(ICE LIBOR USD 3 Month + 1.61%), 3.97%, 5/22/2030 (c) | 374,000 | 337,662 |
(SOFR + 1.41%), 2.87%, 11/22/2032 (c) | 440,000 | 349,646 |
(SOFR + 2.87%), 5.40%, 8/11/2033 (c) | 207,000 | 196,955 |
Iceland Bondco plc 4.63%, 3/15/2025 (a) | GBP 400,000 | 336,661 |
INEOS Quattro Finance 1 plc 3.75%, 7/15/2026 (a) | EUR 500,000 | 428,532 |
INEOS Quattro Finance 2 plc 2.50%, 1/15/2026 (a) | EUR 200,000 | 178,305 |
INEOS Styrolution Group GmbH 2.25%, 1/16/2027 (a) | EUR 300,000 | 248,725 |
International Consolidated Airlines Group SA 1.50%, 7/4/2027 (a) | EUR 700,000 | 496,280 |
Jaguar Land Rover Automotive plc | ||
2.20%, 1/15/2024 (a) | EUR 300,000 | 272,458 |
4.50%, 1/15/2026 (a) | EUR 400,000 | 334,946 |
Lloyds Banking Group plc | ||
4.05%, 8/16/2023 | 415,000 | 414,365 |
(EURIBOR ICE Swap Rate 5 Year + 5.29%), 4.95%, 6/27/2025 (a) (c) (d) (e) | EUR 300,000 | 287,164 |
4.58%, 12/10/2025 | 200,000 | 194,953 |
National Grid plc 0.25%, 9/1/2028 (a) | EUR 800,000 | 667,401 |
NatWest Group plc | ||
(ICE LIBOR USD 3 Month + 1.76%), 4.27%, 3/22/2025 (c) | 780,000 | 771,050 |
INVESTMENTS | PRINCIPAL AMOUNT($) | VALUE($) |
United Kingdom — continued | ||
(U.K. Government Bonds 5 Year Note Generic Bid Yield + 4.99%), 5.13%, 5/12/2027 (c) (d) (e) | GBP 884,000 | 872,901 |
(US Treasury Yield Curve Rate T Note Constant Maturity 1 Year + 2.27%), 5.52%, 9/30/2028 (c) | 400,000 | 400,210 |
(EURIBOR 3 Month + 0.89%), 0.67%, 9/14/2029 (a) (c) | EUR 1,200,000 | 973,893 |
NGG Finance plc (EUR Swap Annual 5 Year + 2.53%), 2.13%, 9/5/2082 (a) (c) | EUR 730,000 | 597,854 |
Pinnacle Bidco plc 5.50%, 2/15/2025 (a) | EUR 500,000 | 463,508 |
Punch Finance plc 6.13%, 6/30/2026 (a) | GBP 438,000 | 442,301 |
RAC Bond Co. plc 5.25%, 11/4/2027 (a) | GBP 654,000 | 612,540 |
Rolls-Royce plc 0.88%, 5/9/2024 (a) | EUR 700,000 | 656,742 |
Santander UK Group Holdings plc (SOFR + 0.99%), 1.67%, 6/14/2027 (c) | 900,000 | 778,441 |
SIG plc 5.25%, 11/30/2026 (a) | EUR 317,000 | 265,209 |
Standard Chartered plc | ||
(US Treasury Yield Curve Rate T Note Constant Maturity 1 Year + 1.65%), 3.97%, 3/30/2026 (b) (c) | 395,000 | 381,735 |
(US Treasury Yield Curve Rate T Note Constant Maturity 1 Year + 3.85%), 4.64%, 4/1/2031 (b) (c) | 306,000 | 288,366 |
Synthomer plc 3.88%, 7/1/2025 (a) | EUR 500,000 | 465,041 |
Virgin Media Finance plc 3.75%, 7/15/2030 (a) | EUR 500,000 | 391,930 |
Vodafone Group plc | ||
5.25%, 5/30/2048 | 180,000 | 166,149 |
4.88%, 6/19/2049 | 121,000 | 107,666 |
(EUR Swap Annual 5 Year + 3.43%), 4.20%, 10/3/2078 (a) (c) | EUR 700,000 | 640,761 |
(EUR Swap Annual 5 Year + 2.67%), 3.10%, 1/3/2079 (a) (c) | EUR 300,000 | 291,913 |
126 | J.P. Morgan Exchange-Traded Funds | August 31, 2022 |
INVESTMENTS | PRINCIPAL AMOUNT($) | VALUE($) |
Corporate Bonds — continued | ||
United Kingdom — continued | ||
(USD Swap Semi 5 Year + 4.87%), 7.00%, 4/4/2079 (c) | 429,000 | 442,878 |
Series NC10, (EUR Swap Annual 5 Year + 3.23%), 3.00%, 8/27/2080 (a) (c) | EUR 625,000 | 502,098 |
25,552,166 | ||
United States — 7.8% | ||
AES Corp. (The) | ||
3.30%, 7/15/2025 (b) | 31,000 | 29,404 |
3.95%, 7/15/2030 (b) | 42,000 | 38,367 |
Aetna, Inc. 2.80%, 6/15/2023 | 595,000 | 589,576 |
Alexander Funding Trust 1.84%, 11/15/2023 (b) | 70,000 | 66,511 |
American Airlines Pass-Through Trust Series 2021-1, 2.88%, 7/11/2034 | 100,000 | 83,646 |
American Express Co. (US Treasury Yield Curve Rate T Note Constant Maturity 5 Year + 2.85%), 3.55%, 9/15/2026 (c) (d) (e) | 104,000 | 89,310 |
American Medical Systems Europe BV 1.63%, 3/8/2031 | EUR 100,000 | 87,714 |
Amgen, Inc. 2.45%, 2/21/2030 | 120,000 | 105,003 |
Anheuser-Busch Cos. LLC 4.90%, 2/1/2046 | 85,000 | 80,695 |
Anheuser-Busch InBev Worldwide, Inc. 4.44%, 10/6/2048 | 344,000 | 305,786 |
Ardagh Metal Packaging Finance USA LLC 3.00%, 9/1/2029 (a) | EUR 379,000 | 298,921 |
AT&T, Inc. | ||
3.50%, 9/15/2053 | 380,000 | 280,142 |
3.55%, 9/15/2055 | 99,000 | 72,487 |
Bank of America Corp. | ||
Series N, (SOFR + 1.22%), 2.65%, 3/11/2032 (c) | 560,000 | 464,286 |
(SOFR + 1.32%), 2.69%, 4/22/2032 (c) | 290,000 | 240,409 |
(SOFR + 1.22%), 2.30%, 7/21/2032 (c) | 470,000 | 375,178 |
Berkshire Hathaway Energy Co. 4.60%, 5/1/2053 (b) | 47,000 | 44,767 |
BP Capital Markets America, Inc. 2.72%, 1/12/2032 | 430,000 | 374,957 |
Bristol-Myers Squibb Co. 2.95%, 3/15/2032 | 125,000 | 113,267 |
INVESTMENTS | PRINCIPAL AMOUNT($) | VALUE($) |
United States — continued | ||
Capital One Financial Corp. Series M, (US Treasury Yield Curve Rate T Note Constant Maturity 5 Year + 3.16%), 3.95%, 9/1/2026 (c) (d) (e) | 442,000 | 375,373 |
CCO Holdings LLC 5.13%, 5/1/2027 (b) | 140,000 | 132,887 |
CenterPoint Energy, Inc. 2.95%, 3/1/2030 | 280,000 | 249,138 |
CF Industries, Inc. 4.95%, 6/1/2043 | 224,000 | 199,107 |
Charles Schwab Corp. (The) | ||
Series I, (US Treasury Yield Curve Rate T Note Constant Maturity 5 Year + 3.17%), 4.00%, 6/1/2026 (c) (d) (e) | 312,000 | 268,320 |
Series H, (US Treasury Yield Curve Rate T Note Constant Maturity 10 Year + 3.08%), 4.00%, 12/1/2030 (c) (d) (e) | 320,000 | 260,400 |
Citigroup, Inc. | ||
Series M, (ICE LIBOR USD 3 Month + 3.42%), 6.30%, 5/15/2024 (c) (d) (e) | 29,000 | 27,985 |
Series W, (US Treasury Yield Curve Rate T Note Constant Maturity 5 Year + 3.60%), 4.00%, 12/10/2025 (c) (d) (e) | 160,000 | 140,400 |
(US Treasury Yield Curve Rate T Note Constant Maturity 5 Year + 3.42%), 3.88%, 2/18/2026 (c) (d) (e) | 720,000 | 622,800 |
Series T, (ICE LIBOR USD 3 Month + 4.52%), 6.25%, 8/15/2026 (c) (e) | 200,000 | 198,490 |
Series Y, (US Treasury Yield Curve Rate T Note Constant Maturity 5 Year + 3.00%), 4.15%, 11/15/2026 (c) (e) | 620,000 | 525,326 |
(SOFR + 1.17%), 2.56%, 5/1/2032 (c) | 320,000 | 261,726 |
(SOFR + 1.18%), 2.52%, 11/3/2032 (c) | 140,000 | 113,150 |
Comcast Corp. 2.94%, 11/1/2056 | 290,000 | 196,479 |
Conagra Brands, Inc. 0.50%, 8/11/2023 | 430,000 | 416,003 |
Constellation Energy Generation LLC 5.60%, 6/15/2042 | 210,000 | 210,090 |
CVS Health Corp. | ||
1.88%, 2/28/2031 | 215,000 | 172,952 |
August 31, 2022 | J.P. Morgan Exchange-Traded Funds | 127 |
AS OF August 31, 2022 (Unaudited) (continued)
INVESTMENTS | PRINCIPAL AMOUNT($) | VALUE($) |
Corporate Bonds — continued | ||
United States — continued | ||
2.13%, 9/15/2031 | 130,000 | 105,891 |
Danaher Corp. 2.80%, 12/10/2051 | 85,000 | 60,324 |
Diamondback Energy, Inc. 3.13%, 3/24/2031 | 277,000 | 238,837 |
Discover Bank 4.20%, 8/8/2023 | 655,000 | 655,458 |
Discovery Communications LLC 3.63%, 5/15/2030 | 50,000 | 43,806 |
Duquesne Light Holdings, Inc. 2.78%, 1/7/2032 (b) | 140,000 | 114,159 |
Entergy Texas, Inc. 1.75%, 3/15/2031 | 115,000 | 92,237 |
Exxon Mobil Corp. 0.52%, 6/26/2028 | EUR 400,000 | 354,578 |
Fells Point Funding Trust 3.05%, 1/31/2027 (b) | 274,000 | 252,661 |
Fidelity National Information Services, Inc. 2.00%, 5/21/2030 | EUR 200,000 | 176,513 |
Fiserv, Inc. 1.63%, 7/1/2030 | EUR 100,000 | 86,029 |
Ford Motor Credit Co. LLC | ||
4.27%, 1/9/2027 | 400,000 | 365,362 |
3.63%, 6/17/2031 | 467,000 | 378,144 |
Freeport-McMoRan, Inc. | ||
4.25%, 3/1/2030 | 103,000 | 93,281 |
5.40%, 11/14/2034 | 523,000 | 495,945 |
5.45%, 3/15/2043 | 48,000 | 43,211 |
General Electric Co. 4.13%, 9/19/2035 (a) | EUR 100,000 | 102,548 |
General Motors Co. 6.13%, 10/1/2025 | 21,000 | 21,615 |
General Motors Financial Co., Inc. 2.75%, 6/20/2025 | 39,000 | 36,894 |
Georgia Power Co. Series A, 2.10%, 7/30/2023 | 785,000 | 771,056 |
Global Payments, Inc. 2.90%, 11/15/2031 | 265,000 | 214,682 |
Goldman Sachs Group, Inc. (The) | ||
Series T, (US Treasury Yield Curve Rate T Note Constant Maturity 5 Year + 2.97%), 3.80%, 5/10/2026 (c) (d) (e) | 10,000 | 8,275 |
(SOFR + 0.91%), 1.95%, 10/21/2027 (c) | 355,000 | 315,306 |
(SOFR + 1.28%), 2.62%, 4/22/2032 (c) | 290,000 | 239,622 |
(SOFR + 1.25%), 2.38%, 7/21/2032 (c) | 190,000 | 153,801 |
(SOFR + 1.26%), 2.65%, 10/21/2032 (c) | 300,000 | 246,328 |
INVESTMENTS | PRINCIPAL AMOUNT($) | VALUE($) |
United States — continued | ||
Gray Oak Pipeline LLC 2.60%, 10/15/2025 (b) | 50,000 | 46,006 |
HCA, Inc. | ||
5.88%, 2/15/2026 | 185,000 | 188,904 |
3.50%, 9/1/2030 | 635,000 | 554,128 |
2.38%, 7/15/2031 | 370,000 | 293,537 |
5.25%, 6/15/2049 | 120,000 | 107,371 |
3.50%, 7/15/2051 | 150,000 | 102,966 |
Hyundai Capital America | ||
3.50%, 11/2/2026 (b) | 555,000 | 520,852 |
3.50%, 11/2/2026 (a) | 150,000 | 140,771 |
International Game Technology plc 2.38%, 4/15/2028 (a) | EUR 350,000 | 293,989 |
Kansas City Southern 3.50%, 5/1/2050 | 90,000 | 70,703 |
Keurig Dr. Pepper, Inc. | ||
3.95%, 4/15/2029 | 345,000 | 328,335 |
4.05%, 4/15/2032 | 310,000 | 289,205 |
Lear Corp. 3.55%, 1/15/2052 | 84,000 | 54,689 |
Lowe's Cos., Inc. 3.75%, 4/1/2032 | 260,000 | 239,440 |
Magallanes, Inc. | ||
4.28%, 3/15/2032 (b) | 822,000 | 716,236 |
5.05%, 3/15/2042 (b) | 155,000 | 126,714 |
Metropolitan Life Global Funding I 3.30%, 3/21/2029 (b) | 185,000 | 170,403 |
Morgan Stanley | ||
(SOFR + 0.88%), 1.59%, 5/4/2027 (c) | 690,000 | 615,019 |
(SOFR + 1.61%), 4.21%, 4/20/2028 (c) | 315,000 | 306,941 |
(SOFR + 1.18%), 2.24%, 7/21/2032 (c) | 220,000 | 177,212 |
(SOFR + 1.20%), 2.51%, 10/20/2032 (c) | 173,000 | 141,668 |
Netflix, Inc. 5.38%, 11/15/2029 (b) | 357,000 | 351,645 |
Pacific Gas and Electric Co. | ||
4.25%, 8/1/2023 | 390,000 | 388,187 |
3.30%, 3/15/2027 | 366,000 | 326,584 |
Par Pharmaceutical, Inc. 7.50%, 4/1/2027 (b) | 9,000 | 7,650 |
PNC Financial Services Group, Inc. (The) Series T, (US Treasury Yield Curve Rate T Note Constant Maturity 5 Year + 2.60%), 3.40%, 9/15/2026 (c) (d) (e) | 410,000 | 331,280 |
Regency Centers LP, REIT 2.95%, 9/15/2029 | 95,000 | 82,938 |
128 | J.P. Morgan Exchange-Traded Funds | August 31, 2022 |
INVESTMENTS | PRINCIPAL AMOUNT($) | VALUE($) |
Corporate Bonds — continued | ||
United States — continued | ||
Roper Technologies, Inc. 2.95%, 9/15/2029 | 446,000 | 392,880 |
Southern California Edison Co. Series J, 0.70%, 8/1/2023 | 460,000 | 445,751 |
Take-Two Interactive Software, Inc. | ||
3.55%, 4/14/2025 | 60,000 | 58,604 |
3.70%, 4/14/2027 | 210,000 | 202,086 |
4.00%, 4/14/2032 | 70,000 | 64,556 |
Thermo Fisher Scientific, Inc. 0.88%, 10/1/2031 | EUR 100,000 | 82,930 |
T-Mobile USA, Inc. 2.55%, 2/15/2031 | 115,000 | 95,713 |
Transocean, Inc. 11.50%, 1/30/2027 (b) | 25,000 | 24,098 |
Union Electric Co. 3.90%, 4/1/2052 | 80,000 | 70,364 |
Verizon Communications, Inc. | ||
2.55%, 3/21/2031 | 330,000 | 278,917 |
2.36%, 3/15/2032 | 60,000 | 49,224 |
2.65%, 11/20/2040 | 60,000 | 43,308 |
VMware, Inc. 2.20%, 8/15/2031 | 290,000 | 226,090 |
Wells Fargo & Co. Series BB, (US Treasury Yield Curve Rate T Note Constant Maturity 5 Year + 3.45%), 3.90%, 3/15/2026 (c) (d) (e) | 340,000 | 299,625 |
23,085,134 | ||
Total Corporate Bonds (Cost $210,361,035) | 170,189,961 | |
Foreign Government Securities — 30.6% | ||
Angola — 0.3% | ||
Republic of Angola | ||
8.00%, 11/26/2029 (a) | 210,000 | 173,775 |
8.75%, 4/14/2032 (b) | 483,000 | 393,645 |
9.13%, 11/26/2049 (a) | 480,000 | 357,990 |
925,410 | ||
Australia — 9.4% | ||
Commonwealth of Australia | ||
5.50%, 4/21/2023 (a) | AUD17,808,000 | 12,393,293 |
1.25%, 5/21/2032 | AUD25,668,000 | 14,198,196 |
3.00%, 3/21/2047 (a) | AUD 2,140,000 | 1,262,376 |
27,853,865 | ||
Bahrain — 0.1% | ||
Kingdom of Bahrain 6.00%, 9/19/2044 (a) | 335,000 | 250,057 |
INVESTMENTS | PRINCIPAL AMOUNT($) | VALUE($) |
Brazil — 3.1% | ||
Notas do Tesouro Nacional | ||
10.00%, 1/1/2025 | BRL40,000,000 | 7,379,284 |
6.00%, 5/15/2035 | BRL 2,540,000 | 1,943,952 |
9,323,236 | ||
Canada — 6.1% | ||
Canada Government Bond | ||
0.25%, 5/1/2023 | CAD12,060,000 | 8,978,219 |
0.25%, 8/1/2023 | CAD12,516,000 | 9,231,545 |
18,209,764 | ||
China — 1.1% | ||
People's Republic of China 2.75%, 2/17/2032 | CNY22,790,000 | 3,306,572 |
Colombia — 0.2% | ||
Republic of Colombia | ||
3.13%, 4/15/2031 | 460,000 | 346,811 |
5.20%, 5/15/2049 | 520,000 | 353,373 |
700,184 | ||
Costa Rica — 0.1% | ||
Republic of Costa Rica 6.13%, 2/19/2031 (a) | 300,000 | 279,713 |
Cote D'Ivoire — 0.2% | ||
Republic of Cote d'Ivoire 6.88%, 10/17/2040 (b) | EUR 730,000 | 526,505 |
Dominican Republic — 0.2% | ||
Dominican Republic Government Bond | ||
6.88%, 1/29/2026 (b) | 280,000 | 286,265 |
5.30%, 1/21/2041 (b) | 375,000 | 277,336 |
563,601 | ||
Ecuador — 0.1% | ||
Republic of Ecuador 2.50%, 7/31/2035 (a) (f) | 537,000 | 205,671 |
Ethiopia — 0.0% ^ | ||
Federal Democratic Republic of Ethiopia 6.63%, 12/11/2024 (a) | 200,000 | 109,788 |
Hungary — 0.2% | ||
Hungary Government Bond | ||
2.13%, 9/22/2031 (b) | 200,000 | 145,662 |
7.63%, 3/29/2041 | 150,000 | 172,200 |
3.13%, 9/21/2051 (b) | 466,000 | 288,862 |
606,724 | ||
August 31, 2022 | J.P. Morgan Exchange-Traded Funds | 129 |
AS OF August 31, 2022 (Unaudited) (continued)
INVESTMENTS | PRINCIPAL AMOUNT($) | VALUE($) |
Foreign Government Securities — continued | ||
Israel — 0.2% | ||
State of Israel Government Bond 3.38%, 1/15/2050 | 570,000 | 472,316 |
Italy — 1.7% | ||
Italian Republic Government Bond | ||
0.88%, 5/6/2024 | 962,000 | 900,932 |
2.38%, 10/17/2024 | 3,295,000 | 3,128,735 |
2.88%, 10/17/2029 | 1,135,000 | 966,650 |
4,996,317 | ||
Ivory Coast — 0.2% | ||
Republic of Cote d'Ivoire | ||
6.38%, 3/3/2028 (a) | 270,000 | 250,644 |
6.13%, 6/15/2033 (a) | 370,000 | 311,101 |
561,745 | ||
Jamaica — 0.2% | ||
Jamaica Government Bond | ||
8.00%, 3/15/2039 | 240,000 | 279,795 |
7.88%, 7/28/2045 | 400,000 | 460,825 |
740,620 | ||
Kazakhstan — 0.1% | ||
Republic of Kazakhstan 1.50%, 9/30/2034 (b) | EUR 370,000 | 280,570 |
Kenya — 0.2% | ||
Republic of Kenya 6.30%, 1/23/2034 (b) | 783,000 | 532,440 |
Lebanon — 0.0% ^ | ||
Lebanese Republic | ||
6.65%, 4/22/2024 (a) (i) | 227,000 | 16,074 |
6.65%, 11/3/2028 (a) (i) | 226,000 | 15,580 |
31,654 | ||
Mexico — 1.6% | ||
Mex Bonos Desarr Fix Rt | ||
7.75%, 5/29/2031 | MXN37,280,000 | 1,704,718 |
8.50%, 11/18/2038 | MXN42,000,000 | 1,985,705 |
United Mexican States | ||
3.77%, 5/24/2061 | 392,000 | 261,733 |
3.75%, 4/19/2071 | 1,433,000 | 938,884 |
4,891,040 | ||
INVESTMENTS | PRINCIPAL AMOUNT($) | VALUE($) |
New Zealand — 0.8% | ||
New Zealand Government Bond | ||
4.50%, 4/15/2027 (a) | NZD 952,000 | 597,859 |
2.75%, 4/15/2037 (a) | NZD 3,201,000 | 1,643,110 |
2,240,969 | ||
Nigeria — 0.3% | ||
Federal Republic of Nigeria | ||
7.63%, 11/21/2025 (a) | 300,000 | 264,750 |
7.38%, 9/28/2033 (b) | 527,000 | 351,772 |
7.63%, 11/28/2047 (a) | 400,000 | 246,000 |
862,522 | ||
Oman — 0.2% | ||
Sultanate of Oman Government Bond | ||
5.63%, 1/17/2028 (a) | 300,000 | 294,375 |
6.75%, 1/17/2048 (a) | 320,000 | 284,400 |
578,775 | ||
Paraguay — 0.3% | ||
Republic of Paraguay | ||
5.00%, 4/15/2026 (a) | 302,000 | 301,396 |
4.95%, 4/28/2031 (b) | 550,000 | 528,791 |
830,187 | ||
Philippines — 0.1% | ||
Republic of Philippines 2.95%, 5/5/2045 | 330,000 | 245,061 |
Portugal — 1.5% | ||
Portuguese Republic 5.13%, 10/15/2024 (a) | 4,260,000 | 4,355,833 |
Qatar — 0.2% | ||
State of Qatar | ||
5.10%, 4/23/2048 (a) | 245,000 | 261,844 |
4.40%, 4/16/2050 (b) | 200,000 | 194,250 |
456,094 | ||
Romania — 0.1% | ||
Romania Government Bond 4.63%, 4/3/2049 (b) | EUR 276,000 | 204,870 |
Senegal — 0.2% | ||
Republic of Senegal | ||
6.25%, 5/23/2033 (a) | 660,000 | 531,423 |
6.75%, 3/13/2048 (a) | 260,000 | 180,749 |
712,172 | ||
130 | J.P. Morgan Exchange-Traded Funds | August 31, 2022 |
INVESTMENTS | PRINCIPAL AMOUNT($) | VALUE($) |
Foreign Government Securities — continued | ||
Serbia — 0.1% | ||
Republic of Serbia 1.50%, 6/26/2029 (b) | EUR 410,000 | 295,451 |
South Africa — 1.2% | ||
Republic of South Africa | ||
4.30%, 10/12/2028 | 490,000 | 433,436 |
7.00%, 2/28/2031 | ZAR37,742,512 | 1,747,544 |
8.88%, 2/28/2035 | ZAR17,942,132 | 888,136 |
5.75%, 9/30/2049 | 710,000 | 503,212 |
3,572,328 | ||
United Arab Emirates — 0.3% | ||
United Arab Emirates Government Bond | ||
4.05%, 7/7/2032 (b) | 441,000 | 446,733 |
4.00%, 7/28/2050 (b) | 400,000 | 252,200 |
4.95%, 7/7/2052 (b) | 305,000 | 320,250 |
1,019,183 | ||
Uruguay — 0.0% ^ | ||
Oriental Republic of Uruguay 5.10%, 6/18/2050 | 88,906 | 90,256 |
Total Foreign Government Securities (Cost $101,540,249) | 90,831,493 | |
Commercial Mortgage-Backed Securities — 1.7% | ||
United States — 1.7% | ||
BAMLL Re-REMIC Trust Series 2014-FRR4, Class BK29, PO, 4/27/2023 (b) | 400,000 | 380,914 |
BANK | ||
Series 2019-BN16, Class C, 4.79%, 2/15/2052 ‡ (h) | 23,000 | 20,945 |
Series 2018-BN10, Class C, 4.16%, 2/15/2061 ‡ (h) | 70,000 | 62,458 |
Series 2018-BN13, Class C, 4.72%, 8/15/2061 ‡ (h) | 118,000 | 105,863 |
Series 2019-BN20, Class C, 3.78%, 9/15/2062 ‡ (h) | 176,000 | 148,595 |
Benchmark Mortgage Trust Series 2019-B11, Class C, 3.75%, 5/15/2052 ‡ (h) | 315,000 | 265,992 |
Cascade Funding Mortgage Trust Series 2021-FRR1, Class BK45, 2.11%, 2/28/2025 ‡ (b) (h) | 1,000,000 | 899,144 |
CCUBS Commercial Mortgage Trust Series 2017-C1, Class C, 4.58%, 11/15/2050 (h) | 28,000 | 24,949 |
INVESTMENTS | PRINCIPAL AMOUNT($) | VALUE($) |
United States — continued | ||
CD Mortgage Trust Series 2016-CD2, Class C, 4.11%, 11/10/2049 ‡ (h) | 21,000 | 17,974 |
Citigroup Commercial Mortgage Trust Series 2014-GC23, Class C, 4.58%, 7/10/2047 ‡ (h) | 21,000 | 20,184 |
FHLMC, Multi-Family Structured Pass-Through Certificates | ||
Series K033, Class X1, IO, 0.40%, 7/25/2023 (h) | 3,684,077 | 7,265 |
Series K739, Class X1, IO, 1.32%, 9/25/2027 (h) | 2,127,037 | 100,305 |
Series K153, Class X3, IO, 3.91%, 4/25/2035 (h) | 340,000 | 87,582 |
Series K036, Class X3, IO, 2.18%, 12/25/2041 (h) | 2,640,000 | 62,084 |
Series K720, Class X3, IO, 2.13%, 8/25/2042 (h) | 447,795 | 4 |
Series K041, Class X3, IO, 1.70%, 11/25/2042 (h) | 3,470,000 | 104,193 |
Series K054, Class X3, IO, 1.65%, 4/25/2043 (h) | 1,365,000 | 63,604 |
Series K050, Class X3, IO, 1.61%, 10/25/2043 (h) | 1,010,000 | 40,228 |
Series K051, Class X3, IO, 1.67%, 10/25/2043 (h) | 1,395,000 | 59,752 |
Series K052, Class X3, IO, 1.67%, 1/25/2044 (h) | 750,000 | 33,820 |
Series K726, Class X3, IO, 2.22%, 7/25/2044 (h) | 2,890,000 | 97,177 |
Series K067, Class X3, IO, 2.19%, 9/25/2044 (h) | 1,385,000 | 120,062 |
Series K072, Class X3, IO, 2.21%, 12/25/2045 (h) | 400,000 | 37,487 |
Series K089, Class X3, IO, 2.38%, 1/25/2046 (h) | 850,000 | 102,103 |
Series K078, Class X3, IO, 2.29%, 6/25/2046 (h) | 1,820,000 | 191,556 |
Series K088, Class X3, IO, 2.43%, 2/25/2047 (h) | 980,000 | 121,094 |
FREMF Series 2018-KF46, Class B, 4.31%, 3/25/2028 (b) (h) | 241,539 | 235,185 |
FREMF Mortgage Trust | ||
Series 2017-KF31, Class B, 5.26%, 4/25/2024 (b) (h) | 38,243 | 37,965 |
Series 2017-KF36, Class B, 5.01%, 8/25/2024 (b) (h) | 32,805 | 32,712 |
Series 2017-KF38, Class B, 4.86%, 9/25/2024 (b) (h) | 19,725 | 19,667 |
August 31, 2022 | J.P. Morgan Exchange-Traded Funds | 131 |
AS OF August 31, 2022 (Unaudited) (continued)
INVESTMENTS | PRINCIPAL AMOUNT($) | VALUE($) |
Commercial Mortgage-Backed Securities — continued | ||
United States — continued | ||
Series 2018-KF47, Class B, 4.36%, 5/25/2025 (b) (h) | 9,422 | 9,293 |
Series 2018-KF49, Class B, 4.26%, 6/25/2025 (b) (h) | 147,239 | 142,650 |
Series 2017-K728, Class B, 3.77%, 11/25/2050 (b) (h) | 190,000 | 186,221 |
Series 2017-K728, Class C, 3.77%, 11/25/2050 (b) (h) | 105,000 | 102,017 |
GNMA Series 2017-23, IO, 0.62%, 5/16/2059 (h) | 283,408 | 10,827 |
GS Mortgage Securities Trust | ||
Series 2012-GCJ9, Class D, 4.78%, 11/10/2045 ‡ (b) (h) | 320,000 | 312,424 |
Series 2015-GC30, Class C, 4.20%, 5/10/2050 ‡ (h) | 36,000 | 33,724 |
JPMBB Commercial Mortgage Securities Trust | ||
Series 2015-C30, Class C, 4.37%, 7/15/2048 ‡ (h) | 62,000 | 55,932 |
Series 2015-C31, Class C, 4.77%, 8/15/2048 ‡ (h) | 23,000 | 21,537 |
JPMDB Commercial Mortgage Securities Trust Series 2017-C7, Class C, 4.30%, 10/15/2050 (h) | 19,509 | 17,587 |
JPMorgan Chase Commercial Mortgage Securities Trust Series 2016-JP4, Class C, 3.52%, 12/15/2049 ‡ (h) | 28,000 | 24,526 |
LB-UBS Commercial Mortgage Trust Series 2006-C6, Class AJ, 5.45%, 9/15/2039 ‡ (h) | 134,898 | 59,558 |
Morgan Stanley Bank of America Merrill Lynch Trust | ||
Series 2014-C14, Class C, 5.21%, 2/15/2047 ‡ (h) | 21,000 | 20,724 |
Series 2015-C24, Class C, 4.48%, 5/15/2048 ‡ (h) | 36,000 | 33,828 |
Morgan Stanley Capital I Trust | ||
Series 2005-HQ7, Class E, 5.49%, 11/14/2042 ‡ (h) | 35,173 | 34,473 |
Series 2015-MS1, Class B, 4.16%, 5/15/2048 ‡ (h) | 28,000 | 26,642 |
UBS Commercial Mortgage Trust Series 2017-C7, Class B, 4.29%, 12/15/2050 ‡ (h) | 106,000 | 98,708 |
Velocity Commercial Capital Loan Trust | ||
Series 2018-2, Class A, 4.05%, 10/26/2048 (b) (h) | 91,104 | 88,954 |
INVESTMENTS | PRINCIPAL AMOUNT($) | VALUE($) |
United States — continued | ||
Series 2019-1, Class M1, 3.94%, 3/25/2049 ‡ (b) (h) | 106,056 | 100,740 |
Wells Fargo Commercial Mortgage Trust | ||
Series 2016-C35, Class C, 4.18%, 7/15/2048 ‡ (h) | 23,000 | 20,253 |
Series 2019-C49, Class C, 4.87%, 3/15/2052 ‡ (h) | 59,000 | 53,937 |
Total Commercial Mortgage-Backed Securities (Cost $5,394,572) | 4,955,418 | |
Asset-Backed Securities — 1.4% | ||
United States — 1.4% | ||
Accelerated Assets LLC Series 2018-1, Class C, 6.65%, 12/2/2033 ‡ (b) | 107,911 | 105,794 |
Chase Funding Trust Series 2003-6, Class 1A7, 5.28%, 11/25/2034 ‡ (f) | 66,342 | 63,930 |
Credit-Based Asset Servicing and Securitization LLC Series 2004-CB5, Class M1, 3.36%, 1/25/2034 ‡ (h) | 77,595 | 72,775 |
Drive Auto Receivables Trust Series 2018-3, Class D, 4.30%, 9/16/2024 | 25,229 | 25,235 |
DT Auto Owner Trust | ||
Series 2019-1A, Class D, 3.87%, 11/15/2024 (b) | 31,446 | 31,447 |
Series 2019-1A, Class E, 4.94%, 2/17/2026 (b) | 100,000 | 100,246 |
Exeter Automobile Receivables Trust Series 2018-3A, Class D, 4.35%, 6/17/2024 (b) | 58,832 | 58,879 |
Flagship Credit Auto Trust Series 2017-4, Class D, 3.58%, 1/15/2024 (b) | 119,548 | 119,533 |
FREED ABS Trust Series 2022-3FP, Class B, 5.79%, 8/20/2029 ‡ (b) | 670,000 | 665,402 |
JetBlue Pass-Through Trust | ||
Series 2019-1, Class B, 8.00%, 11/15/2027 | 147,697 | 147,502 |
Series 2019-1, Class A, 2.95%, 5/15/2028 | 44,513 | 37,927 |
Series 2020-1, Class B, 7.75%, 11/15/2028 | 39,644 | 39,020 |
Lendmark Funding Trust Series 2019-2A, Class C, 3.72%, 4/20/2028 ‡ (b) | 580,000 | 540,453 |
132 | J.P. Morgan Exchange-Traded Funds | August 31, 2022 |
INVESTMENTS | PRINCIPAL AMOUNT($) | VALUE($) |
Asset-Backed Securities — continued | ||
United States — continued | ||
Onemain Financial Issuance Trust Series 2018-1A, Class D, 4.08%, 3/14/2029 ‡ (b) | 100,000 | 99,570 |
Progress Residential Series 2021-SFR1, Class E, 2.11%, 4/17/2038 ‡ (b) | 250,000 | 216,802 |
Santander Revolving Auto Loan Trust | ||
Series 2019-A, Class C, 3.00%, 1/26/2032 (b) | 150,000 | 142,102 |
Series 2019-A, Class D, 3.45%, 1/26/2032 (b) | 650,000 | 618,532 |
Structured Asset Investment Loan Trust | ||
Series 2004-8, Class M3, 3.42%, 9/25/2034 ‡ (h) | 7,386 | 7,377 |
Series 2005-HE3, Class M1, 3.16%, 9/25/2035 ‡ (h) | 28,929 | 28,620 |
US Auto Funding Series 2021-1A, Class C, 2.20%, 5/15/2026 (b) | 1,125,000 | 1,061,996 |
Total Asset-Backed Securities (Cost $4,379,075) | 4,183,142 | |
Collateralized Mortgage Obligations — 1.0% | ||
United Kingdom — 0.0% ^ | ||
Brass NO 8 plc Series 8A, Class A1, 3.62%, 11/16/2066 (b) (h) | 46,002 | 45,997 |
United States — 1.0% | ||
Alternative Loan Trust | ||
Series 2004-25CB, Class A1, 6.00%, 12/25/2034 | 91,156 | 82,454 |
Series 2005-6CB, Class 1A6, 5.50%, 4/25/2035 | 58,877 | 52,622 |
Series 2005-80CB, Class 5A1, 6.00%, 2/25/2036 | 69,571 | 66,832 |
Series 2007-2CB, Class 1A6, 5.75%, 3/25/2037 | 118,728 | 73,697 |
Chase Mortgage Finance Trust Series 2007-A1, Class 1A5, 2.69%, 2/25/2037 (h) | 14,347 | 14,020 |
CHL Mortgage Pass-Through Trust Series 2007-16, Class A1, 6.50%, 10/25/2037 | 42,727 | 22,749 |
FHLMC, REMIC | ||
Series 2916, Class S, IF, IO, 4.86%, 1/15/2035 (h) | 1,224,553 | 122,249 |
Series 4305, Class SK, IF, IO, 4.21%, 2/15/2044 (h) | 421,456 | 59,122 |
INVESTMENTS | PRINCIPAL AMOUNT($) | VALUE($) |
United States — continued | ||
Series 4689, Class SD, IF, IO, 3.76%, 6/15/2047 (h) | 285,811 | 42,099 |
Series 4714, Class SA, IF, IO, 3.76%, 8/15/2047 (h) | 231,025 | 32,052 |
Series 5022, IO, 3.00%, 9/25/2050 | 424,934 | 60,617 |
Series 5023, Class MI, IO, 3.00%, 10/25/2050 | 764,948 | 137,088 |
Series 4839, Class WS, IF, IO, 3.71%, 8/15/2056 (h) | 1,858,039 | 277,561 |
FNMA, Connecticut Avenue Securities Series 2018-C06, Class 2M2, 4.54%, 3/25/2031 (h) | 18,498 | 18,534 |
FNMA, REMIC | ||
Series 2010-57, Class ID, IO, 4.00%, 6/25/2025 | 24,057 | 137 |
Series 2012-146, Class AI, IO, 3.00%, 1/25/2028 | 690,018 | 33,215 |
Series 2016-68, Class BI, IO, 3.00%, 10/25/2031 | 547,845 | 44,280 |
Series 2012-93, Class SE, IF, IO, 3.66%, 9/25/2042 (h) | 87,061 | 10,760 |
Series 2012-124, Class UI, IO, 4.00%, 11/25/2042 | 89,407 | 13,740 |
Series 2012-133, Class NS, IF, IO, 3.71%, 12/25/2042 (h) | 150,080 | 18,350 |
Series 2015-40, Class LS, IF, IO, 3.73%, 6/25/2045 (h) | 215,909 | 26,362 |
Series 2016-75, Class SC, IF, IO, 3.66%, 10/25/2046 (h) | 530,507 | 48,890 |
Series 2017-31, Class SG, IF, IO, 3.66%, 5/25/2047 (h) | 729,251 | 96,169 |
Series 2017-39, Class ST, IF, IO, 3.66%, 5/25/2047 (h) | 209,544 | 29,863 |
Series 2017-69, Class SH, IF, IO, 3.76%, 9/25/2047 (h) | 327,579 | 47,205 |
Series 2019-42, Class SK, IF, IO, 3.61%, 8/25/2049 (h) | 551,183 | 70,985 |
FNMA, STRIPS Series 409, Class 27, IO, 4.00%, 4/25/2027 (h) | 85,914 | 3,874 |
GNMA | ||
Series 2017-107, Class KS, IF, IO, 3.83%, 7/20/2047 (h) | 191,354 | 22,369 |
Series 2019-42, Class SJ, IF, IO, 3.68%, 4/20/2049 (h) | 432,220 | 53,812 |
Series 2015-H13, Class GI, IO, 1.48%, 4/20/2065 (h) | 130,846 | 3,013 |
August 31, 2022 | J.P. Morgan Exchange-Traded Funds | 133 |
AS OF August 31, 2022 (Unaudited) (continued)
INVESTMENTS | PRINCIPAL AMOUNT($) | VALUE($) |
Collateralized Mortgage Obligations — continued | ||
United States — continued | ||
Merrill Lynch Mortgage Investors Trust Series 2004-C, Class A1, 3.00%, 7/25/2029 (h) | 42,650 | 40,592 |
PNMAC FMSR ISSUER TRUST Series 2018-GT2, Class A, 5.09%, 8/25/2025 (b) (h) | 210,000 | 204,876 |
Structured Adjustable Rate Mortgage Loan Trust Series 2004-8, Class 3A, 3.72%, 7/25/2034 (h) | 12,873 | 12,517 |
VM Master Issuer LLC Series 2022-1, Class A1, 5.16%, 5/24/2025 (b) (h) | 1,200,000 | 1,195,440 |
3,038,145 | ||
Total Collateralized Mortgage Obligations (Cost $3,646,952) | 3,084,142 | |
Supranational — 0.3% | ||
African Export-Import Bank (The), 5.25%, 10/11/2023 (a) | 200,000 | 198,500 |
European Union, 0.10%, 10/4/2040 (a) | EUR 1,070,000 | 700,246 |
Total Supranational (Cost $1,416,442) | 898,746 | |
SHARES | ||
Common Stocks — 0.1% | ||
United States — 0.1% | ||
Chord Energy Corp.(Cost $41,321) | 1,711 | 242,192 |
NO. OF WARRANTS | ||
Warrants — 0.0% ^ | ||
United States — 0.0% ^ | ||
Windstream Holdings, Inc. expiring 12/31/2049, price 10.75 USD ‡ *(Cost $—) | 16 | 216 |
SHARES | ||
Short-Term Investments — 3.5% | ||
Investment Companies — 3.5% | ||
JPMorgan U.S. Government Money Market Fund Class IM Shares, 2.00% (j) (k)(Cost $10,471,032) | 10,471,032 | 10,471,032 |
Total Investments — 96.0% (Cost $337,250,678) | 284,856,342 | |
Other Assets Less Liabilities — 4.0% | 11,891,600 | |
NET ASSETS — 100.0% | 296,747,942 | |
Percentages indicated are based on net assets. |
Abbreviations | |
ABS | Asset-Backed Securities |
AUD | Australian Dollar |
BRL | Brazilian Real |
CAD | Canadian Dollar |
CNY | China Yuan |
EUR | Euro |
EURIBOR | Euro Interbank Offered Rate |
FHLMC | Federal Home Loan Mortgage Corp. |
FNMA | Federal National Mortgage Association |
GBP | British Pound |
GNMA | Government National Mortgage Association |
ICE | Intercontinental Exchange |
IF | Inverse Floaters represent securities that pay interest at a rate that increases (decreases) with a decline (incline) in a specified index or have an interest rate that adjusts periodically based on changes in current interest rates and prepayments on the underlying pool of assets. The interest rate shown is the rate in effect as of August 31, 2022. The rate may be subject to a cap and floor. |
IO | Interest Only represents the right to receive the monthly interest payments on an underlying pool of mortgage loans. The principal amount shown represents the par value on the underlying pool. The yields on these securities are subject to accelerated principal paydowns as a result of prepayment or refinancing of the underlying pool of mortgage instruments. As a result, interest income may be reduced considerably. |
JSC | Joint Stock Company |
LIBOR | London Interbank Offered Rate |
MXN | Mexican Peso |
NZD | New Zealand Dollar |
OYJ | Public Limited Company |
PO | Principal Only represents the right to receive the principal portion only on an underlying pool of mortgage loans. The market value of these securities is extremely volatile in response to changes in market interest rates. As prepayments on the underlying mortgages of these securities increase, the yield on these securities increases. |
PT | Limited liability company |
REIT | Real Estate Investment Trust |
REMIC | Real Estate Mortgage Investment Conduit |
Re-REMIC | Combined Real Estate Mortgage Investment Conduit |
SOFR | Secured Overnight Financing Rate |
STRIPS | Separate Trading of Registered Interest and Principal of Securities. The STRIPS Program lets investors hold and trade individual interest and principal components of eligible notes and bonds as separate securities. |
USD | United States Dollar |
ZAR | South African Rand |
^ | Amount rounds to less than 0.1% of net assets. | |
‡ | Value determined using significant unobservable inputs. | |
* | Non-income producing security. | |
134 | J.P. Morgan Exchange-Traded Funds | August 31, 2022 |
(a) | Security exempt from registration pursuant to Regulation S under the Securities Act of 1933, as amended. Regulation S applies to securities offerings that are made outside of the United States and do not involve direct selling efforts in the United States and as such may have restrictions on resale. | |
(b) | Securities exempt from registration under Rule 144A or section 4(a)(2), of the Securities Act of 1933, as amended. | |
(c) | Variable or floating rate security, linked to the referenced benchmark. The interest rate shown is the current rate as of August 31, 2022. | |
(d) | Security is an interest bearing note with preferred security characteristics. | |
(e) | Security is perpetual and thus, does not have a predetermined maturity date. The coupon rate for this security is fixed for a period of time and may be structured to adjust thereafter. The date shown, if applicable, reflects the next call date. The coupon rate shown is the rate in effect as of August 31, 2022. |
(f) | Step bond. Interest rate is a fixed rate for an initial period that either resets at a specific date or may reset in the future contingent upon a predetermined trigger. The interest rate shown is the current rate as of August 31, 2022. | |
(g) | Security has the ability to pay in kind (“PIK”) or pay income in cash. When applicable, separate rates of such payments are disclosed. | |
(h) | Variable or floating rate security, the interest rate of which adjusts periodically based on changes in current interest rates and prepayments on the underlying pool of assets. The interest rate shown is the current rate as of August 31, 2022. | |
(i) | Defaulted security. | |
(j) | Investment in an affiliated fund, which is registered under the Investment Company Act of 1940, as amended, and is advised by J.P. Morgan Investment Management Inc. | |
(k) | The rate shown is the current yield as of August 31, 2022. |
DESCRIPTION | NUMBER OF CONTRACTS | EXPIRATION DATE | TRADING CURRENCY | NOTIONAL AMOUNT ($) | VALUE AND UNREALIZED APPRECIATION (DEPRECIATION) ($) |
Long Contracts | |||||
Australia 10 Year Bond | 28 | 09/15/2022 | AUD | 2,298,299 | 6,164 |
U.S. Treasury Ultra Bond | 22 | 12/20/2022 | USD | 3,275,250 | (5,779) |
385 | |||||
Short Contracts | |||||
Euro-Bobl | (84) | 09/08/2022 | EUR | (10,381,455) | 90,689 |
Euro-Bund | (29) | 09/08/2022 | EUR | (4,304,502) | 84,336 |
U.S. Treasury 10 Year Ultra Note | (25) | 12/20/2022 | USD | (3,121,485) | 26,791 |
U.S. Treasury Long Bond | (4) | 12/20/2022 | USD | (541,875) | 4,460 |
U.S. Treasury 2 Year Note | (205) | 12/30/2022 | USD | (42,691,250) | 18,374 |
U.S. Treasury 5 Year Note | (246) | 12/30/2022 | USD | (27,225,281) | 77,492 |
302,142 | |||||
302,527 |
Abbreviations | |
AUD | Australian Dollar |
EUR | Euro |
USD | United States Dollar |
August 31, 2022 | J.P. Morgan Exchange-Traded Funds | 135 |
AS OF August 31, 2022 (Unaudited) (continued)
CURRENCY PURCHASED | CURRENCY SOLD | COUNTERPARTY | SETTLEMENT DATE | UNREALIZED APPRECIATION (DEPRECIATION) ($) | ||
EUR | 466,750 | USD | 467,571 | BNP Paribas | 9/6/2022 | 1,612 |
EUR | 586,683 | USD | 582,617 | HSBC Bank, NA | 9/6/2022 | 7,124 |
EUR | 463,104 | USD | 463,627 | Royal Bank of Canada | 9/6/2022 | 1,890 |
USD | 98,336,070 | EUR | 95,943,353 | BNP Paribas | 9/6/2022 | 1,892,633 |
USD | 3,196,435 | EUR | 3,125,715 | HSBC Bank, NA | 9/6/2022 | 54,426 |
USD | 531,020 | EUR | 518,543 | Merrill Lynch International | 9/6/2022 | 9,774 |
USD | 9,120,535 | GBP | 7,548,129 | HSBC Bank, NA | 9/6/2022 | 351,235 |
CNY | 10,308,487 | USD | 1,489,429 | Goldman Sachs International** | 9/22/2022 | 6,707 |
CZK | 17,967,572 | EUR | 727,226 | BNP Paribas | 9/22/2022 | 3,059 |
EUR | 729,359 | CHF | 701,782 | Goldman Sachs International | 9/22/2022 | 14,859 |
EUR | 708,818 | HUF | 282,676,663 | Goldman Sachs International | 9/22/2022 | 7,561 |
EUR | 732,204 | ILS | 2,429,234 | Barclays Bank plc | 9/22/2022 | 6,800 |
EUR | 725,480 | ILS | 2,418,170 | BNP Paribas | 9/22/2022 | 3,358 |
EUR | 725,479 | PLN | 3,415,481 | Barclays Bank plc | 9/22/2022 | 5,743 |
EUR | 412,634 | USD | 415,040 | Royal Bank of Canada | 9/22/2022 | 196 |
INR | 117,721,885 | USD | 1,475,830 | BNP Paribas** | 9/22/2022 | 2,132 |
INR | 118,505,144 | USD | 1,485,864 | Citibank, NA** | 9/22/2022 | 1,931 |
MXN | 16,607,434 | USD | 816,642 | Goldman Sachs International | 9/22/2022 | 4,501 |
USD | 328,351 | AUD | 470,949 | Barclays Bank plc | 9/22/2022 | 6,000 |
USD | 1,798,274 | AUD | 2,589,975 | HSBC Bank, NA | 9/22/2022 | 25,508 |
USD | 1,465,314 | AUD | 2,134,654 | Royal Bank of Canada | 9/22/2022 | 4,203 |
USD | 26,485,193 | AUD | 37,224,477 | State Street Corp. | 9/22/2022 | 1,006,076 |
USD | 8,476,085 | BRL | 43,860,786 | Barclays Bank plc** | 9/22/2022 | 86,857 |
USD | 734,586 | BRL | 3,833,070 | BNP Paribas** | 9/22/2022 | 1,437 |
USD | 15,504,080 | CAD | 19,779,175 | BNP Paribas | 9/22/2022 | 446,228 |
USD | 1,462,367 | CAD | 1,902,295 | Royal Bank of Canada | 9/22/2022 | 14,153 |
USD | 1,889,455 | CAD | 2,446,686 | State Street Corp. | 9/22/2022 | 26,797 |
USD | 1,486,878 | CNY | 10,073,106 | BNP Paribas** | 9/22/2022 | 24,904 |
USD | 3,566,396 | CNY | 24,029,619 | HSBC Bank, NA** | 9/22/2022 | 78,825 |
USD | 2,256,755 | COP | 9,555,067,682 | Goldman Sachs International** | 9/22/2022 | 106,033 |
USD | 10,929,812 | EUR | 10,587,883 | BNP Paribas | 9/22/2022 | 275,167 |
USD | 1,439,799 | IDR | 21,129,772,745 | BNP Paribas** | 9/22/2022 | 18,484 |
USD | 748,152 | KRW | 1,000,346,526 | Citibank, NA** | 9/22/2022 | 2,735 |
USD | 3,335,723 | KRW | 4,369,849,791 | Goldman Sachs International** | 9/22/2022 | 79,490 |
USD | 740,736 | MXN | 14,839,174 | Citibank, NA | 9/22/2022 | 7,024 |
USD | 7,084,308 | MXN | 142,190,329 | Goldman Sachs International | 9/22/2022 | 53,807 |
USD | 2,373,481 | NZD | 3,688,875 | Citibank, NA | 9/22/2022 | 116,552 |
USD | 2,196,502 | PHP | 122,317,927 | BNP Paribas** | 9/22/2022 | 23,395 |
USD | 82,031 | PLN | 383,436 | HSBC Bank, NA | 9/22/2022 | 717 |
USD | 741,659 | SGD | 1,020,291 | BNP Paribas | 9/22/2022 | 11,491 |
USD | 191,858 | SGD | 265,141 | HSBC Bank, NA | 9/22/2022 | 2,111 |
USD | 733,545 | ZAR | 12,361,333 | Citibank, NA | 9/22/2022 | 13,205 |
USD | 3,636,992 | ZAR | 59,215,468 | HSBC Bank, NA | 9/22/2022 | 186,291 |
EUR | 506,729 | USD | 508,163 | Goldman Sachs International | 10/5/2022 | 2,217 |
USD | 7,677,632 | GBP | 6,600,820 | BNP Paribas | 10/5/2022 | 4,489 |
Total unrealized appreciation | 4,999,737 | |||||
EUR | 445,128 | USD | 453,388 | BNP Paribas | 9/6/2022 | (5,940) |
EUR | 519,587 | USD | 531,104 | Merrill Lynch International | 9/6/2022 | (8,809) |
EUR | 674,500 | USD | 687,886 | Royal Bank of Canada | 9/6/2022 | (9,870) |
GBP | 209,116 | USD | 253,427 | Barclays Bank plc | 9/6/2022 | (10,479) |
GBP | 738,192 | USD | 894,512 | Royal Bank of Canada | 9/6/2022 | (36,891) |
136 | J.P. Morgan Exchange-Traded Funds | August 31, 2022 |
CURRENCY PURCHASED | CURRENCY SOLD | COUNTERPARTY | SETTLEMENT DATE | UNREALIZED APPRECIATION (DEPRECIATION) ($) | ||
AUD | 537,620 | USD | 369,766 | Citibank, NA | 9/22/2022 | (1,780) |
AUD | 537,620 | USD | 370,976 | Goldman Sachs International | 9/22/2022 | (2,990) |
AUD | 625,151 | USD | 430,799 | HSBC Bank, NA | 9/22/2022 | (2,900) |
AUD | 515,574 | USD | 362,918 | Merrill Lynch International | 9/22/2022 | (10,022) |
BRL | 3,750,194 | USD | 722,134 | Citibank, NA** | 9/22/2022 | (4,837) |
CHF | 698,333 | EUR | 719,188 | Barclays Bank plc | 9/22/2022 | (8,158) |
CHF | 722,840 | EUR | 738,107 | BNP Paribas | 9/22/2022 | (2,086) |
CHF | 3,449 | USD | 3,624 | Goldman Sachs International | 9/22/2022 | (90) |
COP | 3,196,263,686 | USD | 719,717 | BNP Paribas** | 9/22/2022 | (280) |
COP | 6,448,829,041 | USD | 1,456,543 | Goldman Sachs International** | 9/22/2022 | (4,995) |
EUR | 743,118 | CZK | 18,288,996 | BNP Paribas | 9/22/2022 | (213) |
EUR | 752,160 | HUF | 305,452,031 | BNP Paribas | 9/22/2022 | (5,685) |
HUF | 285,893,012 | EUR | 709,641 | Goldman Sachs International | 9/22/2022 | (359) |
IDR | 11,075,694,026 | USD | 748,813 | Barclays Bank plc** | 9/22/2022 | (3,795) |
IDR | 11,119,195,070 | USD | 749,171 | BNP Paribas** | 9/22/2022 | (1,227) |
IDR | 11,058,789,412 | USD | 746,459 | Goldman Sachs International** | 9/22/2022 | (2,578) |
ILS | 2,431,610 | EUR | 745,984 | BNP Paribas | 9/22/2022 | (19,953) |
ILS | 2,476,953 | EUR | 739,722 | Goldman Sachs International | 9/22/2022 | (25) |
KRW | 971,647,298 | USD | 750,214 | Citibank, NA** | 9/22/2022 | (26,182) |
MXN | 14,967,972 | USD | 747,222 | Citibank, NA | 9/22/2022 | (7,141) |
MXN | 31,549,684 | USD | 1,565,164 | Goldman Sachs International | 9/22/2022 | (5,212) |
MXN | 29,808,251 | USD | 1,479,367 | HSBC Bank, NA | 9/22/2022 | (5,519) |
PLN | 3,798,917 | USD | 829,980 | HSBC Bank, NA | 9/22/2022 | (24,355) |
SGD | 1,285,431 | USD | 937,455 | HSBC Bank, NA | 9/22/2022 | (17,540) |
USD | 734,063 | CLP | 701,047,977 | Goldman Sachs International** | 9/22/2022 | (48,139) |
USD | 8,013 | HUF | 3,216,349 | Merrill Lynch International | 9/22/2022 | (16) |
USD | 747,547 | INR | 59,564,513 | BNP Paribas** | 9/22/2022 | (267) |
USD | 1,545,462 | INR | 123,531,757 | Citibank, NA** | 9/22/2022 | (5,441) |
USD | 745,722 | INR | 59,564,510 | Goldman Sachs International** | 9/22/2022 | (2,092) |
USD | 705,082 | TRY | 13,085,349 | Goldman Sachs International | 9/22/2022 | (3,500) |
USD | 96,515,899 | EUR | 96,431,859 | HSBC Bank, NA | 10/5/2022 | (610,732) |
USD | 2,223,576 | EUR | 2,233,689 | State Street Corp. | 10/5/2022 | (26,207) |
Total unrealized depreciation | (926,305) | |||||
Net unrealized appreciation | 4,073,432 | |||||
Abbreviations | |
AUD | Australian Dollar |
BRL | Brazilian Real |
CAD | Canadian Dollar |
CHF | Swiss Franc |
CLP | Chile Peso |
CNY | China Yuan |
COP | Columbian Peso |
CZK | Czech Republic Koruna |
EUR | Euro |
GBP | British Pound |
HUF | Hungarian Forint |
IDR | Indonesian Rupiah |
ILS | Israeli Shekel |
INR | Indian Rupee |
KRW | Korean Republic Won |
MXN | Mexican Peso |
NZD | New Zealand Dollar |
August 31, 2022 | J.P. Morgan Exchange-Traded Funds | 137 |
AS OF August 31, 2022 (Unaudited) (continued)
PHP | Philippines Peso |
PLN | Polish Zloty |
SGD | Singapore Dollar |
TRY | Turkish Lira |
USD | United States Dollar |
ZAR | South African Rand |
** | Non-deliverable forward. |
REFERENCE OBLIGATION/INDEX | FINANCING RATE PAID BY THE FUND (%) | PAYMENT FREQUENCY | MATURITY DATE | IMPLIED CREDIT SPREAD (%)(a) | NOTIONAL AMOUNT(b) | UPFRONT PAYMENTS (RECEIPTS) ($)(c) | UNREALIZED APPRECIATION (DEPRECIATION) ($) | VALUE ($) |
iTraxx.Europe.Crossover.37-V1 | 5.00 | Quarterly | 6/20/2027 | 5.58 | EUR 870,000 | (2,548) | 23,216 | 20,668 |
(*) | The Fund, as a buyer of credit protection, is generally obligated to make periodic payments and may also pay or receive an upfront premium to or from the protection seller, in exchange for the right to receive a contingent payment, upon occurrence of a credit event with respect to an underlying reference obligation, as defined under the terms of individual swap contracts. | ||||||||
(a) | Implied credit spreads are an indication of the seller's performance risk, related to the likelihood of a credit event occurring that would require a seller to make payment to a buyer. Implied credit spreads are used to determine the value of swap contracts and reflect the cost of buying/selling protection, which may include upfront payments made to enter into the contract. Therefore, higher spreads would indicate a greater likelihood that a seller will be obligated to perform (i.e. make payment) under the swap contract.Increasing values, in absolute terms and relative to notional amounts, are also indicative of greater performance risk. Implied credit spreads for credit default swaps on credit indices are linked to the weighted average spread across the underlying reference obligations included in a particular index. | ||||||||
(b) | The notional amount is the maximum amount that a seller of credit protection would be obligated to pay and a buyer of credit protection would receive, upon occurrence of a credit event. | ||||||||
(c) | Upfront payments and receipts generally represent premiums paid or received at the initiation of the agreement to compensate the differences between the stated terms of the swap agreement and current market conditions (credit spreads, interest rates and other relevant factors). | ||||||||
FLOATING RATE INDEX (a) | FIXED RATE | PAY/RECIEVE FLOATING RATE | MATURITY DATE | NOTIONAL AMOUNT | UPFRONT PAYMENTS (RECEIPTS)($) | VALUE AND UNREALIZED APPRECIATION (DEPRECIATION)($) |
6 month EURIBOR semi-annually | (0.08) annually | Pay | 12/21/2024 | EUR 7,000,000 | — | 329,588 |
6 month EURIBOR semi-annually | 1.83 annually | Pay | 9/21/2027 | EUR 20,000,000 | — | 422,710 |
— | 752,298 | |||||
1 day TONAR annually | 0.41 annually | Pay | 3/31/2032 | JPY 1,050,000,000 | — | (26,107) |
6 month EURIBOR semi-annually | (0.33) annually | Pay | 4/13/2052 | EUR 1,900,000 | — | (332,915) |
6 month EURIBOR semi-annually | 1.90 annually | Pay | 9/21/2052 | EUR 4,250,000 | — | (146,844) |
— | (505,866) | |||||
246,432 |
(a) | Value of floating rate index at August 31, 2022 was as follows: |
FLOATING RATE INDEX | VALUE |
1 day TONAR | (0.03)% |
6 Month EURIBOR | 1.20 |
138 | J.P. Morgan Exchange-Traded Funds | August 31, 2022 |
Abbreviations | |
EUR | Euro |
EURIBOR | Euro Interbank Offered Rate |
JPY | Japanese Yen |
TONAR | Tokyo Overnight Average Rate |
August 31, 2022 | J.P. Morgan Exchange-Traded Funds | 139 |
AS OF August 31, 2022 (Unaudited)
INVESTMENTS | PRINCIPAL AMOUNT($) | VALUE($) |
Municipal Bonds — 86.0% (a) | ||
Alabama — 2.2% | ||
Black Belt Energy Gas District, Gas Project Series E, 5.00%, 5/1/2053 (b) | 1,750,000 | 1,858,967 |
Black Belt Energy Gas District, Gas Project No. 7 Series 2021C-1, Rev., 4.00%, 10/1/2052 (b) | 100,000 | 100,177 |
Black Belt Energy Gas District, Gas Project No. 8 Series 2022A, Rev., 4.00%, 12/1/2052 (b) | 150,000 | 149,123 |
Black Belt Energy Gas District, Gas Supply Series 2022, Subseries 2022D-1, LIQ : Royal Bank of Canada, 4.00%, 7/1/2052 (b) | 1,250,000 | 1,268,680 |
City of Pell City, Warrants Series 2015A, GO, 5.00%, 2/1/2025 | 100,000 | 105,720 |
Selma Industrial Development Board, International Paper Co. Project Series 2020A, Rev., 1.38%, 6/16/2025 (b) | 100,000 | 94,577 |
Southeast Alabama Gas Supply District (The), Project No. 1 Series 2018A, Rev., 4.00%, 4/1/2024 (b) | 25,000 | 25,293 |
Southeast Energy Authority A Cooperative District Series 2022B-1, Rev., 5.00%, 8/1/2028 (b) | 1,250,000 | 1,308,647 |
Southeast Energy Authority A Cooperative District, Project No. 2 Series 2021B, Rev., 4.00%, 12/1/2031 (b) | 300,000 | 295,134 |
University of Alabama (The), Huntsville General Fee Series B-2, Rev., 5.00%, 9/1/2031 | 95,000 | 106,420 |
Total Alabama | 5,312,738 | |
Alaska — 0.2% | ||
Alaska Industrial Development and Export Authority, Tanana Chiefs Conference Project Series 2019A, 5.00%, 10/1/2024 | 200,000 | 207,769 |
Alaska Municipal Bond Bank Authority | ||
Series 3, 5.00%, 10/1/2025 | 20,000 | 20,925 |
Series 3, 5.00%, 12/1/2028 | 225,000 | 243,667 |
Total Alaska | 472,361 | |
Arizona — 1.5% | ||
Arizona Board of Regents | ||
Series 2020A, 5.00%, 7/1/2030 | 105,000 | 121,804 |
Series A, 5.00%, 7/1/2033 | 430,000 | 488,321 |
Arizona Industrial Development Authority, Academies of Math & Science Projects 5.00%, 7/1/2032 (c) | 120,000 | 123,403 |
Arizona Industrial Development Authority, Cadence Campus Project | ||
Series 2020A, 4.00%, 7/15/2030 (c) | 120,000 | 115,570 |
Series 2020A, 4.00%, 7/15/2040 (c) | 125,000 | 109,772 |
INVESTMENTS | PRINCIPAL AMOUNT($) | VALUE($) |
Arizona — continued | ||
Arizona Industrial Development Authority, Equitable School Revolving Fund LLC | ||
Series A, 5.00%, 11/1/2033 | 440,000 | 492,496 |
Series A, 5.00%, 11/1/2044 | 250,000 | 261,168 |
Arizona Industrial Development Authority, Great Lakes Senior Living Communities LLC Project Series 2019A, 5.00%, 1/1/2036 | 250,000 | 192,933 |
Arizona Industrial Development Authority, KIPP Nashville Project | ||
Series A, 5.00%, 7/1/2028 | 225,000 | 238,556 |
Series A, 5.00%, 7/1/2029 | 235,000 | 249,855 |
Arizona Industrial Development Authority, Macombs Facility Project Series 2021A, 4.00%, 7/1/2051 | 125,000 | 104,626 |
Arizona Industrial Development Authority, National Charter School Revolving Loan Fund Series 2020A, 4.00%, 11/1/2038 | 200,000 | 192,711 |
Arizona Industrial Development Authority, Phoenix Children's Hospital Series 2020A, 5.00%, 2/1/2031 | 150,000 | 168,677 |
Arizona Industrial Development Authority, Pinecrest Academy of Northern Nevada Project Series 2022A, Rev., 4.50%, 7/15/2029 (c) | 250,000 | 246,648 |
City of Glendora, Waterworks Series 2022A, Rev., 5.00%, 7/1/2033 | 120,000 | 140,075 |
City of Mesa, Excise Tax Rev., 5.00%, 7/1/2031 | 75,000 | 86,394 |
City of Phoenix Civic Improvement Corp., Junior Lien, Airport System Series 2017D, Rev., 5.00%, 7/1/2026 | 160,000 | 173,579 |
Maricopa County School District No. 3, Tempe Elementary, School Improvement, Project of 2016 Series 2017A, GO, 5.00%, 7/1/2027 | 30,000 | 33,256 |
Salt Verde Financial Corp. Rev., 5.25%, 12/1/2026 | 100,000 | 106,568 |
Total Arizona | 3,646,412 | |
Arkansas — 0.0% ^ | ||
City of Fort Smith, Water and Sewer Construction Rev., 5.00%, 10/1/2024 | 75,000 | 78,175 |
California — 9.8% | ||
Azusa Unified School District, Election of 2014 | ||
Series 2022D, 5.00%, 8/1/2029 | 125,000 | 143,957 |
Series 2022D, 5.00%, 8/1/2032 | 175,000 | 203,673 |
Brentwood Infrastructure Financing Authority, Civic Center Project 5.00%, 10/1/2025 | 45,000 | 48,166 |
140 | J.P. Morgan Exchange-Traded Funds | August 31, 2022 |
INVESTMENTS | PRINCIPAL AMOUNT($) | VALUE($) |
Municipal Bonds — continued | ||
California — continued | ||
California Community Choice Financing Authority, Green Bond Series 2022-A-1, 4.00%, 5/1/2053 (b) | 1,780,000 | 1,810,806 |
California Enterprise Development Authority, Riverside County, Rocketship Public Schools-Obligated Group No. 2 4.00%, 6/1/2027 (c) | 260,000 | 256,779 |
California Health Facilities Financing Authority, Kaiser Permanente Series 2006C, 5.00%, 6/1/2041 (b) | 300,000 | 347,044 |
California Health Facilities Financing Authority, On Lok Senior Health Service | ||
3.00%, 8/1/2023 | 100,000 | 99,757 |
5.00%, 8/1/2040 | 100,000 | 105,124 |
California Municipal Finance Authority, Community Health System Series 2021A, 5.00%, 2/1/2033 | 800,000 | 882,812 |
California Municipal Finance Authority, San Antonio Gardens Project 5.00%, 11/15/2039 | 150,000 | 154,840 |
California Public Finance Authority, Enso Village Project Series 2021B-1, Rev., 3.13%, 5/15/2029 (c) | 200,000 | 181,843 |
California School Finance Authority, Kipp SoCal Public Schools Series A, 5.00%, 7/1/2039 (c) | 500,000 | 514,951 |
California Statewide Communities Development Authority, Emanate Health, Tax-Exempt Series 2020A, 5.00%, 4/1/2030 | 150,000 | 168,169 |
California Statewide Communities Development Authority, San Francisco Campus for Jewish Living Project | ||
4.00%, 11/1/2027 | 60,000 | 63,556 |
4.00%, 11/1/2029 | 145,000 | 155,749 |
Chula Vista Municipal Financing Authority 4.00%, 5/1/2026 | 180,000 | 189,135 |
City of Aliso Viejo 4.00%, 11/1/2028 | 175,000 | 187,791 |
City of Los Angeles Department of Airports, International Airport Senior Series A, Rev., AMT, 5.00%, 5/15/2033 | 100,000 | 104,066 |
City of Los Angeles Department of Airports, International Airport Subordinate Series 2019E, Rev., AMT, 5.00%, 5/15/2026 | 10,000 | 10,922 |
City of Roseville, 316 Vernon Street Project COP, 5.00%, 8/1/2025 | 70,000 | 74,895 |
City of Santa Rosa, Courthouse Square Project and Lease COP, 4.00%, 10/1/2024 | 90,000 | 92,643 |
INVESTMENTS | PRINCIPAL AMOUNT($) | VALUE($) |
California — continued | ||
County of San Joaquin, County Administration Building Project COP, AGM, 5.00%, 11/15/2027 | 150,000 | 168,525 |
CSCDA Community Improvement Authority, Essential Housing, Pasadena Portfolio Series 2021A-1, Rev., 2.65%, 12/1/2046 (c) | 255,000 | 197,855 |
CSCDA Community Improvement Authority, Essential Housing, Towne at Glendale Apartments 5.00%, 9/1/2037 (c) | 100,000 | 95,036 |
El Monte City School District, Election of 2014 Series A, GO, 5.00%, 8/1/2025 | 55,000 | 58,766 |
Golden State Tobacco Securitization Corp., Enhanced Tobacco Settlement Series 2018A-1, Rev., 5.00%, 6/1/2028 (d) | 250,000 | 283,658 |
Hermosa Beach City School District, Election of 2016 Series 2016A, GO, 4.00%, 8/1/2023 | 15,000 | 15,228 |
Indian Wells Financing Authority, Solar and Infrastructure Project | ||
Rev., 5.00%, 4/1/2029 | 150,000 | 170,384 |
Rev., 5.00%, 4/1/2031 | 160,000 | 186,003 |
Indio Finance Authority | ||
Series A, Rev., 5.00%, 11/1/2027 | 275,000 | 303,694 |
Series A, Rev., 5.00%, 11/1/2028 | 275,000 | 307,140 |
Series A, Rev., 5.00%, 11/1/2029 | 325,000 | 367,117 |
Series A, Rev., 5.00%, 11/1/2030 | 400,000 | 455,231 |
Series A, Rev., 5.00%, 11/1/2034 | 200,000 | 225,004 |
Los Angeles Department of Water and Power, Power System Series 2022A, Rev., 5.00%, 7/1/2030 | 235,000 | 275,138 |
Los Angeles Department of Water and Power, Water System Series A, Subseries A-2, Rev., VRDO, LIQ : Barclays Bank plc, 0.85%, 9/1/2022 (b) | 3,000,000 | 3,000,000 |
Los Angeles Unified School District Series 2021A, GO, 5.00%, 7/1/2030 | 350,000 | 410,322 |
Ontario Public Financing Authority, Civic Center Improvements Series 2022A, Rev., AGM, 5.00%, 11/1/2033 | 140,000 | 159,965 |
Orange County Community Facilities District No. 2021-1, Rienda Series A, Rev., 5.00%, 8/15/2037 (e) | 500,000 | 531,847 |
Petaluma Public Financing Authority, Road Improvement Projects Rev., 5.00%, 5/1/2026 | 150,000 | 163,031 |
Redding Joint Powers Financing Authority Series 2019A, Rev., 5.00%, 4/1/2026 | 150,000 | 162,807 |
August 31, 2022 | J.P. Morgan Exchange-Traded Funds | 141 |
AS OF August 31, 2022 (Unaudited) (continued)
INVESTMENTS | PRINCIPAL AMOUNT($) | VALUE($) |
Municipal Bonds — continued | ||
California — continued | ||
River Islands Public Financing Authority, Facilities District No. 2003 | ||
Series 2022A-1, Rev., AGM, 5.00%, 9/1/2029 | 210,000 | 235,559 |
Series 2022A-1, Rev., AGM, 5.00%, 9/1/2030 | 330,000 | 373,129 |
Salinas Union High School District Series A, GO, 4.00%, 8/1/2047 | 1,000,000 | 947,888 |
San Diego Redevelopment Agency Successor Agency Series A, Rev., 5.00%, 9/1/2023 | 130,000 | 133,363 |
San Dieguito Union High School District, Election of 2012 Series A-2, GO, 5.00%, 8/1/2024 | 150,000 | 153,800 |
San Francisco Bay Area Rapid Transit District Series C-1, GO, 4.00%, 8/1/2035 | 135,000 | 141,619 |
San Francisco City and County Airport Commission, San Francisco International Airport Series 2016A, Rev., 5.00%, 5/1/2026 | 95,000 | 103,671 |
San Francisco City and County Public Utilities Commission Wastewater System Series B, Rev., 5.00%, 10/1/2034 | 2,000,000 | 2,362,473 |
San Jose Evergreen Community College District Series A, GO, 5.00%, 9/1/2022 | 100,000 | 100,000 |
San Ramon Valley Fire Protection District, Public Safety Complex and Fire Training Facility Projects COP, 4.00%, 8/1/2032 | 125,000 | 134,222 |
Sanger Unified School District | ||
COP, AGM, 5.00%, 6/1/2034 | 400,000 | 451,551 |
COP, AGM, 5.00%, 6/1/2035 | 425,000 | 477,349 |
Santa Cruz County Capital Financing Authority Series 2020A, Rev., 4.00%, 6/1/2025 | 100,000 | 104,106 |
Sierra View Local Health Care District Rev., 4.00%, 7/1/2023 | 165,000 | 166,487 |
Solano Irrigation District, Water COP, 4.00%, 8/1/2031 | 285,000 | 298,791 |
South San Francisco Public Facilities Financing Authority, Community Civic Campus and Multiple Series 2021A, Rev., 4.00%, 6/1/2029 | 220,000 | 236,968 |
South San Francisco Public Facilities Financing Authority, Multiple Capital Project Series 2022A, Rev., 5.00%, 6/1/2029 | 270,000 | 310,582 |
State of California, Various Purpose 5.00%, 11/1/2032 | 335,000 | 388,734 |
Tobacco Securitization Authority of Northern California Series 2021A, Class 1, Rev., 5.00%, 6/1/2032 | 110,000 | 120,975 |
INVESTMENTS | PRINCIPAL AMOUNT($) | VALUE($) |
California — continued | ||
Tracy Public Financing Authority, Legacy Fields Series 2022A, Rev., 5.00%, 11/1/2036 | 1,035,000 | 1,161,595 |
University of California Series 2018AZ, Rev., 4.00%, 5/15/2029 | 130,000 | 140,501 |
Vallecito Union School District Series A, GO, 5.00%, 8/1/2031 | 595,000 | 685,924 |
West Hills Community College District GO, AGM, 5.00%, 8/1/2026 | 120,000 | 130,067 |
Yucaipa Valley Water District Financing Authority, Water & Sewer Revenue Series A, Rev., 5.00%, 9/1/2034 | 500,000 | 574,225 |
Total California | 23,267,008 | |
Colorado — 3.6% | ||
Board of Water Commissioners City & County of Denver (The) Series B, Rev., 4.00%, 9/15/2034 | 2,015,000 | 2,121,031 |
City and County of Denver Series 2020B, GO, 5.00%, 8/1/2029 | 220,000 | 254,721 |
City and County of Denver, Airport System | ||
Series A, Rev., AMT, 5.00%, 12/1/2035 | 505,000 | 531,659 |
Series A, Rev., AMT, 5.50%, 11/15/2042 | 1,500,000 | 1,644,401 |
Colorado Educational and Cultural Facilities Authority, Aspen View Academy Project Rev., 4.00%, 5/1/2036 | 85,000 | 77,143 |
Colorado Educational and Cultural Facilities Authority, Vega Collegiate Academy Project 5.00%, 2/1/2051 (c) | 150,000 | 133,760 |
Colorado Health Facilities Authority, Tax Exempt, Aberdeen Ridge Series 2021B-3, 2.13%, 5/15/2028 | 295,000 | 277,109 |
Colorado Higher Education, Capital Construction, Lease Purchase Financing Program | ||
Series 2014A, 5.00%, 11/1/2025 | 10,000 | 10,788 |
4.00%, 9/1/2034 | 335,000 | 349,883 |
County of Adams | ||
5.00%, 12/1/2023 | 60,000 | 61,902 |
5.00%, 12/1/2024 | 150,000 | 158,176 |
Dominion Water and Sanitation District Rev., 5.00%, 12/1/2027 (e) | 500,000 | 499,960 |
Regional Transportation District, Denver Transit Partners | ||
Rev., 5.00%, 7/15/2029 | 130,000 | 140,187 |
Rev., 5.00%, 1/15/2030 | 170,000 | 183,534 |
Rev., 5.00%, 7/15/2030 | 115,000 | 124,388 |
Rev., 5.00%, 1/15/2031 | 250,000 | 270,719 |
Rev., 4.00%, 7/15/2036 | 185,000 | 179,915 |
142 | J.P. Morgan Exchange-Traded Funds | August 31, 2022 |
INVESTMENTS | PRINCIPAL AMOUNT($) | VALUE($) |
Municipal Bonds — continued | ||
Colorado — continued | ||
Southlands Metropolitan District No. 1 Series A-1, GO, 5.00%, 12/1/2037 | 250,000 | 250,682 |
State of Colorado Series S, 4.00%, 3/15/2037 | 1,000,000 | 1,011,304 |
STC Metropolitan District No. 2, Limited Tax Improvement Series 2019A, GO, 5.00%, 12/1/2038 | 300,000 | 293,477 |
University of Colorado, Enterprise System Series A-2, Rev., 5.00%, 6/1/2026 | 40,000 | 43,654 |
Total Colorado | 8,618,393 | |
Connecticut — 0.2% | ||
Metropolitan District (The) Series 2021A, GO, 5.00%, 9/1/2030 | 200,000 | 233,683 |
State of Connecticut Series A, 5.00%, 4/15/2033 | 135,000 | 146,780 |
State of Connecticut, Special Tax Transportation Infrastructure Purposes Series B, 5.00%, 8/1/2023 | 75,000 | 76,771 |
Total Connecticut | 457,234 | |
Delaware — 0.5% | ||
Delaware State Economic Development Authority, Newark Charter School, Inc., Project | ||
Rev., 4.00%, 9/1/2025 | 100,000 | 101,107 |
Rev., 4.00%, 9/1/2026 | 140,000 | 141,622 |
Delaware State Economic Development Authority, St. Andrews School Project Rev., 4.00%, 7/1/2041 | 1,000,000 | 979,910 |
Total Delaware | 1,222,639 | |
District of Columbia — 2.7% | ||
District of Columbia Series D, GO, 5.00%, 2/1/2033 | 2,300,000 | 2,649,346 |
District of Columbia, Income Tax Series 2019A, Rev., 5.00%, 3/1/2029 | 100,000 | 114,660 |
District of Columbia, International School | ||
Rev., 5.00%, 7/1/2028 | 115,000 | 119,913 |
Rev., 5.00%, 7/1/2039 | 125,000 | 126,101 |
District of Columbia, Kipp DC Project Rev., 4.00%, 7/1/2039 | 100,000 | 93,960 |
District of Columbia, Water and Sewer Authority, Public Utility, Senior Lien Series B, Rev., 5.00%, 10/1/2025 | 65,000 | 70,033 |
Metropolitan Washington Airports Authority Aviation | ||
Series A, Rev., AMT, 5.00%, 10/1/2028 | 2,000,000 | 2,189,454 |
Series A, Rev., AMT, 5.00%, 10/1/2031 | 1,000,000 | 1,108,101 |
Total District of Columbia | 6,471,568 | |
INVESTMENTS | PRINCIPAL AMOUNT($) | VALUE($) |
Florida — 3.3% | ||
Charlotte County Industrial Development Authority, Town and Country Utilities Project Series 2021A, 4.00%, 10/1/2041 (c) | 100,000 | 80,935 |
City of Cape Coral, Florida Special Obligation 5.00%, 10/1/2024 | 110,000 | 115,408 |
City of Cape Coral, Water & Sewer 5.00%, 10/1/2022 | 25,000 | 25,053 |
City of Jacksonville | ||
Series 2022A, Rev., 5.00%, 10/1/2031 | 250,000 | 290,910 |
Series 2022A, Rev., 5.00%, 10/1/2032 | 200,000 | 233,951 |
City of Kissimmee Rev., 4.00%, 10/1/2025 | 170,000 | 177,147 |
City of Lakeland, Lakeland Regional Health Systems Rev., 5.00%, 11/15/2023 | 40,000 | 41,056 |
City of Miami Beach, Water & Sewer Rev., 5.00%, 9/1/2033 | 25,000 | 27,508 |
City of Orlando, Capital Improvement | ||
Series D, Rev., 5.00%, 10/1/2022 | 75,000 | 75,168 |
Series B, Rev., 5.00%, 10/1/2024 | 60,000 | 63,162 |
City of Pompano Beach, John Knox Village Project Rev., 3.50%, 9/1/2030 | 200,000 | 187,460 |
City of Tampa, H. Lee Moffitt Cancer Center Project Series 2016B, Rev., 5.00%, 7/1/2024 | 35,000 | 36,269 |
County of Broward, Port Facilities Series 2019A, 5.00%, 9/1/2030 | 50,000 | 56,104 |
County of Hillsborough, Communications Services Tax Rev., 5.00%, 10/1/2024 | 40,000 | 42,125 |
County of Lee, Airport Series 2021A, Rev., AMT, 5.00%, 10/1/2031 | 400,000 | 441,609 |
County of Miami-Dade, Jackson Health System Series 2015A, Rev., 5.00%, 6/1/2025 | 140,000 | 149,253 |
County of Okaloosa, Sales Tax Rev., 5.00%, 10/1/2024 | 30,000 | 31,562 |
County of Osceola, Sales Tax Series 2016A, Rev., 4.00%, 10/1/2023 | 10,000 | 10,156 |
County of Palm Beach, Palm Beach Atlantic University | ||
Rev., 5.00%, 4/1/2029 (c) | 100,000 | 100,218 |
Rev., 5.00%, 4/1/2039 (c) | 100,000 | 96,286 |
County of Seminole, Special Obligation Rev., 4.00%, 10/1/2024 | 90,000 | 92,921 |
East Central Regional Wastewater Treatment Facilities Operation Board, Biosolids Project Rev., 5.00%, 10/1/2024 | 30,000 | 31,562 |
Florida Atlantic University Finance Corp., Student Housing Project Series 2019B, Rev., 5.00%, 7/1/2032 | 250,000 | 277,811 |
August 31, 2022 | J.P. Morgan Exchange-Traded Funds | 143 |
AS OF August 31, 2022 (Unaudited) (continued)
INVESTMENTS | PRINCIPAL AMOUNT($) | VALUE($) |
Municipal Bonds — continued | ||
Florida — continued | ||
Florida Department of Children and Families, Evaluation Treatment Center Financing Corp. Project Series 2021B, COP, 5.00%, 10/1/2028 | 210,000 | 238,059 |
Florida Development Finance Corp., Educational Facilities, River City Science Academy Projects | ||
Series 2022A-1, Rev., 4.00%, 7/1/2031 | 175,000 | 170,123 |
Rev., 4.00%, 7/1/2035 | 325,000 | 298,230 |
Series 2022A-1, Rev., 5.00%, 7/1/2042 | 215,000 | 215,444 |
Florida Development Finance Corp., IDEA Florida, Inc. Series 2022, Rev., 5.25%, 6/15/2029 (c) | 150,000 | 149,227 |
Florida Development Finance Corp., The Glenridge on Palmer Ranch Project Rev., 3.00%, 6/1/2023 | 115,000 | 113,584 |
Florida Municipal Loan Council, Village of Palmetto Bay Series 2021A, Rev., 4.00%, 10/1/2028 | 75,000 | 79,744 |
Florida Municipal Power Agency, All-Requirements Power Supply Project Series 2016A, Rev., 5.00%, 10/1/2024 | 130,000 | 136,499 |
Florida State Board of Governors, University of Florida Mandatory Student Fee Series 2021A, Rev., AGM, 5.00%, 11/1/2028 | 100,000 | 112,167 |
Monroe County School District Series 2018A, COP, 4.00%, 6/1/2025 | 45,000 | 46,852 |
Orange County School Board Series 2015D, COP, 5.00%, 8/1/2025 | 25,000 | 26,726 |
Palm Beach County Health Facilities Authority, Acts Retirement Life Communities, Inc., Obligated Group Rev., 5.00%, 11/15/2032 | 240,000 | 250,887 |
Palm Beach County Health Facilities Authority, Jupiter Medical Center Series A, Rev., 5.00%, 11/1/2030 | 100,000 | 107,883 |
Pinellas County Industrial Development Authority, Drs. Kiran & Pallavi Patel 2017 Foundation for Global Understanding, Inc., Project Rev., 5.00%, 7/1/2029 | 125,000 | 129,228 |
Reedy Creek Improvement District, Ad Valorem Tax Series 2016-A, GO, 5.00%, 6/1/2026 | 50,000 | 54,362 |
School District of Broward County Series A, 5.00%, 7/1/2028 | 2,000,000 | 2,250,464 |
Seminole County Industrial Development Authority, Galileo Schools for Gifted Learning Series 2021A, Rev., 4.00%, 6/15/2036 (c) | 155,000 | 139,110 |
State of Florida Board of Education, Public Education Capital Outlay | ||
Series B, GO, 5.00%, 6/1/2024 | 30,000 | 31,370 |
INVESTMENTS | PRINCIPAL AMOUNT($) | VALUE($) |
Florida — continued | ||
Series B, GO, 5.00%, 6/1/2026 | 20,000 | 21,857 |
Series B, GO, 5.00%, 6/1/2031 | 75,000 | 82,579 |
State of Florida Department of Transportation, Indirect Garvee Series 2021A, Rev., 5.00%, 7/1/2023 | 155,000 | 158,225 |
State of Florida, State Board of Education, Lottery Series 2016A, Rev., 5.00%, 7/1/2026 | 75,000 | 81,909 |
Tampa Bay Water, Regional Water Supply Authority, Utility System Series C, Rev., 5.00%, 10/1/2025 | 55,000 | 58,903 |
Tampa-Hillsborough County Expressway Authority Series B, Rev., 5.00%, 7/1/2031 | 40,000 | 44,877 |
Tohopekaliga Water Authority, Utility System Rev., 5.00%, 10/1/2025 | 10,000 | 10,777 |
University of Florida Department of Housing & Residence Education Hsg Sys Rev Series 2021A, Rev., 5.00%, 7/1/2026 | 125,000 | 135,989 |
Total Florida | 7,828,709 | |
Georgia — 2.4% | ||
City of Atlanta Airport Passenger Facility Charge, Sub Lien Series 2019D, 4.00%, 7/1/2037 | 2,350,000 | 2,271,008 |
Clayton County Development Authority, Clayton State University 5.00%, 7/1/2034 | 225,000 | 253,754 |
County of DeKalb, Water and Sewerage Series 2006B, Rev., 5.25%, 10/1/2026 | 25,000 | 27,736 |
Georgia Ports Authority Series 2022, Rev., 4.00%, 7/1/2052 | 300,000 | 284,783 |
Glynn-Brunswick Memorial Hospital Authority, Southeast Georgia Health System Project Rev., 4.00%, 8/1/2037 | 255,000 | 238,123 |
Lee County School District Series 2022, GO, 5.00%, 2/1/2028 | 315,000 | 354,875 |
Main Street Natural Gas, Inc., Gas Supply | ||
Series 2021A, Rev., 4.00%, 9/1/2027 (b) | 580,000 | 589,111 |
Series B, Rev., 5.00%, 6/1/2029 (b) | 1,500,000 | 1,574,882 |
Metropolitan Atlanta Rapid Transit Authority, Sales Tax Series 2017D, Rev., 4.00%, 7/1/2028 | 35,000 | 37,282 |
Total Georgia | 5,631,554 | |
Hawaii — 0.1% | ||
City and County of Honolulu Series D, GO, 5.00%, 9/1/2032 | 45,000 | 49,595 |
State of Hawaii | ||
Series EE, GO, 5.00%, 11/1/2022 (d) | 15,000 | 15,068 |
Series EP, GO, 5.00%, 8/1/2023 | 40,000 | 40,948 |
144 | J.P. Morgan Exchange-Traded Funds | August 31, 2022 |
INVESTMENTS | PRINCIPAL AMOUNT($) | VALUE($) |
Municipal Bonds — continued | ||
Hawaii — continued | ||
Series FK, GO, 5.00%, 5/1/2033 | 30,000 | 32,657 |
State of Hawaii, Highway Fund Series B, Rev., 5.00%, 1/1/2027 | 25,000 | 27,284 |
Total Hawaii | 165,552 | |
Idaho — 0.3% | ||
Idaho Health Facilities Authority, St. Luke's Health System Series 2021A, Rev., 5.00%, 3/1/2029 | 35,000 | 39,051 |
Idaho Housing and Finance Association, Transportation Expansion and Congestion Mitigation Fund Series 2022A, Rev., 5.00%, 8/15/2035 | 500,000 | 575,961 |
Total Idaho | 615,012 | |
Illinois — 6.3% | ||
Champaign County Community Unit School District No. 4 Champaign, School Building 5.00%, 1/1/2027 | 45,000 | 48,662 |
Chicago O'Hare International Airport, General Airport, Senior Lien | ||
Series 2020B, 5.00%, 1/1/2024 | 210,000 | 216,889 |
Series 2017B, 5.00%, 1/1/2034 | 40,000 | 42,780 |
Chicago O'Hare International Airport, Senior Lien Series 2020A, 5.00%, 1/1/2034 | 200,000 | 222,316 |
City of Decatur GO, 5.00%, 3/1/2027 | 130,000 | 140,586 |
City of Hilliard GO, 4.00%, 12/30/2028 | 35,000 | 37,600 |
Cook County School District No., 87 Berkeley AGM, 4.00%, 12/1/2030 | 35,000 | 37,364 |
County of Lake, Sales Tax GO, 4.00%, 11/30/2027 | 100,000 | 105,772 |
Illinois Finance Authority, Clark-Lindsey Village Series A, Rev., 5.13%, 6/1/2032 | 185,000 | 183,516 |
Illinois Finance Authority, Clean Water Initiative Revolving Fund Rev., 5.00%, 7/1/2032 | 35,000 | 38,081 |
Illinois Finance Authority, Lake Forest College | ||
Series A, Rev., 5.00%, 10/1/2029 | 320,000 | 331,539 |
Series A, Rev., 5.00%, 10/1/2030 | 205,000 | 211,358 |
Series A, Rev., 5.00%, 10/1/2031 | 235,000 | 240,262 |
Illinois Finance Authority, Smith Crossing Rev., 4.00%, 10/15/2028 | 350,000 | 338,714 |
Illinois Finance Authority, Social Bonds-Learn Chapter School Project Rev., 4.00%, 11/1/2024 | 135,000 | 135,583 |
Illinois Finance Authority, Unitypoint Health Series 2016D, Rev., 5.00%, 2/15/2024 | 115,000 | 119,140 |
Illinois State Toll Highway Authority | ||
Series D, Rev., 5.00%, 1/1/2024 | 25,000 | 25,827 |
INVESTMENTS | PRINCIPAL AMOUNT($) | VALUE($) |
Illinois — continued | ||
Series 2019A, Rev., 5.00%, 1/1/2036 | 250,000 | 274,874 |
Kane McHenry Cook and De Kalb Counties Unit School District No. 300 GO, 5.00%, 1/1/2024 | 35,000 | 36,153 |
Kendall and Kane Counties Community Unit School District No. 115 Series 2017B, GO, 5.00%, 1/1/2027 | 25,000 | 27,485 |
Lake County Community Consolidated School District No. 3 Beach Park GO, AGM, 4.00%, 2/1/2032 | 175,000 | 184,971 |
Lake County Forest Preserve District GO, 5.00%, 12/15/2028 | 165,000 | 186,246 |
McLean and Woodford Counties Community Unit School District No. 5 Normal Series 2017A, GO, 4.00%, 12/1/2023 | 80,000 | 81,203 |
Metropolitan Water Reclamation District of Greater Chicago, Limited Tax Series 2021C, 5.00%, 12/1/2023 | 20,000 | 20,572 |
Northern Illinois University, Auxiliary Facilities System Series 2020B, Rev., 5.00%, 4/1/2034 | 200,000 | 218,823 |
Northern Illinois University, Board of Trustees, Auxiliary Facilities System | ||
Rev., 5.00%, 10/1/2029 | 300,000 | 333,339 |
Rev., 5.00%, 10/1/2030 | 325,000 | 363,736 |
Peoria Tazewell Etc Counties Community College District No. 514 GO, 4.00%, 12/1/2023 | 35,000 | 35,713 |
Southern Illinois University | ||
Series A, Rev., 5.00%, 4/1/2029 | 675,000 | 737,373 |
Series A, Rev., 5.00%, 4/1/2030 | 800,000 | 876,022 |
Series A, Rev., 5.00%, 4/1/2031 | 575,000 | 630,346 |
Series A, Rev., 5.00%, 4/1/2032 | 510,000 | 556,698 |
Southwestern Illinois Development Authority, Flood Prevention District Council Project Rev., 5.00%, 4/15/2030 | 625,000 | 714,068 |
State of Illinois | ||
GO, 5.00%, 4/1/2024 | 30,000 | 30,817 |
Series 2018A, GO, 5.00%, 10/1/2024 | 30,000 | 31,018 |
Series 2017D, GO, 5.00%, 11/1/2025 | 2,550,000 | 2,672,074 |
Series 2022A, GO, 5.00%, 3/1/2029 | 500,000 | 539,931 |
Series B, GO, 5.00%, 10/1/2029 | 2,000,000 | 2,144,858 |
GO, 4.00%, 6/1/2032 | 1,000,000 | 994,364 |
University of Illinois Series 2021A, Rev., 5.00%, 4/1/2029 | 450,000 | 506,247 |
Village of Bolingbrook Series 2018A, AGM, 5.00%, 1/1/2033 | 125,000 | 138,449 |
Village of Elk Grove GO, 5.00%, 1/1/2029 | 25,000 | 27,448 |
August 31, 2022 | J.P. Morgan Exchange-Traded Funds | 145 |
AS OF August 31, 2022 (Unaudited) (continued)
INVESTMENTS | PRINCIPAL AMOUNT($) | VALUE($) |
Municipal Bonds — continued | ||
Illinois — continued | ||
Village of Wilmette Series 2020B, GO, 5.00%, 12/1/2026 | 140,000 | 154,322 |
Will & Kendall Counties Community Consolidated School District 202 Plainfield GO, 4.00%, 1/1/2023 | 10,000 | 10,057 |
Total Illinois | 15,003,196 | |
Indiana — 1.3% | ||
Adams Central Elementary School Building Corp., Ad Valorem Property Tax First Mortgage 5.00%, 1/15/2027 | 20,000 | 21,866 |
Ball State University, Student Fee Series R, 5.00%, 7/1/2024 | 35,000 | 36,562 |
City of Goshen, Multi-Family, Green Oaks of Goshen Project Series 2021A, Rev., 5.00%, 8/1/2041 (c) | 250,000 | 196,020 |
City of Valparaiso Rev., 5.38%, 12/1/2041 (c) | 200,000 | 158,416 |
Decatur County, Jail Building Corp. Rev., 5.00%, 7/15/2028 | 250,000 | 277,789 |
Indiana Finance Authority Series C, Rev., 5.00%, 12/1/2025 | 35,000 | 37,747 |
Indiana Finance Authority, DePauw University Project Series A, Rev., 5.00%, 7/1/2031 | 730,000 | 803,014 |
Indiana Finance Authority, Educational Facilities, Valparaiso University Project Rev., 4.00%, 10/1/2035 | 215,000 | 208,610 |
Indiana Finance Authority, Franciscan Alliance, Inc., Obligated Group Series 2017C, Rev., 4.00%, 11/1/2034 | 115,000 | 114,938 |
Indiana Finance Authority, Parkview Health System, Inc. Series 2017A, Rev., 5.00%, 11/1/2023 | 50,000 | 51,425 |
Indiana Finance Authority, Rose-Hulman Institute of Technology Project Rev., 5.00%, 6/1/2030 | 200,000 | 223,637 |
Indiana State University, Housing and Dining System | ||
Rev., 5.00%, 4/1/2028 | 120,000 | 133,917 |
Rev., 5.00%, 4/1/2031 | 75,000 | 81,705 |
Indiana State University, Student Fee Series R, Rev., 5.00%, 10/1/2022 | 10,000 | 10,018 |
Indiana University, Student Fee Series Y, Rev., 5.00%, 8/1/2028 | 25,000 | 27,799 |
IPS Multi-School Building Corp., Indiana Unlimited Ad Valorem Property Tax, First Mortgage Rev., 5.00%, 7/15/2029 | 50,000 | 56,240 |
Monroe County Community School Corp. GO, 5.00%, 7/15/2027 | 250,000 | 276,141 |
INVESTMENTS | PRINCIPAL AMOUNT($) | VALUE($) |
Indiana — continued | ||
Perry Township Multi School Building Corp., Ad Valorem Property Tax First Mortgage Rev., 5.00%, 7/15/2025 | 35,000 | 37,321 |
Wheeler-Union Township School Building Corp. Rev., 4.00%, 7/15/2034 | 400,000 | 413,901 |
Total Indiana | 3,167,066 | |
Iowa — 0.1% | ||
City of West Des Moines, Urban Renewal Series 2016B, GO, 5.00%, 6/1/2024 | 35,000 | 36,587 |
Des Moines Independent Community School District, Sales Services and Use Tax Rev., 5.00%, 6/1/2028 | 175,000 | 197,062 |
Iowa Finance Authority, State Revolving Fund Rev., 5.00%, 8/1/2027 | 30,000 | 33,557 |
Total Iowa | 267,206 | |
Kansas — 0.2% | ||
City of Manhattan, Meadowlark Hills Series 2022B-2, Rev., 2.38%, 6/1/2027 | 200,000 | 183,377 |
Johnson County Community College Foundation, Inc. COP, 5.00%, 10/1/2024 | 105,000 | 110,555 |
Johnson County Water District No. 1 Series 2017A, Rev., 5.00%, 1/1/2025 | 50,000 | 52,904 |
Kansas Development Finance Authority, AdventHealth Obligated Project Series 2021B, Rev., 5.00%, 11/15/2031 (b) | 200,000 | 226,239 |
Total Kansas | 573,075 | |
Kentucky — 1.2% | ||
City of Hermiston | ||
Series 2022B, Rev., AMT, 3.70%, 1/1/2032 (c) | 130,000 | 127,678 |
Series 2022A, Rev., AMT, 4.45%, 1/1/2042 (c) | 165,000 | 163,093 |
County of Boone, Duke Energy Kentucky, Inc. Series 2008A, 3.70%, 8/1/2027 | 500,000 | 501,183 |
Kentucky Economic Development Finance Authority, Baptist Healthcare System Obligated Group Series B, Rev., 5.00%, 8/15/2029 | 165,000 | 177,387 |
Kentucky Public Energy Authority, Gas Supply Series 2022A-1, Rev., 4.00%, 8/1/2030 (b) | 1,815,000 | 1,799,978 |
Louisville and Jefferson County Metropolitan Government, Norton Healthcare, Inc. Series 2016-A, Rev., 4.00%, 10/1/2036 | 65,000 | 63,212 |
146 | J.P. Morgan Exchange-Traded Funds | August 31, 2022 |
INVESTMENTS | PRINCIPAL AMOUNT($) | VALUE($) |
Municipal Bonds — continued | ||
Kentucky — continued | ||
Louisville and Jefferson County Metropolitan Sewer District, Sewer and Drainage System | ||
Series B, Rev., 5.00%, 5/15/2024 | 25,000 | 26,110 |
Series A, Rev., 5.00%, 5/15/2027 | 40,000 | 43,935 |
Total Kentucky | 2,902,576 | |
Louisiana — 0.4% | ||
City of Shreveport, Water and Sewer, Junior Lien Series 2019B, Rev., AGM, 5.00%, 12/1/2032 | 200,000 | 222,078 |
Louisiana Local Government Environmental Facilities and Community Development Authority, Calcasieu Parish Projects Rev., 5.00%, 12/1/2030 | 250,000 | 281,136 |
Louisiana Public Facilities Authority, Materra Campus Project Series 2021C, Rev., 4.00%, 6/1/2031 (c) | 245,000 | 230,951 |
Louisiana Public Facilities Authority, Tulane University Project Series 2020A, Rev., 5.00%, 4/1/2029 | 220,000 | 243,332 |
State of Louisiana Series 2016-B, GO, 4.00%, 8/1/2026 | 30,000 | 31,601 |
Total Louisiana | 1,009,098 | |
Maine — 0.1% | ||
Maine Health and Higher Educational Facilities Authority | ||
Series 2020A, Rev., 5.00%, 7/1/2023 (d) | 70,690 | 72,184 |
Series 2020A, Rev., 5.00%, 7/1/2023 | 54,310 | 55,341 |
Maine Municipal Bond Bank Series C, Rev., 5.00%, 11/1/2024 | 75,000 | 79,104 |
Total Maine | 206,629 | |
Maryland — 2.3% | ||
County of Howard, Consolidated Public Improvement Series 2022B, GO, 5.00%, 8/15/2030 | 160,000 | 187,852 |
County of Montgomery, Consolidated Public Improvement Series A, GO, 5.00%, 8/1/2031 | 2,000,000 | 2,372,540 |
County of St. Mary's, Public Improvement GO, 4.00%, 7/15/2027 | 70,000 | 74,901 |
Maryland Economic Development Corp., Bowie State University Project Rev., 4.00%, 7/1/2040 | 200,000 | 184,122 |
Maryland Health and Higher Educational Facilities Authority, Stevenson University Project | ||
Rev., 5.00%, 6/1/2033 | 200,000 | 210,797 |
Rev., 4.00%, 6/1/2046 | 250,000 | 217,633 |
INVESTMENTS | PRINCIPAL AMOUNT($) | VALUE($) |
Maryland — continued | ||
State of Maryland, Department of Transportation Rev., 5.00%, 9/1/2026 | 75,000 | 82,373 |
State of Maryland, State and Local Facilities Loan of 2017 Series 2017A, GO, 5.00%, 8/1/2025 | 45,000 | 48,344 |
State of Maryland, State and Local Facilities Loan of 2020 Series 2020A, GO, 5.00%, 8/1/2035 | 300,000 | 342,585 |
State of Maryland, State and Local Facilities Loan of 2021 Series A, GO, 5.00%, 3/1/2031 | 400,000 | 472,644 |
State of Maryland, State and Local Facilities Loan of 2022 Series A, GO, 5.00%, 6/1/2033 | 1,000,000 | 1,186,155 |
Total Maryland | 5,379,946 | |
Massachusetts — 0.4% | ||
City of Boston Series 2017A, 5.00%, 4/1/2025 | 10,000 | 10,664 |
Commonwealth of Massachusetts Series C, GO, 5.00%, 10/1/2026 | 25,000 | 27,495 |
Massachusetts Development Finance Agency, Milford Regional Medical Center Series G, Rev., 5.00%, 7/15/2037 (c) | 245,000 | 247,228 |
Massachusetts Development Finance Agency, Salem Community Corp. Rev., 5.00%, 1/1/2030 | 235,000 | 234,984 |
Massachusetts Development Finance Agency, Southcoast Health System Obligated Group Issue Series 2021G, Rev., 5.00%, 7/1/2035 | 200,000 | 216,910 |
Massachusetts Development Finance Agency, Wellforce Issue Series 2020C, Rev., AGM, 5.00%, 10/1/2030 | 175,000 | 195,201 |
Massachusetts State College Building Authority Series D, Rev., 5.00%, 5/1/2027 | 45,000 | 49,687 |
Town of Hopkinton, Municipal Purpose Loan GO, 5.00%, 11/15/2024 | 30,000 | 31,710 |
Total Massachusetts | 1,013,879 | |
Michigan — 0.3% | ||
Berrien Springs Public Schools, School Building & Site, Unlimited Tax Q-SBLF, 5.00%, 5/1/2030 | 250,000 | 286,412 |
Grand Traverse County Hospital Finance Authority, Munson Healthcare Obligated Group Rev., 5.00%, 7/1/2026 | 175,000 | 189,321 |
Michigan Finance Authority, Lawrence Technological University Series 2022, Rev., 4.00%, 2/1/2032 | 95,000 | 90,496 |
August 31, 2022 | J.P. Morgan Exchange-Traded Funds | 147 |
AS OF August 31, 2022 (Unaudited) (continued)
INVESTMENTS | PRINCIPAL AMOUNT($) | VALUE($) |
Municipal Bonds — continued | ||
Michigan — continued | ||
Michigan State Hospital Finance Authority, Trinity Health Credit Group Series C, Rev., 5.00%, 12/1/2025 | 25,000 | 26,946 |
Western Michigan University, Tax Exempt Series 2021A, Rev., AGM, 5.00%, 11/15/2031 | 25,000 | 28,491 |
Total Michigan | 621,666 | |
Minnesota — 1.5% | ||
City of Mankato | ||
Series B, GO, 5.00%, 2/1/2027 | 750,000 | 827,553 |
Series B, GO, 5.00%, 2/1/2029 | 755,000 | 859,514 |
City of Minneapolis, Health Care System, Fairview Health Services Series 2018A, Rev., 5.00%, 11/15/2033 | 180,000 | 193,924 |
City of Woodbury, Charter School Lease, Woodbury Leadership Academy Project Series 2021A, Rev., 4.00%, 7/1/2031 | 175,000 | 164,049 |
Duluth Economic Development Authority, Benedictine Health System Series 2021A, Rev., 3.00%, 7/1/2024 | 100,000 | 98,734 |
Minnesota Municipal Gas Agency Series 2022A, Rev., LIQ : Royal Bank of Canada, 4.00%, 6/1/2027 | 1,000,000 | 1,021,063 |
State of Minnesota, Various Purpose Series A, GO, 5.00%, 8/1/2030 | 350,000 | 407,196 |
University of Minnesota Series B, Rev., 5.00%, 12/1/2025 | 15,000 | 16,201 |
Total Minnesota | 3,588,234 | |
Mississippi — 2.3% | ||
County of Jackson, Pollution Control, Chevron USA, Inc. Project Series 1993, Rev., VRDO, 0.95%, 9/1/2022 (b) | 5,000,000 | 5,000,000 |
Mississippi Development Bank, Ranking County Project Rev., 5.00%, 3/1/2026 | 205,000 | 222,409 |
Mississippi State University Educational Building Corp., New Facilities and Refinancing Project Rev., 5.00%, 8/1/2025 | 35,000 | 37,315 |
State of Mississippi | ||
Series 2015F, GO, 5.00%, 11/1/2025 (d) | 35,000 | 37,768 |
Series B, GO, 5.00%, 12/1/2025 | 20,000 | 21,615 |
Series 2018A, GO, 5.00%, 11/1/2026 (d) | 60,000 | 66,126 |
University of Mississippi Educational Building Corp., Facilities Refinancing Project Series 2016A, Rev., 5.00%, 10/1/2030 | 40,000 | 43,360 |
Total Mississippi | 5,428,593 | |
INVESTMENTS | PRINCIPAL AMOUNT($) | VALUE($) |
Missouri — 0.8% | ||
Bi-State Development Agency of the Missouri-Illinois Metropolitan District, Combined Lien 5.00%, 10/1/2023 | 280,000 | 287,308 |
Bi-State Development Agency of the Missouri-Illinois Metropolitan District, St. Clair County Metrolink Project AGM, 5.25%, 7/1/2024 | 40,000 | 41,904 |
City of Excelsior Springs Series 2020B, COP, 4.00%, 3/1/2030 | 115,000 | 123,126 |
City of Kansas City, Sanitary Sewer System Series B, Rev., 5.00%, 1/1/2033 | 25,000 | 27,482 |
Health and Educational Facilities Authority of the State of Missouri, City Art Institute Rev., 5.00%, 9/1/2030 | 200,000 | 218,485 |
Health and Educational Facilities Authority of the State of Missouri, Mercy Health Series 2018A, Rev., 5.00%, 6/1/2028 | 180,000 | 199,549 |
Health and Educational Facilities Authority of the State of Missouri, St. Luke's Episcopal-Presbyterian Hospitals Series 2015B, Rev., 5.00%, 12/1/2026 | 165,000 | 173,284 |
Health and Educational Facilities Authority of the State of Missouri, St. Luke's Health System, Inc. Rev., 5.00%, 11/15/2029 | 300,000 | 321,188 |
Health and Educational Facilities Authority of the State of Missouri, Wright Memorial Hospital Rev., 5.00%, 9/1/2026 | 200,000 | 209,006 |
Industrial Development Authority of the City of St. Louis Missouri, Innovation District Series 2022, Rev., 5.00%, 5/15/2041 | 285,000 | 288,214 |
Metropolitan St. Louis Sewer District, Wastewater System Improvement Series 2017A, Rev., 5.00%, 5/1/2027 | 45,000 | 50,021 |
Missouri Development Finance Board, Fulton State Hospital Project Rev., 5.00%, 10/1/2025 | 25,000 | 26,323 |
Total Missouri | 1,965,890 | |
Montana — 0.0% ^ | ||
County of Missoula GO, 4.00%, 7/1/2025 | 50,000 | 52,112 |
Nebraska — 0.5% | ||
Central Plains Energy Project, Gas Project No. 3 Series 2017A, 5.00%, 9/1/2030 | 320,000 | 344,912 |
City of Lincoln, Electric System | ||
Rev., 5.00%, 9/1/2026 | 85,000 | 92,983 |
Rev., 5.00%, 9/1/2028 | 50,000 | 55,389 |
City of Omaha, Sanitary Sewerage System Rev., 5.00%, 4/1/2027 | 50,000 | 54,323 |
148 | J.P. Morgan Exchange-Traded Funds | August 31, 2022 |
INVESTMENTS | PRINCIPAL AMOUNT($) | VALUE($) |
Municipal Bonds — continued | ||
Nebraska — continued | ||
Nebraska Educational Health Cultural and Social Services Finance Authority, Immanuel Retirement Communities Obligated Group Series 2019A, Rev., 4.00%, 1/1/2033 | 250,000 | 251,356 |
Omaha Public Power District, Electric System | ||
Series B, Rev., 5.00%, 2/1/2025 | 20,000 | 20,977 |
Series 2016A, Rev., 5.00%, 2/1/2026 | 40,000 | 43,401 |
Series 2016A, Rev., 5.00%, 2/1/2027 | 30,000 | 32,541 |
Public Power Generation Agency, Whelan Energy Center Unit 2 Series 2015A, Rev., 5.00%, 1/1/2024 | 155,000 | 159,858 |
University of Nebraska Facilities Corp., UNMC Global Center Project Rev., 5.00%, 12/15/2025 | 35,000 | 37,801 |
Total Nebraska | 1,093,541 | |
Nevada — 0.3% | ||
City of Sparks, Senior Sales Tax Series 2019A, Rev., 2.50%, 6/15/2024 (c) | 40,000 | 38,860 |
Clark County School District, Limited Tax | ||
Series 2018A, 5.00%, 6/15/2032 | 95,000 | 104,426 |
Series 2018A, 4.00%, 6/15/2035 | 90,000 | 92,436 |
County of Clark, Indexed Fuel Tax and Subordinate Motor Vehicle Fuel Tax 5.00%, 7/1/2028 | 25,000 | 27,629 |
County of Clark, Limited Tax Series 2018B, 5.00%, 12/1/2027 | 120,000 | 134,487 |
County of Clark, Passenger Facility Charge, Las Vegas-McCarran International Airport Passenger Facility Series 2019E, 5.00%, 7/1/2033 | 155,000 | 171,790 |
Truckee Meadows Water Authority Rev., 5.00%, 7/1/2029 | 50,000 | 55,259 |
Total Nevada | 624,887 | |
New Hampshire — 0.1% | ||
New Hampshire Business Finance Authority, Springpoint Senior Living Project Rev., 4.00%, 1/1/2025 | 290,000 | 290,948 |
New Jersey — 1.5% | ||
Bergen County Improvement Authority (The), New Bridge Medical Center Series 2022, GTD, 5.00%, 8/1/2037 | 1,000,000 | 1,142,845 |
City of New Brunswick GO, 4.00%, 3/15/2024 | 10,000 | 10,247 |
New Jersey Economic Development Authority, Biomedical Research Facilities Series 2016A, Rev., 5.00%, 7/15/2028 | 260,000 | 277,166 |
New Jersey Transportation Trust Fund Authority Series 2020AA, Rev., 4.00%, 6/15/2035 | 130,000 | 127,243 |
INVESTMENTS | PRINCIPAL AMOUNT($) | VALUE($) |
New Jersey — continued | ||
New Jersey Transportation Trust Fund Authority, Transportation System Series 2018A, Rev., 4.00%, 12/15/2031 | 250,000 | 254,321 |
New Jersey Turnpike Authority Series D, Rev., 5.00%, 1/1/2028 | 200,000 | 216,901 |
Passaic County Improvement Authority (The), City of Paterson Project Rev., 5.00%, 6/15/2025 | 10,000 | 10,670 |
State of New Jersey, COVID-19 Emergency Bonds GO, 5.00%, 6/1/2028 | 1,000,000 | 1,118,142 |
Tobacco Settlement Financing Corp. Series 2018A, Rev., 5.00%, 6/1/2027 | 265,000 | 286,997 |
Total New Jersey | 3,444,532 | |
New Mexico — 0.3% | ||
City of Albuquerque Series 2016A, 5.00%, 7/1/2023 | 75,000 | 76,673 |
City of Albuquerque, Gross Receipts Tax Series 2015A, 5.00%, 7/1/2026 | 240,000 | 256,526 |
New Mexico Finance Authority, Senior Lien Public Project Revolving Fund Series 2016E, Rev., 5.00%, 6/1/2024 | 25,000 | 26,120 |
New Mexico Finance Authority, State Transportation, Subordinate Lien Series 2108A, Rev., 5.00%, 6/15/2027 | 100,000 | 111,380 |
New Mexico Hospital Equipment Loan Council, Presbyterian Healthcare Services Series 2015A, Rev., 5.00%, 8/1/2025 | 25,000 | 26,748 |
State of New Mexico, Capital Projects GO, 5.00%, 3/1/2024 | 305,000 | 316,899 |
Total New Mexico | 814,346 | |
New York — 10.6% | ||
Broome County Local Development Corp., Good Shepherd Village at Endwell, Inc. 3.50%, 7/1/2026 | 210,000 | 203,683 |
Build NYC Resource Corp., Grand Concourse Academy Charter School Series 2022A, 5.00%, 7/1/2032 | 100,000 | 105,458 |
Build NYC Resource Corp., New World Preparatory Charter School Project | ||
Series 2021A, 4.00%, 6/15/2041 | 100,000 | 87,570 |
Series 2021A, 4.00%, 6/15/2051 | 150,000 | 123,080 |
City of New York, Fiscal Year 2013 | ||
Series 2013J, GO, 5.00%, 8/1/2023 | 40,000 | 40,963 |
Series I, GO, 5.00%, 8/1/2023 | 25,000 | 25,602 |
City of New York, Fiscal Year 2014 Series 2014E, GO, 5.00%, 8/1/2027 | 35,000 | 35,788 |
August 31, 2022 | J.P. Morgan Exchange-Traded Funds | 149 |
AS OF August 31, 2022 (Unaudited) (continued)
INVESTMENTS | PRINCIPAL AMOUNT($) | VALUE($) |
Municipal Bonds — continued | ||
New York — continued | ||
City of New York, Fiscal Year 2018 Series 2018F-1, GO, 5.00%, 4/1/2033 | 105,000 | 115,766 |
City of New York, Fiscal Year 2019 Series 2019E, GO, 5.00%, 8/1/2033 | 100,000 | 110,261 |
City of New York, Fiscal Year 2020 Series 2020C-1, GO, 5.00%, 8/1/2033 | 160,000 | 179,440 |
City of New York, Fiscal Year 2021 | ||
Series 2021A-1, GO, 5.00%, 8/1/2031 | 185,000 | 211,158 |
Series 2021-1, GO, 5.00%, 4/1/2033 | 235,000 | 265,558 |
Series F, Subseries F-1, GO, 5.00%, 3/1/2037 | 1,000,000 | 1,095,676 |
City of New York, Fiscal Year 2022 Series 2022B-1, GO, 5.00%, 8/1/2033 | 1,650,000 | 1,881,547 |
County of Erie, Public Improvement Series 2019A, GO, 5.00%, 9/15/2025 | 25,000 | 26,932 |
County of Onondaga GO, 5.00%, 3/15/2026 | 20,000 | 20,796 |
Dutchess County Local Development Corp., The Culinary Institute of America Project Rev., 5.00%, 7/1/2025 | 100,000 | 104,539 |
Erie County Water Authority Rev., 5.00%, 12/1/2027 | 30,000 | 33,146 |
Falconer Central School District GO, 4.00%, 12/15/2034 | 1,270,000 | 1,307,953 |
Longwood Central School District, Suffolk County GO, 5.00%, 6/15/2025 | 175,000 | 187,455 |
Metropolitan Transportation Authority, Dedicated Tax Fund Series 2016A, Rev., 5.00%, 11/15/2023 | 315,000 | 325,028 |
Monroe County Industrial Development Corp., Rochester Schools Modernization Project Rev., 5.00%, 5/1/2030 | 80,000 | 84,752 |
New York City Municipal Water Finance Authority, Water And Sewer System Subseries 2012A-2, Rev., VRDO, LIQ : Mizuho Bank Ltd., 1.03%, 9/1/2022 (b) | 3,000,000 | 3,000,000 |
New York City Transitional Finance Authority Building Aid Series S-1, Subseries S-1A, Rev., 5.00%, 7/15/2035 | 800,000 | 904,248 |
New York City Transitional Finance Authority Building Aid, Subordinate | ||
Rev., 5.00%, 7/15/2025 (d) | 45,000 | 48,140 |
Rev., 5.00%, 7/15/2025 | 5,000 | 5,323 |
New York City Transitional Finance Authority, Building Aid, Fiscal Year 2018 Series 2018S-4A, Rev., 5.00%, 7/15/2033 | 105,000 | 116,442 |
New York City Transitional Finance Authority, Future Tax Secured Subseries A-2, Rev., 5.00%, 5/1/2039 | 265,000 | 286,211 |
INVESTMENTS | PRINCIPAL AMOUNT($) | VALUE($) |
New York — continued | ||
New York City Transitional Finance Authority, Future Tax Secured, Fiscal Year 2015 Series C, Rev., 5.00%, 11/1/2022 | 25,000 | 25,116 |
New York City Transitional Finance Authority, Future Tax Secured, Fiscal Year 2017 | ||
Series E, Subseries E-1, Rev., 5.00%, 2/1/2030 | 150,000 | 163,310 |
Series 2017F-1, Rev., 5.00%, 5/1/2030 | 550,000 | 601,419 |
New York City Transitional Finance Authority, Future Tax Secured, Fiscal Year 2018 Series 1, Rev., 5.00%, 11/1/2026 | 25,000 | 27,428 |
New York City Transitional Finance Authority, Future Tax Secured, Tax-Exempt, Fiscal Year 2013 Series 2013G, Rev., 5.00%, 11/1/2026 | 30,000 | 30,496 |
New York City Transitional Finance Authority, Future Tax Secured, Tax-Exempt, Fiscal Year 2022 Series 2022F, Rev., 5.00%, 2/1/2036 | 525,000 | 587,247 |
New York State Dormitory Authority, Columbia University Series B, Rev., 5.00%, 10/1/2038 | 25,000 | 27,522 |
New York State Dormitory Authority, Cornell University Series 2019D, Rev., 5.00%, 7/1/2033 | 135,000 | 161,184 |
New York State Dormitory Authority, Montefiore Obligated Group Series 2020A, Rev., 4.00%, 9/1/2050 | 100,000 | 81,981 |
New York State Dormitory Authority, New York University Series 2017A, Rev., 5.00%, 7/1/2023 | 180,000 | 184,015 |
New York State Dormitory Authority, Northwell Health Obligated Group Series 2019A, Rev., 5.00%, 5/1/2029 | 70,000 | 78,018 |
New York State Dormitory Authority, Personal Income Tax | ||
Series D, Rev., 5.00%, 2/15/2034 | 2,000,000 | 2,221,133 |
Series A, Rev., 4.00%, 3/15/2037 | 990,000 | 980,441 |
New York State Dormitory Authority, State Personal Income Tax Series 2021E, Rev., 5.00%, 3/15/2033 | 1,610,000 | 1,842,615 |
New York State Dormitory Authority, State Personal Income Tax, General Purpose Series 2018A, Rev., 5.00%, 3/15/2031 | 25,000 | 27,994 |
New York State Dormitory Authority, State Supported Debt University Facilities Series 2019A, Rev., 5.00%, 7/1/2024 | 25,000 | 26,088 |
150 | J.P. Morgan Exchange-Traded Funds | August 31, 2022 |
INVESTMENTS | PRINCIPAL AMOUNT($) | VALUE($) |
Municipal Bonds — continued | ||
New York — continued | ||
New York State Environmental Facilities Corp., State Clean Water and Drinking Water Revolving Funds, Municipal Water Finance Authority Projects - Second Resolution Series 2019B, Rev., 5.00%, 6/15/2031 | 100,000 | 114,506 |
New York State Urban Development Corp., State Personal Income Tax, General Purpose | ||
Series 2017A, Rev., 5.00%, 3/15/2026 | 125,000 | 135,372 |
Series 2016A, Rev., 5.00%, 3/15/2027 | 30,000 | 32,426 |
Series 2013A-1, Rev., 5.00%, 3/15/2028 | 25,000 | 25,322 |
Series 2016A, Rev., 5.00%, 3/15/2028 | 75,000 | 80,907 |
Series 2017-A, Rev., 5.00%, 3/15/2028 | 150,000 | 165,431 |
Series 2020A, Rev., 4.00%, 3/15/2045 | 500,000 | 473,037 |
New York State Urban Development Corp., State Sales Tax Series 2021A, Rev., 5.00%, 3/15/2036 | 580,000 | 647,670 |
Onondaga Civic Development Corp., Le Moyne College Series 2020B, Rev., 5.00%, 7/1/2032 | 250,000 | 267,957 |
Onondaga Civic Development Corp., Le Moyne College Project | ||
Rev., 5.00%, 7/1/2027 | 100,000 | 107,278 |
Rev., 5.00%, 7/1/2031 | 360,000 | 392,320 |
Orange County Funding Corp., Mount Saint Mary College Project Series 2012B, Rev., 4.00%, 7/1/2023 | 200,000 | 199,813 |
Port Authority of New York and New Jersey, Consolidated | ||
Series 205, Rev., 5.00%, 11/15/2028 | 30,000 | 33,363 |
Rev., AMT, 5.00%, 9/1/2036 | 1,975,000 | 2,086,085 |
Port Washington Union Free School District GO, 4.00%, 8/1/2036 | 1,370,000 | 1,403,496 |
Suffolk County Economic Development Corp., St. Johnland Assisted Living Inc., Project Rev., 5.13%, 11/1/2041 (c) | 340,000 | 295,874 |
Town of Stony Point GO, 5.00%, 8/15/2027 | 75,000 | 83,072 |
Westchester County Local Development Corp., Kendal on Hudson Project Series 2022B, Rev., 5.00%, 1/1/2032 (e) | 240,000 | 253,478 |
Westchester County Local Development Corp., Purchase Senior Learning Community, Inc. Project | ||
Series 2021D, Rev., 2.88%, 7/1/2026 (c) | 250,000 | 234,173 |
Series 2021C, Rev., 3.20%, 7/1/2028 (c) | 250,000 | 227,121 |
Total New York | 25,257,223 | |
North Carolina — 2.2% | ||
County of Davidson GO, 5.00%, 6/1/2027 | 35,000 | 39,037 |
INVESTMENTS | PRINCIPAL AMOUNT($) | VALUE($) |
North Carolina — continued | ||
County of Duplin Rev., 5.00%, 6/1/2028 | 65,000 | 72,241 |
County of New Hanover, Limited Obligation Series 2022, Rev., 5.00%, 6/1/2027 | 480,000 | 535,356 |
County of Wayne, Limited Obligation Rev., 5.00%, 6/1/2024 | 25,000 | 26,098 |
North Carolina Turnpike Authority, Triangle Expressway System Rev., BAN, 5.00%, 2/1/2024 | 400,000 | 411,828 |
State of North Carolina Series 2020B, Rev., 5.00%, 5/1/2029 | 100,000 | 114,894 |
State of North Carolina, Build NC Programs, Limited Obligation Series C, Rev., 5.00%, 5/1/2024 | 25,000 | 26,086 |
University of North Carolina at Chapel Hill Series A, Rev., VRDO, LIQ : TD Bank NA, 0.92%, 9/1/2022 (b) | 3,000,000 | 3,000,000 |
Winston-Salem State University Foundation LLC, The Board of Governors of The University of North Carolina Rev., 5.00%, 4/1/2031 | 945,000 | 1,061,836 |
Total North Carolina | 5,287,376 | |
North Dakota — 0.1% | ||
North Dakota Building Authority, Facilities Improvement Series 2020A, Rev., 5.00%, 12/1/2023 | 115,000 | 118,646 |
Ohio — 4.6% | ||
Akron Bath Copley Joint Township Hospital District, Summa Health Obligated Group 5.00%, 11/15/2029 | 330,000 | 363,235 |
American Municipal Power, Inc., Greenup Hydroelectric Projects Series 2016A, 5.00%, 2/15/2030 | 25,000 | 26,686 |
Bowling Green State University, General Receipts Series 2016A, 5.00%, 6/1/2024 | 25,000 | 26,028 |
Buckeye Tobacco Settlement Financing Authority Series 2020A-2, Class 1, 4.00%, 6/1/2048 | 250,000 | 223,735 |
City of Cleveland Series A, 5.00%, 12/1/2035 | 460,000 | 523,448 |
City of Reynoldsburg, Limited Tax, Capital Facilities GO, 5.00%, 12/1/2026 | 15,000 | 16,496 |
County of Cuyahoga, Eliza Jennings Senior Care Network Series 2022-A, Rev., 5.00%, 5/15/2032 | 370,000 | 374,123 |
County of Summit, Various Purpose Improvement Series 2022, GO, 5.00%, 12/1/2031 | 100,000 | 117,320 |
August 31, 2022 | J.P. Morgan Exchange-Traded Funds | 151 |
AS OF August 31, 2022 (Unaudited) (continued)
INVESTMENTS | PRINCIPAL AMOUNT($) | VALUE($) |
Municipal Bonds — continued | ||
Ohio — continued | ||
County of Warren, Healthcare Facilities, Otterbein Homes Obligated Group Series 2019A, Rev., 4.00%, 7/1/2033 | 205,000 | 208,550 |
Northeast Ohio Medical University Series 2022, Rev., 5.00%, 12/1/2035 (e) | 1,000,000 | 1,086,357 |
Ohio Air Quality Development Authority, Duke Energy Corp. | ||
Series 2022B, Rev., 4.00%, 6/1/2027 (b) | 2,000,000 | 2,035,112 |
Series 2022A, Rev., AMT, 4.25%, 6/1/2027 (b) | 1,500,000 | 1,529,424 |
Ohio Higher Educational Facility Commission, Denison University Project Series 2017A, Rev., 5.00%, 11/1/2025 | 75,000 | 80,246 |
Ohio Higher Educational Facility Commission, Tiffin University 2019 Project Rev., 5.00%, 11/1/2034 | 125,000 | 121,931 |
Ohio Higher Educational Facility Commission, University of Findlay 2019 Project | ||
Rev., 5.00%, 3/1/2027 | 55,000 | 56,830 |
Rev., 5.00%, 3/1/2034 | 160,000 | 161,716 |
Ohio Turnpike and Infrastructure Commission, Junior Lien | ||
Series A, Rev., 5.00%, 2/15/2027 | 135,000 | 149,014 |
Series 2022A, Rev., 5.00%, 2/15/2033 (e) | 500,000 | 581,312 |
Ohio Water Development Authority, Fresh Water Series 2016B, Rev., 5.00%, 6/1/2026 | 30,000 | 32,774 |
Ohio Water Development Authority, Water Pollution Control Loan Fund Series 2017A, Rev., 5.00%, 12/1/2026 | 45,000 | 49,680 |
State of Ohio Series 2021B, GO, 5.00%, 9/15/2031 | 210,000 | 247,374 |
State of Ohio, Capital Facilities Lease Appropriation Mental Health Facilities Improvement Fund Projects Series 2018A, Rev., 5.00%, 6/1/2025 | 25,000 | 26,687 |
State of Ohio, Capital Facilities Lease Appropriation, Cultural and Sports Facilities Building Fund Projects Series 2021A, Rev., 5.00%, 4/1/2032 | 2,000,000 | 2,353,142 |
State of Ohio, Cleveland Clinic Health System Obligated Group Series 2017A, Rev., 5.00%, 1/1/2028 | 25,000 | 27,952 |
State of Ohio, Infrastructure Improvement Series 2018A, GO, 5.00%, 9/1/2028 | 25,000 | 28,485 |
INVESTMENTS | PRINCIPAL AMOUNT($) | VALUE($) |
Ohio — continued | ||
State of Ohio, Natural Resources Series V, GO, 5.00%, 10/1/2027 | 35,000 | 39,274 |
Youngstown State University, General Receipts Rev., AGM, 4.00%, 12/15/2030 | 490,000 | 530,413 |
Total Ohio | 11,017,344 | |
Oklahoma — 0.1% | ||
Cleveland County Educational Facilities Authority, Norman Public Schools Project 5.00%, 6/1/2025 | 150,000 | 159,955 |
Oklahoma Capitol Improvement Authority, Capitol Repair Project | ||
Series C, Rev., 5.00%, 1/1/2030 | 10,000 | 11,035 |
Series 2018C, Rev., 5.00%, 1/1/2036 | 45,000 | 48,812 |
Oklahoma Capitol Improvement Authority, State Highway, Capital Improvement Rev., 5.00%, 7/1/2024 | 100,000 | 104,390 |
Total Oklahoma | 324,192 | |
Oregon — 1.2% | ||
Hillsboro School District No. 1J GO, 5.00%, 6/15/2028 | 25,000 | 27,690 |
Salem Hospital Facility Authority, Capital Manor Project Rev., 4.00%, 5/15/2040 | 375,000 | 333,292 |
Salem Hospital Facility Authority, Multi Model, Salem Health Project Series 2019A, Rev., 5.00%, 5/15/2028 | 75,000 | 83,013 |
Tri-County Metropolitan Transportation District of Oregon, Senior Lien Series 2021A, Rev., 5.00%, 9/1/2035 | 1,060,000 | 1,204,902 |
Tri-County Metropolitan Transportation District of Oregon, Senior Lien Payroll Tax Series 2018A, Rev., 5.00%, 9/1/2027 (d) | 45,000 | 50,443 |
Union County Hospital Facility Authority, Grande Ronde Hospital, Inc. | ||
Series 2022, Rev., 5.00%, 7/1/2026 | 300,000 | 316,271 |
Series 2022, Rev., 5.00%, 7/1/2028 | 400,000 | 428,198 |
Yamhill County Hospital Authority, Friendsview, Tax Exempt Series 2021B-1, Rev., 2.50%, 11/15/2028 | 350,000 | 317,614 |
Total Oregon | 2,761,423 | |
Pennsylvania — 3.4% | ||
Aliquippa School District, Limited Tax 3.88%, 12/1/2037 | 200,000 | 199,996 |
Allegheny County Higher Education Building Authority, Chatham University | ||
5.00%, 9/1/2024 | 130,000 | 132,831 |
5.00%, 9/1/2025 | 225,000 | 231,700 |
152 | J.P. Morgan Exchange-Traded Funds | August 31, 2022 |
INVESTMENTS | PRINCIPAL AMOUNT($) | VALUE($) |
Municipal Bonds — continued | ||
Pennsylvania — continued | ||
5.00%, 9/1/2026 | 135,000 | 140,317 |
5.00%, 9/1/2027 | 250,000 | 260,692 |
Berks County Industrial Development Authority, The Highlands at Wyomissing Series 2017A, 5.00%, 5/15/2037 | 250,000 | 255,973 |
Bucks County Community College Authority Series 2019A, GTD, 5.00%, 6/15/2033 | 35,000 | 38,835 |
Commonwealth Financing Authority, Tobacco Master Settlement Payment 5.00%, 6/1/2035 | 225,000 | 242,456 |
County of Chester 5.00%, 11/15/2027 | 30,000 | 33,752 |
County of Lehigh, Lehigh Valley Health Network Hospital Series 2016A, Rev., 4.00%, 7/1/2035 | 175,000 | 170,864 |
Delaware Valley Regional Finance Authority, Local Government | ||
Series D, Rev., 4.00%, 3/1/2029 | 1,000,000 | 1,060,269 |
Series 2021A, Rev., 2.00%, 10/1/2029 | 25,000 | 22,629 |
Geisinger Authority, Health System Series 2020B, Rev., 5.00%, 2/15/2027 (b) | 250,000 | 269,807 |
Lancaster County Hospital Authority, St. Anne's Retirement Community, Inc., Project Rev., 5.00%, 3/1/2040 | 250,000 | 234,465 |
Montgomery County Higher Education and Health Authority, Arcadia University Rev., 5.00%, 4/1/2034 | 250,000 | 261,517 |
Montgomery County Higher Education and Health Authority, Thomas Jefferson University | ||
Rev., 5.00%, 9/1/2027 | 265,000 | 289,090 |
Series 2018A, Rev., 4.00%, 9/1/2038 | 135,000 | 132,315 |
Northampton County General Purpose Authority, Moravian College Project Rev., 5.00%, 10/1/2027 | 185,000 | 194,097 |
Pennsylvania Higher Educational Facilities Authority, State System of Higher Education Series 2017AU-1, Rev., 5.00%, 6/15/2026 | 70,000 | 75,876 |
Pennsylvania Turnpike Commission | ||
Series A-1, Rev., 5.00%, 12/1/2029 | 105,000 | 116,610 |
Series A-1, Rev., 5.00%, 12/1/2031 | 60,000 | 65,982 |
Series B, Rev., 4.00%, 6/1/2033 | 575,000 | 586,161 |
Series 2020B, Rev., 5.00%, 12/1/2033 | 280,000 | 312,839 |
Philadelphia Authority for Industrial Development, Holy Family University Rev., 5.00%, 9/1/2027 (e) | 610,000 | 637,205 |
State Public School Building Authority, Delaware County Community College Project Rev., 5.00%, 10/1/2027 | 25,000 | 26,986 |
INVESTMENTS | PRINCIPAL AMOUNT($) | VALUE($) |
Pennsylvania — continued | ||
Township of Hampton | ||
GO, 5.00%, 1/1/2035 (e) | 150,000 | 166,346 |
GO, 5.00%, 1/1/2037 (e) | 175,000 | 191,789 |
GO, 4.00%, 1/1/2042 (e) | 970,000 | 927,363 |
GO, 4.00%, 1/1/2047 (e) | 700,000 | 638,622 |
Township of Palmer Series 2020C, GO, 4.00%, 11/15/2031 | 175,000 | 185,985 |
Township of Upper St. Clair Series 2016A, GO, 4.00%, 6/1/2025 | 20,000 | 20,799 |
Total Pennsylvania | 8,124,168 | |
Rhode Island — 0.0% ^ | ||
State of Rhode Island and Providence Plantations Consolidated Capital Development Loan Series 2018A, GO, 5.00%, 4/1/2029 | 75,000 | 84,378 |
South Carolina — 0.5% | ||
Charleston County Airport District 5.00%, 7/1/2035 | 250,000 | 272,909 |
South Carolina Jobs-Economic Development Authority, Episcopal Home at Still Hopes Series 2018A, Rev., 5.00%, 4/1/2033 | 125,000 | 122,681 |
South Carolina Jobs-Economic Development Authority, Wofford College Project Rev., 5.00%, 4/1/2029 | 10,000 | 11,017 |
University of South Carolina, Athletic Facilities Series 2022A, Rev., 5.00%, 5/1/2034 | 585,000 | 666,333 |
Total South Carolina | 1,072,940 | |
South Dakota — 0.1% | ||
City of Rapid City, Sales Tax Rev., 5.00%, 12/1/2023 | 25,000 | 25,792 |
South Dakota Board of Regents Housing and Auxiliary Facilities System Rev., 5.00%, 4/1/2027 | 35,000 | 38,123 |
South Dakota Conservancy District, State Revolving Fund Program Rev., 5.00%, 8/1/2025 | 35,000 | 37,580 |
South Dakota Health and Educational Facilities Authority, Sanford Obligated Group Rev., 5.00%, 11/1/2023 | 145,000 | 149,301 |
Total South Dakota | 250,796 | |
Tennessee — 3.6% | ||
City of Johnson City Series 2016A, GO, 5.00%, 6/1/2023 | 15,000 | 15,291 |
City of Lenoir City, Electric System Series 2022, Rev., 5.00%, 6/1/2033 | 165,000 | 189,640 |
City of Murfreesboro GO, 4.00%, 4/1/2025 | 25,000 | 25,627 |
August 31, 2022 | J.P. Morgan Exchange-Traded Funds | 153 |
AS OF August 31, 2022 (Unaudited) (continued)
INVESTMENTS | PRINCIPAL AMOUNT($) | VALUE($) |
Municipal Bonds — continued | ||
Tennessee — continued | ||
County of Coffee, Rural High School Series 2021A, GO, 5.00%, 6/1/2028 | 125,000 | 140,901 |
County of Maury GO, 5.00%, 4/1/2027 | 40,000 | 44,372 |
County of Montgomery, Public Improvement GO, 5.00%, 4/1/2027 | 25,000 | 27,778 |
County of Robertson GO, 5.00%, 6/1/2025 | 25,000 | 26,714 |
County of Shelby, Public Improvement Series 2019A, GO, 5.00%, 4/1/2027 | 105,000 | 116,717 |
County of Sullivan GO, 5.00%, 5/1/2026 | 30,000 | 32,705 |
County of Washington Series 2016A, GO, 4.00%, 6/1/2027 | 50,000 | 52,733 |
County of Williamson GO, 5.00%, 4/1/2024 | 20,000 | 20,821 |
Knox County Health Educational and Housing Facility Board, East Tennessee Children's Hospital Rev., 5.00%, 11/15/2023 | 50,000 | 51,350 |
Metropolitan Government Nashville and Davidson County Health and Educational Facilities Board, Belmon University Rev., 5.00%, 5/1/2026 | 450,000 | 480,300 |
Metropolitan Government Nashville and Davidson County Health and Educational Facilities Board, Trevecca Nazarene University Project Series 2021B, Rev., 4.00%, 10/1/2041 | 355,000 | 307,143 |
Metropolitan Government of Nashville and Davidson County | ||
Series 2015A, GO, 5.00%, 7/1/2025 | 10,000 | 10,709 |
GO, 5.00%, 7/1/2031 | 2,000,000 | 2,245,020 |
Series B, GO, 4.00%, 1/1/2032 | 1,500,000 | 1,624,951 |
Metropolitan Government of Nashville and Davidson County, Electric System Series 2017A, Rev., 5.00%, 5/15/2024 | 10,000 | 10,427 |
Metropolitan Government of Nashville and Davidson County, Water and Sewer Series A, Rev., 4.00%, 7/1/2035 | 1,805,000 | 1,874,333 |
Shelby County Health Educational and Housing Facilities Board, Methodist Le Bonheur Healthcare | ||
Series 2017A, Rev., 5.00%, 5/1/2024 | 155,000 | 160,934 |
Series 2017A, Rev., 5.00%, 5/1/2027 | 200,000 | 218,807 |
Shelby County Health Educational and Housing Facilities Board, The Farms at Bailey Station Project | ||
Series 2019A, Rev., 5.00%, 10/1/2029 | 150,000 | 149,199 |
Series 2019A, Rev., 5.50%, 10/1/2034 | 150,000 | 148,818 |
INVESTMENTS | PRINCIPAL AMOUNT($) | VALUE($) |
Tennessee — continued | ||
State of Tennessee Series A, GO, 5.00%, 9/1/2024 (d) | 25,000 | 26,272 |
Tennessee Energy Acquisition Corp., Commodity Project Series 2021A, Rev., 5.00%, 11/1/2031 (b) | 400,000 | 418,125 |
Total Tennessee | 8,419,687 | |
Texas — 4.4% | ||
Alamo Community College District, Limited Tax 5.00%, 2/15/2024 | 75,000 | 77,732 |
Board of Regents of the University of Texas System, Financing System Series 2016D, Rev., 5.00%, 8/15/2024 | 50,000 | 52,500 |
Brushy Creek Regional Utility Authority, Inc., Brushy Creek Regional Water Treatment and Distribution Project 5.00%, 8/1/2026 | 85,000 | 92,131 |
City of Austin, Airport System | ||
Series 2019B, 5.00%, 11/15/2029 | 240,000 | 263,367 |
5.00%, 11/15/2035 | 1,000,000 | 1,085,390 |
City of Corpus Christi, Certificates of Obligation Series 2016A, 4.00%, 3/1/2026 | 100,000 | 104,772 |
City of Corpus Christi, Utility System Series B, 5.00%, 7/15/2032 | 325,000 | 371,276 |
City of Dallas, Waterworks & Sewer System Series C, Rev., 5.00%, 10/1/2029 | 1,000,000 | 1,150,710 |
City of Houston, Airport System, Subordinate Lien Series 2021A, Rev., AMT, 5.00%, 7/1/2033 | 250,000 | 272,511 |
City of Houston, Combined Utility System, First Lien Series 2018D, Rev., 5.00%, 11/15/2030 | 45,000 | 50,769 |
City of Hutto, Waterworks and Sewer System GO, 5.00%, 8/1/2026 | 80,000 | 87,177 |
City of League City, Combination Tax GO, 5.00%, 2/15/2027 | 20,000 | 21,657 |
City of Pflugerville, Limited Tax GO, 5.00%, 8/1/2026 | 25,000 | 27,311 |
City of San Angelo GO, 5.00%, 2/15/2027 | 20,000 | 21,926 |
City of San Marcos, Combination Tax, Certificates of Obligation GO, 5.00%, 8/15/2031 | 170,000 | 186,734 |
City of Temple, Utility System Series 2021, Rev., 5.00%, 8/1/2029 | 245,000 | 281,320 |
Clifton Higher Education Finance Corp., Idea Public Schools Series 2022A, 5.00%, 8/15/2031 | 250,000 | 275,086 |
Clifton Higher Education Finance Corp., Yes Prep Public Schools, Inc. | ||
PSF-GTD, 5.00%, 4/1/2029 | 100,000 | 112,372 |
154 | J.P. Morgan Exchange-Traded Funds | August 31, 2022 |
INVESTMENTS | PRINCIPAL AMOUNT($) | VALUE($) |
Municipal Bonds — continued | ||
Texas — continued | ||
PSF-GTD, 5.00%, 4/1/2030 | 185,000 | 210,209 |
PSF-GTD, 4.00%, 4/1/2031 | 175,000 | 185,257 |
Clint Independent School District, Unlimited Tax Series 2015A, PSF-GTD, 5.00%, 2/15/2024 | 25,000 | 25,925 |
County of Harris, Unlimited Tax Series 2017A, GO, 5.00%, 10/1/2026 | 25,000 | 27,413 |
County of Hays, Limited Tax GO, 5.00%, 2/15/2026 | 20,000 | 21,629 |
County of Montgomery, Unlimited Tax GO, 5.00%, 3/1/2025 | 25,000 | 26,509 |
County of Williamson, Limited Tax GO, 5.00%, 2/15/2026 | 40,000 | 43,397 |
Cypress-Fairbanks Independent School District, Unlimited Tax Series 2015A, GO, PSF-GTD, 5.00%, 2/15/2025 | 20,000 | 21,240 |
Fort Worth Independent School District, Unlimited Tax Series A, GO, PSF-GTD, 5.00%, 2/15/2029 | 285,000 | 324,988 |
Harris County Cultural Education Facilities Finance Corp., Baylor College of Medicine Project Rev., 5.00%, 11/15/2023 | 25,000 | 25,687 |
Laredo Independent School District, Unlimited Tax GO, PSF-GTD, 5.00%, 8/1/2024 | 25,000 | 26,241 |
Lower Colorado River Authority, LCRA Transmission Services Corp. Project Rev., 5.00%, 5/15/2035 | 155,000 | 167,621 |
Metropolitan Transit Authority of Harris County, Sales and Use Tax | ||
Series 2017A, Rev., 5.00%, 11/1/2023 | 150,000 | 154,501 |
Series 2017A, Rev., 5.00%, 11/1/2025 | 45,000 | 48,403 |
Metropolitan Transit Authority of Harris County, Sales and Use Tax, Contractual Obligations Series B, Rev., 5.00%, 11/1/2029 | 25,000 | 27,923 |
New Hope Cultural Education Facilities Finance Corp, Outlook at Windhaven Forefront Living Series 2022B-3, Rev., 4.25%, 10/1/2026 | 800,000 | 801,067 |
North East Independent School District, Unlimited Tax GO, PSF-GTD, 5.00%, 8/1/2025 | 20,000 | 21,469 |
North Texas Municipal Water District, Wastewater System Rev., 5.00%, 6/1/2027 | 20,000 | 22,146 |
Northside Independent School District, Unlimited Tax GO, PSF-GTD, 5.00%, 8/15/2024 | 65,000 | 68,288 |
Old Spanish Trail-Alemda Corridors Redevelopment Authority Rev., 5.00%, 9/1/2028 | 125,000 | 139,035 |
INVESTMENTS | PRINCIPAL AMOUNT($) | VALUE($) |
Texas — continued | ||
Pearland Independent School District, Unlimited Tax Series 2016A, GO, PSF-GTD, 5.00%, 2/15/2023 | 25,000 | 25,311 |
Permanent University Fund - University of Texas System Series 2016A, Rev., 5.00%, 7/1/2024 | 85,000 | 88,918 |
Prosper Independent School District, Unlimited Tax School Building GO, PSF-GTD, 5.00%, 2/15/2037 | 25,000 | 27,381 |
San Antonio Education Facilities Corp., Hallmark University Project Series 2021A, Rev., 5.00%, 10/1/2041 | 100,000 | 92,354 |
San Antonio Water System, Junior Lien Series 2017A, Rev., 5.00%, 5/15/2025 | 25,000 | 26,674 |
Sherman Independent School District, Unlimited Tax Series 2018A, GO, PSF-GTD, 5.00%, 2/15/2030 | 25,000 | 28,033 |
State of Texas, Transportation Commission Mobility Fund Series 2015-A, GO, 5.00%, 10/1/2024 | 50,000 | 52,656 |
Stephen F Austin State University, Financing System Series 2019A, Rev., 5.00%, 10/15/2026 | 60,000 | 65,059 |
Tarrant County College District Series 2022, GO, 5.00%, 8/15/2034 | 2,000,000 | 2,323,976 |
Tarrant Regional, Water Control and Improvement District, Water System Rev., 5.00%, 3/1/2025 | 25,000 | 26,553 |
Texas A&M University, Financing System Series E, Rev., 5.00%, 5/15/2030 | 155,000 | 170,586 |
Texas Tech University System Series 2017A, Rev., 5.00%, 2/15/2024 | 35,000 | 36,285 |
Trinity River Authority, Water Project Rev., 5.00%, 2/1/2026 | 60,000 | 64,713 |
Uptown Development Authority, Tax Increment Contract Rev., 4.00%, 9/1/2032 | 400,000 | 390,770 |
Total Texas | 10,342,958 | |
Utah — 1.0% | ||
City of Salt Lake, International Airport Series 2022A, Rev., 4.00%, 10/1/2030 | 155,000 | 168,287 |
City of South Jordan, Sales Tax Rev., 5.00%, 8/15/2029 | 45,000 | 51,914 |
County of Summit, Sales Tax Rev., 5.00%, 12/15/2023 | 70,000 | 72,376 |
Metropolitan Water District of Salt Lake & Sandy Series A, Rev., 4.00%, 7/1/2030 | 365,000 | 398,633 |
Military Installation Development Authority, Tax Allocation and Hotel Tax Series 2021A-1, Rev., 4.00%, 6/1/2041 | 125,000 | 103,485 |
August 31, 2022 | J.P. Morgan Exchange-Traded Funds | 155 |
AS OF August 31, 2022 (Unaudited) (continued)
INVESTMENTS | PRINCIPAL AMOUNT($) | VALUE($) |
Municipal Bonds — continued | ||
Utah — continued | ||
Snyderville Basin Special Recreation District GO, 4.00%, 12/15/2025 | 100,000 | 104,993 |
University of Utah (The) Series B, Rev., 5.00%, 8/1/2023 (d) | 25,000 | 25,591 |
Utah Charter School Finance Authority, Summit Academy Incorporated Series A, Rev., 5.00%, 4/15/2030 | 110,000 | 121,922 |
Utah Charter School Finance Authority, The Freedom Academy Foundation, St. George Campus Project Series 2021A, Rev., 5.00%, 6/15/2041 (c) | 150,000 | 147,123 |
Utah Infrastructure Agency | ||
Series 2022, Rev., 5.00%, 10/15/2027 | 130,000 | 134,910 |
Series 2022, Rev., 5.00%, 10/15/2032 | 310,000 | 318,538 |
Utah Transit Authority, Sales Tax Series A, Rev., BHAC - CR, 5.00%, 6/15/2035 | 295,000 | 339,720 |
Wasatch County Municipal Building Authority Rev., 4.00%, 12/1/2027 | 270,000 | 287,355 |
Total Utah | 2,274,847 | |
Virgin Islands — 0.1% | ||
Matching Fund Special Purpose Securitization Corp. Series 2022A, Rev., 5.00%, 10/1/2025 | 150,000 | 155,828 |
Virginia — 0.6% | ||
City of Richmond, Public Improvement Series B, GO, 5.00%, 7/15/2027 | 175,000 | 195,919 |
Commonwealth of Virginia Series 2018A, GO, 5.00%, 6/1/2030 | 25,000 | 28,339 |
County of Fairfax, Public Improvement Series 2022A, GO, 4.00%, 10/1/2031 | 100,000 | 111,396 |
County of Spotsylvania, Public Improvement GO, 5.00%, 7/15/2029 | 85,000 | 96,744 |
Virginia Public Building Authority Series 2021A-1, Rev., 5.00%, 8/1/2030 | 145,000 | 169,371 |
Virginia Public Building Authority, Public Facilities Series 2022A, Rev., 5.00%, 8/1/2030 | 345,000 | 402,985 |
Virginia Resources Authority, Infrastructure Pooled Financing Program Series 2013-C, Rev., 5.00%, 11/1/2023 | 35,000 | 36,079 |
Virginia Small Business Financing Authority, Senior Lien Rev., AMT, 4.00%, 7/1/2032 | 250,000 | 249,288 |
Total Virginia | 1,290,121 | |
Washington — 2.9% | ||
Auburn School District No. 408 of King and Pierce Counties, Unlimited Tax GO, 4.00%, 12/1/2036 | 1,000,000 | 1,026,753 |
INVESTMENTS | PRINCIPAL AMOUNT($) | VALUE($) |
Washington — continued | ||
Central Puget Sound Regional Transit Authority, Sales and Use Tax Series 2015S-1, 5.00%, 11/1/2024 | 30,000 | 31,668 |
City of Bonney Lake, Water & Sewer System 4.00%, 12/1/2030 | 10,000 | 10,456 |
City of Richland, Waterworks Utility Rev., 4.00%, 11/1/2022 | 10,000 | 10,029 |
City of Seattle, Drainage and Wastewater System Improvement Rev., 4.00%, 4/1/2026 | 20,000 | 21,090 |
City of Seattle, Water System Rev., 5.00%, 8/1/2024 | 35,000 | 36,737 |
City of Tacoma, Solid Waste Utility Rev., 5.00%, 12/1/2031 | 700,000 | 815,051 |
City of University Place, Limited Tax GO, 5.00%, 12/1/2026 | 85,000 | 92,765 |
Clark County School District No. 101 La Center, Unlimited Tax 5.00%, 12/1/2029 | 50,000 | 56,242 |
County of King, Limited Tax | ||
Series A, GO, 5.00%, 7/1/2025 | 50,000 | 52,992 |
Series B, GO, 5.00%, 12/1/2025 | 20,000 | 20,669 |
Series 2022A, GO, 5.00%, 7/1/2033 | 1,000,000 | 1,179,409 |
County of Snohomish, Limited Tax GO, 5.00%, 12/1/2025 | 10,000 | 10,678 |
Energy Northwest, Bonneville Power Administrator Series 2016-A, Rev., 5.00%, 7/1/2028 | 25,000 | 27,255 |
Energy Northwest, Project 1 Series 2017A, Rev., 5.00%, 7/1/2028 | 55,000 | 61,180 |
Franklin County School District No. 1 Pasco, Unlimited Tax GO, 5.00%, 12/1/2030 | 35,000 | 38,826 |
King County Public Hospital District No. 2, Evergreen Healthcare, Limited Tax GO, 5.00%, 12/1/2024 (d) | 105,000 | 110,865 |
King County School District No. 403 Renton, Unlimited Tax GO, 4.00%, 12/1/2023 | 160,000 | 163,218 |
King County School District No. 405 Bellevue, Unlimited Tax GO, 5.00%, 12/1/2026 | 20,000 | 22,080 |
King County School District No. 411 Issaquah, Unlimited Tax GO, 5.00%, 12/1/2024 | 35,000 | 37,026 |
Mason County School District No. 309 Shelton, Unlimited Tax GO, 5.00%, 12/1/2029 | 45,000 | 49,891 |
Pend Oreille County, Public Utility District No. 1, Box Canyon Production System Rev., 5.00%, 1/1/2027 | 65,000 | 69,047 |
Pierce County School District No. 10 Tacoma, Unlimited Tax Series 2020B, GO, 4.00%, 12/1/2032 | 1,085,000 | 1,157,552 |
156 | J.P. Morgan Exchange-Traded Funds | August 31, 2022 |
INVESTMENTS | PRINCIPAL AMOUNT($) | VALUE($) |
Municipal Bonds — continued | ||
Washington — continued | ||
Pierce County School District No. 403 Bethel, Unlimited Tax GO, 4.00%, 12/1/2023 | 20,000 | 20,402 |
Pierce County School District No. 416 White River, Unlimited Tax GO, 5.00%, 12/1/2025 | 50,000 | 54,037 |
Port of Seattle, Intermediate Lien Series 2022B, Rev., AMT, 4.00%, 8/1/2047 | 400,000 | 369,496 |
Snohomish County School District No. 15 Edmonds, Unlimited Tax GO, 5.00%, 12/1/2025 | 25,000 | 27,019 |
Snohomish County School District No. 4 Lake Stevens, Unlimited Tax GO, 5.00%, 12/1/2024 | 25,000 | 26,419 |
Snohomish County School District No. 6 Mukilteo, Unlimited Tax GO, 5.00%, 12/1/2023 | 105,000 | 108,460 |
Spokane County School District No. 354 Mead, Unlimited Tax GO, 5.00%, 12/1/2024 | 20,000 | 21,113 |
State of Washington Series 2021B, GO, 5.00%, 6/1/2033 | 1,000,000 | 1,139,999 |
State of Washington, State and Local Agency Real and Personal Property Series 2015-C, COP, 5.00%, 1/1/2029 | 55,000 | 59,020 |
Washington Health Care Facilities Authority, Providence St. Joseph Health Series 2018B, Rev., 5.00%, 10/1/2028 | 30,000 | 33,472 |
Total Washington | 6,960,916 | |
Wisconsin — 3.9% | ||
City of Oshkosh, Sewer | ||
Series E, Rev., 5.00%, 5/1/2027 | 550,000 | 606,270 |
Series E, Rev., 5.00%, 5/1/2029 | 605,000 | 684,415 |
City of Oshkosh, Water | ||
Series D, Rev., 5.00%, 1/1/2027 | 265,000 | 289,980 |
Series D, Rev., 5.00%, 1/1/2028 | 180,000 | 199,645 |
Hamilton School District, School Building and Improvement GO, 5.00%, 4/1/2025 | 60,000 | 63,922 |
Public Finance Authority, Acts Retirement Life Communities, Inc., Obligated Group Series 2020A, Rev., 4.00%, 11/15/2037 | 300,000 | 287,427 |
Public Finance Authority, Entrance Fee Principal Redemption, Searstone CCRC Project Series 2021B2, Rev., 2.25%, 6/1/2027 (c) | 250,000 | 227,189 |
Public Finance Authority, Lenoir-Rhyne University | ||
Series 2022, Rev., 5.00%, 4/1/2029 | 1,155,000 | 1,210,348 |
Series 2022, Rev., 5.00%, 4/1/2030 | 1,215,000 | 1,270,420 |
Series 2022, Rev., 5.00%, 4/1/2031 | 1,275,000 | 1,328,107 |
Series 2022, Rev., 5.00%, 4/1/2032 | 665,000 | 686,553 |
INVESTMENTS | PRINCIPAL AMOUNT($) | VALUE($) |
Wisconsin — continued | ||
Public Finance Authority, Piedmont Community Charter School Rev., 5.00%, 6/15/2039 | 200,000 | 203,254 |
Public Finance Authority, Roseman University of Health Rev., 4.00%, 4/1/2032 (c) | 225,000 | 214,964 |
Public Finance Authority, Scotland Healthcare System Series 2021A, Rev., 5.00%, 10/1/2027 | 500,000 | 540,903 |
Public Finance Authority, Ultimate Medical Academy Project Series 2019A, Rev., 5.00%, 10/1/2029 (c) | 150,000 | 153,950 |
State of Wisconsin | ||
Series B, GO, 4.00%, 5/1/2023 | 40,000 | 40,450 |
Series 1, GO, 5.00%, 11/1/2024 | 40,000 | 42,206 |
Series 2, GO, 5.00%, 11/1/2026 | 50,000 | 54,454 |
State of Wisconsin, Clean Water Fund Leveraged Loan Portfolio | ||
Series 1, Rev., 5.00%, 6/1/2023 (d) | 25,000 | 25,487 |
Rev., 5.00%, 6/1/2024 (d) | 65,000 | 67,685 |
State of Wisconsin, Environmental Improvement Fund | ||
Series 2018A, Rev., 5.00%, 6/1/2025 | 35,000 | 37,419 |
Series 2018A, Rev., 5.00%, 6/1/2026 | 20,000 | 21,857 |
Village of Pleasant Prairie GO, 4.00%, 8/1/2024 | 10,000 | 10,246 |
Wisconsin Department of Transportation | ||
Series 2, Rev., 5.00%, 7/1/2031 | 180,000 | 199,370 |
Series 2, Rev., 5.00%, 7/1/2032 | 50,000 | 55,210 |
Wisconsin Health and Educational Facilities Authority, Oakwood Lutheran Senior Ministries | ||
Rev., 4.00%, 1/1/2026 | 175,000 | 174,722 |
Rev., 4.00%, 1/1/2027 | 175,000 | 173,619 |
Wisconsin Health and Educational Facilities Authority, St. Camillus Health System Series 2019A, Rev., 5.00%, 11/1/2029 | 150,000 | 149,722 |
WPPI Energy Series 2016A, Rev., 5.00%, 7/1/2024 | 170,000 | 177,028 |
Total Wisconsin | 9,196,822 | |
Total Municipal Bonds (Cost $209,082,599) | 204,174,440 | |
August 31, 2022 | J.P. Morgan Exchange-Traded Funds | 157 |
AS OF August 31, 2022 (Unaudited) (continued)
INVESTMENTS | SHARES | VALUE($) |
Short-Term Investments — 14.5% | ||
Investment Companies — 14.5% | ||
JPMorgan Institutional Tax Free Money Market Fund Class IM Shares, 1.36% (f) (g) (Cost $34,481,860) | 34,469,496 | 34,479,837 |
Total Investments — 100.5% (Cost $243,564,459) | 238,654,277 | |
Liabilities in Excess of Other Assets — (0.5)% | (1,217,182) | |
NET ASSETS — 100.0% | 237,437,095 | |
Percentages indicated are based on net assets. |
Abbreviations | |
AGM | Insured by Assured Guaranty Municipal Corp. |
AMT | Alternative Minimum Tax |
BAN | Bond Anticipation Note |
BHAC | Insured by Berkshire Hathaway Assurance Corp. |
CCRC | Congregate Care Retirement Center |
COP | Certificate of Participation |
CR | Custodial Receipts |
GO | General Obligation |
GTD | Guaranteed |
LIQ | Liquidity Agreement |
PSF-GTD | Permanent School Fund Guaranteed |
Q-SBLF | Qualified School Bond Loan Fund |
Rev. | Revenue |
VRDO | Variable Rate Demand Obligation |
^ | Amount rounds to less than 0.1% of net assets. | |
(a) | The date shown represents the earliest of the prerefunded date, next put date or final maturity date. | |
(b) | Variable or floating rate security, the interest rate of which adjusts periodically based on changes in current interest rates and prepayments on the underlying pool of assets. The interest rate shown is the current rate as of August 31, 2022. | |
(c) | Securities exempt from registration under Rule 144A or section 4(a)(2), of the Securities Act of 1933, as amended. | |
(d) | Security is prerefunded or escrowed to maturity. | |
(e) | All or a portion of the security is a when-issued security, delayed delivery security, or forward commitment. | |
(f) | Investment in an affiliated fund, which is registered under the Investment Company Act of 1940, as amended, and is advised by J.P. Morgan Investment Management Inc. | |
(g) | The rate shown is the current yield as of August 31, 2022. | |
DESCRIPTION | NUMBER OF CONTRACTS | EXPIRATION DATE | TRADING CURRENCY | NOTIONAL AMOUNT ($) | VALUE AND UNREALIZED APPRECIATION (DEPRECIATION) ($) |
Short Contracts | |||||
U.S. Treasury 10 Year Ultra Note | (7) | 12/20/2022 | USD | (874,016) | 7,501 |
Abbreviations | |
USD | United States Dollar |
158 | J.P. Morgan Exchange-Traded Funds | August 31, 2022 |
AS OF August 31, 2022 (Unaudited)
INVESTMENTS | PRINCIPAL AMOUNT($) | VALUE($) |
Corporate Bonds — 39.7% | ||
Aerospace & Defense — 0.5% | ||
Boeing Co. (The) | ||
4.88%, 5/1/2025 | 570,000 | 571,592 |
2.20%, 2/4/2026 | 125,000 | 114,385 |
Bombardier, Inc. (Canada) 6.00%, 2/15/2028 (a) | 55,000 | 48,623 |
BWX Technologies, Inc. | ||
4.13%, 6/30/2028 (a) | 45,000 | 41,400 |
4.13%, 4/15/2029 (a) | 60,000 | 53,550 |
Howmet Aerospace, Inc. 5.90%, 2/1/2027 | 50,000 | 50,260 |
Moog, Inc. 4.25%, 12/15/2027 (a) | 25,000 | 22,884 |
Spirit AeroSystems, Inc. 7.50%, 4/15/2025 (a) | 70,000 | 68,454 |
TransDigm, Inc. 6.25%, 3/15/2026 (a) | 60,000 | 58,950 |
Triumph Group, Inc. 8.88%, 6/1/2024 (a) | 50,000 | 50,625 |
1,080,723 | ||
Airlines — 0.1% | ||
American Airlines, Inc. | ||
5.50%, 4/20/2026 (a) | 12,000 | 11,415 |
5.75%, 4/20/2029 (a) | 54,750 | 49,425 |
United Airlines, Inc. 4.38%, 4/15/2026 (a) | 53,000 | 48,323 |
109,163 | ||
Auto Components — 0.3% | ||
Adient Global Holdings Ltd. 4.88%, 8/15/2026 (a) | 200,000 | 185,088 |
Allison Transmission, Inc. 5.88%, 6/1/2029 (a) | 40,000 | 37,603 |
American Axle & Manufacturing, Inc. | ||
6.50%, 4/1/2027 | 50,000 | 46,750 |
5.00%, 10/1/2029 (b) | 30,000 | 25,263 |
Clarios Global LP | ||
6.75%, 5/15/2025 (a) | 60,000 | 59,690 |
6.25%, 5/15/2026 (a) | 36,000 | 35,600 |
Dana, Inc. | ||
5.38%, 11/15/2027 | 50,000 | 44,579 |
4.50%, 2/15/2032 | 25,000 | 19,959 |
Goodyear Tire & Rubber Co. (The) 5.25%, 4/30/2031 (b) | 124,000 | 108,130 |
Icahn Enterprises LP 5.25%, 5/15/2027 | 90,000 | 81,877 |
644,539 | ||
Automobiles — 0.8% | ||
BMW US Capital LLC (Germany) 3.90%, 4/9/2025 (a) | 150,000 | 148,854 |
Ford Motor Co. 9.63%, 4/22/2030 | 70,000 | 81,867 |
INVESTMENTS | PRINCIPAL AMOUNT($) | VALUE($) |
Automobiles — continued | ||
Hyundai Capital America | ||
4.13%, 6/8/2023 (a) | 150,000 | 150,195 |
2.65%, 2/10/2025 (a) | 250,000 | 237,011 |
1.80%, 10/15/2025 (a) | 200,000 | 181,462 |
Nissan Motor Acceptance Co. LLC 1.85%, 9/16/2026 (a) | 255,000 | 216,194 |
Stellantis Finance US, Inc. 1.71%, 1/29/2027 (a) | 210,000 | 181,656 |
Volkswagen Group of America Finance LLC (Germany) | ||
3.35%, 5/13/2025 (a) | 200,000 | 193,738 |
4.35%, 6/8/2027 (a) | 385,000 | 374,782 |
1,765,759 | ||
Banks — 13.3% | ||
ABN AMRO Bank NV (Netherlands) 4.75%, 7/28/2025 (a) | 400,000 | 394,502 |
AIB Group plc (Ireland) (ICE LIBOR USD 3 Month + 1.87%), 4.26%, 4/10/2025 (a) (c) | 645,000 | 628,086 |
Australia & New Zealand Banking Group Ltd. (Australia) | ||
4.40%, 5/19/2026 (a) | 750,000 | 737,435 |
(US Treasury Yield Curve Rate T Note Constant Maturity 5 Year + 1.29%), 2.95%, 7/22/2030 (a) (c) | 200,000 | 186,106 |
Banco Continental SAECA (Paraguay) 2.75%, 12/10/2025 (a) | 150,000 | 132,750 |
Banco Santander SA (Spain) | ||
2.75%, 5/28/2025 | 600,000 | 564,213 |
5.15%, 8/18/2025 | 400,000 | 398,076 |
5.18%, 11/19/2025 | 200,000 | 198,080 |
(US Treasury Yield Curve Rate T Note Constant Maturity 1 Year + 0.90%), 1.72%, 9/14/2027 (c) | 200,000 | 172,167 |
(US Treasury Yield Curve Rate T Note Constant Maturity 1 Year + 2.00%), 4.17%, 3/24/2028 (c) | 200,000 | 187,677 |
Bank of America Corp. | ||
(ICE LIBOR USD 3 Month + 0.94%), 3.86%, 7/23/2024 (c) | 200,000 | 198,926 |
(ICE LIBOR USD 3 Month + 0.64%), 2.01%, 2/13/2026 (c) | 585,000 | 548,555 |
(SOFR + 1.33%), 3.38%, 4/2/2026 (c) | 380,000 | 366,688 |
(SOFR + 0.96%), 1.73%, 7/22/2027 (c) | 230,000 | 204,091 |
(SOFR + 1.05%), 2.55%, 2/4/2028 (c) | 345,000 | 312,777 |
August 31, 2022 | J.P. Morgan Exchange-Traded Funds | 159 |
AS OF August 31, 2022 (Unaudited) (continued)
INVESTMENTS | PRINCIPAL AMOUNT($) | VALUE($) |
Corporate Bonds — continued | ||
Banks — continued | ||
(SOFR + 2.04%), 4.95%, 7/22/2028 (c) | 475,000 | 474,566 |
Bank of Ireland Group plc (Ireland) (US Treasury Yield Curve Rate T Note Constant Maturity 1 Year + 1.10%), 2.03%, 9/30/2027 (a) (c) | 245,000 | 210,674 |
Banque Federative du Credit Mutuel SA (France) 4.75%, 7/13/2027 (a) | 530,000 | 526,021 |
Barclays plc (United Kingdom) | ||
(ICE LIBOR USD 3 Month + 1.61%), 3.93%, 5/7/2025 (c) | 600,000 | 586,524 |
(US Treasury Yield Curve Rate T Note Constant Maturity 1 Year + 1.05%), 2.28%, 11/24/2027 (c) | 320,000 | 281,039 |
BNP Paribas SA (France) (ICE LIBOR USD 3 Month + 2.24%), 4.70%, 1/10/2025 (a) (c) | 1,695,000 | 1,690,759 |
Citigroup, Inc. | ||
(SOFR + 0.67%), 0.98%, 5/1/2025 (c) | 85,000 | 80,003 |
(SOFR + 0.69%), 2.01%, 1/25/2026 (c) | 455,000 | 427,523 |
(SOFR + 2.84%), 3.11%, 4/8/2026 (c) | 200,000 | 192,105 |
(SOFR + 0.77%), 1.12%, 1/28/2027 (c) | 85,000 | 75,027 |
(SOFR + 1.89%), 4.66%, 5/24/2028 (c) | 870,000 | 857,769 |
Citizens Bank NA | ||
2.25%, 4/28/2025 | 250,000 | 236,877 |
(SOFR + 1.40%), 4.12%, 5/23/2025 (c) | 560,000 | 555,068 |
Credit Agricole SA (France) | ||
4.38%, 3/17/2025 (a) | 1,100,000 | 1,078,458 |
(SOFR + 1.68%), 1.91%, 6/16/2026 (a) (c) | 565,000 | 518,541 |
Danske Bank A/S (Denmark) | ||
(US Treasury Yield Curve Rate T Note Constant Maturity 1 Year + 1.03%), 1.17%, 12/8/2023 (a) (c) | 200,000 | 197,889 |
(US Treasury Yield Curve Rate T Note Constant Maturity 1 Year + 0.55%), 0.98%, 9/10/2025 (a) (c) | 305,000 | 280,062 |
Federation des Caisses Desjardins du Quebec (Canada) 2.05%, 2/10/2025 (a) | 200,000 | 187,701 |
First-Citizens Bank & Trust Co. 6.13%, 3/9/2028 | 35,000 | 36,098 |
INVESTMENTS | PRINCIPAL AMOUNT($) | VALUE($) |
Banks — continued | ||
HSBC Holdings plc (United Kingdom) | ||
(ICE LIBOR USD 3 Month + 0.99%), 3.95%, 5/18/2024 (c) | 200,000 | 198,896 |
(SOFR + 0.53%), 0.73%, 8/17/2024 (c) | 270,000 | 259,014 |
(ICE LIBOR USD 3 Month + 1.21%), 3.80%, 3/11/2025 (c) | 250,000 | 245,220 |
(SOFR + 0.71%), 0.98%, 5/24/2025 (c) | 350,000 | 326,251 |
(SOFR + 1.54%), 1.64%, 4/18/2026 (c) | 200,000 | 182,116 |
(SOFR + 1.10%), 2.25%, 11/22/2027 (c) | 385,000 | 339,415 |
(SOFR + 2.11%), 4.75%, 6/9/2028 (c) | 480,000 | 462,908 |
(SOFR + 2.61%), 5.21%, 8/11/2028 (c) | 420,000 | 409,942 |
ING Groep NV (Netherlands) | ||
(SOFR + 1.01%), 1.73%, 4/1/2027 (c) | 200,000 | 177,097 |
(SOFR + 1.83%), 4.02%, 3/28/2028 (c) | 235,000 | 222,792 |
Lloyds Banking Group plc (United Kingdom) | ||
(US Treasury Yield Curve Rate T Note Constant Maturity 1 Year + 1.00%), 2.44%, 2/5/2026 (c) | 200,000 | 187,931 |
4.65%, 3/24/2026 | 700,000 | 682,988 |
(US Treasury Yield Curve Rate T Note Constant Maturity 1 Year + 1.75%), 4.72%, 8/11/2026 (c) | 415,000 | 409,434 |
Mitsubishi UFJ Financial Group, Inc. (Japan) | ||
(US Treasury Yield Curve Rate T Note Constant Maturity 1 Year + 1.13%), 3.84%, 4/17/2026 (c) | 570,000 | 556,887 |
(US Treasury Yield Curve Rate T Note Constant Maturity 1 Year + 0.75%), 1.54%, 7/20/2027 (c) | 200,000 | 176,194 |
(US Treasury Yield Curve Rate T Note Constant Maturity 1 Year + 0.83%), 2.34%, 1/19/2028 (c) | 400,000 | 358,935 |
Mizuho Financial Group Cayman 3 Ltd. (Japan) 4.60%, 3/27/2024 (a) | 690,000 | 687,087 |
Mizuho Financial Group, Inc. (Japan) | ||
(SOFR + 1.25%), 1.24%, 7/10/2024 (c) | 200,000 | 194,256 |
(SOFR + 1.24%), 2.84%, 7/16/2025 (c) | 200,000 | 192,530 |
(US Treasury Yield Curve Rate T Note Constant Maturity 1 Year + 0.90%), 2.65%, 5/22/2026 (c) | 470,000 | 441,077 |
160 | J.P. Morgan Exchange-Traded Funds | August 31, 2022 |
INVESTMENTS | PRINCIPAL AMOUNT($) | VALUE($) |
Corporate Bonds — continued | ||
Banks — continued | ||
NatWest Group plc (United Kingdom) | ||
(ICE LIBOR USD 3 Month + 1.55%), 4.52%, 6/25/2024 (c) | 200,000 | 198,885 |
4.80%, 4/5/2026 | 500,000 | 497,212 |
(US Treasury Yield Curve Rate T Note Constant Maturity 1 Year + 0.90%), 1.64%, 6/14/2027 (c) | 210,000 | 183,845 |
Santander UK Group Holdings plc (United Kingdom) | ||
(ICE LIBOR USD 3 Month + 1.08%), 3.37%, 1/5/2024 (c) | 200,000 | 198,906 |
(SOFR + 0.79%), 1.09%, 3/15/2025 (c) | 645,000 | 603,434 |
(US Treasury Yield Curve Rate T Note Constant Maturity 1 Year + 1.25%), 1.53%, 8/21/2026 (c) | 955,000 | 853,936 |
Societe Generale SA (France) | ||
3.88%, 3/28/2024 (a) | 200,000 | 197,031 |
4.25%, 4/14/2025 (a) | 770,000 | 753,957 |
(US Treasury Yield Curve Rate T Note Constant Maturity 1 Year + 1.05%), 2.23%, 1/21/2026 (a) (c) | 365,000 | 337,595 |
(US Treasury Yield Curve Rate T Note Constant Maturity 1 Year + 1.10%), 1.49%, 12/14/2026 (a) (c) | 200,000 | 174,293 |
4.68%, 6/15/2027 (a) | 285,000 | 282,257 |
Standard Chartered plc (United Kingdom) | ||
5.20%, 1/26/2024 (a) | 350,000 | 350,667 |
(ICE LIBOR USD 3 Month + 1.08%), 3.89%, 3/15/2024 (a) (c) | 200,000 | 198,954 |
(US Treasury Yield Curve Rate T Note Constant Maturity 1 Year + 0.78%), 0.99%, 1/12/2025 (a) (c) | 250,000 | 236,275 |
(ICE LIBOR USD 3 Month + 1.21%), 2.82%, 1/30/2026 (a) (c) | 200,000 | 188,039 |
(US Treasury Yield Curve Rate T Note Constant Maturity 1 Year + 1.65%), 3.97%, 3/30/2026 (a) (c) | 310,000 | 299,590 |
Sumitomo Mitsui Financial Group, Inc. (Japan) | ||
4.44%, 4/2/2024 (a) | 400,000 | 397,846 |
2.35%, 1/15/2025 | 200,000 | 190,522 |
Sumitomo Mitsui Trust Bank Ltd. (Japan) 0.85%, 3/25/2024 (a) | 200,000 | 189,367 |
UniCredit SpA (Italy) (US Treasury Yield Curve Rate T Note Constant Maturity 1 Year + 1.20%), 1.98%, 6/3/2027 (a) (c) | 200,000 | 169,227 |
INVESTMENTS | PRINCIPAL AMOUNT($) | VALUE($) |
Banks — continued | ||
Wells Fargo & Co. | ||
(ICE LIBOR USD 3 Month + 0.75%), 2.16%, 2/11/2026 (c) | 150,000 | 141,132 |
(SOFR + 1.56%), 4.54%, 8/15/2026 (c) | 535,000 | 531,371 |
(SOFR + 1.51%), 3.53%, 3/24/2028 (c) | 285,000 | 269,232 |
(SOFR + 1.98%), 4.81%, 7/25/2028 (c) | 445,000 | 441,733 |
Westpac Banking Corp. (Australia) (US Treasury Yield Curve Rate T Note Constant Maturity 5 Year + 1.35%), 2.89%, 2/4/2030 (c) | 150,000 | 140,856 |
28,459,965 | ||
Beverages — 0.1% | ||
Central American Bottling Corp. (Guatemala) 5.25%, 4/27/2029 (a) | 140,000 | 128,975 |
Keurig Dr Pepper, Inc. 0.75%, 3/15/2024 | 85,000 | 80,781 |
209,756 | ||
Biotechnology — 0.1% | ||
Emergent BioSolutions, Inc. 3.88%, 8/15/2028 (a) | 80,000 | 56,000 |
Grifols Escrow Issuer SA (Spain) 4.75%, 10/15/2028 (a) | 200,000 | 166,710 |
222,710 | ||
Building Products — 0.2% | ||
Builders FirstSource, Inc. 4.25%, 2/1/2032 (a) | 35,000 | 27,938 |
Griffon Corp. 5.75%, 3/1/2028 | 75,000 | 69,375 |
PGT Innovations, Inc. 4.38%, 10/1/2029 (a) | 55,000 | 46,521 |
Standard Industries, Inc. 4.75%, 1/15/2028 (a) | 200,000 | 174,828 |
Summit Materials LLC 5.25%, 1/15/2029 (a) | 35,000 | 31,482 |
350,144 | ||
Capital Markets — 4.3% | ||
Coinbase Global, Inc. | ||
3.38%, 10/1/2028 (a) | 8,000 | 5,170 |
3.63%, 10/1/2031 (a) | 8,000 | 4,871 |
Credit Suisse Group AG (Switzerland) | ||
3.80%, 6/9/2023 | 380,000 | 378,128 |
(SOFR + 1.56%), 2.59%, 9/11/2025 (a) (c) | 250,000 | 231,307 |
August 31, 2022 | J.P. Morgan Exchange-Traded Funds | 161 |
AS OF August 31, 2022 (Unaudited) (continued)
INVESTMENTS | PRINCIPAL AMOUNT($) | VALUE($) |
Corporate Bonds — continued | ||
Capital Markets — continued | ||
(SOFR + 2.04%), 2.19%, 6/5/2026 (a) (c) | 250,000 | 223,365 |
(SOFR + 3.34%), 6.37%, 7/15/2026 (a) (c) | 405,000 | 403,100 |
Deutsche Bank AG (Germany) | ||
(SOFR + 2.16%), 2.22%, 9/18/2024 (c) | 150,000 | 144,665 |
(SOFR + 1.22%), 2.31%, 11/16/2027 (c) | 320,000 | 271,850 |
Goldman Sachs Group, Inc. (The) | ||
Series VAR, (SOFR + 0.54%), 0.63%, 11/17/2023 (c) | 500,000 | 495,928 |
(SOFR + 0.57%), 0.67%, 3/8/2024 (c) | 200,000 | 196,068 |
(SOFR + 0.73%), 1.76%, 1/24/2025 (c) | 500,000 | 480,481 |
(SOFR + 1.51%), 4.39%, 6/15/2027 (c) | 475,000 | 466,181 |
(SOFR + 0.91%), 1.95%, 10/21/2027 (c) | 423,000 | 375,703 |
(SOFR + 1.11%), 2.64%, 2/24/2028 (c) | 390,000 | 353,667 |
(SOFR + 1.85%), 3.62%, 3/15/2028 (c) | 220,000 | 208,197 |
Macquarie Bank Ltd. (Australia) 2.30%, 1/22/2025 (a) | 150,000 | 142,938 |
Macquarie Group Ltd. (Australia) | ||
(ICE LIBOR USD 3 Month + 1.02%), 3.19%, 11/28/2023 (a) (c) | 500,000 | 498,537 |
(SOFR + 0.91%), 1.63%, 9/23/2027 (a) (c) | 140,000 | 120,418 |
(SOFR + 2.13%), 4.10%, 6/21/2028 (a) (c) | 380,000 | 361,529 |
Morgan Stanley | ||
(SOFR + 0.62%), 0.73%, 4/5/2024 (c) | 160,000 | 156,510 |
(ICE LIBOR USD 3 Month + 0.85%), 3.74%, 4/24/2024 (c) | 200,000 | 199,121 |
(SOFR + 1.99%), 2.19%, 4/28/2026 (c) | 150,000 | 140,896 |
(SOFR + 1.67%), 4.68%, 7/17/2026 (c) | 520,000 | 520,560 |
(SOFR + 0.86%), 1.51%, 7/20/2027 (c) | 335,000 | 296,643 |
(SOFR + 1.00%), 2.48%, 1/21/2028 (c) | 400,000 | 363,341 |
(SOFR + 1.61%), 4.21%, 4/20/2028 (c) | 220,000 | 214,371 |
MSCI, Inc. 4.00%, 11/15/2029 (a) | 35,000 | 31,154 |
INVESTMENTS | PRINCIPAL AMOUNT($) | VALUE($) |
Capital Markets — continued | ||
Nomura Holdings, Inc. (Japan) | ||
5.10%, 7/3/2025 | 530,000 | 533,766 |
1.85%, 7/16/2025 | 200,000 | 183,998 |
1.65%, 7/14/2026 | 200,000 | 175,987 |
UBS Group AG (Switzerland) | ||
(US Treasury Yield Curve Rate T Note Constant Maturity 1 Year + 0.83%), 1.01%, 7/30/2024 (a) (c) | 400,000 | 387,659 |
(US Treasury Yield Curve Rate T Note Constant Maturity 1 Year + 2.05%), 4.70%, 8/5/2027 (a) (c) | 410,000 | 402,434 |
(US Treasury Yield Curve Rate T Note Constant Maturity 1 Year + 0.85%), 1.49%, 8/10/2027 (a) (c) | 270,000 | 234,499 |
9,203,042 | ||
Chemicals — 0.9% | ||
Albemarle Corp. 4.65%, 6/1/2027 | 450,000 | 446,734 |
Axalta Coating Systems LLC 4.75%, 6/15/2027 (a) | 150,000 | 138,937 |
Braskem Netherlands Finance BV (Brazil) 4.50%, 1/31/2030 (d) | 200,000 | 175,750 |
Celanese US Holdings LLC | ||
5.90%, 7/5/2024 | 560,000 | 564,243 |
1.40%, 8/5/2026 | 75,000 | 62,943 |
Chemours Co. (The) | ||
5.38%, 5/15/2027 | 30,000 | 27,671 |
5.75%, 11/15/2028 (a) | 40,000 | 35,800 |
Element Solutions, Inc. 3.88%, 9/1/2028 (a) | 70,000 | 60,813 |
INEOS Quattro Finance 2 plc (United Kingdom) 3.38%, 1/15/2026 (a) | 200,000 | 173,000 |
NOVA Chemicals Corp. (Canada) | ||
5.00%, 5/1/2025 (a) | 35,000 | 32,917 |
4.25%, 5/15/2029 (a) | 75,000 | 61,687 |
Olin Corp. 5.63%, 8/1/2029 | 30,000 | 28,583 |
Rain CII Carbon LLC 7.25%, 4/1/2025 (a) | 75,000 | 70,134 |
Scotts Miracle-Gro Co. (The) 4.50%, 10/15/2029 | 85,000 | 68,099 |
1,947,311 | ||
Commercial Services & Supplies — 0.4% | ||
ACCO Brands Corp. 4.25%, 3/15/2029 (a) | 75,000 | 62,521 |
Allied Universal Holdco LLC 6.63%, 7/15/2026 (a) | 35,000 | 32,770 |
Aramark Services, Inc. 5.00%, 2/1/2028 (a) | 65,000 | 59,821 |
Brink's Co. (The) 4.63%, 10/15/2027 (a) | 35,000 | 31,500 |
162 | J.P. Morgan Exchange-Traded Funds | August 31, 2022 |
INVESTMENTS | PRINCIPAL AMOUNT($) | VALUE($) |
Corporate Bonds — continued | ||
Commercial Services & Supplies — continued | ||
Garda World Security Corp. (Canada) 4.63%, 2/15/2027 (a) | 60,000 | 52,734 |
GFL Environmental, Inc. (Canada) | ||
3.75%, 8/1/2025 (a) | 55,000 | 51,961 |
4.00%, 8/1/2028 (a) | 45,000 | 38,025 |
3.50%, 9/1/2028 (a) | 25,000 | 21,715 |
Madison IAQ LLC 4.13%, 6/30/2028 (a) | 140,000 | 120,050 |
Nielsen Finance LLC 5.63%, 10/1/2028 (a) | 95,000 | 95,217 |
Prime Security Services Borrower LLC | ||
5.75%, 4/15/2026 (a) | 135,000 | 129,893 |
3.38%, 8/31/2027 (a) | 45,000 | 38,728 |
Stericycle, Inc. 3.88%, 1/15/2029 (a) | 60,000 | 51,975 |
786,910 | ||
Communications Equipment — 0.1% | ||
CommScope, Inc. | ||
6.00%, 3/1/2026 (a) | 65,000 | 61,431 |
4.75%, 9/1/2029 (a) | 105,000 | 89,350 |
Plantronics, Inc. 4.75%, 3/1/2029 (a) | 35,000 | 34,913 |
185,694 | ||
Construction & Engineering — 0.1% | ||
Dycom Industries, Inc. 4.50%, 4/15/2029 (a) | 50,000 | 44,631 |
Global Infrastructure Solutions, Inc. 5.63%, 6/1/2029 (a) | 60,000 | 47,980 |
MasTec, Inc. 4.50%, 8/15/2028 (a) | 85,000 | 78,009 |
Weekley Homes LLC 4.88%, 9/15/2028 (a) | 65,000 | 53,882 |
224,502 | ||
Consumer Finance — 2.6% | ||
AerCap Ireland Capital DAC (Ireland) | ||
4.88%, 1/16/2024 | 450,000 | 447,840 |
2.88%, 8/14/2024 | 200,000 | 191,049 |
2.45%, 10/29/2026 | 490,000 | 432,059 |
American Express Co. 2.55%, 3/4/2027 | 335,000 | 311,087 |
Avolon Holdings Funding Ltd. (Ireland) | ||
5.25%, 5/15/2024 (a) | 450,000 | 441,187 |
5.50%, 1/15/2026 (a) | 125,000 | 120,529 |
Capital One Financial Corp. | ||
(SOFR + 0.69%), 1.34%, 12/6/2024 (c) | 270,000 | 258,945 |
3.20%, 2/5/2025 | 150,000 | 146,136 |
(SOFR + 1.29%), 2.64%, 3/3/2026 (c) | 360,000 | 341,176 |
INVESTMENTS | PRINCIPAL AMOUNT($) | VALUE($) |
Consumer Finance — continued | ||
(SOFR + 0.86%), 1.88%, 11/2/2027 (c) | 330,000 | 290,757 |
Ford Motor Credit Co. LLC | ||
4.27%, 1/9/2027 | 425,000 | 388,197 |
5.11%, 5/3/2029 | 200,000 | 184,835 |
General Motors Financial Co., Inc. | ||
4.00%, 1/15/2025 | 150,000 | 148,119 |
3.80%, 4/7/2025 | 475,000 | 463,132 |
4.30%, 7/13/2025 | 370,000 | 365,408 |
5.00%, 4/9/2027 | 380,000 | 374,868 |
Navient Corp. 7.25%, 9/25/2023 | 21,000 | 21,035 |
OneMain Finance Corp. | ||
7.13%, 3/15/2026 | 75,000 | 69,862 |
6.63%, 1/15/2028 | 25,000 | 22,857 |
5.38%, 11/15/2029 | 25,000 | 20,705 |
Park Aerospace Holdings Ltd. (Ireland) | ||
4.50%, 3/15/2023 (a) | 350,000 | 347,973 |
5.50%, 2/15/2024 (a) | 150,000 | 148,119 |
5,535,875 | ||
Containers & Packaging — 0.3% | ||
Ardagh Packaging Finance plc 4.13%, 8/15/2026 (a) | 200,000 | 172,534 |
Ball Corp. 4.88%, 3/15/2026 | 35,000 | 33,869 |
Graphic Packaging International LLC 1.51%, 4/15/2026 (a) | 70,000 | 62,573 |
LABL, Inc. 6.75%, 7/15/2026 (a) | 110,000 | 104,500 |
Mauser Packaging Solutions Holding Co. 5.50%, 4/15/2024 (a) | 110,000 | 106,488 |
Owens-Brockway Glass Container, Inc. 6.63%, 5/13/2027 (a) | 70,000 | 64,972 |
Pactiv Evergreen Group Issuer, Inc. 4.00%, 10/15/2027 (a) | 55,000 | 48,007 |
Sealed Air Corp. 4.00%, 12/1/2027 (a) | 30,000 | 27,300 |
620,243 | ||
Diversified Consumer Services — 0.0% ^ | ||
Service Corp. International 5.13%, 6/1/2029 | 45,000 | 42,633 |
Diversified Financial Services — 0.3% | ||
Element Fleet Management Corp. (Canada) | ||
1.60%, 4/6/2024 (a) | 145,000 | 137,480 |
August 31, 2022 | J.P. Morgan Exchange-Traded Funds | 163 |
AS OF August 31, 2022 (Unaudited) (continued)
INVESTMENTS | PRINCIPAL AMOUNT($) | VALUE($) |
Corporate Bonds — continued | ||
Diversified Financial Services — continued | ||
3.85%, 6/15/2025 (a) | 200,000 | 192,843 |
Fondo MIVIVIENDA SA (Peru) 4.63%, 4/12/2027 (a) | 200,000 | 191,000 |
521,323 | ||
Diversified Telecommunication Services — 0.8% | ||
Altice France Holding SA (Luxembourg) 6.00%, 2/15/2028 (a) | 200,000 | 135,619 |
Altice France SA (France) 5.13%, 7/15/2029 (a) | 200,000 | 151,932 |
CCO Holdings LLC | ||
5.00%, 2/1/2028 (a) | 245,000 | 223,886 |
4.75%, 3/1/2030 (a) | 285,000 | 244,968 |
4.75%, 2/1/2032 (a) | 15,000 | 12,408 |
4.50%, 5/1/2032 | 240,000 | 194,755 |
Frontier Communications Holdings LLC 5.88%, 10/15/2027 (a) | 85,000 | 79,284 |
Level 3 Financing, Inc. 4.63%, 9/15/2027 (a) | 70,000 | 61,839 |
Lumen Technologies, Inc. | ||
5.13%, 12/15/2026 (a) | 85,000 | 73,447 |
4.00%, 2/15/2027 (a) | 185,000 | 160,808 |
NBN Co. Ltd. (Australia) 1.45%, 5/5/2026 (a) | 200,000 | 179,181 |
Sprint Capital Corp. 8.75%, 3/15/2032 | 75,000 | 90,542 |
Telecom Italia Capital SA (Italy) 6.38%, 11/15/2033 | 35,000 | 29,575 |
Zayo Group Holdings, Inc. 4.00%, 3/1/2027 (a) | 45,000 | 38,363 |
1,676,607 | ||
Electric Utilities — 1.8% | ||
Enel Finance International NV (Italy) | ||
1.38%, 7/12/2026 (a) | 200,000 | 174,235 |
4.63%, 6/15/2027 (a) | 445,000 | 433,622 |
Eskom Holdings SOC Ltd. (South Africa) 6.75%, 8/6/2023 (d) | 200,000 | 193,912 |
Eversource Energy 4.60%, 7/1/2027 | 415,000 | 416,212 |
Exelon Corp. 2.75%, 3/15/2027 (a) | 335,000 | 312,971 |
Fells Point Funding Trust 3.05%, 1/31/2027 (a) | 535,000 | 493,334 |
ITC Holdings Corp. 3.65%, 6/15/2024 | 745,000 | 734,530 |
NextEra Energy Capital Holdings, Inc. 0.65%, 3/1/2023 | 115,000 | 112,947 |
NRG Energy, Inc. | ||
3.75%, 6/15/2024 (a) | 200,000 | 194,187 |
6.63%, 1/15/2027 | 34,000 | 33,730 |
INVESTMENTS | PRINCIPAL AMOUNT($) | VALUE($) |
Electric Utilities — continued | ||
3.38%, 2/15/2029 (a) | 50,000 | 41,074 |
5.25%, 6/15/2029 (a) | 75,000 | 67,035 |
PG&E Corp. 5.00%, 7/1/2028 | 93,000 | 82,581 |
Southern California Edison Co. 1.10%, 4/1/2024 | 150,000 | 142,725 |
Vistra Operations Co. LLC | ||
3.55%, 7/15/2024 (a) | 350,000 | 337,454 |
5.00%, 7/31/2027 (a) | 70,000 | 65,148 |
4.38%, 5/1/2029 (a) | 29,000 | 25,282 |
3,860,979 | ||
Electrical Equipment — 0.0% ^ | ||
EnerSys 4.38%, 12/15/2027 (a) | 25,000 | 22,750 |
Electronic Equipment, Instruments & Components — 0.0% ^ | ||
CDW LLC 4.25%, 4/1/2028 | 35,000 | 32,399 |
Sensata Technologies, Inc. 4.38%, 2/15/2030 (a) | 40,000 | 35,640 |
68,039 | ||
Energy Equipment & Services — 0.1% | ||
Guara Norte SARL (Brazil) 5.20%, 6/15/2034 (a) | 187,230 | 156,080 |
Oceaneering International, Inc. 4.65%, 11/15/2024 | 70,000 | 65,304 |
221,384 | ||
Entertainment — 0.4% | ||
Cinemark USA, Inc. | ||
5.88%, 3/15/2026 (a) | 35,000 | 31,052 |
5.25%, 7/15/2028 (a) | 30,000 | 24,302 |
Live Nation Entertainment, Inc. 4.75%, 10/15/2027 (a) | 95,000 | 86,450 |
Magallanes, Inc. 3.76%, 3/15/2027 (a) | 475,000 | 443,689 |
Netflix, Inc. 4.88%, 6/15/2030 (a) | 195,000 | 186,250 |
WMG Acquisition Corp. 3.88%, 7/15/2030 (a) | 60,000 | 51,600 |
823,343 | ||
Equity Real Estate Investment Trusts (REITs) — 0.3% | ||
American Tower Corp. 2.40%, 3/15/2025 | 150,000 | 142,132 |
Corporate Office Properties LP 2.00%, 1/15/2029 | 140,000 | 110,584 |
Iron Mountain, Inc. 4.88%, 9/15/2027 (a) | 110,000 | 100,964 |
Office Properties Income Trust 2.65%, 6/15/2026 | 93,000 | 74,876 |
RHP Hotel Properties LP 4.75%, 10/15/2027 | 75,000 | 68,200 |
164 | J.P. Morgan Exchange-Traded Funds | August 31, 2022 |
INVESTMENTS | PRINCIPAL AMOUNT($) | VALUE($) |
Corporate Bonds — continued | ||
Equity Real Estate Investment Trusts (REITs) — continued | ||
SBA Communications Corp. 3.13%, 2/1/2029 | 95,000 | 78,273 |
VICI Properties LP | ||
5.63%, 5/1/2024 (a) | 50,000 | 50,075 |
3.50%, 2/15/2025 (a) | 65,000 | 61,221 |
686,325 | ||
Food & Staples Retailing — 0.2% | ||
Albertsons Cos., Inc. | ||
4.63%, 1/15/2027 (a) | 240,000 | 219,005 |
3.50%, 3/15/2029 (a) | 65,000 | 53,417 |
Performance Food Group, Inc. 5.50%, 10/15/2027 (a) | 50,000 | 47,131 |
Rite Aid Corp. 8.00%, 11/15/2026 (a) | 95,000 | 77,425 |
396,978 | ||
Food Products — 0.4% | ||
Lamb Weston Holdings, Inc. 4.88%, 5/15/2028 (a) | 65,000 | 61,934 |
Post Holdings, Inc. | ||
5.63%, 1/15/2028 (a) | 115,000 | 109,250 |
4.63%, 4/15/2030 (a) | 35,000 | 30,396 |
Viterra Finance BV (Netherlands) | ||
2.00%, 4/21/2026 (a) | 200,000 | 174,860 |
4.90%, 4/21/2027 (a) | 570,000 | 547,176 |
923,616 | ||
Gas Utilities — 0.1% | ||
AmeriGas Partners LP 5.88%, 8/20/2026 | 55,000 | 52,351 |
CenterPoint Energy Resources Corp. 0.70%, 3/2/2023 | 250,000 | 246,298 |
298,649 | ||
Health Care Equipment & Supplies — 0.3% | ||
Avantor Funding, Inc. 4.63%, 7/15/2028 (a) | 60,000 | 54,593 |
Hologic, Inc. 3.25%, 2/15/2029 (a) | 85,000 | 72,459 |
Medline Borrower LP | ||
3.88%, 4/1/2029 (a) | 65,000 | 55,087 |
5.25%, 10/1/2029 (a) | 30,000 | 25,213 |
Teleflex, Inc. 4.25%, 6/1/2028 (a) | 60,000 | 54,513 |
Zimmer Biomet Holdings, Inc. 1.45%, 11/22/2024 | 385,000 | 361,853 |
623,718 | ||
Health Care Providers & Services — 0.8% | ||
Acadia Healthcare Co., Inc. 5.50%, 7/1/2028 (a) | 65,000 | 61,576 |
INVESTMENTS | PRINCIPAL AMOUNT($) | VALUE($) |
Health Care Providers & Services — continued | ||
AdaptHealth LLC 4.63%, 8/1/2029 (a) | 60,000 | 49,963 |
Centene Corp. 4.63%, 12/15/2029 | 220,000 | 207,249 |
Community Health Systems, Inc. | ||
5.63%, 3/15/2027 (a) | 25,000 | 21,200 |
6.00%, 1/15/2029 (a) | 75,000 | 61,557 |
4.75%, 2/15/2031 (a) | 85,000 | 62,764 |
CVS Health Corp. 4.10%, 3/25/2025 | 150,000 | 150,309 |
DaVita, Inc. 4.63%, 6/1/2030 (a) | 115,000 | 92,580 |
Encompass Health Corp. 4.75%, 2/1/2030 | 135,000 | 115,456 |
HCA, Inc. | ||
5.38%, 9/1/2026 | 175,000 | 175,480 |
5.63%, 9/1/2028 | 255,000 | 256,297 |
Highmark, Inc. 1.45%, 5/10/2026 (a) | 130,000 | 117,162 |
Tenet Healthcare Corp. | ||
5.13%, 11/1/2027 (a) | 155,000 | 143,608 |
4.25%, 6/1/2029 (a) | 175,000 | 150,910 |
1,666,111 | ||
Hotels, Restaurants & Leisure — 0.7% | ||
1011778 BC ULC (Canada) 3.88%, 1/15/2028 (a) | 70,000 | 62,224 |
Boyne USA, Inc. 4.75%, 5/15/2029 (a) | 40,000 | 35,577 |
Caesars Entertainment, Inc. 6.25%, 7/1/2025 (a) | 105,000 | 102,523 |
Carnival Corp. 9.88%, 8/1/2027 (a) | 100,000 | 100,375 |
Cedar Fair LP 5.50%, 5/1/2025 (a) | 30,000 | 29,427 |
Gohl Capital Ltd. (Malaysia) 4.25%, 1/24/2027 (d) | 200,000 | 180,600 |
Hilton Domestic Operating Co., Inc. 4.88%, 1/15/2030 | 80,000 | 73,104 |
Hilton Worldwide Finance LLC 4.88%, 4/1/2027 | 50,000 | 47,750 |
International Game Technology plc 6.25%, 1/15/2027 (a) | 200,000 | 195,862 |
Marriott Ownership Resorts, Inc. 4.50%, 6/15/2029 (a) | 55,000 | 46,370 |
MGM Resorts International 5.50%, 4/15/2027 | 110,000 | 101,355 |
Royal Caribbean Cruises Ltd. 9.13%, 6/15/2023 (a) | 120,000 | 120,973 |
Six Flags Entertainment Corp. | ||
4.88%, 7/31/2024 (a) | 55,000 | 52,770 |
5.50%, 4/15/2027 (a) | 30,000 | 27,510 |
Six Flags Theme Parks, Inc. 7.00%, 7/1/2025 (a) | 24,000 | 24,256 |
Station Casinos LLC 4.50%, 2/15/2028 (a) | 55,000 | 47,379 |
August 31, 2022 | J.P. Morgan Exchange-Traded Funds | 165 |
AS OF August 31, 2022 (Unaudited) (continued)
INVESTMENTS | PRINCIPAL AMOUNT($) | VALUE($) |
Corporate Bonds — continued | ||
Hotels, Restaurants & Leisure — continued | ||
Vail Resorts, Inc. 6.25%, 5/15/2025 (a) | 35,000 | 35,033 |
Wynn Resorts Finance LLC 7.75%, 4/15/2025 (a) | 90,000 | 89,700 |
Yum! Brands, Inc. | ||
4.75%, 1/15/2030 (a) | 30,000 | 27,337 |
4.63%, 1/31/2032 | 8,000 | 7,068 |
1,407,193 | ||
Household Durables — 0.2% | ||
CD&R Smokey Buyer, Inc. 6.75%, 7/15/2025 (a) | 60,000 | 55,800 |
Lennar Corp. 4.75%, 5/30/2025 | 150,000 | 151,077 |
PulteGroup, Inc. 5.50%, 3/1/2026 | 150,000 | 151,910 |
Tempur Sealy International, Inc. 4.00%, 4/15/2029 (a) | 60,000 | 49,297 |
408,084 | ||
Household Products — 0.1% | ||
Central Garden & Pet Co. | ||
4.13%, 10/15/2030 | 35,000 | 29,134 |
4.13%, 4/30/2031 (a) | 35,000 | 28,653 |
Energizer Holdings, Inc. | ||
4.75%, 6/15/2028 (a) | 45,000 | 37,437 |
4.38%, 3/31/2029 (a) | 50,000 | 40,671 |
Spectrum Brands, Inc. 5.00%, 10/1/2029 (a) | 100,000 | 87,066 |
222,961 | ||
Independent Power and Renewable Electricity Producers — 0.1% | ||
Calpine Corp. 4.50%, 2/15/2028 (a) | 95,000 | 86,899 |
Termocandelaria Power Ltd. (Colombia) 7.88%, 1/30/2029 (d) | 170,000 | 158,238 |
245,137 | ||
Insurance — 0.6% | ||
Athene Global Funding | ||
0.95%, 1/8/2024 (a) | 259,000 | 246,441 |
0.91%, 8/19/2024 (a) | 295,000 | 272,273 |
2.50%, 1/14/2025 (a) | 308,000 | 289,326 |
Equitable Financial Life Global Funding 0.80%, 8/12/2024 (a) | 230,000 | 214,280 |
Jackson National Life Global Funding 3.88%, 6/11/2025 (a) | 150,000 | 146,885 |
1,169,205 | ||
Internet & Direct Marketing Retail — 0.1% | ||
B2W Digital Lux SARL (Brazil) 4.38%, 12/20/2030 (d) | 200,000 | 153,412 |
INVESTMENTS | PRINCIPAL AMOUNT($) | VALUE($) |
IT Services — 0.7% | ||
Arches Buyer, Inc. 4.25%, 6/1/2028 (a) | 55,000 | 44,275 |
Black Knight InfoServ LLC 3.63%, 9/1/2028 (a) | 65,000 | 56,745 |
Block, Inc. | ||
2.75%, 6/1/2026 | 17,000 | 15,107 |
3.50%, 6/1/2031 | 42,000 | 34,555 |
Booz Allen Hamilton, Inc. 3.88%, 9/1/2028 (a) | 35,000 | 31,132 |
Fidelity National Information Services, Inc. 4.70%, 7/15/2027 | 530,000 | 528,748 |
Gartner, Inc. | ||
3.63%, 6/15/2029 (a) | 85,000 | 73,100 |
3.75%, 10/1/2030 (a) | 30,000 | 25,725 |
Global Payments, Inc. | ||
1.20%, 3/1/2026 | 415,000 | 366,215 |
4.95%, 8/15/2027 | 335,000 | 331,816 |
Presidio Holdings, Inc. 4.88%, 2/1/2027 (a) | 50,000 | 46,780 |
1,554,198 | ||
Leisure Products — 0.1% | ||
Mattel, Inc. | ||
3.38%, 4/1/2026 (a) | 64,000 | 58,149 |
3.75%, 4/1/2029 (a) | 30,000 | 26,730 |
Vista Outdoor, Inc. 4.50%, 3/15/2029 (a) | 65,000 | 48,387 |
133,266 | ||
Life Sciences Tools & Services — 0.0% ^ | ||
Charles River Laboratories International, Inc. 3.75%, 3/15/2029 (a) | 40,000 | 34,475 |
Media — 0.8% | ||
Clear Channel Outdoor Holdings, Inc. | ||
5.13%, 8/15/2027 (a) | 65,000 | 58,216 |
7.75%, 4/15/2028 (a) | 30,000 | 24,399 |
CSC Holdings LLC 6.50%, 2/1/2029 (a) | 200,000 | 184,047 |
Directv Financing LLC 5.88%, 8/15/2027 (a) | 55,000 | 50,325 |
DISH DBS Corp. | ||
5.88%, 11/15/2024 | 50,000 | 45,250 |
7.75%, 7/1/2026 | 310,000 | 244,410 |
5.25%, 12/1/2026 (a) | 110,000 | 90,819 |
Gray Escrow II, Inc. 5.38%, 11/15/2031 (a) | 100,000 | 84,518 |
iHeartCommunications, Inc. | ||
8.38%, 5/1/2027 | 25,000 | 22,020 |
5.25%, 8/15/2027 (a) | 110,000 | 98,686 |
166 | J.P. Morgan Exchange-Traded Funds | August 31, 2022 |
INVESTMENTS | PRINCIPAL AMOUNT($) | VALUE($) |
Corporate Bonds — continued | ||
Media — continued | ||
Lamar Media Corp. 4.00%, 2/15/2030 | 60,000 | 52,237 |
News Corp. 3.88%, 5/15/2029 (a) | 74,000 | 64,380 |
Nexstar Media, Inc. 5.63%, 7/15/2027 (a) | 110,000 | 104,739 |
Outfront Media Capital LLC | ||
6.25%, 6/15/2025 (a) | 22,000 | 21,813 |
5.00%, 8/15/2027 (a) | 55,000 | 50,339 |
Scripps Escrow II, Inc. 3.88%, 1/15/2029 (a) | 40,000 | 33,914 |
Scripps Escrow, Inc. 5.88%, 7/15/2027 (a) | 20,000 | 18,100 |
Sinclair Television Group, Inc. 4.13%, 12/1/2030 (a) | 65,000 | 52,909 |
Sirius XM Radio, Inc. | ||
5.00%, 8/1/2027 (a) | 55,000 | 51,776 |
5.50%, 7/1/2029 (a) | 210,000 | 196,367 |
Stagwell Global LLC 5.63%, 8/15/2029 (a) | 75,000 | 63,604 |
TEGNA, Inc. 5.00%, 9/15/2029 | 90,000 | 86,149 |
Univision Communications, Inc. 4.50%, 5/1/2029 (a) | 59,000 | 51,610 |
Videotron Ltd. (Canada) 5.13%, 4/15/2027 (a) | 45,000 | 42,187 |
1,792,814 | ||
Metals & Mining — 0.4% | ||
Alcoa Nederland Holding BV 6.13%, 5/15/2028 (a) | 200,000 | 194,376 |
Arconic Corp. 6.13%, 2/15/2028 (a) | 85,000 | 79,788 |
ATI, Inc. 5.88%, 12/1/2027 | 75,000 | 71,276 |
Carpenter Technology Corp. 6.38%, 7/15/2028 | 75,000 | 71,710 |
Cleveland-Cliffs, Inc. | ||
6.75%, 3/15/2026 (a) | 70,000 | 70,775 |
4.63%, 3/1/2029 (a) | 20,000 | 17,754 |
CSN Inova Ventures (Brazil) 6.75%, 1/28/2028 (d) | 200,000 | 188,870 |
FMG Resources August 2006 Pty. Ltd. (Australia) 4.50%, 9/15/2027 (a) | 70,000 | 63,948 |
Glencore Funding LLC (Australia) 1.63%, 9/1/2025 (a) | 90,000 | 82,057 |
Kaiser Aluminum Corp. 4.63%, 3/1/2028 (a) | 30,000 | 25,840 |
Novelis Corp. 4.75%, 1/30/2030 (a) | 85,000 | 73,950 |
940,344 | ||
Multiline Retail — 0.0% ^ | ||
Nordstrom, Inc. 2.30%, 4/8/2024 | 20,000 | 18,784 |
INVESTMENTS | PRINCIPAL AMOUNT($) | VALUE($) |
Multi-Utilities — 0.0% ^ | ||
Puget Energy, Inc. 2.38%, 6/15/2028 | 50,000 | 43,500 |
Oil, Gas & Consumable Fuels — 2.1% | ||
Aker BP ASA (Norway) 2.00%, 7/15/2026 (a) | 200,000 | 178,407 |
Antero Midstream Partners LP | ||
7.88%, 5/15/2026 (a) | 20,000 | 20,350 |
5.38%, 6/15/2029 (a) | 30,000 | 27,507 |
Antero Resources Corp. | ||
7.63%, 2/1/2029 (a) | 29,000 | 29,498 |
5.38%, 3/1/2030 (a) | 65,000 | 61,182 |
APA Infrastructure Ltd. (Australia) 4.20%, 3/23/2025 (a) | 350,000 | 343,356 |
Buckeye Partners LP 4.13%, 12/1/2027 | 90,000 | 79,561 |
Cheniere Energy Partners LP | ||
4.50%, 10/1/2029 | 100,000 | 92,083 |
3.25%, 1/31/2032 | 53,000 | 42,427 |
Chesapeake Energy Corp. 6.75%, 4/15/2029 (a) | 80,000 | 78,104 |
CNX Resources Corp. | ||
7.25%, 3/14/2027 (a) | 40,000 | 39,710 |
6.00%, 1/15/2029 (a) | 60,000 | 56,412 |
Comstock Resources, Inc. 6.75%, 3/1/2029 (a) | 75,000 | 71,586 |
Crestwood Midstream Partners LP | ||
5.63%, 5/1/2027 (a) | 55,000 | 51,288 |
8.00%, 4/1/2029 (a) | 40,000 | 39,657 |
DT Midstream, Inc. 4.13%, 6/15/2029 (a) | 95,000 | 83,408 |
Ecopetrol SA (Colombia) 5.38%, 6/26/2026 | 150,000 | 140,569 |
Energean Israel Finance Ltd. (Israel) | ||
4.50%, 3/30/2024 (d) | 12,000 | 11,543 |
4.88%, 3/30/2026 (d) | 80,000 | 73,800 |
Energy Transfer LP 4.05%, 3/15/2025 | 105,000 | 103,068 |
EnLink Midstream Partners LP 4.15%, 6/1/2025 | 38,000 | 37,033 |
EQM Midstream Partners LP | ||
4.00%, 8/1/2024 | 12,000 | 11,349 |
6.00%, 7/1/2025 (a) | 15,000 | 14,466 |
6.50%, 7/1/2027 (a) | 50,000 | 48,262 |
Genesis Energy LP 6.25%, 5/15/2026 | 70,000 | 63,213 |
Gray Oak Pipeline LLC 2.60%, 10/15/2025 (a) | 475,000 | 437,055 |
Greenko Dutch BV (India) 3.85%, 3/29/2026 (a) | 194,000 | 163,406 |
Gulfport Energy Corp. 8.00%, 5/17/2026 (a) | 55,000 | 55,366 |
August 31, 2022 | J.P. Morgan Exchange-Traded Funds | 167 |
AS OF August 31, 2022 (Unaudited) (continued)
INVESTMENTS | PRINCIPAL AMOUNT($) | VALUE($) |
Corporate Bonds — continued | ||
Oil, Gas & Consumable Fuels — continued | ||
Hess Midstream Operations LP 5.63%, 2/15/2026 (a) | 70,000 | 68,255 |
Hilcorp Energy I LP 5.75%, 2/1/2029 (a) | 75,000 | 68,271 |
Holly Energy Partners LP 6.38%, 4/15/2027 (a) | 60,000 | 58,390 |
Leviathan Bond Ltd. (Israel) 6.13%, 6/30/2025 (d) | 50,000 | 49,072 |
MEG Energy Corp. (Canada) 7.13%, 2/1/2027 (a) | 50,000 | 50,525 |
MPLX LP 4.88%, 12/1/2024 | 150,000 | 151,355 |
NGL Energy Operating LLC 7.50%, 2/1/2026 (a) | 30,000 | 27,450 |
NuStar Logistics LP 5.63%, 4/28/2027 | 60,000 | 54,626 |
Occidental Petroleum Corp. | ||
8.00%, 7/15/2025 | 110,000 | 119,487 |
6.13%, 1/1/2031 | 180,000 | 187,067 |
Oil and Gas Holding Co. BSCC (The) (Bahrain) 7.63%, 11/7/2024 (d) | 200,000 | 202,787 |
Petroleos Mexicanos (Mexico) | ||
4.25%, 1/15/2025 | 100,000 | 94,300 |
4.50%, 1/23/2026 | 100,000 | 89,650 |
6.88%, 8/4/2026 | 30,000 | 28,004 |
6.49%, 1/23/2027 | 270,000 | 239,220 |
Range Resources Corp. 4.75%, 2/15/2030 (a) | 50,000 | 46,326 |
Sabine Pass Liquefaction LLC 5.88%, 6/30/2026 | 80,000 | 82,224 |
Southwestern Energy Co. | ||
5.38%, 2/1/2029 | 45,000 | 42,537 |
5.38%, 3/15/2030 | 105,000 | 98,414 |
Sunoco LP 5.88%, 3/15/2028 | 45,000 | 41,842 |
Tallgrass Energy Partners LP | ||
7.50%, 10/1/2025 (a) | 25,000 | 25,031 |
6.00%, 12/31/2030 (a) | 85,000 | 74,397 |
Targa Resources Partners LP 6.88%, 1/15/2029 | 60,000 | 61,315 |
Western Midstream Operating LP 4.75%, 8/15/2028 | 55,000 | 51,775 |
4,465,986 | ||
Personal Products — 0.1% | ||
Edgewell Personal Care Co. 5.50%, 6/1/2028 (a) | 120,000 | 110,821 |
Prestige Brands, Inc. 5.13%, 1/15/2028 (a) | 60,000 | 55,344 |
166,165 | ||
INVESTMENTS | PRINCIPAL AMOUNT($) | VALUE($) |
Pharmaceuticals — 0.3% | ||
Bausch Health Americas, Inc. | ||
9.25%, 4/1/2026 (a) | 310,000 | 186,000 |
8.50%, 1/31/2027 (a) | 120,000 | 57,600 |
Bausch Health Cos., Inc. 4.88%, 6/1/2028 (a) | 285,000 | 197,009 |
Organon & Co. 5.13%, 4/30/2031 (a) | 200,000 | 175,000 |
Par Pharmaceutical, Inc. 7.50%, 4/1/2027 (a) | 50,000 | 42,498 |
658,107 | ||
Real Estate Management & Development — 0.1% | ||
Kennedy-Wilson, Inc. 4.75%, 3/1/2029 | 75,000 | 62,578 |
Realogy Group LLC 5.75%, 1/15/2029 (a) | 55,000 | 43,091 |
105,669 | ||
Road & Rail — 0.3% | ||
Avis Budget Car Rental LLC | ||
5.75%, 7/15/2027 (a) | 45,000 | 42,638 |
4.75%, 4/1/2028 (a) | 35,000 | 30,552 |
Hertz Corp. (The) 4.63%, 12/1/2026 (a) | 75,000 | 64,238 |
Triton Container International Ltd. (Bermuda) | ||
1.15%, 6/7/2024 (a) | 200,000 | 185,850 |
2.05%, 4/15/2026 (a) | 359,000 | 315,992 |
Uber Technologies, Inc. 7.50%, 5/15/2025 (a) | 60,000 | 60,388 |
699,658 | ||
Semiconductors & Semiconductor Equipment — 0.3% | ||
Broadcom Corp. 3.88%, 1/15/2027 | 150,000 | 144,182 |
Entegris Escrow Corp. 5.95%, 6/15/2030 (a) | 35,000 | 33,209 |
Marvell Technology, Inc. 1.65%, 4/15/2026 | 125,000 | 112,442 |
Microchip Technology, Inc. 4.25%, 9/1/2025 | 380,000 | 375,953 |
ON Semiconductor Corp. 3.88%, 9/1/2028 (a) | 75,000 | 66,885 |
732,671 | ||
Software — 0.1% | ||
Clarivate Science Holdings Corp. 3.88%, 7/1/2028 (a) | 70,000 | 59,920 |
NCR Corp. | ||
5.13%, 4/15/2029 (a) | 9,000 | 8,404 |
168 | J.P. Morgan Exchange-Traded Funds | August 31, 2022 |
INVESTMENTS | PRINCIPAL AMOUNT($) | VALUE($) |
Corporate Bonds — continued | ||
Software — continued | ||
6.13%, 9/1/2029 (a) | 115,000 | 109,657 |
SS&C Technologies, Inc. 5.50%, 9/30/2027 (a) | 70,000 | 66,329 |
244,310 | ||
Specialty Retail — 0.3% | ||
Asbury Automotive Group, Inc. 4.50%, 3/1/2028 | 65,000 | 58,050 |
Bath & Body Works, Inc. | ||
5.25%, 2/1/2028 | 45,000 | 40,326 |
7.50%, 6/15/2029 | 20,000 | 19,236 |
6.75%, 7/1/2036 | 25,000 | 21,573 |
Gap, Inc. (The) 3.63%, 10/1/2029 (a) | 95,000 | 66,166 |
Group 1 Automotive, Inc. 4.00%, 8/15/2028 (a) | 55,000 | 46,991 |
Lithia Motors, Inc. | ||
4.63%, 12/15/2027 (a) | 35,000 | 32,408 |
4.38%, 1/15/2031 (a) | 35,000 | 30,800 |
Penske Automotive Group, Inc. | ||
3.50%, 9/1/2025 | 30,000 | 28,166 |
3.75%, 6/15/2029 | 25,000 | 21,147 |
PetSmart, Inc. 4.75%, 2/15/2028 (a) | 250,000 | 222,771 |
SRS Distribution, Inc. 4.63%, 7/1/2028 (a) | 55,000 | 48,684 |
Staples, Inc. 7.50%, 4/15/2026 (a) | 60,000 | 50,704 |
687,022 | ||
Technology Hardware, Storage & Peripherals — 0.0% ^ | ||
Seagate HDD Cayman 4.88%, 6/1/2027 | 50,000 | 47,167 |
Textiles, Apparel & Luxury Goods — 0.0% ^ | ||
William Carter Co. (The) 5.63%, 3/15/2027 (a) | 35,000 | 33,797 |
Thrifts & Mortgage Finance — 1.3% | ||
BPCE SA (France) | ||
5.70%, 10/22/2023 (a) | 400,000 | 402,407 |
5.15%, 7/21/2024 (a) | 285,000 | 283,455 |
2.38%, 1/14/2025 (a) | 500,000 | 470,715 |
4.50%, 3/15/2025 (a) | 200,000 | 194,010 |
4.75%, 7/19/2027 (a) | 535,000 | 529,596 |
Ladder Capital Finance Holdings LLLP 5.25%, 10/1/2025 (a) | 85,000 | 82,685 |
Nationstar Mortgage Holdings, Inc. 6.00%, 1/15/2027 (a) | 80,000 | 71,153 |
INVESTMENTS | PRINCIPAL AMOUNT($) | VALUE($) |
Thrifts & Mortgage Finance — continued | ||
Nationwide Building Society (United Kingdom) | ||
(ICE LIBOR USD 3 Month + 1.06%), 3.77%, 3/8/2024 (a) (c) | 200,000 | 199,036 |
(ICE LIBOR USD 3 Month + 1.39%), 4.36%, 8/1/2024 (a) (c) | 200,000 | 198,499 |
4.00%, 9/14/2026 (a) | 350,000 | 330,793 |
Rocket Mortgage LLC | ||
2.88%, 10/15/2026 (a) | 19,000 | 15,960 |
3.63%, 3/1/2029 (a) | 50,000 | 40,250 |
4.00%, 10/15/2033 (a) | 5,000 | 3,726 |
2,822,285 | ||
Tobacco — 0.4% | ||
BAT Capital Corp. (United Kingdom) 3.22%, 9/6/2026 | 150,000 | 140,127 |
BAT International Finance plc (United Kingdom) 4.45%, 3/16/2028 | 475,000 | 449,962 |
Imperial Brands Finance plc (United Kingdom) 3.13%, 7/26/2024 (a) | 200,000 | 192,438 |
782,527 | ||
Trading Companies & Distributors — 0.7% | ||
Air Lease Corp. | ||
4.25%, 2/1/2024 | 150,000 | 149,608 |
2.30%, 2/1/2025 | 480,000 | 449,525 |
Aviation Capital Group LLC | ||
4.38%, 1/30/2024 (a) | 200,000 | 194,761 |
5.50%, 12/15/2024 (a) | 150,000 | 146,851 |
1.95%, 1/30/2026 (a) | 250,000 | 215,693 |
Herc Holdings, Inc. 5.50%, 7/15/2027 (a) | 60,000 | 56,654 |
Imola Merger Corp. 4.75%, 5/15/2029 (a) | 82,000 | 69,615 |
United Rentals North America, Inc. 4.88%, 1/15/2028 | 155,000 | 144,865 |
WESCO Distribution, Inc. 7.25%, 6/15/2028 (a) | 70,000 | 70,578 |
1,498,150 | ||
Wireless Telecommunication Services — 0.3% | ||
Hughes Satellite Systems Corp. 6.63%, 8/1/2026 | 75,000 | 70,969 |
Kenbourne Invest SA (Chile) 4.70%, 1/22/2028 (d) | 200,000 | 160,662 |
Sprint Corp. 7.63%, 3/1/2026 | 115,000 | 121,627 |
August 31, 2022 | J.P. Morgan Exchange-Traded Funds | 169 |
AS OF August 31, 2022 (Unaudited) (continued)
INVESTMENTS | PRINCIPAL AMOUNT($) | VALUE($) |
Corporate Bonds — continued | ||
Wireless Telecommunication Services — continued | ||
T-Mobile USA, Inc. | ||
3.50%, 4/15/2025 | 150,000 | 146,473 |
4.75%, 2/1/2028 | 75,000 | 73,358 |
573,089 | ||
Total Corporate Bonds (Cost $92,110,948) | 84,818,767 | |
Asset-Backed Securities — 18.4% | ||
ACC Auto Trust Series 2021-A, Class A, 1.08%, 4/15/2027 (a) | 147,094 | 144,709 |
Accelerated LLC Series 2021-1H, Class B, 1.90%, 10/20/2040 ‡ (a) | 233,215 | 212,219 |
ACM Auto Trust Series 2022-1A, Class B, 4.47%, 4/20/2029 (a) | 438,000 | 435,131 |
AIMCO CLO Ltd. (Cayman Islands) Series 2019-10A, Class AR, 3.82%, 7/22/2032 (a) (e) | 350,000 | 342,620 |
Aligned Data Centers Issuer LLC Series 2021-1A, Class A2, 1.94%, 8/15/2046 (a) | 263,000 | 231,571 |
American Credit Acceptance Receivables Trust | ||
Series 2019-4, Class D, 2.97%, 12/12/2025 (a) | 426,362 | 422,508 |
Series 2020-1, Class E, 3.32%, 3/13/2026 (a) | 450,000 | 441,060 |
Series 2022-1, Class C, 2.12%, 3/13/2028 (a) | 1,000,000 | 941,608 |
Series 2022-3, Class D, 5.83%, 10/13/2028 (a) | 284,000 | 281,663 |
AMSR Trust | ||
Series 2021-SFR3, Class E1, 2.33%, 10/17/2038 ‡ (a) | 300,000 | 260,568 |
Series 2021-SFR4, Class E1, 2.97%, 12/17/2038 ‡ (a) | 400,000 | 346,162 |
Aqua Finance Trust Series 2021-A, Class B, 2.40%, 7/17/2046 ‡ (a) | 313,000 | 267,844 |
Ares CLO Ltd. (Cayman Islands) Series 2016-40A, Class A1RR, 3.38%, 1/15/2029 (a) (e) | 676,443 | 666,104 |
Atlas Senior Loan Fund (Cayman Islands) Series 2019-13A, Class A1NR, 3.84%, 4/22/2031 (a) (e) | 200,000 | 196,956 |
Bain Capital Credit CLO Ltd. (Cayman Islands) Series 2017-1A, Class A1R, 3.68%, 7/20/2030 (a) (e) | 337,000 | 332,381 |
Ballyrock CLO Ltd. (Cayman Islands) Series 2019-1A, Class A1R, 3.54%, 7/15/2032 (a) (e) | 250,000 | 244,334 |
INVESTMENTS | PRINCIPAL AMOUNT($) | VALUE($) |
BSPRT Issuer Ltd. (Cayman Islands) Series 2021-FL7, Class B, 4.44%, 12/15/2038 ‡ (a) (e) | 475,000 | 453,476 |
Business Jet Securities LLC | ||
Series 2020-1A, Class A, 2.98%, 11/15/2035 (a) | 505,954 | 473,184 |
Series 2021-1A, Class A, 2.16%, 4/15/2036 (a) | 290,307 | 261,148 |
CarNow Auto Receivables Trust | ||
Series 2020-1A, Class C, 3.84%, 9/16/2024 (a) | 368,945 | 367,746 |
Series 2021-1A, Class C, 2.16%, 2/17/2026 (a) | 196,000 | 190,624 |
Series 2021-2A, Class C, 1.69%, 3/15/2027 (a) | 500,000 | 477,430 |
Series 2022-1A, Class D, 5.79%, 9/15/2027 (a) | 397,000 | 395,152 |
CIFC Funding Ltd. (Cayman Islands) | ||
Series 2012-2RA, Class A1, 3.51%, 1/20/2028 (a) (e) | 154,055 | 152,115 |
Series 2019-1A, Class AR, 3.81%, 4/20/2032 (a) (e) | 250,000 | 245,612 |
Consumer Loan Underlying Bond Certificate Issuer Trust I Series 2019-HP1, Class B, 3.48%, 12/15/2026 ‡ (a) | 42,604 | 42,590 |
Continental Finance Credit Card ABS Master Trust Series 2021-A, Class A, 2.55%, 12/17/2029 (a) | 400,000 | 374,186 |
CPS Auto Receivables Trust | ||
Series 2019-B, Class E, 5.00%, 3/17/2025 (a) | 500,000 | 500,497 |
Series 2019-A, Class E, 5.81%, 3/16/2026 (a) | 500,000 | 502,233 |
Series 2021-C, Class C, 1.21%, 6/15/2027 (a) | 244,000 | 234,332 |
Series 2021-D, Class D, 2.31%, 12/15/2027 (a) | 200,000 | 186,255 |
Series 2022-C, Class D, 6.45%, 4/15/2030 (a) | 240,000 | 239,807 |
Credit Acceptance Auto Loan Trust | ||
Series 2021-3A, Class C, 1.63%, 9/16/2030 (a) | 250,000 | 228,853 |
Series 2022-1A, Class C, 5.70%, 10/15/2032 (a) | 467,000 | 463,260 |
Crossroads Asset Trust Series 2021-A, Class C, 1.44%, 1/20/2026 ‡ (a) | 125,000 | 119,356 |
Dext ABS LLC Series 2021-1, Class A, 1.12%, 2/15/2028 (a) | 218,635 | 210,181 |
170 | J.P. Morgan Exchange-Traded Funds | August 31, 2022 |
INVESTMENTS | PRINCIPAL AMOUNT($) | VALUE($) |
Asset-Backed Securities — continued | ||
Dryden Senior Loan Fund (Cayman Islands) Series 2017-49A, Class AR, 3.69%, 7/18/2030 (a) (e) | 500,000 | 493,509 |
DT Auto Owner Trust | ||
Series 2020-1A, Class D, 2.55%, 11/17/2025 (a) | 190,000 | 185,771 |
Series 2018-3A, Class E, 5.33%, 11/17/2025 (a) | 1,000,000 | 998,718 |
Series 2021-1A, Class D, 1.16%, 11/16/2026 (a) | 250,000 | 233,062 |
Series 2021-3A, Class D, 1.31%, 5/17/2027 (a) | 250,000 | 226,834 |
Exeter Automobile Receivables Trust | ||
Series 2019-3A, Class D, 3.11%, 8/15/2025 (a) | 176,087 | 174,623 |
Series 2020-1A, Class E, 3.74%, 1/15/2027 (a) | 635,000 | 618,828 |
Series 2021-2A, Class D, 1.40%, 4/15/2027 | 210,000 | 195,599 |
Series 2021-4A, Class D, 1.96%, 1/17/2028 | 480,000 | 443,613 |
Series 2022-2A, Class D, 4.56%, 7/17/2028 | 800,000 | 762,213 |
FCI Funding LLC Series 2021-1A, Class A, 1.13%, 4/15/2033 (a) | 78,083 | 76,187 |
FHF Trust | ||
Series 2021-2A, Class A, 0.83%, 12/15/2026 (a) | 281,868 | 268,931 |
Series 2021-1A, Class A, 1.27%, 3/15/2027 (a) | 93,503 | 89,719 |
FirstKey Homes Trust | ||
Series 2021-SFR3, Class E1, 2.99%, 12/17/2038 ‡ (a) | 500,000 | 442,956 |
Series 2022-SFR2, Class D, 4.50%, 7/17/2039 ‡ (a) | 615,000 | 575,128 |
Flagship Credit Auto Trust | ||
Series 2019-1, Class D, 4.08%, 2/18/2025 (a) | 550,000 | 544,956 |
Series 2020-1, Class C, 2.24%, 1/15/2026 (a) | 500,000 | 489,972 |
Series 2021-1, Class D, 1.27%, 3/15/2027 (a) | 225,000 | 209,361 |
Series 2021-3, Class C, 1.46%, 9/15/2027 (a) | 143,000 | 131,939 |
Series 2022-1, Class D, 3.64%, 3/15/2028 (a) | 536,000 | 500,118 |
Foundation Finance Trust Series 2021-1A, Class A, 1.27%, 5/15/2041 (a) | 114,355 | 104,287 |
INVESTMENTS | PRINCIPAL AMOUNT($) | VALUE($) |
FREED ABS Trust | ||
Series 2021-1CP, Class B, 1.41%, 3/20/2028 ‡ (a) | 128,275 | 126,844 |
Series 2022-3FP, Class A, 4.50%, 8/20/2029 (a) | 747,294 | 744,603 |
FRTKL Series 2021-SFR1, Class D, 2.17%, 9/17/2038 ‡ (a) | 238,000 | 207,151 |
Galaxy CLO Ltd. (Cayman Islands) | ||
Series 2015-19A, Class A1RR, 3.73%, 7/24/2030 (a) (e) | 250,000 | 246,853 |
Series 2015-21A, Class AR, 3.73%, 4/20/2031 (a) (e) | 250,000 | 245,375 |
GLS Auto Receivables Issuer Trust | ||
Series 2019-4A, Class C, 3.06%, 8/15/2025 (a) | 175,000 | 172,991 |
Series 2019-1A, Class D, 4.94%, 12/15/2025 (a) | 550,000 | 549,231 |
Series 2021-3A, Class D, 1.48%, 7/15/2027 (a) | 200,000 | 179,685 |
Goldman Home Improvement Trust Issuer Trust Series 2021-GRN2, Class A, 1.15%, 6/25/2051 (a) | 137,547 | 128,705 |
Home Partners of America Trust Series 2021-3, Class E1, 3.20%, 1/17/2041 ‡ (a) | 472,594 | 414,082 |
LCM LP (Cayman Islands) Series 14A, Class AR, 3.75%, 7/20/2031 (a) (e) | 400,000 | 393,324 |
LCM Ltd. (Cayman Islands) Series 26A, Class A1, 3.78%, 1/20/2031 (a) (e) | 250,000 | 246,849 |
Lendbuzz Securitization Trust Series 2021-1A, Class A, 1.46%, 6/15/2026 (a) | 155,608 | 150,791 |
Lendingpoint Asset Securitization Trust | ||
Series 2021-A, Class B, 1.46%, 12/15/2028 ‡ (a) | 203,000 | 197,110 |
Series 2022-A, Class C, 2.82%, 6/15/2029 ‡ (a) | 300,000 | 278,818 |
LendingPoint Asset Securitization Trust Series 2020-REV1, Class B, 4.49%, 10/15/2028 ‡ (a) | 300,000 | 294,053 |
LendingPoint Pass-Through Trust Series 2022-ST1, Class A, 2.50%, 3/15/2028 (a) | 171,994 | 163,927 |
Lendmark Funding Trust Series 2019-2A, Class A, 2.78%, 4/20/2028 (a) | 225,000 | 219,547 |
LL ABS Trust Series 2021-1A, Class A, 1.07%, 5/15/2029 (a) | 140,668 | 135,297 |
LMREC LLC Series 2021-CRE4, Class A, 3.48%, 4/22/2037 (a) (e) | 154,813 | 150,945 |
August 31, 2022 | J.P. Morgan Exchange-Traded Funds | 171 |
AS OF August 31, 2022 (Unaudited) (continued)
INVESTMENTS | PRINCIPAL AMOUNT($) | VALUE($) |
Asset-Backed Securities — continued | ||
Longfellow Place CLO Ltd. (Cayman Islands) Series 2013-1A, Class AR3, 3.51%, 4/15/2029 (a) (e) | 86,062 | 85,365 |
Mariner Finance Issuance Trust Series 2021-AA, Class A, 1.86%, 3/20/2036 (a) | 192,000 | 165,751 |
Mercury Financial Credit Card Master Trust Series 2021-1A, Class A, 1.54%, 3/20/2026 (a) | 284,000 | 269,026 |
Mission Lane Credit Card Master Trust Series 2021-A, Class A, 1.59%, 9/15/2026 (a) | 355,000 | 342,709 |
MVW LLC | ||
Series 2021-1WA, Class A, 1.14%, 1/22/2041 (a) | 153,115 | 141,110 |
Series 2021-1WA, Class B, 1.44%, 1/22/2041 ‡ (a) | 65,715 | 60,939 |
Neuberger Berman CLO (Cayman Islands) Series 2013-15A, Class A1R2, 3.43%, 10/15/2029 (a) (e) | 608,000 | 599,160 |
Neuberger Berman Loan Advisers CLO Ltd. (Cayman Islands) Series 2020-37A, Class AR, 3.68%, 7/20/2031 (a) (e) | 354,000 | 347,577 |
New Residential Mortgage Loan Trust Series 2022-SFR1, Class E1, 3.55%, 2/17/2039 ‡ (a) | 520,000 | 466,743 |
NMEF Funding LLC Series 2021-A, Class B, 1.85%, 12/15/2027 ‡ (a) | 178,000 | 167,940 |
NRZ Excess Spread-Collateralized Notes Series 2021-FNT1, Class A, 2.98%, 3/25/2026 (a) | 124,164 | 112,277 |
Oportun Funding XIV LLC Series 2021-A, Class A, 1.21%, 3/8/2028 (a) | 172,000 | 160,382 |
Pagaya AI Debt Selection Trust | ||
Series 2021-1, Class A, 1.18%, 11/15/2027 (a) | 67,274 | 65,784 |
Series 2021-HG1, Class A, 1.22%, 1/16/2029 (a) | 226,590 | 214,543 |
Series 2021-3, Class A, 1.15%, 5/15/2029 (a) | 128,312 | 124,583 |
Palmer Square Loan Funding Ltd. (Cayman Islands) | ||
Series 2020-1A, Class A1, 3.78%, 2/20/2028 (a) (e) | 78,211 | 77,473 |
Series 2021-2A, Class A1, 3.78%, 5/20/2029 (a) (e) | 143,486 | 141,595 |
PRET LLC | ||
Series 2021-NPL3, Class A1, 1.87%, 7/25/2051 (a) (f) | 213,333 | 191,639 |
INVESTMENTS | PRINCIPAL AMOUNT($) | VALUE($) |
Series 2021-NPL6, Class A1, 2.49%, 7/25/2051 (a) (f) | 290,852 | 273,699 |
Series 2021-RN4, Class A1, 2.49%, 10/25/2051 (a) (e) | 445,285 | 418,113 |
Pretium Mortgage Credit Partners I LLC | ||
Series 2021-NPL2, Class A1, 1.99%, 6/27/2060 (a) (f) | 211,678 | 198,364 |
Series 2021-NPL1, Class A1, 2.24%, 9/27/2060 (a) (f) | 161,165 | 153,590 |
Progress Residential Series 2021-SFR3, Class E1, 2.54%, 5/17/2026 ‡ (a) | 200,000 | 174,640 |
Progress Residential Trust | ||
Series 2021-SFR8, Class E1, 2.38%, 10/17/2038 ‡ (a) | 350,000 | 301,459 |
Series 2022-SFR3, Class D, 4.45%, 4/17/2039 ‡ (a) | 562,000 | 525,139 |
Santander Drive Auto Receivables Trust | ||
Series 2021-1, Class D, 1.13%, 11/16/2026 | 190,000 | 182,169 |
Series 2021-3, Class D, 1.33%, 9/15/2027 | 300,000 | 283,902 |
Skopos Auto Receivables Trust | ||
Series 2019-1A, Class C, 3.63%, 9/16/2024 (a) | 50,823 | 50,669 |
Series 2019-1A, Class D, 5.24%, 4/15/2025 (a) | 320,000 | 314,064 |
SoFi Consumer Loan Program Trust Series 2018-4, Class D, 4.76%, 11/26/2027 ‡ (a) | 142,274 | 142,168 |
Sound Point CLO Ltd. (Cayman Islands) Series 2019-1A, Class AR, 3.79%, 1/20/2032 (a) (e) | 400,000 | 392,833 |
Stratus CLO Ltd. (Cayman Islands) Series 2021-1A, Class A, 3.51%, 12/29/2029 (a) (e) | 462,551 | 454,382 |
Symphony CLO Ltd. (Cayman Islands) Series 2016-18A, Class A1RR, 3.88%, 7/23/2033 (a) (e) | 250,000 | 245,380 |
Tricon Residential Trust Series 2021-SFR1, Class E1, 2.79%, 7/17/2038 ‡ (a) | 240,000 | 210,558 |
Upstart Pass-Through Trust | ||
Series 2021-ST4, Class A, 2.00%, 7/20/2027 (a) | 126,183 | 118,584 |
Series 2021-ST5, Class A, 2.00%, 7/20/2027 (a) | 147,675 | 139,133 |
Series 2021-ST8, Class A, 1.75%, 10/20/2029 (a) | 212,440 | 199,586 |
Series 2021-ST9, Class A, 1.70%, 11/20/2029 (a) | 178,211 | 164,042 |
172 | J.P. Morgan Exchange-Traded Funds | August 31, 2022 |
INVESTMENTS | PRINCIPAL AMOUNT($) | VALUE($) |
Asset-Backed Securities — continued | ||
Series 2021-ST10, Class A, 2.25%, 1/20/2030 (a) | 341,943 | 326,976 |
Series 2022-ST1, Class A, 2.60%, 3/20/2030 (a) | 488,198 | 461,615 |
Upstart Securitization Trust | ||
Series 2020-1, Class B, 3.09%, 4/22/2030 ‡ (a) | 70,799 | 70,512 |
Series 2021-2, Class B, 1.75%, 6/20/2031 ‡ (a) | 275,000 | 257,541 |
Series 2021-3, Class A, 0.83%, 7/20/2031 (a) | 107,766 | 104,547 |
Series 2021-4, Class B, 1.84%, 9/20/2031 ‡ (a) | 231,000 | 204,782 |
Series 2021-5, Class B, 2.49%, 11/20/2031 ‡ (a) | 225,000 | 202,935 |
Series 2022-4, Class A, 5.98%, 8/20/2032 (a) | 584,000 | 581,878 |
US Auto Funding | ||
Series 2021-1A, Class A, 0.79%, 7/15/2024 (a) | 25,339 | 25,194 |
Series 2021-1A, Class B, 1.49%, 3/17/2025 (a) | 142,000 | 137,986 |
US Auto Funding Trust Series 2022-1A, Class B, 5.13%, 12/15/2025 (a) | 574,000 | 554,936 |
VCAT LLC | ||
Series 2021-NPL2, Class A1, 2.12%, 3/27/2051 (a) (f) | 152,392 | 144,776 |
Series 2021-NPL3, Class A1, 1.74%, 5/25/2051 (a) (f) | 162,596 | 151,860 |
Series 2021-NPL4, Class A1, 1.87%, 8/25/2051 ‡ (a) (f) | 237,568 | 222,164 |
Venture CLO Ltd. (Cayman Islands) Series 2018-32A, Class A2A, 3.81%, 7/18/2031 (a) (e) | 150,000 | 147,639 |
Veros Auto Receivables Trust | ||
Series 2022-1, Class A, 3.47%, 12/15/2025 (a) | 375,477 | 367,891 |
Series 2021-1, Class A, 0.92%, 10/15/2026 (a) | 61,276 | 60,200 |
VOLT CIII LLC Series 2021-CF1, Class A1, 1.99%, 8/25/2051 ‡ (a) (f) | 291,195 | 274,686 |
VOLT XCIX LLC Series 2021-NPL8, Class A1, 2.12%, 4/25/2051 ‡ (a) (f) | 147,684 | 140,110 |
VOLT XCVI LLC Series 2021-NPL5, Class A1, 2.12%, 3/27/2051 ‡ (a) (f) | 121,033 | 113,551 |
VOLT XCVII LLC Series 2021-NPL6, Class A1, 2.24%, 4/25/2051 (a) (f) | 150,621 | 142,773 |
INVESTMENTS | PRINCIPAL AMOUNT($) | VALUE($) |
Westlake Automobile Receivables Trust | ||
Series 2019-3A, Class E, 3.59%, 3/17/2025 (a) | 100,000 | 98,757 |
Series 2020-1A, Class D, 2.80%, 6/16/2025 (a) | 175,000 | 172,258 |
Series 2021-1A, Class C, 0.95%, 3/16/2026 (a) | 260,000 | 250,237 |
Series 2021-1A, Class D, 1.23%, 4/15/2026 (a) | 250,000 | 235,705 |
Series 2021-3A, Class D, 2.12%, 1/15/2027 (a) | 450,000 | 417,437 |
Total Asset-Backed Securities (Cost $41,203,833) | 39,443,996 | |
U.S. Treasury Obligations — 16.5% | ||
U.S. Treasury Notes | ||
2.50%, 5/31/2024 | 2,025,000 | 1,991,540 |
1.75%, 3/15/2025 | 4,010,000 | 3,842,394 |
2.63%, 4/15/2025 | 650,000 | 635,883 |
2.75%, 5/15/2025 | 5,370,000 | 5,266,586 |
2.88%, 6/15/2025 | 13,810,000 | 13,581,272 |
3.00%, 7/15/2025 | 7,147,800 | 7,052,310 |
3.13%, 8/15/2025 | 195,000 | 193,035 |
0.50%, 2/28/2026 | 15,000 | 13,534 |
0.75%, 5/31/2026 | 80,000 | 72,416 |
0.75%, 8/31/2026 | 80,000 | 72,006 |
0.88%, 9/30/2026 | 420,000 | 379,427 |
1.25%, 12/31/2026 | 150,000 | 137,068 |
1.50%, 1/31/2027 | 150,000 | 138,410 |
2.63%, 5/31/2027 | 65,000 | 62,954 |
2.75%, 7/31/2027 | 95,000 | 92,454 |
1.25%, 9/30/2028 | 840,000 | 742,973 |
2.38%, 3/31/2029 | 1,140,000 | 1,074,940 |
Total U.S. Treasury Obligations (Cost $35,942,780) | 35,349,202 | |
Mortgage-Backed Securities — 9.7% | ||
FHLMC Gold Pools, 30 Year Pool # G08878, 4.50%, 5/1/2049 | 282,708 | 284,802 |
FHLMC UMBS, 10 Year Pool # RD5034, 2.00%, 9/1/2030 | 523,307 | 493,351 |
FHLMC UMBS, 15 Year | ||
Pool # ZS6689, 2.50%, 4/1/2028 | 208,986 | 202,477 |
Pool # SB0661, 2.50%, 4/1/2037 | 521,116 | 493,317 |
FHLMC, 30 Year | ||
Pool # SD8231, 4.50%, 7/1/2052 | 890,538 | 885,886 |
Pool # SD8233, 5.00%, 7/1/2052 | 246,247 | 249,000 |
August 31, 2022 | J.P. Morgan Exchange-Traded Funds | 173 |
AS OF August 31, 2022 (Unaudited) (continued)
INVESTMENTS | PRINCIPAL AMOUNT($) | VALUE($) |
Mortgage-Backed Securities — continued | ||
FNMA UMBS, 15 Year | ||
Pool # FS1563, 2.50%, 7/1/2036 | 569,416 | 539,053 |
Pool # FS1329, 2.00%, 2/1/2037 | 1,033,501 | 953,563 |
FNMA UMBS, 20 Year Pool # CA8310, 2.50%, 12/1/2040 | 271,165 | 247,763 |
FNMA UMBS, 30 Year | ||
Pool # FM2972, 4.00%, 12/1/2044 | 970,846 | 968,709 |
Pool # FS2237, 4.00%, 10/1/2046 | 2,238,403 | 2,240,365 |
Pool # BM1285, 4.50%, 5/1/2047 | 157,058 | 160,009 |
Pool # FS1847, 4.00%, 1/1/2049 | 283,843 | 281,653 |
Pool # FS1891, 4.00%, 1/1/2050 | 957,586 | 947,848 |
Pool # FS0085, 4.00%, 11/1/2050 | 1,032,468 | 1,026,244 |
FNMA/FHLMC UMBS, Single Family, 15 Year TBA, 4.00%, 9/25/2037 (g) | 5,150,000 | 5,132,026 |
FNMA/FHLMC UMBS, Single Family, 30 Year TBA, 5.50%, 9/25/2052 (g) | 1,750,000 | 1,789,375 |
Freddie Mac Pool, 15 Year Pool # SB0725, 4.00%, 8/1/2037 | 1,050,000 | 1,050,380 |
Freddie Mac Pool, 30 Year Pool # ZT1703, 4.00%, 1/1/2049 | 942,149 | 934,838 |
GNMA II, 30 Year Pool # MA8201, 4.50%, 8/20/2052 | 470,000 | 470,703 |
GNMA II, Single Family, 30 Year | ||
TBA, 4.50%, 9/15/2052 (g) | 280,000 | 280,044 |
TBA, 5.50%, 9/15/2052 (g) | 1,000,000 | 1,025,312 |
Total Mortgage-Backed Securities (Cost $21,034,080) | 20,656,718 | |
Commercial Mortgage-Backed Securities — 7.2% | ||
AREIT Trust (Cayman Islands) | ||
Series 2022-CRE6, Class C, 4.16%, 1/16/2037 ‡ (a) (e) | 450,000 | 426,909 |
Series 2021-CRE5, Class C, 4.63%, 11/17/2038 ‡ (a) (e) | 336,000 | 318,353 |
Beast Mortgage Trust Series 2021-1818, Class B, 3.84%, 3/15/2036 ‡ (a) (e) | 179,000 | 171,538 |
BX Commercial Mortgage Trust | ||
Series 2021-VOLT, Class A, 3.09%, 9/15/2036 (a) (e) | 410,000 | 396,065 |
Series 2021-VOLT, Class D, 4.04%, 9/15/2036 ‡ (a) (e) | 275,000 | 262,767 |
Series 2021-XL2, Class E, 4.24%, 10/15/2038 ‡ (a) (e) | 359,165 | 341,374 |
BX Mortgage Trust Series 2022-MVRK, Class A, 3.76%, 3/15/2039 (a) (e) | 500,000 | 490,422 |
BX Trust | ||
Series 2021-LBA, Class AJV, 3.19%, 2/15/2036 (a) (e) | 377,000 | 361,806 |
INVESTMENTS | PRINCIPAL AMOUNT($) | VALUE($) |
Series 2021-RISE, Class D, 4.14%, 11/15/2036 ‡ (a) (e) | 360,000 | 340,992 |
Series 2022-LBA6, Class D, 4.31%, 1/15/2039 ‡ (a) (e) | 525,000 | 499,152 |
Citigroup Commercial Mortgage Trust | ||
Series 2021-PRM2, Class F, 6.14%, 10/15/2036 ‡ (a) (e) | 275,000 | 261,843 |
Series 2013-GC11, Class AS, 3.42%, 4/10/2046 | 500,000 | 495,398 |
Series 2014-GC19, Class D, 5.26%, 3/10/2047 ‡ (a) (e) | 250,000 | 243,984 |
Series 2014-GC23, Class C, 4.58%, 7/10/2047 ‡ (e) | 200,000 | 192,225 |
Series 2015-GC27, Class B, 3.77%, 2/10/2048 ‡ | 200,000 | 189,974 |
Series 2015-GC27, Class C, 4.57%, 2/10/2048 ‡ (e) | 440,000 | 418,791 |
Series 2015-GC29, Class C, 4.28%, 4/10/2048 (e) | 400,000 | 378,046 |
Series 2015-GC31, Class C, 4.17%, 6/10/2048 ‡ (e) | 250,000 | 227,765 |
Commercial Mortgage Trust | ||
Series 2019-WCM, Class G, 5.09%, 10/15/2034 ‡ (a) (e) | 385,000 | 364,082 |
Series 2013-CR10, Class AM, 4.52%, 8/10/2046 (a) (e) | 200,000 | 198,333 |
Series 2014-UBS5, Class C, 4.77%, 9/10/2047 ‡ (e) | 500,000 | 461,058 |
Series 2014-CR20, Class C, 4.64%, 11/10/2047 ‡ (e) | 100,000 | 94,984 |
Series 2015-CR26, Class B, 4.62%, 10/10/2048 ‡ (e) | 200,000 | 192,669 |
Series 2015-PC1, Class B, 4.43%, 7/10/2050 ‡ (e) | 200,000 | 189,744 |
CSAIL Commercial Mortgage Trust Series 2015-C4, Class E, 3.71%, 11/15/2048 ‡ (e) | 325,000 | 277,744 |
FHLMC, Multi-Family Structured Pass-Through Certificates | ||
Series K068, Class X1, IO, 0.56%, 8/25/2027 (e) | 3,614,124 | 65,814 |
Series K028, Class X3, IO, 1.72%, 6/25/2041 (e) | 4,629,000 | 44,886 |
Series K111, Class X3, IO, 3.29%, 4/25/2048 (e) | 405,000 | 77,493 |
Series K110, Class X3, IO, 3.52%, 6/25/2048 (e) | 380,000 | 76,524 |
Series K119, Class X3, IO, 2.82%, 9/25/2048 (e) | 460,000 | 77,678 |
174 | J.P. Morgan Exchange-Traded Funds | August 31, 2022 |
INVESTMENTS | PRINCIPAL AMOUNT($) | VALUE($) |
Commercial Mortgage-Backed Securities — continued | ||
Series K115, Class X3, IO, 3.06%, 9/25/2048 (e) | 430,000 | 76,883 |
Series K125, Class X3, IO, 2.75%, 2/25/2049 (e) | 460,000 | 77,874 |
FREMF Mortgage Trust | ||
Series 2018-K732, Class C, 4.19%, 5/25/2025 (a) (e) | 200,000 | 192,572 |
Series 2013-K31, Class C, 3.75%, 7/25/2046 (a) (e) | 275,000 | 271,929 |
Series 2014-K41, Class C, 3.96%, 11/25/2047 (a) (e) | 100,000 | 97,275 |
Series 2016-K57, Class C, 4.05%, 8/25/2049 (a) (e) | 185,000 | 175,292 |
Series 2016-K58, Class C, 3.87%, 9/25/2049 (a) (e) | 110,000 | 102,647 |
Series 2017-K62, Class C, 4.01%, 1/25/2050 (a) (e) | 200,000 | 186,487 |
GS Mortgage Securities Trust | ||
Series 2016-GS2, Class B, 3.76%, 5/10/2049 ‡ (e) | 100,000 | 92,970 |
Series 2016-GS3, Class C, 4.12%, 10/10/2049 ‡ (e) | 165,000 | 149,770 |
Series 2017-GS5, Class D, 3.51%, 3/10/2050 ‡ (a) (e) | 250,000 | 200,202 |
Independence Plaza Trust | ||
Series 2018-INDP, Class A, 3.76%, 7/10/2035 (a) | 175,000 | 168,064 |
Series 2018-INDP, Class C, 4.16%, 7/10/2035 ‡ (a) | 150,000 | 142,357 |
JPMBB Commercial Mortgage Securities Trust | ||
Series 2015-C31, Class C, 4.77%, 8/15/2048 ‡ (e) | 150,000 | 140,461 |
Series 2016-C1, Class D1, 4.39%, 3/17/2049 ‡ (a) (e) | 400,000 | 355,043 |
JPMCC Commercial Mortgage Securities Trust Series 2017-JP5, Class D, 4.69%, 3/15/2050 ‡ (a) (e) | 275,000 | 226,515 |
JPMorgan Chase Commercial Mortgage Securities Trust Series 2013-C16, Class D, 5.17%, 12/15/2046 ‡ (a) (e) | 200,000 | 190,951 |
KKR Industrial Portfolio Trust Series 2021-KDIP, Class D, 3.64%, 12/15/2037 ‡ (a) (e) | 131,250 | 125,344 |
Life Mortgage Trust Series 2021-BMR, Class C, 3.49%, 3/15/2038 ‡ (a) (e) | 191,679 | 184,491 |
MHC Commercial Mortgage Trust Series 2021-MHC, Class D, 3.99%, 4/15/2038 ‡ (a) (e) | 250,000 | 238,125 |
INVESTMENTS | PRINCIPAL AMOUNT($) | VALUE($) |
Morgan Stanley Bank of America Merrill Lynch Trust | ||
Series 2014-C14, Class D, 5.21%, 2/15/2047 ‡ (a) (e) | 175,023 | 168,970 |
Series 2015-C24, Class D, 3.26%, 5/15/2048 ‡ (a) | 220,000 | 188,467 |
Series 2015-C25, Class B, 4.68%, 10/15/2048 ‡ (e) | 500,000 | 484,150 |
PFP Ltd. (Cayman Islands) Series 2021-7, Class C, 4.04%, 4/14/2038 ‡ (a) (e) | 166,492 | 156,370 |
SG Commercial Mortgage Securities Trust Series 2016-C5, Class B, 3.93%, 10/10/2048 ‡ | 225,000 | 205,361 |
SMRT Series 2022-MINI, Class E, 5.01%, 1/15/2039 ‡ (a) (e) | 350,000 | 324,626 |
STWD Mortgage Trust (Cayman Islands) Series 2021-LIH, Class B, 4.05%, 11/15/2036 ‡ (a) (e) | 400,000 | 383,359 |
Velocity Commercial Capital Loan Trust Series 2021-2, Class A, 1.52%, 8/25/2051 (a) (e) | 314,806 | 277,161 |
Wells Fargo Commercial Mortgage Trust | ||
Series 2015-NXS4, Class B, 4.22%, 12/15/2048 ‡ (e) | 500,000 | 476,814 |
Series 2015-LC22, Class D, 4.71%, 9/15/2058 ‡ (e) | 205,000 | 183,211 |
WFRBS Commercial Mortgage Trust | ||
Series 2013-C11, Class C, 4.31%, 3/15/2045 ‡ (e) | 117,000 | 115,770 |
Series 2014-C25, Class B, 4.24%, 11/15/2047 ‡ (e) | 160,000 | 154,268 |
Series 2014-C22, Class C, 3.91%, 9/15/2057 (e) | 725,000 | 684,965 |
Total Commercial Mortgage-Backed Securities (Cost $16,398,893) | 15,337,157 | |
Collateralized Mortgage Obligations — 4.2% | ||
Connecticut Avenue Securities Trust | ||
Series 2022-R01, Class 1M2, 4.08%, 12/25/2041 ‡ (a) (e) | 521,000 | 486,027 |
Series 2022-R02, Class 2M2, 5.18%, 1/25/2042 ‡ (a) (e) | 225,000 | 215,989 |
Series 2022-R07, Class 1M1, 5.16%, 6/25/2042 (a) (e) | 440,121 | 446,751 |
FHLMC STACR REMIC Trust | ||
Series 2020-DNA1, Class M2, 4.14%, 1/25/2050 (a) (e) | 83,002 | 82,379 |
Series 2020-HQA3, Class B1, 8.19%, 7/25/2050 (a) (e) | 200,000 | 205,887 |
August 31, 2022 | J.P. Morgan Exchange-Traded Funds | 175 |
AS OF August 31, 2022 (Unaudited) (continued)
INVESTMENTS | PRINCIPAL AMOUNT($) | VALUE($) |
Collateralized Mortgage Obligations — continued | ||
FHLMC Structured Agency Credit Risk Debt Notes Series 2021-DNA2, Class M2, 4.48%, 8/25/2033 (a) (e) | 100,000 | 98,502 |
FHLMC, REMIC | ||
Series 2673, Class PE, 5.50%, 9/15/2033 | 108,311 | 113,028 |
Series 3878, Class PL, 4.50%, 11/15/2040 | 463,712 | 474,937 |
Series 4718, Class DA, 3.00%, 2/15/2047 | 290,210 | 279,120 |
Series 5021, Class MI, IO, 3.00%, 10/25/2050 | 488,403 | 79,417 |
FNMA, Connecticut Avenue Securities Series 2017-C07, Class 2M2, 4.94%, 5/25/2030 (e) | 104,884 | 106,646 |
FNMA, REMIC | ||
Series 2012-136, Class DL, 3.50%, 12/25/2042 | 263,378 | 255,819 |
Series 2022-42, Class EA, 3.75%, 6/25/2052 | 2,709,978 | 2,666,178 |
GNMA Series 2021-9, Class MI, IO, 2.50%, 1/20/2051 | 254,519 | 32,802 |
Legacy Mortgage Asset Trust Series 2021-GS3, Class A1, 1.75%, 7/25/2061 (a) (f) | 123,987 | 113,928 |
LHOME Mortgage Trust Series 2021-RTL1, Class A1, 2.09%, 9/25/2026 (a) (e) | 188,000 | 181,310 |
NYMT Loan Trust Series 2021-SP1, Class A1, 1.67%, 8/25/2061 (a) (f) | 286,131 | 260,873 |
PRPM LLC | ||
Series 2020-4, Class A1, 2.95%, 10/25/2025 ‡ (a) (f) | 715,505 | 690,389 |
Series 2021-2, Class A1, 2.12%, 3/25/2026 (a) (e) | 125,893 | 119,542 |
Series 2021-5, Class A1, 1.79%, 6/25/2026 (a) (f) | 840,974 | 784,736 |
Series 2021-6, Class A1, 1.79%, 7/25/2026 (a) (f) | 280,861 | 261,017 |
Series 2021-7, Class A1, 1.87%, 8/25/2026 (a) (f) | 247,048 | 228,857 |
Series 2021-11, Class A1, 2.49%, 11/25/2026 (a) (f) | 251,467 | 234,859 |
Verus Securitization Trust Series 2021-2, Class M1, 2.19%, 2/25/2066 ‡ (a) (e) | 144,000 | 113,286 |
VOLT CV LLC Series 2021-CF2, Class A1, 2.49%, 11/27/2051 (a) (f) | 423,215 | 399,312 |
Total Collateralized Mortgage Obligations (Cost $9,264,632) | 8,931,591 | |
INVESTMENTS | PRINCIPAL AMOUNT($) | VALUE($) |
Foreign Government Securities — 0.7% | ||
Dominican Republic Government Bond, 6.00%, 7/19/2028 (d) | 300,000 | 286,276 |
Federal Republic of Nigeria | ||
6.50%, 11/28/2027 (d) | 200,000 | 152,500 |
8.38%, 3/24/2029 (a) | 200,000 | 158,000 |
Hashemite Kingdom of Jordan 4.95%, 7/7/2025 (a) | 200,000 | 188,850 |
Islamic Republic of Pakistan 6.00%, 4/8/2026 (a) | 200,000 | 124,022 |
Republic of Angola 8.25%, 5/9/2028 (d) | 200,000 | 173,500 |
Republic of Cote d'Ivoire | ||
6.38%, 3/3/2028 (d) | 200,000 | 185,662 |
5.75%, 12/31/2032 (d) (f) | 62,695 | 55,731 |
Republic of Ecuador | ||
5.50%, 7/31/2030 (a) (f) | 75,000 | 39,319 |
2.50%, 7/31/2035 (d) (f) | 110,000 | 42,130 |
Republic of Iraq 6.75%, 3/9/2023 (d) | 200,000 | 192,412 |
Total Foreign Government Securities (Cost $1,946,866) | 1,598,402 | |
Municipal Bonds — 0.1% (e) (h) | ||
California — 0.1% | ||
California Housing Finance Agency Series 2021-1, Class X, 0.80%, 11/20/2035(Cost $128,393) | 2,157,486 | 124,434 |
SHARES | ||
Short-Term Investments — 6.8% | ||
Investment Companies — 6.4% | ||
JPMorgan Prime Money Market Fund Class IM Shares, 2.30% (i) (j) (Cost $13,778,329) | 13,776,790 | 13,782,301 |
Investment of Cash Collateral from Securities Loaned — 0.1% | ||
JPMorgan U.S. Government Money Market Fund Class IM Shares, 2.00% (i) (j) (Cost $135,300) | 135,300 | 135,300 |
176 | J.P. Morgan Exchange-Traded Funds | August 31, 2022 |
INVESTMENTS | PRINCIPAL AMOUNT($) | VALUE($) |
U.S. Treasury Obligations — 0.3% | ||
U.S. Treasury Bills, 0.79%, 9/8/2022 (k) (l)(Cost $636,903) | 637,000 | 636,747 |
Total Short-Term Investments (Cost $14,550,532) | 14,554,348 | |
Total Investments — 103.3% (Cost $232,580,957) | 220,814,615 | |
Liabilities in Excess of Other Assets — (3.3)% | (7,070,073) | |
NET ASSETS — 100.0% | 213,744,542 | |
Percentages indicated are based on net assets. |
Abbreviations | |
ABS | Asset-Backed Securities |
CIFC | Commercial Industrial Finance Corp. |
CLO | Collateralized Loan Obligations |
FHLMC | Federal Home Loan Mortgage Corp. |
FNMA | Federal National Mortgage Association |
GNMA | Government National Mortgage Association |
ICE | Intercontinental Exchange |
IO | Interest Only represents the right to receive the monthly interest payments on an underlying pool of mortgage loans. The principal amount shown represents the par value on the underlying pool. The yields on these securities are subject to accelerated principal paydowns as a result of prepayment or refinancing of the underlying pool of mortgage instruments. As a result, interest income may be reduced considerably. |
LIBOR | London Interbank Offered Rate |
REMIC | Real Estate Mortgage Investment Conduit |
SOFR | Secured Overnight Financing Rate |
TBA | To Be Announced; Security is subject to delayed delivery. |
UMBS | Uniform Mortgage-Backed Securities |
USD | United States Dollar |
^ | Amount rounds to less than 0.1% of net assets. | |
‡ | Value determined using significant unobservable inputs. | |
(a) | Securities exempt from registration under Rule 144A or section 4(a)(2), of the Securities Act of 1933, as amended. | |
(b) | The security or a portion of this security is on loan at August 31, 2022. The total value of securities on loan at August 31, 2022 is $129,062. | |
(c) | Variable or floating rate security, linked to the referenced benchmark. The interest rate shown is the current rate as of August 31, 2022. | |
(d) | Security exempt from registration pursuant to Regulation S under the Securities Act of 1933, as amended. Regulation S applies to securities offerings that are made outside of the United States and do not involve direct selling efforts in the United States and as such may have restrictions on resale. | |
(e) | Variable or floating rate security, the interest rate of which adjusts periodically based on changes in current interest rates and prepayments on the underlying pool of assets. The interest rate shown is the current rate as of August 31, 2022. | |
(f) | Step bond. Interest rate is a fixed rate for an initial period that either resets at a specific date or may reset in the future contingent upon a predetermined trigger. The interest rate shown is the current rate as of August 31, 2022. | |
(g) | All or a portion of the security is a when-issued security, delayed delivery security, or forward commitment. | |
(h) | The date shown represents the earliest of the prerefunded date, next put date or final maturity date. | |
(i) | Investment in an affiliated fund, which is registered under the Investment Company Act of 1940, as amended, and is advised by J.P. Morgan Investment Management Inc. | |
(j) | The rate shown is the current yield as of August 31, 2022. | |
(k) | The rate shown is the effective yield as of August 31, 2022. | |
(l) | All or a portion of this security is deposited with the broker as initial margin for futures contracts or centrally cleared swaps. |
DESCRIPTION | NUMBER OF CONTRACTS | EXPIRATION DATE | TRADING CURRENCY | NOTIONAL AMOUNT ($) | VALUE AND UNREALIZED APPRECIATION (DEPRECIATION) ($) |
Long Contracts | |||||
U.S. Treasury 2 Year Note | 156 | 12/30/2022 | USD | 32,487,000 | (64,117) |
U.S. Treasury 5 Year Note | 9 | 12/30/2022 | USD | 996,047 | (18) |
(64,135) |
August 31, 2022 | J.P. Morgan Exchange-Traded Funds | 177 |
AS OF August 31, 2022 (Unaudited) (continued)
DESCRIPTION | NUMBER OF CONTRACTS | EXPIRATION DATE | TRADING CURRENCY | NOTIONAL AMOUNT ($) | VALUE AND UNREALIZED APPRECIATION (DEPRECIATION) ($) |
Short Contracts | |||||
U.S. Treasury 10 Year Note | (109) | 12/20/2022 | USD | (12,712,125) | 98,240 |
U.S. Treasury 10 Year Ultra Note | (32) | 12/20/2022 | USD | (3,995,500) | 34,292 |
132,532 | |||||
68,397 |
Abbreviations | |
USD | United States Dollar |
REFERENCE OBLIGATION/INDEX | FINANCING RATE PAID BY THE FUND (%) | PAYMENT FREQUENCY | MATURITY DATE | IMPLIED CREDIT SPREAD (%)(a) | NOTIONAL AMOUNT(b) | UPFRONT PAYMENTS (RECEIPTS) ($)(c) | UNREALIZED APPRECIATION (DEPRECIATION) ($) | VALUE ($) |
CDX.NA.HY.38-V2 | 5.00 | Quarterly | 6/20/2027 | 5.31 | USD 2,150,000 | (61,020) | 65,815 | 4,795 |
(*) | The Fund, as a buyer of credit protection, is generally obligated to make periodic payments and may also pay or receive an upfront premium to or from the protection seller, in exchange for the right to receive a contingent payment, upon occurrence of a credit event with respect to an underlying reference obligation, as defined under the terms of individual swap contracts. | ||||||||
(a) | Implied credit spreads are an indication of the seller's performance risk, related to the likelihood of a credit event occurring that would require a seller to make payment to a buyer. Implied credit spreads are used to determine the value of swap contracts and reflect the cost of buying/selling protection, which may include upfront payments made to enter into the contract. Therefore, higher spreads would indicate a greater likelihood that a seller will be obligated to perform (i.e. make payment) under the swap contract.Increasing values, in absolute terms and relative to notional amounts, are also indicative of greater performance risk. Implied credit spreads for credit default swaps on credit indices are linked to the weighted average spread across the underlying reference obligations included in a particular index. | ||||||||
(b) | The notional amount is the maximum amount that a seller of credit protection would be obligated to pay and a buyer of credit protection would receive, upon occurrence of a credit event. | ||||||||
(c) | Upfront payments and receipts generally represent premiums paid or received at the initiation of the agreement to compensate the differences between the stated terms of the swap agreement and current market conditions (credit spreads, interest rates and other relevant factors). | ||||||||
Abbreviations | |
CDX | Credit Default Swap Index |
USD | United States Dollar |
178 | J.P. Morgan Exchange-Traded Funds | August 31, 2022 |
AS OF August 31, 2022 (Unaudited)
INVESTMENTS | PRINCIPAL AMOUNT($) | VALUE($) |
U.S. Treasury Obligations — 40.2% | ||
U.S. Treasury Bonds | ||
6.88%, 8/15/2025 | 638,000 | 696,217 |
6.63%, 2/15/2027 | 591,000 | 667,461 |
6.38%, 8/15/2027 | 4,000,000 | 4,533,438 |
6.13%, 11/15/2027 | 2,819,000 | 3,179,744 |
5.25%, 11/15/2028 | 2,000,000 | 2,207,969 |
6.13%, 8/15/2029 | 2,100,000 | 2,465,859 |
5.38%, 2/15/2031 | 3,169,000 | 3,665,642 |
4.50%, 2/15/2036 | 2,903,000 | 3,345,254 |
4.75%, 2/15/2037 | 206,000 | 243,885 |
5.00%, 5/15/2037 | 3,774,000 | 4,576,565 |
4.50%, 5/15/2038 | 542,000 | 626,518 |
3.50%, 2/15/2039 | 4,178,000 | 4,281,144 |
4.25%, 5/15/2039 | 10,000 | 11,222 |
4.50%, 8/15/2039 | 996,000 | 1,150,224 |
4.38%, 11/15/2039 | 356,000 | 404,616 |
4.63%, 2/15/2040 | 2,621,000 | 3,069,027 |
1.13%, 5/15/2040 | 13,700,000 | 9,330,984 |
4.38%, 5/15/2040 | 679,000 | 769,392 |
1.13%, 8/15/2040 | 2,701,000 | 1,822,753 |
1.38%, 11/15/2040 | 4,209,400 | 2,963,023 |
1.88%, 2/15/2041 | 7,837,000 | 6,006,326 |
2.25%, 5/15/2041 | 955,000 | 778,922 |
1.75%, 8/15/2041 | 240,000 | 178,387 |
2.00%, 11/15/2041 | 314,000 | 243,939 |
2.38%, 2/15/2042 | 5,811,000 | 4,819,498 |
3.13%, 2/15/2042 | 1,963,000 | 1,844,300 |
2.50%, 2/15/2045 | 3,384,000 | 2,797,616 |
3.00%, 5/15/2045 | 38,000 | 34,348 |
2.50%, 5/15/2046 | 10,713,000 | 8,826,508 |
2.25%, 8/15/2046 | 1,749,000 | 1,369,412 |
3.00%, 2/15/2047 | 164,000 | 148,779 |
2.25%, 8/15/2049 | 994,000 | 796,598 |
2.00%, 2/15/2050 | 2,457,000 | 1,858,874 |
1.25%, 5/15/2050 | 21,151,400 | 13,080,819 |
1.38%, 8/15/2050 | 6,409,000 | 4,098,756 |
1.63%, 11/15/2050 | 8,150,000 | 5,577,656 |
2.00%, 8/15/2051 | 598,000 | 449,434 |
1.88%, 11/15/2051 | 2,009,000 | 1,464,059 |
2.25%, 2/15/2052 | 5,288,000 | 4,227,921 |
2.88%, 5/15/2052 | 256,000 | 236,080 |
U.S. Treasury Notes | ||
1.50%, 9/15/2022 | 804,000 | 803,686 |
0.13%, 9/30/2022 | 173,000 | 172,662 |
0.13%, 7/15/2023 | 3,984,000 | 3,869,304 |
INVESTMENTS | PRINCIPAL AMOUNT($) | VALUE($) |
0.13%, 8/15/2023 | 331,000 | 320,579 |
0.13%, 8/31/2023 | 517,000 | 499,794 |
1.38%, 8/31/2023 | 360,000 | 352,519 |
1.38%, 9/30/2023 | 13,060,000 | 12,770,231 |
0.13%, 10/15/2023 | 719,000 | 692,683 |
0.25%, 11/15/2023 | 25,361,000 | 24,407,981 |
2.88%, 11/30/2023 | 837,000 | 830,853 |
2.25%, 1/31/2024 | 10,000 | 9,830 |
2.50%, 1/31/2024 | 2,434,000 | 2,400,723 |
0.13%, 2/15/2024 | 11,119,000 | 10,593,454 |
1.50%, 2/29/2024 | 338,000 | 328,296 |
2.13%, 2/29/2024 | 10,000 | 9,804 |
2.38%, 2/29/2024 | 3,723,000 | 3,663,228 |
0.25%, 3/15/2024 | 9,776,000 | 9,303,621 |
0.25%, 5/15/2024 | 2,274,000 | 2,153,016 |
2.50%, 5/15/2024 | 100,000 | 98,387 |
1.75%, 6/30/2024 | 1,967,000 | 1,907,145 |
0.38%, 7/15/2024 | 2,101,000 | 1,984,296 |
1.75%, 7/31/2024 | 10,000 | 9,684 |
3.00%, 7/31/2024 | 859,000 | 851,551 |
0.38%, 8/15/2024 | 3,126,000 | 2,944,423 |
2.38%, 8/15/2024 | 2,800,000 | 2,742,359 |
1.25%, 8/31/2024 | 3,403,000 | 3,258,638 |
1.88%, 8/31/2024 | 259,000 | 251,139 |
0.38%, 9/15/2024 | 22,818,000 | 21,431,093 |
1.50%, 9/30/2024 | 100,000 | 96,070 |
1.50%, 10/31/2024 | 993,000 | 952,737 |
1.50%, 11/30/2024 | 8,182,000 | 7,834,265 |
1.38%, 1/31/2025 | 723,000 | 687,867 |
2.50%, 1/31/2025 | 450,000 | 439,699 |
1.13%, 2/28/2025 | 1,153,000 | 1,088,414 |
0.50%, 3/31/2025 | 6,602,000 | 6,118,713 |
0.25%, 5/31/2025 | 103,300 | 94,560 |
2.88%, 5/31/2025 | 6,189,000 | 6,087,462 |
0.25%, 6/30/2025 | 2,174,000 | 1,986,323 |
3.00%, 7/15/2025 | 849,000 | 837,724 |
0.25%, 7/31/2025 | 1,665,000 | 1,516,321 |
0.25%, 8/31/2025 | 3,416,000 | 3,102,155 |
0.25%, 9/30/2025 | 10,929,000 | 9,903,552 |
0.25%, 10/31/2025 | 16,549,000 | 14,950,987 |
0.38%, 11/30/2025 | 11,313,000 | 10,235,614 |
0.38%, 12/31/2025 | 1,308,000 | 1,180,572 |
2.63%, 12/31/2025 | 3,319,000 | 3,231,358 |
0.38%, 1/31/2026 | 11,644,000 | 10,482,329 |
1.63%, 2/15/2026 | 516,000 | 484,758 |
August 31, 2022 | J.P. Morgan Exchange-Traded Funds | 179 |
AS OF August 31, 2022 (Unaudited) (continued)
INVESTMENTS | PRINCIPAL AMOUNT($) | VALUE($) |
U.S. Treasury Obligations — continued | ||
0.50%, 2/28/2026 | 23,440,000 | 21,149,106 |
2.50%, 2/28/2026 | 136,000 | 131,676 |
0.75%, 4/30/2026 | 1,811,000 | 1,642,917 |
0.75%, 5/31/2026 | 1,692,000 | 1,531,657 |
2.13%, 5/31/2026 | 200,000 | 190,750 |
0.63%, 7/31/2026 | 3,673,000 | 3,295,657 |
1.50%, 8/15/2026 | 507,000 | 470,678 |
1.38%, 8/31/2026 | 398,000 | 367,746 |
1.63%, 10/31/2026 | 3,033,000 | 2,823,060 |
1.63%, 11/30/2026 | 133,000 | 123,763 |
1.75%, 12/31/2026 | 2,528,000 | 2,362,495 |
2.25%, 2/15/2027 | 1,300,000 | 1,237,945 |
1.13%, 2/28/2027 | 3,235,000 | 2,934,246 |
0.50%, 4/30/2027 | 800 | 702 |
0.50%, 5/31/2027 | 6,170,000 | 5,398,750 |
0.50%, 6/30/2027 | 1,890,000 | 1,650,502 |
0.38%, 7/31/2027 | 6,133,000 | 5,317,503 |
2.25%, 8/15/2027 | 2,000,000 | 1,899,375 |
0.50%, 8/31/2027 | 3,414,000 | 2,969,913 |
0.38%, 9/30/2027 | 1,763,000 | 1,519,623 |
0.50%, 10/31/2027 | 6,573,000 | 5,690,267 |
2.25%, 11/15/2027 | 400,000 | 378,937 |
0.63%, 11/30/2027 | 16,659,000 | 14,482,918 |
0.63%, 12/31/2027 | 1,227,000 | 1,064,039 |
0.75%, 1/31/2028 | 8,768,000 | 7,641,860 |
1.13%, 2/29/2028 | 2,001,000 | 1,778,076 |
1.25%, 4/30/2028 | 1,000,000 | 891,484 |
2.88%, 5/15/2028 | 400,000 | 389,687 |
1.25%, 5/31/2028 | 2,852,000 | 2,539,840 |
1.00%, 7/31/2028 | 4,293,000 | 3,752,686 |
2.88%, 8/15/2028 | 800,000 | 778,812 |
1.13%, 8/31/2028 | 479,000 | 421,333 |
1.38%, 10/31/2028 | 2,338,000 | 2,081,733 |
1.50%, 11/30/2028 | 1,749,000 | 1,567,268 |
1.38%, 12/31/2028 | 5,673,000 | 5,045,868 |
2.38%, 3/31/2029 | 15,000 | 14,147 |
2.63%, 7/31/2029 | 1,014,000 | 972,172 |
1.63%, 8/15/2029 | 5,982,000 | 5,381,931 |
1.75%, 11/15/2029 | 3,031,000 | 2,751,580 |
1.50%, 2/15/2030 | 8,746,000 | 7,757,975 |
0.63%, 5/15/2030 | 20,227,000 | 16,674,633 |
0.63%, 8/15/2030 | 8,185,000 | 6,715,537 |
1.38%, 11/15/2031 | 6,811,000 | 5,836,176 |
1.88%, 2/15/2032 | 1,422,000 | 1,271,801 |
INVESTMENTS | PRINCIPAL AMOUNT($) | VALUE($) |
2.88%, 5/15/2032 | 1,147,000 | 1,118,325 |
2.75%, 8/15/2032 | 302,000 | 291,430 |
Total U.S. Treasury Obligations (Cost $502,176,834) | 453,130,207 | |
Mortgage-Backed Securities — 27.7% | ||
FHLMC Gold Pools, 15 Year | ||
Pool # J10548, 4.00%, 8/1/2024 | 12,276 | 12,256 |
Pool # J15449, 4.00%, 5/1/2026 | 66,611 | 66,597 |
Pool # G14781, 3.50%, 3/1/2027 | 38,437 | 37,942 |
Pool # G15201, 4.00%, 5/1/2027 | 11,884 | 11,865 |
Pool # J20129, 2.50%, 8/1/2027 | 66,367 | 64,527 |
Pool # G15438, 4.00%, 9/1/2027 | 10,531 | 10,514 |
Pool # G15602, 2.50%, 11/1/2027 | 48,963 | 47,647 |
Pool # E09028, 2.00%, 3/1/2028 | 81,399 | 78,002 |
Pool # J23362, 2.00%, 4/1/2028 | 78,110 | 74,814 |
Pool # G18466, 2.00%, 5/1/2028 | 11,229 | 10,750 |
Pool # G18465, 2.50%, 5/1/2028 | 21,258 | 20,589 |
Pool # G15601, 2.50%, 1/1/2029 | 48,275 | 46,755 |
Pool # G14957, 3.50%, 1/1/2029 | 101,277 | 100,254 |
Pool # G16570, 4.00%, 7/1/2029 | 8,561 | 8,548 |
Pool # G18540, 2.50%, 2/1/2030 | 28,096 | 26,942 |
Pool # G18556, 2.50%, 6/1/2030 | 36,177 | 34,689 |
Pool # V60840, 3.00%, 6/1/2030 | 9,654 | 9,450 |
Pool # G16622, 3.00%, 11/1/2030 | 35,375 | 34,627 |
Pool # G16019, 3.50%, 12/1/2030 | 15,317 | 15,125 |
Pool # G16044, 2.50%, 1/1/2032 | 99,275 | 95,185 |
Pool # J36524, 3.00%, 3/1/2032 | 112,345 | 109,272 |
Pool # J36660, 3.00%, 3/1/2032 | 36,993 | 35,906 |
Pool # J38270, 2.50%, 1/1/2033 | 280,608 | 269,025 |
Pool # G16568, 2.50%, 4/1/2033 | 123,554 | 118,454 |
FHLMC Gold Pools, 30 Year | ||
Pool # V81680, 4.50%, 12/1/2034 | 77,565 | 79,036 |
Pool # A30892, 5.00%, 1/1/2035 | 57,402 | 58,901 |
Pool # A39210, 5.50%, 10/1/2035 | 22,787 | 24,073 |
Pool # V83754, 5.50%, 1/1/2036 | 38,386 | 40,433 |
Pool # A82255, 5.50%, 9/1/2036 | 110,640 | 113,353 |
Pool # G03381, 5.50%, 9/1/2037 | 21,117 | 22,171 |
Pool # A89760, 4.50%, 12/1/2039 | 21,125 | 21,579 |
Pool # A92197, 5.00%, 5/1/2040 | 62,391 | 64,974 |
Pool # G06856, 6.00%, 5/1/2040 | 4,137 | 4,461 |
Pool # A93359, 4.00%, 8/1/2040 | 3,664 | 3,613 |
Pool # G06222, 4.00%, 1/1/2041 | 208,099 | 208,476 |
Pool # G07794, 5.50%, 6/1/2041 | 10,431 | 11,069 |
Pool # Q03516, 4.50%, 9/1/2041 | 23,601 | 24,048 |
Pool # Q04088, 3.50%, 10/1/2041 | 21,088 | 20,498 |
180 | J.P. Morgan Exchange-Traded Funds | August 31, 2022 |
INVESTMENTS | PRINCIPAL AMOUNT($) | VALUE($) |
Mortgage-Backed Securities — continued | ||
Pool # Q04688, 4.00%, 11/1/2041 | 3,108 | 3,109 |
Pool # G08477, 3.50%, 2/1/2042 | 7,698 | 7,500 |
Pool # Q06771, 3.00%, 3/1/2042 | 37,844 | 35,984 |
Pool # C03858, 3.50%, 4/1/2042 | 103,448 | 100,784 |
Pool # Q08646, 3.50%, 6/1/2042 | 24,724 | 24,087 |
Pool # G60737, 4.50%, 8/1/2042 | 102,378 | 104,670 |
Pool # Q11220, 3.50%, 9/1/2042 | 85,667 | 83,257 |
Pool # Q13477, 3.00%, 12/1/2042 | 116,240 | 110,531 |
Pool # Q14321, 3.00%, 12/1/2042 | 29,124 | 27,724 |
Pool # C04420, 3.00%, 1/1/2043 | 180,795 | 172,244 |
Pool # Q14694, 3.00%, 1/1/2043 | 1,359,301 | 1,293,943 |
Pool # G61723, 3.50%, 1/1/2043 | 71,678 | 70,642 |
Pool # C09031, 2.50%, 2/1/2043 | 93,289 | 84,388 |
Pool # V80026, 3.00%, 4/1/2043 | 52,395 | 49,835 |
Pool # Q17374, 4.00%, 4/1/2043 | 94,205 | 94,835 |
Pool # G62033, 4.00%, 11/1/2043 | 128,873 | 128,197 |
Pool # Z40090, 4.50%, 9/1/2044 | 28,878 | 29,416 |
Pool # G61769, 4.50%, 12/1/2044 | 70,532 | 72,041 |
Pool # G61617, 4.50%, 1/1/2045 | 23,542 | 24,114 |
Pool # G08651, 4.00%, 6/1/2045 | 98,866 | 98,719 |
Pool # G08653, 3.00%, 7/1/2045 | 47,272 | 44,746 |
Pool # Q35223, 4.00%, 8/1/2045 | 10,855 | 10,670 |
Pool # G60238, 3.50%, 10/1/2045 | 696,748 | 676,641 |
Pool # G60506, 3.50%, 4/1/2046 | 38,877 | 37,693 |
Pool # G08710, 3.00%, 6/1/2046 | 32,607 | 30,882 |
Pool # Q41024, 3.00%, 6/1/2046 | 555,782 | 526,040 |
Pool # G08724, 2.50%, 9/1/2046 | 11,886 | 10,707 |
Pool # G61070, 3.00%, 9/1/2046 | 462,654 | 439,691 |
Pool # G61730, 3.00%, 9/1/2046 | 129,952 | 123,573 |
Pool # G61235, 4.50%, 9/1/2046 | 24,224 | 24,740 |
Pool # G08736, 2.50%, 12/1/2046 | 12,667 | 11,411 |
Pool # Q45872, 3.00%, 1/1/2047 | 329,655 | 310,928 |
Pool # G08747, 3.00%, 2/1/2047 | 166,015 | 156,578 |
Pool # G61623, 3.00%, 4/1/2047 | 24,204 | 22,914 |
Pool # G60985, 3.00%, 5/1/2047 | 92,999 | 88,135 |
Pool # G60996, 3.50%, 5/1/2047 | 7,597 | 7,365 |
Pool # Q47884, 4.00%, 5/1/2047 | 23,162 | 23,003 |
Pool # V83233, 4.00%, 6/1/2047 | 96,146 | 95,487 |
Pool # G08775, 4.00%, 8/1/2047 | 32,264 | 31,898 |
Pool # Q50152, 4.00%, 8/1/2047 | 76,983 | 76,198 |
Pool # Q51268, 3.50%, 10/1/2047 | 50,330 | 48,608 |
Pool # G08787, 3.00%, 11/1/2047 | 294,927 | 276,500 |
Pool # G61681, 3.00%, 12/1/2047 | 6,769 | 6,362 |
Pool # Q52866, 3.00%, 12/1/2047 | 23,793 | 22,411 |
Pool # G08793, 4.00%, 12/1/2047 | 30,067 | 29,862 |
INVESTMENTS | PRINCIPAL AMOUNT($) | VALUE($) |
Pool # Q53751, 3.50%, 1/1/2048 | 86,961 | 84,048 |
Pool # G08812, 3.00%, 4/1/2048 | 10,570 | 9,922 |
Pool # G61866, 4.00%, 6/1/2048 | 24,132 | 24,093 |
Pool # G61607, 4.50%, 9/1/2048 | 114,964 | 116,943 |
Pool # G08842, 4.00%, 10/1/2048 | 12,512 | 12,410 |
Pool # G61885, 4.50%, 11/1/2048 | 27,449 | 27,700 |
Pool # G08862, 4.00%, 2/1/2049 | 20,265 | 20,126 |
Pool # Q61487, 4.00%, 2/1/2049 | 35,533 | 35,290 |
Pool # G08876, 3.50%, 5/1/2049 | 39,484 | 38,027 |
FHLMC UMBS, 15 Year | ||
Pool # ZS5890, 4.00%, 7/1/2024 | 77,704 | 77,574 |
Pool # ZK2080, 4.00%, 1/1/2025 | 26,664 | 26,593 |
Pool # ZA2587, 4.00%, 9/1/2025 | 7,945 | 7,926 |
Pool # ZK2723, 3.50%, 11/1/2025 | 14,526 | 14,305 |
Pool # ZK3540, 3.00%, 9/1/2026 | 65,260 | 64,217 |
Pool # ZS8460, 3.00%, 4/1/2027 | 17,622 | 17,303 |
Pool # SB0031, 3.50%, 10/1/2027 | 27,457 | 27,040 |
Pool # ZS6674, 2.50%, 4/1/2028 | 365,043 | 353,680 |
Pool # ZS7140, 2.00%, 1/1/2029 | 201,328 | 192,228 |
Pool # ZS7751, 3.00%, 1/1/2029 | 111,034 | 108,729 |
Pool # SB0071, 2.50%, 5/1/2030 | 27,938 | 27,115 |
Pool # ZS7331, 3.00%, 12/1/2030 | 26,681 | 26,094 |
Pool # ZS7888, 2.50%, 10/1/2032 | 306,296 | 293,396 |
Pool # ZK9070, 3.00%, 11/1/2032 | 675,678 | 656,611 |
Pool # ZS7938, 2.50%, 1/1/2033 | 72,605 | 69,548 |
Pool # SB0256, 4.00%, 11/1/2033 | 70,566 | 70,385 |
Pool # SB0077, 3.50%, 10/1/2034 | 50,746 | 49,978 |
Pool # QN1148, 2.50%, 12/1/2034 | 71,539 | 68,080 |
Pool # SB8031, 2.50%, 2/1/2035 | 148,630 | 140,894 |
Pool # SB0302, 3.00%, 4/1/2035 | 541,122 | 525,499 |
Pool # QN2407, 2.00%, 6/1/2035 | 134,235 | 123,854 |
Pool # SB8500, 2.50%, 7/1/2035 | 390,851 | 370,506 |
Pool # SB0424, 2.00%, 10/1/2035 | 909,152 | 845,591 |
Pool # RC1712, 1.50%, 12/1/2035 | 1,198,327 | 1,079,991 |
Pool # SB8090, 2.50%, 2/1/2036 | 1,038,426 | 984,346 |
Pool # QN6095, 2.00%, 5/1/2036 | 159,868 | 147,498 |
Pool # QN6718, 2.00%, 6/1/2036 | 315,927 | 291,477 |
Pool # QN7057, 2.00%, 7/1/2036 | 180,336 | 166,380 |
Pool # SB8111, 2.00%, 7/1/2036 | 170,867 | 157,647 |
Pool # QN8347, 1.50%, 10/1/2036 | 373,207 | 335,761 |
Pool # SB8127, 1.50%, 11/1/2036 | 367,708 | 330,810 |
Pool # SB0570, 2.00%, 11/1/2036 | 362,614 | 334,574 |
Pool # SB8131, 1.50%, 12/1/2036 | 745,386 | 670,587 |
Pool # SB8136, 1.50%, 1/1/2037 | 469,882 | 422,583 |
Pool # SB8140, 1.50%, 2/1/2037 | 569,321 | 512,010 |
August 31, 2022 | J.P. Morgan Exchange-Traded Funds | 181 |
AS OF August 31, 2022 (Unaudited) (continued)
INVESTMENTS | PRINCIPAL AMOUNT($) | VALUE($) |
Mortgage-Backed Securities — continued | ||
Pool # SB8147, 1.50%, 4/1/2037 | 966,501 | 869,148 |
FHLMC UMBS, 20 Year | ||
Pool # ZA2277, 3.00%, 9/1/2032 | 76,358 | 73,493 |
Pool # ZJ9491, 3.50%, 12/1/2032 | 18,502 | 18,330 |
Pool # ZS9164, 3.00%, 9/1/2033 | 468,129 | 450,565 |
Pool # SC0107, 3.50%, 11/1/2034 | 1,078,294 | 1,068,266 |
Pool # ZA2463, 3.50%, 6/1/2037 | 32,007 | 31,551 |
Pool # RB5026, 2.50%, 11/1/2039 | 38,296 | 34,989 |
Pool # QK0157, 2.50%, 1/1/2040 | 16,351 | 14,940 |
Pool # RB5032, 2.50%, 2/1/2040 | 31,441 | 28,728 |
Pool # RB5037, 2.50%, 3/1/2040 | 100,964 | 92,252 |
Pool # RB5043, 2.50%, 4/1/2040 | 42,762 | 39,082 |
Pool # RB5048, 2.50%, 5/1/2040 | 91,228 | 83,356 |
Pool # SC0131, 1.50%, 3/1/2041 | 218,270 | 184,681 |
Pool # SC0134, 1.50%, 3/1/2041 | 223,014 | 188,695 |
Pool # RB5142, 2.50%, 1/1/2042 | 472,777 | 430,183 |
Pool # RB5145, 2.00%, 2/1/2042 | 1,645,069 | 1,449,608 |
FHLMC UMBS, 30 Year | ||
Pool # ZI3765, 5.50%, 11/1/2035 | 39,646 | 41,584 |
Pool # ZS2546, 5.00%, 2/1/2039 | 19,182 | 20,017 |
Pool # ZJ0449, 4.00%, 9/1/2040 | 20,965 | 20,984 |
Pool # ZL3548, 3.50%, 8/1/2042 | 75,428 | 73,343 |
Pool # ZA4209, 3.00%, 4/1/2043 | 802,641 | 759,544 |
Pool # ZS3712, 3.50%, 4/1/2043 | 163,519 | 161,004 |
Pool # ZS4077, 3.50%, 1/1/2044 | 22,498 | 21,995 |
Pool # ZS4592, 4.00%, 11/1/2044 | 147,489 | 147,164 |
Pool # ZS4609, 3.00%, 4/1/2045 | 39,380 | 37,257 |
Pool # ZS9618, 3.50%, 3/1/2046 | 481,334 | 467,008 |
Pool # SD0146, 3.00%, 11/1/2046 | 130,840 | 123,742 |
Pool # ZM2209, 3.50%, 12/1/2046 | 325,463 | 315,169 |
Pool # SD0388, 3.50%, 6/1/2047 | 484,369 | 471,656 |
Pool # ZS4729, 3.00%, 8/1/2047 | 310,740 | 293,395 |
Pool # ZM4635, 4.00%, 11/1/2047 | 435,544 | 432,160 |
Pool # SD0225, 3.00%, 12/1/2047 | 603,206 | 569,926 |
Pool # ZT0534, 3.50%, 12/1/2047 | 313,810 | 304,466 |
Pool # ZS4750, 3.00%, 1/1/2048 | 24,705 | 23,185 |
Pool # SD0343, 3.00%, 3/1/2048 | 837,913 | 792,711 |
Pool # SI2002, 4.00%, 3/1/2048 | 518,573 | 515,518 |
Pool # ZM6887, 3.00%, 5/1/2048 | 47,062 | 43,948 |
Pool # ZM7669, 3.50%, 8/1/2048 | 76,436 | 73,846 |
Pool # ZN4476, 3.50%, 12/1/2048 | 279,888 | 270,405 |
Pool # ZA6286, 4.00%, 2/1/2049 | 130,378 | 129,366 |
Pool # ZT1776, 3.50%, 3/1/2049 | 24,259 | 23,351 |
Pool # ZN5087, 4.00%, 4/1/2049 | 118,192 | 117,348 |
Pool # ZT1864, 4.00%, 4/1/2049 | 3,265 | 3,240 |
INVESTMENTS | PRINCIPAL AMOUNT($) | VALUE($) |
Pool # ZT1951, 3.50%, 5/1/2049 | 7,873 | 7,576 |
Pool # ZT1952, 4.00%, 5/1/2049 | 51,763 | 51,303 |
Pool # QA4907, 3.00%, 6/1/2049 | 137,026 | 129,118 |
Pool # ZT2086, 3.50%, 6/1/2049 | 44,319 | 42,642 |
Pool # SD7502, 3.50%, 7/1/2049 | 130,787 | 126,580 |
Pool # SD8001, 3.50%, 7/1/2049 | 15,369 | 14,786 |
Pool # SD7501, 4.00%, 7/1/2049 | 81,061 | 80,482 |
Pool # QA1997, 3.00%, 8/1/2049 | 18,898 | 17,586 |
Pool # RA1202, 3.50%, 8/1/2049 | 426,025 | 409,809 |
Pool # SD8005, 3.50%, 8/1/2049 | 54,247 | 52,184 |
Pool # SD8006, 4.00%, 8/1/2049 | 32,975 | 32,607 |
Pool # SD8023, 2.50%, 11/1/2049 | 8,684 | 7,790 |
Pool # QA4509, 3.00%, 11/1/2049 | 422,446 | 393,045 |
Pool # SD8025, 3.50%, 11/1/2049 | 161,417 | 155,510 |
Pool # SD8029, 2.50%, 12/1/2049 | 163,990 | 147,068 |
Pool # RA1878, 3.50%, 12/1/2049 | 121,602 | 116,831 |
Pool # SD8037, 2.50%, 1/1/2050 | 436,094 | 391,002 |
Pool # QA7416, 3.00%, 2/1/2050 | 383,117 | 356,110 |
Pool # QA7554, 3.00%, 2/1/2050 | 1,724,426 | 1,612,301 |
Pool # RA2116, 3.00%, 2/1/2050 | 606,745 | 565,507 |
Pool # SD0303, 2.50%, 4/1/2050 | 754,512 | 678,285 |
Pool # QA9653, 3.50%, 5/1/2050 | 41,601 | 40,025 |
Pool # SD8080, 2.00%, 6/1/2050 | 64,851 | 56,022 |
Pool # QB1691, 2.00%, 7/1/2050 | 882,357 | 761,960 |
Pool # SD8089, 2.50%, 7/1/2050 | 1,746,422 | 1,564,957 |
Pool # SD8083, 2.50%, 8/1/2050 | 1,290,595 | 1,156,459 |
Pool # RA3727, 2.00%, 10/1/2050 | 2,109,835 | 1,820,645 |
Pool # SD8104, 1.50%, 11/1/2050 | 1,287,033 | 1,053,645 |
Pool # RA4197, 2.50%, 12/1/2050 | 561,218 | 502,535 |
Pool # RA4349, 2.50%, 1/1/2051 | 363,278 | 326,909 |
Pool # QB8583, 1.50%, 2/1/2051 | 1,274,204 | 1,043,052 |
Pool # RA4530, 2.50%, 2/1/2051 | 550,311 | 492,998 |
Pool # SD8129, 2.50%, 2/1/2051 | 704,776 | 631,345 |
Pool # SD8140, 2.00%, 4/1/2051 | 418,674 | 361,026 |
Pool # SD8142, 3.00%, 4/1/2051 | 1,127,096 | 1,045,938 |
Pool # SD8145, 1.50%, 5/1/2051 | 1,092,525 | 894,326 |
Pool # QC2565, 2.00%, 6/1/2051 | 1,829,298 | 1,577,263 |
Pool # QC3259, 2.00%, 6/1/2051 | 1,666,728 | 1,444,936 |
Pool # SD8158, 3.50%, 6/1/2051 | 336,562 | 321,536 |
Pool # SD8155, 2.00%, 7/1/2051 | 1,371,924 | 1,182,870 |
Pool # SD8156, 2.50%, 7/1/2051 | 656,437 | 587,247 |
Pool # QC5125, 2.00%, 8/1/2051 | 279,202 | 240,712 |
Pool # QC6057, 2.50%, 8/1/2051 | 271,363 | 242,760 |
Pool # SD8163, 3.50%, 8/1/2051 | 137,684 | 131,596 |
Pool # RA5832, 2.50%, 9/1/2051 | 765,382 | 684,353 |
182 | J.P. Morgan Exchange-Traded Funds | August 31, 2022 |
INVESTMENTS | PRINCIPAL AMOUNT($) | VALUE($) |
Mortgage-Backed Securities — continued | ||
Pool # SD8168, 3.00%, 9/1/2051 | 255,736 | 237,318 |
Pool # SD8172, 2.00%, 10/1/2051 | 848,149 | 730,174 |
Pool # SD8173, 2.50%, 10/1/2051 | 460,077 | 411,298 |
Pool # RA6507, 2.00%, 12/1/2051 | 1,957,797 | 1,685,035 |
Pool # QD3500, 2.50%, 12/1/2051 | 2,070,626 | 1,858,863 |
Pool # RA6694, 2.00%, 1/1/2052 | 479,291 | 412,758 |
Pool # SD0963, 3.50%, 1/1/2052 | 1,115,160 | 1,064,303 |
Pool # SD0897, 2.00%, 2/1/2052 | 1,966,985 | 1,696,364 |
Pool # SD8204, 2.00%, 4/1/2052 | 1,962,841 | 1,689,478 |
Pool # QD9578, 2.50%, 4/1/2052 | 1,568,964 | 1,402,204 |
Pool # QD9765, 2.50%, 4/1/2052 | 1,571,177 | 1,404,178 |
Pool # SD0945, 3.50%, 4/1/2052 | 1,139,480 | 1,087,171 |
Pool # SD8214, 3.50%, 5/1/2052 | 1,176,680 | 1,122,228 |
FNMA UMBS, 15 Year | ||
Pool # AC8711, 4.00%, 12/1/2024 | 171,504 | 171,100 |
Pool # AC7007, 4.50%, 1/1/2025 | 12,948 | 13,097 |
Pool # AL9580, 4.00%, 3/1/2025 | 10,355 | 10,329 |
Pool # 932724, 4.00%, 4/1/2025 | 5,693 | 5,679 |
Pool # AE0971, 4.00%, 5/1/2025 | 20,125 | 20,073 |
Pool # AE0939, 3.50%, 2/1/2026 | 35,602 | 35,093 |
Pool # FM2968, 4.00%, 5/1/2026 | 10,169 | 10,156 |
Pool # AJ6632, 3.00%, 11/1/2026 | 44,634 | 43,872 |
Pool # AJ9357, 3.50%, 1/1/2027 | 92,281 | 91,048 |
Pool # AK4047, 3.00%, 2/1/2027 | 17,182 | 16,880 |
Pool # AL4586, 4.00%, 2/1/2027 | 35,902 | 35,859 |
Pool # AO0527, 3.00%, 5/1/2027 | 23,084 | 22,666 |
Pool # AO4400, 2.50%, 7/1/2027 | 57,654 | 56,039 |
Pool # AB5823, 3.50%, 8/1/2027 | 88,422 | 87,426 |
Pool # AL8138, 4.00%, 9/1/2027 | 20,777 | 20,737 |
Pool # AB6811, 2.50%, 10/1/2027 | 13,355 | 12,951 |
Pool # AQ9442, 2.00%, 12/1/2027 | 28,449 | 27,274 |
Pool # AB8447, 2.50%, 2/1/2028 | 23,919 | 23,175 |
Pool # AR4180, 2.50%, 2/1/2028 | 11,219 | 10,870 |
Pool # AL3802, 3.00%, 2/1/2028 | 70,185 | 68,661 |
Pool # AB8787, 2.00%, 3/1/2028 | 78,057 | 74,790 |
Pool # AP6059, 2.00%, 6/1/2028 | 9,262 | 8,849 |
Pool # BM5381, 3.00%, 6/1/2028 | 76,116 | 74,619 |
Pool # BM1892, 2.50%, 9/1/2028 | 23,286 | 22,590 |
Pool # AS0761, 3.00%, 10/1/2028 | 28,875 | 28,215 |
Pool # AU6961, 3.00%, 10/1/2028 | 56,194 | 54,939 |
Pool # AL6132, 4.50%, 3/1/2029 | 7,166 | 7,249 |
Pool # FM1105, 2.50%, 6/1/2029 | 48,585 | 47,093 |
Pool # AS3345, 2.00%, 7/1/2029 | 13,861 | 13,110 |
Pool # MA2061, 3.00%, 10/1/2029 | 72,908 | 71,305 |
Pool # FM1465, 3.00%, 5/1/2030 | 124,171 | 121,451 |
INVESTMENTS | PRINCIPAL AMOUNT($) | VALUE($) |
Pool # 890666, 2.00%, 6/1/2030 | 29,266 | 27,683 |
Pool # MA2684, 3.00%, 7/1/2031 | 123,710 | 120,980 |
Pool # AL9418, 3.50%, 8/1/2031 | 43,289 | 42,815 |
Pool # BD5647, 2.00%, 11/1/2031 | 18,673 | 17,474 |
Pool # 890776, 3.50%, 11/1/2031 | 28,531 | 28,159 |
Pool # BM5490, 3.50%, 11/1/2031 | 19,710 | 19,500 |
Pool # AS8708, 2.50%, 2/1/2032 | 406,889 | 389,743 |
Pool # BM4993, 3.50%, 3/1/2032 | 43,904 | 43,431 |
Pool # BM4741, 3.00%, 4/1/2032 | 12,308 | 12,031 |
Pool # FM1645, 3.00%, 4/1/2032 | 152,784 | 149,579 |
Pool # MA3124, 2.50%, 9/1/2032 | 39,316 | 37,660 |
Pool # FM3099, 3.50%, 9/1/2032 | 50,362 | 49,684 |
Pool # CA0775, 2.50%, 11/1/2032 | 28,585 | 27,345 |
Pool # MA3188, 3.00%, 11/1/2032 | 20,959 | 20,368 |
Pool # BH7081, 2.50%, 12/1/2032 | 43,765 | 41,921 |
Pool # BH8720, 3.50%, 12/1/2032 | 40,287 | 39,642 |
Pool # FM1161, 2.50%, 1/1/2033 | 43,440 | 41,621 |
Pool # FM1691, 2.50%, 1/1/2033 | 17,358 | 16,632 |
Pool # FM2549, 2.50%, 1/1/2033 | 94,235 | 90,279 |
Pool # CA9078, 3.00%, 9/1/2033 | 573,797 | 560,660 |
Pool # FM1123, 4.00%, 9/1/2033 | 123,093 | 123,965 |
Pool # FM2153, 4.00%, 11/1/2033 | 150,209 | 149,917 |
Pool # BD9105, 4.00%, 1/1/2034 | 39,493 | 39,448 |
Pool # BM5306, 4.00%, 1/1/2034 | 5,084 | 5,095 |
Pool # FM1733, 3.50%, 5/1/2034 | 731,960 | 721,068 |
Pool # FM1842, 3.50%, 6/1/2034 | 156,410 | 154,261 |
Pool # FM6946, 3.00%, 7/1/2034 | 439,667 | 430,153 |
Pool # BO1822, 3.50%, 7/1/2034 | 73,285 | 72,112 |
Pool # MA3764, 2.50%, 9/1/2034 | 9,198 | 8,753 |
Pool # MA3910, 2.00%, 1/1/2035 | 29,086 | 26,837 |
Pool # FM3569, 3.00%, 1/1/2035 | 137,946 | 134,950 |
Pool # FM7941, 2.50%, 2/1/2035 | 392,557 | 376,077 |
Pool # FM8550, 3.00%, 2/1/2035 | 293,925 | 285,773 |
Pool # FM2708, 3.00%, 3/1/2035 | 72,112 | 70,562 |
Pool # MA4075, 2.50%, 7/1/2035 | 425,646 | 403,487 |
Pool # FM4035, 2.50%, 8/1/2035 | 71,599 | 67,870 |
Pool # CA7497, 2.50%, 10/1/2035 | 1,317,804 | 1,249,131 |
Pool # FM5396, 2.00%, 12/1/2035 | 834,709 | 770,415 |
Pool # BR3349, 1.50%, 1/1/2036 | 1,479,894 | 1,331,565 |
Pool # BR1309, 2.00%, 1/1/2036 | 564,973 | 521,288 |
Pool # FM5537, 2.00%, 1/1/2036 | 633,365 | 584,368 |
Pool # FM5797, 2.00%, 1/1/2036 | 619,042 | 571,178 |
Pool # FM5367, 1.50%, 2/1/2036 | 462,959 | 416,525 |
Pool # MA4261, 2.00%, 2/1/2036 | 681,773 | 629,040 |
Pool # CB0305, 1.50%, 5/1/2036 | 946,501 | 851,555 |
August 31, 2022 | J.P. Morgan Exchange-Traded Funds | 183 |
AS OF August 31, 2022 (Unaudited) (continued)
INVESTMENTS | PRINCIPAL AMOUNT($) | VALUE($) |
Mortgage-Backed Securities — continued | ||
Pool # FM7843, 1.50%, 6/1/2036 | 87,945 | 79,122 |
Pool # BP3507, 2.00%, 6/1/2036 | 170,459 | 157,274 |
Pool # FM8292, 2.00%, 7/1/2036 | 290,264 | 267,812 |
Pool # MA4430, 1.00%, 8/1/2036 | 182,047 | 158,987 |
Pool # BT0273, 1.50%, 9/1/2036 | 457,347 | 411,454 |
Pool # MA4417, 1.50%, 9/1/2036 | 360,106 | 323,863 |
Pool # MA4418, 2.00%, 9/1/2036 | 175,573 | 161,988 |
Pool # MA4441, 1.50%, 10/1/2036 | 502,186 | 451,643 |
Pool # BT9452, 1.50%, 11/1/2036 | 184,524 | 165,950 |
Pool # FM9247, 2.00%, 11/1/2036 | 355,190 | 327,695 |
Pool # MA4497, 2.00%, 12/1/2036 | 2,592,413 | 2,391,774 |
Pool # MA4516, 2.00%, 1/1/2037 | 560,528 | 517,143 |
Pool # BV7189, 2.00%, 3/1/2037 | 928,911 | 857,027 |
Pool # MA4581, 1.50%, 4/1/2037 | 966,060 | 868,803 |
FNMA UMBS, 20 Year | ||
Pool # AE6799, 4.50%, 11/1/2030 | 2,485 | 2,521 |
Pool # MA0885, 3.50%, 10/1/2031 | 31,152 | 30,862 |
Pool # AB4853, 3.00%, 4/1/2032 | 28,527 | 27,459 |
Pool # MA1058, 3.00%, 5/1/2032 | 13,476 | 12,971 |
Pool # MA1165, 3.00%, 9/1/2032 | 74,484 | 71,692 |
Pool # MA2079, 4.00%, 11/1/2034 | 14,917 | 14,939 |
Pool # AL7654, 3.00%, 9/1/2035 | 63,857 | 61,485 |
Pool # MA2472, 3.00%, 12/1/2035 | 12,782 | 12,303 |
Pool # FM1133, 4.00%, 6/1/2036 | 31,174 | 31,221 |
Pool # MA3099, 4.00%, 8/1/2037 | 91,672 | 91,809 |
Pool # BM5330, 2.50%, 12/1/2037 | 41,599 | 37,860 |
Pool # FM3204, 4.00%, 10/1/2038 | 35,715 | 36,119 |
Pool # MA4072, 2.50%, 7/1/2040 | 152,321 | 139,195 |
Pool # MA4128, 2.00%, 9/1/2040 | 1,410,292 | 1,252,055 |
Pool # MA4204, 2.00%, 12/1/2040 | 875,755 | 777,287 |
Pool # CA9019, 2.00%, 2/1/2041 | 394,034 | 349,664 |
Pool # MA4310, 1.50%, 4/1/2041 | 791,627 | 670,329 |
Pool # MA4422, 2.00%, 9/1/2041 | 412,442 | 364,454 |
Pool # MA4446, 2.00%, 10/1/2041 | 416,378 | 367,931 |
Pool # FS0316, 1.50%, 11/1/2041 | 679,041 | 575,016 |
Pool # MA4521, 2.50%, 1/1/2042 | 567,575 | 516,439 |
Pool # BV7697, 2.50%, 4/1/2042 | 976,138 | 888,223 |
Pool # MA4587, 2.50%, 4/1/2042 | 976,522 | 888,579 |
FNMA UMBS, 30 Year | ||
Pool # 254447, 6.00%, 9/1/2032 | 23,308 | 25,106 |
Pool # 711215, 5.50%, 6/1/2033 | 17,816 | 18,271 |
Pool # AA1005, 5.00%, 12/1/2033 | 13,539 | 14,055 |
Pool # 725232, 5.00%, 3/1/2034 | 10,906 | 11,340 |
Pool # 725228, 6.00%, 3/1/2034 | 56,535 | 60,405 |
Pool # 790003, 6.00%, 8/1/2034 | 16,448 | 17,420 |
INVESTMENTS | PRINCIPAL AMOUNT($) | VALUE($) |
Pool # 735503, 6.00%, 4/1/2035 | 39,977 | 42,322 |
Pool # 190360, 5.00%, 8/1/2035 | 29,272 | 30,543 |
Pool # 904601, 6.00%, 11/1/2036 | 39,717 | 42,792 |
Pool # 888538, 5.50%, 1/1/2037 | 21,619 | 22,919 |
Pool # AB0284, 6.00%, 2/1/2037 | 39,336 | 42,379 |
Pool # AL2627, 5.00%, 7/1/2037 | 19,703 | 20,479 |
Pool # 956965, 6.50%, 12/1/2037 | 12,278 | 12,829 |
Pool # BH7907, 6.50%, 12/1/2037 | 18,934 | 20,423 |
Pool # 961793, 5.00%, 3/1/2038 | 75,526 | 78,823 |
Pool # 985661, 5.50%, 6/1/2038 | 13,413 | 14,009 |
Pool # AU7519, 3.50%, 9/1/2038 | 32,235 | 31,420 |
Pool # AA7402, 4.50%, 6/1/2039 | 118,452 | 120,976 |
Pool # AC2638, 5.00%, 10/1/2039 | 159,446 | 166,441 |
Pool # AL0100, 6.00%, 10/1/2039 | 55,302 | 58,788 |
Pool # AC4886, 5.00%, 11/1/2039 | 29,066 | 30,298 |
Pool # 190399, 5.50%, 11/1/2039 | 85,688 | 90,845 |
Pool # AB1143, 4.50%, 6/1/2040 | 92,304 | 94,818 |
Pool # AD6938, 4.50%, 6/1/2040 | 127,196 | 129,818 |
Pool # AD5479, 5.00%, 6/1/2040 | 25,077 | 26,170 |
Pool # AB1259, 5.00%, 7/1/2040 | 30,283 | 31,606 |
Pool # AB1292, 5.00%, 8/1/2040 | 14,206 | 14,535 |
Pool # AL5437, 5.00%, 8/1/2040 | 99,454 | 103,557 |
Pool # AB1421, 5.00%, 9/1/2040 | 45,475 | 47,471 |
Pool # AE4142, 5.00%, 9/1/2040 | 32,234 | 33,324 |
Pool # AE3857, 5.00%, 10/1/2040 | 668,791 | 697,125 |
Pool # AE8289, 4.00%, 12/1/2040 | 96,223 | 96,308 |
Pool # MA0622, 3.50%, 1/1/2041 | 32,757 | 31,919 |
Pool # AH2312, 5.00%, 1/1/2041 | 70,823 | 73,200 |
Pool # AE0828, 3.50%, 2/1/2041 | 18,433 | 17,966 |
Pool # AH3804, 4.00%, 2/1/2041 | 20,932 | 20,951 |
Pool # MA0639, 4.00%, 2/1/2041 | 32,975 | 33,004 |
Pool # AB2676, 3.50%, 4/1/2041 | 110,102 | 107,270 |
Pool # AL0241, 4.00%, 4/1/2041 | 66,222 | 66,281 |
Pool # AI1887, 4.50%, 5/1/2041 | 243,283 | 247,875 |
Pool # BM3118, 6.00%, 7/1/2041 | 84,832 | 91,401 |
Pool # AJ2293, 4.00%, 9/1/2041 | 20,114 | 19,984 |
Pool # AL0933, 5.00%, 10/1/2041 | 83,813 | 87,478 |
Pool # AW8154, 3.50%, 1/1/2042 | 21,572 | 21,010 |
Pool # AX5318, 4.50%, 1/1/2042 | 72,739 | 74,236 |
Pool # BD4480, 4.50%, 1/1/2042 | 362,374 | 369,823 |
Pool # AL1998, 4.00%, 3/1/2042 | 102,135 | 102,226 |
Pool # AO4134, 3.50%, 6/1/2042 | 13,537 | 13,144 |
Pool # AO8694, 4.50%, 7/1/2042 | 36,296 | 36,338 |
Pool # AP4258, 3.00%, 8/1/2042 | 86,668 | 82,458 |
Pool # AB6632, 3.50%, 10/1/2042 | 128,823 | 125,388 |
184 | J.P. Morgan Exchange-Traded Funds | August 31, 2022 |
INVESTMENTS | PRINCIPAL AMOUNT($) | VALUE($) |
Mortgage-Backed Securities — continued | ||
Pool # AB6633, 3.50%, 10/1/2042 | 23,817 | 23,182 |
Pool # AL3344, 4.50%, 10/1/2042 | 146,759 | 150,260 |
Pool # AB6828, 3.50%, 11/1/2042 | 120,094 | 116,892 |
Pool # AL3182, 3.50%, 12/1/2042 | 20,549 | 20,233 |
Pool # AQ9316, 2.50%, 1/1/2043 | 56,761 | 51,296 |
Pool # AB7580, 3.00%, 1/1/2043 | 133,867 | 127,635 |
Pool # AQ1104, 3.00%, 1/1/2043 | 29,080 | 27,567 |
Pool # AR0168, 3.00%, 2/1/2043 | 51,641 | 49,141 |
Pool # AB7964, 3.50%, 2/1/2043 | 74,442 | 73,297 |
Pool # AR2271, 3.50%, 2/1/2043 | 284,575 | 276,527 |
Pool # BM4751, 3.50%, 3/1/2043 | 33,934 | 33,082 |
Pool # AB8742, 4.00%, 3/1/2043 | 15,999 | 16,085 |
Pool # AR6770, 4.00%, 3/1/2043 | 17,310 | 17,294 |
Pool # AT2015, 3.00%, 4/1/2043 | 35,304 | 33,548 |
Pool # AT2016, 3.00%, 4/1/2043 | 532,352 | 505,735 |
Pool # AB9194, 3.50%, 5/1/2043 | 123,203 | 119,916 |
Pool # FM4462, 3.50%, 5/1/2043 | 910,671 | 886,413 |
Pool # AU1629, 3.00%, 7/1/2043 | 82,618 | 78,446 |
Pool # BM3785, 3.50%, 7/1/2043 | 131,779 | 128,266 |
Pool # AS0241, 4.00%, 8/1/2043 | 798,287 | 792,410 |
Pool # BM3704, 3.00%, 9/1/2043 | 36,182 | 34,378 |
Pool # AT2612, 3.50%, 9/1/2043 | 77,807 | 75,954 |
Pool # AU4256, 3.50%, 9/1/2043 | 26,867 | 26,040 |
Pool # AU4283, 3.50%, 9/1/2043 | 20,263 | 19,675 |
Pool # AL4062, 4.00%, 9/1/2043 | 31,473 | 31,520 |
Pool # BM4635, 2.50%, 10/1/2043 | 162,560 | 146,952 |
Pool # AS1121, 4.00%, 11/1/2043 | 31,586 | 31,517 |
Pool # AV0022, 4.00%, 11/1/2043 | 480,009 | 478,953 |
Pool # AL7696, 3.00%, 12/1/2043 | 58,770 | 55,872 |
Pool # AV6103, 4.00%, 1/1/2044 | 173,963 | 173,581 |
Pool # BC1737, 4.00%, 1/1/2044 | 75,116 | 74,695 |
Pool # BM5365, 4.00%, 3/1/2044 | 72,523 | 72,587 |
Pool # FM1744, 3.50%, 5/1/2044 | 33,772 | 33,254 |
Pool # AS2700, 4.00%, 6/1/2044 | 41,413 | 41,322 |
Pool # AW6233, 4.50%, 6/1/2044 | 1,681,969 | 1,708,935 |
Pool # AS2947, 4.00%, 7/1/2044 | 42,040 | 41,948 |
Pool # AL9072, 5.00%, 7/1/2044 | 76,419 | 80,105 |
Pool # AL9569, 5.00%, 8/1/2044 | 113,170 | 118,596 |
Pool # AX0152, 4.50%, 9/1/2044 | 27,450 | 28,254 |
Pool # BM4620, 3.00%, 10/1/2044 | 92,203 | 87,780 |
Pool # AS3867, 4.00%, 11/1/2044 | 11,195 | 11,170 |
Pool # FM1746, 3.50%, 1/1/2045 | 103,593 | 101,538 |
Pool # FM0015, 4.00%, 2/1/2045 | 103,848 | 104,004 |
Pool # MA2193, 4.50%, 2/1/2045 | 19,189 | 19,583 |
Pool # FM3414, 4.00%, 3/1/2045 | 673,614 | 667,504 |
INVESTMENTS | PRINCIPAL AMOUNT($) | VALUE($) |
Pool # BM3398, 3.50%, 4/1/2045 | 14,914 | 14,516 |
Pool # CA2709, 4.00%, 9/1/2045 | 1,313,100 | 1,313,585 |
Pool # AS5851, 4.50%, 9/1/2045 | 11,627 | 11,792 |
Pool # AS6184, 3.50%, 11/1/2045 | 140,790 | 137,995 |
Pool # BA0315, 3.50%, 11/1/2045 | 434,073 | 420,131 |
Pool # FM1869, 4.00%, 11/1/2045 | 67,703 | 66,497 |
Pool # BM4833, 3.00%, 12/1/2045 | 583,764 | 552,705 |
Pool # FM1708, 3.00%, 12/1/2045 | 42,033 | 39,999 |
Pool # BC0066, 3.50%, 12/1/2045 | 30,809 | 29,783 |
Pool # FM3413, 4.00%, 1/1/2046 | 84,638 | 84,515 |
Pool # FM2323, 4.00%, 2/1/2046 | 41,915 | 41,952 |
Pool # AL9128, 4.50%, 2/1/2046 | 20,804 | 21,161 |
Pool # AS6811, 3.00%, 3/1/2046 | 31,207 | 29,514 |
Pool # BM4834, 3.00%, 3/1/2046 | 30,702 | 29,184 |
Pool # FM1782, 4.00%, 3/1/2046 | 13,157 | 13,167 |
Pool # FM2195, 4.00%, 3/1/2046 | 31,168 | 31,196 |
Pool # AS7003, 3.00%, 4/1/2046 | 39,148 | 36,999 |
Pool # AS7198, 4.50%, 5/1/2046 | 113,975 | 115,850 |
Pool # BD0166, 2.50%, 6/1/2046 | 120,198 | 108,234 |
Pool # BM5168, 2.50%, 6/1/2046 | 26,139 | 23,629 |
Pool # BC6105, 3.50%, 6/1/2046 | 1,079,667 | 1,045,735 |
Pool # FM1780, 4.00%, 7/1/2046 | 715,739 | 713,852 |
Pool # AS7660, 2.50%, 8/1/2046 | 239,516 | 215,663 |
Pool # MA2730, 2.50%, 8/1/2046 | 33,930 | 30,426 |
Pool # FM3810, 3.00%, 10/1/2046 | 111,546 | 105,786 |
Pool # AL9385, 3.00%, 11/1/2046 | 52,433 | 49,480 |
Pool # MA2806, 3.00%, 11/1/2046 | 162,119 | 153,071 |
Pool # BM3288, 3.50%, 12/1/2046 | 23,191 | 22,464 |
Pool # BM4990, 2.50%, 1/1/2047 | 12,319 | 11,137 |
Pool # FM2807, 3.00%, 1/1/2047 | 86,065 | 81,445 |
Pool # 890856, 3.50%, 1/1/2047 | 132,997 | 128,813 |
Pool # FM3374, 3.50%, 1/1/2047 | 161,265 | 157,158 |
Pool # FM0041, 3.00%, 2/1/2047 | 626,739 | 591,537 |
Pool # BM5955, 4.00%, 2/1/2047 | 38,441 | 38,357 |
Pool # BM5270, 4.50%, 2/1/2047 | 17,292 | 17,647 |
Pool # BM4350, 3.00%, 3/1/2047 | 816,199 | 771,918 |
Pool # MA2920, 3.00%, 3/1/2047 | 8,046 | 7,587 |
Pool # FM3107, 3.50%, 3/1/2047 | 269,340 | 260,908 |
Pool # AS9313, 4.00%, 3/1/2047 | 17,368 | 17,247 |
Pool # FM4735, 3.00%, 4/1/2047 | 164,608 | 155,575 |
Pool # FM6073, 4.00%, 4/1/2047 | 1,262,675 | 1,248,368 |
Pool # AS9480, 4.50%, 4/1/2047 | 31,016 | 31,520 |
Pool # FM1772, 4.50%, 5/1/2047 | 16,628 | 16,968 |
Pool # BD0667, 4.50%, 6/1/2047 | 404,238 | 406,284 |
Pool # AS9937, 3.00%, 7/1/2047 | 592,457 | 558,408 |
August 31, 2022 | J.P. Morgan Exchange-Traded Funds | 185 |
AS OF August 31, 2022 (Unaudited) (continued)
INVESTMENTS | PRINCIPAL AMOUNT($) | VALUE($) |
Mortgage-Backed Securities — continued | ||
Pool # AS9946, 3.50%, 7/1/2047 | 44,634 | 43,234 |
Pool # BM1568, 3.50%, 7/1/2047 | 72,692 | 71,576 |
Pool # BH7375, 3.50%, 8/1/2047 | 48,508 | 46,984 |
Pool # CA0148, 4.50%, 8/1/2047 | 12,440 | 12,466 |
Pool # CA0850, 3.00%, 9/1/2047 | 36,064 | 33,897 |
Pool # MA3147, 3.00%, 10/1/2047 | 41,572 | 39,057 |
Pool # BM2003, 4.00%, 10/1/2047 | 166,435 | 164,973 |
Pool # BH9392, 3.50%, 11/1/2047 | 14,071 | 13,579 |
Pool # CA0681, 3.50%, 11/1/2047 | 235,615 | 230,547 |
Pool # FM0028, 3.00%, 12/1/2047 | 49,974 | 47,353 |
Pool # MA3209, 3.00%, 12/1/2047 | 288,172 | 270,339 |
Pool # FM1420, 3.50%, 12/1/2047 | 223,663 | 217,045 |
Pool # CA4015, 3.00%, 1/1/2048 | 9,943 | 9,339 |
Pool # BJ6154, 3.50%, 1/1/2048 | 182,449 | 176,519 |
Pool # MA3238, 3.50%, 1/1/2048 | 51,158 | 49,448 |
Pool # BJ5910, 3.50%, 2/1/2048 | 200,221 | 196,751 |
Pool # MA3305, 3.50%, 3/1/2048 | 216,936 | 209,666 |
Pool # FM3494, 2.50%, 4/1/2048 | 11,677 | 10,519 |
Pool # CA2687, 3.00%, 5/1/2048 | 23,423 | 22,104 |
Pool # BM4054, 4.00%, 5/1/2048 | 100,088 | 99,313 |
Pool # MA3425, 3.00%, 6/1/2048 | 34,612 | 32,411 |
Pool # BM4757, 3.50%, 7/1/2048 | 41,074 | 39,908 |
Pool # FM3438, 3.00%, 8/1/2048 | 710,194 | 670,338 |
Pool # BM2007, 4.00%, 9/1/2048 | 4,587 | 4,546 |
Pool # CA2368, 4.00%, 9/1/2048 | 30,273 | 30,039 |
Pool # MA3472, 5.00%, 9/1/2048 | 10,282 | 10,542 |
Pool # CA4655, 3.50%, 10/1/2048 | 94,228 | 91,270 |
Pool # MA3495, 4.00%, 10/1/2048 | 30,201 | 29,968 |
Pool # CA2432, 4.50%, 10/1/2048 | 55,307 | 55,965 |
Pool # FM7895, 3.50%, 11/1/2048 | 286,479 | 277,519 |
Pool # FM1248, 4.50%, 11/1/2048 | 17,489 | 17,563 |
Pool # CA2797, 4.50%, 12/1/2048 | 672,665 | 683,589 |
Pool # FM0030, 3.00%, 2/1/2049 | 53,027 | 50,071 |
Pool # FM6237, 3.50%, 4/1/2049 | 588,007 | 572,031 |
Pool # MA3637, 3.50%, 4/1/2049 | 18,832 | 18,124 |
Pool # MA3638, 4.00%, 4/1/2049 | 17,588 | 17,442 |
Pool # BN5418, 4.50%, 4/1/2049 | 21,683 | 21,903 |
Pool # MA3664, 4.00%, 5/1/2049 | 8,943 | 8,836 |
Pool # FM4074, 4.50%, 5/1/2049 | 302,220 | 305,800 |
Pool # CA4358, 3.50%, 7/1/2049 | 17,392 | 16,733 |
Pool # FM1672, 4.50%, 7/1/2049 | 795,375 | 811,683 |
Pool # MA3745, 3.50%, 8/1/2049 | 86,625 | 83,522 |
Pool # MA3746, 4.00%, 8/1/2049 | 13,329 | 13,170 |
Pool # FM1385, 5.00%, 8/1/2049 | 401,208 | 418,502 |
Pool # BO4012, 3.00%, 9/1/2049 | 110,659 | 102,933 |
INVESTMENTS | PRINCIPAL AMOUNT($) | VALUE($) |
Pool # FM1449, 3.50%, 9/1/2049 | 146,646 | 141,082 |
Pool # FM4430, 3.50%, 9/1/2049 | 574,679 | 553,870 |
Pool # FM3572, 4.50%, 9/1/2049 | 83,942 | 84,934 |
Pool # MA3803, 3.50%, 10/1/2049 | 41,740 | 40,241 |
Pool # MA3833, 2.50%, 11/1/2049 | 131,806 | 118,928 |
Pool # BK0350, 3.00%, 11/1/2049 | 1,103,271 | 1,028,411 |
Pool # MA3870, 2.50%, 12/1/2049 | 204,298 | 183,328 |
Pool # FM2363, 3.00%, 1/1/2050 | 2,020,534 | 1,892,279 |
Pool # MA3905, 3.00%, 1/1/2050 | 906,904 | 841,980 |
Pool # CA5021, 3.50%, 1/1/2050 | 38,909 | 37,370 |
Pool # FM5922, 3.50%, 1/1/2050 | 381,905 | 368,543 |
Pool # MA3906, 3.50%, 1/1/2050 | 39,364 | 37,851 |
Pool # CA5135, 2.50%, 2/1/2050 | 150,298 | 135,703 |
Pool # MA3936, 2.50%, 2/1/2050 | 149,683 | 134,236 |
Pool # FM2733, 2.50%, 3/1/2050 | 105,168 | 94,335 |
Pool # FM4883, 2.50%, 3/1/2050 | 2,027,427 | 1,817,923 |
Pool # FM4372, 3.50%, 3/1/2050 | 578,213 | 556,205 |
Pool # BP2403, 3.50%, 4/1/2050 | 281,516 | 269,116 |
Pool # BP5001, 2.50%, 5/1/2050 | 610,402 | 547,195 |
Pool # FM3257, 3.00%, 5/1/2050 | 252,133 | 236,584 |
Pool # BK2753, 2.50%, 7/1/2050 | 950,103 | 851,671 |
Pool # MA4078, 2.50%, 7/1/2050 | 367,979 | 329,618 |
Pool # BP6626, 2.00%, 8/1/2050 | 2,433,368 | 2,101,920 |
Pool # MA4100, 2.00%, 8/1/2050 | 1,145,641 | 993,211 |
Pool # BP9500, 2.50%, 8/1/2050 | 94,388 | 84,606 |
Pool # BQ0723, 3.50%, 8/1/2050 | 1,300,332 | 1,248,228 |
Pool # FM5750, 4.00%, 8/1/2050 | 358,456 | 352,446 |
Pool # MA4119, 2.00%, 9/1/2050 | 154,580 | 133,619 |
Pool # BK3044, 2.50%, 9/1/2050 | 807,228 | 723,510 |
Pool # BP6702, 2.50%, 9/1/2050 | 618,402 | 555,078 |
Pool # FM8260, 4.00%, 9/1/2050 | 590,507 | 586,316 |
Pool # MA4158, 2.00%, 10/1/2050 | 1,803,513 | 1,561,090 |
Pool # MA4159, 2.50%, 10/1/2050 | 607,875 | 544,818 |
Pool # MA4182, 2.00%, 11/1/2050 | 1,888,189 | 1,630,811 |
Pool # CA7603, 2.50%, 11/1/2050 | 333,142 | 298,426 |
Pool # MA4183, 2.50%, 11/1/2050 | 2,723,034 | 2,440,516 |
Pool # CA8222, 1.50%, 12/1/2050 | 1,541,328 | 1,262,432 |
Pool # MA4209, 1.50%, 12/1/2050 | 1,329,949 | 1,089,952 |
Pool # BQ5160, 2.00%, 12/1/2050 | 2,769,141 | 2,390,828 |
Pool # FM5849, 2.00%, 12/1/2050 | 928,091 | 800,691 |
Pool # MA4208, 2.00%, 12/1/2050 | 486,200 | 419,990 |
Pool # BR2807, 2.50%, 12/1/2050 | 1,343,412 | 1,204,434 |
Pool # MA4210, 2.50%, 12/1/2050 | 1,519,940 | 1,362,177 |
Pool # FM5597, 2.00%, 1/1/2051 | 226,396 | 195,248 |
Pool # FM6241, 2.00%, 1/1/2051 | 3,923,142 | 3,383,937 |
186 | J.P. Morgan Exchange-Traded Funds | August 31, 2022 |
INVESTMENTS | PRINCIPAL AMOUNT($) | VALUE($) |
Mortgage-Backed Securities — continued | ||
Pool # FM5854, 2.50%, 1/1/2051 | 195,311 | 175,072 |
Pool # MA4254, 1.50%, 2/1/2051 | 355,603 | 291,365 |
Pool # CA9190, 2.00%, 2/1/2051 | 876,742 | 756,343 |
Pool # FM6037, 2.00%, 2/1/2051 | 1,871,724 | 1,621,541 |
Pool # FM6126, 2.00%, 2/1/2051 | 221,617 | 191,126 |
Pool # MA4255, 2.00%, 2/1/2051 | 4,884,762 | 4,225,954 |
Pool # BR3515, 2.50%, 2/1/2051 | 167,173 | 149,781 |
Pool # FM6244, 2.00%, 3/1/2051 | 891,255 | 769,216 |
Pool # MA4281, 2.00%, 3/1/2051 | 268,373 | 231,549 |
Pool # FM6523, 2.50%, 3/1/2051 | 318,217 | 284,860 |
Pool # FM6764, 2.50%, 3/1/2051 | 895,229 | 802,014 |
Pool # FM6537, 2.00%, 4/1/2051 | 3,889,131 | 3,375,752 |
Pool # MA4306, 2.50%, 4/1/2051 | 261,964 | 234,568 |
Pool # FM7099, 3.00%, 4/1/2051 | 1,260,803 | 1,181,205 |
Pool # MA4325, 2.00%, 5/1/2051 | 2,411,951 | 2,077,860 |
Pool # FM7066, 2.50%, 5/1/2051 | 877,096 | 795,462 |
Pool # MA4355, 2.00%, 6/1/2051 | 452,717 | 390,516 |
Pool # CB0727, 2.50%, 6/1/2051 | 1,515,399 | 1,357,706 |
Pool # FM7418, 2.50%, 6/1/2051 | 935,580 | 837,961 |
Pool # FM8194, 2.00%, 7/1/2051 | 378,056 | 325,991 |
Pool # MA4378, 2.00%, 7/1/2051 | 2,194,151 | 1,892,522 |
Pool # CB1027, 2.50%, 7/1/2051 | 279,047 | 249,548 |
Pool # MA4379, 2.50%, 7/1/2051 | 654,264 | 585,379 |
Pool # MA4380, 3.00%, 7/1/2051 | 236,251 | 219,261 |
Pool # FM8278, 3.50%, 7/1/2051 | 440,343 | 420,990 |
Pool # BT9030, 2.00%, 8/1/2051 | 190,303 | 164,063 |
Pool # MA4398, 2.00%, 8/1/2051 | 2,212,671 | 1,905,329 |
Pool # BR2236, 2.50%, 8/1/2051 | 275,888 | 246,646 |
Pool # BR2237, 2.50%, 8/1/2051 | 542,647 | 485,330 |
Pool # BR2258, 2.50%, 8/1/2051 | 182,279 | 163,050 |
Pool # CB1276, 2.50%, 8/1/2051 | 782,758 | 699,888 |
Pool # MA4399, 2.50%, 8/1/2051 | 1,505,375 | 1,346,593 |
Pool # MA4401, 3.50%, 8/1/2051 | 142,330 | 135,988 |
Pool # BT0240, 2.00%, 9/1/2051 | 188,182 | 162,239 |
Pool # MA4413, 2.00%, 9/1/2051 | 797,189 | 686,423 |
Pool # MA4414, 2.50%, 9/1/2051 | 542,269 | 484,967 |
Pool # MA4437, 2.00%, 10/1/2051 | 801,638 | 690,415 |
Pool # MA4438, 2.50%, 10/1/2051 | 551,669 | 493,273 |
Pool # CB1917, 3.00%, 10/1/2051 | 2,054,041 | 1,908,487 |
Pool # MA4464, 1.50%, 11/1/2051 | 576,480 | 472,222 |
Pool # MA4465, 2.00%, 11/1/2051 | 1,332,914 | 1,148,163 |
Pool # MA4492, 2.00%, 12/1/2051 | 3,097,304 | 2,665,786 |
Pool # FM9868, 2.50%, 12/1/2051 | 572,769 | 514,194 |
Pool # FM9870, 2.50%, 12/1/2051 | 580,185 | 520,378 |
Pool # MA4493, 2.50%, 12/1/2051 | 946,937 | 846,489 |
INVESTMENTS | PRINCIPAL AMOUNT($) | VALUE($) |
Pool # MA4511, 2.00%, 1/1/2052 | 867,566 | 746,696 |
Pool # MA4512, 2.50%, 1/1/2052 | 478,438 | 427,673 |
Pool # MA4547, 2.00%, 2/1/2052 | 2,440,949 | 2,100,874 |
Pool # MA4548, 2.50%, 2/1/2052 | 481,700 | 430,499 |
Pool # MA4578, 2.50%, 4/1/2052 | 1,662,846 | 1,486,092 |
Pool # MA4598, 2.50%, 5/1/2052 | 1,674,278 | 1,496,316 |
Pool # MA4600, 3.50%, 5/1/2052 | 980,784 | 935,397 |
FNMA/FHLMC UMBS, Single Family, 15 Year | ||
TBA, 1.50%, 9/25/2037 (a) | 500,000 | 449,277 |
TBA, 2.00%, 9/25/2037 (a) | 200,000 | 184,375 |
TBA, 2.50%, 9/25/2037 (a) | 600,000 | 567,562 |
TBA, 3.00%, 9/25/2037 (a) | 500,000 | 484,277 |
TBA, 3.50%, 9/25/2037 (a) | 500,000 | 490,997 |
FNMA/FHLMC UMBS, Single Family, 30 Year | ||
TBA, 2.00%, 9/25/2052 (a) | 7,000,000 | 6,021,504 |
TBA, 2.50%, 9/25/2052 (a) | 10,600,000 | 9,463,812 |
TBA, 3.00%, 9/25/2052 (a) | 9,300,000 | 8,607,586 |
TBA, 3.50%, 9/25/2052 (a) | 6,000,000 | 5,716,406 |
TBA, 4.00%, 9/25/2052 (a) | 6,751,000 | 6,589,081 |
TBA, 4.50%, 9/25/2052 (a) | 2,866,000 | 2,848,535 |
TBA, 5.00%, 9/25/2052 (a) | 1,100,000 | 1,110,055 |
GNMA I, 30 Year | ||
Pool # 704155, 5.50%, 1/15/2039 | 17,771 | 19,058 |
Pool # 726769, 5.00%, 9/15/2039 | 13,674 | 14,005 |
Pool # 721340, 5.00%, 12/15/2039 | 47,887 | 49,017 |
Pool # 754439, 3.50%, 12/15/2041 | 110,712 | 109,288 |
Pool # 711674, 3.00%, 9/15/2042 | 46,806 | 44,342 |
Pool # 783748, 3.50%, 4/15/2043 | 66,290 | 65,549 |
Pool # 784660, 4.00%, 4/15/2043 | 6,000 | 6,074 |
Pool # AC2224, 3.50%, 6/15/2043 | 46,313 | 45,791 |
Pool # 785088, 3.50%, 7/15/2043 | 59,938 | 59,654 |
Pool # AJ4151, 4.00%, 9/15/2044 | 213,736 | 216,473 |
Pool # AL9314, 3.00%, 3/15/2045 | 42,017 | 39,601 |
Pool # 784664, 4.00%, 4/15/2045 | 22,863 | 23,365 |
Pool # AO0544, 3.00%, 8/15/2045 | 24,041 | 22,656 |
Pool # 627030, 3.00%, 12/15/2045 | 22,350 | 21,062 |
Pool # 784429, 3.00%, 8/15/2046 | 82,534 | 78,213 |
Pool # 784652, 4.00%, 11/15/2047 | 468,795 | 480,925 |
Pool # 784766, 3.50%, 3/15/2048 | 540,694 | 530,004 |
GNMA II, 15 Year | ||
Pool # MA0513, 2.50%, 11/20/2027 | 62,514 | 60,680 |
Pool # MA4625, 3.50%, 8/20/2032 | 23,932 | 23,623 |
Pool # MA6906, 2.50%, 10/20/2035 | 403,666 | 380,664 |
August 31, 2022 | J.P. Morgan Exchange-Traded Funds | 187 |
AS OF August 31, 2022 (Unaudited) (continued)
INVESTMENTS | PRINCIPAL AMOUNT($) | VALUE($) |
Mortgage-Backed Securities — continued | ||
GNMA II, 30 Year | ||
Pool # 711773, 3.50%, 6/20/2033 | 56,782 | 54,809 |
Pool # 3459, 5.50%, 10/20/2033 | 50,263 | 53,436 |
Pool # AQ5932, 3.50%, 1/20/2036 | 81,494 | 78,667 |
Pool # 4222, 6.00%, 8/20/2038 | 9,269 | 10,114 |
Pool # 709148, 4.50%, 2/20/2039 | 29,054 | 29,198 |
Pool # 4446, 4.50%, 5/20/2039 | 2,815 | 2,902 |
Pool # 4467, 4.00%, 6/20/2039 | 13,043 | 13,123 |
Pool # 4468, 4.50%, 6/20/2039 | 2,507 | 2,584 |
Pool # 4494, 4.00%, 7/20/2039 | 13,979 | 14,064 |
Pool # 4495, 4.50%, 7/20/2039 | 10,839 | 11,172 |
Pool # 4519, 4.50%, 8/20/2039 | 4,008 | 4,131 |
Pool # 4558, 4.50%, 10/20/2039 | 3,402 | 3,507 |
Pool # 4576, 4.00%, 11/20/2039 | 6,418 | 6,457 |
Pool # 4598, 4.50%, 12/20/2039 | 6,622 | 6,728 |
Pool # 4617, 4.50%, 1/20/2040 | 3,605 | 3,716 |
Pool # 4636, 4.50%, 2/20/2040 | 5,188 | 5,347 |
Pool # 4656, 4.00%, 3/20/2040 | 10,451 | 10,515 |
Pool # 4677, 4.00%, 4/20/2040 | 27,949 | 28,120 |
Pool # 4678, 4.50%, 4/20/2040 | 1,258 | 1,297 |
Pool # 4695, 4.00%, 5/20/2040 | 3,096 | 3,115 |
Pool # 4696, 4.50%, 5/20/2040 | 1,262 | 1,300 |
Pool # 4712, 4.00%, 6/20/2040 | 4,820 | 4,849 |
Pool # 4800, 4.00%, 9/20/2040 | 4,977 | 5,007 |
Pool # 737727, 4.00%, 12/20/2040 | 43,704 | 43,838 |
Pool # 4945, 4.00%, 2/20/2041 | 10,813 | 10,879 |
Pool # 759342, 4.50%, 2/20/2041 | 227,306 | 230,983 |
Pool # 4950, 5.50%, 2/20/2041 | 19,430 | 20,796 |
Pool # 4976, 3.50%, 3/20/2041 | 12,334 | 12,149 |
Pool # 4977, 4.00%, 3/20/2041 | 19,833 | 19,954 |
Pool # 5016, 4.00%, 4/20/2041 | 7,727 | 7,774 |
Pool # 5054, 4.00%, 5/20/2041 | 12,101 | 12,175 |
Pool # 5114, 4.00%, 7/20/2041 | 1,583 | 1,593 |
Pool # 779497, 3.50%, 10/20/2041 | 7,890 | 7,642 |
Pool # 5233, 4.00%, 11/20/2041 | 1,941 | 1,953 |
Pool # 5258, 3.50%, 12/20/2041 | 117,883 | 116,066 |
Pool # 5259, 4.00%, 12/20/2041 | 7,413 | 7,458 |
Pool # 5279, 3.50%, 1/20/2042 | 21,901 | 21,558 |
Pool # 5330, 3.00%, 3/20/2042 | 14,111 | 13,472 |
Pool # 754406, 3.50%, 5/20/2042 | 54,114 | 52,464 |
Pool # MA0220, 3.50%, 7/20/2042 | 9,208 | 9,049 |
Pool # MA0318, 3.50%, 8/20/2042 | 128,029 | 125,393 |
Pool # 796468, 4.00%, 9/20/2042 | 19,301 | 19,466 |
Pool # AA6040, 3.00%, 1/20/2043 | 112,283 | 105,918 |
Pool # AD1584, 3.00%, 1/20/2043 | 124,684 | 117,144 |
INVESTMENTS | PRINCIPAL AMOUNT($) | VALUE($) |
Pool # AD2125, 3.50%, 1/20/2043 | 87,064 | 85,922 |
Pool # AA6054, 3.00%, 2/20/2043 | 196,895 | 186,299 |
Pool # AD1744, 3.00%, 2/20/2043 | 16,584 | 16,022 |
Pool # 783755, 3.00%, 4/20/2043 | 128,976 | 123,099 |
Pool # 783976, 3.50%, 4/20/2043 | 21,375 | 20,730 |
Pool # MA1012, 3.50%, 5/20/2043 | 109,342 | 107,303 |
Pool # MA1157, 3.50%, 7/20/2043 | 21,665 | 21,251 |
Pool # MA1284, 3.00%, 9/20/2043 | 17,342 | 16,559 |
Pool # 785065, 3.50%, 10/20/2043 | 224,001 | 216,218 |
Pool # MA1376, 4.00%, 10/20/2043 | 102,427 | 102,172 |
Pool # AI7106, 4.00%, 6/20/2044 | 30,328 | 30,067 |
Pool # 784026, 3.50%, 12/20/2044 | 190,733 | 186,191 |
Pool # MA2678, 3.50%, 3/20/2045 | 135,791 | 133,087 |
Pool # MA2679, 4.00%, 3/20/2045 | 46,781 | 46,665 |
Pool # MA2753, 3.00%, 4/20/2045 | 69,429 | 66,284 |
Pool # 626942, 3.00%, 5/20/2045 | 158,224 | 148,658 |
Pool # MA2825, 3.00%, 5/20/2045 | 176,060 | 168,083 |
Pool # MA2829, 5.00%, 5/20/2045 | 25,907 | 27,040 |
Pool # 784800, 3.00%, 6/20/2045 | 35,696 | 33,607 |
Pool # AM9881, 3.00%, 6/20/2045 | 21,679 | 20,442 |
Pool # MA3247, 5.00%, 11/20/2045 | 22,513 | 23,494 |
Pool # AO9442, 3.50%, 12/20/2045 | 22,140 | 21,472 |
Pool # 784119, 3.00%, 2/20/2046 | 152,184 | 145,246 |
Pool # MA3458, 5.50%, 2/20/2046 | 31,453 | 33,557 |
Pool # MA3520, 3.00%, 3/20/2046 | 413,293 | 394,587 |
Pool # MA3735, 3.00%, 6/20/2046 | 281,067 | 268,245 |
Pool # AT7138, 3.50%, 6/20/2046 | 284,045 | 274,263 |
Pool # MA3935, 2.50%, 9/20/2046 | 73,966 | 67,525 |
Pool # 784768, 3.00%, 9/20/2046 | 81,819 | 77,979 |
Pool # AT8215, 3.00%, 9/20/2046 | 23,463 | 22,157 |
Pool # MA4002, 2.50%, 10/20/2046 | 407,279 | 371,785 |
Pool # AW0199, 3.00%, 10/20/2046 | 50,620 | 47,748 |
Pool # MA4068, 3.00%, 11/20/2046 | 11,894 | 11,341 |
Pool # MA4072, 5.00%, 11/20/2046 | 25,590 | 26,747 |
Pool # MA4125, 2.50%, 12/20/2046 | 373,419 | 340,889 |
Pool # MA4126, 3.00%, 12/20/2046 | 55,876 | 53,342 |
Pool # MA4260, 2.50%, 2/20/2047 | 65,062 | 59,396 |
Pool # AZ3119, 3.50%, 3/20/2047 | 30,606 | 29,552 |
Pool # AZ7084, 3.50%, 4/20/2047 | 100,610 | 97,534 |
Pool # MA4511, 4.00%, 6/20/2047 | 175,011 | 174,353 |
Pool # BA5041, 5.00%, 6/20/2047 | 96,909 | 99,394 |
Pool # MA4584, 2.50%, 7/20/2047 | 88,903 | 81,166 |
Pool # MA4718, 3.00%, 9/20/2047 | 7,704 | 7,326 |
Pool # MA4721, 4.50%, 9/20/2047 | 33,412 | 34,154 |
Pool # MA4836, 3.00%, 11/20/2047 | 373,385 | 355,333 |
188 | J.P. Morgan Exchange-Traded Funds | August 31, 2022 |
INVESTMENTS | PRINCIPAL AMOUNT($) | VALUE($) |
Mortgage-Backed Securities — continued | ||
Pool # BC2742, 3.50%, 11/20/2047 | 648,575 | 636,128 |
Pool # BD6940, 3.50%, 12/20/2047 | 169 | 163 |
Pool # MA4900, 3.50%, 12/20/2047 | 91,413 | 89,159 |
Pool # MA5019, 3.50%, 2/20/2048 | 237,725 | 231,688 |
Pool # MA5077, 3.50%, 3/20/2048 | 35,449 | 34,528 |
Pool # MA5138, 4.50%, 4/20/2048 | 14,077 | 14,215 |
Pool # 785033, 3.50%, 5/20/2048 | 215,293 | 213,652 |
Pool # MA5194, 5.00%, 5/20/2048 | 87,302 | 89,343 |
Pool # MA5329, 3.50%, 7/20/2048 | 8,495 | 8,281 |
Pool # MA5468, 5.00%, 9/20/2048 | 6,787 | 6,920 |
Pool # MA5527, 3.50%, 10/20/2048 | 31,180 | 30,380 |
Pool # MA5595, 4.00%, 11/20/2048 | 38,837 | 38,625 |
Pool # BJ6759, 4.50%, 11/20/2048 | 361,935 | 365,807 |
Pool # MA5650, 3.50%, 12/20/2048 | 12,851 | 12,521 |
Pool # MA5651, 4.00%, 12/20/2048 | 186,409 | 184,044 |
Pool # MA5709, 3.50%, 1/20/2049 | 90,050 | 87,969 |
Pool # BI6473, 4.00%, 1/20/2049 | 717,319 | 723,475 |
Pool # BJ9901, 3.00%, 2/20/2049 | 56,701 | 53,373 |
Pool # MA5930, 3.50%, 5/20/2049 | 11,578 | 11,235 |
Pool # MA5983, 2.50%, 6/20/2049 | 133,143 | 121,528 |
Pool # MA5985, 3.50%, 6/20/2049 | 46,290 | 44,693 |
Pool # MA5987, 4.50%, 6/20/2049 | 41,178 | 41,402 |
Pool # MA5988, 5.00%, 6/20/2049 | 7,880 | 8,089 |
Pool # MA6039, 3.50%, 7/20/2049 | 77,832 | 75,526 |
Pool # BM5450, 4.50%, 7/20/2049 | 74,008 | 74,910 |
Pool # MA6220, 4.00%, 10/20/2049 | 203,860 | 201,658 |
Pool # BR4627, 3.00%, 11/20/2049 | 502,249 | 473,812 |
Pool # 785067, 3.50%, 12/20/2049 | 427,272 | 413,941 |
Pool # MA6478, 5.00%, 2/20/2050 | 27,519 | 28,269 |
Pool # MA6542, 3.50%, 3/20/2050 | 259,222 | 252,118 |
Pool # MA6545, 5.00%, 3/20/2050 | 30,577 | 31,466 |
Pool # BV1348, 2.50%, 6/20/2050 | 50,699 | 45,277 |
Pool # MA6709, 2.50%, 6/20/2050 | 751,447 | 689,987 |
Pool # MA6818, 2.00%, 8/20/2050 | 1,393,200 | 1,239,042 |
Pool # BY8818, 2.00%, 10/20/2050 | 560,824 | 493,093 |
Pool # 785401, 2.50%, 10/20/2050 | 801,452 | 724,541 |
Pool # MA6994, 2.00%, 11/20/2050 | 1,528,190 | 1,359,014 |
Pool # BY8832, 2.50%, 11/20/2050 | 508,932 | 461,643 |
Pool # MA7051, 2.00%, 12/20/2050 | 2,365,020 | 2,103,020 |
Pool # CA4485, 2.50%, 12/20/2050 | 586,168 | 527,825 |
Pool # MA7052, 2.50%, 12/20/2050 | 975,458 | 893,313 |
Pool # MA7055, 4.00%, 12/20/2050 | 259,546 | 256,936 |
Pool # MA7135, 2.00%, 1/20/2051 | 2,704,560 | 2,404,849 |
Pool # MA7254, 2.00%, 3/20/2051 | 1,170,805 | 1,040,773 |
Pool # MA7311, 2.00%, 4/20/2051 | 2,770,395 | 2,462,067 |
INVESTMENTS | PRINCIPAL AMOUNT($) | VALUE($) |
Pool # 785449, 3.00%, 4/20/2051 | 315,002 | 296,741 |
Pool # MA7367, 2.50%, 5/20/2051 | 1,594,125 | 1,459,202 |
Pool # MA7368, 3.00%, 5/20/2051 | 490,622 | 461,979 |
Pool # MA7417, 2.00%, 6/20/2051 | 3,206,742 | 2,847,869 |
Pool # MA7418, 2.50%, 6/20/2051 | 1,755,520 | 1,606,014 |
Pool # MA7420, 3.50%, 6/20/2051 | 445,076 | 429,726 |
Pool # MA7471, 2.00%, 7/20/2051 | 2,612,318 | 2,318,804 |
Pool # MA7472, 2.50%, 7/20/2051 | 844,634 | 772,397 |
Pool # MA7473, 3.00%, 7/20/2051 | 534,070 | 502,659 |
Pool # MA7533, 2.00%, 8/20/2051 | 1,088,170 | 970,325 |
Pool # MA7588, 2.00%, 9/20/2051 | 1,106,507 | 981,434 |
Pool # MA7589, 2.50%, 9/20/2051 | 458,473 | 419,098 |
Pool # MA7766, 2.00%, 12/20/2051 | 2,405,537 | 2,131,996 |
Pool # MA7826, 2.00%, 1/20/2052 | 484,768 | 429,467 |
Pool # 785881, 2.50%, 1/20/2052 | 2,105,504 | 1,896,511 |
Pool # 785945, 3.00%, 2/20/2052 | 978,732 | 921,885 |
Pool # 786017, 3.00%, 3/20/2052 | 983,301 | 926,798 |
Pool # MA7937, 3.00%, 3/20/2052 | 976,448 | 917,641 |
Pool # MA7988, 3.00%, 4/20/2052 | 983,625 | 924,341 |
GNMA II, Single Family, 30 Year | ||
TBA, 2.00%, 9/15/2052 (a) | 1,600,000 | 1,412,844 |
TBA, 2.50%, 9/15/2052 (a) | 6,300,000 | 5,740,137 |
TBA, 3.00%, 9/15/2052 (a) | 4,200,000 | 3,941,930 |
TBA, 3.50%, 9/15/2052 (a) | 600,000 | 578,508 |
TBA, 4.00%, 9/15/2052 (a) | 1,600,000 | 1,576,625 |
TBA, 4.50%, 9/15/2052 (a) | 1,400,000 | 1,400,219 |
TBA, 5.00%, 9/15/2052 (a) | 600,000 | 607,922 |
Total Mortgage-Backed Securities (Cost $345,540,099) | 312,078,533 | |
Corporate Bonds — 24.5% | ||
Aerospace & Defense — 0.4% | ||
Lockheed Martin Corp. | ||
3.55%, 1/15/2026 | 133,000 | 131,967 |
1.85%, 6/15/2030 | 833,000 | 717,029 |
3.60%, 3/1/2035 | 117,000 | 108,178 |
3.80%, 3/1/2045 | 213,000 | 187,948 |
4.09%, 9/15/2052 | 187,000 | 173,863 |
4.30%, 6/15/2062 | 3,229,000 | 2,996,904 |
4,315,889 | ||
Banks — 2.7% | ||
Bank of Nova Scotia (The) (Canada) | ||
3.40%, 2/11/2024 | 409,000 | 405,773 |
1.95%, 2/2/2027 | 1,708,000 | 1,537,538 |
2.45%, 2/2/2032 | 614,000 | 510,570 |
August 31, 2022 | J.P. Morgan Exchange-Traded Funds | 189 |
AS OF August 31, 2022 (Unaudited) (continued)
INVESTMENTS | PRINCIPAL AMOUNT($) | VALUE($) |
Corporate Bonds — continued | ||
Banks — continued | ||
Canadian Imperial Bank of Commerce (Canada) | ||
0.50%, 12/14/2023 | 723,000 | 692,866 |
3.10%, 4/2/2024 | 4,496,000 | 4,433,311 |
0.95%, 10/23/2025 | 231,000 | 210,061 |
Discover Bank | ||
4.25%, 3/13/2026 | 636,000 | 621,291 |
3.45%, 7/27/2026 | 90,000 | 85,275 |
4.65%, 9/13/2028 | 960,000 | 923,204 |
2.70%, 2/6/2030 | 699,000 | 582,508 |
First Horizon Corp. 4.00%, 5/26/2025 | 402,000 | 393,323 |
First-Citizens Bank & Trust Co. (TSFR3M + 1.72%), 2.97%, 9/27/2025 (b) | 1,025,000 | 978,622 |
Korea Development Bank (The) (South Korea) | ||
1.38%, 4/25/2027 | 882,000 | 785,714 |
2.00%, 10/25/2031 | 424,000 | 357,558 |
Kreditanstalt fuer Wiederaufbau (Germany) | ||
2.63%, 2/28/2024 | 36,000 | 35,516 |
0.25%, 3/8/2024 | 371,000 | 353,004 |
0.50%, 9/20/2024 | 500,000 | 470,112 |
2.50%, 11/20/2024 | 75,000 | 73,327 |
0.38%, 7/18/2025 | 198,000 | 180,703 |
0.63%, 1/22/2026 | 72,000 | 65,303 |
1.00%, 10/1/2026 (c) | 403,000 | 364,511 |
3.00%, 5/20/2027 | 66,000 | 64,664 |
1.75%, 9/14/2029 | 70,000 | 62,925 |
Zero Coupon, 6/29/2037 | 832,000 | 494,217 |
Landwirtschaftliche Rentenbank (Germany) | ||
2.00%, 1/13/2025 | 498,000 | 480,466 |
2.38%, 6/10/2025 | 75,000 | 72,547 |
0.88%, 3/30/2026 | 170,000 | 154,604 |
0.88%, 9/3/2030 | 779,000 | 641,853 |
NatWest Group plc (United Kingdom) | ||
(US Treasury Yield Curve Rate T Note Constant Maturity 1 Year + 2.15%), 2.36%, 5/22/2024 (b) | 1,179,000 | 1,158,314 |
(US Treasury Yield Curve Rate T Note Constant Maturity 1 Year + 0.90%), 1.64%, 6/14/2027 (b) | 398,000 | 347,878 |
(US Treasury Yield Curve Rate T Note Constant Maturity 1 Year + 2.55%), 3.07%, 5/22/2028 (b) | 1,381,000 | 1,248,398 |
INVESTMENTS | PRINCIPAL AMOUNT($) | VALUE($) |
Banks — continued | ||
Oesterreichische Kontrollbank AG (Austria) | ||
1.50%, 2/12/2025 | 160,000 | 152,121 |
0.50%, 2/2/2026 | 130,000 | 117,010 |
Regions Financial Corp. | ||
2.25%, 5/18/2025 | 63,000 | 60,002 |
1.80%, 8/12/2028 | 1,999,000 | 1,721,074 |
Royal Bank of Canada (Canada) | ||
0.43%, 1/19/2024 | 18,000 | 17,184 |
2.55%, 7/16/2024 | 1,620,000 | 1,576,207 |
2.25%, 11/1/2024 | 2,242,000 | 2,156,821 |
1.15%, 6/10/2025 | 49,000 | 45,170 |
0.88%, 1/20/2026 | 603,000 | 540,302 |
1.40%, 11/2/2026 | 283,000 | 251,786 |
Series FXD, 2.05%, 1/21/2027 | 698,000 | 636,814 |
3.88%, 5/4/2032 | 1,967,000 | 1,858,397 |
SVB Financial Group | ||
1.80%, 10/28/2026 | 2,278,000 | 2,021,315 |
2.10%, 5/15/2028 | 234,000 | 198,310 |
3.13%, 6/5/2030 | 63,000 | 53,927 |
1.80%, 2/2/2031 | 251,000 | 189,273 |
30,381,669 | ||
Beverages — 0.0% ^ | ||
Brown-Forman Corp. | ||
3.50%, 4/15/2025 | 186,000 | 183,952 |
4.00%, 4/15/2038 | 113,000 | 102,302 |
4.50%, 7/15/2045 | 269,000 | 251,259 |
537,513 | ||
Biotechnology — 0.1% | ||
Regeneron Pharmaceuticals, Inc. | ||
1.75%, 9/15/2030 | 276,000 | 219,464 |
2.80%, 9/15/2050 | 1,950,000 | 1,311,389 |
1,530,853 | ||
Building Products — 0.0% ^ | ||
Allegion plc 3.50%, 10/1/2029 | 344,000 | 303,558 |
Capital Markets — 3.3% | ||
Affiliated Managers Group, Inc. 4.25%, 2/15/2024 | 370,000 | 369,992 |
Ameriprise Financial, Inc. | ||
3.70%, 10/15/2024 | 631,000 | 626,083 |
3.00%, 4/2/2025 | 101,000 | 98,364 |
2.88%, 9/15/2026 | 828,000 | 787,798 |
BGC Partners, Inc. 3.75%, 10/1/2024 | 175,000 | 169,517 |
190 | J.P. Morgan Exchange-Traded Funds | August 31, 2022 |
INVESTMENTS | PRINCIPAL AMOUNT($) | VALUE($) |
Corporate Bonds — continued | ||
Capital Markets — continued | ||
BlackRock, Inc. | ||
3.50%, 3/18/2024 | 269,000 | 268,170 |
3.20%, 3/15/2027 | 1,652,000 | 1,620,892 |
3.25%, 4/30/2029 | 300,000 | 285,283 |
2.40%, 4/30/2030 | 343,000 | 301,380 |
2.10%, 2/25/2032 | 2,117,000 | 1,757,407 |
Cboe Global Markets, Inc. 1.63%, 12/15/2030 | 1,377,000 | 1,109,695 |
Charles Schwab Corp. (The) | ||
0.75%, 3/18/2024 | 260,000 | 248,824 |
3.75%, 4/1/2024 | 227,000 | 226,633 |
4.20%, 3/24/2025 | 85,000 | 85,384 |
3.63%, 4/1/2025 | 10,000 | 9,869 |
2.45%, 3/3/2027 | 534,000 | 498,319 |
3.30%, 4/1/2027 | 1,197,000 | 1,160,904 |
2.00%, 3/20/2028 | 909,000 | 817,244 |
4.00%, 2/1/2029 | 451,000 | 443,591 |
3.25%, 5/22/2029 | 1,057,000 | 990,769 |
4.63%, 3/22/2030 | 513,000 | 519,883 |
1.95%, 12/1/2031 | 12,000 | 9,793 |
CI Financial Corp. (Canada) | ||
3.20%, 12/17/2030 | 163,000 | 123,661 |
4.10%, 6/15/2051 | 22,000 | 14,396 |
CME Group, Inc. | ||
3.00%, 3/15/2025 | 363,000 | 356,002 |
3.75%, 6/15/2028 | 294,000 | 288,841 |
2.65%, 3/15/2032 | 935,000 | 823,122 |
4.15%, 6/15/2048 | 1,990,000 | 1,894,279 |
Deutsche Bank AG (Germany) | ||
0.90%, 5/28/2024 | 2,382,000 | 2,239,082 |
(SOFR + 2.58%), 3.96%, 11/26/2025 (b) | 605,000 | 579,603 |
4.10%, 1/13/2026 | 1,608,000 | 1,568,002 |
(SOFR + 3.19%), 6.12%, 7/14/2026 (b) | 481,000 | 481,219 |
(SOFR + 1.87%), 2.13%, 11/24/2026 (b) | 1,889,000 | 1,664,100 |
Franklin Resources, Inc. 2.95%, 8/12/2051 | 112,000 | 77,593 |
Intercontinental Exchange, Inc. | ||
3.75%, 12/1/2025 | 57,000 | 56,454 |
1.85%, 9/15/2032 | 356,000 | 280,893 |
2.65%, 9/15/2040 | 1,860,000 | 1,378,839 |
3.00%, 6/15/2050 | 445,000 | 324,518 |
4.95%, 6/15/2052 | 103,000 | 101,278 |
INVESTMENTS | PRINCIPAL AMOUNT($) | VALUE($) |
Capital Markets — continued | ||
3.00%, 9/15/2060 | 4,339,000 | 2,943,035 |
5.20%, 6/15/2062 | 57,000 | 56,081 |
Janus Henderson US Holdings, Inc. 4.88%, 8/1/2025 | 520,000 | 521,491 |
Lazard Group LLC | ||
3.75%, 2/13/2025 | 2,269,000 | 2,232,846 |
3.63%, 3/1/2027 | 276,000 | 260,806 |
4.38%, 3/11/2029 | 404,000 | 387,775 |
Morgan Stanley (SOFR + 0.46%), 0.53%, 1/25/2024 (b) | 877,000 | 863,505 |
Nasdaq, Inc. | ||
3.85%, 6/30/2026 | 519,000 | 511,094 |
1.65%, 1/15/2031 | 128,000 | 101,912 |
2.50%, 12/21/2040 | 62,000 | 43,131 |
3.25%, 4/28/2050 | 1,789,000 | 1,330,425 |
3.95%, 3/7/2052 | 289,000 | 241,595 |
Raymond James Financial, Inc. | ||
4.65%, 4/1/2030 | 233,000 | 228,813 |
3.75%, 4/1/2051 | 247,000 | 199,519 |
S&P Global, Inc. | ||
2.95%, 1/22/2027 | 327,000 | 313,811 |
2.50%, 12/1/2029 | 425,000 | 376,055 |
3.25%, 12/1/2049 | 189,000 | 148,175 |
2.30%, 8/15/2060 | 1,140,000 | 690,785 |
Stifel Financial Corp. | ||
4.25%, 7/18/2024 | 780,000 | 777,131 |
4.00%, 5/15/2030 | 686,000 | 621,776 |
37,507,437 | ||
Chemicals — 0.2% | ||
CF Industries, Inc. 5.38%, 3/15/2044 | 371,000 | 347,542 |
EI du Pont de Nemours and Co. | ||
1.70%, 7/15/2025 | 20,000 | 18,799 |
2.30%, 7/15/2030 | 1,668,000 | 1,442,127 |
Huntsman International LLC | ||
4.50%, 5/1/2029 | 497,000 | 457,677 |
2.95%, 6/15/2031 | 541,000 | 432,282 |
2,698,427 | ||
Communications Equipment — 0.6% | ||
Cisco Systems, Inc. | ||
3.63%, 3/4/2024 | 2,374,000 | 2,375,750 |
3.50%, 6/15/2025 | 1,802,000 | 1,798,817 |
2.50%, 9/20/2026 (c) | 669,000 | 642,269 |
5.90%, 2/15/2039 | 200,000 | 227,091 |
August 31, 2022 | J.P. Morgan Exchange-Traded Funds | 191 |
AS OF August 31, 2022 (Unaudited) (continued)
INVESTMENTS | PRINCIPAL AMOUNT($) | VALUE($) |
Corporate Bonds — continued | ||
Communications Equipment — continued | ||
Juniper Networks, Inc. | ||
3.75%, 8/15/2029 | 157,000 | 142,665 |
2.00%, 12/10/2030 | 1,733,000 | 1,349,653 |
6,536,245 | ||
Construction & Engineering — 0.1% | ||
Valmont Industries, Inc. 5.25%, 10/1/2054 | 1,399,000 | 1,321,952 |
Construction Materials — 0.0% ^ | ||
Eagle Materials, Inc. 2.50%, 7/1/2031 | 723,000 | 565,578 |
Consumer Finance — 1.7% | ||
Ally Financial, Inc. | ||
1.45%, 10/2/2023 | 712,600 | 690,346 |
3.88%, 5/21/2024 | 1,242,000 | 1,230,210 |
5.13%, 9/30/2024 | 403,000 | 408,753 |
4.63%, 3/30/2025 | 130,000 | 129,669 |
2.20%, 11/2/2028 | 1,411,000 | 1,164,897 |
8.00%, 11/01/2031 | 740,000 | 820,262 |
American Express Co. | ||
3.70%, 8/3/2023 | 976,000 | 974,671 |
3.40%, 2/22/2024 | 598,000 | 593,209 |
2.50%, 7/30/2024 | 100,000 | 97,290 |
3.00%, 10/30/2024 | 164,000 | 160,732 |
4.20%, 11/6/2025 | 777,000 | 778,279 |
3.13%, 5/20/2026 | 190,000 | 183,390 |
3.30%, 5/3/2027 | 726,000 | 694,731 |
4.05%, 12/3/2042 | 2,737,000 | 2,486,753 |
Discover Financial Services | ||
3.95%, 11/6/2024 | 1,916,000 | 1,895,969 |
4.10%, 2/9/2027 | 856,000 | 824,272 |
Synchrony Financial | ||
4.38%, 3/19/2024 | 178,000 | 177,321 |
4.50%, 7/23/2025 | 142,000 | 138,834 |
3.70%, 8/4/2026 | 1,260,000 | 1,180,398 |
3.95%, 12/1/2027 | 811,000 | 737,652 |
5.15%, 3/19/2029 | 3,871,000 | 3,684,158 |
19,051,796 | ||
Containers & Packaging — 0.1% | ||
Avery Dennison Corp. | ||
4.88%, 12/6/2028 | 108,000 | 109,065 |
2.65%, 4/30/2030 | 935,000 | 788,065 |
2.25%, 2/15/2032 | 10,000 | 7,843 |
904,973 | ||
INVESTMENTS | PRINCIPAL AMOUNT($) | VALUE($) |
Diversified Financial Services — 0.2% | ||
Block Financial LLC | ||
2.50%, 7/15/2028 | 120,000 | 104,202 |
3.88%, 8/15/2030 | 857,000 | 777,926 |
National Rural Utilities Cooperative Finance Corp. Series D, 1.00%, 10/18/2024 | 1,019,000 | 958,053 |
1,840,181 | ||
Diversified Telecommunication Services — 0.1% | ||
Bell Telephone Co. of Canada or Bell Canada (The) (Canada) | ||
Series US-3, 0.75%, 3/17/2024 | 13,000 | 12,355 |
Series US-5, 2.15%, 2/15/2032 | 593,000 | 483,328 |
Series US-6, 3.20%, 2/15/2052 | 237,000 | 172,993 |
Koninklijke KPN NV (Netherlands) 8.38%, 10/1/2030 | 355,000 | 411,848 |
1,080,524 | ||
Electric Utilities — 1.3% | ||
Alabama Power Co. | ||
Series 20-A, 1.45%, 9/15/2030 | 767,000 | 624,141 |
3.45%, 10/1/2049 | 170,000 | 133,824 |
Emera US Finance LP (Canada) 2.64%, 6/15/2031 | 1,034,000 | 853,884 |
Enel Americas SA (Chile) 4.00%, 10/25/2026 | 168,000 | 164,947 |
Georgia Power Co. | ||
Series A, 2.20%, 9/15/2024 | 1,542,000 | 1,490,602 |
5.13%, 5/15/2052 | 47,000 | 47,318 |
Hydro-Quebec (Canada) 8.50%, 12/1/2029 | 50,000 | 64,056 |
Iberdrola International BV (Spain) | ||
5.81%, 3/15/2025 | 345,000 | 359,518 |
6.75%, 7/15/2036 | 267,000 | 298,167 |
Interstate Power and Light Co. | ||
3.70%, 9/15/2046 | 2,496,000 | 2,022,953 |
3.50%, 9/30/2049 | 1,195,000 | 946,094 |
Ohio Edison Co. 6.88%, 7/15/2036 | 400,000 | 459,524 |
Oklahoma Gas and Electric Co. | ||
3.80%, 8/15/2028 | 400,000 | 385,705 |
3.30%, 3/15/2030 | 81,000 | 74,246 |
4.15%, 4/1/2047 | 200,000 | 176,632 |
Southern Co. (The) | ||
Series A, 3.70%, 4/30/2030 | 3,184,000 | 2,972,032 |
4.40%, 7/1/2046 | 561,000 | 494,657 |
Tampa Electric Co. | ||
2.40%, 3/15/2031 | 676,000 | 581,246 |
192 | J.P. Morgan Exchange-Traded Funds | August 31, 2022 |
INVESTMENTS | PRINCIPAL AMOUNT($) | VALUE($) |
Corporate Bonds — continued | ||
Electric Utilities — continued | ||
4.10%, 6/15/2042 | 122,000 | 107,021 |
Tucson Electric Power Co. | ||
1.50%, 8/1/2030 | 78,000 | 62,094 |
3.25%, 5/1/2051 | 264,000 | 193,654 |
Union Electric Co. | ||
8.45%, 3/15/2039 | 60,000 | 79,269 |
3.90%, 9/15/2042 | 2,448,000 | 2,132,451 |
Wisconsin Power & Light Co. 3.05%, 10/15/2027 | 43,000 | 40,895 |
Wisconsin Power and Light Co. | ||
1.95%, 9/16/2031 | 12,000 | 9,803 |
3.65%, 4/1/2050 | 28,000 | 22,506 |
14,797,239 | ||
Electronic Equipment, Instruments & Components — 0.4% | ||
Amphenol Corp. | ||
2.05%, 3/1/2025 | 280,000 | 266,294 |
4.35%, 6/1/2029 | 51,000 | 50,372 |
2.80%, 2/15/2030 | 540,000 | 472,257 |
2.20%, 9/15/2031 | 561,000 | 462,610 |
CDW LLC 3.57%, 12/1/2031 | 2,164,000 | 1,821,342 |
Tyco Electronics Group SA (Switzerland) | ||
3.45%, 8/1/2024 | 38,000 | 37,676 |
2.50%, 2/4/2032 | 979,000 | 850,005 |
3,960,556 | ||
Entertainment — 0.4% | ||
Activision Blizzard, Inc. | ||
3.40%, 9/15/2026 | 36,000 | 35,123 |
1.35%, 9/15/2030 | 2,598,000 | 2,050,866 |
4.50%, 6/15/2047 | 1,249,000 | 1,185,967 |
Electronic Arts, Inc. | ||
4.80%, 3/1/2026 (c) | 473,000 | 481,088 |
1.85%, 2/15/2031 | 523,000 | 427,906 |
4,180,950 | ||
Food & Staples Retailing — 0.2% | ||
Ahold Finance USA LLC (Netherlands) 6.88%, 5/1/2029 | 716,000 | 783,135 |
Costco Wholesale Corp. | ||
2.75%, 5/18/2024 (c) | 200,000 | 197,718 |
1.75%, 4/20/2032 | 1,467,000 | 1,207,443 |
2,188,296 | ||
INVESTMENTS | PRINCIPAL AMOUNT($) | VALUE($) |
Food Products — 0.1% | ||
Flowers Foods, Inc. | ||
3.50%, 10/1/2026 | 487,000 | 463,243 |
2.40%, 3/15/2031 | 159,000 | 131,976 |
595,219 | ||
Gas Utilities — 0.2% | ||
National Fuel Gas Co. | ||
5.20%, 7/15/2025 | 1,539,000 | 1,543,881 |
4.75%, 9/1/2028 | 640,000 | 616,398 |
2,160,279 | ||
Health Care Equipment & Supplies — 0.3% | ||
Edwards Lifesciences Corp. 4.30%, 6/15/2028 | 1,013,000 | 1,007,314 |
STERIS Irish FinCo. UnLtd Co. 3.75%, 3/15/2051 | 2,773,000 | 2,129,932 |
3,137,246 | ||
Health Care Providers & Services — 0.2% | ||
AmerisourceBergen Corp. | ||
0.74%, 3/15/2023 | 70,000 | 68,775 |
3.25%, 3/1/2025 | 255,000 | 248,919 |
3.45%, 12/15/2027 | 413,000 | 394,356 |
2.80%, 5/15/2030 | 49,000 | 42,615 |
4.25%, 3/1/2045 | 350,000 | 303,161 |
4.30%, 12/15/2047 | 962,000 | 867,001 |
1,924,827 | ||
Hotels, Restaurants & Leisure — 0.1% | ||
Choice Hotels International, Inc. 3.70%, 1/15/2031 | 830,000 | 723,916 |
Household Durables — 0.2% | ||
NVR, Inc. 3.00%, 5/15/2030 | 896,000 | 765,792 |
PulteGroup, Inc. | ||
7.88%, 6/15/2032 | 30,000 | 33,459 |
6.00%, 2/15/2035 | 1,615,000 | 1,571,363 |
2,370,614 | ||
Household Products — 0.2% | ||
Church & Dwight Co., Inc. | ||
3.15%, 8/1/2027 (c) | 342,000 | 324,557 |
2.30%, 12/15/2031 | 110,000 | 92,598 |
3.95%, 8/1/2047 | 1,693,000 | 1,477,347 |
1,894,502 | ||
Independent Power and Renewable Electricity Producers — 0.2% | ||
Constellation Energy Generation LLC | ||
3.25%, 6/1/2025 | 247,000 | 239,669 |
August 31, 2022 | J.P. Morgan Exchange-Traded Funds | 193 |
AS OF August 31, 2022 (Unaudited) (continued)
INVESTMENTS | PRINCIPAL AMOUNT($) | VALUE($) |
Corporate Bonds — continued | ||
Independent Power and Renewable Electricity Producers — continued | ||
6.25%, 10/1/2039 | 1,323,000 | 1,389,291 |
5.75%, 10/1/2041 | 427,000 | 423,186 |
5.60%, 6/15/2042 | 510,000 | 505,006 |
2,557,152 | ||
Industrial Conglomerates — 0.0% ^ | ||
Pentair Finance SARL 4.50%, 7/1/2029 | 305,000 | 285,105 |
Interactive Media & Services — 0.6% | ||
Alphabet, Inc. | ||
3.38%, 2/25/2024 | 494,000 | 492,746 |
0.45%, 8/15/2025 | 3,208,000 | 2,930,841 |
2.00%, 8/15/2026 | 2,307,000 | 2,174,672 |
1.90%, 8/15/2040 | 217,000 | 153,398 |
2.05%, 8/15/2050 | 748,000 | 492,850 |
6,244,507 | ||
Internet & Direct Marketing Retail — 0.0% ^ | ||
Alibaba Group Holding Ltd. (China) 2.80%, 6/6/2023 | 213,000 | 210,910 |
IT Services — 0.2% | ||
Amdocs Ltd. 2.54%, 6/15/2030 | 517,000 | 430,069 |
CGI, Inc. (Canada) 1.45%, 9/14/2026 | 1,717,000 | 1,512,757 |
1,942,826 | ||
Life Sciences Tools & Services — 0.0% ^ | ||
Agilent Technologies, Inc. 2.30%, 3/12/2031 | 702,000 | 577,658 |
Machinery — 0.3% | ||
Dover Corp. | ||
3.15%, 11/15/2025 | 463,000 | 447,981 |
2.95%, 11/4/2029 | 220,000 | 199,253 |
5.38%, 10/15/2035 (c) | 283,000 | 284,993 |
IDEX Corp. 3.00%, 5/1/2030 | 1,139,000 | 1,001,087 |
nVent Finance Sarl (United Kingdom) 2.75%, 11/15/2031 | 633,000 | 497,693 |
Oshkosh Corp. 3.10%, 3/1/2030 | 801,000 | 678,574 |
3,109,581 | ||
Media — 0.1% | ||
Interpublic Group of Cos., Inc. (The) | ||
4.75%, 3/30/2030 | 139,000 | 133,534 |
3.38%, 3/1/2041 | 900,000 | 644,072 |
5.40%, 10/1/2048 | 30,000 | 28,886 |
806,492 | ||
INVESTMENTS | PRINCIPAL AMOUNT($) | VALUE($) |
Metals & Mining — 2.2% | ||
ArcelorMittal SA (Luxembourg) 4.55%, 3/11/2026 (c) | 964,000 | 945,925 |
Barrick Gold Corp. (Canada) | ||
6.45%, 10/15/2035 | 1,504,000 | 1,652,815 |
5.25%, 4/1/2042 | 428,000 | 417,111 |
Barrick North America Finance LLC (Canada) 5.75%, 5/1/2043 | 300,000 | 308,103 |
Barrick PD Australia Finance Pty. Ltd. (Canada) 5.95%, 10/15/2039 | 700,000 | 737,507 |
Freeport-McMoRan, Inc. | ||
5.00%, 9/1/2027 | 206,000 | 208,125 |
4.38%, 8/1/2028 | 1,692,000 | 1,595,171 |
5.45%, 3/15/2043 | 2,085,000 | 1,872,002 |
Newmont Corp. | ||
2.80%, 10/1/2029 | 1,603,000 | 1,399,371 |
2.25%, 10/1/2030 | 665,000 | 546,499 |
5.88%, 4/1/2035 | 100,000 | 103,815 |
6.25%, 10/1/2039 | 384,000 | 413,254 |
4.88%, 3/15/2042 | 1,699,000 | 1,614,548 |
5.45%, 6/9/2044 | 843,000 | 835,660 |
Rio Tinto Alcan, Inc. (Canada) | ||
7.25%, 3/15/2031 | 897,000 | 1,062,263 |
6.13%, 12/15/2033 | 701,000 | 796,442 |
5.75%, 6/1/2035 | 106,000 | 114,730 |
Rio Tinto Finance USA plc (Australia) | ||
4.75%, 3/22/2042 | 900,000 | 894,329 |
4.13%, 8/21/2042 | 669,000 | 614,290 |
Southern Copper Corp. (Peru) | ||
3.88%, 4/23/2025 | 2,255,000 | 2,208,512 |
6.75%, 4/16/2040 | 100,000 | 112,516 |
5.25%, 11/8/2042 | 653,000 | 631,400 |
5.88%, 4/23/2045 | 1,863,000 | 1,940,692 |
Vale Overseas Ltd. (Brazil) | ||
6.25%, 8/10/2026 | 1,055,000 | 1,106,136 |
3.75%, 7/8/2030 | 3,176,000 | 2,756,448 |
Vale SA (Brazil) 5.63%, 9/11/2042 | 194,000 | 181,032 |
25,068,696 | ||
Multiline Retail — 0.3% | ||
Dollar General Corp. | ||
3.25%, 4/15/2023 | 381,000 | 379,313 |
4.15%, 11/1/2025 | 100,000 | 99,592 |
194 | J.P. Morgan Exchange-Traded Funds | August 31, 2022 |
INVESTMENTS | PRINCIPAL AMOUNT($) | VALUE($) |
Corporate Bonds — continued | ||
Multiline Retail — continued | ||
3.50%, 4/3/2030 | 686,000 | 632,769 |
4.13%, 4/3/2050 | 2,605,000 | 2,194,027 |
3,305,701 | ||
Multi-Utilities — 0.2% | ||
Ameren Corp. | ||
3.65%, 2/15/2026 | 1,003,000 | 976,068 |
3.50%, 1/15/2031 | 182,000 | 165,965 |
Consolidated Edison Co. of New York, Inc. | ||
2.40%, 6/15/2031 | 185,000 | 158,094 |
3.70%, 11/15/2059 | 151,000 | 118,332 |
Southern Co. Gas Capital Corp. | ||
Series 20-A, 1.75%, 1/15/2031 | 621,000 | 492,102 |
4.40%, 6/1/2043 | 20,000 | 17,303 |
3.95%, 10/1/2046 | 15,000 | 12,038 |
4.40%, 5/30/2047 | 17,000 | 14,714 |
Series 21A, 3.15%, 9/30/2051 | 281,000 | 196,619 |
2,151,235 | ||
Oil, Gas & Consumable Fuels — 2.9% | ||
Burlington Resources LLC 7.20%, 8/15/2031 | 479,000 | 562,015 |
Canadian Natural Resources Ltd. (Canada) | ||
2.95%, 1/15/2023 | 100,000 | 99,512 |
2.05%, 7/15/2025 | 3,502,000 | 3,267,068 |
2.95%, 7/15/2030 | 1,559,000 | 1,359,436 |
5.85%, 2/1/2035 | 1,100,000 | 1,088,527 |
CNOOC Finance 2014 ULC (China) 4.25%, 4/30/2024 | 250,000 | 250,918 |
CNOOC Finance 2015 USA LLC (China) 3.50%, 5/5/2025 | 401,000 | 395,249 |
CNOOC Petroleum North America ULC (China) 5.88%, 3/10/2035 | 575,000 | 591,799 |
ConocoPhillips 5.90%, 10/15/2032 | 323,000 | 357,230 |
ConocoPhillips Co. | ||
2.40%, 3/7/2025 | 90,000 | 86,998 |
3.76%, 3/15/2042 (d) | 771,000 | 677,569 |
4.03%, 3/15/2062 (d) | 3,307,000 | 2,819,266 |
Continental Resources, Inc. | ||
3.80%, 6/1/2024 | 1,037,000 | 1,022,141 |
4.90%, 6/1/2044 | 2,038,000 | 1,592,835 |
Devon Energy Corp. | ||
4.50%, 1/15/2030 | 2,847,000 | 2,720,165 |
7.95%, 4/15/2032 | 218,000 | 253,174 |
5.60%, 7/15/2041 | 1,610,000 | 1,592,546 |
INVESTMENTS | PRINCIPAL AMOUNT($) | VALUE($) |
Oil, Gas & Consumable Fuels — continued | ||
Eni USA, Inc. (Italy) 7.30%, 11/15/2027 | 44,000 | 48,666 |
EOG Resources, Inc. | ||
3.15%, 4/1/2025 | 244,000 | 239,819 |
4.38%, 4/15/2030 | 511,000 | 512,401 |
3.90%, 4/1/2035 | 666,000 | 613,564 |
4.95%, 4/15/2050 | 730,000 | 754,042 |
Equinor ASA (Norway) | ||
7.75%, 6/15/2023 | 288,000 | 296,623 |
3.70%, 3/1/2024 | 100,000 | 99,981 |
3.63%, 9/10/2028 | 159,000 | 155,107 |
Hess Corp. | ||
3.50%, 7/15/2024 | 260,000 | 255,819 |
4.30%, 4/1/2027 | 260,000 | 253,816 |
7.30%, 8/15/2031 | 967,000 | 1,079,784 |
7.13%, 3/15/2033 | 121,000 | 134,418 |
6.00%, 1/15/2040 | 228,000 | 232,585 |
5.60%, 2/15/2041 | 2,388,000 | 2,299,532 |
Magellan Midstream Partners LP | ||
3.25%, 6/1/2030 | 425,000 | 377,106 |
5.15%, 10/15/2043 | 407,000 | 373,785 |
4.25%, 9/15/2046 | 691,000 | 569,730 |
4.20%, 10/3/2047 | 372,000 | 303,005 |
4.85%, 2/1/2049 | 400,000 | 354,983 |
3.95%, 3/1/2050 | 1,155,000 | 907,059 |
Marathon Oil Corp. | ||
4.40%, 7/15/2027 | 195,000 | 189,652 |
6.80%, 3/15/2032 | 300,000 | 320,703 |
6.60%, 10/1/2037 | 300,000 | 314,691 |
5.20%, 6/1/2045 | 553,000 | 505,722 |
Pioneer Natural Resources Co. | ||
0.55%, 5/15/2023 | 1,549,000 | 1,511,854 |
1.13%, 1/15/2026 | 280,000 | 250,204 |
1.90%, 8/15/2030 | 430,000 | 350,758 |
2.15%, 1/15/2031 | 700,000 | 576,235 |
Tosco Corp. 8.13%, 2/15/2030 | 65,000 | 78,380 |
32,696,472 | ||
Pharmaceuticals — 1.5% | ||
Johnson & Johnson | ||
2.05%, 3/1/2023 (c) | 188,000 | 186,986 |
0.55%, 9/1/2025 | 2,850,000 | 2,610,288 |
2.95%, 3/3/2027 | 92,000 | 89,456 |
3.55%, 3/1/2036 | 87,000 | 81,035 |
3.63%, 3/3/2037 | 79,000 | 73,366 |
3.40%, 1/15/2038 | 408,000 | 365,640 |
August 31, 2022 | J.P. Morgan Exchange-Traded Funds | 195 |
AS OF August 31, 2022 (Unaudited) (continued)
INVESTMENTS | PRINCIPAL AMOUNT($) | VALUE($) |
Corporate Bonds — continued | ||
Pharmaceuticals — continued | ||
2.10%, 9/1/2040 | 198,000 | 144,057 |
4.50%, 9/1/2040 | 73,000 | 72,854 |
4.85%, 5/15/2041 | 46,000 | 47,680 |
4.50%, 12/5/2043 | 76,000 | 76,304 |
3.70%, 3/1/2046 | 1,979,000 | 1,767,740 |
3.75%, 3/3/2047 | 518,000 | 466,050 |
3.50%, 1/15/2048 | 399,000 | 350,192 |
2.25%, 9/1/2050 | 1,175,000 | 811,331 |
2.45%, 9/1/2060 | 469,000 | 312,664 |
Merck & Co., Inc. | ||
0.75%, 2/24/2026 | 1,569,000 | 1,419,274 |
2.35%, 6/24/2040 | 896,000 | 660,977 |
2.45%, 6/24/2050 | 134,000 | 92,780 |
Pfizer, Inc. | ||
3.60%, 9/15/2028 | 923,000 | 915,484 |
1.75%, 8/18/2031 | 736,000 | 611,044 |
4.30%, 6/15/2043 | 739,000 | 707,668 |
Wyeth LLC 5.95%, 4/1/2037 | 1,000,000 | 1,135,090 |
Zoetis, Inc. | ||
3.00%, 9/12/2027 | 1,435,000 | 1,358,037 |
3.90%, 8/20/2028 | 550,000 | 535,872 |
2.00%, 5/15/2030 | 1,045,000 | 877,766 |
4.70%, 2/1/2043 | 255,000 | 242,785 |
3.95%, 9/12/2047 | 447,000 | 387,230 |
4.45%, 8/20/2048 | 305,000 | 284,583 |
16,684,233 | ||
Professional Services — 0.2% | ||
Thomson Reuters Corp. (Canada) | ||
3.35%, 5/15/2026 | 1,242,000 | 1,202,984 |
5.85%, 4/15/2040 | 25,000 | 25,817 |
5.65%, 11/23/2043 | 1,186,000 | 1,192,348 |
2,421,149 | ||
Semiconductors & Semiconductor Equipment — 1.3% | ||
Micron Technology, Inc. | ||
4.98%, 2/6/2026 | 658,000 | 658,939 |
3.37%, 11/1/2041 | 536,000 | 378,414 |
3.48%, 11/1/2051 | 3,821,000 | 2,542,950 |
NVIDIA Corp. | ||
0.31%, 6/15/2023 | 1,443,000 | 1,405,334 |
1.55%, 6/15/2028 | 451,000 | 393,042 |
2.85%, 4/1/2030 | 885,000 | 799,619 |
3.50%, 4/1/2050 | 487,000 | 405,519 |
3.70%, 4/1/2060 | 933,000 | 762,123 |
INVESTMENTS | PRINCIPAL AMOUNT($) | VALUE($) |
Semiconductors & Semiconductor Equipment — continued | ||
Texas Instruments, Inc. | ||
2.90%, 11/3/2027 | 212,000 | 202,108 |
2.25%, 9/4/2029 | 716,000 | 638,185 |
1.75%, 5/4/2030 | 1,082,000 | 920,967 |
3.88%, 3/15/2039 | 487,000 | 455,385 |
4.15%, 5/15/2048 | 1,384,000 | 1,322,192 |
TSMC Arizona Corp. (Taiwan) | ||
1.75%, 10/25/2026 | 4,380,000 | 3,957,311 |
3.25%, 10/25/2051 | 201,000 | 160,247 |
Xilinx, Inc. 2.38%, 6/1/2030 | 232,000 | 202,669 |
15,205,004 | ||
Software — 0.1% | ||
Cadence Design Systems, Inc. 4.38%, 10/15/2024 | 715,000 | 719,570 |
Specialty Retail — 0.3% | ||
Advance Auto Parts, Inc. 3.90%, 4/15/2030 | 1,580,000 | 1,428,499 |
Best Buy Co., Inc. | ||
4.45%, 10/1/2028 | 337,000 | 330,744 |
1.95%, 10/1/2030 | 64,000 | 51,214 |
O'Reilly Automotive, Inc. | ||
3.90%, 6/1/2029 | 382,000 | 361,756 |
1.75%, 3/15/2031 | 1,223,000 | 972,018 |
Tractor Supply Co. 1.75%, 11/1/2030 | 728,000 | 575,440 |
3,719,671 | ||
Technology Hardware, Storage & Peripherals — 0.3% | ||
HP, Inc. | ||
2.20%, 6/17/2025 | 784,000 | 739,605 |
1.45%, 6/17/2026 | 1,802,000 | 1,605,869 |
3.00%, 6/17/2027 | 1,343,000 | 1,243,489 |
3.40%, 6/17/2030 | 400,000 | 346,017 |
3,934,980 | ||
Textiles, Apparel & Luxury Goods — 0.0% ^ | ||
Tapestry, Inc. | ||
4.13%, 7/15/2027 | 15,000 | 14,341 |
3.05%, 3/15/2032 | 546,000 | 435,350 |
449,691 | ||
Tobacco — 0.2% | ||
Altria Group, Inc. | ||
2.35%, 5/6/2025 | 63,000 | 59,901 |
3.40%, 5/6/2030 | 250,000 | 216,370 |
5.38%, 1/31/2044 | 658,000 | 581,409 |
196 | J.P. Morgan Exchange-Traded Funds | August 31, 2022 |
INVESTMENTS | PRINCIPAL AMOUNT($) | VALUE($) |
Corporate Bonds — continued | ||
Tobacco — continued | ||
4.45%, 5/6/2050 | 174,000 | 127,620 |
4.00%, 2/4/2061 | 1,155,000 | 784,175 |
1,769,475 | ||
Trading Companies & Distributors — 0.1% | ||
WW Grainger, Inc. | ||
1.85%, 2/15/2025 | 121,000 | 114,985 |
4.60%, 6/15/2045 | 757,000 | 731,880 |
4.20%, 5/15/2047 | 378,000 | 344,204 |
1,191,069 | ||
Wireless Telecommunication Services — 0.4% | ||
America Movil SAB de CV (Mexico) | ||
3.63%, 4/22/2029 | 3,529,000 | 3,337,338 |
6.38%, 3/1/2035 | 172,000 | 194,186 |
6.13%, 3/30/2040 | 202,000 | 221,403 |
4.38%, 4/22/2049 | 1,013,000 | 927,979 |
4,680,906 | ||
Total Corporate Bonds (Cost $307,592,146) | 276,242,322 | |
Commercial Mortgage-Backed Securities — 1.9% | ||
BANK | ||
Series 2017-BNK4, Class ASB, 3.42%, 5/15/2050 | 27,018 | 26,299 |
Series 2019-BN16, Class A4, 4.01%, 2/15/2052 | 60,000 | 58,408 |
Series 2019-BN21, Class A5, 2.85%, 10/17/2052 | 60,000 | 54,154 |
Series 2019-BN23, Class A3, 2.92%, 12/15/2052 | 142,000 | 128,428 |
Series 2018-BN10, Class A5, 3.69%, 2/15/2061 | 20,000 | 19,254 |
Series 2018-BN10, Class AS, 3.90%, 2/15/2061 (e) | 180,000 | 169,304 |
Series 2019-BN19, Class A3, 3.18%, 8/15/2061 | 100,000 | 92,334 |
Series 2018-BN13, Class C, 4.72%, 8/15/2061 ‡ (e) | 500,000 | 442,299 |
Series 2019-BN22, Class A4, 2.98%, 11/15/2062 | 260,000 | 236,248 |
Bank of America Merrill Lynch Commercial Mortgage Trust Series 2017-BNK3, Class A4, 3.57%, 2/15/2050 | 20,000 | 19,258 |
BBCMS Mortgage Trust Series 2018-C2, Class A5, 4.31%, 12/15/2051 | 40,000 | 39,534 |
INVESTMENTS | PRINCIPAL AMOUNT($) | VALUE($) |
Benchmark Mortgage Trust | ||
Series 2018-B1, Class A5, 3.67%, 1/15/2051 (e) | 50,000 | 48,070 |
Series 2018-B2, Class B, 4.38%, 2/15/2051 ‡ (e) | 20,000 | 18,927 |
Series 2018-B5, Class A4, 4.21%, 7/15/2051 | 110,000 | 108,232 |
Series 2018-B6, Class A2, 4.20%, 10/10/2051 | 36,941 | 36,674 |
Series 2018-B8, Class A5, 4.23%, 1/15/2052 | 40,000 | 39,381 |
Series 2019-B11, Class A2, 3.41%, 5/15/2052 | 286,730 | 280,367 |
Series 2020-B16, Class AM, 2.94%, 2/15/2053 ‡ (e) | 180,000 | 156,305 |
Series 2021-B31, Class A5, 2.67%, 12/15/2054 | 600,000 | 520,437 |
Series 2019-B13, Class A3, 2.70%, 8/15/2057 | 450,000 | 401,063 |
Cantor Commercial Real Estate Lending Series 2019-CF2, Class AS, 3.12%, 11/15/2052 | 75,000 | 65,959 |
CD Mortgage Trust | ||
Series 2017-CD6, Class ASB, 3.33%, 11/13/2050 | 20,000 | 19,298 |
Series 2017-CD6, Class AM, 3.71%, 11/13/2050 (e) | 30,000 | 28,151 |
Series 2018-CD7, Class A3, 4.01%, 8/15/2051 | 400,000 | 390,411 |
CFCRE Commercial Mortgage Trust | ||
Series 2017-C8, Class A4, 3.57%, 6/15/2050 | 30,000 | 28,496 |
Series 2016-C7, Class ASB, 3.64%, 12/10/2054 | 16,351 | 16,002 |
Citigroup Commercial Mortgage Trust | ||
Series 2014-GC21, Class AAB, 3.48%, 5/10/2047 | 6,200 | 6,131 |
Series 2014-GC23, Class B, 4.17%, 7/10/2047 ‡ (e) | 30,000 | 29,146 |
Series 2015-GC29, Class C, 4.28%, 4/10/2048 (e) | 40,000 | 37,714 |
Series 2016-C1, Class AAB, 3.00%, 5/10/2049 | 72,725 | 70,768 |
Series 2019-GC43, Class A4, 3.04%, 11/10/2052 | 1,000,000 | 909,175 |
Commercial Mortgage Trust | ||
Series 2013-CR9, Class A4, 4.41%, 7/10/2045 (e) | 1,213 | 1,206 |
August 31, 2022 | J.P. Morgan Exchange-Traded Funds | 197 |
AS OF August 31, 2022 (Unaudited) (continued)
INVESTMENTS | PRINCIPAL AMOUNT($) | VALUE($) |
Commercial Mortgage-Backed Securities — continued | ||
Series 2013-CR6, Class A4, 3.10%, 3/10/2046 | 20,000 | 19,924 |
Series 2013-CR7, Class A4, 3.21%, 3/10/2046 | 10,995 | 10,916 |
Series 2013-CR13, Class B, 5.04%, 11/10/2046 ‡ (e) | 364,000 | 354,402 |
Series 2014-UBS5, Class AM, 4.19%, 9/10/2047 (e) | 40,000 | 38,940 |
Series 2014-CR20, Class A3, 3.33%, 11/10/2047 | 37,183 | 36,262 |
Series 2014-UBS6, Class A4, 3.38%, 12/10/2047 | 131,998 | 128,958 |
Series 2015-LC19, Class A4, 3.18%, 2/10/2048 | 250,000 | 242,243 |
Series 2015-LC21, Class AM, 4.04%, 7/10/2048 (e) | 30,000 | 28,922 |
Series 2015-CR25, Class A4, 3.76%, 8/10/2048 | 30,000 | 29,291 |
Series 2015-PC1, Class A5, 3.90%, 7/10/2050 | 300,000 | 294,809 |
CSAIL Commercial Mortgage Trust | ||
Series 2015-C3, Class A4, 3.72%, 8/15/2048 | 30,000 | 29,245 |
Series 2016-C5, Class A5, 3.76%, 11/15/2048 | 27,000 | 26,312 |
Series 2019-C15, Class A4, 4.05%, 3/15/2052 | 210,000 | 204,126 |
DBGS Mortgage Trust Series 2018-C1, Class A4, 4.47%, 10/15/2051 | 20,000 | 19,897 |
DBJPM Mortgage Trust Series 2017-C6, Class A5, 3.33%, 6/10/2050 | 20,000 | 19,012 |
FHLMC, Multi-Family Structured Pass-Through Certificates | ||
Series K036, Class A2, 3.53%, 10/25/2023 (e) | 162,000 | 161,065 |
Series K725, Class AM, 3.10%, 2/25/2024 (e) | 50,000 | 49,313 |
Series K728, Class A2, 3.06%, 8/25/2024 (e) | 49,007 | 48,372 |
Series K040, Class A2, 3.24%, 9/25/2024 | 70,000 | 69,040 |
Series K731, Class A2, 3.60%, 2/25/2025 (e) | 49,688 | 49,336 |
Series K733, Class A2, 3.75%, 8/25/2025 | 500,000 | 497,066 |
Series K051, Class A2, 3.31%, 9/25/2025 | 40,000 | 39,331 |
Series K734, Class A2, 3.21%, 2/25/2026 | 370,000 | 361,901 |
INVESTMENTS | PRINCIPAL AMOUNT($) | VALUE($) |
Series K735, Class A2, 2.86%, 5/25/2026 | 49,941 | 48,226 |
Series K057, Class A2, 2.57%, 7/25/2026 | 63,000 | 60,262 |
Series K063, Class A1, 3.05%, 8/25/2026 | 35,283 | 34,740 |
Series K072, Class A2, 3.44%, 12/25/2027 | 400,000 | 393,690 |
Series K084, Class A2, 3.78%, 10/25/2028 (e) | 500,000 | 496,914 |
Series K096, Class A2, 2.52%, 7/25/2029 | 295,000 | 272,095 |
Series K099, Class A2, 2.60%, 9/25/2029 | 400,000 | 370,266 |
Series K100, Class A2, 2.67%, 9/25/2029 | 400,000 | 371,960 |
Series K102, Class A2, 2.54%, 10/25/2029 | 400,000 | 368,379 |
Series K113, Class A2, 1.34%, 6/25/2030 | 700,000 | 584,216 |
Series K159, Class A2, 3.95%, 11/25/2030 (e) | 400,000 | 402,321 |
Series K123, Class A2, 1.62%, 12/25/2030 | 500,000 | 422,087 |
Series K125, Class A2, 1.85%, 1/25/2031 | 300,000 | 257,488 |
Series K127, Class A2, 2.11%, 1/25/2031 | 600,000 | 525,913 |
Series K-1512, Class A2, 2.99%, 5/25/2031 | 75,000 | 70,449 |
Series K156, Class A3, 3.70%, 6/25/2033 (e) | 91,000 | 88,869 |
Series K-1512, Class A3, 3.06%, 4/25/2034 | 150,000 | 136,577 |
Series K-1513, Class A3, 2.80%, 8/25/2034 | 325,000 | 286,120 |
Series K-1514, Class A2, 2.86%, 10/25/2034 | 400,000 | 352,520 |
Series K-1518, Class A2, 1.86%, 10/25/2035 | 300,000 | 231,488 |
FNMA ACES | ||
Series 2014-M2, Class A2, 3.51%, 12/25/2023 (e) | 17,204 | 17,109 |
Series 2014-M3, Class A2, 3.50%, 1/25/2024 (e) | 11,626 | 11,544 |
Series 2017-M10, Class AV2, 2.64%, 7/25/2024 (e) | 42,872 | 42,107 |
Series 2016-M11, Class A1, 2.08%, 7/25/2026 | 33,570 | 32,433 |
198 | J.P. Morgan Exchange-Traded Funds | August 31, 2022 |
INVESTMENTS | PRINCIPAL AMOUNT($) | VALUE($) |
Commercial Mortgage-Backed Securities — continued | ||
Series 2017-M1, Class A2, 2.50%, 10/25/2026 (e) | 159,690 | 151,183 |
Series 2017-M2, Class A2, 2.85%, 2/25/2027 (e) | 338,253 | 324,808 |
Series 2017-M7, Class A2, 2.96%, 2/25/2027 (e) | 310,936 | 299,253 |
Series 2017-M12, Class A2, 3.17%, 6/25/2027 (e) | 140,656 | 136,502 |
Series 2018-M10, Class A2, 3.48%, 7/25/2028 (e) | 40,000 | 39,087 |
Series 2018-M14, Class A2, 3.70%, 8/25/2028 (e) | 442,535 | 436,762 |
Series 2019-M1, Class A2, 3.67%, 9/25/2028 (e) | 77,996 | 76,885 |
Series 2019-M22, Class A2, 2.52%, 8/25/2029 | 627,699 | 578,801 |
Series 2021-M2S, Class A2, 1.87%, 10/25/2031 (e) | 700,000 | 592,906 |
GS Mortgage Securities Trust | ||
Series 2012-GCJ9, Class A3, 2.77%, 11/10/2045 | 21,454 | 21,420 |
Series 2014-GC24, Class AAB, 3.65%, 9/10/2047 | 9,870 | 9,773 |
Series 2014-GC24, Class AS, 4.16%, 9/10/2047 (e) | 170,000 | 165,234 |
Series 2015-GC28, Class A4, 3.14%, 2/10/2048 | 36,839 | 35,853 |
Series 2015-GC30, Class A4, 3.38%, 5/10/2050 | 25,000 | 24,238 |
Series 2018-GS9, Class A4, 3.99%, 3/10/2051 (e) | 200,000 | 194,752 |
Series 2019-GSA1, Class A4, 3.05%, 11/10/2052 | 260,000 | 236,481 |
JPMBB Commercial Mortgage Securities Trust | ||
Series 2013-C12, Class C, 4.23%, 7/15/2045 ‡ (e) | 26,000 | 25,497 |
Series 2015-C29, Class B, 4.12%, 5/15/2048 ‡ (e) | 40,000 | 37,388 |
Series 2015-C31, Class A3, 3.80%, 8/15/2048 | 555,603 | 544,174 |
JPMCC Commercial Mortgage Securities Trust Series 2017-JP5, Class A5, 3.72%, 3/15/2050 | 600,000 | 581,112 |
JPMDB Commercial Mortgage Securities Trust | ||
Series 2016-C2, Class B, 3.99%, 6/15/2049 (e) | 20,000 | 17,968 |
Series 2017-C5, Class B, 4.01%, 3/15/2050 ‡ (e) | 20,000 | 17,539 |
INVESTMENTS | PRINCIPAL AMOUNT($) | VALUE($) |
JPMorgan Chase Commercial Mortgage Securities Trust Series 2012-LC9, Class A5, 2.84%, 12/15/2047 | 3,909 | 3,901 |
Morgan Stanley Bank of America Merrill Lynch Trust | ||
Series 2013-C9, Class A4, 3.10%, 5/15/2046 | 30,000 | 29,639 |
Series 2015-C22, Class AS, 3.56%, 4/15/2048 ‡ | 40,000 | 38,409 |
Series 2015-C25, Class ASB, 3.38%, 10/15/2048 | 26,721 | 26,182 |
Series 2015-C25, Class A5, 3.64%, 10/15/2048 | 40,000 | 38,834 |
Series 2016-C31, Class A5, 3.10%, 11/15/2049 | 450,000 | 425,297 |
Series 2016-C32, Class A4, 3.72%, 12/15/2049 | 295,000 | 285,109 |
Morgan Stanley Capital I Trust | ||
Series 2016-UB12, Class A3, 3.34%, 12/15/2049 | 540,925 | 516,234 |
Series 2017-H1, Class C, 4.28%, 6/15/2050 ‡ (e) | 25,000 | 23,257 |
Series 2019-L2, Class A4, 4.07%, 3/15/2052 | 50,000 | 48,618 |
Series 2019-L3, Class A4, 3.13%, 11/15/2052 | 100,000 | 91,243 |
UBS Commercial Mortgage Trust | ||
Series 2017-C2, Class A4, 3.49%, 8/15/2050 | 700,000 | 668,654 |
Series 2017-C4, Class ASB, 3.37%, 10/15/2050 | 40,000 | 38,795 |
Series 2017-C5, Class AS, 3.78%, 11/15/2050 (e) | 70,000 | 64,879 |
Series 2017-C7, Class AS, 4.06%, 12/15/2050 (e) | 50,000 | 47,495 |
UBS-Barclays Commercial Mortgage Trust | ||
Series 2013-C5, Class A4, 3.18%, 3/10/2046 | 37,971 | 37,812 |
Series 2012-C2, Class A4, 3.53%, 5/10/2063 | 808 | 808 |
Wells Fargo Commercial Mortgage Trust | ||
Series 2013-LC12, Class A4, 4.22%, 7/15/2046 (e) | 300,000 | 294,956 |
Series 2015-C27, Class A4, 3.19%, 2/15/2048 | 29,332 | 28,477 |
Series 2015-C28, Class A4, 3.54%, 5/15/2048 | 20,000 | 19,498 |
Series 2015-C29, Class A4, 3.64%, 6/15/2048 | 120,000 | 117,147 |
August 31, 2022 | J.P. Morgan Exchange-Traded Funds | 199 |
AS OF August 31, 2022 (Unaudited) (continued)
INVESTMENTS | PRINCIPAL AMOUNT($) | VALUE($) |
Commercial Mortgage-Backed Securities — continued | ||
Series 2018-C45, Class A3, 3.92%, 6/15/2051 | 41,916 | 40,665 |
Series 2019-C51, Class A3, 3.06%, 6/15/2052 | 500,000 | 457,872 |
Series 2019-C53, Class A4, 3.04%, 10/15/2052 | 125,000 | 113,536 |
Series 2020-C55, Class A5, 2.73%, 2/15/2053 | 240,000 | 212,525 |
WFRBS Commercial Mortgage Trust | ||
Series 2012-C9, Class AS, 3.39%, 11/15/2045 | 28,254 | 28,202 |
Series 2014-C22, Class A4, 3.49%, 9/15/2057 | 37,281 | 36,474 |
Series 2014-C22, Class A5, 3.75%, 9/15/2057 | 25,000 | 24,614 |
Total Commercial Mortgage-Backed Securities (Cost $23,941,952) | 21,440,637 | |
Foreign Government Securities — 1.6% | ||
Export Development Canada | ||
2.63%, 2/21/2024 | 65,000 | 64,104 |
3.00%, 5/25/2027 | 105,000 | 102,645 |
Export-Import Bank of Korea 0.75%, 9/21/2025 | 215,000 | 194,708 |
Hungary Government Bond 7.63%, 3/29/2041 | 262,000 | 299,918 |
Italian Republic Government Bond | ||
1.25%, 2/17/2026 | 216,000 | 188,955 |
2.88%, 10/17/2029 | 659,000 | 565,585 |
5.38%, 6/15/2033 | 651,000 | 654,076 |
Japan Bank for International Cooperation | ||
3.38%, 10/31/2023 | 200,000 | 199,100 |
0.50%, 4/15/2024 | 200,000 | 189,888 |
3.00%, 5/29/2024 | 201,000 | 198,257 |
2.50%, 5/28/2025 | 220,000 | 212,309 |
2.88%, 6/1/2027 | 202,000 | 193,673 |
2.88%, 7/21/2027 | 218,000 | 208,739 |
3.50%, 10/31/2028 | 650,000 | 636,848 |
Oriental Republic of Uruguay | ||
4.50%, 8/14/2024 | 200,000 | 202,545 |
7.63%, 3/21/2036 | 380,000 | 488,931 |
Province of Alberta | ||
3.35%, 11/1/2023 | 100,000 | 99,699 |
2.95%, 1/23/2024 | 50,000 | 49,501 |
1.00%, 5/20/2025 | 750,000 | 697,952 |
1.30%, 7/22/2030 | 137,000 | 114,592 |
INVESTMENTS | PRINCIPAL AMOUNT($) | VALUE($) |
Province of British Columbia | ||
1.75%, 9/27/2024 | 942,000 | 907,137 |
2.25%, 6/2/2026 | 299,000 | 283,401 |
0.90%, 7/20/2026 | 705,000 | 634,701 |
Province of Ontario | ||
3.40%, 10/17/2023 | 257,000 | 256,375 |
3.05%, 1/29/2024 | 155,000 | 153,684 |
2.50%, 4/27/2026 | 10,000 | 9,560 |
2.30%, 6/15/2026 (c) | 500,000 | 473,634 |
2.13%, 1/21/2032 | 398,000 | 346,626 |
Province of Quebec | ||
1.50%, 2/11/2025 | 970,000 | 922,291 |
2.50%, 4/20/2026 | 122,000 | 116,759 |
Republic of Chile 4.34%, 3/7/2042 | 370,000 | 316,978 |
Republic of Indonesia | ||
3.40%, 9/18/2029 | 200,000 | 190,624 |
4.35%, 1/11/2048 | 500,000 | 449,447 |
3.35%, 3/12/2071 | 402,000 | 288,713 |
Republic of Korea 3.88%, 9/20/2048 | 500,000 | 487,459 |
Republic of Panama | ||
8.88%, 9/30/2027 | 733,000 | 869,674 |
9.38%, 4/1/2029 | 126,000 | 154,036 |
6.70%, 1/26/2036 | 178,000 | 191,788 |
Republic of Peru | ||
2.39%, 1/23/2026 | 623,000 | 582,982 |
8.75%, 11/21/2033 | 364,000 | 468,931 |
3.23%, 7/28/2121 | 1,020,000 | 636,082 |
Republic of Philippines | ||
9.50%, 2/2/2030 | 547,000 | 721,264 |
2.95%, 5/5/2045 | 210,000 | 156,657 |
Republic of Poland 4.00%, 1/22/2024 | 12,000 | 11,990 |
State of Israel Government Bond 2.75%, 7/3/2030 | 225,000 | 212,862 |
Svensk Exportkredit AB 1.75%, 12/12/2023 | 200,000 | 195,289 |
United Mexican States | ||
4.50%, 4/22/2029 | 280,000 | 274,502 |
6.75%, 9/27/2034 | 265,000 | 292,316 |
4.75%, 3/8/2044 | 500,000 | 424,040 |
5.55%, 1/21/2045 | 184,000 | 172,265 |
4.60%, 1/23/2046 | 400,000 | 326,647 |
5.00%, 4/27/2051 | 300,000 | 254,598 |
5.75%, 10/12/2110 | 940,000 | 806,455 |
Total Foreign Government Securities (Cost $19,945,141) | 18,151,792 | |
200 | J.P. Morgan Exchange-Traded Funds | August 31, 2022 |
INVESTMENTS | PRINCIPAL AMOUNT($) | VALUE($) |
Supranational — 1.3% | ||
African Development Bank (Supranational) | ||
0.75%, 4/3/2023 | 540,000 | 531,623 |
3.00%, 9/20/2023 | 51,000 | 50,676 |
0.88%, 3/23/2026 | 182,000 | 165,417 |
0.88%, 7/22/2026 | 100,000 | 90,174 |
Asian Development Bank (Supranational) | ||
2.75%, 3/17/2023 | 64,000 | 63,790 |
1.50%, 10/18/2024 | 130,000 | 124,611 |
0.63%, 4/29/2025 | 79,000 | 73,127 |
0.38%, 9/3/2025 | 1,944,000 | 1,766,981 |
0.50%, 2/4/2026 | 835,000 | 752,861 |
1.88%, 1/24/2030 | 40,000 | 35,961 |
Asian Infrastructure Investment Bank (The) (Supranational) | ||
0.50%, 10/30/2024 | 145,000 | 135,678 |
0.50%, 5/28/2025 | 159,000 | 145,576 |
0.50%, 1/27/2026 | 350,000 | 313,174 |
Corp. Andina de Fomento (Supranational) 2.25%, 2/8/2027 (c) | 444,000 | 408,223 |
Council of Europe Development Bank (Supranational) 1.38%, 2/27/2025 (c) | 281,000 | 266,227 |
European Investment Bank (Supranational) | ||
0.25%, 9/15/2023 | 623,000 | 602,097 |
1.88%, 2/10/2025 | 479,000 | 460,132 |
0.38%, 12/15/2025 | 1,199,000 | 1,080,793 |
0.38%, 3/26/2026 | 3,099,000 | 2,772,567 |
0.88%, 5/17/2030 | 10,000 | 8,321 |
Inter-American Development Bank (Supranational) | ||
0.50%, 5/24/2023 | 500,000 | 489,302 |
0.88%, 4/3/2025 | 150,000 | 139,967 |
7.00%, 6/15/2025 | 91,000 | 98,724 |
2.00%, 6/2/2026 | 481,000 | 454,742 |
3.13%, 9/18/2028 | 27,000 | 26,435 |
4.38%, 1/24/2044 | 69,000 | 74,237 |
International Bank for Reconstruction & Development (Supranational) | ||
2.50%, 11/25/2024 | 500,000 | 489,005 |
1.63%, 1/15/2025 | 150,000 | 143,434 |
0.75%, 3/11/2025 | 43,000 | 40,083 |
0.63%, 4/22/2025 | 308,000 | 285,414 |
0.38%, 7/28/2025 | 1,344,000 | 1,225,746 |
2.50%, 7/29/2025 | 870,000 | 843,569 |
3.13%, 11/20/2025 | 70,000 | 68,989 |
INVESTMENTS | PRINCIPAL AMOUNT($) | VALUE($) |
0.75%, 11/24/2027 | 228,000 | 198,258 |
1.38%, 4/20/2028 | 190,000 | 169,512 |
4.75%, 2/15/2035 | 223,000 | 247,163 |
Total Supranational (Cost $15,803,798) | 14,842,589 | |
U.S. Government Agency Securities — 1.2% | ||
FFCB | ||
0.75%, 12/16/2026 | 100,000 | 88,181 |
1.38%, 1/14/2031 | 135,000 | 110,730 |
FFCB Funding Corp. | ||
0.57%, 7/2/2024 | 45,000 | 42,402 |
1.30%, 3/30/2027 | 820,000 | 733,603 |
0.84%, 2/2/2028 | 50,000 | 42,771 |
1.23%, 7/29/2030 | 26,000 | 21,332 |
1.24%, 9/3/2030 | 129,000 | 105,464 |
1.32%, 9/9/2030 | 23,000 | 18,825 |
1.24%, 12/23/2030 | 120,000 | 96,411 |
1.30%, 2/3/2031 | 125,000 | 101,679 |
1.69%, 8/20/2035 | 296,000 | 221,193 |
FHLB | ||
1.38%, 2/17/2023 | 700,000 | 693,692 |
2.13%, 3/10/2023 | 75,000 | 74,496 |
0.13%, 3/17/2023 | 100,000 | 98,236 |
3.38%, 12/8/2023 | 100,000 | 99,672 |
2.50%, 2/13/2024 | 620,000 | 611,109 |
1.50%, 8/15/2024 | 1,425,000 | 1,371,851 |
2.88%, 9/13/2024 | 130,000 | 128,127 |
2.75%, 12/13/2024 | 400,000 | 392,260 |
3.25%, 11/16/2028 | 1,325,000 | 1,318,134 |
2.13%, 9/14/2029 | 100,000 | 91,168 |
1.50%, 3/14/2031 | 30,000 | 25,301 |
5.63%, 3/14/2036 | 50,000 | 59,811 |
5.50%, 7/15/2036 | 35,000 | 41,541 |
FHLMC | ||
0.38%, 4/20/2023 | 428,000 | 419,589 |
2.75%, 6/19/2023 | 282,000 | 280,239 |
0.25%, 6/26/2023 | 184,000 | 179,068 |
0.25%, 8/24/2023 | 357,000 | 345,498 |
1.50%, 2/12/2025 | 379,000 | 361,414 |
0.38%, 9/23/2025 | 585,000 | 532,369 |
0.65%, 10/27/2025 | 23,000 | 20,941 |
0.90%, 10/13/2027 | 65,000 | 56,506 |
2.68%, 12/14/2029 (f) | 80,000 | 62,248 |
FNMA | ||
0.30%, 8/3/2023 | 1,022,000 | 992,078 |
August 31, 2022 | J.P. Morgan Exchange-Traded Funds | 201 |
AS OF August 31, 2022 (Unaudited) (continued)
INVESTMENTS | PRINCIPAL AMOUNT($) | VALUE($) |
U.S. Government Agency Securities — continued | ||
2.88%, 9/12/2023 | 256,000 | 254,358 |
2.50%, 2/5/2024 | 161,000 | 158,788 |
1.63%, 10/15/2024 | 10,000 | 9,613 |
0.38%, 8/25/2025 | 300,000 | 273,567 |
1.88%, 9/24/2026 | 103,000 | 96,894 |
0.88%, 12/18/2026 | 60,000 | 53,065 |
0.75%, 10/8/2027 | 17,000 | 14,926 |
6.25%, 5/15/2029 | 310,000 | 362,376 |
7.13%, 1/15/2030 | 31,000 | 38,373 |
0.88%, 8/5/2030 | 1,366,000 | 1,122,816 |
6.63%, 11/15/2030 | 98,000 | 119,937 |
Israel Government AID Bond (Israel) 5.50%, 9/18/2023 | 473,000 | 482,033 |
Tennessee Valley Authority | ||
0.75%, 5/15/2025 | 59,000 | 54,682 |
7.13%, 5/1/2030 | 166,000 | 204,852 |
4.70%, 7/15/2033 | 601,000 | 639,771 |
6.15%, 1/15/2038 | 35,000 | 43,007 |
Total U.S. Government Agency Securities (Cost $14,574,860) | 13,766,997 | |
Municipal Bonds — 0.5% (g) | ||
Arizona — 0.1% | ||
City of Tucson, Taxable Series 2021A, COP, AGM, 2.86%, 7/1/2047 | 865,000 | 635,753 |
California — 0.3% | ||
Bay Area Toll Authority, Toll Bridge | ||
Series 2010S-1, 6.92%, 4/1/2040 | 40,000 | 48,961 |
Series 2009F-2, 6.26%, 4/1/2049 | 100,000 | 123,732 |
California State University, Taxable Series 2021B, 2.72%, 11/1/2052 | 1,080,000 | 800,910 |
East Bay Municipal Utility District, Water System Series 2010B, Rev., 5.87%, 6/1/2040 | 155,000 | 177,561 |
Golden State Tobacco Securitization Corp., Enhanced Tobacco Settlement Series 2021B, Rev., 3.29%, 6/1/2042 | 455,000 | 366,886 |
Los Angeles Unified School District, Build America Bonds | ||
GO, 5.75%, 7/1/2034 | 20,000 | 22,037 |
Series 2010RY, GO, 6.76%, 7/1/2034 | 105,000 | 123,995 |
Regents of the University of California Medical Center Pooled | ||
Series H, Rev., 6.55%, 5/15/2048 | 40,000 | 48,748 |
Series 2020N, Rev., 3.71%, 5/15/2120 | 140,000 | 97,854 |
INVESTMENTS | PRINCIPAL AMOUNT($) | VALUE($) |
California — continued | ||
Santa Clara Valley Transportation Authority, Measure A Sales Tax Series 2010A, Rev., 5.88%, 4/1/2032 | 190,000 | 204,932 |
State of California, Build America Bonds 7.50%, 4/1/2034 | 235,000 | 298,215 |
State of California, Various Purpose 7.55%, 4/1/2039 | 400,000 | 530,598 |
Total California | 2,844,429 | |
Connecticut — 0.0% ^ | ||
State of Connecticut Series A, 5.85%, 3/15/2032 | 75,000 | 83,017 |
Illinois — 0.1% | ||
Chicago O'Hare International Airport, General Airport, Senior Lien Series 2018C, 4.47%, 1/1/2049 | 25,000 | 24,100 |
Metropolitan Water Reclamation District of Greater Chicago 5.72%, 12/1/2038 | 55,000 | 61,383 |
Sales Tax Securitization Corp. Series 2019A, Rev., 4.64%, 1/1/2040 | 55,000 | 54,382 |
State of Illinois GO, 5.10%, 6/1/2033 | 410,000 | 405,928 |
Total Illinois | 545,793 | |
Missouri — 0.0% ^ | ||
Health and Educational Facilities Authority of the State of Missouri, The Washington University Series 2017A, Rev., 3.65%, 8/15/2057 | 45,000 | 38,231 |
Nebraska — 0.0% ^ | ||
University of Nebraska Facilities Corp., Taxable Series 2019A, Rev., 3.04%, 10/1/2049 | 50,000 | 36,517 |
New Jersey — 0.0% ^ | ||
New Jersey Economic Development Authority, Pension Funding Series 1997A, Rev., NATL-RE, 7.43%, 2/15/2029 | 35,000 | 38,768 |
New Jersey Turnpike Authority Series F, Rev., 7.41%, 1/1/2040 | 250,000 | 325,025 |
Total New Jersey | 363,793 | |
New York — 0.0% ^ | ||
Port Authority of New York and New Jersey, Consolidated Series 192, Rev., 4.81%, 10/15/2065 | 120,000 | 122,255 |
202 | J.P. Morgan Exchange-Traded Funds | August 31, 2022 |
INVESTMENTS | PRINCIPAL AMOUNT($) | VALUE($) |
Municipal Bonds — continued | ||
Ohio — 0.0% ^ | ||
American Municipal Power, Inc., Combined Hydroelectric Projects Series 2010B, 7.83%, 2/15/2041 | 25,000 | 32,566 |
Texas — 0.0% ^ | ||
Grand Parkway Transportation Corp., System Toll Series 2020B, Rev., 3.24%, 10/1/2052 | 100,000 | 75,876 |
Permanent University Fund - Texas A&M University System Series B, Rev., 3.66%, 7/1/2047 | 20,000 | 17,769 |
State of Texas, Transportation Commission Highway Improvement Series 2010A, GO, 4.68%, 4/1/2040 | 45,000 | 46,329 |
State of Texas, Transportation Commission Mobility Fund Series 2009A, GO, 5.52%, 4/1/2039 | 120,000 | 131,684 |
Total Texas | 271,658 | |
Total Municipal Bonds (Cost $6,064,433) | 4,974,012 | |
Asset-Backed Securities — 0.3% | ||
American Express Credit Account Master Trust Series 2022-2, Class A, 3.39%, 5/17/2027 | 800,000 | 789,964 |
Capital One Multi-Asset Execution Trust | ||
Series 2017-A6, Class A6, 2.29%, 7/15/2025 | 10,000 | 9,997 |
Series 2019-A3, Class A3, 2.06%, 8/15/2028 | 400,000 | 372,041 |
CarMax Auto Owner Trust Series 2022-1, Class A4, 1.70%, 8/16/2027 | 365,000 | 345,964 |
Citibank Credit Card Issuance Trust | ||
Series 2018-A6, Class A6, 3.21%, 12/7/2024 | 50,000 | 50,005 |
Series 2018-A7, Class A7, 3.96%, 10/13/2030 | 100,000 | 99,643 |
Discover Card Execution Note Trust Series 2018-A1, Class A1, 3.03%, 8/15/2025 | 18,000 | 17,956 |
Ford Credit Auto Owner Trust Series 2020-A, Class A4, 1.35%, 7/15/2025 | 700,000 | 680,888 |
Honda Auto Receivables Owner Trust Series 2019-4, Class A4, 1.87%, 1/20/2026 | 620,000 | 612,691 |
Synchrony Credit Card Master Note Trust Series 2018-2, Class A, 3.47%, 5/15/2026 | 50,000 | 49,893 |
INVESTMENTS | PRINCIPAL AMOUNT($) | VALUE($) |
World Omni Select Auto Trust Series 2019-A, Class D, 2.59%, 12/15/2025 | 182,000 | 176,935 |
Total Asset-Backed Securities (Cost $3,285,264) | 3,205,977 | |
SHARES | ||
Short-Term Investments — 5.4% | ||
Investment Companies — 5.3% | ||
JPMorgan U.S. Government Money Market Fund Class IM Shares, 2.00% (h) (i) (Cost $59,478,775) | 59,478,775 | 59,478,775 |
Investment of Cash Collateral from Securities Loaned — 0.1% | ||
JPMorgan Securities Lending Money Market Fund Agency SL Class Shares, 2.22% (h) (i) | 492,047 | 491,998 |
JPMorgan U.S. Government Money Market Fund Class IM Shares, 2.00% (h) (i) | 980,265 | 980,265 |
Total Investment of Cash Collateral from Securities Loaned (Cost $1,471,869) | 1,472,263 | |
Total Short-Term Investments (Cost $60,950,644) | 60,951,038 | |
Total Investments — 104.6% (Cost $1,299,875,171) | 1,178,784,104 | |
Liabilities in Excess of Other Assets — (4.6)% | (51,553,561) | |
NET ASSETS — 100.0% | 1,127,230,543 | |
Percentages indicated are based on net assets. |
Abbreviations | |
ACES | Alternative Credit Enhancement Securities |
AGM | Insured by Assured Guaranty Municipal Corp. |
COP | Certificate of Participation |
FFCB | Federal Farm Credit Bank |
FHLB | Federal Home Loan Bank |
FHLMC | Federal Home Loan Mortgage Corp. |
FNMA | Federal National Mortgage Association |
GNMA | Government National Mortgage Association |
GO | General Obligation |
RE | Reinsured |
Rev. | Revenue |
SOFR | Secured Overnight Financing Rate |
TBA | To Be Announced; Security is subject to delayed delivery. |
UMBS | Uniform Mortgage-Backed Securities |
^ | Amount rounds to less than 0.1% of net assets. | |
August 31, 2022 | J.P. Morgan Exchange-Traded Funds | 203 |
AS OF August 31, 2022 (Unaudited) (continued)
‡ | Value determined using significant unobservable inputs. | |
(a) | All or a portion of the security is a when-issued security, delayed delivery security, or forward commitment. | |
(b) | Variable or floating rate security, linked to the referenced benchmark. The interest rate shown is the current rate as of August 31, 2022. | |
(c) | The security or a portion of this security is on loan at August 31, 2022. The total value of securities on loan at August 31, 2022 is $1,434,712. | |
(d) | Securities exempt from registration under Rule 144A or section 4(a)(2), of the Securities Act of 1933, as amended. | |
(e) | Variable or floating rate security, the interest rate of which adjusts periodically based on changes in current interest rates and prepayments on the underlying pool of assets. The interest rate shown is the current rate as of August 31, 2022. |
(f) | The rate shown is the effective yield as of August 31, 2022. | |
(g) | The date shown represents the earliest of the prerefunded date, next put date or final maturity date. | |
(h) | Investment in an affiliated fund, which is registered under the Investment Company Act of 1940, as amended, and is advised by J.P. Morgan Investment Management Inc. | |
(i) | The rate shown is the current yield as of August 31, 2022. |
204 | J.P. Morgan Exchange-Traded Funds | August 31, 2022 |
AS OF August 31, 2022 (Unaudited)
INVESTMENTS | PRINCIPAL AMOUNT($) | VALUE($) |
Corporate Bonds — 42.7% | ||
Aerospace & Defense — 0.5% | ||
Boeing Co. (The) 4.51%, 5/1/2023 | 31,519,000 | 31,576,582 |
Leidos, Inc. 2.95%, 5/15/2023 | 46,063,000 | 45,636,033 |
Northrop Grumman Corp. 3.25%, 8/1/2023 | 37,294,000 | 37,069,514 |
114,282,129 | ||
Automobiles — 1.8% | ||
BMW US Capital LLC (Germany) | ||
3.80%, 4/6/2023 (a) | 72,574,000 | 72,652,600 |
2.25%, 9/15/2023 (a) | 18,130,000 | 17,833,964 |
(SOFRINDX + 0.53%), 2.82%, 4/1/2024 (a) (b) | 22,838,000 | 22,769,883 |
Hyundai Capital America | ||
2.85%, 11/1/2022 (a) | 10,000,000 | 9,983,943 |
1.15%, 11/10/2022 (a) | 27,058,000 | 26,924,017 |
2.38%, 2/10/2023 (a) | 1,745,000 | 1,731,357 |
0.80%, 4/3/2023 (a) | 42,540,000 | 41,663,426 |
5.75%, 4/6/2023 (a) | 13,857,000 | 13,968,133 |
4.13%, 6/8/2023 (a) | 837,000 | 838,089 |
1.25%, 9/18/2023 (a) | 1,272,000 | 1,233,938 |
4.30%, 2/1/2024 (a) | 876,000 | 870,409 |
0.88%, 6/14/2024 (a) | 30,000,000 | 28,071,856 |
Kia Corp. (South Korea) | ||
3.00%, 4/25/2023 (a) | 8,970,000 | 8,898,419 |
1.00%, 4/16/2024 (a) | 12,580,000 | 11,897,535 |
Mercedes-Benz Finance North America LLC (Germany) | ||
3.35%, 2/22/2023 (a) (c) | 250,000 | 249,576 |
0.75%, 3/1/2024 (a) | 1,065,000 | 1,012,438 |
Volkswagen Group of America Finance LLC (Germany) | ||
2.70%, 9/26/2022 (a) | 16,266,000 | 16,261,940 |
0.75%, 11/23/2022 (a) | 35,711,000 | 35,488,561 |
3.13%, 5/12/2023 (a) | 55,217,000 | 54,925,347 |
4.25%, 11/13/2023 (a) | 10,686,000 | 10,675,101 |
0.88%, 11/22/2023 (a) | 14,938,000 | 14,339,533 |
392,290,065 | ||
Banks — 16.7% | ||
ANZ New Zealand Int'l Ltd. (New Zealand) 1.90%, 2/13/2023 (a) (c) | 9,790,000 | 9,708,813 |
ASB Bank Ltd. (New Zealand) | ||
(ICE LIBOR USD 3 Month + 0.97%), 2.71%, 6/14/2023 (a) (b) | 8,887,000 | 8,901,324 |
3.75%, 6/14/2023 (a) | 13,938,000 | 13,938,105 |
INVESTMENTS | PRINCIPAL AMOUNT($) | VALUE($) |
Banks — continued | ||
Australia & New Zealand Banking Group Ltd. (Australia) | ||
2.63%, 11/9/2022 | 16,021,000 | 16,006,812 |
(ICE LIBOR USD 3 Month + 0.58%), 3.45%, 11/9/2022 (a) (b) | 15,400,000 | 15,405,200 |
2.05%, 11/21/2022 | 12,527,000 | 12,493,848 |
Banco Bilbao Vizcaya Argentaria SA (Spain) 0.88%, 9/18/2023 | 200,000 | 193,133 |
Banco Santander SA (Spain) | ||
3.13%, 2/23/2023 | 70,914,000 | 70,691,493 |
(ICE LIBOR USD 3 Month + 1.09%), 4.05%, 2/23/2023 (b) | 6,000,000 | 6,006,228 |
(ICE LIBOR USD 3 Month + 1.12%), 3.54%, 4/12/2023 (b) | 4,000,000 | 3,999,630 |
3.85%, 4/12/2023 | 65,583,000 | 65,463,325 |
(US Treasury Yield Curve Rate T Note Constant Maturity 1 Year + 0.45%), 0.70%, 6/30/2024 (b) | 37,000,000 | 35,811,435 |
Bank of America Corp. | ||
3.30%, 1/11/2023 | 1,907,000 | 1,905,500 |
4.10%, 7/24/2023 | 1,101,000 | 1,102,864 |
(ICE LIBOR USD 3 Month + 0.79%), 3.00%, 12/20/2023 (b) | 41,219,000 | 41,066,727 |
(SOFR + 1.46%), 1.49%, 5/19/2024 (b) | 6,834,000 | 6,691,879 |
(SOFR + 0.41%), 0.52%, 6/14/2024 (b) | 75,060,000 | 72,730,998 |
(ICE LIBOR USD 3 Month + 0.97%), 3.46%, 3/15/2025 (b) | 2,392,000 | 2,352,719 |
(SOFR + 0.69%), 0.98%, 4/22/2025 (b) | 42,672,000 | 40,233,238 |
(SOFR + 1.11%), 3.84%, 4/25/2025 (b) | 75,312,000 | 74,413,276 |
Bank of Montreal (Canada) | ||
2.35%, 9/11/2022 (c) | 5,511,000 | 5,510,378 |
2.05%, 11/1/2022 (c) | 5,930,000 | 5,918,603 |
(SOFRINDX + 0.68%), 2.97%, 3/10/2023 (b) | 44,757,000 | 44,759,274 |
(SOFRINDX + 0.27%), 2.56%, 4/14/2023 (b) | 90,125,000 | 89,908,324 |
(SOFRINDX + 0.35%), 2.64%, 12/8/2023 (b) | 14,990,000 | 14,879,107 |
August 31, 2022 | J.P. Morgan Exchange-Traded Funds | 205 |
AS OF August 31, 2022 (Unaudited) (continued)
INVESTMENTS | PRINCIPAL AMOUNT($) | VALUE($) |
Corporate Bonds — continued | ||
Banks — continued | ||
Bank of Nova Scotia (The) (Canada) | ||
2.45%, 9/19/2022 | 5,887,000 | 5,886,709 |
1.95%, 2/1/2023 | 16,309,000 | 16,205,021 |
1.63%, 5/1/2023 (c) | 12,270,000 | 12,101,287 |
0.80%, 6/15/2023 | 5,025,000 | 4,909,937 |
0.55%, 9/15/2023 | 166,000 | 160,280 |
Banque Federative du Credit Mutuel SA (France) | ||
2.13%, 11/21/2022 (a) | 10,991,000 | 10,965,957 |
3.75%, 7/20/2023 (a) | 14,865,000 | 14,841,894 |
0.65%, 2/27/2024 (a) | 5,485,000 | 5,205,853 |
Barclays plc (United Kingdom) (US Treasury Yield Curve Rate T Note Constant Maturity 1 Year + 0.80%), 1.01%, 12/10/2024 (b) | 29,647,000 | 28,096,763 |
BNP Paribas SA (France) | ||
3.50%, 3/1/2023 (a) | 182,660,000 | 182,213,513 |
3.80%, 1/10/2024 (a) | 33,080,000 | 32,845,631 |
3.38%, 1/9/2025 (a) | 17,041,000 | 16,528,795 |
BNZ International Funding Ltd. (New Zealand) | ||
2.65%, 11/3/2022 (a) | 4,855,000 | 4,851,206 |
3.38%, 3/1/2023 (a) | 13,260,000 | 13,241,995 |
Canadian Imperial Bank of Commerce (Canada) | ||
(SOFR + 0.80%), 3.10%, 3/17/2023 (b) | 46,199,000 | 46,221,830 |
(SOFRINDX + 0.40%), 2.69%, 12/14/2023 (b) | 50,032,000 | 49,723,453 |
(SOFR + 0.94%), 3.23%, 4/7/2025 (b) | 100,000,000 | 98,847,755 |
Citigroup, Inc. | ||
3.38%, 3/1/2023 | 1,007,000 | 1,006,632 |
(SOFR + 1.67%), 1.68%, 5/15/2024 (b) | 500,000 | 491,019 |
(ICE LIBOR USD 3 Month + 1.02%), 4.04%, 6/1/2024 (b) | 1,937,000 | 1,933,545 |
Citizens Bank NA | ||
(ICE LIBOR USD 3 Month + 0.95%), 3.18%, 3/29/2023 (b) | 16,770,000 | 16,760,662 |
3.70%, 3/29/2023 | 49,508,000 | 49,395,628 |
Commonwealth Bank of Australia (Australia) | ||
2.50%, 9/18/2022 (a) | 13,980,000 | 13,977,401 |
INVESTMENTS | PRINCIPAL AMOUNT($) | VALUE($) |
Banks — continued | ||
1.63%, 10/17/2022 (a) | 25,290,000 | 25,251,597 |
Cooperatieve Rabobank UA (Netherlands) | ||
0.38%, 1/12/2024 | 650,000 | 619,209 |
(SOFRINDX + 0.30%), 2.59%, 1/12/2024 (b) | 60,834,000 | 60,447,275 |
Credit Agricole SA (France) | ||
3.75%, 4/24/2023 (a) | 117,965,000 | 117,752,731 |
(ICE LIBOR USD 3 Month + 1.02%), 3.80%, 4/24/2023 (a) (b) | 1,916,000 | 1,920,658 |
Credit Suisse Group Funding Guernsey Ltd. (Switzerland) 3.80%, 9/15/2022 | 64,064,000 | 64,065,297 |
DNB Bank ASA (Norway) 2.15%, 12/2/2022 (a) | 35,121,000 | 35,030,955 |
Federation des Caisses Desjardins du Quebec (Canada) | ||
1.95%, 9/26/2022 (a) | 25,000,000 | 24,991,739 |
0.70%, 5/21/2024 (a) (c) | 26,044,000 | 24,466,768 |
(SOFR + 0.43%), 2.71%, 5/21/2024 (a) (b) | 41,345,000 | 40,808,966 |
Fifth Third Bancorp | ||
1.63%, 5/5/2023 | 18,545,000 | 18,292,089 |
3.65%, 1/25/2024 | 2,742,000 | 2,724,418 |
First Republic Bank (SOFR + 0.62%), 1.91%, 2/12/2024 (b) | 592,000 | 585,343 |
HSBC Holdings plc (United Kingdom) | ||
3.60%, 5/25/2023 | 5,436,000 | 5,429,170 |
(SOFR + 0.53%), 0.73%, 8/17/2024 (b) | 63,688,000 | 61,096,591 |
(SOFR + 0.71%), 0.98%, 5/24/2025 (b) | 59,681,000 | 55,631,307 |
ING Groep NV (Netherlands) 4.10%, 10/2/2023 | 14,532,000 | 14,521,991 |
KeyBank NA | ||
2.30%, 9/14/2022 | 5,119,000 | 5,117,773 |
1.25%, 3/10/2023 | 3,444,000 | 3,396,748 |
(SOFR + 0.32%), 0.43%, 6/14/2024 (b) | 68,003,000 | 66,011,574 |
Lloyds Banking Group plc (United Kingdom) | ||
4.05%, 8/16/2023 | 27,349,000 | 27,307,131 |
(ICE LIBOR USD 3 Month + 0.81%), 2.91%, 11/7/2023 (b) | 3,334,000 | 3,324,091 |
206 | J.P. Morgan Exchange-Traded Funds | August 31, 2022 |
INVESTMENTS | PRINCIPAL AMOUNT($) | VALUE($) |
Corporate Bonds — continued | ||
Banks — continued | ||
(US Treasury Yield Curve Rate T Note Constant Maturity 1 Year + 0.55%), 0.70%, 5/11/2024 (b) | 45,000,000 | 43,721,688 |
M&T Bank Corp. (ICE LIBOR USD 3 Month + 0.68%), 3.45%, 7/26/2023 (b) | 7,000,000 | 7,007,026 |
Mitsubishi UFJ Financial Group, Inc. (Japan) | ||
3.46%, 3/2/2023 | 64,340,000 | 64,307,804 |
(ICE LIBOR USD 3 Month + 0.86%), 3.63%, 7/26/2023 (b) | 1,594,000 | 1,594,010 |
3.76%, 7/26/2023 | 19,164,000 | 19,136,788 |
2.53%, 9/13/2023 | 1,247,000 | 1,228,392 |
(US Treasury Yield Curve Rate T Note Constant Maturity 1 Year + 0.45%), 0.96%, 10/11/2025 (b) | 33,780,000 | 31,242,589 |
Mizuho Financial Group, Inc. (Japan) | ||
2.60%, 9/11/2022 | 17,086,000 | 17,084,142 |
(ICE LIBOR USD 3 Month + 0.79%), 2.40%, 3/5/2023 (b) | 13,182,000 | 13,204,229 |
3.55%, 3/5/2023 | 16,442,000 | 16,436,020 |
(ICE LIBOR USD 3 Month + 0.85%), 2.57%, 9/13/2023 (b) | 107,214,000 | 107,217,721 |
(ICE LIBOR USD 3 Month + 0.63%), 3.63%, 5/25/2024 (b) | 10,000,000 | 9,957,806 |
(SOFR + 1.25%), 1.24%, 7/10/2024 (b) | 19,000,000 | 18,454,334 |
(SOFR + 0.87%), 0.85%, 9/8/2024 (b) | 49,400,000 | 47,521,629 |
(ICE LIBOR USD 3 Month + 1.00%), 3.92%, 9/11/2024 (b) | 13,066,000 | 12,968,628 |
MUFG Bank Ltd. (Japan) 4.10%, 9/9/2023 (a) | 200,000 | 199,960 |
MUFG Union Bank NA (SOFR + 0.71%), 3.01%, 12/9/2022 (b) | 24,750,000 | 24,736,565 |
National Australia Bank Ltd. (Australia) | ||
(ICE LIBOR USD 3 Month + 0.41%), 2.13%, 12/13/2022 (a) (b) | 3,563,000 | 3,564,334 |
3.00%, 1/20/2023 | 5,600,000 | 5,593,816 |
2.88%, 4/12/2023 | 3,345,000 | 3,329,212 |
INVESTMENTS | PRINCIPAL AMOUNT($) | VALUE($) |
Banks — continued | ||
National Bank of Canada (Canada) | ||
2.15%, 10/7/2022 (a) (c) | 30,876,000 | 30,851,245 |
2.10%, 2/1/2023 | 68,667,000 | 68,096,191 |
(SOFR + 1.01%), 3.75%, 6/9/2025 (b) | 45,529,000 | 44,900,947 |
NatWest Group plc (United Kingdom) | ||
3.88%, 9/12/2023 | 73,172,000 | 72,754,941 |
(US Treasury Yield Curve Rate T Note Constant Maturity 1 Year + 2.15%), 2.36%, 5/22/2024 (b) | 133,000 | 130,650 |
(ICE LIBOR USD 3 Month + 1.76%), 4.27%, 3/22/2025 (b) | 10,045,000 | 9,929,739 |
NatWest Markets plc (United Kingdom) | ||
3.63%, 9/29/2022 (a) | 25,670,000 | 25,679,511 |
(SOFR + 1.66%), 3.95%, 9/29/2022 (a) (b) | 1,500,000 | 1,500,726 |
2.38%, 5/21/2023 (a) | 12,650,000 | 12,481,576 |
(SOFR + 0.53%), 2.81%, 8/12/2024 (a) (b) | 19,015,000 | 18,789,886 |
Nordea Bank Abp (Finland) | ||
1.00%, 6/9/2023 (a) | 17,512,000 | 17,133,230 |
3.75%, 8/30/2023 (a) (c) | 20,954,000 | 20,876,570 |
PNC Bank NA 3.50%, 6/8/2023 | 3,000,000 | 2,997,818 |
PNC Financial Services Group, Inc. (The) | ||
2.85%, 11/9/2022 (d) | 1,465,000 | 1,464,489 |
3.50%, 1/23/2024 | 9,103,000 | 9,074,467 |
Royal Bank of Canada (Canada) | ||
1.95%, 1/17/2023 | 479,000 | 476,682 |
1.60%, 4/17/2023 | 26,338,000 | 26,010,974 |
(SOFRINDX + 0.45%), 2.73%, 10/26/2023 (b) | 33,530,000 | 33,346,270 |
Santander UK plc (United Kingdom) 2.10%, 1/13/2023 | 21,152,000 | 21,022,152 |
Skandinaviska Enskilda Banken AB (Sweden) | ||
2.20%, 12/12/2022 (a) | 10,957,000 | 10,922,950 |
0.55%, 9/1/2023 (a) | 1,060,000 | 1,024,501 |
Societe Generale SA (France) | ||
4.25%, 9/14/2023 (a) | 17,560,000 | 17,502,893 |
3.88%, 3/28/2024 (a) | 15,819,000 | 15,584,154 |
2.63%, 10/16/2024 (a) | 20,595,000 | 19,715,795 |
2.63%, 1/22/2025 (a) | 5,000,000 | 4,711,296 |
August 31, 2022 | J.P. Morgan Exchange-Traded Funds | 207 |
AS OF August 31, 2022 (Unaudited) (continued)
INVESTMENTS | PRINCIPAL AMOUNT($) | VALUE($) |
Corporate Bonds — continued | ||
Banks — continued | ||
Standard Chartered plc (United Kingdom) | ||
(US Treasury Yield Curve Rate T Note Constant Maturity 1 Year + 1.17%), 1.32%, 10/14/2023 (a) (b) | 16,742,000 | 16,670,436 |
(SOFR + 1.25%), 3.54%, 10/14/2023 (a) (b) | 21,479,000 | 21,480,252 |
(US Treasury Yield Curve Rate T Note Constant Maturity 1 Year + 0.78%), 0.99%, 1/12/2025 (a) (b) | 10,000,000 | 9,450,994 |
(US Treasury Yield Curve Rate T Note Constant Maturity 1 Year + 0.88%), 1.21%, 3/23/2025 (a) (b) | 12,000,000 | 11,293,118 |
(SOFR + 1.74%), 4.03%, 3/30/2026 (a) (b) | 58,195,000 | 57,862,825 |
Sumitomo Mitsui Financial Group, Inc. (Japan) | ||
2.78%, 10/18/2022 | 8,447,000 | 8,443,543 |
3.10%, 1/17/2023 | 4,919,000 | 4,911,966 |
3.94%, 10/16/2023 | 10,000,000 | 9,987,926 |
Sumitomo Mitsui Trust Bank Ltd. (Japan) | ||
0.80%, 9/12/2023 (a) | 20,499,000 | 19,816,008 |
(SOFR + 0.44%), 2.73%, 9/16/2024 (a) (b) | 33,827,000 | 33,399,500 |
Toronto-Dominion Bank (The) (Canada) | ||
1.90%, 12/1/2022 (c) | 3,189,000 | 3,179,921 |
0.25%, 1/6/2023 (c) | 53,078,000 | 52,547,073 |
(SOFR + 0.24%), 2.53%, 1/6/2023 (b) | 73,141,000 | 73,049,218 |
(SOFR + 0.48%), 2.77%, 1/27/2023 (b) | 29,380,000 | 29,368,700 |
0.30%, 6/2/2023 | 3,714,000 | 3,619,935 |
(SOFR + 0.22%), 2.51%, 6/2/2023 (b) | 84,848,000 | 84,505,189 |
0.75%, 6/12/2023 | 48,222,000 | 47,116,148 |
0.45%, 9/11/2023 | 548,000 | 529,179 |
Truist Bank (SOFR + 0.20%), 2.49%, 1/17/2024 (b) | 99,246,000 | 98,366,283 |
Truist Financial Corp. 2.20%, 3/16/2023 | 2,946,000 | 2,923,021 |
Wells Fargo & Co. | ||
3.75%, 1/24/2024 | 294,000 | 293,117 |
INVESTMENTS | PRINCIPAL AMOUNT($) | VALUE($) |
Banks — continued | ||
(SOFR + 1.60%), 1.65%, 6/2/2024 (b) | 51,914,000 | 50,862,900 |
(SOFR + 0.51%), 0.80%, 5/19/2025 (b) | 19,800,000 | 18,573,491 |
(SOFR + 1.32%), 3.91%, 4/25/2026 (b) | 49,500,000 | 48,500,770 |
Westpac Banking Corp. (Australia) | ||
2.75%, 1/11/2023 (c) | 11,857,000 | 11,826,382 |
2.00%, 1/13/2023 | 1,140,000 | 1,134,472 |
3,600,497,133 | ||
Beverages — 0.4% | ||
Coca-Cola Europacific Partners plc (United Kingdom) 0.50%, 5/5/2023 (a) | 54,995,000 | 53,630,024 |
Constellation Brands, Inc. 3.60%, 5/9/2024 | 14,562,000 | 14,431,724 |
Heineken NV (Netherlands) 2.75%, 4/1/2023 (a) | 15,352,000 | 15,239,303 |
Keurig Dr Pepper, Inc. 3.13%, 12/15/2023 | 7,035,000 | 6,974,776 |
90,275,827 | ||
Biotechnology — 0.6% | ||
AbbVie, Inc. | ||
2.90%, 11/6/2022 | 35,000,000 | 34,973,763 |
2.30%, 11/21/2022 | 96,662,000 | 96,466,940 |
Gilead Sciences, Inc. 0.75%, 9/29/2023 | 9,125,000 | 8,818,393 |
140,259,096 | ||
Building Products — 0.0% ^ | ||
Carlisle Cos., Inc. 0.55%, 9/1/2023 | 2,027,000 | 1,960,973 |
Capital Markets — 3.9% | ||
Bank of New York Mellon Corp. (The) | ||
1.85%, 1/27/2023 | 1,210,000 | 1,203,372 |
2.95%, 1/29/2023 | 396,000 | 394,815 |
3.50%, 4/28/2023 | 1,018,000 | 1,018,507 |
Charles Schwab Corp. (The) | ||
3.23%, 9/1/2022 | 300,000 | 300,000 |
2.65%, 1/25/2023 | 3,499,000 | 3,489,564 |
(SOFRINDX + 0.50%), 2.79%, 3/18/2024 (b) | 1,642,000 | 1,634,255 |
Credit Suisse AG (Switzerland) | ||
1.00%, 5/5/2023 | 8,715,000 | 8,528,209 |
Series FXD, 0.52%, 8/9/2023 | 50,000,000 | 48,185,106 |
208 | J.P. Morgan Exchange-Traded Funds | August 31, 2022 |
INVESTMENTS | PRINCIPAL AMOUNT($) | VALUE($) |
Corporate Bonds — continued | ||
Capital Markets — continued | ||
(SOFRINDX + 0.39%), 2.67%, 2/2/2024 (b) | 40,999,000 | 40,251,019 |
Goldman Sachs Group, Inc. (The) | ||
0.52%, 3/8/2023 | 32,717,000 | 32,189,750 |
Series VAR, (SOFR + 0.54%), 0.63%, 11/17/2023 (b) | 33,389,000 | 33,117,111 |
(SOFR + 0.57%), 0.67%, 3/8/2024 (b) | 77,500,000 | 75,976,499 |
Macquarie Bank Ltd. (Australia) | ||
2.10%, 10/17/2022 (a) | 4,920,000 | 4,912,757 |
(SOFR + 0.30%), 2.59%, 4/6/2023 (a) (b) | 140,000,000 | 139,399,953 |
Morgan Stanley | ||
3.75%, 2/25/2023 | 5,500,000 | 5,505,264 |
(SOFR + 0.47%), 0.56%, 11/10/2023 (b) | 21,754,000 | 21,592,759 |
(SOFR + 0.46%), 0.53%, 1/25/2024 (b) | 8,363,000 | 8,234,045 |
(SOFR + 0.62%), 0.73%, 4/5/2024 (b) | 38,073,000 | 37,242,413 |
(SOFR + 1.16%), 3.62%, 4/17/2025 (b) | 95,300,000 | 93,897,048 |
(SOFR + 0.53%), 0.79%, 5/30/2025 (b) | 25,000,000 | 23,368,854 |
State Street Corp. 3.70%, 11/20/2023 | 6,479,000 | 6,484,597 |
UBS AG (Switzerland) | ||
0.38%, 6/1/2023 (a) (c) | 61,462,000 | 59,930,415 |
(SOFR + 0.36%), 2.64%, 2/9/2024 (a) (b) | 23,894,000 | 23,771,902 |
(SOFR + 0.45%), 2.73%, 8/9/2024 (a) (b) | 30,423,000 | 30,220,257 |
UBS Group AG (Switzerland) | ||
(US Treasury Yield Curve Rate T Note Constant Maturity 1 Year + 0.83%), 1.01%, 7/30/2024 (a) (b) (c) | 36,500,000 | 35,373,893 |
(US Treasury Yield Curve Rate T Note Constant Maturity 1 Year + 1.60%), 4.49%, 8/5/2025 (a) (b) | 71,499,000 | 71,257,159 |
(US Treasury Yield Curve Rate T Note Constant Maturity 1 Year + 1.55%), 4.49%, 5/12/2026 (a) (b) | 33,653,000 | 33,302,320 |
840,781,843 | ||
INVESTMENTS | PRINCIPAL AMOUNT($) | VALUE($) |
Chemicals — 0.4% | ||
Air Liquide Finance SA (France) 2.25%, 9/27/2023 (a) | 32,489,000 | 31,960,565 |
Chevron Phillips Chemical Co. LLC 3.30%, 5/1/2023 (a) | 4,703,000 | 4,687,847 |
DuPont de Nemours, Inc. 4.21%, 11/15/2023 | 617,000 | 618,500 |
International Flavors & Fragrances, Inc. 0.70%, 9/15/2022 (a) | 15,000,000 | 14,984,446 |
Nutrien Ltd. (Canada) 1.90%, 5/13/2023 | 22,880,000 | 22,511,314 |
Sherwin-Williams Co. (The) 4.05%, 8/8/2024 | 10,400,000 | 10,387,422 |
Westlake Corp. 0.88%, 8/15/2024 | 4,583,000 | 4,329,554 |
89,479,648 | ||
Construction Materials — 0.1% | ||
Martin Marietta Materials, Inc. 0.65%, 7/15/2023 | 16,655,000 | 16,159,044 |
Consumer Finance — 3.5% | ||
AerCap Ireland Capital DAC (Ireland) | ||
4.13%, 7/3/2023 | 20,510,000 | 20,459,520 |
1.15%, 10/29/2023 | 57,979,000 | 55,458,943 |
American Express Co. | ||
2.65%, 12/2/2022 | 5,685,000 | 5,677,506 |
3.40%, 2/27/2023 | 5,495,000 | 5,490,696 |
(ICE LIBOR USD 3 Month + 0.65%), 3.69%, 2/27/2023 (b) | 834,000 | 834,200 |
3.70%, 8/3/2023 | 3,130,000 | 3,125,740 |
0.75%, 11/3/2023 | 514,000 | 496,651 |
3.38%, 5/3/2024 | 13,210,000 | 13,059,276 |
American Honda Finance Corp. | ||
(ICE LIBOR USD 3 Month + 0.15%), 3.13%, 2/22/2023 (b) | 99,001,000 | 98,819,945 |
0.35%, 4/20/2023 | 7,431,000 | 7,270,705 |
1.95%, 5/10/2023 | 14,987,000 | 14,774,766 |
0.88%, 7/7/2023 | 9,506,000 | 9,285,024 |
Capital One Financial Corp. | ||
(ICE LIBOR USD 3 Month + 0.72%), 3.53%, 1/30/2023 (b) | 891,000 | 889,236 |
2.60%, 5/11/2023 | 95,472,000 | 94,771,425 |
Caterpillar Financial Services Corp. | ||
1.95%, 11/18/2022 | 7,500,000 | 7,484,478 |
2.55%, 11/29/2022 | 9,656,000 | 9,643,162 |
3.45%, 5/15/2023 | 590,000 | 590,324 |
August 31, 2022 | J.P. Morgan Exchange-Traded Funds | 209 |
AS OF August 31, 2022 (Unaudited) (continued)
INVESTMENTS | PRINCIPAL AMOUNT($) | VALUE($) |
Corporate Bonds — continued | ||
Consumer Finance — continued | ||
0.65%, 7/7/2023 | 16,000,000 | 15,609,980 |
3.75%, 11/24/2023 | 971,000 | 972,867 |
General Motors Financial Co., Inc. | ||
(SOFR + 1.20%), 3.48%, 11/17/2023 (b) | 23,000,000 | 22,916,397 |
1.05%, 3/8/2024 | 18,436,000 | 17,495,275 |
Hyundai Capital Services, Inc. (South Korea) 0.75%, 9/15/2023 (a) | 13,658,000 | 13,147,191 |
John Deere Capital Corp. | ||
2.80%, 1/27/2023 | 573,000 | 571,189 |
(SOFR + 0.12%), 2.41%, 7/10/2023 (b) | 57,027,000 | 56,878,946 |
Toyota Motor Credit Corp. | ||
0.35%, 10/14/2022 | 30,417,000 | 30,326,603 |
(SOFR + 0.20%), 2.48%, 2/13/2023 (b) | 74,615,000 | 74,530,981 |
0.40%, 4/6/2023 (c) | 68,327,000 | 67,178,230 |
(SOFR + 0.75%), 3.03%, 7/25/2023 (b) | 64,017,000 | 64,120,363 |
0.45%, 1/11/2024 | 881,000 | 843,602 |
(SOFRINDX + 0.33%), 2.62%, 1/11/2024 (b) | 41,950,000 | 41,708,274 |
754,431,495 | ||
Diversified Financial Services — 1.4% | ||
AIG Global Funding | ||
0.80%, 7/7/2023 (a) | 8,310,000 | 8,107,568 |
0.40%, 9/13/2023 (a) | 39,623,000 | 38,205,507 |
(SOFR + 0.38%), 2.67%, 12/15/2023 (a) (b) | 48,943,000 | 48,561,389 |
Citigroup Global Markets Holdings, Inc. 0.75%, 6/7/2024 | 29,285,000 | 27,582,026 |
Element Fleet Management Corp. (Canada) 1.60%, 4/6/2024 (a) | 15,298,000 | 14,504,602 |
National Rural Utilities Cooperative Finance Corp. | ||
2.30%, 9/15/2022 | 2,070,000 | 2,069,350 |
Series D, (ICE LIBOR USD 3 Month + 0.07%), 2.99%, 2/16/2023 (b) | 65,911,000 | 65,853,684 |
(SOFR + 0.40%), 2.68%, 8/7/2023 (b) (c) | 11,905,000 | 11,895,275 |
NTT Finance Corp. (Japan) | ||
0.37%, 3/3/2023 (a) (c) | 42,004,000 | 41,335,264 |
0.58%, 3/1/2024 (a) | 320,000 | 303,970 |
INVESTMENTS | PRINCIPAL AMOUNT($) | VALUE($) |
Diversified Financial Services — continued | ||
Siemens Financieringsmaatschappij NV (Germany) | ||
0.40%, 3/11/2023 (a) | 14,889,000 | 14,660,123 |
(SOFR + 0.43%), 2.72%, 3/11/2024 (a) (b) | 23,914,000 | 23,905,910 |
296,984,668 | ||
Diversified Telecommunication Services — 0.2% | ||
AT&T, Inc. (SOFRINDX + 0.64%), 2.93%, 3/25/2024 (b) | 24,755,000 | 24,599,143 |
Deutsche Telekom International Finance BV (Germany) 2.49%, 9/19/2023 (a) | 15,070,000 | 14,813,702 |
39,412,845 | ||
Electric Utilities — 1.0% | ||
American Electric Power Co., Inc. Series M, 0.75%, 11/1/2023 | 9,684,000 | 9,315,106 |
Emera US Finance LP (Canada) 0.83%, 6/15/2024 | 11,121,000 | 10,416,158 |
Entergy Louisiana LLC 0.62%, 11/17/2023 | 9,363,000 | 9,056,907 |
Eversource Energy | ||
2.80%, 5/1/2023 | 14,173,000 | 14,063,726 |
Series T, (SOFRINDX + 0.25%), 2.53%, 8/15/2023 (b) | 22,322,000 | 22,177,211 |
Series N, 3.80%, 12/1/2023 | 174,000 | 173,237 |
Florida Power & Light Co. (SOFRINDX + 0.38%), 2.67%, 1/12/2024 (b) | 49,271,000 | 48,830,807 |
ITC Holdings Corp. 2.70%, 11/15/2022 | 18,617,000 | 18,585,764 |
NextEra Energy Capital Holdings, Inc. | ||
(ICE LIBOR USD 3 Month + 0.27%), 3.25%, 2/22/2023 (b) | 31,052,000 | 30,981,698 |
0.65%, 3/1/2023 | 30,294,000 | 29,753,156 |
(SOFRINDX + 0.54%), 2.83%, 3/1/2023 (b) | 2,905,000 | 2,901,329 |
(SOFRINDX + 0.40%), 2.68%, 11/3/2023 (b) | 5,000,000 | 4,957,150 |
4.26%, 9/1/2024 | 13,097,000 | 13,105,011 |
Virginia Electric and Power Co. Series C, 2.75%, 3/15/2023 | 11,008,000 | 10,956,151 |
225,273,411 | ||
210 | J.P. Morgan Exchange-Traded Funds | August 31, 2022 |
INVESTMENTS | PRINCIPAL AMOUNT($) | VALUE($) |
Corporate Bonds — continued | ||
Electrical Equipment — 0.0% ^ | ||
Eaton Corp. 2.75%, 11/2/2022 | 4,062,000 | 4,058,872 |
Electronic Equipment, Instruments & Components — 0.3% | ||
TD SYNNEX Corp. 1.25%, 8/9/2024 | 24,822,000 | 23,055,461 |
Teledyne Technologies, Inc. 0.65%, 4/1/2023 | 39,910,000 | 39,170,957 |
62,226,418 | ||
Energy Equipment & Services — 0.0% ^ | ||
Schlumberger Finance Canada Ltd. 2.65%, 11/20/2022 (a) | 3,623,000 | 3,618,246 |
Entertainment — 0.2% | ||
Take-Two Interactive Software, Inc. 3.30%, 3/28/2024 | 20,386,000 | 20,099,077 |
TWDC Enterprises 18 Corp. 2.35%, 12/1/2022 | 5,400,000 | 5,385,152 |
Walt Disney Co. (The) | ||
1.65%, 9/1/2022 | 19,999,000 | 19,999,000 |
3.00%, 9/15/2022 | 5,500,000 | 5,500,824 |
50,984,053 | ||
Food & Staples Retailing — 0.3% | ||
7-Eleven, Inc. 0.63%, 2/10/2023 (a) | 67,817,000 | 66,802,163 |
Kroger Co. (The) 3.85%, 8/1/2023 | 4,554,000 | 4,552,818 |
71,354,981 | ||
Food Products — 0.3% | ||
Bunge Ltd. Finance Corp. 3.00%, 9/25/2022 | 10,841,000 | 10,840,696 |
Conagra Brands, Inc. 0.50%, 8/11/2023 | 23,177,000 | 22,422,587 |
Kellogg Co. 2.65%, 12/1/2023 | 3,269,000 | 3,230,072 |
Mondelez International Holdings Netherlands BV 2.13%, 9/19/2022 (a) | 20,385,000 | 20,374,611 |
56,867,966 | ||
Gas Utilities — 1.5% | ||
Atmos Energy Corp. | ||
0.63%, 3/9/2023 | 55,468,000 | 54,497,525 |
(ICE LIBOR USD 3 Month + 0.38%), 2.07%, 3/9/2023 (b) | 92,141,000 | 92,105,884 |
CenterPoint Energy Resources Corp. | ||
0.70%, 3/2/2023 | 25,649,000 | 25,269,176 |
(ICE LIBOR USD 3 Month + 0.50%), 2.11%, 3/2/2023 (b) | 16,053,000 | 16,026,940 |
INVESTMENTS | PRINCIPAL AMOUNT($) | VALUE($) |
Gas Utilities — continued | ||
ONE Gas, Inc. | ||
0.85%, 3/11/2023 | 98,719,000 | 97,215,037 |
(ICE LIBOR USD 3 Month + 0.61%), 2.33%, 3/11/2023 (b) | 30,397,000 | 30,397,681 |
Southern Natural Gas Co. LLC 0.63%, 4/28/2023 (a) | 4,600,000 | 4,482,983 |
319,995,226 | ||
Health Care Equipment & Supplies — 0.0% ^ | ||
DH Europe Finance II SARL 2.05%, 11/15/2022 | 1,000,000 | 997,048 |
Health Care Providers & Services — 0.6% | ||
Aetna, Inc. 2.80%, 6/15/2023 | 9,649,000 | 9,561,043 |
AmerisourceBergen Corp. 0.74%, 3/15/2023 | 30,080,000 | 29,626,933 |
Cigna Corp. (ICE LIBOR USD 3 Month + 0.89%), 3.40%, 7/15/2023 (b) | 14,963,000 | 14,990,335 |
CVS Health Corp. 2.75%, 12/1/2022 | 14,896,000 | 14,896,000 |
Elevance Health, Inc. | ||
2.95%, 12/1/2022 | 6,928,000 | 6,915,632 |
3.30%, 1/15/2023 | 6,166,000 | 6,157,410 |
Humana, Inc. | ||
3.15%, 12/1/2022 | 15,124,000 | 15,117,006 |
2.90%, 12/15/2022 | 21,770,000 | 21,739,894 |
0.65%, 8/3/2023 | 16,792,000 | 16,298,619 |
Laboratory Corp. of America Holdings 4.00%, 11/1/2023 | 1,900,000 | 1,897,334 |
137,200,206 | ||
Hotels, Restaurants & Leisure — 0.0% ^ | ||
Booking Holdings, Inc. 2.75%, 3/15/2023 | 985,000 | 983,149 |
Industrial Conglomerates — 0.0% ^ | ||
3M Co. | ||
1.75%, 2/14/2023 | 205,000 | 203,342 |
2.25%, 3/15/2023 | 5,202,000 | 5,160,475 |
5,363,817 | ||
Insurance — 3.4% | ||
Allstate Corp. (The) 3.15%, 6/15/2023 | 1,230,000 | 1,225,415 |
Athene Global Funding | ||
1.20%, 10/13/2023 (a) | 32,955,000 | 31,682,234 |
0.95%, 1/8/2024 (a) | 9,598,000 | 9,132,570 |
August 31, 2022 | J.P. Morgan Exchange-Traded Funds | 211 |
AS OF August 31, 2022 (Unaudited) (continued)
INVESTMENTS | PRINCIPAL AMOUNT($) | VALUE($) |
Corporate Bonds — continued | ||
Insurance — continued | ||
1.00%, 4/16/2024 (a) | 21,061,000 | 19,810,181 |
(SOFRINDX + 0.70%), 2.98%, 5/24/2024 (a) (b) | 43,521,000 | 42,648,306 |
Brighthouse Financial Global Funding | ||
0.60%, 6/28/2023 (a) | 11,451,000 | 11,103,029 |
1.20%, 12/15/2023 (a) | 43,419,000 | 41,697,147 |
1.00%, 4/12/2024 (a) | 7,007,000 | 6,609,680 |
Equitable Financial Life Global Funding | ||
0.50%, 4/6/2023 (a) | 247,000 | 241,385 |
(SOFR + 0.39%), 2.69%, 4/6/2023 (a) (b) | 63,649,000 | 63,557,992 |
Guardian Life Global Funding 3.40%, 4/25/2023 (a) | 500,000 | 498,518 |
Jackson National Life Global Funding | ||
2.38%, 9/15/2022 (a) | 900,000 | 899,857 |
(SOFR + 0.60%), 2.89%, 1/6/2023 (a) (b) | 22,504,000 | 22,520,680 |
3.25%, 1/30/2024 (a) | 21,256,000 | 20,896,970 |
Marsh & McLennan Cos., Inc. 3.30%, 3/14/2023 | 9,648,000 | 9,617,311 |
MassMutual Global Funding II 0.85%, 6/9/2023 (a) | 39,446,000 | 38,570,309 |
Metropolitan Life Global Funding I | ||
3.00%, 1/10/2023 (a) | 243,000 | 242,714 |
0.90%, 6/8/2023 (a) | 12,598,000 | 12,298,852 |
New York Life Global Funding | ||
1.10%, 5/5/2023 (a) (c) | 8,899,000 | 8,751,795 |
3.86%, 8/26/2024 (a) | 180,500,000 | 179,780,076 |
Principal Financial Group, Inc. 3.13%, 5/15/2023 | 5,375,000 | 5,353,643 |
Principal Life Global Funding II | ||
1.25%, 5/11/2023 (a) (c) | 75,151,000 | 74,436,495 |
0.50%, 1/8/2024 (a) | 1,046,000 | 996,681 |
Protective Life Global Funding | ||
0.33%, 12/9/2022 (a) | 62,913,000 | 62,379,077 |
1.08%, 6/9/2023 (a) | 8,062,000 | 7,884,878 |
Reliance Standard Life Global Funding II | ||
2.15%, 1/21/2023 (a) | 9,976,000 | 9,899,960 |
3.85%, 9/19/2023 (a) | 4,360,000 | 4,352,229 |
INVESTMENTS | PRINCIPAL AMOUNT($) | VALUE($) |
Insurance — continued | ||
2.50%, 10/30/2024 (a) | 2,780,000 | 2,659,986 |
Swiss Re Treasury U.S. Corp. (Switzerland) 2.88%, 12/6/2022 (a) | 35,796,000 | 35,720,969 |
725,468,939 | ||
IT Services — 0.0% ^ | ||
Fidelity National Information Services, Inc. 0.60%, 3/1/2024 | 316,000 | 299,861 |
International Business Machines Corp. 2.88%, 11/9/2022 | 2,215,000 | 2,214,107 |
2,513,968 | ||
Life Sciences Tools & Services — 0.7% | ||
Thermo Fisher Scientific, Inc. (SOFRINDX + 0.35%), 2.64%, 4/18/2023 (b) | 143,174,000 | 143,092,137 |
Machinery — 0.3% | ||
Daimler Trucks Finance North America LLC (Germany) (SOFR + 1.00%), 3.29%, 4/5/2024 (a) (b) | 58,479,000 | 58,249,640 |
Media — 0.0% ^ | ||
Fox Corp. 4.03%, 1/25/2024 | 2,511,000 | 2,504,503 |
Metals & Mining — 0.3% | ||
Glencore Finance Canada Ltd. (Australia) 4.25%, 10/25/2022 (a) (d) | 33,060,000 | 33,048,429 |
Glencore Funding LLC (Australia) | ||
3.00%, 10/27/2022 (a) | 1,490,000 | 1,486,592 |
4.13%, 5/30/2023 (a) | 28,801,000 | 28,730,438 |
63,265,459 | ||
Multi-Utilities — 0.5% | ||
Berkshire Hathaway Energy Co. 3.75%, 11/15/2023 | 2,000,000 | 1,999,612 |
CenterPoint Energy, Inc. (SOFRINDX + 0.65%), 2.93%, 5/13/2024 (b) | 35,739,000 | 35,349,916 |
Consolidated Edison, Inc. Series A, 0.65%, 12/1/2023 | 329,000 | 316,217 |
Dominion Energy, Inc. Series D, (ICE LIBOR USD 3 Month + 0.53%), 2.36%, 9/15/2023 (b) | 31,071,000 | 30,958,032 |
DTE Energy Co. | ||
Series H, 0.55%, 11/1/2022 | 20,525,000 | 20,430,736 |
2.25%, 11/1/2022 | 1,600,000 | 1,597,466 |
212 | J.P. Morgan Exchange-Traded Funds | August 31, 2022 |
INVESTMENTS | PRINCIPAL AMOUNT($) | VALUE($) |
Corporate Bonds — continued | ||
Multi-Utilities — continued | ||
Engie SA (France) 2.88%, 10/10/2022 (a) | 3,700,000 | 3,694,564 |
WEC Energy Group, Inc. 0.55%, 9/15/2023 | 15,845,000 | 15,297,247 |
109,643,790 | ||
Oil, Gas & Consumable Fuels — 1.2% | ||
APA Infrastructure Ltd. (Australia) 4.20%, 3/23/2025 (a) | 12,446,000 | 12,209,751 |
BP Capital Markets plc (United Kingdom) 2.50%, 11/6/2022 | 9,228,000 | 9,215,361 |
Canadian Natural Resources Ltd. (Canada) 2.95%, 1/15/2023 | 19,006,000 | 18,905,473 |
Enbridge, Inc. (Canada) (SOFR + 0.40%), 2.68%, 2/17/2023 (b) | 22,769,000 | 22,695,889 |
Enterprise Products Operating LLC 3.35%, 3/15/2023 | 85,829,000 | 85,673,674 |
EOG Resources, Inc. 2.63%, 3/15/2023 (c) | 18,698,000 | 18,612,654 |
Equinor ASA (Norway) 2.45%, 1/17/2023 | 1,130,000 | 1,126,429 |
Exxon Mobil Corp. 1.57%, 4/15/2023 (c) | 48,100,000 | 47,561,289 |
Phillips 66 3.70%, 4/6/2023 | 5,000,000 | 4,999,228 |
Saudi Arabian Oil Co. (Saudi Arabia) 1.25%, 11/24/2023 (a) | 8,000,000 | 7,720,000 |
TransCanada PipeLines Ltd. (Canada) 3.75%, 10/16/2023 | 25,013,000 | 24,932,587 |
253,652,335 | ||
Pharmaceuticals — 0.7% | ||
AstraZeneca plc (United Kingdom) 0.30%, 5/26/2023 | 105,787,000 | 103,261,430 |
Bristol-Myers Squibb Co. 3.25%, 2/20/2023 | 410,000 | 409,562 |
Shire Acquisitions Investments Ireland DAC 2.88%, 9/23/2023 | 130,000 | 128,261 |
Takeda Pharmaceutical Co. Ltd. (Japan) 4.40%, 11/26/2023 | 1,125,000 | 1,126,786 |
Zoetis, Inc. 3.25%, 2/1/2023 | 48,982,000 | 48,931,228 |
153,857,267 | ||
Road & Rail — 0.5% | ||
Burlington Northern Santa Fe LLC 3.00%, 3/15/2023 | 3,856,000 | 3,842,266 |
INVESTMENTS | PRINCIPAL AMOUNT($) | VALUE($) |
Road & Rail — continued | ||
ERAC USA Finance LLC 3.30%, 10/15/2022 (a) | 32,027,000 | 32,009,882 |
Penske Truck Leasing Co. LP | ||
4.25%, 1/17/2023 (a) | 927,000 | 927,471 |
2.70%, 3/14/2023 (a) | 37,371,000 | 37,090,904 |
4.13%, 8/1/2023 (a) | 4,071,000 | 4,055,454 |
Triton Container International Ltd. (Bermuda) 0.80%, 8/1/2023 (a) (c) | 22,739,000 | 21,834,670 |
Union Pacific Corp. | ||
2.75%, 4/15/2023 | 6,395,000 | 6,358,179 |
3.50%, 6/8/2023 | 1,540,000 | 1,536,579 |
107,655,405 | ||
Semiconductors & Semiconductor Equipment — 0.2% | ||
NVIDIA Corp. 0.31%, 6/15/2023 | 39,037,000 | 38,003,330 |
Software — 0.4% | ||
Oracle Corp. | ||
2.50%, 10/15/2022 | 23,711,000 | 23,680,723 |
2.63%, 2/15/2023 | 39,961,000 | 39,772,735 |
2.40%, 9/15/2023 | 3,827,000 | 3,759,645 |
VMware, Inc. 0.60%, 8/15/2023 | 25,574,000 | 24,727,363 |
91,940,466 | ||
Specialty Retail — 0.0% ^ | ||
AutoZone, Inc. 2.88%, 1/15/2023 | 5,100,000 | 5,093,180 |
Technology Hardware, Storage & Peripherals — 0.1% | ||
Apple, Inc. 1.70%, 9/11/2022 | 21,091,000 | 21,085,746 |
Thrifts & Mortgage Finance — 0.4% | ||
BPCE SA (France) | ||
2.75%, 1/11/2023 (a) | 5,000,000 | 4,984,407 |
4.00%, 9/12/2023 (a) | 19,526,000 | 19,412,164 |
Nationwide Building Society (United Kingdom) 2.00%, 1/27/2023 (a) | 56,360,000 | 55,934,268 |
80,330,839 | ||
Tobacco — 0.2% | ||
Altria Group, Inc. 2.95%, 5/2/2023 | 195,000 | 193,579 |
Philip Morris International, Inc. 2.50%, 11/2/2022 | 2,620,000 | 2,616,565 |
Reynolds American, Inc. (United Kingdom) 4.85%, 9/15/2023 | 45,368,000 | 45,624,449 |
48,434,593 | ||
August 31, 2022 | J.P. Morgan Exchange-Traded Funds | 213 |
AS OF August 31, 2022 (Unaudited) (continued)
INVESTMENTS | PRINCIPAL AMOUNT($) | VALUE($) |
Corporate Bonds — continued | ||
Trading Companies & Distributors — 0.1% | ||
Air Lease Corp. (ICE LIBOR USD 3 Month + 0.35%), 2.18%, 12/15/2022 (b) | 13,922,000 | 13,909,911 |
Transportation Infrastructure — 0.0% ^ | ||
Sydney Airport Finance Co. Pty. Ltd. (Australia) 3.90%, 3/22/2023 (a) | 650,000 | 648,297 |
Wireless Telecommunication Services — 0.0% ^ | ||
Vodafone Group plc (United Kingdom) 2.50%, 9/26/2022 | 150,000 | 149,890 |
Total Corporate Bonds (Cost $9,372,383,173) | 9,235,237,854 | |
Asset-Backed Securities — 8.6% | ||
522 Funding CLO Ltd. (Cayman Islands) Series 2019-4A, Class AR, 3.79%, 4/20/2030 (a) (e) | 48,357,790 | 47,774,933 |
Aimco CLO Ltd. (Cayman Islands) | ||
Series 2020-12A, Class XR, 3.33%, 1/17/2032 ‡ (a) (e) | 3,800,000 | 3,796,926 |
Series 2020-12A, Class AR, 3.65%, 1/17/2032 (a) (e) | 23,689,000 | 23,147,209 |
AIMCO CLO Ltd. (Cayman Islands) Series 2019-10A, Class AR, 3.82%, 7/22/2032 (a) (e) | 5,000,000 | 4,894,565 |
Anchorage Capital CLO Ltd. (Cayman Islands) | ||
Series 2016-9A, Class XR, 3.46%, 7/15/2032 ‡ (a) (e) | 1,000,000 | 999,540 |
Series 2016-9A, Class AR2, 3.65%, 7/15/2032 (a) (e) | 12,000,000 | 11,776,560 |
Apidos CLO (Cayman Islands) | ||
Series 2016-24A, Class A1AL, 3.66%, 10/20/2030 (a) (e) | 35,000,000 | 34,318,725 |
Series 2019-31A, Class A1R, 3.61%, 4/15/2031 (a) (e) | 28,565,000 | 28,117,586 |
Ares CLO Ltd. (Cayman Islands) Series 2013-2A, Class XR2, 3.74%, 10/28/2034 (a) (e) | 4,250,000 | 4,247,101 |
Atlas Senior Loan Fund (Cayman Islands) Series 2019-13A, Class A1NR, 3.84%, 4/22/2031 (a) (e) | 14,675,000 | 14,451,617 |
Atlas Senior Loan Fund Ltd. (Cayman Islands) Series 2021-18A, Class X, 3.59%, 1/18/2035 ‡ (a) (e) | 1,866,667 | 1,864,970 |
INVESTMENTS | PRINCIPAL AMOUNT($) | VALUE($) |
Bain Capital Credit CLO (Cayman Islands) Series 2019-1A, Class X, 3.57%, 4/19/2034 (a) (e) | 4,500,000 | 4,497,259 |
Ballyrock CLO Ltd. (Cayman Islands) | ||
Series 2020-2A, Class A1R, 3.72%, 10/20/2031 (a) (e) | 20,955,000 | 20,546,650 |
Series 2019-1A, Class A1R, 3.54%, 7/15/2032 (a) (e) | 42,764,000 | 41,794,711 |
Barings CLO Ltd. (Cayman Islands) Series 2013-IA, Class AR, 3.51%, 1/20/2028 (a) (e) | 29,025,315 | 28,646,041 |
Benefit Street Partners CLO Ltd. (Cayman Islands) | ||
Series 2013-IIA, Class A1R2, 3.38%, 7/15/2029 (a) (e) | 24,787,803 | 24,487,524 |
Series 2013-IIIA, Class A1R2, 3.71%, 7/20/2029 (a) (e) | 33,537,187 | 33,175,589 |
Series 2016-10A, Class X, 3.31%, 4/20/2034 (a) (e) | 462,500 | 462,337 |
Series 2015-6BR, Class X, 3.41%, 7/20/2034 (a) (e) | 1,800,000 | 1,799,338 |
BMW Vehicle Lease Trust Series 2021-2, Class A2, 0.19%, 11/27/2023 | 23,162,875 | 23,044,641 |
Buckhorn Park CLO Ltd. (Cayman Islands) Series 2019-1A, Class XR, 3.39%, 7/18/2034 (a) (e) | 3,333,332 | 3,330,815 |
Capital One Prime Auto Receivables Trust Series 2020-1, Class A3, 1.60%, 11/15/2024 | 6,752,696 | 6,694,375 |
Carlyle Global Market Strategies CLO Ltd. (Cayman Islands) | ||
Series 2015-1A, Class AR3, 3.69%, 7/20/2031 (a) (e) | 7,900,000 | 7,783,230 |
Series 2015-5A, Class A1RR, 3.79%, 1/20/2032 (a) (e) | 7,485,000 | 7,333,795 |
CarMax Auto Owner Trust | ||
Series 2018-3, Class A4, 3.27%, 3/15/2024 | 4,416,763 | 4,416,638 |
Series 2021-2, Class A2A, 0.27%, 6/17/2024 | 5,816,654 | 5,798,153 |
Series 2021-4, Class A2A, 0.24%, 11/15/2024 | 24,020,230 | 23,794,060 |
Series 2022-2, Class A2A, 2.81%, 5/15/2025 | 20,534,000 | 20,381,024 |
Carvana Auto Receivables Trust | ||
Series 2021-P3, Class A2, 0.38%, 1/10/2025 | 28,547,206 | 28,211,534 |
214 | J.P. Morgan Exchange-Traded Funds | August 31, 2022 |
INVESTMENTS | PRINCIPAL AMOUNT($) | VALUE($) |
Asset-Backed Securities — continued | ||
Series 2021-P4, Class A2, 0.82%, 4/10/2025 | 15,540,116 | 15,369,479 |
Series 2022-P1, Class A2, 2.57%, 5/12/2025 | 72,437,300 | 71,820,482 |
CBAM Ltd. (Cayman Islands) Series 2017-2A, Class XR, 3.44%, 7/17/2034 (a) (e) | 2,500,000 | 2,499,952 |
CIFC Funding Ltd. (Cayman Islands) | ||
Series 2017-1A, Class AR, 3.74%, 4/23/2029 (a) (e) | 1,896,219 | 1,871,578 |
Series 2017-5A, Class A1, 3.92%, 11/16/2030 (a) (e) | 26,090,000 | 25,788,608 |
Cloud Pass-Through Trust Series 2019-1A, Class CLOU, 3.55%, 12/5/2022 (a) (e) | 79,887 | 79,758 |
Dell Equipment Finance Trust Series 2021-2, Class A2, 0.33%, 12/22/2026 (a) | 23,905,344 | 23,569,154 |
Dryden Senior Loan Fund (Cayman Islands) | ||
Series 2017-47A, Class A1R, 3.49%, 4/15/2028 (a) (e) | 29,230,298 | 28,903,591 |
Series 2014-36A, Class AR3, 3.53%, 4/15/2029 (a) (e) | 42,900,919 | 42,403,740 |
Elmwood CLO Ltd. (Cayman Islands) Series 2021-3A, Class A, 3.75%, 10/20/2034 (a) (e) | 30,000,000 | 29,244,000 |
Exeter Automobile Receivables Trust Series 2021-3A, Class A3, 0.35%, 2/18/2025 | 12,187,196 | 12,140,311 |
Galaxy CLO Ltd. (Cayman Islands) | ||
Series 2013-15A, Class ARR, 3.48%, 10/15/2030 (a) (e) | 28,160,000 | 27,722,591 |
Series 2016-22A, Class XRR, 3.64%, 4/16/2034 (a) (e) | 3,157,895 | 3,155,981 |
GM Financial Automobile Leasing Trust Series 2022-2, Class A2, 2.93%, 10/21/2024 | 72,390,000 | 71,786,941 |
GM Financial Consumer Automobile Receivables Trust Series 2022-1, Class A2, 0.76%, 2/18/2025 | 23,157,994 | 22,866,132 |
Goldentree Loan Management US CLO Ltd. (Cayman Islands) | ||
Series 2022-12A, Class X, 2.04%, 4/20/2034 ‡ (a) (e) | 4,800,000 | 4,794,955 |
Series 2020-7A, Class XR, 3.21%, 4/20/2034 (a) (e) | 1,875,000 | 1,874,968 |
Series 2022-14A, Class X, 3.70%, 7/20/2035 (a) (e) | 3,690,000 | 3,690,000 |
INVESTMENTS | PRINCIPAL AMOUNT($) | VALUE($) |
Harriman Park CLO Ltd. (Cayman Islands) Series 2020-1A, Class XR, 3.31%, 4/20/2034 (a) (e) | 2,916,665 | 2,914,693 |
ICG US CLO Ltd. (Cayman Islands) Series 2016-1A, Class XRR, 3.71%, 4/29/2034 (a) (e) | 2,947,370 | 2,945,658 |
KKR CLO Ltd. (Cayman Islands) | ||
Series 13, Class A1R, 3.54%, 1/16/2028 (a) (e) | 3,391,105 | 3,365,160 |
Series 28A, Class A, 2.97%, 3/15/2031 (a) (e) | 13,479,544 | 13,272,727 |
Series 32A, Class A1, 3.83%, 1/15/2032 (a) (e) | 18,000,000 | 17,797,122 |
Series 24, Class A1R, 3.79%, 4/20/2032 (a) (e) | 20,000,000 | 19,561,140 |
Series 16, Class X, 3.46%, 10/20/2034 (a) (e) | 4,375,000 | 4,373,329 |
LCM LP (Cayman Islands) | ||
Series 20A, Class AR, 3.75%, 10/20/2027 (a) (e) | 8,658,791 | 8,591,607 |
Series 14A, Class AR, 3.75%, 7/20/2031 (a) (e) | 20,980,000 | 20,629,823 |
LCM Ltd. (Cayman Islands) | ||
Series 24A, Class AR, 3.69%, 3/20/2030 (a) (e) | 43,099,000 | 42,406,140 |
Series 25A, Class AR, 3.58%, 7/20/2030 (a) (e) | 30,000,000 | 29,563,710 |
Series 29A, Class AR, 3.58%, 4/15/2031 (a) (e) | 20,000,000 | 19,657,100 |
LMREC LLC Series 2021-CRE4, Class A, 3.48%, 4/22/2037 (a) (e) | 24,752,413 | 24,133,984 |
Longfellow Place CLO Ltd. (Cayman Islands) Series 2013-1A, Class AR3, 3.51%, 4/15/2029 (a) (e) | 8,606,218 | 8,536,516 |
Madison Park Funding Ltd. (Cayman Islands) Series 2019-36A, Class X, 3.38%, 4/15/2035 ‡ (a) (e) | 1,750,000 | 1,746,941 |
Magnetite Ltd. (Cayman Islands) | ||
Series 2012-7A, Class A1R2, 3.31%, 1/15/2028 (a) (e) | 27,720,353 | 27,328,082 |
Series 2015-16A, Class AR, 3.54%, 1/18/2028 (a) (e) | 8,171,808 | 8,076,272 |
Series 2016-18A, Class AR2, 3.79%, 11/15/2028 (a) (e) | 11,472,919 | 11,285,520 |
Series 2014-8A, Class AR2, 3.49%, 4/15/2031 (a) (e) | 1,982,221 | 1,957,778 |
August 31, 2022 | J.P. Morgan Exchange-Traded Funds | 215 |
AS OF August 31, 2022 (Unaudited) (continued)
INVESTMENTS | PRINCIPAL AMOUNT($) | VALUE($) |
Asset-Backed Securities — continued | ||
Series 2016-17A, Class AR, 3.81%, 7/20/2031 (a) (e) | 4,000,000 | 3,930,324 |
Series 2020-25A, Class A, 3.98%, 1/25/2032 (a) (e) | 20,250,000 | 19,929,483 |
Series 2017-19A, Class X, 3.44%, 4/17/2034 (a) (e) | 3,750,000 | 3,749,929 |
Marathon CLO Ltd. (Cayman Islands) Series 2019-1A, Class AANR, 3.83%, 4/15/2032 (a) (e) | 35,000,000 | 34,523,685 |
Marlette Funding Trust | ||
Series 2021-2A, Class A, 0.51%, 9/15/2031 (a) | 2,251,152 | 2,231,955 |
Series 2022-1A, Class A, 1.36%, 4/15/2032 (a) | 3,177,076 | 3,112,393 |
Neuberger Berman CLO (Cayman Islands) Series 2013-15A, Class A1R2, 3.43%, 10/15/2029 (a) (e) | 24,276,666 | 23,923,708 |
Neuberger Berman CLO Ltd. (Cayman Islands) | ||
Series 2013-14A, Class AR2, 3.82%, 1/28/2030 (a) (e) | 15,659,622 | 15,474,087 |
Series 2017-16SA, Class XR, 3.31%, 4/15/2034 (a) (e) | 5,000,000 | 4,999,905 |
Neuberger Berman Loan Advisers CLO Ltd. (Cayman Islands) | ||
Series 2017-26A, Class AR, 3.66%, 10/18/2030 (a) (e) | 38,286,000 | 37,730,087 |
Series 2020-37A, Class AR, 3.68%, 7/20/2031 (a) (e) | 26,036,000 | 25,563,577 |
Newark BSL CLO 2 Ltd. (Cayman Islands) Series 2017-1A, Class A1R, 3.75%, 7/25/2030 (a) (e) | 30,619,000 | 30,185,251 |
Newark BSL CLO Ltd. (Cayman Islands) Series 2016-1A, Class A1R, 3.87%, 12/21/2029 (a) (e) | 31,930,258 | 31,575,672 |
OCP CLO Ltd. (Cayman Islands) | ||
Series 2020-8RA, Class A1, 3.96%, 1/17/2032 (a) (e) | 35,000,000 | 34,431,600 |
Series 2019-17A, Class A1R, 3.75%, 7/20/2032 (a) (e) | 25,500,000 | 24,865,840 |
Series 2015-9A, Class X, 1.60%, 1/15/2033 ‡ (a) (e) | 4,000,000 | 3,993,104 |
Series 2020-19A, Class XR, 3.41%, 10/20/2034 (a) (e) | 625,000 | 624,799 |
INVESTMENTS | PRINCIPAL AMOUNT($) | VALUE($) |
Octagon Investment Partners 30 Ltd. (Cayman Islands) Series 2017-1A, Class A1R, 3.71%, 3/17/2030 (a) (e) | 35,000,000 | 34,537,965 |
OHA Credit Funding 7 Ltd. (Cayman Islands) Series 2020-7A, Class XR, 3.25%, 2/24/2037 ‡ (a) (e) | 937,500 | 935,649 |
OHA Credit Partners Ltd. (Cayman Islands) Series 2016-13A, Class XR, 3.58%, 10/25/2034 (a) (e) | 1,625,000 | 1,624,967 |
Palmer Square Loan Funding Ltd. (Cayman Islands) | ||
Series 2019-4A, Class A1, 3.68%, 10/24/2027 (a) (e) | 8,090,515 | 8,066,511 |
Series 2020-1A, Class A1, 3.78%, 2/20/2028 (a) (e) | 6,198,107 | 6,139,541 |
Series 2020-4A, Class A1, 4.00%, 11/25/2028 (a) (e) | 31,570,715 | 31,281,211 |
Series 2021-1A, Class A1, 3.61%, 4/20/2029 (a) (e) | 30,424,335 | 30,066,819 |
Series 2021-2A, Class A1, 3.78%, 5/20/2029 (a) (e) | 28,697,117 | 28,318,918 |
Series 2021-3A, Class A1, 3.51%, 7/20/2029 (a) (e) | 22,462,646 | 22,113,262 |
Series 2021-4A, Class A1, 3.31%, 10/15/2029 (a) (e) | 39,605,702 | 38,901,829 |
Series 2022-1A, Class A1, 3.38%, 4/15/2030 (a) (e) | 28,535,309 | 28,123,516 |
Santander Drive Auto Receivables Trust Series 2021-2, Class A3, 0.34%, 2/18/2025 | 2,197,632 | 2,195,307 |
Sculptor CLO Ltd. (Cayman Islands) Series 27A, Class X, 3.76%, 7/20/2034 (a) (e) | 4,000,000 | 3,999,908 |
Sound Point CLO II Ltd. (Cayman Islands) Series 2013-1A, Class A1R, 3.84%, 1/26/2031 (a) (e) | 2,430,000 | 2,395,956 |
Sound Point CLO Ltd. (Cayman Islands) Series 2019-1A, Class AR, 3.79%, 1/20/2032 (a) (e) | 14,268,000 | 14,012,346 |
Southwick Park CLO LLC (Cayman Islands) Series 2019-4A, Class A1R, 3.77%, 7/20/2032 (a) (e) | 15,000,000 | 14,698,305 |
216 | J.P. Morgan Exchange-Traded Funds | August 31, 2022 |
INVESTMENTS | PRINCIPAL AMOUNT($) | VALUE($) |
Asset-Backed Securities — continued | ||
Symphony CLO Ltd. (Cayman Islands) | ||
Series 2014-14A, Class AR, 3.43%, 7/14/2026 (a) (e) | 3,035,098 | 3,022,178 |
Series 2018-20A, Class X, 3.74%, 1/16/2032 (a) (e) | 750,000 | 749,962 |
Series 2020-24A, Class A, 3.98%, 1/23/2032 (a) (e) | 28,550,000 | 28,163,119 |
Symphony Static CLO Ltd. (Cayman Islands) Series 2021-1A, Class A, 3.61%, 10/25/2029 (a) (e) | 28,929,853 | 28,423,176 |
TCI-Symphony CLO Ltd. (Cayman Islands) Series 2017-1A, Class AR, 3.44%, 7/15/2030 (a) (e) | 20,000,000 | 19,694,840 |
Tesla Auto Lease Trust Series 2020-A, Class A3, 0.68%, 12/20/2023 (a) | 3,353,833 | 3,318,535 |
Venture CLO Ltd. (Cayman Islands) | ||
Series 2016-25A, Class ARR, 3.73%, 4/20/2029 (a) (e) | 1,329,492 | 1,306,838 |
Series 2018-33A, Class A1LR, 3.57%, 7/15/2031 (a) (e) | 21,836,000 | 21,367,378 |
Series 2019-36A, Class XR, 3.41%, 4/20/2032 (a) (e) | 3,208,333 | 3,191,117 |
Series 2021-43A, Class X, 3.56%, 4/15/2034 (a) (e) | 5,000,000 | 4,996,450 |
Voya CLO Ltd. (Cayman Islands) Series 2015-1A, Class A1R, 3.64%, 1/18/2029 ‡ (a) (e) | 12,241,986 | 12,090,896 |
Westlake Automobile Receivables Trust | ||
Series 2021-3A, Class A2, 0.57%, 9/16/2024 (a) | 3,757,477 | 3,720,197 |
Series 2021-3A, Class A3, 0.95%, 6/16/2025 (a) | 20,541,000 | 19,936,495 |
World Omni Select Auto Trust Series 2021-A, Class A2, 0.29%, 2/18/2025 | 9,811,458 | 9,750,201 |
Total Asset-Backed Securities (Cost $1,870,958,257) | 1,847,301,760 | |
Commercial Mortgage-Backed Securities — 1.7% | ||
ACRE Commercial Mortgage Ltd. Series 2021-FL4, Class A, 3.21%, 12/18/2037 (a) (e) | 6,680,582 | 6,613,963 |
Benchmark Mortgage Trust | ||
Series 2018-B3, Class A2, 3.85%, 4/10/2051 | 2,412,961 | 2,400,765 |
INVESTMENTS | PRINCIPAL AMOUNT($) | VALUE($) |
Series 2018-B5, Class A2, 4.08%, 7/15/2051 | 5,000,000 | 4,948,455 |
BX Commercial Mortgage Trust | ||
Series 2021-VOLT, Class A, 3.09%, 9/15/2036 (a) (e) | 13,404,255 | 12,948,685 |
Series 2020-VKNG, Class A, 3.32%, 10/15/2037 (a) (e) | 32,588,449 | 31,783,547 |
Series 2021-SOAR, Class A, 3.06%, 6/15/2038 (a) (e) | 23,508,225 | 22,706,028 |
Series 2022-LP2, Class A, 3.31%, 2/15/2039 (a) (e) | 23,345,626 | 22,569,566 |
BX Trust | ||
Series 2021-LBA, Class AJV, 3.19%, 2/15/2036 (a) (e) | 39,712,098 | 38,111,653 |
Series 2022-IND, Class A, 3.79%, 4/15/2037 (a) (e) | 22,000,000 | 21,620,130 |
BXMT Ltd. (Cayman Islands) Series 2020-FL3, Class A, 3.50%, 11/15/2037 (a) (e) | 45,000,000 | 44,453,655 |
Citigroup Commercial Mortgage Trust | ||
Series 2013-GC11, Class AS, 3.42%, 4/10/2046 | 12,950,249 | 12,831,049 |
Series 2014-GC25, Class B, 4.34%, 10/10/2047 ‡ (e) | 8,626,000 | 8,359,517 |
Series 2018-B2, Class A2, 3.79%, 3/10/2051 | 6,000,000 | 5,956,003 |
Credit Suisse Mortgage Capital Certificates Series 2019-ICE4, Class A, 3.37%, 5/15/2036 (a) (e) | 28,000,000 | 27,681,226 |
DBGS Mortgage Trust Series 2018-BIOD, Class A, 3.17%, 5/15/2035 (a) (e) | 26,339,210 | 26,009,998 |
GS Mortgage Securities Corp. Trust Series 2021-RENT, Class A, 3.07%, 11/21/2035 (a) (e) | 4,948,778 | 4,842,848 |
Independence Plaza Trust Series 2018-INDP, Class A, 3.76%, 7/10/2035 (a) | 10,000,000 | 9,603,632 |
KNDL Mortgage Trust Series 2019-KNSQ, Class A, 3.19%, 5/15/2036 (a) (e) | 5,600,000 | 5,536,204 |
Morgan Stanley Capital I Trust Series 2018-H3, Class A2, 4.00%, 7/15/2051 | 3,227,020 | 3,206,491 |
SREIT Trust Series 2021-MFP, Class A, 3.12%, 11/15/2038 (a) (e) | 6,000,000 | 5,781,992 |
August 31, 2022 | J.P. Morgan Exchange-Traded Funds | 217 |
AS OF August 31, 2022 (Unaudited) (continued)
INVESTMENTS | PRINCIPAL AMOUNT($) | VALUE($) |
Commercial Mortgage-Backed Securities — continued | ||
UBS Commercial Mortgage Trust Series 2018-C11, Class A2, 3.99%, 6/15/2051 | 1,751,104 | 1,736,056 |
Wells Fargo Commercial Mortgage Trust | ||
Series 2021-SAVE, Class A, 3.54%, 2/15/2040 (a) (e) | 31,490,985 | 30,236,447 |
Series 2018-C46, Class A2, 4.06%, 8/15/2051 | 10,863,024 | 10,789,222 |
WFRBS Commercial Mortgage Trust | ||
Series 2013-UBS1, Class AS, 4.31%, 3/15/2046 (e) | 6,584,641 | 6,499,500 |
Series 2014-C22, Class AS, 4.07%, 9/15/2057 (e) | 6,901,000 | 6,744,112 |
Total Commercial Mortgage-Backed Securities (Cost $386,050,022) | 373,970,744 | |
Foreign Government Securities — 0.1% | ||
Svensk Exportkredit AB (SOFRINDX + 1.00%), 3.27%, 5/25/2023 (b)(Cost $28,573,678) | 28,420,000 | 28,583,037 |
Short-Term Investments — 43.9% | ||
Certificates of Deposits — 15.9% | ||
Bank of Montreal (Canada) | ||
0.40%, 11/18/2022 | 55,800,000 | 55,505,864 |
3.87%, 7/21/2023 | 54,100,000 | 53,982,459 |
Bank of Nova Scotia (The) (Canada) | ||
(SOFR + 0.53%), 2.82%, 2/6/2023 (b) | 91,172,000 | 91,204,612 |
(SOFR + 0.58%), 2.87%, 3/24/2023 (b) | 153,980,000 | 154,061,058 |
Barclays Bank plc (United Kingdom) , 2.37%, 3/30/2023 | 191,925,000 | 190,295,002 |
Canadian Imperial Bank of Commerce (Canada) , 3.72%, 3/13/2023 | 18,950,000 | 18,950,000 |
Citibank NA | ||
3.77%, 5/2/2023 | 77,750,000 | 77,657,844 |
3.85%, 7/28/2023 | 72,600,000 | 72,380,675 |
Cooperatieve Rabobank UA (Netherlands) | ||
(SOFR + 0.44%), 2.73%, 1/27/2023 (b) | 40,547,000 | 40,552,310 |
2.80%, 5/17/2023 | 40,743,000 | 40,418,249 |
3.74%, 5/31/2023 | 69,508,000 | 69,385,697 |
INVESTMENTS | PRINCIPAL AMOUNT($) | VALUE($) |
Certificates of Deposits — continued | ||
Credit Suisse AG (Switzerland) , 1.10%, 2/3/2023 | 100,098,000 | 98,983,085 |
First Abu Dhabi Bank PJSC , 1.46%, 9/26/2022 (a) | 74,940,000 | 74,887,642 |
HSBC Bank USA NA | ||
(SOFR + 0.50%), 2.79%, 4/20/2023 (b) | 119,515,000 | 119,447,370 |
4.01%, 8/10/2023 | 53,686,000 | ��� 53,614,599 |
Lloyds Bank Corporate Markets plc (United Kingdom) (SOFR + 0.67), 2.96%, 3/22/2023 (b) | 70,740,000 | 70,823,740 |
Lloyds Bank plc (United Kingdom) | ||
3.68%, 3/17/2023 | 19,669,000 | 19,666,955 |
3.89%, 6/16/2023 | 17,860,000 | 17,846,242 |
Mitsubishi UFJ Trust & Banking Corp. (Japan) (SOFR + 0.49), 2.78%, 3/3/2023 (b) | 40,700,000 | 40,703,915 |
Natixis SA (France) (SOFR + 0.60), 2.89%, 3/24/2023 (b) | 94,460,000 | 94,546,285 |
Nordea Bank Abp (Finland) | ||
(SOFR + 0.53%), 2.81%, 12/23/2022 (b) | 183,097,000 | 183,202,673 |
3.43%, 2/10/2023 | 126,407,000 | 126,436,234 |
2.97%, 6/8/2023 | 57,500,000 | 57,101,886 |
Norinchukin Bank (Japan) , 3.95%, 8/15/2023 | 198,472,000 | 198,274,520 |
Oversea-Chinese Banking Corp., Ltd. (Singapore) (SOFR + 0.47), 2.75%, 1/24/2023 (b) | 137,489,000 | 137,495,715 |
Royal Bank of Canada (Canada) , 4.08%, 8/4/2023 | 73,300,000 | 73,265,054 |
Skandinaviska Enskilda Banken AB (Sweden) , 2.85%, 6/1/2023 | 155,975,000 | 154,671,798 |
Standard Chartered Bank (United Kingdom) | ||
2.22%, 11/29/2022 | 2,700,000 | 2,695,737 |
2.82%, 5/26/2023 | 7,111,000 | 7,049,906 |
4.02%, 8/11/2023 | 54,640,000 | 54,569,089 |
Sumitomo Mitsui Banking Corp. (Japan) | ||
(SOFR + 0.40%), 2.69%, 9/29/2022 (b) | 34,914,000 | 34,919,912 |
(SOFR + 0.51%), 2.80%, 12/27/2022 (b) | 12,722,000 | 12,731,575 |
2.70%, 4/25/2023 | 39,988,000 | 39,705,130 |
2.70%, 4/28/2023 | 46,823,000 | 46,485,288 |
3.05%, 6/7/2023 | 2,999,000 | 2,979,529 |
218 | J.P. Morgan Exchange-Traded Funds | August 31, 2022 |
INVESTMENTS | PRINCIPAL AMOUNT($) | VALUE($) |
Short-Term Investments — continued | ||
Certificates of Deposits — continued | ||
Svenska Handelsbanken AB (Sweden) | ||
(SOFR + 0.43%), 2.71%, 12/22/2022 (b) | 202,015,000 | 202,050,747 |
2.01%, 3/22/2023 | 171,141,000 | 169,498,618 |
3.46%, 6/13/2023 | 111,881,000 | 111,405,537 |
Toronto-Dominion Bank (The) (Canada) | ||
0.73%, 1/13/2023 | 75,150,000 | 74,476,062 |
2.90%, 6/1/2023 | 5,344,000 | 5,297,492 |
4.07%, 7/18/2023 | 143,784,000 | 143,657,089 |
UBS AG (Switzerland) , 0.46%, 12/2/2022 | 40,092,000 | 39,879,747 |
Woorib Float 08/18/23 (South Korea) (SOFR + 0.80), 3.09%, 8/18/2023 (b) | 101,808,000 | 101,836,510 |
Total Certificates of Deposit (Cost $3,444,099,395) | 3,434,599,451 | |
Commercial Paper — 17.9% | ||
ASB Bank Ltd. (New Zealand) | ||
4.10%, 8/18/2023 (a) (f) | 67,001,000 | 64,320,900 |
Banco Santander SA (Spain) | ||
1.56%, 10/3/2022 (a) (f) | 25,588,000 | 25,529,713 |
Bank of Montreal (Canada) | ||
0.67%, 1/5/2023 (f) | 31,950,000 | 31,590,818 |
Canadian Imperial Bank of Commerce (Canada) | ||
3.67%, 5/2/2023 (a) (f) | 98,836,000 | 96,228,794 |
3.81%, 7/26/2023 (a) (f) | 84,793,000 | 81,601,130 |
Citigroup Global Markets, Inc. | ||
2.81%, 5/17/2023 (a) (f) | 63,509,000 | 61,760,855 |
4.12%, 8/9/2023 (a) (f) | 8,640,000 | 8,300,759 |
Cooperatieve Rabobank UA (Netherlands) | ||
1.01%, 9/2/2022 (f) | 73,195,000 | 73,185,728 |
Credit Agricole Corporate and Investment Bank (France) | ||
3.83%, 5/22/2023 (f) | 189,761,000 | 184,479,951 |
Credit Industriel et Commercial (France) | ||
3.69%, 2/9/2023 (a) (f) | 20,180,000 | 19,875,968 |
DNB Bank ASA (Norway) | ||
1.36%, 9/21/2022 (a) (f) | 161,920,000 | 161,699,640 |
3.89%, 5/24/2023 (a) (f) | 52,540,000 | 51,020,149 |
3.96%, 5/31/2023 (a) (f) | 72,042,000 | 69,891,690 |
3.96%, 8/16/2023 (a) (f) | 196,307,000 | 188,485,801 |
INVESTMENTS | PRINCIPAL AMOUNT($) | VALUE($) |
Commercial Paper — continued | ||
E.ON SE (Germany) | ||
3.28%, 11/21/2022 (a) (f) | 4,926,000 | 4,889,972 |
E.On Se Corporate Commercial Paper Discount Dtd (Germany) | ||
3.28%, 11/22/2022 (a) (f) | 14,000,000 | 13,896,098 |
3.28%, 11/25/2022 (a) (f) | 30,000,000 | 29,767,728 |
3.28%, 11/28/2022 (a) (f) | 25,000,000 | 24,798,329 |
Enbridge US Inc | ||
3.77%, 2/6/2023 (a) (f) | 55,800,000 | 54,845,006 |
3.77%, 2/7/2023 (a) (f) | 51,800,000 | 50,906,968 |
Enbridge US, Inc. | ||
1.96%, 9/14/2022 (a) (f) | 23,962,000 | 23,936,215 |
Enel Finance America LLC | ||
0.40%, 9/29/2022 (a) (f) | 16,093,000 | 16,057,700 |
0.40%, 10/3/2022 (a) (f) | 16,338,000 | 16,296,635 |
3.58%, 10/18/2022 (a) (f) | 27,510,000 | 27,402,307 |
3.58%, 10/24/2022 (a) (f) | 17,690,000 | 17,609,652 |
1.01%, 1/20/2023 (a) (f) | 6,543,000 | 6,439,637 |
1.01%, 1/24/2023 (a) (f) | 96,810,000 | 95,228,926 |
Evergy Missouri West, Inc. | ||
2.92%, 10/25/2022 (a) (f) | 28,180,000 | 28,050,971 |
HSBC USA Inc. | ||
4.18%, 8/1/2023 (a) (f) | 7,400,000 | 7,107,822 |
HSBC USA, Inc. | ||
0.84%, 1/6/2023 (a) (f) | 14,000,000 | 13,832,796 |
ING US Funding LLC (Netherlands) | ||
1.38%, 9/21/2022 (f) | 177,850,000 | 177,602,047 |
KEB Hana Bank | ||
3.77%, 1/17/2023 (a) (f) | 56,008,000 | 55,292,418 |
Korea Development Bk Corporate Commercial Paper (South Korea) | ||
0.00%, 5/26/2023 (f) | 100,000,000 | 97,086,244 |
Macquarie Bank Ltd. (Australia) | ||
3.60%, 2/28/2023 (a) (f) | 103,200,000 | 101,277,599 |
4.06%, 8/18/2023 (a) (f) | 9,745,000 | 9,347,378 |
Mizuho Bank Singapore Corporate Commercial Paper (Japan) | ||
3.45%, 1/10/2023 (a) (f) | 11,634,000 | 11,491,693 |
National Australia Bank Ltd. (Australia) | ||
1.01%, 9/6/2022 (a) (f) | 81,618,000 | 81,586,863 |
(SOFR + 0.48%), 2.77%, 1/3/2023 (a) (b) | 193,244,000 | 193,310,623 |
Natixis SA (France) | ||
3.59%, 3/28/2023 (f) | 120,852,000 | 118,227,266 |
August 31, 2022 | J.P. Morgan Exchange-Traded Funds | 219 |
AS OF August 31, 2022 (Unaudited) (continued)
INVESTMENTS | PRINCIPAL AMOUNT($) | VALUE($) |
Short-Term Investments — continued | ||
Commercial Paper — continued | ||
Nutrien Ltd. (Canada) | ||
2.76%, 10/13/2022 (a) (f) | 5,100,000 | 5,082,279 |
Raytheon Technologies Corp. | ||
3.53%, 11/7/2022 (a) (f) | 75,000,000 | 74,545,392 |
4.45%, 5/8/2023 (a) (f) | 12,000,000 | 11,643,000 |
Royal Bank of Canada (Canada) | ||
0.25%, 10/11/2022 (a) (f) | 184,382,000 | 183,855,763 |
0.40%, 11/15/2022 (a) (f) | 52,500,000 | 52,175,037 |
0.83%, 1/20/2023 (a) (f) | 44,300,000 | 43,720,042 |
Skandinaviska Enskilda Banken AB (Sweden) | ||
1.41%, 9/21/2022 (a) (f) | 48,985,000 | 48,917,564 |
1.41%, 9/26/2022 (a) (f) | 71,683,000 | 71,560,251 |
Societe Generale SA (France) | ||
0.63%, 1/4/2023 (a) (f) | 100,500,000 | 99,391,284 |
Standard Chartered Bank (United Kingdom) | ||
0.27%, 10/14/2022 (a) (f) | 67,223,000 | 67,021,869 |
3.00%, 6/6/2023 (a) (f) | 38,300,000 | 37,107,654 |
Sumitomo Mitsui Banking Corp. (Japan) | ||
1.26%, 9/8/2022 (a) (f) | 88,758,000 | 88,712,043 |
Svenska Handelsbanken AB (Sweden) | ||
0.81%, 1/18/2023 (a) (f) | 86,648,000 | 85,629,357 |
Telus Corp Corporate Commercial Paper Discount Dtd (Canada) | ||
3.67%, 2/21/2023 (a) (f) | 65,000,000 | 63,773,179 |
TELUS Corp. (Canada) | ||
1.71%, 9/13/2022 (a) (f) | 31,219,000 | 31,189,644 |
TransCanada PipeLines Ltd. (Canada) | ||
2.92%, 10/17/2022 (a) (f) | 10,680,000 | 10,639,411 |
3.11%, 10/20/2022 (a) (f) | 5,460,000 | 5,437,682 |
3.23%, 11/7/2022 (a) (f) | 36,470,000 | 36,255,828 |
Volvo Group Treasury US, Inc. | ||
1.36%, 9/1/2022 (a) (f) | 109,390,000 | 109,382,249 |
Walt Disney Co. (The) | ||
3.04%, 11/15/2022 (a) (f) | 13,900,000 | 13,816,280 |
3.04%, 11/18/2022 (a) (f) | 18,300,000 | 18,185,027 |
Westpac Banking Corp. (Australia) | ||
3.37%, 1/18/2023 (a) (f) | 69,000,000 | 68,151,261 |
Westpac Securities NZ Ltd. (New Zealand) | ||
0.25%, 10/7/2022 (a) (f) | 82,043,000 | 81,841,049 |
0.52%, 11/25/2022 (a) (f) | 79,320,000 | 78,786,026 |
INVESTMENTS | PRINCIPAL AMOUNT($) | VALUE($) |
Commercial Paper — continued | ||
3.37%, 1/18/2023 (a) (f) | 21,550,000 | 21,284,923 |
3.49%, 2/2/2023 (a) (f) | 54,500,000 | 53,724,473 |
Total Commercial Paper (Cost $3,864,384,137) | 3,856,089,356 | |
SHARES | ||
Investment Companies — 9.5% | ||
JPMorgan U.S. Government Money Market Fund Class IM Shares, 2.00% (g) (h) (Cost $2,061,647,797) | 2,061,647,797 | 2,061,647,797 |
Investment of Cash Collateral from Securities Loaned — 0.1% | ||
JPMorgan Securities Lending Money Market Fund Agency SL Class Shares, 2.22% (g) (h) | 18,711,668 | 18,709,796 |
JPMorgan U.S. Government Money Market Fund Class IM Shares, 2.00% (g) (h) | 4,688,335 | 4,688,335 |
Total Investment of Cash Collateral from Securities Loaned (Cost $23,392,476) | 23,398,131 | |
PRINCIPAL AMOUNT($) | ||
Repurchase Agreements — 0.5% | ||
Wells Fargo Securities LLC, 2.47%, dated 8/31/2022, due 9/16/2022, repurchase price $100,109,778, collateralized by Asset-Backed Securities, 0.00% - 10.21%, due 4/16/2025 - 8/25/2060, with the value of $110,656,609. (Cost $100,000,000) | 100,000,000 | 100,000,000 |
Total Short-Term Investments (Cost $9,493,523,805) | 9,475,734,735 | |
Total Investments — 97.0% (Cost $21,151,488,935) | 20,960,828,130 | |
Other Assets Less Liabilities — 3.0% | 647,534,656 | |
NET ASSETS — 100.0% | 21,608,362,786 | |
Percentages indicated are based on net assets. |
Abbreviations | |
CIFC | Commercial Industrial Finance Corp. |
CLO | Collateralized Loan Obligations |
220 | J.P. Morgan Exchange-Traded Funds | August 31, 2022 |
ICE | Intercontinental Exchange |
LIBOR | London Interbank Offered Rate |
PJSC | Public Joint Stock Company |
SOFR | Secured Overnight Financing Rate |
SOFRINDX | Compounding index of the Secured Overnight Financing Rate |
USD | United States Dollar |
^ | Amount rounds to less than 0.1% of net assets. | |
‡ | Value determined using significant unobservable inputs. | |
(a) | Securities exempt from registration under Rule 144A or section 4(a)(2), of the Securities Act of 1933, as amended. | |
(b) | Variable or floating rate security, linked to the referenced benchmark. The interest rate shown is the current rate as of August 31, 2022. | |
(c) | The security or a portion of this security is on loan at August 31, 2022. The total value of securities on loan at August 31, 2022 is $22,844,603. | |
(d) | Step bond. Interest rate is a fixed rate for an initial period that either resets at a specific date or may reset in the future contingent upon a predetermined trigger. The interest rate shown is the current rate as of August 31, 2022. | |
(e) | Variable or floating rate security, the interest rate of which adjusts periodically based on changes in current interest rates and prepayments on the underlying pool of assets. The interest rate shown is the current rate as of August 31, 2022. | |
(f) | The rate shown is the effective yield as of August 31, 2022. | |
(g) | Investment in an affiliated fund, which is registered under the Investment Company Act of 1940, as amended, and is advised by J.P. Morgan Investment Management Inc. | |
(h) | The rate shown is the current yield as of August 31, 2022. |
DESCRIPTION | NUMBER OF CONTRACTS | EXPIRATION DATE | TRADING CURRENCY | NOTIONAL AMOUNT ($) | VALUE AND UNREALIZED APPRECIATION (DEPRECIATION) ($) |
Short Contracts | |||||
U.S. Treasury 2 Year Note | (6,462) | 12/30/2022 | USD | (1,345,711,500) | 2,511,625 |
Abbreviations | |
USD | United States Dollar |
August 31, 2022 | J.P. Morgan Exchange-Traded Funds | 221 |
AS OF August 31, 2022 (Unaudited)
INVESTMENTS | PRINCIPAL AMOUNT($) | VALUE($) |
Municipal Bonds — 88.9% (a) | ||
Alabama — 3.7% | ||
Alabama Drinking Water Finance Authority, Revolving Fund Loan Series 2013-A, 3.00%, 8/15/2023 | 50,000 | 50,288 |
Alabama Federal Aid Highway Finance Authority | ||
Series 2012A, 5.00%, 9/1/2022 (b) | 160,000 | 160,000 |
Series A, 5.00%, 9/1/2022 (b) | 160,000 | 160,000 |
Series A, 5.00%, 9/1/2023 (b) | 90,000 | 92,355 |
Series B, Rev., 5.00%, 9/1/2023 (b) | 25,000 | 25,654 |
Series 2012A, 5.00%, 9/1/2026 (b) | 40,000 | 40,000 |
Alabama Incentives Financing Authority, Special Obligation | ||
Series 2012-A, 3.75%, 9/1/2037 (b) | 80,000 | 80,000 |
Series 2012-A, 5.00%, 9/1/2042 (b) | 100,000 | 100,000 |
Alabama Public Health Care Authority (The), Publica Health Facilities 5.00%, 9/1/2022 | 35,000 | 35,000 |
Alabama Public School and College Authority, Capital Improvement | ||
Series C, 5.00%, 9/1/2022 | 360,000 | 360,000 |
Series 2020A, 5.00%, 11/1/2022 | 215,000 | 215,968 |
Series 2014-A, 5.00%, 2/1/2023 | 30,000 | 30,336 |
Series 2012B, 3.00%, 3/1/2023 | 40,000 | 40,024 |
Series 2013A, 3.25%, 6/1/2024 | 40,000 | 40,269 |
Series 2014-B, 5.00%, 1/1/2025 | 75,000 | 78,414 |
Alabama Special Care Facilities Financing Authority-Birmingham, Ascension Senior Credit Group Series 2006C-1, 1.85%, 11/15/2046 (c) | 1,025,000 | 1,023,593 |
Auburn University, General Fee Series 2020A, 5.00%, 6/1/2023 | 10,000 | 10,195 |
Auburn Water Works Board Series 2020A, 3.00%, 9/1/2022 | 345,000 | 345,000 |
Autauga County Board of Education 5.00%, 4/1/2024 | 30,000 | 31,170 |
Birmingham-Jefferson Civic Center Authority, Capital Appreciation NATL-RE, Zero Coupon, 9/1/2022 (b) | 90,000 | 90,000 |
Black Belt Energy Gas District, Gas Prepay Series 2018A, Rev., 4.00%, 12/1/2048 (c) | 245,000 | 247,480 |
Black Belt Energy Gas District, Gas Prepay Project No. 4 Series 2019A-1, 4.00%, 12/1/2049 (c) | 40,000,000 | 40,407,820 |
Black Belt Energy Gas District, Gas Project Series E, Rev., 5.00%, 5/1/2053 (c) | 34,795,000 | 36,961,577 |
INVESTMENTS | PRINCIPAL AMOUNT($) | VALUE($) |
Alabama — continued | ||
Black Belt Energy Gas District, Gas Project No. 6 Series 2021B, 4.00%, 10/1/2052 (c) | 60,000 | 60,106 |
Black Belt Energy Gas District, Gas Supply Subseries 2022D-2, Rev., LIQ : Royal Bank of Canada, (SOFR + 1.40%), 2.93%, 7/1/2052 (d) | 25,575,000 | 24,801,576 |
Board of Water and Sewer Commissioners of the City of Mobile Rev., 5.00%, 1/1/2027 | 160,000 | 161,343 |
City of Auburn 5.00%, 11/1/2022 | 35,000 | 35,154 |
City of Auburn, Warrant Series 2014A, 5.00%, 12/1/2022 | 95,000 | 95,629 |
City of Birmingham | ||
Series 2013A, 5.00%, 3/1/2027 (b) | 20,000 | 20,249 |
Series 2013A, 5.00%, 3/1/2032 (b) | 130,000 | 131,715 |
Series 2013A, 5.00%, 3/1/2037 (b) | 50,000 | 50,660 |
City of Graysville Rev., AGM, 5.38%, 6/1/2023 (b) | 25,000 | 25,537 |
City of Guntersville, Warrants GO, 5.00%, 12/1/2022 | 20,000 | 20,043 |
City of Homewood, Warrants | ||
GO, 5.00%, 9/1/2022 | 30,000 | 30,000 |
GO, 2.00%, 3/1/2025 | 30,000 | 29,581 |
City of Huntsville, Warrants | ||
Series 2020A, GO, 5.00%, 9/1/2022 | 75,000 | 75,000 |
Series 2020B, GO, 5.00%, 9/1/2022 | 125,000 | 125,000 |
Series 2020B, GO, 5.00%, 9/1/2023 | 30,000 | 30,797 |
Series 2013-C, GO, 5.00%, 11/1/2023 (b) | 25,000 | 25,759 |
City of Irondale, Warrants GO, 4.00%, 10/1/2022 | 25,000 | 25,033 |
City of Madison, Warrants GO, 4.00%, 4/1/2023 (b) | 20,000 | 20,194 |
City of Montgomery, Warrants | ||
Series 2021B, GO, 3.00%, 12/1/2022 | 395,000 | 395,772 |
GO, 3.00%, 2/1/2023 | 15,000 | 15,048 |
City of Oxford Series 2012C, GO, 3.50%, 10/1/2022 (b) | 25,000 | 25,025 |
City of Oxford, Warrants | ||
Series 2015A, GO, 5.00%, 9/1/2022 | 110,000 | 110,000 |
GO, 3.25%, 10/1/2022 (b) | 35,000 | 35,028 |
Series 2013-A, GO, 3.25%, 10/1/2022 (b) | 25,000 | 25,020 |
Series 2012C, GO, 5.00%, 10/1/2022 (b) | 35,000 | 35,078 |
222 | J.P. Morgan Exchange-Traded Funds | August 31, 2022 |
INVESTMENTS | PRINCIPAL AMOUNT($) | VALUE($) |
Municipal Bonds — continued | ||
Alabama — continued | ||
City of Trussville, Warrants | ||
Series 2014A, GO, 5.00%, 10/1/2022 | 190,000 | 190,419 |
Series 2014A, GO, 5.00%, 10/1/2023 (b) | 25,000 | 25,707 |
City of Tuscaloosa, Warrants Series 2020A, GO, 3.00%, 10/1/2022 | 75,000 | 75,033 |
County of Jefferson, Warrants | ||
Rev., 3.00%, 9/15/2022 | 125,000 | 125,032 |
Rev., 5.00%, 9/15/2022 | 35,000 | 35,034 |
County of Madison, Warrants Series 2019C, GO, 5.00%, 9/1/2022 | 25,000 | 25,000 |
County of Mobile, Warrants | ||
Series 2020B, GO, 4.00%, 8/1/2023 | 25,000 | 25,373 |
GO, 5.00%, 8/1/2025 (b) | 25,000 | 26,792 |
County of Montgomery, Warrants GO, 5.00%, 3/1/2023 | 45,000 | 45,598 |
Escambia County Board of Education, Tax Anticipation Warrants Rev., 5.00%, 12/1/2022 (b) | 50,000 | 50,332 |
Homewood Educational Building Authority, Educational Facilities, Samford University | ||
Series 2013A, Rev., AGM, 4.75%, 12/1/2022 (b) | 540,000 | 543,109 |
Series 2013A, Rev., AGM, 5.00%, 12/1/2022 (b) | 150,000 | 150,978 |
Series 2013A, Rev., 5.00%, 12/1/2022 (b) | 300,000 | 301,956 |
Industrial Development Board of The City of Mobile, Alabama Power Control, Barry Plant Project Series 2007A, Rev., 1.00%, 6/26/2025 (c) | 100,000 | 94,778 |
Jacksonville Water Works Gas and Sewer Board Rev., 2.00%, 9/1/2022 | 25,000 | 25,000 |
Limestone County Water and Sewer Authority | ||
Rev., 5.00%, 12/1/2022 | 425,000 | 427,685 |
Series 2014B, Rev., 4.00%, 12/1/2023 (b) | 30,000 | 30,596 |
Lower Alabama Gas District (The), Gas Project | ||
Rev., 4.00%, 12/1/2022 | 135,000 | 135,224 |
Rev., 4.00%, 12/1/2025 (c) | 150,000 | 151,434 |
Madison County Board of Education, Tax Anticipation Warrants | ||
Rev., 5.00%, 9/1/2022 | 25,000 | 25,000 |
Rev., 5.00%, 9/1/2023 | 20,000 | 20,495 |
INVESTMENTS | PRINCIPAL AMOUNT($) | VALUE($) |
Alabama — continued | ||
Madison Water and Wastewater Board | ||
Rev., 3.00%, 12/1/2022 | 60,000 | 60,114 |
Rev., 5.00%, 12/1/2022 | 145,000 | 145,985 |
Montgomery County Public Education Cooperative District, Public Schools Project Rev., 5.00%, 4/1/2023 | 200,000 | 202,888 |
Muscle Shoals Utilities Board Rev., 5.00%, 12/1/2022 | 45,000 | 45,290 |
Oxford Public Building Authority, Oxford Project Series 2015A, Rev., 5.00%, 10/1/2022 | 25,000 | 25,055 |
Ozark Utilities Board Rev., AGM, 3.38%, 9/1/2022 (b) | 25,000 | 25,000 |
Southeast Alabama Gas Supply District (The), Project No. 1 Series 2018A, Rev., 4.00%, 4/1/2024 (c) | 145,000 | 146,698 |
Southeast Alabama Gas Supply District (The), Project No. 2 Series 2018A, Rev., 4.00%, 6/1/2024 (c) | 1,120,000 | 1,128,935 |
Southeast Energy Authority A Cooperative District | ||
Series B-1, Rev., 5.00%, 8/1/2023 | 500,000 | 505,907 |
Series B-1, Rev., 5.00%, 8/1/2024 | 1,160,000 | 1,186,009 |
St. Clair County Public Building Authority Series 2012A, Rev., 2.25%, 9/1/2022 | 25,000 | 25,000 |
State of Alabama Series 2016A, 5.00%, 11/1/2022 | 120,000 | 120,547 |
University of Alabama (The) | ||
Series 2019B, Rev., 4.00%, 7/1/2023 | 35,000 | 35,477 |
Series 2012-A, Rev., 5.00%, 7/1/2023 | 150,000 | 150,333 |
Series 2014B, Rev., 5.00%, 7/1/2023 | 25,000 | 25,545 |
Series 2012-A, Rev., 5.00%, 7/1/2024 | 310,000 | 310,628 |
Series 2014B, Rev., 5.00%, 7/1/2024 (b) | 50,000 | 52,341 |
Series 2017A, Rev., 5.00%, 7/1/2024 | 20,000 | 20,889 |
University of Alabama at Birmingham | ||
Series 2019A, Rev., 4.00%, 10/1/2022 | 310,000 | 310,427 |
Series 2015A, Rev., 5.00%, 10/1/2022 | 615,000 | 616,337 |
Water Works Board of the City of Birmingham (The) | ||
Series 2016A, 5.00%, 1/1/2023 | 20,000 | 20,179 |
Series 2016B, 5.00%, 1/1/2023 (b) | 25,000 | 25,225 |
Total Alabama | 114,744,874 | |
Alaska — 0.1% | ||
Alaska Housing Finance Corp., General Mortgage | ||
Series 2016A, 1.55%, 12/1/2022 | 70,000 | 69,846 |
August 31, 2022 | J.P. Morgan Exchange-Traded Funds | 223 |
AS OF August 31, 2022 (Unaudited) (continued)
INVESTMENTS | PRINCIPAL AMOUNT($) | VALUE($) |
Municipal Bonds — continued | ||
Alaska — continued | ||
Series 2019A, 1.50%, 6/1/2024 | 305,000 | 298,663 |
Alaska Housing Finance Corp., State Capital Project | ||
Series 2014D, 5.00%, 12/1/2022 | 100,000 | 100,659 |
Series 2015A, 5.00%, 12/1/2022 | 25,000 | 25,147 |
Series 2017A, 5.00%, 12/1/2022 | 20,000 | 20,118 |
Series 2018B, 5.00%, 12/1/2022 | 25,000 | 25,165 |
Alaska Industrial Development and Export Authority, Tanana Chiefs Conference Project Series 2019A, 5.00%, 10/1/2022 | 250,000 | 250,459 |
Alaska Municipal Bond Bank Authority | ||
5.00%, 10/1/2022 | 225,000 | 225,478 |
Series 2014-3, 5.00%, 10/1/2022 | 335,000 | 335,712 |
Series ONE, 5.00%, 10/1/2022 | 65,000 | 65,138 |
Series 1, Rev., 5.00%, 12/1/2022 | 85,000 | 85,550 |
Series 2017-3, 5.00%, 12/1/2022 | 40,000 | 40,264 |
Series 3, 5.00%, 12/1/2022 | 85,000 | 85,550 |
Series 2013-1, 4.00%, 2/1/2023 | 95,000 | 95,633 |
Series TWO, 5.00%, 9/1/2024 | 135,000 | 135,242 |
Alaska Municipal Bond Bank Authority, Master Resolution Series 2017A, 4.00%, 10/1/2022 | 165,000 | 165,212 |
Borough of Fairbanks North Star Series 2011-Q, GO, 5.00%, 9/1/2022 | 50,000 | 50,000 |
Borough of Matanuska-Susitna | ||
Series 2014B, GO, 5.00%, 11/1/2022 | 85,000 | 85,380 |
Series C, GO, 5.00%, 3/1/2023 | 40,000 | 40,522 |
Borough of Matanuska-Susitna, Goose Creek Correctional Center Project | ||
Rev., 5.00%, 9/1/2022 | 225,000 | 225,000 |
Series 2016, Rev., 5.00%, 9/1/2024 | 490,000 | 511,900 |
Rev., 5.00%, 9/1/2025 | 40,000 | 42,576 |
Rev., 5.25%, 9/1/2026 | 95,000 | 101,712 |
Borough of Matanuska-Susitna, Public Safety Building Lease COP, 3.00%, 10/1/2022 | 25,000 | 25,012 |
Borough of North Slope | ||
Series B, GO, 5.00%, 10/30/2023 | 20,000 | 20,601 |
Series 2020A, GO, 5.00%, 6/30/2025 | 35,000 | 37,447 |
Borough of North Slope, General Purpose Series 2019A, GO, 5.00%, 6/30/2023 | 40,000 | 40,869 |
Municipality of Anchorage | ||
Series D, 4.00%, 9/1/2022 | 445,000 | 445,000 |
Series D, 5.00%, 9/1/2022 | 130,000 | 130,000 |
Series D, 5.00%, 9/1/2023 | 25,000 | 25,644 |
INVESTMENTS | PRINCIPAL AMOUNT($) | VALUE($) |
Alaska — continued | ||
Municipality of Anchorage, General Purpose | ||
Series 2018A, 5.00%, 9/1/2022 | 180,000 | 180,000 |
Series 2108B, 5.00%, 9/1/2022 | 130,000 | 130,000 |
State of Alaska | ||
Series 2013B, 5.00%, 8/1/2023 | 60,000 | 60,664 |
Series 2013B, 5.00%, 8/1/2024 | 145,000 | 146,730 |
Series 2013B, 5.00%, 8/1/2025 | 20,000 | 20,215 |
State of Alaska, Native Tribal Health Consortium Housing Facility Project 5.00%, 6/1/2023 | 25,000 | 25,485 |
University of Alaska Series 2015T, Rev., 5.00%, 10/1/2022 | 200,000 | 200,369 |
Total Alaska | 4,568,962 | |
Arizona — 0.7% | ||
Arizona Health Facilities Authority, Banner Health Series 2015B, (SIFMA Municipal Swap Index Yield + 0.25%), 1.92%, 1/1/2046 (d) | 3,400,000 | 3,363,614 |
Arizona Health Facilities Authority, Scottsdale Lincoln Hospitals Series 2014A, 5.00%, 12/1/2025 | 140,000 | 147,097 |
Arizona Industrial Development Authority, Equitable School Revolving Fund LLC | ||
Series 2019A, 5.00%, 11/1/2022 | 450,000 | 451,779 |
Series 2019A, 5.00%, 11/1/2024 | 95,000 | 99,808 |
Arizona School Facilities Board Series 2015A, 5.00%, 9/1/2023 (b) | 20,000 | 20,523 |
Arizona State University Series 2016A, 5.00%, 7/1/2023 | 25,000 | 25,549 |
Arizona State University, Excise Tax, Maricopa County Regional Area Road Fund 5.00%, 7/1/2025 | 40,000 | 42,777 |
Arizona Transportation Board, Excise Tax, Maricopa County Regional Area Road Fund 5.00%, 7/1/2023 | 175,000 | 178,830 |
Arizona Water Infrastructure Finance Authority | ||
Series 2012A, 4.00%, 10/1/2022 | 20,000 | 20,029 |
Series 2012A, 5.00%, 10/1/2022 | 30,000 | 30,067 |
Series 2012A, 5.00%, 10/1/2025 (b) | 30,000 | 30,067 |
City of Buckeye, Excise Tax 5.00%, 7/1/2023 | 25,000 | 25,537 |
City of Casa Grande Series 2016B, 4.00%, 8/1/2023 (b) | 20,000 | 20,302 |
City of Flagstaff, Road Repair, Street Improvement Project Rev., 4.00%, 7/1/2023 | 20,000 | 20,274 |
224 | J.P. Morgan Exchange-Traded Funds | August 31, 2022 |
INVESTMENTS | PRINCIPAL AMOUNT($) | VALUE($) |
Municipal Bonds — continued | ||
Arizona — continued | ||
City of Goodyear GO, 5.00%, 7/1/2023 | 35,000 | 35,751 |
City of Mesa, Utility System Rev., 3.00%, 7/1/2023 | 20,000 | 20,113 |
City of Phoenix | ||
GO, 4.00%, 7/1/2023 (b) | 5,000 | 5,061 |
GO, 4.00%, 7/1/2023 | 5,000 | 5,070 |
City of Phoenix Civic Improvement Corp., Junior Lien | ||
Rev., 5.00%, 7/1/2023 | 85,000 | 85,183 |
Rev., 5.00%, 7/1/2024 | 230,000 | 230,476 |
City of Phoenix Civic Improvement Corp., Junior Lien, Airport System Series 2017D, Rev., 5.00%, 7/1/2024 | 515,000 | 536,196 |
City of Scottsdale, Preserve Acquisition GO, 3.00%, 7/1/2023 | 35,000 | 35,180 |
County of Maricopa Series 2018A, COP, 5.00%, 7/1/2024 | 25,000 | 26,143 |
County of Navajo Rev., 4.00%, 7/1/2025 | 20,000 | 20,761 |
County of Pima | ||
Series 2019A, COP, 5.00%, 12/1/2022 | 50,000 | 50,336 |
Series 2020A, COP, 5.00%, 12/1/2022 | 20,000 | 20,134 |
Series A, COP, 5.00%, 12/1/2022 | 45,000 | 45,302 |
County of Pima, Sewer System | ||
Series 2020A, Rev., 5.00%, 7/1/2023 | 30,000 | 30,664 |
Series 2012A, Rev., 5.00%, 7/1/2025 | 195,000 | 196,195 |
County of Pinal Rev., 5.00%, 8/1/2023 | 35,000 | 35,839 |
Gila County Unified School District No. 10-Payson GO, 5.00%, 7/1/2023 | 20,000 | 20,413 |
Glendale Industrial Development Authority, Midwestern University Rev., 5.00%, 5/15/2023 | 65,000 | 66,181 |
Glendale Union High School District No. 205, Project of 2020 Series 2021A, GO, AGM, 5.00%, 7/1/2023 | 25,000 | 25,553 |
Kyrene Elementary School District No. 28 GO, 4.00%, 7/1/2023 | 20,000 | 20,274 |
Madison Elementary School District No. 38, School Improvement, Project of 2014 Series 2019C, GO, 5.00%, 7/1/2023 | 25,000 | 25,556 |
Maricopa County Elementary School District No. 79, Litchfield Elementary, School Improvement GO, 3.00%, 7/1/2023 | 25,000 | 25,118 |
Maricopa County Industrial Development Authority, Banner Health | ||
Series 2016A, Rev., 5.00%, 1/1/2023 | 475,000 | 479,221 |
Series C, Rev., 5.00%, 10/18/2024 (c) | 375,000 | 392,168 |
INVESTMENTS | PRINCIPAL AMOUNT($) | VALUE($) |
Arizona — continued | ||
Maricopa County Industrial Development Authority, HonorHealth Series 2019A, Rev., 5.00%, 9/1/2022 | 235,000 | 235,000 |
Maricopa County School District No. 3, Tempe Elementary, School Improvement GO, 4.00%, 7/1/2023 | 70,000 | 70,937 |
Maricopa County Special Health Care District, Integrated Health Services Series 2018C, GO, 5.00%, 7/1/2023 | 45,000 | 45,929 |
Maricopa County Unified School District No. 69 Paradise Valley, School Improvement, Project of 2015 Series C, GO, 5.00%, 7/1/2023 | 20,000 | 20,446 |
Maricopa County Unified School District No. 97-Deer Valley, School Improvement Series C, GO, 3.00%, 7/1/2023 | 75,000 | 75,177 |
Maricopa County Union High School District No. 210 Phoenix, School Improvement, Project of 2011 and 2017 GO, 5.00%, 7/1/2023 | 30,000 | 30,667 |
Maricopa County Union High School District No. 216 Agua Fria, School Improvement Series 2014B, GO, 3.00%, 7/1/2023 | 30,000 | 30,166 |
McAllister Academic Village LLC, Arizona State University Rev., 5.00%, 7/1/2023 | 20,000 | 20,421 |
Northern Arizona University, Stimulus Plan for Economic and Educational Development Series 2020B, Rev., AGM, 5.00%, 8/1/2025 | 100,000 | 106,557 |
Pima County Regional Transportation Authority, Excise Tax | ||
Rev., 5.00%, 6/1/2024 | 60,000 | 62,678 |
Series 2014, Rev., 5.00%, 6/1/2025 | 30,000 | 30,571 |
Pima County Unified School District No. 20 Vail, School Improvement GO, AGM, 3.00%, 7/1/2023 | 20,000 | 20,094 |
Pinal County Community College District GO, 5.00%, 7/1/2023 | 30,000 | 30,637 |
Pinal County School District No. 1 Florence GO, 5.00%, 7/1/2023 | 20,000 | 20,413 |
RBC Municipal Products, Inc. Trust, Floater Certificates Series E-147, Rev., VRDO, LOC : Royal Bank of Canada, 1.53%, 9/12/2022 (c) (e) | 11,000,000 | 11,000,000 |
Salt River Project Agricultural Improvement and Power District, Arizona Salt River Project Series 2015A, Rev., 5.00%, 12/1/2022 | 25,000 | 25,165 |
State of Arizona | ||
Series 2015, 5.00%, 9/1/2022 (b) | 570,000 | 570,000 |
August 31, 2022 | J.P. Morgan Exchange-Traded Funds | 225 |
AS OF August 31, 2022 (Unaudited) (continued)
INVESTMENTS | PRINCIPAL AMOUNT($) | VALUE($) |
Municipal Bonds — continued | ||
Arizona — continued | ||
Series 2015, 5.00%, 9/1/2022 | 170,000 | 170,000 |
Series 2016, 4.00%, 10/1/2022 (b) | 25,000 | 25,036 |
5.00%, 10/1/2022 (b) | 30,000 | 30,067 |
Series 2019A, 5.00%, 10/1/2022 (b) | 245,000 | 245,545 |
Series B, 5.00%, 10/1/2022 | 90,000 | 90,194 |
Tempe Industrial Development Authority, Friendship Village of Tempe Project Series 2021C-2, Rev., 1.13%, 12/1/2026 | 1,880,000 | 1,645,810 |
Town of Marana, Excise Tax Series 2017B, Rev., 5.00%, 7/1/2023 | 35,000 | 35,737 |
Town of Queen Creek, Excise Tax Series 2018A, Rev., 5.00%, 8/1/2023 | 40,000 | 40,963 |
University Medical Center Corp., Hospital Rev., 5.63%, 7/1/2023 (b) | 30,000 | 30,800 |
Total Arizona | 21,618,151 | |
Arkansas — 0.3% | ||
Arkansas Development Finance Authority, Cancer Research Project AMBAC, Zero Coupon, 7/1/2023 | 75,000 | 73,198 |
Arkansas State Community Water System Public Water Authority Series A, 4.00%, 10/1/2042 (b) | 25,000 | 25,033 |
City of Bella Vista, Sales and Use Tax 4.00%, 10/1/2022 | 25,000 | 25,033 |
City of Bentonville, Sales and Use Tax 4.00%, 11/1/2022 | 50,000 | 50,140 |
City of Cabot, Sales Tax Series 2021B, 5.00%, 12/1/2022 | 25,000 | 25,154 |
City of Fayetteville, Sales & Use Tax Series 2019A, Rev., 5.00%, 11/1/2022 | 180,000 | 180,751 |
City of Rogers Rev., 4.00%, 11/1/2022 | 50,000 | 50,140 |
City of Van Buren, Water and Sewer Rev., AGM, 4.00%, 12/1/2022 | 25,000 | 25,091 |
County of Cross, Sales Tax Rev., 5.00%, 10/1/2022 | 25,000 | 25,052 |
Lake Hamilton School District No. 5 of Garland County | ||
GO, 3.25%, 10/1/2022 (b) | 80,000 | 80,061 |
GO, 3.50%, 10/1/2022 (b) | 50,000 | 50,048 |
Pulaski County Public Facilities Board, Baptist Health Rev., 5.00%, 12/1/2022 | 240,000 | 241,342 |
State of Arkansas, Federal Highway | ||
3.00%, 10/1/2022 | 225,000 | 225,147 |
5.00%, 10/1/2022 | 20,000 | 20,045 |
5.00%, 4/1/2023 | 20,000 | 20,317 |
5.00%, 10/1/2023 | 45,000 | 46,291 |
INVESTMENTS | PRINCIPAL AMOUNT($) | VALUE($) |
Arkansas — continued | ||
State of Arkansas, Waste Disposal and Pollution Abatement Facilities 5.00%, 7/1/2023 | 30,000 | 30,669 |
Tender Option Bond Trust Receipts Series 2020-XF0954, GO, VRDO, LOC : TD Bank NA, 1.55%, 9/12/2022 (c) (e) | 8,000,000 | 8,000,000 |
University of Arkansas Student Fee, UALR Campus Rev., 5.00%, 10/1/2022 | 45,000 | 45,101 |
University of Arkansas, Auxiliary Enterprises, UALR Campus Rev., 5.00%, 10/1/2022 | 50,000 | 50,112 |
University of Arkansas, Fayetteville Campus | ||
Series 2015A, Rev., 5.00%, 9/15/2022 | 25,000 | 25,025 |
Series 2014A, Rev., 4.00%, 11/1/2022 (b) | 25,000 | 25,070 |
Series 2015A, Rev., 5.00%, 11/1/2022 (b) | 30,000 | 30,135 |
University of Arkansas, Student Fee, Capital Improvement, UALR Energy Conservation Project Series 2013C, Rev., 5.00%, 10/1/2022 | 115,000 | 115,259 |
University of Arkansas, Various Facility Fayetteville Campus | ||
Series 2013A, Rev., 5.00%, 9/15/2022 | 80,000 | 80,081 |
Rev., 5.00%, 11/1/2022 | 50,000 | 50,228 |
Series 2012A, Rev., 5.00%, 11/1/2022 (b) | 25,000 | 25,111 |
Series 2019A, Rev., 5.00%, 11/1/2022 | 30,000 | 30,137 |
Series 2019A, Rev., 5.00%, 9/15/2023 | 35,000 | 35,961 |
University of Arkansas, Various Facility Pine Bluff Campus Rev., 4.00%, 12/1/2022 | 35,000 | 35,154 |
University of Arkansas, Various Facility UAMS Campus Rev., 5.00%, 11/1/2022 | 90,000 | 90,410 |
Total Arkansas | 9,831,296 | |
California — 4.6% | ||
Alameda Corridor Transportation Authority, Senior Lien Series 2013A, 5.00%, 10/1/2022 (b) | 250,000 | 250,550 |
Alameda County Joint Powers Authority, Multiple Capital Projects Series 2013A, 5.00%, 12/1/2022 | 165,000 | 166,109 |
Anaheim Housing and Public Improvements Authority Series 2017B, 5.00%, 10/1/2022 | 50,000 | 50,107 |
Anaheim Housing and Public Improvements Authority, Water System Project Series 2020A, 5.00%, 10/1/2022 | 60,000 | 60,133 |
226 | J.P. Morgan Exchange-Traded Funds | August 31, 2022 |
INVESTMENTS | PRINCIPAL AMOUNT($) | VALUE($) |
Municipal Bonds — continued | ||
California — continued | ||
Anaheim Public Financing Authority, Public Improvement Project Series 2019A, 5.00%, 9/1/2022 | 25,000 | 25,000 |
Antelope Valley Community College District 5.00%, 8/1/2028 (b) | 70,000 | 74,480 |
Antelope Valley-East Kern Water Agency 5.00%, 6/1/2023 | 30,000 | 30,593 |
Bay Area Toll Authority, Toll Bridge | ||
Series 2017S-7, 5.00%, 4/1/2023 | 140,000 | 142,176 |
Series 2013S-4, 5.13%, 4/1/2048 (b) | 25,000 | 25,411 |
Bay Area Water Supply and Conservation Agency | ||
Series 2013A, 5.00%, 10/1/2022 | 45,000 | 45,101 |
Series 2013A, 3.00%, 10/1/2024 | 100,000 | 100,333 |
Beaumont Public Improvement Authority, Local Agency Series 2019A, 4.00%, 9/1/2022 | 30,000 | 30,000 |
Beaumont Unified School District NATL-RE, Zero Coupon, 9/1/2022 | 35,000 | 35,000 |
Brea Redevelopment Agency, Tax Allocation 3.00%, 9/1/2022 | 90,000 | 90,000 |
Brentwood Infrastructure Financing Authority | ||
Series 2012A, AGM, 3.25%, 9/2/2022 | 50,000 | 50,000 |
Series 2012A, AGM, 3.50%, 9/2/2023 | 50,000 | 50,029 |
Brentwood Infrastructure Financing Authority, Civic Center Project | ||
4.00%, 10/1/2022 | 25,000 | 25,035 |
5.00%, 10/1/2024 | 40,000 | 41,950 |
Burbank Redevelopment Agency Successor Agency 5.00%, 12/1/2022 | 75,000 | 75,500 |
Burlingame School District, Election of 2012 Series 2013A, 4.00%, 8/1/2030 (b) | 20,000 | 20,309 |
California Communities Local Measurer, Sales Tax Series 2013A, AGM, 5.13%, 6/1/2039 (b) | 20,000 | 20,419 |
California County Tobacco Securitization Agency, Gold Country Settlement Funding Corp. Series 2020A, 5.00%, 6/1/2026 | 1,090,000 | 1,165,379 |
California County Tobacco Securitization Agency, Los Angeles County Securitization Corp. Series 2020A, 4.00%, 6/1/2023 | 700,000 | 709,524 |
California Educational Facilities Authority, Loyola Marymount University Series 2018B, 5.00%, 10/1/2022 | 75,000 | 75,165 |
INVESTMENTS | PRINCIPAL AMOUNT($) | VALUE($) |
California — continued | ||
California Educational Facilities Authority, Pepperdine University | ||
Series 2017B, 4.00%, 9/1/2022 | 25,000 | 25,000 |
5.00%, 9/1/2023 (b) | 20,000 | 20,000 |
California Educational Facilities Authority, Stanford University 5.00%, 10/1/2022 | 25,000 | 25,056 |
California Educational Facilities Authority, University of Southern California Series 2012A, 5.00%, 10/1/2023 (b) | 35,000 | 35,997 |
California Health Facilities Financing Authority 5.00%, 10/1/2039 (c) | 420,000 | 444,560 |
California Health Facilities Financing Authority, Adventist Health System | ||
Series 2013A, 5.00%, 3/1/2024 | 90,000 | 91,278 |
Series 2011A, Rev., 3.00%, 3/1/2041 (c) | 495,000 | 492,109 |
California Health Facilities Financing Authority, Cedars-Sinai Medical Center | ||
5.00%, 11/15/2022 | 180,000 | 180,957 |
5.00%, 11/15/2024 | 250,000 | 263,808 |
California Health Facilities Financing Authority, Children's Hospital Series 2019A, 5.00%, 11/1/2022 | 25,000 | 25,114 |
California Health Facilities Financing Authority, Kaiser Permanente | ||
Series 2017B, 5.00%, 11/1/2029 (c) | 650,000 | 652,993 |
Series C, 5.00%, 8/1/2031 (c) | 3,665,000 | 3,681,875 |
Series D, 5.00%, 11/1/2032 (c) | 505,000 | 507,325 |
California Health Facilities Financing Authority, Memorial Health Services | ||
Series A, 5.00%, 10/1/2022 | 45,000 | 45,100 |
Series 2012A, 5.00%, 10/1/2023 | 350,000 | 350,742 |
Series 2012A, Rev., 5.00%, 10/1/2026 | 300,000 | 300,595 |
California Health Facilities Financing Authority, Providence Health and Services Series 2014A, 5.00%, 10/1/2022 | 110,000 | 110,220 |
California Health Facilities Financing Authority, Providence St. Joseph Health Series 2016B-2, 4.00%, 10/1/2036 (c) | 160,000 | 163,990 |
California Health Facilities Financing Authority, St. Joseph Health System | ||
Series 2013A, 5.00%, 7/1/2026 (b) | 25,000 | 25,533 |
Series 2013A, 5.00%, 7/1/2026 | 60,000 | 61,124 |
Series 2009D, 1.70%, 7/1/2033 (c) | 1,035,000 | 1,033,648 |
Series 2009C, 5.00%, 7/1/2034 (c) | 355,000 | 356,013 |
August 31, 2022 | J.P. Morgan Exchange-Traded Funds | 227 |
AS OF August 31, 2022 (Unaudited) (continued)
INVESTMENTS | PRINCIPAL AMOUNT($) | VALUE($) |
Municipal Bonds — continued | ||
California — continued | ||
California Health Facilities Financing Authority, Sutter Health Series 2018A, 5.00%, 11/15/2022 | 175,000 | 175,876 |
California Infrastructure & Economic Development Bank, Colburn School (The) (SIFMA Municipal Swap Index Yield + 0.90%), 2.57%, 8/1/2072 (d) | 28,500,000 | 28,252,158 |
California Infrastructure and Economic Development Bank Series 2018C, Rev., (SIFMA Municipal Swap Index Yield + 0.35%), 2.02%, 8/1/2047 (d) | 5,250,000 | 5,180,714 |
California Infrastructure and Economic Development Bank, Academy of Motion Picture Arts and Sciences Obligated Group Series 2015A, 5.00%, 11/1/2022 | 125,000 | 125,565 |
California Infrastructure and Economic Development Bank, Clean Water State Revolving Fund | ||
4.00%, 10/1/2022 | 95,000 | 95,138 |
5.00%, 10/1/2022 | 150,000 | 150,337 |
California Infrastructure and Economic Development Bank, Infrastructure State Revolving Fund Series 2014A, 5.00%, 10/1/2029 (b) | 25,000 | 25,726 |
California Infrastructure and Economic Development Bank, National Charter School Revolving Loan Fund Series 2019B, 5.00%, 11/1/2022 | 25,000 | 25,099 |
California Municipal Finance Authority, Anaheim Water System Project Series 2015-A, 5.00%, 10/1/2022 | 25,000 | 25,056 |
California Municipal Finance Authority, City of Anaheim Electric Utility Distribution System Series 2015-B, 5.00%, 10/1/2022 | 20,000 | 20,045 |
California Municipal Finance Authority, Santa Rosa Community Health Centre 5.00%, 2/1/2023 | 25,000 | 25,271 |
California Municipal Finance Authority, St. John's Well Child and Family Center 4.00%, 12/1/2022 | 110,000 | 110,456 |
California Municipal Finance Authority, Tuolumne Project Series 2018A, 4.00%, 12/1/2022 | 50,000 | 50,220 |
California Pollution Control Financing Authority, American Water Capital Corp. Project Rev., 0.60%, 8/1/2040 (c) | 145,000 | 141,495 |
INVESTMENTS | PRINCIPAL AMOUNT($) | VALUE($) |
California — continued | ||
California Public Finance Authority, Henry Mayo Newhall Hospital | ||
4.00%, 10/15/2022 | 240,000 | 240,340 |
4.00%, 10/15/2023 | 290,000 | 293,462 |
4.00%, 10/15/2024 | 380,000 | 385,641 |
California State Public Works Board | ||
Series 2014B, 5.00%, 10/1/2022 | 75,000 | 75,165 |
Series 2017B, 5.00%, 10/1/2022 | 315,000 | 315,695 |
Series 2021A, 5.00%, 2/1/2023 | 5,000,000 | 5,055,862 |
Series 2019B, 5.00%, 5/1/2023 | 35,000 | 35,619 |
Series E, 4.00%, 9/1/2037 (b) | 25,000 | 25,000 |
California State Public Works Board, Department of Corrections and Rehabilitation | ||
5.00%, 9/1/2022 | 45,000 | 45,000 |
Series 2013G, 5.00%, 9/1/2022 | 85,000 | 85,000 |
Series 2014A, 5.00%, 9/1/2022 | 220,000 | 220,000 |
Series D, 5.00%, 9/1/2022 | 40,000 | 40,000 |
Series 2014C, 4.00%, 10/1/2022 | 35,000 | 35,049 |
California State Public Works Board, Judicial Council of California | ||
Series A, 5.00%, 3/1/2025 | 50,000 | 50,660 |
Series A, 5.00%, 3/1/2026 | 30,000 | 30,394 |
California State Public Works Board, Judicial Council Project Series A, 5.00%, 3/1/2024 | 275,000 | 278,563 |
California State Public Works Board, Various Capital Projects | ||
Series 2013-I, 5.00%, 11/1/2022 | 50,000 | 50,224 |
Series 2016C, 5.00%, 11/1/2022 | 50,000 | 50,224 |
Series 2019C, 5.00%, 11/1/2022 | 50,000 | 50,224 |
Series H, 5.00%, 12/1/2022 | 40,000 | 40,269 |
Series B, 5.00%, 10/1/2023 | 45,000 | 46,267 |
Series 2012G, 5.00%, 11/1/2023 | 450,000 | 452,080 |
Series 2013-I, 5.00%, 11/1/2025 | 660,000 | 679,883 |
Series 2012G, 5.00%, 11/1/2026 | 5,000,000 | 5,023,105 |
Series 2013-I, 5.00%, 11/1/2026 | 40,000 | 41,200 |
Series 2012G, 5.00%, 11/1/2027 | 9,240,000 | 9,282,699 |
Series 2012G, 5.00%, 11/1/2037 | 11,295,000 | 11,347,195 |
California State Public Works Board, Various Correctional Facilities Series 2018C, 5.00%, 11/1/2022 | 20,000 | 20,089 |
California State University, Systemwide | ||
Series 2016A, 3.00%, 11/1/2022 | 55,000 | 55,072 |
Series 2015A, 5.00%, 11/1/2022 | 70,000 | 70,319 |
Series 2017C, 5.00%, 11/1/2022 | 25,000 | 25,114 |
228 | J.P. Morgan Exchange-Traded Funds | August 31, 2022 |
INVESTMENTS | PRINCIPAL AMOUNT($) | VALUE($) |
Municipal Bonds — continued | ||
California — continued | ||
Series 2019A, 5.00%, 11/1/2022 | 25,000 | 25,114 |
Series 2012A, 5.00%, 11/1/2023 (b) | 75,000 | 75,347 |
Series 2016A, 5.00%, 11/1/2023 | 20,000 | 20,617 |
Series 2012A, 4.00%, 11/1/2024 (b) | 45,000 | 45,131 |
Series 2012A, 5.00%, 11/1/2024 (b) | 50,000 | 50,231 |
Series 2012A, 5.00%, 11/1/2025 (b) | 175,000 | 175,809 |
Series 2012A, 4.00%, 11/1/2028 (b) | 25,000 | 25,073 |
Series 2012A, 4.00%, 11/1/2030 (b) | 70,000 | 70,203 |
Series 2012A, 5.00%, 11/1/2030 (b) | 20,000 | 20,092 |
Series 2012A, Rev., 4.00%, 11/1/2031 (b) | 155,000 | 155,450 |
Series 2012A, 3.25%, 11/1/2032 (b) | 45,000 | 45,078 |
Series 2012A, 5.00%, 11/1/2037 (b) | 160,000 | 160,739 |
Series 2012A, 3.75%, 11/1/2042 (b) | 75,000 | 75,191 |
Series 2012A, 5.00%, 11/1/2042 (b) | 50,000 | 50,231 |
California Statewide Communities Development Authority, City of Glendora Series A, AGM, 4.00%, 10/1/2022 | 25,000 | 25,036 |
California Statewide Communities Development Authority, Henry Mayo Newhall Memorial Hospital Series 2014A, AGM, 5.25%, 10/1/2043 (b) | 400,000 | 423,014 |
California Statewide Communities Development Authority, North Coast County Water District Series C, AGM, 4.00%, 10/1/2022 | 20,000 | 20,029 |
California Statewide Communities Development Authority, Rady Children's Hospital Series 2016B, 5.00%, 8/15/2025 | 125,000 | 133,853 |
California Statewide Communities Development Authority, Redlands Community Hospital 5.00%, 10/1/2022 | 40,000 | 40,080 |
California Statewide Communities Development Authority, Southern California Edison Co. Series D, 2.63%, 11/1/2033 (c) | 290,000 | 286,671 |
Camarillo Community Development Commission Successor Agency, Camarillo Corridor Project AGM, 5.00%, 9/1/2023 | 25,000 | 25,619 |
Campbell Union High School District 5.00%, 8/1/2034 (b) | 25,000 | 25,618 |
Capistrano Unified School District Community Facilities District No. 90-2, Special Tax AGM, 3.75%, 9/1/2022 | 80,000 | 80,000 |
Capistrano Unified School District Community Facilities District, Special Tax 5.00%, 9/1/2022 | 65,000 | 65,000 |
INVESTMENTS | PRINCIPAL AMOUNT($) | VALUE($) |
California — continued | ||
Carlsbad Unified School District, School Financing Project 5.00%, 10/1/2022 | 50,000 | 50,106 |
Castaic Lake Water Agency, Capital Appreciation, Water System Improvement Project Series 1999A, AMBAC, Zero Coupon, 8/1/2023 | 45,000 | 43,918 |
Central Contra Costa Sanitary District Series 2018A, 5.00%, 9/1/2022 | 25,000 | 25,000 |
Chabot-Las Positas Community College District 5.00%, 8/1/2025 (b) | 20,000 | 20,494 |
Chaffey Joint Union High School District, Election of 2008 Series A, 5.00%, 8/1/2025 (b) | 30,000 | 30,742 |
Chino Basin Regional Financing Authority, Inland Utilities Series 2017A, 5.00%, 11/1/2022 | 95,000 | 95,430 |
Chula Vista Elementary School District | ||
AGM, 4.00%, 9/1/2022 | 50,000 | 50,000 |
AGM, 5.00%, 9/1/2022 | 35,000 | 35,000 |
Rev., BAN, Zero Coupon, 8/1/2023 | 20,000 | 19,519 |
AGM, 5.00%, 9/1/2023 | 30,000 | 30,755 |
Chula Vista Municipal Financing Authority | ||
Series 2015B, 5.00%, 9/1/2023 | 45,000 | 46,038 |
5.00%, 5/1/2024 | 10,000 | 10,426 |
Chula Vista Redevelopment Agency Successor Agency 4.00%, 10/1/2022 | 30,000 | 30,033 |
City & County of San Francisco, Moscon Center Series 2011A, COP, 5.00%, 9/1/2022 | 115,000 | 115,000 |
City & County of San Francisco, Multi-Family, Eastern Park Apartments Series 2019K, Rev., 1.30%, 1/1/2023 (c) | 520,000 | 517,532 |
City and County of San Francisco Series 2015A-1, COP, 5.00%, 4/1/2023 | 30,000 | 30,440 |
City and County of San Francisco, City Office Buildings - Multiple Properties Project Series 2015-R1, COP, 5.00%, 9/1/2022 | 25,000 | 25,000 |
City and County of San Francisco, Moscone Convention Centre Series 2017B, COP, 5.00%, 4/1/2025 | 75,000 | 79,574 |
City of Bakersfield, Wastewater Series 2015A, 5.00%, 9/15/2022 | 60,000 | 60,060 |
City of Berkeley 5.00%, 9/1/2022 | 20,000 | 20,000 |
City of Calabasas 5.00%, 12/1/2022 | 60,000 | 60,378 |
City of Glendora, Waterworks Series 2016A, Rev., 5.00%, 10/1/2022 | 25,000 | 25,056 |
August 31, 2022 | J.P. Morgan Exchange-Traded Funds | 229 |
AS OF August 31, 2022 (Unaudited) (continued)
INVESTMENTS | PRINCIPAL AMOUNT($) | VALUE($) |
Municipal Bonds — continued | ||
California — continued | ||
City of Lincoln, Community Facilities District No. 2003-1, Lincoln Crossing Project, Special Tax Rev., 4.00%, 9/1/2022 | 70,000 | 70,000 |
City of Livermore | ||
Series 2020B, COP, 4.00%, 10/1/2022 | 150,000 | 150,209 |
Series 2020B, COP, 4.00%, 10/1/2023 | 40,000 | 40,702 |
City of Long Beach Harbor Series 2014B, Rev., 5.00%, 5/15/2023 | 70,000 | 71,326 |
City of Long Beach Harbor, Private Activity | ||
Series 2020A, Rev., 4.00%, 5/15/2024 | 20,000 | 20,546 |
Rev., 4.00%, 5/15/2025 | 155,000 | 161,367 |
City of Los Alamitos COP, 5.00%, 10/1/2022 | 30,000 | 30,066 |
City of Los Angeles | ||
Series 2021B, GO, 5.00%, 9/1/2022 | 25,000 | 25,000 |
Series 2013A, Rev., 5.00%, 6/1/2027 | 75,000 | 76,540 |
City of Los Angeles Department of Airports, International Airport Subordinate Series 2018E, Rev., 5.00%, 5/15/2024 | 15,000 | 15,633 |
City of Los Angeles, Solid Waste Resources | ||
Series 2013A, Rev., 2.00%, 2/1/2023 | 45,000 | 44,905 |
Series 2015A, Rev., 5.00%, 2/1/2023 | 25,000 | 25,270 |
City of Los Angeles, Tax Exempt Series 2017B, GO, 5.00%, 9/1/2022 | 45,000 | 45,000 |
City of Los Angeles, Wastewater System | ||
Series 2013-A, Rev., 5.00%, 6/1/2025 | 75,000 | 76,551 |
Series 2013A, Rev., 5.00%, 6/1/2026 | 50,000 | 51,030 |
City of Manhattan Beach, Police and Fire Facility COP, 3.00%, 1/1/2023 | 25,000 | 25,058 |
City of Newark COP, 5.00%, 6/1/2023 | 45,000 | 45,833 |
City of Oakland, Sewer Series 2014A, Rev., 5.00%, 6/15/2023 | 35,000 | 35,741 |
City of Pico Rivera, Sales Tax Series 2018A, COP, AGM, 5.00%, 6/1/2023 | 35,000 | 35,705 |
City of Richmond, Wastewater, Capital Appreciation Rev., FGIC, Zero Coupon, 8/1/2023 (b) | 200,000 | 195,492 |
City of Riverside Series 2019A, Rev., 5.00%, 10/1/2022 | 115,000 | 115,258 |
City of Sacramento Rev., 5.00%, 9/1/2022 | 60,000 | 60,000 |
City of San Francisco, Public Utilities Commission | ||
Rev., 5.00%, 11/1/2022 | 75,000 | 75,342 |
Series 2015A, Rev., 5.00%, 11/1/2022 | 50,000 | 50,228 |
Series 2016A, Rev., 5.00%, 11/1/2022 | 125,000 | 125,569 |
Series 2017A, Rev., 5.00%, 11/1/2024 (b) | 30,000 | 31,668 |
INVESTMENTS | PRINCIPAL AMOUNT($) | VALUE($) |
California — continued | ||
City of Santa Cruz Rev., 5.00%, 3/1/2023 | 45,000 | 45,614 |
City of Santa Rosa, Wastewater | ||
Series 2012A, Rev., 5.00%, 9/1/2022 (b) | 145,000 | 145,000 |
Series 2014A, Rev., 5.00%, 9/1/2022 | 20,000 | 20,000 |
Series 2016A, Rev., 5.00%, 9/1/2022 | 50,000 | 50,000 |
City of Sausalito, 2016 Financing Project COP, 4.00%, 5/1/2023 | 50,000 | 50,566 |
City of South Lake Tahoe, Road Improvement Projects COP, 4.00%, 9/1/2022 | 50,000 | 50,000 |
City of Susanville, Natural Gas Enterprise Rev., AGM, 3.00%, 6/1/2023 | 20,000 | 20,086 |
City of Tulare, Sewer System | ||
Rev., AGM, 3.75%, 11/15/2022 (b) | 40,000 | 40,118 |
Rev., AGM, 5.00%, 11/15/2022 | 30,000 | 30,158 |
Clovis Unified School District, Election of 2012 Series B, 5.00%, 8/1/2038 (b) | 20,000 | 20,494 |
Coachella Redevelopment Agency Successor Agency, Merged Project Areas | ||
AGM, 5.00%, 9/1/2022 | 150,000 | 150,000 |
Series A, AGM, 5.00%, 9/1/2022 | 25,000 | 25,000 |
Coast Community College District, Election of 2012 Series 2013A, 4.00%, 8/1/2038 (b) | 20,000 | 20,309 |
Colton Joint Unified School District, Election of 2008 Series 2010B, AGM, 5.80%, 8/1/2035 (b) | 25,000 | 28,225 |
Contra Costa Community College District, Election of 2006 5.00%, 8/1/2038 (b) | 20,000 | 20,494 |
Contra Costa Community College District, Election of 2014 Series C, 4.00%, 8/1/2023 | 25,000 | 25,375 |
Contra Costa Transportation Authority, Sales Tax Series 2012B, 5.00%, 3/1/2027 (b) | 105,000 | 106,448 |
Contra Costa Water District | ||
Series T, 4.00%, 10/1/2022 | 25,000 | 25,036 |
Series 2012Q, 5.00%, 10/1/2022 | 70,000 | 70,157 |
Series R, 5.00%, 10/1/2022 | 50,000 | 50,112 |
Series T, 5.00%, 10/1/2022 | 45,000 | 45,101 |
Series U, 5.00%, 10/1/2022 | 110,000 | 110,246 |
Corona Utility Authority, Water Projects Rev., 5.00%, 9/1/2022 | 30,000 | 30,000 |
Corona-Norco Unified School District Public Financing Authority, Senior Lien Series A, 5.00%, 9/1/2023 (b) | 20,000 | 20,537 |
County of Calaveras 3.00%, 11/1/2022 | 110,000 | 110,117 |
230 | J.P. Morgan Exchange-Traded Funds | August 31, 2022 |
INVESTMENTS | PRINCIPAL AMOUNT($) | VALUE($) |
Municipal Bonds — continued | ||
California — continued | ||
County of Los Angeles, Disney Concert Hall Parking Garage COP, 5.00%, 9/1/2022 | 140,000 | 140,000 |
County of Marin, 2015 Financing Project COP, 5.00%, 11/1/2022 | 50,000 | 50,223 |
County of Mono, Mono County Civic Center Series 2018A, COP, 5.00%, 10/1/2022 | 260,000 | 260,477 |
County of Monterey, Public Facilities Refinancing COP, 5.00%, 10/1/2022 | 25,000 | 25,055 |
County of Sacramento COP, 5.00%, 10/1/2022 | 30,000 | 30,063 |
County of San Bernardino, Arrowhead Project Series 2019A, COP, 5.00%, 10/1/2022 | 25,000 | 25,053 |
County of San Diego, Sanford Burnham Prebys Medical Discovery Institute Series 2015A, Rev., 5.00%, 11/1/2022 | 25,000 | 25,110 |
County of San Joaquin, County Administration Building Project COP, AGM, 5.00%, 11/15/2022 | 125,000 | 125,662 |
County of Solano COP, 5.00%, 11/1/2022 | 80,000 | 80,363 |
County of Sonoma, Measure F Sales Tax, Limited Tax, Agricultural Preservation and Open Space Rev., 5.00%, 9/1/2022 | 80,000 | 80,000 |
Cucamonga Valley Water District Financing Authority | ||
Rev., 4.00%, 9/1/2022 (b) | 60,000 | 60,000 |
Rev., 5.00%, 9/1/2022 | 20,000 | 20,000 |
Series 2021B, Rev., 5.00%, 9/1/2022 | 20,000 | 20,000 |
Culver Redevelopment Agency Successor Agency Series 2017A, Rev., 5.00%, 11/1/2022 | 45,000 | 45,196 |
Cupertino Union School District, 2013 Crossover Series 2013A, GO, 5.00%, 8/1/2023 (b) | 25,000 | 25,618 |
Desert Hot Springs Redevelopment Agency Successor Agency, Subordinate Tax Rev., 5.00%, 9/1/2022 | 30,000 | 30,000 |
Desert Sands Unified School District GO, 5.00%, 8/1/2023 | 10,000 | 10,244 |
Downey Public Finance Authority Rev., 5.00%, 12/1/2022 | 40,000 | 40,271 |
East Bay Regional Park District Series B-1, GO, 5.00%, 9/1/2022 | 20,000 | 20,000 |
East Bay Regional Park District, Election of 2008 Series 2013A, GO, 4.00%, 9/1/2022 | 50,000 | 50,000 |
East Side Union High School District | ||
GO, AGM, 5.25%, 9/1/2022 | 100,000 | 100,000 |
INVESTMENTS | PRINCIPAL AMOUNT($) | VALUE($) |
California — continued | ||
Series B, GO, NATL-RE, 5.25%, 2/1/2023 | 1,050,000 | 1,062,805 |
El Dorado Irrigation District Series 2016B, COP, 5.00%, 3/1/2023 | 55,000 | 55,750 |
El Dorado Union High School District, 2021 Energy Efficiency Projects COP, AGM, 2.00%, 12/1/2022 | 160,000 | 159,731 |
El Monte City School District, Election of 2004 Series 2008C, GO, AGC, Zero Coupon, 8/1/2023 | 600,000 | 583,682 |
Emeryville Redevelopment Agency, Successor Agency Tax Allocation Series A, Rev., AGM, 5.00%, 9/1/2022 | 170,000 | 170,000 |
Etiwanda School District Public Financing Authority Series 2018A, Rev., 5.00%, 9/1/2022 | 35,000 | 35,000 |
Evergreen School District GO, 5.00%, 9/1/2022 | 70,000 | 70,000 |
Fairfield Community Facilities District, North Cordella General Improvements, Special Tax Rev., 4.00%, 9/1/2022 | 65,000 | 65,000 |
Folsom Cordova Unified School District School Facilities Improvement Dist No. 2, Capital Appreciation Series 2002A, GO, NATL-RE, Zero Coupon, 10/1/2022 | 20,000 | 19,959 |
Folsom Cordova Unified School District School Facilities Improvement Dist No. 3, Capital Appreciation, Election of 2007 Series 2007A, GO, NATL-RE, Zero Coupon, 10/1/2022 | 20,000 | ��19,959 |
Folsom Cordova Unified School District School Facilities Improvement Dist No. 4, Election of 2012 Series A, GO, 5.00%, 10/1/2023 (b) | 20,000 | 20,580 |
Folsom Public Financing Authority Rev., 4.00%, 12/1/2022 | 35,000 | 35,154 |
Fontana Redevelopment Agency, Successor Agency, Tax Allocation Series 2017A, Rev., 5.00%, 10/1/2023 | 30,000 | 30,812 |
Fremont Public Financing Authority | ||
Rev., 5.00%, 10/1/2022 | 75,000 | 75,169 |
Series 2017B, Rev., 5.00%, 10/1/2023 | 25,000 | 25,688 |
Fresno County Financing Authority Rev., 5.00%, 4/1/2023 | 550,000 | 558,709 |
Fullerton Joint Union High School District COP, 5.00%, 9/1/2022 | 35,000 | 35,000 |
August 31, 2022 | J.P. Morgan Exchange-Traded Funds | 231 |
AS OF August 31, 2022 (Unaudited) (continued)
INVESTMENTS | PRINCIPAL AMOUNT($) | VALUE($) |
Municipal Bonds — continued | ||
California — continued | ||
Garden Grove Agency Community Development Successor Agency, Tax Allocation | ||
Rev., 5.00%, 10/1/2022 | 25,000 | 25,051 |
Rev., 5.00%, 10/1/2023 | 20,000 | 20,535 |
Garden Grove Unified School District, Election of 2010 Series C, GO, 5.00%, 8/1/2023 | 10,000 | 10,244 |
Gateway Unified School District, Election of 2008 GO, AGM, 5.00%, 8/1/2023 (b) | 20,000 | 20,494 |
Glendale Unified School District | ||
Series E, GO, 3.00%, 9/1/2022 | 30,000 | 30,000 |
GO, 4.25%, 9/1/2022 (b) | 30,000 | 30,000 |
Series 2015A, GO, 5.00%, 9/1/2022 | 60,000 | 60,000 |
Golden Valley Unified School District, 2021 School Financing Project COP, 3.00%, 9/1/2022 | 275,000 | 275,000 |
Grossmont Healthcare District Series C, GO, 5.00%, 7/15/2024 | 25,000 | 25,980 |
Grossmont Union High School District, Election of 2008 Series E, GO, 5.00%, 8/1/2023 (b) | 20,000 | 20,494 |
Grossmont-Cuyamaca Community College District GO, 5.00%, 8/1/2023 | 30,000 | 30,725 |
Helendale School District COP, AGM, 2.50%, 12/1/2022 | 20,000 | 20,004 |
Hemet Unified School District COP, AGM, 4.00%, 10/1/2022 | 250,000 | 250,314 |
Hermosa Beach Public Financing Authority Rev., 4.00%, 11/1/2024 | 25,000 | 25,817 |
Hesperia Unified School District Series 2013B, COP, 5.53%, 2/1/2023 (b) | 25,000 | 25,207 |
Hollister School District, Election of 2016 Series 2019B, GO, 4.00%, 9/1/2022 | 20,000 | 20,000 |
Huntington Beach Union High School District | ||
COP, 5.00%, 9/1/2022 | 40,000 | 40,000 |
GO, 5.00%, 8/1/2023 (b) | 50,000 | 51,236 |
Imperial Public Financing Authority, Water Facility Rev., 3.50%, 10/15/2022 | 25,000 | 25,030 |
Inglewood Unified School District, Election of 2012 Series 2013A, GO, AGM, 5.13%, 8/1/2023 (b) | 20,000 | 20,508 |
Irvine Unified School District, School Facilities Improvement District No. 1 Series 2016A, GO, 5.00%, 9/1/2022 | 25,000 | 25,000 |
Jefferson Elementary School District GO, 5.00%, 9/1/2022 | 25,000 | 25,000 |
INVESTMENTS | PRINCIPAL AMOUNT($) | VALUE($) |
California — continued | ||
Jefferson Elementary School District, Election of 2018 Series 2020B, GO, 3.00%, 9/1/2022 | 50,000 | 50,000 |
La Mirada Public Financing Authority Rev., 5.00%, 5/1/2023 | 25,000 | �� 25,447 |
Lancaster School District, Election of 2012 Series A, GO, AGM, 4.00%, 8/1/2023 (b) | 20,000 | 20,300 |
Lincoln Public Financing Authority Series A, Rev., 4.00%, 10/1/2022 | 25,000 | 25,026 |
Lodi Public Financing Authority Rev., AGM, 5.00%, 9/1/2022 | 25,000 | 25,000 |
Lodi Unified School District, Election of 2006 GO, 3.00%, 8/1/2023 | 40,000 | 40,212 |
Long Beach Bond Finance Authority, Natural Gas Series 2007A, Rev., 5.25%, 11/15/2022 | 25,000 | 25,113 |
Long Beach Community College District Series 2017G, GO, 5.00%, 8/1/2023 | 35,000 | 35,856 |
Los Angeles Community College District | ||
Series 2015A, GO, 5.00%, 8/1/2023 | 25,000 | 25,611 |
Series 2015C, GO, 5.00%, 8/1/2023 | 20,000 | 20,489 |
Los Angeles County Metropolitan Transportation Authority, Measure J Junior Subordinate Sales Tax Series 2020A, Rev., 5.00%, 6/1/2023 | 30,000 | 30,578 |
Los Angeles County Metropolitan Transportation Authority, Measure R Senior Sales Tax Series 2016A, Rev., 5.00%, 6/1/2023 | 25,000 | 25,504 |
Los Angeles County Public Works Financing Authority Series 2019E1, Rev., 4.00%, 12/1/2023 | 85,000 | 86,826 |
Los Angeles County Public Works Financing Authority, MLK Hospital Project Series 2016D, Rev., 5.00%, 12/1/2022 | 75,000 | 75,528 |
Los Angeles County Public Works Financing Authority, Multiple Capital Projects II Series 2015A, Rev., 5.00%, 12/1/2022 | 25,000 | 25,176 |
Los Angeles County Redevelopment Refunding Authority Redevelopment Agency Successor Agency, CRA/LA Bunker Hill Project Rev., 5.00%, 12/1/2022 | 50,000 | 50,317 |
Los Angeles County Sanitation Districts Financing Authority Series 2016A, Rev., 5.00%, 10/1/2022 | 25,000 | 25,053 |
232 | J.P. Morgan Exchange-Traded Funds | August 31, 2022 |
INVESTMENTS | PRINCIPAL AMOUNT($) | VALUE($) |
Municipal Bonds — continued | ||
California — continued | ||
Los Angeles Department of Water and Power, Power System | ||
Series 2018B, Rev., 5.00%, 1/1/2023 | 140,000 | 140,971 |
Series 2013A, Rev., 5.00%, 7/1/2023 | 345,000 | 348,126 |
Series 2013A, Rev., 5.00%, 7/1/2025 | 125,000 | 126,107 |
Series 2013A, Rev., 5.00%, 7/1/2026 | 25,000 | 25,221 |
Los Angeles Department of Water and Power, Water System | ||
Series 2013A, Rev., 5.00%, 7/1/2024 | 1,050,000 | 1,059,307 |
Series 2013B, Rev., 5.00%, 7/1/2024 | 180,000 | 184,001 |
Series 2013B, Rev., 5.00%, 7/1/2025 | 40,000 | 40,899 |
Series 2013B, Rev., 5.00%, 7/1/2026 | 35,000 | 35,786 |
Los Angeles Unified School District | ||
Series 2015A, GO, 5.00%, 7/1/2023 | 70,000 | 71,579 |
Series D, GO, 5.00%, 7/1/2023 | 20,000 | 20,451 |
Los Angeles Unified School District, Headquarters Building Projects Series 2012A, COP, 5.00%, 10/1/2022 (b) | 745,000 | 746,521 |
Madera County Board of Education COP, 4.00%, 10/1/2023 | 20,000 | 20,308 |
Manteca Redevelopment Agency Successor Agency Series 2020A, Rev., 4.00%, 10/1/2022 | 130,000 | 130,163 |
McFarland Unified School District, Election of 2020 Series A, GO, 4.00%, 11/1/2022 | 25,000 | 25,066 |
Merced Union High School District GO, AGM, Zero Coupon, 2/18/2025 (b) | 350,000 | 105,975 |
Metropolitan Water District of Southern California, Waterworks Series 2017B, Rev., 5.00%, 8/1/2023 | 70,000 | 71,672 |
Middletown Unified School District, Election of 2018 Series 2019A, GO, 4.00%, 8/1/2023 | 25,000 | 25,370 |
Midpeninsula Regional Open Space District Series A, GO, 5.00%, 9/1/2022 | 155,000 | 155,000 |
Midpeninsula Regional Open Space District, Promissory Notes, 1999 Project Lease Rev., 5.00%, 9/1/2022 (b) | 105,000 | 105,000 |
Milpitas Redevelopment Agency Successor Agency, Redevelopment Project Area No.1 Rev., 5.00%, 9/1/2022 | 100,000 | 100,000 |
Modesto Irrigation District, Electric System | ||
Rev., 5.00%, 10/1/2022 | 145,000 | 145,325 |
Series 2015B, Rev., 5.00%, 10/1/2022 | 25,000 | 25,055 |
Mojave Water Agency Public Facilities Corp., Morongo Basin Pipeline Project, Election of 1990 GO, 4.00%, 9/1/2022 | 25,000 | 25,000 |
INVESTMENTS | PRINCIPAL AMOUNT($) | VALUE($) |
California — continued | ||
Moreno Valley Public Financing Authority Rev., 5.00%, 11/1/2022 | 45,000 | 45,200 |
Morgan Hill Financing Authority Rev., 5.00%, 10/1/2022 | 50,000 | 50,112 |
Morgan Hill Redevelopment Agency Successor Agency Series 2013A, Rev., 5.00%, 9/1/2022 (b) | 50,000 | 50,000 |
Mount Diablo Unified School District COP, 5.00%, 9/1/2022 | 135,000 | 135,000 |
Mount San Antonio Community College District, Election of 2008 | ||
Series 2013A, GO, 5.00%, 9/1/2022 | 140,000 | 140,000 |
Series A, GO, Zero Coupon, 8/1/2023 | 35,000 | 19,972 |
Municipal Improvement Corp. of Los Angeles Series 2016A, Rev., 5.00%, 11/1/2022 | 60,000 | 60,271 |
Municipal Improvement Corp., of Los Angeles, Real Property | ||
Series 2016B, Rev., 4.00%, 11/1/2022 | 55,000 | 55,160 |
Series 2016B, Rev., 5.00%, 11/1/2022 | 80,000 | 80,362 |
Series 2018B, Rev., 5.00%, 11/1/2022 | 50,000 | 50,226 |
Series 2019B, Rev., 5.00%, 11/1/2022 (b) | 30,000 | 30,136 |
Series 2020-B, Rev., 5.00%, 11/1/2022 | 75,000 | 75,339 |
Series 2016B, Rev., 5.00%, 11/1/2023 | 25,000 | 25,765 |
Murrieta Valley Unified School District, Election of 2002 GO, AGM, 3.00%, 9/1/2022 (b) | 25,000 | 25,000 |
Natomas Unified School District, Election of 2002 Series 2004-B, GO, NATL-RE, Zero Coupon, 9/1/2022 (b) | 30,000 | 30,000 |
Norco Community Redevelopment Agency Successor Agency, Redevelopment Project Area #1 Series 2017A, Rev., 4.00%, 3/1/2023 | 20,000 | 20,154 |
Norco Financing Authority Enterprise Series 2019A, Rev., 4.00%, 10/1/2022 | 50,000 | 50,073 |
Norris School District, Election of 2012 Series 2012A, GO, 4.00%, 11/1/2022 (b) | 20,000 | 20,058 |
North City West School Facilities Financing Authority, Special Tax Series 2005B, Rev., AMBAC, 5.25%, 9/1/2022 | 95,000 | 95,000 |
Northern California Energy Authority Series 2018A, Rev., 4.00%, 7/1/2024 (c) | 445,000 | 451,958 |
Oakland Joint Powers Financing Authority Rev., 5.00%, 11/1/2022 | 80,000 | 80,352 |
August 31, 2022 | J.P. Morgan Exchange-Traded Funds | 233 |
AS OF August 31, 2022 (Unaudited) (continued)
INVESTMENTS | PRINCIPAL AMOUNT($) | VALUE($) |
Municipal Bonds — continued | ||
California — continued | ||
Oakland State Building Authority, Elihu M. Harris State Office Building Series A, Rev., 5.00%, 12/1/2022 | 25,000 | 25,171 |
Orange County Sanitation District, Wastewater Series 2014A, Rev., 5.00%, 2/1/2023 | 85,000 | 85,967 |
Orange County Water District | ||
Series 2019A, COP, 2.00%, 8/15/2023 | 200,000 | 199,197 |
Series 2003B, COP, NATL-RE, 4.75%, 8/15/2023 (b) | 25,000 | 25,578 |
Series 2013A, Rev., 5.00%, 8/15/2023 (b) | 25,000 | 25,644 |
Series 2021A, COP, 4.00%, 2/15/2025 | 175,000 | 181,690 |
Orchard School District GO, 5.00%, 8/1/2023 | 45,000 | 46,100 |
Otay Water District Rev., 4.00%, 9/1/2022 | 35,000 | 35,000 |
Otay Water District Financing Authority Series 2018A, Rev., 5.00%, 9/1/2023 | 30,000 | 30,797 |
Padre Dam Municipal Water District | ||
Series 2017A, COP, 5.00%, 10/1/2022 | 20,000 | 20,043 |
Series 2017A, COP, 5.00%, 10/1/2024 | 50,000 | 52,583 |
Palm Springs Financing Authority Rev., 5.00%, 11/1/2022 | 30,000 | 30,137 |
Palm Springs Financing Authority, Convention Center Project | ||
Series 2012A, Rev., 3.13%, 11/1/2022 (b) | 25,000 | 25,037 |
Series 2012A, Rev., 3.25%, 11/1/2022 (b) | 65,000 | 65,107 |
Palmdale Community Redevelopment Agency Successor Agency | ||
Series 2016B, Rev., 5.00%, 9/1/2022 | 35,000 | 35,000 |
Series 2016A, Rev., 5.00%, 9/1/2023 | 45,000 | 46,115 |
Palmdale Financing Authority Rev., AGM, 5.00%, 11/1/2022 | 25,000 | 25,114 |
Palomar Community College District GO, 5.00%, 5/1/2024 | 50,000 | 52,080 |
Palos Verdes Peninsula Unified School District GO, 5.00%, 11/1/2022 | 20,000 | 20,091 |
Paramount Unified School District, Election of 2006 | ||
GO, Zero Coupon, 8/1/2023 (b) | 355,000 | 47,616 |
GO, 4.50%, 8/1/2023 (b) | 40,000 | 40,798 |
Perris Union High School District GO, 5.00%, 9/1/2023 | 10,000 | 10,263 |
Perris Union High School District, Election of 2018 Series 2019A, GO, AGM, 5.00%, 9/1/2022 | 70,000 | 70,000 |
INVESTMENTS | PRINCIPAL AMOUNT($) | VALUE($) |
California — continued | ||
Pico Rivera Public Financing Authority Rev., 4.00%, 9/1/2022 | 30,000 | 30,000 |
Pismo Beach Public Financing Agency, Beach Municipal Pier Project Rev., 5.00%, 12/1/2023 | 30,000 | 30,989 |
Pittsburg Successor Agency Redevelopment Agency, Subordinate Tax Allocation Series A, Rev., AGM, 5.00%, 9/1/2022 | 50,000 | 50,000 |
Placentia-Yorba Linda Unified School District Series 2016A, COP, AGM, 5.00%, 10/1/2022 | 70,000 | 70,143 |
Plumas Unified School District, Election of 2016 Series B, GO, 5.00%, 8/1/2023 | 30,000 | 30,706 |
Poway Unified School District Public Financing Authority, Special Tax Community Facilities District No. 2 Series 2015C, Rev., AGM, 5.00%, 9/1/2023 | 40,000 | 41,035 |
Puente Basin Water Agency, Walnut Valley Water District Project Series 2013A, Rev., 5.00%, 6/1/2023 (b) | 25,000 | 25,510 |
Rancho Cucamonga Redevelopment Agency Successor Agency Rev., AGM, 5.00%, 9/1/2022 | 305,000 | 305,000 |
Rancho Santiago Community College District | ||
Series B, GO, AGM, Zero Coupon, 9/1/2022 | 20,000 | 20,000 |
GO, 4.00%, 9/1/2022 | 25,000 | 25,000 |
GO, 5.00%, 9/1/2022 | 135,000 | 135,000 |
GO, AGM, 5.25%, 9/1/2022 | 50,000 | 50,000 |
Regents of the University of California Medical Center Pooled Series 2016L, Rev., 4.00%, 5/15/2025 | 20,000 | 20,873 |
Rescue Union School District, Election of 1998 Series 2005, GO, NATL-RE, 5.00%, 9/1/2022 | 20,000 | 20,000 |
Rialto Redevelopment Agency, Merged Project Area Series 2014A, Rev., 5.00%, 9/1/2022 | 50,000 | 50,000 |
Richmond Joint Powers Financing Authority, Civics Center Project Series 2019A, Rev., AGM, 5.00%, 11/1/2022 | 20,000 | 20,089 |
Riverside County Asset Leasing Corp., Defender/Probation Building Series 2013A, Rev., 5.00%, 11/1/2022 (b) | 40,000 | 40,185 |
Riverside County Infrastructure Financing Authority Series 2021A, Rev., 5.00%, 11/1/2022 | 50,000 | 50,224 |
234 | J.P. Morgan Exchange-Traded Funds | August 31, 2022 |
INVESTMENTS | PRINCIPAL AMOUNT($) | VALUE($) |
Municipal Bonds — continued | ||
California — continued | ||
Riverside County Public Financing Authority, Tax Allocation, Project Area No. 1 Series 2015A, Rev., 5.00%, 10/1/2022 | 75,000 | 75,137 |
Riverside County Redevelopment Successor Agency, Jurupa Valley Redevelopment project Area Series 2016B, Rev., 5.00%, 10/1/2022 | 110,000 | 110,225 |
Riverside County Transportation Commission, Limited Tax Series 2013A, Rev., 5.25%, 6/1/2023 (b) | 25,000 | 25,546 |
Riverside County Transportation Commission, Sales Tax Series 2017A, Rev., 5.00%, 6/1/2023 | 25,000 | 25,504 |
Riverside Redevelopment Agency Successor Agency Series 2018A, Rev., 5.00%, 9/1/2022 | 40,000 | 40,000 |
Riverside Unified School District Financing Authority, Superior Lien Series A, Rev., 5.00%, 9/1/2022 (b) | 75,000 | 75,000 |
Rocklin Public Financing Authority Rev., 5.00%, 11/1/2022 | 25,000 | 25,114 |
Rocklin Unified School District Community Facilities District, Capital Appreciation Rev., AMBAC, Zero Coupon, 9/1/2022 | 170,000 | 170,000 |
Sacramento City Financing Authority, Master Lease Program Facilities Series E, Rev., AMBAC, 5.25%, 12/1/2022 | 55,000 | 55,382 |
Sacramento County Sanitation Districts Financing Authority | ||
Series 2014A, Rev., 5.00%, 12/1/2022 | 20,000 | 20,137 |
Series 2014A, Rev., 5.00%, 12/1/2023 | 35,000 | 36,153 |
Sacramento Municipal Utility District, Electric | ||
Series 2019A, Rev., 5.00%, 10/17/2023 (c) | 1,175,000 | 1,192,907 |
Series 2019B, Rev., 5.00%, 10/15/2025 (c) | 215,000 | 225,652 |
Sacramento Transportation Authority, Measure A Sales Tax Rev., 5.00%, 10/1/2023 | 210,000 | 210,435 |
San Bernardino City Unified School District | ||
GO, AGM, 5.00%, 8/1/2023 | 10,000 | 10,234 |
Series 2013A, GO, AGM, 5.00%, 8/1/2023 (b) | 25,000 | 25,606 |
San Bernardino City Unified School District, Election of 2012 Series A, GO, AGM, 4.00%, 8/1/2023 (b) | 20,000 | 20,300 |
INVESTMENTS | PRINCIPAL AMOUNT($) | VALUE($) |
California — continued | ||
San Bernardino County Transportation Authority, Sales Tax Series 2014A, Rev., 5.00%, 3/1/2023 | 20,000 | 20,273 |
San Carlos School District GO, 5.00%, 10/1/2022 | 20,000 | 20,045 |
San Diego Community College District, CABS, Election of 2006 GO, Zero Coupon, 8/1/2023 | 90,000 | 55,417 |
San Diego Community College District, Election of 2002 GO, 5.00%, 8/1/2023 (b) | 40,000 | 40,988 |
San Diego County Regional Transportation Commission, Sales Tax Series 2021A, Rev., 5.00%, 10/1/2022 | 180,000 | 180,405 |
San Diego County Water Authority | ||
Rev., 5.00%, 11/1/2022 (b) | 25,000 | 25,116 |
Series 2013A, Rev., 5.00%, 11/1/2022 (b) | 90,000 | ��� 90,416 |
Series 2013A, Rev., 5.00%, 5/1/2023 | 20,000 | 20,092 |
San Diego Public Facilities Financing Authority | ||
Rev., 5.00%, 10/15/2022 | 180,000 | 180,588 |
Rev., 5.00%, 5/15/2023 | 45,000 | 45,840 |
Series 2016B, Rev., 5.00%, 8/1/2023 | 20,000 | 20,487 |
San Diego Redevelopment Agency Successor Agency | ||
Series 2017A, Rev., 5.00%, 9/1/2022 | 110,000 | 110,000 |
Series A, Rev., 5.00%, 9/1/2022 | 100,000 | 100,000 |
Series 2017A, Rev., 5.00%, 9/1/2023 | 10,000 | 10,259 |
San Diego Regional Building Authority, County Operations Center Series 2016A, Rev., 5.00%, 10/15/2022 | 50,000 | 50,166 |
San Diego Unified Port District Series 2013A, Rev., 5.00%, 9/1/2022 | 25,000 | 25,000 |
San Diego Unified School District, Election of 1998 Series D-1, GO, NATL-RE, 5.50%, 7/1/2023 | 25,000 | 25,660 |
San Francisco Bay Area Rapid Transit District, Election of 2004 Series 2013C, GO, 5.00%, 8/1/2023 | 10,000 | 10,244 |
San Francisco Bay Area Rapid Transit District, Sales Tax Series 2016A, Rev., 5.00%, 7/1/2023 | 55,000 | 56,208 |
San Francisco City and County Airport Commission, San Francisco International Airport | ||
Series 2019D, Rev., 5.00%, 5/1/2024 | 45,000 | 46,850 |
Series 2016A, Rev., 4.00%, 5/1/2025 | 25,000 | 25,997 |
August 31, 2022 | J.P. Morgan Exchange-Traded Funds | 235 |
AS OF August 31, 2022 (Unaudited) (continued)
INVESTMENTS | PRINCIPAL AMOUNT($) | VALUE($) |
Municipal Bonds — continued | ||
California — continued | ||
San Francisco City and County Public Utilities Commission Wastewater | ||
Series 2013A, Rev., 5.00%, 10/1/2022 | 20,000 | 20,045 |
Series 2018A, Rev., 5.00%, 10/1/2022 | 130,000 | 130,292 |
Series 2018B, Rev., 5.00%, 10/1/2022 | 60,000 | 60,135 |
Series 2016B, Rev., 5.00%, 10/1/2023 | 35,000 | 36,004 |
San Joaquin County Transportation Authority, Measure K Sales Tax Rev., 5.00%, 3/1/2023 | 20,000 | 20,270 |
San Joaquin County Transportation Authority, Sales Tax Rev., 3.00%, 3/1/2023 | 20,000 | 20,073 |
San Joaquin Delta Community College District Series A, GO, 5.00%, 8/1/2023 | 25,000 | 25,611 |
San Joaquin Hills Transportation Corridor Agency, Toll Road, Senior Lien Rev., Zero Coupon, 1/1/2025 (b) | 120,000 | 113,249 |
San Jose Evergreen Community College District | ||
GO, 5.00%, 9/1/2022 | 90,000 | 90,000 |
Series A, GO, 5.00%, 9/1/2022 | 55,000 | 55,000 |
San Jose Evergreen Community College District, Election of 2016 | ||
Series A, GO, 4.00%, 9/1/2022 | 20,000 | 20,000 |
Series B, GO, 4.00%, 9/1/2022 | 25,000 | 25,000 |
San Jose Financing Authority, Civic Center Project Series 2013A, Rev., 5.00%, 6/1/2023 (b) | 80,000 | 81,600 |
San Jose Unified School District Series 2013-GO, GO, 5.00%, 8/1/2023 (b) | 25,000 | 25,618 |
San Juan Unified School District, Election of 2002 | ||
GO, 3.00%, 8/1/2023 | 75,000 | 75,485 |
GO, 5.00%, 8/1/2023 (b) | 40,000 | 40,989 |
San Juan Water District Rev., 5.00%, 2/1/2025 | 45,000 | 47,628 |
San Luis Obispo County Financing Authority Series 2012A, Rev., 5.00%, 10/15/2022 | 25,000 | 25,083 |
San Luis Obispo County Financing Authority, Nacimiento Water Project Series 2015A, Rev., 5.00%, 9/1/2022 | 70,000 | 70,000 |
San Marcos Public Financing Authority Series 1994A, Rev., 6.25%, 9/2/2022 (b) | 90,000 | 90,000 |
San Marcos Unified School, District No. 4, Community Facilities, Special Tax Rev., 4.00%, 9/1/2023 | 25,000 | 25,412 |
INVESTMENTS | PRINCIPAL AMOUNT($) | VALUE($) |
California — continued | ||
San Mateo County Community College District | ||
GO, 4.25%, 9/1/2022 (b) | 25,000 | 25,000 |
GO, 5.00%, 9/1/2022 (b) | 145,000 | 145,000 |
San Mateo Foster City Public Financing Authority, Street and Flood Control Project Series 2020A, Rev., 5.00%, 5/1/2023 | 20,000 | 20,357 |
San Mateo Union High School District Series 2016C, GO, 5.00%, 9/1/2022 | 65,000 | 65,000 |
San Mateo Union High School District, Election of 2006 Series 2013A, GO, 5.00%, 9/1/2022 | 155,000 | 155,000 |
San Mateo Union High School District, Election of 2020 Series A, GO, 4.00%, 9/1/2022 | 35,000 | 35,000 |
Santa Clara County Financing Authority | ||
Series 2018A, Rev., 5.00%, 11/15/2022 | 135,000 | 135,759 |
Series 2021A, Rev., 5.00%, 5/1/2023 | 140,000 | 142,521 |
Santa Clara County Financing Authority, Fire District Facilities Series 2020A, Rev., 5.00%, 5/1/2023 | 45,000 | 45,810 |
Santa Clara Valley Transportation Authority, Measure A Sales Tax Series 2015A, Rev., 5.00%, 4/1/2023 | 15,000 | 15,238 |
Santa Clara Valley Transportation Authority, Sales Tax Series 2017B, Rev., 5.00%, 6/1/2023 | 25,000 | 25,504 |
Santa Margarita Water District, Community Facilities District No. 99-1, Special Tax Series 2017A, Rev., 3.00%, 9/1/2022 | 50,000 | 50,000 |
Santa Monica-Malibu Unified School District Series 2001C, COP, NATL-RE, Zero Coupon, 11/1/2022 | 50,000 | 49,790 |
Santa Monica-Malibu Unified School District, Election of 2006 Series D, GO, 4.00%, 7/1/2023 (b) | 30,000 | 30,424 |
Sequoia Union High School District GO, 5.00%, 7/1/2024 (b) | 40,000 | 41,932 |
Shafter Wasco Irrigation District Series 2020A, Rev., 5.00%, 11/1/2022 | 120,000 | 120,491 |
Sierra Joint Community College District No. 1, School Facilities Improvement Series A, GO, 5.00%, 8/1/2023 (b) | 45,000 | 46,112 |
Signal Hill Redevelopment Agency Successor Agency, Tax Allocation Series A, Rev., 5.00%, 10/1/2022 | 25,000 | 25,051 |
236 | J.P. Morgan Exchange-Traded Funds | August 31, 2022 |
INVESTMENTS | PRINCIPAL AMOUNT($) | VALUE($) |
Municipal Bonds — continued | ||
California — continued | ||
Silicon Valley Clean Water, Wastewater Series 2019A, Rev., 3.00%, 3/1/2024 | 625,000 | 628,591 |
Simi Valley Public Financing Authority, Public Facilities Series 2014A, Rev., 5.00%, 10/1/2022 | 110,000 | 110,238 |
Solano County Community College District Series 2014A, GO, 5.00%, 8/1/2023 | 40,000 | 40,978 |
Sonoma County Community Redevelopment Agency Successor Agency Rev., 4.00%, 8/1/2023 | 20,000 | 20,276 |
Sonoma County Junior College District Series 2013A, GO, 5.00%, 8/1/2023 (b) | 65,000 | 66,606 |
Sonoma County Transportation Authority, Limited Tax Rev., 5.00%, 12/1/2022 | 85,000 | 85,582 |
South Placer Wastewater Authority Rev., 5.00%, 11/1/2022 | 100,000 | 100,455 |
South San Francisco Public Facilities Financing Authority, Police Station Project Series 2020A, Rev., 5.00%, 6/1/2023 | 40,000 | 40,806 |
South San Francisco Unified School District, Measure J, Dedicated Unlimited Ad Valorem Property Tax Rev., NATL-RE, 5.25%, 9/15/2022 | 60,000 | 60,066 |
Southern California Public Power Authority, Project No. 1 Series 2007A, Rev., 5.25%, 11/1/2022 | 825,000 | 827,909 |
Southern California Public Power Authority, Transmission Project Series 2017A, Rev., 5.00%, 7/1/2023 | 160,000 | 163,635 |
Southern California Public Power Authority, Windy Point/Windy Flats Project Rev., 5.00%, 4/1/2024 | 75,000 | 77,719 |
State of California Department of Water Resources, Central Valley Project, Water System | ||
Series AR, Rev., 5.00%, 12/1/2022 | 45,000 | 45,319 |
Series AS, 5.00%, 12/1/2022 | 70,000 | 70,497 |
Series AW, 5.00%, 12/1/2022 | 165,000 | 166,171 |
Series AX, Rev., 5.00%, 12/1/2022 | 50,000 | 50,355 |
Series BB, 5.00%, 12/1/2022 | 25,000 | 25,177 |
Series AM, 5.00%, 12/1/2023 (b) | 25,000 | 25,510 |
Series AW, 5.00%, 12/1/2023 | 45,000 | 46,539 |
Series AQ, 4.00%, 12/1/2024 (b) | 20,000 | 20,256 |
Series AN, 5.00%, 12/1/2028 (b) | 35,000 | 35,243 |
Series AN, 5.00%, 12/1/2030 (b) | 20,000 | 20,139 |
Series AP, 4.00%, 12/1/2033 (b) | 30,000 | 30,384 |
Series AN, 5.00%, 12/1/2035 (b) | 105,000 | 105,729 |
INVESTMENTS | PRINCIPAL AMOUNT($) | VALUE($) |
California — continued | ||
State of California, Various Purpose | ||
3.00%, 9/1/2022 | 50,000 | 50,000 |
4.00%, 9/1/2022 | 160,000 | 160,000 |
5.00%, 9/1/2022 | 700,000 | 700,000 |
5.25%, 9/1/2022 | 260,000 | 260,000 |
4.00%, 10/1/2022 | 75,000 | 75,108 |
5.00%, 10/1/2022 | 540,000 | 541,237 |
5.00%, 10/1/2022 | 85,000 | 85,200 |
5.25%, 10/1/2022 | 220,000 | 220,547 |
2.88%, 11/1/2022 | 35,000 | 35,038 |
4.00%, 11/1/2022 | 50,000 | 50,145 |
5.00%, 11/1/2022 | 25,000 | 25,116 |
5.00%, 11/1/2022 | 295,000 | 296,368 |
3.00%, 12/1/2022 | 25,000 | 25,048 |
4.00%, 12/1/2022 | 170,000 | 170,744 |
5.00%, 2/1/2023 | 90,000 | 91,043 |
4.00%, 3/1/2023 | 20,000 | 20,172 |
4.00%, 5/1/2023 | 20,000 | 20,227 |
5.00%, 9/1/2023 | 110,000 | 110,240 |
5.00%, 12/1/2023 | 25,000 | 25,818 |
5.00%, 2/1/2024 | 110,000 | 111,232 |
5.00%, 9/1/2024 | 20,000 | 20,043 |
5.00%, 9/1/2024 | 50,000 | 51,330 |
5.00%, 11/1/2024 | 60,000 | 61,934 |
5.00%, 2/1/2025 | 65,000 | 65,756 |
5.00%, 9/1/2025 | 75,000 | 75,177 |
5.00%, 9/1/2025 | 135,000 | 138,735 |
5.00%, 11/1/2025 | 40,000 | 41,289 |
5.00%, 12/1/2025 | 50,000 | 51,729 |
5.00%, 10/1/2026 | 50,000 | 50,815 |
State of California, Various Purpose, Tax Exempt 5.00%, 8/1/2023 | 65,000 | 66,619 |
Suisun City Redevelopment Agency, Redevelopment Project Series B, Rev., 5.00%, 10/1/2023 | 40,000 | 41,070 |
Sulphur Springs Union School District, Community Facilities District No. 2002-1, Special Tax Series 2014A, Rev., 3.00%, 9/1/2023 (b) | 25,000 | 25,181 |
Summerville Union High School District, Capital Appreciation GO, AGM, Zero Coupon, 9/1/2022 | 20,000 | 20,000 |
Sunnyvale School District | ||
GO, 4.00%, 9/1/2022 | 125,000 | 125,000 |
GO, 5.00%, 9/1/2022 | 25,000 | 25,000 |
August 31, 2022 | J.P. Morgan Exchange-Traded Funds | 237 |
AS OF August 31, 2022 (Unaudited) (continued)
INVESTMENTS | PRINCIPAL AMOUNT($) | VALUE($) |
Municipal Bonds — continued | ||
California — continued | ||
Sunnyvale School District, Election of 2013 Series 2019C, GO, 4.00%, 9/1/2022 | 25,000 | 25,000 |
Tahoe-Truckee Sanitation Agency, Wastewater Rev., 5.00%, 7/1/2024 | 30,000 | 31,366 |
Tahoe-Truckee Unified School District, Election of 2014, School Facilities Improvement District No. 1 Series C, GO, 3.00%, 8/1/2023 | 20,000 | 20,126 |
Temecula Valley Unified School District Financing Authority, Special Tax Rev., 5.00%, 9/1/2022 | 125,000 | 125,000 |
Tender Option Bond Trust Receipts/ Certificates Series 2017-XX1045, Rev., VRDO, LIQ : Barclays Bank plc, 1.70%, 9/8/2022 (c) (e) | 17,000,000 | 17,000,000 |
Tobacco Securitization Authority of Northern California Class 1, Rev., 5.00%, 6/1/2025 | 105,000 | 111,837 |
Tobacco Securitization Authority of Southern California Series 2019A, Class 1, Rev., 5.00%, 6/1/2025 | 55,000 | 57,787 |
Torrance Unified School District, Election of 2008 GO, 5.00%, 8/1/2023 (b) | 25,000 | 25,618 |
Tulare City School District Series 2016A, COP, 2.00%, 11/1/2022 | 25,000 | 24,974 |
Tuolumne Wind Project Authority, Tuolumne Wind Project Series 2016A, Rev., 5.00%, 1/1/2023 | 180,000 | 181,455 |
Turlock Public Financing Authority, Sewer Rev., 4.00%, 9/15/2022 (b) | 55,000 | 55,036 |
Tustin Community Facilities District No. 6-1, Special Tax Rev., 5.00%, 9/1/2022 | 80,000 | 80,000 |
Tustin Unified School District, Community Facilities District No. 88-10F Rev., 5.00%, 9/1/2022 | 75,000 | 75,000 |
Tustin Unified School District, School Facilities Improvement Districts No. 2002-1 and 2008-1 GO, 5.00%, 8/1/2025 | 30,000 | 32,229 |
Twin Rivers Unified School District Series 2014A, GO, Zero Coupon, 2/1/2024 (b) | 350,000 | 165,470 |
Union Elementary School District Series B, GO, 4.00%, 9/1/2022 | 60,000 | 60,000 |
University of California | ||
Series 2013AF, Rev., 5.00%, 5/15/2023 (b) | 20,000 | 20,371 |
Series 2015AO, Rev., 5.00%, 5/15/2023 | 20,000 | 20,390 |
Series 2017AV, Rev., 5.00%, 5/15/2023 | 20,000 | 20,390 |
INVESTMENTS | PRINCIPAL AMOUNT($) | VALUE($) |
California — continued | ||
Series S, Rev., 5.00%, 5/15/2023 | 3,000,000 | 3,058,512 |
Series S, Rev., 5.00%, 5/15/2025 | 4,000,000 | 4,276,536 |
Series S, Rev., 5.00%, 5/15/2026 | 1,520,000 | 1,661,817 |
Ventura County Public Financing Authority | ||
Series 2013A, Rev., 5.00%, 11/1/2022 (b) | 55,000 | 55,254 |
Series 2013B, Rev., 5.00%, 11/1/2022 | 25,000 | 25,114 |
Series 2013B, Rev., 5.00%, 11/1/2023 | 20,000 | 20,617 |
Series 2016A, Rev., 5.00%, 11/1/2024 | 25,000 | 26,368 |
West Hollywood Public Financing Authority, Hollywood Park Phase II Rev., 5.00%, 4/1/2024 | 75,000 | 77,985 |
Western Municipal Water District Facilities Authority Series 2020A, Rev., 5.00%, 10/1/2022 | 25,000 | 25,056 |
Western Riverside Water and Wastewater Financing Authority, Eastern Municipal Water District, Local Agency Series A-1, Rev., 5.00%, 9/1/2022 | 30,000 | 30,000 |
Westlands Water District Series 2016A, Rev., AGM, 5.00%, 9/1/2022 | 70,000 | 70,000 |
Westminster School District, Refinancing of 2015 Energy Conservation Projects COP, 4.00%, 5/1/2023 | 35,000 | 35,343 |
William S Hart Union High School District | ||
GO, 3.50%, 9/1/2022 (b) | 90,000 | 90,000 |
GO, 4.00%, 9/1/2022 | 50,000 | 50,000 |
GO, 4.00%, 9/1/2022 (b) | 105,000 | 105,000 |
GO, 5.00%, 9/1/2022 (b) | 195,000 | 195,000 |
William S Hart Union High School District, Election of 2008 | ||
Series 2013C, GO, 4.00%, 8/1/2023 (b) | 75,000 | 76,159 |
Series 2013C, GO, 5.00%, 8/1/2023 (b) | 20,000 | 20,494 |
Yucaipa Valley Water District Series 2015A, Rev., 3.00%, 9/1/2022 (b) | 40,000 | 40,000 |
Total California | 141,800,111 | |
Colorado — 2.5% | ||
Adams & Arapahoe Joint School District 28J Aurora | ||
Zero Coupon, 12/1/2022 | 25,000 | 24,856 |
5.00%, 12/1/2024 | 60,000 | 60,343 |
Adams 12 Five Star Schools, The City & County of Broomfield | ||
Series A, 5.00%, 12/15/2022 | 25,000 | 25,198 |
5.50%, 12/15/2022 | 125,000 | 126,165 |
4.00%, 12/15/2023 | 75,000 | 75,357 |
238 | J.P. Morgan Exchange-Traded Funds | August 31, 2022 |
INVESTMENTS | PRINCIPAL AMOUNT($) | VALUE($) |
Municipal Bonds — continued | ||
Colorado — continued | ||
5.00%, 12/15/2024 | 30,000 | 30,215 |
Adams and Weld Counties School District No. 27J Brighton Series A, 1.75%, 12/1/2022 | 25,000 | 24,958 |
Adams County School District No. 1, Mapleton Public Schools 4.00%, 12/1/2022 | 25,000 | 25,110 |
Apex Park and Recreation District 3.00%, 12/1/2024 | 50,000 | 50,614 |
Arapahoe County School District No. 5 Cherry Creek 5.00%, 12/15/2022 | 15,000 | 15,119 |
Arapahoe County School District No. 6 Littleton | ||
5.00%, 12/1/2022 | 50,000 | 50,323 |
Series 2019A, GO, 5.00%, 12/1/2022 | 145,000 | 145,938 |
Arapahoe County Water and Wastewater Authority 4.00%, 12/1/2022 | 25,000 | 25,110 |
Arapahoe County Water and Wastewater Public Improvement District 3.00%, 12/1/2022 | 25,000 | 25,047 |
Board of Governors of Colorado State University System | ||
Series A, 3.00%, 3/1/2023 (b) | 105,000 | 105,379 |
Series 2019A, 4.00%, 3/1/2023 (b) | 20,000 | 20,170 |
Series 2015A, 5.00%, 3/1/2045 (b) | 45,000 | 47,728 |
Boulder Larimer and Weld Counties St. Vrain Valley School District Re1J | ||
4.00%, 12/15/2022 | 50,000 | 50,072 |
5.00%, 12/15/2022 | 45,000 | 45,356 |
Series 2011-B, 5.00%, 12/15/2022 | 140,000 | 141,107 |
Series 2016B, 5.00%, 12/15/2022 | 110,000 | 110,870 |
Series 2016C, 5.00%, 12/15/2022 | 55,000 | 55,435 |
Series 2014A, 5.00%, 12/15/2023 | 40,000 | 41,358 |
Boulder Valley School District No. Re-2 Boulder | ||
Series 2017B, 3.00%, 12/1/2022 | 75,000 | 75,147 |
Series 2019A, 6.00%, 12/1/2022 | 30,000 | 30,279 |
Brush School District No. RE-2J GO, 3.00%, 12/1/2022 | 25,000 | 25,048 |
City & County of Broomfield, Sales and Use Tax | ||
3.00%, 12/1/2022 | 25,000 | 25,045 |
Series A, 4.50%, 12/1/2022 | 420,000 | 422,298 |
Series A, 5.00%, 12/1/2024 | 180,000 | 181,142 |
City and County of Denver Series 2018A, COP, 5.00%, 6/1/2023 | 20,000 | 20,388 |
INVESTMENTS | PRINCIPAL AMOUNT($) | VALUE($) |
Colorado — continued | ||
City and County of Denver, Airport System | ||
Series 2020A-2, Rev., 5.00%, 11/15/2022 | 205,000 | 206,132 |
Series B, Rev., 5.00%, 11/15/2022 | 130,000 | 130,718 |
Series B, Rev., 5.00%, 11/15/2024 | 125,000 | 131,766 |
Series B, Rev., 5.00%, 11/15/2025 | 1,045,000 | 1,050,841 |
Series B, Rev., 5.25%, 11/15/2026 | 25,000 | 25,791 |
City and County of Denver, Buell Theatre Property Series 2013A, COP, 5.00%, 12/1/2022 | 100,000 | 100,659 |
City and County of Denver, Fire Station and Library Series 20015A, COP, 5.00%, 12/1/2022 | 20,000 | 20,132 |
City of Aspen 5.00%, 12/1/2022 | 40,000 | 40,266 |
City of Aurora 5.00%, 12/1/2022 | 180,000 | 181,210 |
City of Brighton 4.00%, 12/1/2022 | 20,000 | 20,081 |
City of Colorado Springs, Utilities System Improvement | ||
Series 2012B, 5.00%, 11/15/2022 | 30,000 | 30,169 |
Series 2015A, 5.00%, 11/15/2022 | 25,000 | 25,141 |
Series 2020B, 5.00%, 11/15/2022 | 40,000 | 40,225 |
Series 2020C, 5.00%, 11/15/2022 | 115,000 | 115,647 |
Series A-1, 5.00%, 11/15/2022 | 25,000 | 25,141 |
Series A-3, 5.00%, 11/15/2022 | 225,000 | 226,265 |
Series B-2, 5.00%, 11/15/2022 | 30,000 | 30,169 |
Series 2015A, 5.00%, 11/15/2023 | 40,000 | 41,273 |
Series 2018A-1, 5.00%, 11/15/2023 | 35,000 | 36,114 |
Series A-1, 5.00%, 11/15/2023 | 25,000 | 25,795 |
Series A-2, 5.00%, 11/15/2023 | 25,000 | 25,795 |
City of Englewood GO, 5.00%, 12/1/2022 | 50,000 | 50,342 |
City of Fort Collins, Wastewater Utility Series 2016A, Rev., 4.00%, 12/1/2022 | 20,000 | 20,088 |
City of Glendale COP, AGM, 5.00%, 12/1/2022 | 70,000 | 70,465 |
City of Grand Junction COP, 3.00%, 12/1/2022 | 25,000 | 25,023 |
City of Greeley COP, 4.00%, 12/1/2022 | 50,000 | 50,176 |
City of Lone Tree, Sales Tax, Recreational Projects Series 2017A, Rev., 5.00%, 12/1/2022 | 25,000 | 25,167 |
City of Longmont Series A, COP, 5.00%, 12/1/2022 (b) | 25,000 | 25,160 |
City of Longmont, Electric and Broadband Utility Rev., AGM, 3.00%, 12/1/2022 | 75,000 | 75,119 |
City of Longmont, Storm Drainage Rev., 5.00%, 12/1/2022 | 20,000 | 20,136 |
August 31, 2022 | J.P. Morgan Exchange-Traded Funds | 239 |
AS OF August 31, 2022 (Unaudited) (continued)
INVESTMENTS | PRINCIPAL AMOUNT($) | VALUE($) |
Municipal Bonds — continued | ||
Colorado — continued | ||
City of Longmont, Wastewater Rev., 5.00%, 11/1/2023 | 25,000 | 25,765 |
City of Northglenn COP, 5.00%, 12/1/2022 | 155,000 | 156,026 |
City of Northglenn, Wastewater System Rev., 4.00%, 12/1/2022 | 20,000 | 20,083 |
City of Thornton | ||
COP, AMBAC, 4.00%, 12/1/2022 | 55,000 | 55,231 |
COP, 5.00%, 12/1/2022 | 45,000 | 45,293 |
Rev., 5.00%, 12/1/2022 | 25,000 | 25,171 |
City of Westminster, Sales and Use Tax | ||
Rev., 5.00%, 12/1/2022 | 95,000 | 95,650 |
Series 2017A, Rev., 5.00%, 12/1/2022 | 65,000 | 65,440 |
Colorado Educational and Cultural Facilities Authority, Johnson and Wales University Project Series B, 5.00%, 4/1/2027 (b) | 35,000 | 35,515 |
Colorado Educational and Cultural Facilities Authority, Stargate Charter School Project 7.25%, 6/1/2045 (b) | 260,000 | 273,775 |
Colorado Health Facilities Authority | ||
Series 2019A, 5.00%, 11/1/2022 | 275,000 | 276,248 |
Series 2019A, 5.00%, 11/1/2023 | 25,000 | 25,709 |
Colorado Health Facilities Authority, Adventist Health System/Sunbelt Obligated Group | ||
5.00%, 11/15/2022 | 475,000 | 477,554 |
Series 2014E, 5.00%, 11/15/2024 | 100,000 | 104,158 |
Series 2016C, 5.00%, 11/15/2036 (c) | 500,000 | 514,101 |
5.00%, 11/15/2048 (c) | 120,000 | 128,793 |
Colorado Health Facilities Authority, Catholic Health Initiatives | ||
Series 2009B-1, 5.00%, 7/1/2026 (b) | 125,000 | 125,604 |
Series 2009B-1, 5.00%, 7/1/2027 (b) | 5,000 | 5,024 |
Series 2009B-1, 4.00%, 7/1/2033 (b) | 110,000 | 110,317 |
Series 2009B-1, 4.00%, 7/1/2039 (b) | 340,000 | 340,980 |
Series 2013A, 5.25%, 1/1/2045 (b) | 1,970,000 | 1,987,010 |
Colorado Health Facilities Authority, Children's Hospital Colorado Project | ||
Series 2013A, 5.00%, 12/1/2022 | 75,000 | 75,438 |
Series C, 5.00%, 12/1/2024 | 20,000 | 21,005 |
Colorado Health Facilities Authority, CommonSpirit Health | ||
Series 2019A-2, 5.00%, 8/1/2027 | 5,000,000 | 5,353,204 |
Series B-2, 5.00%, 8/1/2049 (c) | 440,000 | 462,925 |
Series 2019B, 5.00%, 11/15/2049 (c) | 1,410,000 | 1,540,181 |
Colorado Health Facilities Authority, Craig Hospital Project 5.00%, 12/1/2022 | 60,000 | 60,321 |
INVESTMENTS | PRINCIPAL AMOUNT($) | VALUE($) |
Colorado — continued | ||
Colorado Health Facilities Authority, NCMC, Inc., Project 4.00%, 5/15/2029 (b) | 20,000 | 20,994 |
Colorado Health Facilities Authority, Parkview Medical Center, Inc., Project | ||
Series 2015A, 4.00%, 9/1/2022 | 80,000 | 80,000 |
5.00%, 9/1/2022 | 170,000 | 170,000 |
5.00%, 9/1/2023 | 270,000 | 275,560 |
Colorado Health Facilities Authority, School Health System Series 2019A, 5.00%, 1/1/2025 | 1,210,000 | 1,278,311 |
Colorado Health Facilities Authority, Valley View Hospital Association Project Rev., 2.80%, 5/15/2042 (c) | 3,090,000 | 3,092,781 |
Colorado Higher Education, Capital Construction, Lease Purchase Financing Program | ||
5.00%, 9/1/2022 | 115,000 | 115,000 |
Series 2009A, 5.00%, 11/1/2022 | 60,000 | 60,273 |
Series 2014A, 5.00%, 11/1/2022 | 490,000 | 492,232 |
Colorado Housing and Finance Authority, Multi-Family Project Series 2020A-2, Class I, 1.55%, 4/1/2023 | 100,000 | 99,434 |
Colorado Housing and Finance Authority, Single Family Mortgage Series 2021B, Class I, GNMA, 0.20%, 11/1/2022 | 25,000 | 24,915 |
Colorado Mesa University Series 2009A, 5.00%, 5/15/2023 | 45,000 | 45,798 |
Colorado Springs School District No. 11 Facilities Corp. GO, 4.00%, 12/1/2022 | 50,000 | 50,220 |
Colorado State Board for Community Colleges and Occupational Educational System, Arapahoe Community College - Castle Rock Collaboration Campus Series 2017A, 3.00%, 11/1/2023 | 20,000 | 20,126 |
Colorado State Board for Community Colleges and Occupational Educational System, Front Range Community College - Larimer & Westminster Campus Projects 5.00%, 11/1/2022 | 20,000 | 20,089 |
Colorado State Education Loan Program Series 2022A, Rev., TRAN, 5.00%, 6/29/2023 | 565,000 | 576,971 |
Colorado Water Resources and Power Development Authority, Clean Water | ||
Series 2013A, 4.00%, 9/1/2022 | 55,000 | 55,000 |
Series 2016B, 5.00%, 9/1/2022 | 50,000 | 50,000 |
Series 2018A, 5.00%, 9/1/2022 | 30,000 | 30,000 |
240 | J.P. Morgan Exchange-Traded Funds | August 31, 2022 |
INVESTMENTS | PRINCIPAL AMOUNT($) | VALUE($) |
Municipal Bonds — continued | ||
Colorado — continued | ||
Colorado Water Resources and Power Development Authority, Drinking Water Series 2019A, 5.00%, 9/1/2022 | 25,000 | 25,000 |
Colorado Water Resources and Power Development Authority, State Revolving Fund Series 2019A, 5.00%, 9/1/2022 | 35,000 | 35,000 |
Conservatory Metropolitan District, Limited Tax 4.00%, 12/1/2022 | 20,000 | 20,082 |
Copperleaf Metropolitan District No. 2, Limited Tax 4.00%, 12/1/2022 | 45,000 | 45,189 |
County of Adams | ||
5.00%, 12/1/2022 | 85,000 | 85,565 |
5.00%, 12/1/2023 | 860,000 | 887,263 |
County of Boulder, Flood Reconstruction Project Series 2021A, 5.00%, 12/1/2022 | 20,000 | 20,137 |
County of Eagle COP, 5.00%, 12/1/2022 | 85,000 | 85,565 |
County of El Paso, Pikes Peak Regional Development Center Project COP, 5.00%, 12/1/2022 | 25,000 | 25,166 |
County of El Paso, Terry R. Harris Judicial Complex Project COP, AGM, 5.00%, 12/1/2022 | 180,000 | 181,196 |
County of Gunnison Series 2020B, COP, 5.00%, 12/1/2022 | 25,000 | 25,165 |
County of Jefferson COP, 5.00%, 12/1/2023 | 20,000 | 20,649 |
County of Pueblo, Building Acquisition Project Series 2021B, COP, 4.00%, 9/15/2022 | 100,000 | 100,058 |
Dawson Ridge Metropolitan District No. 1, Limited Tax | ||
Series 1992-A, GO, Zero Coupon, 10/1/2022 (b) | 280,000 | 279,489 |
Series 1992-B, GO, Zero Coupon, 10/1/2022 (b) | 1,165,000 | 1,162,874 |
Denver City and County School District No. 1 | ||
Series 2017A, COP, 2.00%, 12/1/2022 | 50,000 | 49,948 |
GO, 4.00%, 12/1/2022 | 45,000 | 45,198 |
Series 2010C, GO, 4.00%, 12/1/2022 | 125,000 | 125,550 |
Series 2012B, GO, 4.00%, 12/1/2022 | 210,000 | 210,924 |
GO, 5.00%, 12/1/2022 | 60,000 | 60,411 |
Series 2010C, GO, 5.00%, 12/1/2022 | 55,000 | 55,376 |
Series 2012B, GO, 5.00%, 12/1/2022 (b) | 340,000 | 342,301 |
Series 2014A, GO, 5.00%, 12/1/2022 | 25,000 | 25,171 |
Series 2017B, COP, 5.00%, 12/1/2022 | 35,000 | 35,233 |
Series 2020A, COP, 5.00%, 12/1/2022 | 200,000 | 201,329 |
INVESTMENTS | PRINCIPAL AMOUNT($) | VALUE($) |
Colorado — continued | ||
Series 2005A, GO, NATL-RE, 5.50%, 12/1/2022 | 50,000 | 50,403 |
Series 2013C, COP, 5.00%, 12/15/2022 | 225,000 | 226,734 |
Denver Urban Renewal Authority, Stapleton Senior Tax Series 2013A-1, Rev., 5.00%, 12/1/2022 | 50,000 | 50,305 |
Denver Wastewater Management Division Department of Public Works Rev., 4.00%, 11/1/2022 | 25,000 | 25,073 |
Douglas County School District No. Re-1 Douglas and Elbert Counties | ||
GO, 3.50%, 12/15/2022 | 50,000 | 50,168 |
GO, 5.00%, 12/15/2022 | 130,000 | 131,028 |
GO, 5.25%, 12/15/2022 | 20,000 | 20,172 |
E-470 Public Highway Authority, Capital Appreciation | ||
Series 2000B, Rev., NATL-RE, Zero Coupon, 9/1/2022 | 1,825,000 | 1,825,000 |
Series B, Rev., NATL-RE, Zero Coupon, 9/1/2022 | 230,000 | 230,000 |
Eagle County School District No. Re50J GO, 3.00%, 12/1/2023 (b) | 20,000 | 20,146 |
East Cherry Creek Valley Water and Sanitation District | ||
Rev., 3.00%, 11/15/2022 | 25,000 | 25,039 |
Series 2019A, Rev., 5.00%, 11/15/2022 | 35,000 | 35,195 |
El Paso County School District No. 2 Harrison GO, 5.00%, 12/1/2022 | 25,000 | 25,171 |
El Paso County School District No. 20 Academy | ||
GO, 5.00%, 12/15/2022 | 25,000 | 25,198 |
Series 2017, GO, 5.00%, 12/15/2022 | 20,000 | 20,158 |
Series 2017, GO, 5.00%, 12/15/2023 | 20,000 | 20,679 |
El Paso County School District No. 3 Widefield | ||
GO, 5.00%, 12/1/2022 (b) | 65,000 | 65,440 |
GO, 5.00%, 12/1/2022 | 25,000 | 25,169 |
El Paso County School District No. 49 Falcon | ||
Series 2017A, COP, 3.00%, 12/15/2022 | 25,000 | 25,046 |
Series 2017B, COP, 5.00%, 12/15/2022 | 100,000 | 100,750 |
Series 2017B, COP, 5.00%, 12/15/2023 | 10,000 | 10,317 |
Foothills Park and Recreation District COP, 4.00%, 12/1/2022 | 75,000 | 75,302 |
Garfield County School District No. RE-2 Garfield GO, 5.00%, 12/1/2022 | 200,000 | 201,359 |
August 31, 2022 | J.P. Morgan Exchange-Traded Funds | 241 |
AS OF August 31, 2022 (Unaudited) (continued)
INVESTMENTS | PRINCIPAL AMOUNT($) | VALUE($) |
Municipal Bonds — continued | ||
Colorado — continued | ||
Harmony Technology Park Metropolitan District GO, 4.50%, 12/1/2022 (b) | 945,000 | 978,170 |
Interlocken Metropolitan District Series 2018A-1, GO, AGM, 5.00%, 12/1/2022 | 20,000 | 20,130 |
Jefferson County School District R-1 | ||
GO, 4.00%, 12/15/2022 (b) | 30,000 | 30,145 |
GO, 5.00%, 12/15/2022 | 140,000 | 141,107 |
GO, 5.00%, 12/15/2022 (b) | 90,000 | 90,706 |
GO, 5.00%, 12/15/2023 | 20,000 | 20,679 |
Larimer County School District No. R-1 Poudre | ||
GO, 4.00%, 12/15/2022 | 320,000 | 321,588 |
GO, 5.00%, 12/15/2022 | 230,000 | 231,792 |
Larimer Weld & Boulder County School District, R-2J Thompson | ||
GO, 3.25%, 12/15/2022 | 55,000 | 55,163 |
GO, 4.00%, 12/15/2023 | 35,000 | 35,166 |
Mesa County Valley School District No. 51 Grand Junction | ||
GO, 5.00%, 12/1/2022 | 135,000 | 135,924 |
COP, 5.00%, 12/1/2022 | 100,000 | 100,639 |
GO, 5.00%, 12/1/2023 | 35,000 | 36,140 |
Moffat County School District No.1 GO, 3.00%, 12/1/2022 | 25,000 | 25,046 |
Pueblo County School District No. 70 | ||
GO, 4.00%, 12/1/2022 | 50,000 | 50,220 |
GO, 4.00%, 12/1/2022 (b) | 50,000 | 50,202 |
Regional Transportation District Series 2014A, COP, 5.00%, 6/1/2023 (b) | 195,000 | 198,652 |
Regional Transportation District Sales Tax, Fastracks Project Series 2012A, Rev., 5.00%, 11/1/2022 (b) | 1,175,000 | 1,180,293 |
Rio Blanco County School District No. Re-1 Meeker GO, 4.00%, 12/1/2022 | 25,000 | 25,110 |
Routt County School District Re-2 Steamboat Springs GO, 5.00%, 12/1/2022 | 150,000 | 151,027 |
State of Colorado | ||
Series 2010A, 5.00%, 9/1/2022 | 25,000 | 25,000 |
Series 2018A, 5.00%, 12/15/2022 | 180,000 | 181,392 |
State of Colorado, Tax-Exempt | ||
Series 2020A, 5.00%, 12/15/2022 | 505,000 | 508,905 |
Series 2018N, 5.00%, 3/15/2023 | 30,000 | 30,405 |
Series 2020A, 5.00%, 9/1/2023 | 35,000 | 35,905 |
State of Colorado, UCDHSC Fitzsimons Academic Series 2013A, 5.00%, 11/1/2026 (b) | 25,000 | 25,730 |
INVESTMENTS | PRINCIPAL AMOUNT($) | VALUE($) |
Colorado — continued | ||
Thornton Development Authority, Tax Increment, North Washington Street Corridor Project Series N, Rev., 5.00%, 12/1/2022 | 50,000 | 50,311 |
Town of Breckenridge Series 2020B, 4.00%, 12/1/2022 | 50,000 | 50,204 |
Town of Castle Rock, Sales and Use Tax 5.00%, 6/1/2025 | 25,000 | 26,645 |
Town of Castle Rock, Water and Sewer Enterprise | ||
3.00%, 12/1/2022 | 25,000 | 25,041 |
5.00%, 12/1/2022 | 150,000 | 150,982 |
Town of Parker COP, 5.00%, 11/1/2022 | 25,000 | 25,111 |
Town of Winter Park COP, 4.00%, 12/1/2022 | 25,000 | 25,104 |
University of Colorado | ||
Series B-1, Rev., 4.00%, 6/1/2024 (b) | 25,000 | 25,682 |
Series A, Rev., 5.00%, 6/1/2024 (b) | 60,000 | 62,688 |
University of Colorado Hospital Authority Series 2012A, Rev., 5.00%, 11/15/2022 | 145,000 | 145,816 |
University of Colorado Hospital Authority, Health System Series 2019C, Rev., 5.00%, 11/15/2024 (c) | 520,000 | 539,021 |
University of Colorado Hospital Authority, University of Colorado Health Series 2017B-2, Rev., VRDO, 1.50%, 9/12/2022 (c) | 35,000,000 | 35,000,000 |
University of Colorado, Enterprise System | ||
Series A, Rev., 5.00%, 6/1/2023 | 70,000 | 71,385 |
Series A, Rev., 5.00%, 6/1/2023 (b) | 20,000 | 20,397 |
Series 2021C-3B, Rev., 2.00%, 10/15/2026 (c) | 6,250,000 | 5,998,390 |
Weld County School District No. Re-1 GO, AGM, 5.00%, 12/15/2022 | 25,000 | 25,198 |
Weld County School District No. RE-2 Eaton GO, 4.00%, 12/1/2022 | 25,000 | 25,110 |
Westminster Public Schools, District No. 50 | ||
COP, 5.00%, 12/1/2022 (b) | 45,000 | 45,299 |
5.00%, 12/1/2022 | 25,000 | 25,169 |
4.00%, 12/1/2023 (b) | 30,000 | 30,125 |
4.00%, 12/1/2024 (b) | 30,000 | 30,125 |
Total Colorado | 78,473,136 | |
Connecticut — 0.5% | ||
City of Danbury Series 2019B, GO, 5.00%, 11/1/2022 | 130,000 | 130,592 |
242 | J.P. Morgan Exchange-Traded Funds | August 31, 2022 |
INVESTMENTS | PRINCIPAL AMOUNT($) | VALUE($) |
Municipal Bonds — continued | ||
Connecticut — continued | ||
City of Hastings Series 2016A, GO, 5.00%, 12/1/2022 | 100,000 | 100,684 |
City of Meriden Series 2016B, GO, 5.00%, 5/15/2023 | 25,000 | 25,458 |
City of New Britain Series 2016A, GO, 5.00%, 3/1/2023 (b) | 15,000 | 15,198 |
City of New Haven | ||
Series 2012A, GO, AGM, 4.00%, 11/1/2022 (b) | 25,000 | 25,070 |
Series 2013B, GO, AGM, 3.75%, 9/1/2023 (b) | 25,000 | 25,308 |
City of Norwalk Series 2020B, GO, 5.00%, 9/1/2022 | 25,000 | 25,000 |
City of Stamford GO, 5.00%, 6/1/2023 | 60,000 | 61,209 |
City of Stamford, Water Pollution Control System and Facility Rev., 5.00%, 9/15/2022 | 25,000 | 25,025 |
City of Waterbury GO, 5.00%, 8/1/2023 | 50,000 | 51,140 |
Connecticut Housing Finance Authority, Housing Mortgage Finance Program | ||
Series E, Subseries E-1, 1.50%, 11/15/2022 | 50,000 | 49,905 |
Subseries A-4, 2.10%, 11/15/2022 | 30,000 | 29,984 |
Series C, Subseries C-1, 2.50%, 11/15/2022 | 5,000 | 5,001 |
Connecticut State Health and Educational Facilities Authority, Connecticut State University System Series L, 4.00%, 11/1/2023 | 100,000 | 100,253 |
Connecticut State Health and Educational Facilities Authority, Middlesex Hospital Series O, 5.00%, 7/1/2023 | 25,000 | 25,454 |
Connecticut State Health and Educational Facilities Authority, Quinnipiac University Series L, 5.00%, 7/1/2023 | 20,000 | 20,413 |
Connecticut State Health and Educational Facilities Authority, Trinity Health Credit Group 3.00%, 12/1/2023 | 100,000 | 100,667 |
Connecticut State Health and Educational Facilities Authority, University System Issue Series L, 3.00%, 11/1/2026 | 120,000 | 120,080 |
Connecticut State Health and Educational Facilities Authority, Yale New Haven Health Issue Series 2010A3, 0.25%, 7/1/2049 (c) | 950,000 | 911,086 |
Connecticut State Health and Educational Facilities Authority, Yale University | ||
Series X-2, 0.25%, 7/1/2037 (c) | 635,000 | 607,273 |
Series 2014A, 1.10%, 7/1/2048 (c) | 1,465,000 | 1,452,239 |
INVESTMENTS | PRINCIPAL AMOUNT($) | VALUE($) |
Connecticut — continued | ||
Hartford County Metropolitan District, Clean Water Project Series 2014A, Rev., 5.00%, 11/1/2022 (b) | 20,000 | 20,090 |
Metropolitan District (The) Series 2015B, GO, 5.00%, 11/1/2022 | 40,000 | 40,182 |
State of Connecticut | ||
Series 2014E, 5.00%, 9/1/2022 | 50,000 | 50,000 |
Series 2012E, 5.00%, 9/15/2022 | 25,000 | 25,024 |
Series 2018F, 5.00%, 9/15/2022 | 230,000 | 230,223 |
Series E, 5.00%, 10/15/2022 | 250,000 | 250,798 |
Series F, 5.00%, 11/15/2022 | 150,000 | 150,810 |
Series 2014C, 5.00%, 12/15/2022 | 135,000 | 136,025 |
Series 2022A, 3.00%, 1/15/2023 | 45,000 | 45,107 |
Series 2015A, 5.00%, 3/15/2023 | 25,000 | 25,349 |
Series 2016B, 5.00%, 5/15/2023 | 35,000 | 35,646 |
Series 2018C, 5.00%, 6/15/2023 | 10,000 | 10,201 |
Series 2014E, 5.00%, 9/1/2023 | 375,000 | 384,475 |
Series 2012E, 5.00%, 9/15/2023 | 265,000 | 265,259 |
Series 2012G, 5.00%, 10/15/2023 | 25,000 | 25,077 |
Series 2013A, 5.00%, 10/15/2023 | 340,000 | 349,599 |
Series 2017A, 5.00%, 4/15/2024 | 35,000 | 36,385 |
Series 2018D, 5.00%, 4/15/2024 | 105,000 | 109,156 |
Series 2012G, 5.00%, 10/15/2024 | 25,000 | 25,073 |
Series 2013A, (SIFMA Municipal Swap Index Yield + 0.99%), 2.66%, 3/1/2025 (d) | 175,000 | 177,453 |
Series 2017A, 5.00%, 4/15/2025 | 1,325,000 | 1,407,301 |
Series 2016B, 5.00%, 5/15/2025 | 200,000 | 212,798 |
Series 2013C, 5.00%, 7/15/2025 | 125,000 | 127,650 |
Series 2012E, 5.00%, 9/15/2025 | 175,000 | 175,171 |
Series 2012E, 5.00%, 9/15/2026 | 50,000 | 50,049 |
Series 2013A, 5.00%, 10/15/2026 | 50,000 | 51,344 |
State of Connecticut Clean Water Fund, State Revolving Fund | ||
Series 2015A, 5.00%, 3/1/2023 | 25,000 | 25,326 |
Series 2013A, 5.00%, 3/1/2024 | 45,000 | 45,565 |
State of Connecticut Special Tax Series 2021D, 5.00%, 11/1/2022 | 120,000 | 120,537 |
State of Connecticut, GAAP Conversion | ||
Series 2013A, 5.00%, 10/15/2022 | 245,000 | 245,782 |
Series 2013A, 5.00%, 10/15/2024 | 25,000 | 25,691 |
State of Connecticut, Special Tax Transportation Infrastructure Purposes | ||
Series A, 5.00%, 9/1/2022 | 220,000 | 220,000 |
Series B, 5.00%, 9/1/2022 | 510,000 | 510,000 |
Series A, 5.00%, 10/1/2022 | 325,000 | 325,717 |
August 31, 2022 | J.P. Morgan Exchange-Traded Funds | 243 |
AS OF August 31, 2022 (Unaudited) (continued)
INVESTMENTS | PRINCIPAL AMOUNT($) | VALUE($) |
Municipal Bonds — continued | ||
Connecticut — continued | ||
Series A, 4.00%, 1/1/2023 | 20,000 | 20,111 |
Series 2018A, 5.00%, 1/1/2023 | 90,000 | 90,794 |
Series 2020A, 5.00%, 5/1/2023 | 65,000 | 66,131 |
Series B, 5.00%, 8/1/2023 | 25,000 | 25,590 |
5.00%, 9/1/2023 | 25,000 | 25,642 |
5.00%, 1/1/2024 | 375,000 | 378,178 |
Series 2018A, 5.00%, 1/1/2024 | 20,000 | 20,672 |
Series A, 5.00%, 1/1/2024 | 35,000 | 35,297 |
Series A, 5.00%, 10/1/2024 | 55,000 | 56,523 |
Series A, 5.00%, 1/1/2025 | 955,000 | 963,366 |
Series B, 5.00%, 1/1/2025 | 20,000 | 20,175 |
Series A, 5.00%, 10/1/2025 | 50,000 | 51,422 |
State of Connecticut, Tax-Exempt Series 2018E, 5.00%, 9/15/2022 | 230,000 | 230,223 |
Town of Avon 3.00%, 10/15/2022 | 95,000 | 95,092 |
Town of Berlin | ||
Series 2016B, 5.00%, 9/1/2022 | 80,000 | 80,000 |
5.00%, 12/1/2022 | 50,000 | 50,342 |
Town of Bethel 5.00%, 11/15/2022 | 165,000 | 165,928 |
Town of Branford 3.13%, 8/1/2034 (b) | 30,000 | 30,201 |
Town of Brookfield Series 2018A, 5.00%, 11/15/2022 | 45,000 | 45,249 |
Town of East Haddam Series 2020A, GO, 4.00%, 12/1/2022 | 40,000 | 40,169 |
Town of East Hampton Series 2020A, GO, 4.00%, 9/1/2022 | 40,000 | 40,000 |
Town of East Hartford GO, 4.00%, 10/15/2022 | 20,000 | 20,043 |
Town of East Lyme GO, 5.00%, 8/15/2023 | 35,000 | 35,857 |
Town of East Windsor GO, 3.00%, 10/15/2022 | 75,000 | 75,068 |
Town of Griswold GO, 5.00%, 9/15/2022 | 25,000 | 25,025 |
Town of Groton Series 2020A, GO, 5.00%, 10/15/2022 | 25,000 | 25,082 |
Town of North Haven GO, 4.00%, 11/1/2022 | 20,000 | 20,059 |
Town of Plainville GO, 4.00%, 9/1/2022 | 50,000 | 50,000 |
Town of South Windsor | ||
GO, 5.00%, 2/1/2023 | 25,000 | 25,285 |
Series 2017B, GO, 3.00%, 8/15/2023 | 30,000 | 30,181 |
Town of Southington Series 2015B, GO, 5.00%, 9/1/2022 | 25,000 | 25,000 |
Town of Stonington Series 2012A, GO, 4.00%, 9/1/2022 | 70,000 | 70,000 |
Town of Stratford GO, 5.00%, 12/15/2022 (b) | 225,000 | 226,731 |
INVESTMENTS | PRINCIPAL AMOUNT($) | VALUE($) |
Connecticut — continued | ||
Town of Trumbull | ||
GO, 4.00%, 9/1/2022 | 25,000 | 25,000 |
Series 2020A, GO, 4.00%, 9/1/2022 | 75,000 | 75,000 |
Series 2017B, GO, 5.00%, 9/1/2022 | 35,000 | 35,000 |
Series 2021B, GO, 4.00%, 9/15/2022 | 20,000 | 20,013 |
Town of Wilton Series 2021B, GO, 5.00%, 9/15/2022 | 20,000 | 20,020 |
Town of Wolcott Series 2017A, GO, 5.00%, 10/15/2022 | 20,000 | 20,066 |
University of Connecticut | ||
Series 2019A, Rev., 5.00%, 11/1/2022 | 1,280,000 | 1,285,808 |
Series A, Rev., 4.00%, 2/15/2023 | 25,000 | 25,198 |
Series 2015A, Rev., 5.00%, 2/15/2023 | 135,000 | 136,672 |
Series 2020A, Rev., 5.00%, 2/15/2023 | 975,000 | 987,079 |
Series A, Rev., 5.00%, 3/15/2023 | 145,000 | 147,111 |
Series 2013A, Rev., 5.00%, 2/15/2024 | 120,000 | 121,497 |
Series 2015A, Rev., 5.00%, 2/15/2026 | 25,000 | 26,483 |
University of Connecticut, Special Obligation Student Fee Series 2012A, Rev., 5.00%, 11/15/2023 | 400,000 | 402,317 |
Total Connecticut | 16,328,602 | |
Delaware — 0.1% | ||
City of Newark GO, 3.00%, 9/15/2022 | 80,000 | 80,023 |
City of Wilmington GO, 5.00%, 12/1/2022 | 50,000 | 50,334 |
County of New Castle GO, 5.00%, 4/1/2024 | 25,000 | 26,042 |
County of Sussex Series 2012A, GO, 4.00%, 9/15/2022 (b) | 90,000 | 90,058 |
Delaware River and Bay Authority | ||
Series B, Rev., 5.00%, 1/1/2023 | 170,000 | 171,448 |
Series 2012B, Rev., 5.00%, 1/1/2024 | 25,000 | 25,175 |
Series C, Rev., 5.00%, 1/1/2027 | 85,000 | 87,676 |
Delaware State Economic Development Authority, Delmarva Power and Light Co. Project Series 2020A, Rev., 1.05%, 7/1/2025 (c) | 715,000 | 676,025 |
Delaware Transportation Authority Rev., 5.00%, 9/1/2025 | 100,000 | 107,245 |
Delaware Transportation Authority, Transportation System Rev., 5.00%, 7/1/2023 | 120,000 | 120,280 |
State of Delaware Series 2016C, GO, 5.00%, 3/1/2023 | 30,000 | 30,409 |
University of Delaware | ||
Rev., 5.00%, 11/1/2022 | 25,000 | 25,114 |
244 | J.P. Morgan Exchange-Traded Funds | August 31, 2022 |
INVESTMENTS | PRINCIPAL AMOUNT($) | VALUE($) |
Municipal Bonds — continued | ||
Delaware — continued | ||
Series 2013A, Rev., 5.00%, 11/1/2022 (b) | 70,000 | 70,315 |
Series 2019A, Rev., 5.00%, 11/1/2022 | 60,000 | 60,273 |
Series 2013A, Rev., 5.00%, 5/1/2023 (b) | 25,000 | 25,443 |
Total Delaware | 1,645,860 | |
District of Columbia — 0.9% | ||
District of Columbia | ||
Series 2019A, GO, 5.00%, 10/15/2022 | 150,000 | 150,492 |
Series D, GO, 5.00%, 6/1/2023 | 25,000 | 25,495 |
Series 2013A, GO, 5.00%, 6/1/2024 | 225,000 | 229,425 |
Series 2013A, GO, 5.00%, 6/1/2026 | 35,000 | 35,682 |
District of Columbia Housing Finance Agency, Multi-Family Development Program | ||
Series 2019B-2, Rev., FHA, 1.70%, 3/1/2023 | 165,000 | 164,290 |
Series 2019B-1, Rev., FHA, 1.75%, 9/1/2023 (c) | 545,000 | 537,882 |
District of Columbia Housing Finance Agency, Paxton Project Series 2022, Rev., 4.00%, 9/1/2025 (c) | 3,750,000 | 3,821,725 |
District of Columbia, Deed Tax Series 2012A, Rev., 5.00%, 6/1/2023 | 20,000 | 20,041 |
District of Columbia, Federal Highway | ||
Rev., 5.00%, 12/1/2022 | 75,000 | 75,495 |
Rev., 5.00%, 12/1/2022 | 20,000 | 20,132 |
Rev., 5.00%, 12/1/2024 | 320,000 | 321,990 |
Rev., 5.00%, 12/1/2024 | 175,000 | 184,578 |
District of Columbia, Gallery Place Project Rev., 5.00%, 6/1/2024 | 100,000 | 100,211 |
District of Columbia, Income Tax | ||
Series 2019C, Rev., 5.00%, 10/1/2022 | 55,000 | 55,126 |
Series 2020B, Rev., 5.00%, 10/1/2022 | 105,000 | 105,241 |
Series 2012C, Rev., 3.25%, 12/1/2022 | 25,000 | 25,068 |
Series 2012A, Rev., 4.00%, 12/1/2022 | 125,000 | 125,572 |
Series 2012C, Rev., 4.00%, 12/1/2022 | 185,000 | 185,846 |
Series 2012A, Rev., 5.00%, 12/1/2022 | 405,000 | 407,691 |
Series 2012A, Rev., 5.00%, 12/1/2022 | 115,000 | 115,807 |
Series 2012B, Rev., 5.00%, 12/1/2022 | 120,000 | 120,797 |
Series 2012C, Rev., 5.00%, 12/1/2022 | 205,000 | 206,362 |
Series 2012C, Rev., 5.00%, 12/1/2022 | 180,000 | 181,264 |
Series 2012D, Rev., 5.00%, 12/1/2022 | 25,000 | 25,175 |
Series 2014A, Rev., 5.00%, 12/1/2022 | 245,000 | 246,720 |
Series 2019A, Rev., 5.00%, 3/1/2023 | 60,000 | 60,839 |
INVESTMENTS | PRINCIPAL AMOUNT($) | VALUE($) |
District of Columbia — continued | ||
District of Columbia, The Catholic University of America Issue Rev., 5.00%, 10/1/2022 | 230,000 | 230,460 |
District of Columbia, Water and Sewer Authority, Public Utility, Senior Lien | ||
Series 2017B, Rev., 5.00%, 10/1/2022 | 75,000 | 75,162 |
Rev., AGM, 5.50%, 10/1/2023 | 150,000 | 152,820 |
District of Columbia, Water and Sewer Authority, Public Utility, Subordinate Lien | ||
Series A, Rev., 4.00%, 10/1/2022 | 25,000 | 25,036 |
Series 2014C, Rev., 5.00%, 10/1/2022 | 100,000 | 100,224 |
Series A, Rev., 5.00%, 10/1/2022 | 290,000 | 290,650 |
Series C, Rev., 5.00%, 10/1/2022 | 475,000 | 476,036 |
Series 2014C, Rev., 5.00%, 10/1/2024 | 25,000 | 26,318 |
Metropolitan Washington Airports Authority Aviation | ||
Subseries C-2, Rev., VRDO, LOC : TD Bank NA, 1.48%, 9/12/2022 (c) | 20,000,000 | 20,000,000 |
Series 2013C, Rev., 5.00%, 10/1/2022 | 20,000 | 20,042 |
Series B, Rev., 5.00%, 10/1/2022 | 200,000 | 200,425 |
Metropolitan Washington Airports Authority Dulles Toll Road, Capital Appreciation Series 2009B, Rev., AGC, Zero Coupon, 10/1/2022 | 80,000 | 79,825 |
Washington Metropolitan Area Transit Authority Series 2017B, Rev., 5.00%, 7/1/2024 | 20,000 | 20,889 |
Total District of Columbia | 29,246,833 | |
Florida — 4.2% | ||
Alachua County Health Facilities Authority, Shands Teaching Hospital and Clinic Series 2019B-1, 5.00%, 12/1/2022 | 205,000 | 206,146 |
Brevard County School District Series 2013A, 5.00%, 7/1/2023 | 195,000 | 199,089 |
Broward County, Water and Sewer Utility | ||
Series B, 5.00%, 10/1/2022 | 115,000 | 115,258 |
Series A, 5.00%, 10/1/2037 (b) | 225,000 | 225,500 |
Capital Trust Agency, Inc., Mission Spring Apartments Project Series 2017A, 4.38%, 12/1/2052 (b) | 125,000 | 131,802 |
Capital Trust Agency, Inc., Multi-Family Housing, Mission Springs Apartments Project Series A, 4.25%, 12/1/2042 (b) | 620,000 | 653,550 |
Capital Trust Agency, Inc., Multi-Family, GMF Jacksonville Pool Project Series 2012A, 3.75%, 12/1/2026 (b) | 155,000 | 155,506 |
August 31, 2022 | J.P. Morgan Exchange-Traded Funds | 245 |
AS OF August 31, 2022 (Unaudited) (continued)
INVESTMENTS | PRINCIPAL AMOUNT($) | VALUE($) |
Municipal Bonds — continued | ||
Florida — continued | ||
Capital Trust Agency, Inc., Multi-Family, GMF Windsor Cove Apartments Series 2012A, 4.63%, 11/1/2035 (b) | 125,000 | 125,443 |
Capital Trust Agency, Inc., Sustainability Bonds -The Marie | ||
4.00%, 6/15/2023 | 575,000 | 572,378 |
4.00%, 6/15/2024 | 1,000,000 | 987,411 |
4.00%, 6/15/2025 | 240,000 | 234,851 |
Central Florida Expressway Authority, Senior Lien | ||
5.00%, 7/1/2023 | 10,000 | 10,205 |
Series 2016B, 5.00%, 7/1/2025 | 25,000 | 26,686 |
City of Apopka, Utility System 5.00%, 10/1/2023 | 30,000 | 30,065 |
City of Bradenton, Special Obligation 4.00%, 9/1/2022 | 25,000 | 25,000 |
City of Cape Coral, Water & Sewer 5.00%, 10/1/2022 | 25,000 | 25,053 |
City of Clearwater, Stormwater System 4.75%, 11/1/2022 | 85,000 | 85,337 |
City of Clearwater, Water and Sewer | ||
5.00%, 12/1/2022 | 50,000 | 50,328 |
5.00%, 12/1/2023 | 50,000 | 51,579 |
City of Cocoa 4.00%, 10/1/2022 | 25,000 | 25,034 |
City of Delray Beach Rev., 5.00%, 6/1/2023 | 40,000 | 40,773 |
City of Deltona, Utility System Rev., 5.00%, 10/1/2023 (b) | 25,000 | 25,680 |
City of Fort Lauderdale Water and Sewer Rev., 5.00%, 9/1/2022 | 25,000 | 25,000 |
City of Fort Myers | ||
Series 2014A, Rev., 3.00%, 12/1/2022 | 50,000 | 50,079 |
Series 2018A, Rev., 5.00%, 12/1/2022 | 35,000 | 35,226 |
City of Gainesville, Utilities System | ||
Series 2012A, Rev., 2.50%, 10/1/2022 | 370,000 | 370,052 |
Series 2012A, Rev., 5.00%, 10/1/2022 | 850,000 | 851,854 |
City of Hallandale Beach Rev., 5.00%, 10/1/2023 | 25,000 | 25,661 |
City of Jacksonville | ||
Series 2012A, Rev., 4.25%, 10/1/2022 (b) | 60,000 | 60,095 |
Rev., 5.00%, 10/1/2022 | 60,000 | 60,131 |
Series 2012A, Rev., 5.00%, 10/1/2022 (b) | 740,000 | 741,644 |
Series 2012B, Rev., 5.00%, 10/1/2022 | 665,000 | 666,467 |
Series 2012C, Rev., 5.00%, 10/1/2022 | 350,000 | 350,749 |
Series 2020A, Rev., 5.00%, 10/1/2022 | 250,000 | 250,547 |
INVESTMENTS | PRINCIPAL AMOUNT($) | VALUE($) |
Florida — continued | ||
Series C, Rev., 5.00%, 10/1/2022 | 140,000 | 140,307 |
Series C, Rev., 5.00%, 10/1/2022 | 235,000 | 235,503 |
Rev., 5.00%, 10/1/2023 | 10,000 | 10,280 |
City of Jacksonville, Better Jacksonville Sales Tax | ||
Rev., 5.00%, 10/1/2022 | 145,000 | 145,316 |
Rev., 5.00%, 10/1/2022 | 700,000 | 701,544 |
City of Jacksonville, Florida Power and Light Co., Project Series 1995, Rev., VRDO, 1.17%, 9/1/2022 (c) | 3,150,000 | 3,150,000 |
City of Jacksonville, Sales Tax | ||
Rev., 5.00%, 10/1/2022 | 4,705,000 | 4,715,265 |
Rev., 5.00%, 10/1/2022 | 65,000 | 65,143 |
City of Lakeland, Department of Electric Utilities | ||
Rev., 5.00%, 10/1/2022 | 65,000 | 65,146 |
Rev., 5.00%, 10/1/2023 | 25,000 | 25,717 |
Rev., 5.00%, 10/1/2026 | 20,000 | 21,679 |
City of Lakeland, Lakeland Regional Health Systems Rev., 5.00%, 11/15/2022 | 50,000 | 50,235 |
City of Miami Rev., 5.00%, 3/1/2023 (b) (e) | 5,000,000 | 5,049,827 |
City of Miami Beach, Stormwater Rev., 5.00%, 9/1/2022 | 220,000 | 220,000 |
City of Miramar, Utility System Rev., 5.00%, 10/1/2022 | 150,000 | 150,337 |
City of Oakland Park, Water and Sewer Rev., 5.00%, 9/1/2022 | 30,000 | 30,000 |
City of Ocoee, Capital Improvement Rev., 5.00%, 10/1/2022 | 120,000 | 120,256 |
City of Ocoee, Water and Sewer System Rev., 5.00%, 10/1/2022 | 20,000 | 20,043 |
City of Orlando, Capital Improvement | ||
Series 2016B, Rev., 5.00%, 10/1/2022 | 25,000 | 25,056 |
Series B, Rev., 5.00%, 10/1/2022 | 240,000 | 240,537 |
Series C, Rev., 5.00%, 10/1/2022 | 25,000 | 25,056 |
Series 2016B, Rev., 5.00%, 10/1/2024 | 25,000 | 26,318 |
City of Orlando, Florida Contract Tourist Development Tax Payments | ||
Series 2014A, Rev., 5.00%, 11/1/2022 (b) | 50,000 | 50,221 |
Series 2014A, Rev., 5.00%, 5/1/2024 (b) | 20,000 | 20,839 |
City of Palm Coast, Utility System Rev., 5.00%, 10/1/2022 | 55,000 | 55,119 |
City of Pembroke Pines GO, 5.00%, 9/1/2022 | 30,000 | 30,000 |
246 | J.P. Morgan Exchange-Traded Funds | August 31, 2022 |
INVESTMENTS | PRINCIPAL AMOUNT($) | VALUE($) |
Municipal Bonds — continued | ||
Florida — continued | ||
City of Pompano Beach, John Knox Village Project | ||
Rev., 3.25%, 9/1/2022 | 145,000 | 145,000 |
Series 2021B-2, Rev., 1.45%, 1/1/2027 | 760,000 | 677,456 |
City of Port St. Lucie, Utility System | ||
Rev., 5.00%, 9/1/2022 (b) | 295,000 | 295,000 |
Rev., 5.00%, 9/1/2022 | 30,000 | 30,000 |
Rev., NATL-RE, 5.25%, 9/1/2022 | 120,000 | 120,000 |
City of Sarasota, St. Armands Paid Parking Area Improvements | ||
Series 2017B, Rev., 3.00%, 10/1/2022 | 25,000 | 25,016 |
Series 2017A, Rev., 4.00%, 10/1/2023 | 25,000 | 25,412 |
City of St. Petersburg, Public Service Tax Series 2016A, Rev., 4.00%, 10/1/2022 | 215,000 | 215,303 |
City of St. Petersburg, Public Utility | ||
Rev., 3.00%, 10/1/2022 | 25,000 | 25,015 |
Series 2013A, Rev., 3.00%, 10/1/2022 | 30,000 | 30,018 |
Series 2013A, Rev., 3.75%, 10/1/2022 (b) | 25,000 | 25,030 |
Series 2013A, Rev., 4.00%, 10/1/2022 (b) | 65,000 | 65,089 |
Series 2013B, Rev., 4.00%, 10/1/2022 (b) | 50,000 | 50,069 |
Series 2013C, Rev., 5.00%, 10/1/2022 | 25,000 | 25,055 |
Series 2014B, Rev., 5.00%, 10/1/2022 | 20,000 | 20,044 |
Series 2016C, Rev., 5.00%, 10/1/2022 | 55,000 | 55,121 |
Series 2014B, Rev., 5.00%, 10/1/2023 | 30,000 | 30,835 |
City of Tallahassee | ||
Rev., 5.00%, 10/1/2022 | 120,000 | 120,265 |
Rev., 5.00%, 10/1/2023 | 150,000 | 150,340 |
Rev., 5.00%, 10/1/2024 | 200,000 | 200,402 |
City of Tallahassee, Energy System Rev., 5.00%, 10/1/2022 | 80,000 | 80,176 |
City of Tallahassee, Utility System Rev., 5.00%, 10/1/2023 | 30,000 | 30,845 |
City of Tampa, Capital Improvement Cigarette Tax Allocation, H. Lee Moffitt Cancer Center Project Series 2012A, Rev., 5.00%, 9/1/2022 | 100,000 | 100,000 |
City of Tampa, Sales Tax Rev., 5.00%, 10/1/2022 | 225,000 | 225,500 |
City of Tampa, Utilities Tax Series 2012A, Rev., 5.00%, 10/1/2022 | 50,000 | 50,111 |
City of Venice, Utility System | ||
Rev., 3.13%, 12/1/2022 (b) | 25,000 | 25,053 |
Rev., 3.50%, 12/1/2022 (b) | 25,000 | 25,076 |
Rev., 3.63%, 12/1/2022 (b) | 20,000 | 20,067 |
INVESTMENTS | PRINCIPAL AMOUNT($) | VALUE($) |
Florida — continued | ||
Rev., 5.00%, 12/1/2022 (b) | 50,000 | 50,338 |
City of West Palm Beach, Utility System | ||
Series 2017C, Rev., 5.00%, 10/1/2022 | 25,000 | 25,056 |
Series 2012A, Rev., 5.00%, 10/1/2023 | 100,000 | 100,216 |
City of Winter Haven Series 2015A, Rev., 4.00%, 10/1/2022 | 20,000 | 20,028 |
City of Winter Park Rev., 5.00%, 10/1/2022 | 25,000 | 25,054 |
County of Bay, Water and Sewer System Series 2015A, 2.25%, 9/1/2022 | 25,000 | 25,000 |
County of Bay, Wholesale Water System 5.00%, 9/1/2022 | 30,000 | 30,000 |
County of Brevard, Water and Wastewater Utility | ||
5.00%, 9/1/2022 | 80,000 | 80,000 |
5.00%, 9/1/2023 | 40,000 | 40,979 |
County of Broward, Airport System | ||
Series 2013C, 5.00%, 10/1/2022 | 195,000 | 195,416 |
Series P-2, 5.00%, 10/1/2022 | 270,000 | 270,576 |
Series Q-1, 5.00%, 10/1/2022 | 155,000 | 155,331 |
Series P-2, 5.00%, 10/1/2023 | 415,000 | 415,839 |
Series Q-1, 5.00%, 10/1/2023 | 540,000 | 541,092 |
Series Q-1, 5.00%, 10/1/2024 | 280,000 | 280,623 |
Series Q-1, 5.00%, 10/1/2025 | 195,000 | 195,432 |
Series Q-1, 5.00%, 10/1/2026 (b) | 25,000 | 25,056 |
Series 2013C, 5.25%, 10/1/2026 | 400,000 | 412,269 |
Series Q-1, 5.00%, 10/1/2037 (b) | 170,000 | 170,378 |
County of Broward, Half-Cent Sales Tax 5.00%, 10/1/2023 | 30,000 | 30,828 |
County of Broward, Port Facilities Series 2019C, 5.00%, 9/1/2022 | 150,000 | 150,000 |
County of Citrus, Capital Improvement 5.00%, 10/1/2022 | 70,000 | 70,140 |
County of Citrus, Water and Wastewater System 5.00%, 10/1/2022 | 45,000 | 45,099 |
County of Clay, Sales Surtax 5.00%, 10/1/2022 | 25,000 | 25,054 |
County of Escambia Rev., 5.00%, 10/1/2022 | 120,000 | 120,265 |
County of Escambia, Sales Tax Rev., 5.00%, 10/1/2022 | 25,000 | 25,055 |
County of Hernando, Water and Sewer Series 2013A, Rev., 5.00%, 6/1/2023 (b) | 40,000 | 40,704 |
County of Hillsborough, Communications Services Tax Rev., 5.00%, 10/1/2024 | 35,000 | 36,859 |
August 31, 2022 | J.P. Morgan Exchange-Traded Funds | 247 |
AS OF August 31, 2022 (Unaudited) (continued)
INVESTMENTS | PRINCIPAL AMOUNT($) | VALUE($) |
Municipal Bonds — continued | ||
Florida — continued | ||
County of Hillsborough, Community Investment Tax | ||
Rev., 5.00%, 11/1/2022 | 150,000 | 150,666 |
Series 2012B, Rev., 5.00%, 11/1/2022 | 155,000 | 155,688 |
Rev., 5.00%, 11/1/2025 | 25,000 | 26,827 |
County of Lee Rev., 5.00%, 10/1/2022 | 125,000 | 125,280 |
County of Lee, Tourist Development Tax Series 2019A, Rev., 5.00%, 10/1/2024 | 25,000 | 26,245 |
County of Lee, Transportation Facilities Rev., AGM, 5.00%, 10/1/2022 | 490,000 | 491,049 |
County of Lee, Water and Sewer | ||
Series 2012A, Rev., 5.00%, 10/1/2022 (b) | 20,000 | 20,044 |
Series 2012B, Rev., 5.00%, 10/1/2022 (b) | 50,000 | 50,111 |
Series 2013B, Rev., 5.00%, 10/1/2022 | 155,000 | 155,347 |
Series A, Rev., 5.00%, 10/1/2022 | 20,000 | 20,045 |
Series A, Rev., 4.25%, 10/1/2023 (b) | 25,000 | 25,500 |
Series A, Rev., 5.00%, 10/1/2023 (b) | 40,000 | 41,131 |
Series B, Rev., 5.00%, 10/1/2023 | 55,000 | 56,531 |
County of Manatee, Public Utilities Rev., 5.00%, 10/1/2022 | 200,000 | 200,450 |
County of Manatee, Transportation Projects Rev., 5.00%, 10/1/2022 | 25,000 | 25,056 |
County of Miami-Dade, Aviation System | ||
Series A, Rev., 5.00%, 10/1/2022 | 1,090,000 | 1,092,181 |
Series B, Rev., 5.00%, 10/1/2022 | 145,000 | 145,290 |
Series B, Rev., 4.00%, 10/1/2023 | 225,000 | 225,230 |
Series 2012B, Rev., 5.00%, 10/1/2024 | 400,000 | 400,890 |
County of Miami-Dade, Building Better Communities Program | ||
Series 2015-D, GO, 5.00%, 7/1/2023 | 25,000 | 25,551 |
Series 2016A, GO, 5.00%, 7/1/2023 | 25,000 | 25,551 |
Series 2016A, GO, 5.00%, 7/1/2024 | 30,000 | 31,372 |
County of Miami-Dade, Parks Program | ||
Series 2011B, GO, 3.50%, 11/1/2022 | 30,000 | 30,031 |
Series 2015A, GO, 5.00%, 11/1/2022 | 110,000 | 110,501 |
County of Miami-Dade, Solid Waste System Rev., 5.00%, 10/1/2022 | 70,000 | 70,152 |
County of Miami-Dade, Special Obligation | ||
Series B, Rev., AGM, 4.00%, 10/1/2022 (b) | 50,000 | 50,069 |
Series 2012A, Rev., 5.00%, 10/1/2022 (b) | 175,000 | 175,389 |
Series A, Rev., 5.00%, 10/1/2022 (b) | 90,000 | 90,200 |
Series B, Rev., 5.00%, 10/1/2022 (b) | 175,000 | 175,389 |
INVESTMENTS | PRINCIPAL AMOUNT($) | VALUE($) |
Florida — continued | ||
Series B, Rev., AGM, 5.00%, 10/1/2022 (b) | 50,000 | 50,111 |
County of Miami-Dade, Subordinate Special Obligation Series A, Rev., 5.00%, 10/1/2022 (b) | 35,000 | 35,078 |
County of Miami-Dade, Water and Sewer System | ||
Rev., 5.00%, 10/1/2022 | 180,000 | 180,393 |
Series 2013A, Rev., 5.00%, 10/1/2022 (b) | 45,000 | 45,100 |
Series A, Rev., 5.00%, 10/1/2022 (b) | 80,000 | 80,178 |
Series 2008B, Rev., AGM, 5.25%, 10/1/2022 | 120,000 | 120,294 |
Series B, Rev., 5.00%, 10/1/2023 (b) | 20,000 | 20,565 |
Series B, Rev., 5.25%, 10/1/2023 (b) | 20,000 | 20,618 |
County of Okaloosa, Sales Tax | ||
Rev., 5.00%, 10/1/2022 | 130,000 | 130,292 |
Rev., 5.00%, 10/1/2023 | 25,000 | 25,696 |
County of Orange, Water Utility System Rev., 5.00%, 10/1/2022 | 20,000 | 20,045 |
County of Osceola, Sales Tax Series 2016A, Rev., 4.00%, 10/1/2022 | 280,000 | 280,374 |
County of Palm Beach | ||
Rev., 5.00%, 11/1/2022 | 25,000 | 25,114 |
Rev., 5.00%, 11/1/2023 | 30,000 | 30,911 |
County of Palm Beach, Public Improvement Series 2014A, Rev., 5.00%, 11/1/2022 | 30,000 | 30,137 |
County of Palm Beach, Water and Sewer, FPL Reclaimed Water Project Rev., 5.00%, 10/1/2022 | 35,000 | 35,079 |
County of Pasco, Fire-Rescue Projects Series 2019B, GO, 5.00%, 10/1/2023 | 35,000 | 35,986 |
County of Pasco, Half-Cent Sales Tax and Improvement Series 2013A, Rev., 5.00%, 12/1/2022 | 295,000 | 296,982 |
County of Pasco, Water and Sewer Series 2014A, Rev., 5.00%, 10/1/2022 | 70,000 | 70,154 |
County of Pinellas, Sewer System Rev., 5.00%, 10/1/2022 (b) | 165,000 | 165,360 |
County of Polk, Public Facilities Rev., 4.00%, 12/1/2022 | 25,000 | 25,107 |
County of Polk, Utility System | ||
Rev., 5.00%, 10/1/2022 | 285,000 | 285,641 |
Rev., 5.00%, 10/1/2023 (b) | 10,000,000 | 10,228,670 |
County of Sarasota | ||
Rev., 5.00%, 10/1/2022 | 190,000 | 190,404 |
Rev., 5.00%, 10/1/2023 | 25,000 | 25,677 |
248 | J.P. Morgan Exchange-Traded Funds | August 31, 2022 |
INVESTMENTS | PRINCIPAL AMOUNT($) | VALUE($) |
Municipal Bonds — continued | ||
Florida — continued | ||
County of Sarasota, Infrastructure Sales Surtax Rev., 5.00%, 10/1/2022 | 190,000 | 190,404 |
County of Sarasota, Utility System | ||
Rev., 5.00%, 10/1/2022 | 100,000 | 100,225 |
Rev., 5.00%, 10/1/2023 (b) | 25,000 | 25,707 |
County of Seminole, Water and Sewer System | ||
Series 2015A, Rev., 5.00%, 10/1/2022 | 20,000 | 20,045 |
Series 2015B, Rev., 5.00%, 10/1/2022 | 75,000 | 75,169 |
County of St. Johns, Sales Tax Rev., AGM, 5.00%, 10/1/2023 | 35,000 | 35,985 |
County of St. Johns, Transportation Improvement Rev., AGM, 5.00%, 10/1/2022 | 45,000 | 45,099 |
County of St. Johns, Water and Sewer System Series A, Rev., 5.00%, 12/1/2022 (b) | 75,000 | 75,508 |
County of St. Lucie, Power and Light Co. Project Rev., VRDO, 1.16%, 9/1/2022 (c) | 45,750,000 | 45,750,000 |
Escambia County Housing Finance Authority, Multi-County Program Series 2019B, Rev., GNMA COLL, 1.65%, 4/1/2023 | 75,000 | 74,555 |
Escambia County School Board, Sales Tax Rev., 5.00%, 9/1/2022 | 140,000 | 140,000 |
Florida Department of Children and Families, Evaluation Treatment Center Financing Corp. Project Series 2021A, COP, 5.00%, 10/1/2022 | 30,000 | 30,062 |
Florida Department of Management Services | ||
Series 2018A, COP, 5.00%, 11/1/2022 | 135,000 | 135,592 |
Series 2021A, COP, 5.00%, 11/1/2022 | 495,000 | 497,172 |
Series 2015A, COP, 5.00%, 8/1/2024 | 115,000 | 120,552 |
Series 2018A, COP, 5.00%, 11/1/2024 | 25,000 | 26,357 |
Series 2018A, COP, 5.00%, 11/1/2026 | 20,000 | 21,967 |
Florida Development Finance Corp., Nova Southeastern University Project Series 2020A, Rev., 5.00%, 4/1/2025 | 190,000 | 198,773 |
Florida Governmental Utility Authority, North Fort Myers Utility System Rev., AGM, 5.00%, 10/1/2022 | 70,000 | 70,150 |
Florida Gulf Coast University Financing Corp., Housing Project | ||
Series A, Rev., VRDO, LOC : TD Bank NA, 1.50%, 9/12/2022 (c) | 10,300,000 | 10,300,000 |
Series 2020A, Rev., 5.00%, 2/1/2023 | 120,000 | 121,096 |
INVESTMENTS | PRINCIPAL AMOUNT($) | VALUE($) |
Florida — continued | ||
Series 2020A, Rev., 5.00%, 2/1/2025 | 115,000 | 120,531 |
Florida Higher Educational Facilities Financial Authority, Nova Southeast University Rev., 5.00%, 4/1/2025 | 135,000 | 141,233 |
Florida Higher Educational Facilities Financial Authority, Rollins College Project | ||
Series 2012A, Rev., 2.63%, 12/1/2022 (b) | 50,000 | 50,042 |
Series 2012B, Rev., 3.00%, 12/1/2022 | 50,000 | 50,073 |
Series 2012A, Rev., 3.50%, 12/1/2022 (b) | 55,000 | 55,160 |
Series 2012A, Rev., 5.00%, 12/1/2022 (b) | 100,000 | 100,665 |
Florida Municipal Power Agency, All-Requirements Power Supply Project | ||
Series 2015B, Rev., 5.00%, 10/1/2022 | 30,000 | 30,065 |
Series 2016A, Rev., 5.00%, 10/1/2022 | 135,000 | 135,293 |
Florida Municipal Power Agency, Stanton II Project | ||
Series 2012A, Rev., 5.00%, 10/1/2022 (b) | 270,000 | 270,589 |
Series 2012A, Rev., 5.00%, 10/1/2022 | 415,000 | 415,905 |
FSU Financial Assistance, Inc. | ||
Series 2012C, Rev., 4.00%, 10/1/2022 | 25,000 | 25,033 |
Series C, Rev., 5.00%, 10/1/2022 | 25,000 | 25,053 |
Series 2012C, Rev., 3.00%, 10/1/2025 | 100,000 | 100,014 |
Greater Orlando Aviation Authority, Airport Facilities Series 2016B, Rev., 5.00%, 10/1/2022 | 95,000 | 95,202 |
Hillsborough County School Board | ||
Series 2015B, Rev., AGM, 5.00%, 10/1/2022 | 85,000 | 85,178 |
Series 2017A, COP, 5.00%, 7/1/2023 | 25,000 | 25,506 |
Hollywood Community Redevelopment Agency Rev., 5.00%, 3/1/2023 | 40,000 | 40,470 |
Inland Protection Financing Corp. Series 2019A, Rev., 5.00%, 7/1/2023 | 30,000 | 30,624 |
Jacksonville Transportation Authority, Senior Lien Gas Tax Rev., 5.00%, 8/1/2024 | 25,000 | 26,173 |
JEA Electric System | ||
Series 2013A, Rev., 5.00%, 10/1/2022 | 630,000 | 631,364 |
Series 2013A, Rev., 5.00%, 10/1/2022 (b) | 100,000 | 100,214 |
Series 2013A, Rev., 5.00%, 10/1/2022 (b) | 60,000 | 60,131 |
August 31, 2022 | J.P. Morgan Exchange-Traded Funds | 249 |
AS OF August 31, 2022 (Unaudited) (continued)
INVESTMENTS | PRINCIPAL AMOUNT($) | VALUE($) |
Municipal Bonds — continued | ||
Florida — continued | ||
Series 2015A, Rev., 5.00%, 10/1/2022 (b) | 20,000 | 20,044 |
Series A, Rev., 5.00%, 10/1/2022 | 175,000 | 175,379 |
Series B, Rev., 5.00%, 10/1/2022 | 100,000 | 100,217 |
JEA Water and Sewer System | ||
Series 2008A-1, Rev., VRDO, LIQ : U.S. Bank NA, 1.05%, 9/1/2022 (c) | 14,100,000 | 14,100,000 |
Series 2013A, Rev., 5.00%, 10/1/2022 (b) | 185,000 | 185,404 |
Series 2013A, Rev., 5.00%, 10/1/2022 (b) | 30,000 | 30,064 |
Key West Utility Board, Electric System | ||
Rev., 5.00%, 10/1/2022 | 20,000 | 20,044 |
Rev., 5.00%, 10/1/2023 | 25,000 | 25,704 |
Lee County School Board (The) Series 2012B, COP, 5.00%, 8/1/2023 | 30,000 | 30,064 |
Lee Memorial Health System | ||
Series 2019A-1, Rev., 5.00%, 4/1/2023 | 20,000 | 20,259 |
Series A-1, Rev., 5.00%, 4/1/2025 | 160,000 | 168,037 |
Leon County School District, Sales Tax Rev., 5.00%, 9/1/2022 | 65,000 | 65,000 |
Manatee County School District, Sales Tax Rev., AGM, 5.00%, 10/1/2022 | 50,000 | 50,106 |
Marion County School Board Series 2015B, COP, 5.00%, 6/1/2023 | 20,000 | 20,384 |
Martin County Health Facilities Authority, Martin Memorial Medical Center Rev., 5.00%, 11/15/2022 (b) | 45,000 | 45,232 |
Martin County School District, Florida Master Lease Program COP, 5.00%, 10/1/2022 | 160,000 | 160,343 |
Miami-Dade County Expressway Authority, Toll System | ||
Series 2014B, Rev., 5.00%, 7/1/2023 | 30,000 | 30,532 |
Series 2014B, Rev., 5.00%, 7/1/2025 | 220,000 | 229,295 |
Miami-Dade County Health Facilities Authority, Miami Children's Hospital Rev., 5.00%, 8/1/2023 (b) | 25,000 | 25,590 |
Miami-Dade County Health Facilities Authority, Niklaus Children's Hospital Rev., 5.00%, 8/1/2023 | 25,000 | 25,497 |
Miami-Dade County Housing Finance Authority, Multi-family Rev., 0.25%, 8/1/2023 (c) | 100,000 | 97,478 |
Monroe County School District, Sales Tax Rev., AGM, 5.00%, 10/1/2022 | 250,000 | 250,529 |
New Smyrna Beach Utilities Commission Rev., 5.00%, 10/1/2022 | 65,000 | 65,146 |
INVESTMENTS | PRINCIPAL AMOUNT($) | VALUE($) |
Florida — continued | ||
Orange County Convention Center Rev., 5.00%, 10/1/2022 | 25,000 | 25,056 |
Orange County Convention Center, Tourist Development Tax Rev., 5.00%, 10/1/2022 | 450,000 | 451,012 |
Orange County Health Facilities Authority, Orlando Health Obligated Group Series 2016A, Rev., 5.00%, 10/1/2023 | 115,000 | 117,679 |
Orange County Housing Finance Authority, Jernigan Gardens Project Series 2020B, Rev., 0.35%, 10/1/2022 (c) | 75,000 | 74,788 |
Orlando Utilities Commission, Utility System | ||
Series 2011C, Rev., 4.00%, 10/1/2022 | 115,000 | 115,162 |
Series 2011C, Rev., 5.00%, 10/1/2022 | 475,000 | 476,048 |
Series 2010C, Rev., 5.25%, 10/1/2022 | 150,000 | 150,361 |
Series 2012A, Rev., 5.00%, 10/1/2023 | 20,000 | 20,563 |
Series 2016A, Rev., 5.00%, 10/1/2023 | 25,000 | 25,704 |
Series 2018A, Rev., 5.00%, 10/1/2023 | 25,000 | 25,704 |
Series 2013A, Rev., 5.00%, 10/1/2024 | 45,000 | 47,372 |
Orlando-Orange County Expressway Authority Series 2013B, Rev., 5.00%, 7/1/2023 | 20,000 | 20,403 |
Palm Beach County Health Facilities Authority, Baptist Health South Florida Obligated Group Rev., 5.00%, 8/15/2024 | 560,000 | 582,978 |
Palm Beach County School District | ||
Series 2017B, COP, 5.00%, 8/1/2023 | 50,000 | 51,195 |
Series 2018B, COP, 5.00%, 8/1/2023 | 20,000 | 20,478 |
Series 2017B, COP, 5.00%, 8/1/2025 | 40,000 | 42,716 |
Pasco County School Board Series 2015A, COP, 5.00%, 8/1/2023 | 40,000 | 40,978 |
Pasco County School Board, Sales Tax Rev., 5.00%, 10/1/2023 | 35,000 | 36,004 |
Peace River Manasota Regional Water Supply Authority, Utility System Rev., 4.00%, 10/1/2022 | 55,000 | 55,078 |
Polk County School District, Sales Tax | ||
Rev., 5.00%, 10/1/2022 | 280,000 | 280,611 |
Rev., 5.00%, 10/1/2023 | 25,000 | 25,688 |
Rev., 5.00%, 10/1/2024 | 30,000 | 31,594 |
Reedy Creek Improvement District Utility Series 2013-1, Rev., 5.00%, 10/1/2022 | 225,000 | 225,483 |
Reedy Creek Improvement District, Ad Valorem Tax Series A, GO, 5.00%, 6/1/2023 (b) | 25,000 | 25,487 |
Riviera Beach Utility Special District Rev., 5.00%, 10/1/2022 | 25,000 | 25,054 |
250 | J.P. Morgan Exchange-Traded Funds | August 31, 2022 |
INVESTMENTS | PRINCIPAL AMOUNT($) | VALUE($) |
Municipal Bonds — continued | ||
Florida — continued | ||
Santa Rosa County School Board COP, 5.00%, 2/1/2023 | 75,000 | 75,813 |
Sarasota County Public Hospital District, Sarasota Memorial Hospital Series 1998B, Rev., NATL-RE, 5.25%, 7/1/2024 | 690,000 | 712,966 |
School Board of Miami-Dade County (The) | ||
GO, 5.00%, 3/15/2023 (b) | 30,000 | 30,441 |
GO, 5.00%, 3/15/2023 | 45,000 | 45,626 |
Series 2015D, COP, 5.00%, 2/1/2024 | 445,000 | 460,606 |
Series 2014D, COP, 5.00%, 11/1/2024 | 20,000 | 21,038 |
Series 2015D, COP, 5.00%, 2/1/2025 | 25,000 | 26,430 |
Series 2014D, COP, 5.00%, 11/1/2025 | 25,000 | 26,228 |
Series 2015B, COP, 5.00%, 5/1/2026 | 340,000 | 358,670 |
Series 2014D, COP, 5.00%, 11/1/2026 | 25,000 | 26,179 |
Series 2015A, COP, AGM, 5.00%, 5/1/2027 | 85,000 | 90,252 |
School District of Broward County | ||
Series A, 5.00%, 7/1/2023 | 315,000 | 321,239 |
Series 2015A, 5.00%, 7/1/2024 | 25,000 | 26,052 |
Series 2015B, 5.00%, 7/1/2024 | 215,000 | 224,595 |
Series 2015A, 5.00%, 7/1/2026 | 135,000 | 144,105 |
Seacoast Utility Authority, Water and Sewer Utility System Series B, Rev., 5.00%, 3/1/2023 | 20,000 | 20,269 |
South Broward Hospital District, Memorial Healthcare System Rev., 4.00%, 5/1/2026 | 25,000 | 26,302 |
St. Johns County Industrial Development Authority, Vicar's Landing Project | ||
Series 2021A, Rev., 4.00%, 12/15/2022 | 110,000 | 109,927 |
Series 2021A, Rev., 4.00%, 12/15/2023 | 120,000 | 119,474 |
Series 2021A, Rev., 4.00%, 12/15/2024 | 145,000 | 143,279 |
St. Johns County School Board | ||
COP, 5.00%, 7/1/2023 | 100,000 | 102,147 |
Series 2020A, COP, 5.00%, 7/1/2023 | 20,000 | 20,429 |
St. Johns County School Board, Sales Tax | ||
Rev., 5.00%, 10/1/2022 | 20,000 | 20,042 |
Rev., 5.00%, 10/1/2024 | 35,000 | 36,735 |
St. Johns River Power Park Series SEVEN, Rev., 2.50%, 10/1/2022 | 75,000 | 75,016 |
St. Lucie County School Board Series 2013A, COP, 5.00%, 7/1/2023 | 45,000 | 45,955 |
INVESTMENTS | PRINCIPAL AMOUNT($) | VALUE($) |
Florida — continued | ||
St. Lucie County School Board, Sales Tax Rev., AGM, 5.00%, 10/1/2022 | 225,000 | 225,472 |
St. Lucie County, Water and Sewer District Utility System Rev., 5.00%, 10/1/2022 | 310,000 | 310,671 |
State of Florida Board of Education, Public Education Capital Outlay | ||
Series 2014A, GO, 5.00%, 6/1/2023 | 45,000 | 45,900 |
Series 2019A, GO, 5.00%, 6/1/2023 | 45,000 | 45,900 |
Series 2013C, GO, 5.00%, 6/1/2026 | 20,000 | 20,345 |
Series 2015A, GO, 5.00%, 6/1/2026 | 35,000 | 36,489 |
State of Florida Department of Transportation Rev., 5.00%, 7/1/2024 | 35,000 | 36,665 |
State of Florida Department of Transportation Turnpike System | ||
Series 2013A, Rev., 5.00%, 7/1/2023 | 35,000 | 35,760 |
Series 2016A, Rev., 5.00%, 7/1/2023 | 40,000 | 40,869 |
Series 2016C, Rev., 5.00%, 7/1/2023 | 45,000 | 45,977 |
Series 2013C, Rev., 5.00%, 7/1/2024 | 50,000 | 51,062 |
Series 2013A, Rev., 5.00%, 7/1/2025 | 55,000 | 56,057 |
Series 2016B, Rev., 2.50%, 7/1/2026 | 20,000 | 19,703 |
State of Florida, State Board of Education, Lottery Series 2014A, Rev., 3.00%, 7/1/2025 | 70,000 | 70,234 |
Sunshine State Governmental Financing Commission | ||
Series 2010A-1, Rev., 5.00%, 9/1/2022 (b) | 25,000 | 25,000 |
Series 2010B-1, Rev., 5.00%, 9/1/2022 (b) | 60,000 | 60,000 |
Series 2011B-1, Rev., 5.00%, 9/1/2022 (b) | 150,000 | 150,000 |
Series 2010A-1, Rev., 5.00%, 9/1/2023 (b) | 25,000 | 25,654 |
Sunshine State Governmental Financing Commission, Coral Gables Program Series 2018B, Rev., 5.00%, 10/1/2022 | 35,000 | 35,079 |
Sunshine State Governmental Financing Commission, Miami Dade County Program | ||
Series 2011C-1, Rev., 5.00%, 9/1/2022 (b) | 95,000 | 95,000 |
Series 2011B-1, Rev., 3.75%, 9/1/2023 (b) | 50,000 | 50,666 |
Series 2010A-1, Rev., 4.00%, 9/1/2023 (b) | 50,000 | 50,803 |
Series 2011B-1, Rev., 4.00%, 9/1/2023 (b) | 30,000 | 30,482 |
August 31, 2022 | J.P. Morgan Exchange-Traded Funds | 251 |
AS OF August 31, 2022 (Unaudited) (continued)
INVESTMENTS | PRINCIPAL AMOUNT($) | VALUE($) |
Municipal Bonds — continued | ||
Florida — continued | ||
Series 2010A-1, Rev., 4.13%, 9/1/2023 (b) | 25,000 | 25,432 |
Series 2011B-1, Rev., 5.00%, 9/1/2023 (b) | 20,000 | 20,523 |
Series 2011B-1, Rev., 5.50%, 9/1/2023 (b) | 30,000 | 30,932 |
Series 2011C-1, Rev., 5.50%, 9/1/2023 (b) | 45,000 | 46,398 |
Tampa Bay Water, Regional Water Supply Authority, Utility System Rev., NATL-RE, 5.50%, 10/1/2022 | 50,000 | 50,132 |
Tampa Bay Water, Water Supply Rev., NATL-RE, 5.50%, 10/1/2023 | 40,000 | 41,356 |
Tohopekaliga Water Authority, Utility System Rev., 4.00%, 10/1/2022 | 50,000 | 50,073 |
Town of Palm Beach, Public Improvement Series 2016A, Rev., 5.00%, 1/1/2023 | 25,000 | 25,227 |
University of Central Florida Housing Facility Series 2018A, Rev., 5.00%, 10/1/2022 | 20,000 | 20,044 |
USF Financing Corp., Master Lease Program Series 2012A, COP, 5.00%, 7/1/2023 | 50,000 | 51,053 |
Volusia County Educational Facility Authority, Embry Riddle Aeronautical University, Inc., Project Series 2020A, Rev., 4.00%, 10/15/2022 | 75,000 | 75,134 |
Volusia County School Board, Master Lease Program Series 2014B, COP, 5.00%, 8/1/2025 | 100,000 | 104,617 |
Volusia County School Board, Sales Tax Rev., 5.00%, 10/1/2022 | 55,000 | 55,119 |
Waterset North Community Development District, Senior Lien Series A-1, 3.00%, 5/1/2023 | 25,000 | 25,064 |
Total Florida | 131,138,827 | |
Georgia — 0.8% | ||
Athens-Clarke County Unified Government, Sales Tax 5.00%, 12/1/2022 | 415,000 | 417,840 |
Atlanta and Fulton County Recreation Authority, Park Improvement | ||
Series 2014A, 5.00%, 12/1/2022 | 20,000 | 20,134 |
Series A, 5.00%, 12/1/2023 | 25,000 | 25,808 |
Atlanta Development Authority (The), Piedmont/Ellis LLC University of Commons Project 5.00%, 9/1/2022 (b) | 100,000 | 100,000 |
Atlanta Public Safety and Judicial Facilities Authority, Public Safety Facilities Project 2.00%, 12/1/2022 | 25,000 | 24,988 |
INVESTMENTS | PRINCIPAL AMOUNT($) | VALUE($) |
Georgia — continued | ||
Atlanta Urban Residential Finance Authority, Multi-Family 0.44%, 9/1/2023 (c) | 1,740,000 | 1,716,278 |
Bartow County School District | ||
3.00%, 10/1/2022 | 25,000 | 25,013 |
5.00%, 10/1/2022 | 110,000 | 110,234 |
Braselton Urban Redevelopment Agency, Municipal Facilities Project GTD, 4.00%, 7/1/2024 | 30,000 | 30,773 |
Bulloch County Board of Education, Sales Tax 3.25%, 5/1/2023 | 20,000 | 20,126 |
Carroll City-County Hospital Authority, Tanner Medical Center Project GTD, 5.00%, 7/1/2023 | 20,000 | 20,421 |
Carrollton Independent School System 5.00%, 4/1/2023 | 20,000 | 20,314 |
Cherokee County Board of Education, School System Series B, 5.00%, 8/1/2023 | 20,000 | 20,483 |
City of Atlanta Series 2019B, 4.00%, 12/1/2022 | 55,000 | 55,239 |
City of Atlanta Airport Passenger Facility Charge, Sub Lien | ||
Series 2014A, 5.00%, 1/1/2024 | 25,000 | 25,850 |
Series 2014A, 5.00%, 1/1/2025 | 20,000 | 20,660 |
Series 2014A, 5.00%, 1/1/2026 | 30,000 | 30,975 |
City of Atlanta, Department of Aviation Series 2014B, 5.00%, 1/1/2023 | 25,000 | 25,221 |
City of Atlanta, Public Improvement | ||
5.00%, 12/1/2022 | 25,000 | 25,170 |
4.75%, 12/1/2034 (b) | 30,000 | 31,540 |
City of Atlanta, Water and Wastewater | ||
5.00%, 11/1/2022 | 275,000 | 276,230 |
5.00%, 11/1/2026 | 25,000 | 26,682 |
Series 2013B, 5.25%, 11/1/2029 (b) | 35,000 | 36,162 |
City of Columbus, Water and Sewerage | ||
Series 2012A, 3.00%, 5/1/2023 | 50,000 | 50,013 |
5.00%, 5/1/2023 | 40,000 | 40,704 |
Series 2013A, 5.00%, 5/1/2026 (b) | 20,000 | 20,355 |
Clayton County Development Authority, Clayton State University Rev., 5.00%, 7/1/2026 | 50,000 | 54,149 |
Cobb County Kennestone Hospital Authority 5.00%, 4/1/2024 | 80,000 | 81,276 |
Cobb-Marietta Coliseum and Exhibit Hall Authority, Performing Arts Center Project GTD, 4.00%, 1/1/2024 | 85,000 | 85,479 |
252 | J.P. Morgan Exchange-Traded Funds | August 31, 2022 |
INVESTMENTS | PRINCIPAL AMOUNT($) | VALUE($) |
Municipal Bonds — continued | ||
Georgia — continued | ||
Coffee County Hospital Authority, Coffee Regional Medical Center Inc., Project Series 2016A, GTD, 5.00%, 12/1/2022 | 25,000 | 25,162 |
Columbia County School District 5.00%, 10/1/2022 | 40,000 | 40,090 |
Columbus Medical Center Hospital Authority, Piedmont Healthcare Inc., Project Series 2019A, 5.00%, 7/1/2054 (c) | 235,000 | 250,244 |
County of Clayton, Water Authority 5.00%, 5/1/2023 | 160,000 | 160,344 |
County of Cobb 5.00%, 1/1/2023 | 45,000 | 45,410 |
County of DeKalb, Special Transportation, Parks and Greenspace and Libraries Tax | ||
GO, 5.00%, 12/1/2022 | 75,000 | 75,491 |
GO, 5.00%, 12/1/2025 | 40,000 | 43,217 |
County of DeKalb, Water and Sewerage Series B, Rev., 5.25%, 10/1/2022 | 30,000 | 30,070 |
County of DeKalb, Water and Sewerage, Second Resolution Rev., 5.00%, 10/1/2022 | 170,000 | 170,365 |
County of Fayette | ||
Series 2012A, Rev., 5.00%, 10/1/2022 (b) | 75,000 | 75,167 |
Series 2012B, Rev., 5.00%, 10/1/2022 (b) | 25,000 | 25,056 |
County of Henry, Sales Tax GO, 5.00%, 5/1/2023 | 20,000 | 20,356 |
DeKalb Newton and Gwinnett Counties Joint Development Authority, GPC Real Estate Student Support I, LLC Project Rev., 5.00%, 6/1/2023 | 35,000 | 35,692 |
Development Authority for Fulton County, Georgia Tech Facilities | ||
Rev., 5.00%, 3/1/2023 | 25,000 | 25,335 |
Series 2014A, Rev., 5.00%, 5/1/2023 | 25,000 | 25,442 |
Development Authority for Fulton County, Tech Athletic Association Project Series A, Rev., 5.00%, 10/1/2022 (b) | 40,000 | 40,087 |
Development Authority of Greene County, Catholic Health East Rev., 4.25%, 11/15/2022 (b) | 75,000 | 75,289 |
Fayette County School District, Sales Tax GO, 5.25%, 9/1/2022 | 75,000 | 75,000 |
Forsyth County School District GO, 5.00%, 2/1/2023 | 45,000 | 45,512 |
Gainesville and Hall County Development Authority, Hall County Facilities Project Rev., 5.00%, 5/1/2024 | 20,000 | 20,852 |
INVESTMENTS | PRINCIPAL AMOUNT($) | VALUE($) |
Georgia — continued | ||
Georgia State Road and Tollway Authority Series 2011B, Rev., 5.00%, 10/1/2022 | 55,000 | 55,124 |
Gilmer County Schools, Sales Tax GO, 4.00%, 12/1/2022 | 175,000 | 175,761 |
Gwinnett County School District GO, 5.00%, 2/1/2023 | 25,000 | 25,279 |
Hall County School District GO, 5.00%, 11/1/2022 | 80,000 | 80,364 |
Houston County School District, Sales Tax GO, 5.00%, 9/1/2022 | 95,000 | 95,000 |
Lowndes County Public Facilies Authority, Lowndes County School District Projects Rev., 3.00%, 2/1/2023 | 20,000 | 20,063 |
Lumpkin County School District GO, 3.00%, 12/1/2022 | 25,000 | 25,047 |
Macon Water Authority Series 2018A, Rev., 5.00%, 10/1/2022 | 25,000 | 25,054 |
Main Street Natural Gas, Inc., Gas Supply | ||
Rev., LIQ : Royal Bank of Canada, (SIFMA Municipal Swap Index Yield + 0.57%), 2.07%, 9/8/2022 (d) | 11,590,000 | 11,537,264 |
Series 2018B, Rev., (ICE LIBOR USD 1 Month + 0.75%), 2.47%, 10/3/2022 (d) | 370,000 | 367,610 |
Series 2019B, Rev., 4.00%, 12/1/2022 | 345,000 | 346,303 |
Series 2019B, Rev., 4.00%, 6/1/2023 | 240,000 | 242,553 |
Series 2018A, Rev., LIQ : Royal Bank of Canada, 4.00%, 9/1/2023 (c) | 1,525,000 | 1,546,594 |
Series 2018C, Rev., LIQ : Royal Bank of Canada, 4.00%, 12/1/2023 (c) | 680,000 | 691,316 |
Subseries C, Rev., LIQ : Royal Bank of Canada, 4.00%, 12/1/2023 | 100,000 | 101,777 |
Series 2019B, Rev., 4.00%, 12/2/2024 (c) | 485,000 | 496,268 |
Metropolitan Atlanta Rapid Transit Authority, Sales Tax Series 2007A, Rev., NATL-RE, 5.25%, 7/1/2023 | 40,000 | 40,937 |
Municipal Gas Authority of Georgia Series S, Rev., 5.00%, 10/1/2027 | 500,000 | 501,029 |
Municipal Gas Authority of Georgia, Gas Portfolio IV Project Series A, Rev., 5.00%, 10/1/2022 | 125,000 | 125,230 |
Paulding County School District GO, 5.00%, 2/1/2025 (b) | 50,000 | 53,053 |
Pike County School District GO, 3.00%, 10/1/2022 | 100,000 | 100,065 |
Private Colleges and Universities Authority, Emory University | ||
Series 2019A, Rev., 5.00%, 9/1/2022 | 20,000 | 20,000 |
August 31, 2022 | J.P. Morgan Exchange-Traded Funds | 253 |
AS OF August 31, 2022 (Unaudited) (continued)
INVESTMENTS | PRINCIPAL AMOUNT($) | VALUE($) |
Municipal Bonds — continued | ||
Georgia — continued | ||
Series B, Rev., 5.00%, 10/1/2022 | 35,000 | 35,078 |
Series 2020B, Rev., 5.00%, 9/1/2025 | 980,000 | 1,052,764 |
Putnam County School District GO, 3.00%, 10/1/2022 | 25,000 | 25,013 |
Rabun County School District GO, 3.00%, 10/1/2022 | 30,000 | 30,019 |
Richmond County Board of Education, Sales Tax GO, 5.00%, 10/1/2022 | 75,000 | 75,169 |
Richmond County Hospital Authority, University Health Services, Inc., Project Rev., 5.00%, 1/1/2023 | 295,000 | 297,198 |
South Regional Joint Development Authority, Valdosta State University Parking and Student Service Center Project Rev., 5.00%, 8/1/2025 | 1,095,000 | 1,166,802 |
South Regional Joint Development Authority, Valdosta State University Student Union Project Rev., 5.00%, 8/1/2025 | 215,000 | 229,098 |
State of Georgia | ||
Series 2012C, GO, 4.00%, 9/1/2022 | 215,000 | 215,000 |
Series C, GO, 5.00%, 9/1/2022 | 20,000 | 20,000 |
Series 2013C, GO, 4.00%, 10/1/2022 | 145,000 | 145,194 |
Series 2011-I, GO, 4.00%, 11/1/2022 | 25,000 | 25,036 |
Series 2011J-2, GO, 4.50%, 11/1/2022 | 305,000 | 305,565 |
Series 2016C, GO, 5.00%, 1/1/2023 | 25,000 | 25,226 |
Series 2016A, GO, 5.00%, 2/1/2023 | 25,000 | 25,281 |
Series 2018A, GO, 5.00%, 7/1/2023 | 15,000 | 15,331 |
Series 2013A, GO, 5.00%, 1/1/2025 | 50,000 | 50,435 |
Tift County Hospital Authority | ||
Rev., 5.00%, 12/1/2022 | 60,000 | 60,406 |
Rev., 5.00%, 12/1/2022 (b) | 135,000 | 135,913 |
Valdosta and Lowndes County Hospital Authority Series 2019A, Rev., 5.00%, 10/1/2022 | 150,000 | 150,332 |
Whitfield County School District GO, 5.00%, 4/1/2023 | 25,000 | 25,392 |
Total Georgia | 25,524,241 | |
Hawaii — 0.5% | ||
City and County Honolulu | ||
Series 2018A, GO, 4.00%, 9/1/2022 | 115,000 | 115,000 |
Series 2017B, GO, 5.00%, 9/1/2022 | 85,000 | 85,000 |
Series 2018B, GO, 5.00%, 9/1/2022 | 60,000 | 60,000 |
Series A, GO, 5.00%, 9/1/2022 | 100,000 | 100,000 |
Series 2016B, GO, 5.00%, 10/1/2022 | 50,000 | 50,110 |
Series 2016C, GO, 5.00%, 10/1/2022 | 45,000 | 45,099 |
INVESTMENTS | PRINCIPAL AMOUNT($) | VALUE($) |
Hawaii — continued | ||
Series A, GO, 5.00%, 10/1/2022 | 165,000 | 165,364 |
Series B, GO, 5.00%, 10/1/2022 | 60,000 | 60,132 |
Series 2012A, GO, 4.00%, 11/1/2022 (b) | 20,000 | 20,054 |
Series 2012A, GO, 5.00%, 11/1/2022 (b) | 145,000 | 145,642 |
Series 2012B, GO, 5.00%, 11/1/2022 | 20,000 | 20,090 |
Series 2012B, GO, 5.00%, 11/1/2022 | 350,000 | 351,547 |
Series C, GO, 4.00%, 10/1/2023 | 20,000 | 20,351 |
Series C, GO, 5.00%, 10/1/2023 | 40,000 | 41,126 |
Series 2022A, GO, 5.00%, 11/1/2023 | 2,375,000 | 2,446,826 |
Series C, GO, 5.00%, 10/1/2024 | 25,000 | 26,333 |
Series 2022A, GO, 5.00%, 11/1/2024 | 2,875,000 | 3,034,213 |
Series 2012C, GO, 3.00%, 11/1/2025 | 175,000 | 175,179 |
Series 2022A, GO, 5.00%, 11/1/2025 | 3,000,000 | 3,236,337 |
Series 2022A, GO, 5.00%, 11/1/2026 | 3,500,000 | 3,854,443 |
City and County Honolulu, Wastewater System | ||
Series B, Rev., 5.00%, 7/1/2023 | 30,000 | 30,659 |
Series B, Rev., 5.00%, 7/1/2024 | 25,000 | 26,166 |
County of Hawaii | ||
Series 2013B, GO, 5.00%, 9/1/2022 | 95,000 | 95,000 |
Series A, GO, 5.00%, 9/1/2022 | 165,000 | 165,000 |
Series B, GO, 5.00%, 9/1/2022 | 25,000 | 25,000 |
Series C, GO, 5.00%, 9/1/2022 | 85,000 | 85,000 |
Series D, GO, 5.00%, 9/1/2022 | 20,000 | 20,000 |
Series 2013B, GO, 3.00%, 9/1/2023 | 45,000 | 45,025 |
State of Hawaii | ||
Series ET, GO, 4.00%, 10/1/2022 | 40,000 | 40,055 |
Series FE, GO, 5.00%, 10/1/2022 | 75,000 | 75,164 |
Series FG, GO, 5.00%, 10/1/2022 | 30,000 | 30,066 |
Series FH, GO, 5.00%, 10/1/2022 | 115,000 | 115,251 |
Series FN, GO, 5.00%, 10/1/2022 | 45,000 | 45,098 |
Series 2012EE, GO, 4.00%, 11/1/2022 (b) | 50,000 | 50,144 |
Series EE, GO, 5.00%, 11/1/2022 (b) | 75,000 | 75,338 |
Series EE-2017, GO, 5.00%, 11/1/2022 (b) | 120,000 | 120,541 |
Series EF, GO, 5.00%, 11/1/2022 | 105,000 | 105,471 |
Series EF, GO, 5.00%, 11/1/2022 (b) | 125,000 | 125,563 |
Series FK, GO, 4.00%, 5/1/2023 | 20,000 | 20,219 |
Series FK, GO, 5.00%, 5/1/2023 | 30,000 | 30,524 |
Series EL, GO, 3.00%, 8/1/2023 | 50,000 | 50,287 |
Series FG, GO, 4.00%, 10/1/2023 | 20,000 | 20,349 |
Series FG, GO, 5.00%, 10/1/2024 | 25,000 | 26,302 |
254 | J.P. Morgan Exchange-Traded Funds | August 31, 2022 |
INVESTMENTS | PRINCIPAL AMOUNT($) | VALUE($) |
Municipal Bonds — continued | ||
Hawaii — continued | ||
Series FH, GO, 5.00%, 10/1/2024 | 35,000 | 36,823 |
State of Hawaii State Highway Fund Series B, Rev., 5.00%, 1/1/2023 | 25,000 | 25,221 |
State of Hawaii, Department of Hawaiian Home Lands, Kapolei Office Facility Series 2017A, COP, 4.00%, 11/1/2022 | 25,000 | 25,071 |
University of Hawaii Series 2020D, Rev., 5.00%, 10/1/2022 | 20,000 | 20,045 |
Total Hawaii | 15,582,228 | |
Idaho — 0.2% | ||
Ada and Canyon Counties Joint School District No. 2 Meridian, Sales Tax Guaranty Program Series 2018A, 5.00%, 9/15/2022 | 20,000 | 20,020 |
Boise State University Series 2015A, 5.00%, 4/1/2023 | 35,000 | 35,485 |
Canyon County School District No. 134 Middleton | ||
5.00%, 9/15/2022 | 20,000 | 20,020 |
5.00%, 9/15/2023 | 10,000 | 10,274 |
Idaho Bond Bank Authority | ||
Series 2012D, Rev., 3.00%, 9/15/2022 (b) | 10,000 | 10,002 |
Series 2012D, Rev., 3.00%, 9/15/2022 | 125,000 | 125,036 |
Series 2014C, Rev., 5.00%, 9/15/2022 | 50,000 | 50,050 |
Series A, Rev., 5.00%, 9/15/2022 | 45,000 | 45,045 |
Idaho Health Facilities Authority, Trinity Health Credit Group Series 2015D, Rev., 5.00%, 12/1/2022 | 210,000 | 211,358 |
Idaho Housing and Finance Association, Federal Highway Trust | ||
Series A, Rev., 5.00%, 7/15/2025 | 30,000 | 32,016 |
Series A, Rev., 5.00%, 7/15/2026 | 20,000 | 21,760 |
Idaho Housing and Finance Association, Idaho Arts Charter School Series 2012A, Rev., 6.00%, 12/1/2022 (b) | 100,000 | 100,881 |
Idaho Housing and Finance Association, Single Family Mortgage Series 2009A, Class I, Rev., VRDO, 1.68%, 9/12/2022 (c) | 4,360,000 | 4,360,000 |
Idaho State Building Authority | ||
Series 2012B, Rev., 4.00%, 9/1/2022 (b) | 70,000 | 70,000 |
Rev., 5.00%, 9/1/2022 (b) | 60,000 | 60,000 |
Idaho State Building Authority, Eastern Idaho Technical College Project Rev., 4.00%, 9/1/2022 (b) | 400,000 | 400,000 |
INVESTMENTS | PRINCIPAL AMOUNT($) | VALUE($) |
Idaho — continued | ||
Idaho State Building Authority, Prison Facilities Project Series 2018C, Rev., 5.00%, 9/1/2022 (b) | 20,000 | 20,000 |
Twin Falls County School District No. 411 Twin Falls Series C, GO, 5.00%, 9/15/2022 | 20,000 | 20,020 |
Total Idaho | 5,611,967 | |
Illinois — 5.1% | ||
Boone Mchenry and Dekalb Counties Community Unit School District 100 Series 2005B, AGM - CR, NATL-RE, Zero Coupon, 12/1/2022 | 25,000 | 24,837 |
Bureau County Township High School District No. 502 Series 2017A, 3.00%, 12/1/2022 | 50,000 | 50,060 |
Champaign Coles Et Al Counties Community College District No. 505 Series 2018B, 4.00%, 12/1/2022 | 100,000 | 100,388 |
Champaign County Community Unit School District No. 7 Tolono Series 2014B, 3.45%, 12/1/2022 | 25,000 | 25,070 |
Chicago Board of Education, Capital Appreciation School Reform | ||
Series 1998B-1, NATL-RE, Zero Coupon, 12/1/2022 | 3,110,000 | 3,084,388 |
Series 1999A, NATL-RE, Zero Coupon, 12/1/2023 | 3,420,000 | 3,275,085 |
Chicago Board of Education, Unlimited Tax Series 2019B, 5.00%, 12/1/2022 | 1,575,000 | 1,584,052 |
Chicago Midway International Airport, Second Lien | ||
Series 2013B, 5.00%, 1/1/2025 | 720,000 | 725,419 |
Series 2013B, 5.00%, 1/1/2026 | 360,000 | 362,566 |
Chicago O'Hare International Airport, General Airport, Senior Lien | ||
Series B, 5.00%, 1/1/2023 | 1,040,000 | 1,048,894 |
Series C, 5.00%, 1/1/2023 | 1,015,000 | 1,023,680 |
Series B, 5.00%, 1/1/2024 | 160,000 | 165,249 |
Series 2013B, 5.00%, 1/1/2025 | 930,000 | 938,054 |
Series 2020B, 5.00%, 1/1/2026 | 40,000 | 43,136 |
Series B, 5.00%, 1/1/2026 | 440,000 | 443,576 |
Series B, 5.00%, 1/1/2026 | 430,000 | 453,877 |
Series 2013B, 5.00%, 1/1/2027 | 265,000 | 267,101 |
Chicago O'Hare International Airport, Senior Lien | ||
4.13%, 1/1/2023 | 25,000 | 25,123 |
Series D, 5.00%, 1/1/2023 | 155,000 | 156,326 |
August 31, 2022 | J.P. Morgan Exchange-Traded Funds | 255 |
AS OF August 31, 2022 (Unaudited) (continued)
INVESTMENTS | PRINCIPAL AMOUNT($) | VALUE($) |
Municipal Bonds — continued | ||
Illinois — continued | ||
Series 2013B, 5.00%, 1/1/2024 | 25,000 | 25,219 |
Series E, 5.00%, 1/1/2026 | 30,000 | 32,352 |
Chicago Park District Series 2015A, 5.00%, 1/1/2035 (b) | 35,000 | 36,186 |
City of Aurora Series 2015-C, GO, 3.00%, 12/30/2022 | 50,000 | 50,103 |
City of Canton 4.00%, 12/15/2022 | 25,000 | 25,090 |
City of Chicago, Second Lien Waterworks Project Series 2012, 4.00%, 11/1/2023 | 500,000 | 500,859 |
City of Chicago, Wastewater Transmission, Second Lien | ||
5.00%, 11/1/2022 | 3,315,000 | 3,326,728 |
5.00%, 1/1/2023 | 25,000 | 25,177 |
City of Chicago, Waterworks, Second Lien | ||
5.00%, 11/1/2022 | 100,000 | 100,354 |
Series 2017-2, 5.00%, 11/1/2022 | 50,000 | 50,177 |
Series 2008C, 5.00%, 1/1/2023 | 625,000 | 629,429 |
5.00%, 11/1/2024 | 1,450,000 | 1,460,061 |
City of Decatur | ||
GO, 4.00%, 3/1/2023 | 120,000 | 120,614 |
GO, 4.00%, 3/1/2024 | 120,000 | 121,756 |
GO, 4.00%, 3/1/2025 | 195,000 | 201,065 |
GO, 4.00%, 3/1/2026 | 170,000 | 177,129 |
GO, 4.00%, 3/1/2027 | 200,000 | 210,328 |
City of Elgin GO, 3.00%, 12/15/2022 | 25,000 | 25,017 |
City of Evanston | ||
Series 2017B, GO, 2.00%, 12/1/2022 | 100,000 | 99,896 |
Series 2017A, GO, 4.00%, 12/1/2022 | 25,000 | 25,105 |
GO, 5.00%, 12/1/2022 | 20,000 | 20,133 |
GO, 5.00%, 12/1/2022 | 110,000 | 110,731 |
City of Naperville GO, 4.00%, 12/1/2022 | 25,000 | 25,100 |
City of Rochelle GO, AGM, 3.00%, 5/1/2023 | 100,000 | 100,189 |
City of Rockford, Sales Tax Alternative Revenue Source Series 2016A, GO, 5.00%, 12/15/2022 | 25,000 | 25,183 |
City of Waukegan, First Lien, Water and Sewer System Rev., AGM, 4.00%, 12/30/2022 | 105,000 | 105,492 |
Cook & Du Page Counties High School District No. 210 Lemont Series 2015A, 3.00%, 1/1/2023 | 25,000 | 25,060 |
Cook & Will Counties Community College District No. 515, Limited Community College 5.00%, 12/1/2022 | 110,000 | 110,698 |
Cook & Will Counties School District No. 194 Series B, 5.00%, 12/1/2022 | 100,000 | 100,634 |
INVESTMENTS | PRINCIPAL AMOUNT($) | VALUE($) |
Illinois — continued | ||
Cook County Community College District No. 527 Morton 5.00%, 12/15/2022 | 25,000 | 25,180 |
Cook County Community Consolidated School District No. 146 Tinley Park 4.00%, 12/1/2022 | 20,000 | 20,085 |
Cook County Community Consolidated School District No. 15 Palatine 5.00%, 12/1/2022 | 65,000 | 65,404 |
Cook County Community Consolidated School District No. 34, Glenview 5.00%, 12/1/2022 | 40,000 | 40,273 |
Cook County Community Consolidated School District No. 65, Evanston, Limited Tax 5.00%, 12/1/2022 | 85,000 | 85,548 |
Cook County Community High School District No. 234, Ridgewood 4.00%, 12/1/2022 | 115,000 | 115,492 |
Cook County Community School District No. 97, Oak Park GO, 4.00%, 1/1/2023 | 90,000 | 90,512 |
Cook County Community Unit School District No. 401, Elmwood Park 3.00%, 12/1/2022 | 520,000 | 520,887 |
Cook County Forest Preserve District, Limited Tax Series 2012B, 5.00%, 12/15/2022 | 85,000 | 85,070 |
Cook County Forest Preserve District, Unlimited Tax Series 2021A, 5.00%, 11/15/2022 | 390,000 | 392,009 |
Cook County High School District No. 203 New Trier Township | ||
Series 2016B, 3.50%, 12/15/2022 | 25,000 | 25,084 |
Series 2016A, 5.00%, 12/15/2022 | 25,000 | 25,190 |
Cook County High School District No. 205, Thornton Township, Limited Tax | ||
Series 2017C, 5.00%, 12/1/2022 | 125,000 | 125,793 |
Series 2017C, 5.00%, 12/1/2023 | 30,000 | 30,876 |
Cook County School District No. 109, Indian Springs, Limited Tax 3.00%, 12/1/2022 | 100,000 | 100,171 |
Cook County School District No. 111, Burbank AGM, 4.00%, 12/1/2022 | 90,000 | 90,351 |
Cook County School District No. 122 Ridgeland Series 2012D, 4.00%, 12/1/2022 | 35,000 | 35,145 |
Cook County School District No. 123 Oak Lawn, Capital Appreciation | ||
NATL-RE, Zero Coupon, 12/1/2022 | 100,000 | 99,249 |
FGIC, Zero Coupon, 12/1/2022 (b) | 20,000 | 19,882 |
256 | J.P. Morgan Exchange-Traded Funds | August 31, 2022 |
INVESTMENTS | PRINCIPAL AMOUNT($) | VALUE($) |
Municipal Bonds — continued | ||
Illinois — continued | ||
Cook County School District No. 123 Oak Lawn, Limited Tax Series A, 4.00%, 12/1/2022 | 30,000 | 30,117 |
Cook County School District No. 130 Blue Island, Limited Tax Series 2018C, AGM, 5.00%, 12/1/2022 | 30,000 | 30,190 |
Cook County School District No. 144 Prairie Hills Series 2011C, AGM, Zero Coupon, 12/1/2022 | 45,000 | 44,670 |
Cook County School District No. 159, Matteson-Richton Park, Capital Appreciation | ||
AGM, Zero Coupon, 12/1/2022 (b) | 90,000 | 89,458 |
AGM, Zero Coupon, 12/1/2022 | 150,000 | 148,907 |
Cook County School District No. 23, Prospect Heights 4.00%, 12/15/2022 | 25,000 | 25,123 |
Cook County School District No. 95-Brookfield 4.00%, 12/1/2022 | 100,000 | 100,427 |
Cook County School District No. 99 Cicero, Limited Tax Series 2019B, GO, 5.00%, 12/1/2022 | 25,000 | 25,143 |
Cook County School District No., 73.5 Skokie, East Prairie 4.00%, 12/1/2022 | 25,000 | 25,098 |
Cook County School District No., 74 Lincolnwood 4.00%, 12/1/2022 | 45,000 | 45,197 |
Cook County School District No., 78 Rosemont AGM, 5.00%, 12/1/2022 | 200,000 | 201,269 |
Cook County School District No., 81 Schiller Park 4.00%, 12/1/2022 | 105,000 | 105,417 |
Cook County School District No., 87 Berkeley Series 2012B, 3.00%, 12/1/2022 | 50,000 | 50,089 |
Cook County School District No., 88 Bellwood Series 2021A, 4.00%, 12/1/2022 | 375,000 | 376,407 |
Cook County Township High School District No. 220 Reavis 3.00%, 12/1/2022 | 100,000 | 100,121 |
Cook County Township High School District No. 225, Glenbrook Series 2016A, 5.00%, 12/1/2022 | 80,000 | 80,546 |
County of Cook | ||
Series 2021B, 4.00%, 11/15/2022 | 755,000 | 757,345 |
Series 2016A, 5.00%, 11/15/2022 | 20,000 | 20,099 |
Series 2021A, 5.00%, 11/15/2022 | 325,000 | 326,634 |
Series C, GO, 5.00%, 11/15/2022 | 60,000 | 60,307 |
Series 2012C, 5.00%, 11/15/2023 | 435,000 | 437,381 |
Series 2012C, 5.00%, 11/15/2024 | 3,860,000 | 3,881,130 |
Series 2012C, 5.00%, 11/15/2025 | 125,000 | 125,684 |
INVESTMENTS | PRINCIPAL AMOUNT($) | VALUE($) |
Illinois — continued | ||
County of Cook, Sales Tax 2.50%, 11/15/2022 | 40,000 | 40,006 |
County of Kendall GO, 5.00%, 12/15/2022 | 55,000 | 55,403 |
County of Lake, Sales Tax GO, 5.00%, 11/30/2022 | 145,000 | 145,952 |
County of Rock Island GO, 3.00%, 12/1/2022 | 100,000 | 100,146 |
County of Will | ||
GO, 5.00%, 11/15/2022 | 75,000 | 75,420 |
GO, 5.00%, 11/15/2022 (b) | 315,000 | 316,725 |
County of Winnebago, Public Safety Sales Tax | ||
Series 2013A, GO, 4.00%, 12/30/2022 | 60,000 | 60,318 |
Series 2013A, GO, 5.00%, 12/30/2023 | 375,000 | 378,139 |
Series 2013A, GO, 5.00%, 12/30/2024 | 20,000 | 20,180 |
Douglas and Champaign Counties Community Unit School District No. 302 Villa Grove, Alternative Revenue Source Series 2019A, GO, AGM, 3.00%, 12/1/2022 | 50,000 | 50,073 |
Du Page County High School District No. 88, Villa Park GO, 4.00%, 1/15/2023 | 45,000 | 45,288 |
DuPage and Cook Counties Township High School District No. 86 Hinsdale, School Building GO, 5.00%, 1/15/2023 | 140,000 | 141,279 |
DuPage County Forest Preserve District GO, 5.00%, 1/1/2023 | 260,000 | 262,345 |
DuPage County Forest Preserve District, Limited Tax GO, 4.50%, 11/1/2023 | 300,000 | 301,072 |
DuPage County School District No. 2 Bensenville GO, 5.00%, 5/1/2025 | 75,000 | 79,654 |
Ford Etc. Counties Community Unit School District No. 10 Paxton-Buckley-Loda, School Building Series 2017A, GO, AGM, 4.00%, 12/1/2022 | 25,000 | 25,098 |
Fox Valley Park District | ||
Series 2015B, GO, 4.00%, 12/15/2022 | 50,000 | 50,239 |
GO, 5.00%, 12/15/2022 | 45,000 | 45,343 |
Fulton Mason Knox Schuyler Etc Counties Community College District No. 534 GO, 4.00%, 12/1/2022 (b) | 55,000 | 55,223 |
Godfrey Fire Protection District GO, 3.00%, 12/1/2022 | 20,000 | 20,031 |
Greater Peoria Sanitary and Sewerage Disposal District Series A, GO, 4.00%, 8/15/2023 | 100,000 | 101,303 |
August 31, 2022 | J.P. Morgan Exchange-Traded Funds | 257 |
AS OF August 31, 2022 (Unaudited) (continued)
INVESTMENTS | PRINCIPAL AMOUNT($) | VALUE($) |
Municipal Bonds — continued | ||
Illinois — continued | ||
Greene and Scott Counties Community Unit School District No. 3 Series 2017B, GO, 3.00%, 12/1/2022 | 50,000 | 50,060 |
Greene Jersey and Macoupin Counties Community Unit School District No. 9 Southwestern GO, 2.70%, 12/1/2022 | 50,000 | 50,036 |
Grundy Kendall and Will Counties Community Consolidated School District No. 111 Minooka GO, 5.00%, 12/1/2022 | 215,000 | 216,299 |
Grundy Kendall and Will Counties Community Consolidated School District No. 201 Minooka GO, 5.00%, 10/15/2022 | 60,000 | 60,192 |
Grundy Kendall and Will Counties Community Consolidated School District No. 201 Minooka, Capital Appreciation Series 2010B, GO, Zero Coupon, 10/15/2022 | 135,000 | 134,536 |
Highland Park District, Limited Tax | ||
GO, 4.00%, 12/15/2022 | 25,000 | 25,126 |
Rev., 5.00%, 12/15/2022 | 95,000 | 95,746 |
Illinois Finance Authority, Ann and Robert H Lurie Children's Hospital Obligated Group Rev., 5.00%, 8/15/2025 | 255,000 | 272,685 |
Illinois Finance Authority, Centegra Health System Series 2014A, Rev., 5.00%, 9/1/2022 (b) | 115,000 | 115,000 |
Illinois Finance Authority, DePaul University | ||
Rev., 5.00%, 10/1/2022 | 25,000 | 25,050 |
Series 2016A, Rev., 5.00%, 10/1/2022 | 115,000 | 115,230 |
Illinois Finance Authority, Downers Grove Community High School | ||
Rev., 4.00%, 12/15/2022 | 35,000 | 35,176 |
Series 2020A, Rev., 4.00%, 12/15/2022 | 160,000 | 160,803 |
Illinois Finance Authority, Mercy Health System Rev., 5.00%, 12/1/2022 | 40,000 | 40,224 |
Illinois Finance Authority, Northwestern Memorial Healthcare | ||
Series 2021C, Rev., VRDO, LIQ : Barclays Bank plc, 0.98%, 9/1/2022 (c) | 11,000,000 | 11,000,000 |
Series 2017B, Rev., 5.00%, 12/15/2022 (c) | 90,000 | 90,626 |
Illinois Finance Authority, OSF Healthcare System | ||
Series 2015A, Rev., 5.00%, 11/15/2022 | 165,000 | 165,758 |
INVESTMENTS | PRINCIPAL AMOUNT($) | VALUE($) |
Illinois — continued | ||
Series 2015A, Rev., 5.00%, 11/15/2024 | 140,000 | 146,106 |
Illinois Finance Authority, Presbyterian Homes Obligated Group | ||
Series 2021B, Rev., (SIFMA Municipal Swap Index Yield + 0.70%), 2.20%, 9/8/2022 (d) | 5,790,000 | 5,607,354 |
Series 2016A, Rev., 5.00%, 11/1/2022 | 60,000 | 60,188 |
Illinois Finance Authority, Presence Health Network Series 2016C, Rev., 5.00%, 2/15/2023 | 265,000 | 268,054 |
Illinois Finance Authority, Regency Park at Lincolnwood Series 1991A, Rev., Zero Coupon, 7/15/2023 (b) | 60,000 | 58,708 |
Illinois Finance Authority, Riverside Health System | ||
Rev., 5.00%, 11/15/2022 | 165,000 | 165,758 |
Rev., 5.00%, 11/15/2023 | 215,000 | 215,936 |
Illinois Finance Authority, Rush University Medical Center Obligated Group Series 2015A, Rev., 5.00%, 11/15/2025 | 25,000 | 26,489 |
Illinois Finance Authority, Social Bonds-Learn Chapter School Project | ||
Rev., 4.00%, 11/1/2022 | 125,000 | 125,129 |
Rev., 4.00%, 11/1/2023 | 135,000 | 135,838 |
Illinois Finance Authority, State Clean Water Initiative | ||
Rev., 4.00%, 1/1/2023 | 155,000 | 155,814 |
Rev., 5.00%, 1/1/2023 | 25,000 | 25,213 |
Illinois Finance Authority, Swedish American Hospital | ||
Rev., 4.25%, 11/15/2022 (b) | 45,000 | 45,159 |
Rev., 5.00%, 11/15/2022 (b) | 25,000 | 25,129 |
Illinois Finance Authority, Swedish Covenant Hospital Series 2016A, Rev., 5.00%, 8/15/2026 (b) | 155,000 | 169,161 |
Illinois Finance Authority, The University of Chicago Medical Center | ||
Series 2014A, Rev., 5.00%, 10/1/2022 | 315,000 | 315,643 |
Series 2013A, Rev., 4.00%, 4/1/2023 (b) | 15,220,000 | 15,349,970 |
Series 2016B, Rev., 5.00%, 8/15/2023 | 740,000 | 756,351 |
Series A, Rev., 5.00%, 8/15/2023 | 200,000 | 204,419 |
Series 2016A, Rev., 5.00%, 8/15/2024 | 235,000 | 244,916 |
Illinois Finance Authority, Unitypoint Health | ||
Series 2016D, Rev., 5.00%, 2/15/2023 | 1,520,000 | 1,537,863 |
Series 2016D, Rev., 5.00%, 2/15/2024 | 230,000 | 238,279 |
258 | J.P. Morgan Exchange-Traded Funds | August 31, 2022 |
INVESTMENTS | PRINCIPAL AMOUNT($) | VALUE($) |
Municipal Bonds — continued | ||
Illinois — continued | ||
Illinois Health Facilities Authority, Advocate Health and Hospital Corp. Obligated Group Series 2003C, Rev., 1.60%, 11/15/2022 | 130,000 | 129,723 |
Illinois Municipal Electric Agency, Power Supply System Series 2015A, Rev., 5.00%, 2/1/2024 | 310,000 | 320,433 |
Illinois State Toll Highway Authority | ||
Series 2014D, Rev., 5.00%, 1/1/2023 | 780,000 | 786,723 |
Series 2018A, Rev., 5.00%, 1/1/2023 | 120,000 | 121,034 |
Series 2013A, Rev., 5.00%, 1/1/2027 | 35,000 | 35,295 |
Kane and DeKalb Counties Community Unit School District No. 302 Kaneland GO, NATL-RE, Zero Coupon, 2/1/2023 | 20,000 | 19,762 |
Kane County Community Unit School District No. 101 Batavia GO, 5.00%, 1/1/2023 | 40,000 | 40,358 |
Kane County Forest Preserve District | ||
GO, 5.00%, 12/15/2022 | 60,000 | 60,474 |
Series 2016C, GO, 5.00%, 12/15/2022 | 260,000 | 262,056 |
Kane County School District No. 131 Aurora East Side Series 2020C, GO, 5.00%, 12/1/2022 | 160,000 | 161,015 |
Kane McHenry Cook and De Kalb Counties Unit School District No. 300 | ||
Series 2021A, GO, 4.00%, 1/1/2023 | 75,000 | 75,404 |
GO, 5.00%, 1/1/2024 | 480,000 | 495,811 |
Kankakee and Will Counties Community Unit School District No. 5, Capital Appreciation GO, AGM, Zero Coupon, 5/1/2023 | 25,000 | 24,575 |
Kankakee and Will Counties Community Unit School District No. 5, Limited Tax GO, 4.00%, 12/1/2022 | 275,000 | 276,093 |
Kankakee County Community High School District No. 307 Bradley-Bourbonnais, Alternative Revenue Source GO, 4.00%, 12/1/2022 | 130,000 | 130,488 |
Kankakee County School District No. 61 Bradley Series 2012B, GO, 4.00%, 10/1/2022 | 25,000 | 25,030 |
Kendall County Community Unit School District No. 88 Plano GO, AMBAC, Zero Coupon, 12/1/2022 (b) | 20,000 | 19,885 |
Kendall Kane and Will Counties Community Unit School District No. 308 Series B, GO, 5.00%, 10/1/2022 | 200,000 | 200,408 |
Lake County Community Consolidated School District No. 3 Beach Park GO, AGM, 4.00%, 2/1/2023 | 300,000 | 301,938 |
INVESTMENTS | PRINCIPAL AMOUNT($) | VALUE($) |
Illinois — continued | ||
Lake County Community Consolidated School District No. 46 Grayslake GO, 5.00%, 11/1/2022 | 80,000 | 80,330 |
Lake County Community High School District No. 115 Lake Forest GO, 4.00%, 11/1/2022 | 45,000 | 45,132 |
Lake County Consolidated High School District No. 120 Mundelein, Limited Tax GO, 5.00%, 12/1/2022 | 135,000 | 135,890 |
Lake County School District No. 76-Diamond Lake, School Building GO, 5.00%, 1/1/2023 | 35,000 | 35,307 |
Lake County Township High School District No. 121 Warren Series 2016A, GO, 3.00%, 1/1/2024 (b) | 370,000 | 373,146 |
Madison and Jersey Counties Unit School District No. 11-Alton, Capital Appreciation GO, AGM, Zero Coupon, 12/1/2022 | 50,000 | 49,660 |
Madison-Macoupin Etc. Counties Community College District No. 536, Lewis and Clark Community GO, 5.00%, 11/1/2022 | 35,000 | 35,132 |
McHenry County Conservation District GO, 5.00%, 2/1/2024 | 20,000 | 20,684 |
McLean and Woodford Counties Community Unit School District No. 5 Normal | ||
Series 2017A, GO, 4.00%, 12/1/2022 | 460,000 | 461,714 |
Series 2017A, GO, 4.00%, 12/1/2023 | 30,000 | 30,451 |
McLean County Community Unit School District No. 3, Tri-Valley GO, 3.00%, 12/1/2022 | 25,000 | 25,046 |
McLean County Public Building Commission Rev., 5.00%, 12/1/2022 | 180,000 | 181,132 |
Metropolitan Water Reclamation District of Greater Chicago Series 2014D, 5.00%, 12/1/2022 | 60,000 | 60,358 |
Mundelein Park and Recreation District, Limited Tax GO, 3.00%, 12/15/2022 | 25,000 | 25,021 |
Peoria Metropolitan Airport Authority Series 2017D, GO, 5.00%, 12/1/2022 | 45,000 | 45,297 |
Peoria Tazewell Etc Counties Community College District No. 514 Series 2014A, GO, 5.00%, 12/1/2022 | 200,000 | 201,369 |
Piatt and Dewitt Counties Community Unit School District No. 57 Deland-Weldon GO, 3.13%, 12/1/2022 | 20,000 | 20,035 |
Pleasant Dale Park District Series A, GO, 4.00%, 12/15/2022 | 255,000 | 256,089 |
August 31, 2022 | J.P. Morgan Exchange-Traded Funds | 259 |
AS OF August 31, 2022 (Unaudited) (continued)
INVESTMENTS | PRINCIPAL AMOUNT($) | VALUE($) |
Municipal Bonds — continued | ||
Illinois — continued | ||
Railsplitter Tobacco Settlement Authority | ||
Rev., 5.00%, 6/1/2023 | 685,000 | 696,960 |
Rev., 5.00%, 6/1/2024 | 2,905,000 | 3,016,391 |
Regional Transportation Authority | ||
Series 2003B, Rev., NATL-RE, 5.50%, 6/1/2023 | 570,000 | 582,858 |
Series 2003A, Rev., NATL-RE, 5.50%, 7/1/2023 | 50,000 | 51,249 |
Series 2017A, Rev., 5.00%, 7/1/2024 | 25,000 | 26,093 |
Rock Island County Community Unit School District No. 40 Moline Series 2019A, GO, 5.00%, 2/1/2023 | 175,000 | 176,955 |
Rock Island County Community Unit School District No. 40 Moline, Alternative Revenue Source GO, 3.00%, 2/1/2024 | 20,000 | 20,060 |
Sangamon County School District No. 186 Springfield Series 2014B, GO, 5.00%, 2/1/2023 (b) | 95,000 | 96,026 |
Skokie Park District, Capital Appreciation GO, AMBAC, Zero Coupon, 12/1/2022 | 40,000 | 39,711 |
South Suburban College Community School District No. 510 AGC, Zero Coupon, 12/1/2023 | 25,000 | 24,094 |
Southwestern Illinois Development Authority, Flood Prevention District Council Project Rev., 4.00%, 4/15/2023 | 125,000 | 126,103 |
St. Charles Park District, Master Lease Program Series 2017B, GO, 5.00%, 12/15/2022 | 25,000 | 25,183 |
St. Clair County Township High School District No. 203 O'Fallon | ||
GO, 3.00%, 12/1/2022 | 35,000 | 35,051 |
GO, 4.00%, 12/1/2022 | 50,000 | 50,214 |
State of Illinois | ||
Series B, GO, 5.00%, 10/1/2022 | 35,000 | 35,061 |
Series 2017D, GO, 5.00%, 11/1/2022 | 9,530,000 | 9,563,215 |
Series 2019A, GO, 5.00%, 11/1/2022 | 345,000 | 346,202 |
GO, 5.00%, 2/1/2023 | 90,000 | 90,775 |
Series 2022B, GO, 5.00%, 3/1/2023 | 3,000,000 | 3,030,805 |
Series 2013A, GO, 5.00%, 4/1/2023 | 40,000 | 40,471 |
GO, 5.00%, 8/1/2023 | 1,830,000 | 1,861,695 |
Series D, GO, 5.00%, 11/1/2023 | 200,000 | 204,219 |
GO, 5.00%, 2/1/2024 | 265,000 | 271,590 |
Series 2021C, GO, 4.00%, 3/1/2024 | 825,000 | 834,533 |
Series 2021A, GO, 5.00%, 3/1/2024 | 1,035,000 | 1,061,973 |
Series 2022A, GO, 5.00%, 3/1/2024 | 4,865,000 | 4,991,784 |
Series 2022B, GO, 5.00%, 3/1/2024 | 5,500,000 | 5,643,332 |
INVESTMENTS | PRINCIPAL AMOUNT($) | VALUE($) |
Illinois — continued | ||
GO, 5.50%, 7/1/2024 | 75,000 | 76,723 |
Series D, GO, 5.00%, 11/1/2024 | 75,000 | 77,625 |
Series 2021A, GO, 5.00%, 3/1/2025 | 20,000 | 20,792 |
Series 2022B, GO, 5.00%, 3/1/2025 | 1,200,000 | 1,247,493 |
GO, 5.50%, 7/1/2025 | 3,405,000 | 3,485,198 |
GO, 4.00%, 8/1/2025 | 75,000 | 75,079 |
Series 2020B, GO, 5.00%, 10/1/2025 | 20,000 | 20,937 |
Series 2017D, GO, 5.00%, 11/1/2025 | 20,650,000 | 21,638,557 |
GO, 5.00%, 2/1/2026 | 25,000 | 26,274 |
GO, 5.00%, 6/1/2026 | 250,000 | 263,769 |
Series B, GO, 5.00%, 10/1/2026 | 25,000 | 26,472 |
Series 2017D, GO, 5.00%, 11/1/2026 | 675,000 | 715,361 |
GO, 5.00%, 2/1/2027 | 100,000 | 102,732 |
Series A, GO, 5.00%, 3/1/2027 | 50,000 | 53,171 |
State of Illinois, Sales Tax Series 2016D, Rev., 5.00%, 6/15/2023 | 120,000 | 121,928 |
Tender Option Bond Trust Receipts/ Certificates Series 2017-XF2500, Rev., VRDO, LIQ : Citibank NA, 1.55%, 9/12/2022 (c) (e) | 10,220,000 | 10,220,000 |
Town of Normal Series 2017A, GO, 4.00%, 6/1/2023 | 35,000 | 35,390 |
Township of Campton 5.00%, 12/15/2022 | 40,000 | 40,304 |
University of Illinois Series C, COP, 5.00%, 3/15/2023 | 45,000 | 45,563 |
University of Illinois, Auxiliary Facilities System Series 2013A, Rev., 5.00%, 4/1/2024 | 40,000 | 40,568 |
Vermilion and Edgar Counties Community Unit School District No. 4 Series 2016B, GO, AGM, 3.50%, 12/1/2022 | 200,000 | 200,511 |
Village of Antioch 4.00%, 12/1/2026 | 210,000 | 221,239 |
Village of Arlington Heights 3.00%, 12/1/2022 | 45,000 | 45,079 |
Village of Bolingbrook Series 1999A, NATL-RE, 5.25%, 1/1/2034 (b) | 30,000 | 30,292 |
Village of Channahon 4.00%, 12/1/2027 (b) | 25,000 | 25,104 |
Village of Elk Grove Village GO, 5.00%, 1/1/2023 | 20,000 | 20,175 |
Village of Elmwood Park GO, 4.75%, 12/1/2022 (b) | 50,000 | 50,300 |
Village of Glendale Heights GO, 5.00%, 12/15/2022 | 155,000 | 156,230 |
Village of Glenview Series 2012B, GO, 4.00%, 12/1/2022 | 25,000 | 25,105 |
260 | J.P. Morgan Exchange-Traded Funds | August 31, 2022 |
INVESTMENTS | PRINCIPAL AMOUNT($) | VALUE($) |
Municipal Bonds — continued | ||
Illinois — continued | ||
Village of Hoffman Estates GO, 5.00%, 12/1/2022 | 40,000 | 40,266 |
Village of La Grange GO, 3.00%, 12/1/2022 | 20,000 | 20,035 |
Village of Lyons Series 2014B, GO, AGM, 4.00%, 12/1/2022 | 35,000 | 35,130 |
Village of Midlothian | ||
GO, AGM, 4.00%, 1/1/2023 | 15,000 | 15,065 |
GO, AGM, 4.00%, 1/1/2024 | 70,000 | 71,266 |
GO, AGM, 4.00%, 1/1/2025 | 40,000 | 41,221 |
Village of Morton Grove GO, 5.00%, 12/15/2022 | 75,000 | 75,556 |
Village of Northbrook Series 2014A, GO, 5.00%, 12/1/2022 | 215,000 | 216,439 |
Village of Rantoul GO, 4.00%, 1/1/2025 | 350,000 | 360,680 |
Village of Schaumburg Series 2012A, GO, 4.00%, 12/1/2022 | 25,000 | 25,092 |
Village of South Holland Series 2015B, GO, 4.00%, 12/15/2022 | 195,000 | 195,659 |
Village of Streamwood GO, 5.00%, 12/1/2023 | 20,000 | 20,577 |
Village of Villa Park, Sales Tax Series 2018A, GO, 4.00%, 12/15/2022 | 135,000 | 135,569 |
Village of Western Springs GO, 3.00%, 12/1/2022 | 50,000 | 50,060 |
Village of Wheeling GO, 5.00%, 12/1/2022 | 40,000 | 40,266 |
Will County Community Consolidated School District No. 33-C Homer Glen Rev., 5.00%, 12/1/2022 | 25,000 | 25,168 |
Will County Community Unit School District No. 201-U Crete-Monee GO, AGM, Zero Coupon, 11/1/2023 | 300,000 | 290,554 |
Will County Community Unit School District No. 365-U Valley View GO, AGM, Zero Coupon, 11/1/2022 | 210,000 | 209,189 |
Will County Forest Preserve District GO, 5.00%, 12/15/2022 | 215,000 | 216,638 |
Will County Forest Preserve District, Limited Tax Series 2016A, GO, 2.00%, 12/15/2022 | 100,000 | 99,869 |
Will County School District No. 122, Capital Appreciation GO, AGM, Zero Coupon, 11/1/2022 | 60,000 | 59,726 |
Will County School District No. 86 Joliet Series 2015C, GO, AGM - CR, 5.00%, 3/1/2024 | 6,005,000 | 6,205,130 |
Will County Township High School District No. 204 Joliet, Limited Tax Series 2013A, GO, 2.75%, 1/1/2023 | 35,000 | 35,026 |
INVESTMENTS | PRINCIPAL AMOUNT($) | VALUE($) |
Illinois — continued | ||
Will Grundy Counties Community College District No. 525 Series 2012A, GO, 4.00%, 12/1/2022 (b) | 25,000 | 25,104 |
Will Grundy Etc Counties Community College District No. 525 | ||
Series 2013A, GO, 5.00%, 6/1/2023 | 535,000 | 545,382 |
Series 2013B, GO, 5.25%, 12/1/2023 (b) | 25,000 | 25,888 |
Total Illinois | 158,340,394 | |
Indiana — 0.5% | ||
Allen County War Memorial Coliseum Additions Building Corp. | ||
Series 2016A, 4.00%, 11/1/2022 | 50,000 | 50,132 |
Series 2016A, 4.00%, 11/1/2024 | 110,000 | 113,208 |
Allen County War Memorial Coliseum Expansion Building Corp., Lease Rental First Mortgage Bonds 5.00%, 11/1/2022 | 100,000 | 100,432 |
Anderson Redevelopment District Series 2018A, 5.00%, 2/1/2023 | 175,000 | 176,737 |
Anderson School Building Corp., First Mortgage | ||
5.00%, 1/20/2023 | 45,000 | 45,457 |
5.00%, 7/20/2023 | 20,000 | 20,455 |
Avon Community School Building Corp., Ad Valorem Property Tax First Mortgage | ||
2.00%, 1/15/2023 | 2,275,000 | 2,269,504 |
5.00%, 1/15/2023 | 40,000 | 40,397 |
5.00%, 7/15/2023 | 20,000 | 20,449 |
4.00%, 7/15/2024 | 25,000 | 25,680 |
Ball State University, Housing & Dining System 5.00%, 7/1/2024 | 25,000 | 25,535 |
Brownsburg 1999 School Building Corp., Ad Valorem Property Tax First Mortgage Series 2015B, 5.00%, 7/15/2024 | 30,000 | 31,349 |
Carmel Local Public Improvement Bond Bank Series 2021A, 4.00%, 7/15/2025 | 65,000 | 67,527 |
Carmel Local Public Improvement Bond Bank, Waterworks 5.00%, 6/1/2023 | 225,000 | 229,215 |
Carmel Redevelopment Authority, Option Income Tax Lease Rental | ||
Series 2014B, 5.00%, 1/1/2024 | 35,000 | 36,106 |
Series 2014B, 5.00%, 7/1/2024 | 70,000 | 73,047 |
City of Fishers, Local Income Tax Rev., 3.00%, 1/15/2023 | 65,000 | 65,174 |
August 31, 2022 | J.P. Morgan Exchange-Traded Funds | 261 |
AS OF August 31, 2022 (Unaudited) (continued)
INVESTMENTS | PRINCIPAL AMOUNT($) | VALUE($) |
Municipal Bonds — continued | ||
Indiana — continued | ||
City of Indianapolis, Energy System, First Lien Series 2016A, Rev., 5.00%, 10/1/2022 | 360,000 | 360,750 |
City of Knox, Sewage Works Rev., 4.00%, 12/1/2022 | 65,000 | 65,200 |
City of La Porte, Sewage Works Rev., 3.00%, 3/1/2023 | 40,000 | 40,117 |
City of Rockport, AEP Generating Co. Project Series A, Rev., VRDO, 1.35%, 9/1/2022 (c) | 50,000 | 50,000 |
Clark Pleasant Middle School Corp., Ad Valorem Property Tax First Mortgage 4.00%, 1/15/2025 | 35,000 | 35,988 |
Clarksville Redevelopment Authority 4.00%, 8/1/2023 | 125,000 | 126,534 |
Clay Multi School Building Corp. 5.00%, 1/15/2023 | 210,000 | 212,012 |
Concord Community Schools Building Corp., First Mortgage 5.00%, 7/15/2023 | 25,000 | 25,565 |
County of Johnson, Local Income Tax Series 2020A, Rev., 4.00%, 7/15/2023 | 25,000 | 25,345 |
Decatur Township Multi-School Building Corp., Ad Valorem Property Tax First Mortgage Rev., 4.00%, 1/15/2023 | 20,000 | 20,116 |
East Allen Multi School Building Corp., Indiana Ad Valorem Property Tax, First Mortgage | ||
Rev., 4.00%, 7/15/2023 | 10,000 | 10,130 |
Rev., 4.00%, 1/15/2024 | 40,000 | 40,754 |
East Porter County School Corp. GO, 2.00%, 1/15/2023 | 30,000 | 29,954 |
Fishers Industrial Redevelopment District, Income Tax | ||
Rev., 4.00%, 1/15/2024 | 25,000 | 25,448 |
Rev., 4.00%, 7/15/2024 | 35,000 | 35,829 |
Fort Wayne Redevelopment Authority Lease Rental Series 2014A, Rev., 3.00%, 8/1/2024 | 50,000 | 50,064 |
Franklin Township-Marion County Multiple School Building Corp., Ad Valorem Property Tax First Mortgage Rev., 4.00%, 1/15/2023 | 40,000 | 40,249 |
GCS School Building Corp. One, Unlimited Ad Valorem Property Tax First Mortgage | ||
Rev., 4.00%, 1/15/2023 | 75,000 | 75,447 |
Rev., 5.00%, 1/15/2026 | 45,000 | 48,688 |
Greenfield Middle School Building Corp., Ad Valorem Property Tax First Mortgage Rev., 5.00%, 7/15/2023 | 30,000 | 30,678 |
INVESTMENTS | PRINCIPAL AMOUNT($) | VALUE($) |
Indiana — continued | ||
Hamilton County Public Building Corp., First Mortgage Rev., 5.00%, 2/1/2023 | 75,000 | 75,181 |
Hamilton Southeastern Consolidated School Building Corp., Ad Valorem Property Tax First Mortgage Rev., 4.00%, 1/15/2024 | 25,000 | 25,522 |
Hammond Multi-School Building Corp., Ad Valorem Property Tax First Mortgage | ||
Rev., 5.00%, 7/15/2024 | 100,000 | 103,245 |
Rev., 5.00%, 1/15/2025 | 100,000 | 105,358 |
Indiana Bond Bank, Special Program, Columbus Learning Center Project Series 2012C, Rev., 5.00%, 8/1/2023 | 200,000 | 200,420 |
Indiana Finance Authority | ||
Series 2010A, Rev., 5.00%, 12/1/2022 | 130,000 | 130,877 |
Series 2016C, Rev., 5.00%, 12/1/2022 | 75,000 | 75,506 |
Indiana Finance Authority, Beacon Health System Obligation Group Series 2013A, Rev., 5.00%, 8/15/2023 | 250,000 | 255,810 |
Indiana Finance Authority, Butler University Project Series 2014A, Rev., 5.00%, 2/1/2023 | 100,000 | 101,034 |
Indiana Finance Authority, Community Foundation of Northwest Indiana Obligated Group | ||
Rev., 5.00%, 9/1/2022 | 100,000 | 100,000 |
Rev., 5.00%, 3/1/2023 | 25,000 | 25,335 |
Indiana Finance Authority, Deaconess Health System Obligated Project | ||
Series 2013A, Rev., 5.00%, 3/1/2023 | 25,000 | 25,304 |
Series 2013A, Rev., 5.00%, 3/1/2023 (b) | 25,000 | 25,317 |
Indiana Finance Authority, First Lien, CWA Authority Project | ||
Series 2012A, Rev., 5.00%, 10/1/2022 (b) | 535,000 | 536,167 |
Series 2014A, Rev., 5.00%, 10/1/2022 | 205,000 | 205,437 |
Series 2016A, Rev., 5.00%, 10/1/2022 | 50,000 | 50,107 |
Series 2021-1, Rev., 5.00%, 10/1/2022 | 125,000 | 125,267 |
Series 2021-1, Rev., 5.00%, 10/1/2023 | 10,000 | 10,265 |
Indiana Finance Authority, Franciscan Alliance, Inc., Obligated Group | ||
Rev., 5.00%, 11/1/2022 | 170,000 | 170,746 |
Series 2017C, Rev., 5.00%, 11/1/2022 | 50,000 | 50,219 |
Series 2016B, Rev., 5.00%, 11/1/2024 | 345,000 | 363,133 |
Indiana Finance Authority, Goshen Health Series B, Rev., 2.10%, 11/1/2026 (c) | 60,000 | 58,043 |
262 | J.P. Morgan Exchange-Traded Funds | August 31, 2022 |
INVESTMENTS | PRINCIPAL AMOUNT($) | VALUE($) |
Municipal Bonds — continued | ||
Indiana — continued | ||
Indiana Finance Authority, Indiana University Health Obligated Group | ||
Rev., 5.00%, 12/1/2022 | 600,000 | 603,851 |
Series 2014A, Rev., 5.00%, 12/1/2022 | 220,000 | 221,412 |
Series 2016A, Rev., 5.00%, 12/1/2022 | 575,000 | 578,691 |
Rev., 5.00%, 12/1/2024 | 75,000 | 79,088 |
Series B, Rev., 2.25%, 7/1/2025 (c) | 150,000 | 148,642 |
Indiana Finance Authority, Lease Appropriation, Convention Center Expansion Project Series 2019B, Rev., 5.00%, 2/1/2025 | 90,000 | 95,257 |
Indiana Finance Authority, Parkview Health System, Inc. Series 2017A, Rev., 5.00%, 11/1/2022 | 420,000 | 421,773 |
Indiana Finance Authority, State Revolving Fund Program | ||
Rev., 5.00%, 2/1/2023 | 50,000 | 50,569 |
Series 2012C, Rev., 5.00%, 2/1/2023 | 70,000 | 70,797 |
Series 2015B, Rev., 5.00%, 2/1/2023 | 45,000 | 45,512 |
Series 2017C, Rev., 5.00%, 2/1/2023 | 25,000 | 25,284 |
Series 2012C, Rev., 5.00%, 2/1/2025 | 25,000 | 25,267 |
Indiana Health Facility Financing Authority, Ascension Health Credit Group Rev., 4.00%, 10/1/2025 | 30,000 | 31,192 |
Indiana State University, Student Fee Series R, Rev., 5.00%, 10/1/2022 | 280,000 | 280,514 |
Indiana University Series 2015A, Rev., 5.00%, 6/1/2023 | 70,000 | 71,411 |
Indiana University, Student Fee Series W-2, Rev., 5.00%, 8/1/2023 | 10,000 | 10,244 |
Indianapolis Local Public Improvement Bond Bank Series 2019E, Rev., 5.00%, 1/1/2023 | 30,000 | 30,274 |
Indianapolis Local Public Improvement Bond Bank, Capital Appreciation Series 1999E, Rev., AMBAC, Zero Coupon, 2/1/2023 | 25,000 | 24,735 |
Indianapolis Local Public Improvement Bond Bank, Indianapolis Airport Authority Series 2019I-2, Rev., 5.00%, 1/1/2023 | 25,000 | 25,216 |
Indianapolis Local Public Improvement Bond Bank, Pilot Infrastructure Project Series 2017C, Rev., 5.00%, 1/1/2023 | 35,000 | 35,314 |
Indianapolis Local Public Improvement Bond Bank, Stormwater Project | ||
Series 2013D, Rev., 5.00%, 1/1/2023 | 20,000 | 20,182 |
Series 2013D, Rev., 3.25%, 1/1/2025 | 100,000 | 100,169 |
INVESTMENTS | PRINCIPAL AMOUNT($) | VALUE($) |
Indiana — continued | ||
Indianapolis-Marion County Public Library GO, 5.00%, 1/1/2023 | 60,000 | 60,127 |
Ivy Tech Community College of Indiana, Student Fee | ||
Series R-1, Rev., 5.00%, 7/1/2023 | 35,000 | 35,775 |
Series W, Rev., 5.00%, 7/1/2025 | 25,000 | 26,524 |
Jackson County Building Corp. | ||
Rev., 2.00%, 1/15/2023 | 120,000 | 119,623 |
Rev., 2.00%, 7/15/2023 | 125,000 | 123,990 |
Rev., 2.00%, 1/15/2025 | 125,000 | 122,627 |
Jasper Hospital Authority, Memorial Health and Health Center Project Rev., 5.00%, 11/1/2022 | 125,000 | 125,465 |
Jennings County School Building Corp., First Mortgage Series 2019A, Rev., 2.00%, 1/15/2023 | 60,000 | 59,862 |
LaPorte Multi School Building Corp., Ad Valorem Property Tax, First Mortgage Series 2017A, Rev., 2.00%, 1/15/2023 | 25,000 | 24,951 |
Lawrence Township School Building Corp., Unlimited Tax Rev., 4.00%, 1/15/2023 | 25,000 | 25,163 |
Merrillville Community School Corp. | ||
GO, 2.00%, 7/15/2023 | 1,025,000 | 1,016,720 |
GO, 2.00%, 1/15/2024 | 1,040,000 | 1,025,436 |
Merrillville Multi School Building Corp., Ad Valorem Property Tax, First Mortgage Rev., 5.00%, 7/15/2023 | 40,000 | 40,887 |
Michigan City School Building Corp., Ad Valorem Property Tax First Mortgage Series 2016B, Rev., 4.00%, 7/15/2023 | 30,000 | 30,390 |
Mooresville Redevelopment District, Tax Increment Rev., 4.00%, 1/15/2023 (b) | 25,000 | 25,148 |
Munster School Building Corp., Valorem Tax First Mortgage Rev., 4.00%, 7/15/2023 | 85,000 | 86,121 |
New Palestine Multi-School Building Corp., First Mortgage, Ad Valorem Property Tax Rev., 4.00%, 1/15/2023 | 45,000 | 45,283 |
New Prairie United School District Building Corp., First Mortgage Rev., 4.00%, 1/15/2025 | 35,000 | 36,118 |
North Adams Community Schools Renovation Building Corp., First Mortgage, Ad Valorem Property Tax | ||
Rev., 5.00%, 1/15/2023 | 20,000 | 20,189 |
Rev., 5.00%, 7/15/2023 | 35,000 | 35,761 |
North West Hendricks Multi-Building Corp., First Mortgage Series 2016A, Rev., 4.00%, 1/15/2023 | 25,000 | 25,156 |
August 31, 2022 | J.P. Morgan Exchange-Traded Funds | 263 |
AS OF August 31, 2022 (Unaudited) (continued)
INVESTMENTS | PRINCIPAL AMOUNT($) | VALUE($) |
Municipal Bonds — continued | ||
Indiana — continued | ||
Pike Township Multi-School Building Corp., First Mortgage | ||
Rev., 5.00%, 1/15/2024 | 320,000 | 330,969 |
Rev., 5.00%, 7/15/2024 | 350,000 | 365,999 |
Rev., 5.00%, 1/15/2025 | 335,000 | 354,217 |
Plainfield High School Building Corp., Ad Valorem Property Tax, First Mortgage Series 2019A, Rev., 5.00%, 7/15/2023 | 35,000 | 35,800 |
Purdue University | ||
Series 2016CC, Rev., 5.00%, 7/1/2023 | 40,000 | 40,862 |
Series EE, Rev., 5.00%, 7/1/2023 | 20,000 | 20,431 |
South Bend Community School Building Corp., First Mortgage Rev., 4.00%, 1/15/2023 | 30,000 | 30,191 |
South Bend Redevelopment Authority, Eddy Street Commons Project Rev., 5.00%, 2/15/2023 | 100,000 | 101,130 |
South Gibson School Building Corp., First Mortgage Rev., 4.00%, 1/10/2025 | 40,000 | 41,326 |
Southmont School Building Corp., Ad Valorem Property Tax, First Mortgage Rev., 5.00%, 1/15/2025 | 20,000 | 21,133 |
Tell City-Troy Township Elementary School Building Corp., First Mortgage Refunding and Improvement Rev., 5.00%, 1/15/2023 | 50,000 | 50,472 |
Twin Lakes Regional Sewer District Rev., AGM, 3.00%, 7/1/2023 (b) | 25,000 | 25,118 |
Twin Lakes School Building Corp., First Mortgage Rev., 4.00%, 7/15/2024 | 35,000 | 35,868 |
University of Southern Indiana Foundation Series N, Rev., 4.00%, 10/1/2022 | 145,000 | 145,188 |
Wa-Nee Community Schools GO, 3.00%, 1/15/2023 | 125,000 | 125,299 |
Warsaw Multi-School Building Corp., First Mortgage Rev., 5.00%, 1/15/2023 | 85,000 | 85,802 |
West Clark 2000 School Building Corp., First Mortgage Rev., 5.00%, 1/15/2023 | 25,000 | 25,243 |
West Lafayette School Building Corp., Ad Valorem Property Tax, First Mortgage Rev., 5.00%, 7/15/2023 | 85,000 | 86,921 |
Whitestown Redevelopment Authority Rev., 3.00%, 1/15/2024 | 25,000 | 25,117 |
Winfield Building Corp., Indiana Lease Rental, Sewage Works Treatment Plant Project | ||
Rev., 4.00%, 1/15/2023 | 130,000 | 130,728 |
INVESTMENTS | PRINCIPAL AMOUNT($) | VALUE($) |
Indiana — continued | ||
Rev., 4.00%, 7/15/2023 | 85,000 | 86,069 |
Rev., 4.00%, 1/15/2024 | 35,000 | 35,674 |
Rev., 4.00%, 7/15/2024 | 35,000 | 35,900 |
Rev., 4.00%, 1/15/2025 | 145,000 | 149,664 |
Rev., 4.00%, 7/15/2025 | 145,000 | 150,593 |
Rev., 4.00%, 1/15/2026 | 150,000 | 156,728 |
Zionsville Community Schools Building Corp., First Mortgage, Capital Appreciation Series 2003Z, Rev., NATL-RE, Zero Coupon, 1/15/2025 | 25,000 | 23,346 |
Total Indiana | 16,380,063 | |
Iowa — 0.6% | ||
Ames Community School District 5.00%, 6/1/2023 | 25,000 | 25,491 |
Ankeny Community School District Series 2015A, 5.00%, 6/1/2023 | 20,000 | 20,397 |
City of Bettendorf Series 2013A, 4.00%, 6/1/2023 | 50,000 | 50,603 |
City of Cedar Rapids Series 2018D, 5.00%, 6/1/2023 | 30,000 | 30,560 |
City of Des Moines Series 2016B, GO, 4.00%, 6/1/2023 | 25,000 | 25,305 |
County of Polk Series 2017C, GO, 5.00%, 6/1/2023 | 45,000 | 45,873 |
County of Scott, Solid Waste Disposal Series 2015A, GO, 4.00%, 6/1/2023 | 25,000 | 25,301 |
GMG Community School District GO, 4.00%, 6/1/2023 | 40,000 | 40,411 |
Iowa Finance Authority, Health System Rev., (SIFMA Municipal Swap Index Yield + 0.58%), 2.08%, 9/8/2022 (d) (e) | 14,990,000 | 14,943,618 |
Iowa Finance Authority, Single Family Mortgage-Backed Securities Program Series 2017C, Rev., GNMA/FNMA/FHLMC, 1.70%, 1/1/2023 | 165,000 | 164,584 |
Iowa Finance Authority, Unitypoint Health Series 2018B, Rev., 5.00%, 2/15/2025 | 340,000 | 356,853 |
Janesville Consolidated School District GO, 3.00%, 6/1/2023 | 25,000 | 25,117 |
Linn-Mar Community School District GO, 5.00%, 5/1/2023 | 80,000 | 81,424 |
North Polk Community School District Series 2017A, GO, 3.00%, 6/1/2023 | 30,000 | 30,141 |
State of Iowa Board of Regents, University of Iowa, Hospitals and Clinics | ||
Rev., 4.00%, 9/1/2022 (b) | 100,000 | 100,000 |
Series 2021A, Rev., 5.00%, 9/1/2022 | 1,305,000 | 1,305,000 |
264 | J.P. Morgan Exchange-Traded Funds | August 31, 2022 |
INVESTMENTS | PRINCIPAL AMOUNT($) | VALUE($) |
Municipal Bonds — continued | ||
Iowa — continued | ||
Series SUI, Rev., 5.00%, 9/1/2022 | 50,000 | 50,000 |
Series 2019SUI, Rev., 5.00%, 9/1/2025 | 25,000 | 26,796 |
State of Iowa, Special Obligation Rev., 5.00%, 6/15/2023 | 25,000 | 25,495 |
University of Iowa (The), Recreational Facilities Series 2017B, Rev., 4.00%, 7/1/2023 | 20,000 | 20,279 |
University of Iowa, Utility System Series SUI, Rev., 5.00%, 11/1/2022 (b) | 65,000 | 65,282 |
Total Iowa | 17,458,530 | |
Kansas — 0.3% | ||
Blue Valley Recreation Commission | ||
Series A, AGM, 5.00%, 10/1/2022 | 75,000 | 75,163 |
Series B, AGM, 5.00%, 10/1/2023 | 30,000 | 30,835 |
Bourbon County Unified School District No 234-Fort Scott 5.00%, 9/1/2022 | 25,000 | 25,000 |
Butler County Unified School District No. 206 Remington AGM, 5.00%, 9/1/2022 | 40,000 | 40,000 |
Butler County Unified School District No. 375 Circle Series 2013-1, AGM, 3.38%, 9/1/2030 (b) | 20,000 | 20,183 |
Cherokee County Unified School District No. 499 Galena Series 2013A, AGM, 5.00%, 9/1/2033 (b) | 40,000 | 40,000 |
City of Derby | ||
Series 2015C, GO, 3.00%, 12/1/2022 | 20,000 | 20,037 |
Series 2019B, GO, 4.00%, 12/1/2022 | 105,000 | 105,449 |
Series 2019-A, GO, 5.00%, 12/1/2022 | 30,000 | 30,202 |
City of Goddard | ||
Series 2021-1, GO, 4.00%, 10/1/2022 | 40,000 | 40,053 |
Series 2019-1, GO, 3.00%, 12/1/2022 | 125,000 | 125,064 |
City of Hutchinson Series 2016A, GO, 4.00%, 10/1/2022 | 30,000 | 30,041 |
City of Lawrence | ||
Series 2015-A, GO, 3.00%, 9/1/2022 | 30,000 | 30,000 |
Series 2017D, GO, 5.00%, 9/1/2022 | 180,000 | 180,000 |
City of Lawrence, Water and Sewer System Rev., 5.00%, 11/1/2022 | 25,000 | 25,114 |
City of Manhattan Series A, GO, 5.00%, 11/1/2022 | 30,000 | 30,134 |
City of Manhattan, Temporary Notes Series 2020-03, GO, 0.75%, 6/15/2024 | 185,000 | 176,218 |
City of Olathe | ||
Series 233, GO, 3.00%, 10/1/2022 | 160,000 | 160,098 |
Series 234, GO, 4.25%, 10/1/2022 | 25,000 | 25,040 |
Series 230, GO, 5.00%, 10/1/2022 | 185,000 | 185,408 |
INVESTMENTS | PRINCIPAL AMOUNT($) | VALUE($) |
Kansas — continued | ||
Series 231, GO, 5.00%, 10/1/2022 | 75,000 | 75,165 |
City of Oswego Series 2012A, GO, 4.13%, 12/1/2022 (b) | 100,000 | 100,436 |
City of Overland Park, Unlimited Tax Series 2013C, GO, 4.00%, 9/1/2022 | 65,000 | 65,000 |
City of Wichita | ||
Series 2012A, GO, 4.00%, 9/1/2022 | 25,000 | 25,000 |
GO, 4.00%, 10/15/2022 | 1,510,000 | 1,513,183 |
Series 823, GO, 4.00%, 12/1/2022 | 20,000 | 20,088 |
GO, 5.00%, 12/1/2022 | 115,000 | 115,787 |
City of Wichita, Water & Sewer Utility Series 2015D, Rev., 5.00%, 10/1/2022 | 25,000 | 25,056 |
County of Anderson Series 2013A, AGM, 4.75%, 8/1/2043 (b) | 50,000 | 51,055 |
County of Johnson, Internal Improvement | ||
Series 2012A, GO, 3.00%, 9/1/2022 (b) | 25,000 | 25,000 |
Series 2015A, GO, 5.00%, 9/1/2022 | 20,000 | 20,000 |
Series 2018A, GO, 5.00%, 9/1/2022 | 20,000 | 20,000 |
County of Saline, Sales Tax Series 2021B, GO, 4.00%, 9/1/2022 | 245,000 | 245,000 |
County of Shawnee COP, 3.00%, 9/1/2024 | 35,000 | 35,244 |
County of Shawnee, Public Building Commission, Kansas Expocentre Project Rev., 4.00%, 9/1/2022 | 25,000 | 25,000 |
Douglas County Unified School District No. 497 Lawrence Series 2016-A, GO, 5.00%, 9/1/2022 | 110,000 | 110,000 |
Finney County Unified School District No. 457 Garden City Series B, GO, 5.00%, 9/1/2022 | 50,000 | 50,000 |
Franklin County Unified School District No. 290 Ottawa GO, 3.00%, 9/1/2022 (b) | 100,000 | 100,000 |
Johnson County Community College Foundation, Inc. COP, 5.00%, 10/1/2022 | 150,000 | 150,320 |
Johnson County Community College Foundation, Inc., Student Common and Parking System Rev., 4.00%, 11/15/2022 | 100,000 | 100,339 |
Johnson County Park and Recreation District Series 2013A, COP, 5.00%, 9/1/2022 | 225,000 | 225,000 |
Johnson County Public Building Commission Series 2012A, Rev., 3.00%, 9/1/2022 | 25,000 | 25,000 |
Johnson County Public Building Commission, Courthouse and Medical Examiners Facilities Series 2018A, Rev., 5.00%, 9/1/2022 | 75,000 | 75,000 |
August 31, 2022 | J.P. Morgan Exchange-Traded Funds | 265 |
AS OF August 31, 2022 (Unaudited) (continued)
INVESTMENTS | PRINCIPAL AMOUNT($) | VALUE($) |
Municipal Bonds — continued | ||
Kansas — continued | ||
Johnson County Unified School District No. 229 Blue Valley Series 2015B, GO, 5.00%, 10/1/2022 | 20,000 | 20,041 |
Johnson County Unified School District No. 233 Olathe | ||
Series 2017B, GO, 3.00%, 9/1/2022 | 30,000 | 30,000 |
Series 2016A, GO, 4.00%, 9/1/2022 | 35,000 | 35,000 |
Series 2017A, GO, 4.00%, 9/1/2022 | 175,000 | 175,000 |
Series 2016B, GO, 5.00%, 9/1/2022 | 150,000 | 150,000 |
Series 2016C, GO, 5.00%, 9/1/2022 | 85,000 | 85,000 |
Series 2016C, GO, 5.00%, 9/1/2023 | 50,000 | 51,313 |
Kansas Development Finance Authority Series 2015A, Rev., 5.00%, 5/1/2023 (b) | 775,000 | 788,489 |
Kansas Development Finance Authority, Kansas Department of Commerce Impact Program Series 2020T, Rev., 5.00%, 12/1/2022 | 410,000 | 412,652 |
Kansas Development Finance Authority, National Bio and Agro-Defense Facility Series 2015G, Rev., 5.00%, 4/1/2023 (b) | 175,000 | 177,628 |
Kansas Development Finance Authority, State of Kansas Project Series 2019F, Rev., 5.00%, 11/1/2022 | 240,000 | 241,037 |
Kansas Development Finance Authority, University Project Series 2014C, Rev., 5.00%, 5/1/2023 | 195,000 | 195,304 |
Kansas Turnpike Authority Series 2020A, Rev., 3.00%, 9/1/2022 | 90,000 | 90,000 |
Leavenworth County Unified School District No. 464 Series B, GO, 4.00%, 9/1/2022 | 125,000 | 125,000 |
Neosho County Unified School District No. 413 GO, AGM, 4.00%, 9/1/2023 (b) | 25,000 | 25,389 |
Reno County Unified School District No. 310 GO, 3.00%, 9/1/2022 | 125,000 | 125,000 |
Reno County Unified School District No. 313 Buhler Series A, GO, 4.00%, 9/1/2022 (b) | 265,000 | 265,000 |
Sedgwick County Unified School District No. 259 Wichita Series 2017-A, GO, 3.00%, 10/1/2022 | 420,000 | 420,264 |
Sedgwick County Unified School District No. 261 Haysville GO, 4.00%, 11/1/2022 | 50,000 | 50,136 |
Sedgwick County Unified School District No. 265 Goddard Series 2016B, GO, 4.00%, 10/1/2022 | 125,000 | 125,173 |
INVESTMENTS | PRINCIPAL AMOUNT($) | VALUE($) |
Kansas — continued | ||
Sedgwick County Unified School District No. 266 Maize | ||
Series 2015A, GO, 4.00%, 9/1/2022 | 100,000 | 100,000 |
Series 2015A, GO, 4.00%, 9/1/2023 (b) | 25,000 | 25,402 |
Seward County Unified School District No. 480 Liberal | ||
GO, 5.00%, 9/1/2022 (b) | 335,000 | 335,000 |
Series 2017-B, GO, 5.00%, 9/1/2023 | 10,000 | 10,252 |
State of Kansas Department of Transportation | ||
Series 2012B, Rev., 5.00%, 9/1/2022 | 125,000 | 125,000 |
Series 2012C, Rev., 5.00%, 9/1/2022 | 105,000 | 105,000 |
Series 2015A, Rev., 5.00%, 9/1/2023 | 45,000 | 46,196 |
Washington County Public Building Commission, Law Enforcement Center and Hospital Project Rev., AGM, 5.00%, 9/1/2022 (b) | 100,000 | 100,000 |
Wyandotte County Unified School District No. 202 Turner GO, 5.00%, 9/1/2022 | 20,000 | 20,000 |
Wyandotte County Unified School District No. 203 Piper Series 2016A, GO, 4.00%, 9/1/2022 | 100,000 | 100,000 |
Wyandotte County, Unified Government Utility System Improvement | ||
Series 2020-A, Rev., 3.00%, 9/1/2022 | 25,000 | 25,000 |
Series 2012A, Rev., 5.00%, 9/1/2022 (b) | 360,000 | 360,000 |
Series 2012A, Rev., 5.00%, 9/1/2022 | 125,000 | 125,000 |
Series 2012B, Rev., 5.00%, 9/1/2022 | 85,000 | 85,000 |
Series 2012B, Rev., 5.00%, 9/1/2022 (b) | 45,000 | 45,000 |
Series B, Rev., 5.00%, 9/1/2022 | 40,000 | 40,000 |
Wyandotte County-Kansas City Unified Government Utility System Series 2012A, Rev., 3.50%, 9/1/2022 (b) | 25,000 | 25,000 |
Wyandotte County-Kansas City Unified Government Utility System, Public Utilities Series 2012A, Rev., 3.25%, 9/1/2022 (b) | 25,000 | 25,000 |
Total Kansas | 9,874,988 | |
Kentucky — 0.6% | ||
Augusta Independent School District Finance Corp. 2.00%, 2/1/2023 | 45,000 | 44,877 |
Boone County School District Finance Corp. Series 2016B, 2.00%, 11/1/2022 | 125,000 | 124,841 |
City of Russell, Bon Secours Health System, Inc. Rev., 5.00%, 11/1/2022 (b) | 70,000 | 70,315 |
266 | J.P. Morgan Exchange-Traded Funds | August 31, 2022 |
INVESTMENTS | PRINCIPAL AMOUNT($) | VALUE($) |
Municipal Bonds — continued | ||
Kentucky — continued | ||
County of Campbell 2.00%, 12/1/2022 | 45,000 | 44,966 |
County of Daviess Series 2012A, GO, 2.00%, 9/1/2023 | 50,000 | 49,713 |
Crittenden County School District Finance Corp. Rev., 2.50%, 10/1/2022 | 25,000 | 25,005 |
Eastern Kentucky University, General Receipts | ||
Series 2018A, Rev., 5.00%, 10/1/2022 | 30,000 | 30,058 |
Series 2012A, Rev., 5.00%, 4/1/2023 | 35,000 | 35,477 |
Fayette County School District Finance Corp. | ||
Series 2020B, Rev., 4.00%, 12/1/2022 | 20,000 | 20,082 |
Series 2013A, Rev., 5.00%, 10/1/2023 (b) | 25,000 | 25,707 |
Glasgow Electric Plant Board, Electric System Series 2014B, Rev., 2.75%, 12/1/2022 | 25,000 | 25,024 |
Henderson County School District Finance Corp. Rev., 2.00%, 10/1/2022 | 25,000 | 24,991 |
Kenton County Public Properties Corp., Court Facilities Project Rev., 3.00%, 3/1/2024 | 500,000 | 502,454 |
Kentucky Asset Liability Commission, Federal Highway Trust Fund | ||
Series 2015A, Rev., 5.00%, 9/1/2022 | 590,000 | 590,000 |
Series 2020A, Rev., 5.00%, 9/1/2022 | 30,000 | 30,000 |
Series 2013A, Rev., 5.25%, 9/1/2022 | 610,000 | 610,000 |
Series 2013A, Rev., 5.25%, 9/1/2024 | 260,000 | 266,800 |
Series 2013A, Rev., 5.25%, 9/1/2025 | 310,000 | 317,911 |
Series A, Rev., 5.00%, 9/1/2026 | 145,000 | 151,394 |
Kentucky Bond Development Corp. Rev., 5.00%, 9/1/2022 (b) | 400,000 | 400,000 |
Kentucky Economic Development Finance Authority, Catholic Health Initiatives Series 2013A, Rev., 5.25%, 1/1/2023 (b) | 100,000 | 100,947 |
Kentucky Infrastructure Authority, Wastewater and Drinking Water Revolving Fund | ||
Series 2016A, Rev., 5.00%, 2/1/2023 | 20,000 | 20,217 |
Series 2018A, Rev., 3.00%, 2/1/2024 | 25,000 | 25,193 |
Kentucky Public Energy Authority, Gas Supply | ||
Series A-1, Rev., 4.00%, 2/1/2023 | 955,000 | 958,174 |
Series A-1, Rev., 4.00%, 8/1/2023 | 1,050,000 | 1,056,257 |
Series A-1, Rev., 4.00%, 2/1/2024 | 2,500,000 | 2,520,149 |
Series 2018A, Rev., 4.00%, 4/1/2024 (c) | 155,000 | 156,171 |
INVESTMENTS | PRINCIPAL AMOUNT($) | VALUE($) |
Kentucky — continued | ||
Series 2018B, Rev., 4.00%, 1/1/2025 (c) | 1,810,000 | 1,825,465 |
Series 2018C-1, Rev., 4.00%, 6/1/2025 (c) | 395,000 | 398,435 |
Series 2020A, Rev., 4.00%, 6/1/2026 (c) | 90,000 | 90,640 |
Kentucky State Property and Building Commission, Project No. 104 Rev., 5.00%, 11/1/2022 | 310,000 | 311,360 |
Kentucky State Property and Building Commission, Project No. 106 | ||
Series 2013A, Rev., 5.00%, 10/1/2022 | 110,000 | 110,249 |
Series 2013A, Rev., 5.00%, 10/1/2023 (b) | 55,000 | 56,567 |
Kentucky State Property and Building Commission, Project No. 108 | ||
Series B, Rev., 5.00%, 8/1/2023 | 870,000 | 889,751 |
Series B, Rev., 5.00%, 8/1/2026 | 125,000 | 135,197 |
Kentucky State Property and Building Commission, Project No. 112 Series B, Rev., 5.00%, 11/1/2022 | 510,000 | 512,297 |
Kentucky State Property and Building Commission, Project No. 115 Rev., 5.00%, 4/1/2023 | 120,000 | 121,767 |
Kentucky State Property and Building Commission, Project No. 116 Rev., AGM, 3.00%, 10/1/2022 | 105,000 | 105,064 |
Kentucky State Property and Building Commission, Project No. 119 Rev., 5.00%, 5/1/2023 | 25,000 | 25,419 |
Kentucky State Property and Building Commission, Project No. 125 Series A, Rev., 5.00%, 9/1/2022 | 40,000 | 40,000 |
Kentucky Turnpike Authority, Revitalization Projects | ||
Series 2016A, Rev., 5.00%, 7/1/2023 | 875,000 | 893,058 |
Series B, Rev., 5.00%, 7/1/2023 | 70,000 | 71,445 |
Series 2014A, Rev., 5.00%, 7/1/2024 | 35,000 | 36,536 |
Series B, Rev., 5.00%, 7/1/2025 | 95,000 | 100,925 |
Lexington-Fayette Urban County Government | ||
Series 2014A, GO, 5.00%, 9/1/2022 | 20,000 | 20,000 |
Series 2013A, GO, 5.00%, 10/1/2022 | 95,000 | 95,207 |
Lexington-Fayette Urban County Government Sewer System Series 2014A, Rev., 5.00%, 9/1/2022 | 100,000 | 100,000 |
August 31, 2022 | J.P. Morgan Exchange-Traded Funds | 267 |
AS OF August 31, 2022 (Unaudited) (continued)
INVESTMENTS | PRINCIPAL AMOUNT($) | VALUE($) |
Municipal Bonds — continued | ||
Kentucky — continued | ||
Lexington-Fayette Urban County Government, Various Purpose | ||
Series 2017A, GO, 5.00%, 9/1/2022 | 280,000 | 280,000 |
Series 2018A, GO, 5.00%, 10/1/2022 | 30,000 | 30,066 |
Series 2012B, GO, 3.00%, 7/1/2024 | 100,000 | 100,023 |
Louisville and Jefferson County Metropolitan Government Series 2016A, GO, 5.00%, 12/1/2022 | 55,000 | 55,381 |
Louisville and Jefferson County Metropolitan Government, Norton Healthcare, Inc. | ||
Series 2020B, Rev., 5.00%, 10/1/2023 (c) | 420,000 | 429,604 |
Series 2016A, Rev., 5.00%, 10/1/2024 | 660,000 | 686,992 |
Louisville and Jefferson County Metropolitan Sewer District, Sewer and Drainage System | ||
Rev., BAN, 3.00%, 10/14/2022 | 1,160,000 | 1,160,650 |
Series 2013C, Rev., 3.25%, 5/15/2023 (b) | 25,000 | 25,156 |
Series 2016C, Rev., 5.00%, 5/15/2023 | 25,000 | 25,475 |
Louisville Water Co., Metro Government Waterworks Board | ||
Series 2014A, Rev., 4.00%, 11/15/2022 | 30,000 | 30,106 |
Rev., 5.00%, 11/15/2023 | 25,000 | 25,783 |
McCracken County School District Finance Corp. Rev., 3.00%, 12/1/2022 | 25,000 | 25,043 |
Meade County School District Finance Corp. Rev., 5.00%, 9/1/2022 | 75,000 | 75,000 |
Nelson County School District Finance Corp., School Building Rev., 2.00%, 12/1/2022 | 60,000 | 59,915 |
Oldham County School District Finance Corp. Rev., 2.00%, 9/1/2022 | 25,000 | 25,000 |
Pendleton County Public Properties Corp., First Mortgage, Court Facilities Project Rev., 4.00%, 12/1/2022 | 25,000 | 25,074 |
Scott County School District Finance Corp. | ||
Rev., 4.00%, 1/1/2023 | 25,000 | 25,113 |
Rev., 5.00%, 6/1/2025 | 20,000 | 21,278 |
University of Kentucky, General Receipts | ||
Series 2014D, Rev., 5.00%, 10/1/2022 | 75,000 | 75,166 |
Series 2015B, Rev., 5.00%, 10/1/2022 | 110,000 | 110,243 |
Series 2017A, Rev., 5.00%, 10/1/2022 | 150,000 | 150,331 |
Series 2015A, Rev., 5.00%, 4/1/2023 | 25,000 | 25,387 |
Series 2015B, Rev., 5.00%, 10/1/2024 | 20,000 | 21,004 |
University of Louisville, General Receipts | ||
Series 2016C, Rev., 4.00%, 9/1/2022 | 120,000 | 120,000 |
INVESTMENTS | PRINCIPAL AMOUNT($) | VALUE($) |
Kentucky — continued | ||
Series 2021B, Rev., 5.00%, 9/1/2025 | 895,000 | 947,078 |
Versailles Public Properties, Inc., KCTCS Project Rev., 5.00%, 12/1/2022 | 100,000 | 100,634 |
Total Kentucky | 18,821,607 | |
Louisiana — 0.7% | ||
Calcasieu Parish School District No. 23, Public School Improvement 5.00%, 9/1/2022 | 50,000 | 50,000 |
City of Hammond, Sales and Use Tax Rev., 4.00%, 12/1/2022 | 80,000 | 80,352 |
City of Lafayette, Utilities | ||
Rev., 5.00%, 11/1/2022 | 50,000 | 50,215 |
Rev., 5.00%, 11/1/2022 (b) | 90,000 | 90,399 |
City of New Orleans GO, 5.00%, 12/1/2024 | 25,000 | 25,154 |
City of New Orleans, Sewerage Service Rev., 5.00%, 6/1/2023 | 15,000 | 15,274 |
City of Shreveport, Water and Sewer | ||
GO, 5.00%, 9/1/2022 | 200,000 | 200,000 |
Series 2014A, Rev., 5.00%, 12/1/2022 | 80,000 | 80,459 |
City of West Monroe, Sales & Use Tax Rev., 2.00%, 12/1/2022 | 20,000 | 19,975 |
East Baton Rouge Sewerage Commission Series 2021A, Rev., 5.00%, 2/1/2023 | 75,000 | 75,854 |
Jefferson Sales Tax District Series 2019A, Rev., AGM, 5.00%, 12/1/2022 | 325,000 | 327,021 |
Lafayette Consolidated Government Rev., AGM, 5.00%, 11/1/2022 | 150,000 | 150,628 |
Lafayette Public Power Authority | ||
Rev., 5.00%, 11/1/2022 | 50,000 | 50,219 |
Rev., 5.00%, 11/1/2022 (b) | 75,000 | 75,338 |
Lafayette Public Trust Financing Authority, Ragin Cajun Facilities, Inc. Project Rev., AGM, 3.00%, 10/1/2022 | 25,000 | 25,012 |
Louisiana Energy & Power Authority, Power Project Series 2013A, Rev., AGM, 4.50%, 6/1/2023 (b) | 40,000 | 40,608 |
Louisiana Housing Corp., Valencia Park Project Rev., 0.35%, 11/1/2022 (c) | 2,000,000 | 1,991,362 |
Louisiana Local Government Environmental Facilities and Community Development Authority, Calcasieu Parish Project Rev., 5.00%, 12/1/2022 | 25,000 | 25,169 |
Louisiana Local Government Environmental Facilities and Community Development Authority, City of Lake Charles Public Improvement Project Rev., 5.00%, 5/1/2023 | 100,000 | 101,701 |
268 | J.P. Morgan Exchange-Traded Funds | August 31, 2022 |
INVESTMENTS | PRINCIPAL AMOUNT($) | VALUE($) |
Municipal Bonds — continued | ||
Louisiana — continued | ||
Louisiana Local Government Environmental Facilities and Community Development Authority, Jefferson Parish Projects Rev., 5.00%, 4/1/2023 | 100,000 | 101,496 |
Louisiana Local Government Environmental Facilities and Community Development Authority, Jefferson Parking Garage Project Rev., 2.38%, 9/1/2022 | 30,000 | 30,000 |
Louisiana Local Government Environmental Facilities and Community Development Authority, Woman's Hospital Foundation Project Series 2017A, Rev., 3.00%, 10/1/2022 | 75,000 | 75,018 |
Louisiana Office Facilities Corp., State Capitol Complex Program Rev., 5.00%, 11/1/2022 | 385,000 | 386,625 |
Louisiana Public Facilities Authority | ||
Series 2016A, Rev., 5.00%, 12/15/2022 (b) | 25,000 | 25,189 |
Series 2016A, Rev., 5.00%, 12/15/2022 | 35,000 | 35,261 |
Louisiana Public Facilities Authority, Hurricane Recovery Program Rev., 5.00%, 6/1/2024 (b) | 170,000 | 177,319 |
Louisiana Public Facilities Authority, Ochsner Clinic Foundation Project | ||
Rev., 5.00%, 5/15/2023 | 285,000 | 289,514 |
Rev., 5.00%, 5/15/2025 (c) | 315,000 | 330,606 |
Louisiana Public Facilities Authority, Tulane University Project Series 2016A, Rev., 5.00%, 12/15/2026 | 130,000 | 140,114 |
Parish of Plaquemines Rev., 5.00%, 3/1/2025 | 100,000 | 105,217 |
Parish of St. John the Baptist, Marathon Oil Corp., Project Series 2017A-1, Rev., 2.00%, 4/1/2023 (c) | 3,665,000 | 3,648,197 |
State of Louisiana | ||
Rev., 5.00%, 9/1/2022 | 590,000 | 590,000 |
Series 2016A, GO, 5.00%, 9/1/2022 | 75,000 | 75,000 |
Series 2019A, Rev., 5.00%, 9/1/2022 | 140,000 | 140,000 |
Series D-1, GO, 5.00%, 12/1/2022 | 25,000 | 25,171 |
Series 2014-C, GO, 5.00%, 8/1/2023 | 10,000 | 10,240 |
Rev., 5.00%, 9/1/2023 | 15,000 | 15,376 |
State of Louisiana Gasoline and Fuels Tax, Second Lien | ||
Series 2022A, Rev., (SOFR + 0.50%), 2.10%, 9/2/2022 (d) | 7,940,000 | 7,646,797 |
Series 2017A, Rev., 0.60%, 5/1/2023 (c) | 2,880,000 | 2,809,363 |
INVESTMENTS | PRINCIPAL AMOUNT($) | VALUE($) |
Louisiana — continued | ||
Series 2017D, Rev., 0.60%, 5/1/2023 (c) | 115,000 | 112,179 |
West Ouachita Parish School District Rev., 4.00%, 9/1/2022 | 25,000 | 25,000 |
Total Louisiana | 20,268,422 | |
Maine — 0.1% | ||
City of Biddeford 2.50%, 10/1/2022 | 400,000 | 400,089 |
City of Lewiston, Public Improvement GO, 4.00%, 4/15/2023 | 25,000 | 25,268 |
County of Cumberland | ||
GO, 3.00%, 12/1/2022 (b) | 25,000 | 25,045 |
GO, 2.00%, 4/1/2023 | 30,000 | 29,925 |
Maine Governmental Facilities Authority, Lease Rental | ||
Series 2015B, Rev., 5.00%, 10/1/2022 | 180,000 | 180,375 |
Series 2017A, Rev., 5.00%, 10/1/2022 | 140,000 | 140,292 |
Series 2020A, Rev., 5.00%, 10/1/2022 | 45,000 | 45,094 |
Series 2015B, Rev., 2.00%, 10/1/2023 | 10,000 | 9,962 |
Maine Health and Higher Educational Facilities Authority | ||
Series 2014A, Rev., 5.00%, 7/1/2023 | 85,000 | 86,825 |
Series 2017B, Rev., 5.00%, 7/1/2023 | 25,000 | 25,528 |
Series 2019A, Rev., 5.00%, 7/1/2023 | 50,000 | 50,907 |
Series 2020A, Rev., 5.00%, 7/1/2023 (b) | 39,310 | 40,141 |
Series 2020A, Rev., 5.00%, 7/1/2023 | 60,690 | 61,842 |
Maine Municipal Bond Bank | ||
Series 2016A, Rev., 3.00%, 9/1/2022 | 110,000 | 110,000 |
Series 2014A, Rev., 5.00%, 9/1/2022 | 195,000 | 195,000 |
Series 2016A, Rev., 3.00%, 11/1/2022 | 40,000 | 40,049 |
Series 2014C, Rev., 4.00%, 11/1/2022 | 25,000 | 25,071 |
Series 2016C, Rev., 4.00%, 11/1/2022 | 25,000 | 25,071 |
Series B, Rev., 4.00%, 11/1/2022 | 95,000 | 95,269 |
Series 2010C, Rev., 5.00%, 11/1/2022 | 215,000 | 215,958 |
Series 2012B, Rev., 5.00%, 11/1/2022 | 60,000 | 60,267 |
Series 2014C, Rev., 5.00%, 11/1/2022 | 20,000 | 20,089 |
Series 2015A, Rev., 5.00%, 11/1/2022 | 75,000 | 75,334 |
Series 2018A, Rev., 5.00%, 11/1/2022 | 95,000 | 95,423 |
Series 2018B, Rev., 5.00%, 11/1/2022 | 20,000 | 20,089 |
Series 2019A, Rev., 5.00%, 11/1/2022 | 50,000 | 50,223 |
Series 2020A, Rev., 5.00%, 11/1/2022 | 20,000 | 20,089 |
Series C, Rev., 5.00%, 11/1/2022 | 200,000 | 200,891 |
Series D, Rev., 5.00%, 11/1/2022 | 160,000 | 160,713 |
Series 2016C, Rev., 4.00%, 11/1/2023 | 25,000 | 25,468 |
Series 2018B, Rev., 5.00%, 11/1/2023 | 20,000 | 20,603 |
August 31, 2022 | J.P. Morgan Exchange-Traded Funds | 269 |
AS OF August 31, 2022 (Unaudited) (continued)
INVESTMENTS | PRINCIPAL AMOUNT($) | VALUE($) |
Municipal Bonds — continued | ||
Maine — continued | ||
Series 2014C, Rev., 5.00%, 11/1/2024 | 25,000 | 26,368 |
Maine Municipal Bond Bank, Transcap Program Series 2015A, Rev., 5.00%, 9/1/2022 | 595,000 | 595,000 |
Maine School Administrative District No. 51 | ||
GO, 2.50%, 10/15/2022 | 100,000 | 100,031 |
GO, 4.00%, 8/1/2025 | 50,000 | 52,200 |
Maine Turnpike Authority Rev., 5.00%, 7/1/2023 | 10,000 | 10,213 |
Regional School Unit No. 1 Lower Kennebec Region School Unit GO, 5.00%, 11/1/2022 | 75,000 | 75,335 |
Regional School Unit No. 21 GO, 5.00%, 11/1/2022 | 25,000 | 25,112 |
State of Maine Series 2017B, GO, 5.00%, 6/1/2023 | 10,000 | 10,202 |
Town of Cumberland GO, 5.00%, 5/1/2023 | 35,000 | 35,625 |
Town of Gorham Series 2020A, GO, 2.00%, 10/1/2022 | 50,000 | 49,988 |
Town of Scarborough | ||
GO, 4.00%, 11/1/2022 (b) | 70,000 | 70,196 |
GO, 5.00%, 11/1/2022 | 25,000 | 25,103 |
University of Maine System | ||
Rev., 5.00%, 3/1/2023 | 70,000 | 70,917 |
Rev., 5.00%, 3/1/2025 | 55,000 | 58,389 |
Total Maine | 3,781,579 | |
Maryland — 0.2% | ||
City of Baltimore Series D, 5.00%, 7/1/2023 | 25,000 | 25,537 |
City of Baltimore, Consolidated Public Improvement | ||
Series 2021A, 4.00%, 10/15/2022 | 20,000 | 20,042 |
Series 2013A, 5.00%, 10/15/2022 | 55,000 | 55,180 |
Series 2013B, 5.00%, 10/15/2022 | 55,000 | 55,180 |
Series 2014A, 5.00%, 10/15/2022 | 55,000 | 55,180 |
Series 2017A, 5.00%, 10/15/2022 | 25,000 | 25,082 |
Series 2013A, 4.00%, 10/15/2023 (b) | 35,000 | 35,072 |
Series 2013A, 4.00%, 10/15/2024 (b) | 25,000 | 25,051 |
City of Baltimore, Wastewater Projects Series 2013C, 5.00%, 7/1/2023 | 30,000 | 30,644 |
City of Frederick, Public Improvement GO, 5.00%, 9/1/2022 | 50,000 | 50,000 |
County of Anne Arundel 5.00%, 10/1/2022 | 130,000 | 130,291 |
County of Anne Arundel, Arundel Mills Project GTD, 5.00%, 7/1/2023 | 50,000 | 51,115 |
INVESTMENTS | PRINCIPAL AMOUNT($) | VALUE($) |
Maryland — continued | ||
County of Anne Arundel, Consolidated General Improvements 5.00%, 4/1/2023 | 60,000 | 60,950 |
County of Anne Arundel, Consolidated Water and Sewer 5.00%, 10/1/2022 | 65,000 | 65,146 |
County of Baltimore, Consolidated Public Improvement | ||
5.00%, 3/1/2023 | 70,000 | 70,948 |
5.00%, 2/1/2025 | 25,000 | 26,551 |
County of Baltimore, Equipment Acquisition Program 5.00%, 10/1/2022 | 250,000 | 250,502 |
County of Baltimore, Metropolitan District 76th Issue 5.00%, 2/1/2023 | 25,000 | 25,282 |
County of Baltimore, Metropolitan District, Public Improvement | ||
Series 2014C, 4.00%, 9/1/2022 | 25,000 | 25,000 |
Series 2014B, 4.50%, 9/1/2022 | 50,000 | 50,000 |
County of Carroll, Consolidated Public Improvement | ||
Series 2019A, 4.00%, 11/1/2022 | 40,000 | 40,117 |
5.00%, 11/1/2022 | 95,000 | 95,433 |
County of Cecil 4.00%, 12/1/2022 | 130,000 | 130,556 |
County of Cecil, County Commissioners, Consolidated Public Improvement 3.38%, 11/1/2030 (b) | 25,000 | 25,045 |
County of Charles, Consolidated Public Improvement | ||
5.00%, 10/1/2022 | 70,000 | 70,157 |
5.00%, 11/1/2022 | 25,000 | 25,114 |
5.00%, 7/15/2023 | 45,000 | 46,049 |
County of Harford, Consolidated Public Improvement GO, 5.00%, 9/15/2022 | 225,000 | 225,226 |
County of Harford, Public Improvement GO, 5.00%, 10/1/2022 | 25,000 | 25,056 |
County of Howard, Consolidated Public Improvement GO, 5.00%, 2/15/2023 (b) | 20,000 | 20,246 |
County of Howard, Metropolitan District Project Series 2015A, GO, 3.38%, 2/15/2023 (b) | 20,000 | 20,095 |
County of Montgomery, Consolidated Public Improvement | ||
Series 2017C, GO, 5.00%, 10/1/2022 | 25,000 | 25,058 |
Series 2017A, GO, 5.00%, 11/1/2022 | 80,000 | 80,371 |
Series 2015B, GO, 5.00%, 12/1/2022 | 40,000 | 40,280 |
Series 2016A, GO, 5.00%, 12/1/2022 | 25,000 | 25,175 |
Series 2015B, GO, 5.00%, 12/1/2023 | 115,000 | 118,818 |
270 | J.P. Morgan Exchange-Traded Funds | August 31, 2022 |
INVESTMENTS | PRINCIPAL AMOUNT($) | VALUE($) |
Municipal Bonds — continued | ||
Maryland — continued | ||
County of Montgomery, Montgomery College Series 2016A, COP, 5.00%, 11/1/2022 | 70,000 | 70,304 |
County of Prince George's COP, 5.00%, 10/15/2022 | 35,000 | 35,106 |
County of Prince George's, Consolidated Public Improvement | ||
Series 2014A, GO, 5.00%, 9/1/2022 | 70,000 | 70,000 |
Series 2013A, GO, 3.00%, 3/1/2023 | 25,000 | 25,086 |
Series 2013B, GO, 3.00%, 3/1/2023 | 45,000 | 45,156 |
Series 2013A, GO, 3.00%, 3/1/2024 | 30,000 | 30,101 |
County of Prince George's, Suitland Public Infrastructure COP, 4.00%, 10/1/2022 | 25,000 | 25,036 |
County of Queen Anne's, Public Facilities GO, 5.00%, 1/15/2023 | 50,000 | 50,509 |
County of Washington GO, 5.00%, 1/1/2023 | 35,000 | 35,307 |
County of Washington, Consolidated Public Improvement GO, 4.00%, 7/1/2023 | 30,000 | 30,399 |
County of Wicomico, Public Improvement | ||
GO, 5.00%, 10/1/2022 | 25,000 | 25,056 |
GO, 5.00%, 11/1/2022 | 50,000 | 50,228 |
Maryland Community Development Administration, Housing and Community Development | ||
Series 2020D, Rev., 0.30%, 9/1/2022 | 330,000 | 330,000 |
Series 2018A, Rev., 2.60%, 9/1/2022 | 25,000 | 25,000 |
Series 2019A, Rev., 2.10%, 3/1/2024 | 20,000 | 19,807 |
Maryland Health and Higher Educational Facilities Authority, Lifebridge Health Issue Rev., 5.00%, 7/1/2025 | 45,000 | 47,580 |
Maryland Health and Higher Educational Facilities Authority, Loyola University Issue Series 2012A, Rev., 3.00%, 10/1/2022 | 50,000 | 50,029 |
Maryland Industrial Development Financing Authority, McDonogh School Facility Rev., 5.00%, 9/1/2022 | 55,000 | 55,000 |
Maryland National Capital Park and Planning Commission, Park Acquisition and Development Project Series MC-2021A, GO, 5.00%, 12/1/2022 (b) | 50,000 | 50,338 |
St. Mary's College of Maryland | ||
Series 2012A, Rev., 4.00%, 9/1/2022 | 50,000 | 50,000 |
Series 2018A, Rev., 4.00%, 9/1/2022 | 40,000 | 40,000 |
State of Maryland Department of Transportation Series 2016, Rev., 4.00%, 9/1/2022 | 55,000 | 55,000 |
INVESTMENTS | PRINCIPAL AMOUNT($) | VALUE($) |
Maryland — continued | ||
State of Maryland Department of Transportation, Second Issue | ||
Rev., 5.00%, 10/1/2022 | 205,000 | 205,461 |
Rev., 5.00%, 6/1/2025 | 65,000 | 66,225 |
State of Maryland Department of Transportation, Third Issue Rev., 5.00%, 12/15/2022 | 150,000 | 151,186 |
State of Maryland, Department of Transportation | ||
Rev., 5.00%, 9/1/2022 | 70,000 | 70,000 |
Rev., 5.00%, 10/1/2022 | 210,000 | 210,472 |
Rev., 5.00%, 12/1/2022 | 35,000 | 35,243 |
Rev., 5.00%, 2/15/2023 | 255,000 | 258,171 |
Rev., 5.00%, 5/1/2023 | 20,000 | 20,337 |
Rev., 5.00%, 11/1/2023 | 40,000 | 41,158 |
State of Maryland, State and Local Facilities Loan of 2015 Series 2015A, GO, 4.00%, 3/1/2023 (b) | 20,000 | 20,167 |
Town of Ocean City, Mayor and City Council, Municipal Purpose GO, 4.00%, 10/1/2022 (b) | 50,000 | 50,069 |
Town of Ocean City, Municipal Purpose Loan GO, 4.00%, 10/1/2022 | 35,000 | 35,047 |
University System of Maryland, Auxiliary Facility and Tuition | ||
Series 2012D, Rev., 5.00%, 10/1/2022 | 45,000 | 45,101 |
Series 2017B, Rev., 5.00%, 4/1/2023 | 25,000 | 25,396 |
Washington Suburban Sanitary Commission, Consolidated Public Improvement Rev., 5.00%, 6/1/2023 (b) | 35,000 | 35,695 |
Total Maryland | 4,630,319 | |
Massachusetts — 2.5% | ||
Berkshire Hills Regional School District 5.00%, 10/15/2022 | 55,000 | 55,182 |
Boston Water and Sewer Commission | ||
Series 2012A, 4.25%, 11/1/2022 | 130,000 | 130,434 |
Series A, 5.00%, 11/1/2022 | 195,000 | 195,888 |
Series 2012A, 5.00%, 11/1/2024 (b) | 140,000 | 140,633 |
Series 2012A, 4.00%, 11/1/2025 (b) | 25,000 | 25,070 |
Series 2012A, 5.00%, 11/1/2026 (b) | 20,000 | 20,090 |
Series B, 5.00%, 11/1/2033 (b) | 25,000 | 25,762 |
Series 2012A, 3.50%, 11/1/2034 (b) | 20,000 | 20,041 |
Bristol-Plymouth Regional Vocational Technical School District 3.25%, 2/28/2023 | 6,000,000 | 6,007,084 |
Brockton Area Transit Authority 3.75%, 7/28/2023 | 6,100,000 | 6,131,574 |
August 31, 2022 | J.P. Morgan Exchange-Traded Funds | 271 |
AS OF August 31, 2022 (Unaudited) (continued)
INVESTMENTS | PRINCIPAL AMOUNT($) | VALUE($) |
Municipal Bonds — continued | ||
Massachusetts — continued | ||
City of Amesbury 4.00%, 9/1/2022 | 25,000 | 25,000 |
City of Beverly, Municipal Purpose Loan 3.00%, 9/1/2022 | 40,000 | 40,000 |
City of Boston | ||
Series 2016A, 5.00%, 3/1/2023 | 20,000 | 20,273 |
Series 2010B, 3.00%, 4/1/2023 | 40,000 | 40,175 |
Series 2013B, 4.00%, 1/1/2024 | 20,000 | 20,120 |
Series 2013A, 4.00%, 3/1/2028 (b) | 30,000 | 30,253 |
Series 2013D, 3.00%, 10/1/2031 (b) | 20,000 | 20,012 |
City of Cambridge | ||
Series 2015A, 4.00%, 2/15/2023 | 20,000 | 20,159 |
5.00%, 2/15/2023 | 25,000 | 25,311 |
City of Fall River GO, 4.00%, 12/1/2022 | 180,000 | 180,724 |
City of Framingham, Municipal Purpose Loan | ||
GO, 5.00%, 11/1/2022 | 115,000 | 115,514 |
GO, 5.00%, 12/1/2022 | 105,000 | 105,706 |
GO, 5.00%, 12/15/2022 | 45,000 | 45,349 |
City of Franklin, Otterbeit Homes GO, 5.00%, 12/15/2022 | 45,000 | 45,349 |
City of Holyoke GO, 3.25%, 9/1/2022 (b) | 20,000 | 20,000 |
City of Lowell GO, 4.00%, 9/1/2022 | 40,000 | 40,000 |
City of Lowell, Municipal Purpose Loan GO, 5.00%, 9/1/2022 | 110,000 | 110,000 |
City of Malden, Municipal Purpose Loan | ||
GO, 5.00%, 11/15/2022 | 25,000 | 25,137 |
Series 2012A, GO, 5.00%, 12/15/2022 | 50,000 | 50,385 |
City of Melrose Series 2012A, GO, 2.00%, 11/1/2022 | 40,000 | 39,988 |
City of Newton Series B, GO, 3.00%, 11/1/2022 | 50,000 | 50,065 |
City of Northampton GO, 5.00%, 9/1/2022 | 35,000 | 35,000 |
City of Northampton, Municipal Purpose Loan GO, 4.00%, 6/1/2023 | 25,000 | 25,311 |
City of Peabody, Municipal Purpose Loan | ||
GO, 4.00%, 10/1/2022 | 35,000 | 35,049 |
Series 2015A, GO, 5.00%, 11/15/2022 | 30,000 | 30,166 |
City of Quincy GO, BAN, 1.50%, 9/16/2022 | 110,000 | 109,968 |
City of Revere GO, 5.00%, 9/1/2022 | 80,000 | 80,000 |
City of Salem, Municipal Purpose Loan GO, 5.00%, 9/15/2022 | 25,000 | 25,024 |
City of Salem, State Qualified Municipal Loan GO, 4.00%, 9/1/2022 | 75,000 | 75,000 |
City of Somerville, Municipal Purpose Loan of 2013 GO, 5.00%, 10/1/2022 | 70,000 | 70,154 |
INVESTMENTS | PRINCIPAL AMOUNT($) | VALUE($) |
Massachusetts — continued | ||
City of Somerville, Municipal Purpose Loan of 2015 GO, 4.00%, 10/15/2022 | 45,000 | 45,093 |
City of Springfield GO, 4.00%, 9/1/2022 | 80,000 | 80,000 |
City of Taunton, Muni Purpose Loan GO, 5.00%, 9/15/2022 | 265,000 | 265,265 |
City of Waltham GO, 5.00%, 10/15/2022 | 55,000 | 55,183 |
City of Waltham, Municipal Purpose Loan GO, 4.10%, 2/1/2023 | 35,000 | 35,052 |
City of Woburn, Municipal Purpose Loan | ||
GO, 5.00%, 9/15/2022 | 130,000 | 130,131 |
GO, 4.00%, 11/15/2022 | 140,000 | 140,507 |
GO, 2.63%, 11/15/2025 | 100,000 | 100,021 |
City of Worcester | ||
Series 2014A, GO, 4.00%, 11/1/2022 (b) | 25,000 | 25,070 |
Series 2014A, GO, 5.00%, 11/1/2022 (b) | 55,000 | 55,249 |
City of Worcester, Municipal Purpose Loan | ||
Series 2014A, GO, 3.00%, 11/1/2022 (b) | 45,000 | 45,055 |
Series 2014A, GO, 4.00%, 11/1/2022 | 70,000 | 70,199 |
Commonwealth of Massachusetts | ||
Series 2018C, GO, 5.00%, 9/1/2022 | 50,000 | 50,000 |
Series 2018E, GO, 5.00%, 9/1/2022 | 20,000 | 20,000 |
Series E, GO, 5.00%, 9/1/2022 | 145,000 | 145,000 |
Series E, GO, 5.00%, 9/1/2022 (b) | 120,000 | 120,000 |
Series B, GO, AGM, 5.25%, 9/1/2022 | 330,000 | 330,000 |
Series C, GO, 5.00%, 10/1/2022 | 215,000 | 215,503 |
Series 2017E, GO, 5.00%, 11/1/2022 | 45,000 | 45,213 |
Series 2021B, GO, 5.00%, 11/1/2022 | 20,000 | 20,095 |
Series F, GO, 5.00%, 11/1/2022 (b) | 555,000 | 557,509 |
Series C, GO, AMBAC, 5.50%, 12/1/2022 | 390,000 | 393,254 |
Series 2016C, GO, 5.00%, 4/1/2023 | 20,000 | 20,319 |
Series 2019C, GO, 5.00%, 5/1/2023 | 30,000 | 30,542 |
Series C, GO, 5.00%, 10/1/2023 | 25,000 | 25,717 |
Series 2015A, GO, 5.00%, 5/1/2024 | 80,000 | 81,455 |
Commonwealth of Massachusetts Federal Highway, Accelerated Bridge Program | ||
Series 2014A, Rev., GAN, 5.00%, 6/15/2024 | 25,000 | 26,162 |
Series 2016A, Rev., GAN, 5.00%, 6/15/2024 | 25,000 | 25,517 |
Series 2017A, Rev., GAN, 5.00%, 6/15/2024 | 20,000 | 20,413 |
272 | J.P. Morgan Exchange-Traded Funds | August 31, 2022 |
INVESTMENTS | PRINCIPAL AMOUNT($) | VALUE($) |
Municipal Bonds — continued | ||
Massachusetts — continued | ||
Commonwealth of Massachusetts Transportation Fund Series 2016A, Rev., 5.00%, 6/1/2023 | 20,000 | 20,388 |
Commonwealth of Massachusetts, Consolidated Loan of 2014 | ||
Series E, GO, 2.00%, 9/1/2022 | 100,000 | 100,000 |
Series E, GO, 5.00%, 9/1/2022 (b) | 655,000 | 655,000 |
Series C, GO, 5.00%, 7/1/2023 | 50,000 | 50,109 |
Commonwealth of Massachusetts, Consolidated Loan of 2016 Series 2016H, GO, 5.00%, 12/1/2022 | 40,000 | 40,285 |
Commonwealth of Massachusetts, Consolidated Loan of 2017 Series 2017C, GO, 5.00%, 2/1/2023 | 40,000 | 40,459 |
Commonwealth of Massachusetts, Consolidated Loan of 2020 Series 2020E, GO, 5.00%, 11/1/2022 | 20,000 | 20,095 |
Lynn Water and Sewer Commission Series 2013A, Rev., 5.00%, 12/1/2022 | 50,000 | 50,332 |
Manchester Essex Regional School District GO, 4.00%, 1/15/2023 | 25,000 | 25,158 |
Manchester Essex Regional School District, Unlimited Tax GO, 5.00%, 2/1/2023 | 35,000 | 35,391 |
Massachusetts Bay Transportation Authority, Sales Tax | ||
Series 2014A, Rev., 5.00%, 7/1/2023 | 10,000 | 10,223 |
Series 2003C, Rev., 5.25%, 7/1/2023 | 30,000 | 30,730 |
Massachusetts Clean Water Trust (The), Revolving Fund, Abatement Trust Subseries 17A, Rev., 5.00%, 2/1/2027 | 35,000 | 35,369 |
Massachusetts Department of Transportation, Capital Appreciation Series 1997C, Rev., NATL-RE, Zero Coupon, 1/1/2023 | 130,000 | 128,883 |
Massachusetts Development Finance Agency, Babson College Issue Series 2015A, Rev., 5.00%, 10/1/2022 | 80,000 | 80,163 |
Massachusetts Development Finance Agency, Berklee College Music Rev., 5.00%, 10/1/2022 | 25,000 | 25,051 |
Massachusetts Development Finance Agency, Boston University Issue Series 2019DD-1, Rev., 5.00%, 4/1/2024 (c) | 5,110,000 | 5,239,512 |
Massachusetts Development Finance Agency, Caregroup Issue | ||
Series 2015H-1, Rev., 5.00%, 7/1/2023 | 50,000 | 50,949 |
Series 2015H-1, Rev., 5.00%, 7/1/2025 | 35,000 | 37,153 |
INVESTMENTS | PRINCIPAL AMOUNT($) | VALUE($) |
Massachusetts — continued | ||
Massachusetts Development Finance Agency, College of the Holy Cross Series 2016A, Rev., 5.00%, 9/1/2022 | 65,000 | 65,000 |
Massachusetts Development Finance Agency, North Hill Community Issue Series 2013A, Rev., 6.50%, 11/15/2023 (b) (e) | 675,000 | 707,192 |
Massachusetts Development Finance Agency, Northeastern University Issue Series 2020A, Rev., 5.00%, 10/1/2022 | 405,000 | 405,890 |
Massachusetts Development Finance Agency, Partners Healthcare System Issue | ||
Series 2017S, Rev., (SIFMA Municipal Swap Index Yield + 0.50%), 2.00%, 9/8/2022 (d) | 250,000 | 249,246 |
Series 2019T-1, Rev., (SIFMA Municipal Swap Index Yield + 0.60%), 2.10%, 9/8/2022 (d) (e) | 1,075,000 | 1,067,692 |
Series 2017S-4, Rev., 5.00%, 1/25/2024 (c) | 200,000 | 205,625 |
Series 2016S-2, Rev., 5.00%, 1/30/2025 (c) | 165,000 | 174,071 |
Massachusetts Development Finance Agency, Salem Community Corp. | ||
Rev., 5.00%, 1/1/2023 | 450,000 | 451,062 |
Rev., 5.00%, 1/1/2024 | 345,000 | 347,360 |
Rev., 5.00%, 1/1/2025 | 365,000 | 368,731 |
Massachusetts Development Finance Agency, Suffolk University Issue Rev., 5.00%, 7/1/2023 | 115,000 | 116,849 |
Massachusetts Development Finance Agency, Trustees of Boston University Series DD-2, Rev., 5.00%, 4/1/2024 (c) | 40,000 | 41,014 |
Massachusetts Development Finance Agency, Wellforce Issue Series 2020C, Rev., AGM, 5.00%, 10/1/2022 | 50,000 | 50,096 |
Massachusetts Development Finance Agency, Williams College Series 2013P, Rev., 5.00%, 7/1/2024 | 45,000 | 45,929 |
Massachusetts Housing Finance Agency | ||
Series C2, Rev., FHA, 0.40%, 12/1/2022 | 1,135,000 | 1,129,307 |
Series 2015D, Rev., 2.60%, 12/1/2022 | 50,000 | 50,008 |
Series 2020C-2, Rev., FHA, 0.50%, 6/1/2023 | 765,000 | 753,131 |
Series 2020A-3, Rev., FHA, 0.88%, 12/1/2023 | 300,000 | 294,006 |
August 31, 2022 | J.P. Morgan Exchange-Traded Funds | 273 |
AS OF August 31, 2022 (Unaudited) (continued)
INVESTMENTS | PRINCIPAL AMOUNT($) | VALUE($) |
Municipal Bonds — continued | ||
Massachusetts — continued | ||
Massachusetts Housing Finance Agency, Single Family Housing Series 220, Rev., GNMA/FNMA/FHLMC, 5.00%, 6/1/2023 | 295,000 | 300,173 |
Massachusetts School Building Authority, Dedicated Sales Tax | ||
Series 2013A, Rev., 3.00%, 5/15/2023 (b) | 20,000 | 20,100 |
Series 2013A, Rev., 5.00%, 5/15/2023 (b) | 20,000 | 20,377 |
Series 2018A, Rev., 5.00%, 2/15/2024 (b) | 20,000 | 20,755 |
Massachusetts State College Building Authority | ||
Series A, Rev., 4.00%, 5/1/2023 (b) | 5,000 | 5,053 |
Series A, Rev., 4.00%, 5/1/2023 | 15,000 | 15,168 |
Series 2011A, Rev., 5.00%, 5/1/2023 | 35,000 | 35,621 |
Series 2014A, Rev., 5.00%, 5/1/2023 (b) | 20,000 | 20,356 |
Series 2014A, Rev., 5.00%, 5/1/2023 (b) | 55,000 | 55,979 |
Massachusetts Transportation Trust Fund Metropolitan Highway System, Senior Series 2019A, Rev., 5.00%, 1/1/2023 | 200,000 | 201,590 |
Massachusetts Water Resources Authority | ||
Series F, Rev., 5.00%, 8/1/2024 (b) | 15,000 | 15,736 |
Series F, Rev., 5.00%, 8/1/2024 | 20,000 | 20,985 |
Minuteman Regional Vocational Technical School District GO, 5.00%, 10/15/2022 | 25,000 | 25,081 |
Monomoy Regional School District GO, 5.00%, 9/15/2022 | 45,000 | 45,045 |
Onset Fire District GO, 5.00%, 10/15/2022 | 55,000 | 55,176 |
Pentucket Regional School District, Unlimited Tax GO, 5.00%, 6/1/2023 | 25,000 | 25,498 |
Pioneer Valley Transit Authority Rev., RAN, 4.00%, 7/14/2023 | 9,500,000 | 9,580,621 |
Town of Abington, Unlimited Tax 5.00%, 11/15/2022 | 150,000 | 150,837 |
Town of Andover, Municipal Purpose Loan 5.00%, 11/15/2022 | 45,000 | 45,253 |
Town of Arlington, Municipal Purpose Loan | ||
5.00%, 9/1/2022 | 20,000 | 20,000 |
Series 2015A, 5.00%, 11/1/2022 | 20,000 | 20,088 |
Town of Auburn, Municipal Purpose Loan 5.00%, 9/1/2022 | 50,000 | 50,000 |
Town of Avon, Municipal Purpose Loan 4.00%, 12/1/2022 | 25,000 | 25,109 |
Town of Bedford 4.00%, 9/15/2022 | 60,000 | 60,037 |
INVESTMENTS | PRINCIPAL AMOUNT($) | VALUE($) |
Massachusetts — continued | ||
Town of Bedford, Municipal Purpose Loan | ||
5.00%, 10/15/2022 | 50,000 | 50,161 |
5.00%, 11/15/2022 | 75,000 | 75,408 |
Town of Berlin, Highway Barn Loan 5.00%, 10/15/2022 | 40,000 | 40,133 |
Town of Billerica, Municipal Purpose Loan 5.00%, 10/15/2022 | 265,000 | 265,852 |
Town of Billerica, School Project Loan 5.00%, 2/1/2023 | 35,000 | 35,390 |
Town of Bourne, Municipal Purpose Loan 5.00%, 12/1/2022 | 155,000 | 156,061 |
Town of Braintree 2.25%, 9/15/2022 | 2,019,000 | 2,018,635 |
Town of Braintree, Municipal Purpose Loan 4.00%, 10/15/2022 | 45,000 | 45,096 |
Town of Brewster, Municipal Purpose Loan 5.00%, 5/1/2023 | 20,000 | 20,360 |
Town of Brookline, Municipal Purpose Loan | ||
4.00%, 3/15/2023 | 20,000 | 20,187 |
5.00%, 3/15/2023 | 20,000 | 20,293 |
Town of Duxbury, Municipal Purpose Loan GO, 4.00%, 9/1/2022 | 25,000 | 25,000 |
Town of Falmouth, Municipal Purpose Loan GO, 4.00%, 11/1/2022 | 40,000 | 40,117 |
Town of Hamilton GO, BAN, 3.50%, 8/17/2023 | 2,257,767 | 2,255,943 |
Town of Hanover GO, 4.00%, 5/15/2023 | 45,000 | 45,544 |
Town of Hanover, Municipal Purpose Loan GO, 5.00%, 9/1/2022 | 125,000 | 125,000 |
Town of Hingham GO, 5.00%, 9/15/2022 | 75,000 | 75,075 |
Town of Mansfield, Municipal Purpose Loan GO, 4.00%, 10/15/2022 | 50,000 | 50,103 |
Town of Marblehead GO, 4.00%, 8/15/2023 | 50,000 | 50,066 |
Town of Marshfield, Municipal Purpose Loan | ||
GO, 5.00%, 11/1/2022 | 160,000 | 160,721 |
GO, 5.00%, 11/1/2024 | 25,000 | 25,105 |
Town of Medfield, Municipal Purpose Loan GO, 2.13%, 9/15/2023 | 100,000 | 99,799 |
Town of Mendon, Municipal Purpose Loan GO, 4.00%, 9/15/2022 | 30,000 | 30,019 |
Town of Middleborough, Municipal Purpose Loan GO, 5.00%, 10/1/2022 | 85,000 | 85,191 |
Town of Middleton, Municipal Purpose Loan GO, 2.50%, 8/15/2025 | 40,000 | 40,002 |
Town of Millis GO, BAN, 3.50%, 5/24/2023 | 4,120,000 | 4,137,692 |
Town of Millis, Municipal Purpose Loan GO, 5.00%, 11/1/2022 | 25,000 | 25,113 |
274 | J.P. Morgan Exchange-Traded Funds | August 31, 2022 |
INVESTMENTS | PRINCIPAL AMOUNT($) | VALUE($) |
Municipal Bonds — continued | ||
Massachusetts — continued | ||
Town of Nantucket GO, 4.00%, 12/15/2022 | 70,000 | 70,355 |
Town of Needham, Municipal Purpose Loan | ||
GO, 4.00%, 11/1/2022 | 25,000 | 25,068 |
GO, 4.00%, 11/15/2022 | 90,000 | 90,303 |
Town of Norwood GO, 5.00%, 6/15/2023 | 45,000 | 45,952 |
Town of Plainville GO, BAN, 3.50%, 6/28/2023 | 2,500,000 | 2,504,260 |
Town of Reading, Municipal Purpose Loan GO, 4.00%, 11/1/2022 | 45,000 | 45,132 |
Town of Scituate Series B, GO, BAN, 2.00%, 1/26/2023 | 7,490,248 | 7,474,223 |
Town of Scituate, Municipal Purpose Loan | ||
GO, 5.00%, 9/15/2022 | 195,000 | 195,194 |
GO, 2.00%, 11/15/2022 | 75,000 | 74,949 |
Town of Stoughton, Municipal Purpose Loan GO, 5.00%, 10/15/2022 | 35,000 | 35,107 |
Town of Tewksbury, Municipal Purpose Loan GO, 4.00%, 1/15/2025 | 25,000 | 25,892 |
Town of Topsfield, Municipal Purpose Loan Series 2019B, GO, 5.00%, 11/15/2022 | 25,000 | 25,136 |
Town of Walpole, Municipal Purpose Loan GO, 4.00%, 9/1/2022 | 20,000 | 20,000 |
Town of Wayland, Municipal Purpose Loan | ||
GO, 5.00%, 11/1/2022 | 75,000 | 75,342 |
GO, 5.00%, 12/15/2022 | 25,000 | 25,198 |
Town of Wellesley, Municipal Purpose Loan GO, 4.00%, 12/1/2022 | 20,000 | 20,084 |
Town of West Newbury GO, BAN, 3.50%, 7/13/2023 | 1,060,000 | 1,062,583 |
Town of West Springfield, Municipal Purpose Loan GO, 4.00%, 9/15/2022 | 75,000 | 75,048 |
Town of Weston GO, 4.00%, 12/1/2022 | 120,000 | 120,516 |
Town of Wilmington, Municipal Purpose Loan GO, 5.00%, 11/15/2022 | 25,000 | 25,141 |
Town of Winthrop, Municipal Purpose Loan GO, 4.00%, 11/15/2022 | 50,000 | 50,181 |
University of Massachusetts Building Authority | ||
Series 2013-1, Rev., 4.00%, 11/1/2022 (b) | 155,000 | 155,434 |
Series 1, Rev., 5.00%, 11/1/2022 | 25,000 | 25,114 |
Series 2013-1, Rev., 5.00%, 11/1/2022 | 45,000 | 45,205 |
Series 2013-1, Rev., 5.00%, 11/1/2022 (b) | 585,000 | 587,645 |
Series 2015-2, Rev., 5.00%, 11/1/2022 | 755,000 | 758,439 |
Series 2017-3, Rev., 5.00%, 11/1/2022 | 20,000 | 20,091 |
INVESTMENTS | PRINCIPAL AMOUNT($) | VALUE($) |
Massachusetts — continued | ||
Series 2021-1, Rev., 5.00%, 11/1/2022 | 130,000 | 130,592 |
Wachusett Regional School District, State Qualified School GO, 4.00%, 12/1/2022 | 20,000 | 20,085 |
Worcester Regional Transit Authority Rev., RAN, 3.25%, 6/23/2023 | 11,300,000 | 11,325,553 |
Total Massachusetts | 76,684,459 | |
Michigan — 1.4% | ||
Adrian City School District, Unlimited Tax Q-SBLF, 4.00%, 5/1/2023 | 200,000 | 202,013 |
Allen Independent School District, Unlimited Tax Series 2017I, AGM, 4.00%, 11/1/2022 | 30,000 | 30,081 |
Ann Arbor School District, Unlimited Tax Q-SBLF, 5.00%, 5/1/2023 | 40,000 | 40,694 |
Bay City School District Q-SBLF, 5.00%, 11/1/2022 | 25,000 | 25,107 |
Bloomfield Hills School District, Unlimited Tax 5.00%, 5/1/2023 | 20,000 | 20,360 |
Caledonia Community Schools, Unlimited Tax Series 2020I, Q-SBLF, 4.00%, 5/1/2023 | 10,000 | 10,111 |
Charter Township of Canton, Limited Tax | ||
5.00%, 10/1/2022 | 110,000 | 110,237 |
5.00%, 4/1/2023 | 20,000 | 20,304 |
Charter Township of Lyon Series 2006-A, GO, XLCA, 4.13%, 11/1/2023 | 45,000 | 45,132 |
Charter Township of Meridian, Unlimited Tax GO, 5.00%, 10/1/2022 | 25,000 | 25,056 |
Chippewa Valley Schools | ||
Q-SBLF, 5.25%, 5/1/2025 (b) | 30,000 | 30,581 |
Q-SBLF, 5.00%, 5/1/2026 (b) | 20,000 | 20,355 |
Q-SBLF, 3.50%, 5/1/2033 (b) | 30,000 | 30,226 |
Q-SBLF, 3.63%, 5/1/2034 (b) | 45,000 | 45,375 |
Chippewa Valley Schools, Unlimited Tax | ||
Q-SBLF, 4.00%, 5/1/2023 | 45,000 | 45,397 |
Series 2016B, Q-SBLF, 5.00%, 5/1/2023 | 20,000 | 20,320 |
City of Ann Arbor, Limited Tax 3.00%, 10/1/2023 | 25,000 | 25,166 |
City of Auburn Hills, Limited tax 3.00%, 6/1/2023 | 35,000 | 35,151 |
City of Battle Creek, Limited Tax 5.00%, 5/1/2023 | 25,000 | 25,432 |
City of Detroit, Sewage Disposal System Senior Lien Series 2012A, Rev., 5.00%, 7/1/2023 | 85,000 | 85,455 |
August 31, 2022 | J.P. Morgan Exchange-Traded Funds | 275 |
AS OF August 31, 2022 (Unaudited) (continued)
INVESTMENTS | PRINCIPAL AMOUNT($) | VALUE($) |
Municipal Bonds — continued | ||
Michigan — continued | ||
City of Farmington Hills GO, 5.00%, 10/1/2022 | 30,000 | 30,066 |
City of Grand Rapids, Capital Improvement, Limited Tax GO, 5.00%, 4/1/2024 | 50,000 | 51,958 |
City of Grand Rapids, Limited Tax GO, 5.00%, 10/1/2022 | 50,000 | 50,107 |
City of Grand Rapids, Sanitary Sewer System Rev., 4.00%, 1/1/2023 (b) | 40,000 | 40,198 |
City of Grand Rapids, Water Supply System Rev., 5.00%, 1/1/2023 | 30,000 | 30,260 |
City Of Huntington Woods, Street Improvement Bonds, Unlimited Tax GO, 2.20%, 10/1/2022 | 25,000 | 24,998 |
City of Kalamazoo, Waterwaste System Rev., AGM, 5.00%, 10/1/2022 | 150,000 | 150,272 |
City of Lathrup Village, Limited Tax GO, 5.00%, 10/1/2025 | 45,000 | 48,221 |
City of Marquette, Capital Improvement | ||
GO, 4.00%, 5/1/2023 | 200,000 | 201,868 |
GO, 4.00%, 5/1/2025 | 290,000 | 300,767 |
City of Marquette, Transportation Fund, Limited Tax | ||
GO, 4.00%, 5/1/2023 | 170,000 | 171,588 |
GO, 4.00%, 5/1/2025 | 105,000 | 108,898 |
City of Romulus, Limited Tax, Capital Improvement Series 2017A, GO, 4.00%, 11/1/2022 | 25,000 | 25,069 |
City of Royal Oak, Limited Tax, Capital Improvement GO, 3.00%, 10/1/2022 | 25,000 | 25,014 |
City of South Haven, Limited Tax GO, 4.00%, 10/1/2023 | 70,000 | 71,003 |
City of Southfield, Water and Sewer Capital Improvement, Limited Tax GO, 3.00%, 5/1/2023 | 85,000 | 85,417 |
City of Sterling Heights, Capital Improvement GO, 5.00%, 4/1/2025 | 40,000 | 42,388 |
City of Warren, Capital Improvement Series 2012A, GO, 2.25%, 11/1/2022 | 25,000 | 25,001 |
City of Wyandotte, Electric System Series A, Rev., 5.00%, 10/1/2022 | 290,000 | 290,556 |
Clarkston Community Schools, Unlimited Tax Series 2016A, Q-SBLF, 5.00%, 5/1/2023 | 40,000 | 40,694 |
Constantine Public Schools Q-SBLF, 5.00%, 5/1/2023 | 35,000 | 35,607 |
County of Jackson, Transportation GO, 2.00%, 5/1/2024 | 250,000 | 247,204 |
INVESTMENTS | PRINCIPAL AMOUNT($) | VALUE($) |
Michigan — continued | ||
County of Macomb, Limited Tax GO, 4.00%, 5/1/2023 | 35,000 | 35,401 |
County of Muskegon, Water Supply System GO, 3.50%, 11/1/2022 | 50,000 | 50,096 |
Dansville Schools, Unlimited Tax GO, Q-SBLF, 5.00%, 5/1/2023 | 25,000 | 25,435 |
Dearborn School District, School Building and Site Series 2014A, GO, Q-SBLF, 4.00%, 11/1/2023 (b) | 35,000 | 35,631 |
East Lansing School District, Unlimited Tax Series 2020-II, GO, Q-SBLF, 4.00%, 5/1/2023 | 180,000 | 182,003 |
Farmington Public School District, School Building Site, Unlimited Tax GO, 4.00%, 5/1/2023 | 20,000 | 20,227 |
Forest Hills Public Schools, 2021 School Building and Site, Unlimited Tax GO, 4.00%, 5/1/2023 | 20,000 | 20,225 |
Forest Hills Public Schools, Unlimited Tax GO, 5.00%, 5/1/2023 | 20,000 | 20,356 |
Fraser Public School District, School Building and Site, Unlimited Tax GO, Q-SBLF, 5.00%, 5/1/2023 | 35,000 | 35,609 |
Genesee Intermediate School District GO, 3.00%, 5/1/2023 | 30,000 | 30,126 |
Gerald R Ford International Airport Authority, Limited Tax Rev., 5.00%, 1/1/2023 | 20,000 | 20,182 |
Grand River Floodwalls and Embankments Drainage District GO, 4.00%, 11/1/2022 | 50,000 | 50,147 |
Grand Valley State University | ||
Rev., 5.00%, 12/1/2022 | 20,000 | 20,132 |
Series 2014B, Rev., 5.00%, 12/1/2022 | 160,000 | 161,055 |
Series 2015A, Rev., 5.00%, 12/1/2022 | 45,000 | 45,258 |
Series 2016A, Rev., 5.00%, 12/1/2022 | 20,000 | 20,132 |
Series 2014B, Rev., 5.00%, 12/1/2023 | 310,000 | 319,440 |
Series 2016A, Rev., 5.00%, 12/1/2024 | 670,000 | 701,273 |
Great Lakes Water Authority, Water Supply System, Second Lien Series 2018A, Rev., 5.00%, 7/1/2023 | 85,000 | 86,684 |
Hanover Horton School District, Unlimited tax GO, AGM, 4.00%, 5/1/2023 | 20,000 | 20,192 |
Healthsource Saginaw, Inc., Unlimited Tax GO, 4.00%, 5/1/2023 | 50,000 | 50,066 |
Hudsonville Public Schools, Unlimited Tax GO, Q-SBLF, 5.00%, 5/1/2023 | 25,000 | 25,438 |
Ingham County Building Authority, Ingham County Justice Complex, Limited Tax Rev., 2.00%, 5/1/2023 | 35,000 | 34,827 |
276 | J.P. Morgan Exchange-Traded Funds | August 31, 2022 |
INVESTMENTS | PRINCIPAL AMOUNT($) | VALUE($) |
Municipal Bonds — continued | ||
Michigan — continued | ||
Kalamazoo Hospital Finance Authority, Bronson Healthcare Group, Inc. | ||
Rev., 5.00%, 5/15/2023 | 210,000 | 213,253 |
Rev., 5.00%, 5/15/2024 (b) | 5,000 | 5,210 |
Kenowa Hills Public Schools, School Building and Site Series 2018-II, GO, Q-SBLF, 4.00%, 11/1/2022 | 65,000 | 65,183 |
Kent Hospital Finance Authority, Mary Free Bed Rehabilitation Hospital | ||
Series 2021A, Rev., 5.00%, 4/1/2024 | 540,000 | 555,210 |
Series 2021A, Rev., 5.00%, 4/1/2025 | 565,000 | 589,946 |
Series 2021A, Rev., 5.00%, 4/1/2026 | 520,000 | 551,016 |
Lake Michigan College District, Building and Site, Limited Tax | ||
GO, 4.00%, 9/1/2023 (b) | 25,000 | 25,402 |
GO, 4.25%, 9/1/2023 (b) | 20,000 | 20,370 |
Lake Orion Community School District GO, Q-SBLF, 5.00%, 5/1/2023 | 25,000 | 25,440 |
L'Anse Creuse Public Schools, Unlimited Tax GO, Q-SBLF, 5.00%, 5/1/2023 | 50,000 | 50,800 |
Lansing School District, Unlimited Tax GO, Q-SBLF, 4.00%, 5/1/2023 | 65,000 | 65,667 |
Linden Community School District, School Building and Site, Unlimited Tax Series 2021-I, GO, Q-SBLF, 4.00%, 5/1/2025 | 30,000 | 31,122 |
Livonia Municipal Building Authority, Limited Tax Rev., 4.00%, 5/1/2024 | 40,000 | 40,983 |
Macomb Interceptor Drain Drainage District, Limited Tax Series 2017A, 5.00%, 5/1/2023 | 80,000 | 81,414 |
Madison District Public Schools, School Building and Site | ||
GO, Q-SBLF, 4.00%, 5/1/2023 (b) | 20,000 | 20,207 |
GO, Q-SBLF, 4.25%, 5/1/2023 (b) | 30,000 | 30,359 |
Marquette Board of Light and Power Series 2016A, Rev., 5.00%, 7/1/2023 | 45,000 | 45,869 |
Michigan Finance Authority, Ascension Senior Credit Group Series 2016E-1, Rev., 4.00%, 8/15/2024 (c) | 60,000 | 61,364 |
Michigan Finance Authority, Beaumont Health Credit Group | ||
Rev., 5.00%, 11/1/2022 (b) | 6,175,000 | 6,201,785 |
Series 2015A, Rev., 5.00%, 8/1/2024 (b) | 40,000 | 41,916 |
Michigan Finance Authority, Bronson Healthcare Group, Inc. Series B, Rev., 3.50%, 11/15/2022 (c) | 3,175,000 | 3,179,478 |
INVESTMENTS | PRINCIPAL AMOUNT($) | VALUE($) |
Michigan — continued | ||
Michigan Finance Authority, Charter County of Wayne Criminal Justice Center Project Rev., 5.00%, 11/1/2022 | 135,000 | 135,552 |
Michigan Finance Authority, Clean Water Revolving Fund | ||
Rev., 4.00%, 10/1/2022 | 130,000 | 130,173 |
Rev., 5.00%, 10/1/2022 (b) | 445,000 | 445,989 |
Rev., 5.00%, 10/1/2022 | 25,000 | 25,053 |
Series 2016B, Rev., 5.00%, 10/1/2022 | 75,000 | 75,159 |
Series 2018B, Rev., 5.00%, 10/1/2022 | 100,000 | 100,212 |
Series 2016B, Rev., 5.00%, 10/1/2023 | 25,000 | 25,677 |
Series 2016B, Rev., 5.00%, 10/1/2024 | 150,000 | 157,499 |
Michigan Finance Authority, Drinking Water Revolving Fund Rev., 5.00%, 10/1/2022 (b) | 185,000 | 185,411 |
Michigan Finance Authority, Henry Ford Health System | ||
Rev., 5.00%, 11/15/2023 | 20,000 | 20,511 |
Rev., 5.00%, 11/15/2024 | 440,000 | 459,765 |
Michigan Finance Authority, Local Government Loan Program, Detroit Regional Convention Facility Authority Local Project Series 2014H-1, Rev., 5.00%, 10/1/2022 | 90,000 | 90,210 |
Michigan Finance Authority, Sparrow Obligated Group | ||
Rev., 4.00%, 11/15/2022 (b) | 270,000 | 270,937 |
Rev., 5.00%, 11/15/2022 | 245,000 | 246,341 |
Michigan Finance Authority, Trinity Health Credit Group | ||
Rev., 5.00%, 12/1/2022 (b) | 485,000 | 488,283 |
Rev., 5.00%, 12/1/2022 | 460,000 | 462,976 |
Series 2017A-MI, Rev., 5.00%, 12/1/2022 | 695,000 | 699,496 |
Series 2019MI-1, Rev., 5.00%, 12/1/2022 | 135,000 | 135,873 |
Series 2019MI-1, Rev., 5.00%, 12/1/2023 | 125,000 | 128,884 |
Series 2017A, Rev., 5.00%, 12/1/2024 | 240,000 | 253,135 |
Series 2019MI-2, Rev., 5.00%, 2/1/2025 (c) | 5,835,000 | 6,144,925 |
Michigan State Building Authority, Facilities Program Series 2013 1-A, Rev., 5.00%, 10/15/2022 | 210,000 | 210,670 |
Michigan State Building Authority, Multi Modal Program Rev., VRDO, 1.56%, 9/12/2022 (c) | 8,635,000 | 8,635,000 |
August 31, 2022 | J.P. Morgan Exchange-Traded Funds | 277 |
AS OF August 31, 2022 (Unaudited) (continued)
INVESTMENTS | PRINCIPAL AMOUNT($) | VALUE($) |
Municipal Bonds — continued | ||
Michigan — continued | ||
Michigan State Hospital Finance Authority, Ascension Health Credit Group | ||
Series 2005A-3, Rev., 4.00%, 11/1/2022 | 240,000 | 240,608 |
Series 2005A-4, Rev., 5.00%, 11/1/2022 | 385,000 | 386,599 |
Series F-5, Rev., 2.40%, 3/15/2023 (c) | 1,230,000 | 1,227,907 |
Michigan State Hospital Finance Authority, Trinity Health Credit Group | ||
Series 2008C, Rev., 5.00%, 12/1/2022 | 155,000 | 156,003 |
Series 2008C, Rev., 5.00%, 12/1/2024 | 255,000 | 268,956 |
Series C, Rev., 5.00%, 12/1/2025 | 200,000 | 215,564 |
Michigan State Housing Development Authority, Rental Housing | ||
Series 2019A-1, Rev., 1.50%, 10/1/2022 | 2,195,000 | 2,193,190 |
Series A, Rev., 2.65%, 10/1/2022 | 75,000 | 75,013 |
Michigan State Housing Development Authority, Single Family Mortgage Series 2020A, Rev., 0.80%, 6/1/2023 | 150,000 | 148,003 |
Michigan State University Series 2013A, Rev., 5.00%, 8/15/2023 | 10,000 | 10,254 |
Mount Clemens Community School District, Unlimited Tax Series 2017A, GO, Q-SBLF, 5.00%, 5/1/2023 | 25,000 | 25,432 |
Muskegon Local Development Finance Authority Rev., AGM, 3.00%, 11/1/2022 | 50,000 | 50,028 |
North Kent Sewer Authority, State of Michigan, Sanitary Sewer System, Limited Tax of Constituent Municipalities Rev., 4.00%, 11/1/2022 | 170,000 | 170,499 |
Northern Michigan University Series 2018A, Rev., 5.00%, 12/1/2022 | 20,000 | 20,133 |
Northville Public Schools, School Building and Site, Unlimited Tax Series 2020-III, GO, 4.00%, 5/1/2025 | 30,000 | 31,075 |
Oakland County Building Authority Series 2012A, Rev., 3.00%, 11/1/2022 | 30,000 | 30,039 |
Oakland County Building Authority, Limited Tax Series 2020A, Rev., 5.00%, 11/1/2022 | 120,000 | 120,547 |
Oakland University Rev., 5.00%, 3/1/2023 | 115,000 | 116,346 |
Plymouth-Canton Community School District GO, Q-SBLF, 5.00%, 5/1/2023 | 45,000 | 45,807 |
Plymouth-Canton Community School District, School Building and Site Series 2013A, GO, 4.00%, 5/1/2023 (b) | 20,000 | 20,220 |
INVESTMENTS | PRINCIPAL AMOUNT($) | VALUE($) |
Michigan — continued | ||
Port Huron Area School District, School Building and Site, Unlimited Tax GO, AGM, 4.00%, 5/1/2023 | 25,000 | 25,265 |
Rochester Community School District, School Building and Site, Unlimited Tax Series II, GO, 3.00%, 5/1/2023 | 40,000 | 40,141 |
Royal Oak Hospital Finance Authority, William Beaumont Hospital Obligated Group | ||
Rev., 3.00%, 9/1/2022 (b) | 40,000 | 40,000 |
Rev., 5.00%, 9/1/2022 (b) | 110,000 | 110,000 |
Saginaw City School District, Unlimited Tax GO, Q-SBLF, 5.00%, 5/1/2024 | 35,000 | 36,317 |
Saline Area Schools, Unlimited Tax GO, Q-SBLF, 5.00%, 5/1/2023 | 90,000 | 91,572 |
Schoolcraft Community College District, Limited Tax GO, 3.00%, 5/1/2024 | 115,000 | 115,871 |
Shepherd Public Schools, Unlimited Tax Series 2017A, GO, Q-SBLF, 3.00%, 5/1/2023 | 45,000 | 45,182 |
South Lake Schools, School Building and Site GO, Q-SBLF, 4.00%, 11/1/2024 | 25,000 | 25,585 |
Southfield Library Building Authority, Limited Tax Rev., 5.00%, 5/1/2023 | 40,000 | 40,691 |
State of Michigan Series 2016B, GO, 5.00%, 11/1/2022 | 20,000 | 20,091 |
State of Michigan, Environmental Program | ||
Series 2015A, GO, 5.00%, 12/1/2022 | 110,000 | 110,753 |
Series 2016A, GO, 5.00%, 12/1/2022 | 300,000 | 302,053 |
State of Michigan, Trunk Line Fund | ||
Series 2020A, Rev., 5.00%, 11/15/2022 | 65,000 | 65,362 |
Series 2021A, Rev., 5.00%, 11/15/2022 | 180,000 | 181,001 |
Series B, Rev., 5.00%, 11/15/2022 | 30,000 | 30,167 |
Troy School District, School Building and Site GO, Q-SBLF, 5.00%, 5/1/2023 | 25,000 | 25,442 |
Troy School District, Unlimited Tax, School Building and Site GO, Q-SBLF, 5.00%, 11/1/2023 (b) | 20,000 | 20,607 |
Utica Community Schools, School Building and Site, Unlimited Tax GO, Q-SBLF, 4.00%, 5/1/2023 | 45,000 | 45,441 |
Vicksburg Community Schools, Unlimited Tax Series 2020-I, GO, Q-SBLF, 4.50%, 5/1/2023 | 40,000 | 40,539 |
Walled Lake Consolidated School District, School Building and Site GO, Q-SBLF, 5.00%, 11/1/2023 (b) | 30,000 | 30,893 |
278 | J.P. Morgan Exchange-Traded Funds | August 31, 2022 |
INVESTMENTS | PRINCIPAL AMOUNT($) | VALUE($) |
Municipal Bonds — continued | ||
Michigan — continued | ||
Warren Woods Public Schools, Unlimited Tax GO, Q-SBLF, 5.00%, 5/1/2023 | 20,000 | 20,333 |
Waterford School District, Unlimited Tax GO, Q-SBLF, 5.00%, 5/1/2023 | 60,000 | 60,960 |
Wayne County Airport Authority | ||
Series C, Rev., 5.00%, 12/1/2022 | 10,000 | 10,065 |
Series G, Rev., 5.00%, 12/1/2022 | 45,000 | 45,292 |
Wayne State University | ||
Series 2018A, Rev., 5.00%, 11/15/2022 | 85,000 | 85,469 |
Series 2013A, Rev., 5.00%, 11/15/2024 | 100,000 | 102,844 |
Series 2019A, Rev., 5.00%, 11/15/2024 | 210,000 | 220,536 |
Wayne-Westland Community Schools, Building and Site Unlimited Tax GO, Q-SBLF, 5.00%, 11/1/2022 | 40,000 | 40,171 |
West Ottawa Public Schools GO, Q-SBLF, 4.00%, 11/1/2022 | 50,000 | 50,145 |
West Ottawa Public Schools, School Building and Site, Unlimited Tax GO, 4.00%, 5/1/2023 | 20,000 | 20,227 |
Western Michigan University | ||
Rev., 5.00%, 11/15/2022 | 50,000 | 50,276 |
Series 2015A, Rev., 5.00%, 11/15/2022 | 25,000 | 25,138 |
Western Michigan University, Tax Exempt Series 2019A, Rev., 5.00%, 11/15/2022 | 250,000 | 251,380 |
White Cloud Public Schools, Unlimited Tax GO, Q-SBLF, 4.00%, 5/1/2023 | 25,000 | 25,237 |
Ypsilanti Community Utilities Authority, Water Supply System No. 7, Charter Township Ypsilanti, Limited Tax Rev., 4.00%, 4/1/2023 | 175,000 | 176,424 |
Ypsilanti School District, Unlimited Tax Series 2016A, GO, Q-SBLF, 5.00%, 5/1/2023 | 40,000 | 40,694 |
Total Michigan | 44,649,754 | |
Minnesota — 1.7% | ||
Alexandria Lake Area Sanitation District, Sanitary Sewer Board Series 2015A, 5.00%, 2/1/2023 | 25,000 | 25,279 |
Bloomington Independent School District No. 271, Enhancement Program Series 2015A, 5.00%, 2/1/2023 | 90,000 | 91,009 |
INVESTMENTS | PRINCIPAL AMOUNT($) | VALUE($) |
Minnesota — continued | ||
Cass Lake-Bena Independent School District No. 115 Series 2019A, 5.00%, 2/1/2023 | 10,000 | 10,106 |
City of Alexandria Series 2020A, 4.00%, 2/1/2023 | 50,000 | 50,333 |
City of Burnsville 4.00%, 12/20/2022 | 30,000 | 30,158 |
City of Chaska Series 2020C, 5.00%, 2/1/2023 | 20,000 | 20,215 |
City of Columbia Heights Series 2017B, 3.00%, 2/1/2023 | 35,000 | 35,102 |
City of Fife Series 2017A, GO, 4.00%, 12/1/2022 | 25,000 | 25,103 |
City of Minneapolis GO, 4.00%, 12/1/2022 | 85,000 | 85,365 |
City of Minneapolis & St. Paul Housing and Redevelopment Authority, Health Care, Allina Health System | ||
Rev., 5.00%, 11/15/2022 | 100,000 | 100,517 |
Series 2017A, Rev., 5.00%, 11/15/2022 | 125,000 | 125,646 |
City of Minneapolis, Health Care System, Fairview Health Services Series 2015A, Rev., 5.00%, 11/15/2022 | 25,000 | 25,115 |
City of Minneapolis, Improvement and Various Purpose | ||
GO, 4.00%, 12/1/2022 | 25,000 | 25,107 |
GO, 4.00%, 12/1/2023 | 45,000 | 45,955 |
City of Minneapolis, University Gateway Project Rev., 4.00%, 12/1/2022 | 75,000 | 75,330 |
City of New Hope, Hennepin County Series 2018A, GO, 4.00%, 2/1/2024 | 50,000 | 51,084 |
City of New ULM Series 2017B, GO, 2.00%, 12/1/2022 | 45,000 | 44,950 |
City of Red Wing Series 2017A, GO, 3.00%, 2/1/2023 | 35,000 | 35,090 |
City of Redwood Falls Series 2018A, GO, 3.00%, 2/1/2023 | 20,000 | 20,047 |
City of Rochester Series 2015B, GO, 5.00%, 12/1/2023 | 20,000 | 20,654 |
City of Rochester, Electric Utility Series 2015E, Rev., 5.00%, 12/1/2022 | 20,000 | 20,135 |
City of Sauk Centre GO, 2.00%, 9/1/2022 | 45,000 | 45,000 |
City of St. Cloud, Infrastructure Management Fund Series 2013A, GO, 3.00%, 2/1/2025 | 45,000 | 45,021 |
City of St. Paul Series 2012D, GO, 2.00%, 10/1/2022 | 25,000 | 24,995 |
City of St. Paul, Capital Improvement Series 2016A, GO, 5.00%, 9/1/2022 | 25,000 | 25,000 |
August 31, 2022 | J.P. Morgan Exchange-Traded Funds | 279 |
AS OF August 31, 2022 (Unaudited) (continued)
INVESTMENTS | PRINCIPAL AMOUNT($) | VALUE($) |
Municipal Bonds — continued | ||
Minnesota — continued | ||
City of St. Paul, Sales Tax Series 2019C, Rev., 3.00%, 11/1/2023 | 25,000 | 25,163 |
City of St. Paul, Sewer Series 2020D, Rev., 4.00%, 12/1/2022 | 50,000 | 50,220 |
City of St. Paul, Street Improvement, Special Assessment Series 2018B, GO, 5.00%, 5/1/2023 | 20,000 | 20,360 |
City of Wayzata Series 2017A, GO, 3.00%, 12/1/2022 | 30,000 | 30,056 |
City of West St. Paul Series 2017A, GO, 4.00%, 2/1/2025 | 30,000 | 31,018 |
County of Anoka, Capital Improvement | ||
Series 2017A, 5.00%, 2/1/2023 | 20,000 | 20,219 |
Series 2020A, 5.00%, 2/1/2024 | 40,000 | 41,431 |
County of Blue Earth Series 2015A, 2.00%, 12/1/2022 | 30,000 | 29,965 |
County of Blue Earth, Capital Improvement Series 2018A, 5.00%, 12/1/2022 | 20,000 | 20,127 |
County of Clay Series 2017A, 5.00%, 2/1/2025 | 50,000 | 52,993 |
County of Hennepin | ||
Series 2014A, GO, 5.00%, 12/1/2022 | 85,000 | 85,575 |
Series 2014B, GO, 5.00%, 12/1/2022 | 125,000 | 125,846 |
Series 2016A, GO, 5.00%, 12/1/2022 | 30,000 | 30,203 |
Series 2017C, GO, 5.00%, 12/1/2022 | 140,000 | 140,948 |
County of Hennepin, Sales Tax Series 2020C, GO, 5.00%, 12/15/2022 | 20,000 | 20,156 |
County of Martin Series 2021A, GO, 3.00%, 12/15/2023 | 40,000 | 40,325 |
County of Mille Lacs, Drainage Series 2019B, GO, 3.00%, 2/1/2024 | 45,000 | 45,279 |
County of Scott, Capital Improvement Series 2014B, GO, 5.00%, 12/1/2022 | 65,000 | 65,440 |
County of Sherburne, Capital Improvement Series 2017A, GO, 3.00%, 2/1/2023 | 25,000 | 25,062 |
County of St. Louis, Capital Improvement | ||
Series 2015C, GO, 3.00%, 12/1/2022 | 25,000 | 25,049 |
Series 2015B, GO, 3.00%, 12/1/2023 | 75,000 | 75,602 |
Series 2016B, GO, 5.00%, 12/1/2023 | 35,000 | 36,136 |
County of Wright Series 2019A, COP, 5.00%, 12/1/2022 | 65,000 | 65,432 |
County of Wright, Jail Series 2017A, GO, 4.00%, 12/1/2022 | 240,000 | 240,996 |
Duluth Economic Development Authority, Benedictine Health System Series 2021A, Rev., 3.00%, 7/1/2023 | 205,000 | 204,046 |
INVESTMENTS | PRINCIPAL AMOUNT($) | VALUE($) |
Minnesota — continued | ||
Duluth Independent School District No. 709 | ||
Series 2016A, COP, 5.00%, 2/1/2023 | 100,000 | 101,034 |
Series 2016A, COP, 5.00%, 2/1/2025 | 400,000 | 422,207 |
Housing and Redevelopment Authority of The City of St. Paul Minnesota, Fairview Health Services Series 2017A, Rev., 5.00%, 11/15/2022 | 285,000 | 286,310 |
Hutchinson Utilities Commission Series 2017B, Rev., 4.00%, 12/1/2022 | 25,000 | 25,104 |
Jackson County Central Independent School District No. 2895 Series 2020A, GO, 4.00%, 2/1/2023 | 80,000 | 80,540 |
Lake Superior Independent School District No. 381 Series 2016A, GO, 5.00%, 10/1/2022 | 35,000 | 35,077 |
Lakeville Independent School District No. 194 Series 2016A, GO, 5.00%, 2/1/2023 | 25,000 | 25,270 |
Metropolitan Council, Minneapolis St. Paul Metropolitan Area Series 2017B, GO, 5.00%, 3/1/2023 | 35,000 | 35,474 |
Metropolitan Council, Minneapolis St. Paul Metropolitan Area, Wastewater | ||
Series 2012B, GO, 5.00%, 9/1/2022 | 170,000 | 170,000 |
Series 2016C, GO, 5.00%, 3/1/2023 | 30,000 | 30,406 |
Minneapolis Special School District No. 1 | ||
Series 2015A, GO, 4.00%, 2/1/2023 | 20,000 | 20,137 |
Series 2014D, COP, 5.00%, 2/1/2025 | 30,000 | 30,328 |
Minneapolis-St. Paul Metropolitan Airports Commission | ||
Series B, Rev., 4.00%, 1/1/2023 | 40,000 | 40,221 |
Series 2014A, Rev., 5.00%, 1/1/2026 | 20,000 | 20,647 |
Minnesota Higher Education Facilities Authority, Carleton College Rev., 5.00%, 3/1/2023 | 220,000 | 222,837 |
Minnesota Higher Education Facilities Authority, St. Olaf College Series 8-G, Rev., 5.00%, 12/1/2022 | 15,000 | 15,096 |
Minnesota Higher Education Facilities Authority, University of St. Thomas Series 2017A, Rev., 3.00%, 10/1/2022 | 135,000 | 135,061 |
Minnesota Municipal Gas Agency Series 2022B, Rev., LIQ : Royal Bank of Canada, (SOFR + 1.00%), 2.53%, 9/2/2022 (d) | 48,000,000 | 45,865,498 |
Minnesota Municipal Power Agency | ||
Rev., 4.00%, 10/1/2022 | 275,000 | 275,363 |
Rev., 5.00%, 10/1/2022 | 200,000 | 200,425 |
Series 2014A, Rev., 5.00%, 10/1/2022 | 25,000 | 25,053 |
280 | J.P. Morgan Exchange-Traded Funds | August 31, 2022 |
INVESTMENTS | PRINCIPAL AMOUNT($) | VALUE($) |
Municipal Bonds — continued | ||
Minnesota — continued | ||
Minnesota Public Facilities Authority Series 2010A, Rev., 5.00%, 3/1/2023 | 50,000 | 50,682 |
Minnesota State Colleges and Universities Foundation | ||
Rev., 4.00%, 10/1/2022 | 125,000 | 125,174 |
Series 2013A, Rev., 4.00%, 10/1/2022 | 65,000 | 65,091 |
Series 2019A, Rev., 5.00%, 10/1/2023 | 25,000 | 25,699 |
Minnetonka Independent School District No. 276 | ||
Series E, COP, 3.00%, 10/1/2022 | 85,000 | 85,045 |
Series 2016F, COP, 5.00%, 2/1/2023 (b) | 25,000 | 25,280 |
Series E, COP, 4.00%, 10/1/2023 | 115,000 | 116,895 |
Monticello Independent School District No. 882, School Building Series 2016A, GO, 2.00%, 2/1/2023 | 25,000 | 24,935 |
Northern Municipal Power Agency Series 2013A, Rev., 5.00%, 1/1/2024 | 50,000 | 50,414 |
Owatonna Independent School District No. 761 Series 2020A, GO, 4.00%, 2/1/2023 | 80,000 | 80,560 |
Prior Lake-Savage Independent School District No. 719 Series 2013C, GO, 4.00%, 2/1/2023 | 200,000 | 201,424 |
Rochester Independent School District No. 535 Series 2014A, COP, 3.00%, 2/1/2024 | 25,000 | 25,068 |
Rosemount-Apple Valley-Eagan Independent School District No. 196 Series 2016A, GO, 5.00%, 2/1/2025 | 35,000 | 37,112 |
South Washington County Independent School District No. 833, School Building | ||
Series 2016B, GO, 5.00%, 2/1/2023 | 145,000 | 146,644 |
Series 2018B, GO, 5.00%, 2/1/2023 | 35,000 | 35,397 |
Southern Minnesota Municipal Power Agency Series 1994A, Rev., NATL-RE, Zero Coupon, 1/1/2024 | 50,000 | 48,225 |
St. Cloud Independent School District No. 742 Series 2021A, COP, 3.00%, 2/1/2025 | 125,000 | 126,070 |
St. Francis Independent School District No. 15 Series 2018A, GO, 5.00%, 2/1/2023 | 35,000 | 35,382 |
St. Paul Port Authority, State of Minnesota Freeman Office Building Series 2013-2, Rev., 5.00%, 12/1/2022 | 250,000 | 251,711 |
Staples United Hospital District GO, 3.00%, 12/1/2022 | 40,000 | 40,053 |
INVESTMENTS | PRINCIPAL AMOUNT($) | VALUE($) |
Minnesota — continued | ||
State of Minnesota | ||
Series 2014A, Rev., 5.00%, 6/1/2023 | 45,000 | 45,856 |
Series 2012B, GO, 2.00%, 8/1/2023 | 25,000 | 24,912 |
Series 2012B, Rev., 5.00%, 3/1/2024 | 50,000 | 50,597 |
Series 2012B, Rev., 5.00%, 3/1/2025 | 50,000 | 50,594 |
Series 2012B, Rev., 4.00%, 3/1/2026 | 90,000 | 90,193 |
State of Minnesota, Tax-Exempt | ||
Series 2012B, Rev., 5.00%, 3/1/2023 | 100,000 | 100,599 |
Series A, Rev., 5.00%, 6/1/2026 | 70,000 | 71,353 |
State of Minnesota, Trunk Highway | ||
Series 2021B, GO, 5.00%, 9/1/2022 | 110,000 | 110,000 |
Series 2018B, GO, 5.00%, 8/1/2023 | 25,000 | 25,616 |
State of Minnesota, Various Purpose | ||
Series 2021A, GO, 5.00%, 9/1/2022 | 25,000 | 25,000 |
Series 2012A, GO, 5.00%, 9/12/2022 | 25,000 | 25,019 |
Series 2013D, GO, 5.00%, 10/1/2022 | 110,000 | 110,247 |
Series 2013F, GO, 5.00%, 10/1/2022 | 90,000 | 90,202 |
Series 2017D, GO, 5.00%, 10/1/2022 | 285,000 | 285,638 |
Series 2014A, GO, 5.00%, 8/1/2023 | 10,000 | 10,246 |
Three Rivers Park District Series 2015B, GO, 3.00%, 2/1/2023 | 20,000 | 20,052 |
West St. Paul-Mendota Heights-Eagan Independent School District No. 197 Series 2021A, GO, 5.00%, 2/1/2023 | 55,000 | 55,585 |
White Bear Lake Independent School District No. 624 Series 2020A, GO, 4.00%, 2/1/2023 | 80,000 | 80,583 |
Total Minnesota | 53,581,204 | |
Mississippi — 0.3% | ||
Alcorn State University Educational Building Corp. (The), Refinancing Project 3.00%, 9/1/2022 | 130,000 | 130,000 |
City of Ridgeland GO, 4.00%, 8/1/2024 | 25,000 | 25,728 |
City of Starkville, Water and Sewer System Rev., 4.00%, 5/1/2023 | 55,000 | 55,561 |
County of DeSoto GO, 5.00%, 7/1/2023 | 40,000 | 40,796 |
County of Madison GO, 2.50%, 5/1/2023 | 30,000 | 30,029 |
Jackson State University Educational Building Corp. Series 2015A, Rev., 5.00%, 3/1/2023 | 150,000 | 151,852 |
Madison County School District GO, 5.00%, 3/1/2024 | 25,000 | 25,934 |
Mississippi Business Finance Corp., Waste Management, Inc. Project Rev., 0.70%, 9/1/2026 (c) | 1,250,000 | 1,099,009 |
August 31, 2022 | J.P. Morgan Exchange-Traded Funds | 281 |
AS OF August 31, 2022 (Unaudited) (continued)
INVESTMENTS | PRINCIPAL AMOUNT($) | VALUE($) |
Municipal Bonds — continued | ||
Mississippi — continued | ||
Mississippi Development Bank, Biloxi Project Rev., 5.00%, 11/1/2022 | 70,000 | 70,286 |
Mississippi Development Bank, Department of Corrections Walnut Grove Correctional Facility Refunding Bonds Project | ||
Rev., 5.00%, 8/1/2025 | 295,000 | 313,661 |
Rev., 5.00%, 8/1/2026 | 35,000 | 37,788 |
Mississippi Development Bank, Desoto Highway Construction Rev., 5.00%, 1/1/2023 | 30,000 | 30,249 |
Mississippi Development Bank, Harrison County Series 2013A, Rev., 5.00%, 1/1/2026 | 2,190,000 | 2,356,585 |
Mississippi Development Bank, Hinds Project | ||
Rev., 5.00%, 11/1/2022 | 70,000 | 70,255 |
Rev., 5.00%, 11/1/2023 | 95,000 | 97,211 |
Mississippi Development Bank, Industrial Development Authority Series B, Rev., 5.00%, 1/1/2023 | 20,000 | 20,166 |
Mississippi Development Bank, Jackson Public School District, Limited Tax Refunding Note Project | ||
Rev., 5.00%, 4/1/2023 | 25,000 | 25,345 |
Series 2012B, Rev., 5.00%, 10/1/2023 | 1,465,000 | 1,482,413 |
Series 2015A, Rev., 5.00%, 4/1/2025 | 90,000 | 95,095 |
Mississippi Development Bank, Madison County, Mississippi Highway Refunding Project Series 2013C, Rev., 5.00%, 1/1/2024 | 20,000 | 20,635 |
Mississippi Development Bank, Rankin County School District Project | ||
Rev., 5.00%, 6/1/2024 | 30,000 | 31,182 |
Rev., 5.00%, 6/1/2025 | 35,000 | 37,217 |
Mississippi Development Bank, Special Obligation, Tupelo Project Rev., 5.00%, 11/1/2022 | 30,000 | 30,134 |
Mississippi Home Corp., Single Family Mortgage Series A, Rev., GNMA/FNMA/FHLMC COLL, 1.80%, 12/1/2022 | 30,000 | 29,956 |
Mississippi Hospital Equipment and Facilities Authority, Health Services | ||
Series 2020-I, Rev., 5.00%, 10/1/2022 | 400,000 | 400,800 |
Series 2020-I, Rev., 5.00%, 10/1/2025 | 140,000 | 148,314 |
Mississippi State University Educational Building Corp., Campus Improvement Project Rev., 5.00%, 11/1/2022 | 310,000 | 311,376 |
INVESTMENTS | PRINCIPAL AMOUNT($) | VALUE($) |
Mississippi — continued | ||
Rankin County School District, Limited Tax | ||
GO, 3.00%, 8/1/2023 | 175,000 | 175,076 |
GO, 5.00%, 8/1/2025 | 25,000 | 26,785 |
State of Mississippi | ||
Series 2015C, GO, 5.00%, 10/1/2022 | 90,000 | 90,202 |
Series 2009F, GO, 5.25%, 10/1/2022 | 50,000 | 50,122 |
Series 2012F, GO, 4.00%, 11/1/2022 | 250,000 | 250,733 |
Series 2012F, GO, 5.00%, 11/1/2022 (b) | 50,000 | 50,225 |
Series 2012H, GO, 5.00%, 12/1/2022 | 110,000 | 110,753 |
Series 2020B, GO, 5.00%, 9/1/2024 | 150,000 | 157,751 |
State of Mississippi, Gaming Tax Series 2019A, Rev., 5.00%, 10/15/2022 | 125,000 | 125,370 |
State of Mississippi, Nissan North America Inc., Project Series 2012B, GO, 5.00%, 11/1/2022 | 50,000 | 50,228 |
State of Mississippi, Tax-Exempt | ||
Series 2012H, GO, 3.00%, 12/1/2022 (b) | 55,000 | 55,099 |
Series 2012H, GO, 3.13%, 12/1/2022 (b) | 50,000 | 50,106 |
Series 2012H, GO, 4.00%, 12/1/2022 (b) | 30,000 | 30,125 |
Series 2012H, GO, 4.00%, 12/1/2023 | 25,000 | 25,103 |
Series 2017A, GO, 5.00%, 10/1/2024 | 25,000 | 26,344 |
University of Mississippi Educational Building Corp., Campus Improvement Project | ||
Series 2015C, Rev., 3.00%, 11/1/2022 | 25,000 | 25,032 |
Series 2015C, Rev., 5.00%, 11/1/2023 | 35,000 | 36,038 |
University of Mississippi Educational Building Corp., Facilities Refinancing Project | ||
Rev., 3.00%, 10/1/2022 | 195,000 | 195,124 |
Series 2016A, Rev., 5.00%, 10/1/2022 | 80,000 | 80,178 |
Rev., 5.00%, 10/1/2024 | 195,000 | 204,465 |
University of Southern Mississippi (The), Educational Building Corp. Series 2015A, Rev., 5.00%, 3/1/2023 | 35,000 | 35,432 |
West Rankin Utility Authority Rev., AGM, 3.00%, 1/1/2023 | 25,000 | 25,056 |
Total Mississippi | 9,042,924 | |
Missouri — 2.4% | ||
Bi-State Development Agency of the Missouri-Illinois Metropolitan District, Combine Lien, Mass Transit Sales Tax Series 2013A, 5.00%, 10/1/2022 | 395,000 | 395,810 |
282 | J.P. Morgan Exchange-Traded Funds | August 31, 2022 |
INVESTMENTS | PRINCIPAL AMOUNT($) | VALUE($) |
Municipal Bonds — continued | ||
Missouri — continued | ||
Bi-State Development Agency of the Missouri-Illinois Metropolitan District, Combined Lien | ||
Series 2013A, 5.00%, 10/1/2023 (b) | 140,000 | 140,311 |
Series 2013A, 5.00%, 10/1/2024 (b) | 25,000 | 25,056 |
Series 2013A, 5.00%, 10/1/2025 (b) | 100,000 | 100,222 |
Series 2013A, 4.38%, 10/1/2033 (b) | 25,000 | 25,042 |
Series 2013A, 5.00%, 10/1/2044 (b) | 40,000 | 40,089 |
Cape Girardeau School District No. 63 4.00%, 3/1/2025 | 25,000 | 25,938 |
City of Brentwood 3.00%, 10/1/2022 | 135,000 | 135,065 |
City of Chesterfield 5.00%, 12/1/2023 | 75,000 | 77,396 |
City of Clayton 5.00%, 12/1/2022 | 115,000 | 115,773 |
City of Columbia, Water and Electric System | ||
5.00%, 10/1/2022 | 50,000 | 50,107 |
Series 2019B, 5.00%, 10/1/2022 | 25,000 | 25,054 |
City of Excelsior Springs | ||
Series 2020A, COP, 4.00%, 9/1/2022 | 125,000 | 125,000 |
Series 2020B, COP, 4.00%, 3/1/2023 | 25,000 | 25,203 |
City of Kansas City | ||
Series 2019A, Rev., 3.00%, 12/1/2022 | 30,000 | 30,051 |
Series 2014A, Rev., 4.00%, 12/1/2022 | 35,000 | 35,145 |
Series 2019A, Rev., 5.00%, 12/1/2022 | 40,000 | 40,264 |
Series 2020A, Rev., 5.00%, 12/1/2022 | 40,000 | 40,264 |
Series 2021A, Rev., 5.00%, 12/1/2022 | 25,000 | 25,165 |
Series 2019A, Rev., 5.00%, 12/1/2023 | 35,000 | 36,110 |
City of Kansas City, Special Obligation | ||
Series B, Rev., 5.00%, 9/1/2022 | 135,000 | 135,000 |
Series 2009E, Rev., Zero Coupon, 2/1/2023 | 45,000 | 44,447 |
Series E, Rev., Zero Coupon, 2/1/2024 | 275,000 | 263,004 |
City of Kirkwood COP, 3.00%, 9/1/2022 | 25,000 | 25,000 |
City of Sedalia COP, 3.00%, 9/15/2022 | 65,000 | 65,015 |
City of Springfield Series 2014A, Rev., 4.00%, 9/1/2022 | 25,000 | 25,000 |
City of Springfield, Public Utility, Lease Purchase Agreement Rev., 5.00%, 9/1/2022 | 100,000 | 100,000 |
County of Clay Series 2018A, 4.00%, 5/1/2024 (b) | 30,000 | 30,797 |
County of Dunklin Rev., 3.00%, 12/1/2026 | 400,000 | 402,752 |
County of Franklin COP, 4.00%, 11/1/2022 | 20,000 | 20,059 |
County of Greene, Capital Projects COP, 4.00%, 9/1/2022 | 80,000 | 80,000 |
INVESTMENTS | PRINCIPAL AMOUNT($) | VALUE($) |
Missouri — continued | ||
County of Jackson, Harry S. Truman Sports Complex Project Rev., 5.00%, 12/1/2022 | 135,000 | 135,802 |
County of Jackson, Special Obligation Rev., 4.00%, 12/1/2023 | 35,000 | 35,682 |
County of St. Louis, Special Obligation Series 2021F, Rev., 5.00%, 12/1/2022 | 100,000 | 100,659 |
Curators of the University of Missouri (The), System Facilities Bonds | ||
Series 2014A, Rev., 5.00%, 11/1/2022 (b) | 165,000 | 165,743 |
Series A, Rev., 5.00%, 11/1/2022 | 25,000 | 25,113 |
Hazelwood School District GO, 5.00%, 3/1/2023 | 20,000 | 20,264 |
Health and Educational Facilities Authority of the State of Missouri, BJC Health System | ||
Series C, Rev., VRDO, LIQ : BJC Health System, 1.63%, 9/8/2022 (c) | 13,110,000 | 13,110,000 |
Series 2021B, Rev., 4.00%, 5/1/2026 (c) | 5,375,000 | 5,574,631 |
Health and Educational Facilities Authority of the State of Missouri, Coxhealth and Obligated Group Series 2013A, Rev., 5.00%, 11/15/2022 | 270,000 | 271,241 |
Health and Educational Facilities Authority of the State of Missouri, Mercy Health Rev., 3.00%, 11/15/2022 | 50,000 | 50,055 |
Health and Educational Facilities Authority of the State of Missouri, SSM Health Care | ||
Series F, Rev., VRDO, 0.98%, 9/1/2022 (c) | 40,000,000 | 40,000,000 |
Series 2014A, Rev., 5.00%, 6/1/2024 (b) | 25,000 | 26,076 |
Hickman Mills C-1 School District Series 2020C-1, GO, 4.00%, 3/1/2023 | 50,000 | 50,399 |
Jackson County Reorganized School District No. 7, Lee's Summit R-7 | ||
GO, 4.00%, 3/1/2023 | 20,000 | 20,159 |
GO, 5.00%, 3/1/2023 | 20,000 | 20,257 |
Joplin Schools, Missouri Direct Deposit Program GO, 4.00%, 3/1/2025 | 100,000 | 100,622 |
Ladue School District GO, 4.00%, 3/1/2023 | 20,000 | 20,172 |
Metropolitan St. Louis Sewer District, Wastewater System Series 2013B, Rev., 5.00%, 5/1/2023 (b) | 65,000 | 66,153 |
August 31, 2022 | J.P. Morgan Exchange-Traded Funds | 283 |
AS OF August 31, 2022 (Unaudited) (continued)
INVESTMENTS | PRINCIPAL AMOUNT($) | VALUE($) |
Municipal Bonds — continued | ||
Missouri — continued | ||
Missouri Development Finance Board, Fulton State Hospital Project Rev., 5.00%, 10/1/2022 | 95,000 | 95,200 |
Missouri Development Finance Board, Office Building Project Series 2013A, Rev., 3.00%, 10/1/2023 | 50,000 | 50,026 |
Missouri Housing Development Commission, Single Family Mortgage, First Place Homeownership Loan Program Series 2021C, Rev., GNMA/FNMA/FHLMC, 0.35%, 11/1/2023 | 480,000 | 467,439 |
Missouri Joint Municipal Electric Utility Commission, Prairie State Project Series 2015A, Rev., 5.00%, 12/1/2022 | 105,000 | 105,650 |
Missouri State Board of Public Buildings | ||
Series 2014A, Rev., 5.00%, 10/1/2022 | 135,000 | 135,303 |
Series 2015B, Rev., 5.00%, 4/1/2023 | 25,000 | 25,393 |
Series 2014A, Rev., 4.00%, 10/1/2023 | 95,000 | 95,135 |
Series 2020B, Rev., 5.00%, 10/1/2023 | 30,000 | 30,855 |
Missouri State Environmental Improvement and Energy Resources Authority, State Revolving Funds Program Series 2015B, Rev., 5.00%, 7/1/2023 | 25,000 | 25,551 |
Missouri State Environmental Improvement and Energy Resources Authority, Water Pollution Control and Drinking Water | ||
Series 2020A, Rev., 5.00%, 1/1/2023 | 290,000 | 292,616 |
Series 2013A, Rev., 5.00%, 7/1/2024 | 60,000 | 61,489 |
Park Hill School District of Platte County, Missouri Direct Deposit Program GO, 5.00%, 3/1/2023 | 40,000 | 40,546 |
Plaza at Noah's Ark Community Improvement District Rev., 3.00%, 5/1/2023 | 150,000 | 149,012 |
Springfield School District No. R-12, Missouri Direct Deposit Program Series 2014B, GO, 5.00%, 3/1/2023 | 20,000 | 20,273 |
St. Charles Community College GO, 4.00%, 2/15/2023 | 35,000 | 35,248 |
St. Charles County Public Water Supply District No. 2 | ||
COP, 5.00%, 12/1/2022 | 80,000 | 80,508 |
Series 2016B, COP, 5.00%, 12/1/2022 | 30,000 | 30,190 |
COP, 3.00%, 12/1/2023 | 45,000 | 45,273 |
Series 2016B, COP, 5.00%, 12/1/2023 | 50,000 | 50,303 |
St. Joseph Industrial Development Authority, Sewer System Improvements Project Series 2015B, Rev., 5.00%, 4/1/2023 | 20,000 | 20,300 |
INVESTMENTS | PRINCIPAL AMOUNT($) | VALUE($) |
Missouri — continued | ||
St. Louis County Industrial Development Authority, Friendship Village Chesterfield Rev., 5.00%, 9/1/2022 (b) | 50,000 | 50,000 |
Tender Option Bond Trust Receipts/ Certificates Series 2018-XG0176, Rev., VRDO, LIQ : Royal Bank of Canada, 1.62%, 9/12/2022 (c) (e) | 9,500,000 | 9,500,000 |
Total Missouri | 73,903,477 | |
Montana — 0.0% ^ | ||
City of Billings Series 2012A, 3.00%, 7/1/2023 | 35,000 | 35,020 |
Montana Facility Finance Authority, School Health System Series 2019A, Rev., 5.00%, 1/1/2023 | 70,000 | 70,596 |
Montana State Board of Regents, Montana State University Series 2017D, Rev., 5.00%, 11/15/2022 | 50,000 | 50,281 |
Total Montana | 155,897 | |
Nebraska — 0.7% | ||
Central Plains Energy Project, Gas Project No. 4 Series 2018A, Rev., 5.00%, 3/1/2050 (c) | 970,000 | 992,397 |
City of Lincoln, Electric System | ||
Rev., 3.00%, 9/1/2022 (b) | 25,000 | 25,000 |
Rev., 5.00%, 9/1/2022 (b) | 100,000 | 100,000 |
Rev., 5.00%, 9/1/2022 | 910,000 | 910,000 |
Rev., 2.70%, 9/1/2023 | 10,000 | 10,040 |
City of Lincoln, Stormwater Drainage and Flood Management System GO, 3.00%, 12/15/2023 | 40,000 | 40,350 |
City of Omaha | ||
Series 2014B, GO, 5.00%, 11/15/2022 | 100,000 | 100,562 |
Series A, GO, 5.00%, 11/15/2022 | 40,000 | 40,225 |
City of Omaha, Sanitary Sewerage System | ||
Rev., 3.25%, 11/15/2022 (b) | 45,000 | 45,090 |
Rev., 4.00%, 11/15/2022 (b) | 75,000 | 75,259 |
Rev., 5.00%, 11/15/2022 (b) | 100,000 | 100,557 |
Rev., 5.00%, 11/15/2022 | 50,000 | 50,281 |
Series 2020A, Rev., 4.00%, 4/1/2025 | 35,000 | 36,316 |
City of Omaha, Various Purpose | ||
Series 2012A, GO, 3.00%, 11/15/2022 | 50,000 | 50,081 |
Series 2012A, GO, 3.25%, 11/15/2022 (b) | 75,000 | 75,151 |
284 | J.P. Morgan Exchange-Traded Funds | August 31, 2022 |
INVESTMENTS | PRINCIPAL AMOUNT($) | VALUE($) |
Municipal Bonds — continued | ||
Nebraska — continued | ||
County of Douglas, Creighton University Projects Rev., (SIFMA Municipal Swap Index Yield + 0.53%), 2.03%, 9/8/2022 (d) | 16,100,000 | 16,081,256 |
Douglas County School District No. 010, Elkhorn Public Schools Series 2019, GO, 5.00%, 12/15/2022 | 25,000 | 25,198 |
Loup River Public Power District Rev., 5.00%, 12/1/2022 | 25,000 | 25,163 |
Metropolitan Utilities District of Omaha Water System Rev., 5.00%, 12/1/2022 | 175,000 | 176,185 |
Municipal Energy Agency of Nebraska, Power Supply System | ||
Series 2016A, Rev., 5.00%, 4/1/2023 | 40,000 | 40,619 |
Series 2022A, Rev., 5.00%, 4/1/2023 | 105,000 | 106,620 |
Nebraska Cooperative Republican Platte Enhancement Project Series 2020A, Rev., 2.00%, 12/15/2022 | 445,000 | 444,028 |
Nebraska Investment Finance Authority, Single Family Housing | ||
Series 2020A, Rev., GNMA/FNMA/FHLMC, 0.80%, 9/1/2022 | 85,000 | 85,000 |
Series 2018C, Rev., 2.13%, 9/1/2022 | 5,000 | 5,000 |
Nebraska Public Power District | ||
Series A, Rev., 4.00%, 1/1/2023 | 10,000 | 10,055 |
Series B, Rev., 5.00%, 1/1/2023 | 40,000 | 40,349 |
Series 2020A, Rev., 0.60%, 7/1/2023 (c) | 690,000 | 677,287 |
Series 2012B, Rev., 5.00%, 1/1/2025 | 165,000 | 166,323 |
Series 2021A, Rev., 5.00%, 1/1/2025 | 525,000 | 553,783 |
Series A-1, Rev., 5.00%, 1/1/2025 | 35,000 | 36,919 |
Omaha Public Facilities Corp., Omaha Baseball Stadium Project Series 2016A, Rev., 5.00%, 6/1/2023 | 25,000 | 25,483 |
Omaha Public Power District Nebraska City Station Unit 2 Series 2016A, Rev., 5.00%, 2/1/2023 | 20,000 | 20,219 |
Omaha Public Power District, Electric System | ||
Series 2016A, Rev., 5.00%, 2/1/2023 | 80,000 | 80,877 |
Series B, Rev., 5.00%, 2/1/2025 | 125,000 | 131,107 |
Papillion-La Vista School District No. 27 | ||
Series 2016A, GO, 4.00%, 12/1/2022 | 25,000 | 25,104 |
Series 2020B, GO, 4.00%, 12/1/2022 | 250,000 | 251,038 |
Series 2020B, GO, 4.00%, 12/1/2023 | 35,000 | 35,678 |
INVESTMENTS | PRINCIPAL AMOUNT($) | VALUE($) |
Nebraska — continued | ||
Public Power Generation Agency, Whelan Energy Center Unit 2 Series 2015A, Rev., 5.00%, 1/1/2026 | 800,000 | 843,488 |
State of Nebraska Series 2020A, COP, 3.00%, 9/1/2023 | 45,000 | 45,300 |
University of Nebraska Facilities Corp., University System Facilities, Tax Exempt Series 2019B, Rev., 4.00%, 10/1/2022 | 35,000 | 35,049 |
University of Nebraska Facilities Corp., UNMC Cancer Center Series 2014A, Rev., 5.00%, 2/15/2023 | 20,000 | 20,242 |
University of Nebraska, OMAHA Student Housing Project Rev., 3.25%, 5/15/2024 (b) | 60,000 | 60,823 |
Total Nebraska | 22,699,502 | |
Nevada — 0.2% | ||
Carson City School District, Limited Tax Series 2019A, 5.00%, 6/1/2023 | 75,000 | 76,467 |
City of Henderson | ||
Series 2012A, GO, 4.00%, 12/1/2022 (b) | 50,000 | 50,209 |
Series 2012A, GO, 5.00%, 12/1/2022 (b) | 30,000 | 30,203 |
Series 2012A, GO, 5.00%, 6/1/2023 | 25,000 | 25,163 |
City of Las Vegas Series 2015C, GO, 5.00%, 9/1/2022 | 50,000 | 50,000 |
City of Las Vegas, City Hall Series 2015C, GO, 5.00%, 9/1/2024 | 125,000 | 131,209 |
Clark County School District, Limited Tax | ||
Series 2016B, 5.00%, 6/15/2023 | 225,000 | 229,494 |
Series 2016D, 5.00%, 6/15/2023 | 75,000 | 76,498 |
Clark County School District, Limited Tax, Various Purpose Series 2016F, 3.00%, 6/15/2026 | 100,000 | 100,052 |
County of Clark, Department of Aviation, Nevada Airport System, Subordinate Lien | ||
Series 2019D, 5.00%, 7/1/2023 | 1,120,000 | 1,143,114 |
Series 2019D, 5.00%, 7/1/2024 | 400,000 | 417,559 |
Series 2019D, 5.00%, 7/1/2025 | 40,000 | 42,754 |
Series A-2, 5.00%, 7/1/2025 | 125,000 | 130,633 |
County of Clark, Department of Aviation, Nevada Airport System, Subordinate Lien, McCarran International Airport Series 2019A, 5.00%, 7/1/2023 | 190,000 | 193,890 |
County of Clark, Flood Control, Limited Tax | ||
5.00%, 11/1/2022 | 60,000 | 60,263 |
Series 2020B, 5.00%, 11/1/2022 | 30,000 | 30,132 |
August 31, 2022 | J.P. Morgan Exchange-Traded Funds | 285 |
AS OF August 31, 2022 (Unaudited) (continued)
INVESTMENTS | PRINCIPAL AMOUNT($) | VALUE($) |
Municipal Bonds — continued | ||
Nevada — continued | ||
County of Clark, Indexed Fuel Tax and Subordinate Motor Vehicle Fuel Tax 5.00%, 7/1/2025 | 710,000 | 757,484 |
County of Clark, Las Vegas Convention and Visitors Authority, Limited Tax 5.00%, 7/1/2023 | 20,000 | 20,429 |
County of Clark, Limited Tax | ||
Series 2016A, 5.00%, 11/1/2022 | 125,000 | 125,548 |
Series 2019A, 5.00%, 12/1/2022 | 170,000 | 171,121 |
5.00%, 6/1/2023 | 35,000 | 35,679 |
Series 2016B, 5.00%, 11/1/2023 | 25,000 | 25,741 |
Series 2016B, 5.00%, 11/1/2024 | 45,000 | 47,414 |
County of Clark, Nevada Power Co. 1.65%, 1/1/2036 (c) | 1,600,000 | 1,588,408 |
County of Clark, Park Improvement, Limited Tax 5.00%, 12/1/2024 | 25,000 | 26,391 |
County of Clark, Passenger Facility Charge, Las Vegas-McCarran International Airport Passenger Facility Series 2019E, 5.00%, 7/1/2023 | 25,000 | 25,516 |
County of Clark, Sales and Excise Tax 5.00%, 7/1/2023 | 25,000 | 25,537 |
County of Clark, Transportation Improvement, Limited Tax | ||
Series 2018B, 5.00%, 12/1/2023 | 20,000 | 20,634 |
Series 2018B, 5.00%, 12/1/2025 | 35,000 | 37,769 |
Series 2019B, 5.00%, 6/1/2026 | 300,000 | 326,843 |
County of Washoe, Fuel Tax Rev., 5.00%, 2/1/2023 | 35,000 | 35,391 |
County of Washoe, Sales Tax Series 2016A, Rev., 5.00%, 12/1/2022 | 140,000 | 140,944 |
Las Vegas Valley Water District, Limited Tax Series 2016B, GO, 5.00%, 6/1/2023 | 20,000 | 20,391 |
Las Vegas Valley Water District, Water Improvement, Limited Tax Series 2016A, GO, 5.00%, 6/1/2023 | 65,000 | 66,271 |
Nevada Housing Division, Whittell Pointe Apartments Rev., 0.30%, 10/1/2022 (c) | 175,000 | 174,576 |
Nevada System of Higher Education Rev., 5.00%, 7/1/2023 | 25,000 | 25,510 |
State of Nevada Series 2012-A, GO, 4.00%, 11/1/2024 | 55,000 | 55,026 |
State of Nevada Highway Improvement, Motor Vehicle Fuel Tax | ||
Rev., 4.00%, 12/1/2022 | 295,000 | 296,298 |
Rev., 5.00%, 12/1/2022 | 110,000 | 110,753 |
Series 2020A, Rev., 5.00%, 12/1/2022 | 245,000 | 246,677 |
Rev., 5.00%, 12/1/2023 | 40,000 | 41,318 |
INVESTMENTS | PRINCIPAL AMOUNT($) | VALUE($) |
Nevada — continued | ||
State of Nevada, Capital Improvement and Cultural Affairs | ||
Series 2015B, GO, 5.00%, 11/1/2022 | 85,000 | 85,387 |
Series 2015B, GO, 5.00%, 11/1/2024 | 25,000 | �� 26,395 |
Series 2015B, GO, 5.00%, 11/1/2025 | 20,000 | 21,316 |
State of Nevada, Limited Tax | ||
Series 2015C, GO, 5.00%, 11/1/2022 | 25,000 | 25,114 |
Series 2015E, GO, 5.00%, 2/1/2023 | 20,000 | 20,228 |
Washoe County School District, Limited Tax | ||
GO, 5.00%, 10/1/2022 | 45,000 | 45,099 |
Series A, GO, PSF-GTD, 5.00%, 6/1/2023 | 25,000 | 25,495 |
Total Nevada | 7,484,343 | |
New Hampshire — 0.0% ^ | ||
City of Dover | ||
Series 2017B, GO, 5.00%, 12/15/2022 | 50,000 | 50,395 |
GO, 5.00%, 6/15/2023 | 35,000 | 35,740 |
City of Keene | ||
GO, 4.00%, 11/1/2022 | 30,000 | 30,087 |
GO, NATL-RE, 5.00%, 3/1/2023 | 20,000 | 20,271 |
City of Nashua GO, 5.00%, 9/15/2022 | 25,000 | 25,025 |
County of Rockingham, Municipal Purpose Loan GO, 3.00%, 5/15/2023 | 30,000 | 30,153 |
New Hampshire Health and Education Facilities Authority Act, Concord Hospital Series 2013A, Rev., 4.00%, 10/1/2022 (b) | 660,000 | 660,855 |
New Hampshire Health and Education Facilities Authority Act, Southern New Hampshire University Rev., 5.00%, 1/1/2023 (b) | 40,000 | 40,353 |
New Hampshire State Turnpike System Series 2015A, Rev., 5.00%, 10/1/2022 | 110,000 | 110,247 |
State of New Hampshire Series 2020C, GO, 5.00%, 12/1/2022 | 35,000 | 35,240 |
State of New Hampshire, Capital Improvement Series 2018A, GO, 5.00%, 12/1/2022 | 145,000 | 145,992 |
Windham School District Series 2014A, GO, 5.00%, 7/15/2024 | 60,000 | 62,664 |
Total New Hampshire | 1,247,022 | |
New Jersey — 9.3% | ||
Atlantic County Improvement Authority (The), Atlantic City Campus Phase II Project | ||
Series 2016B, AGM, 5.00%, 9/1/2022 | 45,000 | 45,000 |
286 | J.P. Morgan Exchange-Traded Funds | August 31, 2022 |
INVESTMENTS | PRINCIPAL AMOUNT($) | VALUE($) |
Municipal Bonds — continued | ||
New Jersey — continued | ||
Series 2016A, AGM, 5.00%, 7/1/2023 | 30,000 | 30,569 |
Atlantic County Improvement Authority (The), The Egg Harbor Township Golf Corp., Project AGM, 5.00%, 11/1/2022 | 30,000 | 30,125 |
Barrington Board of Education 4.00%, 4/1/2023 | 35,000 | 35,313 |
Bergen County Improvement Authority (The), Guaranteed Fort Lee Board of Education | ||
GTD, 5.00%, 12/1/2022 | 75,000 | 75,504 |
GTD, 4.00%, 12/1/2027 (b) | 45,000 | 45,188 |
Bergen County Improvement Authority (The), Guaranteed Governmental Loan GTD, 5.00%, 10/15/2022 | 30,000 | 30,098 |
Bergen County Improvement Authority (The), Saddle Brook Project GTD, 5.00%, 9/1/2022 | 35,000 | 35,000 |
Borough of Alpine 2.00%, 11/16/2022 | 2,325,311 | 2,322,427 |
Borough of Bloomingdale 2.00%, 2/22/2023 | 8,676,000 | 8,650,133 |
Borough of Cliffside Park 1.25%, 9/30/2022 | 5,510,000 | 5,504,551 |
Borough of Englewood Cliffs GO, BAN, 2.00%, 2/17/2023 | 5,945,049 | 5,926,788 |
Borough of Fair Haven GO, 4.00%, 10/1/2022 | 25,000 | 25,034 |
Borough of Flemington GO, BAN, 1.50%, 10/27/2022 | 5,984,000 | 5,974,565 |
Borough of Frenchtown GO, BAN, 1.50%, 10/21/2022 | 1,285,183 | 1,283,609 |
Borough of Glen Ridge GO, BAN, 4.00%, 7/13/2023 | 4,434,625 | 4,469,901 |
Borough of Haddonfield GO, BAN, 2.00%, 2/17/2023 | 11,038,750 | 11,005,846 |
Borough of Haledon GO, 2.00%, 10/15/2022 | 45,000 | 44,957 |
Borough of Haworth GO, BAN, 1.50%, 11/10/2022 | 2,436,000 | 2,430,942 |
Borough of Hawthorne GO, BAN, 1.50%, 9/9/2022 | 2,696,500 | 2,695,856 |
Borough of High Bridge GO, BAN, 3.25%, 6/15/2023 | 2,408,350 | 2,414,285 |
Borough of Hopatcong GO, BAN, 3.75%, 7/21/2023 | 3,467,585 | 3,483,543 |
Borough of Kinnelon GO, BAN, 1.50%, 9/30/2022 | 1,304,000 | 1,302,917 |
Borough of Lakehurst GO, 2.50%, 12/1/2022 | 40,000 | 39,975 |
INVESTMENTS | PRINCIPAL AMOUNT($) | VALUE($) |
New Jersey — continued | ||
Borough of Metuchen GO, 2.25%, 9/1/2022 | 145,000 | 145,000 |
Borough of Morris Plains GO, BAN, 1.50%, 12/9/2022 | 1,415,880 | 1,411,605 |
Borough of Oakland, General Improvement GO, 3.00%, 12/1/2022 | 50,000 | 50,091 |
Borough of Ogdensburg GO, BAN, 1.50%, 10/28/2022 | 1,239,000 | 1,236,972 |
Borough of Paramus GO, BAN, 1.50%, 10/14/2022 | 14,409,000 | 14,391,405 |
Borough of Pitman Series A, GO, BAN, 1.50%, 12/13/2022 | 4,287,927 | 4,274,895 |
Borough of Ramsey GO, BAN, 3.50%, 6/2/2023 | 10,514,000 | 10,556,317 |
Borough of Riverdale GO, BAN, 3.75%, 9/7/2023 (f) | 8,496,000 | 8,549,887 |
Borough of Rutherford GO, 3.00%, 11/1/2022 | 65,000 | 65,080 |
Borough of Seaside Heights GO, AGM, 2.75%, 12/1/2022 | 25,000 | 25,022 |
Borough of South River, General Improvement | ||
GO, 3.00%, 12/1/2022 | 55,000 | 55,094 |
GO, 4.00%, 12/1/2022 | 65,000 | 65,270 |
Borough of Spotswood, Water and Sewer Utilities GO, 2.25%, 12/1/2022 | 25,000 | 25,003 |
Borough of Waldwick GO, 2.00%, 11/1/2022 | 50,000 | 49,952 |
Brick Township Board of Education 4.00%, 1/1/2025 | 35,000 | 36,148 |
Brick Township Municipal Utilities Authority (The) Series 2016A, GTD, 5.00%, 12/1/2022 | 40,000 | 40,264 |
Burlington County Bridge Commission, Governmental Leasing Program | ||
5.00%, 10/1/2022 | 95,000 | 95,210 |
Series 2014A, GTD, 5.00%, 12/1/2022 | 20,000 | 20,135 |
4.00%, 4/1/2023 | 20,000 | 20,197 |
5.00%, 4/15/2023 | 25,000 | 25,415 |
Burlington County Bridge Commission, Governmental Loan Program | ||
GTD, 5.00%, 12/1/2022 | 240,000 | 241,619 |
Series 2013A, GTD, 5.00%, 12/1/2023 | 80,000 | 80,533 |
Burlington County Bridge Commission, Guaranteed Bridge System GTD, 5.00%, 10/1/2022 | 135,000 | 135,299 |
August 31, 2022 | J.P. Morgan Exchange-Traded Funds | 287 |
AS OF August 31, 2022 (Unaudited) (continued)
INVESTMENTS | PRINCIPAL AMOUNT($) | VALUE($) |
Municipal Bonds — continued | ||
New Jersey — continued | ||
Camden County Improvement Authority (The) | ||
Series 2015A, GTD, 5.00%, 9/1/2022 | 25,000 | 25,000 |
Series A, GTD, 5.00%, 1/15/2023 | 40,000 | 40,389 |
Series 2012A, GTD, 2.25%, 6/1/2023 | 75,000 | 74,905 |
Series 2017B, GTD, 4.00%, 1/15/2024 | 25,000 | 25,526 |
Series 2015A, GTD, 5.00%, 9/1/2024 | 25,000 | 26,222 |
Camden County Improvement Authority (The), City Hall Project | ||
GTD, 5.00%, 12/1/2022 | 75,000 | 75,491 |
GTD, 5.00%, 12/1/2025 | 30,000 | 32,325 |
Camden County Improvement Authority (The), Open Space Preservation Trust Fund GTD, 5.00%, 6/1/2023 | 50,000 | 50,104 |
City of Brigantine 4.00%, 10/15/2022 | 75,000 | 75,156 |
City of Clifton | ||
4.00%, 10/15/2022 | 70,000 | 70,147 |
3.00%, 10/15/2023 | 20,000 | 20,015 |
City of Elizabeth | ||
GO, AGM, 2.50%, 4/1/2023 | 25,000 | 25,012 |
GO, 3.00%, 4/1/2023 | 25,000 | 25,083 |
City of Englewood GO, 3.00%, 2/1/2023 | 115,000 | 115,325 |
City of Hoboken, Packaging Utility GO, 5.00%, 1/1/2023 | 25,000 | 25,203 |
City of Jersey City Series 2017A, GO, 4.00%, 11/1/2022 | 100,000 | 100,277 |
City of Long Branch | ||
Series 2020A, GO, 5.00%, 9/15/2022 | 50,000 | 50,050 |
Series 2020A, GO, 5.00%, 9/15/2025 | 30,000 | 32,118 |
City of New Brunswick GO, 4.00%, 3/15/2023 | 40,000 | 40,375 |
City of New Brunswick, Redevelopment Area, Cultural Center Project GO, AGM, 4.00%, 9/15/2022 | 34,000 | 34,022 |
City of Newark Series 2020A, GO, AGM, 5.00%, 10/1/2023 | 1,000,000 | 1,024,266 |
City of Ocean City, General Improvement | ||
Series 2020A&B, GO, 3.00%, 10/15/2022 | 25,000 | 25,024 |
GO, 4.00%, 12/15/2022 | 50,000 | 50,254 |
GO, 4.00%, 9/15/2023 | 120,000 | 122,024 |
GO, 4.00%, 9/15/2025 | 40,000 | 41,768 |
City of Orange Township GO, 4.00%, 12/1/2022 | 25,000 | 25,096 |
City of Plainfield GO, 4.00%, 9/15/2022 | 25,000 | 25,016 |
INVESTMENTS | PRINCIPAL AMOUNT($) | VALUE($) |
New Jersey — continued | ||
City of Rahway | ||
GO, 4.00%, 4/15/2023 | 100,000 | 101,049 |
GO, 4.00%, 8/1/2023 | 25,000 | 25,377 |
GO, 4.00%, 10/1/2023 | 25,000 | 25,441 |
City of Sea Isle City | ||
GO, 3.00%, 9/1/2022 | 20,000 | 20,000 |
GO, 3.00%, 9/1/2023 | 45,000 | 45,260 |
City of Summit GO, 5.00%, 11/1/2022 | 20,000 | 20,090 |
County of Atlantic 0.50%, 6/1/2024 | 1,805,000 | 1,715,002 |
County of Bergen | ||
5.00%, 10/15/2022 | 65,000 | 65,217 |
3.00%, 11/1/2022 | 50,000 | 50,066 |
County of Burlington, General Improvement Series 2016A-1, 4.00%, 9/1/2022 | 155,000 | 155,000 |
County of Essex | ||
Series A, GO, 2.00%, 9/1/2022 | 25,000 | 25,000 |
Series A, GO, 4.00%, 9/1/2022 | 20,000 | 20,000 |
GO, 5.00%, 9/1/2022 | 35,000 | 35,000 |
Series AC, GO, 5.00%, 3/1/2023 | 25,000 | 25,336 |
GO, 3.00%, 8/1/2023 | 25,000 | 25,153 |
Series A, GO, 4.00%, 9/1/2023 | 20,000 | 20,327 |
County of Essex, Vocational School Bonds Series 2017B, GO, 5.00%, 9/1/2022 | 125,000 | 125,000 |
County of Gloucester | ||
Series 2019A, GO, 5.00%, 9/15/2022 | 65,000 | 65,063 |
Series 2017B, GO, 4.00%, 10/15/2022 | 125,000 | 125,253 |
County of Hudson | ||
GO, 5.00%, 12/1/2022 | 215,000 | 216,353 |
GO, 5.00%, 12/1/2023 | 25,000 | 25,755 |
Series B, GO, 4.00%, 7/1/2025 | 40,000 | 41,503 |
County of Mercer, County College GO, 3.00%, 6/1/2023 | 20,000 | 20,076 |
County of Middlesex | ||
Series 2019A, GO, 4.00%, 11/15/2022 | 20,000 | 20,071 |
GO, 3.00%, 1/15/2023 | 15,000 | 15,041 |
GO, 4.00%, 1/15/2023 | 20,000 | 20,128 |
County of Middlesex, Civic Square II Redevelopment Associates LLC COP, 4.00%, 6/15/2023 | 25,000 | 25,302 |
County of Middlesex, Civic Square III Redevelopment Associates LLC COP, 4.00%, 6/15/2023 | 100,000 | 101,208 |
County of Middlesex, Civic Square IV Redevelopment Associates LLC COP, 5.00%, 10/15/2022 | 50,000 | 50,156 |
288 | J.P. Morgan Exchange-Traded Funds | August 31, 2022 |
INVESTMENTS | PRINCIPAL AMOUNT($) | VALUE($) |
Municipal Bonds — continued | ||
New Jersey — continued | ||
County of Monmouth GO, 5.00%, 7/15/2023 | 25,000 | 25,576 |
County of Morris | ||
GO, 4.00%, 10/15/2022 | 25,000 | 25,051 |
GO, 4.00%, 2/1/2023 | 25,000 | 25,172 |
County of Ocean, General Improvement | ||
GO, 4.00%, 9/1/2022 | 45,000 | 45,000 |
GO, 5.00%, 10/1/2022 | 45,000 | 45,101 |
County of Passaic | ||
Series 2015A, GO, 4.00%, 12/1/2022 | 20,000 | 20,085 |
Series 2016A, GO, 4.00%, 12/1/2022 | 125,000 | 125,534 |
County of Passaic, Consisting of General Improvement and College GO, 5.00%, 4/1/2023 | 25,000 | 25,389 |
County of Passaic, Vocational School Series 2018B, GO, 4.00%, 12/1/2024 | 165,000 | 170,385 |
County of Somerset GO, BAN, 1.00%, 9/7/2022 | 75,000 | 74,987 |
County of Somerset, General Improvement Series 2013A/B, GO, 2.50%, 10/1/2022 | 100,000 | 100,015 |
County of Sussex GO, 4.00%, 9/1/2022 | 25,000 | 25,000 |
County of Union Series B, GO, 3.00%, 3/1/2023 | 40,000 | 40,024 |
County of Union, Vocational Technical School GO, 5.00%, 3/1/2023 | 45,000 | 45,603 |
Cumberland County Improvement Authority (The), County Correctional Facility Project Rev., 5.00%, 10/1/2022 | 20,000 | 20,044 |
East Brunswick Township Board of Education GO, 5.00%, 11/1/2022 | 45,000 | 45,204 |
Egg Harbor Township School District GO, 5.00%, 9/15/2022 | 65,000 | 65,063 |
Essex County Improvement Authority Series 2006, Rev., AMBAC, 5.25%, 12/15/2022 | 205,000 | 206,677 |
Essex County Improvement Authority, County Guaranteed Project Rev., 5.00%, 10/1/2022 | 50,000 | 50,106 |
Fair Lawn Board of Education GO, 3.13%, 9/1/2022 | 20,000 | 20,000 |
Franklin Township Board of Education GO, 3.00%, 2/1/2023 (b) | 40,000 | 40,111 |
Freehold Township Board of Education | ||
GO, 5.00%, 2/15/2023 | 85,000 | 86,018 |
GO, 5.00%, 7/15/2023 | 25,000 | 25,052 |
INVESTMENTS | PRINCIPAL AMOUNT($) | VALUE($) |
New Jersey — continued | ||
Garden State Preservation Trust, Open Space and Farmland Preservation | ||
Series 2003B, Rev., AGM, Zero Coupon, 11/1/2022 | 105,000 | 104,574 |
Series 2012A, Rev., 5.00%, 11/1/2022 | 245,000 | 245,924 |
Gloucester County Improvement Authority (The) | ||
Series 2011A, Rev., 5.00%, 7/15/2023 | 20,000 | 20,449 |
Series 2013A, Rev., 5.00%, 9/1/2023 | 40,000 | 40,513 |
Series 2013A, Rev., 5.00%, 9/1/2024 | 15,000 | 15,187 |
Gloucester County Improvement Authority (The), GCSSSD/GCVTSD Project Rev., 4.00%, 5/15/2023 | 35,000 | 35,413 |
Hainesport Township School District GO, 5.00%, 1/15/2024 | 35,000 | 36,190 |
Holmdel Township School District GO, 4.00%, 3/15/2023 | 25,000 | 25,214 |
Hopewell Valley Regional School District GO, 3.25%, 1/15/2025 | 25,000 | 25,324 |
Hudson County Improvement Authority, Capital Appreciation Series 2006A-1, Rev., NATL-RE, Zero Coupon, 12/15/2022 | 150,000 | 148,877 |
Hudson County Improvement Authority, Courthouse Project Rev., 4.00%, 10/1/2025 | 40,000 | 41,766 |
Hudson County Improvement Authority, Vocational-Technical Schools Project Rev., 5.00%, 5/1/2023 | 270,000 | 274,645 |
Jefferson Township School District GO, 4.00%, 9/15/2022 (b) | 50,000 | 50,031 |
Lenape Regional High School District GO, 5.00%, 3/15/2023 | 20,000 | 20,266 |
Mainland Regional High School District GO, 4.00%, 10/15/2022 | 175,000 | 175,343 |
Mercer County Improvement Authority (The) Series A, Rev., 5.00%, 11/1/2022 | 70,000 | 70,313 |
Middlesex County Improvement Authority, Capital Equipment and Improvement Rev., 2.00%, 9/15/2022 | 125,000 | 124,988 |
Middlesex County Improvement Authority, Open Space Trust Fund | ||
Rev., 4.00%, 12/15/2022 | 65,000 | 65,330 |
Series 2011, Rev., 3.00%, 9/15/2023 | 30,000 | 30,016 |
Middlesex County Improvement Authority, Perth Amboy Franchise Acquisit Series 1999B, Rev., AMBAC, Zero Coupon, 9/1/2022 | 180,000 | 180,000 |
August 31, 2022 | J.P. Morgan Exchange-Traded Funds | 289 |
AS OF August 31, 2022 (Unaudited) (continued)
INVESTMENTS | PRINCIPAL AMOUNT($) | VALUE($) |
Municipal Bonds — continued | ||
New Jersey — continued | ||
Middletown Township Board of Education GO, 2.25%, 8/1/2024 | 720,000 | 715,546 |
Monmouth County Improvement Authority (The), Governmental Pooled Loan Project | ||
Rev., 5.00%, 12/1/2022 | 395,000 | 397,704 |
Series 2019B, Rev., 5.00%, 12/1/2022 | 50,000 | 50,342 |
Morris County Improvement Authority, Morris Hills Regional District Project Rev., 5.00%, 10/1/2022 (b) | 100,000 | 100,222 |
Mount Olive Township Board of Education GO, 4.00%, 7/15/2023 | 20,000 | 20,278 |
New Brunswick Parking Authority, Tax-Exempt Series 2020B, Rev., 5.00%, 9/1/2022 | 475,000 | 475,000 |
New Jersey Economic Development Authority, Department of the Treasury Series 2005N1, Rev., AMBAC, 5.50%, 9/1/2024 | 1,375,000 | 1,447,814 |
New Jersey Economic Development Authority, Motor Vehicle Surcharges Series 2017A, Rev., 5.00%, 7/1/2023 | 50,000 | ��51,053 |
New Jersey Economic Development Authority, School Facilities Construction | ||
Series KK, Rev., 5.00%, 9/1/2022 (b) | 60,000 | 60,000 |
Series 2013NN, Rev., 5.00%, 3/1/2023 (b) | 30,000 | 30,388 |
Series 2021QQQ, Rev., 5.00%, 6/15/2023 | 165,000 | 167,932 |
Series XX, Rev., 5.00%, 6/15/2023 | 2,710,000 | 2,758,159 |
Series 2012-II, Rev., 3.00%, 3/1/2024 | 350,000 | 350,035 |
Series NN, Rev., 5.00%, 3/1/2024 | 325,000 | 328,484 |
Series XX, Rev., 5.00%, 6/15/2024 | 800,000 | 830,890 |
Series 2012-II, Rev., 5.00%, 3/1/2025 | 220,000 | 220,307 |
Series NN, Rev., 5.00%, 3/1/2025 | 495,000 | 500,313 |
Series 2014PP, Rev., AGM - CR, 5.00%, 6/15/2025 | 3,500,000 | 3,638,160 |
Series 2005N1, Rev., AGM, 5.50%, 9/1/2025 | 75,000 | 80,755 |
Series NN, Rev., 5.00%, 3/1/2026 | 525,000 | 530,618 |
Series 2013NN, Rev., 4.00%, 3/1/2027 | 25,000 | 25,108 |
New Jersey Economic Development Authority, Transit Corporation Projects Series B, Rev., 5.00%, 11/1/2022 | 1,090,000 | 1,094,746 |
New Jersey Educational Facilities Authority, Princeton University | ||
Series 2021C, Rev., 5.00%, 3/1/2023 | 20,000 | 20,278 |
Series 2017B, Rev., 5.00%, 7/1/2023 | 25,000 | 25,568 |
INVESTMENTS | PRINCIPAL AMOUNT($) | VALUE($) |
New Jersey — continued | ||
New Jersey Educational Facilities Authority, Ramapo College | ||
Series 2015B, Rev., AGM, 4.00%, 7/1/2023 (b) | 10,000 | 10,134 |
Series 2017A, Rev., AGM, 5.00%, 7/1/2023 (b) | 100,000 | 102,155 |
New Jersey Educational Facilities Authority, Seton Hall University Series 2013D, Rev., 3.50%, 7/1/2023 | 25,000 | 25,066 |
New Jersey Health Care Facilities Financing Authority, AHS Hospital Corp. Rev., 5.00%, 7/1/2025 | 125,000 | 133,501 |
New Jersey Health Care Facilities Financing Authority, Barnabas Health Obligated Group | ||
Series 2019B-1, Rev., 5.00%, 7/1/2024 (c) | 875,000 | 910,375 |
Series 2019B-2, Rev., 5.00%, 7/1/2025 (c) | 220,000 | 231,937 |
New Jersey Health Care Facilities Financing Authority, Hackensack Meridian Health Obligated Group | ||
Rev., 5.00%, 7/1/2023 | 20,000 | 20,380 |
Series 2017A, Rev., 5.00%, 7/1/2025 | 190,000 | 202,653 |
New Jersey Health Care Facilities Financing Authority, Valley Health System Obligated Rev., 5.00%, 7/1/2026 | 50,000 | 53,452 |
New Jersey Health Care Facilities Financing Authority, Virtual Health, Inc. | ||
Rev., 5.00%, 1/1/2024 (b) | 30,000 | 30,975 |
Rev., 5.00%, 7/1/2024 | 95,000 | 97,872 |
Rev., 5.00%, 7/1/2025 | 135,000 | 139,053 |
Rev., 5.00%, 7/1/2026 | 145,000 | 149,336 |
New Jersey Higher Education Student Assistance Authority, Senior Student Loan | ||
Series 2019A, Rev., 5.00%, 12/1/2022 | 40,000 | 40,267 |
Series 2019A, Rev., 5.00%, 12/1/2024 | 40,000 | 42,279 |
New Jersey Housing and Mortgage Finance Agency, Multi-Family Series 2019B, Rev., 1.50%, 5/1/2023 | 90,000 | 89,353 |
New Jersey Housing and Mortgage Finance Agency, NBA-New Brunswick LLC Series C2, Rev., 3.13%, 8/1/2024 (c) | 5,100,000 | 5,068,531 |
New Jersey Housing and Mortgage Finance Agency, Riverside Senior Apartments Project Series 2019D, Rev., 2.03%, 12/1/2022 | 2,035,000 | 2,033,395 |
290 | J.P. Morgan Exchange-Traded Funds | August 31, 2022 |
INVESTMENTS | PRINCIPAL AMOUNT($) | VALUE($) |
Municipal Bonds — continued | ||
New Jersey — continued | ||
New Jersey Housing and Mortgage Finance Agency, Riverside Village Family Apartment Series 2019F, Rev., 1.35%, 12/1/2022 | 130,000 | 129,650 |
New Jersey Infrastructure Bank, Environmental Infrastructure | ||
Series 2020A-R1, Rev., 3.00%, 9/1/2022 | 150,000 | 150,000 |
Series 2012A-R, Rev., 4.00%, 9/1/2022 | 470,000 | 470,000 |
Series 2007A, Rev., 5.00%, 9/1/2022 | 140,000 | 140,000 |
Series 2007-C, Rev., 5.00%, 9/1/2022 | 50,000 | 50,000 |
Series 2014A, Rev., 5.00%, 9/1/2022 | 25,000 | 25,000 |
Series 2015A-1, Rev., 5.00%, 9/1/2022 | 25,000 | 25,000 |
Series 2016A-1, Rev., 5.00%, 9/1/2022 | 80,000 | 80,000 |
Series 2016A2, Rev., 5.00%, 9/1/2022 | 65,000 | 65,000 |
Series 2016A-R1, Rev., 5.00%, 9/1/2022 | 70,000 | 70,000 |
Series 2016A-R2, Rev., 5.00%, 9/1/2022 | 75,000 | 75,000 |
Series 2020A-1, Rev., 5.00%, 9/1/2022 | 40,000 | 40,000 |
Series 2002A, Rev., 5.25%, 9/1/2022 | 50,000 | 50,000 |
Series 2020A-R1, Rev., 3.00%, 9/1/2023 | 40,000 | 40,267 |
Series 2012A-R, Rev., 4.00%, 9/1/2023 | 165,000 | 167,766 |
Series 2007A, Rev., 5.00%, 9/1/2023 | 10,000 | 10,266 |
Rev., 5.00%, 9/1/2024 | 35,000 | 36,788 |
New Jersey Sports and Exposition Authority | ||
Series 2018A, Rev., 5.00%, 9/1/2022 | 70,000 | 70,000 |
Series 2018A, Rev., 5.00%, 9/1/2024 | 190,000 | 197,701 |
New Jersey Transportation Trust Fund Authority, Federal Highway Reimbursement | ||
Series 2016A-1, Rev., 5.00%, 6/15/2023 | 1,000,000 | 1,017,849 |
Series 2018A, Rev., 5.00%, 6/15/2023 | 35,000 | 35,625 |
New Jersey Transportation Trust Fund Authority, Transportation System | ||
Series 2006A, Rev., NATL-RE, 4.25%, 12/15/2022 | 50,000 | 50,196 |
Series 2006A, Rev., 5.25%, 12/15/2022 | 250,000 | 252,067 |
Series 2006A, Rev., AMBAC, 5.25%, 12/15/2022 | 190,000 | 191,279 |
Series 2006A, Rev., AGM - CR, 5.25%, 12/15/2022 | 75,000 | 75,609 |
Series B, Rev., AMBAC, 5.25%, 12/15/2022 | 155,000 | 156,044 |
INVESTMENTS | PRINCIPAL AMOUNT($) | VALUE($) |
New Jersey — continued | ||
Series 2006A, Rev., 5.50%, 12/15/2022 | 90,000 | 90,808 |
Series 2006A, Rev., AGM - CR, 5.50%, 12/15/2022 | 215,000 | 216,898 |
Series 2004A, Rev., NATL-RE, 5.75%, 6/15/2023 | 50,000 | 51,095 |
Series 2008A, Rev., Zero Coupon, 12/15/2023 | 140,000 | 134,495 |
Series 2010D, Rev., 5.00%, 12/15/2023 | 20,000 | 20,550 |
Series 2006A, Rev., 5.50%, 12/15/2023 | 45,000 | 46,520 |
Series 2006C, Rev., AMBAC, Zero Coupon, 12/15/2024 | 2,400,000 | 2,235,525 |
Series 2013AA, Rev., 5.00%, 6/15/2027 | 1,500,000 | 1,525,100 |
New Jersey Turnpike Authority | ||
Series 2012B, Rev., 5.00%, 1/1/2023 (b) | 125,000 | 126,124 |
Series 2013F, Rev., 5.00%, 1/1/2023 (b) | 20,000 | 20,180 |
Series 2014A, Rev., 5.00%, 1/1/2027 | 1,050,000 | 1,095,129 |
Newark Housing Authority Scholarship Foundation A New Jersey Non (The), South Ward Police Facility Rev., AGM, 5.00%, 12/1/2022 | 40,000 | 40,253 |
North Bergen Township Board of Education COP, 4.00%, 12/15/2022 | 75,000 | 75,338 |
Old Bridge Township Municipal Utilities Authority Series 2014C, Rev., 5.00%, 11/1/2022 | 20,000 | 20,088 |
Passaic County Improvement Authority (The), City of Paterson Project Rev., 5.00%, 6/15/2023 | 25,000 | 25,509 |
Passaic County Improvement Authority (The), Preakness Healthcare Center Expansion Project Rev., 2.63%, 5/1/2023 | 100,000 | 100,015 |
Passaic County Utilities Authority, Solid Waste Disposal Rev., 4.50%, 3/1/2024 | 75,000 | 77,288 |
Passaic Valley Sewerage Commission, Sewer System Series G, Rev., 5.75%, 12/1/2022 | 200,000 | 201,585 |
Pequannock Township Board of Education GO, 4.00%, 1/15/2025 | 50,000 | 51,725 |
Pleasantville School District GO, AGM, 2.38%, 2/15/2023 | 25,000 | 24,995 |
Ramsey School District GO, 3.13%, 1/15/2023 | 25,000 | 25,082 |
August 31, 2022 | J.P. Morgan Exchange-Traded Funds | 291 |
AS OF August 31, 2022 (Unaudited) (continued)
INVESTMENTS | PRINCIPAL AMOUNT($) | VALUE($) |
Municipal Bonds — continued | ||
New Jersey — continued | ||
Rancocas Valley Regional High School District GO, 5.00%, 2/1/2023 | 60,000 | 60,645 |
Readington Township Board of Education GO, 5.00%, 7/15/2023 | 25,000 | 25,550 |
Rutgers The State University of New Jersey Series 2016M, Rev., 5.00%, 5/1/2024 | 25,000 | 26,003 |
Somerdale School District GO, 3.38%, 9/1/2022 | 40,000 | 40,000 |
Somerset County Improvement Authority, Bridgewater, Hillsborough and Bernards Property Acquisition Project Rev., 4.00%, 10/1/2022 | 25,000 | 25,036 |
Somerset County Improvement Authority, County Guaranteed Lease, Township of Montgomery Project Rev., 5.00%, 9/1/2022 | 35,000 | 35,000 |
South Brunswick Township Board of Education GO, 5.00%, 8/1/2024 | 45,000 | 46,570 |
South Harrison Township School District GO, 4.00%, 1/15/2023 | 25,000 | 25,149 |
South Jersey Transportation Authority, Transportation System Series 2012A, Rev., 5.00%, 11/1/2022 (b) | 100,000 | 100,434 |
South Orange and Maplewood School District | ||
GO, 2.00%, 11/1/2022 | 125,000 | 124,923 |
GO, 4.00%, 1/15/2023 | 25,000 | 25,157 |
GO, 5.00%, 1/15/2023 | 25,000 | 25,249 |
Southampton School District GO, 2.13%, 9/1/2022 | 50,000 | 50,000 |
State of New Jersey | ||
Series 2016T, GO, 5.00%, 6/1/2023 | 35,000 | 35,622 |
GO, 5.00%, 6/1/2024 | 20,000 | 20,798 |
State of New Jersey, Various Purpose | ||
GO, 5.00%, 6/1/2023 | 360,000 | 366,393 |
GO, 4.00%, 6/1/2026 | 40,000 | 40,373 |
GO, 5.00%, 6/1/2026 | 65,000 | 69,102 |
Tobacco Settlement Financing Corp. | ||
Series 2018A, Rev., 5.00%, 6/1/2023 | 1,865,000 | 1,901,481 |
Series 2018A, Rev., 5.00%, 6/1/2025 | 805,000 | 855,397 |
Town of Hammonton | ||
GO, BAN, 1.00%, 11/3/2022 | 1,705,250 | 1,700,667 |
GO, 4.00%, 3/1/2023 | 30,000 | 30,041 |
Town of Morristown GO, 5.00%, 3/1/2023 | 25,000 | 25,330 |
Town of Westfield, General Improvement GO, 2.00%, 9/15/2022 | 65,000 | 64,994 |
INVESTMENTS | PRINCIPAL AMOUNT($) | VALUE($) |
New Jersey — continued | ||
Township of Aberdeen 1.50%, 10/14/2022 | 10,362,135 | 10,349,357 |
Township of Allamuchy, General Improvement 2.50%, 12/1/2022 | 30,000 | 30,011 |
Township of Alloway 4.00%, 12/1/2022 | 35,000 | 35,134 |
Township of Berlin 5.00%, 1/1/2023 | 20,000 | 20,172 |
Township of Bloomfield Series 2022A, 2.50%, 3/23/2023 | 8,900,000 | 8,906,135 |
Township of Bloomfield, General Improvement 3.00%, 1/15/2023 | 40,000 | 40,096 |
Township of Bloomfield, General Improvement and Water Utility 5.00%, 2/1/2024 | 40,000 | 41,403 |
Township of Bloomfield, Water Improvement Utility 5.00%, 2/1/2023 | 25,000 | 25,271 |
Township of Brick 4.00%, 11/1/2022 | 25,000 | 25,068 |
Township of Bridgewater 4.00%, 9/1/2023 | 25,000 | 25,419 |
Township of Colts Neck 4.00%, 11/15/2025 | 40,000 | 41,899 |
Township of Delran Series A, GO, BAN, 1.50%, 12/7/2022 | 4,102,947 | 4,090,830 |
Township of Dennis GO, BAN, 3.25%, 6/16/2023 | 2,578,444 | 2,581,196 |
Township of East Amwell GO, 4.00%, 2/15/2023 | 25,000 | 25,176 |
Township of East Brunswick GO, 3.00%, 3/15/2023 | 25,000 | 25,102 |
Township of Evesham, General Improvement and Golf Utility GO, 4.00%, 5/1/2023 | 25,000 | 25,270 |
Township of Ewing, General Improvement GO, 2.00%, 3/1/2023 | 100,000 | 99,683 |
Township of Florence GO, 4.00%, 11/1/2022 | 25,000 | 25,064 |
Township of Hardyston GO, 4.00%, 2/1/2023 | 40,000 | 40,283 |
Township of Harrison GO, 4.00%, 8/1/2025 | 50,000 | 51,957 |
Township of Howell Series 2022A, GO, BAN, 2.50%, 3/23/2023 | 13,850,000 | 13,846,495 |
Township of Lakewood, General Improvement GO, 3.00%, 11/1/2022 | 30,000 | 30,036 |
Township of Little Egg Harbor | ||
GO, 3.00%, 11/15/2022 | 25,000 | 25,038 |
Series B, GO, BAN, 4.00%, 1/26/2023 | 9,063,000 | 9,091,684 |
Township of Little Falls, General Improvement | ||
GO, 4.00%, 8/15/2023 | 25,000 | 25,378 |
GO, 4.00%, 8/15/2025 | 30,000 | 31,146 |
292 | J.P. Morgan Exchange-Traded Funds | August 31, 2022 |
INVESTMENTS | PRINCIPAL AMOUNT($) | VALUE($) |
Municipal Bonds — continued | ||
New Jersey — continued | ||
Township of Livingston, Water and Sewer Utility GO, 4.00%, 11/1/2022 | 75,000 | 75,215 |
Township of Lopatcong GO, 4.00%, 9/1/2023 | 30,000 | 30,473 |
Township of Mahwah GO, 4.00%, 12/1/2022 | 70,000 | 70,308 |
Township of Montclair, School Series 2016B, GO, 4.00%, 10/1/2022 | 85,000 | 85,123 |
Township of Montville | ||
GO, 3.00%, 10/1/2022 | 35,000 | 35,022 |
GO, 5.00%, 11/1/2022 | 130,000 | 130,586 |
GO, BAN, 1.50%, 11/10/2022 | 5,750,000 | 5,738,281 |
Township of Moorestown, General Improvement and Water Sewer Utility GO, 5.00%, 2/1/2023 | 25,000 | 25,281 |
Township of Moorestown, Water and Sewer Utility GO, 5.00%, 2/1/2023 | 25,000 | 25,281 |
Township of Nutley GO, 2.25%, 4/15/2023 | 45,000 | 44,949 |
Township of Parsippany-Troy Hills GO, 5.00%, 7/15/2023 | 40,000 | 40,086 |
Township of Parsippany-Troy Hills, Golf Recreation Utility GO, 3.00%, 6/1/2023 | 35,000 | 35,159 |
Township of Pequannock GO, BAN, 4.00%, 7/12/2023 | 3,752,000 | 3,778,906 |
Township of Piscataway GO, 5.00%, 12/1/2022 | 45,000 | 45,302 |
Township of Plainsboro GO, BAN, 1.50%, 11/10/2022 | 8,000,000 | 7,983,390 |
Township of Randolph, Various Purpose GO, 3.00%, 10/15/2022 | 45,000 | 45,041 |
Township of Readington, General Improvement GO, 5.00%, 1/15/2025 | 25,000 | 26,434 |
Township of River Vale | ||
GO, 4.00%, 6/15/2023 | 35,000 | 35,442 |
GO, BAN, 4.00%, 7/14/2023 | 3,158,000 | 3,184,529 |
Township of South Brunswick | ||
GO, 5.00%, 9/1/2022 | 30,000 | 30,000 |
GO, 4.00%, 10/1/2022 | 30,000 | 30,041 |
Township of South Hackensack GO, BAN, 2.00%, 2/16/2023 | 1,332,500 | 1,328,674 |
Township of South Orange Village GO, BAN, 4.00%, 7/5/2023 | 20,868,000 | 21,113,182 |
Township of Stafford | ||
Series 2022A, GO, BAN, 3.00%, 10/25/2022 | 3,220,000 | 3,222,065 |
Series 2014B, GO, 5.00%, 2/1/2023 | 30,000 | 30,330 |
INVESTMENTS | PRINCIPAL AMOUNT($) | VALUE($) |
New Jersey — continued | ||
Township of Toms River GO, 4.00%, 12/1/2022 | 125,000 | 125,500 |
Township of Toms River, General Improvement | ||
GO, 4.00%, 10/15/2022 | 100,000 | 100,195 |
Series 2016A, GO, 5.00%, 11/15/2022 | 40,000 | 40,212 |
Township of Toms River, General Improvement, Golf Utility Improvement Series 2011A, GO, 3.00%, 12/15/2023 | 45,000 | 45,303 |
Township of Union, General Improvement GO, 4.00%, 2/1/2023 | 25,000 | 25,174 |
Township of Upper Freehold GO, BAN, 2.50%, 3/23/2023 | 9,900,000 | 9,898,591 |
Township of Voorhees GO, 1.75%, 9/15/2022 | 25,000 | 24,992 |
Township of Washington GO, 4.00%, 3/1/2025 | 30,000 | 30,993 |
Township of Wayne GO, 4.00%, 11/1/2022 | 50,000 | 50,146 |
Township of West Deptford GO, 3.00%, 9/1/2026 | 100,000 | 100,850 |
Township of West Milford GO, BAN, 1.00%, 9/16/2022 | 245,000 | 244,730 |
Township of West Orange Series 2021A, GO, 2.00%, 11/11/2022 | 1,325,000 | 1,324,303 |
Union County Improvement Authority, College Cranford Facility Rev., 3.00%, 12/1/2022 | 70,000 | 70,123 |
Village of Ridgewood GO, BAN, 1.50%, 1/25/2023 | 34,432,500 | 34,290,063 |
Washington Township Fire District No.1, Gloucester GO, 1.00%, 5/1/2023 | 250,000 | 246,517 |
Washington Township Municipal Utilities Authority Series 2021A, Rev., 4.00%, 2/1/2023 | 25,000 | 25,163 |
West Essex Regional School District GO, 5.00%, 11/1/2022 | 40,000 | 40,182 |
West Windsor-Plainsboro Regional School District GO, 4.00%, 9/15/2022 | 75,000 | 75,048 |
Woodland Park School District GO, 5.00%, 4/15/2023 | 100,000 | 101,591 |
Wyckoff Township School District GO, 3.00%, 4/1/2023 (b) | 25,000 | 25,095 |
Total New Jersey | 290,604,430 | |
New Mexico — 0.0% ^ | ||
Bloomfield School District No. 6 2.00%, 10/1/2022 | 25,000 | 24,990 |
City of Albuquerque Series 2014A, 4.00%, 7/1/2037 (b) | 25,000 | 25,339 |
August 31, 2022 | J.P. Morgan Exchange-Traded Funds | 293 |
AS OF August 31, 2022 (Unaudited) (continued)
INVESTMENTS | PRINCIPAL AMOUNT($) | VALUE($) |
Municipal Bonds — continued | ||
New Mexico — continued | ||
City of Albuquerque, Lodgers Tax and Improvement Series 2014A, 3.50%, 7/1/2032 (b) | 20,000 | 20,184 |
City of Roswell, Joint Water and Sewer Improvement Series B, Rev., 5.00%, 6/1/2023 | 25,000 | 25,485 |
County of Los Alamos, Gross Receipts Tax Rev., 5.00%, 6/1/2023 | 25,000 | 25,474 |
Hobbs School District No. 16 Series 2014B, GO, 5.00%, 9/15/2022 | 150,000 | 150,151 |
New Mexico Finance Authority, Senior Lien Public Project Revolving Fund | ||
Series 2016A, Rev., 5.00%, 6/1/2023 | 25,000 | 25,497 |
Series 2019B, Rev., 5.00%, 6/1/2023 | 35,000 | 35,695 |
Series 2020B, Rev., 5.00%, 6/1/2023 | 25,000 | 25,496 |
Series 2016C, Rev., 5.00%, 6/1/2024 | 25,000 | 26,120 |
New Mexico Finance Authority, Subordinate Lien Public Project Revolving Fund, Tax-Exempt | ||
Series 2017D, Rev., 5.00%, 6/15/2023 | 120,000 | 122,501 |
Series 2019C-1, Rev., 5.00%, 6/15/2023 | 40,000 | 40,834 |
Series 2017B, Rev., 3.50%, 6/15/2024 | 50,000 | 50,984 |
Series 2018C-1, Rev., 4.00%, 6/15/2024 | 30,000 | 30,851 |
New Mexico Municipal Energy Acquisition Authority Series 2019A, Rev., LIQ : Royal Bank of Canada, 4.00%, 11/1/2022 | 50,000 | 50,121 |
State of New Mexico, Capital Projects GO, 5.00%, 3/1/2025 | 55,000 | 58,457 |
State of New Mexico, Severance Tax Permanent Fund | ||
Series 2015B, Rev., 5.00%, 7/1/2023 | 170,000 | 173,551 |
Series 2016D, Rev., 5.00%, 7/1/2023 | 25,000 | 25,522 |
Series 2017A, Rev., 5.00%, 7/1/2023 | 110,000 | 112,298 |
University of New Mexico (The), Subordinate Lien System | ||
Series 2016A, Rev., 5.00%, 6/1/2023 | 40,000 | 40,746 |
Series 2014C, Rev., 5.00%, 6/1/2024 | 25,000 | 26,050 |
Village of Los Lunas Rev., 3.00%, 4/1/2023 | 20,000 | 20,047 |
Total New Mexico | 1,136,393 | |
New York — 20.7% | ||
Albany City School District Series 2022A, 2.50%, 3/24/2023 | 85,135,156 | 85,099,109 |
Amherst Central School District 5.00%, 2/1/2023 | 70,000 | 70,794 |
INVESTMENTS | PRINCIPAL AMOUNT($) | VALUE($) |
New York — continued | ||
Arlington Central School District | ||
Series 2012B, 4.00%, 12/15/2022 | 25,000 | 25,120 |
5.00%, 5/15/2023 | 10,000 | 10,183 |
Baldwinsville Central School District 5.00%, 9/15/2022 | 50,000 | 50,050 |
Battery Park City Authority | ||
Series 2013A, 4.00%, 11/1/2022 | 60,000 | 60,176 |
Series 2013A, 5.00%, 11/1/2022 | 75,000 | 75,342 |
Battery Park City Authority, Tax Exempt Series 2013A, 5.00%, 11/1/2026 | 70,000 | 72,150 |
Bay Shore Union Free School District 5.00%, 1/15/2023 | 15,000 | 15,150 |
Bedford Central School District, Boces Project 3.00%, 11/15/2023 | 25,000 | 25,034 |
Berlin Central School District 4.00%, 6/28/2023 | 8,635,000 | 8,642,614 |
Bethlehem Central School District 5.00%, 6/15/2023 | 20,000 | 20,423 |
Brentwood Union Free School District 4.50%, 11/15/2022 | 25,000 | 25,116 |
Broome County Local Development Corp., Good Shepherd Village at Endwell, Inc. | ||
3.00%, 7/1/2023 | 255,000 | 252,990 |
3.00%, 7/1/2024 | 610,000 | 598,051 |
3.50%, 7/1/2025 | 455,000 | 445,733 |
Brunswick Central School District 4.00%, 6/29/2023 | 7,500,000 | 7,547,418 |
Buffalo Municipal Water Finance Authority Series 2021A, AGM, 4.00%, 7/1/2023 | 125,000 | 126,611 |
Central Square Central School District 4.00%, 6/15/2023 | 25,000 | 25,330 |
City of Beacon, Public Improvement Series 2018A, 3.00%, 5/15/2023 | 30,000 | 30,130 |
City of Buffalo Series 2012D, AGM, 2.25%, 12/1/2022 | 25,000 | 25,003 |
City of Buffalo, General Improvement 5.00%, 4/1/2023 | 50,000 | 50,754 |
City of Ithaca GO, BAN, 2.00%, 2/17/2023 | 7,745,493 | 7,733,334 |
City of Ithaca, Public Improvement GO, 4.00%, 1/15/2023 | 25,000 | 25,158 |
City of New Rochelle GO, 5.00%, 2/15/2023 | 35,000 | 35,435 |
City of New York | ||
Subseries A-1, GO, 5.00%, 10/1/2022 (b) | 275,000 | 275,616 |
Series B, GO, 5.00%, 8/1/2023 | 50,000 | 50,106 |
Series C, GO, 5.00%, 8/1/2023 | 25,000 | 25,053 |
294 | J.P. Morgan Exchange-Traded Funds | August 31, 2022 |
INVESTMENTS | PRINCIPAL AMOUNT($) | VALUE($) |
Municipal Bonds — continued | ||
New York — continued | ||
Series D, GO, 5.00%, 8/1/2023 | 435,000 | 439,780 |
Series E, GO, 5.00%, 8/1/2023 | 65,000 | 65,714 |
Series 2013-I, GO, 5.00%, 8/1/2024 | 30,000 | 30,710 |
Series 2013J, GO, 5.00%, 8/1/2024 | 345,000 | 353,171 |
Series B, GO, 5.00%, 8/1/2024 | 230,000 | 230,479 |
Series D, GO, 5.00%, 8/1/2024 | 30,000 | 30,323 |
Series E, GO, 5.00%, 8/1/2024 | 160,000 | 161,723 |
Series G, GO, 5.00%, 8/1/2024 | 35,000 | 36,275 |
Series I, GO, 5.00%, 8/1/2024 | 280,000 | 280,583 |
Subseries F-1, GO, 5.00%, 3/1/2025 | 110,000 | 111,413 |
Series 2004A-6, GO, 5.00%, 8/1/2025 | 40,000 | 40,429 |
Series 2013J, GO, 5.00%, 8/1/2025 | 130,000 | 132,987 |
Series B, GO, 5.00%, 8/1/2025 | 190,000 | 190,440 |
Series C, GO, 5.00%, 8/1/2025 | 105,000 | 105,244 |
Series E, GO, 5.00%, 8/1/2025 | 85,000 | 85,911 |
Series J, GO, 5.00%, 8/1/2025 | 30,000 | 31,402 |
Series F, Subseries F-1, GO, 5.00%, 3/1/2026 | 155,000 | 156,983 |
Series D, GO, 5.00%, 8/1/2026 | 40,000 | 40,427 |
City of New York, Fiscal Year 2006 Series I, Subseries I-4, GO, VRDO, LOC : TD Bank NA, 1.03%, 9/1/2022 (c) | 30,000,000 | 30,000,000 |
City of New York, Fiscal Year 2012 Series 2012-I, GO, 5.00%, 8/1/2023 | 615,000 | 616,306 |
City of New York, Fiscal Year 2012, Tax-Exempt Series I, GO, 5.00%, 8/1/2025 | 185,000 | 185,429 |
City of New York, Fiscal Year 2013 Series 2013E, GO, 4.50%, 8/1/2023 | 55,000 | 55,492 |
City of New York, Fiscal Year 2013, Tax-Exempt | ||
Series F, Subseries F-1, GO, 5.00%, 3/1/2024 | 170,000 | 172,219 |
Series H, GO, 5.00%, 8/1/2025 | 50,000 | 51,149 |
City of New York, Fiscal Year 2014 | ||
Series I, Subseries 2014I-1, GO, 5.00%, 3/1/2023 (b) | 5,000 | 5,066 |
Series 2014I-1, GO, 5.00%, 3/1/2024 | 75,000 | 77,903 |
Series 2014E, GO, 5.00%, 8/1/2024 | 35,000 | 35,829 |
Series D, Subseries D-1, GO, 5.00%, 8/1/2025 | 225,000 | 230,170 |
City of New York, Fiscal Year 2015 | ||
Series 1, GO, 5.00%, 8/1/2023 | 240,000 | 245,778 |
Series 2012I, GO, 5.00%, 8/1/2025 | 85,000 | 86,953 |
Series 2015A, GO, 5.00%, 8/1/2025 | 110,000 | 115,142 |
Series 2015A, GO, 5.00%, 8/1/2026 | 30,000 | 31,397 |
INVESTMENTS | PRINCIPAL AMOUNT($) | VALUE($) |
New York — continued | ||
City of New York, Fiscal Year 2016 Series E, GO, 5.00%, 8/1/2024 | 90,000 | 94,414 |
City of New York, Fiscal Year 2017 | ||
Series 2017B-1, GO, 5.00%, 12/1/2022 | 145,000 | 145,978 |
Series C, GO, 5.00%, 8/1/2025 | 40,000 | 42,832 |
City of New York, Fiscal Year 2018 | ||
Series 2018D, GO, 5.00%, 8/1/2023 | 800,000 | 819,261 |
Series 2018F-1, GO, 4.00%, 4/1/2025 | 30,000 | 31,143 |
City of New York, Fiscal Year 2019 Series D, Subseries D-4, GO, VRDO, LIQ : Barclays Bank plc, 1.08%, 9/1/2022 (c) | 5,000,000 | 5,000,000 |
City of New York, Tax-Exempt | ||
Subseries A-1, GO, 4.00%, 10/1/2022 (b) | 60,000 | 60,081 |
Series A-1, GO, 5.00%, 10/1/2022 (b) | 200,000 | 200,448 |
Subseries A-1, GO, 5.00%, 10/1/2022 (b) | 50,000 | 50,112 |
Subseries A-1, GO, 5.00%, 8/1/2024 | 25,000 | 25,592 |
Subseries A-1, GO, 5.00%, 10/1/2024 | 70,000 | 70,163 |
Series 2015C, GO, 5.00%, 8/1/2025 | 30,000 | 31,767 |
Series A, Subseries A-6, GO, 5.00%, 8/1/2025 | 60,000 | 62,104 |
Series A, Subseries A-1, GO, 5.25%, 8/1/2025 | 60,000 | 61,513 |
City of Rochester Series 2018-1, GO, 4.00%, 2/15/2023 | 215,000 | 216,584 |
City of Syracuse, Public Improvement | ||
Series 2015B, GO, 4.00%, 11/1/2022 | 45,000 | 45,128 |
Series 2019A, GO, 4.00%, 5/15/2023 | 20,000 | 20,233 |
City of White Plains, Public Improvement Series 2020B, GO, 5.00%, 9/15/2022 | 45,000 | 45,043 |
City of Yonkers | ||
Series 2017A, GO, 5.00%, 9/1/2022 | 25,000 | 25,000 |
Series 2017C, GO, 5.00%, 10/1/2022 | 65,000 | 65,141 |
Series 2014D, GO, AGM, 3.00%, 10/15/2022 | 150,000 | 150,120 |
Clarkstown Central School District 2.00%, 11/15/2022 | 40,000 | 39,976 |
Commack Union Free School District 4.00%, 11/15/2022 | 175,000 | 175,597 |
Cooperstown Central School District 4.00%, 6/28/2023 | 5,204,000 | 5,241,470 |
Corning City School District Series A, 4.00%, 6/26/2023 | 5,119,500 | 5,173,178 |
County of Albany | ||
5.00%, 9/15/2022 | 250,000 | 250,246 |
Series 2020A, 5.00%, 9/15/2022 | 50,000 | 50,049 |
August 31, 2022 | J.P. Morgan Exchange-Traded Funds | 295 |
AS OF August 31, 2022 (Unaudited) (continued)
INVESTMENTS | PRINCIPAL AMOUNT($) | VALUE($) |
Municipal Bonds — continued | ||
New York — continued | ||
County of Albany, Various Purpose Series 2019A, 5.00%, 9/15/2022 | 20,000 | 20,020 |
County of Chemung, Public Improvement 3.00%, 12/15/2022 | 40,000 | 40,072 |
County of Erie, Public Improvement Series A, GO, 5.00%, 9/15/2022 | 75,000 | 75,075 |
County of Livingston, Public Improvement GO, 4.00%, 2/1/2024 | 35,000 | 35,803 |
County of Nassau, General Improvement | ||
Series 2016B, GO, 5.00%, 10/1/2022 | 215,000 | 215,450 |
Series C, GO, 5.00%, 10/1/2022 | 1,065,000 | 1,067,227 |
Series 2016A, GO, 5.00%, 1/1/2025 | 50,000 | 52,730 |
County of Onondaga | ||
GO, 5.00%, 2/1/2023 | 25,000 | 25,285 |
GO, 5.00%, 3/15/2023 | 25,000 | 25,367 |
County of Orange, Various Purpose Series 2015A, GO, AGM, 5.00%, 3/1/2023 | 70,000 | 70,951 |
County of Putnam, Public Improvement GO, 4.00%, 1/15/2023 | 20,000 | 20,124 |
County of Rensselaer, Public Improvement GO, 5.00%, 9/1/2022 | 50,000 | 50,000 |
County of Rockland, Various Purpose GO, AGM, 2.75%, 12/1/2022 | 25,000 | 25,033 |
County of Schoharie, Public Improvement GO, 3.00%, 11/1/2022 | 20,000 | 20,025 |
County of Suffolk | ||
Series 2015B, GO, AGM, 5.00%, 10/1/2022 | 20,000 | 20,041 |
Series 2017D, GO, 4.00%, 10/15/2022 | 100,000 | 100,184 |
Series B, GO, AGM, 4.00%, 10/15/2022 | 625,000 | 626,151 |
County of Ulster, Public Improvement GO, 4.50%, 11/15/2022 | 50,000 | 50,231 |
County of Westchester | ||
Series 2012A, GO, 4.00%, 10/15/2022 | 25,000 | 25,054 |
Series 2020A, GO, 5.00%, 10/15/2022 | 25,000 | 25,083 |
Series 2018A, GO, 5.00%, 12/1/2022 | 90,000 | 90,616 |
Series 2012B, GO, 2.00%, 7/1/2023 | 35,000 | 34,937 |
Dunkirk City School District GO, BAN, 4.00%, 6/28/2023 | 7,200,000 | 7,251,842 |
Dutchess County Local Development Corp., Nuvance Health Issue Series 2019B, Rev., 5.00%, 7/1/2023 | 525,000 | 532,791 |
East Aurora Union Free School District GO, AGM, 5.00%, 6/15/2023 | 45,000 | 45,920 |
East Greenbush Central School District Series 2019A, GO, 5.00%, 12/15/2022 | 30,000 | 30,237 |
INVESTMENTS | PRINCIPAL AMOUNT($) | VALUE($) |
New York — continued | ||
Erie County Fiscal Stability Authority, Sales Tax and State Aid Secured | ||
Rev., 5.00%, 9/1/2022 | 75,000 | 75,000 |
Series 2017D, Rev., 5.00%, 9/1/2022 | 85,000 | 85,000 |
Erie County Industrial Development Agency (The), City School District of the City of Buffalo Project | ||
Rev., 5.00%, 5/1/2023 | 25,000 | 25,432 |
Series 2013A, Rev., 5.00%, 5/1/2026 | 195,000 | 198,251 |
Series 2013A, Rev., 5.00%, 5/1/2027 | 75,000 | 76,250 |
Erie County Water Authority Rev., 5.00%, 12/1/2022 | 245,000 | 246,677 |
Fairport Central School District GO, 4.00%, 6/15/2023 | 20,000 | 20,265 |
Freeport Union Free School District GO, 5.00%, 12/1/2022 | 50,000 | 50,342 |
Goshen Central School District GO, 2.00%, 12/1/2022 | 35,000 | 34,974 |
Grand Island Central School District GO, 5.00%, 12/1/2022 | 135,000 | 135,914 |
Greece Central School District Series B, GO, 5.00%, 12/15/2022 | 25,000 | 25,193 |
Greene Central School District Series B, GO, BAN, 4.00%, 6/29/2023 | 11,678,000 | 11,798,658 |
Greenport Union Free School District GO, BAN, 3.50%, 6/23/2023 | 2,880,000 | 2,888,095 |
Haverstraw-Stony Point Central School District GO, 5.00%, 10/15/2022 | 300,000 | 300,983 |
Hempstead Town Local Development Corp., Adelphi University Project Rev., 5.00%, 10/1/2022 | 40,000 | 40,080 |
Hewlett-Woodmere Union Free School District GO, 5.00%, 11/1/2022 | 30,000 | 30,137 |
Hudson Yards Infrastructure Corp., Second Indenture | ||
Series 2017A, Rev., 4.00%, 2/15/2023 | 45,000 | 45,338 |
Series 2017A, Rev., 5.00%, 2/15/2023 | 565,000 | 571,768 |
Series 2017A, Rev., 5.00%, 2/15/2025 | 20,000 | 21,186 |
Iroquois Central School District GO, 5.00%, 6/15/2025 | 25,000 | 26,564 |
Island Trees Union Free School District GO, 4.00%, 8/1/2023 | 25,000 | 25,034 |
Lakeland Central School District GO, 5.00%, 11/15/2022 | 60,000 | 60,337 |
Long Island Power Authority, Electric System | ||
Rev., 5.00%, 9/1/2022 (b) | 150,000 | 150,000 |
296 | J.P. Morgan Exchange-Traded Funds | August 31, 2022 |
INVESTMENTS | PRINCIPAL AMOUNT($) | VALUE($) |
Municipal Bonds — continued | ||
New York — continued | ||
Series 2015B, Rev., 5.00%, 9/1/2022 (b) | 85,000 | 85,000 |
Series 2016B, Rev., 5.00%, 9/1/2022 (b) | 30,000 | 30,000 |
Series 2016B, Rev., 5.00%, 9/1/2022 | 70,000 | 70,000 |
Series B, Rev., 5.00%, 9/1/2022 | 905,000 | 905,000 |
Series 2016B, Rev., 5.00%, 9/1/2023 | 220,000 | 225,845 |
Series 2020B, Rev., 0.85%, 9/1/2025 (c) | 125,000 | 113,595 |
Rev., 1.00%, 9/1/2025 | 315,000 | 293,362 |
Series B, Rev., 5.00%, 9/1/2026 | 245,000 | 245,555 |
Longwood Central School District Suffolk County GO, 5.00%, 6/1/2023 | 20,000 | 20,403 |
Massapequa Union Free School District GO, 5.00%, 10/1/2022 | 20,000 | 20,045 |
Metropolitan Transportation Authority | ||
Series 2019D-1, Rev., BAN, 5.00%, 9/1/2022 | 2,605,000 | 2,605,000 |
Series 2002D-1, Rev., AGM, 4.00%, 11/1/2022 | 40,000 | 40,115 |
Series 2002D-1, Rev., 5.00%, 11/1/2022 | 330,000 | 331,448 |
Series 2012B, Rev., 4.00%, 11/15/2022 (b) | 95,000 | 95,331 |
Series 2012F, Rev., 4.00%, 11/15/2022 | 100,000 | 100,347 |
Series 2008B-2, Rev., 5.00%, 11/15/2022 | 440,000 | 442,387 |
Series 2008B-4, Rev., 5.00%, 11/15/2022 | 30,000 | 30,166 |
Series 2012B, Rev., 5.00%, 11/15/2022 | 25,000 | 25,136 |
Series 2012B, Rev., 5.00%, 11/15/2022 (b) | 40,000 | 40,225 |
Series 2012B, Rev., AGM - CR, 5.00%, 11/15/2022 (b) | 50,000 | 50,281 |
Series 2012C, Rev., 5.00%, 11/15/2022 (b) | 330,000 | 331,793 |
Series 2012C, Rev., 5.00%, 11/15/2022 | 120,000 | 120,651 |
Series 2012E, Rev., 5.00%, 11/15/2022 | 130,000 | 130,705 |
Series 2012E, Rev., 5.00%, 11/15/2022 (b) | 855,000 | 859,715 |
Series 2012F, Rev., 5.00%, 11/15/2022 | 7,935,000 | 7,979,429 |
Series 2013A, Rev., 5.00%, 11/15/2022 | 250,000 | 251,356 |
Series 2013B, Rev., 5.00%, 11/15/2022 | 65,000 | 65,353 |
INVESTMENTS | PRINCIPAL AMOUNT($) | VALUE($) |
New York — continued | ||
Series 2013C, Rev., 5.00%, 11/15/2022 | 55,000 | 55,298 |
Series 2015A, Subseries 2015A-1, Rev., 5.00%, 11/15/2022 | 500,000 | 502,712 |
Series 2015F, Rev., 5.00%, 11/15/2022 | 120,000 | 120,651 |
Series 2016B, Rev., 5.00%, 11/15/2022 | 35,000 | 35,190 |
Series 2016D, Rev., 5.00%, 11/15/2022 | 60,000 | 60,325 |
Series 2017B, Rev., 5.00%, 11/15/2022 | 250,000 | 251,356 |
Series 2019F, Rev., BAN, 5.00%, 11/15/2022 | 1,000,000 | 1,003,972 |
Series A2, Rev., 5.00%, 11/15/2022 | 65,000 | 65,353 |
Series A-2, Rev., 5.00%, 11/15/2022 | 220,000 | 221,193 |
Subseries B-1, Rev., 5.00%, 11/15/2022 | 120,000 | 120,663 |
Subseries B-2, Rev., 5.00%, 11/15/2022 (b) | 20,000 | 20,112 |
Series 2020A-1, Rev., BAN, 5.00%, 2/1/2023 | 1,365,000 | 1,375,787 |
Series 2013A, Rev., 5.00%, 5/15/2023 (b) | 60,000 | 61,071 |
Series 2013A, Rev., AGM - CR, 5.00%, 5/15/2023 (b) | 30,000 | 30,536 |
Series 2002D-1, Rev., 5.00%, 11/1/2023 | 125,000 | 125,528 |
Series 2012F, Rev., 5.00%, 11/15/2023 | 235,000 | 236,226 |
Series 2014C, Rev., 5.00%, 11/15/2023 | 240,000 | 247,098 |
Series 2017B, Rev., 5.00%, 11/15/2023 | 175,000 | 180,186 |
Series A-1, Rev., 5.00%, 11/15/2023 | 35,000 | 36,035 |
Series 2012F, Rev., 5.00%, 11/15/2024 | 295,000 | 296,394 |
Series 2017B, Rev., 5.00%, 11/15/2024 | 250,000 | 261,168 |
Series 2012D, Rev., 5.00%, 11/15/2025 | 140,000 | 140,657 |
Metropolitan Transportation Authority, Dedicated Tax Fund | ||
Series 2002B-1, Rev., 3.00%, 11/1/2022 | 40,000 | 40,054 |
Series 2012A, Rev., 4.00%, 11/15/2022 | 65,000 | 65,230 |
Series B-1, Rev., 4.00%, 11/15/2022 | 305,000 | 306,081 |
Series 2012A, Rev., 5.00%, 11/15/2022 | 150,000 | 150,829 |
August 31, 2022 | J.P. Morgan Exchange-Traded Funds | 297 |
AS OF August 31, 2022 (Unaudited) (continued)
INVESTMENTS | PRINCIPAL AMOUNT($) | VALUE($) |
Municipal Bonds — continued | ||
New York — continued | ||
Series 2017A, Rev., 5.00%, 11/15/2022 | 105,000 | 105,580 |
Series B-2, Rev., 5.00%, 11/15/2022 | 180,000 | 180,995 |
Subseries B-1, Rev., 5.00%, 11/15/2022 | 130,000 | 130,719 |
Series 2012A, Rev., 5.00%, 11/15/2023 | 1,065,000 | 1,070,558 |
Series 2016A, Rev., 5.00%, 11/15/2023 | 100,000 | 103,183 |
Series 2017A, Rev., 5.00%, 11/15/2023 | 10,000 | 10,318 |
Series 2012A, Rev., 5.00%, 11/15/2024 | 675,000 | 678,426 |
Series 2013B-1, Rev., 5.00%, 11/15/2024 | 125,000 | 128,479 |
Series 2012A, Rev., 5.00%, 11/15/2025 | 1,640,000 | 1,648,526 |
Series 2012A, Rev., 5.00%, 11/15/2026 | 380,000 | 381,975 |
Series 2012A, Rev., 5.00%, 11/15/2027 | 25,000 | 25,130 |
Middletown City School District GO, 5.00%, 9/15/2022 | 25,000 | 25,025 |
Monroe County Industrial Development Corp., Rochester General Hospital Series 2013B, Rev., 4.00%, 12/1/2022 | 30,000 | 30,104 |
Monroe County Industrial Development Corp., University of Rochester Project Series 2013A, Rev., 5.00%, 7/1/2023 (b) | 20,000 | 20,443 |
Moravia Central School District GO, AGM, 2.50%, 6/15/2023 | 200,000 | 200,081 |
Moriah Central School District GO, BAN, 3.75%, 7/13/2023 | 14,750,000 | 14,854,964 |
Mount Vernon City School District | ||
GO, 4.00%, 9/15/2022 | 25,000 | 25,016 |
GO, 5.00%, 12/1/2022 | 55,000 | 55,345 |
GO, 5.00%, 9/15/2023 | 25,000 | 25,663 |
Nassau County Interim Finance Authority, Sales Tax | ||
Series 2012A, Rev., 4.00%, 11/15/2022 (b) | 185,000 | 185,638 |
Series 2012A, Rev., 5.00%, 11/15/2022 (b) | 145,000 | 145,815 |
New Rochelle City School District GO, 5.00%, 9/1/2022 | 200,000 | 200,000 |
INVESTMENTS | PRINCIPAL AMOUNT($) | VALUE($) |
New York — continued | ||
New York City Health and Hospitals Corp., Health System | ||
Series 2008C, Rev., VRDO, LOC : TD Bank NA, 1.49%, 9/12/2022 (c) | 25,000,000 | 25,000,000 |
Series 2013A, Rev., 5.00%, 2/15/2023 | 465,000 | 470,169 |
New York City Industrial Development Agency, Queens Baseball Stadium Project Series 2021A, Rev., AGM, 5.00%, 1/1/2028 | 1,250,000 | 1,363,760 |
New York City Municipal Water Finance Authority Series 2009BB-1, Rev., VRDO, LIQ : UBS AG, 1.08%, 9/1/2022 (c) | 4,485,000 | 4,485,000 |
New York City Municipal Water Finance Authority, Water And Sewer System Series BB-1B, Rev., VRDO, LIQ : State Street Bank & Trust, 1.01%, 9/1/2022 (c) | 12,000,000 | 12,000,000 |
New York City Transitional Finance Authority Future Tax Secured Series B, Subseries B-1, Rev., 5.00%, 8/1/2024 | 25,000 | 26,250 |
New York City Transitional Finance Authority, Building Aid, Fiscal Year 2016 Series 2016S-1, Rev., 5.00%, 7/15/2023 (b) | 45,000 | 46,043 |
New York City Transitional Finance Authority, Future Tax Secured | ||
Series B, Rev., 5.00%, 11/1/2022 | 30,000 | 30,134 |
Series 2013 I, Rev., 5.00%, 5/1/2023 | 45,000 | 45,822 |
Subseries F-1, Rev., 5.00%, 2/1/2024 | 20,000 | 20,224 |
New York City Transitional Finance Authority, Future Tax Secured, Fiscal Year 2003 | ||
Series 21-B, Rev., 4.00%, 11/1/2022 | 25,000 | 25,075 |
Subseries 13, Rev., 5.00%, 11/1/2022 | 115,000 | 115,533 |
New York City Transitional Finance Authority, Future Tax Secured, Fiscal Year 2011 Subseries A-4, Rev., VRDO, LIQ : Barclays Bank plc, 1.08%, 9/1/2022 (c) | 50,000,000 | 50,000,000 |
New York City Transitional Finance Authority, Future Tax Secured, Fiscal Year 2013 | ||
Series A, Rev., 5.00%, 10/7/2022 | 205,000 | 205,544 |
Series B, Rev., 2.00%, 11/1/2022 | 25,000 | 24,992 |
Series B, Rev., 3.00%, 11/1/2022 | 75,000 | 75,087 |
Series E, Rev., 4.00%, 11/1/2022 | 155,000 | 155,424 |
Series 2013D, Rev., 5.00%, 11/1/2022 | 120,000 | 120,557 |
Series 2013E, Rev., 5.00%, 11/1/2022 | 95,000 | 95,441 |
Series 2013G, Rev., 5.00%, 11/1/2022 | 30,000 | 30,139 |
298 | J.P. Morgan Exchange-Traded Funds | August 31, 2022 |
INVESTMENTS | PRINCIPAL AMOUNT($) | VALUE($) |
Municipal Bonds — continued | ||
New York — continued | ||
Series B, Rev., 5.00%, 11/1/2022 | 40,000 | 40,178 |
Series D, Rev., 2.00%, 11/1/2024 | 40,000 | 39,297 |
Series H, Rev., 5.00%, 11/1/2024 | 185,000 | 188,245 |
Series I, Rev., 3.00%, 5/1/2025 | 50,000 | 50,099 |
Series I, Rev., 5.00%, 5/1/2027 | 55,000 | 55,891 |
New York City Transitional Finance Authority, Future Tax Secured, Fiscal Year 2014 | ||
Series 2014A-1, Rev., 5.00%, 11/1/2022 | 175,000 | 175,812 |
Series 2014B-1, Rev., 5.00%, 11/1/2024 | 25,000 | 26,032 |
Subseries C, Rev., 5.00%, 11/1/2026 | 20,000 | 20,816 |
New York City Transitional Finance Authority, Future Tax Secured, Fiscal Year 2015 | ||
Series 2015C, Rev., 4.00%, 11/1/2022 | 185,000 | 185,558 |
Series C, Rev., 5.00%, 11/1/2022 | 320,000 | 321,484 |
Series B, Subseries B-1, Rev., 3.00%, 8/1/2023 | 15,000 | 15,102 |
New York City Transitional Finance Authority, Future Tax Secured, Fiscal Year 2016 Series 2016A-1, Rev., 4.00%, 8/1/2023 | 25,000 | 25,395 |
New York City Transitional Finance Authority, Future Tax Secured, Fiscal Year 2017 Series 2017F-1, Rev., 5.00%, 5/1/2024 | 25,000 | 26,090 |
New York City Transitional Finance Authority, Future Tax Secured, Fiscal Year 2018 | ||
Series 2018-1, Rev., 5.00%, 11/1/2022 | 130,000 | 130,603 |
Series 2018-A-1, Rev., 5.00%, 8/1/2023 | 10,000 | 10,248 |
Series B, Subseries B-1, Rev., 5.00%, 8/1/2024 (b) | 30,000 | 31,420 |
Series B, Subseries B-1, Rev., 5.00%, 8/1/2024 | 10,000 | 10,500 |
New York City Transitional Finance Authority, Future Tax Secured, Fiscal Year 2019 Series 2019C-1, Rev., 5.00%, 11/1/2022 | 20,000 | 20,093 |
New York City Transitional Finance Authority, Future Tax Secured, Fiscal Year 2020 Series 2020A, Rev., 5.00%, 5/1/2023 | 20,000 | 20,365 |
INVESTMENTS | PRINCIPAL AMOUNT($) | VALUE($) |
New York — continued | ||
New York City Transitional Finance Authority, Future Tax Secured, Fiscal Year 2021 | ||
Series 2021A, Rev., 3.00%, 11/1/2022 | 620,000 | 620,865 |
Subseries E-1, Rev., 5.00%, 2/1/2023 | 20,000 | 20,230 |
Series 2021C, Subseries C-1, Rev., 5.00%, 5/1/2024 | 25,000 | 26,090 |
Series 2021-1, Rev., 5.00%, 11/1/2025 | 40,000 | 43,024 |
New York City Transitional Finance Authority, Future Tax Secured, Fiscal Year 2022 Series 2022B, Rev., 5.00%, 8/1/2024 | 530,000 | 556,503 |
New York City Transitional Finance Authority, Future Tax Secured, Tax-Exempt | ||
Series 2013B, Rev., 5.00%, 11/1/2022 | 190,000 | 190,881 |
Series F-1, Rev., 5.00%, 2/1/2023 | 390,000 | 394,341 |
Subseries F-1, Rev., 5.00%, 2/1/2025 | 520,000 | 525,701 |
Subseries F-1, Rev., 5.00%, 2/1/2026 | 100,000 | 101,046 |
New York City Transitional Finance Authority, Future Tax Secured, Tax-Exempt, Fiscal Year 2013 | ||
Series 2013G, Rev., 4.00%, 11/1/2022 | 25,000 | 25,075 |
Series B, Rev., 5.00%, 11/1/2022 | 160,000 | 160,713 |
Series D, Rev., 5.00%, 11/1/2022 | 25,000 | 25,111 |
Series 2013H, Rev., 5.00%, 11/1/2023 | 70,000 | 71,256 |
Series 2013C, Subseries C-1, Rev., 5.00%, 11/1/2025 | 405,000 | 406,804 |
Subseries C-1, Rev., 5.00%, 11/1/2026 | 175,000 | 175,779 |
New York City Transitional Finance Authority, Future Tax Secured, Tax-Exempt, Fiscal Year 2016 | ||
Series 2016C, Rev., 5.00%, 11/1/2022 | 70,000 | 70,325 |
Subseries E-1, Rev., 5.00%, 2/1/2025 | 125,000 | 132,301 |
New York City Transitional Finance Authority, Future Tax Secured, Tax-Exempt, Fiscal Year 2017 Series C, Rev., 5.00%, 11/1/2022 | 80,000 | 80,371 |
New York City Transitional Finance Authority, Future Tax Secured, Tax-Exempt, Fiscal Year 2022 Series A, Subseries A-1, Rev., 5.00%, 11/1/2022 | 300,000 | 301,391 |
New York City Water and Sewer System, Fiscal Year 2012 Subseries 2012A-1, Rev., VRDO, LIQ : Mizuho Bank Ltd., 0.98%, 9/1/2022 (c) | 5,200,000 | 5,200,000 |
August 31, 2022 | J.P. Morgan Exchange-Traded Funds | 299 |
AS OF August 31, 2022 (Unaudited) (continued)
INVESTMENTS | PRINCIPAL AMOUNT($) | VALUE($) |
Municipal Bonds — continued | ||
New York — continued | ||
New York City Water and Sewer System, Second General Resolution, Fiscal Year 2018 Series 2018CC-2, Rev., 5.00%, 6/15/2024 | 310,000 | 312,647 |
New York City Water and Sewer System, Second General Resolution, Fiscal Year 2019 | ||
Rev., VRDO, LIQ : TD Bank NA, 1.46%, 9/12/2022 (c) | 50,000,000 | 50,000,000 |
Series 2019DD-2, Rev., 5.00%, 6/15/2024 | 90,000 | 90,769 |
Series 2019DD-2, Rev., 5.00%, 6/15/2025 | 25,000 | 25,826 |
New York City Water and Sewer System, Second General Resolution, Fiscal Year 2020 Series CC, Rev., 4.00%, 6/15/2023 (b) | 35,000 | 35,465 |
New York Convention Center Development Corp., Hotel Unit Fee Secured Rev., 5.00%, 11/15/2022 | 150,000 | 150,797 |
New York Convention Center Development Corp., Subordinate Lien, Hotel Unit Fee Secured Series 2016B, Rev., 5.00%, 11/15/2022 | 80,000 | 80,374 |
New York Municipal Bond Bank Agency, Prior Year Claims | ||
Series 2012A, Rev., 4.00%, 12/1/2022 | 175,000 | 175,770 |
Series 2012A, Rev., 5.00%, 12/1/2022 | 85,000 | 85,582 |
New York Power Authority Series 2011A, Rev., 5.00%, 11/15/2022 (b) | 175,000 | 175,983 |
New York State Dormitory Authority, Barnard College Series 2020A, Rev., 4.00%, 7/1/2023 | 30,000 | 30,362 |
New York State Dormitory Authority, Columbia University Series B, Rev., 5.00%, 10/1/2022 | 70,000 | 70,157 |
New York State Dormitory Authority, Great Neck Library Series 2014, Rev., 3.00%, 5/1/2023 | 50,000 | 50,246 |
New York State Dormitory Authority, Hospitals Center, Langone Hospitals Obligated Group | ||
Rev., 5.00%, 7/1/2023 | 150,000 | 153,033 |
Rev., 5.00%, 7/1/2026 | 465,000 | 484,263 |
New York State Dormitory Authority, Icahn School of Medicine at Mount Sinai | ||
Rev., 5.00%, 7/1/2023 | 350,000 | 357,107 |
Series 2015A, Rev., 5.00%, 7/1/2025 | 35,000 | 36,987 |
INVESTMENTS | PRINCIPAL AMOUNT($) | VALUE($) |
New York — continued | ||
New York State Dormitory Authority, Municipal Health Facilities Improvement Program Series 1, Rev., 5.00%, 1/15/2027 | 75,000 | 82,519 |
New York State Dormitory Authority, North Shore-Long Island Jewish Obligated Group | ||
Series 2015A, Rev., 5.00%, 5/1/2023 | 1,035,000 | 1,050,880 |
Rev., 5.00%, 5/1/2025 | 300,000 | 317,027 |
New York State Dormitory Authority, Northwell Health Obligated Group Series 2019B2, Rev., 5.00%, 5/1/2024 (c) | 240,000 | 245,585 |
New York State Dormitory Authority, Onondaga-Cortland-Madison Board of Cooperative Educational Services Rev., 5.00%, 8/15/2023 | 25,000 | 25,600 |
New York State Dormitory Authority, School Districts Financing Program | ||
Rev., 4.00%, 10/1/2022 | 125,000 | 125,171 |
Series 2017G, Rev., 4.00%, 10/1/2022 | 45,000 | 45,062 |
Series 2018C, Rev., 4.00%, 10/1/2022 | 45,000 | 45,064 |
Series 2019C, Rev., 4.00%, 10/1/2022 | 100,000 | 100,133 |
Series 2019D, Rev., 4.00%, 10/1/2022 | 165,000 | 165,234 |
Series 2021A, Rev., 4.00%, 10/1/2022 | 210,000 | 210,289 |
Series A, Rev., 4.00%, 10/1/2022 | 75,000 | 75,109 |
Series C, Rev., 4.00%, 10/1/2022 | 45,000 | 45,065 |
Series 2013A, Rev., AGM, 5.00%, 10/1/2022 | 100,000 | 100,216 |
Series 2013C, Rev., 5.00%, 10/1/2022 | 50,000 | 50,112 |
Series 2013E, Rev., AGM, 5.00%, 10/1/2022 | 25,000 | 25,054 |
Series 2014A, Rev., AGM, 5.00%, 10/1/2022 | 250,000 | 250,543 |
Series 2014E, Rev., AGM, 5.00%, 10/1/2022 | 50,000 | 50,108 |
Series 2015B, Rev., AGM, 5.00%, 10/1/2022 | 65,000 | 65,138 |
Series 2015D, Rev., 5.00%, 10/1/2022 | 35,000 | 35,069 |
Series 2017C, Rev., 5.00%, 10/1/2022 | 50,000 | 50,112 |
Series 2017G, Rev., 5.00%, 10/1/2022 | 35,000 | 35,076 |
Series 2018A, Rev., 5.00%, 10/1/2022 | 470,000 | 471,022 |
Series 2019A, Rev., 5.00%, 10/1/2022 | 345,000 | 345,750 |
Series 2020A, Rev., AGM, 5.00%, 10/1/2022 | 40,000 | 40,087 |
Series 2020D, Rev., AGM, 5.00%, 10/1/2022 | 45,000 | 45,096 |
300 | J.P. Morgan Exchange-Traded Funds | August 31, 2022 |
INVESTMENTS | PRINCIPAL AMOUNT($) | VALUE($) |
Municipal Bonds — continued | ||
New York — continued | ||
Series A, Rev., 5.00%, 10/1/2022 | 1,000,000 | 1,002,065 |
Series A, Subseries A-1, Rev., 5.00%, 10/1/2022 | 200,000 | 200,449 |
Series E, Rev., 5.00%, 10/1/2022 | 120,000 | 120,270 |
Series H, Rev., 5.00%, 10/1/2022 | 30,000 | 30,065 |
Series A, Rev., AGM, 5.00%, 4/1/2023 | 105,000 | 105,230 |
Series 2017G, Rev., 4.00%, 10/1/2023 | 20,000 | 20,342 |
Series 2012D, Rev., AGM, 5.00%, 10/1/2023 | 300,000 | 300,631 |
Series 2015D, Rev., 5.00%, 10/1/2023 | 20,000 | 20,554 |
Series 2016G, Rev., 5.00%, 10/1/2023 | 40,000 | 41,144 |
Series H, Rev., 5.00%, 10/1/2023 | 195,000 | 195,401 |
Series C, Rev., 5.00%, 10/1/2024 | 100,000 | 100,202 |
Series 2017G, Rev., 5.00%, 10/1/2025 | 1,375,000 | 1,476,803 |
Series H, Rev., 5.00%, 10/1/2025 | 135,000 | 135,246 |
New York State Dormitory Authority, St. John's University Series 2007C, Rev., NATL-RE, 5.25%, 7/1/2023 | 110,000 | 112,660 |
New York State Dormitory Authority, State Personal Income Tax | ||
Series 2020A, Rev., 5.00%, 9/15/2022 | 25,000 | 25,025 |
Series 2021E, Rev., 5.00%, 3/15/2023 | 20,000 | 20,287 |
Series 2015B, Rev., 5.00%, 2/15/2024 | 20,000 | 20,746 |
New York State Dormitory Authority, State Personal Income Tax, General Purpose | ||
Series 2012A, Rev., 4.00%, 12/15/2022 (b) | 345,000 | 346,788 |
Series 2012A, Rev., 5.00%, 12/15/2022 (b) | 175,000 | 176,357 |
Series 2012A, Rev., 5.00%, 12/15/2022 | 635,000 | 639,911 |
Series 2013A, Rev., 5.00%, 2/15/2023 (b) | 95,000 | 96,192 |
Series 2014A, Rev., 5.00%, 2/15/2023 | 350,000 | 354,256 |
Series 2016A, Rev., 5.00%, 2/15/2023 | 60,000 | 60,730 |
Series 2017A, Rev., 5.00%, 2/15/2023 | 15,000 | 15,182 |
Series A, Rev., 5.00%, 3/15/2023 (b) | 205,000 | 208,034 |
Series 2012A, Rev., 5.00%, 12/15/2023 | 320,000 | 322,375 |
Series 2014A, Rev., 4.00%, 2/15/2024 (b) | 35,000 | 35,860 |
Series 2013A, Rev., 5.00%, 2/15/2024 | 45,000 | 45,529 |
Series 2019D, Rev., 5.00%, 2/15/2024 | 40,000 | 41,492 |
Series 2018A, Rev., 5.00%, 3/15/2024 (b) | 525,000 | 546,485 |
Series 2012A, Rev., 5.00%, 12/15/2024 | 580,000 | 584,234 |
INVESTMENTS | PRINCIPAL AMOUNT($) | VALUE($) |
New York — continued | ||
Series 2014A, Rev., 5.00%, 2/15/2025 | 115,000 | 119,273 |
Series 2012A, Rev., 5.00%, 12/15/2025 | 185,000 | 186,350 |
Series 2014A, Rev., 5.00%, 2/15/2026 | 40,000 | 41,475 |
Series 2012A, Rev., 5.00%, 12/15/2026 | 150,000 | 151,086 |
Series 2014A, Rev., 5.00%, 2/15/2027 | 20,000 | 20,732 |
Series 2012A, Rev., 5.00%, 12/15/2027 | 90,000 | 90,652 |
New York State Dormitory Authority, State Sales Tax | ||
Series 2013A, Rev., 5.00%, 3/15/2023 | 260,000 | 263,729 |
Series 2013A, Rev., 5.00%, 3/15/2023 (b) | 20,000 | 20,292 |
Series 2015A, Rev., 5.00%, 3/15/2023 | 215,000 | 218,084 |
Series 2015B, Rev., 5.00%, 3/15/2023 | 270,000 | 273,873 |
Series 2017A, Rev., 5.00%, 3/15/2023 | 95,000 | 96,363 |
Series 2018A, Rev., 5.00%, 3/15/2023 | 30,000 | 30,430 |
Series 2018C, Rev., 5.00%, 3/15/2023 | 20,000 | 20,287 |
Series 2013A, Rev., 5.00%, 3/15/2024 | 910,000 | 922,640 |
Series 2016A, Rev., 5.00%, 3/15/2024 | 50,000 | 51,968 |
Series 2015A, Rev., 5.00%, 3/15/2025 | 25,000 | 26,563 |
New York State Dormitory Authority, Third General Resolution, State University Educational Facilities Series 2005A, Rev., NATL-RE, 5.50%, 5/15/2023 | 30,000 | 30,661 |
New York State Energy Research and Development Authority, Electric and Gas Corp. Project Series 2004C, Rev., 2.63%, 7/3/2023 (c) | 425,000 | 423,056 |
New York State Environmental Facilities Corp., State Clean Water and Drinking Water Revolving Funds, Municipal Water Finance Authority Projects - Second Resolution | ||
Series 2015A, Rev., 5.00%, 6/15/2023 | 20,000 | 20,417 |
Series 2013A, Rev., 5.00%, 6/15/2024 | 50,000 | 51,018 |
Series 2013A, Rev., 5.00%, 6/15/2025 | 40,000 | 40,805 |
New York State Environmental Facilities Corp., State Revolving Funds, Master Financing Program | ||
Series 2012D, Rev., 5.00%, 9/15/2022 | 90,000 | 90,089 |
Series 2013B, Rev., 4.00%, 11/15/2022 | 50,000 | 50,177 |
Series 2019A, Rev., 4.00%, 2/15/2023 | 65,000 | 65,505 |
Series 2012E, Rev., 5.00%, 5/15/2024 | 40,000 | 40,128 |
August 31, 2022 | J.P. Morgan Exchange-Traded Funds | 301 |
AS OF August 31, 2022 (Unaudited) (continued)
INVESTMENTS | PRINCIPAL AMOUNT($) | VALUE($) |
Municipal Bonds — continued | ||
New York — continued | ||
New York State Housing Finance Agency, 160 Madison Avenue LLC Series 2013A, Rev., VRDO, LOC : Landesbank Hessen-Thueringen, 0.99%, 9/1/2022 (c) | 20,000,000 | 20,000,000 |
New York State Housing Finance Agency, Historic Front Street Series 2003A, Rev., VRDO, LOC : Landesbank Hessen-Thueringen, 1.52%, 9/8/2022 (c) | 22,000,000 | 22,000,000 |
New York State Thruway Authority | ||
Series J, Rev., 3.00%, 1/1/2023 | 20,000 | 20,042 |
Series K, Rev., 5.00%, 1/1/2023 | 545,000 | 549,697 |
Series K, Rev., 5.00%, 1/1/2024 | 50,000 | 51,654 |
Series L, Rev., 5.00%, 1/1/2024 | 40,000 | 41,323 |
Series J, Rev., 5.00%, 1/1/2026 | 485,000 | 499,236 |
New York State Thruway Authority, State Personal Income Tax, Transportation | ||
Series 2013A, Rev., 5.00%, 3/15/2024 | 25,000 | 25,347 |
Series 2013A, Rev., 5.00%, 3/15/2025 | 60,000 | 60,809 |
New York State Urban Development Corp., Income Tax | ||
Series 2013D, Rev., 5.00%, 3/15/2023 | 45,000 | 45,650 |
Series 2013D, Rev., 5.00%, 3/15/2024 | 265,000 | 268,681 |
New York State Urban Development Corp., State Personal Income Tax, General Purpose | ||
Series 2013C, Rev., 5.00%, 3/15/2023 | 35,000 | 35,506 |
Series 2013E-A, Rev., 5.00%, 3/15/2023 | 60,000 | 60,867 |
Series 2015A, Rev., 5.00%, 3/15/2023 | 150,000 | 152,168 |
Series 2020C, Rev., 5.00%, 3/15/2023 | 75,000 | 76,084 |
Series 2013C, Rev., 5.00%, 3/15/2024 | 175,000 | 177,431 |
Series 2013E-B, Rev., 5.00%, 3/15/2024 | 195,000 | 197,709 |
Series A-1, Rev., 5.00%, 3/15/2024 | 95,000 | 96,320 |
Series 2014A, Rev., 5.00%, 3/15/2025 | 50,000 | 51,937 |
Series 2015A, Rev., 5.00%, 3/15/2025 | 75,000 | 79,594 |
Series 2016A, Rev., 5.00%, 3/15/2025 | 30,000 | 31,838 |
Series 2017A, Rev., 5.00%, 3/15/2025 | 80,000 | 84,900 |
Series A-1, Rev., 5.00%, 3/15/2025 | 25,000 | 25,340 |
Series 2013C, Rev., 5.00%, 3/15/2026 | 45,000 | 45,609 |
Series 2013C, Rev., 5.00%, 3/15/2027 | 260,000 | 263,492 |
New York State Urban Development Corp., State Personal Income Tax, State Facilities and Equipment Series A-2, Rev., NATL - RE, 5.50%, 3/15/2023 | 30,000 | 30,513 |
INVESTMENTS | PRINCIPAL AMOUNT($) | VALUE($) |
New York — continued | ||
New York State Urban Development Corp., State Sales Tax Series 2021A, Rev., 5.00%, 3/15/2023 | 50,000 | 50,717 |
Niskayuna Central School District GO, 4.00%, 4/15/2023 | 70,000 | 70,708 |
North Tonawanda City School District GO, 5.00%, 9/1/2022 | 25,000 | 25,000 |
Norwood-Norfolk Central School District GO, BAN, 3.75%, 6/29/2023 | 8,055,000 | 8,096,845 |
Odessa-Montour Central School District GO, BAN, 4.00%, 6/30/2023 | 14,071,000 | 14,179,800 |
Onondaga County Water Authority | ||
Series 2016A, Rev., 5.00%, 9/15/2022 | 55,000 | 55,055 |
Series 2015A, Rev., 2.25%, 9/15/2023 | 40,000 | 39,983 |
Otselic Valley Central School District GO, BAN, 4.00%, 6/29/2023 | 4,320,000 | 4,355,076 |
Oyster Bay-East Norwich Central School District GO, 4.00%, 9/15/2022 | 260,000 | 260,169 |
Pearl River Union Free School District GO, 2.00%, 6/1/2023 | 20,000 | 19,920 |
Pelham Union Free School District GO, 4.00%, 11/15/2022 | 70,000 | 70,253 |
Pembroke Central School District GO, BAN, 4.00%, 6/30/2023 | 3,790,536 | 3,820,778 |
Pittsford Central School District | ||
GO, 4.00%, 10/1/2022 | 105,000 | 105,152 |
Series 2012B, GO, 4.00%, 12/15/2022 | 20,000 | 20,102 |
Pleasantville Union Free School District GO, 5.00%, 5/1/2023 | 20,000 | 20,348 |
Port Authority of New York and New Jersey Series 175, Rev., 4.00%, 12/1/2026 | 25,000 | 25,085 |
Port Authority of New York and New Jersey, Consolidated | ||
Series 194, Rev., 5.00%, 10/15/2022 | 265,000 | 265,881 |
Series 205, Rev., 5.00%, 11/15/2022 | 175,000 | 175,984 |
Series 209, Rev., 5.00%, 7/15/2023 | 20,000 | 20,466 |
Series 189, Rev., 5.00%, 5/1/2025 | 45,000 | 47,948 |
Series 175, Rev., 5.00%, 12/1/2025 | 100,000 | 100,667 |
Series 179, Rev., 5.00%, 12/1/2025 | 175,000 | 180,569 |
Port Washington Union Free School District GO, 5.00%, 12/1/2022 | 60,000 | 60,411 |
Putnam Valley Central School District GO, BAN, 3.75%, 7/14/2023 | 11,130,000 | 11,233,277 |
Queensbury Union Free School District Series A, GO, BAN, 3.50%, 6/28/2023 | 8,370,000 | 8,399,191 |
Rockland County Solid Waste Management Authority Series 2018A, Rev., 5.00%, 12/15/2022 | 60,000 | 60,450 |
302 | J.P. Morgan Exchange-Traded Funds | August 31, 2022 |
INVESTMENTS | PRINCIPAL AMOUNT($) | VALUE($) |
Municipal Bonds — continued | ||
New York — continued | ||
Sachem Central School District GO, 5.00%, 10/15/2022 | 105,000 | 105,349 |
Sales Tax Asset Receivable Corp., Fiscal Year 2015 | ||
Series 2015A, Rev., 4.00%, 10/15/2022 (b) | 485,000 | 486,038 |
Series 2015A, Rev., 5.00%, 10/15/2022 (b) | 485,000 | 486,611 |
Series 2015A, Rev., 5.00%, 10/15/2023 (b) | 40,000 | 41,179 |
Series 2015A, Rev., 5.00%, 10/15/2024 (b) | 45,000 | 47,443 |
Sandy Creek Central School District GO, BAN, 3.25%, 6/23/2023 | 4,757,648 | 4,764,612 |
Saratoga Springs City School District GO, BAN, 3.50%, 6/29/2023 | 12,012,000 | 12,022,741 |
Sayville Union Free School District GO, 3.00%, 6/15/2023 | 25,000 | 25,142 |
Shenendehowa Central School District | ||
GO, 4.00%, 12/15/2022 | 190,000 | 190,965 |
GO, 3.00%, 6/15/2023 | 65,000 | 65,369 |
Smithtown Central School District GO, 5.00%, 10/15/2022 | 60,000 | 60,200 |
South Country Central School District at Brookhaven | ||
GO, 4.00%, 10/15/2022 | 50,000 | 50,099 |
GO, 5.00%, 10/15/2023 | 35,000 | 35,984 |
South Huntington Union Free School District GO, 5.00%, 12/15/2022 | 35,000 | 35,266 |
Southwestern Central School District GO, BAN, 3.75%, 7/19/2023 | 3,950,723 | 3,975,383 |
State of New York | ||
Series 2018A, GO, 5.00%, 2/15/2023 | 25,000 | 25,311 |
Series 2013A, GO, 3.00%, 3/1/2023 (b) | 30,000 | 30,102 |
Series 2013A, GO, 5.00%, 3/1/2023 (b) | 50,000 | 50,678 |
Series 2015A, GO, 5.00%, 3/15/2023 | 25,000 | 25,367 |
Suffern Central School District GO, 5.00%, 10/15/2022 | 155,000 | 155,516 |
Suffolk County Water Authority, Water System Series 2014A, Rev., 5.00%, 6/1/2023 (b) | 20,000 | 20,393 |
Sweet Home Central School District GO, BAN, 3.75%, 6/28/2023 | 31,110,218 | 31,365,204 |
Syosset Central School District Series 2013B, GO, 5.00%, 12/15/2022 | 40,000 | 40,316 |
Three Village Central School District Brookhaven & Smithtown | ||
GO, 4.00%, 12/15/2022 | 35,000 | 35,170 |
INVESTMENTS | PRINCIPAL AMOUNT($) | VALUE($) |
New York — continued | ||
GO, 5.00%, 5/15/2025 | 30,000 | 31,960 |
Town of Babylon, Public Improvement 3.00%, 9/1/2022 | 35,000 | 35,000 |
Town of Brookhaven 5.00%, 11/15/2022 | 255,000 | 256,434 |
Town of Brookhaven, Public Improvement Series 2018A, 5.00%, 9/15/2022 | 70,000 | 70,070 |
Town of Colonie, Public Improvement AGM, 2.00%, 3/1/2023 | 50,000 | 49,868 |
Town of Cornwall, Public Improvement 3.50%, 3/1/2023 | 40,000 | 40,036 |
Town of Deerfield, Public Improvement GO, 5.00%, 9/1/2022 | 50,000 | 50,000 |
Town of East Hampton Series 2016A, GO, 4.00%, 11/1/2022 | 25,000 | 25,073 |
Town of Grand Island GO, BAN, 1.50%, 10/7/2022 | 9,000,000 | 8,990,264 |
Town of Greenburgh, Public Improvement GO, 5.00%, 10/1/2022 | 55,000 | 55,124 |
Town of Harrison, Public Improvement GO, 5.00%, 12/1/2022 | 35,000 | 35,240 |
Town of Hempstead Series 2018A, GO, 5.00%, 6/15/2023 | 35,000 | 35,735 |
Town of Huntington, Public Improvement Series 2017B, GO, 5.00%, 11/1/2022 | 20,000 | 20,091 |
Town of Islip, Public Improvement | ||
Series 2016B, GO, 4.00%, 10/15/2022 | 50,000 | 50,107 |
Series 2016A, GO, 5.00%, 11/15/2022 | 70,000 | 70,394 |
Town of Mount Pleasant, Public Improvement GO, 5.00%, 10/1/2022 | 60,000 | 60,126 |
Town of North Hempstead, Public Improvement Series 2017C, GO, 2.00%, 9/15/2022 | 30,000 | 29,997 |
Town of Oyster Bay GO, 3.00%, 3/9/2023 | 25,000 | 25,086 |
Town of Oyster Bay, Public Improvement | ||
GO, 4.00%, 11/1/2022 | 610,000 | 611,648 |
GO, 4.00%, 2/15/2025 | 225,000 | 232,103 |
Triborough Bridge and Tunnel Authority | ||
Series A, Rev., 4.00%, 11/15/2022 | 25,000 | 25,087 |
Series 2012A, Rev., 5.00%, 11/15/2022 | 25,000 | 25,138 |
Series 2012A, Rev., 5.00%, 11/15/2022 (b) | 160,000 | 160,899 |
Series 2013C, Rev., 5.00%, 5/15/2023 (b) | 40,000 | 40,756 |
Series 2013A, Rev., 4.00%, 11/15/2023 | 100,000 | 101,162 |
Series 2008B-1, Rev., 5.00%, 11/15/2023 (b) | 25,000 | 25,790 |
August 31, 2022 | J.P. Morgan Exchange-Traded Funds | 303 |
AS OF August 31, 2022 (Unaudited) (continued)
INVESTMENTS | PRINCIPAL AMOUNT($) | VALUE($) |
Municipal Bonds — continued | ||
New York — continued | ||
Series 2013A, Rev., 5.00%, 11/15/2024 | 370,000 | 376,017 |
Series 2012B, Rev., 5.00%, 11/15/2025 | 40,000 | 40,201 |
Series 2013A, Rev., 5.00%, 11/15/2026 | 85,000 | 86,340 |
Triborough Bridge and Tunnel Authority, MTA Bridges and Tunnels | ||
Series 2012B, Rev., 5.00%, 11/15/2022 | 455,000 | 457,503 |
Series 2013A, Rev., 5.00%, 11/15/2022 | 415,000 | 417,129 |
Subseries 2008B-1, Rev., 5.00%, 11/15/2022 | 205,000 | 206,128 |
Series 2012B, Rev., 5.00%, 11/15/2023 | 1,120,000 | 1,125,888 |
Series 2013A, Rev., 5.00%, 11/15/2023 | 570,000 | 580,408 |
Series 2016A, Rev., 5.00%, 11/15/2023 | 20,000 | 20,622 |
Series 2012B, Rev., 5.00%, 11/15/2024 | 235,000 | 236,181 |
Series 2012B, Rev., 4.00%, 11/15/2025 | 355,000 | 356,078 |
Series 2013A, Rev., 5.00%, 11/15/2025 | 390,000 | 396,150 |
Trust for Cultural Resources of City of New York (The), Carnegie Hall Rev., 5.00%, 12/1/2022 | 55,000 | 55,338 |
Trust for Cultural Resources of City of New York (The), The Museum of Modern Art Series 2016-1-E, Rev., 4.00%, 2/1/2023 (b) | 240,000 | 241,729 |
Tully Central School District GO, BAN, 4.00%, 6/28/2023 | 3,400,000 | 3,424,481 |
Utility Debt Securitization Authority | ||
Rev., 5.00%, 12/15/2024 | 50,000 | 50,377 |
Series 2016B, Rev., 5.00%, 12/15/2024 | 250,000 | 251,883 |
Series 2016A, Rev., 5.00%, 6/15/2025 | 185,000 | 188,812 |
Series 2016B, Rev., 5.00%, 6/15/2025 | 25,000 | 25,515 |
Series 2016A, Rev., 5.00%, 12/15/2025 | 25,000 | 25,826 |
Utility Debt Securitization Authority, Restructuring Rev., 5.00%, 6/15/2025 | 25,000 | 25,515 |
Valhalla Union Free School District GO, 5.00%, 2/1/2023 | 25,000 | 25,285 |
INVESTMENTS | PRINCIPAL AMOUNT($) | VALUE($) |
New York — continued | ||
Van Spencer Etten Central School GO, 4.00%, 6/15/2023 | 25,000 | 25,286 |
Victor Central School District Series B, GO, BAN, 3.75%, 9/15/2023 (f) | 2,267,382 | 2,284,924 |
Village of Frankfort, Public Improvement GO, AGM, 3.00%, 11/15/2023 | 25,000 | 25,132 |
Village of Freeport Series 2021D, GO, BAN, 1.50%, 11/16/2022 | 5,140,075 | 5,129,056 |
Village of Garden City GO, BAN, 2.00%, 2/17/2023 | 44,685,000 | 44,586,358 |
Village of Mount Kisco, Various Purpose GO, 4.00%, 12/1/2022 | 50,000 | 50,212 |
Village of Ossining GO, BAN, 1.25%, 9/23/2022 | 6,998,526 | 6,993,013 |
Washingtonville Central School District GO, 5.00%, 6/15/2023 | 65,000 | 66,350 |
Wayland-Cohocton Central School District GO, BAN, 3.25%, 6/23/2023 | 9,000,000 | 9,020,352 |
Webster Central School District | ||
GO, 4.00%, 10/1/2022 | 50,000 | 50,071 |
GO, 5.00%, 10/1/2022 | 55,000 | 55,122 |
Westchester County Local Development Corp., Purchase Senior Learning Community, Inc. Project Series 2021D, Rev., 2.88%, 7/1/2026 (e) | 1,885,000 | 1,765,664 |
William Floyd Union Free School District of the Mastics-Moriches-Shirley GO, 5.00%, 12/15/2022 | 25,000 | 25,193 |
Yorktown Central School District GO, 2.00%, 10/1/2022 | 110,000 | 109,976 |
Total New York | 646,160,880 | |
North Carolina — 1.5% | ||
Appalachian State University Series A, 5.00%, 10/1/2022 | 265,000 | 265,576 |
Charlotte-Mecklenburg Hospital Authority (The), Carolinas Healthcare System | ||
Series 2016A, 4.00%, 1/15/2023 | 25,000 | 25,148 |
Series 2013A, 5.00%, 1/15/2023 | 25,000 | 25,240 |
Series 2016A, 5.00%, 1/15/2025 | 340,000 | 359,504 |
Charlotte-Mecklenburg Hospital Authority (The), Healthcare System, Atrium Health Series 2018C, 5.00%, 1/15/2048 (c) | 910,000 | 921,643 |
City of Asheville 4.00%, 10/1/2022 | 45,000 | 45,065 |
City of Charlotte | ||
5.00%, 12/1/2022 | 40,000 | 40,267 |
5.00%, 12/1/2022 | 270,000 | 271,848 |
Series 2013C, 5.00%, 6/1/2023 | 25,000 | 25,495 |
304 | J.P. Morgan Exchange-Traded Funds | August 31, 2022 |
INVESTMENTS | PRINCIPAL AMOUNT($) | VALUE($) |
Municipal Bonds — continued | ||
North Carolina — continued | ||
Series 2013B, 5.00%, 7/1/2023 | 25,000 | 25,551 |
City of Charlotte, Airport Special Facilities, Charlotte Douglas International Airport Series 2017A, 5.00%, 7/1/2024 | 35,000 | 36,568 |
City of Charlotte, Convention Facility Project Series 2019A, 5.00%, 6/1/2024 | 60,000 | 62,678 |
City of Charlotte, Equipment Acquisition and Public Facilities Series 2016A, 5.00%, 12/1/2023 | 30,000 | 30,970 |
City of Durham | ||
GO, 5.00%, 9/1/2022 | 165,000 | 165,000 |
GO, 5.00%, 9/1/2023 | 10,000 | 10,266 |
City of Greensboro | ||
Series 2018B, GO, 5.00%, 10/1/2022 | 30,000 | 30,067 |
GO, 5.00%, 2/1/2023 | 25,000 | 25,285 |
City of High Point, Combined Water and Sewer System Rev., 5.00%, 11/1/2022 | 50,000 | 50,220 |
City of Raleigh | ||
Series 2011A, GO, 3.00%, 9/1/2022 | 25,000 | 25,000 |
Series 2016A, GO, 5.00%, 9/1/2022 | 50,000 | 50,000 |
Series 2020A, Rev., 5.00%, 6/1/2023 | 25,000 | 25,495 |
City of Raleigh, Combined Enterprise System | ||
Series 2015B, Rev., 5.00%, 12/1/2022 | 25,000 | 25,171 |
Rev., 5.00%, 3/1/2023 (b) | 20,000 | 20,264 |
Series 2013A, Rev., 5.00%, 3/1/2023 (b) | 25,000 | 25,330 |
City of Raleigh, Limited Obligation | ||
Series 2014A, Rev., 4.00%, 10/1/2022 | 55,000 | 55,080 |
Rev., 5.00%, 2/1/2024 | 50,000 | 51,824 |
County of Alamance 5.00%, 2/1/2023 | 55,000 | 55,626 |
County of Brunswick, Enterprise Systems 5.00%, 4/1/2023 | 25,000 | 25,384 |
County of Cabarrus 5.00%, 3/1/2023 | 20,000 | 20,270 |
County of Carteret Series 2015B, 5.00%, 11/1/2022 | 20,000 | 20,091 |
County of Chatham, Limited Obligation | ||
5.00%, 11/1/2022 | 125,000 | 125,559 |
4.00%, 6/1/2023 (b) | 20,000 | 20,081 |
County of Chatham, Public Facility Corp. GTD, 5.00%, 12/1/2022 | 20,000 | 20,134 |
County of Cumberland, Limited Obligation Rev., 5.00%, 11/1/2022 | 20,000 | 20,090 |
County of Durham GO, 5.00%, 10/1/2022 | 60,000 | 60,135 |
County of Forsyth | ||
GO, 5.00%, 12/1/2022 | 25,000 | 25,174 |
INVESTMENTS | PRINCIPAL AMOUNT($) | VALUE($) |
North Carolina — continued | ||
GO, 5.00%, 4/1/2023 | 30,000 | 30,477 |
GO, 5.00%, 12/1/2023 | 25,000 | 25,827 |
County of Forsyth, Public Improvement GO, 4.00%, 5/1/2023 | 125,000 | 125,173 |
County of Granville, Limited Obligation Rev., 5.00%, 10/1/2022 | 20,000 | 20,044 |
County of Harnett, Limited Obligation Rev., 4.00%, 12/1/2022 | 25,000 | 25,104 |
County of Johnson, Limited Obligation Series 2020A, Rev., 5.00%, 4/1/2023 | 10,000 | 10,158 |
County of Mecklenburg | ||
Series 2016A, GO, 5.00%, 9/1/2022 | 75,000 | 75,000 |
Series 2011-C, GO, 5.25%, 12/1/2022 | 25,000 | 25,190 |
County of Mecklenburg, Limited Obligation Series 2015A, Rev., 5.00%, 10/1/2022 | 140,000 | 140,314 |
County of New Hanover, Community College Series 2013A, GO, 3.00%, 6/1/2023 (b) | 20,000 | 20,094 |
County of New Hanover, Limited Obligation Rev., 4.00%, 12/1/2022 | 50,000 | 50,205 |
County of Onslow GO, 5.00%, 12/1/2022 | 100,000 | 100,684 |
County of Onslow, Limited Obligation | ||
Rev., 4.00%, 10/1/2022 | 25,000 | 25,036 |
Rev., 5.00%, 6/1/2023 | 20,000 | 20,397 |
County of Orange, Limited Obligation | ||
Series 2019B, Rev., 5.00%, 10/1/2022 | 115,000 | 115,251 |
Series 2021A, Rev., 5.00%, 11/15/2022 | 25,000 | 25,137 |
County of Randolph, Limited Obligation Series 2013C, Rev., 4.00%, 10/1/2022 | 30,000 | 30,043 |
County of Sampson, Limited Obligation Rev., 5.00%, 12/1/2022 | 85,000 | 85,563 |
County of Union | ||
GO, 4.00%, 9/1/2022 | 20,000 | 20,000 |
GO, 5.00%, 9/1/2022 | 30,000 | 30,000 |
County of Wake, Hospital System Rev., NATL-RE, 5.13%, 10/1/2026 (b) | 125,000 | 131,404 |
County of Wake, Limited Obligation | ||
Rev., 5.00%, 9/1/2022 | 75,000 | 75,000 |
Series 2016A, Rev., 5.00%, 12/1/2022 | 25,000 | 25,165 |
County of Wake, Public Improvement Series 2018A, GO, 5.00%, 3/1/2023 | 25,000 | 25,341 |
Durham Capital Financing Corp., Limited Obligation | ||
Rev., 4.00%, 12/1/2022 | 50,000 | 50,220 |
Rev., 5.00%, 6/1/2023 (b) | 20,000 | 20,397 |
August 31, 2022 | J.P. Morgan Exchange-Traded Funds | 305 |
AS OF August 31, 2022 (Unaudited) (continued)
INVESTMENTS | PRINCIPAL AMOUNT($) | VALUE($) |
Municipal Bonds — continued | ||
North Carolina — continued | ||
Durham Housing Authority, Multi-Family Housing, JFK Towers Project Series 2012A, Rev., 5.00%, 12/1/2022 (b) | 405,000 | 407,589 |
East Carolina University Series 2014A, Rev., 5.00%, 10/1/2022 | 25,000 | 25,054 |
Greenville Utilities Commission Rev., 5.00%, 4/1/2023 | 75,000 | 76,170 |
Jacksonville Public Facilities Corp. Rev., 5.00%, 4/1/2023 | 20,000 | 20,309 |
Mooresville Public Facilities Corp., Limited Obligation Rev., 4.00%, 11/1/2022 | 25,000 | 25,068 |
North Carolina Capital Facilities Finance Agency, Duke University Project Series 2015B, Rev., 5.00%, 10/1/2025 (b) | 20,000 | 21,542 |
North Carolina Housing Finance Agency, Homeownership | ||
Rev., GNMA/FNMA/FHLMC COLL, 0.15%, 1/1/2023 | 180,000 | 178,582 |
Series 43, Rev., GNMA/FNMA/FHLMC, 1.35%, 1/1/2023 | 80,000 | 79,683 |
Series 45, Rev., GNMA/FNMA/FHLMC COLL, 0.40%, 7/1/2023 | 110,000 | 108,006 |
Series 44, Rev., 1.50%, 7/1/2024 | 240,000 | 234,556 |
North Carolina Medical Care Commission, Caromont Health Series 2021B, Rev., 5.00%, 2/1/2026 (c) | 325,000 | 348,001 |
North Carolina Medical Care Commission, Duke University Health System Rev., 5.00%, 6/1/2025 | 120,000 | 127,931 |
North Carolina Medical Care Commission, Health Care Facilities, Wakemed | ||
Series 2012A, Rev., 4.13%, 10/1/2022 (b) | 45,000 | 45,066 |
Series 2012A, Rev., 5.00%, 10/1/2022 (b) | 555,000 | 556,233 |
North Carolina Medical Care Commission, Moses Cone Health System Series 2004A, Rev., VRDO, 1.50%, 9/12/2022 (c) | 30,000,000 | 30,000,000 |
North Carolina Medical Care Commission, Novant Health Series 2013A, Rev., 5.00%, 11/1/2024 | 160,000 | 160,619 |
North Carolina Medical Care Commission, Wake Forest Baptist Obligated Group | ||
Series 2019B, Rev., 2.20%, 12/1/2022 (c) | 6,710,000 | 6,706,501 |
Series 2019A, Rev., 5.00%, 12/1/2022 | 25,000 | 25,152 |
Series 2012B, Rev., 5.00%, 12/1/2023 | 240,000 | 241,467 |
INVESTMENTS | PRINCIPAL AMOUNT($) | VALUE($) |
North Carolina — continued | ||
North Carolina Municipal Power Agency No. 1, Catawba Electric | ||
Series E, Rev., 5.00%, 1/1/2023 | 20,000 | 20,177 |
Series A, Rev., 5.00%, 1/1/2024 | 25,000 | 25,850 |
Series A, Rev., 5.00%, 1/1/2027 | 600,000 | 644,265 |
North Carolina State University at Raleigh | ||
Rev., 5.00%, 10/1/2022 | 115,000 | 115,259 |
Series 2020A, Rev., 5.00%, 10/1/2022 | 25,000 | 25,056 |
Series 2013A, Rev., 5.00%, 10/1/2023 (b) | 20,000 | 20,565 |
North Carolina Turnpike Authority, Triangle Expressway System Rev., BAN, 5.00%, 2/1/2024 | 1,005,000 | 1,034,718 |
North Carolina Turnpike Authority, Triangle Expressway System, Senior Lien Rev., 5.00%, 1/1/2025 | 315,000 | 325,257 |
Onslow Water & Sewer Authority, Combined Enterprise System Rev., 5.00%, 12/1/2022 | 65,000 | 65,438 |
Orange County Public Facilities Co., Limited Obligation | ||
Rev., 4.75%, 10/1/2022 (b) | 25,000 | 25,049 |
Rev., 5.00%, 10/1/2022 | 90,000 | 90,201 |
Rev., 5.00%, 10/1/2023 | 40,000 | 41,135 |
State of North Carolina | ||
Rev., 5.00%, 3/1/2023 | 265,000 | 268,430 |
Series 2013A, Rev., 5.00%, 5/1/2023 | 10,000 | 10,180 |
Series 2015A, GO, 5.00%, 6/1/2023 | 25,000 | 25,508 |
Rev., 5.00%, 3/1/2024 | 40,000 | 41,489 |
State of North Carolina, Limited Obligation Series 2013A, Rev., 2.25%, 5/1/2026 | 10,000 | 9,877 |
Town of Cary, Combined Utility Enterprise System | ||
5.00%, 12/1/2023 (b) | 25,000 | 25,169 |
5.00%, 12/1/2025 (b) | 30,000 | 30,203 |
5.00%, 12/1/2026 (b) | 35,000 | 35,237 |
5.00%, 12/1/2027 (b) | 30,000 | 30,203 |
4.00%, 12/1/2032 (b) | 90,000 | 90,376 |
4.00%, 12/1/2037 (b) | 185,000 | 185,772 |
5.00%, 12/1/2042 (b) | 95,000 | 95,643 |
Town of Cary, Public Improvement 5.00%, 9/1/2022 | 60,000 | 60,000 |
Town of Oak Island, Enterprise System Rev., AGM, 5.00%, 6/1/2023 | 10,000 | 10,191 |
University of North Carolina at Charlotte (The) | ||
Series 2017A, Rev., 5.00%, 10/1/2022 | 150,000 | 150,326 |
306 | J.P. Morgan Exchange-Traded Funds | August 31, 2022 |
INVESTMENTS | PRINCIPAL AMOUNT($) | VALUE($) |
Municipal Bonds — continued | ||
North Carolina — continued | ||
Series 2020A, Rev., 5.00%, 10/1/2022 | 30,000 | 30,065 |
University of North Carolina at Wilmington Series 2019B, Rev., 5.00%, 10/1/2022 | 150,000 | 150,326 |
University of North Carolina, School of the Arts | ||
Rev., 5.00%, 2/1/2023 | 185,000 | 186,859 |
Rev., 5.00%, 2/1/2024 | 150,000 | 154,815 |
Rev., 5.00%, 2/1/2025 | 295,000 | 309,469 |
Total North Carolina | 48,134,960 | |
North Dakota — 0.1% | ||
City of Fargo Series 2019A, GO, 5.00%, 5/1/2023 | 20,000 | 20,341 |
City of Grand Forks Series 2017B, GO, 5.00%, 12/1/2022 | 40,000 | 40,254 |
City of Grand Forks, Altru Health System | ||
Rev., 5.00%, 12/1/2024 | 120,000 | 124,697 |
Rev., 5.00%, 12/1/2025 | 200,000 | 210,952 |
Rev., 5.00%, 12/1/2026 | 210,000 | 224,474 |
City of Watford City Rev., AGM, 3.00%, 12/1/2022 | 25,000 | 25,004 |
City of West Fargo Series 2017A, GO, 5.00%, 5/1/2023 | 25,000 | 25,394 |
County of Burleigh, Multi-County Sales Tax Series 2015A, AGM, 5.00%, 11/1/2022 (b) | 40,000 | 40,177 |
County of Stutsman Series 2014A, GO, 4.00%, 10/1/2023 | 25,000 | 25,401 |
Minot Public School District No. 1 GO, 4.00%, 8/1/2025 | 25,000 | 26,122 |
North Dakota Building Authority, Facilities Improvement Series 2020A, Rev., 5.00%, 12/1/2022 | 290,000 | 291,970 |
North Dakota Housing Finance Agency, Home Mortgage Finance Program Series 2020B, Rev., 1.05%, 7/1/2026 | 125,000 | 116,222 |
North Dakota Public Finance Authority, Capital Financing Program | ||
Series 2019A, Rev., 4.00%, 11/1/2022 | 25,000 | 25,070 |
Series 2019A, Rev., 1.75%, 11/1/2023 | 430,000 | 425,424 |
North Dakota Public Finance Authority, State Revolving Fund Program | ||
Series 2015A, Rev., 5.00%, 10/1/2022 | 25,000 | 25,056 |
Series 2016A, Rev., 5.00%, 10/1/2022 | 20,000 | 20,045 |
Series 2012A, Rev., 5.00%, 10/1/2023 | 35,000 | 35,075 |
INVESTMENTS | PRINCIPAL AMOUNT($) | VALUE($) |
North Dakota — continued | ||
North Dakota State University of Housing and Auxiliary Facilities Series 2015A, Rev., 5.00%, 4/1/2023 | 20,000 | 20,296 |
West Fargo Public School District No. 6, School Building GO, 4.00%, 8/1/2024 | 40,000 | 41,165 |
Total North Dakota | 1,763,139 | |
Ohio — 4.1% | ||
Akron Bath Copley Joint Township Hospital District, Children's Hospital Medical Center of Akron | ||
Series 2022A, 5.00%, 11/15/2026 | 355,000 | 385,781 |
Series 2022A, 5.00%, 11/15/2027 | 470,000 | 518,616 |
American Municipal Power, Inc., Combined Hydroelectric Projects | ||
Series 2016A, 5.00%, 2/15/2023 | 660,000 | 667,816 |
Series 2020A, 5.00%, 2/15/2023 | 245,000 | 247,901 |
American Municipal Power, Inc., Prairie State Energy Campus Project | ||
Series 2019B, 5.00%, 2/15/2025 | 390,000 | 412,943 |
Series 2015A, 5.00%, 2/15/2026 | 75,000 | 77,558 |
Series 2015A, 5.00%, 2/15/2027 | 400,000 | 413,528 |
Bellbrook-Sugarcreek Local School District, School Improvement, Unlimited Tax 4.00%, 12/1/2022 | 50,000 | 50,219 |
Berea City School District 2.00%, 10/1/2022 | 25,000 | 24,988 |
Big Walnut Local School District, Unlimited Tax Series 2021A, 4.00%, 12/1/2022 | 35,000 | 35,150 |
Bowling Green State University, General Receipts Series 2020A, 5.00%, 6/1/2023 | 20,000 | 20,373 |
Brock Independent School District, Unlimited Tax, School Facilities Improvement 5.00%, 1/15/2023 | 105,000 | 105,990 |
Butler County Port Authority, Liberty Center Project Series 2014A, 5.00%, 12/1/2024 (b) | 100,000 | 100,664 |
Butler County Transportation Improvement District, Highway Improvement 4.00%, 12/1/2022 | 30,000 | 30,132 |
Centerville City School District, School Improvement | ||
4.00%, 12/1/2025 (b) | 60,000 | 60,250 |
3.00%, 12/1/2030 (b) | 20,000 | 20,036 |
Central Ohio Solid Waste Authority, Solid Waste Facilities, Limited Tax 5.00%, 12/1/2023 | 45,000 | 46,472 |
August 31, 2022 | J.P. Morgan Exchange-Traded Funds | 307 |
AS OF August 31, 2022 (Unaudited) (continued)
INVESTMENTS | PRINCIPAL AMOUNT($) | VALUE($) |
Municipal Bonds — continued | ||
Ohio — continued | ||
Champion Local School District, Classroom Facilities Series 2016-2, 1.75%, 12/1/2022 | 35,000 | 34,912 |
City of Akron, Income Tax 5.00%, 12/1/2023 | 20,000 | 20,639 |
City of Akron, Income Tax, Community Learning Centers 5.00%, 12/1/2022 | 85,000 | 85,565 |
City of Akron, Various Purpose | ||
Series 2015A, 2.25%, 12/1/2022 | 75,000 | 74,944 |
Series 2017A, 4.00%, 12/1/2022 | 25,000 | 25,094 |
City of Athens, Swimming Pool Facilities 3.00%, 12/1/2023 | 25,000 | 25,198 |
City of Cincinnati, Unlimited Tax, Various Purpose | ||
Series 2016A, 4.00%, 12/1/2022 | 40,000 | 40,171 |
Series 2015A, 5.00%, 12/1/2022 | 150,000 | 151,008 |
Series 2021A, 5.00%, 12/1/2022 | 85,000 | 85,571 |
Series 2015A, 5.00%, 12/1/2023 | 35,000 | 36,131 |
City of Cleveland AMBAC, 5.50%, 10/1/2022 | 155,000 | 155,396 |
City of Cleveland, Income Tax, Subordinate Lien, Public Facilities Improvements | ||
Series 2017A-1, 4.00%, 10/1/2022 | 45,000 | 45,062 |
Series 2014B-1, 5.00%, 10/1/2024 (b) | 25,000 | 25,056 |
Series 2014B-1, 5.00%, 10/1/2027 (b) | 20,000 | 20,044 |
Series 2014B-2, 5.00%, 10/1/2032 (b) | 25,000 | 25,056 |
City of Cleveland, Subordinate Lien, Income Tax Series 2014B-1, 5.00%, 10/1/2022 | 35,000 | 35,076 |
City of Cleveland, Various Purpose 5.00%, 12/1/2022 | 55,000 | 55,361 |
City of Delaware, Limited Tax Series 2019B, GO, 4.00%, 12/1/2022 | 35,000 | 35,145 |
City of Dublin, Various Purpose GO, 5.00%, 12/1/2022 | 25,000 | 25,171 |
City of Fairview Park, Limited Tax | ||
GO, 3.00%, 12/1/2022 (b) | 55,000 | 55,099 |
GO, 4.00%, 12/1/2022 (b) | 165,000 | 165,714 |
City of Hilliard, Limited Tax, Various Purpose Series 2019A, GO, 5.00%, 12/1/2022 | 20,000 | 20,121 |
City of Kettering GO, 2.00%, 12/1/2022 | 25,000 | 24,971 |
City of Lima, Sanitary Sewer System | ||
Rev., 3.00%, 12/1/2022 | 35,000 | 35,055 |
Rev., 4.00%, 12/1/2022 (b) | 30,000 | 30,121 |
City of Marysville, Limited Tax GO, 2.25%, 12/1/2022 | 60,000 | 59,989 |
City of Mentor, Limited tax, Various Purpose GO, 3.00%, 12/1/2022 | 25,000 | 25,043 |
INVESTMENTS | PRINCIPAL AMOUNT($) | VALUE($) |
Ohio — continued | ||
City of Middletown GO, 2.00%, 12/1/2022 | 50,000 | 49,937 |
City of New Albany, Limited Tax GO, 3.50%, 12/1/2022 | 30,000 | 30,091 |
City of Newark GO, 2.00%, 12/1/2022 | 35,000 | 34,961 |
City of North Olmsted, Capital Improvement, Limited Tax GO, 3.00%, 12/1/2022 | 20,000 | 20,037 |
City of Reynoldsburg, Limited Tax, Capital Facilities GO, 5.00%, 12/1/2022 | 25,000 | 25,164 |
City of Sharonville, Special Obligation Rev., 4.00%, 12/1/2022 | 50,000 | 50,214 |
City of Springboro, Various Purpose, Limited Tax GO, 2.25%, 12/1/2022 | 75,000 | 74,845 |
City of Tiffin, Limited Tax, Capital Improvement GO, 2.00%, 12/1/2022 | 50,000 | 49,840 |
City of Toledo, Sewerage System Rev., 5.00%, 11/15/2022 | 55,000 | 55,309 |
City of Westerville, Special Obligation | ||
Rev., 5.00%, 12/1/2022 | 65,000 | 65,440 |
Rev., 5.00%, 12/1/2023 | 25,000 | 25,808 |
Clear Fork Valley Local School District 4.00%, 12/1/2022 | 25,000 | 25,101 |
Cleveland Department of Public Utilities Division of Public Power AGM, 5.00%, 11/15/2022 | 60,000 | 60,320 |
Cleveland Municipal School District Series 2015A, 5.00%, 12/1/2022 | 180,000 | 181,205 |
Clyde-Green Springs Exempted Village School District 4.00%, 12/1/2022 | 180,000 | 180,680 |
Columbus City School District, Limited Tax, School Bus Acquisition 4.00%, 12/1/2022 | 25,000 | 25,109 |
Columbus City School District, Ohio School Facilities Construction and Improvement, Unlimited Tax 4.00%, 12/1/2022 | 20,000 | 20,087 |
Columbus Metropolitan Library, Ohio Library Facilities, Special Obligation | ||
4.00%, 12/1/2022 | 135,000 | 135,544 |
4.00%, 12/1/2024 | 20,000 | 20,656 |
County of Allen, Hospital Facilities, Bon Secours Mercy Health, Inc. Series 2020A, 5.00%, 12/1/2022 | 25,000 | 25,149 |
County of Allen, Hospital Facilities, Mercy Health Series 2017A, 5.00%, 8/1/2024 | 570,000 | 593,925 |
County of Butler, Hospital Facilities, UC Health 4.00%, 11/15/2022 | 340,000 | 340,917 |
County of Butler, Sewer System 4.00%, 12/1/2022 | 55,000 | 55,242 |
308 | J.P. Morgan Exchange-Traded Funds | August 31, 2022 |
INVESTMENTS | PRINCIPAL AMOUNT($) | VALUE($) |
Municipal Bonds — continued | ||
Ohio — continued | ||
County of Cuyahoga, Capital Improvement, Limited Tax Series 2020A, GO, 4.00%, 12/1/2022 | 220,000 | 220,940 |
County of Cuyahoga, Ohio Economic Development Series 2020D, Rev., 4.00%, 12/1/2022 | 495,000 | 497,178 |
County of Cuyahoga, Public Library Fund, Library Facilities Rev., 4.00%, 12/1/2022 | 70,000 | 70,282 |
County of Cuyahoga, Sports Facilities Improvement Project, Excise Tax Rev., 5.00%, 12/1/2022 (b) | 105,000 | 105,711 |
County of Delaware, Sanitary Sewer System Improvement Rev., 4.00%, 12/1/2022 | 25,000 | 25,110 |
County of Franklin, Hospital Facilities, OhioHealth Corp. | ||
Series 2018D, Rev., VRDO, 1.47%, 9/12/2022 (c) | 30,000,000 | 30,000,000 |
Rev., 5.00%, 5/15/2023 | 35,000 | 35,663 |
County of Franklin, Limited Tax GO, 5.00%, 6/1/2023 | 25,000 | 25,500 |
County of Franklin, Various Purpose, Limited Tax GO, 5.00%, 12/1/2022 | 20,000 | 20,136 |
County of Geauga, South Franklin Circle Project Rev., 8.00%, 12/31/2022 (b) (c) | 4,890,000 | 5,075,324 |
County of Greene, Sewer System | ||
GO, 5.00%, 12/1/2022 | 50,000 | 50,342 |
Series 2007A, Rev., AMBAC, 5.00%, 12/1/2023 | 50,000 | 51,585 |
County of Hamilton, Parking Facilities, Limited Tax Series 2021A, GO, 5.00%, 12/1/2023 | 25,000 | 25,818 |
County of Hamilton, Sales Tax | ||
Series 2000B, Rev., AMBAC, Zero Coupon, 12/1/2022 | 100,000 | 99,376 |
Series 2016A, Rev., 5.00%, 12/1/2022 | 445,000 | 448,001 |
County of Hamilton, Sewer System, The Metropolitan Sewer District of Greater Cincinnati | ||
Series 2013A, Rev., 5.00%, 12/1/2022 | 295,000 | 296,960 |
Series 2014A, Rev., 5.00%, 12/1/2022 | 165,000 | 166,109 |
Series 2019A, Rev., 5.00%, 12/1/2022 | 140,000 | 140,930 |
County of Lake, Various Purpose GO, 3.50%, 12/1/2022 | 50,000 | 50,159 |
County of Lorain, Various Purpose, Limited Tax | ||
GO, 3.00%, 12/1/2022 | 55,000 | 55,101 |
INVESTMENTS | PRINCIPAL AMOUNT($) | VALUE($) |
Ohio — continued | ||
Series 2020B, GO, 3.00%, 12/1/2022 | 65,000 | 65,119 |
County of Mahoning, Various Purpose, Limited Tax GO, AGM, 2.00%, 12/1/2022 | 25,000 | 24,966 |
County of Medina, Limited Tax GO, 2.00%, 12/1/2022 | 50,000 | 49,961 |
County of Montgomery, Catholic Health Initiatives Series 2008D-2, Rev., 5.45%, 11/13/2023 (b) | 140,000 | 144,941 |
County of Portage, Limited Tax GO, 5.00%, 12/1/2022 | 65,000 | 65,443 |
County of Stark, Communication System, Limited Tax GO, 2.50%, 12/1/2022 | 50,000 | 50,037 |
County of Summit, Various Purpose GO, 4.50%, 12/1/2022 | 60,000 | 60,321 |
County of Union, Memorial Hospital, Various Purpose GO, 4.00%, 12/1/2022 | 80,000 | 80,330 |
Cuyahoga Community College District, Facilities Construction Improvement, Unlimited Tax GO, 3.00%, 12/1/2023 | 20,000 | 20,160 |
Dayton Metro Library, Unlimited Tax GO, 4.00%, 12/1/2024 | 40,000 | 41,392 |
Defiance City School District, Various Purpose GO, 5.00%, 12/1/2022 (b) | 45,000 | 45,304 |
Dublin City School District, School Facilities Construction and Improvement | ||
GO, 4.00%, 12/1/2022 | 35,000 | 35,148 |
Series 2019A, GO, 4.00%, 12/1/2022 | 20,000 | 20,084 |
GO, 4.00%, 12/1/2024 | 20,000 | 20,705 |
Dublin City School District, Various Purpose Series 2013A, GO, 5.00%, 12/1/2022 | 80,000 | 80,542 |
Eastwood Local School District COP, 3.00%, 6/1/2023 | 30,000 | 30,085 |
Eaton Community City School District, Unlimited Tax GO, 4.00%, 12/1/2022 | 25,000 | 25,107 |
Edgewood City School District GO, 5.00%, 12/1/2022 | 45,000 | 45,303 |
Forest Hills Local School District, School Improvement GO, 4.00%, 12/1/2022 | 40,000 | 40,170 |
Franklin City School District GO, AMBAC, Zero Coupon, 12/1/2022 | 30,000 | 29,811 |
Franklin County Convention Facilities Authority, Tax Lease | ||
Rev., 5.00%, 12/1/2023 (b) | 50,000 | 51,623 |
Rev., 5.00%, 12/1/2024 (b) | 75,000 | 79,274 |
Gahanna-Jefferson City School District GO, 3.00%, 12/1/2022 | 75,000 | 75,137 |
August 31, 2022 | J.P. Morgan Exchange-Traded Funds | 309 |
AS OF August 31, 2022 (Unaudited) (continued)
INVESTMENTS | PRINCIPAL AMOUNT($) | VALUE($) |
Municipal Bonds — continued | ||
Ohio — continued | ||
Galion City School District GO, Zero Coupon, 12/1/2022 | 50,000 | 49,686 |
Greater Cleveland Regional Transit Authority, Sales Tax Supported Capital Improvement | ||
Rev., 5.00%, 12/1/2022 | 55,000 | 55,376 |
Series 2014A, Rev., 5.00%, 12/1/2022 | 320,000 | 322,190 |
Greene County Vocational School District, School Facilities Construction and Improvement GO, 5.00%, 12/1/2022 | 20,000 | 20,136 |
Hamilton City School District, Various Purpose, Unlimited Tax GO, 5.00%, 12/1/2022 | 45,000 | 45,292 |
Highland Local School District GO, 5.00%, 12/1/2022 | 215,000 | 216,466 |
Hilliard School District Series 2013A, GO, 5.00%, 12/1/2022 | 55,000 | 55,376 |
Hocking Technical College District Rev., 5.00%, 7/1/2023 (b) | 40,000 | 40,829 |
Kettering City School District COP, 4.00%, 12/1/2022 | 25,000 | 25,107 |
Lake County Community College District COP, 4.00%, 10/1/2022 | 225,000 | 225,282 |
Lake Local School District, School Improvement, Unlimited Tax GO, 3.00%, 12/1/2022 | 50,000 | 50,053 |
Lakewood City School District, School Facilities Improvement, Unlimited Tax | ||
Series 2014A, GO, 5.00%, 11/1/2022 (b) | 150,000 | 150,676 |
GO, 4.00%, 12/1/2022 | 20,000 | 20,087 |
Lakota Local School District | ||
GO, 3.00%, 12/1/2022 | 30,000 | 30,056 |
GO, 5.00%, 12/1/2022 | 45,000 | 45,308 |
Lancaster City School District, School Facilities Construction and Improvement | ||
GO, 3.25%, 10/1/2022 (b) | 20,000 | 20,016 |
GO, 3.75%, 10/1/2022 (b) | 245,000 | 245,295 |
GO, 4.00%, 10/1/2022 | 35,000 | 35,049 |
Licking County Career and Technology Education Centers GO, 3.13%, 12/1/2023 | 50,000 | 50,028 |
Lorain County Community College District Rev., 4.00%, 12/1/2022 | 25,000 | 25,101 |
Lucas-Plaza Housing Development Corp. Rev., FHA, Zero Coupon, 6/1/2024 (b) | 810,000 | 774,453 |
INVESTMENTS | PRINCIPAL AMOUNT($) | VALUE($) |
Ohio — continued | ||
Marysville Exempted Village School District, School Improvement GO, 5.00%, 12/1/2022 | 30,000 | 30,195 |
Miami East Local School District, School Improvement GO, 4.00%, 12/1/2022 | 65,000 | 65,254 |
Miami University, General Receipts | ||
Rev., 4.00%, 9/1/2022 | 260,000 | 260,000 |
Rev., 5.00%, 9/1/2022 | 135,000 | 135,000 |
Series 2020A, Rev., 5.00%, 9/1/2022 | 20,000 | 20,000 |
Miamisburg City School District GO, 2.00%, 12/1/2022 | 25,000 | 24,972 |
Middletown City School District GO, 5.25%, 12/1/2022 (b) | 120,000 | 120,886 |
New Albany Plain Local School District, School Improvement | ||
GO, 3.75%, 12/1/2022 (b) | 50,000 | 50,182 |
GO, 4.00%, 12/1/2022 (b) | 45,000 | 45,188 |
New Albany Plain Local School District, Various Purpose GO, 4.00%, 12/1/2022 | 25,000 | 25,110 |
Northeast Ohio Regional Sewer District, Wastewater Improvement | ||
Rev., 3.00%, 11/15/2022 | 50,000 | 50,081 |
Rev., 5.00%, 11/15/2022 | 65,000 | 65,366 |
Rev., 5.00%, 5/15/2023 (b) | 40,000 | 40,737 |
Northwest Local School District, School Improvement, Unlimited Tax | ||
GO, 5.00%, 12/1/2022 | 30,000 | 30,205 |
GO, 5.00%, 12/1/2023 (b) | 45,000 | 46,432 |
Oak Hills Local School District, School Improvement | ||
GO, 5.00%, 12/1/2022 | 65,000 | 65,443 |
GO, 5.00%, 12/1/2023 | 20,000 | 20,609 |
Ohio Higher Educational Facility Commission, Case Western Reserve, Inc. | ||
Rev., 5.00%, 12/1/2023 (b) | 45,000 | 46,348 |
Rev., 5.00%, 12/1/2023 | 100,000 | 103,170 |
Ohio Higher Educational Facility Commission, Case Western University Project | ||
Series 2021B, Rev., (SIFMA Municipal Swap Index Yield + 0.23%), 1.73%, 9/8/2022 (d) | 5,500,000 | 5,385,560 |
Rev., 4.00%, 12/1/2022 | 20,000 | 20,083 |
Rev., 5.00%, 12/1/2022 (b) | 160,000 | 161,063 |
Series 2015A, Rev., 5.00%, 12/1/2022 | 40,000 | 40,264 |
310 | J.P. Morgan Exchange-Traded Funds | August 31, 2022 |
INVESTMENTS | PRINCIPAL AMOUNT($) | VALUE($) |
Municipal Bonds — continued | ||
Ohio — continued | ||
Ohio Higher Educational Facility Commission, University of Dayton 2013 Project Rev., 5.00%, 12/1/2025 | 20,000 | 20,128 |
Ohio Housing Finance Agency, Marianna Terrace Apartments Series 2022A, Rev., 1.30%, 3/1/2024 (c) | 1,000,000 | 972,959 |
Ohio Housing Finance Agency, Park Eden Apartments Series 2020A, Rev., VRDO, FHA, GNMA, 0.40%, 9/1/2022 (c) | 700,000 | 700,000 |
Ohio Housing Finance Agency, RAD Post Oak LLC Series 2022, Rev., 3.35%, 7/1/2024 (c) | 4,740,000 | 4,734,932 |
Ohio State University (The), General Receipts | ||
Series 2010D, Rev., 5.00%, 12/1/2022 | 45,000 | 45,309 |
Series 2014A, Rev., 5.00%, 12/1/2022 | 50,000 | 50,343 |
Series 2020A, Rev., 5.00%, 12/1/2022 | 160,000 | 161,099 |
Series 2012A, Rev., 5.00%, 6/1/2023 | 20,000 | 20,405 |
Series 2010D, Rev., 5.00%, 12/1/2023 | 40,000 | 41,323 |
Ohio State University (The), General Receipts, Multiyear Debt Issuance Program II Rev., 5.00%, 12/1/2022 | 155,000 | 156,065 |
Ohio State University (The), General Receipts, Special Purpose | ||
Series 2013A, Rev., 5.00%, 6/1/2024 | 170,000 | 173,356 |
Series 2013A, Rev., 5.00%, 6/1/2025 | 20,000 | 20,330 |
Ohio Turnpike and Infrastructure Commission, Infrastructure Project Series 2013A-1, Rev., 5.25%, 2/15/2039 | 6,000,000 | 6,072,192 |
Ohio Turnpike and Infrastructure Commission, Junior Lien | ||
Series 2013A-1, Rev., 5.00%, 2/15/2024 | 275,000 | 278,001 |
Series 2013A-1, Rev., 5.00%, 2/15/2025 | 220,000 | 222,401 |
Ohio University, General Receipts | ||
Rev., 4.00%, 12/1/2022 (b) | 40,000 | 40,167 |
Rev., 5.00%, 12/1/2022 (b) | 155,000 | 156,049 |
Rev., 5.00%, 12/1/2022 | 130,000 | 130,880 |
Ohio Water Development Authority, Drinking Water Assistance | ||
Rev., 5.00%, 12/1/2022 | 145,000 | 145,992 |
Series 2019B, Rev., 5.00%, 12/1/2022 | 25,000 | 25,171 |
Ohio Water Development Authority, Fresh Water | ||
Series 2013A, Rev., 5.00%, 12/1/2022 | 35,000 | 35,240 |
Rev., 5.50%, 12/1/2022 | 170,000 | 171,371 |
INVESTMENTS | PRINCIPAL AMOUNT($) | VALUE($) |
Ohio — continued | ||
Ohio Water Development Authority, Water Pollution Control Loan Fund | ||
Rev., 5.00%, 12/1/2022 | 185,000 | 186,266 |
Series 2015A, Rev., 5.00%, 12/1/2022 | 20,000 | 20,146 |
Rev., 5.50%, 12/1/2022 | 105,000 | 105,847 |
Olentangy Local School District Series B, GO, 4.00%, 12/1/2022 (b) | 35,000 | 35,146 |
Olentangy Local School District, Unlimited Tax | ||
Series 2020A, GO, 4.00%, 12/1/2022 | 55,000 | 55,199 |
Series B, GO, 4.00%, 12/1/2022 (b) | 75,000 | 75,313 |
Orange City School District, Unlimited Tax GO, 5.00%, 12/1/2023 | 40,000 | 41,278 |
Ottawa and Glandorf Local School District, Unlimited Tax GO, 4.00%, 12/1/2022 | 25,000 | 25,098 |
Patrick Henry Local School District, Ohio School Facilities Project | ||
Series A, COP, 4.00%, 12/1/2022 | 25,000 | 25,101 |
COP, 5.00%, 12/1/2022 (b) | 45,000 | 45,293 |
Perry Local School District COP, 4.00%, 12/1/2022 | 20,000 | 20,081 |
Perrysburg Exempted Village School District, Unlimited Tax GO, 5.00%, 12/1/2023 | 30,000 | 30,895 |
Port of Greater Cincinnati Development Authority, Mariemont City School District Project, Tax-Exempt | ||
Rev., 5.00%, 12/1/2022 | 100,000 | 100,682 |
Rev., 5.00%, 12/1/2024 | 200,000 | 210,901 |
Princeton City School District GO, 5.00%, 12/1/2022 | 20,000 | 20,136 |
Revere Local School District, School Facilities Improvement, Unlimited Tax Series 2017C, GO, Zero Coupon, 12/1/2022 | 135,000 | 134,049 |
Reynoldsburg City School District, Unlimited Tax GO, 5.00%, 12/1/2022 | 160,000 | 161,091 |
Rossford Exempted Village School District, School Facilities Project COP, 5.00%, 12/1/2022 | 30,000 | 30,139 |
Shaker Heights City School District, School Facilities Improvement, Unlimited Tax Series 2018A, GO, 2.25%, 12/15/2022 | 50,000 | 49,999 |
Shaker Heights Public Library COP, 2.00%, 12/1/2022 | 85,000 | 84,841 |
Shelby City School District, School Facilities Improvement GO, 4.00%, 11/1/2022 (b) | 90,000 | 90,236 |
August 31, 2022 | J.P. Morgan Exchange-Traded Funds | 311 |
AS OF August 31, 2022 (Unaudited) (continued)
INVESTMENTS | PRINCIPAL AMOUNT($) | VALUE($) |
Municipal Bonds — continued | ||
Ohio — continued | ||
Southwest Licking Local School District, School Facilities Project COP, 4.00%, 12/1/2022 | 245,000 | 245,962 |
Stark County Library District, Library Facilities Rev., 4.00%, 12/1/2022 | 50,000 | 50,193 |
State of Ohio | ||
Series 2014A, GO, 5.00%, 9/15/2022 | 95,000 | 95,095 |
Series 2016A, Rev., 5.00%, 10/1/2022 | 125,000 | 125,271 |
Series 2016A, GO, 5.00%, 12/15/2023 | 35,000 | 36,183 |
Series 2017A, Rev., 5.00%, 12/1/2024 | 25,000 | 26,374 |
Series 2016A, Rev., 5.00%, 2/1/2025 | 50,000 | 52,981 |
State of Ohio, Adult Correctional Building Fund Projects | ||
Series 2013A, Rev., 5.00%, 10/1/2022 | 140,000 | 140,303 |
Series 2013A, Rev., 5.00%, 10/1/2024 | 35,000 | 36,808 |
State of Ohio, Capital Facilities Lease Appropriation | ||
Series 2013A, Rev., 5.00%, 10/1/2022 | 250,000 | 250,541 |
Series 2015B, Rev., 5.00%, 10/1/2022 | 95,000 | 95,206 |
Series 2015B, Rev., 5.00%, 10/1/2022 (b) | 150,000 | 150,333 |
Series 2015C, Rev., 5.00%, 10/1/2022 | 70,000 | 70,152 |
Series 2016A, Rev., 5.00%, 10/1/2022 | 85,000 | 85,184 |
Series 2017A, Rev., 5.00%, 12/1/2022 | 30,000 | 30,198 |
Series 2017A, Rev., 5.00%, 12/1/2023 | 25,000 | 25,793 |
State of Ohio, Capital Facilities Lease Appropriation Adult Correctional Building Fund Projects Series 2017A, Rev., 4.00%, 10/1/2022 | 25,000 | 25,034 |
State of Ohio, Capital Facilities Lease Appropriation Cultural and Sports Facilities Building Fund Projects Series 2016A, Rev., 5.00%, 10/1/2023 | 50,000 | 51,381 |
State of Ohio, Capital Facilities Lease Appropriation Mental Health Facilities Improvement Fund Projects Series 2015A, Rev., 5.00%, 2/1/2024 | 170,000 | 176,082 |
State of Ohio, Capital Facilities Lease Appropriation, Administrative Building Fund Projects | ||
Series 2018A, Rev., 5.00%, 10/1/2022 | 20,000 | 20,043 |
Series 2019A, Rev., 5.00%, 10/1/2022 | 85,000 | 85,184 |
State of Ohio, Capital Facilities Lease Appropriation, Cultural and Sports Facilities Building Fund Projects Series 2017A, Rev., 5.00%, 10/1/2022 | 25,000 | 25,054 |
INVESTMENTS | PRINCIPAL AMOUNT($) | VALUE($) |
Ohio — continued | ||
State of Ohio, Capital Facilities Lease Appropriation, Parks and Recreation Improvement Fund Projects | ||
Series 2016C, Rev., 5.00%, 12/1/2022 | 155,000 | 156,022 |
Series 2020A, Rev., 5.00%, 12/1/2022 | 260,000 | 261,714 |
State of Ohio, Capital Facilities, Juvenile Correctional Building Fund | ||
Series 2020A, Rev., 3.00%, 10/1/2022 | 30,000 | 30,017 |
Series 2019B, Rev., 5.00%, 10/1/2022 | 25,000 | 25,054 |
State of Ohio, Cleveland Clinic Health System Obligated Group | ||
Series 2019D-2, Rev., VRDO, 1.45%, 9/12/2022 (c) | 20,890,000 | 20,890,000 |
Series 2017A, Rev., 5.00%, 1/1/2023 | 20,000 | 20,171 |
State of Ohio, Common Schools | ||
Series 2011C, GO, 4.00%, 9/15/2022 | 40,000 | 40,026 |
Series 2010C, GO, 4.25%, 9/15/2022 | 310,000 | 310,228 |
Series 2012A, GO, 5.00%, 9/15/2022 | 185,000 | 185,186 |
Series 2012C, GO, 5.00%, 9/15/2022 | 135,000 | 135,135 |
Series 2013A, GO, 5.00%, 9/15/2022 | 130,000 | 130,130 |
Series 2016A, GO, 5.00%, 12/15/2022 | 170,000 | 171,339 |
State of Ohio, Conservation Project Series 2015A, GO, 5.00%, 9/1/2022 | 225,000 | 225,000 |
State of Ohio, Department of Administrative Services, Administrative Knowledge System and Enterprise Data Center Solutions Project COP, 5.00%, 9/1/2022 | 255,000 | 255,000 |
State of Ohio, Department of Administrative Services, Enterprise Data Center Solutions COP, 5.00%, 9/1/2022 | 25,000 | 25,000 |
State of Ohio, Department of Administrative Services, Radio Communications COP, 5.00%, 9/1/2022 (b) | 20,000 | 20,000 |
State of Ohio, Garvee Series 2018-1, Rev., 5.00%, 12/15/2024 | 30,000 | 31,704 |
State of Ohio, Higher Education | ||
Series 2015C, GO, 5.00%, 11/1/2022 | 40,000 | 40,182 |
Series 2018A, GO, 5.00%, 2/1/2023 | 20,000 | 20,227 |
Series 2014A, GO, 4.00%, 5/1/2023 | 25,000 | 25,285 |
Series 2011A, GO, 5.00%, 8/1/2023 | 10,000 | 10,244 |
Series 2014A, GO, 4.00%, 5/1/2024 | 80,000 | 82,178 |
State of Ohio, Highway Improvement Series T, GO, 5.00%, 11/1/2023 | 95,000 | 97,818 |
State of Ohio, Infrastructure Improvement | ||
Series 2012C, GO, 5.00%, 9/1/2022 | 20,000 | 20,000 |
Series 2015A, GO, 5.00%, 9/1/2022 | 85,000 | 85,000 |
Series 2015B, GO, 5.00%, 9/1/2022 | 115,000 | 115,000 |
312 | J.P. Morgan Exchange-Traded Funds | August 31, 2022 |
INVESTMENTS | PRINCIPAL AMOUNT($) | VALUE($) |
Municipal Bonds — continued | ||
Ohio — continued | ||
Series 2015B, GO, 5.00%, 3/1/2023 (b) | 75,000 | 76,008 |
Series 2012C, GO, 5.00%, 9/1/2023 | 25,000 | 25,662 |
Series 2015A, GO, 5.00%, 9/1/2023 | 25,000 | 25,662 |
Series 2015B, GO, 5.00%, 9/1/2023 | 25,000 | 25,662 |
Series 2016A, GO, 5.00%, 9/1/2023 | 20,000 | 20,529 |
Series 2017B, GO, 5.00%, 9/1/2025 | 30,000 | 32,245 |
State of Ohio, Juvenile Correctional Building Fund Projects Rev., 5.00%, 10/1/2023 | 35,000 | 35,967 |
State of Ohio, Major New Infrastructure Project | ||
Rev., 5.00%, 12/15/2022 | 255,000 | 256,943 |
Series 2016-1, Rev., 5.00%, 12/15/2022 | 100,000 | 100,762 |
Series 2018-1, Rev., 5.00%, 12/15/2022 | 200,000 | 201,524 |
Series 2019-1, Rev., 5.00%, 12/15/2022 | 165,000 | 166,257 |
Series 2016-1, Rev., 5.00%, 12/15/2023 | 25,000 | 25,816 |
Series 2018-1, Rev., 5.00%, 12/15/2023 | 120,000 | 123,918 |
Series 2019-1, Rev., 5.00%, 12/15/2023 | 25,000 | 25,816 |
State of Ohio, State Infrastructure Series 2019A, GO, 5.00%, 3/1/2023 | 20,000 | 20,272 |
State of Ohio, Third Frontier Research and Development, Tax-Exempt GO, 4.00%, 11/1/2022 | 110,000 | 110,321 |
State of Ohio, Toledo Parking Facilities Project Series 2012-1, Rev., 4.00%, 11/15/2022 | 205,000 | 205,691 |
State of Ohio, Treasury Management System Project COP, 5.00%, 9/1/2022 | 30,000 | 30,000 |
State of Ohio, University Hospitals Health System, Inc. | ||
Series 2021B, Rev., VRDO, 1.70%, 9/1/2022 (c) | 11,000,000 | 11,000,000 |
Series B, Rev., VRDO, 1.70%, 9/12/2022 (c) | 5,500,000 | 5,500,000 |
Series 2013A, Rev., 4.00%, 1/15/2025 | 270,000 | 271,090 |
Series 2020B, Rev., 5.00%, 1/15/2025 (c) | 295,000 | 310,459 |
Series 2013A, Rev., 4.13%, 1/15/2026 | 95,000 | 95,413 |
Series 2013A, Rev., 5.00%, 1/15/2027 | 4,325,000 | 4,354,875 |
Streetsboro City School District, School Improvement, Unlimited Tax GO, 2.00%, 12/1/2022 | 25,000 | 24,967 |
INVESTMENTS | PRINCIPAL AMOUNT($) | VALUE($) |
Ohio — continued | ||
Strongsville City School District, Unlimited Tax Improvement GO, 4.00%, 12/1/2022 | 45,000 | 45,197 |
Sylvania City School District, School Improvement, Unlimited Tax GO, 2.25%, 12/1/2022 | 25,000 | 24,993 |
Tender Option Bond Trust Receipts/ Certificates | ||
Series C, Rev., VRDO, LIQ : Citibank NA, 1.57%, 9/12/2022 (c) (e) | 4,000,000 | 4,000,000 |
Series 2018-XF2703, GO, VRDO, LIQ : Barclays Bank plc, 1.60%, 9/12/2022 (c) (e) | 4,000,000 | 4,000,000 |
Toledo City School District, School Facilities Improvement GO, 5.00%, 12/1/2023 (b) | 20,000 | 20,637 |
Township of West Chester, Various Purpose, Limited Tax GO, 5.00%, 12/1/2022 | 50,000 | 50,342 |
Trotwood-Madison City School District, Unlimited Tax, School Improvement GO, 4.00%, 12/1/2022 | 30,000 | 30,122 |
United Local School District, Columbiana County COP, 3.00%, 12/1/2022 | 20,000 | 19,999 |
University of Akron (The), General Receipts Series 2016A, Rev., 5.00%, 1/1/2023 | 25,000 | 25,210 |
University of Cincinnati, General Receipts Series 2012C, Rev., 5.00%, 12/1/2022 (b) | 250,000 | 251,630 |
Village of Bluffton, Ohio Hospital Facilities, Blanchard Valley Health System 5.00%, 12/1/2022 | 160,000 | 160,895 |
Village of Evendale Ohio Public Infrastructure, Income Tax Rev., 4.00%, 12/1/2022 | 25,000 | 25,101 |
Village of Hebron, Water System Mortgage Rev., 5.00%, 12/1/2022 | 95,000 | 95,555 |
Warren City School District, Unlimited Tax GO, 2.00%, 12/1/2022 | 20,000 | 19,971 |
Westerville City School District, School Facilities Project COP, 5.00%, 12/1/2023 | 30,000 | 30,951 |
Westerville City School District, Unlimited Tax GO, 4.00%, 12/1/2022 | 100,000 | 100,440 |
Worthington City School District, School Facilities Construction and Improvement, Unlimited Tax GO, 4.00%, 12/1/2022 | 60,000 | 60,242 |
Total Ohio | 128,031,518 | |
August 31, 2022 | J.P. Morgan Exchange-Traded Funds | 313 |
AS OF August 31, 2022 (Unaudited) (continued)
INVESTMENTS | PRINCIPAL AMOUNT($) | VALUE($) |
Municipal Bonds — continued | ||
Oklahoma — 1.1% | ||
Bryan County School Finance Authority, Durant Public Schools Project Rev., 4.00%, 12/1/2022 | 20,000 | 20,079 |
Canadian County Educational Facilities Authority, Mustang Public Schools Project 3.00%, 9/1/2022 | 20,000 | 20,000 |
Canadian County Independent School District No. 69 Mustang 2.00%, 6/1/2023 | 45,000 | 44,794 |
City of Norman GO, 4.00%, 6/1/2023 | 60,000 | 60,745 |
City of Oklahoma City GO, 5.00%, 3/1/2023 | 25,000 | 25,341 |
Cleveland County Educational Facilities Authority, Lexington Public Schools Project Rev., 4.00%, 9/1/2022 | 125,000 | 125,000 |
Cleveland County Educational Facilities Authority, Norman Public Schools Project | ||
5.00%, 6/1/2024 | 570,000 | 593,047 |
5.00%, 6/1/2025 | 150,000 | 159,955 |
Cleveland County Independent School District No. 2 Moore, Combined Purpose 3.50%, 3/1/2023 | 380,000 | 381,836 |
Cleveland County Independent School District No. 29 Norman, Combined Purpose | ||
3.00%, 3/1/2023 | 45,000 | 45,131 |
Series 2019B, 3.00%, 5/1/2023 | 10,000 | 10,037 |
Clinton Public Works Authority, Sales Tax 4.00%, 12/1/2022 | 25,000 | 25,101 |
County of Oklahoma, Limited Tax GO, 2.00%, 9/1/2022 | 20,000 | 20,000 |
Delaware County Educational Facilities Authority, Grove Public Schools Project Rev., 5.00%, 9/1/2022 | 50,000 | 50,000 |
Grady County School Finance Authority, Educational Facilities Lease, Tuttle Public Schools Project Rev., 5.00%, 9/1/2023 | 10,000 | 10,251 |
Lincoln County Educational Facilities Authority, Stroud Public Schools Project Rev., 5.00%, 9/1/2022 | 55,000 | 55,000 |
McClain County Economic Development Authority, Educational Facilities, Blanchard Public Schools Project Rev., 4.00%, 9/1/2022 | 285,000 | 285,000 |
Oklahoma Capitol Improvement Authority, Office of Juvenile Affairs Project Series 2019B, Rev., 5.00%, 7/1/2023 | 20,000 | 20,444 |
INVESTMENTS | PRINCIPAL AMOUNT($) | VALUE($) |
Oklahoma — continued | ||
Oklahoma Capitol Improvement Authority, Oklahoma Department of Transportation Project Rev., 5.00%, 7/1/2025 | 140,000 | 149,521 |
Oklahoma Capitol Improvement Authority, State Highway Capital Improvement, Capitol Repair Project Series 2017B, Rev., 5.00%, 1/1/2023 | 35,000 | 35,318 |
Oklahoma County Finance Authority, Deer Creek Public Schools Project Rev., 5.00%, 12/1/2022 | 130,000 | 130,829 |
Oklahoma County Finance Authority, Educational Facilities, Lease Midwest City-Del City Public Schools Project | ||
Series 2018, Rev., 5.00%, 10/1/2022 | 375,000 | 375,803 |
Rev., 5.00%, 10/1/2025 | 30,000 | 31,918 |
Oklahoma County Finance Authority, Harrah Public Schools Project Rev., 4.00%, 9/1/2022 | 350,000 | 350,000 |
Oklahoma County Finance Authority, Western Heights Public Schools Project | ||
Series 2018A, Rev., 5.00%, 9/1/2022 | 125,000 | 125,000 |
Series 2018A, Rev., 5.00%, 9/1/2023 | 10,000 | 10,237 |
Oklahoma County Independent School District No. 89 Oklahoma City, Combined Purpose Series 2019A, GO, 3.00%, 7/1/2023 | 95,000 | 95,487 |
Oklahoma Department of Transportation Series 2018A, Rev., GAN, 5.00%, 9/1/2022 | 55,000 | 55,000 |
Oklahoma Development Finance Authority, Health System, Integris Obligated Group Series 2020C, Rev., VRDO, 1.75%, 9/12/2022 (c) | 29,125,000 | 29,125,000 |
Oklahoma Development Finance Authority, Higher Education Master Real Project Series 2019A, Rev., 5.00%, 12/1/2022 | 50,000 | 50,315 |
Oklahoma Development Finance Authority, System of Higher Education, Master Real Property Series 2020A, Rev., 4.00%, 6/1/2023 | 260,000 | 262,901 |
Oklahoma Turnpike Authority, Second Senior Series 2017E, Rev., 4.00%, 1/1/2023 | 30,000 | 30,171 |
Oklahoma Water Resources Board, Master Trust Series 2013A, Rev., 5.00%, 4/1/2023 (b) | 15,000 | 15,234 |
Oklahoma Water Resources Board, State Loan Program Series 2018B, Rev., 5.00%, 10/1/2022 | 50,000 | 50,112 |
314 | J.P. Morgan Exchange-Traded Funds | August 31, 2022 |
INVESTMENTS | PRINCIPAL AMOUNT($) | VALUE($) |
Municipal Bonds — continued | ||
Oklahoma — continued | ||
Pontotoc County Educational Facilities Authority, Ada Public Schools Project Rev., 5.00%, 9/1/2022 | 75,000 | 75,000 |
Sand Springs Municipal Authority Water Sewer Utility & 1% Sales Tax Rev., 2.00%, 11/1/2022 | 55,000 | 54,940 |
Tulsa County Independent School District No. 1, Combined Purpose Series 2018B, GO, 3.00%, 8/1/2023 | 35,000 | 35,179 |
Tulsa County Industrial Authority Educational Facilities Lease, Broken Arrow Public Schools Project | ||
Rev., 3.00%, 9/1/2022 | 225,000 | 225,000 |
Rev., 4.00%, 9/1/2022 | 340,000 | 340,000 |
Rev., 5.00%, 9/1/2022 | 25,000 | 25,000 |
Rev., 5.00%, 9/1/2025 | 35,000 | 35,874 |
Tulsa County Industrial Authority Educational Facilities Lease, Jenks Public Schools Project Rev., 5.00%, 9/1/2022 | 105,000 | 105,000 |
Tulsa County Industrial Authority, Capital Improvement Rev., 2.00%, 9/1/2022 | 30,000 | 30,000 |
Tulsa County Industrial Authority, Owasso Public Schools Project Rev., 5.00%, 9/1/2022 | 300,000 | 300,000 |
Tulsa Metropolitan Utility Authority | ||
Rev., 3.00%, 10/1/2022 | 30,000 | 30,020 |
Series 2016C, Rev., 5.00%, 10/1/2022 | 75,000 | 75,169 |
Series 2019A, Rev., 5.00%, 4/1/2023 | 10,000 | 10,155 |
Tulsa Public Facilities Authority, Capital Improvement Rev., 3.00%, 6/1/2023 | 110,000 | 110,492 |
Total Oklahoma | 34,296,436 | |
Oregon — 0.4% | ||
City of Beaverton Series 2020A, 5.00%, 6/1/2023 | 30,000 | 30,582 |
City of Bend, Bridge Creek Project 5.00%, 12/1/2022 | 65,000 | 65,442 |
City of Eugene, Electric Utility System Rev., 4.00%, 8/1/2024 | 140,000 | 140,148 |
City of Hermiston GO, 3.00%, 3/1/2023 | 25,000 | 25,077 |
City of McMinnville GO, 5.00%, 2/1/2023 | 45,000 | 45,493 |
City of Portland, Sewer System, First Lien Series 2014A, Rev., 5.00%, 10/1/2022 | 70,000 | 70,157 |
City of Portland, Water System, Second Lien | ||
Rev., 5.00%, 10/1/2022 | 135,000 | 135,301 |
Rev., 5.00%, 10/1/2023 | 20,000 | 20,308 |
City of Salem GO, 5.00%, 6/1/2023 | 30,000 | 30,605 |
INVESTMENTS | PRINCIPAL AMOUNT($) | VALUE($) |
Oregon — continued | ||
City of Salem, Water and Sewer Rev., 5.00%, 6/1/2023 | 20,000 | 20,403 |
City of St. Helens GO, 3.00%, 6/1/2023 | 25,000 | 25,127 |
Clackamas Community College District Series B, Zero Coupon, 6/15/2023 | 20,000 | 19,582 |
Columbia Multnomah and Washington Counties School District No. 1J 5.00%, 6/15/2023 | 35,000 | 35,716 |
County of Clatsop 4.00%, 6/15/2023 | 20,000 | 20,259 |
County of Yamhill, George Fox University Project Rev., 4.00%, 12/1/2022 | 280,000 | 281,022 |
County of Yamhill, Linfield University Project Rev., 4.00%, 10/1/2022 | 250,000 | 250,179 |
Deschutes & Jefferson Counties School District No. 2J Redmond Series 2008B, GO, Zero Coupon, 6/15/2023 | 20,000 | 19,593 |
Hillsboro School District No. 1J GO, 5.00%, 6/15/2023 | 10,000 | 10,207 |
Hospital Facilities Authority of Multnomah County Oregon, Adventist Health System Rev., 5.00%, 3/1/2025 (c) | 260,000 | 270,281 |
Klamath Falls City Schools Series 2015A, GO, 5.00%, 6/15/2023 | 30,000 | 30,611 |
Klamath Falls Intercommunity Hospital Authority, Sky Lakes Medical Center, Inc. Project Rev., 4.00%, 9/1/2022 | 85,000 | 85,000 |
Lane County School District No. 52 Bethel GO, 4.00%, 6/15/2023 (b) | 25,000 | 25,323 |
Lebanon Rural Fire Protection District GO, 5.00%, 6/15/2023 | 25,000 | 25,480 |
Metro Series 2012A, GO, 5.00%, 6/1/2023 | 85,000 | 85,121 |
Metro, Oregon Convention Center Hotel Project Rev., 5.00%, 6/15/2025 | 20,000 | 21,340 |
Metropolitan Wastewater Management Commission Rev., 5.00%, 11/1/2022 | 40,000 | 40,182 |
Oregon State Facilities Authority, Peacehealth Project Series 2014A, Rev., 5.00%, 11/15/2022 | 25,000 | 25,115 |
Oregon State Facilities Authority, Providence Health and Services Series 2013A, Rev., 5.00%, 10/1/2022 | 85,000 | 85,170 |
Oregon State Lottery | ||
Series 2016-XF2290, Rev., VRDO, LIQ : Citibank NA, 1.56%, 9/12/2022 (c) (e) | 8,000,000 | 8,000,000 |
Series A, Rev., 4.00%, 4/1/2023 | 100,000 | 101,010 |
Portland Community College District | ||
GO, 3.00%, 6/15/2023 (b) | 55,000 | 55,271 |
August 31, 2022 | J.P. Morgan Exchange-Traded Funds | 315 |
AS OF August 31, 2022 (Unaudited) (continued)
INVESTMENTS | PRINCIPAL AMOUNT($) | VALUE($) |
Municipal Bonds — continued | ||
Oregon — continued | ||
GO, 5.00%, 6/15/2023 | 30,000 | 30,635 |
Salem Hospital Facility Authority, Salem Health Project Series 2019A, Rev., 5.00%, 5/15/2023 | 25,000 | 25,422 |
State of Oregon | ||
Series 2013G, GO, 4.00%, 11/1/2022 | 20,000 | 20,056 |
Series F, GO, 5.00%, 5/1/2023 | 45,000 | 45,810 |
State of Oregon, Alternate Energy GO, 4.00%, 10/1/2022 | 60,000 | 60,087 |
State of Oregon, Article XI-F(1) University Projects Series I, GO, 5.00%, 8/1/2023 | 20,000 | 20,478 |
State of Oregon, Article XI-Q State Projects Series 2019A, GO, 5.00%, 5/1/2023 | 45,000 | 45,810 |
State of Oregon, Department of Transportation Series 2012A, Rev., 5.00%, 11/15/2022 (b) | 80,000 | 80,446 |
State of Oregon, Department of Transportation Highway User Senior Lien | ||
Series 2012A, Rev., 5.00%, 11/15/2022 | 25,000 | 25,141 |
Series 2012A, Rev., 5.00%, 11/15/2022 (b) | 25,000 | 25,139 |
Series 2013A, Rev., 5.00%, 11/15/2022 | 75,000 | 75,422 |
Series 2014A, Rev., 5.00%, 11/15/2022 | 85,000 | 85,478 |
Series 2017C, Rev., 5.00%, 11/15/2022 | 75,000 | 75,422 |
Series A, Rev., 5.00%, 11/15/2022 | 145,000 | 145,815 |
State of Oregon, Housing and Community Services Department, Single-Family Mortgage Program | ||
Series 2020A, Rev., 0.88%, 1/1/2024 | 325,000 | 317,066 |
Series 2014A, Rev., 3.00%, 1/1/2024 | 200,000 | 199,851 |
Series 2020A, Rev., 0.90%, 7/1/2024 | 435,000 | 420,507 |
State of Oregon, University System Series 2013A, GO, 3.25%, 8/1/2023 (b) | 25,000 | 25,195 |
State of Oregon, Veterans Welfare Series 2018E-102, GO, 2.45%, 12/1/2022 | 25,000 | 25,008 |
Tri-County Metropolitan Transportation District of Oregon | ||
Series 2018A, Rev., 5.00%, 10/1/2022 | 60,000 | 60,130 |
Series 2017A, Rev., 5.00%, 10/1/2023 | 45,000 | 46,218 |
Tri-County Metropolitan Transportation District of Oregon, Senior Lien Payroll Tax Series 2015B, Rev., 5.00%, 9/1/2022 | 45,000 | 45,000 |
INVESTMENTS | PRINCIPAL AMOUNT($) | VALUE($) |
Oregon — continued | ||
Tri-County Metropolitan Transportation District of Oregon, Tax Exempt Series 2017A, Rev., 5.00%, 10/1/2022 | 905,000 | 906,967 |
Tri-County Metropolitan Transportation District, Senior Lien Payroll Tax Series 2012A, Rev., 5.00%, 9/1/2022 | 65,000 | 65,000 |
Washington County Clean Water Services, Senior Lien | ||
5.00%, 10/1/2022 | 95,000 | 95,213 |
5.00%, 10/1/2023 | 20,000 | 20,572 |
Total Oregon | 13,082,993 | |
Pennsylvania — 3.1% | ||
Abington School District Series 2021AA, 5.00%, 3/15/2023 | 40,000 | 40,557 |
Aliquippa Municipal Water Authority Water and Sewer 4.00%, 11/15/2022 | 20,000 | 20,064 |
Allegheny County Higher Education Building Authority, Duquesne University Series 2014A, 5.00%, 3/1/2023 | 50,000 | 50,570 |
Allegheny County Hospital Development Authority, Pittsburgh Medical Center | ||
Series 2011A, 5.00%, 10/15/2022 | 435,000 | 436,256 |
Series 2021B, 5.00%, 10/15/2022 | 175,000 | 175,505 |
Series 1997B, NATL-RE, 6.00%, 7/1/2023 | 215,000 | 220,905 |
Series 2021B, 5.00%, 10/15/2024 | 705,000 | 738,195 |
5.00%, 7/15/2025 | 110,000 | 116,919 |
Allegheny County Sanitary Authority, Sewer 5.00%, 12/1/2022 | 345,000 | 347,275 |
Allegheny Valley Joint School District 3.00%, 11/1/2022 | 25,000 | 25,029 |
Altoona Area School District | ||
AGM, 3.00%, 12/1/2022 (b) | 20,000 | 20,035 |
AGM, 3.13%, 12/1/2033 (b) | 40,000 | 40,079 |
Avon Grove School District Chester County 4.00%, 11/15/2022 | 115,000 | 115,371 |
Bethel Park School District 5.00%, 8/1/2025 | 35,000 | 37,417 |
Bethlehem Area School District | ||
5.00%, 10/15/2022 | 75,000 | 75,245 |
5.00%, 11/15/2022 | 50,000 | 50,276 |
Blue Mountain School District 5.00%, 10/1/2022 | 25,000 | 25,051 |
Borough of West Chester GO, 4.00%, 11/15/2022 | 25,000 | 25,088 |
Boyertown Area School District 2.00%, 10/1/2022 | 200,000 | 199,934 |
316 | J.P. Morgan Exchange-Traded Funds | August 31, 2022 |
INVESTMENTS | PRINCIPAL AMOUNT($) | VALUE($) |
Municipal Bonds — continued | ||
Pennsylvania — continued | ||
Bristol Township School District 5.00%, 6/1/2023 | 25,000 | 25,465 |
Bucks County Water and Sewer Authority, Sewer System 4.00%, 12/1/2022 | 240,000 | 240,972 |
Carlisle Area School District, Limited Tax 3.00%, 9/1/2024 | 25,000 | 25,218 |
Centennial School District Bucks County | ||
5.00%, 12/15/2022 | 150,000 | 151,186 |
Series 2017C, 5.00%, 12/15/2023 | 55,000 | 56,817 |
Series 2017A, 5.00%, 12/15/2024 | 25,000 | 26,334 |
Central Dauphin School District 2.00%, 2/1/2023 (b) | 20,000 | 19,949 |
Central York School District 4.00%, 11/15/2022 | 100,000 | 100,341 |
Chartiers Valley School District Series A, 5.00%, 10/15/2022 | 120,000 | 120,384 |
Cheltenham Township School District | ||
Series 2021A, 2.00%, 9/15/2022 | 20,000 | 19,998 |
4.00%, 9/15/2023 | 25,000 | 25,432 |
Series 2019A, 4.00%, 2/15/2025 | 20,000 | 20,641 |
Chester County Industrial Development Authority, Longwood Gardens Project 3.00%, 12/1/2022 | 75,000 | 75,135 |
Chester Water Authority 5.00%, 12/1/2022 | 70,000 | 70,479 |
City of Bethlehem Series 2019AA, AGM, 4.00%, 10/1/2022 | 65,000 | 65,090 |
City of Lancaster GO, AGM, 4.00%, 11/1/2022 | 20,000 | 20,056 |
City of New Castle GO, AGM, 3.00%, 11/1/2022 | 25,000 | 25,013 |
City of Philadelphia, Water and Wastewater System | ||
Rev., 5.00%, 11/1/2022 (b) | 35,000 | 35,155 |
Series 2014A, Rev., 5.00%, 7/1/2025 | 100,000 | 104,445 |
City of Pittsburgh | ||
Series 2020A, GO, 4.00%, 9/1/2022 | 50,000 | 50,000 |
Series 2012A, GO, 5.00%, 9/1/2022 | 455,000 | 455,000 |
Series 2012A, GO, 5.00%, 9/1/2022 (b) | 110,000 | 110,000 |
Series 2012B, GO, 5.00%, 9/1/2022 (b) | 225,000 | 225,000 |
Commonwealth Financing Authority Series B, 5.00%, 6/1/2023 | 10,000 | 10,180 |
Commonwealth Financing Authority, Tobacco Master Settlement Payment | ||
Rev., 5.00%, 6/1/2024 | 3,465,000 | 3,591,846 |
Rev., 5.00%, 6/1/2025 | 40,000 | 42,229 |
INVESTMENTS | PRINCIPAL AMOUNT($) | VALUE($) |
Pennsylvania — continued | ||
Commonwealth of Pennsylvania | ||
GO, 5.00%, 9/15/2022 | 190,000 | 190,187 |
Series 2013-2, GO, 5.00%, 10/15/2022 | 270,000 | 270,878 |
COP, AGM, 5.00%, 11/1/2022 | 50,000 | 50,215 |
Series 1, GO, 4.00%, 7/1/2023 | 20,000 | 20,279 |
Series 2, GO, 5.00%, 1/15/2024 | 25,000 | 25,891 |
Series 2014-1, GO, 5.00%, 6/15/2024 | 40,000 | 41,837 |
GO, 5.00%, 7/1/2024 | 25,000 | 26,175 |
GO, 5.00%, 10/15/2024 | 50,000 | 51,423 |
Series 2018A, COP, 5.00%, 7/1/2025 | 100,000 | 106,518 |
GO, 5.00%, 9/15/2026 | 20,000 | 21,927 |
Conestoga Valley School District Series 2019B, 4.00%, 4/1/2025 | 35,000 | 36,209 |
Council Rock School District | ||
4.00%, 11/15/2022 | 750,000 | 752,437 |
4.00%, 11/15/2023 | 120,000 | 122,145 |
Series 2019A, 4.00%, 11/15/2025 | 35,000 | 36,501 |
County of Adams Series 2017B, 5.00%, 11/15/2023 | 25,000 | 25,747 |
County of Allegheny | ||
Series C-69, 5.00%, 12/1/2022 (b) | 50,000 | 50,361 |
Series C-69, 5.00%, 12/1/2023 | 50,000 | 50,347 |
Series C-70, 5.00%, 12/1/2034 (b) | 35,000 | 35,237 |
Series C-70, 5.00%, 12/1/2037 (b) | 25,000 | 25,169 |
County of Armstrong 4.00%, 6/1/2023 | 125,000 | 126,460 |
County of Berks 5.00%, 11/15/2022 | 90,000 | 90,508 |
County of Bucks 5.00%, 12/1/2022 | 70,000 | 70,479 |
County of Chester 5.00%, 11/15/2030 (b) | 170,000 | 170,948 |
County of Dauphin | ||
Series 2016A, GO, 4.00%, 11/15/2022 | 75,000 | 75,258 |
Series 2017, GO, 5.00%, 11/15/2022 | 85,000 | 85,462 |
Series 2016C, GO, 4.00%, 10/1/2023 | 25,000 | 25,428 |
GO, 4.00%, 11/15/2023 | 35,000 | 35,663 |
County of Lancaster | ||
Series 2016B, GO, 3.00%, 11/1/2022 | 155,000 | 155,178 |
GO, 4.00%, 11/1/2022 | 30,000 | 30,083 |
Series 2017C, GO, 4.00%, 11/1/2022 | 20,000 | 20,055 |
Series A, GO, 5.00%, 11/1/2022 | 35,000 | 35,154 |
GO, 5.00%, 5/1/2023 | 45,000 | 45,771 |
County of Luzerne Series 2017A, GO, AGM, 5.00%, 12/15/2022 | 60,000 | 60,440 |
County of Monroe GO, 5.00%, 9/15/2022 (b) | 30,000 | 30,029 |
County of Montgomery Series 2009C, GO, 5.00%, 12/15/2023 | 25,000 | 25,058 |
August 31, 2022 | J.P. Morgan Exchange-Traded Funds | 317 |
AS OF August 31, 2022 (Unaudited) (continued)
INVESTMENTS | PRINCIPAL AMOUNT($) | VALUE($) |
Municipal Bonds — continued | ||
Pennsylvania — continued | ||
County of Northampton Series B, GO, 3.00%, 10/1/2022 (b) | 55,000 | 55,035 |
County of Westmoreland | ||
Series 2013A, GO, 5.00%, 12/1/2022 (b) | 30,000 | 30,199 |
Series 2013A, GO, 5.00%, 12/1/2022 | 105,000 | 105,661 |
County of York | ||
Series 2016A, GO, 3.00%, 12/1/2022 | 50,000 | 50,088 |
GO, 4.00%, 12/1/2022 | 30,000 | 30,126 |
GO, 5.00%, 6/1/2023 (b) | 20,000 | 20,397 |
Series 2016A, GO, 3.00%, 12/1/2023 | 30,000 | 30,182 |
Crawford Central School District Series 2012A, AGM, 4.00%, 2/15/2023 | 50,000 | 50,066 |
Cumberland County Municipal Authority, Dickinson College Project Series 2018A, Rev., 5.00%, 11/1/2022 | 70,000 | 70,295 |
Cumberland Valley School District Series 2018A, GO, 4.00%, 12/1/2022 | 265,000 | 266,106 |
Delaware County Authority, Haverford College Series 2017A, Rev., 5.00%, 10/1/2022 | 100,000 | 100,221 |
Delaware County Authority, Villanova University Rev., 5.00%, 8/1/2024 | 25,000 | 26,092 |
Delaware River Joint Toll Bridge Commission, Bridge System Series 2012A, Rev., 5.00%, 7/1/2023 | 50,000 | 50,135 |
Delaware Valley School District GO, 5.00%, 11/1/2022 | 25,000 | 25,107 |
Derry Township Industrial and Commercial Development Authority, Derry Township Municipal Center Project Rev., 1.00%, 11/15/2023 | 160,000 | 155,040 |
Derry Township School District Series 2019C, GO, 4.00%, 11/15/2022 | 55,000 | 55,199 |
East Penn School District | ||
GO, 4.00%, 11/15/2022 | 25,000 | 25,085 |
GO, 4.00%, 11/15/2023 | 45,000 | 45,788 |
East Stroudsburg Area School District Series AA, GO, 5.00%, 9/1/2022 | 40,000 | 40,000 |
Economy Borough Municipal Authority Rev., 3.13%, 12/15/2022 (b) | 20,000 | 20,046 |
Elizabeth Forward School District | ||
Series 2021B, GO, AGM, 2.00%, 12/1/2022 | 20,000 | 19,963 |
Series 2021C, GO, AGM, 2.00%, 12/1/2022 | 15,000 | 14,972 |
Series 2021B, GO, AGM, 2.00%, 12/1/2023 | 20,000 | 19,779 |
INVESTMENTS | PRINCIPAL AMOUNT($) | VALUE($) |
Pennsylvania — continued | ||
Series 2021C, GO, AGM, 2.00%, 12/1/2023 | 10,000 | 9,889 |
Elizabethtown Area School District Series 2021A, GO, 4.00%, 11/15/2022 | 35,000 | 35,114 |
Exeter Township School District GO, 5.00%, 9/1/2022 | 25,000 | 25,000 |
Garnet Valley School District | ||
GO, 4.00%, 2/1/2023 | 45,000 | 45,291 |
GO, 4.00%, 4/1/2023 | 25,000 | 25,224 |
Geisinger Authority, Health System Series 2020B, Rev., 5.00%, 2/15/2027 (c) | 145,000 | 156,488 |
General Authority of Southcentral Pennsylvania, AICUP Financing Program, York College of Pennsylvania Project Series 2017 PP4, Rev., 3.00%, 11/1/2022 | 25,000 | 25,020 |
Gettysburg Area School District | ||
GO, 5.00%, 1/15/2023 | 30,000 | 30,272 |
GO, 5.00%, 1/15/2024 | 20,000 | 20,612 |
Governor Mifflin School District Series 2012B, GO, 4.00%, 4/1/2023 (b) | 25,000 | 25,240 |
Greater Latrobe School Authority Rev., 4.00%, 10/1/2022 | 25,000 | 25,033 |
Hamburg Area School District GO, 5.00%, 4/1/2023 | 120,000 | 121,830 |
Hanover Public School District GO, 4.50%, 3/1/2023 | 25,000 | 25,236 |
Hatboro-Horsham School District | ||
GO, 4.00%, 9/15/2022 | 20,000 | 20,012 |
GO, 4.00%, 9/15/2022 | 70,000 | 70,044 |
Series B, GO, 5.00%, 3/15/2023 (b) | 80,000 | 81,159 |
Haverford Township School District GO, 4.00%, 9/15/2022 | 40,000 | 40,025 |
Hempfield School District, Lancaster County Series 2020A, GO, 4.00%, 10/15/2022 | 45,000 | 45,086 |
Hollidaysburg Sewer Authority Rev., AGM, 3.00%, 12/1/2022 | 50,000 | 50,067 |
Horsham Water and Sewer Authority Rev., 5.00%, 11/15/2022 | 120,000 | 120,653 |
Kennett Consolidated School District Series 2018AA, GO, 4.00%, 2/15/2023 | 55,000 | 55,428 |
Lancaster Higher Education Authority, Harrisburg Area Community College Project Series 2016A, Rev., 5.00%, 10/1/2022 | 30,000 | 30,062 |
Lancaster Industrial Development Authority, Garden Spot Village Project Rev., 5.38%, 5/1/2023 (b) | 20,000 | 20,397 |
318 | J.P. Morgan Exchange-Traded Funds | August 31, 2022 |
INVESTMENTS | PRINCIPAL AMOUNT($) | VALUE($) |
Municipal Bonds — continued | ||
Pennsylvania — continued | ||
Lehigh County Authority Rev., 3.00%, 11/1/2022 | 50,000 | 50,065 |
Lehigh County Industrial Development Authority, PPL Electric Utilities Corp., Project Series 2016A, Rev., VRDO, 1.80%, 9/1/2022 (c) | 240,000 | 240,000 |
Lower Lackawanna Valley Sanitary Authority Rev., AGM, 4.00%, 9/15/2022 | 25,000 | 25,015 |
Lower Merion School District GO, 5.00%, 9/15/2022 | 35,000 | 35,035 |
Marple Newtown School District GO, 5.00%, 6/1/2023 | 30,000 | 30,598 |
Marshall Township Municipal Sanitary Authority Rev., 3.00%, 10/1/2022 | 25,000 | 25,014 |
Methacton School District | ||
GO, 5.00%, 3/1/2023 | 45,000 | 45,591 |
GO, 4.00%, 9/15/2025 | 75,000 | 78,113 |
Monroeville Finance Authority, University of Pittsburg Medical Center | ||
Rev., 3.00%, 2/15/2023 | 430,000 | 430,260 |
Series 2013B, Rev., 3.50%, 7/1/2023 | 230,000 | 231,627 |
Rev., 5.00%, 2/15/2025 | 85,000 | 89,606 |
Rev., 5.00%, 2/15/2026 | 20,000 | 21,479 |
Montgomery County Industrial Development Authority, Waverly Heights Ltd. Project | ||
Rev., 4.00%, 12/1/2022 | 100,000 | 100,258 |
Rev., 4.00%, 12/1/2023 | 125,000 | 126,496 |
Moon Area School District Series 2015A, GO, 5.00%, 11/15/2022 | 285,000 | 286,486 |
Nazareth Area School District GO, 4.00%, 11/15/2022 | 50,000 | 50,145 |
Neshaminy School District GO, 5.00%, 10/15/2022 | 125,000 | 125,401 |
New Kensington Municipal Sanitary Authority Rev., AGM, 3.45%, 12/1/2022 (b) | 20,000 | 20,053 |
Norristown Area School District GO, 5.00%, 9/1/2022 | 190,000 | 190,000 |
North Allegheny School District, Unlimited Tax Series 2019A, GO, 4.00%, 5/1/2024 | 25,000 | 25,602 |
North East School District GO, AGM, 2.00%, 9/1/2022 | 170,000 | 170,000 |
North Hills School District Series 2016A, GO, 5.00%, 12/15/2022 | 20,000 | 20,152 |
North Hills School District, Limited Tax GO, 4.00%, 10/15/2022 | 205,000 | 205,415 |
INVESTMENTS | PRINCIPAL AMOUNT($) | VALUE($) |
Pennsylvania — continued | ||
North Penn School District | ||
Series 2019A, GO, 3.00%, 1/15/2023 | 20,000 | 20,055 |
Series 2019A, GO, 3.00%, 1/15/2025 | 30,000 | 30,315 |
North Penn Water Authority Rev., (SIFMA Municipal Swap Index Yield + 0.56%), 2.06%, 9/12/2022 (d) | 1,225,000 | 1,223,903 |
North Wales Water Authority Rev., 3.00%, 11/1/2022 | 20,000 | 20,017 |
North Wales Water Authority, Water and Sewer System Rev., 4.00%, 11/1/2022 | 100,000 | 100,249 |
Northampton County General Purpose Authority, Lafayette College Rev., 5.00%, 11/1/2023 | 30,000 | 30,890 |
Northampton County General Purpose Authority, St. Luke's University Health Network Project Series 2016A, Rev., 5.00%, 8/15/2023 | 45,000 | 45,930 |
Northeastern School District Series 2021B, GO, 2.00%, 9/1/2022 | 200,000 | 200,000 |
Norwin School District GO, AGM, 3.00%, 11/15/2022 | 110,000 | 110,137 |
Owen J Roberts School District GO, 5.00%, 5/15/2023 (b) | 70,000 | 71,314 |
Oxford Area School District | ||
Series 2019A, GO, 4.00%, 9/1/2022 | 35,000 | 35,000 |
Series 2019A, GO, 4.00%, 9/1/2023 | 40,000 | 40,579 |
Parkland School District | ||
Series 2020A, GO, 4.00%, 1/15/2023 | 130,000 | 130,809 |
GO, 4.00%, 2/1/2023 | 25,000 | 25,174 |
Pennsylvania Economic Development Financing Authority, PPL Electric Utilities Corporation Project Rev., 0.40%, 10/1/2023 | 800,000 | 772,660 |
Pennsylvania Economic Development Financing Authority, University of Pittsburgh Medical Center | ||
Series 2021A, Rev., 4.00%, 10/15/2022 | 45,000 | 45,077 |
Series 2017A, Rev., 4.00%, 11/15/2022 | 325,000 | 325,936 |
Series 2017A, Rev., 5.00%, 11/15/2023 | 1,730,000 | 1,777,544 |
Series 2014A, Rev., 5.00%, 2/1/2025 | 50,000 | 52,129 |
Series 2017A, Rev., 5.00%, 11/15/2026 | 25,000 | 27,219 |
August 31, 2022 | J.P. Morgan Exchange-Traded Funds | 319 |
AS OF August 31, 2022 (Unaudited) (continued)
INVESTMENTS | PRINCIPAL AMOUNT($) | VALUE($) |
Municipal Bonds — continued | ||
Pennsylvania — continued | ||
Pennsylvania Economic Development Financing Authority, UPMC Series 2017C, Subseries C1, Rev., (SIFMA Municipal Swap Index Yield + 0.37%), 1.87%, 9/12/2022 (d) | 1,500,000 | 1,490,245 |
Pennsylvania Higher Educational Facilities Authority, BRYN MAWR College | ||
Series 2012A, Rev., 4.00%, 12/1/2022 | 130,000 | 130,539 |
Rev., 5.00%, 12/1/2023 | 25,000 | 25,793 |
Rev., 5.00%, 12/1/2024 | 70,000 | 73,815 |
Pennsylvania Higher Educational Facilities Authority, Drexel University Rev., 5.00%, 5/1/2023 | 265,000 | 269,330 |
Pennsylvania Higher Educational Facilities Authority, Philadelphia University Rev., 5.00%, 6/1/2023 (b) | 20,000 | 20,390 |
Pennsylvania Higher Educational Facilities Authority, State System of Higher Education Series AN, Rev., 5.00%, 6/15/2023 | 25,000 | 25,499 |
Pennsylvania Higher Educational Facilities Authority, Trustees of the University | ||
Series B, Rev., 5.00%, 10/1/2022 | 60,000 | 60,129 |
Series 2018A, Rev., 5.00%, 2/15/2023 | 60,000 | 60,713 |
Series 2016A, Rev., 5.00%, 8/15/2023 | 25,000 | 25,607 |
Series 2015A, Rev., 5.00%, 10/1/2023 | 25,000 | 25,685 |
Pennsylvania Housing Finance Agency, Single Family Mortgage Series 2019-130A, Rev., 1.40%, 4/1/2024 | 260,000 | 254,853 |
Pennsylvania State University (The) | ||
Series 2015B, Rev., 5.00%, 9/1/2022 | 90,000 | 90,000 |
Series B, Rev., 5.00%, 9/1/2022 | 160,000 | 160,000 |
Pennsylvania Turnpike Commission | ||
Rev., VRDO, LOC : TD Bank NA, 1.65%, 9/8/2022 (c) | 8,000,000 | 8,000,000 |
Series 2019-2, Rev., VRDO, LOC : TD Bank NA, 1.65%, 9/8/2022 (c) | 14,095,000 | 14,095,000 |
Series 2020A, Rev., VRDO, LOC : Barclays Bank plc, 1.46%, 9/12/2022 (c) | 40,000,000 | 40,000,000 |
Series 2018A-1, Rev., (SIFMA Municipal Swap Index Yield + 0.60%), 2.10%, 9/12/2022 (d) | 25,000 | 25,054 |
Series 2010C-3, Rev., Zero Coupon, 12/1/2022 | 105,000 | 104,294 |
Series 2021A, Rev., 3.00%, 12/1/2022 | 75,000 | 75,107 |
Series 2021B, Rev., 3.00%, 12/1/2022 | 60,000 | 60,113 |
Series A-1, Rev., 3.00%, 12/1/2022 | 60,000 | 60,095 |
Rev., 5.00%, 12/1/2022 | 235,000 | 236,485 |
INVESTMENTS | PRINCIPAL AMOUNT($) | VALUE($) |
Pennsylvania — continued | ||
Series 2011A, Rev., 5.00%, 12/1/2022 | 125,000 | 125,790 |
Series 2012B, Rev., 5.00%, 12/1/2022 | 75,000 | 75,485 |
Series 2012B, Rev., AGM, 5.00%, 12/1/2022 (b) | 110,000 | 110,745 |
Series 2014A, Rev., 5.00%, 12/1/2022 | 75,000 | 75,474 |
Series 2015B, Rev., 5.00%, 12/1/2022 | 100,000 | 100,632 |
Series 2017A, Rev., 5.00%, 12/1/2022 | 45,000 | 45,291 |
Series 2019A, Rev., 5.00%, 12/1/2022 | 140,000 | 140,885 |
Series A-1, Rev., 5.00%, 12/1/2022 (b) | 70,000 | 70,474 |
Series A-1, Rev., 5.00%, 12/1/2022 | 440,000 | 442,780 |
Series 2016B, Rev., 5.00%, 6/1/2023 | 25,000 | 25,476 |
Series 2011A, Rev., 5.00%, 12/1/2023 | 35,000 | 36,101 |
Series A-1, Rev., 5.00%, 12/1/2023 | 25,000 | 25,786 |
Pennsylvania Turnpike Commission, Motor License Fund, Enhanced, Subordinate Series 2013A, Rev., 5.00%, 12/1/2022 (b) | 145,000 | 145,982 |
Pennsylvania Turnpike Commission, Motor License Fund-Enhanced | ||
Rev., 5.00%, 12/1/2022 (b) | 75,000 | 75,508 |
Series 2012B, Rev., 5.00%, 12/1/2022 | 45,000 | 45,284 |
Series 2013A, Rev., 5.00%, 12/1/2022 (b) | 40,000 | 40,271 |
Rev., 5.00%, 12/1/2023 | 290,000 | 299,121 |
Pennsylvania Turnpike Commission, Oil Franchise Tax Series A, Rev., 5.00%, 12/1/2022 | 85,000 | 85,582 |
Pennsylvania Turnpike Commission, Senior Lien | ||
Series 2012A, Rev., 5.00%, 12/1/2022 | 180,000 | 181,137 |
Series 2012A, Rev., 5.00%, 12/1/2022 (b) | 270,000 | 271,794 |
Series 2012A, Rev., 5.00%, 12/1/2023 | 175,000 | 176,126 |
Perkiomen Valley School District | ||
GO, 5.00%, 3/1/2023 | 25,000 | 25,334 |
GO, 5.00%, 3/1/2024 | 25,000 | 25,960 |
Peters Township School District Washington County | ||
GO, 4.00%, 9/1/2022 | 135,000 | 135,000 |
GO, 5.00%, 1/15/2026 | 20,000 | 21,511 |
Philadelphia Authority for Industrial Development Rev., 5.00%, 10/1/2022 | 350,000 | 350,700 |
Philadelphia Authority for Industrial Development, National Board of Medical Examiners Project Rev., 5.00%, 5/1/2025 | 160,000 | 169,674 |
320 | J.P. Morgan Exchange-Traded Funds | August 31, 2022 |
INVESTMENTS | PRINCIPAL AMOUNT($) | VALUE($) |
Municipal Bonds — continued | ||
Pennsylvania — continued | ||
Philadelphia Authority for Industrial Development, Thomas Jefferson University Series 2017A, Rev., VRDO, 4.00%, 9/1/2022 (b) (c) | 500,000 | 500,000 |
Philadelphia Gas Works Co., 1998 General Ordinance | ||
Rev., 5.00%, 10/1/2022 | 515,000 | 516,022 |
Rev., 5.00%, 10/1/2025 | 85,000 | 91,006 |
Philipsburg-Osceola Area School District GO, 4.00%, 10/15/2022 | 25,000 | 25,049 |
Pittsburgh School District | ||
GO, 4.00%, 9/1/2022 | 70,000 | 70,000 |
GO, 5.00%, 9/1/2022 | 20,000 | 20,000 |
Series 2017A, GO, 5.00%, 9/1/2022 | 35,000 | 35,000 |
GO, AGM, 5.00%, 9/1/2023 | 25,000 | 25,654 |
Pittsburgh Water and Sewer Authority, First Lien | ||
Series 2019A, Rev., 5.00%, 9/1/2022 | 125,000 | 125,000 |
Series A, Rev., 5.00%, 9/1/2022 | 210,000 | 210,000 |
Reading Area Water Authority Rev., AGM, 4.00%, 12/1/2023 | 75,000 | 75,774 |
Saucon Valley School District GO, 4.00%, 9/1/2022 | 100,000 | 100,000 |
Shikellamy School District Series 2020A, GO, 5.00%, 9/1/2022 | 25,000 | 25,000 |
Souderton Area School District | ||
GO, 2.00%, 11/1/2022 | 40,000 | 39,956 |
GO, 5.00%, 11/1/2022 | 25,000 | 25,103 |
South Fayette Township School District Series 2014A, GO, AGM, 4.00%, 9/15/2022 | 50,000 | 50,030 |
Southeastern Pennsylvania Transportation Authority Rev., 5.00%, 3/1/2025 | 45,000 | 47,492 |
Southeastern Pennsylvania Transportation Authority, Capital Grant Receipts Rev., 5.00%, 6/1/2024 | 20,000 | 20,805 |
Southern Lehigh School District | ||
Series A, GO, 5.00%, 9/1/2022 | 20,000 | 20,000 |
Series A, GO, 5.00%, 9/1/2023 | 35,000 | 35,867 |
Sports and Exhibition Authority of Pittsburgh and Allegheny County, Sales Tax Rev., AGM, 4.00%, 2/1/2023 | 1,785,000 | 1,796,677 |
Spring Grove Area School District Series A, GO, 5.00%, 10/1/2022 | 115,000 | 115,249 |
St. Mary Hospital Authority, Trinity Health Corp. Series 2012B, Rev., 5.00%, 11/15/2022 | 280,000 | 281,459 |
INVESTMENTS | PRINCIPAL AMOUNT($) | VALUE($) |
Pennsylvania — continued | ||
State College Area School District GO, 4.00%, 3/1/2023 | 40,000 | 40,345 |
State Public School Building Authority, Dauphin County Technical School Project Rev., 5.00%, 9/15/2022 | 60,000 | 60,059 |
State Public School Building Authority, Delaware County Community College Project Rev., 5.00%, 10/1/2022 | 75,000 | 75,162 |
State Public School Building Authority, The School District of the City of Harrisburg Project Series 2016A, Rev., AGM, 4.00%, 12/1/2026 (b) | 15,000 | 15,877 |
State Public School Building Authority, Westmoreland County Community College | ||
Series 2016A, Rev., AGM, 5.00%, 10/15/2022 | 145,000 | 145,465 |
Series 2016A, Rev., AGM, 5.00%, 10/15/2023 | 10,000 | 10,286 |
Steel Valley School District, Capital Appreciation GO, AGM, Zero Coupon, 11/1/2022 | 40,000 | 39,808 |
Sto Rox School District GO, 3.00%, 12/15/2022 | 150,000 | 150,165 |
Susquehanna Township School District GO, 4.00%, 5/15/2023 | 25,000 | 25,285 |
Swarthmore Borough Authority | ||
Rev., 5.00%, 9/15/2022 | 75,000 | 75,074 |
Series 2016A, Rev., 5.00%, 9/15/2022 | 35,000 | 35,035 |
Swarthmore Borough Authority, Swarthmore College Series 2016B, Rev., 5.00%, 9/15/2022 | 50,000 | 50,049 |
Township of Cranberry 4.00%, 3/1/2023 | 35,000 | 35,305 |
Township of Derry GO, 2.00%, 11/15/2022 | 25,000 | 24,977 |
Township of Hempfield | ||
GO, 2.00%, 10/15/2022 | 50,000 | 49,953 |
GO, 5.00%, 10/15/2023 | 35,000 | 35,980 |
Township of Lower Merion GO, 5.00%, 1/15/2023 | 20,000 | 20,200 |
Township of Lower Paxton GO, 4.00%, 4/1/2024 | 30,000 | 30,685 |
Township of Palmer | ||
Series 2020A, GO, 5.00%, 11/15/2022 | 30,000 | 30,169 |
Series 2020A, GO, 5.00%, 11/15/2023 | 30,000 | 30,900 |
Township of Radnor | ||
GO, 3.63%, 11/1/2022 (b) | 40,000 | 40,089 |
GO, 3.88%, 11/1/2022 (b) | 35,000 | 35,092 |
GO, 4.00%, 11/1/2022 (b) | 85,000 | 85,237 |
August 31, 2022 | J.P. Morgan Exchange-Traded Funds | 321 |
AS OF August 31, 2022 (Unaudited) (continued)
INVESTMENTS | PRINCIPAL AMOUNT($) | VALUE($) |
Municipal Bonds — continued | ||
Pennsylvania — continued | ||
Troy Area School District Bradford County GO, 4.00%, 3/1/2023 | 20,000 | 20,165 |
Tussey Mountain School District Series 2017A, GO, AGM, 3.00%, 10/1/2022 (b) | 25,000 | 25,013 |
Upper Perkiomen School District GO, 5.00%, 11/15/2022 | 20,000 | 20,110 |
Warwick School District GO, 5.00%, 2/1/2023 | 40,000 | 40,447 |
West Allegheny School District Series 2017A, GO, 4.00%, 9/1/2022 | 60,000 | 60,000 |
West Jefferson Hills School District | ||
Series 2017A, GO, 5.00%, 8/1/2023 | 30,000 | 30,720 |
GO, 3.00%, 8/1/2024 | 25,000 | 25,226 |
West View Municipal Authority Water Rev., 4.50%, 11/15/2022 | 40,000 | 40,177 |
Westmont Hilltop School District GO, 3.00%, 10/1/2022 | 90,000 | 90,037 |
Yough School District Series 2019A, GO, 4.00%, 10/1/2022 | 50,000 | 50,062 |
Total Pennsylvania | 96,096,651 | |
Rhode Island — 0.1% | ||
Narragansett Bay Commission, Wastewater System | ||
Series 2013A, Rev., 5.00%, 9/1/2022 (b) | 310,000 | 310,000 |
Series C, Rev., 5.00%, 9/1/2022 | 25,000 | 25,000 |
Rhode Island Commerce Corp. Series 2016A, Rev., 5.00%, 6/15/2023 | 150,000 | 152,760 |
Rhode Island Health and Educational Building Corp. Series 2016A, Rev., 5.00%, 9/15/2022 | 50,000 | 50,050 |
Rhode Island Health and Educational Building Corp., Higher Education Facilities, Brown University | ||
Rev., 5.00%, 9/1/2022 | 390,000 | 390,000 |
Rev., 5.00%, 9/1/2023 | 25,000 | 25,659 |
Rhode Island Health and Educational Building Corp., Hospital Financing Lifespan Obligated Group Issue | ||
Rev., 5.00%, 5/15/2024 | 30,000 | 31,057 |
Rev., 5.00%, 5/15/2026 | 65,000 | 67,957 |
Rhode Island Health and Educational Building Corp., Providence College | ||
Rev., 5.00%, 11/1/2022 | 100,000 | 100,435 |
Series 2012B, Rev., 5.00%, 11/1/2022 | 75,000 | 75,327 |
Series 2012B, Rev., 5.00%, 11/1/2023 | 125,000 | 125,510 |
INVESTMENTS | PRINCIPAL AMOUNT($) | VALUE($) |
Rhode Island — continued | ||
Rhode Island Infrastructure Bank Series 2018A, Rev., 5.00%, 10/1/2022 | 50,000 | 50,106 |
Rhode Island Infrastructure Bank Water Pollution Control Revolving Fund | ||
Series 2015A, Rev., 3.25%, 10/1/2022 | 85,000 | 85,072 |
Series 2012A, Rev., 4.00%, 10/1/2022 | 35,000 | 35,051 |
Series 2013A, Rev., 4.00%, 10/1/2022 (b) | 75,000 | 75,103 |
Series 2002B, Rev., 4.50%, 10/1/2022 | 25,000 | 25,046 |
Series 2012B, Rev., 5.00%, 10/1/2022 | 40,000 | 40,090 |
Series 2012B, Rev., 5.00%, 10/1/2022 (b) | 25,000 | 25,056 |
Series 2013A, Rev., 5.00%, 10/1/2022 | 110,000 | 110,247 |
Series 2013A, Rev., 5.00%, 10/1/2022 (b) | 30,000 | 30,067 |
Series 2014A, Rev., 5.00%, 10/1/2022 | 45,000 | 45,101 |
Series 2017B, Rev., 5.00%, 10/1/2022 | 45,000 | 45,101 |
Series B, Rev., 5.00%, 10/1/2022 | 20,000 | 20,045 |
Series C, Rev., 5.00%, 10/1/2022 | 35,000 | 35,079 |
Rhode Island Infrastructure Bank, Municipal Road and Bridge Series 2019A, Rev., 5.00%, 10/1/2022 | 150,000 | 150,319 |
Rhode Island Infrastructure Bank, Safe Drinking Water | ||
Series 2012A, Rev., 3.00%, 10/1/2022 (b) | 25,000 | 25,015 |
Series 2012A, Rev., 5.00%, 10/1/2022 (b) | 170,000 | 170,379 |
Rhode Island Turnpike and Bridge Authority, Motor Fuel Tax Series 2016A, Rev., 4.00%, 10/1/2022 | 220,000 | 220,283 |
State of Rhode Island and Providence Plantations Consolidated Capital Development Loan | ||
Series 2013A, GO, 5.00%, 10/15/2022 (b) | 25,000 | 25,082 |
Series 2014B, GO, 5.00%, 11/1/2022 (b) | 45,000 | 45,203 |
Series 2012B, GO, 4.00%, 10/15/2023 | 35,000 | 35,071 |
State of Rhode Island and Providence Plantations Lease Participation Certificates, School for The Deaf Project Series 2017D, COP, 5.00%, 4/1/2024 | 30,000 | 31,180 |
State of Rhode Island and Providence Plantations, Courthouse Project Series 2013A, COP, 5.00%, 10/1/2023 | 45,000 | 46,228 |
322 | J.P. Morgan Exchange-Traded Funds | August 31, 2022 |
INVESTMENTS | PRINCIPAL AMOUNT($) | VALUE($) |
Municipal Bonds — continued | ||
Rhode Island — continued | ||
State of Rhode Island, Eleanor Slater Hospital Project Series 2018B, COP, 5.00%, 11/1/2022 | 200,000 | 200,867 |
Town of Smithfield Series 2016A, GO, 4.00%, 9/1/2022 | 20,000 | 20,000 |
Town of Westerly Series 2014A, GO, 5.00%, 7/1/2023 | 45,000 | 45,985 |
Total Rhode Island | 2,990,531 | |
South Carolina — 0.6% | ||
Beaufort County School District | ||
Series 2015B, SCSDE, 5.00%, 3/1/2024 | 30,000 | 31,143 |
Series 2015B, SCSDE, 5.00%, 3/1/2025 | 75,000 | 79,771 |
Berkeley County School District, Securing Assets for Education | ||
5.00%, 12/1/2022 | 55,000 | 55,376 |
Series 2015A, 5.00%, 12/1/2025 | 95,000 | 98,003 |
Charleston Educational Excellence Finance Corp. | ||
5.00%, 12/1/2022 | 90,000 | 90,609 |
Series 2013B, 5.00%, 12/1/2022 | 25,000 | 25,169 |
5.00%, 12/1/2024 | 65,000 | 67,071 |
Series 2013B, 5.00%, 12/1/2025 | 35,000 | 36,111 |
City of Anderson, Water and Sewer | ||
5.00%, 7/1/2023 | 2,005,000 | 2,047,714 |
5.00%, 7/1/2025 | 1,400,000 | 1,496,401 |
5.00%, 7/1/2026 | 1,450,000 | 1,583,015 |
City of Columbia, Waterworks and Sewer System Series 2019A, 4.00%, 2/1/2023 | 35,000 | 35,219 |
City of Columbus, Water and Sewerage | ||
3.00%, 2/1/2023 | 40,000 | 40,087 |
5.00%, 2/1/2023 | 25,000 | 25,258 |
City of Florence Rev., 4.00%, 9/1/2022 | 25,000 | 25,000 |
City of Greenwood Rev., 5.00%, 12/1/2022 | 20,000 | 20,132 |
City of Sumter, Waterworks & Sewer System Rev., 5.00%, 12/1/2022 | 20,000 | 20,135 |
Clemson University, Higher Education Bonds Series 2015B, 5.00%, 5/1/2023 | 80,000 | 81,382 |
County of Charleston Series 2021C, 4.00%, 11/1/2022 | 30,000 | 30,089 |
County of Charleston, Transportation Sales Tax 5.00%, 11/1/2022 | 40,000 | 40,183 |
County of Dorchester, Waterworks and Sewer System | ||
Rev., 5.00%, 10/1/2022 | 110,000 | 110,245 |
Rev., 5.00%, 10/1/2022 (b) | 125,000 | 125,273 |
INVESTMENTS | PRINCIPAL AMOUNT($) | VALUE($) |
South Carolina — continued | ||
County of Florence, McLeod Medical Center Project Rev., 5.00%, 11/1/2022 | 270,000 | 271,140 |
County of Richland Series 2013B, GO, 5.00%, 3/1/2023 | 40,000 | 40,538 |
Dorchester County School District No. 2, Growth Installment Purchase | ||
Series 2013B, Rev., 5.00%, 12/1/2022 | 60,000 | 60,411 |
Series 2013B, Rev., 4.00%, 12/1/2024 | 50,000 | 50,951 |
Florence Public Facilities Corp., Installment Purchase Series 2020B, Rev., 5.00%, 11/1/2022 | 25,000 | 25,108 |
Fort Mill School District No. 4 | ||
Series 2012A, GO, SCSDE, 3.00%, 9/1/2022 (b) | 75,000 | 75,000 |
Series 2017B, GO, SCSDE, 5.00%, 3/1/2023 | 20,000 | 20,268 |
Fort Mill School Facilities Corp., Fort Mill School District no.4 Rev., 5.00%, 12/1/2022 | 160,000 | 161,095 |
Greenville County School District, Building Equity Sooner for Tomorrow Installment Purchase Rev., 5.00%, 12/1/2022 | 90,000 | 90,616 |
Greenwood Fifty Schools Facilities, Inc., Installment Purchase Rev., 5.00%, 12/1/2022 | 80,000 | 80,529 |
Horry County School District | ||
GO, SCSDE, 5.00%, 3/1/2023 | 40,000 | 40,524 |
GO, SCSDE, 5.00%, 3/1/2025 | 25,000 | 26,571 |
Joint Municipal Water and Sewer Commission, System Improvement Rev., 4.75%, 6/1/2023 (b) | 20,000 | 20,356 |
Kershaw County Public Schools Foundation Rev., 5.00%, 12/1/2022 | 25,000 | 25,160 |
Lee County School Facilities, Inc. Rev., AGM, 5.00%, 12/1/2022 | 50,000 | 50,330 |
Lexington County School District No. 1 Series 2013B, GO, SCSDE, 3.38%, 2/1/2023 (b) | 60,000 | 60,259 |
Lexington One School Facilities Corp., Lexington County School District No. 1 Rev., 5.00%, 12/1/2022 | 60,000 | 60,411 |
Lexington School District No. 2 Educational Facilities Corp. Series 2015B, Rev., 5.00%, 12/1/2022 | 50,000 | 50,331 |
Medical University of South Carolina (The) Rev., 5.00%, 10/1/2022 | 30,000 | 30,065 |
Patriots Energy Group Financing Agency Series 2018A, Rev., LIQ : Royal Bank of Canada, 4.00%, 2/1/2024 (c) | 4,385,000 | 4,456,581 |
August 31, 2022 | J.P. Morgan Exchange-Traded Funds | 323 |
AS OF August 31, 2022 (Unaudited) (continued)
INVESTMENTS | PRINCIPAL AMOUNT($) | VALUE($) |
Municipal Bonds — continued | ||
South Carolina — continued | ||
Piedmont Municipal Power Agency | ||
Subseries A-2, Rev., NATL-RE, Zero Coupon, 1/1/2023 | 75,000 | 74,312 |
Series 2015A, Rev., 5.00%, 1/1/2025 | 360,000 | 378,817 |
Rev., NATL-RE, 5.38%, 1/1/2025 | 105,000 | 111,461 |
Richland County School District No. 1 Series 2014C, GO, SCSDE, 5.00%, 3/1/2023 | 35,000 | 35,477 |
Richland County School District No. 2 Series 2015A, GO, SCSDE, 5.00%, 2/1/2023 | 70,000 | 70,797 |
SCAGO Educational Facilities Corp. for Calhoun School District Rev., 5.00%, 12/1/2022 | 20,000 | 20,132 |
Scago Educational Facilities Corp. for Colleton School District Rev., 5.00%, 12/1/2022 | 65,000 | 65,412 |
SCAGO Educational Facilities Corp. for Pickens School District Rev., 5.00%, 12/1/2022 | 520,000 | 523,455 |
Scago Educational Facilities Corp. for Union School District Rev., 5.00%, 12/1/2022 | 20,000 | 20,127 |
South Carolina Jobs-Economic Development Authority, Bon Secours Health System, Inc. | ||
Rev., 5.00%, 10/1/2022 | 45,000 | 45,094 |
Rev., 3.75%, 11/1/2022 (b) | 70,000 | 70,164 |
Rev., 5.00%, 11/1/2022 (b) | 235,000 | 236,039 |
South Carolina Jobs-Economic Development Authority, Bon Secours Mercy Health, Inc. Rev., 5.00%, 10/1/2025 (c) | 300,000 | 321,014 |
South Carolina Jobs-Economic Development Authority, Hospital Refunding and Improvement, Mcleod Health Projects Rev., 5.00%, 11/1/2022 | 490,000 | 492,068 |
South Carolina Jobs-Economic Development Authority, Wofford College Rev., 5.00%, 4/1/2023 | 125,000 | 126,754 |
South Carolina Public Service Authority, Santee Cooper | ||
Series 2014C, Rev., 5.00%, 12/1/2022 | 140,000 | 140,902 |
Series C, Rev., 5.00%, 12/1/2022 | 220,000 | 221,418 |
Series 2013A, Rev., 5.75%, 12/1/2023 (b) | 40,000 | 41,614 |
Series A, Rev., 5.00%, 12/1/2026 | 1,170,000 | 1,226,222 |
South Carolina State Fiscal Accountability Authority, Mental Health Project Rev., 5.00%, 10/1/2022 | 75,000 | 75,166 |
INVESTMENTS | PRINCIPAL AMOUNT($) | VALUE($) |
South Carolina — continued | ||
South Carolina Transportation Infrastructure Bank | ||
Series 2016A, Rev., 5.00%, 10/1/2022 | 110,000 | 110,243 |
Series 2015A, Rev., 5.00%, 10/1/2024 | 25,000 | 26,281 |
Spartanburg Sanitary Sewer District, Sewer System Series B, Rev., 5.00%, 3/1/2023 (b) | 25,000 | 25,336 |
Town of Summerville, Hospitality Fee Pledge Series 2015B, Rev., 5.00%, 10/1/2023 | 300,000 | 307,636 |
University of South Carolina, Athletic Facilities | ||
Series 2017B, Rev., 5.00%, 5/1/2024 | 410,000 | 426,650 |
Series 2017B, Rev., 5.00%, 5/1/2025 | 530,000 | 562,184 |
University of South Carolina, Higher Education Facilities | ||
Rev., 5.00%, 5/1/2023 | 90,000 | 91,602 |
Rev., 5.00%, 5/1/2025 | 70,000 | 74,549 |
York County School District No. 3 Rock Hill Series 2017B, GO, SCSDE, 5.00%, 3/1/2023 | 30,000 | 30,409 |
Total South Carolina | 17,810,965 | |
South Dakota — 0.2% | ||
Bon Homme School District No. 4-2, Limited Tax 2.00%, 12/1/2022 | 50,000 | 49,948 |
City of Sioux Falls, Sales Tax | ||
Series 2016A, Rev., 3.00%, 11/15/2022 | 20,000 | 20,031 |
Series 2012A, Rev., 4.00%, 11/15/2022 | 180,000 | 180,644 |
Series 2017A, Rev., 5.00%, 11/15/2022 | 355,000 | 356,982 |
Series 2020A, Rev., 5.00%, 11/15/2022 | 25,000 | 25,140 |
County of Minnehaha Series 2017A, GO, 4.00%, 12/1/2022 | 25,000 | 25,101 |
County of Pennington, Limited Tax | ||
Series 2017A, COP, 3.00%, 6/1/2023 | 25,000 | 25,136 |
Series 2017A, COP, 3.00%, 12/1/2023 | 100,000 | 100,851 |
Rapid City Area School District No. 51-4, Limited Tax, Capital Outlay GO, 4.00%, 8/1/2023 | 630,000 | 639,449 |
South Dakota Health and Educational Facilities Authority, Regional Health Rev., 5.00%, 9/1/2022 | 240,000 | 240,000 |
324 | J.P. Morgan Exchange-Traded Funds | August 31, 2022 |
INVESTMENTS | PRINCIPAL AMOUNT($) | VALUE($) |
Municipal Bonds — continued | ||
South Dakota — continued | ||
South Dakota Health and Educational Facilities Authority, Sanford Health Obligated Group Series B, Rev., 5.00%, 11/1/2022 | 85,000 | 85,386 |
South Dakota State Building Authority | ||
Series 2014D, Rev., 5.00%, 9/1/2022 | 80,000 | 80,000 |
Series 2020C, Rev., 3.00%, 6/1/2023 | 35,000 | 35,164 |
Series B, Rev., 5.00%, 6/1/2023 (b) | 45,000 | 45,893 |
Series 2019A, Rev., 4.00%, 6/1/2024 | 30,000 | 30,751 |
Series 2014D, Rev., 5.00%, 9/1/2024 | 25,000 | 26,192 |
Tender Option Bond Trust Receipts/ Certificates Series 2020-XG0302, Rev., VRDO, LIQ : Barclays Bank plc, 1.60%, 9/12/2022 (c) (e) | 5,760,000 | 5,760,000 |
Total South Dakota | 7,726,668 | |
Tennessee — 0.2% | ||
City of Chattanooga 3.13%, 10/1/2025 | 140,000 | 140,069 |
City of Chattanooga, Electric System Series 2015A, Rev., 5.00%, 9/1/2022 | 155,000 | 155,000 |
City of Clarksville 3.00%, 6/1/2023 | 25,000 | 25,136 |
City of Clarksville, Electric System 2.00%, 9/1/2022 | 50,000 | 50,000 |
City of Clarksville, Water Sewer and Gas 5.00%, 2/1/2023 | 80,000 | 80,910 |
City of La Vergne, Sewage Works GO, 3.30%, 3/1/2023 (b) | 25,000 | 25,120 |
City of Memphis, Electric System Series 2020A, Rev., 4.00%, 12/1/2022 | 35,000 | 35,149 |
City of Memphis, Gas System Rev., 4.00%, 12/1/2022 | 35,000 | 35,155 |
City of Memphis, Sanitary Sewerage System Rev., 5.00%, 10/1/2022 | 45,000 | 45,101 |
City of Memphis, Storm Water System Rev., 5.00%, 10/1/2022 | 20,000 | 20,045 |
City of Morristown GO, 5.00%, 9/1/2022 | 30,000 | 30,000 |
City of Murfreesboro Series 2016B, GO, 5.00%, 12/1/2022 | 25,000 | 25,170 |
County of Hamilton Series 2015B, GO, 5.00%, 3/1/2023 | 20,000 | 20,268 |
County of Hawkins GO, 5.00%, 6/1/2023 | 25,000 | 25,465 |
County of Maury GO, 5.00%, 4/1/2024 | 30,000 | 31,218 |
County of Shelby | ||
Series 2012A, GO, 4.00%, 3/1/2023 | 30,000 | 30,242 |
Series 2019B, GO, 5.00%, 4/1/2023 | 15,000 | 15,226 |
County of Sumner, School and Public Improvement GO, 5.00%, 12/1/2022 | 170,000 | 171,091 |
INVESTMENTS | PRINCIPAL AMOUNT($) | VALUE($) |
Tennessee — continued | ||
County of Williamson, Public Improvement and School GO, 5.00%, 4/1/2023 | 25,000 | 25,394 |
Greeneville Health and Educational Facilities Board, Ballad Health Obligated Group | ||
Series 2018A, Rev., 5.00%, 7/1/2024 | 145,000 | 147,609 |
Series 2018A, Rev., 5.00%, 7/1/2025 | 440,000 | 446,638 |
Hallsdale-Powell Utility District, Water and Sewer Rev., 5.00%, 4/1/2023 | 45,000 | 45,697 |
Jackson Energy Authority, Wastewater System Rev., 5.00%, 12/1/2022 | 25,000 | 25,168 |
Knox County First Utility District, Water and Sewer Rev., 4.00%, 12/1/2022 (b) | 20,000 | 20,084 |
Knox County Health Educational and Housing Facility Board, Covenant Health | ||
Series 2012A, Rev., 4.00%, 1/1/2023 | 100,000 | 100,419 |
Series 2012A, Rev., 5.00%, 1/1/2024 | 85,000 | 85,604 |
Series 2012A, Rev., 5.00%, 1/1/2026 | 25,000 | 25,162 |
Metropolitan Government Nashville and Davidson County | ||
Series 2013A, GO, 5.00%, 1/1/2023 (b) | 25,000 | 25,225 |
GO, 5.00%, 7/1/2023 (b) | 25,000 | 25,549 |
GO, 5.00%, 7/1/2023 | 105,000 | 107,193 |
Metropolitan Government Nashville and Davidson County Health and Educational Facilities Board, Trevecca Nazarene University Project | ||
Series 2021B, Rev., 4.00%, 10/1/2023 | 130,000 | 130,483 |
Series 2021B, Rev., 4.00%, 10/1/2024 | 170,000 | 169,702 |
Series 2021B, Rev., 4.00%, 10/1/2025 | 170,000 | 169,325 |
Metropolitan Government Nashville and Davidson County Health and Educational Facilities Board, Vanderbilt University Medical Center | ||
Series 2012D, Rev., 4.00%, 10/3/2022 (b) | 170,000 | 170,235 |
Series 2012D, Rev., 5.00%, 10/3/2022 (b) | 50,000 | 50,114 |
Metropolitan Government Nashville and Davidson County, District Energy Series 2012A, GO, 4.00%, 10/1/2022 | 25,000 | 25,033 |
Metropolitan Government Nashville and Davidson County, Electric System Series 2014A, Rev., 5.00%, 5/15/2023 | 20,000 | 20,356 |
Metropolitan Government Nashville and Davidson County, Water and Sewer | ||
Series 2017B, Rev., 5.00%, 7/1/2023 | 25,000 | 25,522 |
Series 2020B, Rev., 5.00%, 7/1/2023 | 35,000 | 35,731 |
August 31, 2022 | J.P. Morgan Exchange-Traded Funds | 325 |
AS OF August 31, 2022 (Unaudited) (continued)
INVESTMENTS | PRINCIPAL AMOUNT($) | VALUE($) |
Municipal Bonds — continued | ||
Tennessee — continued | ||
Shelby County Health Educational and Housing Facilities Board, Methodist Le Bonheur Healthcare Series 2017A, Rev., 5.00%, 5/1/2025 | 160,000 | 169,208 |
Shelby County Health Educational and Housing Facilities Board, The Village of Germantown | ||
Rev., 5.00%, 12/1/2022 (b) | 325,000 | 327,078 |
Rev., 5.38%, 12/1/2022 (b) | 80,000 | 80,595 |
State of Tennessee | ||
Series 2019A, GO, 5.00%, 9/1/2022 | 90,000 | 90,000 |
Series 2021A, GO, 5.00%, 11/1/2022 | 20,000 | 20,091 |
Tennessee Energy Acquisition Corp. Series 2006A, Rev., 5.25%, 9/1/2023 | 70,000 | 71,231 |
Tennessee Energy Acquisition Corp., Commodity Project | ||
Series 2021A, Rev., 5.00%, 11/1/2025 | 350,000 | 365,168 |
Series 2021A, Rev., 5.00%, 11/1/2026 | 400,000 | 421,498 |
Tennessee Energy Acquisition Corp., Gas Project Series 2017A, Rev., 4.00%, 5/1/2023 (c) | 1,605,000 | 1,613,809 |
Tennessee Housing Development Agency, Residential Finance Program Series 1C, Rev., 3.00%, 7/1/2023 | 20,000 | 20,013 |
Tennessee State School Bond Authority, Higher Educational Facilities Second Program | ||
Rev., 5.00%, 11/1/2022 | 435,000 | 436,981 |
Series 2013A, Rev., 5.00%, 11/1/2022 | 50,000 | 50,228 |
Series 2018A, Rev., 5.00%, 11/1/2022 | 140,000 | 140,638 |
Series B, Rev., 5.00%, 11/1/2022 | 45,000 | 45,205 |
Series B, Rev., 5.00%, 11/1/2024 | 20,000 | 21,069 |
Town of Smyrna GO, 5.00%, 4/1/2024 | 30,000 | 31,218 |
Total Tennessee | 6,740,638 | |
Texas — 4.9% | ||
Abilene Independent School District, Unlimited Tax School Building | ||
PSF-GTD, 5.00%, 2/15/2024 (b) | 25,000 | 25,307 |
PSF-GTD, 5.00%, 2/15/2026 (b) | 35,000 | 35,430 |
Alamo Community College District, Financing System Senior Lien Series 2012A, 5.00%, 11/1/2022 | 195,000 | 195,888 |
Aldine Independent School District, Unlimited Tax PSF-GTD, 5.00%, 2/15/2023 | 20,000 | 20,247 |
Alief Independent School District, Unlimited Tax PSF-GTD, 5.00%, 2/15/2023 | 50,000 | 50,617 |
INVESTMENTS | PRINCIPAL AMOUNT($) | VALUE($) |
Texas — continued | ||
Allen Economic Development Corp., Sales Tax Series 2017A, 5.00%, 9/1/2022 | 40,000 | 40,000 |
Alvin Independent School District, Unlimited Tax PSF-GTD, 4.00%, 2/15/2023 | 35,000 | 35,277 |
Amarillo Junior College District, Limited Tax 3.00%, 2/15/2023 | 35,000 | 35,104 |
Arlington Higher Education Finance Corp. Series 2021A, 5.00%, 8/15/2023 | 155,000 | 156,852 |
Aubrey Independent School District, Capital Appreciation, Unlimited Tax PSF-GTD, Zero Coupon, 2/15/2023 | 45,000 | 44,492 |
Austin Community College District Public Facility Corp., Highland Campus - Building 3000 Project 5.00%, 8/1/2023 | 25,000 | 25,593 |
Austin Community College District, Combined Fee Series 2016A, 4.00%, 2/1/2023 | 150,000 | 151,074 |
Austin Community College District, Limited Tax 5.00%, 8/1/2023 | 45,000 | 46,067 |
Barbers Hill Independent School District, Unlimited Tax 5.00%, 2/15/2023 | 25,000 | 25,284 |
Bastrop Independent School District, Unlimited Tax Series 2013A, PSF-GTD, 3.00%, 2/15/2023 | 70,000 | 70,231 |
Bay City Independent School District, Unlimited Tax PSF-GTD, 5.00%, 2/15/2025 | 40,000 | 42,422 |
Belton Independent School District Series 2017, PSF-GTD, 4.00%, 2/15/2023 | 100,000 | 100,768 |
Bexar County Hospital District 5.00%, 2/15/2023 | 75,000 | 75,878 |
Bexar County Hospital District, Limited Tax 5.00%, 2/15/2023 | 200,000 | 202,341 |
Board of Regents of the University of Texas System, Financing System | ||
Series 2012A, Rev., 5.00%, 8/15/2023 | 20,000 | 20,505 |
Series 2016C, Rev., 5.00%, 8/15/2023 | 30,000 | 30,757 |
Brazoria-Fort Bend County Municipal Utility District No. 1 2.00%, 9/1/2022 | 80,000 | 80,000 |
Brazos Port Water Authority, Water Supply System Series 2015C, 4.00%, 9/1/2022 | 25,000 | 25,000 |
Brazos River Authority, Williamson County Regional Raw Water Line Project 3.00%, 9/1/2022 | 65,000 | 65,000 |
Buna Independent School District, School Building, Unlimited Tax PSF-GTD, 2.25%, 8/15/2023 | 80,000 | 79,668 |
326 | J.P. Morgan Exchange-Traded Funds | August 31, 2022 |
INVESTMENTS | PRINCIPAL AMOUNT($) | VALUE($) |
Municipal Bonds — continued | ||
Texas — continued | ||
Carrollton-Farmers Branch Independent School District, Unlimited Tax PSF-GTD, 5.00%, 2/15/2023 | 25,000 | 25,299 |
Center Independent School District, Unlimited Tax PSF-GTD, 5.00%, 2/15/2023 | 45,000 | 45,453 |
Central Texas Regional Mobility Authority, Subordinated Lien Series 2020F, Rev., BAN, 5.00%, 1/1/2025 | 720,000 | 745,042 |
Chambers County Improvement District No. 1, Unlimited Tax 3.00%, 9/1/2022 | 30,000 | 30,000 |
City of Abilene | ||
4.00%, 2/15/2023 | 20,000 | 20,150 |
5.00%, 2/15/2024 | 25,000 | 25,882 |
City of Albany, Combination Tax AGM, 4.00%, 2/1/2023 | 30,000 | 30,157 |
City of Amarillo 5.00%, 4/1/2023 | 20,000 | 20,306 |
City of Arlington, Special Tax 4.00%, 2/15/2023 | 45,000 | 45,327 |
City of Austin | ||
5.00%, 9/1/2022 | 615,000 | 615,000 |
Series 2011A, 5.00%, 9/1/2022 | 75,000 | 75,000 |
5.00%, 9/1/2023 | 25,000 | 25,674 |
City of Austin, Electric Utility System | ||
Series 2015A, 5.00%, 11/15/2022 | 120,000 | 120,663 |
Series 2012A, 5.00%, 11/15/2024 | 495,000 | 497,774 |
5.00%, 11/15/2025 | 100,000 | 100,558 |
City of Austin, Public Improvement | ||
5.00%, 9/1/2022 | 335,000 | 335,000 |
5.00%, 11/1/2022 | 25,000 | 25,112 |
5.00%, 9/1/2023 | 70,000 | 71,888 |
City of Austin, Public Property Financing 5.00%, 11/1/2022 | 85,000 | 85,380 |
City of Austin, Water and Wastewater System | ||
5.00%, 11/15/2022 | 50,000 | 50,278 |
Series 2014, 5.00%, 11/15/2022 | 50,000 | 50,278 |
5.00%, 11/15/2023 (b) | 20,000 | 20,107 |
Series 2013A, 5.00%, 11/15/2023 (b) | 10,000 | 10,181 |
Series 2013A, 5.00%, 11/15/2023 | 10,000 | 10,187 |
5.00%, 11/15/2024 | 25,000 | 25,140 |
Series 2013A, 5.00%, 11/15/2024 | 25,000 | 25,473 |
City of Baytown 5.00%, 2/1/2023 | 20,000 | 20,220 |
City of Beaumont 5.00%, 3/1/2023 | 100,000 | 101,299 |
INVESTMENTS | PRINCIPAL AMOUNT($) | VALUE($) |
Texas — continued | ||
City of Beaumont, Waterworks & Sewer System | ||
Series A, AGM, 5.00%, 9/1/2022 | 105,000 | 105,000 |
5.00%, 9/1/2025 (b) | 55,000 | 55,000 |
City of Boerne 5.00%, 3/1/2023 | 50,000 | 50,672 |
City of Brownsville, Utilities System | ||
AGM, 5.00%, 9/1/2022 | 150,000 | 150,000 |
Series 2013A, 5.00%, 9/1/2022 | 425,000 | 425,000 |
Series 2013A, 5.00%, 9/1/2024 | 225,000 | 230,289 |
City of Bryan, Electric System 5.00%, 7/1/2023 | 15,000 | 15,318 |
City of Bryan, Rural Electric System 5.00%, 7/1/2023 | 10,000 | 10,212 |
City of Buda 5.00%, 8/15/2024 | 20,000 | 20,969 |
City of Cedar Hill, Refunding and Improvement 4.00%, 2/15/2023 | 45,000 | 45,315 |
City of Cedar Hill, Refunding and Improvement | ||
5.00%, 2/15/2023 | 25,000 | 25,287 |
5.00%, 2/15/2025 | 40,000 | 42,461 |
City of Cedar Park, Refunding and Improvement 5.00%, 2/15/2023 | 30,000 | 30,363 |
City of College Station | ||
5.00%, 2/15/2023 | 30,000 | 30,365 |
5.00%, 2/15/2023 | 20,000 | 20,243 |
City of Conroe | ||
Series 2019B, 5.00%, 11/15/2022 | 60,000 | 60,330 |
Series 2018B, 5.00%, 11/15/2024 | 25,000 | 26,359 |
Series 2019A, 5.00%, 3/1/2025 | 35,000 | 37,104 |
City of Copperas Cove 4.00%, 8/15/2025 | 25,000 | 25,983 |
City of Corinth, Combination Tax 5.00%, 2/15/2023 | 25,000 | 25,299 |
City of Corpus Christi 5.00%, 3/1/2023 | 35,000 | 35,434 |
City of Corpus Christi, General Improvement Series 2020A, 5.00%, 3/1/2023 | 45,000 | 45,558 |
City of Dallas | ||
GO, 5.00%, 2/15/2025 | 100,000 | 103,571 |
Series 2013A, GO, 5.00%, 2/15/2025 | 25,000 | 25,287 |
GO, 5.00%, 2/15/2026 | 185,000 | 191,580 |
GO, 5.00%, 2/15/2027 | 160,000 | 165,669 |
City of Dallas, Equipment Acquisition Contract Series 2020B, GO, 5.00%, 2/15/2023 | 95,000 | 96,116 |
City of Dallas, Waterworks and Sewer System | ||
Rev., 5.00%, 10/1/2022 | 75,000 | 75,161 |
August 31, 2022 | J.P. Morgan Exchange-Traded Funds | 327 |
AS OF August 31, 2022 (Unaudited) (continued)
INVESTMENTS | PRINCIPAL AMOUNT($) | VALUE($) |
Municipal Bonds — continued | ||
Texas — continued | ||
Series 2012A, Rev., 5.00%, 10/1/2022 | 50,000 | 50,111 |
Series 2016A, Rev., 5.00%, 10/1/2022 | 35,000 | 35,078 |
Series 2020C, Rev., 5.00%, 10/1/2022 | 70,000 | 70,155 |
Series 2012A, Rev., 5.00%, 10/1/2023 | 120,000 | 120,258 |
City of Deer Park GO, 3.00%, 3/15/2024 | 25,000 | 25,219 |
City of Denton | ||
GO, 3.00%, 2/15/2023 | 50,000 | 50,156 |
GO, 5.00%, 2/15/2023 | 45,000 | 45,543 |
City of DeSoto GO, 5.00%, 2/15/2023 | 110,000 | 111,353 |
City of Eagle Pass GO, AGM, 5.00%, 3/1/2023 | 25,000 | 25,330 |
City of El Paso, Water and Sewer System Rev., 5.00%, 3/1/2023 | 50,000 | 50,658 |
City of Farmers Branch GO, 4.00%, 2/15/2025 | 35,000 | 36,274 |
City of Farmers Branch, Combination Tax GO, 5.00%, 2/15/2023 | 30,000 | 30,358 |
City of Fort Worth, Drainage Utility System Rev., 5.00%, 2/15/2023 | 30,000 | 30,363 |
City of Frisco | ||
GO, 5.00%, 2/15/2023 | 160,000 | 161,989 |
Series 2011, GO, 5.00%, 2/15/2023 | 45,000 | 45,099 |
Series 2015A, GO, 5.00%, 2/15/2023 | 15,000 | 15,187 |
GO, 5.00%, 2/15/2025 | 35,000 | 37,119 |
City of Garland | ||
GO, 5.00%, 2/15/2023 | 55,000 | 55,676 |
Series 2015A, GO, 5.00%, 2/15/2023 | 25,000 | 25,307 |
City of Garland, Electric Utility System | ||
Rev., 5.00%, 3/1/2023 | 660,000 | 668,412 |
Series 2016A, Rev., 5.00%, 3/1/2023 | 20,000 | 20,255 |
Series 2016B, Rev., 5.00%, 3/1/2023 | 490,000 | 496,245 |
Rev., 5.00%, 3/1/2025 | 250,000 | 263,909 |
Series 2019A, Rev., 5.00%, 3/1/2025 | 3,480,000 | 3,673,607 |
Rev., 5.00%, 3/1/2026 | 250,000 | 268,882 |
Series 2019A, Rev., 5.00%, 3/1/2026 | 240,000 | 258,126 |
City of Georgetown GO, 5.00%, 8/15/2023 | 25,000 | 25,612 |
City of Granbury Series 2016A, GO, 4.00%, 8/15/2025 | 35,000 | 36,508 |
City of Grapevine | ||
GO, 4.00%, 2/15/2023 | 40,000 | 40,302 |
GO, 5.00%, 2/15/2023 | 40,000 | 40,481 |
City of Harlingen GO, 5.00%, 2/15/2023 | 20,000 | 20,235 |
City of Heath, Combination Tax and Surplus GO, 5.00%, 2/15/2025 | 40,000 | 42,373 |
City of Houston Series 2016A, GO, 5.00%, 3/1/2024 | 35,000 | 36,371 |
INVESTMENTS | PRINCIPAL AMOUNT($) | VALUE($) |
Texas — continued | ||
City of Houston, Airport System, Subordinate Lien | ||
Series 2018D, Rev., 5.00%, 7/1/2026 | 45,000 | 48,819 |
Series 2020B, Rev., 5.00%, 7/1/2026 | 35,000 | 37,970 |
City of Houston, Combined Utility System, First Lien | ||
Series 2012D, Rev., 4.00%, 11/15/2022 (b) | 80,000 | 80,268 |
Series 2012D, Rev., 5.00%, 11/15/2022 (b) | 155,000 | 155,864 |
Series 2014D, Rev., 5.00%, 11/15/2022 | 375,000 | 377,094 |
Series 2016B, Rev., 5.00%, 11/15/2022 | 350,000 | 351,954 |
Series 2017B, Rev., 5.00%, 11/15/2022 | 25,000 | 25,140 |
Series 2018D, Rev., 5.00%, 11/15/2022 | 180,000 | 181,005 |
Series 2014C, Rev., 5.00%, 5/15/2023 | 115,000 | 117,129 |
Series 2013B, Rev., 4.00%, 11/15/2023 | 25,000 | 25,480 |
Series 2002C, Rev., 5.00%, 11/15/2023 | 25,000 | 25,774 |
City of Houston, Combined Utility System, Junior Lien | ||
Rev., AGM, Zero Coupon, 12/1/2022 (b) | 70,000 | 69,570 |
Rev., AGM, Zero Coupon, 12/1/2022 | 90,000 | 89,452 |
Series A, Rev., AGM, Zero Coupon, 12/1/2024 | 85,000 | 79,870 |
City of Houston, Demolition Program Series 2013A, GO, 5.00%, 3/1/2023 | 30,000 | 30,402 |
City of Houston, Public Improvement Series 2013A, GO, 5.00%, 3/1/2023 | 20,000 | 20,268 |
City of Hutto Series 2019A, GO, 5.00%, 8/1/2025 | 20,000 | 21,369 |
City of Irving GO, 5.00%, 9/15/2022 | 25,000 | 25,025 |
City of Kenedy, Combination Tax GO, 4.00%, 5/1/2025 | 25,000 | 25,931 |
City of Lakeway GO, 4.00%, 2/1/2024 | 45,000 | 45,925 |
City of Lancaster GO, 5.00%, 2/15/2023 | 25,000 | 25,293 |
City of Laredo | ||
GO, 4.00%, 2/15/2023 | 20,000 | 20,157 |
GO, 5.00%, 2/15/2024 | 50,000 | 50,638 |
GO, 5.00%, 2/15/2024 | 25,000 | 25,947 |
City of Laredo, Combination Tax GO, 5.00%, 2/15/2025 | 40,000 | 42,363 |
City of Lewisville GO, 4.00%, 2/15/2023 | 25,000 | 25,182 |
328 | J.P. Morgan Exchange-Traded Funds | August 31, 2022 |
INVESTMENTS | PRINCIPAL AMOUNT($) | VALUE($) |
Municipal Bonds — continued | ||
Texas — continued | ||
City of Lubbock | ||
Series 2018A, GO, 3.00%, 2/15/2023 | 40,000 | 40,139 |
Series 2016A, GO, 4.00%, 2/15/2023 | 35,000 | 35,278 |
GO, 5.00%, 2/15/2023 | 80,000 | 80,995 |
GO, 5.00%, 2/15/2023 | 15,000 | 15,187 |
GO, 5.00%, 2/15/2027 | 20,000 | 21,177 |
City of Lubbock Water and Wastewater System Series 2020A, Rev., 5.00%, 2/15/2023 | 45,000 | 45,510 |
City of Lubbock, Electric Light and Power System | ||
Rev., 5.00%, 4/15/2023 | 25,000 | 25,410 |
Rev., 5.00%, 4/15/2024 | 400,000 | 416,287 |
Rev., 5.00%, 4/15/2025 | 125,000 | 132,405 |
City of Mansfield GO, 5.00%, 2/15/2023 | 20,000 | 20,232 |
City of Mansfield, Combination Tax GO, 2.00%, 2/15/2024 | 25,000 | 24,875 |
City of McAllen, Limited Tax GO, 5.00%, 2/15/2023 | 25,000 | 25,297 |
City of McAllen, Water and Sewer Rev., 5.00%, 2/1/2023 | 25,000 | 25,270 |
City of McKinney | ||
GO, 5.00%, 8/15/2023 | 30,000 | 30,746 |
GO, 5.00%, 8/15/2025 | 25,000 | 26,778 |
City of McKinney, Waterworks and Sewer System Rev., 5.00%, 3/15/2023 | 20,000 | 20,287 |
City of Mesquite GO, 5.00%, 2/15/2023 | 30,000 | 30,357 |
City of Mesquite, Waterworks and Sewer System Rev., 3.00%, 3/1/2023 | 45,000 | 45,096 |
City of Midland | ||
GO, 5.00%, 3/1/2023 | 45,000 | 45,603 |
Series 2018A, GO, 5.00%, 3/1/2025 | 70,000 | 74,225 |
City of Midland, Certificates of Obligation GO, 5.00%, 3/1/2025 | 40,000 | 42,414 |
City of Midlothian, Combination Tax, Navarro College District GO, 3.00%, 8/15/2024 | 25,000 | 25,268 |
City of Missouri City | ||
GO, 5.00%, 6/15/2023 | 55,000 | 56,116 |
GO, 5.00%, 6/15/2024 | 30,000 | 31,329 |
City of Missouri City, Combination Tax, Certificates of Obligation Series 2018B, GO, 4.00%, 6/15/2025 | 25,000 | 25,987 |
City of New Braunfels, Combination Tax, Certificates of Obligation GO, 5.00%, 2/1/2025 | 40,000 | 42,278 |
INVESTMENTS | PRINCIPAL AMOUNT($) | VALUE($) |
Texas — continued | ||
City of New Braunfels, Utility System Rev., 5.00%, 7/1/2023 | 40,000 | 40,859 |
City of North Richland Hills GO, 3.00%, 2/15/2023 | 30,000 | 30,098 |
City of Odessa | ||
GO, 5.00%, 3/1/2023 | 110,000 | 111,396 |
GO, 5.00%, 3/1/2026 | 265,000 | 274,473 |
City of Pasadena Series 2012A, GO, 5.00%, 2/15/2024 | 55,000 | 55,119 |
City of Pearland, Permanent Improvement | ||
GO, 5.00%, 3/1/2023 | 180,000 | 182,315 |
GO, 5.00%, 3/1/2024 | 40,000 | 41,477 |
Series 2016B, GO, 5.00%, 3/1/2024 | 25,000 | 25,923 |
City of Pearland, Waterworks and Sewer System Series 2019B, Rev., 5.00%, 9/1/2022 | 190,000 | 190,000 |
City of Plano | ||
GO, 5.00%, 9/1/2022 | 240,000 | 240,000 |
GO, 5.00%, 9/1/2023 | 40,000 | 40,533 |
GO, 5.00%, 9/1/2023 | 30,000 | 30,785 |
City of Port Aransas, Combination Tax, Certificates of Obligation GO, 4.00%, 2/1/2025 | 25,000 | 25,848 |
City of Portland, Combination Tax, Certificates of Obligation GO, 4.00%, 8/15/2023 | 25,000 | 25,378 |
City of Richardson GO, 5.00%, 2/15/2023 | 20,000 | 20,237 |
City of Richardson, Combination Tax, Certificates of Obligation | ||
GO, 3.00%, 2/15/2023 | 45,000 | 45,130 |
GO, 4.50%, 2/15/2023 | 30,000 | 30,288 |
GO, 5.00%, 2/15/2023 | 100,000 | 101,184 |
City of Sachse, Combination Tax and Limited Surplus Series 2017A, GO, 4.00%, 2/15/2025 | 65,000 | 67,381 |
City of San Antonio, Drainage Utility System | ||
Rev., 5.00%, 2/1/2024 | 100,000 | 101,111 |
Rev., 5.00%, 2/1/2027 | 50,000 | 50,534 |
City of San Antonio, Electric and Gas Systems Rev., 5.00%, 2/1/2023 | 2,235,000 | 2,259,505 |
City of San Marcos, Combination Tax, Certificates of Obligation GO, 5.00%, 8/15/2024 | 35,000 | 36,668 |
City of Seguin | ||
GO, 4.00%, 9/1/2022 | 25,000 | 25,000 |
GO, 5.00%, 9/1/2022 | 75,000 | 75,000 |
August 31, 2022 | J.P. Morgan Exchange-Traded Funds | 329 |
AS OF August 31, 2022 (Unaudited) (continued)
INVESTMENTS | PRINCIPAL AMOUNT($) | VALUE($) |
Municipal Bonds — continued | ||
Texas — continued | ||
City of Seguin, Combination Tax, Certificates of Obligation Series 2016A, GO, 5.50%, 9/1/2022 | 25,000 | 25,000 |
City of Sherman, Combination Tax, Certificates of Obligation GO, 5.00%, 8/15/2024 | 25,000 | 26,181 |
City of Sugar Land GO, 5.00%, 2/15/2023 | 45,000 | 45,543 |
City of The Colony, Combination Tax, Certificates of Obligation 5.00%, 2/15/2023 | 35,000 | 35,383 |
City of Tyler, Water and Sewer System Rev., 5.00%, 9/1/2022 | 20,000 | 20,000 |
City of Victoria, Utility System Rev., 5.00%, 12/1/2022 | 165,000 | 166,047 |
City of Waco GO, 5.00%, 2/1/2023 | 25,000 | 25,280 |
City of Waco, Certificates of Obligation GO, 5.00%, 2/1/2023 | 40,000 | 40,449 |
City of Waco, Combination Tax, Certificates of Obligation | ||
GO, 5.00%, 2/1/2023 | 80,000 | 80,898 |
GO, 5.00%, 2/1/2024 | 20,000 | 20,733 |
GO, 5.00%, 2/1/2025 | 30,000 | 31,774 |
City of Waxahachie GO, 4.00%, 8/1/2023 | 35,000 | 35,531 |
City of Waxahachie, Combination Tax, Certificates of Obligation GO, 4.00%, 8/1/2024 | 25,000 | 25,666 |
City of Weatherford GO, 4.00%, 3/1/2025 | 30,000 | 31,058 |
City of Weatherford, Utility System Rev., AGM, 5.00%, 9/1/2022 | 30,000 | 30,000 |
City of Weslaco, Certificates of Obligation GO, 5.00%, 2/15/2024 | 20,000 | 20,697 |
City of Wichita Falls Series 2018B, GO, 4.00%, 10/1/2022 | 100,000 | 100,136 |
City of Windcrest Series 2019B, GO, 5.00%, 2/15/2023 | 75,000 | 75,861 |
City of Woodway GO, 5.00%, 8/15/2023 | 25,000 | 25,629 |
City of Wylie, Combination Tax, Certificates of Obligation GO, 4.00%, 2/15/2023 | 40,000 | 40,295 |
Clear Lake City Water Authority 4.00%, 3/1/2023 | 145,000 | 146,071 |
Clifton Higher Education Finance Corp., Idea Public Schools PSF-GTD, 5.00%, 8/15/2023 | 530,000 | 542,266 |
Columbia-Brazoria Independent School District, Unlimited Tax PSF-GTD, 3.00%, 2/1/2025 | 200,000 | 201,712 |
INVESTMENTS | PRINCIPAL AMOUNT($) | VALUE($) |
Texas — continued | ||
Comal Independent School District, Unlimited Tax | ||
PSF-GTD, 5.00%, 2/1/2023 | 20,000 | 20,226 |
Series 2015A, PSF-GTD, 5.00%, 2/1/2023 | 20,000 | 20,226 |
PSF-GTD, 5.00%, 2/1/2025 | 55,000 | 58,279 |
Series B, PSF-GTD, 5.00%, 2/1/2025 | 25,000 | 25,884 |
Community Independent School District, Unlimited Tax PSF-GTD, 3.00%, 2/15/2023 | 45,000 | 45,148 |
Conroe Independent School District, Unlimited Tax, School Building Series 2014A, PSF-GTD, 5.00%, 2/15/2023 | 20,000 | 20,244 |
Coppell Independent School District, Unlimited Tax Series 2019A, 5.00%, 8/15/2023 | 40,000 | 41,014 |
Coppell Recreational Development Corp. 5.00%, 8/1/2023 | 25,000 | 25,565 |
Cotulla Independent School District, Unlimited Tax PSF-GTD, 5.00%, 2/15/2023 | 25,000 | 25,296 |
County of Bexar, Flood Control Tax 5.00%, 6/15/2024 | 45,000 | 47,091 |
County of Brazos, Certificates of Obligation 5.00%, 9/1/2022 | 25,000 | 25,000 |
County of Brazos, Limited Tax 5.00%, 9/1/2022 | 70,000 | 70,000 |
County of Comal, Combination Tax, Certificates of Obligation Series 2017A, 3.00%, 2/1/2023 | 25,000 | 25,070 |
County of Comal, Limited Tax 4.00%, 2/1/2025 | 35,000 | 36,254 |
County of El Paso | ||
GO, 5.00%, 2/15/2023 | 30,000 | 30,344 |
Series 2015, GO, 5.00%, 2/15/2024 | 20,000 | 20,647 |
County of Falls GO, 5.00%, 9/1/2022 | 25,000 | 25,000 |
County of Fort Bend, Unlimited Tax | ||
GO, 5.00%, 3/1/2023 | 25,000 | 25,344 |
Series B, GO, 5.00%, 3/1/2023 | 20,000 | 20,275 |
County of Galveston, Capital Appreciation, Justice Center Series 2001A, GO, NATL-RE, Zero Coupon, 2/1/2023 | 30,000 | 29,714 |
County of Galveston, Limited Tax GO, 5.00%, 2/1/2025 | 30,000 | 31,723 |
County of Harris, Permanent Improvement | ||
Series B, GO, 5.00%, 10/1/2022 | 20,000 | 20,043 |
Series 2017A, GO, 5.00%, 10/1/2023 | 25,000 | 25,690 |
330 | J.P. Morgan Exchange-Traded Funds | August 31, 2022 |
INVESTMENTS | PRINCIPAL AMOUNT($) | VALUE($) |
Municipal Bonds — continued | ||
Texas — continued | ||
County of Harris, Subordinated Lien, Toll Road Series 2007C, GO, 5.25%, 8/15/2024 | 280,000 | 295,106 |
County of Harris, Toll Road, Senior Lien Series 2015B, Rev., 5.00%, 8/15/2023 | 25,000 | 25,636 |
County of Harris, Unlimited Tax | ||
GO, 5.00%, 10/1/2022 | 50,000 | 50,108 |
Series 2012A, GO, 5.00%, 10/1/2022 | 100,000 | 100,218 |
Series 2017A, GO, 5.00%, 10/1/2022 | 20,000 | 20,043 |
Series 2019A, GO, 5.00%, 10/1/2022 | 300,000 | 300,650 |
County of Hays, Limited Tax | ||
GO, 3.25%, 2/15/2023 (b) | 20,000 | 20,079 |
GO, 4.00%, 2/15/2023 (b) | 20,000 | 20,149 |
GO, 5.00%, 2/15/2025 | 35,000 | 37,102 |
County of Hays, Pass Through Toll, Unlimited Tax GO, 4.25%, 2/15/2023 (b) | 25,000 | 25,214 |
County of Hays, Unlimited Tax GO, 4.00%, 2/15/2023 | 40,000 | 40,309 |
County of Hidalgo GO, 5.00%, 8/15/2023 | 20,000 | 20,495 |
County of Hidalgo, Limited Tax Series 2019B, GO, 5.00%, 8/15/2023 | 20,000 | 20,495 |
County of Kendall, Limited Tax GO, 4.00%, 3/1/2023 | 25,000 | 25,193 |
County of Montgomery, Unlimited Tax | ||
GO, 5.00%, 3/1/2023 | 30,000 | 30,387 |
Series 2016A, GO, 5.00%, 3/1/2023 | 250,000 | 253,223 |
County of Nueces, Combination of Tax GO, 4.00%, 2/15/2025 | 25,000 | 25,849 |
County of Smith GO, 4.00%, 2/15/2023 | 20,000 | 20,150 |
County of Taylor, Limited Tax GO, 5.00%, 2/15/2025 | 30,000 | 31,757 |
County of Tom Green, Combination Tax and Limited Surplus GO, 5.00%, 2/1/2025 | 35,000 | 36,968 |
County of Williamson, Limited Tax | ||
GO, 4.00%, 2/15/2023 | 60,000 | 60,447 |
GO, 4.00%, 2/15/2023 (b) | 30,000 | 30,230 |
County of Williamson, Unlimited Tax GO, 4.00%, 2/15/2023 | 20,000 | 20,149 |
Crowley Independent School District, Unlimited Tax GO, PSF-GTD, 4.75%, 8/1/2023 (b) | 25,000 | 25,539 |
Cypress-Fairbanks Independent School District, Unlimited Tax | ||
GO, PSF-GTD, 3.00%, 2/15/2023 | 50,000 | 50,156 |
GO, PSF-GTD, 5.00%, 2/15/2023 | 20,000 | 20,241 |
INVESTMENTS | PRINCIPAL AMOUNT($) | VALUE($) |
Texas — continued | ||
Series 2019A, GO, PSF-GTD, 5.00%, 2/15/2023 | 75,000 | 75,905 |
Dallas Area Rapid Transit, Sales Tax, Senior Lien | ||
Series 2016B, Rev., 4.00%, 12/1/2022 | 30,000 | 30,131 |
Rev., 5.00%, 12/1/2022 (b) | 245,000 | 246,658 |
Series 2014A, Rev., 5.00%, 12/1/2022 | 315,000 | 317,148 |
Series 2016B, Rev., 5.00%, 12/1/2022 | 630,000 | 634,296 |
Series 2020A, Rev., 5.00%, 12/1/2022 | 25,000 | 25,171 |
Rev., 5.00%, 12/1/2024 | 35,000 | 36,971 |
Series 2014A, Rev., 5.00%, 12/1/2024 | 120,000 | 126,757 |
Dallas County Park Cities Municipal Utility District Rev., 4.00%, 8/1/2025 | 25,000 | 25,979 |
Dallas County Utility and Reclamation District, Unlimited Tax GO, 5.00%, 2/15/2023 | 45,000 | 45,494 |
Dallas Fort Worth International Airport | ||
Rev., 5.00%, 11/1/2022 | 65,000 | 65,278 |
Series 2013B, Rev., 5.00%, 11/1/2022 | 715,000 | 718,101 |
Series 2013F, Rev., 5.00%, 11/1/2022 | 510,000 | 512,178 |
Series 2013G, Rev., 5.00%, 11/1/2022 | 140,000 | 140,598 |
Series 2014E, Rev., 5.00%, 11/1/2022 | 185,000 | 185,790 |
Series 2014E, Rev., 5.00%, 11/1/2022 | 170,000 | 170,752 |
Series C, Rev., 5.00%, 11/1/2024 | 175,000 | 180,128 |
Series F, Rev., 5.00%, 11/1/2024 | 655,000 | 674,194 |
Series 2020B, Rev., 5.00%, 11/1/2025 | 30,000 | 32,240 |
Series 2013F, Rev., 5.13%, 11/1/2025 | 505,000 | 520,341 |
Dallas Independent School District, Unlimited Tax | ||
Series 2019B, GO, PSF-GTD, 5.00%, 2/15/2023 | 45,000 | 45,555 |
Series 2016A, GO, PSF-GTD, 4.00%, 2/15/2025 (b) | 25,000 | 25,820 |
GO, PSF-GTD, 5.00%, 2/15/2025 | 50,000 | 53,039 |
Deer Park Independent School District, Limited Tax GO, PSF-GTD, 5.00%, 2/15/2023 | 20,000 | 20,240 |
Del Mar College District, Limited Tax GO, 4.00%, 8/15/2023 | 20,000 | 20,306 |
Del Valle Independent School District, Unlimited Tax Series 2014A, GO, PSF-GTD, 5.00%, 6/15/2023 | 55,000 | 56,142 |
Denton County Housing Finance Corp., THF Pathway on Woodrow LP Series 2022, Rev., 5.00%, 2/1/2025 (c) | 3,250,000 | 3,385,467 |
August 31, 2022 | J.P. Morgan Exchange-Traded Funds | 331 |
AS OF August 31, 2022 (Unaudited) (continued)
INVESTMENTS | PRINCIPAL AMOUNT($) | VALUE($) |
Municipal Bonds — continued | ||
Texas — continued | ||
Denton Independent School District, Unlimited Tax GO, PSF-GTD, 5.00%, 8/15/2023 | 30,000 | 30,760 |
Dilley Independent School District, Unlimited Tax, School Building GO, PSF-GTD, 5.00%, 8/15/2023 (b) | 25,000 | 25,627 |
El Paso County Hospital District GO, 5.00%, 8/15/2023 | 55,000 | 56,017 |
El Paso Independent School District, Unlimited Tax GO, PSF-GTD, 5.00%, 8/15/2023 | 75,000 | 76,907 |
Elm Ridge Water Control and Improvement District of Denton County, Fresh Water Supply, Unlimited Tax GO, 3.00%, 9/1/2022 | 130,000 | 130,000 |
Ferris Independent School District, Unlimited Tax GO, PSF-GTD, 3.00%, 8/15/2023 | 25,000 | 25,132 |
Floresville Independent School District, Unlimited Tax GO, PSF-GTD, 3.00%, 2/1/2025 | 35,000 | 35,300 |
Fort Bend County Levee Improvement District No. 10, Unlimited Tax GO, 3.00%, 9/1/2022 | 25,000 | 25,000 |
Fort Bend County Municipal Utility District No. 143, Unlimited Tax Series 2017A, GO, AGM, 3.00%, 9/1/2022 | 50,000 | 50,000 |
Fort Bend County Municipal Utility District No. 169 Series 2021A, GO, AGM, 4.00%, 12/1/2022 | 195,000 | 195,795 |
Fort Bend County Municipal Utility District No. 169, Road Facilities Series 2015A, Rev., AGM, 4.13%, 12/1/2022 | 100,000 | 100,438 |
Fort Bend County Municipal Utility District No. 192, Unlimited Tax GO, 4.50%, 9/1/2022 | 40,000 | 40,000 |
Fort Bend County Municipal Utility District No. 35, Unlimited Tax GO, AGM, 3.00%, 9/1/2022 | 50,000 | 50,000 |
Fort Bend County Municipal Utility District No. 58, Unlimited Tax GO, 3.00%, 4/1/2023 | 50,000 | 50,103 |
Fort Bend Grand Parkway Toll Road Authority, Subordinate Lien Series A, Rev., 5.00%, 3/1/2023 | 45,000 | 45,603 |
Fort Bend Municipal Utility District No. 159, Unlimited Tax GO, 2.00%, 9/1/2022 | 40,000 | 40,000 |
Fort Worth Independent School District, Unlimited Tax GO, PSF-GTD, 5.00%, 2/15/2023 | 45,000 | 45,533 |
INVESTMENTS | PRINCIPAL AMOUNT($) | VALUE($) |
Texas — continued | ||
Frisco Independent School District, Unlimited Tax School Building GO, PSF-GTD, 2.50%, 8/15/2023 | 40,000 | 40,031 |
Galveston County Municipal Utility District No. 68, Unlimited Tax GO, 3.00%, 9/1/2022 | 125,000 | 125,000 |
Galveston Public Facility Corp., The Oleanders at Broadway Rev., 0.47%, 8/1/2024 (c) | 3,775,000 | 3,556,819 |
Garland Independent School District, Unlimited Tax, School Building Series A, GO, PSF-GTD, 5.00%, 2/15/2025 | 50,000 | 53,076 |
Goose Creek Consolidated Independent School District, Unlimited Tax | ||
GO, PSF-GTD, 5.00%, 2/15/2023 (b) | 25,000 | 25,307 |
GO, PSF-GTD, 5.00%, 2/15/2023 | 20,000 | 20,247 |
Harris County Cultural Education Facilities Finance Corp., Baylor College of Medicine Project | ||
Rev., 5.00%, 11/15/2022 | 365,000 | 366,782 |
Series 2012A, Rev., 5.00%, 11/15/2022 (b) | 915,000 | 920,009 |
Harris County Cultural Education Facilities Finance Corp., Memorial Hermann Health System | ||
Series 2019C-2, Rev., (SIFMA Municipal Swap Index Yield + 0.57%), 2.07%, 9/8/2022 (d) | 575,000 | 573,099 |
Series 2013A, Rev., 4.00%, 12/1/2022 (b) | 340,000 | 341,377 |
Rev., 5.00%, 12/1/2022 (b) | 25,000 | 25,166 |
Rev., 5.00%, 12/1/2022 | 555,000 | 558,284 |
Series 2013A, Rev., 5.00%, 12/1/2022 (b) | 430,000 | 432,857 |
Series 2019A, Rev., 5.00%, 12/1/2022 | 25,000 | 25,148 |
Series 2013A, Rev., 5.00%, 12/1/2023 | 320,000 | 322,140 |
Series 2019A, Rev., 5.00%, 12/1/2024 | 25,000 | 26,290 |
Series 2020C-2, Rev., 5.00%, 12/1/2024 (c) | 60,000 | 62,801 |
Series 2020C-3, Rev., 5.00%, 12/1/2026 (c) | 40,000 | 43,053 |
Series A, Rev., 5.00%, 12/1/2027 | 25,000 | 26,240 |
Harris County Cultural Education Facilities Finance Corp., Texas Children's Hospital | ||
Series 2015-1, Rev., 5.00%, 10/1/2022 | 560,000 | 561,180 |
Rev., 5.00%, 10/1/2023 | 20,000 | 20,537 |
Harris County Flood Control District | ||
Series 2019A, Rev., 5.00%, 10/1/2022 | 75,000 | 75,169 |
332 | J.P. Morgan Exchange-Traded Funds | August 31, 2022 |
INVESTMENTS | PRINCIPAL AMOUNT($) | VALUE($) |
Municipal Bonds — continued | ||
Texas — continued | ||
Series 2021A, GO, 5.00%, 10/1/2023 | 30,000 | 30,861 |
Harris County Health Facilities Development Corp., Sisters of Charity of the Incarnate Word Series B, Rev., 5.75%, 7/1/2027 (b) | 6,275,000 | 6,831,942 |
Harris County Improvement District No. 18 , Unlimited Tax GO, AGM, 5.00%, 9/1/2022 | 25,000 | 25,000 |
Harris County Improvement District No. 18, Unlimited Tax GO, AGM, 3.00%, 9/1/2022 | 55,000 | 55,000 |
Harris County Municipal Utility District No. 171 GO, 4.75%, 12/1/2022 | 45,000 | 45,268 |
Harris County Municipal Utility District No. 213B, Unlimited Tax GO, 3.00%, 9/1/2022 | 50,000 | 50,000 |
Harris County Municipal Utility District No. 383, Unlimited Tax GO, 2.00%, 9/1/2022 | 30,000 | 30,000 |
Harris County Municipal Utility District No. 457, Unlimited Tax GO, AGM, 3.00%, 9/1/2022 | 475,000 | 475,000 |
Harris County Municipal Utility District No. 500, Water Sewer and Drainage Facility Co. GO, AGM, 3.00%, 12/1/2022 | 20,000 | 20,029 |
Harris Montgomery Counties Municipal Utility District No. 386, Unlimited Tax | ||
GO, 1.00%, 9/1/2022 | 450,000 | 450,000 |
GO, 3.00%, 9/1/2022 | 45,000 | 45,000 |
Hays Consolidated Independent School District, Unlimited Tax Series 2018B, GO, PSF-GTD, 2.70%, 8/15/2023 (c) | 65,000 | 65,013 |
Hidalgo County Drain District No. 1, Unlimited Tax | ||
GO, 4.00%, 9/1/2022 | 115,000 | 115,000 |
GO, 5.00%, 9/1/2022 | 100,000 | 100,000 |
Hidalgo County Regional Mobility Authority, Senior Lien Rev., 5.00%, 12/1/2022 | 100,000 | 100,627 |
Highland Park Independent School District GO, PSF-GTD, 5.00%, 2/15/2023 | 65,000 | 65,808 |
Housing Options, Inc., Brooks Manor - The Oaks Project Rev., 0.50%, 3/1/2025 (c) | 6,250,000 | 5,830,072 |
Houston Community College System, Maintenance Tax GO, 5.00%, 2/15/2023 | 70,000 | 70,845 |
Houston Independent School District, Limited Tax Schoolhouse GO, PSF-GTD, 5.00%, 2/15/2025 | 155,000 | 164,422 |
INVESTMENTS | PRINCIPAL AMOUNT($) | VALUE($) |
Texas — continued | ||
Houston Independent School District, Maintenance Tax Notes GO, 5.00%, 7/15/2023 | 45,000 | 46,029 |
Humble Independent School District, Unlimited Tax School Building | ||
Series 2012B, GO, 5.00%, 2/15/2023 | 20,000 | 20,249 |
Series 2016C, GO, 5.00%, 2/15/2023 | 40,000 | 40,476 |
Series 2015A, GO, PSF-GTD, 5.25%, 2/15/2023 | 20,000 | 20,271 |
Series 2020A, GO, PSF-GTD, 5.00%, 2/15/2025 | 35,000 | 37,188 |
Irving Independent School District, Unlimited Tax GO, PSF-GTD, 5.00%, 2/15/2023 | 45,000 | 45,560 |
Katy Independent School District Series A, GO, PSF-GTD, 5.00%, 2/15/2023 | 65,000 | 65,805 |
Killeen Independent School District, Unlimited Tax GO, PSF-GTD, 5.00%, 2/15/2023 | 140,000 | 141,741 |
Klein Independent School District, Unlimited Tax | ||
Series 2015A, GO, PSF-GTD, 5.00%, 8/1/2024 | 65,000 | 68,163 |
GO, PSF-GTD, 5.00%, 2/1/2025 | 50,000 | 53,029 |
La Porte Independent School District, Unlimited Tax GO, 5.00%, 2/15/2023 | 30,000 | 30,063 |
Lamar Consolidated Independent School District, Unlimited Tax Series 2014B, GO, PSF-GTD, 5.00%, 2/15/2023 | 50,000 | 50,617 |
Leander Independent School District, Unlimited Tax | ||
Series 2013A, GO, PSF-GTD, Zero Coupon, 8/15/2023 (b) | 25,000 | 23,435 |
Series 2013A, GO, PSF-GTD, 5.00%, 8/15/2023 (b) | 40,000 | 40,947 |
Lewisville Independent School District, Unlimited Tax GO, PSF-GTD, 5.00%, 8/15/2023 | 25,000 | 25,612 |
Lone Star College System, Limited Tax | ||
Series A, GO, 5.00%, 2/15/2023 | 20,000 | 20,246 |
Series B, GO, 5.00%, 2/15/2023 | 75,000 | 75,922 |
GO, 5.00%, 2/15/2024 | 40,000 | 40,082 |
Lower Colorado River Authority | ||
Rev., 5.00%, 5/15/2023 | 65,000 | 66,098 |
Rev., 5.13%, 5/15/2024 | 300,000 | 305,286 |
Rev., 5.00%, 5/15/2025 | 750,000 | 797,387 |
Lower Colorado River Authority, LCRA Transmission Services Corp. Project | ||
August 31, 2022 | J.P. Morgan Exchange-Traded Funds | 333 |
AS OF August 31, 2022 (Unaudited) (continued)
INVESTMENTS | PRINCIPAL AMOUNT($) | VALUE($) |
Municipal Bonds — continued | ||
Texas — continued | ||
Rev., 5.00%, 5/15/2025 | 805,000 | 855,862 |
Rev., 5.00%, 5/15/2026 | 50,000 | 51,948 |
Series 2013A, Rev., 5.00%, 5/15/2026 | 445,000 | 452,487 |
Lower Neches Valley Authority Industrial Development Corp., Exxon Capital Ventures, Inc. Series 2019, Rev., VRDO, 1.00%, 9/1/2022 (c) | 14,400,000 | 14,400,000 |
Lower Neches Valley Authority Industrial Development Corp., ExxonMobil Project Series 2012, Rev., VRDO, 1.00%, 9/1/2022 (c) | 16,000,000 | 16,000,000 |
Lubbock Independent School District GO, PSF-GTD, 4.00%, 2/15/2023 | 50,000 | 50,396 |
Manor Independent School District, Unlimited Tax, School Building Series 2017A, GO, PSF-GTD, 5.00%, 8/1/2023 | 20,000 | 20,467 |
McKinney Independent School District, School Building, Unlimited Tax | ||
GO, PSF-GTD, 5.00%, 2/15/2023 | 25,000 | 25,309 |
Series 2016A, GO, PSF-GTD, 5.00%, 2/15/2023 | 40,000 | 40,494 |
Meadowhill Regional Municipal Utility District, Waterworks Sewer System GO, AGM, 4.00%, 10/1/2022 | 65,000 | 65,084 |
Mesquite Independent School District, Unlimited Tax Series 2016C, GO, PSF-GTD, 5.00%, 8/15/2023 | 25,000 | 25,636 |
Metropolitan Transit Authority of Harris County, Sales and Use Tax | ||
Series 2016A, Rev., 5.00%, 11/1/2022 | 90,000 | 90,399 |
Series 2017A, Rev., 5.00%, 11/1/2022 | 130,000 | 130,577 |
Metropolitan Transit Authority of Harris County, Sales and Use Tax, Contractual Obligations | ||
Rev., 5.00%, 11/1/2022 | 75,000 | 75,333 |
Series 2015B, Rev., 5.00%, 11/1/2022 | 255,000 | 256,132 |
Series 2016D, Rev., 5.00%, 11/1/2022 | 25,000 | 25,111 |
Series 2017B, Rev., 5.00%, 11/1/2022 | 90,000 | 90,399 |
Rev., 5.00%, 11/1/2023 | 30,000 | 30,900 |
Series 2015B, Rev., 5.00%, 11/1/2023 | 25,000 | 25,750 |
Midland County Fresh Water Supply District No. 1, Midland Project | ||
Rev., 5.00%, 9/15/2022 (b) | 380,000 | 380,379 |
Series 2012A, Rev., 5.00%, 9/15/2022 (b) | 20,000 | 20,020 |
Midland Independent School District, Unlimited Tax GO, PSF-GTD, 5.00%, 2/15/2023 | 25,000 | 25,311 |
INVESTMENTS | PRINCIPAL AMOUNT($) | VALUE($) |
Texas — continued | ||
Midlothian Independent School District, Unlimited Tax Series 2013A, GO, PSF-GTD, 5.00%, 2/15/2023 (b) | 20,000 | 20,232 |
Montgomery County Health Facilities Development Co., Heritage Manor-Woodlands Project | ||
Rev., Zero Coupon, 7/15/2023 (b) | 90,000 | 88,099 |
Rev., AGM - CR, Zero Coupon, 7/15/2023 (b) | 235,000 | 229,938 |
Mueller Local Government Corp., Tax Increment Rev., 5.00%, 9/1/2022 | 125,000 | 125,000 |
Mustang Special Utility District Rev., 3.00%, 9/1/2022 | 25,000 | 25,000 |
New Hope Cultural Education Facilities Finance Corp., Jubilee Academic Center Rev., 4.00%, 8/15/2024 (e) | 735,000 | 731,714 |
North East Independent School District GO, PSF-GTD, 5.25%, 2/1/2023 | 20,000 | 20,239 |
North Harris County Regional Water Authority Rev., 4.00%, 12/15/2022 | 150,000 | 150,757 |
North Harris County Regional Water Authority, Senior Lien Rev., 5.00%, 12/15/2022 | 35,000 | 35,276 |
North Texas Municipal Water District Water System | ||
Rev., 5.00%, 9/1/2022 | 100,000 | 100,000 |
Series 2019A, Rev., 3.00%, 9/1/2024 | 40,000 | 40,491 |
Rev., 5.00%, 9/1/2024 | 30,000 | 31,532 |
North Texas Municipal Water District, Regional Solid Waste Disposal System Rev., 5.00%, 9/1/2022 | 75,000 | 75,000 |
North Texas Municipal Water District, Upper East Fork Wastewater Interceptor System Rev., 5.00%, 6/1/2023 | 25,000 | 25,495 |
North Texas Tollway Authority, First Tier | ||
Series 2019A, Rev., 5.00%, 1/1/2023 | 20,000 | 20,176 |
Series 2016A, Rev., 5.00%, 1/1/2024 | 20,000 | 20,677 |
Series 2017A, Rev., 5.00%, 1/1/2024 | 585,000 | 590,114 |
Series 2019A, Rev., 5.00%, 1/1/2024 | 20,000 | 20,677 |
Series 2016A, Rev., 5.00%, 1/1/2025 | 135,000 | 139,447 |
Series 2017A, Rev., 5.00%, 1/1/2025 | 915,000 | 923,039 |
Series A, Rev., 5.00%, 1/1/2025 | 275,000 | 284,059 |
Series 2016A, Rev., 5.00%, 1/1/2026 | 275,000 | 284,022 |
Series A, Rev., 5.00%, 1/1/2026 | 410,000 | 413,588 |
Series 2016A, Rev., 5.00%, 1/1/2027 | 370,000 | 382,089 |
North Texas Tollway Authority, Second Tier | ||
Series B, Rev., 5.00%, 1/1/2023 | 460,000 | 463,965 |
334 | J.P. Morgan Exchange-Traded Funds | August 31, 2022 |
INVESTMENTS | PRINCIPAL AMOUNT($) | VALUE($) |
Municipal Bonds — continued | ||
Texas — continued | ||
Series B, Rev., 5.00%, 1/1/2024 | 120,000 | 123,969 |
Series B, Rev., 5.00%, 1/1/2024 | 375,000 | 378,103 |
Series B, Rev., 5.00%, 1/1/2025 | 1,060,000 | 1,069,994 |
Series 2017B, Rev., 5.00%, 1/1/2026 | 4,965,000 | 5,011,482 |
Northside Independent School District, Unlimited Tax Series 2019B, GO, PSF-GTD, 5.00%, 2/15/2023 | 25,000 | 25,311 |
Northwest Harris County Municipal Utility District No. 19, Unlimited Tax GO, AGM, 3.00%, 10/1/2022 | 25,000 | 25,012 |
Old Spanish Trail-Alemda Corridors Redevelopment Authority Rev., 5.00%, 9/1/2022 | 35,000 | 35,000 |
Permanent University Fund - Texas A&M University System Series 2012A, Rev., 5.00%, 7/1/2023 | 65,000 | 65,194 |
Permanent University Fund - University of Texas System Series 2015B, Rev., 5.00%, 7/1/2023 | 25,000 | 25,558 |
Pflugerville Independent School District, School Building, Unlimited Tax | ||
GO, PSF-GTD, 5.00%, 2/15/2023 | 20,000 | 20,239 |
Series 2019A, GO, PSF-GTD, 5.00%, 2/15/2023 | 25,000 | 25,298 |
Pflugerville Independent School District, Unlimited Tax | ||
GO, PSF-GTD, 5.00%, 2/15/2023 | 25,000 | 25,298 |
Series 2020A, GO, PSF-GTD, 5.00%, 2/15/2023 | 90,000 | 91,074 |
Pharr San Juan Alamo Independent School District, Unlimited Tax GO, PSF-GTD, 5.00%, 2/1/2023 | 35,000 | 35,391 |
Plano Independent School District, Unlimited Tax, School Building Series 2016A, GO, PSF-GTD, 5.00%, 2/15/2023 | 40,000 | 40,485 |
Port Aransas Public Facilities Corp., Multi- Family Housing, Palladium Port Aransas Apartments Rev., 0.70%, 1/1/2023 (c) | 500,000 | 495,901 |
Port Authority of Houston of Harris County Texas Series A, GO, 5.00%, 10/1/2022 | 185,000 | 185,416 |
Prosper Independent School District, Unlimited Tax, School Building GO, PSF-GTD, 5.00%, 2/15/2023 | 35,000 | 35,419 |
Red River Education Finance Corp., Christian University Project | ||
Rev., 5.00%, 3/15/2023 (b) | 40,000 | 40,547 |
Rev., 5.00%, 3/15/2025 | 20,000 | 21,149 |
INVESTMENTS | PRINCIPAL AMOUNT($) | VALUE($) |
Texas — continued | ||
Richardson Independent School District, Unlimited Tax Series 2015B, GO, 5.00%, 2/15/2025 | 30,000 | 31,809 |
Rockwall Independent School District, Unlimited Tax | ||
GO, PSF-GTD, 5.00%, 2/15/2023 | 25,000 | 25,292 |
GO, PSF-GTD, Zero Coupon, 2/15/2025 | 50,000 | 46,713 |
Royal Independent School District, Unlimited Tax GO, PSF-GTD, 5.00%, 2/15/2023 | 40,000 | 40,470 |
San Antonio Education Facilities Corp., Trinity University Project Rev., 5.00%, 6/1/2023 (b) | 50,000 | 50,993 |
San Antonio Independent School District GO, PSF-GTD, 5.00%, 8/15/2024 | 30,000 | 31,482 |
San Antonio Municipal Facilities Corp., Public Safety Answering Point Project Rev., 4.00%, 8/15/2023 | 25,000 | 25,034 |
San Antonio Public Facilities Corp., Convention Center Refinancing and Expansion Project | ||
Rev., 5.00%, 9/15/2022 | 20,000 | 20,018 |
Rev., 5.00%, 9/15/2024 | 35,000 | 35,063 |
Rev., 5.00%, 9/15/2026 | 220,000 | 220,391 |
San Antonio Water System, Junior Lien | ||
Series 2015B, Rev., 5.00%, 5/15/2023 | 10,000 | 10,190 |
Series 2019C, Rev., 5.00%, 5/15/2023 | 25,000 | 25,475 |
Series 2020A, Rev., 5.00%, 5/15/2023 | 20,000 | 20,363 |
Series 2013E, Rev., 5.00%, 5/15/2024 | 20,000 | 20,380 |
Series 2016A, Rev., 5.00%, 5/15/2024 | 25,000 | 26,063 |
Series 2014A, Rev., 5.00%, 5/15/2025 | 45,000 | 46,410 |
San Jacinto Community College District | ||
GO, 5.00%, 2/15/2023 (b) | 10,000 | 10,118 |
GO, 5.00%, 2/15/2023 | 45,000 | 45,560 |
San Jacinto Community College District, Limited Tax | ||
Series 2019A, GO, 5.00%, 2/15/2023 | 25,000 | 25,311 |
Series 2019B, GO, 5.00%, 2/15/2023 | 25,000 | 25,311 |
GO, 5.00%, 2/15/2025 | 30,000 | 31,743 |
San Jacinto River Authority Series 2019A, Rev., 4.00%, 10/1/2022 | 30,000 | 30,041 |
San Marcos Consolidated Independent School District, Unlimited Tax GO, PSF-GTD, 5.00%, 8/1/2023 (b) | 25,000 | 25,602 |
Santa Fe Independent School District, Unlimited Tax GO, PSF-GTD, 5.00%, 2/15/2023 | 35,000 | 35,427 |
August 31, 2022 | J.P. Morgan Exchange-Traded Funds | 335 |
AS OF August 31, 2022 (Unaudited) (continued)
INVESTMENTS | PRINCIPAL AMOUNT($) | VALUE($) |
Municipal Bonds — continued | ||
Texas — continued | ||
Sienna Parks & Levee Improvement District of Fort Bend County | ||
GO, 2.00%, 9/1/2022 | 35,000 | 35,000 |
GO, 4.00%, 9/1/2022 | 50,000 | 50,000 |
Sienna Plantation Municipal Utility District No. 2, Unlimited Tax GO, 3.00%, 10/1/2022 | 25,000 | 25,014 |
South Texas College, Limited Tax GO, 5.00%, 8/15/2023 | 20,000 | 20,474 |
Southwest Higher Education Authority, Inc., Southern Methodist University Project | ||
Rev., 5.00%, 10/1/2022 | 130,000 | 130,283 |
Series 2016A, Rev., 5.00%, 10/1/2024 | 20,000 | 20,971 |
Southwest Independent School District, Unlimited Tax, School Building GO, PSF-GTD, 3.00%, 2/1/2023 | 30,000 | 30,090 |
State of Texas, Public Finance Authority | ||
GO, 5.00%, 10/1/2022 | 20,000 | 20,044 |
Series 2017A, GO, 5.00%, 10/1/2022 | 250,000 | 250,556 |
State of Texas, Transport Commission | ||
GO, 5.00%, 10/1/2022 | 45,000 | 45,100 |
GO, 5.00%, 4/1/2024 (b) | 35,000 | 36,398 |
State of Texas, Transportation Commission Mobility Fund | ||
Series A, GO, 5.00%, 10/1/2022 | 135,000 | 135,300 |
GO, 5.00%, 10/1/2024 | 20,000 | 20,828 |
State of Texas, Veterans | ||
Series 2015 A, GO, VRDO, LIQ : State Street Bank & Trust, 1.56%, 9/8/2022 (c) | 17,370,000 | 17,370,000 |
Series 2013A, GO, VRDO, LIQ : State Street Bank & Trust, 1.56%, 9/12/2022 (c) | 10,525,000 | 10,525,000 |
State of Texas, Water Financial Assistance | ||
Series 2021B, GO, 5.00%, 2/1/2023 | 25,000 | 25,289 |
GO, 5.00%, 8/1/2024 | 25,000 | 25,052 |
Stephen F Austin State University Rev., 5.00%, 10/15/2022 | 150,000 | 150,466 |
Stephen F Austin State University, Financing System Series 2019A, Rev., 5.00%, 10/15/2022 | 25,000 | 25,078 |
Tarrant County Cultural Education Facilities Finance Corp., Hendrick Medical Center Rev., 5.00%, 9/1/2022 | 170,000 | 170,000 |
Tarrant County Cultural Education Facilities Finance Corp., Hospital, Cook Children's Medical Center Rev., 5.00%, 12/1/2022 | 20,000 | 20,129 |
INVESTMENTS | PRINCIPAL AMOUNT($) | VALUE($) |
Texas — continued | ||
Tarrant County Hospital District, Senior Lien Rev., 5.00%, 8/15/2023 | 100,000 | 100,202 |
Tarrant Regional Water District, City of Dallas Project, Water Control and Improvement District | ||
Series 2021A, Rev., 4.00%, 9/1/2022 | 130,000 | 130,000 |
Rev., 5.00%, 9/1/2022 | 40,000 | 40,000 |
Tarrant Regional, Water Control and Improvement District, Water System Rev., 4.00%, 9/1/2022 (b) | 160,000 | 160,000 |
Texas A&M University, Financing System Series 2013B, Rev., 5.00%, 5/15/2023 | 25,000 | 25,472 |
Texas Department of Housing & Community Affairs, Socorro Village 34 LLC Series 2022, Rev., 4.00%, 8/1/2024 (c) | 3,175,000 | 3,213,887 |
Texas Department of Housing and Community Affairs Series 2020A, Rev., GNMA, 0.60%, 9/1/2022 | 80,000 | 80,000 |
Texas Department of Housing and Community Affairs, Fishpond at Corpus Christi Apartments Rev., 0.50%, 6/1/2023 (c) | 750,000 | 734,839 |
Texas Department of Housing and Community Affairs, Multi-Family Housing, Scott Street Lofts Rev., 0.70%, 8/1/2023 (c) | 540,000 | 524,574 |
Texas Municipal Gas Acquisition and Supply Corp., I Gas Supply Senior Lien Series D, Rev., 6.25%, 12/15/2026 | 85,000 | 90,302 |
Texas Public Finance Authority Rev., 5.00%, 2/1/2025 | 25,000 | 26,515 |
Texas Southmost College District Series 2014B, GO, 5.00%, 2/15/2023 | 20,000 | 20,235 |
Texas State Technical College, Financing System Improvement Rev., AGM, 5.00%, 10/15/2022 | 115,000 | 115,357 |
Texas State University System | ||
Rev., 5.00%, 3/15/2023 | 30,000 | 30,440 |
Series 2021A, Rev., 5.00%, 3/15/2023 | 25,000 | 25,367 |
Series 2017A, Rev., 5.00%, 3/15/2025 | 60,000 | 63,767 |
Texas State University, Financing System | ||
Rev., 3.00%, 3/15/2023 (b) | 35,000 | 35,097 |
Series 2019A, Rev., 5.00%, 3/15/2025 | 40,000 | 42,511 |
Texas Transportation Commission State Highway Fund, First Tier | ||
Rev., 5.00%, 10/1/2022 | 330,000 | 330,739 |
Rev., 5.00%, 10/1/2023 | 110,000 | 113,121 |
Series 2016B, Rev., 0.56%, 4/1/2026 | 10,135,000 | 9,128,360 |
336 | J.P. Morgan Exchange-Traded Funds | August 31, 2022 |
INVESTMENTS | PRINCIPAL AMOUNT($) | VALUE($) |
Municipal Bonds — continued | ||
Texas — continued | ||
Texas Water Development Board, Water Implementation Fund | ||
Series 2018B, Rev., 4.00%, 10/15/2022 | 85,000 | 85,180 |
Series 2018B, Rev., 5.00%, 10/15/2022 | 145,000 | 145,479 |
Series 2019A, Rev., 5.00%, 10/15/2022 | 45,000 | 45,149 |
Series 2019A, Rev., 5.00%, 4/15/2023 | 75,000 | 76,254 |
Series 2018A, Rev., 5.00%, 10/15/2024 | 50,000 | 52,672 |
Texas Woman's University, Financing System Rev., 4.00%, 7/1/2023 | 20,000 | 20,256 |
Tomball Independent School District, Unlimited Tax School Building | ||
GO, PSF-GTD, 5.00%, 2/15/2023 | 85,000 | 86,057 |
GO, PSF-GTD, 5.00%, 2/15/2025 | 35,000 | 37,153 |
Town of Addison GO, 4.00%, 2/15/2023 | 20,000 | 20,156 |
Town of Addison, Combination Tax 4.00%, 2/15/2023 | 50,000 | 50,373 |
Travis County Housing Finance Corp., Multi-Family Housing, Cascades at Onion Creek Apartments Rev., 0.35%, 2/1/2023 (c) | 165,000 | 163,068 |
Travis County Water Control and Improvement District No. 17 Rev., 4.00%, 11/1/2022 | 25,000 | 25,067 |
Trinity River Authority, Central Regional Wastewater System Rev., 5.00%, 8/1/2023 | 30,000 | 30,717 |
Trinity River Authority, Denton Creek Wastewater Treatment System | ||
Rev., 5.00%, 2/1/2024 | 40,000 | 41,431 |
Rev., 5.00%, 2/1/2025 | 100,000 | 105,744 |
Trinity River Authority, Water Project | ||
Rev., 5.00%, 2/1/2024 | 25,000 | 25,894 |
Rev., 5.00%, 2/1/2025 | 75,000 | 79,308 |
Troy Independent School District, Unlimited Tax GO, PSF-GTD, 3.00%, 8/1/2023 | 30,000 | 30,153 |
Tyler Independent School District, Unlimited Tax GO, PSF-GTD, 5.00%, 2/15/2023 (b) | 25,000 | 25,296 |
University of Houston Series 2017A, Rev., 5.00%, 2/15/2025 | 45,000 | 47,581 |
University of North Texas System, Financing System Series 2017A, Rev., 5.00%, 4/15/2025 | 25,000 | 26,501 |
University of North Texas, Financing System Series 2020A, Rev., 5.00%, 4/15/2025 | 500,000 | 530,012 |
INVESTMENTS | PRINCIPAL AMOUNT($) | VALUE($) |
Texas — continued | ||
Valwood Improvement Authority, Unlimited Tax GO, 4.00%, 9/1/2022 | 180,000 | 180,000 |
Weatherford Independent School District, Unlimited Tax GO, PSF-GTD, Zero Coupon, 2/15/2025 | 50,000 | 46,951 |
Weslaco Independent School District, Unlimited Tax Series 2015A, GO, PSF-GTD, 5.00%, 2/15/2023 | 15,000 | 15,168 |
West Harris County Regional Water Authority Series 2016A, Rev., 5.00%, 12/15/2022 | 20,000 | 20,158 |
Total Texas | 153,092,936 | |
Utah — 1.2% | ||
Alpine School District, School Building, Guaranty Program | ||
5.00%, 3/15/2023 | 25,000 | 25,360 |
Series 2017B, 5.00%, 3/15/2023 | 25,000 | 25,360 |
Central Utah Water Conservancy District | ||
Series 2012B, 5.00%, 10/1/2022 | 90,000 | 90,202 |
Series 2016A, 5.00%, 10/1/2022 | 60,000 | 60,135 |
Series 2017B, 5.00%, 10/1/2022 | 125,000 | 125,281 |
Series 2012C, 5.00%, 10/1/2042 (b) | 35,000 | 35,078 |
City of Provo, Wastewater Series 2015A, Rev., 5.00%, 2/1/2023 | 25,000 | 25,279 |
City of Riverton Rev., 3.00%, 9/1/2022 | 35,000 | 35,000 |
City of Salt Lake City, Sales and Excise Tax | ||
Series 2022A, Rev., 4.00%, 10/1/2022 | 20,000 | 20,029 |
Series 2016A, Rev., 4.00%, 10/1/2023 | 30,000 | 30,533 |
City of Sandy City, Sales Tax Rev., 5.00%, 3/1/2024 | 25,000 | 25,972 |
City of South Jordan, Daybreak Assessment Area No. 1 3.00%, 11/1/2022 | 40,000 | 40,052 |
City of St. George Rev., AGM, 5.00%, 6/1/2024 | 150,000 | 156,301 |
City of St. George, Excise Tax GO, 4.00%, 8/1/2023 | 75,000 | 75,101 |
City of St. George, Franchise Tax | ||
Rev., 5.00%, 12/1/2022 | 115,000 | 115,787 |
Rev., 5.00%, 12/1/2023 | 40,000 | 41,218 |
County of Salt Lake, Crossover GO, 4.00%, 12/15/2022 | 75,000 | 75,381 |
County of Summit, Sales Tax Rev., 5.00%, 12/15/2022 | 50,000 | 50,395 |
County of Utah, IHC Health Services, Inc. | ||
Series 2016D, Rev., VRDO, LIQ : U.S. Bank NA, 1.58%, 9/12/2022 (c) | 30,000,000 | 30,000,000 |
August 31, 2022 | J.P. Morgan Exchange-Traded Funds | 337 |
AS OF August 31, 2022 (Unaudited) (continued)
INVESTMENTS | PRINCIPAL AMOUNT($) | VALUE($) |
Municipal Bonds — continued | ||
Utah — continued | ||
Series 2018B-2, Rev., 5.00%, 8/1/2024 (c) | 890,000 | 919,450 |
Series 2020B-1, Rev., 5.00%, 8/1/2024 (c) | 675,000 | 704,746 |
Series 2020B-2, Rev., 5.00%, 8/1/2026 (c) | 880,000 | 952,467 |
County of Utah, Transportation Sales Tax Rev., 4.00%, 12/1/2022 | 25,000 | 25,109 |
Davis School District, School District Bond Guaranty Program Series 2019B, GO, 5.00%, 6/1/2023 | 25,000 | 25,504 |
Jordan Valley Water Conservancy District Series B, Rev., 5.00%, 10/1/2022 | 145,000 | 145,326 |
Magna Water District GO, 5.00%, 6/1/2023 | 50,000 | 50,997 |
Midvale Redevelopment Agency, Sales Tax Rev., 4.00%, 5/1/2023 | 20,000 | 20,223 |
Mountain Regional Water Special Service District Series 2014A, Rev., AGM, 3.00%, 12/15/2022 | 75,000 | 75,153 |
Murray City Municipal Building Authority Rev., 4.00%, 12/1/2022 | 40,000 | 40,169 |
Nebo School District Series 2017C, GO, 4.00%, 7/1/2023 | 20,000 | 20,274 |
Salt Lake County Municipal Building Authority Rev., 5.00%, 1/15/2023 | 160,000 | 161,622 |
South Valley Water Reclamation Facility, Sewer Rev., AGM, 5.00%, 2/15/2023 | 75,000 | 75,881 |
State of Utah GO, 5.00%, 7/1/2024 | 75,000 | 78,581 |
University of Utah (The) | ||
Series 2013A, Rev., 5.00%, 8/1/2023 | 30,000 | 30,722 |
Series 2017A, Rev., 5.00%, 8/1/2023 | 20,000 | 20,482 |
Series A-1, Rev., 5.00%, 8/1/2023 | 20,000 | 20,482 |
Series 2017A, Rev., 5.00%, 8/1/2024 | 45,000 | 47,164 |
Utah Associated Municipal Power Systems, Horse Butte Wind Series 2017A, Rev., 5.00%, 9/1/2026 | 725,000 | 787,620 |
Utah Charter School Finance Authority, Summit Academy Incorporated Series A, Rev., 5.00%, 4/15/2023 | 155,000 | 157,351 |
Utah State Building Ownership Authority, Facilities Master Lease Program Rev., 5.00%, 5/15/2023 | 40,000 | 40,758 |
Utah State Building Ownership Authority, Master Lease Program Series 2012A, Rev., 3.00%, 5/15/2025 | 35,000 | 35,045 |
Utah State University Series 2015B, Rev., 5.00%, 12/1/2022 | 75,000 | 75,511 |
INVESTMENTS | PRINCIPAL AMOUNT($) | VALUE($) |
Utah — continued | ||
Utah State University, Student Building Fee Series 2013B, Rev., 4.00%, 12/1/2022 | 25,000 | 25,109 |
Utah Transit Authority, Sales Tax | ||
Series 2018-2, Rev., 5.00%, 12/15/2022 | 25,000 | 25,194 |
Series 2015A, Rev., 5.00%, 6/15/2023 | 20,000 | 20,423 |
Utah Water Finance Agency, Loan Financing Program Series 2019B, Rev., 5.00%, 3/1/2023 | 110,000 | 111,479 |
Washington County School District Board of Education Series 2016B, GO, 5.00%, 3/1/2023 | 30,000 | 30,400 |
Washington County-St George Interlocal Agency Series 2012A, Rev., 2.13%, 12/1/2022 | 135,000 | 134,942 |
White City Water Improvement District Rev., 3.00%, 2/1/2023 | 25,000 | 25,075 |
Total Utah | 35,935,723 | |
Vermont — 0.0% ^ | ||
City of Burlington Series 2018D, 5.00%, 11/1/2022 | 50,000 | 50,216 |
University of Vermont and State Agricultural College | ||
Rev., 5.00%, 10/1/2022 | 70,000 | 70,155 |
Series 2019B, Rev., 5.00%, 10/1/2022 | 80,000 | 80,177 |
Vermont Educational and Health Buildings Financing Agency Rev., 5.00%, 11/1/2024 | 25,000 | 25,103 |
Vermont Educational and Health Buildings Financing Agency, The University of Vermont Medical Center Project Series 2016A, Rev., 5.00%, 12/1/2022 | 50,000 | 50,280 |
Vermont Municipal Bond Bank | ||
Series 2015-1, Rev., 4.00%, 12/1/2022 | 35,000 | 35,150 |
Series 2021-4, Rev., 4.00%, 12/1/2022 | 160,000 | 160,684 |
Series 2, Rev., 5.00%, 12/1/2022 | 25,000 | 25,168 |
Series 2016-2, Rev., 5.00%, 12/1/2022 | 180,000 | 181,209 |
Series 3, Rev., 5.00%, 12/1/2022 | 155,000 | 156,041 |
Series 5, Rev., 5.00%, 12/1/2022 | 65,000 | 65,437 |
Series 3, Rev., 5.00%, 12/1/2023 | 25,000 | 25,808 |
Vermont Municipal Bond Bank, State Colleges System Bonds Series 2017A, Rev., 5.00%, 10/1/2022 | 55,000 | 55,123 |
Total Vermont | 980,551 | |
338 | J.P. Morgan Exchange-Traded Funds | August 31, 2022 |
INVESTMENTS | PRINCIPAL AMOUNT($) | VALUE($) |
Municipal Bonds — continued | ||
Virgin Islands — 0.1% | ||
Matching Fund Special Purpose Securitization Corp. Series 2022A, Rev., 5.00%, 10/1/2025 | 1,000,000 | 1,038,850 |
Virgin Islands Public Finance Authority Series 2012A, Rev., AGM - CR, 5.00%, 10/1/2022 (b) | 1,000,000 | 1,002,141 |
Virgin Islands | 2,040,991 | |
Virginia — 1.5% | ||
Arlington County Industrial Development Authority 5.00%, 2/15/2023 | 35,000 | 35,435 |
Chesapeake Bay Bridge and Tunnel District General Resolution 5.00%, 11/1/2023 | 22,860,000 | 23,384,036 |
City of Chesapeake Series A, 5.00%, 7/15/2023 | 185,000 | 185,372 |
City of Hampton, Public Improvement | ||
Series 2015B, GO, 5.00%, 9/1/2022 (b) | 15,000 | 15,000 |
Series 2015B, GO, 5.00%, 9/1/2022 | 65,000 | 65,000 |
City of Norfolk | ||
Series A, GO, 4.00%, 10/1/2022 | 25,000 | 25,036 |
Series A, GO, 5.00%, 10/1/2022 (b) | 25,000 | 25,056 |
Series A, GO, 5.00%, 10/1/2022 | 25,000 | 25,056 |
Series B, GO, 5.00%, 10/1/2022 | 50,000 | 50,112 |
Series A, GO, 5.00%, 10/1/2023 | 10,000 | 10,287 |
Rev., 5.00%, 11/1/2024 | 100,000 | 105,343 |
City of Poquoson GO, 5.00%, 2/15/2023 | 35,000 | 35,434 |
City of Richland, Waterworks Utility | ||
Series 2013A, Rev., 5.00%, 1/15/2023 (b) | 30,000 | 30,301 |
Series 2020A, Rev., 5.00%, 1/15/2023 | 25,000 | 25,256 |
City of Suffolk, Tax-Exempt Series 2017A, GO, 5.00%, 2/1/2023 | 25,000 | 25,270 |
City of Virginia Beach Series 2015B, GO, 5.00%, 9/15/2022 | 55,000 | 55,055 |
City of Virginia Beach, Public Improvement Series A, GO, 5.00%, 2/1/2023 | 25,000 | 25,281 |
City of Winchester, Public Improvement | ||
GO, 5.00%, 9/1/2022 (b) | 210,000 | 210,000 |
GO, 5.00%, 9/1/2022 | 75,000 | 75,000 |
GO, 5.00%, 3/1/2023 | 35,000 | 35,463 |
Commonwealth of Virginia Series 2013B, GO, 4.00%, 6/1/2025 | 20,000 | 20,275 |
County of Chesterfield 4.00%, 11/1/2023 | 100,000 | 100,258 |
County of Chesterfield, Public Improvement Series 2015B, 5.00%, 1/1/2023 | 20,000 | 20,182 |
County of Culpeper GO, 5.00%, 1/15/2024 | 25,000 | 25,881 |
INVESTMENTS | PRINCIPAL AMOUNT($) | VALUE($) |
Virginia — continued | ||
County of Fairfax, Public Improvement | ||
Series 2018A, GO, 4.00%, 10/1/2022 | 50,000 | 50,080 |
Series 2020A, GO, 4.00%, 10/1/2022 | 20,000 | 20,032 |
Series 2012B, GO, 5.00%, 4/1/2023 | 25,000 | 25,396 |
County of Hanover, Public Improvement Series A, GO, 4.13%, 1/15/2023 | 50,000 | 50,075 |
County of Henrico, Water and Sewer Rev., 3.13%, 5/1/2023 (b) | 20,000 | 20,101 |
County of Loudoun, Public Improvement Series 2018A, GO, 5.00%, 12/1/2022 | 25,000 | 25,171 |
County of Prince William | ||
COP, 5.00%, 10/1/2022 | 100,000 | 100,217 |
COP, 5.00%, 10/1/2023 | 230,000 | 236,327 |
County of Pulaski GO, 5.00%, 2/1/2024 | 40,000 | 41,454 |
County of Smyth GO, 5.00%, 11/1/2022 | 25,000 | 25,114 |
Culpeper County Economic Development Authority, Capital Projects Rev., 5.00%, 6/1/2024 | 30,000 | 31,297 |
Fairfax County Industrial Development Authority, Virginia Health Care, Inova Health System Project Series 2018B, Rev., 5.00%, 5/15/2023 (c) | 6,115,000 | 6,215,730 |
Franklin County Industrial Development Authority Rev., 5.00%, 10/15/2022 | 50,000 | 50,165 |
Hampton Roads Sanitation District, Wastewater | ||
Series 2014A, Rev., 5.00%, 7/1/2023 | 10,000 | 10,223 |
Series 2016A, Rev., 5.00%, 8/1/2023 | 25,000 | 25,611 |
Henry County Industrial Development Authority Rev., GAN, 2.00%, 11/1/2023 | 1,040,000 | 1,031,997 |
Loudoun County Economic Development Authority, Public Facilities Project Series 2016A, Rev., 5.00%, 12/1/2022 | 50,000 | 50,317 |
Louisa Industrial Development Authority, Electric and Power Co. Project Series 2008B, Rev., 0.75%, 9/2/2025 (c) | 100,000 | 93,571 |
Norfolk Economic Development Authority, Sentara Healthcare | ||
Series 2012B, Rev., 5.00%, 11/1/2022 | 20,000 | 20,091 |
Series 2012B, Rev., 4.00%, 11/1/2023 | 100,000 | 100,273 |
Peninsula Ports Authority, Dominion Terminal Associates Project - DETC Issue Rev., 1.70%, 10/1/2022 (c) | 4,850,000 | 4,845,360 |
Powhatan County Economic Development Authority Rev., 5.00%, 10/15/2022 | 25,000 | 25,079 |
August 31, 2022 | J.P. Morgan Exchange-Traded Funds | 339 |
AS OF August 31, 2022 (Unaudited) (continued)
INVESTMENTS | PRINCIPAL AMOUNT($) | VALUE($) |
Municipal Bonds — continued | ||
Virginia — continued | ||
Prince William County Industrial Development Authority, Novant Health Obligation Group Series 2013B, Rev., 3.25%, 11/1/2022 (b) | 30,000 | 30,046 |
Southampton County Industrial Development Authority, Southampton County Capital Rev., 5.00%, 12/1/2022 | 65,000 | 65,403 |
Virginia Beach Development Authority, Public Facilities Series B, Rev., 5.00%, 12/1/2022 | 70,000 | 70,474 |
Virginia Beach Development Authority, Westminster-Canterbury on Chesapeake Bay Rev., 5.00%, 9/1/2022 | 35,000 | 35,000 |
Virginia College Building Authority Series 2014B, Rev., 5.00%, 9/1/2022 (b) | 145,000 | 145,000 |
Virginia College Building Authority, 21st Century College and Equipment Programs Series 2020A, Rev., 5.00%, 2/1/2023 | 25,000 | 25,285 |
Virginia College Building Authority, Educational Facilities, 21st Century College and Equipment Programs | ||
Series 2009E-1, Rev., 5.00%, 2/1/2023 | 35,000 | 35,398 |
Series 2009E-2, Rev., 5.00%, 2/1/2023 | 40,000 | 40,455 |
Series 2013A, Rev., 5.00%, 2/1/2023 | 20,000 | 20,228 |
Series 2015A, Rev., 5.00%, 2/1/2023 | 65,000 | 65,740 |
Series 2018A, Rev., 5.00%, 2/1/2023 | 20,000 | 20,228 |
Series B, Rev., 5.00%, 2/1/2023 | 20,000 | 20,228 |
Virginia College Building Authority, Educational Facilities, Public Higher Education Financing Program | ||
Series 2012-A, Rev., 5.00%, 9/1/2022 (b) | 385,000 | 385,000 |
Series 2014B, Rev., 5.00%, 9/1/2022 | 160,000 | 160,000 |
Series 2016A, Rev., 5.00%, 9/1/2022 | 60,000 | 60,000 |
Series A, Rev., 5.00%, 9/1/2022 | 70,000 | 70,000 |
Virginia College Building Authority, Public Higher Educational Financing Program | ||
Series 2018A, Rev., 5.00%, 9/1/2022 | 125,000 | 125,000 |
Series 2019A, Rev., 5.00%, 9/1/2022 | 25,000 | 25,000 |
Series 2021A, Rev., 5.00%, 9/1/2022 | 55,000 | 55,000 |
Virginia Commonwealth Transportation Board Series 2012B, Rev., GAN, 5.00%, 9/15/2022 (b) | 35,000 | 35,035 |
Virginia Commonwealth Transportation Board, Capital Projects | ||
Rev., 5.00%, 5/15/2023 | 100,000 | 101,823 |
Rev., 5.00%, 5/15/2024 | 35,000 | 36,554 |
Series 2017A, Rev., 5.00%, 5/15/2025 | 40,000 | 42,798 |
INVESTMENTS | PRINCIPAL AMOUNT($) | VALUE($) |
Virginia — continued | ||
Virginia Commonwealth Transportation Board, Federal Transportation | ||
Rev., GAN, 5.00%, 9/15/2022 | 435,000 | 435,419 |
Series 2012B, Rev., GAN, 5.00%, 9/15/2022 (b) | 320,000 | 320,319 |
Series 2012B, Rev., GAN, 5.00%, 9/15/2022 | 325,000 | 325,314 |
Series 2013A, Rev., GAN, 5.00%, 3/15/2023 (b) | 235,000 | 238,402 |
Rev., GAN, 5.00%, 3/15/2025 | 30,000 | 31,982 |
Virginia Commonwealth University Series 2018A, Rev., 5.00%, 11/1/2022 | 20,000 | 20,088 |
Virginia Commonwealth University Health System Authority Rev., 5.00%, 7/1/2025 | 45,000 | 48,060 |
Virginia Housing Development Authority Series 2020B, Rev., 0.99%, 3/1/2024 | 210,000 | 204,514 |
Virginia Public Building Authority, Public Facilities | ||
Series 2012A, Rev., 4.00%, 8/1/2023 | 10,000 | 10,153 |
Series 2018A, Rev., 5.00%, 8/1/2023 | 30,000 | 30,728 |
Series 2020B, Rev., 5.00%, 8/1/2023 | 10,000 | 10,243 |
Series A, Rev., 5.00%, 8/1/2023 | 20,000 | 20,485 |
Series 2014C, Rev., 4.00%, 8/1/2026 | 25,000 | 25,727 |
Virginia Public School Authority, School Financing 1997 Resolution | ||
Series 2013A, Rev., 5.00%, 8/1/2023 | 10,000 | 10,241 |
Series 2013A, Rev., 5.00%, 8/1/2023 (b) | 25,000 | 25,602 |
Series 2014C, Rev., 5.00%, 8/1/2023 | 25,000 | 25,602 |
Series 2015A, Rev., 5.00%, 8/1/2024 | 25,000 | 26,221 |
Virginia Public School Authority, School Financing, Special Obligation Rev., 5.00%, 2/1/2023 | 120,000 | 121,346 |
Virginia Public School Authority, School Technology and Security Notes Series VI, Rev., 5.00%, 4/15/2023 | 80,000 | 81,328 |
Virginia Resources Authority | ||
Series 2012C, Rev., 4.00%, 11/1/2022 (b) | 20,000 | 20,056 |
Series 2012A, Rev., 4.00%, 11/1/2042 | 25,000 | 25,068 |
Virginia Resources Authority, Clean Water State Revolving Fund Rev., 5.00%, 10/1/2022 | 105,000 | 105,236 |
Virginia Resources Authority, Infrastructure | ||
Series 2015B, Rev., 4.00%, 11/1/2022 | 20,000 | 20,058 |
340 | J.P. Morgan Exchange-Traded Funds | August 31, 2022 |
INVESTMENTS | PRINCIPAL AMOUNT($) | VALUE($) |
Municipal Bonds — continued | ||
Virginia — continued | ||
Series 2012A, Rev., 5.00%, 11/1/2022 (b) | 800,000 | 803,604 |
Series 2016A, Rev., 5.00%, 11/1/2022 | 40,000 | 40,180 |
Series 2016C, Rev., 5.00%, 11/1/2022 | 120,000 | 120,541 |
Virginia Resources Authority, Infrastructure Moral Obligation | ||
Rev., 4.00%, 11/1/2022 | 25,000 | 25,073 |
Series 2012B, Rev., 4.00%, 11/1/2022 (b) | 155,000 | 155,419 |
Series 2013A, Rev., 4.00%, 11/1/2022 | 50,000 | 50,147 |
Series 2014C, Rev., AMT, 5.00%, 11/1/2022 | 35,000 | 35,158 |
Series 2016A, Rev., 5.00%, 11/1/2022 | 50,000 | 50,228 |
Series 2019A, Rev., 5.00%, 11/1/2022 | 25,000 | 25,114 |
Series 2012B, Rev., 4.00%, 11/1/2024 | 15,000 | 15,040 |
Virginia Resources Authority, Infrastructure Moral Obligation, Pooled Financing Program | ||
Rev., 5.00%, 11/1/2022 | 60,000 | 60,272 |
Series 2020C, Rev., 5.00%, 11/1/2022 | 75,000 | 75,342 |
Virginia Resources Authority, Infrastructure Pooled Financing Program | ||
Rev., 5.00%, 11/1/2022 | 75,000 | 75,338 |
Series 2012A, Rev., 5.00%, 11/1/2022 | 40,000 | 40,180 |
Series 2012B, Rev., 5.00%, 11/1/2022 | 115,000 | 115,518 |
Series 2017A, Rev., 5.00%, 11/1/2022 | 25,000 | 25,113 |
Virginia Resources Authority, Infrastructure Tax Exempt Series A, Rev., 5.00%, 11/1/2022 | 20,000 | 20,090 |
Virginia Resources Authority, Pooled Financing Program | ||
Series 2017C, Rev., 4.00%, 11/1/2022 | 65,000 | 65,187 |
Series 2016B, Rev., 5.00%, 11/1/2022 | 80,000 | 80,360 |
Virginia Resources Authority, Tuckahoe Creek Service District Project | ||
Rev., Zero Coupon, 11/1/2022 (b) | 95,000 | 71,092 |
Rev., 4.00%, 11/1/2022 (b) | 30,000 | 30,084 |
Virginia Resources Authority, Virginia Pooled Financing Program Series 2018C, Rev., 5.00%, 11/1/2022 | 185,000 | 185,833 |
Western Regional Jail Authority, Regional Jail Facility | ||
Rev., 4.00%, 12/1/2022 | 50,000 | 50,207 |
Rev., 5.00%, 12/1/2024 | 1,285,000 | 1,351,580 |
INVESTMENTS | PRINCIPAL AMOUNT($) | VALUE($) |
Virginia — continued | ||
Winchester Economic Development Authority, Health System Obligation Group Series 2014A, Rev., 5.00%, 1/1/2023 | 25,000 | 25,203 |
Wise County Industrial Development Authority, Electric and Power Co. Project Series 2010A, Rev., 1.20%, 5/31/2024 (c) | 2,110,000 | 2,048,416 |
Total Virginia | 47,195,276 | |
Washington — 2.0% | ||
Auburn School District No. 408 of King and Pierce Counties | ||
GO, 3.00%, 12/1/2022 | 150,000 | 150,070 |
GO, 4.00%, 12/1/2023 | 95,000 | 95,385 |
GO, 4.00%, 12/1/2024 | 60,000 | 60,243 |
Auburn School District No. 408 of King and Pierce Counties, Unlimited Tax GO, 5.00%, 12/1/2024 | 25,000 | 26,441 |
Benton County School District No. 17 Kennewick, Unlimited Tax | ||
5.00%, 12/1/2022 | 90,000 | 90,594 |
5.00%, 12/1/2023 | 60,000 | 61,902 |
Benton County School District No. 400 Richland, Unlimited Tax 5.00%, 12/1/2023 | 50,000 | 51,030 |
Cascade Water Alliance | ||
5.00%, 9/1/2022 | 25,000 | 25,000 |
5.00%, 1/1/2023 | 25,000 | 25,227 |
Central Puget Sound Regional Transit Authority, Sales and Motor Vehicle Excise Tax Series 2016S-1, 5.00%, 11/1/2022 | 50,000 | 50,228 |
Central Puget Sound Regional Transit Authority, Sales and Use Tax | ||
Series 2012S-1, 5.00%, 11/1/2022 | 140,000 | 140,638 |
Series 2012S-1, 5.00%, 11/1/2024 (b) | 25,000 | 25,113 |
Series 2012S-1, 5.00%, 11/1/2026 (b) | 35,000 | 35,158 |
Series 2012S-1, 5.00%, 11/1/2027 (b) | 45,000 | 45,203 |
Central Washington University | ||
AGM, 5.00%, 5/1/2024 | 360,000 | 374,440 |
4.00%, 5/1/2026 | 270,000 | 272,225 |
City of Auburn, Utility System | ||
5.00%, 12/1/2022 | 35,000 | 35,230 |
5.00%, 12/1/2023 | 35,000 | 36,092 |
City of Bellevue, Limited Tax 5.00%, 12/1/2022 | 75,000 | 75,510 |
City of Bellingham, Limited Tax 5.00%, 12/1/2022 | 25,000 | 25,170 |
August 31, 2022 | J.P. Morgan Exchange-Traded Funds | 341 |
AS OF August 31, 2022 (Unaudited) (continued)
INVESTMENTS | PRINCIPAL AMOUNT($) | VALUE($) |
Municipal Bonds — continued | ||
Washington — continued | ||
City of Bonney Lake, Water & Sewer System 4.00%, 12/1/2022 | 75,000 | 75,330 |
City of Bothell, Limited Tax 5.00%, 3/1/2023 | 25,000 | 25,329 |
City of Centralia Electric System 5.00%, 12/1/2022 | 150,000 | 150,989 |
City of Edmonds, Water and Sewer Rev., 5.00%, 12/1/2023 | 25,000 | 25,494 |
City of Everett, Water and Sewer | ||
Rev., 5.00%, 12/1/2022 | 500,000 | 503,423 |
Rev., 5.00%, 12/1/2023 | 25,000 | 25,805 |
Rev., 5.00%, 12/1/2024 | 40,000 | 40,193 |
City of Fife Rev., 4.00%, 10/1/2022 | 100,000 | 100,137 |
City of Gig Harbor, Water and Sewer Rev., 4.00%, 10/1/2022 | 50,000 | 50,066 |
City of Kennewick, Limited Tax GO, 3.00%, 12/1/2022 | 20,000 | 20,030 |
City of Lynnwood | ||
Rev., 4.00%, 12/1/2022 | 45,000 | 45,198 |
Rev., 4.00%, 12/1/2023 | 30,000 | 30,603 |
City of Olympia, Limited Tax GO, 5.00%, 12/1/2024 | 25,000 | 26,408 |
City of Olympia, Unlimited Tax GO, 5.00%, 12/1/2022 | 45,000 | 45,308 |
City of Renton, Limited Tax Series A, GO, 4.00%, 12/1/2022 | 50,000 | 50,214 |
City of Richland Rev., 5.00%, 11/1/2022 | 45,000 | 45,205 |
City of Richland, Waterworks Utility | ||
Rev., 4.00%, 11/1/2022 | 20,000 | 20,059 |
Rev., 4.00%, 11/1/2023 | 20,000 | 20,365 |
City of Seattle, Limited Tax | ||
Series 2017A, GO, 5.00%, 11/1/2022 | 150,000 | 150,683 |
Series 2016A, GO, 5.00%, 4/1/2023 | 30,000 | 30,472 |
GO, 5.00%, 5/1/2023 | 20,000 | 20,357 |
Series 2013A, GO, 4.00%, 10/1/2023 | 25,000 | 25,244 |
City of Seattle, Municipal Light and Power Improvement | ||
Rev., 5.00%, 9/1/2022 | 345,000 | 345,000 |
Series 2017C, Rev., 5.00%, 9/1/2022 | 45,000 | 45,000 |
Series 2016C, Rev., 5.00%, 10/1/2022 | 115,000 | 115,258 |
Series 2019A, Rev., 5.00%, 4/1/2023 | 25,000 | 25,396 |
Series 2020A, Rev., 5.00%, 7/1/2023 | 30,000 | 30,669 |
Series 2016C, Rev., 5.00%, 10/1/2023 | 45,000 | 46,291 |
City of Seattle, Water System | ||
Rev., 4.00%, 9/1/2022 (b) | 70,000 | 70,000 |
INVESTMENTS | PRINCIPAL AMOUNT($) | VALUE($) |
Washington — continued | ||
Rev., 5.00%, 9/1/2022 | 230,000 | 230,000 |
Rev., 5.00%, 9/1/2022 (b) | 110,000 | 110,000 |
City of Shelton, Limited Tax GO, 4.00%, 12/1/2022 | 150,000 | 150,540 |
City of Spokane, Unlimited Tax GO, 5.00%, 12/1/2022 | 200,000 | 201,369 |
City of Spokane, Water and Wastewater System | ||
Rev., 5.00%, 12/1/2022 | 25,000 | 25,171 |
Rev., 5.00%, 12/1/2023 | 20,000 | 20,652 |
City of Tacoma | ||
Rev., 3.00%, 12/1/2022 | 30,000 | 30,051 |
Rev., 5.00%, 12/1/2022 | 280,000 | 281,846 |
Series 2015A, Rev., 5.00%, 12/1/2022 | 20,000 | 20,132 |
City of Tacoma, Water Supply System Rev., 5.00%, 12/1/2022 | 25,000 | 25,165 |
City of University Place, Limited Tax GO, 4.00%, 12/1/2023 | 35,000 | 35,704 |
City of Vancouver, Limited Tax Series 2015B, GO, 5.00%, 12/1/2022 | 80,000 | 80,548 |
City of Walla Walla, Unlimited Tax | ||
GO, 3.00%, 12/1/2022 | 70,000 | 70,119 |
GO, 3.00%, 12/1/2023 | 25,000 | 25,182 |
City of Wenatchee, Water and Sewer System Rev., 3.00%, 12/1/2022 | 25,000 | 25,043 |
City of Yakima, Limited Tax Series 2014A, GO, 5.00%, 6/1/2023 | 25,000 | 25,457 |
Clark County Public Utility District No. 1 5.00%, 1/1/2024 | 15,000 | 15,506 |
Clark County Public Utility District No. 1, Electric System 5.00%, 1/1/2023 | 330,000 | 332,899 |
Clark County School District No. 114 Evergreen, Unlimited Tax 5.00%, 12/1/2022 | 80,000 | 80,538 |
Clark County School District No. 117 Camas, Unlimited Tax 2.00%, 12/1/2022 | 30,000 | 29,978 |
Clark County School District No. 122 Ridgefield, Unlimited Tax 5.00%, 12/1/2022 | 30,000 | 30,202 |
Clark County School District No. 37 Vancouver, Unlimited Tax | ||
3.00%, 12/1/2022 | 30,000 | 30,055 |
5.00%, 12/1/2023 | 30,000 | 30,970 |
Clark County, Vancouver School District No. 37 3.00%, 12/1/2023 | 25,000 | 25,198 |
Clark Regional Wastewater District 5.00%, 12/1/2022 | 25,000 | 25,166 |
342 | J.P. Morgan Exchange-Traded Funds | August 31, 2022 |
INVESTMENTS | PRINCIPAL AMOUNT($) | VALUE($) |
Municipal Bonds — continued | ||
Washington — continued | ||
County of Benton, Limited Tax | ||
3.00%, 12/1/2022 | 45,000 | 45,077 |
3.00%, 12/1/2023 | 30,000 | 30,211 |
County of King, Limited Tax | ||
Series 2012E, GO, 3.00%, 12/1/2022 | 30,000 | 30,059 |
GO, 5.00%, 12/1/2022 | 50,000 | 50,342 |
Series 2014C, GO, 5.00%, 12/1/2022 | 180,000 | 181,232 |
Series 2021A, GO, 3.00%, 1/1/2023 | 120,000 | 120,310 |
County of King, Sewer Series 2013A, Rev., 5.00%, 1/1/2024 | 30,000 | 30,258 |
County of King, Sewer, Junior Lien | ||
Series 2020A, Rev., 0.63%, 1/1/2024 (c) | 1,545,000 | 1,476,811 |
Series B, Rev., 0.88%, 1/1/2026 (c) | 60,000 | 55,644 |
County of Kitsap, Limited Tax GO, 4.00%, 12/1/2022 | 70,000 | 70,308 |
County of Kitsap, Sewer Rev., 5.00%, 12/1/2022 | 25,000 | 25,171 |
County of Skagit, Limited Tax GO, 5.00%, 12/1/2024 | 60,000 | 63,405 |
County of Snohomish, Limited Tax | ||
GO, 4.00%, 12/1/2022 | 190,000 | 190,836 |
GO, 5.00%, 12/1/2022 | 70,000 | 70,479 |
County of Spokane, Limited Tax GO, 5.00%, 12/1/2022 (b) | 75,000 | 75,507 |
East Wenatchee Water District Rev., 4.00%, 8/1/2023 | 25,000 | 25,352 |
Eastern Washington University, Services and Activities Fee Rev., 5.00%, 10/1/2023 | 35,000 | 35,929 |
Energy Northwest, Columbia Generating Station Series 2017-A, Rev., 5.00%, 7/1/2023 | 35,000 | 35,746 |
Energy Northwest, Project 1 Series 2014-C, Rev., 5.00%, 7/1/2026 | 100,000 | 104,610 |
Energy Northwest, Project 3 Electric | ||
Series 2018C, Rev., 4.00%, 7/1/2023 | 30,000 | 30,394 |
Series C, Rev., 5.00%, 7/1/2023 | 25,000 | 25,533 |
Series 2018C, Rev., 5.00%, 7/1/2025 | 25,000 | 26,736 |
FYI Properties, State of Washington District Project Rev., 5.00%, 6/1/2023 | 45,000 | 45,840 |
Grays Harbor County, Public Utility District No. 1 | ||
Series 2015A, Rev., 5.00%, 1/1/2023 | 40,000 | 40,350 |
Rev., 5.00%, 7/1/2023 (b) | 20,000 | 20,431 |
Series 2015A, Rev., 5.00%, 1/1/2025 | 100,000 | 105,413 |
INVESTMENTS | PRINCIPAL AMOUNT($) | VALUE($) |
Washington — continued | ||
Greater Wenatchee Regional Events Center Public Facilities District Series A, Rev., 5.50%, 9/1/2022 (b) | 250,000 | 250,000 |
King and Snohomish Counties School District No. 417 Northshore | ||
GO, 5.00%, 12/1/2022 | 135,000 | 135,907 |
GO, 5.00%, 12/1/2024 | 25,000 | 26,419 |
King County Fire Protection District No. 2, Unlimited Tax GO, 5.00%, 12/1/2022 | 30,000 | 30,205 |
King County Fire Protection District No. 39, Unlimited Tax Series 2015A, GO, 5.00%, 12/1/2024 | 40,000 | 42,261 |
King County Housing Authority, Workforce Housing Preservation Rev., 2.00%, 10/1/2022 | 220,000 | 219,906 |
King County Public Hospital District No. 1, Valley Medical Center, Limited Tax | ||
GO, 4.00%, 12/1/2022 | 150,000 | 150,510 |
GO, 5.00%, 12/1/2022 | 410,000 | 412,601 |
King County Public Hospital District No. 2, Evergreen Healthcare, Unlimited Tax GO, 5.00%, 12/1/2022 | 50,000 | 50,340 |
King County Rural Library District, Unlimited Tax GO, 4.00%, 12/1/2022 | 395,000 | 396,708 |
King County School District No. 210 Federal Way, Unlimited Tax GO, 4.00%, 12/1/2022 | 35,000 | 35,154 |
King County School District No. 401 Highline, Unlimited Tax | ||
Series 2012B, GO, 3.25%, 12/1/2022 | 25,000 | 25,064 |
GO, 4.00%, 12/1/2022 | 35,000 | 35,154 |
Series 2012B, GO, 5.00%, 12/1/2022 | 165,000 | 166,096 |
King County School District No. 403 Renton, Unlimited Tax GO, 4.00%, 12/1/2024 | 65,000 | 67,276 |
King County School District No. 405 Bellevue, Unlimited Tax | ||
Series 2012B, GO, 3.00%, 12/1/2022 | 40,000 | 40,078 |
GO, 5.00%, 12/1/2022 | 160,000 | 161,095 |
Series 2012A, GO, 5.00%, 12/1/2022 | 45,000 | 45,308 |
GO, 5.00%, 12/1/2023 | 25,000 | 25,824 |
GO, 5.00%, 12/1/2024 | 160,000 | 169,261 |
King County School District No. 410 Snoqualmie Valley , Unlimited Tax GO, 5.00%, 12/1/2022 | 30,000 | 30,205 |
King County School District No. 410 Snoqualmie Valley, Unlimited Tax GO, 4.00%, 12/1/2022 | 95,000 | 95,418 |
August 31, 2022 | J.P. Morgan Exchange-Traded Funds | 343 |
AS OF August 31, 2022 (Unaudited) (continued)
INVESTMENTS | PRINCIPAL AMOUNT($) | VALUE($) |
Municipal Bonds — continued | ||
Washington — continued | ||
King County School District No. 411 Issaquah, Unlimited Tax | ||
GO, 2.50%, 12/1/2022 | 40,000 | 40,026 |
GO, 3.00%, 12/1/2022 | 35,000 | 35,066 |
GO, 4.00%, 12/1/2022 | 20,000 | 20,086 |
King County School District No. 414 Lake Washington, Unlimited Tax GO, 5.00%, 12/1/2022 | 410,000 | 412,795 |
King County School District No. 415 Kent, Unlimited Tax GO, 5.00%, 12/1/2023 | 30,000 | 30,970 |
Kitsap County Public Utility District No. 1 Rev., 4.00%, 12/1/2022 | 40,000 | 40,147 |
Kitsap County School District No. 303 Bainbridge Island Series 2014B, GO, 5.00%, 12/1/2022 | 20,000 | 20,134 |
Kitsap County School District No. 401 Central Kitsap, Unlimited Tax GO, 5.00%, 12/1/2022 | 185,000 | 186,243 |
Lake Stevens Sewer District Rev., 5.00%, 11/1/2022 | 35,000 | 35,155 |
Lewis County Public Utility District No. 1, Cowlitz Falls Hydro Electric Project | ||
Rev., 5.00%, 10/1/2022 | 45,000 | 45,101 |
Rev., 5.00%, 10/1/2023 | 100,000 | 102,827 |
Lynnwood Public Facilities District, Convention Center Rev., 5.00%, 12/1/2022 | 50,000 | 50,303 |
Mason County School District No. 309 Shelton, Unlimited Tax GO, 5.00%, 12/1/2022 | 25,000 | 25,165 |
North Thurston Public Schools, Unlimited Tax GO, 4.00%, 12/1/2022 | 40,000 | 40,176 |
Pierce County School District No. 10 Tacoma, Unlimited Tax GO, 5.00%, 12/1/2022 | 25,000 | 25,168 |
Pierce County School District No. 3 Puyallup, Unlimited Tax | ||
Series 2012A, GO, 4.00%, 12/1/2022 | 95,000 | 95,387 |
Series 2012A, GO, 5.00%, 12/1/2022 | 75,000 | 75,498 |
Pierce County School District No. 320 Sumner, Unlimited Tax | ||
GO, 3.00%, 12/1/2022 | 25,000 | 25,046 |
GO, 5.00%, 12/1/2022 | 45,000 | 45,302 |
Pierce County School District No. 401 Peninsula, Unlimited Tax GO, 5.00%, 12/1/2022 | 20,000 | 20,134 |
INVESTMENTS | PRINCIPAL AMOUNT($) | VALUE($) |
Washington — continued | ||
Pierce County School District No. 83 University Place, Unlimited Tax GO, 3.00%, 12/1/2022 | 75,000 | 75,135 |
Port of Bellingham Rev., 4.00%, 12/1/2022 | 50,000 | 50,195 |
Port of Everett Rev., 4.00%, 12/1/2022 | 70,000 | 70,285 |
Port of Everett, Limited Tax GO, 5.00%, 12/1/2022 | 50,000 | 50,342 |
Port of Seattle Series 2013A, GO, 4.00%, 11/1/2023 | 150,000 | 150,409 |
Port of Seattle, Intermediate Lien | ||
Series 2021A, Rev., 5.00%, 12/1/2022 | 120,000 | 120,761 |
Series B, Rev., 5.00%, 3/1/2023 | 315,000 | 318,983 |
Port of Tacoma, Limited Tax Series 2016A, GO, 4.00%, 12/1/2022 | 80,000 | 80,352 |
Public Utility District No. 1 of Cowlitz County 5.00%, 9/1/2022 | 25,000 | 25,000 |
Skagit County School District No. 103 Anacortes GO, 5.00%, 12/1/2022 | 40,000 | 40,269 |
Snohomish County Public Utility District No. 1, Electric System | ||
Rev., 5.00%, 12/1/2022 (b) | 305,000 | 307,064 |
Rev., 5.00%, 12/1/2022 | 65,000 | 65,445 |
Snohomish County Public Utility District No. 1, Generation System Series 2020A, Rev., 5.00%, 12/1/2022 | 200,000 | 201,369 |
Snohomish County School District No. 103 Monroe, Unlimited Tax GO, 5.00%, 12/1/2022 | 30,000 | 30,202 |
Snohomish County School District No. 2 Everett, Unlimited Tax GO, 3.00%, 12/1/2022 | 65,000 | 65,119 |
Spokane & Whitman Counties School District No. 360 Cheney, Unlimited Tax GO, 5.00%, 12/1/2022 | 25,000 | 25,168 |
Spokane County School District No. 354 Mead, Unlimited Tax GO, 5.00%, 12/1/2022 | 20,000 | 20,132 |
Spokane County School District No. 356 Central Valley, Unlimited Tax GO, 5.00%, 12/1/2023 | 45,000 | 46,455 |
Spokane Public Facilities District, Hotel and Sales Tax Series 2013A, Rev., 5.00%, 6/1/2023 (b) | 25,000 | 25,468 |
State of Washington Series R-2022C, GO, 4.00%, 7/1/2027 | 15,000,000 | 16,070,916 |
State of Washington, Motor Vehicle Fuel Tax | ||
Series 2003F, GO, NATL-RE, Zero Coupon, 12/1/2022 | 75,000 | 74,552 |
344 | J.P. Morgan Exchange-Traded Funds | August 31, 2022 |
INVESTMENTS | PRINCIPAL AMOUNT($) | VALUE($) |
Municipal Bonds — continued | ||
Washington — continued | ||
Series R-2020B, GO, 5.00%, 1/1/2023 | 45,000 | 45,415 |
Series 2013E, GO, 5.00%, 2/1/2023 | 30,000 | 30,341 |
Series 2014E, GO, 5.25%, 2/1/2023 | 30,000 | 30,372 |
Series 2003C, GO, NATL-RE, Zero Coupon, 6/1/2023 | 45,000 | 44,159 |
Series R-2013D, GO, 5.00%, 7/1/2023 | 20,000 | 20,446 |
Series 2013E, GO, 5.00%, 2/1/2024 | 20,000 | 20,217 |
Series R-2021A, GO, 5.00%, 6/1/2024 | 500,000 | 522,840 |
Series 2013E, GO, 5.00%, 2/1/2025 | 85,000 | 85,978 |
Series 2015C, GO, 5.00%, 2/1/2025 | 100,000 | 106,082 |
State of Washington, Senior 520 Corridor Program Series 2012F, Rev., 5.00%, 9/1/2022 | 170,000 | 170,000 |
State of Washington, Senior 520 Corridor Program, Federal Highway Series 2014C, Rev., 5.00%, 9/1/2024 | 95,000 | 97,243 |
State of Washington, State and Local Agency Personal Property Series 2014B, COP, 5.00%, 7/1/2024 | 50,000 | 52,222 |
State of Washington, State and Local Agency Real and Personal Property | ||
Series 2015C, COP, 5.00%, 7/1/2023 | 55,000 | 56,167 |
Series 2016A, COP, 5.00%, 7/1/2023 | 35,000 | 35,743 |
Series 2019B, COP, 5.00%, 7/1/2023 | 120,000 | 122,546 |
Series 2018C, COP, 5.00%, 7/1/2024 | 35,000 | 36,556 |
State of Washington, Various Purpose | ||
Series 2013D, GO, 5.00%, 2/1/2023 | 10,000 | 10,114 |
Series 2017D, GO, 5.00%, 2/1/2023 | 25,000 | 25,285 |
Series 2019C, GO, 5.00%, 2/1/2023 | 45,000 | 45,512 |
Series R-2015C, GO, 5.00%, 7/1/2023 | 80,000 | 81,784 |
Series R-C, GO, 5.00%, 7/1/2023 | 20,000 | 20,446 |
Series 2015E, GO, 5.00%, 7/1/2024 | 25,000 | 26,180 |
Series 2018A, GO, 5.00%, 8/1/2024 | 40,000 | 41,969 |
Series R-2013C, GO, 5.00%, 7/1/2025 | 50,000 | 51,144 |
Series 2014A, GO, 5.00%, 8/1/2025 | 35,000 | 35,881 |
Series R-2013C, GO, 4.00%, 7/1/2026 | 75,000 | 76,007 |
Series 2014A, GO, 5.00%, 8/1/2026 | 70,000 | 71,756 |
Tacoma Metropolitan Park District, Unlimited Tax | ||
Series B, GO, 4.00%, 12/1/2022 | 20,000 | 20,087 |
GO, 5.00%, 12/1/2022 | 215,000 | 216,461 |
Series B, GO, 5.00%, 12/1/2022 | 60,000 | 60,408 |
Thurston County School District No. 33 Tumwater, Unlimited Tax GO, 5.00%, 12/1/2022 | 55,000 | 55,376 |
INVESTMENTS | PRINCIPAL AMOUNT($) | VALUE($) |
Washington — continued | ||
Tobacco Settlement Authority Rev., 5.00%, 6/1/2024 | 3,480,000 | 3,544,656 |
University of Washington | ||
Series 2015C, Rev., 5.00%, 12/1/2022 | 115,000 | 115,787 |
Series A, Rev., 5.00%, 12/1/2022 | 140,000 | 140,958 |
Washington Economic Development Finance Authority, Washington Biomedical Research Properties II Rev., 5.00%, 6/1/2023 | 35,000 | 35,674 |
Washington Health Care Facilities Authority, Overlake Hospital Medical Center Rev., 5.00%, 7/1/2023 | 30,000 | 30,544 |
Washington Health Care Facilities Authority, Peacehealth Series 2014A, Rev., 5.00%, 11/15/2022 (b) | 25,000 | 25,129 |
Washington Health Care Facilities Authority, Providence Health and Services | ||
Series 2012A, Rev., 5.00%, 10/1/2022 | 135,000 | 135,270 |
Series 2012A, Rev., 5.00%, 10/1/2023 | 230,000 | 230,473 |
Series 2012A, Rev., 5.00%, 10/1/2024 | 55,000 | 55,098 |
Series 2012A, Rev., 5.00%, 10/1/2026 | 1,030,000 | 1,031,722 |
Washington Health Care Facilities Authority, Seattle Cancer Care Alliance Rev., 5.00%, 3/1/2026 | 500,000 | 523,011 |
Washington Health Care Facilities Authority, Seattle Children's Hospital Series 2017A, Rev., 5.00%, 10/1/2022 | 365,000 | 365,790 |
Washington State Housing Finance Commission, Mirabella Project Series 2012A, Rev., 6.75%, 10/3/2022 (b) (e) | 22,450,000 | 22,530,640 |
Washington State University Rev., 5.00%, 10/1/2022 | 70,000 | 70,149 |
Washington State University, Green Bond Rev., 5.00%, 10/1/2022 | 30,000 | 30,064 |
Western Washington University, Housing and Dining System Rev., AGM, 5.00%, 4/1/2023 | 50,000 | 50,713 |
Yakima County School District No. 203 Highland, Unlimited Tax GO, 4.00%, 12/1/2022 | 25,000 | 25,104 |
Yakima County School District No. 208 West Valley GO, 2.00%, 12/1/2022 | 25,000 | 24,981 |
Yakima County School District No. 7 Yakima GO, 5.00%, 12/1/2022 | 35,000 | 35,235 |
Total Washington | 62,085,775 | |
West Virginia — 0.1% | ||
State of West Virginia Series 2018A, GO, 5.00%, 12/1/2022 | 50,000 | 50,342 |
August 31, 2022 | J.P. Morgan Exchange-Traded Funds | 345 |
AS OF August 31, 2022 (Unaudited) (continued)
INVESTMENTS | PRINCIPAL AMOUNT($) | VALUE($) |
Municipal Bonds — continued | ||
West Virginia — continued | ||
State of West Virginia, Infrastructure Series 2015A, GO, 5.00%, 11/1/2022 | 25,000 | 25,114 |
West Virginia Economic Development Authority, Appalachian Power Co. Series 2015A, Rev., 2.55%, 4/1/2024 (c) | 135,000 | 131,913 |
West Virginia Economic Development Authority, Correctional Juvenile and Public Safety Facilities | ||
Series 2012A, Rev., 5.00%, 6/1/2024 | 125,000 | 125,297 |
Rev., 5.00%, 6/1/2025 | 805,000 | 817,518 |
West Virginia Economic Development Authority, Solid Waste Disposal Facilities, Appalachian Power Co. Amos Project Rev., 0.63%, 12/15/2025 (c) | 100,000 | 89,048 |
West Virginia Hospital Finance Authority, Charleston Area Medical Center Series 2014A, Rev., 5.00%, 9/1/2025 | 115,000 | 118,868 |
West Virginia Housing Development Fund Series 2020B, Rev., 0.30%, 11/1/2022 | 20,000 | 19,937 |
West Virginia State School Building Authority, Lottery Series 2015A, Rev., 5.00%, 7/1/2023 | 25,000 | 25,516 |
West Virginia State School Building Authority, Lottery Capital Improvement Series 2012A, Rev., 5.00%, 7/1/2023 | 100,000 | 100,216 |
West Virginia University Project Series 2013A, Rev., 5.00%, 10/1/2022 (b) | 190,000 | 190,422 |
West Virginia University, University Improvement, West Virginia University Project | ||
Series 2013A, Rev., 5.00%, 10/1/2022 (b) | 50,000 | 50,111 |
Series 2019A, Rev., 5.00%, 10/1/2022 | 275,000 | 275,598 |
West Virginia Water Development Authority Series A-II, Rev., 5.00%, 11/1/2022 | 25,000 | 25,114 |
West Virginia Water Development Authority, Infrastructure and Jobs Development Council Program Rev., 2.00%, 10/1/2022 | 20,000 | 19,996 |
West Virginia Water Development Authority, Loan Program II Series 2016A-II, Rev., 5.00%, 11/1/2022 | 45,000 | 45,205 |
Total West Virginia | 2,110,215 | |
Wisconsin — 1.3% | ||
Central Brown County Water Authority Series 2014A, 5.00%, 11/1/2022 | 190,000 | 190,824 |
City of Brookfield 3.00%, 12/1/2022 | 455,000 | 455,776 |
INVESTMENTS | PRINCIPAL AMOUNT($) | VALUE($) |
Wisconsin — continued | ||
City of De Pere Series 2019A, GO, 3.00%, 9/1/2022 | 50,000 | 50,000 |
City of Greensboro Rev., 3.00%, 11/1/2022 | 20,000 | 20,018 |
City of Kaukauna, Promissory Note GO, 4.00%, 9/1/2022 | 100,000 | 100,000 |
City of Kenosha, Promissory Notes | ||
Series 2017B, GO, 2.00%, 9/1/2022 | ��� 50,000 | 50,000 |
Series 2018C, GO, 3.00%, 11/1/2022 | 50,000 | 50,063 |
City of Lake Mills, Capital Purpose Series 2014B, GO, 4.00%, 9/1/2022 | 140,000 | 140,000 |
City of Madison | ||
Series 2020B, GO, 2.00%, 10/1/2022 | 25,000 | 24,995 |
Series 2014C, Rev., 5.00%, 12/1/2022 | 50,000 | 50,342 |
Series 2019A, Rev., 5.00%, 1/1/2023 | 35,000 | 35,313 |
City of Madison, Promissory Notes | ||
Series 2017A, GO, 4.00%, 10/1/2022 | 125,000 | 125,181 |
Series 2018A, GO, 4.00%, 10/1/2022 | 140,000 | 140,203 |
City of Madison, Water Utility Rev., BAN, 1.50%, 11/1/2024 | 1,075,000 | 1,040,531 |
City of Manitowoc GO, 2.00%, 2/1/2023 | 320,000 | 319,126 |
City of Merrill Series 2019A, GO, 3.00%, 10/1/2022 | 60,000 | 60,031 |
City of Milwaukee, Promissory Notes | ||
Series 2018 N1, GO, 5.00%, 2/1/2023 | 1,325,000 | 1,339,528 |
Series 2016N2, GO, 4.00%, 3/1/2023 | 30,000 | 30,247 |
Series 2020N4, GO, 5.00%, 4/1/2023 | 35,000 | 35,534 |
City of Milwaukee, Sewerage System Series 2016S7, Rev., 5.00%, 6/1/2023 | 25,000 | 25,465 |
City of Oak Creek | ||
Series 2016C, GO, 3.00%, 10/1/2022 | 25,000 | 25,015 |
Series 2021B, Rev., 2.00%, 4/1/2024 | 5,020,000 | 4,956,639 |
City of Oshkosh, Promissory Notes Series 2017B, GO, 4.00%, 12/1/2022 | 80,000 | 80,302 |
City of Oshkosh, Street Improvement | ||
Series 2019A, GO, 0.05%, 12/1/2022 | 70,000 | 69,531 |
Series 2019A, GO, 2.00%, 12/1/2023 | 200,000 | 197,790 |
City of Oshkosh, Wisconsin Sewer System Series D, Rev., 5.00%, 5/1/2023 | 25,000 | 25,408 |
City of Racine | ||
GO, 3.00%, 12/1/2022 | 25,000 | 25,047 |
GO, 5.00%, 12/1/2022 | 25,000 | 25,169 |
City of Waukesha, Promissory Notes | ||
Series 2021B, GO, 2.00%, 10/1/2022 | 130,000 | 129,956 |
Series 2019C, GO, 3.00%, 10/1/2022 | 20,000 | 20,012 |
Series 2020A, GO, 3.00%, 10/1/2022 | 65,000 | 65,037 |
346 | J.P. Morgan Exchange-Traded Funds | August 31, 2022 |
INVESTMENTS | PRINCIPAL AMOUNT($) | VALUE($) |
Municipal Bonds — continued | ||
Wisconsin — continued | ||
Series 2015A, GO, 4.00%, 10/1/2022 | 75,000 | 75,106 |
Series 2015A, GO, 4.00%, 10/1/2022 (b) | 35,000 | 35,048 |
Series B, GO, 4.00%, 10/1/2022 | 40,000 | 40,057 |
City of Wauwatosa Series 2019A, GO, 4.00%, 12/1/2022 | 75,000 | 75,319 |
County of Dane, Promissory Notes Series 2019A, GO, 2.00%, 6/1/2023 | 20,000 | 19,924 |
County of Eau Claire, Promissory Notes Series 2020A, GO, 5.00%, 9/1/2022 | 20,000 | 20,000 |
County of Kenosha, Promissory Notes Series 2018A, GO, 4.00%, 9/1/2022 | 140,000 | 140,000 |
County of Milwaukee | ||
Series 2019A, GO, 5.00%, 10/1/2022 | 65,000 | 65,142 |
Series 2017B, GO, 2.00%, 12/1/2022 | 25,000 | 24,975 |
Series 2014A, GO, 3.00%, 12/1/2022 | 25,000 | 25,045 |
County of Milwaukee, Corporate Purpose Series 2018D, GO, 3.00%, 8/1/2024 | 100,000 | 100,737 |
County of Taylor, Promissory Notes Series 2021A, GO, 2.00%, 10/1/2022 | 85,000 | 84,970 |
County of Washington GO, 3.00%, 3/1/2023 | 50,000 | 50,163 |
East Troy Community School District GO, 3.00%, 3/1/2023 | 20,000 | 20,067 |
Fond Du Lac School District, Promissory Notes Series 2019A, GO, 3.00%, 4/1/2023 | 40,000 | 40,140 |
Fox Valley Technical College District, Promissory Notes | ||
Series 2018A, GO, 4.00%, 12/1/2022 | 60,000 | 60,237 |
Series 2019A, GO, 4.00%, 12/1/2022 | 55,000 | 55,217 |
Fox Valley Technical College District, School Facilities | ||
Series 2012C, GO, 3.00%, 12/1/2022 | 50,000 | 50,075 |
Series 2012C, GO, 3.00%, 12/1/2022 (b) | 25,000 | 25,045 |
Franklin Public School District GO, 4.00%, 4/1/2023 | 25,000 | 25,253 |
Glendale Community Development Authority Series A, Rev., 2.55%, 10/1/2022 (b) | 20,000 | 20,003 |
Glendale Community Development Authority, Bayshore Public Parking Facility Rev., 2.30%, 10/1/2022 (b) | 20,000 | 20,000 |
Grafton School District, School Building and Improvement GO, 5.00%, 4/1/2023 (b) | 20,000 | 20,312 |
Kohler School District GO, 5.00%, 3/1/2023 | 30,000 | 30,393 |
INVESTMENTS | PRINCIPAL AMOUNT($) | VALUE($) |
Wisconsin — continued | ||
Milton School District GO, 5.00%, 3/1/2023 | 85,000 | 86,096 |
Milwaukee Area Technical College District, Promissory Notes Series B, GO, 4.00%, 6/1/2023 | 25,000 | 25,316 |
Milwaukee Metropolitan Sewerage District, Promissory Notes Series 2015A, GO, 4.00%, 10/1/2022 | 115,000 | 115,164 |
Milwaukee Metropolitan Sewerage District, Sewer System | ||
Series 2020A, GO, 3.00%, 10/1/2022 | 220,000 | 220,138 |
Series 2017A, GO, 5.00%, 10/1/2022 | 110,000 | 110,245 |
Milwaukee Redevelopment Authority, Public Schools | ||
Rev., 5.00%, 11/15/2022 | 415,000 | 417,172 |
Series 2016A, Rev., 5.00%, 11/15/2022 | 25,000 | 25,131 |
Rev., 5.00%, 11/15/2023 | 130,000 | 133,838 |
Series 2016A, Rev., 5.00%, 11/15/2023 | 40,000 | 41,181 |
Public Finance Authority, Coral Academy of Science Series 2021A, Rev., 4.00%, 7/1/2025 | 315,000 | 312,862 |
Public Finance Authority, Entrance Fee Principal Redemption, Searstone CCRC Project Series 2021B2, Rev., 2.25%, 6/1/2027 (e) | 1,975,000 | 1,794,796 |
Public Finance Authority, KU Campus Development Corp. - Central District Development Project | ||
Rev., 5.00%, 3/1/2023 | 145,000 | 146,834 |
Rev., 5.00%, 3/1/2025 | 160,000 | 169,458 |
Public Finance Authority, Renown Regional Medical Center Project Series 2015A, Rev., 5.00%, 6/1/2025 | 145,000 | 152,295 |
Public Finance Authority, Retirement Housing Foundation, Distribution System Series 2017B, Rev., 5.00%, 11/15/2022 | 25,000 | 25,120 |
Public Finance Authority, Voyager Foundation Inc., Project Series 2012A, Rev., 6.20%, 10/1/2022 (b) | 325,000 | 325,977 |
Richland School District GO, 2.50%, 10/1/2022 | 25,000 | 25,001 |
River Falls School District, Corporate Purpose Series 2018A, GO, 5.00%, 4/1/2023 | 40,000 | 40,615 |
August 31, 2022 | J.P. Morgan Exchange-Traded Funds | 347 |
AS OF August 31, 2022 (Unaudited) (continued)
INVESTMENTS | PRINCIPAL AMOUNT($) | VALUE($) |
Municipal Bonds — continued | ||
Wisconsin — continued | ||
River Falls School District, School Building and Improvement Series 2019A, GO, 3.00%, 4/1/2023 | 25,000 | 25,098 |
School District of Maple Series 2015A, GO, 5.00%, 4/1/2023 | 30,000 | 30,449 |
Sevastopol School District, Promissory Notes | ||
GO, 4.00%, 3/1/2024 | 985,000 | 1,007,845 |
GO, 4.00%, 3/1/2025 | 625,000 | 647,685 |
State of Wisconsin | ||
Series 2016-2, GO, 1.50%, 11/1/2022 | 75,000 | 74,864 |
Series 2, GO, 4.00%, 11/1/2022 | 310,000 | 310,889 |
Series 2014-3, GO, 4.00%, 11/1/2022 | 70,000 | 70,201 |
Series 2, GO, 5.00%, 11/1/2022 | 205,000 | 205,920 |
Series 2014-3, GO, 5.00%, 11/1/2022 (b) | 425,000 | 426,914 |
Series 2014-3, GO, 5.00%, 11/1/2022 | 145,000 | 145,651 |
Series 2016-1, GO, 5.00%, 11/1/2022 | 125,000 | 125,561 |
Series 2017-2, GO, 5.00%, 11/1/2022 | 100,000 | 100,449 |
Series 2013-1, GO, 5.00%, 5/1/2023 | 25,000 | 25,445 |
Series 2015A, GO, 5.00%, 5/1/2023 (b) | 30,000 | 30,522 |
Series 2017A, GO, 5.00%, 5/1/2023 | 20,000 | 20,356 |
Series 2018A, GO, 5.00%, 5/1/2023 | 25,000 | 25,445 |
Series 2018B, GO, 5.00%, 5/1/2023 (b) | 45,000 | 45,783 |
Series 2021A, GO, 5.00%, 5/1/2023 | 25,000 | 25,445 |
Series 2014-3, GO, 5.00%, 11/1/2023 | 165,000 | 165,709 |
Series 1, GO, 5.00%, 5/1/2024 | 40,000 | 40,710 |
Series 4, GO, 5.00%, 5/1/2025 | 40,000 | 42,198 |
State of Wisconsin Clean Water Fund Leveraged Loan Portfolio | ||
Series 2013-1, Rev., 4.00%, 6/1/2023 (b) | 40,000 | 40,485 |
Series 2013-1, Rev., 5.00%, 6/1/2023 (b) | 30,000 | 30,584 |
State of Wisconsin, Environmental Improvement Fund Series 2017A, Rev., 5.00%, 6/1/2023 | 20,000 | 20,403 |
State of Wisconsin, Master Lease Series 2021A, COP, 4.00%, 3/1/2023 | 30,000 | 30,247 |
Tender Option Bond Trust Receipts/ Certificates Series 2020-XL0147, Rev., VRDO, AGM, LOC : Barclays Bank plc, 1.71%, 9/8/2022 (c) (e) | 10,640,000 | 10,640,000 |
Town of Liberty Grove, Promissory Notes GO, 4.00%, 9/1/2022 | 20,000 | 20,000 |
Village of Fox Crossing, Corporate Purpose GO, 3.00%, 4/1/2024 | 185,000 | 186,115 |
INVESTMENTS | PRINCIPAL AMOUNT($) | VALUE($) |
Wisconsin — continued | ||
Village of Jackson Series 2017A, GO, 2.00%, 12/1/2022 | 35,000 | 34,948 |
Village of Menomonee Falls, Corporate Purpose Series B, GO, 3.50%, 2/1/2024 | 245,000 | 248,825 |
Village of Pleasant Prairie Series 2014A, GO, 5.00%, 9/1/2022 | 150,000 | 150,000 |
Walworth County Joint School District No. 2 Genoa - Bloomfield, School Improvement GO, 4.00%, 4/1/2023 | 20,000 | 20,180 |
Waterford Graded Joint School District No. 1, Promissory Notes GO, 3.00%, 4/1/2023 | 25,000 | 25,078 |
Wauwatosa School District, School Building and Improvement Series 2019B, GO, 5.00%, 9/1/2022 | 200,000 | 200,000 |
Wisconsin Center District, Capital Appreciation Series 1996A, Rev., NATL-RE, Zero Coupon, 12/15/2022 | 90,000 | 89,273 |
Wisconsin Department of Transportation | ||
Series 2013-1, Rev., 5.00%, 7/1/2023 (b) | 25,000 | 25,549 |
Series 2017-1, Rev., 5.00%, 7/1/2023 | 10,000 | 10,219 |
Wisconsin Health & Educational Facilities Authority Rev., 5.00%, 4/1/2023 | 650,000 | 659,725 |
Wisconsin Health and Educational Facilities Authority, Advocate Aurora Health Credit Rev., 5.00%, 1/29/2025 (c) | 200,000 | 210,265 |
Wisconsin Health and Educational Facilities Authority, Gundersen Lutheran Rev., 3.00%, 11/15/2022 | 20,000 | 20,028 |
Wisconsin Health and Educational Facilities Authority, Medical College of Wisconsin Rev., 5.00%, 12/1/2022 | 80,000 | 80,542 |
Wisconsin Health and Educational Facilities Authority, Advocate Aurora Health Credit Group | ||
Series 2018B-2, Rev., 5.00%, 1/25/2023 (c) | 1,465,000 | 1,479,314 |
Series 2018B-3, Rev., 5.00%, 1/31/2024 (c) | 1,075,000 | 1,110,572 |
Series 2018C1, Rev., 5.00%, 7/29/2026 (c) | 180,000 | 194,318 |
Wisconsin Health and Educational Facilities Authority, Ascension Health Credit | ||
Series 2013B-1, Rev., 4.00%, 11/15/2022 | 50,000 | 50,165 |
Series 2013A, Rev., 5.00%, 11/15/2023 (b) | 20,000 | 20,591 |
348 | J.P. Morgan Exchange-Traded Funds | August 31, 2022 |
INVESTMENTS | PRINCIPAL AMOUNT($) | VALUE($) |
Municipal Bonds — continued | ||
Wisconsin — continued | ||
Wisconsin Health and Educational Facilities Authority, Ascension Senior Credit Group | ||
Series 2016A, Rev., 5.00%, 11/15/2022 | 315,000 | 316,668 |
Series 2019A, Rev., 5.00%, 11/15/2024 | 250,000 | 263,312 |
Wisconsin Health and Educational Facilities Authority, Aspirus, Inc., Obligated Group | ||
Rev., 5.00%, 8/15/2023 | 100,000 | 102,448 |
Rev., 5.00%, 8/15/2024 | 100,000 | 104,433 |
Rev., 5.00%, 8/15/2025 | 100,000 | 106,436 |
Wisconsin Health and Educational Facilities Authority, Hospital Sisters Services, Inc., Obligated Group Rev., 5.00%, 11/15/2022 | 1,105,000 | 1,110,510 |
Wisconsin Health and Educational Facilities Authority, Marquette University Rev., 5.00%, 10/1/2022 | 95,000 | 95,199 |
Wisconsin Health and Educational Facilities Authority, Marshfield Clinic Health System, Inc. Series 2016B, Rev., 5.00%, 2/15/2023 | 80,000 | 80,813 |
Wisconsin Health and Educational Facilities Authority, Mercy Alliance, Inc. Rev., 5.00%, 6/1/2026 | 160,000 | 160,357 |
Wisconsin Health and Educational Facilities Authority, Oakwood Lutheran Senior Ministries | ||
Rev., 4.00%, 1/1/2023 | 125,000 | 125,112 |
Rev., 4.00%, 1/1/2024 | 160,000 | 160,302 |
Rev., 4.00%, 1/1/2025 | 210,000 | 210,454 |
Wisconsin Health and Educational Facilities Authority, The Monroe Clinic, Inc. | ||
Rev., 3.00%, 8/15/2025 (b) | 25,000 | 25,285 |
Rev., 4.00%, 8/15/2025 (b) | 30,000 | 31,215 |
Wisconsin Health and Educational Facilities Authority, Thedacare, Inc. Rev., 5.00%, 12/15/2022 | 135,000 | 135,911 |
Wisconsin Health and Educational Facilities Authority, Unity Point Health | ||
Series 2014A, Rev., 5.00%, 12/1/2024 | 185,000 | 194,081 |
Series 2014A, Rev., 5.00%, 12/1/2025 | 285,000 | 298,929 |
Wisconsin Health and Educational Facilities Authority, Unitypoint Health Series 2014A, Rev., 5.00%, 12/1/2022 | 180,000 | 181,164 |
INVESTMENTS | PRINCIPAL AMOUNT($) | VALUE($) |
Wisconsin — continued | ||
WPPI Energy Power Supply System | ||
Series 2013A, Rev., 5.00%, 7/1/2024 | 465,000 | 475,143 |
Series 2013A, Rev., 4.00%, 7/1/2026 | 450,000 | 455,427 |
Total Wisconsin | 39,017,314 | |
Wyoming — 0.0% ^ | ||
Albany County School District No. 1 4.00%, 6/1/2023 | 20,000 | 20,234 |
Wyoming State Loan and Investment Board, Capital Facilities | ||
Series 2012A, Rev., 4.00%, 10/1/2022 | 25,000 | 25,036 |
Series 2012A, Rev., 5.00%, 10/1/2023 | 30,000 | 30,461 |
Total Wyoming | 75,731 | |
Total Municipal Bonds (Cost $2,791,559,795) | 2,772,230,286 | |
SHARES | ||
Short-Term Investments — 13.2% | ||
Investment Companies — 13.2% | ||
JPMorgan Institutional Tax Free Money Market Fund Class IM Shares, 1.36% (g) (h) (Cost $410,771,778) | 410,645,444 | 410,768,637 |
Total Investments — 102.1% (Cost $3,202,331,573) | 3,182,998,923 | |
Liabilities in Excess of Other Assets — (2.1)% | (65,254,059) | |
NET ASSETS — 100.0% | 3,117,744,864 | |
Percentages indicated are based on net assets. |
Abbreviations | |
AGC | Insured by Assured Guaranty Corp. |
AGM | Insured by Assured Guaranty Municipal Corp. |
AMBAC | Insured by American Municipal Bond Assurance Corp. |
AMT | Alternative Minimum Tax |
BAN | Bond Anticipation Note |
CCRC | Congregate Care Retirement Center |
COLL | Collateral |
COP | Certificate of Participation |
CR | Custodial Receipts |
FGIC | Insured by Financial Guaranty Insurance Co. |
FHA | Federal Housing Administration |
FHLMC | Federal Home Loan Mortgage Corp. |
FNMA | Federal National Mortgage Association |
GAN | Grant Anticipation Notes |
GNMA | Government National Mortgage Association |
August 31, 2022 | J.P. Morgan Exchange-Traded Funds | 349 |
AS OF August 31, 2022 (Unaudited) (continued)
GO | General Obligation |
GTD | Guaranteed |
ICE | Intercontinental Exchange |
LIBOR | London Interbank Offered Rate |
LIQ | Liquidity Agreement |
LOC | Letter of Credit |
MTA | Metropolitan Transportation Authority |
NATL | Insured by National Public Finance Guarantee Corp. |
PSF-GTD | Permanent School Fund Guaranteed |
Q-SBLF | Qualified School Bond Loan Fund |
RAN | Revenue Anticipation Note |
RE | Reinsured |
Rev. | Revenue |
SCSDE | South Carolina School District Enhancement |
SIFMA | The Securities Industry and Financial Markets Association |
SOFR | Secured Overnight Financing Rate |
TRAN | Tax & Revenue Anticipation Note |
USD | United States Dollar |
VRDO | Variable Rate Demand Obligation |
XLCA | Insured by XL Capital Assurance |
^ | Amount rounds to less than 0.1% of net assets. | |
(a) | The date shown represents the earliest of the prerefunded date, next put date or final maturity date. | |
(b) | Security is prerefunded or escrowed to maturity. | |
(c) | Variable or floating rate security, the interest rate of which adjusts periodically based on changes in current interest rates and prepayments on the underlying pool of assets. The interest rate shown is the current rate as of August 31, 2022. | |
(d) | Variable or floating rate security, linked to the referenced benchmark. The interest rate shown is the current rate as of August 31, 2022. | |
(e) | Securities exempt from registration under Rule 144A or section 4(a)(2), of the Securities Act of 1933, as amended. | |
(f) | All or a portion of the security is a when-issued security, delayed delivery security, or forward commitment. | |
(g) | Investment in an affiliated fund, which is registered under the Investment Company Act of 1940, as amended, and is advised by J.P. Morgan Investment Management Inc. | |
(h) | The rate shown is the current yield as of August 31, 2022. |
350 | J.P. Morgan Exchange-Traded Funds | August 31, 2022 |
AS OF August 31, 2022 (Unaudited)
INVESTMENTS | PRINCIPAL AMOUNT($) | VALUE($) |
Foreign Government Securities — 87.2% | ||
Angola — 2.2% | ||
Republic of Angola | ||
8.25%, 5/9/2028 (a) | 552,000 | 478,860 |
8.00%, 11/26/2029 (a) | 639,000 | 528,772 |
9.38%, 5/8/2048 (a) | 680,000 | 516,800 |
1,524,432 | ||
Azerbaijan — 0.5% | ||
Republic of Azerbaijan 3.50%, 9/01/2032 (a) (b) | 420,000 | 361,148 |
Bahrain — 4.6% | ||
CBB International Sukuk Programme Co. SPC | ||
6.25%, 11/14/2024 (a) | 207,000 | 211,761 |
4.50%, 3/30/2027 (c) | 389,000 | 377,281 |
Kingdom of Bahrain | ||
6.13%, 8/1/2023 (a) | 250,000 | 251,766 |
7.00%, 1/26/2026 (a) | 310,000 | 317,905 |
7.00%, 10/12/2028 (a) (c) | 802,000 | 801,649 |
6.75%, 9/20/2029 (a) | 200,000 | 195,975 |
5.63%, 9/30/2031 (a) | 334,000 | 291,373 |
5.45%, 9/16/2032 (a) | 484,000 | 412,852 |
5.25%, 1/25/2033 (a) | 200,000 | 165,663 |
6.00%, 9/19/2044 (a) | 228,000 | 170,188 |
3,196,413 | ||
Bolivia, Plurinational State of — 0.2% | ||
Plurinational State of Bolivia 4.50%, 3/20/2028 (a) | 200,000 | 159,163 |
Brazil — 6.7% | ||
Federative Republic of Brazil | ||
8.88%, 4/15/2024 | 230,000 | 246,646 |
4.25%, 1/7/2025 | 227,000 | 224,560 |
2.88%, 6/6/2025 | 200,000 | 191,200 |
6.00%, 4/7/2026 | 589,000 | 611,934 |
4.63%, 1/13/2028 | 480,000 | 459,540 |
4.50%, 5/30/2029 | 310,000 | 287,099 |
3.88%, 6/12/2030 | 440,000 | 383,158 |
3.75%, 9/12/2031 (c) | 200,000 | 170,300 |
8.25%, 1/20/2034 | 380,000 | 430,302 |
7.13%, 1/20/2037 | 395,000 | 411,738 |
5.63%, 1/7/2041 | 140,000 | 119,289 |
5.00%, 1/27/2045 | 265,000 | 205,425 |
5.63%, 2/21/2047 | 342,000 | 282,962 |
4.75%, 1/14/2050 | 871,000 | 631,910 |
4,656,063 | ||
INVESTMENTS | PRINCIPAL AMOUNT($) | VALUE($) |
Chile — 1.6% | ||
Republic of Chile | ||
2.75%, 1/31/2027 | 200,000 | 185,100 |
2.45%, 1/31/2031 (c) | 393,000 | 331,176 |
2.55%, 7/27/2033 | 200,000 | 160,600 |
3.10%, 5/7/2041 | 200,000 | 147,100 |
3.86%, 6/21/2047 | 200,000 | 159,413 |
3.50%, 4/15/2053 | 200,000 | 142,350 |
1,125,739 | ||
China — 1.1% | ||
People's Republic of China | ||
1.95%, 12/3/2024 (a) | 200,000 | 192,836 |
3.50%, 10/19/2028 (a) | 200,000 | 199,037 |
1.20%, 10/21/2030 (a) | 200,000 | 170,518 |
1.75%, 10/26/2031 (a) | 200,000 | 175,980 |
738,371 | ||
Colombia — 5.6% | ||
Republic of Colombia | ||
4.00%, 2/26/2024 | 200,000 | 195,537 |
8.13%, 5/21/2024 | 238,000 | 246,821 |
4.50%, 1/28/2026 | 200,000 | 188,788 |
4.50%, 3/15/2029 | 1,122,000 | 982,311 |
3.00%, 1/30/2030 | 222,000 | 171,953 |
3.13%, 4/15/2031 | 200,000 | 150,788 |
3.25%, 4/22/2032 | 232,000 | 170,868 |
7.38%, 9/18/2037 | 100,000 | 94,706 |
6.13%, 1/18/2041 | 325,000 | 259,147 |
4.13%, 2/22/2042 | 206,000 | 128,441 |
5.63%, 2/26/2044 | 200,000 | 144,788 |
5.00%, 6/15/2045 | 637,000 | 426,710 |
5.20%, 5/15/2049 | 1,053,000 | 715,579 |
3,876,437 | ||
Costa Rica — 0.9% | ||
Republic of Costa Rica | ||
7.00%, 4/04/2044 (a) | 494,000 | 428,329 |
7.16%, 3/12/2045 (a) | 237,000 | 208,901 |
637,230 | ||
Cote D'Ivoire — 0.3% | ||
Republic of Cote d'Ivoire 6.13%, 6/15/2033 (b) | 210,000 | 176,571 |
Croatia — 0.3% | ||
Republic of Croatia 6.00%, 1/26/2024 (a) | 200,000 | 204,538 |
August 31, 2022 | J.P. Morgan Exchange-Traded Funds | 351 |
AS OF August 31, 2022 (Unaudited) (continued)
INVESTMENTS | PRINCIPAL AMOUNT($) | VALUE($) |
Foreign Government Securities — continued | ||
Dominican Republic — 5.8% | ||
Dominican Republic Government Bond | ||
5.50%, 1/27/2025 (a) | 220,000 | 219,079 |
6.88%, 1/29/2026 (a) | 507,000 | 518,344 |
5.95%, 1/25/2027 (a) (b) | 398,000 | 388,373 |
6.00%, 7/19/2028 (a) (b) | 457,000 | 436,092 |
4.50%, 1/30/2030 (a) | 550,000 | 460,900 |
4.88%, 9/23/2032 (a) | 274,000 | 220,707 |
7.45%, 4/30/2044 (a) (b) | 430,000 | 391,649 |
6.85%, 1/27/2045 (a) (b) | 461,000 | 390,064 |
6.40%, 6/05/2049 (a) (b) | 815,000 | 639,419 |
5.88%, 1/30/2060 (a) | 585,000 | 413,266 |
4,077,893 | ||
Egypt — 0.0% ^ | ||
Arab Republic of Egypt | ||
5.58%, 2/21/2023 (a) | 1,000 | 980 |
7.50%, 1/31/2027 (a) | 25,000 | 21,000 |
21,980 | ||
Ethiopia — 0.2% | ||
Federal Democratic Republic of Ethiopia 6.63%, 12/11/2024 (b) | 200,000 | 109,788 |
Gabon — 0.2% | ||
Gabonese Republic 6.63%, 2/6/2031 (a) | 200,000 | 148,350 |
Guatemala — 0.5% | ||
Republic of Guatemala 6.13%, 6/1/2050 (a) | 400,000 | 363,950 |
Hungary — 0.9% | ||
Hungary Government Bond | ||
5.75%, 11/22/2023 | 144,000 | 145,917 |
5.38%, 3/25/2024 | 90,000 | 90,242 |
7.63%, 3/29/2041 | 260,000 | 298,480 |
3.13%, 9/21/2051 (a) | 200,000 | 123,975 |
658,614 | ||
India — 0.3% | ||
Export-Import Bank of India 3.25%, 1/15/2030 (a) | 249,000 | 220,801 |
Indonesia — 3.0% | ||
Perusahaan Penerbit SBSN Indonesia III | ||
1.50%, 6/9/2026 (a) | 200,000 | 183,022 |
4.15%, 3/29/2027 (b) | 200,000 | 200,037 |
4.40%, 6/6/2027 (a) | 200,000 | 201,500 |
Republic of Indonesia | ||
3.85%, 7/18/2027 (a) | 473,000 | 467,620 |
4.10%, 4/24/2028 | 200,000 | 199,975 |
INVESTMENTS | PRINCIPAL AMOUNT($) | VALUE($) |
Indonesia—continued | ||
8.50%, 10/12/2035 (a) | 204,000 | 262,178 |
6.63%, 2/17/2037 (a) (b) (c) | 245,000 | 274,370 |
7.75%, 1/17/2038 (a) | 100,000 | 122,331 |
3.05%, 3/12/2051 | 271,000 | 205,312 |
2,116,345 | ||
Iraq — 0.6% | ||
Republic of Iraq 5.80%, 1/15/2028 (a) (b) | 529,375 | 440,142 |
Jamaica — 1.7% | ||
Jamaica Government Bond | ||
6.75%, 4/28/2028 | 510,000 | 551,214 |
8.00%, 3/15/2039 (c) | 104,000 | 121,245 |
7.88%, 7/28/2045 | 471,000 | 542,621 |
1,215,080 | ||
Jordan — 1.2% | ||
Hashemite Kingdom of Jordan | ||
6.13%, 1/29/2026 (b) | 346,000 | 334,712 |
5.85%, 7/7/2030 (a) | 536,000 | 466,755 |
801,467 | ||
Kazakhstan — 0.9% | ||
Republic of Kazakhstan | ||
3.88%, 10/14/2024 (b) | 350,000 | 356,737 |
4.88%, 10/14/2044 (a) | 280,000 | 235,340 |
592,077 | ||
Kenya — 1.6% | ||
Republic of Kenya | ||
6.88%, 6/24/2024 (a) | 302,000 | 264,250 |
7.25%, 2/28/2028 (a) (b) | 651,000 | 504,525 |
8.00%, 5/22/2032 (a) | 200,000 | 148,000 |
8.25%, 2/28/2048 (a) | 335,000 | 226,962 |
1,143,737 | ||
Kuwait — 0.6% | ||
State of Kuwait 3.50%, 3/20/2027 (a) (b) | 400,000 | 399,825 |
Malaysia — 0.4% | ||
Malaysia Sovereign Sukuk Bhd. 3.04%, 4/22/2025 (a) | 286,000 | 279,440 |
Mexico — 2.2% | ||
United Mexican States | ||
4.13%, 1/21/2026 | 261,000 | 260,347 |
4.50%, 4/22/2029 | 200,000 | 195,400 |
2.66%, 5/24/2031 | 235,000 | 194,462 |
8.30%, 8/15/2031 | 24,000 | 29,660 |
352 | J.P. Morgan Exchange-Traded Funds | August 31, 2022 |
INVESTMENTS | PRINCIPAL AMOUNT($) | VALUE($) |
Foreign Government Securities — continued | ||
Mexico—continued | ||
6.05%, 1/11/2040 | 86,000 | 86,097 |
4.75%, 3/8/2044 | 76,000 | 64,662 |
4.60%, 1/23/2046 | 528,000 | 431,739 |
4.40%, 2/12/2052 | 200,000 | 153,500 |
5.75%, 10/12/2110 | 122,000 | 104,523 |
1,520,390 | ||
Morocco — 0.6% | ||
Kingdom of Morocco | ||
3.00%, 12/15/2032 (a) | 400,000 | 297,575 |
4.00%, 12/15/2050 (a) | 200,000 | 128,850 |
426,425 | ||
Nigeria — 3.6% | ||
Federal Republic of Nigeria | ||
7.63%, 11/21/2025 (a) | 586,000 | 517,145 |
6.50%, 11/28/2027 (a) | 263,000 | 200,537 |
6.13%, 9/28/2028 (a) | 496,000 | 356,593 |
7.14%, 2/23/2030 (a) | 206,000 | 151,410 |
7.14%, 2/23/2030 | 200,000 | 147,000 |
7.38%, 9/28/2033 (a) | 200,000 | 133,500 |
7.70%, 2/23/2038 (a) | 451,000 | 287,512 |
7.63%, 11/28/2047 (a) | 824,000 | 506,760 |
8.25%, 9/28/2051 (a) | 302,000 | 191,393 |
2,491,850 | ||
Oman — 5.8% | ||
Oman Sovereign Sukuk SAOC | ||
4.40%, 6/1/2024 (a) | 346,000 | 344,270 |
5.93%, 10/31/2025 (a) | 333,000 | 344,655 |
4.88%, 6/15/2030 (a) | 201,000 | 199,593 |
Sultanate of Oman Government Bond | ||
4.88%, 2/1/2025 (a) | 200,000 | 199,000 |
4.75%, 6/15/2026 (a) | 300,000 | 291,000 |
5.38%, 3/8/2027 (a) | 200,000 | 197,000 |
6.75%, 10/28/2027 (a) | 200,000 | 207,750 |
5.63%, 1/17/2028 (a) | 300,000 | 294,375 |
6.00%, 8/01/2029 (a) (b) | 621,000 | 618,671 |
6.25%, 1/25/2031 (a) | 220,000 | 221,650 |
7.38%, 10/28/2032 (a) | 200,000 | 216,000 |
6.50%, 3/08/2047 (a) (b) | 474,000 | 413,566 |
6.75%, 1/17/2048 (a) | 550,000 | 488,812 |
4,036,342 | ||
INVESTMENTS | PRINCIPAL AMOUNT($) | VALUE($) |
Pakistan — 1.4% | ||
Islamic Republic of Pakistan | ||
8.25%, 4/15/2024 (a) | 270,000 | 191,730 |
6.00%, 4/08/2026 (a) | 558,000 | 346,021 |
6.88%, 12/05/2027 (a) (b) | 742,000 | 456,412 |
994,163 | ||
Panama — 1.9% | ||
Republic of Panama | ||
3.88%, 3/17/2028 | 207,000 | 198,694 |
3.16%, 1/23/2030 | 200,000 | 175,600 |
2.25%, 9/29/2032 | 231,000 | 178,996 |
6.70%, 1/26/2036 | 105,000 | 112,829 |
4.50%, 4/16/2050 | 200,000 | 157,475 |
4.30%, 4/29/2053 | 296,000 | 225,848 |
3.87%, 7/23/2060 | 414,000 | 284,185 |
1,333,627 | ||
Paraguay — 0.9% | ||
Republic of Paraguay | ||
4.95%, 4/28/2031 (a) | 200,000 | 192,287 |
6.10%, 8/11/2044 (a) | 262,000 | 244,037 |
5.40%, 3/30/2050 (a) | 200,000 | 166,975 |
603,299 | ||
Peru — 2.0% | ||
Republic of Peru | ||
7.35%, 7/21/2025 | 321,000 | 344,734 |
4.13%, 8/25/2027 | 216,000 | 211,518 |
2.78%, 1/23/2031 | 192,000 | 164,016 |
1.86%, 12/1/2032 | 108,000 | 81,965 |
8.75%, 11/21/2033 | 8,000 | 10,301 |
3.00%, 1/15/2034 | 8,000 | 6,524 |
6.55%, 3/14/2037 | 54,000 | 59,022 |
3.30%, 3/11/2041 | 56,000 | 42,448 |
5.63%, 11/18/2050 | 66,000 | 68,467 |
2.78%, 12/1/2060 | 367,000 | 227,953 |
3.23%, 7/28/2121 | 306,000 | 189,873 |
1,406,821 | ||
Philippines — 2.6% | ||
Republic of Philippines | ||
10.63%, 3/16/2025 | 64,000 | 74,407 |
9.50%, 2/2/2030 | 160,000 | 210,418 |
2.46%, 5/5/2030 | 1,000 | 895 |
7.75%, 1/14/2031 | 150,000 | 183,766 |
6.38%, 1/15/2032 | 159,000 | 179,687 |
August 31, 2022 | J.P. Morgan Exchange-Traded Funds | 353 |
AS OF August 31, 2022 (Unaudited) (continued)
INVESTMENTS | PRINCIPAL AMOUNT($) | VALUE($) |
Foreign Government Securities — continued | ||
Philippines—continued | ||
6.38%, 10/23/2034 | 196,000 | 224,442 |
5.00%, 1/13/2037 | 200,000 | 203,522 |
3.95%, 1/20/2040 | 400,000 | 363,544 |
3.70%, 3/1/2041 | 200,000 | 172,772 |
3.70%, 2/2/2042 | 200,000 | 171,772 |
1,785,225 | ||
Poland — 0.4% | ||
Republic of Poland | ||
4.00%, 1/22/2024 | 130,000 | 129,659 |
3.25%, 4/6/2026 | 180,000 | 176,883 |
306,542 | ||
Qatar — 2.4% | ||
State of Qatar | ||
3.38%, 3/14/2024 (a) | 450,000 | 446,625 |
4.00%, 3/14/2029 (a) | 212,000 | 215,445 |
9.75%, 6/15/2030 (a) | 116,000 | 161,965 |
6.40%, 1/20/2040 (a) | 150,000 | 182,062 |
4.63%, 6/2/2046 (b) | 276,000 | 278,415 |
5.10%, 4/23/2048 (a) | 200,000 | 213,750 |
4.82%, 3/14/2049 (a) | 200,000 | 205,250 |
1,703,512 | ||
Romania — 0.9% | ||
Romania Government Bond | ||
3.00%, 2/27/2027 (a) | 68,000 | 61,234 |
5.25%, 11/25/2027 (a) | 26,000 | 25,285 |
3.00%, 2/14/2031 (a) | 366,000 | 289,780 |
3.63%, 3/27/2032 (a) | 56,000 | 45,056 |
6.13%, 1/22/2044 (a) | 32,000 | 30,206 |
5.13%, 6/15/2048 (b) | 90,000 | 74,014 |
4.00%, 2/14/2051 (a) | 188,000 | 128,991 |
654,566 | ||
Saudi Arabia — 3.4% | ||
Kingdom of Saudi Arabia | ||
2.88%, 3/4/2023 (a) | 28,000 | 27,874 |
4.00%, 4/17/2025 (a) | 495,000 | 497,722 |
3.63%, 3/4/2028 (a) | 326,000 | 323,555 |
4.50%, 4/17/2030 (b) | 282,000 | 293,280 |
2.25%, 2/2/2033 (a) | 200,000 | 171,000 |
4.50%, 10/26/2046 (a) | 200,000 | 186,250 |
INVESTMENTS | PRINCIPAL AMOUNT($) | VALUE($) |
Saudi Arabia—continued | ||
4.63%, 10/04/2047 (a) (b) | 501,000 | 469,062 |
4.50%, 4/22/2060 (a) | 270,000 | 251,100 |
KSA Sukuk Ltd. 2.25%, 5/17/2031 (a) | 200,000 | 177,750 |
2,397,593 | ||
Senegal — 0.2% | ||
Republic of Senegal 6.75%, 3/13/2048 (a) | 216,000 | 150,161 |
Serbia — 0.2% | ||
Republic of Serbia 2.13%, 12/1/2030 (a) | 230,000 | 164,996 |
South Africa — 4.4% | ||
Republic of South Africa | ||
5.88%, 9/16/2025 | 518,000 | 524,248 |
4.88%, 4/14/2026 | 200,000 | 192,850 |
4.30%, 10/12/2028 | 393,000 | 347,633 |
4.85%, 9/30/2029 | 400,000 | 353,575 |
5.88%, 6/22/2030 | 465,000 | 434,426 |
5.88%, 4/20/2032 | 275,000 | 243,375 |
5.38%, 7/24/2044 | 200,000 | 142,850 |
5.00%, 10/12/2046 | 612,000 | 410,729 |
5.65%, 9/27/2047 | 349,000 | 248,728 |
5.75%, 9/30/2049 | 274,000 | 194,198 |
3,092,612 | ||
Trinidad and Tobago — 0.3% | ||
Republic of Trinidad and Tobago 4.50%, 8/4/2026 (a) | 200,000 | 197,163 |
Tunisia — 0.2% | ||
Tunisian Republic 5.75%, 1/30/2025 (a) | 200,000 | 119,350 |
Turkey — 8.0% | ||
Hazine Mustesarligi Varlik Kiralama A/S | ||
5.00%, 4/6/2023 (a) | 400,000 | 395,700 |
4.49%, 11/25/2024 (b) | 1,000 | 944 |
5.13%, 6/22/2026 (a) | 200,000 | 184,600 |
Republic of Turkey | ||
7.25%, 12/23/2023 | 200,000 | 200,250 |
5.75%, 3/22/2024 | 275,000 | 261,250 |
7.38%, 2/5/2025 | 257,000 | 243,507 |
4.25%, 3/13/2025 | 310,000 | 270,475 |
4.75%, 1/26/2026 | 624,000 | 533,520 |
4.25%, 4/14/2026 | 568,000 | 471,440 |
4.88%, 10/9/2026 | 200,000 | 166,000 |
6.00%, 3/25/2027 | 470,000 | 394,800 |
7.63%, 4/26/2029 | 200,000 | 172,000 |
354 | J.P. Morgan Exchange-Traded Funds | August 31, 2022 |
INVESTMENTS | PRINCIPAL AMOUNT($) | VALUE($) |
Foreign Government Securities — continued | ||
Turkey—continued | ||
11.88%, 1/15/2030 | 245,000 | 263,375 |
5.95%, 1/15/2031 | 600,000 | 447,000 |
5.88%, 6/26/2031 | 285,000 | 208,763 |
6.50%, 9/20/2033 | 200,000 | 147,000 |
8.00%, 2/14/2034 (c) | 128,000 | 110,080 |
6.88%, 3/17/2036 | 104,000 | 77,480 |
6.75%, 5/30/2040 | 646,000 | 461,890 |
6.63%, 2/17/2045 | 455,000 | 302,575 |
5.75%, 5/11/2047 | 433,000 | 259,800 |
5,572,449 | ||
United Arab Emirates — 2.0% | ||
United Arab Emirates Government Bond | ||
2.50%, 4/16/2025 (a) | 200,000 | 193,912 |
3.13%, 10/11/2027 (a) | 300,000 | 295,275 |
1.88%, 9/15/2031 (a) | 232,000 | 200,868 |
2.00%, 10/19/2031 (a) | 200,000 | 172,413 |
3.13%, 9/30/2049 (a) (b) | 465,000 | 365,548 |
3.88%, 4/16/2050 (a) | 200,000 | 180,288 |
1,408,304 | ||
Uruguay — 1.6% | ||
Oriental Republic of Uruguay | ||
4.50%, 8/14/2024 | 73,334 | 74,172 |
4.38%, 10/27/2027 | 240,000 | 245,820 |
4.38%, 1/23/2031 | 84,000 | 85,643 |
7.63%, 3/21/2036 | 169,000 | 216,721 |
5.10%, 6/18/2050 | 101,000 | 102,534 |
4.98%, 4/20/2055 | 381,000 | 381,667 |
1,106,557 | ||
Vietnam — 0.3% | ||
Socialist Republic of Vietnam 4.80%, 11/19/2024 (b) | 200,000 | 199,788 |
Total Foreign Government Securities (Cost $70,303,572) | 60,917,329 | |
Corporate Bonds — 11.0% | ||
Azerbaijan — 0.9% | ||
Southern Gas Corridor CJSC | ||
6.88%, 3/24/2026 (a) | 200,000 | 209,975 |
6.88%, 3/24/2026 (b) (c) | 393,000 | 412,601 |
622,576 | ||
Bahrain — 0.3% | ||
Oil and Gas Holding Co. BSCC (The) 7.50%, 10/25/2027 (b) | 203,000 | 206,553 |
INVESTMENTS | PRINCIPAL AMOUNT($) | VALUE($) |
Chile — 0.6% | ||
Corp. Nacional del Cobre de Chile | ||
4.38%, 2/5/2049 (a) | 200,000 | 164,850 |
3.70%, 1/30/2050 (a) | 320,000 | 232,260 |
397,110 | ||
China — 1.8% | ||
CNAC HK Finbridge Co. Ltd. 4.13%, 7/19/2027 (a) | 200,000 | 191,022 |
Minmetals Bounteous Finance BVI Ltd. (US Treasury Yield Curve Rate T Note Constant Maturity 5 Year + 5.21%), 3.38%, 9/3/2024 (a) (d) (e) (f) | 200,000 | 194,000 |
Sinopec Group Overseas Development 2017 Ltd. 3.63%, 4/12/2027 (b) | 200,000 | 196,364 |
Sinopec Group Overseas Development 2018 Ltd. 2.15%, 5/13/2025 (a) | 396,000 | 375,832 |
State Grid Overseas Investment BVI Ltd. | ||
3.50%, 5/4/2027 (b) | 2,000 | 1,959 |
1.63%, 8/5/2030 (a) | 400,000 | 332,900 |
1,292,077 | ||
Indonesia — 0.6% | ||
Pertamina Persero PT 1.40%, 2/9/2026 (a) | 238,000 | 213,631 |
Perusahaan Perseroan Persero PT Perusahaan Listrik Negara 6.15%, 5/21/2048 (a) | 201,000 | 190,674 |
404,305 | ||
Kazakhstan — 0.6% | ||
KazMunayGas National Co. JSC | ||
5.38%, 4/24/2030 (a) | 200,000 | 185,975 |
6.38%, 10/24/2048 (a) | 257,000 | 213,438 |
399,413 | ||
Malaysia — 1.3% | ||
Petronas Capital Ltd. | ||
3.50%, 3/18/2025 (a) | 200,000 | 197,413 |
2.48%, 1/28/2032 (a) | 200,000 | 174,482 |
4.55%, 4/21/2050 (a) | 320,000 | 314,072 |
3.40%, 4/28/2061 (a) | 306,000 | 234,757 |
920,724 | ||
Mexico — 1.7% | ||
Mexico City Airport Trust 5.50%, 7/31/2047 (a) | 209,000 | 157,273 |
Petroleos Mexicanos | ||
4.50%, 1/23/2026 (c) | 214,000 | 191,851 |
6.70%, 2/16/2032 | 536,000 | 415,266 |
6.63%, 6/15/2035 | 370,000 | 264,568 |
6.50%, 6/2/2041 | 24,000 | 15,270 |
August 31, 2022 | J.P. Morgan Exchange-Traded Funds | 355 |
AS OF August 31, 2022 (Unaudited) (continued)
INVESTMENTS | PRINCIPAL AMOUNT($) | VALUE($) |
Corporate Bonds — continued | ||
Mexico — continued | ||
6.75%, 9/21/2047 | 16,000 | 10,046 |
6.35%, 2/12/2048 | 24,000 | 14,474 |
7.69%, 1/23/2050 | 48,000 | 32,760 |
6.95%, 1/28/2060 | 167,000 | 103,958 |
1,205,466 | ||
Panama — 0.2% | ||
Aeropuerto Internacional de Tocumen SA 5.13%, 8/11/2061 (a) | 200,000 | 160,475 |
Peru — 0.2% | ||
Petroleos del Peru SA 5.63%, 6/19/2047 (b) | 200,000 | 136,190 |
Philippines — 0.2% | ||
Power Sector Assets & Liabilities Management Corp. 7.39%, 12/2/2024 (a) | 156,000 | 166,140 |
Qatar — 0.6% | ||
Qatar Energy | ||
3.13%, 7/12/2041 (a) | 300,000 | 242,681 |
3.30%, 7/12/2051 (a) | 200,000 | 158,663 |
401,344 | ||
South Africa — 0.7% | ||
Eskom Holdings SOC Ltd. | ||
6.75%, 8/6/2023 (b) | 2,000 | 1,939 |
7.13%, 2/11/2025 (b) | 327,000 | 306,726 |
6.35%, 8/10/2028 (b) | 240,000 | 227,325 |
535,990 | ||
United Arab Emirates — 1.3% | ||
Abu Dhabi Crude Oil Pipeline LLC 4.60%, 11/2/2047 (a) | 222,000 | 216,214 |
DP World Ltd. 6.85%, 7/2/2037 (a) | 270,000 | 297,472 |
MDGH GMTN RSC Ltd. | ||
2.88%, 11/7/2029 (a) | 200,000 | 188,038 |
2.88%, 5/21/2030 (a) | 201,000 | 187,156 |
888,880 | ||
Total Corporate Bonds (Cost $9,112,860) | 7,737,243 | |
SHARES | ||
Short-Term Investments — 3.4% | ||
Investment Companies — 0.6% | ||
JPMorgan U.S. Government Money Market Fund Class IM Shares, 2.00% (g) (h)(Cost $437,315) | 437,315 | 437,315 |
INVESTMENTS | SHARES | VALUE($) |
Investment of Cash Collateral from Securities Loaned — 2.8% | ||
JPMorgan Securities Lending Money Market Fund Agency SL Class Shares, 2.22% (g) (h) | 800,480 | 800,400 |
JPMorgan U.S. Government Money Market Fund Class IM Shares, 2.00% (g) (h) | 1,123,022 | 1,123,022 |
Total Investment of Cash Collateral from Securities Loaned (Cost $1,923,022) | 1,923,422 | |
Total Short-Term Investments (Cost $2,360,337) | 2,360,737 | |
Total Investments — 101.6% (Cost $81,776,769) | 71,015,309 | |
Liabilities in Excess of Other Assets — (1.6)% | (1,148,758) | |
NET ASSETS — 100.0% | 69,866,551 | |
Percentages indicated are based on net assets. |
Abbreviations | |
CJSC | Closed Joint Stock Company |
GMTN | Global Medium Term Note |
JSC | Joint Stock Company |
PT | Limited liability company |
SPC | Special purpose company |
^ | Amount rounds to less than 0.1% of net assets. | |
(a) | Security exempt from registration pursuant to Regulation S under the Securities Act of 1933, as amended. Regulation S applies to securities offerings that are made outside of the United States and do not involve direct selling efforts in the United States and as such may have restrictions on resale. | |
(b) | Securities exempt from registration under Rule 144A or section 4(a)(2), of the Securities Act of 1933, as amended. | |
(c) | The security or a portion of this security is on loan at August 31, 2022. The total value of securities on loan at August 31, 2022 is $1,839,202. | |
(d) | Security is an interest bearing note with preferred security characteristics. | |
(e) | Security is perpetual and thus, does not have a predetermined maturity date. The coupon rate for this security is fixed for a period of time and may be structured to adjust thereafter. The date shown, if applicable, reflects the next call date. The coupon rate shown is the rate in effect as of August 31, 2022. | |
(f) | Variable or floating rate security, linked to the referenced benchmark. The interest rate shown is the current rate as of August 31, 2022. | |
356 | J.P. Morgan Exchange-Traded Funds | August 31, 2022 |
(g) | Investment in an affiliated fund, which is registered under the Investment Company Act of 1940, as amended, and is advised by J.P. Morgan Investment Management Inc. | |
(h) | The rate shown is the current yield as of August 31, 2022. |
August 31, 2022 | J.P. Morgan Exchange-Traded Funds | 357 |
AS OF August 31, 2022 (Unaudited)
JPMorgan BetaBuilders 1-5 Year U.S. Aggregate Bond ETF | JPMorgan Core Plus Bond ETF | JPMorgan Corporate Bond Research Enhanced ETF | |
ASSETS: | |||
Investments in non-affiliates, at value | $37,835,678 | $358,384,731 | $38,459,866 |
Investments in affiliates, at value | 1,095,512 | 64,292,445 | 618,875 |
Cash | 5,157 | 58,148 | 666 |
Foreign currency, at value | 6 | 27 | — |
Deposits at broker for futures contracts | — | 897,000 | 56,000 |
Deposits at broker for centrally cleared swaps | — | 373,000 | — |
Segregated cash balance with Authorized Participant for deposit securities | 3,133,217 | — | — |
Receivables: | |||
Investment securities sold | 877,149 | — | 747,521 |
Interest from non-affiliates | 137,504 | 2,069,982 | 431,322 |
Dividends from non-affiliates | — | 53 | — |
Dividends from affiliates | 60 | 3,523 | 34 |
Variation margin on futures contracts | — | — | 2,564 |
Total Assets | 43,084,283 | 426,078,909 | 40,316,848 |
LIABILITIES: | |||
Payables: | |||
Due to Authorized Participant | 353,845 | — | — |
Investment securities purchased | 487,872 | 358,253 | 1,232,931 |
Investment securities purchased — delayed delivery securities | 915,116 | 15,162,402 | — |
Variation margin on futures contracts | — | 147,483 | — |
Collateral upon return of deposit securities | 3,133,217 | — | — |
Variation margin on centrally cleared swaps | — | 2,443 | — |
Accrued liabilities: | |||
Management fees (See Note 3.A) | 1,538 | 131,228 | 4,501 |
Total Liabilities | 4,891,588 | 15,801,809 | 1,237,432 |
Net Assets | $38,192,695 | $410,277,100 | $39,079,416 |
NET ASSETS: | |||
Paid-in-Capital | $40,430,862 | $446,203,878 | $46,434,542 |
Total distributable earnings (loss) | (2,238,167) | (35,926,778) | (7,355,126) |
Total Net Assets | $38,192,695 | $410,277,100 | $39,079,416 |
Outstanding number of shares (unlimited number of shares authorized - par value $0.0001) | 799,946 | 8,600,000 | 850,000 |
Net asset value, per share | $47.74 | $47.71 | $45.98 |
Cost of investments in non-affiliates | $39,830,115 | $390,498,022 | $43,879,546 |
Cost of investments in affiliates | 1,095,512 | 64,292,445 | 618,875 |
Cost of foreign currency | 6 | 27 | — |
Net upfront receipts on centrally cleared swaps | — | (237,187) | — |
358 | J.P. Morgan Exchange-Traded Funds | August 31, 2022 |
JPMorgan High Yield Research Enhanced ETF | JPMorgan Income ETF | JPMorgan International Bond Opportunities ETF | |
ASSETS: | |||
Investments in non-affiliates, at value | $394,887,550 | $166,610,006 | $274,385,310 |
Investments in affiliates, at value | 1,852,115 | 101,234 | 10,471,032 |
Cash | 256,574 | — | — |
Foreign currency, at value | — | — | 4,458,281 |
Deposits at broker for futures contracts | — | 520,000 | 1,058,500 |
Deposits at broker for centrally cleared swaps | — | 162,000 | 756,000 |
Receivables: | |||
Due from custodian | 300,981 | — | 178,738 |
Investment securities sold | 1,250,160 | 1,490,301 | 2,798,395 |
Investment securities sold — delayed delivery securities | — | 8,469,829 | 170,675 |
Interest from non-affiliates | 6,413,597 | 1,561,169 | 3,264,739 |
Dividends from affiliates | 102 | 6 | 574 |
Tax reclaims | — | 1,469 | 1,617 |
Variation margin on futures contracts | — | 18,269 | 791,298 |
Variation margin on centrally cleared swaps | — | 28,968 | 99,684 |
Unrealized appreciation on forward foreign currency exchange contracts | — | — | 4,999,737 |
Total Assets | 404,961,079 | 178,963,251 | 303,434,580 |
LIABILITIES: | |||
Payables: | |||
Due to custodian | — | 1,018,154 | — |
TBA short commitments, at value | — | 10,605,284 | — |
Investment securities purchased | 300,981 | 366,476 | 5,636,010 |
Investment securities purchased — delayed delivery securities | — | 10,569,483 | — |
Unrealized depreciation on forward foreign currency exchange contracts | — | — | 926,305 |
Accrued liabilities: | |||
Management fees (See Note 3.A) | 84,540 | 53,346 | 124,323 |
Total Liabilities | 385,521 | 22,612,743 | 6,686,638 |
Net Assets | $404,575,558 | $156,350,508 | $296,747,942 |
NET ASSETS: | |||
Paid-in-Capital | $558,031,630 | $169,237,050 | $335,392,075 |
Total distributable earnings (loss) | (153,456,072) | (12,886,542) | (38,644,133) |
Total Net Assets | $404,575,558 | $156,350,508 | $296,747,942 |
Outstanding number of shares (unlimited number of shares authorized - par value $0.0001) | 9,100,000 | 3,420,000 | 6,500,000 |
Net asset value, per share | $44.46 | $45.72 | $45.65 |
Cost of investments in non-affiliates | $451,324,502 | $180,333,726 | $326,779,646 |
Cost of investments in affiliates | 1,852,115 | 101,234 | 10,471,032 |
Cost of foreign currency | — | — | 4,702,043 |
Proceeds from short TBAs | — | 10,694,218 | — |
Net upfront receipts on centrally cleared swaps | — | (16,098) | (2,548) |
August 31, 2022 | J.P. Morgan Exchange-Traded Funds | 359 |
AS OF August 31, 2022 (Unaudited) (continued)
JPMorgan Municipal ETF | JPMorgan Short Duration Core Plus ETF | JPMorgan U.S. Aggregate Bond ETF | |
ASSETS: | |||
Investments in non-affiliates, at value | $204,174,440 | $206,897,014 | $1,117,833,066 |
Investments in affiliates, at value | 34,479,837 | 13,782,301 | 59,478,775 |
Investments of cash collateral received from securities loaned, at value (See Note 2.E) | — | 135,300 | 1,472,263 |
Cash | — | — | 104,253 |
Foreign currency, at value | — | 1 | 112 |
Deposits at broker for futures contracts | 45,000 | — | — |
Segregated cash balance with Authorized Participant for deposit securities | — | — | 228,629 |
Receivables: | |||
Due from custodian | 1,159,283 | 156,848 | — |
Investment securities sold | — | — | 6,749,746 |
Investment securities sold — delayed delivery securities | 30,231 | 1,069,875 | 1,497,281 |
Fund shares sold | 2,500,575 | — | 7,134,865 |
Interest from non-affiliates | 1,920,555 | 1,334,917 | 5,273,187 |
Dividends from affiliates | 40,137 | 869 | 3,259 |
Tax reclaims | — | — | 82 |
Securities lending income (See Note 2.E) | — | 131 | 608 |
Variation margin on futures contracts | 3,934 | 64,625 | — |
Variation margin on centrally cleared swaps | — | 14,800 | — |
Total Assets | 244,353,992 | 223,456,681 | 1,199,776,126 |
LIABILITIES: | |||
Payables: | |||
Investment securities purchased | 1,163,770 | 160,326 | 10,099,993 |
Investment securities purchased — delayed delivery securities | 5,721,081 | 9,357,996 | 60,684,140 |
Collateral received on securities loaned (See Note 2.E) | — | 135,300 | 1,472,263 |
Collateral upon return of deposit securities | — | — | 228,629 |
Accrued liabilities: | |||
Management fees (See Note 3.A) | 32,046 | 58,517 | 60,558 |
Total Liabilities | 6,916,897 | 9,712,139 | 72,545,583 |
Net Assets | $237,437,095 | $213,744,542 | $1,127,230,543 |
NET ASSETS: | |||
Paid-in-Capital | $245,101,596 | $228,269,947 | $1,270,810,257 |
Total distributable earnings (loss) | (7,664,501) | (14,525,405) | (143,579,714) |
Total Net Assets | $237,437,095 | $213,744,542 | $1,127,230,543 |
Outstanding number of shares (unlimited number of shares authorized - par value $0.0001) | 4,750,000 | 4,610,000 | 23,698,203 |
Net asset value, per share | $49.99 | $46.37 | $47.57 |
Cost of investments in non-affiliates | $209,082,599 | $218,667,328 | $1,238,924,527 |
Cost of investments in affiliates | 34,481,860 | 13,778,329 | 59,478,775 |
Cost of foreign currency | — | 1 | 112 |
Investment securities on loan, at value (See Note 2.E) | — | 129,062 | 1,434,712 |
Cost of investment of cash collateral (See Note 2.E) | — | 135,300 | 1,471,869 |
Net upfront receipts on centrally cleared swaps | — | (61,020) | — |
360 | J.P. Morgan Exchange-Traded Funds | August 31, 2022 |
JPMorgan Ultra-Short Income ETF | JPMorgan Ultra-Short Municipal Income ETF | JPMorgan USD Emerging Markets Sovereign Bond ETF | |
ASSETS: | |||
Investments in non-affiliates, at value | $18,775,782,202 | $2,772,230,286 | $68,654,572 |
Investments in affiliates, at value | 2,061,647,797 | 410,768,637 | 437,315 |
Investments of cash collateral received from securities loaned, at value (See Note 2.E) | 23,398,131 | — | 1,923,422 |
Repurchase agreements, at value | 100,000,000 | — | — |
Cash | 4,853,098 | — | 9,629 |
Foreign currency, at value | — | — | 26 |
Deposits at broker for futures contracts | 7,308,000 | — | — |
Receivables: | |||
Investment securities sold | — | — | 571,933 |
Fund shares sold | 728,089,105 | 156,667 | — |
Interest from non-affiliates | 75,054,060 | 21,433,934 | 1,044,280 |
Dividends from affiliates | 112,976 | 489,976 | 24 |
Securities lending income (See Note 2.E) | 6,064 | — | 2,172 |
Variation margin on futures contracts | 250,191 | — | — |
Total Assets | 21,776,501,624 | 3,205,079,500 | 72,643,373 |
LIABILITIES: | |||
Payables: | |||
Due to custodian | — | 91,132 | — |
Investment securities purchased | 141,875,303 | 100,434 | 830,192 |
Investment securities purchased — delayed delivery securities | — | 10,844,691 | — |
Collateral received on securities loaned (See Note 2.E) | 23,398,131 | — | 1,923,422 |
Fund shares redeemed | — | 75,861,926 | — |
Accrued liabilities: | |||
Management fees (See Note 3.A) | 2,865,404 | 436,453 | 23,208 |
Total Liabilities | 168,138,838 | 87,334,636 | 2,776,822 |
Net Assets | $21,608,362,786 | $3,117,744,864 | $69,866,551 |
NET ASSETS: | |||
Paid-in-Capital | $21,736,029,556 | $3,142,399,630 | $88,748,175 |
Total distributable earnings (loss) | (127,666,770) | (24,654,766) | (18,881,624) |
Total Net Assets | $21,608,362,786 | $3,117,744,864 | $69,866,551 |
Outstanding number of shares (unlimited number of shares authorized - par value $0.0001) | 430,550,000 | 61,650,000 | 1,800,000 |
Net asset value, per share | $50.19 | $50.57 | $38.81 |
Cost of investments in non-affiliates | $18,966,448,662 | $2,791,559,795 | $79,416,432 |
Cost of investments in affiliates | 2,061,647,797 | 410,771,778 | 437,315 |
Cost of repurchase agreements | 100,000,000 | — | — |
Cost of foreign currency | — | — | 26 |
Investment securities on loan, at value (See Note 2.E) | 22,844,603 | — | 1,839,202 |
Cost of investment of cash collateral (See Note 2.E) | 23,392,476 | — | 1,923,022 |
August 31, 2022 | J.P. Morgan Exchange-Traded Funds | 361 |
FOR THE SIX MONTHS ENDED August 31, 2022 (Unaudited)
JPMorgan BetaBuilders 1-5 Year U.S. Aggregate Bond ETF | JPMorgan Core Plus Bond ETF | JPMorgan Corporate Bond Research Enhanced ETF | |
INVESTMENT INCOME: | |||
Interest income from non-affiliates | $258,489 | $4,960,825 | $695,420 |
Interest income from affiliates | 159 | — | — |
Dividend income from non-affiliates | — | 2,303 | — |
Dividend income from affiliates | 3,880 | 245,492 | 1,223 |
Total investment income | 262,528 | 5,208,620 | 696,643 |
EXPENSES: | |||
Management fees (See Note 3.A) | 8,597 | 645,072 | 31,307 |
Interest expense to non-affiliates | — | 273 | — |
Other | 19,253 | 30,225 | — |
Total expenses | 27,850 | 675,570 | 31,307 |
Net investment income (loss) | 234,678 | 4,533,050 | 665,336 |
REALIZED/UNREALIZED GAINS (LOSSES): | |||
Net realized gain (loss) on transactions from: | |||
Investments in non-affiliates | (263,601) | (2,482,207) | (899,460) |
In-kind redemptions of investments in non-affiliates (See Note 4) | — | — | (1,095,592) |
Futures contracts | — | (665,205) | (11,988) |
Foreign currency transactions | — | 20,434 | — |
Swaps | — | (2,644) | — |
Net realized gain (loss) | (263,601) | (3,129,622) | (2,007,040) |
Change in net unrealized appreciation/depreciation on: | |||
Investments in non-affiliates | (1,337,094) | (24,868,204) | (3,527,573) |
Futures contracts | — | (280,848) | 234 |
Forward foreign currency exchange contracts | — | (20,436) | — |
Swaps | — | 338,308 | — |
Change in net unrealized appreciation/depreciation | (1,337,094) | (24,831,180) | (3,527,339) |
Net realized/unrealized gains (losses) | (1,600,695) | (27,960,802) | (5,534,379) |
Change in net assets resulting from operations | $(1,366,017) | $(23,427,752) | $(4,869,043) |
362 | J.P. Morgan Exchange-Traded Funds | August 31, 2022 |
JPMorgan High Yield Research Enhanced ETF | JPMorgan Income ETF | JPMorgan International Bond Opportunities ETF | |
INVESTMENT INCOME: | |||
Interest income from non-affiliates | $17,174,828 | $3,331,401 | $5,293,514 |
Interest income from affiliates | — | 10 | 49 |
Dividend income from non-affiliates | — | 55,739 | 33,835 |
Dividend income from affiliates | 42,167 | 18,381 | 55,870 |
Foreign taxes withheld (net) | — | — | (170) |
Total investment income | 17,216,995 | 3,405,531 | 5,383,098 |
EXPENSES: | |||
Management fees (See Note 3.A) | 852,322 | 288,577 | 762,476 |
Interest expense to non-affiliates | — | 23 | 1,362 |
Interest expense to affiliates | — | — | 1,031 |
Other | — | — | 9,497 |
Total expenses | 852,322 | 288,600 | 774,366 |
Net investment income (loss) | 16,364,673 | 3,116,931 | 4,608,732 |
REALIZED/UNREALIZED GAINS (LOSSES): | |||
Net realized gain (loss) on transactions from: | |||
Investments in non-affiliates | (24,832,059) | (843,690) | (12,199,597) |
Investments in affiliates | — | (4,026) | — |
In-kind redemptions of investments in non-affiliates (See Note 4) | (61,228,459) | — | — |
Futures contracts | — | 248,003 | 2,723,378 |
Foreign currency transactions | — | 19,534 | (1,569,743) |
Forward foreign currency exchange contracts | — | — | 14,031,425 |
Swaps | — | 485,755 | 3,636,168 |
Net realized gain (loss) | (86,060,518) | (94,424) | 6,621,631 |
Change in net unrealized appreciation/depreciation on: | |||
Investments in non-affiliates | 615,663 | (9,671,510) | (31,777,491)(a) |
Investments in affiliates | — | 566 | — |
Futures contracts | — | 98,150 | 59,925 |
Foreign currency translations | — | — | 325,075 |
Forward foreign currency exchange contracts | — | (19,542) | 5,394,978 |
Swaps | — | (215,052) | (1,384,598) |
Change in net unrealized appreciation/depreciation | 615,663 | (9,807,388) | (27,382,111) |
Net realized/unrealized gains (losses) | (85,444,855) | (9,901,812) | (20,760,480) |
Change in net assets resulting from operations | $(69,080,182) | $(6,784,881) | $(16,151,748) |
August 31, 2022 | J.P. Morgan Exchange-Traded Funds | 363 |
FOR THE SIX MONTHS ENDED August 31, 2022 (Unaudited) (continued)
JPMorgan Municipal ETF | JPMorgan Short Duration Core Plus ETF | JPMorgan U.S. Aggregate Bond ETF | |
INVESTMENT INCOME: | |||
Interest income from non-affiliates | $1,706,390 | $2,384,139 | $11,255,555 |
Interest income from affiliates | — | 4 | 2 |
Dividend income from affiliates | 86,626 | 96,097 | 233,785 |
Income from securities lending (net) (See Note 2.E) | — | 1,110 | 5,597 |
Total investment income | 1,793,016 | 2,481,350 | 11,494,939 |
EXPENSES: | |||
Management fees (See Note 3.A) | 127,600 | 320,918 | 369,433 |
Interest expense to non-affiliates | 4 | 283 | — |
Other | — | 351 | 28,618 |
Total expenses | 127,604 | 321,552 | 398,051 |
Net investment income (loss) | 1,665,412 | 2,159,798 | 11,096,888 |
REALIZED/UNREALIZED GAINS (LOSSES): | |||
Net realized gain (loss) on transactions from: | |||
Investments in non-affiliates | (3,118,077) | (3,597,739) | (15,264,342) |
Investments in affiliates | 2,411 | (4,305) | — |
In-kind redemptions of investments in non-affiliates (See Note 4) | — | — | (5,260,672) |
Futures contracts | 134,699 | 885,002 | — |
Foreign currency transactions | — | — | (5) |
Swaps | — | 119,384 | — |
Net realized gain (loss) | (2,980,967) | (2,597,658) | (20,525,019) |
Change in net unrealized appreciation/depreciation on: | |||
Investments in non-affiliates | (4,286,041) | (6,793,906) | (82,843,477) |
Investments in affiliates | (2,023) | 5,370 | 1,293 |
Futures contracts | 28,040 | 162,037 | — |
Swaps | — | 101,332 | — |
Change in net unrealized appreciation/depreciation | (4,260,024) | (6,525,167) | (82,842,184) |
Net realized/unrealized gains (losses) | (7,240,991) | (9,122,825) | (103,367,203) |
Change in net assets resulting from operations | $(5,575,579) | $(6,963,027) | $(92,270,315) |
364 | J.P. Morgan Exchange-Traded Funds | August 31, 2022 |
JPMorgan Ultra-Short Income ETF | JPMorgan Ultra-Short Municipal Income ETF | JPMorgan USD Emerging Markets Sovereign Bond ETF | |
INVESTMENT INCOME: | |||
Interest income from non-affiliates | $123,509,786 | $15,770,205 | $1,767,911 |
Interest income from affiliates | 1,303 | 78 | — |
Dividend income from affiliates | 12,367,189 | 1,144,079 | 2,243 |
Income from securities lending (net) (See Note 2.E) | 22,523 | — | 5,208 |
Total investment income | 135,900,801 | 16,914,362 | 1,775,362 |
EXPENSES: | |||
Management fees (See Note 3.A) | 16,369,856 | 2,844,873 | 130,674 |
Interest expense to non-affiliates | 1,519 | — | — |
Interest expense to affiliates | — | 8 | — |
Other | 59,581 | — | 226 |
Total expenses | 16,430,956 | 2,844,881 | 130,900 |
Net investment income (loss) | 119,469,845 | 14,069,481 | 1,644,462 |
REALIZED/UNREALIZED GAINS (LOSSES): | |||
Net realized gain (loss) on transactions from: | |||
Investments in non-affiliates | (18,833,503) | (8,947,689) | (4,304,099) |
Investments in affiliates | — | (1,146) | — |
Futures contracts | 34,568,546 | — | — |
Foreign currency transactions | — | — | (1) |
Net realized gain (loss) | 15,735,043 | (8,948,835) | (4,304,100) |
Change in net unrealized appreciation/depreciation on: | |||
Investments in non-affiliates | (105,696,269) | (8,216,096) | (2,902,267) |
Investments in affiliates | 11,200 | (4,277) | 400 |
Futures contracts | 6,212,215 | — | — |
Change in net unrealized appreciation/depreciation | (99,472,854) | (8,220,373) | (2,901,867) |
Net realized/unrealized gains (losses) | (83,737,811) | (17,169,208) | (7,205,967) |
Change in net assets resulting from operations | $35,732,034 | $(3,099,727) | $(5,561,505) |
August 31, 2022 | J.P. Morgan Exchange-Traded Funds | 365 |
FOR THE PERIODS INDICATED
JPMorgan BetaBuilders 1-5 Year U.S. Aggregate Bond ETF | JPMorgan Core Plus Bond ETF | |||
Six Months Ended August 31, 2022 (Unaudited) | Year Ended February 28, 2022 | Six Months Ended August 31, 2022 (Unaudited) | Year Ended February 28, 2022 | |
CHANGE IN NET ASSETS RESULTING FROM OPERATIONS: | ||||
Net investment income (loss) | $234,678 | $536,337 | $4,533,050 | $3,795,906 |
Net realized gain (loss) | (263,601) | 209,822 | (3,129,622) | (1,600,902) |
Change in net unrealized appreciation/depreciation | (1,337,094) | (1,505,381) | (24,831,180) | (7,745,875) |
Change in net assets resulting from operations | (1,366,017) | (759,222) | (23,427,752) | (5,550,871) |
DISTRIBUTIONS TO SHAREHOLDERS: | ||||
Total distributions to shareholders | (221,807) | (784,471) | (4,006,943) | (4,121,522) |
CAPITAL TRANSACTIONS: | ||||
Change in net assets resulting from capital transactions | 4,887,624 | (23,217,818) | 160,857,863 | 139,878,215 |
NET ASSETS: | ||||
Change in net assets | 3,299,800 | (24,761,511) | 133,423,168 | 130,205,822 |
Beginning of period | 34,892,895 | 59,654,406 | 276,853,932 | 146,648,110 |
End of period | $38,192,695 | $34,892,895 | $410,277,100 | $276,853,932 |
CAPITAL TRANSACTIONS: | ||||
Proceeds from shares issued | $8,480,710 | $19,211,437 | $160,857,863 | $139,878,215 |
Cost of shares redeemed | (3,593,086) | (42,429,255) | — | — |
Total change in net assets resulting from capital transactions | $4,887,624 | $(23,217,818) | $160,857,863 | $139,878,215 |
SHARE TRANSACTIONS: | ||||
Issued | 175,000 | 375,000(a) | 3,300,000 | 2,600,000 |
Redeemed | (75,000) | (825,054)(a) | — | — |
Net increase (decrease) in shares from share transactions | 100,000 | (450,054) | 3,300,000 | 2,600,000 |
366 | J.P. Morgan Exchange-Traded Funds | August 31, 2022 |
JPMorgan Corporate Bond Research Enhanced ETF | JPMorgan High Yield Research Enhanced ETF | |||
Six Months Ended August 31, 2022 (Unaudited) | Year Ended February 28, 2022 | Six Months Ended August 31, 2022 (Unaudited) | Year Ended February 28, 2022 | |
CHANGE IN NET ASSETS RESULTING FROM OPERATIONS: | ||||
Net investment income (loss) | $665,336 | $1,375,203 | $16,364,673 | $60,400,432 |
Net realized gain (loss) | (2,007,040) | 196,620 | (86,060,518) | 5,498,489 |
Change in net unrealized appreciation/depreciation | (3,527,339) | (3,536,948) | 615,663 | (58,608,372) |
Change in net assets resulting from operations | (4,869,043) | (1,965,125) | (69,080,182) | 7,290,549 |
DISTRIBUTIONS TO SHAREHOLDERS: | ||||
Total distributions to shareholders | (689,086) | (1,888,820) | (21,225,596) | (67,588,263) |
CAPITAL TRANSACTIONS: | ||||
Change in net assets resulting from capital transactions | (6,841,148) | — | (958,677,428) | (45,777,577) |
NET ASSETS: | ||||
Change in net assets | (12,399,277) | (3,853,945) | (1,048,983,206) | (106,075,291) |
Beginning of period | 51,478,693 | 55,332,638 | 1,453,558,764 | 1,559,634,055 |
End of period | $39,079,416 | $51,478,693 | $404,575,558 | $1,453,558,764 |
CAPITAL TRANSACTIONS: | ||||
Proceeds from shares issued | $2,364,713 | $— | $23,388,060 | $195,784,063 |
Cost of shares redeemed | (9,205,861) | — | (982,065,488) | (241,561,640) |
Total change in net assets resulting from capital transactions | $(6,841,148) | $— | $(958,677,428) | $(45,777,577) |
SHARE TRANSACTIONS: | ||||
Issued | 50,000 | — | 500,000 | 3,800,000 |
Redeemed | (200,000) | — | (20,700,000) | (4,700,000) |
Net increase (decrease) in shares from share transactions | (150,000) | — | (20,200,000) | (900,000) |
August 31, 2022 | J.P. Morgan Exchange-Traded Funds | 367 |
FOR THE PERIODS INDICATED (continued)
JPMorgan Income ETF | JPMorgan International Bond Opportunities ETF | |||
Six Months Ended August 31, 2022 (Unaudited) | Period Ended February 28, 2022 (a) | Six Months Ended August 31, 2022 (Unaudited) | Year Ended February 28, 2022 | |
CHANGE IN NET ASSETS RESULTING FROM OPERATIONS: | ||||
Net investment income (loss) | $3,116,931 | $1,328,187 | $4,608,732 | $6,732,085 |
Net realized gain (loss) | (94,424) | 147,031 | 6,621,631 | 10,350,399 |
Change in net unrealized appreciation/depreciation | (9,807,388) | (3,827,621) | (27,382,111) | (23,460,795) |
Change in net assets resulting from operations | (6,784,881) | (2,352,403) | (16,151,748) | (6,378,311) |
DISTRIBUTIONS TO SHAREHOLDERS: | ||||
Total distributions to shareholders | (2,764,689) | (984,569) | (5,758,590) | (7,636,751) |
CAPITAL TRANSACTIONS: | ||||
Change in net assets resulting from capital transactions | 28,039,077 | 141,197,973 | (4,460,285) | 87,036,344 |
NET ASSETS: | ||||
Change in net assets | 18,489,507 | 137,861,001 | (26,370,623) | 73,021,282 |
Beginning of period | 137,861,001 | — | 323,118,565 | 250,097,283 |
End of period | $156,350,508 | $137,861,001 | $296,747,942 | $323,118,565 |
CAPITAL TRANSACTIONS: | ||||
Proceeds from shares issued | $28,039,077 | $141,197,973 | $19,000,557 | $87,036,344 |
Cost of shares redeemed | — | — | (23,460,842) | — |
Total change in net assets resulting from capital transactions | $28,039,077 | $141,197,973 | $(4,460,285) | $87,036,344 |
SHARE TRANSACTIONS: | ||||
Issued | 600,000 | 2,820,000 | 400,000 | 1,700,000 |
Redeemed | — | — | (500,000) | — |
Net increase (decrease) in shares from share transactions | 600,000 | 2,820,000 | (100,000) | 1,700,000 |
368 | J.P. Morgan Exchange-Traded Funds | August 31, 2022 |
JPMorgan Municipal ETF | JPMorgan Short Duration Core Plus ETF | |||
Six Months Ended August 31, 2022 (Unaudited) | Year Ended February 28, 2022 | Six Months Ended August 31, 2022 (Unaudited) | Period Ended February 28, 2022 (a) | |
CHANGE IN NET ASSETS RESULTING FROM OPERATIONS: | ||||
Net investment income (loss) | $1,665,412 | $1,397,193 | $2,159,798 | $1,516,076 |
Net realized gain (loss) | (2,980,967) | (100,086) | (2,597,658) | (415,043) |
Distributions of capital gains received from investment company affiliates | — | 34 | — | — |
Change in net unrealized appreciation/depreciation | (4,260,024) | (2,535,308) | (6,525,167) | (5,106,963) |
Change in net assets resulting from operations | (5,575,579) | (1,238,167) | (6,963,027) | (4,005,930) |
DISTRIBUTIONS TO SHAREHOLDERS: | ||||
Total distributions to shareholders | (1,289,555) | (1,753,715) | (2,067,385) | (1,489,063) |
CAPITAL TRANSACTIONS: | ||||
Change in net assets resulting from capital transactions | 143,659,681 | 27,514,125 | 30,313,275 | 197,956,672 |
NET ASSETS: | ||||
Change in net assets | 136,794,547 | 24,522,243 | 21,282,863 | 192,461,679 |
Beginning of period | 100,642,548 | 76,120,305 | 192,461,679 | — |
End of period | $237,437,095 | $100,642,548 | $213,744,542 | $192,461,679 |
CAPITAL TRANSACTIONS: | ||||
Proceeds from shares issued | $143,659,681 | $41,051,194 | $30,313,275 | $197,956,672 |
Cost of shares redeemed | — | (13,537,069) | — | — |
Total change in net assets resulting from capital transactions | $143,659,681 | $27,514,125 | $30,313,275 | $197,956,672 |
SHARE TRANSACTIONS: | ||||
Issued | 2,850,000 | 750,000 | 650,000 | 3,960,000 |
Redeemed | — | (250,000) | — | — |
Net increase (decrease) in shares from share transactions | 2,850,000 | 500,000 | 650,000 | 3,960,000 |
August 31, 2022 | J.P. Morgan Exchange-Traded Funds | 369 |
FOR THE PERIODS INDICATED (continued)
JPMorgan U.S. Aggregate Bond ETF | JPMorgan Ultra-Short Income ETF | |||
Six Months Ended August 31, 2022 (Unaudited) | Year Ended February 28, 2022 | Six Months Ended August 31, 2022 (Unaudited) | Year Ended February 28, 2022 | |
CHANGE IN NET ASSETS RESULTING FROM OPERATIONS: | ||||
Net investment income (loss) | $11,096,888 | $13,989,635 | $119,469,845 | $98,746,807 |
Net realized gain (loss) | (20,525,019) | (2,350,814) | 15,735,043 | 30,234,646 |
Change in net unrealized appreciation/depreciation | (82,842,184) | (41,110,948) | (99,472,854) | (158,866,623) |
Change in net assets resulting from operations | (92,270,315) | (29,472,127) | 35,732,034 | (29,885,170) |
DISTRIBUTIONS TO SHAREHOLDERS: | ||||
Total distributions to shareholders | (10,530,673) | (15,219,336) | (92,354,600) | (124,672,702) |
CAPITAL TRANSACTIONS: | ||||
Change in net assets resulting from capital transactions | 205,764,455 | 242,169,209 | 2,978,810,872 | 2,696,694,639 |
NET ASSETS: | ||||
Change in net assets | 102,963,467 | 197,477,746 | 2,922,188,306 | 2,542,136,767 |
Beginning of period | 1,024,267,076 | 826,789,330 | 18,686,174,480 | 16,144,037,713 |
End of period | $1,127,230,543 | $1,024,267,076 | $21,608,362,786 | $18,686,174,480 |
CAPITAL TRANSACTIONS: | ||||
Proceeds from shares issued | $336,587,130 | $696,907,792 | $4,044,224,053 | $3,431,664,325 |
Cost of shares redeemed | (130,822,675) | (454,738,583) | (1,065,413,181) | (734,969,686) |
Total change in net assets resulting from capital transactions | $205,764,455 | $242,169,209 | $2,978,810,872 | $2,696,694,639 |
SHARE TRANSACTIONS: | ||||
Issued | 6,700,000 | 12,925,000(a) | 80,650,000 | 67,750,000 |
Redeemed | (2,650,000) | (8,476,797)(a) | (21,250,000) | (14,550,000) |
Net increase (decrease) in shares from share transactions | 4,050,000 | 4,448,203 | 59,400,000 | 53,200,000 |
370 | J.P. Morgan Exchange-Traded Funds | August 31, 2022 |
JPMorgan Ultra-Short Municipal Income ETF | JPMorgan USD Emerging Markets Sovereign Bond ETF | |||
Six Months Ended August 31, 2022 (Unaudited) | Year Ended February 28, 2022 | Six Months Ended August 31, 2022 (Unaudited) | Year Ended February 28, 2022 | |
CHANGE IN NET ASSETS RESULTING FROM OPERATIONS: | ||||
Net investment income (loss) | $14,069,481 | $5,322,377 | $1,644,462 | $3,222,748 |
Net realized gain (loss) | (8,948,835) | (261,767) | (4,304,100) | 754,185 |
Distributions of capital gains received from investment company affiliates | — | 2,079 | — | — |
Change in net unrealized appreciation/depreciation | (8,220,373) | (13,691,226) | (2,901,867) | (10,014,066) |
Change in net assets resulting from operations | (3,099,727) | (8,628,537) | (5,561,505) | (6,037,133) |
DISTRIBUTIONS TO SHAREHOLDERS: | ||||
Total distributions to shareholders | (11,015,860) | (5,051,152) | (1,612,739) | (3,273,450) |
CAPITAL TRANSACTIONS: | ||||
Change in net assets resulting from capital transactions | 15,240,585 | 1,719,988,397 | 7,564,800 | (4,964,085) |
NET ASSETS: | ||||
Change in net assets | 1,124,998 | 1,706,308,708 | 390,556 | (14,274,668) |
Beginning of period | 3,116,619,866 | 1,410,311,158 | 69,475,995 | 83,750,663 |
End of period | $3,117,744,864 | $3,116,619,866 | $69,866,551 | $69,475,995 |
CAPITAL TRANSACTIONS: | ||||
Proceeds from shares issued | $784,498,960 | $1,819,089,400 | $7,564,800 | $39,044,798 |
Cost of shares redeemed | (769,258,375) | (99,101,003) | — | (44,008,883) |
Total change in net assets resulting from capital transactions | $15,240,585 | $1,719,988,397 | $7,564,800 | $(4,964,085) |
SHARE TRANSACTIONS: | ||||
Issued | 15,450,000 | 35,700,000 | 200,000 | 800,000 |
Redeemed | (15,200,000) | (1,950,000) | — | (900,000) |
Net increase (decrease) in shares from share transactions | 250,000 | 33,750,000 | 200,000 | (100,000) |
August 31, 2022 | J.P. Morgan Exchange-Traded Funds | 371 |
FOR THE SIX MONTHS ENDED August 31, 2022 (Unaudited)
JPMorgan Core Plus Bond ETF | JPMorgan Income ETF | |
INCREASE (DECREASE) IN CASH | ||
Cash flows provided (used) by operating activities: | ||
Net decrease in net assets resulting from operations | $(23,427,752) | $(6,784,881) |
Adjustments to reconcile net increase/decrease in net assets resulting from operations to net cash provided (used) by operating activities: | ||
Purchases of investment securities | (225,297,136) | (125,610,151) |
Proceeds from disposition of investment securities | 89,155,593 | 75,877,034 |
Purchases of short-term investments — affiliates, net | (28,591,155) | 18,425,038 |
Change in unrealized (appreciation)/depreciation on investments in non-affiliates | 24,868,204 | 9,671,510 |
Change in unrealized (appreciation)/depreciation on investments in affiliates | — | (566) |
Net realized (gain)/loss on investments in non-affiliates | 2,482,207 | 843,690 |
Net realized (gain)/loss on investments in affiliates | — | 4,026 |
Net amortization (accretion) of income | (69,147) | 989,075 |
Increase in interest receivable from non-affiliates | (737,431) | (486,583) |
Decrease/(Increase) in dividends receivable from affiliates | (3,498) | 28 |
Decrease in dividends receivable from non-affiliates | 11 | — |
Increase in tax reclaims receivable | — | (854) |
Decrease/(Increase) in variation margin receivable | 99,206 | (47,237) |
Decrease in unrealized appreciation on forward foreign currency exchange contracts | 46,775 | 46,873 |
Decrease in prepaid expenses and other assets | 30,225 | — |
Decrease in due from custodian | — | 105,150 |
Decrease in outstanding swap contracts, at value, net | — | 249,883 |
Decrease in unrealized depreciation on forward foreign currency exchange contracts | (26,339) | (27,331) |
Increase/(Decrease) in variation margin payable | 142,320 | (225,519) |
Increase in management fees payable | 51,986 | 14,512 |
Net cash provided (used) by operating activities | (161,275,931) | (26,956,303) |
Cash flows provided (used) by financing activities: | ||
Due to custodian | — | 1,018,154 |
Proceeds from shares issued | 166,101,866 | 28,039,077 |
Cash distributions paid to shareholders (net of reinvestments $0 and $0, respectively) | (4,006,943) | (2,764,689) |
Net cash provided (used) by financing activities | 162,094,923 | 26,292,542 |
Cash | ||
Net increase (decrease) in unrestricted and restricted cash, foreign currency and deposits at broker | 818,992 | (663,761) |
Restricted and unrestricted cash and foreign currency at beginning of period | 509,183 | 1,345,761 |
Restricted and unrestricted cash and foreign currency at end of period | $1,328,175 | $682,000 |
Supplemental disclosure of cash flow information:
372 | J.P. Morgan Exchange-Traded Funds | August 31, 2022 |
JPMorgan Core Plus Bond ETF | JPMorgan Core Plus Bond ETF | JPMorgan Income ETF | JPMorgan Income ETF | |
February 28, 2022 | August 31, 2022 | February 28, 2022 | August 31, 2022 | |
Cash | $14,183 | $58,148 | $593,761 | $— |
Foreign currency, at value | — | 27 | — | — |
Deposits at broker: | ||||
Futures contracts | 361,000 | 897,000 | 399,000 | 520,000 |
Centrally cleared swaps | 134,000 | 373,000 | 353,000 | 162,000 |
$509,183 | $1,328,175 | $1,345,761 | $682,000 |
August 31, 2022 | J.P. Morgan Exchange-Traded Funds | 373 |
FOR THE PERIODS INDICATED
Per share operating performance | |||||||
Investment operations | Distributions | ||||||
Net asset value, beginning of period | Net investment income (loss) (b) | Net realized and unrealized gains (losses) on investments | Total from investment operations | Net investment income | Net realized gain | Total distributions | |
JPMorgan BetaBuilders 1-5 Year U.S. Aggregate Bond ETF | |||||||
Six Months Ended August 31, 2022 (Unaudited) | $49.85 | $0.34 | $(2.14) | $(1.80) | $(0.31) | $— | $(0.31) |
Year Ended February 28, 2022 (g) | 51.87 | 0.53 | (1.72) | (1.19) | (0.57) | (0.26) | (0.83) |
Year Ended February 28, 2021 (g) | 51.72 | 0.85 | 0.34 | 1.19 | (0.83) | (0.21) | (1.04) |
March 12, 2019 (h) through February 29, 2020 (g) | 50.00 | 1.17 | 1.76 | 2.93 | (1.21) | — | (1.21) |
JPMorgan Core Plus Bond ETF | |||||||
Six Months Ended August 31, 2022 (Unaudited) | 52.24 | 0.68 | (4.60) | (3.92) | (0.61) | — | (0.61) |
Year Ended February 28, 2022 | 54.31 | 1.09 | (1.96) | (0.87) | (1.09) | (0.11) | (1.20) |
Year Ended February 28, 2021 | 54.17 | 0.97 | 0.70(j) | 1.67 | (0.88) | (0.65) | (1.53) |
Year Ended February 29, 2020 | 50.36 | 1.45 | 4.13 | 5.58 | (1.44) | (0.33) | (1.77) |
January 28, 2019 (h) through February 28, 2019 | 50.00 | 0.13 | 0.36 | 0.49 | (0.13) | — | (0.13) |
JPMorgan Corporate Bond Research Enhanced ETF | |||||||
Six Months Ended August 31, 2022 (Unaudited) | 51.48 | 0.71 | (5.47) | (4.76) | (0.74) | — | (0.74) |
Year Ended February 28, 2022 | 55.33 | 1.38 | (3.34) | (1.96) | (1.40) | (0.49) | (1.89) |
Year Ended February 28, 2021 | 56.27 | 1.58 | (0.31) | 1.27 | (1.46) | (0.75) | (2.21) |
Year Ended February 29, 2020 | 51.19 | 1.95 | 5.96 | 7.91 | (1.93) | (0.90) | (2.83) |
December 12, 2018 (h) through February 28, 2019 | 50.00 | 0.44 | 1.19 | 1.63 | (0.44) | — | (0.44) |
JPMorgan High Yield Research Enhanced ETF | |||||||
Six Months Ended August 31, 2022 (Unaudited) | 49.61 | 1.07 | (4.86) | (3.79) | (1.36) | — | (1.36) |
Year Ended February 28, 2022 | 51.64 | 1.97 | (1.79) | 0.18 | (2.21) | — | (2.21) |
Year Ended February 28, 2021 | 50.31 | 2.12 | 1.31(j) | 3.43 | (2.07) | (0.03) | (2.10) |
Year Ended February 29, 2020 | 49.86 | 2.50 | 0.53 | 3.03 | (2.58) | — | (2.58) |
Year Ended February 28, 2019 | 50.09 | 2.47 | (0.23) | 2.24 | (2.47) | — | (2.47) |
Year Ended February 28, 2018 | 50.96 | 2.44 | (0.92) | 1.52 | (2.39) | — | (2.39) |
(a) | Annualized for periods less than one year, unless otherwise noted. |
(b) | Calculated based upon average shares outstanding. |
(c) | Not annualized for periods less than one year. |
(d) | Includes adjustments in accordance with accounting principles generally accepted in the United States of America and as such, the net asset values for financial reporting purposes and the returns based upon those net asset values may differ from the net asset values and returns for shareholder transactions. |
(e) | Prior to December 9, 2019, market price return was calculated assuming an initial investment made at the market price at the beginning of the reporting period, reinvestment of all dividends and distributions at market price during the period, and sale at the market price on the last day of the period. The price used to calculate the market price return was the midpoint of the bid/ask spread at the close of business on the listing exchange of the fund. Effective December 9, 2019, the closing price was used to calculate the market price return; however, any prices used in the calculation for market price return prior to December 9, 2019, would have used the midpoint of the bid/ask spread at the close of business on the exchange. |
(f) | Certain non-recurring expenses incurred by the Fund were not annualized for the period indicated. |
(g) | Per share amounts reflects a 1:2 reverse stock split that occurred on April 12, 2021. See Note 1. |
(h) | Commencement of operations. |
(i) | Since the Shares of the Fund did not trade in the secondary market until the day after the Fund’s inception, for the period from the inception to the first day of secondary market trading, the NAV is used as a proxy for the secondary market trading price to calculate the market returns. |
(j) | Calculation of the net realized and unrealized gains (losses) per share does not correlate with the Fund’s net realized and unrealized gains (losses) presented in the Statement of Operations due to the timing of capital transactions in relation to the fluctuating market values of the Fund’s investments. |
(k) | Prior to November 1, 2019, the Fund may have waived fees if expenses exceeded the expense cap. On November 1, 2019, the Fund adopted a unitary fee structure where a management fee is accrued by the fund based on prior day net assets and other expenses are paid by the Advisor. |
(l) | Amount rounds to less than 0.5%. |
374 | J.P. Morgan Exchange-Traded Funds | August 31, 2022 |
Ratios/Supplemental data | ||||||||
Ratios to average net assets (a) | ||||||||
Net asset value, end of period | Market price, end of period | Total return (c)(d) | Market price total return (c)(e) | Net assets, end of period | Net expenses | Net investment income (loss) | Expenses without waivers and reimbursements | Portfolio turnover rate (c) |
$47.74 | $47.72 | (3.63)% | (3.71)% | $38,192,695 | 0.05%(f) | 1.41%(f) | 0.05%(f) | 27% |
49.85 | 49.87 | (2.31) | (2.44) | 34,892,895 | 0.05 | 1.02 | 0.05 | 45 |
51.87 | 51.96 | 2.32 | 2.55 | 59,654,406 | 0.05 | 1.62 | 0.05 | 40 |
51.72 | 51.68 | 5.93 | 5.85(i) | 37,495,084 | 0.05 | 2.38 | 0.05 | 56 |
47.71 | 47.82 | (7.54) | (7.56) | 410,277,100 | 0.39(f) | 2.74(f) | 0.39(f) | 30 |
52.24 | 52.37 | (1.66) | (1.73) | 276,853,932 | 0.40 | 2.02 | 0.40 | 81 |
54.31 | 54.48 | 3.08 | 2.87 | 146,648,110 | 0.36 | 1.76 | 0.36 | 272 |
54.17 | 54.44 | 11.24 | 11.52 | 54,168,824 | 0.38 | 2.76 | 0.69(k) | 91 |
50.36 | 50.48 | 0.97 | 1.21(i) | 25,178,102 | 0.38(f) | 2.96 | 5.38(f)(k) | —(l) |
45.98 | 45.88 | (9.29) | (9.63) | 39,079,416 | 0.14 | 2.97 | 0.14 | 18 |
51.48 | 51.56 | (3.70) | (3.83) | 51,478,693 | 0.14 | 2.51 | 0.14 | 36 |
55.33 | 55.48 | 2.24 | 2.09 | 55,332,638 | 0.14 | 2.81 | 0.14 | 41 |
56.27 | 56.50 | 15.74 | 15.95 | 35,170,394 | 0.14 | 3.58 | 0.65(k) | 67 |
51.19 | 51.30 | 3.26 | 3.48(i) | 25,595,493 | 0.14(f) | 3.98 | 2.13(f)(k) | 12 |
44.46 | 44.30 | (7.73) | (8.15) | 404,575,558 | 0.24 | 4.56 | 0.24 | 23 |
49.61 | 49.65 | 0.26 | 0.40 | 1,453,558,764 | 0.24 | 3.83 | 0.24 | 46 |
51.64 | 51.61 | 7.16 | 6.43 | 1,559,634,055 | 0.23 | 4.18 | 0.23 | 50 |
50.31 | 50.62 | 6.15 | 6.88 | 171,037,324 | 0.32 | 4.90 | 0.44(k) | 128 |
49.86 | 49.82 | 4.66 | 4.00 | 154,570,385 | 0.40 | 5.01 | 0.57(k) | 23 |
50.09 | 50.36 | 3.00 | 3.12 | 105,191,308 | 0.40 | 4.78 | 0.98(k) | 23 |
August 31, 2022 | J.P. Morgan Exchange-Traded Funds | 375 |
FOR THE PERIODS INDICATED (continued)
Per share operating performance | |||||||
Investment operations | Distributions | ||||||
Net asset value, beginning of period | Net investment income (loss) (b) | Net realized and unrealized gains (losses) on investments | Total from investment operations | Net investment income | Net realized gain | Total distributions | |
JPMorgan Income ETF | |||||||
Six Months Ended August 31, 2022 (Unaudited) | $48.89 | $1.02 | $(3.29) | $(2.27) | $(0.90) | $— | $(0.90) |
October 28, 2021 (f) through February 28, 2022 | 50.00 | 0.58 | (1.24) | (0.66) | (0.45) | — | (0.45) |
JPMorgan International Bond Opportunities ETF | |||||||
Six Months Ended August 31, 2022 (Unaudited) | 48.96 | 0.71 | (3.14) | (2.43) | (0.88) | — | (0.88) |
Year Ended February 28, 2022 | 51.04 | 1.16 | (1.92) | (0.76) | (1.32) | — | (1.32) |
Year Ended February 28, 2021 | 49.98 | 1.45 | 1.00(i) | 2.45 | (1.39) | — | (1.39) |
Year Ended February 29, 2020 | 48.75 | 1.71 | 1.86 | 3.57 | (2.34) | — | (2.34) |
Year Ended February 28, 2019 | 50.54 | 1.94 | (0.97) | 0.97 | (2.56) | (0.20) | (2.76) |
April 5, 2017 (f) through February 28, 2018 | 50.00 | 1.83 | 0.05(i) | 1.88 | (1.34) | — | (1.34) |
JPMorgan Municipal ETF | |||||||
Six Months Ended August 31, 2022 (Unaudited) | 52.97 | 0.55 | (3.08) | (2.53) | (0.45) | — | (0.45) |
Year Ended February 28, 2022 | 54.37 | 0.85 | (1.18) | (0.33) | (0.85) | (0.22) | (1.07) |
Year Ended February 28, 2021 | 55.15 | 1.00 | (0.71) | 0.29 | (0.94) | (0.13) | (1.07) |
Year Ended February 29, 2020 | 51.92 | 1.24 | 3.91 | 5.15 | (1.22) | (0.70) | (1.92) |
October 29, 2018 (f) through February 28, 2019 | 50.00 | 0.46 | 1.90 | 2.36 | (0.44) | — | (0.44) |
JPMorgan Short Duration Core Plus ETF | |||||||
Six Months Ended August 31, 2022 (Unaudited) | 48.60 | 0.51 | (2.25) | (1.74) | (0.49) | — | (0.49) |
March 1, 2021 (f) through February 28, 2022 | 50.00 | 0.62 | (1.42) | (0.80) | (0.59) | (0.01) | (0.60) |
(a) | Annualized for periods less than one year, unless otherwise noted. |
(b) | Calculated based upon average shares outstanding. |
(c) | Not annualized for periods less than one year. |
(d) | Includes adjustments in accordance with accounting principles generally accepted in the United States of America and as such, the net asset values for financial reporting purposes and the returns based upon those net asset values may differ from the net asset values and returns for shareholder transactions. |
(e) | Prior to December 9, 2019, market price return was calculated assuming an initial investment made at the market price at the beginning of the reporting period, reinvestment of all dividends and distributions at market price during the period, and sale at the market price on the last day of the period. The price used to calculate the market price return was the midpoint of the bid/ask spread at the close of business on the listing exchange of the fund. Effective December 9, 2019, the closing price was used to calculate the market price return; however, any prices used in the calculation for market price return prior to December 9, 2019, would have used the midpoint of the bid/ask spread at the close of business on the exchange. |
(f) | Commencement of operations. |
(g) | Since the Shares of the Fund did not trade in the secondary market until the day after the Fund’s inception, for the period from the inception to the first day of secondary market trading, the NAV is used as a proxy for the secondary market trading price to calculate the market returns. |
(h) | Certain non-recurring expenses incurred by the Fund were not annualized for the period indicated. |
(i) | Calculation of the net realized and unrealized gains (losses) per share does not correlate with the Fund’s net realized and unrealized gains (losses) presented in the Statement of Operations due to the timing of capital transactions in relation to the fluctuating market values of the Fund’s investments. |
(j) | Prior to November 1, 2019, the Fund may have waived fees if expenses exceeded the expense cap. On November 1, 2019, the Fund adopted a unitary fee structure where a management fee is accrued by the fund based on prior day net assets and other expenses are paid by the Advisor. |
376 | J.P. Morgan Exchange-Traded Funds | August 31, 2022 |
Ratios/Supplemental data | ||||||||
Ratios to average net assets (a) | ||||||||
Net asset value, end of period | Market price, end of period | Total return (c)(d) | Market price total return (c)(e) | Net assets, end of period | Net expenses | Net investment income (loss) | Expenses without waivers and reimbursements | Portfolio turnover rate (c) |
$45.72 | $46.09 | (4.68)% | (4.32)% | $156,350,508 | 0.39% | 4.33% | 0.39% | 84% |
48.89 | 49.09 | (1.34) | (0.94)(g) | 137,861,001 | 0.39 | 3.47 | 0.39 | 13 |
45.65 | 45.85 | (5.01) | (4.63) | 296,747,942 | 0.50(h) | 3.01(h) | 0.50(h) | 43 |
48.96 | 48.98 | (1.56) | (2.10) | 323,118,565 | 0.50 | 2.28 | 0.50 | 52 |
51.04 | 51.34 | 5.02 | 5.95 | 250,097,283 | 0.50 | 2.90 | 0.50 | 136 |
49.98 | 49.83 | 7.39 | 6.89 | 169,928,839 | 0.53 | 3.40 | 0.69(j) | 88 |
48.75 | 48.83 | 2.09 | 2.13 | 180,357,231 | 0.54 | 3.92 | 0.82(j) | 73 |
50.54 | 50.60 | 3.76 | 3.88(g) | 151,634,232 | 0.53(h) | 3.98 | 1.10(h)(j) | 52 |
49.99 | 50.00 | (4.79) | (4.84) | 237,437,095 | 0.16 | 2.14 | 0.16 | 30 |
52.97 | 53.01 | (0.66) | (0.55) | 100,642,548 | 0.18 | 1.56 | 0.18 | 48 |
54.37 | 54.35 | 0.54 | 0.67 | 76,120,305 | 0.23 | 1.84 | 0.23 | 56 |
55.15 | 55.06 | 10.09 | 9.71 | 52,390,882 | 0.23 | 2.31 | 0.67(j) | 51 |
51.92 | 52.01 | 4.74 | 4.92(g) | 31,153,558 | 0.23(h) | 2.65 | 1.06(h)(j) | 15 |
46.37 | 46.40 | (3.59) | (3.55) | 213,744,542 | 0.32(h) | 2.15(h) | 0.32(h) | 121 |
48.60 | 48.61 | (1.63) | (1.61)(g) | 192,461,679 | 0.32 | 1.26 | 0.32 | 175 |
August 31, 2022 | J.P. Morgan Exchange-Traded Funds | 377 |
FOR THE PERIODS INDICATED (continued)
Per share operating performance | |||||||
Investment operations | Distributions | ||||||
Net asset value, beginning of period | Net investment income (loss) (b) | Net realized and unrealized gains (losses) on investments | Total from investment operations | Net investment income | Net realized gain | Total distributions | |
JPMorgan U.S. Aggregate Bond ETF | |||||||
Six Months Ended August 31, 2022 (Unaudited) | $52.13 | $0.49 | $(4.58) | $(4.09) | $(0.47) | $— | $(0.47) |
Year Ended February 28, 2022 (g) | 54.39 | 0.71 | (2.19) | (1.48) | (0.72) | (0.06) | (0.78) |
Year Ended February 28, 2021 (g) | 54.86 | 0.89 | (0.32) | 0.57 | (0.85) | (0.19) | (1.04) |
Year Ended February 29, 2020 (g) | 50.63 | 1.39 | 4.35 | 5.74 | (1.44) | (0.07) | (1.51) |
December 12, 2018 (i) through February 28, 2019 (g) | 50.00 | 0.36 | 0.58 | 0.94 | (0.31) | — | (0.31) |
JPMorgan Ultra-Short Income ETF | |||||||
Six Months Ended August 31, 2022 (Unaudited) | 50.35 | 0.31 | (0.23) | 0.08 | (0.24) | — | (0.24) |
Year Ended February 28, 2022 | 50.78 | 0.28 | (0.35) | (0.07) | (0.32) | (0.04) | (0.36) |
Year Ended February 28, 2021 | 50.51 | 0.58 | 0.28 | 0.86 | (0.59) | —(k) | (0.59) |
Year Ended February 29, 2020 | 50.20 | 1.28 | 0.32 | 1.60 | (1.29) | — | (1.29) |
Year Ended February 28, 2019 | 50.01 | 1.37 | (0.04)(l) | 1.33 | (1.14) | — | (1.14) |
May 17, 2017 (i) through February 28, 2018 | 50.00 | 0.70 | (0.08) | 0.62 | (0.61) | — | (0.61) |
JPMorgan Ultra-Short Municipal Income ETF | |||||||
Six Months Ended August 31, 2022 (Unaudited) | 50.76 | 0.21 | (0.23) | (0.02) | (0.17) | — | (0.17) |
Year Ended February 28, 2022 | 51.01 | 0.13 | (0.25) | (0.12) | (0.13) | — | (0.13) |
Year Ended February 28, 2021 | 50.53 | 0.32 | 0.52 | 0.84 | (0.36) | — | (0.36) |
Year Ended February 29, 2020 | 50.26 | 0.78 | 0.26 | 1.04 | (0.77) | — | (0.77) |
October 16, 2018 (i) through February 28, 2019 | 50.00 | 0.35 | 0.23 | 0.58 | (0.32) | — | (0.32) |
JPMorgan USD Emerging Markets Sovereign Bond ETF | |||||||
Six Months Ended August 31, 2022 (Unaudited) | 43.42 | 0.99 | (4.62) | (3.63) | (0.98) | — | (0.98) |
Year Ended February 28, 2022 | 49.27 | 2.03 | (5.81) | (3.78) | (2.07) | — | (2.07) |
Year Ended February 28, 2021 | 50.95 | 2.17 | (1.83) | 0.34 | (2.02) | — | (2.02) |
Year Ended February 29, 2020 | 47.52 | 2.32 | 3.40 | 5.72 | (2.29) | — | (2.29) |
Year Ended February 28, 2019 | 48.83 | 2.31 | (1.30) | 1.01 | (2.32) | — | (2.32) |
January 29, 2018 (i) through February 28, 2018 | 50.00 | 0.19 | (1.21) | (1.02) | (0.15) | — | (0.15) |
(a) | Annualized for periods less than one year, unless otherwise noted. |
(b) | Calculated based upon average shares outstanding. |
(c) | Not annualized for periods less than one year. |
(d) | Includes adjustments in accordance with accounting principles generally accepted in the United States of America and as such, the net asset values for financial reporting purposes and the returns based upon those net asset values may differ from the net asset values and returns for shareholder transactions. |
(e) | Prior to December 9, 2019, market price return was calculated assuming an initial investment made at the market price at the beginning of the reporting period, reinvestment of all dividends and distributions at market price during the period, and sale at the market price on the last day of the period. The price used to calculate the market price return was the midpoint of the bid/ask spread at the close of business on the listing exchange of the fund. Effective December 9, 2019, the closing price was used to calculate the market price return; however, any prices used in the calculation for market price return prior to December 9, 2019, would have used the midpoint of the bid/ask spread at the close of business on the exchange. |
(f) | Certain non-recurring expenses incurred by the Fund were not annualized for the period indicated. |
(g) | Per share amounts reflects a 1:2 reverse stock split that occurred on April 12, 2021. See Note 1. |
(h) | Prior to November 1, 2019, the Fund may have waived fees if expenses exceeded the expense cap. On November 1, 2019, the Fund adopted a unitary fee structure where a management fee is accrued by the fund based on prior day net assets and other expenses are paid by the Advisor. |
(i) | Commencement of operations. |
(j) | Since the Shares of the Fund did not trade in the secondary market until the day after the Fund’s inception, for the period from the inception to the first day of secondary market trading, the NAV is used as a proxy for the secondary market trading price to calculate the market returns. |
(k) | Amount rounds to less than $0.005. |
(l) | Calculation of the net realized and unrealized gains (losses) per share does not correlate with the Fund’s net realized and unrealized gains (losses) presented in the Statement of Operations due to the timing of capital transactions in relation to the fluctuating market values of the Fund’s investments. |
378 | J.P. Morgan Exchange-Traded Funds | August 31, 2022 |
Ratios/Supplemental data | ||||||||
Ratios to average net assets (a) | ||||||||
Net asset value, end of period | Market price, end of period | Total return (c)(d) | Market price total return (c)(e) | Net assets, end of period | Net expenses | Net investment income (loss) | Expenses without waivers and reimbursements | Portfolio turnover rate (c) |
$47.57 | $47.61 | (7.87)% | (7.81)% | $1,127,230,543 | 0.07%(f) | 1.98%(f) | 0.07%(f) | 51% |
52.13 | 52.14 | (2.76) | (2.69) | 1,024,267,076 | 0.07 | 1.32 | 0.07 | 78 |
54.39 | 54.36 | 1.04 | 0.85 | 826,789,330 | 0.07 | 1.60 | 0.07 | 64 |
54.86 | 54.92 | 11.46 | 11.49 | 543,070,946 | 0.07 | 2.61 | 0.20(h) | 57 |
50.63 | 50.68 | 1.90 | 1.98(j) | 98,730,082 | 0.07(f) | 3.26 | 1.14(f)(h) | 53 |
50.19 | 50.21 | 0.16 | 0.16 | 21,608,362,786 | 0.17(f) | 1.22(f) | 0.17(f) | 27 |
50.35 | 50.37 | (0.14) | (0.12) | 18,686,174,480 | 0.18 | 0.56 | 0.18 | 70 |
50.78 | 50.79 | 1.72 | 1.67 | 16,144,037,713 | 0.17 | 1.14 | 0.17 | 94 |
50.51 | 50.54 | 3.22 | 3.22 | 11,591,489,504 | 0.18 | 2.53 | 0.22(h) | 46 |
50.20 | 50.23 | 2.68 | 2.66 | 5,703,062,275 | 0.17 | 2.74 | 0.28(h) | 43 |
50.01 | 50.05 | 1.25 | 1.33(j) | 200,051,266 | 0.16(f) | 1.77 | 0.55(f)(h) | 25 |
50.57 | 50.46 | (0.05) | (0.24) | 3,117,744,864 | 0.17 | 0.82 | 0.17 | 45 |
50.76 | 50.75 | (0.23) | (0.29) | 3,116,619,866 | 0.17 | 0.26 | 0.17 | 50 |
51.01 | 51.03 | 1.66 | 1.64 | 1,410,311,158 | 0.16 | 0.63 | 0.16 | 67 |
50.53 | 50.56 | 2.09 | 2.09 | 207,185,582 | 0.18 | 1.55 | 0.34(h) | 153 |
50.26 | 50.29 | 1.16 | 1.22(j) | 57,799,591 | 0.17(f) | 1.88 | 0.79(f)(h) | 61 |
38.81 | 38.79 | (8.45) | (9.84) | 69,866,551 | 0.39(f) | 4.90(f) | 0.39(f) | 19 |
43.42 | 44.06 | (8.06) | (6.78) | 69,475,995 | 0.39 | 4.17 | 0.39 | 38 |
49.27 | 49.30 | 0.85 | 0.50 | 83,750,663 | 0.39 | 4.50 | 0.39 | 59 |
50.95 | 51.15 | 12.25 | 12.44 | 91,713,454 | 0.39 | 4.64 | 0.58(h) | 53 |
47.52 | 47.62 | 2.29 | 2.23 | 61,776,747 | 0.39 | 4.96 | 0.87(h) | 28 |
48.83 | 48.95 | (2.03) | (1.79)(j) | 53,713,929 | 0.35(f) | 4.79 | 2.74(f)(h) | 2 |
August 31, 2022 | J.P. Morgan Exchange-Traded Funds | 379 |
AS OF August 31, 2022 (Unaudited)
Diversification Classification | |
JPMorgan BetaBuilders 1-5 Year U.S. Aggregate Bond ETF | Diversified |
JPMorgan Core Plus Bond ETF | Diversified |
JPMorgan Corporate Bond Research Enhanced ETF | Diversified |
JPMorgan High Yield Research Enhanced ETF | Diversified |
JPMorgan Income ETF | Diversified |
JPMorgan International Bond Opportunities ETF | Diversified |
JPMorgan Municipal ETF | Diversified |
JPMorgan Short Duration Core Plus ETF | Diversified |
JPMorgan U.S. Aggregate Bond ETF | Diversified |
JPMorgan Ultra-Short Income ETF | Diversified |
JPMorgan Ultra-Short Municipal Income ETF | Diversified |
JPMorgan USD Emerging Markets Sovereign Bond ETF | Diversified |
380 | J.P. Morgan Exchange-Traded Funds | August 31, 2022 |
Listing Exchange | |
BetaBuilders 1-5 Year U.S. Aggregate Bond ETF | Cboe BZX Exchange, Inc. |
Core Plus Bond ETF | Cboe BZX Exchange, Inc. |
Corporate Bond Research Enhanced ETF | NYSE Arca |
High Yield Research Enhanced ETF | Cboe BZX Exchange, Inc. |
Income ETF | NYSE Arca |
International Bond Opportunities ETF | Cboe BZX Exchange, Inc. |
Municipal ETF | Cboe BZX Exchange, Inc. |
Short Duration Core Plus ETF | NYSE Arca |
U.S. Aggregate Bond ETF | NYSE Arca |
Ultra-Short Income ETF | NYSE Arca* |
Ultra-Short Municipal Income ETF | Cboe BZX Exchange, Inc. |
USD Emerging Markets Sovereign Bond ETF | NYSE Arca |
* | Effective September 15, 2022, the Ultra-Short Income ETF changed its listing exchange from Cboe BZX Exchange, Inc. to NYSE Arca. |
Shares per Creation Unit | |
BetaBuilders 1-5 Year U.S. Aggregate Bond ETF | 25,000 |
Core Plus Bond ETF | 100,000 |
Corporate Bond Research Enhanced ETF | 25,000 |
High Yield Research Enhanced ETF | 100,000 |
Income ETF | 30,000 |
International Bond Opportunities ETF | 100,000 |
Municipal ETF | 50,000 |
Short Duration Core Plus ETF | 10,000 |
U.S. Aggregate Bond ETF | 25,000 |
Ultra-Short Income ETF | 50,000 |
Ultra-Short Municipal Income ETF | 50,000 |
USD Emerging Markets Sovereign Bond ETF | 100,000 |
August 31, 2022 | J.P. Morgan Exchange-Traded Funds | 381 |
AS OF August 31, 2022 (Unaudited) (continued)
382 | J.P. Morgan Exchange-Traded Funds | August 31, 2022 |
BetaBuilders 1-5 Year U.S. Aggregate Bond ETF | ||||
Level 1 Quoted prices | Level 2 Other significant observable inputs | Level 3 Significant unobservable inputs | Total | |
Investments in Securities | ||||
Asset-Backed Securities | $— | $302,873 | $— | $302,873 |
Commercial Mortgage-Backed Securities | — | 764,752 | 71,723 | 836,475 |
Corporate Bonds | — | 9,381,416 | — | 9,381,416 |
Foreign Government Securities | — | 608,812 | — | 608,812 |
Mortgage-Backed Securities | — | 3,061,930 | — | 3,061,930 |
Municipal Bonds | — | 55,228 | — | 55,228 |
Supranational | — | 1,009,923 | — | 1,009,923 |
U.S. Government Agency Securities | — | 771,131 | — | 771,131 |
U.S. Treasury Obligations | — | 21,807,890 | — | 21,807,890 |
Short-Term Investments | ||||
Investment Companies | 1,095,512 | — | — | 1,095,512 |
Total Investments in Securities | $1,095,512 | $37,763,955 | $71,723 | $38,931,190 |
Core Plus Bond ETF | ||||
Level 1 Quoted prices | Level 2 Other significant observable inputs | Level 3 Significant unobservable inputs | Total | |
Investments in Securities | ||||
Asset-Backed Securities | $— | $31,208,766 | $38,652,198 | $69,860,964 |
Collateralized Mortgage Obligations | — | 8,166,217 | 4,510,804 | 12,677,021 |
Commercial Mortgage-Backed Securities | — | 18,617,843 | 6,093,108 | 24,710,951 |
Common Stocks | ||||
Oil, Gas & Consumable Fuels | 17,740 | 2,338 | — | 20,078 |
Professional Services | — | 180 | — | 180 |
Wireless Telecommunication Services | — | — | 7,425 | 7,425 |
Total Common Stocks | 17,740 | 2,518 | 7,425 | 27,683 |
Corporate Bonds | ||||
Aerospace & Defense | — | 2,292,093 | — | 2,292,093 |
Airlines | — | 782,507 | — | 782,507 |
Auto Components | — | 1,211,755 | — | 1,211,755 |
Automobiles | — | 715,088 | — | 715,088 |
Banks | — | 22,767,171 | — | 22,767,171 |
Beverages | — | 1,357,928 | — | 1,357,928 |
Biotechnology | — | 2,155,917 | — | 2,155,917 |
Building Products | — | 865,418 | — | 865,418 |
Capital Markets | — | 9,523,932 | — | 9,523,932 |
Chemicals | — | 1,877,739 | — | 1,877,739 |
Commercial Services & Supplies | — | 1,736,610 | — | 1,736,610 |
Communications Equipment | — | 327,801 | — | 327,801 |
Construction & Engineering | — | 285,360 | — | 285,360 |
Construction Materials | — | 57,655 | — | 57,655 |
Consumer Finance | — | 3,987,848 | — | 3,987,848 |
Containers & Packaging | — | 1,300,133 | — | 1,300,133 |
Diversified Consumer Services | — | 134,802 | — | 134,802 |
Diversified Financial Services | — | 788,923 | — | 788,923 |
Diversified Telecommunication Services | — | 4,584,549 | 3 | 4,584,552 |
August 31, 2022 | J.P. Morgan Exchange-Traded Funds | 383 |
AS OF August 31, 2022 (Unaudited) (continued)
Core Plus Bond ETF (continued) | ||||
Level 1 Quoted prices | Level 2 Other significant observable inputs | Level 3 Significant unobservable inputs | Total | |
Electric Utilities | $— | $6,396,033 | $— | $6,396,033 |
Electrical Equipment | — | 146,100 | — | 146,100 |
Electronic Equipment, Instruments & Components | — | 295,297 | — | 295,297 |
Energy Equipment & Services | — | 352,581 | — | 352,581 |
Entertainment | — | 2,268,483 | — | 2,268,483 |
Equity Real Estate Investment Trusts (REITs) | — | 2,084,049 | — | 2,084,049 |
Food & Staples Retailing | — | 849,211 | — | 849,211 |
Food Products | — | 503,496 | — | 503,496 |
Gas Utilities | — | 223,137 | — | 223,137 |
Health Care Equipment & Supplies | — | 659,796 | — | 659,796 |
Health Care Providers & Services | — | 4,929,301 | — | 4,929,301 |
Health Care Technology | — | 193,278 | — | 193,278 |
Hotels, Restaurants & Leisure | — | 2,874,831 | — | 2,874,831 |
Household Durables | — | 338,965 | — | 338,965 |
Household Products | — | 498,215 | — | 498,215 |
Independent Power and Renewable Electricity Producers | — | 338,425 | — | 338,425 |
Industrial Conglomerates | — | 189,107 | — | 189,107 |
Insurance | — | 1,307,321 | — | 1,307,321 |
Interactive Media & Services | — | 423,263 | — | 423,263 |
Internet & Direct Marketing Retail | — | 725,573 | — | 725,573 |
IT Services | — | 801,983 | — | 801,983 |
Leisure Products | — | 142,062 | — | 142,062 |
Life Sciences Tools & Services | — | 204,096 | — | 204,096 |
Machinery | — | 506,352 | — | 506,352 |
Media | — | 5,954,560 | — | 5,954,560 |
Metals & Mining | — | 2,377,919 | — | 2,377,919 |
Mortgage Real Estate Investment Trusts (REITs) | — | 988,089 | — | 988,089 |
Multiline Retail | — | 95,205 | — | 95,205 |
Multi-Utilities | — | 1,009,538 | — | 1,009,538 |
Oil, Gas & Consumable Fuels | — | 11,785,565 | — | 11,785,565 |
Personal Products | — | 367,485 | — | 367,485 |
Pharmaceuticals | — | 2,841,197 | — | 2,841,197 |
Real Estate Management & Development | — | 144,843 | — | 144,843 |
Road & Rail | — | 1,581,478 | — | 1,581,478 |
Semiconductors & Semiconductor Equipment | — | 1,905,197 | — | 1,905,197 |
Software | — | 1,309,218 | — | 1,309,218 |
Specialty Retail | — | 1,891,820 | — | 1,891,820 |
Technology Hardware, Storage & Peripherals | — | 1,239,393 | — | 1,239,393 |
Textiles, Apparel & Luxury Goods | — | 127,486 | — | 127,486 |
Thrifts & Mortgage Finance | — | 674,231 | — | 674,231 |
Tobacco | — | 1,526,943 | — | 1,526,943 |
Trading Companies & Distributors | — | 1,479,065 | — | 1,479,065 |
Transportation Infrastructure | — | 9,756 | — | 9,756 |
Wireless Telecommunication Services | — | 681,446 | — | 681,446 |
Total Corporate Bonds | — | 121,994,618 | 3 | 121,994,621 |
Mortgage-Backed Securities | — | 63,949,116 | — | 63,949,116 |
Municipal Bonds | — | 24,387 | — | 24,387 |
384 | J.P. Morgan Exchange-Traded Funds | August 31, 2022 |
Core Plus Bond ETF (continued) | ||||
Level 1 Quoted prices | Level 2 Other significant observable inputs | Level 3 Significant unobservable inputs | Total | |
Preferred Stocks | $— | $— | $3,140 | $3,140 |
Rights | — | — | 1 | 1 |
U.S. Treasury Obligations | — | 65,116,259 | — | 65,116,259 |
Warrants | ||||
Diversified Telecommunication Services | — | — | 216 | 216 |
Media | — | — | 3,965 | 3,965 |
Oil, Gas & Consumable Fuels | 16,407 | — | — | 16,407 |
Total Warrants | 16,407 | — | 4,181 | 20,588 |
Short-Term Investments | ||||
Investment Companies | 64,292,445 | — | — | 64,292,445 |
Total Investments in Securities | $64,326,592 | $309,079,724 | $49,270,860 | $422,677,176 |
Appreciation in Other Financial Instruments | ||||
Futures Contracts | $39,842 | $— | $— | $39,842 |
Swaps | — | 301,251 | — | 301,251 |
Depreciation in Other Financial Instruments | ||||
Futures Contracts | (255,030) | — | — | (255,030) |
Total Net Appreciation/ Depreciation in Other Financial Instruments | $(215,188) | $301,251 | $— | $86,063 |
Corporate Bond Research Enhanced ETF | ||||
Level 1 Quoted prices | Level 2 Other significant observable inputs | Level 3 Significant unobservable inputs | Total | |
Investments in Securities | ||||
Corporate Bonds | $— | $38,459,866 | $— | $38,459,866 |
Short-Term Investments | ||||
Investment Companies | 618,875 | — | — | 618,875 |
Total Investments in Securities | $618,875 | $38,459,866 | $— | $39,078,741 |
Appreciation in Other Financial Instruments | ||||
Futures Contracts | $11,504 | $— | $— | $11,504 |
Depreciation in Other Financial Instruments | ||||
Futures Contracts | (11,380) | — | — | (11,380) |
Total Net Appreciation/ Depreciation in Other Financial Instruments | $124 | $— | $— | $124 |
High Yield Research Enhanced ETF | ||||
Level 1 Quoted prices | Level 2 Other significant observable inputs | Level 3 Significant unobservable inputs | Total | |
Investments in Securities | ||||
Corporate Bonds | $— | $394,887,550 | $— | $394,887,550 |
Short-Term Investments | ||||
Investment Companies | 1,852,115 | — | — | 1,852,115 |
Total Investments in Securities | $1,852,115 | $394,887,550 | $— | $396,739,665 |
August 31, 2022 | J.P. Morgan Exchange-Traded Funds | 385 |
AS OF August 31, 2022 (Unaudited) (continued)
Income ETF | ||||
Level 1 Quoted prices | Level 2 Other significant observable inputs | Level 3 Significant unobservable inputs | Total | |
Investments in Securities | ||||
Asset-Backed Securities | $— | $30,727,625 | $13,437,292 | $44,164,917 |
Collateralized Mortgage Obligations | — | 11,186,221 | 777,935 | 11,964,156 |
Commercial Mortgage-Backed Securities | — | 19,347,124 | 8,084,595 | 27,431,719 |
Corporate Bonds | — | 61,322,847 | — | 61,322,847 |
Exchange-Traded Funds | 2,694,260 | — | — | 2,694,260 |
Foreign Government Securities | — | 4,525,889 | — | 4,525,889 |
Mortgage-Backed Securities | — | 14,506,218 | — | 14,506,218 |
Short-Term Investments | ||||
Investment Companies | 101,234 | — | — | 101,234 |
Total Investments in Securities | $2,795,494 | $141,615,924 | $22,299,822 | $166,711,240 |
Liabilities | ||||
TBA Short Commitment | $— | $(10,605,284) | $— | $(10,605,284) |
Total Liabilities in Securities Sold Short | $— | $(10,605,284) | $— | $(10,605,284) |
Appreciation in Other Financial Instruments | ||||
Futures Contracts | $156,173 | $— | $— | $156,173 |
Swaps | — | 22,120 | — | 22,120 |
Depreciation in Other Financial Instruments | ||||
Futures Contracts | (178,519) | — | — | (178,519) |
Total Net Appreciation/ Depreciation in Other Financial Instruments | $(22,346) | $22,120 | $— | $(226) |
International Bond Opportunities ETF | ||||
Level 1 Quoted prices | Level 2 Other significant observable inputs | Level 3 Significant unobservable inputs | Total | |
Investments in Securities | ||||
Asset-Backed Securities | ||||
United States | $— | $2,382,419 | $1,800,723 | $4,183,142 |
Collateralized Mortgage Obligations | — | 3,084,142 | — | 3,084,142 |
Commercial Mortgage-Backed Securities | ||||
United States | — | 2,517,257 | 2,438,161 | 4,955,418 |
Common Stocks | 242,192 | — | — | 242,192 |
Corporate Bonds | — | 170,189,961 | — | 170,189,961 |
Foreign Government Securities | — | 90,831,493 | — | 90,831,493 |
Supranational | — | 898,746 | — | 898,746 |
Warrants | — | — | 216 | 216 |
Short-Term Investments | ||||
Investment Companies | 10,471,032 | — | — | 10,471,032 |
Total Investments in Securities | $10,713,224 | $269,904,018 | $4,239,100 | $284,856,342 |
Appreciation in Other Financial Instruments | ||||
Forward Foreign Currency Exchange Contracts | $— | $4,999,737 | $— | $4,999,737 |
Futures Contracts | 308,306 | — | — | 308,306 |
Swaps | — | 775,514 | — | 775,514 |
Depreciation in Other Financial Instruments | ||||
Forward Foreign Currency Exchange Contracts | — | (926,305) | — | (926,305) |
386 | J.P. Morgan Exchange-Traded Funds | August 31, 2022 |
International Bond Opportunities ETF (continued) | ||||
Level 1 Quoted prices | Level 2 Other significant observable inputs | Level 3 Significant unobservable inputs | Total | |
Futures Contracts | $(5,779) | $— | $— | $(5,779) |
Swaps | — | (505,866) | — | (505,866) |
Total Net Appreciation/ Depreciation in Other Financial Instruments | $302,527 | $4,343,080 | $— | $4,645,607 |
Municipal ETF | ||||
Level 1 Quoted prices | Level 2 Other significant observable inputs | Level 3 Significant unobservable inputs | Total | |
Investments in Securities | ||||
Municipal Bonds | $— | $204,174,440 | $— | $204,174,440 |
Short-Term Investments | ||||
Investment Companies | 34,479,837 | — | — | 34,479,837 |
Total Investments in Securities | $34,479,837 | $204,174,440 | $— | $238,654,277 |
Appreciation in Other Financial Instruments | ||||
Futures Contracts | $7,501 | $— | $— | $7,501 |
Short Duration Core Plus ETF | ||||
Level 1 Quoted prices | Level 2 Other significant observable inputs | Level 3 Significant unobservable inputs | Total | |
Investments in Securities | ||||
Asset-Backed Securities | $— | $31,669,772 | $7,774,224 | $39,443,996 |
Collateralized Mortgage Obligations | — | 7,425,900 | 1,505,691 | 8,931,591 |
Commercial Mortgage-Backed Securities | — | 4,973,614 | 10,363,543 | 15,337,157 |
Corporate Bonds | — | 84,818,767 | — | 84,818,767 |
Foreign Government Securities | — | 1,598,402 | — | 1,598,402 |
Mortgage-Backed Securities | — | 20,656,718 | — | 20,656,718 |
Municipal Bonds | — | 124,434 | — | 124,434 |
U.S. Treasury Obligations | — | 35,349,202 | — | 35,349,202 |
Short-Term Investments | ||||
Investment Companies | 13,782,301 | — | — | 13,782,301 |
Investment of Cash Collateral from Securities Loaned | 135,300 | — | — | 135,300 |
U.S. Treasury Obligations | — | 636,747 | — | 636,747 |
Total Short-Term Investments | 13,917,601 | 636,747 | — | 14,554,348 |
Total Investments in Securities | $13,917,601 | $187,253,556 | $19,643,458 | $220,814,615 |
Appreciation in Other Financial Instruments | ||||
Futures Contracts | $132,532 | $— | $— | $132,532 |
Swaps | — | 65,815 | — | 65,815 |
Depreciation in Other Financial Instruments | ||||
Futures Contracts | (64,135) | — | — | (64,135) |
Total Net Appreciation/ Depreciation in Other Financial Instruments | $68,397 | $65,815 | $— | $134,212 |
August 31, 2022 | J.P. Morgan Exchange-Traded Funds | 387 |
AS OF August 31, 2022 (Unaudited) (continued)
U.S. Aggregate Bond ETF | ||||
Level 1 Quoted prices | Level 2 Other significant observable inputs | Level 3 Significant unobservable inputs | Total | |
Investments in Securities | ||||
Asset-Backed Securities | $— | $3,205,977 | $— | $3,205,977 |
Commercial Mortgage-Backed Securities | — | 20,297,468 | 1,143,169 | 21,440,637 |
Corporate Bonds | — | 276,242,322 | — | 276,242,322 |
Foreign Government Securities | — | 18,151,792 | — | 18,151,792 |
Mortgage-Backed Securities | — | 312,078,533 | — | 312,078,533 |
Municipal Bonds | — | 4,974,012 | — | 4,974,012 |
Supranational | — | 14,842,589 | — | 14,842,589 |
U.S. Government Agency Securities | — | 13,766,997 | — | 13,766,997 |
U.S. Treasury Obligations | — | 453,130,207 | — | 453,130,207 |
Short-Term Investments | ||||
Investment Companies | 59,478,775 | — | — | 59,478,775 |
Investment of Cash Collateral from Securities Loaned | 1,472,263 | — | — | 1,472,263 |
Total Short-Term Investments | 60,951,038 | — | — | 60,951,038 |
Total Investments in Securities | $60,951,038 | $1,116,689,897 | $1,143,169 | $1,178,784,104 |
Ultra-Short Income ETF | ||||
Level 1 Quoted prices | Level 2 Other significant observable inputs | Level 3 Significant unobservable inputs | Total | |
Investments in Securities | ||||
Asset-Backed Securities | $— | $1,817,078,779 | $30,222,981 | $1,847,301,760 |
Commercial Mortgage-Backed Securities | — | 365,611,227 | 8,359,517 | 373,970,744 |
Corporate Bonds | — | 9,235,237,854 | — | 9,235,237,854 |
Foreign Government Securities | — | 28,583,037 | — | 28,583,037 |
Short-Term Investments | ||||
Certificates of Deposits | — | 3,434,599,451 | — | 3,434,599,451 |
Commercial Paper | — | 3,856,089,356 | — | 3,856,089,356 |
Investment Companies | 2,061,647,797 | — | — | 2,061,647,797 |
Investment of Cash Collateral from Securities Loaned | 23,398,131 | — | — | 23,398,131 |
Repurchase Agreements | — | 100,000,000 | — | 100,000,000 |
Total Short-Term Investments | 2,085,045,928 | 7,390,688,807 | — | 9,475,734,735 |
Total Investments in Securities | $2,085,045,928 | $18,837,199,704 | $38,582,498 | $20,960,828,130 |
Appreciation in Other Financial Instruments | ||||
Futures Contracts | $2,511,625 | $— | $— | $2,511,625 |
Ultra-Short Municipal Income ETF | ||||
Level 1 Quoted prices | Level 2 Other significant observable inputs | Level 3 Significant unobservable inputs | Total | |
Investments in Securities | ||||
Municipal Bonds | $— | $2,772,230,286 | $— | $2,772,230,286 |
388 | J.P. Morgan Exchange-Traded Funds | August 31, 2022 |
Ultra-Short Municipal Income ETF (continued) | ||||
Level 1 Quoted prices | Level 2 Other significant observable inputs | Level 3 Significant unobservable inputs | Total | |
Short-Term Investments | ||||
Investment Companies | $410,768,637 | $— | $— | $410,768,637 |
Total Investments in Securities | $410,768,637 | $2,772,230,286 | $— | $3,182,998,923 |
USD Emerging Markets Sovereign Bond ETF | ||||
Level 1 Quoted prices | Level 2 Other significant observable inputs | Level 3 Significant unobservable inputs | Total | |
Investments in Securities | ||||
Corporate Bonds | $— | $7,737,243 | $— | $7,737,243 |
Foreign Government Securities | — | 60,917,329 | — | 60,917,329 |
Short-Term Investments | ||||
Investment Companies | 437,315 | — | — | 437,315 |
Investment of Cash Collateral from Securities Loaned | 1,923,422 | — | — | 1,923,422 |
Total Short-Term Investments | 2,360,737 | — | — | 2,360,737 |
Total Investments in Securities | $2,360,737 | $68,654,572 | $— | $71,015,309 |
Core Plus Bond ETF | Balance as of February 28, 2022 | Realized gain (loss) | Change in net unrealized appreciation (depreciation) | Net accretion (amortization) | Purchases1 | Sales2 | Transfers into Level 3 | Transfers out of Level 3 | Other(a) | Balance as of August 31, 2022 |
Investments in Securities: | ||||||||||
Asset-Backed Securities | $20,370,556 | $— | $(2,113,343) | $21,671 | $14,002,747 | $(1,829,224) | $8,664,246 | $(848,882) | $384,427 | $38,652,198 |
Collateralized Mortgage Obligations | 2,918,444 | — | (127,026) | (388) | 2,358,301 | (412,486) | 306,861 | (148,475) | (384,427) | 4,510,804 |
Commercial Mortgage-Backed Securities | 5,075,115 | — | (322,710) | 55,008 | 2,649,862 | (1,364,167) | — | — | — | 6,093,108 |
Common Stocks | 9,180 | — | (1,755) | — | — | — | — | — | — | 7,425 |
Corporate Bonds | 3 | — | — | — | 280 | (280) | — | — | — | 3 |
Preferred Stocks | 5,377 | — | (2,237) | — | — | — | — | — | — | 3,140 |
Rights | 1 | — | — | — | — | — | — | — | — | 1 |
Warrants | 1,861 | — | 2,320 | — | — | — | — | — | — | 4,181 |
Total | $28,380,537 | $— | $(2,564,751) | $76,291 | $19,011,190 | $(3,606,157) | $8,971,107 | $(997,357) | $— | $49,270,860 |
1 | Purchases include all purchases of securities and securities received in corporate actions. | ||||||||
2 | Sales include all sales of securities, maturities, paydowns and securities tendered in corporate actions. | ||||||||
(a) | Certain Level 3 investments were re-classified between Asset-Backed Securities and Collateralized Mortgage Obligations. |
August 31, 2022 | J.P. Morgan Exchange-Traded Funds | 389 |
AS OF August 31, 2022 (Unaudited) (continued)
Income ETF | Balance as of February 28, 2022 | Realized gain (loss) | Change in net unrealized appreciation (depreciation) | Net accretion (amortization) | Purchases1 | Sales2 | Transfers into Level 3 | Transfers out of Level 3 | Balance as of August 31, 2022 |
Investments in Securities: | |||||||||
Asset-Backed Securities | $8,815,163 | $— | $(645,520) | $40,388 | $8,973,600 | $(4,005,955) | $259,616 | $— | $13,437,292 |
Collateralized Mortgage Obligations | 1,517,003 | — | (15,756) | 2 | 799,902 | (6,213) | — | (1,517,003) | 777,935 |
Commercial Mortgage-Backed Securities | 6,631,360 | 12 | (564,557) | 2,706 | 2,019,393 | (4,319) | — | — | 8,084,595 |
Total | $16,963,526 | $12 | $(1,225,833) | $43,096 | $11,792,895 | $(4,016,487) | $259,616 | $(1,517,003) | $22,299,822 |
1 | Purchases include all purchases of securities and securities received in corporate actions. | ||||||||
2 | Sales include all sales of securities, maturities, paydowns and securities tendered in corporate actions. | ||||||||
International Bond Opportunities ETF | Balance as of February 28, 2022 | Realized gain (loss) | Change in net unrealized appreciation (depreciation) | Net accretion (amortization) | Purchases1 | Sales2 | Transfers into Level 3 | Transfers out of Level 3 | Balance as of August 31, 2022 |
Investments in Securities: | |||||||||
Asset-Backed Securities | $1,043,618 | $— | $(69,589) | $731 | $891,376 | $(65,413) | $— | $— | $1,800,723 |
Commercial Mortgage-Backed Securities | 2,815,947 | 6,782 | (215,369) | 3,570 | �� | (200,697) | 56,454 | (28,526) | 2,438,161 |
Warrants | 184 | — | 32 | — | — | — | — | — | 216 |
Total | $3,859,749 | $6,782 | $(284,926) | $4,301 | $891,376 | $(266,110) | $56,454 | $(28,526) | $4,239,100 |
1 | Purchases include all purchases of securities and securities received in corporate actions. | ||||||||
2 | Sales include all sales of securities, maturities, paydowns and securities tendered in corporate actions. | ||||||||
Short Duration Core Plus ETF | Balance as of February 28, 2022 | Realized gain (loss) | Change in net unrealized appreciation (depreciation) | Net accretion (amortization) | Purchases1 | Sales2 | Transfers into Level 3 | Transfers out of Level 3 | Balance as of August 31, 2022 |
Investments in Securities: | |||||||||
Asset-Backed Securities | $7,077,155 | $— | $(389,953) | $(827) | $1,111,854 | $(752,148) | $1,079,958 | $(351,815) | $7,774,224 |
390 | J.P. Morgan Exchange-Traded Funds | August 31, 2022 |
Short Duration Core Plus ETF | Balance as of February 28, 2022 | Realized gain (loss) | Change in net unrealized appreciation (depreciation) | Net accretion (amortization) | Purchases1 | Sales2 | Transfers into Level 3 | Transfers out of Level 3 | Balance as of August 31, 2022 |
Collateralized Mortgage Obligations | $649,255 | $— | $(57,763) | $1,230 | $717,279 | $(25,755) | $221,445 | $— | $1,505,691 |
Commercial Mortgage-Backed Securities | 8,663,746 | — | (495,666) | (5,822) | 1,444,414 | (94,189) | 1,477,763 | (626,703) | 10,363,543 |
Total | $16,390,156 | $— | $(943,382) | $(5,419) | $3,273,547 | $(872,092) | $2,779,166 | $(978,518) | $19,643,458 |
1 | Purchases include all purchases of securities and securities received in corporate actions. | ||||||||
2 | Sales include all sales of securities, maturities, paydowns and securities tendered in corporate actions. | ||||||||
Bond ETF
Fair Value at August 31, 2022 | Valuation Technique(s) | Unobservable Input | Range (Weighted Average) (a) | |
$38,020,455 | Discounted Cash Flow | Constant Prepayment Rate | 0.00% - 35.00% (9.87%) | |
Constant Default Rate | 0.00% - 1.00% (0.03%) | |||
Yield (Discount Rate of Cash Flows) | 4.40% - 10.47% (7.31%) | |||
Asset-Backed Securities | 38,020,455 | |||
2,812,291 | Discounted Cash Flow | Constant Prepayment Rate | 10.00% - 100.00% (62.26%) | |
Constant Default Rate | 0.00% - 0.50% (0.09%) | |||
Yield (Discount Rate of Cash Flows) | 4.25% - 8.28% (5.64%) | |||
Collateralized Mortgage Obligations | 2,812,291 | |||
2,183,058 | Discounted Cash Flow | Constant Prepayment Rate | 0.00% - 100.00% (9.06%) | |
Yield (Discount Rate of Cash Flows) | 5.00% - 9.25% (6.85%) | |||
Commercial Mortgage- Backed Securities | 2,183,058 | |||
-(b) | Pending Distribution Amount | Expected Recovery | $0.01 ($0.01) | |
Rights | -(b) |
August 31, 2022 | J.P. Morgan Exchange-Traded Funds | 391 |
AS OF August 31, 2022 (Unaudited) (continued)
Fair Value at August 31, 2022 | Valuation Technique(s) | Unobservable Input | Range (Weighted Average) (a) | |
Total | $43,015,804 |
# | The table above does not include certain level 3 investments that are valued by brokers and Pricing Services. At August 31 2022, the value of these investments was $6,225,056. The inputs for these investments are not readily available or cannot be reasonably estimated and are generally those inputs described in Note 2.A. |
(a) | Unobservable inputs were weighted by the relative fair value of the instruments. |
(b) | Amount rounds to less than one thousand. |
Fair Value at August 31, 2022 | Valuation Technique(s) | Unobservable Input | Range (Weighted Average) (a) | |
$9,672,219 | Discounted Cash Flow | Constant Prepayment Rate | 0.00% - 30.00% (17.50%) | |
Yield (Discount Rate of Cash Flows) | 5.28% - 12.40% (8.54%) | |||
Asset-Backed Securities | 9,672,219 | |||
293,785 | Discounted Cash Flow | Constant Prepayment Rate | 10.00% (10.00%) | |
Yield (Discount Rate of Cash Flows) | 5.00% (5.00%) | |||
Collateralized Mortgage Obligations | 293,785 | |||
8,084,595 | Discounted Cash Flow | Constant Prepayment Rate | 0.00% - 100.00% (0.23%) | |
Yield (Discount Rate of Cash Flows) | 5.00% - 9.61% (8.39%) | |||
Commercial Mortgage- Backed Securities | 8,084,595 | |||
Total | $18,050,599 |
# | The table above does not include certain level 3 investments that are valued by brokers and Pricing Services. At August 31 2022, the value of these investments was $4,249,223. The inputs for these investments are not readily available or cannot be reasonably estimated and are generally those inputs described in Note 2.A. |
(a) | Unobservable inputs were weighted by the relative fair value of the instruments. |
Bond
Opportunities
ETF
Fair Value at August 31, 2022 | Valuation Technique(s) | Unobservable Input | Range (Weighted Average) (a) | |
$1,800,723 | Discounted Cash Flow | Constant Prepayment Rate | 0.00% - 35.00% (19.91%) | |
Constant Default Rate | 0.00% - 3.00% (0.26%) | |||
Yield (Discount Rate of Cash Flows) | 4.65% - 8.07% (6.45%) | |||
Asset-Backed Securities | 1,800,723 | |||
1,479,459 | Discounted Cash Flow | Constant Prepayment Rate | 0.00% - 100.00% (6.81%) | |
Constant Default Rate | 0.00% - 2.00% (0.14%) | |||
Yield (Discount Rate of Cash Flows) | 5.81% - 140.50% (11.93%) | |||
Commercial Mortgage- Backed Securities | 1,479,459 |
392 | J.P. Morgan Exchange-Traded Funds | August 31, 2022 |
Fair Value at August 31, 2022 | Valuation Technique(s) | Unobservable Input | Range (Weighted Average) (a) | |
Total | $3,280,182 |
# | The table above does not include certain level 3 investments that are valued by brokers and Pricing Services. At August 31, 2022, the value of these investments was $958,918. The inputs for these investments are not readily available or cannot be reasonably estimated and are generally those inputs described in Note 2.A. |
(a) | Unobservable inputs were weighted by the relative fair value of the instruments. |
Duration
Core Plus
ETF
Fair Value at August 31, 2022 | Valuation Technique(s) | Unobservable Input | Range (Weighted Average) (a) | |
$7,046,062 | Discounted Cash Flow | Constant Prepayment Rate | 0.00% - 100.00% (15.61%) | |
Yield (Discount Rate of Cash Flows) | 3.81% - 8.29% (6.28%) | |||
Asset-Backed Securities | 7,046,062 | |||
1,505,691 | Discounted Cash Flow | Constant Prepayment Rate | 10.00%-15.00%(10.38%) | |
Constant Default Rate | 0.00%-0.01%(0.00%) | |||
Yield (Discount Rate of Cash Flows) | 5.24%-6.70% (6.27%) | |||
Collateralized Mortgage Obligations | 1,505,691 | |||
9,461,912 | Discounted Cash Flow | Yield (Discount Rate of Cash Flows) | 5.66% - 9.57% (7.10%) | |
Commercial Mortgage- Backed Securities | 9,461,912 | |||
Total | $18,013,665 |
# | The table above does not include certain level 3 investments that are valued by brokers and Pricing Services. At August 31, 2022, the value of these investments was $1,629,793. The inputs for these investments are not readily available or cannot be reasonably estimated and are generally those inputs described in Note 2.A. |
(a) | Unobservable inputs were weighted by the relative fair value of the instruments. |
August 31, 2022 | J.P. Morgan Exchange-Traded Funds | 393 |
AS OF August 31, 2022 (Unaudited) (continued)
394 | J.P. Morgan Exchange-Traded Funds | August 31, 2022 |
Investment Securities on Loan, at value, Presented on the Statements of Assets and Liabilities | Cash Collateral Posted by Borrower* | Net Amount Due to Counterparty (not less than zero) | |
Short Duration Core Plus ETF | $129,062 | $(129,062) | $— |
U.S. Aggregate Bond ETF | 1,434,712 | (1,434,712) | — |
Ultra-Short Income ETF | 22,844,603 | (22,844,603) | — |
USD Emerging Markets Sovereign Bond ETF | 1,839,202 | (1,839,202) | — |
* | Collateral posted reflects the value of securities on loan and does not include any additional amounts received from the borrower. |
Short Duration Core Plus ETF | $74 |
U.S. Aggregate Bond ETF | 1,193 |
Ultra-Short Income ETF | 2,054 |
USD Emerging Markets Sovereign Bond ETF | 344 |
BetaBuilders 1-5 Year U.S. Aggregate Bond ETF | |||||||||
For the six months ended August 31, 2022 | |||||||||
Security Description | Value at February 28, 2022 | Purchases at Cost | Proceeds from Sales | Net Realized Gain (Loss) | Change in Unrealized Appreciation/ (Depreciation) | Value at August 31, 2022 | Shares at August 31, 2022 | Dividend Income | Capital Gain Distributions |
JPMorgan U.S. Government Money Market Fund Class IM Shares, 2.00% (a) (b) | $601,648 | $2,661,922 | $2,168,058 | $— | $— | $1,095,512 | 1,095,512 | $3,880 | $— |
(a) | Investment in an affiliated fund, which is registered under the Investment Company Act of 1940, as amended, and is advised by J.P. Morgan Investment Management Inc. |
(b) | The rate shown is the current yield as of August 31, 2022. |
August 31, 2022 | J.P. Morgan Exchange-Traded Funds | 395 |
AS OF August 31, 2022 (Unaudited) (continued)
Core Plus Bond ETF | |||||||||
For the six months ended August 31, 2022 | |||||||||
Security Description | Value at February 28, 2022 | Purchases at Cost | Proceeds from Sales | Net Realized Gain (Loss) | Change in Unrealized Appreciation/ (Depreciation) | Value at August 31, 2022 | Shares at August 31, 2022 | Dividend Income | Capital Gain Distributions |
JPMorgan U.S. Government Money Market Fund Class IM Shares, 2.00% (a) (b) | $35,701,290 | $148,346,489 | $119,755,334 | $— | $— | $64,292,445 | 64,292,445 | $245,492 | $— |
(a) | Investment in an affiliated fund, which is registered under the Investment Company Act of 1940, as amended, and is advised by J.P. Morgan Investment Management Inc. |
(b) | The rate shown is the current yield as of August 31, 2022. |
Corporate Bond Research Enhanced ETF | |||||||||
For the six months ended August 31, 2022 | |||||||||
Security Description | Value at February 28, 2022 | Purchases at Cost | Proceeds from Sales | Net Realized Gain (Loss) | Change in Unrealized Appreciation/ (Depreciation) | Value at August 31, 2022 | Shares at August 31, 2022 | Dividend Income | Capital Gain Distributions |
JPMorgan U.S. Government Money Market Fund Class IM Shares, 2.00% (a) (b) | $159,865 | $2,308,330 | $1,849,320 | $— | $— | $618,875 | 618,875 | $1,223 | $— |
(a) | Investment in an affiliated fund, which is registered under the Investment Company Act of 1940, as amended, and is advised by J.P. Morgan Investment Management Inc. |
(b) | The rate shown is the current yield as of August 31, 2022. |
High Yield Research Enhanced ETF | |||||||||
For the six months ended August 31, 2022 | |||||||||
Security Description | Value at February 28, 2022 | Purchases at Cost | Proceeds from Sales | Net Realized Gain (Loss) | Change in Unrealized Appreciation/ (Depreciation) | Value at August 31, 2022 | Shares at August 31, 2022 | Dividend Income | Capital Gain Distributions |
JPMorgan U.S. Government Money Market Fund Class IM Shares, 2.00% (a) (b) | $20,697,667 | $208,293,135 | $227,138,687 | $— | $— | $1,852,115 | 1,852,115 | $42,167 | $— |
(a) | Investment in an affiliated fund, which is registered under the Investment Company Act of 1940, as amended, and is advised by J.P. Morgan Investment Management Inc. |
(b) | The rate shown is the current yield as of August 31, 2022. |
Income ETF | |||||||||
For the six months ended August 31, 2022 | |||||||||
Security Description | Value at February 28, 2022 | Purchases at Cost | Proceeds from Sales | Net Realized Gain (Loss) | Change in Unrealized Appreciation/ (Depreciation) | Value at August 31, 2022 | Shares at August 31, 2022 | Dividend Income | Capital Gain Distributions |
JPMorgan Prime Money Market Fund Class IM Shares, 2.30% (a) (b) | $18,529,733 | $42,762,871 | $61,187,910 | $(4,026) | $566 | $101,234 | 101,194 | $18,381 | $— |
(a) | Investment in an affiliated fund, which is registered under the Investment Company Act of 1940, as amended, and is advised by J.P. Morgan Investment Management Inc. |
(b) | The rate shown is the current yield as of August 31, 2022. |
396 | J.P. Morgan Exchange-Traded Funds | August 31, 2022 |
International Bond Opportunities ETF | |||||||||
For the six months ended August 31, 2022 | |||||||||
Security Description | Value at February 28, 2022 | Purchases at Cost | Proceeds from Sales | Net Realized Gain (Loss) | Change in Unrealized Appreciation/ (Depreciation) | Value at August 31, 2022 | Shares at August 31, 2022 | Dividend Income | Capital Gain Distributions |
JPMorgan U.S. Government Money Market Fund Class IM Shares, 2.00% (a) (b) | $9,903,539 | $85,543,844 | $84,976,351 | $— | $— | $10,471,032 | 10,471,032 | $55,870 | $— |
(a) | Investment in an affiliated fund, which is registered under the Investment Company Act of 1940, as amended, and is advised by J.P. Morgan Investment Management Inc. |
(b) | The rate shown is the current yield as of August 31, 2022. |
Municipal ETF | |||||||||
For the six months ended August 31, 2022 | |||||||||
Security Description | Value at February 28, 2022 | Purchases at Cost | Proceeds from Sales | Net Realized Gain (Loss) | Change in Unrealized Appreciation/ (Depreciation) | Value at August 31, 2022 | Shares at August 31, 2022 | Dividend Income | Capital Gain Distributions |
JPMorgan Institutional Tax Free Money Market Fund Class IM Shares, 1.36% (a) (b) | $10,795,128 | $143,735,333 | $120,051,012 | $2,411 | $(2,023) | $34,479,837 | 34,469,496 | $86,626 | $— |
(a) | Investment in an affiliated fund, which is registered under the Investment Company Act of 1940, as amended, and is advised by J.P. Morgan Investment Management Inc. |
(b) | The rate shown is the current yield as of August 31, 2022. |
Short Duration Core Plus ETF | |||||||||
For the six months ended August 31, 2022 | |||||||||
Security Description | Value at February 28, 2022 | Purchases at Cost | Proceeds from Sales | Net Realized Gain (Loss) | Change in Unrealized Appreciation/ (Depreciation) | Value at August 31, 2022 | Shares at August 31, 2022 | Dividend Income | Capital Gain Distributions |
JPMorgan Prime Money Market Fund Class IM Shares, 2.30% (a) (b) | $23,982,204 | $61,884,082 | $72,085,050 | $(4,305) | $5,370 | $13,782,301 | 13,776,790 | $96,097 | $— |
JPMorgan U.S. Government Money Market Fund Class IM Shares, 2.00% (a) (b) | 110,760 | 1,083,648 | 1,059,108 | — | — | 135,300 | 135,300 | 1,055* | — |
Total | $24,092,964 | $62,967,730 | $73,144,158 | $(4,305) | $5,370 | $13,917,601 | $97,152 | $— | |
(a) | Investment in an affiliated fund, which is registered under the Investment Company Act of 1940, as amended, and is advised by J.P. Morgan Investment Management Inc. |
(b) | The rate shown is the current yield as of August 31, 2022. |
* | Amount is included on the Statements of Operations as Income from securities lending (net) (after payments of rebates and Citibank’s fee). |
U.S. Aggregate Bond ETF | |||||||||
For the six months ended August 31, 2022 | |||||||||
Security Description | Value at February 28, 2022 | Purchases at Cost | Proceeds from Sales | Net Realized Gain (Loss) | Change in Unrealized Appreciation/ (Depreciation) | Value at August 31, 2022 | Shares at August 31, 2022 | Dividend Income | Capital Gain Distributions |
JPMorgan Securities Lending Money Market Fund Agency SL Class Shares, 2.22% (a) (b) | $6,493,451 | $5,000,000 | $11,000,000 | $(2,746)* | $1,293 | $491,998 | 492,047 | $3,473 * | $— |
August 31, 2022 | J.P. Morgan Exchange-Traded Funds | 397 |
AS OF August 31, 2022 (Unaudited) (continued)
U.S. Aggregate Bond ETF (continued) | |||||||||
For the six months ended August 31, 2022 | |||||||||
Security Description | Value at February 28, 2022 | Purchases at Cost | Proceeds from Sales | Net Realized Gain (Loss) | Change in Unrealized Appreciation/ (Depreciation) | Value at August 31, 2022 | Shares at August 31, 2022 | Dividend Income | Capital Gain Distributions |
JPMorgan U.S. Government Money Market Fund Class IM Shares, 2.00% (a) (b) | $17,328,257 | $99,661,693 | $57,511,175 | $— | $— | $59,478,775 | 59,478,775 | $233,785 | $— |
JPMorgan U.S. Government Money Market Fund Class IM Shares, 2.00% (a) (b) | 680,960 | 30,105,008 | 29,805,703 | — | — | 980,265 | 980,265 | 12,744* | — |
Total | $24,502,668 | $134,766,701 | $98,316,878 | $(2,746) | $1,293 | $60,951,038 | $250,002 | $— | |
(a) | Investment in an affiliated fund, which is registered under the Investment Company Act of 1940, as amended, and is advised by J.P. Morgan Investment Management Inc. |
(b) | The rate shown is the current yield as of August 31, 2022. |
* | Amount is included on the Statements of Operations as Income from securities lending (net) (after payments of rebates and Citibank’s fee). |
JPMorgan Ultra-Short Income ETF | |||||||||
For the six months ended August 31, 2022 | |||||||||
Security Description | Value at February 28, 2022 | Purchases at Cost | Proceeds from Sales | Net Realized Gain (Loss) | Change in Unrealized Appreciation/ (Depreciation) | Value at August 31, 2022 | Shares at August 31, 2022 | Dividend Income | Capital Gain Distributions |
JPMorgan Securities Lending Money Market Fund | |||||||||
Class Agency SL Class Shares, | |||||||||
2.22%(a)(b) | $36,712,288 | $58,000,000 | $76,000,000 | $(13,692)* | $11,200 | $18,709,796 | $18,711,668 | $93,488* | $— |
JPMorgan U.S. Government Money Market Fund | |||||||||
Class IM Class Shares, | |||||||||
2.00%(a)(b) | 3,227,762,466 | 5,715,492,762 | 6,881,607,431 | — | — | 2,061,647,797 | 2,061,647,797 | 12,367,189 | — |
JPMorgan U.S. Government Money Market Fund | |||||||||
Class IM Class Shares, | |||||||||
2.00%(a)(b) | 5,092,765 | 94,611,456 | 95,015,886 | — | — | 4,688,335 | 4,688,335 | 25,181* | — |
Total | $3,269,567,519 | $5,868,104,218 | $7,052,623,317 | $(13,692) | $11,200 | $2,085,045,928 | $12,485,858 | $— | |
(a) | Investment in an affiliated fund, which is registered under the Investment Company Act of 1940, as amended, and is advised by J.P. Morgan Investment Management Inc. |
(b) | The rate shown is the current yield as of August 31, 2022. |
* | Amount is included on the Statements of Operations as Income from securities lending (net) (after payments of rebates and Citibank’s fee). |
398 | J.P. Morgan Exchange-Traded Funds | August 31, 2022 |
Ultra-Short Municipal Income ETF | |||||||||
For the six months ended August 31, 2022 | |||||||||
Security Description | Value at February 28, 2022 | Purchases at Cost | Proceeds from Sales | Net Realized Gain (Loss) | Change in Unrealized Appreciation/ (Depreciation) | Value at August 31, 2022 | Shares at August 31, 2022 | Dividend Income | Capital Gain Distributions |
JPMorgan Institutional Tax Free Money Market Fund Class IM Shares, 1.36% (a) (b) | $288,389,747 | $2,769,259,800 | $2,646,875,487 | $(1,146) | $(4,277) | $410,768,637 | 410,645,444 | $1,144,079 | $— |
(a) | Investment in an affiliated fund, which is registered under the Investment Company Act of 1940, as amended, and is advised by J.P. Morgan Investment Management Inc. |
(b) | The rate shown is the current yield as of August 31, 2022. |
USD Emerging Markets Sovereign Bond ETF | |||||||||
For the six months ended August 31, 2022 | |||||||||
Security Description | Value at February 28, 2022 | Purchases at Cost | Proceeds from Sales | Net Realized Gain (Loss) | Change in Unrealized Appreciation/ (Depreciation) | Value at August 31, 2022 | Shares at August 31, 2022 | Dividend Income | Capital Gain Distributions |
JPMorgan Securities Lending Money Market Fund Agency SL Class Shares, 2.22% (a) (b) | $— | $800,000 | $— | $— | $400 | $800,400 | 800,480 | $2,003* | $— |
JPMorgan U.S. Government Money Market Fund Class IM Shares, 2.00% (a) (b) | 177,868 | 8,899,952 | 8,640,505 | — | — | 437,315 | 437,315 | 2,243 | — |
JPMorgan U.S. Government Money Market Fund Class IM Shares, 2.00% (a) (b) | 786,418 | 13,193,228 | 12,856,624 | — | — | 1,123,022 | 1,123,022 | 5,361* | — |
Total | $964,286 | $22,893,180 | $21,497,129 | $— | $400 | $2,360,737 | $9,607 | $— | |
(a) | Investment in an affiliated fund, which is registered under the Investment Company Act of 1940, as amended, and is advised by J.P. Morgan Investment Management Inc. |
(b) | The rate shown is the current yield as of August 31, 2022. |
* | Amount is included on the Statements of Operations as Income from securities lending (net) (after payments of rebates and Citibank’s fee). |
August 31, 2022 | J.P. Morgan Exchange-Traded Funds | 399 |
AS OF August 31, 2022 (Unaudited) (continued)
400 | J.P. Morgan Exchange-Traded Funds | August 31, 2022 |
August 31, 2022 | J.P. Morgan Exchange-Traded Funds | 401 |
AS OF August 31, 2022 (Unaudited) (continued)
Core Plus Bond ETF | Corporate Bond Research Enhanced ETF | Income ETF | International Bond Opportunities ETF | Municipal ETF | Short Duration Core Plus ETF | Ultra-Short Income ETF | |
Foreign Exchange Rate Risk Exposure: | |||||||
Unrealized Appreciation on Forward Foreign Currency Exchange Contracts | $— | $— | $— | $4,999,737 | $— | $— | $— |
Unrealized Depreciation on Forward Foreign Currency Exchange Contracts | — | — | — | (926,305) | — | — | — |
Interest Rate Risk Exposure: | |||||||
Unrealized Appreciation on Futures Contracts * | 39,842 | 11,504 | 156,173 | 308,306 | 7,501 | 132,532 | 2,511,625 |
Swaps at Value (Assets) ** | — | — | — | 752,298 | — | — | — |
Unrealized Depreciation on Futures Contracts * | (255,030) | (11,380) | (178,519) | (5,779) | — | (64,135) | — |
Swaps at Value (Liabilities) ** | — | — | — | (505,866) | — | — | — |
Credit Risk Exposure: | |||||||
Swaps at Value (Assets) ** | 72,317 | — | 6,022 | 20,668 | — | 4,795 | — |
Swaps at Value (Liabilities) ** | (8,252) | — | — | — | — | — | — |
Net Fair Value of Derivative Contracts: | |||||||
Unrealized Appreciation (Depreciation) on Futures Contracts * | (215,188) | 124 | (22,346) | 302,527 | 7,501 | 68,397 | 2,511,625 |
Swaps at Value ** | 64,065 | — | 6,022 | 267,100 | — | 4,795 | — |
Unrealized Appreciation (Depreciation) on Forward Foreign Currency Exchange Contracts | — | — | — | 4,073,432 | — | — | — |
* | Includes cumulative appreciation/(depreciation) on futures contracts, if any, as reported on the SOIs. Only current day’s variation margin is reported within the Statements of Assets and Liabilities. |
** | Includes the fair value of centrally cleared swap contracts as reported on the SOIs. Only current day’s variation margin is reported within the Statements of Assets and Liabilities. |
Counterparty | Gross Amount of Derivative Assets Subject to Netting Arrangements Presented on the Statement of Assets and Liabilities (a) | Derivatives Available for Offset | Collateral Received | Net Amount Due From Counterparty (Not less than zero) |
Barclays Bank plc | $105,400 | $(22,432) | $— | $82,968 |
BNP Paribas | 2,708,389 | (35,651) | — | 2,672,738 |
Citibank, NA | 141,447 | (45,381) | — | 96,066 |
402 | J.P. Morgan Exchange-Traded Funds | August 31, 2022 |
Counterparty | Gross Amount of Derivative Assets Subject to Netting Arrangements Presented on the Statement of Assets and Liabilities (a) | Derivatives Available for Offset | Collateral Received | Net Amount Due From Counterparty (Not less than zero) |
Goldman Sachs International | $275,175 | $(69,980) | $— | $205,195 |
HSBC Bank, NA | 706,237 | (661,046) | — | 45,191 |
Merrill Lynch International | 9,774 | (9,774) | — | — |
Royal Bank of Canada | 20,442 | (20,442) | — | — |
State Street Corp. | 1,032,873 | (26,207) | — | 1,006,666 |
$4,999,737 | $(890,913) | $— | $4,108,824 |
Counterparty | Gross Amount of Derivative Liabilities Subject to Netting Arrangements Presented on the Statement of Assets and Liabilities (a) | Derivative Available for Offset | Collateral Posted | Net Amount Due to Counterparty (Not less than zero) |
Barclays Bank plc | $22,432 | $(22,432) | $— | $— |
BNP Paribas | 35,651 | (35,651) | — | — |
Citibank, NA | 45,381 | (45,381) | — | — |
Goldman Sachs International | 69,980 | (69,980) | — | — |
HSBC Bank, NA | 661,046 | (661,046) | — | — |
Merrill Lynch International | 18,847 | (9,774) | — | 9,073 |
Royal Bank of Canada | 46,761 | (20,442) | — | 26,319 |
State Street Corp. | 26,207 | (26,207) | — | — |
$926,305 | $(890,913) | $— | $35,392 |
(a) | For financial reporting purposes the Fund does not offset derivative assets and derivative liabilities subject to master netting arrangements on the Statement of Assets and Liabilities. |
Core Plus Bond ETF | Corporate Bond Research Enhanced ETF | Income ETF | International Bond Opportunities ETF | Municipal ETF | Short Duration Core Plus ETF | Ultra-Short Income ETF | |
Realized Gain (Loss) on Derivatives Recognized as a Result From Operations: | |||||||
Foreign Exchange Rate Risk Exposure: | |||||||
Forward Foreign Currency Exchange Contracts | $20,434 | $— | $— | $14,031,425 | $— | $— | $— |
Interest Rate Risk Exposure: | |||||||
Futures Contracts | (665,205) | (11,988) | 248,003 | 2,723,378 | 134,699 | 885,002 | 34,568,546 |
Swap Contracts | — | — | — | 2,688,036 | — | — | — |
Credit Exposure Risk: | |||||||
Swap Contracts | (2,644) | — | 485,755 | 948,132 | — | 119,384 | — |
Net Change in Unrealized Appreciation (Depreciation) on Derivatives Recognized as a Result of Operations: |
August 31, 2022 | J.P. Morgan Exchange-Traded Funds | 403 |
AS OF August 31, 2022 (Unaudited) (continued)
Core Plus Bond ETF | Corporate Bond Research Enhanced ETF | Income ETF | International Bond Opportunities ETF | Municipal ETF | Short Duration Core Plus ETF | Ultra-Short Income ETF | |
Foreign Exchange Rate Risk Exposure: | |||||||
Forward Foreign Currency Exchange Contracts | $(20,436) | $— | $(19,542) | $5,394,978 | $— | $— | $— |
Interest Rate Risk Exposure: | |||||||
Futures Contracts | (280,848) | 234 | 98,148 | 59,925 | 28,040 | 162,037 | 6,212,215 |
Swap Contracts | — | — | — | (608,494) | — | — | — |
Credit Exposure Risk: | |||||||
Swap Contracts | 338,308 | — | (215,052) | (776,104) | — | 101,332 | — |
Core Plus Bond ETF | Corporate Bond Research Enhanced ETF | Income ETF | International Bond Opportunities ETF | |
Futures Contracts: | ||||
Average Notional Balance Long | $40,653,819 | $1,889,721 | $24,355,894 | $5,572,425 |
Average Notional Balance Short | (4,132,819) | (1,377,165) | (27,561,664) | (40,123,046) |
Ending Notional Balance Long | 60,378,266 | 2,066,484 | 34,329,859 | 5,573,549 |
Ending Notional Balance Short | (4,714,000) | (1,556,609) | (27,762,125) | (88,265,848) |
Forward Foreign Currency Exchange Contracts: | ||||
Average Settlement Value Purchased | (548,767) | — | (554,341) | (67,596,558) |
Average Settlement Value Sold | 551,686 | — | 557,133 | 300,210,100 |
Ending Settlement Value Purchased | — | — | — | (33,039,364) |
Ending Settlement Value Sold | — | — | — | 321,775,386 |
Interest Rate-Related Swaps : | ||||
Average Notional Balance - Pays Fixed Rate | — | — | — | 72,781,867 |
Average Notional Balance - Receives Fixed Rate | — | — | — | 7,095,329 |
Ending Notional Balance - Receives Fixed Rate | — | — | — | 6,180,443 |
Ending Notional Balance - Pays Fixed Rate | — | — | — | 34,691,685 |
Credit Default Swaps: | ||||
Average Notional Balance - Buy Protection | 1,222,857 | — | 1,592,714 | 2,828,080 |
Average Notional Balance -Sell Protection | 4,200,000 | — | 810,714 | 211,015 |
Ending Notional Balance - Buy Protection | 6,000,000 | — | 2,700,000 | 874,307 |
Ending Notional Balance - Sell Protection | 14,700,000 | — | — | — |
Municipal ETF | Short Duration Core Plus ETF | Ultra-Short Income ETF | |
Futures Contracts: | |||
Average Notional Balance Long | $— | $34,071,352 | $— |
Average Notional Balance Short | (1,078,705) | (24,025,174) | (1,197,885,898) |
Ending Notional Balance Long | — | 33,483,047 | — |
Ending Notional Balance Short | (874,016) | (16,707,625) | (1,345,711,500) |
404 | J.P. Morgan Exchange-Traded Funds | August 31, 2022 |
Municipal ETF | Short Duration Core Plus ETF | Ultra-Short Income ETF | |
Forward Foreign Currency Exchange Contracts: | |||
Average Settlement Value Purchased | $— | $— | $— |
Average Settlement Value Sold | — | — | — |
Ending Settlement Value Purchased | — | — | — |
Ending Settlement Value Sold | — | — | — |
Interest Rate-Related Swaps : | |||
Average Notional Balance - Pays Fixed Rate | — | — | — |
Average Notional Balance - Receives Fixed Rate | — | — | — |
Ending Notional Balance - Receives Fixed Rate | — | — | — |
Ending Notional Balance - Pays Fixed Rate | — | — | — |
Credit Default Swaps: | |||
Average Notional Balance - Buy Protection | — | 1,635,714 | — |
Average Notional Balance -Sell Protection | — | 514,286 | — |
Ending Notional Balance - Buy Protection | — | 2,150,000 | — |
Ending Notional Balance - Sell Protection | — | — | — |
August 31, 2022 | J.P. Morgan Exchange-Traded Funds | 405 |
AS OF August 31, 2022 (Unaudited) (continued)
BetaBuilders 1-5 Year U.S. Aggregate Bond ETF | 0.05% |
Core Plus Bond ETF | 0.40 |
Corporate Bond Research Enhanced ETF | 0.14 |
High Yield Research Enhanced ETF | 0.24 |
Income ETF | 0.40 |
International Bond Opportunities ETF | 0.50 |
Municipal ETF | 0.18 |
Short Duration Core Plus ETF | 0.33 |
U.S. Aggregate Bond ETF | 0.07 |
Ultra-Short Income ETF | 0.18 |
Ultra-Short Municipal Income ETF | 0.18 |
USD Emerging Markets Sovereign Bond ETF | 0.39 |
406 | J.P. Morgan Exchange-Traded Funds | August 31, 2022 |
Purchases (excluding U.S. Government) | Sales (excluding U.S. Government) | Purchases of U.S. Government | Sales of U.S. Government | |
BetaBuilders 1-5 Year U.S. Aggregate Bond ETF | $9,720,730 | $8,125,214 | $4,082,646 | $1,309,114 |
Core Plus Bond ETF | 189,218,685 | 83,042,811 | 41,645,284 | 6,251,467 |
Corporate Bond Research Enhanced ETF | 7,677,021 | 8,799,386 | 16,827 | 15,984 |
High Yield Research Enhanced ETF | 176,175,808 | 305,127,158 | — | — |
Income ETF | 187,725,306 | 126,800,174 | — | — |
International Bond Opportunities ETF | 119,220,897 | 127,708,294 | — | — |
Municipal ETF | 154,586,795 | 40,411,110 | — | — |
Short Duration Core Plus ETF | 216,628,686 | 182,075,273 | 49,168,948 | 54,506,063 |
U.S. Aggregate Bond ETF | 568,736,205 | 532,470,125 | 29,488,908 | 26,934,309 |
Ultra-Short Income ETF | 3,199,137,665 | 3,467,081,256 | — | — |
Ultra-Short Municipal Income ETF | 1,408,416,276 | 1,137,986,250 | — | — |
USD Emerging Markets Sovereign Bond ETF | 15,609,869 | 12,409,247 | — | — |
In-Kind Creations | In-Kind Redemptions | |
BetaBuilders 1-5 Year U.S. Aggregate Bond ETF | $4,292,618 | $3,117,130 |
Corporate Bond Research Enhanced ETF | 2,274,865 | 7,945,411 |
High Yield Research Enhanced ETF | — | 788,680,540 |
U.S. Aggregate Bond ETF | 247,990,198 | 82,698,330 |
USD Emerging Markets Sovereign Bond ETF | 4,480,335 | — |
August 31, 2022 | J.P. Morgan Exchange-Traded Funds | 407 |
AS OF August 31, 2022 (Unaudited) (continued)
Aggregate Cost | Gross Unrealized Appreciation | Gross Unrealized Depreciation | Net Unrealized Appreciation (Depreciation) | |
BetaBuilders 1-5 Year U.S. Aggregate Bond ETF | $40,925,627 | $406 | $1,994,843 | $(1,994,437) |
Core Plus Bond ETF | 454,553,281 | 606,850 | 32,634,078 | (32,027,228) |
Corporate Bond Research Enhanced ETF | 44,498,421 | 16,647 | 5,436,203 | (5,419,556) |
High Yield Research Enhanced ETF | 453,176,617 | 531,250 | 56,968,202 | (56,436,952) |
Income ETF | 169,724,644 | 522,781 | 14,157,793 | (13,635,012) |
International Bond Opportunities ETF | 337,248,130 | 6,393,736 | 54,142,465 | (47,748,729) |
Municipal ETF | 243,564,459 | 748,902 | 5,651,583 | (4,902,681) |
Short Duration Core Plus ETF | 232,519,937 | 238,905 | 11,871,035 | (11,632,130) |
U.S. Aggregate Bond ETF | 1,299,875,171 | 13,873 | 121,104,940 | (121,091,067) |
Ultra-Short Income ETF | 21,151,488,935 | 3,587,060 | 191,736,240 | (188,149,180) |
Ultra-Short Municipal Income ETF | 3,202,331,573 | 619,164 | 19,951,814 | (19,332,650) |
USD Emerging Markets Sovereign Bond ETF | 81,776,769 | 203,338 | 10,964,798 | (10,761,460) |
Capital Loss Carryforward Character | ||
Short-Term | Long-Term | |
Core Plus Bond ETF | $350,128 | $— |
High Yield Research Enhanced ETF | 426,152 | — |
International Bond Opportunities ETF | 1,249,981 | 2,372,743 |
U.S. Aggregate Bond ETF | 610,721 | — |
Ultra-Short Municipal Income ETF | 121,390 | 14,525 |
USD Emerging Markets Sovereign Bond ETF | 1,970,006 | 1,974,142* |
* | Amount includes capital loss carryforwards which are limited in future years under Internal Revenue Code sections 381-384. |
Net Capital Losses (Gains) | ||
Short-Term | Long-Term | |
BetaBuilders 1-5 Year U.S. Aggregate Bond ETF | $27,498 | $(16,117) |
Core Plus Bond ETF | 629,807 | 456,732 |
Corporate Bond Research Enhanced ETF | (633) | 1,157 |
High Yield Research Enhanced ETF | 3,497,276 | 1,725,761 |
Municipal ETF | 300,855 | 23,404 |
Short Duration Core Plus ETF | 571,777 | (54,823) |
U.S. Aggregate Bond ETF | 2,401,411 | 379,510 |
Ultra-Short Income ETF | 527,978 | — |
Ultra-Short Municipal Income ETF | (228,965) | 367,453 |
USD Emerging Markets Sovereign Bond ETF | 11,922 | 120,934 |
408 | J.P. Morgan Exchange-Traded Funds | August 31, 2022 |
Capital Loss Utilized | ||
Short-Term | Long-Term | |
High Yield Research Enhanced ETF | $2,046,668 | $421,874 |
USD Emerging Markets Sovereign Bond ETF | 49,092 | 172,863 |
JPMorgan SmartRetirement Funds | JPMorgan SmartRetirement Blend Funds | |
High Yield Research Enhanced ETF | 32.1% | 14.8% |
U.S. Aggregate Bond ETF | — | 43.7 |
% of Ownership | |
Corporate Bond Research Enhanced ETF | 58% |
Income ETF | 37 |
August 31, 2022 | J.P. Morgan Exchange-Traded Funds | 409 |
AS OF August 31, 2022 (Unaudited) (continued)
or other restrictions. To the extent of the previously outlined items, each Fund’s return may differ from the return of the underlying index.
410 | J.P. Morgan Exchange-Traded Funds | August 31, 2022 |
laws or currency exchange restrictions could cause the securities and their markets to be less liquid and their prices to be more volatile than those of comparable U.S. securities.
International Bond Opportunities ETF | Ultra-Short Income ETF | |
Australia | 10.5% | —% |
Canada | — | 11.5 |
August 31, 2022 | J.P. Morgan Exchange-Traded Funds | 411 |
(Unaudited)
Hypothetical $1,000 Investment
Beginning Account Value March 1, 2022 | Ending Account Value August 31, 2022 | Expenses Paid During the Period* | Annualized Expense Ratio | |
JPMorgan BetaBuilders 1-5 Year U.S. Aggregate Bond ETF | ||||
Actual | $1,000.00 | $963.70 | $0.25 | 0.05% |
Hypothetical | 1,000.00 | 1,024.95 | 0.26 | 0.05 |
JPMorgan Core Plus Bond ETF | ||||
Actual | 1,000.00 | 924.60 | 1.89 | 0.39 |
Hypothetical | 1,000.00 | 1,023.24 | 1.99 | 0.39 |
JPMorgan Corporate Bond Research Enhanced ETF | ||||
Actual | 1,000.00 | 907.10 | 0.67 | 0.14 |
Hypothetical | 1,000.00 | 1,024.50 | 0.71 | 0.14 |
JPMorgan High Yield Research Enhanced ETF | ||||
Actual | 1,000.00 | 922.70 | 1.16 | 0.24 |
Hypothetical | 1,000.00 | 1,024.00 | 1.22 | 0.24 |
JPMorgan Income ETF | ||||
Actual | 1,000.00 | 953.20 | 1.92 | 0.39 |
Hypothetical | 1,000.00 | 1,023.24 | 1.99 | 0.39 |
JPMorgan International Bond Opportunities ETF | ||||
Actual | 1,000.00 | 949.90 | 2.46 | 0.50 |
Hypothetical | 1,000.00 | 1,022.68 | 2.55 | 0.50 |
JPMorgan Municipal ETF | ||||
Actual | 1,000.00 | 952.10 | 0.79 | 0.16 |
Hypothetical | 1,000.00 | 1,024.40 | 0.82 | 0.16 |
JPMorgan Short Duration Core Plus ETF | ||||
Actual | 1,000.00 | 964.10 | 1.58 | 0.32 |
Hypothetical | 1,000.00 | 1,023.59 | 1.63 | 0.32 |
JPMorgan U.S. Aggregate Bond ETF | ||||
Actual | 1,000.00 | 921.30 | 0.34 | 0.07 |
Hypothetical | 1,000.00 | 1,024.85 | 0.36 | 0.07 |
412 | J.P. Morgan Exchange-Traded Funds | August 31, 2022 |
Beginning Account Value March 1, 2022 | Ending Account Value August 31, 2022 | Expenses Paid During the Period* | Annualized Expense Ratio | |
JPMorgan Ultra-Short Income ETF | ||||
Actual | $1,000.00 | $1,001.60 | $0.86 | 0.17% |
Hypothetical | 1,000.00 | 1,024.35 | 0.87 | 0.17 |
JPMorgan Ultra-Short Municipal Income ETF | ||||
Actual | 1,000.00 | 999.50 | 0.86 | 0.17 |
Hypothetical | 1,000.00 | 1,024.35 | 0.87 | 0.17 |
JPMorgan USD Emerging Markets Sovereign Bond ETF | ||||
Actual | 1,000.00 | 915.50 | 1.88 | 0.39 |
Hypothetical | 1,000.00 | 1,023.24 | 1.99 | 0.39 |
* | Expenses are equal to the Fund’s annualized expense ratio, multiplied by the average account value over the period, multiplied by 184/365 (to reflect the one-half year period). |
August 31, 2022 | J.P. Morgan Exchange-Traded Funds | 413 |
(Unaudited)
416 | J.P. Morgan Exchange-Traded Funds | August 31, 2022 |
August 31, 2022 | J.P. Morgan Exchange-Traded Funds | 417 |
(Unaudited) (continued)
418 | J.P. Morgan Exchange-Traded Funds | August 31, 2022 |
August 31, 2022 | J.P. Morgan Exchange-Traded Funds | 419 |
(Unaudited) (continued)
420 | J.P. Morgan Exchange-Traded Funds | August 31, 2022 |
August 31, 2022 | J.P. Morgan Exchange-Traded Funds | 421 |


Fund | Ticker | Listing Exchange |
JPMorgan BetaBuilders MSCI US REIT ETF | BBRE | Cboe BZX Exchange, Inc. |

1 | |
2 | |
5 | |
8 | |
12 | |
14 | |
20 | |
21 |
Past performance is no guarantee of future performance. The general market views expressed in this report are opinions based on market and other conditions through the end of the reporting period and are subject to change without notice. These views are not intended to predict the future performance of the Fund or the securities markets.
Prospective investors should refer to the Fund's prospectus for a discussion of the Fund's investment objectives, strategies and risks. Call J.P. Morgan Exchange-Traded Funds at (844) 457-6383 for a prospectus containing more complete information about the Fund, including management fees and other expenses. Please read it carefully before investing.
Shares are bought and sold throughout the day on an exchange at market price (not at net asset value) through a brokerage account, and are not individually subscribed and redeemed from the Fund. Shares may only be subscribed and redeemed directly from the Fund by Authorized Participants, in large creation/redemption units. Brokerage commissions will reduce returns.
October 17, 2022 (Unaudited)
 | “Given the current circumstances in financial markets, we believe it is important that investors consider a long-term view and maintain a diversified portfolio.” — Brian S. Shlissel |

President, J.P. Morgan Exchange-Traded Funds
J.P. Morgan Asset Management
1-844-4JPM-ETF or jpmorgan.com/etfs for more information
August 31, 2022 | J.P. Morgan Exchange-Traded Funds | 1 |
SIX MONTHS ENDED August 31, 2022 (Unaudited)
REPORTING PERIOD RETURN: | |
Net Asset Value * | (9.40)% |
Market Price ** | (9.40)% |
MSCI US REIT Custom Capped Index | (9.37)% |
MSCI US REIT Index | (9.37)% |
Net Assets as of 8/31/2022 | $1,002,597,179 |
Fund Ticker | BBRE |
TOP TEN HOLDINGS OF THE PORTFOLIO AS OF August 31, 2022 | PERCENT OF TOTAL INVESTMENTS | |
1. | Prologis, Inc. | 8.7% |
2. | Equinix, Inc. | 5.7 |
3. | Public Storage | 4.9 |
4. | Realty Income Corp. | 3.9 |
5. | Digital Realty Trust, Inc. | 3.3 |
6. | Welltower, Inc. | 3.3 |
7. | Simon Property Group, Inc. | 3.2 |
8. | VICI Properties, Inc. | 3.0 |
9. | AvalonBay Communities, Inc. | 2.7 |
10. | Extra Space Storage, Inc. | 2.5 |
PORTFOLIO COMPOSTION BY SECTOR AS OF August 31, 2022 | PERCENT OF TOTAL INVESTMENTS |
Apartments | 25.6% |
Diversified | 19.1 |
Industrial | 13.1 |
Storage | 11.3 |
Health Care | 10.5 |
Office | 7.4 |
Shopping Centers | 5.3 |
Regional Malls | 3.6 |
Hotels | 3.5 |
Short-Term Investments | 0.6 |
2 | J.P. Morgan Exchange-Traded Funds | August 31, 2022 |
August 31, 2022 | J.P. Morgan Exchange-Traded Funds | 3 |
SIX MONTHS ENDED August 31, 2022 (Unaudited) (continued)
INCEPTION DATE | SIX MONTHS* | 1 YEAR | SINCE INCEPTION | |
JPMorgan BetaBuilders MSCI US REIT ETF | ||||
Net Asset Value | June 15, 2018 | (9.40)% | (10.38)% | 6.76% |
Market Price | (9.40) | (10.27) | 6.77 |
* | Not annualized. |
4 | J.P. Morgan Exchange-Traded Funds | August 31, 2022 |
AS OF August 31, 2022 (Unaudited)
INVESTMENTS | SHARES | VALUE($) |
Common Stocks — 99.8% | ||
Apartments — 25.7% | ||
Agree Realty Corp., REIT | 71,634 | 5,395,473 |
American Homes 4 Rent, Class A, REIT | 298,151 | 10,602,249 |
Apartment Income REIT Corp., REIT | 149,696 | 6,115,082 |
Apartment Investment and Management Co., Class A, REIT * | 145,490 | 1,286,132 |
AvalonBay Communities, Inc., REIT | 133,231 | 26,767,440 |
Bluerock Residential Growth REIT, Inc., REIT | 28,414 | 757,233 |
Camden Property Trust, REIT | 96,427 | 12,391,834 |
Centerspace, REIT | 14,641 | 1,103,638 |
Equity LifeStyle Properties, Inc., REIT | 168,385 | 11,803,788 |
Equity Residential, REIT | 340,409 | 24,911,131 |
Essential Properties Realty Trust, Inc., REIT | 124,973 | 2,829,389 |
Essex Property Trust, Inc., REIT | 62,255 | 16,501,310 |
Four Corners Property Trust, Inc., REIT | 76,578 | 2,059,182 |
Getty Realty Corp., REIT | 37,852 | 1,138,588 |
Independence Realty Trust, Inc., REIT | 210,741 | 4,098,912 |
Invitation Homes, Inc., REIT | 581,567 | 21,099,251 |
Mid-America Apartment Communities, Inc., REIT | 109,989 | 18,221,878 |
National Retail Properties, Inc., REIT | 167,623 | 7,526,273 |
NexPoint Residential Trust, Inc., REIT | 22,040 | 1,164,153 |
Realty Income Corp., REIT | 573,255 | 39,141,851 |
Spirit Realty Capital, Inc., REIT | 127,981 | 5,228,024 |
STORE Capital Corp., REIT | 240,614 | 6,491,766 |
Sun Communities, Inc., REIT | 115,883 | 17,812,376 |
UDR, Inc., REIT | 303,400 | 13,613,558 |
258,060,511 | ||
Diversified — 19.2% | ||
Alexander & Baldwin, Inc., REIT | 69,256 | 1,297,165 |
American Assets Trust, Inc., REIT | 49,020 | 1,360,795 |
Armada Hoffler Properties, Inc., REIT | 64,517 | 847,108 |
Broadstone Net Lease, Inc., REIT | 161,329 | 3,087,837 |
Digital Realty Trust, Inc., REIT | 271,260 | 33,535,874 |
Duke Realty Corp., REIT | 366,342 | 21,559,227 |
EPR Properties, REIT | 71,438 | 3,106,838 |
Equinix, Inc., REIT | 86,733 | 57,015,671 |
Farmland Partners, Inc., REIT | 45,323 | 657,637 |
Gaming and Leisure Properties, Inc., REIT | 243,443 | 11,750,993 |
Gladstone Commercial Corp., REIT | 36,828 | 702,310 |
Gladstone Land Corp., REIT (a) | 30,968 | 728,058 |
Global Net Lease, Inc., REIT | 98,745 | 1,359,719 |
InvenTrust Properties Corp., REIT | 64,214 | 1,686,260 |
iStar, Inc., REIT | 78,945 | 1,087,073 |
LXP Industrial Trust, REIT | 273,144 | 2,747,829 |
INVESTMENTS | SHARES | VALUE($) |
Diversified — continued | ||
Necessity Retail REIT, Inc. (The), REIT | 126,773 | 945,726 |
One Liberty Properties, Inc., REIT (a) | 16,105 | 388,936 |
Safehold, Inc., REIT (a) | 17,707 | 673,397 |
UMH Properties, Inc., REIT | 49,106 | 885,872 |
VICI Properties, Inc., REIT | 917,632 | 30,272,680 |
Washington, REIT | 83,307 | 1,633,650 |
WP Carey, Inc., REIT | 183,799 | 15,444,630 |
192,775,285 | ||
Health Care — 10.5% | ||
CareTrust REIT, Inc., REIT | 92,457 | 1,991,524 |
Community Healthcare Trust, Inc., REIT | 22,697 | 837,292 |
Diversified Healthcare Trust, REIT | 227,729 | 332,484 |
Global Medical REIT, Inc., REIT | 59,310 | 642,920 |
Healthcare Realty Trust, Inc., REIT | 362,770 | 8,822,567 |
Healthpeak Properties, Inc., REIT | 514,137 | 13,496,096 |
LTC Properties, Inc., REIT | 37,603 | 1,687,999 |
Medical Properties Trust, Inc., REIT | 571,827 | 8,354,393 |
National Health Investors, Inc., REIT | 43,690 | 2,862,132 |
Omega Healthcare Investors, Inc., REIT | 224,135 | 7,320,249 |
Physicians Realty Trust, REIT | 214,682 | 3,576,602 |
Sabra Health Care REIT, Inc., REIT | 220,074 | 3,294,508 |
Universal Health Realty Income Trust, REIT | 12,479 | 635,056 |
Ventas, Inc., REIT | 380,864 | 18,228,151 |
Welltower, Inc., REIT | 432,579 | 33,157,180 |
105,239,153 | ||
Hotels — 3.5% | ||
Apple Hospitality REIT, Inc., REIT | 207,200 | 3,296,552 |
Chatham Lodging Trust, REIT * | 44,180 | 537,229 |
DiamondRock Hospitality Co., REIT * | 200,927 | 1,754,093 |
Host Hotels & Resorts, Inc., REIT | 681,101 | 12,103,165 |
Park Hotels & Resorts, Inc., REIT | 222,375 | 3,113,250 |
Pebblebrook Hotel Trust, REIT | 125,163 | 2,205,372 |
RLJ Lodging Trust, REIT | 158,983 | 1,917,335 |
Ryman Hospitality Properties, Inc., REIT * | 49,920 | 4,104,422 |
Service Properties Trust, REIT | 157,313 | 1,076,021 |
Summit Hotel Properties, Inc., REIT | 101,865 | 800,659 |
Sunstone Hotel Investors, Inc., REIT * | 205,071 | 2,233,223 |
Xenia Hotels & Resorts, Inc., REIT * | 108,966 | 1,728,201 |
34,869,522 | ||
Industrial — 13.1% | ||
Americold Realty Trust, Inc., REIT | 256,589 | 7,548,848 |
EastGroup Properties, Inc., REIT | 39,717 | 6,554,497 |
First Industrial Realty Trust, Inc., REIT | 125,782 | 6,374,632 |
August 31, 2022 | J.P. Morgan Exchange-Traded Funds | 5 |
AS OF August 31, 2022 (Unaudited) (continued)
INVESTMENTS | SHARES | VALUE($) |
Common Stocks — continued | ||
Industrial — continued | ||
Indus Realty Trust, Inc., REIT | 3,882 | 238,432 |
Industrial Logistics Properties Trust, REIT | 62,323 | 466,799 |
Innovative Industrial Properties, Inc., REIT | 26,653 | 2,444,613 |
Plymouth Industrial REIT, Inc., REIT | 38,229 | 774,902 |
Prologis, Inc., REIT | 705,390 | 87,828,109 |
Rexford Industrial Realty, Inc., REIT | 157,246 | 9,782,274 |
STAG Industrial, Inc., REIT | 170,770 | 5,259,716 |
Terreno Realty Corp., REIT | 71,977 | 4,389,877 |
131,662,699 | ||
Office — 7.5% | ||
Alexandria Real Estate Equities, Inc., REIT | 147,752 | 22,665,157 |
Boston Properties, Inc., REIT | 141,862 | 11,268,099 |
Brandywine Realty Trust, REIT | 163,309 | 1,311,371 |
City Office REIT, Inc., REIT | 41,502 | 479,348 |
Corporate Office Properties Trust, REIT | 107,119 | 2,767,955 |
Cousins Properties, Inc., REIT | 141,755 | 3,806,122 |
Douglas Emmett, Inc., REIT | 167,502 | 3,269,639 |
Easterly Government Properties, Inc., REIT | 82,178 | 1,475,095 |
Empire State Realty Trust, Inc., Class A, REIT | 134,914 | 940,351 |
Equity Commonwealth, REIT * | 107,362 | 2,824,694 |
Franklin Street Properties Corp., REIT | 98,292 | 276,201 |
Highwoods Properties, Inc., REIT | 100,200 | 3,047,082 |
Hudson Pacific Properties, Inc., REIT | 137,811 | 1,820,483 |
JBG SMITH Properties, REIT | 105,955 | 2,327,831 |
Kilroy Realty Corp., REIT | 100,095 | 4,881,633 |
Office Properties Income Trust, REIT | 46,144 | 810,750 |
Orion Office REIT, Inc., REIT | 53,958 | 532,565 |
Paramount Group, Inc., REIT | 166,999 | 1,157,303 |
Piedmont Office Realty Trust, Inc., Class A, REIT | 117,520 | 1,384,386 |
SL Green Realty Corp., REIT | 61,103 | 2,698,919 |
Veris Residential, Inc., REIT * | 73,731 | 990,945 |
Vornado Realty Trust, REIT | 155,303 | 4,072,045 |
74,807,974 | ||
Regional Malls — 3.6% | ||
CBL & Associates Properties, Inc., REIT (a) | 12,126 | 350,926 |
Macerich Co. (The), REIT | 204,533 | 1,957,381 |
Simon Property Group, Inc., REIT | 313,155 | 31,935,547 |
Tanger Factory Outlet Centers, Inc., REIT | 99,476 | 1,533,920 |
35,777,774 | ||
Shopping Centers — 5.3% | ||
Acadia Realty Trust, REIT | 90,415 | 1,440,311 |
Alexander's, Inc., REIT | 2,190 | 518,811 |
INVESTMENTS | SHARES | VALUE($) |
Shopping Centers — continued | ||
Brixmor Property Group, Inc., REIT | 285,422 | 6,130,864 |
Federal Realty OP LP, REIT | 68,111 | 6,897,601 |
Kimco Realty Corp., REIT | 588,890 | 12,413,801 |
Kite Realty Group Trust, REIT | 208,721 | 4,040,839 |
NETSTREIT Corp., REIT (a) | 45,664 | 897,754 |
Phillips Edison & Co., Inc., REIT (a) | 108,534 | 3,545,806 |
Regency Centers Corp., REIT | 147,818 | 8,993,247 |
Retail Opportunity Investments Corp., REIT | 118,352 | 1,982,396 |
RPT Realty, REIT | 81,101 | 781,003 |
Saul Centers, Inc., REIT | 13,664 | 605,179 |
SITE Centers Corp., REIT | 183,377 | 2,376,566 |
Urban Edge Properties, REIT | 111,895 | 1,760,108 |
Urstadt Biddle Properties, Inc., Class A, REIT | 28,740 | 480,533 |
Whitestone, REIT | 44,489 | 437,772 |
53,302,591 | ||
Storage — 11.4% | ||
CubeSmart, REIT | 213,864 | 9,848,437 |
Extra Space Storage, Inc., REIT | 127,953 | 25,428,100 |
Iron Mountain, Inc., REIT | 276,872 | 14,566,236 |
Life Storage, Inc., REIT | 80,390 | 10,229,628 |
National Storage Affiliates Trust, REIT | 82,854 | 4,185,784 |
Public Storage, REIT | 150,533 | 49,800,832 |
114,059,017 | ||
Total Common Stocks (Cost $1,114,957,448) | 1,000,554,526 | |
Short-Term Investments — 0.6% | ||
Investment Companies — 0.4% | ||
JPMorgan U.S. Government Money Market Fund Class IM Shares, 2.00% (b) (c) (Cost $3,953,702) | 3,953,702 | 3,953,702 |
6 | J.P. Morgan Exchange-Traded Funds | August 31, 2022 |
INVESTMENTS | SHARES | VALUE($) |
Short-Term Investments — continued | ||
Investment of Cash Collateral from Securities Loaned — 0.2% | ||
JPMorgan Securities Lending Money Market Fund Agency SL Class Shares, 2.22% (b) (c) | 1,997,100 | 1,996,900 |
JPMorgan U.S. Government Money Market Fund Class IM Shares, 2.00% (b) (c) | 593,646 | 593,646 |
Total Investment of Cash Collateral from Securities Loaned (Cost $2,589,947) | 2,590,546 | |
Total Short-Term Investments (Cost $6,543,649) | 6,544,248 | |
Total Investments — 100.4% (Cost $1,121,501,097) | 1,007,098,774 | |
Liabilities in Excess of Other Assets — (0.4)% | (4,501,595) | |
NET ASSETS — 100.0% | 1,002,597,179 | |
Percentages indicated are based on net assets. |
Abbreviations | |
REIT | Real Estate Investment Trust |
* | Non-income producing security. |
(a) | The security or a portion of this security is on loan at August 31, 2022. The total value of securities on loan at August 31, 2022 is $2,122,327. |
(b) | Investment in an affiliated fund, which is registered under the Investment Company Act of 1940, as amended, and is advised by J.P. Morgan Investment Management Inc. |
(c) | The rate shown is the current yield as of August 31, 2022. |
DESCRIPTION | NUMBER OF CONTRACTS | EXPIRATION DATE | TRADING CURRENCY | NOTIONAL AMOUNT ($) | VALUE AND UNREALIZED APPRECIATION (DEPRECIATION) ($) |
Long Contracts | |||||
DJ US Real Estate Index | 45 | 09/16/2022 | USD | 1,639,800 | 112,340 |
Abbreviations | |
USD | United States Dollar |
August 31, 2022 | J.P. Morgan Exchange-Traded Funds | 7 |
AS OF August 31, 2022 (Unaudited)
JPMorgan BetaBuilders MSCI US REIT ETF | |
ASSETS: | |
Investments in non-affiliates, at value | $1,000,554,526 |
Investments in affiliates, at value | 3,953,702 |
Investments of cash collateral received from securities loaned, at value (See Note 2.B) | 2,590,546 |
Cash | 55,382 |
Deposits at broker for futures contracts | 479,000 |
Receivables: | |
Investment securities sold | 3,663,888 |
Dividends from non-affiliates | 626,167 |
Dividends from affiliates | 217 |
Securities lending income (See Note 2.B) | 1,196 |
Total Assets | 1,011,924,624 |
LIABILITIES: | |
Payables: | |
Investment securities purchased | 6,618,772 |
Collateral received on securities loaned (See Note 2.B) | 2,590,546 |
Variation margin on futures contracts | 19,723 |
Accrued liabilities: | |
Management fees (See Note 3.A) | 98,404 |
Total Liabilities | 9,327,445 |
Net Assets | $1,002,597,179 |
NET ASSETS: | |
Paid-in-Capital | $1,084,101,890 |
Total distributable earnings (loss) | (81,504,711) |
Total Net Assets | $1,002,597,179 |
Outstanding number of shares (unlimited number of shares authorized - par value $0.0001) | 11,150,000 |
Net asset value, per share | $89.92 |
Cost of investments in non-affiliates | $1,114,957,448 |
Cost of investments in affiliates | 3,953,702 |
Investment securities on loan, at value (See Note 2.B) | 2,122,327 |
Cost of investment of cash collateral (See Note 2.B) | 2,589,947 |
8 | J.P. Morgan Exchange-Traded Funds | August 31, 2022 |
FOR THE SIX MONTHS ENDED August 31, 2022 (Unaudited)
JPMorgan BetaBuilders MSCI US REIT ETF | |
INVESTMENT INCOME: | |
Interest income from non-affiliates | $419 |
Interest income from affiliates | 8 |
Dividend income from non-affiliates | 17,270,617 |
Dividend income from affiliates | 30,142 |
Income from securities lending (net) (See Note 2.B) | 7,385 |
Total investment income | 17,308,571 |
EXPENSES: | |
Management fees (See Note 3.A) | 657,744 |
Interest expense to non-affiliates | 183 |
Other | 877 |
Total expenses | 658,804 |
Net investment income (loss) | 16,649,767 |
REALIZED/UNREALIZED GAINS (LOSSES): | |
Net realized gain (loss) on transactions from: | |
Investments in non-affiliates | (31,542,036) |
In-kind redemptions of investments in non-affiliates (See Note 4) | 61,891,468 |
Futures contracts | (118,403) |
Net realized gain (loss) | 30,231,029 |
Change in net unrealized appreciation/depreciation on: | |
Investments in non-affiliates | (166,226,441) |
Investments in affiliates | 1,699 |
Futures contracts | 128,713 |
Change in net unrealized appreciation/depreciation | (166,096,029) |
Net realized/unrealized gains (losses) | (135,865,000) |
Change in net assets resulting from operations | $(119,215,233) |
August 31, 2022 | J.P. Morgan Exchange-Traded Funds | 9 |
FOR THE PERIODS INDICATED
JPMorgan BetaBuilders MSCI US REIT ETF | ||
Six Months Ended August 31, 2022 (Unaudited) | Year Ended February 28, 2022 | |
CHANGE IN NET ASSETS RESULTING FROM OPERATIONS: | ||
Net investment income (loss) | $16,649,767 | $28,015,841 |
Net realized gain (loss) | 30,231,029 | 120,936,985 |
Change in net unrealized appreciation/depreciation | (166,096,029) | 136,251,529 |
Change in net assets resulting from operations | (119,215,233) | 285,204,355 |
DISTRIBUTIONS TO SHAREHOLDERS: | ||
Total distributions to shareholders | (8,533,760) | (27,102,001) |
CAPITAL TRANSACTIONS: | ||
Change in net assets resulting from capital transactions | (226,930,212) | 155,051,115 |
NET ASSETS: | ||
Change in net assets | (354,679,205) | 413,153,469 |
Beginning of period | 1,357,276,384 | 944,122,915 |
End of period | $1,002,597,179 | $1,357,276,384 |
CAPITAL TRANSACTIONS: | ||
Proceeds from shares issued | $305,521,947 | $741,079,084 |
Cost of shares redeemed | (532,452,159) | (586,027,969) |
Total change in net assets resulting from capital transactions | $(226,930,212) | $155,051,115 |
SHARE TRANSACTIONS: | ||
Issued | 3,125,000 | 8,000,000 |
Redeemed | (5,550,000) | (5,875,000) |
Net increase (decrease) in shares from share transactions | (2,425,000) | 2,125,000 |
10 | J.P. Morgan Exchange-Traded Funds | August 31, 2022 |
FOR THE PERIODS INDICATED
Per share operating performance | |||||||
Investment operations | Distributions | ||||||
Net asset value, beginning of period | Net investment income (loss) (b) | Net realized and unrealized gains (losses) on investments | Total from investment operations | Net investment income | Net realized gain | Total distributions | |
JPMorgan BetaBuilders MSCI US REIT ETF | |||||||
Six Months Ended August 31, 2022 (Unaudited) | $99.98 | $1.35 | $(10.74) | $(9.39) | $(0.67) | $— | $(0.67) |
Year Ended February 28, 2022 | 82.46 | 1.93 | 17.48 | 19.41 | (1.89) | — | (1.89) |
Year Ended February 28, 2021 | 82.62 | 2.07 | 0.28(g) | 2.35 | (2.51) | — | (2.51) |
Year Ended February 29, 2020 | 81.21 | 2.55 | 0.80(g) | 3.35 | (1.85) | (0.09) | (1.94) |
June 15, 2018 (i) through February 28, 2019 | 75.67 | 1.85 | 5.10 | 6.95 | (1.35) | (0.06) | (1.41) |
(a) | Annualized for periods less than one year, unless otherwise noted. |
(b) | Calculated based upon average shares outstanding. |
(c) | Not annualized for periods less than one year. |
(d) | Includes adjustments in accordance with accounting principles generally accepted in the United States of America and as such, the net asset values for financial reporting purposes and the returns based upon those net asset values may differ from the net asset values and returns for shareholder transactions. |
(e) | Prior to December 9, 2019, market price return was calculated assuming an initial investment made at the market price at the beginning of the reporting period, reinvestment of all dividends and distributions at market price during the period, and sale at the market price on the last day of the period. The price used to calculate the market price return was the midpoint of the bid/ask spread at the close of business on the listing exchange of the fund. Effective December 9, 2019, the closing price was used to calculate the market price return; however, any prices used in the calculation for market price return prior to December 9, 2019, would have used the midpoint of the bid/ask spread at the close of business on the exchange. |
(f) | Certain non-recurring expenses incurred by the Fund were not annualized for the period indicated. |
(g) | Calculation of the net realized and unrealized gains (losses) per share does not correlate with the Fund’s net realized and unrealized gains (losses) presented in the Statement of Operations due to the timing of capital transactions in relation to the fluctuating market values of the Fund’s investments. |
(h) | Prior to November 1, 2019, the Fund may have waived fees if expenses exceeded the expense cap. On November 1, 2019, the Fund adopted a unitary fee structure where a management fee is accrued by the fund based on prior day net assets and other expenses are paid by the Advisor. |
(i) | Commencement of operations. |
(j) | Since the Shares of the Fund did not trade in the secondary market until the day after the Fund’s inception, for the period from the inception to the first day of secondary market trading, the NAV is used as a proxy for the secondary market trading price to calculate the market returns. |
12 | J.P. Morgan Exchange-Traded Funds | August 31, 2022 |
Ratios/Supplemental data | ||||||||
Ratios to average net assets (a) | ||||||||
Net asset value, end of period | Market price, end of period | Total return (c)(d) | Market price total return (c)(e) | Net assets, end of period | Net expenses | Net investment income (loss) | Expenses without waivers and reimbursements | Portfolio turnover rate (c) |
$89.92 | $89.96 | (9.40)% | (9.40)% | $1,002,597,179 | 0.11%(f) | 2.77% | 0.11%(f) | 5% |
99.98 | 100.02 | 23.55 | 23.45 | 1,357,276,384 | 0.11 | 1.96 | 0.11 | 5 |
82.46 | 82.56 | 3.37 | 3.36 | 944,122,915 | 0.11 | 2.82 | 0.11 | 7 |
82.62 | 82.73 | 4.06 | 4.18 | 1,206,297,493 | 0.11 | 2.88 | 0.16(h) | 5 |
81.21 | 81.22 | 9.40 | 9.41(j) | 136,028,924 | 0.11(f) | 3.37 | 0.40(f)(h) | 5 |
August 31, 2022 | J.P. Morgan Exchange-Traded Funds | 13 |
AS OF August 31, 2022 (Unaudited)
14 | J.P. Morgan Exchange-Traded Funds | August 31, 2022 |
Level 1 Quoted prices | Level 2 Other significant observable inputs | Level 3 Significant unobservable inputs | Total | |
Total Investments in Securities (a) | $1,007,098,774 | $— | $— | $1,007,098,774 |
Appreciation in Other Financial Instruments | ||||
Futures Contracts (a) | $112,340 | $— | $— | $112,340 |
(a) | Please refer to the SOI for specifics of portfolio holdings. |
Investment Securities on Loan, at value, Presented on the Statement of Assets and Liabilities | Cash Collateral Posted by Borrower* | Net Amount Due to Counterparty (not less than zero) | |
$2,122,327 | $(2,122,327) | $— |
* | Collateral posted reflects the value of securities on loan and does not include any additional amounts received from the borrower. |
August 31, 2022 | J.P. Morgan Exchange-Traded Funds | 15 |
AS OF August 31, 2022 (Unaudited) (continued)
$1,342 |
For the six months ended August 31, 2022 | |||||||||
Security Description | Value at February 28, 2022 | Purchases at Cost | Proceeds from Sales | Net Realized Gain (Loss) | Change in Unrealized Appreciation/ (Depreciation) | Value at August 31, 2022 | Shares at August 31, 2022 | Dividend Income | Capital Gain Distributions |
JPMorgan Securities Lending Money Market Fund Agency SL Class Shares, 2.22% (a) (b) | $10,994,199 | $85,000,000 | $94,000,000 | $1,002* | $1,699 | $1,996,900 | 1,997,100 | $42,386* | $— |
JPMorgan U.S. Government Money Market Fund Class IM Shares, 2.00% (a) (b) | 11,322,728 | 53,705,018 | 61,074,044 | — | — | 3,953,702 | 3,953,702 | 30,142 | — |
JPMorgan U.S. Government Money Market Fund Class IM Shares, 2.00% (a) (b) | 2,282,053 | 100,582,067 | 102,270,474 | — | — | 593,646 | 593,646 | 11,249* | — |
Total | $24,598,980 | $239,287,085 | $257,344,518 | $1,002 | $1,699 | $6,544,248 | $83,777 | $— | |
(a) | Investment in an affiliated fund, which is registered under the Investment Company Act of 1940, as amended, and is advised by J.P. Morgan Investment Management Inc. |
(b) | The rate shown is the current yield as of August 31, 2022. |
* | Amount is included on the Statement of Operations as Income from securities lending (net) (after payments of rebates and Citibank’s fee). |
16 | J.P. Morgan Exchange-Traded Funds | August 31, 2022 |
Futures Contracts: | |
Average Notional Balance Long | $6,171,846 |
Ending Notional Balance Long | 1,639,800 |
August 31, 2022 | J.P. Morgan Exchange-Traded Funds | 17 |
AS OF August 31, 2022 (Unaudited) (continued)
Purchases (excluding U.S. Government) | Sales (excluding U.S. Government) | |
$62,595,557 | $117,134,758 |
In-Kind Creations | In-Kind Redemptions | |
$302,435,791 | $460,280,329 |
Aggregate Cost | Gross Unrealized Appreciation | Gross Unrealized Depreciation | Net Unrealized Appreciation (Depreciation) | |
$1,121,501,097 | $30,719,899 | $145,009,882 | $(114,289,983) |
Capital Loss Carryforward Character | ||
Short-Term | Long-Term | |
$1,762,128 | $— | |
Capital Loss Utilized | ||
Short-Term | Long-Term | |
$9,062,678 | $— | |
18 | J.P. Morgan Exchange-Traded Funds | August 31, 2022 |
JPMorgan SmartRetirement Funds | JPMorgan SmartRetirement Blend Funds | |
10.8% | 32.8% |
August 31, 2022 | J.P. Morgan Exchange-Traded Funds | 19 |
(Unaudited)
Hypothetical $1,000 Investment
Beginning Account Value March 1, 2022 | Ending Account Value August 31, 2022 | Expenses Paid During the Period* | Annualized Expense Ratio | |
JPMorgan BetaBuilders MSCI US REIT ETF | ||||
Actual | $1,000.00 | $906.00 | $0.53 | 0.11% |
Hypothetical | 1,000.00 | 1,024.65 | 0.56 | 0.11 |
* | Expenses are equal to the Fund’s annualized expense ratio, multiplied by the average account value over the period, multiplied by 184/365 (to reflect the one-half year period). |
20 | J.P. Morgan Exchange-Traded Funds | August 31, 2022 |
(Unaudited)
August 31, 2022 | J.P. Morgan Exchange-Traded Funds | 21 |
(Unaudited) (continued)
22 | J.P. Morgan Exchange-Traded Funds | August 31, 2022 |
August 31, 2022 | J.P. Morgan Exchange-Traded Funds | 23 |


Fund | Ticker | Listing Exchange |
JPMorgan Inflation Managed Bond ETF | JCPI | Cboe BZX Exchange, Inc. |
JPMorgan Realty Income ETF | JPRE | NYSE Arca |

1 | |
2 | |
2 | |
5 | |
8 | |
32 | |
42 | |
44 | |
58 | |
59 |
Past performance is no guarantee of future performance. The general market views expressed in this report are opinions based on market and other conditions through the end of the reporting period and are subject to change without notice. These views are not intended to predict the future performance of a Fund or the securities markets.
Prospective investors should refer to the Funds’ prospectuses for a discussion of the Funds’ investment objectives, strategies and risks. Call J.P. Morgan Exchange-Traded Funds at (844) 457-6383 for a prospectus containing more complete information about a Fund, including management fees and other expenses. Please read it carefully before investing.
Shares are bought and sold throughout the day on an exchange at market price (not at net asset value) through a brokerage account, and are not individually subscribed and redeemed from a Fund. Shares may only be subscribed and redeemed directly from a Fund by Authorized Participants, in very large creation/redemption units. Brokerage commissions will reduce returns.
October 17, 2022 (Unaudited)
 | “Given the current circumstances in financial markets, we believe it is important that investors consider a long-term view and maintain a diversified portfolio.” — Brian S. Shlissel |

President, J.P. Morgan Exchange-Traded Funds
J.P. Morgan Asset Management
1-844-4JPM-ETF or jpmorgan.com/etfs for more information
August 31, 2022 | J.P. Morgan Exchange-Traded Funds | 1 |
SIX MONTHS ENDED August 31, 2022 (Unaudited)
REPORTING PERIOD RETURN: | |
Net Asset Value * | (4.06)% |
Market Price ** | (4.28)% |
Bloomberg 1-10 Year U.S. TIPS Index | (3.80)% |
Bloomberg U.S. Intermediate Aggregate Index | (5.70)% |
Net Assets as of 8/31/2022 | $1,015,914,233 |
Duration as of 8/31/2022 | 4.5 Years |
Fund Ticker | JCPI |
2 | J.P. Morgan Exchange-Traded Funds | August 31, 2022 |
PORTFOLIO COMPOSITION AS OF August 31, 2022 | PERCENT OF TOTAL INVESTMENTS |
U.S. Treasury Obligations | 32.2% |
Corporate Bonds | 27.8 |
Asset-Backed Securities | 11.1 |
Commercial Mortgage-Backed Securities | 11.0 |
Mortgage-Backed Securities | 7.7 |
Collateralized Mortgage Obligations | 6.1 |
U.S. Government Agency Securities | 1.3 |
Others (each less than 1.0%) | 0.5 |
Short-Term Investments | 2.5 |
August 31, 2022 | J.P. Morgan Exchange-Traded Funds | 3 |
SIX MONTHS ENDED August 31, 2022 (Unaudited) (continued)
INCEPTION DATE | SIX MONTHS* | 1 YEAR | 5 YEAR | 10 YEAR | |
JPMorgan Inflation Managed Bond ETF | |||||
Net Asset Value | November 30, 2010** | (4.06)% | (3.68)% | 2.45% | 1.63% |
Market Price | (4.28) | (3.89) | 2.41 | 1.61 |
* | Not annualized. |
** | Inception date Class R6 Shares of the Predecessor Fund (as defined below). |
4 | J.P. Morgan Exchange-Traded Funds | August 31, 2022 |
SIX MONTHS ENDED August 31, 2022 (Unaudited)
REPORTING PERIOD RETURN: | |
Net Asset Value * | (10.29)% |
Market Price ** | (10.31)% |
MSCI US REIT Index | (9.37)% |
Net Assets as of 8/31/2022 | $927,880,481 |
Fund Ticker | JPRE |
August 31, 2022 | J.P. Morgan Exchange-Traded Funds | 5 |
SIX MONTHS ENDED August 31, 2022 (Unaudited) (continued)
TOP TEN HOLDINGS OF THE PORTFOLIO AS OF August 31, 2022 | PERCENT OF TOTAL INVESTMENTS | |
1. | Prologis, Inc. | 8.6% |
2. | Public Storage | 7.9 |
3. | Equinix, Inc. | 7.8 |
4. | Realty Income Corp. | 5.7 |
5. | Ventas, Inc. | 5.6 |
6. | Duke Realty Corp. | 5.2 |
7. | UDR, Inc. | 4.9 |
8. | Rexford Industrial Realty, Inc. | 4.6 |
9. | Sun Communities, Inc. | 4.6 |
10. | Welltower, Inc. | 4.4 |
PORTFOLIO COMPOSTION BY SECTOR AS OF August 31, 2022 | PERCENT OF TOTAL INVESTMENTS |
Apartments | 30.2% |
Diversified | 18.7 |
Industrial | 14.2 |
Health Care | 12.9 |
Storage | 7.9 |
Office | 4.7 |
Shopping Centers | 4.2 |
Hotels | 3.4 |
Short-Term Investments | 3.8 |
6 | J.P. Morgan Exchange-Traded Funds | August 31, 2022 |
INCEPTION DATE | SIX MONTHS* | 1 YEAR | 5 YEAR | 10 YEAR | |
JPMorgan Realty Income ETF | |||||
Net Asset Value | May 15, 2006** | (10.29)% | (9.66)% | 6.42% | 7.19% |
Market Price | (10.31) | (9.68) | 6.42 | 7.19 |
* | Not annualized. |
** | Inception date Class R5 Shares of the Predecessor Fund (as defined below). |
August 31, 2022 | J.P. Morgan Exchange-Traded Funds | 7 |
AS OF August 31, 2022 (Unaudited)
INVESTMENTS | PRINCIPAL AMOUNT($) | VALUE($) |
U.S. Treasury Obligations — 32.2% | ||
U.S. Treasury Inflation Indexed Notes | ||
0.63%, 1/15/2024 (a) | 107,518,000 | 135,243,202 |
0.38%, 1/15/2027 | 35,024,000 | 42,237,547 |
0.13%, 4/15/2027 | 92,938,000 | 94,652,487 |
0.38%, 7/15/2027 | 38,187,000 | 45,556,201 |
0.25%, 7/15/2029 | 5,413,600 | 6,088,289 |
0.13%, 1/15/2032 | 2,120,400 | 2,141,367 |
U.S. Treasury Notes 0.25%, 8/31/2025 | 1,911,800 | 1,735,929 |
Total U.S. Treasury Obligations (Cost $334,885,059) | 327,655,022 | |
Corporate Bonds — 27.9% | ||
Aerospace & Defense — 0.9% | ||
BAE Systems plc (United Kingdom) 3.40%, 4/15/2030 (b) | 1,000,000 | 910,384 |
Boeing Co. (The) | ||
1.43%, 2/4/2024 | 841,000 | 806,231 |
4.88%, 5/1/2025 | 541,000 | 542,512 |
2.75%, 2/1/2026 | 1,150,000 | 1,075,929 |
2.20%, 2/4/2026 | 1,036,000 | 948,020 |
3.10%, 5/1/2026 | 2,392,000 | 2,258,471 |
L3Harris Technologies, Inc. | ||
3.85%, 12/15/2026 | 475,000 | 462,346 |
4.85%, 4/27/2035 | 500,000 | 486,425 |
Leidos, Inc. 2.30%, 2/15/2031 | 964,000 | 756,670 |
Raytheon Technologies Corp. 3.15%, 12/15/2024 | 476,000 | 464,306 |
Textron, Inc. 3.00%, 6/1/2030 | 1,064,000 | 921,575 |
9,632,869 | ||
Airlines — 0.0% ^ | ||
Continental Airlines Pass-Through Trust Series 2012-2, Class A Shares, 4.00%, 10/29/2024 | 160,781 | 152,979 |
Auto Components — 0.0% ^ | ||
Lear Corp. 2.60%, 1/15/2032 | 222,000 | 171,163 |
Automobiles — 0.6% | ||
General Motors Co. 6.13%, 10/1/2025 | 656,000 | 675,200 |
Hyundai Capital America | ||
2.85%, 11/1/2022 (b) | 266,000 | 265,573 |
3.00%, 2/10/2027 (b) | 1,291,000 | 1,178,806 |
2.38%, 10/15/2027 (b) | 479,000 | 417,538 |
1.80%, 1/10/2028 (b) | 308,000 | 255,976 |
Mercedes-Benz Finance North America LLC (Germany) 2.13%, 3/10/2025 (b) | 1,250,000 | 1,182,980 |
INVESTMENTS | PRINCIPAL AMOUNT($) | VALUE($) |
Automobiles — continued | ||
Nissan Motor Co. Ltd. (Japan) | ||
4.35%, 9/17/2027 (b) | 800,000 | 740,678 |
4.81%, 9/17/2030 (b) | 800,000 | 716,205 |
Stellantis Finance US, Inc. 2.69%, 9/15/2031 (b) | 378,000 | 299,588 |
Volkswagen Group of America Finance LLC (Germany) 1.63%, 11/24/2027 (b) | 621,000 | 526,638 |
6,259,182 | ||
Banks — 6.2% | ||
ABN AMRO Bank NV (Netherlands) (US Treasury Yield Curve Rate T Note Constant Maturity 1 Year + 1.10%), 2.47%, 12/13/2029 (b) (c) | 1,000,000 | 835,892 |
AIB Group plc (Ireland) 4.75%, 10/12/2023 (b) | 800,000 | 793,345 |
Australia & New Zealand Banking Group Ltd. (Australia) 4.40%, 5/19/2026 (b) | 1,000,000 | 983,247 |
Banco Santander SA (Spain) | ||
5.15%, 8/18/2025 | 200,000 | 199,038 |
(US Treasury Yield Curve Rate T Note Constant Maturity 1 Year + 0.90%), 1.72%, 9/14/2027 (c) | 200,000 | 172,167 |
2.75%, 12/3/2030 | 600,000 | 465,887 |
Bank of America Corp. | ||
3.30%, 1/11/2023 | 32,000 | 31,975 |
(ICE LIBOR USD 3 Month + 0.78%), 3.55%, 3/5/2024 (c) | 1,133,000 | 1,128,417 |
4.00%, 1/22/2025 | 1,100,000 | 1,090,962 |
(SOFR + 1.33%), 3.38%, 4/2/2026 (c) | 556,000 | 536,523 |
(SOFR + 1.15%), 1.32%, 6/19/2026 (c) | 21,000 | 19,105 |
Series N, (SOFR + 0.91%), 1.66%, 3/11/2027 (c) | 1,446,000 | 1,295,845 |
(SOFR + 0.96%), 1.73%, 7/22/2027 (c) | 964,000 | 855,407 |
(ICE LIBOR USD 3 Month + 1.58%), 3.82%, 1/20/2028 (c) | 1,819,000 | 1,741,204 |
(SOFR + 1.53%), 1.90%, 7/23/2031 (c) | 2,874,000 | 2,263,584 |
Bank of Ireland Group plc (Ireland) (US Treasury Yield Curve Rate T Note Constant Maturity 1 Year + 1.10%), 2.03%, 9/30/2027 (b) (c) | 1,125,000 | 967,381 |
8 | J.P. Morgan Exchange-Traded Funds | August 31, 2022 |
INVESTMENTS | PRINCIPAL AMOUNT($) | VALUE($) |
Corporate Bonds — continued | ||
Banks — continued | ||
Bank of Montreal (Canada) | ||
2.35%, 9/11/2022 | 100,000 | 99,989 |
2.50%, 6/28/2024 | 500,000 | 488,386 |
(USD Swap Semi 5 Year + 1.28%), 4.34%, 10/5/2028 (c) | 764,000 | 760,633 |
Bank of New Zealand (New Zealand) 3.50%, 2/20/2024 (b) | 1,580,000 | 1,564,025 |
Bank of Nova Scotia (The) (Canada) 2.20%, 2/3/2025 | 600,000 | 571,943 |
Barclays plc (United Kingdom) (ICE LIBOR USD 3 Month + 1.61%), 3.93%, 5/7/2025 (c) | 1,255,000 | 1,226,813 |
BNP Paribas SA (France) | ||
(ICE LIBOR USD 3 Month + 2.24%), 4.70%, 1/10/2025 (b) (c) | 500,000 | 498,749 |
(SOFR + 2.07%), 2.22%, 6/9/2026 (b) (c) | 800,000 | 737,425 |
4.63%, 3/13/2027 (b) | 1,000,000 | 974,130 |
Canadian Imperial Bank of Commerce (Canada) 3.10%, 4/2/2024 | 1,014,000 | 999,356 |
Citigroup, Inc. | ||
(ICE LIBOR USD 3 Month + 0.90%), 3.35%, 4/24/2025 (c) | 482,000 | 472,382 |
(SOFR + 0.77%), 1.12%, 1/28/2027 (c) | 3,556,000 | 3,138,765 |
4.45%, 9/29/2027 | 714,000 | 696,132 |
(ICE LIBOR USD 3 Month + 1.17%), 3.88%, 1/24/2039 (c) | 1,146,000 | 994,457 |
Citizens Financial Group, Inc. 2.64%, 9/30/2032 | 500,000 | 397,694 |
Cooperatieve Rabobank UA (Netherlands) (US Treasury Yield Curve Rate T Note Constant Maturity 1 Year + 0.73%), 1.98%, 12/15/2027 (b) (c) | 1,000,000 | 883,819 |
Credit Agricole SA (France) | ||
(SOFR + 1.68%), 1.91%, 6/16/2026 (b) (c) | 1,500,000 | 1,376,659 |
(SOFR + 0.89%), 1.25%, 1/26/2027 (b) (c) | 874,000 | 767,971 |
Discover Bank | ||
2.45%, 9/12/2024 | 900,000 | 864,301 |
3.45%, 7/27/2026 | 447,000 | 423,299 |
DNB Bank ASA (Norway) (US Treasury Yield Curve Rate T Note Constant Maturity 1 Year + 0.68%), 1.60%, 3/30/2028 (b) (c) | 1,450,000 | 1,254,496 |
INVESTMENTS | PRINCIPAL AMOUNT($) | VALUE($) |
Banks — continued | ||
HSBC Holdings plc (United Kingdom) | ||
(ICE LIBOR USD 3 Month + 0.99%), 3.95%, 5/18/2024 (c) | 1,800,000 | 1,790,064 |
(ICE LIBOR USD 3 Month + 1.35%), 4.29%, 9/12/2026 (c) | 1,250,000 | 1,214,246 |
(SOFR + 2.61%), 5.21%, 8/11/2028 (c) | 640,000 | 624,674 |
(SOFR + 1.73%), 2.01%, 9/22/2028 (c) | 300,000 | 253,637 |
(SOFR + 2.39%), 2.85%, 6/4/2031 (c) | 941,000 | 777,110 |
Huntington Bancshares, Inc. (SOFR + 2.05%), 5.02%, 5/17/2033 (c) | 1,122,000 | 1,105,524 |
ING Groep NV (Netherlands) | ||
3.95%, 3/29/2027 | 406,000 | 390,332 |
(SOFR + 1.01%), 1.73%, 4/1/2027 (c) | 480,000 | 425,032 |
KeyCorp (SOFR + 1.25%), 3.88%, 5/23/2025 (c) | 184,000 | 182,400 |
Lloyds Banking Group plc (United Kingdom) | ||
(US Treasury Yield Curve Rate T Note Constant Maturity 1 Year + 1.00%), 2.44%, 2/5/2026 (c) | 350,000 | 328,879 |
3.75%, 1/11/2027 | 869,000 | 828,442 |
Mitsubishi UFJ Financial Group, Inc. (Japan) | ||
2.19%, 2/25/2025 | 1,550,000 | 1,468,997 |
(US Treasury Yield Curve Rate T Note Constant Maturity 1 Year + 0.83%), 2.34%, 1/19/2028 (c) | 850,000 | 762,737 |
Mizuho Financial Group Cayman 3 Ltd. (Japan) 4.60%, 3/27/2024 (b) | 1,000,000 | 995,778 |
NatWest Group plc (United Kingdom) | ||
(ICE LIBOR USD 3 Month + 1.55%), 4.52%, 6/25/2024 (c) | 1,000,000 | 994,425 |
(US Treasury Yield Curve Rate T Note Constant Maturity 1 Year + 0.90%), 1.64%, 6/14/2027 (c) | 286,000 | 250,379 |
(ICE LIBOR USD 3 Month + 1.75%), 4.89%, 5/18/2029 (c) | 620,000 | 596,516 |
NatWest Markets plc (United Kingdom) 0.80%, 8/12/2024 (b) | 577,000 | 536,948 |
Nordea Bank Abp (Finland) | ||
4.25%, 9/21/2022 (b) | 591,000 | 591,242 |
1.50%, 9/30/2026 (b) | 900,000 | 796,628 |
PNC Financial Services Group, Inc. (The) 2.55%, 1/22/2030 | 1,014,000 | 889,228 |
August 31, 2022 | J.P. Morgan Exchange-Traded Funds | 9 |
AS OF August 31, 2022 (Unaudited) (continued)
INVESTMENTS | PRINCIPAL AMOUNT($) | VALUE($) |
Corporate Bonds — continued | ||
Banks — continued | ||
Royal Bank of Canada (Canada) 4.65%, 1/27/2026 | 1,061,000 | 1,069,009 |
Santander UK Group Holdings plc (United Kingdom) (SOFR + 0.79%), 1.09%, 3/15/2025 (c) | 1,632,000 | 1,526,830 |
Societe Generale SA (France) | ||
2.63%, 1/22/2025 (b) | 1,200,000 | 1,130,711 |
4.25%, 4/14/2025 (b) | 400,000 | 391,666 |
(US Treasury Yield Curve Rate T Note Constant Maturity 1 Year + 1.00%), 1.79%, 6/9/2027 (b) (c) | 937,000 | 810,995 |
Sumitomo Mitsui Financial Group, Inc. (Japan) | ||
2.70%, 7/16/2024 | 1,982,000 | 1,922,026 |
2.35%, 1/15/2025 | 800,000 | 762,088 |
Sumitomo Mitsui Trust Bank Ltd. (Japan) 1.55%, 3/25/2026 (b) | 515,000 | 464,664 |
Toronto-Dominion Bank (The) (Canada) 3.77%, 6/6/2025 | 970,000 | 959,035 |
Truist Bank 2.75%, 5/1/2023 | 1,500,000 | 1,491,988 |
UniCredit SpA (Italy) | ||
(US Treasury Yield Curve Rate T Note Constant Maturity 1 Year + 1.20%), 1.98%, 6/3/2027 (b) (c) | 635,000 | 537,294 |
(USD ICE Swap Rate 5 Year + 3.70%), 5.86%, 6/19/2032 (b) (c) | 600,000 | 517,417 |
Wachovia Corp. 7.57%, 8/1/2026 (d) | 660,000 | 719,982 |
Wells Fargo & Co. | ||
(SOFR + 1.09%), 2.41%, 10/30/2025 (c) | 1,146,000 | 1,095,027 |
(SOFR + 1.43%), 2.88%, 10/30/2030 (c) | 964,000 | 845,561 |
Westpac Banking Corp. (Australia) (US Treasury Yield Curve Rate T Note Constant Maturity 5 Year + 1.35%), 2.89%, 2/4/2030 (c) | 500,000 | 469,521 |
63,088,435 | ||
Beverages — 0.3% | ||
Anheuser-Busch Cos. LLC (Belgium) 3.65%, 2/1/2026 | 1,196,000 | 1,175,546 |
Coca-Cola Europacific Partners plc (United Kingdom) 1.50%, 1/15/2027 (b) | 1,400,000 | 1,234,329 |
Constellation Brands, Inc. | ||
3.15%, 8/1/2029 | 400,000 | 359,614 |
INVESTMENTS | PRINCIPAL AMOUNT($) | VALUE($) |
Beverages — continued | ||
2.88%, 5/1/2030 | 119,000 | 103,675 |
Keurig Dr Pepper, Inc. 4.42%, 5/25/2025 | 178,000 | 179,222 |
3,052,386 | ||
Biotechnology — 0.6% | ||
AbbVie, Inc. | ||
3.85%, 6/15/2024 | 1,196,000 | 1,190,060 |
2.95%, 11/21/2026 | 1,891,000 | 1,783,786 |
4.25%, 11/14/2028 | 964,000 | 946,895 |
Amgen, Inc. | ||
1.65%, 8/15/2028 | 356,000 | 307,051 |
3.35%, 2/22/2032 | 397,000 | 358,946 |
Biogen, Inc. 2.25%, 5/1/2030 | 594,000 | 485,227 |
Gilead Sciences, Inc. | ||
3.70%, 4/1/2024 | 964,000 | 961,860 |
3.50%, 2/1/2025 | 35,000 | 34,526 |
Regeneron Pharmaceuticals, Inc. 1.75%, 9/15/2030 | 381,000 | 301,295 |
6,369,646 | ||
Building Products — 0.0% ^ | ||
CRH America Finance, Inc. (Ireland) 3.40%, 5/9/2027 (b) | 222,000 | 210,858 |
Capital Markets — 2.2% | ||
Ameriprise Financial, Inc. 3.70%, 10/15/2024 | 550,000 | 547,219 |
Blackstone Holdings Finance Co. LLC 4.75%, 2/15/2023 (b) | 470,000 | 469,508 |
Blackstone Secured Lending Fund 3.65%, 7/14/2023 | 550,000 | 544,823 |
Brookfield Finance, Inc. (Canada) 4.25%, 6/2/2026 | 814,000 | 803,626 |
Credit Suisse AG (Switzerland) 3.63%, 9/9/2024 | 1,920,000 | 1,873,818 |
Credit Suisse Group AG (Switzerland) (SOFR + 1.73%), 3.09%, 5/14/2032 (b) (c) | 378,000 | 285,694 |
Deutsche Bank AG (Germany) | ||
3.95%, 2/27/2023 | 500,000 | 498,213 |
(SOFR + 2.16%), 2.22%, 9/18/2024 (c) | 360,000 | 347,197 |
(SOFR + 1.32%), 2.55%, 1/7/2028 (c) | 500,000 | 426,249 |
(SOFR + 1.72%), 3.04%, 5/28/2032 (c) | 626,000 | 484,672 |
10 | J.P. Morgan Exchange-Traded Funds | August 31, 2022 |
INVESTMENTS | PRINCIPAL AMOUNT($) | VALUE($) |
Corporate Bonds — continued | ||
Capital Markets — continued | ||
Goldman Sachs Group, Inc. (The) | ||
(SOFR + 0.57%), 0.67%, 3/8/2024 (c) | 388,000 | 380,373 |
4.25%, 10/21/2025 | 1,523,000 | 1,502,254 |
3.50%, 11/16/2026 | 1,678,000 | 1,611,910 |
(ICE LIBOR USD 3 Month + 1.51%), 3.69%, 6/5/2028 (c) | 964,000 | 911,228 |
(ICE LIBOR USD 3 Month + 1.30%), 4.22%, 5/1/2029 (c) | 500,000 | 478,083 |
(SOFR + 1.09%), 1.99%, 1/27/2032 (c) | 764,000 | 604,134 |
Invesco Finance plc 3.75%, 1/15/2026 | 436,000 | 425,706 |
Macquarie Bank Ltd. (Australia) 2.30%, 1/22/2025 (b) | 964,000 | 918,617 |
Macquarie Group Ltd. (Australia) (ICE LIBOR USD 3 Month + 1.75%), 5.03%, 1/15/2030 (b) (c) | 200,000 | 196,139 |
Morgan Stanley | ||
(SOFR + 1.99%), 2.19%, 4/28/2026 (c) | 1,913,000 | 1,796,897 |
4.35%, 9/8/2026 | 4,103,000 | 4,054,781 |
Nomura Holdings, Inc. (Japan) | ||
2.33%, 1/22/2027 | 1,000,000 | 890,014 |
2.68%, 7/16/2030 | 453,000 | 369,473 |
S&P Global, Inc. | ||
4.25%, 5/1/2029 (b) | 346,000 | 341,358 |
2.90%, 3/1/2032 (b) | 538,000 | 477,155 |
UBS Group AG (Switzerland) | ||
(US Treasury Yield Curve Rate T Note Constant Maturity 1 Year + 2.05%), 4.70%, 8/5/2027 (b) (c) | 437,000 | 428,936 |
(ICE LIBOR USD 3 Month + 1.47%), 3.13%, 8/13/2030 (b) (c) | 449,000 | 392,315 |
(US Treasury Yield Curve Rate T Note Constant Maturity 1 Year + 1.10%), 2.75%, 2/11/2033 (b) (c) | 750,000 | 600,900 |
22,661,292 | ||
Chemicals — 0.3% | ||
International Flavors & Fragrances, Inc. 1.83%, 10/15/2027 (b) | 310,000 | 265,584 |
LYB International Finance III LLC 2.25%, 10/1/2030 | 964,000 | 789,908 |
Mosaic Co. (The) 3.25%, 11/15/2022 | 243,000 | 242,921 |
Nutrien Ltd. (Canada) 2.95%, 5/13/2030 | 200,000 | 177,184 |
INVESTMENTS | PRINCIPAL AMOUNT($) | VALUE($) |
Chemicals — continued | ||
RPM International, Inc. 2.95%, 1/15/2032 | 238,000 | 194,012 |
Sherwin-Williams Co. (The) 3.30%, 2/1/2025 | 225,000 | 220,756 |
Westlake Corp. 3.60%, 8/15/2026 | 1,092,000 | 1,057,131 |
2,947,496 | ||
Construction & Engineering — 0.1% | ||
Quanta Services, Inc. | ||
2.90%, 10/1/2030 | 175,000 | 149,473 |
2.35%, 1/15/2032 | 668,000 | 527,801 |
677,274 | ||
Construction Materials — 0.1% | ||
CRH America, Inc. (Ireland) 3.88%, 5/18/2025 (b) | 250,000 | 245,916 |
Martin Marietta Materials, Inc. | ||
3.45%, 6/1/2027 | 260,000 | 247,740 |
3.50%, 12/15/2027 | 300,000 | 286,446 |
780,102 | ||
Consumer Finance — 1.6% | ||
AerCap Ireland Capital DAC (Ireland) | ||
3.30%, 1/23/2023 | 1,200,000 | 1,194,969 |
4.50%, 9/15/2023 | 234,000 | 232,783 |
2.88%, 8/14/2024 | 700,000 | 668,673 |
4.45%, 10/1/2025 | 800,000 | 774,556 |
2.45%, 10/29/2026 | 1,404,000 | 1,237,982 |
3.00%, 10/29/2028 | 635,000 | 539,825 |
American Express Co. | ||
2.50%, 7/30/2024 | 964,000 | 937,580 |
2.55%, 3/4/2027 | 328,000 | 304,587 |
Avolon Holdings Funding Ltd. (Ireland) | ||
5.25%, 5/15/2024 (b) | 814,000 | 798,058 |
3.95%, 7/1/2024 (b) | 660,000 | 630,198 |
5.50%, 1/15/2026 (b) | 400,000 | 385,694 |
2.13%, 2/21/2026 (b) | 844,000 | 727,461 |
4.25%, 4/15/2026 (b) | 1,044,000 | 962,205 |
4.38%, 5/1/2026 (b) | 1,346,000 | 1,244,270 |
2.53%, 11/18/2027 (b) | 3,459,000 | 2,824,974 |
Capital One Financial Corp. | ||
(SOFR + 1.37%), 4.17%, 5/9/2025 (c) | 580,000 | 574,707 |
(SOFR + 1.27%), 2.62%, 11/2/2032 (c) | 1,061,000 | 845,606 |
General Motors Financial Co., Inc. | ||
1.20%, 10/15/2024 | 480,000 | 448,768 |
August 31, 2022 | J.P. Morgan Exchange-Traded Funds | 11 |
AS OF August 31, 2022 (Unaudited) (continued)
INVESTMENTS | PRINCIPAL AMOUNT($) | VALUE($) |
Corporate Bonds — continued | ||
Consumer Finance — continued | ||
2.35%, 1/8/2031 | 1,343,000 | 1,039,932 |
Park Aerospace Holdings Ltd. (Ireland) 5.50%, 2/15/2024 (b) | 392,000 | 387,085 |
16,759,913 | ||
Containers & Packaging — 0.1% | ||
Graphic Packaging International LLC 1.51%, 4/15/2026 (b) | 513,000 | 458,568 |
Packaging Corp. of America 3.00%, 12/15/2029 | 300,000 | 267,284 |
WRKCo, Inc. | ||
3.00%, 9/15/2024 | 350,000 | 340,568 |
4.90%, 3/15/2029 | 150,000 | 149,646 |
1,216,066 | ||
Diversified Financial Services — 0.4% | ||
Hutchison Whampoa International 12 II Ltd. (United Kingdom) 3.25%, 11/8/2022 (b) | 490,000 | 489,774 |
LSEGA Financing plc (United Kingdom) 2.00%, 4/6/2028 (b) | 1,700,000 | 1,488,492 |
Mitsubishi HC Capital, Inc. (Japan) 3.96%, 9/19/2023 (b) | 820,000 | 815,573 |
National Rural Utilities Cooperative Finance Corp. 3.40%, 2/7/2028 | 1,196,000 | 1,148,416 |
Siemens Financieringsmaatschappij NV (Germany) 3.13%, 3/16/2024 (b) | 400,000 | 395,584 |
4,337,839 | ||
Diversified Telecommunication Services — 0.6% | ||
AT&T, Inc. 1.65%, 2/1/2028 | 2,871,000 | 2,466,324 |
NBN Co. Ltd. (Australia) 2.63%, 5/5/2031 (b) | 1,100,000 | 928,792 |
Verizon Communications, Inc. | ||
2.63%, 8/15/2026 | 1,913,000 | 1,802,799 |
4.02%, 12/3/2029 | 533,000 | 511,380 |
5,709,295 | ||
Electric Utilities — 1.6% | ||
American Electric Power Co., Inc. 2.03%, 3/15/2024 | 295,000 | 285,728 |
Arizona Public Service Co. 3.35%, 6/15/2024 | 372,000 | 364,611 |
Cleveland Electric Illuminating Co. (The) | ||
3.50%, 4/1/2028 (b) | 476,000 | 442,491 |
4.55%, 11/15/2030 (b) | 290,000 | 283,386 |
DTE Electric Co. 3.65%, 3/15/2024 | 482,000 | 480,747 |
INVESTMENTS | PRINCIPAL AMOUNT($) | VALUE($) |
Electric Utilities — continued | ||
Duke Energy Carolinas LLC 6.45%, 10/15/2032 | 50,000 | 55,867 |
Duquesne Light Holdings, Inc. | ||
2.53%, 10/1/2030 (b) | 421,000 | 343,497 |
2.78%, 1/7/2032 (b) | 254,000 | 207,117 |
Edison International 3.55%, 11/15/2024 | 1,014,000 | 991,224 |
Entergy Arkansas LLC | ||
3.05%, 6/1/2023 | 729,000 | 724,510 |
3.50%, 4/1/2026 | 242,000 | 236,910 |
Entergy Mississippi LLC 2.85%, 6/1/2028 | 251,000 | 228,357 |
Evergy, Inc. 2.90%, 9/15/2029 | 368,000 | 322,880 |
Fells Point Funding Trust 3.05%, 1/31/2027 (b) | 1,324,000 | 1,220,886 |
Fortis, Inc. (Canada) 3.06%, 10/4/2026 | 541,000 | 506,268 |
Indiana Michigan Power Co. Series J, 3.20%, 3/15/2023 | 100,000 | 99,563 |
Interstate Power and Light Co. 4.10%, 9/26/2028 | 964,000 | 951,283 |
ITC Holdings Corp. 2.95%, 5/14/2030 (b) | 251,000 | 219,301 |
Jersey Central Power & Light Co. 2.75%, 3/1/2032 (b) | 288,000 | 243,332 |
Kentucky Utilities Co. 3.30%, 10/1/2025 | 200,000 | 194,139 |
NextEra Energy Capital Holdings, Inc. 2.25%, 6/1/2030 | 150,000 | 126,435 |
Niagara Mohawk Power Corp. 3.51%, 10/1/2024 (b) | 902,000 | 875,420 |
NRG Energy, Inc. 2.45%, 12/2/2027 (b) | 445,000 | 380,998 |
OGE Energy Corp. 0.70%, 5/26/2023 | 208,000 | 203,049 |
Oncor Electric Delivery Co. LLC 5.75%, 3/15/2029 | 300,000 | 324,109 |
Pacific Gas and Electric Co. | ||
3.25%, 2/16/2024 | 1,196,000 | 1,169,855 |
4.55%, 7/1/2030 | 1,146,999 | 1,020,048 |
Pennsylvania Electric Co. 3.25%, 3/15/2028 (b) | 256,000 | 236,896 |
PG&E Wildfire Recovery Funding LLC Series A-2, 4.26%, 6/1/2036 | 1,065,000 | 1,031,240 |
PPL Electric Utilities Corp. 2.50%, 9/1/2022 | 224,000 | 224,000 |
Public Service Co. of New Hampshire 3.50%, 11/1/2023 | 283,000 | 282,286 |
12 | J.P. Morgan Exchange-Traded Funds | August 31, 2022 |
INVESTMENTS | PRINCIPAL AMOUNT($) | VALUE($) |
Corporate Bonds — continued | ||
Electric Utilities — continued | ||
SCE Recovery Funding LLC Series A-2, 1.94%, 5/15/2038 | 285,000 | 215,474 |
Southern Co. (The) Series 21-B, 1.75%, 3/15/2028 | 500,000 | 427,999 |
Vistra Operations Co. LLC 4.88%, 5/13/2024 (b) | 1,020,000 | 1,006,726 |
15,926,632 | ||
Electronic Equipment, Instruments & Components — 0.1% | ||
Arrow Electronics, Inc. 3.88%, 1/12/2028 | 890,000 | 839,414 |
Energy Equipment & Services — 0.1% | ||
Baker Hughes Holdings LLC 3.34%, 12/15/2027 | 250,000 | 233,841 |
Halliburton Co. 2.92%, 3/1/2030 | 150,000 | 132,563 |
Schlumberger Holdings Corp. 3.75%, 5/1/2024 (b) | 460,000 | 456,703 |
823,107 | ||
Entertainment — 0.1% | ||
Walt Disney Co. (The) 7.43%, 10/1/2026 | 600,000 | 669,357 |
Equity Real Estate Investment Trusts (REITs) — 2.1% | ||
Alexandria Real Estate Equities, Inc. | ||
3.95%, 1/15/2027 | 285,000 | 278,162 |
3.38%, 8/15/2031 | 675,000 | 601,455 |
American Tower Corp. | ||
1.45%, 9/15/2026 | 1,988,000 | 1,746,251 |
1.50%, 1/31/2028 | 545,000 | 458,365 |
AvalonBay Communities, Inc. 3.35%, 5/15/2027 | 225,000 | 214,181 |
Boston Properties LP 3.80%, 2/1/2024 | 873,000 | 866,737 |
Brixmor Operating Partnership LP | ||
3.85%, 2/1/2025 | 375,000 | 365,663 |
2.25%, 4/1/2028 | 186,000 | 157,125 |
2.50%, 8/16/2031 | 450,000 | 348,245 |
Corporate Office Properties LP 2.00%, 1/15/2029 | 257,000 | 203,001 |
Crown Castle, Inc. 4.45%, 2/15/2026 | 1,146,000 | 1,140,246 |
Equinix, Inc. 2.90%, 11/18/2026 | 1,123,000 | 1,047,725 |
Essex Portfolio LP 1.65%, 1/15/2031 | 529,000 | 411,073 |
Extra Space Storage LP 2.35%, 3/15/2032 | 964,000 | 756,977 |
Goodman US Finance Three LLC (Australia) 3.70%, 3/15/2028 (b) | 163,000 | 154,178 |
INVESTMENTS | PRINCIPAL AMOUNT($) | VALUE($) |
Equity Real Estate Investment Trusts (REITs) — continued | ||
Healthcare Trust of America Holdings LP | ||
3.10%, 2/15/2030 | 269,000 | 231,800 |
2.00%, 3/15/2031 | 575,000 | 447,289 |
Healthpeak Properties, Inc. 2.13%, 12/1/2028 | 310,000 | 266,501 |
Kilroy Realty LP 2.65%, 11/15/2033 | 814,000 | 618,290 |
Life Storage LP | ||
2.20%, 10/15/2030 | 550,000 | 441,597 |
2.40%, 10/15/2031 | 476,000 | 379,892 |
Mid-America Apartments LP 1.70%, 2/15/2031 | 387,000 | 307,432 |
National Retail Properties, Inc. | ||
3.60%, 12/15/2026 | 247,000 | 235,185 |
4.30%, 10/15/2028 | 550,000 | 525,749 |
Office Properties Income Trust | ||
2.65%, 6/15/2026 | 218,000 | 175,515 |
2.40%, 2/1/2027 | 734,000 | 555,044 |
3.45%, 10/15/2031 | 466,000 | 310,641 |
Physicians Realty LP 2.63%, 11/1/2031 | 469,000 | 375,847 |
Public Storage 2.25%, 11/9/2031 | 495,000 | 414,811 |
Regency Centers LP | ||
2.95%, 9/15/2029 | 566,000 | 494,134 |
3.70%, 6/15/2030 | 400,000 | 363,320 |
Sabra Health Care LP 3.20%, 12/1/2031 | 652,000 | 518,437 |
Safehold Operating Partnership LP 2.80%, 6/15/2031 | 1,022,000 | 821,391 |
Scentre Group Trust 1 (Australia) 3.50%, 2/12/2025 (b) | 400,000 | 387,215 |
SITE Centers Corp. 3.63%, 2/1/2025 | 100,000 | 96,242 |
UDR, Inc. | ||
2.95%, 9/1/2026 | 106,000 | 98,835 |
3.50%, 7/1/2027 | 305,000 | 289,262 |
3.20%, 1/15/2030 | 260,000 | 230,619 |
2.10%, 8/1/2032 | 306,000 | 235,763 |
2.10%, 6/15/2033 | 400,000 | 300,770 |
Ventas Realty LP | ||
3.75%, 5/1/2024 | 452,000 | 447,018 |
3.50%, 2/1/2025 | 90,000 | 87,840 |
4.13%, 1/15/2026 | 45,000 | 44,139 |
3.25%, 10/15/2026 | 345,000 | 326,045 |
Welltower, Inc. | ||
4.50%, 1/15/2024 | 864,000 | 866,677 |
2.75%, 1/15/2032 | 600,000 | 497,117 |
August 31, 2022 | J.P. Morgan Exchange-Traded Funds | 13 |
AS OF August 31, 2022 (Unaudited) (continued)
INVESTMENTS | PRINCIPAL AMOUNT($) | VALUE($) |
Corporate Bonds — continued | ||
Equity Real Estate Investment Trusts (REITs) — continued | ||
WP Carey, Inc. | ||
2.40%, 2/1/2031 | 285,000 | 231,668 |
2.25%, 4/1/2033 | 1,346,000 | 1,023,513 |
21,394,982 | ||
Food & Staples Retailing — 0.3% | ||
7-Eleven, Inc. 1.30%, 2/10/2028 (b) | 1,069,000 | 892,284 |
Kroger Co. (The) 4.50%, 1/15/2029 | 914,000 | 907,234 |
Sysco Corp. 3.25%, 7/15/2027 | 600,000 | 568,112 |
Walmart, Inc. 3.30%, 4/22/2024 | 200,000 | 199,087 |
2,566,717 | ||
Food Products — 0.4% | ||
Bunge Ltd. Finance Corp. 1.63%, 8/17/2025 | 864,000 | 802,122 |
Campbell Soup Co. | ||
3.95%, 3/15/2025 | 300,000 | 297,312 |
2.38%, 4/24/2030 | 576,000 | 486,544 |
Cargill, Inc. | ||
2.13%, 4/23/2030 (b) | 400,000 | 341,744 |
1.70%, 2/2/2031 (b) | 864,000 | 700,077 |
Mead Johnson Nutrition Co. (United Kingdom) 4.13%, 11/15/2025 | 89,000 | 89,265 |
Smithfield Foods, Inc. 5.20%, 4/1/2029 (b) | 556,000 | 539,844 |
Tyson Foods, Inc. 3.90%, 9/28/2023 | 500,000 | 499,840 |
3,756,748 | ||
Gas Utilities — 0.0% ^ | ||
ONE Gas, Inc. 2.00%, 5/15/2030 | 248,000 | 204,593 |
Health Care Equipment & Supplies — 0.2% | ||
Abbott Laboratories | ||
3.88%, 9/15/2025 | 600,000 | 603,300 |
3.75%, 11/30/2026 | 650,000 | 652,003 |
Becton Dickinson and Co. | ||
3.36%, 6/6/2024 | 46,000 | 45,452 |
3.70%, 6/6/2027 | 482,000 | 468,125 |
1,768,880 | ||
Health Care Providers & Services — 0.7% | ||
Cigna Corp. | ||
3.50%, 6/15/2024 | 400,000 | 396,959 |
4.38%, 10/15/2028 | 964,000 | 949,332 |
CommonSpirit Health | ||
3.35%, 10/1/2029 | 697,000 | 622,971 |
2.78%, 10/1/2030 | 582,000 | 487,248 |
CVS Health Corp. 1.88%, 2/28/2031 | 1,623,000 | 1,305,587 |
INVESTMENTS | PRINCIPAL AMOUNT($) | VALUE($) |
Health Care Providers & Services — continued | ||
HCA, Inc. 4.13%, 6/15/2029 | 1,678,000 | 1,544,660 |
Humana, Inc. 3.95%, 3/15/2027 | 650,000 | 632,521 |
Quest Diagnostics, Inc. | ||
2.95%, 6/30/2030 | 93,000 | 82,160 |
2.80%, 6/30/2031 | 669,000 | 570,506 |
UnitedHealth Group, Inc. 2.75%, 2/15/2023 | 365,000 | 364,019 |
6,955,963 | ||
Hotels, Restaurants & Leisure — 0.2% | ||
Expedia Group, Inc. 3.25%, 2/15/2030 | 1,346,000 | 1,164,059 |
Starbucks Corp. 2.25%, 3/12/2030 | 814,000 | 690,556 |
1,854,615 | ||
Industrial Conglomerates — 0.1% | ||
GE Capital International Funding Co. Unlimited Co. 4.42%, 11/15/2035 | 1,600,000 | 1,512,856 |
Insurance — 1.2% | ||
AIA Group Ltd. (Hong Kong) | ||
3.60%, 4/9/2029 (b) | 595,000 | 565,548 |
3.38%, 4/7/2030 (b) | 200,000 | 184,850 |
Allstate Corp. (The) 3.15%, 6/15/2023 | 651,000 | 648,573 |
American International Group, Inc. 3.90%, 4/1/2026 | 400,000 | 393,427 |
Assurant, Inc. 4.20%, 9/27/2023 | 109,000 | 108,816 |
Athene Global Funding | ||
2.75%, 6/25/2024 (b) | 550,000 | 527,880 |
2.72%, 1/7/2029 (b) | 1,064,000 | 902,868 |
Brighthouse Financial Global Funding 1.00%, 4/12/2024 (b) | 528,000 | 498,061 |
CNA Financial Corp. | ||
3.95%, 5/15/2024 | 499,000 | 497,354 |
4.50%, 3/1/2026 | 364,000 | 364,775 |
CNO Global Funding | ||
1.75%, 10/7/2026 (b) | 531,000 | 472,790 |
2.65%, 1/6/2029 (b) | 400,000 | 345,518 |
F&G Global Funding 2.30%, 4/11/2027 (b) | 1,014,000 | 902,084 |
Guardian Life Global Funding | ||
3.40%, 4/25/2023 (b) | 230,000 | 229,318 |
0.88%, 12/10/2025 (b) | 764,000 | 680,999 |
Jackson National Life Global Funding 3.05%, 4/29/2026 (b) | 1,084,000 | 1,025,399 |
Liberty Mutual Group, Inc. | ||
4.25%, 6/15/2023 (b) | 210,000 | 209,719 |
4.57%, 2/1/2029 (b) | 964,000 | 937,788 |
14 | J.P. Morgan Exchange-Traded Funds | August 31, 2022 |
INVESTMENTS | PRINCIPAL AMOUNT($) | VALUE($) |
Corporate Bonds — continued | ||
Insurance — continued | ||
Manulife Financial Corp. (Canada) 4.15%, 3/4/2026 | 449,000 | 444,692 |
Marsh & McLennan Cos., Inc. 3.88%, 3/15/2024 | 656,000 | 655,358 |
Principal Financial Group, Inc. 3.70%, 5/15/2029 | 764,000 | 718,580 |
Prudential Insurance Co. of America (The) 8.30%, 7/1/2025 (b) | 650,000 | 709,648 |
12,024,045 | ||
Internet & Direct Marketing Retail — 0.1% | ||
eBay, Inc. 2.60%, 5/10/2031 | 1,196,000 | 990,984 |
IT Services — 0.1% | ||
Global Payments, Inc. | ||
2.15%, 1/15/2027 | 713,000 | 633,375 |
3.20%, 8/15/2029 | 600,000 | 523,992 |
1,157,367 | ||
Leisure Products — 0.1% | ||
Hasbro, Inc. 3.90%, 11/19/2029 | 814,000 | 745,548 |
Media — 0.6% | ||
Charter Communications Operating LLC 4.91%, 7/23/2025 | 1,528,000 | 1,522,762 |
Comcast Corp. | ||
3.70%, 4/15/2024 | 964,000 | 960,766 |
4.15%, 10/15/2028 | 1,014,000 | 1,005,153 |
Discovery Communications LLC 3.95%, 3/20/2028 | 864,000 | 793,656 |
Grupo Televisa SAB (Mexico) 4.63%, 1/30/2026 | 285,000 | 283,628 |
Paramount Global 2.90%, 1/15/2027 | 539,000 | 500,853 |
Time Warner Entertainment Co. LP 8.38%, 7/15/2033 | 482,000 | 555,016 |
5,621,834 | ||
Metals & Mining — 0.1% | ||
Glencore Funding LLC (Australia) | ||
2.50%, 9/1/2030 (b) | 500,000 | 406,547 |
2.85%, 4/27/2031 (b) | 400,000 | 329,977 |
Steel Dynamics, Inc. 1.65%, 10/15/2027 | 374,000 | 319,659 |
Teck Resources Ltd. (Canada) 3.90%, 7/15/2030 | 400,000 | 361,227 |
1,417,410 | ||
Multi-Utilities — 0.3% | ||
CenterPoint Energy, Inc. 1.45%, 6/1/2026 | 288,000 | 259,749 |
INVESTMENTS | PRINCIPAL AMOUNT($) | VALUE($) |
Multi-Utilities — continued | ||
CMS Energy Corp. 2.95%, 2/15/2027 | 170,000 | 157,739 |
Consolidated Edison Co. of New York, Inc. 3.80%, 5/15/2028 | 668,000 | 649,713 |
Dominion Energy, Inc. Series B, 2.75%, 9/15/2022 | 332,000 | 331,984 |
PG&E Energy Recovery Funding LLC Series A-2, 2.28%, 1/15/2036 | 225,000 | 179,290 |
Public Service Enterprise Group, Inc. 1.60%, 8/15/2030 | 781,000 | 621,522 |
Puget Energy, Inc. 2.38%, 6/15/2028 | 234,000 | 203,582 |
WEC Energy Group, Inc. 1.38%, 10/15/2027 | 764,000 | 659,894 |
3,063,473 | ||
Oil, Gas & Consumable Fuels — 2.0% | ||
Aker BP ASA (Norway) 2.00%, 7/15/2026 (b) | 730,000 | 651,184 |
APA Infrastructure Ltd. (Australia) 4.25%, 7/15/2027 (b) | 886,000 | 855,533 |
BP Capital Markets America, Inc. | ||
4.23%, 11/6/2028 | 482,000 | 477,956 |
2.72%, 1/12/2032 | 1,146,000 | 999,303 |
Cameron LNG LLC 2.90%, 7/15/2031 (b) | 146,000 | 128,192 |
Cheniere Corpus Christi Holdings LLC 5.88%, 3/31/2025 | 714,000 | 728,520 |
Coterra Energy, Inc. 3.90%, 5/15/2027 (b) | 656,000 | 626,028 |
Ecopetrol SA (Colombia) | ||
4.13%, 1/16/2025 | 449,000 | 422,141 |
5.38%, 6/26/2026 | 737,000 | 690,661 |
Energy Transfer LP | ||
5.95%, 12/1/2025 | 506,000 | 518,464 |
4.40%, 3/15/2027 | 494,000 | 478,637 |
5.50%, 6/1/2027 | 244,000 | 246,458 |
Eni SpA (Italy) Series X-R, 4.00%, 9/12/2023 (b) | 1,145,000 | 1,141,034 |
Enterprise Products Operating LLC 3.95%, 2/15/2027 | 578,000 | 571,641 |
Flex Intermediate Holdco LLC 3.36%, 6/30/2031 (b) | 1,560,000 | 1,288,106 |
Gray Oak Pipeline LLC | ||
2.60%, 10/15/2025 (b) | 312,000 | 287,076 |
3.45%, 10/15/2027 (b) | 964,000 | 882,607 |
HF Sinclair Corp. | ||
2.63%, 10/1/2023 (b) | 95,000 | 92,156 |
August 31, 2022 | J.P. Morgan Exchange-Traded Funds | 15 |
AS OF August 31, 2022 (Unaudited) (continued)
INVESTMENTS | PRINCIPAL AMOUNT($) | VALUE($) |
Corporate Bonds — continued | ||
Oil, Gas & Consumable Fuels — continued | ||
5.88%, 4/1/2026 (b) | 500,000 | 504,348 |
Kinder Morgan, Inc. 3.15%, 1/15/2023 | 1,446,000 | 1,442,993 |
MPLX LP | ||
3.38%, 3/15/2023 | 200,000 | 199,846 |
4.13%, 3/1/2027 | 518,000 | 502,176 |
4.25%, 12/1/2027 | 118,000 | 114,016 |
2.65%, 8/15/2030 | 514,000 | 428,468 |
NGPL PipeCo LLC 3.25%, 7/15/2031 (b) | 271,000 | 226,277 |
Ovintiv Exploration, Inc. 5.38%, 1/1/2026 | 480,000 | 488,208 |
Phillips 66 2.15%, 12/15/2030 | 186,000 | 152,494 |
Pioneer Natural Resources Co. | ||
1.13%, 1/15/2026 | 660,000 | 589,639 |
1.90%, 8/15/2030 | 582,000 | 474,183 |
Plains All American Pipeline LP | ||
4.65%, 10/15/2025 | 407,000 | 402,485 |
3.55%, 12/15/2029 | 100,000 | 87,524 |
Sabine Pass Liquefaction LLC 4.50%, 5/15/2030 | 250,000 | 239,333 |
Saudi Arabian Oil Co. (Saudi Arabia) 1.63%, 11/24/2025 (b) | 210,000 | 194,250 |
Suncor Energy, Inc. (Canada) 5.95%, 12/1/2034 | 282,000 | 291,764 |
Targa Resources Partners LP 4.00%, 1/15/2032 | 153,000 | 133,984 |
Texas Eastern Transmission LP 2.80%, 10/15/2022 (b) | 1,099,000 | 1,096,759 |
TotalEnergies Capital International SA (France) 2.70%, 1/25/2023 | 200,000 | 198,996 |
Valero Energy Corp. 2.85%, 4/15/2025 | 294,000 | 284,638 |
Williams Cos., Inc. (The) 2.60%, 3/15/2031 | 1,296,000 | 1,082,662 |
20,220,740 | ||
Personal Products — 0.1% | ||
GSK Consumer Healthcare Capital US LLC 3.38%, 3/24/2029 (b) | 632,000 | 574,107 |
Pharmaceuticals — 0.4% | ||
AstraZeneca plc (United Kingdom) 0.70%, 4/8/2026 | 400,000 | 356,062 |
Bristol-Myers Squibb Co. 2.90%, 7/26/2024 | 638,000 | 629,780 |
Mylan, Inc. 3.13%, 1/15/2023 (b) | 600,000 | 597,898 |
Shire Acquisitions Investments Ireland DAC 3.20%, 9/23/2026 | 656,000 | 627,033 |
INVESTMENTS | PRINCIPAL AMOUNT($) | VALUE($) |
Pharmaceuticals — continued | ||
Takeda Pharmaceutical Co. Ltd. (Japan) 2.05%, 3/31/2030 | 1,500,000 | 1,254,035 |
Zoetis, Inc. 3.00%, 9/12/2027 | 864,000 | 818,694 |
4,283,502 | ||
Real Estate Management & Development — 0.1% | ||
Mitsui Fudosan Co. Ltd. (Japan) 3.65%, 7/20/2027 (b) | 219,000 | 212,728 |
Ontario Teachers' Cadillac Fairview Properties Trust (Canada) 3.88%, 3/20/2027 (b) | 325,000 | 312,459 |
525,187 | ||
Road & Rail — 0.6% | ||
CSX Corp. | ||
3.25%, 6/1/2027 | 1,032,000 | 994,045 |
4.25%, 3/15/2029 | 500,000 | 494,398 |
ERAC USA Finance LLC 3.85%, 11/15/2024 (b) | 632,000 | 621,376 |
JB Hunt Transport Services, Inc. 3.88%, 3/1/2026 | 400,000 | 393,703 |
Norfolk Southern Corp. | ||
3.85%, 1/15/2024 | 714,000 | 713,210 |
2.90%, 6/15/2026 | 200,000 | 191,059 |
Penske Truck Leasing Co. LP 4.20%, 4/1/2027 (b) | 1,196,000 | 1,150,346 |
Triton Container International Ltd. (Bermuda) | ||
2.05%, 4/15/2026 (b) | 964,000 | 848,513 |
3.25%, 3/15/2032 | 760,000 | 595,080 |
6,001,730 | ||
Semiconductors & Semiconductor Equipment — 0.6% | ||
Broadcom, Inc. 4.11%, 9/15/2028 | 1,666,000 | 1,585,650 |
Marvell Technology, Inc. 2.95%, 4/15/2031 | 650,000 | 532,912 |
Microchip Technology, Inc. | ||
0.97%, 2/15/2024 | 798,000 | 759,686 |
0.98%, 9/1/2024 | 600,000 | 560,493 |
NXP BV (China) 2.50%, 5/11/2031 | 1,196,000 | 956,277 |
TSMC Arizona Corp. (Taiwan) 4.25%, 4/22/2032 | 985,000 | 964,512 |
Xilinx, Inc. 2.38%, 6/1/2030 | 600,000 | 523,089 |
5,882,619 | ||
Software — 0.2% | ||
Oracle Corp. | ||
2.88%, 3/25/2031 | 1,496,000 | 1,240,139 |
16 | J.P. Morgan Exchange-Traded Funds | August 31, 2022 |
INVESTMENTS | PRINCIPAL AMOUNT($) | VALUE($) |
Corporate Bonds — continued | ||
Software — continued | ||
6.50%, 4/15/2038 | 50,000 | 50,688 |
Roper Technologies, Inc. 3.80%, 12/15/2026 | 964,000 | 943,674 |
Workday, Inc. 3.50%, 4/1/2027 | 320,000 | 305,264 |
2,539,765 | ||
Specialty Retail — 0.2% | ||
Advance Auto Parts, Inc. 3.50%, 3/15/2032 | 500,000 | 424,408 |
AutoZone, Inc. 1.65%, 1/15/2031 | 787,000 | 619,953 |
O'Reilly Automotive, Inc. | ||
3.55%, 3/15/2026 | 300,000 | 292,490 |
3.60%, 9/1/2027 | 463,000 | 446,362 |
1,783,213 | ||
Technology Hardware, Storage & Peripherals — 0.2% | ||
Apple, Inc. 2.75%, 1/13/2025 | 861,000 | 844,559 |
Dell International LLC | ||
4.90%, 10/1/2026 | 600,000 | 602,314 |
5.30%, 10/1/2029 | 664,000 | 657,979 |
2,104,852 | ||
Thrifts & Mortgage Finance — 0.2% | ||
BPCE SA (France) | ||
(SOFR + 1.09%), 2.05%, 10/19/2027 (b) (c) | 1,114,000 | 970,819 |
(SOFR + 1.31%), 2.28%, 1/20/2032 (b) (c) | 694,000 | 537,454 |
Nationwide Building Society (United Kingdom) 1.00%, 8/28/2025 (b) | 963,000 | 868,751 |
2,377,024 | ||
Tobacco — 0.2% | ||
Altria Group, Inc. 2.45%, 2/4/2032 | 1,032,000 | 779,991 |
BAT Capital Corp. (United Kingdom) | ||
3.22%, 8/15/2024 | 500,000 | 488,398 |
2.26%, 3/25/2028 | 1,026,000 | 865,885 |
2,134,274 | ||
Trading Companies & Distributors — 0.5% | ||
Air Lease Corp. | ||
3.88%, 7/3/2023 | 400,000 | 398,662 |
3.00%, 9/15/2023 | 1,346,000 | 1,327,143 |
1.88%, 8/15/2026 | 624,000 | 545,851 |
3.63%, 4/1/2027 | 964,000 | 891,758 |
Aircastle Ltd. 4.40%, 9/25/2023 | 550,000 | 546,586 |
INVESTMENTS | PRINCIPAL AMOUNT($) | VALUE($) |
Trading Companies & Distributors — continued | ||
Aviation Capital Group LLC 5.50%, 12/15/2024 (b) | 824,000 | 806,704 |
BOC Aviation Ltd. (Singapore) 3.50%, 10/10/2024 (b) | 400,000 | 390,200 |
4,906,904 | ||
Wireless Telecommunication Services — 0.2% | ||
Rogers Communications, Inc. (Canada) 3.80%, 3/15/2032 (b) | 1,092,000 | 996,675 |
T-Mobile USA, Inc. | ||
2.05%, 2/15/2028 | 739,000 | 641,362 |
3.88%, 4/15/2030 | 961,000 | 888,182 |
2,526,219 | ||
Total Corporate Bonds (Cost $312,744,887) | 283,181,456 | |
Asset-Backed Securities — 11.1% | ||
Air Canada Pass-Through Trust (Canada) | ||
Series 2013-1, Class A, 4.13%, 5/15/2025 (b) | 381,137 | 341,638 |
Series 2017-1, Class AA, 3.30%, 1/15/2030 (b) | 488,253 | 435,236 |
Aligned Data Centers Issuer LLC Series 2021-1A, Class A2, 1.94%, 8/15/2046 (b) | 1,966,000 | 1,731,056 |
American Airlines Pass-Through Trust | ||
Series 2016-3, Class AA, 3.00%, 10/15/2028 | 152,345 | 136,866 |
Series 2017-1, Class AA, 3.65%, 2/15/2029 | 206,917 | 189,095 |
Series 2021-1, Class B, 3.95%, 7/11/2030 | 1,391,000 | 1,157,589 |
American Credit Acceptance Receivables Trust | ||
Series 2022-1, Class A, 0.99%, 12/15/2025 (b) | 1,039,534 | 1,022,569 |
Series 2022-2, Class A, 2.66%, 2/13/2026 (b) | 723,740 | 715,794 |
American Tower Trust #1, 3.07%, 3/15/2023 (b) | 504,000 | 501,263 |
AmeriCredit Automobile Receivables Trust | ||
Series 2020-1, Class A3, 1.11%, 8/19/2024 | 65,202 | 65,112 |
Series 2020-2, Class A3, 0.66%, 12/18/2024 | 70,666 | 70,227 |
Series 2021-1, Class A3, 0.37%, 8/18/2025 | 977,172 | 960,215 |
August 31, 2022 | J.P. Morgan Exchange-Traded Funds | 17 |
AS OF August 31, 2022 (Unaudited) (continued)
INVESTMENTS | PRINCIPAL AMOUNT($) | VALUE($) |
Asset-Backed Securities — continued | ||
Series 2020-3, Class B, 0.76%, 12/18/2025 | 740,000 | 713,760 |
Series 2021-2, Class B, 0.69%, 1/19/2027 | 704,000 | 665,853 |
Series 2022-2, Class A3, 4.38%, 4/18/2028 | 81,000 | 80,996 |
AMSR Trust | ||
Series 2020-SFR4, Class A, 1.36%, 11/17/2037 (b) | 2,019,000 | 1,856,026 |
Series 2020-SFR5, Class A, 1.38%, 11/17/2037 (b) | 526,971 | 484,958 |
Amur Equipment Finance Receivables X LLC Series 2022-1A, Class A2, 1.64%, 10/20/2027 (b) | 1,630,423 | 1,558,909 |
Avis Budget Rental Car Funding AESOP LLC Series 2020-1A, Class A, 2.33%, 8/20/2026 (b) | 710,000 | 668,557 |
BA Credit Card Trust Series 2020-A1, Class A1, 0.34%, 5/15/2026 | 930,000 | 889,856 |
Business Jet Securities LLC | ||
Series 2020-1A, Class A, 2.98%, 11/15/2035 (b) | 278,275 | 260,251 |
Series 2022-1A, Class A, 4.46%, 6/15/2037 (b) | 1,152,268 | 1,097,634 |
CarMax Auto Owner Trust | ||
Series 2019-1, Class A3, 3.05%, 3/15/2024 | 14,686 | 14,686 |
Series 2020-1, Class A3, 1.89%, 12/16/2024 | 339,351 | 336,385 |
Series 2020-3, Class A3, 0.62%, 3/17/2025 | 378,173 | 372,285 |
Series 2021-1, Class A3, 0.34%, 12/15/2025 | 2,363,606 | 2,300,929 |
Series 2022-2, Class A3, 3.49%, 2/16/2027 | 1,038,000 | 1,031,177 |
Carvana Auto Receivables Trust | ||
Series 2021-P3, Class A3, 0.70%, 11/10/2026 | 1,230,000 | 1,160,687 |
Series 2022-P3, Class A3, 4.61%, 11/10/2027 (e) | 245,000 | 244,962 |
Series 2021-P4, Class A4, 1.64%, 12/10/2027 | 2,700,000 | 2,482,485 |
CIG Auto Receivables Trust Series 2021-1A, Class A, 0.69%, 4/14/2025 (b) | 384,558 | 377,049 |
CoreVest American Finance Trust | ||
Series 2019-3, Class A, 2.71%, 10/15/2052 (b) | 175,352 | 167,135 |
INVESTMENTS | PRINCIPAL AMOUNT($) | VALUE($) |
Series 2022-1, Class A, 4.74%, 6/17/2055 (b) (f) | 548,969 | 548,935 |
CPS Auto Receivables Trust | ||
Series 2021-B, Class B, 0.81%, 12/15/2025 (b) | 1,248,000 | 1,229,063 |
Series 2022-C, Class B, 4.88%, 4/15/2030 (b) | 2,200,000 | 2,183,001 |
Credit Acceptance Auto Loan Trust | ||
Series 2019-3A, Class A, 2.38%, 11/15/2028 (b) | 19,799 | 19,780 |
Series 2020-1A, Class A, 2.01%, 2/15/2029 (b) | 416,900 | 416,181 |
Series 2020-2A, Class A, 1.37%, 7/16/2029 (b) | 3,086,059 | 3,045,891 |
Series 2020-3A, Class A, 1.24%, 10/15/2029 (b) | 2,000,000 | 1,953,683 |
Series 2021-2A, Class A, 0.96%, 2/15/2030 (b) | 1,396,000 | 1,339,538 |
Series 2021-3A, Class A, 1.00%, 5/15/2030 (b) | 695,000 | 664,008 |
Drive Auto Receivables Trust Series 2021-3, Class B, 1.11%, 5/15/2026 | 357,000 | 345,636 |
DT Auto Owner Trust | ||
Series 2020-3A, Class B, 0.91%, 12/16/2024 (b) | 384,408 | 381,838 |
Series 2021-1A, Class B, 0.62%, 9/15/2025 (b) | 272,000 | 267,786 |
Series 2022-1A, Class A, 1.58%, 4/15/2026 (b) | 1,533,045 | 1,509,037 |
Series 2022-2A, Class A, 2.88%, 6/15/2026 (b) | 1,284,807 | 1,269,594 |
Series 2021-3A, Class C, 0.87%, 5/17/2027 (b) | 1,292,000 | 1,219,147 |
Series 2021-4A, Class D, 1.99%, 9/15/2027 (b) | 760,000 | 682,814 |
Exeter Automobile Receivables Trust | ||
Series 2022-1A, Class A2, 1.15%, 6/17/2024 | 1,088,837 | 1,085,228 |
Series 2021-1A, Class B, 0.50%, 2/18/2025 | 227,777 | 227,353 |
Series 2021-2A, Class B, 0.57%, 9/15/2025 | 700,370 | 694,318 |
Series 2021-3A, Class B, 0.69%, 1/15/2026 | 594,000 | 581,525 |
Series 2022-3A, Class A3, 4.21%, 1/15/2026 | 400,000 | 398,000 |
Series 2021-4A, Class B, 1.05%, 5/15/2026 | 946,000 | 915,968 |
18 | J.P. Morgan Exchange-Traded Funds | August 31, 2022 |
INVESTMENTS | PRINCIPAL AMOUNT($) | VALUE($) |
Asset-Backed Securities — continued | ||
Series 2022-4A, Class C, 4.92%, 12/15/2028 | 1,076,000 | 1,069,800 |
Fifth Third Auto Trust Series 2019-1, Class A4, 2.69%, 11/16/2026 | 328,474 | 327,796 |
First Investors Auto Owner Trust Series 2021-1A, Class A, 0.45%, 3/16/2026 (b) | 114,450 | 112,921 |
FirstKey Homes Trust | ||
Series 2020-SFR2, Class A, 1.27%, 10/19/2037 (b) | 1,071,410 | 983,921 |
Series 2021-SFR1, Class E1, 2.39%, 8/17/2038 ‡ (b) | 600,000 | 518,659 |
Series 2021-SFR2, Class D, 2.06%, 9/17/2038 ‡ (b) | 2,900,000 | 2,506,676 |
Flagship Credit Auto Trust | ||
Series 2020-4, Class A, 0.53%, 4/15/2025 (b) | 344,219 | 342,730 |
Series 2019-4, Class C, 2.77%, 12/15/2025 (b) | 310,000 | 306,949 |
Series 2021-4, Class A, 0.81%, 7/17/2026 (b) | 997,949 | 972,126 |
Series 2022-1, Class A, 1.79%, 10/15/2026 (b) | 1,975,922 | 1,914,827 |
Series 2021-3, Class A, 0.36%, 7/15/2027 (b) | 1,086,934 | 1,060,546 |
Ford Credit Auto Lease Trust | ||
Series 2020-B, Class A4, 0.69%, 10/15/2023 | 391,132 | 390,494 |
Series 2021-A, Class A3, 0.26%, 2/15/2024 | 631,662 | 628,102 |
Ford Credit Auto Owner Trust Series 2018-B, Class A4, 3.38%, 3/15/2024 | 120,945 | 120,954 |
FRTKL Series 2021-SFR1, Class A, 1.57%, 9/17/2038 (b) | 2,118,000 | 1,872,391 |
GLS Auto Receivables Issuer Trust | ||
Series 2021-4A, Class A, 0.84%, 7/15/2025 (b) | 1,076,542 | 1,056,882 |
Series 2021-2A, Class B, 0.77%, 9/15/2025 (b) | 408,000 | 400,158 |
Series 2021-3A, Class C, 1.11%, 9/15/2026 (b) | 815,000 | 760,690 |
GM Financial Automobile Leasing Trust | ||
Series 2020-3, Class A3, 0.45%, 8/21/2023 | 156,133 | 155,750 |
Series 2021-3, Class A3, 0.39%, 10/21/2024 | 1,137,000 | 1,100,772 |
Series 2021-1, Class A4, 0.33%, 2/20/2025 | 1,000,000 | 976,733 |
INVESTMENTS | PRINCIPAL AMOUNT($) | VALUE($) |
Series 2022-2, Class A3, 3.42%, 6/20/2025 | 1,057,000 | 1,049,154 |
GM Financial Consumer Automobile Receivables Trust | ||
Series 2020-1, Class A3, 1.84%, 9/16/2024 | 1,136,283 | 1,131,004 |
Series 2021-1, Class A3, 0.35%, 10/16/2025 | 416,412 | 405,667 |
Series 2021-1, Class A4, 0.54%, 5/17/2027 | 2,800,000 | 2,625,790 |
HERO Funding (Cayman Islands) Series 2017-3A, Class A2, 3.95%, 9/20/2048 (b) | 147,594 | 142,118 |
Hertz Vehicle Financing III LLC Series 2022-1A, Class A, 1.99%, 6/25/2026 (b) | 922,000 | 857,049 |
Home Partners of America Trust Series 2022-1, Class D, 4.73%, 4/17/2039 ‡ (b) | 1,183,439 | 1,122,596 |
Honda Auto Receivables Owner Trust Series 2019-4, Class A3, 1.83%, 1/18/2024 | 142,273 | 141,632 |
Hyundai Auto Lease Securitization Trust | ||
Series 2020-B, Class A3, 0.51%, 9/15/2023 (b) | 462,837 | 461,083 |
Series 2021-A, Class A3, 0.33%, 1/16/2024 (b) | 358,390 | 355,411 |
Lendmark Funding Trust Series 2022-1A, Class A, 5.12%, 7/20/2032 (b) | 177,000 | 174,995 |
Mercedes-Benz Auto Lease Trust Series 2021-A, Class A3, 0.25%, 1/16/2024 | 566,385 | 559,811 |
MVW LLC | ||
Series 2021-2A, Class A, 1.43%, 5/20/2039 (b) | 1,018,744 | 917,061 |
Series 2021-1WA, Class A, 1.14%, 1/22/2041 (b) | 211,601 | 195,010 |
Nissan Auto Lease Trust Series 2020-B, Class A3, 0.43%, 10/16/2023 | 311,433 | 310,417 |
Octane Receivables Trust Series 2020-1A, Class A, 1.71%, 2/20/2025 (b) | 560,019 | 553,412 |
PRET LLC Series 2021-NPL6, Class A1, 2.49%, 7/25/2051 (b) (d) | 1,017,591 | 957,580 |
Progress Residential Trust | ||
Series 2020-SFR3, Class B, 1.50%, 10/17/2027 ‡ (b) | 785,000 | 717,112 |
Series 2021-SFR2, Class E1, 2.55%, 4/19/2038 ‡ (b) | 350,000 | 304,479 |
August 31, 2022 | J.P. Morgan Exchange-Traded Funds | 19 |
AS OF August 31, 2022 (Unaudited) (continued)
INVESTMENTS | PRINCIPAL AMOUNT($) | VALUE($) |
Asset-Backed Securities — continued | ||
Series 2021-SFR8, Class E1, 2.38%, 10/17/2038 ‡ (b) | 1,144,000 | 985,341 |
Series 2021-SFR11, Class A, 2.28%, 1/17/2039 (b) | 1,995,577 | 1,723,138 |
Series 2021-SFR9, Class E1, 2.81%, 11/17/2040 (b) | 1,048,000 | 849,902 |
Santander Consumer Auto Receivables Trust Series 2021-AA, Class A3, 0.33%, 10/15/2025 (b) | 413,946 | 406,016 |
Santander Drive Auto Receivables Trust | ||
Series 2022-1, Class A2, 1.36%, 12/16/2024 | 1,407,606 | 1,399,531 |
Series 2021-1, Class B, 0.50%, 4/15/2025 | 838,563 | 836,189 |
Series 2021-3, Class B, 0.60%, 12/15/2025 | 1,426,000 | 1,406,101 |
Series 2020-4, Class C, 1.01%, 1/15/2026 | 465,000 | 459,264 |
Series 2021-2, Class C, 0.90%, 6/15/2026 | 956,000 | 931,096 |
Series 2022-3, Class A3, 3.40%, 12/15/2026 | 914,000 | 902,390 |
Series 2022-4, Class A3, 4.14%, 2/16/2027 | 1,248,000 | 1,240,856 |
Series 2022-5, Class B, 4.43%, 3/15/2027 | 562,000 | 559,020 |
Santander Retail Auto Lease Trust Series 2022-A, Class A3, 1.34%, 7/21/2025 (b) | 611,000 | 580,869 |
Sierra Timeshare Receivables Funding LLC Series 2022-2A, Class A, 4.73%, 6/20/2040 (b) | 161,726 | 160,626 |
Spirit Airlines Pass-Through Trust Series 2017-1, Class AA, 3.38%, 2/15/2030 | 115,334 | 101,712 |
SpringCastle America Funding LLC Series 2020-AA, Class A, 1.97%, 9/25/2037 (b) | 272,444 | 251,545 |
Tesla Auto Lease Trust Series 2021-B, Class A4, 0.63%, 9/22/2025 (b) | 715,000 | 672,693 |
Theorem Funding Trust Series 2021-1A, Class A, 1.21%, 12/15/2027 (b) | 823,279 | 803,807 |
Toyota Auto Receivables Owner Trust | ||
Series 2020-A, Class A3, 1.66%, 5/15/2024 | 133,117 | 132,299 |
Series 2021-A, Class A3, 0.26%, 5/15/2025 | 1,494,098 | 1,456,805 |
Series 2020-C, Class A4, 0.57%, 10/15/2025 | 532,000 | 508,217 |
INVESTMENTS | PRINCIPAL AMOUNT($) | VALUE($) |
United Airlines Pass-Through Trust | ||
Series 2016-1, Class AA, 3.10%, 7/7/2028 | 990,885 | 893,484 |
Series 2016-2, Class AA, 2.88%, 10/7/2028 | 1,025,815 | 901,994 |
Series 2018-1, Class AA, 3.50%, 3/1/2030 | 633,602 | 566,489 |
Series 2018-1, Class A, 3.70%, 3/1/2030 | 1,125,774 | 946,688 |
United Auto Credit Securitization Trust Series 2021-1, Class C, 0.84%, 6/10/2026 (b) | 270,000 | 266,060 |
US Auto Funding Series 2021-1A, Class A, 0.79%, 7/15/2024 (b) | 362,127 | 360,049 |
US Auto Funding Trust Series 2022-1A, Class A, 3.98%, 4/15/2025 (b) | 760,807 | 750,615 |
Volkswagen Auto Lease Trust Series 2020-A, Class A3, 0.39%, 1/22/2024 | 366,447 | 363,491 |
VOLT C LLC Series 2021-NPL9, Class A1, 1.99%, 5/25/2051 (b) (d) | 491,446 | 458,732 |
VOLT CI LLC Series 2021-NP10, Class A1, 1.99%, 5/25/2051 (b) (d) | 919,501 | 858,525 |
VOLT XCIII LLC Series 2021-NPL2, Class A1, 1.89%, 2/27/2051 (b) (d) | 888,244 | 839,487 |
VOLT XCIV LLC Series 2021-NPL3, Class A1, 2.24%, 2/27/2051 (b) (d) | 1,201,883 | 1,143,220 |
VOLT XCIX LLC Series 2021-NPL8, Class A1, 2.12%, 4/25/2051 ‡ (b) (d) | 692,977 | 657,441 |
VOLT XCVI LLC Series 2021-NPL5, Class A1, 2.12%, 3/27/2051 ‡ (b) (d) | 1,256,333 | 1,178,667 |
VOLT XCVII LLC Series 2021-NPL6, Class A1, 2.24%, 4/25/2051 (b) (d) | 1,484,993 | 1,407,620 |
Westgate Resorts LLC Series 2022-1A, Class A, 1.79%, 8/20/2036 (b) | 1,146,375 | 1,091,511 |
Westlake Automobile Receivables Trust | ||
Series 2021-3A, Class A3, 0.95%, 6/16/2025 (b) | 550,000 | 533,814 |
Series 2020-3A, Class B, 0.78%, 11/17/2025 (b) | 815,000 | 806,582 |
Series 2021-3A, Class D, 2.12%, 1/15/2027 (b) | 806,000 | 747,676 |
World Omni Auto Receivables Trust | ||
Series 2019-B, Class A3, 2.59%, 7/15/2024 | 68,225 | 68,193 |
Series 2021-A, Class A3, 0.30%, 1/15/2026 | 1,471,461 | 1,434,846 |
20 | J.P. Morgan Exchange-Traded Funds | August 31, 2022 |
INVESTMENTS | PRINCIPAL AMOUNT($) | VALUE($) |
Asset-Backed Securities — continued | ||
Series 2021-C, Class A3, 0.44%, 8/17/2026 | 747,000 | 715,963 |
Series 2022-B, Class A3, 3.25%, 7/15/2027 | 1,750,000 | 1,720,052 |
World Omni Automobile Lease Securitization Trust | ||
Series 2020-A, Class A3, 1.70%, 1/17/2023 | 25,734 | 25,723 |
Series 2021-A, Class A3, 0.42%, 8/15/2024 | 912,000 | 881,466 |
Series 2020-B, Class A4, 0.52%, 2/17/2026 | 480,000 | 468,743 |
World Omni Select Auto Trust Series 2020-A, Class A3, 0.55%, 7/15/2025 | 304,663 | 301,841 |
Total Asset-Backed Securities (Cost $117,765,891) | 112,387,211 | |
Commercial Mortgage-Backed Securities — 11.0% | ||
20 Times Square Trust Series 2018-20TS, Class A, 3.20%, 5/15/2035 (b) (f) | 1,162,000 | 1,137,055 |
BB-UBS Trust Series 2012-SHOW, Class A, 3.43%, 11/5/2036 (b) | 1,400,000 | 1,336,814 |
FHLMC, Multi-Family Structured Pass-Through Certificates | ||
Series KSMC, Class A2, 2.62%, 1/25/2023 | 6,000,000 | 5,967,141 |
Series K027, Class A2, 2.64%, 1/25/2023 | 731,923 | 729,512 |
Series KJ11, Class A2, 2.93%, 1/25/2023 | 299,620 | 298,294 |
Series K029, Class A2, 3.32%, 2/25/2023 (f) | 1,946,511 | 1,941,154 |
Series K034, Class A2, 3.53%, 7/25/2023 (f) | 5,000,000 | 4,982,158 |
Series K036, Class A2, 3.53%, 10/25/2023 (f) | 3,000,000 | 2,984,169 |
Series K038, Class A2, 3.39%, 3/25/2024 | 4,768,000 | 4,728,788 |
Series K727, Class AM, 3.04%, 7/25/2024 | 1,400,000 | 1,375,688 |
Series K039, Class A2, 3.30%, 7/25/2024 | 2,550,000 | 2,524,800 |
Series J22F, Class A2, 4.09%, 9/25/2024 | 146,499 | 146,541 |
Series K729, Class A2, 3.14%, 10/25/2024 | 1,219,000 | 1,200,816 |
Series K041, Class A2, 3.17%, 10/25/2024 | 7,000,000 | 6,907,351 |
INVESTMENTS | PRINCIPAL AMOUNT($) | VALUE($) |
Series K046, Class A2, 3.21%, 3/25/2025 | 2,503,000 | 2,461,312 |
Series KL3L, Class ALNZ, 3.46%, 4/25/2025 (f) | 2,000,000 | 1,959,590 |
Series K048, Class A2, 3.28%, 6/25/2025 (f) | 3,480,000 | 3,424,856 |
Series K049, Class A2, 3.01%, 7/25/2025 | 2,469,000 | 2,410,810 |
Series KLU2, Class A7, 2.23%, 9/25/2025 (f) | 334,333 | 318,058 |
Series K056, Class A2, 2.53%, 5/25/2026 | 4,000,000 | 3,820,916 |
Series K058, Class A1, 2.34%, 7/25/2026 | 1,316,551 | 1,272,041 |
Series K737, Class AM, 2.10%, 10/25/2026 | 3,110,000 | 2,887,690 |
Series K060, Class A2, 3.30%, 10/25/2026 | 2,000,000 | 1,960,797 |
Series K066, Class A2, 3.12%, 6/25/2027 | 1,362,000 | 1,321,700 |
Series K067, Class A2, 3.19%, 7/25/2027 | 1,686,000 | 1,640,541 |
Series K069, Class A2, 3.19%, 9/25/2027 (f) | 3,235,000 | 3,146,492 |
Series K070, Class A2, 3.30%, 11/25/2027 (f) | 910,000 | 889,485 |
Series K072, Class A2, 3.44%, 12/25/2027 | 473,000 | 465,296 |
Series K081, Class A1, 3.88%, 2/25/2028 | 1,058,292 | 1,063,866 |
Series K078, Class A2, 3.85%, 6/25/2028 | 1,541,000 | 1,544,429 |
Series K079, Class A2, 3.93%, 6/25/2028 | 3,600,000 | 3,625,726 |
Series K083, Class A2, 4.05%, 9/25/2028 (f) | 594,000 | 601,907 |
Series K145, Class AM, 2.58%, 6/25/2055 | 880,000 | 786,664 |
FNMA ACES | ||
Series 2013-M7, Class A2, 2.28%, 12/25/2022 | 499,454 | 497,311 |
Series 2013-M9, Class A2, 2.39%, 1/25/2023 (f) | 1,117,731 | 1,108,685 |
Series 2013-M13, Class A2, 2.62%, 4/25/2023 (f) | 739,429 | 729,715 |
Series 2014-M1, Class A2, 3.34%, 7/25/2023 (f) | 851,694 | 845,606 |
Series 2014-M2, Class A2, 3.51%, 12/25/2023 (f) | 2,652,113 | 2,634,732 |
August 31, 2022 | J.P. Morgan Exchange-Traded Funds | 21 |
AS OF August 31, 2022 (Unaudited) (continued)
INVESTMENTS | PRINCIPAL AMOUNT($) | VALUE($) |
Commercial Mortgage-Backed Securities — continued | ||
Series 2014-M3, Class A2, 3.50%, 1/25/2024 (f) | 720,816 | 714,375 |
Series 2014-M8, Class A2, 3.06%, 6/25/2024 (f) | 2,795,086 | 2,738,895 |
Series 2014-M13, Class A2, 3.02%, 8/25/2024 (f) | 1,211,061 | 1,192,094 |
Series 2016-M6, Class A2, 2.49%, 5/25/2026 | 710,688 | 679,242 |
Series 2015-M10, Class A2, 3.09%, 4/25/2027 (f) | 1,217,430 | 1,182,247 |
Series 2017-M8, Class A2, 3.06%, 5/25/2027 (f) | 1,407,229 | 1,363,310 |
Series 2017-M12, Class A2, 3.17%, 6/25/2027 (f) | 2,875,463 | 2,788,354 |
Series 2017-M13, Class A2, 3.03%, 9/25/2027 (f) | 389,009 | 376,632 |
Series 2018-M2, Class A2, 3.00%, 1/25/2028 (f) | 3,302,303 | 3,176,232 |
Series 2018-M4, Class A2, 3.16%, 3/25/2028 (f) | 2,184,727 | 2,112,547 |
Series 2018-M9, Class APT2, 3.22%, 4/25/2028 (f) | 3,373,508 | 3,265,777 |
Series 2018-M14, Class A2, 3.70%, 8/25/2028 (f) | 393,364 | 388,801 |
Series 2017-M5, Class A2, 3.20%, 4/25/2029 (f) | 2,873,494 | 2,764,257 |
Series 2018-M3, Class A2, 3.18%, 2/25/2030 (f) | 1,301,218 | 1,246,262 |
Series 2020-M50, Class A1, 0.67%, 10/25/2030 | 672,916 | 612,718 |
Series 2020-M50, Class A2, 1.20%, 10/25/2030 | 415,000 | 368,024 |
Series 2020-M50, Class X1, IO, 2.00%, 10/25/2030 (f) | 6,382,907 | 568,985 |
Series 2021-M11, Class A2, 1.51%, 3/25/2031 (f) | 1,517,000 | 1,267,187 |
Series 2021-M3, Class 1A1, 1.00%, 11/25/2033 | 40,661 | 38,676 |
Series 2021-M3, Class X1, IO, 2.07%, 11/25/2033 (f) | 354,568 | 39,429 |
FREMF Mortgage Trust | ||
Series 2015-K44, Class B, 3.85%, 1/25/2048 (b) (f) | 1,500,000 | 1,465,957 |
Series 2016-K722, Class B, 4.02%, 7/25/2049 (b) (f) | 735,000 | 730,444 |
Morgan Stanley Capital I Trust Series 2021-PLZA, Class A, 2.57%, 11/9/2043 (b) | 1,958,000 | 1,569,592 |
INVESTMENTS | PRINCIPAL AMOUNT($) | VALUE($) |
MRCD MARK Mortgage Trust Series 2019-PARK, Class A, 2.72%, 12/15/2036 (b) | 300,000 | 282,858 |
SLG Office Trust Series 2021-OVA, Class A, 2.59%, 7/15/2041 (b) | 1,770,000 | 1,499,900 |
UBS-BAMLL Trust Series 2012-WRM, Class A, 3.66%, 6/10/2030 (b) | 27,444 | 27,415 |
UBS-Barclays Commercial Mortgage Trust | ||
Series 2013-C6, Class A4, 3.24%, 4/10/2046 | 1,486,000 | 1,473,986 |
Series 2012-C2, Class A4, 3.53%, 5/10/2063 | 42,037 | 41,991 |
Total Commercial Mortgage-Backed Securities (Cost $115,812,428) | 111,654,693 | |
Mortgage-Backed Securities — 7.7% | ||
FHLMC Gold Pools, 15 Year Pool # G13603, 5.50%, 2/1/2024 | 228 | 228 |
FHLMC Gold Pools, 20 Year | ||
Pool # C91030, 5.50%, 5/1/2027 | 28,376 | 29,071 |
Pool # C91802, 3.50%, 1/1/2035 | 2,346,997 | 2,327,284 |
FHLMC Gold Pools, 30 Year | ||
Pool # A15232, 5.00%, 10/1/2033 | 106,414 | 109,412 |
Pool # A57681, 6.00%, 12/1/2036 | 681 | 734 |
Pool # G06493, 4.50%, 5/1/2041 | 450,450 | 460,144 |
FHLMC Gold Pools, Other Pool # U90690, 3.50%, 6/1/2042 | 472,065 | 458,872 |
FHLMC UMBS, 30 Year | ||
Pool # ZM6956, 4.50%, 6/1/2048 | 987,843 | 997,938 |
Pool # RA6702, 3.00%, 2/1/2052 | 3,738,390 | 3,480,923 |
FNMA Pool # AM2292 ARM, 2.71%, 1/1/2023 (f) | 685,505 | 684,106 |
FNMA UMBS, 15 Year Pool # 995381, 6.00%, 1/1/2024 | 243 | 243 |
FNMA UMBS, 20 Year | ||
Pool # MA1138, 3.50%, 8/1/2032 | 403,171 | 399,420 |
Pool # AP9584, 3.00%, 10/1/2032 | 1,935,603 | 1,863,004 |
FNMA UMBS, 30 Year | ||
Pool # AL0045, 6.00%, 12/1/2032 | 177,624 | 191,320 |
Pool # 735503, 6.00%, 4/1/2035 | 45,002 | 47,643 |
Pool # 888460, 6.50%, 10/1/2036 | 295,149 | 321,071 |
Pool # 888890, 6.50%, 10/1/2037 | 6,299 | 6,767 |
Pool # 949320, 7.00%, 10/1/2037 | 40,214 | 41,557 |
Pool # 995149, 6.50%, 10/1/2038 | 14,614 | 15,675 |
Pool # 994410, 7.00%, 11/1/2038 | 143,639 | 157,575 |
Pool # AD9151, 5.00%, 8/1/2040 | 223,756 | 233,857 |
22 | J.P. Morgan Exchange-Traded Funds | August 31, 2022 |
INVESTMENTS | PRINCIPAL AMOUNT($) | VALUE($) |
Mortgage-Backed Securities — continued | ||
Pool # AE0681, 4.50%, 12/1/2040 | 520,054 | 530,719 |
Pool # BM3500, 4.00%, 9/1/2047 | 941,460 | 950,443 |
Pool # BM3499, 4.00%, 12/1/2047 | 1,157,675 | 1,148,726 |
Pool # BE8354, 4.00%, 3/1/2048 | 429,201 | 425,823 |
Pool # CB2637, 2.50%, 1/1/2052 | 2,598,721 | 2,327,178 |
Pool # CB2670, 3.00%, 1/1/2052 | 2,335,100 | 2,174,347 |
FNMA, Other | ||
Pool # AM1804, 2.19%, 12/1/2022 | 790,660 | 789,230 |
Pool # AM1619, 2.34%, 12/1/2022 | 2,051,209 | 2,047,647 |
Pool # AL3594, 2.71%, 4/1/2023 (f) | 801,701 | 799,235 |
Pool # AM3301, 2.35%, 5/1/2023 | 2,034,430 | 2,025,120 |
Pool # AM3244, 2.52%, 5/1/2023 | 3,000,000 | 2,987,503 |
Pool # AM3432, 2.40%, 7/1/2023 | 2,804,388 | 2,783,110 |
Pool # AM4628, 3.69%, 11/1/2023 | 1,087,856 | 1,087,027 |
Pool # AM4716, 3.38%, 12/1/2023 | 1,380,533 | 1,376,325 |
Pool # AM8674, 2.81%, 4/1/2025 | 2,200,000 | 2,137,619 |
Pool # AM8846, 2.68%, 5/1/2025 | 1,814,267 | 1,757,317 |
Pool # AN1413, 2.49%, 5/1/2026 | 801,383 | 764,384 |
Pool # AN1497, 2.61%, 6/1/2026 | 860,000 | 822,154 |
Pool # AN1243, 2.64%, 6/1/2026 | 1,600,000 | 1,531,283 |
Pool # AN1247, 2.64%, 6/1/2026 | 1,576,000 | 1,508,313 |
Pool # AN6732, 2.83%, 5/1/2027 | 1,196,017 | 1,143,114 |
Pool # AN7338, 3.06%, 11/1/2027 | 971,249 | 938,255 |
Pool # AN7943, 3.10%, 1/1/2028 | 2,433,547 | 2,348,847 |
Pool # AN1161, 3.05%, 4/1/2028 | 958,079 | 883,137 |
Pool # AN9486, 3.57%, 6/1/2028 | 3,716,000 | 3,667,762 |
Pool # AN2069, 2.35%, 8/1/2028 | 1,413,897 | 1,309,050 |
Pool # BL0907, 3.88%, 12/1/2028 | 700,000 | 702,825 |
Pool # BM4162, 3.27%, 10/1/2029 (f) | 254,211 | 247,278 |
Pool # BL4333, 2.52%, 11/1/2029 | 1,163,338 | 1,076,015 |
Pool # BM7037, 1.76%, 3/1/2032 (f) | 999,955 | 840,918 |
Pool # BS5117, 2.58%, 3/1/2032 | 2,393,690 | 2,153,198 |
Pool # MA1125, 4.00%, 7/1/2042 | 611,491 | 607,907 |
Pool # MA1437, 3.50%, 5/1/2043 | 860,681 | 835,732 |
Pool # MA1463, 3.50%, 6/1/2043 | 812,615 | 789,052 |
Pool # BF0230, 5.50%, 1/1/2058 | 3,607,698 | 3,901,119 |
Pool # BF0497, 3.00%, 7/1/2060 | 2,007,248 | 1,859,703 |
Pool # BF0546, 2.50%, 7/1/2061 | 931,465 | 824,321 |
GNMA II, 30 Year | ||
Pool # 4245, 6.00%, 9/20/2038 | 72,374 | 78,654 |
Pool # BA7567, 4.50%, 5/20/2048 | 711,934 | 711,113 |
Pool # BI0416, 4.50%, 11/20/2048 | 79,536 | 80,190 |
Pool # BM9692, 4.50%, 7/20/2049 | 382,765 | 384,295 |
INVESTMENTS | PRINCIPAL AMOUNT($) | VALUE($) |
Pool # MA7534, 2.50%, 8/20/2051 | 9,260,372 | 8,483,241 |
Pool # MA7649, 2.50%, 10/20/2051 | 2,645,498 | 2,417,790 |
Total Mortgage-Backed Securities (Cost $82,972,085) | 78,083,863 | |
Collateralized Mortgage Obligations — 6.1% | ||
CHL Mortgage Pass-Through Trust Series 2004-8, Class 2A1, 4.50%, 6/25/2019 | 420 | 84 |
Citigroup Mortgage Loan Trust, Inc. | ||
Series 2003-1, Class 3A4, 5.25%, 9/25/2033 | 4,162 | 3,847 |
Series 2004-HYB4, Class WA, 2.25%, 12/25/2034 (f) | 13,634 | 13,494 |
CSFB Mortgage-Backed Pass-Through Certificates Series 2003-27, Class 5A4, 5.25%, 11/25/2033 | 1,537 | 1,422 |
CSMC Trust Series 2022-JR1, Class A1, 4.27%, 10/25/2066 (b) (d) | 1,159,327 | 1,118,832 |
FHLMC, REMIC | ||
Series 2626, Class JC, 5.00%, 6/15/2023 | 19,640 | 19,638 |
Series 2649, Class WB, 3.50%, 7/15/2023 | 131 | 131 |
Series 1578, Class K, 6.90%, 9/15/2023 | 1,293 | 1,306 |
Series 2685, Class DT, 5.00%, 10/15/2023 | 53,891 | 53,946 |
Series 2687, Class JH, 5.00%, 10/15/2023 | 12,409 | 12,422 |
Series 2701, Class AC, 5.00%, 11/15/2023 | 92,973 | 93,070 |
Series 3521, Class B, 4.00%, 4/15/2024 | 70,713 | 70,381 |
Series 3544, Class BC, 4.00%, 6/15/2024 | 7,231 | 7,215 |
Series 3546, Class NB, 4.00%, 6/15/2024 | 331,434 | 331,682 |
Series 3562, Class JC, 4.00%, 8/15/2024 | 181,091 | 181,225 |
Series 3563, Class BD, 4.00%, 8/15/2024 | 113,605 | 113,719 |
Series 3571, Class MY, 4.00%, 9/15/2024 | 46,628 | 46,662 |
Series 3575, Class EB, 4.00%, 9/15/2024 | 120,064 | 119,450 |
Series 3577, Class B, 4.00%, 9/15/2024 | 206,483 | 206,626 |
August 31, 2022 | J.P. Morgan Exchange-Traded Funds | 23 |
AS OF August 31, 2022 (Unaudited) (continued)
INVESTMENTS | PRINCIPAL AMOUNT($) | VALUE($) |
Collateralized Mortgage Obligations — continued | ||
Series 3578, Class KB, 4.00%, 9/15/2024 | 27,786 | 27,621 |
Series 2989, Class TG, 5.00%, 6/15/2025 | 149,914 | 150,881 |
Series 2988, Class TY, 5.50%, 6/15/2025 | 7,136 | 7,215 |
Series 3816, Class HA, 3.50%, 11/15/2025 | 747,451 | 744,660 |
Series 3087, Class KX, 5.50%, 12/15/2025 | 20,341 | 20,541 |
Series 3787, Class AY, 3.50%, 1/15/2026 | 249,377 | 248,391 |
Series 3794, Class LB, 3.50%, 1/15/2026 | 213,056 | 212,221 |
Series 3102, Class CE, 5.50%, 1/15/2026 | 211,461 | 213,503 |
Series 3123, Class HT, 5.00%, 3/15/2026 | 28,940 | 29,103 |
Series 3121, Class JD, 5.50%, 3/15/2026 | 9,362 | 9,480 |
Series 3150, Class EQ, 5.00%, 5/15/2026 | 85,616 | 86,085 |
Series 3898, Class KH, 3.50%, 6/15/2026 | 342,354 | 340,786 |
Series 3885, Class AC, 4.00%, 6/15/2026 | 139,700 | 139,783 |
Series 3911, Class B, 3.50%, 8/15/2026 | 307,474 | 306,177 |
Series 3959, Class PB, 3.00%, 11/15/2026 | 1,815,937 | 1,792,396 |
Series 4337, Class VJ, 3.50%, 6/15/2027 | 1,257,766 | 1,254,099 |
Series 3337, Class MD, 5.50%, 6/15/2027 | 20,900 | 21,257 |
Series 2110, Class PG, 6.00%, 1/15/2029 | 53,673 | 55,822 |
Series 3563, Class LB, 4.00%, 8/15/2029 | 8,871 | 8,878 |
Series 3653, Class B, 4.50%, 4/15/2030 | 74,735 | 75,882 |
Series 3824, Class EY, 3.50%, 3/15/2031 | 189,209 | 187,327 |
Series 2525, Class AM, 4.50%, 4/15/2032 | 389,730 | 395,300 |
Series 2441, Class GF, 6.50%, 4/15/2032 | 12,593 | 13,455 |
Series 2436, Class MC, 7.00%, 4/15/2032 | 7,627 | 8,059 |
Series 2760, Class KT, 4.50%, 9/15/2032 | 50,725 | 51,151 |
INVESTMENTS | PRINCIPAL AMOUNT($) | VALUE($) |
Series 2505, Class D, 5.50%, 9/15/2032 | 57,153 | 59,836 |
Series 2544, Class KE, 5.50%, 12/15/2032 | 34,643 | 36,119 |
Series 2557, Class HL, 5.30%, 1/15/2033 | 93,180 | 96,662 |
Series 2575, Class PE, 5.50%, 2/15/2033 | 27,086 | 28,387 |
Series 2586, Class WG, 4.00%, 3/15/2033 | 114,655 | 115,448 |
Series 2596, Class QD, 4.00%, 3/15/2033 | 98,319 | 98,305 |
Series 2621, Class QH, 5.00%, 5/15/2033 | 109,516 | 112,266 |
Series 2624, Class QH, 5.00%, 6/15/2033 | 137,856 | 142,763 |
Series 2648, Class BK, 5.00%, 7/15/2033 | 11,010 | 11,389 |
Series 4238, Class UY, 3.00%, 8/15/2033 | 2,715,773 | 2,630,551 |
Series 2673, Class PE, 5.50%, 9/15/2033 | 220,294 | 229,888 |
Series 2696, Class DG, 5.50%, 10/15/2033 | 200,732 | 206,249 |
Series 2725, Class TA, 4.50%, 12/15/2033 | 284,000 | 289,420 |
Series 2733, Class ME, 5.00%, 1/15/2034 | 188,585 | 193,737 |
Series 2768, Class PK, 5.00%, 3/15/2034 | 160,129 | 163,597 |
Series 2934, Class KG, 5.00%, 2/15/2035 | 140,608 | 144,885 |
Series 3077, Class TO, PO, 4/15/2035 | 5,518 | 5,260 |
Series 2960, Class JH, 5.50%, 4/15/2035 | 407,252 | 426,538 |
Series 3082, Class PW, 5.50%, 12/15/2035 | 28,597 | 30,128 |
Series 3084, Class BH, 5.50%, 12/15/2035 | 638,867 | 673,440 |
Series 3098, Class KG, 5.50%, 1/15/2036 | 600,161 | 620,741 |
Series 3136, Class CO, PO, 4/15/2036 | 14,548 | 12,917 |
Series 3145, Class AJ, 5.50%, 4/15/2036 | 23,136 | 24,056 |
Series 3819, Class ZQ, 6.00%, 4/15/2036 | 417,926 | 448,730 |
Series 3200, PO, 8/15/2036 | 44,570 | 36,302 |
24 | J.P. Morgan Exchange-Traded Funds | August 31, 2022 |
INVESTMENTS | PRINCIPAL AMOUNT($) | VALUE($) |
Collateralized Mortgage Obligations — continued | ||
Series 3270, Class AT, 5.50%, 1/15/2037 | 16,217 | 16,932 |
Series 3272, Class PA, 6.00%, 2/15/2037 | 4,213 | 4,481 |
Series 3348, Class HT, 6.00%, 7/15/2037 | 38,757 | 40,470 |
Series 3501, Class A, 4.50%, 1/15/2039 | 99,371 | 97,845 |
Series 3508, Class PK, 4.00%, 2/15/2039 | ���2,594 | 2,551 |
Series 3513, Class A, 4.50%, 2/15/2039 | 11,025 | 11,071 |
Series 3653, Class HJ, 5.00%, 4/15/2040 | 479,921 | 495,811 |
Series 3677, Class KB, 4.50%, 5/15/2040 | 819,448 | 831,224 |
Series 3677, Class PB, 4.50%, 5/15/2040 | 399,162 | 400,813 |
Series 3715, Class PC, 4.50%, 8/15/2040 | 132,848 | 134,572 |
Series 3955, Class HB, 3.00%, 12/15/2040 | 87,789 | 86,425 |
Series 3828, Class PU, 4.50%, 3/15/2041 | 48,076 | 49,269 |
Series 3852, Class TP, IF, 5.50%, 5/15/2041 (f) | 149,511 | 145,147 |
Series 3956, Class EB, 3.25%, 11/15/2041 | 795,189 | 773,501 |
Series 3963, Class JB, 4.50%, 11/15/2041 | 1,233,058 | 1,252,317 |
Series 4026, Class MQ, 4.00%, 4/15/2042 | 46,404 | 45,232 |
Series 4616, Class HP, 3.00%, 9/15/2046 | 1,139,330 | 1,083,986 |
Series 3688, Class GT, 7.53%, 11/15/2046 (f) | 24,316 | 26,285 |
FHLMC, STRIPS Series 262, Class 35, 3.50%, 7/15/2042 | 504,113 | 486,248 |
FNMA, REMIC | ||
Series 2003-5, Class EQ, 5.50%, 2/25/2023 | 1,885 | 1,883 |
Series 2003-48, Class TC, 5.00%, 6/25/2023 | 4,644 | 4,642 |
Series 2003-55, Class HY, 5.00%, 6/25/2023 | 3,986 | 3,984 |
Series 2006-22, Class CE, 4.50%, 8/25/2023 | 15,417 | 15,396 |
Series 2004-44, Class KT, 6.00%, 6/25/2024 | 8,432 | 8,455 |
INVESTMENTS | PRINCIPAL AMOUNT($) | VALUE($) |
Series 2004-53, Class NC, 5.50%, 7/25/2024 | 6,496 | 6,512 |
Series 2009-71, Class MB, 4.50%, 9/25/2024 | 2,094 | 2,092 |
Series 2004-70, Class EB, 5.00%, 10/25/2024 | 14,578 | 14,545 |
Series 2010-49, Class KB, 4.00%, 5/25/2025 | 163,468 | 163,379 |
Series 2010-41, Class DC, 4.50%, 5/25/2025 | 30,437 | 30,369 |
Series 1997-57, Class PN, 5.00%, 9/18/2027 | 60,462 | 61,123 |
Series 2009-39, Class LB, 4.50%, 6/25/2029 | 55,338 | 55,393 |
Series 2009-96, Class DB, 4.00%, 11/25/2029 | 67,255 | 67,093 |
Series 2010-28, Class DE, 5.00%, 4/25/2030 | 184,234 | 187,016 |
Series 2001-63, Class TC, 6.00%, 12/25/2031 | 37,543 | 38,913 |
Series 2001-81, Class HE, 6.50%, 1/25/2032 | 93,104 | 98,546 |
Series 2002-75, Class GB, 5.50%, 11/25/2032 | 46,810 | 47,162 |
Series 2011-39, Class ZA, 6.00%, 11/25/2032 | 386,339 | 407,950 |
Series 2002-85, Class PE, 5.50%, 12/25/2032 | 30,349 | 31,373 |
Series 2003-21, Class OU, 5.50%, 3/25/2033 | 24,400 | 25,543 |
Series 2003-26, Class EB, 3.50%, 4/25/2033 | 676,541 | 658,248 |
Series 2003-23, Class CH, 5.00%, 4/25/2033 | 23,536 | 24,020 |
Series 2003-63, Class YB, 5.00%, 7/25/2033 | 81,722 | 83,983 |
Series 2003-69, Class N, 5.00%, 7/25/2033 | 157,195 | 161,253 |
Series 2003-80, Class QG, 5.00%, 8/25/2033 | 199,933 | 203,143 |
Series 2003-85, Class QD, 5.50%, 9/25/2033 | 86,518 | 90,848 |
Series 2003-94, Class CE, 5.00%, 10/25/2033 | 15,676 | 15,873 |
Series 2005-5, Class CK, 5.00%, 1/25/2035 | 139,720 | 141,346 |
Series 2005-29, Class WC, 4.75%, 4/25/2035 | 252,524 | 253,480 |
Series 2005-48, Class TD, 5.50%, 6/25/2035 | 206,305 | 217,302 |
August 31, 2022 | J.P. Morgan Exchange-Traded Funds | 25 |
AS OF August 31, 2022 (Unaudited) (continued)
INVESTMENTS | PRINCIPAL AMOUNT($) | VALUE($) |
Collateralized Mortgage Obligations — continued | ||
Series 2005-53, Class MJ, 5.50%, 6/25/2035 | 207,823 | 218,314 |
Series 2005-58, Class EP, 5.50%, 7/25/2035 | 15,930 | 16,508 |
Series 2005-68, Class BE, 5.25%, 8/25/2035 | 250,000 | 254,246 |
Series 2005-68, Class PG, 5.50%, 8/25/2035 | 82,509 | 85,516 |
Series 2005-102, Class PG, 5.00%, 11/25/2035 | 268,871 | 276,321 |
Series 2005-110, Class GL, 5.50%, 12/25/2035 | 334,445 | 352,133 |
Series 2006-49, Class PA, 6.00%, 6/25/2036 | 36,437 | 39,058 |
Series 2009-19, Class PW, 4.50%, 10/25/2036 | 217,406 | 219,620 |
Series 2006-114, Class HE, 5.50%, 12/25/2036 | 249,419 | 261,321 |
Series 2007-33, Class HE, 5.50%, 4/25/2037 | 18,089 | 18,939 |
Series 2007-65, Class KI, IF, IO, 4.18%, 7/25/2037 (f) | 4,571 | 539 |
Series 2007-71, Class KP, 5.50%, 7/25/2037 | 19,977 | 20,082 |
Series 2007-71, Class GB, 6.00%, 7/25/2037 | 147,650 | 156,984 |
Series 2009-86, Class OT, PO, 10/25/2037 | 27,801 | 23,016 |
Series 2008-72, Class BX, 5.50%, 8/25/2038 | 13,025 | 13,642 |
Series 2008-74, Class B, 5.50%, 9/25/2038 | 5,172 | 5,365 |
Series 2009-62, Class HJ, 6.00%, 5/25/2039 | 45,695 | 45,936 |
Series 2009-37, Class KI, IF, IO, 3.56%, 6/25/2039 (f) | 3,362 | 258 |
Series 2009-86, Class IP, IO, 5.50%, 10/25/2039 | 8,461 | 1,582 |
Series 2009-92, Class AD, 6.00%, 11/25/2039 | 416,298 | 427,693 |
Series 2009-112, Class ST, IF, IO, 3.81%, 1/25/2040 (f) | 64,183 | 6,800 |
Series 2010-22, Class PE, 5.00%, 3/25/2040 | 1,341,455 | 1,384,222 |
Series 2010-35, Class SB, IF, IO, 3.98%, 4/25/2040 (f) | 25,278 | 2,412 |
Series 2010-37, Class CY, 5.00%, 4/25/2040 | 799,633 | 821,995 |
Series 2010-54, Class EA, 4.50%, 6/25/2040 | 27,663 | 27,812 |
INVESTMENTS | PRINCIPAL AMOUNT($) | VALUE($) |
Series 2010-64, Class DM, 5.00%, 6/25/2040 | 4,059 | 4,172 |
Series 2010-71, Class HJ, 5.50%, 7/25/2040 | 83,954 | 88,837 |
Series 2010-123, Class BP, 4.50%, 11/25/2040 | 1,967,092 | 1,987,047 |
Series 2011-5, Class CP, 4.50%, 11/25/2040 | 15,436 | 15,474 |
Series 2011-41, Class KL, 4.00%, 5/25/2041 | 1,006,000 | 989,482 |
Series 2011-50, Class LP, 4.00%, 6/25/2041 | 449,078 | 445,376 |
Series 2012-137, Class CF, 2.74%, 8/25/2041 (f) | 128,566 | 128,117 |
Series 2012-103, Class DA, 3.50%, 10/25/2041 | 17,706 | 17,606 |
Series 2012-14, Class DE, 3.50%, 3/25/2042 | 660,533 | 643,853 |
Series 2012-139, Class JA, 3.50%, 12/25/2042 | 332,602 | 324,493 |
Series 2013-104, Class CY, 5.00%, 10/25/2043 | 2,250,000 | 2,361,185 |
Series 2019-65, Class PA, 2.50%, 5/25/2048 | 254,447 | 240,431 |
Series 2009-96, Class CB, 4.00%, 11/25/2049 | 19,385 | 19,036 |
Series 2019-7, Class CA, 3.50%, 11/25/2057 | 2,829,873 | 2,776,057 |
FNMA, STRIPS | ||
Series 293, Class 1, PO, 12/25/2024 | 3,648 | 3,562 |
Series 314, Class 1, PO, 7/25/2031 | 27,940 | 25,032 |
GNMA | ||
Series 2003-10, Class KJ, 5.50%, 2/20/2033 | 43,823 | 43,968 |
Series 2003-29, Class PD, 5.50%, 4/16/2033 | 169,405 | 171,847 |
Series 2003-33, Class NE, 5.50%, 4/16/2033 | 89,916 | 89,789 |
Series 2003-65, Class AP, 5.50%, 8/20/2033 | 58,276 | 60,172 |
Series 2003-77, Class TK, 5.00%, 9/16/2033 | 233,146 | 233,688 |
Series 2004-16, Class GC, 5.50%, 2/20/2034 | 612,586 | 637,886 |
Series 2004-54, Class BG, 5.50%, 7/20/2034 | 13,037 | 13,425 |
Series 2004-93, Class PD, 5.00%, 11/16/2034 | 356,165 | 360,038 |
26 | J.P. Morgan Exchange-Traded Funds | August 31, 2022 |
INVESTMENTS | PRINCIPAL AMOUNT($) | VALUE($) |
Collateralized Mortgage Obligations — continued | ||
Series 2004-101, Class BE, 5.00%, 11/20/2034 | 304,038 | 312,660 |
Series 2005-11, Class PL, 5.00%, 2/20/2035 | 143,832 | 147,955 |
Series 2005-26, Class XY, 5.50%, 3/20/2035 | 562,847 | 587,061 |
Series 2005-33, Class AY, 5.50%, 4/16/2035 | 147,726 | 152,887 |
Series 2005-49, Class B, 5.50%, 6/20/2035 | 47,107 | 49,019 |
Series 2005-51, Class DC, 5.00%, 7/20/2035 | 115,470 | 119,433 |
Series 2005-56, Class BD, 5.00%, 7/20/2035 | 18,009 | 18,443 |
Series 2006-7, Class ND, 5.50%, 8/20/2035 | 17,885 | 18,647 |
Series 2007-37, Class LB, 5.50%, 6/16/2037 | 142,860 | 147,778 |
Series 2007-79, Class BL, 5.75%, 8/20/2037 | 98,453 | 101,715 |
Series 2009-106, Class ST, IF, IO, 3.63%, 2/20/2038 (f) | 94,493 | 6,055 |
Series 2008-7, Class PQ, 5.00%, 2/20/2038 | 293,008 | 296,284 |
Series 2008-9, Class PW, 5.25%, 2/20/2038 | 309,010 | 316,930 |
Series 2008-23, Class YA, 5.25%, 3/20/2038 | 72,637 | 73,803 |
Series 2008-35, Class NF, 5.00%, 4/20/2038 | 74,282 | 75,937 |
Series 2008-34, Class PG, 5.25%, 4/20/2038 | 86,238 | 88,232 |
Series 2008-33, Class PB, 5.50%, 4/20/2038 | 251,059 | 260,137 |
Series 2008-38, Class BG, 5.00%, 5/16/2038 | 418,403 | 426,530 |
Series 2008-43, Class NB, 5.50%, 5/20/2038 | 126,754 | 130,653 |
Series 2008-56, Class PX, 5.50%, 6/20/2038 | 241,783 | 244,472 |
Series 2008-58, Class PE, 5.50%, 7/16/2038 | 659,467 | 682,598 |
Series 2008-62, Class SA, IF, IO, 3.78%, 7/20/2038 (f) | 1,840 | 54 |
Series 2008-76, Class US, IF, IO, 3.53%, 9/20/2038 (f) | 53,616 | 2,956 |
Series 2011-97, Class WA, 6.11%, 11/20/2038 (f) | 553,477 | 589,765 |
Series 2008-95, Class DS, IF, IO, 4.93%, 12/20/2038 (f) | 50,001 | 3,390 |
INVESTMENTS | PRINCIPAL AMOUNT($) | VALUE($) |
Series 2009-14, Class AG, 4.50%, 3/20/2039 | 86,215 | 87,124 |
Series 2009-72, Class SM, IF, IO, 3.86%, 8/16/2039 (f) | 119,820 | 9,646 |
Series 2009-61, Class AP, 4.00%, 8/20/2039 | 9,340 | 9,350 |
Series 2010-130, Class BD, 4.00%, 12/20/2039 | 244,731 | 245,697 |
Series 2010-157, Class OP, PO, 12/20/2040 | 82,492 | 70,123 |
Series 2014-H11, Class VA, 2.30%, 6/20/2064 (f) | 1,069,082 | 1,059,813 |
Series 2015-H20, Class FA, 2.27%, 8/20/2065 (f) | 1,548,803 | 1,535,231 |
Series 2015-H26, Class FG, 2.32%, 10/20/2065 (f) | 1,086,627 | 1,078,133 |
GSR Mortgage Loan Trust Series 2004-6F, Class 2A4, 5.50%, 5/25/2034 | 48,325 | 45,739 |
JPMorgan Mortgage Trust | ||
Series 2006-A2, Class 5A3, 2.68%, 11/25/2033 (f) | 110,271 | 108,045 |
Series 2007-A1, Class 5A5, 2.49%, 7/25/2035 (f) | 24,336 | 23,907 |
MASTR Adjustable Rate Mortgages Trust Series 2004-13, Class 2A1, 2.86%, 4/21/2034 (f) | 37,979 | 36,697 |
MASTR Asset Securitization Trust Series 2003-11, Class 8A1, 5.50%, 12/25/2033 | 24,885 | 22,293 |
Merrill Lynch Mortgage Investors Trust | ||
Series 2003-F, Class A1, 3.08%, 10/25/2028 (f) | 49,506 | 47,076 |
Series 2004-B, Class A1, 2.94%, 5/25/2029 (f) | 76,345 | 74,231 |
Morgan Stanley Mortgage Loan Trust Series 2004-3, Class 4A, 5.65%, 4/25/2034 (f) | 21,239 | 20,684 |
PHH Mortgage Trust Series 2008-CIM2, Class 5A1, 6.00%, 7/25/2038 | 7,254 | 6,869 |
PRPM LLC Series 2021-10, Class A1, 2.49%, 10/25/2026 (b) (d) | 724,095 | 676,411 |
Seasoned Credit Risk Transfer Trust | ||
Series 2018-1, Class M60C, 3.50%, 5/25/2057 | 1,605,620 | 1,558,850 |
Series 2017-4, Class M60C, 3.50%, 6/25/2057 | 1,538,888 | 1,492,880 |
Series 2017-4, Class MT, 3.50%, 6/25/2057 ‡ | 377,640 | 362,191 |
August 31, 2022 | J.P. Morgan Exchange-Traded Funds | 27 |
AS OF August 31, 2022 (Unaudited) (continued)
INVESTMENTS | PRINCIPAL AMOUNT($) | VALUE($) |
Collateralized Mortgage Obligations — continued | ||
Series 2018-2, Class M55D, 4.00%, 11/25/2057 | 1,614,961 | 1,590,191 |
Series 2019-3, Class M55D, 4.00%, 10/25/2058 ‡ | 365,827 | 360,866 |
Series 2020-1, Class M55G, 3.00%, 8/25/2059 | 3,701,999 | 3,512,259 |
Seasoned Loans Structured Transaction Series 2018-2, Class A1, 3.50%, 11/25/2028 | 441,459 | 431,609 |
Sequoia Mortgage Trust Series 2004-11, Class A1, 2.97%, 12/20/2034 (f) | 181,045 | 166,038 |
Structured Asset Mortgage Investments II Trust Series 2003-AR4, Class A1, 3.07%, 1/19/2034 (f) | 86,562 | 83,329 |
Thornburg Mortgage Securities Trust Series 2004-4, Class 3A, 2.03%, 12/25/2044 (f) | 112,150 | 107,081 |
Vendee Mortgage Trust Series 2003-2, Class Z, 5.00%, 5/15/2033 ‡ | 329,798 | 334,381 |
VOLT CV LLC Series 2021-CF2, Class A1, 2.49%, 11/27/2051 (b) (d) | 829,502 | 782,651 |
WaMu Mortgage Pass-Through Certificates Trust Series 2003-AR11, Class A6, 2.63%, 10/25/2033 (f) | 65,868 | 62,742 |
Total Collateralized Mortgage Obligations (Cost $64,343,126) | 61,954,302 | |
U.S. Government Agency Securities — 1.3% | ||
FNMA 0.50%, 6/17/2025(Cost $14,411,801) | 14,391,000 | 13,228,878 |
Foreign Government Securities — 0.3% | ||
Republic of Colombia 7.38%, 9/18/2037 | 300,000 | 284,119 |
Republic of Panama | ||
4.00%, 9/22/2024 | 347,000 | 345,764 |
3.16%, 1/23/2030 | 400,000 | 351,200 |
United Mexican States | ||
4.13%, 1/21/2026 | 332,000 | 331,170 |
2.66%, 5/24/2031 | 1,646,000 | 1,362,065 |
Total Foreign Government Securities (Cost $3,082,972) | 2,674,318 | |
INVESTMENTS | SHARES | VALUE($) |
Short-Term Investments — 2.5% | ||
Investment Companies — 2.5% | ||
JPMorgan Prime Money Market Fund Class IM Shares, 2.30% (g) (h) (Cost $25,863,283) | 25,860,229 | 25,870,574 |
Total Investments — 100.1% (Cost $1,071,881,532) | 1,016,690,317 | |
Liabilities in Excess of Other Assets — (0.1)% | (776,084) | |
NET ASSETS — 100.0% | 1,015,914,233 | |
Percentages indicated are based on net assets. |
Abbreviations | |
ACES | Alternative Credit Enhancement Securities |
ARM | Adjustable Rate Mortgage. The interest rate shown is the rate in effect as of August 31, 2022. |
CSMC | Credit Suisse Mortgage Trust |
FHLMC | Federal Home Loan Mortgage Corp. |
FNMA | Federal National Mortgage Association |
GNMA | Government National Mortgage Association |
ICE | Intercontinental Exchange |
IF | Inverse Floaters represent securities that pay interest at a rate that increases (decreases) with a decline (incline) in a specified index or have an interest rate that adjusts periodically based on changes in current interest rates and prepayments on the underlying pool of assets. The interest rate shown is the rate in effect as of August 31, 2022. The rate may be subject to a cap and floor. |
IO | Interest Only represents the right to receive the monthly interest payments on an underlying pool of mortgage loans. The principal amount shown represents the par value on the underlying pool. The yields on these securities are subject to accelerated principal paydowns as a result of prepayment or refinancing of the underlying pool of mortgage instruments. As a result, interest income may be reduced considerably. |
LIBOR | London Interbank Offered Rate |
PO | Principal Only represents the right to receive the principal portion only on an underlying pool of mortgage loans. The market value of these securities is extremely volatile in response to changes in market interest rates. As prepayments on the underlying mortgages of these securities increase, the yield on these securities increases. |
REMIC | Real Estate Mortgage Investment Conduit |
SOFR | Secured Overnight Financing Rate |
STRIPS | Separate Trading of Registered Interest and Principal of Securities. The STRIPS Program lets investors hold and trade individual interest and principal components of eligible notes and bonds as separate securities. |
UMBS | Uniform Mortgage-Backed Securities |
USD | United States Dollar |
^ | Amount rounds to less than 0.1% of net assets. | |
28 | J.P. Morgan Exchange-Traded Funds | August 31, 2022 |
‡ | Value determined using significant unobservable inputs. | |
(a) | All or a portion of this security is deposited with the broker as initial margin for futures contracts or centrally cleared swaps. | |
(b) | Securities exempt from registration under Rule 144A or section 4(a)(2), of the Securities Act of 1933, as amended. | |
(c) | Variable or floating rate security, linked to the referenced benchmark. The interest rate shown is the current rate as of August 31, 2022. | |
(d) | Step bond. Interest rate is a fixed rate for an initial period that either resets at a specific date or may reset in the future contingent upon a predetermined trigger. The interest rate shown is the current rate as of August 31, 2022. |
(e) | All or a portion of the security is a when-issued security, delayed delivery security, or forward commitment. | |
(f) | Variable or floating rate security, the interest rate of which adjusts periodically based on changes in current interest rates and prepayments on the underlying pool of assets. The interest rate shown is the current rate as of August 31, 2022. | |
(g) | Investment in an affiliated fund, which is registered under the Investment Company Act of 1940, as amended, and is advised by J.P. Morgan Investment Management Inc. | |
(h) | The rate shown is the current yield as of August 31, 2022. |
DESCRIPTION | NUMBER OF CONTRACTS | EXPIRATION DATE | TRADING CURRENCY | NOTIONAL AMOUNT ($) | VALUE AND UNREALIZED APPRECIATION (DEPRECIATION) ($) |
Long Contracts | |||||
U.S. Treasury 10 Year Note | 1,358 | 12/20/2022 | USD | 158,376,750 | (1,273,071) |
U.S. Treasury 10 Year Ultra Note | 668 | 12/20/2022 | USD | 83,406,063 | (870,802) |
U.S. Treasury 5 Year Note | 112 | 12/30/2022 | USD | 12,395,250 | (48,321) |
(2,192,194) | |||||
Short Contracts | |||||
U.S. Treasury Long Bond | (60) | 12/20/2022 | USD | (8,128,125) | 66,965 |
U.S. Treasury Ultra Bond | (11) | 12/20/2022 | USD | (1,637,625) | 5,812 |
U.S. Treasury 2 Year Note | (269) | 12/30/2022 | USD | (56,019,250) | 104,554 |
177,331 | |||||
(2,014,863) |
Abbreviations | |
USD | United States Dollar |
August 31, 2022 | J.P. Morgan Exchange-Traded Funds | 29 |
AS OF August 31, 2022 (Unaudited) (continued)
FLOATING RATE INDEX(a) | FIXED RATE | PAY/ RECEIVE FLOATING RATE | MATURITY DATE | NOTIONAL AMOUNT | UPFRONT PAYMENTS (RECEIPTS) $ | UNREALIZED APPRECIATION (DEPRECIATION) ($) | VALUE ($) |
CPI-U at termination | 2.82% at termination | Receive | 8/2/2032 | USD 43,909,000 | 46,569 | 68,333 | 114,902 |
CPI-U at termination | 2.89% at termination | Receive | 7/21/2027 | USD 17,143,000 | 20,602 | 225,216 | 245,818 |
CPI-U at termination | 2.90% at termination | Receive | 7/21/2027 | USD 45,023,000 | 115,665 | 521,259 | 636,924 |
CPI-U at termination | 2.90% at termination | Receive | 8/2/2029 | USD 83,826,000 | 109,240 | 231,600 | 340,840 |
CPI-U at termination | 2.91% at termination | Receive | 7/20/2027 | USD 11,389,000 | — | 157,494 | 157,494 |
CPI-U at termination | 2.93% at termination | Receive | 5/31/2032 | USD 9,112,000 | — | 21,435 | 21,435 |
CPI-U at termination | 2.96% at termination | Receive | 3/8/2032 | USD 4,742,000 | — | 83,693 | 83,693 |
CPI-U at termination | 2.98% at termination | Receive | 5/13/2032 | USD 46,427,000 | — | 164,413 | 164,413 |
CPI-U at termination | 3.03% at termination | Receive | 4/4/2032 | USD 2,480,000 | — | 15,458 | 15,458 |
CPI-U at termination | 3.04% at termination | Receive | 3/14/2032 | USD 5,072,000 | 19,879 | 23,628 | 43,507 |
CPI-U at termination | 3.14% at termination | Receive | 6/29/2027 | USD 34,106,000 | 16,523 | 247,160 | 263,683 |
CPI-U at termination | 3.30% at termination | Receive | 6/28/2026 | USD 6,903,000 | — | 45,571 | 45,571 |
CPI-U at termination | 3.60% at termination | Receive | 6/29/2025 | USD 76,081,000 | 99,093 | 56,902 | 155,995 |
CPI-U at termination | 3.67% at termination | Receive | 3/10/2026 | USD 13,966,000 | (68,118) | 223,016 | 154,898 |
CPI-U at termination | 3.69% at termination | Receive | 5/31/2025 | USD 32,038,000 | 18,878 | 17,213 | 36,091 |
378,331 | 2,102,391 | 2,480,722 | |||||
CPI-U at termination | 2.91% at termination | Receive | 9/1/2028 | USD 6,991,000 | 1,020 | (35,526) | (34,506) |
CPI-U at termination | 3.07% at termination | Receive | 6/13/2032 | USD 16,305,000 | (451) | (190,626) | (191,077) |
CPI-U at termination | 3.13% at termination | Receive | 3/15/2032 | USD 10,572,000 | (460) | (5,960) | (6,420) |
CPI-U at termination | 3.35% at termination | Receive | 6/7/2027 | USD 8,651,000 | 13,832 | (23,124) | (9,292) |
CPI-U at termination | 3.35% at termination | Receive | 6/9/2027 | USD 2,160,000 | 7,160 | (10,472) | (3,312) |
CPI-U at termination | 3.35% at termination | Receive | 5/3/2029 | USD 84,404,000 | (88,887) | (602,800) | (691,687) |
(67,786) | (868,508) | (936,294) | |||||
310,545 | 1,233,883 | 1,544,428 |
Abbreviations | |
CPI-U | Consumer Price Index for All Urban Consumers |
USD | United States Dollar |
(a) Value of floating rate index at August 31, 2022 was as follows: |
FLOATING RATE INDEX | VALUE |
CPI-U | 2.96% |
30 | J.P. Morgan Exchange-Traded Funds | August 31, 2022 |
AS OF August 31, 2022 (Unaudited)
INVESTMENTS | SHARES | VALUE($) |
Common Stocks — 96.2% | ||
Apartments — 30.2% | ||
American Homes 4 Rent, Class A, REIT | 418,964 | 14,898,360 |
Apartment Income REIT Corp., REIT | 380,452 | 15,541,463 |
Equity LifeStyle Properties, Inc., REIT | 278,548 | 19,526,215 |
Equity Residential, REIT | 385,248 | 28,192,449 |
Independence Realty Trust, Inc., REIT | 399,770 | 7,775,526 |
Invitation Homes, Inc., REIT | 952,421 | 34,553,834 |
Mid-America Apartment Communities, Inc., REIT | 111,734 | 18,510,972 |
Realty Income Corp., REIT | 777,365 | 53,078,483 |
Sun Communities, Inc., REIT | 277,008 | 42,578,900 |
UDR, Inc., REIT | 1,013,334 | 45,468,296 |
280,124,498 | ||
Diversified — 18.7% | ||
Duke Realty Corp., REIT | 810,899 | 47,721,406 |
Equinix, Inc., REIT | 109,962 | 72,285,720 |
SBA Communications Corp., REIT | 34,691 | 11,283,248 |
Weyerhaeuser Co., REIT | 90,547 | 3,093,085 |
WP Carey, Inc., REIT | 465,524 | 39,117,982 |
173,501,441 | ||
Health Care — 12.9% | ||
Healthcare Realty Trust, Inc., REIT | 1,112,239 | 27,049,652 |
Ventas, Inc., REIT | 1,080,347 | 51,705,407 |
Welltower, Inc., REIT | 532,087 | 40,784,469 |
119,539,528 | ||
Hotels — 3.4% | ||
DiamondRock Hospitality Co., REIT * | 767,666 | 6,701,724 |
Host Hotels & Resorts, Inc., REIT | 1,145,331 | 20,352,532 |
Sunstone Hotel Investors, Inc., REIT * | 464,214 | 5,055,291 |
32,109,547 | ||
Industrial — 14.2% | ||
First Industrial Realty Trust, Inc., REIT | 174,997 | 8,868,848 |
Prologis, Inc., REIT | 641,982 | 79,933,179 |
Rexford Industrial Realty, Inc., REIT | 687,741 | 42,784,367 |
131,586,394 | ||
INVESTMENTS | SHARES | VALUE($) |
Office — 4.7% | ||
Alexandria Real Estate Equities, Inc., REIT | 229,799 | 35,251,166 |
Kilroy Realty Corp., REIT | 173,057 | 8,439,990 |
43,691,156 | ||
Shopping Centers — 4.2% | ||
Kimco Realty Corp., REIT | 867,483 | 18,286,542 |
Kite Realty Group Trust, REIT | 1,063,492 | 20,589,205 |
38,875,747 | ||
Storage — 7.9% | ||
Public Storage, REIT | 221,990 | 73,440,952 |
Total Common Stocks (Cost $726,637,696) | 892,869,263 | |
Short-Term Investments — 3.8% | ||
Investment Companies — 3.8% | ||
JPMorgan Prime Money Market Fund Class IM Shares, 2.30% (a) (b) (Cost $34,890,560) | 61,762 | 34,899,420 |
Total Investments — 100.0% (Cost $761,528,256) | 927,768,683 | |
Other Assets Less Liabilities — 0.0% ^ | 111,798 | |
NET ASSETS — 100.0% | 927,880,481 | |
Percentages indicated are based on net assets. |
Abbreviations | |
REIT | Real Estate Investment Trust |
^ | Amount rounds to less than 0.1% of net assets. | |
* | Non-income producing security. | |
(a) | Investment in an affiliated fund, which is registered under the Investment Company Act of 1940, as amended, and is advised by J.P. Morgan Investment Management Inc. | |
(b) | The rate shown is the current yield as of August 31, 2022. | |
August 31, 2022 | Realty Income ETF | 31 |
AS OF August 31, 2022 (Unaudited)
JPMorgan Inflation Managed Bond ETF | JPMorgan Realty Income ETF | |
ASSETS: | ||
Investments in non-affiliates, at value | $990,819,743 | $892,869,263 |
Investments in affiliates, at value | 25,870,574 | 34,899,420 |
Cash | 274,468 | 61,765 |
Receivables: | ||
Investment securities sold | 54,348 | — |
Fund shares sold | 1,213 | — |
Interest from non-affiliates | 3,759,253 | — |
Dividends from non-affiliates | — | 567,448 |
Dividends from affiliates | 1,726 | 2,197 |
Prepaid expenses | 1,130 | 8,787 |
Total Assets | 1,020,782,455 | 928,408,880 |
LIABILITIES: | ||
Payables: | ||
Investment securities purchased | 244,962 | 61,787 |
Fund shares redeemed | 2,425,400 | — |
Variation margin on futures contracts | 933,153 | — |
Variation margin on centrally cleared swaps | 974,870 | — |
Accrued liabilities: | ||
Investment advisory fees | 112,876 | 328,925 |
Administration fees | 67,582 | 63,568 |
Printing and mailing costs | 2,824 | 39,375 |
Custodian and accounting fees | 53,459 | 21,943 |
Trustees’ and Chief Compliance Officer’s fees | 262 | 181 |
Other | 52,834 | 12,620 |
Total Liabilities | 4,868,222 | 528,399 |
Net Assets | $1,015,914,233 | $927,880,481 |
32 | J.P. Morgan Exchange-Traded Funds | August 31, 2022 |
JPMorgan Inflation Managed Bond ETF | JPMorgan Realty Income ETF | |
NET ASSETS: | ||
Paid-in-Capital | $1,067,438,829 | $597,602,406 |
Total distributable earnings (loss) | (51,524,596) | 330,278,075 |
Total Net Assets | $1,015,914,233 | $927,880,481 |
Outstanding number of shares (unlimited number of shares authorized - par value $0.0001) (a) (b) | 20,943,210 | 18,822,859 |
Net asset value, per share | $48.51 | $49.30 |
Cost of investments in non-affiliates | $1,046,018,249 | $726,637,696 |
Cost of investments in affiliates | 25,863,283 | 34,890,560 |
Net upfront payments on centrally cleared swaps | 310,545 | — |
August 31, 2022 | J.P. Morgan Exchange-Traded Funds | 33 |
FOR THE SIX MONTHS ENDED August 31, 2022 (Unaudited)
JPMorgan Inflation Managed Bond ETF (a) | JPMorgan Realty Income ETF (b) | |
INVESTMENT INCOME: | ||
Interest income from non-affiliates | $25,684,801 | $70 |
Interest income from affiliates | 295 | 5,536 |
Dividend income from non-affiliates | — | 14,601,203 |
Dividend income from affiliates | 125,096 | 174,883 |
Income from securities lending (net) (See Note 2.B) | — | 144 |
Total investment income | 25,810,192 | 14,781,836 |
EXPENSES: | ||
Investment advisory fees | 1,545,505 | 3,551,198 |
Administration fees | 413,978 | 443,900 |
Distribution fees (See Note 3.F) | 16,322 | 19,878 |
Service fees (See Note 3.D) | 68,635 | 59,482 |
Custodian and accounting fees | 98,381 | 30,076 |
Interest expense to non-affiliates | 826 | — |
Interest expense to affiliates | 306 | — |
Professional fees | 42,117 | 30,351 |
Trustees’ and Chief Compliance Officer’s fees | 14,596 | 14,517 |
Printing and mailing costs | 30,357 | 60,179 |
Registration and filing fees | 67,429 | 75,738 |
Transfer agency fees (See Note 2.F) | 1,437 | 6,019 |
Other | 13,276 | 32,432 |
Total expenses | 2,313,165 | 4,323,770 |
Less fees waived | (152,174) | (174,124) |
Less expense reimbursements | (606,973) | (585,593) |
Net expenses | 1,554,018 | 3,564,053 |
Net investment income (loss) | 24,256,174 | 11,217,783 |
34 | J.P. Morgan Exchange-Traded Funds | August 31, 2022 |
JPMorgan Inflation Managed Bond ETF (a) | JPMorgan Realty Income ETF (b) | |
REALIZED/UNREALIZED GAINS (LOSSES): | ||
Net realized gain (loss) on transactions from: | ||
Investments in non-affiliates | $(13,073,259) | $166,289,559 |
Investments in affiliates | 2,727 | (9,725) |
In-kind redemptions of investments in non-affiliates (See Note 4) | (741,813) | 56,093,947 |
Futures contracts | (21,192,920) | — |
Swaps | 35,855,839 | — |
Net realized gain (loss) | 850,574 | 222,373,781 |
Change in net unrealized appreciation/depreciation on: | ||
Investments in non-affiliates | (51,348,821) | (357,180,471) |
Investments in affiliates | 1,148 | 9,249 |
Futures contracts | (3,610,286) | — |
Swaps | (16,231,391) | — |
Change in net unrealized appreciation/depreciation | (71,189,350) | (357,171,222) |
Net realized/unrealized gains (losses) | (70,338,776) | (134,797,441) |
Change in net assets resulting from operations | $(46,082,602) | $(123,579,658) |
August 31, 2022 | J.P. Morgan Exchange-Traded Funds | 35 |
FOR THE PERIODS INDICATED
JPMorgan Inflation Managed Bond ETF | JPMorgan Realty Income ETF | |||
Six Months Ended August 31, 2022 (Unaudited)(a) | Year Ended February 28, 2022 (a) | Six Months Ended August 31, 2022 (Unaudited)(b) | Year Ended February 28, 2022 (b) | |
CHANGE IN NET ASSETS RESULTING FROM OPERATIONS: | ||||
Net investment income (loss) | 24,256,174 | 33,058,100 | 11,217,783 | 18,870,161 |
Net realized gain (loss) | 850,574 | 61,666,081 | 222,373,781 | 271,663,607 |
Change in net unrealized appreciation/depreciation | (71,189,350) | (39,670,845) | (357,171,222) | 174,696,642 |
Change in net assets resulting from operations | (46,082,602) | 55,053,336 | (123,579,658) | 465,230,410 |
Total distributions to shareholders | (18,524,934) | (33,229,570) | (140,469,232) | (155,134,166) |
CAPITAL TRANSACTIONS: | ||||
Change in net assets resulting from capital transactions | (86,636,588) | (255,104,251) | (350,348,930) | (676,938,664) |
NET ASSETS: | ||||
Change in net assets | (151,244,124) | (233,280,485) | (614,397,820) | (366,842,420) |
Beginning of period | 1,167,158,357 | 1,400,438,842 | 1,542,278,301 | 1,909,120,721 |
End of period | 1,015,914,233 | 1,167,158,357 | 927,880,481 | 1,542,278,301 |
36 | J.P. Morgan Exchange-Traded Funds | August 31, 2022 |
JPMorgan Inflation Managed Bond ETF | JPMorgan Realty Income ETF | |||
Six Months Ended August 31, 2022 (Unaudited)(a) | Year Ended February 28, 2022(a) | Six Months Ended August 31, 2022 (Unaudited)(b) | Year Ended February 28, 2022(b) | |
CAPITAL TRANSACTIONS: (c) (d) | ||||
Proceeds from shares issued | $54,337,307 | $109,028,137 | $46,011,321 | $141,320,325 |
Distributions reinvested | 2,379,990 | 27,014,278 | 116,182,036 | 140,755,402 |
Cost of shares redeemed | (126,413,160) | (429,007,482) | (642,110,153) | (757,325,764) |
Change in net assets resulting from capital transactions | (69,695,863) | (292,965,067) | (479,916,796) | (475,250,037) |
Class A | ||||
Proceeds from shares issued | 327,168 | 35,274,598 | 556,975 | 5,773,141 |
Distributions reinvested | 112,969 | 738,032 | 2,660,213 | 1,922,502 |
Cost of shares redeemed | (4,796,467) | (12,335,362) | (3,873,369) | (4,276,243) |
Change in net assets resulting from Class A capital transactions | (4,356,330) | 23,677,268 | (656,181) | 3,419,400 |
Class C | ||||
Proceeds from shares issued | 368,640 | 2,772,443 | 112,851 | 1,898,686 |
Distributions reinvested | 12,667 | 57,816 | 425,744 | 275,902 |
Cost of shares redeemed | (394,486) | (601,781) | (405,113) | (778,352) |
Change in net assets resulting from Class C capital transactions | (13,179) | 2,228,478 | 133,482 | 1,396,236 |
Class I | ||||
Proceeds from shares issued | 8,724,880 | 72,398,399 | 129,926,978 | 96,820,415 |
Distributions reinvested | 477,895 | 4,669,819 | 13,727,046 | 7,912,362 |
Cost of shares redeemed | (18,917,128) | (66,652,083) | (3,968,685) | (304,095,084) |
Change in net assets resulting from Class I capital transactions | (9,714,353) | 10,416,135 | 139,685,339 | (199,362,307) |
Class L | ||||
Proceeds from shares issued | — | — | 454,227 | 6,327,061 |
Distributions reinvested | — | — | 3,503,082 | 2,681,565 |
Cost of shares redeemed | — | — | (8,909,073) | (17,936,072) |
Change in net assets resulting from Class L capital transactions | — | — | (4,951,764) | (8,927,446) |
August 31, 2022 | J.P. Morgan Exchange-Traded Funds | 37 |
FOR THE PERIODS INDICATED (continued)
JPMorgan Inflation Managed Bond ETF | JPMorgan Realty Income ETF | |||
Six Months Ended August 31, 2022 (Unaudited)(a) | Year Ended February 28, 2022(a) | Six Months Ended August 31, 2022 (Unaudited)(b) | Year Ended February 28, 2022(b) | |
CAPITAL TRANSACTIONS: (c) (d) (continued) | ||||
Class R5 | ||||
Proceeds from shares issued | $218,011 | $4,616,313 | $290,370 | $2,595,870 |
Distributions reinvested | 6,602 | 80,590 | 1,343,475 | 1,090,495 |
Cost of shares redeemed | (3,081,476) | (3,157,968) | (6,276,855) | (1,900,876) |
Change in net assets resulting from Class R5 capital transactions | (2,856,863) | 1,538,935 | (4,643,010) | 1,785,489 |
Total change in net assets resulting from capital transactions | $(86,636,588) | $(255,104,251) | $(350,348,930) | $(676,938,665) |
38 | J.P. Morgan Exchange-Traded Funds | August 31, 2022 |
JPMorgan Inflation Managed Bond ETF | JPMorgan Realty Income ETF | |||
Six Months Ended August 31, 2022 (Unaudited)(a) | Year Ended February 28, 2022(a) | Six Months Ended August 31, 2022 (Unaudited)(b) | Year Ended February 28, 2022(b) | |
SHARES TRANSACTIONS: (c) (d) | ||||
Issued | 1,078,252 | 10,013,533 | 746,419 | 9,095,815 |
Reinvested | 47,051 | 2,475,521 | 2,310,713 | 8,644,053 |
Redeemed | (2,544,105) | (39,414,895) | (10,807,768) | (46,884,614) |
Change in Shares | (1,418,802) | (26,925,841) | (7,750,636) | (29,144,746) |
Class A | ||||
Issued | 6,350 | 3,223,923 | 8,864 | 362,649 |
Reinvested | 2,233 | 67,689 | 53,046 | 119,427 |
Redeemed | (94,521) | (1,135,134) | (73,337) | (276,648) |
Change in Class A Shares | (85,938) | 2,156,478 | (11,427) | 205,428 |
Class C | ||||
Issued | 7,128 | 255,541 | 1,671 | 122,967 |
Reinvested | 250 | 5,338 | 8,495 | 17,913 |
Redeemed | (7,815) | (55,875) | (7,226) | (52,699) |
Change in Class C Shares | (437) | 205,004 | 2,940 | 88,181 |
Class I | ||||
Issued | 170,457 | 6,653,148 | 1,964,395 | 6,323,956 |
Reinvested | 9,449 | 428,645 | 274,216 | 489,166 |
Redeemed | (372,698) | (6,117,885) | (69,363) | (18,743,708) |
Change in Class I Shares | (192,792) | 963,908 | 2,169,248 | (11,930,586) |
Class L | ||||
Issued | — | — | 6,979 | 386,631 |
Reinvested | — | — | 69,818 | 164,742 |
Redeemed | — | — | (170,346) | (1,169,957) |
Change in Class L Shares | — | — | (93,549) | (618,584) |
August 31, 2022 | J.P. Morgan Exchange-Traded Funds | 39 |
FOR THE PERIODS INDICATED (continued)
JPMorgan Inflation Managed Bond ETF | JPMorgan Realty Income ETF | |||
Six Months Ended August 31, 2022 (Unaudited)(a) | Year Ended February 28, 2022(a) | Six Months Ended August 31, 2022 (Unaudited)(b) | Year Ended February 28, 2022(b) | |
SHARES TRANSACTIONS: (c) (d) (continued) | ||||
Class R5 | ||||
Issued | 4,219 | 421,764 | 4,497 | 163,570 |
Reinvested | 131 | 7,367 | 26,820 | 66,491 |
Redeemed | (61,097) | (290,549) | (120,979) | (117,089) |
Change in Class R5 Shares | (56,747) | 138,582 | (89,662) | 112,972 |
40 | J.P. Morgan Exchange-Traded Funds | August 31, 2022 |
FOR THE PERIODS INDICATED
Per share operating performance (a) | ||||||
Investment operations | Distributions | |||||
Net asset value, beginning of period | Net investment income (loss) (c) | Net realized and unrealized gains (losses) on investments | Total from investment operations | Net investment income | Net realized gain | |
JPMorgan Inflation Managed Bond ETF(h) | ||||||
Six Months Ended August 31, 2022(Unaudited) | $51.43 | $1.11 | $(3.19) | $(2.08) | $(0.84) | $— |
Year Ended February 28, 2022 | 50.58 | 1.27 | 0.85 | 2.12 | (1.27) | — |
Year Ended February 28, 2021 | 49.26 | 0.94 | 1.32 | 2.26 | (0.94) | — |
Year Ended February 29, 2020 | 47.33 | 1.27 | 1.93 | 3.20 | (1.27) | — |
Year Ended February 28, 2019 | 47.85 | 1.18 | (0.52) | 0.66 | (1.18) | — |
Year Ended February 28, 2018 | 48.79 | 1.04 | (0.90) | 0.14 | (1.08) | — |
JPMorgan Realty Income ETF(j) | ||||||
Six Months Ended August 31, 2022(Unaudited) | 62.71 | 0.55 | (6.90) | (6.35) | (0.16) | (6.90) |
Year Ended February 28, 2022 | 54.76 | 0.64 | 13.05 | 13.69 | (0.80) | (4.94) |
Year Ended February 28, 2021 | 54.40 | 0.84 | 1.89 | 2.73 | (0.72) | (1.65) |
Year Ended February 29, 2020 | 54.92 | 1.12 | 3.53 | 4.65 | (1.20) | (3.97) |
September 1, 2018 through February 28, 2019 (k) | 54.44 | 0.52 | 0.60 | 1.12 | (0.64) | — |
Year Ended August 31, 2018 | 53.24 | 1.20 | 1.24 | 2.44 | (1.24) | — |
(a) | Per share amounts reflect the conversion of the JPMorgan Inflation Managed Bond Fund into the JPMorgan Inflation Managed Bond ETF as of the close of business on April 8, 2022 and the conversion of the JPMorgan Realty Income Fund into the JPMorgan Realty Income ETF as of the close of business on May 20, 2022. See Note 1. |
(b) | Annualized for periods less than one year, unless otherwise noted. |
(c) | Calculated based upon average shares outstanding. |
(d) | Includes adjustments in accordance with accounting principles generally accepted in the United States of America and as such, the net asset values for financial reporting purposes and the returns based upon those net asset values may differ from the net asset values and returns for shareholder transactions. |
(e) | JPMorgan Inflation Managed Bond ETF acquired all of the assets and liabilities of the JPMorgan Inflation Managed Bond Fund (“Predecessor Fund”) in a reorganization that occurred as of the close of business on April 8, 2022. Market price returns are calculated using the official closing price of the JPMorgan Inflation Managed Bond ETF on the listing exchange as of the time that the JPMorgan Inflation Managed Bond ETF's NAV is calculated. Prior to the JPMorgan Inflation Managed Bond ETF's listing on April, 11, 2022, the NAV performance of the Class R6 Shares of the Predecessor Fund are used as proxy market price returns. |
(f) | JPMorgan Realty Income ETF acquired all of the assets and liabilities of the JPMorgan Realty Income Fund (“Predecessor Fund”) in a reorganization that occurred as of the close of business on May 20, 2022. Market price returns are calculated using the official closing price of the JPMorgan Realty Income ETF on the listing exchange as of the time that the JPMorgan Realty Income ETF's NAV is calculated. Prior to the JPMorgan Realty Income ETF's listing on May 23, 2022, the NAV performance of the Class R6 Shares of the Predecessor Fund are used as proxy market price returns. |
(g) | Not annualized for periods less than one year. |
(h) | JPMorgan Inflation Managed Bond ETF (the “Fund”) acquired all of the assets and liabilities of the JPMorgan Inflation Managed Bond Fund (“Predecessor Fund”) in a reorganization that occurred as of the close of business on April 8, 2022. Performance and financial history of the Predecessor Fund’s Class R6 Shares have been adopted by the Fund and will be used going forward. As a result, the financial highlight information reflects that of the Predecessor Fund’s Class R6 Shares for the period March 1, 2017 up through the reorganization. |
(i) | Certain non-recurring expenses incurred by the Fund were not annualized for the period indicated. |
(j) | JPMorgan Realty Income ETF (the “Fund”) acquired all of the assets and liabilities of the JPMorgan Realty Income Fund (“Predecessor Fund”) in a reorganization that occurred as of the close of business on May 20, 2022. Performance and financial history of the Predecessor Fund’s Class R6 Shares have been adopted by the Fund and will be used going forward. As a result, the financial highlight information reflects that of the Predecessor Fund’s Class R6 Shares for the period September 1, 2017 up through the reorganization. |
(k) | The Fund changed its fiscal year end from August 31st to the last day of February. |
42 | J.P. Morgan Exchange-Traded Funds | August 31, 2022 |
Per share operating performance (a) | Ratios/Supplemental data | ||||||||
Distributions | Ratios to average net assets (b) | ||||||||
Total Distributions | Net asset value, end of period | Market price, end of period | Total Return(d) (g) | Market price total return(e) (f) (g) | Net assets, end of period | Net expenses | Net investment income (loss) | Expenses without waivers and reimbursements | Portfolio turnover rate(g) |
$(0.84) | $48.51 | $48.40 | (4.06)% | (4.28)% | $1,015,914,233 | 0.26%(i) | 4.46%(i) | 0.40%(i) | 75% |
(1.27) | 51.43 | 51.43 | 4.23 | 4.23 | 897,545,065 | 0.34 | 2.49 | 0.39 | 159 |
(0.94) | 50.58 | 50.58 | 4.70 | 4.70 | 1,172,320,983 | 0.34 | 1.93 | 0.38 | 89 |
(1.27) | 49.26 | 49.26 | 6.84 | 6.84 | 1,169,195,274 | 0.42 | 2.62 | 0.44 | 146 |
(1.18) | 47.33 | 47.33 | 1.41 | 1.41 | 859,081,298 | 0.47 | 2.46 | 0.47 | 74 |
(1.08) | 47.85 | 47.85 | 0.31 | 0.31 | 1,199,611,618 | 0.45 | 2.14 | 0.47 | 68 |
(7.06) | 49.30 | 49.29 | (10.29) | (10.31) | 927,880,481 | 0.59(i) | 1.94(i) | 0.72(i) | 38 |
(5.74) | 62.71 | 62.71 | 24.69 | 24.69 | 1,450,453,154 | 0.68 | 0.98 | 0.70 | 59 |
(2.37) | 54.76 | 54.76 | 5.38 | 5.38 | 1,663,701,422 | 0.68 | 1.67 | 0.70 | 90 |
(5.17) | 54.40 | 54.40 | 8.23 | 8.23 | 1,289,280,883 | 0.68 | 1.92 | 0.76 | 71 |
(0.64) | 54.92 | 54.92 | 2.13 | 2.13 | 2,238,096,452 | 0.67 | 1.99 | 0.85 | 50 |
(1.24) | 54.44 | 54.44 | 4.79 | 4.79 | 2,325,640,388 | 0.68 | 2.34 | 0.85 | 107 |
August 31, 2022 | J.P. Morgan Exchange-Traded Funds | 43 |
AS OF August 31, 2022 (Unaudited)
Diversification Classification | |
JPMorgan Inflation Managed Bond ETF | Diversified |
JPMorgan Realty Income ETF | Non-Diversified |
Acquired Fund | Fund | Closing Date |
JPMorgan Inflation Managed Bond Fund | JPMorgan Inflation Managed Bond ETF | April 8, 2022 |
JPMorgan Realty Income Fund | JPMorgan Realty Income ETF | May 20, 2022 |
Listing Exchange | |
Inflation Managed Bond ETF | Cboe BZX Exchange, Inc. |
Realty Income ETF | NYSE Arca |
44 | J.P. Morgan Exchange-Traded Funds | August 31, 2022 |
Shares per Creation Unit | |
Inflation Managed Bond ETF | 50,000 |
Realty Income ETF | 25,000 |
August 31, 2022 | J.P. Morgan Exchange-Traded Funds | 45 |
AS OF August 31, 2022 (Unaudited) (continued)
Inflation Managed Bond ETF | ||||
Level 1 Quoted prices | Level 2 Other significant observable inputs | Level 3 Significant unobservable inputs | Total | |
Investments in Securities | ||||
Asset-Backed Securities | $— | $104,396,240 | $7,990,971 | $112,387,211 |
Collateralized Mortgage Obligations | — | 60,896,864 | 1,057,438 | 61,954,302 |
Commercial Mortgage-Backed Securities | — | 111,654,693 | — | 111,654,693 |
Corporate Bonds | — | 283,181,456 | — | 283,181,456 |
Foreign Government Securities | — | 2,674,318 | — | 2,674,318 |
Mortgage-Backed Securities | — | 78,083,863 | — | 78,083,863 |
U.S. Government Agency Securities | — | 13,228,878 | — | 13,228,878 |
U.S. Treasury Obligations | — | 327,655,022 | — | 327,655,022 |
Short-Term Investments | ||||
Investment Companies | 25,870,574 | — | — | 25,870,574 |
Total Investments in Securities | $25,870,574 | $981,771,334 | $9,048,409 | $1,016,690,317 |
Appreciation in Other Financial Instruments | ||||
Futures Contracts | $177,331 | $— | $— | $177,331 |
Swaps | — | 2,102,391 | — | 2,102,391 |
Depreciation in Other Financial Instruments | ||||
Futures Contracts | (2,192,194) | — | — | (2,192,194) |
Swaps | — | (868,508) | — | (868,508) |
Total Net Appreciation/ Depreciation in Other Financial Instruments | $(2,014,863) | $1,233,883 | $— | $(780,980) |
Realty Income ETF | ||||
Level 1 Quoted prices | Level 2 Other significant observable inputs | Level 3 Significant unobservable inputs | Total | |
Total Investments in Securities (a) | $927,768,683 | $— | $— | $927,768,683 |
(a) | Please refer to the SOI for specifics of portfolio holdings. |
46 | J.P. Morgan Exchange-Traded Funds | August 31, 2022 |
Inflation Managed Bond ETF | Balance as of February 28, 2022 | Realized gain (loss) | Change in net unrealized appreciation (depreciation) | Net accretion (amortization) | Purchases1 | Sales2 | Transfers into Level 3 | Transfers out of Level 3 | Balance as of August 31, 2022 |
Investments in Securities: | |||||||||
Asset-Backed Securities | $5,714,010 | $— | $(395,198) | $1,975 | $1,171,994 | $(137,867) | $3,864,154 | $(2,228,097) | $7,990,971 |
Collateralized Mortgage Obligations | 499,673 | — | (23,155) | (648) | 387,720 | (107,648) | 800,832 | (499,336) | 1,057,438 |
Total | $6,163,683 | $— | $(418,353) | $1,327 | $1,559,714 | $(245,515) | $4,664,986 | $(2,677,433) | $9,048,409 |
1 | Purchases include all purchases of securities and securities received in corporate actions. | ||||||||
2 | Sales include all sales of securities, maturities, paydowns and securities tendered in corporate actions. | ||||||||
Managed
Bond ETF
Fair Value at August 31, 2022 | Valuation Technique(s) | Unobservable Input | Range (Weighted Average) (a) | |
$7,990,971 | Discounted Cash Flow | Constant Prepayment Rate | 0.00% - 10.00% (2.30%) | |
Yield (Discount Rate of Cash Flows) | 4.48% - 6.69% (6.06%) | |||
Asset-Backed Securities | 7,990,971 | |||
1,057,438 | Discounted Cash Flow | Constant Prepayment Rate | 100.00% - 150.00% (115.81%) | |
Yield (Discount Rate of Cash Flows) | 4.25% - 4.61% (4.39%) | |||
Collateralized Mortgage Obligations | 1,057,438 | |||
Total | $9,048,409 |
(a) | Unobservable inputs were weighted by the relative fair value of the instruments. |
August 31, 2022 | J.P. Morgan Exchange-Traded Funds | 47 |
AS OF August 31, 2022 (Unaudited) (continued)
Realty Income ETF | $146 |
48 | J.P. Morgan Exchange-Traded Funds | August 31, 2022 |
Inflation Managed Bond ETF | |||||||||
For the six months ended August 31, 2022* | |||||||||
Security Description | Value at February 28, 2022 | Purchases at Cost | Proceeds from Sales | Net Realized Gain (Loss) | Change in Unrealized Appreciation/ (Depreciation) | Value at August 31, 2022 | Shares at August 31, 2022 | Dividend Income | Capital Gain Distributions |
JPMorgan Prime Money Market Fund Class IM Shares, 2.30% (a) (b) | $— | $210,557,926 | $184,693,711 | $(931) | $7,290 | $25,870,574 | 25,860,229 | $120,826 | $— |
JPMorgan Prime Money Market Fund Class Institutional Shares, 2.24% (a) (b) | 20,605,752 | 67,013,404 | 87,616,672 | 3,658 | (6,142) | — | — | 4,270 | — |
Total | $20,605,752 | $277,571,330 | $272,310,383 | $2,727 | $1,148 | $25,870,574 | $125,096 | $— | |
(a) | Investment in an affiliated fund, which is registered under the Investment Company Act of 1940, as amended, and is advised by J.P. Morgan Investment Management Inc. |
(b) | The rate shown is the current yield as of August 31, 2022. |
* | As of the close of business on April 8, 2022, JPMorgan Inflation Managed Bond Fund (the "Acquired fund"), a series of Trust I Funds, reorganized ("the Reorganization") into a newly created exchange-traded fund, JPMorgan Inflation Managed Bond ETF (the "Fund"). Following the Reorganization, the Acquired Fund's performance and financial history were adopted by the Fund. The tables include transactions from the Acquired Fund for the period March 1, 2021 through April 8, 2022. |
Realty Income ETF | |||||||||
For the six months ended August 31, 2022** | |||||||||
Security Description | Value at February 28, 2022 | Purchases at Cost | Proceeds from Sales | Net Realized Gain (Loss) | Change in Unrealized Appreciation/ (Depreciation) | Value at August 31, 2022 | Shares at August 31, 2022 | Dividend Income | Capital Gain Distributions |
JPMorgan Prime Money Market Fund Class IM Shares, 2.30% (a) (b) | $28,286,016 | $424,596,576 | $417,982,696 | $(9,725) | $9,249 | $34,899,420 | 61,762 | $174,883 | $— |
JPMorgan U.S. Government Money Market Fund Class IM Shares, 2.00% (a) (b) | — | 203,049 | 203,049 | — | — | — | — | — | — |
Total | $28,286,016 | $424,799,625 | $418,185,745 | $(9,725) | $9,249 | $34,899,420 | $174,883 | $— | |
(a) | Investment in an affiliated fund, which is registered under the Investment Company Act of 1940, as amended, and is advised by J.P. Morgan Investment Management Inc. |
(b) | The rate shown is the current yield as of August 31, 2022. |
** | As of the close of business on May 20, 2022, JPMorgan Realty Income (the "Acquired fund"), a series of Undiscovered Managers Funds, reorganized ("the Reorganization") into a newly created exchange-traded fund, JPMorgan Realty Income ETF (the "Fund"). Following the Reorganization, the Acquired Fund's performance and financial history were adopted by the Fund. The tables include transactions from the Acquired Fund for the period March 1, 2021 through May 20, 2022. |
August 31, 2022 | J.P. Morgan Exchange-Traded Funds | 49 |
AS OF August 31, 2022 (Unaudited) (continued)
50 | J.P. Morgan Exchange-Traded Funds | August 31, 2022 |
Inflation Managed Bond ETF | |
Futures Contracts: | |
Average Notional Balance Long | $313,331,502 |
Average Notional Balance Short | (204,395,978) |
Ending Notional Balance Long | 254,178,063 |
Ending Notional Balance Short | (65,785,000) |
Interest Rate-Related Swaps (Inflation-Linked Swaps): | |
Average Notional Balance - Pays Fixed Rate | 731,343,714 |
Ending Notional Balance - Pays Fixed Rate | 561,300,000 |
Class A | Class C | Class I | Class L | Class R5 | ETF Shares | Total | |
Inflation Managed Bond ETF | |||||||
Transfer agency fees | $189 | $72 | $300 | n/a | $16 | $860 | $1,437 |
Realty Income ETF | |||||||
Transfer agency fees | 1,478 | 130 | 1,765 | $450 | 204 | 1,992 | 6,019 |
August 31, 2022 | J.P. Morgan Exchange-Traded Funds | 51 |
AS OF August 31, 2022 (Unaudited) (continued)
Inflation Managed Bond ETF | 0.28% |
Realty Income ETF | 0.60 |
Class A | Class C | |
Inflation Managed Bond ETF | 0.25% | 0.75% |
Realty Income ETF | 0.25 | 0.75 |
52 | J.P. Morgan Exchange-Traded Funds | August 31, 2022 |
Class A | Class C | Class I | Class L | Class R5 | |
Inflation Managed Bond ETF | 0.25% | 0.25% | 0.25% | n/a | 0.10% |
Realty Income ETF | 0.25 | 0.25 | 0.25 | 0.10% | 0.10 |
Class A | Class C | Class I | Class L | Class R5 | Class R6 | |
Inflation Managed Bond ETF | 0.75% | 1.40% | 0.55% | n/a | 0.45% | 0.35% |
Realty Income ETF | 1.18 | 1.68 | 0.93 | 0.78% | 0.78 | 0.68 |
Contractual Waivers | Voluntary Waivers | |||||
Investment Advisory Fees | Administration Fees | Service Fees | Total | Contractual Reimbursements | 12b-1 | |
Inflation Managed Bond ETF | $74,098 | $36,676 | $16,061 | $126,835 | $606,973 | $16,322 |
Realty Income ETF | 90,559 | 45,010 | 3,809 | 139,378 | 585,593 | 19,878 |
August 31, 2022 | J.P. Morgan Exchange-Traded Funds | 53 |
AS OF August 31, 2022 (Unaudited) (continued)
Inflation Managed Bond ETF | $8,155 |
Realty Income ETF | 13,997 |
Inflation Managed Bond ETF | $862 |
Realty Income ETF | 871 |
Purchases (excluding U.S. Government) | Sales (excluding U.S. Government) | Purchases of U.S. Government | Sales of U.S. Government | |
Inflation Managed Bond ETF | $36,046,405 | $145,462,494 | $614,570,149 | $581,735,626 |
Realty Income ETF | 292,380,237 | 295,915,623 | — | — |
In-Kind Creations | In-Kind Redemptions | |
Inflation Managed Bond ETF | $4,243,738 | $24,379,510 |
Realty Income ETF | 3,696,965 | 160,382,459 |
54 | J.P. Morgan Exchange-Traded Funds | August 31, 2022 |
Aggregate Cost | Gross Unrealized Appreciation | Gross Unrealized Depreciation | Net Unrealized Appreciation (Depreciation) | |
Inflation Managed Bond ETF | $1,072,192,077 | $2,421,768 | $58,393,963 | $(55,972,195) |
Realty Income ETF | 761,528,256 | 190,295,584 | 24,055,157 | 166,240,427 |
Net Capital Losses | Late Year Ordinary Loss Deferral | ||
Short-Term | Long-Term | ||
Inflation Managed Bond ETF | $— | $1,738,180 | $— |
Realty Income ETF | — | — | 787,509 |
Capital Loss Utilized | ||
Short-Term | Long-Term | |
Inflation Managed Bond ETF | $61,768,490 | $— |
Realty Income ETF | 30,822,563 | 4,114,912 |
August 31, 2022 | J.P. Morgan Exchange-Traded Funds | 55 |
AS OF August 31, 2022 (Unaudited) (continued)
56 | J.P. Morgan Exchange-Traded Funds | August 31, 2022 |
August 31, 2022 | J.P. Morgan Exchange-Traded Funds | 57 |
(Unaudited)
Hypothetical $1,000 Investment
Beginning Account Value March 1, 2022 | Ending Account Value August 31, 2022 | Expenses Paid During the Period* | Annualized Expense Ratio | |
JPMorgan Inflation Managed Bond ETF | ||||
Actual | $1,000.00 | $959.40 | $1.28 | 0.26% |
Hypothetical | 1,000.00 | 1,023.89 | 1.33 | 0.26 |
JPMorgan Realty Income ETF | ||||
Actual | 1,000.00 | 897.10 | 2.82 | 0.59 |
Hypothetical | 1,000.00 | 1,022.23 | 3.01 | 0.59 |
* | Expenses are equal to the Fund’s annualized expense ratio, multiplied by the average account value over the period, multiplied by 184/365 (to reflect the one-half year period). |
58 | J.P. Morgan Exchange-Traded Funds | August 31, 2022 |
(Unaudited)
August 31, 2022 | J.P. Morgan Exchange-Traded Funds | 59 |
(Unaudited) (continued)
60 | J.P. Morgan Exchange-Traded Funds | August 31, 2022 |


ITEM 2. CODE OF ETHICS.
Not applicable to a semi-annual report.
ITEM 3. AUDIT COMMITTEE FINANCIAL EXPERT.
Not applicable to a semi-annual report.
ITEM 4. PRINCIPAL ACCOUNTANT FEES AND SERVICES.
Not applicable to a semi-annual report.
ITEM 5. AUDIT COMMITTEE OF LISTED REGISTRANTS.
Not applicable to a semi-annual report.
ITEM 6. SCHEDULE OF INVESTMENTS.
File Schedule I – Investments in securities of unaffiliated issuers as of the close of the reporting period as set forth in Section 210.12-12 of Regulation S-X, unless the schedule is included as part of the report to shareholders filed under Item 1 of this Form.
Included in Item 1.
ITEM 7. DISCLOSURE OF PROXY VOTING POLICIES AND PROCEDURES FOR CLOSED-END MANAGEMENT INVESTMENT COMPANIES.
Not applicable.
ITEM 8. PORTFOLIO MANAGERS OF CLOSED-END MANAGEMENT INVESTMENT COMPANIES.
Not applicable.
ITEM 9. PURCHASE OF EQUITY SECURITIES BY CLOSED-END MANAGEMENT INVESTMENT COMPANY AND AFFILIATED PURCHASERS.
Not applicable.
ITEM 10. SUBMISSION OF MATTERS TO A VOTE OF SECURITY HOLDERS.
Describe any material changes to the procedures by which shareholders may recommend nominees to the registrant`s board of directors, where those changes were implemented after the registrant last provided disclosure in response to the requirements of Item 7(d)(2)(ii)(G) of Schedule 14A (17 CFR 240.14a-101), or this Item.
No material changes to report.
ITEM 11. CONTROLS AND PROCEDURES.
(a) Disclose the conclusions of the registrant’s principal executive and principal financial officers, or persons performing similar functions, regarding the effectiveness of the registrant’s disclosure controls and procedures (as defined in Rule 30a-3(c) under the Act (17 CFR 270.30a-3(c))) as of a date within 90 days of the filing date of the report that includes the disclosure required by this paragraph, based on the evaluation of these controls and procedures required by Rule 30a-3(b) under the Act (17 CFR 270.30a-3(b)) and Rules 13a-15(b) or 15d-15(b) under the Exchange Act (17 CFR 240.13a-15(b) or 240.15d-15(b)).
The Registrant’s principal executive and principal financial officers have concluded, based on their evaluation of the Registrant’s disclosure controls and procedures as of a date within 90 days of the filing date of this report, that the Registrant’s disclosure controls and procedures are reasonably designed to ensure that information required to be disclosed by the Registrant on Form N-CSR is recorded, processed, summarized and reported within the required time periods and that information required to be disclosed by the Registrant in the reports that it files or submits on Form N-CSR is accumulated and communicated to the Registrant’s management, including its principal executive and principal financial officers, as appropriate to allow timely decisions regarding required disclosure.
(b) Disclose any change in the registrant’s internal control over financial reporting (as defined in Rule 30a-3(d) under the Act (17 CFR 270.30a-3(d)) that occurred during the period covered by this report that has materially affected, or is reasonably likely to materially affect, the registrant’s internal control over financial reporting.
There were no changes in the Registrant’s internal control over financial reporting that occurred during the period covered by this report that have materially affected, or are reasonably likely to materially affect, the Registrant’s internal control over financial reporting.
ITEM 12. DISCLOSURE OF SECURITIES LENDING ACTIVITIES FOR CLOSED-END MANAGEMENT INVESTMENT COMPANIES.
Not applicable.
ITEM 13. EXHIBITS.
| (a) | File the exhibits listed below as part of this Form. Letter or number the exhibits in the sequence indicated. |
(1) Any code of ethics, or amendment thereto, that is the subject of the disclosure required by Item 2, to the extent that the registrant intends to satisfy the Item 2 requirements through filing of an exhibit.
Not applicable.
(2) A separate certification for each principal executive officer and principal financial officer of the registrant as required by Rule 30a-2(a) under the Act (17 CFR 270.30a-2), exactly as set forth below:
(1) Any written solicitation to purchase securities under Rule 23c-1 under the Act (17 CFR 270.23c-1) sent or given during the period covered by the report by or on behalf of the registrant to 10 or more persons.
Not applicable.
(2) Change in the registrant’s independent public accountant. Provide the information called for by Item 4 of Form 8-K under the Exchange Act (17 CFR 249.308). Unless otherwise specified by Item 4, or related to and necessary for a complete understanding of information not previously disclosed, the information should relate to events occurring during the reporting period.
Not applicable.
| (b) | A separate or combined certification for each principal executive officer and principal officer of the registrant as required by Rule 30a-2(b) under the Act of 1940. |
SIGNATURES
Pursuant to the requirements of the Securities Exchange Act of 1934 and the Investment Company Act of 1940, the registrant has duly caused this report to be signed on its behalf by the undersigned, thereunto duly authorized.
J.P. Morgan Exchange-Traded Fund Trust
| By: | /s/ Brian S. Shlissel | |
| Brian S. Shlissel | ||
| President and Principal Executive Officer | ||
| November 3, 2022 |
Pursuant to the requirements of the Securities Exchange Act of 1934 and the Investment Company Act of 1940, this report has been signed below by the following persons on behalf of the registrant and in the capacities and on the dates indicated.
| By: | /s/ Brian S. Shlissel | |
| Brian S. Shlissel | ||
| President and Principal Executive Officer | ||
| November 3, 2022 | ||
| By: | /s/ Timothy J. Clemens | |
| Timothy J. Clemens | ||
| Treasurer and Principal Financial Officer | ||
| November 3, 2022 | ||