UNITED STATES
SECURITIES AND EXCHANGE COMMISSION
Washington, D.C. 20549
FORM N-CSR
CERTIFIED SHAREHOLDER REPORT OF REGISTERED
MANAGEMENT INVESTMENT COMPANIES
Investment Company Act file number: 811-22903
J.P. Morgan Exchange-Traded Fund Trust
(Exact name of registrant as specified in charter)
277 Park Avenue
New York, NY 10172
(Address of principal executive offices) (Zip code)
Gregory S. Samuels
J.P. Morgan Investment Management Inc.
277 Park Avenue
New York, NY 10172
(Name and Address of Agent for Service)
With copies to:
Elizabeth A. Davin, Esq. | Jon S. Rand, Esq. | |
JPMorgan Chase & Co. | Dechert LLP | |
1111 Polaris Parkway | 1095 Avenue of the Americas | |
Columbus, OH 43240 | New York, NY 10036 |
Registrant’s telephone number, including area code: 1-844-457-6383
Date of fiscal year end: June 30
Date of reporting period: July 1, 2022 through December 31, 2022
Form N-CSR is to be used by management investment companies to file reports with the Commission not later than 10 days after the transmission to stockholders of any report that is required to be transmitted to stockholders under Rule 30e-1 under the Investment Company Act of 1940 (17 CFR 270.30e-1). The Commission may use the information provided on Form N-CSR in its regulatory, disclosure review, inspection, and policymaking roles.
A registrant is required to disclose the information specified by Form N-CSR, and the Commission will make this information public. A registrant is not required to respond to the collection of information contained in Form N-CSR unless the Form displays a currently valid Office of Management and Budget (“OMB”) control number. Please direct comments concerning the accuracy of the information collection burden estimate and any suggestions for reducing the burden to Secretary, Securities and Exchange Commission, 450 Fifth Street, NW, Washington, DC 20549-0609. The OMB has reviewed this collection of information under the clearance requirements of 44 U.S.C. Section 3507.
ITEM 1. REPORTS TO STOCKHOLDERS.
a.) The following is a copy of the report transmitted to shareholders pursuant to Rule 30e-1 under the Investment Company Act of 1940 (17 CFR 270.30e-1).
b.) A copy of the notice transmitted to shareholders in reliance on Rule 30e-3 under the 1940 Act that contains disclosures specified by paragraph (c)(3) of that rule is included in the Annual Report. Not Applicable. Notices do not incorporate disclosures from the shareholder reports.
Fund | Ticker | Listing Exchange |
JPMorgan ActiveBuilders U.S. Large Cap Equity ETF | JUSA | NYSE Arca |
JPMorgan Active Growth ETF | JGRO | NYSE Arca |
JPMorgan Active Value ETF | JAVA | NYSE Arca |
JPMorgan Equity Premium Income ETF | JEPI | NYSE Arca |
JPMorgan Nasdaq Equity Premium Income ETF | JEPQ | Nasdaq Stock Market® LLC |

1 | |
2 | |
3 | |
3 | |
6 | |
9 | |
12 | |
15 | |
18 | |
37 | |
44 | |
46 | |
56 | |
57 | |
61 |
Past performance is no guarantee of future performance. The general market views expressed in this report are opinions based on market and other conditions through the end of the reporting period and are subject to change without notice. These views are not intended to predict the future performance of a Fund or the securities markets.
Prospective investors should refer to the Funds’ prospectuses for a discussion of the Funds’ investment objectives, strategies and risks. Call J.P. Morgan Exchange-Traded Funds at (844) 457-6383 for a prospectus containing more complete information about a Fund, including management fees and other expenses. Please read it carefully before investing.
Shares are bought and sold throughout the day on an exchange at market price (not at net asset value) through a brokerage account, and are not individually subscribed and redeemed from a Fund. Shares may only be subscribed and redeemed directly from a Fund by Authorized Participants, in very large creation/redemption units. Brokerage commissions will reduce returns.
February 13, 2023 (Unaudited)
 | “Investors may face continued economic and geopolitical challenges in the year ahead. However, some of the acute risks encountered in 2022 appear to have receded and last year’s reset in asset prices may provide attractive investment opportunities.” — Brian S. Shlissel |

President - J.P. Morgan Exchange-Traded Funds
J.P. Morgan Asset Management
1-844-4JPM-ETF or jpmorgan.com/etfs for more information
December 31, 2022 | J.P. Morgan Exchange-Traded Funds | 1 |
SIX MONTHS ENDED December 31, 2022 (Unaudited)
2 | J.P. Morgan Exchange-Traded Funds | December 31, 2022 |
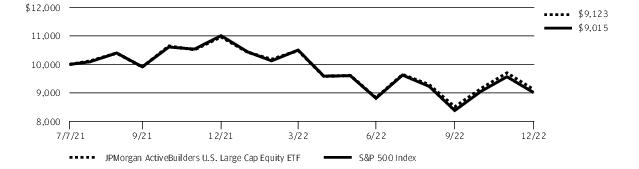
SIX MONTHS ENDED DECEMBER 31, 2022 (Unaudited)
REPORTING PERIOD RETURN: | |
Net Asset Value * | 3.28% |
Market Price ** | 3.45% |
S&P 500 Index | 2.31% |
Net Assets as of 12/31/2022 | $24,075,020 |
Fund Ticker | JUSA |
December 31, 2022 | J.P. Morgan Exchange-Traded Funds | 3 |
SIX MONTHS ENDED DECEMBER 31, 2022 (Unaudited) (continued)
TOP TEN HOLDINGS OF THE PORTFOLIO AS OF December 31, 2022 | PERCENT OF TOTAL INVESTMENTS | |
1. | Microsoft Corp. | 6.0% |
2. | Apple, Inc. | 5.2 |
3. | AbbVie, Inc. | 2.8 |
4. | UnitedHealth Group, Inc. | 2.7 |
5. | Amazon.com, Inc. | 2.3 |
6. | Alphabet, Inc., Class A | 2.1 |
7. | ConocoPhillips | 2.0 |
8. | Coca-Cola Co. (The) | 1.7 |
9. | Deere & Co. | 1.6 |
10. | NextEra Energy, Inc. | 1.6 |
PORTFOLIO COMPOSITION BY SECTOR AS OF December 31, 2022 | PERCENT OF TOTAL INVESTMENTS |
Information Technology | 23.0% |
Health Care | 18.4 |
Financials | 12.2 |
Consumer Discretionary | 11.9 |
Industrials | 9.9 |
Communication Services | 5.7 |
Energy | 5.5 |
Consumer Staples | 4.7 |
Utilities | 3.2 |
Materials | 3.2 |
Real Estate | 1.9 |
Short-Term Investments | 0.4 |
4 | J.P. Morgan Exchange-Traded Funds | December 31, 2022 |
INCEPTION DATE | SIX MONTHS* | 1 YEAR | SINCE INCEPTION | |
JPMorgan ActiveBuilders U.S. Large Cap Equity ETF | ||||
Net Asset Value | July 7, 2021 | 3.28% | (16.78)% | (6.00)% |
Market Price | 3.45 | (16.89) | (6.02) |
* | Not annualized. |
December 31, 2022 | J.P. Morgan Exchange-Traded Funds | 5 |
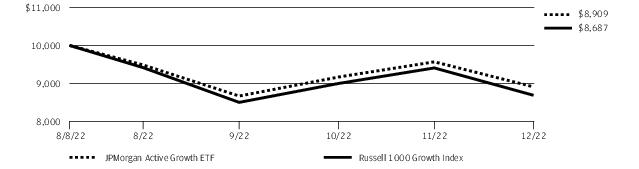
FOR THE PERIOD AUGUST 8, 2022 (FUND INCEPTION) THROUGH DECEMBER 31, 2022 (Unaudited)
REPORTING PERIOD RETURN: | |
Net Asset Value * | (10.91)% |
Market Price ** | (10.91)% |
Russell 1000 Growth Index | (13.13)% |
Net Assets as of 12/31/2022 | $139,938,629 |
Fund Ticker | JGRO |
Shares of SVB Financial Group, a regional banking and financial services company, fell after the company reported lower-than-expected revenue for the third quarter of 2022 and amid investor concern about the company’s exposure to the information technology sector. Shares of Catalent, a pharmaceuticals maker, fell after the company reported lower-than-expected earnings and revenue for the third quarter of 2022 and lowered its forecast for the full year. Shares of Visa, a credit card and financial transactions processor, rose after the company reported better-than-expected earnings and revenue for its fiscal fourth quarter, increased its quarterly dividend by 20% and unveiled a $12 billion share repurchase plan.
6 | J.P. Morgan Exchange-Traded Funds | December 31, 2022 |
TOP TEN HOLDINGS OF THE PORTFOLIO AS OF December 31, 2022 | PERCENT OF TOTAL INVESTMENTS | |
1. | Apple, Inc. | 7.9% |
2. | Microsoft Corp. | 7.8 |
3. | Alphabet, Inc., Class C | 3.6 |
4. | Amazon.com, Inc. | 3.3 |
5. | UnitedHealth Group, Inc. | 2.7 |
6. | Deere & Co. | 2.6 |
7. | Regeneron Pharmaceuticals, Inc. | 2.3 |
8. | Eli Lilly & Co. | 2.2 |
9. | Charles Schwab Corp. (The) | 2.0 |
10. | McKesson Corp. | 1.9 |
PORTFOLIO COMPOSITION BY SECTOR AS OF December 31, 2022 | PERCENT OF TOTAL INVESTMENTS |
Information Technology | 33.5% |
Health Care | 21.5 |
Consumer Discretionary | 13.1 |
Industrials | 9.5 |
Financials | 6.0 |
Communication Services | 4.4 |
Energy | 3.3 |
Consumer Staples | 3.1 |
Materials | 1.5 |
Short-Term Investments | 4.1 |
December 31, 2022 | J.P. Morgan Exchange-Traded Funds | 7 |
FOR THE PERIOD AUGUST 8, 2022 (FUND INCEPTION) THROUGH DECEMBER 31, 2022 (Unaudited) (continued)
INCEPTION DATE | CUMULATIVE SINCE INCEPTION | |
JPMorgan Active Growth ETF | ||
Net Asset Value | August 8, 2022 | (10.91)% |
Market Price | (10.91) |
8 | J.P. Morgan Exchange-Traded Funds | December 31, 2022 |
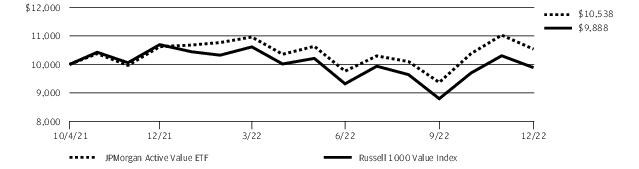
SIX MONTHS ENDED DECEMBER 31, 2022 (Unaudited)
REPORTING PERIOD RETURN: | |
Net Asset Value * | 7.94% |
Market Price ** | 8.12% |
Russell 1000 Value Index | 6.11% |
Net Assets as of 12/31/2022 | $302,386,680 |
Fund Ticker | JAVA |
December 31, 2022 | J.P. Morgan Exchange-Traded Funds | 9 |
SIX MONTHS ENDED DECEMBER 31, 2022 (Unaudited) (continued)
TOP TEN HOLDINGS OF THE PORTFOLIO AS OF December 31, 2022 | PERCENT OF TOTAL INVESTMENTS | |
1. | Bristol-Myers Squibb Co. | 2.9% |
2. | Wells Fargo & Co. | 2.7 |
3. | Exxon Mobil Corp. | 2.5 |
4. | Berkshire Hathaway, Inc., Class B | 2.4 |
5. | Raytheon Technologies Corp. | 2.0 |
6. | AbbVie, Inc. | 2.0 |
7. | Chevron Corp. | 1.9 |
8. | Bank of America Corp. | 1.9 |
9. | Charter Communications, Inc., Class A | 1.4 |
10. | ConocoPhillips | 1.4 |
PORTFOLIO COMPOSITION BY SECTOR AS OF December 31, 2022 | PERCENT OF TOTAL INVESTMENTS |
Financials | 21.1% |
Health Care | 17.9 |
Industrials | 12.2 |
Energy | 9.2 |
Consumer Discretionary | 7.1 |
Consumer Staples | 6.7 |
Communication Services | 5.5 |
Materials | 5.2 |
Information Technology | 5.1 |
Utilities | 4.7 |
Real Estate | 3.0 |
Short-Term Investments | 2.3 |
10 | J.P. Morgan Exchange-Traded Funds | December 31, 2022 |
INCEPTION DATE | SIX MONTHS* | 1 YEAR | SINCE INCEPTION | |
JPMorgan Active Value ETF | ||||
Net Asset Value | October 4, 2021 | 7.94% | (0.78)% | 4.32% |
Market Price | 8.12 | (0.88) | 4.28 |
* | Not annualized. |
December 31, 2022 | J.P. Morgan Exchange-Traded Funds | 11 |
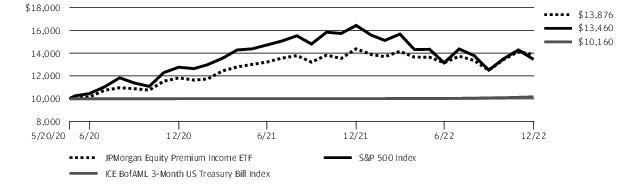
SIX MONTHS ENDED December 31, 2022 (Unaudited)
REPORTING PERIOD RETURN: | |
Net Asset Value * | 5.48% |
Market Price ** | 5.56% |
S&P 500 Index | 2.31% |
ICE BofAML 3-Month US Treasury Bill Index | 1.32% |
Net Assets as of 12/31/2022 | $17,485,138,199 |
Fund Ticker | JEPI |
12 | J.P. Morgan Exchange-Traded Funds | December 31, 2022 |
**** | Equity-Linked Notes that are linked to the S&P 500 Index. |
TOP TEN HOLDINGS OF THE PORTFOLIO AS OF December 31, 2022 | PERCENT OF TOTAL INVESTMENTS | |
1. | AbbVie, Inc. | 1.6% |
2. | Progressive Corp. (The) | 1.6 |
3. | Exxon Mobil Corp. | 1.6 |
4. | UnitedHealth Group, Inc. | 1.5 |
5. | Coca-Cola Co. (The) | 1.5 |
6. | Hershey Co. (The) | 1.5 |
7. | PepsiCo, Inc. | 1.5 |
8. | Honeywell International, Inc. | 1.4 |
9. | Bristol-Myers Squibb Co. | 1.4 |
10. | Eli Lilly & Co. | 1.4 |
PORTFOLIO COMPOSITION BY SECTOR AS OF December 31, 2022 | PERCENT OF TOTAL INVESTMENTS |
Industrials | 12.4% |
Health Care | 12.3 |
Consumer Staples | 11.6 |
Information Technology | 10.8 |
Financials | 10.3 |
Utilities | 7.8 |
Consumer Discretionary | 5.6 |
Communication Services | 3.7 |
Materials | 3.3 |
Energy | 2.8 |
Real Estate | 2.6 |
Other **** | 15.3 |
Short-Term Investments | 1.5 |
December 31, 2022 | J.P. Morgan Exchange-Traded Funds | 13 |
SIX MONTHS ENDED December 31, 2022 (Unaudited) (continued)
INCEPTION DATE | SIX MONTHS* | 1 YEAR | SINCE INCEPTION | |
JPMorgan Equity Premium Income ETF | ||||
Net Asset Value | May 20, 2020 | 5.48% | (3.54)% | 13.34% |
Market Price | 5.56 | (3.52) | 13.36 |
* | Not annualized. |
14 | J.P. Morgan Exchange-Traded Funds | December 31, 2022 |
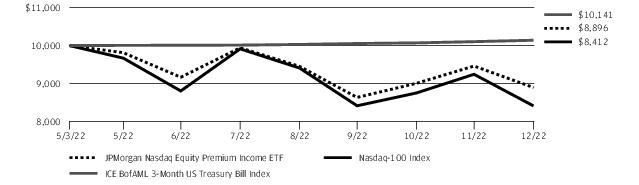
SIX MONTHS ENDED DECEMBER 31, 2022 (Unaudited)
REPORTING PERIOD RETURN: | |
Net Asset Value * | (2.96)% |
Market Price ** | (3.51)% |
Nasdaq-100 Index® | (4.46)% |
ICE BofAML 3-Month US Treasury Bill Index | 1.32% |
Net Assets as of 12/31/2022 | $1,004,291,637 |
Fund Ticker | JEPQ |
December 31, 2022 | J.P. Morgan Exchange-Traded Funds | 15 |
SIX MONTHS ENDED DECEMBER 31, 2022 (Unaudited) (continued)
**** | Equity-Linked Notes that are linked to the Nasdaq-100 Index. |
ELN | Equity-Linked Note |
TOP TEN HOLDINGS OF THE PORTFOLIO AS OF December 31, 2022 | PERCENT OF TOTAL INVESTMENTS | |
1. | Microsoft Corp. | 10.5% |
2. | Apple, Inc. | 8.8 |
3. | Alphabet, Inc., Class C | 6.6 |
4. | Amazon.com, Inc. | 5.0 |
5. | UBS AG, ELN, 97.50%, 2/7/2023, (linked to Nasdaq-100 Index) (Switzerland) | 4.6 |
6. | Citigroup Global Markets Holdings, Inc., ELN, 103.55%, 1/31/2023, (linked to Nasdaq-100 Index) | 4.1 |
7. | BofA Finance LLC, ELN, 91.38%, 1/10/2023, (linked to Nasdaq-100 Index) | 3.5 |
8. | BNP Paribas, ELN, 92.00%, 1/24/2023, (linked to Nasdaq-100 Index) | 3.0 |
9. | NVIDIA Corp. | 2.4 |
10. | Tesla, Inc. | 2.1 |
PORTFOLIO COMPOSITION BY SECTOR AS OF December 31, 2022 | PERCENT OF TOTAL INVESTMENTS |
Information Technology | 39.4% |
Communication Services | 12.3 |
Consumer Discretionary | 11.6 |
Health Care | 6.2 |
Consumer Staples | 5.3 |
Industrials | 3.7 |
Utilities | 1.6 |
Real Estate | 0.4 |
Energy | 0.4 |
Other **** | 17.3 |
Short-Term Investments | 1.8 |
16 | J.P. Morgan Exchange-Traded Funds | December 31, 2022 |
INCEPTION DATE | SIX MONTHS* | SINCE INCEPTION | |
JPMorgan Nasdaq Equity Premium Income ETF | |||
Net Asset Value | May 3, 2022 | (2.96)% | (11.04)% |
Market Price | (3.51) | (11.01) |
* | Not annualized. |
December 31, 2022 | J.P. Morgan Exchange-Traded Funds | 17 |
AS OF December 31, 2022 (Unaudited)
INVESTMENTS | SHARES | VALUE($) |
Common Stocks — 99.4% | ||
Aerospace & Defense — 1.7% | ||
General Dynamics Corp. | 303 | 75,177 |
Northrop Grumman Corp. | 269 | 146,769 |
Raytheon Technologies Corp. | 1,520 | 153,399 |
Textron, Inc. | 380 | 26,904 |
402,249 | ||
Air Freight & Logistics — 0.9% | ||
United Parcel Service, Inc., Class B | 1,193 | 207,391 |
Airlines — 0.2% | ||
Southwest Airlines Co. * | 1,119 | 37,677 |
Auto Components — 0.0% ^ | ||
Magna International, Inc. (Canada) | 210 | 11,798 |
Automobiles — 1.0% | ||
Tesla, Inc. * | 2,027 | 249,686 |
Banks — 4.2% | ||
Bank of America Corp. | 3,879 | 128,473 |
Citigroup, Inc. | 817 | 36,953 |
Citizens Financial Group, Inc. | 438 | 17,244 |
Fifth Third Bancorp | 756 | 24,804 |
M&T Bank Corp. | 170 | 24,660 |
PNC Financial Services Group, Inc. (The) | 287 | 45,329 |
SVB Financial Group * | 205 | 47,179 |
Truist Financial Corp. | 6,049 | 260,288 |
US Bancorp | 4,333 | 188,962 |
Wells Fargo & Co. | 5,719 | 236,138 |
1,010,030 | ||
Beverages — 2.5% | ||
Coca-Cola Co. (The) | 6,508 | 413,974 |
Constellation Brands, Inc., Class A | 135 | 31,286 |
Monster Beverage Corp. * | 929 | 94,322 |
PepsiCo, Inc. | 382 | 69,012 |
608,594 | ||
Biotechnology — 5.9% | ||
AbbVie, Inc. | 4,132 | 667,772 |
Alnylam Pharmaceuticals, Inc. * | 112 | 26,617 |
Amgen, Inc. | 513 | 134,734 |
Biogen, Inc. * | 126 | 34,892 |
BioMarin Pharmaceutical, Inc. * | 67 | 6,934 |
Neurocrine Biosciences, Inc. * | 61 | 7,286 |
Regeneron Pharmaceuticals, Inc. * | 494 | 356,416 |
INVESTMENTS | SHARES | VALUE($) |
Biotechnology — continued | ||
Seagen, Inc. * | 225 | 28,915 |
Vertex Pharmaceuticals, Inc. * | 558 | 161,139 |
1,424,705 | ||
Building Products — 1.0% | ||
Masco Corp. | 357 | 16,661 |
Trane Technologies plc | 1,289 | 216,668 |
233,329 | ||
Capital Markets — 4.8% | ||
Ameriprise Financial, Inc. | 374 | 116,452 |
BlackRock, Inc. | 117 | 82,910 |
Blackstone, Inc. | 456 | 33,831 |
Charles Schwab Corp. (The) | 2,109 | 175,595 |
CME Group, Inc. | 182 | 30,605 |
Goldman Sachs Group, Inc. (The) | 146 | 50,134 |
Intercontinental Exchange, Inc. | 334 | 34,265 |
Morgan Stanley | 3,970 | 337,529 |
MSCI, Inc. | 52 | 24,189 |
Raymond James Financial, Inc. | 182 | 19,447 |
S&P Global, Inc. | 634 | 212,352 |
State Street Corp. | 185 | 14,350 |
T. Rowe Price Group, Inc. | 284 | 30,973 |
1,162,632 | ||
Chemicals — 2.0% | ||
Air Products and Chemicals, Inc. | 274 | 84,463 |
Axalta Coating Systems Ltd. * | 2,294 | 58,428 |
DuPont de Nemours, Inc. | 212 | 14,550 |
Eastman Chemical Co. | 1,067 | 86,897 |
Linde plc (United Kingdom) | 190 | 61,974 |
PPG Industries, Inc. | 1,066 | 134,039 |
Sherwin-Williams Co. (The) | 161 | 38,210 |
478,561 | ||
Commercial Services & Supplies — 0.1% | ||
Cintas Corp. | 22 | 9,936 |
Republic Services, Inc. | 203 | 26,185 |
36,121 | ||
Communications Equipment — 0.1% | ||
Motorola Solutions, Inc. | 66 | 17,009 |
Construction Materials — 0.6% | ||
Martin Marietta Materials, Inc. | 35 | 11,829 |
Vulcan Materials Co. | 763 | 133,609 |
145,438 | ||
18 | J.P. Morgan Exchange-Traded Funds | December 31, 2022 |
INVESTMENTS | SHARES | VALUE($) |
Common Stocks — continued | ||
Consumer Finance — 0.6% | ||
American Express Co. | 742 | 109,631 |
Capital One Financial Corp. | 490 | 45,550 |
155,181 | ||
Containers & Packaging — 0.1% | ||
Avery Dennison Corp. | 54 | 9,774 |
Ball Corp. | 331 | 16,927 |
26,701 | ||
Diversified Financial Services — 0.8% | ||
Berkshire Hathaway, Inc., Class B * | 638 | 197,078 |
Diversified Telecommunication Services — 0.4% | ||
Verizon Communications, Inc. | 2,196 | 86,522 |
Electric Utilities — 2.4% | ||
Entergy Corp. | 148 | 16,650 |
FirstEnergy Corp. | 233 | 9,772 |
NextEra Energy, Inc. | 4,553 | 380,631 |
PG&E Corp. * | 3,775 | 61,381 |
Xcel Energy, Inc. | 1,689 | 118,416 |
586,850 | ||
Electrical Equipment — 1.2% | ||
Eaton Corp. plc | 1,687 | 264,774 |
Rockwell Automation, Inc. | 124 | 31,939 |
296,713 | ||
Electronic Equipment, Instruments & Components — 0.4% | ||
Amphenol Corp., Class A | 945 | 71,952 |
Corning, Inc. | 226 | 7,219 |
TE Connectivity Ltd. (Switzerland) | 83 | 9,528 |
88,699 | ||
Energy Equipment & Services — 0.7% | ||
Baker Hughes Co. | 5,586 | 164,955 |
Entertainment — 0.3% | ||
Netflix, Inc. * | 133 | 39,219 |
Walt Disney Co. (The) * | 279 | 24,239 |
63,458 | ||
Equity Real Estate Investment Trusts (REITs) — 1.9% | ||
AvalonBay Communities, Inc. | 74 | 11,953 |
Camden Property Trust | 65 | 7,272 |
Equinix, Inc. | 33 | 21,616 |
Equity LifeStyle Properties, Inc. | 188 | 12,145 |
Host Hotels & Resorts, Inc. | 1,425 | 22,871 |
Prologis, Inc. | 2,454 | 276,639 |
INVESTMENTS | SHARES | VALUE($) |
Equity Real Estate Investment Trusts (REITs) — continued | ||
SBA Communications Corp. | 129 | 36,160 |
Sun Communities, Inc. | 119 | 17,017 |
UDR, Inc. | 435 | 16,848 |
Ventas, Inc. | 966 | 43,518 |
466,039 | ||
Food & Staples Retailing — 0.4% | ||
Costco Wholesale Corp. | 120 | 54,780 |
Walmart, Inc. | 335 | 47,500 |
102,280 | ||
Food Products — 0.3% | ||
Hershey Co. (The) | 41 | 9,495 |
Mondelez International, Inc., Class A | 1,019 | 67,916 |
77,411 | ||
Health Care Equipment & Supplies — 2.6% | ||
Abbott Laboratories | 359 | 39,415 |
Baxter International, Inc. | 479 | 24,415 |
Becton Dickinson and Co. | 144 | 36,619 |
Boston Scientific Corp. * | 4,961 | 229,545 |
Dexcom, Inc. * | 298 | 33,745 |
Intuitive Surgical, Inc. * | 596 | 158,149 |
Medtronic plc | 868 | 67,461 |
Zimmer Biomet Holdings, Inc. | 345 | 43,987 |
633,336 | ||
Health Care Providers & Services — 5.3% | ||
Centene Corp. * | 411 | 33,706 |
Cigna Corp. | 188 | 62,292 |
CVS Health Corp. | 956 | 89,090 |
Elevance Health, Inc. | 181 | 92,848 |
HCA Healthcare, Inc. | 421 | 101,023 |
Humana, Inc. | 133 | 68,121 |
McKesson Corp. | 465 | 174,431 |
UnitedHealth Group, Inc. | 1,229 | 651,591 |
1,273,102 | ||
Hotels, Restaurants & Leisure — 2.4% | ||
Airbnb, Inc., Class A * | 139 | 11,885 |
Booking Holdings, Inc. * | 38 | 76,581 |
Chipotle Mexican Grill, Inc. * | 49 | 67,987 |
Expedia Group, Inc. * | 168 | 14,717 |
Marriott International, Inc., Class A | 916 | 136,383 |
McDonald's Corp. | 972 | 256,151 |
Yum! Brands, Inc. | 93 | 11,911 |
575,615 | ||
December 31, 2022 | J.P. Morgan Exchange-Traded Funds | 19 |
AS OF December 31, 2022 (Unaudited) (continued)
INVESTMENTS | SHARES | VALUE($) |
Common Stocks — continued | ||
Household Durables — 0.2% | ||
Lennar Corp., Class A | 265 | 23,982 |
Newell Brands, Inc. | 937 | 12,256 |
Toll Brothers, Inc. | 143 | 7,139 |
43,377 | ||
Household Products — 0.8% | ||
Colgate-Palmolive Co. | 583 | 45,935 |
Kimberly-Clark Corp. | 194 | 26,335 |
Procter & Gamble Co. (The) | 827 | 125,340 |
197,610 | ||
Industrial Conglomerates — 0.4% | ||
Honeywell International, Inc. | 400 | 85,720 |
Insurance — 1.7% | ||
Aon plc, Class A | 56 | 16,808 |
Chubb Ltd. | 237 | 52,282 |
Globe Life, Inc. | 101 | 12,176 |
Hartford Financial Services Group, Inc. (The) | 617 | 46,787 |
Loews Corp. | 348 | 20,299 |
Marsh & McLennan Cos., Inc. | 131 | 21,678 |
MetLife, Inc. | 538 | 38,935 |
Progressive Corp. (The) | 941 | 122,057 |
Prudential Financial, Inc. | 296 | 29,440 |
Travelers Cos., Inc. (The) | 274 | 51,372 |
411,834 | ||
Interactive Media & Services — 4.1% | ||
Alphabet, Inc., Class A * | 5,706 | 503,441 |
Alphabet, Inc., Class C * | 3,836 | 340,368 |
Meta Platforms, Inc., Class A * | 1,274 | 153,313 |
997,122 | ||
Internet & Direct Marketing Retail — 2.4% | ||
Amazon.com, Inc. * | 6,534 | 548,856 |
Etsy, Inc. * | 95 | 11,379 |
MercadoLibre, Inc. (Brazil) * | 27 | 22,848 |
583,083 | ||
IT Services — 3.1% | ||
Accenture plc, Class A | 243 | 64,842 |
Automatic Data Processing, Inc. | 322 | 76,913 |
Cognizant Technology Solutions Corp., Class A | 696 | 39,804 |
FleetCor Technologies, Inc. * | 134 | 24,613 |
International Business Machines Corp. | 809 | 113,980 |
INVESTMENTS | SHARES | VALUE($) |
IT Services — continued | ||
Mastercard, Inc., Class A | 967 | 336,255 |
Visa, Inc., Class A | 467 | 97,024 |
753,431 | ||
Life Sciences Tools & Services — 0.6% | ||
Danaher Corp. | 166 | 44,060 |
Thermo Fisher Scientific, Inc. | 194 | 106,834 |
150,894 | ||
Machinery — 2.4% | ||
Deere & Co. | 918 | 393,602 |
Dover Corp. | 560 | 75,829 |
Otis Worldwide Corp. | 338 | 26,469 |
Parker-Hannifin Corp. | 254 | 73,914 |
569,814 | ||
Media — 0.7% | ||
Charter Communications, Inc., Class A * | 102 | 34,588 |
Comcast Corp., Class A | 3,097 | 108,302 |
Trade Desk, Inc. (The), Class A * | 488 | 21,877 |
164,767 | ||
Metals & Mining — 0.5% | ||
Freeport-McMoRan, Inc. | 2,689 | 102,182 |
Nucor Corp. | 91 | 11,995 |
114,177 | ||
Multiline Retail — 0.9% | ||
Dollar General Corp. | 661 | 162,771 |
Target Corp. | 314 | 46,799 |
209,570 | ||
Multi-Utilities — 0.8% | ||
Ameren Corp. | 219 | 19,474 |
CenterPoint Energy, Inc. | 718 | 21,533 |
CMS Energy Corp. | 777 | 49,207 |
Public Service Enterprise Group, Inc. | 886 | 54,285 |
Sempra Energy | 243 | 37,553 |
182,052 | ||
Oil, Gas & Consumable Fuels — 4.8% | ||
Cheniere Energy, Inc. | 251 | 37,640 |
Chevron Corp. | 479 | 85,976 |
ConocoPhillips | 4,006 | 472,708 |
Coterra Energy, Inc. | 492 | 12,088 |
Diamondback Energy, Inc. | 322 | 44,043 |
EOG Resources, Inc. | 934 | 120,972 |
Exxon Mobil Corp. | 2,365 | 260,859 |
20 | J.P. Morgan Exchange-Traded Funds | December 31, 2022 |
INVESTMENTS | SHARES | VALUE($) |
Common Stocks — continued | ||
Oil, Gas & Consumable Fuels — continued | ||
Phillips 66 | 119 | 12,386 |
Pioneer Natural Resources Co. | 428 | 97,751 |
Valero Energy Corp. | 80 | 10,149 |
1,154,572 | ||
Personal Products — 0.1% | ||
Estee Lauder Cos., Inc. (The), Class A | 71 | 17,616 |
Pharmaceuticals — 3.9% | ||
Bristol-Myers Squibb Co. | 4,740 | 341,043 |
Eli Lilly & Co. | 822 | 300,721 |
Johnson & Johnson | 859 | 151,742 |
Merck & Co., Inc. | 656 | 72,783 |
Pfizer, Inc. | 1,211 | 62,052 |
928,341 | ||
Professional Services — 0.7% | ||
Booz Allen Hamilton Holding Corp. | 69 | 7,212 |
Equifax, Inc. | 88 | 17,104 |
Leidos Holdings, Inc. | 733 | 77,104 |
Verisk Analytics, Inc. | 318 | 56,101 |
157,521 | ||
Road & Rail — 1.4% | ||
CSX Corp. | 1,841 | 57,034 |
Norfolk Southern Corp. | 707 | 174,219 |
Uber Technologies, Inc. * | 3,451 | 85,343 |
Union Pacific Corp. | 127 | 26,298 |
342,894 | ||
Semiconductors & Semiconductor Equipment — 5.6% | ||
Advanced Micro Devices, Inc. * | 2,925 | 189,452 |
Analog Devices, Inc. | 768 | 125,975 |
ASML Holding NV (Registered), NYRS (Netherlands) | 164 | 89,610 |
Broadcom, Inc. | 26 | 14,537 |
Enphase Energy, Inc. * | 86 | 22,787 |
Lam Research Corp. | 234 | 98,350 |
Microchip Technology, Inc. | 301 | 21,145 |
Micron Technology, Inc. | 139 | 6,947 |
NVIDIA Corp. | 1,354 | 197,874 |
NXP Semiconductors NV (China) | 2,029 | 320,643 |
QUALCOMM, Inc. | 127 | 13,962 |
Teradyne, Inc. | 758 | 66,211 |
Texas Instruments, Inc. | 1,113 | 183,890 |
1,351,383 | ||
Software — 8.4% | ||
Adobe, Inc. * | 145 | 48,797 |
INVESTMENTS | SHARES | VALUE($) |
Software — continued | ||
Cadence Design Systems, Inc. * | 59 | 9,478 |
DocuSign, Inc. * | 132 | 7,315 |
Fortinet, Inc. * | 144 | 7,040 |
Intuit, Inc. | 399 | 155,299 |
Microsoft Corp. | 6,048 | 1,450,431 |
Oracle Corp. | 2,674 | 218,573 |
Salesforce, Inc. * | 315 | 41,766 |
Synopsys, Inc. * | 222 | 70,882 |
Workday, Inc., Class A * | 141 | 23,594 |
2,033,175 | ||
Specialty Retail — 4.1% | ||
AutoNation, Inc. * | 88 | 9,442 |
AutoZone, Inc. * | 105 | 258,949 |
Best Buy Co., Inc. | 330 | 26,469 |
Burlington Stores, Inc. * | 64 | 12,977 |
Home Depot, Inc. (The) | 309 | 97,601 |
Lowe's Cos., Inc. | 1,766 | 351,858 |
O'Reilly Automotive, Inc. * | 76 | 64,146 |
TJX Cos., Inc. (The) | 2,083 | 165,807 |
987,249 | ||
Technology Hardware, Storage & Peripherals — 5.3% | ||
Apple, Inc. | 9,702 | 1,260,581 |
Seagate Technology Holdings plc | 422 | 22,201 |
1,282,782 | ||
Textiles, Apparel & Luxury Goods — 0.9% | ||
NIKE, Inc., Class B | 1,485 | 173,760 |
Tapestry, Inc. | 865 | 32,939 |
206,699 | ||
Tobacco — 0.5% | ||
Altria Group, Inc. | 516 | 23,586 |
Philip Morris International, Inc. | 951 | 96,251 |
119,837 | ||
Wireless Telecommunication Services — 0.3% | ||
T-Mobile US, Inc. * | 456 | 63,840 |
Total Common Stocks (Cost $25,502,902) | 23,928,520 | |
December 31, 2022 | J.P. Morgan Exchange-Traded Funds | 21 |
AS OF December 31, 2022 (Unaudited) (continued)
INVESTMENTS | SHARES | VALUE($) |
Short-Term Investments — 0.4% | ||
Investment Companies — 0.4% | ||
JPMorgan U.S. Government Money Market Fund Class IM Shares, 4.12% (a) (b) (Cost $108,080) | 108,080 | 108,080 |
Total Investments — 99.8% (Cost $25,610,982) | 24,036,600 | |
Other Assets Less Liabilities — 0.2% | 38,420 | |
NET ASSETS — 100.0% | 24,075,020 | |
Percentages indicated are based on net assets. |
Abbreviations | |
NYRS | New York Registry Shares |
^ | Amount rounds to less than 0.1% of net assets. | |
* | Non-income producing security. | |
(a) | Investment in an affiliated fund, which is registered under the Investment Company Act of 1940, as amended, and is advised by J.P. Morgan Investment Management Inc. | |
(b) | The rate shown is the current yield as of December 31, 2022. | |
DESCRIPTION | NUMBER OF CONTRACTS | EXPIRATION DATE | TRADING CURRENCY | NOTIONAL AMOUNT ($) | VALUE AND UNREALIZED APPRECIATION (DEPRECIATION) ($) |
Long Contracts | |||||
Micro E-mini S&P 500 Index | 6 | 03/17/2023 | USD | 115,830 | (2,051) |
Abbreviations | |
USD | United States Dollar |
22 | J.P. Morgan Exchange-Traded Funds | December 31, 2022 |
AS OF December 31, 2022 (Unaudited)
INVESTMENTS | SHARES | VALUE($) |
Common Stocks — 95.9% | ||
Air Freight & Logistics — 0.7% | ||
United Parcel Service, Inc., Class B | 5,414 | 941,170 |
Automobiles — 1.6% | ||
Tesla, Inc. * | 18,242 | 2,247,050 |
Banks — 0.8% | ||
First Republic Bank | 3,191 | 388,951 |
SVB Financial Group * | 3,107 | 715,045 |
1,103,996 | ||
Beverages — 2.5% | ||
Coca-Cola Co. (The) | 29,946 | 1,904,865 |
Constellation Brands, Inc., Class A | 3,118 | 722,597 |
Monster Beverage Corp. * | 8,872 | 900,774 |
3,528,236 | ||
Biotechnology — 8.1% | ||
AbbVie, Inc. | 15,807 | 2,554,569 |
Alnylam Pharmaceuticals, Inc. * | 4,429 | 1,052,552 |
Amgen, Inc. | 6,978 | 1,832,702 |
Exact Sciences Corp. * | 12,301 | 609,023 |
Exelixis, Inc. * | 17,889 | 286,940 |
Horizon Therapeutics plc * | 10,303 | 1,172,481 |
Moderna, Inc. * | 350 | 62,867 |
Natera, Inc. * | 6,065 | 243,631 |
Regeneron Pharmaceuticals, Inc. * | 4,379 | 3,159,405 |
Seagen, Inc. * | 2,848 | 365,996 |
11,340,166 | ||
Building Products — 1.3% | ||
Trane Technologies plc | 10,885 | 1,829,660 |
Capital Markets — 4.5% | ||
Blackstone, Inc. | 14,419 | 1,069,745 |
Charles Schwab Corp. (The) | 34,038 | 2,834,004 |
Morgan Stanley | 14,993 | 1,274,705 |
MSCI, Inc. | 613 | 285,149 |
S&P Global, Inc. | 2,321 | 777,396 |
6,240,999 | ||
Chemicals — 0.3% | ||
Sherwin-Williams Co. (The) | 1,938 | 459,946 |
Commercial Services & Supplies — 0.6% | ||
Copart, Inc. * | 14,439 | 879,191 |
Communications Equipment — 0.2% | ||
Arista Networks, Inc. * | 2,418 | 293,424 |
Construction & Engineering — 1.0% | ||
Quanta Services, Inc. | 10,033 | 1,429,703 |
INVESTMENTS | SHARES | VALUE($) |
Consumer Finance — 0.1% | ||
Capital One Financial Corp. | 1,745 | 162,215 |
Electrical Equipment — 1.3% | ||
AMETEK, Inc. | 6,314 | 882,192 |
Hubbell, Inc. | 2,379 | 558,304 |
Rockwell Automation, Inc. | 1,490 | 383,779 |
1,824,275 | ||
Electronic Equipment, Instruments & Components — 1.3% | ||
Amphenol Corp., Class A | 11,413 | 868,986 |
Keysight Technologies, Inc. * | 2,768 | 473,522 |
Zebra Technologies Corp., Class A * | 1,591 | 407,948 |
1,750,456 | ||
Energy Equipment & Services — 0.2% | ||
Baker Hughes Co. | 9,216 | 272,149 |
Entertainment — 0.1% | ||
Take-Two Interactive Software, Inc. * | 893 | 92,988 |
Health Care Equipment & Supplies — 2.7% | ||
Cooper Cos., Inc. (The) | 2,017 | 666,961 |
Dexcom, Inc. * | 8,928 | 1,011,007 |
Insulet Corp. * | 1,880 | 553,453 |
Intuitive Surgical, Inc. * | 5,680 | 1,507,188 |
3,738,609 | ||
Health Care Providers & Services — 6.5% | ||
Centene Corp. * | 4,365 | 357,974 |
CVS Health Corp. | 11,078 | 1,032,359 |
HCA Healthcare, Inc. | 5,120 | 1,228,595 |
McKesson Corp. | 7,211 | 2,704,990 |
UnitedHealth Group, Inc. | 7,228 | 3,832,141 |
9,156,059 | ||
Hotels, Restaurants & Leisure — 2.7% | ||
Airbnb, Inc., Class A * | 1,601 | 136,885 |
Aramark | 13,628 | 563,382 |
Booking Holdings, Inc. * | 331 | 667,058 |
Chipotle Mexican Grill, Inc. * | 326 | 452,322 |
Hilton Worldwide Holdings, Inc. | 5,848 | 738,953 |
Marriott International, Inc., Class A | 5,870 | 873,984 |
Royal Caribbean Cruises Ltd. * | 6,065 | 299,793 |
3,732,377 | ||
Household Durables — 0.2% | ||
Garmin Ltd. | 3,569 | 329,383 |
Insurance — 0.6% | ||
Progressive Corp. (The) | 6,837 | 886,827 |
December 31, 2022 | J.P. Morgan Exchange-Traded Funds | 23 |
AS OF December 31, 2022 (Unaudited) (continued)
INVESTMENTS | SHARES | VALUE($) |
Common Stocks — continued | ||
Interactive Media & Services — 4.0% | ||
Alphabet, Inc., Class C * | 56,677 | 5,028,950 |
Bumble, Inc., Class A * | 17,155 | 361,113 |
Match Group, Inc. * | 1,050 | 43,564 |
Meta Platforms, Inc., Class A * | 720 | 86,645 |
Snap, Inc., Class A * | 1,704 | 15,251 |
5,535,523 | ||
Internet & Direct Marketing Retail — 3.6% | ||
Amazon.com, Inc. * | 54,512 | 4,579,008 |
Etsy, Inc. * | 1,216 | 145,652 |
MercadoLibre, Inc. (Brazil) * | 336 | 284,337 |
5,008,997 | ||
IT Services — 4.5% | ||
Automatic Data Processing, Inc. | 4,024 | 961,173 |
Block, Inc., Class A * | 459 | 28,843 |
Cognizant Technology Solutions Corp., Class A | 8,667 | 495,666 |
Global Payments, Inc. | 4,776 | 474,352 |
Globant SA * | 2,508 | 421,745 |
International Business Machines Corp. | 7,531 | 1,061,043 |
Mastercard, Inc., Class A | 6,993 | 2,431,676 |
MongoDB, Inc. * | 2,374 | 467,298 |
Shopify, Inc., Class A (Canada) * | 389 | 13,502 |
6,355,298 | ||
Life Sciences Tools & Services — 1.2% | ||
Mettler-Toledo International, Inc. * | 399 | 576,735 |
Thermo Fisher Scientific, Inc. | 1,992 | 1,096,974 |
1,673,709 | ||
Machinery — 3.4% | ||
Deere & Co. | 8,372 | 3,589,579 |
Ingersoll Rand, Inc. | 13,245 | 692,051 |
Toro Co. (The) | 4,384 | 496,269 |
4,777,899 | ||
Media — 0.4% | ||
Trade Desk, Inc. (The), Class A * | 12,334 | 552,933 |
Metals & Mining — 1.2% | ||
Freeport-McMoRan, Inc. | 43,058 | 1,636,204 |
Multiline Retail — 0.3% | ||
Target Corp. | 2,938 | 437,880 |
Oil, Gas & Consumable Fuels — 3.1% | ||
Cheniere Energy, Inc. | 7,302 | 1,095,008 |
INVESTMENTS | SHARES | VALUE($) |
Oil, Gas & Consumable Fuels — continued | ||
ConocoPhillips | 16,314 | 1,925,052 |
EOG Resources, Inc. | 9,651 | 1,249,997 |
4,270,057 | ||
Personal Products — 0.6% | ||
Estee Lauder Cos., Inc. (The), Class A | 3,305 | 820,004 |
Pharmaceuticals — 3.0% | ||
Eli Lilly & Co. | 8,460 | 3,095,006 |
Jazz Pharmaceuticals plc * | 3,153 | 502,304 |
Royalty Pharma plc, Class A | 14,847 | 586,754 |
4,184,064 | ||
Professional Services — 0.9% | ||
Equifax, Inc. | 3,098 | 602,127 |
Verisk Analytics, Inc. | 3,829 | 675,512 |
1,277,639 | ||
Road & Rail — 0.2% | ||
Old Dominion Freight Line, Inc. | 1,185 | 336,279 |
Semiconductors & Semiconductor Equipment — 5.7% | ||
Advanced Micro Devices, Inc. * | 21,568 | 1,396,959 |
ASML Holding NV (Registered), NYRS (Netherlands) | 848 | 463,347 |
Enphase Energy, Inc. * | 1,021 | 270,524 |
Entegris, Inc. | 5,646 | 370,321 |
Lam Research Corp. | 1,795 | 754,439 |
Marvell Technology, Inc. | 9,647 | 357,325 |
NVIDIA Corp. | 14,200 | 2,075,188 |
QUALCOMM, Inc. | 6,885 | 756,937 |
SolarEdge Technologies, Inc. * | 2,626 | 743,867 |
Texas Instruments, Inc. | 3,547 | 586,035 |
Wolfspeed, Inc. * | 3,714 | 256,415 |
8,031,357 | ||
Software — 13.9% | ||
Confluent, Inc., Class A * | 17,333 | 385,486 |
Crowdstrike Holdings, Inc., Class A * | 2,553 | 268,805 |
HubSpot, Inc. * | 1,113 | 321,802 |
Intuit, Inc. | 4,168 | 1,622,269 |
Microsoft Corp. | 45,257 | 10,853,534 |
Oracle Corp. | 19,723 | 1,612,158 |
Palo Alto Networks, Inc. * | 6,014 | 839,193 |
Salesforce, Inc. * | 3,169 | 420,178 |
ServiceNow, Inc. * | 1,669 | 648,023 |
Synopsys, Inc. * | 5,102 | 1,629,017 |
Workday, Inc., Class A * | 651 | 108,932 |
24 | J.P. Morgan Exchange-Traded Funds | December 31, 2022 |
INVESTMENTS | SHARES | VALUE($) |
Common Stocks — continued | ||
Software — continued | ||
Zoom Video Communications, Inc., Class A * | 7,161 | 485,086 |
Zscaler, Inc. * | 1,979 | 221,450 |
19,415,933 | ||
Specialty Retail — 4.1% | ||
AutoZone, Inc. * | 871 | 2,148,043 |
Burlington Stores, Inc. * | 3,787 | 767,852 |
CarMax, Inc. * | 3,181 | 193,691 |
Lowe's Cos., Inc. | 9,354 | 1,863,691 |
Ross Stores, Inc. | 1,447 | 167,953 |
Tractor Supply Co. | 2,738 | 615,968 |
5,757,198 | ||
Technology Hardware, Storage & Peripherals — 7.9% | ||
Apple, Inc. | 85,051 | 11,050,676 |
Textiles, Apparel & Luxury Goods — 0.6% | ||
NIKE, Inc., Class B | 3,941 | 461,136 |
Tapestry, Inc. | 10,932 | 416,291 |
877,427 | ||
Total Common Stocks (Cost $138,182,203) | 134,237,956 | |
INVESTMENTS | SHARES | VALUE($) |
Short-Term Investments — 4.1% | ||
Investment Companies — 4.1% | ||
JPMorgan U.S. Government Money Market Fund Class IM Shares, 4.12% (a) (b) (Cost $5,698,329) | 5,698,329 | 5,698,329 |
Total Investments — 100.0% (Cost $143,880,532) | 139,936,285 | |
Other Assets Less Liabilities — 0.0% ^ | 2,344 | |
NET ASSETS — 100.0% | 139,938,629 | |
Percentages indicated are based on net assets. |
Abbreviations | |
NYRS | New York Registry Shares |
^ | Amount rounds to less than 0.1% of net assets. | |
* | Non-income producing security. | |
(a) | Investment in an affiliated fund, which is registered under the Investment Company Act of 1940, as amended, and is advised by J.P. Morgan Investment Management Inc. | |
(b) | The rate shown is the current yield as of December 31, 2022. | |
December 31, 2022 | J.P. Morgan Exchange-Traded Funds | 25 |
AS OF December 31, 2022 (Unaudited)
INVESTMENTS | SHARES | VALUE($) |
Common Stocks — 97.6% | ||
Aerospace & Defense — 3.2% | ||
General Dynamics Corp. | 9,023 | 2,238,697 |
Northrop Grumman Corp. | 2,471 | 1,348,202 |
Raytheon Technologies Corp. | 59,638 | 6,018,667 |
9,605,566 | ||
Air Freight & Logistics — 1.3% | ||
FedEx Corp. | 9,608 | 1,664,106 |
GXO Logistics, Inc. * | 3,379 | 144,249 |
United Parcel Service, Inc., Class B | 12,148 | 2,111,808 |
3,920,163 | ||
Airlines — 0.9% | ||
Delta Air Lines, Inc. * | 50,420 | 1,656,801 |
Southwest Airlines Co. * | 33,141 | 1,115,858 |
2,772,659 | ||
Banks — 9.4% | ||
Bank of America Corp. | 169,702 | 5,620,530 |
Citigroup, Inc. | 64,137 | 2,900,917 |
Citizens Financial Group, Inc. | 16,015 | 630,511 |
Fifth Third Bancorp | 62,183 | 2,040,224 |
First Republic Bank | 7,723 | 941,356 |
M&T Bank Corp. | 6,109 | 886,172 |
PNC Financial Services Group, Inc. (The) | 9,810 | 1,549,391 |
Truist Financial Corp. | 37,643 | 1,619,778 |
US Bancorp | 92,406 | 4,029,826 |
Wells Fargo & Co. | 200,535 | 8,280,090 |
28,498,795 | ||
Beverages — 1.0% | ||
Coca-Cola Co. (The) | 9,684 | 615,999 |
Keurig Dr Pepper, Inc. | 15,555 | 554,691 |
Monster Beverage Corp. * | 7,188 | 729,798 |
PepsiCo, Inc. | 6,820 | 1,232,101 |
3,132,589 | ||
Biotechnology — 5.4% | ||
AbbVie, Inc. | 37,219 | 6,014,963 |
Amgen, Inc. | 3,589 | 942,615 |
Biogen, Inc. * | 3,765 | 1,042,604 |
BioMarin Pharmaceutical, Inc. * | 12,647 | 1,308,838 |
Neurocrine Biosciences, Inc. * | 2,462 | 294,061 |
Regeneron Pharmaceuticals, Inc. * | 5,425 | 3,914,083 |
Vertex Pharmaceuticals, Inc. * | 9,622 | 2,778,641 |
16,295,805 | ||
INVESTMENTS | SHARES | VALUE($) |
Building Products — 0.5% | ||
Carrier Global Corp. | 36,816 | 1,518,660 |
Capital Markets — 4.5% | ||
BlackRock, Inc. | 5,172 | 3,665,034 |
Charles Schwab Corp. (The) | 12,621 | 1,050,825 |
Goldman Sachs Group, Inc. (The) | 5,092 | 1,748,491 |
Intercontinental Exchange, Inc. | 8,740 | 896,637 |
Morgan Stanley | 39,769 | 3,381,160 |
Raymond James Financial, Inc. | 8,047 | 859,822 |
S&P Global, Inc. | 2,825 | 946,206 |
T. Rowe Price Group, Inc. | 9,572 | 1,043,922 |
13,592,097 | ||
Chemicals — 2.8% | ||
Air Products and Chemicals, Inc. | 7,885 | 2,430,630 |
Axalta Coating Systems Ltd. * | 108,683 | 2,768,156 |
Chemours Co. (The) | 54,477 | 1,668,086 |
PPG Industries, Inc. | 11,987 | 1,507,245 |
8,374,117 | ||
Commercial Services & Supplies — 0.3% | ||
Republic Services, Inc. | 7,268 | 937,499 |
Construction Materials — 0.6% | ||
Vulcan Materials Co. | 10,350 | 1,812,389 |
Consumer Finance — 1.3% | ||
American Express Co. | 20,045 | 2,961,649 |
Capital One Financial Corp. | 10,011 | 930,622 |
3,892,271 | ||
Containers & Packaging — 0.4% | ||
Ball Corp. | 11,400 | 582,996 |
Sealed Air Corp. | 14,396 | 718,072 |
1,301,068 | ||
Diversified Financial Services — 2.4% | ||
Berkshire Hathaway, Inc., Class B * | 23,397 | 7,227,333 |
Electric Utilities — 1.9% | ||
Entergy Corp. | 4,837 | 544,163 |
NextEra Energy, Inc. | 44,332 | 3,706,155 |
Xcel Energy, Inc. | 20,417 | 1,431,436 |
5,681,754 | ||
Electrical Equipment — 1.0% | ||
Eaton Corp. plc | 11,473 | 1,800,687 |
Rockwell Automation, Inc. | 4,429 | 1,140,778 |
2,941,465 | ||
26 | J.P. Morgan Exchange-Traded Funds | December 31, 2022 |
INVESTMENTS | SHARES | VALUE($) |
Common Stocks — continued | ||
Entertainment — 0.1% | ||
Walt Disney Co. (The) * | 4,994 | 433,879 |
Equity Real Estate Investment Trusts (REITs) — 3.0% | ||
Alexandria Real Estate Equities, Inc. | 2,550 | 371,459 |
AvalonBay Communities, Inc. | 2,710 | 437,719 |
Equity LifeStyle Properties, Inc. | 38,646 | 2,496,532 |
Host Hotels & Resorts, Inc. | 44,683 | 717,162 |
Prologis, Inc. | 12,564 | 1,416,340 |
SBA Communications Corp. | 3,333 | 934,273 |
Ventas, Inc. | 57,047 | 2,569,967 |
8,943,452 | ||
Food & Staples Retailing — 2.4% | ||
BJ's Wholesale Club Holdings, Inc. * | 17,126 | 1,133,056 |
Performance Food Group Co. * | 23,598 | 1,377,887 |
US Foods Holding Corp. * | 49,616 | 1,687,937 |
Walmart, Inc. | 21,514 | 3,050,470 |
7,249,350 | ||
Food Products — 1.4% | ||
Bunge Ltd. | 12,286 | 1,225,774 |
Lamb Weston Holdings, Inc. | 8,618 | 770,104 |
Mondelez International, Inc., Class A | 35,050 | 2,336,083 |
4,331,961 | ||
Health Care Equipment & Supplies — 2.5% | ||
Baxter International, Inc. | 27,960 | 1,425,121 |
Becton Dickinson and Co. | 4,854 | 1,234,372 |
Boston Scientific Corp. * | 33,807 | 1,564,250 |
Medtronic plc | 17,608 | 1,368,494 |
Zimmer Biomet Holdings, Inc. | 15,795 | 2,013,863 |
7,606,100 | ||
Health Care Providers & Services — 4.6% | ||
Cardinal Health, Inc. | 11,513 | 885,004 |
Centene Corp. * | 40,468 | 3,318,781 |
Cigna Corp. | 6,408 | 2,123,227 |
CVS Health Corp. | 10,547 | 982,875 |
Elevance Health, Inc. | 2,932 | 1,504,028 |
Humana, Inc. | 3,364 | 1,723,007 |
UnitedHealth Group, Inc. | 6,202 | 3,288,176 |
13,825,098 | ||
Hotels, Restaurants & Leisure — 1.5% | ||
Booking Holdings, Inc. * | 558 | 1,124,526 |
Darden Restaurants, Inc. | 6 | 830 |
Domino's Pizza, Inc. | 828 | 286,819 |
McDonald's Corp. | 5,670 | 1,494,215 |
INVESTMENTS | SHARES | VALUE($) |
Hotels, Restaurants & Leisure — continued | ||
Royal Caribbean Cruises Ltd. * | 28,854 | 1,426,253 |
Yum! Brands, Inc. | 2,429 | 311,107 |
4,643,750 | ||
Household Durables — 0.5% | ||
DR Horton, Inc. | 9,429 | 840,501 |
KB Home | 12,761 | 406,438 |
Newell Brands, Inc. | 29,524 | 386,174 |
1,633,113 | ||
Household Products — 0.6% | ||
Procter & Gamble Co. (The) | 12,371 | 1,874,949 |
Industrial Conglomerates — 0.7% | ||
Honeywell International, Inc. | 10,177 | 2,180,931 |
Insurance — 3.5% | ||
Chubb Ltd. | 8,086 | 1,783,772 |
Hartford Financial Services Group, Inc. (The) | 36,986 | 2,804,648 |
Loews Corp. | 11,979 | 698,735 |
Marsh & McLennan Cos., Inc. | 4,561 | 754,754 |
MetLife, Inc. | 18,615 | 1,347,168 |
Progressive Corp. (The) | 19,593 | 2,541,408 |
Prudential Financial, Inc. | 6,878 | 684,086 |
10,614,571 | ||
Interactive Media & Services — 2.3% | ||
Alphabet, Inc., Class C * | 32,511 | 2,884,701 |
Meta Platforms, Inc., Class A * | 32,535 | 3,915,262 |
6,799,963 | ||
IT Services — 0.8% | ||
Fiserv, Inc. * | 6,992 | 706,681 |
FleetCor Technologies, Inc. * | 3,811 | 700,005 |
International Business Machines Corp. | 7,809 | 1,100,210 |
2,506,896 | ||
Machinery — 2.8% | ||
AGCO Corp. | 6,105 | 846,702 |
Deere & Co. | 3,945 | 1,691,458 |
Dover Corp. | 15,345 | 2,077,867 |
Parker-Hannifin Corp. | 10,103 | 2,939,973 |
Stanley Black & Decker, Inc. | 12,917 | 970,325 |
8,526,325 | ||
Media — 2.7% | ||
Charter Communications, Inc., Class A * | 12,254 | 4,155,331 |
Comcast Corp., Class A | 114,041 | 3,988,014 |
8,143,345 | ||
December 31, 2022 | J.P. Morgan Exchange-Traded Funds | 27 |
AS OF December 31, 2022 (Unaudited) (continued)
INVESTMENTS | SHARES | VALUE($) |
Common Stocks — continued | ||
Metals & Mining — 1.4% | ||
Alcoa Corp. | 41,451 | 1,884,777 |
Freeport-McMoRan, Inc. | 61,284 | 2,328,792 |
4,213,569 | ||
Multiline Retail — 0.5% | ||
Dollar General Corp. | 5,598 | 1,378,508 |
Multi-Utilities — 2.8% | ||
Ameren Corp. | 26,068 | 2,317,966 |
CenterPoint Energy, Inc. | 61,317 | 1,838,897 |
CMS Energy Corp. | 26,140 | 1,655,446 |
Public Service Enterprise Group, Inc. | 44,555 | 2,729,885 |
8,542,194 | ||
Oil, Gas & Consumable Fuels — 9.2% | ||
Chevron Corp. | 31,384 | 5,633,114 |
ConocoPhillips | 34,966 | 4,125,988 |
Coterra Energy, Inc. | 6 | 148 |
Diamondback Energy, Inc. | 16,031 | 2,192,720 |
EOG Resources, Inc. | 28,679 | 3,714,504 |
EQT Corp. | 20,065 | 678,799 |
Exxon Mobil Corp. | 68,855 | 7,594,707 |
Hess Corp. | 25,316 | 3,590,315 |
Valero Energy Corp. | 2,770 | 351,402 |
27,881,697 | ||
Pharmaceuticals — 5.4% | ||
Bristol-Myers Squibb Co. | 122,888 | 8,841,792 |
Elanco Animal Health, Inc. * | 24,925 | 304,583 |
Eli Lilly & Co. | 3,130 | 1,145,079 |
Johnson & Johnson | 15,715 | 2,776,055 |
Merck & Co., Inc. | 5,175 | 574,166 |
Pfizer, Inc. | 52,396 | 2,684,771 |
16,326,446 | ||
Road & Rail �� 0.9% | ||
CSX Corp. | 78,332 | 2,426,725 |
Knight-Swift Transportation Holdings, Inc. | 5,736 | 300,624 |
2,727,349 | ||
Semiconductors & Semiconductor Equipment — 3.0% | ||
Analog Devices, Inc. | 14,150 | 2,321,025 |
Lam Research Corp. | 1,804 | 758,221 |
NXP Semiconductors NV (China) | 20,655 | 3,264,110 |
Qorvo, Inc. * | 7,419 | 672,458 |
Texas Instruments, Inc. | 12,078 | 1,995,527 |
9,011,341 | ||
INVESTMENTS | SHARES | VALUE($) |
Software — 0.7% | ||
Coupa Software, Inc. * | 6 | 475 |
Microsoft Corp. | 6,471 | 1,551,875 |
Oracle Corp. | 5,761 | 470,904 |
2,023,254 | ||
Specialty Retail — 3.1% | ||
AutoZone, Inc. * | 657 | 1,620,280 |
Home Depot, Inc. (The) | 5,846 | 1,846,518 |
Lowe's Cos., Inc. | 13,246 | 2,639,133 |
O'Reilly Automotive, Inc. * | 1,334 | 1,125,936 |
TJX Cos., Inc. (The) | 27,707 | 2,205,477 |
9,437,344 | ||
Technology Hardware, Storage & Peripherals — 0.6% | ||
Apple, Inc. | 3,838 | 498,671 |
Seagate Technology Holdings plc | 26,910 | 1,415,735 |
1,914,406 | ||
Textiles, Apparel & Luxury Goods — 1.5% | ||
Kontoor Brands, Inc. | 19,177 | 766,888 |
NIKE, Inc., Class B | 13,721 | 1,605,494 |
Tapestry, Inc. | 52,448 | 1,997,220 |
4,369,602 | ||
Tobacco — 1.3% | ||
Philip Morris International, Inc. | 38,735 | 3,920,369 |
Trading Companies & Distributors — 0.6% | ||
WESCO International, Inc. * | 13,868 | 1,736,274 |
Wireless Telecommunication Services — 0.3% | ||
T-Mobile US, Inc. * | 6,860 | 960,400 |
Total Common Stocks (Cost $286,593,258) | 295,260,666 | |
28 | J.P. Morgan Exchange-Traded Funds | December 31, 2022 |
INVESTMENTS | SHARES | VALUE($) |
Short-Term Investments — 2.3% | ||
Investment Companies — 2.3% | ||
JPMorgan U.S. Government Money Market Fund Class IM Shares, 4.12% (a) (b) (Cost $6,913,734) | 6,913,734 | 6,913,734 |
Total Investments — 99.9% (Cost $293,506,992) | 302,174,400 | |
Other Assets Less Liabilities — 0.1% | 212,280 | |
NET ASSETS — 100.0% | 302,386,680 | |
Percentages indicated are based on net assets. |
* | Non-income producing security. |
(a) | Investment in an affiliated fund, which is registered under the Investment Company Act of 1940, as amended, and is advised by J.P. Morgan Investment Management Inc. |
(b) | The rate shown is the current yield as of December 31, 2022. |
December 31, 2022 | J.P. Morgan Exchange-Traded Funds | 29 |
AS OF December 31, 2022 (Unaudited)
INVESTMENTS | SHARES | VALUE($) |
Common Stocks — 82.7% | ||
Aerospace & Defense — 1.7% | ||
General Dynamics Corp. | 598,009 | 148,372,013 |
Raytheon Technologies Corp. | 879,084 | 88,717,157 |
Textron, Inc. | 750,173 | 53,112,249 |
290,201,419 | ||
Air Freight & Logistics — 1.3% | ||
United Parcel Service, Inc., Class B | 1,262,428 | 219,460,483 |
Banks — 1.2% | ||
US Bancorp | 5,015,920 | 218,744,271 |
Beverages — 3.7% | ||
Coca-Cola Co. (The) | 4,094,080 | 260,424,429 |
Constellation Brands, Inc., Class A | 364,128 | 84,386,664 |
Keurig Dr Pepper, Inc. | 1,279,750 | 45,635,885 |
PepsiCo, Inc. | 1,402,253 | 253,331,027 |
643,778,005 | ||
Biotechnology — 3.4% | ||
AbbVie, Inc. | 1,774,713 | 286,811,368 |
Regeneron Pharmaceuticals, Inc. * | 241,685 | 174,373,311 |
Vertex Pharmaceuticals, Inc. * | 485,234 | 140,125,874 |
601,310,553 | ||
Building Products — 1.2% | ||
Trane Technologies plc | 1,275,207 | 214,349,545 |
Capital Markets — 2.5% | ||
CME Group, Inc. | 1,061,385 | 178,482,502 |
Intercontinental Exchange, Inc. | 1,366,899 | 140,230,168 |
S&P Global, Inc. | 375,415 | 125,741,500 |
444,454,170 | ||
Chemicals — 3.0% | ||
Air Products and Chemicals, Inc. | 587,173 | 181,001,949 |
Ecolab, Inc. | 215,007 | 31,296,419 |
Linde plc (United Kingdom) | 703,942 | 229,611,801 |
PPG Industries, Inc. | 618,592 | 77,781,758 |
519,691,927 | ||
Consumer Finance — 0.8% | ||
American Express Co. | 903,896 | 133,550,634 |
Containers & Packaging — 0.3% | ||
Avery Dennison Corp. | 327,715 | 59,316,415 |
Diversified Financial Services — 1.0% | ||
Berkshire Hathaway, Inc., Class B * | 565,237 | 174,601,709 |
Diversified Telecommunication Services — 0.6% | ||
Verizon Communications, Inc. | 2,456,933 | 96,803,160 |
INVESTMENTS | SHARES | VALUE($) |
Electric Utilities — 2.9% | ||
Alliant Energy Corp. | 1,363,543 | 75,281,209 |
Duke Energy Corp. | 219,111 | 22,566,242 |
Evergy, Inc. | 662,651 | 41,700,627 |
NextEra Energy, Inc. | 2,701,183 | 225,818,899 |
Xcel Energy, Inc. | 2,081,413 | 145,927,866 |
511,294,843 | ||
Electrical Equipment — 1.1% | ||
Eaton Corp. plc | 1,239,108 | 194,478,001 |
Electronic Equipment, Instruments & Components — 0.7% | ||
Keysight Technologies, Inc. * | 695,640 | 119,003,135 |
Entertainment — 0.1% | ||
Electronic Arts, Inc. | 162,398 | 19,841,788 |
Equity Real Estate Investment Trusts (REITs) — 2.6% | ||
Camden Property Trust | 292,801 | 32,758,576 |
Mid-America Apartment Communities, Inc. | 199,990 | 31,396,430 |
Prologis, Inc. | 1,011,015 | 113,971,721 |
Public Storage | 307,446 | 86,143,295 |
SBA Communications Corp. | 355,205 | 99,567,513 |
Sun Communities, Inc. | 515,986 | 73,785,998 |
UDR, Inc. | 369,849 | 14,324,252 |
451,947,785 | ||
Food & Staples Retailing — 1.0% | ||
Costco Wholesale Corp. | 173,620 | 79,257,530 |
Walmart, Inc. | 709,597 | 100,613,759 |
179,871,289 | ||
Food Products — 2.3% | ||
Archer-Daniels-Midland Co. | 354,085 | 32,876,792 |
Hershey Co. (The) | 1,110,002 | 257,043,163 |
Mondelez International, Inc., Class A | 1,740,480 | 116,002,992 |
405,922,947 | ||
Health Care Equipment & Supplies — 0.3% | ||
Boston Scientific Corp. * | 1,124,908 | 52,049,493 |
Health Care Providers & Services — 2.4% | ||
Centene Corp. * | 580,687 | 47,622,141 |
Elevance Health, Inc. | 198,805 | 101,981,001 |
UnitedHealth Group, Inc. | 499,133 | 264,630,334 |
414,233,476 | ||
Hotels, Restaurants & Leisure — 2.0% | ||
Chipotle Mexican Grill, Inc. * | 20,217 | 28,050,885 |
Domino's Pizza, Inc. | 131,896 | 45,688,775 |
30 | J.P. Morgan Exchange-Traded Funds | December 31, 2022 |
INVESTMENTS | SHARES | VALUE($) |
Common Stocks — continued | ||
Hotels, Restaurants & Leisure — continued | ||
McDonald's Corp. | 518,657 | 136,681,679 |
Yum! Brands, Inc. | 1,033,150 | 132,325,852 |
342,747,191 | ||
Household Products — 3.7% | ||
Colgate-Palmolive Co. | 2,837,591 | 223,573,795 |
Kimberly-Clark Corp. | 1,390,219 | 188,722,229 |
Procter & Gamble Co. (The) | 1,559,706 | 236,389,041 |
648,685,065 | ||
Industrial Conglomerates — 1.4% | ||
Honeywell International, Inc. | 1,174,466 | 251,688,064 |
Insurance — 4.5% | ||
Aon plc, Class A | 531,808 | 159,616,853 |
Arthur J Gallagher & Co. | 604,408 | 113,955,084 |
Progressive Corp. (The) | 2,116,452 | 274,524,989 |
Travelers Cos., Inc. (The) | 1,320,385 | 247,558,984 |
795,655,910 | ||
Interactive Media & Services — 1.0% | ||
Alphabet, Inc., Class A * | 1,990,840 | 175,651,813 |
Internet & Direct Marketing Retail — 0.6% | ||
Amazon.com, Inc. * | 1,226,702 | 103,042,968 |
IT Services — 6.3% | ||
Accenture plc, Class A | 843,649 | 225,119,299 |
Automatic Data Processing, Inc. | 638,957 | 152,621,269 |
FleetCor Technologies, Inc. * | 311,893 | 57,288,506 |
Jack Henry & Associates, Inc. | 1,074,164 | 188,580,232 |
Mastercard, Inc., Class A | 700,176 | 243,472,200 |
Visa, Inc., Class A | 1,095,584 | 227,618,532 |
1,094,700,038 | ||
Life Sciences Tools & Services — 1.1% | ||
Thermo Fisher Scientific, Inc. | 363,814 | 200,348,732 |
Machinery — 1.7% | ||
Deere & Co. | 217,246 | 93,146,395 |
Dover Corp. | 1,043,348 | 141,279,752 |
Otis Worldwide Corp. | 745,638 | 58,390,912 |
292,817,059 | ||
Media — 1.6% | ||
Charter Communications, Inc., Class A * | 168,741 | 57,220,073 |
Comcast Corp., Class A | 6,385,958 | 223,316,951 |
280,537,024 | ||
INVESTMENTS | SHARES | VALUE($) |
Multi-Utilities — 4.9% | ||
Ameren Corp. | 1,317,715 | 117,171,218 |
CMS Energy Corp. | 1,327,444 | 84,067,029 |
Consolidated Edison, Inc. | 582,179 | 55,487,480 |
Dominion Energy, Inc. | 886,954 | 54,388,019 |
DTE Energy Co. | 840,746 | 98,812,877 |
Public Service Enterprise Group, Inc. | 2,827,856 | 173,262,737 |
Sempra Energy | 776,851 | 120,054,554 |
WEC Energy Group, Inc. | 1,571,739 | 147,366,249 |
850,610,163 | ||
Oil, Gas & Consumable Fuels — 2.8% | ||
Chevron Corp. | 803,155 | 144,158,291 |
ConocoPhillips | 387,539 | 45,729,602 |
EOG Resources, Inc. | 169,113 | 21,903,516 |
Exxon Mobil Corp. | 2,446,720 | 269,873,216 |
481,664,625 | ||
Pharmaceuticals — 4.9% | ||
Bristol-Myers Squibb Co. | 3,484,785 | 250,730,281 |
Eli Lilly & Co. | 682,861 | 249,817,868 |
Johnson & Johnson | 866,678 | 153,098,669 |
Merck & Co., Inc. | 1,865,287 | 206,953,592 |
860,600,410 | ||
Professional Services — 0.4% | ||
Booz Allen Hamilton Holding Corp. | 351,409 | 36,729,268 |
Leidos Holdings, Inc. | 242,431 | 25,501,317 |
62,230,585 | ||
Road & Rail — 3.6% | ||
CSX Corp. | 1,155,689 | 35,803,245 |
Norfolk Southern Corp. | 829,526 | 204,411,797 |
Old Dominion Freight Line, Inc. | 605,049 | 171,700,805 |
Union Pacific Corp. | 1,058,335 | 219,149,429 |
631,065,276 | ||
Semiconductors & Semiconductor Equipment — 1.7% | ||
Analog Devices, Inc. | 500,252 | 82,056,336 |
Texas Instruments, Inc. | 1,324,832 | 218,888,743 |
300,945,079 | ||
Software — 2.0% | ||
Adobe, Inc. * | 123,451 | 41,544,965 |
Intuit, Inc. | 246,534 | 95,955,963 |
Microsoft Corp. | 881,358 | 211,367,276 |
348,868,204 | ||
December 31, 2022 | J.P. Morgan Exchange-Traded Funds | 31 |
AS OF December 31, 2022 (Unaudited) (continued)
INVESTMENTS | SHARES | VALUE($) |
Common Stocks — continued | ||
Specialty Retail — 2.8% | ||
AutoZone, Inc. * | 52,236 | 128,823,378 |
Lowe's Cos., Inc. | 1,072,233 | 213,631,703 |
O'Reilly Automotive, Inc. * | 166,129 | 140,217,860 |
482,672,941 | ||
Technology Hardware, Storage & Peripherals — 0.1% | ||
Apple, Inc. | 184,474 | 23,968,707 |
Textiles, Apparel & Luxury Goods — 0.2% | ||
NIKE, Inc., Class B | 343,172 | 40,154,556 |
Tobacco — 0.9% | ||
Altria Group, Inc. | 1,500,039 | 68,566,783 |
Philip Morris International, Inc. | 890,744 | 90,152,200 |
158,718,983 | ||
Wireless Telecommunication Services — 0.4% | ||
T-Mobile US, Inc. * | 478,826 | 67,035,640 |
Total Common Stocks (Cost $14,074,511,976) | 14,459,314,081 | |
PRINCIPAL AMOUNT($) | ||
Equity-Linked Notes — 15.2% | ||
Barclays Bank plc, ELN, 63.40%, 1/23/2023, (linked to S&P 500 Index) (United Kingdom) (a) | 45,052 | 179,776,852 |
BNP Paribas, ELN, 60.40%, 1/10/2023, (linked to S&P 500 Index) (a) | 49,061 | 191,718,123 |
BNP Paribas, ELN, 66.70%, 1/20/2023, (linked to S&P 500 Index) (a) | 46,024 | 183,347,190 |
BNP Paribas, ELN, 67.10%, 1/24/2023, (linked to S&P 500 Index) (a) | 43,637 | 172,955,686 |
BNP Paribas, ELN, 70.90%, 1/31/2023, (linked to S&P 500 Index) (a) | 48,399 | 188,755,132 |
BofA Finance LLC, ELN, 64.70%, 1/9/2023, (linked to S&P 500 Index) (b) | 42,891 | 167,503,509 |
BofA Finance LLC, ELN, 67.30%, 1/27/2023, (linked to S&P 500 Index) (b) | 44,484 | 172,185,108 |
BofA Finance LLC, ELN, 71.70%, 2/7/2023, (linked to S&P 500 Index) (b) | 45,463 | 177,605,301 |
Canadian Imperial Bank of Commerce, ELN, 64.11%, 1/6/2023, (linked to S&P 500 Index) (Canada) (b) | 40,428 | 157,010,628 |
Canadian Imperial Bank of Commerce, ELN, 72.23%, 2/6/2023, (linked to S&P 500 Index) (Canada) (b) | 48,107 | 181,952,701 |
INVESTMENTS | PRINCIPAL AMOUNT($) | VALUE($) |
Morgan Stanley BV, ELN, 68.54%, 1/18/2023, (linked to S&P 500 Index) (b) | 42,891 | 170,257,969 |
Royal Bank of Canada, ELN, 66.10%, 1/30/2023, (linked to S&P 500 Index) (Canada) (b) | 47,699 | 188,828,893 |
Royal Bank of Canada, ELN, 68.71%, 1/13/2023, (linked to S&P 500 Index) (Canada) (b) | 42,118 | 165,773,079 |
Royal Bank of Canada, ELN, 69.53%, 2/3/2023, (linked to S&P 500 Index) (Canada) (b) | 48,312 | 188,410,036 |
UBS AG, ELN, 67.99%, 1/17/2023, (linked to S&P 500 Index) (Switzerland) (b) | 42,197 | 167,145,271 |
Total Equity-Linked Notes (Cost $2,653,988,968) | 2,653,225,478 | |
SHARES | ||
Short-Term Investments — 1.5% | ||
Investment Companies — 1.5% | ||
JPMorgan U.S. Government Money Market Fund Class IM Shares, 4.12% (c) (d) (Cost $264,972,342) | 264,972,342 | 264,972,342 |
Total Investments — 99.4% (Cost $16,993,473,286) | 17,377,511,901 | |
Other Assets Less Liabilities — 0.6% | 107,626,298 | |
NET ASSETS — 100.0% | 17,485,138,199 | |
Percentages indicated are based on net assets. |
Abbreviations | |
ELN | Equity-Linked Note |
* | Non-income producing security. |
(a) | Security exempt from registration pursuant to Regulation S under the Securities Act of 1933, as amended. Regulation S applies to securities offerings that are made outside of the United States and do not involve direct selling efforts in the United States and as such may have restrictions on resale. |
(b) | Securities exempt from registration under Rule 144A or section 4(a)(2), of the Securities Act of 1933, as amended. |
(c) | Investment in an affiliated fund, which is registered under the Investment Company Act of 1940, as amended, and is advised by J.P. Morgan Investment Management Inc. |
(d) | The rate shown is the current yield as of December 31, 2022. |
32 | J.P. Morgan Exchange-Traded Funds | December 31, 2022 |
DESCRIPTION | NUMBER OF CONTRACTS | EXPIRATION DATE | TRADING CURRENCY | NOTIONAL AMOUNT ($) | VALUE AND UNREALIZED APPRECIATION (DEPRECIATION) ($) |
Short Contracts | |||||
S&P 500 E-Mini Index | (1,150) | 03/17/2023 | USD | (222,036,250) | 2,720,263 |
Abbreviations | |
USD | United States Dollar |
December 31, 2022 | J.P. Morgan Exchange-Traded Funds | 33 |
AS OF December 31, 2022 (Unaudited)
INVESTMENTS | SHARES | VALUE($) |
Common Stocks — 81.2% | ||
Air Freight & Logistics — 0.3% | ||
United Parcel Service, Inc., Class B | 16,511 | 2,870,272 |
Automobiles — 2.2% | ||
Tesla, Inc. * | 175,885 | 21,665,514 |
Beverages — 2.8% | ||
Coca-Cola Co. (The) | 115,211 | 7,328,572 |
Constellation Brands, Inc., Class A | 19,920 | 4,616,460 |
Monster Beverage Corp. * | 68,373 | 6,941,910 |
PepsiCo, Inc. | 49,071 | 8,865,167 |
27,752,109 | ||
Biotechnology — 3.3% | ||
AbbVie, Inc. | 41,231 | 6,663,342 |
Amgen, Inc. | 9,747 | 2,559,952 |
Biogen, Inc. * | 21,204 | 5,871,812 |
Regeneron Pharmaceuticals, Inc. * | 14,290 | 10,310,092 |
Seagen, Inc. * | 32,453 | 4,170,535 |
Vertex Pharmaceuticals, Inc. * | 13,378 | 3,863,299 |
33,439,032 | ||
Commercial Services & Supplies — 0.5% | ||
Copart, Inc. * | 80,993 | 4,931,664 |
Communications Equipment — 1.8% | ||
Cisco Systems, Inc. | 370,455 | 17,648,476 |
Electric Utilities — 1.6% | ||
NextEra Energy, Inc. | 80,420 | 6,723,112 |
Xcel Energy, Inc. | 138,766 | 9,728,884 |
16,451,996 | ||
Electrical Equipment — 0.6% | ||
Eaton Corp. plc | 36,302 | 5,697,599 |
Entertainment — 1.1% | ||
Electronic Arts, Inc. | 8,654 | 1,057,346 |
Netflix, Inc. * | 34,512 | 10,176,898 |
11,234,244 | ||
Equity Real Estate Investment Trusts (REITs) — 0.4% | ||
Prologis, Inc. | 33,870 | 3,818,165 |
Food & Staples Retailing — 1.1% | ||
Costco Wholesale Corp. | 23,202 | 10,591,713 |
Food Products — 1.6% | ||
Kraft Heinz Co. (The) | 129,954 | 5,290,427 |
Mondelez International, Inc., Class A | 154,853 | 10,320,953 |
15,611,380 | ||
INVESTMENTS | SHARES | VALUE($) |
Health Care Equipment & Supplies — 1.8% | ||
Dexcom, Inc. * | 70,363 | 7,967,906 |
Intuitive Surgical, Inc. * | 38,037 | 10,093,118 |
18,061,024 | ||
Health Care Providers & Services — 0.4% | ||
UnitedHealth Group, Inc. | 7,981 | 4,231,367 |
Hotels, Restaurants & Leisure — 2.1% | ||
Airbnb, Inc., Class A * | 4,838 | 413,649 |
Booking Holdings, Inc. * | 5,238 | 10,556,037 |
Chipotle Mexican Grill, Inc. * | 3,756 | 5,211,412 |
Marriott International, Inc., Class A | 32,263 | 4,803,638 |
20,984,736 | ||
Industrial Conglomerates — 0.8% | ||
Honeywell International, Inc. | 37,144 | 7,959,959 |
Interactive Media & Services — 8.7% | ||
Alphabet, Inc., Class C * | 751,414 | 66,672,964 |
Meta Platforms, Inc., Class A * | 172,161 | 20,717,855 |
87,390,819 | ||
Internet & Direct Marketing Retail — 5.4% | ||
Amazon.com, Inc. * | 599,438 | 50,352,792 |
MercadoLibre, Inc. (Brazil) * | 4,743 | 4,013,716 |
54,366,508 | ||
IT Services — 1.3% | ||
Mastercard, Inc., Class A | 12,110 | 4,211,010 |
PayPal Holdings, Inc. * | 128,484 | 9,150,631 |
13,361,641 | ||
Life Sciences Tools & Services — 0.3% | ||
Thermo Fisher Scientific, Inc. | 6,302 | 3,470,448 |
Machinery — 0.6% | ||
Deere & Co. | 14,985 | 6,424,969 |
Media — 1.7% | ||
Charter Communications, Inc., Class A * | 10,300 | 3,492,730 |
Comcast Corp., Class A | 377,164 | 13,189,425 |
16,682,155 | ||
Multiline Retail — 0.3% | ||
Dollar Tree, Inc. * | 24,752 | 3,500,923 |
Oil, Gas & Consumable Fuels — 0.4% | ||
Diamondback Energy, Inc. | 26,042 | 3,562,025 |
Pharmaceuticals — 0.4% | ||
Bristol-Myers Squibb Co. | 53,076 | 3,818,818 |
34 | J.P. Morgan Exchange-Traded Funds | December 31, 2022 |
INVESTMENTS | SHARES | VALUE($) |
Common Stocks — continued | ||
Professional Services — 0.5% | ||
Verisk Analytics, Inc. | 26,512 | 4,677,247 |
Road & Rail — 0.4% | ||
CSX Corp. | 121,297 | 3,757,781 |
Semiconductors & Semiconductor Equipment — 11.6% | ||
Advanced Micro Devices, Inc. * | 184,517 | 11,951,166 |
Analog Devices, Inc. | 76,999 | 12,630,146 |
Applied Materials, Inc. | 35,493 | 3,456,308 |
ASML Holding NV (Registered), NYRS (Netherlands) | 10,928 | 5,971,059 |
Broadcom, Inc. | 19,873 | 11,111,591 |
Intel Corp. | 134,103 | 3,544,342 |
Lam Research Corp. | 20,161 | 8,473,668 |
Marvell Technology, Inc. | 99,016 | 3,667,553 |
Micron Technology, Inc. | 22,707 | 1,134,896 |
NVIDIA Corp. | 165,072 | 24,123,622 |
NXP Semiconductors NV (China) | 44,087 | 6,967,069 |
QUALCOMM, Inc. | 95,280 | 10,475,083 |
Teradyne, Inc. | 51,996 | 4,541,851 |
Texas Instruments, Inc. | 53,343 | 8,813,330 |
116,861,684 | ||
Software — 15.5% | ||
Adobe, Inc. * | 15,523 | 5,223,955 |
HubSpot, Inc. * | 8,893 | 2,571,233 |
Intuit, Inc. | 31,087 | 12,099,682 |
Microsoft Corp. | 439,287 | 105,349,808 |
Oracle Corp. | 58,480 | 4,780,155 |
Palo Alto Networks, Inc. * | 38,271 | 5,340,335 |
ServiceNow, Inc. * | 5,513 | 2,140,533 |
Synopsys, Inc. * | 35,098 | 11,206,441 |
Workday, Inc., Class A * | 33,702 | 5,639,356 |
Zscaler, Inc. * | 11,815 | 1,322,099 |
155,673,597 | ||
Specialty Retail — 1.3% | ||
Lowe's Cos., Inc. | 28,654 | 5,709,023 |
O'Reilly Automotive, Inc. * | 9,138 | 7,712,746 |
13,421,769 | ||
Technology Hardware, Storage & Peripherals — 9.2% | ||
Apple, Inc. | 684,741 | 88,968,398 |
Seagate Technology Holdings plc | 71,737 | 3,774,084 |
92,742,482 | ||
Textiles, Apparel & Luxury Goods — 0.4% | ||
NIKE, Inc., Class B | 36,692 | 4,293,331 |
INVESTMENTS | SHARES | VALUE($) |
Wireless Telecommunication Services — 0.8% | ||
T-Mobile US, Inc. * | 57,858 | 8,100,120 |
Total Common Stocks (Cost $863,246,796) | 815,055,567 | |
PRINCIPAL AMOUNT($) | ||
Equity-Linked Notes — 17.3% | ||
BNP Paribas, ELN, 92.00%, 1/24/2023, (linked to Nasdaq-100 Index) (a) | 2,644 | 30,577,437 |
BofA Finance LLC, ELN, 91.38%, 1/10/2023, (linked to Nasdaq-100 Index) (b) | 3,155 | 35,498,135 |
Citigroup Global Markets Holdings, Inc., ELN, 103.55%, 1/31/2023, (linked to Nasdaq-100 Index) (a) | 3,650 | 41,590,327 |
National Bank of Canada, ELN, 95.50%, 1/18/2023, (linked to Nasdaq-100 Index) (Canada) (b) | 1,718 | 19,741,143 |
UBS AG, ELN, 97.50%, 2/7/2023, (linked to Nasdaq-100 Index) (Switzerland) (b) | 4,200 | 46,851,168 |
Total Equity-Linked Notes (Cost $173,966,444) | 174,258,210 | |
SHARES | ||
Short-Term Investments — 1.8% | ||
Investment Companies — 1.8% | ||
JPMorgan U.S. Government Money Market Fund Class IM Shares, 4.12% (c) (d) (Cost $18,135,704) | 18,135,704 | 18,135,704 |
Total Investments — 100.3% (Cost $1,055,348,944) | 1,007,449,481 | |
Liabilities in Excess of Other Assets — (0.3)% | (3,157,844) | |
NET ASSETS — 100.0% | 1,004,291,637 | |
Percentages indicated are based on net assets. |
December 31, 2022 | J.P. Morgan Exchange-Traded Funds | 35 |
AS OF December 31, 2022 (Unaudited) (continued)
Abbreviations | |
ELN | Equity-Linked Note |
NYRS | New York Registry Shares |
* | Non-income producing security. |
(a) | Security exempt from registration pursuant to Regulation S under the Securities Act of 1933, as amended. Regulation S applies to securities offerings that are made outside of the United States and do not involve direct selling efforts in the United States and as such may have restrictions on resale. |
(b) | Securities exempt from registration under Rule 144A or section 4(a)(2), of the Securities Act of 1933, as amended. |
(c) | Investment in an affiliated fund, which is registered under the Investment Company Act of 1940, as amended, and is advised by J.P. Morgan Investment Management Inc. |
(d) | The rate shown is the current yield as of December 31, 2022. |
36 | J.P. Morgan Exchange-Traded Funds | December 31, 2022 |
AS OF December 31, 2022 (Unaudited)
JPMorgan ActiveBuilders U.S. Large Cap Equity ETF | JPMorgan Active Growth ETF | JPMorgan Active Value ETF | |
ASSETS: | |||
Investments in non-affiliates, at value | $23,928,520 | $134,237,956 | $295,260,666 |
Investments in affiliates, at value | 108,080 | 5,698,329 | 6,913,734 |
Cash | 320 | 18,931 | 19,430 |
Deposits at broker for futures contracts | 19,000 | — | — |
Receivables: | |||
Dividends from non-affiliates | 19,811 | 36,365 | 357,881 |
Dividends from affiliates | 12 | 644 | 781 |
Total Assets | 24,075,743 | 139,992,225 | 302,552,492 |
LIABILITIES: | |||
Payables: | |||
Distributions | — | 6,835 | 68,145 |
Variation margin on futures contracts | 346 | — | — |
Accrued liabilities: | |||
Management fees (See Note 3.A.) | 377 | 46,761 | 97,667 |
Total Liabilities | 723 | 53,596 | 165,812 |
Net Assets | $24,075,020 | $139,938,629 | $302,386,680 |
NET ASSETS: | |||
Paid-in-Capital | $26,962,153 | $145,748,475 | $298,041,102 |
Total distributable earnings (loss) | (2,887,133) | (5,809,846) | 4,345,578 |
Total Net Assets | $24,075,020 | $139,938,629 | $302,386,680 |
Outstanding number of shares (unlimited number of shares authorized - par value $0.0001) | 550,000 | 3,150,000 | 5,900,000 |
Net asset value, per share | $43.77 | $44.42 | $51.25 |
Cost of investments in non-affiliates | $25,502,902 | $138,182,203 | $286,593,258 |
Cost of investments in affiliates | 108,080 | 5,698,329 | 6,913,734 |
December 31, 2022 | J.P. Morgan Exchange-Traded Funds | 37 |
AS OF December 31, 2022 (Unaudited) (continued)
JPMorgan Equity Premium Income ETF | JPMorgan Nasdaq Equity Premium Income ETF | |
ASSETS: | ||
Investments in non-affiliates, at value | $17,112,539,559 | $989,313,777 |
Investments in affiliates, at value | 264,972,342 | 18,135,704 |
Cash | 949,586 | 42,647 |
Deposits at broker for futures contracts | 11,458,000 | — |
Receivables: | ||
Investment securities sold | 513,519,770 | 46,582,543 |
Fund shares sold | 171,862,171 | 17,337,895 |
Interest from non-affiliates | 79,903,301 | 7,000,632 |
Dividends from non-affiliates | 20,924,313 | 304,492 |
Dividends from affiliates | 29,931 | 2,049 |
Variation margin on futures contracts | 493,043 | — |
Total Assets | 18,176,652,016 | 1,078,719,739 |
LIABILITIES: | ||
Payables: | ||
Distributions | 182,159,914 | 13,942,456 |
Investment securities purchased | 498,960,870 | 60,220,748 |
Fund shares redeemed | 5,445,335 | — |
Accrued liabilities: | ||
Management fees (See Note 3.A.) | 4,947,698 | 264,898 |
Total Liabilities | 691,513,817 | 74,428,102 |
Net Assets | $17,485,138,199 | $1,004,291,637 |
NET ASSETS: | ||
Paid-in-Capital | $18,611,983,950 | $1,092,145,620 |
Total distributable earnings (loss) | (1,126,845,751) | (87,853,983) |
Total Net Assets | $17,485,138,199 | $1,004,291,637 |
Outstanding number of shares (unlimited number of shares authorized - par value $0.0001) | 321,100,000 | 24,625,000 |
Net asset value, per share | $54.45 | $40.78 |
Cost of investments in non-affiliates | $16,728,500,944 | $1,037,213,240 |
Cost of investments in affiliates | 264,972,342 | 18,135,704 |
38 | J.P. Morgan Exchange-Traded Funds | December 31, 2022 |
FOR THE SIX MONTHS ENDED December 31, 2022 (Unaudited)
JPMorgan ActiveBuilders U.S. Large Cap Equity ETF | JPMorgan Active Growth ETF (a) | JPMorgan Active Value ETF | |
INVESTMENT INCOME: | |||
Interest income from non-affiliates | $383 | $— | $— |
Interest income from affiliates | — | 2 | — |
Dividend income from non-affiliates | 207,114 | 289,268 | 1,667,534 |
Dividend income from affiliates | 1,350 | 43,646 | 66,149 |
Total investment income | 208,847 | 332,916 | 1,733,683 |
EXPENSES: | |||
Management fees (See Note 3.A.) | 21,147 | 129,094 | 326,389 |
Total expenses | 21,147 | 129,094 | 326,389 |
Net investment income (loss) | 187,700 | 203,822 | 1,407,294 |
REALIZED/UNREALIZED GAINS (LOSSES): | |||
Net realized gain (loss) on transactions from: | |||
Investments in non-affiliates | (440,828) | (2,085,210) | (4,005,585) |
In-kind redemptions of investments in non-affiliates (See Note 4) | — | 222,434 | 375,540 |
Futures contracts | 2,266 | — | — |
Net realized gain (loss) | (438,562) | (1,862,776) | (3,630,045) |
Change in net unrealized appreciation/depreciation on: | |||
Investments in non-affiliates | 1,027,496 | (3,944,247) | 10,611,308 |
Futures contracts | (2,041) | — | — |
Change in net unrealized appreciation/depreciation | 1,025,455 | (3,944,247) | 10,611,308 |
Net realized/unrealized gains (losses) | 586,893 | (5,807,023) | 6,981,263 |
Change in net assets resulting from operations | $774,593 | $(5,603,201) | $8,388,557 |
December 31, 2022 | J.P. Morgan Exchange-Traded Funds | 39 |
FOR THE SIX MONTHS ENDED December 31, 2022 (Unaudited) (continued)
JPMorgan Equity Premium Income ETF | JPMorgan Nasdaq Equity Premium Income ETF | |
INVESTMENT INCOME: | ||
Interest income from non-affiliates | $767,277,331 | $43,317,314 |
Interest income from affiliates | 22,198 | 470 |
Dividend income from non-affiliates | 112,553,319 | 1,941,789 |
Dividend income from affiliates | 3,273,594 | 131,523 |
Total investment income | 883,126,442 | 45,391,096 |
EXPENSES: | ||
Management fees (See Note 3.A.) | 23,716,839 | 888,842 |
Interest expense to non-affiliates | 520 | 16 |
Other | 35,463 | — |
Total expenses | 23,752,822 | 888,858 |
Net investment income (loss) | 859,373,620 | 44,502,238 |
REALIZED/UNREALIZED GAINS (LOSSES): | ||
Net realized gain (loss) on transactions from: | ||
Investments in non-affiliates | (974,922,192) | (45,557,266) |
In-kind redemptions of investments in non-affiliates (See Note 4) | 81,956,747 | 6,458,459 |
Futures contracts | 7,687,248 | 83,798 |
Net realized gain (loss) | (885,278,197) | (39,015,009) |
Change in net unrealized appreciation/depreciation on: | ||
Investments in non-affiliates | 743,570,894 | (43,275,801) |
Futures contracts | 2,720,263 | 15,350 |
Change in net unrealized appreciation/depreciation | 746,291,157 | (43,260,451) |
Net realized/unrealized gains (losses) | (138,987,040) | (82,275,460) |
Change in net assets resulting from operations | $720,386,580 | $(37,773,222) |
40 | J.P. Morgan Exchange-Traded Funds | December 31, 2022 |
FOR THE PERIODS INDICATED
JPMorgan ActiveBuilders U.S. Large Cap Equity ETF | JPMorgan Active Growth ETF | ||
Six Months Ended December 31, 2022 (Unaudited) | Period Ended June 30, 2022 (a) | Period Ended December 31, 2022 (Unaudited)(b) | |
CHANGE IN NET ASSETS RESULTING FROM OPERATIONS: | |||
Net investment income (loss) | $187,700 | $334,991 | $203,822 |
Net realized gain (loss) | (438,562) | (861,236) | (1,862,776) |
Change in net unrealized appreciation/depreciation | 1,025,455 | (2,601,888) | (3,944,247) |
Change in net assets resulting from operations | 774,593 | (3,128,133) | (5,603,201) |
DISTRIBUTIONS TO SHAREHOLDERS: | |||
Total distributions to shareholders | (378,735) | (154,858) | (206,645) |
CAPITAL TRANSACTIONS: | |||
Change in net assets resulting from capital transactions | — | 26,962,153 | 145,748,475 |
NET ASSETS: | |||
Change in net assets | 395,858 | 23,679,162 | 139,938,629 |
Beginning of period | 23,679,162 | — | — |
End of period | $24,075,020 | $23,679,162 | $139,938,629 |
CAPITAL TRANSACTIONS: | |||
Proceeds from shares issued | $— | $26,962,153 | $148,038,213 |
Cost of shares redeemed | — | — | (2,289,738) |
Total change in net assets resulting from capital transactions | $— | $26,962,153 | $145,748,475 |
SHARE TRANSACTIONS: | |||
Issued | — | 550,000 | 3,200,000 |
Redeemed | — | — | (50,000) |
Net increase in shares from transactions | — | 550,000 | 3,150,000 |
December 31, 2022 | J.P. Morgan Exchange-Traded Funds | 41 |
FOR THE PERIODS INDICATED (continued)
JPMorgan Active Value ETF | JPMorgan Equity Premium Income ETF | |||
Six Months Ended December 31, 2022 (Unaudited) | Period Ended June 30, 2022 (a) | Six Months Ended December 31, 2022 (Unaudited) | Year Ended June 30, 2022 | |
CHANGE IN NET ASSETS RESULTING FROM OPERATIONS: | ||||
Net investment income (loss) | $1,407,294 | $410,429 | $859,373,620 | $600,120,493 |
Net realized gain (loss) | (3,630,045) | (635,535) | (885,278,197) | (538,883,868) |
Change in net unrealized appreciation/depreciation | 10,611,308 | (1,943,900) | 746,291,157 | (450,224,219) |
Change in net assets resulting from operations | 8,388,557 | (2,169,006) | 720,386,580 | (388,987,594) |
DISTRIBUTIONS TO SHAREHOLDERS: | ||||
Total distributions to shareholders | (1,496,549) | (377,424) | (984,646,951) | (493,807,029) |
CAPITAL TRANSACTIONS: | ||||
Change in net assets resulting from capital transactions | 251,269,545 | 46,771,557 | 7,542,987,617 | 9,172,786,489 |
NET ASSETS: | ||||
Change in net assets | 258,161,553 | 44,225,127 | 7,278,727,246 | 8,289,991,866 |
Beginning of period | 44,225,127 | — | 10,206,410,953 | 1,916,419,087 |
End of period | $302,386,680 | $44,225,127 | $17,485,138,199 | $10,206,410,953 |
CAPITAL TRANSACTIONS: | ||||
Proceeds from shares issued | $253,783,924 | $46,771,557 | $8,184,733,322 | $9,663,664,928 |
Cost of shares redeemed | (2,514,379) | — | (641,745,705) | (490,878,439) |
Total change in net assets resulting from capital transactions | $251,269,545 | $46,771,557 | $7,542,987,617 | $9,172,786,489 |
SHARE TRANSACTIONS: | ||||
Issued | 5,025,000 | 925,000 | 148,600,000 | 160,575,000 |
Redeemed | (50,000) | — | (11,575,000) | (8,175,000) |
Net increase in shares from transactions | 4,975,000 | 925,000 | 137,025,000 | 152,400,000 |
42 | J.P. Morgan Exchange-Traded Funds | December 31, 2022 |
JPMorgan Nasdaq Equity Premium Income ETF | ||
Six Months Ended December 31, 2022 (Unaudited) | Period Ended June 30, 2022 (a) | |
CHANGE IN NET ASSETS RESULTING FROM OPERATIONS: | ||
Net investment income (loss) | $44,502,238 | $1,172,963 |
Net realized gain (loss) | (39,015,009) | (478,926) |
Change in net unrealized appreciation/depreciation | (43,260,451) | (4,639,012) |
Change in net assets resulting from operations | (37,773,222) | (3,944,975) |
DISTRIBUTIONS TO SHAREHOLDERS: | ||
Total distributions to shareholders | (45,797,035) | (338,751) |
CAPITAL TRANSACTIONS: | ||
Change in net assets resulting from capital transactions | 986,706,165 | 105,439,455 |
NET ASSETS: | ||
Change in net assets | 903,135,908 | 101,155,729 |
Beginning of period | 101,155,729 | — |
End of period | $1,004,291,637 | $101,155,729 |
CAPITAL TRANSACTIONS: | ||
Proceeds from shares issued | $1,067,219,914 | $105,439,455 |
Cost of shares redeemed | (80,513,749) | — |
Total change in net assets resulting from capital transactions | $986,706,165 | $105,439,455 |
SHARE TRANSACTIONS: | ||
Issued | 24,225,000 | 2,225,000 |
Redeemed | (1,825,000) | — |
Net increase in shares from transactions | 22,400,000 | 2,225,000 |
December 31, 2022 | J.P. Morgan Exchange-Traded Funds | 43 |
FOR THE PERIODS INDICATED
Per share operating performance | |||||||
Investment operations | Distributions | ||||||
Net asset value, beginning of period | Net investment income (loss) (b) | Net realized and unrealized gains (losses) on investments | Total from investment operations | Net investment income | Net realized gain | Total distributions | |
JPMorgan ActiveBuilders U.S. Large Cap Equity ETF | |||||||
Six Months Ended December 31, 2022 (Unaudited) | $43.05 | $0.34 | $1.07 | $1.41 | $(0.69) | $— | $(0.69) |
July 7, 2021 (f) through June 30, 2022 | 49.00 | 0.61 | (6.28) | (5.67) | (0.28) | — | (0.28) |
JPMorgan Active Growth ETF | |||||||
August 8, 2022 (f) through December 31, 2022 (Unaudited) | 49.95 | 0.12 | (5.58) | (5.46) | (0.07) | — | (0.07) |
JPMorgan Active Value ETF | |||||||
Six Months Ended December 31, 2022 (Unaudited) | 47.81 | 0.48 | 3.31 | 3.79 | (0.35) | — | (0.35) |
October 4, 2021 (f) through June 30, 2022 | 49.50 | 0.63 | (1.78) | (1.15) | (0.47) | (0.07) | (0.54) |
JPMorgan Equity Premium Income ETF | |||||||
Six Months Ended December 31, 2022 (Unaudited) | 55.45 | 3.48 | (0.53) | 2.95 | (3.95) | — | (3.95) |
Year Ended June 30, 2022 | 60.50 | 6.11 | (6.20) | (0.09) | (4.96) | — | (4.96) |
Year Ended June 30, 2021 | 50.76 | 5.17 | 9.42 | 14.59 | (4.85) | — | (4.85) |
May 20, 2020 (f) through June 30, 2020 | 50.00 | 0.63 | 0.13(i) | 0.76 | — | — | — |
JPMorgan Nasdaq Equity Premium Income ETF | |||||||
Six Months Ended December 31, 2022 (Unaudited) | 45.46 | 3.79 | (4.99) | (1.20) | (3.48) | — | (3.48) |
May 3, 2022 (f) through June 30, 2022 | 50.00 | 1.11 | (5.27) | (4.16) | (0.38) | — | (0.38) |
(a) | Annualized for periods less than one year, unless otherwise noted. |
(b) | Calculated based upon average shares outstanding. |
(c) | Not annualized for periods less than one year. |
(d) | Includes adjustments in accordance with accounting principles generally accepted in the United States of America and as such, the net asset values for financial reporting purposes and the returns based upon those net asset values may differ from the net asset values and returns for shareholder transactions. |
(e) | Market price return was calculated assuming an initial investment made at the market price at the beginning of the reporting period, reinvestment of all dividends and distributions at market price during the period, and sale at the market price on the last day of the period. The closing price was used to calculate the market price return. |
(f) | Commencement of operations. |
(g) | Since the Shares of the Fund did not trade in the secondary market until the day after the Fund’s inception, for the period from the inception to the first day of secondary market trading, the net asset value is used as a proxy for the secondary market trading price to calculate the market returns. |
(h) | Certain non-recurring expenses incurred by the Fund were not annualized for the period indicated. |
(i) | Calculation of the net realized and unrealized gains (losses) per share do not correlate with the Fund’s net realized and unrealized gains (losses) presented in the Statement of Operations due to the timing of capital transactions in relation to the fluctuating market values of the Fund’s investments. |
44 | J.P. Morgan Exchange-Traded Funds | December 31, 2022 |
Ratios/Supplemental data | |||||||
Ratios to average net assets (a) | |||||||
Net asset value, end of period | Market price, end of period | Total return (c)(d) | Market price total return (c)(e) | Net assets, end of period | Net expenses | Net investment income (loss) | Portfolio turnover rate (c) |
$43.77 | $43.75 | 3.28% | 3.45% | $24,075,020 | 0.17% | 1.50% | 14% |
43.05 | 42.96 | (11.67) | (11.85)(g) | 23,679,162 | 0.17(h) | 1.25(h) | 40 |
44.42 | 44.43 | (10.93) | (10.91)(g) | 139,938,629 | 0.44 | 0.68 | 14 |
51.25 | 51.23 | 7.94 | 8.12 | 302,386,680 | 0.43 | 1.87 | 41 |
47.81 | 47.71 | (2.37) | (2.57)(g) | 44,225,127 | 0.44 | 1.64 | 56 |
54.45 | 54.49 | 5.48 | 5.56 | 17,485,138,199 | 0.35(h) | 12.58(h) | 95 |
55.45 | 55.45 | (0.49) | (0.62) | 10,206,410,953 | 0.35 | 10.23 | 195 |
60.50 | 60.57 | 30.22 | 29.90 | 1,916,419,087 | 0.35 | 8.89 | 195 |
50.76 | 50.94 | 1.52 | 1.88(g) | 27,916,586 | 0.35 | 11.11 | 13 |
40.78 | 40.80 | (2.91) | (3.51) | 1,004,291,637 | 0.35 | 17.28 | 90 |
45.46 | 45.76 | (8.37) | (7.77)(g) | 101,155,729 | 0.35 | 14.59 | 12 |
December 31, 2022 | J.P. Morgan Exchange-Traded Funds | 45 |
AS OF December 31, 2022 (Unaudited)
Diversification Classification | |
JPMorgan ActiveBuilders U.S. Large Cap Equity ETF | Diversified |
JPMorgan Active Growth ETF(1) | Non-diversified |
JPMorgan Active Value ETF | Diversified |
JPMorgan Equity Premium Income ETF | Diversified |
JPMorgan Nasdaq Equity Premium Income ETF | Non-Diversified |
(1) | Commencement of operations was August 8, 2022. |
Listing Exchange | |
ActiveBuilders U.S. Large Cap Equity ETF | NYSE Arca |
Active Growth ETF | NYSE Arca |
Active Value ETF | NYSE Arca |
Equity Premium Income ETF | NYSE Arca |
Nasdaq Equity Premium Income ETF | Nasdaq Stock Market® LLC |
46 | J.P. Morgan Exchange-Traded Funds | December 31, 2022 |
ActiveBuilders U.S. Large Cap Equity ETF | ||||
Level 1 Quoted prices | Level 2 Other significant observable inputs | Level 3 Significant unobservable inputs | Total | |
Total Investments in Securities (a) | $24,036,600 | $— | $— | $24,036,600 |
Depreciation in Other Financial Instruments | ||||
Futures Contracts (a) | $(2,051) | $— | $— | $(2,051) |
(a) | Please refer to the SOI for specifics of portfolio holdings. |
Active Growth ETF | ||||
Level 1 Quoted prices | Level 2 Other significant observable inputs | Level 3 Significant unobservable inputs | Total | |
Total Investments in Securities (a) | $139,936,285 | $— | $— | $139,936,285 |
(a) | Please refer to the SOI for specifics of portfolio holdings. |
December 31, 2022 | J.P. Morgan Exchange-Traded Funds | 47 |
AS OF December 31, 2022 (Unaudited) (continued)
Active Value ETF | ||||
Level 1 Quoted prices | Level 2 Other significant observable inputs | Level 3 Significant unobservable inputs | Total | |
Total Investments in Securities (a) | $302,174,400 | $— | $— | $302,174,400 |
(a) | Please refer to the SOI for specifics of portfolio holdings. |
Equity Premium Income ETF | ||||
Level 1 Quoted prices | Level 2 Other significant observable inputs | Level 3 Significant unobservable inputs | Total | |
Investments in Securities | ||||
Common Stocks | $14,459,314,081 | $— | $— | $14,459,314,081 |
Equity Linked Notes | — | 2,653,225,478 | — | 2,653,225,478 |
Short-Term Investments | ||||
Investment Companies | 264,972,342 | — | — | 264,972,342 |
Total Investments in Securities | $14,724,286,423 | $2,653,225,478 | $— | $17,377,511,901 |
Appreciation in Other Financial Instruments | ||||
Futures Contracts | $2,720,263 | $— | $— | $2,720,263 |
Nasdaq Equity Premium Income ETF | ||||
Level 1 Quoted prices | Level 2 Other significant observable inputs | Level 3 Significant unobservable inputs | Total | |
Investments in Securities | ||||
Common Stocks | $815,055,567 | $— | $— | $815,055,567 |
Equity Linked Notes | — | 174,258,210 | — | 174,258,210 |
Short-Term Investments | ||||
Investment Companies | 18,135,704 | — | — | 18,135,704 |
Total Investments in Securities | $833,191,271 | $174,258,210 | $— | $1,007,449,481 |
48 | J.P. Morgan Exchange-Traded Funds | December 31, 2022 |
ActiveBuilders U.S. Large Cap Equity ETF | |||||||||
For the six months ended December 31, 2022 | |||||||||
Security Description | Value at June 30, 2022 | Purchases at Cost | Proceeds from Sales | Net Realized Gain (Loss) | Change in Unrealized Appreciation/ (Depreciation) | Value at December 31, 2022 | Shares at December 31, 2022 | Dividend Income | Capital Gain Distributions |
JPMorgan U.S. Government Money Market Fund Class IM Shares, 4.12% (a) (b) | $108,091 | $816,036 | $816,047 | $— | $— | $108,080 | 108,080 | $1,350 | $— |
(a) | Investment in an affiliated fund, which is registered under the Investment Company Act of 1940, as amended, and is advised by J.P. Morgan Investment Management Inc. |
(b) | The rate shown is the current yield as of December 31, 2022. |
Active Growth ETF | |||||||||
For the six months ended December 31, 2022 | |||||||||
Security Description | Value at August 8, 2022(a) | Purchases at Cost | Proceeds from Sales | Net Realized Gain (Loss) | Change in Unrealized Appreciation/ (Depreciation) | Value at December 31, 2022 | Shares at December 31, 2022 | Dividend Income | Capital Gain Distributions |
JPMorgan U.S. Government Money Market Fund Class IM Shares, 4.12% (b) (c) | $— | $8,979,704 | $3,281,375 | $— | $— | $5,698,329 | 5,698,329 | $43,646 | $— |
(a) | Commencement of operations was August 8, 2022. |
(b) | Investment in an affiliated fund, which is registered under the Investment Company Act of 1940, as amended, and is advised by J.P. Morgan Investment Management Inc. |
(c) | The rate shown is the current yield as of December 31, 2022. |
December 31, 2022 | J.P. Morgan Exchange-Traded Funds | 49 |
AS OF December 31, 2022 (Unaudited) (continued)
Active Value ETF | |||||||||
For the six months ended December 31, 2022 | |||||||||
Security Description | Value at June 30, 2022 | Purchases at Cost | Proceeds from Sales | Net Realized Gain (Loss) | Change in Unrealized Appreciation/ (Depreciation) | Value at December 31, 2022 | Shares at December 31, 2022 | Dividend Income | Capital Gain Distributions |
JPMorgan U.S. Government Money Market Fund Class IM Shares, 4.12% (a) (b) | $1,396,966 | $15,017,341 | $9,500,573 | $— | $— | $6,913,734 | 6,913,734 | $66,149 | $— |
(a) | Investment in an affiliated fund, which is registered under the Investment Company Act of 1940, as amended, and is advised by J.P. Morgan Investment Management Inc. |
(b) | The rate shown is the current yield as of December 31, 2022. |
Equity Premium Income ETF | |||||||||
For the six months ended December 31, 2022 | |||||||||
Security Description | Value at June 30, 2022 | Purchases at Cost | Proceeds from Sales | Net Realized Gain (Loss) | Change in Unrealized Appreciation/ (Depreciation) | Value at December 31, 2022 | Shares at December 31, 2022 | Dividend Income | Capital Gain Distributions |
JPMorgan U.S. Government Money Market Fund Class IM Shares, 4.12% (a) (b) | $121,300,698 | $3,345,724,539 | $3,202,052,895 | $— | $— | $264,972,342 | 264,972,342 | $3,273,594 | $— |
(a) | Investment in an affiliated fund, which is registered under the Investment Company Act of 1940, as amended, and is advised by J.P. Morgan Investment Management Inc. |
(b) | The rate shown is the current yield as of December 31, 2022. |
Nasdaq Equity Premium Income ETF | |||||||||
For the six months ended December 31, 2022 | |||||||||
Security Description | Value at June 30, 2022 | Purchases at Cost | Proceeds from Sales | Net Realized Gain (Loss) | Change in Unrealized Appreciation/ (Depreciation) | Value at December 31, 2022 | Shares at December 31, 2022 | Dividend Income | Capital Gain Distributions |
JPMorgan U.S. Government Money Market Fund Class IM Shares, 4.12% (a) (b) | $1,754,620 | $223,364,984 | $206,983,900 | $— | $— | $18,135,704 | 18,135,704 | $131,523 | $— |
(a) | Investment in an affiliated fund, which is registered under the Investment Company Act of 1940, as amended, and is advised by J.P. Morgan Investment Management Inc. |
(b) | The rate shown is the current yield as of December 31, 2022. |
50 | J.P. Morgan Exchange-Traded Funds | December 31, 2022 |
ActiveBuilders U.S. Large Cap Equity ETF | Equity Premium Income ETF | Nasdaq Equity Premium Income ETF | |
Futures Contracts: | |||
Average Notional Balance Long | $97,779 | $9,348,446 | $201,418 |
Average Notional Balance Short | — | (118,470,518) | — |
Ending Notional Balance Long | 115,830 | — | — |
Ending Notional Balance Short | — | (222,036,250) | — |
December 31, 2022 | J.P. Morgan Exchange-Traded Funds | 51 |
AS OF December 31, 2022 (Unaudited) (continued)
ActiveBuilders U.S. Large Cap Equity ETF | 0.17% |
Active Growth ETF | 0.44 |
Active Value ETF | 0.44 |
Equity Premium Income ETF | 0.35 |
Nasdaq Equity Premium Income ETF | 0.35 |
52 | J.P. Morgan Exchange-Traded Funds | December 31, 2022 |
Purchases (excluding U.S. Government) | Sales (excluding U.S. Government) | |
ActiveBuilders U.S. Large Cap Equity ETF | $3,454,888 | $3,637,703 |
Active Growth ETF | 34,944,696 | 9,642,212 |
Active Value ETF | 69,020,296 | 61,121,671 |
Equity Premium Income ETF | 14,047,129,397 | 12,638,989,439 |
Nasdaq Equity Premium Income ETF | 646,266,804 | 459,753,377 |
In-Kind Purchases | In-Kind Sales | |
Active Growth ETF | $116,954,838 | $2,212,342 |
Active Value ETF | 240,001,519 | 2,371,394 |
Equity Premium Income ETF | 6,405,784,630 | 531,547,015 |
Nasdaq Equity Premium Income ETF | 851,528,899 | 64,965,249 |
Aggregate Cost | Gross Unrealized Appreciation | Gross Unrealized Depreciation | Net Unrealized Appreciation (Depreciation) | |
ActiveBuilders U.S. Large Cap Equity ETF | $25,610,982 | $1,633,792 | $3,210,225 | $(1,576,433) |
Active Growth ETF | 143,880,532 | 4,134,873 | 8,079,120 | (3,944,247) |
Active Value ETF | 293,506,992 | 12,920,519 | 4,253,111 | 8,667,408 |
Equity Premium Income ETF | 16,993,473,286 | 810,725,964 | 423,967,086 | 386,758,878 |
Nasdaq Equity Premium Income ETF | 1,055,348,944 | 19,369,082 | 67,268,545 | (47,899,463) |
December 31, 2022 | J.P. Morgan Exchange-Traded Funds | 53 |
AS OF December 31, 2022 (Unaudited) (continued)
Capital Loss Carryforward Character | ||
Short-Term | Long-Term | |
ActiveBuilders U.S. Large Cap Equity ETF | $37,530 | $— |
Equity Premium Income ETF | 38,787,304 | 17,023,570 |
Nasdaq Equity Premium Income ETF | 491,679 | — |
Net Capital Losses (Gains) | ||
Short-Term | Long-Term | |
ActiveBuilders U.S. Large Cap Equity ETF | $754,043 | $13,501 |
Active Value ETF | 461,324 | (2,753) |
Equity Premium Income ETF | 469,512,656 | 58,409,907 |
54 | J.P. Morgan Exchange-Traded Funds | December 31, 2022 |
% of Ownership | |
ActiveBuilders U.S. Large Cap Equity ETF | 91% |
Active Growth ETF | 16 |
December 31, 2022 | J.P. Morgan Exchange-Traded Funds | 55 |
(Unaudited)
Hypothetical $1,000 Investment
Beginning Account Value July 1, 2022 | Ending Account Value December 31, 2022 | Expenses Paid During the Period | Annualized Expense Ratio | |
JPMorgan ActiveBuilders U.S. Large Cap Equity ETF | ||||
Actual * | $1,000.00 | $1,032.80 | $0.87 | 0.17% |
Hypothetical * | 1,000.00 | 1,024.35 | 0.87 | 0.17 |
JPMorgan Active Growth ETF | ||||
Actual ** | 1,000.00 | 890.70 | 1.65 | 0.44 |
Hypothetical * | 1,000.00 | 1,022.99 | 2.24 | 0.44 |
JPMorgan Active Value ETF | ||||
Actual * | 1,000.00 | 1,079.40 | 2.25 | 0.43 |
Hypothetical * | 1,000.00 | 1,023.04 | 2.19 | 0.43 |
JPMorgan Equity Premium Income ETF | ||||
Actual * | 1,000.00 | 1,054.80 | 1.81 | 0.35 |
Hypothetical * | 1,000.00 | 1,023.44 | 1.79 | 0.35 |
JPMorgan Nasdaq Equity Premium Income ETF | ||||
Actual * | 1,000.00 | 970.90 | 1.74 | 0.35 |
Hypothetical * | 1,000.00 | 1,023.44 | 1.79 | 0.35 |
* | Expenses are equal to the Fund’s annualized expense ratio, multiplied by the average account value over the period, multiplied by 184/365 (to reflect the one-half year period). |
** | Expenses are equal to the Fund’s annualized net expense ratio, multiplied by the average account value over the period, multiplied by 145/365 (to reflect the actual period). The Fund commenced operations on August 8, 2022. |
56 | J.P. Morgan Exchange-Traded Funds | December 31, 2022 |
(Unaudited)
(ii) The qualifications, backgrounds and responsibilities of the portfolio management team primarily responsible for the day-to-day management each of the Funds, including personnel changes, if any;
December 31, 2022 | J.P. Morgan Exchange-Traded Funds | 57 |
(Unaudited) (continued)
(iv) Information about the structure and distribution strategy for each of the Funds and how it fits within the Trust’s other fund offerings;
(v) The administration services provided by the Adviser in its role as Administrator;
(vi) Their knowledge of the nature and quality of the services provided by the Adviser and its affiliates gained from their experience as Trustees of the Trusts and in the financial industry generally;
(vii) The overall reputation and capabilities of the Adviser and its affiliates;
(viii) The commitment of the Adviser to provide high quality service to the Funds;
(ix) Their overall confidence in the Adviser’s integrity;
(x) The Adviser’s responsiveness to requests for additional information, questions or concerns raised by them, including the Adviser’s willingness to consider and implement organizational and operational changes designed to improve investment results and the services provided to each Fund; and
(xi) The Adviser’s business continuity plan and steps the Adviser and its affiliates have taken to provide ongoing services to the Funds during the COVID-19 pandemic, and the Adviser’s and its affiliates’ success in continuing to provide services to the Funds and their shareholders throughout this period.
58 | J.P. Morgan Exchange-Traded Funds | December 31, 2022 |
December 31, 2022 | J.P. Morgan Exchange-Traded Funds | 59 |
(Unaudited) (continued)
60 | J.P. Morgan Exchange-Traded Funds | December 31, 2022 |
(Unaudited)
(i) The background and experience of the Adviser’s senior management and investment personnel;
(ii) The qualifications, backgrounds and responsibilities of the portfolio management team to be primarily responsible for the
(iii) The investment strategy for the Fund, and the infrastructure supporting the portfolio management team;
(iv) Information about the structure and distribution strategy of the Fund and how it fits within the Trust’s other fund offerings;
(v) The administration services to be provided by the Adviser under the Management Agreement;
(vi) Their knowledge of the nature and quality of the services provided by the Adviser and its affiliates gained from their experience as Trustees of the Trust and in the financial industry generally;
(vii) The overall reputation and capabilities of the Adviser and its affiliates;
(viii) The commitment of the Adviser to provide high quality service to the Fund;
(ix) Their overall confidence in the Adviser’s integrity;
(x) The Adviser’s responsiveness to requests for additional information, questions or concerns raised by them; and
(xi) The Adviser’s business continuity plan, steps the Adviser and its affiliates have taken to provide services to the Fund during the COVID-19 pandemic and the Adviser’s and its affiliates’ success in continuing to provide services to the other J.P. Morgan ETFs and their shareholders throughout this period.
December 31, 2022 | J.P. Morgan Exchange-Traded Funds | 61 |
(Unaudited) (continued)
62 | J.P. Morgan Exchange-Traded Funds | December 31, 2022 |


Fund | Ticker | Listing Exchange |
JPMorgan Market Expansion Enhanced Equity ETF | JMEE | NYSE Arca |

1 | |
2 | |
5 | |
15 | |
20 | |
22 | |
30 |
Past performance is no guarantee of future performance. The general market views expressed in this report are opinions based on market and other conditions through the end of the reporting period and are subject to change without notice. These views are not intended to predict the future performance of the Fund or the securities markets.
Prospective investors should refer to the Fund's prospectus for a discussion of the Fund's investment objectives, strategies and risks. Call J.P. Morgan Exchange-Traded Funds at (844) 457-6383 for a prospectus containing more complete information about the Fund, including management fees and other expenses. Please read it carefully before investing.
Shares are bought and sold throughout the day on an exchange at market price (not at net asset value) through a brokerage account, and are not individually subscribed and redeemed from the Fund. Shares may only be subscribed and redeemed directly from the Fund by Authorized Participants, in very large creation/redemption units. Brokerage commissions will reduce returns.
February 13, 2023 (Unaudited)
 | “Investors may face continued economic and geopolitical challenges in the year ahead. However, some of the acute risks encountered in 2022 appear to have receded and last year’s reset in asset prices may provide attractive investment opportunities.” — Brian S. Shlissel |

President - J.P. Morgan Exchange-Traded Funds
J.P. Morgan Asset Management
1-844-4JPM-ETF or jpmorgan.com/etfs for more information
December 31, 2022 | J.P. Morgan Exchange-Traded Funds | 1 |
SIX MONTHS ENDED December 31, 2022 (Unaudited)
REPORTING PERIOD RETURN: | |
Net Asset Value * | 7.19% |
Market Price ** | 7.16% |
S&P 1000 Index | 6.67% |
Net Assets as of 12/31/2022 | $786,533,246 |
Fund Ticker | JMEE |
Shares of Exelixis, a pharmaceuticals developer focused on cancer treatments, fell after a run-up in the share price early in the period. Shares of Lantheus Holdings, a provider of diagnostics imaging and nuclear medicine products, fell after a run-up in the share price ahead of the company’s third quarter results. Shares of Toro, a manufacturer of tractors, mowers and related landscaping equipment, rose after the company reported consecutive quarters of better-than-expected earnings and increased its quarterly dividend.
2 | J.P. Morgan Exchange-Traded Funds | December 31, 2022 |
TOP TEN HOLDINGS OF THE PORTFOLIO AS OF December 31, 2022 | PERCENT OF TOTAL INVESTMENTS | |
1. | United Therapeutics Corp. | 0.9% |
2. | First Solar, Inc. | 0.8 |
3. | Steel Dynamics, Inc. | 0.7 |
4. | Builders FirstSource, Inc. | 0.7 |
5. | Jabil, Inc. | 0.6 |
6. | Reliance Steel & Aluminum Co. | 0.6 |
7. | Ciena Corp. | 0.6 |
8. | Genpact Ltd. | 0.6 |
9. | AGCO Corp. | 0.5 |
10. | Essential Utilities, Inc. | 0.5 |
PORTFOLIO COMPOSITION BY SECTOR AS OF December 31, 2022 | PERCENT OF TOTAL INVESTMENTS |
Industrials | 20.1% |
Financials | 15.4 |
Information Technology | 12.9 |
Consumer Discretionary | 12.6 |
Health Care | 10.8 |
Real Estate | 7.6 |
Materials | 6.5 |
Consumer Staples | 4.6 |
Energy | 4.2 |
Utilities | 3.1 |
Communication Services | 1.4 |
Short-Term Investments | 0.8 |
December 31, 2022 | J.P. Morgan Exchange-Traded Funds | 3 |
SIX MONTHS ENDED December 31, 2022 (Unaudited) (continued)
INCEPTION DATE | SIX MONTHS* | 1 YEAR | 5 YEAR | 10 YEAR | |
JPMorgan Market Expansion Enhanced Equity ETF | |||||
Net Asset Value | July 31, 1998** | 7.19% | (12.83)% | 5.88% | 10.62% |
Market Price | 7.16 | (12.87) | 5.87 | 10.61 |
* | Not annualized. |
** | Inception date for Class I Shares of the Predecessor Fund (as defined below). |
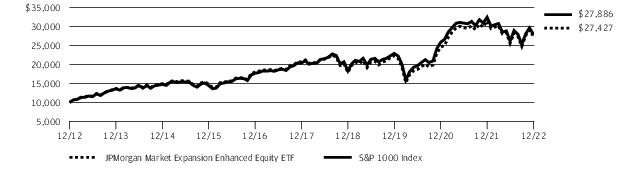
4 | J.P. Morgan Exchange-Traded Funds | December 31, 2022 |
AS OF December 31, 2022 (Unaudited)
INVESTMENTS | SHARES | VALUE($) |
Common Stocks — 99.2% | ||
Aerospace & Defense — 0.6% | ||
Aerojet Rocketdyne Holdings, Inc. * | 20,334 | 1,137,280 |
AeroVironment, Inc. * | 5,804 | 497,171 |
Axon Enterprise, Inc. * | 15,997 | 2,654,382 |
Curtiss-Wright Corp. | 1,609 | 268,687 |
Woodward, Inc. | 4,516 | 436,291 |
4,993,811 | ||
Air Freight & Logistics — 0.5% | ||
Atlas Air Worldwide Holdings, Inc. * | 7,498 | 755,798 |
Forward Air Corp. | 8,331 | 873,839 |
GXO Logistics, Inc. * | 20,639 | 881,079 |
Hub Group, Inc., Class A * | 22,245 | 1,768,255 |
4,278,971 | ||
Airlines — 0.3% | ||
Hawaiian Holdings, Inc. * | 22,473 | 230,573 |
JetBlue Airways Corp. * | 266,258 | 1,725,352 |
1,955,925 | ||
Auto Components — 1.1% | ||
Adient plc * | 24,159 | 838,076 |
American Axle & Manufacturing Holdings, Inc. * | 37,071 | 289,895 |
Dana, Inc. | 86,573 | 1,309,849 |
Fox Factory Holding Corp. * | 5,659 | 516,271 |
Gentherm, Inc. * | 8,594 | 561,102 |
Goodyear Tire & Rubber Co. (The) * | 182,845 | 1,855,877 |
LCI Industries | 6,386 | 590,386 |
Lear Corp. | 14,991 | 1,859,184 |
Patrick Industries, Inc. | 7,134 | 432,320 |
8,252,960 | ||
Automobiles — 0.4% | ||
Harley-Davidson, Inc. | 40,146 | 1,670,074 |
Thor Industries, Inc. | 15,019 | 1,133,784 |
Winnebago Industries, Inc. | 10,275 | 541,492 |
3,345,350 | ||
Banks — 7.7% | ||
Ameris Bancorp | 40,246 | 1,897,197 |
Associated Banc-Corp. | 40,847 | 943,157 |
Banc of California, Inc. | 38,614 | 615,121 |
Bancorp, Inc. (The) * | 14,476 | 410,829 |
Bank OZK | 11,595 | 464,496 |
Banner Corp. | 30,746 | 1,943,147 |
Brookline Bancorp, Inc. | 18,869 | 266,996 |
Cadence Bank | 18,829 | 464,323 |
Cathay General Bancorp | 10,663 | 434,944 |
INVESTMENTS | SHARES | VALUE($) |
Banks — continued | ||
Commerce Bancshares, Inc. | 11,359 | 773,207 |
Cullen/Frost Bankers, Inc. | 17,251 | 2,306,459 |
Customers Bancorp, Inc. * | 32,926 | 933,123 |
CVB Financial Corp. | 71,692 | 1,846,069 |
Dime Community Bancshares, Inc. | 12,536 | 399,021 |
East West Bancorp, Inc. | 61,547 | 4,055,947 |
FB Financial Corp. | 35,846 | 1,295,475 |
First Bancorp | 9,349 | 400,511 |
First BanCorp (Puerto Rico) | 61,676 | 784,519 |
First Commonwealth Financial Corp. | 28,385 | 396,539 |
First Financial Bancorp | 11,658 | 282,473 |
First Financial Bankshares, Inc. | 16,720 | 575,168 |
First Horizon Corp. | 138,580 | 3,395,210 |
FNB Corp. | 151,886 | 1,982,112 |
Glacier Bancorp, Inc. | 2,727 | 134,768 |
Hancock Whitney Corp. | 36,253 | 1,754,283 |
Hanmi Financial Corp. | 8,814 | 218,147 |
HomeStreet, Inc. | 5,964 | 164,487 |
Independent Bank Corp. | 7,198 | 607,727 |
National Bank Holdings Corp., Class A | 47,505 | 1,998,535 |
NBT Bancorp, Inc. | 8,908 | 386,785 |
OFG Bancorp (Puerto Rico) | 71,623 | 1,973,930 |
Old National Bancorp | 165,040 | 2,967,419 |
PacWest Bancorp | 49,873 | 1,144,585 |
Pathward Financial, Inc. | 7,168 | 308,582 |
Pinnacle Financial Partners, Inc. | 42,094 | 3,089,700 |
Preferred Bank | 14,279 | 1,065,499 |
Prosperity Bancshares, Inc. | 24,805 | 1,802,827 |
Renasant Corp. | 14,290 | 537,161 |
Simmons First National Corp., Class A | 85,421 | 1,843,385 |
Synovus Financial Corp. | 38,296 | 1,438,015 |
Triumph Financial, Inc. * | 5,912 | 288,919 |
UMB Financial Corp. | 11,338 | 946,950 |
Umpqua Holdings Corp. | 56,005 | 999,689 |
United Community Banks, Inc. | 26,927 | 910,133 |
Valley National Bancorp | 80,292 | 908,103 |
Veritex Holdings, Inc. | 67,952 | 1,908,092 |
Washington Federal, Inc. | 60,770 | 2,038,834 |
Webster Financial Corp. | 30,842 | 1,460,060 |
Wintrust Financial Corp. | 35,235 | 2,978,062 |
60,740,720 | ||
December 31, 2022 | J.P. Morgan Exchange-Traded Funds | 5 |
AS OF December 31, 2022 (Unaudited) (continued)
INVESTMENTS | SHARES | VALUE($) |
Common Stocks — continued | ||
Beverages — 0.2% | ||
Boston Beer Co., Inc. (The), Class A * | 2,402 | 791,507 |
Coca-Cola Consolidated, Inc. | 1,396 | 715,255 |
1,506,762 | ||
Biotechnology — 2.3% | ||
Arrowhead Pharmaceuticals, Inc. * | 41,442 | 1,680,888 |
Eagle Pharmaceuticals, Inc. * | 28,785 | 841,386 |
Emergent BioSolutions, Inc. * | 3,878 | 45,799 |
Exelixis, Inc. * | 228,551 | 3,665,958 |
Neurocrine Biosciences, Inc. * | 27,289 | 3,259,398 |
REGENXBIO, Inc. * | 61,583 | 1,396,702 |
United Therapeutics Corp. * | 26,205 | 7,287,348 |
18,177,479 | ||
Building Products — 2.2% | ||
Builders FirstSource, Inc. * | 80,823 | 5,243,796 |
Carlisle Cos., Inc. | 13,633 | 3,212,617 |
Griffon Corp. | 13,236 | 473,716 |
Lennox International, Inc. | 6,507 | 1,556,670 |
Owens Corning | 26,989 | 2,302,162 |
Resideo Technologies, Inc. * | 41,152 | 676,950 |
Simpson Manufacturing Co., Inc. | 11,438 | 1,014,093 |
Trex Co., Inc. * | 4,273 | 180,876 |
UFP Industries, Inc. | 36,069 | 2,858,468 |
17,519,348 | ||
Capital Markets — 1.7% | ||
Affiliated Managers Group, Inc. | 10,673 | 1,690,923 |
Blucora, Inc. * | 94,696 | 2,417,589 |
Donnelley Financial Solutions, Inc. * | 12,747 | 492,672 |
Evercore, Inc., Class A | 6,146 | 670,406 |
Interactive Brokers Group, Inc., Class A | 37,728 | 2,729,621 |
Jefferies Financial Group, Inc. | 60,240 | 2,065,027 |
Stifel Financial Corp. | 34,444 | 2,010,496 |
StoneX Group, Inc. * | 8,626 | 822,058 |
Virtus Investment Partners, Inc. | 1,934 | 370,245 |
13,269,037 | ||
Chemicals — 2.4% | ||
AdvanSix, Inc. | 29,383 | 1,117,142 |
Ashland, Inc. | 11,060 | 1,189,282 |
Avient Corp. | 41,332 | 1,395,368 |
Cabot Corp. | 27,435 | 1,833,755 |
Chemours Co. (The) | 62,614 | 1,917,241 |
Hawkins, Inc. | 5,011 | 193,425 |
HB Fuller Co. | 27,019 | 1,935,101 |
INVESTMENTS | SHARES | VALUE($) |
Chemicals — continued | ||
Ingevity Corp. * | 24,223 | 1,706,268 |
Livent Corp. * | 19,350 | 384,485 |
Mativ Holdings, Inc. | 9,023 | 188,581 |
Minerals Technologies, Inc. | 14,483 | 879,408 |
RPM International, Inc. | 24,801 | 2,416,857 |
Scotts Miracle-Gro Co. (The) | 11,009 | 534,927 |
Sensient Technologies Corp. | 11,202 | 816,850 |
Stepan Co. | 6,887 | 733,190 |
Trinseo plc | 10,185 | 231,301 |
Valvoline, Inc. | 51,248 | 1,673,247 |
19,146,428 | ||
Commercial Services & Supplies — 1.8% | ||
ABM Industries, Inc. | 16,808 | 746,611 |
Brady Corp., Class A | 47,450 | 2,234,895 |
Brink's Co. (The) | 13,784 | 740,339 |
Clean Harbors, Inc. * | 30,101 | 3,435,126 |
CoreCivic, Inc., REIT * | 115,970 | 1,340,613 |
Deluxe Corp. | 12,014 | 203,998 |
Harsco Corp. * | 17,359 | 109,188 |
IAA, Inc. * | 35,425 | 1,417,000 |
Interface, Inc. | 16,925 | 167,050 |
KAR Auction Services, Inc. * | 33,586 | 438,297 |
Matthews International Corp., Class A | 8,684 | 264,341 |
MillerKnoll, Inc. | 22,152 | 465,413 |
Pitney Bowes, Inc. | 40,036 | 152,137 |
Stericycle, Inc. * | 6,386 | 318,598 |
Tetra Tech, Inc. | 14,221 | 2,064,747 |
Viad Corp. * | 5,264 | 128,389 |
14,226,742 | ||
Communications Equipment — 1.5% | ||
ADTRAN Holdings, Inc. | 14,632 | 274,935 |
Calix, Inc. * | 14,646 | 1,002,226 |
Ciena Corp. * | 88,337 | 4,503,420 |
Comtech Telecommunications Corp. | 8,331 | 101,138 |
Digi International, Inc. * | 8,879 | 324,527 |
Extreme Networks, Inc. * | 31,357 | 574,147 |
Lumentum Holdings, Inc. * | 14,632 | 763,351 |
NETGEAR, Inc. * | 99,077 | 1,794,285 |
Viasat, Inc. * | 44,632 | 1,412,603 |
Viavi Solutions, Inc. * | 58,825 | 618,251 |
11,368,883 | ||
Construction & Engineering — 2.3% | ||
AECOM | 34,555 | 2,934,756 |
6 | J.P. Morgan Exchange-Traded Funds | December 31, 2022 |
INVESTMENTS | SHARES | VALUE($) |
Common Stocks — continued | ||
Construction & Engineering — continued | ||
Arcosa, Inc. | 14,143 | 768,531 |
Comfort Systems USA, Inc. | 26,210 | 3,016,247 |
EMCOR Group, Inc. | 27,084 | 4,011,411 |
Fluor Corp. * | 39,201 | 1,358,707 |
MasTec, Inc. * | 15,117 | 1,289,934 |
MDU Resources Group, Inc. | 136,883 | 4,153,030 |
MYR Group, Inc. * | 4,263 | 392,494 |
17,925,110 | ||
Construction Materials — 0.1% | ||
Eagle Materials, Inc. | 7,198 | 956,254 |
Consumer Finance — 0.7% | ||
Bread Financial Holdings, Inc. | 23,268 | 876,273 |
Encore Capital Group, Inc. * | 8,594 | 411,996 |
Enova International, Inc. * | 40,842 | 1,567,108 |
EZCORP, Inc., Class A * | 23,421 | 190,881 |
Green Dot Corp., Class A * | 13,505 | 213,649 |
LendingTree, Inc. * | 1,834 | 39,119 |
Navient Corp. | 13,383 | 220,150 |
PROG Holdings, Inc. * | 17,989 | 303,834 |
SLM Corp. | 96,211 | 1,597,103 |
5,420,113 | ||
Containers & Packaging — 1.0% | ||
AptarGroup, Inc. | 13,854 | 1,523,663 |
Greif, Inc., Class A | 12,789 | 857,630 |
Myers Industries, Inc. | 10,190 | 226,524 |
Silgan Holdings, Inc. | 41,721 | 2,162,816 |
Sonoco Products Co. | 52,887 | 3,210,770 |
7,981,403 | ||
Diversified Consumer Services — 1.0% | ||
Adtalem Global Education, Inc. * | 13,595 | 482,623 |
American Public Education, Inc. * | 21,541 | 264,739 |
Graham Holdings Co., Class B | 1,681 | 1,015,677 |
Grand Canyon Education, Inc. * | 5,100 | 538,866 |
H&R Block, Inc. | 44,493 | 1,624,439 |
Service Corp. International | 43,755 | 3,025,221 |
Strategic Education, Inc. | 7,044 | 551,686 |
WW International, Inc. * | 14,243 | 54,978 |
7,558,229 | ||
Diversified Financial Services — 0.2% | ||
Voya Financial, Inc. | 20,270 | 1,246,402 |
Diversified Telecommunication Services — 0.3% | ||
ATN International, Inc. | 2,482 | 112,459 |
INVESTMENTS | SHARES | VALUE($) |
Diversified Telecommunication Services — continued | ||
Cogent Communications Holdings, Inc. | 10,813 | 617,206 |
Iridium Communications, Inc. * | 35,520 | 1,825,728 |
2,555,393 | ||
Electric Utilities — 1.3% | ||
Hawaiian Electric Industries, Inc. | 77,675 | 3,250,699 |
IDACORP, Inc. | 32,520 | 3,507,282 |
OGE Energy Corp. | 92,975 | 3,677,161 |
10,435,142 | ||
Electrical Equipment — 1.5% | ||
Acuity Brands, Inc. | 8,862 | 1,467,636 |
AZZ, Inc. | 6,486 | 260,737 |
Encore Wire Corp. | 15,131 | 2,081,420 |
Hubbell, Inc. | 6,202 | 1,455,485 |
nVent Electric plc | 94,694 | 3,642,878 |
Regal Rexnord Corp. | 18,181 | 2,181,357 |
Sunrun, Inc. * | 40,146 | 964,307 |
12,053,820 | ||
Electronic Equipment, Instruments & Components — 2.8% | ||
Advanced Energy Industries, Inc. | 11,107 | 952,759 |
Arrow Electronics, Inc. * | 25,130 | 2,627,844 |
Belden, Inc. | 11,582 | 832,746 |
Benchmark Electronics, Inc. | 9,980 | 266,366 |
Cognex Corp. | 36,621 | 1,725,215 |
Coherent Corp. * | 19,253 | 675,780 |
Fabrinet (Thailand) * | 26,905 | 3,449,759 |
Itron, Inc. * | 3,130 | 158,535 |
Jabil, Inc. | 71,044 | 4,845,201 |
Littelfuse, Inc. | 5,557 | 1,223,651 |
OSI Systems, Inc. * | 4,716 | 375,016 |
Rogers Corp. * | 4,981 | 594,433 |
TD SYNNEX Corp. | 23,147 | 2,192,252 |
Vontier Corp. | 123,759 | 2,392,262 |
22,311,819 | ||
Energy Equipment & Services — 1.1% | ||
Bristow Group, Inc. * | 7,626 | 206,893 |
ChampionX Corp. | 124,400 | 3,606,356 |
Helmerich & Payne, Inc. | 18,211 | 902,719 |
Nabors Industries Ltd. * | 1,596 | 247,173 |
NOV, Inc. | 104,943 | 2,192,259 |
Oceaneering International, Inc. * | 28,385 | 496,454 |
December 31, 2022 | J.P. Morgan Exchange-Traded Funds | 7 |
AS OF December 31, 2022 (Unaudited) (continued)
INVESTMENTS | SHARES | VALUE($) |
Common Stocks — continued | ||
Energy Equipment & Services — continued | ||
Patterson-UTI Energy, Inc. | 55,026 | 926,638 |
ProPetro Holding Corp. * | 19,891 | 206,270 |
8,784,762 | ||
Entertainment — 0.0% ^ | ||
Marcus Corp. (The) | 8,146 | 117,221 |
Equity Real Estate Investment Trusts (REITs) — 7.1% | ||
Agree Realty Corp. | 49,175 | 3,487,983 |
American Assets Trust, Inc. | 12,598 | 333,847 |
Apartment Income REIT Corp. | 57,698 | 1,979,618 |
Armada Hoffler Properties, Inc. | 47,751 | 549,137 |
Brixmor Property Group, Inc. | 42,655 | 966,989 |
Centerspace | 12,508 | 733,844 |
Community Healthcare Trust, Inc. | 5,748 | 205,778 |
Corporate Office Properties Trust | 59,542 | 1,544,519 |
Cousins Properties, Inc. | 41,085 | 1,039,040 |
CubeSmart | 98,150 | 3,950,537 |
DiamondRock Hospitality Co. | 51,350 | 420,557 |
Douglas Emmett, Inc. | 7,848 | 123,057 |
EastGroup Properties, Inc. | 11,112 | 1,645,243 |
EPR Properties | 19,907 | 750,892 |
Essential Properties Realty Trust, Inc. | 72,150 | 1,693,361 |
First Industrial Realty Trust, Inc. | 59,221 | 2,858,005 |
Four Corners Property Trust, Inc. | 7,260 | 188,252 |
Getty Realty Corp. | 12,044 | 407,689 |
Healthcare Realty Trust, Inc. | 79,227 | 1,526,704 |
Highwoods Properties, Inc. | 29,089 | 813,910 |
Hudson Pacific Properties, Inc. | 37,126 | 361,236 |
Independence Realty Trust, Inc. | 60,137 | 1,013,910 |
Innovative Industrial Properties, Inc. | 10,762 | 1,090,729 |
Kilroy Realty Corp. | 67,415 | 2,606,938 |
Kite Realty Group Trust | 59,203 | 1,246,223 |
Lamar Advertising Co., Class A | 23,664 | 2,233,882 |
Life Storage, Inc. | 36,816 | 3,626,376 |
Macerich Co. (The) | 54,979 | 619,064 |
National Retail Properties, Inc. | 14,432 | 660,408 |
National Storage Affiliates Trust | 66,326 | 2,395,695 |
NexPoint Residential Trust, Inc. | 14,094 | 613,371 |
Park Hotels & Resorts, Inc. | 65,483 | 772,045 |
Pebblebrook Hotel Trust | 34,301 | 459,290 |
Physicians Realty Trust | 57,598 | 833,443 |
PotlatchDeltic Corp. | 21,442 | 943,234 |
Rayonier, Inc. | 50,336 | 1,659,075 |
Rexford Industrial Realty, Inc. | 75,863 | 4,145,154 |
Sabra Health Care REIT, Inc. | 60,968 | 757,832 |
INVESTMENTS | SHARES | VALUE($) |
Equity Real Estate Investment Trusts (REITs) — continued | ||
Saul Centers, Inc. | 2,971 | 120,860 |
SITE Centers Corp. | 49,915 | 681,839 |
Spirit Realty Capital, Inc. | 42,170 | 1,683,848 |
STORE Capital Corp. | 17,798 | 570,604 |
Tanger Factory Outlet Centers, Inc. | 8,046 | 144,345 |
Uniti Group, Inc. | 112,780 | 623,673 |
Xenia Hotels & Resorts, Inc. | 30,039 | 395,914 |
55,477,950 | ||
Food & Staples Retailing — 1.3% | ||
Andersons, Inc. (The) | 32,353 | 1,132,031 |
BJ's Wholesale Club Holdings, Inc. * | 55,216 | 3,653,091 |
SpartanNash Co. | 51,863 | 1,568,337 |
Sprouts Farmers Market, Inc. * | 99,140 | 3,209,162 |
United Natural Foods, Inc. * | 15,918 | 616,186 |
10,178,807 | ||
Food Products — 1.8% | ||
Darling Ingredients, Inc. * | 44,104 | 2,760,469 |
Flowers Foods, Inc. | 108,865 | 3,128,780 |
Hain Celestial Group, Inc. (The) * | 21,730 | 351,591 |
Hostess Brands, Inc. * | 35,440 | 795,274 |
Ingredion, Inc. | 31,422 | 3,077,156 |
John B Sanfilippo & Son, Inc. | 2,682 | 218,100 |
Pilgrim's Pride Corp. * | 50,226 | 1,191,863 |
Post Holdings, Inc. * | 15,180 | 1,370,147 |
Simply Good Foods Co. (The) * | 22,125 | 841,414 |
TreeHouse Foods, Inc. * | 13,186 | 651,125 |
14,385,919 | ||
Gas Utilities — 0.8% | ||
New Jersey Resources Corp. | 24,249 | 1,203,235 |
Southwest Gas Holdings, Inc. | 20,637 | 1,277,018 |
Spire, Inc. | 7,134 | 491,247 |
UGI Corp. | 94,855 | 3,516,275 |
6,487,775 | ||
Health Care Equipment & Supplies — 4.1% | ||
Avanos Medical, Inc. * | 11,933 | 322,907 |
CONMED Corp. | 6,560 | 581,478 |
Cutera, Inc. * | 4,362 | 192,888 |
Envista Holdings Corp. * | 94,429 | 3,179,424 |
Glaukos Corp. * | 20,803 | 908,675 |
Globus Medical, Inc., Class A * | 20,334 | 1,510,206 |
Haemonetics Corp. * | 30,061 | 2,364,298 |
Heska Corp. * | 2,782 | 172,929 |
8 | J.P. Morgan Exchange-Traded Funds | December 31, 2022 |
INVESTMENTS | SHARES | VALUE($) |
Common Stocks — continued | ||
Health Care Equipment & Supplies — continued | ||
Integer Holdings Corp. * | 8,530 | 583,964 |
Integra LifeSciences Holdings Corp. * | 18,759 | 1,051,817 |
Lantheus Holdings, Inc. * | 73,437 | 3,742,349 |
LivaNova plc * | 11,561 | 642,098 |
Masimo Corp. * | 27,727 | 4,102,210 |
Meridian Bioscience, Inc. * | 15,339 | 509,408 |
Merit Medical Systems, Inc. * | 13,310 | 939,952 |
Neogen Corp. * | 117,786 | 1,793,881 |
NuVasive, Inc. * | 46,048 | 1,899,019 |
Omnicell, Inc. * | 11,009 | 555,074 |
Orthofix Medical, Inc. * | 12,847 | 263,749 |
Penumbra, Inc. * | 6,486 | 1,442,876 |
Shockwave Medical, Inc. * | 9,724 | 1,999,352 |
Tandem Diabetes Care, Inc. * | 67,801 | 3,047,655 |
Varex Imaging Corp. * | 10,628 | 215,748 |
32,021,957 | ||
Health Care Providers & Services — 2.2% | ||
Acadia Healthcare Co., Inc. * | 23,321 | 1,919,785 |
Addus HomeCare Corp. * | 3,978 | 395,771 |
Amedisys, Inc. * | 21,951 | 1,833,787 |
AMN Healthcare Services, Inc. * | 5,539 | 569,520 |
Chemed Corp. | 4,362 | 2,226,496 |
Encompass Health Corp. | 25,045 | 1,497,941 |
Enhabit, Inc. * | 12,544 | 165,079 |
Ensign Group, Inc. (The) | 13,405 | 1,268,247 |
Fulgent Genetics, Inc. * | 40,170 | 1,196,263 |
HealthEquity, Inc. * | 39,522 | 2,436,136 |
LHC Group, Inc. * | 8,784 | 1,420,285 |
ModivCare, Inc. * | 12,014 | 1,078,016 |
Option Care Health, Inc. * | 36,083 | 1,085,737 |
R1 RCM, Inc. * | 30,719 | 336,373 |
RadNet, Inc. * | 11,366 | 214,022 |
17,643,458 | ||
Health Care Technology — 0.5% | ||
HealthStream, Inc. * | 7,848 | 194,944 |
NextGen Healthcare, Inc. * | 149,097 | 2,800,042 |
Veradigm, Inc. * | 51,512 | 908,672 |
3,903,658 | ||
Hotels, Restaurants & Leisure — 2.4% | ||
BJ's Restaurants, Inc. * | 6,207 | 163,741 |
Bloomin' Brands, Inc. | 20,089 | 404,191 |
Boyd Gaming Corp. | 22,189 | 1,209,966 |
Brinker International, Inc. * | 35,973 | 1,147,898 |
INVESTMENTS | SHARES | VALUE($) |
Hotels, Restaurants & Leisure — continued | ||
Cheesecake Factory, Inc. (The) | 14,538 | 461,000 |
Churchill Downs, Inc. | 6,660 | 1,408,124 |
Cracker Barrel Old Country Store, Inc. | 4,377 | 414,677 |
Dave & Buster's Entertainment, Inc. * | 13,505 | 478,617 |
Dine Brands Global, Inc. | 19,148 | 1,236,961 |
Golden Entertainment, Inc. * | 9,068 | 339,143 |
Jack in the Box, Inc. | 6,660 | 454,412 |
Light & Wonder, Inc. * | 16,466 | 964,908 |
Marriott Vacations Worldwide Corp. | 10,813 | 1,455,322 |
Papa John's International, Inc. | 6,486 | 533,863 |
Ruth's Hospitality Group, Inc. | 6,002 | 92,911 |
Six Flags Entertainment Corp. * | 47,085 | 1,094,726 |
Texas Roadhouse, Inc. | 15,778 | 1,435,009 |
Travel + Leisure Co. | 30,968 | 1,127,235 |
Wendy's Co. (The) | 34,234 | 774,715 |
Wyndham Hotels & Resorts, Inc. | 50,400 | 3,594,024 |
18,791,443 | ||
Household Durables — 1.6% | ||
Cavco Industries, Inc. * | 2,134 | 482,818 |
Helen of Troy Ltd. * | 6,471 | 717,699 |
KB Home | 24,059 | 766,279 |
La-Z-Boy, Inc. | 12,199 | 278,381 |
Meritage Homes Corp. * | 9,896 | 912,411 |
Taylor Morrison Home Corp. * | 34,254 | 1,039,609 |
Tempur Sealy International, Inc. | 51,348 | 1,762,777 |
Toll Brothers, Inc. | 78,711 | 3,929,253 |
Tri Pointe Homes, Inc. * | 136,783 | 2,542,796 |
Tupperware Brands Corp. * | 14,632 | 60,576 |
Universal Electronics, Inc. * | 7,288 | 151,663 |
12,644,262 | ||
Household Products — 0.5% | ||
Central Garden & Pet Co. * | 27,389 | 1,025,718 |
Central Garden & Pet Co., Class A * | 55,126 | 1,973,511 |
Energizer Holdings, Inc. | 17,573 | 589,574 |
3,588,803 | ||
Insurance — 3.4% | ||
American Financial Group, Inc. | 23,925 | 3,284,424 |
Assured Guaranty Ltd. | 11,212 | 698,059 |
CNO Financial Group, Inc. | 32,991 | 753,844 |
Employers Holdings, Inc. | 8,046 | 347,024 |
First American Financial Corp. | 43,877 | 2,296,522 |
Hanover Insurance Group, Inc. (The) | 9,845 | 1,330,355 |
Horace Mann Educators Corp. | 10,614 | 396,645 |
December 31, 2022 | J.P. Morgan Exchange-Traded Funds | 9 |
AS OF December 31, 2022 (Unaudited) (continued)
INVESTMENTS | SHARES | VALUE($) |
Common Stocks — continued | ||
Insurance — continued | ||
James River Group Holdings Ltd. | 43,128 | 901,806 |
Kinsale Capital Group, Inc. | 4,720 | 1,234,374 |
Mercury General Corp. | 7,020 | 240,084 |
Old Republic International Corp. | 75,830 | 1,831,295 |
Palomar Holdings, Inc. * | 6,207 | 280,308 |
Primerica, Inc. | 7,090 | 1,005,504 |
Reinsurance Group of America, Inc. | 18,121 | 2,574,813 |
RenaissanceRe Holdings Ltd. (Bermuda) | 15,805 | 2,911,755 |
RLI Corp. | 16,589 | 2,177,638 |
Stewart Information Services Corp. | 26,324 | 1,124,825 |
Unum Group | 77,993 | 3,200,053 |
26,589,328 | ||
Interactive Media & Services — 0.3% | ||
QuinStreet, Inc. * | 35,425 | 508,349 |
TripAdvisor, Inc. * | 25,445 | 457,501 |
Yelp, Inc. * | 17,852 | 488,073 |
Ziff Davis, Inc. * | 12,957 | 1,024,899 |
2,478,822 | ||
IT Services — 1.9% | ||
Concentrix Corp. | 13,784 | 1,835,477 |
Euronet Worldwide, Inc. * | 4,068 | 383,938 |
EVERTEC, Inc. (Puerto Rico) | 16,450 | 532,651 |
ExlService Holdings, Inc. * | 9,304 | 1,576,377 |
Genpact Ltd. | 94,229 | 4,364,688 |
Maximus, Inc. | 17,309 | 1,269,269 |
Perficient, Inc. * | 9,232 | 644,670 |
Sabre Corp. * | 93,976 | 580,772 |
TTEC Holdings, Inc. | 18,869 | 832,689 |
Unisys Corp. * | 32,152 | 164,297 |
WEX, Inc. * | 17,669 | 2,891,532 |
15,076,360 | ||
Leisure Products — 0.7% | ||
Brunswick Corp. | 23,769 | 1,713,270 |
Mattel, Inc. * | 89,524 | 1,597,108 |
Polaris, Inc. | 15,267 | 1,541,967 |
YETI Holdings, Inc. * | 18,311 | 756,427 |
5,608,772 | ||
Life Sciences Tools & Services — 0.8% | ||
Azenta, Inc. * | 20,709 | 1,205,678 |
Bruker Corp. | 26,414 | 1,805,397 |
Medpace Holdings, Inc. * | 7,044 | 1,496,216 |
INVESTMENTS | SHARES | VALUE($) |
Life Sciences Tools & Services — continued | ||
Repligen Corp. * | 4,911 | 831,481 |
Syneos Health, Inc. * | 23,769 | 871,847 |
6,210,619 | ||
Machinery — 4.9% | ||
3D Systems Corp. * | 18,595 | 137,603 |
AGCO Corp. | 30,621 | 4,246,827 |
Alamo Group, Inc. | 6,667 | 944,047 |
Chart Industries, Inc. * | 9,232 | 1,063,803 |
Crane Holdings Co. | 31,923 | 3,206,665 |
Esab Corp. | 11,427 | 536,155 |
Federal Signal Corp. | 15,351 | 713,361 |
Flowserve Corp. | 34,961 | 1,072,603 |
Franklin Electric Co., Inc. | 31,896 | 2,543,706 |
Graco, Inc. | 45,971 | 3,092,009 |
Hillenbrand, Inc. | 28,037 | 1,196,339 |
ITT, Inc. | 44,786 | 3,632,145 |
John Bean Technologies Corp. | 7,946 | 725,708 |
Kennametal, Inc. | 22,135 | 532,568 |
Lincoln Electric Holdings, Inc. | 11,306 | 1,633,604 |
Lindsay Corp. | 2,792 | 454,677 |
Middleby Corp. (The) * | 14,991 | 2,007,295 |
Mueller Industries, Inc. | 15,439 | 910,901 |
Oshkosh Corp. | 32,453 | 2,862,030 |
SPX Technologies, Inc. * | 13,130 | 861,985 |
Standex International Corp. | 19,992 | 2,047,381 |
Terex Corp. | 18,954 | 809,715 |
Timken Co. (The) | 25,501 | 1,802,156 |
Titan International, Inc. * | 15,180 | 232,558 |
Toro Co. (The) | 7,676 | 868,923 |
38,134,764 | ||
Marine — 0.2% | ||
Kirby Corp. * | 16,127 | 1,037,772 |
Matson, Inc. | 11,933 | 745,932 |
1,783,704 | ||
Media — 0.5% | ||
AMC Networks, Inc., Class A * | 8,331 | 130,547 |
Cable One, Inc. | 2,606 | 1,855,107 |
EW Scripps Co. (The), Class A * | 15,529 | 204,828 |
Gannett Co., Inc. * | 35,322 | 71,704 |
John Wiley & Sons, Inc., Class A | 11,266 | 451,316 |
New York Times Co. (The), Class A | 43,938 | 1,426,227 |
4,139,729 | ||
10 | J.P. Morgan Exchange-Traded Funds | December 31, 2022 |
INVESTMENTS | SHARES | VALUE($) |
Common Stocks — continued | ||
Metals & Mining — 2.8% | ||
Alcoa Corp. | 41,206 | 1,873,637 |
Arconic Corp. * | 41,362 | 875,220 |
ATI, Inc. * | 49,314 | 1,472,516 |
Cleveland-Cliffs, Inc. * | 129,418 | 2,084,924 |
Commercial Metals Co. | 54,974 | 2,655,244 |
Haynes International, Inc. | 10,099 | 461,423 |
Materion Corp. | 10,183 | 891,114 |
Reliance Steel & Aluminum Co. | 23,513 | 4,759,972 |
Royal Gold, Inc. | 4,516 | 509,044 |
Steel Dynamics, Inc. | 57,114 | 5,580,038 |
SunCoke Energy, Inc. | 72,689 | 627,306 |
United States Steel Corp. | 15,305 | 383,390 |
22,173,828 | ||
Mortgage Real Estate Investment Trusts (REITs) — 0.6% | ||
Annaly Capital Management, Inc. | 113,290 | 2,388,153 |
Ellington Financial, Inc. | 12,827 | 158,670 |
KKR Real Estate Finance Trust, Inc. | 96,432 | 1,346,191 |
Ready Capital Corp. (a) | 27,468 | 305,994 |
Redwood Trust, Inc. | 29,023 | 196,195 |
4,395,203 | ||
Multiline Retail — 0.7% | ||
Big Lots, Inc. (a) | 11,112 | 163,346 |
Kohl's Corp. | 64,010 | 1,616,253 |
Macy's, Inc. | 145,029 | 2,994,849 |
Nordstrom, Inc. | 28,296 | 456,697 |
Ollie's Bargain Outlet Holdings, Inc. * | 9,232 | 432,427 |
5,663,572 | ||
Multi-Utilities — 0.1% | ||
NorthWestern Corp. | 18,719 | 1,110,785 |
Oil, Gas & Consumable Fuels — 3.1% | ||
Antero Midstream Corp. | 74,623 | 805,182 |
Antero Resources Corp. * | 30,672 | 950,525 |
Callon Petroleum Co. * | 11,127 | 412,701 |
Civitas Resources, Inc. | 18,869 | 1,093,081 |
CONSOL Energy, Inc. | 12,810 | 832,650 |
Dorian LPG Ltd. | 7,498 | 142,087 |
DT Midstream, Inc. | 14,532 | 803,038 |
Equitrans Midstream Corp. | 103,504 | 693,477 |
Green Plains, Inc. * | 29,248 | 892,064 |
HF Sinclair Corp. | 48,466 | 2,514,901 |
Matador Resources Co. | 42,558 | 2,436,020 |
Murphy Oil Corp. | 38,095 | 1,638,466 |
PBF Energy, Inc., Class A | 22,189 | 904,868 |
INVESTMENTS | SHARES | VALUE($) |
Oil, Gas & Consumable Fuels — continued | ||
PDC Energy, Inc. | 43,950 | 2,789,946 |
Range Resources Corp. | 77,660 | 1,943,053 |
REX American Resources Corp. * | 13,024 | 414,945 |
SM Energy Co. | 57,200 | 1,992,276 |
Southwestern Energy Co. * | 457,071 | 2,673,865 |
Talos Energy, Inc. * | 9,342 | 176,377 |
World Fuel Services Corp. | 16,437 | 449,223 |
24,558,745 | ||
Paper & Forest Products — 0.2% | ||
Louisiana-Pacific Corp. | 25,828 | 1,529,018 |
Personal Products — 0.7% | ||
BellRing Brands, Inc. * | 36,693 | 940,809 |
Coty, Inc., Class A * | 77,215 | 660,960 |
Edgewell Personal Care Co. | 15,280 | 588,891 |
elf Beauty, Inc. * | 9,980 | 551,894 |
Inter Parfums, Inc. | 4,954 | 478,160 |
Medifast, Inc. | 12,499 | 1,441,760 |
Nu Skin Enterprises, Inc., Class A | 13,584 | 572,702 |
USANA Health Sciences, Inc. * | 2,987 | 158,908 |
5,394,084 | ||
Pharmaceuticals — 0.9% | ||
Innoviva, Inc. * | 162,302 | 2,150,502 |
Jazz Pharmaceuticals plc * | 22,279 | 3,549,268 |
Prestige Consumer Healthcare, Inc. * | 15,280 | 956,528 |
Supernus Pharmaceuticals, Inc. * | 12,847 | 458,252 |
7,114,550 | ||
Professional Services — 2.4% | ||
ASGN, Inc. * | 15,180 | 1,236,866 |
CACI International, Inc., Class A * | 12,321 | 3,703,569 |
FTI Consulting, Inc. * | 9,313 | 1,478,905 |
Heidrick & Struggles International, Inc. | 33,191 | 928,352 |
Insperity, Inc. | 8,784 | 997,862 |
KBR, Inc. | 69,967 | 3,694,258 |
Kelly Services, Inc., Class A | 10,628 | 179,613 |
Korn Ferry | 36,621 | 1,853,755 |
ManpowerGroup, Inc. | 31,790 | 2,645,246 |
Resources Connection, Inc. | 31,096 | 571,545 |
Science Applications International Corp. | 13,300 | 1,475,369 |
18,765,340 | ||
Real Estate Management & Development — 0.5% | ||
Anywhere Real Estate, Inc. * | 81,119 | 518,350 |
Cushman & Wakefield plc * | 46,280 | 576,649 |
December 31, 2022 | J.P. Morgan Exchange-Traded Funds | 11 |
AS OF December 31, 2022 (Unaudited) (continued)
INVESTMENTS | SHARES | VALUE($) |
Common Stocks — continued | ||
Real Estate Management & Development — continued | ||
Douglas Elliman, Inc. | 16,466 | 67,017 |
Jones Lang LaSalle, Inc. * | 15,127 | 2,410,790 |
RE/MAX Holdings, Inc., Class A | 5,812 | 108,336 |
3,681,142 | ||
Road & Rail — 1.5% | ||
ArcBest Corp. | 13,697 | 959,338 |
Avis Budget Group, Inc. * | 12,598 | 2,065,190 |
Knight-Swift Transportation Holdings, Inc. | 42,918 | 2,249,333 |
Landstar System, Inc. | 19,407 | 3,161,400 |
Saia, Inc. * | 6,750 | 1,415,340 |
Werner Enterprises, Inc. | 25,385 | 1,022,000 |
XPO, Inc. * | 28,935 | 963,246 |
11,835,847 | ||
Semiconductors & Semiconductor Equipment — 4.0% | ||
Axcelis Technologies, Inc. * | 9,527 | 756,063 |
Cirrus Logic, Inc. * | 42,948 | 3,198,767 |
Cohu, Inc. * | 11,009 | 352,838 |
Diodes, Inc. * | 10,728 | 816,830 |
First Solar, Inc. * | 42,369 | 6,346,452 |
FormFactor, Inc. * | 23,111 | 513,758 |
Ichor Holdings Ltd. * | 35,520 | 952,646 |
Kulicke & Soffa Industries, Inc. (Singapore) | 61,706 | 2,731,108 |
Lattice Semiconductor Corp. * | 37,821 | 2,453,826 |
MaxLinear, Inc. * | 18,821 | 638,973 |
MKS Instruments, Inc. | 14,406 | 1,220,620 |
Photronics, Inc. * | 15,649 | 263,373 |
Power Integrations, Inc. | 15,439 | 1,107,285 |
Rambus, Inc. * | 30,256 | 1,083,770 |
Semtech Corp. * | 18,211 | 522,474 |
Silicon Laboratories, Inc. * | 21,266 | 2,885,158 |
SiTime Corp. * | 4,122 | 418,878 |
SMART Global Holdings, Inc. * | 57,598 | 857,058 |
Synaptics, Inc. * | 9,168 | 872,427 |
Ultra Clean Holdings, Inc. * | 21,213 | 703,211 |
Universal Display Corp. | 11,202 | 1,210,264 |
Veeco Instruments, Inc. * | 1,825 | 33,908 |
Wolfspeed, Inc. * | 17,669 | 1,219,868 |
31,159,555 | ||
Software — 2.6% | ||
ACI Worldwide, Inc. * | 28,885 | 664,355 |
Adeia, Inc. | 99,143 | 939,876 |
Alarm.com Holdings, Inc. * | 5,659 | 280,007 |
Aspen Technology, Inc. * | 7,753 | 1,592,466 |
INVESTMENTS | SHARES | VALUE($) |
Software — continued | ||
Blackbaud, Inc. * | 12,662 | 745,285 |
Digital Turbine, Inc. * | 34,882 | 531,602 |
Envestnet, Inc. * | 29,152 | 1,798,678 |
Fair Isaac Corp. * | 4,504 | 2,696,004 |
InterDigital, Inc. | 8,594 | 425,231 |
LiveRamp Holdings, Inc. * | 80,533 | 1,887,694 |
Manhattan Associates, Inc. * | 17,473 | 2,121,222 |
NCR Corp. * | 54,756 | 1,281,838 |
Paylocity Holding Corp. * | 9,527 | 1,850,715 |
Progress Software Corp. | 8,318 | 419,643 |
Qualys, Inc. * | 8,684 | 974,605 |
SPS Commerce, Inc. * | 8,430 | 1,082,665 |
Teradata Corp. * | 27,837 | 936,994 |
Xperi, Inc. * | 39,654 | 341,421 |
20,570,301 | ||
Specialty Retail — 3.4% | ||
Aaron's Co., Inc. (The) | 8,960 | 107,072 |
Abercrombie & Fitch Co., Class A * | 15,828 | 362,619 |
American Eagle Outfitters, Inc. | 56,223 | 784,873 |
Asbury Automotive Group, Inc. * | 5,264 | 943,572 |
AutoNation, Inc. * | 32,553 | 3,492,937 |
Bed Bath & Beyond, Inc. * (a) | 29,013 | 72,823 |
Boot Barn Holdings, Inc. * | 7,782 | 486,531 |
Caleres, Inc. | 12,662 | 282,109 |
Cato Corp. (The), Class A | 5,264 | 49,113 |
Chico's FAS, Inc. * | 28,385 | 139,654 |
Children's Place, Inc. (The) * | 4,003 | 145,789 |
Conn's, Inc. * | 3,530 | 24,286 |
Designer Brands, Inc., Class A | 18,400 | 179,952 |
Dick's Sporting Goods, Inc. | 17,877 | 2,150,424 |
Five Below, Inc. * | 11,461 | 2,027,107 |
Foot Locker, Inc. | 30,619 | 1,157,092 |
GameStop Corp., Class A * (a) | 58,550 | 1,080,833 |
Genesco, Inc. * | 4,168 | 191,811 |
Group 1 Automotive, Inc. | 4,716 | 850,625 |
Guess?, Inc. (a) | 12,847 | 265,804 |
Haverty Furniture Cos., Inc. | 4,453 | 133,145 |
Hibbett, Inc. | 4,362 | 297,576 |
Lithia Motors, Inc., Class A | 6,945 | 1,421,919 |
Murphy USA, Inc. | 6,002 | 1,677,799 |
ODP Corp. (The) * | 14,768 | 672,535 |
Rent-A-Center, Inc. | 31,705 | 714,948 |
RH * | 4,068 | 1,086,929 |
Sally Beauty Holdings, Inc. * | 57,460 | 719,399 |
12 | J.P. Morgan Exchange-Traded Funds | December 31, 2022 |
INVESTMENTS | SHARES | VALUE($) |
Common Stocks — continued | ||
Specialty Retail — continued | ||
Shoe Carnival, Inc. | 5,154 | 123,232 |
Signet Jewelers Ltd. | 15,439 | 1,049,852 |
Sleep Number Corp. * | 6,112 | 158,790 |
Urban Outfitters, Inc. * | 18,695 | 445,876 |
Williams-Sonoma, Inc. | 22,368 | 2,570,531 |
Zumiez, Inc. * | 22,663 | 492,694 |
26,360,251 | ||
Technology Hardware, Storage & Peripherals — 0.1% | ||
Diebold Nixdorf, Inc. * | 23,211 | 32,959 |
Xerox Holdings Corp. | 57,698 | 842,391 |
875,350 | ||
Textiles, Apparel & Luxury Goods — 1.6% | ||
Capri Holdings Ltd. * | 41,895 | 2,401,422 |
Carter's, Inc. | 8,784 | 655,374 |
Columbia Sportswear Co. | 2,234 | 195,654 |
Crocs, Inc. * | 17,114 | 1,855,671 |
Deckers Outdoor Corp. * | 7,676 | 3,063,952 |
G-III Apparel Group Ltd. * | 11,461 | 157,130 |
Kontoor Brands, Inc. | 15,070 | 602,649 |
Oxford Industries, Inc. | 4,068 | 379,056 |
Skechers U.S.A., Inc., Class A * | 47,668 | 1,999,673 |
Steven Madden Ltd. | 21,880 | 699,285 |
Unifi, Inc. * | 5,812 | 50,041 |
Wolverine World Wide, Inc. | 21,915 | 239,531 |
12,299,438 | ||
Thrifts & Mortgage Finance — 1.3% | ||
Axos Financial, Inc. * | 35,143 | 1,343,165 |
Capitol Federal Financial, Inc. | 29,924 | 258,843 |
Essent Group Ltd. | 48,352 | 1,879,926 |
MGIC Investment Corp. | 77,313 | 1,005,069 |
Mr. Cooper Group, Inc. * | 28,487 | 1,143,183 |
New York Community Bancorp, Inc. | 135,032 | 1,161,275 |
NMI Holdings, Inc., Class A * | 59,765 | 1,249,089 |
Walker & Dunlop, Inc. | 15,070 | 1,182,694 |
WSFS Financial Corp. | 17,015 | 771,460 |
9,994,704 | ||
Tobacco — 0.1% | ||
Vector Group Ltd. | 32,190 | 381,773 |
Trading Companies & Distributors — 1.7% | ||
Boise Cascade Co. | 17,473 | 1,199,871 |
DXP Enterprises, Inc. * | 3,430 | 94,497 |
GATX Corp. | 2,136 | 227,142 |
INVESTMENTS | SHARES | VALUE($) |
Trading Companies & Distributors — continued | ||
GMS, Inc. * | 47,325 | 2,356,785 |
MSC Industrial Direct Co., Inc., Class A | 12,393 | 1,012,508 |
NOW, Inc. * | 219,562 | 2,788,437 |
Univar Solutions, Inc. * | 94,811 | 3,014,990 |
Veritiv Corp. | 3,858 | 469,557 |
Watsco, Inc. | 8,818 | 2,199,209 |
13,362,996 | ||
Water Utilities — 0.7% | ||
American States Water Co. | 9,571 | 885,796 |
California Water Service Group | 12,662 | �� 767,824 |
Essential Utilities, Inc. | 88,037 | 4,202,006 |
5,855,626 | ||
Wireless Telecommunication Services — 0.2% | ||
Gogo, Inc. * | 60,485 | 892,759 |
Shenandoah Telecommunications Co. | 12,847 | 204,010 |
Telephone and Data Systems, Inc. | 55,674 | 584,020 |
1,680,789 | ||
Total Common Stocks (Cost $613,716,259) | 780,037,111 | |
Short-Term Investments — 0.7% | ||
Investment Companies — 0.5% | ||
JPMorgan U.S. Government Money Market Fund Class IM Shares, 4.12% (b) (c) (Cost $4,220,087) | 4,220,087 | 4,220,087 |
Investment of Cash Collateral from Securities Loaned — 0.2% | ||
JPMorgan U.S. Government Money Market Fund Class IM Shares, 4.12% (b) (c) (Cost $1,712,939) | 1,712,939 | 1,712,939 |
Total Short-Term Investments (Cost $5,933,026) | 5,933,026 | |
Total Investments — 99.9% (Cost $619,649,285) | 785,970,137 | |
Other Assets Less Liabilities — 0.1% | 563,109 | |
NET ASSETS — 100.0% | 786,533,246 | |
Percentages indicated are based on net assets. |
December 31, 2022 | J.P. Morgan Exchange-Traded Funds | 13 |
AS OF December 31, 2022 (Unaudited) (continued)
Abbreviations | |
REIT | Real Estate Investment Trust |
^ | Amount rounds to less than 0.1% of net assets. | |
* | Non-income producing security. | |
(a) | The security or a portion of this security is on loan at December 31, 2022. The total value of securities on loan at December 31, 2022 is $1,663,580. | |
(b) | Investment in an affiliated fund, which is registered under the Investment Company Act of 1940, as amended, and is advised by J.P. Morgan Investment Management Inc. | |
(c) | The rate shown is the current yield as of December 31, 2022. | |
DESCRIPTION | NUMBER OF CONTRACTS | EXPIRATION DATE | TRADING CURRENCY | NOTIONAL AMOUNT ($) | VALUE AND UNREALIZED APPRECIATION (DEPRECIATION) ($) |
Long Contracts | |||||
Russell 2000 E-Mini Index | 9 | 03/17/2023 | USD | 797,040 | (18,244) |
S&P Midcap 400 E-Mini Index | 11 | 03/17/2023 | USD | 2,687,630 | (47,344) |
(65,588) |
Abbreviations | |
USD | United States Dollar |
14 | J.P. Morgan Exchange-Traded Funds | December 31, 2022 |
AS OF December 31, 2022 (Unaudited)
JPMorgan Market Expansion Enhanced Equity ETF | |
ASSETS: | |
Investments in non-affiliates, at value | $780,037,111 |
Investments in affiliates, at value | 4,220,087 |
Investments of cash collateral received from securities loaned, at value (See Note 2.B.) | 1,712,939 |
Deposits at broker for futures contracts | 401,000 |
Receivables: | |
Due from custodian | 473,787 |
Investment securities sold | 3,794,541 |
Dividends from non-affiliates | 953,298 |
Dividends from affiliates | 477 |
Securities lending income (See Note 2.B.) | 7,150 |
Other assets | 30,629 |
Total Assets | 791,631,019 |
LIABILITIES: | |
Payables: | |
Investment securities purchased | 3,162,711 |
Collateral received on securities loaned (See Note 2.B.) | 1,712,939 |
Variation margin on futures contracts | 16,611 |
Accrued liabilities: | |
Investment advisory fees | 91,117 |
Administration fees | 52,767 |
Printing and mailing costs | 17,775 |
Other | 43,853 |
Total Liabilities | 5,097,773 |
Net Assets | $786,533,246 |
NET ASSETS: | |
Paid-in-Capital | $596,656,288 |
Total distributable earnings (loss) | 189,876,958 |
Total Net Assets | $786,533,246 |
Outstanding number of shares (unlimited number of shares authorized - par value $0.0001) | 17,073,634 |
Net asset value, per share | $46.07 |
Cost of investments in non-affiliates | $613,716,259 |
Cost of investments in affiliates | 4,220,087 |
Investment securities on loan, at value (See Note 2.B.) | 1,663,580 |
Cost of investment of cash collateral (See Note 2.B.) | 1,712,939 |
December 31, 2022 | J.P. Morgan Exchange-Traded Funds | 15 |
FOR THE SIX MONTHS ENDED December 31, 2022 (Unaudited)
JPMorgan Market Expansion Enhanced Equity ETF | |
INVESTMENT INCOME: | |
Interest income from non-affiliates | $89,661 |
Dividend income from non-affiliates | 6,258,903 |
Dividend income from affiliates | 370,570 |
Income from securities lending (net) (See Note 2.B.) | 72,366 |
Total investment income | 6,791,500 |
EXPENSES: | |
Investment advisory fees | 1,073,394 |
Administration fees | 322,020 |
Custodian and accounting fees | 20,786 |
Professional fees | 25,343 |
Trustees’ and Chief Compliance Officer’s fees | 13,548 |
Printing and mailing costs | 54,960 |
Registration and filing fees | 31,167 |
Other | 16,283 |
Total expenses | 1,557,501 |
Less fees waived | (51,128) |
Less expense reimbursements | (492,514) |
Net expenses | 1,013,859 |
Net investment income (loss) | 5,777,641 |
REALIZED/UNREALIZED GAINS (LOSSES): | |
Net realized gain (loss) on transactions from: | |
Investments in non-affiliates | 21,816,949 |
In-kind redemptions of investments in non-affiliates (See Note 4) | 27,352,786 |
Futures contracts | 1,544,938 |
Net realized gain (loss) | 50,714,673 |
Change in net unrealized appreciation/depreciation on: | |
Investments in non-affiliates | 4,350,211 |
Futures contracts | 1,191,099 |
Change in net unrealized appreciation/depreciation | 5,541,310 |
Net realized/unrealized gains (losses) | 56,255,983 |
Change in net assets resulting from operations | $62,033,624 |
16 | J.P. Morgan Exchange-Traded Funds | December 31, 2022 |
FOR THE PERIODS INDICATED
JPMorgan Market Expansion Enhanced Equity ETF | ||
Six Months Ended December 31, 2022 (Unaudited) | Year Ended June 30, 2022 (a) | |
CHANGE IN NET ASSETS RESULTING FROM OPERATIONS: | ||
Net investment income (loss) | $5,777,641 | $12,427,409 |
Net realized gain (loss) | 50,714,673 | 99,215,056 |
Change in net unrealized appreciation/depreciation | 5,541,310 | (248,681,340) |
Change in net assets resulting from operations | 62,033,624 | (137,038,875) |
DISTRIBUTIONS TO SHAREHOLDERS: | ||
Total distributions to shareholders | (52,218,515) | (176,087,906) |
CAPITAL TRANSACTIONS: | ||
Change in net assets resulting from capital transactions | (57,275,249) | 26,187,530 |
NET ASSETS: | ||
Change in net assets | (47,460,140) | (286,939,251) |
Beginning of period | 833,993,386 | 1,120,932,637 |
End of period | $786,533,246 | $833,993,386 |
December 31, 2022 | J.P. Morgan Exchange-Traded Funds | 17 |
FOR THE PERIODS INDICATED (continued)
JPMorgan Market Expansion Enhanced Equity ETF | ||
Six Months Ended December 31, 2022 (Unaudited) | Year Ended June 30, 2022(a) | |
CAPITAL TRANSACTIONS: (b) | ||
Proceeds from shares issued | $5,076,106 | $16,072,047 |
Distributions reinvested | — | 123,329,499 |
Cost of shares redeemed | (62,351,355) | (53,645,989) |
Change in net assets resulting from capital transactions | (57,275,249) | 85,755,557 |
Class A | ||
Proceeds from shares issued | — | 7,213,239 |
Distributions reinvested | — | 17,945,255 |
Cost of shares redeemed | — | (41,770,683) |
Change in net assets resulting from Class A capital transactions | — | (16,612,189) |
Class C | ||
Proceeds from shares issued | — | 1,510,970 |
Distributions reinvested | — | 3,548,357 |
Cost of shares redeemed | — | (11,945,898) |
Change in net assets resulting from Class C capital transactions | — | (6,886,571) |
Class I | ||
Proceeds from shares issued | — | 32,169,494 |
Distributions reinvested | — | 23,772,565 |
Cost of shares redeemed | — | (83,394,480) |
Change in net assets resulting from Class I capital transactions | — | (27,452,421) |
Class R2 | ||
Proceeds from shares issued | — | 2,031,211 |
Distributions reinvested | — | 1,950,085 |
Cost of shares redeemed | — | (12,598,142) |
Change in net assets resulting from Class R2 capital transactions | — | (8,616,846) |
Total change in net assets resulting from capital transactions | $(57,275,249) | $26,187,530 |
18 | J.P. Morgan Exchange-Traded Funds | December 31, 2022 |
JPMorgan Market Expansion Enhanced Equity ETF | ||
Six Months Ended December 31, 2022 (Unaudited) | Year Ended June 30, 2022(a) | |
SHARES TRANSACTIONS: (b) | ||
Issued | 100,000 | 267,214 |
Reinvested | — | 2,224,181 |
Redeemed | (1,225,000) | (1,008,937) |
Change in Shares | (1,125,000) | 1,482,458 |
Class A | ||
Issued | — | 120,263 |
Reinvested | — | 322,868 |
Redeemed | — | (750,550) |
Change in Class A Shares | — | (307,419) |
Class C | ||
Issued | — | 23,706 |
Reinvested | — | 63,214 |
Redeemed | — | (204,223) |
Change in Class C Shares | — | (117,303) |
Class I | ||
Issued | — | 541,296 |
Reinvested | — | 427,319 |
Redeemed | — | (1,480,505) |
Change in Class I Shares | — | (511,890) |
Class R2 | ||
Issued | — | 32,990 |
Reinvested | — | 34,939 |
Redeemed | — | (230,081) |
Change in Class R2 Shares | — | (162,152) |
December 31, 2022 | J.P. Morgan Exchange-Traded Funds | 19 |
FOR THE PERIODS INDICATED
Per share operating performance (a) | |||||||
Investment operations | Distributions | ||||||
Net asset value beginning of period | Net investment income loss(c) | Net realized and unrealized gains (losses) on investments | Total from investment operations | Net investment income | Net realized gain | Total Distributions | |
JPMorgan Market Expansion Enhanced Equity ETF (g) | |||||||
Six Months Ended December 31, 2022 (Unaudited) | $45.83 | $0.36 | $2.93 | $3.29 | $(0.66) | $(2.39) | $(3.05) |
Year Ended June 30, 2022 | 62.87 | 0.70 | (8.03) | (7.33) | (0.66) | (9.05) | (9.71) |
Year Ended June 30, 2021 | 41.41 | 0.63 | 23.22 | 23.85 | (0.63) | (1.76) | (2.39) |
Year Ended June 30, 2020 | 48.77 | 0.63 | (4.82) | (4.19) | (0.68) | (2.49) | (3.17) |
October 1, 2018 through June 30, 2019 | 58.92 | 0.54 | (4.01) | (3.47) | (0.68) | (6.00) | (6.68) |
Year Ended June 30, 2019 | 57.67 | 0.63 | (3.24) | (2.61) | (0.44) | (5.95) | (6.39) |
Year Ended June 30, 2018 | 56.41 | 0.63 | 7.16 | 7.79 | (0.48) | (6.05) | (6.53) |
(a) | Per Share amounts reflect the conversion of the Predecessor Fund into the Fund as of the close of business on May 6, 2022. See Note 1. |
(b) | Annualized for periods less than one year, unless otherwise noted. |
(c) | Calculated based upon average shares outstanding. |
(d) | Not annualized for periods less than one year. |
(e) | Includes adjustments in accordance with accounting principles generally accepted in the United States of America and as such, the net asset values for financial reporting purposes and the returns based upon those net asset values may differ from the net asset values and returns for shareholder transactions. |
(f) | JPMorgan Market Expansion Enhanced Equity ETF acquired all of the assets and liabilities of the JPMorgan Market Expansion Enhanced Index Fund (“Predecessor Fund”) in a reorganization that occurred as of the close of business on May 6, 2022. Market price returns are calculated using the official closing price of the JPMorgan Market Expansion Enhanced Equity ETF on the listing exchange as of the time that the JPMorgan Market Expansion Enhanced Equity ETF's NAV is calculated. Prior to the JPMorgan Market Expansion Enhanced Equity ETF's listing on May 9, 2022, the NAV performance of the Class R6 and the Class I Shares of the Predecessor Fund are used as proxy market price returns. |
(g) | JPMorgan Market Expansion Enhanced Equity ETF (the “Fund”) acquired all of the assets and liabilities of the JPMorgan Market Expansion Enhanced Index Fund (“Predecessor Fund”) in a reorganization that occurred as of the close of business on May 6, 2022. Performance and financial history of the Predecessor Fund’s Class R6 Shares have been adopted by the Fund and will be used going forward. As a result, the financial highlight information reflects that of the Predecessor Fund’s Class R6 Shares for the period October 1, 2018 (“Predecessor Fund's Class R6 Shares inception date”) up through the reorganization and the Predecessor Fund's Class I Shares for the periods July 1, 2017 through June 30, 2018 and July 1, 2018 through June 30, 2019. |
20 | J.P. Morgan Exchange-Traded Funds | December 31, 2022 |
Ratios/Supplemental data | ||||||||
Ratios to average net assets (b) | ||||||||
Net asset value, end of period | Market price, end of period | Total Return(d) (e) | Market price total return(d) (f) | Net assets, end of period | Net expenses | Net investment income (loss) | Expenses without waivers and reimbursements | Portfolio turnover rate(d) |
$46.07 | $46.05 | 7.19% | 7.16% | $786,533,246 | 0.24% | 1.45% | 0.36% | 18% |
45.83 | 45.82 | (13.80) | (13.81) | 833,993,386 | 0.25 | 1.21 | 0.36 | 27 |
62.87 | 62.87 | 58.97 | 58.97 | 766,008,977 | 0.25 | 1.18 | 0.35 | 35 |
41.41 | 41.41 | (9.65) | (9.65) | 500,129,035 | 0.25 | 1.45 | 0.36 | 49 |
48.77 | 48.77 | (4.81) | (4.81) | 512,511,625 | 0.25 | 1.51 | 0.37 | 36 |
48.67 | 48.67 | (3.56) | (3.56) | 264,414,719 | 0.34 | 1.14 | 0.61 | 36 |
57.67 | 57.67 | 14.31 | 14.31 | 864,315,757 | 0.35 | 1.10 | 0.61 | 33 |
December 31, 2022 | J.P. Morgan Exchange-Traded Funds | 21 |
AS OF December 31, 2022 (Unaudited)
22 | J.P. Morgan Exchange-Traded Funds | December 31, 2022 |
Level 1 Quoted prices | Level 2 Other significant observable inputs | Level 3 Significant unobservable inputs | Total | |
Total Investments in Securities (a) | $785,970,137 | $— | $— | $785,970,137 |
Depreciation in Other Financial Instruments | ||||
Futures Contracts (a) | $(65,588) | $— | $— | $(65,588) |
(a) | Please refer to the SOI for specifics of portfolio holdings. |
December 31, 2022 | J.P. Morgan Exchange-Traded Funds | 23 |
AS OF December 31, 2022 (Unaudited) (continued)
Investment Securities on Loan, at value, Presented on the Statement of Assets and Liabilities | Cash Collateral Posted by Borrower* | Net Amount Due to Counterparty (not less than zero) | |
$1,663,580 | $(1,663,580) | $— |
* | Collateral posted reflects the value of securities on loan and does not include any additional amounts received from the borrower. |
$1,035 |
24 | J.P. Morgan Exchange-Traded Funds | December 31, 2022 |
For the six months ended December 31, 2022 | |||||||||
Security Description | Value at June 30, 2022 | Purchases at Cost | Proceeds from Sales | Net Realized Gain (Loss) | Change in Unrealized Appreciation/ (Depreciation) | Value at December 31, 2022 | Shares at December 31, 2022 | Dividend Income | Capital Gain Distributions |
JPMorgan U.S. Government Money Market Fund Class IM Shares, 4.12% (a) (b) | $4,706,771 | $13,744,189 | $16,738,021 | $— | $— | $1,712,939 | 1,712,939 | $32,459* | $— |
JPMorgan U.S. Government Money Market Fund Class IM Shares, 4.12% (a) (b) | 29,389,113 | 112,360,770 | 137,529,796 | — | — | 4,220,087 | 4,220,087 | 370,570 | — |
Total | $34,095,884 | $126,104,959 | $154,267,817 | $— | $— | $5,933,026 | $403,029 | $— | |
(a) | Investment in an affiliated fund, which is registered under the Investment Company Act of 1940, as amended, and is advised by J.P. Morgan Investment Management Inc. |
(b) | The rate shown is the current yield as of December 31, 2022. |
* | Amount is included on the Statement of Operations as Income from securities lending (net) (after payments of rebates and Citibank’s fee). |
Futures Contracts: | |
Average Notional Balance Long | $26,129,210 |
Ending Notional Balance Long | 3,484,670 |
December 31, 2022 | J.P. Morgan Exchange-Traded Funds | 25 |
AS OF December 31, 2022 (Unaudited) (continued)
26 | J.P. Morgan Exchange-Traded Funds | December 31, 2022 |
Contractual Waivers | ||
Investment Advisory Fees | Contractual Reimbursements | |
$32,497 | $491,669 |
Purchases (excluding U.S. Government) | Sales (excluding U.S. Government) | |
$145,760,596 | $171,277,358 |
In-Kind Purchases | In-Kind Sales | |
$4,904,100 | $59,510,189 |
December 31, 2022 | J.P. Morgan Exchange-Traded Funds | 27 |
AS OF December 31, 2022 (Unaudited) (continued)
Aggregate Cost | Gross Unrealized Appreciation | Gross Unrealized Depreciation | Net Unrealized Appreciation (Depreciation) | |
$619,649,285 | $230,515,953 | $64,260,689 | $166,255,264 |
Net Capital Losses (Gains) | |
Short-Term | |
$2,728,600 |
28 | J.P. Morgan Exchange-Traded Funds | December 31, 2022 |
J.P. Morgan Investor Funds | |
71.8% |
December 31, 2022 | J.P. Morgan Exchange-Traded Funds | 29 |
(Unaudited)
Hypothetical $1,000 Investment
Beginning Account Value July 1, 2022 | Ending Account Value December 31, 2022 | Expenses Paid During the Period* | Annualized Expense Ratio | |
JPMorgan Market Expansion Enhanced Equity ETF | ||||
Actual | $1,000.00 | $1,071.90 | $1.25 | 0.24% |
Hypothetical | 1,000.00 | 1,024.00 | 1.22 | 0.24 |
* | Expenses are equal to Fund’s annualized net expense ratio, multiplied by the average account value over the period, multiplied by 184/365 (to reflect the one-half year period). |
30 | J.P. Morgan Exchange-Traded Funds | December 31, 2022 |


ITEM 2. CODE OF ETHICS.
Not applicable to a semi-annual report.
ITEM 3. AUDIT COMMITTEE FINANCIAL EXPERT.
Not applicable to a semi-annual report.
ITEM 4. PRINCIPAL ACCOUNTANT FEES AND SERVICES.
Not applicable to a semi-annual report.
ITEM 5. AUDIT COMMITTEE OF LISTED REGISTRANTS.
Not applicable to a semi-annual report.
ITEM 6. SCHEDULE OF INVESTMENTS.
File Schedule I – Investments in securities of unaffiliated issuers as of the close of the reporting period as set forth in Section 210.12-12 of Regulation S-X, unless the schedule is included as part of the report to shareholders filed under Item 1 of this Form.
Included in Item 1.
ITEM 7. DISCLOSURE OF PROXY VOTING POLICIES AND PROCEDURES FOR CLOSED-END MANAGEMENT INVESTMENT COMPANIES.
Not applicable.
ITEM 8. PORTFOLIO MANAGERS OF CLOSED-END MANAGEMENT INVESTMENT COMPANIES.
Not applicable.
ITEM 9. PURCHASE OF EQUITY SECURITIES BY CLOSED-END MANAGEMENT INVESTMENT COMPANY AND AFFILIATED PURCHASERS.
Not applicable.
ITEM 10. SUBMISSION OF MATTERS TO A VOTE OF SECURITY HOLDERS.
Describe any material changes to the procedures by which shareholders may recommend nominees to the registrant`s board of directors, where those changes were implemented after the registrant last provided disclosure in response to the requirements of Item 7(d)(2)(ii)(G) of Schedule 14A (17 CFR 240.14a-101), or this Item.
No material changes to report.
ITEM 11. CONTROLS AND PROCEDURES.
(a) Disclose the conclusions of the registrant’s principal executive and principal financial officers, or persons performing similar functions, regarding the effectiveness of the registrant’s disclosure controls and procedures (as defined in Rule 30a-3(c) under the Act (17 CFR 270.30a-3(c))) as of a date within 90 days of the filing date of the report that includes the disclosure required by this paragraph, based on the evaluation of these controls and procedures required by Rule 30a-3(b) under the Act (17 CFR 270.30a-3(b))and Rules 13a-15(b) or 15d-15(b) under the Exchange Act (17 CFR 240.13a-15(b) or 240.15d-15(b)).
The Registrant’s principal executive and principal financial officers have concluded, based on their evaluation of the Registrant’s disclosure controls and procedures as of a date within 90 days of the filing date of this report, that the Registrant’s disclosure controls and procedures are reasonably designed to ensure that information required to be disclosed by the Registrant on Form N-CSR is recorded, processed, summarized and reported within the required time periods and that information required to be disclosed by the Registrant in the reports that it files or submits on Form N-CSR is accumulated and communicated to the Registrant’s management, including its principal executive and principal financial officers, as appropriate to allow timely decisions regarding required disclosure.
(b) Disclose any change in the registrant’s internal control over financial reporting (as defined in Rule 30a-3(d) under the Act (17 CFR 270.30a-3(d)) that occurred during the period covered by this report that has materially affected, or is reasonably likely to materially affect, the registrant’s internal control over financial reporting.
There were no changes in the Registrant’s internal control over financial reporting that occurred during the period covered by this report that have materially affected, or are reasonably likely to materially affect, the Registrant’s internal control over financial reporting.
ITEM 12. DISCLOSURE OF SECURITIES LENDING ACTIVITIES FOR CLOSED-END MANAGEMENT INVESTMENT COMPANIES.
Not applicable.
ITEM 13. EXHIBITS.
| (a) | File the exhibits listed below as part of this Form. Letter or number the exhibits in the sequence indicated. |
(1) Any code of ethics, or amendment thereto, that is the subject of the disclosure required by Item 2, to the extent that the registrant intends to satisfy the Item 2 requirements through filing of an exhibit.
Not applicable.
(2) A separate certification for each principal executive officer and principal financial officer of the registrant as required by Rule 30a-2(a) under the Act (17 CFR 270.30a-2), exactly as set forth below:
(1) Any written solicitation to purchase securities under Rule 23c-1 under the Act (17 CFR 270.23c-1) sent or given during the period covered by the report by or on behalf of the registrant to 10 or more persons.
Not applicable.
(2) Change in the registrant’s independent public accountant. Provide the information called for by Item 4 of Form 8-K under the Exchange Act (17 CFR 249.308). Unless otherwise specified by Item 4, or related to and necessary for a complete understanding of information not previously disclosed, the information should relate to events occurring during the reporting period.
Not applicable.
| (b) | A separate or combined certification for each principal executive officer and principal officer of the registrant as required by Rule 30a-2(b) under the Act of 1940. |
SIGNATURES
Pursuant to the requirements of the Securities Exchange Act of 1934 and the Investment Company Act of 1940, the registrant has duly caused this report to be signed on its behalf by the undersigned, thereunto duly authorized.
| J.P. Morgan Exchange-Traded Fund Trust | ||
| By: | /s/ Brian S. Shlissel | |
| Brian S. Shlissel | ||
| President and Principal Executive Officer | ||
| March 2, 2023 | ||
Pursuant to the requirements of the Securities Exchange Act of 1934 and the Investment Company Act of 1940, this report has been signed below by the following persons on behalf of the registrant and in the capacities and on the dates indicated.
| By: | /s/ Brian S. Shlissel | |
| Brian S. Shlissel | ||
| President and Principal Executive Officer | ||
| March 2, 2023 | ||
| By: | /s/ Timothy J. Clemens | |
| Timothy J. Clemens | ||
| Treasurer and Principal Financial Officer | ||
| March 2, 2023 | ||