UNITED STATES
SECURITIES AND EXCHANGE COMMISSION
Washington, D.C. 20549
FORM N-CSR
CERTIFIED SHAREHOLDER REPORT OF REGISTERED
MANAGEMENT INVESTMENT COMPANIES
Investment Company Act file number: 811-22903
J.P. Morgan Exchange-Traded Fund Trust
(Exact name of registrant as specified in charter)
277 Park Avenue
New York, NY 10172
(Address of principal executive offices) (Zip code)
Gregory S. Samuels
J.P. Morgan Investment Management Inc.
277 Park Avenue
New York, NY 10172
(Name and Address of Agent for Service)
With copies to:
| Elizabeth A. Davin, Esq. | Jon S. Rand, Esq. | |
| JPMorgan Chase & Co. | Dechert LLP | |
| 1111 Polaris Parkway | 1095 Avenue of the Americas | |
| Columbus, OH 43240 | New York, NY 10036 |
Registrant’s telephone number, including area code: 1-844-457-6383
Date of fiscal year end: June 30
Date of reporting period: July 1, 2023 through December 31, 2023
Form N-CSR is to be used by management investment companies to file reports with the Commission not later than 10 days after the transmission to stockholders of any report that is required to be transmitted to stockholders under Rule 30e-1 under the Investment Company Act of 1940 (17 CFR 270.30e-1). The Commission may use the information provided on Form N-CSR in its regulatory, disclosure review, inspection, and policymaking roles.
A registrant is required to disclose the information specified by Form N-CSR, and the Commission will make this information public. A registrant is not required to respond to the collection of information contained in Form N-CSR unless the Form displays a currently valid Office of Management and Budget (“OMB”) control number. Please direct comments concerning the accuracy of the information collection burden estimate and any suggestions for reducing the burden to Secretary, Securities and Exchange Commission, 450 Fifth Street, NW, Washington, DC 20549-0609. The OMB has reviewed this collection of information under the clearance requirements of 44 U.S.C. Section 3507.
ITEM 1. REPORTS TO STOCKHOLDERS.
a.) The following is a copy of the report transmitted to shareholders pursuant to Rule 30e-1 under the Investment Company Act of 1940 (17 CFR 270.30e-1).
b.) A copy of the notice transmitted to shareholders in reliance on Rule 30e-3 under the 1940 Act that contains disclosures specified by paragraph (c)(3) of that rule is included in the Annual Reports. Not Applicable. Notices do not incorporate disclosures from the shareholder report.
Fund | Ticker | Listing Exchange |
JPMorgan Active Growth ETF | JGRO | NYSE Arca, Inc. |
JPMorgan Active Small Cap Value ETF | JPSV | NYSE Arca, Inc. |
JPMorgan Active Value ETF | JAVA | NYSE Arca, Inc. |
JPMorgan Equity Premium Income ETF | JEPI | NYSE Arca, Inc. |
JPMorgan Market Expansion Enhanced Equity ETF | JMEE | NYSE Arca, Inc. |
JPMorgan Nasdaq Equity Premium Income ETF | JEPQ | The NASDAQ Stock Market LLC |
JPMorgan U.S. Tech Leaders ETF | JTEK | The NASDAQ Stock Market LLC |

1 | |
2 | |
3 | |
3 | |
6 | |
9 | |
12 | |
15 | |
18 | |
21 | |
24 | |
53 | |
62 | |
64 | |
78 | |
79 | |
83 | |
86 |
 | “Investors appear to have begun 2024 with a positive outlook, with the U.S. economy and its financial markets leading global growth.” — Brian S. Shlissel |

President, J.P. Morgan Exchange-Traded Funds
J.P. Morgan Asset Management
1-844-4JPM-ETF or jpmorgan.com/etfs for more information
December 31, 2023 | J.P. Morgan Exchange-Traded Funds | 1 |
2 | J.P. Morgan Exchange-Traded Funds | December 31, 2023 |
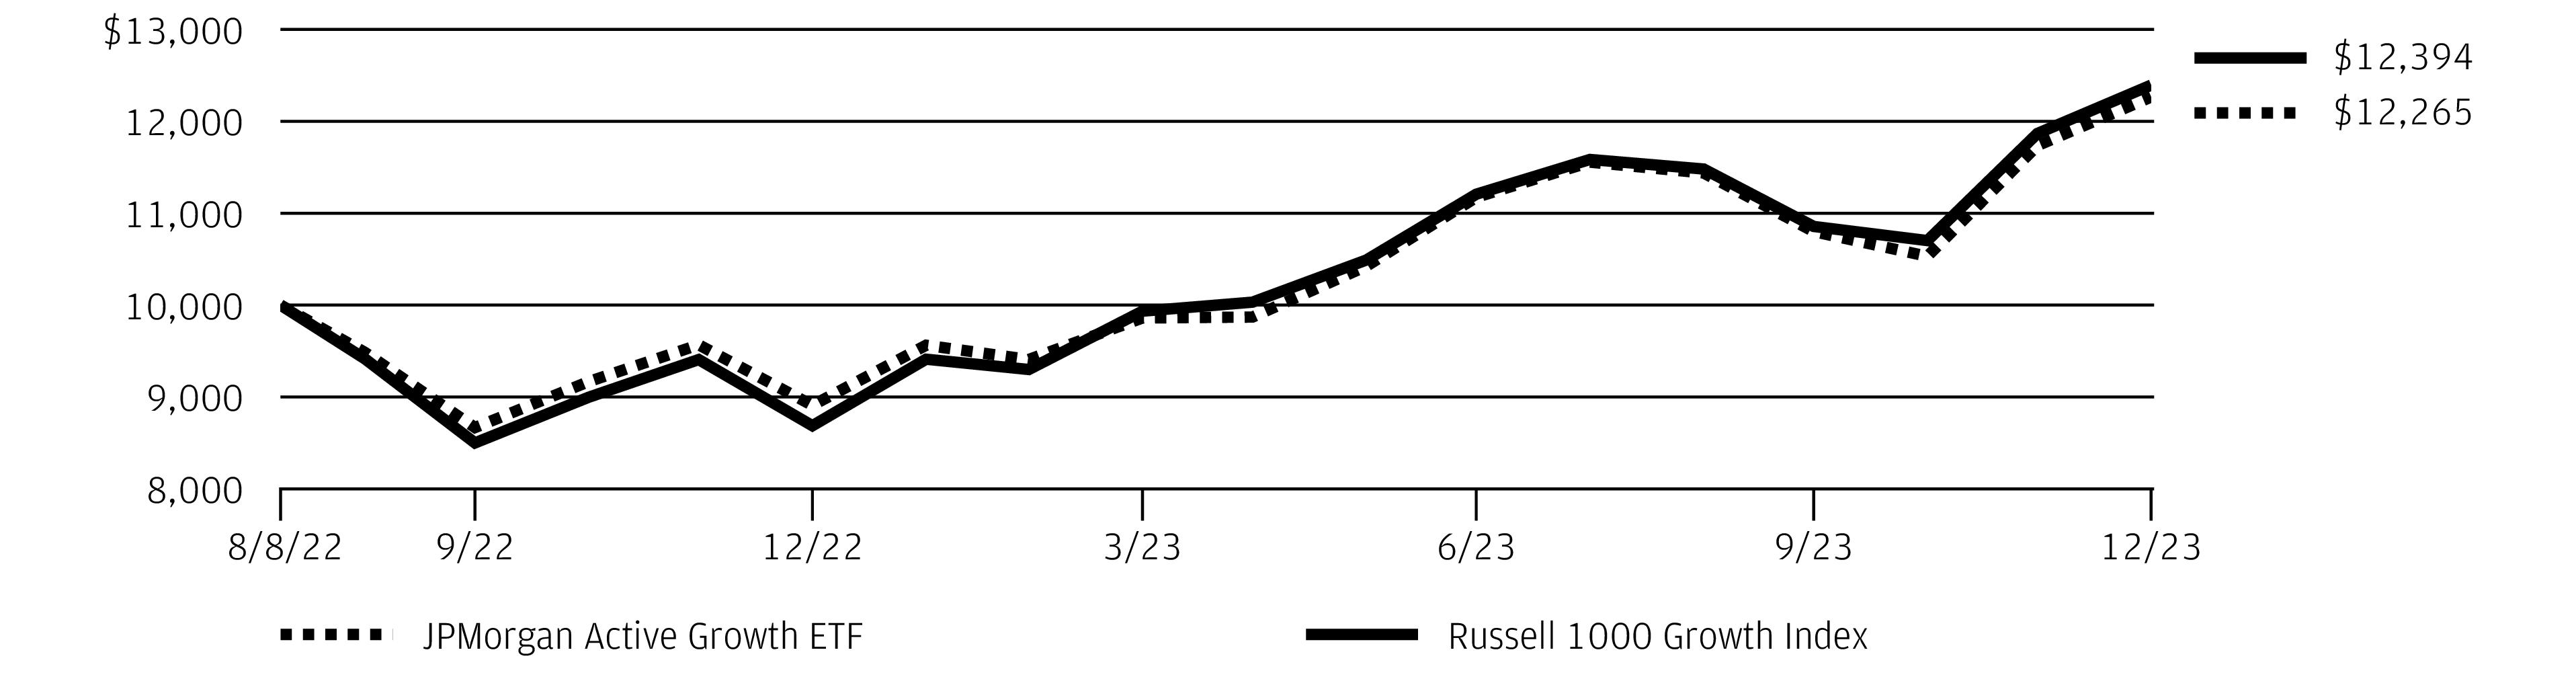
REPORTING PERIOD RETURN: | |
Net Asset Value * | 9.77% |
Market Price ** | 9.78% |
Russell 1000 Growth Index | 10.59% |
Net Assets as of 12/31/2023 | $862,410,523 |
Fund Ticker | JGRO |
TOP TEN HOLDINGS OF THE PORTFOLIO AS OF December 31, 2023 | PERCENT OF TOTAL INVESTMENTS | |
1. | Microsoft Corp. | 10.7 % |
2. | Amazon.com, Inc. | 6.5 |
3. | Apple, Inc. | 6.1 |
4. | NVIDIA Corp. | 4.9 |
5. | Meta Platforms, Inc., Class A | 4.9 |
6. | Alphabet, Inc., Class C | 4.0 |
7. | Eli Lilly & Co. | 3.4 |
8. | Mastercard, Inc., Class A | 3.0 |
9. | Broadcom, Inc. | 2.5 |
10. | Tesla, Inc. | 2.3 |
PORTFOLIO COMPOSITION BY SECTOR AS OF December 31, 2023 | PERCENT OF TOTAL INVESTMENTS |
Information Technology | 40.3% |
Consumer Discretionary | 16.2 |
Communication Services | 12.1 |
Health Care | 11.1 |
Industrials | 9.2 |
Financials | 6.2 |
Energy | 1.6 |
Consumer Staples | 0.8 |
Materials | 0.4 |
Short-Term Investments | 2.1 |
December 31, 2023 | J.P. Morgan Exchange-Traded Funds | 3 |
4 | J.P. Morgan Exchange-Traded Funds | December 31, 2023 |
INCEPTION DATE | SIX MONTHS* | 1 YEAR | SINCE INCEPTION | |
JPMorgan Active Growth ETF | ||||
Net Asset Value | August 8, 2022 | 9.77 % | 37.66 % | 15.73 % |
Market Price | 9.78 | 37.73 | 15.77 |
* | Not annualized. |
December 31, 2023 | J.P. Morgan Exchange-Traded Funds | 5 |
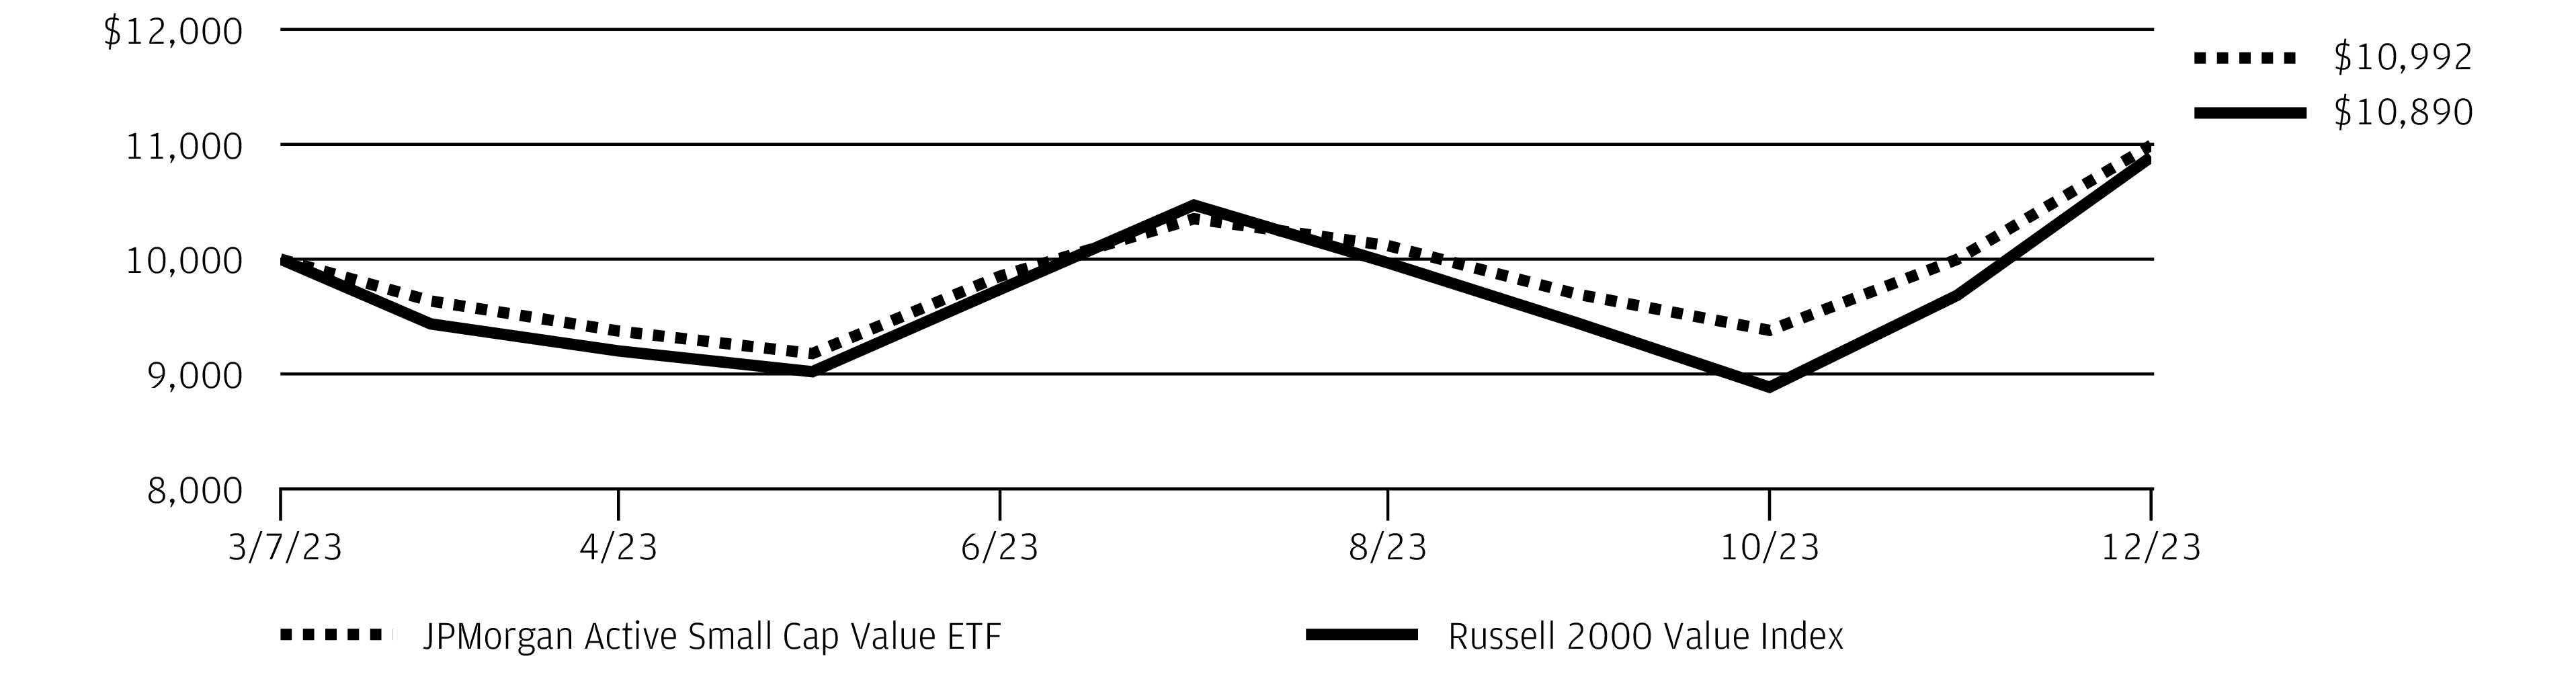
REPORTING PERIOD RETURN: | |
Net Asset Value * | 11.57% |
Market Price ** | 11.56% |
Russell 2000 Value Index | 11.85% |
Net Assets as of 12/31/2023 | $14,407,004 |
Fund Ticker | JPSV |
-of-Benchmark position in Hawkins Inc. Shares of Independent Bank, a regional bank based in Grand Rapids, Michigan, rose after reporting consecutive quarters of better-than-expected earnings and revenue during the period and amid investor expectations that regional banks would benefit from lower interest rates in 2024. Shares of Hostess Brands, a snacks manufacturer, rose on news reports that it had agreed to be acquired by J.M. Smucker Co. for an estimated $5.6 billion. Shares of Hawkins, a specialty chemicals and ingredients manufacturer, rose after the company reported better-than-expected earnings and revenue for consecutive quarters during the period.
6 | J.P. Morgan Exchange-Traded Funds | December 31, 2023 |
TOP TEN HOLDINGS OF THE PORTFOLIO AS OF December 31, 2023 | PERCENT OF TOTAL INVESTMENTS | |
1. | Selective Insurance Group, Inc. | 2.1 % |
2. | Encompass Health Corp. | 1.5 |
3. | Independent Bank Corp. | 1.4 |
4. | Patterson Cos., Inc. | 1.4 |
5. | HB Fuller Co. | 1.4 |
6. | SouthState Corp. | 1.3 |
7. | Chord Energy Corp. | 1.3 |
8. | Radian Group, Inc. | 1.3 |
9. | Safety Insurance Group, Inc. | 1.3 |
10. | Matador Resources Co. | 1.2 |
PORTFOLIO COMPOSITION BY SECTOR AS OF December 31, 2023 | PERCENT OF TOTAL INVESTMENTS |
Financials | 25.8% |
Industrials | 17.2 |
Consumer Discretionary | 9.6 |
Real Estate | 8.3 |
Energy | 7.0 |
Information Technology | 6.8 |
Health Care | 5.5 |
Utilities | 4.7 |
Materials | 4.7 |
Communication Services | 3.4 |
Consumer Staples | 3.0 |
Short-Term Investments | 4.0 |
December 31, 2023 | J.P. Morgan Exchange-Traded Funds | 7 |
INCEPTION DATE | SIX MONTHS* | CUMULATIVE SINCE INCEPTION | |
JPMorgan Active Small Cap Value ETF | |||
Net Asset Value | March 7, 2023 | 11.57 % | 9.92 % |
Market Price | 11.56 | 10.00 |
* | Not annualized. |
8 | J.P. Morgan Exchange-Traded Funds | December 31, 2023 |
REPORTING PERIOD RETURN: | |
Net Asset Value * | 5.59% |
Market Price ** | 5.64% |
Russell 1000 Value Index | 6.03% |
Net Assets as of 12/31/2023 | $782,345,993 |
Fund Ticker | JAVA |
TOP TEN HOLDINGS OF THE PORTFOLIO AS OF December 31, 2023 | PERCENT OF TOTAL INVESTMENTS | |
1. | Bank of America Corp. | 3.3 % |
2. | Wells Fargo & Co. | 2.2 |
3. | Chevron Corp. | 2.2 |
4. | AbbVie, Inc. | 1.9 |
5. | Exxon Mobil Corp. | 1.9 |
6. | Berkshire Hathaway, Inc., Class B | 1.9 |
7. | Bristol-Myers Squibb Co. | 1.7 |
8. | Texas Instruments, Inc. | 1.5 |
9. | Comcast Corp., Class A | 1.4 |
10. | United Parcel Service, Inc., Class B | 1.4 |
December 31, 2023 | J.P. Morgan Exchange-Traded Funds | 9 |
PORTFOLIO COMPOSITION BY SECTOR AS OF December 31, 2023 | PERCENT OF TOTAL INVESTMENTS |
Financials | 23.8% |
Health Care | 14.3 |
Industrials | 14.1 |
Information Technology | 7.8 |
Energy | 6.6 |
Consumer Discretionary | 6.2 |
Communication Services | 6.0 |
Consumer Staples | 6.0 |
Materials | 5.7 |
Utilities | 3.9 |
Real Estate | 2.8 |
Short-Term Investments | 2.8 |
10 | J.P. Morgan Exchange-Traded Funds | December 31, 2023 |
INCEPTION DATE | SIX MONTHS* | 1 YEAR | SINCE INCEPTION | |
JPMorgan Active Value ETF | ||||
Net Asset Value | October 4, 2021 | 5.59 % | 10.33 % | 6.96 % |
Market Price | 5.64 | 10.45 | 6.99 |
* | Not annualized. |
December 31, 2023 | J.P. Morgan Exchange-Traded Funds | 11 |
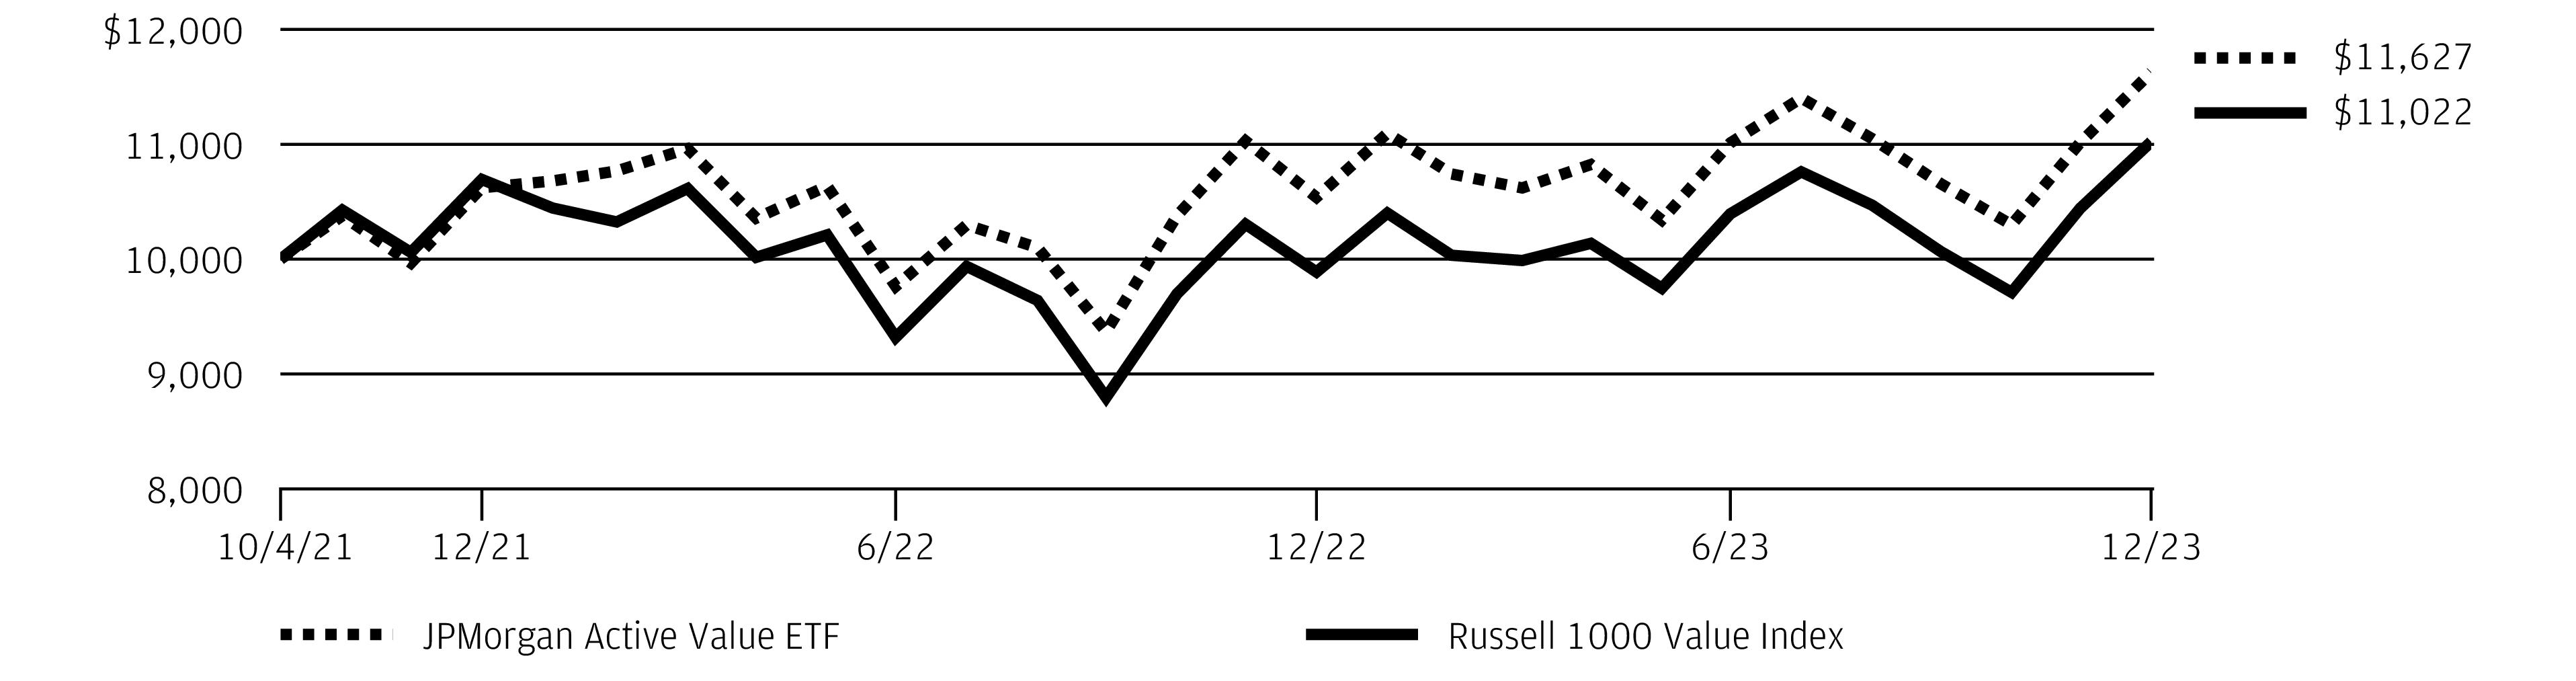
REPORTING PERIOD RETURN: | |
Net Asset Value * | 4.14% |
Market Price ** | 4.08% |
S&P 500 Index | 8.04% |
ICE BofA 3-Month US Treasury Bill Index | 2.71% |
Net Assets as of 12/31/2023 | $30,543,085,184 |
Fund Ticker | JEPI |
12 | J.P. Morgan Exchange-Traded Funds | December 31, 2023 |
TOP TEN HOLDINGS OF THE PORTFOLIO AS OF December 31, 2023 | PERCENT OF TOTAL INVESTMENTS | |
1. | Amazon.com, Inc. | 1.7 % |
2. | Microsoft Corp. | 1.7 |
3. | Intuit, Inc. | 1.6 |
4. | Trane Technologies plc | 1.6 |
5. | Progressive Corp. (The) | 1.6 |
6. | Mastercard, Inc., Class A | 1.5 |
7. | Accenture plc, Class A | 1.5 |
8. | Adobe, Inc. | 1.5 |
9. | Visa, Inc., Class A | 1.5 |
10. | AbbVie, Inc. | 1.4 |
PORTFOLIO COMPOSITION BY SECTOR AS OF December 31, 2023 | PERCENT OF TOTAL INVESTMENTS |
Information Technology | 14.8% |
Financials | 12.1 |
Industrials | 11.8 |
Health Care | 11.8 |
Consumer Staples | 10.7 |
Consumer Discretionary | 7.6 |
Communication Services | 4.2 |
Utilities | 4.1 |
Real Estate | 3.1 |
Materials | 3.0 |
Energy | 2.5 |
Other **** | 13.7 |
Short-Term Investments | 0.6 |
December 31, 2023 | J.P. Morgan Exchange-Traded Funds | 13 |
INCEPTION DATE | SIX MONTHS* | 1 YEAR | SINCE INCEPTION | |
JPMorgan Equity Premium Income ETF | ||||
Net Asset Value | May 20, 2020 | 4.14 % | 9.88 % | 12.37 % |
Market Price | 4.08 | 9.81 | 12.37 |
* | Not annualized. |
14 | J.P. Morgan Exchange-Traded Funds | December 31, 2023 |
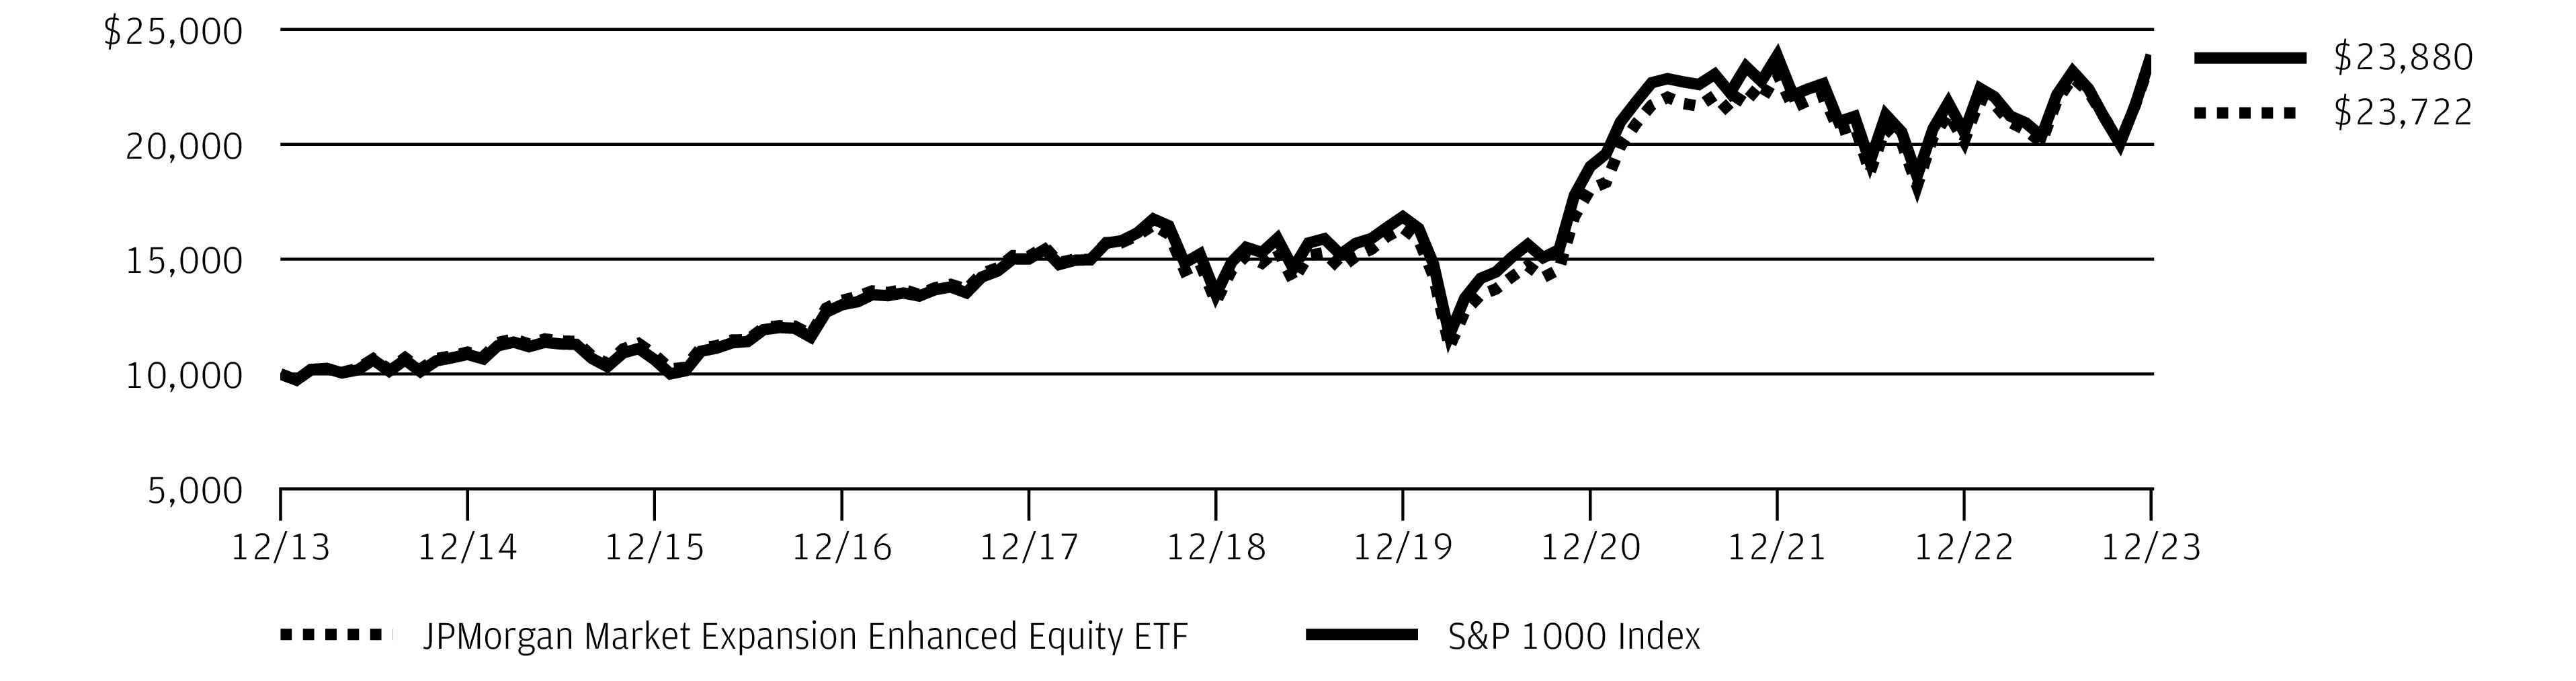
REPORTING PERIOD RETURN: | |
Net Asset Value * | 8.36% |
Market Price ** | 8.41% |
S&P 1000 Index | 7.74% |
Net Assets as of 12/31/2023 | $956,081,216 |
Fund Ticker | JMEE |
December 31, 2023 | J.P. Morgan Exchange-Traded Funds | 15 |
TOP TEN HOLDINGS OF THE PORTFOLIO AS OF December 31, 2023 | PERCENT OF TOTAL INVESTMENTS | |
1. | Jabil, Inc. | 0.9 % |
2. | Builders FirstSource, Inc. | 0.8 |
3. | Reliance Steel & Aluminum Co. | 0.6 |
4. | GoDaddy, Inc., Class A | 0.6 |
5. | United Therapeutics Corp. | 0.6 |
6. | Exelixis, Inc. | 0.5 |
7. | Deckers Outdoor Corp. | 0.5 |
8. | Fabrinet (Thailand) | 0.5 |
9. | Toll Brothers, Inc. | 0.5 |
10. | Super Micro Computer, Inc. | 0.5 |
PORTFOLIO COMPOSITION BY SECTOR AS OF December 31, 2023 | PERCENT OF TOTAL INVESTMENTS |
Industrials | 19.7% |
Consumer Discretionary | 14.5 |
Financials | 14.3 |
Information Technology | 11.1 |
Real Estate | 8.0 |
Health Care | 7.4 |
Materials | 5.1 |
Energy | 4.5 |
Consumer Staples | 4.1 |
Utilities | 2.4 |
Communication Services | 1.1 |
Short-Term Investments | 7.8 |
16 | J.P. Morgan Exchange-Traded Funds | December 31, 2023 |
INCEPTION DATE | SIX MONTHS* | 1 YEAR | 5 YEAR | 10 YEAR | |
JPMorgan Market Expansion Enhanced Equity ETF | |||||
Net Asset Value | July 31, 1998** | 8.36 % | 17.89 % | 12.56 % | 9.02 % |
Market Price | 8.41 | 18.09 | 12.59 | 9.04 |
* | Not annualized. |
** | Inception date for Class I Shares of the Predecessor Fund (as defined below). |
December 31, 2023 | J.P. Morgan Exchange-Traded Funds | 17 |
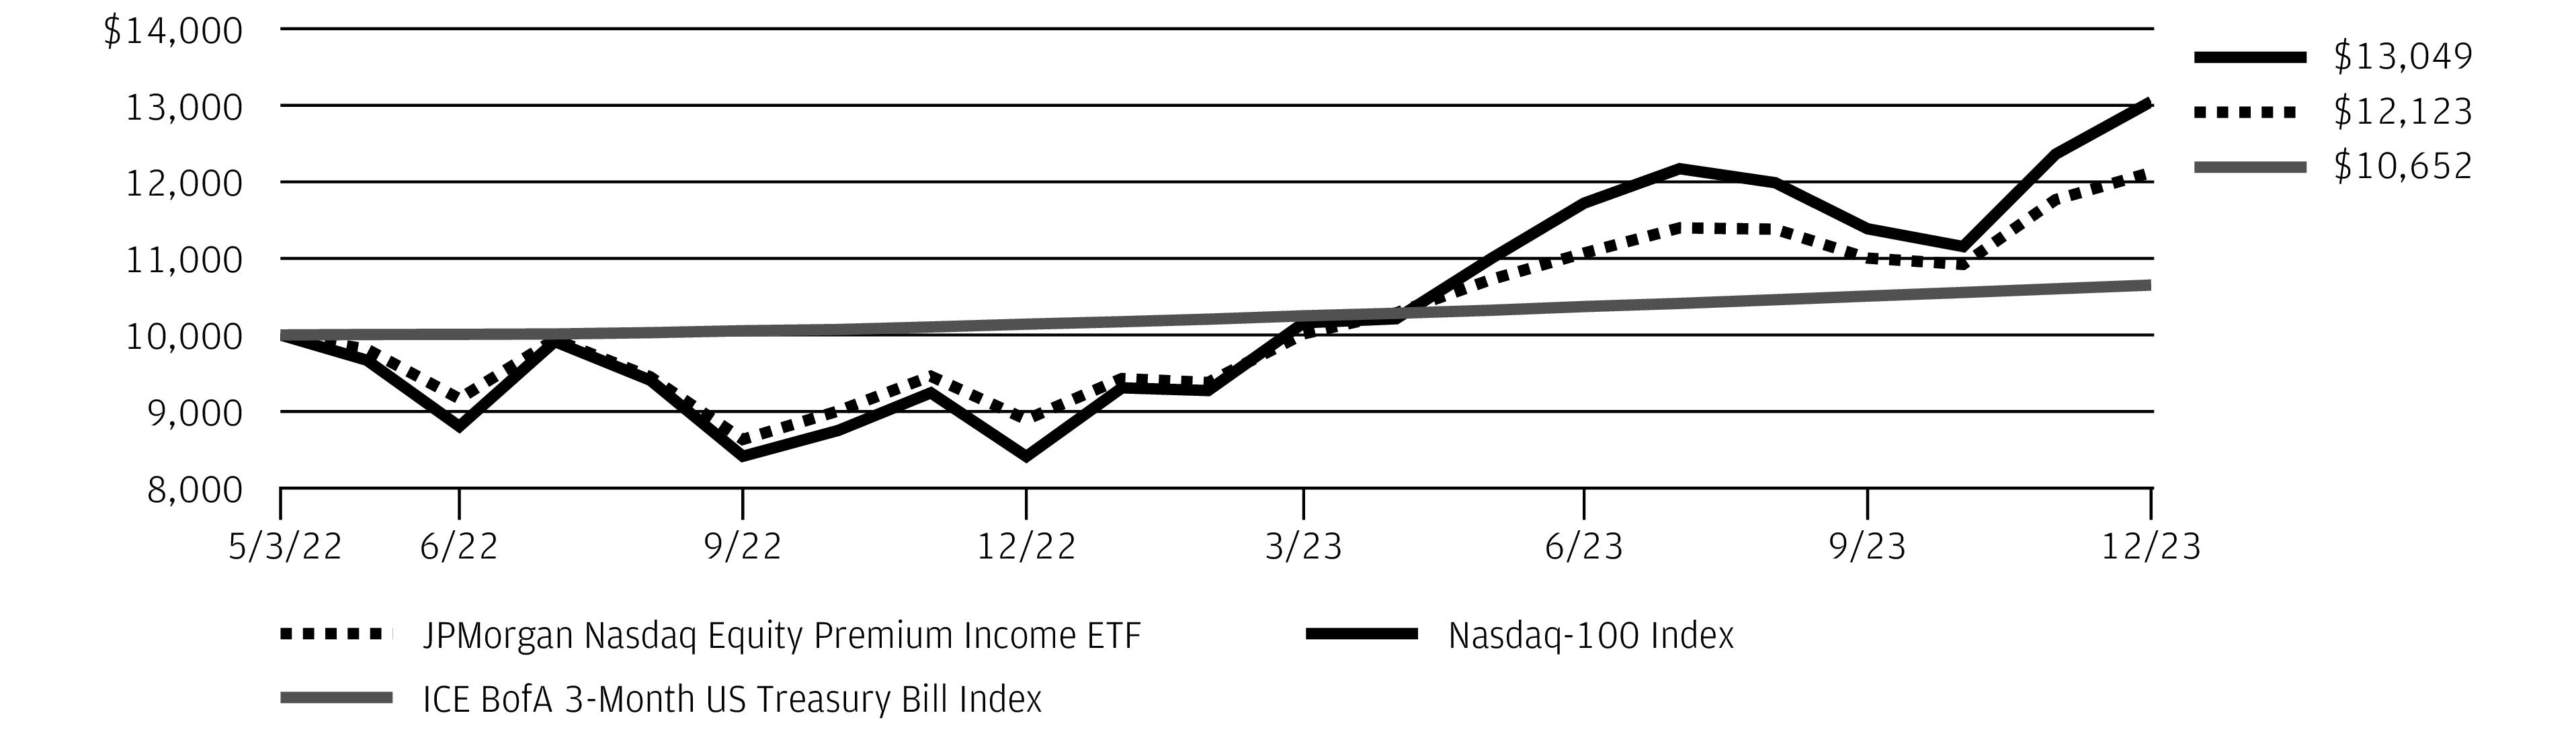
REPORTING PERIOD RETURN: | |
Net Asset Value * | 9.51% |
Market Price ** | 9.45% |
Nasdaq-100 Index® | 11.32% |
ICE BofA 3-Month US Treasury Bill Index | 2.71% |
Net Assets as of 12/31/2023 | $8,485,006,475 |
Fund Ticker | JEPQ |
18 | J.P. Morgan Exchange-Traded Funds | December 31, 2023 |
TOP TEN HOLDINGS OF THE PORTFOLIO AS OF December 31, 2023 | PERCENT OF TOTAL INVESTMENTS | |
1. | Microsoft Corp. | 7.5 % |
2. | Apple, Inc. | 7.1 |
3. | Amazon.com, Inc. | 4.4 |
4. | Alphabet, Inc., Class C | 4.3 |
5. | The Bank of Nova Scotia, ELN, 54.70%, 2/2/2024, (linked to Nasdaq-100 Index) 54.70, 2/02/2024 (Canada) | 3.5 |
6. | BNP Paribas, ELN, 55.52%, 1/26/2024, (linked to S&P 500 Index) 55.52, 1/26/2024 | 3.5 |
7. | Meta Platforms, Inc., Class A | 3.5 |
8. | NVIDIA Corp. | 3.3 |
9. | Royal Bank of Canada, ELN, 51.66%, 1/19/2024, (linked to S&P 500 Index) 51.66, 1/19/2024 (Canada) | 3.2 |
10. | Tesla, Inc. | 2.9 |
PORTFOLIO COMPOSITION BY SECTOR AS OF December 31, 2023 | PERCENT OF TOTAL INVESTMENTS |
Information Technology | 40.9% |
Communication Services | 12.6 |
Consumer Discretionary | 12.3 |
Health Care | 5.9 |
Consumer Staples | 5.7 |
Industrials | 3.8 |
Utilities | 1.1 |
Financials | 0.8 |
Energy | 0.3 |
Real Estate | 0.3 |
Other **** | 15.8 |
Short-Term Investments | 0.5 |
December 31, 2023 | J.P. Morgan Exchange-Traded Funds | 19 |
INCEPTION DATE | SIX MONTHS* | 1 YEAR | SINCE INCEPTION | |
JPMorgan Nasdaq Equity Premium Income ETF | ||||
Net Asset Value | May 3, 2022 | 9.51 % | 36.28 % | 12.27 % |
Market Price | 9.45 | 36.23 | 12.28 |
* | Not annualized. |
20 | J.P. Morgan Exchange-Traded Funds | December 31, 2023 |
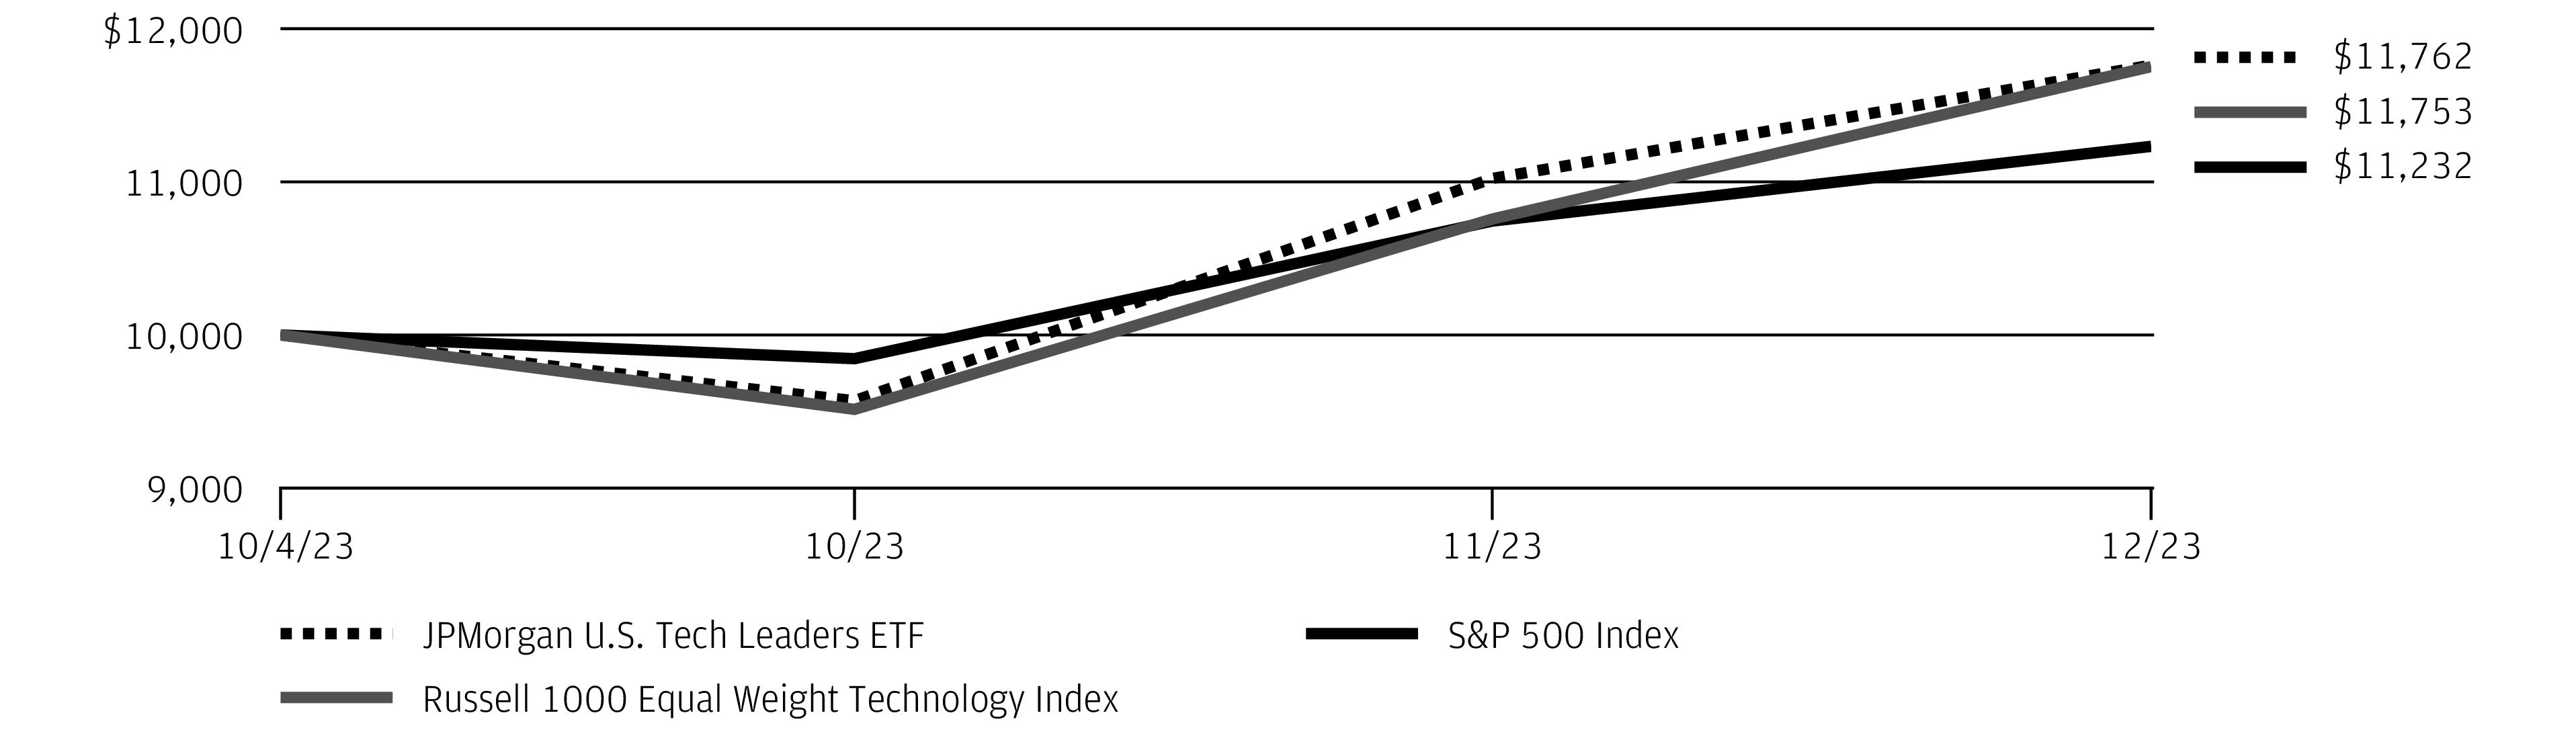
REPORTING PERIOD RETURN: | |
Net Asset Value * | 17.62% |
Market Price ** | 17.60% |
S&P 500 Index | 12.32% |
Russell 1000 Equal Weight Technology Index | 17.53% |
Net Assets as of 12/31/2023 | $191,119,914 |
Fund Ticker | JTEK |
December 31, 2023 | J.P. Morgan Exchange-Traded Funds | 21 |
TOP TEN HOLDINGS OF THE PORTFOLIO AS OF December 31, 2023 | PERCENT OF TOTAL INVESTMENTS | |
1. | Meta Platforms, Inc., Class A | 5.2 % |
2. | NVIDIA Corp. | 4.1 |
3. | Tesla, Inc. | 3.9 |
4. | Synopsys, Inc. | 3.5 |
5. | Advanced Micro Devices, Inc. | 3.4 |
6. | Amazon.com, Inc. | 3.2 |
7. | Alphabet, Inc., Class C | 3.2 |
8. | Netflix, Inc. | 3.1 |
9. | Uber Technologies, Inc. | 2.8 |
10. | Shopify, Inc., Class A (Canada) | 2.7 |
PORTFOLIO COMPOSITION BY SECTOR AS OF December 31, 2023 | PERCENT OF TOTAL INVESTMENTS |
Information Technology | 66.6% |
Communication Services | 14.7 |
Consumer Discretionary | 10.4 |
Industrials | 3.2 |
Real Estate | 1.6 |
Health Care | 1.5 |
Others (each less than 1.0%) | 0.8 |
Short-Term Investments | 1.2 |
22 | J.P. Morgan Exchange-Traded Funds | December 31, 2023 |
INCEPTION DATE | CUMULATIVE SINCE INCEPTION | |
JPMorgan U.S. Tech Leaders ETF | ||
Net Asset Value | October 4, 2023 | 17.62 % |
Market Price | 17.60 |
December 31, 2023 | J.P. Morgan Exchange-Traded Funds | 23 |
INVESTMENTS | SHARES | VALUE($) |
Common Stocks — 97.9% | ||
Aerospace & Defense — 0.7% | ||
TransDigm Group, Inc. | 5,834 | 5,901,674 |
Automobiles — 2.3% | ||
Tesla, Inc. * | 81,787 | 20,322,434 |
Beverages — 0.8% | ||
Celsius Holdings, Inc. * | 53,189 | 2,899,864 |
Constellation Brands, Inc., Class A | 9,115 | 2,203,551 |
Monster Beverage Corp. * | 25,219 | 1,452,867 |
6,556,282 | ||
Biotechnology — 3.4% | ||
Alnylam Pharmaceuticals, Inc. * | 17,385 | 3,327,663 |
Exact Sciences Corp. * | 89,642 | 6,631,715 |
Moderna, Inc. * | 5,292 | 526,289 |
Natera, Inc. * | 33,525 | 2,100,006 |
Regeneron Pharmaceuticals, Inc. * | 19,428 | 17,063,418 |
29,649,091 | ||
Broadline Retail — 7.3% | ||
Amazon.com, Inc. * | 367,959 | 55,907,690 |
MercadoLibre, Inc. (Brazil) * | 4,335 | 6,812,626 |
62,720,316 | ||
Building Products — 1.2% | ||
Trane Technologies plc | 42,988 | 10,484,773 |
Capital Markets — 2.7% | ||
Blackstone, Inc. | 72,929 | 9,547,865 |
Charles Schwab Corp. (The) | 9,256 | 636,813 |
Morgan Stanley | 77,786 | 7,253,545 |
MSCI, Inc. | 1,276 | 721,769 |
S&P Global, Inc. | 12,293 | 5,415,312 |
23,575,304 | ||
Commercial Services & Supplies — 0.5% | ||
Copart, Inc. * | 90,355 | 4,427,395 |
Communications Equipment — 0.7% | ||
Arista Networks, Inc. * | 25,589 | 6,026,465 |
Construction & Engineering — 1.1% | ||
AECOM | 22,351 | 2,065,903 |
Quanta Services, Inc. | 34,930 | 7,537,894 |
9,603,797 | ||
Distributors — 0.2% | ||
Pool Corp. | 4,203 | 1,675,778 |
Electrical Equipment — 1.6% | ||
AMETEK, Inc. | 26,133 | 4,309,070 |
INVESTMENTS | SHARES | VALUE($) |
Electrical Equipment — continued | ||
Eaton Corp. plc | 29,705 | 7,153,558 |
Hubbell, Inc., Class B | 6,166 | 2,028,183 |
13,490,811 | ||
Electronic Equipment, Instruments & Components — 1.1% | ||
Amphenol Corp., Class A | 42,667 | 4,229,580 |
Jabil, Inc. | 43,346 | 5,522,280 |
9,751,860 | ||
Energy Equipment & Services — 0.4% | ||
TechnipFMC plc (United Kingdom) | 188,143 | 3,789,200 |
Entertainment — 2.5% | ||
Netflix, Inc. * | 33,067 | 16,099,661 |
Spotify Technology SA * | 7,724 | 1,451,417 |
Take-Two Interactive Software, Inc. * | 27,738 | 4,464,431 |
22,015,509 | ||
Financial Services — 3.0% | ||
Block, Inc. * | 7,568 | 585,385 |
Mastercard, Inc., Class A | 60,342 | 25,736,466 |
26,321,851 | ||
Ground Transportation — 2.4% | ||
JB Hunt Transport Services, Inc. | 13,899 | 2,776,186 |
Old Dominion Freight Line, Inc. | 7,059 | 2,861,224 |
Uber Technologies, Inc. * | 250,915 | 15,448,837 |
21,086,247 | ||
Health Care Equipment & Supplies — 1.5% | ||
Align Technology, Inc. * | 9,484 | 2,598,616 |
Cooper Cos., Inc. (The) | 7,620 | 2,883,713 |
Edwards Lifesciences Corp. * | 15,108 | 1,151,985 |
Intuitive Surgical, Inc. * | 18,030 | 6,082,601 |
12,716,915 | ||
Health Care Providers & Services — 2.0% | ||
HCA Healthcare, Inc. | 3,584 | 970,117 |
McKesson Corp. | 16,549 | 7,661,856 |
UnitedHealth Group, Inc. | 16,465 | 8,668,329 |
17,300,302 | ||
Hotels, Restaurants & Leisure — 2.9% | ||
Airbnb, Inc., Class A * | 11,312 | 1,540,016 |
Booking Holdings, Inc. * | 1,425 | 5,054,788 |
Chipotle Mexican Grill, Inc. * | 2,298 | 5,255,434 |
DoorDash, Inc., Class A * | 25,459 | 2,517,640 |
Hilton Worldwide Holdings, Inc. | 16,231 | 2,955,503 |
24 | J.P. Morgan Exchange-Traded Funds | December 31, 2023 |
INVESTMENTS | SHARES | VALUE($) |
Common Stocks — continued | ||
Hotels, Restaurants & Leisure — continued | ||
Marriott International, Inc., Class A | 25,431 | 5,734,945 |
Starbucks Corp. | 22,557 | 2,165,698 |
25,224,024 | ||
Household Durables — 0.6% | ||
DR Horton, Inc. | 17,885 | 2,718,162 |
Garmin Ltd. | 18,762 | 2,411,668 |
5,129,830 | ||
Insurance — 0.4% | ||
Progressive Corp. (The) | 24,524 | 3,906,183 |
Interactive Media & Services — 8.9% | ||
Alphabet, Inc., Class C * | 242,172 | 34,129,300 |
Meta Platforms, Inc., Class A * | 119,453 | 42,281,584 |
76,410,884 | ||
IT Services — 2.0% | ||
Cognizant Technology Solutions Corp., Class A | 27,031 | 2,041,651 |
MongoDB, Inc. * | 12,427 | 5,080,779 |
Shopify, Inc., Class A (Canada) * | 83,064 | 6,470,686 |
Snowflake, Inc., Class A * | 17,132 | 3,409,268 |
17,002,384 | ||
Life Sciences Tools & Services — 0.7% | ||
Mettler-Toledo International, Inc. * | 966 | 1,171,720 |
Thermo Fisher Scientific, Inc. | 8,551 | 4,538,785 |
5,710,505 | ||
Machinery — 0.8% | ||
Deere & Co. | 7,179 | 2,870,667 |
Ingersoll Rand, Inc. | 51,148 | 3,955,786 |
6,826,453 | ||
Media — 0.7% | ||
Trade Desk, Inc. (The), Class A * | 86,183 | 6,201,729 |
Metals & Mining — 0.4% | ||
Freeport-McMoRan, Inc. | 74,680 | 3,179,128 |
Oil, Gas & Consumable Fuels — 1.2% | ||
Cheniere Energy, Inc. | 30,046 | 5,129,153 |
ConocoPhillips | 21,086 | 2,447,452 |
EOG Resources, Inc. | 20,911 | 2,529,185 |
10,105,790 | ||
Personal Care Products — 0.0% ^ | ||
Estee Lauder Cos., Inc. (The), Class A | 1,592 | 232,830 |
INVESTMENTS | SHARES | VALUE($) |
Pharmaceuticals — 3.6% | ||
Eli Lilly & Co. | 49,621 | 28,925,073 |
Royalty Pharma plc, Class A | 64,487 | 1,811,440 |
30,736,513 | ||
Professional Services — 0.4% | ||
Booz Allen Hamilton Holding Corp. | 25,285 | 3,234,204 |
Semiconductors & Semiconductor Equipment — 10.3% | ||
Advanced Micro Devices, Inc. * | 64,306 | 9,479,347 |
ASML Holding NV (Registered), NYRS (Netherlands) | 1,962 | 1,485,077 |
Broadcom, Inc. | 19,376 | 21,628,460 |
Entegris, Inc. | 24,290 | 2,910,428 |
First Solar, Inc. * | 5,175 | 891,549 |
Lam Research Corp. | 11,233 | 8,798,359 |
NVIDIA Corp. | 85,409 | 42,296,245 |
ON Semiconductor Corp. * | 18,873 | 1,576,462 |
89,065,927 | ||
Software — 20.1% | ||
Adobe, Inc. * | 12,779 | 7,623,951 |
Cadence Design Systems, Inc. * | 9,633 | 2,623,740 |
Confluent, Inc., Class A * | 86,389 | 2,021,503 |
Crowdstrike Holdings, Inc., Class A * | 13,409 | 3,423,586 |
HubSpot, Inc. * | 10,085 | 5,854,746 |
Intuit, Inc. | 20,683 | 12,927,495 |
Microsoft Corp. | 246,116 | 92,549,461 |
Oracle Corp. | 92,185 | 9,719,065 |
Palo Alto Networks, Inc. * | 31,621 | 9,324,400 |
Salesforce, Inc. * | 28,416 | 7,477,386 |
ServiceNow, Inc. * | 5,327 | 3,763,472 |
Synopsys, Inc. * | 17,578 | 9,051,088 |
Workday, Inc., Class A * | 24,893 | 6,871,962 |
173,231,855 | ||
Specialty Retail — 2.5% | ||
AutoZone, Inc. * | 1,336 | 3,454,375 |
Lowe's Cos., Inc. | 39,982 | 8,897,994 |
Ross Stores, Inc. | 26,955 | 3,730,302 |
TJX Cos., Inc. (The) | 55,091 | 5,168,087 |
21,250,758 | ||
Technology Hardware, Storage & Peripherals — 6.1% | ||
Apple, Inc. | 274,535 | 52,856,224 |
Textiles, Apparel & Luxury Goods — 0.4% | ||
Lululemon Athletica, Inc. * | 6,016 | 3,075,921 |
December 31, 2023 | J.P. Morgan Exchange-Traded Funds | 25 |
INVESTMENTS | SHARES | VALUE($) |
Common Stocks — continued | ||
Trading Companies & Distributors — 0.5% | ||
Air Lease Corp., Class A | 35,058 | 1,470,333 |
WW Grainger, Inc. | 3,051 | 2,528,333 |
3,998,666 | ||
Total Common Stocks (Cost $710,409,670) | 844,795,812 | |
Short-Term Investments — 2.1% | ||
Investment Companies — 2.1% | ||
JPMorgan U.S. Government Money Market Fund Class IM Shares, 5.30% (a) (b) (Cost $17,759,640) | 17,759,640 | 17,759,640 |
Total Investments — 100.0% (Cost $728,169,310) | 862,555,452 | |
Liabilities in Excess of Other Assets — (0.0)% ^ | (144,929 ) | |
NET ASSETS — 100.0% | 862,410,523 | |
Percentages indicated are based on net assets. |
Abbreviations | |
NYRS | New York Registry Shares |
^ | Amount rounds to less than 0.1% of net assets. | |
* | Non-income producing security. | |
(a) | Investment in an affiliated fund, which is registered under the Investment Company Act of 1940, as amended, and is advised by J.P. Morgan Investment Management Inc. | |
(b) | The rate shown is the current yield as of December 31, 2023. | |
26 | J.P. Morgan Exchange-Traded Funds | December 31, 2023 |
INVESTMENTS | SHARES | VALUE($) |
Common Stocks — 96.2% | ||
Aerospace & Defense — 1.1% | ||
Cadre Holdings, Inc. | 1,994 | 65,583 |
Moog, Inc., Class A | 653 | 94,541 |
160,124 | ||
Automobile Components — 0.9% | ||
Atmus Filtration Technologies, Inc. * (a) | 2,029 | 47,661 |
Patrick Industries, Inc. | 814 | 81,685 |
129,346 | ||
Banks — 16.4% | ||
BancFirst Corp. | 756 | 73,581 |
Camden National Corp. | 2,201 | 82,824 |
City Holding Co. | 991 | 109,268 |
Columbia Banking System, Inc. | 6,744 | 179,930 |
First Busey Corp. | 7,044 | 174,832 |
First Commonwealth Financial Corp. | 7,459 | 115,167 |
First Merchants Corp. | 3,667 | 135,972 |
Heritage Commerce Corp. | 11,182 | 110,916 |
Independent Bank Corp. | 2,110 | 138,859 |
Independent Bank Corp. | 7,798 | 202,904 |
Lakeland Bancorp, Inc. | 6,115 | 90,441 |
Old National Bancorp | 10,102 | 170,623 |
Premier Financial Corp. | 5,873 | 141,539 |
QCR Holdings, Inc. | 1,119 | 65,338 |
Simmons First National Corp., Class A | 4,480 | 88,883 |
SouthState Corp. | 2,242 | 189,337 |
TriCo Bancshares | 3,130 | 134,496 |
WSFS Financial Corp. | 3,540 | 162,592 |
2,367,502 | ||
Beverages — 1.0% | ||
Primo Water Corp. | 9,857 | 148,348 |
Building Products — 4.0% | ||
AZZ, Inc. | 2,447 | 142,146 |
CSW Industrials, Inc. | 700 | 145,187 |
Hayward Holdings, Inc. * | 9,829 | 133,675 |
UFP Industries, Inc. | 1,257 | 157,816 |
578,824 | ||
Capital Markets — 3.2% | ||
Donnelley Financial Solutions, Inc. * | 1,900 | 118,503 |
Hamilton Lane, Inc., Class A | 687 | 77,933 |
LPL Financial Holdings, Inc. | 507 | 115,403 |
Virtus Investment Partners, Inc. | 615 | 148,683 |
460,522 | ||
INVESTMENTS | SHARES | VALUE($) |
Chemicals — 4.7% | ||
Hawkins, Inc. | 1,457 | 102,602 |
HB Fuller Co. | 2,425 | 197,419 |
Innospec, Inc. | 1,322 | 162,923 |
Quaker Chemical Corp. | 395 | 84,301 |
Stepan Co. | 1,322 | 124,995 |
672,240 | ||
Construction & Engineering — 1.0% | ||
Comfort Systems USA, Inc. | 729 | 149,933 |
Diversified Telecommunication Services — 1.0% | ||
Iridium Communications, Inc. | 3,530 | 145,295 |
Electric Utilities — 0.7% | ||
Portland General Electric Co. | 2,388 | 103,496 |
Electronic Equipment, Instruments & Components — 4.1% | ||
Insight Enterprises, Inc. * | 422 | 74,774 |
Knowles Corp. * | 7,660 | 137,191 |
Plexus Corp. * | 663 | 71,690 |
TTM Technologies, Inc. * | 10,357 | 163,744 |
Vishay Intertechnology, Inc. | 6,247 | 149,741 |
597,140 | ||
Energy Equipment & Services — 2.3% | ||
Cactus, Inc., Class A | 1,832 | 83,173 |
ChampionX Corp. | 5,189 | 151,571 |
Noble Corp. plc | 1,124 | 54,132 |
Weatherford International plc * | 398 | 38,936 |
327,812 | ||
Financial Services — 2.5% | ||
PennyMac Financial Services, Inc. | 1,888 | 166,842 |
Radian Group, Inc. | 6,498 | 185,518 |
352,360 | ||
Food Products — 0.6% | ||
Flowers Foods, Inc. | 3,666 | 82,522 |
Gas Utilities — 2.2% | ||
Chesapeake Utilities Corp. | 1,203 | 127,073 |
ONE Gas, Inc. | 2,262 | 144,135 |
Southwest Gas Holdings, Inc. | 812 | 51,440 |
322,648 | ||
Ground Transportation — 1.0% | ||
Marten Transport Ltd. | 7,068 | 148,287 |
Health Care Equipment & Supplies — 0.7% | ||
Utah Medical Products, Inc. | 1,119 | 94,242 |
December 31, 2023 | J.P. Morgan Exchange-Traded Funds | 27 |
INVESTMENTS | SHARES | VALUE($) |
Common Stocks — continued | ||
Health Care Providers & Services — 3.8% | ||
Encompass Health Corp. | 3,151 | 210,235 |
Ensign Group, Inc. (The) | 1,220 | 136,896 |
Patterson Cos., Inc. | 6,977 | 198,496 |
545,627 | ||
Health Care REITs — 0.8% | ||
CareTrust REIT, Inc. | 5,278 | 118,122 |
Hotel & Resort REITs — 1.0% | ||
RLJ Lodging Trust | 6,232 | 73,039 |
Sunstone Hotel Investors, Inc. | 6,625 | 71,086 |
144,125 | ||
Hotels, Restaurants & Leisure — 1.5% | ||
Bloomin' Brands, Inc. | 2,746 | 77,300 |
Everi Holdings, Inc. * | 8,076 | 91,016 |
Jack in the Box, Inc. | 663 | 54,121 |
222,437 | ||
Household Durables — 2.1% | ||
La-Z-Boy, Inc. | 2,237 | 82,590 |
M/I Homes, Inc. * | 1,017 | 140,082 |
MDC Holdings, Inc. | 1,428 | 78,897 |
301,569 | ||
Industrial REITs — 1.4% | ||
Plymouth Industrial REIT, Inc. | 4,076 | 98,109 |
Terreno Realty Corp. | 1,700 | 106,539 |
204,648 | ||
Insurance — 3.4% | ||
Safety Insurance Group, Inc. | 2,408 | 182,984 |
Selective Insurance Group, Inc. | 3,013 | 299,733 |
482,717 | ||
Interactive Media & Services — 1.3% | ||
IAC, Inc. * | 2,311 | 121,050 |
TripAdvisor, Inc. * | 2,731 | 58,799 |
179,849 | ||
Life Sciences Tools & Services — 0.5% | ||
Fortrea Holdings, Inc. * | 2,005 | 69,975 |
Machinery — 5.8% | ||
Alamo Group, Inc. | 772 | 162,267 |
Douglas Dynamics, Inc. | 2,327 | 69,065 |
Enpro Inc. | 626 | 98,119 |
Kadant, Inc. | 549 | 153,890 |
Mueller Industries, Inc. | 2,680 | 126,362 |
INVESTMENTS | SHARES | VALUE($) |
Machinery — continued | ||
Toro Co. (The) | 817 | 78,424 |
Watts Water Technologies, Inc., Class A | 729 | 151,880 |
840,007 | ||
Media — 1.2% | ||
John Wiley & Sons, Inc., Class A | 5,256 | 166,825 |
Mortgage Real Estate Investment Trusts (REITs) — 0.4% | ||
Ladder Capital Corp. | 5,257 | 60,508 |
Multi-Utilities — 0.9% | ||
Unitil Corp. | 2,379 | 125,064 |
Office REITs — 1.7% | ||
Equity Commonwealth | 7,666 | 147,187 |
Highwoods Properties, Inc. | 4,113 | 94,435 |
241,622 | ||
Oil, Gas & Consumable Fuels — 4.8% | ||
Chord Energy Corp. | 1,122 | 186,510 |
CNX Resources Corp. * | 4,059 | 81,180 |
Equitrans Midstream Corp. | 9,066 | 92,292 |
Magnolia Oil & Gas Corp., Class A | 6,697 | 142,579 |
Matador Resources Co. | 3,186 | 181,156 |
683,717 | ||
Personal Care Products — 1.4% | ||
Edgewell Personal Care Co. | 3,359 | 123,040 |
Inter Parfums, Inc. | 586 | 84,390 |
207,430 | ||
Pharmaceuticals — 0.6% | ||
Prestige Consumer Healthcare, Inc. * | 1,305 | 79,892 |
Professional Services — 1.1% | ||
ASGN, Inc. * | 1,119 | 107,614 |
Verra Mobility Corp., Class A * | 2,302 | 53,015 |
160,629 | ||
Residential REITs — 1.2% | ||
American Homes 4 Rent, Class A | 2,438 | 87,670 |
Centerspace | 1,459 | 84,914 |
172,584 | ||
Retail REITs — 2.2% | ||
Agree Realty Corp. | 2,843 | 178,967 |
Kite Realty Group Trust | 6,098 | 139,400 |
318,367 | ||
Semiconductors & Semiconductor Equipment — 2.7% | ||
Amkor Technology, Inc. | 2,855 | 94,986 |
28 | J.P. Morgan Exchange-Traded Funds | December 31, 2023 |
INVESTMENTS | SHARES | VALUE($) |
Common Stocks — continued | ||
Semiconductors & Semiconductor Equipment — continued | ||
Cohu, Inc. * | 4,001 | 141,596 |
Synaptics, Inc. * | 1,341 | 152,981 |
389,563 | ||
Specialty Retail — 1.7% | ||
Group 1 Automotive, Inc. | 537 | 163,646 |
Urban Outfitters, Inc. * | 2,386 | 85,156 |
248,802 | ||
Textiles, Apparel & Luxury Goods — 3.3% | ||
Carter's, Inc. | 1,607 | 120,348 |
Kontoor Brands, Inc. | 2,338 | 145,938 |
Movado Group, Inc. | 1,934 | 58,310 |
Steven Madden Ltd. | 3,704 | 155,568 |
480,164 | ||
Trading Companies & Distributors — 3.1% | ||
Applied Industrial Technologies, Inc. | 815 | 140,742 |
Beacon Roofing Supply, Inc. * | 1,741 | 151,502 |
McGrath RentCorp | 1,309 | 156,583 |
448,827 | ||
Water Utilities — 0.9% | ||
American States Water Co. | 1,627 | 130,843 |
Total Common Stocks (Cost $12,812,933) | 13,864,554 | |
Short-Term Investments — 4.0% | ||
Investment Companies — 3.7% | ||
JPMorgan U.S. Government Money Market Fund Class IM Shares, 5.30% (b) (c) (Cost $535,500) | 535,500 | 535,500 |
INVESTMENTS | SHARES | VALUE($) |
Investment of Cash Collateral from Securities Loaned — 0.3% | ||
JPMorgan U.S. Government Money Market Fund Class IM Shares, 5.30% (b) (c) (Cost $38,770) | 38,770 | 38,770 |
Total Short-Term Investments (Cost $574,270) | 574,270 | |
Total Investments — 100.2% (Cost $13,387,203) | 14,438,824 | |
Liabilities in Excess of Other Assets — (0.2)% | (31,820 ) | |
NET ASSETS — 100.0% | 14,407,004 | |
Percentages indicated are based on net assets. |
Abbreviations | |
REIT | Real Estate Investment Trust |
* | Non-income producing security. |
(a) | The security or a portion of this security is on loan at December 31, 2023. The total value of securities on loan at December 31, 2023 is $38,265. |
(b) | Investment in an affiliated fund, which is registered under the Investment Company Act of 1940, as amended, and is advised by J.P. Morgan Investment Management Inc. |
(c) | The rate shown is the current yield as of December 31, 2023. |
December 31, 2023 | J.P. Morgan Exchange-Traded Funds | 29 |
INVESTMENTS | SHARES | VALUE($) |
Common Stocks — 97.1% | ||
Aerospace & Defense — 2.9% | ||
Boeing Co. (The) * | 28,216 | 7,354,783 |
General Dynamics Corp. | 17,707 | 4,597,977 |
Howmet Aerospace, Inc. | 27,076 | 1,465,353 |
Northrop Grumman Corp. | 9,700 | 4,540,958 |
RTX Corp. | 52,137 | 4,386,807 |
22,345,878 | ||
Air Freight & Logistics — 1.8% | ||
FedEx Corp. | 13,547 | 3,426,984 |
United Parcel Service, Inc., Class B | 70,520 | 11,087,860 |
14,514,844 | ||
Banks — 10.5% | ||
Bank of America Corp. | 757,357 | 25,500,210 |
Citigroup, Inc. | 152,599 | 7,849,693 |
Fifth Third Bancorp | 148,856 | 5,134,043 |
M&T Bank Corp. | 26,440 | 3,624,395 |
PNC Financial Services Group, Inc. (The) | 50,412 | 7,806,298 |
Truist Financial Corp. | 266,493 | 9,838,922 |
US Bancorp | 104,088 | 4,504,929 |
Wells Fargo & Co. | 358,223 | 17,631,736 |
81,890,226 | ||
Beverages — 0.6% | ||
Keurig Dr Pepper, Inc. | 45,648 | 1,520,991 |
PepsiCo, Inc. | 17,257 | 2,930,929 |
4,451,920 | ||
Biotechnology — 3.9% | ||
AbbVie, Inc. | 96,395 | 14,938,333 |
Biogen, Inc. * | 22,121 | 5,724,251 |
BioMarin Pharmaceutical, Inc. * | 19,966 | 1,925,122 |
Regeneron Pharmaceuticals, Inc. * | 3,430 | 3,012,535 |
Vertex Pharmaceuticals, Inc. * | 12,211 | 4,968,534 |
30,568,775 | ||
Building Products — 1.4% | ||
Carrier Global Corp. | 117,349 | 6,741,700 |
Masco Corp. | 63,939 | 4,282,634 |
11,024,334 | ||
Capital Markets — 5.6% | ||
BlackRock, Inc. | 9,796 | 7,952,393 |
Charles Schwab Corp. (The) | 124,509 | 8,566,219 |
Goldman Sachs Group, Inc. (The) | 22,783 | 8,788,998 |
Intercontinental Exchange, Inc. | 15,675 | 2,013,140 |
Morgan Stanley | 80,579 | 7,513,992 |
INVESTMENTS | SHARES | VALUE($) |
Capital Markets — continued | ||
Raymond James Financial, Inc. | 51,606 | 5,754,069 |
S&P Global, Inc. | 6,885 | 3,032,980 |
43,621,791 | ||
Chemicals — 3.4% | ||
Air Products and Chemicals, Inc. | 31,009 | 8,490,264 |
Axalta Coating Systems Ltd. * | 226,763 | 7,703,139 |
Chemours Co. (The) | 184,371 | 5,815,062 |
FMC Corp. | 70,806 | 4,464,318 |
26,472,783 | ||
Commercial Services & Supplies — 0.4% | ||
Republic Services, Inc. | 21,521 | 3,549,028 |
Construction Materials — 0.7% | ||
Vulcan Materials Co. | 23,593 | 5,355,847 |
Consumer Finance — 0.8% | ||
American Express Co. | 25,680 | 4,810,891 |
Capital One Financial Corp. | 10,533 | 1,381,087 |
6,191,978 | ||
Consumer Staples Distribution & Retail — 2.9% | ||
BJ's Wholesale Club Holdings, Inc. * | 44,130 | 2,941,706 |
Dollar General Corp. | 18,048 | 2,453,626 |
Dollar Tree, Inc. * | 13,924 | 1,977,904 |
Performance Food Group Co. * | 73,848 | 5,106,589 |
Walmart, Inc. | 64,075 | 10,101,424 |
22,581,249 | ||
Containers & Packaging — 1.0% | ||
Ball Corp. | 27,654 | 1,590,658 |
Graphic Packaging Holding Co. | 76,837 | 1,894,032 |
Silgan Holdings, Inc. | 93,074 | 4,211,599 |
7,696,289 | ||
Diversified Telecommunication Services — 0.2% | ||
AT&T, Inc. | 109,424 | 1,836,135 |
Electric Utilities — 2.0% | ||
Entergy Corp. | 68,126 | 6,893,670 |
NextEra Energy, Inc. | 100,661 | 6,114,149 |
Xcel Energy, Inc. | 49,522 | 3,065,907 |
16,073,726 | ||
Electrical Equipment — 1.6% | ||
Eaton Corp. plc | 22,585 | 5,438,920 |
30 | J.P. Morgan Exchange-Traded Funds | December 31, 2023 |
INVESTMENTS | SHARES | VALUE($) |
Common Stocks — continued | ||
Electrical Equipment — continued | ||
Emerson Electric Co. | 65,657 | 6,390,396 |
Vertiv Holdings Co., Class A | 17,889 | 859,208 |
12,688,524 | ||
Entertainment — 1.4% | ||
Endeavor Group Holdings, Inc., Class A | 90,250 | 2,141,632 |
Walt Disney Co. (The) * | 66,679 | 6,020,447 |
Warner Bros Discovery, Inc. * | 231,281 | 2,631,978 |
10,794,057 | ||
Financial Services — 3.8% | ||
Berkshire Hathaway, Inc., Class B * | 40,962 | 14,609,507 |
Fidelity National Information Services, Inc. | 84,044 | 5,048,523 |
Fiserv, Inc. * | 67,591 | 8,978,789 |
Rocket Cos., Inc., Class A * | 56,769 | 822,015 |
29,458,834 | ||
Food Products — 0.9% | ||
Lamb Weston Holdings, Inc. | 36,671 | 3,963,768 |
Mondelez International, Inc., Class A | 44,856 | 3,248,920 |
7,212,688 | ||
Ground Transportation — 1.7% | ||
CSX Corp. | 302,112 | 10,474,223 |
Knight-Swift Transportation Holdings, Inc. | 25,837 | 1,489,503 |
Union Pacific Corp. | 6,359 | 1,561,898 |
13,525,624 | ||
Health Care Equipment & Supplies — 3.1% | ||
Baxter International, Inc. | 45,889 | 1,774,069 |
Becton Dickinson & Co. | 11,787 | 2,874,024 |
Boston Scientific Corp. * | 73,180 | 4,230,536 |
Medtronic plc | 109,930 | 9,056,033 |
Zimmer Biomet Holdings, Inc. | 50,119 | 6,099,482 |
24,034,144 | ||
Health Care Providers & Services — 3.9% | ||
Centene Corp. * | 92,945 | 6,897,449 |
Cigna Group (The) | 11,827 | 3,541,595 |
CVS Health Corp. | 59,720 | 4,715,491 |
Elevance Health, Inc. | 4,395 | 2,072,506 |
Humana, Inc. | 7,021 | 3,214,284 |
UnitedHealth Group, Inc. | 15,780 | 8,307,697 |
Universal Health Services, Inc., Class B | 10,660 | 1,625,010 |
30,374,032 | ||
Health Care REITs — 0.4% | ||
Ventas, Inc. | 58,316 | 2,906,469 |
INVESTMENTS | SHARES | VALUE($) |
Hotel & Resort REITs — 0.3% | ||
Host Hotels & Resorts, Inc. | 109,391 | 2,129,843 |
Hotels, Restaurants & Leisure — 1.4% | ||
Booking Holdings, Inc. * | 542 | 1,922,593 |
Carnival Corp. * | 69,406 | 1,286,787 |
McDonald's Corp. | 14,601 | 4,329,343 |
Royal Caribbean Cruises Ltd. * | 28,030 | 3,629,605 |
11,168,328 | ||
Household Durables — 0.2% | ||
Lennar Corp., Class A | 10,277 | 1,531,684 |
Household Products — 0.6% | ||
Procter & Gamble Co. (The) | 32,366 | 4,742,914 |
Industrial Conglomerates — 0.7% | ||
Honeywell International, Inc. | 27,342 | 5,733,891 |
Insurance — 3.2% | ||
Chubb Ltd. | 18,114 | 4,093,764 |
Hartford Financial Services Group, Inc. (The) | 47,797 | 3,841,923 |
Marsh & McLennan Cos., Inc. | 10,882 | 2,061,813 |
MetLife, Inc. | 102,069 | 6,749,823 |
Prudential Financial, Inc. | 16,986 | 1,761,618 |
Travelers Cos., Inc. (The) | 33,803 | 6,439,133 |
24,948,074 | ||
Interactive Media & Services — 1.5% | ||
Alphabet, Inc., Class C * | 27,858 | 3,926,028 |
Meta Platforms, Inc., Class A * | 22,748 | 8,051,882 |
11,977,910 | ||
IT Services — 0.4% | ||
International Business Machines Corp. | 17,558 | 2,871,611 |
Life Sciences Tools & Services — 0.4% | ||
Thermo Fisher Scientific, Inc. | 5,419 | 2,876,351 |
Machinery — 1.4% | ||
Dover Corp. | 36,989 | 5,689,278 |
Middleby Corp. (The) * | 14,255 | 2,097,908 |
Parker-Hannifin Corp. | 7,730 | 3,561,211 |
11,348,397 | ||
Media — 2.6% | ||
Charter Communications, Inc., Class A * | 12,182 | 4,734,900 |
Comcast Corp., Class A | 253,718 | 11,125,534 |
Interpublic Group of Cos., Inc. (The) | 69,560 | 2,270,438 |
Liberty Media Corp-Liberty SiriusXM, Class A * | 69,977 | 2,011,139 |
20,142,011 | ||
December 31, 2023 | J.P. Morgan Exchange-Traded Funds | 31 |
INVESTMENTS | SHARES | VALUE($) |
Common Stocks — continued | ||
Metals & Mining — 0.7% | ||
Alcoa Corp. | 57,594 | 1,958,196 |
Freeport-McMoRan, Inc. | 26,135 | 1,112,567 |
Kinross Gold Corp. (Canada) | 155,458 | 940,521 |
Steel Dynamics, Inc. | 9,721 | 1,148,050 |
5,159,334 | ||
Multi-Utilities — 1.8% | ||
CMS Energy Corp. | 94,356 | 5,479,253 |
DTE Energy Co. | 17,011 | 1,875,633 |
Public Service Enterprise Group, Inc. | 116,127 | 7,101,166 |
14,456,052 | ||
Office REITs — 0.2% | ||
Vornado Realty Trust | 64,633 | 1,825,882 |
Oil, Gas & Consumable Fuels — 6.6% | ||
Chevron Corp. | 115,817 | 17,275,264 |
ConocoPhillips | 87,694 | 10,178,642 |
EOG Resources, Inc. | 48,303 | 5,842,248 |
Exxon Mobil Corp. | 146,519 | 14,648,970 |
Pioneer Natural Resources Co. | 15,641 | 3,517,348 |
51,462,472 | ||
Passenger Airlines — 0.3% | ||
Southwest Airlines Co. | 83,062 | 2,398,831 |
Pharmaceuticals — 3.1% | ||
Bristol-Myers Squibb Co. | 254,478 | 13,057,266 |
Eli Lilly & Co. | 3,197 | 1,863,595 |
Johnson & Johnson | 37,811 | 5,926,496 |
Merck & Co., Inc. | 12,830 | 1,398,727 |
Pfizer, Inc. | 63,116 | 1,817,110 |
24,063,194 | ||
Residential REITs — 0.5% | ||
AvalonBay Communities, Inc. | 6,786 | 1,270,475 |
Equity Residential | 45,565 | 2,786,755 |
4,057,230 | ||
Retail REITs — 0.4% | ||
Kimco Realty Corp. | 163,936 | 3,493,476 |
Semiconductors & Semiconductor Equipment — 5.5% | ||
Advanced Micro Devices, Inc. * | 21,947 | 3,235,207 |
Analog Devices, Inc. | 31,563 | 6,267,149 |
Intel Corp. | 33,820 | 1,699,455 |
Microchip Technology, Inc. | 35,331 | 3,186,150 |
NXP Semiconductors NV (China) | 48,030 | 11,031,530 |
INVESTMENTS | SHARES | VALUE($) |
Semiconductors & Semiconductor Equipment — continued | ||
Taiwan Semiconductor Manufacturing Co. Ltd., ADR (Taiwan) | 37,155 | 3,864,120 |
Teradyne, Inc. | 22,049 | 2,392,758 |
Texas Instruments, Inc. | 68,745 | 11,718,273 |
43,394,642 | ||
Software — 1.5% | ||
Microsoft Corp. | 15,641 | 5,881,642 |
Oracle Corp. | 36,122 | 3,808,342 |
Salesforce, Inc. * | 7,803 | 2,053,281 |
11,743,265 | ||
Specialized REITs — 1.0% | ||
Digital Realty Trust, Inc. | 56,589 | 7,615,748 |
Specialty Retail — 3.3% | ||
AutoZone, Inc. * | 1,522 | 3,935,299 |
Best Buy Co., Inc. | 36,599 | 2,864,970 |
Burlington Stores, Inc. * | 9,025 | 1,755,182 |
Home Depot, Inc. (The) | 12,846 | 4,451,781 |
Lowe's Cos., Inc. | 20,700 | 4,606,785 |
O'Reilly Automotive, Inc. * | 2,398 | 2,278,292 |
TJX Cos., Inc. (The) | 63,719 | 5,977,479 |
25,869,788 | ||
Technology Hardware, Storage & Peripherals — 0.4% | ||
Seagate Technology Holdings plc | 36,293 | 3,098,333 |
Textiles, Apparel & Luxury Goods — 1.3% | ||
Capri Holdings Ltd. * | 22,861 | 1,148,536 |
Kontoor Brands, Inc. | 79,173 | 4,941,979 |
NIKE, Inc., Class B | 27,130 | 2,945,504 |
Tapestry, Inc. | 28,749 | 1,058,251 |
10,094,270 | ||
Tobacco — 1.0% | ||
Philip Morris International, Inc. | 81,438 | 7,661,687 |
Trading Companies & Distributors — 1.6% | ||
AerCap Holdings NV (Ireland) * | 70,016 | 5,203,589 |
Air Lease Corp., Class A | 54,521 | 2,286,611 |
WESCO International, Inc. | 28,866 | 5,019,220 |
12,509,420 | ||
Wireless Telecommunication Services — 0.3% | ||
T-Mobile US, Inc. | 12,889 | 2,066,493 |
Total Common Stocks (Cost $695,802,994) | 759,610,306 | |
32 | J.P. Morgan Exchange-Traded Funds | December 31, 2023 |
INVESTMENTS | SHARES | VALUE($) |
Short-Term Investments — 2.8% | ||
Investment Companies — 2.8% | ||
JPMorgan U.S. Government Money Market Fund Class IM Shares, 5.30% (a) (b) (Cost $21,877,028) | 21,877,028 | 21,877,028 |
Total Investments — 99.9% (Cost $717,680,022) | 781,487,334 | |
Other Assets Less Liabilities — 0.1% | 858,659 | |
NET ASSETS — 100.0% | 782,345,993 | |
Percentages indicated are based on net assets. |
Abbreviations | |
ADR | American Depositary Receipt |
REIT | Real Estate Investment Trust |
* | Non-income producing security. |
(a) | Investment in an affiliated fund, which is registered under the Investment Company Act of 1940, as amended, and is advised by J.P. Morgan Investment Management Inc. |
(b) | The rate shown is the current yield as of December 31, 2023. |
December 31, 2023 | J.P. Morgan Exchange-Traded Funds | 33 |
INVESTMENTS | SHARES | VALUE($) |
Common Stocks — 85.0% | ||
Aerospace & Defense — 1.3% | ||
General Dynamics Corp. | 345,461 | 89,705,858 |
RTX Corp. | 1,872,710 | 157,569,820 |
Textron, Inc. | 1,940,096 | 156,022,520 |
403,298,198 | ||
Air Freight & Logistics — 1.5% | ||
FedEx Corp. | 459,428 | 116,221,501 |
United Parcel Service, Inc., Class B | 2,107,975 | 331,436,909 |
447,658,410 | ||
Banks — 0.6% | ||
US Bancorp | 4,393,373 | 190,145,183 |
Beverages — 2.6% | ||
Coca-Cola Co. (The) | 5,128,785 | 302,239,300 |
Monster Beverage Corp. * | 1,628,548 | 93,820,650 |
PepsiCo, Inc. | 2,288,447 | 388,669,839 |
784,729,789 | ||
Biotechnology — 3.8% | ||
AbbVie, Inc. | 2,777,151 | 430,375,091 |
Biogen, Inc. * | 126,061 | 32,620,805 |
Regeneron Pharmaceuticals, Inc. * | 352,208 | 309,340,764 |
Vertex Pharmaceuticals, Inc. * | 986,244 | 401,292,821 |
1,173,629,481 | ||
Broadline Retail — 1.7% | ||
Amazon.com, Inc. * | 3,362,617 | 510,916,027 |
Building Products — 1.6% | ||
Trane Technologies plc | 1,995,296 | 486,652,694 |
Capital Markets — 2.5% | ||
CME Group, Inc. | 1,803,107 | 379,734,334 |
Intercontinental Exchange, Inc. | 1,391,578 | 178,720,362 |
S&P Global, Inc. | 476,986 | 210,121,873 |
768,576,569 | ||
Chemicals — 3.0% | ||
Air Products and Chemicals, Inc. | 1,287,959 | 352,643,174 |
Dow, Inc. | 1,819,524 | 99,782,696 |
Linde plc (a) | 895,811 | 367,918,536 |
LyondellBasell Industries NV, Class A | 935,807 | 88,976,530 |
909,320,936 | ||
Commercial Services & Supplies — 0.0% ^ | ||
Veralto Corp. | 220,018 | 18,098,681 |
Communications Equipment — 0.2% | ||
Motorola Solutions, Inc. | 211,438 | 66,199,123 |
INVESTMENTS | SHARES | VALUE($) |
Consumer Finance — 0.5% | ||
American Express Co. | 770,976 | 144,434,644 |
Consumer Staples Distribution & Retail — 2.4% | ||
Costco Wholesale Corp. | 630,939 | 416,470,215 |
Target Corp. (a) | 485,544 | 69,151,176 |
Walmart, Inc. | 1,506,155 | 237,445,336 |
723,066,727 | ||
Electric Utilities — 2.0% | ||
NextEra Energy, Inc. | 3,851,708 | 233,952,744 |
PG&E Corp. | 5,073,588 | 91,476,792 |
Southern Co. (The) | 4,338,661 | 304,226,909 |
629,656,445 | ||
Electrical Equipment — 1.2% | ||
Eaton Corp. plc | 1,517,184 | 365,368,251 |
Electronic Equipment, Instruments & Components — 0.6% | ||
Keysight Technologies, Inc. * | 1,161,290 | 184,749,626 |
Financial Services — 5.0% | ||
Berkshire Hathaway, Inc., Class B * | 570,349 | 203,420,674 |
FleetCor Technologies, Inc. * | 826,101 | 233,464,403 |
Jack Henry & Associates, Inc. | 1,040,553 | 170,036,766 |
Mastercard, Inc., Class A | 1,095,831 | 467,382,880 |
Visa, Inc., Class A (a) | 1,714,614 | 446,399,755 |
1,520,704,478 | ||
Food Products — 2.0% | ||
Hershey Co. (The) | 1,082,135 | 201,753,250 |
Mondelez International, Inc., Class A | 5,495,459 | 398,036,095 |
599,789,345 | ||
Ground Transportation — 2.5% | ||
CSX Corp. | 5,563,345 | 192,881,171 |
Norfolk Southern Corp. | 899,455 | 212,613,173 |
Old Dominion Freight Line, Inc. | 609,874 | 247,200,229 |
Union Pacific Corp. | 409,099 | 100,482,896 |
753,177,469 | ||
Health Care Equipment & Supplies — 1.0% | ||
Becton Dickinson & Co. | 105,209 | 25,653,111 |
Boston Scientific Corp. * | 2,405,003 | 139,033,223 |
Medtronic plc | 1,727,389 | 142,302,306 |
306,988,640 | ||
Health Care Providers & Services — 2.5% | ||
Centene Corp. * | 908,511 | 67,420,601 |
Elevance Health, Inc. | 310,941 | 146,627,338 |
34 | J.P. Morgan Exchange-Traded Funds | December 31, 2023 |
INVESTMENTS | SHARES | VALUE($) |
Common Stocks — continued | ||
Health Care Providers & Services — continued | ||
Humana, Inc. | 307,298 | 140,684,097 |
UnitedHealth Group, Inc. | 781,248 | 411,303,635 |
766,035,671 | ||
Hotels, Restaurants & Leisure — 3.2% | ||
Booking Holdings, Inc. * | 54,569 | 193,568,248 |
Chipotle Mexican Grill, Inc. * | 174,558 | 399,207,164 |
Yum! Brands, Inc. | 3,062,629 | 400,163,105 |
992,938,517 | ||
Household Products — 3.2% | ||
Church & Dwight Co., Inc. | 2,131,009 | 201,508,211 |
Colgate-Palmolive Co. | 2,366,586 | 188,640,570 |
Kimberly-Clark Corp. | 1,656,441 | 201,274,146 |
Procter & Gamble Co. (The) | 2,673,927 | 391,837,263 |
983,260,190 | ||
Industrial Conglomerates — 1.3% | ||
Honeywell International, Inc. | 1,890,992 | 396,559,932 |
Industrial REITs — 1.0% | ||
Prologis, Inc. (a) | 2,306,781 | 307,493,907 |
Insurance — 3.5% | ||
Chubb Ltd. | 764,286 | 172,728,636 |
Globe Life, Inc. | 346,687 | 42,198,742 |
Progressive Corp. (The) | 2,954,746 | 470,631,943 |
Travelers Cos., Inc. (The) | 1,960,096 | 373,378,687 |
1,058,938,008 | ||
Interactive Media & Services — 2.5% | ||
Alphabet, Inc., Class A * | 2,632,850 | 367,782,816 |
Meta Platforms, Inc., Class A * | 1,164,327 | 412,125,185 |
779,908,001 | ||
IT Services — 2.6% | ||
Accenture plc, Class A | 1,320,100 | 463,236,291 |
Cognizant Technology Solutions Corp., Class A | 3,719,030 | 280,898,336 |
VeriSign, Inc. * | 256,979 | 52,927,395 |
797,062,022 | ||
Life Sciences Tools & Services — 1.1% | ||
Danaher Corp. | 604,262 | 139,789,971 |
Thermo Fisher Scientific, Inc. | 392,147 | 208,147,706 |
347,937,677 | ||
Machinery — 2.2% | ||
Deere & Co. | 520,018 | 207,939,598 |
INVESTMENTS | SHARES | VALUE($) |
Machinery — continued | ||
Dover Corp. | 1,536,476 | 236,325,373 |
Otis Worldwide Corp. | 2,626,844 | 235,023,733 |
679,288,704 | ||
Media — 1.6% | ||
Charter Communications, Inc., Class A * | 195,771 | 76,092,273 |
Comcast Corp., Class A | 9,287,172 | 407,242,492 |
483,334,765 | ||
Multi-Utilities — 2.0% | ||
Ameren Corp. | 1,135,727 | 82,158,491 |
CMS Energy Corp. | 2,077,098 | 120,617,081 |
Dominion Energy, Inc. | 663,094 | 31,165,418 |
Public Service Enterprise Group, Inc. | 6,242,188 | 381,709,796 |
615,650,786 | ||
Oil, Gas & Consumable Fuels — 2.5% | ||
ConocoPhillips | 2,256,525 | 261,914,857 |
EOG Resources, Inc. | 1,613,432 | 195,144,600 |
Exxon Mobil Corp. | 2,993,400 | 299,280,132 |
756,339,589 | ||
Personal Care Products — 0.2% | ||
Kenvue, Inc. | 2,320,153 | 49,952,894 |
Pharmaceuticals — 3.2% | ||
Bristol-Myers Squibb Co. | 6,271,230 | 321,776,811 |
Eli Lilly & Co. | 603,034 | 351,520,579 |
Johnson & Johnson | 835,828 | 131,007,681 |
Merck & Co., Inc. | 1,501,893 | 163,736,375 |
968,041,446 | ||
Residential REITs — 0.2% | ||
Equity Residential | 307,905 | 18,831,470 |
UDR, Inc. (a) | 1,061,697 | 40,652,378 |
59,483,848 | ||
Semiconductors & Semiconductor Equipment — 4.3% | ||
Analog Devices, Inc. | 1,678,891 | 333,360,597 |
ASML Holding NV (Registered), NYRS (Netherlands) | 260,621 | 197,269,247 |
NXP Semiconductors NV (China) | 1,794,062 | 412,060,160 |
Texas Instruments, Inc. | 2,115,262 | 360,567,561 |
1,303,257,565 | ||
Software — 6.6% | ||
Adobe, Inc. * | 767,489 | 457,883,938 |
Autodesk, Inc. * | 114,564 | 27,894,043 |
Cadence Design Systems, Inc. * | 548,528 | 149,402,571 |
December 31, 2023 | J.P. Morgan Exchange-Traded Funds | 35 |
INVESTMENTS | SHARES | VALUE($) |
Common Stocks — continued | ||
Software — continued | ||
Intuit, Inc. | 794,010 | 496,280,070 |
Microsoft Corp. | 1,338,884 | 503,473,939 |
ServiceNow, Inc. * | 365,835 | 258,458,769 |
Synopsys, Inc. * | 261,836 | 134,821,975 |
2,028,215,305 | ||
Specialized REITs — 1.9% | ||
American Tower Corp. | 194,597 | 42,009,601 |
Equinix, Inc. | 324,867 | 261,644,633 |
SBA Communications Corp. | 1,110,364 | 281,688,243 |
585,342,477 | ||
Specialty Retail — 2.6% | ||
AutoZone, Inc. * | 65,533 | 169,442,780 |
Best Buy Co., Inc. | 647,281 | 50,669,157 |
Burlington Stores, Inc. * | 96,993 | 18,863,199 |
Lowe's Cos., Inc. | 1,607,448 | 357,737,552 |
O'Reilly Automotive, Inc. * | 26,819 | 25,480,196 |
TJX Cos., Inc. (The) | 1,768,456 | 165,898,857 |
788,091,741 | ||
Technology Hardware, Storage & Peripherals — 0.3% | ||
Apple, Inc. | 288,514 | 55,547,601 |
Seagate Technology Holdings plc | 478,882 | 40,882,156 |
96,429,757 | ||
Tobacco — 0.4% | ||
Altria Group, Inc. | 961,271 | 38,777,672 |
Philip Morris International, Inc. | 785,498 | 73,899,652 |
112,677,324 | ||
Trading Companies & Distributors — 0.1% | ||
WW Grainger, Inc. | 31,535 | 26,132,739 |
Total Common Stocks (Cost $22,728,803,953) | 25,969,533,581 | |
PRINCIPAL AMOUNT($) | ||
Equity-Linked Notes — 13.7% | ||
BNP Paribas, ELN, 40.46%, 1/9/2024, (linked to S&P 500 Index) (b) | 62,393 | 256,967,442 |
BNP Paribas, ELN, 41.73%, 1/26/2024, (linked to S&P 500 Index) (b) | 61,656 | 295,891,460 |
BNP Paribas, ELN, 42.35%, 1/17/2024, (linked to S&P 500 Index) (b) | 62,151 | 262,149,189 |
BNP Paribas, ELN, 43.63%, 2/2/2024, (linked to S&P 500 Index) (b) | 62,412 | 300,408,304 |
INVESTMENTS | PRINCIPAL AMOUNT($) | VALUE($) |
BofA Finance LLC, ELN, 43.80%, 1/12/2024, (linked to S&P 500 Index) (b) | 62,366 | 257,005,920 |
Canadian Imperial Bank of Commerce, ELN, 42.13%, 2/5/2024, (linked to S&P 500 Index) (Canada) (b) | 62,322 | 299,471,544 |
Goldman Sachs & Co. LLC, ELN, 43.53%, 1/16/2024, (linked to S&P 500 Index) (b) | 62,402 | 256,804,199 |
Goldman Sachs & Co. LLC, ELN, 46.45%, 1/30/2024, (linked to S&P 500 Index) (b) | 60,041 | 287,753,097 |
Royal Bank of Canada, ELN, 47.51%,1/ 29/2024, (linked to S&P 500 Index) (Canada) (b) | 63,426 | 295,553,743 |
Societe Generale, ELN, 38.15%, 1/5/2024, (linked to S&P 500 Index) (France) (b) | 63,667 | 255,342,233 |
Societe Generale, ELN, 38.94%, 1/19/2024, (linked to S&P 500 Index) (b) | 61,373 | 270,776,449 |
Societe Generale, ELN, 40.12%, 1/8/2024, (linked to S&P 500 Index) (France) (b) | 63,728 | 254,578,703 |
The Bank of Nova Scotia, ELN, 42.11%, 2/6/2024, (linked to S&P 500 Index) (Canada) (b) | 62,299 | 298,979,131 |
UBS Securities LLC, ELN, 37.72%, 1/22/2024, (linked to S&P 500 Index) (Switzerland) (b) | 60,547 | 282,593,435 |
UBS Securities LLC, ELN, 38.46%, 1/23/2024, (linked to S&P 500 Index) (Switzerland) (b) | 62,294 | 292,494,002 |
Total Equity-Linked Notes (Cost $4,354,984,017) | 4,166,768,851 | |
SHARES | ||
Short-Term Investments — 0.6% | ||
Investment Companies — 0.0% ^ | ||
JPMorgan U.S. Government Money Market Fund Class IM Shares, 5.30% (c) (d) (Cost $8,580,135) | 8,580,135 | 8,580,135 |
Investment of Cash Collateral from Securities Loaned — 0.6% | ||
JPMorgan Securities Lending Money Market Fund Agency SL Class Shares, 5.56% (c) (d) | 154,033,369 | 154,094,982 |
36 | J.P. Morgan Exchange-Traded Funds | December 31, 2023 |
INVESTMENTS | SHARES | VALUE($) |
Short-Term Investments — continued | ||
Investment of Cash Collateral from Securities Loaned — continued | ||
JPMorgan U.S. Government Money Market Fund Class IM Shares, 5.30% (c) (d) | 18,464,645 | 18,464,645 |
Total Investment of Cash Collateral from Securities Loaned (Cost $172,556,019) | 172,559,627 | |
Total Short-Term Investments (Cost $181,136,154) | 181,139,762 | |
Total Investments — 99.3% (Cost $27,264,924,124) | 30,317,442,194 | |
Other Assets Less Liabilities — 0.7% | 225,642,990 | |
NET ASSETS — 100.0% | 30,543,085,184 | |
Percentages indicated are based on net assets. |
Abbreviations | |
ELN | Equity-Linked Note |
NYRS | New York Registry Shares |
REIT | Real Estate Investment Trust |
^ | Amount rounds to less than 0.1% of net assets. | |
* | Non-income producing security. | |
(a) | The security or a portion of this security is on loan at December 31, 2023. The total value of securities on loan at December 31, 2023 is $169,175,386. | |
(b) | Securities exempt from registration under Rule 144A or section 4(a)(2), of the Securities Act of 1933, as amended. | |
(c) | Investment in an affiliated fund, which is registered under the Investment Company Act of 1940, as amended, and is advised by J.P. Morgan Investment Management Inc. | |
(d) | The rate shown is the current yield as of December 31, 2023. | |
December 31, 2023 | J.P. Morgan Exchange-Traded Funds | 37 |
INVESTMENTS | SHARES | VALUE($) |
Common Stocks — 98.1% | ||
Aerospace & Defense — 0.2% | ||
AeroVironment, Inc. * | 5,905 | 744,266 |
Curtiss-Wright Corp. | 1,631 | 363,371 |
Woodward, Inc. | 4,596 | 625,653 |
1,733,290 | ||
Air Freight & Logistics — 0.4% | ||
Forward Air Corp. | 8,491 | 533,829 |
GXO Logistics, Inc. * | 24,068 | 1,471,999 |
Hub Group, Inc., Class A * | 22,680 | 2,085,199 |
4,091,027 | ||
Automobile Components — 1.5% | ||
Adient plc * | 24,609 | 894,783 |
American Axle & Manufacturing Holdings, Inc. * | 37,783 | 332,868 |
Autoliv, Inc. (Sweden) | 38,109 | 4,199,231 |
Dana, Inc. | 88,246 | 1,289,274 |
Fox Factory Holding Corp. * | 5,764 | 388,955 |
Gentex Corp. * | 70,043 | 2,287,604 |
Gentherm, Inc. * | 8,756 | 458,464 |
Goodyear Tire & Rubber Co. (The) * (a) | 74,078 | 1,060,797 |
LCI Industries | 6,503 | 817,492 |
Lear Corp. | 15,272 | 2,156,559 |
Patrick Industries, Inc. | 7,265 | 729,043 |
14,615,070 | ||
Automobiles — 0.4% | ||
Harley-Davidson, Inc. | 32,670 | 1,203,563 |
Thor Industries, Inc. | 15,299 | 1,809,107 |
Winnebago Industries, Inc. (a) | 10,479 | 763,709 |
3,776,379 | ||
Banks — 6.6% | ||
Ameris Bancorp | 52,998 | 2,811,544 |
Associated Banc-Corp. | 36,445 | 779,558 |
Banc of California, Inc. | 39,369 | 528,726 |
Bancorp, Inc. (The) * | 26,296 | 1,013,974 |
BankUnited, Inc. | 18,793 | 609,457 |
Banner Corp. | 28,418 | 1,522,068 |
Brookline Bancorp, Inc. | 19,236 | 209,865 |
Cadence Bank (a) | 19,198 | 568,069 |
Central Pacific Financial Corp. | 29,564 | 581,819 |
Columbia Banking System, Inc. | 52,144 | 1,391,202 |
Commerce Bancshares, Inc. (a) | 31,760 | 1,696,302 |
Cullen/Frost Bankers, Inc. | 29,981 | 3,252,639 |
Customers Bancorp, Inc. * | 28,514 | 1,642,977 |
CVB Financial Corp. | 73,061 | 1,475,102 |
INVESTMENTS | SHARES | VALUE($) |
Banks — continued | ||
Dime Community Bancshares, Inc. | 12,776 | 344,058 |
East West Bancorp, Inc. | 62,730 | 4,513,423 |
FB Financial Corp. | 8,524 | 339,681 |
First BanCorp (Puerto Rico) | 156,046 | 2,566,957 |
First Commonwealth Financial Corp. | 90,490 | 1,397,166 |
First Horizon Corp. | 141,245 | 2,000,029 |
FNB Corp. | 154,803 | 2,131,637 |
Hancock Whitney Corp. | 21,980 | 1,068,008 |
Hanmi Financial Corp. | 8,992 | 174,445 |
Hope Bancorp, Inc. | 111,530 | 1,347,282 |
National Bank Holdings Corp., Class A | 48,425 | 1,800,926 |
NBT Bancorp, Inc. | 9,085 | 380,752 |
New York Community Bancorp, Inc. | 137,632 | 1,407,975 |
OFG Bancorp (Puerto Rico) | 72,994 | 2,735,815 |
Old National Bancorp | 105,742 | 1,785,982 |
Pathward Financial, Inc. | 32,270 | 1,708,051 |
Pinnacle Financial Partners, Inc. | 46,537 | 4,058,957 |
Preferred Bank | 3,655 | 266,998 |
Prosperity Bancshares, Inc. | 47,060 | 3,187,374 |
Renasant Corp. | 14,557 | 490,280 |
Southside Bancshares, Inc. | 32,081 | 1,004,777 |
SouthState Corp. | 3,714 | 313,647 |
Synovus Financial Corp. | 49,583 | 1,866,800 |
Triumph Financial, Inc. * | 6,019 | 482,603 |
UMB Financial Corp. | 5,216 | 435,797 |
United Community Banks, Inc. | 15,337 | 448,761 |
Veritex Holdings, Inc. | 12,025 | 279,822 |
WaFd, Inc. | 31,109 | 1,025,353 |
Webster Financial Corp. | 31,433 | 1,595,539 |
Wintrust Financial Corp. | 38,106 | 3,534,331 |
WSFS Financial Corp. | 15,732 | 722,571 |
63,499,099 | ||
Beverages — 0.4% | ||
Boston Beer Co., Inc. (The), Class A * | 2,434 | 841,166 |
Celsius Holdings, Inc. * (a) | 37,401 | 2,039,103 |
Coca-Cola Consolidated, Inc. | 1,423 | 1,321,113 |
4,201,382 | ||
Biotechnology — 1.7% | ||
Arrowhead Pharmaceuticals, Inc. * (a) | 42,237 | 1,292,452 |
Exelixis, Inc. * | 232,958 | 5,588,662 |
Neurocrine Biosciences, Inc. * | 27,816 | 3,665,036 |
United Therapeutics Corp. * | 26,696 | 5,870,184 |
16,416,334 | ||
38 | J.P. Morgan Exchange-Traded Funds | December 31, 2023 |
INVESTMENTS | SHARES | VALUE($) |
Common Stocks — continued | ||
Broadline Retail — 0.4% | ||
Kohl's Corp. (a) | 65,232 | 1,870,854 |
Macy's, Inc. (a) | 66,028 | 1,328,483 |
Nordstrom, Inc. (a) | 11,511 | 212,378 |
Ollie's Bargain Outlet Holdings, Inc. * | 9,401 | 713,442 |
4,125,157 | ||
Building Products — 3.8% | ||
AAON, Inc. | 12,293 | 908,084 |
Advanced Drainage Systems, Inc. | 17,680 | 2,486,515 |
Apogee Enterprises, Inc. | 5,616 | 299,951 |
AZZ, Inc. | 6,601 | 383,452 |
Builders FirstSource, Inc. * | 46,679 | 7,792,592 |
Carlisle Cos., Inc. | 13,885 | 4,338,091 |
Gibraltar Industries, Inc. * | 24,584 | 1,941,644 |
Griffon Corp. | 13,489 | 822,155 |
Lennox International, Inc. | 7,495 | 3,354,162 |
Masterbrand, Inc. * | 33,218 | 493,287 |
Owens Corning | 27,513 | 4,078,252 |
PGT Innovations, Inc. * | 31,882 | 1,297,597 |
Resideo Technologies, Inc. * | 41,946 | 789,424 |
Simpson Manufacturing Co., Inc. | 11,654 | 2,307,259 |
Trex Co., Inc. * | 4,350 | 360,136 |
UFP Industries, Inc. | 36,774 | 4,616,976 |
36,269,577 | ||
Capital Markets — 1.7% | ||
Affiliated Managers Group, Inc. | 17,981 | 2,722,683 |
Brightsphere Investment Group, Inc. | 28,952 | 554,720 |
Donnelley Financial Solutions, Inc. * | 12,989 | 810,124 |
Evercore, Inc., Class A | 6,001 | 1,026,471 |
Federated Hermes, Inc. | 12,527 | 424,164 |
Interactive Brokers Group, Inc., Class A | 22,158 | 1,836,898 |
Janus Henderson Group plc | 34,273 | 1,033,331 |
Jefferies Financial Group, Inc. | 11,453 | 462,816 |
Morningstar, Inc. (a) | 6,637 | 1,899,775 |
Piper Sandler Cos. | 3,469 | 606,624 |
SEI Investments Co. | 25,847 | 1,642,577 |
Stifel Financial Corp. | 26,778 | 1,851,699 |
StoneX Group, Inc. * | 6,408 | 473,103 |
Virtus Investment Partners, Inc. | 1,977 | 477,959 |
15,822,944 | ||
Chemicals — 1.9% | ||
AdvanSix, Inc. | 29,948 | 897,242 |
Ashland, Inc. | 11,276 | 950,680 |
Avient Corp. | 42,121 | 1,750,970 |
INVESTMENTS | SHARES | VALUE($) |
Chemicals — continued | ||
Axalta Coating Systems Ltd. * | 23,115 | 785,217 |
Cabot Corp. | 27,957 | 2,334,409 |
Chemours Co. (The) | 57,158 | 1,802,763 |
Hawkins, Inc. | 5,102 | 359,283 |
HB Fuller Co. | 27,551 | 2,242,927 |
Ingevity Corp. * | 8,637 | 407,839 |
Livent Corp. * (a) | 19,727 | 354,691 |
Minerals Technologies, Inc. | 7,861 | 560,568 |
RPM International, Inc. | 25,266 | 2,820,444 |
Scotts Miracle-Gro Co. (The) | 11,226 | 715,657 |
Sensient Technologies Corp. | 15,793 | 1,042,338 |
Stepan Co. | 9,342 | 883,286 |
17,908,314 | ||
Commercial Services & Supplies — 1.5% | ||
ABM Industries, Inc. | 17,135 | 768,162 |
Brady Corp., Class A | 48,364 | 2,838,483 |
Brink's Co. (The) | 14,053 | 1,235,961 |
Clean Harbors, Inc. * | 23,742 | 4,143,217 |
CoreCivic, Inc. * | 29,578 | 429,768 |
Deluxe Corp. (a) | 7,737 | 165,959 |
Enviri Corp. * | 17,694 | 159,246 |
Interface, Inc., Class A | 17,249 | 217,682 |
MillerKnoll, Inc. | 22,581 | 602,461 |
OPENLANE, Inc. * | 34,231 | 506,961 |
Stericycle, Inc. * | 6,503 | 322,289 |
Tetra Tech, Inc. | 14,489 | 2,418,649 |
Viad Corp. * | 5,357 | 193,923 |
14,002,761 | ||
Communications Equipment — 0.9% | ||
ADTRAN Holdings, Inc. | 14,911 | 109,447 |
Calix, Inc. * | 14,925 | 652,073 |
Ciena Corp. * | 90,029 | 4,052,205 |
Digi International, Inc. * | 9,056 | 235,456 |
Extreme Networks, Inc. * | 31,964 | 563,845 |
Lumentum Holdings, Inc. * | 14,911 | 781,635 |
Viasat, Inc. * (a) | 45,493 | 1,271,529 |
Viavi Solutions, Inc. * | 59,954 | 603,737 |
8,269,927 | ||
Construction & Engineering — 1.7% | ||
AECOM | 35,215 | 3,254,922 |
Arcosa, Inc. | 14,412 | 1,191,008 |
Comfort Systems USA, Inc. | 9,189 | 1,889,902 |
EMCOR Group, Inc. | 22,058 | 4,751,955 |
December 31, 2023 | J.P. Morgan Exchange-Traded Funds | 39 |
INVESTMENTS | SHARES | VALUE($) |
Common Stocks — continued | ||
Construction & Engineering — continued | ||
MasTec, Inc. * | 15,415 | 1,167,224 |
MDU Resources Group, Inc. | 56,643 | 1,121,531 |
MYR Group, Inc. * | 17,546 | 2,537,678 |
15,914,220 | ||
Construction Materials — 0.2% | ||
Eagle Materials, Inc. | 7,327 | 1,486,209 |
Consumer Finance — 0.7% | ||
Encore Capital Group, Inc. * (a) | 8,756 | 444,367 |
Enova International, Inc. * | 18,244 | 1,009,988 |
EZCORP, Inc., Class A * (a) | 23,859 | 208,528 |
FirstCash Holdings, Inc. | 22,937 | 2,486,141 |
PROG Holdings, Inc. * | 18,339 | 566,859 |
SLM Corp. | 98,053 | 1,874,773 |
6,590,656 | ||
Consumer Staples Distribution & Retail — 2.1% | ||
Andersons, Inc. (The) | 32,966 | 1,896,864 |
BJ's Wholesale Club Holdings, Inc. * | 35,491 | 2,365,830 |
Casey's General Stores, Inc. | 14,730 | 4,046,920 |
Performance Food Group Co. * | 68,438 | 4,732,488 |
SpartanNash Co. | 52,858 | 1,213,091 |
Sprouts Farmers Market, Inc. * | 43,765 | 2,105,534 |
United Natural Foods, Inc. * | 68,478 | 1,111,398 |
US Foods Holding Corp. * | 59,003 | 2,679,326 |
20,151,451 | ||
Containers & Packaging — 1.2% | ||
AptarGroup, Inc. | 14,122 | 1,745,761 |
Berry Global Group, Inc. | 45,279 | 3,051,352 |
Crown Holdings, Inc. | 12,215 | 1,124,879 |
Greif, Inc., Class A | 13,030 | 854,638 |
Myers Industries, Inc. | 10,395 | 203,222 |
O-I Glass, Inc. * | 19,510 | 319,574 |
Silgan Holdings, Inc. | 20,995 | 950,024 |
Sonoco Products Co. | 53,909 | 3,011,896 |
11,261,346 | ||
Diversified Consumer Services — 1.1% | ||
Adtalem Global Education, Inc. * | 13,848 | 816,340 |
Frontdoor, Inc. * | 21,790 | 767,444 |
Graham Holdings Co., Class B | 1,701 | 1,184,781 |
Grand Canyon Education, Inc. * | 7,971 | 1,052,491 |
H&R Block, Inc. | 45,357 | 2,193,918 |
Service Corp. International | 44,605 | 3,053,212 |
INVESTMENTS | SHARES | VALUE($) |
Diversified Consumer Services — continued | ||
Strategic Education, Inc. | 5,768 | 532,790 |
Stride, Inc. * (a) | 10,758 | 638,702 |
10,239,678 | ||
Diversified REITs — 0.6% | ||
American Assets Trust, Inc. | 35,103 | 790,169 |
Armada Hoffler Properties, Inc. | 48,664 | 601,974 |
Essential Properties Realty Trust, Inc. | 109,015 | 2,786,423 |
WP Carey, Inc. | 20,088 | 1,301,903 |
5,480,469 | ||
Diversified Telecommunication Services — 0.2% | ||
Cogent Communications Holdings, Inc. | 11,012 | 837,573 |
Iridium Communications, Inc. | 36,208 | 1,490,321 |
2,327,894 | ||
Electric Utilities — 0.7% | ||
IDACORP, Inc. | 33,496 | 3,293,327 |
OGE Energy Corp. | 98,932 | 3,455,695 |
6,749,022 | ||
Electrical Equipment — 1.4% | ||
Acuity Brands, Inc. | 9,039 | 1,851,458 |
Encore Wire Corp. (a) | 15,428 | 3,295,421 |
EnerSys | 2,905 | 293,289 |
nVent Electric plc | 82,052 | 4,848,452 |
Regal Rexnord Corp. | 18,534 | 2,743,403 |
13,032,023 | ||
Electronic Equipment, Instruments & Components — 3.6% | ||
Advanced Energy Industries, Inc. (a) | 11,321 | 1,233,083 |
Arrow Electronics, Inc. * | 25,618 | 3,131,801 |
Belden, Inc. | 11,814 | 912,632 |
Benchmark Electronics, Inc. | 10,170 | 281,099 |
Cognex Corp. | 37,322 | 1,557,820 |
Coherent Corp. * | 72,200 | 3,142,866 |
Crane NXT Co. | 11,815 | 671,919 |
Fabrinet (Thailand) * | 27,410 | 5,216,945 |
Jabil, Inc. | 72,420 | 9,226,308 |
Littelfuse, Inc. | 5,665 | 1,515,727 |
OSI Systems, Inc. * | 4,812 | 620,989 |
Rogers Corp. * | 4,056 | 535,676 |
TD SYNNEX Corp. | 23,592 | 2,538,735 |
Vontier Corp. | 107,104 | 3,700,443 |
34,286,043 | ||
40 | J.P. Morgan Exchange-Traded Funds | December 31, 2023 |
INVESTMENTS | SHARES | VALUE($) |
Common Stocks — continued | ||
Energy Equipment & Services — 1.0% | ||
Bristow Group, Inc. * | 7,774 | 219,771 |
ChampionX Corp. | 92,777 | 2,710,016 |
Helmerich & Payne, Inc. (a) | 18,563 | 672,352 |
Liberty Energy, Inc., Class A | 64,649 | 1,172,733 |
NOV, Inc. | 106,965 | 2,169,250 |
Oceaneering International, Inc. * | 59,264 | 1,261,138 |
Patterson-UTI Energy, Inc. | 91,786 | 991,289 |
ProPetro Holding Corp. * | 20,264 | 169,812 |
Valaris Ltd. * | 5,866 | 402,231 |
Weatherford International plc * | 2,714 | 265,511 |
10,034,103 | ||
Entertainment — 0.1% | ||
TKO Group Holdings, Inc., Class A (a) | 9,677 | 789,450 |
Financial Services — 2.1% | ||
Essent Group Ltd. | 52,388 | 2,762,943 |
Euronet Worldwide, Inc. * | 4,150 | 421,183 |
EVERTEC, Inc. (Puerto Rico) | 50,461 | 2,065,873 |
MGIC Investment Corp. | 140,898 | 2,717,922 |
Mr. Cooper Group, Inc. * | 32,921 | 2,143,815 |
NCR Atleos Corp. * | 27,864 | 676,817 |
NMI Holdings, Inc., Class A * | 56,339 | 1,672,142 |
Radian Group, Inc. | 40,214 | 1,148,110 |
Voya Financial, Inc. | 26,683 | 1,946,792 |
Walker & Dunlop, Inc. | 7,883 | 875,092 |
WEX, Inc. * | 18,005 | 3,502,873 |
19,933,562 | ||
Food Products — 1.1% | ||
Darling Ingredients, Inc. * | 44,956 | 2,240,607 |
Flowers Foods, Inc. | 51,185 | 1,152,174 |
Fresh Del Monte Produce, Inc. | 8,327 | 218,584 |
Hain Celestial Group, Inc. (The) * | 20,970 | 229,622 |
Ingredion, Inc. | 32,028 | 3,475,999 |
John B Sanfilippo & Son, Inc. | 2,737 | 282,021 |
Pilgrim's Pride Corp. * | 10,211 | 282,436 |
Post Holdings, Inc. * | 14,471 | 1,274,316 |
Simply Good Foods Co. (The) * | 22,554 | 893,138 |
10,048,897 | ||
Gas Utilities — 0.7% | ||
Chesapeake Utilities Corp. | 18,399 | 1,943,486 |
ONE Gas, Inc. (a) | 26,465 | 1,686,350 |
Southwest Gas Holdings, Inc. | 4,226 | 267,717 |
INVESTMENTS | SHARES | VALUE($) |
Gas Utilities — continued | ||
Spire, Inc. | 7,265 | 452,900 |
UGI Corp. (a) | 77,959 | 1,917,792 |
6,268,245 | ||
Ground Transportation — 1.9% | ||
ArcBest Corp. | 13,969 | 1,679,213 |
Avis Budget Group, Inc. | 5,341 | 946,746 |
Hertz Global Holdings, Inc. * (a) | 38,112 | 395,984 |
Knight-Swift Transportation Holdings, Inc. | 72,038 | 4,152,991 |
Landstar System, Inc. | 19,783 | 3,830,978 |
Ryder System, Inc. | 13,273 | 1,527,191 |
Saia, Inc. * | 6,888 | 3,018,459 |
XPO, Inc. * | 29,480 | 2,582,153 |
18,133,715 | ||
Health Care Equipment & Supplies — 2.1% | ||
Avanos Medical, Inc. * | 12,157 | 272,682 |
CONMED Corp. (a) | 6,682 | 731,746 |
Envista Holdings Corp. * | 96,245 | 2,315,655 |
Glaukos Corp. * | 21,206 | 1,685,665 |
Globus Medical, Inc., Class A * (a) | 55,917 | 2,979,817 |
Haemonetics Corp. * | 30,640 | 2,620,026 |
Integer Holdings Corp. * | 8,686 | 860,609 |
Integra LifeSciences Holdings Corp. * | 19,119 | 832,632 |
Lantheus Holdings, Inc. * | 48,759 | 3,023,058 |
Masimo Corp. * (a) | 25,663 | 3,007,960 |
Merit Medical Systems, Inc. * | 13,562 | 1,030,170 |
Omnicell, Inc. * | 11,226 | 422,434 |
Orthofix Medical, Inc. * | 13,088 | 176,426 |
Varex Imaging Corp. * | 10,832 | 222,056 |
20,180,936 | ||
Health Care Providers & Services — 2.6% | ||
Acadia Healthcare Co., Inc. * | 23,762 | 1,847,733 |
Addus HomeCare Corp. * | 4,063 | 377,250 |
Amedisys, Inc. * | 22,363 | 2,125,827 |
AMN Healthcare Services, Inc. * | 5,647 | 422,847 |
Chemed Corp. | 4,437 | 2,594,536 |
Encompass Health Corp. | 58,216 | 3,884,171 |
Enhabit, Inc. * (a) | 12,783 | 132,304 |
Ensign Group, Inc. (The) | 13,663 | 1,533,125 |
Fulgent Genetics, Inc. * (a) | 40,936 | 1,183,460 |
HealthEquity, Inc. * | 40,274 | 2,670,166 |
Option Care Health, Inc. * | 69,859 | 2,353,550 |
Progyny, Inc. * | 58,893 | 2,189,642 |
R1 RCM, Inc. * | 31,313 | 330,978 |
December 31, 2023 | J.P. Morgan Exchange-Traded Funds | 41 |
INVESTMENTS | SHARES | VALUE($) |
Common Stocks — continued | ||
Health Care Providers & Services — continued | ||
RadNet, Inc. * | 11,583 | 402,741 |
Tenet Healthcare Corp. * | 42,294 | 3,196,158 |
25,244,488 | ||
Health Care REITs — 0.5% | ||
CareTrust REIT, Inc. | 24,709 | 552,987 |
Community Healthcare Trust, Inc. | 56,804 | 1,513,259 |
Omega Healthcare Investors, Inc. (a) | 26,279 | 805,714 |
Physicians Realty Trust | 58,284 | 775,760 |
Sabra Health Care REIT, Inc. | 90,092 | 1,285,613 |
4,933,333 | ||
Health Care Technology — 0.1% | ||
HealthStream, Inc. | 7,990 | 215,970 |
Veradigm, Inc. * (a) | 52,507 | 550,798 |
766,768 | ||
Hotel & Resort REITs — 0.4% | ||
Apple Hospitality REIT, Inc. (a) | 57,131 | 948,946 |
Chatham Lodging Trust | 8,551 | 91,667 |
Park Hotels & Resorts, Inc. | 142,834 | 2,185,360 |
Sunstone Hotel Investors, Inc. | 51,412 | 551,651 |
Xenia Hotels & Resorts, Inc. | 30,618 | 417,017 |
4,194,641 | ||
Hotels, Restaurants & Leisure — 2.8% | ||
Aramark | 28,660 | 805,346 |
BJ's Restaurants, Inc. * | 6,328 | 227,871 |
Bloomin' Brands, Inc. | 20,477 | 576,428 |
Boyd Gaming Corp. | 22,617 | 1,416,050 |
Brinker International, Inc. * | 11,978 | 517,210 |
Cheesecake Factory, Inc. (The) (a) | 14,819 | 518,813 |
Choice Hotels International, Inc. (a) | 6,791 | 769,420 |
Churchill Downs, Inc. | 13,568 | 1,830,730 |
Cracker Barrel Old Country Store, Inc. (a) | 4,452 | 343,160 |
Dave & Buster's Entertainment, Inc. * | 13,761 | 741,030 |
Golden Entertainment, Inc. | 9,241 | 368,993 |
Hilton Grand Vacations, Inc. * | 19,613 | 788,050 |
Jack in the Box, Inc. (a) | 6,779 | 553,370 |
Light & Wonder, Inc. * | 23,367 | 1,918,664 |
Marriott Vacations Worldwide Corp. | 11,012 | 934,809 |
Penn Entertainment, Inc. * (a) | 40,649 | 1,057,687 |
Planet Fitness, Inc., Class A * | 25,490 | 1,860,770 |
Six Flags Entertainment Corp. * | 17,620 | 441,910 |
Texas Roadhouse, Inc., Class A | 16,090 | 1,966,681 |
Travel + Leisure Co. | 31,555 | 1,233,485 |
INVESTMENTS | SHARES | VALUE($) |
Hotels, Restaurants & Leisure — continued | ||
Vail Resorts, Inc. | 4,408 | 940,976 |
Wendy's Co. (The) | 34,893 | 679,716 |
Wingstop, Inc. | 7,911 | 2,029,804 |
Wyndham Hotels & Resorts, Inc. | 49,156 | 3,952,634 |
26,473,607 | ||
Household Durables — 2.5% | ||
Cavco Industries, Inc. * | 2,172 | 752,859 |
Green Brick Partners, Inc. * | 10,306 | 535,294 |
Helen of Troy Ltd. * | 6,554 | 791,789 |
KB Home | 24,511 | 1,530,957 |
La-Z-Boy, Inc. | 12,425 | 458,731 |
Meritage Homes Corp. | 16,187 | 2,819,775 |
Newell Brands, Inc. | 104,001 | 902,729 |
Taylor Morrison Home Corp., Class A * | 34,913 | 1,862,608 |
Tempur Sealy International, Inc. | 52,326 | 2,667,056 |
Toll Brothers, Inc. | 50,010 | 5,140,528 |
TopBuild Corp. * | 8,003 | 2,995,203 |
Tri Pointe Homes, Inc. * | 90,393 | 3,199,912 |
23,657,441 | ||
Household Products — 0.1% | ||
Central Garden & Pet Co., Class A * | 30,308 | 1,334,764 |
Independent Power and Renewable Electricity Producers — 0.4% | ||
Vistra Corp. | 89,382 | 3,442,995 |
Industrial REITs — 1.5% | ||
EastGroup Properties, Inc. | 24,203 | 4,442,218 |
First Industrial Realty Trust, Inc. | 70,182 | 3,696,486 |
Innovative Industrial Properties, Inc. (a) | 10,962 | 1,105,189 |
LXP Industrial Trust | 80,288 | 796,457 |
Rexford Industrial Realty, Inc. | 53,209 | 2,985,025 |
STAG Industrial, Inc. | 35,589 | 1,397,224 |
14,422,599 | ||
Insurance — 3.5% | ||
American Financial Group, Inc. | 24,380 | 2,898,538 |
Assured Guaranty Ltd. | 16,338 | 1,222,573 |
CNO Financial Group, Inc. | 33,620 | 937,998 |
Employers Holdings, Inc. | 8,146 | 320,952 |
Erie Indemnity Co., Class A | 3,718 | 1,245,233 |
Fidelity National Financial, Inc. | 75,490 | 3,851,500 |
First American Financial Corp. | 27,696 | 1,784,730 |
Hanover Insurance Group, Inc. (The) | 3,187 | 386,966 |
Horace Mann Educators Corp. | 10,830 | 354,141 |
Kinsale Capital Group, Inc. | 3,498 | 1,171,515 |
42 | J.P. Morgan Exchange-Traded Funds | December 31, 2023 |
INVESTMENTS | SHARES | VALUE($) |
Common Stocks — continued | ||
Insurance — continued | ||
Mercury General Corp. | 7,153 | 266,878 |
Old Republic International Corp. | 77,280 | 2,272,032 |
Palomar Holdings, Inc. * | 13,508 | 749,694 |
Primerica, Inc. | 5,184 | 1,066,660 |
Reinsurance Group of America, Inc. | 30,048 | 4,861,165 |
RenaissanceRe Holdings Ltd. (Bermuda) | 17,436 | 3,417,456 |
RLI Corp. | 20,174 | 2,685,563 |
Selective Insurance Group, Inc. | 4,576 | 455,220 |
Unum Group | 77,476 | 3,503,465 |
33,452,279 | ||
Interactive Media & Services — 0.3% | ||
Cars.com, Inc. * | 17,177 | 325,848 |
QuinStreet, Inc. * | 36,116 | 463,007 |
TripAdvisor, Inc. * | 25,924 | 558,144 |
Yelp, Inc., Class A * | 18,185 | 860,878 |
Ziff Davis, Inc. * (a) | 13,196 | 886,639 |
3,094,516 | ||
IT Services — 0.7% | ||
GoDaddy, Inc., Class A * | 55,314 | 5,872,134 |
Perficient, Inc. * | 9,401 | 618,774 |
6,490,908 | ||
Leisure Products — 0.7% | ||
Brunswick Corp. | 24,229 | 2,344,156 |
Mattel, Inc. * | 91,246 | 1,722,724 |
Polaris, Inc. | 15,562 | 1,474,811 |
YETI Holdings, Inc. * (a) | 18,661 | 966,267 |
6,507,958 | ||
Life Sciences Tools & Services — 0.7% | ||
Azenta, Inc. * | 21,113 | 1,375,301 |
Bruker Corp. | 26,930 | 1,978,817 |
Medpace Holdings, Inc. * | 7,176 | 2,199,659 |
Repligen Corp. * (a) | 5,003 | 899,539 |
6,453,316 | ||
Machinery — 5.4% | ||
AGCO Corp. | 31,217 | 3,790,056 |
Alamo Group, Inc. | 6,786 | 1,426,349 |
Chart Industries, Inc. * (a) | 9,401 | 1,281,638 |
Crane Co. | 12,186 | 1,439,654 |
Donaldson Co., Inc. | 31,604 | 2,065,321 |
Esab Corp. | 11,643 | 1,008,517 |
Federal Signal Corp. | 15,644 | 1,200,521 |
Flowserve Corp. | 35,633 | 1,468,792 |
INVESTMENTS | SHARES | VALUE($) |
Machinery — continued | ||
Franklin Electric Co., Inc. | 32,519 | 3,142,961 |
Graco, Inc. | 46,859 | 4,065,487 |
Hillenbrand, Inc. | 28,574 | 1,367,266 |
ITT, Inc. | 40,073 | 4,781,510 |
John Bean Technologies Corp. | 8,096 | 805,147 |
Kennametal, Inc. | 22,564 | 581,926 |
Lincoln Electric Holdings, Inc. | 11,504 | 2,501,660 |
Lindsay Corp. | 2,844 | 367,331 |
Middleby Corp. (The) * | 15,272 | 2,247,580 |
Mueller Industries, Inc. | 64,943 | 3,062,063 |
Oshkosh Corp. | 33,064 | 3,584,468 |
RBC Bearings, Inc. * | 7,412 | 2,111,605 |
SPX Technologies, Inc. * | 11,305 | 1,141,918 |
Standex International Corp. | 17,358 | 2,749,160 |
Terex Corp. | 19,320 | 1,110,127 |
Timken Co. (The) | 25,979 | 2,082,217 |
Titan International, Inc. * | 15,476 | 230,283 |
Toro Co. (The) | 7,822 | 750,834 |
Wabash National Corp. | 10,835 | 277,593 |
Watts Water Technologies, Inc., Class A | 5,992 | 1,248,373 |
51,890,357 | ||
Marine Transportation — 0.3% | ||
Kirby Corp. * | 16,439 | 1,290,133 |
Matson, Inc. | 12,157 | 1,332,407 |
2,622,540 | ||
Media — 0.4% | ||
Cable One, Inc. | 2,663 | 1,482,199 |
John Wiley & Sons, Inc., Class A | 11,477 | 364,280 |
New York Times Co. (The), Class A | 44,784 | 2,193,968 |
4,040,447 | ||
Metals & Mining — 2.0% | ||
Alcoa Corp. | 27,578 | 937,652 |
ATI, Inc. * (a) | 33,385 | 1,518,016 |
Cleveland-Cliffs, Inc. * | 131,905 | 2,693,500 |
Commercial Metals Co. | 56,037 | 2,804,092 |
Haynes International, Inc. | 10,287 | 586,873 |
Materion Corp. | 10,388 | 1,351,790 |
Reliance Steel & Aluminum Co. | 23,969 | 6,703,650 |
Royal Gold, Inc. | 4,596 | 555,932 |
SunCoke Energy, Inc. | 74,086 | 795,684 |
United States Steel Corp. (a) | 15,598 | 758,843 |
Warrior Met Coal, Inc. | 13,097 | 798,524 |
19,504,556 | ||
December 31, 2023 | J.P. Morgan Exchange-Traded Funds | 43 |
INVESTMENTS | SHARES | VALUE($) |
Common Stocks — continued | ||
Mortgage Real Estate Investment Trusts (REITs) — 0.6% | ||
Annaly Capital Management, Inc. | 147,489 | 2,856,862 |
Ellington Financial, Inc. (a) | 13,049 | 165,853 |
KKR Real Estate Finance Trust, Inc. | 17,344 | 229,461 |
PennyMac Mortgage Investment Trust (a) | 26,910 | 402,304 |
Ready Capital Corp. (a) | 83,707 | 857,997 |
Starwood Property Trust, Inc. (a) | 55,582 | 1,168,334 |
5,680,811 | ||
Multi-Utilities — 0.3% | ||
Northwestern Energy Group, Inc. | 21,821 | 1,110,470 |
Unitil Corp. | 30,903 | 1,624,571 |
2,735,041 | ||
Office REITs — 0.8% | ||
Brandywine Realty Trust | 129,352 | 698,501 |
COPT Defense Properties | 64,876 | 1,662,772 |
Cousins Properties, Inc. | 41,880 | 1,019,778 |
Easterly Government Properties, Inc., Class A | 27,388 | 368,095 |
Highwoods Properties, Inc. (a) | 45,901 | 1,053,887 |
Hudson Pacific Properties, Inc. | 31,945 | 297,408 |
Kilroy Realty Corp. | 53,090 | 2,115,105 |
SL Green Realty Corp. (a) | 15,741 | 711,021 |
7,926,567 | ||
Oil, Gas & Consumable Fuels — 3.7% | ||
Antero Midstream Corp. | 76,064 | 953,082 |
Antero Resources Corp. * (a) | 31,267 | 709,136 |
California Resources Corp. | 19,110 | 1,044,935 |
Callon Petroleum Co. * | 11,341 | 367,448 |
Chord Energy Corp. | 16,552 | 2,751,439 |
Civitas Resources, Inc. (a) | 30,583 | 2,091,265 |
CNX Resources Corp. * (a) | 24,230 | 484,600 |
CONSOL Energy, Inc. | 13,051 | 1,312,017 |
Dorian LPG Ltd. | 7,649 | 335,562 |
DT Midstream, Inc. | 14,814 | 811,807 |
Equitrans Midstream Corp. | 105,479 | 1,073,776 |
Green Plains, Inc. * (a) | 29,817 | 751,985 |
HF Sinclair Corp. (a) | 49,394 | 2,744,825 |
Matador Resources Co. (a) | 66,446 | 3,778,120 |
Murphy Oil Corp. | 38,820 | 1,656,061 |
Ovintiv, Inc. | 63,037 | 2,768,585 |
PBF Energy, Inc., Class A | 22,617 | 994,243 |
Permian Resources Corp. (a) | 100,098 | 1,361,333 |
Range Resources Corp. | 79,157 | 2,409,539 |
REX American Resources Corp. * | 13,282 | 628,239 |
SM Energy Co. | 75,496 | 2,923,205 |
INVESTMENTS | SHARES | VALUE($) |
Oil, Gas & Consumable Fuels — continued | ||
Southwestern Energy Co. * | 465,856 | 3,051,357 |
Talos Energy, Inc. * | 9,518 | 135,441 |
World Kinect Corp. | 16,743 | 381,405 |
35,519,405 | ||
Paper & Forest Products — 0.2% | ||
Louisiana-Pacific Corp. | 26,329 | 1,864,883 |
Passenger Airlines — 0.1% | ||
SkyWest, Inc. * | 11,005 | 574,461 |
Personal Care Products — 0.6% | ||
BellRing Brands, Inc. * | 37,393 | 2,072,694 |
Coty, Inc., Class A * | 78,692 | 977,355 |
elf Beauty, Inc. * | 13,575 | 1,959,415 |
Inter Parfums, Inc. | 5,046 | 726,674 |
USANA Health Sciences, Inc. * | 3,036 | 162,730 |
5,898,868 | ||
Pharmaceuticals — 0.7% | ||
Innoviva, Inc. * (a) | 165,428 | 2,653,465 |
Jazz Pharmaceuticals plc * | 22,714 | 2,793,822 |
Prestige Consumer Healthcare, Inc. * | 12,659 | 774,984 |
Supernus Pharmaceuticals, Inc. * | 13,088 | 378,767 |
6,601,038 | ||
Professional Services — 2.6% | ||
ASGN, Inc. * | 15,476 | 1,488,327 |
CACI International, Inc., Class A * | 12,566 | 4,069,625 |
Concentrix Corp. (a) | 2,935 | 288,246 |
ExlService Holdings, Inc. * | 47,428 | 1,463,154 |
FTI Consulting, Inc. * | 9,489 | 1,889,734 |
Genpact Ltd. | 96,050 | 3,333,895 |
Heidrick & Struggles International, Inc. | 33,824 | 998,823 |
Insperity, Inc. | 8,963 | 1,050,643 |
KBR, Inc. | 35,940 | 1,991,435 |
Kelly Services, Inc., Class A | 10,832 | 234,188 |
Korn Ferry | 37,322 | 2,215,061 |
ManpowerGroup, Inc. | 13,625 | 1,082,779 |
Maximus, Inc. | 17,645 | 1,479,710 |
Paylocity Holding Corp. * | 9,719 | 1,602,177 |
Resources Connection, Inc. | 31,681 | 448,920 |
Science Applications International Corp. | 13,552 | 1,684,784 |
25,321,501 | ||
Real Estate Management & Development — 0.5% | ||
Anywhere Real Estate, Inc. * | 44,379 | 359,914 |
eXp World Holdings, Inc. (a) | 18,116 | 281,160 |
44 | J.P. Morgan Exchange-Traded Funds | December 31, 2023 |
INVESTMENTS | SHARES | VALUE($) |
Common Stocks — continued | ||
Real Estate Management & Development — continued | ||
Jones Lang LaSalle, Inc. * | 20,030 | 3,783,066 |
St. Joe Co. (The) | 9,808 | 590,246 |
5,014,386 | ||
Residential REITs — 0.6% | ||
Apartment Income REIT Corp. | 39,900 | 1,385,727 |
Centerspace | 12,748 | 741,933 |
Equity LifeStyle Properties, Inc. | 41,621 | 2,935,945 |
NexPoint Residential Trust, Inc. | 6,741 | 232,093 |
Veris Residential, Inc. | 19,438 | 305,760 |
5,601,458 | ||
Retail REITs — 1.9% | ||
Agree Realty Corp. | 56,064 | 3,529,229 |
Brixmor Property Group, Inc. | 158,266 | 3,682,850 |
Getty Realty Corp. | 11,853 | 346,345 |
Kite Realty Group Trust | 60,353 | 1,379,670 |
Macerich Co. (The) | 15,597 | 240,662 |
NNN REIT, Inc. | 76,869 | 3,313,054 |
Retail Opportunity Investments Corp. | 155,348 | 2,179,532 |
RPT Realty | 25,170 | 322,931 |
Saul Centers, Inc. | 3,020 | 118,595 |
SITE Centers Corp. | 44,476 | 606,208 |
Spirit Realty Capital, Inc. | 35,579 | 1,554,446 |
Tanger, Inc. (a) | 27,795 | 770,477 |
18,043,999 | ||
Semiconductors & Semiconductor Equipment — 3.2% | ||
Axcelis Technologies, Inc. * | 9,719 | 1,260,457 |
Cirrus Logic, Inc. * | 11,320 | 941,711 |
Cohu, Inc. * | 11,226 | 397,288 |
Diodes, Inc. * | 10,930 | 880,084 |
FormFactor, Inc. * | 23,556 | 982,521 |
Ichor Holdings Ltd. * | 36,208 | 1,217,676 |
Kulicke & Soffa Industries, Inc. (Singapore) (a) | 62,885 | 3,441,067 |
Lattice Semiconductor Corp. * | 38,543 | 2,659,082 |
MaxLinear, Inc. * | 19,190 | 456,146 |
MKS Instruments, Inc. | 14,691 | 1,511,263 |
Photronics, Inc. * | 15,943 | 500,132 |
Power Integrations, Inc. | 15,739 | 1,292,329 |
Rambus, Inc. * | 30,831 | 2,104,216 |
Semtech Corp. * (a) | 18,563 | 406,715 |
Silicon Laboratories, Inc. * | 21,666 | 2,865,762 |
SiTime Corp. * (a) | 4,203 | 513,102 |
SMART Global Holdings, Inc. * | 58,695 | 1,111,096 |
INVESTMENTS | SHARES | VALUE($) |
Semiconductors & Semiconductor Equipment — continued | ||
SolarEdge Technologies, Inc. * | 39,117 | 3,661,351 |
Synaptics, Inc. * | 9,339 | 1,065,393 |
Ultra Clean Holdings, Inc. * | 21,615 | 737,936 |
Universal Display Corp. | 11,414 | 2,183,042 |
Veeco Instruments, Inc. * | 1,871 | 58,057 |
Wolfspeed, Inc. * (a) | 18,005 | 783,398 |
31,029,824 | ||
Software — 2.9% | ||
ACI Worldwide, Inc. * | 29,432 | 900,619 |
Adeia, Inc. | 101,055 | 1,252,071 |
Alarm.com Holdings, Inc. * | 5,764 | 372,470 |
Aspen Technology, Inc. * | 7,898 | 1,738,745 |
Blackbaud, Inc. * | 12,898 | 1,118,257 |
DoubleVerify Holdings, Inc. * | 54,767 | 2,014,330 |
Dynatrace, Inc. * | 56,471 | 3,088,399 |
Envestnet, Inc. * | 43,019 | 2,130,301 |
InterDigital, Inc. | 8,756 | 950,376 |
LiveRamp Holdings, Inc. * | 70,895 | 2,685,503 |
Manhattan Associates, Inc. * | 17,814 | 3,835,710 |
NCR Voyix Corp. * | 55,803 | 943,629 |
Progress Software Corp. | 8,478 | 460,355 |
Qualys, Inc. * (a) | 8,844 | 1,735,900 |
SPS Commerce, Inc. * | 10,833 | 2,099,869 |
Teradata Corp. * | 28,380 | 1,234,814 |
Xperi, Inc. * | 104,240 | 1,148,725 |
27,710,073 | ||
Specialized REITs — 1.7% | ||
CubeSmart | 80,848 | 3,747,305 |
EPR Properties | 19,459 | 942,788 |
Four Corners Property Trust, Inc. | 24,116 | 610,135 |
Gaming and Leisure Properties, Inc. | 49,326 | 2,434,238 |
Lamar Advertising Co., Class A | 22,178 | 2,357,078 |
National Storage Affiliates Trust | 35,061 | 1,453,980 |
PotlatchDeltic Corp. | 48,406 | 2,376,735 |
Rayonier, Inc. | 67,838 | 2,266,467 |
16,188,726 | ||
Specialty Retail — 4.2% | ||
Abercrombie & Fitch Co., Class A * | 16,139 | 1,423,783 |
Academy Sports & Outdoors, Inc. | 17,381 | 1,147,146 |
American Eagle Outfitters, Inc. | 57,294 | 1,212,341 |
Asbury Automotive Group, Inc. * | 8,932 | 2,009,432 |
AutoNation, Inc. * (a) | 20,929 | 3,143,117 |
Boot Barn Holdings, Inc. * (a) | 7,926 | 608,400 |
December 31, 2023 | J.P. Morgan Exchange-Traded Funds | 45 |
INVESTMENTS | SHARES | VALUE($) |
Common Stocks — continued | ||
Specialty Retail — continued | ||
Buckle, Inc. (The) | 7,025 | 333,828 |
Burlington Stores, Inc. * | 6,519 | 1,267,815 |
Caleres, Inc. | 12,898 | 396,356 |
Chico's FAS, Inc. * | 28,943 | 219,388 |
Designer Brands, Inc., Class A (a) | 18,748 | 165,920 |
Dick's Sporting Goods, Inc. | 18,229 | 2,678,752 |
Five Below, Inc. * | 11,676 | 2,488,856 |
Floor & Decor Holdings, Inc., Class A * (a) | 14,874 | 1,659,344 |
Gap, Inc. (The) | 53,985 | 1,128,826 |
Group 1 Automotive, Inc. | 10,391 | 3,166,553 |
Haverty Furniture Cos., Inc. (a) | 4,526 | 160,673 |
Lithia Motors, Inc., Class A | 7,080 | 2,331,302 |
Murphy USA, Inc. | 6,129 | 2,185,356 |
ODP Corp. (The) * | 15,051 | 847,371 |
RH * (a) | 4,150 | 1,209,642 |
Shoe Carnival, Inc. | 5,262 | 158,965 |
Signet Jewelers Ltd. | 15,739 | 1,688,165 |
Upbound Group, Inc. | 32,304 | 1,097,367 |
Urban Outfitters, Inc. * | 19,056 | 680,109 |
Valvoline, Inc. * | 52,227 | 1,962,691 |
Victoria's Secret & Co. * | 23,519 | 624,194 |
Williams-Sonoma, Inc. (a) | 22,801 | 4,600,786 |
40,596,478 | ||
Technology Hardware, Storage & Peripherals — 0.5% | ||
Super Micro Computer, Inc. * (a) | 17,217 | 4,894,103 |
Textiles, Apparel & Luxury Goods — 1.9% | ||
Capri Holdings Ltd. * | 42,700 | 2,145,248 |
Carter's, Inc. (a) | 8,963 | 671,239 |
Columbia Sportswear Co. (a) | 2,270 | 180,556 |
Crocs, Inc. * | 17,433 | 1,628,417 |
Deckers Outdoor Corp. * | 7,822 | 5,228,459 |
G-III Apparel Group Ltd. * | 11,676 | 396,750 |
Kontoor Brands, Inc. | 15,348 | 958,022 |
Oxford Industries, Inc. | 4,150 | 415,000 |
PVH Corp. | 17,948 | 2,191,810 |
Skechers U.S.A., Inc., Class A * | 48,584 | 3,028,727 |
Steven Madden Ltd. (a) | 22,294 | 936,348 |
Wolverine World Wide, Inc. | 12,732 | 113,187 |
17,893,763 | ||
Tobacco — 0.0% ^ | ||
Vector Group Ltd. | 32,807 | 370,063 |
Trading Companies & Distributors — 1.7% | ||
Applied Industrial Technologies, Inc. | 9,903 | 1,710,149 |
INVESTMENTS | SHARES | VALUE($) |
Trading Companies & Distributors — continued | ||
Boise Cascade Co. | 17,814 | 2,304,419 |
Core & Main, Inc., Class A * | 32,786 | 1,324,882 |
DXP Enterprises, Inc. * | 3,498 | 117,883 |
GATX Corp. | 6,133 | 737,309 |
GMS, Inc. * | 39,022 | 3,216,584 |
MSC Industrial Direct Co., Inc., Class A | 12,635 | 1,279,420 |
NOW, Inc. * | 155,781 | 1,763,441 |
Watsco, Inc. (a) | 8,996 | 3,854,516 |
16,308,603 | ||
Water Utilities — 0.5% | ||
American States Water Co. | 9,763 | 785,140 |
California Water Service Group | 12,898 | 669,019 |
Essential Utilities, Inc. | 89,736 | 3,351,640 |
4,805,799 | ||
Wireless Telecommunication Services — 0.1% | ||
Gogo, Inc. * | 61,644 | 624,454 |
Telephone and Data Systems, Inc. | 22,730 | 417,095 |
1,041,549 | ||
Total Common Stocks (Cost $653,342,893) | 937,788,092 | |
Short-Term Investments — 8.3% | ||
Investment Companies — 1.8% | ||
JPMorgan U.S. Government Money Market Fund Class IM Shares, 5.30% (b) (c) (Cost $17,269,616) | 17,269,616 | 17,269,616 |
Investment of Cash Collateral from Securities Loaned — 6.5% | ||
JPMorgan Securities Lending Money Market Fund Agency SL Class Shares, 5.56% (b) (c) | 54,988,003 | 55,009,998 |
JPMorgan U.S. Government Money Market Fund Class IM Shares, 5.30% (b) (c) | 7,463,967 | 7,463,967 |
Total Investment of Cash Collateral from Securities Loaned (Cost $62,467,966) | 62,473,965 | |
Total Short-Term Investments (Cost $79,737,582) | 79,743,581 | |
Total Investments — 106.4% (Cost $733,080,475) | 1,017,531,673 | |
Liabilities in Excess of Other Assets — (6.4)% | (61,450,457 ) | |
NET ASSETS — 100.0% | 956,081,216 | |
Percentages indicated are based on net assets. |
46 | J.P. Morgan Exchange-Traded Funds | December 31, 2023 |
Abbreviations | |
REIT | Real Estate Investment Trust |
^ | Amount rounds to less than 0.1% of net assets. | |
* | Non-income producing security. | |
(a) | The security or a portion of this security is on loan at December 31, 2023. The total value of securities on loan at December 31, 2023 is $60,173,842. | |
(b) | Investment in an affiliated fund, which is registered under the Investment Company Act of 1940, as amended, and is advised by J.P. Morgan Investment Management Inc. | |
(c) | The rate shown is the current yield as of December 31, 2023. |
DESCRIPTION | NUMBER OF CONTRACTS | EXPIRATION DATE | TRADING CURRENCY | NOTIONAL AMOUNT ($) | VALUE AND UNREALIZED APPRECIATION (DEPRECIATION) ($) |
Long Contracts | |||||
Russell 2000 E-Mini Index | 33 | 03/15/2024 | USD | 3,378,870 | 261,192 |
S&P MidCap 400 E-Mini Index | 39 | 03/15/2024 | USD | 10,955,880 | 622,517 |
883,709 |
Abbreviations | |
USD | United States Dollar |
December 31, 2023 | J.P. Morgan Exchange-Traded Funds | 47 |
INVESTMENTS | SHARES | VALUE($) |
Common Stocks — 83.1% | ||
Air Freight & Logistics — 0.2% | ||
United Parcel Service, Inc., Class B | 122,291 | 19,227,814 |
Automobiles — 2.9% | ||
Tesla, Inc. * | 986,021 | 245,006,498 |
Beverages — 2.5% | ||
Coca-Cola Co. (The) | 762,895 | 44,957,402 |
Constellation Brands, Inc., Class A | 143,748 | 34,751,079 |
Monster Beverage Corp. * | 913,728 | 52,639,870 |
PepsiCo, Inc. | 495,041 | 84,077,764 |
216,426,115 | ||
Biotechnology — 3.3% | ||
AbbVie, Inc. | 282,225 | 43,736,408 |
Amgen, Inc. | 151,639 | 43,675,065 |
Biogen, Inc. * | 140,120 | 36,258,853 |
Regeneron Pharmaceuticals, Inc. * | 94,959 | 83,401,540 |
Vertex Pharmaceuticals, Inc. * | 180,181 | 73,313,847 |
280,385,713 | ||
Broadline Retail — 4.9% | ||
Amazon.com, Inc. * | 2,404,729 | 365,374,524 |
MercadoLibre, Inc. (Brazil) * | 33,813 | 53,138,482 |
418,513,006 | ||
Commercial Services & Supplies — 0.6% | ||
Copart, Inc. * | 1,043,741 | 51,143,309 |
Communications Equipment — 1.4% | ||
Cisco Systems, Inc. | 2,280,825 | 115,227,279 |
Consumer Staples Distribution & Retail — 1.8% | ||
Costco Wholesale Corp. | 189,716 | 125,227,737 |
Dollar Tree, Inc. * | 171,484 | 24,359,302 |
149,587,039 | ||
Electric Utilities — 1.1% | ||
NextEra Energy, Inc. | 431,849 | 26,230,508 |
Southern Co. (The) | 285,481 | 20,017,928 |
Xcel Energy, Inc. | 727,872 | 45,062,555 |
91,310,991 | ||
Electrical Equipment — 0.4% | ||
Eaton Corp. plc | 127,361 | 30,671,076 |
Entertainment — 2.0% | ||
Netflix, Inc. * | 281,822 | 137,213,495 |
Take-Two Interactive Software, Inc. * | 221,312 | 35,620,167 |
172,833,662 | ||
INVESTMENTS | SHARES | VALUE($) |
Financial Services — 0.8% | ||
FleetCor Technologies, Inc. * | 70,045 | 19,795,417 |
Mastercard, Inc., Class A | 64,774 | 27,626,759 |
PayPal Holdings, Inc. * | 340,348 | 20,900,771 |
68,322,947 | ||
Food Products — 1.3% | ||
Kraft Heinz Co. (The) | 907,884 | 33,573,550 |
Mondelez International, Inc., Class A | 1,051,632 | 76,169,706 |
109,743,256 | ||
Ground Transportation — 0.9% | ||
CSX Corp. | 1,555,170 | 53,917,744 |
Uber Technologies, Inc. * | 387,324 | 23,847,539 |
77,765,283 | ||
Health Care Equipment & Supplies — 1.7% | ||
Dexcom, Inc. * | 449,880 | 55,825,609 |
Intuitive Surgical, Inc. * | 254,087 | 85,718,791 |
141,544,400 | ||
Health Care Providers & Services — 0.4% | ||
UnitedHealth Group, Inc. | 58,727 | 30,918,004 |
Hotels, Restaurants & Leisure — 3.0% | ||
Airbnb, Inc., Class A * | 95,362 | 12,982,583 |
Booking Holdings, Inc. * | 31,999 | 113,507,493 |
Chipotle Mexican Grill, Inc. * | 18,635 | 42,617,500 |
DoorDash, Inc., Class A * | 145,159 | 14,354,773 |
Marriott International, Inc., Class A | 221,514 | 49,953,622 |
Starbucks Corp. | 208,149 | 19,984,385 |
253,400,356 | ||
Industrial Conglomerates — 0.8% | ||
Honeywell International, Inc. | 339,138 | 71,120,630 |
Industrial REITs — 0.3% | ||
Prologis, Inc. | 186,662 | 24,882,045 |
Interactive Media & Services — 7.7% | ||
Alphabet, Inc., Class C * | 2,566,073 | 361,636,668 |
Meta Platforms, Inc., Class A * | 825,250 | 292,105,490 |
653,742,158 | ||
IT Services — 0.5% | ||
Cognizant Technology Solutions Corp., Class A | 184,042 | 13,900,692 |
MongoDB, Inc. * | 60,743 | 24,834,776 |
38,735,468 | ||
48 | J.P. Morgan Exchange-Traded Funds | December 31, 2023 |
INVESTMENTS | SHARES | VALUE($) |
Common Stocks — continued | ||
Life Sciences Tools & Services — 0.3% | ||
Thermo Fisher Scientific, Inc. | 47,177 | 25,041,080 |
Machinery — 0.4% | ||
Deere & Co. | 83,006 | 33,191,609 |
Media — 1.8% | ||
Charter Communications, Inc., Class A * | 78,773 | 30,617,490 |
Comcast Corp., Class A | 2,619,530 | 114,866,390 |
Trade Desk, Inc. (The), Class A * | 144,151 | 10,373,106 |
155,856,986 | ||
Oil, Gas & Consumable Fuels — 0.3% | ||
Diamondback Energy, Inc. | 172,693 | 26,781,230 |
Pharmaceuticals — 0.2% | ||
Bristol-Myers Squibb Co. | 410,795 | 21,077,891 |
Professional Services — 0.4% | ||
Verisk Analytics, Inc. | 155,500 | 37,142,730 |
Semiconductors & Semiconductor Equipment — 16.5% | ||
Advanced Micro Devices, Inc. * | 1,142,730 | 168,449,829 |
Analog Devices, Inc. | 472,344 | 93,788,625 |
Applied Materials, Inc. | 316,876 | 51,356,093 |
ASML Holding NV (Registered), NYRS (Netherlands) | 76,525 | 57,923,303 |
Broadcom, Inc. | 217,653 | 242,955,161 |
Intel Corp. | 1,460,008 | 73,365,402 |
Lam Research Corp. | 106,509 | 83,424,240 |
Marvell Technology, Inc. | 647,891 | 39,074,306 |
Micron Technology, Inc. | 427,365 | 36,471,329 |
NVIDIA Corp. | 562,668 | 278,644,447 |
NXP Semiconductors NV (China) | 282,225 | 64,821,438 |
QUALCOMM, Inc. | 684,959 | 99,065,620 |
Teradyne, Inc. | 290,349 | 31,508,674 |
Texas Instruments, Inc. | 442,593 | 75,444,403 |
1,396,292,870 | ||
Software — 14.9% | ||
Adobe, Inc. * | 274,939 | 164,028,607 |
ANSYS, Inc. * | 27,697 | 10,050,687 |
Crowdstrike Holdings, Inc., Class A * | 166,616 | 42,540,397 |
HubSpot, Inc. * | 48,789 | 28,323,966 |
Intuit, Inc. | 211,576 | 132,241,347 |
Microsoft Corp. | 1,679,274 | 631,474,195 |
Oracle Corp. | 255,327 | 26,919,126 |
Palo Alto Networks, Inc. * | 262,210 | 77,320,485 |
ServiceNow, Inc. * | 44,557 | 31,479,075 |
INVESTMENTS | SHARES | VALUE($) |
Software — continued | ||
Synopsys, Inc. * | 157,112 | 80,898,540 |
Workday, Inc., Class A * | 133,841 | 36,948,147 |
1,262,224,572 | ||
Specialty Retail — 1.2% | ||
Lowe's Cos., Inc. | 164,600 | 36,631,730 |
O'Reilly Automotive, Inc. * | 59,130 | 56,178,230 |
Ross Stores, Inc. | 78,137 | 10,813,380 |
103,623,340 | ||
Technology Hardware, Storage & Peripherals — 7.5% | ||
Apple, Inc. | 3,139,283 | 604,406,156 |
Seagate Technology Holdings plc | 372,750 | 31,821,667 |
636,227,823 | ||
Textiles, Apparel & Luxury Goods — 0.2% | ||
Lululemon Athletica, Inc. * | 36,433 | 18,627,829 |
Wireless Telecommunication Services — 0.9% | ||
T-Mobile US, Inc. | 476,810 | 76,446,947 |
Total Common Stocks (Cost $6,149,455,532) | 7,053,041,956 | |
PRINCIPAL AMOUNT($) | ||
Equity-Linked Notes — 15.7% | ||
BNP Paribas, ELN, 55.52%, 1/26/2024, (linked to S&P 500 Index) (a) | 17,249 | 292,663,783 |
GS Finance Corp., ELN, 54.18%, 1/5/2024, (linked to Nasdaq-100 Index) (a) | 16,551 | 239,347,652 |
Royal Bank of Canada, ELN, 51.66%, 1/19/2024, (linked to S&P 500 Index) (Canada) (a) | 17,120 | 271,174,979 |
Societe Generale, ELN, 56.37%, 1/12/2024, (linked to S&P 500 Index) (France) (a) | 17,004 | 236,459,325 |
The Bank of Nova Scotia, ELN, 54.70%, 2/2/2024, (linked to Nasdaq-100 Index) (Canada) (a) | 17,181 | 293,288,432 |
Total Equity-Linked Notes (Cost $1,394,934,562) | 1,332,934,171 | |
December 31, 2023 | J.P. Morgan Exchange-Traded Funds | 49 |
INVESTMENTS | SHARES | VALUE($) |
Short-Term Investments — 0.6% | ||
Investment Companies — 0.6% | ||
JPMorgan U.S. Government Money Market Fund Class IM Shares, 5.30% (b) (c) (Cost $44,936,965) | 44,936,965 | 44,936,965 |
Total Investments — 99.4% (Cost $7,589,327,059) | 8,430,913,092 | |
Other Assets Less Liabilities — 0.6% | 54,093,383 | |
NET ASSETS — 100.0% | 8,485,006,475 | |
Percentages indicated are based on net assets. |
Abbreviations | |
ELN | Equity-Linked Note |
NYRS | New York Registry Shares |
REIT | Real Estate Investment Trust |
* | Non-income producing security. |
(a) | Securities exempt from registration under Rule 144A or section 4(a)(2), of the Securities Act of 1933, as amended. |
(b) | Investment in an affiliated fund, which is registered under the Investment Company Act of 1940, as amended, and is advised by J.P. Morgan Investment Management Inc. |
(c) | The rate shown is the current yield as of December 31, 2023. |
50 | J.P. Morgan Exchange-Traded Funds | December 31, 2023 |
INVESTMENTS | SHARES | VALUE($) |
Common Stocks — 98.8% | ||
Automobiles — 3.9% | ||
Tesla, Inc. * | 29,768 | 7,396,753 |
Banks — 0.5% | ||
NU Holdings Ltd., Class A (Brazil) * | 120,934 | 1,007,380 |
Broadline Retail — 4.6% | ||
Amazon.com, Inc. * | 40,172 | 6,103,734 |
MercadoLibre, Inc. (Brazil) * | 1,691 | 2,657,474 |
8,761,208 | ||
Capital Markets — 0.3% | ||
Robinhood Markets, Inc., Class A * | 48,454 | 617,304 |
Communications Equipment — 0.9% | ||
Arista Networks, Inc. * | 7,424 | 1,748,426 |
Electrical Equipment — 0.3% | ||
Vicor Corp. * | 14,430 | 648,484 |
Electronic Equipment, Instruments & Components — 2.2% | ||
Amphenol Corp., Class A | 20,796 | 2,061,507 |
Jabil, Inc. | 16,247 | 2,069,868 |
4,131,375 | ||
Entertainment — 4.9% | ||
Netflix, Inc. * | 12,328 | 6,002,257 |
Take-Two Interactive Software, Inc. * | 21,491 | 3,458,976 |
9,461,233 | ||
Ground Transportation — 2.8% | ||
Uber Technologies, Inc. * | 87,754 | 5,403,014 |
Health Care Equipment & Supplies — 0.7% | ||
Dexcom, Inc. * | 10,197 | 1,265,346 |
Health Care Technology — 0.8% | ||
Veeva Systems, Inc., Class A * | 8,287 | 1,595,413 |
Hotels, Restaurants & Leisure — 1.9% | ||
Booking Holdings, Inc. * | 1,039 | 3,685,562 |
Interactive Media & Services — 8.4% | ||
Alphabet, Inc., Class C * | 43,053 | 6,067,459 |
Meta Platforms, Inc., Class A * | 28,049 | 9,928,224 |
15,995,683 | ||
IT Services — 7.4% | ||
MongoDB, Inc. * | 10,182 | 4,162,911 |
Okta, Inc. * | 15,897 | 1,439,155 |
Shopify, Inc., Class A (Canada) * | 67,504 | 5,258,562 |
Snowflake, Inc., Class A * | 16,702 | 3,323,698 |
14,184,326 | ||
INVESTMENTS | SHARES | VALUE($) |
Media — 1.4% | ||
Trade Desk, Inc. (The), Class A * | 37,178 | 2,675,329 |
Semiconductors & Semiconductor Equipment — 24.1% | ||
Advanced Micro Devices, Inc. * | 44,330 | 6,534,685 |
Analog Devices, Inc. | 9,900 | 1,965,744 |
ASML Holding NV (Registered), NYRS (Netherlands) | 3,004 | 2,273,788 |
Axcelis Technologies, Inc. * | 4,029 | 522,521 |
Broadcom, Inc. | 2,598 | 2,900,017 |
Credo Technology Group Holding Ltd. * | 109,619 | 2,134,282 |
Entegris, Inc. | 14,243 | 1,706,596 |
First Solar, Inc. * | 3,902 | 672,237 |
Lam Research Corp. | 5,979 | 4,683,112 |
Marvell Technology, Inc. | 35,494 | 2,140,643 |
Micron Technology, Inc. | 25,221 | 2,152,360 |
MKS Instruments, Inc. | 11,867 | 1,220,758 |
Monolithic Power Systems, Inc. | 5,330 | 3,362,057 |
NVIDIA Corp. | 15,866 | 7,857,161 |
Onto Innovation, Inc. * | 4,938 | 755,020 |
Rambus, Inc. * | 20,670 | 1,410,728 |
Universal Display Corp. | 13,884 | 2,655,454 |
Wolfspeed, Inc. * | 24,344 | 1,059,207 |
46,006,370 | ||
Software — 31.7% | ||
Adobe, Inc. * | 8,048 | 4,801,437 |
Atlassian Corp., Class A * | 8,560 | 2,036,082 |
Bill Holdings, Inc. * | 13,657 | 1,114,275 |
Confluent, Inc., Class A * | 94,240 | 2,205,216 |
Crowdstrike Holdings, Inc., Class A * | 11,700 | 2,987,244 |
Datadog, Inc., Class A * | 21,063 | 2,556,627 |
Elastic NV * | 33,377 | 3,761,588 |
HashiCorp, Inc., Class A * | 17,418 | 411,762 |
HubSpot, Inc. * | 6,888 | 3,998,759 |
Intuit, Inc. | 4,552 | 2,845,137 |
Microsoft Corp. | 7,678 | 2,887,235 |
Oracle Corp. | 49,116 | 5,178,300 |
Palo Alto Networks, Inc. * | 6,499 | 1,916,425 |
Procore Technologies, Inc. * | 31,201 | 2,159,733 |
Salesforce, Inc. * | 18,367 | 4,833,092 |
ServiceNow, Inc. * | 4,421 | 3,123,392 |
Synopsys, Inc. * | 12,870 | 6,626,892 |
Unity Software, Inc. * | 49,497 | 2,023,932 |
Workday, Inc., Class A * | 18,286 | 5,048,033 |
60,515,161 | ||
December 31, 2023 | J.P. Morgan Exchange-Traded Funds | 51 |
INVESTMENTS | SHARES | VALUE($) |
Common Stocks — continued | ||
Specialized REITs — 1.6% | ||
American Tower Corp. | 3,379 | 729,458 |
Equinix, Inc. | 2,861 | 2,304,221 |
3,033,679 | ||
Technology Hardware, Storage & Peripherals — 0.4% | ||
Super Micro Computer, Inc. * | 2,472 | 702,691 |
Total Common Stocks (Cost $177,493,146) | 188,834,737 | |
Short-Term Investments — 1.2% | ||
Investment Companies — 1.2% | ||
JPMorgan U.S. Government Money Market Fund Class IM Shares, 5.30% (a) (b) (Cost $2,334,749) | 2,334,749 | 2,334,749 |
Total Investments — 100.0% (Cost $179,827,895) | 191,169,486 | |
Liabilities in Excess of Other Assets — (0.0)% ^ | (49,572 ) | |
NET ASSETS — 100.0% | 191,119,914 | |
Percentages indicated are based on net assets. |
Abbreviations | |
NYRS | New York Registry Shares |
REIT | Real Estate Investment Trust |
^ | Amount rounds to less than 0.1% of net assets. | |
* | Non-income producing security. | |
(a) | Investment in an affiliated fund, which is registered under the Investment Company Act of 1940, as amended, and is advised by J.P. Morgan Investment Management Inc. | |
(b) | The rate shown is the current yield as of December 31, 2023. | |
52 | J.P. Morgan Exchange-Traded Funds | December 31, 2023 |
JPMorgan Active Growth ETF | JPMorgan Active Small Cap Value ETF | JPMorgan Active Value ETF | JPMorgan Equity Premium Income ETF | |
ASSETS: | ||||
Investments in non-affiliates, at value | $844,795,812 | $13,864,554 | $759,610,306 | $30,136,302,432 |
Investments in affiliates, at value | 17,759,640 | 535,500 | 21,877,028 | 8,580,135 |
Investments of cash collateral received from securities loaned, at value (See Note 2.C.) | — | 38,770 | — | 172,559,627 |
Cash | 80,226 | 2,204 | 103,210 | 265,298,605 |
Receivables: | ||||
Investment securities sold | 876 | 12,957 | 77,616 | 830,120,220 |
Fund shares sold | 106,005 | — | — | 13,422,798 |
Interest from non-affiliates | — | — | — | 89,585,610 |
Dividends from non-affiliates | 64,164 | 14,957 | 949,808 | 42,182,680 |
Dividends from affiliates | 2,577 | 78 | 3,174 | 1,245 |
Securities lending income (See Note 2.C.) | — | 234 | — | 43,026 |
Total Assets | 862,809,300 | 14,469,254 | 782,621,142 | 31,558,096,378 |
LIABILITIES: | ||||
Payables: | ||||
Distributions | 100,036 | — | — | 237,445,245 |
Investment securities purchased | — | 15,659 | — | 595,995,551 |
Collateral received on securities loaned (See Note 2.C.) | — | 38,770 | — | 172,559,627 |
Accrued liabilities: | ||||
Management fees (See Note 3.A.) | 298,741 | 7,821 | 275,149 | 9,010,771 |
Total Liabilities | 398,777 | 62,250 | 275,149 | 1,015,011,194 |
Net Assets | $862,410,523 | $14,407,004 | $782,345,993 | $30,543,085,184 |
NET ASSETS: | ||||
Paid-in-Capital | $745,838,173 | $13,389,428 | $730,461,697 | $31,562,871,708 |
Total distributable earnings (loss) | 116,572,350 | 1,017,576 | 51,884,296 | (1,019,786,524 ) |
Total Net Assets | $862,410,523 | $14,407,004 | $782,345,993 | $30,543,085,184 |
Outstanding number of shares (unlimited number of shares authorized - par value $0.0001) | 14,125,000 | 265,000 | 14,075,000 | 555,500,000 |
Net asset value, per share | $61.06 | $54.37 | $55.58 | $54.98 |
Cost of investments in non-affiliates | $710,409,670 | $12,812,933 | $695,802,994 | $27,083,787,970 |
Cost of investments in affiliates | 17,759,640 | 535,500 | 21,877,028 | 8,580,135 |
Investment securities on loan, at value (See Note 2.C.) | — | 38,265 | — | 169,175,386 |
Cost of investment of cash collateral (See Note 2.C.) | — | 38,770 | — | 172,556,019 |
December 31, 2023 | J.P. Morgan Exchange-Traded Funds | 53 |
JPMorgan Market Expansion Enhanced Equity ETF | JPMorgan Nasdaq Equity Premium Income ETF | JPMorgan U.S. Tech Leaders ETF | |
ASSETS: | |||
Investments in non-affiliates, at value | $937,788,092 | $8,385,976,127 | $188,834,737 |
Investments in affiliates, at value | 17,269,616 | 44,936,965 | 2,334,749 |
Investments of cash collateral received from securities loaned, at value (See Note 2.C.) | 62,473,965 | — | — |
Cash | 119,445 | 309,716 | 7,576 |
Deposits at broker for futures contracts | 1,003,000 | — | — |
Receivables: | |||
Investment securities sold | 2,732,576 | 78,200,841 | — |
Fund shares sold | — | 13,988,652 | — |
Interest from non-affiliates | — | 33,022,231 | — |
Dividends from non-affiliates | 1,226,038 | 5,080,493 | 26,269 |
Dividends from affiliates | 2,506 | 6,520 | 339 |
Securities lending income (See Note 2.C.) | 10,588 | — | — |
Total Assets | 1,022,625,826 | 8,561,521,545 | 191,203,670 |
LIABILITIES: | |||
Payables: | |||
Distributions | — | 66,329,120 | — |
Investment securities purchased | 3,699,592 | 7,837,274 | — |
Collateral received on securities loaned (See Note 2.C.) | 62,473,965 | — | — |
Variation margin on futures contracts | 155,311 | — | — |
Accrued liabilities: | |||
Investment advisory fees | 109,996 | — | — |
Administration fees | 59,386 | — | — |
Printing and mailing costs | 13,881 | — | — |
Management fees (See Note 3.A.) | — | 2,348,676 | 83,756 |
Custodian and accounting fees | 14,120 | — | — |
Other | 18,359 | — | — |
Total Liabilities | 66,544,610 | 76,515,070 | 83,756 |
Net Assets | $956,081,216 | $8,485,006,475 | $191,119,914 |
NET ASSETS: | |||
Paid-in-Capital | $667,069,840 | $7,986,942,934 | $179,544,961 |
Total distributable earnings (loss) | 289,011,376 | 498,063,541 | 11,574,953 |
Total Net Assets | $956,081,216 | $8,485,006,475 | $191,119,914 |
Outstanding number of shares (unlimited number of shares authorized - par value $0.0001) | 17,823,634 | 169,925,000 | 3,250,000 |
Net asset value, per share | $53.64 | $49.93 | $58.81 |
Cost of investments in non-affiliates | $653,342,893 | $7,544,390,094 | $177,493,146 |
Cost of investments in affiliates | 17,269,616 | 44,936,965 | 2,334,749 |
Investment securities on loan, at value (See Note 2.C.) | 60,173,842 | — | — |
Cost of investment of cash collateral (See Note 2.C.) | 62,467,966 | — | — |
54 | J.P. Morgan Exchange-Traded Funds | December 31, 2023 |
JPMorgan Active Growth ETF | JPMorgan Active Small Cap Value ETF | JPMorgan Active Value ETF | JPMorgan Equity Premium Income ETF | |
INVESTMENT INCOME: | ||||
Interest income from non-affiliates | $— | $— | $— | $962,922,686 |
Interest income from affiliates | 148 | — | 6 | 112,040 |
Dividend income from non-affiliates | 1,629,639 | 112,272 | 6,710,914 | 231,550,005 |
Dividend income from affiliates | 440,843 | 9,654 | 501,516 | 7,000,884 |
Income from securities lending (net) (See Note 2.C.) | — | 646 | 14,065 | 574,983 |
Total investment income | 2,070,630 | 122,572 | 7,226,501 | 1,202,160,598 |
EXPENSES: | ||||
Management fees (See Note 3.A.) | 1,220,404 | 41,272 | 1,294,243 | 51,458,989 |
Interest expense to non-affiliates | — | — | — | 5 |
Total expenses | 1,220,404 | 41,272 | 1,294,243 | 51,458,994 |
Net investment income (loss) | 850,226 | 81,300 | 5,932,258 | 1,150,701,604 |
REALIZED/UNREALIZED GAINS (LOSSES): | ||||
Net realized gain (loss) on transactions from: | ||||
Investments in non-affiliates | (8,879,317 ) | (2,528 ) | (8,313,505 ) | (1,652,419,871 ) |
In-kind redemptions of investments in non-affiliates (See Note 4) | 3,033,877 | — | 1,525,581 | 195,228,140 |
Futures contracts | — | — | — | 2,575,381 |
Foreign currency transactions | — | — | (120 ) | — |
Net realized gain (loss) | (5,845,440 ) | (2,528 ) | (6,788,044 ) | (1,454,616,350 ) |
Change in net unrealized appreciation/depreciation on: | ||||
Investments in non-affiliates | 77,326,316 | 1,198,229 | 44,287,007 | 1,529,094,881 |
Investments in affiliates | — | — | — | 21,203 |
Foreign currency translations | — | — | (4 ) | — |
Change in net unrealized appreciation/depreciation | 77,326,316 | 1,198,229 | 44,287,003 | 1,529,116,084 |
Net realized/unrealized gains (losses) | 71,480,876 | 1,195,701 | 37,498,959 | 74,499,734 |
Change in net assets resulting from operations | $72,331,102 | $1,277,001 | $43,431,217 | $1,225,201,338 |
December 31, 2023 | J.P. Morgan Exchange-Traded Funds | 55 |
JPMorgan Market Expansion Enhanced Equity ETF | JPMorgan Nasdaq Equity Premium Income ETF | JPMorgan U.S. Tech Leaders ETF (a) | |
INVESTMENT INCOME: | |||
Interest income from non-affiliates | $25,849 | $307,634,346 | $— |
Interest income from affiliates | 6 | — | — |
Dividend income from non-affiliates | 6,532,636 | 23,244,309 | 54,637 |
Dividend income from affiliates | 448,755 | 1,652,365 | 10,565 |
Income from securities lending (net) (See Note 2.C.) | 36,615 | 2 | — |
Total investment income | 7,043,861 | 332,531,022 | 65,202 |
EXPENSES: | |||
Management fees (See Note 3.A.) | — | 10,290,938 | 107,604 |
Investment advisory fees | 1,094,777 | — | — |
Administration fees | 328,435 | — | — |
Custodian and accounting fees | 12,317 | — | — |
Interest expense to non-affiliates | 841 | 4,298 | 261 |
Professional fees | 30,133 | — | — |
Trustees’ and Chief Compliance Officer’s fees | 11,719 | — | — |
Printing and mailing costs | 16,059 | — | — |
Registration and filing fees | 1,459 | — | — |
Other | 17,105 | — | — |
Total expenses | 1,512,845 | 10,295,236 | 107,865 |
Less fees waived | (10,305 ) | — | — |
Less expense reimbursements | (462,795 ) | — | — |
Net expenses | 1,039,745 | 10,295,236 | 107,865 |
Net investment income (loss) | 6,004,116 | 322,235,786 | (42,663 ) |
REALIZED/UNREALIZED GAINS (LOSSES): | |||
Net realized gain (loss) on transactions from: | |||
Investments in non-affiliates | 6,107,623 | (321,913,961 ) | (235,680 ) |
In-kind redemptions of investments in non-affiliates (See Note 4) | 5,713,909 | 300,497,388 | 511,705 |
Futures contracts | 1,739,820 | 7,623,826 | — |
Net realized gain (loss) | 13,561,352 | (13,792,747 ) | 276,025 |
Change in net unrealized appreciation/depreciation on: | |||
Investments in non-affiliates | 54,215,111 | 307,419,501 | 11,341,591 |
Investments in affiliates | 5,999 | — | — |
Futures contracts | 479,009 | — | — |
Change in net unrealized appreciation/depreciation | 54,700,119 | 307,419,501 | 11,341,591 |
Net realized/unrealized gains (losses) | 68,261,471 | 293,626,754 | 11,617,616 |
Change in net assets resulting from operations | $74,265,587 | $615,862,540 | $11,574,953 |
56 | J.P. Morgan Exchange-Traded Funds | December 31, 2023 |
JPMorgan Active Growth ETF | JPMorgan Active Small Cap Value ETF | |||
Six Months Ended December 31, 2023 (Unaudited) | Period Ended June 30, 2023 (a) | Six Months Ended December 31, 2023 (Unaudited) | Period Ended June 30, 2023 (b) | |
CHANGE IN NET ASSETS RESULTING FROM OPERATIONS: | ||||
Net investment income (loss) | $850,226 | $663,053 | $81,300 | $50,609 |
Net realized gain (loss) | (5,845,440 ) | (7,004,640 ) | (2,528 ) | (24,645 ) |
Change in net unrealized appreciation/depreciation | 77,326,316 | 57,059,826 | 1,198,229 | (146,608 ) |
Change in net assets resulting from operations | 72,331,102 | 50,718,239 | 1,277,001 | (120,644 ) |
DISTRIBUTIONS TO SHAREHOLDERS: | ||||
Total distributions to shareholders | (1,449,368 ) | (206,646 ) | (138,781 ) | — |
CAPITAL TRANSACTIONS: | ||||
Change in net assets resulting from capital transactions | 433,498,411 | 307,518,785 | 2,432,128 | 10,957,300 |
NET ASSETS: | ||||
Change in net assets | 504,380,145 | 358,030,378 | 3,570,348 | 10,836,656 |
Beginning of period | 358,030,378 | — | 10,836,656 | — |
End of period | $862,410,523 | $358,030,378 | $14,407,004 | $10,836,656 |
CAPITAL TRANSACTIONS: | ||||
Proceeds from shares issued | $443,370,672 | $329,978,902 | $2,432,128 | $10,957,300 |
Cost of shares redeemed | (9,872,261 ) | (22,460,117 ) | — | — |
Total change in net assets resulting from capital transactions | $433,498,411 | $307,518,785 | $2,432,128 | $10,957,300 |
SHARE TRANSACTIONS: | ||||
Issued | 7,875,000 | 6,875,000 | 45,000 | 220,000 |
Redeemed | (175,000 ) | (450,000 ) | — | — |
Net increase (decrease) in shares from share transactions | 7,700,000 | 6,425,000 | 45,000 | 220,000 |
December 31, 2023 | J.P. Morgan Exchange-Traded Funds | 57 |
JPMorgan Active Value ETF | JPMorgan Equity Premium Income ETF | |||
Six Months Ended December 31, 2023 (Unaudited) | Year Ended June 30, 2023 | Six Months Ended December 31, 2023 (Unaudited) | Year Ended June 30, 2023 | |
CHANGE IN NET ASSETS RESULTING FROM OPERATIONS: | ||||
Net investment income (loss) | $5,932,258 | $4,726,777 | $1,150,701,604 | $1,946,111,691 |
Net realized gain (loss) | (6,788,044 ) | (2,237,043 ) | (1,454,616,350 ) | (1,801,885,017 ) |
Change in net unrealized appreciation/depreciation | 44,287,003 | 21,464,209 | 1,529,116,084 | 1,882,934,265 |
Change in net assets resulting from operations | 43,431,217 | 23,953,943 | 1,225,201,338 | 2,027,160,939 |
DISTRIBUTIONS TO SHAREHOLDERS: | ||||
Total distributions to shareholders | (6,440,706 ) | (4,338,724 ) | (1,364,115,354 ) | (1,873,734,871 ) |
CAPITAL TRANSACTIONS: | ||||
Change in net assets resulting from capital transactions | 326,912,854 | 354,602,282 | 2,635,302,872 | 17,686,859,307 |
NET ASSETS: | ||||
Change in net assets | 363,903,365 | 374,217,501 | 2,496,388,856 | 17,840,285,375 |
Beginning of period | 418,442,628 | 44,225,127 | 28,046,696,328 | 10,206,410,953 |
End of period | $782,345,993 | $418,442,628 | $30,543,085,184 | $28,046,696,328 |
CAPITAL TRANSACTIONS: | ||||
Proceeds from shares issued | $335,971,228 | $370,777,128 | $3,766,410,893 | $19,072,623,769 |
Cost of shares redeemed | (9,058,374 ) | (16,174,846 ) | (1,131,108,021 ) | (1,385,764,462 ) |
Total change in net assets resulting from capital transactions | $326,912,854 | $354,602,282 | $2,635,302,872 | $17,686,859,307 |
SHARE TRANSACTIONS: | ||||
Issued | 6,375,000 | 7,275,000 | 68,925,000 | 348,400,000 |
Redeemed | (175,000 ) | (325,000 ) | (20,650,000 ) | (25,250,000 ) |
Net increase (decrease) in shares from share transactions | 6,200,000 | 6,950,000 | 48,275,000 | 323,150,000 |
58 | J.P. Morgan Exchange-Traded Funds | December 31, 2023 |
JPMorgan Market Expansion Enhanced Equity ETF | JPMorgan Nasdaq Equity Premium Income ETF | |||
Six Months Ended December 31, 2023 (Unaudited) | Year Ended June 30, 2023 | Six Months Ended December 31, 2023 (Unaudited) | Year Ended June 30, 2023 | |
CHANGE IN NET ASSETS RESULTING FROM OPERATIONS: | ||||
Net investment income (loss) | $6,004,116 | $11,481,846 | $322,235,786 | $179,675,536 |
Net realized gain (loss) | 13,561,352 | 50,220,869 | (13,792,747 ) | (285,414,826 ) |
Change in net unrealized appreciation/depreciation | 54,700,119 | 69,920,834 | 307,419,501 | 538,805,544 |
Change in net assets resulting from operations | 74,265,587 | 131,623,549 | 615,862,540 | 433,066,254 |
DISTRIBUTIONS TO SHAREHOLDERS: | ||||
Total distributions to shareholders | (11,920,279 ) | (52,218,514 ) | (352,833,017 ) | (149,409,334 ) |
CAPITAL TRANSACTIONS: | ||||
Change in net assets resulting from capital transactions | 39,175,536 | (58,838,049 ) | 4,264,980,890 | 3,572,183,413 |
NET ASSETS: | ||||
Change in net assets | 101,520,844 | 20,566,986 | 4,528,010,413 | 3,855,840,333 |
Beginning of period | 854,560,372 | 833,993,386 | 3,956,996,062 | 101,155,729 |
End of period | $956,081,216 | $854,560,372 | $8,485,006,475 | $3,956,996,062 |
CAPITAL TRANSACTIONS: | ||||
Proceeds from shares issued | $52,741,960 | $20,677,423 | $5,368,245,142 | $3,840,224,854 |
Cost of shares redeemed | (13,566,424 ) | (79,515,472 ) | (1,103,264,252 ) | (268,041,441 ) |
Total change in net assets resulting from capital transactions | $39,175,536 | $(58,838,049 ) | $4,264,980,890 | $3,572,183,413 |
SHARE TRANSACTIONS: | ||||
Issued | 1,050,000 | 425,000 | 110,575,000 | 85,625,000 |
Redeemed | (275,000 ) | (1,575,000 ) | (22,525,000 ) | (5,975,000 ) |
Net increase (decrease) in shares from share transactions | 775,000 | (1,150,000 ) | 88,050,000 | 79,650,000 |
December 31, 2023 | J.P. Morgan Exchange-Traded Funds | 59 |
JPMorgan U.S. Tech Leaders ETF | |
Period Ended December 31, 2023 (Unaudited)(a) | |
CHANGE IN NET ASSETS RESULTING FROM OPERATIONS: | |
Net investment income (loss) | $(42,663 ) |
Net realized gain (loss) | 276,025 |
Change in net unrealized appreciation/depreciation | 11,341,591 |
Change in net assets resulting from operations | 11,574,953 |
CAPITAL TRANSACTIONS: | |
Change in net assets resulting from capital transactions | 179,544,961 |
NET ASSETS: | |
Change in net assets | 191,119,914 |
Beginning of period | — |
End of period | $191,119,914 |
CAPITAL TRANSACTIONS: | |
Proceeds from shares issued | $183,697,918 |
Cost of shares redeemed | (4,152,957 ) |
Total change in net assets resulting from capital transactions | $179,544,961 |
SHARE TRANSACTIONS: | |
Issued | 3,325,000 |
Redeemed | (75,000 ) |
Net increase (decrease) in shares from share transactions | 3,250,000 |
60 | J.P. Morgan Exchange-Traded Funds | December 31, 2023 |
Per share operating performance | |||||||
Investment operations | Distributions | ||||||
Net asset value, beginning of period | Net investment income (loss) (b) | Net realized and unrealized gains (losses) on investments | Total from investment operations | Net investment income | Net realized gain | Total distributions | |
JPMorgan Active Growth ETF | |||||||
Six Months Ended December 31, 2023 (Unaudited) | $55.72 | $0.09 | $5.35 | $5.44 | $(0.10 ) | $— | $(0.10 ) |
August 8, 2022 (f) through June 30, 2023 | 49.95 | 0.19 | 5.65 | 5.84 | (0.07 ) | — | (0.07 ) |
JPMorgan Active Small Cap Value ETF | |||||||
Six Months Ended December 31, 2023 (Unaudited) | 49.26 | 0.37 | 5.33 | 5.70 | (0.59 ) | — | (0.59 ) |
March 7, 2023 (f) through June 30, 2023 | 50.00 | 0.23 | (0.97 ) | (0.74 ) | — | — | — |
JPMorgan Active Value ETF | |||||||
Six Months Ended December 31, 2023 (Unaudited) | 53.14 | 0.53 | 2.43 | 2.96 | (0.52 ) | — | (0.52 ) |
Year Ended June 30, 2023 | 47.81 | 0.98 | 5.09 | 6.07 | (0.74 ) | — | (0.74 ) |
October 4, 2021 (f) through June 30, 2022 | 49.50 | 0.63 | (1.78 ) | (1.15 ) | (0.47 ) | (0.07 ) | (0.54 ) |
JPMorgan Equity Premium Income ETF | |||||||
Six Months Ended December 31, 2023 (Unaudited) | 55.29 | 2.14 | 0.08 | 2.22 | (2.53 ) | — | (2.53 ) |
Year Ended June 30, 2023 | 55.45 | 5.84 | 0.04 | 5.88 | (6.04 ) | — | (6.04 ) |
Year Ended June 30, 2022 | 60.50 | 6.11 | (6.20 ) | (0.09 ) | (4.96 ) | — | (4.96 ) |
Year Ended June 30, 2021 | 50.76 | 5.17 | 9.42 | 14.59 | (4.85 ) | — | (4.85 ) |
May 20, 2020 (f) through June 30, 2020 | 50.00 | 0.63 | 0.13 (h) | 0.76 | — | — | — |
JPMorgan Market Expansion Enhanced Equity ETF(i) (j) | |||||||
Six Months Ended December 31, 2023 (Unaudited) | 50.12 | 0.35 | 3.84 | 4.19 | (0.67 ) | — | (0.67 ) |
Year Ended June 30, 2023 | 45.83 | 0.67 | 6.67 | 7.34 | (0.66 ) | (2.39 ) | (3.05 ) |
Year Ended June 30, 2022 | 62.87 | 0.70 | (8.03 ) | (7.33 ) | (0.66 ) | (9.05 ) | (9.71 ) |
Year Ended June 30, 2021 | 41.41 | 0.63 | 23.22 | 23.85 | (0.63 ) | (1.76 ) | (2.39 ) |
Year Ended June 30, 2020 | 48.77 | 0.63 | (4.82 ) | (4.19 ) | (0.68 ) | (2.49 ) | (3.17 ) |
Year Ended June 30, 2019 | 57.67 | 0.63 | (3.24 ) | (2.61 ) | (0.44 ) | (5.95 ) | (6.39 ) |
JPMorgan Nasdaq Equity Premium Income ETF | |||||||
Six Months Ended December 31, 2023 (Unaudited) | 48.33 | 2.64 | 1.79 | 4.43 | (2.83 ) | — | (2.83 ) |
Year Ended June 30, 2023 | 45.46 | 6.04 | 2.47 | 8.51 | (5.64 ) | — | (5.64 ) |
May 3, 2022 (f) through June 30, 2022 | 50.00 | 1.11 | (5.27 ) | (4.16 ) | (0.38 ) | — | (0.38 ) |
JPMorgan U.S. Tech Leaders ETF | |||||||
October 4, 2023 (f) through December 31, 2023 (Unaudited) | 50.00 | (0.04 ) | 8.85 | 8.81 | — | — | — |
(a) | Annualized for periods less than one year, unless otherwise noted. |
(b) | Calculated based upon average shares outstanding. |
(c) | Not annualized for periods less than one year. |
(d) | Includes adjustments in accordance with accounting principles generally accepted in the United States of America and as such, the net asset values for financial reporting purposes and the returns based upon those net asset values may differ from the net asset values and returns for shareholder transactions. |
(e) | Market price return was calculated assuming an initial investment made at the market price at the beginning of the reporting period, reinvestment of all dividends and distributions at market price during the period, and sale at the market price on the last day of the period. The closing price was used to calculate the market price return. |
(f) | Commencement of operations. |
(g) | Since the shares of the Fund did not trade in the secondary market until the day after the Fund’s inception, for the period from the inception to the first day of secondary market trading, the net asset value is used as a proxy for the secondary market trading price to calculate the market returns. |
(h) | Calculation of the net realized and unrealized gains (losses) per share do not correlate with the Fund’s net realized and unrealized gains (losses) presented in the Statement of Operations due to the timing of capital transactions in relation to the fluctuating market values of the Fund’s investments. |
(i) | Per Share amounts reflect the conversion of the Predecessor Fund into the Fund as of the close of business on May 6, 2022. See Note 1. |
(j) | JPMorgan Market Expansion Enhanced Equity ETF (the “Fund”) acquired all of the assets and liabilities of the JPMorgan Market Expansion Enhanced Index Fund (“Predecessor Fund”) in a reorganization that occurred as of the close of business on May 6, 2022. Performance and financial history of the Predecessor Fund’s Class R6 Shares have been adopted by the Fund and will be used going forward. As a result, the financial highlight information reflects that of the Predecessor Fund’s Class R6 Shares for the period October 1, 2018 (“Predecessor Fund's Class R6 Shares inception date”) up through the reorganization and the Predecessor Fund's Class I Shares for the periods July 1, 2017 through June 30, 2018 and July 1, 2018 through June 30, 2019. |
(k) | JPMorgan Market Expansion Enhanced Equity ETF acquired all of the assets and liabilities of the JPMorgan Market Expansion Enhanced Index Fund (“Predecessor Fund”) in a reorganization on May 6, 2022. Market price returns are calculated using the official closing price of the JPMorgan Market Expansion Enhanced Equity ETF on the listing exchange as of the time that the JPMorgan Market Expansion Enhanced Equity ETF's NAV is calculated. Prior to the JPMorgan Market Expansion Enhanced Equity ETF's listing on May 9, 2022, the NAV performance of the Class R6 and the Class I Shares of the Predecessor Fund are used as proxy market price returns. |
62 | J.P. Morgan Exchange-Traded Funds | December 31, 2023 |
Ratios/Supplemental data | ||||||||
Ratios to average net assets (a) | ||||||||
Net asset value, end of period | Market price, end of period | Total return (c)(d) | Market price total return (c)(e) | Net assets, end of period | Net expenses | Net investment income (loss) | Expenses without waivers and reimbursements | Portfolio turnover rate (c) |
$61.06 | $61.09 | 9.77 % | 9.78 % | $862,410,523 | 0.43 % | 0.30 % | 0.43 % | 20 % |
55.72 | 55.74 | 11.73 | 11.77 (g) | 358,030,378 | 0.44 | 0.45 | 0.44 | 60 |
54.37 | 54.41 | 11.57 | 11.56 | 14,407,004 | 0.74 | 1.45 | 0.74 | 19 |
49.26 | 49.30 | (1.48 ) | (1.40 )(g) | 10,836,656 | 0.74 | 1.57 | 0.74 | 13 |
55.58 | 55.62 | 5.59 | 5.64 | 782,345,993 | 0.44 | 2.00 | 0.44 | 46 |
53.14 | 53.15 | 12.79 | 13.04 | 418,442,628 | 0.44 | 1.91 | 0.44 | 80 |
47.81 | 47.71 | (2.37 ) | (2.57 )(g) | 44,225,127 | 0.44 | 1.64 | 0.44 | 56 |
54.98 | 54.98 | 4.16 | 4.08 | 30,543,085,184 | 0.35 | 7.80 | 0.35 | 85 |
55.29 | 55.33 | 11.30 | 11.37 | 28,046,696,328 | 0.35 | 10.69 | 0.35 | 190 |
55.45 | 55.45 | (0.49 ) | (0.62 ) | 10,206,410,953 | 0.35 | 10.23 | 0.35 | 195 |
60.50 | 60.57 | 30.22 | 29.90 | 1,916,419,087 | 0.35 | 8.89 | 0.35 | 195 |
50.76 | 50.94 | 1.52 | 1.88 (g) | 27,916,586 | 0.35 | 11.11 | 0.35 | 13 |
53.64 | 53.71 | 8.36 | 8.41 (k) | 956,081,216 | 0.24 | 1.37 | 0.35 | 15 |
50.12 | 50.16 | 16.61 | 16.73 (k) | 854,560,372 | 0.24 | 1.38 | 0.24 | 29 |
45.83 | 45.82 | (13.80 ) | (13.81 )(k) | 833,993,386 | 0.25 | 1.21 | 0.36 | 27 |
62.87 | 62.87 | 58.97 | 58.97 (k) | 766,008,977 | 0.25 | 1.18 | 0.35 | 35 |
41.41 | 41.41 | (9.65 ) | (9.65 )(k) | 500,129,035 | 0.25 | 1.45 | 0.36 | 49 |
48.67 | 48.67 | (3.56 ) | (3.56 )(k) | 264,414,719 | 0.34 | 1.14 | 0.61 | 36 |
49.93 | 49.93 | 9.54 | 9.45 | 8,485,006,475 | 0.35 | 10.87 | 0.35 | 86 |
48.33 | 48.37 | 20.81 | 20.11 | 3,956,996,062 | 0.35 | 13.49 | 0.35 | 162 |
45.46 | 45.76 | (8.37 ) | (7.77 )(g) | 101,155,729 | 0.35 | 14.59 | 0.35 | 12 |
58.81 | 58.80 | 17.62 | 17.60 (g) | 191,119,914 | 0.65 | (0.26 ) | 0.65 | 8 |
December 31, 2023 | J.P. Morgan Exchange-Traded Funds | 63 |
Diversification Classification | |
JPMorgan Active Growth ETF(1) | Non-diversified |
JPMorgan Active Small Cap Value ETF(2) | Diversified |
JPMorgan Active Value ETF | Diversified |
JPMorgan Equity Premium Income ETF | Diversified |
JPMorgan Market Expansion Enhanced Equity ETF | Diversified |
JPMorgan Nasdaq Equity Premium Income ETF | Non-Diversified |
JPMorgan U.S. Tech Leaders ETF(3) | Diversified |
(1) | Commencement of operations was August 8, 2022. |
(2) | Commencement of operations was March 7, 2023. |
(3) | Commencement of Operations was October 4, 2023. |
Listing Exchange | |
Active Growth ETF | NYSE Arca, Inc. |
Active Small Cap Value ETF | NYSE Arca, Inc. |
Active Value ETF | NYSE Arca, Inc. |
Equity Premium Income ETF | NYSE Arca, Inc. |
Market Expansion Enhanced Equity ETF | NYSE Arca, Inc. |
Nasdaq Equity Premium Income ETF | The NASDAQ Stock Market LLC |
U.S. Tech Leaders ETF | The NASDAQ Stock Market LLC |
64 | J.P. Morgan Exchange-Traded Funds | December 31, 2023 |
Active Growth ETF | ||||
Level 1 Quoted prices | Level 2 Other significant observable inputs | Level 3 Significant unobservable inputs | Total | |
Total Investments in Securities (a) | $862,555,452 | $— | $— | $862,555,452 |
(a) | Please refer to the SOI for specifics of portfolio holdings. |
December 31, 2023 | J.P. Morgan Exchange-Traded Funds | 65 |
Active Small Cap Value ETF | ||||
Level 1 Quoted prices | Level 2 Other significant observable inputs | Level 3 Significant unobservable inputs | Total | |
Total Investments in Securities (a) | $14,438,824 | $— | $— | $14,438,824 |
(a) | Please refer to the SOI for specifics of portfolio holdings. |
Active Value ETF | ||||
Level 1 Quoted prices | Level 2 Other significant observable inputs | Level 3 Significant unobservable inputs | Total | |
Total Investments in Securities (a) | $781,487,334 | $— | $— | $781,487,334 |
(a) | Please refer to the SOI for specifics of portfolio holdings. |
Equity Premium Income ETF | ||||
Level 1 Quoted prices | Level 2 Other significant observable inputs | Level 3 Significant unobservable inputs | Total | |
Investments in Securities | ||||
Common Stocks | $25,969,533,581 | $— | $— | $25,969,533,581 |
Equity Linked Notes | — | 4,166,768,851 | — | 4,166,768,851 |
Short-Term Investments | ||||
Investment Companies | 8,580,135 | — | — | 8,580,135 |
Investment of Cash Collateral from Securities Loaned | 172,559,627 | — | — | 172,559,627 |
Total Short-Term Investments | 181,139,762 | — | — | 181,139,762 |
Total Investments in Securities | $26,150,673,343 | $4,166,768,851 | $— | $30,317,442,194 |
Market Expansion Enhanced Equity ETF | ||||
Level 1 Quoted prices | Level 2 Other significant observable inputs | Level 3 Significant unobservable inputs | Total | |
Total Investments in Securities (a) | $1,017,531,673 | $— | $— | $1,017,531,673 |
Appreciation in Other Financial Instruments | ||||
Futures Contracts (a) | $883,709 | $— | $— | $883,709 |
(a) | Please refer to the SOI for specifics of portfolio holdings. |
Nasdaq Equity Premium Income ETF | ||||
Level 1 Quoted prices | Level 2 Other significant observable inputs | Level 3 Significant unobservable inputs | Total | |
Investments in Securities | ||||
Common Stocks | $7,053,041,956 | $— | $— | $7,053,041,956 |
Equity Linked Notes | — | 1,332,934,171 | — | 1,332,934,171 |
Short-Term Investments | ||||
Investment Companies | 44,936,965 | — | — | 44,936,965 |
Total Investments in Securities | $7,097,978,921 | $1,332,934,171 | $— | $8,430,913,092 |
66 | J.P. Morgan Exchange-Traded Funds | December 31, 2023 |
U.S. Tech Leaders ETF | ||||
Level 1 Quoted prices | Level 2 Other significant observable inputs | Level 3 Significant unobservable inputs | Total | |
Total Investments in Securities (a) | $191,169,486 | $— | $— | $191,169,486 |
(a) | Please refer to the SOI for specifics of portfolio holdings. |
Investment Securities on Loan, at value, Presented on the Statements of Assets and Liabilities | Cash Collateral Posted by Borrower* | Net Amount Due to Counterparty (not less than zero) | |
Active Small Cap Value ETF | $38,265 | $(38,265 ) | $— |
Equity Premium Income ETF | 169,175,386 | (169,175,386 ) | — |
Market Expansion Enhanced Equity ETF | 60,173,842 | (60,173,842 ) | — |
* | Collateral posted reflects the value of securities on loan and does not include any additional amounts received from the borrower. |
December 31, 2023 | J.P. Morgan Exchange-Traded Funds | 67 |
Active Small Cap Value ETF | $4 |
Active Value ETF | 81 |
Equity Premium Income ETF | 14,723 |
Market Expansion Enhanced Equity ETF | 3,206 |
Nasdaq Equity Premium Income ETF | 1 |
Active Growth ETF | |||||||||
For the six months ended December 31, 2023 | |||||||||
Security Description | Value at June 30, 2023 | Purchases at Cost | Proceeds from Sales | Net Realized Gain (Loss) | Change in Unrealized Appreciation/ (Depreciation) | Value at December 31, 2023 | Shares at December 31, 2023 | Dividend Income | Capital Gain Distributions |
JPMorgan U.S. Government Money Market Fund Class IM Shares, 5.30% (a) (b) | $6,933,264 | $33,658,726 | $22,832,350 | $— | $— | $17,759,640 | 17,759,640 | $440,843 | $— |
(a) | Investment in an affiliated fund, which is registered under the Investment Company Act of 1940, as amended, and is advised by J.P. Morgan Investment Management Inc. |
(b) | The rate shown is the current yield as of December 31, 2023. |
Active Small Cap Value ETF | |||||||||
For the six months ended December 31, 2023 | |||||||||
Security Description | Value at June 30, 2023 | Purchases at Cost | Proceeds from Sales | Net Realized Gain (Loss) | Change in Unrealized Appreciation/ (Depreciation) | Value at December 31, 2023 | Shares at December 31, 2023 | Dividend Income | Capital Gain Distributions |
JPMorgan Prime Money Market Fund Class IM Shares, 5.51% (a) (b) | $— | $— | $— | $— | $— | $— | — | $26 | $— |
JPMorgan U.S. Government Money Market Fund Class IM Shares, 5.30% (a) (b) | — | 56,340 | 17,570 | — | — | 38,770 | 38,770 | 500 * | — |
JPMorgan U.S. Government Money Market Fund Class IM Shares, 5.30% (a) (b) | 278,027 | 1,439,227 | 1,181,754 | — | — | 535,500 | 535,500 | 9,628 | — |
Total | $278,027 | $1,495,567 | $1,199,324 | $— | $— | $574,270 | $10,154 | $— | |
(a) | Investment in an affiliated fund, which is registered under the Investment Company Act of 1940, as amended, and is advised by J.P. Morgan Investment Management Inc. |
(b) | The rate shown is the current yield as of December 31, 2023. |
* | Amount is included on the Statements of Operations as Income from securities lending (net) (after payments of rebates and Citibank’s fee). |
68 | J.P. Morgan Exchange-Traded Funds | December 31, 2023 |
Active Value ETF | |||||||||
For the six months ended December 31, 2023 | |||||||||
Security Description | Value at June 30, 2023 | Purchases at Cost | Proceeds from Sales | Net Realized Gain (Loss) | Change in Unrealized Appreciation/ (Depreciation) | Value at December 31, 2023 | Shares at December 31, 2023 | Dividend Income | Capital Gain Distributions |
JPMorgan Prime Money Market Fund Class IM Shares, 5.51% (a) (b) | $— | $— | $— | $— | $— | $— | — | $213 | $— |
JPMorgan U.S. Government Money Market Fund Class IM Shares, 5.30% (a) (b) | 252,180 | 1,345,118 | 1,597,298 | — | — | — | — | 3,701 * | — |
JPMorgan U.S. Government Money Market Fund Class IM Shares, 5.30% (a) (b) | 12,221,401 | 18,639,848 | 8,984,221 | — | — | 21,877,028 | 21,877,028 | 501,303 | — |
Total | $12,473,581 | $19,984,966 | $10,581,519 | $— | $— | $21,877,028 | $505,217 | $— | |
(a) | Investment in an affiliated fund, which is registered under the Investment Company Act of 1940, as amended, and is advised by J.P. Morgan Investment Management Inc. |
(b) | The rate shown is the current yield as of December 31, 2023. |
* | Amount is included on the Statements of Operations as Income from securities lending (net) (after payments of rebates and Citibank’s fee). |
Equity Premium Income ETF | |||||||||
For the six months ended December 31, 2023 | |||||||||
Security Description | Value at June 30, 2023 | Purchases at Cost | Proceeds from Sales | Net Realized Gain (Loss) | Change in Unrealized Appreciation/ (Depreciation) | Value at December 31, 2023 | Shares at December 31, 2023 | Dividend Income | Capital Gain Distributions |
JPMorgan Prime Money Market Fund Class IM Shares, 5.51% (a) (b) | $— | $— | $— | $— | $— | $— | — | $1,177 | $— |
JPMorgan Securities Lending Money Market Fund Agency SL Class Shares, 5.56% (a) (b) | 334,966,807 | 758,999,999 | 940,000,000 | 106,973 * | 21,203 | 154,094,982 | 154,033,369 | 10,078,501 * | — |
JPMorgan U.S. Government Money Market Fund Class IM Shares, 5.30% (a) (b) | 47,208,090 | 350,989,669 | 379,733,114 | — | — | 18,464,645 | 18,464,645 | 1,157,595 * | — |
JPMorgan U.S. Government Money Market Fund Class IM Shares, 5.30% (a) (b) | 224,743,189 | 2,805,189,420 | 3,021,352,474 | — | — | 8,580,135 | 8,580,135 | 6,999,707 | — |
Total | $606,918,086 | $3,915,179,088 | $4,341,085,588 | $106,973 | $21,203 | $181,139,762 | $18,236,980 | $— | |
(a) | Investment in an affiliated fund, which is registered under the Investment Company Act of 1940, as amended, and is advised by J.P. Morgan Investment Management Inc. |
(b) | The rate shown is the current yield as of December 31, 2023. |
* | Amount is included on the Statements of Operations as Income from securities lending (net) (after payments of rebates and Citibank’s fee). |
December 31, 2023 | J.P. Morgan Exchange-Traded Funds | 69 |
Market Expansion Enhanced Equity ETF | |||||||||
For the six months ended December 31, 2023 | |||||||||
Security Description | Value at June 30, 2023 | Purchases at Cost | Proceeds from Sales | Net Realized Gain (Loss) | Change in Unrealized Appreciation/ (Depreciation) | Value at December 31, 2023 | Shares at December 31, 2023 | Dividend Income | Capital Gain Distributions |
JPMorgan Prime Money Market Fund Class IM Shares, 5.51% (a) (b) | $— | $— | $— | $— | $— | $— | — | $448 | $— |
JPMorgan Securities Lending Money Market Fund Agency SL Class Shares, 5.56% (a) (b) | 17,998,200 | 140,000,001 | 103,000,000 | 5,798 * | 5,999 | 55,009,998 | 54,988,003 | 1,044,128 * | — |
JPMorgan U.S. Government Money Market Fund Class IM Shares, 5.30% (a) (b) | 5,817,078 | 66,942,929 | 65,296,040 | — | — | 7,463,967 | 7,463,967 | 154,635 * | — |
JPMorgan U.S. Government Money Market Fund Class IM Shares, 5.30% (a) (b) | 19,564,496 | 63,147,861 | 65,442,741 | — | — | 17,269,616 | 17,269,616 | 448,307 | — |
Total | $43,379,774 | $270,090,791 | $233,738,781 | $5,798 | $5,999 | $79,743,581 | $1,647,518 | $— | |
(a) | Investment in an affiliated fund, which is registered under the Investment Company Act of 1940, as amended, and is advised by J.P. Morgan Investment Management Inc. |
(b) | The rate shown is the current yield as of December 31, 2023. |
* | Amount is included on the Statements of Operations as Income from securities lending (net) (after payments of rebates and Citibank’s fee). |
Nasdaq Equity Premium Income ETF | |||||||||
For the six months ended December 31, 2023 | |||||||||
Security Description | Value at June 30, 2023 | Purchases at Cost | Proceeds from Sales | Net Realized Gain (Loss) | Change in Unrealized Appreciation/ (Depreciation) | Value at December 31, 2023 | Shares at December 31, 2023 | Dividend Income | Capital Gain Distributions |
JPMorgan Prime Money Market Fund Class IM Shares, 5.51% (a) (b) | $— | $— | $— | $— | $— | $— | — | $3,767 | $— |
JPMorgan U.S. Government Money Market Fund Class IM Shares, 5.30% (a) (b) | — | 22,900 | 22,900 | — | — | — | — | 3 * | — |
JPMorgan U.S. Government Money Market Fund Class IM Shares, 5.30% (a) (b) | 49,625,385 | 1,215,222,399 | 1,219,910,819 | — | — | 44,936,965 | 44,936,965 | 1,648,598 | — |
Total | $49,625,385 | $1,215,245,299 | $1,219,933,719 | $— | $— | $44,936,965 | $1,652,368 | $— | |
(a) | Investment in an affiliated fund, which is registered under the Investment Company Act of 1940, as amended, and is advised by J.P. Morgan Investment Management Inc. |
(b) | The rate shown is the current yield as of December 31, 2023. |
* | Amount is included on the Statements of Operations as Income from securities lending (net) (after payments of rebates and Citibank’s fee). |
70 | J.P. Morgan Exchange-Traded Funds | December 31, 2023 |
U.S. Tech Leaders ETF | |||||||||
For the period ended December 31, 2023 | |||||||||
Security Description | Value at October 4, 2023(a) | Purchases at Cost | Proceeds from Sales | Net Realized Gain (Loss) | Change in Unrealized Appreciation/ (Depreciation) | Value at December 31, 2023 | Shares at December 31, 2023 | Dividend Income | Capital Gain Distributions |
JPMorgan Prime Money Market Fund Class IM Shares, 5.51% (b) (c) | $— | $— | $— | $— | $— | $— | — | $17 | $— |
JPMorgan U.S. Government Money Market Fund Class IM Shares, 5.30% (b) (c) | — | 542,025 | 542,025 | — | — | — | — | 62 * | — |
JPMorgan U.S. Government Money Market Fund Class IM Shares, 5.30% (b) (c) | — | 10,840,765 | 8,506,016 | — | — | 2,334,749 | 2,334,749 | 10,548 | — |
Total | $— | $11,382,790 | $9,048,041 | $— | $— | $2,334,749 | $10,627 | $— | |
(a) | Commencement of operations was October 4, 2023. |
(b) | Investment in an affiliated fund, which is registered under the Investment Company Act of 1940, as amended, and is advised by J.P. Morgan Investment Management Inc. |
(c) | The rate shown is the current yield as of December 31, 2023. |
* | Amount is included on the Statements of Operations as Income from securities lending (net) (after payments of rebates and Citibank’s fee). |
Equity Premium Income ETF | Market Expansion Enhanced Equity ETF | Nasdaq Equity Premium Income ETF | |
Futures Contracts: | |||
Average Notional Balance Long | $37,580,357 | $14,370,822 | $— |
Average Notional Balance Short | (2,418,482 ) | — | (68,447,985 ) |
Ending Notional Balance Long | — | 14,334,750 | — |
December 31, 2023 | J.P. Morgan Exchange-Traded Funds | 71 |
Active Growth ETF | 0.44 % |
Active Small Cap Value ETF | 0.74 |
Active Value ETF | 0.44 |
Equity Premium Income ETF | 0.35 |
Market Expansion Enhanced Equity ETF | 0.25 |
Nasdaq Equity Premium Income ETF | 0.35 |
U.S. Tech Leaders ETF | 0.65 |
72 | J.P. Morgan Exchange-Traded Funds | December 31, 2023 |
Contractual Reimbursements | |
Market Expansion Enhanced Equity ETF | $461,954 |
Market Expansion Enhanced Equity ETF | $10,305 |
December 31, 2023 | J.P. Morgan Exchange-Traded Funds | 73 |
Market Expansion Enhanced Equity ETF | $841 |
Brokerage Commissions | |
Active Growth ETF | $1,420 |
Market Expansion Enhanced Equity ETF | 214 |
Purchases (excluding U.S. Government) | Sales (excluding U.S. Government) | |
Active Growth ETF | $111,239,959 | $109,274,158 |
Active Small Cap Value ETF | 2,093,871 | 2,320,360 |
Active Value ETF | 265,243,235 | 263,383,698 |
Equity Premium Income ETF | 25,104,084,495 | 24,528,640,034 |
Market Expansion Enhanced Equity ETF | 129,134,567 | 127,560,314 |
Nasdaq Equity Premium Income ETF | 6,034,643,859 | 5,102,938,677 |
U.S. Tech Leaders ETF | 12,013,725 | 6,397,817 |
In-Kind Purchases | In-Kind Sales | |
Active Growth ETF | $429,774,007 | $9,423,935 |
Active Small Cap Value ETF | 2,335,859 | — |
Active Value ETF | 323,501,675 | 8,733,067 |
Equity Premium Income ETF | 2,934,040,795 | 962,985,797 |
Market Expansion Enhanced Equity ETF | 51,217,500 | 13,340,157 |
Nasdaq Equity Premium Income ETF | 4,343,279,961 | 1,050,786,349 |
U.S. Tech Leaders ETF | 175,720,423 | 4,119,210 |
74 | J.P. Morgan Exchange-Traded Funds | December 31, 2023 |
Aggregate Cost | Gross Unrealized Appreciation | Gross Unrealized Depreciation | Net Unrealized Appreciation (Depreciation) | |
Active Growth ETF | $728,169,310 | $135,060,661 | $674,519 | $134,386,142 |
Active Small Cap Value ETF | 13,387,203 | 1,340,464 | 288,843 | 1,051,621 |
Active Value ETF | 717,680,022 | 72,360,705 | 8,553,393 | 63,807,312 |
Equity Premium Income ETF | 27,264,924,124 | 3,586,580,504 | 534,062,434 | 3,052,518,070 |
Market Expansion Enhanced Equity ETF | 733,080,475 | 314,961,232 | 29,626,325 | 285,334,907 |
Nasdaq Equity Premium Income ETF | 7,589,327,059 | 924,013,434 | 82,427,401 | 841,586,033 |
U.S. Tech Leaders ETF | 179,827,895 | 12,170,394 | 828,803 | 11,341,591 |
Capital Loss Carryforward Character | ||
Short-Term | Long-Term | |
Active Growth ETF | $259,031 | $— |
Active Small Cap Value ETF | 22,846 | — |
Active Value ETF | 2,033,118 | 42,420 |
Equity Premium Income ETF | 1,010,524,741 | 164,353,537 |
Nasdaq Equity Premium Income ETF | 19,918,405 | — |
Net Capital Losses (Gains) | Specified Ordinary Losses | ||
Short-Term | Long-Term | ||
Active Growth ETF | $10,376,110 | $— | $3,149 |
Active Value ETF | (72,597 ) | 225,065 | — |
Equity Premium Income ETF | 1,068,373,987 | 157,403,926 | — |
Market Expansion Enhanced Equity ETF | 7,063,101 | (2,363,848 ) | — |
Nasdaq Equity Premium Income ETF | 295,998,408 | 150,981 | — |
December 31, 2023 | J.P. Morgan Exchange-Traded Funds | 75 |
% of Ownership | |
Active Small Cap Value ETF | 75 % |
76 | J.P. Morgan Exchange-Traded Funds | December 31, 2023 |
December 31, 2023 | J.P. Morgan Exchange-Traded Funds | 77 |
Beginning Account Value July 1, 2023 | Ending Account Value December 31, 2023 | Expenses Paid During the Period | Annualized Expense Ratio | |
JPMorgan Active Growth ETF | ||||
Actual * | $1,000.00 | $1,097.70 | $2.27 | 0.43 % |
Hypothetical * | 1,000.00 | 1,023.04 | 2.19 | 0.43 |
JPMorgan Active Small Cap Value ETF | ||||
Actual * | 1,000.00 | 1,115.70 | 3.94 | 0.74 |
Hypothetical * | 1,000.00 | 1,021.47 | 3.76 | 0.74 |
JPMorgan Active Value ETF | ||||
Actual * | 1,000.00 | 1,055.90 | 2.27 | 0.44 |
Hypothetical * | 1,000.00 | 1,022.99 | 2.24 | 0.44 |
JPMorgan Equity Premium Income ETF | ||||
Actual * | 1,000.00 | 1,041.60 | 1.80 | 0.35 |
Hypothetical * | 1,000.00 | 1,023.44 | 1.78 | 0.35 |
JPMorgan Market Expansion Enhanced Equity ETF | ||||
Actual * | 1,000.00 | 1,083.60 | 1.26 | 0.24 |
Hypothetical * | 1,000.00 | 1,023.93 | 1.22 | 0.24 |
JPMorgan Nasdaq Equity Premium Income ETF | ||||
Actual * | 1,000.00 | 1,095.40 | 1.84 | 0.35 |
Hypothetical * | 1,000.00 | 1,023.44 | 1.78 | 0.35 |
JPMorgan U.S. Tech Leaders ETF | ||||
Actual ** | 1,000.00 | 1,176.20 | 1.70 | 0.65 |
Hypothetical * | 1,000.00 | 1,021.93 | 3.30 | 0.65 |
* | Expenses are equal to each Fund's annualized net expense ratio, multiplied by the average account value over the period, multiplied by 184/366 (to reflect the one-half year period). |
** | Expenses are equal to the Fund’s annualized net expense ratio, multiplied by the average account value over the period, multiplied by 88/366 (to reflect the actual period). The Fund commenced operations on October 4, 2023. |
78 | J.P. Morgan Exchange-Traded Funds | December 31, 2023 |
December 31, 2023 | J.P. Morgan Exchange-Traded Funds | 79 |
80 | J.P. Morgan Exchange-Traded Funds | December 31, 2023 |
December 31, 2023 | J.P. Morgan Exchange-Traded Funds | 81 |
82 | J.P. Morgan Exchange-Traded Funds | December 31, 2023 |
December 31, 2023 | J.P. Morgan Exchange-Traded Funds | 83 |
84 | J.P. Morgan Exchange-Traded Funds | December 31, 2023 |
December 31, 2023 | J.P. Morgan Exchange-Traded Funds | 85 |
86 | J.P. Morgan Exchange-Traded Funds | December 31, 2023 |
December 31, 2023 | J.P. Morgan Exchange-Traded Funds | 87 |


Fund | Ticker | Listing Exchange |
JPMorgan Equity Focus ETF | JPEF | The NASDAQ Stock Market LLC |

1 | |
2 | |
5 | |
7 | |
12 | |
14 | |
22 | |
23 |
 | “Investors appear to have begun 2024 with a positive outlook, with the U.S. economy and its financial markets leading global growth.” — Brian S. Shlissel |

President, J.P. Morgan Exchange-Traded Funds
J.P. Morgan Asset Management
1-844-4JPM-ETF or jpmorgan.com/etfs for more information
December 31, 2023 | J.P. Morgan Exchange-Traded Funds | 1 |
REPORTING PERIOD RETURN: | |
Net Asset Value * | 9.58% |
Market Price ** | 9.51% |
S&P 500 Index | 8.04% |
Net Assets as of 12/31/2023 | $366,886,826 |
Fund Ticker | JPEF |
2 | J.P. Morgan Exchange-Traded Funds | December 31, 2023 |
TOP TEN HOLDINGS OF THE PORTFOLIO AS OF December 31, 2023 | PERCENT OF TOTAL INVESTMENTS | |
1. | Microsoft Corp. | 7.8 % |
2. | Amazon.com, Inc. | 5.3 |
3. | Meta Platforms, Inc., Class A | 4.1 |
4. | Apple, Inc. | 4.0 |
5. | Loews Corp. | 3.5 |
6. | NVIDIA Corp. | 3.4 |
7. | Capital One Financial Corp. | 3.2 |
8. | Berkshire Hathaway, Inc., Class B | 3.1 |
9. | Mastercard, Inc., Class A | 3.1 |
10. | Alphabet, Inc., Class C | 2.9 |
PORTFOLIO COMPOSITION BY SECTOR AS OF December 31, 2023 | PERCENT OF TOTAL INVESTMENTS |
Information Technology | 24.2% |
Financials | 17.8 |
Consumer Discretionary | 13.1 |
Health Care | 10.3 |
Communication Services | 7.0 |
Real Estate | 6.8 |
Industrials | 6.5 |
Energy | 4.8 |
Materials | 3.4 |
Consumer Staples | 2.4 |
Utilities | 1.8 |
Short-Term Investments | 1.9 |
December 31, 2023 | J.P. Morgan Exchange-Traded Funds | 3 |
INCEPTION DATE | SIX MONTHS* | 1 YEAR | 5 YEAR | 10 YEAR | |
JPMorgan Equity Focus ETF | |||||
Net Asset Value | July 29, 2011** | 9.58 % | 31.92 % | 17.22 % | 12.36 % |
Market Price | 9.51 | 31.84 | 17.21 | 12.35 |
* | Not annualized. |
** | Inception date for Class I Shares of the Predecessor Fund (as defined below). |
4 | J.P. Morgan Exchange-Traded Funds | December 31, 2023 |
INVESTMENTS | SHARES | VALUE($) |
Common Stocks — 98.1% | ||
Air Freight & Logistics — 1.8% | ||
United Parcel Service, Inc., Class B | 41,961 | 6,597,528 |
Automobiles — 1.3% | ||
Tesla, Inc. * | 19,767 | 4,911,704 |
Banks — 5.0% | ||
Bank of America Corp. | 232,537 | 7,829,521 |
M&T Bank Corp. | 75,677 | 10,373,803 |
18,203,324 | ||
Biotechnology — 5.2% | ||
AbbVie, Inc. | 55,909 | 8,664,218 |
Regeneron Pharmaceuticals, Inc. * | 11,668 | 10,247,887 |
18,912,105 | ||
Broadline Retail — 5.3% | ||
Amazon.com, Inc. * | 128,906 | 19,585,978 |
Building Products — 2.0% | ||
Trane Technologies plc | 29,772 | 7,261,391 |
Construction & Engineering — 1.6% | ||
Quanta Services, Inc. | 26,951 | 5,816,026 |
Construction Materials — 2.0% | ||
Martin Marietta Materials, Inc. | 14,657 | 7,312,524 |
Consumer Finance — 3.2% | ||
Capital One Financial Corp. | 88,990 | 11,668,369 |
Containers & Packaging — 1.4% | ||
Packaging Corp. of America | 30,878 | 5,030,335 |
Electric Utilities — 1.8% | ||
NextEra Energy, Inc. | 109,558 | 6,654,553 |
Financial Services — 6.2% | ||
Berkshire Hathaway, Inc., Class B * | 32,032 | 11,424,533 |
Mastercard, Inc., Class A | 26,408 | 11,263,276 |
22,687,809 | ||
Ground Transportation — 1.1% | ||
JB Hunt Transport Services, Inc. | 20,358 | 4,066,307 |
Health Care Providers & Services — 2.2% | ||
UnitedHealth Group, Inc. | 15,306 | 8,058,150 |
Hotels, Restaurants & Leisure — 1.6% | ||
Booking Holdings, Inc. * | 1,683 | 5,969,971 |
Household Products — 2.4% | ||
Procter & Gamble Co. (The) | 59,567 | 8,728,948 |
Insurance — 3.5% | ||
Loews Corp. | 185,331 | 12,897,184 |
INVESTMENTS | SHARES | VALUE($) |
Interactive Media & Services — 7.0% | ||
Alphabet, Inc., Class C * | 76,268 | 10,748,449 |
Meta Platforms, Inc., Class A * | 42,372 | 14,997,993 |
25,746,442 | ||
Oil, Gas & Consumable Fuels — 4.8% | ||
EOG Resources, Inc. | 77,426 | 9,364,674 |
Kinder Morgan, Inc. | 476,767 | 8,410,170 |
17,774,844 | ||
Pharmaceuticals — 2.9% | ||
Bristol-Myers Squibb Co. | 113,257 | 5,811,217 |
Eli Lilly & Co. | 8,563 | 4,991,544 |
10,802,761 | ||
Retail REITs — 1.8% | ||
Regency Centers Corp. | 99,080 | 6,638,360 |
Semiconductors & Semiconductor Equipment — 8.6% | ||
Advanced Micro Devices, Inc. * | 57,252 | 8,439,518 |
Broadcom, Inc. | 5,097 | 5,689,526 |
Lam Research Corp. | 6,201 | 4,856,995 |
NVIDIA Corp. | 25,377 | 12,567,198 |
31,553,237 | ||
Software — 11.6% | ||
Intuit, Inc. | 11,480 | 7,175,344 |
Microsoft Corp. | 76,175 | 28,644,847 |
Palo Alto Networks, Inc. * | 22,750 | 6,708,520 |
42,528,711 | ||
Specialized REITs — 5.0% | ||
Public Storage | 27,248 | 8,310,640 |
Weyerhaeuser Co. | 288,723 | 10,038,899 |
18,349,539 | ||
Specialty Retail — 4.8% | ||
AutoZone, Inc. * | 1,861 | 4,811,820 |
Home Depot, Inc. (The) | 23,597 | 8,177,541 |
Ross Stores, Inc. | 33,995 | 4,704,568 |
17,693,929 | ||
Technology Hardware, Storage & Peripherals — 4.0% | ||
Apple, Inc. | 75,632 | 14,561,429 |
Total Common Stocks (Cost $275,105,977) | 360,011,458 | |
December 31, 2023 | J.P. Morgan Exchange-Traded Funds | 5 |
INVESTMENTS | SHARES | VALUE($) |
Short-Term Investments — 1.9% | ||
Investment Companies — 1.9% | ||
JPMorgan Prime Money Market Fund Class IM Shares, 5.51% (a) (b) (Cost $7,018,575) | 7,016,014 | 7,021,627 |
Total Investments — 100.0% (Cost $282,124,552) | 367,033,085 | |
Liabilities in Excess of Other Assets — (0.0)% ^ | (146,259 ) | |
NET ASSETS — 100.0% | 366,886,826 | |
Percentages indicated are based on net assets. |
Abbreviations | |
REIT | Real Estate Investment Trust |
^ | Amount rounds to less than 0.1% of net assets. | |
* | Non-income producing security. | |
(a) | Investment in an affiliated fund, which is registered under the Investment Company Act of 1940, as amended, and is advised by J.P. Morgan Investment Management Inc. | |
(b) | The rate shown is the current yield as of December 31, 2023. | |
6 | J.P. Morgan Exchange-Traded Funds | December 31, 2023 |
JPMorgan Equity Focus ETF | |
ASSETS: | |
Investments in non-affiliates, at value | $360,011,458 |
Investments in affiliates, at value | 7,021,627 |
Cash | 28,655 |
Receivables: | |
Fund shares sold | 124,182 |
Dividends from non-affiliates | 93,523 |
Dividends from affiliates | 15,217 |
Total Assets | 367,294,662 |
LIABILITIES: | |
Payables: | |
Investment securities purchased | 263,167 |
Accrued liabilities: | |
Investment advisory fees | 99,968 |
Administration fees | 20,615 |
Printing and mailing costs | 92 |
Custodian and accounting fees | 9,440 |
Other | 14,554 |
Total Liabilities | 407,836 |
Net Assets | $366,886,826 |
NET ASSETS: | |
Paid-in-Capital | $281,892,425 |
Total distributable earnings (loss) | 84,994,401 |
Total Net Assets | $366,886,826 |
Outstanding number of shares (unlimited number of shares authorized - par value $0.0001) (a) | 6,955,111 |
Net asset value, per share | $52.75 |
Cost of investments in non-affiliates | $275,105,977 |
Cost of investments in affiliates | 7,018,575 |
December 31, 2023 | J.P. Morgan Exchange-Traded Funds | 7 |
JPMorgan Equity Focus ETF (a) | |
INVESTMENT INCOME: | |
Interest income from non-affiliates | $570 |
Interest income from affiliates | 16 |
Dividend income from non-affiliates | 1,504,584 |
Dividend income from affiliates | 171,052 |
Total investment income | 1,676,222 |
EXPENSES: | |
Investment advisory fees | 626,635 |
Administration fees | 93,996 |
Distribution fees (See Note 3.C.) | 7,788 |
Service fees (See Note 3.D.) | 32,878 |
Custodian and accounting fees | 14,661 |
Professional fees | 23,842 |
Trustees’ and Chief Compliance Officer’s fees | 12,027 |
Printing and mailing costs | 24,760 |
Registration and filing fees | 38,961 |
Transfer agency fees (See Note 2.F.) | 635 |
Other | 4,040 |
Total expenses | 880,223 |
Less fees waived | (51,860 ) |
Less expense reimbursements | (153,366 ) |
Net expenses | 674,997 |
Net investment income (loss) | 1,001,225 |
REALIZED/UNREALIZED GAINS (LOSSES): | |
Net realized gain (loss) on transactions from: | |
Investments in non-affiliates | 9,468,766 |
Investments in affiliates | 1,456 |
In-kind redemptions of investments in non-affiliates (See Note 4) | 2,893,443 |
Net realized gain (loss) | 12,363,665 |
Change in net unrealized appreciation/depreciation on: | |
Investments in non-affiliates | 14,160,828 |
Investments in affiliates | 2,102 |
Change in net unrealized appreciation/depreciation | 14,162,930 |
Net realized/unrealized gains (losses) | 26,526,595 |
Change in net assets resulting from operations | $27,527,820 |
8 | J.P. Morgan Exchange-Traded Funds | December 31, 2023 |
JPMorgan Equity Focus ETF | ||
Six Months Ended December 31, 2023 (Unaudited)(a) | Year Ended June 30, 2023 (a) | |
CHANGE IN NET ASSETS RESULTING FROM OPERATIONS: | ||
Net investment income (loss) | $1,001,225 | $743,306 |
Net realized gain (loss) | 12,363,665 | (9,034,286 ) |
Change in net unrealized appreciation/depreciation | 14,162,930 | 45,986,915 |
Change in net assets resulting from operations | 27,527,820 | 37,695,935 |
DISTRIBUTIONS TO SHAREHOLDERS: | ||
Total distributions to shareholders | (1,316,197 ) | (3,051,424 ) |
CAPITAL TRANSACTIONS: | ||
Change in net assets resulting from capital transactions | 96,128,091 | 29,979,204 |
NET ASSETS: | ||
Change in net assets | 122,339,714 | 64,623,715 |
Beginning of period | 244,547,112 | 179,923,397 |
End of period | $366,886,826 | $244,547,112 |
December 31, 2023 | J.P. Morgan Exchange-Traded Funds | 9 |
JPMorgan Equity Focus ETF | ||
Six Months Ended December 31, 2023 (Unaudited)(a) | Year Ended June 30, 2023(a) | |
CAPITAL TRANSACTIONS: (b) | ||
Proceeds from shares issued | $128,893,253 | $35,914,400 |
Distributions reinvested | — | 698,903 |
Cost of shares redeemed | (12,775,100 ) | (7,647,667 ) |
Change in net assets resulting from capital transactions | 116,118,153 | 28,965,636 |
Class A | ||
Proceeds from shares issued | 450,351 | 8,559,065 |
Distributions reinvested | — | 285,422 |
Cost of shares redeemed | (1,157,346 ) | (6,815,608 ) |
Change in net assets resulting from Class A capital transactions | (706,995 ) | 2,028,879 |
Class C | ||
Proceeds from shares issued | 58,082 | 2,371,427 |
Distributions reinvested | — | 102,463 |
Cost of shares redeemed | (729,187 ) | (3,880,016 ) |
Change in net assets resulting from Class C capital transactions | (671,105 ) | (1,406,126 ) |
Class I | ||
Proceeds from shares issued | 3,283,083 | 49,318,384 |
Distributions reinvested | — | 1,948,648 |
Cost of shares redeemed | (21,895,045 ) | (50,876,217 ) |
Change in net assets resulting from Class I capital transactions | (18,611,962 ) | 390,815 |
Total change in net assets resulting from capital transactions | $96,128,091 | $29,979,204 |
10 | J.P. Morgan Exchange-Traded Funds | December 31, 2023 |
JPMorgan Equity Focus ETF | ||
Six Months Ended December 31, 2023 (Unaudited)(a) | Year Ended June 30, 2023(a) | |
SHARE TRANSACTIONS: (b) | ||
Issued | 2,559,341 | 1,185,619 |
Reinvested | — | 23,894 |
Redeemed | (258,726 ) | (249,648 ) |
Change in Shares | 2,300,615 | 959,865 |
Class A | ||
Issued | 9,067 | 289,256 |
Reinvested | — | 9,870 |
Redeemed | (23,269 ) | (233,236 ) |
Change in Class A Shares | (14,202 ) | 65,890 |
Class C | ||
Issued | 1,184 | 87,972 |
Reinvested | — | 3,773 |
Redeemed | (14,690 ) | (132,233 ) |
Change in Class C Shares | (13,506 ) | (40,488 ) |
Class I | ||
Issued | 66,311 | 1,633,557 |
Reinvested | — | 65,843 |
Redeemed | (439,873 ) | (1,673,338 ) |
Change in Class I Shares | (373,562 ) | 26,062 |
December 31, 2023 | J.P. Morgan Exchange-Traded Funds | 11 |
Per share operating performance (a) | |||||||
Investment operations | Distributions | ||||||
Net asset value beginning of period | Net investment income (loss)(c) | Net realized and unrealized gains (losses) on investments | Total from investment operations | Net investment income | Net realized gain | Total Distributions | |
JPMorgan Equity Focus ETF (h) | |||||||
Six Months Ended December 31, 2023 (Unaudited) | $48.33 | $0.21 | $4.41 | $4.62 | $(0.20 ) | $— | $(0.20 ) |
Year Ended June 30, 2023 | 41.37 | 0.26 | 7.41 | 7.67 | (0.21 ) | (0.50 ) | (0.71 ) |
Year Ended June 30, 2022 | 50.79 | 0.23 | (3.91 ) | (3.68 ) | (0.16 ) | (5.58 ) | (5.74 ) |
Year Ended June 30, 2021 | 38.86 | 0.26 | 17.20 | 17.46 | (0.33 ) | (5.20 ) | (5.53 ) |
Year Ended June 30, 2020 | 43.46 | 0.43 | 2.41 | 2.84 | (0.34 ) | (7.10 ) | (7.44 ) |
October 1, 2018 through June 30, 2019 | 49.27 | 0.33 | (0.08 ) | 0.25 | (0.76 ) | (5.30 ) | (6.06 ) |
Year Ended June 30, 2019 | 45.63 | 0.26 | 3.38 | 3.64 | (0.53 ) | (5.28 ) | (5.81 ) |
(a) | Per share amounts reflect the conversion of the Predecessor Fund into the Fund as of the close of business on July 28, 2023. See Note 1. |
(b) | Annualized for periods less than one year, unless otherwise noted. |
(c) | Calculated based upon average shares outstanding. |
(d) | Not annualized for periods less than one year. |
(e) | Includes adjustments in accordance with accounting principles generally accepted in the United States of America and as such, the net asset values for financial reporting purposes and the returns based upon those net asset values may differ from the net asset values and returns for shareholder transactions. |
(f) | JPMorgan Equity Focus ETF acquired all of the assets and liabilities of the JPMorgan Equity Focus Fund (“Predecessor Fund”) in a reorganization that occurred as of the close of business on July 28, 2023. Market price returns are calculated using the official closing price of the JPMorgan Equity Focus ETF on the listing exchange as of the time that the JPMorgan Equity Focus ETF's NAV is calculated. Prior to the JPMorgan Equity Focus ETF's listing on July 31, 2023, the NAV performance of the Class R6 Shares of the Predecessor Fund are used as proxy market price returns. |
(g) | Includes interest expense, if applicable, each of which is less than 0.005% unless otherwise noted. |
(h) | JPMorgan Equity Focus ETF (the “Fund”) acquired all of the assets and liabilities of the JPMorgan Equity Focus Fund (“Predecessor Fund”) in a reorganization that occurred as of the close of business on July 28, 2023. Performance and financial history of the Predecessor Fund’s Class R6 Shares have been adopted by the Fund and will be used going forward. As a result, the financial highlight information reflects that of the Predecessor Fund’s Class R6 Shares for the period October 1, 2018 ("Predecessor Fund's Class R6 Shares inception date") up through the reorganization and the Predecessor Fund's Class I Shares for the period July 1, 2018 through June 30, 2019. |
12 | J.P. Morgan Exchange-Traded Funds | December 31, 2023 |
Ratios/Supplemental data | ||||||||
Ratios to average net assets (b) | ||||||||
Net asset value, end of period | Market price, end of period | Total Return(d)(e) | Market price total return(d)(f) | Net assets, end of period | Net expenses(g) | Net investment income (loss) | Expenses without waivers and reimbursements | Portfolio turnover rate(d) |
$52.75 | $52.72 | 9.58 % | 9.51 % | $366,886,826 | 0.50 % | 0.83 % | 0.65 % | 24 % |
48.33 | 48.33 | 18.85 | 18.85 | 73,543,793 | 0.60 | 0.60 | 0.68 | 41 |
41.37 | 41.37 | (8.87 ) | (8.87 ) | 35,124,561 | 0.60 | 0.47 | 0.69 | 29 |
50.79 | 50.79 | 47.82 | 47.82 | 34,054,483 | 0.60 | 0.55 | 0.73 | 58 |
38.86 | 38.86 | 6.39 | 6.39 | 23,880,786 | 0.60 | 1.06 | 0.83 | 44 |
43.46 | 43.46 | 2.03 | 2.03 | 22,345,977 | 0.59 | 1.08 | 0.95 | 45 |
43.46 | 43.46 | 9.50 | 9.50 | 75,887,175 | 0.84 | 0.57 | 1.08 | 45 |
December 31, 2023 | J.P. Morgan Exchange-Traded Funds | 13 |
14 | J.P. Morgan Exchange-Traded Funds | December 31, 2023 |
Level 1 Quoted prices | Level 2 Other significant observable inputs | Level 3 Significant unobservable inputs | Total | |
Total Investments in Securities (a) | $367,033,085 | $— | $— | $367,033,085 |
(a) | Please refer to the SOI for specifics of portfolio holdings. |
December 31, 2023 | J.P. Morgan Exchange-Traded Funds | 15 |
For the six months ended December 31, 2023* | |||||||||
Security Description | Value at June 30, 2023 | Purchases at Cost | Proceeds from Sales | Net Realized Gain (Loss) | Change in Unrealized Appreciation/ (Depreciation) | Value at December 31, 2023 | Shares at December 31, 2023 | Dividend Income | Capital Gain Distributions |
JPMorgan Prime Money Market Fund Class IM Shares, 5.51% (a) (b) | $2,664,835 | $26,933,482 | $22,580,248 | $1,456 | $2,102 | $7,021,627 | 7,016,014 | $171,052 | $— |
(a) | Investment in an affiliated fund, which is registered under the Investment Company Act of 1940, as amended, and is advised by J.P. Morgan Investment Management Inc. |
(b) | The rate shown is the current yield as of December 31, 2023. |
* | As of the close of business on July 28, 2023, JPMorgan Equity Focus Fund (the "Acquired Fund"), a series of Trust I Funds, reorganized ("the Reorganization") into a newly created exchange-traded fund, JPMorgan Equity Focus ETF (the "Fund"). Following the Reorganization, the Acquired Fund's performance and financial history were adopted by the Fund. The table includes transactions from the Acquired Fund for the period July 1, 2023 through July 28, 2023. |
Class A | Class C | Class I | ETF Shares | Total | |
Transfer agency fees | $232 | $51 | $307 | $45 | $635 |
16 | J.P. Morgan Exchange-Traded Funds | December 31, 2023 |
Class A | Class C | |
0.25 % | 0.75 % |
Class A | Class C | Class I | |
0.25 % | 0.25 % | 0.25 % |
December 31, 2023 | J.P. Morgan Exchange-Traded Funds | 17 |
Class A | Class C | Class I | Class R6 | |
1.10 % | 1.60 % | 0.85 % | 0.60 % |
Contractual Waivers | Voluntary Waivers | |||||
Investment Advisory Fees | Administration Fees | Service Fees | Total | Contractual Reimbursements | 12b-1 | |
$27,748 | $13,202 | $484 | $41,434 | $153,233 | $7,788 | |
18 | J.P. Morgan Exchange-Traded Funds | December 31, 2023 |
Purchases (excluding U.S. Government) | Sales (excluding U.S. Government) | |
$58,562,947 | $83,114,526 |
In-Kind Purchases | In-Kind Sales | |
$122,196,285 | $5,835,207 |
Aggregate Cost | Gross Unrealized Appreciation | Gross Unrealized Depreciation | Net Unrealized Appreciation (Depreciation) | |
$282,124,552 | $85,727,200 | $818,667 | $84,908,533 |
Capital Loss Carryforward Character | ||
Short-Term | Long-Term | |
$3,307,035 | $99,741 | |
Net Capital Losses (Gains) | ||
Short-Term | Long-Term | |
$3,361,836 | $1,309,500 | |
December 31, 2023 | J.P. Morgan Exchange-Traded Funds | 19 |
20 | J.P. Morgan Exchange-Traded Funds | December 31, 2023 |
December 31, 2023 | J.P. Morgan Exchange-Traded Funds | 21 |
Beginning Account Value July 1, 2023 | Ending Account Value December 31, 2023 | Expenses Paid During the Period* | Annualized Expense Ratio | |
JPMorgan Equity Focus ETF | ||||
Actual | $1,000.00 | $1,095.80 | $2.63 | 0.50 % |
Hypothetical | 1,000.00 | 1,022.62 | 2.54 | 0.50 |
* | Expenses are equal to the Fund’s annualized net expense ratio, multiplied by the average account value over the period, multiplied by 184/366 (to reflect the one-half year period). |
22 | J.P. Morgan Exchange-Traded Funds | December 31, 2023 |
December 31, 2023 | J.P. Morgan Exchange-Traded Funds | 23 |
24 | J.P. Morgan Exchange-Traded Funds | December 31, 2023 |


ITEM 2. CODE OF ETHICS.
Not applicable to a semi-annual report.
ITEM 3. AUDIT COMMITTEE FINANCIAL EXPERT.
Not applicable to a semi-annual report.
ITEM 4. PRINCIPAL ACCOUNTANT FEES AND SERVICES.
Not applicable to a semi-annual report.
ITEM 5. AUDIT COMMITTEE OF LISTED REGISTRANTS.
Not applicable to a semi-annual report.
ITEM 6. SCHEDULE OF INVESTMENTS.
File Schedule I – Investments in securities of unaffiliated issuers as of the close of the reporting period as set forth in Section 210.12-12 of Regulation S-X, unless the schedule is included as part of the report to shareholders filed under Item 1 of this Form.
Included in Item 1.
ITEM 7. DISCLOSURE OF PROXY VOTING POLICIES AND PROCEDURES FOR CLOSED-END MANAGEMENT INVESTMENT COMPANIES.
Not applicable.
ITEM 8. PORTFOLIO MANAGERS OF CLOSED-END MANAGEMENT INVESTMENT COMPANIES.
Not applicable.
ITEM 9. PURCHASE OF EQUITY SECURITIES BY CLOSED-END MANAGEMENT INVESTMENT COMPANY AND AFFILIATED PURCHASERS.
Not applicable.
ITEM 10. SUBMISSION OF MATTERS TO A VOTE OF SECURITY HOLDERS.
Describe any material changes to the procedures by which shareholders may recommend nominees to the registrant`s board of directors, where those changes were implemented after the registrant last provided disclosure in response to the requirements of Item 7(d)(2)(ii)(G) of Schedule 14A (17 CFR 240.14a-101), or this Item.
No material changes to report.
ITEM 11. CONTROLS AND PROCEDURES.
(a) Disclose the conclusions of the registrant’s principal executive and principal financial officers, or persons performing similar functions, regarding the effectiveness of the registrant’s disclosure controls and procedures (as defined in Rule 30a-3(c) under the Act (17 CFR 270.30a-3(c))) as of a date within 90 days of the filing date of the report that includes the disclosure required by this paragraph, based on the evaluation of these controls and procedures required by Rule 30a-3(b) under the Act (17 CFR 270.30a-3(b))and Rules 13a-15(b) or 15d-15(b) under the Exchange Act (17 CFR 240.13a-15(b) or 240.15d-15(b)).
The Registrant’s principal executive and principal financial officers have concluded, based on their evaluation of the Registrant’s disclosure controls and procedures as of a date within 90 days of the filing date of this report, that the Registrant’s disclosure controls and procedures are reasonably designed to ensure that information required to be disclosed by the Registrant on Form N-CSR is recorded, processed, summarized and reported within the required time periods and that information required to be disclosed by the Registrant in the reports that it files or submits on Form N-CSR is accumulated and communicated to the Registrant’s management, including its principal executive and principal financial officers, as appropriate to allow timely decisions regarding required disclosure.
(b) Disclose any change in the registrant’s internal control over financial reporting (as defined in Rule 30a-3(d) under the Act (17 CFR 270.30a-3(d)) that occurred during the period covered by this report that has materially affected, or is reasonably likely to materially affect, the registrant’s internal control over financial reporting.
There were no changes in the Registrant’s internal control over financial reporting that occurred during the last fiscal quarter covered by this report that have materially affected, or are reasonably likely to materially affect, the Registrant’s internal control over financial reporting.
ITEM 12. DISCLOSURE OF SECURITIES LENDING ACTIVITIES FOR CLOSED-END MANAGEMENT INVESTMENT COMPANIES.
Not applicable.
ITEM 13. EXHIBITS.
| (a) | File the exhibits listed below as part of this Form. Letter or number the exhibits in the sequence indicated. |
(1) Any code of ethics, or amendment thereto, that is the subject of the disclosure required by Item 2, to the extent that the registrant intends to satisfy the Item 2 requirements through filing of an exhibit.
Not applicable.
(2) A separate certification for each principal executive officer and principal financial officer of the registrant as required by Rule 30a-2(a) under the Act (17 CFR 270.30a-2), exactly as set forth below:
(1) Any written solicitation to purchase securities under Rule 23c-1 under the Act (17 CFR 270.23c-1) sent or given during the period covered by the report by or on behalf of the registrant to 10 or more persons.
Not applicable.
(2) Change in the registrant’s independent public accountant. Provide the information called for by Item 4 of Form 8-K under the Exchange Act (17 CFR 249.308). Unless otherwise specified by Item 4, or related to and necessary for a complete understanding of information not previously disclosed, the information should relate to events occurring during the reporting period.
Not applicable.
| (b) | A separate or combined certification for each principal executive officer and principal officer of the registrant as required by Rule 30a-2(b) under the Act of 1940. |
SIGNATURES
Pursuant to the requirements of the Securities Exchange Act of 1934 and the Investment Company Act of 1940, the registrant has duly caused this report to be signed on its behalf by the undersigned, thereunto duly authorized.
J.P. Morgan Exchange-Traded Fund Trust
| By: | /s/ Brian S. Shlissel | |
| Brian S. Shlissel | ||
| President and Principal Executive Officer | ||
| March 4, 2024 |
Pursuant to the requirements of the Securities Exchange Act of 1934 and the Investment Company Act of 1940, this report has been signed below by the following persons on behalf of the registrant and in the capacities and on the dates indicated.
| By: | /s/ Brian S. Shlissel | |
| Brian S. Shlissel | ||
| President and Principal Executive Officer | ||
| March 4, 2024 | ||
| By: | /s/ Timothy J. Clemens | |
| Timothy J. Clemens | ||
| Treasurer and Principal Financial Officer | ||
| March 4, 2024 | ||