UNITED STATES
SECURITIES AND EXCHANGE COMMISSION
Washington, D.C. 20549
FORM N-CSR
CERTIFIED SHAREHOLDER REPORT OF REGISTERED
MANAGEMENT INVESTMENT COMPANIES
Investment Company Act file number: 811-22903
J.P. Morgan Exchange-Traded Fund Trust
(Exact name of registrant as specified in charter)
277 Park Avenue
New York, NY 10172
(Address of principal executive offices) (Zip code)
Gregory S. Samuels
J.P. Morgan Investment Management Inc.
277 Park Avenue
New York, NY 10172
(Name and Address of Agent for Service)
With copies to:
Elizabeth A. Davin, Esq. JPMorgan Chase & Co. 1111 Polaris Parkway Columbus, OH 43240 | Jon S. Rand, Esq. Dechert LLP 1095 Avenue of the Americas New York, NY 10036 |
Registrant’s telephone number, including area code: 1-844-457-6383
Date of fiscal year end: October 31
Date of reporting period: November 1, 2021 through October 31, 2022
Form N-CSR is to be used by management investment companies to file reports with the Commission not later than 10 days after the transmission to stockholders of any report that is required to be transmitted to stockholders under Rule 30e-1 under the Investment Company Act of 1940 (17 CFR 270.30e-1). The Commission may use the information provided on Form N-CSR in its regulatory, disclosure review, inspection, and policymaking roles.
A registrant is required to disclose the information specified by Form N-CSR, and the Commission will make this information public. A registrant is not required to respond to the collection of information contained in Form N-CSR unless the Form displays a currently valid Office of Management and Budget (“OMB”) control number. Please direct comments concerning the accuracy of the information collection burden estimate and any suggestions for reducing the burden to Secretary, Securities and Exchange Commission, 450 Fifth Street, NW, Washington, DC 20549-0609. The OMB has reviewed this collection of information under the clearance requirements of 44 U.S.C. Section 3507.
ITEM 1. REPORTS TO STOCKHOLDERS.
a.) The following is a copy of the report transmitted to shareholders pursuant to Rule 30e-1 under the Investment Company Act of 1940 (17 CFR 270.30e-1).
b.) A copy of the notice transmitted to shareholders in reliance on Rule 30e-3 under the 1940 Act that contains disclosures specified by paragraph (c)(3) of that rule is included in the Annual Reports. Not Applicable. Notices do not incorporate disclosures from the shareholder report.
Fund | Ticker | Listing Exchange |
JPMorgan ActiveBuilders Emerging Markets Equity ETF | JEMA | Cboe BZX Exchange, Inc. |
JPMorgan ActiveBuilders International Equity ETF | JIDA | NYSE Arca |
JPMorgan BetaBuilders Canada ETF | BBCA | Cboe BZX Exchange, Inc. |
JPMorgan BetaBuilders Developed Asia Pacific ex-Japan ETF (formerly known as JPMorgan BetaBuilders Developed Asia ex-Japan ETF) | BBAX | Cboe BZX Exchange, Inc. |
JPMorgan BetaBuilders Europe ETF | BBEU | Cboe BZX Exchange, Inc. |
JPMorgan BetaBuilders International Equity ETF | BBIN | Cboe BZX Exchange, Inc. |
JPMorgan BetaBuilders Japan ETF | BBJP | Cboe BZX Exchange, Inc. |
JPMorgan BetaBuilders U.S. Equity ETF | BBUS | Cboe BZX Exchange, Inc. |
JPMorgan BetaBuilders U.S. Mid Cap Equity ETF | BBMC | NYSE Arca |
JPMorgan BetaBuilders U.S. Small Cap Equity ETF | BBSC | NYSE Arca |
JPMorgan Carbon Transition U.S. Equity ETF | JCTR | NYSE Arca |
JPMorgan Climate Change Solutions ETF | TEMP | NYSE Arca |
JPMorgan Diversified Return Emerging Markets Equity ETF | JPEM | NYSE Arca |
JPMorgan Diversified Return International Equity ETF | JPIN | NYSE Arca |
JPMorgan Diversified Return U.S. Equity ETF | JPUS | NYSE Arca |
JPMorgan Diversified Return U.S. Mid Cap Equity ETF | JPME | NYSE Arca |
JPMorgan Diversified Return U.S. Small Cap Equity ETF | JPSE | NYSE Arca |
JPMorgan International Growth ETF | JIG | NYSE Arca |
JPMorgan U.S. Momentum Factor ETF | JMOM | NYSE Arca |
JPMorgan U.S. Quality Factor ETF | JQUA | NYSE Arca |
JPMorgan U.S. Value Factor ETF | JVAL | NYSE Arca |

1 | |
2 | |
3 | |
6 | |
9 | |
12 | |
15 | |
18 | |
21 | |
24 | |
27 | |
30 | |
33 | |
36 | |
39 | |
42 | |
45 | |
48 | |
51 | |
54 | |
57 | |
60 | |
63 | |
66 | |
216 | |
240 | |
250 | |
289 | |
291 | |
295 | |
297 | |
299 | |
304 |
Past performance is no guarantee of future performance. The general market views expressed in this report are opinions based on market and other conditions through the end of the reporting period and are subject to change without notice. These views are not intended to predict the future performance of a Fund or the securities markets.
Prospective investors should refer to the Funds’ prospectuses for a discussion of the Funds’ investment objectives, strategies and risks. Call J.P. Morgan Exchange-Traded Funds at (844) 457-6383 for a prospectus containing more complete information about a Fund, including management fees and other expenses. Please read it carefully before investing.
Shares are bought and sold throughout the day on an exchange at market price (not at net asset value) through a brokerage account, and are not individually subscribed and redeemed from a Fund. Shares may only be subscribed and redeemed directly from a Fund by Authorized Participants, in large creation/redemption units. Brokerage commissions will reduce returns.
December 15, 2022 (Unaudited)
 | “While investors seek to adapt to the current market environment, we believe a well-diversified portfolio and a patient outlook remain crucial components of a successful invest- ment approach.” — Brian S. Shlissel |

President, J.P. Morgan Funds
J.P. Morgan Asset Management
1-844-457-6383 or www.jpmorganfunds.com for more information
October 31, 2022 | J.P. Morgan Exchange-Traded Funds | 1 |
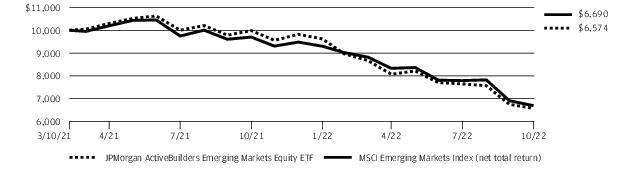
TWELVE MONTHS ENDED October 31, 2022 (Unaudited)
2 | J.P. Morgan Exchange-Traded Funds | October 31, 2022 |
TWELVE MONTHS ENDED October 31, 2022 (Unaudited)
REPORTING PERIOD RETURN: | |
Net Asset Value * | (34.15)% |
Market Price ** | (34.32)% |
MSCI Emerging Markets Index (net total return) | (31.03)% |
Net Assets as of 10/31/2022 | $907,154,126 |
Fund Ticker | JEMA |
October 31, 2022 | J.P. Morgan Exchange-Traded Funds | 3 |
TWELVE MONTHS ENDED October 31, 2022 (Unaudited) (continued)
TOP TEN HOLDINGS OF THE PORTFOLIO AS OF October 31, 2022 | PERCENT OF TOTAL INVESTMENTS | |
1. | Taiwan Semiconductor Manufacturing Co. Ltd. (Taiwan) | 4.6% |
2. | Samsung Electronics Co. Ltd. (South Korea) | 3.5 |
3. | Tencent Holdings Ltd. (China) | 2.1 |
4. | Infosys Ltd. (India) | 2.0 |
5. | Housing Development Finance Corp. Ltd. (India) | 1.8 |
6. | Wal-Mart de Mexico SAB de CV (Mexico) | 1.6 |
7. | Alibaba Group Holding Ltd. (China) | 1.4 |
8. | HDFC Bank Ltd., ADR (India) | 1.3 |
9. | Grupo Financiero Banorte SAB de CV, Class O (Mexico) | 1.2 |
10. | SK Hynix, Inc. (South Korea) | 1.0 |
PORTFOLIO COMPOSITION BY COUNTRY AS OF October 31, 2022 | PERCENT OF TOTAL INVESTMENTS |
China | 25.8% |
Taiwan | 14.7 |
India | 14.3 |
South Korea | 11.9 |
Brazil | 7.5 |
Mexico | 5.1 |
South Africa | 4.1 |
Saudi Arabia | 3.1 |
Indonesia | 2.8 |
Thailand | 1.8 |
Hong Kong | 1.5 |
United States | 1.4 |
United Arab Emirates | 1.1 |
Others (each less than 1.0%) | 4.5 |
Short-Term Investments | 0.4 |
4 | J.P. Morgan Exchange-Traded Funds | October 31, 2022 |
INCEPTION DATE | 1 YEAR | SINCE INCEPTION | |
JPMorgan ActiveBuilders Emerging Markets Equity ETF | |||
Net Asset Value | March 10, 2021 | (34.15)% | (22.52)% |
Market Price | (34.32) | (22.40) |
October 31, 2022 | J.P. Morgan Exchange-Traded Funds | 5 |
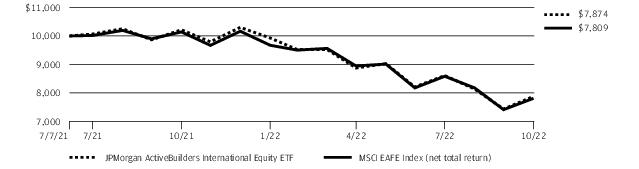
TWELVE MONTHS ENDED October 31, 2022 (Unaudited)
REPORTING PERIOD RETURN: | |
Net Asset Value * | (22.91)% |
Market Price ** | (23.23)% |
MSCI EAFE Index (net total return) | (23.00)% |
Net Assets as of 10/31/2022 | $22,426,876 |
Fund Ticker | JIDA |
6 | J.P. Morgan Exchange-Traded Funds | October 31, 2022 |
TOP TEN HOLDINGS OF THE PORTFOLIO AS OF October 31, 2022 | PERCENT OF TOTAL INVESTMENTS | |
1. | Nestle SA (Registered) | 3.2% |
2. | Roche Holding AG | 2.8 |
3. | Novo Nordisk A/S, Class B (Denmark) | 2.3 |
4. | Shell plc (Netherlands) | 2.2 |
5. | LVMH Moet Hennessy Louis Vuitton SE (France) | 2.1 |
6. | TotalEnergies SE (France) | 2.1 |
7. | ASML Holding NV (Netherlands) | 2.0 |
8. | BHP Group Ltd. (Australia) | 1.7 |
9. | Diageo plc (United Kingdom) | 1.6 |
10. | Novartis AG (Registered) (Switzerland) | 1.6 |
PORTFOLIO COMPOSITION BY COUNTRY AS OF October 31, 2022 | PERCENT OF TOTAL INVESTMENTS |
Japan | 19.1 % |
United Kingdom | 12.5 |
France | 12.1 |
United States | 8.6 |
Germany | 8.2 |
Netherlands | 7.3 |
Australia | 6.2 |
Switzerland | 5.2 |
Denmark | 4.4 |
Sweden | 2.2 |
Spain | 1.9 |
Hong Kong | 1.6 |
Singapore | 1.5 |
Italy | 1.1 |
PORTFOLIO COMPOSITION BY COUNTRY AS OF October 31, 2022 | PERCENT OF TOTAL INVESTMENTS |
Finland | 1.1% |
Others (each less than 1.0%) | 5.6 |
Short-Term Investments | 1.4 |
October 31, 2022 | J.P. Morgan Exchange-Traded Funds | 7 |
TWELVE MONTHS ENDED October 31, 2022 (Unaudited) (continued)
INCEPTION DATE | 1 YEAR | SINCE INCEPTION | |
JPMorgan ActiveBuilders International Equity ETF | |||
Net Asset Value | July 7, 2021 | (22.91)% | (16.59)% |
Market Price | (23.23) | (16.62) |
8 | J.P. Morgan Exchange-Traded Funds | October 31, 2022 |
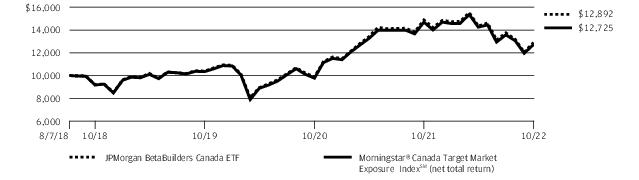
TWELVE MONTHS ENDED October 31, 2022 (Unaudited)
REPORTING PERIOD RETURN: | |
Net Asset Value * | (13.34)% |
Market Price ** | (13.49)% |
Morningstar® Canada Target Market Exposure IndexSM (net total return) | (13.40)% |
Net Assets as of 10/31/2022 | $5,644,273,295 |
Fund Ticker | BBCA |
TOP TEN HOLDINGS OF THE PORTFOLIO AS OF October 31, 2022 | PERCENT OF TOTAL INVESTMENTS | |
1. | Royal Bank of Canada (Canada) | 6.9% |
2. | Toronto-Dominion Bank (The) (Canada) | 6.2 |
3. | Enbridge, Inc. (Canada) | 4.2 |
4. | Canadian National Railway Co. (Canada) | 3.9 |
5. | Canadian Pacific Railway Ltd. (Canada) | 3.7 |
6. | Canadian Natural Resources Ltd. (Canada) | 3.6 |
7. | Bank of Montreal (Canada) | 3.3 |
8. | Bank of Nova Scotia (The) (Canada) | 3.1 |
9. | Brookfield Asset Management, Inc., Class A (Canada) | 3.0 |
10. | Suncor Energy, Inc. (Canada) | 2.5 |
PORTFOLIO COMPOSITION BY SECTOR AS OF October 31, 2022 | PERCENT OF TOTAL INVESTMENTS |
Financials | 32.9% |
Energy | 18.0 |
Industrials | 13.1 |
Materials | 9.5 |
Information Technology | 5.1 |
Consumer Staples | 4.1 |
Consumer Discretionary | 3.3 |
Utilities | 3.1 |
Communication Services | 2.8 |
Others (each less than 1.0%) | 0.7 |
Short-Term Investments | 7.4 |
October 31, 2022 | J.P. Morgan Exchange-Traded Funds | 9 |
TWELVE MONTHS ENDED October 31, 2022 (Unaudited) (continued)
10 | J.P. Morgan Exchange-Traded Funds | October 31, 2022 |
INCEPTION DATE | 1 YEAR | SINCE INCEPTION | |
JPMorgan BetaBuilders Canada ETF | |||
Net Asset Value | August 7, 2018 | (13.34)% | 6.18% |
Market Price | (13.49) | 6.20 |
October 31, 2022 | J.P. Morgan Exchange-Traded Funds | 11 |
(formerly known as JPMorgan BetaBuilders Developed Asia ex-Japan ETF)
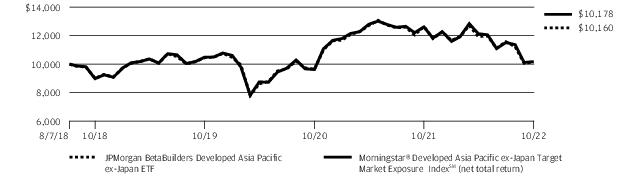
TWELVE MONTHS ENDED October 31, 2022 (Unaudited)
REPORTING PERIOD RETURN: | |
Net Asset Value * | (19.60)% |
Market Price ** | (19.87)% |
Morningstar® Developed Asia Pacific ex-Japan Target Market Exposure IndexSM (net total return) | (19.32)% |
Net Assets as of 10/31/2022 | $3,412,010,904 |
Fund Ticker | BBAX |
TOP TEN HOLDINGS OF THE PORTFOLIO AS OF October 31, 2022 | PERCENT OF TOTAL INVESTMENTS | |
1. | BHP Group Ltd. (Australia) | 7.6% |
2. | Commonwealth Bank of Australia (Australia) | 7.2 |
3. | AIA Group Ltd. (Hong Kong) | 5.7 |
4. | CSL Ltd. | 5.4 |
5. | National Australia Bank Ltd. (Australia) | 4.1 |
6. | Westpac Banking Corp. (Australia) | 3.4 |
7. | Australia & New Zealand Banking Group Ltd. (Australia) | 3.1 |
8. | DBS Group Holdings Ltd. (Singapore) | 2.8 |
9. | Woodside Energy Group Ltd. (Australia) | 2.8 |
10. | Macquarie Group Ltd. (Australia) | 2.5 |
PORTFOLIO COMPOSITION BY COUNTRY AS OF October 31, 2022 | PERCENT OF TOTAL INVESTMENTS |
Australia | 59.3 % |
Hong Kong | 17.0 |
Singapore | 11.3 |
United States | 6.6 |
China | 2.3 |
New Zealand | 1.9 |
Others (each less than 1.0%) | 1.6 |
Short-Term Investments | 0.0**** |
12 | J.P. Morgan Exchange-Traded Funds | October 31, 2022 |
**** | Amount rounds to less than 0.1%. |
October 31, 2022 | J.P. Morgan Exchange-Traded Funds | 13 |
(formerly known as JPMorgan BetaBuilders Developed Asia ex-Japan ETF)
TWELVE MONTHS ENDED October 31, 2022 (Unaudited) (continued)
INCEPTION DATE | 1 YEAR | SINCE INCEPTION | |
JPMorgan BetaBuilders Developed Asia Pacific ex-Japan ETF (formerly known as JPMorgan BetaBuilders Developed Asia ex-Japan ETF) | |||
Net Asset Value | August 7, 2018 | (19.60)% | 0.38% |
Market Price | (19.87) | 0.39 |
14 | J.P. Morgan Exchange-Traded Funds | October 31, 2022 |
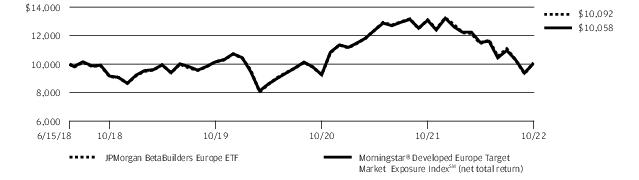
TWELVE MONTHS ENDED October 31, 2022 (Unaudited)
REPORTING PERIOD RETURN: | |
Net Asset Value * | (23.01)% |
Market Price ** | (23.22)% |
Morningstar® Developed Europe Target Market Exposure IndexSM (net total return) | (23.13)% |
Net Assets as of 10/31/2022 | $3,527,687,759 |
Fund Ticker | BBEU |
TOP TEN HOLDINGS OF THE PORTFOLIO AS OF October 31, 2022 | PERCENT OF TOTAL INVESTMENTS | |
1. | Nestle SA (Registered) | 3.5% |
2. | Roche Holding AG | 2.7 |
3. | Shell plc (Netherlands) | 2.5 |
4. | Novartis AG (Registered) (Switzerland) | 2.3 |
5. | ASML Holding NV (Netherlands) | 2.2 |
6. | AstraZeneca plc (United Kingdom) | 2.1 |
7. | Novo Nordisk A/S, Class B (Denmark) | 2.1 |
8. | LVMH Moet Hennessy Louis Vuitton SE (France) | 1.9 |
9. | TotalEnergies SE (France) | 1.6 |
10. | Unilever plc (United Kingdom) | 1.4 |
PORTFOLIO COMPOSITION BY COUNTRY AS OF October 31, 2022 | PERCENT OF TOTAL INVESTMENTS |
United Kingdom | 18.8 % |
France | 15.9 |
Germany | 11.3 |
United States | 9.0 |
Switzerland | 8.8 |
Netherlands | 8.2 |
Sweden | 5.2 |
Denmark | 4.1 |
Spain | 3.8 |
Italy | 3.3 |
Finland | 2.1 |
Australia | 1.7 |
Belgium | 1.5 |
Norway | 1.3 |
Others (each less than 1.0%) | 3.9 |
Short-Term Investments | 1.1 |
October 31, 2022 | J.P. Morgan Exchange-Traded Funds | 15 |
TWELVE MONTHS ENDED October 31, 2022 (Unaudited) (continued)
16 | J.P. Morgan Exchange-Traded Funds | October 31, 2022 |
INCEPTION DATE | 1 YEAR | SINCE INCEPTION | |
JPMorgan BetaBuilders Europe ETF | |||
Net Asset Value | June 15, 2018 | (23.01)% | 0.21% |
Market Price | (23.22) | 0.22 |
October 31, 2022 | J.P. Morgan Exchange-Traded Funds | 17 |
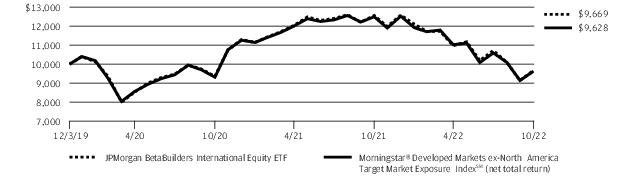
TWELVE MONTHS ENDED October 31, 2022 (Unaudited)
REPORTING PERIOD RETURN: | |
Net Asset Value * | (23.02)% |
Market Price ** | (23.11)% |
Morningstar® Developed Markets ex-North America Target Market Exposure IndexSM (net total return) | (22.95)% |
Net Assets as of 10/31/2022 | $2,710,097,518 |
Fund Ticker | BBIN |
TOP TEN HOLDINGS OF THE PORTFOLIO AS OF October 31, 2022 | PERCENT OF TOTAL INVESTMENTS | |
1. | Nestle SA (Registered) | 2.2% |
2. | Roche Holding AG | 1.7 |
3. | Shell plc (Netherlands) | 1.6 |
4. | Novartis AG (Registered) (Switzerland) | 1.4 |
5. | ASML Holding NV (Netherlands) | 1.4 |
6. | AstraZeneca plc (United Kingdom) | 1.3 |
7. | Novo Nordisk A/S, Class B (Denmark) | 1.3 |
8. | Toyota Motor Corp. (Japan) | 1.3 |
9. | LVMH Moet Hennessy Louis Vuitton SE (France) | 1.2 |
10. | TotalEnergies SE (France) | 1.0 |
PORTFOLIO COMPOSITION BY COUNTRY AS OF October 31, 2022 | PERCENT OF TOTAL INVESTMENTS |
Japan | 23.7 % |
United Kingdom | 12.1 |
France | 10.1 |
Australia | 8.0 |
Germany | 7.2 |
United States | 6.5 |
Switzerland | 5.6 |
Netherlands | 5.2 |
Sweden | 3.3 |
Denmark | 2.6 |
Spain | 2.4 |
Hong Kong | 2.2 |
Italy | 2.1 |
Singapore | 1.5 |
Finland | 1.3 |
Others (each less than 1.0%) | 5.1 |
Short-Term Investments | 1.1 |
18 | J.P. Morgan Exchange-Traded Funds | October 31, 2022 |
October 31, 2022 | J.P. Morgan Exchange-Traded Funds | 19 |
TWELVE MONTHS ENDED October 31, 2022 (Unaudited) (continued)
INCEPTION DATE | 1 YEAR | SINCE INCEPTION | |
JPMorgan BetaBuilders International Equity ETF | |||
Net Asset Value | December 3, 2019 | (23.02)% | (1.15)% |
Market Price | (23.11) | (1.13) |
20 | J.P. Morgan Exchange-Traded Funds | October 31, 2022 |
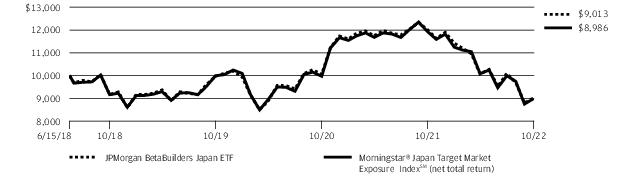
TWELVE MONTHS ENDED October 31, 2022 (Unaudited)
REPORTING PERIOD RETURN: | |
Net Asset Value * | (24.96)% |
Market Price ** | (24.95)% |
Morningstar® Japan Target Market Exposure IndexSM (net total return) | (24.66)% |
Net Assets as of 10/31/2022 | $6,211,237,563 |
Fund Ticker | BBJP |
TOP TEN HOLDINGS OF THE PORTFOLIO AS OF October 31, 2022 | PERCENT OF TOTAL INVESTMENTS | |
1. | Toyota Motor Corp. (Japan) | 5.4% |
2. | Sony Group Corp. (Japan) | 2.6 |
3. | Keyence Corp. (Japan) | 2.3 |
4. | Daiichi Sankyo Co. Ltd. (Japan) | 1.9 |
5. | Mitsubishi UFJ Financial Group, Inc. (Japan) | 1.9 |
6. | Recruit Holdings Co. Ltd. (Japan) | 1.6 |
7. | SoftBank Group Corp. (Japan) | 1.6 |
8. | Nintendo Co. Ltd. (Japan) | 1.5 |
9. | KDDI Corp. (Japan) | 1.4 |
10. | Hitachi Ltd. (Japan) | 1.4 |
PORTFOLIO COMPOSITION BY SECTOR AS OF October 31, 2022 | PERCENT OF TOTAL INVESTMENTS |
Industrials | 22.8% |
Consumer Discretionary | 18.9 |
Information Technology | 12.5 |
Health Care | 10.4 |
Financials | 10.0 |
Communication Services | 7.9 |
Consumer Staples | 6.8 |
Materials | 4.7 |
Real Estate | 4.0 |
Others (each less than 1.0%) | 1.7 |
Short-Term Investments | 0.3 |
October 31, 2022 | J.P. Morgan Exchange-Traded Funds | 21 |
TWELVE MONTHS ENDED October 31, 2022 (Unaudited) (continued)
22 | J.P. Morgan Exchange-Traded Funds | October 31, 2022 |
INCEPTION DATE | 1 YEAR | SINCE INCEPTION | |
JPMorgan BetaBuilders Japan ETF | |||
Net Asset Value | June 15, 2018 | (24.96)% | (2.35)% |
Market Price | (24.95) | (2.33) |
October 31, 2022 | J.P. Morgan Exchange-Traded Funds | 23 |
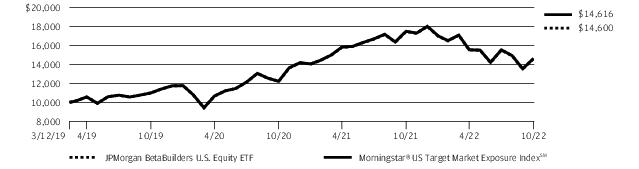
TWELVE MONTHS ENDED October 31, 2022 (Unaudited)
REPORTING PERIOD RETURN: | |
Net Asset Value * | (16.42)% |
Market Price ** | (16.33)% |
Morningstar® US Target Market Exposure IndexSM | (16.42)% |
Net Assets as of 10/31/2022 | $1,276,523,608 |
Fund Ticker | BBUS |
TOP TEN HOLDINGS OF THE PORTFOLIO AS OF October 31, 2022 | PERCENT OF TOTAL INVESTMENTS | |
1. | Apple, Inc. | 6.8% |
2. | Microsoft Corp. | 5.0 |
3. | Amazon.com, Inc. | 2.6 |
4. | Tesla, Inc. | 1.8 |
5. | Alphabet, Inc., Class A | 1.7 |
6. | Berkshire Hathaway, Inc., Class B | 1.6 |
7. | UnitedHealth Group, Inc. | 1.5 |
8. | Alphabet, Inc., Class C | 1.5 |
9. | Exxon Mobil Corp. | 1.4 |
10. | Johnson & Johnson | 1.3 |
PORTFOLIO COMPOSITION BY SECTOR AS OF October 31, 2022 | PERCENT OF TOTAL INVESTMENTS |
Information Technology | 26.4% |
Health Care | 15.1 |
Financials | 11.5 |
Consumer Discretionary | 10.8 |
Industrials | 8.0 |
Communication Services | 7.3 |
Consumer Staples | 6.6 |
Energy | 5.2 |
Utilities | 2.9 |
Real Estate | 2.7 |
Materials | 2.5 |
Short-Term Investments | 1.0 |
24 | J.P. Morgan Exchange-Traded Funds | October 31, 2022 |
October 31, 2022 | J.P. Morgan Exchange-Traded Funds | 25 |
TWELVE MONTHS ENDED October 31, 2022 (Unaudited) (continued)
INCEPTION DATE | 1 YEAR | SINCE INCEPTION | |
JPMorgan BetaBuilders U.S. Equity ETF | |||
Net Asset Value | March 12, 2019 | (16.42)% | 10.96% |
Market Price | (16.33) | 10.98 |
26 | J.P. Morgan Exchange-Traded Funds | October 31, 2022 |
TWELVE MONTHS ENDED October 31, 2022 (Unaudited)
REPORTING PERIOD RETURN: | |
Net Asset Value * | (19.87)% |
Market Price ** | (20.10)% |
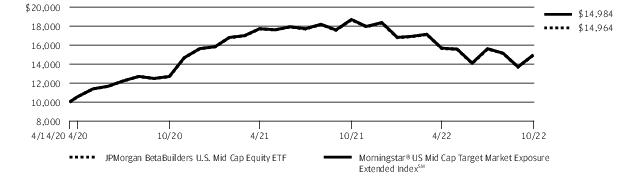
Morningstar® US Mid Cap Target Market Exposure Extended IndexSM | (19.90)% |
Net Assets as of 10/31/2022 | $1,390,564,346 |
Fund Ticker | BBMC |
TOP TEN HOLDINGS OF THE PORTFOLIO AS OF October 31, 2022 | PERCENT OF TOTAL INVESTMENTS | |
1. | LPL Financial Holdings, Inc. | 0.7% |
2. | EQT Corp. | 0.5 |
3. | APA Corp. | 0.5 |
4. | First Solar, Inc. | 0.5 |
5. | Booz Allen Hamilton Holding Corp. | 0.5 |
6. | First Horizon Corp. | 0.5 |
7. | Ovintiv, Inc. | 0.4 |
8. | Gaming and Leisure Properties, Inc. | 0.4 |
9. | Darling Ingredients, Inc. | 0.4 |
10. | Carlisle Cos., Inc. | 0.4 |
PORTFOLIO COMPOSITION BY SECTOR AS OF October 31, 2022 | PERCENT OF TOTAL INVESTMENTS |
Industrials | 18.1% |
Financials | 14.6 |
Information Technology | 12.5 |
Consumer Discretionary | 12.5 |
Health Care | 11.1 |
Real Estate | 8.6 |
Materials | 5.5 |
Energy | 5.5 |
Consumer Staples | 3.5 |
Utilities | 2.6 |
Communication Services | 2.3 |
Short-Term Investments | 3.2 |
October 31, 2022 | J.P. Morgan Exchange-Traded Funds | 27 |
TWELVE MONTHS ENDED October 31, 2022 (Unaudited) (continued)
28 | J.P. Morgan Exchange-Traded Funds | October 31, 2022 |
INCEPTION DATE | 1 YEAR | SINCE INCEPTION | |
JPMorgan BetaBuilders U.S. Mid Cap Equity ETF | |||
Net Asset Value | April 14, 2020 | (19.87)% | 17.14% |
Market Price | (20.10) | 17.05 |
October 31, 2022 | J.P. Morgan Exchange-Traded Funds | 29 |
TWELVE MONTHS ENDED October 31, 2022 (Unaudited)
REPORTING PERIOD RETURN: | |
Net Asset Value * | (17.87)% |
Market Price ** | (18.39)% |
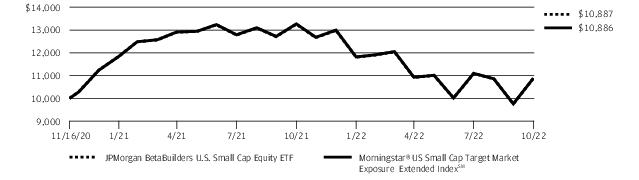
Morningstar® US Small Cap Target Market Exposure Extended IndexSM | (17.94)% |
Net Assets as of 10/31/2022 | $494,762,260 |
Fund Ticker | BBSC |
TOP TEN HOLDINGS OF THE PORTFOLIO AS OF October 31, 2022 | PERCENT OF TOTAL INVESTMENTS | |
1. | Toast, Inc., Class A | 0.5% |
2. | Chord Energy Corp. | 0.5 |
3. | Karuna Therapeutics, Inc. | 0.4 |
4. | Livent Corp. | 0.4 |
5. | Applied Industrial Technologies, Inc. | 0.4 |
6. | PBF Energy, Inc., Class A | 0.4 |
7. | Denbury, Inc. | 0.3 |
8. | Comfort Systems USA, Inc. | 0.3 |
9. | Magnolia Oil & Gas Corp., Class A | 0.3 |
10. | Fluor Corp. | 0.3 |
PORTFOLIO COMPOSITION BY SECTOR AS OF October 31, 2022 | PERCENT OF TOTAL INVESTMENTS |
Financials | 17.5% |
Industrials | 16.3 |
Health Care | 14.1 |
Information Technology | 13.0 |
Consumer Discretionary | 10.1 |
Energy | 6.9 |
Real Estate | 5.1 |
Materials | 4.5 |
Consumer Staples | 3.9 |
Communication Services | 2.5 |
Utilities | 2.2 |
Short-Term Investments | 3.9 |
30 | J.P. Morgan Exchange-Traded Funds | October 31, 2022 |
October 31, 2022 | J.P. Morgan Exchange-Traded Funds | 31 |
TWELVE MONTHS ENDED October 31, 2022 (Unaudited) (continued)
INCEPTION DATE | 1 YEAR | SINCE INCEPTION | |
JPMorgan BetaBuilders U.S. Small Cap Equity ETF | |||
Net Asset Value | November 16, 2020 | (17.87)% | 4.44% |
Market Price | (18.39) | 4.16 |
32 | J.P. Morgan Exchange-Traded Funds | October 31, 2022 |
TWELVE MONTHS ENDED October 31, 2022 (Unaudited)
REPORTING PERIOD RETURN: | |
Net Asset Value * | (14.79)% |
Market Price ** | (14.79)% |
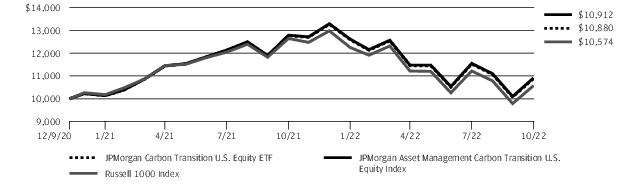
JPMorgan Asset Management Carbon Transition U.S. Equity Index | (14.67)% |
Russell 1000 Index | (16.38)% |
Net Assets as of 10/31/2022 | $20,947,681 |
Fund Ticker | JCTR |
TOP TEN HOLDINGS OF THE PORTFOLIO AS OF October 31, 2022 | PERCENT OF TOTAL INVESTMENTS | |
1. | Apple, Inc. | 6.7% |
2. | Microsoft Corp. | 5.0 |
3. | Alphabet, Inc., Class A | 3.2 |
4. | Amazon.com, Inc. | 2.5 |
5. | Tesla, Inc. | 1.9 |
6. | UnitedHealth Group, Inc. | 1.8 |
7. | Exxon Mobil Corp. | 1.6 |
8. | Johnson & Johnson | 1.6 |
9. | Visa, Inc., Class A | 1.3 |
10. | Chevron Corp. | 1.3 |
PORTFOLIO COMPOSITION BY SECTOR AS OF October 31, 2022 | PERCENT OF TOTAL INVESTMENTS |
Information Technology | 28.4% |
Health Care | 15.7 |
Financials | 11.7 |
Consumer Discretionary | 10.4 |
Communication Services | 7.1 |
Industrials | 6.9 |
Consumer Staples | 6.1 |
Energy | 5.3 |
Real Estate | 3.1 |
Utilities | 2.6 |
Materials | 2.5 |
Short-Term Investments | 0.2 |
October 31, 2022 | J.P. Morgan Exchange-Traded Funds | 33 |
TWELVE MONTHS ENDED October 31, 2022 (Unaudited) (continued)
34 | J.P. Morgan Exchange-Traded Funds | October 31, 2022 |
INCEPTION DATE | 1 YEAR | SINCE INCEPTION | |
JPMorgan Carbon Transition U.S. Equity ETF | |||
Net Asset Value | December 9, 2020 | (14.79)% | 4.55% |
Market Price | (14.79) | 4.57 |
October 31, 2022 | J.P. Morgan Exchange-Traded Funds | 35 |
FOR THE PERIOD December 13, 2021 (FUND INCEPTION) THROUGH October 31, 2022 (Unaudited)
REPORTING PERIOD RETURN: | |
Net Asset Value * | (25.87)% |
Market Price ** | (25.56)% |
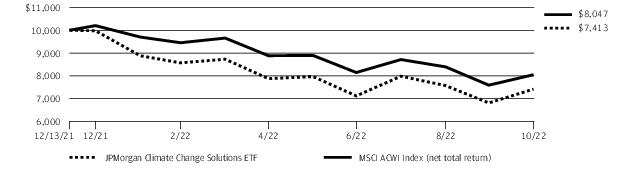
MSCI ACWI Index (net total return) | (21.14)% |
Net Assets as of 10/31/2022 | $19,560,686 |
Fund Ticker | TEMP |
36 | J.P. Morgan Exchange-Traded Funds | October 31, 2022 |
TOP TEN HOLDINGS OF THE PORTFOLIO AS OF October 31, 2022 | PERCENT OF TOTAL INVESTMENTS | |
1. | Deere & Co. | 4.7% |
2. | Trane Technologies plc | 3.9 |
3. | Xylem, Inc. | 3.9 |
4. | NextEra Energy, Inc. | 3.8 |
5. | Autodesk, Inc. | 3.5 |
6. | Schneider Electric SE | 3.5 |
7. | AGCO Corp. | 3.3 |
8. | Carrier Global Corp. | 3.3 |
9. | Keyence Corp. (Japan) | 3.1 |
10. | Enphase Energy, Inc. | 3.0 |
PORTFOLIO COMPOSITION BY COUNTRY AS OF October 31, 2022 | PERCENT OF TOTAL INVESTMENTS |
United States | 44.2 % |
United Kingdom | 7.2 |
France | 6.8 |
Germany | 6.4 |
Japan | 6.1 |
Switzerland | 5.6 |
Spain | 5.3 |
Finland | 2.9 |
South Korea | 2.9 |
Netherlands | 2.6 |
Italy | 2.0 |
Canada | 1.9 |
China | 1.9 |
Sweden | 1.6 |
PORTFOLIO COMPOSITION BY COUNTRY AS OF October 31, 2022 | PERCENT OF TOTAL INVESTMENTS |
Ireland | 1.2% |
Others (each less than 1.0%) | 1.4 |
October 31, 2022 | J.P. Morgan Exchange-Traded Funds | 37 |
FOR THE PERIOD December 13, 2021 (FUND INCEPTION) THROUGH October 31, 2022 (Unaudited) (continued)
INCEPTION DATE | CUMULATIVE SINCE INCEPTION | |
JPMorgan Climate Change Solutions ETF | ||
Net Asset Value | December 13, 2021 | (25.87)% |
Market Price | (25.56) |
38 | J.P. Morgan Exchange-Traded Funds | October 31, 2022 |
TWELVE MONTHS ENDED October 31, 2022 (Unaudited)
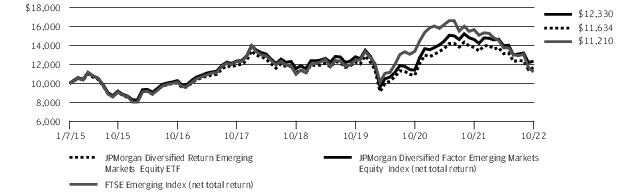
REPORTING PERIOD RETURN: | |
Net Asset Value * | (15.61)% |
Market Price ** | (15.20)% |
JP Morgan Diversified Factor Emerging Markets Equity Index (net total return) | (15.62)% |
FTSE Emerging Index (net total return) | (28.39)% |
Net Assets as of 10/31/2022 | $163,926,226 |
Fund Ticker | JPEM |
October 31, 2022 | J.P. Morgan Exchange-Traded Funds | 39 |
TWELVE MONTHS ENDED October 31, 2022 (Unaudited) (continued)
TOP TEN HOLDINGS OF THE PORTFOLIO AS OF October 31, 2022 | PERCENT OF TOTAL INVESTMENTS | |
1. | Infosys Ltd. (India) | 1.9% |
2. | Vale SA (Brazil) | 1.4 |
3. | Reliance Industries Ltd. (India) | 1.1 |
4. | Hindustan Unilever Ltd. (India) | 1.1 |
5. | Taiwan Semiconductor Manufacturing Co. Ltd. (Taiwan) | 1.1 |
6. | Petroleo Brasileiro SA (Preference) (Brazil) | 1.1 |
7. | Grupo Financiero Banorte SAB de CV, Class O (Mexico) | 1.0 |
8. | Tata Consultancy Services Ltd. (India) | 0.9 |
9. | Emirates Telecommunications Group Co. PJSC (United Arab Emirates) | 0.9 |
10. | National Bank of Kuwait SAKP (Kuwait) | 0.9 |
PORTFOLIO COMPOSITION BY COUNTRY AS OF October 31, 2022 | PERCENT OF TOTAL INVESTMENTS |
China | 22.1 % |
India | 11.8 |
Brazil | 10.0 |
Taiwan | 10.0 |
Mexico | 7.2 |
Turkey | 6.7 |
Saudi Arabia | 6.4 |
South Africa | 5.5 |
Indonesia | 3.7 |
United Arab Emirates | 3.1 |
Thailand | 2.3 |
Kuwait | 2.3 |
Qatar | 2.3 |
Malaysia | 2.1 |
PORTFOLIO COMPOSITION BY COUNTRY AS OF October 31, 2022 | PERCENT OF TOTAL INVESTMENTS |
Chile | 1.2% |
Greece | 1.0 |
Others (each less than 1.0%) | 2.2 |
Short-Term Investments | 0.1 |
40 | J.P. Morgan Exchange-Traded Funds | October 31, 2022 |
INCEPTION DATE | 1 YEAR | 5 YEAR | SINCE INCEPTION | |
JPMorgan Diversified Return Emerging Markets Equity ETF | ||||
Net Asset Value | January 7, 2015 | (15.61)% | (0.53)% | 1.96% |
Market Price | (15.20) | (0.48) | 2.04 |
October 31, 2022 | J.P. Morgan Exchange-Traded Funds | 41 |
TWELVE MONTHS ENDED October 31, 2022 (Unaudited)
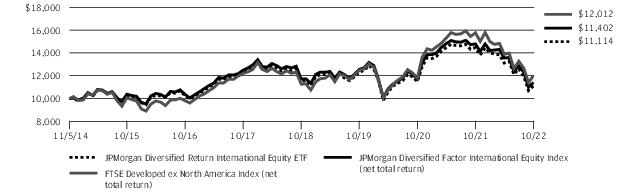
REPORTING PERIOD RETURN: | |
Net Asset Value * | (23.21)% |
Market Price ** | (23.15)% |
JP Morgan Diversified Factor International Equity Index (net total return) | (22.92)% |
FTSE Developed ex North America Index (net total return) | (23.81)% |
Net Assets as of 10/31/2022 | $671,062,140 |
Fund Ticker | JPIN |
TOP TEN HOLDINGS OF THE PORTFOLIO AS OF October 31, 2022 | PERCENT OF TOTAL INVESTMENTS | |
1. | Shell plc (Netherlands) | 0.5% |
2. | Imperial Brands plc (United Kingdom) | 0.5 |
3. | KT&G Corp. (South Korea) | 0.5 |
4. | Pearson plc (United Kingdom) | 0.5 |
5. | Glencore plc (Australia) | 0.5 |
6. | BAE Systems plc (United Kingdom) | 0.5 |
7. | Novo Nordisk A/S, Class B (Denmark) | 0.4 |
8. | British American Tobacco plc (United Kingdom) | 0.4 |
9. | AstraZeneca plc (United Kingdom) | 0.4 |
10. | NN Group NV (Netherlands) | 0.4 |
42 | J.P. Morgan Exchange-Traded Funds | October 31, 2022 |
PORTFOLIO COMPOSITION BY COUNTRY AS OF October 31, 2022 | PERCENT OF TOTAL INVESTMENTS |
Japan | 30.0% |
United Kingdom | 16.0 |
Australia | 10.7 |
South Korea | 6.7 |
France | 4.2 |
Sweden | 3.5 |
Netherlands | 3.4 |
Hong Kong | 2.9 |
Singapore | 2.9 |
Germany | 2.5 |
Spain | 2.1 |
Italy | 2.1 |
United States | 1.8 |
Finland | 1.6 |
Switzerland | 1.6 |
China | 1.4 |
PORTFOLIO COMPOSITION BY COUNTRY AS OF October 31, 2022 | PERCENT OF TOTAL INVESTMENTS |
Norway | 1.2% |
Others (each less than 1.0%) | 4.7 |
Short-Term Investments | 0.7 |
October 31, 2022 | J.P. Morgan Exchange-Traded Funds | 43 |
TWELVE MONTHS ENDED October 31, 2022 (Unaudited) (continued)
INCEPTION DATE | 1 YEAR | 5 YEAR | SINCE INCEPTION | |
JPMorgan Diversified Return International Equity ETF | ||||
Net Asset Value | November 5, 2014 | (23.21)% | (2.06)% | 1.33% |
Market Price | (23.15) | (2.08) | 1.35 |
44 | J.P. Morgan Exchange-Traded Funds | October 31, 2022 |
TWELVE MONTHS ENDED October 31, 2022 (Unaudited)
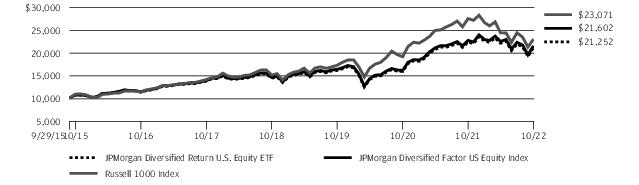
REPORTING PERIOD RETURN: | |
Net Asset Value * | (5.36)% |
Market Price ** | (5.28)% |
JP Morgan Diversified Factor US Equity Index | (5.25)% |
Russell 1000 Index | (16.38)% |
Net Assets as of 10/31/2022 | $507,282,453 |
Fund Ticker | JPUS |
TOP TEN HOLDINGS OF THE PORTFOLIO AS OF October 31, 2022 | PERCENT OF TOTAL INVESTMENTS | |
1. | Prologis, Inc. | 0.5% |
2. | Eli Lilly & Co. | 0.5 |
3. | Steel Dynamics, Inc. | 0.5 |
4. | Marathon Oil Corp. | 0.5 |
5. | Lockheed Martin Corp. | 0.5 |
6. | Bristol-Myers Squibb Co. | 0.5 |
7. | Cigna Corp. | 0.5 |
8. | Elevance Health, Inc. | 0.5 |
9. | Vertex Pharmaceuticals, Inc. | 0.5 |
10. | Archer-Daniels-Midland Co. | 0.4 |
PORTFOLIO COMPOSITION BY SECTOR AS OF October 31, 2022 | PERCENT OF TOTAL INVESTMENTS |
Consumer Staples | 14.9% |
Health Care | 12.4 |
Utilities | 11.2 |
Industrials | 9.8 |
Financials | 8.7 |
Technology | 8.6 |
Real Estate | 7.8 |
Basic Materials | 7.8 |
Consumer Discretionary | 7.7 |
Energy | 5.5 |
Telecommunications | 5.3 |
Short-Term Investments | 0.3 |
October 31, 2022 | J.P. Morgan Exchange-Traded Funds | 45 |
TWELVE MONTHS ENDED October 31, 2022 (Unaudited) (continued)
46 | J.P. Morgan Exchange-Traded Funds | October 31, 2022 |
INCEPTION DATE | 1 YEAR | 5 YEAR | SINCE INCEPTION | |
JPMorgan Diversified Return U.S. Equity ETF | ||||
Net Asset Value | September 29, 2015 | (5.36)% | 8.90% | 11.22% |
Market Price | (5.28) | 8.92 | 11.24 |
October 31, 2022 | J.P. Morgan Exchange-Traded Funds | 47 |
TWELVE MONTHS ENDED October 31, 2022 (Unaudited)
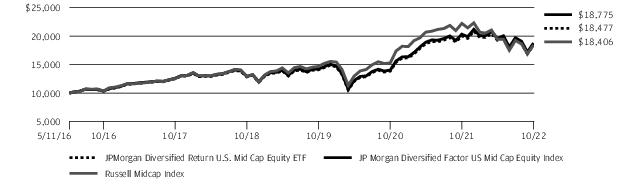
REPORTING PERIOD RETURN: | |
Net Asset Value * | (7.79)% |
Market Price ** | (7.90)% |
JP Morgan Diversified Factor US Mid Cap Equity Index | (7.63)% |
Russell Midcap Index | (17.17)% |
Net Assets as of 10/31/2022 | $267,520,530 |
Fund Ticker | JPME |
TOP TEN HOLDINGS OF THE PORTFOLIO AS OF October 31, 2022 | PERCENT OF TOTAL INVESTMENTS | |
1. | Marathon Oil Corp. | 0.5% |
2. | Principal Financial Group, Inc. | 0.5 |
3. | Steel Dynamics, Inc. | 0.5 |
4. | Quest Diagnostics, Inc. | 0.5 |
5. | Ubiquiti, Inc. | 0.5 |
6. | LPL Financial Holdings, Inc. | 0.5 |
7. | Devon Energy Corp. | 0.5 |
8. | Diamondback Energy, Inc. | 0.4 |
9. | J M Smucker Co. (The) | 0.4 |
10. | NRG Energy, Inc. | 0.4 |
PORTFOLIO COMPOSITION BY SECTOR AS OF October 31, 2022 | PERCENT OF TOTAL INVESTMENTS |
Health Care | 12.4% |
Industrials | 11.7 |
Financials | 10.1 |
Utilities | 10.0 |
Technology | 9.7 |
Consumer Staples | 9.4 |
Basic Materials | 9.2 |
Real Estate | 8.8 |
Consumer Discretionary | 8.4 |
Energy | 6.3 |
Telecommunications | 3.8 |
Short-Term Investments | 0.2 |
48 | J.P. Morgan Exchange-Traded Funds | October 31, 2022 |
October 31, 2022 | J.P. Morgan Exchange-Traded Funds | 49 |
TWELVE MONTHS ENDED October 31, 2022 (Unaudited) (continued)
INCEPTION DATE | 1 YEAR | 5 YEAR | SINCE INCEPTION | |
JPMorgan Diversified Return U.S. Mid Cap Equity ETF | ||||
Net Asset Value | May 11, 2016 | (7.79)% | 8.09% | 9.95% |
Market Price | (7.90) | 8.07 | 9.94 |
50 | J.P. Morgan Exchange-Traded Funds | October 31, 2022 |
TWELVE MONTHS ENDED October 31, 2022 (Unaudited)
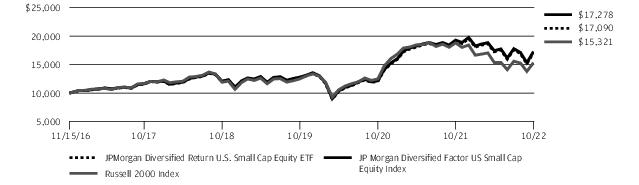
REPORTING PERIOD RETURN: | |
Net Asset Value * | (10.59)% |
Market Price ** | (10.49)% |
JP Morgan Diversified Factor US Small Cap Equity Index | (10.44)% |
Russell 2000 Index | (18.54)% |
Net Assets as of 10/31/2022 | $286,932,997 |
Fund Ticker | JPSE |
TOP TEN HOLDINGS OF THE PORTFOLIO AS OF October 31, 2022 | PERCENT OF TOTAL INVESTMENTS | |
1. | Prothena Corp. plc (Ireland) | 0.4% |
2. | Globalstar, Inc. | 0.4 |
3. | Harmonic, Inc. | 0.4 |
4. | Medpace Holdings, Inc. | 0.4 |
5. | Extreme Networks, Inc. | 0.4 |
6. | Calix, Inc. | 0.4 |
7. | Comfort Systems USA, Inc. | 0.3 |
8. | Applied Industrial Technologies, Inc. | 0.3 |
9. | Old National Bancorp | 0.3 |
10. | Rambus, Inc. | 0.3 |
PORTFOLIO COMPOSITION BY SECTOR AS OF October 31, 2022 | PERCENT OF TOTAL INVESTMENTS |
Financials | 10.9% |
Industrials | 10.4 |
Technology | 9.9 |
Health Care | 9.4 |
Consumer Staples | 9.3 |
Basic Materials | 8.9 |
Real Estate | 8.8 |
Consumer Discretionary | 7.4 |
Energy | 6.9 |
Utilities | 5.8 |
Telecommunications | 5.0 |
Short-Term Investments | 7.3 |
October 31, 2022 | J.P. Morgan Exchange-Traded Funds | 51 |
TWELVE MONTHS ENDED October 31, 2022 (Unaudited) (continued)
52 | J.P. Morgan Exchange-Traded Funds | October 31, 2022 |
INCEPTION DATE | 1 YEAR | 5 YEAR | SINCE INCEPTION | |
JPMorgan Diversified Return U.S. Small Cap Equity ETF | ||||
Net Asset Value | November 15, 2016 | (10.59)% | 8.07% | 9.41% |
Market Price | (10.49) | 8.07 | 9.45 |
October 31, 2022 | J.P. Morgan Exchange-Traded Funds | 53 |
TWELVE MONTHS ENDED October 31, 2022 (Unaudited)
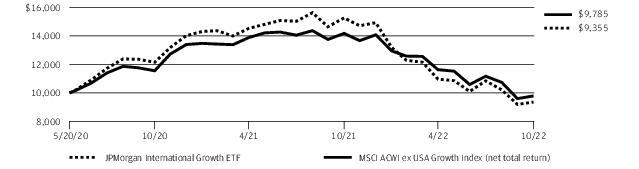
REPORTING PERIOD RETURN: | |
Net Asset Value * | (38.72)% |
Market Price ** | (38.97)% |
MSCI ACWI ex USA Growth Index (net total return) | (30.99)% |
Net Assets as of 10/31/2022 | $54,982,105 |
Fund Ticker | JIG |
54 | J.P. Morgan Exchange-Traded Funds | October 31, 2022 |
TOP TEN HOLDINGS OF THE PORTFOLIO AS OF October 31, 2022 | PERCENT OF TOTAL INVESTMENTS | |
1. | Nestle SA (Registered) | 5.0% |
2. | Roche Holding AG | 3.9 |
3. | Taiwan Semiconductor Manufacturing Co. Ltd., ADR (Taiwan) | 3.8 |
4. | Novo Nordisk A/S, Class B (Denmark) | 3.4 |
5. | LVMH Moet Hennessy Louis Vuitton SE (France) | 3.3 |
6. | ASML Holding NV (Netherlands) | 3.1 |
7. | Canadian National Railway Co. (Canada) | 3.0 |
8. | Diageo plc (United Kingdom) | 2.9 |
9. | RELX plc (United Kingdom) | 2.7 |
10. | Keyence Corp. (Japan) | 2.6 |
PORTFOLIO COMPOSITION BY COUNTRY AS OF October 31, 2022 | PERCENT OF TOTAL INVESTMENTS |
United Kingdom | 13.0% |
Japan | 11.5 |
United States | 11.0 |
Netherlands | 7.1 |
Canada | 6.2 |
Denmark | 5.9 |
Germany | 5.4 |
France | 5.3 |
China | 4.5 |
Taiwan | 3.9 |
Hong Kong | 3.6 |
Sweden | 3.5 |
Indonesia | 2.7 |
Switzerland | 2.1 |
PORTFOLIO COMPOSITION BY COUNTRY AS OF October 31, 2022 | PERCENT OF TOTAL INVESTMENTS |
Singapore | 1.7% |
Australia | 1.6 |
Mexico | 1.4 |
India | 1.3 |
Brazil | 1.0 |
South Africa | 1.0 |
South Korea | 0.5 |
Short-Term Investments | 5.8 |
October 31, 2022 | J.P. Morgan Exchange-Traded Funds | 55 |
TWELVE MONTHS ENDED October 31, 2022 (Unaudited) (continued)
INCEPTION DATE | 1 YEAR | SINCE INCEPTION | |
JPMorgan International Growth ETF | |||
Net Asset Value | May 20, 2020 | (38.72)% | (2.68)% |
Market Price | (38.97) | (2.69) |
56 | J.P. Morgan Exchange-Traded Funds | October 31, 2022 |
TWELVE MONTHS ENDED October 31, 2022 (Unaudited)
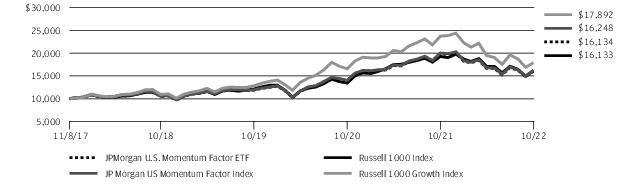
REPORTING PERIOD RETURN: | |
Net Asset Value * | (18.97)% |
Market Price ** | (18.86)% |
JP Morgan US Momentum Factor Index | (18.90)% |
Russell 1000 Growth Index | (24.60)% |
Russell 1000 Index | (16.38)% |
Net Assets as of 10/31/2022 | $229,323,118 |
Fund Ticker | JMOM |
TOP TEN HOLDINGS OF THE PORTFOLIO AS OF October 31, 2022 | PERCENT OF TOTAL INVESTMENTS | |
1. | Apple, Inc. | 2.0% |
2. | Microsoft Corp. | 1.8 |
3. | UnitedHealth Group, Inc. | 1.8 |
4. | Eli Lilly & Co. | 1.7 |
5. | Tesla, Inc. | 1.7 |
6. | Home Depot, Inc. (The) | 1.6 |
7. | Alphabet, Inc., Class A | 1.5 |
8. | NVIDIA Corp. | 1.5 |
9. | Berkshire Hathaway, Inc., Class B | 1.5 |
10. | AbbVie, Inc. | 1.4 |
PORTFOLIO COMPOSITION BY SECTOR AS OF October 31, 2022 | PERCENT OF TOTAL INVESTMENTS |
Technology | 24.9% |
Consumer Discretionary | 14.8 |
Health Care | 13.8 |
Industrials | 13.0 |
Financials | 11.1 |
Consumer Staples | 5.9 |
Energy | 5.3 |
Utilities | 3.1 |
Real Estate | 3.0 |
Telecommunications | 2.6 |
Basic Materials | 1.9 |
Short-Term Investments | 0.6 |
October 31, 2022 | J.P. Morgan Exchange-Traded Funds | 57 |
TWELVE MONTHS ENDED October 31, 2022 (Unaudited) (continued)
58 | J.P. Morgan Exchange-Traded Funds | October 31, 2022 |
INCEPTION DATE | 1 YEAR | SINCE INCEPTION | |
JPMorgan U.S. Momentum Factor ETF | |||
Net Asset Value | November 8, 2017 | (18.97)% | 10.09% |
Market Price | (18.86) | 10.10 |
October 31, 2022 | J.P. Morgan Exchange-Traded Funds | 59 |
TWELVE MONTHS ENDED October 31, 2022 (Unaudited)
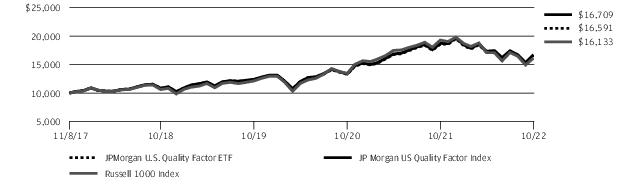
REPORTING PERIOD RETURN: | |
Net Asset Value * | (10.84)% |
Market Price ** | (10.85)% |
JP Morgan US Quality Factor Index | (10.76)% |
Russell 1000 Index | (16.38)% |
Net Assets as of 10/31/2022 | $579,728,107 |
Fund Ticker | JQUA |
TOP TEN HOLDINGS OF THE PORTFOLIO AS OF October 31, 2022 | PERCENT OF TOTAL INVESTMENTS | |
1. | Apple, Inc. | 1.9% |
2. | Visa, Inc., Class A | 1.8 |
3. | Berkshire Hathaway, Inc., Class B | 1.8 |
4. | Johnson & Johnson | 1.8 |
5. | Microsoft Corp. | 1.7 |
6. | Exxon Mobil Corp. | 1.7 |
7. | Alphabet, Inc., Class A | 1.7 |
8. | Procter & Gamble Co. (The) | 1.7 |
9. | Mastercard, Inc., Class A | 1.5 |
10. | Home Depot, Inc. (The) | 1.5 |
PORTFOLIO COMPOSITION BY SECTOR AS OF October 31, 2022 | PERCENT OF TOTAL INVESTMENTS |
Technology | 23.8% |
Consumer Discretionary | 14.6 |
Health Care | 13.8 |
Industrials | 12.7 |
Financials | 10.4 |
Consumer Staples | 5.6 |
Energy | 5.3 |
Real Estate | 3.0 |
Utilities | 3.0 |
Telecommunications | 2.4 |
Basic Materials | 1.9 |
Short-Term Investments | 3.5 |
60 | J.P. Morgan Exchange-Traded Funds | October 31, 2022 |
October 31, 2022 | J.P. Morgan Exchange-Traded Funds | 61 |
TWELVE MONTHS ENDED October 31, 2022 (Unaudited) (continued)
INCEPTION DATE | 1 YEAR | SINCE INCEPTION | |
JPMorgan U.S. Quality Factor ETF | |||
Net Asset Value | November 8, 2017 | (10.84)% | 10.71% |
Market Price | (10.85) | 10.72 |
62 | J.P. Morgan Exchange-Traded Funds | October 31, 2022 |
TWELVE MONTHS ENDED October 31, 2022 (Unaudited)
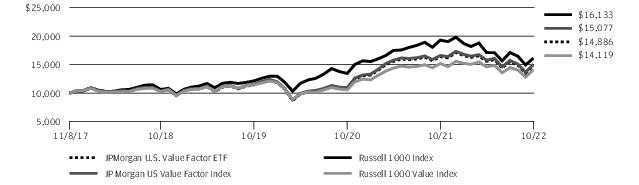
REPORTING PERIOD RETURN: | |
Net Asset Value * | (9.21)% |
Market Price ** | (9.24)% |
JP Morgan US Value Factor Index | (9.16)% |
Russell 1000 Value Index | (6.99)% |
Russell 1000 Index | (16.38)% |
Net Assets as of 10/31/2022 | $444,083,720 |
Fund Ticker | JVAL |
TOP TEN HOLDINGS OF THE PORTFOLIO AS OF October 31, 2022 | PERCENT OF TOTAL INVESTMENTS | |
1. | Exxon Mobil Corp. | 2.3% |
2. | UnitedHealth Group, Inc. | 2.2 |
3. | Apple, Inc. | 2.0 |
4. | Johnson & Johnson | 1.8 |
5. | Microsoft Corp. | 1.7 |
6. | Alphabet, Inc., Class A | 1.5 |
7. | Pfizer, Inc. | 1.4 |
8. | Merck & Co., Inc. | 1.4 |
9. | Walmart, Inc. | 1.1 |
10. | Broadcom, Inc. | 1.1 |
PORTFOLIO COMPOSITION BY SECTOR AS OF October 31, 2022 | PERCENT OF TOTAL INVESTMENTS |
Technology | 24.7% |
Consumer Discretionary | 14.8 |
Health Care | 14.4 |
Industrials | 13.1 |
Financials | 10.8 |
Consumer Staples | 5.9 |
Energy | 5.5 |
Real Estate | 3.1 |
Utilities | 3.1 |
Telecommunications | 2.4 |
Basic Materials | 1.9 |
Short-Term Investments | 0.3 |
October 31, 2022 | J.P. Morgan Exchange-Traded Funds | 63 |
TWELVE MONTHS ENDED October 31, 2022 (Unaudited) (continued)
64 | J.P. Morgan Exchange-Traded Funds | October 31, 2022 |
INCEPTION DATE | 1 YEAR | SINCE INCEPTION | |
JPMorgan U.S. Value Factor ETF | |||
Net Asset Value | November 8, 2017 | (9.21)% | 8.32% |
Market Price | (9.24) | 8.31 |
October 31, 2022 | J.P. Morgan Exchange-Traded Funds | 65 |
AS OF October 31, 2022
INVESTMENTS | SHARES | VALUE($) |
Common Stocks — 99.5% | ||
Australia — 0.0% ^ | ||
Perseus Mining Ltd. | 210,908 | 245,645 |
Brazil — 7.5% | ||
Ambev SA | 790,465 | 2,449,975 |
Arcos Dorados Holdings, Inc., Class A | 34,147 | 257,468 |
Atacadao SA | 577,310 | 2,177,136 |
B3 SA - Brasil Bolsa Balcao | 2,766,683 | 8,034,120 |
Banco Bradesco SA (Preference) | 538,546 | 2,066,399 |
Banco BTG Pactual SA * | 108,611 | 608,709 |
Banco do Brasil SA | 234,168 | 1,680,497 |
BB Seguridade Participacoes SA | 205,277 | 1,178,689 |
Blau Farmaceutica SA | 59,127 | 388,724 |
Caixa Seguridade Participacoes S/A | 237,077 | 404,346 |
Centrais Eletricas Brasileiras SA (Preference) | 100,401 | 1,039,871 |
Cia Energetica de Minas Gerais (Preference) | 297,812 | 654,950 |
EDP - Energias do Brasil SA | 611,637 | 2,731,675 |
Gerdau SA (Preference) | 127,288 | 635,023 |
Itau Unibanco Holding SA (Preference) * | 950,489 | 5,582,777 |
Itausa SA (Preference) | 708,684 | 1,472,109 |
Localiza Rent a Car SA | 248,973 | 3,395,152 |
Locaweb Servicos de Internet SA * (a) | 134,893 | 284,384 |
Lojas Renner SA * | 807,376 | 4,831,283 |
MercadoLibre, Inc. * | 6,689 | 6,030,936 |
Petroleo Brasileiro SA, ADR | 647,028 | 8,294,899 |
Porto Seguro SA | 148,665 | 669,431 |
Raia Drogasil SA | 375,544 | 1,925,158 |
Rumo SA | 132,873 | 571,311 |
Sao Martinho SA | 85,848 | 448,394 |
Sendas Distribuidora SA | 103,937 | 398,403 |
SLC Agricola SA | 51,390 | 457,640 |
Suzano SA | 123,202 | 1,270,062 |
TIM SA * | 215,082 | 550,457 |
TOTVS SA * | 55,518 | 358,871 |
Vale SA, ADR | 319,321 | 4,132,014 |
WEG SA | 258,408 | 2,016,538 |
XP, Inc., BDR * | 21,910 | 401,044 |
XP, Inc., Class A * | 10,840 | 198,697 |
67,597,142 | ||
Canada — 0.1% | ||
B2Gold Corp. | 128,216 | 391,514 |
Ivanhoe Mines Ltd., Class A * | 41,204 | 285,813 |
677,327 | ||
INVESTMENTS | SHARES | VALUE($) |
Chile — 0.3% | ||
Banco Santander Chile | 77,411,521 | 2,773,195 |
Cencosud SA | 262,732 | 353,651 |
3,126,846 | ||
China — 25.8% | ||
Advanced Micro-Fabrication Equipment, Inc., Class A * | 24,266 | 366,692 |
Aier Eye Hospital Group Co. Ltd., Class A | 301,894 | 1,019,129 |
Airtac International Group | 14,000 | 320,368 |
Alibaba Group Holding Ltd. * | 1,591,300 | 12,372,209 |
Angel Yeast Co. Ltd., Class A | 231,009 | 1,142,802 |
Anjoy Foods Group Co. Ltd., Class A | 88,900 | 1,630,636 |
ANTA Sports Products Ltd. | 179,000 | 1,573,700 |
Bank of Ningbo Co. Ltd., Class A | 350,540 | 1,138,105 |
Baoshan Iron & Steel Co. Ltd., Class A | 700,400 | 460,067 |
Beijing Huafeng Test & Control Technology Co. Ltd., Class A | 5,675 | 205,093 |
Beijing Kingsoft Office Software, Inc., Class A | 73,007 | 2,900,992 |
BOC Hong Kong Holdings Ltd. | 137,500 | 427,255 |
BOE Technology Group Co. Ltd., Class A | 1,445,200 | 659,471 |
Bosideng International Holdings Ltd. | 1,160,000 | 501,012 |
Budweiser Brewing Co. APAC Ltd. (a) | 1,223,300 | 2,574,709 |
Centre Testing International Group Co. Ltd., Class A | 8,300 | 21,209 |
Chacha Food Co. Ltd., Class A | 158,400 | 956,647 |
Changzhou Xingyu Automotive Lighting Systems Co. Ltd., Class A | 66,900 | 1,117,949 |
China Construction Bank Corp., Class H | 12,092,000 | 6,417,085 |
China Lesso Group Holdings Ltd. | 550,000 | 446,407 |
China Longyuan Power Group Corp. Ltd., Class H | 697,000 | 796,441 |
China Merchants Bank Co. Ltd., Class H | 1,847,000 | 6,046,893 |
China Merchants Energy Shipping Co. Ltd., Class A | 331,300 | 316,030 |
China Overseas Land & Investment Ltd. | 1,186,000 | 2,266,350 |
China Petroleum & Chemical Corp., Class H | 4,126,000 | 1,635,243 |
China Railway Group Ltd., Class H | 1,998,000 | 868,761 |
China Resources Gas Group Ltd. | 704,400 | 1,804,089 |
China Resources Land Ltd. | 580,000 | 1,814,694 |
China Resources Mixc Lifestyle Services Ltd. (a) | 645,400 | 1,889,984 |
China Resources Pharmaceutical Group Ltd. (a) | 578,000 | 389,908 |
China Resources Sanjiu Medical & Pharmaceutical Co. Ltd., Class A | 137,200 | 1,020,805 |
China State Construction Engineering Corp. Ltd., Class A | 408,100 | 263,982 |
66 | J.P. Morgan Exchange-Traded Funds | October 31, 2022 |
INVESTMENTS | SHARES | VALUE($) |
Common Stocks — continued | ||
China — continued | ||
China Vanke Co. Ltd., Class H | 496,100 | 636,659 |
China Yangtze Power Co. Ltd., Class A | 1,122,700 | 3,108,002 |
Chongqing Brewery Co. Ltd., Class A | 205,400 | 2,445,297 |
Chongqing Fuling Zhacai Group Co. Ltd., Class A | 60,500 | 185,856 |
CITIC Securities Co. Ltd., Class H | 725,000 | 1,083,262 |
Contemporary Amperex Technology Co. Ltd., Class A | 6,304 | 321,824 |
DaShenLin Pharmaceutical Group Co. Ltd., Class A | 102,060 | 506,126 |
ENN Energy Holdings Ltd. | 237,400 | 2,360,244 |
ENN Natural Gas Co. Ltd., Class A | 232,100 | 491,858 |
Fangda Special Steel Technology Co. Ltd., Class A | 668,500 | 520,022 |
Foshan Haitian Flavouring & Food Co. Ltd., Class A | 347,275 | 2,831,323 |
Fuyao Glass Industry Group Co. Ltd., Class H (a) | 1,128,000 | 4,042,420 |
Guangdong Investment Ltd. | 1,160,000 | 731,353 |
Guangzhou Automobile Group Co. Ltd., Class H | 1,184,000 | 721,531 |
H World Group Ltd. | 703,800 | 1,920,099 |
Haier Smart Home Co. Ltd., Class H | 3,393,000 | 8,492,637 |
Han's Laser Technology Industry Group Co. Ltd., Class A | 200,800 | 695,464 |
Hefei Meiya Optoelectronic Technology, Inc., Class A | 798,021 | 2,584,581 |
Huatai Securities Co. Ltd., Class H (a) | 474,600 | 464,756 |
Huayu Automotive Systems Co. Ltd., Class A | 639,246 | 1,461,702 |
Hubei Xingfa Chemicals Group Co. Ltd., Class A | 69,200 | 267,260 |
Hundsun Technologies, Inc., Class A | 111,410 | 634,682 |
Industrial & Commercial Bank of China Ltd., Class H | 582,000 | 252,684 |
Industrial Bank Co. Ltd., Class A | 728,425 | 1,494,707 |
Inner Mongolia Yili Industrial Group Co. Ltd., Class A | 1,788,613 | 6,165,030 |
Jade Bird Fire Co. Ltd., Class A | 93,622 | 318,165 |
JD Health International, Inc. * (a) | 131,550 | 721,694 |
JD Logistics, Inc. * (a) | 208,800 | 291,897 |
JD.com, Inc., Class A | 388,750 | 7,079,340 |
Jiangsu Hengli Hydraulic Co. Ltd., Class A | 189,500 | 1,425,262 |
Joyoung Co. Ltd., Class A | 148,500 | 294,419 |
Kanzhun Ltd., ADR * | 44,359 | 484,844 |
KE Holdings, Inc., Class A * | 203,600 | 674,559 |
Kingdee International Software Group Co. Ltd. * | 1,170,000 | 1,917,176 |
INVESTMENTS | SHARES | VALUE($) |
China — continued | ||
Kunlun Energy Co. Ltd. | 2,268,000 | 1,355,515 |
Kweichow Moutai Co. Ltd., Class A | 16,800 | 3,097,629 |
Lenovo Group Ltd. | 1,162,000 | 928,680 |
Livzon Pharmaceutical Group, Inc., Class H | 175,100 | 458,317 |
Longfor Group Holdings Ltd. (b) | 290,500 | 370,151 |
LONGi Green Energy Technology Co. Ltd., Class A | 248,696 | 1,633,823 |
Meituan * (a) | 529,500 | 8,477,584 |
Midea Group Co. Ltd., Class A | 798,312 | 4,374,748 |
Montage Technology Co. Ltd., Class A | 87,889 | 677,657 |
NARI Technology Co. Ltd., Class A | 523,440 | 1,748,797 |
NetEase, Inc. | 758,600 | 8,416,859 |
NIO, Inc., ADR * | 23,445 | 226,713 |
Oppein Home Group, Inc., Class A | 63,384 | 704,280 |
PetroChina Co. Ltd., Class H | 2,846,000 | 1,088,672 |
Pharmaron Beijing Co. Ltd., Class H (a) | 224,900 | 758,322 |
PICC Property & Casualty Co. Ltd., Class H | 1,740,000 | 1,604,821 |
Pinduoduo, Inc., ADR * | 57,555 | 3,155,741 |
Ping An Bank Co. Ltd., Class A | 1,895,256 | 2,676,299 |
Ping An Insurance Group Co. of China Ltd., Class H | 1,482,500 | 5,935,026 |
Poly Developments and Holdings Group Co. Ltd., Class A | 498,100 | 941,470 |
Postal Savings Bank of China Co. Ltd., Class H (a) | 4,540,000 | 2,105,472 |
Qingdao Haier Biomedical Co. Ltd., Class A | 61,239 | 644,112 |
Sany Heavy Industry Co. Ltd., Class A | 109,600 | 202,313 |
Shanghai Baosight Software Co. Ltd., Class A | 263,893 | 1,528,516 |
Shanghai Liangxin Electrical Co. Ltd., Class A | 242,000 | 371,643 |
Shanghai Pharmaceuticals Holding Co. Ltd., Class H | 320,500 | 434,361 |
Shenzhen Inovance Technology Co. Ltd., Class A | 234,500 | 2,137,198 |
Shenzhen Mindray Bio-Medical Electronics Co. Ltd., Class A | 29,600 | 1,316,260 |
Shenzhou International Group Holdings Ltd. | 262,900 | 1,825,316 |
Sichuan Chuantou Energy Co. Ltd., Class A | 208,700 | 314,473 |
Sichuan Swellfun Co. Ltd., Class A | 116,400 | 900,450 |
Silergy Corp. | 219,000 | 2,525,441 |
SITC International Holdings Co. Ltd. | 120,000 | 196,536 |
Skshu Paint Co. Ltd., Class A * | 166,040 | 1,972,096 |
StarPower Semiconductor Ltd., Class A | 31,274 | 1,588,927 |
Suzhou Maxwell Technologies Co. Ltd., Class A | 16,960 | 1,110,098 |
TBEA Co. Ltd., Class A | 378,200 | 1,054,297 |
Tencent Holdings Ltd. | 729,800 | 19,176,804 |
October 31, 2022 | J.P. Morgan Exchange-Traded Funds | 67 |
AS OF October 31, 2022 (continued)
INVESTMENTS | SHARES | VALUE($) |
Common Stocks — continued | ||
China — continued | ||
Tingyi Cayman Islands Holding Corp. | 1,744,000 | 2,726,043 |
Tongwei Co. Ltd., Class A | 533,200 | 3,171,479 |
Topsports International Holdings Ltd. (a) | 1,756,000 | 885,442 |
Trip.com Group Ltd. * | 62,650 | 1,407,263 |
Wanhua Chemical Group Co. Ltd., Class A | 265,300 | 2,912,622 |
Want Want China Holdings Ltd. | 571,000 | 375,081 |
Wuliangye Yibin Co. Ltd., Class A | 184,500 | 3,363,927 |
Wuxi Biologics Cayman, Inc. * (a) | 893,500 | 4,020,431 |
Xinyi Glass Holdings Ltd. | 1,209,000 | 1,553,753 |
Xinyi Solar Holdings Ltd. | 1,132,000 | 1,123,847 |
YTO Express Group Co. Ltd., Class A | 193,000 | 496,783 |
Yum China Holdings, Inc. | 91,687 | 3,791,257 |
Yunnan Energy New Material Co. Ltd. | 16,600 | 334,892 |
Zhejiang Chint Electrics Co. Ltd., Class A | 60,000 | 208,231 |
Zhejiang Supor Co. Ltd., Class A | 438,306 | 2,393,597 |
Zhejiang Weixing New Building Materials Co. Ltd., Class A | 124,300 | 295,208 |
Zhuhai Huafa Properties Co. Ltd., Class A | 280,000 | 326,487 |
Zhuzhou CRRC Times Electric Co. Ltd. | 269,300 | 1,168,360 |
Zijin Mining Group Co. Ltd., Class H | 2,306,000 | 2,199,551 |
ZTO Express Cayman, Inc. | 20,800 | 353,895 |
234,135,018 | ||
Colombia — 0.0% ^ | ||
Ecopetrol SA | 491,175 | 241,473 |
Czech Republic — 0.2% | ||
CEZ A/S | 41,337 | 1,351,864 |
Komercni Banka A/S | 13,693 | 392,171 |
1,744,035 | ||
Ghana — 0.1% | ||
Kosmos Energy Ltd. * | 98,415 | 638,713 |
Greece — 0.2% | ||
Hellenic Telecommunications Organization SA | 57,268 | 899,368 |
JUMBO SA | 20,571 | 292,182 |
OPAP SA | 56,978 | 698,160 |
1,889,710 | ||
Hong Kong — 1.5% | ||
AIA Group Ltd. | 640,200 | 4,849,383 |
Hang Seng Bank Ltd. | 87,200 | 1,227,584 |
HKT Trust & HKT Ltd. | 584,000 | 660,471 |
Hong Kong Exchanges & Clearing Ltd. | 141,200 | 3,747,959 |
Prudential plc | 16,951 | 157,469 |
INVESTMENTS | SHARES | VALUE($) |
Hong Kong — continued | ||
Techtronic Industries Co. Ltd. | 288,000 | 2,727,006 |
WH Group Ltd. (a) | 740,077 | 373,747 |
13,743,619 | ||
Hungary — 0.3% | ||
MOL Hungarian Oil & Gas plc | 63,693 | 382,419 |
OTP Bank Nyrt. | 66,580 | 1,452,498 |
Richter Gedeon Nyrt. | 24,370 | 482,057 |
2,316,974 | ||
India — 14.3% | ||
Aarti Industries Ltd. | 43,680 | 369,293 |
Aarti Pharmalabs Ltd. ‡ * | 10,920 | 50,024 |
Apollo Hospitals Enterprise Ltd. | 29,477 | 1,609,559 |
Asian Paints Ltd. | 16,971 | 638,841 |
AU Small Finance Bank Ltd. (a) | 105,184 | 749,285 |
Axis Bank Ltd. | 421,434 | 4,621,646 |
Bajaj Auto Ltd. | 16,954 | 752,804 |
Bharat Electronics Ltd. | 1,474,410 | 1,902,755 |
Britannia Industries Ltd. | 28,876 | 1,314,816 |
Colgate-Palmolive India Ltd. | 22,811 | 450,123 |
Computer Age Management Services Ltd. | 23,267 | 717,198 |
Cummins India Ltd. | 44,102 | 718,116 |
Dr Lal PathLabs Ltd. (a) | 9,076 | 281,162 |
Dr Reddy's Laboratories Ltd. | 18,244 | 982,015 |
Eicher Motors Ltd. | 11,080 | 516,256 |
Embassy Office Parks, REIT | 165,286 | 688,136 |
GAIL India Ltd. | 1,056,469 | 1,164,555 |
Godrej Properties Ltd. * | 28,013 | 427,451 |
HCL Technologies Ltd. | 270,726 | 3,408,071 |
HDFC Bank Ltd., ADR | 194,165 | 12,098,421 |
HDFC Life Insurance Co. Ltd. (a) | 795,984 | 5,201,874 |
Hero MotoCorp Ltd. | 23,945 | 775,058 |
Hindustan Unilever Ltd. | 270,215 | 8,337,112 |
Housing Development Finance Corp. Ltd. | 537,872 | 16,081,714 |
ICICI Bank Ltd. | 793,678 | 8,726,768 |
ICICI Prudential Life Insurance Co. Ltd. (a) | 133,228 | 818,183 |
IndusInd Bank Ltd. | 46,752 | 646,316 |
Infosys Ltd. | 961,262 | 17,916,070 |
ITC Ltd. | 129,949 | 547,908 |
Jubilant Foodworks Ltd. | 91,985 | 678,566 |
Kajaria Ceramics Ltd. | 26,019 | 340,407 |
Kotak Mahindra Bank Ltd. | 281,759 | 6,487,532 |
Larsen & Toubro Ltd. | 52,337 | 1,281,373 |
Lemon Tree Hotels Ltd. * (a) | 730,679 | 744,898 |
68 | J.P. Morgan Exchange-Traded Funds | October 31, 2022 |
INVESTMENTS | SHARES | VALUE($) |
Common Stocks — continued | ||
India — continued | ||
Maruti Suzuki India Ltd. | 13,517 | 1,558,380 |
Metropolis Healthcare Ltd. (a) | 22,878 | 467,763 |
Oil & Natural Gas Corp. Ltd. | 499,320 | 806,592 |
Petronet LNG Ltd. | 806,447 | 2,003,370 |
Power Grid Corp. of India Ltd. | 557,122 | 1,537,141 |
Reliance Industries Ltd. | 218,114 | 6,730,296 |
Shriram Transport Finance Co. Ltd. | 121,158 | 1,801,823 |
Tata Consultancy Services Ltd. | 215,084 | 8,300,537 |
Tata Power Co. Ltd. (The) | 226,946 | 620,435 |
UltraTech Cement Ltd. | 18,955 | 1,539,872 |
United Spirits Ltd. * | 76,543 | 829,240 |
UPL Ltd. | 66,027 | 582,895 |
WNS Holdings Ltd., ADR * | 12,111 | 1,042,515 |
129,865,165 | ||
Indonesia — 2.8% | ||
Adaro Energy Indonesia Tbk. PT | 1,587,200 | 404,924 |
Astra International Tbk. PT | 1,200,500 | 513,010 |
Bank Central Asia Tbk. PT | 14,598,400 | 8,252,147 |
Bank Mandiri Persero Tbk. PT | 1,258,800 | 850,387 |
Bank Negara Indonesia Persero Tbk. PT | 931,500 | 561,633 |
Bank Rakyat Indonesia Persero Tbk. PT | 24,821,470 | 7,405,070 |
Charoen Pokphand Indonesia Tbk. PT | 952,100 | 340,143 |
Kalbe Farma Tbk. PT | 2,891,600 | 380,263 |
Merdeka Copper Gold Tbk. PT * | 783,900 | 189,811 |
Telkom Indonesia Persero Tbk. PT | 19,887,100 | 5,585,310 |
Unilever Indonesia Tbk. PT | 967,500 | 287,836 |
United Tractors Tbk. PT | 202,400 | 418,672 |
25,189,206 | ||
Kuwait — 0.1% | ||
National Bank of Kuwait SAKP | 311,526 | 1,084,148 |
Macau — 0.1% | ||
Sands China Ltd. * | 348,400 | 609,081 |
Malaysia — 0.5% | ||
CIMB Group Holdings Bhd. | 407,400 | 475,894 |
Hong Leong Bank Bhd. | 86,400 | 387,291 |
IHH Healthcare Bhd. | 203,100 | 255,654 |
Kuala Lumpur Kepong Bhd. | 59,000 | 270,124 |
Malayan Banking Bhd. | 262,200 | 476,301 |
Petronas Chemicals Group Bhd. | 233,100 | 429,749 |
Press Metal Aluminium Holdings Bhd. | 261,300 | 240,537 |
Public Bank Bhd. | 1,811,800 | 1,713,418 |
Tenaga Nasional Bhd. | 232,800 | 414,575 |
4,663,543 | ||
INVESTMENTS | SHARES | VALUE($) |
Mexico — 5.1% | ||
America Movil SAB de CV | 4,268,443 | 4,028,662 |
Arca Continental SAB de CV | 106,842 | 872,833 |
Corp. Inmobiliaria Vesta SAB de CV | 264,387 | 576,066 |
Fomento Economico Mexicano SAB de CV | 71,508 | 513,004 |
Gentera SAB de CV | 658,964 | 675,827 |
Gruma SAB de CV, Class B | 42,052 | 485,297 |
Grupo Aeroportuario del Centro Norte SAB de CV | 41,138 | 328,058 |
Grupo Aeroportuario del Pacifico SAB de CV, Class B | 264,586 | 4,103,867 |
Grupo Aeroportuario del Sureste SAB de CV, Class B | 130,543 | 3,063,573 |
Grupo Financiero Banorte SAB de CV, Class O | 1,314,216 | 10,698,526 |
Grupo Mexico SAB de CV | 647,921 | 2,333,928 |
Kimberly-Clark de Mexico SAB de CV, Class A | 1,501,775 | 2,366,397 |
Orbia Advance Corp. SAB de CV | 207,004 | 348,228 |
Qualitas Controladora SAB de CV | 57,656 | 226,253 |
Regional SAB de CV | 130,817 | 911,817 |
Wal-Mart de Mexico SAB de CV | 3,835,336 | 14,816,364 |
46,348,700 | ||
Nigeria — 0.0% ^ | ||
Airtel Africa plc (a) | 141,640 | 183,340 |
Panama — 0.1% | ||
Copa Holdings SA, Class A * | 6,406 | 481,923 |
Peru — 0.4% | ||
Credicorp Ltd. | 19,575 | 2,864,997 |
Southern Copper Corp. | 16,588 | 779,138 |
3,644,135 | ||
Philippines — 0.2% | ||
ACEN Corp. | 76,740 | 8,344 |
Ayala Corp. | 26,210 | 304,162 |
Ayala Land, Inc. | 611,400 | 271,333 |
Bank of the Philippine Islands | 141,300 | 234,991 |
BDO Unibank, Inc. | 146,250 | 323,269 |
International Container Terminal Services, Inc. | 69,920 | 209,597 |
SM Investments Corp. | 18,950 | 270,083 |
SM Prime Holdings, Inc. | 523,800 | 286,059 |
1,907,838 | ||
Poland — 0.6% | ||
Allegro.eu SA * (a) | 155,894 | 756,110 |
Bank Polska Kasa Opieki SA | 35,341 | 579,220 |
Dino Polska SA * (a) | 28,408 | 1,854,256 |
October 31, 2022 | J.P. Morgan Exchange-Traded Funds | 69 |
AS OF October 31, 2022 (continued)
INVESTMENTS | SHARES | VALUE($) |
Common Stocks — continued | ||
Poland — continued | ||
Powszechna Kasa Oszczednosci Bank Polski SA | 94,286 | 513,800 |
Powszechny Zaklad Ubezpieczen SA | 329,999 | 1,848,759 |
5,552,145 | ||
Portugal — 0.2% | ||
Jeronimo Martins SGPS SA | 102,463 | 2,120,270 |
Qatar — 0.9% | ||
Industries Qatar QSC | 537,940 | 2,328,752 |
Qatar Gas Transport Co. Ltd. | 776,627 | 874,369 |
Qatar Islamic Bank SAQ | 98,098 | 656,416 |
Qatar National Bank QPSC | 799,409 | 4,377,284 |
8,236,821 | ||
Russia — 0.0% ^ | ||
Gazprom PJSC, ADR ‡ * | 12,780 | 1,426 |
Gazprom PJSC ‡ | 1,135,066 | 87,074 |
Magnitogorsk Iron & Steel Works PJSC, GDR ‡ | 12,378 | 1,869 |
MMC Norilsk Nickel PJSC, ADR ‡ | 2,018 | 969 |
MMC Norilsk Nickel PJSC ‡ | 2,036 | 13,125 |
Moscow Exchange MICEX-RTS PJSC ‡ * | 571,670 | 13,582 |
Rosneft Oil Co. PJSC ‡ | 141,777 | 14,075 |
Sberbank of Russia PJSC ‡ * | 629,236 | 26,468 |
Severstal PAO, GDR ‡ (a) | 98,048 | 31,375 |
VTB Bank PJSC ‡ * | 168,450,798 | 793 |
X5 Retail Group NV, GDR ‡ (a) | 13,771 | 3,324 |
194,080 | ||
Saudi Arabia — 3.1% | ||
ACWA Power Co. | 22,292 | 1,031,908 |
Al Rajhi Bank * | 216,194 | 4,902,387 |
Alinma Bank | 176,612 | 1,761,876 |
Almarai Co. JSC | 64,544 | 966,555 |
Dr Sulaiman Al Habib Medical Services Group Co. | 14,042 | 847,054 |
Etihad Etisalat Co. | 57,198 | 556,856 |
Jarir Marketing Co. | 8,731 | 380,834 |
Leejam Sports Co. JSC | 17,804 | 374,637 |
Mouwasat Medical Services Co. | 28,014 | 1,630,783 |
SABIC Agri-Nutrients Co. | 40,262 | 1,701,147 |
Sahara International Petrochemical Co. | 31,590 | 340,094 |
Saudi Arabian Mining Co. * | 111,046 | 2,471,687 |
Saudi Arabian Oil Co. (a) | 104,391 | 968,803 |
Saudi Basic Industries Corp. | 88,866 | 2,086,620 |
Saudi National Bank (The) | 279,143 | 4,411,920 |
Saudi Tadawul Group Holding Co. | 15,789 | 911,395 |
INVESTMENTS | SHARES | VALUE($) |
Saudi Arabia — continued | ||
Saudi Telecom Co. | 167,092 | 1,795,203 |
United International Transportation Co. | 59,387 | 722,776 |
27,862,535 | ||
Singapore — 0.1% | ||
Sea Ltd., ADR * | 19,575 | 972,486 |
South Africa — 4.1% | ||
Absa Group Ltd. | 63,094 | 685,152 |
African Rainbow Minerals Ltd. | 17,501 | 246,441 |
Anglo American plc | 68,123 | 2,040,571 |
AVI Ltd. | 313,627 | 1,256,230 |
Bid Corp. Ltd. | 222,571 | 3,581,250 |
Bidvest Group Ltd. (The) | 37,103 | 429,188 |
Capitec Bank Holdings Ltd. | 54,001 | 5,591,635 |
Clicks Group Ltd. | 183,376 | 3,107,222 |
FirstRand Ltd. | 1,620,299 | 5,664,536 |
Foschini Group Ltd. (The) | 67,609 | 422,706 |
Gold Fields Ltd. | 42,923 | 343,848 |
Impala Platinum Holdings Ltd. | 173,777 | 1,779,245 |
Mr Price Group Ltd. | 51,668 | 497,292 |
MTN Group Ltd. | 138,696 | 980,228 |
Naspers Ltd., Class N | 16,390 | 1,689,512 |
Sanlam Ltd. | 686,351 | 2,000,674 |
Shoprite Holdings Ltd. | 93,140 | 1,185,539 |
Sibanye Stillwater Ltd. | 153,904 | 360,478 |
SPAR Group Ltd. (The) | 26,945 | 228,469 |
Standard Bank Group Ltd. | 150,505 | 1,405,000 |
Transaction Capital Ltd. | 175,216 | 391,950 |
Truworths International Ltd. | 123,132 | 350,416 |
Vodacom Group Ltd. | 390,507 | 2,659,943 |
36,897,525 | ||
South Korea — 11.9% | ||
AfreecaTV Co. Ltd. | 12,007 | 668,492 |
BGF retail Co. Ltd. | 14,348 | 1,876,318 |
CJ CheilJedang Corp. | 4,365 | 1,267,342 |
Coupang, Inc. * | 34,629 | 598,043 |
Coway Co. Ltd. | 16,507 | 640,074 |
DL E&C Co. Ltd. | 22,190 | 535,358 |
DL Holdings Co. Ltd. | 7,566 | 326,042 |
Dongjin Semichem Co. Ltd. | 23,652 | 497,717 |
Green Cross Corp. | 2,036 | 181,854 |
Hana Financial Group, Inc. | 152,579 | 4,411,268 |
Hankook Tire & Technology Co. Ltd. | 53,994 | 1,383,017 |
Hanon Systems | 110,095 | 601,592 |
70 | J.P. Morgan Exchange-Traded Funds | October 31, 2022 |
INVESTMENTS | SHARES | VALUE($) |
Common Stocks — continued | ||
South Korea — continued | ||
Hite Jinro Co. Ltd. | 16,765 | 301,445 |
HL Mando Co. Ltd. | 7,499 | 259,643 |
Hugel, Inc. * | 9,606 | 752,508 |
Hyundai Glovis Co. Ltd. | 7,859 | 957,912 |
Hyundai Mobis Co. Ltd. | 21,616 | 3,315,448 |
Hyundai Motor Co. | 5,240 | 603,850 |
Industrial Bank of Korea | 96,632 | 708,178 |
ISC Co. Ltd. | 28,358 | 602,468 |
JYP Entertainment Corp. | 26,699 | 1,037,911 |
KakaoBank Corp. * | 14,614 | 174,933 |
Kakaopay Corp. * | 5,240 | 129,685 |
Kangwon Land, Inc. * | 49,914 | 804,782 |
KB Financial Group, Inc. | 65,420 | 2,201,322 |
Kia Corp. | 87,943 | 4,086,782 |
KIWOOM Securities Co. Ltd. | 15,476 | 875,648 |
Korea Gas Corp. | 13,624 | 332,482 |
Korea Investment Holdings Co. Ltd. | 20,742 | 720,033 |
Korea Zinc Co. Ltd. | 1,755 | 787,034 |
LG Chem Ltd. | 14,901 | 6,539,138 |
LG Energy Solution Ltd. * | 1,705 | 630,883 |
LG H&H Co. Ltd. | 5,860 | 2,093,666 |
LG Innotek Co. Ltd. | 1,785 | 370,324 |
NAVER Corp. | 22,181 | 2,631,073 |
NCSoft Corp. | 8,747 | 2,389,500 |
Orion Corp. | 5,020 | 357,233 |
Pan Ocean Co. Ltd. | 120,920 | 364,129 |
POSCO Holdings, Inc. | 14,032 | 2,445,649 |
Samsung Biologics Co. Ltd. * (a) | 4,502 | 2,766,647 |
Samsung Electro-Mechanics Co. Ltd. | 20,154 | 1,706,873 |
Samsung Electronics Co. Ltd. | 770,298 | 32,059,689 |
Samsung Engineering Co. Ltd. * | 25,969 | 433,820 |
Samsung Fire & Marine Insurance Co. Ltd. | 7,705 | 1,080,622 |
Samsung Life Insurance Co. Ltd. | 13,234 | 625,409 |
Shinhan Financial Group Co. Ltd. | 65,998 | 1,677,442 |
SK Hynix, Inc. | 155,935 | 9,027,320 |
SK IE Technology Co. Ltd. * (a) | 4,372 | 159,111 |
SK Innovation Co. Ltd. * | 11,378 | 1,377,742 |
SK Telecom Co. Ltd. | 37,349 | 1,312,508 |
SK, Inc. | 14,919 | 2,235,592 |
SKC Co. Ltd. | 18,425 | 1,334,540 |
S-Oil Corp. | 39,147 | 2,373,662 |
Yuhan Corp. | 8,501 | 356,437 |
107,988,190 | ||
INVESTMENTS | SHARES | VALUE($) |
Taiwan — 14.7% | ||
Accton Technology Corp. | 519,000 | 3,902,806 |
Advantech Co. Ltd. | 505,000 | 4,575,117 |
Alchip Technologies Ltd. | 16,000 | 320,413 |
ASE Technology Holding Co. Ltd. | 847,000 | 2,091,371 |
ASPEED Technology, Inc. | 39,500 | 2,047,712 |
Bizlink Holding, Inc. | 109,000 | 831,217 |
Cathay Financial Holding Co. Ltd. | 1,728,000 | 2,022,292 |
Chailease Holding Co. Ltd. | 547,345 | 2,524,732 |
China Development Financial Holding Corp. | 5,514,000 | 2,006,412 |
Compeq Manufacturing Co. Ltd. | 239,000 | 322,872 |
CTBC Financial Holding Co. Ltd. | 3,528,000 | 2,228,768 |
Delta Electronics, Inc. | 863,000 | 6,866,733 |
E Ink Holdings, Inc. | 293,000 | 1,861,772 |
E.Sun Financial Holding Co. Ltd. | 3,654,427 | 2,626,305 |
Eclat Textile Co. Ltd. | 291,000 | 3,818,710 |
eMemory Technology, Inc. | 15,000 | 497,392 |
Faraday Technology Corp. | 181,000 | 792,669 |
Feng TAY Enterprise Co. Ltd. | 79,000 | 392,336 |
Formosa Plastics Corp. | 580,000 | 1,494,319 |
Fubon Financial Holding Co. Ltd. | 1,755,600 | 2,773,030 |
Giant Manufacturing Co. Ltd. | 284,000 | 1,807,308 |
Global Unichip Corp. | 178,000 | 2,677,608 |
Hon Hai Precision Industry Co. Ltd. | 1,851,000 | 5,878,922 |
Largan Precision Co. Ltd. | 29,000 | 1,659,147 |
Lite-On Technology Corp. | 290,000 | 574,267 |
Lotes Co. Ltd. | 96,000 | 2,303,897 |
Makalot Industrial Co. Ltd. | 260,000 | 1,610,001 |
MediaTek, Inc. | 117,000 | 2,132,700 |
Mega Financial Holding Co. Ltd. | 1,599,000 | 1,481,390 |
Micro-Star International Co. Ltd. | 307,000 | 1,039,872 |
momo.com, Inc. | 7,920 | 118,164 |
Nien Made Enterprise Co. Ltd. | 90,000 | 693,940 |
Novatek Microelectronics Corp. | 425,000 | 3,166,568 |
Pegavision Corp. | 28,000 | 244,448 |
Poya International Co. Ltd. | 20,000 | 254,201 |
President Chain Store Corp. | 483,000 | 4,016,142 |
Primax Electronics Ltd. | 179,000 | 299,872 |
Quanta Computer, Inc. | 1,149,000 | 2,433,705 |
Realtek Semiconductor Corp. | 299,000 | 2,357,096 |
SDI Corp. | 350,000 | 964,964 |
Sinbon Electronics Co. Ltd. | 95,000 | 737,732 |
Taishin Financial Holding Co. Ltd. | 2,119,990 | 870,029 |
Taiwan Cement Corp. | 596,961 | 559,761 |
Taiwan Semiconductor Manufacturing Co. Ltd. | 3,492,000 | 41,981,554 |
October 31, 2022 | J.P. Morgan Exchange-Traded Funds | 71 |
AS OF October 31, 2022 (continued)
INVESTMENTS | SHARES | VALUE($) |
Common Stocks — continued | ||
Taiwan — continued | ||
Unimicron Technology Corp. | 319,000 | 1,225,716 |
Uni-President Enterprises Corp. | 876,000 | 1,778,946 |
United Microelectronics Corp. * | 389,000 | 467,757 |
Vanguard International Semiconductor Corp. | 1,160,000 | 2,381,678 |
Voltronic Power Technology Corp. | 12,000 | 486,530 |
Wiwynn Corp. | 129,000 | 2,889,822 |
133,090,715 | ||
Tanzania, United Republic of — 0.0% ^ | ||
AngloGold Ashanti Ltd. | 19,298 | 252,026 |
Thailand — 1.8% | ||
Advanced Info Service PCL | 145,300 | 730,135 |
Airports of Thailand PCL * | 582,200 | 1,124,322 |
Bangkok Dusit Medical Services PCL, Class F | 902,300 | 700,319 |
Bangkok Expressway & Metro PCL, NVDR | 990,100 | 244,626 |
Central Pattana PCL, NVDR | 233,000 | 421,549 |
CP ALL PCL | 436,700 | 688,817 |
Delta Electronics Thailand PCL, NVDR | 31,100 | 475,537 |
Energy Absolute PCL, NVDR | 119,000 | 302,942 |
Gulf Energy Development PCL | 291,400 | 387,276 |
Intouch Holdings PCL, NVDR | 145,400 | 275,256 |
Kasikornbank PCL, NVDR | 81,500 | 313,589 |
Krung Thai Bank PCL, NVDR | 1,527,400 | 703,813 |
PTT Exploration & Production PCL | 898,200 | 4,259,724 |
PTT Global Chemical PCL | 203,800 | 233,496 |
PTT PCL | 815,100 | 770,911 |
SCB X PCL | 548,700 | 1,533,041 |
SCG Packaging PCL, NVDR | 197,800 | 270,520 |
Siam Cement PCL (The) (Registered) | 262,100 | 2,232,120 |
Thai Oil PCL | 410,663 | 590,496 |
16,258,489 | ||
United Arab Emirates — 1.1% | ||
Abu Dhabi Commercial Bank PJSC | 106,060 | 273,016 |
Abu Dhabi Islamic Bank PJSC | 283,017 | 732,279 |
Abu Dhabi National Oil Co. for Distribution PJSC | 531,234 | 652,875 |
Aldar Properties PJSC | 755,118 | 888,224 |
Dubai Electricity & Water Authority PJSC | 2,196,907 | 1,459,381 |
Dubai Islamic Bank PJSC | 194,528 | 308,186 |
Emaar Properties PJSC | 818,331 | 1,350,865 |
Emirates Telecommunications Group Co. PJSC | 130,785 | 919,165 |
Fertiglobe plc | 681,253 | 943,734 |
INVESTMENTS | SHARES | VALUE($) |
United Arab Emirates — continued | ||
First Abu Dhabi Bank PJSC | 439,826 | 2,144,926 |
Salik Co. PJSC * | 1,110,900 | 692,593 |
10,365,244 | ||
United States — 1.3% | ||
EPAM Systems, Inc. * | 11,381 | 3,983,350 |
Genpact Ltd. | 82,107 | 3,982,190 |
Globant SA * | 12,880 | 2,430,198 |
JS Global Lifestyle Co. Ltd. (a) | 904,500 | 728,589 |
Parade Technologies Ltd. | 60,000 | 1,129,920 |
12,254,247 | ||
Zambia — 0.1% | ||
First Quantum Minerals Ltd. | 34,777 | 613,419 |
Total Common Stocks (Cost $1,192,403,952) | 902,991,773 | |
Short-Term Investments — 0.4% | ||
Investment Companies — 0.4% | ||
JPMorgan Prime Money Market Fund Class IM Shares, 3.18% (c) (d)(Cost $3,448,736) | 3,448,164 | 3,448,509 |
Total Investments — 99.9% (Cost $1,195,852,688) | 906,440,282 | |
Other Assets Less Liabilities — 0.1% | 713,844 | |
NET ASSETS — 100.0% | 907,154,126 | |
Percentages indicated are based on net assets. |
Abbreviations | |
ADR | American Depositary Receipt |
APAC | Asia Pacific |
BDR | Brazilian Depositary Receipt |
GDR | Global Depositary Receipt |
JSC | Joint Stock Company |
NVDR | Non-Voting Depositary Receipt |
PJSC | Public Joint Stock Company |
Preference | A special type of equity investment that shares in the earnings of the company, has limited voting rights, and may have a dividend preference. Preference shares may also have liquidation preference. |
PT | Limited liability company |
REIT | Real Estate Investment Trust |
RTS | Russian Trading System |
SGPS | Holding company |
^ | Amount rounds to less than 0.1% of net assets. | |
‡ | Value determined using significant unobservable inputs. | |
* | Non-income producing security. | |
72 | J.P. Morgan Exchange-Traded Funds | October 31, 2022 |
(a) | Security exempt from registration pursuant to Regulation S under the Securities Act of 1933, as amended. Regulation S applies to securities offerings that are made outside of the United States and do not involve direct selling efforts in the United States and as such may have restrictions on resale. | |
(b) | Securities exempt from registration under Rule 144A or section 4(a)(2), of the Securities Act of 1933, as amended. | |
(c) | Investment in an affiliated fund, which is registered under the Investment Company Act of 1940, as amended, and is advised by J.P. Morgan Investment Management Inc. | |
(d) | The rate shown is the current yield as of October 31, 2022. |
INDUSTRY | PERCENT OF TOTAL INVESTMENTS |
Banks | 17.0% |
Semiconductors & Semiconductor Equipment | 8.9 |
Technology Hardware, Storage & Peripherals | 4.9 |
IT Services | 4.7 |
Internet & Direct Marketing Retail | 4.5 |
Food & Staples Retailing | 4.3 |
Oil, Gas & Consumable Fuels | 3.8 |
Insurance | 3.7 |
Food Products | 3.1 |
Electronic Equipment, Instruments & Components | 2.7 |
Diversified Financial Services | 2.7 |
Metals & Mining | 2.6 |
Chemicals | 2.6 |
Interactive Media & Services | 2.5 |
Household Durables | 2.0 |
Beverages | 1.9 |
Capital Markets | 1.9 |
Real Estate Management & Development | 1.5 |
Entertainment | 1.4 |
Auto Components | 1.3 |
Hotels, Restaurants & Leisure | 1.2 |
Wireless Telecommunication Services | 1.2 |
Personal Products | 1.2 |
Machinery | 1.2 |
Electrical Equipment | 1.1 |
Diversified Telecommunication Services | 1.1 |
Transportation Infrastructure | 1.1 |
Automobiles | 1.1 |
Textiles, Apparel & Luxury Goods | 1.1 |
Others (each less than 1.0%) | 11.3 |
Short-Term Investments | 0.4 |
October 31, 2022 | J.P. Morgan Exchange-Traded Funds | 73 |
AS OF October 31, 2022
INVESTMENTS | SHARES | VALUE($) |
Common Stocks — 97.8% | ||
Australia — 6.1% | ||
Australia & New Zealand Banking Group Ltd. | 4,221 | 69,156 |
BHP Group Ltd. | 15,480 | 371,833 |
BlueScope Steel Ltd. | 1,589 | 16,001 |
Commonwealth Bank of Australia | 1,125 | 75,428 |
Glencore plc | 16,520 | 94,710 |
Goodman Group, REIT | 1,508 | 16,408 |
IDP Education Ltd. | 443 | 8,358 |
Macquarie Group Ltd. | 281 | 30,484 |
Medibank Pvt Ltd. | 9,752 | 17,560 |
National Australia Bank Ltd. | 3,494 | 72,578 |
Rio Tinto Ltd. | 1,519 | 86,203 |
Rio Tinto plc | 2,332 | 121,874 |
South32 Ltd. | 12,504 | 28,688 |
Wesfarmers Ltd. | 421 | 12,217 |
Westpac Banking Corp. | 8,031 | 124,006 |
Woodside Energy Group Ltd. | 8,382 | 193,779 |
Woolworths Group Ltd. | 794 | 16,767 |
Worley Ltd. | 1,754 | 16,021 |
1,372,071 | ||
Austria — 0.3% | ||
BAWAG Group AG * (a) | 354 | 17,090 |
Erste Group Bank AG | 1,087 | 26,789 |
OMV AG | 719 | 33,105 |
76,984 | ||
Belgium — 0.7% | ||
Ageas SA | 379 | 13,121 |
Bekaert SA | 325 | 9,057 |
D'ieteren Group | 185 | 30,789 |
KBC Group NV | 1,963 | 98,377 |
151,344 | ||
Brazil — 0.1% | ||
MercadoLibre, Inc. * | 17 | 15,328 |
Canada — 0.7% | ||
Alimentation Couche-Tard, Inc. | 818 | 36,626 |
Canadian National Railway Co. | 517 | 61,250 |
Toronto-Dominion Bank (The) | 1,001 | 64,064 |
161,940 | ||
China — 0.6% | ||
BOC Hong Kong Holdings Ltd. | 12,500 | 38,841 |
Prosus NV * | 359 | 15,524 |
INVESTMENTS | SHARES | VALUE($) |
China — continued | ||
Tencent Holdings Ltd. | 2,170 | 57,021 |
Yangzijiang Shipbuilding Holdings Ltd. | 34,200 | 28,992 |
140,378 | ||
Denmark — 4.4% | ||
AP Moller - Maersk A/S, Class B | 16 | 33,427 |
Carlsberg A/S, Class B | 840 | 98,906 |
Coloplast A/S, Class B | 707 | 78,809 |
D/S Norden A/S | 448 | 23,186 |
Drilling Co. of 1972 A/S (The) * | 232 | 11,507 |
Genmab A/S * | 273 | 105,162 |
ISS A/S * | 1,323 | 24,297 |
Novo Nordisk A/S, Class B | 4,726 | 513,864 |
Orsted A/S (a) | 608 | 50,163 |
Solar A/S, Class B | 268 | 20,211 |
Spar Nord Bank A/S | 972 | 11,769 |
Sydbank A/S | 306 | 9,318 |
Vestas Wind Systems A/S | 288 | 5,678 |
986,297 | ||
Finland — 1.0% | ||
Elisa OYJ | 541 | 26,145 |
Kone OYJ, Class B | 642 | 26,287 |
Nokia OYJ | 13,900 | 61,770 |
Nordea Bank Abp | 10,655 | 101,782 |
Outokumpu OYJ | 4,620 | 18,542 |
234,526 | ||
France — 12.0% | ||
Air Liquide SA | 568 | 74,302 |
Airbus SE | 277 | 29,972 |
AXA SA | 5,072 | 125,253 |
BNP Paribas SA | 3,441 | 161,362 |
Capgemini SE | 1,220 | 199,947 |
Carrefour SA | 1,861 | 29,954 |
Cie de Saint-Gobain | 745 | 30,456 |
Dassault Systemes SE | 328 | 10,994 |
Eiffage SA | 314 | 28,392 |
Engie SA | 3,595 | 46,711 |
IPSOS | 605 | 29,286 |
Kering SA | 134 | 61,367 |
L'Oreal SA | 857 | 269,102 |
LVMH Moet Hennessy Louis Vuitton SE | 751 | 473,877 |
Pernod Ricard SA | 535 | 93,899 |
Publicis Groupe SA | 643 | 36,011 |
Renault SA * | 957 | 29,465 |
74 | J.P. Morgan Exchange-Traded Funds | October 31, 2022 |
INVESTMENTS | SHARES | VALUE($) |
Common Stocks — continued | ||
France — continued | ||
Rothschild & Co. | 530 | 18,796 |
Safran SA | 1,009 | 112,372 |
Sanofi | 715 | 61,531 |
Societe Generale SA | 1,729 | 39,658 |
Technip Energies NV | 1,471 | 18,989 |
TotalEnergies SE | 8,516 | 464,577 |
Veolia Environnement SA | 1,377 | 30,729 |
Vinci SA | 2,237 | 205,887 |
2,682,889 | ||
Germany — 8.2% | ||
adidas AG | 700 | ��� 68,330 |
Allianz SE (Registered) | 1,418 | 255,105 |
Aurubis AG | 256 | 16,154 |
Bayer AG (Registered) | 1,523 | 80,081 |
Bayerische Motoren Werke AG | 678 | 53,217 |
Daimler Truck Holding AG * | 465 | 12,403 |
Deutsche Boerse AG | 799 | 129,933 |
Deutsche Post AG (Registered) | 2,445 | 86,430 |
Deutsche Telekom AG (Registered) | 10,528 | 198,721 |
E.ON SE | 992 | 8,307 |
Infineon Technologies AG | 1,407 | 34,141 |
Kloeckner & Co. SE | 1,716 | 13,449 |
Mercedes-Benz Group AG | 1,265 | 73,220 |
Merck KGaA | 212 | 34,549 |
Muenchener Rueckversicherungs-Gesellschaft AG (Registered) | 639 | 168,681 |
RWE AG | 4,396 | 169,225 |
SAP SE | 431 | 41,485 |
Sartorius AG (Preference) | 57 | 20,098 |
Siemens AG (Registered) | 1,262 | 137,822 |
Symrise AG | 818 | 83,495 |
Volkswagen AG (Preference) | 958 | 122,625 |
Zalando SE * (a) | 847 | 19,522 |
1,826,993 | ||
Hong Kong — 1.6% | ||
AIA Group Ltd. | 27,800 | 210,579 |
Hong Kong Exchanges & Clearing Ltd. | 3,500 | 92,903 |
Kerry Properties Ltd. | 3,500 | 5,537 |
Pacific Basin Shipping Ltd. | 38,000 | 9,200 |
Prudential plc | 2,835 | 26,336 |
Techtronic Industries Co. Ltd. | 2,000 | 18,937 |
363,492 | ||
INVESTMENTS | SHARES | VALUE($) |
India — 0.5% | ||
HDFC Bank Ltd., ADR | 1,869 | 116,457 |
Indonesia — 0.1% | ||
Bank Central Asia Tbk. PT | 42,200 | 23,855 |
Ireland — 0.1% | ||
Bank of Ireland Group plc | 1,552 | 11,175 |
Kingspan Group plc | 352 | 17,747 |
28,922 | ||
Italy — 1.1% | ||
Assicurazioni Generali SpA | 2,102 | 31,545 |
Azimut Holding SpA | 1,051 | 16,923 |
Eni SpA | 3,931 | 51,629 |
FinecoBank Banca Fineco SpA | 1,466 | 19,755 |
Pirelli & C SpA (a) | 5,521 | 20,825 |
Prysmian SpA | 263 | 8,560 |
UniCredit SpA | 6,252 | 77,533 |
Unipol Gruppo SpA | 5,834 | 25,109 |
251,879 | ||
Japan — 18.9% | ||
AGC, Inc. | 900 | 28,201 |
Asahi Group Holdings Ltd. | 600 | 16,788 |
Asahi Kasei Corp. | 1,500 | 9,618 |
Bridgestone Corp. | 1,600 | 57,866 |
Brother Industries Ltd. | 400 | 6,814 |
Central Japan Railway Co. | 200 | 23,155 |
Cosmo Energy Holdings Co. Ltd. | 1,300 | 33,487 |
Credit Saison Co. Ltd. | 2,300 | 24,583 |
Dai-ichi Life Holdings, Inc. | 2,600 | 41,295 |
Daiichi Sankyo Co. Ltd. | 1,600 | 51,217 |
Daikin Industries Ltd. | 1,000 | 149,787 |
Daiwa House Industry Co. Ltd. | 400 | 8,059 |
Denso Corp. | 300 | 14,885 |
Dentsu Group, Inc. | 1,800 | 55,986 |
FANUC Corp. | 100 | 13,085 |
Fuji Electric Co. Ltd. | 800 | 30,932 |
Fujitsu Ltd. | 100 | 11,506 |
Fuyo General Lease Co. Ltd. | 400 | 22,231 |
Hitachi Ltd. | 1,700 | 77,136 |
Honda Motor Co. Ltd. | 4,100 | 93,490 |
Hoya Corp. | 1,900 | 176,627 |
Inpex Corp. | 4,100 | 41,379 |
Isuzu Motors Ltd. | 3,100 | 36,455 |
ITOCHU Corp. | 2,800 | 72,365 |
Japan Airlines Co. Ltd. * | 1,200 | 22,414 |
October 31, 2022 | J.P. Morgan Exchange-Traded Funds | 75 |
AS OF October 31, 2022 (continued)
INVESTMENTS | SHARES | VALUE($) |
Common Stocks — continued | ||
Japan — continued | ||
Japan Post Holdings Co. Ltd. | 4,000 | 26,898 |
Japan Post Insurance Co. Ltd. | 2,300 | 34,047 |
Kao Corp. | 300 | 11,206 |
KDDI Corp. | 3,000 | 88,671 |
Keyence Corp. | 600 | 226,239 |
Konami Group Corp. | 400 | 17,533 |
Kubota Corp. | 1,200 | 16,740 |
Kyowa Kirin Co. Ltd. | 3,800 | 89,496 |
Makita Corp. | 400 | 7,309 |
Marubeni Corp. | 5,300 | 46,396 |
Mitsubishi Corp. | 3,200 | 86,684 |
Mitsubishi UFJ Financial Group, Inc. | 25,100 | 118,569 |
Mitsui & Co. Ltd. | 2,500 | 55,323 |
Mitsui Fudosan Co. Ltd. | 3,300 | 63,190 |
Mizuho Financial Group, Inc. | 2,800 | 30,283 |
MS&AD Insurance Group Holdings, Inc. | 700 | 18,537 |
Murata Manufacturing Co. Ltd. | 400 | 18,936 |
Nidec Corp. | 700 | 38,489 |
Nintendo Co. Ltd. | 1,000 | 40,599 |
NIPPON EXPRESS HOLDINGS, Inc. | 300 | 15,074 |
Nippon Steel Corp. | 2,800 | 38,412 |
Nippon Telegraph & Telephone Corp. | 4,000 | 110,323 |
Nomura Real Estate Holdings, Inc. | 1,400 | 31,645 |
Nomura Research Institute Ltd. | 300 | 6,639 |
Ono Pharmaceutical Co. Ltd. | 1,400 | 32,947 |
ORIX Corp. | 4,700 | 69,032 |
Otsuka Corp. | 300 | 9,448 |
Recruit Holdings Co. Ltd. | 1,800 | 55,388 |
Resona Holdings, Inc. | 2,200 | 8,292 |
Rohm Co. Ltd. | 100 | 7,026 |
SBI Holdings, Inc. | 1,100 | 19,870 |
Sekisui House Ltd. | 2,000 | 33,206 |
Seven & i Holdings Co. Ltd. | 800 | 29,863 |
Shimano, Inc. | 200 | 30,949 |
Shin-Etsu Chemical Co. Ltd. | 1,700 | 176,681 |
Shionogi & Co. Ltd. | 200 | 9,287 |
SMC Corp. | 200 | 80,280 |
SoftBank Corp. | 5,700 | 56,227 |
SoftBank Group Corp. | 600 | 25,756 |
Sojitz Corp. | 2,120 | 31,253 |
Sompo Holdings, Inc. | 800 | 33,354 |
Sony Group Corp. | 3,800 | 256,252 |
Sumitomo Corp. | 2,700 | 34,327 |
Sumitomo Electric Industries Ltd. | 800 | 8,360 |
INVESTMENTS | SHARES | VALUE($) |
Japan — continued | ||
Sumitomo Forestry Co. Ltd. | 1,500 | 23,465 |
Sumitomo Mitsui Financial Group, Inc. | 3,700 | 103,902 |
Sumitomo Mitsui Trust Holdings, Inc. | 1,400 | 40,277 |
Sumitomo Warehouse Co. Ltd. (The) | 1,900 | 25,788 |
Suzuki Motor Corp. | 500 | 16,905 |
Sysmex Corp. | 300 | 16,147 |
Takeda Pharmaceutical Co. Ltd. | 3,400 | 89,791 |
Terumo Corp. | 500 | 15,175 |
Tokio Marine Holdings, Inc. | 6,900 | 124,926 |
Tokyo Electron Ltd. | 500 | 131,548 |
Tokyu Fudosan Holdings Corp. | 5,900 | 29,934 |
Toyota Boshoku Corp. | 2,000 | 25,449 |
Toyota Motor Corp. | 16,200 | 224,769 |
Yamaha Motor Co. Ltd. | 400 | 8,257 |
4,240,730 | ||
Luxembourg — 0.2% | ||
ArcelorMittal SA | 1,516 | 33,888 |
Netherlands — 7.2% | ||
ABN AMRO Bank NV, CVA (a) | 737 | 7,245 |
Adyen NV * (a) | 43 | 61,387 |
Aegon NV | 2,742 | 12,693 |
Akzo Nobel NV | 247 | 15,249 |
Argenx SE * | 111 | 43,096 |
ASM International NV | 35 | 7,743 |
ASML Holding NV | 951 | 446,102 |
ASR Nederland NV | 754 | 33,201 |
Heijmans NV, CVA | 1,725 | 17,480 |
ING Groep NV | 4,126 | 40,598 |
Koninklijke Ahold Delhaize NV | 3,967 | 110,633 |
Koninklijke BAM Groep NV * | 6,479 | 14,140 |
Koninklijke DSM NV | 308 | 36,230 |
Koninklijke KPN NV | 23,636 | 66,112 |
NN Group NV | 1,808 | 76,555 |
Randstad NV | 389 | 19,387 |
Shell plc | 17,392 | 481,786 |
Wolters Kluwer NV | 1,253 | 133,142 |
1,622,779 | ||
Norway — 0.9% | ||
DNB Bank ASA | 1,794 | 31,730 |
Elkem ASA (a) | 5,946 | 19,754 |
Equinor ASA | 2,516 | 91,667 |
Norsk Hydro ASA | 4,600 | 29,193 |
76 | J.P. Morgan Exchange-Traded Funds | October 31, 2022 |
INVESTMENTS | SHARES | VALUE($) |
Common Stocks — continued | ||
Norway — continued | ||
SpareBank 1 Nord Norge | 2,902 | 24,080 |
SpareBank 1 SMN | 803 | 8,668 |
205,092 | ||
Singapore — 1.5% | ||
DBS Group Holdings Ltd. | 10,100 | 244,181 |
Oversea-Chinese Banking Corp. Ltd. | 6,200 | 53,221 |
Sea Ltd., ADR * | 183 | 9,091 |
United Overseas Bank Ltd. | 1,000 | 19,619 |
326,112 | ||
South Africa — 0.6% | ||
Anglo American plc | 4,216 | 126,287 |
South Korea — 0.5% | ||
Delivery Hero SE * (a) | 827 | 27,216 |
Samsung Electronics Co. Ltd., GDR (a) | 78 | 80,558 |
107,774 | ||
Spain — 1.9% | ||
Banco Bilbao Vizcaya Argentaria SA | 15,929 | 82,174 |
Banco Santander SA | 12,143 | 31,493 |
CaixaBank SA | 4,264 | 14,140 |
Corp. ACCIONA Energias Renovables SA | 228 | 8,965 |
Iberdrola SA | 18,117 | 184,237 |
Industria de Diseno Textil SA | 1,643 | 37,293 |
Repsol SA | 3,130 | 42,582 |
Telefonica SA | 7,030 | 24,234 |
425,118 | ||
Sweden — 2.2% | ||
Assa Abloy AB, Class B | 2,692 | 54,357 |
Atlas Copco AB, Class A | 13,074 | 139,542 |
Boliden AB | 1,489 | 43,302 |
Loomis AB | 923 | 25,843 |
Securitas AB, Class B | 1,831 | 14,961 |
Skandinaviska Enskilda Banken AB, Class A | 2,286 | 24,102 |
SKF AB, Class B | 1,112 | 16,097 |
SSAB AB, Class B | 3,611 | 16,778 |
Svenska Handelsbanken AB, Class A | 7,031 | 65,325 |
Volvo AB, Class B | 5,492 | 89,887 |
490,194 | ||
Switzerland — 5.1% | ||
ABB Ltd. (Registered) | 1,416 | 39,323 |
Accelleron Industries AG * | 70 | 1,187 |
Cie Financiere Richemont SA (Registered) | 528 | 51,603 |
Givaudan SA (Registered) | 5 | 14,935 |
INVESTMENTS | SHARES | VALUE($) |
Switzerland — continued | ||
Julius Baer Group Ltd. | 1,013 | 48,603 |
Lonza Group AG (Registered) | 324 | 166,790 |
Mobilezone Holding AG (Registered) | 1,458 | 23,123 |
Novartis AG (Registered) | 4,369 | 353,412 |
SGS SA (Registered) | 20 | 44,090 |
Sika AG (Registered) | 226 | 50,958 |
Straumann Holding AG (Registered) | 268 | 25,506 |
Swiss Life Holding AG (Registered) | 74 | 35,832 |
UBS Group AG (Registered) | 8,397 | 133,127 |
Zurich Insurance Group AG | 385 | 164,077 |
1,152,566 | ||
Taiwan — 0.4% | ||
Taiwan Semiconductor Manufacturing Co. Ltd., ADR | 1,369 | 84,262 |
United Kingdom — 12.4% | ||
3i Group plc | 5,081 | 67,671 |
Allfunds Group plc | 1,845 | 11,603 |
AstraZeneca plc | 2,884 | 338,386 |
Aviva plc | 1,228 | 5,890 |
BAE Systems plc | 1,831 | 17,126 |
Balfour Beatty plc | 7,457 | 25,535 |
Barclays plc | 41,542 | 70,590 |
Berkeley Group Holdings plc | 778 | 30,955 |
BP plc | 46,909 | 259,529 |
British American Tobacco plc | 1,927 | 76,104 |
Centrica plc | 37,771 | 33,190 |
CK Hutchison Holdings Ltd. | 7,000 | 34,845 |
Compass Group plc | 1,357 | 28,581 |
Diageo plc | 8,780 | 361,319 |
Drax Group plc | 3,036 | 18,130 |
Haleon plc * | 3,630 | 11,131 |
HSBC Holdings plc | 26,911 | 138,109 |
Inchcape plc | 3,445 | 29,389 |
InterContinental Hotels Group plc | 524 | 28,155 |
Intertek Group plc | 523 | 21,910 |
Investec plc | 1,947 | 9,758 |
JD Sports Fashion plc | 19,904 | 22,241 |
Legal & General Group plc | 11,862 | 31,734 |
Linde plc | 571 | 170,489 |
Lloyds Banking Group plc | 185,338 | 89,012 |
London Stock Exchange Group plc | 1,004 | 87,029 |
Man Group plc | 8,713 | 21,675 |
Marks & Spencer Group plc * | 11,914 | 14,429 |
Mitie Group plc | 27,630 | 22,684 |
Morgan Sindall Group plc | 862 | 15,210 |
October 31, 2022 | J.P. Morgan Exchange-Traded Funds | 77 |
AS OF October 31, 2022 (continued)
INVESTMENTS | SHARES | VALUE($) |
Common Stocks — continued | ||
United Kingdom — continued | ||
NatWest Group plc | 8,451 | 22,761 |
OSB Group plc | 5,527 | 26,339 |
Reckitt Benckiser Group plc | 1,302 | 86,406 |
RELX plc | 7,757 | 208,357 |
Segro plc, REIT | 1,261 | 11,349 |
SSE plc | 2,509 | 44,838 |
Standard Chartered plc | 9,889 | 59,084 |
Taylor Wimpey plc | 8,971 | 9,645 |
Tesco plc | 22,060 | 54,486 |
Unilever plc | 2,346 | 106,636 |
Vistry Group plc | 850 | 5,878 |
Vodafone Group plc | 21,036 | 24,557 |
WPP plc | 3,427 | 30,158 |
2,782,903 | ||
United States — 8.5% | ||
CSL Ltd. | 349 | 62,476 |
GSK plc | 8,427 | 138,044 |
Nestle SA (Registered) | 6,468 | 704,099 |
Roche Holding AG | 1,902 | 631,081 |
Schneider Electric SE | 1,911 | 241,658 |
Stellantis NV | 7,649 | 103,197 |
Tenaris SA | 1,635 | 25,590 |
1,906,145 | ||
Total Common Stocks (Cost $26,943,499) | 21,937,205 | |
Short-Term Investments — 1.4% | ||
Investment Companies — 1.4% | ||
JPMorgan U.S. Government Money Market Fund Class IM Shares, 2.85% (b) (c)(Cost $316,955) | 316,955 | 316,955 |
Total Investments — 99.2% (Cost $27,260,454) | 22,254,160 | |
Other Assets Less Liabilities — 0.8% | 172,716 | |
NET ASSETS — 100.0% | 22,426,876 | |
Percentages indicated are based on net assets. |
Abbreviations | |
ADR | American Depositary Receipt |
CVA | Dutch Certification |
GDR | Global Depositary Receipt |
OYJ | Public Limited Company |
Preference | A special type of equity investment that shares in the earnings of the company, has limited voting rights, and may have a dividend preference. Preference shares may also have liquidation preference. |
PT | Limited liability company |
REIT | Real Estate Investment Trust |
* | Non-income producing security. |
(a) | Security exempt from registration pursuant to Regulation S under the Securities Act of 1933, as amended. Regulation S applies to securities offerings that are made outside of the United States and do not involve direct selling efforts in the United States and as such may have restrictions on resale. |
(b) | Investment in an affiliated fund, which is registered under the Investment Company Act of 1940, as amended, and is advised by J.P. Morgan Investment Management Inc. |
(c) | The rate shown is the current yield as of October 31, 2022. |
78 | J.P. Morgan Exchange-Traded Funds | October 31, 2022 |
INDUSTRY | PERCENT OF TOTAL INVESTMENTS |
Banks | 11.2% |
Pharmaceuticals | 10.9 |
Oil, Gas & Consumable Fuels | 7.6 |
Insurance | 6.8 |
Metals & Mining | 4.7 |
Automobiles | 3.4 |
Semiconductors & Semiconductor Equipment | 3.2 |
Food Products | 3.2 |
Capital Markets | 3.1 |
Textiles, Apparel & Luxury Goods | 2.9 |
Chemicals | 2.9 |
Beverages | 2.6 |
Professional Services | 2.2 |
Machinery | 2.0 |
Diversified Telecommunication Services | 1.9 |
Personal Products | 1.8 |
Electrical Equipment | 1.6 |
Trading Companies & Distributors | 1.6 |
Household Durables | 1.6 |
Health Care Equipment & Supplies | 1.4 |
Construction & Engineering | 1.4 |
Food & Staples Retailing | 1.3 |
IT Services | 1.3 |
Building Products | 1.3 |
Electric Utilities | 1.3 |
Industrial Conglomerates | 1.1 |
Electronic Equipment, Instruments & Components | 1.1 |
Others (each less than 1.0%) | 13.2 |
Short-Term Investments | 1.4 |
October 31, 2022 | J.P. Morgan Exchange-Traded Funds | 79 |
AS OF October 31, 2022
INVESTMENTS | SHARES | VALUE($) |
Common Stocks — 99.4% | ||
Aerospace & Defense — 0.4% | ||
CAE, Inc. * | 1,029,042 | 19,638,927 |
Airlines — 0.3% | ||
Air Canada * | 1,089,521 | 15,682,832 |
Auto Components — 0.9% | ||
Magna International, Inc. | 870,127 | 48,489,773 |
Banks — 24.6% | ||
Bank of Montreal (a) | 2,183,929 | 201,168,019 |
Bank of Nova Scotia (The) | 3,862,501 | 186,696,290 |
Canadian Imperial Bank of Commerce | 2,926,585 | 132,908,441 |
National Bank of Canada | 1,089,397 | 74,175,113 |
Royal Bank of Canada | 4,515,576 | 417,798,916 |
Toronto-Dominion Bank (The) | 5,850,109 | 374,405,258 |
1,387,152,037 | ||
Capital Markets — 3.9% | ||
Brookfield Asset Management, Inc., Class A | 4,624,363 | 183,127,966 |
IGM Financial, Inc. | 261,628 | 7,003,760 |
Onex Corp. | 232,927 | 11,723,716 |
TMX Group Ltd. | 180,037 | 17,309,242 |
219,164,684 | ||
Chemicals — 2.6% | ||
Nutrien Ltd. | 1,744,981 | 147,439,911 |
Commercial Services & Supplies — 2.6% | ||
GFL Environmental, Inc. (a) | 556,975 | 15,032,826 |
Ritchie Bros Auctioneers, Inc. | 358,913 | 23,447,174 |
Waste Connections, Inc. | 832,665 | 109,899,434 |
148,379,434 | ||
Construction & Engineering — 1.0% | ||
SNC-Lavalin Group, Inc. (a) | 568,440 | 9,842,918 |
WSP Global, Inc. | 382,792 | 47,047,156 |
56,890,074 | ||
Containers & Packaging — 0.4% | ||
CCL Industries, Inc., Class B | 470,506 | 22,103,266 |
Diversified Telecommunication Services — 1.3% | ||
BCE, Inc. | 974,368 | 43,949,729 |
TELUS Corp. | 1,514,977 | 31,637,315 |
75,587,044 | ||
Electric Utilities — 2.1% | ||
Emera, Inc. (a) | 859,731 | 31,862,457 |
INVESTMENTS | SHARES | VALUE($) |
Electric Utilities — continued | ||
Fortis, Inc. (a) | 1,549,937 | 60,468,420 |
Hydro One Ltd. (a) (b) | 1,027,453 | 25,762,685 |
118,093,562 | ||
Equity Real Estate Investment Trusts (REITs) — 0.3% | ||
Canadian Apartment Properties | 274,593 | 8,503,746 |
RioCan (a) | 481,389 | 6,858,561 |
15,362,307 | ||
Food & Staples Retailing — 4.1% | ||
Alimentation Couche-Tard, Inc. | 2,549,074 | 114,136,245 |
Empire Co. Ltd., Class A | 532,854 | 13,689,500 |
George Weston Ltd. | 215,371 | 23,705,275 |
Loblaw Cos. Ltd. | 498,529 | 40,845,456 |
Metro, Inc. | 773,544 | 40,523,974 |
232,900,450 | ||
Food Products — 0.3% | ||
Saputo, Inc. (a) | 784,738 | 19,100,754 |
Gas Utilities — 0.3% | ||
AltaGas Ltd. | 910,013 | 16,412,096 |
Hotels, Restaurants & Leisure — 1.0% | ||
Restaurant Brands International, Inc. | 990,995 | 58,884,314 |
Independent Power and Renewable Electricity Producers — 0.2% | ||
Brookfield Renewable Corp. | 412,673 | 12,822,291 |
Insurance — 6.9% | ||
Fairfax Financial Holdings Ltd. | 74,158 | 36,421,167 |
Great-West Lifeco, Inc. | 874,927 | 20,255,586 |
iA Financial Corp., Inc. | 343,079 | 19,093,662 |
Intact Financial Corp. | 568,348 | 86,360,861 |
Manulife Financial Corp. | 6,173,360 | 102,319,131 |
Power Corp. of Canada | 1,829,259 | 45,424,327 |
Sun Life Financial, Inc. | 1,897,651 | 80,594,625 |
390,469,359 | ||
IT Services — 3.4% | ||
CGI, Inc. * | 687,414 | 55,372,564 |
Nuvei Corp. * (b) | 210,437 | 6,333,113 |
Shopify, Inc., Class A * | 3,841,608 | 131,714,691 |
193,420,368 | ||
Media — 0.8% | ||
Quebecor, Inc., Class B | 508,912 | 9,592,880 |
Shaw Communications, Inc., Class B | 1,451,986 | 37,292,172 |
46,885,052 | ||
80 | J.P. Morgan Exchange-Traded Funds | October 31, 2022 |
INVESTMENTS | SHARES | VALUE($) |
Common Stocks — continued | ||
Metals & Mining — 7.0% | ||
Agnico Eagle Mines Ltd. (a) | 1,477,206 | 64,982,534 |
Barrick Gold Corp. | 5,732,487 | 86,217,682 |
First Quantum Minerals Ltd. | 1,814,337 | 32,002,436 |
Franco-Nevada Corp. | 620,235 | 76,635,342 |
Ivanhoe Mines Ltd., Class A * | 1,844,205 | 12,792,408 |
Kinross Gold Corp. (a) | 4,209,409 | 15,263,684 |
Lundin Mining Corp. | 2,193,710 | 11,497,111 |
Teck Resources Ltd., Class B | 1,503,460 | 45,765,395 |
Wheaton Precious Metals Corp. | 1,462,543 | 47,847,867 |
393,004,459 | ||
Multiline Retail — 1.3% | ||
Canadian Tire Corp. Ltd., Class A (a) | 179,906 | 20,163,575 |
Dollarama, Inc. | 933,009 | 55,438,822 |
75,602,397 | ||
Multi-Utilities — 0.6% | ||
Algonquin Power & Utilities Corp. (a) | 2,181,304 | 24,145,090 |
Canadian Utilities Ltd., Class A | 384,025 | 10,218,304 |
34,363,394 | ||
Oil, Gas & Consumable Fuels — 19.4% | ||
ARC Resources Ltd. | 2,152,197 | 30,299,951 |
Cameco Corp. | 1,385,986 | 32,870,560 |
Canadian Natural Resources Ltd. | 3,638,167 | 218,207,234 |
Cenovus Energy, Inc. | 4,501,932 | 91,006,869 |
Enbridge, Inc. | 6,556,051 | 255,437,433 |
Imperial Oil Ltd. | 633,956 | 34,486,350 |
Keyera Corp. (a) | 715,657 | 15,339,072 |
Pembina Pipeline Corp. (a) | 1,797,726 | 59,354,583 |
Suncor Energy, Inc. | 4,468,693 | 153,707,163 |
TC Energy Corp. | 3,276,537 | 143,918,945 |
Tourmaline Oil Corp. | 1,022,395 | 57,605,637 |
1,092,233,797 | ||
Paper & Forest Products — 0.3% | ||
West Fraser Timber Co. Ltd. | 199,189 | 14,955,806 |
Pharmaceuticals — 0.1% | ||
Bausch Health Cos., Inc. * (a) | 935,070 | 6,081,198 |
Professional Services — 1.0% | ||
Thomson Reuters Corp. | 516,501 | 54,931,427 |
Real Estate Management & Development — 0.3% | ||
FirstService Corp. | 125,919 | 15,741,377 |
Road & Rail — 8.6% | ||
Canadian National Railway Co. | 1,994,715 | 236,317,393 |
INVESTMENTS | SHARES | VALUE($) |
Road & Rail — continued | ||
Canadian Pacific Railway Ltd. | 3,010,842 | 224,451,216 |
TFI International, Inc. | 257,831 | 23,469,463 |
484,238,072 | ||
Software — 2.1% | ||
Constellation Software, Inc. | 63,825 | 92,287,760 |
Open Text Corp. | 872,687 | 25,277,079 |
117,564,839 | ||
Textiles, Apparel & Luxury Goods — 0.3% | ||
Gildan Activewear, Inc. | 591,725 | 18,672,337 |
Trading Companies & Distributors — 0.2% | ||
Finning International, Inc. | 499,843 | 10,629,025 |
Wireless Telecommunication Services — 0.8% | ||
Rogers Communications, Inc., Class B | 1,134,741 | 47,235,411 |
Total Common Stocks (Cost $5,041,664,833) | 5,610,132,074 | |
Short-Term Investments — 8.0% | ||
Investment of Cash Collateral from Securities Loaned — 8.0% | ||
JPMorgan Securities Lending Money Market Fund Agency SL Class Shares, 3.23% (c) (d) | 111,362,203 | 111,362,203 |
JPMorgan U.S. Government Money Market Fund Class IM Shares, 2.85% (c) (d) | 339,229,246 | 339,229,246 |
Total Investment of Cash Collateral from Securities Loaned (Cost $450,591,449) | 450,591,449 | |
Total Investments — 107.4% (Cost $5,492,256,282) | 6,060,723,523 | |
Liabilities in Excess of Other Assets — (7.4)% | (416,450,228) | |
NET ASSETS — 100.0% | 5,644,273,295 | |
Percentages indicated are based on net assets. |
* | Non-income producing security. |
(a) | The security or a portion of this security is on loan at October 31, 2022. The total value of securities on loan at October 31, 2022 is $267,554,005. |
(b) | Security exempt from registration pursuant to Regulation S under the Securities Act of 1933, as amended. Regulation S applies to securities offerings that are made outside of the United States and do not involve direct selling efforts in the United States and as such may have restrictions on resale. |
October 31, 2022 | J.P. Morgan Exchange-Traded Funds | 81 |
AS OF October 31, 2022 (continued)
(c) | Investment in an affiliated fund, which is registered under the Investment Company Act of 1940, as amended, and is advised by J.P. Morgan Investment Management Inc. |
(d) | The rate shown is the current yield as of October 31, 2022. |
DESCRIPTION | NUMBER OF CONTRACTS | EXPIRATION DATE | TRADING CURRENCY | NOTIONAL AMOUNT ($) | VALUE AND UNREALIZED APPRECIATION (DEPRECIATION) ($) |
Long Contracts | |||||
S&P / TSX 60 Index | 180 | 12/15/2022 | CAD | 31,144,420 | 530,645 |
Abbreviations | |
CAD | Canadian Dollar |
TSX | Toronto Stock Exchange |
82 | J.P. Morgan Exchange-Traded Funds | October 31, 2022 |
(formerly known as JPMorgan BetaBuilders Developed Asia ex-Japan ETF)
AS OF October 31, 2022
INVESTMENTS | SHARES | VALUE($) |
Common Stocks — 99.6% | ||
Australia — 59.0% | ||
Alumina Ltd. | 5,020,569 | 4,339,011 |
Ampol Ltd. | 509,034 | 8,878,481 |
APA Group | 2,520,352 | 16,967,993 |
Aristocrat Leisure Ltd. | 1,420,621 | 33,719,806 |
ASX Ltd. | 413,534 | 17,917,795 |
Aurizon Holdings Ltd. | 3,931,899 | 9,111,653 |
Australia & New Zealand Banking Group Ltd. | 6,386,729 | 104,638,500 |
Bendigo & Adelaide Bank Ltd. | 1,206,919 | 6,967,076 |
BHP Group Ltd. | 10,813,552 | 259,743,725 |
BlueScope Steel Ltd. | 1,005,248 | 10,122,832 |
Brambles Ltd. | 2,962,298 | 22,177,949 |
Challenger Ltd. | 1,253,311 | 5,631,542 |
Cochlear Ltd. | 140,501 | 17,948,117 |
Coles Group Ltd. | 2,854,425 | 29,844,911 |
Commonwealth Bank of Australia | 3,645,000 | 244,385,562 |
Dexus, REIT | 2,297,498 | 11,448,669 |
Domino's Pizza Enterprises Ltd. | 134,966 | 5,503,060 |
Endeavour Group Ltd. | 2,677,980 | 12,257,934 |
Evolution Mining Ltd. | 3,915,463 | 5,194,057 |
Fortescue Metals Group Ltd. | 3,617,312 | 34,078,716 |
Goodman Group, REIT | 3,631,523 | 39,513,550 |
GPT Group (The), REIT | 4,091,837 | 11,308,062 |
Harvey Norman Holdings Ltd. | 1,384,018 | 3,681,890 |
IDP Education Ltd. | 445,913 | 8,412,950 |
IGO Ltd. | 1,439,561 | 14,078,839 |
Incitec Pivot Ltd. | 4,148,758 | 9,977,562 |
Insurance Australia Group Ltd. | 5,265,665 | 16,528,595 |
LendLease Corp. Ltd. | 1,471,563 | 8,183,013 |
Macquarie Group Ltd. | 776,012 | 84,183,963 |
Medibank Pvt Ltd. | 5,882,785 | 10,592,951 |
Mineral Resources Ltd. | 356,027 | 16,691,194 |
Mirvac Group, REIT | 8,428,690 | 11,167,729 |
National Australia Bank Ltd. | 6,780,642 | 140,847,816 |
Newcrest Mining Ltd. | 1,907,788 | 21,129,288 |
Northern Star Resources Ltd. | 2,488,809 | 13,890,288 |
Orica Ltd. | 961,499 | 8,552,769 |
Origin Energy Ltd. | 3,679,933 | 13,146,855 |
Qantas Airways Ltd. * | 1,974,090 | 7,376,717 |
QBE Insurance Group Ltd. | 3,168,363 | 24,824,005 |
Ramsay Health Care Ltd. | 396,017 | 14,854,271 |
REA Group Ltd. | 110,064 | 8,530,612 |
Reece Ltd. | 455,362 | 4,521,686 |
Rio Tinto Ltd. | 792,951 | 44,999,680 |
Santos Ltd. | 7,167,527 | 34,989,422 |
INVESTMENTS | SHARES | VALUE($) |
Australia — continued | ||
Scentre Group, REIT | 11,087,090 | 20,633,325 |
SEEK Ltd. | 757,709 | 10,430,526 |
Seven Group Holdings Ltd. | 333,660 | 3,912,637 |
Sonic Healthcare Ltd. | 1,025,519 | 21,469,738 |
South32 Ltd. | 9,886,721 | 22,682,801 |
Stockland, REIT | 5,099,202 | 11,749,069 |
Suncorp Group Ltd. | 2,697,033 | 19,728,836 |
Tabcorp Holdings Ltd. | 4,754,438 | 2,935,299 |
Telstra Group Ltd. | 8,638,432 | 21,660,246 |
TPG Telecom Ltd. | 913,495 | 2,865,635 |
Transurban Group | 6,559,310 | 55,642,281 |
Treasury Wine Estates Ltd. | 1,541,927 | 12,777,600 |
Vicinity Ltd., REIT | 8,265,441 | 10,304,228 |
Washington H Soul Pattinson & Co. Ltd. | 524,319 | 9,383,247 |
Wesfarmers Ltd. | 2,421,978 | 70,283,493 |
Westpac Banking Corp. | 7,478,707 | 115,478,472 |
WiseTech Global Ltd. | 369,512 | 13,665,664 |
Woodside Energy Group Ltd. | 4,055,894 | 93,766,053 |
Woolworths Group Ltd. | 2,592,995 | 54,758,339 |
Worley Ltd. | 794,279 | 7,255,035 |
2,014,243,620 | ||
China — 2.3% | ||
Budweiser Brewing Co. APAC Ltd. (a) | 3,677,500 | 7,740,122 |
ESR Cayman Ltd. (a) | 5,222,400 | 8,906,031 |
Wharf Holdings Ltd. (The) | 2,610,000 | 7,473,725 |
Wilmar International Ltd. | 6,685,200 | 18,314,458 |
Wuxi Biologics Cayman, Inc. * (a) | 7,651,000 | 34,426,764 |
76,861,100 | ||
Hong Kong — 16.9% | ||
AIA Group Ltd. | 25,494,000 | 193,111,800 |
CK Asset Holdings Ltd. | 4,201,000 | 23,225,527 |
CK Infrastructure Holdings Ltd. | 1,291,000 | 6,133,186 |
CLP Holdings Ltd. | 3,562,000 | 23,907,456 |
DFI Retail Group Holdings Ltd. | 635,800 | 1,425,401 |
Hang Lung Properties Ltd. | 3,941,000 | 4,957,633 |
Hang Seng Bank Ltd. (b) | 1,551,600 | 21,843,101 |
Henderson Land Development Co. Ltd. | 2,789,700 | 6,829,912 |
HK Electric Investments & HK Electric Investments Ltd. (a) | 4,906,500 | 3,119,619 |
HKT Trust & HKT Ltd. | 7,773,000 | 8,790,828 |
Hong Kong & China Gas Co. Ltd. | 23,118,789 | 17,819,262 |
Hong Kong Exchanges & Clearing Ltd. | 2,545,800 | 67,574,745 |
Jardine Matheson Holdings Ltd. | 519,000 | 23,909,294 |
Link, REIT | 4,510,800 | 26,661,611 |
October 31, 2022 | J.P. Morgan Exchange-Traded Funds | 83 |
(formerly known as JPMorgan BetaBuilders Developed Asia ex-Japan ETF)
AS OF October 31, 2022 (continued)
INVESTMENTS | SHARES | VALUE($) |
Common Stocks — continued | ||
Hong Kong — continued | ||
MTR Corp. Ltd. | 3,309,500 | 14,562,434 |
New World Development Co. Ltd. | 2,958,250 | 6,051,027 |
Power Assets Holdings Ltd. | 2,917,000 | 13,947,775 |
Sino Land Co. Ltd. | 6,920,000 | 7,389,287 |
Sun Hung Kai Properties Ltd. | 3,218,500 | 34,587,038 |
Swire Pacific Ltd., Class B | 1,847,500 | 1,903,755 |
Swire Pacific Ltd., Class A | 984,500 | 6,530,697 |
Swire Properties Ltd. | 2,249,200 | 4,322,768 |
Techtronic Industries Co. Ltd. | 3,919,500 | 37,112,839 |
WH Group Ltd. (a) | 16,718,191 | 8,442,874 |
Wharf Real Estate Investment Co. Ltd. | 3,307,000 | 13,029,779 |
577,189,648 | ||
Macau — 0.9% | ||
Galaxy Entertainment Group Ltd. | 4,285,000 | 19,576,663 |
Sands China Ltd. * | 5,185,779 | 9,065,906 |
28,642,569 | ||
New Zealand — 1.9% | ||
Auckland International Airport Ltd. * | 2,579,538 | 11,531,625 |
Contact Energy Ltd. | 1,667,511 | 7,314,380 |
Fisher & Paykel Healthcare Corp. Ltd. | 1,233,240 | 14,015,801 |
Fletcher Building Ltd. | 1,672,648 | 4,994,412 |
Mercury NZ Ltd. | 1,387,313 | 4,690,913 |
Meridian Energy Ltd. | 2,587,773 | 7,335,293 |
Ryman Healthcare Ltd. | 897,154 | 4,369,397 |
Spark New Zealand Ltd. | 3,997,869 | 11,900,706 |
66,152,527 | ||
Singapore — 11.2% | ||
CapitaLand Ascendas REIT, REIT | 7,178,828 | 13,282,210 |
CapitaLand Integrated Commercial Trust, REIT | 10,755,732 | 14,274,521 |
Capitaland Investment Ltd. | 5,243,800 | 11,151,707 |
City Developments Ltd. | 1,085,100 | 5,850,441 |
DBS Group Holdings Ltd. | 3,897,900 | 94,236,867 |
Frasers Property Ltd. | 1,090,400 | 689,395 |
Genting Singapore Ltd. | 12,141,800 | 6,904,708 |
Great Eastern Holdings Ltd. | 121,000 | 1,529,895 |
Jardine Cycle & Carriage Ltd. | 211,300 | 4,438,073 |
Keppel Corp. Ltd. | 2,974,400 | 14,640,053 |
Mapletree Pan Asia Commercial Trust, REIT | 4,919,000 | 5,520,151 |
Olam Group Ltd. | 2,298,400 | 2,176,015 |
Oversea-Chinese Banking Corp. Ltd. | 8,649,200 | 74,245,517 |
SATS Ltd. * | 1,414,300 | 2,729,981 |
Singapore Airlines Ltd. * | 2,789,100 | 10,345,632 |
INVESTMENTS | SHARES | VALUE($) |
Singapore — continued | ||
Singapore Exchange Ltd. | 1,756,600 | 10,445,856 |
Singapore Technologies Engineering Ltd. | 3,327,500 | 7,757,523 |
Singapore Telecommunications Ltd. | 15,162,800 | 26,697,842 |
United Overseas Bank Ltd. | 3,290,800 | 64,561,539 |
UOL Group Ltd. | 992,100 | 4,333,285 |
Venture Corp. Ltd. | 578,000 | 6,504,436 |
382,315,647 | ||
United Kingdom — 0.8% | ||
CK Hutchison Holdings Ltd. | 5,732,500 | 28,535,432 |
United States — 6.6% | ||
Computershare Ltd. | 1,225,134 | 19,832,524 |
CSL Ltd. | 1,028,962 | 184,200,108 |
James Hardie Industries plc, CHDI | 951,457 | 20,773,144 |
224,805,776 | ||
Total Common Stocks (Cost $4,002,360,290) | 3,398,746,319 | |
Short-Term Investments — 0.0% ^ | ||
Investment of Cash Collateral from Securities Loaned — 0.0% ^ | ||
JPMorgan Securities Lending Money Market Fund Agency SL Class Shares, 3.23% (c) (d) | 54,455 | 54,456 |
JPMorgan U.S. Government Money Market Fund Class IM Shares, 2.85% (c) (d) | 135,282 | 135,282 |
Total Investment of Cash Collateral from Securities Loaned (Cost $189,705) | 189,738 | |
Total Investments — 99.6% (Cost $4,002,549,995) | 3,398,936,057 | |
Other Assets Less Liabilities — 0.4% | 13,074,847 | |
NET ASSETS — 100.0% | 3,412,010,904 | |
Percentages indicated are based on net assets. |
Abbreviations | |
APAC | Asia Pacific |
CHDI | Clearing House Electronic Subregister System (CHESS) Depository Interest |
REIT | Real Estate Investment Trust |
^ | Amount rounds to less than 0.1% of net assets. | |
* | Non-income producing security. | |
84 | J.P. Morgan Exchange-Traded Funds | October 31, 2022 |
(a) | Security exempt from registration pursuant to Regulation S under the Securities Act of 1933, as amended. Regulation S applies to securities offerings that are made outside of the United States and do not involve direct selling efforts in the United States and as such may have restrictions on resale. | |
(b) | The security or a portion of this security is on loan at October 31, 2022. The total value of securities on loan at October 31, 2022 is $228,806. | |
(c) | Investment in an affiliated fund, which is registered under the Investment Company Act of 1940, as amended, and is advised by J.P. Morgan Investment Management Inc. | |
(d) | The rate shown is the current yield as of October 31, 2022. |
INDUSTRY | PERCENT OF TOTAL INVESTMENTS |
Banks | 25.5% |
Metals & Mining | 13.2 |
Insurance | 7.8 |
Biotechnology | 5.4 |
Capital Markets | 5.3 |
Equity Real Estate Investment Trusts (REITs) | 5.2 |
Real Estate Management & Development | 4.6 |
Oil, Gas & Consumable Fuels | 4.3 |
Food & Staples Retailing | 3.0 |
Hotels, Restaurants & Leisure | 2.3 |
Multiline Retail | 2.2 |
Electric Utilities | 2.1 |
Diversified Telecommunication Services | 2.1 |
Industrial Conglomerates | 2.1 |
Transportation Infrastructure | 2.1 |
Health Care Providers & Services | 1.2 |
Machinery | 1.1 |
Gas Utilities | 1.0 |
Life Sciences Tools & Services | 1.0 |
Others (each less than 1.0%) | 8.5 |
Short-Term Investments | 0.0(a) |
(a) | Amount rounds to less than 0.1%. |
October 31, 2022 | J.P. Morgan Exchange-Traded Funds | 85 |
(formerly known as JPMorgan BetaBuilders Developed Asia ex-Japan ETF)
AS OF October 31, 2022 (continued)
DESCRIPTION | NUMBER OF CONTRACTS | EXPIRATION DATE | TRADING CURRENCY | NOTIONAL AMOUNT ($) | VALUE AND UNREALIZED APPRECIATION (DEPRECIATION) ($) |
Long Contracts | |||||
MSCI Singapore Index | 213 | 11/29/2022 | SGD | 4,201,770 | 196,203 |
SPI 200 Index | 71 | 12/15/2022 | AUD | 7,795,510 | 166,901 |
363,104 |
Abbreviations | |
AUD | Australian Dollar |
MSCI | Morgan Stanley Capital International |
SGD | Singapore Dollar |
SPI | Australian Securities Exchange |
86 | J.P. Morgan Exchange-Traded Funds | October 31, 2022 |
AS OF October 31, 2022
INVESTMENTS | SHARES | VALUE($) |
Common Stocks — 98.8% | ||
Australia — 1.7% | ||
Flutter Entertainment plc * | 62,521 | 8,257,108 |
Glencore plc | 4,950,252 | 28,380,160 |
Rio Tinto plc | 433,792 | 22,670,687 |
59,307,955 | ||
Austria — 0.5% | ||
ANDRITZ AG | 29,333 | 1,363,296 |
BAWAG Group AG * (a) | 36,447 | 1,759,510 |
Erste Group Bank AG | 145,855 | 3,594,589 |
EVN AG | 15,514 | 258,096 |
Mondi plc | 198,524 | 3,330,930 |
OMV AG | 58,888 | 2,711,403 |
Raiffeisen Bank International AG | 55,139 | 766,831 |
Strabag SE | 5,864 | 225,140 |
Telekom Austria AG * | 56,922 | 330,884 |
Verbund AG (b) | 13,213 | 1,035,039 |
Vienna Insurance Group AG Wiener Versicherung Gruppe | 14,651 | 327,682 |
voestalpine AG | 45,266 | 982,738 |
16,686,138 | ||
Belgium — 1.5% | ||
Ackermans & van Haaren NV | 9,165 | 1,276,882 |
Ageas SA | 72,919 | 2,524,324 |
Anheuser-Busch InBev SA | 404,864 | 20,251,464 |
Azelis Group NV | 28,669 | 656,146 |
D'ieteren Group | 9,255 | 1,540,293 |
Elia Group SA/NV | 14,713 | 1,860,200 |
Etablissements Franz Colruyt NV | 22,970 | 553,672 |
Groupe Bruxelles Lambert NV | 41,288 | 3,044,017 |
KBC Group NV | 138,084 | 6,920,185 |
Proximus SADP | 63,593 | 666,692 |
Sofina SA | 6,439 | 1,255,598 |
Solvay SA | 29,874 | 2,695,857 |
Telenet Group Holding NV | 19,371 | 295,335 |
UCB SA | 51,699 | 3,896,442 |
Umicore SA | 84,644 | 2,790,367 |
Warehouses De Pauw CVA, REIT | 57,986 | 1,488,265 |
51,715,739 | ||
Brazil — 0.1% | ||
Yara International ASA | 66,645 | 2,974,463 |
Chile — 0.0% ^ | ||
Antofagasta plc | 141,074 | 1,901,032 |
INVESTMENTS | SHARES | VALUE($) |
China — 0.6% | ||
Prosus NV * | 491,782 | 21,265,488 |
Denmark — 4.1% | ||
AP Moller - Maersk A/S, Class A | 1,225 | 2,450,840 |
AP Moller - Maersk A/S, Class B | 2,267 | 4,736,155 |
Carlsberg A/S, Class B | 40,253 | 4,739,618 |
Chr Hansen Holding A/S | 42,053 | 2,335,669 |
Coloplast A/S, Class B | 48,575 | 5,414,664 |
Danske Bank A/S | 278,497 | 4,492,433 |
Demant A/S * | 39,567 | 1,080,467 |
DSV A/S | 78,459 | 10,602,029 |
Genmab A/S * | 26,882 | 10,355,154 |
Novo Nordisk A/S, Class B | 669,770 | 72,824,936 |
Novozymes A/S, Class B | 85,500 | 4,487,947 |
Orsted A/S (a) | 77,364 | 6,382,975 |
Pandora A/S | 39,040 | 2,053,641 |
Tryg A/S | 147,226 | 3,184,386 |
Vestas Wind Systems A/S | 412,910 | 8,139,970 |
143,280,884 | ||
Finland — 2.1% | ||
Elisa OYJ | 61,575 | 2,975,694 |
Fortum OYJ | 177,976 | 2,504,885 |
Huhtamaki OYJ | 39,199 | 1,408,788 |
Kesko OYJ, Class A | 38,583 | 742,003 |
Kesko OYJ, Class B | 111,679 | 2,173,349 |
Kone OYJ, Class B | 164,925 | 6,752,986 |
Metso Outotec OYJ | 288,110 | 2,186,496 |
Neste OYJ | 176,143 | 7,720,082 |
Nokia OYJ | 2,212,686 | 9,832,996 |
Nordea Bank Abp | 1,350,431 | 12,900,019 |
Orion OYJ, Class A | 12,259 | 562,134 |
Orion OYJ, Class B | 43,615 | 2,007,086 |
Sampo OYJ, Class A | 202,721 | 9,269,978 |
Stora Enso OYJ, Class A (b) | 20,904 | 304,711 |
Stora Enso OYJ, Class R | 250,381 | 3,264,671 |
UPM-Kymmene OYJ | 218,248 | 7,336,945 |
Wartsila OYJ Abp | 198,391 | 1,352,486 |
73,295,309 | ||
France — 15.9% | ||
Adevinta ASA * | 109,609 | 750,314 |
Aeroports de Paris * (b) | 11,330 | 1,532,164 |
Air Liquide SA | 213,958 | 27,988,651 |
Airbus SE | 251,374 | 27,199,616 |
Alstom SA | 125,329 | 2,579,427 |
October 31, 2022 | J.P. Morgan Exchange-Traded Funds | 87 |
AS OF October 31, 2022 (continued)
INVESTMENTS | SHARES | VALUE($) |
Common Stocks — continued | ||
France — continued | ||
Amundi SA (a) | 25,010 | 1,179,971 |
Arkema SA | 26,112 | 2,066,453 |
AXA SA | 811,992 | 20,052,067 |
BioMerieux | 20,072 | 1,775,943 |
BNP Paribas SA | 464,332 | 21,774,348 |
Bollore SE | 373,970 | 1,870,427 |
Bouygues SA | 86,010 | 2,453,967 |
Bureau Veritas SA | 118,368 | 2,928,457 |
Capgemini SE | 64,135 | 10,511,140 |
Carrefour SA (b) | 239,722 | 3,858,435 |
Cie de Saint-Gobain | 212,654 | 8,693,502 |
Cie Generale des Etablissements Michelin SCA | 291,999 | 7,441,321 |
Covivio, REIT | 18,963 | 1,015,310 |
Credit Agricole SA | 556,760 | 5,051,852 |
Danone SA | 259,741 | 12,909,002 |
Dassault Aviation SA | 9,587 | 1,423,847 |
Dassault Systemes SE | 283,428 | 9,500,160 |
Edenred | 102,049 | 5,231,666 |
Eiffage SA | 32,070 | 2,899,827 |
Electricite de France SA | 254,259 | 3,002,790 |
Engie SA | 756,765 | 9,832,925 |
EssilorLuxottica SA | 124,409 | 19,672,575 |
Gecina SA, REIT | 22,213 | 1,980,380 |
Getlink SE | 164,172 | 2,597,941 |
Hermes International | 14,259 | 18,456,649 |
Ipsen SA | 16,438 | 1,689,298 |
Kering SA | 29,611 | 13,560,692 |
Legrand SA | 109,104 | 8,314,238 |
L'Oreal SA | 103,130 | 32,383,273 |
LVMH Moet Hennessy Louis Vuitton SE | 106,995 | 67,513,299 |
Orange SA | 772,262 | 7,358,047 |
Pernod Ricard SA | 83,323 | 14,624,128 |
Publicis Groupe SA | 96,521 | 5,405,600 |
Safran SA | 143,246 | 15,953,305 |
Sanofi | 471,618 | 40,586,437 |
Sartorius Stedim Biotech | 9,796 | 3,108,652 |
Societe Generale SA | 323,167 | 7,412,495 |
Sodexo SA | 34,350 | 3,042,805 |
Teleperformance | 24,178 | 6,478,010 |
Thales SA | 43,633 | 5,549,244 |
TotalEnergies SE | 1,006,669 | 54,917,183 |
Unibail-Rodamco-Westfield, REIT * | 43,688 | 2,064,677 |
Veolia Environnement SA | 269,275 | 6,009,147 |
Vinci SA | 219,910 | 20,239,861 |
INVESTMENTS | SHARES | VALUE($) |
France — continued | ||
Vivendi SE | 330,894 | 2,708,361 |
Worldline SA * (a) | 102,204 | 4,460,846 |
561,610,725 | ||
Germany — 11.2% | ||
adidas AG | 73,039 | 7,129,711 |
Allianz SE (Registered) | 166,999 | 30,043,874 |
Aroundtown SA | 377,081 | 747,467 |
BASF SE | 375,549 | 16,851,138 |
Bayer AG (Registered) | 401,685 | 21,121,029 |
Bayerische Motoren Werke AG | 130,450 | 10,239,274 |
Bayerische Motoren Werke AG (Preference) | 24,289 | 1,791,165 |
Beiersdorf AG | 40,197 | 3,858,720 |
Brenntag SE | 63,170 | 3,832,925 |
Carl Zeiss Meditec AG | 14,976 | 1,812,744 |
Commerzbank AG * | 430,155 | 3,436,812 |
Continental AG | 44,176 | 2,288,127 |
Covestro AG (a) | 79,010 | 2,682,076 |
Daimler Truck Holding AG * | 211,992 | 5,654,375 |
Deutsche Bank AG (Registered) | 845,098 | 8,055,260 |
Deutsche Boerse AG | 77,688 | 12,633,605 |
Deutsche Lufthansa AG (Registered) * | 244,407 | 1,671,013 |
Deutsche Post AG (Registered) | 405,311 | 14,327,674 |
Deutsche Telekom AG (Registered) | 1,427,234 | 26,939,754 |
Deutsche Wohnen SE | 21,268 | 428,980 |
E.ON SE | 918,017 | 7,687,469 |
Evonik Industries AG | 83,852 | 1,544,699 |
Fresenius Medical Care AG & Co. KGaA | 81,485 | 2,253,924 |
Fresenius SE & Co. KGaA | 166,705 | 3,836,410 |
GEA Group AG | 67,159 | 2,347,507 |
Hannover Rueck SE | 24,639 | 4,009,359 |
HeidelbergCement AG | 59,208 | 2,722,787 |
Henkel AG & Co. KGaA | 40,370 | 2,369,925 |
Henkel AG & Co. KGaA (Preference) | 72,847 | 4,589,260 |
Infineon Technologies AG | 533,977 | 12,957,209 |
KION Group AG | 29,707 | 658,613 |
Mercedes-Benz Group AG | 319,345 | 18,484,197 |
Merck KGaA | 52,835 | 8,610,263 |
MTU Aero Engines AG | 21,849 | 3,910,061 |
Muenchener Rueckversicherungs- Gesellschaft AG (Registered) | 57,292 | 15,123,717 |
Porsche Automobil Holding SE (Preference) | 62,598 | 3,497,494 |
Puma SE | 41,941 | 1,854,248 |
RWE AG | 276,508 | 10,644,226 |
SAP SE | 447,081 | 43,032,833 |
88 | J.P. Morgan Exchange-Traded Funds | October 31, 2022 |
INVESTMENTS | SHARES | VALUE($) |
Common Stocks — continued | ||
Germany — continued | ||
Sartorius AG (Preference) | 11,036 | 3,891,189 |
Siemens AG (Registered) | 305,848 | 33,401,365 |
Siemens Energy AG (b) | 163,415 | 1,905,031 |
Siemens Healthineers AG (a) | 115,289 | 5,281,687 |
Symrise AG | 54,290 | 5,541,519 |
Talanx AG | 21,750 | 816,808 |
Telefonica Deutschland Holding AG | 377,041 | 821,535 |
TUI AG * (b) | 532,878 | 804,208 |
Uniper SE (b) | 32,934 | 98,586 |
Volkswagen AG (Preference) | 75,049 | 9,606,379 |
Vonovia SE | 325,407 | 7,194,949 |
Zalando SE * (a) (b) | 91,121 | 2,100,174 |
397,143,354 | ||
Hong Kong — 0.3% | ||
Prudential plc | 1,124,183 | 10,443,291 |
Ireland — 0.7% | ||
CRH plc | 314,093 | 11,312,957 |
Kerry Group plc, Class A | 63,673 | 5,530,313 |
Kingspan Group plc | 63,132 | 3,182,908 |
Smurfit Kappa Group plc | 106,379 | 3,521,462 |
23,547,640 | ||
Italy — 3.3% | ||
A2A SpA | 641,837 | 711,694 |
Amplifon SpA | 37,956 | 942,978 |
Assicurazioni Generali SpA | 493,029 | 7,398,943 |
Atlantia SpA | 205,984 | 4,594,993 |
Banca Mediolanum SpA | 88,165 | 659,643 |
Banco BPM SpA | 619,550 | 1,874,459 |
Buzzi Unicem SpA | 38,609 | 640,785 |
Coca-Cola HBC AG | 83,325 | 1,820,095 |
Davide Campari-Milano NV | 218,482 | 1,962,040 |
DiaSorin SpA (b) | 10,742 | 1,404,363 |
Enel SpA | 3,159,355 | 14,113,942 |
Eni SpA | 1,032,017 | 13,554,237 |
Ferrari NV (b) | 52,344 | 10,319,018 |
FinecoBank Banca Fineco SpA | 249,459 | 3,361,609 |
Hera SpA | 322,800 | 769,130 |
Infrastrutture Wireless Italiane SpA (a) | 145,283 | 1,282,292 |
Intesa Sanpaolo SpA | 7,232,942 | 13,789,824 |
Leonardo SpA | 165,461 | 1,329,330 |
Mediobanca Banca di Credito Finanziario SpA | 265,183 | 2,402,450 |
Moncler SpA | 85,044 | 3,669,159 |
INVESTMENTS | SHARES | VALUE($) |
Italy — continued | ||
Nexi SpA * (a) | 348,206 | 3,010,410 |
Pirelli & C SpA (a) | 163,550 | 616,920 |
Poste Italiane SpA (a) | 186,916 | 1,628,836 |
Prysmian SpA | 109,623 | 3,568,024 |
Recordati Industria Chimica e Farmaceutica SpA | 41,033 | 1,541,672 |
Snam SpA | 838,269 | 3,727,375 |
Telecom Italia SpA * (b) | 4,136,940 | 809,362 |
Telecom Italia SpA * | 2,469,640 | 472,075 |
Terna - Rete Elettrica Nazionale (b) | 575,302 | 3,815,212 |
UniCredit SpA | 826,863 | 10,254,156 |
UnipolSai Assicurazioni SpA | 173,880 | 392,060 |
116,437,086 | ||
Jordan — 0.0% ^ | ||
Hikma Pharmaceuticals plc | 72,631 | 1,042,635 |
Luxembourg — 0.2% | ||
ArcelorMittal SA | 233,290 | 5,214,887 |
Eurofins Scientific SE | 52,722 | 3,374,990 |
RTL Group SA | 15,285 | 518,864 |
9,108,741 | ||
Mexico — 0.0% ^ | ||
Fresnillo plc | 75,323 | 629,740 |
Netherlands — 8.2% | ||
Adyen NV * (a) | 12,677 | 18,097,679 |
Aegon NV | 578,785 | 2,679,290 |
Akzo Nobel NV | 74,266 | 4,584,846 |
Argenx SE * | 20,458 | 7,942,831 |
Argenx SE * | 2,062 | 797,991 |
ASM International NV | 18,933 | 4,188,354 |
ASML Holding NV | 166,188 | 77,956,657 |
HAL Trust | 36,235 | 4,174,860 |
Heineken Holding NV | 44,742 | 3,052,935 |
Heineken NV | 96,551 | 8,065,316 |
ING Groep NV | 1,540,386 | 15,156,773 |
JDE Peet's NV | 53,445 | 1,529,870 |
Koninklijke Ahold Delhaize NV | 427,568 | 11,924,143 |
Koninklijke DSM NV | 71,456 | 8,405,398 |
Koninklijke KPN NV | 1,333,825 | 3,730,850 |
Koninklijke Philips NV | 363,615 | 4,612,417 |
NN Group NV | 126,767 | 5,367,629 |
Randstad NV | 51,141 | 2,548,827 |
Shell plc | 3,128,004 | 86,650,740 |
October 31, 2022 | J.P. Morgan Exchange-Traded Funds | 89 |
AS OF October 31, 2022 (continued)
INVESTMENTS | SHARES | VALUE($) |
Common Stocks — continued | ||
Netherlands — continued | ||
Universal Music Group NV | 311,420 | 6,114,874 |
Wolters Kluwer NV | 107,351 | 11,406,969 |
288,989,249 | ||
Norway — 1.3% | ||
Aker ASA, Class A | 9,724 | 686,162 |
Aker BP ASA | 126,611 | 4,021,971 |
AutoStore Holdings Ltd. * (b) | 406,531 | 768,306 |
DNB Bank ASA | 367,662 | 6,502,794 |
Equinor ASA | 428,491 | 15,611,522 |
Gjensidige Forsikring ASA | 77,688 | 1,420,038 |
Kongsberg Gruppen ASA | 36,229 | 1,299,187 |
Leroy Seafood Group ASA | 114,476 | 527,125 |
Mowi ASA | 186,069 | 2,777,225 |
Norsk Hydro ASA | 558,349 | 3,543,461 |
Orkla ASA | 307,120 | 2,071,573 |
Salmar ASA | 23,135 | 784,315 |
Schibsted ASA, Class A | 30,309 | 467,789 |
Schibsted ASA, Class B | 40,849 | 607,308 |
Storebrand ASA | 192,967 | 1,501,159 |
Telenor ASA | 263,211 | 2,392,027 |
TOMRA Systems ASA | 95,621 | 1,544,432 |
Var Energi ASA (b) | 163,325 | 555,142 |
47,081,536 | ||
Poland — 0.4% | ||
Allegro.eu SA * (a) | 172,875 | 838,471 |
Bank Polska Kasa Opieki SA | 71,910 | 1,178,566 |
Cyfrowy Polsat SA | 99,377 | 372,076 |
Dino Polska SA * (a) | 19,633 | 1,281,492 |
ING Bank Slaski SA | 13,284 | 462,852 |
KGHM Polska Miedz SA | 55,618 | 1,111,944 |
LPP SA | 406 | 703,496 |
PGE Polska Grupa Energetyczna SA * | 348,627 | 397,347 |
Polski Koncern Naftowy ORLEN SA | 156,246 | 1,794,255 |
Polskie Gornictwo Naftowe i Gazownictwo SA * | 663,140 | 704,405 |
Powszechna Kasa Oszczednosci Bank Polski SA | 352,670 | 1,921,831 |
Powszechny Zaklad Ubezpieczen SA | 233,034 | 1,305,530 |
Santander Bank Polska SA | 13,787 | 732,061 |
12,804,326 | ||
Portugal — 0.3% | ||
EDP - Energias de Portugal SA | 1,199,923 | 5,242,843 |
INVESTMENTS | SHARES | VALUE($) |
Portugal — continued | ||
Galp Energia SGPS SA | 186,043 | 1,888,914 |
Jeronimo Martins SGPS SA | 113,219 | 2,342,844 |
9,474,601 | ||
Russia — 0.0% ^ | ||
Evraz plc ‡ | 453,755 | 21,304 |
Singapore — 0.2% | ||
STMicroelectronics NV | 268,057 | 8,334,951 |
South Africa — 0.5% | ||
Anglo American plc | 546,921 | 16,382,590 |
South Korea — 0.1% | ||
Delivery Hero SE * (a) (b) | 74,971 | 2,467,215 |
Spain — 3.8% | ||
Acciona SA | 10,077 | 1,814,482 |
ACS Actividades de Construccion y Servicios SA | 93,973 | 2,411,468 |
Aena SME SA * (a) | 30,048 | 3,531,588 |
Amadeus IT Group SA * | 184,215 | 9,607,789 |
Banco Bilbao Vizcaya Argentaria SA | 2,726,431 | 14,065,096 |
Banco Santander SA (b) | 6,867,058 | 17,809,562 |
CaixaBank SA | 1,779,798 | 5,901,890 |
Cellnex Telecom SA (a) | 233,313 | 7,636,395 |
Corp. ACCIONA Energias Renovables SA | 22,877 | 899,544 |
EDP Renovaveis SA | 86,415 | 1,818,388 |
Enagas SA | 101,776 | 1,652,222 |
Endesa SA | 129,855 | 2,169,623 |
Ferrovial SA | 203,970 | 4,984,694 |
Grifols SA * (b) | 120,240 | 1,022,952 |
Grifols SA (Preference), Class B * | 106,890 | 668,485 |
Iberdrola SA | 2,395,359 | 24,359,076 |
Industria de Diseno Textil SA (b) | 458,770 | 10,413,257 |
Mapfre SA | 403,744 | 692,499 |
Naturgy Energy Group SA | 75,325 | 1,933,031 |
Red Electrica Corp. SA | 177,002 | 2,863,134 |
Repsol SA | 624,538 | 8,496,514 |
Siemens Gamesa Renewable Energy SA * | 91,923 | 1,629,673 |
Telefonica SA | 2,306,032 | 7,949,348 |
134,330,710 | ||
Sweden — 5.2% | ||
Alfa Laval AB | 120,135 | 2,957,162 |
Assa Abloy AB, Class B | 405,507 | 8,188,030 |
Atlas Copco AB, Class A | 1,043,399 | 11,136,462 |
Atlas Copco AB, Class B | 638,230 | 6,172,426 |
90 | J.P. Morgan Exchange-Traded Funds | October 31, 2022 |
INVESTMENTS | SHARES | VALUE($) |
Common Stocks — continued | ||
Sweden — continued | ||
Axfood AB | 44,340 | 1,097,797 |
Beijer Ref AB (b) | 101,311 | 1,570,566 |
Boliden AB | 111,828 | 3,252,061 |
Castellum AB | 117,333 | 1,341,597 |
Electrolux AB, Class B (b) | 92,169 | 1,137,105 |
Embracer Group AB * (b) | 334,735 | 1,610,328 |
Epiroc AB, Class A | 255,976 | 3,918,598 |
Epiroc AB, Class B | 159,453 | 2,141,005 |
EQT AB (b) | 113,795 | 2,239,480 |
Essity AB, Class A | 11,519 | 242,040 |
Essity AB, Class B | 246,409 | 5,206,218 |
Evolution AB (a) | 78,290 | 7,303,103 |
Fabege AB | 109,541 | 795,267 |
Fastighets AB Balder, Class B * | 258,003 | 968,452 |
Getinge AB, Class B | 89,355 | 1,813,280 |
H & M Hennes & Mauritz AB, Class B (b) | 292,664 | 2,947,759 |
Hexagon AB, Class B | 870,169 | 8,602,401 |
Holmen AB, Class B | 37,886 | 1,374,899 |
Husqvarna AB, Class A | 9,515 | 56,768 |
Husqvarna AB, Class B | 169,678 | 1,007,404 |
Industrivarden AB, Class A | 74,636 | 1,690,348 |
Industrivarden AB, Class C | 69,945 | 1,570,644 |
Indutrade AB | 108,732 | 1,903,675 |
Intrum AB | 30,494 | 383,681 |
Investment AB Latour, Class B (b) | 55,699 | 940,883 |
Investor AB, Class A | 229,421 | 3,901,251 |
Investor AB, Class B | 744,977 | 12,158,485 |
Kinnevik AB, Class A * | 3,470 | 43,479 |
Kinnevik AB, Class B * | 99,243 | 1,225,993 |
L E Lundbergforetagen AB, Class B | 26,094 | 1,029,868 |
Lifco AB, Class B | 86,647 | 1,252,035 |
Nibe Industrier AB, Class B | 626,962 | 5,001,134 |
Nordnet AB publ | 66,440 | 823,048 |
Orron Energy ab | 78,764 | 163,393 |
Saab AB, Class B | 33,283 | 1,176,023 |
Sagax AB, Class B | 76,766 | 1,414,594 |
Sagax AB, Class D | 41,210 | 99,240 |
Samhallsbyggnadsbolaget i Norden AB (b) | 437,512 | 601,091 |
Samhallsbyggnadsbolaget i Norden AB, Class D (b) | 61,234 | 100,683 |
Sandvik AB | 446,243 | 6,973,327 |
Securitas AB, Class B (b) | 205,659 | 1,680,400 |
Skandinaviska Enskilda Banken AB, Class C (b) | 5,903 | 67,364 |
Skandinaviska Enskilda Banken AB, Class A | 695,966 | 7,337,844 |
INVESTMENTS | SHARES | VALUE($) |
Sweden — continued | ||
Skanska AB, Class B | 163,644 | 2,544,884 |
SKF AB, Class A (b) | 5,661 | 86,547 |
SKF AB, Class B | 153,250 | 2,218,389 |
SSAB AB, Class A | 90,905 | 437,259 |
SSAB AB, Class B | 258,136 | 1,199,409 |
Storskogen Group AB, Class B | 619,777 | 452,528 |
Svenska Cellulosa AB SCA, Class A | 12,700 | 153,272 |
Svenska Cellulosa AB SCA, Class B | 245,126 | 2,891,945 |
Svenska Handelsbanken AB, Class B (b) | 14,397 | 157,431 |
Svenska Handelsbanken AB, Class A | 628,190 | 5,836,535 |
Swedbank AB, Class A | 374,906 | 5,589,117 |
Swedish Match AB | 623,566 | 6,413,310 |
Tele2 AB, Class B | 224,742 | 1,841,990 |
Telefonaktiebolaget LM Ericsson, Class A | 22,488 | 133,580 |
Telefonaktiebolaget LM Ericsson, Class B | 1,256,278 | 6,984,083 |
Telia Co. AB (b) | 1,003,320 | 2,658,563 |
Trelleborg AB, Class B | 99,199 | 2,184,269 |
Vitrolife AB | 30,473 | 492,501 |
Volvo AB, Class A | 78,249 | 1,336,621 |
Volvo AB, Class B | 649,513 | 10,630,538 |
Volvo Car AB, Class B * (b) | 219,291 | 930,689 |
183,792,151 | ||
Switzerland — 8.8% | ||
ABB Ltd. (Registered) | 698,930 | 19,409,497 |
Alcon, Inc. | 204,338 | 12,441,199 |
Baloise Holding AG (Registered) | 18,722 | 2,557,840 |
Barry Callebaut AG (Registered) | 1,466 | 2,773,544 |
Chocoladefabriken Lindt & Spruengli AG | 425 | 4,078,742 |
Chocoladefabriken Lindt & Spruengli AG (Registered) | 44 | 4,276,311 |
Cie Financiere Richemont SA (Registered) | 213,447 | 20,860,934 |
Credit Suisse Group AG (Registered) (b) | 1,029,680 | 4,265,412 |
EMS-Chemie Holding AG (Registered) | 2,758 | 1,734,205 |
Geberit AG (Registered) | 14,664 | 6,518,699 |
Givaudan SA (Registered) | 3,247 | 9,698,601 |
Holcim AG * | 231,686 | 10,526,039 |
Julius Baer Group Ltd. | 87,419 | 4,194,265 |
Kuehne + Nagel International AG (Registered) | 23,241 | 4,947,226 |
Lonza Group AG (Registered) | 30,462 | 15,681,356 |
Mediclinic International plc | 165,801 | 943,196 |
Novartis AG (Registered) | 982,862 | 79,504,460 |
Partners Group Holding AG | 9,263 | 8,314,318 |
Schindler Holding AG | 16,664 | 2,717,331 |
October 31, 2022 | J.P. Morgan Exchange-Traded Funds | 91 |
AS OF October 31, 2022 (continued)
INVESTMENTS | SHARES | VALUE($) |
Common Stocks — continued | ||
Switzerland — continued | ||
Schindler Holding AG (Registered) | 8,485 | 1,335,710 |
SGS SA (Registered) | 2,480 | 5,467,189 |
Sika AG (Registered) | 62,871 | 14,175,891 |
Sonova Holding AG (Registered) | 21,701 | 5,129,330 |
Straumann Holding AG (Registered) | 47,602 | 4,530,347 |
Swatch Group AG (The) | 11,845 | 2,661,684 |
Swatch Group AG (The) (Registered) | 22,483 | 939,311 |
Swiss Life Holding AG (Registered) | 12,619 | 6,110,402 |
Swisscom AG (Registered) | 10,385 | 5,128,001 |
Temenos AG (Registered) | 27,532 | 1,639,773 |
UBS Group AG (Registered) | 1,441,174 | 22,848,609 |
Zurich Insurance Group AG | 61,520 | 26,218,222 |
311,627,644 | ||
United Arab Emirates — 0.0% ^ | ||
NMC Health plc ‡ * | 23,176 | — |
United Kingdom — 18.8% | ||
3i Group plc | 397,965 | 5,300,249 |
abrdn plc | 891,670 | 1,624,784 |
Admiral Group plc | 111,590 | 2,580,592 |
Ashtead Group plc | 183,715 | 9,570,280 |
Associated British Foods plc | 145,666 | 2,257,720 |
AstraZeneca plc | 633,566 | 74,337,688 |
Auto Trader Group plc (a) | 396,227 | 2,371,728 |
AVEVA Group plc | 50,621 | 1,811,637 |
Aviva plc | 1,146,038 | 5,497,118 |
B&M European Value Retail SA | 347,978 | 1,285,983 |
BAE Systems plc | 1,318,562 | 12,333,262 |
Barclays plc | 6,513,973 | 11,068,894 |
Barratt Developments plc | 418,111 | 1,803,351 |
Berkeley Group Holdings plc | 45,947 | 1,828,110 |
BP plc | 8,529,940 | 47,192,817 |
British American Tobacco plc | 914,077 | 36,100,075 |
British Land Co. plc (The), REIT | 383,524 | 1,608,842 |
BT Group plc | 2,853,120 | 4,251,810 |
Bunzl plc | 138,039 | 4,498,075 |
Burberry Group plc | 165,559 | 3,449,771 |
Centrica plc | 2,415,508 | 2,122,535 |
CNH Industrial NV | 407,245 | 5,268,562 |
Coca-Cola Europacific Partners plc | 82,196 | 3,867,322 |
Compass Group plc | 730,021 | 15,375,576 |
ConvaTec Group plc (a) | 659,529 | 1,650,291 |
Croda International plc | 58,281 | 4,515,006 |
Darktrace plc * | 136,915 | 560,420 |
DCC plc | 41,427 | 2,299,235 |
INVESTMENTS | SHARES | VALUE($) |
United Kingdom — continued | ||
Dechra Pharmaceuticals plc | 46,500 | 1,397,895 |
Derwent London plc, REIT | 45,889 | 1,135,722 |
Diageo plc | 953,279 | 39,229,830 |
Direct Line Insurance Group plc | 536,221 | 1,238,905 |
DS Smith plc | 562,835 | 1,877,013 |
easyJet plc * | 232,446 | 925,527 |
Entain plc | 240,762 | 3,483,003 |
Experian plc | 396,426 | 12,640,153 |
Halma plc | 155,237 | 3,764,389 |
Harbour Energy plc | 222,238 | 964,476 |
Hargreaves Lansdown plc | 143,505 | 1,254,178 |
Hiscox Ltd. | 144,683 | 1,490,483 |
Howden Joinery Group plc | 237,392 | 1,398,381 |
HSBC Holdings plc | 8,164,712 | 41,901,739 |
Imperial Brands plc | 392,373 | 9,557,853 |
Informa plc | 614,619 | 3,916,304 |
InterContinental Hotels Group plc | 76,760 | 4,124,372 |
Intermediate Capital Group plc | 120,271 | 1,464,513 |
International Distributions Services plc | 323,013 | 747,252 |
Intertek Group plc | 66,007 | 2,765,230 |
ITV plc | 1,481,353 | 1,140,581 |
J Sainsbury plc | 718,884 | 1,602,460 |
JD Sports Fashion plc | 1,012,360 | 1,131,243 |
Johnson Matthey plc | 81,361 | 1,806,021 |
Kingfisher plc | 824,600 | 2,071,754 |
Land Securities Group plc, REIT | 307,215 | 2,008,844 |
Legal & General Group plc | 2,442,192 | 6,533,505 |
Lloyds Banking Group plc | 29,046,839 | 13,950,266 |
London Stock Exchange Group plc | 140,757 | 12,201,105 |
M&G plc | 1,063,075 | 2,136,385 |
Melrose Industries plc | 1,657,808 | 2,223,758 |
National Grid plc | 1,584,967 | 17,268,417 |
NatWest Group plc | 2,068,536 | 5,571,199 |
Next plc | 52,843 | 2,984,554 |
Ocado Group plc * | 296,807 | 1,609,079 |
Pearson plc | 309,348 | 3,419,262 |
Pepco Group NV * (a) | 49,272 | 346,179 |
Persimmon plc | 130,552 | 1,953,564 |
Phoenix Group Holdings plc | 347,582 | 2,163,342 |
Reckitt Benckiser Group plc | 301,153 | 19,985,724 |
RELX plc | 810,590 | 21,772,849 |
Rentokil Initial plc | 1,025,948 | 6,402,029 |
Rightmove plc | 357,991 | 2,015,917 |
Rolls-Royce Holdings plc * | 3,421,442 | 3,068,567 |
92 | J.P. Morgan Exchange-Traded Funds | October 31, 2022 |
INVESTMENTS | SHARES | VALUE($) |
Common Stocks — continued | ||
United Kingdom — continued | ||
Sage Group plc (The) | 450,089 | 3,751,376 |
Schroders plc | 412,688 | 1,852,974 |
Segro plc, REIT | 494,383 | 4,449,449 |
Severn Trent plc | 103,583 | 2,972,806 |
Smith & Nephew plc | 361,805 | 4,275,419 |
Smiths Group plc | 153,800 | 2,754,950 |
Spirax-Sarco Engineering plc | 30,092 | 3,708,346 |
SSE plc | 428,630 | 7,659,998 |
St. James's Place plc | 222,467 | 2,716,669 |
Standard Chartered plc | 1,014,585 | 6,061,885 |
Tate & Lyle plc | 164,213 | 1,319,483 |
Taylor Wimpey plc | 1,491,871 | 1,603,955 |
Tesco plc | 3,062,308 | 7,563,547 |
Travis Perkins plc | 86,879 | 818,834 |
Unilever plc | 1,075,076 | 48,866,891 |
United Utilities Group plc | 278,829 | 3,004,717 |
Vodafone Group plc | 10,958,112 | 12,792,529 |
Weir Group plc (The) | 106,146 | 1,849,470 |
Whitbread plc | 82,369 | 2,424,293 |
Wise plc, Class A * | 192,707 | 1,467,810 |
WPP plc | 496,666 | 4,370,736 |
663,361,692 | ||
United States — 9.0% | ||
Carnival plc * | 64,872 | 515,431 |
Ferguson plc | 94,920 | 10,351,855 |
GSK plc | 1,638,553 | 26,841,298 |
Nestle SA (Registered) | 1,124,451 | 122,406,389 |
QIAGEN NV * (b) | 94,395 | 4,076,276 |
Roche Holding AG | 287,268 | 95,315,002 |
Roche Holding AG | 10,889 | 4,419,738 |
Schneider Electric SE | 233,527 | 29,530,988 |
Sinch AB * (a) (b) | 270,548 | 635,236 |
Stellantis NV | 884,431 | 11,932,372 |
Swiss Re AG | 118,137 | 8,775,781 |
Tenaris SA | 188,267 | 2,946,596 |
317,746,962 | ||
Total Common Stocks (Cost $4,381,041,728) | 3,486,805,151 | |
Short-Term Investments — 1.2% | ||
Investment of Cash Collateral from Securities Loaned — 1.2% | ||
JPMorgan Securities Lending Money Market Fund Agency SL Class Shares, 3.23% (c) (d) | 35,657,896 | 35,657,896 |
INVESTMENTS | SHARES | VALUE($) |
Investment of Cash Collateral from Securities Loaned — continued | ||
JPMorgan U.S. Government Money Market Fund Class IM Shares, 2.85% (c) (d) | 4,769,602 | 4,769,602 |
Total Investment of Cash Collateral from Securities Loaned (Cost $40,419,170) | 40,427,498 | |
Total Investments — 100.0% (Cost $4,421,460,898) | 3,527,232,649 | |
Other Assets Less Liabilities — 0.0% ^ | 455,110 | |
NET ASSETS — 100.0% | 3,527,687,759 | |
Percentages indicated are based on net assets. |
Abbreviations | |
CVA | Dutch Certification |
OYJ | Public Limited Company |
Preference | A special type of equity investment that shares in the earnings of the company, has limited voting rights, and may have a dividend preference. Preference shares may also have liquidation preference. |
REIT | Real Estate Investment Trust |
SCA | Limited partnership with share capital |
SGPS | Holding company |
^ | Amount rounds to less than 0.1% of net assets. | |
‡ | Value determined using significant unobservable inputs. | |
* | Non-income producing security. | |
(a) | Security exempt from registration pursuant to Regulation S under the Securities Act of 1933, as amended. Regulation S applies to securities offerings that are made outside of the United States and do not involve direct selling efforts in the United States and as such may have restrictions on resale. | |
(b) | The security or a portion of this security is on loan at October 31, 2022. The total value of securities on loan at October 31, 2022 is $36,958,615. | |
(c) | Investment in an affiliated fund, which is registered under the Investment Company Act of 1940, as amended, and is advised by J.P. Morgan Investment Management Inc. | |
(d) | The rate shown is the current yield as of October 31, 2022. | |
October 31, 2022 | J.P. Morgan Exchange-Traded Funds | 93 |
AS OF October 31, 2022 (continued)
INDUSTRY | PERCENT OF TOTAL INVESTMENTS |
Pharmaceuticals | 12.4% |
Banks | 7.4 |
Oil, Gas & Consumable Fuels | 7.0 |
Insurance | 5.1 |
Food Products | 4.6 |
Textiles, Apparel & Luxury Goods | 4.1 |
Chemicals | 3.3 |
Semiconductors & Semiconductor Equipment | 2.9 |
Beverages | 2.8 |
Machinery | 2.6 |
Capital Markets | 2.6 |
Metals & Mining | 2.4 |
Personal Products | 2.4 |
Electric Utilities | 2.2 |
Diversified Telecommunication Services | 2.1 |
Aerospace & Defense | 2.1 |
Electrical Equipment | 2.1 |
Health Care Equipment & Supplies | 2.0 |
Automobiles | 1.9 |
Professional Services | 1.9 |
Software | 1.7 |
IT Services | 1.5 |
Tobacco | 1.5 |
Hotels, Restaurants & Leisure | 1.3 |
Multi-Utilities | 1.3 |
Industrial Conglomerates | 1.2 |
Construction & Engineering | 1.1 |
Food & Staples Retailing | 1.0 |
Others (each less than 1.0%) | 14.4 |
Short-Term Investments | 1.1 |
94 | J.P. Morgan Exchange-Traded Funds | October 31, 2022 |
DESCRIPTION | NUMBER OF CONTRACTS | EXPIRATION DATE | TRADING CURRENCY | NOTIONAL AMOUNT ($) | VALUE AND UNREALIZED APPRECIATION (DEPRECIATION) ($) |
Long Contracts | |||||
EURO STOXX 50 Index | 712 | 12/16/2022 | EUR | 25,450,442 | 1,204,811 |
FTSE 100 Index | 178 | 12/16/2022 | GBP | 14,523,878 | (121,281) |
1,083,530 |
Abbreviations | |
EUR | Euro |
FTSE | Financial Times and the London Stock Exchange |
GBP | British Pound |
October 31, 2022 | J.P. Morgan Exchange-Traded Funds | 95 |
AS OF October 31, 2022
INVESTMENTS | SHARES | VALUE($) |
Common Stocks — 99.0% | ||
Australia — 8.0% | ||
Alumina Ltd. | 471,969 | 407,898 |
Ampol Ltd. | 47,764 | 833,091 |
APA Group | 236,463 | 1,591,961 |
Aristocrat Leisure Ltd. | 133,143 | 3,160,277 |
ASX Ltd. | 38,798 | 1,681,058 |
Aurizon Holdings Ltd. | 368,900 | 854,877 |
Australia & New Zealand Banking Group Ltd. | 598,509 | 9,805,815 |
Bendigo & Adelaide Bank Ltd. | 112,830 | 651,324 |
BHP Group Ltd. | 1,013,505 | 24,344,597 |
BlueScope Steel Ltd. | 94,217 | 948,764 |
Brambles Ltd. | 277,638 | 2,078,603 |
Challenger Ltd. | 117,470 | 527,832 |
Cochlear Ltd. | 13,162 | 1,681,363 |
Coles Group Ltd. | 267,533 | 2,797,235 |
Commonwealth Bank of Australia | 341,622 | 22,904,660 |
Dexus, REIT | 215,555 | 1,074,133 |
Domino's Pizza Enterprises Ltd. | 12,675 | 516,806 |
Endeavour Group Ltd. | 250,990 | 1,148,858 |
Evolution Mining Ltd. | 367,657 | 487,715 |
Flutter Entertainment plc * | 30,617 | 4,043,567 |
Fortescue Metals Group Ltd. | 339,034 | 3,194,041 |
Glencore plc | 2,423,788 | 13,895,755 |
Goodman Group, REIT | 340,361 | 3,703,369 |
GPT Group (The), REIT | 383,911 | 1,060,963 |
Harvey Norman Holdings Ltd. | 130,108 | 346,125 |
IDP Education Ltd. | 41,795 | 788,538 |
IGO Ltd. | 129,725 | 1,268,704 |
Incitec Pivot Ltd. | 389,574 | 936,907 |
Insurance Australia Group Ltd. | 494,038 | 1,550,755 |
LendLease Corp. Ltd. | 138,072 | 767,786 |
Macquarie Group Ltd. | 72,731 | 7,890,063 |
Medibank Pvt Ltd. | 551,950 | 993,879 |
Mineral Resources Ltd. | 33,367 | 1,564,306 |
Mirvac Group, REIT | 790,251 | 1,047,056 |
National Australia Bank Ltd. | 635,513 | 13,200,906 |
Newcrest Mining Ltd. | 178,918 | 1,981,567 |
Northern Star Resources Ltd. | 233,513 | 1,303,259 |
Orica Ltd. | 89,975 | 800,350 |
Origin Energy Ltd. | 344,900 | 1,232,183 |
Qantas Airways Ltd. * | 185,579 | 693,466 |
QBE Insurance Group Ltd. | 296,956 | 2,326,639 |
Ramsay Health Care Ltd. | 37,160 | 1,393,841 |
REA Group Ltd. | 10,315 | 799,474 |
Reece Ltd. | 42,680 | 423,807 |
INVESTMENTS | SHARES | VALUE($) |
Australia — continued | ||
Rio Tinto Ltd. | 74,316 | 4,217,406 |
Rio Tinto plc | 212,401 | 11,100,427 |
Santos Ltd. | 671,778 | 3,279,391 |
Scentre Group, REIT | 1,039,135 | 1,933,854 |
SEEK Ltd. | 70,985 | 977,171 |
Seven Group Holdings Ltd. | 31,386 | 368,045 |
Sonic Healthcare Ltd. | 96,114 | 2,012,193 |
South32 Ltd. | 926,634 | 2,125,948 |
Stockland, REIT | 478,426 | 1,102,341 |
Suncorp Group Ltd. | 253,043 | 1,851,013 |
Tabcorp Holdings Ltd. | 446,439 | 275,623 |
Telstra Group Ltd. | 809,639 | 2,030,111 |
TPG Telecom Ltd. (a) | 85,623 | 268,599 |
Transurban Group | 614,773 | 5,215,087 |
Treasury Wine Estates Ltd. | 144,663 | 1,198,789 |
Vicinity Ltd., REIT | 775,489 | 966,774 |
Washington H Soul Pattinson & Co. Ltd. | 49,176 | 880,057 |
Wesfarmers Ltd. | 226,998 | 6,587,266 |
Westpac Banking Corp. | 700,940 | 10,823,192 |
WiseTech Global Ltd. | 34,630 | 1,280,721 |
Woodside Energy Group Ltd. | 380,144 | 8,788,347 |
Woolworths Group Ltd. | 243,028 | 5,132,216 |
Worley Ltd. | 74,433 | 679,880 |
217,798,624 | ||
Austria — 0.3% | ||
ANDRITZ AG | 14,361 | 667,450 |
BAWAG Group AG * (b) | 17,848 | 861,627 |
Erste Group Bank AG | 71,424 | 1,760,241 |
EVN AG | 7,585 | 126,187 |
Mondi plc | 97,310 | 1,632,713 |
OMV AG | 28,857 | 1,328,674 |
Raiffeisen Bank International AG | 27,082 | 376,636 |
Strabag SE | 2,905 | 111,533 |
Telekom Austria AG * | 27,936 | 162,390 |
Verbund AG | 6,472 | 506,984 |
Vienna Insurance Group AG Wiener Versicherung Gruppe | 7,197 | 160,967 |
voestalpine AG | 22,231 | 482,641 |
8,178,043 | ||
Belgium — 0.9% | ||
Ackermans & van Haaren NV | 4,503 | 627,365 |
Ageas SA | 35,707 | 1,236,112 |
Anheuser-Busch InBev SA | 198,239 | 9,915,996 |
Azelis Group NV | 14,041 | 321,356 |
96 | J.P. Morgan Exchange-Traded Funds | October 31, 2022 |
INVESTMENTS | SHARES | VALUE($) |
Common Stocks — continued | ||
Belgium — continued | ||
D'ieteren Group | 4,540 | 755,584 |
Elia Group SA/NV | 7,209 | 911,451 |
Etablissements Franz Colruyt NV | 11,253 | 271,244 |
Groupe Bruxelles Lambert NV | 20,240 | 1,492,223 |
KBC Group NV | 67,604 | 3,388,026 |
Proximus SADP | 31,224 | 327,344 |
Sofina SA | 3,160 | 616,196 |
Solvay SA | 14,623 | 1,319,593 |
Telenet Group Holding NV | 9,426 | 143,711 |
UCB SA | 25,343 | 1,910,047 |
Umicore SA | 41,441 | 1,366,141 |
Warehouses De Pauw CVA, REIT | 28,389 | 728,630 |
25,331,019 | ||
Brazil — 0.1% | ||
Yara International ASA | 32,641 | 1,456,815 |
Chile — 0.0% ^ | ||
Antofagasta plc | 69,150 | 931,825 |
China — 0.7% | ||
Budweiser Brewing Co. APAC Ltd. (b) | 344,600 | 725,288 |
ESR Cayman Ltd. (b) | 489,400 | 834,599 |
Prosus NV * | 240,794 | 10,412,341 |
Wharf Holdings Ltd. (The) | 248,000 | 710,147 |
Wilmar International Ltd. | 627,300 | 1,718,522 |
Wuxi Biologics Cayman, Inc. * (b) | 719,000 | 3,235,243 |
17,636,140 | ||
Denmark — 2.6% | ||
AP Moller - Maersk A/S, Class A | 601 | 1,202,412 |
AP Moller - Maersk A/S, Class B | 1,110 | 2,318,982 |
Carlsberg A/S, Class B | 19,705 | 2,320,179 |
Chr Hansen Holding A/S | 20,611 | 1,144,757 |
Coloplast A/S, Class B | 23,779 | 2,650,650 |
Danske Bank A/S | 136,502 | 2,201,913 |
Demant A/S * | 19,291 | 526,784 |
DSV A/S | 38,417 | 5,191,223 |
Genmab A/S * | 13,161 | 5,069,719 |
Novo Nordisk A/S, Class B | 327,562 | 35,616,229 |
Novozymes A/S, Class B | 41,857 | 2,197,099 |
Orsted A/S (b) | 37,873 | 3,124,740 |
Pandora A/S | 19,137 | 1,006,674 |
Tryg A/S | 72,160 | 1,560,766 |
Vestas Wind Systems A/S | 202,177 | 3,985,650 |
70,117,777 | ||
INVESTMENTS | SHARES | VALUE($) |
Finland — 1.3% | ||
Elisa OYJ | 30,187 | 1,458,827 |
Fortum OYJ | 87,235 | 1,227,770 |
Huhtamaki OYJ | 19,239 | 691,438 |
Kesko OYJ, Class A | 18,865 | 362,799 |
Kesko OYJ, Class B | 54,744 | 1,065,355 |
Kone OYJ, Class B | 80,743 | 3,306,087 |
Metso Outotec OYJ | 141,217 | 1,071,710 |
Neste OYJ | 86,244 | 3,779,944 |
Nokia OYJ | 1,083,405 | 4,814,563 |
Nordea Bank Abp | 661,214 | 6,316,260 |
Orion OYJ, Class A | 6,007 | 275,450 |
Orion OYJ, Class B | 21,312 | 980,741 |
Sampo OYJ, Class A | 99,257 | 4,538,801 |
Stora Enso OYJ, Class A (a) | 10,137 | 147,764 |
Stora Enso OYJ, Class R | 122,732 | 1,600,280 |
UPM-Kymmene OYJ | 106,861 | 3,592,396 |
Wartsila OYJ Abp | 97,246 | 662,953 |
35,893,138 | ||
France — 10.2% | ||
Adevinta ASA * | 53,675 | 367,425 |
Aeroports de Paris * | 5,543 | 749,584 |
Air Liquide SA | 104,772 | 13,705,620 |
Airbus SE | 123,073 | 13,316,963 |
Alstom SA | 61,357 | 1,262,803 |
Amundi SA (b) | 12,225 | 576,775 |
Arkema SA | 12,800 | 1,012,967 |
AXA SA | 397,569 | 9,817,930 |
BioMerieux | 9,816 | 868,506 |
BNP Paribas SA | 227,347 | 10,661,192 |
Bollore SE | 183,117 | 915,868 |
Bouygues SA | 42,119 | 1,201,705 |
Bureau Veritas SA | 58,017 | 1,435,357 |
Capgemini SE | 31,412 | 5,148,139 |
Carrefour SA | 117,377 | 1,889,236 |
Cie de Saint-Gobain | 104,124 | 4,256,690 |
Cie Generale des Etablissements Michelin SCA | 142,973 | 3,643,533 |
Covivio, REIT | 9,296 | 497,723 |
Credit Agricole SA | 272,614 | 2,473,607 |
Danone SA | 127,182 | 6,320,884 |
Dassault Aviation SA | 4,683 | 695,512 |
Dassault Systemes SE | 138,781 | 4,651,770 |
Edenred | 49,974 | 2,561,978 |
Eiffage SA | 15,699 | 1,419,532 |
October 31, 2022 | J.P. Morgan Exchange-Traded Funds | 97 |
AS OF October 31, 2022 (continued)
INVESTMENTS | SHARES | VALUE($) |
Common Stocks — continued | ||
France — continued | ||
Electricite de France SA | 124,499 | 1,470,329 |
Engie SA | 370,543 | 4,814,601 |
EssilorLuxottica SA | 60,911 | 9,631,749 |
Gecina SA, REIT | 10,897 | 971,512 |
Getlink SE | 80,378 | 1,271,942 |
Hermes International | 6,975 | 9,028,342 |
Ipsen SA | 8,067 | 829,028 |
Kering SA | 14,494 | 6,637,691 |
Legrand SA | 53,414 | 4,070,398 |
L'Oreal SA | 50,509 | 15,860,048 |
LVMH Moet Hennessy Louis Vuitton SE | 52,394 | 33,060,346 |
Orange SA | 378,117 | 3,602,667 |
Pernod Ricard SA | 40,802 | 7,161,212 |
Publicis Groupe SA | 47,243 | 2,645,816 |
Safran SA | 70,133 | 7,810,711 |
Sanofi | 230,900 | 19,870,761 |
Sartorius Stedim Biotech | 4,805 | 1,524,814 |
Societe Generale SA | 158,238 | 3,629,511 |
Sodexo SA | 16,821 | 1,490,044 |
Teleperformance | 11,835 | 3,170,951 |
Thales SA | 21,357 | 2,716,183 |
TotalEnergies SE | 492,905 | 26,889,627 |
Unibail-Rodamco-Westfield, REIT * | 21,396 | 1,011,166 |
Veolia Environnement SA | 131,841 | 2,942,167 |
Vinci SA | 107,668 | 9,909,442 |
Vivendi SE | 162,183 | 1,327,465 |
Worldline SA * (b) | 50,046 | 2,184,332 |
274,984,154 | ||
Germany — 7.2% | ||
adidas AG | 35,767 | 3,491,400 |
Allianz SE (Registered) | 81,777 | 14,712,052 |
Aroundtown SA | 184,629 | 365,980 |
BASF SE | 183,886 | 8,251,090 |
Bayer AG (Registered) | 196,685 | 10,341,909 |
Bayerische Motoren Werke AG | 63,880 | 5,014,065 |
Bayerische Motoren Werke AG (Preference) | 11,902 | 877,700 |
Beiersdorf AG | 19,677 | 1,888,898 |
Brenntag SE | 30,930 | 1,876,720 |
Carl Zeiss Meditec AG | 7,347 | 889,305 |
Commerzbank AG * | 210,611 | 1,682,720 |
Continental AG | 21,641 | 1,120,911 |
Covestro AG (b) | 38,723 | 1,314,492 |
Daimler Truck Holding AG * | 103,804 | 2,768,721 |
Deutsche Bank AG (Registered) | 413,784 | 3,944,084 |
INVESTMENTS | SHARES | VALUE($) |
Germany — continued | ||
Deutsche Boerse AG | 38,032 | 6,184,755 |
Deutsche Lufthansa AG (Registered) * | 119,900 | 819,758 |
Deutsche Post AG (Registered) | 198,454 | 7,015,315 |
Deutsche Telekom AG (Registered) | 698,817 | 13,190,520 |
Deutsche Wohnen SE | 10,413 | 210,032 |
E.ON SE | 449,480 | 3,763,943 |
Evonik Industries AG | 41,044 | 756,102 |
Fresenius Medical Care AG & Co. KGaA | 39,937 | 1,104,682 |
Fresenius SE & Co. KGaA | 81,621 | 1,878,358 |
GEA Group AG | 32,923 | 1,150,806 |
Hannover Rueck SE | 12,074 | 1,964,731 |
HeidelbergCement AG | 28,998 | 1,333,525 |
Henkel AG & Co. KGaA | 19,762 | 1,160,130 |
Henkel AG & Co. KGaA (Preference) | 35,673 | 2,247,350 |
Infineon Technologies AG | 261,454 | 6,344,307 |
KION Group AG | 14,386 | 318,942 |
Mercedes-Benz Group AG | 156,357 | 9,050,192 |
Merck KGaA | 25,871 | 4,216,071 |
MTU Aero Engines AG | 10,706 | 1,915,928 |
Muenchener Rueckversicherungs- Gesellschaft AG (Registered) | 28,054 | 7,405,584 |
Porsche Automobil Holding SE (Preference) | 30,655 | 1,712,765 |
Puma SE | 20,557 | 908,843 |
RWE AG | 135,386 | 5,211,709 |
SAP SE | 218,893 | 21,069,081 |
Sartorius AG (Preference) | 5,399 | 1,903,636 |
Siemens AG (Registered) | 149,751 | 16,354,162 |
Siemens Energy AG | 80,093 | 933,694 |
Siemens Healthineers AG (b) | 56,454 | 2,586,303 |
Symrise AG | 26,587 | 2,713,803 |
Talanx AG | 10,661 | 400,367 |
Telefonica Deutschland Holding AG | 185,167 | 403,460 |
TUI AG * (a) | 261,467 | 394,600 |
Uniper SE (a) | 16,117 | 48,245 |
Volkswagen AG (Preference) | 36,739 | 4,702,644 |
Vonovia SE | 159,335 | 3,522,995 |
Zalando SE * (b) | 44,607 | 1,028,111 |
194,465,496 | ||
Hong Kong — 2.2% | ||
AIA Group Ltd. | 2,388,200 | 18,090,123 |
CK Asset Holdings Ltd. | 396,000 | 2,189,314 |
CK Infrastructure Holdings Ltd. | 122,000 | 579,588 |
CLP Holdings Ltd. | 332,500 | 2,231,676 |
DFI Retail Group Holdings Ltd. | 59,900 | 134,290 |
98 | J.P. Morgan Exchange-Traded Funds | October 31, 2022 |
INVESTMENTS | SHARES | VALUE($) |
Common Stocks — continued | ||
Hong Kong — continued | ||
Hang Lung Properties Ltd. | 365,000 | 459,157 |
Hang Seng Bank Ltd. | 145,700 | 2,051,134 |
Henderson Land Development Co. Ltd. | 264,000 | 646,341 |
HK Electric Investments & HK Electric Investments Ltd. (b) | 461,500 | 293,428 |
HKT Trust & HKT Ltd. | 722,000 | 816,542 |
Hong Kong & China Gas Co. Ltd. | 2,165,100 | 1,668,794 |
Hong Kong Exchanges & Clearing Ltd. | 238,800 | 6,338,616 |
Jardine Matheson Holdings Ltd. | 49,100 | 2,261,939 |
Link, REIT | 422,900 | 2,499,600 |
MTR Corp. Ltd. | 309,500 | 1,361,859 |
New World Development Co. Ltd. | 279,000 | 570,688 |
Power Assets Holdings Ltd. | 274,500 | 1,312,535 |
Prudential plc | 550,432 | 5,113,332 |
Sino Land Co. Ltd. | 646,000 | 689,809 |
Sun Hung Kai Properties Ltd. | 301,500 | 3,240,016 |
Swire Pacific Ltd., Class B | 172,500 | 177,752 |
Swire Pacific Ltd., Class A | 94,500 | 626,867 |
Swire Properties Ltd. | 209,600 | 402,833 |
Techtronic Industries Co. Ltd. | 364,500 | 3,451,366 |
WH Group Ltd. (b) | 1,566,424 | 791,062 |
Wharf Real Estate Investment Co. Ltd. | 310,000 | 1,221,419 |
59,220,080 | ||
Ireland — 0.4% | ||
CRH plc | 153,799 | 5,539,511 |
Kerry Group plc, Class A | 31,173 | 2,707,528 |
Kingspan Group plc | 30,943 | 1,560,044 |
Smurfit Kappa Group plc | 52,148 | 1,726,254 |
11,533,337 | ||
Israel — 0.6% | ||
Azrieli Group Ltd. | 7,307 | 541,343 |
Bank Hapoalim BM | 246,235 | 2,373,523 |
Bank Leumi Le-Israel BM | 309,077 | 2,948,515 |
Bezeq The Israeli Telecommunication Corp. Ltd. | 410,074 | 725,928 |
Elbit Systems Ltd. | 4,967 | 1,005,000 |
ICL Group Ltd. | 144,305 | 1,301,285 |
Israel Discount Bank Ltd., Class A | 247,652 | 1,408,172 |
Mizrahi Tefahot Bank Ltd. | 29,808 | 1,126,789 |
Nice Ltd. * | 12,721 | 2,397,518 |
Teva Pharmaceutical Industries Ltd. * | 222,527 | 1,989,595 |
15,817,668 | ||
INVESTMENTS | SHARES | VALUE($) |
Italy — 2.1% | ||
A2A SpA | 315,170 | 349,473 |
Amplifon SpA | 18,516 | 460,011 |
Assicurazioni Generali SpA | 241,413 | 3,622,913 |
Atlantia SpA | 100,850 | 2,249,714 |
Banca Mediolanum SpA | 42,900 | 320,974 |
Banco BPM SpA | 303,664 | 918,741 |
Buzzi Unicem SpA | 18,968 | 314,808 |
Coca-Cola HBC AG | 40,802 | 891,252 |
Davide Campari-Milano NV | 106,976 | 960,679 |
DiaSorin SpA | 5,260 | 687,670 |
Enel SpA | 1,546,915 | 6,910,609 |
Eni SpA | 505,305 | 6,636,542 |
Ferrari NV | 25,630 | 5,052,660 |
FinecoBank Banca Fineco SpA | 122,283 | 1,647,836 |
Hera SpA | 158,057 | 376,599 |
Infrastrutture Wireless Italiane SpA (b) | 71,342 | 629,676 |
Intesa Sanpaolo SpA | 3,541,460 | 6,751,901 |
Leonardo SpA | 81,177 | 652,184 |
Mediobanca Banca di Credito Finanziario SpA | 129,832 | 1,176,225 |
Moncler SpA | 41,637 | 1,796,397 |
Nexi SpA * (b) | 170,504 | 1,474,090 |
Pirelli & C SpA (b) | 80,079 | 302,063 |
Poste Italiane SpA (b) | 91,111 | 793,966 |
Prysmian SpA | 53,735 | 1,748,974 |
Recordati Industria Chimica e Farmaceutica SpA | 20,112 | 755,638 |
Snam SpA | 410,449 | 1,825,068 |
Telecom Italia SpA * | 2,035,650 | 398,260 |
Telecom Italia SpA * | 1,210,424 | 231,374 |
Terna - Rete Elettrica Nazionale | 281,987 | 1,870,044 |
UniCredit SpA | 404,857 | 5,020,743 |
UnipolSai Assicurazioni SpA | 85,234 | 192,183 |
57,019,267 | ||
Japan — 23.7% | ||
ABC-Mart, Inc. | 6,200 | 276,351 |
Acom Co. Ltd. | 93,900 | 205,139 |
Advance Residence Investment Corp., REIT | 279 | 649,558 |
Advantest Corp. | 37,600 | 1,979,324 |
Aeon Co. Ltd. | 175,100 | 3,265,719 |
AGC, Inc. | 44,900 | 1,406,940 |
Air Water, Inc. | 45,400 | 506,883 |
Aisin Corp. | 36,300 | 931,812 |
Ajinomoto Co., Inc. | 108,200 | 2,975,849 |
October 31, 2022 | J.P. Morgan Exchange-Traded Funds | 99 |
AS OF October 31, 2022 (continued)
INVESTMENTS | SHARES | VALUE($) |
Common Stocks — continued | ||
Japan — continued | ||
Alfresa Holdings Corp. | 40,200 | 462,818 |
ANA Holdings, Inc. * | 32,000 | 622,039 |
Asahi Group Holdings Ltd. | 101,200 | 2,831,651 |
Asahi Intecc Co. Ltd. | 47,800 | 814,280 |
Asahi Kasei Corp. | 278,900 | 1,788,283 |
Asics Corp. | 37,700 | 577,705 |
Astellas Pharma, Inc. | 367,300 | 5,068,074 |
Bandai Namco Holdings, Inc. | 43,900 | 2,901,918 |
Bank of Kyoto Ltd. (The) | 15,200 | 547,745 |
Bridgestone Corp. | 122,900 | 4,444,857 |
Brother Industries Ltd. | 52,900 | 901,200 |
Canon, Inc. | 208,500 | 4,419,676 |
Capcom Co. Ltd. | 31,900 | 887,298 |
Central Japan Railway Co. | 40,800 | 4,723,683 |
Chiba Bank Ltd. (The) | 147,100 | 805,979 |
Chubu Electric Power Co., Inc. | 151,800 | 1,235,641 |
Chugai Pharmaceutical Co. Ltd. | 127,400 | 2,952,095 |
Concordia Financial Group Ltd. | 242,000 | 738,395 |
Cosmos Pharmaceutical Corp. | 4,100 | 396,530 |
CyberAgent, Inc. | 83,300 | 684,325 |
Dai Nippon Printing Co. Ltd. | 54,300 | 1,087,669 |
Daifuku Co. Ltd. | 25,500 | 1,167,261 |
Dai-ichi Life Holdings, Inc. | 206,700 | 3,282,965 |
Daiichi Sankyo Co. Ltd. | 389,900 | 12,480,998 |
Daikin Industries Ltd. | 58,800 | 8,807,486 |
Daito Trust Construction Co. Ltd. | 13,700 | 1,356,626 |
Daiwa House Industry Co. Ltd. | 133,000 | 2,679,596 |
Daiwa House REIT Investment Corp., REIT | 422 | 851,721 |
Daiwa Securities Group, Inc. | 299,000 | 1,166,600 |
Denso Corp. | 100,500 | 4,986,401 |
Dentsu Group, Inc. | 48,400 | 1,505,403 |
Disco Corp. | 5,900 | 1,411,166 |
East Japan Railway Co. | 75,000 | 3,996,404 |
Eisai Co. Ltd. | 59,400 | 3,582,010 |
ENEOS Holdings, Inc. | 646,300 | 2,131,922 |
FANUC Corp. | 38,100 | 4,985,447 |
Fast Retailing Co. Ltd. | 12,500 | 6,964,265 |
Fuji Electric Co. Ltd. | 30,000 | 1,159,949 |
FUJIFILM Holdings Corp. | 80,800 | 3,696,591 |
Fujitsu Ltd. | 36,300 | 4,176,625 |
Fukuoka Financial Group, Inc. | 37,800 | 643,190 |
GLP J-REIT, REIT | 899 | 932,337 |
GMO Payment Gateway, Inc. | 8,900 | 639,962 |
Hakuhodo DY Holdings, Inc. | 60,900 | 513,128 |
INVESTMENTS | SHARES | VALUE($) |
Japan — continued | ||
Hamamatsu Photonics KK | 29,400 | 1,330,094 |
Hankyu Hanshin Holdings, Inc. | 48,900 | 1,452,367 |
Haseko Corp. | 44,600 | 459,301 |
Hikari Tsushin, Inc. | 4,100 | 495,257 |
Hino Motors Ltd. | 57,700 | 239,788 |
Hirose Electric Co. Ltd. | 6,300 | 817,245 |
Hitachi Construction Machinery Co. Ltd. | 21,000 | 410,845 |
Hitachi Ltd. | 193,500 | 8,779,836 |
Hitachi Metals Ltd. * | 39,800 | 581,248 |
Honda Motor Co. Ltd. | 340,600 | 7,766,523 |
Hoshizaki Corp. | 24,000 | 687,600 |
Hoya Corp. | 72,800 | 6,767,589 |
Hulic Co. Ltd. | 119,900 | 870,995 |
Ibiden Co. Ltd. | 28,200 | 950,548 |
Idemitsu Kosan Co. Ltd. | 44,700 | 978,047 |
Iida Group Holdings Co. Ltd. | 35,100 | 487,376 |
Inpex Corp. | 211,000 | 2,129,496 |
Isuzu Motors Ltd. | 124,400 | 1,462,902 |
ITOCHU Corp. | 295,500 | 7,637,066 |
Itochu Techno-Solutions Corp. | 19,200 | 445,128 |
Japan Airlines Co. Ltd. * | 29,000 | 541,666 |
Japan Airport Terminal Co. Ltd. * | 19,100 | 817,498 |
Japan Exchange Group, Inc. | 105,200 | 1,382,516 |
Japan Metropolitan Fund Invest, REIT | 1,402 | 1,032,895 |
Japan Post Holdings Co. Ltd. | 483,400 | 3,250,661 |
Japan Post Insurance Co. Ltd. | 39,700 | 587,685 |
Japan Prime Realty Investment Corp., REIT | 205 | 556,748 |
Japan Real Estate Investment Corp., REIT | 278 | 1,164,900 |
Japan Tobacco, Inc. | 220,000 | 3,684,436 |
JFE Holdings, Inc. | 115,900 | 1,061,774 |
JSR Corp. | 42,400 | 805,644 |
Kajima Corp. | 95,100 | 895,194 |
Kakaku.com, Inc. | 25,600 | 432,973 |
Kansai Electric Power Co., Inc. (The) | 165,100 | 1,250,676 |
Kansai Paint Co. Ltd. | 52,100 | 679,863 |
Kao Corp. | 95,000 | 3,548,435 |
Kawasaki Heavy Industries Ltd. | 33,600 | 571,449 |
KDDI Corp. | 313,200 | 9,257,244 |
Keio Corp. | 24,700 | 865,995 |
Keisei Electric Railway Co. Ltd. | 34,400 | 913,048 |
Keyence Corp. | 39,600 | 14,931,786 |
Kikkoman Corp. | 38,600 | 2,091,737 |
Kintetsu Group Holdings Co. Ltd. | 37,900 | 1,280,827 |
Kirin Holdings Co. Ltd. | 166,100 | 2,441,660 |
100 | J.P. Morgan Exchange-Traded Funds | October 31, 2022 |
INVESTMENTS | SHARES | VALUE($) |
Common Stocks — continued | ||
Japan — continued | ||
Kobayashi Pharmaceutical Co. Ltd. | 11,700 | 620,881 |
Kobe Bussan Co. Ltd. | 28,500 | 618,183 |
Koei Tecmo Holdings Co. Ltd. | 24,400 | 368,170 |
Koito Manufacturing Co. Ltd. | 51,800 | 735,397 |
Komatsu Ltd. | 194,400 | 3,808,334 |
Konami Group Corp. | 20,600 | 902,926 |
Kose Corp. | 7,100 | 708,725 |
Kubota Corp. | 227,600 | 3,174,927 |
Kurita Water Industries Ltd. | 21,700 | 794,329 |
Kyocera Corp. | 69,200 | 3,351,111 |
Kyowa Kirin Co. Ltd. | 51,100 | 1,203,492 |
Kyushu Electric Power Co., Inc. | 94,700 | 468,867 |
Kyushu Railway Co. | 31,500 | 658,782 |
Lasertec Corp. | 15,500 | 2,177,919 |
Lawson, Inc. | 10,100 | 322,665 |
Lion Corp. | 58,500 | 591,242 |
Lixil Corp. | 58,500 | 883,659 |
M3, Inc. | 85,800 | 2,556,855 |
Makita Corp. | 56,300 | 1,028,799 |
Marubeni Corp. | 343,400 | 3,006,096 |
Marui Group Co. Ltd. | 41,400 | 677,320 |
MatsukiyoCocokara & Co. | 28,600 | 1,041,287 |
Mazda Motor Corp. | 120,000 | 807,956 |
McDonald's Holdings Co. Japan Ltd. | 17,800 | 617,967 |
Medipal Holdings Corp. | 41,600 | 515,759 |
MEIJI Holdings Co. Ltd. | 28,400 | 1,168,635 |
MINEBEA MITSUMI, Inc. | 81,600 | 1,205,921 |
MISUMI Group, Inc. | 57,200 | 1,218,329 |
Mitsubishi Chemical Group Corp. | 285,900 | 1,291,511 |
Mitsubishi Corp. | 297,700 | 8,064,361 |
Mitsubishi Electric Corp. | 429,700 | 3,780,764 |
Mitsubishi Estate Co. Ltd. | 265,000 | 3,332,454 |
Mitsubishi Gas Chemical Co., Inc. | 40,600 | 515,913 |
Mitsubishi HC Capital, Inc. | 157,900 | 677,558 |
Mitsubishi Heavy Industries Ltd. | 67,300 | 2,318,087 |
Mitsubishi Motors Corp. * | 136,600 | 460,170 |
Mitsubishi UFJ Financial Group, Inc. | 2,525,700 | 11,931,030 |
Mitsui & Co. Ltd. | 329,000 | 7,280,503 |
Mitsui Chemicals, Inc. | 38,300 | 708,892 |
Mitsui Fudosan Co. Ltd. | 190,700 | 3,651,595 |
Mitsui OSK Lines Ltd. | 72,000 | 1,425,254 |
Mizuho Financial Group, Inc. | 508,600 | 5,500,748 |
MonotaRO Co. Ltd. | 49,600 | 752,921 |
MS&AD Insurance Group Holdings, Inc. | 91,500 | 2,423,030 |
INVESTMENTS | SHARES | VALUE($) |
Japan — continued | ||
Murata Manufacturing Co. Ltd. | 128,300 | 6,073,651 |
Nagoya Railroad Co. Ltd. | 39,100 | 598,974 |
NEC Corp. | 54,800 | 1,813,930 |
Nexon Co. Ltd. | 93,700 | 1,567,997 |
NGK Insulators Ltd. | 54,100 | 631,134 |
NGK Spark Plug Co. Ltd. | 34,200 | 623,947 |
NH Foods Ltd. | 21,200 | 505,228 |
Nidec Corp. | 105,700 | 5,811,811 |
Nihon M&A Center Holdings, Inc. | 59,800 | 674,772 |
Nikon Corp. | 69,400 | 671,177 |
Nintendo Co. Ltd. | 235,000 | 9,540,788 |
Nippon Building Fund, Inc., REIT | 339 | 1,506,938 |
NIPPON EXPRESS HOLDINGS, Inc. | 17,600 | 884,363 |
Nippon Paint Holdings Co. Ltd. | 213,500 | 1,360,641 |
Nippon Prologis REIT, Inc., REIT | 538 | 1,128,882 |
Nippon Sanso Holdings Corp. | 42,100 | 670,292 |
Nippon Shinyaku Co. Ltd. | 12,200 | 675,468 |
Nippon Steel Corp. | 190,000 | 2,606,520 |
Nippon Telegraph & Telephone Corp. | 239,500 | 6,605,579 |
Nippon Yusen KK | 101,700 | 1,842,242 |
Nissan Chemical Corp. | 28,500 | 1,282,939 |
Nissan Motor Co. Ltd. | 473,700 | 1,509,826 |
Nisshin Seifun Group, Inc. | 53,200 | 574,859 |
Nissin Foods Holdings Co. Ltd. | 17,100 | 1,106,864 |
Nitori Holdings Co. Ltd. | 18,000 | 1,631,107 |
Nitto Denko Corp. | 30,000 | 1,580,572 |
Nomura Holdings, Inc. | 602,300 | 1,949,018 |
Nomura Real Estate Holdings, Inc. | 23,300 | 526,669 |
Nomura Real Estate Master Fund, Inc., REIT | 944 | 1,076,945 |
Nomura Research Institute Ltd. | 89,400 | 1,978,440 |
NSK Ltd. | 97,900 | 517,424 |
NTT Data Corp. | 128,900 | 1,866,969 |
Obayashi Corp. | 144,800 | 929,423 |
Obic Co. Ltd. | 13,100 | 1,965,824 |
Odakyu Electric Railway Co. Ltd. | 69,800 | 829,779 |
Oji Holdings Corp. | 203,000 | 703,745 |
Olympus Corp. | 256,800 | 5,414,497 |
Omron Corp. | 40,900 | 1,907,508 |
Ono Pharmaceutical Co. Ltd. | 95,100 | 2,238,041 |
Open House Group Co. Ltd. | 14,800 | 526,427 |
Oracle Corp. | 6,700 | 356,919 |
Oriental Land Co. Ltd. | 46,000 | 6,160,674 |
ORIX Corp. | 239,500 | 3,517,705 |
Orix JREIT, Inc., REIT | 554 | 743,256 |
October 31, 2022 | J.P. Morgan Exchange-Traded Funds | 101 |
AS OF October 31, 2022 (continued)
INVESTMENTS | SHARES | VALUE($) |
Common Stocks — continued | ||
Japan — continued | ||
Osaka Gas Co. Ltd. | 83,600 | 1,237,924 |
Otsuka Corp. | 23,900 | 752,663 |
Otsuka Holdings Co. Ltd. | 112,100 | 3,593,311 |
Pan Pacific International Holdings Corp. | 106,000 | 1,739,537 |
Panasonic Holdings Corp. | 466,300 | 3,321,275 |
Persol Holdings Co. Ltd. | 37,600 | 752,840 |
Rakuten Group, Inc. | 181,400 | 809,836 |
Recruit Holdings Co. Ltd. | 339,300 | 10,440,658 |
Renesas Electronics Corp. * | 281,100 | 2,351,613 |
Resona Holdings, Inc. | 480,800 | 1,812,113 |
Ricoh Co. Ltd. | 127,400 | 933,561 |
Rinnai Corp. | 8,000 | 544,522 |
Rohm Co. Ltd. | 18,100 | 1,271,790 |
Santen Pharmaceutical Co. Ltd. | 80,700 | 552,230 |
SBI Holdings, Inc. | 54,800 | 989,911 |
SCSK Corp. | 30,800 | 454,407 |
Secom Co. Ltd. | 42,400 | 2,415,549 |
Sega Sammy Holdings, Inc. | 32,200 | 411,880 |
Seibu Holdings, Inc. | 54,500 | 487,842 |
Seiko Epson Corp. | 63,800 | 866,159 |
Sekisui Chemical Co. Ltd. | 87,400 | 1,091,454 |
Sekisui House Ltd. | 136,500 | 2,266,282 |
Seven & i Holdings Co. Ltd. | 159,500 | 5,953,876 |
SG Holdings Co. Ltd. | 97,200 | 1,288,007 |
Sharp Corp. | 45,000 | 269,914 |
Shimadzu Corp. | 55,300 | 1,456,761 |
Shimano, Inc. | 17,400 | 2,692,533 |
Shimizu Corp. | 135,200 | 674,647 |
Shin-Etsu Chemical Co. Ltd. | 83,700 | 8,698,937 |
Shinsei Bank Ltd. | 11,900 | 177,080 |
Shionogi & Co. Ltd. | 56,900 | 2,642,280 |
Shiseido Co. Ltd. | 80,500 | 2,780,246 |
Shizuoka Financial Group, Inc. | 113,500 | 716,732 |
Showa Denko KK | 36,700 | 535,767 |
SMC Corp. | 12,200 | 4,897,108 |
SoftBank Corp. | 555,500 | 5,479,668 |
SoftBank Group Corp. | 238,200 | 10,225,026 |
Sojitz Corp. | 41,080 | 605,600 |
Sompo Holdings, Inc. | 69,200 | 2,885,107 |
Sony Group Corp. | 252,000 | 16,993,535 |
Square Enix Holdings Co. Ltd. | 18,400 | 821,045 |
Stanley Electric Co. Ltd. | 30,200 | 513,415 |
Subaru Corp. | 123,300 | 1,927,282 |
SUMCO Corp. | 69,700 | 883,436 |
INVESTMENTS | SHARES | VALUE($) |
Japan — continued | ||
Sumitomo Chemical Co. Ltd. | 331,800 | 1,117,257 |
Sumitomo Corp. | 250,200 | 3,180,985 |
Sumitomo Electric Industries Ltd. | 158,900 | 1,660,557 |
Sumitomo Metal Mining Co. Ltd. | 54,800 | 1,536,091 |
Sumitomo Mitsui Financial Group, Inc. | 275,100 | 7,725,239 |
Sumitomo Mitsui Trust Holdings, Inc. | 74,600 | 2,146,169 |
Sumitomo Pharma Co. Ltd. | 38,000 | 264,705 |
Sumitomo Realty & Development Co. Ltd. | 95,100 | 2,181,015 |
Suntory Beverage & Food Ltd. | 25,700 | 859,837 |
Suzuki Motor Corp. | 98,000 | 3,313,362 |
Sysmex Corp. | 33,800 | 1,819,247 |
T&D Holdings, Inc. | 118,000 | 1,167,045 |
Taisei Corp. | 39,800 | 1,084,177 |
Taisho Pharmaceutical Holdings Co. Ltd. | 11,500 | 414,783 |
Takeda Pharmaceutical Co. Ltd. | 316,200 | 8,350,526 |
TDK Corp. | 78,300 | 2,445,964 |
Terumo Corp. | 152,000 | 4,613,049 |
TIS, Inc. | 45,100 | 1,215,974 |
Tobu Railway Co. Ltd. | 41,600 | 962,312 |
Toho Co. Ltd. | 25,500 | 906,741 |
Tokio Marine Holdings, Inc. | 407,500 | 7,377,857 |
Tokyo Century Corp. | 9,300 | 317,199 |
Tokyo Electric Power Co. Holdings, Inc. * | 160,400 | 522,513 |
Tokyo Electron Ltd. | 31,400 | 8,261,234 |
Tokyo Gas Co. Ltd. | 82,400 | 1,472,611 |
Tokyu Corp. | 124,900 | 1,440,161 |
Tokyu Fudosan Holdings Corp. | 120,500 | 611,366 |
TOPPAN, Inc. | 69,700 | 1,039,518 |
Toray Industries, Inc. | 326,800 | 1,587,382 |
Toshiba Corp. | 86,800 | 3,012,094 |
Tosoh Corp. | 64,500 | 701,727 |
TOTO Ltd. | 31,800 | 907,021 |
Toyo Suisan Kaisha Ltd. | 20,800 | 780,358 |
Toyota Boshoku Corp. | 20,600 | 262,126 |
Toyota Industries Corp. | 40,600 | 2,091,517 |
Toyota Motor Corp. | 2,515,000 | 34,894,648 |
Toyota Tsusho Corp. | 48,000 | 1,611,163 |
Trend Micro, Inc. | 28,300 | 1,426,986 |
Unicharm Corp. | 88,300 | 2,683,563 |
United Urban Investment Corp., REIT | 624 | 660,210 |
USS Co. Ltd. | 42,700 | 644,289 |
Welcia Holdings Co. Ltd. | 21,100 | 441,019 |
West Japan Railway Co. | 49,400 | 1,958,540 |
Yakult Honsha Co. Ltd. | 31,800 | 1,761,686 |
102 | J.P. Morgan Exchange-Traded Funds | October 31, 2022 |
INVESTMENTS | SHARES | VALUE($) |
Common Stocks — continued | ||
Japan — continued | ||
Yamaha Corp. | 34,400 | 1,298,747 |
Yamaha Motor Co. Ltd. | 69,700 | 1,438,787 |
Yamato Holdings Co. Ltd. | 66,600 | 986,298 |
Yaskawa Electric Corp. | 53,700 | 1,486,915 |
Yokogawa Electric Corp. | 48,300 | 807,630 |
Z Holdings Corp. | 532,800 | 1,375,029 |
ZOZO, Inc. | 22,700 | 481,653 |
642,565,379 | ||
Jordan — 0.0% ^ | ||
Hikma Pharmaceuticals plc | 35,553 | 510,372 |
Luxembourg — 0.2% | ||
ArcelorMittal SA | 114,233 | 2,553,526 |
Eurofins Scientific SE | 25,813 | 1,652,415 |
RTL Group SA | 7,458 | 253,169 |
4,459,110 | ||
Macau — 0.1% | ||
Galaxy Entertainment Group Ltd. | 398,000 | 1,818,322 |
Sands China Ltd. * | 486,800 | 851,036 |
2,669,358 | ||
Mexico — 0.0% ^ | ||
Fresnillo plc | 36,993 | 309,281 |
Netherlands — 5.2% | ||
Adyen NV * (b) | 6,196 | 8,845,406 |
Aegon NV | 282,827 | 1,309,252 |
Akzo Nobel NV | 36,360 | 2,244,702 |
Argenx SE * | 10,150 | 3,940,744 |
Argenx SE * | 870 | 336,689 |
ASM International NV | 9,281 | 2,053,141 |
ASML Holding NV (a) | 81,384 | 38,176,190 |
HAL Trust | 17,729 | 2,042,668 |
Heineken Holding NV | 21,909 | 1,494,943 |
Heineken NV | 47,282 | 3,949,667 |
ING Groep NV | 754,218 | 7,421,199 |
JDE Peet's NV | 26,166 | 749,005 |
Koninklijke Ahold Delhaize NV | 209,361 | 5,838,722 |
Koninklijke DSM NV | 34,988 | 4,115,652 |
Koninklijke KPN NV | 653,072 | 1,826,712 |
Koninklijke Philips NV | 178,051 | 2,258,558 |
NN Group NV | 62,066 | 2,628,028 |
Randstad NV | 25,074 | 1,249,668 |
Shell plc | 1,531,578 | 42,427,173 |
INVESTMENTS | SHARES | VALUE($) |
Netherlands — continued | ||
Universal Music Group NV | 152,477 | 2,993,955 |
Wolters Kluwer NV | 52,552 | 5,584,103 |
141,486,177 | ||
New Zealand — 0.2% | ||
Auckland International Airport Ltd. * | 241,770 | 1,080,814 |
Contact Energy Ltd. | 156,858 | 688,043 |
Fisher & Paykel Healthcare Corp. Ltd. | 115,699 | 1,314,922 |
Fletcher Building Ltd. | 156,528 | 467,382 |
Mercury NZ Ltd. | 130,024 | 439,649 |
Meridian Energy Ltd. | 242,534 | 687,486 |
Ryman Healthcare Ltd. | 84,339 | 410,755 |
Spark New Zealand Ltd. | 374,705 | 1,115,408 |
6,204,459 | ||
Norway — 0.9% | ||
Aker ASA, Class A (a) | 4,777 | 337,083 |
Aker BP ASA | 62,006 | 1,969,705 |
AutoStore Holdings Ltd. * (a) | 199,060 | 376,205 |
DNB Bank ASA | 180,025 | 3,184,081 |
Equinor ASA | 209,791 | 7,643,467 |
Gjensidige Forsikring ASA | 38,113 | 696,657 |
Kongsberg Gruppen ASA | 17,754 | 636,666 |
Leroy Seafood Group ASA | 56,209 | 258,824 |
Mowi ASA | 91,108 | 1,359,858 |
Norsk Hydro ASA | 273,673 | 1,736,816 |
Orkla ASA | 150,365 | 1,014,236 |
Salmar ASA | 11,327 | 384,004 |
Schibsted ASA, Class A | 14,849 | 229,180 |
Schibsted ASA, Class B | 20,072 | 298,413 |
Storebrand ASA | 94,589 | 735,842 |
Telenor ASA | 129,020 | 1,172,517 |
TOMRA Systems ASA | 46,876 | 757,122 |
Var Energi ASA (a) | 79,968 | 271,811 |
23,062,487 | ||
Poland — 0.2% | ||
Allegro.eu SA * (b) | 84,636 | 410,498 |
Bank Polska Kasa Opieki SA | 35,268 | 578,024 |
Cyfrowy Polsat SA | 48,660 | 182,187 |
Dino Polska SA * (b) | 9,647 | 629,682 |
ING Bank Slaski SA | 6,545 | 228,046 |
KGHM Polska Miedz SA | 27,279 | 545,376 |
LPP SA | 211 | 365,610 |
PGE Polska Grupa Energetyczna SA * | 170,692 | 194,546 |
Polski Koncern Naftowy ORLEN SA | 76,475 | 878,203 |
October 31, 2022 | J.P. Morgan Exchange-Traded Funds | 103 |
AS OF October 31, 2022 (continued)
INVESTMENTS | SHARES | VALUE($) |
Common Stocks — continued | ||
Poland — continued | ||
Polskie Gornictwo Naftowe i Gazownictwo SA * | 324,892 | 345,109 |
Powszechna Kasa Oszczednosci Bank Polski SA | 172,656 | 940,867 |
Powszechny Zaklad Ubezpieczen SA | 114,310 | 640,401 |
Santander Bank Polska SA | 6,772 | 359,579 |
6,298,128 | ||
Portugal — 0.2% | ||
EDP - Energias de Portugal SA | 587,523 | 2,567,074 |
Galp Energia SGPS SA | 91,187 | 925,831 |
Jeronimo Martins SGPS SA | 55,492 | 1,148,298 |
4,641,203 | ||
Russia — 0.0% ^ | ||
Evraz plc ‡ | 96,418 | 4,527 |
Singapore — 1.5% | ||
CapitaLand Ascendas REIT, REIT | 672,800 | 1,244,809 |
CapitaLand Integrated Commercial Trust, REIT | 1,007,737 | 1,337,423 |
Capitaland Investment Ltd. | 491,200 | 1,044,609 |
City Developments Ltd. | 101,300 | 546,171 |
DBS Group Holdings Ltd. | 365,200 | 8,829,191 |
Frasers Property Ltd. | 101,800 | 64,362 |
Genting Singapore Ltd. | 1,136,400 | 646,240 |
Great Eastern Holdings Ltd. | 11,400 | 144,139 |
Jardine Cycle & Carriage Ltd. | 20,200 | 424,274 |
Keppel Corp. Ltd. | 278,600 | 1,371,274 |
Mapletree Pan Asia Commercial Trust, REIT | 460,700 | 517,002 |
Olam Group Ltd. | 215,300 | 203,836 |
Oversea-Chinese Banking Corp. Ltd. | 810,900 | 6,960,839 |
SATS Ltd. * | 132,000 | 254,796 |
Singapore Airlines Ltd. * | 261,850 | 971,282 |
Singapore Exchange Ltd. | 164,200 | 976,437 |
Singapore Technologies Engineering Ltd. | 311,600 | 726,445 |
Singapore Telecommunications Ltd. | 1,421,300 | 2,502,548 |
STMicroelectronics NV | 131,302 | 4,082,698 |
United Overseas Bank Ltd. | 308,200 | 6,046,513 |
UOL Group Ltd. | 92,900 | 405,768 |
Venture Corp. Ltd. | 54,400 | 612,182 |
39,912,838 | ||
South Africa — 0.3% | ||
Anglo American plc | 267,793 | 8,021,530 |
South Korea — 0.0% ^ | ||
Delivery Hero SE * (b) | 36,701 | 1,207,790 |
INVESTMENTS | SHARES | VALUE($) |
Spain — 2.4% | ||
Acciona SA | 4,944 | 890,225 |
ACS Actividades de Construccion y Servicios SA | 46,017 | 1,180,855 |
Aena SME SA * (b) | 14,736 | 1,731,945 |
Amadeus IT Group SA * | 90,196 | 4,704,200 |
Banco Bilbao Vizcaya Argentaria SA | 1,334,948 | 6,886,722 |
Banco Santander SA (a) | 3,362,328 | 8,720,123 |
CaixaBank SA (a) | 871,442 | 2,889,741 |
Cellnex Telecom SA (b) | 114,244 | 3,739,236 |
Corp. ACCIONA Energias Renovables SA | 11,259 | 442,714 |
EDP Renovaveis SA | 42,312 | 890,350 |
Enagas SA | 49,823 | 808,822 |
Endesa SA | 63,656 | 1,063,567 |
Ferrovial SA | 99,876 | 2,440,807 |
Grifols SA * | 58,922 | 501,284 |
Grifols SA (Preference), Class B * | 52,496 | 328,307 |
Iberdrola SA | 1,172,841 | 11,926,948 |
Industria de Diseno Textil SA (a) | 224,624 | 5,098,562 |
Mapfre SA | 195,484 | 335,293 |
Naturgy Energy Group SA | 36,887 | 946,614 |
Red Electrica Corp. SA | 86,749 | 1,403,227 |
Repsol SA | 305,790 | 4,160,114 |
Siemens Gamesa Renewable Energy SA * | 45,052 | 798,712 |
Telefonica SA | 1,129,107 | 3,892,255 |
65,780,623 | ||
Sweden — 3.3% | ||
Alfa Laval AB | 58,828 | 1,448,070 |
Assa Abloy AB, Class B | 198,550 | 4,009,138 |
Atlas Copco AB, Class A | 510,875 | 5,452,699 |
Atlas Copco AB, Class B | 312,492 | 3,022,161 |
Axfood AB | 21,753 | 538,574 |
Beijer Ref AB | 49,612 | 769,106 |
Boliden AB | 54,790 | 1,593,343 |
Castellum AB | 57,455 | 656,946 |
Electrolux AB, Class B (a) | 45,129 | 556,765 |
Embracer Group AB * (a) | 163,894 | 788,454 |
Epiroc AB, Class A | 125,472 | 1,920,783 |
Epiroc AB, Class B | 78,079 | 1,048,381 |
EQT AB | 55,770 | 1,097,551 |
Essity AB, Class A | 5,668 | 119,097 |
Essity AB, Class B | 120,640 | 2,548,925 |
Evolution AB (b) | 38,324 | 3,574,967 |
Fabege AB | 53,642 | 389,441 |
Fastighets AB Balder, Class B * | 126,325 | 474,179 |
104 | J.P. Morgan Exchange-Traded Funds | October 31, 2022 |
INVESTMENTS | SHARES | VALUE($) |
Common Stocks — continued | ||
Sweden — continued | ||
Getinge AB, Class B | 43,845 | 889,746 |
H & M Hennes & Mauritz AB, Class B (a) | 143,294 | 1,443,280 |
Hexagon AB, Class B | 426,052 | 4,211,906 |
Holmen AB, Class B | 18,563 | 673,659 |
Husqvarna AB, Class A | 4,925 | 29,383 |
Husqvarna AB, Class B | 83,348 | 494,850 |
Industrivarden AB, Class A (a) | 36,590 | 828,686 |
Industrivarden AB, Class C | 34,087 | 765,438 |
Indutrade AB | 53,284 | 932,894 |
Intrum AB (a) | 14,910 | 187,601 |
Investment AB Latour, Class B | 27,297 | 461,108 |
Investor AB, Class A | 112,327 | 1,910,094 |
Investor AB, Class B | 364,762 | 5,953,141 |
Kinnevik AB, Class A * | 1,693 | 21,213 |
Kinnevik AB, Class B * | 48,582 | 600,155 |
L E Lundbergforetagen AB, Class B | 12,822 | 506,054 |
Lifco AB, Class B | 42,270 | 610,795 |
Nibe Industrier AB, Class B | 306,977 | 2,448,686 |
Nordnet AB publ | 32,631 | 404,227 |
Orron Energy ab | 38,396 | 79,651 |
Saab AB, Class B | 16,348 | 577,641 |
Sagax AB, Class B | 37,584 | 692,574 |
Sagax AB, Class D | 20,226 | 48,707 |
Samhallsbyggnadsbolaget i Norden AB (a) | 214,216 | 294,308 |
Samhallsbyggnadsbolaget i Norden AB, Class D (a) | 29,746 | 48,909 |
Sandvik AB | 218,487 | 3,414,241 |
Securitas AB, Class B (a) | 100,697 | 822,776 |
Skandinaviska Enskilda Banken AB, Class C | 2,825 | 32,238 |
Skandinaviska Enskilda Banken AB, Class A | 340,775 | 3,592,925 |
Skanska AB, Class B | 80,217 | 1,247,482 |
SKF AB, Class A | 2,909 | 44,473 |
SKF AB, Class B | 75,048 | 1,086,367 |
SSAB AB, Class A | 44,591 | 214,486 |
SSAB AB, Class B | 126,392 | 587,271 |
Storskogen Group AB, Class B (a) | 303,457 | 221,568 |
Svenska Cellulosa AB SCA, Class A | 6,241 | 75,321 |
Svenska Cellulosa AB SCA, Class B | 120,141 | 1,417,399 |
Svenska Handelsbanken AB, Class B (a) | 7,053 | 77,124 |
Svenska Handelsbanken AB, Class A | 307,588 | 2,857,811 |
Swedbank AB, Class A | 183,575 | 2,736,745 |
Swedish Match AB | 305,318 | 3,140,163 |
Tele2 AB, Class B | 109,887 | 900,636 |
Telefonaktiebolaget LM Ericsson, Class A | 11,002 | 65,352 |
Telefonaktiebolaget LM Ericsson, Class B | 615,109 | 3,419,603 |
INVESTMENTS | SHARES | VALUE($) |
Sweden — continued | ||
Telia Co. AB (a) | 491,255 | 1,301,711 |
Trelleborg AB, Class B | 48,610 | 1,070,347 |
Vitrolife AB | 14,912 | 241,006 |
Volvo AB, Class A | 38,425 | 656,362 |
Volvo AB, Class B | 318,024 | 5,205,079 |
Volvo Car AB, Class B * | 107,574 | 456,553 |
90,008,325 | ||
Switzerland — 5.6% | ||
ABB Ltd. (Registered) | 342,211 | 9,503,303 |
Alcon, Inc. | 100,142 | 6,097,185 |
Baloise Holding AG (Registered) | 9,175 | 1,253,508 |
Barry Callebaut AG (Registered) | 711 | 1,345,150 |
Chocoladefabriken Lindt & Spruengli AG | 211 | 2,024,976 |
Chocoladefabriken Lindt & Spruengli AG (Registered) | 20 | 1,943,778 |
Cie Financiere Richemont SA (Registered) | 104,508 | 10,213,939 |
Credit Suisse Group AG (Registered) (a) | 504,692 | 2,090,668 |
EMS-Chemie Holding AG (Registered) | 1,353 | 850,754 |
Geberit AG (Registered) | 7,193 | 3,197,559 |
Givaudan SA (Registered) | 1,588 | 4,743,264 |
Holcim AG * | 113,443 | 5,153,982 |
Julius Baer Group Ltd. | 42,800 | 2,053,496 |
Kuehne + Nagel International AG (Registered) | 11,356 | 2,417,310 |
Lonza Group AG (Registered) | 14,910 | 7,675,432 |
Mediclinic International plc | 81,424 | 463,199 |
Novartis AG (Registered) | 481,234 | 38,927,387 |
Partners Group Holding AG | 4,548 | 4,082,211 |
Schindler Holding AG | 8,152 | 1,329,314 |
Schindler Holding AG (Registered) | 4,166 | 655,812 |
SGS SA (Registered) | 1,218 | 2,685,095 |
Sika AG (Registered) | 30,814 | 6,947,812 |
Sonova Holding AG (Registered) | 10,633 | 2,513,256 |
Straumann Holding AG (Registered) | 23,305 | 2,217,968 |
Swatch Group AG (The) | 5,797 | 1,302,641 |
Swatch Group AG (The) (Registered) | 10,998 | 459,482 |
Swiss Life Holding AG (Registered) | 6,167 | 2,986,199 |
Swisscom AG (Registered) | 5,089 | 2,512,893 |
Temenos AG (Registered) | 13,477 | 802,674 |
UBS Group AG (Registered) | 705,652 | 11,187,522 |
Zurich Insurance Group AG | 30,134 | 12,842,326 |
152,480,095 | ||
United Arab Emirates — 0.0% ^ | ||
NMC Health plc ‡ * | 300 | — |
October 31, 2022 | J.P. Morgan Exchange-Traded Funds | 105 |
AS OF October 31, 2022 (continued)
INVESTMENTS | SHARES | VALUE($) |
Common Stocks — continued | ||
United Kingdom — 12.1% | ||
3i Group plc | 194,854 | 2,595,140 |
abrdn plc | 437,045 | 796,375 |
Admiral Group plc | 54,688 | 1,264,696 |
Ashtead Group plc | 89,956 | 4,686,085 |
Associated British Foods plc | 71,403 | 1,106,696 |
AstraZeneca plc | 310,218 | 36,398,558 |
Auto Trader Group plc (b) | 194,206 | 1,162,475 |
AVEVA Group plc | 24,798 | 887,477 |
Aviva plc | 561,128 | 2,691,522 |
B&M European Value Retail SA | 170,564 | 630,334 |
BAE Systems plc | 645,608 | 6,038,740 |
Barclays plc | 3,189,433 | 5,419,657 |
Barratt Developments plc | 204,928 | 883,874 |
Berkeley Group Holdings plc | 22,514 | 895,773 |
BP plc | 4,176,514 | 23,107,016 |
British American Tobacco plc | 447,556 | 17,675,541 |
British Land Co. plc (The), REIT | 187,979 | 788,552 |
BT Group plc | 1,396,963 | 2,081,799 |
Bunzl plc | 67,617 | 2,203,336 |
Burberry Group plc | 81,144 | 1,690,806 |
Centrica plc | 1,183,361 | 1,039,833 |
CK Hutchison Holdings Ltd. | 540,500 | 2,690,519 |
CNH Industrial NV | 199,405 | 2,579,719 |
Coca-Cola Europacific Partners plc | 40,294 | 1,895,833 |
Compass Group plc | 357,451 | 7,528,571 |
ConvaTec Group plc (b) | 322,933 | 808,052 |
Croda International plc | 28,534 | 2,210,518 |
Darktrace plc * | 67,039 | 274,404 |
DCC plc | 20,309 | 1,127,168 |
Dechra Pharmaceuticals plc | 22,775 | 684,668 |
Derwent London plc, REIT | 22,499 | 556,835 |
Diageo plc | 466,755 | 19,208,143 |
Direct Line Insurance Group plc | 262,540 | 606,582 |
DS Smith plc | 275,755 | 919,622 |
easyJet plc * | 113,301 | 451,129 |
Entain plc | 117,902 | 1,705,639 |
Experian plc | 194,107 | 6,189,155 |
Halma plc | 76,086 | 1,845,033 |
Harbour Energy plc | 108,808 | 472,209 |
Hargreaves Lansdown plc | 70,272 | 614,150 |
Hiscox Ltd. | 70,912 | 730,515 |
Howden Joinery Group plc | 116,246 | 684,759 |
HSBC Holdings plc | 3,997,699 | 20,516,405 |
Imperial Brands plc | 192,118 | 4,679,821 |
INVESTMENTS | SHARES | VALUE($) |
United Kingdom — continued | ||
Informa plc | 301,245 | 1,919,510 |
InterContinental Hotels Group plc | 37,581 | 2,019,255 |
Intermediate Capital Group plc | 58,938 | 717,675 |
International Distributions Services plc | 158,458 | 366,574 |
Intertek Group plc | 32,349 | 1,355,196 |
ITV plc | 725,320 | 558,466 |
J Sainsbury plc | 352,036 | 784,721 |
JD Sports Fashion plc | 495,690 | 553,900 |
Johnson Matthey plc | 39,875 | 885,130 |
Kingfisher plc | 404,180 | 1,015,476 |
Land Securities Group plc, REIT | 150,575 | 984,593 |
Legal & General Group plc | 1,195,762 | 3,198,977 |
Lloyds Banking Group plc | 14,222,203 | 6,830,468 |
London Stock Exchange Group plc | 68,913 | 5,973,520 |
M&G plc | 521,066 | 1,047,149 |
Melrose Industries plc | 811,718 | 1,088,826 |
National Grid plc | 776,048 | 8,455,142 |
NatWest Group plc | 1,012,820 | 2,727,833 |
Next plc | 25,874 | 1,461,355 |
Ocado Group plc * | 145,327 | 787,861 |
Pearson plc | 151,627 | 1,675,952 |
Pepco Group NV * (b) | 24,178 | 169,872 |
Persimmon plc | 63,991 | 957,553 |
Phoenix Group Holdings plc | 170,276 | 1,059,794 |
Reckitt Benckiser Group plc | 147,463 | 9,786,237 |
RELX plc | 396,891 | 10,660,689 |
Rentokil Initial plc | 502,323 | 3,134,551 |
Rightmove plc | 175,474 | 988,128 |
Rolls-Royce Holdings plc * | 1,677,009 | 1,504,048 |
Sage Group plc (The) | 220,614 | 1,838,761 |
Schroders plc | 202,235 | 908,037 |
Segro plc, REIT | 242,068 | 2,178,613 |
Severn Trent plc | 50,777 | 1,457,287 |
Smith & Nephew plc | 177,159 | 2,093,473 |
Smiths Group plc | 75,388 | 1,350,391 |
Spirax-Sarco Engineering plc | 14,757 | 1,818,558 |
SSE plc | 209,871 | 3,750,581 |
St. James's Place plc | 108,921 | 1,330,095 |
Standard Chartered plc | 496,633 | 2,967,254 |
Tate & Lyle plc | 80,398 | 646,013 |
Taylor Wimpey plc | 731,231 | 786,168 |
Tesco plc | 1,499,398 | 3,703,340 |
Travis Perkins plc | 42,541 | 400,949 |
Unilever plc | 526,386 | 23,926,538 |
106 | J.P. Morgan Exchange-Traded Funds | October 31, 2022 |
INVESTMENTS | SHARES | VALUE($) |
Common Stocks — continued | ||
United Kingdom — continued | ||
United Utilities Group plc | 136,660 | 1,472,676 |
Vodafone Group plc | 5,365,430 | 6,263,617 |
Weir Group plc (The) | 52,035 | 906,649 |
Whitbread plc | 40,367 | 1,188,086 |
Wise plc, Class A * | 94,354 | 718,675 |
WPP plc | 243,186 | 2,140,073 |
327,538,019 | ||
United States — 6.5% | ||
Carnival plc * | 31,425 | 249,682 |
Computershare Ltd. | 114,942 | 1,860,686 |
CSL Ltd. | 96,437 | 17,263,714 |
Ferguson plc | 46,477 | 5,068,722 |
GSK plc | 802,295 | 13,142,474 |
James Hardie Industries plc, CHDI | 89,167 | 1,946,782 |
Nestle SA (Registered) | 550,563 | 59,933,629 |
QIAGEN NV * | 46,206 | 1,995,322 |
Roche Holding AG | 140,654 | 46,668,742 |
Roche Holding AG | 5,350 | 2,171,513 |
Schneider Electric SE | 114,332 | 14,458,015 |
Sinch AB * (a) (b) | 132,474 | 311,044 |
Stellantis NV | 433,047 | 5,842,488 |
Swiss Re AG | 57,844 | 4,296,929 |
Tenaris SA | 92,266 | 1,444,070 |
176,653,812 | ||
Total Common Stocks (Cost $2,967,992,598) | 2,684,196,896 | |
Short-Term Investments — 1.1% | ||
Investment Companies — 0.4% | ||
JPMorgan U.S. Government Money Market Fund Class IM Shares, 2.85% (c) (d)(Cost $12,102,999) | 12,102,999 | 12,102,999 |
Investment of Cash Collateral from Securities Loaned — 0.7% | ||
JPMorgan Securities Lending Money Market Fund Agency SL Class Shares, 3.23% (c) (d) | 14,009,724 | 14,009,724 |
JPMorgan U.S. Government Money Market Fund Class IM Shares, 2.85% (c) (d) | 3,852,619 | 3,852,619 |
Total Investment of Cash Collateral from Securities Loaned (Cost $17,862,441) | 17,862,343 | |
Total Short-Term Investments (Cost $29,965,440) | 29,965,342 | |
INVESTMENTS | SHARES | VALUE($) |
Total Investments — 100.1% (Cost $2,997,958,038) | 2,714,162,238 | |
Liabilities in Excess of Other Assets — (0.1)% | (4,064,720) | |
NET ASSETS — 100.0% | 2,710,097,518 |
Percentages indicated are based on net assets. |
Abbreviations | |
APAC | Asia Pacific |
CHDI | Clearing House Electronic Subregister System (CHESS) Depository Interest |
CVA | Dutch Certification |
OYJ | Public Limited Company |
Preference | A special type of equity investment that shares in the earnings of the company, has limited voting rights, and may have a dividend preference. Preference shares may also have liquidation preference. |
REIT | Real Estate Investment Trust |
SCA | Limited partnership with share capital |
SGPS | Holding company |
^ | Amount rounds to less than 0.1% of net assets. | |
‡ | Value determined using significant unobservable inputs. | |
* | Non-income producing security. | |
(a) | The security or a portion of this security is on loan at October 31, 2022. The total value of securities on loan at October 31, 2022 is $16,847,367. | |
(b) | Security exempt from registration pursuant to Regulation S under the Securities Act of 1933, as amended. Regulation S applies to securities offerings that are made outside of the United States and do not involve direct selling efforts in the United States and as such may have restrictions on resale. | |
(c) | Investment in an affiliated fund, which is registered under the Investment Company Act of 1940, as amended, and is advised by J.P. Morgan Investment Management Inc. | |
(d) | The rate shown is the current yield as of October 31, 2022. | |
October 31, 2022 | J.P. Morgan Exchange-Traded Funds | 107 |
AS OF October 31, 2022 (continued)
INDUSTRY | PERCENT OF TOTAL INVESTMENTS |
Pharmaceuticals | 9.6% |
Banks | 9.2 |
Oil, Gas & Consumable Fuels | 5.2 |
Insurance | 5.0 |
Food Products | 3.4 |
Metals & Mining | 3.3 |
Automobiles | 3.2 |
Chemicals | 3.1 |
Machinery | 2.9 |
Textiles, Apparel & Luxury Goods | 2.6 |
Semiconductors & Semiconductor Equipment | 2.5 |
Capital Markets | 2.5 |
Health Care Equipment & Supplies | 2.1 |
Beverages | 2.1 |
Diversified Telecommunication Services | 1.9 |
Personal Products | 1.8 |
Trading Companies & Distributors | 1.8 |
Electric Utilities | 1.8 |
Electrical Equipment | 1.7 |
Professional Services | 1.6 |
IT Services | 1.6 |
Electronic Equipment, Instruments & Components | 1.5 |
Industrial Conglomerates | 1.5 |
Food & Staples Retailing | 1.4 |
Aerospace & Defense | 1.4 |
Real Estate Management & Development | 1.4 |
Hotels, Restaurants & Leisure | 1.3 |
Software | 1.3 |
Equity Real Estate Investment Trusts (REITs) | 1.3 |
Wireless Telecommunication Services | 1.2 |
Household Durables | 1.1 |
Tobacco | 1.1 |
Building Products | 1.0 |
Biotechnology | 1.0 |
Others (each less than 1.0%) | 13.5 |
Short-Term Investments | 1.1 |
108 | J.P. Morgan Exchange-Traded Funds | October 31, 2022 |
DESCRIPTION | NUMBER OF CONTRACTS | EXPIRATION DATE | TRADING CURRENCY | NOTIONAL AMOUNT ($) | VALUE AND UNREALIZED APPRECIATION (DEPRECIATION) ($) |
Long Contracts | |||||
MSCI EAFE E-Mini Index | 300 | 12/16/2022 | USD | 26,343,000 | (562,111) |
Abbreviations | |
EAFE | Europe, Australasia and Far East |
MSCI | Morgan Stanley Capital International |
USD | United States Dollar |
October 31, 2022 | J.P. Morgan Exchange-Traded Funds | 109 |
AS OF October 31, 2022
INVESTMENTS | SHARES | VALUE($) |
Common Stocks — 98.9% | ||
Air Freight & Logistics — 0.5% | ||
NIPPON EXPRESS HOLDINGS, Inc. | 162,600 | 8,170,312 |
SG Holdings Co. Ltd. | 929,900 | 12,322,198 |
Yamato Holdings Co. Ltd. | 639,100 | 9,464,615 |
29,957,125 | ||
Airlines — 0.2% | ||
ANA Holdings, Inc. * | 305,400 | 5,936,585 |
Japan Airlines Co. Ltd. * | 275,700 | 5,149,561 |
11,086,146 | ||
Auto Components — 2.2% | ||
Aisin Corp. | 349,400 | 8,969,011 |
Bridgestone Corp. | 1,173,300 | 42,434,099 |
Denso Corp. | 963,900 | 47,824,792 |
Koito Manufacturing Co. Ltd. | 491,700 | 6,980,589 |
NGK Spark Plug Co. Ltd. | 327,500 | 5,974,927 |
Stanley Electric Co. Ltd. | 287,800 | 4,892,744 |
Sumitomo Electric Industries Ltd. | 1,517,200 | 15,855,233 |
Toyota Boshoku Corp. | 193,900 | 2,467,297 |
135,398,692 | ||
Automobiles — 8.2% | ||
Honda Motor Co. Ltd. | 3,254,700 | 74,215,218 |
Isuzu Motors Ltd. | 1,188,800 | 13,979,883 |
Mazda Motor Corp. | 1,146,900 | 7,722,035 |
Mitsubishi Motors Corp. * | 1,310,500 | 4,414,731 |
Nissan Motor Co. Ltd. | 4,517,800 | 14,399,604 |
Subaru Corp. | 1,176,300 | 18,386,550 |
Suzuki Motor Corp. | 939,000 | 31,747,419 |
Toyota Motor Corp. | 24,010,600 | 333,137,751 |
Yamaha Motor Co. Ltd. | 669,400 | 13,818,137 |
511,821,328 | ||
Banks — 5.0% | ||
Bank of Kyoto Ltd. (The) | 145,000 | 5,225,196 |
Chiba Bank Ltd. (The) | 1,403,000 | 7,687,210 |
Concordia Financial Group Ltd. | 2,311,900 | 7,054,118 |
Fukuoka Financial Group, Inc. | 365,400 | 6,217,503 |
Mitsubishi UFJ Financial Group, Inc. | 24,116,900 | 113,924,638 |
Mizuho Financial Group, Inc. | 4,853,200 | 52,489,639 |
Resona Holdings, Inc. | 4,589,300 | 17,296,860 |
Shinsei Bank Ltd. | 113,500 | 1,688,956 |
Shizuoka Financial Group, Inc. | 1,080,200 | 6,821,273 |
Sumitomo Mitsui Financial Group, Inc. | 2,627,300 | 73,778,699 |
Sumitomo Mitsui Trust Holdings, Inc. | 717,600 | 20,644,654 |
312,828,746 | ||
INVESTMENTS | SHARES | VALUE($) |
Beverages — 0.9% | ||
Asahi Group Holdings Ltd. | 969,000 | 27,113,341 |
Kirin Holdings Co. Ltd. | 1,589,500 | 23,365,551 |
Suntory Beverage & Food Ltd. | 242,000 | 8,096,523 |
58,575,415 | ||
Building Products — 1.8% | ||
AGC, Inc. | 434,800 | 13,624,441 |
Daikin Industries Ltd. | 559,900 | 83,865,843 |
Lixil Corp. | 556,600 | 8,407,598 |
TOTO Ltd. | 304,400 | 8,682,298 |
114,580,180 | ||
Capital Markets — 0.8% | ||
Daiwa Securities Group, Inc. | 2,849,400 | 11,117,426 |
Japan Exchange Group, Inc. | 1,010,600 | 13,281,091 |
Nomura Holdings, Inc. | 5,747,600 | 18,599,001 |
SBI Holdings, Inc. | 520,300 | 9,398,731 |
52,396,249 | ||
Chemicals — 3.7% | ||
Air Water, Inc. | 439,200 | 4,903,590 |
Asahi Kasei Corp. | 2,664,400 | 17,083,908 |
JSR Corp. | 410,200 | 7,794,224 |
Kansai Paint Co. Ltd. | 495,300 | 6,463,264 |
Mitsubishi Chemical Group Corp. | 2,735,200 | 12,355,861 |
Mitsubishi Gas Chemical Co., Inc. | 390,600 | 4,963,440 |
Mitsui Chemicals, Inc. | 367,900 | 6,809,439 |
Nippon Paint Holdings Co. Ltd. (a) | 2,038,600 | 12,992,050 |
Nippon Sanso Holdings Corp. | 405,300 | 6,452,957 |
Nissan Chemical Corp. | 271,700 | 12,230,687 |
Nitto Denko Corp. | 286,300 | 15,083,930 |
Shin-Etsu Chemical Co. Ltd. | 796,600 | 82,790,603 |
Showa Denko KK | 353,600 | 5,162,052 |
Sumitomo Chemical Co. Ltd. | 3,164,500 | 10,655,694 |
Toray Industries, Inc. | 3,118,400 | 15,147,156 |
Tosoh Corp. | 621,100 | 6,757,249 |
227,646,104 | ||
Commercial Services & Supplies — 0.7% | ||
Dai Nippon Printing Co. Ltd. | 515,400 | 10,323,837 |
Secom Co. Ltd. | 409,900 | 23,352,208 |
TOPPAN, Inc. | 668,400 | 9,968,635 |
43,644,680 | ||
Construction & Engineering — 0.6% | ||
Kajima Corp. | 909,200 | 8,558,471 |
Obayashi Corp. | 1,378,700 | 8,849,418 |
110 | J.P. Morgan Exchange-Traded Funds | October 31, 2022 |
INVESTMENTS | SHARES | VALUE($) |
Common Stocks — continued | ||
Construction & Engineering — continued | ||
Shimizu Corp. | 1,295,800 | 6,466,031 |
Taisei Corp. | 383,700 | 10,452,227 |
34,326,147 | ||
Consumer Finance — 0.1% | ||
Acom Co. Ltd. | 898,200 | 1,962,257 |
Marui Group Co. Ltd. | 398,600 | 6,521,249 |
8,483,506 | ||
Diversified Financial Services — 0.7% | ||
Mitsubishi HC Capital, Inc. | 1,513,800 | 6,495,805 |
ORIX Corp. | 2,284,900 | 33,559,931 |
Tokyo Century Corp. | 89,200 | 3,042,379 |
43,098,115 | ||
Diversified Telecommunication Services — 1.0% | ||
Nippon Telegraph & Telephone Corp. | 2,284,700 | 63,013,643 |
Electric Utilities — 0.5% | ||
Chubu Electric Power Co., Inc. | 1,448,500 | 11,790,683 |
Kansai Electric Power Co., Inc. (The) | 1,578,800 | 11,959,827 |
Kyushu Electric Power Co., Inc. | 906,200 | 4,486,665 |
Tokyo Electric Power Co. Holdings, Inc. * | 1,536,000 | 5,003,620 |
33,240,795 | ||
Electrical Equipment — 1.7% | ||
Fuji Electric Co. Ltd. | 285,500 | 11,038,851 |
Mitsubishi Electric Corp. | 4,103,900 | 36,108,630 |
Nidec Corp. | 1,014,600 | 55,786,784 |
102,934,265 | ||
Electronic Equipment, Instruments & Components — 5.3% | ||
Hamamatsu Photonics KK | 280,900 | 12,708,281 |
Hirose Electric Co. Ltd. | 59,900 | 7,770,314 |
Ibiden Co. Ltd. | 269,500 | 9,084,137 |
Keyence Corp. | 381,100 | 143,699,588 |
Kyocera Corp. | 664,100 | 32,160,009 |
Murata Manufacturing Co. Ltd. | 1,226,800 | 58,076,032 |
Omron Corp. | 394,000 | 18,375,509 |
Shimadzu Corp. | 526,200 | 13,861,624 |
TDK Corp. | 743,100 | 23,213,226 |
Yokogawa Electric Corp. | 456,900 | 7,639,879 |
326,588,599 | ||
Entertainment — 2.3% | ||
Capcom Co. Ltd. | 305,600 | 8,500,255 |
Koei Tecmo Holdings Co. Ltd. | 231,300 | 3,490,070 |
Konami Group Corp. | 192,300 | 8,428,766 |
INVESTMENTS | SHARES | VALUE($) |
Entertainment — continued | ||
Nexon Co. Ltd. (a) | 896,400 | 15,000,563 |
Nintendo Co. Ltd. | 2,234,000 | 90,698,382 |
Square Enix Holdings Co. Ltd. | 170,800 | 7,621,443 |
Toho Co. Ltd. | 242,200 | 8,612,264 |
142,351,743 | ||
Equity Real Estate Investment Trusts (REITs) — 1.6% | ||
Advance Residence Investment Corp. | 2,650 | 6,169,635 |
Daiwa House REIT Investment Corp. | 4,076 | 8,226,578 |
GLP J-REIT | 8,578 | 8,896,092 |
Japan Metropolitan Fund Invest | 13,359 | 9,841,968 |
Japan Prime Realty Investment Corp. | 1,909 | 5,184,547 |
Japan Real Estate Investment Corp. | 2,650 | 11,104,267 |
Nippon Building Fund, Inc. | 3,249 | 14,442,601 |
Nippon Prologis REIT, Inc. | 5,104 | 10,709,691 |
Nomura Real Estate Master Fund, Inc. | 9,011 | 10,280,037 |
Orix JREIT, Inc. | 5,275 | 7,077,027 |
United Urban Investment Corp. | 5,959 | 6,304,790 |
98,237,233 | ||
Food & Staples Retailing — 1.9% | ||
Aeon Co. Ltd. | 1,666,300 | 31,077,488 |
Cosmos Pharmaceutical Corp. | 41,600 | 4,023,333 |
Kobe Bussan Co. Ltd. (a) | 272,200 | 5,904,185 |
Lawson, Inc. | 95,700 | 3,057,330 |
MatsukiyoCocokara & Co. | 273,500 | 9,957,766 |
Seven & i Holdings Co. Ltd. | 1,524,500 | 56,907,107 |
Welcia Holdings Co. Ltd. | 196,500 | 4,107,124 |
115,034,333 | ||
Food Products — 1.7% | ||
Ajinomoto Co., Inc. | 1,026,500 | 28,232,059 |
Kikkoman Corp. | 370,600 | 20,082,847 |
MEIJI Holdings Co. Ltd. | 269,700 | 11,097,917 |
NH Foods Ltd. | 197,000 | 4,694,805 |
Nisshin Seifun Group, Inc. | 500,500 | 5,408,214 |
Nissin Foods Holdings Co. Ltd. | 157,300 | 10,181,858 |
Toyo Suisan Kaisha Ltd. | 195,200 | 7,323,357 |
Yakult Honsha Co. Ltd. | 304,000 | 16,841,279 |
103,862,336 | ||
Gas Utilities — 0.4% | ||
Osaka Gas Co. Ltd. | 796,600 | 11,795,812 |
Tokyo Gas Co. Ltd. | 783,500 | 14,002,317 |
25,798,129 | ||
October 31, 2022 | J.P. Morgan Exchange-Traded Funds | 111 |
AS OF October 31, 2022 (continued)
INVESTMENTS | SHARES | VALUE($) |
Common Stocks — continued | ||
Health Care Equipment & Supplies — 3.0% | ||
Asahi Intecc Co. Ltd. (a) | 451,600 | 7,693,074 |
Hoya Corp. | 698,800 | 64,961,419 |
Olympus Corp. | 2,457,700 | 51,819,349 |
Sysmex Corp. | 324,300 | 17,455,084 |
Terumo Corp. | 1,451,300 | 44,045,510 |
185,974,436 | ||
Health Care Providers & Services — 0.2% | ||
Alfresa Holdings Corp. | 387,500 | 4,461,240 |
Medipal Holdings Corp. | 401,700 | 4,980,297 |
9,441,537 | ||
Health Care Technology — 0.4% | ||
M3, Inc. | 817,500 | 24,361,646 |
Hotels, Restaurants & Leisure — 1.1% | ||
McDonald's Holdings Co. Japan Ltd. | 165,000 | 5,728,348 |
Oriental Land Co. Ltd. | 444,900 | 59,584,428 |
65,312,776 | ||
Household Durables — 4.1% | ||
Haseko Corp. | 431,300 | 4,441,624 |
Iida Group Holdings Co. Ltd. | 335,900 | 4,664,095 |
Nikon Corp. | 665,300 | 6,434,205 |
Open House Group Co. Ltd. | 142,500 | 5,068,642 |
Panasonic Holdings Corp. | 4,456,100 | 31,739,085 |
Rinnai Corp. | 76,500 | 5,206,996 |
Sekisui Chemical Co. Ltd. | 832,600 | 10,397,538 |
Sekisui House Ltd. | 1,308,900 | 21,731,405 |
Sharp Corp. | 435,200 | 2,610,367 |
Sony Group Corp. | 2,410,100 | 162,524,276 |
254,818,233 | ||
Household Products — 0.5% | ||
Lion Corp. | 558,800 | 5,647,622 |
Unicharm Corp. | 842,300 | 25,598,703 |
31,246,325 | ||
Industrial Conglomerates — 1.8% | ||
Hitachi Ltd. | 1,851,300 | 84,000,567 |
Toshiba Corp. | 827,800 | 28,725,934 |
112,726,501 | ||
Insurance — 3.2% | ||
Dai-ichi Life Holdings, Inc. | 1,970,900 | 31,303,315 |
Japan Post Holdings Co. Ltd. | 4,614,200 | 31,028,549 |
Japan Post Insurance Co. Ltd. | 381,900 | 5,653,326 |
MS&AD Insurance Group Holdings, Inc. | 874,000 | 23,144,572 |
INVESTMENTS | SHARES | VALUE($) |
Insurance — continued | ||
Sompo Holdings, Inc. | 664,600 | 27,708,702 |
T&D Holdings, Inc. | 1,125,700 | 11,133,410 |
Tokio Marine Holdings, Inc. | 3,898,700 | 70,586,633 |
200,558,507 | ||
Interactive Media & Services — 0.3% | ||
Kakaku.com, Inc. | 243,100 | 4,111,549 |
Z Holdings Corp. | 5,081,400 | 13,113,873 |
17,225,422 | ||
Internet & Direct Marketing Retail — 0.2% | ||
Rakuten Group, Inc. | 1,748,100 | 7,804,161 |
ZOZO, Inc. | 214,500 | 4,551,305 |
12,355,466 | ||
IT Services — 2.4% | ||
Fujitsu Ltd. | 348,400 | 40,086,393 |
GMO Payment Gateway, Inc. | 84,800 | 6,097,615 |
Itochu Techno-Solutions Corp. | 178,600 | 4,140,617 |
NEC Corp. | 521,500 | 17,262,129 |
Nomura Research Institute Ltd. | 852,700 | 18,870,427 |
NTT Data Corp. | 1,233,400 | 17,864,391 |
Obic Co. Ltd. | 125,900 | 18,892,921 |
Otsuka Corp. | 225,100 | 7,088,885 |
SCSK Corp. | 292,900 | 4,321,292 |
TIS, Inc. | 436,900 | 11,779,582 |
146,404,252 | ||
Leisure Products — 1.1% | ||
Bandai Namco Holdings, Inc. | 424,500 | 28,060,690 |
Sega Sammy Holdings, Inc. | 308,800 | 3,949,957 |
Shimano, Inc. | 160,200 | 24,789,874 |
Yamaha Corp. | 329,100 | 12,424,936 |
69,225,457 | ||
Machinery — 4.8% | ||
Daifuku Co. Ltd. | 241,800 | 11,068,384 |
FANUC Corp. | 366,700 | 47,983,293 |
Hino Motors Ltd. | 548,800 | 2,280,691 |
Hitachi Construction Machinery Co. Ltd. | 197,500 | 3,863,896 |
Hoshizaki Corp. | 227,000 | 6,503,549 |
Kawasaki Heavy Industries Ltd. | 320,700 | 5,454,275 |
Komatsu Ltd. | 1,860,000 | 36,437,762 |
Kubota Corp. | 2,179,200 | 30,398,950 |
Kurita Water Industries Ltd. | 204,500 | 7,485,723 |
Makita Corp. | 535,100 | 9,778,154 |
MINEBEA MITSUMI, Inc. | 775,200 | 11,456,248 |
112 | J.P. Morgan Exchange-Traded Funds | October 31, 2022 |
INVESTMENTS | SHARES | VALUE($) |
Common Stocks — continued | ||
Machinery — continued | ||
MISUMI Group, Inc. | 543,600 | 11,578,385 |
Mitsubishi Heavy Industries Ltd. | 645,000 | 22,216,434 |
NGK Insulators Ltd. | 515,600 | 6,015,023 |
NSK Ltd. | 938,000 | 4,957,547 |
SMC Corp. | 117,500 | 47,164,767 |
Toyota Industries Corp. | 392,200 | 20,204,264 |
Yaskawa Electric Corp. | 509,800 | 14,116,001 |
298,963,346 | ||
Marine — 0.5% | ||
Mitsui OSK Lines Ltd. (a) | 691,600 | 13,690,359 |
Nippon Yusen KK | 974,900 | 17,659,799 |
31,350,158 | ||
Media — 0.4% | ||
CyberAgent, Inc. | 792,800 | 6,512,998 |
Dentsu Group, Inc. | 457,400 | 14,226,680 |
Hakuhodo DY Holdings, Inc. | 580,900 | 4,894,516 |
25,634,194 | ||
Metals & Mining — 0.9% | ||
Hitachi Metals Ltd. * | 385,200 | 5,625,544 |
JFE Holdings, Inc. | 1,104,000 | 10,113,881 |
Nippon Steel Corp. | 1,816,100 | 24,914,212 |
Sumitomo Metal Mining Co. Ltd. | 522,500 | 14,646,120 |
55,299,757 | ||
Multiline Retail — 0.3% | ||
Pan Pacific International Holdings Corp. | 1,018,700 | 16,717,604 |
Oil, Gas & Consumable Fuels — 0.8% | ||
ENEOS Holdings, Inc. | 6,174,100 | 20,366,234 |
Idemitsu Kosan Co. Ltd. | 432,852 | 9,470,906 |
Inpex Corp. | 2,014,200 | 20,328,107 |
50,165,247 | ||
Paper & Forest Products — 0.1% | ||
Oji Holdings Corp. | 1,938,800 | 6,721,287 |
Personal Products — 1.2% | ||
Kao Corp. | 907,700 | 33,904,360 |
Kobayashi Pharmaceutical Co. Ltd. (a) | 111,000 | 5,890,413 |
Kose Corp. | 68,400 | 6,827,721 |
Shiseido Co. Ltd. (a) | 764,300 | 26,396,792 |
73,019,286 | ||
Pharmaceuticals — 6.8% | ||
Astellas Pharma, Inc. | 3,508,800 | 48,415,074 |
Chugai Pharmaceutical Co. Ltd. | 1,219,200 | 28,251,136 |
INVESTMENTS | SHARES | VALUE($) |
Pharmaceuticals — continued | ||
Daiichi Sankyo Co. Ltd. | 3,721,400 | 119,124,867 |
Eisai Co. Ltd. | 567,100 | 34,197,940 |
Kyowa Kirin Co. Ltd. | 484,700 | 11,415,510 |
Nippon Shinyaku Co. Ltd. | 117,100 | 6,483,389 |
Ono Pharmaceutical Co. Ltd. | 909,700 | 21,408,479 |
Otsuka Holdings Co. Ltd. | 1,066,000 | 34,170,112 |
Santen Pharmaceutical Co. Ltd. | 765,700 | 5,239,685 |
Shionogi & Co. Ltd. | 541,700 | 25,155,059 |
Sumitomo Pharma Co. Ltd. | 364,500 | 2,539,075 |
Taisho Pharmaceutical Holdings Co. Ltd. | 108,700 | 3,920,597 |
Takeda Pharmaceutical Co. Ltd. | 3,024,500 | 79,874,024 |
420,194,947 | ||
Professional Services — 1.8% | ||
Nihon M&A Center Holdings, Inc. | 572,700 | 6,462,235 |
Persol Holdings Co. Ltd. | 362,000 | 7,248,089 |
Recruit Holdings Co. Ltd. | 3,241,100 | 99,732,436 |
113,442,760 | ||
Real Estate Management & Development — 2.3% | ||
Daito Trust Construction Co. Ltd. | 131,900 | 13,061,239 |
Daiwa House Industry Co. Ltd. | 1,273,300 | 25,653,603 |
Hulic Co. Ltd. | 1,144,600 | 8,314,769 |
Mitsubishi Estate Co. Ltd. | 2,526,600 | 31,772,750 |
Mitsui Fudosan Co. Ltd. | 1,822,800 | 34,903,655 |
Nomura Real Estate Holdings, Inc. | 220,100 | 4,975,098 |
Sumitomo Realty & Development Co. Ltd. | 909,800 | 20,865,270 |
Tokyu Fudosan Holdings Corp. | 1,155,300 | 5,861,501 |
145,407,885 | ||
Road & Rail — 3.1% | ||
Central Japan Railway Co. | 393,500 | 45,558,073 |
East Japan Railway Co. | 722,600 | 38,504,020 |
Hankyu Hanshin Holdings, Inc. | 461,600 | 13,709,871 |
Keio Corp. | 233,300 | 8,179,625 |
Keisei Electric Railway Co. Ltd. | 329,200 | 8,737,660 |
Kintetsu Group Holdings Co. Ltd. (a) | 364,500 | 12,318,244 |
Kyushu Railway Co. | 300,600 | 6,286,660 |
Nagoya Railroad Co. Ltd. | 375,900 | 5,758,423 |
Odakyu Electric Railway Co. Ltd. (a) | 669,100 | 7,954,227 |
Seibu Holdings, Inc. | 519,300 | 4,648,374 |
Tobu Railway Co. Ltd. | 400,800 | 9,271,502 |
Tokyu Corp. | 1,194,300 | 13,770,888 |
West Japan Railway Co. | 466,200 | 18,483,230 |
193,180,797 | ||
October 31, 2022 | J.P. Morgan Exchange-Traded Funds | 113 |
AS OF October 31, 2022 (continued)
INVESTMENTS | SHARES | VALUE($) |
Common Stocks — continued | ||
Semiconductors & Semiconductor Equipment — 2.8% | ||
Advantest Corp. | 362,400 | 19,077,314 |
Disco Corp. | 56,700 | 13,561,544 |
Lasertec Corp. | 147,800 | 20,767,516 |
Renesas Electronics Corp. * | 2,687,400 | 22,482,123 |
Rohm Co. Ltd. | 167,200 | 11,748,244 |
SUMCO Corp. | 669,300 | 8,483,263 |
Tokyo Electron Ltd. | 300,500 | 79,060,534 |
175,180,538 | ||
Software — 0.3% | ||
Oracle Corp. | 63,800 | 3,398,724 |
Trend Micro, Inc. | 269,400 | 13,584,100 |
16,982,824 | ||
Specialty Retail — 1.5% | ||
ABC-Mart, Inc. | 60,100 | 2,678,818 |
Fast Retailing Co. Ltd. | 119,900 | 66,801,231 |
Hikari Tsushin, Inc. | 39,100 | 4,723,064 |
Nitori Holdings Co. Ltd. | 166,100 | 15,051,497 |
USS Co. Ltd. | 412,200 | 6,219,579 |
95,474,189 | ||
Technology Hardware, Storage & Peripherals — 1.7% | ||
Brother Industries Ltd. | 501,400 | 8,541,809 |
Canon, Inc. | 1,988,600 | 42,153,322 |
FUJIFILM Holdings Corp. | 767,000 | 35,090,168 |
Ricoh Co. Ltd. | 1,218,100 | 8,925,984 |
Seiko Epson Corp. | 610,900 | 8,293,680 |
103,004,963 | ||
Textiles, Apparel & Luxury Goods — 0.1% | ||
Asics Corp. | 363,000 | 5,562,518 |
Tobacco — 0.6% | ||
Japan Tobacco, Inc. | 2,102,300 | 35,208,136 |
Trading Companies & Distributors — 4.9% | ||
ITOCHU Corp. | 2,817,300 | 72,811,861 |
Marubeni Corp. | 3,282,800 | 28,737,363 |
Mitsubishi Corp. | 2,839,600 | 76,921,595 |
Mitsui & Co. Ltd. | 3,138,900 | 69,461,309 |
MonotaRO Co. Ltd. (a) | 469,300 | 7,123,910 |
INVESTMENTS | SHARES | VALUE($) |
Trading Companies & Distributors — continued | ||
Sojitz Corp. | 396,800 | 5,849,614 |
Sumitomo Corp. | 2,391,700 | 30,407,518 |
Toyota Tsusho Corp. | 453,300 | 15,215,418 |
306,528,588 | ||
Transportation Infrastructure — 0.1% | ||
Japan Airport Terminal Co. Ltd. * | 177,800 | 7,610,006 |
Wireless Telecommunication Services — 3.8% | ||
KDDI Corp. | 2,994,600 | 88,511,311 |
SoftBank Corp. | 5,306,700 | 52,347,350 |
SoftBank Group Corp. | 2,271,900 | 97,524,083 |
238,382,744 | ||
Total Common Stocks (Cost $7,775,017,695) | 6,138,585,841 | |
Short-Term Investments — 0.3% | ||
Investment of Cash Collateral from Securities Loaned — 0.3% | ||
JPMorgan Securities Lending Money Market Fund Agency SL Class Shares, 3.23% (b) (c) | 10,118,832 | 10,118,832 |
JPMorgan U.S. Government Money Market Fund Class IM Shares, 2.85% (b) (c) | 9,777,050 | 9,777,050 |
Total Investment of Cash Collateral from Securities Loaned (Cost $19,895,882) | 19,895,882 | |
Total Investments — 99.2% (Cost $7,794,913,577) | 6,158,481,723 | |
Other Assets Less Liabilities — 0.8% | 52,755,840 | |
NET ASSETS — 100.0% | 6,211,237,563 | |
Percentages indicated are based on net assets. |
* | Non-income producing security. |
(a) | The security or a portion of this security is on loan at October 31, 2022. The total value of securities on loan at October 31, 2022 is $18,722,079. |
(b) | Investment in an affiliated fund, which is registered under the Investment Company Act of 1940, as amended, and is advised by J.P. Morgan Investment Management Inc. |
(c) | The rate shown is the current yield as of October 31, 2022. |
114 | J.P. Morgan Exchange-Traded Funds | October 31, 2022 |
DESCRIPTION | NUMBER OF CONTRACTS | EXPIRATION DATE | TRADING CURRENCY | NOTIONAL AMOUNT ($) | VALUE AND UNREALIZED APPRECIATION (DEPRECIATION) ($) |
Long Contracts | |||||
TOPIX Index | 576 | 12/08/2022 | JPY | 74,684,959 | 2,052,806 |
Abbreviations | |
JPY | Japanese Yen |
TOPIX | Tokyo Stock Price Index |
October 31, 2022 | J.P. Morgan Exchange-Traded Funds | 115 |
AS OF October 31, 2022
INVESTMENTS | SHARES | VALUE($) |
Common Stocks — 99.2% | ||
Aerospace & Defense — 1.7% | ||
Boeing Co. (The) * | 20,780 | 2,961,358 |
General Dynamics Corp. | 8,384 | 2,094,323 |
HEICO Corp. | 1,481 | 240,870 |
HEICO Corp., Class A | 2,579 | 328,307 |
Howmet Aerospace, Inc. | 13,761 | 489,204 |
Huntington Ingalls Industries, Inc. | 1,487 | 382,263 |
L3Harris Technologies, Inc. | 7,118 | 1,754,373 |
Lockheed Martin Corp. | 8,794 | 4,279,864 |
Northrop Grumman Corp. | 5,426 | 2,978,928 |
Raytheon Technologies Corp. | 54,993 | 5,214,436 |
Textron, Inc. | 7,869 | 538,554 |
TransDigm Group, Inc. | 1,913 | 1,101,429 |
22,363,909 | ||
Air Freight & Logistics — 0.6% | ||
CH Robinson Worldwide, Inc. | 4,600 | 449,512 |
Expeditors International of Washington, Inc. | 6,107 | 597,570 |
FedEx Corp. | 8,900 | 1,426,492 |
United Parcel Service, Inc., Class B | 27,262 | 4,573,746 |
7,047,320 | ||
Airlines — 0.2% | ||
Delta Air Lines, Inc. * | 23,890 | 810,588 |
Southwest Airlines Co. * | 22,103 | 803,444 |
United Airlines Holdings, Inc. * | 12,170 | 524,283 |
2,138,315 | ||
Auto Components — 0.1% | ||
Aptiv plc * | 10,081 | 918,077 |
BorgWarner, Inc. | 8,824 | 331,165 |
Lear Corp. | 2,212 | 306,826 |
1,556,068 | ||
Automobiles — 2.2% | ||
Ford Motor Co. | 147,135 | 1,967,195 |
General Motors Co. | 54,329 | 2,132,413 |
Lucid Group, Inc. * (a) | 21,804 | 311,579 |
Rivian Automotive, Inc., Class A * (a) | 20,299 | 709,856 |
Tesla, Inc. * | 99,234 | 22,579,705 |
27,700,748 | ||
Banks — 3.7% | ||
Bank of America Corp. | 260,438 | 9,386,186 |
Citigroup, Inc. | 72,148 | 3,308,707 |
Citizens Financial Group, Inc. | 18,460 | 755,014 |
Comerica, Inc. | 4,867 | 343,123 |
East West Bancorp, Inc. | 5,242 | 375,170 |
INVESTMENTS | SHARES | VALUE($) |
Banks — continued | ||
Fifth Third Bancorp | 25,550 | 911,879 |
First Republic Bank | 6,793 | 815,839 |
Huntington Bancshares, Inc. | 53,727 | 815,576 |
JPMorgan Chase & Co. (b) | 109,253 | 13,752,768 |
KeyCorp | 34,733 | 620,679 |
M&T Bank Corp. | 6,549 | 1,102,655 |
PNC Financial Services Group, Inc. (The) | 15,264 | 2,470,173 |
Regions Financial Corp. | 34,821 | 764,321 |
Signature Bank | 2,334 | 370,009 |
SVB Financial Group * | 2,202 | 508,574 |
Truist Financial Corp. | 49,406 | 2,212,895 |
US Bancorp | 50,373 | 2,138,334 |
Wells Fargo & Co. | 141,306 | 6,498,663 |
Zions Bancorp NA | 5,599 | 290,812 |
47,441,377 | ||
Beverages — 1.8% | ||
Brown-Forman Corp., Class A | 2,090 | 143,729 |
Brown-Forman Corp., Class B | 6,797 | 462,196 |
Coca-Cola Co. (The) | 144,998 | 8,678,130 |
Constellation Brands, Inc., Class A | 5,932 | 1,465,679 |
Keurig Dr Pepper, Inc. | 31,652 | 1,229,364 |
Molson Coors Beverage Co., Class B | 7,010 | 353,514 |
Monster Beverage Corp. * | 14,331 | 1,343,101 |
PepsiCo, Inc. | 51,422 | 9,337,207 |
23,012,920 | ||
Biotechnology — 2.5% | ||
AbbVie, Inc. | 65,869 | 9,643,222 |
Alnylam Pharmaceuticals, Inc. * | 4,467 | 925,830 |
Amgen, Inc. | 19,924 | 5,386,453 |
Biogen, Inc. * | 5,415 | 1,534,828 |
BioMarin Pharmaceutical, Inc. * | 6,916 | 599,133 |
Exact Sciences Corp. * | 6,595 | 229,374 |
Gilead Sciences, Inc. | 46,696 | 3,663,768 |
Horizon Therapeutics plc * | 8,574 | 534,332 |
Incyte Corp. * | 6,886 | 511,905 |
Moderna, Inc. * | 12,532 | 1,883,936 |
Neurocrine Biosciences, Inc. * | 3,572 | 411,209 |
Regeneron Pharmaceuticals, Inc. * | 3,997 | 2,992,754 |
Seagen, Inc. * | 5,090 | 647,244 |
Vertex Pharmaceuticals, Inc. * | 9,555 | 2,981,160 |
31,945,148 | ||
Building Products — 0.4% | ||
Allegion plc | 3,275 | 343,122 |
116 | J.P. Morgan Exchange-Traded Funds | October 31, 2022 |
INVESTMENTS | SHARES | VALUE($) |
Common Stocks — continued | ||
Building Products — continued | ||
Carrier Global Corp. | 31,347 | 1,246,357 |
Fortune Brands Home & Security, Inc. | 4,815 | 290,441 |
Johnson Controls International plc | 25,668 | 1,484,637 |
Lennox International, Inc. | 1,194 | 278,882 |
Masco Corp. | 8,406 | 388,946 |
Owens Corning | 3,592 | 307,511 |
Trane Technologies plc | 8,620 | 1,376,010 |
5,715,906 | ||
Capital Markets — 3.2% | ||
Ameriprise Financial, Inc. | 4,031 | 1,246,063 |
Bank of New York Mellon Corp. (The) | 27,383 | 1,153,098 |
BlackRock, Inc. | 5,609 | 3,622,909 |
Blackstone, Inc. | 26,139 | 2,382,309 |
Carlyle Group, Inc. (The) | 8,078 | 228,446 |
Charles Schwab Corp. (The) | 56,896 | 4,532,904 |
CME Group, Inc. | 13,379 | 2,318,581 |
Coinbase Global, Inc., Class A * | 5,865 | 388,556 |
FactSet Research Systems, Inc. | 1,419 | 603,770 |
Franklin Resources, Inc. | 10,589 | 248,312 |
Goldman Sachs Group, Inc. (The) | 12,729 | 4,385,268 |
Intercontinental Exchange, Inc. | 20,790 | 1,986,900 |
Invesco Ltd. | 16,945 | 259,597 |
Jefferies Financial Group, Inc. | 6,933 | 238,565 |
KKR & Co., Inc. | 21,453 | 1,043,259 |
MarketAxess Holdings, Inc. | 1,408 | 343,608 |
Moody's Corp. | 5,880 | 1,557,436 |
Morgan Stanley | 49,900 | 4,100,283 |
MSCI, Inc. | 2,995 | 1,404,236 |
Nasdaq, Inc. | 12,618 | 785,344 |
Northern Trust Corp. | 7,761 | 654,640 |
Raymond James Financial, Inc. | 7,246 | 856,043 |
S&P Global, Inc. | 12,679 | 4,073,129 |
SEI Investments Co. | 3,824 | 207,643 |
State Street Corp. | 13,689 | 1,012,986 |
T. Rowe Price Group, Inc. | 8,412 | 893,018 |
40,526,903 | ||
Chemicals — 1.7% | ||
Air Products and Chemicals, Inc. | 8,250 | 2,065,800 |
Albemarle Corp. | 4,367 | 1,222,192 |
Celanese Corp. | 3,711 | 356,701 |
CF Industries Holdings, Inc. | 7,418 | 788,237 |
Corteva, Inc. | 26,778 | 1,749,674 |
Dow, Inc. | 26,763 | 1,250,903 |
INVESTMENTS | SHARES | VALUE($) |
Chemicals — continued | ||
DuPont de Nemours, Inc. | 18,669 | 1,067,867 |
Eastman Chemical Co. | 4,563 | 350,484 |
Ecolab, Inc. | 9,234 | 1,450,384 |
FMC Corp. | 4,699 | 558,711 |
International Flavors & Fragrances, Inc. | 9,503 | 927,588 |
Linde plc (United Kingdom) | 18,553 | 5,516,735 |
LyondellBasell Industries NV, Class A | 9,486 | 725,205 |
Mosaic Co. (The) | 12,864 | 691,440 |
PPG Industries, Inc. | 8,760 | 1,000,217 |
Sherwin-Williams Co. (The) | 8,790 | 1,978,014 |
Westlake Corp. | 1,273 | 123,035 |
21,823,187 | ||
Commercial Services & Supplies — 0.5% | ||
Cintas Corp. | 3,212 | 1,373,290 |
Copart, Inc. * | 7,978 | 917,629 |
Republic Services, Inc. | 7,656 | 1,015,339 |
Rollins, Inc. | 8,610 | 362,309 |
Waste Management, Inc. | 14,010 | 2,218,764 |
5,887,331 | ||
Communications Equipment — 0.8% | ||
Arista Networks, Inc. * | 9,183 | 1,109,858 |
Cisco Systems, Inc. | 154,261 | 7,008,077 |
F5, Inc. * | 2,218 | 316,974 |
Juniper Networks, Inc. | 12,028 | 368,057 |
Motorola Solutions, Inc. | 6,220 | 1,553,196 |
10,356,162 | ||
Construction & Engineering — 0.1% | ||
Quanta Services, Inc. | 5,315 | 754,943 |
Construction Materials — 0.1% | ||
Martin Marietta Materials, Inc. | 2,315 | 777,794 |
Vulcan Materials Co. | 4,938 | 808,350 |
1,586,144 | ||
Consumer Finance — 0.5% | ||
Ally Financial, Inc. | 11,487 | 316,582 |
American Express Co. | 22,353 | 3,318,303 |
Capital One Financial Corp. | 14,303 | 1,516,404 |
Discover Financial Services | 10,186 | 1,064,029 |
Synchrony Financial | 17,954 | 638,444 |
6,853,762 | ||
Containers & Packaging — 0.3% | ||
Amcor plc | 55,980 | 648,248 |
Avery Dennison Corp. | 3,021 | 512,211 |
October 31, 2022 | J.P. Morgan Exchange-Traded Funds | 117 |
AS OF October 31, 2022 (continued)
INVESTMENTS | SHARES | VALUE($) |
Common Stocks — continued | ||
Containers & Packaging — continued | ||
Ball Corp. | 11,714 | 578,554 |
Crown Holdings, Inc. | 4,506 | 309,067 |
International Paper Co. | 13,496 | 453,601 |
Packaging Corp. of America | 3,478 | 418,090 |
Sealed Air Corp. | 5,419 | 258,053 |
Westrock Co. | 9,481 | 322,923 |
3,500,747 | ||
Distributors — 0.1% | ||
Genuine Parts Co. | 5,260 | 935,544 |
LKQ Corp. | 9,700 | 539,708 |
Pool Corp. | 1,475 | 448,739 |
1,923,991 | ||
Diversified Financial Services — 1.7% | ||
Apollo Global Management, Inc. | 16,168 | 895,061 |
Berkshire Hathaway, Inc., Class B * | 67,245 | 19,843,327 |
Equitable Holdings, Inc. | 13,004 | 398,182 |
Voya Financial, Inc. | 3,650 | 249,514 |
21,386,084 | ||
Diversified Telecommunication Services — 0.9% | ||
AT&T, Inc. | 265,460 | 4,839,336 |
Lumen Technologies, Inc. | 35,473 | 261,081 |
Verizon Communications, Inc. | 156,451 | 5,846,574 |
10,946,991 | ||
Electric Utilities — 1.8% | ||
Alliant Energy Corp. | 9,337 | 487,111 |
American Electric Power Co., Inc. | 19,138 | 1,682,613 |
Avangrid, Inc. | 2,591 | 105,402 |
Constellation Energy Corp. | 12,174 | 1,150,930 |
Duke Energy Corp. | 28,686 | 2,672,962 |
Edison International | 14,221 | 853,829 |
Entergy Corp. | 7,590 | 813,193 |
Evergy, Inc. | 8,544 | 522,295 |
Eversource Energy | 12,904 | 984,317 |
Exelon Corp. | 36,936 | 1,425,360 |
FirstEnergy Corp. | 20,224 | 762,647 |
NextEra Energy, Inc. | 73,198 | 5,672,845 |
NRG Energy, Inc. | 8,766 | 389,210 |
PG&E Corp. * | 59,979 | 895,486 |
Pinnacle West Capital Corp. | 4,199 | 282,215 |
PPL Corp. | 27,411 | 726,117 |
INVESTMENTS | SHARES | VALUE($) |
Electric Utilities — continued | ||
Southern Co. (The) | 39,612 | 2,593,794 |
Xcel Energy, Inc. | 20,367 | 1,326,095 |
23,346,421 | ||
Electrical Equipment — 0.6% | ||
AMETEK, Inc. | 8,546 | 1,108,075 |
Eaton Corp. plc | 14,829 | 2,225,388 |
Emerson Electric Co. | 22,032 | 1,907,971 |
Generac Holdings, Inc. * | 2,365 | 274,127 |
Hubbell, Inc. | 1,988 | 472,110 |
Plug Power, Inc. * (a) | 19,410 | 310,172 |
Rockwell Automation, Inc. | 4,309 | 1,100,088 |
Sensata Technologies Holding plc | 5,792 | 232,896 |
7,630,827 | ||
Electronic Equipment, Instruments & Components — 0.7% | ||
Amphenol Corp., Class A | 22,154 | 1,679,938 |
CDW Corp. | 5,047 | 872,172 |
Cognex Corp. | 6,441 | 297,767 |
Corning, Inc. | 28,342 | 911,762 |
Flex Ltd. * | 16,986 | 332,586 |
Keysight Technologies, Inc. * | 6,698 | 1,166,457 |
TE Connectivity Ltd. (Switzerland) | 11,905 | 1,455,148 |
Teledyne Technologies, Inc. * | 1,753 | 697,659 |
Trimble, Inc. * | 9,224 | 554,916 |
Zebra Technologies Corp., Class A * | 1,923 | 544,632 |
8,513,037 | ||
Energy Equipment & Services — 0.4% | ||
Baker Hughes Co. | 37,680 | 1,042,229 |
Halliburton Co. | 33,792 | 1,230,705 |
Schlumberger NV | 52,686 | 2,741,252 |
5,014,186 | ||
Entertainment — 1.4% | ||
Activision Blizzard, Inc. | 26,519 | 1,930,583 |
AMC Entertainment Holdings, Inc., Class A * (a) | 19,245 | 128,172 |
Electronic Arts, Inc. | 9,848 | 1,240,454 |
Live Nation Entertainment, Inc. * | 5,282 | 420,500 |
Netflix, Inc. * | 16,566 | 4,835,284 |
Playtika Holding Corp. * | 3,831 | 36,203 |
Roku, Inc. * | 4,492 | 249,486 |
Take-Two Interactive Software, Inc. * | 5,841 | 692,042 |
118 | J.P. Morgan Exchange-Traded Funds | October 31, 2022 |
INVESTMENTS | SHARES | VALUE($) |
Common Stocks — continued | ||
Entertainment — continued | ||
Walt Disney Co. (The) * | 67,897 | 7,233,746 |
Warner Bros Discovery, Inc. * | 82,308 | 1,070,004 |
17,836,474 | ||
Equity Real Estate Investment Trusts (REITs) — 2.6% | ||
Alexandria Real Estate Equities, Inc. | 5,531 | 803,654 |
American Tower Corp. | 17,341 | 3,592,882 |
AvalonBay Communities, Inc. | 5,205 | 911,500 |
Boston Properties, Inc. | 5,301 | 385,383 |
Camden Property Trust | 3,975 | 459,311 |
Crown Castle, Inc. | 16,137 | 2,150,417 |
Digital Realty Trust, Inc. | 10,704 | 1,073,076 |
Equinix, Inc. | 3,387 | 1,918,532 |
Equity LifeStyle Properties, Inc. | 6,524 | 417,275 |
Equity Residential | 12,603 | 794,241 |
Essex Property Trust, Inc. | 2,438 | 541,821 |
Extra Space Storage, Inc. | 5,001 | 887,377 |
Federal Realty Investment Trust | 2,702 | 267,444 |
Healthpeak Properties, Inc. | 20,112 | 477,258 |
Host Hotels & Resorts, Inc. | 26,622 | 502,623 |
Invitation Homes, Inc. | 21,610 | 684,821 |
Iron Mountain, Inc. | 10,817 | 541,607 |
Kimco Realty Corp. | 23,052 | 492,852 |
Mid-America Apartment Communities, Inc. | 4,309 | 678,452 |
Prologis, Inc. | 34,393 | 3,809,025 |
Public Storage | 5,886 | 1,823,188 |
Realty Income Corp. | 22,993 | 1,431,774 |
Regency Centers Corp. | 5,749 | 347,872 |
SBA Communications Corp. | 4,021 | 1,085,268 |
Simon Property Group, Inc. | 12,191 | 1,328,575 |
Sun Communities, Inc. | 4,581 | 617,748 |
UDR, Inc. | 11,381 | 452,509 |
Ventas, Inc. | 14,878 | 582,176 |
VICI Properties, Inc. | 35,865 | 1,148,397 |
Vornado Realty Trust | 5,993 | 141,375 |
Welltower, Inc. | 17,265 | 1,053,856 |
Weyerhaeuser Co. | 27,581 | 853,080 |
WP Carey, Inc. | 7,732 | 589,952 |
32,845,321 | ||
Food & Staples Retailing — 1.5% | ||
Albertsons Cos., Inc., Class A | 5,940 | 121,829 |
Costco Wholesale Corp. | 16,506 | 8,277,759 |
Kroger Co. (The) | 24,260 | 1,147,255 |
Sysco Corp. | 18,992 | 1,643,948 |
INVESTMENTS | SHARES | VALUE($) |
Food & Staples Retailing — continued | ||
Walgreens Boots Alliance, Inc. | 26,734 | 975,791 |
Walmart, Inc. | 53,093 | 7,556,727 |
19,723,309 | ||
Food Products — 1.2% | ||
Archer-Daniels-Midland Co. | 20,890 | 2,025,912 |
Bunge Ltd. | 5,648 | 557,458 |
Campbell Soup Co. | 7,492 | 396,402 |
Conagra Brands, Inc. | 17,896 | 656,783 |
General Mills, Inc. | 22,184 | 1,809,771 |
Hershey Co. (The) | 5,475 | 1,307,266 |
Hormel Foods Corp. | 10,773 | 500,406 |
J M Smucker Co. (The) | 3,976 | 599,024 |
Kellogg Co. | 9,508 | 730,405 |
Kraft Heinz Co. (The) | 29,684 | 1,141,943 |
Lamb Weston Holdings, Inc. | 5,370 | 463,001 |
McCormick & Co., Inc. (Non-Voting) | 9,321 | 733,003 |
Mondelez International, Inc., Class A | 51,066 | 3,139,538 |
Tyson Foods, Inc., Class A | 10,780 | 736,813 |
14,797,725 | ||
Gas Utilities — 0.1% | ||
Atmos Energy Corp. | 5,207 | 554,806 |
UGI Corp. | 7,795 | 275,397 |
830,203 | ||
Health Care Equipment & Supplies — 2.6% | ||
Abbott Laboratories | 65,232 | 6,454,054 |
ABIOMED, Inc. * | 1,705 | 429,796 |
Align Technology, Inc. * | 2,696 | 523,833 |
Baxter International, Inc. | 18,762 | 1,019,715 |
Becton Dickinson and Co. | 10,628 | 2,507,889 |
Boston Scientific Corp. * | 53,335 | 2,299,272 |
Cooper Cos., Inc. (The) | 1,838 | 502,491 |
DENTSPLY SIRONA, Inc. | 8,032 | 247,546 |
Dexcom, Inc. * | 14,632 | 1,767,253 |
Edwards Lifesciences Corp. * | 23,102 | 1,673,278 |
Hologic, Inc. * | 9,293 | 630,065 |
IDEXX Laboratories, Inc. * | 3,090 | 1,111,411 |
Insulet Corp. * | 2,585 | 669,024 |
Intuitive Surgical, Inc. * | 13,300 | 3,278,051 |
Medtronic plc | 49,485 | 4,322,020 |
Novocure Ltd. * | 3,352 | 236,852 |
ResMed, Inc. | 5,460 | 1,221,347 |
STERIS plc | 3,722 | 642,343 |
Stryker Corp. | 12,541 | 2,874,899 |
October 31, 2022 | J.P. Morgan Exchange-Traded Funds | 119 |
AS OF October 31, 2022 (continued)
INVESTMENTS | SHARES | VALUE($) |
Common Stocks — continued | ||
Health Care Equipment & Supplies — continued | ||
Teleflex, Inc. | 1,754 | 376,338 |
Zimmer Biomet Holdings, Inc. | 7,810 | 885,264 |
33,672,741 | ||
Health Care Providers & Services — 3.6% | ||
agilon health, Inc. * | 7,349 | 145,878 |
AmerisourceBergen Corp. | 5,798 | 911,562 |
Cardinal Health, Inc. | 10,161 | 771,220 |
Centene Corp. * | 21,297 | 1,813,014 |
Cigna Corp. | 11,370 | 3,673,192 |
CVS Health Corp. | 48,911 | 4,631,872 |
DaVita, Inc. * | 2,085 | 152,226 |
Elevance Health, Inc. | 8,933 | 4,884,296 |
HCA Healthcare, Inc. | 8,025 | 1,745,197 |
Henry Schein, Inc. * | 5,077 | 347,571 |
Humana, Inc. | 4,720 | 2,634,138 |
Laboratory Corp. of America Holdings | 3,364 | 746,337 |
McKesson Corp. | 5,370 | 2,090,917 |
Molina Healthcare, Inc. * | 2,168 | 778,008 |
Quest Diagnostics, Inc. | 4,349 | 624,734 |
UnitedHealth Group, Inc. | 34,855 | 19,349,753 |
Universal Health Services, Inc., Class B | 2,458 | 284,808 |
45,584,723 | ||
Health Care Technology — 0.1% | ||
Veeva Systems, Inc., Class A * | 5,214 | 875,639 |
Hotels, Restaurants & Leisure — 2.0% | ||
Airbnb, Inc., Class A * | 14,859 | 1,588,576 |
Aramark | 9,598 | 350,327 |
Booking Holdings, Inc. * | 1,479 | 2,764,961 |
Caesars Entertainment, Inc. * | 7,996 | 349,665 |
Carnival Corp. * (a) | 36,775 | 333,181 |
Chipotle Mexican Grill, Inc. * | 1,040 | 1,558,263 |
Darden Restaurants, Inc. | 4,555 | 652,003 |
Domino's Pizza, Inc. | 1,347 | 447,527 |
Expedia Group, Inc. * | 5,653 | 528,386 |
Hilton Worldwide Holdings, Inc. | 10,225 | 1,383,033 |
Las Vegas Sands Corp. * | 12,234 | 465,014 |
Marriott International, Inc., Class A | 10,279 | 1,645,771 |
McDonald's Corp. | 27,395 | 7,469,521 |
MGM Resorts International | 12,154 | 432,318 |
Royal Caribbean Cruises Ltd. * (a) | 8,166 | 435,901 |
Starbucks Corp. | 42,741 | 3,700,943 |
Vail Resorts, Inc. | 1,497 | 328,038 |
INVESTMENTS | SHARES | VALUE($) |
Hotels, Restaurants & Leisure — continued | ||
Wynn Resorts Ltd. * | 3,842 | 245,504 |
Yum! Brands, Inc. | 10,606 | 1,254,159 |
25,933,091 | ||
Household Durables — 0.3% | ||
DR Horton, Inc. | 11,780 | 905,647 |
Garmin Ltd. | 5,758 | 506,934 |
Lennar Corp., Class A | 9,504 | 766,973 |
Lennar Corp., Class B | 529 | 34,501 |
Mohawk Industries, Inc. * | 1,955 | 185,236 |
Newell Brands, Inc. | 14,019 | 193,602 |
NVR, Inc. * | 106 | 449,202 |
PulteGroup, Inc. | 8,612 | 344,394 |
Whirlpool Corp. | 2,016 | 278,692 |
3,665,181 | ||
Household Products — 1.3% | ||
Church & Dwight Co., Inc. | 9,061 | 671,692 |
Clorox Co. (The) | 4,575 | 668,133 |
Colgate-Palmolive Co. | 31,062 | 2,293,618 |
Kimberly-Clark Corp. | 12,573 | 1,564,836 |
Procter & Gamble Co. (The) | 89,023 | 11,988,727 |
17,187,006 | ||
Independent Power and Renewable Electricity Producers — 0.1% | ||
AES Corp. (The) | 24,894 | 651,227 |
Vistra Corp. | 14,591 | 335,155 |
986,382 | ||
Industrial Conglomerates — 0.9% | ||
3M Co. | 20,623 | 2,594,167 |
General Electric Co. | 40,851 | 3,178,616 |
Honeywell International, Inc. | 25,092 | 5,119,270 |
10,892,053 | ||
Insurance — 2.4% | ||
Aflac, Inc. | 21,417 | 1,394,461 |
Allstate Corp. (The) | 10,059 | 1,269,949 |
American Financial Group, Inc. | 2,600 | 377,286 |
American International Group, Inc. | 28,329 | 1,614,753 |
Aon plc, Class A | 7,848 | 2,209,134 |
Arch Capital Group Ltd. * | 13,741 | 790,107 |
Arthur J Gallagher & Co. | 7,828 | 1,464,462 |
Brown & Brown, Inc. | 8,741 | 513,883 |
Chubb Ltd. | 15,551 | 3,341,754 |
Cincinnati Financial Corp. | 5,928 | 612,481 |
Everest Re Group Ltd. | 1,468 | 473,665 |
120 | J.P. Morgan Exchange-Traded Funds | October 31, 2022 |
INVESTMENTS | SHARES | VALUE($) |
Common Stocks — continued | ||
Insurance — continued | ||
Fidelity National Financial, Inc. | 10,295 | 405,417 |
Globe Life, Inc. | 3,371 | 389,418 |
Hartford Financial Services Group, Inc. (The) | 12,046 | 872,251 |
Lincoln National Corp. | 5,780 | 311,369 |
Loews Corp. | 7,443 | 424,400 |
Markel Corp. * | 494 | 595,813 |
Marsh & McLennan Cos., Inc. | 18,576 | 2,999,838 |
MetLife, Inc. | 24,965 | 1,827,688 |
Principal Financial Group, Inc. | 8,622 | 759,857 |
Progressive Corp. (The) | 21,784 | 2,797,066 |
Prudential Financial, Inc. | 13,868 | 1,458,775 |
Reinsurance Group of America, Inc. | 2,502 | 368,219 |
Travelers Cos., Inc. (The) | 8,840 | 1,630,626 |
Willis Towers Watson plc | 4,093 | 893,134 |
WR Berkley Corp. | 7,618 | 566,627 |
30,362,433 | ||
Interactive Media & Services — 3.9% | ||
Alphabet, Inc., Class A * | 223,374 | 21,111,077 |
Alphabet, Inc., Class C * | 199,754 | 18,908,714 |
IAC, Inc. * | 2,922 | 142,243 |
Match Group, Inc. * | 10,552 | 455,846 |
Meta Platforms, Inc., Class A * | 84,967 | 7,915,526 |
Pinterest, Inc., Class A * | 21,714 | 534,164 |
Snap, Inc., Class A * | 38,435 | 380,891 |
ZoomInfo Technologies, Inc., Class A * | 10,060 | 447,972 |
49,896,433 | ||
Internet & Direct Marketing Retail — 2.9% | ||
Amazon.com, Inc. * | 330,180 | 33,823,639 |
DoorDash, Inc., Class A * | 9,722 | 423,199 |
eBay, Inc. | 20,477 | 815,804 |
Etsy, Inc. * | 4,722 | 443,443 |
MercadoLibre, Inc. (Brazil) * | 1,734 | 1,563,409 |
37,069,494 | ||
IT Services — 4.7% | ||
Accenture plc, Class A | 23,564 | 6,689,820 |
Akamai Technologies, Inc. * | 5,919 | 522,825 |
Automatic Data Processing, Inc. | 15,478 | 3,741,033 |
Block, Inc., Class A * | 19,738 | 1,185,662 |
Broadridge Financial Solutions, Inc. | 4,371 | 655,912 |
Cloudflare, Inc., Class A * | 10,553 | 594,345 |
Cognizant Technology Solutions Corp., Class A | 19,278 | 1,200,056 |
DXC Technology Co. * | 8,556 | 245,985 |
EPAM Systems, Inc. * | 2,143 | 750,050 |
INVESTMENTS | SHARES | VALUE($) |
IT Services — continued | ||
Fidelity National Information Services, Inc. | 22,665 | 1,880,968 |
Fiserv, Inc. * | 23,834 | 2,448,705 |
FleetCor Technologies, Inc. * | 2,806 | 522,253 |
Gartner, Inc. * | 2,946 | 889,456 |
Global Payments, Inc. | 10,324 | 1,179,620 |
GoDaddy, Inc., Class A * | 5,830 | 468,732 |
International Business Machines Corp. | 33,635 | 4,651,384 |
Jack Henry & Associates, Inc. | 2,704 | 538,258 |
Mastercard, Inc., Class A | 31,775 | 10,427,920 |
MongoDB, Inc. * | 2,540 | 464,896 |
Okta, Inc. * | 5,611 | 314,889 |
Paychex, Inc. | 11,921 | 1,410,374 |
PayPal Holdings, Inc. * | 43,081 | 3,600,710 |
Snowflake, Inc., Class A * | 10,556 | 1,692,127 |
SS&C Technologies Holdings, Inc. | 8,253 | 424,369 |
Twilio, Inc., Class A * | 6,441 | 479,017 |
VeriSign, Inc. * | 3,465 | 694,594 |
Visa, Inc., Class A | 60,896 | 12,615,215 |
60,289,175 | ||
Leisure Products — 0.0% ^ | ||
Hasbro, Inc. | 4,832 | 315,288 |
Life Sciences Tools & Services — 1.8% | ||
Agilent Technologies, Inc. | 11,121 | 1,538,590 |
Avantor, Inc. * | 25,104 | 506,348 |
Bio-Rad Laboratories, Inc., Class A * | 794 | 279,258 |
Bio-Techne Corp. | 1,462 | 433,132 |
Charles River Laboratories International, Inc. * | 1,891 | 401,365 |
Danaher Corp. | 24,382 | 6,136,218 |
Illumina, Inc. * | 5,855 | 1,339,741 |
IQVIA Holdings, Inc. * | 6,951 | 1,457,416 |
Mettler-Toledo International, Inc. * | 831 | 1,051,157 |
PerkinElmer, Inc. | 4,709 | 629,028 |
Thermo Fisher Scientific, Inc. | 14,605 | 7,506,532 |
Waters Corp. * | 2,229 | 666,850 |
West Pharmaceutical Services, Inc. | 2,745 | 631,624 |
22,577,259 | ||
Machinery — 1.6% | ||
Caterpillar, Inc. | 19,654 | 4,254,305 |
Cummins, Inc. | 5,245 | 1,282,455 |
Deere & Co. | 10,357 | 4,099,508 |
Dover Corp. | 5,333 | 696,970 |
Fortive Corp. | 13,251 | 846,739 |
IDEX Corp. | 2,822 | 627,359 |
October 31, 2022 | J.P. Morgan Exchange-Traded Funds | 121 |
AS OF October 31, 2022 (continued)
INVESTMENTS | SHARES | VALUE($) |
Common Stocks — continued | ||
Machinery — continued | ||
Illinois Tool Works, Inc. | 10,482 | 2,238,221 |
Ingersoll Rand, Inc. | 15,025 | 758,762 |
Otis Worldwide Corp. | 15,640 | 1,104,810 |
PACCAR, Inc. | 12,948 | 1,253,755 |
Parker-Hannifin Corp. | 4,782 | 1,389,745 |
Pentair plc | 6,137 | 263,584 |
Snap-on, Inc. | 1,973 | 438,105 |
Stanley Black & Decker, Inc. | 5,508 | 432,323 |
Westinghouse Air Brake Technologies Corp. | 6,764 | 630,946 |
Xylem, Inc. | 6,706 | 686,895 |
21,004,482 | ||
Media — 0.8% | ||
Charter Communications, Inc., Class A * | 4,123 | 1,515,697 |
Comcast Corp., Class A | 164,064 | 5,207,391 |
DISH Network Corp., Class A * | 9,340 | 139,259 |
Fox Corp., Class A | 11,417 | 329,609 |
Fox Corp., Class B | 5,236 | 142,419 |
Interpublic Group of Cos., Inc. (The) | 14,579 | 434,308 |
Liberty Broadband Corp., Class A * | 643 | 54,861 |
Liberty Broadband Corp., Class C * | 4,601 | 388,463 |
Liberty Media Corp.-Liberty SiriusXM, Class A * | 2,793 | 118,535 |
Liberty Media Corp.-Liberty SiriusXM, Class C * | 5,692 | 240,146 |
News Corp., Class A | 14,364 | 242,321 |
News Corp., Class B | 4,447 | 76,177 |
Omnicom Group, Inc. | 7,639 | 555,737 |
Paramount Global, Class A | 336 | 7,083 |
Paramount Global, Class B | 18,809 | 344,581 |
Sirius XM Holdings, Inc. (a) | 26,115 | 157,735 |
Trade Desk, Inc. (The), Class A * | 16,543 | 880,749 |
10,835,071 | ||
Metals & Mining — 0.4% | ||
Freeport-McMoRan, Inc. | 53,280 | 1,688,443 |
Newmont Corp. | 29,558 | 1,250,895 |
Nucor Corp. | 9,738 | 1,279,378 |
Southern Copper Corp. (Peru) | 3,179 | 149,318 |
Steel Dynamics, Inc. | 6,475 | 608,974 |
4,977,008 | ||
Mortgage Real Estate Investment Trusts (REITs) — 0.0% ^ | ||
Annaly Capital Management, Inc. | 16,069 | 298,080 |
Multiline Retail — 0.5% | ||
Dollar General Corp. | 8,457 | 2,156,958 |
INVESTMENTS | SHARES | VALUE($) |
Multiline Retail — continued | ||
Dollar Tree, Inc. * | 7,853 | 1,244,700 |
Target Corp. | 17,276 | 2,837,583 |
6,239,241 | ||
Multi-Utilities — 0.8% | ||
Ameren Corp. | 9,621 | 784,304 |
CenterPoint Energy, Inc. | 23,459 | 671,162 |
CMS Energy Corp. | 10,800 | 616,140 |
Consolidated Edison, Inc. | 13,212 | 1,162,128 |
Dominion Energy, Inc. | 31,006 | 2,169,490 |
DTE Energy Co. | 7,228 | 810,331 |
NiSource, Inc. | 15,121 | 388,458 |
Public Service Enterprise Group, Inc. | 18,570 | 1,041,220 |
Sempra Energy | 11,714 | 1,768,111 |
WEC Energy Group, Inc. | 11,753 | 1,073,401 |
10,484,745 | ||
Oil, Gas & Consumable Fuels — 4.8% | ||
Cheniere Energy, Inc. | 9,297 | 1,640,084 |
Chevron Corp. | 67,080 | 12,134,772 |
ConocoPhillips | 47,429 | 5,980,323 |
Continental Resources, Inc. | 2,014 | 148,976 |
Coterra Energy, Inc. | 29,624 | 922,195 |
Devon Energy Corp. | 24,386 | 1,886,257 |
Diamondback Energy, Inc. | 6,622 | 1,040,382 |
EOG Resources, Inc. | 21,823 | 2,979,276 |
Exxon Mobil Corp. | 155,263 | 17,204,693 |
Hess Corp. | 10,375 | 1,463,705 |
Kinder Morgan, Inc. | 73,869 | 1,338,506 |
Marathon Oil Corp. | 25,254 | 768,984 |
Marathon Petroleum Corp. | 18,562 | 2,109,014 |
Occidental Petroleum Corp. | 27,749 | 2,014,577 |
ONEOK, Inc. | 16,641 | 987,144 |
Phillips 66 | 17,929 | 1,869,815 |
Pioneer Natural Resources Co. | 8,887 | 2,278,716 |
Targa Resources Corp. | 8,442 | 577,180 |
Texas Pacific Land Corp. | 241 | 555,233 |
Valero Energy Corp. | 14,680 | 1,843,074 |
Williams Cos., Inc. (The) | 45,385 | 1,485,451 |
61,228,357 | ||
Personal Products — 0.1% | ||
Estee Lauder Cos., Inc. (The), Class A | 8,623 | 1,728,825 |
Olaplex Holdings, Inc. * | 3,128 | 13,763 |
1,742,588 | ||
122 | J.P. Morgan Exchange-Traded Funds | October 31, 2022 |
INVESTMENTS | SHARES | VALUE($) |
Common Stocks — continued | ||
Pharmaceuticals — 4.5% | ||
Bristol-Myers Squibb Co. | 79,542 | 6,162,119 |
Catalent, Inc. * | 6,672 | 438,550 |
Elanco Animal Health, Inc. * | 16,599 | 218,941 |
Eli Lilly & Co. | 29,385 | 10,640,015 |
Jazz Pharmaceuticals plc * | 2,325 | 334,312 |
Johnson & Johnson | 97,943 | 17,039,144 |
Merck & Co., Inc. | 94,362 | 9,549,434 |
Pfizer, Inc. | 209,077 | 9,732,534 |
Royalty Pharma plc, Class A | 13,675 | 578,726 |
Viatris, Inc. | 45,165 | 457,521 |
Zoetis, Inc. | 17,429 | 2,627,945 |
57,779,241 | ||
Professional Services — 0.4% | ||
Clarivate plc * | 16,068 | 165,982 |
CoStar Group, Inc. * | 14,748 | 1,219,955 |
Dun & Bradstreet Holdings, Inc. | 8,082 | 103,854 |
Equifax, Inc. | 4,549 | 771,237 |
Jacobs Solutions, Inc. | 4,756 | 547,986 |
Leidos Holdings, Inc. | 5,092 | 517,296 |
TransUnion | 7,158 | 424,255 |
Verisk Analytics, Inc. | 5,850 | 1,069,556 |
4,820,121 | ||
Real Estate Management & Development — 0.1% | ||
CBRE Group, Inc., Class A * | 11,950 | 847,733 |
Zillow Group, Inc., Class A * | 2,198 | 67,984 |
Zillow Group, Inc., Class C * | 6,170 | 190,406 |
1,106,123 | ||
Road & Rail — 1.0% | ||
CSX Corp. | 79,776 | 2,318,291 |
JB Hunt Transport Services, Inc. | 3,083 | 527,409 |
Lyft, Inc., Class A * | 11,410 | 167,042 |
Norfolk Southern Corp. | 8,756 | 1,996,981 |
Old Dominion Freight Line, Inc. | 3,407 | 935,562 |
Uber Technologies, Inc. * | 73,747 | 1,959,458 |
Union Pacific Corp. | 23,258 | 4,585,082 |
12,489,825 | ||
Semiconductors & Semiconductor Equipment — 4.6% | ||
Advanced Micro Devices, Inc. * | 60,128 | 3,611,288 |
Analog Devices, Inc. | 19,375 | 2,763,262 |
Applied Materials, Inc. | 32,407 | 2,861,214 |
Broadcom, Inc. | 15,047 | 7,073,896 |
Enphase Energy, Inc. * | 5,054 | 1,551,578 |
INVESTMENTS | SHARES | VALUE($) |
Semiconductors & Semiconductor Equipment — continued | ||
Entegris, Inc. | 5,547 | 440,099 |
Intel Corp. | 152,974 | 4,349,051 |
KLA Corp. | 5,273 | 1,668,641 |
Lam Research Corp. | 5,107 | 2,067,211 |
Marvell Technology, Inc. | 31,661 | 1,256,308 |
Microchip Technology, Inc. | 20,584 | 1,270,856 |
Micron Technology, Inc. | 41,105 | 2,223,780 |
Monolithic Power Systems, Inc. | 1,642 | 557,377 |
NVIDIA Corp. | 93,270 | 12,588,652 |
NXP Semiconductors NV (China) | 9,794 | 1,430,708 |
ON Semiconductor Corp. * | 16,144 | 991,726 |
Qorvo, Inc. * | 3,832 | 329,859 |
QUALCOMM, Inc. | 41,845 | 4,923,483 |
Skyworks Solutions, Inc. | 5,970 | 513,480 |
SolarEdge Technologies, Inc. * | 2,083 | 479,152 |
Teradyne, Inc. | 5,844 | 475,409 |
Texas Instruments, Inc. | 34,025 | 5,465,436 |
58,892,466 | ||
Software — 8.6% | ||
Adobe, Inc. * | 17,424 | 5,549,544 |
ANSYS, Inc. * | 3,249 | 718,549 |
AppLovin Corp., Class A * | 4,556 | 77,270 |
Autodesk, Inc. * | 8,094 | 1,734,544 |
Bentley Systems, Inc., Class B | 7,324 | 258,391 |
Bill.com Holdings, Inc. * | 3,482 | 464,359 |
Cadence Design Systems, Inc. * | 10,210 | 1,545,692 |
Ceridian HCM Holding, Inc. * | 5,688 | 376,489 |
Crowdstrike Holdings, Inc., Class A * | 7,962 | 1,283,474 |
Datadog, Inc., Class A * | 9,208 | 741,336 |
DocuSign, Inc. * | 7,442 | 359,449 |
Dynatrace, Inc. * | 7,483 | 263,701 |
Fortinet, Inc. * | 24,374 | 1,393,218 |
HubSpot, Inc. * | 1,793 | 531,732 |
Intuit, Inc. | 10,521 | 4,497,727 |
Microsoft Corp. | 277,835 | 64,493,839 |
NortonLifeLock, Inc. | 22,059 | 496,989 |
Oracle Corp. | 56,595 | 4,418,372 |
Palantir Technologies, Inc., Class A * | 65,114 | 572,352 |
Palo Alto Networks, Inc. * | 11,128 | 1,909,453 |
Paycom Software, Inc. * | 1,813 | 627,298 |
Paylocity Holding Corp. * | 1,520 | 352,321 |
PTC, Inc. * | 3,947 | 465,075 |
RingCentral, Inc., Class A * | 2,868 | 101,871 |
Roper Technologies, Inc. | 3,957 | 1,640,335 |
October 31, 2022 | J.P. Morgan Exchange-Traded Funds | 123 |
AS OF October 31, 2022 (continued)
INVESTMENTS | SHARES | VALUE($) |
Common Stocks — continued | ||
Software — continued | ||
Salesforce, Inc. * | 37,075 | 6,028,024 |
ServiceNow, Inc. * | 7,513 | 3,161,020 |
Splunk, Inc. * | 5,515 | 458,352 |
Synopsys, Inc. * | 5,685 | 1,663,147 |
Tyler Technologies, Inc. * | 1,543 | 498,898 |
UiPath, Inc., Class A * | 12,913 | 163,349 |
Unity Software, Inc. * (a) | 6,662 | 196,529 |
VMware, Inc., Class A | 7,696 | 866,031 |
Workday, Inc., Class A * | 7,409 | 1,154,470 |
Zoom Video Communications, Inc., Class A * | 8,240 | 687,546 |
Zscaler, Inc. * | 3,105 | 478,480 |
110,229,226 | ||
Specialty Retail — 2.2% | ||
Advance Auto Parts, Inc. | 2,255 | 428,270 |
AutoZone, Inc. * | 727 | 1,841,404 |
Bath & Body Works, Inc. | 8,502 | 283,797 |
Best Buy Co., Inc. | 7,458 | 510,202 |
Burlington Stores, Inc. * | 2,470 | 353,111 |
CarMax, Inc. * | 5,926 | 373,397 |
Home Depot, Inc. (The) | 38,287 | 11,337,929 |
Lowe's Cos., Inc. | 23,818 | 4,643,319 |
O'Reilly Automotive, Inc. * | 2,362 | 1,977,395 |
Ross Stores, Inc. | 13,024 | 1,246,267 |
TJX Cos., Inc. (The) | 43,659 | 3,147,814 |
Tractor Supply Co. | 4,129 | 907,430 |
Ulta Beauty, Inc. * | 1,924 | 806,868 |
27,857,203 | ||
Technology Hardware, Storage & Peripherals — 7.0% | ||
Apple, Inc. | 562,768 | 86,294,845 |
Dell Technologies, Inc., Class C | 9,901 | 380,199 |
Hewlett Packard Enterprise Co. | 48,390 | 690,525 |
HP, Inc. | 33,899 | 936,290 |
NetApp, Inc. | 8,179 | 566,559 |
Seagate Technology Holdings plc | 7,282 | 361,624 |
Western Digital Corp. * | 11,675 | 401,270 |
89,631,312 | ||
Textiles, Apparel & Luxury Goods — 0.5% | ||
Lululemon Athletica, Inc. * | 4,334 | 1,426,059 |
NIKE, Inc., Class B | 47,078 | 4,363,189 |
Tapestry, Inc. | 9,367 | 296,747 |
VF Corp. | 12,290 | 347,192 |
6,433,187 | ||
INVESTMENTS | SHARES | VALUE($) |
Tobacco — 0.7% | ||
Altria Group, Inc. | 67,079 | 3,103,746 |
Philip Morris International, Inc. | 57,752 | 5,304,521 |
8,408,267 | ||
Trading Companies & Distributors — 0.2% | ||
Fastenal Co. | 21,404 | 1,034,455 |
United Rentals, Inc. * | 2,605 | 822,425 |
Watsco, Inc. | 1,227 | 332,468 |
WW Grainger, Inc. | 1,698 | 992,226 |
3,181,574 | ||
Water Utilities — 0.1% | ||
American Water Works Co., Inc. | 6,761 | 982,644 |
Wireless Telecommunication Services — 0.3% | ||
T-Mobile US, Inc. * | 22,426 | 3,398,885 |
Total Common Stocks (Cost $1,332,143,636) | 1,266,332,003 | |
Short-Term Investments — 1.0% | ||
Investment Companies — 0.7% | ||
JPMorgan U.S. Government Money Market Fund Class IM Shares, 2.85% (c) (d) (Cost $8,865,488) | 8,865,488 | 8,865,488 |
Investment of Cash Collateral from Securities Loaned — 0.3% | ||
JPMorgan Securities Lending Money Market Fund Agency SL Class Shares, 3.23% (c) (d) | 1,501,652 | 1,501,652 |
JPMorgan U.S. Government Money Market Fund Class IM Shares, 2.85% (c) (d) | 2,238,043 | 2,238,043 |
Total Investment of Cash Collateral from Securities Loaned (Cost $3,739,695) | 3,739,695 | |
Total Short-Term Investments (Cost $12,605,183) | 12,605,183 | |
Total Investments — 100.2% (Cost $1,344,748,819) | 1,278,937,186 | |
Liabilities in Excess of Other Assets — (0.2)% | (2,413,578) | |
NET ASSETS — 100.0% | 1,276,523,608 | |
Percentages indicated are based on net assets. |
^ | Amount rounds to less than 0.1% of net assets. | |
* | Non-income producing security. | |
(a) | The security or a portion of this security is on loan at October 31, 2022. The total value of securities on loan at October 31, 2022 is $2,190,898. | |
124 | J.P. Morgan Exchange-Traded Funds | October 31, 2022 |
(b) | Investment in affiliate. This security is included in an index in which the Fund, as an index fund, tracks. | |
(c) | Investment in an affiliated fund, which is registered under the Investment Company Act of 1940, as amended, and is advised by J.P. Morgan Investment Management Inc. | |
(d) | The rate shown is the current yield as of October 31, 2022. |
DESCRIPTION | NUMBER OF CONTRACTS | EXPIRATION DATE | TRADING CURRENCY | NOTIONAL AMOUNT ($) | VALUE AND UNREALIZED APPRECIATION (DEPRECIATION) ($) |
Long Contracts | |||||
S&P 500 E-Mini Index | 51 | 12/16/2022 | USD | 9,901,650 | (62,102) |
Abbreviations | |
USD | United States Dollar |
October 31, 2022 | J.P. Morgan Exchange-Traded Funds | 125 |
AS OF October 31, 2022
INVESTMENTS | SHARES | VALUE($) |
Common Stocks — 99.4% | ||
Aerospace & Defense — 1.4% | ||
Axon Enterprise, Inc. * | 33,215 | 4,830,790 |
BWX Technologies, Inc. | 44,868 | 2,556,579 |
Curtiss-Wright Corp. | 18,886 | 3,169,637 |
Hexcel Corp. | 41,369 | 2,304,253 |
Mercury Systems, Inc. * | 28,369 | 1,373,060 |
Moog, Inc., Class A | 14,246 | 1,207,348 |
Rocket Lab USA, Inc. * | 106,127 | 540,186 |
Spirit AeroSystems Holdings, Inc., Class A | 51,717 | 1,197,766 |
Woodward, Inc. | 29,594 | 2,713,770 |
19,893,389 | ||
Air Freight & Logistics — 0.2% | ||
GXO Logistics, Inc. * | 58,346 | 2,131,963 |
Airlines — 0.7% | ||
Alaska Air Group, Inc. * | 62,355 | 2,772,303 |
Allegiant Travel Co. * | 7,602 | 570,530 |
American Airlines Group, Inc. * | 319,654 | 4,532,694 |
Frontier Group Holdings, Inc. * (a) | 18,203 | 238,641 |
JetBlue Airways Corp. * | 159,301 | 1,280,780 |
Joby Aviation, Inc. * (a) | 140,463 | 677,032 |
10,071,980 | ||
Auto Components — 1.2% | ||
Adient plc * | 46,637 | 1,631,362 |
Autoliv, Inc. (Sweden) | 38,555 | 3,097,894 |
Dana, Inc. | 62,758 | 1,001,618 |
Fox Factory Holding Corp. * | 20,789 | 1,826,314 |
Gentex Corp. | 115,659 | 3,063,807 |
Goodyear Tire & Rubber Co. (The) * | 139,108 | 1,766,672 |
Luminar Technologies, Inc. * (a) | 112,888 | 913,264 |
QuantumScape Corp. * (a) | 134,174 | 1,117,669 |
Visteon Corp. * | 13,833 | 1,804,791 |
16,223,391 | ||
Automobiles — 0.4% | ||
Harley-Davidson, Inc. | 65,425 | 2,813,275 |
Thor Industries, Inc. (a) | 26,823 | 2,185,270 |
4,998,545 | ||
Banks — 6.4% | ||
Associated Banc-Corp. | 73,934 | 1,800,293 |
Bank of Hawaii Corp. | 19,766 | 1,501,228 |
Bank OZK | 54,703 | 2,351,135 |
BankUnited, Inc. | 38,330 | 1,377,963 |
BOK Financial Corp. | 14,342 | 1,580,345 |
Cadence Bank | 89,752 | 2,481,643 |
INVESTMENTS | SHARES | VALUE($) |
Banks — continued | ||
Commerce Bancshares, Inc. | 53,662 | 3,801,416 |
Cullen/Frost Bankers, Inc. | 31,544 | 4,890,897 |
First Citizens BancShares, Inc., Class A | 6,492 | 5,337,203 |
First Financial Bankshares, Inc. | 63,805 | 2,455,854 |
First Hawaiian, Inc. | 62,814 | 1,606,782 |
First Horizon Corp. | 263,954 | 6,469,513 |
FNB Corp. | 172,524 | 2,492,972 |
Glacier Bancorp, Inc. | 54,484 | 3,120,843 |
Hancock Whitney Corp. | 42,163 | 2,355,647 |
Home BancShares, Inc. | 93,809 | 2,391,191 |
Old National Bancorp | 144,072 | 2,818,048 |
PacWest Bancorp | 57,931 | 1,440,165 |
Pinnacle Financial Partners, Inc. | 37,589 | 3,119,511 |
Popular, Inc. (Puerto Rico) | 36,897 | 2,609,356 |
Prosperity Bancshares, Inc. | 44,867 | 3,211,131 |
ServisFirst Bancshares, Inc. | 24,043 | 1,811,159 |
SouthState Corp. | 37,219 | 3,365,714 |
Synovus Financial Corp. | 71,506 | 2,849,514 |
Texas Capital Bancshares, Inc. * | 24,538 | 1,472,280 |
UMB Financial Corp. | 21,385 | 1,779,660 |
Umpqua Holdings Corp. | 106,766 | 2,122,508 |
United Bankshares, Inc. | 66,199 | 2,803,528 |
Valley National Bancorp | 206,719 | 2,453,755 |
Webster Financial Corp. | 86,491 | 4,693,002 |
Western Alliance Bancorp | 53,262 | 3,577,609 |
Wintrust Financial Corp. | 29,876 | 2,796,991 |
88,938,856 | ||
Beverages — 0.3% | ||
Boston Beer Co., Inc. (The), Class A * | 4,678 | 1,746,251 |
Celsius Holdings, Inc. * | 19,720 | 1,796,097 |
National Beverage Corp. | 11,478 | 544,287 |
4,086,635 | ||
Biotechnology — 3.2% | ||
ACADIA Pharmaceuticals, Inc. * | 58,911 | 944,343 |
Alkermes plc * | 80,795 | 1,834,047 |
Apellis Pharmaceuticals, Inc. * | 45,935 | 2,778,608 |
Arrowhead Pharmaceuticals, Inc. * | 52,066 | 1,812,418 |
Beam Therapeutics, Inc. * | 29,070 | 1,280,824 |
Blueprint Medicines Corp. * | 29,376 | 1,522,852 |
Cerevel Therapeutics Holdings, Inc. * | 31,411 | 878,252 |
CRISPR Therapeutics AG (Switzerland) * (a) | 38,372 | 2,008,391 |
Denali Therapeutics, Inc. * | 53,280 | 1,528,070 |
Exelixis, Inc. * | 158,307 | 2,624,730 |
126 | J.P. Morgan Exchange-Traded Funds | October 31, 2022 |
INVESTMENTS | SHARES | VALUE($) |
Common Stocks — continued | ||
Biotechnology — continued | ||
Fate Therapeutics, Inc. * | 40,556 | 848,432 |
Halozyme Therapeutics, Inc. * | 67,772 | 3,240,179 |
Intellia Therapeutics, Inc. * | 37,390 | 1,973,444 |
Ionis Pharmaceuticals, Inc. * | 69,820 | 3,086,044 |
Iovance Biotherapeutics, Inc. * | 67,530 | 630,730 |
Mirati Therapeutics, Inc. * | 24,619 | 1,657,351 |
Natera, Inc. * | 47,692 | 2,239,616 |
Novavax, Inc. * | 38,473 | 856,794 |
Relay Therapeutics, Inc. * | 43,760 | 972,347 |
Sarepta Therapeutics, Inc. * | 43,074 | 4,911,298 |
Ultragenyx Pharmaceutical, Inc. * | 34,451 | 1,393,887 |
United Therapeutics Corp. * | 22,389 | 5,161,336 |
Vir Biotechnology, Inc. * | 37,189 | 817,414 |
45,001,407 | ||
Building Products — 2.0% | ||
A O Smith Corp. | 63,197 | 3,461,932 |
Advanced Drainage Systems, Inc. | 31,559 | 3,657,057 |
Armstrong World Industries, Inc. | 22,819 | 1,724,432 |
AZEK Co., Inc. (The) * | 53,882 | 943,474 |
Builders FirstSource, Inc. * | 76,772 | 4,733,761 |
Carlisle Cos., Inc. | 25,443 | 6,075,788 |
Hayward Holdings, Inc. * | 49,923 | 461,788 |
JELD-WEN Holding, Inc. * | 41,446 | 439,742 |
Simpson Manufacturing Co., Inc. | 21,233 | 1,814,997 |
Trex Co., Inc. * | 54,237 | 2,608,257 |
UFP Industries, Inc. | 30,312 | 2,159,124 |
28,080,352 | ||
Capital Markets — 2.9% | ||
Affiliated Managers Group, Inc. | 18,803 | 2,334,580 |
Ares Management Corp. | 76,134 | 5,773,241 |
Artisan Partners Asset Management, Inc., Class A | 33,160 | 945,392 |
Blue Owl Capital, Inc. | 165,497 | 1,658,280 |
Evercore, Inc., Class A | 17,714 | 1,861,741 |
Federated Hermes, Inc. | 41,652 | 1,447,407 |
Forge Global Holdings, Inc. * | 50,596 | 78,424 |
Houlihan Lokey, Inc. | 24,429 | 2,181,998 |
Interactive Brokers Group, Inc., Class A | 50,588 | 4,054,628 |
Janus Henderson Group plc | 65,189 | 1,484,354 |
LPL Financial Holdings, Inc. | 39,238 | 10,031,195 |
Morningstar, Inc. | 12,330 | 2,862,779 |
INVESTMENTS | SHARES | VALUE($) |
Capital Markets — continued | ||
Stifel Financial Corp. | 52,211 | 3,230,295 |
Tradeweb Markets, Inc., Class A | 52,871 | 2,912,135 |
40,856,449 | ||
Chemicals — 2.5% | ||
Ashland, Inc. | 24,500 | 2,570,540 |
Avient Corp. | 42,047 | 1,450,201 |
Axalta Coating Systems Ltd. * | 108,486 | 2,529,894 |
Balchem Corp. | 15,800 | 2,208,840 |
Cabot Corp. | 27,693 | 2,034,882 |
Chemours Co. (The) | 76,311 | 2,184,784 |
Diversey Holdings Ltd. * | 38,281 | 206,717 |
Element Solutions, Inc. | 112,229 | 1,930,339 |
Ginkgo Bioworks Holdings, Inc. * (a) | 405,132 | 1,106,010 |
Huntsman Corp. | 93,127 | 2,492,079 |
Ingevity Corp. * | 17,593 | 1,183,481 |
NewMarket Corp. | 3,398 | 1,034,147 |
Olin Corp. | 66,398 | 3,515,774 |
RPM International, Inc. | 63,458 | 6,001,223 |
Scotts Miracle-Gro Co. (The) | 19,895 | 913,379 |
Sensient Technologies Corp. | 20,678 | 1,477,650 |
Valvoline, Inc. | 87,075 | 2,556,522 |
35,396,462 | ||
Commercial Services & Supplies — 1.1% | ||
Brink's Co. (The) | 23,238 | 1,385,682 |
Clean Harbors, Inc. * | 24,750 | 3,030,885 |
Driven Brands Holdings, Inc. * | 27,186 | 869,408 |
IAA, Inc. * | 65,789 | 2,495,377 |
MSA Safety, Inc. | 18,091 | 2,428,536 |
Stericycle, Inc. * | 45,343 | 2,021,391 |
Tetra Tech, Inc. | 26,227 | 3,705,350 |
15,936,629 | ||
Communications Equipment — 0.7% | ||
Ciena Corp. * | 73,639 | 3,527,308 |
Lumentum Holdings, Inc. * | 33,941 | 2,526,908 |
Viasat, Inc. * | 37,164 | 1,522,237 |
Viavi Solutions, Inc. * | 112,068 | 1,692,227 |
9,268,680 | ||
Construction & Engineering — 1.7% | ||
AECOM | 68,693 | 5,171,209 |
API Group Corp. * | 98,891 | 1,630,713 |
EMCOR Group, Inc. | 24,274 | 3,425,061 |
MasTec, Inc. * | 28,998 | 2,235,166 |
October 31, 2022 | J.P. Morgan Exchange-Traded Funds | 127 |
AS OF October 31, 2022 (continued)
INVESTMENTS | SHARES | VALUE($) |
Common Stocks — continued | ||
Construction & Engineering — continued | ||
MDU Resources Group, Inc. | 100,027 | 2,848,769 |
Valmont Industries, Inc. | 10,502 | 3,352,448 |
WillScot Mobile Mini Holdings Corp. * | 105,118 | 4,470,669 |
23,134,035 | ||
Construction Materials — 0.2% | ||
Eagle Materials, Inc. | 18,537 | 2,267,260 |
Consumer Finance — 0.8% | ||
Bread Financial Holdings, Inc. | 24,519 | 885,381 |
Credit Acceptance Corp. * | 2,987 | 1,390,807 |
FirstCash Holdings, Inc. | 18,741 | 1,845,051 |
OneMain Holdings, Inc. | 60,831 | 2,345,643 |
SLM Corp. | 123,654 | 2,051,420 |
SoFi Technologies, Inc. * (a) | 399,265 | 2,172,002 |
Upstart Holdings, Inc. * (a) | 34,412 | 797,670 |
11,487,974 | ||
Containers & Packaging — 1.0% | ||
AptarGroup, Inc. | 32,139 | 3,186,582 |
Berry Global Group, Inc. * | 61,536 | 2,911,884 |
Graphic Packaging Holding Co. | 151,418 | 3,476,557 |
Silgan Holdings, Inc. | 41,203 | 1,951,374 |
Sonoco Products Co. | 47,962 | 2,977,481 |
14,503,878 | ||
Diversified Consumer Services — 1.2% | ||
ADT, Inc. | 105,653 | 893,824 |
Bright Horizons Family Solutions, Inc. * | 28,437 | 1,857,505 |
Chegg, Inc. * | 62,175 | 1,341,115 |
Coursera, Inc. * | 41,586 | 536,044 |
Frontdoor, Inc. * | 40,084 | 884,253 |
Graham Holdings Co., Class B | 1,908 | 1,190,344 |
Grand Canyon Education, Inc. * | 15,722 | 1,582,105 |
H&R Block, Inc. | 78,503 | 3,230,398 |
Mister Car Wash, Inc. * (a) | 38,869 | 343,213 |
PowerSchool Holdings, Inc., Class A * | 15,591 | 311,820 |
Service Corp. International | 77,559 | 4,700,851 |
16,871,472 | ||
Diversified Telecommunication Services — 0.4% | ||
Frontier Communications Parent, Inc. * | 109,661 | 2,568,261 |
Iridium Communications, Inc. * | 62,457 | 3,218,409 |
5,786,670 | ||
Electric Utilities — 1.0% | ||
ALLETE, Inc. | 28,073 | 1,579,668 |
Hawaiian Electric Industries, Inc. | 53,847 | 2,048,340 |
INVESTMENTS | SHARES | VALUE($) |
Electric Utilities — continued | ||
IDACORP, Inc. | 24,870 | 2,603,889 |
OGE Energy Corp. | 98,478 | 3,607,249 |
PNM Resources, Inc. | 42,222 | 1,962,056 |
Portland General Electric Co. | 43,898 | 1,972,776 |
13,773,978 | ||
Electrical Equipment — 1.6% | ||
Acuity Brands, Inc. | 16,091 | 2,953,825 |
Atkore, Inc. * | 20,325 | 1,936,972 |
Bloom Energy Corp., Class A * | 86,718 | 1,622,494 |
ChargePoint Holdings, Inc. * (a) | 127,627 | 1,784,225 |
EnerSys | 19,999 | 1,325,734 |
GrafTech International Ltd. | 94,663 | 481,835 |
nVent Electric plc | 81,894 | 2,989,131 |
Regal Rexnord Corp. | 32,700 | 4,137,858 |
SunPower Corp. * | 41,961 | 775,859 |
Sunrun, Inc. * | 104,332 | 2,348,513 |
Vertiv Holdings Co. | 148,370 | 2,123,175 |
22,479,621 | ||
Electronic Equipment, Instruments & Components — 1.8% | ||
Arrow Electronics, Inc. * | 31,566 | 3,196,373 |
Avnet, Inc. | 46,566 | 1,871,488 |
Belden, Inc. | 21,410 | 1,490,778 |
Coherent Corp. * | 63,762 | 2,143,041 |
IPG Photonics Corp. * | 16,300 | 1,396,258 |
Jabil, Inc. | 67,662 | 4,347,284 |
Littelfuse, Inc. | 12,177 | 2,681,984 |
National Instruments Corp. | 65,085 | 2,484,945 |
Novanta, Inc. * | 17,532 | 2,479,025 |
TD SYNNEX Corp. | 20,745 | 1,898,375 |
Vontier Corp. | 77,691 | 1,483,898 |
25,473,449 | ||
Energy Equipment & Services — 0.7% | ||
ChampionX Corp. | 99,821 | 2,856,877 |
Helmerich & Payne, Inc. | 51,791 | 2,564,173 |
NOV, Inc. | 193,216 | 4,328,038 |
9,749,088 | ||
Entertainment — 0.7% | ||
Liberty Media Corp.-Liberty Formula One, Class A * | 11,792 | 613,420 |
Liberty Media Corp.-Liberty Formula One, Class C * | 101,556 | 5,862,828 |
Lions Gate Entertainment Corp., Class A * | 29,506 | 237,818 |
Lions Gate Entertainment Corp., Class B * | 61,425 | 466,216 |
128 | J.P. Morgan Exchange-Traded Funds | October 31, 2022 |
INVESTMENTS | SHARES | VALUE($) |
Common Stocks — continued | ||
Entertainment — continued | ||
Madison Square Garden Sports Corp. | 8,914 | 1,396,022 |
Warner Music Group Corp., Class A | 57,364 | 1,492,611 |
10,068,915 | ||
Equity Real Estate Investment Trusts (REITs) — 8.2% | ||
Agree Realty Corp. | 39,269 | 2,697,780 |
American Homes 4 Rent, Class A | 148,812 | 4,753,055 |
Americold Realty Trust, Inc. | 132,499 | 3,213,101 |
Apartment Income REIT Corp. | 75,843 | 2,914,646 |
Apple Hospitality REIT, Inc. | 104,702 | 1,792,498 |
Brixmor Property Group, Inc. | 147,405 | 3,141,201 |
Broadstone Net Lease, Inc. | 85,154 | 1,459,540 |
Cousins Properties, Inc. | 74,489 | 1,769,859 |
CubeSmart | 110,407 | 4,622,741 |
Douglas Emmett, Inc. | 86,467 | 1,520,955 |
EastGroup Properties, Inc. | 21,430 | 3,357,867 |
EPR Properties | 36,899 | 1,424,301 |
Equity Commonwealth | 54,719 | 1,431,449 |
First Industrial Realty Trust, Inc. | 64,965 | 3,094,283 |
Gaming and Leisure Properties, Inc. | 125,668 | 6,298,480 |
Healthcare Realty Trust, Inc. | 187,189 | 3,805,552 |
Highwoods Properties, Inc. | 51,740 | 1,460,620 |
Hudson Pacific Properties, Inc. | 63,409 | 700,035 |
Independence Realty Trust, Inc. | 109,113 | 1,828,734 |
Innovative Industrial Properties, Inc. | 13,760 | 1,487,456 |
JBG SMITH Properties | 48,953 | 963,395 |
Kilroy Realty Corp. | 51,739 | 2,211,325 |
Kite Realty Group Trust | 107,780 | 2,116,799 |
Lamar Advertising Co., Class A | 42,851 | 3,952,148 |
Life Storage, Inc. | 41,508 | 4,591,200 |
Medical Properties Trust, Inc. | 294,643 | 3,373,662 |
National Health Investors, Inc. | 21,965 | 1,245,415 |
National Retail Properties, Inc. | 87,120 | 3,661,654 |
National Storage Affiliates Trust | 41,977 | 1,790,739 |
Omega Healthcare Investors, Inc. | 115,157 | 3,659,689 |
Outfront Media, Inc. | 71,817 | 1,296,297 |
Park Hotels & Resorts, Inc. | 110,598 | 1,446,622 |
Pebblebrook Hotel Trust | 64,660 | 1,037,146 |
Phillips Edison & Co., Inc. | 57,404 | 1,730,157 |
Piedmont Office Realty Trust, Inc., Class A | 60,697 | 634,284 |
Rayonier, Inc. | 72,024 | 2,427,209 |
Rexford Industrial Realty, Inc. | 84,146 | 4,651,591 |
RLJ Lodging Trust | 80,055 | 974,269 |
Ryman Hospitality Properties, Inc. | 27,130 | 2,412,400 |
Sabra Health Care REIT, Inc. | 113,612 | 1,551,940 |
INVESTMENTS | SHARES | VALUE($) |
Equity Real Estate Investment Trusts (REITs) — continued | ||
SITE Centers Corp. | 91,598 | 1,133,983 |
SL Green Realty Corp. | 31,629 | 1,255,039 |
Spirit Realty Capital, Inc. | 67,066 | 2,604,173 |
STAG Industrial, Inc. | 88,155 | 2,784,816 |
STORE Capital Corp. | 130,709 | 4,156,546 |
Sunstone Hotel Investors, Inc. | 104,436 | 1,164,461 |
Terreno Realty Corp. | 32,702 | 1,868,592 |
Uniti Group, Inc. | 116,702 | 905,608 |
114,375,312 | ||
Food & Staples Retailing — 1.3% | ||
BJ's Wholesale Club Holdings, Inc. * | 66,495 | 5,146,713 |
Casey's General Stores, Inc. | 18,323 | 4,263,945 |
Performance Food Group Co. * | 76,244 | 3,967,738 |
PriceSmart, Inc. | 12,324 | 788,366 |
Sprouts Farmers Market, Inc. * | 52,856 | 1,559,252 |
US Foods Holding Corp. * | 100,510 | 2,991,178 |
18,717,192 | ||
Food Products — 1.4% | ||
Beyond Meat, Inc. * (a) | 29,752 | 467,106 |
Darling Ingredients, Inc. * | 78,886 | 6,190,973 |
Flowers Foods, Inc. | 94,915 | 2,725,010 |
Freshpet, Inc. * | 23,522 | 1,386,622 |
Hain Celestial Group, Inc. (The) * | 44,170 | 826,421 |
Ingredion, Inc. | 32,229 | 2,872,248 |
Lancaster Colony Corp. | 9,747 | 1,757,189 |
Pilgrim's Pride Corp. * | 22,341 | 514,960 |
Post Holdings, Inc. * | 26,749 | 2,418,645 |
Seaboard Corp. | 126 | 472,044 |
19,631,218 | ||
Gas Utilities — 0.8% | ||
National Fuel Gas Co. | 44,996 | 3,036,780 |
New Jersey Resources Corp. | 47,334 | 2,112,990 |
ONE Gas, Inc. | 26,630 | 2,063,292 |
Southwest Gas Holdings, Inc. | 30,323 | 2,215,702 |
Spire, Inc. | 25,821 | 1,802,564 |
11,231,328 | ||
Health Care Equipment & Supplies — 3.0% | ||
Enovis Corp. * | 23,431 | 1,158,663 |
Envista Holdings Corp. * | 80,371 | 2,653,047 |
Figs, Inc., Class A * | 62,495 | 461,213 |
Globus Medical, Inc., Class A * | 37,894 | 2,538,898 |
Haemonetics Corp. * | 25,242 | 2,144,308 |
October 31, 2022 | J.P. Morgan Exchange-Traded Funds | 129 |
AS OF October 31, 2022 (continued)
INVESTMENTS | SHARES | VALUE($) |
Common Stocks — continued | ||
Health Care Equipment & Supplies — continued | ||
ICU Medical, Inc. * | 9,875 | 1,465,549 |
Inari Medical, Inc. * | 23,636 | 1,818,318 |
Inspire Medical Systems, Inc. * | 13,595 | 2,650,345 |
Integra LifeSciences Holdings Corp. * | 35,735 | 1,795,684 |
Lantheus Holdings, Inc. * | 33,814 | 2,501,898 |
LivaNova plc * | 26,339 | 1,240,567 |
Masimo Corp. * | 23,772 | 3,128,395 |
Nevro Corp. * | 17,407 | 667,384 |
NuVasive, Inc. * | 25,608 | 1,130,081 |
Omnicell, Inc. * | 21,785 | 1,684,416 |
Penumbra, Inc. * | 18,637 | 3,195,686 |
QuidelOrtho Corp. * | 26,676 | 2,396,038 |
Shockwave Medical, Inc. * | 17,672 | 5,180,547 |
STAAR Surgical Co. * | 23,629 | 1,674,587 |
Tandem Diabetes Care, Inc. * | 31,590 | 1,773,779 |
41,259,403 | ||
Health Care Providers & Services — 2.7% | ||
Acadia Healthcare Co., Inc. * | 44,684 | 3,632,809 |
Amedisys, Inc. * | 15,958 | 1,557,341 |
AMN Healthcare Services, Inc. * | 21,286 | 2,671,393 |
Apollo Medical Holdings, Inc. * (a) | 19,299 | 684,343 |
Chemed Corp. | 7,332 | 3,423,091 |
Encompass Health Corp. | 49,080 | 2,671,915 |
Ensign Group, Inc. (The) | 27,197 | 2,441,747 |
Guardant Health, Inc. * | 50,281 | 2,488,909 |
HealthEquity, Inc. * | 41,500 | 3,233,265 |
LifeStance Health Group, Inc. * (a) | 46,260 | 349,263 |
Oak Street Health, Inc. * | 56,995 | 1,153,009 |
Option Care Health, Inc. * | 76,038 | 2,300,910 |
Patterson Cos., Inc. | 42,612 | 1,106,634 |
Premier, Inc., Class A | 58,037 | 2,024,331 |
Privia Health Group, Inc. * | 24,095 | 806,701 |
Progyny, Inc. * | 36,688 | 1,631,515 |
R1 RCM, Inc. * | 67,538 | 1,192,721 |
Signify Health, Inc., Class A * | 33,919 | 991,452 |
Surgery Partners, Inc. * | 19,022 | 517,208 |
Tenet Healthcare Corp. * | 53,070 | 2,354,185 |
37,232,742 | ||
Health Care Technology — 0.4% | ||
Certara, Inc. * | 51,905 | 634,798 |
Definitive Healthcare Corp. * | 17,799 | 280,868 |
Doximity, Inc., Class A * (a) | 54,338 | 1,438,327 |
Multiplan Corp. * | 116,311 | 333,813 |
INVESTMENTS | SHARES | VALUE($) |
Health Care Technology — continued | ||
Nutex Health, Inc. * (a) | 12,738 | 10,254 |
Teladoc Health, Inc. * (a) | 79,518 | 2,356,913 |
5,054,973 | ||
Hotels, Restaurants & Leisure — 3.2% | ||
Boyd Gaming Corp. | 39,942 | 2,307,050 |
Choice Hotels International, Inc. | 14,268 | 1,852,557 |
Churchill Downs, Inc. | 16,318 | 3,392,675 |
Cracker Barrel Old Country Store, Inc. | 11,210 | 1,280,406 |
DraftKings, Inc., Class A * (a) | 220,636 | 3,486,049 |
Hilton Grand Vacations, Inc. * | 39,946 | 1,567,481 |
Hyatt Hotels Corp., Class A * | 24,651 | 2,322,371 |
Life Time Group Holdings, Inc. * | 27,656 | 290,111 |
Light & Wonder, Inc. * | 46,400 | 2,604,896 |
Marriott Vacations Worldwide Corp. | 19,324 | 2,855,314 |
Norwegian Cruise Line Holdings Ltd. * (a) | 207,278 | 3,500,925 |
Penn Entertainment, Inc. * | 77,996 | 2,581,668 |
Planet Fitness, Inc., Class A * | 41,439 | 2,713,426 |
SeaWorld Entertainment, Inc. * | 20,622 | 1,199,376 |
Six Flags Entertainment Corp. * | 36,384 | 811,363 |
Texas Roadhouse, Inc. | 32,884 | 3,253,872 |
Travel + Leisure Co. | 41,233 | 1,566,029 |
Wendy's Co. (The) | 83,741 | 1,740,138 |
Wingstop, Inc. | 14,714 | 2,330,551 |
Wyndham Hotels & Resorts, Inc. | 44,431 | 3,373,646 |
45,029,904 | ||
Household Durables — 0.8% | ||
Helen of Troy Ltd. * | 11,790 | 1,115,570 |
Leggett & Platt, Inc. | 65,234 | 2,201,647 |
Tempur Sealy International, Inc. | 84,701 | 2,277,610 |
Toll Brothers, Inc. | 52,597 | 2,265,879 |
TopBuild Corp. * | 15,927 | 2,709,820 |
10,570,526 | ||
Household Products — 0.2% | ||
Energizer Holdings, Inc. | 32,596 | 941,698 |
Reynolds Consumer Products, Inc. | 26,840 | 819,694 |
Spectrum Brands Holdings, Inc. | 20,057 | 925,430 |
2,686,822 | ||
Independent Power and Renewable Electricity Producers — 0.2% | ||
Ormat Technologies, Inc. (a) | 22,011 | 1,990,895 |
Sunnova Energy International, Inc. * (a) | 48,503 | 899,246 |
2,890,141 | ||
130 | J.P. Morgan Exchange-Traded Funds | October 31, 2022 |
INVESTMENTS | SHARES | VALUE($) |
Common Stocks — continued | ||
Insurance — 3.5% | ||
Assurant, Inc. | 26,173 | 3,555,864 |
Assured Guaranty Ltd. | 30,451 | 1,802,395 |
Axis Capital Holdings Ltd. | 37,894 | 2,071,665 |
Brighthouse Financial, Inc. * | 35,326 | 2,016,055 |
CNO Financial Group, Inc. | 56,271 | 1,241,338 |
Enstar Group Ltd. * | 6,681 | 1,339,674 |
Erie Indemnity Co., Class A | 12,269 | 3,153,256 |
First American Financial Corp. | 51,236 | 2,582,294 |
Hanover Insurance Group, Inc. (The) | 17,528 | 2,567,677 |
Kemper Corp. | 31,408 | 1,497,219 |
Kinsale Capital Group, Inc. | 10,590 | 3,337,650 |
Mercury General Corp. | 13,074 | 379,146 |
Old Republic International Corp. | 141,326 | 3,280,177 |
Primerica, Inc. | 18,423 | 2,665,808 |
RenaissanceRe Holdings Ltd. (Bermuda) | 21,498 | 3,325,311 |
RLI Corp. | 19,862 | 2,583,450 |
Ryan Specialty Holdings, Inc., Class A * | 40,664 | 1,823,780 |
Selective Insurance Group, Inc. | 29,676 | 2,910,622 |
Unum Group | 92,476 | 4,215,981 |
White Mountains Insurance Group Ltd. | 1,247 | 1,765,939 |
48,115,301 | ||
Interactive Media & Services — 0.4% | ||
Bumble, Inc., Class A * | 38,883 | 987,628 |
Cargurus, Inc. * | 45,866 | 667,809 |
TripAdvisor, Inc. * | 51,243 | 1,210,360 |
Yelp, Inc. * | 34,567 | 1,327,718 |
Ziff Davis, Inc. * | 23,213 | 1,796,454 |
5,989,969 | ||
Internet & Direct Marketing Retail — 0.2% | ||
Chewy, Inc., Class A * (a) | 44,673 | 1,730,185 |
Wayfair, Inc., Class A * (a) | 37,621 | 1,426,589 |
3,156,774 | ||
IT Services — 1.9% | ||
Affirm Holdings, Inc. * (a) | 101,284 | 2,032,770 |
Concentrix Corp. | 20,992 | 2,565,852 |
DigitalOcean Holdings, Inc. * (a) | 30,038 | 1,078,965 |
Euronet Worldwide, Inc. * | 23,169 | 1,946,428 |
ExlService Holdings, Inc. * | 16,263 | 2,957,426 |
Flywire Corp. * | 30,186 | 662,583 |
Genpact Ltd. | 83,034 | 4,027,149 |
Maximus, Inc. | 29,785 | 1,836,841 |
Rackspace Technology, Inc. * (a) | 27,968 | 144,035 |
SolarWinds Corp. * | 22,954 | 214,161 |
INVESTMENTS | SHARES | VALUE($) |
IT Services — continued | ||
Switch, Inc., Class A | 68,071 | 2,317,818 |
Thoughtworks Holding, Inc. * | 32,056 | 308,058 |
Western Union Co. (The) | 189,749 | 2,563,509 |
WEX, Inc. * | 21,729 | 3,566,598 |
26,222,193 | ||
Leisure Products — 0.9% | ||
Brunswick Corp. | 36,582 | 2,585,250 |
Mattel, Inc. * | 173,762 | 3,294,528 |
Peloton Interactive, Inc., Class A * (a) | 151,136 | 1,269,542 |
Polaris, Inc. | 27,537 | 2,797,759 |
Topgolf Callaway Brands Corp. * | 68,165 | 1,276,049 |
YETI Holdings, Inc. * | 42,389 | 1,359,839 |
12,582,967 | ||
Life Sciences Tools & Services — 1.2% | ||
10X Genomics, Inc., Class A * | 46,752 | 1,270,719 |
Azenta, Inc. | 36,902 | 1,638,449 |
Bruker Corp. | 49,550 | 3,064,172 |
Maravai LifeSciences Holdings, Inc., Class A * | 53,703 | 891,470 |
Medpace Holdings, Inc. * | 12,351 | 2,741,675 |
Repligen Corp. * | 25,385 | 4,632,509 |
Sotera Health Co. * | 48,705 | 335,090 |
Syneos Health, Inc. * | 50,494 | 2,543,888 |
17,117,972 | ||
Machinery — 4.5% | ||
AGCO Corp. | 30,456 | 3,781,722 |
Allison Transmission Holdings, Inc. | 47,342 | 2,000,200 |
Chart Industries, Inc. * | 17,641 | 3,931,826 |
Crane Holdings Co. | 23,455 | 2,353,475 |
Donaldson Co., Inc. | 60,777 | 3,491,639 |
Evoqua Water Technologies Corp. * | 59,758 | 2,341,318 |
Flowserve Corp. | 64,287 | 1,843,751 |
Gates Industrial Corp. plc * | 49,988 | 557,366 |
Graco, Inc. | 83,187 | 5,788,151 |
ITT, Inc. | 40,679 | 3,107,469 |
Kennametal, Inc. | 40,010 | 1,068,667 |
Lincoln Electric Holdings, Inc. | 28,490 | 4,045,580 |
Middleby Corp. (The) * | 26,505 | 3,706,989 |
Nikola Corp. * (a) | 158,958 | 602,451 |
Nordson Corp. | 26,592 | 5,983,200 |
Oshkosh Corp. | 32,156 | 2,829,728 |
RBC Bearings, Inc. * | 14,231 | 3,607,985 |
Timken Co. (The) | 32,876 | 2,343,730 |
Toro Co. (The) | 51,438 | 5,423,108 |
October 31, 2022 | J.P. Morgan Exchange-Traded Funds | 131 |
AS OF October 31, 2022 (continued)
INVESTMENTS | SHARES | VALUE($) |
Common Stocks — continued | ||
Machinery — continued | ||
Trinity Industries, Inc. | 40,339 | 1,150,872 |
Watts Water Technologies, Inc., Class A | 13,431 | 1,965,761 |
61,924,988 | ||
Marine — 0.2% | ||
Kirby Corp. * | 29,464 | 2,055,114 |
Media — 0.8% | ||
Altice USA, Inc., Class A * | 106,377 | 703,152 |
Cable One, Inc. | 2,400 | 2,062,632 |
John Wiley & Sons, Inc., Class A | 21,142 | 891,981 |
New York Times Co. (The), Class A | 81,393 | 2,357,141 |
Nexstar Media Group, Inc., Class A | 19,082 | 3,268,747 |
TEGNA, Inc. | 109,746 | 2,291,496 |
11,575,149 | ||
Metals & Mining — 1.7% | ||
Alcoa Corp. | 88,504 | 3,454,311 |
Cleveland-Cliffs, Inc. * | 254,455 | 3,305,370 |
Commercial Metals Co. | 59,268 | 2,696,694 |
Compass Minerals International, Inc. | 16,804 | 664,430 |
MP Materials Corp. * | 45,409 | 1,364,086 |
Reliance Steel & Aluminum Co. | 29,658 | 5,975,494 |
Royal Gold, Inc. | 32,287 | 3,065,974 |
United States Steel Corp. | 116,690 | 2,375,808 |
Worthington Industries, Inc. | 14,860 | 706,742 |
23,608,909 | ||
Mortgage Real Estate Investment Trusts (REITs) — 0.7% | ||
AGNC Investment Corp. | 257,123 | 2,113,551 |
Blackstone Mortgage Trust, Inc., Class A | 83,768 | 2,090,849 |
Chimera Investment Corp. | 113,996 | 769,473 |
Rithm Capital Corp. | 229,643 | 1,935,891 |
Starwood Property Trust, Inc. | 152,103 | 3,142,448 |
10,052,212 | ||
Multiline Retail — 0.6% | ||
Dillard's, Inc., Class A (a) | 1,731 | 569,135 |
Kohl's Corp. | 63,189 | 1,892,511 |
Macy's, Inc. | 132,679 | 2,766,357 |
Nordstrom, Inc. | 55,291 | 1,124,619 |
Ollie's Bargain Outlet Holdings, Inc. * (a) | 28,589 | 1,600,984 |
7,953,606 | ||
INVESTMENTS | SHARES | VALUE($) |
Multi-Utilities — 0.3% | ||
Avista Corp. | 35,897 | 1,472,854 |
Black Hills Corp. | 32,012 | 2,092,624 |
3,565,478 | ||
Oil, Gas & Consumable Fuels — 4.9% | ||
Antero Midstream Corp. | 164,745 | 1,754,534 |
Antero Resources Corp. * | 138,531 | 5,078,546 |
APA Corp. | 160,617 | 7,301,649 |
Chesapeake Energy Corp. | 47,556 | 4,863,552 |
Civitas Resources, Inc. | 25,514 | 1,783,684 |
CNX Resources Corp. * | 93,190 | 1,566,524 |
DT Midstream, Inc. | 47,583 | 2,840,705 |
Enviva, Inc. | 15,086 | 902,746 |
EQT Corp. | 181,979 | 7,614,001 |
Equitrans Midstream Corp. | 212,881 | 1,792,458 |
HF Sinclair Corp. | 71,465 | 4,371,514 |
Matador Resources Co. | 55,196 | 3,667,774 |
Murphy Oil Corp. | 71,878 | 3,486,802 |
New Fortress Energy, Inc. | 23,482 | 1,293,154 |
Ovintiv, Inc. | 125,087 | 6,335,657 |
PDC Energy, Inc. | 47,373 | 3,417,488 |
Range Resources Corp. | 121,883 | 3,471,228 |
SM Energy Co. | 60,303 | 2,712,429 |
Southwestern Energy Co. * | 548,118 | 3,798,458 |
68,052,903 | ||
Paper & Forest Products — 0.2% | ||
Louisiana-Pacific Corp. | 36,337 | 2,058,491 |
Personal Products — 0.3% | ||
Beauty Health Co. (The) * | 51,951 | 593,800 |
BellRing Brands, Inc. * | 66,624 | 1,613,633 |
Coty, Inc., Class A * | 177,500 | 1,191,025 |
Herbalife Nutrition Ltd. * | 48,137 | 1,023,393 |
4,421,851 | ||
Pharmaceuticals — 0.8% | ||
Intra-Cellular Therapies, Inc. * | 43,185 | 1,972,259 |
Organon & Co. | 125,103 | 3,275,197 |
Pacira BioSciences, Inc. * | 22,540 | 1,166,670 |
Perrigo Co. plc | 66,217 | 2,667,221 |
Prestige Consumer Healthcare, Inc. * | 24,478 | 1,333,561 |
Tilray Brands, Inc. (Canada) * (a) | 285,300 | 1,161,171 |
11,576,079 | ||
Professional Services — 2.5% | ||
Alight, Inc., Class A * | 132,877 | 1,101,550 |
132 | J.P. Morgan Exchange-Traded Funds | October 31, 2022 |
INVESTMENTS | SHARES | VALUE($) |
Common Stocks — continued | ||
Professional Services — continued | ||
ASGN, Inc. * | 24,693 | 2,093,473 |
Booz Allen Hamilton Holding Corp. | 65,091 | 7,085,155 |
CACI International, Inc., Class A * | 11,519 | 3,502,122 |
Exponent, Inc. | 25,144 | 2,395,217 |
FTI Consulting, Inc. * | 16,990 | 2,644,154 |
Insperity, Inc. | 17,582 | 2,075,028 |
KBR, Inc. | 68,395 | 3,404,019 |
ManpowerGroup, Inc. | 25,451 | 1,993,831 |
Robert Half International, Inc. | 53,896 | 4,120,888 |
Science Applications International Corp. | 27,391 | 2,967,541 |
TriNet Group, Inc. * | 18,029 | 1,171,524 |
Upwork, Inc. * | 58,428 | 785,857 |
35,340,359 | ||
Real Estate Management & Development — 0.6% | ||
Cushman & Wakefield plc * | 79,926 | 923,145 |
DigitalBridge Group, Inc. | 72,558 | 928,742 |
eXp World Holdings, Inc. (a) | 35,841 | 473,460 |
Howard Hughes Corp. (The) * | 17,677 | 1,084,484 |
Jones Lang LaSalle, Inc. * | 23,570 | 3,749,751 |
Opendoor Technologies, Inc. * | 247,477 | 640,966 |
WeWork, Inc. * (a) | 115,148 | 295,930 |
8,096,478 | ||
Road & Rail — 1.6% | ||
AMERCO | 4,823 | 2,774,141 |
Avis Budget Group, Inc. * | 14,186 | 3,354,422 |
Hertz Global Holdings, Inc. * | 88,621 | 1,630,626 |
Knight-Swift Transportation Holdings, Inc. | 79,030 | 3,795,811 |
Landstar System, Inc. | 17,918 | 2,799,150 |
Ryder System, Inc. | 25,182 | 2,027,403 |
Saia, Inc. * | 12,992 | 2,583,589 |
TuSimple Holdings, Inc., Class A * | 67,060 | 230,016 |
XPO Logistics, Inc. * | 56,587 | 2,927,811 |
22,122,969 | ||
Semiconductors & Semiconductor Equipment — 2.3% | ||
Allegro MicroSystems, Inc. (Japan) * | 31,989 | 812,840 |
Ambarella, Inc. * | 17,813 | 974,906 |
Amkor Technology, Inc. | 49,378 | 1,026,569 |
Cirrus Logic, Inc. * | 27,516 | 1,846,874 |
First Solar, Inc. * | 48,763 | 7,098,430 |
Lattice Semiconductor Corp. * | 67,545 | 3,276,608 |
MKS Instruments, Inc. | 28,127 | 2,310,633 |
Power Integrations, Inc. | 28,127 | 1,876,352 |
Semtech Corp. * | 31,224 | 864,593 |
INVESTMENTS | SHARES | VALUE($) |
Semiconductors & Semiconductor Equipment — continued | ||
Silicon Laboratories, Inc. * | 16,834 | 1,934,563 |
SiTime Corp. * | 7,853 | 705,278 |
Synaptics, Inc. * | 19,489 | 1,726,725 |
Universal Display Corp. | 21,373 | 2,035,137 |
Wolfspeed, Inc. * | 60,815 | 4,789,181 |
31,278,689 | ||
Software — 6.0% | ||
ACI Worldwide, Inc. * | 56,099 | 1,364,889 |
Alteryx, Inc., Class A * | 29,888 | 1,456,442 |
Asana, Inc., Class A * | 37,106 | 764,384 |
Aspen Technology, Inc. * | 14,234 | 3,436,799 |
Black Knight, Inc. * | 76,747 | 4,640,891 |
Blackbaud, Inc. * | 21,911 | 1,198,532 |
Blackline, Inc. * | 26,692 | 1,494,752 |
Box, Inc., Class A * | 70,860 | 2,058,483 |
Clear Secure, Inc., Class A * | 35,174 | 950,401 |
CommVault Systems, Inc. * | 22,040 | 1,342,016 |
Coupa Software, Inc. * | 37,163 | 1,978,187 |
Cvent Holding Corp. * | 30,871 | 180,595 |
Digital Turbine, Inc. * | 44,244 | 645,962 |
Dolby Laboratories, Inc., Class A | 30,296 | 2,024,985 |
DoubleVerify Holdings, Inc. * | 31,468 | 919,810 |
Dropbox, Inc., Class A * | 135,409 | 2,945,146 |
Duck Creek Technologies, Inc. * | 37,170 | 443,810 |
Elastic NV * | 37,794 | 2,416,926 |
Envestnet, Inc. * | 27,151 | 1,338,816 |
Fair Isaac Corp. * | 12,422 | 5,948,150 |
Five9, Inc. * | 34,483 | 2,077,946 |
Guidewire Software, Inc. * | 41,228 | 2,449,355 |
Informatica, Inc., Class A * (a) | 18,656 | 361,180 |
Jamf Holding Corp. * | 21,966 | 519,935 |
JFrog Ltd. (Israel) * | 29,311 | 744,499 |
LiveRamp Holdings, Inc. * | 33,027 | 606,376 |
Manhattan Associates, Inc. * | 30,851 | 3,753,641 |
MicroStrategy, Inc., Class A * (a) | 4,593 | 1,228,673 |
nCino, Inc. * | 37,402 | 1,177,415 |
NCR Corp. * | 67,340 | 1,431,648 |
New Relic, Inc. * | 28,145 | 1,667,310 |
Nutanix, Inc., Class A * | 110,328 | 3,022,987 |
Paycor HCM, Inc. * | 23,230 | 707,818 |
Pegasystems, Inc. | 20,156 | 750,005 |
Qualtrics International, Inc., Class A * | 52,723 | 631,094 |
Qualys, Inc. * | 17,173 | 2,448,183 |
Rapid7, Inc. * | 28,874 | 1,307,126 |
October 31, 2022 | J.P. Morgan Exchange-Traded Funds | 133 |
AS OF October 31, 2022 (continued)
INVESTMENTS | SHARES | VALUE($) |
Common Stocks — continued | ||
Software — continued | ||
SentinelOne, Inc., Class A * | 98,237 | 2,243,733 |
Smartsheet, Inc., Class A * | 63,675 | 2,223,531 |
Sprout Social, Inc., Class A * | 23,060 | 1,391,210 |
SPS Commerce, Inc. * | 17,715 | 2,241,302 |
Tenable Holdings, Inc. * | 54,917 | 2,231,827 |
Teradata Corp. * | 50,566 | 1,597,380 |
Varonis Systems, Inc. * | 54,054 | 1,447,026 |
Verint Systems, Inc. * | 31,814 | 1,127,170 |
Workiva, Inc. * | 22,405 | 1,743,333 |
Zendesk, Inc. * | 60,732 | 4,657,537 |
83,339,216 | ||
Specialty Retail — 2.9% | ||
American Eagle Outfitters, Inc. | 77,495 | 880,343 |
AutoNation, Inc. * | 19,001 | 2,019,996 |
Carvana Co. * (a) | 48,921 | 661,901 |
Dick's Sporting Goods, Inc. | 27,992 | 3,184,370 |
Five Below, Inc. * | 27,295 | 3,994,623 |
Floor & Decor Holdings, Inc., Class A * | 52,159 | 3,826,906 |
Foot Locker, Inc. | 39,515 | 1,252,625 |
GameStop Corp., Class A * (a) | 124,325 | 3,519,641 |
Gap, Inc. (The) | 104,980 | 1,183,125 |
Leslie's, Inc. * | 72,924 | 1,023,853 |
Lithia Motors, Inc., Class A | 13,540 | 2,682,951 |
Murphy USA, Inc. | 10,568 | 3,323,742 |
National Vision Holdings, Inc. * | 38,804 | 1,437,300 |
Penske Automotive Group, Inc. | 12,775 | 1,425,945 |
Petco Health & Wellness Co., Inc. * (a) | 39,189 | 412,660 |
RH * | 9,834 | 2,497,148 |
Urban Outfitters, Inc. * | 29,628 | 706,924 |
Victoria's Secret & Co. * | 40,866 | 1,536,562 |
Warby Parker, Inc., Class A * (a) | 30,623 | 491,499 |
Williams-Sonoma, Inc. | 33,824 | 4,188,426 |
40,250,540 | ||
Technology Hardware, Storage & Peripherals — 0.4% | ||
Pure Storage, Inc., Class A * | 136,874 | 4,223,932 |
Xerox Holdings Corp. | 55,097 | 806,069 |
5,030,001 | ||
Textiles, Apparel & Luxury Goods — 1.5% | ||
Capri Holdings Ltd. * | 67,897 | 3,101,535 |
Carter's, Inc. | 19,182 | 1,301,882 |
Columbia Sportswear Co. | 17,409 | 1,296,971 |
Crocs, Inc. * | 30,325 | 2,145,494 |
Deckers Outdoor Corp. * | 13,050 | 4,566,587 |
INVESTMENTS | SHARES | VALUE($) |
Textiles, Apparel & Luxury Goods — continued | ||
Hanesbrands, Inc. | 171,642 | 1,170,598 |
PVH Corp. | 32,938 | 1,690,378 |
Ralph Lauren Corp. | 21,101 | 1,955,852 |
Skechers U.S.A., Inc., Class A * | 66,347 | 2,284,327 |
Under Armour, Inc., Class A * | 92,815 | 691,472 |
Under Armour, Inc., Class C * | 98,183 | 644,080 |
20,849,176 | ||
Thrifts & Mortgage Finance — 0.6% | ||
Essent Group Ltd. | 52,975 | 2,096,751 |
MGIC Investment Corp. | 149,260 | 2,037,399 |
New York Community Bancorp, Inc. (a) | 229,295 | 2,134,736 |
Radian Group, Inc. | 79,496 | 1,659,082 |
TFS Financial Corp. | 23,463 | 329,655 |
8,257,623 | ||
Trading Companies & Distributors — 1.2% | ||
Air Lease Corp. | 50,729 | 1,790,226 |
Beacon Roofing Supply, Inc. * | 24,940 | 1,405,369 |
Core & Main, Inc., Class A * | 35,521 | 837,585 |
GATX Corp. | 17,364 | 1,818,185 |
Herc Holdings, Inc. | 12,509 | 1,471,184 |
MSC Industrial Direct Co., Inc., Class A | 23,282 | 1,931,940 |
SiteOne Landscape Supply, Inc. * | 22,152 | 2,566,752 |
Univar Solutions, Inc. * | 82,045 | 2,090,507 |
WESCO International, Inc. * | 21,990 | 3,029,562 |
16,941,310 | ||
Water Utilities — 0.4% | ||
Essential Utilities, Inc. | 117,307 | 5,187,315 |
Total Common Stocks (Cost $1,463,806,734) | 1,381,884,271 | |
Short-Term Investments — 3.2% | ||
Investment Companies — 0.5% | ||
JPMorgan U.S. Government Money Market Fund Class IM Shares, 2.85% (b) (c) (Cost $7,709,091) | 7,709,091 | 7,709,091 |
Investment of Cash Collateral from Securities Loaned — 2.7% | ||
JPMorgan Securities Lending Money Market Fund Agency SL Class Shares, 3.23% (b) (c) | 33,490,848 | 33,490,848 |
134 | J.P. Morgan Exchange-Traded Funds | October 31, 2022 |
INVESTMENTS | SHARES | VALUE($) |
Short-Term Investments — continued | ||
Investment of Cash Collateral from Securities Loaned — continued | ||
JPMorgan U.S. Government Money Market Fund Class IM Shares, 2.85% (b) (c) | 4,093,018 | 4,093,018 |
Total Investment of Cash Collateral from Securities Loaned (Cost $37,581,419) | 37,583,866 | |
Total Short-Term Investments (Cost $45,290,510) | 45,292,957 | |
Total Investments — 102.6% (Cost $1,509,097,244) | 1,427,177,228 | |
Liabilities in Excess of Other Assets — (2.6)% | (36,612,882) | |
NET ASSETS — 100.0% | 1,390,564,346 | |
Percentages indicated are based on net assets. |
* | Non-income producing security. |
(a) | The security or a portion of this security is on loan at October 31, 2022. The total value of securities on loan at October 31, 2022 is $36,819,568. |
(b) | Investment in an affiliated fund, which is registered under the Investment Company Act of 1940, as amended, and is advised by J.P. Morgan Investment Management Inc. |
(c) | The rate shown is the current yield as of October 31, 2022. |
DESCRIPTION | NUMBER OF CONTRACTS | EXPIRATION DATE | TRADING CURRENCY | NOTIONAL AMOUNT ($) | VALUE AND UNREALIZED APPRECIATION (DEPRECIATION) ($) |
Long Contracts | |||||
S&P Midcap 400 E-Mini Index | 32 | 12/16/2022 | USD | 7,809,280 | 499,942 |
Abbreviations | |
USD | United States Dollar |
October 31, 2022 | J.P. Morgan Exchange-Traded Funds | 135 |
AS OF October 31, 2022
INVESTMENTS | SHARES | VALUE($) |
Common Stocks — 98.2% | ||
Aerospace & Defense — 1.1% | ||
AAR Corp. * | 12,571 | 557,147 |
Aerojet Rocketdyne Holdings, Inc. * | 28,256 | 1,369,003 |
AeroVironment, Inc. * | 9,340 | 854,610 |
Astra Space, Inc. * (a) | 54,120 | 34,117 |
Kaman Corp. | 10,468 | 336,023 |
Kratos Defense & Security Solutions, Inc. * | 47,066 | 521,491 |
Maxar Technologies, Inc. | 27,732 | 619,533 |
Parsons Corp. * | 12,384 | 580,562 |
Triumph Group, Inc. * | 24,279 | 219,725 |
Virgin Galactic Holdings, Inc. * (a) | 84,113 | 388,602 |
5,480,813 | ||
Air Freight & Logistics — 0.7% | ||
Air Transport Services Group, Inc. * | 21,678 | 632,998 |
Atlas Air Worldwide Holdings, Inc. * | 9,633 | 974,282 |
Forward Air Corp. | 10,035 | 1,062,405 |
Hub Group, Inc., Class A * | 12,701 | 985,597 |
3,655,282 | ||
Airlines — 0.4% | ||
Hawaiian Holdings, Inc. * | 19,203 | 277,099 |
SkyWest, Inc. * | 18,904 | 334,223 |
Spirit Airlines, Inc. | 40,677 | 894,894 |
Sun Country Airlines Holdings, Inc. * | 12,170 | 198,128 |
Wheels Up Experience, Inc. * | 63,898 | 113,099 |
1,817,443 | ||
Auto Components — 1.0% | ||
American Axle & Manufacturing Holdings, Inc. * | 42,807 | 414,800 |
Dorman Products, Inc. * | 10,571 | 862,805 |
Gentherm, Inc. * | 12,393 | 723,999 |
Holley, Inc. * (a) | 18,964 | 75,477 |
LCI Industries | 9,502 | 1,008,257 |
Patrick Industries, Inc. | 8,115 | 370,936 |
Solid Power, Inc. * | 40,443 | 226,885 |
Standard Motor Products, Inc. | 6,960 | 263,993 |
Tenneco, Inc., Class A * | 30,687 | 604,534 |
XPEL, Inc. * (b) | 7,326 | 506,886 |
5,058,572 | ||
Automobiles — 0.3% | ||
Canoo, Inc. * | 57,057 | 78,168 |
Faraday Future Intelligent Electric, Inc. * (a) | 43,630 | 23,564 |
Fisker, Inc. * (a) | 54,706 | 445,854 |
Winnebago Industries, Inc. | 11,868 | 708,401 |
1,255,987 | ||
INVESTMENTS | SHARES | VALUE($) |
Banks — 9.9% | ||
1st Source Corp. | 6,359 | 369,839 |
Amerant Bancorp, Inc. | 9,591 | 288,689 |
Ameris Bancorp | 24,364 | 1,254,990 |
Atlantic Union Bankshares Corp. | 27,916 | 964,219 |
BancFirst Corp. | 6,494 | 622,255 |
Bancorp, Inc. (The) * | 21,134 | 582,876 |
Banner Corp. | 12,776 | 955,006 |
Berkshire Hills Bancorp, Inc. | 17,110 | 500,468 |
Brookline Bancorp, Inc. | 28,657 | 394,034 |
Cathay General Bancorp | 27,813 | 1,268,273 |
Central Pacific Financial Corp. | 10,232 | 209,961 |
City Holding Co. | 5,550 | 559,717 |
Columbia Banking System, Inc. | 29,391 | 983,717 |
Community Bank System, Inc. | 20,078 | 1,253,470 |
Community Trust Bancorp, Inc. | 5,687 | 268,938 |
Customers Bancorp, Inc. * | 11,397 | 383,965 |
CVB Financial Corp. | 49,110 | 1,410,439 |
Dime Community Bancshares, Inc. | 12,114 | 418,296 |
Eagle Bancorp, Inc. | 11,990 | 542,907 |
Eastern Bankshares, Inc. | 60,648 | 1,162,622 |
Enterprise Financial Services Corp. | 13,908 | 743,661 |
FB Financial Corp. | 13,139 | 551,312 |
First Bancorp | 13,336 | 594,386 |
First BanCorp (Puerto Rico) | 70,251 | 1,109,263 |
First Busey Corp. | 19,191 | 506,834 |
First Commonwealth Financial Corp. | 34,895 | 500,394 |
First Financial Bancorp | 35,455 | 924,312 |
First Foundation, Inc. | 18,964 | 302,665 |
First Interstate BancSystem, Inc., Class A | 33,932 | 1,547,639 |
First Merchants Corp. | 22,230 | 998,127 |
Flushing Financial Corp. | 10,643 | 209,667 |
Fulton Financial Corp. | 62,543 | 1,140,159 |
German American Bancorp, Inc. | 10,359 | 407,005 |
Heartland Financial USA, Inc. | 14,115 | 696,152 |
Hilltop Holdings, Inc. | 17,133 | 496,000 |
Hope Bancorp, Inc. | 44,647 | 605,860 |
Independent Bank Corp. | 17,152 | 1,492,396 |
Independent Bank Group, Inc. | 13,233 | 834,870 |
International Bancshares Corp. | 19,773 | 980,741 |
Lakeland Financial Corp. | 9,473 | 782,943 |
Live Oak Bancshares, Inc. | 12,297 | 399,284 |
National Bank Holdings Corp., Class A | 11,240 | 492,537 |
NBT Bancorp, Inc. | 16,008 | 758,619 |
Northwest Bancshares, Inc. | 47,414 | 714,055 |
136 | J.P. Morgan Exchange-Traded Funds | October 31, 2022 |
INVESTMENTS | SHARES | VALUE($) |
Common Stocks — continued | ||
Banks — continued | ||
OFG Bancorp (Puerto Rico) | 17,771 | 495,455 |
Origin Bancorp, Inc. | 10,876 | 449,505 |
Pacific Premier Bancorp, Inc. | 35,487 | 1,292,082 |
Park National Corp. | 5,406 | 797,385 |
Pathward Financial, Inc. | 10,858 | 456,362 |
Renasant Corp. | 20,909 | 844,096 |
S&T Bancorp, Inc. | 14,627 | 553,047 |
Sandy Spring Bancorp, Inc. | 16,683 | 591,246 |
Seacoast Banking Corp. of Florida | 22,948 | 709,093 |
Silvergate Capital Corp., Class A * | 11,832 | 671,584 |
Simmons First National Corp., Class A | 47,951 | 1,144,590 |
Southside Bancshares, Inc. | 11,396 | 390,199 |
Stock Yards Bancorp, Inc. | 10,928 | 854,460 |
Tompkins Financial Corp. | 4,711 | 390,259 |
Towne Bank | 24,730 | 814,606 |
Triumph Bancorp, Inc. * | 8,595 | 442,643 |
Trustmark Corp. | 22,870 | 836,356 |
United Community Banks, Inc. | 39,634 | 1,525,909 |
Veritex Holdings, Inc. | 20,173 | 637,063 |
Washington Federal, Inc. | 24,410 | 944,667 |
Washington Trust Bancorp, Inc. | 6,418 | 311,273 |
WesBanco, Inc. | 22,313 | 902,338 |
Westamerica BanCorp | 10,058 | 630,938 |
48,868,718 | ||
Beverages — 0.3% | ||
Coca-Cola Consolidated, Inc. | 1,721 | 838,144 |
Duckhorn Portfolio, Inc. (The) * | 15,927 | 232,853 |
MGP Ingredients, Inc. | 5,754 | 644,736 |
1,715,733 | ||
Biotechnology — 6.3% | ||
Agios Pharmaceuticals, Inc. * | 20,487 | 564,212 |
Alector, Inc. * | 22,832 | 210,054 |
Allogene Therapeutics, Inc. * | 33,855 | 348,706 |
Amicus Therapeutics, Inc. * | 93,294 | 932,940 |
AnaptysBio, Inc. * | 7,386 | 213,086 |
Arcus Biosciences, Inc. * | 19,417 | 494,745 |
Arcutis Biotherapeutics, Inc. * | 14,845 | 262,460 |
Atara Biotherapeutics, Inc. * | 35,262 | 164,321 |
Avid Bioservices, Inc. * | 23,109 | 391,466 |
Avidity Biosciences, Inc. * | 19,481 | 278,189 |
BioCryst Pharmaceuticals, Inc. * | 69,489 | 927,678 |
Bridgebio Pharma, Inc. * | 39,887 | 416,021 |
CareDx, Inc. * | 19,977 | 397,742 |
INVESTMENTS | SHARES | VALUE($) |
Biotechnology — continued | ||
Celldex Therapeutics, Inc. * | 17,478 | 614,002 |
Coherus Biosciences, Inc. * | 24,110 | 209,757 |
Cytokinetics, Inc. * | 35,181 | 1,536,002 |
Deciphera Pharmaceuticals, Inc. * | 18,228 | 295,658 |
Dynavax Technologies Corp. * (a) | 43,954 | 503,273 |
Eagle Pharmaceuticals, Inc. * | 3,972 | 124,999 |
Editas Medicine, Inc. * | 25,688 | 322,384 |
Emergent BioSolutions, Inc. * | 16,585 | 345,963 |
Enanta Pharmaceuticals, Inc. * | 7,280 | 328,401 |
EQRx, Inc. * | 85,738 | 440,693 |
FibroGen, Inc. * | 32,579 | 530,386 |
Gossamer Bio, Inc. * (a) | 28,789 | 319,558 |
GreenLight Biosciences Holdings PBC * (a) | 26,704 | 47,533 |
IGM Biosciences, Inc. * | 3,248 | 64,960 |
ImmunityBio, Inc. * (a) | 38,893 | 213,912 |
Inhibrx, Inc. * | 10,072 | 324,117 |
Insmed, Inc. * | 49,896 | 864,199 |
Ironwood Pharmaceuticals, Inc. * | 49,821 | 545,042 |
iTeos Therapeutics, Inc. * | 9,172 | 178,671 |
IVERIC bio, Inc. * | 41,480 | 992,202 |
Karuna Therapeutics, Inc. * | 9,993 | 2,191,865 |
Keros Therapeutics, Inc. * | 6,065 | 305,312 |
Krystal Biotech, Inc. * | 8,055 | 616,207 |
Kura Oncology, Inc. * | 22,996 | 356,898 |
Kymera Therapeutics, Inc. * | 13,761 | 417,509 |
Ligand Pharmaceuticals, Inc. * | 5,996 | 525,549 |
Madrigal Pharmaceuticals, Inc. * | 4,536 | 321,240 |
Morphic Holding, Inc. * | 11,074 | 310,183 |
Myovant Sciences Ltd. * | 16,134 | 431,423 |
Myriad Genetics, Inc. * | 30,133 | 624,958 |
Organogenesis Holdings, Inc. * | 26,413 | 86,635 |
PMV Pharmaceuticals, Inc. * | 12,103 | 148,988 |
Prothena Corp. plc (Ireland) * | 13,150 | 807,936 |
PTC Therapeutics, Inc. * | 26,736 | 1,011,156 |
REGENXBIO, Inc. * | 14,056 | 332,706 |
Replimune Group, Inc. * | 11,976 | 219,879 |
REVOLUTION Medicines, Inc. * | 27,857 | 564,383 |
Rocket Pharmaceuticals, Inc. * | 18,262 | 340,769 |
Roivant Sciences Ltd. * | 39,420 | 202,619 |
Sage Therapeutics, Inc. * | 19,318 | 727,516 |
Sana Biotechnology, Inc. * | 32,700 | 189,660 |
Sangamo Therapeutics, Inc. * | 48,558 | 213,170 |
SpringWorks Therapeutics, Inc. * | 11,827 | 283,966 |
Stoke Therapeutics, Inc. * | 8,396 | 124,681 |
October 31, 2022 | J.P. Morgan Exchange-Traded Funds | 137 |
AS OF October 31, 2022 (continued)
INVESTMENTS | SHARES | VALUE($) |
Common Stocks — continued | ||
Biotechnology — continued | ||
Tango Therapeutics, Inc. * | 16,120 | 129,605 |
TG Therapeutics, Inc. * | 51,573 | 300,155 |
Travere Therapeutics, Inc. * | 20,556 | 445,654 |
Twist Bioscience Corp. * | 21,063 | 691,498 |
Vaxcyte, Inc. * | 22,211 | 968,622 |
Veracyte, Inc. * | 26,749 | 537,922 |
Vericel Corp. * | 17,632 | 473,948 |
Verve Therapeutics, Inc. * | 15,232 | 574,246 |
Xencor, Inc. * | 22,311 | 624,708 |
Zentalis Pharmaceuticals, Inc. * | 16,396 | 411,376 |
30,916,274 | ||
Building Products — 1.4% | ||
AAON, Inc. | 15,693 | 1,012,042 |
American Woodmark Corp. * | 6,201 | 281,215 |
Apogee Enterprises, Inc. | 8,281 | 379,932 |
Gibraltar Industries, Inc. * | 11,821 | 603,817 |
Griffon Corp. | 17,700 | 568,878 |
Janus International Group, Inc. * | 29,578 | 284,836 |
Masonite International Corp. * | 8,322 | 595,273 |
Quanex Building Products Corp. | 12,450 | 275,892 |
Resideo Technologies, Inc. * | 54,442 | 1,285,920 |
Tecnoglass, Inc. | 7,484 | 153,646 |
Zurn Elkay Water Solutions Corp. | 54,467 | 1,279,430 |
6,720,881 | ||
Capital Markets — 2.0% | ||
AssetMark Financial Holdings, Inc. * | 7,992 | 165,514 |
B. Riley Financial, Inc. (a) | 5,919 | 240,785 |
BGC Partners, Inc., Class A | 122,349 | 484,502 |
Blucora, Inc. * | 17,842 | 393,059 |
Brightsphere Investment Group, Inc. | 12,076 | 227,270 |
Cohen & Steers, Inc. | 9,283 | 558,465 |
Focus Financial Partners, Inc., Class A * | 21,521 | 748,716 |
Freedom Holding Corp. (Kazakhstan) * | 6,229 | 345,460 |
Hamilton Lane, Inc., Class A | 13,100 | 783,642 |
Moelis & Co., Class A | 23,945 | 1,016,705 |
Open Lending Corp., Class A * | 39,152 | 280,720 |
Piper Sandler Cos. | 5,123 | 655,590 |
PJT Partners, Inc., Class A | 9,053 | 673,543 |
StepStone Group, Inc., Class A | 17,895 | 528,260 |
StoneX Group, Inc. * | 6,437 | 600,701 |
TPG, Inc. | 19,100 | 587,325 |
Victory Capital Holdings, Inc., Class A | 10,231 | 295,881 |
Virtu Financial, Inc., Class A | 35,812 | 801,473 |
INVESTMENTS | SHARES | VALUE($) |
Capital Markets — continued | ||
Virtus Investment Partners, Inc. | 2,555 | 438,157 |
WisdomTree Investments, Inc. | 41,632 | 226,062 |
10,051,830 | ||
Chemicals — 2.1% | ||
AdvanSix, Inc. | 10,467 | 380,790 |
Amyris, Inc. * (a) | 85,280 | 239,637 |
Aspen Aerogels, Inc. * | 11,184 | 141,813 |
Ecovyst, Inc. * | 26,061 | 259,307 |
HB Fuller Co. | 19,868 | 1,384,998 |
Innospec, Inc. | 9,266 | 926,507 |
Kronos Worldwide, Inc. | 8,200 | 77,900 |
Livent Corp. * | 66,985 | 2,114,716 |
LSB Industries, Inc. * | 14,305 | 252,197 |
Mativ Holdings, Inc. | 20,431 | 485,032 |
Minerals Technologies, Inc. | 12,182 | 670,132 |
Perimeter Solutions SA * | 57,132 | 456,485 |
PureCycle Technologies, Inc. * (a) | 49,496 | 409,332 |
Quaker Chemical Corp. | 5,092 | 828,163 |
Stepan Co. | 7,919 | 827,060 |
Trinseo plc | 13,069 | 245,959 |
Tronox Holdings plc, Class A | 42,707 | 512,484 |
10,212,512 | ||
Commercial Services & Supplies — 2.2% | ||
ABM Industries, Inc. | 24,959 | 1,110,925 |
ACCO Brands Corp. | 35,225 | 162,035 |
ACV Auctions, Inc., Class A * | 43,050 | 392,616 |
Aurora Innovation, Inc. * (a) | 135,302 | 278,722 |
Brady Corp., Class A | 17,446 | 798,154 |
BrightView Holdings, Inc. * | 14,248 | 127,092 |
Casella Waste Systems, Inc., Class A * | 18,942 | 1,549,645 |
Cimpress plc (Ireland) * | 7,324 | 170,503 |
CoreCivic, Inc., REIT * | 43,953 | 460,188 |
Deluxe Corp. | 16,099 | 295,900 |
GEO Group, Inc. (The), REIT * (a) | 46,373 | 392,316 |
Harsco Corp. * | 29,684 | 157,028 |
Healthcare Services Group, Inc. | 27,673 | 386,315 |
HNI Corp. | 15,448 | 447,838 |
Interface, Inc. | 21,961 | 248,379 |
KAR Auction Services, Inc. * | 43,288 | 628,975 |
Matthews International Corp., Class A | 11,439 | 307,480 |
MillerKnoll, Inc. | 28,342 | 600,284 |
Montrose Environmental Group, Inc. * | 10,204 | 446,731 |
Pitney Bowes, Inc. | 60,430 | 187,937 |
138 | J.P. Morgan Exchange-Traded Funds | October 31, 2022 |
INVESTMENTS | SHARES | VALUE($) |
Common Stocks — continued | ||
Commercial Services & Supplies — continued | ||
SP Plus Corp. * | 8,698 | 322,087 |
Steelcase, Inc., Class A | 34,479 | 267,902 |
UniFirst Corp. | 5,642 | 1,038,184 |
10,777,236 | ||
Communications Equipment — 1.1% | ||
ADTRAN Holdings, Inc. | 26,329 | 591,349 |
Calix, Inc. * | 21,213 | 1,562,125 |
CommScope Holding Co., Inc. * | 77,803 | 1,030,112 |
Extreme Networks, Inc. * | 48,304 | 866,574 |
Infinera Corp. * | 70,531 | 395,679 |
NETGEAR, Inc. * | 10,739 | 211,021 |
NetScout Systems, Inc. * | 25,378 | 911,578 |
5,568,438 | ||
Construction & Engineering — 1.8% | ||
Ameresco, Inc., Class A * | 12,644 | 764,709 |
Arcosa, Inc. | 18,072 | 1,160,222 |
Comfort Systems USA, Inc. | 13,370 | 1,648,254 |
Dycom Industries, Inc. * | 11,042 | 1,304,944 |
Fluor Corp. * | 53,098 | 1,606,746 |
Granite Construction, Inc. | 16,473 | 555,634 |
MYR Group, Inc. * | 6,224 | 544,662 |
NV5 Global, Inc. * | 4,649 | 673,873 |
Primoris Services Corp. | 19,886 | 401,498 |
8,660,542 | ||
Construction Materials — 0.2% | ||
Summit Materials, Inc., Class A * | 44,209 | 1,164,907 |
Consumer Finance — 0.8% | ||
Atlanticus Holdings Corp. * | 1,786 | 51,008 |
Encore Capital Group, Inc. * | 8,926 | 454,512 |
Enova International, Inc. * | 11,962 | 448,455 |
Green Dot Corp., Class A * | 17,876 | 340,180 |
LendingClub Corp. * | 38,736 | 412,151 |
LendingTree, Inc. * | 4,061 | 102,459 |
Navient Corp. | 41,355 | 626,115 |
Nelnet, Inc., Class A | 6,746 | 601,001 |
PRA Group, Inc. * | 14,565 | 487,928 |
PROG Holdings, Inc. * | 18,860 | 311,567 |
World Acceptance Corp. * | 1,363 | 110,703 |
3,946,079 | ||
Containers & Packaging — 0.5% | ||
Greif, Inc., Class A | 9,949 | 658,723 |
Myers Industries, Inc. | 13,630 | 276,553 |
INVESTMENTS | SHARES | VALUE($) |
Containers & Packaging — continued | ||
O-I Glass, Inc. * | 58,193 | 949,128 |
Pactiv Evergreen, Inc. | 14,611 | 159,406 |
Ranpak Holdings Corp. * | 14,772 | 56,133 |
TriMas Corp. | 15,695 | 358,631 |
2,458,574 | ||
Diversified Consumer Services — 0.9% | ||
2U, Inc. * | 28,957 | 179,244 |
Adtalem Global Education, Inc. * | 16,894 | 704,480 |
Duolingo, Inc. * | 9,268 | 758,493 |
European Wax Center, Inc., Class A | 9,448 | 135,862 |
Laureate Education, Inc., Class A | 41,229 | 521,135 |
OneSpaWorld Holdings Ltd. (Bahamas) * | 22,061 | 200,093 |
Rover Group, Inc. * | 36,202 | 158,927 |
Strategic Education, Inc. | 8,378 | 578,082 |
Stride, Inc. * | 15,185 | 508,850 |
Udemy, Inc. * | 24,204 | 352,168 |
Vivint Smart Home, Inc. * | 16,697 | 127,732 |
WW International, Inc. * | 19,989 | 90,350 |
4,315,416 | ||
Diversified Financial Services — 0.4% | ||
Cannae Holdings, Inc. * | 27,853 | 645,075 |
Compass Diversified Holdings | 23,053 | 490,568 |
Jackson Financial, Inc., Class A | 22,516 | 863,714 |
1,999,357 | ||
Diversified Telecommunication Services — 0.4% | ||
Cogent Communications Holdings, Inc. | 15,943 | 837,167 |
EchoStar Corp., Class A * | 13,262 | 250,254 |
Globalstar, Inc. * | 262,486 | 569,594 |
Liberty Latin America Ltd., Class A (Chile) * | 14,092 | 109,636 |
Liberty Latin America Ltd., Class C (Chile) * | 55,609 | 433,194 |
2,199,845 | ||
Electric Utilities — 0.4% | ||
MGE Energy, Inc. | 13,513 | 920,100 |
Otter Tail Corp. | 15,558 | 1,048,921 |
1,969,021 | ||
Electrical Equipment — 1.4% | ||
Array Technologies, Inc. * | 52,244 | 945,616 |
AZZ, Inc. | 9,265 | 372,453 |
Blink Charging Co. * (a) | 15,200 | 224,960 |
Encore Wire Corp. | 7,149 | 983,631 |
Energy Vault Holdings, Inc. * (a) | 25,093 | 80,799 |
Enovix Corp. * | 40,985 | 773,387 |
October 31, 2022 | J.P. Morgan Exchange-Traded Funds | 139 |
AS OF October 31, 2022 (continued)
INVESTMENTS | SHARES | VALUE($) |
Common Stocks — continued | ||
Electrical Equipment — continued | ||
ESS Tech, Inc. * | 20,560 | 86,969 |
FREYR Battery SA (Norway) * (a) | 30,092 | 400,525 |
FuelCell Energy, Inc. * (a) | 144,480 | 450,778 |
SES AI Corp. * | 53,464 | 321,319 |
Shoals Technologies Group, Inc., Class A * | 39,485 | 912,498 |
Stem, Inc. * | 54,179 | 736,834 |
Tritium DCFC Ltd. (Australia) * | 42,496 | 86,692 |
Vicor Corp. * | 8,310 | 396,969 |
6,773,430 | ||
Electronic Equipment, Instruments & Components — 3.0% | ||
908 Devices, Inc. * | 8,144 | 130,223 |
Advanced Energy Industries, Inc. | 13,963 | 1,098,190 |
Aeva Technologies, Inc. * | 39,069 | 78,138 |
Badger Meter, Inc. | 10,937 | 1,230,194 |
Benchmark Electronics, Inc. | 13,138 | 372,988 |
CTS Corp. | 11,909 | 470,644 |
ePlus, Inc. * | 10,051 | 489,685 |
Fabrinet (Thailand) * | 13,747 | 1,572,657 |
FARO Technologies, Inc. * | 6,831 | 199,533 |
Insight Enterprises, Inc. * | 11,408 | 1,078,170 |
Itron, Inc. * | 16,870 | 824,774 |
Knowles Corp. * | 34,248 | 470,910 |
Lightwave Logic, Inc. * (a) | 41,888 | 354,791 |
Methode Electronics, Inc. | 13,734 | 566,253 |
MicroVision, Inc. * (a) | 61,860 | 226,408 |
Mirion Technologies, Inc. * | 45,608 | 368,513 |
OSI Systems, Inc. * | 5,922 | 486,670 |
Ouster, Inc. * | 36,670 | 45,837 |
PAR Technology Corp. * | 10,189 | 293,239 |
PC Connection, Inc. | 4,223 | 224,410 |
Plexus Corp. * | 10,358 | 1,019,227 |
Sanmina Corp. * | 21,603 | 1,210,848 |
ScanSource, Inc. * | 9,429 | 292,110 |
SmartRent, Inc. * (a) | 45,817 | 125,997 |
TTM Technologies, Inc. * | 38,188 | 584,658 |
Vishay Intertechnology, Inc. | 48,836 | 1,021,161 |
14,836,228 | ||
Energy Equipment & Services — 2.6% | ||
Archrock, Inc. | 50,015 | 375,613 |
Cactus, Inc., Class A | 22,654 | 1,171,665 |
Core Laboratories NV | 17,313 | 336,911 |
Dril-Quip, Inc. * | 12,844 | 319,559 |
Liberty Energy, Inc., Class A * | 59,356 | 1,003,710 |
INVESTMENTS | SHARES | VALUE($) |
Energy Equipment & Services — continued | ||
Nabors Industries Ltd. * | 3,343 | 581,782 |
NexTier Oilfield Solutions, Inc. * | 59,305 | 597,794 |
Noble Corp. plc * | 37,550 | 1,353,302 |
Oceaneering International, Inc. * | 37,466 | 524,149 |
Patterson-UTI Energy, Inc. | 81,028 | 1,430,144 |
ProPetro Holding Corp. * | 32,753 | 387,796 |
RPC, Inc. | 31,096 | 346,098 |
Tidewater, Inc. * | 17,280 | 585,792 |
Transocean Ltd. * | 242,629 | 892,875 |
US Silica Holdings, Inc. * | 28,236 | 406,316 |
Valaris Ltd. * | 22,475 | 1,504,252 |
Weatherford International plc * | 23,989 | 999,861 |
12,817,619 | ||
Entertainment — 0.6% | ||
Cinemark Holdings, Inc. * | 40,099 | 425,450 |
IMAX Corp. * | 17,399 | 221,489 |
Liberty Media Corp.-Liberty Braves, Class A * | 3,856 | 122,968 |
Liberty Media Corp.-Liberty Braves, Class C * | 13,823 | 430,725 |
Madison Square Garden Entertainment Corp. * | 9,709 | 476,032 |
Skillz, Inc. * (a) | 111,320 | 114,660 |
World Wrestling Entertainment, Inc., Class A | 16,163 | 1,275,099 |
3,066,423 | ||
Equity Real Estate Investment Trusts (REITs) — 4.7% | ||
Acadia Realty Trust | 35,477 | 495,614 |
Alexander & Baldwin, Inc. | 27,168 | 529,233 |
Alexander's, Inc. | 801 | 188,147 |
American Assets Trust, Inc. | 19,454 | 534,596 |
Apartment Investment and Management Co., Class A | 56,859 | 451,460 |
Brandywine Realty Trust | 64,116 | 420,601 |
CareTrust REIT, Inc. | 36,260 | 677,337 |
CBL & Associates Properties, Inc. | 9,153 | 262,966 |
Centerspace | 5,745 | 398,128 |
Corporate Office Properties Trust | 42,013 | 1,119,646 |
DiamondRock Hospitality Co. | 78,824 | 736,216 |
Diversified Healthcare Trust | 89,362 | 121,532 |
Easterly Government Properties, Inc. | 33,940 | 590,217 |
Elme Communities | 32,662 | 623,518 |
Empire State Realty Trust, Inc., Class A | 49,835 | 367,284 |
Essential Properties Realty Trust, Inc. | 52,776 | 1,135,740 |
Four Corners Property Trust, Inc. | 30,442 | 779,924 |
Getty Realty Corp. | 15,893 | 500,471 |
Gladstone Land Corp. | 11,890 | 241,961 |
Global Net Lease, Inc. | 38,749 | 474,675 |
140 | J.P. Morgan Exchange-Traded Funds | October 31, 2022 |
INVESTMENTS | SHARES | VALUE($) |
Common Stocks — continued | ||
Equity Real Estate Investment Trusts (REITs) — continued | ||
Industrial Logistics Properties Trust | 24,448 | 114,417 |
InvenTrust Properties Corp. | 25,200 | 635,040 |
iStar, Inc. | 31,905 | 334,364 |
LTC Properties, Inc. | 15,138 | 585,386 |
LXP Industrial Trust | 104,598 | 1,012,509 |
Macerich Co. (The) | 80,264 | 893,338 |
Necessity Retail REIT, Inc. (The) | 49,805 | 340,666 |
NexPoint Residential Trust, Inc. | 8,532 | 389,059 |
Office Properties Income Trust | 18,108 | 277,052 |
Paramount Group, Inc. | 63,160 | 408,645 |
Physicians Realty Trust | 84,579 | 1,273,760 |
PotlatchDeltic Corp. | 30,119 | 1,339,994 |
Retail Opportunity Investments Corp. | 46,544 | 673,957 |
RPT Realty | 31,830 | 296,019 |
Safehold, Inc. | 6,507 | 190,330 |
Saul Centers, Inc. | 4,818 | 197,297 |
Service Properties Trust | 61,711 | 500,476 |
Summit Hotel Properties, Inc. | 39,947 | 345,142 |
Tanger Factory Outlet Centers, Inc. | 39,005 | 702,480 |
Universal Health Realty Income Trust | 4,744 | 230,890 |
Urban Edge Properties | 43,888 | 619,699 |
Urstadt Biddle Properties, Inc., Class A | 11,271 | 211,219 |
Veris Residential, Inc. * | 29,613 | 468,774 |
Xenia Hotels & Resorts, Inc. | 42,734 | 729,897 |
23,419,676 | ||
Food & Staples Retailing — 0.9% | ||
Andersons, Inc. (The) | 11,895 | 419,537 |
Chefs' Warehouse, Inc. (The) * | 12,725 | 466,117 |
Grocery Outlet Holding Corp. * | 32,963 | 1,139,531 |
Ingles Markets, Inc., Class A | 5,372 | 506,956 |
SpartanNash Co. | 13,499 | 482,049 |
United Natural Foods, Inc. * | 21,783 | 923,817 |
Weis Markets, Inc. | 6,132 | 574,384 |
4,512,391 | ||
Food Products — 1.5% | ||
B&G Foods, Inc. (a) | 26,783 | 438,706 |
Benson Hill, Inc. * | 47,652 | 161,540 |
Calavo Growers, Inc. | 6,629 | 229,297 |
Cal-Maine Foods, Inc. | 14,185 | 801,594 |
Fresh Del Monte Produce, Inc. | 11,442 | 298,407 |
Hostess Brands, Inc. * | 51,010 | 1,350,745 |
J & J Snack Foods Corp. | 5,592 | 825,435 |
Mission Produce, Inc. * | 15,052 | 250,465 |
INVESTMENTS | SHARES | VALUE($) |
Food Products — continued | ||
Simply Good Foods Co. (The) * | 31,882 | 1,221,081 |
Sovos Brands, Inc. * | 14,332 | 198,642 |
Tattooed Chef, Inc. * (a) | 17,563 | 83,424 |
Tootsie Roll Industries, Inc. | 6,638 | 268,109 |
TreeHouse Foods, Inc. * | 18,849 | 946,974 |
Utz Brands, Inc. | 24,763 | 401,408 |
7,475,827 | ||
Gas Utilities — 0.5% | ||
Chesapeake Utilities Corp. | 6,628 | 824,391 |
Northwest Natural Holding Co. | 13,012 | 625,747 |
South Jersey Industries, Inc. | 27,941 | 968,714 |
2,418,852 | ||
Health Care Equipment & Supplies — 3.0% | ||
AtriCure, Inc. * | 17,350 | 730,782 |
Atrion Corp. | 506 | 303,757 |
Avanos Medical, Inc. * | 17,372 | 384,790 |
Axonics, Inc. * | 18,361 | 1,342,924 |
BioLife Solutions, Inc. * | 12,737 | 299,574 |
Butterfly Network, Inc. * (a) | 53,695 | 263,106 |
Cardiovascular Systems, Inc. * | 15,241 | 220,080 |
CONMED Corp. | 11,383 | 907,567 |
Embecta Corp. | 21,601 | 667,903 |
Establishment Labs Holdings, Inc. (Costa Rica) * | 8,254 | 465,443 |
Glaukos Corp. * | 17,787 | 997,317 |
Heska Corp. * | 3,799 | 272,616 |
Inogen, Inc. * | 8,547 | 193,675 |
Integer Holdings Corp. * | 12,377 | 771,458 |
iRhythm Technologies, Inc. * | 11,221 | 1,430,565 |
Meridian Bioscience, Inc. * | 16,348 | 522,646 |
Merit Medical Systems, Inc. * | 21,215 | 1,458,956 |
Mesa Laboratories, Inc. | 1,867 | 246,836 |
Neogen Corp. * | 80,760 | 1,066,032 |
Outset Medical, Inc. * | 17,942 | 278,819 |
PROCEPT BioRobotics Corp. * (a) | 12,166 | 552,701 |
Pulmonx Corp. * | 13,925 | 186,038 |
Senseonics Holdings, Inc. * (a) | 173,938 | 205,247 |
Silk Road Medical, Inc. * | 13,168 | 580,445 |
Treace Medical Concepts, Inc. * (a) | 11,803 | 288,937 |
Varex Imaging Corp. * | 14,910 | 329,660 |
14,967,874 | ||
Health Care Providers & Services — 2.0% | ||
1Life Healthcare, Inc. * | 62,728 | 1,072,649 |
October 31, 2022 | J.P. Morgan Exchange-Traded Funds | 141 |
AS OF October 31, 2022 (continued)
INVESTMENTS | SHARES | VALUE($) |
Common Stocks — continued | ||
Health Care Providers & Services — continued | ||
23andMe Holding Co. * | 97,076 | 304,819 |
AdaptHealth Corp. * | 28,650 | 653,220 |
Addus HomeCare Corp. * | 6,011 | 615,647 |
Agiliti, Inc. * | 12,443 | 217,379 |
Alignment Healthcare, Inc. * | 30,791 | 407,673 |
Brookdale Senior Living, Inc. * | 69,803 | 312,019 |
Cano Health, Inc. * | 65,003 | 232,711 |
Castle Biosciences, Inc. * | 9,236 | 235,703 |
Clover Health Investments Corp. * | 121,737 | 192,345 |
Community Health Systems, Inc. * | 46,818 | 134,368 |
CorVel Corp. * | 3,445 | 565,703 |
Fulgent Genetics, Inc. * | 7,578 | 300,316 |
Hims & Hers Health, Inc. * | 45,308 | 205,698 |
Invitae Corp. * (a) | 82,644 | 213,222 |
ModivCare, Inc. * | 4,726 | 459,556 |
National HealthCare Corp. | 5,093 | 310,266 |
National Research Corp. | 5,277 | 214,932 |
OPKO Health, Inc. * | 152,896 | 290,502 |
Owens & Minor, Inc. | 28,495 | 484,415 |
Pediatrix Medical Group, Inc. * | 31,523 | 611,546 |
RadNet, Inc. * | 18,203 | 348,041 |
Select Medical Holdings Corp. | 38,587 | 990,914 |
Sema4 Holdings Corp. * | 100,094 | 103,097 |
US Physical Therapy, Inc. | 4,858 | 431,390 |
9,908,131 | ||
Health Care Technology — 0.8% | ||
Allscripts Healthcare Solutions, Inc. * | 41,402 | 608,609 |
American Well Corp., Class A * | 89,920 | 367,773 |
Evolent Health, Inc., Class A * | 31,174 | 991,645 |
GoodRx Holdings, Inc., Class A * | 28,699 | 154,114 |
Health Catalyst, Inc. * | 20,448 | 180,351 |
HealthStream, Inc. * | 9,025 | 222,917 |
NextGen Healthcare, Inc. * | 20,590 | 412,624 |
Phreesia, Inc. * | 19,524 | 533,396 |
Schrodinger, Inc. * | 19,935 | 477,842 |
Sharecare, Inc. * | 118,521 | 227,560 |
4,176,831 | ||
Hotels, Restaurants & Leisure — 2.1% | ||
Bally's Corp. * | 10,384 | 234,055 |
BJ's Restaurants, Inc. * | 8,764 | 287,897 |
Bloomin' Brands, Inc. | 33,370 | 801,214 |
Bowlero Corp. * | 12,882 | 187,562 |
Brinker International, Inc. * | 16,383 | 547,028 |
INVESTMENTS | SHARES | VALUE($) |
Hotels, Restaurants & Leisure — continued | ||
Cheesecake Factory, Inc. (The) | 18,151 | 649,987 |
Dave & Buster's Entertainment, Inc. * | 15,910 | 634,014 |
Denny's Corp. * | 21,650 | 245,295 |
Dine Brands Global, Inc. | 5,859 | 422,375 |
Dutch Bros, Inc., Class A * | 9,607 | 354,594 |
Everi Holdings, Inc. * | 33,578 | 637,310 |
F45 Training Holdings, Inc. * | 13,505 | 45,107 |
Golden Entertainment, Inc. * | 8,204 | 346,373 |
Jack in the Box, Inc. | 7,870 | 694,370 |
Krispy Kreme, Inc. (a) | 25,008 | 358,865 |
Monarch Casino & Resort, Inc. * | 4,942 | 392,444 |
Papa John's International, Inc. | 12,020 | 873,013 |
Portillo's, Inc., Class A * | 10,742 | 230,309 |
Red Rock Resorts, Inc., Class A | 18,564 | 773,191 |
Shake Shack, Inc., Class A * | 13,941 | 774,701 |
Sonder Holdings, Inc. * | 52,823 | 115,682 |
Sweetgreen, Inc., Class A * (a) | 27,820 | 517,452 |
Vacasa, Inc., Class A * | 30,506 | 111,347 |
10,234,185 | ||
Household Durables — 2.2% | ||
Cavco Industries, Inc. * | 3,089 | 700,184 |
Century Communities, Inc. | 10,735 | 477,815 |
GoPro, Inc., Class A * | 48,388 | 263,715 |
Installed Building Products, Inc. | 8,808 | 757,488 |
iRobot Corp. * (a) | 10,176 | 574,944 |
KB Home | 31,571 | 909,876 |
La-Z-Boy, Inc. | 16,217 | 401,695 |
LGI Homes, Inc. * | 7,653 | 704,459 |
M/I Homes, Inc. * | 10,376 | 430,500 |
MDC Holdings, Inc. | 21,274 | 648,006 |
Meritage Homes Corp. * | 13,666 | 1,040,803 |
Skyline Champion Corp. * | 19,773 | 1,150,986 |
Snap One Holdings Corp. * | 6,520 | 77,718 |
Sonos, Inc. * | 47,553 | 766,554 |
Taylor Morrison Home Corp.���* | 42,474 | 1,118,765 |
Tri Pointe Homes, Inc. * | 37,983 | 636,215 |
Tupperware Brands Corp. * | 14,456 | 111,745 |
Vizio Holding Corp., Class A * | 20,915 | 234,248 |
11,005,716 | ||
Household Products — 0.3% | ||
Central Garden & Pet Co. * | 3,636 | 150,058 |
142 | J.P. Morgan Exchange-Traded Funds | October 31, 2022 |
INVESTMENTS | SHARES | VALUE($) |
Common Stocks — continued | ||
Household Products — continued | ||
Central Garden & Pet Co., Class A * | 15,491 | 606,318 |
WD-40 Co. | 5,092 | 815,534 |
1,571,910 | ||
Independent Power and Renewable Electricity Producers — 0.3% | ||
Altus Power, Inc. * | 13,205 | 131,522 |
Clearway Energy, Inc. | 12,931 | 418,059 |
Clearway Energy, Inc., Class C | 30,718 | 1,067,143 |
1,616,724 | ||
Insurance — 1.8% | ||
American Equity Investment Life Holding Co. | 26,527 | 1,142,783 |
AMERISAFE, Inc. | 7,207 | 420,961 |
Argo Group International Holdings Ltd. | 13,087 | 325,474 |
BRP Group, Inc., Class A * | 22,513 | 638,244 |
Employers Holdings, Inc. | 10,203 | 444,953 |
Genworth Financial, Inc., Class A * | 188,241 | 879,085 |
Goosehead Insurance, Inc., Class A * | 7,671 | 318,423 |
Hagerty, Inc., Class A * | 11,707 | 106,417 |
Hippo Holdings, Inc. * | 5,648 | 97,597 |
Horace Mann Educators Corp. | 15,283 | 603,067 |
James River Group Holdings Ltd. | 13,997 | 353,704 |
Lemonade, Inc. * (a) | 16,747 | 405,277 |
Oscar Health, Inc., Class A * | 40,755 | 152,016 |
Palomar Holdings, Inc. * | 9,434 | 839,249 |
ProAssurance Corp. | 20,167 | 447,909 |
Safety Insurance Group, Inc. | 5,508 | 478,921 |
SiriusPoint Ltd. (Bermuda) * | 31,750 | 203,835 |
Stewart Information Services Corp. | 10,131 | 394,704 |
Trupanion, Inc. * (a) | 13,095 | 660,905 |
8,913,524 | ||
Interactive Media & Services — 0.4% | ||
Cars.com, Inc. * | 23,585 | 327,360 |
Eventbrite, Inc., Class A * | 30,122 | 197,901 |
fuboTV, Inc. * (a) | 69,245 | 253,437 |
MediaAlpha, Inc., Class A * | 8,499 | 93,319 |
Shutterstock, Inc. | 9,006 | 450,570 |
System1, Inc. * | 7,784 | 40,321 |
Vimeo, Inc. * | 58,665 | 222,927 |
ZipRecruiter, Inc., Class A * | 21,252 | 356,396 |
1,942,231 | ||
Internet & Direct Marketing Retail — 0.4% | ||
BARK, Inc. * | 38,867 | 71,127 |
Boxed, Inc. * | 21,402 | 10,699 |
INVESTMENTS | SHARES | VALUE($) |
Internet & Direct Marketing Retail — continued | ||
ContextLogic, Inc., Class A * | 188,897 | 147,906 |
Overstock.com, Inc. * | 17,076 | 397,017 |
Qurate Retail, Inc. | 127,096 | 297,405 |
Revolve Group, Inc. * | 15,220 | 365,280 |
Stitch Fix, Inc., Class A * | 27,218 | 108,872 |
Vivid Seats, Inc., Class A * | 8,893 | 72,922 |
Xometry, Inc., Class A * | 10,997 | 660,480 |
2,131,708 | ||
IT Services — 2.7% | ||
AvidXchange Holdings, Inc. * | 49,600 | 451,360 |
BigCommerce Holdings, Inc. * | 22,760 | 338,214 |
Conduent, Inc. * | 62,094 | 255,827 |
Core Scientific, Inc. * (a) | 96,388 | 19,278 |
CSG Systems International, Inc. | 11,989 | 775,329 |
Cyxtera Technologies, Inc. * | 20,686 | 50,060 |
EVERTEC, Inc. (Puerto Rico) | 24,655 | 882,896 |
Fastly, Inc., Class A * | 41,558 | 352,827 |
Grid Dynamics Holdings, Inc. * | 17,605 | 239,604 |
Kyndryl Holdings, Inc. * | 76,270 | 737,531 |
Marqeta, Inc., Class A * | 149,899 | 1,181,204 |
Paya Holdings, Inc. * | 32,575 | 261,903 |
Payoneer Global, Inc. * | 73,796 | 571,919 |
Perficient, Inc. * | 12,932 | 866,056 |
Repay Holdings Corp. * | 28,250 | 172,042 |
Sabre Corp. * | 122,646 | 712,573 |
Shift4 Payments, Inc., Class A * | 19,094 | 877,751 |
Squarespace, Inc., Class A * | 15,684 | 348,342 |
TaskUS, Inc., Class A (Philippines) * | 9,891 | 199,699 |
Toast, Inc., Class A * | 112,536 | 2,485,920 |
TTEC Holdings, Inc. | 7,055 | 313,736 |
Unisys Corp. * | 25,332 | 215,322 |
Verra Mobility Corp. * | 53,238 | 908,773 |
13,218,166 | ||
Leisure Products — 0.5% | ||
Acushnet Holdings Corp. | 12,234 | 569,738 |
Latham Group, Inc. * | 15,755 | 69,637 |
Malibu Boats, Inc., Class A * | 7,661 | 405,267 |
Smith & Wesson Brands, Inc. | 17,101 | 193,070 |
Sturm Ruger & Co., Inc. | 6,602 | 370,570 |
Vista Outdoor, Inc. * | 21,124 | 613,441 |
2,221,723 | ||
Life Sciences Tools & Services — 0.7% | ||
AbCellera Biologics, Inc. (Canada) * | 77,788 | 920,232 |
October 31, 2022 | J.P. Morgan Exchange-Traded Funds | 143 |
AS OF October 31, 2022 (continued)
INVESTMENTS | SHARES | VALUE($) |
Common Stocks — continued | ||
Life Sciences Tools & Services — continued | ||
Adaptive Biotechnologies Corp. * | 41,114 | 319,867 |
Codexis, Inc. * | 24,477 | 137,561 |
CryoPort, Inc. * | 18,121 | 503,039 |
NanoString Technologies, Inc. * | 15,984 | 167,192 |
NeoGenomics, Inc. * | 47,011 | 357,519 |
Pacific Biosciences of California, Inc. * | 77,300 | 652,412 |
Quanterix Corp. * | 12,853 | 142,283 |
SomaLogic, Inc. * | 55,860 | 193,834 |
3,393,939 | ||
Machinery — 4.3% | ||
3D Systems Corp. * | 48,685 | 429,889 |
Alamo Group, Inc. | 3,847 | 585,052 |
Albany International Corp., Class A | 11,622 | 1,064,808 |
Altra Industrial Motion Corp. | 24,315 | 1,462,304 |
Astec Industries, Inc. | 8,546 | 373,033 |
Barnes Group, Inc. | 18,878 | 667,715 |
Desktop Metal, Inc., Class A * (a) | 87,268 | 220,788 |
Enerpac Tool Group Corp. | 21,728 | 552,108 |
EnPro Industries, Inc. | 7,772 | 827,718 |
ESCO Technologies, Inc. | 9,663 | 832,661 |
Federal Signal Corp. | 22,658 | 1,056,996 |
Franklin Electric Co., Inc. | 14,531 | 1,190,670 |
Gorman-Rupp Co. (The) | 8,482 | 230,201 |
Greenbrier Cos., Inc. (The) | 12,180 | 430,076 |
Helios Technologies, Inc. | 12,163 | 689,520 |
Hillenbrand, Inc. | 25,958 | 1,146,824 |
Hillman Solutions Corp. * | 45,039 | 351,755 |
Hyzon Motors, Inc. * (a) | 32,426 | 61,934 |
John Bean Technologies Corp. | 11,907 | 1,085,918 |
Kadant, Inc. | 4,357 | 775,328 |
Lindsay Corp. | 4,102 | 694,469 |
Markforged Holding Corp. * | 33,104 | 72,167 |
Microvast Holdings, Inc. * | 70,099 | 171,743 |
Mueller Industries, Inc. | 21,181 | 1,326,778 |
Mueller Water Products, Inc., Class A | 58,544 | 684,965 |
Omega Flex, Inc. | 1,131 | 106,766 |
Proterra, Inc. * | 72,345 | 451,433 |
Proto Labs, Inc. * | 10,276 | 392,440 |
SPX Technologies, Inc. * | 16,898 | 1,112,564 |
Standex International Corp. | 4,470 | 442,753 |
Tennant Co. | 6,946 | 404,604 |
Terex Corp. | 25,337 | 1,027,162 |
INVESTMENTS | SHARES | VALUE($) |
Machinery — continued | ||
Velo3D, Inc. * (a) | 22,804 | 89,848 |
Wabash National Corp. | 18,143 | 392,796 |
21,405,786 | ||
Marine — 0.2% | ||
Matson, Inc. | 14,566 | 1,071,766 |
Media — 0.8% | ||
Advantage Solutions, Inc. * | 34,516 | 116,664 |
AMC Networks, Inc., Class A * | 10,455 | 235,342 |
Cardlytics, Inc. * | 12,293 | 115,923 |
Clear Channel Outdoor Holdings, Inc. * | 177,938 | 254,451 |
EW Scripps Co. (The), Class A * | 21,639 | 307,057 |
Gray Television, Inc. | 31,958 | 452,206 |
iHeartMedia, Inc., Class A * | 39,064 | 323,450 |
Magnite, Inc. * | 43,719 | 318,712 |
Scholastic Corp. | 11,293 | 430,715 |
Sinclair Broadcast Group, Inc., Class A | 16,357 | 291,318 |
TechTarget, Inc. * | 10,145 | 654,860 |
Thryv Holdings, Inc. * | 11,455 | 234,369 |
WideOpenWest, Inc. * | 19,342 | 265,179 |
4,000,246 | ||
Metals & Mining — 1.7% | ||
Alpha Metallurgical Resources, Inc. | 5,890 | 994,527 |
Arconic Corp. * | 38,366 | 796,478 |
ATI, Inc. * | 48,545 | 1,444,699 |
Carpenter Technology Corp. | 18,043 | 674,808 |
Century Aluminum Co. * | 19,120 | 137,855 |
Coeur Mining, Inc. * | 104,962 | 396,757 |
Hecla Mining Co. | 209,454 | 957,205 |
Kaiser Aluminum Corp. | 5,955 | 481,105 |
Materion Corp. | 7,669 | 657,310 |
Piedmont Lithium, Inc. * | 6,110 | 380,164 |
Ryerson Holding Corp. | 7,753 | 260,113 |
Schnitzer Steel Industries, Inc., Class A | 9,570 | 258,294 |
Warrior Met Coal, Inc. | 19,302 | 716,876 |
8,156,191 | ||
Mortgage Real Estate Investment Trusts (REITs) — 1.4% | ||
Apollo Commercial Real Estate Finance, Inc. | 48,336 | 544,263 |
Arbor Realty Trust, Inc. | 63,643 | 876,364 |
ARMOUR Residential REIT, Inc. (a) | 42,838 | 227,898 |
Brightspire Capital, Inc. | 35,662 | 273,884 |
Broadmark Realty Capital, Inc. | 49,652 | 288,975 |
Hannon Armstrong Sustainable Infrastructure Capital, Inc. | 32,694 | 888,623 |
144 | J.P. Morgan Exchange-Traded Funds | October 31, 2022 |
INVESTMENTS | SHARES | VALUE($) |
Common Stocks — continued | ||
Mortgage Real Estate Investment Trusts (REITs) — continued | ||
Invesco Mortgage Capital, Inc. (a) | 12,341 | 144,513 |
KKR Real Estate Finance Trust, Inc. | 21,739 | 378,694 |
Ladder Capital Corp. | 42,181 | 450,071 |
MFA Financial, Inc. | 33,855 | 337,193 |
New York Mortgage Trust, Inc. | 141,157 | 379,712 |
PennyMac Mortgage Investment Trust | 33,845 | 469,430 |
Ready Capital Corp. | 38,050 | 461,166 |
Redwood Trust, Inc. | 43,634 | 311,111 |
TPG RE Finance Trust, Inc. | 22,851 | 193,548 |
Two Harbors Investment Corp. | 128,721 | 458,247 |
6,683,692 | ||
Multiline Retail — 0.1% | ||
Big Lots, Inc. | 10,807 | 203,928 |
Franchise Group, Inc. | 10,558 | 320,435 |
524,363 | ||
Multi-Utilities — 0.2% | ||
NorthWestern Corp. | 20,984 | 1,108,585 |
Oil, Gas & Consumable Fuels — 4.5% | ||
Arch Resources, Inc. | 6,933 | 1,055,827 |
Archaea Energy, Inc. * | 27,338 | 705,594 |
Brigham Minerals, Inc., Class A | 20,074 | 622,294 |
California Resources Corp. | 28,169 | 1,270,704 |
Callon Petroleum Co. * | 19,141 | 841,438 |
Chord Energy Corp. | 15,493 | 2,371,822 |
Clean Energy Fuels Corp. * | 65,605 | 440,210 |
Comstock Resources, Inc. * | 33,983 | 638,201 |
CONSOL Energy, Inc. | 12,249 | 771,932 |
CVR Energy, Inc. | 10,895 | 425,559 |
Delek US Holdings, Inc. | 26,545 | 787,325 |
Denbury, Inc. * | 18,580 | 1,698,398 |
Gevo, Inc. * | 87,884 | 197,739 |
Green Plains, Inc. * | 21,709 | 627,173 |
Gulfport Energy Corp. * | 4,342 | 388,652 |
Kosmos Energy Ltd. (Ghana) * | 170,352 | 1,105,584 |
Laredo Petroleum, Inc. * | 6,393 | 413,307 |
Magnolia Oil & Gas Corp., Class A | 62,810 | 1,612,961 |
Northern Oil and Gas, Inc. | 25,658 | 875,964 |
PBF Energy, Inc., Class A * | 40,097 | 1,774,292 |
Peabody Energy Corp. * | 43,557 | 1,041,012 |
Permian Resources Corp. * | 75,635 | 738,954 |
Talos Energy, Inc. * | 24,367 | 518,530 |
INVESTMENTS | SHARES | VALUE($) |
Oil, Gas & Consumable Fuels — continued | ||
Tellurian, Inc. * | 191,245 | 516,361 |
World Fuel Services Corp. | 23,139 | 589,813 |
22,029,646 | ||
Paper & Forest Products — 0.2% | ||
Mercer International, Inc. (Germany) | 15,085 | 202,441 |
Sylvamo Corp. | 12,367 | 595,718 |
798,159 | ||
Personal Products — 0.7% | ||
Edgewell Personal Care Co. | 19,366 | 758,954 |
elf Beauty, Inc. * | 18,610 | 805,069 |
Inter Parfums, Inc. | 6,666 | 539,146 |
Medifast, Inc. | 4,116 | 481,531 |
Nu Skin Enterprises, Inc., Class A | 18,828 | 719,041 |
USANA Health Sciences, Inc. * | 4,159 | 218,389 |
3,522,130 | ||
Pharmaceuticals — 1.5% | ||
Aclaris Therapeutics, Inc. * | 19,185 | 299,478 |
Amneal Pharmaceuticals, Inc. * | 37,344 | 82,157 |
Amphastar Pharmaceuticals, Inc. * | 14,286 | 441,437 |
Arvinas, Inc. * | 18,094 | 899,453 |
Axsome Therapeutics, Inc. * | 11,899 | 537,240 |
Cassava Sciences, Inc. * (a) | 14,086 | 513,294 |
CinCor Pharma, Inc. * (a) | 7,010 | 235,816 |
Corcept Therapeutics, Inc. * | 35,621 | 1,018,761 |
DICE Therapeutics, Inc. * | 12,317 | 437,377 |
Harmony Biosciences Holdings, Inc. * | 11,052 | 574,704 |
Innoviva, Inc. * | 23,445 | 317,914 |
Nektar Therapeutics * | 70,032 | 263,320 |
NGM Biopharmaceuticals, Inc. * | 13,815 | 73,772 |
Reata Pharmaceuticals, Inc., Class A * | 10,388 | 334,494 |
Revance Therapeutics, Inc. * | 30,307 | 676,149 |
Supernus Pharmaceuticals, Inc. * | 19,990 | 685,057 |
7,390,423 | ||
Professional Services — 1.1% | ||
CBIZ, Inc. * | 19,217 | 953,932 |
First Advantage Corp. * | 21,760 | 305,728 |
Forrester Research, Inc. * | 4,187 | 177,194 |
HireRight Holdings Corp. * | 7,125 | 95,902 |
Huron Consulting Group, Inc. * | 7,765 | 571,737 |
ICF International, Inc. | 6,328 | 757,019 |
Kelly Services, Inc., Class A | 12,927 | 211,227 |
Kforce, Inc. | 7,441 | 470,792 |
October 31, 2022 | J.P. Morgan Exchange-Traded Funds | 145 |
AS OF October 31, 2022 (continued)
INVESTMENTS | SHARES | VALUE($) |
Common Stocks — continued | ||
Professional Services — continued | ||
Korn Ferry | 20,406 | 1,134,369 |
Planet Labs PBC * | 71,228 | 373,947 |
Sterling Check Corp. * | 8,643 | 168,798 |
TrueBlue, Inc. * | 12,216 | 240,167 |
5,460,812 | ||
Real Estate Management & Development — 0.5% | ||
Anywhere Real Estate, Inc. * | 42,743 | 317,580 |
Doma Holdings, Inc. * | 42,772 | 23,208 |
Forestar Group, Inc. * | 6,692 | 77,493 |
Kennedy-Wilson Holdings, Inc. | 43,770 | 727,020 |
Marcus & Millichap, Inc. | 9,409 | 346,628 |
Newmark Group, Inc., Class A | 48,361 | 396,077 |
Offerpad Solutions, Inc. * (a) | 30,365 | 29,591 |
Redfin Corp. * | 40,530 | 194,949 |
St. Joe Co. (The) | 12,767 | 453,611 |
2,566,157 | ||
Road & Rail — 0.5% | ||
ArcBest Corp. | 9,165 | 727,976 |
Heartland Express, Inc. | 17,404 | 258,972 |
Marten Transport Ltd. | 21,495 | 403,461 |
Schneider National, Inc., Class B | 13,842 | 307,846 |
Werner Enterprises, Inc. | 22,041 | 864,007 |
2,562,262 | ||
Semiconductors & Semiconductor Equipment — 2.3% | ||
ACM Research, Inc., Class A * | 15,386 | 98,470 |
Axcelis Technologies, Inc. * | 12,345 | 716,010 |
Cohu, Inc. * | 18,024 | 593,350 |
Credo Technology Group Holding Ltd. * | 33,739 | 463,574 |
Diodes, Inc. * | 16,997 | 1,218,175 |
FormFactor, Inc. * | 28,826 | 582,573 |
Ichor Holdings Ltd. * | 10,742 | 273,277 |
Impinj, Inc. * (a) | 7,846 | 899,387 |
indie Semiconductor, Inc., Class A (China) * | 24,041 | 188,001 |
Kulicke & Soffa Industries, Inc. (Singapore) | 21,701 | 910,140 |
MACOM Technology Solutions Holdings, Inc. * | 19,097 | 1,105,143 |
MaxLinear, Inc. * | 26,930 | 831,598 |
Navitas Semiconductor Corp. * (a) | 28,658 | 120,650 |
Onto Innovation, Inc. * | 18,565 | 1,240,885 |
Rambus, Inc. * | 41,305 | 1,245,759 |
Rigetti Computing, Inc. * | 27,133 | 56,979 |
Ultra Clean Holdings, Inc. * | 16,978 | 528,186 |
Veeco Instruments, Inc. * | 19,217 | 350,326 |
11,422,483 | ||
INVESTMENTS | SHARES | VALUE($) |
Software — 3.8% | ||
8x8, Inc. * | 44,832 | 189,639 |
Adeia, Inc. | 38,940 | 435,349 |
Alarm.com Holdings, Inc. * | 18,587 | 1,093,659 |
Altair Engineering, Inc., Class A * | 19,509 | 956,916 |
Amplitude, Inc., Class A * | 19,305 | 324,324 |
Appfolio, Inc., Class A * | 6,936 | 869,566 |
Appian Corp., Class A * | 15,303 | 747,092 |
Avaya Holdings Corp. * | 32,457 | 51,282 |
AvePoint, Inc. * | 31,849 | 139,180 |
Braze, Inc., Class A * (a) | 11,357 | 336,281 |
BTRS Holdings, Inc., Class 1 * | 32,399 | 305,847 |
C3.ai, Inc., Class A * | 30,712 | 402,634 |
Cerence, Inc. * | 14,719 | 253,167 |
Confluent, Inc., Class A * | 52,761 | 1,418,216 |
Consensus Cloud Solutions, Inc. * | 6,594 | 370,187 |
CS Disco, Inc. * | 6,356 | 68,136 |
Dave, Inc. * | 55,928 | 17,578 |
Domo, Inc., Class B * | 11,383 | 201,138 |
E2open Parent Holdings, Inc. * | 64,314 | 374,951 |
Ebix, Inc. (a) | 8,777 | 173,697 |
Embark Technology, Inc. * | 5,164 | 31,191 |
Enfusion, Inc., Class A * | 4,757 | 67,407 |
Everbridge, Inc. * | 14,848 | 465,188 |
Freshworks, Inc., Class A * | 54,332 | 738,372 |
Gitlab, Inc., Class A * | 20,034 | 970,848 |
HashiCorp, Inc., Class A * | 14,743 | 453,052 |
Intapp, Inc. * | 5,579 | 125,304 |
InterDigital, Inc. | 11,085 | 552,809 |
LivePerson, Inc. * | 25,950 | 274,292 |
Marathon Digital Holdings, Inc. * (a) | 41,472 | 543,698 |
Matterport, Inc. * | 81,659 | 284,990 |
MeridianLink, Inc. * | 7,549 | 135,882 |
Momentive Global, Inc. * | 47,442 | 368,150 |
N-Able, Inc. * | 24,919 | 269,873 |
PagerDuty, Inc. * | 29,869 | 744,933 |
Progress Software Corp. | 16,243 | 828,880 |
PROS Holdings, Inc. * | 15,238 | 380,188 |
Q2 Holdings, Inc. * | 21,417 | 664,784 |
Riot Blockchain, Inc. * | 50,581 | 348,503 |
Samsara, Inc., Class A * | 30,449 | 374,827 |
Sprinklr, Inc., Class A * | 21,913 | 202,695 |
Sumo Logic, Inc. * | 39,358 | 303,450 |
Telos Corp. * | 19,955 | 211,523 |
146 | J.P. Morgan Exchange-Traded Funds | October 31, 2022 |
INVESTMENTS | SHARES | VALUE($) |
Common Stocks — continued | ||
Software — continued | ||
Zeta Global Holdings Corp., Class A * | 46,099 | 384,466 |
Zuora, Inc., Class A * | 45,293 | 348,303 |
18,802,447 | ||
Specialty Retail — 2.2% | ||
Aaron's Co., Inc. (The) | 11,502 | 119,851 |
Abercrombie & Fitch Co., Class A * | 18,852 | 331,418 |
Academy Sports & Outdoors, Inc. | 31,802 | 1,400,242 |
Arko Corp. | 27,374 | 280,583 |
Asbury Automotive Group, Inc. * | 8,271 | 1,304,750 |
Bed Bath & Beyond, Inc. * (a) | 25,997 | 118,806 |
Boot Barn Holdings, Inc. * | 11,140 | 632,752 |
Buckle, Inc. (The) | 11,043 | 434,321 |
Camping World Holdings, Inc., Class A (a) | 14,858 | 413,498 |
Children's Place, Inc. (The) * | 4,925 | 199,364 |
Designer Brands, Inc., Class A | 21,061 | 320,759 |
Group 1 Automotive, Inc. | 5,899 | 1,020,527 |
Guess?, Inc. | 12,470 | 211,741 |
Monro, Inc. | 12,031 | 574,480 |
ODP Corp. (The) * | 15,988 | 632,645 |
Rent-A-Center, Inc. | 19,911 | 415,144 |
Sally Beauty Holdings, Inc. * | 39,991 | 508,286 |
Signet Jewelers Ltd. | 17,382 | 1,134,002 |
Sleep Number Corp. * | 8,209 | 227,718 |
Sonic Automotive, Inc., Class A | 6,921 | 323,557 |
Zumiez, Inc. * | 5,818 | 130,498 |
10,734,942 | ||
Technology Hardware, Storage & Peripherals — 0.4% | ||
Avid Technology, Inc. * | 12,678 | 348,518 |
Corsair Gaming, Inc. * | 14,321 | 197,630 |
IonQ, Inc. * (a) | 56,273 | 331,448 |
Super Micro Computer, Inc. * | 16,878 | 1,174,540 |
2,052,136 | ||
Textiles, Apparel & Luxury Goods — 0.7% | ||
G-III Apparel Group Ltd. * | 16,221 | 316,309 |
Kontoor Brands, Inc. | 18,421 | 657,630 |
Levi Strauss & Co., Class A | 36,979 | 553,206 |
Oxford Industries, Inc. | 5,594 | 569,078 |
Steven Madden Ltd. | 27,753 | 828,982 |
Wolverine World Wide, Inc. | 29,423 | 504,016 |
3,429,221 | ||
Thrifts & Mortgage Finance — 1.5% | ||
Axos Financial, Inc. * | 19,882 | 774,603 |
INVESTMENTS | SHARES | VALUE($) |
Thrifts & Mortgage Finance — continued | ||
Capitol Federal Financial, Inc. | 48,257 | 394,742 |
Columbia Financial, Inc. * | 12,387 | 254,429 |
Kearny Financial Corp. | 25,661 | 260,202 |
Merchants Bancorp | 9,503 | 227,597 |
Mr. Cooper Group, Inc. * | 26,776 | 1,057,384 |
NMI Holdings, Inc., Class A * | 31,652 | 694,128 |
Northfield Bancorp, Inc. | 15,920 | 255,357 |
PennyMac Financial Services, Inc. | 11,762 | 627,150 |
Provident Financial Services, Inc. | 28,041 | 628,679 |
Rocket Cos., Inc., Class A (a) | 43,154 | 297,763 |
Walker & Dunlop, Inc. | 11,481 | 1,032,831 |
WSFS Financial Corp. | 23,737 | 1,105,195 |
7,610,060 | ||
Tobacco — 0.2% | ||
Turning Point Brands, Inc. | 5,799 | 136,624 |
Universal Corp. | 9,192 | 465,207 |
Vector Group Ltd. | 49,172 | 522,207 |
1,124,038 | ||
Trading Companies & Distributors — 1.7% | ||
Applied Industrial Technologies, Inc. | 14,368 | 1,787,092 |
Boise Cascade Co. | 14,743 | 984,390 |
Custom Truck One Source, Inc. * (a) | 23,176 | 160,610 |
Global Industrial Co. | 6,095 | 193,455 |
GMS, Inc. * | 15,937 | 752,226 |
H&E Equipment Services, Inc. | 12,568 | 474,568 |
McGrath RentCorp | 9,110 | 856,796 |
NOW, Inc. * | 41,424 | 527,328 |
Rush Enterprises, Inc., Class A | 16,024 | 799,437 |
Triton International Ltd. (Bermuda) | 23,177 | 1,406,612 |
Veritiv Corp. * | 5,217 | 606,528 |
8,549,042 | ||
Water Utilities — 0.8% | ||
American States Water Co. | 13,810 | 1,249,252 |
California Water Service Group | 20,313 | 1,260,625 |
Middlesex Water Co. | 6,580 | 588,713 |
SJW Group | 9,945 | 702,913 |
3,801,503 | ||
Wireless Telecommunication Services — 0.3% | ||
Gogo, Inc. * | 24,528 | 348,788 |
Shenandoah Telecommunications Co. | 18,715 | 424,082 |
October 31, 2022 | J.P. Morgan Exchange-Traded Funds | 147 |
AS OF October 31, 2022 (continued)
INVESTMENTS | SHARES | VALUE($) |
Common Stocks — continued | ||
Wireless Telecommunication Services — continued | ||
Telephone and Data Systems, Inc. | 37,420 | 636,140 |
United States Cellular Corp. * | 5,305 | 165,357 |
1,574,367 | ||
Total Common Stocks (Cost $543,796,972) | 485,817,025 | |
NO. OF RIGHTS | ||
Rights — 0.0% ^ | ||
Pharmaceuticals — 0.0% ^ | ||
Zogenix, Inc., CVR ‡ *(Cost $—) | 14,091 | 9,582 |
SHARES | ||
Short-Term Investments — 4.0% | ||
Investment Companies — 1.7% | ||
JPMorgan U.S. Government Money Market Fund Class IM Shares, 2.85% (c) (d) (Cost $8,224,756) | 8,224,756 | 8,224,756 |
Investment of Cash Collateral from Securities Loaned — 2.3% | ||
JPMorgan Securities Lending Money Market Fund Agency SL Class Shares, 3.23% (c) (d) | 10,003,601 | 10,003,601 |
JPMorgan U.S. Government Money Market Fund Class IM Shares, 2.85% (c) (d) | 1,618,100 | 1,618,100 |
Total Investment of Cash Collateral from Securities Loaned (Cost $11,617,499) | 11,621,701 | |
Total Short-Term Investments (Cost $19,842,255) | 19,846,457 | |
Total Investments — 102.2% (Cost $563,639,227) | 505,673,064 | |
Liabilities in Excess of Other Assets — (2.2)% | (10,910,804) | |
NET ASSETS — 100.0% | 494,762,260 | |
Percentages indicated are based on net assets. |
Abbreviations | |
CVR | Contingent Value Rights |
REIT | Real Estate Investment Trust |
^ | Amount rounds to less than 0.1% of net assets. | |
‡ | Value determined using significant unobservable inputs. | |
* | Non-income producing security. | |
(a) | The security or a portion of this security is on loan at October 31, 2022. The total value of securities on loan at October 31, 2022 is $11,082,834. | |
(b) | Security exempt from registration pursuant to Regulation S under the Securities Act of 1933, as amended. Regulation S applies to securities offerings that are made outside of the United States and do not involve direct selling efforts in the United States and as such may have restrictions on resale. | |
(c) | Investment in an affiliated fund, which is registered under the Investment Company Act of 1940, as amended, and is advised by J.P. Morgan Investment Management Inc. | |
(d) | The rate shown is the current yield as of October 31, 2022. | |
DESCRIPTION | NUMBER OF CONTRACTS | EXPIRATION DATE | TRADING CURRENCY | NOTIONAL AMOUNT ($) | VALUE AND UNREALIZED APPRECIATION (DEPRECIATION) ($) |
Long Contracts | |||||
Russell 2000 E-Mini Index | 93 | 12/16/2022 | USD | 8,616,915 | 293,417 |
Abbreviations | |
USD | United States Dollar |
148 | J.P. Morgan Exchange-Traded Funds | October 31, 2022 |
AS OF October 31, 2022
INVESTMENTS | SHARES | VALUE($) |
Common Stocks — 99.7% | ||
Aerospace & Defense — 0.2% | ||
L3Harris Technologies, Inc. | 190 | 46,829 |
Air Freight & Logistics — 0.3% | ||
CH Robinson Worldwide, Inc. | 141 | 13,779 |
Expeditors International of Washington, Inc. | 189 | 18,494 |
United Parcel Service, Inc., Class B | 211 | 35,399 |
67,672 | ||
Auto Components — 0.2% | ||
Aptiv plc * | 313 | 28,505 |
BorgWarner, Inc. | 273 | 10,246 |
38,751 | ||
Automobiles — 2.0% | ||
Ford Motor Co. | 1,001 | 13,383 |
Harley-Davidson, Inc. | 148 | 6,364 |
Tesla, Inc. * | 1,707 | 388,411 |
408,158 | ||
Banks — 2.5% | ||
Bank of America Corp. | 5,862 | 211,267 |
Citigroup, Inc. | 2,242 | 102,818 |
Fifth Third Bancorp | 781 | 27,874 |
PNC Financial Services Group, Inc. (The) | 475 | 76,869 |
Regions Financial Corp. | 1,073 | 23,552 |
SVB Financial Group * | 59 | 13,627 |
Wells Fargo & Co. | 1,494 | 68,709 |
524,716 | ||
Beverages — 2.2% | ||
Brown-Forman Corp., Class B | 264 | 17,952 |
Coca-Cola Co. (The) | 3,307 | 197,924 |
Keurig Dr Pepper, Inc. | 992 | 38,529 |
Monster Beverage Corp. * | 430 | 40,299 |
PepsiCo, Inc. | 939 | 170,504 |
465,208 | ||
Biotechnology — 2.5% | ||
AbbVie, Inc. | 1,449 | 212,134 |
Amgen, Inc. | 138 | 37,308 |
Biogen, Inc. * | 128 | 36,280 |
Gilead Sciences, Inc. | 192 | 15,064 |
Incyte Corp. * | 208 | 15,463 |
Regeneron Pharmaceuticals, Inc. * | 113 | 84,609 |
Seagen, Inc. * | 157 | 19,964 |
Vertex Pharmaceuticals, Inc. * | 296 | 92,352 |
513,174 | ||
INVESTMENTS | SHARES | VALUE($) |
Building Products — 0.5% | ||
Carrier Global Corp. | 894 | 35,545 |
Lennox International, Inc. | 37 | 8,642 |
Masco Corp. | 261 | 12,077 |
Trane Technologies plc | 270 | 43,100 |
99,364 | ||
Capital Markets — 4.6% | ||
Ares Management Corp. | 164 | 12,436 |
Bank of New York Mellon Corp. (The) | 844 | 35,541 |
BlackRock, Inc. | 165 | 106,575 |
Blackstone, Inc. | 31 | 2,825 |
Carlyle Group, Inc. (The) | 183 | 5,175 |
Charles Schwab Corp. (The) | 1,349 | 107,475 |
CME Group, Inc. | 334 | 57,882 |
FactSet Research Systems, Inc. | 44 | 18,722 |
Goldman Sachs Group, Inc. (The) | 378 | 130,225 |
Intercontinental Exchange, Inc. | 315 | 30,105 |
Invesco Ltd. | 376 | 5,760 |
Lazard Ltd., Class A | 42 | 1,584 |
LPL Financial Holdings, Inc. | 91 | 23,264 |
Moody's Corp. | 184 | 48,736 |
Morgan Stanley | 1,255 | 103,123 |
Morningstar, Inc. | 29 | 6,733 |
MSCI, Inc. | 91 | 42,666 |
Nasdaq, Inc. | 385 | 23,963 |
Northern Trust Corp. | 218 | 18,388 |
S&P Global, Inc. | 370 | 118,863 |
State Street Corp. | 420 | 31,080 |
T. Rowe Price Group, Inc. | 257 | 27,283 |
958,404 | ||
Chemicals — 2.1% | ||
Air Products and Chemicals, Inc. | 76 | 19,030 |
Albemarle Corp. | 135 | 37,783 |
Ashland, Inc. | 56 | 5,876 |
Ecolab, Inc. | 287 | 45,079 |
Element Solutions, Inc. | 287 | 4,936 |
FMC Corp. | 146 | 17,359 |
Huntsman Corp. | 221 | 5,914 |
International Flavors & Fragrances, Inc. | 295 | 28,795 |
Linde plc (United Kingdom) | 519 | 154,325 |
Mosaic Co. (The) | 399 | 21,446 |
PPG Industries, Inc. | 271 | 30,943 |
Scotts Miracle-Gro Co. (The) | 49 | 2,250 |
October 31, 2022 | J.P. Morgan Exchange-Traded Funds | 149 |
AS OF October 31, 2022 (continued)
INVESTMENTS | SHARES | VALUE($) |
Common Stocks — continued | ||
Chemicals — continued | ||
Sherwin-Williams Co. (The) | 275 | 61,883 |
Valvoline, Inc. | 197 | 5,784 |
441,403 | ||
Commercial Services & Supplies — 0.8% | ||
Cintas Corp. | 100 | 42,755 |
Clean Harbors, Inc. * | 59 | 7,225 |
MSA Safety, Inc. | 43 | 5,772 |
Republic Services, Inc. | 238 | 31,563 |
Stericycle, Inc. * | 115 | 5,127 |
Waste Management, Inc. | 480 | 76,018 |
168,460 | ||
Communications Equipment — 1.3% | ||
Arista Networks, Inc. * | 284 | 34,324 |
Ciena Corp. * | 181 | 8,670 |
Cisco Systems, Inc. | 3,846 | 174,724 |
Juniper Networks, Inc. | 365 | 11,169 |
Motorola Solutions, Inc. | 190 | 47,445 |
276,332 | ||
Consumer Finance — 0.8% | ||
American Express Co. | 697 | 103,469 |
Capital One Financial Corp. | 441 | 46,755 |
Synchrony Financial | 555 | 19,736 |
169,960 | ||
Containers & Packaging — 0.1% | ||
Avery Dennison Corp. | 94 | 15,938 |
Distributors — 0.1% | ||
LKQ Corp. | 297 | 16,525 |
Diversified Financial Services — 1.0% | ||
Apollo Global Management, Inc. | 462 | 25,576 |
Berkshire Hathaway, Inc., Class B * | 602 | 177,644 |
Voya Financial, Inc. | 113 | 7,725 |
210,945 | ||
Diversified Telecommunication Services — 0.7% | ||
AT&T, Inc. | 1,640 | 29,897 |
Verizon Communications, Inc. | 3,348 | 125,115 |
155,012 | ||
Electric Utilities — 1.4% | ||
Avangrid, Inc. | 82 | 3,336 |
Duke Energy Corp. | 181 | 16,866 |
Edison International | 435 | 26,117 |
Eversource Energy | 398 | 30,359 |
INVESTMENTS | SHARES | VALUE($) |
Electric Utilities — continued | ||
Exelon Corp. | 1,149 | 44,340 |
NextEra Energy, Inc. | 1,868 | 144,770 |
PG&E Corp. * | 1,793 | 26,769 |
Southern Co. (The) | 74 | 4,846 |
297,403 | ||
Electrical Equipment — 0.6% | ||
AMETEK, Inc. | 267 | 34,619 |
Emerson Electric Co. | 679 | 58,802 |
Rockwell Automation, Inc. | 134 | 34,210 |
127,631 | ||
Electronic Equipment, Instruments & Components — 0.4% | ||
Keysight Technologies, Inc. * | 207 | 36,049 |
Teledyne Technologies, Inc. * | 54 | 21,491 |
Trimble, Inc. * | 289 | 17,386 |
Zebra Technologies Corp., Class A * | 60 | 16,993 |
91,919 | ||
Energy Equipment & Services — 0.6% | ||
Halliburton Co. | 1,039 | 37,840 |
Schlumberger NV | 1,634 | 85,017 |
122,857 | ||
Entertainment — 2.0% | ||
Activision Blizzard, Inc. | 899 | 65,447 |
Liberty Media Corp.-Liberty Formula One, Class C * | 254 | 14,664 |
Netflix, Inc. * | 507 | 147,983 |
Spotify Technology SA * | 162 | 13,054 |
Take-Two Interactive Software, Inc. * | 189 | 22,393 |
Walt Disney Co. (The) * | 1,421 | 151,393 |
414,934 | ||
Equity Real Estate Investment Trusts (REITs) — 2.9% | ||
American Homes 4 Rent, Class A | 351 | 11,211 |
American Tower Corp. | 103 | 21,341 |
AvalonBay Communities, Inc. | 162 | 28,369 |
Boston Properties, Inc. | 180 | 13,086 |
Brixmor Property Group, Inc. | 338 | 7,203 |
Crown Castle, Inc. | 496 | 66,097 |
CubeSmart | 259 | 10,844 |
Douglas Emmett, Inc. | 187 | 3,289 |
Equity Residential | 428 | 26,973 |
Essex Property Trust, Inc. | 75 | 16,668 |
Extra Space Storage, Inc. | 53 | 9,404 |
Federal Realty Investment Trust | 93 | 9,205 |
Healthcare Realty Trust, Inc. | 439 | 8,925 |
150 | J.P. Morgan Exchange-Traded Funds | October 31, 2022 |
INVESTMENTS | SHARES | VALUE($) |
Common Stocks — continued | ||
Equity Real Estate Investment Trusts (REITs) — continued | ||
Hudson Pacific Properties, Inc. | 143 | 1,579 |
Kilroy Realty Corp. | 134 | 5,727 |
Kimco Realty Corp. | 698 | 14,923 |
Life Storage, Inc. | 97 | 10,729 |
National Retail Properties, Inc. | 203 | 8,532 |
Omega Healthcare Investors, Inc. | 272 | 8,644 |
Prologis, Inc. | 855 | 94,691 |
Public Storage | 181 | 56,065 |
Rayonier, Inc. | 183 | 6,167 |
Realty Income Corp. | 715 | 44,523 |
Regency Centers Corp. | 199 | 12,042 |
Rexford Industrial Realty, Inc. | 198 | 10,945 |
SBA Communications Corp. | 122 | 32,928 |
Simon Property Group, Inc. | 377 | 41,086 |
SL Green Realty Corp. | 72 | 2,857 |
UDR, Inc. | 375 | 14,910 |
Vornado Realty Trust | 187 | 4,411 |
603,374 | ||
Food & Staples Retailing — 1.1% | ||
Costco Wholesale Corp. | 293 | 146,939 |
Sysco Corp. | 26 | 2,251 |
Walmart, Inc. | 517 | 73,585 |
222,775 | ||
Food Products — 0.8% | ||
Hershey Co. (The) | 169 | 40,352 |
McCormick & Co., Inc. (Non-Voting) | 290 | 22,805 |
Mondelez International, Inc., Class A | 1,589 | 97,692 |
160,849 | ||
Gas Utilities — 0.2% | ||
Atmos Energy Corp. | 160 | 17,048 |
National Fuel Gas Co. | 99 | 6,681 |
UGI Corp. | 244 | 8,621 |
32,350 | ||
Health Care Equipment & Supplies — 1.8% | ||
Abbott Laboratories | 1,377 | 136,240 |
Becton Dickinson and Co. | 274 | 64,656 |
Boston Scientific Corp. * | 1,596 | 68,803 |
Edwards Lifesciences Corp. * | 689 | 49,904 |
Insulet Corp. * | 42 | 10,870 |
Medtronic plc | 399 | 34,849 |
INVESTMENTS | SHARES | VALUE($) |
Health Care Equipment & Supplies — continued | ||
ResMed, Inc. | 29 | 6,487 |
Stryker Corp. | 3 | 688 |
372,497 | ||
Health Care Providers & Services — 4.4% | ||
AmerisourceBergen Corp. | 171 | 26,885 |
Cigna Corp. | 349 | 112,748 |
CVS Health Corp. | 1,406 | 133,148 |
Elevance Health, Inc. | 267 | 145,987 |
Humana, Inc. | 140 | 78,131 |
McKesson Corp. | 168 | 65,414 |
UnitedHealth Group, Inc. | 665 | 369,175 |
931,488 | ||
Hotels, Restaurants & Leisure — 1.8% | ||
Booking Holdings, Inc. * | 46 | 85,996 |
Chipotle Mexican Grill, Inc. * | 32 | 47,947 |
McDonald's Corp. | 679 | 185,136 |
Planet Fitness, Inc., Class A * | 98 | 6,417 |
Starbucks Corp. | 166 | 14,374 |
Yum! Brands, Inc. | 331 | 39,141 |
379,011 | ||
Household Products — 1.7% | ||
Church & Dwight Co., Inc. | 281 | 20,830 |
Clorox Co. (The) | 142 | 20,738 |
Colgate-Palmolive Co. | 959 | 70,813 |
Procter & Gamble Co. (The) | 1,856 | 249,947 |
362,328 | ||
Industrial Conglomerates — 0.5% | ||
General Electric Co. | 1,268 | 98,663 |
Insurance — 2.8% | ||
Aflac, Inc. | 724 | 47,140 |
Allstate Corp. (The) | 311 | 39,264 |
American International Group, Inc. | 880 | 50,160 |
Aon plc, Class A | 242 | 68,121 |
Arch Capital Group Ltd. * | 76 | 4,370 |
Assurant, Inc. | 61 | 8,287 |
Assured Guaranty Ltd. | 75 | 4,439 |
Chubb Ltd. | 481 | 103,362 |
Cincinnati Financial Corp. | 173 | 17,874 |
First American Financial Corp. | 117 | 5,897 |
Hartford Financial Services Group, Inc. (The) | 373 | 27,009 |
Lincoln National Corp. | 196 | 10,559 |
Marsh & McLennan Cos., Inc. | 30 | 4,845 |
October 31, 2022 | J.P. Morgan Exchange-Traded Funds | 151 |
AS OF October 31, 2022 (continued)
INVESTMENTS | SHARES | VALUE($) |
Common Stocks — continued | ||
Insurance — continued | ||
MetLife, Inc. | 777 | 56,884 |
Principal Financial Group, Inc. | 285 | 25,117 |
Prudential Financial, Inc. | 431 | 45,337 |
RenaissanceRe Holdings Ltd. (Bermuda) | 12 | 1,856 |
Travelers Cos., Inc. (The) | 274 | 50,542 |
WR Berkley Corp. | 238 | 17,702 |
588,765 | ||
Interactive Media & Services — 3.7% | ||
Alphabet, Inc., Class A * | 7,126 | 673,478 |
Meta Platforms, Inc., Class A * | 1,080 | 100,613 |
774,091 | ||
Internet & Direct Marketing Retail — 2.6% | ||
Amazon.com, Inc. * | 5,013 | 513,532 |
eBay, Inc. | 636 | 25,338 |
Etsy, Inc. * | 146 | 13,711 |
552,581 | ||
IT Services — 6.0% | ||
Accenture plc, Class A | 592 | 168,069 |
Amdocs Ltd. | 140 | 12,083 |
Automatic Data Processing, Inc. | 65 | 15,710 |
Block, Inc., Class A * | 611 | 36,703 |
Cognizant Technology Solutions Corp., Class A | 593 | 36,914 |
Fidelity National Information Services, Inc. | 706 | 58,591 |
Fiserv, Inc. * | 681 | 69,966 |
Genpact Ltd. | 209 | 10,137 |
Global Payments, Inc. | 318 | 36,335 |
Globant SA * | 49 | 9,245 |
International Business Machines Corp. | 824 | 113,951 |
Jack Henry & Associates, Inc. | 84 | 16,721 |
Mastercard, Inc., Class A | 696 | 228,413 |
Okta, Inc. * | 173 | 9,709 |
Paychex, Inc. | 373 | 44,130 |
PayPal Holdings, Inc. * | 1,341 | 112,081 |
Switch, Inc., Class A | 169 | 5,754 |
Toast, Inc., Class A * | 287 | 6,340 |
Visa, Inc., Class A | 1,276 | 264,336 |
Western Union Co. (The) | 445 | 6,012 |
1,261,200 | ||
Leisure Products — 0.1% | ||
Hasbro, Inc. | 152 | 9,918 |
YETI Holdings, Inc. * | 112 | 3,593 |
13,511 | ||
INVESTMENTS | SHARES | VALUE($) |
Life Sciences Tools & Services — 2.3% | ||
Agilent Technologies, Inc. | 343 | 47,454 |
Danaher Corp. | 429 | 107,966 |
Illumina, Inc. * | 163 | 37,298 |
IQVIA Holdings, Inc. * | 215 | 45,079 |
Mettler-Toledo International, Inc. * | 26 | 32,888 |
PerkinElmer, Inc. | 125 | 16,697 |
Thermo Fisher Scientific, Inc. | 344 | 176,806 |
Waters Corp. * | 69 | 20,643 |
484,831 | ||
Machinery — 2.8% | ||
Caterpillar, Inc. | 606 | 131,175 |
Cummins, Inc. | 162 | 39,611 |
Deere & Co. | 320 | 126,662 |
Dover Corp. | 166 | 21,695 |
Fortive Corp. | 415 | 26,518 |
IDEX Corp. | 87 | 19,341 |
Illinois Tool Works, Inc. | 358 | 76,444 |
Ingersoll Rand, Inc. | 470 | 23,735 |
Middleby Corp. (The) * | 62 | 8,671 |
Nordson Corp. | 67 | 15,075 |
Otis Worldwide Corp. | 490 | 34,614 |
PACCAR, Inc. | 397 | 38,442 |
Pentair plc | 190 | 8,160 |
Xylem, Inc. | 208 | 21,305 |
591,448 | ||
Media — 0.6% | ||
Comcast Corp., Class A | 1,884 | 59,798 |
Fox Corp., Class A | 501 | 14,464 |
Interpublic Group of Cos., Inc. (The) | 455 | 13,555 |
Liberty Media Corp.-Liberty SiriusXM, Class C * | 266 | 11,223 |
Omnicom Group, Inc. | 235 | 17,096 |
Paramount Global, Class B | 523 | 9,581 |
125,717 | ||
Metals & Mining — 0.3% | ||
Freeport-McMoRan, Inc. | 1,663 | 52,701 |
Mortgage Real Estate Investment Trusts (REITs) — 0.0% ^ | ||
Annaly Capital Management, Inc. | 496 | 9,201 |
Multiline Retail — 0.0% ^ | ||
Target Corp. | 11 | 1,807 |
Multi-Utilities — 0.9% | ||
CenterPoint Energy, Inc. | 728 | 20,828 |
CMS Energy Corp. | 98 | 5,591 |
152 | J.P. Morgan Exchange-Traded Funds | October 31, 2022 |
INVESTMENTS | SHARES | VALUE($) |
Common Stocks — continued | ||
Multi-Utilities — continued | ||
Consolidated Edison, Inc. | 410 | 36,064 |
NiSource, Inc. | 469 | 12,049 |
Public Service Enterprise Group, Inc. | 576 | 32,296 |
Sempra Energy | 364 | 54,942 |
WEC Energy Group, Inc. | 365 | 33,335 |
195,105 | ||
Oil, Gas & Consumable Fuels — 4.7% | ||
Chevron Corp. | 1,445 | 261,400 |
ConocoPhillips | 1,324 | 166,943 |
Devon Energy Corp. | 761 | 58,863 |
Enviva, Inc. | 39 | 2,334 |
Exxon Mobil Corp. | 3,086 | 341,960 |
Hess Corp. | 326 | 45,992 |
Occidental Petroleum Corp. | 946 | 68,680 |
Targa Resources Corp. | 8 | 547 |
Williams Cos., Inc. (The) | 1,409 | 46,117 |
992,836 | ||
Personal Products — 0.3% | ||
Estee Lauder Cos., Inc. (The), Class A | 266 | 53,330 |
Pharmaceuticals — 4.6% | ||
Bristol-Myers Squibb Co. | 2,057 | 159,356 |
Eli Lilly & Co. | 693 | 250,928 |
Johnson & Johnson | 1,873 | 325,846 |
Merck & Co., Inc. | 1,063 | 107,575 |
Pfizer, Inc. | 2,503 | 116,515 |
Zoetis, Inc. | 55 | 8,293 |
968,513 | ||
Professional Services — 0.5% | ||
Booz Allen Hamilton Holding Corp. | 152 | 16,545 |
Equifax, Inc. | 141 | 23,905 |
FTI Consulting, Inc. * | 38 | 5,914 |
ManpowerGroup, Inc. | 67 | 5,249 |
Robert Half International, Inc. | 125 | 9,558 |
Science Applications International Corp. | 38 | 4,117 |
TransUnion | 223 | 13,217 |
Verisk Analytics, Inc. | 180 | 32,909 |
111,414 | ||
Real Estate Management & Development — 0.2% | ||
CBRE Group, Inc., Class A * | 371 | 26,319 |
Howard Hughes Corp. (The) * | 42 | 2,576 |
INVESTMENTS | SHARES | VALUE($) |
Real Estate Management & Development — continued | ||
Jones Lang LaSalle, Inc. * | 55 | 8,750 |
Zillow Group, Inc., Class C * | 251 | 7,746 |
45,391 | ||
Road & Rail — 0.5% | ||
Lyft, Inc., Class A * | 359 | 5,256 |
Uber Technologies, Inc. * | 2,188 | 58,135 |
Union Pacific Corp. | 179 | 35,288 |
98,679 | ||
Semiconductors & Semiconductor Equipment — 4.3% | ||
Advanced Micro Devices, Inc. * | 1,577 | 94,715 |
Analog Devices, Inc. | 600 | 85,572 |
Applied Materials, Inc. | 981 | 86,612 |
Broadcom, Inc. | 153 | 71,928 |
Cirrus Logic, Inc. * | 59 | 3,960 |
Enphase Energy, Inc. * | 151 | 46,357 |
First Solar, Inc. * | 123 | 17,905 |
Intel Corp. | 984 | 27,975 |
Lam Research Corp. | 156 | 63,146 |
MKS Instruments, Inc. | 66 | 5,422 |
NVIDIA Corp. | 1,714 | 231,338 |
QUALCOMM, Inc. | 1,057 | 124,367 |
Texas Instruments, Inc. | 276 | 44,334 |
903,631 | ||
Software — 9.5% | ||
Adobe, Inc. * | 380 | 121,030 |
Atlassian Corp., Class A * | 158 | 32,031 |
Autodesk, Inc. * | 245 | 52,503 |
Cadence Design Systems, Inc. * | 309 | 46,780 |
Confluent, Inc., Class A * | 144 | 3,871 |
Dolby Laboratories, Inc., Class A | 71 | 4,746 |
Guidewire Software, Inc. * | 97 | 5,763 |
Intuit, Inc. | 312 | 133,380 |
Microsoft Corp. | 4,517 | 1,048,531 |
NortonLifeLock, Inc. | 618 | 13,924 |
Oracle Corp. | 1,588 | 123,975 |
Palo Alto Networks, Inc. * | 248 | 42,554 |
PTC, Inc. * | 117 | 13,786 |
Salesforce, Inc. * | 782 | 127,145 |
ServiceNow, Inc. * | 218 | 91,721 |
Synopsys, Inc. * | 159 | 46,515 |
Teradata Corp. * | 128 | 4,044 |
Unity Software, Inc. * | 241 | 7,110 |
VMware, Inc., Class A | 205 | 23,069 |
October 31, 2022 | J.P. Morgan Exchange-Traded Funds | 153 |
AS OF October 31, 2022 (continued)
INVESTMENTS | SHARES | VALUE($) |
Common Stocks — continued | ||
Software — continued | ||
Workday, Inc., Class A * | 208 | 32,411 |
Zendesk, Inc. * | 134 | 10,276 |
1,985,165 | ||
Specialty Retail — 2.7% | ||
AutoZone, Inc. * | 23 | 58,256 |
Home Depot, Inc. (The) | 819 | 242,530 |
Lithia Motors, Inc., Class A | 34 | 6,737 |
Lowe's Cos., Inc. | 689 | 134,320 |
TJX Cos., Inc. (The) | 1,269 | 91,495 |
Tractor Supply Co. | 128 | 28,131 |
Williams-Sonoma, Inc. | 79 | 9,783 |
571,252 | ||
Technology Hardware, Storage & Peripherals — 6.9% | ||
Apple, Inc. | 9,134 | 1,400,609 |
Dell Technologies, Inc., Class C | 278 | 10,675 |
HP, Inc. | 1,197 | 33,061 |
1,444,345 | ||
Textiles, Apparel & Luxury Goods — 0.9% | ||
Lululemon Athletica, Inc. * | 129 | 42,446 |
NIKE, Inc., Class B | 1,310 | 121,411 |
PVH Corp. | 85 | 4,362 |
Ralph Lauren Corp. | 49 | 4,542 |
Tapestry, Inc. | 291 | 9,219 |
VF Corp. | 411 | 11,611 |
193,591 | ||
Trading Companies & Distributors — 0.2% | ||
Univar Solutions, Inc. * | 190 | 4,841 |
WW Grainger, Inc. | 53 | 30,971 |
35,812 | ||
INVESTMENTS | SHARES | VALUE($) |
Water Utilities — 0.1% | ||
Essential Utilities, Inc. | 267 | 11,807 |
Wireless Telecommunication Services — 0.1% | ||
T-Mobile US, Inc. * | 179 | 27,129 |
Total Common Stocks (Cost $20,936,668) | 20,888,783 | |
Short-Term Investments — 0.2% | ||
Investment Companies — 0.2% | ||
JPMorgan U.S. Government Money Market Fund Class IM Shares, 2.85% (a) (b) (Cost $31,835) | 31,835 | 31,835 |
Total Investments — 99.9% (Cost $20,968,503) | 20,920,618 | |
Other Assets Less Liabilities — 0.1% | 27,063 | |
NET ASSETS — 100.0% | 20,947,681 | |
Percentages indicated are based on net assets. |
^ | Amount rounds to less than 0.1% of net assets. | |
* | Non-income producing security. | |
(a) | Investment in an affiliated fund, which is registered under the Investment Company Act of 1940, as amended, and is advised by J.P. Morgan Investment Management Inc. | |
(b) | The rate shown is the current yield as of October 31, 2022. | |
DESCRIPTION | NUMBER OF CONTRACTS | EXPIRATION DATE | TRADING CURRENCY | NOTIONAL AMOUNT ($) | VALUE AND UNREALIZED APPRECIATION (DEPRECIATION) ($) |
Long Contracts | |||||
Micro E-Mini S&P 500 Index | 2 | 12/16/2022 | USD | 38,828 | 1,844 |
Abbreviations | |
USD | United States Dollar |
154 | J.P. Morgan Exchange-Traded Funds | October 31, 2022 |
AS OF October 31, 2022
INVESTMENTS | SHARES | VALUE($) |
Common Stocks — 98.5% | ||
Canada — 1.9% | ||
West Fraser Timber Co. Ltd. | 5,014 | 376,469 |
China — 1.9% | ||
Contemporary Amperex Technology Co. Ltd., Class A | 3,600 | 183,783 |
NARI Technology Co. Ltd., Class A | 23,100 | 77,176 |
Tongwei Co. Ltd., Class A | 18,300 | 108,849 |
369,808 | ||
Denmark — 0.9% | ||
Orsted A/S (a) | 1,074 | 88,611 |
Vestas Wind Systems A/S | 4,530 | 89,303 |
177,914 | ||
Finland — 2.9% | ||
UPM-Kymmene OYJ | 16,602 | 558,117 |
France — 6.7% | ||
Dassault Systemes SE | 15,074 | 505,262 |
Neoen SA (a) | 6,204 | 216,396 |
Nexans SA | 1,461 | 136,426 |
SPIE SA | 19,002 | 444,525 |
1,302,609 | ||
Germany — 6.4% | ||
Encavis AG | 7,762 | 144,511 |
Infineon Technologies AG | 22,005 | 533,962 |
Mercedes-Benz Group AG | 9,737 | 563,593 |
1,242,066 | ||
Ireland — 1.2% | ||
Kingspan Group plc | 4,635 | 233,681 |
Italy — 2.0% | ||
Ariston Holding NV | 4,127 | 35,231 |
Prysmian SpA | 10,964 | 356,858 |
392,089 | ||
Japan — 6.0% | ||
Daikin Industries Ltd. | 2,300 | 344,511 |
Keyence Corp. | 1,600 | 603,304 |
Kurita Water Industries Ltd. | 2,300 | 84,191 |
RENOVA, Inc. * | 6,800 | 149,243 |
1,181,249 | ||
Netherlands — 2.5% | ||
Alfen Beheer BV * (a) | 1,415 | 150,101 |
Arcadis NV | 2,947 | 100,013 |
Koninklijke DSM NV | 2,082 | 244,907 |
495,021 | ||
INVESTMENTS | SHARES | VALUE($) |
Norway — 0.4% | ||
Aker Carbon Capture ASA * | 20,897 | 23,516 |
TOMRA Systems ASA | 3,974 | 64,186 |
87,702 | ||
South Korea — 2.8% | ||
LG Energy Solution Ltd. * | 544 | 201,291 |
Samsung SDI Co. Ltd. | 686 | 353,918 |
555,209 | ||
Spain — 5.2% | ||
EDP Renovaveis SA | 11,032 | 232,141 |
Iberdrola SA | 56,455 | 574,107 |
Solaria Energia y Medio Ambiente SA * | 13,474 | 213,106 |
1,019,354 | ||
Sweden — 1.6% | ||
Boliden AB | 3,391 | 98,614 |
Nibe Industrier AB, Class B | 26,812 | 213,873 |
312,487 | ||
Switzerland — 5.5% | ||
ABB Ltd. (Registered) | 18,705 | 519,444 |
Sika AG (Registered) | 858 | 193,458 |
TE Connectivity Ltd. | 2,971 | 363,145 |
1,076,047 | ||
United Kingdom — 7.1% | ||
CNH Industrial NV | 45,013 | 582,468 |
Linde plc | 1,925 | 572,399 |
SSE plc | 12,652 | 226,102 |
1,380,969 | ||
United States — 43.5% | ||
AGCO Corp. | 5,131 | 637,116 |
Array Technologies, Inc. * | 2,797 | 50,626 |
Autodesk, Inc. * | 3,190 | 683,617 |
Brookfield Renewable Corp. | 3,929 | 121,917 |
Carrier Global Corp. | 15,781 | 627,453 |
ChargePoint Holdings, Inc. * | 6,531 | 91,303 |
Deere & Co. | 2,283 | 903,658 |
Eaton Corp. plc | 560 | 84,039 |
Enphase Energy, Inc. * | 1,901 | 583,607 |
Evoqua Water Technologies Corp. * | 10,089 | 395,287 |
Johnson Controls International plc | 1,948 | 112,672 |
NextEra Energy, Inc. | 9,569 | 741,598 |
Plug Power, Inc. * | 1,873 | 29,931 |
Schneider Electric SE | 5,268 | 666,172 |
October 31, 2022 | 155 |
AS OF October 31, 2022 (continued)
INVESTMENTS | SHARES | VALUE($) |
Common Stocks — continued | ||
United States — continued | ||
Shoals Technologies Group, Inc., Class A * | 2,187 | 50,542 |
SolarEdge Technologies, Inc. * | 1,379 | 317,211 |
Tetra Tech, Inc. | 1,461 | 206,410 |
Trane Technologies plc | 4,752 | 758,562 |
Trimble, Inc. * | 3,032 | 182,405 |
Weyerhaeuser Co., REIT | 16,883 | 522,191 |
Xylem, Inc. | 7,318 | 749,583 |
8,515,900 | ||
Total Common Stocks (Cost $23,170,856) | 19,276,691 | |
Total Investments — 98.5% (Cost $23,170,856) | 19,276,691 | |
Other Assets Less Liabilities — 1.5% | 283,995 | |
NET ASSETS — 100.0% | 19,560,686 | |
Percentages indicated are based on net assets. |
Abbreviations | |
OYJ | Public Limited Company |
REIT | Real Estate Investment Trust |
* | Non-income producing security. |
(a) | Security exempt from registration pursuant to Regulation S under the Securities Act of 1933, as amended. Regulation S applies to securities offerings that are made outside of the United States and do not involve direct selling efforts in the United States and as such may have restrictions on resale. |
INDUSTRY | PERCENT OF TOTAL INVESTMENTS |
Machinery | 17.4% |
Electrical Equipment | 13.9 |
Building Products | 11.9 |
Electric Utilities | 8.5 |
Electronic Equipment, Instruments & Components | 7.8 |
Semiconductors & Semiconductor Equipment | 7.4 |
Software | 6.2 |
Independent Power and Renewable Electricity Producers | 5.6 |
Chemicals | 5.2 |
Paper & Forest Products | 4.9 |
Commercial Services & Supplies | 3.8 |
Automobiles | 2.9 |
Equity Real Estate Investment Trusts (REITs) | 2.7 |
Others (each less than 1.0%) | 1.8 |
156 | October 31, 2022 |
AS OF October 31, 2022
INVESTMENTS | SHARES | VALUE($) |
Common Stocks — 99.8% | ||
Brazil — 10.0% | ||
Ambev SA | 266,548 | 826,141 |
Auren Energia SA | 65,309 | 188,765 |
Banco Bradesco SA (Preference) | 105,686 | 405,517 |
Banco do Brasil SA | 70,278 | 504,347 |
Banco Santander Brasil SA | 73,546 | 422,724 |
BB Seguridade Participacoes SA | 20,512 | 117,779 |
Bradespar SA (Preference) | 41,443 | 192,232 |
CCR SA | 168,316 | 424,578 |
Centrais Eletricas Brasileiras SA | 78,018 | 753,824 |
Cia de Saneamento Basico do Estado de Sao Paulo * | 37,434 | 435,975 |
Cia de Transmissao de Energia Eletrica Paulista (Preference) | 85,348 | 403,980 |
Cia Energetica de Minas Gerais (Preference) | 213,188 | 468,844 |
Cia Paranaense de Energia (Preference) | 311,443 | 446,770 |
Cielo SA * | 395,900 | 456,027 |
CPFL Energia SA | 41,036 | 281,624 |
Dexco SA | 135,823 | 254,265 |
EDP - Energias do Brasil SA | 86,284 | 385,359 |
Embraer SA * | 160,099 | 425,546 |
Energisa SA | 15,697 | 147,626 |
Engie Brasil Energia SA | 30,989 | 240,929 |
Gerdau SA (Preference) | 86,805 | 433,059 |
Grendene SA | 113,425 | 158,319 |
Hypera SA * | 18,246 | 180,217 |
Itau Unibanco Holding SA (Preference) * | 151,333 | 888,867 |
Itausa SA (Preference) | 186,165 | 386,710 |
M Dias Branco SA * | 27,008 | 227,546 |
Marfrig Global Foods SA | 77,444 | 160,120 |
Metalurgica Gerdau SA (Preference) | 121,638 | 264,681 |
Neoenergia SA | 8,752 | 27,956 |
Petroleo Brasileiro SA (Preference) | 297,979 | 1,719,054 |
Sao Martinho SA | 48,160 | 251,545 |
SIMPAR SA | 50,980 | 106,095 |
Telefonica Brasil SA | 57,967 | 464,926 |
TIM SA * | 129,039 | 330,248 |
TOTVS SA * | 38,220 | 247,056 |
Transmissora Alianca de Energia Eletrica SA | 53,063 | 412,547 |
Unipar Carbocloro SA (Preference), Class B | 5,449 | 112,514 |
Vale SA | 174,629 | 2,265,731 |
16,420,043 | ||
Chile — 1.2% | ||
Banco de Chile | 3,332,329 | 304,766 |
Banco Santander Chile | 6,750,037 | 241,814 |
INVESTMENTS | SHARES | VALUE($) |
Chile — continued | ||
CAP SA | 17,248 | 92,296 |
Cencosud SA | 269,241 | 362,412 |
Cia Cervecerias Unidas SA | 23,043 | 126,388 |
Cia Sud Americana de Vapores SA | 4,437,394 | 308,054 |
Colbun SA | 2,015,387 | 198,036 |
Embotelladora Andina SA (Preference), Class B | 67,443 | 117,945 |
Enel Americas SA | 1,555,429 | 154,109 |
1,905,820 | ||
China — 22.1% | ||
Agile Group Holdings Ltd. * | 80,000 | 15,216 |
Agricultural Bank of China Ltd., Class A | 734,700 | 276,546 |
An Hui Wenergy Co. Ltd., Class A * | 189,900 | 120,404 |
Angang Steel Co. Ltd., Class H | 383,800 | 79,634 |
Anhui Conch Cement Co. Ltd., Class H | 125,000 | 321,742 |
Anhui Expressway Co. Ltd., Class A | 177,600 | 162,982 |
ANTA Sports Products Ltd. | 12,400 | 109,016 |
BAIC Motor Corp. Ltd., Class H (a) | 344,500 | 76,322 |
Bank of Beijing Co. Ltd., Class A | 359,100 | 197,850 |
Bank of China Ltd., Class H | 4,156,000 | 1,338,554 |
Bank of Communications Co. Ltd., Class A | 386,100 | 234,362 |
Bank of Hangzhou Co. Ltd., Class A | 140,600 | 232,054 |
Baoshan Iron & Steel Co. Ltd., Class A | 257,900 | 169,405 |
Beijing Enterprises Holdings Ltd. | 50,500 | 128,113 |
BGI Genomics Co. Ltd., Class A | 4,200 | 31,723 |
Bosideng International Holdings Ltd. | 522,000 | 225,455 |
BYD Electronic International Co. Ltd. | 75,500 | 219,402 |
CGN Power Co. Ltd., Class H (a) | 1,717,000 | 347,809 |
China CITIC Bank Corp. Ltd., Class H | 1,111,000 | 418,800 |
China Coal Energy Co. Ltd., Class H | 290,000 | 213,267 |
China Communications Services Corp. Ltd., Class H | 518,000 | 144,540 |
China Construction Bank Corp., Class H | 1,935,000 | 1,026,882 |
China Everbright Bank Co. Ltd., Class H | 304,000 | 78,601 |
China Feihe Ltd. (a) | 264,000 | 152,079 |
China Hongqiao Group Ltd. | 347,000 | 245,589 |
China International Marine Containers Group Co. Ltd., Class A | 208,000 | 188,576 |
China Lesso Group Holdings Ltd. | 147,000 | 119,312 |
China Longyuan Power Group Corp. Ltd., Class H | 178,000 | 203,395 |
China Medical System Holdings Ltd. | 239,000 | 261,209 |
China Merchants Bank Co. Ltd., Class H | 108,500 | 355,218 |
China Merchants Energy Shipping Co. Ltd., Class A | 191,700 | 182,864 |
October 31, 2022 | J.P. Morgan Exchange-Traded Funds | 157 |
AS OF October 31, 2022 (continued)
INVESTMENTS | SHARES | VALUE($) |
Common Stocks — continued | ||
China — continued | ||
China Merchants Port Group Co. Ltd., Class A | 47,100 | 89,258 |
China Merchants Port Holdings Co. Ltd. | 190,000 | 222,755 |
China Minsheng Banking Corp. Ltd., Class H | 205,300 | 59,624 |
China National Building Material Co. Ltd., Class H | 412,250 | 239,380 |
China National Chemical Engineering Co. Ltd., Class A | 101,900 | 98,464 |
China National Nuclear Power Co. Ltd., Class A | 263,600 | 217,031 |
China Petroleum & Chemical Corp., Class H | 1,040,000 | 412,180 |
China Resources Cement Holdings Ltd. | 232,000 | 83,860 |
China Resources Double Crane Pharmaceutical Co. Ltd., Class A | 106,000 | 259,328 |
China Resources Gas Group Ltd. | 93,800 | 240,238 |
China Resources Land Ltd. | 84,000 | 262,818 |
China Resources Pharmaceutical Group Ltd. (a) | 253,000 | 170,669 |
China Resources Power Holdings Co. Ltd. | 174,000 | 252,835 |
China Resources Sanjiu Medical & Pharmaceutical Co. Ltd., Class A | 38,800 | 288,682 |
China Shenhua Energy Co. Ltd., Class H | 257,000 | 675,103 |
China South Publishing & Media Group Co. Ltd., Class A | 227,000 | 295,369 |
China Vanke Co. Ltd., Class H | 50,500 | 64,808 |
China Yangtze Power Co. Ltd., Class A | 151,800 | 420,232 |
Chinese Universe Publishing and Media Group Co. Ltd., Class A | 238,700 | 278,014 |
Chongqing Changan Automobile Co. Ltd., Class A | 137,230 | 211,261 |
Chongqing Rural Commercial Bank Co. Ltd., Class H | 178,000 | 53,952 |
CITIC Ltd. | 441,000 | 394,626 |
Citic Pacific Special Steel Group Co. Ltd., Class A | 85,276 | 187,136 |
COSCO SHIPPING Energy Transportation Co. Ltd., Class H * | 80,000 | 58,275 |
COSCO SHIPPING Holdings Co. Ltd., Class H | 376,350 | 405,582 |
COSCO SHIPPING Ports Ltd. | 218,000 | 107,505 |
CSG Holding Co. Ltd., Class A | 119,100 | 111,420 |
CSPC Pharmaceutical Group Ltd. | 152,000 | 156,129 |
Daan Gene Co. Ltd., Class A | 73,160 | 178,004 |
Dali Foods Group Co. Ltd. (a) | 374,000 | 153,951 |
Daqin Railway Co. Ltd., Class A | 238,200 | 208,108 |
Datang International Power Generation Co. Ltd., Class H * | 876,000 | 111,475 |
Dongfeng Motor Group Co. Ltd., Class H | 168,000 | 76,004 |
Dongguan Development Holdings Co. Ltd., Class A | 112,300 | 134,395 |
INVESTMENTS | SHARES | VALUE($) |
China — continued | ||
ENN Energy Holdings Ltd. | 62,000 | 616,407 |
Fosun International Ltd. | 103,576 | 63,296 |
Fujian Sunner Development Co. Ltd., Class A | 47,900 | 143,387 |
G-bits Network Technology Xiamen Co. Ltd., Class A | 3,700 | 128,644 |
GD Power Development Co. Ltd., Class A * | 508,500 | 303,134 |
Great Wall Motor Co. Ltd., Class H | 283,500 | 309,696 |
Guangdong Baolihua New Energy Stock Co. Ltd., Class A | 317,300 | 232,527 |
Guangxi Guiguan Electric Power Co. Ltd., Class A | 241,900 | 206,573 |
Guangzhou Baiyunshan Pharmaceutical Holdings Co. Ltd., Class H | 50,000 | 111,545 |
Guangzhou Shiyuan Electronic Technology Co. Ltd., Class A | 11,900 | 105,550 |
Haitian International Holdings Ltd. | 103,000 | 206,222 |
Heilongjiang Agriculture Co. Ltd., Class A | 154,300 | 290,426 |
Henan Shuanghui Investment & Development Co. Ltd., Class A | 10,500 | 32,624 |
Hopson Development Holdings Ltd. (b) | 54,852 | 44,023 |
Huabao Flavours & Fragrances Co. Ltd., Class A | 40,100 | 125,479 |
Huadian Power International Corp. Ltd., Class H (b) | 576,000 | 172,987 |
Huadong Medicine Co. Ltd., Class A | 44,300 | 247,939 |
Huaibei Mining Holdings Co. Ltd., Class A | 92,500 | 164,077 |
Huapont Life Sciences Co. Ltd., Class A | 251,400 | 180,092 |
Huaxin Cement Co. Ltd., Class H | 144,300 | 124,603 |
Huayu Automotive Systems Co. Ltd., Class A | 57,700 | 131,937 |
Hubei Energy Group Co. Ltd., Class A | 280,100 | 160,041 |
Hubei Jumpcan Pharmaceutical Co. Ltd., Class A | 54,200 | 240,976 |
Hunan Valin Steel Co. Ltd., Class A | 213,400 | 116,431 |
Industrial & Commercial Bank of China Ltd., Class H | 2,521,000 | 1,094,531 |
Inner Mongolia Dian Tou Energy Corp. Ltd., Class A | 152,816 | 257,533 |
Inner Mongolia Yitai Coal Co. Ltd., Class B | 167,900 | 237,579 |
Intco Medical Technology Co. Ltd., Class A | 32,020 | 92,966 |
Jiangling Motors Corp. Ltd., Class A | 69,100 | 133,644 |
Jiangsu Expressway Co. Ltd., Class A | 40,800 | 41,462 |
Jiangsu Hengli Hydraulic Co. Ltd., Class A | 30,256 | 227,561 |
Jiangsu Yuyue Medical Equipment & Supply Co. Ltd., Class A | 49,600 | 219,975 |
Jiangsu Zhongnan Construction Group Co. Ltd., Class A * | 172,900 | 48,132 |
158 | J.P. Morgan Exchange-Traded Funds | October 31, 2022 |
INVESTMENTS | SHARES | VALUE($) |
Common Stocks — continued | ||
China — continued | ||
Jiangsu Zhongtian Technology Co. Ltd., Class A | 116,100 | 348,190 |
Joincare Pharmaceutical Group Industry Co. Ltd., Class A | 96,700 | 154,096 |
Jointo Energy Investment Co. Ltd. Hebei, Class A * | 215,300 | 150,644 |
Joyoung Co. Ltd., Class A | 33,871 | 67,153 |
JOYY, Inc., ADR | 4,513 | 113,863 |
Kingboard Holdings Ltd. | 111,000 | 274,021 |
KingClean Electric Co. Ltd., Class A | 50,318 | 225,031 |
Kunlun Energy Co. Ltd. | 266,000 | 158,980 |
Kweichow Moutai Co. Ltd., Class A | 5,100 | 940,352 |
LB Group Co. Ltd., Class A | 82,600 | 173,435 |
Li Ning Co. Ltd. | 157,500 | 814,735 |
Livzon Pharmaceutical Group, Inc., Class A | 30,400 | 146,322 |
Longfor Group Holdings Ltd. (c) | 55,500 | 70,717 |
Luolai Lifestyle Technology Co. Ltd., Class A | 80,400 | 103,174 |
Maanshan Iron & Steel Co. Ltd., Class H | 246,000 | 39,466 |
Metallurgical Corp. of China Ltd., Class A | 334,600 | 131,586 |
Nanjing Iron & Steel Co. Ltd., Class A | 403,900 | 168,154 |
Ningbo Sanxing Medical Electric Co. Ltd., Class A | 87,000 | 163,368 |
Pharmaron Beijing Co. Ltd., Class H (a) | 4,350 | 14,667 |
Ping An Insurance Group Co. of China Ltd., Class H | 95,500 | 382,324 |
Postal Savings Bank of China Co. Ltd., Class H (a) | 714,000 | 331,125 |
Qinhuangdao Port Co. Ltd., Class A | 374,800 | 134,348 |
Sansteel Minguang Co. Ltd. Fujian, Class A | 133,600 | 76,580 |
Sany Heavy Industry Co. Ltd., Class A | 87,900 | 162,256 |
SDIC Power Holdings Co. Ltd., Class A | 228,400 | 314,304 |
Seazen Group Ltd. * | 152,000 | 24,416 |
Seazen Holdings Co. Ltd., Class A * | 39,700 | 71,486 |
Shaanxi Coal Industry Co. Ltd., Class A | 138,200 | 373,649 |
Shandong Buchang Pharmaceuticals Co. Ltd., Class A | 56,600 | 148,238 |
Shandong Chenming Paper Holdings Ltd., Class A * | 233,600 | 149,892 |
Shandong Hualu Hengsheng Chemical Co. Ltd., Class A | 78,940 | 282,108 |
Shandong Publishing & Media Co. Ltd., Class A | 282,100 | 228,440 |
Shandong Weigao Group Medical Polymer Co. Ltd., Class H | 203,600 | 280,517 |
Shanghai International Port Group Co. Ltd., Class A | 261,700 | 184,640 |
INVESTMENTS | SHARES | VALUE($) |
China — continued | ||
Shanghai Pharmaceuticals Holding Co. Ltd., Class H | 19,400 | 26,292 |
Shanghai Tunnel Engineering Co. Ltd., Class A | 219,300 | 155,728 |
Shanxi Lu'an Environmental Energy Development Co. Ltd., Class A | 64,700 | 148,300 |
Shenzhen Jinjia Group Co. Ltd., Class A | 116,600 | 114,394 |
Shenzhen Mindray Bio-Medical Electronics Co. Ltd., Class A | 8,700 | 386,874 |
Shenzhen New Nanshan Holding Group Co. Ltd., Class A * | 338,400 | 139,864 |
Shenzhen Overseas Chinese Town Co. Ltd., Class A | 203,900 | 117,139 |
Shenzhen Salubris Pharmaceuticals Co. Ltd., Class A | 39,000 | 164,666 |
Sinoma International Engineering Co., Class A | 75,600 | 88,250 |
Sino-Ocean Group Holding Ltd. | 412,500 | 27,354 |
Sinopharm Group Co. Ltd., Class H | 90,400 | 171,499 |
Sinotruk Hong Kong Ltd. | 148,500 | 132,387 |
Tangshan Jidong Cement Co. Ltd., Class A ‡ | 93,300 | 96,672 |
TangShan Port Group Co. Ltd., Class A | 823,400 | 282,023 |
Tian Di Science & Technology Co. Ltd., Class A | 356,800 | 238,613 |
Tianhe Chemicals Group Ltd. ‡ * | 20,000 | — |
Wanxiang Qianchao Co. Ltd., Class A | 454,000 | 307,363 |
Weichai Power Co. Ltd., Class A | 129,256 | 160,484 |
Weifu High-Technology Group Co. Ltd., Class A | 64,600 | 151,577 |
Wuliangye Yibin Co. Ltd., Class A | 22,800 | 415,705 |
Xiamen C & D, Inc., Class A | 104,600 | 171,181 |
Xinhua Winshare Publishing and Media Co. Ltd., Class A | 186,800 | 238,781 |
Xinxing Ductile Iron Pipes Co. Ltd., Class A | 320,200 | 151,576 |
Yangzijiang Shipbuilding Holdings Ltd. | 423,600 | 359,097 |
Yankuang Energy Group Co. Ltd., Class H | 176,000 | 494,827 |
Yintai Gold Co. Ltd., Class A | 119,120 | 233,340 |
Yuexiu Property Co. Ltd. | 79,400 | 67,756 |
Yunnan Baiyao Group Co. Ltd., Class A | 19,160 | 142,577 |
Zhejiang Expressway Co. Ltd., Class H (b) | 282,000 | 174,956 |
Zhejiang Hisoar Pharmaceutical Co. Ltd., Class A | 119,500 | 109,029 |
Zhejiang Sanhua Intelligent Controls Co. Ltd., Class A | 83,080 | 240,755 |
Zhejiang Semir Garment Co. Ltd., Class A | 156,200 | 95,543 |
Zhejiang Weixing New Building Materials Co. Ltd., Class A | 63,997 | 151,991 |
Zhengzhou Coal Mining Machinery Group Co. Ltd., Class A | 151,700 | 256,079 |
Zhongsheng Group Holdings Ltd. | 55,000 | 208,742 |
October 31, 2022 | J.P. Morgan Exchange-Traded Funds | 159 |
AS OF October 31, 2022 (continued)
INVESTMENTS | SHARES | VALUE($) |
Common Stocks — continued | ||
China — continued | ||
Zhuzhou Kibing Group Co. Ltd., Class A | 97,300 | 104,280 |
Zijin Mining Group Co. Ltd., Class H | 298,000 | 284,244 |
Zoomlion Heavy Industry Science and Technology Co. Ltd., Class H | 348,800 | 112,408 |
36,192,014 | ||
Colombia — 0.2% | ||
Bancolombia SA (Preference) | 45,626 | 287,775 |
Grupo Aval Acciones y Valores SA (Preference) | 381,469 | 41,401 |
329,176 | ||
Czech Republic — 0.4% | ||
CEZ A/S | 17,070 | 558,248 |
Moneta Money Bank A/S (a) | 38,208 | 111,448 |
669,696 | ||
Egypt — 0.1% | ||
Commercial International Bank Egypt SAE | 59,474 | 79,723 |
Greece — 1.0% | ||
Hellenic Telecommunications Organization SA | 32,355 | 508,121 |
JUMBO SA | 23,106 | 328,188 |
Mytilineos SA | 26,811 | 449,573 |
OPAP SA | 34,083 | 417,624 |
1,703,506 | ||
Hong Kong — 0.1% | ||
Kingboard Laminates Holdings Ltd. | 176,000 | 140,603 |
Nine Dragons Paper Holdings Ltd. | 11,000 | 6,519 |
147,122 | ||
Hungary — 0.4% | ||
Magyar Telekom Telecommunications plc | 92,628 | 66,513 |
MOL Hungarian Oil & Gas plc | 38,436 | 230,774 |
Richter Gedeon Nyrt. | 17,396 | 344,106 |
641,393 | ||
India — 11.8% | ||
Adani Power Ltd. * | 65,928 | 267,293 |
Aurobindo Pharma Ltd. | 13,247 | 86,122 |
Bajaj Auto Ltd. | 8,425 | 374,093 |
Bajaj Holdings & Investment Ltd. | 783 | 63,032 |
Bharat Petroleum Corp. Ltd. | 44,246 | 162,439 |
Castrol India Ltd. | 13,180 | 19,792 |
Cipla Ltd. | 32,712 | 461,532 |
Colgate-Palmolive India Ltd. | 5,339 | 105,353 |
Dabur India Ltd. | 43,053 | 288,655 |
INVESTMENTS | SHARES | VALUE($) |
India — continued | ||
Divi's Laboratories Ltd. | 7,286 | 317,817 |
Dr Reddy's Laboratories Ltd. | 6,999 | 376,733 |
GAIL India Ltd. | 19,015 | 20,960 |
Glenmark Pharmaceuticals Ltd. | 7,714 | 37,713 |
HCL Technologies Ltd. | 47,583 | 599,005 |
Hindalco Industries Ltd. | 20,511 | 100,485 |
Hindustan Petroleum Corp. Ltd. | 27,375 | 70,787 |
Hindustan Unilever Ltd. | 59,070 | 1,822,524 |
Hindustan Zinc Ltd. | 13,166 | 45,121 |
Housing Development Finance Corp. Ltd. | 40,786 | 1,219,451 |
ICICI Lombard General Insurance Co. Ltd. (a) | 2,940 | 41,578 |
Indian Oil Corp. Ltd. | 97,019 | 80,016 |
Indus Towers Ltd. | 78,971 | 177,159 |
Infosys Ltd. | 170,555 | 3,178,817 |
ITC Ltd. | 227,271 | 958,250 |
Jindal Steel & Power Ltd. | 19,790 | 109,969 |
JSW Steel Ltd. | 29,858 | 243,273 |
Mphasis Ltd. | 2,876 | 68,757 |
Nestle India Ltd. | 2,013 | 495,701 |
NHPC Ltd. | 208,938 | 107,570 |
NMDC Ltd. | 57,455 | 69,216 |
NMDC Ltd. ‡ * | 54,263 | 25,238 |
NTPC Ltd. | 183,822 | 384,799 |
Oil & Natural Gas Corp. Ltd. | 146,277 | 236,293 |
Oil India Ltd. | 9,540 | 22,209 |
Petronet LNG Ltd. | 53,308 | 132,427 |
Piramal Enterprises Ltd. | 4,614 | 47,417 |
Power Grid Corp. of India Ltd. | 108,155 | 298,408 |
REC Ltd. | 64,289 | 79,655 |
Reliance Industries Ltd. | 59,587 | 1,838,663 |
Samvardhana Motherson International Ltd. | 37,095 | 28,918 |
Steel Authority of India Ltd. | 74,444 | 70,815 |
Sun Pharmaceutical Industries Ltd. | 31,379 | 385,546 |
Tata Consultancy Services Ltd. | 38,057 | 1,468,698 |
Tata Power Co. Ltd. (The) | 202,532 | 553,691 |
Tata Steel Ltd. | 411,942 | 505,252 |
Tech Mahindra Ltd. | 5,858 | 75,339 |
Titan Co. Ltd. | 12,568 | 419,370 |
Torrent Power Ltd. | 11,680 | 71,228 |
United Breweries Ltd. | 2,196 | 43,891 |
UPL Ltd. | 20,043 | 176,942 |
Vedanta Ltd. | 107,080 | 362,848 |
160 | J.P. Morgan Exchange-Traded Funds | October 31, 2022 |
INVESTMENTS | SHARES | VALUE($) |
Common Stocks — continued | ||
India — continued | ||
Wipro Ltd. | 22,528 | 105,419 |
Zydus Lifesciences Ltd. | 12,791 | 67,031 |
19,369,310 | ||
Indonesia — 3.7% | ||
Adaro Energy Indonesia Tbk. PT | 2,017,100 | 514,600 |
Astra International Tbk. PT | 1,523,300 | 650,953 |
Bank Central Asia Tbk. PT | 1,824,900 | 1,031,575 |
Bukit Asam Tbk. PT | 1,424,500 | 356,753 |
Charoen Pokphand Indonesia Tbk. PT | 580,000 | 207,208 |
Gudang Garam Tbk. PT | 42,500 | 65,668 |
Hanjaya Mandala Sampoerna Tbk. PT | 1,803,600 | 116,326 |
Indofood CBP Sukses Makmur Tbk. PT | 145,200 | 90,631 |
Indofood Sukses Makmur Tbk. PT | 593,200 | 245,445 |
Kalbe Farma Tbk. PT | 3,002,700 | 394,874 |
Media Nusantara Citra Tbk. PT * | 2,707,600 | 142,489 |
Perusahaan Gas Negara Tbk. PT | 2,021,200 | 256,106 |
Sarana Menara Nusantara Tbk. PT | 3,557,500 | 263,342 |
Telkom Indonesia Persero Tbk. PT | 3,499,100 | 982,725 |
Unilever Indonesia Tbk. PT | 362,300 | 107,786 |
United Tractors Tbk. PT | 174,000 | 359,925 |
XL Axiata Tbk. PT | 1,304,600 | 210,883 |
5,997,289 | ||
Kuwait — 2.3% | ||
Agility Public Warehousing Co. KSC | 210,609 | 533,284 |
Humansoft Holding Co. KSC | 20,599 | 223,597 |
Kuwait Finance House KSCP | 387,722 | 1,014,017 |
Mobile Telecommunications Co. KSCP | 291,645 | 563,713 |
National Bank of Kuwait SAKP | 410,173 | 1,427,451 |
3,762,062 | ||
Malaysia — 2.1% | ||
Astro Malaysia Holdings Bhd. | 324,900 | 46,385 |
Axiata Group Bhd. | 259,100 | 155,929 |
DiGi.Com Bhd. | 315,900 | 253,388 |
Hartalega Holdings Bhd. | 240,700 | 109,888 |
Hong Leong Financial Group Bhd. | 8,400 | 33,937 |
Kuala Lumpur Kepong Bhd. | 24,100 | 110,339 |
Malayan Banking Bhd. | 43,408 | 78,853 |
Maxis Bhd. | 412,900 | 336,099 |
Nestle Malaysia Bhd. | 7,200 | 202,538 |
Petronas Chemicals Group Bhd. | 227,300 | 419,056 |
Petronas Gas Bhd. | 117,500 | 424,968 |
PPB Group Bhd. | 101,060 | 356,855 |
RHB Bank Bhd. | 101,700 | 123,158 |
INVESTMENTS | SHARES | VALUE($) |
Malaysia — continued | ||
Telekom Malaysia Bhd. | 262,900 | 309,200 |
Tenaga Nasional Bhd. | 273,900 | 487,767 |
3,448,360 | ||
Mexico — 7.1% | ||
Alfa SAB de CV, Class A | 687,790 | 456,837 |
America Movil SAB de CV | 1,354,443 | 1,278,357 |
Arca Continental SAB de CV | 72,806 | 594,780 |
Banco del Bajio SA (a) | 45,359 | 127,700 |
Cemex SAB de CV * | 1,022,269 | 398,320 |
Coca-Cola Femsa SAB de CV | 73,812 | 464,263 |
El Puerto de Liverpool SAB de CV, Class C1 | 34,283 | 175,161 |
Fibra Uno Administracion SA de CV, REIT | 470,916 | 549,755 |
Fomento Economico Mexicano SAB de CV | 20,443 | 146,660 |
Gruma SAB de CV, Class B | 39,915 | 460,635 |
Grupo Aeroportuario del Centro Norte SAB de CV | 66,343 | 529,056 |
Grupo Aeroportuario del Pacifico SAB de CV, Class B | 41,586 | 645,021 |
Grupo Aeroportuario del Sureste SAB de CV, Class B | 26,454 | 620,820 |
Grupo Bimbo SAB de CV | 209,589 | 812,524 |
Grupo Carso SAB de CV | 46,912 | 189,182 |
Grupo Financiero Banorte SAB de CV, Class O | 203,676 | 1,658,048 |
Grupo Mexico SAB de CV | 66,326 | 238,918 |
Kimberly-Clark de Mexico SAB de CV, Class A | 41,627 | 65,593 |
Megacable Holdings SAB de CV | 94,215 | 196,248 |
Orbia Advance Corp. SAB de CV | 187,524 | 315,458 |
Promotora y Operadora de Infraestructura SAB de CV | 40,127 | 301,849 |
Qualitas Controladora SAB de CV | 25,373 | 99,569 |
Sitios Latinoamerica SAB de CV * | 67,721 | 20,064 |
Wal-Mart de Mexico SAB de CV | 351,699 | 1,358,655 |
11,703,473 | ||
Pakistan — 0.0% ^ | ||
Oil & Gas Development Co. Ltd. | 115,306 | 36,645 |
Panama — 0.0% ^ | ||
BAC Holding International Corp. * | 353,223 | 14,054 |
Philippines — 0.6% | ||
Globe Telecom, Inc. | 4,658 | 187,789 |
Manila Electric Co. | 40,040 | 208,764 |
Metro Pacific Investments Corp. | 3,122,200 | 197,192 |
October 31, 2022 | J.P. Morgan Exchange-Traded Funds | 161 |
AS OF October 31, 2022 (continued)
INVESTMENTS | SHARES | VALUE($) |
Common Stocks — continued | ||
Philippines — continued | ||
PLDT, Inc. | 11,335 | 319,647 |
Puregold Price Club, Inc. | 24,700 | 12,816 |
926,208 | ||
Qatar — 2.3% | ||
Commercial Bank PSQC (The) | 154,212 | 266,560 |
Industries Qatar QSC | 155,840 | 674,634 |
Masraf Al Rayan QSC | 113,913 | 120,023 |
Mesaieed Petrochemical Holding Co. | 278,891 | 173,942 |
Ooredoo QPSC | 183,290 | 491,399 |
Qatar Electricity & Water Co. QSC | 54,315 | 275,864 |
Qatar Fuel QSC | 39,610 | 207,520 |
Qatar Gas Transport Co. Ltd. | 458,812 | 516,556 |
Qatar International Islamic Bank QSC | 34,730 | 110,313 |
Qatar Islamic Bank SAQ | 96,949 | 648,727 |
Qatar National Bank QPSC | 22,405 | 122,682 |
Qatar Navigation QSC | 44,916 | 126,296 |
United Development Co. QSC | 59,749 | 23,502 |
3,758,018 | ||
Russia — 0.1% | ||
Alrosa PJSC ‡ * | 200,448 | 4,122 |
Federal Grid Co. Unified Energy System PJSC ‡ * | 127,925,624 | 2,782 |
Inter RAO UES PJSC ‡ | 6,142,220 | 4,185 |
LUKOIL PJSC ‡ | 17,853 | 21,998 |
M.Video PJSC ‡ | 8,526 | 539 |
Magnit PJSC ‡ | 7,858 | 5,824 |
Magnitogorsk Iron & Steel Works PJSC ‡ | 334,440 | 3,866 |
MMC Norilsk Nickel PJSC ‡ | 3,087 | 14,762 |
Mobile TeleSystems PJSC ‡ | 120,496 | 6,770 |
Novolipetsk Steel PJSC ‡ | 155,019 | 6,950 |
PhosAgro PJSC ‡ | 1,940 | 2,387 |
ROSSETI PJSC ‡ * | 6,397,653 | 1,040 |
Rostelecom PJSC ‡ | 157,186 | 2,668 |
RusHydro PJSC ‡ | 35,715,691 | 5,977 |
Sberbank of Russia PJSC ‡ * | 537,391 | 16,767 |
Severstal PAO ‡ | 20,498 | 6,910 |
Sistema PJSFC ‡ * | 308,352 | 918 |
Surgutneftegas PJSC (Preference) ‡ | 655,737 | 4,970 |
Tatneft PJSC ‡ | 17,275 | 1,549 |
Unipro PJSC ‡ | 4,941,067 | 1,948 |
116,932 | ||
Saudi Arabia — 6.4% | ||
Abdullah Al Othaim Markets Co. | 5,516 | 166,637 |
INVESTMENTS | SHARES | VALUE($) |
Saudi Arabia — continued | ||
ACWA Power Co. | 2,763 | 127,901 |
Al Rajhi Bank * | 14,066 | 318,959 |
Alinma Bank | 74,588 | 744,088 |
Almarai Co. JSC | 24,982 | 374,109 |
Arab National Bank | 18,657 | 160,204 |
Arabian Internet & Communications Services Co. | 6,005 | 396,067 |
Bank Al-Jazira | 49,043 | 305,131 |
Banque Saudi Fransi | 17,736 | 203,875 |
Dr Sulaiman Al Habib Medical Services Group Co. | 9,685 | 584,227 |
Elm Co. | 3,123 | 274,471 |
Etihad Etisalat Co. | 55,697 | 542,242 |
Jarir Marketing Co. | 10,803 | 471,212 |
Mouwasat Medical Services Co. | 5,970 | 347,532 |
Riyad Bank | 47,695 | 455,840 |
SABIC Agri-Nutrients Co. | 15,615 | 659,764 |
Sahara International Petrochemical Co. | 37,168 | 400,146 |
Saudi Airlines Catering Co. * | 17,543 | 361,259 |
Saudi Arabian Mining Co. * | 17,269 | 384,377 |
Saudi Arabian Oil Co. (a) | 136,075 | 1,262,847 |
Saudi Cement Co. | 20,176 | 286,163 |
Saudi Electricity Co. | 91,911 | 659,966 |
Saudi Ground Services Co. * | 17,574 | 121,677 |
Saudi Investment Bank (The) | 50,515 | 243,684 |
Saudi Telecom Co. | 23,936 | 257,164 |
Yanbu Cement Co. | 27,396 | 303,885 |
10,413,427 | ||
Singapore — 0.1% | ||
Yangzijiang Financial Holding Ltd. * | 393,600 | 86,187 |
South Africa — 5.5% | ||
African Rainbow Minerals Ltd. | 27,112 | 381,778 |
Anglo American Platinum Ltd. | 4,963 | 395,184 |
Aspen Pharmacare Holdings Ltd. | 37,384 | 307,518 |
AVI Ltd. | 86,295 | 345,654 |
Bidvest Group Ltd. (The) | 44,763 | 517,795 |
Clicks Group Ltd. | 4,261 | 72,201 |
Distell Group Holdings Ltd. * | 17,130 | 161,921 |
Exxaro Resources Ltd. | 37,145 | 413,915 |
Foschini Group Ltd. (The) | 58,235 | 364,098 |
Impala Platinum Holdings Ltd. | 55,776 | 571,072 |
Investec Ltd. | 26,788 | 131,762 |
Life Healthcare Group Holdings Ltd. | 83,924 | 90,235 |
MTN Group Ltd. | 133,012 | 940,057 |
162 | J.P. Morgan Exchange-Traded Funds | October 31, 2022 |
INVESTMENTS | SHARES | VALUE($) |
Common Stocks — continued | ||
South Africa — continued | ||
MultiChoice Group | 62,145 | 406,084 |
Nedbank Group Ltd. | 36,142 | 428,067 |
Netcare Ltd. | 96,775 | 82,309 |
Pepkor Holdings Ltd. (a) | 329,759 | 406,976 |
Pick n Pay Stores Ltd. | 79,116 | 254,291 |
Royal Bafokeng Platinum Ltd. | 9,793 | 78,728 |
Shoprite Holdings Ltd. | 51,734 | 658,499 |
Sibanye Stillwater Ltd. | 145,289 | 340,299 |
SPAR Group Ltd. (The) | 7,060 | 59,862 |
Tiger Brands Ltd. | 28,346 | 287,075 |
Truworths International Ltd. | 120,891 | 344,039 |
Vodacom Group Ltd. | 71,395 | 486,308 |
Woolworths Holdings Ltd. | 135,857 | 465,880 |
8,991,607 | ||
Taiwan — 9.9% | ||
Asia Cement Corp. | 219,000 | 253,226 |
Capital Securities Corp. | 467,000 | 144,670 |
Cheng Shin Rubber Industry Co. Ltd. | 349,000 | 349,170 |
Chicony Electronics Co. Ltd. | 25,551 | 63,390 |
China Airlines Ltd. | 572,000 | 299,430 |
China Motor Corp. | 59,000 | 76,361 |
China Steel Corp. | 158,000 | 131,522 |
Chunghwa Telecom Co. Ltd. | 284,000 | 979,208 |
CTBC Financial Holding Co. Ltd. | 1,396,395 | 882,154 |
E.Sun Financial Holding Co. Ltd. | 877,216 | 630,424 |
Eva Airways Corp. | 358,000 | 258,520 |
Evergreen Marine Corp. Taiwan Ltd. | 89,800 | 382,037 |
Far Eastern New Century Corp. | 464,000 | 462,472 |
Far EasTone Telecommunications Co. Ltd. | 178,000 | 390,283 |
Feng TAY Enterprise Co. Ltd. | 27,000 | 134,090 |
First Financial Holding Co. Ltd. | 733,357 | 562,560 |
Formosa Chemicals & Fibre Corp. | 132,000 | 284,523 |
Formosa Taffeta Co. Ltd. | 183,000 | 145,518 |
Fubon Financial Holding Co. Ltd. | 160,185 | 253,018 |
Globalwafers Co. Ltd. | 14,000 | 155,175 |
Hotai Motor Co. Ltd. | 15,000 | 271,387 |
Lite-On Technology Corp. | 186,000 | 368,323 |
Mega Financial Holding Co. Ltd. | 770,013 | 713,377 |
Nan Ya Plastics Corp. | 412,000 | 872,963 |
Nien Made Enterprise Co. Ltd. | 35,000 | 269,866 |
Novatek Microelectronics Corp. | 11,000 | 81,958 |
Pou Chen Corp. | 448,000 | 378,206 |
President Chain Store Corp. | 68,000 | 565,420 |
Realtek Semiconductor Corp. | 40,000 | 315,331 |
INVESTMENTS | SHARES | VALUE($) |
Taiwan — continued | ||
SinoPac Financial Holdings Co. Ltd. | 1,159,275 | 578,426 |
Taiwan Cooperative Financial Holding Co. Ltd. | 697,819 | 540,679 |
Taiwan Fertilizer Co. Ltd. | 204,000 | 330,745 |
Taiwan Mobile Co. Ltd. | 191,000 | 563,180 |
Taiwan Semiconductor Manufacturing Co. Ltd. | 143,000 | 1,719,175 |
Uni-President Enterprises Corp. | 404,000 | 820,427 |
Yang Ming Marine Transport Corp. | 143,000 | 266,213 |
Yuanta Financial Holding Co. Ltd. | 1,087,529 | 664,054 |
Yulon Motor Co. Ltd. | 96,000 | 135,616 |
16,293,097 | ||
Thailand — 2.3% | ||
Advanced Info Service PCL | 112,700 | 566,319 |
Bangkok Dusit Medical Services PCL, Class F | 273,000 | 211,888 |
Bumrungrad Hospital PCL | 54,400 | 324,280 |
Digital Telecommunications Infrastructure Fund, Class F | 890,000 | 315,686 |
Electricity Generating PCL | 35,500 | 159,160 |
Home Product Center PCL | 774,400 | 297,586 |
Intouch Holdings PCL, NVDR | 158,000 | 299,109 |
Krung Thai Bank PCL | 1,059,300 | 488,116 |
PTT Exploration & Production PCL | 147,600 | 699,995 |
Ratch Group PCL | 95,200 | 102,483 |
Sri Trang Gloves Thailand PCL, NVDR | 76,500 | 22,350 |
Thai Union Group PCL, Class F | 236,600 | 111,977 |
Total Access Communication PCL | 49,600 | 58,747 |
Total Access Communication PCL, NVDR | 124,000 | 146,867 |
3,804,563 | ||
Turkey — 6.7% | ||
AG Anadolu Grubu Holding A/S | 77,224 | 356,991 |
Aksa Enerji Uretim A/S | 148,674 | 330,666 |
Alarko Holding A/S | 125,790 | 434,105 |
Anadolu Efes Biracilik ve Malt Sanayii A/S | 164,975 | 424,503 |
Arcelik A/S | 83,598 | 353,323 |
Aselsan Elektronik Sanayi ve Ticaret A/S | 263,533 | 456,243 |
Aygaz A/S | 43,776 | 138,593 |
BIM Birlesik Magazalar A/S | 81,855 | 589,346 |
Coca-Cola Icecek A/S | 42,582 | 393,299 |
Dogan Sirketler Grubu Holding A/S | 1,193,047 | 381,649 |
Dogus Otomotiv Servis ve Ticaret A/S | 35,316 | 232,692 |
EIS Eczacibasi Ilac ve Sinai ve Finansal Yatirimlar Sanayi ve Ticaret A/S | 211,258 | 225,699 |
Enerjisa Enerji A/S (a) | 312,387 | 344,231 |
Enka Insaat ve Sanayi A/S | 392,083 | 394,924 |
Eregli Demir ve Celik Fabrikalari TAS | 211,480 | 337,025 |
October 31, 2022 | J.P. Morgan Exchange-Traded Funds | 163 |
AS OF October 31, 2022 (continued)
INVESTMENTS | SHARES | VALUE($) |
Common Stocks — continued | ||
Turkey — continued | ||
Ford Otomotiv Sanayi A/S | 22,262 | 434,489 |
Haci Omer Sabanci Holding A/S | 223,584 | 402,654 |
Iskenderun Demir ve Celik A/S | 55,538 | 75,987 |
KOC Holding A/S | 131,047 | 390,928 |
Koza Altin Isletmeleri A/S | 17,918 | 187,412 |
Koza Anadolu Metal Madencilik Isletmeleri A/S * | 146,099 | 250,127 |
Otokar Otomotiv ve Savunma Sanayi AS | 6,473 | 183,957 |
Oyak Cimento Fabrikalari A/S * | 301,163 | 271,969 |
TAV Havalimanlari Holding A/S * | 111,724 | 470,573 |
Tekfen Holding A/S | 113,969 | 202,095 |
Tofas Turk Otomobil Fabrikasi A/S | 75,234 | 396,962 |
Turk Hava Yollari AO * | 117,622 | 640,190 |
Turk Telekomunikasyon A/S | 610,061 | 406,555 |
Turk Traktor ve Ziraat Makineleri A/S | 10,399 | 212,577 |
Turkcell Iletisim Hizmetleri A/S | 352,608 | 486,682 |
Turkiye Sise ve Cam Fabrikalari A/S | 330,627 | 589,535 |
10,995,981 | ||
United Arab Emirates — 3.1% | ||
Abu Dhabi Commercial Bank PJSC | 239,956 | 617,687 |
Abu Dhabi Islamic Bank PJSC | 134,029 | 346,787 |
Abu Dhabi Ports Co. PJSC * | 158,974 | 245,611 |
Air Arabia PJSC | 309,171 | 171,718 |
Aldar Properties PJSC | 360,420 | 423,952 |
Alpha Dhabi Holding PJSC * | 81,518 | 543,734 |
Dubai Islamic Bank PJSC | 261,397 | 414,125 |
Emirates Telecommunications Group Co. PJSC | 206,279 | 1,449,742 |
First Abu Dhabi Bank PJSC | 190,611 | 929,564 |
5,142,920 | ||
United States — 0.3% | ||
JBS SA | 114,014 | 551,143 |
Total Common Stocks (Cost $175,358,922) | 163,499,769 | |
NO. OF RIGHTS | ||
Rights — 0.0% | ||
Thailand — 0.0% ^ | ||
Thai Union Group PCL, expiring 12/31/2022(Cost $—) | 6,708 | — |
INVESTMENTS | SHARES | VALUE($) |
Short-Term Investments — 0.1% | ||
Investment of Cash Collateral from Securities Loaned — 0.1% | ||
JPMorgan U.S. Government Money Market Fund Class IM Shares, 2.85% (d) (e)(Cost $182,157) | 182,157 | 182,157 |
Total Investments — 99.9% (Cost $175,541,079) | 163,681,926 | |
Other Assets Less Liabilities — 0.1% | 244,300 | |
NET ASSETS — 100.0% | 163,926,226 | |
Percentages indicated are based on net assets. |
Abbreviations | |
ADR | American Depositary Receipt |
JSC | Joint Stock Company |
NVDR | Non-Voting Depositary Receipt |
PJSC | Public Joint Stock Company |
Preference | A special type of equity investment that shares in the earnings of the company, has limited voting rights, and may have a dividend preference. Preference shares may also have liquidation preference. |
PT | Limited liability company |
REIT | Real Estate Investment Trust |
^ | Amount rounds to less than 0.1% of net assets. | |
‡ | Value determined using significant unobservable inputs. | |
* | Non-income producing security. | |
(a) | Security exempt from registration pursuant to Regulation S under the Securities Act of 1933, as amended. Regulation S applies to securities offerings that are made outside of the United States and do not involve direct selling efforts in the United States and as such may have restrictions on resale. | |
(b) | The security or a portion of this security is on loan at October 31, 2022. The total value of securities on loan at October 31, 2022 is $160,016. | |
(c) | Securities exempt from registration under Rule 144A or section 4(a)(2), of the Securities Act of 1933, as amended. | |
(d) | Investment in an affiliated fund, which is registered under the Investment Company Act of 1940, as amended, and is advised by J.P. Morgan Investment Management Inc. | |
(e) | The rate shown is the current yield as of October 31, 2022. | |
164 | J.P. Morgan Exchange-Traded Funds | October 31, 2022 |
INDUSTRY | PERCENT OF TOTAL INVESTMENTS |
Banks | 16.0% |
Oil, Gas & Consumable Fuels | 7.3 |
Metals & Mining | 6.2 |
Wireless Telecommunication Services | 5.0 |
Food Products | 4.2 |
Electric Utilities | 4.1 |
IT Services | 4.0 |
Diversified Telecommunication Services | 3.9 |
Industrial Conglomerates | 3.6 |
Independent Power and Renewable Electricity Producers | 3.3 |
Pharmaceuticals | 3.1 |
Transportation Infrastructure | 3.0 |
Beverages | 2.8 |
Chemicals | 2.8 |
Food & Staples Retailing | 2.5 |
Specialty Retail | 2.0 |
Automobiles | 1.8 |
Machinery | 1.6 |
Textiles, Apparel & Luxury Goods | 1.6 |
Construction Materials | 1.5 |
Personal Products | 1.5 |
Semiconductors & Semiconductor Equipment | 1.4 |
Diversified Financial Services | 1.4 |
Health Care Providers & Services | 1.3 |
Gas Utilities | 1.2 |
Media | 1.0 |
Others (each less than 1.0%) | 11.8 |
Short-Term Investments | 0.1 |
October 31, 2022 | J.P. Morgan Exchange-Traded Funds | 165 |
AS OF October 31, 2022 (continued)
DESCRIPTION | NUMBER OF CONTRACTS | EXPIRATION DATE | TRADING CURRENCY | NOTIONAL AMOUNT ($) | VALUE AND UNREALIZED APPRECIATION (DEPRECIATION) ($) |
Long Contracts | |||||
MSCI Emerging Markets E-Mini Index | 3 | 12/16/2022 | USD | 128,115 | 654 |
Abbreviations | |
MSCI | Morgan Stanley Capital International |
USD | United States Dollar |
166 | J.P. Morgan Exchange-Traded Funds | October 31, 2022 |
AS OF October 31, 2022
INVESTMENTS | SHARES | VALUE($) |
Common Stocks — 99.4% | ||
Australia — 10.7% | ||
AGL Energy Ltd. | 523,203 | 2,279,485 |
Altium Ltd. | 53,984 | 1,218,921 |
Alumina Ltd. | 1,474,211 | 1,274,082 |
Ampol Ltd. | 87,550 | 1,527,032 |
Ansell Ltd. | 109,193 | 1,971,273 |
APA Group | 308,064 | 2,074,007 |
Aurizon Holdings Ltd. | 240,848 | 558,133 |
Australia & New Zealand Banking Group Ltd. | 28,032 | 459,269 |
BHP Group Ltd. | 91,755 | 2,203,974 |
BlueScope Steel Ltd. | 78,372 | 789,205 |
Charter Hall Group, REIT | 71,773 | 595,777 |
Cochlear Ltd. | 7,692 | 982,604 |
Coles Group Ltd. | 240,213 | 2,511,587 |
CSR Ltd. | 544,470 | 1,612,869 |
Dexus, REIT | 426,546 | 2,125,523 |
Endeavour Group Ltd. | 213,003 | 974,980 |
Flutter Entertainment plc * | 9,245 | 1,225,344 |
Fortescue Metals Group Ltd. | 167,960 | 1,582,352 |
Glencore plc | 532,607 | 3,053,475 |
GPT Group (The), REIT | 783,001 | 2,163,875 |
Harvey Norman Holdings Ltd. | 506,343 | 1,347,019 |
Iluka Resources Ltd. | 68,299 | 378,413 |
Incitec Pivot Ltd. | 471,790 | 1,134,632 |
JB Hi-Fi Ltd. | 70,243 | 1,925,499 |
Lottery Corp. Ltd. (The) * | 644,321 | 1,767,610 |
Macquarie Group Ltd. | 2,700 | 292,904 |
Metcash Ltd. | 703,069 | 1,845,648 |
Mirvac Group, REIT | 1,069,172 | 1,416,617 |
Origin Energy Ltd. | 683,532 | 2,441,973 |
Ramsay Health Care Ltd. | 53,664 | 2,012,892 |
REA Group Ltd. | 680 | 52,704 |
Rio Tinto Ltd. | 35,662 | 2,023,805 |
Rio Tinto plc | 45,907 | 2,399,176 |
Santos Ltd. | 534,788 | 2,610,653 |
Sonic Healthcare Ltd. | 119,178 | 2,495,049 |
South32 Ltd. | 786,516 | 1,804,480 |
Stockland, REIT | 227,972 | 525,270 |
Tabcorp Holdings Ltd. | 1,307,054 | 806,950 |
Telstra Group Ltd. | 689,484 | 1,728,831 |
TPG Telecom Ltd. | 34,395 | 107,897 |
Treasury Wine Estates Ltd. | 84,685 | 701,765 |
Vicinity Ltd., REIT | 547,849 | 682,984 |
Wesfarmers Ltd. | 79,482 | 2,306,492 |
Whitehaven Coal Ltd. | 234,621 | 1,362,867 |
INVESTMENTS | SHARES | VALUE($) |
Australia — continued | ||
WiseTech Global Ltd. | 23,407 | 865,661 |
Woodside Energy Group Ltd. | 125,662 | 2,905,113 |
Woolworths Group Ltd. | 113,055 | 2,387,472 |
71,514,143 | ||
Austria — 0.6% | ||
Mondi plc | 170,381 | 2,858,733 |
OMV AG | 31,546 | 1,452,485 |
4,311,218 | ||
Belgium — 0.4% | ||
D'ieteren Group | 2,542 | 423,060 |
Etablissements Franz Colruyt NV | 6,500 | 156,677 |
Groupe Bruxelles Lambert NV | 7,603 | 560,542 |
Proximus SADP | 117,570 | 1,232,572 |
2,372,851 | ||
Brazil — 0.4% | ||
Yara International ASA | 60,080 | 2,681,457 |
Cambodia — 0.0% ^ | ||
NagaCorp Ltd. * | 133,231 | 60,758 |
Chile — 0.3% | ||
Antofagasta plc | 167,469 | 2,256,715 |
China — 1.4% | ||
Budweiser Brewing Co. APAC Ltd. (a) | 201,300 | 423,681 |
Chow Tai Fook Jewellery Group Ltd. | 261,200 | 447,194 |
Lenovo Group Ltd. | 3,576,000 | 2,857,967 |
SITC International Holdings Co. Ltd. | 214,000 | 350,489 |
Want Want China Holdings Ltd. | 2,546,000 | 1,672,430 |
Wilmar International Ltd. | 795,000 | 2,177,945 |
Xinyi Glass Holdings Ltd. | 963,000 | 1,237,605 |
9,167,311 | ||
Denmark — 0.7% | ||
Carlsberg A/S, Class B | 11,346 | 1,335,943 |
DSV A/S | 606 | 81,888 |
Novo Nordisk A/S, Class B | 27,686 | 3,010,333 |
4,428,164 | ||
Finland — 1.6% | ||
Elisa OYJ | 48,482 | 2,342,958 |
Fortum OYJ | 130,558 | 1,837,511 |
Kesko OYJ, Class B | 104,647 | 2,036,501 |
Orion OYJ, Class B | 15,269 | 702,653 |
Stora Enso OYJ, Class R | 132,161 | 1,723,222 |
October 31, 2022 | J.P. Morgan Exchange-Traded Funds | 167 |
AS OF October 31, 2022 (continued)
INVESTMENTS | SHARES | VALUE($) |
Common Stocks — continued | ||
Finland — continued | ||
UPM-Kymmene OYJ | 60,316 | 2,027,671 |
Valmet OYJ | 17,112 | 389,182 |
11,059,698 | ||
France — 4.2% | ||
Air Liquide SA | 4,960 | 648,836 |
Arkema SA | 21,067 | 1,667,202 |
Capgemini SE | 16,303 | 2,671,912 |
Carrefour SA | 127,088 | 2,045,539 |
Covivio, REIT | 12,017 | 643,410 |
Eiffage SA | 28,445 | 2,572,048 |
EssilorLuxottica SA | 2,479 | 392,000 |
Gecina SA, REIT | 22,770 | 2,030,039 |
Klepierre SA, REIT * | 107,721 | 2,165,004 |
Orange SA | 208,728 | 1,988,743 |
Pernod Ricard SA | 15,240 | 2,674,792 |
Publicis Groupe SA | 31,881 | 1,785,476 |
Sanofi | 8,756 | 753,523 |
TotalEnergies SE | 43,009 | 2,346,286 |
Unibail-Rodamco-Westfield, REIT * | 8,397 | 396,839 |
Vinci SA | 22,866 | 2,104,519 |
Vivendi SE | 166,116 | 1,359,656 |
28,245,824 | ||
Germany — 2.5% | ||
Aroundtown SA | 116,384 | 230,702 |
Bayerische Motoren Werke AG | 11,999 | 941,825 |
Covestro AG (a) | 14,949 | 507,459 |
Daimler Truck Holding AG * | 25,116 | 669,909 |
Deutsche Telekom AG (Registered) | 152,142 | 2,871,756 |
E.ON SE | 51,167 | 428,472 |
Evonik Industries AG | 27,124 | 499,671 |
Fresenius Medical Care AG & Co. KGaA | 36,281 | 1,003,554 |
Hannover Rueck SE | 3,287 | 534,874 |
Hella GmbH & Co. KGaA | 7,275 | 567,949 |
Infineon Technologies AG | 11,259 | 273,205 |
LEG Immobilien SE | 14,458 | 943,894 |
Mercedes-Benz Group AG | 42,430 | 2,455,916 |
Merck KGaA | 8,732 | 1,423,012 |
SAP SE | 20,944 | 2,015,920 |
Telefonica Deutschland Holding AG | 612,726 | 1,335,069 |
Uniper SE (b) | 46,706 | 139,812 |
16,842,999 | ||
Hong Kong — 2.9% | ||
ASMPT Ltd. | 107,100 | 589,104 |
INVESTMENTS | SHARES | VALUE($) |
Hong Kong — continued | ||
CK Asset Holdings Ltd. | 383,000 | 2,117,443 |
CK Infrastructure Holdings Ltd. | 470,000 | 2,232,841 |
CLP Holdings Ltd. | 327,000 | 2,194,761 |
Hong Kong & China Gas Co. Ltd. | 737,393 | 568,360 |
Hutchison Port Holdings Trust | 2,985,000 | 487,525 |
Link, REIT | 217,100 | 1,283,195 |
MTR Corp. Ltd. | 221,500 | 974,642 |
New World Development Co. Ltd. | 122,750 | 251,082 |
Orient Overseas International Ltd. | 46,000 | 672,205 |
PCCW Ltd. | 3,409,000 | 1,302,414 |
Power Assets Holdings Ltd. | 496,000 | 2,371,648 |
Sun Hung Kai Properties Ltd. | 179,500 | 1,928,965 |
Swire Pacific Ltd., Class A | 97,500 | 646,768 |
WH Group Ltd. (a) | 3,272,500 | 1,652,649 |
Yue Yuen Industrial Holdings Ltd. | 405,000 | 411,742 |
19,685,344 | ||
Indonesia — 0.2% | ||
First Pacific Co. Ltd. | 446,000 | 118,103 |
Golden Agri-Resources Ltd. | 5,083,200 | 1,042,357 |
1,160,460 | ||
Ireland — 0.4% | ||
CRH plc | 48,690 | 1,753,709 |
Smurfit Kappa Group plc | 24,907 | 824,496 |
2,578,205 | ||
Italy — 2.1% | ||
A2A SpA | 489,211 | 542,456 |
Assicurazioni Generali SpA | 53,249 | 799,114 |
Banca Mediolanum SpA | 68,814 | 514,860 |
Coca-Cola HBC AG | 111,861 | 2,443,417 |
Davide Campari-Milano NV | 89,646 | 805,050 |
Eni SpA | 76,991 | 1,011,179 |
Italgas SpA | 364,289 | 1,876,909 |
Poste Italiane SpA (a) | 175,302 | 1,527,629 |
Recordati Industria Chimica e Farmaceutica SpA | 32,219 | 1,210,517 |
Snam SpA | 294,315 | 1,308,676 |
Telecom Italia SpA * | 506,331 | 99,060 |
Terna - Rete Elettrica Nazionale | 243,704 | 1,616,164 |
13,755,031 | ||
Japan — 30.1% | ||
Activia Properties, Inc., REIT | 216 | 639,804 |
Advance Residence Investment Corp., REIT | 255 | 593,682 |
Advantest Corp. | 5,900 | 310,585 |
168 | J.P. Morgan Exchange-Traded Funds | October 31, 2022 |
INVESTMENTS | SHARES | VALUE($) |
Common Stocks — continued | ||
Japan — continued | ||
Aeon Mall Co. Ltd. | 23,800 | 258,910 |
AEON REIT Investment Corp., REIT | 513 | 552,309 |
AGC, Inc. | 27,200 | 852,311 |
Ajinomoto Co., Inc. | 106,100 | 2,918,092 |
Alfresa Holdings Corp. | 84,300 | 970,536 |
Anritsu Corp. | 144,900 | 1,458,400 |
Aozora Bank Ltd. | 29,700 | 510,892 |
Asahi Group Holdings Ltd. | 56,800 | 1,589,306 |
Astellas Pharma, Inc. | 203,300 | 2,805,171 |
Brother Industries Ltd. | 40,600 | 691,658 |
Canon Marketing Japan, Inc. | 60,700 | 1,280,891 |
Canon, Inc. | 69,700 | 1,477,465 |
Capcom Co. Ltd. | 84,200 | 2,342,020 |
Casio Computer Co. Ltd. | 39,100 | 339,847 |
Chubu Electric Power Co., Inc. | 282,300 | 2,297,901 |
Chugai Pharmaceutical Co. Ltd. | 74,100 | 1,717,035 |
COMSYS Holdings Corp. | 82,000 | 1,343,396 |
Cosmo Energy Holdings Co. Ltd. | 100,300 | 2,583,664 |
Cosmos Pharmaceutical Corp. | 5,900 | 570,617 |
CyberAgent, Inc. | 162,100 | 1,331,681 |
Dai Nippon Printing Co. Ltd. | 47,600 | 953,463 |
Daito Trust Construction Co. Ltd. | 29,600 | 2,931,104 |
Daiwa House REIT Investment Corp., REIT | 746 | 1,505,649 |
Daiwa Securities Group, Inc. | 530,800 | 2,071,008 |
Denka Co. Ltd. | 12,400 | 287,259 |
DIC Corp. | 35,100 | 589,342 |
Dowa Holdings Co. Ltd. | 11,000 | 349,272 |
Electric Power Development Co. Ltd. | 180,400 | 2,508,949 |
ENEOS Holdings, Inc. | 223,400 | 736,920 |
Fuji Media Holdings, Inc. | 18,200 | 126,583 |
FUJIFILM Holdings Corp. | 45,500 | 2,081,620 |
Fujitsu Ltd. | 20,700 | 2,381,712 |
Fukuoka Financial Group, Inc. | 22,300 | 379,448 |
H.U. Group Holdings, Inc. | 69,000 | 1,284,422 |
Hachijuni Bank Ltd. (The) | 132,400 | 422,245 |
Hikari Tsushin, Inc. | 5,300 | 640,211 |
Hoya Corp. | 600 | 55,777 |
Idemitsu Kosan Co. Ltd. | 81,637 | 1,786,237 |
Iida Group Holdings Co. Ltd. | 39,500 | 548,472 |
Industrial & Infrastructure Fund Investment Corp., REIT | 58 | 61,256 |
Inpex Corp. | 258,800 | 2,611,912 |
ITOCHU Corp. | 93,800 | 2,424,219 |
Itochu Techno-Solutions Corp. | 25,000 | 579,594 |
Iwatani Corp. | 37,700 | 1,388,168 |
INVESTMENTS | SHARES | VALUE($) |
Japan — continued | ||
Japan Metropolitan Fund Invest, REIT | 1,899 | 1,399,049 |
Japan Post Holdings Co. Ltd. | 277,300 | 1,864,726 |
Japan Post Insurance Co. Ltd. | 131,700 | 1,949,576 |
Japan Real Estate Investment Corp., REIT | 16 | 67,045 |
Japan Tobacco, Inc. | 170,700 | 2,858,787 |
Kajima Corp. | 62,300 | 586,442 |
Kaken Pharmaceutical Co. Ltd. | 15,800 | 404,405 |
Kaneka Corp. | 9,400 | 233,094 |
Kansai Electric Power Co., Inc. (The) | 301,500 | 2,283,942 |
Kawasaki Kisen Kaisha Ltd. | 51,600 | 782,422 |
KDDI Corp. | 92,700 | 2,739,931 |
Kikkoman Corp. | 6,400 | 346,817 |
Kinden Corp. | 48,500 | 493,505 |
Kirin Holdings Co. Ltd. | 59,100 | 868,766 |
K's Holdings Corp. | 188,900 | 1,480,299 |
Kyowa Kirin Co. Ltd. | 115,500 | 2,720,222 |
Kyushu Electric Power Co., Inc. | 313,200 | 1,550,677 |
Lawson, Inc. | 50,600 | 1,616,519 |
Lintec Corp. | 54,400 | 816,196 |
Mani, Inc. | 24,100 | 351,079 |
Marubeni Corp. | 288,900 | 2,529,007 |
Matsui Securities Co. Ltd. | 62,600 | 333,368 |
MatsukiyoCocokara & Co. | 28,000 | 1,019,442 |
Mebuki Financial Group, Inc. | 176,200 | 342,654 |
Medipal Holdings Corp. | 105,200 | 1,304,275 |
MEIJI Holdings Co. Ltd. | 61,300 | 2,522,441 |
Mitsubishi Chemical Group Corp. | 250,400 | 1,131,145 |
Mitsubishi Corp. | 34,000 | 921,022 |
Mitsubishi Estate Co. Ltd. | 18,200 | 228,870 |
Mitsubishi Gas Chemical Co., Inc. | 49,300 | 626,466 |
Mitsubishi HC Capital, Inc. | 400,500 | 1,718,569 |
Mitsubishi UFJ Financial Group, Inc. | 241,400 | 1,140,338 |
Mitsui & Co. Ltd. | 127,100 | 2,812,620 |
Mitsui Fudosan Co. Ltd. | 89,300 | 1,709,950 |
Mitsui Fudosan Logistics Park, Inc., REIT | 38 | 126,079 |
Mitsui Mining & Smelting Co. Ltd. | 50,700 | 1,024,018 |
Morinaga Milk Industry Co. Ltd. | 15,900 | 451,088 |
MS&AD Insurance Group Holdings, Inc. | 36,800 | 974,508 |
NH Foods Ltd. | 29,800 | 710,179 |
Nifco, Inc. | 9,400 | 218,310 |
Nintendo Co. Ltd. | 59,300 | 2,407,526 |
Nippon Electric Glass Co. Ltd. | 75,700 | 1,310,791 |
Nippon Shinyaku Co. Ltd. | 17,300 | 957,836 |
Nippon Shokubai Co. Ltd. | 12,000 | 430,449 |
October 31, 2022 | J.P. Morgan Exchange-Traded Funds | 169 |
AS OF October 31, 2022 (continued)
INVESTMENTS | SHARES | VALUE($) |
Common Stocks — continued | ||
Japan — continued | ||
Nippon Steel Corp. | 185,200 | 2,540,671 |
Nippon Telegraph & Telephone Corp. | 106,500 | 2,937,345 |
Nippon Yusen KK | 89,400 | 1,619,434 |
Nisshin Seifun Group, Inc. | 45,100 | 487,334 |
Nissin Foods Holdings Co. Ltd. | 24,600 | 1,592,331 |
Nitto Denko Corp. | 38,200 | 2,012,596 |
NOF Corp. | 16,000 | 550,343 |
Nomura Holdings, Inc. | 42,800 | 138,499 |
Nomura Real Estate Holdings, Inc. | 103,700 | 2,344,015 |
Nomura Research Institute Ltd. | 81,700 | 1,808,038 |
Obayashi Corp. | 112,200 | 720,175 |
Ono Pharmaceutical Co. Ltd. | 106,300 | 2,501,617 |
Open House Group Co. Ltd. | 75,300 | 2,678,377 |
ORIX Corp. | 159,900 | 2,348,564 |
Osaka Gas Co. Ltd. | 178,800 | 2,647,616 |
Otsuka Holdings Co. Ltd. | 49,700 | 1,593,109 |
Resona Holdings, Inc. | 475,000 | 1,790,253 |
Rinnai Corp. | 5,500 | 374,359 |
Sankyo Co. Ltd. | 31,500 | 1,040,189 |
Sapporo Holdings Ltd. | 18,500 | 408,051 |
Sawai Group Holdings Co. Ltd. | 27,100 | 782,247 |
SBI Holdings, Inc. | 69,800 | 1,260,872 |
SCREEN Holdings Co. Ltd. | 35,700 | 1,959,463 |
SCSK Corp. | 51,000 | 752,427 |
Sekisui Chemical Co. Ltd. | 54,600 | 681,847 |
Sekisui House Ltd. | 82,900 | 1,376,372 |
Sekisui House REIT, Inc., REIT | 656 | 353,483 |
Shimamura Co. Ltd. | 8,700 | 703,547 |
Shionogi & Co. Ltd. | 47,600 | 2,210,413 |
Ship Healthcare Holdings, Inc. | 21,300 | 408,510 |
Skylark Holdings Co. Ltd. | 70,600 | 753,123 |
SoftBank Corp. | 246,200 | 2,428,612 |
SoftBank Group Corp. | 54,700 | 2,348,064 |
Sojitz Corp. | 151,420 | 2,232,229 |
Sony Group Corp. | 16,400 | 1,105,928 |
Sugi Holdings Co. Ltd. | 21,800 | 874,291 |
Sumitomo Chemical Co. Ltd. | 746,100 | 2,512,313 |
Sumitomo Mitsui Financial Group, Inc. | 59,400 | 1,668,045 |
Sumitomo Pharma Co. Ltd. | 159,700 | 1,112,456 |
Suntory Beverage & Food Ltd. | 59,400 | 1,987,329 |
Suzuken Co. Ltd. | 23,900 | 532,104 |
Taisho Pharmaceutical Holdings Co. Ltd. | 4,000 | 144,272 |
Takeda Pharmaceutical Co. Ltd. | 87,200 | 2,302,865 |
Teijin Ltd. | 82,400 | 748,110 |
INVESTMENTS | SHARES | VALUE($) |
Japan — continued | ||
TIS, Inc. | 6,000 | 161,770 |
Toho Gas Co. Ltd. | 28,200 | 525,417 |
Tohoku Electric Power Co., Inc. | 261,600 | 1,098,827 |
Tokyo Electric Power Co. Holdings, Inc. * | 755,100 | 2,459,788 |
Tokyo Electron Ltd. | 6,800 | 1,789,057 |
Tokyo Gas Co. Ltd. | 158,600 | 2,834,419 |
Tokyo Tatemono Co. Ltd. | 99,000 | 1,361,481 |
Tosoh Corp. | 102,100 | 1,110,796 |
Toyo Suisan Kaisha Ltd. | 64,400 | 2,416,108 |
Toyota Boshoku Corp. | 27,600 | 351,199 |
Toyota Industries Corp. | 30,700 | 1,581,517 |
Trend Micro, Inc. | 11,600 | 584,913 |
Tsumura & Co. | 61,900 | 1,292,866 |
UBE Corp. | 86,100 | 1,110,501 |
Unicharm Corp. | 27,400 | 832,725 |
United Urban Investment Corp., REIT | 224 | 236,998 |
USS Co. Ltd. | 62,500 | 943,046 |
Yakult Honsha Co. Ltd. | 27,200 | 1,506,851 |
Yamada Holdings Co. Ltd. | 450,800 | 1,452,709 |
Yamaguchi Financial Group, Inc. | 8,200 | 43,183 |
Yamaha Motor Co. Ltd. | 121,400 | 2,506,008 |
Yokohama Rubber Co. Ltd. (The) | 69,800 | 1,091,470 |
Zeon Corp. | 63,300 | 533,573 |
201,702,525 | ||
Jordan — 0.3% | ||
Hikma Pharmaceuticals plc | 127,179 | 1,825,685 |
Luxembourg — 0.1% | ||
RTL Group SA | 26,684 | 905,814 |
Mexico — 0.1% | ||
Fresnillo plc | 109,033 | 911,574 |
Netherlands — 3.4% | ||
ASML Holding NV (b) | 2,703 | 1,267,943 |
ASR Nederland NV | 56,369 | 2,482,091 |
BE Semiconductor Industries NV | 17,017 | 867,268 |
Heineken Holding NV | 28,026 | 1,912,332 |
Koninklijke Ahold Delhaize NV | 102,631 | 2,862,204 |
Koninklijke DSM NV | 8,487 | 998,329 |
Koninklijke KPN NV | 878,608 | 2,457,560 |
Koninklijke Philips NV | 14,423 | 182,954 |
NN Group NV | 69,759 | 2,953,769 |
OCI NV | 18,157 | 694,467 |
Shell plc | 117,006 | 3,241,253 |
170 | J.P. Morgan Exchange-Traded Funds | October 31, 2022 |
INVESTMENTS | SHARES | VALUE($) |
Common Stocks — continued | ||
Netherlands — continued | ||
Universal Music Group NV | 4,326 | 84,943 |
Wolters Kluwer NV | 26,883 | 2,856,551 |
22,861,664 | ||
New Zealand — 0.6% | ||
Fisher & Paykel Healthcare Corp. Ltd. | 141,936 | 1,613,106 |
Spark New Zealand Ltd. | 745,461 | 2,219,060 |
3,832,166 | ||
Norway — 1.2% | ||
Aker BP ASA | 15,438 | 490,409 |
DNB Bank ASA | 36,080 | 638,143 |
Equinor ASA | 75,935 | 2,766,595 |
Mowi ASA | 42,913 | 640,510 |
Norsk Hydro ASA | 244,547 | 1,551,974 |
Orkla ASA | 148,008 | 998,337 |
Salmar ASA | 8,518 | 288,774 |
Telenor ASA | 81,306 | 738,898 |
8,113,640 | ||
Portugal — 0.3% | ||
Jeronimo Martins SGPS SA | 101,050 | 2,091,030 |
Russia — 0.0% ^ | ||
Evraz plc ‡ | 393,430 | 18,472 |
Singapore — 2.9% | ||
CapitaLand Ascendas REIT, REIT | 641,342 | 1,186,606 |
CapitaLand Integrated Commercial Trust, REIT | 839,808 | 1,114,555 |
ComfortDelGro Corp. Ltd. | 466,500 | 418,774 |
DBS Group Holdings Ltd. | 112,500 | 2,719,836 |
Keppel Corp. Ltd. | 435,600 | 2,144,031 |
Mapletree Pan Asia Commercial Trust, REIT | 828,500 | 929,751 |
Oversea-Chinese Banking Corp. Ltd. | 221,900 | 1,904,810 |
Sembcorp Industries Ltd. | 1,343,500 | 2,761,770 |
Singapore Telecommunications Ltd. | 857,800 | 1,510,368 |
STMicroelectronics NV | 27,233 | 846,782 |
Suntec, REIT | 1,490,400 | 1,359,246 |
Venture Corp. Ltd. | 199,100 | 2,240,542 |
19,137,071 | ||
South Africa — 0.3% | ||
Anglo American plc | 68,413 | 2,049,258 |
South Korea — 6.7% | ||
CJ CheilJedang Corp. | 2,016 | 585,329 |
Daewoo Engineering & Construction Co. Ltd. * | 132,357 | 389,782 |
DL Holdings Co. Ltd. | 10,643 | 458,639 |
INVESTMENTS | SHARES | VALUE($) |
South Korea — continued | ||
E-MART, Inc. | 5,844 | 346,448 |
F&F Co. Ltd. | 7,848 | 799,617 |
GS Engineering & Construction Corp. | 67,304 | 1,022,668 |
GS Holdings Corp. | 5,376 | 173,406 |
GS Retail Co. Ltd. | 34,496 | 614,253 |
Hana Financial Group, Inc. | 82,856 | 2,395,481 |
Hanwha Corp. | 21,839 | 388,585 |
Hanwha Life Insurance Co. Ltd. * | 241,303 | 369,428 |
Hite Jinro Co. Ltd. | 34,033 | 611,935 |
Hyundai Department Store Co. Ltd. | 3,914 | 148,449 |
Hyundai Mobis Co. Ltd. | 5,541 | 849,875 |
Industrial Bank of Korea | 190,552 | 1,396,481 |
KB Financial Group, Inc. | 69,717 | 2,345,912 |
Kia Corp. | 44,436 | 2,064,977 |
Korea Electric Power Corp. * | 35,214 | 412,937 |
Korea Gas Corp. | 56,927 | 1,389,252 |
Korea Investment Holdings Co. Ltd. | 13,599 | 472,072 |
Korean Air Lines Co. Ltd. * | 50,973 | 825,459 |
KT&G Corp. | 46,968 | 3,154,444 |
LG Corp. | 40,184 | 2,230,734 |
LG Innotek Co. Ltd. | 10,611 | 2,201,403 |
LG Uplus Corp. | 94,926 | 762,283 |
Mirae Asset Securities Co. Ltd. | 77,791 | 346,289 |
NAVER Corp. | 9,202 | 1,091,526 |
NH Investment & Securities Co. Ltd. | 72,322 | 454,737 |
NongShim Co. Ltd. | 442 | 93,625 |
Orion Corp. | 11,539 | 821,138 |
POSCO Holdings, Inc. | 9,213 | 1,605,741 |
Samsung Electronics Co. Ltd. | 55,737 | 2,319,766 |
Samsung Engineering Co. Ltd. * | 47,407 | 791,949 |
Samsung Securities Co. Ltd. | 41,240 | 917,541 |
SK Hynix, Inc. | 42,971 | 2,487,658 |
SK Square Co. Ltd. * | 27,961 | 722,959 |
SK Telecom Co. Ltd. | 54,270 | 1,907,141 |
Woori Financial Group, Inc. | 289,648 | 2,390,175 |
Yuhan Corp. | 63,628 | 2,667,849 |
45,027,943 | ||
Spain — 2.1% | ||
Acciona SA | 10,730 | 1,932,062 |
Corp. ACCIONA Energias Renovables SA | 8,800 | 346,024 |
Enagas SA | 103,035 | 1,672,661 |
Endesa SA | 141,867 | 2,370,320 |
Iberdrola SA | 273,811 | 2,784,461 |
Merlin Properties Socimi SA, REIT | 65,027 | 551,207 |
October 31, 2022 | J.P. Morgan Exchange-Traded Funds | 171 |
AS OF October 31, 2022 (continued)
INVESTMENTS | SHARES | VALUE($) |
Common Stocks — continued | ||
Spain — continued | ||
Naturgy Energy Group SA | 102,043 | 2,618,682 |
Red Electrica Corp. SA | 94,988 | 1,536,499 |
13,811,916 | ||
Sweden — 3.5% | ||
Boliden AB | 70,937 | 2,062,913 |
Castellum AB | 138,620 | 1,584,995 |
Fastighets AB Balder, Class B * | 167,393 | 628,334 |
Getinge AB, Class B | 39,245 | 796,398 |
H & M Hennes & Mauritz AB, Class B (b) | 167,052 | 1,682,575 |
Hexagon AB, Class B | 233,054 | 2,303,948 |
Husqvarna AB, Class B | 472 | 2,802 |
Investor AB, Class B | 165,451 | 2,700,263 |
Sagax AB, Class B | 43,791 | 806,952 |
Securitas AB, Class B (b) | 226,537 | 1,850,991 |
Skanska AB, Class B | 82,804 | 1,287,713 |
Swedish Match AB | 286,774 | 2,949,440 |
Tele2 AB, Class B | 174,447 | 1,429,771 |
Telia Co. AB (b) | 737,177 | 1,953,347 |
Trelleborg AB, Class B | 72,084 | 1,587,222 |
23,627,664 | ||
Switzerland — 1.6% | ||
EMS-Chemie Holding AG (Registered) | 433 | 272,267 |
Kuehne + Nagel International AG (Registered) | 3,904 | 831,030 |
Logitech International SA (Registered) (b) | 28,617 | 1,423,179 |
Novartis AG (Registered) | 31,648 | 2,560,031 |
Sonova Holding AG (Registered) | 9,111 | 2,153,510 |
Swiss Prime Site AG (Registered) | 12,346 | 996,235 |
Swisscom AG (Registered) | 5,370 | 2,651,648 |
10,887,900 | ||
United Kingdom — 16.0% | ||
3i Group plc | 214,908 | 2,862,226 |
abrdn plc | 486,582 | 886,641 |
Admiral Group plc | 96,244 | 2,225,705 |
Ashtead Group plc | 3,923 | 204,361 |
Associated British Foods plc | 116,273 | 1,802,149 |
AstraZeneca plc | 25,295 | 2,967,918 |
Auto Trader Group plc (a) | 314,599 | 1,883,121 |
AVEVA Group plc | 59,768 | 2,138,992 |
Aviva plc | 434,847 | 2,085,799 |
B&M European Value Retail SA | 333,526 | 1,232,574 |
BAE Systems plc | 326,199 | 3,051,125 |
Barratt Developments plc | 64,954 | 280,153 |
Bellway plc | 9,745 | 207,249 |
INVESTMENTS | SHARES | VALUE($) |
United Kingdom — continued | ||
Berkeley Group Holdings plc | 20,955 | 833,744 |
BP plc | 301,799 | 1,669,736 |
British American Tobacco plc | 75,174 | 2,968,882 |
British Land Co. plc (The), REIT | 363,982 | 1,526,866 |
BT Group plc | 1,390,723 | 2,072,500 |
Bunzl plc | 52,772 | 1,719,604 |
Burberry Group plc | 37,378 | 778,849 |
Centrica plc | 3,026,782 | 2,659,669 |
CK Hutchison Holdings Ltd. | 110,542 | 550,260 |
ConvaTec Group plc (a) | 976,287 | 2,442,891 |
Croda International plc | 27,848 | 2,157,374 |
Dechra Pharmaceuticals plc | 36,959 | 1,111,071 |
Derwent London plc, REIT | 60,601 | 1,499,834 |
Diageo plc | 68,992 | 2,839,194 |
Direct Line Insurance Group plc | 591,972 | 1,367,714 |
Haleon plc * | 750,796 | 2,302,283 |
Halma plc | 22,746 | 551,575 |
HSBC Holdings plc | 369,758 | 1,897,618 |
IMI plc | 99,264 | 1,398,320 |
Imperial Brands plc | 132,768 | 3,234,109 |
Informa plc | 226,675 | 1,444,355 |
InterContinental Hotels Group plc | 24,302 | 1,305,765 |
Intertek Group plc | 21,975 | 920,598 |
J Sainsbury plc | 624,604 | 1,392,301 |
Johnson Matthey plc | 19,610 | 435,295 |
Land Securities Group plc, REIT | 290,277 | 1,898,089 |
Legal & General Group plc | 970,706 | 2,596,893 |
M&G plc | 369,031 | 741,615 |
National Grid plc | 74,992 | 817,047 |
Next plc | 30,587 | 1,727,543 |
Pearson plc | 281,315 | 3,109,410 |
Pennon Group plc | 92,297 | 886,948 |
Persimmon plc | 46,782 | 700,040 |
Phoenix Group Holdings plc | 192,962 | 1,200,991 |
Reckitt Benckiser Group plc | 39,785 | 2,640,293 |
Rentokil Initial plc | 125,541 | 783,390 |
Rightmove plc | 305,063 | 1,717,869 |
Sage Group plc (The) | 203,648 | 1,697,353 |
Segro plc, REIT | 206,537 | 1,858,834 |
Severn Trent plc | 54,445 | 1,562,558 |
Smith & Nephew plc | 78,927 | 932,674 |
Smiths Group plc | 142,079 | 2,544,997 |
Spirax-Sarco Engineering plc | 9,192 | 1,132,763 |
SSE plc | 141,937 | 2,536,540 |
172 | J.P. Morgan Exchange-Traded Funds | October 31, 2022 |
INVESTMENTS | SHARES | VALUE($) |
Common Stocks — continued | ||
United Kingdom — continued | ||
St. James's Place plc | 64,516 | 787,841 |
Standard Chartered plc | 122,471 | 731,733 |
Tate & Lyle plc | 259,229 | 2,082,954 |
Taylor Wimpey plc | 244,222 | 262,570 |
Tesco plc | 926,743 | 2,288,948 |
Unilever plc | 8,760 | 399,826 |
Unilever plc | 9,170 | 416,816 |
United Utilities Group plc | 231,099 | 2,490,369 |
Vodafone Group plc | 1,701,029 | 1,985,786 |
WPP plc | 232,815 | 2,048,807 |
107,489,917 | ||
United States — 1.8% | ||
CSL Ltd. | 14,018 | 2,509,439 |
Ferguson plc | 25,136 | 2,741,300 |
GSK plc | 141,203 | 2,313,060 |
NortonLifeLock, Inc. | 1 | 23 |
Roche Holding AG | 8,755 | 2,904,893 |
Schneider Electric SE | 7,501 | 948,550 |
Sims Ltd. | 123,737 | 967,419 |
12,384,684 | ||
Total Common Stocks (Cost $806,370,835) | 666,799,101 | |
Short-Term Investments — 0.7% | ||
Investment Companies — 0.1% | ||
JPMorgan Prime Money Market Fund Class IM Shares, 3.18% (c) (d)(Cost $569,430) | 569,342 | 569,398 |
Investment of Cash Collateral from Securities Loaned — 0.6% | ||
JPMorgan Securities Lending Money Market Fund Agency SL Class Shares, 3.23% (c) (d) | 2,258,925 | 2,258,925 |
JPMorgan U.S. Government Money Market Fund Class IM Shares, 2.85% (c) (d) | 1,789,624 | 1,789,624 |
Total Investment of Cash Collateral from Securities Loaned (Cost $4,047,394) | 4,048,549 | |
Total Short-Term Investments (Cost $4,616,824) | 4,617,947 | |
Total Investments — 100.1% (Cost $810,987,659) | 671,417,048 | |
Liabilities in Excess of Other Assets — (0.1)% | (354,908) | |
NET ASSETS — 100.0% | 671,062,140 | |
Percentages indicated are based on net assets. |
Abbreviations | |
APAC | Asia Pacific |
OYJ | Public Limited Company |
REIT | Real Estate Investment Trust |
SGPS | Holding company |
^ | Amount rounds to less than 0.1% of net assets. | |
‡ | Value determined using significant unobservable inputs. | |
* | Non-income producing security. | |
(a) | Security exempt from registration pursuant to Regulation S under the Securities Act of 1933, as amended. Regulation S applies to securities offerings that are made outside of the United States and do not involve direct selling efforts in the United States and as such may have restrictions on resale. | |
(b) | The security or a portion of this security is on loan at October 31, 2022. The total value of securities on loan at October 31, 2022 is $3,818,777. | |
(c) | Investment in an affiliated fund, which is registered under the Investment Company Act of 1940, as amended, and is advised by J.P. Morgan Investment Management Inc. | |
(d) | The rate shown is the current yield as of October 31, 2022. | |
October 31, 2022 | J.P. Morgan Exchange-Traded Funds | 173 |
AS OF October 31, 2022 (continued)
INDUSTRY | PERCENT OF TOTAL INVESTMENTS |
Pharmaceuticals | 6.5% |
Electric Utilities | 5.1 |
Equity Real Estate Investment Trusts (REITs) | 4.7 |
Metals & Mining | 4.6 |
Oil, Gas & Consumable Fuels | 4.5 |
Diversified Telecommunication Services | 4.5 |
Food Products | 4.0 |
Food & Staples Retailing | 3.8 |
Chemicals | 3.6 |
Banks | 3.4 |
Insurance | 3.4 |
Real Estate Management & Development | 2.8 |
Beverages | 2.8 |
Gas Utilities | 2.6 |
Trading Companies & Distributors | 2.3 |
Tobacco | 2.3 |
Wireless Telecommunication Services | 1.9 |
Media | 1.8 |
Health Care Equipment & Supplies | 1.8 |
Construction & Engineering | 1.8 |
Electronic Equipment, Instruments & Components | 1.7 |
Semiconductors & Semiconductor Equipment | 1.7 |
Technology Hardware, Storage & Peripherals | 1.6 |
Capital Markets | 1.6 |
Health Care Providers & Services | 1.5 |
Multi-Utilities | 1.4 |
Household Durables | 1.4 |
Specialty Retail | 1.4 |
Diversified Financial Services | 1.3 |
Software | 1.3 |
IT Services | 1.2 |
Industrial Conglomerates | 1.2 |
Automobiles | 1.2 |
Multiline Retail | 1.0 |
Machinery | 1.0 |
Paper & Forest Products | 1.0 |
Others (each less than 1.0%) | 9.6 |
Short-Term Investments | 0.7 |
174 | J.P. Morgan Exchange-Traded Funds | October 31, 2022 |
DESCRIPTION | NUMBER OF CONTRACTS | EXPIRATION DATE | TRADING CURRENCY | NOTIONAL AMOUNT ($) | VALUE AND UNREALIZED APPRECIATION (DEPRECIATION) ($) |
Long Contracts | |||||
MSCI EAFE E-Mini Index | 40 | 12/16/2022 | USD | 3,512,400 | 105,847 |
Abbreviations | |
EAFE | Europe, Australasia and Far East |
MSCI | Morgan Stanley Capital International |
USD | United States Dollar |
October 31, 2022 | J.P. Morgan Exchange-Traded Funds | 175 |
AS OF October 31, 2022
INVESTMENTS | SHARES | VALUE ($) |
Common Stocks — 99.7% | ||
Aerospace & Defense — 1.0% | ||
General Dynamics Corp. | 8,994 | 2,246,701 |
L3Harris Technologies, Inc. | 1,605 | 395,585 |
Lockheed Martin Corp. | 4,900 | 2,384,732 |
5,027,018 | ||
Automobiles & Parts — 0.6% | ||
Ford Motor Co. | 118,910 | 1,589,827 |
Gentex Corp. | 58,634 | 1,553,214 |
3,143,041 | ||
Banks — 2.0% | ||
Bank of America Corp. | 39,976 | 1,440,735 |
Bank of Hawaii Corp. | 3,854 | 292,711 |
Citizens Financial Group, Inc. | 9,212 | 376,771 |
Discover Financial Services | 9,255 | 966,777 |
Fifth Third Bancorp | 42,915 | 1,531,637 |
Huntington Bancshares, Inc. | 109,429 | 1,661,132 |
KeyCorp | 19,922 | 356,006 |
Popular, Inc. (Puerto Rico) | 13,425 | 949,416 |
Regions Financial Corp. | 24,385 | 535,251 |
Truist Financial Corp. | 29,246 | 1,309,928 |
US Bancorp | 13,349 | 566,665 |
9,987,029 | ||
Beverages — 2.3% | ||
Brown-Forman Corp., Class B | 23,496 | 1,597,728 |
Coca-Cola Co. (The) | 33,392 | 1,998,511 |
Constellation Brands, Inc., Class A | 8,395 | 2,074,237 |
Keurig Dr Pepper, Inc. | 53,677 | 2,084,815 |
Molson Coors Beverage Co., Class B | 39,957 | 2,015,031 |
PepsiCo, Inc. | 11,961 | 2,171,878 |
11,942,200 | ||
Chemicals — 4.1% | ||
Ashland, Inc. | 18,480 | 1,938,922 |
Celanese Corp. | 12,784 | 1,228,798 |
CF Industries Holdings, Inc. | 19,777 | 2,101,504 |
Chemours Co. (The) | 50,372 | 1,442,150 |
Dow, Inc. | 31,931 | 1,492,455 |
Eastman Chemical Co. | 17,379 | 1,334,881 |
Element Solutions, Inc. | 74,306 | 1,278,063 |
FMC Corp. | 8,748 | 1,040,137 |
Huntsman Corp. | 73,534 | 1,967,770 |
LyondellBasell Industries NV, Class A | 19,891 | 1,520,667 |
Mosaic Co. (The) | 34,652 | 1,862,545 |
NewMarket Corp. | 1,112 | 338,426 |
INVESTMENTS | SHARES | VALUE ($) |
Chemicals — continued | ||
Olin Corp. | 35,900 | 1,900,905 |
Westlake Corp. | 16,755 | 1,619,371 |
21,066,594 | ||
Construction & Materials — 1.6% | ||
A O Smith Corp. | 26,601 | 1,457,203 |
Carrier Global Corp. | 8,591 | 341,578 |
Eagle Materials, Inc. | 4,360 | 533,272 |
Fortune Brands Home & Security, Inc. | 10,753 | 648,621 |
Louisiana-Pacific Corp. | 31,049 | 1,758,926 |
Masco Corp. | 26,198 | 1,212,181 |
Quanta Services, Inc. | 14,483 | 2,057,165 |
8,008,946 | ||
Consumer Services — 0.5% | ||
H&R Block, Inc. | 38,105 | 1,568,021 |
Service Corp. International | 13,295 | 805,810 |
2,373,831 | ||
Electricity — 7.2% | ||
Alliant Energy Corp. | 27,362 | 1,427,475 |
American Electric Power Co., Inc. | 20,410 | 1,794,447 |
Avangrid, Inc. | 31,734 | 1,290,939 |
CMS Energy Corp. | 27,120 | 1,547,196 |
Consolidated Edison, Inc. | 20,934 | 1,841,355 |
Dominion Energy, Inc. | 24,155 | 1,690,125 |
DTE Energy Co. | 15,700 | 1,760,127 |
Edison International | 16,641 | 999,126 |
Entergy Corp. | 13,278 | 1,422,605 |
Evergy, Inc. | 29,842 | 1,824,241 |
Exelon Corp. | 46,626 | 1,799,297 |
FirstEnergy Corp. | 52,111 | 1,965,106 |
Hawaiian Electric Industries, Inc. | 26,715 | 1,016,239 |
IDACORP, Inc. | 15,489 | 1,621,698 |
NRG Energy, Inc. | 49,714 | 2,207,302 |
OGE Energy Corp. | 50,862 | 1,863,075 |
Pinnacle West Capital Corp. | 21,336 | 1,433,993 |
PPL Corp. | 70,904 | 1,878,247 |
Public Service Enterprise Group, Inc. | 31,211 | 1,750,001 |
Southern Co. (The) | 26,549 | 1,738,428 |
Vistra Corp. | 82,955 | 1,905,476 |
Xcel Energy, Inc. | 27,543 | 1,793,325 |
36,569,823 | ||
Electronic & Electrical Equipment — 0.8% | ||
AMETEK, Inc. | 8,422 | 1,091,996 |
176 | J.P. Morgan Exchange-Traded Funds | October 31, 2022 |
INVESTMENTS | SHARES | VALUE ($) |
Common Stocks — continued | ||
Electronic & Electrical Equipment — continued | ||
Emerson Electric Co. | 7,956 | 688,990 |
Hubbell, Inc. | 4,889 | 1,161,040 |
IDEX Corp. | 4,068 | 904,357 |
3,846,383 | ||
Finance & Credit Services — 0.4% | ||
Ally Financial, Inc. | 44,047 | 1,213,935 |
FactSet Research Systems, Inc. | 1,227 | 522,076 |
OneMain Holdings, Inc. | 12,787 | 493,067 |
2,229,078 | ||
Food Producers — 7.1% | ||
Archer-Daniels-Midland Co. | 23,440 | 2,273,211 |
Bunge Ltd. | 20,776 | 2,050,591 |
Campbell Soup Co. | 40,882 | 2,163,067 |
Conagra Brands, Inc. | 60,386 | 2,216,166 |
Corteva, Inc. | 33,537 | 2,191,307 |
Darling Ingredients, Inc. * | 24,790 | 1,945,519 |
Flowers Foods, Inc. | 66,258 | 1,902,267 |
General Mills, Inc. | 26,831 | 2,188,873 |
Hershey Co. (The) | 9,171 | 2,189,760 |
Hormel Foods Corp. | 35,297 | 1,639,546 |
Ingredion, Inc. | 18,397 | 1,639,541 |
J M Smucker Co. (The) | 14,825 | 2,233,534 |
Kellogg Co. | 28,534 | 2,191,982 |
Kraft Heinz Co. (The) | 55,075 | 2,118,735 |
McCormick & Co., Inc. (Non-Voting) | 5,865 | 461,224 |
Mondelez International, Inc., Class A | 33,308 | 2,047,776 |
Pilgrim's Pride Corp. * | 22,579 | 520,446 |
Post Holdings, Inc. * | 23,054 | 2,084,543 |
Tyson Foods, Inc., Class A | 27,353 | 1,869,577 |
35,927,665 | ||
Gas, Water & Multi-utilities — 2.9% | ||
Ameren Corp. | 22,092 | 1,800,940 |
American Water Works Co., Inc. | 3,098 | 450,263 |
CenterPoint Energy, Inc. | 64,895 | 1,856,646 |
Duke Energy Corp. | 19,139 | 1,783,372 |
National Fuel Gas Co. | 28,709 | 1,937,570 |
NiSource, Inc. | 69,300 | 1,780,317 |
Sempra Energy | 12,405 | 1,872,411 |
UGI Corp. | 41,975 | 1,482,977 |
WEC Energy Group, Inc. | 19,839 | 1,811,896 |
14,776,392 | ||
INVESTMENTS | SHARES | VALUE ($) |
General Industrials — 2.3% | ||
Carlisle Cos., Inc. | 2,368 | 565,478 |
Eaton Corp. plc | 13,604 | 2,041,552 |
Honeywell International, Inc. | 5,135 | 1,047,643 |
Illinois Tool Works, Inc. | 7,894 | 1,685,606 |
ITT, Inc. | 10,254 | 783,303 |
Packaging Corp. of America | 8,323 | 1,000,508 |
Parker-Hannifin Corp. | 3,657 | 1,062,797 |
RPM International, Inc. | 21,499 | 2,033,161 |
Sherwin-Williams Co. (The) | 6,375 | 1,434,566 |
Sonoco Products Co. | 1,554 | 96,472 |
11,751,086 | ||
Health Care Providers — 2.7% | ||
Chemed Corp. | 1,667 | 778,272 |
Cigna Corp. | 7,221 | 2,332,816 |
DaVita, Inc. * | 14,788 | 1,079,672 |
Elevance Health, Inc. | 4,247 | 2,322,132 |
HCA Healthcare, Inc. | 8,302 | 1,805,436 |
Humana, Inc. | 741 | 413,537 |
IQVIA Holdings, Inc. * | 4,011 | 840,987 |
Molina Healthcare, Inc. * | 2,626 | 942,367 |
UnitedHealth Group, Inc. | 3,942 | 2,188,401 |
Universal Health Services, Inc., Class B | 10,902 | 1,263,215 |
13,966,835 | ||
Household Goods & Home Construction — 0.9% | ||
Leggett & Platt, Inc. | 17,230 | 581,512 |
Lennar Corp., Class A | 19,877 | 1,604,074 |
NVR, Inc. * | 171 | 724,655 |
PulteGroup, Inc. | 1,420 | 56,786 |
Toll Brothers, Inc. | 5,184 | 223,327 |
Whirlpool Corp. | 8,863 | 1,225,221 |
4,415,575 | ||
Industrial Engineering — 0.6% | ||
Caterpillar, Inc. | 4,864 | 1,052,862 |
Cummins, Inc. | 7,912 | 1,934,563 |
Otis Worldwide Corp. | 4,446 | 314,065 |
3,301,490 | ||
Industrial Materials — 0.2% | ||
International Paper Co. | 37,892 | 1,273,550 |
Industrial Metals & Mining — 3.2% | ||
Alcoa Corp. | 30,998 | 1,209,852 |
Cleveland-Cliffs, Inc. * | 88,812 | 1,153,668 |
Fastenal Co. | 35,279 | 1,705,034 |
October 31, 2022 | J.P. Morgan Exchange-Traded Funds | 177 |
AS OF October 31, 2022 (continued)
INVESTMENTS | SHARES | VALUE ($) |
Common Stocks — continued | ||
Industrial Metals & Mining — continued | ||
Freeport-McMoRan, Inc. | 51,310 | 1,626,014 |
Nucor Corp. | 15,391 | 2,022,070 |
Reliance Steel & Aluminum Co. | 10,886 | 2,193,311 |
Southern Copper Corp. (Peru) | 24,833 | 1,166,406 |
Steel Dynamics, Inc. | 25,502 | 2,398,463 |
Timken Co. (The) | 11,348 | 808,999 |
United States Steel Corp. | 87,225 | 1,775,901 |
16,059,718 | ||
Industrial Support Services — 2.3% | ||
Accenture plc, Class A | 6,432 | 1,826,045 |
Booz Allen Hamilton Holding Corp. | 13,150 | 1,431,377 |
Capital One Financial Corp. | 15,452 | 1,638,221 |
MSC Industrial Direct Co., Inc., Class A | 8,417 | 698,443 |
Robert Half International, Inc. | 18,724 | 1,431,637 |
Synchrony Financial | 52,001 | 1,849,156 |
Western Union Co. (The) | 64,455 | 870,787 |
WW Grainger, Inc. | 3,687 | 2,154,498 |
11,900,164 | ||
Industrial Transportation — 1.2% | ||
Allison Transmission Holdings, Inc. | 12,494 | 527,871 |
CSX Corp. | 23,273 | 676,313 |
Norfolk Southern Corp. | 4,390 | 1,001,227 |
PACCAR, Inc. | 2,557 | 247,594 |
Ryder System, Inc. | 6,217 | 500,531 |
Schneider National, Inc., Class B | 9,723 | 216,240 |
Union Pacific Corp. | 6,971 | 1,374,263 |
United Parcel Service, Inc., Class B | 10,514 | 1,763,934 |
6,307,973 | ||
Investment Banking & Brokerage Services — 1.7% | ||
Ameriprise Financial, Inc. | 3,198 | 988,566 |
Broadridge Financial Solutions, Inc. | 1,346 | 201,981 |
Jefferies Financial Group, Inc. | 24,752 | 851,716 |
Morgan Stanley | 22,563 | 1,854,002 |
Nasdaq, Inc. | 11,229 | 698,893 |
Raymond James Financial, Inc. | 7,039 | 831,587 |
State Street Corp. | 24,206 | 1,791,244 |
Virtu Financial, Inc., Class A | 53,762 | 1,203,194 |
8,421,183 | ||
Leisure Goods — 0.8% | ||
Activision Blizzard, Inc. | 16,401 | 1,193,993 |
Electronic Arts, Inc. | 6,785 | 854,639 |
Garmin Ltd. | 12,798 | 1,126,736 |
INVESTMENTS | SHARES | VALUE ($) |
Leisure Goods — continued | ||
Harley-Davidson, Inc. | 5,539 | 238,177 |
Pool Corp. | 1,563 | 475,511 |
3,889,056 | ||
Life Insurance — 1.3% | ||
Aflac, Inc. | 22,111 | 1,439,647 |
Globe Life, Inc. | 5,218 | 602,784 |
MetLife, Inc. | 8,291 | 606,984 |
Principal Financial Group, Inc. | 19,461 | 1,715,098 |
Prudential Financial, Inc. | 4,430 | 465,992 |
Unum Group | 40,858 | 1,862,716 |
6,693,221 | ||
Media — 0.7% | ||
Interpublic Group of Cos., Inc. (The) | 52,048 | 1,550,510 |
Nexstar Media Group, Inc., Class A | 10,774 | 1,845,586 |
3,396,096 | ||
Medical Equipment & Services — 4.2% | ||
Abbott Laboratories | 17,394 | 1,720,962 |
Becton Dickinson and Co. | 5,255 | 1,240,022 |
Bio-Rad Laboratories, Inc., Class A * | 2,925 | 1,028,752 |
Bio-Techne Corp. | 4,698 | 1,391,830 |
Danaher Corp. | 7,314 | 1,840,714 |
Hologic, Inc. * | 21,622 | 1,465,972 |
Laboratory Corp. of America Holdings | 7,385 | 1,638,436 |
Medtronic plc | 16,977 | 1,482,771 |
PerkinElmer, Inc. | 11,564 | 1,544,719 |
Quest Diagnostics, Inc. | 12,551 | 1,802,951 |
QuidelOrtho Corp. * | 8,816 | 791,853 |
STERIS plc | 7,377 | 1,273,123 |
Stryker Corp. | 4,861 | 1,114,336 |
Thermo Fisher Scientific, Inc. | 3,576 | 1,837,957 |
West Pharmaceutical Services, Inc. | 5,110 | 1,175,811 |
21,350,209 | ||
Mortgage Real Estate Investment Trusts — 0.4% | ||
Rithm Capital Corp. | 87,178 | 734,911 |
Starwood Property Trust, Inc. | 62,297 | 1,287,056 |
2,021,967 | ||
Non-life Insurance — 2.9% | ||
Allstate Corp. (The) | 6,086 | 768,357 |
American Financial Group, Inc. | 6,008 | 871,821 |
Aon plc, Class A | 6,548 | 1,843,197 |
Assurant, Inc. | 6,003 | 815,568 |
Chubb Ltd. | 5,772 | 1,240,345 |
178 | J.P. Morgan Exchange-Traded Funds | October 31, 2022 |
INVESTMENTS | SHARES | VALUE ($) |
Common Stocks — continued | ||
Non-life Insurance — continued | ||
Fidelity National Financial, Inc. | 31,295 | 1,232,397 |
Hanover Insurance Group, Inc. (The) | 3,154 | 462,029 |
Hartford Financial Services Group, Inc. (The) | 26,749 | 1,936,895 |
Marsh & McLennan Cos., Inc. | 9,847 | 1,590,192 |
Old Republic International Corp. | 13,776 | 319,741 |
Progressive Corp. (The) | 16,683 | 2,142,097 |
WR Berkley Corp. | 18,986 | 1,412,179 |
14,634,818 | ||
Non-Renewable Energy — 5.5% | ||
Antero Midstream Corp. | 167,030 | 1,778,870 |
Baker Hughes Co. | 60,318 | 1,668,396 |
Chevron Corp. | 9,031 | 1,633,708 |
Continental Resources, Inc. | 22,020 | 1,628,819 |
Coterra Energy, Inc. | 63,247 | 1,968,879 |
Devon Energy Corp. | 29,172 | 2,256,454 |
DT Midstream, Inc. | 7,131 | 425,721 |
EOG Resources, Inc. | 15,869 | 2,166,436 |
Exxon Mobil Corp. | 15,661 | 1,735,395 |
Halliburton Co. | 53,620 | 1,952,840 |
HF Sinclair Corp. | 12,272 | 750,678 |
Marathon Oil Corp. | 78,586 | 2,392,944 |
Pioneer Natural Resources Co. | 7,816 | 2,004,101 |
Targa Resources Corp. | 29,988 | 2,050,280 |
Texas Pacific Land Corp. | 640 | 1,474,477 |
Williams Cos., Inc. (The) | 59,032 | 1,932,117 |
27,820,115 | ||
Personal Care, Drug & Grocery Stores — 4.6% | ||
Albertsons Cos., Inc., Class A | 75,008 | 1,538,414 |
AmerisourceBergen Corp. | 14,058 | 2,210,199 |
Casey's General Stores, Inc. | 8,696 | 2,023,646 |
Church & Dwight Co., Inc. | 18,072 | 1,339,677 |
Clorox Co. (The) | 2,447 | 357,360 |
Colgate-Palmolive Co. | 26,353 | 1,945,906 |
CVS Health Corp. | 20,849 | 1,974,400 |
Kimberly-Clark Corp. | 12,735 | 1,584,998 |
Kroger Co. (The) | 43,243 | 2,044,961 |
McKesson Corp. | 5,576 | 2,171,127 |
Olaplex Holdings, Inc. * | 17,000 | 74,800 |
Procter & Gamble Co. (The) | 14,676 | 1,976,417 |
Spectrum Brands Holdings, Inc. | 14,004 | 646,145 |
Sysco Corp. | 17,916 | 1,550,809 |
Walgreens Boots Alliance, Inc. | 45,931 | 1,676,482 |
23,115,341 | ||
INVESTMENTS | SHARES | VALUE ($) |
Personal Goods — 0.6% | ||
Carter's, Inc. | 3,156 | 214,198 |
Estee Lauder Cos., Inc. (The), Class A | 7,030 | 1,409,445 |
NIKE, Inc., Class B | 14,167 | 1,312,997 |
2,936,640 | ||
Pharmaceuticals, Biotechnology & Marijuana Producers — 5.5% | ||
AbbVie, Inc. | 15,311 | 2,241,530 |
Amgen, Inc. | 8,162 | 2,206,597 |
Bristol-Myers Squibb Co. | 30,755 | 2,382,590 |
Cardinal Health, Inc. | 15,590 | 1,183,281 |
Eli Lilly & Co. | 6,836 | 2,475,247 |
Gilead Sciences, Inc. | 26,815 | 2,103,905 |
Johnson & Johnson | 12,256 | 2,132,176 |
Merck & Co., Inc. | 21,819 | 2,208,083 |
Moderna, Inc. * | 7,936 | 1,193,019 |
Pfizer, Inc. | 45,894 | 2,136,366 |
Regeneron Pharmaceuticals, Inc. * | 2,672 | 2,000,660 |
United Therapeutics Corp. * | 9,030 | 2,081,686 |
Vertex Pharmaceuticals, Inc. * | 7,361 | 2,296,632 |
Zoetis, Inc. | 9,898 | 1,492,420 |
28,134,192 | ||
Precious Metals & Mining — 0.3% | ||
Newmont Corp. | 27,102 | 1,146,957 |
SSR Mining, Inc. (Canada) | 24,340 | 335,892 |
1,482,849 | ||
Real Estate Investment & Services — 0.6% | ||
CBRE Group, Inc., Class A * | 20,979 | 1,488,250 |
Jones Lang LaSalle, Inc. * | 9,810 | 1,560,673 |
3,048,923 | ||
Real Estate Investment Trusts — 7.3% | ||
American Tower Corp. | 4,880 | 1,011,087 |
Brixmor Property Group, Inc. | 29,111 | 620,355 |
Camden Property Trust | 10,199 | 1,178,495 |
Crown Castle, Inc. | 9,551 | 1,272,766 |
CubeSmart | 18,145 | 759,731 |
Digital Realty Trust, Inc. | 11,326 | 1,135,432 |
Extra Space Storage, Inc. | 10,296 | 1,826,922 |
First Industrial Realty Trust, Inc. | 10,578 | 503,830 |
Gaming and Leisure Properties, Inc. | 42,681 | 2,139,172 |
Host Hotels & Resorts, Inc. | 66,302 | 1,251,782 |
Iron Mountain, Inc. | 38,892 | 1,947,322 |
Kimco Realty Corp. | 74,147 | 1,585,263 |
Lamar Advertising Co., Class A | 15,270 | 1,408,352 |
October 31, 2022 | J.P. Morgan Exchange-Traded Funds | 179 |
AS OF October 31, 2022 (continued)
INVESTMENTS | SHARES | VALUE ($) |
Common Stocks — continued | ||
Real Estate Investment Trusts — continued | ||
Life Storage, Inc. | 11,792 | 1,304,313 |
Medical Properties Trust, Inc. | 77,931 | 892,310 |
Mid-America Apartment Communities, Inc. | 8,992 | 1,415,790 |
Omega Healthcare Investors, Inc. | 41,327 | 1,313,372 |
Prologis, Inc. | 24,193 | 2,679,375 |
Public Storage | 5,899 | 1,827,215 |
Rayonier, Inc. | 9,850 | 331,945 |
Simon Property Group, Inc. | 14,928 | 1,626,853 |
Spirit Realty Capital, Inc. | 18,096 | 702,668 |
Ventas, Inc. | 26,662 | 1,043,284 |
VICI Properties, Inc. | 62,022 | 1,985,945 |
Welltower, Inc. | 21,325 | 1,301,678 |
Weyerhaeuser Co. | 60,351 | 1,866,656 |
WP Carey, Inc. | 24,539 | 1,872,326 |
36,804,239 | ||
Retailers — 3.5% | ||
AutoZone, Inc. * | 756 | 1,914,857 |
Best Buy Co., Inc. | 16,157 | 1,105,300 |
Dick's Sporting Goods, Inc. | 16,894 | 1,921,861 |
Kohl's Corp. | 29,448 | 881,968 |
Lowe's Cos., Inc. | 8,988 | 1,752,211 |
Macy's, Inc. | 92,436 | 1,927,291 |
O'Reilly Automotive, Inc. * | 2,459 | 2,058,601 |
Penske Automotive Group, Inc. | 12,913 | 1,441,349 |
Target Corp. | 8,105 | 1,331,246 |
Tractor Supply Co. | 8,957 | 1,968,480 |
Williams-Sonoma, Inc. | 11,696 | 1,448,316 |
17,751,480 | ||
Software & Computer Services — 4.3% | ||
Alphabet, Inc., Class A * | 16,806 | 1,588,335 |
Amdocs Ltd. | 16,533 | 1,426,963 |
CACI International, Inc., Class A * | 1,782 | 541,781 |
Cadence Design Systems, Inc. * | 11,777 | 1,782,920 |
Cognizant Technology Solutions Corp., Class A | 29,281 | 1,822,742 |
Dolby Laboratories, Inc., Class A | 4,913 | 328,385 |
Gartner, Inc. * | 3,884 | 1,172,657 |
Hewlett Packard Enterprise Co. | 112,778 | 1,609,342 |
International Business Machines Corp. | 13,006 | 1,798,600 |
Intuit, Inc. | 3,568 | 1,525,320 |
Leidos Holdings, Inc. | 2,363 | 240,057 |
Meta Platforms, Inc., Class A * | 7,949 | 740,529 |
Microsoft Corp. | 7,799 | 1,810,382 |
NortonLifeLock, Inc. | 56,306 | 1,268,574 |
INVESTMENTS | SHARES | VALUE ($) |
Software & Computer Services — continued | ||
Oracle Corp. | 23,554 | 1,838,861 |
Roper Technologies, Inc. | 2,768 | 1,147,447 |
Science Applications International Corp. | 3,879 | 420,251 |
SS&C Technologies Holdings, Inc. | 15,125 | 777,728 |
21,840,874 | ||
Technology Hardware & Equipment — 4.3% | ||
Amphenol Corp., Class A | 20,776 | 1,575,444 |
Analog Devices, Inc. | 12,683 | 1,808,850 |
Apple, Inc. | 13,112 | 2,010,594 |
Applied Materials, Inc. | 16,480 | 1,455,019 |
Broadcom, Inc. | 3,837 | 1,803,851 |
Cirrus Logic, Inc. * | 566 | 37,990 |
Concentrix Corp. | 2,792 | 341,266 |
HP, Inc. | 44,955 | 1,241,657 |
Intel Corp. | 30,509 | 867,371 |
KLA Corp. | 5,849 | 1,850,916 |
Lam Research Corp. | 3,617 | 1,464,089 |
NetApp, Inc. | 20,456 | 1,416,987 |
NVIDIA Corp. | 8,394 | 1,132,938 |
Skyworks Solutions, Inc. | 11,133 | 957,549 |
TD SYNNEX Corp. | 8,181 | 748,643 |
Teradyne, Inc. | 15,571 | 1,266,701 |
Texas Instruments, Inc. | 11,190 | 1,797,450 |
21,777,315 | ||
Telecommunications Equipment — 2.7% | ||
Arista Networks, Inc. * | 17,069 | 2,062,959 |
Ciena Corp. * | 33,228 | 1,591,621 |
Cisco Systems, Inc. | 46,068 | 2,092,869 |
Juniper Networks, Inc. | 72,454 | 2,217,093 |
Lumentum Holdings, Inc. * | 24,477 | 1,822,313 |
Motorola Solutions, Inc. | 8,407 | 2,099,312 |
Ubiquiti, Inc. (a) | 5,248 | 1,819,744 |
13,705,911 | ||
Telecommunications Service Providers — 2.6% | ||
Altice USA, Inc., Class A * | 156,993 | 1,037,724 |
AT&T, Inc. | 117,425 | 2,140,658 |
Cable One, Inc. | 125 | 107,429 |
Charter Communications, Inc., Class A * | 3,213 | 1,181,163 |
Comcast Corp., Class A | 51,433 | 1,632,483 |
DISH Network Corp., Class A * | 77,320 | 1,152,841 |
Frontier Communications Parent, Inc. * | 25,161 | 589,271 |
Lumen Technologies, Inc. | 205,326 | 1,511,199 |
180 | J.P. Morgan Exchange-Traded Funds | October 31, 2022 |
INVESTMENTS | SHARES | VALUE ($) |
Common Stocks — continued | ||
Telecommunications Service Providers — continued | ||
T-Mobile US, Inc. * | 14,213 | 2,154,122 |
Verizon Communications, Inc. | 48,913 | 1,827,879 |
13,334,769 | ||
Tobacco — 0.8% | ||
Altria Group, Inc. | 45,656 | 2,112,503 |
Philip Morris International, Inc. | 21,626 | 1,986,348 |
4,098,851 | ||
Travel & Leisure — 0.1% | ||
Travel + Leisure Co. | 9,038 | 343,263 |
Waste & Disposal Services — 1.1% | ||
Clean Harbors, Inc. * | 12,858 | 1,574,591 |
Republic Services, Inc. | 14,338 | 1,901,505 |
Stericycle, Inc. * | 3,826 | 170,563 |
Waste Management, Inc. | 12,105 | 1,917,069 |
5,563,728 | ||
Total Common Stocks (Cost $470,387,088) | 506,039,431 | |
Short-Term Investments — 0.3% | ||
Investment Companies — 0.2% | ||
JPMorgan U.S. Government Money Market Fund Class IM Shares, 2.85% (b) (c)(Cost $1,020,750) | 1,020,750 | 1,020,750 |
Investment of Cash Collateral from Securities Loaned — 0.1% | ||
JPMorgan Securities Lending Money Market Fund Class Agency SL Shares, 3.23% (b) (c) | 200,027 | 200,027 |
INVESTMENTS | SHARES | VALUE ($) |
JPMorgan U.S. Government Money Market Fund Class IM Shares, 2.85% (b) (c) | 191,848 | 191,848 |
Total Investment of Cash Collateral from Securities Loaned (Cost $391,775) | 391,875 | |
Total Short-Term Investments (Cost $1,412,525) | 1,412,625 | |
Total Investments — 100.0% (Cost $471,799,613) | 507,452,056 | |
Liabilities in Excess of Other Assets — (0.0)% ^ | (169,603) | |
NET ASSETS — 100.0% | 507,282,453 | |
Percentages indicated are based on net assets. |
^ | Amount rounds to less than 0.1% of net assets. | |
* | Non-income producing security. | |
(a) | The security or a portion of this security is on loan at October 31, 2022. The total value of securities on loan at October 31, 2022 is $380,385. | |
(b) | Investment in an affiliated fund, which is registered under the Investment Company Act of 1940, as amended, and is advised by J.P. Morgan Investment Management Inc. | |
(c) | The rate shown is the current yield as of October 31, 2022. | |
DESCRIPTION | NUMBER OF CONTRACTS | EXPIRATION DATE | TRADING CURRENCY | NOTIONAL AMOUNT ($) | VALUE AND UNREALIZED APPRECIATION (DEPRECIATION) ($) |
Long Contracts | |||||
S&P 500 E-Mini Index | 4 | 12/16/2022 | USD | 776,600 | 41,166 |
Abbreviations | |
USD | United States Dollar |
October 31, 2022 | J.P. Morgan Exchange-Traded Funds | 181 |
AS OF October 31, 2022
INVESTMENTS | SHARES | VALUE ($) |
Common Stocks — 99.7% | ||
Aerospace & Defense — 0.1% | ||
Textron, Inc. | 4,883 | 334,192 |
Automobiles & Parts — 0.6% | ||
BorgWarner, Inc. | 11,358 | 426,266 |
Gentex Corp. | 32,590 | 863,309 |
LKQ Corp. | 3,628 | 201,862 |
1,491,437 | ||
Banks — 2.3% | ||
Bank of Hawaii Corp. | 2,723 | 206,812 |
Citizens Financial Group, Inc. | 7,464 | 305,278 |
Comerica, Inc. | 3,506 | 247,173 |
Discover Financial Services | 6,506 | 679,617 |
Fifth Third Bancorp | 12,922 | 461,186 |
First Horizon Corp. | 11,513 | 282,184 |
FNB Corp. | 14,337 | 207,170 |
Huntington Bancshares, Inc. | 69,710 | 1,058,198 |
KeyCorp | 16,234 | 290,101 |
M&T Bank Corp. | 4,400 | 740,828 |
Popular, Inc. (Puerto Rico) | 9,956 | 704,088 |
Prosperity Bancshares, Inc. | 2,423 | 173,414 |
Regions Financial Corp. | 20,435 | 448,548 |
Zions Bancorp NA | 5,074 | 263,543 |
6,068,140 | ||
Beverages — 0.7% | ||
Brown-Forman Corp., Class B | 13,206 | 898,008 |
Molson Coors Beverage Co., Class B | 20,199 | 1,018,636 |
1,916,644 | ||
Chemicals — 5.4% | ||
Albemarle Corp. | 3,359 | 940,083 |
Ashland, Inc. | 10,836 | 1,136,913 |
Celanese Corp. | 7,363 | 707,732 |
CF Industries Holdings, Inc. | 10,654 | 1,132,094 |
Chemours Co. (The) | 26,563 | 760,499 |
Eastman Chemical Co. | 10,095 | 775,397 |
Element Solutions, Inc. | 53,364 | 917,861 |
FMC Corp. | 7,592 | 902,689 |
Huntsman Corp. | 39,388 | 1,054,023 |
LyondellBasell Industries NV, Class A | 12,814 | 979,630 |
Mosaic Co. (The) | 20,486 | 1,101,122 |
NewMarket Corp. | 459 | 139,692 |
Olin Corp. | 20,205 | 1,069,855 |
Univar Solutions, Inc. * | 32,365 | 824,660 |
INVESTMENTS | SHARES | VALUE ($) |
Chemicals — continued | ||
Valvoline, Inc. | 34,747 | 1,020,172 |
Westlake Corp. | 11,189 | 1,081,417 |
14,543,839 | ||
Construction & Materials — 2.4% | ||
A O Smith Corp. | 13,093 | 717,235 |
Builders FirstSource, Inc. * | 18,802 | 1,159,331 |
Eagle Materials, Inc. | 2,221 | 271,650 |
Fortune Brands Home & Security, Inc. | 10,683 | 644,399 |
Louisiana-Pacific Corp. | 18,448 | 1,045,079 |
Masco Corp. | 14,273 | 660,412 |
Owens Corning | 10,173 | 870,911 |
Quanta Services, Inc. | 7,806 | 1,108,764 |
6,477,781 | ||
Consumer Services — 0.7% | ||
H&R Block, Inc. | 18,755 | 771,768 |
IAA, Inc. * | 8,479 | 321,609 |
Service Corp. International | 12,271 | 743,745 |
1,837,122 | ||
Electricity — 6.4% | ||
Alliant Energy Corp. | 15,457 | 806,392 |
Avangrid, Inc. | 17,381 | 707,059 |
CMS Energy Corp. | 16,346 | 932,539 |
Consolidated Edison, Inc. | 11,288 | 992,892 |
DTE Energy Co. | 8,466 | 949,123 |
Edison International | 15,385 | 923,715 |
Entergy Corp. | 8,259 | 884,869 |
Evergy, Inc. | 16,107 | 984,621 |
Eversource Energy | 3,617 | 275,905 |
FirstEnergy Corp. | 27,876 | 1,051,204 |
Hawaiian Electric Industries, Inc. | 19,188 | 729,912 |
IDACORP, Inc. | 9,440 | 988,368 |
NRG Energy, Inc. | 26,710 | 1,185,924 |
OGE Energy Corp. | 27,168 | 995,164 |
Pinnacle West Capital Corp. | 12,767 | 858,070 |
PPL Corp. | 37,952 | 1,005,348 |
Public Service Enterprise Group, Inc. | 16,994 | 952,854 |
Vistra Corp. | 43,979 | 1,010,198 |
Xcel Energy, Inc. | 14,869 | 968,121 |
17,202,278 | ||
Electronic & Electrical Equipment — 2.1% | ||
AMETEK, Inc. | 7,952 | 1,031,056 |
Crane Holdings Co. | 3,003 | 301,321 |
182 | J.P. Morgan Exchange-Traded Funds | October 31, 2022 |
INVESTMENTS | SHARES | VALUE ($) |
Common Stocks — continued | ||
Electronic & Electrical Equipment — continued | ||
Hubbell, Inc. | 4,222 | 1,002,641 |
IDEX Corp. | 4,766 | 1,059,529 |
Keysight Technologies, Inc. * | 6,326 | 1,101,673 |
nVent Electric plc | 7,961 | 290,577 |
Pentair plc | 5,509 | 236,612 |
Regal Rexnord Corp. | 4,732 | 598,787 |
5,622,196 | ||
Finance & Credit Services — 0.5% | ||
Ally Financial, Inc. | 10,841 | 298,778 |
Morningstar, Inc. | 1,305 | 302,995 |
OneMain Holdings, Inc. | 17,189 | 662,808 |
1,264,581 | ||
Food Producers — 5.8% | ||
Bunge Ltd. | 9,688 | 956,206 |
Campbell Soup Co. | 21,616 | 1,143,702 |
Conagra Brands, Inc. | 29,316 | 1,075,897 |
Corteva, Inc. | 17,949 | 1,172,788 |
Darling Ingredients, Inc. * | 14,499 | 1,137,881 |
Flowers Foods, Inc. | 40,429 | 1,160,717 |
Hershey Co. (The) | 4,905 | 1,171,167 |
Hormel Foods Corp. | 19,496 | 905,589 |
Ingredion, Inc. | 12,265 | 1,093,057 |
J M Smucker Co. (The) | 7,872 | 1,185,995 |
Kellogg Co. | 14,265 | 1,095,837 |
Lamb Weston Holdings, Inc. | 2,609 | 224,948 |
McCormick & Co., Inc. (Non-Voting) | 9,289 | 730,487 |
Pilgrim's Pride Corp. * | 22,433 | 517,081 |
Post Holdings, Inc. * | 12,426 | 1,123,559 |
Tyson Foods, Inc., Class A | 12,443 | 850,479 |
15,545,390 | ||
Gas, Water & Multi-utilities — 2.6% | ||
Ameren Corp. | 11,916 | 971,392 |
Atmos Energy Corp. | 7,397 | 788,150 |
CenterPoint Energy, Inc. | 34,982 | 1,000,835 |
Essential Utilities, Inc. | 8,613 | 380,867 |
National Fuel Gas Co. | 15,484 | 1,045,015 |
NiSource, Inc. | 37,395 | 960,678 |
UGI Corp. | 27,212 | 961,400 |
WEC Energy Group, Inc. | 10,698 | 977,048 |
7,085,385 | ||
General Industrials — 1.9% | ||
AptarGroup, Inc. | 170 | 16,856 |
INVESTMENTS | SHARES | VALUE ($) |
General Industrials — continued | ||
Carlisle Cos., Inc. | 1,094 | 261,247 |
ITT, Inc. | 3,732 | 285,087 |
Packaging Corp. of America | 5,888 | 707,797 |
Parker-Hannifin Corp. | 2,814 | 817,805 |
PPG Industries, Inc. | 7,217 | 824,037 |
RPM International, Inc. | 11,839 | 1,119,614 |
Silgan Holdings, Inc. | 10,017 | 474,405 |
Sonoco Products Co. | 8,566 | 531,777 |
Westrock Co. | 4,921 | 167,609 |
5,206,234 | ||
Health Care Providers — 3.3% | ||
Acadia Healthcare Co., Inc. * | 13,459 | 1,094,217 |
Amedisys, Inc. * | 3,564 | 347,811 |
Chemed Corp. | 2,310 | 1,078,470 |
DaVita, Inc. * | 8,825 | 644,313 |
Encompass Health Corp. | 10,872 | 591,872 |
Enhabit, Inc. * | 5,749 | 71,402 |
IQVIA Holdings, Inc. * | 4,743 | 994,465 |
Molina Healthcare, Inc. * | 3,266 | 1,172,037 |
Premier, Inc., Class A | 20,111 | 701,471 |
Tenet Healthcare Corp. * | 13,277 | 588,968 |
Universal Health Services, Inc., Class B | 6,128 | 710,051 |
Veeva Systems, Inc., Class A * | 5,252 | 882,021 |
8,877,098 | ||
Household Goods & Home Construction — 1.0% | ||
Leggett & Platt, Inc. | 10,453 | 352,789 |
Lennar Corp., Class A | 10,723 | 865,346 |
NVR, Inc. * | 25 | 105,944 |
Toll Brothers, Inc. | 17,248 | 743,044 |
Whirlpool Corp. | 4,873 | 673,643 |
2,740,766 | ||
Industrial Engineering — 1.9% | ||
Cummins, Inc. | 4,737 | 1,158,244 |
Graco, Inc. | 14,405 | 1,002,300 |
Lincoln Electric Holdings, Inc. | 4,542 | 644,964 |
Nordson Corp. | 717 | 161,325 |
Snap-on, Inc. | 5,065 | 1,124,683 |
Toro Co. (The) | 8,339 | 879,181 |
4,970,697 | ||
Industrial Materials — 0.5% | ||
Avery Dennison Corp. | 1,523 | 258,224 |
October 31, 2022 | J.P. Morgan Exchange-Traded Funds | 183 |
AS OF October 31, 2022 (continued)
INVESTMENTS | SHARES | VALUE ($) |
Common Stocks — continued | ||
Industrial Materials — continued | ||
Hexcel Corp. | 6,067 | 337,932 |
International Paper Co. | 20,388 | 685,241 |
1,281,397 | ||
Industrial Metals & Mining — 3.1% | ||
Alcoa Corp. | 16,497 | 643,878 |
Cleveland-Cliffs, Inc. * | 47,231 | 613,531 |
Fastenal Co. | 19,286 | 932,092 |
MP Materials Corp. * | 21,650 | 650,366 |
Nucor Corp. | 8,307 | 1,091,374 |
Reliance Steel & Aluminum Co. | 5,865 | 1,181,680 |
Steel Dynamics, Inc. | 13,666 | 1,285,287 |
Timken Co. (The) | 12,958 | 923,776 |
United States Steel Corp. | 48,273 | 982,838 |
8,304,822 | ||
Industrial Support Services — 1.8% | ||
ADT, Inc. | 11,420 | 96,613 |
Booz Allen Hamilton Holding Corp. | 2,972 | 323,502 |
FTI Consulting, Inc. * | 1,834 | 285,426 |
MSC Industrial Direct Co., Inc., Class A | 7,292 | 605,090 |
Paychex, Inc. | 6,261 | 740,739 |
Robert Half International, Inc. | 6,850 | 523,751 |
Synchrony Financial | 23,394 | 831,891 |
Western Union Co. (The) | 10,428 | 140,882 |
WW Grainger, Inc. | 1,989 | 1,162,272 |
4,710,166 | ||
Industrial Transportation — 1.5% | ||
Allison Transmission Holdings, Inc. | 17,372 | 733,967 |
Expeditors International of Washington, Inc. | 6,311 | 617,531 |
Landstar System, Inc. | 5,509 | 860,616 |
Old Dominion Freight Line, Inc. | 3,346 | 918,812 |
PACCAR, Inc. | 3,113 | 301,432 |
Ryder System, Inc. | 4,977 | 400,698 |
Schneider National, Inc., Class B | 7,429 | 165,221 |
3,998,277 | ||
Investment Banking & Brokerage Services — 2.7% | ||
Ameriprise Financial, Inc. | 2,846 | 879,755 |
Broadridge Financial Solutions, Inc. | 1,237 | 185,624 |
Invesco Ltd. | 46,530 | 712,840 |
Jefferies Financial Group, Inc. | 33,868 | 1,165,398 |
LPL Financial Holdings, Inc. | 4,735 | 1,210,503 |
Nasdaq, Inc. | 10,344 | 643,810 |
Raymond James Financial, Inc. | 6,033 | 712,739 |
INVESTMENTS | SHARES | VALUE ($) |
Investment Banking & Brokerage Services — continued | ||
State Street Corp. | 14,120 | 1,044,880 |
Virtu Financial, Inc., Class A | 26,886 | 601,709 |
7,157,258 | ||
Leisure Goods ��� 0.9% | ||
Garmin Ltd. | 6,949 | 611,790 |
Harley-Davidson, Inc. | 1,691 | 72,713 |
Polaris, Inc. | 4,000 | 406,400 |
Pool Corp. | 2,151 | 654,399 |
Take-Two Interactive Software, Inc. * | 6,040 | 715,619 |
2,460,921 | ||
Life Insurance — 0.8% | ||
Lincoln National Corp. | 3,532 | 190,269 |
Principal Financial Group, Inc. | 14,748 | 1,299,741 |
Unum Group | 15,414 | 702,724 |
2,192,734 | ||
Media — 0.9% | ||
Interpublic Group of Cos., Inc. (The) | 34,365 | 1,023,733 |
Liberty Media Corp.-Liberty SiriusXM, Class A * | 10,251 | 435,053 |
Nexstar Media Group, Inc., Class A | 5,767 | 987,887 |
2,446,673 | ||
Medical Equipment & Services — 6.2% | ||
Agilent Technologies, Inc. | 6,961 | 963,054 |
Bio-Rad Laboratories, Inc., Class A * | 1,650 | 580,322 |
Bio-Techne Corp. | 2,540 | 752,500 |
Bruker Corp. | 13,658 | 844,611 |
Cooper Cos., Inc. (The) | 1,795 | 490,735 |
DENTSPLY SIRONA, Inc. | 16,836 | 518,886 |
Envista Holdings Corp. * | 25,355 | 836,969 |
Globus Medical, Inc., Class A * | 10,811 | 724,337 |
Henry Schein, Inc. * | 15,026 | 1,028,680 |
Hologic, Inc. * | 16,278 | 1,103,648 |
ICU Medical, Inc. * | 3,400 | 504,594 |
Integra LifeSciences Holdings Corp. * | 7,584 | 381,096 |
Laboratory Corp. of America Holdings | 4,016 | 890,990 |
Masimo Corp. * | 3,482 | 458,231 |
PerkinElmer, Inc. | 6,588 | 880,025 |
QIAGEN NV * | 18,707 | 814,877 |
Quest Diagnostics, Inc. | 8,799 | 1,263,976 |
QuidelOrtho Corp. * | 9,038 | 811,793 |
ResMed, Inc. | 4,300 | 961,867 |
STERIS plc | 5,037 | 869,285 |
184 | J.P. Morgan Exchange-Traded Funds | October 31, 2022 |
INVESTMENTS | SHARES | VALUE ($) |
Common Stocks — continued | ||
Medical Equipment & Services — continued | ||
Teleflex, Inc. | 651 | 139,679 |
West Pharmaceutical Services, Inc. | 2,754 | 633,695 |
16,453,850 | ||
Mortgage Real Estate Investment Trusts — 0.6% | ||
Annaly Capital Management, Inc. | 8,764 | 162,572 |
Rithm Capital Corp. | 76,003 | 640,706 |
Starwood Property Trust, Inc. | 40,638 | 839,581 |
1,642,859 | ||
Non-life Insurance — 3.2% | ||
American Financial Group, Inc. | 7,241 | 1,050,741 |
Arch Capital Group Ltd. * | 2,331 | 134,032 |
Arthur J Gallagher & Co. | 6,072 | 1,135,950 |
Assurant, Inc. | 4,001 | 543,576 |
Assured Guaranty Ltd. | 5,517 | 326,551 |
Axis Capital Holdings Ltd. | 5,156 | 281,878 |
Brown & Brown, Inc. | 16,197 | 952,222 |
CNA Financial Corp. | 144 | 6,005 |
Everest Re Group Ltd. | 1,500 | 483,990 |
Fidelity National Financial, Inc. | 8,407 | 331,068 |
First American Financial Corp. | 4,807 | 242,273 |
Hanover Insurance Group, Inc. (The) | 1,998 | 292,687 |
Hartford Financial Services Group, Inc. (The) | 16,037 | 1,161,239 |
Old Republic International Corp. | 41,779 | 969,691 |
Reinsurance Group of America, Inc. | 2,767 | 407,219 |
WR Berkley Corp. | 3,492 | 259,735 |
8,578,857 | ||
Non-Renewable Energy — 5.9% | ||
Antero Midstream Corp. | 106,833 | 1,137,771 |
Antero Resources Corp. * | 22,091 | 809,856 |
APA Corp. | 18,295 | 831,691 |
Baker Hughes Co. | 31,926 | 883,073 |
Chesapeake Energy Corp. | 4,291 | 438,841 |
Continental Resources, Inc. | 15,784 | 1,167,543 |
Coterra Energy, Inc. | 35,410 | 1,102,313 |
Devon Energy Corp. | 15,621 | 1,208,284 |
Diamondback Energy, Inc. | 7,658 | 1,203,148 |
DT Midstream, Inc. | 4,044 | 241,427 |
Halliburton Co. | 28,364 | 1,033,017 |
HF Sinclair Corp. | 16,801 | 1,027,717 |
Marathon Oil Corp. | 43,100 | 1,312,395 |
Targa Resources Corp. | 16,135 | 1,103,150 |
INVESTMENTS | SHARES | VALUE ($) |
Non-Renewable Energy — continued | ||
Texas Pacific Land Corp. | 506 | 1,165,758 |
Williams Cos., Inc. (The) | 31,494 | 1,030,799 |
15,696,783 | ||
Personal Care, Drug & Grocery Stores — 2.9% | ||
Albertsons Cos., Inc., Class A | 32,435 | 665,242 |
AmerisourceBergen Corp. | 7,512 | 1,181,037 |
Casey's General Stores, Inc. | 4,631 | 1,077,680 |
Church & Dwight Co., Inc. | 11,479 | 850,938 |
Clorox Co. (The) | 6,025 | 879,891 |
Grocery Outlet Holding Corp. * | 22,450 | 776,097 |
Kroger Co. (The) | 20,111 | 951,049 |
Olaplex Holdings, Inc. * | 50,838 | 223,687 |
Reynolds Consumer Products, Inc. | 17,756 | 542,268 |
Spectrum Brands Holdings, Inc. | 12,516 | 577,488 |
7,725,377 | ||
Personal Goods — 0.4% | ||
Carter's, Inc. | 2,284 | 155,015 |
Tapestry, Inc. | 24,918 | 789,402 |
944,417 | ||
Pharmaceuticals, Biotechnology & Marijuana Producers — 2.9% | ||
Cardinal Health, Inc. | 15,593 | 1,183,509 |
Exelixis, Inc. * | 20,786 | 344,632 |
Horizon Therapeutics plc * | 10,800 | 673,056 |
Incyte Corp. * | 7,433 | 552,569 |
Jazz Pharmaceuticals plc * | 7,114 | 1,022,922 |
Maravai LifeSciences Holdings, Inc., Class A * | 17,362 | 288,209 |
Organon & Co. | 17,138 | 448,673 |
Royalty Pharma plc | 26,377 | 1,116,274 |
Syneos Health, Inc. * | 6,478 | 326,362 |
United Therapeutics Corp. * | 4,866 | 1,121,759 |
Viatris, Inc. | 54,694 | 554,050 |
7,632,015 | ||
Precious Metals & Mining — 0.2% | ||
SSR Mining, Inc. (Canada) | 42,289 | 583,588 |
Real Estate Investment & Services — 0.7% | ||
CBRE Group, Inc., Class A * | 13,168 | 934,138 |
Jones Lang LaSalle, Inc. * | 5,191 | 825,836 |
1,759,974 | ||
Real Estate Investment Trusts — 8.1% | ||
American Homes 4 Rent, Class A | 14,058 | 449,013 |
Brixmor Property Group, Inc. | 35,724 | 761,278 |
Camden Property Trust | 5,994 | 692,607 |
October 31, 2022 | J.P. Morgan Exchange-Traded Funds | 185 |
AS OF October 31, 2022 (continued)
INVESTMENTS | SHARES | VALUE ($) |
Common Stocks — continued | ||
Real Estate Investment Trusts — continued | ||
CubeSmart | 19,106 | 799,968 |
EPR Properties | 3,434 | 132,552 |
Extra Space Storage, Inc. | 5,556 | 985,857 |
First Industrial Realty Trust, Inc. | 8,591 | 409,189 |
Gaming and Leisure Properties, Inc. | 22,859 | 1,145,693 |
Healthcare Realty Trust, Inc. | 28,590 | 581,235 |
Highwoods Properties, Inc. | 8,945 | 252,517 |
Host Hotels & Resorts, Inc. | 50,462 | 952,723 |
Iron Mountain, Inc. | 20,988 | 1,050,869 |
Kimco Realty Corp. | 49,180 | 1,051,468 |
Lamar Advertising Co., Class A | 10,702 | 987,046 |
Life Storage, Inc. | 8,299 | 917,952 |
Medical Properties Trust, Inc. | 43,383 | 496,735 |
Mid-America Apartment Communities, Inc. | 5,427 | 854,481 |
National Retail Properties, Inc. | 4,005 | 168,330 |
Omega Healthcare Investors, Inc. | 33,781 | 1,073,560 |
Rayonier, Inc. | 20,839 | 702,274 |
Regency Centers Corp. | 7,300 | 441,723 |
Rexford Industrial Realty, Inc. | 13,458 | 743,958 |
Simon Property Group, Inc. | 8,114 | 884,264 |
SL Green Realty Corp. | 7,110 | 282,125 |
Spirit Realty Capital, Inc. | 11,388 | 442,196 |
Ventas, Inc. | 15,874 | 621,150 |
VICI Properties, Inc. | 30,558 | 978,467 |
Welltower, Inc. | 12,740 | 777,650 |
Weyerhaeuser Co. | 32,328 | 999,905 |
WP Carey, Inc. | 13,142 | 1,002,735 |
21,639,520 | ||
Renewable Energy — 0.4% | ||
Enphase Energy, Inc. * | 3,847 | 1,181,029 |
Retailers — 3.3% | ||
AutoNation, Inc. * | 8,862 | 942,119 |
AutoZone, Inc. * | 426 | 1,079,007 |
Bath & Body Works, Inc. | 3,163 | 105,581 |
Best Buy Co., Inc. | 9,196 | 629,099 |
Dick's Sporting Goods, Inc. | 9,187 | 1,045,113 |
Kohl's Corp. | 16,559 | 495,942 |
Macy's, Inc. | 36,326 | 757,397 |
O'Reilly Automotive, Inc. * | 1,123 | 940,142 |
Penske Automotive Group, Inc. | 8,989 | 1,003,352 |
Tractor Supply Co. | 4,877 | 1,071,818 |
Williams-Sonoma, Inc. | 6,249 | 773,814 |
8,843,384 | ||
INVESTMENTS | SHARES | VALUE ($) |
Software & Computer Services — 5.2% | ||
Akamai Technologies, Inc. * | 3,925 | 346,695 |
Amdocs Ltd. | 12,903 | 1,113,658 |
ANSYS, Inc. * | 3,232 | 714,789 |
CACI International, Inc., Class A * | 3,064 | 931,548 |
Cadence Design Systems, Inc. * | 6,344 | 960,418 |
Dell Technologies, Inc., Class C | 13,883 | 533,107 |
Dolby Laboratories, Inc., Class A | 9,105 | 608,578 |
EPAM Systems, Inc. * | 2,082 | 728,700 |
Fortinet, Inc. * | 17,673 | 1,010,189 |
Gartner, Inc. * | 3,282 | 990,902 |
Hewlett Packard Enterprise Co. | 55,175 | 787,347 |
Leidos Holdings, Inc. | 8,087 | 821,558 |
Manhattan Associates, Inc. * | 7,805 | 949,634 |
NortonLifeLock, Inc. | 29,862 | 672,791 |
Paycom Software, Inc. * | 473 | 163,658 |
Science Applications International Corp. | 2,797 | 303,027 |
SS&C Technologies Holdings, Inc. | 15,261 | 784,721 |
Synopsys, Inc. * | 3,190 | 933,235 |
Tyler Technologies, Inc. * | 1,976 | 638,900 |
13,993,455 | ||
Technology Hardware & Equipment — 4.5% | ||
Amphenol Corp., Class A | 14,907 | 1,130,398 |
CDW Corp. | 6,167 | 1,065,719 |
Cirrus Logic, Inc. * | 8,487 | 569,648 |
Concentrix Corp. | 4,156 | 507,988 |
Corning, Inc. | 22,523 | 724,565 |
Entegris, Inc. | 9,009 | 714,774 |
HP, Inc. | 22,226 | 613,882 |
Jabil, Inc. | 16,097 | 1,034,232 |
Microchip Technology, Inc. | 8,826 | 544,917 |
Monolithic Power Systems, Inc. | 2,438 | 827,579 |
National Instruments Corp. | 2,012 | 76,818 |
NetApp, Inc. | 10,853 | 751,787 |
ON Semiconductor Corp. * | 15,269 | 937,975 |
Qorvo, Inc. * | 6,663 | 573,551 |
Skyworks Solutions, Inc. | 6,243 | 536,961 |
TD SYNNEX Corp. | 6,751 | 617,784 |
Teradyne, Inc. | 8,349 | 679,191 |
11,907,769 | ||
Telecommunications Equipment — 2.4% | ||
Arista Networks, Inc. * | 9,197 | 1,111,549 |
Ciena Corp. * | 17,579 | 842,034 |
Juniper Networks, Inc. | 34,457 | 1,054,384 |
186 | J.P. Morgan Exchange-Traded Funds | October 31, 2022 |
INVESTMENTS | SHARES | VALUE ($) |
Common Stocks — continued | ||
Telecommunications Equipment — continued | ||
Lumentum Holdings, Inc. * | 12,601 | 938,145 |
Motorola Solutions, Inc. | 4,532 | 1,131,686 |
Ubiquiti, Inc. | 3,554 | 1,232,350 |
Viasat, Inc. * | 3,295 | 134,963 |
6,445,111 | ||
Telecommunications Service Providers — 1.4% | ||
Altice USA, Inc., Class A * | 82,382 | 544,545 |
Cable One, Inc. | 666 | 572,380 |
DISH Network Corp., Class A * | 47,046 | 701,456 |
Frontier Communications Parent, Inc. * | 20,103 | 470,812 |
Liberty Broadband Corp., Class C * | 6,873 | 580,288 |
Lumen Technologies, Inc. | 108,275 | 796,904 |
3,666,385 | ||
Travel & Leisure — 0.6% | ||
Boyd Gaming Corp. | 13,151 | 759,602 |
Choice Hotels International, Inc. | 2,492 | 323,561 |
Copa Holdings SA, Class A (Panama) * | 5,923 | 445,587 |
Travel + Leisure Co. | 4,862 | 184,659 |
Wendy's Co. (The) | 733 | 15,232 |
1,728,641 | ||
Waste & Disposal Services — 0.9% | ||
Clean Harbors, Inc. * | 9,390 | 1,149,899 |
INVESTMENTS | SHARES | VALUE ($) |
Waste & Disposal Services — continued | ||
Republic Services, Inc. | 7,724 | 1,024,357 |
Stericycle, Inc. * | 6,706 | 298,954 |
2,473,210 | ||
Total Common Stocks (Cost $257,200,919) | 266,632,252 | |
Short-Term Investments — 0.1% | ||
Investment Companies — 0.1% | ||
JPMorgan U.S. Government Money Market Fund Class IM Shares, 2.85% (a) (b)(Cost $414,054) | 414,054 | 414,054 |
Total Investments — 99.8% (Cost $257,614,973) | 267,046,306 | |
Assets in Excess of Other Liabilities — 0.2% | 474,224 | |
NET ASSETS — 100.0% | 267,520,530 | |
Percentages indicated are based on net assets. |
* | Non-income producing security. |
(a) | Investment in an affiliated fund, which is registered under the Investment Company Act of 1940, as amended, and is advised by J.P. Morgan Investment Management Inc. |
(b) | The rate shown is the current yield as of October 31, 2022. |
DESCRIPTION | NUMBER OF CONTRACTS | EXPIRATION DATE | TRADING CURRENCY | NOTIONAL AMOUNT ($) | VALUE AND UNREALIZED APPRECIATION (DEPRECIATION) ($) |
Long Contracts | |||||
S&P Midcap 400 E-Mini Index | 3 | 12/16/2022 | USD | 732,120 | 35,424 |
Abbreviations | |
USD | United States Dollar |
October 31, 2022 | J.P. Morgan Exchange-Traded Funds | 187 |
AS OF October 31, 2022
INVESTMENTS | SHARES | VALUE ($) |
Common Stocks — 99.8% | ||
Aerospace & Defense — 0.1% | ||
Moog, Inc., Class A | 1,815 | 153,821 |
National Presto Industries, Inc. | 2,049 | 144,434 |
298,255 | ||
Automobiles & Parts — 0.4% | ||
Dorman Products, Inc. * | 5,578 | 455,276 |
Gentherm, Inc. * | 12,578 | 734,807 |
1,190,083 | ||
Banks — 5.6% | ||
1st Source Corp. | 2,273 | 132,198 |
Ameris Bancorp | 13,966 | 719,389 |
Atlantic Union Bankshares Corp. | 8,726 | 301,396 |
Axos Financial, Inc. * | 8,732 | 340,199 |
BancFirst Corp. | 1,572 | 150,629 |
Bank of NT Butterfield & Son Ltd. (The) (Bermuda) | 13,684 | 472,645 |
Banner Corp. | 5,055 | 377,861 |
Brookline Bancorp, Inc. | 12,614 | 173,443 |
Capital City Bank Group, Inc. | 966 | 34,216 |
Cathay General Bancorp | 13,982 | 637,579 |
Community Trust Bancorp, Inc. | 3,541 | 167,454 |
First BanCorp (Puerto Rico) | 24,647 | 389,176 |
First Busey Corp. | 3,517 | 92,884 |
First Financial Bancorp | 9,190 | 239,583 |
First Financial Bankshares, Inc. | 11,413 | 439,286 |
First Financial Corp. | 1,698 | 82,336 |
First Merchants Corp. | 4,452 | 199,895 |
Flagstar Bancorp, Inc. | 13,428 | 519,664 |
Fulton Financial Corp. | 18,621 | 339,461 |
Hancock Whitney Corp. | 8,679 | 484,896 |
Hilltop Holdings, Inc. | 28,885 | 836,221 |
Home BancShares, Inc. | 2,127 | 54,217 |
Hope Bancorp, Inc. | 42,023 | 570,252 |
Independent Bank Group, Inc. | 6,086 | 383,966 |
Lakeland Financial Corp. | 3,142 | 259,686 |
NBT Bancorp, Inc. | 3,657 | 173,305 |
OceanFirst Financial Corp. | 16,224 | 366,338 |
OFG Bancorp (Puerto Rico) | 10,769 | 300,240 |
Old National Bancorp | 52,045 | 1,018,000 |
Renasant Corp. | 11,039 | 445,644 |
Republic Bancorp, Inc., Class A | 2,733 | 126,675 |
Sandy Spring Bancorp, Inc. | 3,507 | 124,288 |
Simmons First National Corp., Class A | 21,429 | 511,510 |
TrustCo Bank Corp. | 3,125 | 116,625 |
Trustmark Corp. | 16,627 | 608,049 |
INVESTMENTS | SHARES | VALUE ($) |
Banks — continued | ||
UMB Financial Corp. | 8,555 | 711,947 |
United Bankshares, Inc. | 23,429 | 992,218 |
United Community Banks, Inc. | 12,546 | 483,021 |
Valley National Bancorp | 74,867 | 888,671 |
Washington Federal, Inc. | 10,505 | 406,544 |
WesBanco, Inc. (a) | 10,309 | 416,896 |
16,088,503 | ||
Beverages — 1.6% | ||
BRC, Inc., Class A * (a) | 31,961 | 231,717 |
Celsius Holdings, Inc. * | 8,278 | 753,960 |
Coca-Cola Consolidated, Inc. | 1,586 | 772,398 |
Duckhorn Portfolio, Inc. (The) * | 31,223 | 456,481 |
MGP Ingredients, Inc. | 7,925 | 887,996 |
National Beverage Corp. | 15,386 | 729,604 |
Primo Water Corp. | 45,337 | 661,467 |
4,493,623 | ||
Chemicals — 3.6% | ||
AdvanSix, Inc. | 16,671 | 606,491 |
American Vanguard Corp. | 21,800 | 507,286 |
Avient Corp. | 19,005 | 655,482 |
Balchem Corp. | 6,599 | 922,540 |
Cabot Corp. | 12,089 | 888,300 |
Ingevity Corp. * | 12,196 | 820,425 |
Innospec, Inc. | 8,443 | 844,215 |
Intrepid Potash, Inc. * | 10,239 | 463,315 |
Livent Corp. * (a) | 26,631 | 840,741 |
LSB Industries, Inc. * | 43,054 | 759,042 |
Orion Engineered Carbons SA (Germany) | 33,251 | 530,686 |
Quaker Chemical Corp. | 1,883 | 306,251 |
Rayonier Advanced Materials, Inc. * | 60,978 | 277,450 |
Sensient Technologies Corp. | 10,743 | 767,695 |
Stepan Co. | 6,670 | 696,615 |
Tronox Holdings plc, Class A | 47,092 | 565,104 |
10,451,638 | ||
Construction & Materials — 1.7% | ||
Comfort Systems USA, Inc. | 8,653 | 1,066,742 |
EMCOR Group, Inc. | 6,690 | 943,959 |
Exponent, Inc. | 5,775 | 550,126 |
GMS, Inc. * | 8,660 | 408,752 |
Griffon Corp. | 6,396 | 205,567 |
Installed Building Products, Inc. | 4,043 | 347,698 |
Masonite International Corp. * | 4,155 | 297,207 |
Mueller Water Products, Inc., Class A | 5,367 | 62,794 |
188 | J.P. Morgan Exchange-Traded Funds | October 31, 2022 |
INVESTMENTS | SHARES | VALUE ($) |
Common Stocks — continued | ||
Construction & Materials — continued | ||
Patrick Industries, Inc. | 5,070 | 231,750 |
Quanex Building Products Corp. | 6,962 | 154,278 |
Simpson Manufacturing Co., Inc. | 7,204 | 615,798 |
4,884,671 | ||
Consumer Services — 0.5% | ||
Carriage Services, Inc. | 2,761 | 67,396 |
Laureate Education, Inc., Class A | 58,309 | 737,026 |
Perdoceo Education Corp. * | 28,762 | 328,750 |
Rent-A-Center, Inc. | 17,279 | 360,267 |
1,493,439 | ||
Electricity — 1.9% | ||
ALLETE, Inc. | 10,742 | 604,452 |
Clearway Energy, Inc., Class C | 23,054 | 800,896 |
MGE Energy, Inc. | 7,526 | 512,445 |
NorthWestern Corp. | 14,892 | 786,744 |
NuScale Power Corp. * (a) | 24,084 | 271,668 |
Ormat Technologies, Inc. (a) | 7,492 | 677,652 |
PNM Resources, Inc. | 18,261 | 848,589 |
Portland General Electric Co. | 16,579 | 745,060 |
Via Renewables, Inc. | 25,925 | 181,216 |
5,428,722 | ||
Electronic & Electrical Equipment — 1.4% | ||
Atkore, Inc. * | 8,839 | 842,357 |
AZZ, Inc. | 6,444 | 259,049 |
Badger Meter, Inc. | 7,971 | 896,578 |
Brady Corp., Class A | 6,840 | 312,930 |
Encore Wire Corp. | 6,673 | 918,138 |
Watts Water Technologies, Inc., Class A | 5,289 | 774,098 |
4,003,150 | ||
Finance & Credit Services — 1.6% | ||
Encore Capital Group, Inc. * | 6,840 | 348,293 |
Enova International, Inc. * | 11,779 | 441,595 |
Mr. Cooper Group, Inc. * | 20,135 | 795,131 |
Navient Corp. | 56,357 | 853,245 |
Nelnet, Inc., Class A | 2,279 | 203,036 |
PennyMac Financial Services, Inc. | 13,935 | 743,014 |
Radian Group, Inc. | 37,603 | 784,775 |
Walker & Dunlop, Inc. | 5,092 | 458,076 |
4,627,165 | ||
Food Producers — 4.3% | ||
Andersons, Inc. (The) | 15,805 | 557,442 |
B&G Foods, Inc. (a) | 26,482 | 433,775 |
INVESTMENTS | SHARES | VALUE ($) |
Food Producers — continued | ||
BellRing Brands, Inc. * | 25,953 | 628,582 |
Cal-Maine Foods, Inc. | 16,127 | 911,337 |
Fresh Del Monte Produce, Inc. | 22,354 | 582,992 |
GrowGeneration Corp. * (a) | 31,658 | 113,019 |
Hain Celestial Group, Inc. (The) * | 28,134 | 526,387 |
Herbalife Nutrition Ltd. * | 27,246 | 579,250 |
Hostess Brands, Inc. * | 37,417 | 990,802 |
J & J Snack Foods Corp. | 4,886 | 721,222 |
John B Sanfilippo & Son, Inc. | 6,533 | 544,918 |
Lancaster Colony Corp. | 4,692 | 845,874 |
Medifast, Inc. | 4,532 | 530,199 |
Nature's Sunshine Products, Inc. * | 7,541 | 63,646 |
Simply Good Foods Co. (The) * | 23,135 | 886,070 |
Sovos Brands, Inc. * | 10,942 | 151,656 |
SunOpta, Inc. (Canada) * | 47,303 | 531,213 |
Tootsie Roll Industries, Inc. | 19,502 | 787,686 |
TreeHouse Foods, Inc. * | 18,616 | 935,268 |
USANA Health Sciences, Inc. * | 7,770 | 408,003 |
Utz Brands, Inc. | 40,893 | 662,875 |
12,392,216 | ||
Gas, Water & Multi-utilities — 4.1% | ||
American States Water Co. | 9,505 | 859,822 |
Archaea Energy, Inc. * | 21,111 | 544,875 |
Aris Water Solution, Inc., Class A | 10,673 | 181,761 |
Avista Corp. | 17,437 | 715,440 |
Black Hills Corp. | 11,526 | 753,455 |
Brookfield Infrastructure Corp., Class A (Canada) | 18,001 | 776,203 |
California Water Service Group (a) | 11,495 | 713,380 |
Chesapeake Utilities Corp. | 5,018 | 624,139 |
Evoqua Water Technologies Corp. * | 22,582 | 884,763 |
Excelerate Energy, Inc., Class A | 10,210 | 282,000 |
Middlesex Water Co. | 5,277 | 472,133 |
New Jersey Resources Corp. | 19,329 | 862,847 |
Northwest Natural Holding Co. | 11,971 | 575,685 |
ONE Gas, Inc. | 11,078 | 858,323 |
SJW Group | 8,405 | 594,065 |
South Jersey Industries, Inc. (a) | 17,388 | 602,842 |
Southwest Gas Holdings, Inc. | 10,022 | 732,308 |
Spire, Inc. | 10,132 | 707,315 |
11,741,356 | ||
General Industrials — 1.4% | ||
Apogee Enterprises, Inc. | 6,818 | 312,810 |
Barnes Group, Inc. | 3,508 | 124,078 |
October 31, 2022 | J.P. Morgan Exchange-Traded Funds | 189 |
AS OF October 31, 2022 (continued)
INVESTMENTS | SHARES | VALUE ($) |
Common Stocks — continued | ||
General Industrials — continued | ||
CSW Industrials, Inc. | 2,346 | 302,446 |
Greif, Inc., Class A | 8,457 | 559,938 |
HB Fuller Co. | 13,117 | 914,386 |
Kronos Worldwide, Inc. | 23,366 | 221,977 |
Myers Industries, Inc. | 7,036 | 142,760 |
Otter Tail Corp. | 11,197 | 754,902 |
Standex International Corp. | 2,373 | 235,045 |
TriMas Corp. | 2,728 | 62,335 |
Trinseo plc | 20,024 | 376,852 |
4,007,529 | ||
Health Care Providers — 2.6% | ||
Addus HomeCare Corp. * (a) | 3,976 | 407,222 |
Apollo Medical Holdings, Inc. * (a) | 16,133 | 572,076 |
Brookdale Senior Living, Inc. * | 11,478 | 51,307 |
Computer Programs and Systems, Inc. * | 5,871 | 189,633 |
CorVel Corp. * | 3,470 | 569,809 |
Ensign Group, Inc. (The) | 10,189 | 914,768 |
Healthcare Services Group, Inc. | 12,068 | 168,469 |
LHC Group, Inc. * | 4,773 | 797,568 |
ModivCare, Inc. * | 4,990 | 485,228 |
NextGen Healthcare, Inc. * | 13,426 | 269,057 |
Omnicell, Inc. * | 5,476 | 423,404 |
Option Care Health, Inc. * | 28,051 | 848,823 |
Pennant Group, Inc. (The) * | 12,470 | 153,506 |
RadNet, Inc. * | 9,807 | 187,510 |
Select Medical Holdings Corp. | 24,954 | 640,819 |
Surgery Partners, Inc. * (a) | 19,751 | 537,030 |
US Physical Therapy, Inc. | 2,296 | 203,885 |
7,420,114 | ||
Household Goods & Home Construction — 1.5% | ||
Beazer Homes USA, Inc. * | 6,805 | 76,965 |
Central Garden & Pet Co., Class A * | 10,421 | 407,878 |
CompX International, Inc. | 2,029 | 36,177 |
Ethan Allen Interiors, Inc. | 26,815 | 686,196 |
HNI Corp. | 13,680 | 396,583 |
Interface, Inc. | 34,479 | 389,957 |
La-Z-Boy, Inc. | 22,840 | 565,747 |
LGI Homes, Inc. * (a) | 1,639 | 150,870 |
M/I Homes, Inc. * | 9,834 | 408,013 |
MDC Holdings, Inc. | 5,917 | 180,232 |
MillerKnoll, Inc. | 15,108 | 319,987 |
Sleep Number Corp. * | 2,205 | 61,167 |
Steelcase, Inc., Class A | 23,946 | 186,060 |
INVESTMENTS | SHARES | VALUE ($) |
Household Goods & Home Construction — continued | ||
Taylor Morrison Home Corp. * | 13,912 | 366,442 |
Tri Pointe Homes, Inc. * | 10,605 | 177,634 |
4,409,908 | ||
Industrial Engineering — 1.3% | ||
Albany International Corp., Class A | 4,041 | 370,237 |
Astec Industries, Inc. | 5,364 | 234,139 |
Columbus McKinnon Corp. (a) | 8,016 | 228,616 |
EnPro Industries, Inc. | 4,884 | 520,146 |
Franklin Electric Co., Inc. | 9,096 | 745,326 |
Hillenbrand, Inc. | 16,094 | 711,033 |
John Bean Technologies Corp. | 2,501 | 228,091 |
Tennant Co. | 1,681 | 97,918 |
Titan Machinery, Inc. * | 4,134 | 142,127 |
Zurn Elkay Water Solutions Corp. | 13,929 | 327,192 |
3,604,825 | ||
Industrial Materials — 2.0% | ||
Boise Cascade Co. | 13,893 | 927,636 |
Clearwater Paper Corp. * | 15,093 | 671,337 |
Glatfelter Corp. | 8,908 | 25,210 |
Koppers Holdings, Inc. | 16,240 | 405,350 |
Materion Corp. | 10,058 | 862,071 |
Mativ Holdings, Inc. | 30,804 | 731,287 |
Minerals Technologies, Inc. | 11,921 | 655,774 |
Resolute Forest Products, Inc. * | 11,447 | 238,212 |
Sylvamo Corp. | 8,420 | 405,591 |
Tredegar Corp. | 13,306 | 144,902 |
UFP Industries, Inc. | 10,963 | 780,895 |
5,848,265 | ||
Industrial Metals & Mining — 3.7% | ||
Arconic Corp. * | 2,039 | 42,330 |
Carpenter Technology Corp. | 25,516 | 954,298 |
Century Aluminum Co. * (a) | 33,255 | 239,768 |
Commercial Metals Co. | 21,455 | 976,202 |
Compass Minerals International, Inc. | 13,292 | 525,566 |
Constellium SE * | 40,345 | 444,602 |
Energy Fuels, Inc. * (a) | 69,378 | 499,522 |
GrafTech International Ltd. | 76,288 | 388,306 |
Haynes International, Inc. | 9,610 | 470,025 |
Kaiser Aluminum Corp. (a) | 5,221 | 421,804 |
Mueller Industries, Inc. | 13,749 | 861,237 |
Olympic Steel, Inc. | 6,652 | 181,001 |
RBC Bearings, Inc. * | 3,623 | 918,539 |
Ryerson Holding Corp. | 11,985 | 402,097 |
190 | J.P. Morgan Exchange-Traded Funds | October 31, 2022 |
INVESTMENTS | SHARES | VALUE ($) |
Common Stocks — continued | ||
Industrial Metals & Mining — continued | ||
Schnitzer Steel Industries, Inc., Class A | 18,181 | 490,705 |
TimkenSteel Corp. * | 35,597 | 620,812 |
Uranium Energy Corp. * (a) | 122,671 | 516,445 |
US Silica Holdings, Inc. * | 58,443 | 840,995 |
Worthington Industries, Inc. | 14,448 | 687,147 |
10,481,401 | ||
Industrial Support Services — 2.4% | ||
ABM Industries, Inc. | 11,229 | 499,803 |
Applied Industrial Technologies, Inc. | 8,201 | 1,020,040 |
ASGN, Inc. * | 7,211 | 611,349 |
CoreCivic, Inc., REIT * | 44,084 | 461,559 |
CRA International, Inc. | 3,576 | 367,398 |
Distribution Solutions Group, Inc. * | 339 | 10,197 |
DXP Enterprises, Inc. * | 1,545 | 44,202 |
EVERTEC, Inc. (Puerto Rico) (a) | 9,820 | 351,654 |
ExlService Holdings, Inc. * | 4,605 | 837,419 |
Forrester Research, Inc. * | 3,958 | 167,503 |
Heidrick & Struggles International, Inc. | 5,505 | 155,021 |
Insperity, Inc. | 4,286 | 505,834 |
Korn Ferry | 6,308 | 350,662 |
Maximus, Inc. | 11,779 | 726,411 |
Pitney Bowes, Inc. (a) | 46,049 | 143,212 |
Resources Connection, Inc. | 6,202 | 113,311 |
TriNet Group, Inc. * | 6,815 | 442,839 |
TrueBlue, Inc. * | 4,070 | 80,016 |
TTEC Holdings, Inc. | 1,772 | 78,801 |
UniFirst Corp. | 33 | 6,072 |
6,973,303 | ||
Industrial Transportation — 2.8% | ||
ArcBest Corp. | 6,840 | 543,301 |
Atlas Air Worldwide Holdings, Inc. * | 8,684 | 878,300 |
Costamare, Inc. (Monaco) | 20,293 | 191,566 |
DHT Holdings, Inc. | 110,975 | 988,787 |
Federal Signal Corp. | 8,117 | 378,658 |
Forward Air Corp. | 5,158 | 546,077 |
Frontline Ltd. (Norway) (a) | 53,859 | 676,469 |
GATX Corp. | 4,645 | 486,378 |
Genco Shipping & Trading Ltd. | 19,297 | 258,580 |
Hub Group, Inc., Class A * | 1,988 | 154,269 |
Matson, Inc. | 9,933 | 730,870 |
McGrath RentCorp | 4,118 | 387,298 |
Saia, Inc. * | 3,688 | 733,396 |
Scorpio Tankers, Inc. (Monaco) | 4,003 | 191,904 |
INVESTMENTS | SHARES | VALUE ($) |
Industrial Transportation — continued | ||
Triton International Ltd. (Bermuda) | 14,587 | 885,285 |
Wabash National Corp. | 7,047 | 152,567 |
8,183,705 | ||
Investment Banking & Brokerage Services — 1.4% | ||
Artisan Partners Asset Management, Inc., Class A | 21,369 | 609,230 |
B. Riley Financial, Inc. (a) | 2,599 | 105,727 |
Brightsphere Investment Group, Inc. | 21,495 | 404,536 |
Cohen & Steers, Inc. | 5,084 | 305,853 |
Cowen, Inc., Class A (a) | 22,431 | 866,285 |
Federated Hermes, Inc. | 21,086 | 732,739 |
Houlihan Lokey, Inc. | 6,028 | 538,421 |
Moelis & Co., Class A | 12,681 | 538,435 |
Virtus Investment Partners, Inc. | 87 | 14,920 |
4,116,146 | ||
Leisure Goods — 1.1% | ||
Camping World Holdings, Inc., Class A | 23,926 | 665,861 |
Fox Factory Holding Corp. * | 446 | 39,181 |
LCI Industries | 3,910 | 414,890 |
Smith & Wesson Brands, Inc. | 57,453 | 648,644 |
Sonos, Inc. * (a) | 23,510 | 378,981 |
Sturm Ruger & Co., Inc. | 13,275 | 745,126 |
Universal Electronics, Inc. * | 6,648 | 135,686 |
3,028,369 | ||
Life Insurance — 0.6% | ||
American Equity Investment Life Holding Co. | 15,430 | 664,724 |
CNO Financial Group, Inc. | 43,483 | 959,235 |
National Western Life Group, Inc., Class A | 308 | 60,990 |
1,684,949 | ||
Media — 0.5% | ||
Gray Television, Inc. | 19,718 | 279,010 |
QuinStreet, Inc. * | 5,381 | 61,397 |
Scholastic Corp. | 4,033 | 153,819 |
TEGNA, Inc. | 40,491 | 845,452 |
1,339,678 | ||
Medical Equipment & Services — 3.2% | ||
AdaptHealth Corp. * | 22,463 | 512,156 |
Anika Therapeutics, Inc. * (a) | 2,748 | 78,098 |
AtriCure, Inc. * | 11,038 | 464,921 |
Atrion Corp. | 283 | 169,888 |
Avanos Medical, Inc. * | 8,601 | 190,512 |
CONMED Corp. (a) | 7,533 | 600,606 |
October 31, 2022 | J.P. Morgan Exchange-Traded Funds | 191 |
AS OF October 31, 2022 (continued)
INVESTMENTS | SHARES | VALUE ($) |
Common Stocks — continued | ||
Medical Equipment & Services — continued | ||
Fulgent Genetics, Inc. * | 13,169 | 521,888 |
Inogen, Inc. * | 2,030 | 46,000 |
Integer Holdings Corp. * | 8,753 | 545,575 |
Lantheus Holdings, Inc. * | 11,059 | 818,255 |
Meridian Bioscience, Inc. * | 26,610 | 850,722 |
Merit Medical Systems, Inc. * | 14,670 | 1,008,856 |
Neogen Corp. * | 22,136 | 292,195 |
NeoGenomics, Inc. * | 27,242 | 207,175 |
OraSure Technologies, Inc. * | 57,595 | 251,114 |
Orthofix Medical, Inc. * | 5,244 | 84,219 |
Owens & Minor, Inc. | 23,648 | 402,016 |
Patterson Cos., Inc. | 29,753 | 772,685 |
STAAR Surgical Co. * | 7,336 | 519,902 |
Surmodics, Inc. * | 4,964 | 169,471 |
Varex Imaging Corp. * | 23,764 | 525,422 |
Zynex, Inc. (a) | 8,067 | 91,964 |
9,123,640 | ||
Mortgage Real Estate Investment Trusts — 1.7% | ||
Apollo Commercial Real Estate Finance, Inc. | 32,603 | 367,110 |
Arbor Realty Trust, Inc. (a) | 31,551 | 434,457 |
Blackstone Mortgage Trust, Inc., Class A | 20,975 | 523,536 |
Dynex Capital, Inc. | 9,895 | 118,146 |
Ellington Financial, Inc. (a) | 43,938 | 587,890 |
Granite Point Mortgage Trust, Inc. | 8,598 | 67,580 |
iStar, Inc. | 43,616 | 457,096 |
KKR Real Estate Finance Trust, Inc. | 35,998 | 627,085 |
Ladder Capital Corp. | 31,941 | 340,811 |
MFA Financial, Inc. | 27,930 | 278,183 |
New York Mortgage Trust, Inc. (a) | 81,445 | 219,087 |
PennyMac Mortgage Investment Trust | 10,709 | 148,534 |
Ready Capital Corp. | 25,760 | 312,211 |
Redwood Trust, Inc. | 48,498 | 345,791 |
TPG RE Finance Trust, Inc. | 12,732 | 107,840 |
4,935,357 | ||
Non-life Insurance — 0.9% | ||
Employers Holdings, Inc. | 8,007 | 349,185 |
Enstar Group Ltd. * | 779 | 156,205 |
Essent Group Ltd. | 7,123 | 281,928 |
Horace Mann Educators Corp. | 7,012 | 276,694 |
Safety Insurance Group, Inc. | 3,449 | 299,891 |
Selective Insurance Group, Inc. | 6,808 | 667,729 |
Stewart Information Services Corp. | 15,164 | 590,789 |
2,622,421 | ||
INVESTMENTS | SHARES | VALUE ($) |
Non-Renewable Energy — 6.9% | ||
Alpha Metallurgical Resources, Inc. | 3,625 | 612,081 |
Arch Resources, Inc. (a) | 3,912 | 595,759 |
Archrock, Inc. | 85,428 | 641,564 |
Berry Corp. | 42,907 | 380,585 |
Brigham Minerals, Inc., Class A | 12,588 | 390,228 |
Cactus, Inc., Class A | 18,066 | 934,374 |
ChampionX Corp. | 19,486 | 557,689 |
Civitas Resources, Inc. | 11,395 | 796,624 |
CNX Resources Corp. * | 38,596 | 648,799 |
CONSOL Energy, Inc. | 12,089 | 761,849 |
CVR Energy, Inc. (a) | 17,439 | 681,167 |
DMC Global, Inc. * | 8,710 | 188,484 |
Dril-Quip, Inc. * | 2,617 | 65,111 |
Helix Energy Solutions Group, Inc. * | 80,596 | 564,172 |
Magnolia Oil & Gas Corp., Class A | 31,207 | 801,396 |
Matador Resources Co. (a) | 14,173 | 941,796 |
MRC Global, Inc. * | 22,777 | 228,453 |
Nabors Industries Ltd. * | 5,170 | 899,735 |
Newpark Resources, Inc. * | 15,308 | 56,027 |
Northern Oil and Gas, Inc. | 11,039 | 376,872 |
NOW, Inc. * | 32,831 | 417,939 |
Oceaneering International, Inc. * | 22,720 | 317,853 |
Patterson-UTI Energy, Inc. | 49,161 | 867,692 |
PBF Energy, Inc., Class A * (a) | 18,409 | 814,598 |
Permian Resources Corp. * | 95,244 | 930,534 |
ProPetro Holding Corp. * | 65,150 | 771,376 |
Ranger Oil Corp. | 17,708 | 724,257 |
RPC, Inc. | 24,618 | 273,998 |
SandRidge Energy, Inc. * | 27,136 | 512,599 |
SM Energy Co. | 18,189 | 818,141 |
Solaris Oilfield Infrastructure, Inc., Class A | 43,435 | 591,585 |
SunCoke Energy, Inc. | 73,398 | 532,870 |
Warrior Met Coal, Inc. | 12,241 | 454,631 |
World Fuel Services Corp. | 26,527 | 676,173 |
19,827,011 | ||
Personal Care, Drug & Grocery Stores — 3.5% | ||
ACCO Brands Corp. | 61,748 | 284,041 |
Beauty Health Co. (The) * (a) | 48,985 | 559,899 |
Chefs' Warehouse, Inc. (The) * | 20,498 | 750,842 |
Edgewell Personal Care Co. | 19,216 | 753,075 |
Energizer Holdings, Inc. | 20,489 | 591,927 |
Ingles Markets, Inc., Class A | 9,890 | 933,319 |
Nu Skin Enterprises, Inc., Class A | 15,217 | 581,137 |
PetMed Express, Inc. (a) | 28,048 | 597,983 |
192 | J.P. Morgan Exchange-Traded Funds | October 31, 2022 |
INVESTMENTS | SHARES | VALUE ($) |
Common Stocks — continued | ||
Personal Care, Drug & Grocery Stores — continued | ||
PLBY Group, Inc. * (a) | 18,001 | 65,164 |
Rite Aid Corp. * (a) | 94,498 | 493,280 |
SpartanNash Co. | 27,550 | 983,810 |
Sprouts Farmers Market, Inc. * | 29,969 | 884,085 |
United Natural Foods, Inc. * | 19,280 | 817,665 |
Veru, Inc. * (a) | 55,832 | 683,384 |
WD-40 Co. (a) | 3,713 | 594,674 |
Weis Markets, Inc. | 3,762 | 352,386 |
9,926,671 | ||
Personal Goods — 0.8% | ||
Movado Group, Inc. | 12,709 | 420,286 |
Oxford Industries, Inc. | 6,603 | 671,723 |
Signet Jewelers Ltd. | 11,799 | 769,767 |
Steven Madden Ltd. | 13,502 | 403,305 |
2,265,081 | ||
Pharmaceuticals, Biotechnology & Marijuana Producers — 4.3% | ||
Amphastar Pharmaceuticals, Inc. * | 19,615 | 606,104 |
ANI Pharmaceuticals, Inc. * | 5,856 | 225,983 |
Arcus Biosciences, Inc. * | 8,742 | 222,746 |
Arrowhead Pharmaceuticals, Inc. * | 16,860 | 586,897 |
Arvinas, Inc. * | 9,121 | 453,405 |
Castle Biosciences, Inc. * | 7,962 | 203,190 |
Catalyst Pharmaceuticals, Inc. * | 56,155 | 778,870 |
Collegium Pharmaceutical, Inc. * | 19,080 | 342,295 |
Corcept Therapeutics, Inc. * | 19,111 | 546,575 |
Dynavax Technologies Corp. * (a) | 47,558 | 544,539 |
Eagle Pharmaceuticals, Inc. * | 4,242 | 133,496 |
Emergent BioSolutions, Inc. * | 8,850 | 184,611 |
Halozyme Therapeutics, Inc. * (a) | 16,304 | 779,494 |
Heska Corp. * (a) | 1,673 | 120,054 |
Innoviva, Inc. * (a) | 39,646 | 537,600 |
Ligand Pharmaceuticals, Inc. * | 3,647 | 319,660 |
Medpace Holdings, Inc. * | 5,129 | 1,138,535 |
Myriad Genetics, Inc. * | 13,939 | 289,095 |
Pacira BioSciences, Inc. * | 13,196 | 683,025 |
PDL BioPharma, Inc. ‡ * | 22,361 | 55,455 |
Prestige Consumer Healthcare, Inc. * | 14,076 | 766,861 |
Prothena Corp. plc (Ireland) * | 21,766 | 1,337,303 |
Supernus Pharmaceuticals, Inc. * | 21,282 | 729,334 |
Travere Therapeutics, Inc. * | 12,586 | 272,864 |
Vanda Pharmaceuticals, Inc. * | 23,483 | 245,867 |
Xencor, Inc. * | 8,370 | 234,360 |
12,338,218 | ||
INVESTMENTS | SHARES | VALUE ($) |
Precious Metals & Mining — 0.2% | ||
Hecla Mining Co. | 132,430 | 605,205 |
Real Estate Investment & Services — 1.0% | ||
Anywhere Real Estate, Inc. * | 62,043 | 460,980 |
Cushman & Wakefield plc * | 27,701 | 319,947 |
Douglas Elliman, Inc. | 50,156 | 231,721 |
eXp World Holdings, Inc. (a) | 25,991 | 343,341 |
Kennedy-Wilson Holdings, Inc. | 23,500 | 390,335 |
Marcus & Millichap, Inc. | 8,392 | 309,161 |
Newmark Group, Inc., Class A | 65,485 | 536,322 |
St. Joe Co. (The) | 11,197 | 397,829 |
2,989,636 | ||
Real Estate Investment Trusts — 8.4% | ||
Agree Realty Corp. | 11,384 | 782,081 |
Alexander & Baldwin, Inc. | 14,255 | 277,687 |
American Assets Trust, Inc. | 3,595 | 98,791 |
Apartment Investment and Management Co., Class A | 74,628 | 592,546 |
Apple Hospitality REIT, Inc. | 29,674 | 508,019 |
Ares Commercial Real Estate Corp. | 35,436 | 437,280 |
Bluerock Homes Trust, Inc. * | 1,640 | 41,492 |
Brandywine Realty Trust | 32,150 | 210,904 |
Broadstone Net Lease, Inc. | 43,336 | 742,779 |
CareTrust REIT, Inc. | 39,617 | 740,046 |
Centerspace | 2,650 | 183,645 |
Community Healthcare Trust, Inc. | 5,439 | 188,189 |
Corporate Office Properties Trust | 11,556 | 307,967 |
DiamondRock Hospitality Co. | 16,240 | 151,682 |
DigitalBridge Group, Inc. | 5,923 | 75,814 |
Easterly Government Properties, Inc. | 13,478 | 234,382 |
Elme Communities | 9,330 | 178,110 |
Equity Commonwealth | 11,553 | 302,226 |
Essential Properties Realty Trust, Inc. | 15,530 | 334,206 |
Four Corners Property Trust, Inc. | 31,732 | 812,974 |
GEO Group, Inc. (The) * (a) | 105,862 | 895,593 |
Global Net Lease, Inc. (a) | 10,767 | 131,896 |
Hannon Armstrong Sustainable Infrastructure Capital, Inc. (a) | 14,592 | 396,611 |
Independence Realty Trust, Inc. | 38,351 | 642,763 |
Industrial Logistics Properties Trust | 11,049 | 51,709 |
Innovative Industrial Properties, Inc. | 4,264 | 460,938 |
Kite Realty Group Trust | 44,242 | 868,913 |
LTC Properties, Inc. | 19,008 | 735,039 |
LXP Industrial Trust | 64,142 | 620,895 |
Macerich Co. (The) | 53,253 | 592,706 |
October 31, 2022 | J.P. Morgan Exchange-Traded Funds | 193 |
AS OF October 31, 2022 (continued)
INVESTMENTS | SHARES | VALUE ($) |
Common Stocks — continued | ||
Real Estate Investment Trusts — continued | ||
National Health Investors, Inc. | 13,019 | 738,177 |
NexPoint Residential Trust, Inc. | 6,343 | 289,241 |
Office Properties Income Trust | 12,849 | 196,590 |
Pebblebrook Hotel Trust | 36,336 | 582,829 |
Phillips Edison & Co., Inc. | 23,483 | 707,778 |
Physicians Realty Trust | 43,783 | 659,372 |
Piedmont Office Realty Trust, Inc., Class A | 41,030 | 428,763 |
PotlatchDeltic Corp. | 18,700 | 831,963 |
Retail Opportunity Investments Corp. | 40,953 | 592,999 |
RPT Realty | 30,996 | 288,263 |
Ryman Hospitality Properties, Inc. | 5,473 | 486,659 |
Sabra Health Care REIT, Inc. | 57,014 | 778,811 |
SITE Centers Corp. | 51,555 | 638,251 |
STAG Industrial, Inc. | 24,892 | 786,338 |
Summit Hotel Properties, Inc. | 28,346 | 244,909 |
Sunstone Hotel Investors, Inc. | 41,157 | 458,901 |
Tanger Factory Outlet Centers, Inc. (a) | 55,397 | 997,700 |
Terreno Realty Corp. | 14,039 | 802,188 |
Uniti Group, Inc. | 53,238 | 413,127 |
Urban Edge Properties | 34,430 | 486,152 |
Whitestone | 18,155 | 170,839 |
Xenia Hotels & Resorts, Inc. | 1,708 | 29,173 |
24,206,906 | ||
Renewable Energy — 0.5% | ||
Arcosa, Inc. | 14,848 | 953,242 |
Green Plains, Inc. * | 5,453 | 157,537 |
REX American Resources Corp. * | 10,809 | 324,162 |
1,434,941 | ||
Retailers — 3.1% | ||
Abercrombie & Fitch Co., Class A * | 35,016 | 615,581 |
Academy Sports & Outdoors, Inc. | 4,069 | 179,158 |
America's Car-Mart, Inc. * | 2,246 | 153,537 |
Asbury Automotive Group, Inc. * | 1,403 | 221,323 |
Big 5 Sporting Goods Corp. (a) | 42,722 | 550,687 |
Big Lots, Inc. (a) | 9,994 | 188,587 |
Buckle, Inc. (The) | 25,315 | 995,639 |
Caleres, Inc. | 3,010 | 82,263 |
Citi Trends, Inc. * | 9,566 | 216,287 |
Dillard's, Inc., Class A (a) | 2,926 | 962,040 |
Genesco, Inc. * | 10,676 | 502,199 |
Global Industrial Co. | 1,852 | 58,783 |
Group 1 Automotive, Inc. | 4,475 | 774,175 |
Haverty Furniture Cos., Inc. (a) | 17,550 | 466,479 |
INVESTMENTS | SHARES | VALUE ($) |
Retailers — continued | ||
Hibbett, Inc. | 7,577 | 472,956 |
LL Flooring Holdings, Inc. * | 11,803 | 98,201 |
Murphy USA, Inc. | 2,985 | 938,812 |
ODP Corp. (The) * | 9,399 | 371,918 |
PriceSmart, Inc. | 1,995 | 127,620 |
Shoe Carnival, Inc. (a) | 25,106 | 602,042 |
Zumiez, Inc. * | 18,629 | 417,849 |
8,996,136 | ||
Software & Computer Services — 3.9% | ||
A10 Networks, Inc. | 14,013 | 235,418 |
Agilysys, Inc. * | 8,323 | 534,087 |
Alarm.com Holdings, Inc. * | 3,343 | 196,702 |
Allscripts Healthcare Solutions, Inc. * | 28,347 | 416,701 |
Appfolio, Inc., Class A * | 2,601 | 326,087 |
Avid Technology, Inc. * | 15,566 | 427,909 |
Cerence, Inc. * | 12,936 | 222,499 |
ChannelAdvisor Corp. * | 26,447 | 609,339 |
Consensus Cloud Solutions, Inc. * | 5,376 | 301,809 |
CSG Systems International, Inc. | 12,009 | 776,622 |
MicroStrategy, Inc., Class A * (a) | 2,214 | 592,267 |
Mitek Systems, Inc. * | 12,818 | 144,972 |
NetScout Systems, Inc. * | 18,208 | 654,031 |
OneSpan, Inc. * | 13,347 | 146,684 |
Perficient, Inc. * | 8,005 | 536,095 |
Progress Software Corp. | 15,233 | 777,340 |
Qualys, Inc. * | 5,741 | 818,437 |
Shutterstock, Inc. | 10,066 | 503,602 |
Simulations Plus, Inc. (a) | 8,927 | 370,471 |
SPS Commerce, Inc. * | 7,113 | 899,937 |
Verint Systems, Inc. * | 12,918 | 457,685 |
Workiva, Inc. * | 9,089 | 707,215 |
Ziff Davis, Inc. * | 8,519 | 659,285 |
11,315,194 | ||
Technology Hardware & Equipment — 6.7% | ||
Adeia, Inc. | 36,433 | 407,321 |
Advanced Energy Industries, Inc. | 8,915 | 701,165 |
Alpha & Omega Semiconductor Ltd. * | 15,420 | 505,005 |
Amkor Technology, Inc. | 41,004 | 852,473 |
Axcelis Technologies, Inc. * | 12,769 | 740,602 |
Benchmark Electronics, Inc. | 10,633 | 301,871 |
CEVA, Inc. * | 6,781 | 187,562 |
Cohu, Inc. * | 21,234 | 699,023 |
CTS Corp. | 11,440 | 452,109 |
194 | J.P. Morgan Exchange-Traded Funds | October 31, 2022 |
INVESTMENTS | SHARES | VALUE ($) |
Common Stocks — continued | ||
Technology Hardware & Equipment — continued | ||
Diodes, Inc. * | 10,551 | 756,190 |
Fabrinet (Thailand) * | 7,263 | 830,887 |
FormFactor, Inc. * | 23,588 | 476,713 |
Ichor Holdings Ltd. * | 9,218 | 234,506 |
Insight Enterprises, Inc. * | 9,274 | 876,486 |
Kulicke & Soffa Industries, Inc. (Singapore) (a) | 15,405 | 646,086 |
MaxLinear, Inc. * | 16,452 | 508,038 |
Methode Electronics, Inc. (a) | 13,070 | 538,876 |
Novanta, Inc. * | 5,072 | 717,181 |
Onto Innovation, Inc. * | 11,939 | 798,003 |
PC Connection, Inc. | 4,015 | 213,357 |
Photronics, Inc. * | 34,239 | 555,357 |
Plexus Corp. * | 6,811 | 670,202 |
Power Integrations, Inc. | 11,157 | 744,283 |
Rambus, Inc. * | 33,640 | 1,014,582 |
Rogers Corp. * | 1,502 | 353,466 |
Sanmina Corp. * | 8,012 | 449,073 |
ScanSource, Inc. * | 7,690 | 238,236 |
Semtech Corp. * | 12,130 | 335,880 |
SiTime Corp. * | 4,045 | 363,281 |
SMART Global Holdings, Inc. * | 18,418 | 249,195 |
Super Micro Computer, Inc. * | 2,908 | 202,368 |
Synaptics, Inc. * | 4,346 | 385,056 |
TTM Technologies, Inc. * | 36,247 | 554,941 |
Ultra Clean Holdings, Inc. * | 22,125 | 688,309 |
Vishay Intertechnology, Inc. | 32,081 | 670,814 |
Xperi, Inc. * | 14,571 | 203,557 |
19,122,054 | ||
Telecommunications Equipment — 3.1% | ||
ADTRAN Holdings, Inc. | 34,909 | 784,056 |
Aviat Networks, Inc. * | 11,496 | 375,459 |
Calix, Inc. * | 14,733 | 1,084,938 |
Cambium Networks Corp. * | 22,601 | 437,329 |
Clearfield, Inc. * | 7,354 | 893,291 |
Comtech Telecommunications Corp. | 18,487 | 204,281 |
EchoStar Corp., Class A * | 38,247 | 721,721 |
Extreme Networks, Inc. * | 60,585 | 1,086,895 |
Harmonic, Inc. * | 75,641 | 1,168,654 |
Infinera Corp. * (a) | 12,145 | 68,134 |
InterDigital, Inc. | 10,998 | 548,470 |
Lightwave Logic, Inc. * (a) | 23,485 | 198,918 |
NETGEAR, Inc. * | 14,545 | 285,809 |
INVESTMENTS | SHARES | VALUE ($) |
Telecommunications Equipment — continued | ||
Ribbon Communications, Inc. * | 1,005 | 2,663 |
Viavi Solutions, Inc. * | 60,781 | 917,793 |
8,778,411 | ||
Telecommunications Service Providers — 2.4% | ||
Anterix, Inc. * | 3,792 | 145,423 |
Cogent Communications Holdings, Inc. | 13,108 | 688,301 |
Consolidated Communications Holdings, Inc. * | 73,038 | 377,606 |
Globalstar, Inc. * (a) | 575,493 | 1,248,820 |
Gogo, Inc. * | 46,025 | 654,475 |
IDT Corp., Class B * | 24,922 | 649,467 |
Iridium Communications, Inc. * | 19,584 | 1,009,164 |
Liberty Latin America Ltd., Class C (Chile) * | 51,583 | 401,832 |
Shenandoah Telecommunications Co. | 28,008 | 634,661 |
Telephone and Data Systems, Inc. | 38,987 | 662,779 |
WideOpenWest, Inc. * | 28,180 | 386,348 |
6,858,876 | ||
Tobacco — 0.7% | ||
22nd Century Group, Inc. * (a) | 120,263 | 157,545 |
Turning Point Brands, Inc. | 21,109 | 497,328 |
Universal Corp. | 11,799 | 597,147 |
Vector Group Ltd. | 67,983 | 721,979 |
1,973,999 | ||
Travel & Leisure — 0.1% | ||
Biglari Holdings, Inc., Class B * | 165 | 22,762 |
Chuy's Holdings, Inc. * (a) | 2,509 | 73,514 |
El Pollo Loco Holdings, Inc. | 4,649 | 46,676 |
Ruth's Hospitality Group, Inc. | 3,839 | 79,774 |
222,726 | ||
Waste & Disposal Services — 0.3% | ||
Casella Waste Systems, Inc., Class A * | 9,220 | 754,288 |
Total Common Stocks (Cost $290,344,602) | 286,487,784 | |
NO. OF RIGHTS | ||
Rights—0.0% ^ | ||
Pharmaceuticals, Biotechnology & Marijuana Producers — 0.0% ^ | ||
Achillion Pharmaceuticals, Inc. ‡ *(Cost $—) | 12,757 | 6,379 |
October 31, 2022 | J.P. Morgan Exchange-Traded Funds | 195 |
AS OF October 31, 2022 (continued)
INVESTMENTS | SHARES | VALUE ($) |
Short-Term Investments — 7.9% | ||
Investment Companies — 0.1% | ||
JPMorgan U.S. Government Money Market Fund Class IM Shares, 2.85% (b) (c)(Cost $325,140) | 325,140 | 325,140 |
Investment of Cash Collateral from Securities Loaned — 7.8% | ||
JPMorgan Securities Lending Money Market Fund Class Agency SL Shares, 3.23% (b) (c) | 19,342,762 | 19,342,762 |
JPMorgan U.S. Government Money Market Fund Class IM Shares, 2.85% (b) (c) | 2,902,497 | 2,902,497 |
Total Investment of Cash Collateral from Securities Loaned (Cost $22,242,620) | 22,245,259 | |
Total Short-Term Investments (Cost $22,567,760) | 22,570,399 | |
Total Investments — 107.7% (Cost $312,912,362) | 309,064,562 | |
Liabilities in Excess of Other Assets — (7.7)% | (22,131,565) | |
NET ASSETS — 100.0% | 286,932,997 | |
Percentages indicated are based on net assets. |
Abbreviations | |
REIT | Real Estate Investment Trust |
^ | Amount rounds to less than 0.1% of net assets. | |
‡ | Value determined using significant unobservable inputs. | |
* | Non-income producing security. | |
(a) | The security or a portion of this security is on loan at October 31, 2022. The total value of securities on loan at October 31, 2022 is $21,395,218. | |
(b) | Investment in an affiliated fund, which is registered under the Investment Company Act of 1940, as amended, and is advised by J.P. Morgan Investment Management Inc. | |
(c) | The rate shown is the current yield as of October 31, 2022. | |
DESCRIPTION | NUMBER OF CONTRACTS | EXPIRATION DATE | TRADING CURRENCY | NOTIONAL AMOUNT ($) | VALUE AND UNREALIZED APPRECIATION (DEPRECIATION) ($) |
Long Contracts | |||||
Russell 2000 E-Mini Index | 3 | 12/16/2022 | USD | 277,965 | 12,769 |
Abbreviations | |
USD | United States Dollar |
196 | J.P. Morgan Exchange-Traded Funds | October 31, 2022 |
AS OF October 31, 2022
INVESTMENTS | SHARES | VALUE($) |
Common Stocks — 95.3% | ||
Australia — 1.6% | ||
IDP Education Ltd. | 12,333 | 232,684 |
Woodside Energy Group Ltd. | 27,944 | 646,023 |
878,707 | ||
Brazil — 1.0% | ||
MercadoLibre, Inc. * | 622 | 560,808 |
Canada — 6.2% | ||
Alimentation Couche-Tard, Inc. | 18,450 | 826,109 |
Canadian National Railway Co. | 13,892 | 1,645,810 |
Canadian Pacific Railway Ltd. | 12,797 | 953,986 |
3,425,905 | ||
China — 4.5% | ||
NXP Semiconductors NV | 3,407 | 497,695 |
Silergy Corp. | 43,000 | 495,863 |
Tencent Holdings Ltd. | 46,700 | 1,227,126 |
Wuxi Biologics Cayman, Inc. * (a) | 60,500 | 272,228 |
2,492,912 | ||
Denmark — 6.0% | ||
Coloplast A/S, Class B | 6,549 | 730,018 |
Genmab A/S * | 1,840 | 708,782 |
Novo Nordisk A/S, Class B | 17,168 | 1,866,699 |
3,305,499 | ||
France — 5.4% | ||
L'Oreal SA | 3,620 | 1,136,696 |
LVMH Moet Hennessy Louis Vuitton SE | 2,901 | 1,830,516 |
2,967,212 | ||
Germany — 5.4% | ||
adidas AG | 4,141 | 404,224 |
Deutsche Boerse AG | 5,410 | 879,773 |
Sartorius AG (Preference) | 1,206 | 425,224 |
Symrise AG | 9,474 | 967,036 |
Zalando SE * (a) | 13,351 | 307,716 |
2,983,973 | ||
Hong Kong — 3.7% | ||
AIA Group Ltd. | 140,000 | 1,060,471 |
Hong Kong Exchanges & Clearing Ltd. | 16,700 | 443,278 |
Techtronic Industries Co. Ltd. | 53,000 | 501,845 |
2,005,594 | ||
India — 1.3% | ||
HDFC Bank Ltd., ADR | 11,767 | 733,202 |
INVESTMENTS | SHARES | VALUE($) |
Indonesia — 2.8% | ||
Bank Central Asia Tbk. PT | 1,910,700 | 1,080,076 |
Telkom Indonesia Persero Tbk. PT, ADR | 15,668 | 435,884 |
1,515,960 | ||
Japan — 11.6% | ||
Daikin Industries Ltd. | 5,800 | 868,766 |
Hoya Corp. | 10,100 | 938,910 |
Keyence Corp. | 3,800 | 1,432,848 |
Kyowa Kirin Co. Ltd. | 31,800 | 748,944 |
Shin-Etsu Chemical Co. Ltd. | 7,700 | 800,261 |
Sony Group Corp. | 17,900 | 1,207,080 |
Sysmex Corp. | 7,400 | 398,297 |
6,395,106 | ||
Mexico — 1.4% | ||
Wal-Mart de Mexico SAB de CV | 196,986 | 760,981 |
Netherlands — 7.2% | ||
Adyen NV * (a) | 490 | 699,524 |
Argenx SE * | 1,425 | 553,257 |
ASML Holding NV | 3,715 | 1,742,659 |
Wolters Kluwer NV | 9,212 | 978,854 |
3,974,294 | ||
Singapore — 1.8% | ||
DBS Group Holdings Ltd. | 35,400 | 855,842 |
Sea Ltd., ADR * | 2,317 | 115,108 |
970,950 | ||
South Africa — 1.0% | ||
Anglo American plc | 18,663 | 559,036 |
South Korea — 0.6% | ||
Delivery Hero SE * (a) | 8,988 | 295,785 |
Sweden — 3.5% | ||
Assa Abloy AB, Class B | 32,602 | 658,302 |
Atlas Copco AB, Class A | 84,000 | 896,553 |
Epiroc AB, Class A | 24,123 | 369,286 |
1,924,141 | ||
Switzerland — 2.1% | ||
Lonza Group AG (Registered) | 1,429 | 735,627 |
Straumann Holding AG (Registered) | 4,617 | 439,406 |
1,175,033 | ||
Taiwan — 3.9% | ||
Taiwan Semiconductor Manufacturing Co. Ltd., ADR | 34,829 | 2,143,725 |
October 31, 2022 | J.P. Morgan Exchange-Traded Funds | 197 |
AS OF October 31, 2022 (continued)
INVESTMENTS | SHARES | VALUE($) |
Common Stocks — continued | ||
United Kingdom — 13.1% | ||
AstraZeneca plc | 9,588 | 1,124,981 |
Diageo plc | 38,716 | 1,593,261 |
Intertek Group plc | 15,766 | 660,485 |
Linde plc (b) | 3,523 | 1,051,895 |
London Stock Exchange Group plc | 10,353 | 897,419 |
Oxford Nanopore Technologies plc * | 54,429 | 163,957 |
RELX plc | 56,812 | 1,527,177 |
Spirax-Sarco Engineering plc | 1,613 | 198,776 |
7,217,951 | ||
United States — 11.2% | ||
Cadence Design Systems, Inc. * | 4,781 | 723,795 |
EPAM Systems, Inc. * | 1,096 | 383,600 |
Nestle SA (Registered) | 25,716 | 2,799,413 |
Roche Holding AG | 6,546 | 2,171,951 |
Unity Software, Inc. * | 1,576 | 46,492 |
6,125,251 | ||
Total Common Stocks (Cost $61,114,176) | 52,412,025 | |
Short-Term Investments — 5.9% | ||
Investment Companies — 4.5% | ||
JPMorgan U.S. Government Money Market Fund Class IM Shares, 2.85% (c) (d)(Cost $2,455,095) | 2,455,095 | 2,455,095 |
Investment of Cash Collateral from Securities Loaned — 1.4% | ||
JPMorgan U.S. Government Money Market Fund Class IM Shares, 2.85% (c) (d)(Cost $749,113) | 749,113 | 749,113 |
Total Short-Term Investments (Cost $3,204,208) | 3,204,208 | |
Total Investments — 101.2% (Cost $64,318,384) | 55,616,233 | |
Liabilities in Excess of Other Assets — (1.2)% | (634,128) | |
NET ASSETS — 100.0% | 54,982,105 | |
Percentages indicated are based on net assets. |
Abbreviations | |
ADR | American Depositary Receipt |
Preference | A special type of equity investment that shares in the earnings of the company, has limited voting rights, and may have a dividend preference. Preference shares may also have liquidation preference. |
PT | Limited liability company |
* | Non-income producing security. |
(a) | Security exempt from registration pursuant to Regulation S under the Securities Act of 1933, as amended. Regulation S applies to securities offerings that are made outside of the United States and do not involve direct selling efforts in the United States and as such may have restrictions on resale. |
(b) | The security or a portion of this security is on loan at October 31, 2022. The total value of securities on loan at October 31, 2022 is $704,050. |
(c) | Investment in an affiliated fund, which is registered under the Investment Company Act of 1940, as amended, and is advised by J.P. Morgan Investment Management Inc. |
(d) | The rate shown is the current yield as of October 31, 2022. |
198 | J.P. Morgan Exchange-Traded Funds | October 31, 2022 |
INDUSTRY | PERCENT OF TOTAL INVESTMENTS |
Pharmaceuticals | 10.6% |
Semiconductors & Semiconductor Equipment | 8.8 |
Professional Services | 5.7 |
Chemicals | 5.1 |
Food Products | 5.0 |
Banks | 4.8 |
Road & Rail | 4.7 |
Health Care Equipment & Supplies | 4.5 |
Textiles, Apparel & Luxury Goods | 4.0 |
Capital Markets | 4.0 |
Machinery | 3.5 |
Life Sciences Tools & Services | 2.9 |
Beverages | 2.9 |
Food & Staples Retailing | 2.8 |
Building Products | 2.7 |
Electronic Equipment, Instruments & Components | 2.6 |
Biotechnology | 2.3 |
Interactive Media & Services | 2.2 |
Household Durables | 2.2 |
Internet & Direct Marketing Retail | 2.1 |
Personal Products | 2.0 |
IT Services | 1.9 |
Insurance | 1.9 |
Software | 1.4 |
Oil, Gas & Consumable Fuels | 1.2 |
Metals & Mining | 1.0 |
Others (each less than 1.0%) | 1.4 |
Short-Term Investments | 5.8 |
October 31, 2022 | J.P. Morgan Exchange-Traded Funds | 199 |
AS OF October 31, 2022
INVESTMENTS | SHARES | VALUE ($) |
Common Stocks — 99.8% | ||
Aerospace & Defense — 3.0% | ||
Curtiss-Wright Corp. | 891 | 149,537 |
General Dynamics Corp. | 4,819 | 1,203,786 |
HEICO Corp. | 1,680 | 273,235 |
Howmet Aerospace, Inc. | 10,449 | 371,462 |
Lockheed Martin Corp. | 3,793 | 1,845,977 |
Northrop Grumman Corp. | 2,631 | 1,444,445 |
Raytheon Technologies Corp. | 10,770 | 1,021,212 |
Textron, Inc. | 7,063 | 483,392 |
6,793,046 | ||
Automobiles & Parts — 2.6% | ||
Ford Motor Co. | 75,451 | 1,008,780 |
Gentex Corp. | 9,280 | 245,827 |
Genuine Parts Co. | 4,538 | 807,129 |
Tesla, Inc. * | 17,025 | 3,873,868 |
5,935,604 | ||
Banks — 1.4% | ||
Bank OZK | 4,808 | 206,648 |
Discover Financial Services | 3,525 | 368,222 |
East West Bancorp, Inc. | 6,097 | 436,362 |
First Horizon Corp. | 13,363 | 327,527 |
M&T Bank Corp. | 4,554 | 766,757 |
Pinnacle Financial Partners, Inc. | 2,673 | 221,832 |
Popular, Inc. (Puerto Rico) | 3,524 | 249,217 |
Regions Financial Corp. | 27,992 | 614,425 |
3,190,990 | ||
Beverages — 0.2% | ||
Constellation Brands, Inc., Class A | 2,135 | 527,516 |
Chemicals — 1.6% | ||
Albemarle Corp. | 3,121 | 873,474 |
Ashland, Inc. | 1,498 | 157,170 |
CF Industries Holdings, Inc. | 6,507 | 691,434 |
Element Solutions, Inc. | 1,414 | 24,321 |
Huntsman Corp. | 11,921 | 319,006 |
Mosaic Co. (The) | 12,205 | 656,019 |
Olin Corp. | 8,089 | 428,312 |
Westlake Corp. | 4,186 | 404,577 |
3,554,313 | ||
Construction & Materials — 1.7% | ||
Acuity Brands, Inc. | 1,665 | 305,644 |
Advanced Drainage Systems, Inc. | 2,915 | 337,790 |
AECOM | 7,848 | 590,797 |
Builders FirstSource, Inc. * | 9,445 | 582,379 |
INVESTMENTS | SHARES | VALUE ($) |
Construction & Materials — continued | ||
Eagle Materials, Inc. | 3,921 | 479,578 |
Louisiana-Pacific Corp. | 8,114 | 459,658 |
Masco Corp. | 1,096 | 50,712 |
Quanta Services, Inc. | 4,845 | 688,184 |
Watsco, Inc. | 1,239 | 335,719 |
3,830,461 | ||
Consumer Services — 1.0% | ||
AMERCO | 261 | 150,125 |
Avis Budget Group, Inc. * | 3,155 | 746,031 |
Copart, Inc. * | 6,394 | 735,438 |
H&R Block, Inc. | 12,055 | 496,063 |
Rollins, Inc. | 1,413 | 59,459 |
2,187,116 | ||
Electricity — 1.4% | ||
Consolidated Edison, Inc. | 8,766 | 771,057 |
Exelon Corp. | 21,839 | 842,767 |
FirstEnergy Corp. | 9,152 | 345,122 |
OGE Energy Corp. | 6,782 | 248,425 |
Southern Co. (The) | 7,312 | 478,790 |
Vistra Corp. | 22,590 | 518,892 |
3,205,053 | ||
Electronic & Electrical Equipment — 0.8% | ||
Keysight Technologies, Inc. * | 4,886 | 850,897 |
Mettler-Toledo International, Inc. * | 631 | 798,171 |
nVent Electric plc | 4,545 | 165,892 |
1,814,960 | ||
Finance & Credit Services — 0.3% | ||
Morningstar, Inc. | 901 | 209,194 |
MSCI, Inc. | 27 | 12,659 |
SLM Corp. | 28,709 | 476,283 |
698,136 | ||
Food Producers — 2.9% | ||
Archer-Daniels-Midland Co. | 11,605 | 1,125,453 |
Bunge Ltd. | 6,189 | 610,854 |
Campbell Soup Co. | 9,171 | 485,238 |
Corteva, Inc. | 15,798 | 1,032,241 |
Darling Ingredients, Inc. * | 7,899 | 619,913 |
General Mills, Inc. | 12,805 | 1,044,632 |
Hershey Co. (The) | 3,731 | 890,851 |
Kellogg Co. | 9,119 | 700,522 |
Pilgrim's Pride Corp. * | 5,491 | 126,568 |
6,636,272 | ||
200 | J.P. Morgan Exchange-Traded Funds | October 31, 2022 |
INVESTMENTS | SHARES | VALUE ($) |
Common Stocks — continued | ||
Gas, Water & Multi-utilities — 0.9% | ||
CenterPoint Energy, Inc. | 21,454 | 613,799 |
National Fuel Gas Co. | 7,460 | 503,475 |
NiSource, Inc. | 19,604 | 503,627 |
Sempra Energy | 2,095 | 316,219 |
WEC Energy Group, Inc. | 677 | 61,831 |
1,998,951 | ||
General Industrials — 0.9% | ||
Carlisle Cos., Inc. | 2,123 | 506,972 |
Crown Holdings, Inc. | 5,372 | 368,465 |
Graphic Packaging Holding Co. | 19,009 | 436,447 |
RPM International, Inc. | 3,229 | 305,366 |
Sealed Air Corp. | 6,088 | 289,911 |
Valmont Industries, Inc. | 626 | 199,832 |
2,106,993 | ||
Health Care Providers — 3.0% | ||
Acadia Healthcare Co., Inc. * | 1,810 | 147,153 |
Cigna Corp. | 2,115 | 683,272 |
HCA Healthcare, Inc. | 1,809 | 393,403 |
Humana, Inc. | 1,205 | 672,486 |
IQVIA Holdings, Inc. * | 4,339 | 909,758 |
UnitedHealth Group, Inc. | 7,357 | 4,084,239 |
6,890,311 | ||
Household Goods & Home Construction — 0.3% | ||
DR Horton, Inc. | 3,770 | 289,838 |
PulteGroup, Inc. | 12,086 | 483,319 |
Tempur Sealy International, Inc. | 260 | 6,991 |
780,148 | ||
Industrial Engineering — 0.7% | ||
Deere & Co. | 4,162 | 1,647,403 |
Industrial Metals & Mining — 0.4% | ||
Fastenal Co. | 1,757 | 84,916 |
Nucor Corp. | 6,528 | 857,648 |
942,564 | ||
Industrial Support Services — 3.6% | ||
Accenture plc, Class A | 8,809 | 2,500,875 |
American Express Co. | 5,302 | 787,082 |
Automatic Data Processing, Inc. | 1,480 | 357,716 |
Bill.com Holdings, Inc. * | 3,600 | 480,096 |
Cintas Corp. | 2,085 | 891,442 |
FTI Consulting, Inc. * | 1,642 | 255,545 |
Jack Henry & Associates, Inc. | 3,206 | 638,186 |
Paychex, Inc. | 7,453 | 881,764 |
INVESTMENTS | SHARES | VALUE ($) |
Industrial Support Services — continued | ||
Paylocity Holding Corp. * | 2,384 | 552,587 |
Robert Half International, Inc. | 894 | 68,355 |
WW Grainger, Inc. | 1,356 | 792,379 |
8,206,027 | ||
Industrial Transportation — 2.3% | ||
CH Robinson Worldwide, Inc. | 5,328 | 520,652 |
JB Hunt Transport Services, Inc. | 3,539 | 605,417 |
Norfolk Southern Corp. | 3,980 | 907,719 |
Old Dominion Freight Line, Inc. | 2,675 | 734,555 |
Ryder System, Inc. | 3,678 | 296,116 |
United Parcel Service, Inc., Class B | 10,190 | 1,709,576 |
WillScot Mobile Mini Holdings Corp. * | 11,752 | 499,812 |
5,273,847 | ||
Investment Banking & Brokerage Services — 5.1% | ||
Ameriprise Financial, Inc. | 2,531 | 782,383 |
Ares Management Corp. | 7,978 | 604,972 |
Berkshire Hathaway, Inc., Class B * | 11,403 | 3,364,911 |
Blackstone, Inc. | 12,094 | 1,102,247 |
Charles Schwab Corp. (The) | 20,543 | 1,636,661 |
Jefferies Financial Group, Inc. | 16,779 | 577,365 |
KKR & Co., Inc. | 15,797 | 768,208 |
LPL Financial Holdings, Inc. | 3,026 | 773,597 |
Morgan Stanley | 19,524 | 1,604,287 |
Nasdaq, Inc. | 7,560 | 470,535 |
11,685,166 | ||
Leisure Goods — 0.1% | ||
Mattel, Inc. * | 15,022 | 284,817 |
Life Insurance — 0.2% | ||
Unum Group | 8,519 | 388,381 |
Media — 1.0% | ||
Interpublic Group of Cos., Inc. (The) | 20,449 | 609,176 |
Liberty Media Corp.-Liberty Formula One, Class C * | 9,409 | 543,182 |
Nexstar Media Group, Inc., Class A | 1,658 | 284,015 |
Trade Desk, Inc. (The), Class A * | 12,008 | 639,306 |
World Wrestling Entertainment, Inc., Class A (a) | 2,781 | 219,393 |
2,295,072 | ||
Medical Equipment & Services — 4.2% | ||
Agilent Technologies, Inc. | 6,483 | 896,923 |
Bio-Rad Laboratories, Inc., Class A * | 327 | 115,009 |
Bio-Techne Corp. | 526 | 155,833 |
Danaher Corp. | 9,025 | 2,271,322 |
October 31, 2022 | J.P. Morgan Exchange-Traded Funds | 201 |
AS OF October 31, 2022 (continued)
INVESTMENTS | SHARES | VALUE ($) |
Common Stocks — continued | ||
Medical Equipment & Services — continued | ||
Dexcom, Inc. * | 7,510 | 907,058 |
Insulet Corp. * | 2,425 | 627,614 |
Quest Diagnostics, Inc. | 4,360 | 626,314 |
Repligen Corp. * | 2,791 | 509,330 |
ResMed, Inc. | 3,181 | 711,558 |
STERIS plc | 826 | 142,551 |
Thermo Fisher Scientific, Inc. | 5,261 | 2,703,996 |
West Pharmaceutical Services, Inc. | 324 | 74,552 |
9,742,060 | ||
Non-life Insurance — 4.1% | ||
American Financial Group, Inc. | 4,101 | 595,096 |
Aon plc, Class A | 4,050 | 1,140,034 |
Arch Capital Group Ltd. * | 12,373 | 711,448 |
Arthur J Gallagher & Co. | 4,936 | 923,427 |
Assured Guaranty Ltd. | 2,269 | 134,302 |
Brown & Brown, Inc. | 9,920 | 583,197 |
Chubb Ltd. | 6,903 | 1,483,386 |
Marsh & McLennan Cos., Inc. | 8,565 | 1,383,162 |
Old Republic International Corp. | 10,825 | 251,248 |
Progressive Corp. (The) | 10,400 | 1,335,360 |
Ryan Specialty Holdings, Inc., Class A * | 5,892 | 264,256 |
WR Berkley Corp. | 9,363 | 696,420 |
9,501,336 | ||
Non-Renewable Energy — 5.4% | ||
Antero Midstream Corp. | 7,708 | 82,090 |
Antero Resources Corp. * | 14,802 | 542,641 |
Cheniere Energy, Inc. | 5,679 | 1,001,832 |
Chevron Corp. | 12,697 | 2,296,887 |
ConocoPhillips | 17,455 | 2,200,901 |
Continental Resources, Inc. | 6,823 | 504,697 |
Coterra Energy, Inc. | 4,836 | 150,545 |
Devon Energy Corp. | 14,056 | 1,087,232 |
Diamondback Energy, Inc. | 1,523 | 239,279 |
Hess Corp. | 5,647 | 796,679 |
Marathon Oil Corp. | 21,525 | 655,436 |
Occidental Petroleum Corp. | 16,016 | 1,162,762 |
Pioneer Natural Resources Co. | 3,929 | 1,007,435 |
Targa Resources Corp. | 8,530 | 583,196 |
12,311,612 | ||
Personal Care, Drug & Grocery Stores — 2.8% | ||
AmerisourceBergen Corp. | 4,822 | 758,115 |
Casey's General Stores, Inc. | 707 | 164,526 |
Church & Dwight Co., Inc. | 1,333 | 98,815 |
INVESTMENTS | SHARES | VALUE ($) |
Personal Care, Drug & Grocery Stores — continued | ||
CVS Health Corp. | 14,231 | 1,347,676 |
Grocery Outlet Holding Corp. * | 7,058 | 243,995 |
Kroger Co. (The) | 14,178 | 670,478 |
McKesson Corp. | 2,920 | 1,136,960 |
Procter & Gamble Co. (The) | 12,912 | 1,738,859 |
Spectrum Brands Holdings, Inc. | 3,894 | 179,669 |
6,339,093 | ||
Personal Goods — 1.1% | ||
Capri Holdings Ltd. * | 10,213 | 466,530 |
Deckers Outdoor Corp. * | 1,732 | 606,079 |
Estee Lauder Cos., Inc. (The), Class A | 4,261 | 854,288 |
Tapestry, Inc. | 16,054 | 508,590 |
2,435,487 | ||
Pharmaceuticals, Biotechnology & Marijuana Producers — 6.7% | ||
AbbVie, Inc. | 22,648 | 3,315,667 |
Alnylam Pharmaceuticals, Inc. * | 3,638 | 754,012 |
Cardinal Health, Inc. | 9,495 | 720,671 |
Catalent, Inc. * | 5,475 | 359,872 |
Eli Lilly & Co. | 10,956 | 3,967,058 |
Moderna, Inc. * | 6,715 | 1,009,466 |
Pfizer, Inc. | 56,191 | 2,615,691 |
Seagen, Inc. * | 4,070 | 517,541 |
United Therapeutics Corp. * | 2,563 | 590,848 |
Vertex Pharmaceuticals, Inc. * | 4,543 | 1,417,416 |
15,268,242 | ||
Real Estate Investment & Services — 0.3% | ||
CBRE Group, Inc., Class A * | 9,686 | 687,125 |
Jones Lang LaSalle, Inc. * | 707 | 112,477 |
799,602 | ||
Real Estate Investment Trusts — 2.7% | ||
Camden Property Trust | 2,789 | 322,269 |
Crown Castle, Inc. | 3,379 | 450,285 |
CubeSmart | 8,655 | 362,385 |
Extra Space Storage, Inc. | 3,775 | 669,836 |
Gaming and Leisure Properties, Inc. | 6,618 | 331,694 |
Invitation Homes, Inc. | 15,194 | 481,498 |
Iron Mountain, Inc. | 11,997 | 600,690 |
Life Storage, Inc. | 4,523 | 500,289 |
Prologis, Inc. | 12,231 | 1,354,583 |
Weyerhaeuser Co. | 21,111 | 652,963 |
WP Carey, Inc. | 7,186 | 548,292 |
6,274,784 | ||
202 | J.P. Morgan Exchange-Traded Funds | October 31, 2022 |
INVESTMENTS | SHARES | VALUE ($) |
Common Stocks — continued | ||
Retailers — 6.9% | ||
AutoNation, Inc. * | 4,212 | 447,778 |
AutoZone, Inc. * | 441 | 1,117,000 |
BJ's Wholesale Club Holdings, Inc. * | 7,726 | 597,992 |
Costco Wholesale Corp. | 5,913 | 2,965,369 |
Dick's Sporting Goods, Inc. | 4,828 | 549,233 |
Dollar Tree, Inc. * | 5,815 | 921,677 |
GameStop Corp., Class A * (a) | 16,608 | 470,172 |
Home Depot, Inc. (The) | 12,721 | 3,767,070 |
Kohl's Corp. | 8,009 | 239,870 |
Lowe's Cos., Inc. | 4,494 | 876,105 |
O'Reilly Automotive, Inc. * | 1,369 | 1,146,086 |
Penske Automotive Group, Inc. | 3,753 | 418,910 |
TJX Cos., Inc. (The) | 19,657 | 1,417,270 |
Tractor Supply Co. | 1,814 | 398,663 |
Williams-Sonoma, Inc. | 3,790 | 469,316 |
15,802,511 | ||
Software & Computer Services — 12.7% | ||
Alphabet, Inc., Class A * | 37,398 | 3,534,485 |
Amdocs Ltd. | 6,809 | 587,685 |
Atlassian Corp., Class A * | 3,411 | 691,512 |
CACI International, Inc., Class A * | 1,920 | 583,738 |
Cadence Design Systems, Inc. * | 5,859 | 886,994 |
Cloudflare, Inc., Class A * | 8,844 | 498,094 |
Crowdstrike Holdings, Inc., Class A * | 4,513 | 727,496 |
Datadog, Inc., Class A * | 6,449 | 519,209 |
Dell Technologies, Inc., Class C | 12,212 | 468,941 |
DXC Technology Co. * | 12,276 | 352,935 |
F5, Inc. * | 2,191 | 313,116 |
Fortinet, Inc. * | 15,311 | 875,177 |
Gartner, Inc. * | 2,484 | 749,969 |
GoDaddy, Inc., Class A * | 5,277 | 424,271 |
HubSpot, Inc. * | 1,512 | 448,399 |
International Business Machines Corp. | 13,797 | 1,907,987 |
Intuit, Inc. | 4,218 | 1,803,195 |
KBR, Inc. | 11,157 | 555,284 |
Leidos Holdings, Inc. | 3,355 | 340,834 |
Manhattan Associates, Inc. * | 4,043 | 491,912 |
Microsoft Corp. | 17,967 | 4,170,680 |
MongoDB, Inc. * | 2,125 | 388,939 |
NCR Corp. * | 7,382 | 156,941 |
NortonLifeLock, Inc. | 23,698 | 533,916 |
Oracle Corp. | 23,320 | 1,820,592 |
Palo Alto Networks, Inc. * | 5,921 | 1,015,984 |
Paycom Software, Inc. * | 1,573 | 544,258 |
INVESTMENTS | SHARES | VALUE ($) |
Software & Computer Services — continued | ||
Roper Technologies, Inc. | 1,196 | 495,790 |
Science Applications International Corp. | 1,715 | 185,803 |
ServiceNow, Inc. * | 2,998 | 1,261,378 |
Synopsys, Inc. * | 3,137 | 917,729 |
Tyler Technologies, Inc. * | 1,623 | 524,765 |
Zscaler, Inc. * | 2,922 | 450,280 |
29,228,288 | ||
Technology Hardware & Equipment — 12.2% | ||
Advanced Micro Devices, Inc. * | 24,045 | 1,444,143 |
Apple, Inc. | 29,524 | 4,527,210 |
Applied Materials, Inc. | 14,797 | 1,306,427 |
Avnet, Inc. | 11,042 | 443,778 |
Broadcom, Inc. | 5,413 | 2,544,760 |
CDW Corp. | 4,289 | 741,182 |
Cirrus Logic, Inc. * | 1,496 | 100,412 |
Concentrix Corp. | 1,187 | 145,087 |
Corning, Inc. | 22,217 | 714,721 |
Entegris, Inc. | 6,086 | 482,863 |
GLOBALFOUNDRIES, Inc. * (a) | 8,602 | 487,733 |
HP, Inc. | 28,600 | 789,932 |
Jabil, Inc. | 9,404 | 604,207 |
KLA Corp. | 3,002 | 949,983 |
Lam Research Corp. | 2,565 | 1,038,261 |
Marvell Technology, Inc. | 18,489 | 733,644 |
Monolithic Power Systems, Inc. | 1,604 | 544,478 |
NetApp, Inc. | 8,885 | 615,464 |
NVIDIA Corp. | 25,785 | 3,480,200 |
ON Semiconductor Corp. * | 11,835 | 727,024 |
Pure Storage, Inc., Class A * | 18,820 | 580,785 |
QUALCOMM, Inc. | 10,529 | 1,238,842 |
Switch, Inc., Class A | 15,110 | 514,495 |
TD SYNNEX Corp. | 2,236 | 204,616 |
Teradyne, Inc. | 6,414 | 521,779 |
Texas Instruments, Inc. | 13,252 | 2,128,669 |
Wolfspeed, Inc. * | 5,492 | 432,495 |
28,043,190 | ||
Telecommunications Equipment — 2.0% | ||
Arista Networks, Inc. * | 6,767 | 817,860 |
Cisco Systems, Inc. | 40,205 | 1,826,513 |
Juniper Networks, Inc. | 19,696 | 602,698 |
Lumentum Holdings, Inc. * | 6,485 | 482,808 |
Motorola Solutions, Inc. | 3,775 | 942,655 |
4,672,534 | ||
October 31, 2022 | J.P. Morgan Exchange-Traded Funds | 203 |
AS OF October 31, 2022 (continued)
INVESTMENTS | SHARES | VALUE ($) |
Common Stocks — continued | ||
Telecommunications Service Providers — 0.6% | ||
AT&T, Inc. | 60,370 | 1,100,545 |
T-Mobile US, Inc. * | 1,141 | 172,930 |
1,273,475 | ||
Travel & Leisure — 1.9% | ||
Boyd Gaming Corp. | 8,636 | 498,815 |
Chipotle Mexican Grill, Inc. * | 604 | 904,991 |
Choice Hotels International, Inc. | 2,228 | 289,284 |
Hilton Worldwide Holdings, Inc. | 6,482 | 876,755 |
Hyatt Hotels Corp., Class A * | 3,956 | 372,695 |
McDonald's Corp. | 4,996 | 1,362,210 |
4,304,750 | ||
Waste & Disposal Services — 0.8% | ||
Republic Services, Inc. | 5,606 | 743,468 |
Waste Management, Inc. | 7,453 | 1,180,331 |
1,923,799 | ||
Total Common Stocks (Cost $241,340,048) | 228,793,910 | |
Short-Term Investments — 0.6% | ||
Investment Companies — 0.1% | ||
JPMorgan U.S. Government Money Market Fund Class IM Shares, 2.85% (b) (c)(Cost $340,337) | 340,337 | 340,337 |
INVESTMENTS | SHARES | VALUE ($) |
Investment of Cash Collateral from Securities Loaned — 0.5% | ||
JPMorgan U.S. Government Money Market Fund Class IM Shares, 2.85% (b) (c)(Cost $1,131,417) | 1,131,417 | 1,131,417 |
Total Short-Term Investments (Cost $1,471,754) | 1,471,754 | |
Total Investments — 100.4% (Cost $242,811,802) | 230,265,664 | |
Liabilities in Excess of Other Assets — (0.4)% | (942,546) | |
NET ASSETS — 100.0% | 229,323,118 | |
Percentages indicated are based on net assets. |
* | Non-income producing security. |
(a) | The security or a portion of this security is on loan at October 31, 2022. The total value of securities on loan at October 31, 2022 is $1,103,874. |
(b) | Investment in an affiliated fund, which is registered under the Investment Company Act of 1940, as amended, and is advised by J.P. Morgan Investment Management Inc. |
(c) | The rate shown is the current yield as of October 31, 2022. |
DESCRIPTION | NUMBER OF CONTRACTS | EXPIRATION DATE | TRADING CURRENCY | NOTIONAL AMOUNT ($) | VALUE AND UNREALIZED APPRECIATION (DEPRECIATION) ($) |
Long Contracts | |||||
Micro E-Mini S&P 500 Index | 19 | 12/16/2022 | USD | 368,861 | 27,027 |
Abbreviations | |
USD | United States Dollar |
204 | J.P. Morgan Exchange-Traded Funds | October 31, 2022 |
AS OF October 31, 2022
INVESTMENTS | SHARES | VALUE ($) |
Common Stocks — 99.8% | ||
Aerospace & Defense — 0.7% | ||
Lockheed Martin Corp. | 8,888 | 4,325,612 |
Automobiles & Parts — 0.6% | ||
Gentex Corp. | 46,371 | 1,228,368 |
Genuine Parts Co. | 11,226 | 1,996,656 |
3,225,024 | ||
Banks — 0.5% | ||
Bank of Hawaii Corp. | 9,010 | 684,309 |
Commerce Bancshares, Inc. | 19,895 | 1,409,362 |
US Bancorp | 14,084 | 597,866 |
2,691,537 | ||
Beverages — 0.5% | ||
Brown-Forman Corp., Class B | 21,166 | 1,439,288 |
Coca-Cola Co. (The) | 22,274 | 1,333,099 |
2,772,387 | ||
Chemicals — 1.1% | ||
Celanese Corp. | 10,812 | 1,039,250 |
CF Industries Holdings, Inc. | 16,377 | 1,740,220 |
Linde plc | 11,394 | 3,388,006 |
NewMarket Corp. | 39 | 11,869 |
6,179,345 | ||
Construction & Materials — 0.5% | ||
A O Smith Corp. | 13,628 | 746,542 |
Acuity Brands, Inc. | 2,750 | 504,818 |
Louisiana-Pacific Corp. | 7,600 | 430,540 |
Watsco, Inc. (a) | 4,488 | 1,216,068 |
2,897,968 | ||
Consumer Services — 1.1% | ||
Copart, Inc. * | 15,897 | 1,828,473 |
Grand Canyon Education, Inc. * | 14,162 | 1,425,122 |
H&R Block, Inc. | 30,329 | 1,248,038 |
Rollins, Inc. | 40,582 | 1,707,691 |
6,209,324 | ||
Electricity — 1.6% | ||
CMS Energy Corp. | 16,760 | 956,158 |
Evergy, Inc. | 9,200 | 562,396 |
Hawaiian Electric Industries, Inc. | 16,336 | 621,421 |
IDACORP, Inc. | 8,794 | 920,732 |
NextEra Energy, Inc. | 56,623 | 4,388,283 |
NRG Energy, Inc. | 34,363 | 1,525,717 |
8,974,707 | ||
INVESTMENTS | SHARES | VALUE ($) |
Electronic & Electrical Equipment — 1.6% | ||
Allegion plc | 9,828 | 1,029,679 |
Donaldson Co., Inc. | 18,578 | 1,067,306 |
IDEX Corp. | 7,523 | 1,672,438 |
Keysight Technologies, Inc. * | 12,019 | 2,093,109 |
Mettler-Toledo International, Inc. * | 1,518 | 1,920,164 |
Waters Corp. * | 4,394 | 1,314,553 |
9,097,249 | ||
Finance & Credit Services — 1.3% | ||
FactSet Research Systems, Inc. | 3,744 | 1,593,035 |
Moody's Corp. | 8,107 | 2,147,301 |
Morningstar, Inc. | 2,408 | 559,089 |
S&P Global, Inc. | 10,943 | 3,515,439 |
7,814,864 | ||
Food Producers — 0.4% | ||
Flowers Foods, Inc. | 863 | 24,777 |
General Mills, Inc. | 6,893 | 562,331 |
Hershey Co. (The) | 7,645 | 1,825,396 |
2,412,504 | ||
Gas, Water & Multi-utilities — 0.6% | ||
National Fuel Gas Co. | 18,761 | 1,266,180 |
UGI Corp. | 14,493 | 512,038 |
WEC Energy Group, Inc. | 20,058 | 1,831,897 |
3,610,115 | ||
General Industrials — 1.1% | ||
3M Co. | 22,979 | 2,890,528 |
Honeywell International, Inc. | 2,784 | 567,992 |
Illinois Tool Works, Inc. | 14,157 | 3,022,944 |
6,481,464 | ||
Health Care Providers — 0.4% | ||
Chemed Corp. | 2,853 | 1,331,980 |
DaVita, Inc. * | 10,956 | 799,898 |
Premier, Inc., Class A | 8,800 | 306,944 |
2,438,822 | ||
Household Goods & Home Construction — 0.3% | ||
NVR, Inc. * | 351 | 1,487,450 |
Industrial Engineering — 0.9% | ||
Cummins, Inc. | 8,120 | 1,985,421 |
Graco, Inc. | 20,882 | 1,452,970 |
Lincoln Electric Holdings, Inc. | 9,674 | 1,373,708 |
Toro Co. (The) | 1,831 | 193,042 |
5,005,141 | ||
October 31, 2022 | J.P. Morgan Exchange-Traded Funds | 205 |
AS OF October 31, 2022 (continued)
INVESTMENTS | SHARES | VALUE ($) |
Common Stocks — continued | ||
Industrial Metals & Mining — 0.7% | ||
Fastenal Co. | 8,764 | 423,564 |
Freeport-McMoRan, Inc. | 73,701 | 2,335,585 |
Southern Copper Corp. (Peru) | 22,187 | 1,042,123 |
3,801,272 | ||
Industrial Support Services — 7.1% | ||
Accenture plc, Class A | 21,405 | 6,076,879 |
Automatic Data Processing, Inc. | 16,746 | 4,047,508 |
Cintas Corp. | 5,283 | 2,258,747 |
Jack Henry & Associates, Inc. (a) | 6,919 | 1,377,296 |
Mastercard, Inc., Class A | 28,032 | 9,199,542 |
Paychex, Inc. | 18,625 | 2,203,524 |
Robert Half International, Inc. | 12,788 | 977,770 |
Verisk Analytics, Inc. | 9,650 | 1,764,310 |
Visa, Inc., Class A (a) | 52,578 | 10,892,058 |
Western Union Co. (The) | 47,329 | 639,415 |
WW Grainger, Inc. | 3,362 | 1,964,585 |
41,401,634 | ||
Industrial Transportation — 1.1% | ||
Allison Transmission Holdings, Inc. | 18,831 | 795,610 |
Landstar System, Inc. | 5,331 | 832,809 |
Union Pacific Corp. | 21,590 | 4,256,252 |
United Parcel Service, Inc., Class B | 2,444 | 410,030 |
6,294,701 | ||
Investment Banking & Brokerage Services — 3.9% | ||
Berkshire Hathaway, Inc., Class B * | 36,638 | 10,811,507 |
BlackRock, Inc. | 5,133 | 3,315,456 |
Broadridge Financial Solutions, Inc. | 10,204 | 1,531,212 |
Intercontinental Exchange, Inc. | 17,731 | 1,694,552 |
MarketAxess Holdings, Inc. | 2,207 | 538,596 |
Nasdaq, Inc. | 28,716 | 1,787,284 |
SEI Investments Co. | 18,085 | 982,015 |
T. Rowe Price Group, Inc. | 12,285 | 1,304,176 |
Virtu Financial, Inc., Class A | 28,444 | 636,577 |
22,601,375 | ||
Leisure Goods — 0.8% | ||
Activision Blizzard, Inc. | 36,136 | 2,630,701 |
Electronic Arts, Inc. (a) | 16,234 | 2,044,835 |
4,675,536 | ||
Life Insurance — 0.7% | ||
Aflac, Inc. | 37,052 | 2,412,455 |
Globe Life, Inc. | 12,286 | 1,419,279 |
3,831,734 | ||
INVESTMENTS | SHARES | VALUE ($) |
Media — 1.0% | ||
Interpublic Group of Cos., Inc. (The) | 50,945 | 1,517,652 |
Omnicom Group, Inc. | 22,571 | 1,642,040 |
Sirius XM Holdings, Inc. (a) | 209,010 | 1,262,420 |
World Wrestling Entertainment, Inc., Class A | 17,528 | 1,382,784 |
5,804,896 | ||
Medical Equipment & Services — 1.7% | ||
Abbott Laboratories | 29,401 | 2,908,935 |
Bio-Techne Corp. | 3,976 | 1,177,930 |
Edwards Lifesciences Corp. * | 29,243 | 2,118,071 |
Hologic, Inc. * | 19,365 | 1,312,947 |
IDEXX Laboratories, Inc. * | 4,737 | 1,703,804 |
QuidelOrtho Corp. * | 6,787 | 609,608 |
ResMed, Inc. | 67 | 14,987 |
9,846,282 | ||
Non-life Insurance — 4.4% | ||
Allstate Corp. (The) | 16,914 | 2,135,393 |
Aon plc, Class A | 10,092 | 2,840,797 |
Arch Capital Group Ltd. * | 29,829 | 1,715,168 |
Arthur J Gallagher & Co. | 12,252 | 2,292,104 |
Brown & Brown, Inc. | 24,947 | 1,466,634 |
Chubb Ltd. | 12,362 | 2,656,470 |
Erie Indemnity Co., Class A | 4,840 | 1,243,928 |
Fidelity National Financial, Inc. | 22,712 | 894,399 |
Hanover Insurance Group, Inc. (The) | 2,726 | 399,332 |
Marsh & McLennan Cos., Inc. | 21,517 | 3,474,780 |
Progressive Corp. (The) | 20,998 | 2,696,143 |
Travelers Cos., Inc. (The) (a) | 11,779 | 2,172,754 |
WR Berkley Corp. | 22,752 | 1,692,294 |
25,680,196 | ||
Non-Renewable Energy — 5.5% | ||
Antero Midstream Corp. | 71,003 | 756,182 |
APA Corp. | 33,453 | 1,520,773 |
Chevron Corp. | 42,576 | 7,701,998 |
Coterra Energy, Inc. | 57,690 | 1,795,890 |
Devon Energy Corp. | 29,000 | 2,243,150 |
EOG Resources, Inc. | 24,250 | 3,310,610 |
Exxon Mobil Corp. | 92,089 | 10,204,382 |
PDC Energy, Inc. | 16,650 | 1,201,131 |
Targa Resources Corp. | 21,787 | 1,489,577 |
Texas Pacific Land Corp. | 610 | 1,405,361 |
31,629,054 | ||
206 | J.P. Morgan Exchange-Traded Funds | October 31, 2022 |
INVESTMENTS | SHARES | VALUE ($) |
Common Stocks — continued | ||
Personal Care, Drug & Grocery Stores — 3.2% | ||
Albertsons Cos., Inc., Class A | 12,474 | 255,842 |
Church & Dwight Co., Inc. | 11,443 | 848,269 |
Clorox Co. (The) | 9,291 | 1,356,858 |
Colgate-Palmolive Co. | 38,140 | 2,816,258 |
Kimberly-Clark Corp. | 6,223 | 774,514 |
McKesson Corp. | 7,262 | 2,827,605 |
Procter & Gamble Co. (The) | 73,586 | 9,909,827 |
18,789,173 | ||
Personal Goods — 1.0% | ||
Deckers Outdoor Corp. * | 443 | 155,019 |
Estee Lauder Cos., Inc. (The), Class A | 11,121 | 2,229,649 |
NIKE, Inc., Class B | 19,182 | 1,777,788 |
Tapestry, Inc. | 40,377 | 1,279,144 |
Under Armour, Inc., Class A * (a) | 74,574 | 555,576 |
5,997,176 | ||
Pharmaceuticals, Biotechnology & Marijuana Producers — 12.1% | ||
AbbVie, Inc. | 58,663 | 8,588,263 |
Amgen, Inc. | 19,515 | 5,275,880 |
Biogen, Inc. * | 5,798 | 1,643,385 |
Bristol-Myers Squibb Co. | 44,125 | 3,418,364 |
Eli Lilly & Co. | 24,835 | 8,992,505 |
Gilead Sciences, Inc. | 46,511 | 3,649,253 |
Johnson & Johnson | 62,014 | 10,788,576 |
Merck & Co., Inc. | 83,202 | 8,420,042 |
Moderna, Inc. * | 15,951 | 2,397,914 |
Pfizer, Inc. | 172,955 | 8,051,055 |
Regeneron Pharmaceuticals, Inc. * | 3,732 | 2,794,335 |
Vertex Pharmaceuticals, Inc. * | 11,332 | 3,535,584 |
Zoetis, Inc. | 18,792 | 2,833,458 |
70,388,614 | ||
Precious Metals & Mining — 0.3% | ||
Newmont Corp. | 26,550 | 1,123,596 |
SSR Mining, Inc. (Canada) | 28,129 | 388,180 |
1,511,776 | ||
Real Estate Investment & Services — 0.3% | ||
CBRE Group, Inc., Class A * | 23,951 | 1,699,084 |
Real Estate Investment Trusts — 2.8% | ||
American Tower Corp. | 11,685 | 2,421,015 |
Camden Property Trust | 5,983 | 691,336 |
Crown Castle, Inc. | 9,273 | 1,235,720 |
Equity LifeStyle Properties, Inc. | 16,270 | 1,040,629 |
Equity Residential | 10,401 | 655,471 |
INVESTMENTS | SHARES | VALUE ($) |
Real Estate Investment Trusts — continued | ||
Extra Space Storage, Inc. | 9,499 | 1,685,502 |
Gaming and Leisure Properties, Inc. | 11,541 | 578,435 |
Lamar Advertising Co., Class A | 14,355 | 1,323,962 |
Life Storage, Inc. | 6,878 | 760,776 |
Public Storage | 7,566 | 2,343,568 |
Rayonier, Inc. | 18,837 | 634,807 |
Simon Property Group, Inc. | 14,561 | 1,586,858 |
Weyerhaeuser Co. | 37,827 | 1,169,989 |
16,128,068 | ||
Retailers — 5.8% | ||
AutoZone, Inc. * | 1,094 | 2,770,971 |
Costco Wholesale Corp. | 14,805 | 7,424,707 |
Dollar General Corp. | 10,192 | 2,599,470 |
Home Depot, Inc. (The) | 30,938 | 9,161,670 |
Lowe's Cos., Inc. | 733 | 142,898 |
O'Reilly Automotive, Inc. * | 3,412 | 2,856,424 |
Target Corp. | 16,717 | 2,745,767 |
Tractor Supply Co. | 7,363 | 1,618,166 |
Ulta Beauty, Inc. * | 4,172 | 1,749,612 |
Victoria's Secret & Co. * (a) | 30,106 | 1,131,986 |
Williams-Sonoma, Inc. (a) | 9,807 | 1,214,401 |
33,416,072 | ||
Software & Computer Services — 14.6% | ||
Adobe, Inc. * | 16,578 | 5,280,093 |
Akamai Technologies, Inc. * (a) | 17,442 | 1,540,652 |
Alphabet, Inc., Class A * | 106,711 | 10,085,257 |
Amdocs Ltd. | 14,887 | 1,284,897 |
Aspen Technology, Inc. * | 4,052 | 978,355 |
Autodesk, Inc. * | 11,942 | 2,559,171 |
Cadence Design Systems, Inc. * | 14,545 | 2,201,968 |
Cognizant Technology Solutions Corp., Class A | 33,501 | 2,085,437 |
Crowdstrike Holdings, Inc., Class A * | 10,014 | 1,614,257 |
Dell Technologies, Inc., Class C (a) | 21,911 | 841,382 |
DocuSign, Inc. * | 26,675 | 1,288,402 |
Dolby Laboratories, Inc., Class A | 17,488 | 1,168,898 |
Dropbox, Inc., Class A * | 62,747 | 1,364,747 |
Dynatrace, Inc. * | 36,871 | 1,299,334 |
F5, Inc. * | 4,776 | 682,538 |
Fortinet, Inc. * | 41,887 | 2,394,261 |
Gartner, Inc. * | 6,156 | 1,858,619 |
International Business Machines Corp. | 29,082 | 4,021,750 |
Intuit, Inc. | 10,194 | 4,357,935 |
Manhattan Associates, Inc. * | 10,164 | 1,236,654 |
October 31, 2022 | J.P. Morgan Exchange-Traded Funds | 207 |
AS OF October 31, 2022 (continued)
INVESTMENTS | SHARES | VALUE ($) |
Common Stocks — continued | ||
Software & Computer Services — continued | ||
Meta Platforms, Inc., Class A * | 71,797 | 6,688,608 |
Microsoft Corp. | 44,943 | 10,432,619 |
NortonLifeLock, Inc. | 65,955 | 1,485,966 |
Palo Alto Networks, Inc. * | 14,718 | 2,525,462 |
Paycom Software, Inc. * | 4,780 | 1,653,880 |
Pinterest, Inc., Class A * | 36,956 | 909,118 |
Roper Technologies, Inc. | 4,342 | 1,799,933 |
ServiceNow, Inc. * | 8,316 | 3,498,874 |
SS&C Technologies Holdings, Inc. | 14,764 | 759,165 |
Synopsys, Inc. * | 7,786 | 2,277,794 |
Teradata Corp. * | 38,755 | 1,224,270 |
VeriSign, Inc. * | 8,988 | 1,801,734 |
VMware, Inc., Class A | 15,020 | 1,690,201 |
84,892,231 | ||
Technology Hardware & Equipment — 9.9% | ||
Amphenol Corp., Class A | 14,038 | 1,064,502 |
Analog Devices, Inc. | 22,511 | 3,210,519 |
Apple, Inc. | 73,862 | 11,325,999 |
Applied Materials, Inc. | 37,182 | 3,282,799 |
Broadcom, Inc. | 13,539 | 6,364,955 |
Corning, Inc. (a) | 24,774 | 796,980 |
GLOBALFOUNDRIES, Inc. * (a) | 21,632 | 1,226,534 |
IPG Photonics Corp. * | 6,352 | 544,112 |
KLA Corp. | 7,443 | 2,355,337 |
Lattice Semiconductor Corp. * | 14,505 | 703,638 |
Microchip Technology, Inc. | 33,028 | 2,039,149 |
Micron Technology, Inc. | 38,795 | 2,098,809 |
NetApp, Inc. | 14,051 | 973,313 |
NVIDIA Corp. | 52,837 | 7,131,410 |
Pure Storage, Inc., Class A * | 38,102 | 1,175,828 |
Qorvo, Inc. * | 10,603 | 912,706 |
QUALCOMM, Inc. | 40,894 | 4,811,588 |
Skyworks Solutions, Inc. | 9,334 | 802,817 |
Teradyne, Inc. | 18,258 | 1,485,288 |
Texas Instruments, Inc. | 33,316 | 5,351,549 |
57,657,832 | ||
Telecommunications Equipment — 1.6% | ||
Cisco Systems, Inc. | 129,984 | 5,905,173 |
Lumentum Holdings, Inc. * | 15,986 | 1,190,158 |
Motorola Solutions, Inc. | 4,242 | 1,059,270 |
Ubiquiti, Inc. (a) | 3,432 | 1,190,046 |
9,344,647 | ||
INVESTMENTS | SHARES | VALUE ($) |
Telecommunications Service Providers — 0.8% | ||
Charter Communications, Inc., Class A * | 1,692 | 622,013 |
Verizon Communications, Inc. | 112,001 | 4,185,477 |
4,807,490 | ||
Tobacco — 1.5% | ||
Altria Group, Inc. | 76,817 | 3,554,322 |
Philip Morris International, Inc. | 56,329 | 5,173,819 |
8,728,141 | ||
Travel & Leisure — 4.8% | ||
Airbnb, Inc., Class A * (a) | 9,230 | 986,779 |
Booking Holdings, Inc. * | 1,759 | 3,288,415 |
Boyd Gaming Corp. | 12,963 | 748,743 |
Choice Hotels International, Inc. | 11,127 | 1,444,730 |
Copa Holdings SA, Class A (Panama) * | 12,033 | 905,243 |
Domino's Pizza, Inc. | 3,717 | 1,234,936 |
Expedia Group, Inc. * | 15,525 | 1,451,122 |
Live Nation Entertainment, Inc. * | 17,170 | 1,366,904 |
Madison Square Garden Sports Corp. | 1,961 | 307,112 |
Marriott International, Inc., Class A | 15,215 | 2,436,074 |
McDonald's Corp. | 25,552 | 6,967,008 |
Starbucks Corp. | 46,612 | 4,036,133 |
Wyndham Hotels & Resorts, Inc. | 9,273 | 704,099 |
Yum! Brands, Inc. | 18,048 | 2,134,176 |
28,011,474 | ||
Waste & Disposal Services — 1.0% | ||
Clean Harbors, Inc. * | 8,328 | 1,019,847 |
Republic Services, Inc. | 13,879 | 1,840,633 |
Waste Management, Inc. | 18,567 | 2,940,456 |
5,800,936 | ||
Total Common Stocks (Cost $594,885,184) | 578,362,907 | |
Short-Term Investments — 3.6% | ||
Investment Companies — 0.1% | ||
JPMorgan U.S. Government Money Market Fund Class IM Shares, 2.85% (b) (c)(Cost $785,535) | 785,535 | 785,535 |
Investment of Cash Collateral from Securities Loaned — 3.5% | ||
JPMorgan Securities Lending Money Market Fund Class Agency SL Shares, 3.23% (b) (c) | 16,497,925 | 16,497,925 |
208 | J.P. Morgan Exchange-Traded Funds | October 31, 2022 |
INVESTMENTS | SHARES | VALUE ($) |
Short-Term Investments — continued | ||
Investment of Cash Collateral from Securities Loaned — continued | ||
JPMorgan U.S. Government Money Market Fund Class IM Shares, 2.85% (b) (c) | 3,688,865 | 3,688,865 |
Total Investment of Cash Collateral from Securities Loaned (Cost $20,186,590) | 20,186,790 | |
Total Short-Term Investments (Cost $20,972,125) | 20,972,325 | |
Total Investments — 103.4% (Cost $615,857,309) | 599,335,232 | |
Liabilities in Excess of Other Assets — (3.4)% | (19,607,125) | |
NET ASSETS — 100.0% | 579,728,107 | |
Percentages indicated are based on net assets. |
* | Non-income producing security. |
(a) | The security or a portion of this security is on loan at October 31, 2022. The total value of securities on loan at October 31, 2022 is $19,486,422. |
(b) | Investment in an affiliated fund, which is registered under the Investment Company Act of 1940, as amended, and is advised by J.P. Morgan Investment Management Inc. |
(c) | The rate shown is the current yield as of October 31, 2022. |
DESCRIPTION | NUMBER OF CONTRACTS | EXPIRATION DATE | TRADING CURRENCY | NOTIONAL AMOUNT ($) | VALUE AND UNREALIZED APPRECIATION (DEPRECIATION) ($) |
Long Contracts | |||||
S&P 500 E-Mini Index | 5 | 12/16/2022 | USD | 970,750 | 55,014 |
Abbreviations | |
USD | United States Dollar |
October 31, 2022 | J.P. Morgan Exchange-Traded Funds | 209 |
AS OF October 31, 2022
INVESTMENTS | SHARES | VALUE ($) |
Common Stocks — 99.8% | ||
Aerospace & Defense — 1.7% | ||
General Dynamics Corp. | 7,247 | 1,810,301 |
Huntington Ingalls Industries, Inc. | 3,351 | 861,442 |
L3Harris Technologies, Inc. | 7,121 | 1,755,113 |
Raytheon Technologies Corp. | 23,625 | 2,240,122 |
Textron, Inc. | 12,371 | 846,671 |
7,513,649 | ||
Automobiles & Parts — 2.2% | ||
BorgWarner, Inc. | 28,921 | 1,085,405 |
Ford Motor Co. | 145,600 | 1,946,672 |
General Motors Co. | 47,559 | 1,866,691 |
Gentex Corp. | 35,954 | 952,422 |
Genuine Parts Co. | 8,776 | 1,560,899 |
Lear Corp. | 7,658 | 1,062,241 |
LKQ Corp. | 22,513 | 1,252,623 |
9,726,953 | ||
Banks — 4.6% | ||
Bank OZK | 10,954 | 470,803 |
BOK Financial Corp. | 6,847 | 754,471 |
Citigroup, Inc. | 60,633 | 2,780,629 |
Citizens Financial Group, Inc. | 32,551 | 1,331,336 |
Comerica, Inc. | 14,015 | 988,058 |
Fifth Third Bancorp | 39,564 | 1,412,039 |
First Hawaiian, Inc. | 25,212 | 644,923 |
First Horizon Corp. | 25,497 | 624,931 |
FNB Corp. | 84,897 | 1,226,762 |
KeyCorp | 67,826 | 1,212,051 |
New York Community Bancorp, Inc. (a) | 100,264 | 933,458 |
PacWest Bancorp | 33,149 | 824,084 |
Popular, Inc. (Puerto Rico) | 13,133 | 928,766 |
Prosperity Bancshares, Inc. | 5,220 | 373,595 |
Regions Financial Corp. | 62,779 | 1,377,999 |
Synovus Financial Corp. | 22,700 | 904,595 |
Truist Financial Corp. | 40,542 | 1,815,876 |
Umpqua Holdings Corp. | 33,958 | 675,085 |
US Bancorp | 9,283 | 394,063 |
Zions Bancorp NA | 14,381 | 746,949 |
20,420,473 | ||
Beverages — 0.4% | ||
Keurig Dr Pepper, Inc. | 19,152 | 743,864 |
Molson Coors Beverage Co., Class B | 21,310 | 1,074,663 |
1,818,527 | ||
INVESTMENTS | SHARES | VALUE ($) |
Chemicals — 0.8% | ||
Chemours Co. (The) | 20,682 | 592,126 |
Dow, Inc. | 22,584 | 1,055,576 |
Huntsman Corp. | 26,812 | 717,489 |
LyondellBasell Industries NV, Class A | 15,081 | 1,152,942 |
3,518,133 | ||
Construction & Materials — 0.9% | ||
Acuity Brands, Inc. | 3,690 | 677,373 |
Louisiana-Pacific Corp. | 18,529 | 1,049,668 |
MDU Resources Group, Inc. | 17,697 | 504,011 |
Mohawk Industries, Inc. * | 6,677 | 632,646 |
Owens Corning | 13,025 | 1,115,070 |
3,978,768 | ||
Consumer Services — 0.9% | ||
AMERCO | 716 | 411,836 |
eBay, Inc. | 32,515 | 1,295,398 |
Grand Canyon Education, Inc. * | 2,583 | 259,927 |
H&R Block, Inc. | 21,024 | 865,138 |
Service Corp. International | 16,561 | 1,003,762 |
3,836,061 | ||
Electricity — 2.2% | ||
Avangrid, Inc. | 11,080 | 450,734 |
Consolidated Edison, Inc. | 14,825 | 1,304,007 |
Evergy, Inc. | 12,095 | 739,367 |
Exelon Corp. | 13,069 | 504,333 |
FirstEnergy Corp. | 22,528 | 849,531 |
Hawaiian Electric Industries, Inc. | 17,506 | 665,928 |
NRG Energy, Inc. | 26,071 | 1,157,552 |
OGE Energy Corp. | 15,477 | 566,922 |
Pinnacle West Capital Corp. | 14,193 | 953,912 |
PPL Corp. | 47,346 | 1,254,196 |
Southern Co. (The) | 21,693 | 1,420,458 |
9,866,940 | ||
Electronic & Electrical Equipment — 1.8% | ||
Crane Holdings Co. | 10,706 | 1,074,240 |
Emerson Electric Co. | 20,343 | 1,761,704 |
Hubbell, Inc. | 5,423 | 1,287,854 |
Johnson Controls International plc | 27,877 | 1,612,406 |
MKS Instruments, Inc. | 5,676 | 466,283 |
nVent Electric plc | 29,749 | 1,085,838 |
Pentair plc | 18,463 | 792,986 |
8,081,311 | ||
210 | J.P. Morgan Exchange-Traded Funds | October 31, 2022 |
INVESTMENTS | SHARES | VALUE ($) |
Common Stocks — continued | ||
Finance & Credit Services — 0.6% | ||
Ally Financial, Inc. | 33,633 | 926,925 |
MGIC Investment Corp. | 51,790 | 706,934 |
OneMain Holdings, Inc. | 26,997 | 1,041,004 |
2,674,863 | ||
Food Producers — 3.1% | ||
Archer-Daniels-Midland Co. | 22,480 | 2,180,111 |
Bunge Ltd. | 3,116 | 307,549 |
Campbell Soup Co. | 22,591 | 1,195,290 |
Conagra Brands, Inc. | 36,622 | 1,344,027 |
Flowers Foods, Inc. | 21,319 | 612,069 |
General Mills, Inc. | 24,468 | 1,996,100 |
Ingredion, Inc. | 6,361 | 566,892 |
J M Smucker Co. (The) | 8,694 | 1,309,838 |
Kellogg Co. | 11,851 | 910,394 |
Kraft Heinz Co. (The) | 39,454 | 1,517,795 |
Post Holdings, Inc. * | 8,250 | 745,965 |
Tyson Foods, Inc., Class A | 18,298 | 1,250,668 |
13,936,698 | ||
Gas, Water & Multi-utilities — 0.9% | ||
Duke Energy Corp. | 25,200 | 2,348,136 |
National Fuel Gas Co. | 8,873 | 598,839 |
UGI Corp. | 26,256 | 927,624 |
3,874,599 | ||
General Industrials — 2.8% | ||
3M Co. | 15,369 | 1,933,267 |
Amcor plc | 66,605 | 771,286 |
Berry Global Group, Inc. * | 10,520 | 497,806 |
Dover Corp. | 8,746 | 1,143,015 |
DuPont de Nemours, Inc. | 27,416 | 1,568,195 |
Eaton Corp. plc | 13,846 | 2,077,869 |
Packaging Corp. of America | 8,485 | 1,019,982 |
Parker-Hannifin Corp. | 5,934 | 1,724,539 |
Silgan Holdings, Inc. | 17,884 | 846,986 |
Westrock Co. | 27,720 | 944,143 |
12,527,088 | ||
Health Care Providers — 5.1% | ||
Centene Corp. * | 18,423 | 1,568,350 |
Cigna Corp. | 9,643 | 3,115,268 |
Elevance Health, Inc. | 7,171 | 3,920,888 |
Encompass Health Corp. | 7,596 | 413,526 |
Enhabit, Inc. * | 11,770 | 146,183 |
Humana, Inc. | 4,176 | 2,330,542 |
INVESTMENTS | SHARES | VALUE ($) |
Health Care Providers — continued | ||
Premier, Inc., Class A | 20,801 | 725,539 |
UnitedHealth Group, Inc. | 17,234 | 9,567,455 |
Universal Health Services, Inc., Class B | 7,085 | 820,939 |
22,608,690 | ||
Household Goods & Home Construction — 1.7% | ||
DR Horton, Inc. | 16,849 | 1,295,351 |
Leggett & Platt, Inc. | 26,253 | 886,039 |
Lennar Corp., Class A | 17,053 | 1,376,177 |
Newell Brands, Inc. | 56,340 | 778,056 |
PulteGroup, Inc. | 27,366 | 1,094,366 |
Toll Brothers, Inc. | 22,829 | 983,473 |
Whirlpool Corp. | 6,976 | 964,362 |
7,377,824 | ||
Industrial Engineering — 1.8% | ||
AGCO Corp. | 8,028 | 996,837 |
Brunswick Corp. | 7,918 | 559,565 |
Caterpillar, Inc. | 14,631 | 3,167,026 |
Cummins, Inc. | 6,547 | 1,600,807 |
Snap-on, Inc. | 5,297 | 1,176,199 |
Stanley Black & Decker, Inc. | 8,313 | 652,487 |
8,152,921 | ||
Industrial Materials — 0.2% | ||
International Paper Co. | 28,667 | 963,498 |
Industrial Metals & Mining — 0.9% | ||
Nucor Corp. | 12,639 | 1,660,512 |
Reliance Steel & Aluminum Co. | 6,213 | 1,251,795 |
Timken Co. (The) | 4,761 | 339,412 |
United States Steel Corp. | 27,767 | 565,336 |
3,817,055 | ||
Industrial Support Services — 1.6% | ||
ADT, Inc. | 65,071 | 550,501 |
Capital One Financial Corp. | 16,967 | 1,798,841 |
ManpowerGroup, Inc. | 13,285 | 1,040,747 |
MSC Industrial Direct Co., Inc., Class A | 10,461 | 868,054 |
Robert Half International, Inc. | 5,930 | 453,408 |
Synchrony Financial | 38,689 | 1,375,781 |
Western Union Co. (The) | 68,854 | 930,217 |
7,017,549 | ||
Industrial Transportation — 2.5% | ||
Allison Transmission Holdings, Inc. | 25,948 | 1,096,303 |
FedEx Corp. | 7,290 | 1,168,441 |
Knight-Swift Transportation Holdings, Inc. | 21,371 | 1,026,449 |
October 31, 2022 | J.P. Morgan Exchange-Traded Funds | 211 |
AS OF October 31, 2022 (continued)
INVESTMENTS | SHARES | VALUE ($) |
Common Stocks — continued | ||
Industrial Transportation — continued | ||
Norfolk Southern Corp. | 7,834 | 1,786,701 |
Oshkosh Corp. | 9,202 | 809,776 |
PACCAR, Inc. | 15,141 | 1,466,103 |
Ryder System, Inc. | 13,213 | 1,063,779 |
Schneider National, Inc., Class B | 20,138 | 447,869 |
Union Pacific Corp. | 12,329 | 2,430,539 |
11,295,960 | ||
Investment Banking & Brokerage Services — 1.3% | ||
Bank of New York Mellon Corp. (The) | 37,136 | 1,563,797 |
Franklin Resources, Inc. | 40,218 | 943,112 |
Invesco Ltd. | 62,862 | 963,046 |
Jefferies Financial Group, Inc. | 33,091 | 1,138,661 |
State Street Corp. | 18,501 | 1,369,074 |
5,977,690 | ||
Leisure Goods — 1.5% | ||
Activision Blizzard, Inc. | 28,305 | 2,060,604 |
Garmin Ltd. | 10,412 | 916,672 |
Harley-Davidson, Inc. | 25,972 | 1,116,796 |
Hasbro, Inc. | 13,303 | 868,021 |
Polaris, Inc. | 4,720 | 479,552 |
Thor Industries, Inc. | 12,467 | 1,015,687 |
6,457,332 | ||
Life Insurance — 1.8% | ||
Lincoln National Corp. | 21,783 | 1,173,450 |
MetLife, Inc. | 28,476 | 2,084,728 |
Principal Financial Group, Inc. | 17,471 | 1,539,719 |
Prudential Financial, Inc. | 17,689 | 1,860,706 |
Unum Group | 28,296 | 1,290,015 |
7,948,618 | ||
Media — 1.5% | ||
Fox Corp., Class A | 31,045 | 896,269 |
Interpublic Group of Cos., Inc. (The) | 41,586 | 1,238,847 |
Liberty Media Corp.-Liberty SiriusXM, Class C * | 13,776 | 581,209 |
News Corp., Class A | 53,827 | 908,062 |
Nexstar Media Group, Inc., Class A | 5,550 | 950,715 |
Omnicom Group, Inc. | 18,041 | 1,312,483 |
Paramount Global, Class B | 45,318 | 830,226 |
6,717,811 | ||
Medical Equipment & Services — 2.2% | ||
Baxter International, Inc. | 8,394 | 456,214 |
Becton Dickinson and Co. | 7,892 | 1,862,275 |
Laboratory Corp. of America Holdings | 3,578 | 793,815 |
INVESTMENTS | SHARES | VALUE ($) |
Medical Equipment & Services — continued | ||
Medtronic plc | 35,619 | 3,110,964 |
PerkinElmer, Inc. | 5,720 | 764,078 |
Quest Diagnostics, Inc. | 9,631 | 1,383,493 |
QuidelOrtho Corp. * | 6,599 | 592,722 |
Zimmer Biomet Holdings, Inc. | 7,041 | 798,097 |
9,761,658 | ||
Mortgage Real Estate Investment Trusts — 0.7% | ||
AGNC Investment Corp. | 72,868 | 598,975 |
Annaly Capital Management, Inc. | 43,876 | 813,900 |
Rithm Capital Corp. | 104,384 | 879,957 |
Starwood Property Trust, Inc. | 38,622 | 797,930 |
3,090,762 | ||
Non-life Insurance — 1.8% | ||
American International Group, Inc. | 29,868 | 1,702,476 |
Assured Guaranty Ltd. | 16,672 | 986,816 |
Axis Capital Holdings Ltd. | 9,781 | 534,727 |
Everest Re Group Ltd. | 2,531 | 816,652 |
Fidelity National Financial, Inc. | 16,754 | 659,773 |
First American Financial Corp. | 18,587 | 936,785 |
Hartford Financial Services Group, Inc. (The) | 9,445 | 683,912 |
Old Republic International Corp. | 44,824 | 1,040,365 |
Reinsurance Group of America, Inc. | 5,352 | 787,654 |
8,149,160 | ||
Non-Renewable Energy — 5.5% | ||
Antero Midstream Corp. | 94,221 | 1,003,454 |
Chevron Corp. | 24,582 | 4,446,884 |
ConocoPhillips | 3,977 | 501,460 |
Diamondback Energy, Inc. | 8,245 | 1,295,372 |
DT Midstream, Inc. | 6,638 | 396,288 |
Exxon Mobil Corp. | 90,333 | 10,009,800 |
Kinder Morgan, Inc. | 92,741 | 1,680,467 |
Marathon Oil Corp. | 14,382 | 437,932 |
Marathon Petroleum Corp. | 7,594 | 862,830 |
ONEOK, Inc. | 16,398 | 972,729 |
Phillips 66 | 19,606 | 2,044,710 |
Valero Energy Corp. | 6,901 | 866,420 |
24,518,346 | ||
Personal Care, Drug & Grocery Stores — 1.6% | ||
Albertsons Cos., Inc., Class A | 25,085 | 514,493 |
CVS Health Corp. | 37,808 | 3,580,418 |
212 | J.P. Morgan Exchange-Traded Funds | October 31, 2022 |
INVESTMENTS | SHARES | VALUE ($) |
Common Stocks — continued | ||
Personal Care, Drug & Grocery Stores — continued | ||
Kroger Co. (The) | 27,801 | 1,314,709 |
Walgreens Boots Alliance, Inc. | 41,261 | 1,506,027 |
6,915,647 | ||
Personal Goods — 1.3% | ||
Capri Holdings Ltd. * | 12,661 | 578,354 |
Carter's, Inc. | 10,916 | 740,869 |
Columbia Sportswear Co. | 6,930 | 516,285 |
Hanesbrands, Inc. | 91,430 | 623,553 |
PVH Corp. | 17,599 | 903,181 |
Ralph Lauren Corp. | 10,155 | 941,267 |
Tapestry, Inc. | 30,977 | 981,351 |
VF Corp. | 17,763 | 501,805 |
5,786,665 | ||
Pharmaceuticals, Biotechnology & Marijuana Producers — 7.1% | ||
Amgen, Inc. | 12,071 | 3,263,395 |
Biogen, Inc. * | 3,324 | 942,155 |
Bristol-Myers Squibb Co. | 36,059 | 2,793,491 |
Gilead Sciences, Inc. | 34,254 | 2,687,569 |
Johnson & Johnson | 46,950 | 8,167,891 |
Merck & Co., Inc. | 60,037 | 6,075,744 |
Perrigo Co. plc | 5,990 | 241,277 |
Pfizer, Inc. | 136,294 | 6,344,486 |
United Therapeutics Corp. * | 4,201 | 968,456 |
31,484,464 | ||
Real Estate Investment & Services — 0.2% | ||
Jones Lang LaSalle, Inc. * | 4,136 | 657,996 |
Real Estate Investment Trusts — 3.0% | ||
Brixmor Property Group, Inc. | 27,765 | 591,672 |
Cousins Properties, Inc. | 9,167 | 217,808 |
EPR Properties | 16,832 | 649,715 |
Equity Residential | 12,708 | 800,858 |
Gaming and Leisure Properties, Inc. | 12,845 | 643,792 |
Highwoods Properties, Inc. | 16,934 | 478,047 |
Iron Mountain, Inc. | 1,302 | 65,191 |
Kilroy Realty Corp. | 9,296 | 397,311 |
Kimco Realty Corp. | 55,779 | 1,192,555 |
Medical Properties Trust, Inc. | 50,032 | 572,866 |
National Retail Properties, Inc. | 14,433 | 606,619 |
Omega Healthcare Investors, Inc. | 29,021 | 922,287 |
Regency Centers Corp. | 10,562 | 639,107 |
Simon Property Group, Inc. | 11,481 | 1,251,199 |
SL Green Realty Corp. | 21,242 | 842,883 |
Ventas, Inc. | 14,755 | 577,363 |
INVESTMENTS | SHARES | VALUE ($) |
Real Estate Investment Trusts — continued | ||
VICI Properties, Inc. | 29,633 | 948,849 |
Vornado Realty Trust | 11,697 | 275,932 |
Welltower, Inc. | 14,516 | 886,057 |
Weyerhaeuser Co. | 7,497 | 231,882 |
WP Carey, Inc. | 8,985 | 685,556 |
13,477,549 | ||
Retailers — 4.1% | ||
Advance Auto Parts, Inc. | 5,500 | 1,044,560 |
AutoNation, Inc. * | 8,007 | 851,224 |
Bath & Body Works, Inc. | 16,013 | 534,514 |
Best Buy Co., Inc. | 13,921 | 952,336 |
Dick's Sporting Goods, Inc. | 9,534 | 1,084,588 |
Gap, Inc. (The) | 69,902 | 787,795 |
Kohl's Corp. | 21,319 | 638,504 |
Lithia Motors, Inc., Class A | 3,905 | 773,776 |
Macy's, Inc. | 58,593 | 1,221,664 |
Nordstrom, Inc. | 27,153 | 552,292 |
Penske Automotive Group, Inc. | 8,256 | 921,535 |
Target Corp. | 12,674 | 2,081,704 |
Victoria's Secret & Co. * | 23,900 | 898,640 |
Walmart, Inc. | 35,184 | 5,007,739 |
Williams-Sonoma, Inc. | 7,520 | 931,202 |
18,282,073 | ||
Software & Computer Services — 11.4% | ||
Akamai Technologies, Inc. * | 9,608 | 848,675 |
Alphabet, Inc., Class A * | 72,170 | 6,820,787 |
Amdocs Ltd. | 13,271 | 1,145,420 |
Black Knight, Inc. * | 8,518 | 515,083 |
CACI International, Inc., Class A * | 3,655 | 1,111,230 |
Cognizant Technology Solutions Corp., Class A | 25,150 | 1,565,587 |
Dell Technologies, Inc., Class C | 16,815 | 645,696 |
Dolby Laboratories, Inc., Class A | 13,408 | 896,191 |
Dun & Bradstreet Holdings, Inc. | 36,700 | 471,595 |
DXC Technology Co. * | 28,693 | 824,924 |
F5, Inc. * | 4,520 | 645,953 |
Hewlett Packard Enterprise Co. | 96,286 | 1,374,001 |
International Business Machines Corp. | 26,484 | 3,662,472 |
Intuit, Inc. | 6,824 | 2,917,260 |
KBR, Inc. | 12,031 | 598,783 |
Leidos Holdings, Inc. | 12,301 | 1,249,658 |
Meta Platforms, Inc., Class A * | 48,598 | 4,527,390 |
Microsoft Corp. | 32,982 | 7,656,112 |
NCR Corp. * | 20,724 | 440,592 |
October 31, 2022 | J.P. Morgan Exchange-Traded Funds | 213 |
AS OF October 31, 2022 (continued)
INVESTMENTS | SHARES | VALUE ($) |
Common Stocks — continued | ||
Software & Computer Services — continued | ||
NortonLifeLock, Inc. | 38,432 | 865,873 |
Oracle Corp. | 45,017 | 3,514,477 |
PTC, Inc. * | 6,631 | 781,331 |
Roper Technologies, Inc. | 3,466 | 1,436,796 |
Salesforce, Inc. * | 19,456 | 3,163,351 |
Science Applications International Corp. | 11,029 | 1,194,882 |
SS&C Technologies Holdings, Inc. | 19,884 | 1,022,435 |
Teradata Corp. * | 19,640 | 620,428 |
50,516,982 | ||
Technology Hardware & Equipment — 13.3% | ||
Amphenol Corp., Class A | 19,047 | 1,444,334 |
Analog Devices, Inc. | 17,432 | 2,486,152 |
Apple, Inc. | 57,189 | 8,769,361 |
Applied Materials, Inc. | 28,779 | 2,540,898 |
Arrow Electronics, Inc. * | 8,616 | 872,456 |
Avnet, Inc. | 22,486 | 903,712 |
Azenta, Inc. | 10,140 | 450,216 |
Broadcom, Inc. | 10,130 | 4,762,316 |
CDW Corp. | 7,688 | 1,328,563 |
Cirrus Logic, Inc. * | 8,250 | 553,740 |
Coherent Corp. * | 10,864 | 365,139 |
Concentrix Corp. | 4,464 | 545,635 |
Corning, Inc. | 43,742 | 1,407,180 |
Entegris, Inc. | 11,170 | 886,228 |
HP, Inc. | 51,552 | 1,423,866 |
Intel Corp. | 117,357 | 3,336,460 |
IPG Photonics Corp. * | 5,585 | 478,411 |
Jabil, Inc. | 18,529 | 1,190,488 |
KLA Corp. | 5,783 | 1,830,030 |
Lam Research Corp. | 5,018 | 2,031,186 |
Marvell Technology, Inc. | 29,744 | 1,180,242 |
Microchip Technology, Inc. | 24,147 | 1,490,836 |
Micron Technology, Inc. | 39,716 | 2,148,636 |
National Instruments Corp. | 15,424 | 588,888 |
NetApp, Inc. | 17,497 | 1,212,017 |
ON Semiconductor Corp. * | 22,796 | 1,400,358 |
Qorvo, Inc. * | 8,250 | 710,160 |
QUALCOMM, Inc. | 31,603 | 3,718,409 |
Skyworks Solutions, Inc. | 12,449 | 1,070,739 |
TD SYNNEX Corp. | 10,336 | 945,848 |
Teradyne, Inc. | 11,370 | 924,950 |
Texas Instruments, Inc. | 25,743 | 4,135,098 |
Universal Display Corp. | 5,006 | 476,671 |
INVESTMENTS | SHARES | VALUE ($) |
Technology Hardware & Equipment — continued | ||
Vertiv Holdings Co. | 34,546 | 494,353 |
Western Digital Corp. * | 23,933 | 822,577 |
58,926,153 | ||
Telecommunications Equipment — 1.0% | ||
Cisco Systems, Inc. | 86,674 | 3,937,600 |
Juniper Networks, Inc. | 17,971 | 549,913 |
4,487,513 | ||
Telecommunications Service Providers — 1.4% | ||
AT&T, Inc. | 172,591 | 3,146,334 |
Comcast Corp., Class A | 62,407 | 1,980,798 |
DISH Network Corp., Class A * | 31,399 | 468,159 |
Lumen Technologies, Inc. | 86,167 | 634,189 |
Verizon Communications, Inc. | 4,546 | 169,884 |
6,399,364 | ||
Tobacco — 0.8% | ||
Altria Group, Inc. | 51,149 | 2,366,664 |
Philip Morris International, Inc. | 10,634 | 976,733 |
3,343,397 | ||
Travel & Leisure — 1.6% | ||
Boyd Gaming Corp. | 12,270 | 708,715 |
Copa Holdings SA, Class A (Panama) * | 12,850 | 966,706 |
Darden Restaurants, Inc. | 9,867 | 1,412,362 |
Marriott Vacations Worldwide Corp. | 3,931 | 580,845 |
MGM Resorts International | 23,486 | 835,397 |
Penn Entertainment, Inc. * | 7,437 | 246,165 |
Travel + Leisure Co. | 22,081 | 838,636 |
Wendy's Co. (The) | 47,294 | 982,769 |
Wyndham Hotels & Resorts, Inc. | 8,511 | 646,240 |
7,217,835 | ||
Total Common Stocks (Cost $489,954,879) | 443,124,575 | |
Short-Term Investments — 0.3% | ||
Investment Companies — 0.1% | ||
JPMorgan U.S. Government Money Market Fund Class IM Shares, 2.85% (b) (c)(Cost $377,263) | 377,263 | 377,263 |
Investment of Cash Collateral from Securities Loaned — 0.2% | ||
JPMorgan Securities Lending Money Market Fund Class Agency SL Shares, 3.23% (b) (c) | 297,072 | 297,072 |
214 | J.P. Morgan Exchange-Traded Funds | October 31, 2022 |
INVESTMENTS | SHARES | VALUE ($) |
Short-Term Investments — continued | ||
Investment of Cash Collateral from Securities Loaned — continued | ||
JPMorgan U.S. Government Money Market Fund Class IM Shares, 2.85% (b) (c) | 623,020 | 623,020 |
Total Investment of Cash Collateral from Securities Loaned (Cost $919,884) | 920,092 | |
Total Short-Term Investments (Cost $1,297,147) | 1,297,355 | |
Total Investments — 100.1% (Cost $491,252,026) | 444,421,930 | |
Liabilities in Excess of Other Assets — (0.1)% | (338,210) | |
NET ASSETS — 100.0% | 444,083,720 | |
Percentages indicated are based on net assets. |
* | Non-income producing security. |
(a) | The security or a portion of this security is on loan at October 31, 2022. The total value of securities on loan at October 31, 2022 is $904,560. |
(b) | Investment in an affiliated fund, which is registered under the Investment Company Act of 1940, as amended, and is advised by J.P. Morgan Investment Management Inc. |
(c) | The rate shown is the current yield as of October 31, 2022. |
DESCRIPTION | NUMBER OF CONTRACTS | EXPIRATION DATE | TRADING CURRENCY | NOTIONAL AMOUNT ($) | VALUE AND UNREALIZED APPRECIATION (DEPRECIATION) ($) |
Long Contracts | |||||
S&P 500 E-Mini Index | 3 | 12/16/2022 | USD | 582,450 | 28,231 |
Abbreviations | |
USD | United States Dollar |
October 31, 2022 | J.P. Morgan Exchange-Traded Funds | 215 |
AS OF October 31, 2022
JPMorgan ActiveBuilders Emerging Markets Equity ETF | JPMorgan ActiveBuilders International Equity ETF | JPMorgan BetaBuilders Canada ETF | JPMorgan BetaBuilders Developed Asia Pacific ex-Japan ETF (formerly known as JPMorgan BetaBuilders Developed Asia ex-Japan ETF) | |
ASSETS: | ||||
Investments in non-affiliates, at value | $902,991,773 | $21,937,205 | $5,610,132,074 | $3,398,746,319 |
Investments in affiliates, at value | 3,448,509 | 316,955 | — | — |
Investments of cash collateral received from securities loaned, at value (See Note 2.C.) | — | — | 450,591,449 | 189,738 |
Cash | 175,700 | 66,141 | 825,404 | 10,066 |
Foreign currency, at value | 344,388 | 28,905 | 15,221,904 | 11,574,264 |
Deposits at broker for futures contracts | — | — | 2,138,485 | 1,031,837 |
Receivables: | ||||
Dividends from non-affiliates | 676,387 | 49,095 | 16,558,758 | 663,226 |
Dividends from affiliates | 300 | 25 | — | — |
Tax reclaims | 30,876 | 33,145 | — | 387,864 |
Securities lending income (See Note 2.C.) | — | 7 | 126,851 | — |
Variation margin on futures contracts | — | — | 171,767 | 172,446 |
Total Assets | 907,667,933 | 22,431,478 | 6,095,766,692 | 3,412,775,760 |
LIABILITIES: | ||||
Payables: | ||||
Investment securities purchased | 27,046 | — | — | — |
Collateral received on securities loaned (See Note 2.C.) | — | — | 450,591,449 | 189,738 |
Accrued liabilities: | ||||
Management fees (See Note 3.A.) | 255,031 | 4,602 | 901,948 | 575,118 |
Deferred foreign capital gains tax | 231,730 | — | — | — |
Total Liabilities | 513,807 | 4,602 | 451,493,397 | 764,856 |
Net Assets | $907,154,126 | $22,426,876 | $5,644,273,295 | $3,412,010,904 |
NET ASSETS: | ||||
Paid-in-Capital | $1,240,516,782 | $28,789,940 | $5,234,513,892 | $4,285,216,920 |
Total distributable earnings (loss) | (333,362,656) | (6,363,064) | 409,759,403 | (873,206,016) |
Total Net Assets | $907,154,126 | $22,426,876 | $5,644,273,295 | $3,412,010,904 |
Outstanding number of shares (unlimited number of shares authorized - par value $0.0001) | 29,200,000 | 600,000 | 98,498,911 | 79,798,641 |
Net asset value, per share | $31.07 | $37.38 | $57.30 | $42.76 |
Cost of investments in non-affiliates | $1,192,403,952 | $26,943,499 | $5,041,664,833 | $4,002,360,290 |
Cost of investments in affiliates | 3,448,736 | 316,955 | — | — |
Cost of foreign currency | 344,583 | 28,657 | 15,104,916 | 11,300,866 |
Investment securities on loan, at value (See Note 2.C.) | — | — | 267,554,005 | 228,806 |
Cost of investment of cash collateral (See Note 2.C.) | — | — | 450,591,449 | 189,705 |
216 | J.P. Morgan Exchange-Traded Funds | October 31, 2022 |
JPMorgan BetaBuilders Europe ETF | JPMorgan BetaBuilders International Equity ETF | JPMorgan BetaBuilders Japan ETF | JPMorgan BetaBuilders U.S. Equity ETF | |
ASSETS: | ||||
Investments in non-affiliates, at value | $3,486,805,151 | $2,684,196,896 | $6,138,585,841 | $1,252,579,235 |
Investments in affiliates, at value | — | 12,102,999 | — | 22,618,256 |
Investments of cash collateral received from securities loaned, at value (See Note 2.C.) | 40,427,498 | 17,862,343 | 19,895,882 | 3,739,695 |
Cash | 25,274 | 282,093 | 67,298 | 12,379 |
Foreign currency, at value | 16,638,212 | 843,592 | 11,308,906 | — |
Deposits at broker for futures contracts | 3,740,905 | 1,516,000 | 3,195,804 | 440,000 |
Receivables: | ||||
Fund shares sold | 582,722 | — | — | — |
Dividends from non-affiliates | 2,304,518 | 6,790,262 | 54,701,665 | 948,700 |
Dividends from affiliates | — | 946 | — | 693 |
Tax reclaims | 17,683,248 | 4,735,542 | 3,442,277 | — |
Securities lending income (See Note 2.C.) | 36,586 | 13,649 | 24,173 | 3,798 |
Variation margin on futures contracts | 153,381 | — | 929,596 | — |
Total Assets | 3,568,397,495 | 2,728,344,322 | 6,232,151,442 | 1,280,342,756 |
LIABILITIES: | ||||
Payables: | ||||
Collateral received on securities loaned (See Note 2.C.) | 40,427,498 | 17,862,343 | 19,895,882 | 3,739,695 |
Variation margin on futures contracts | — | 228,449 | — | 58,976 |
Accrued liabilities: | ||||
Management fees (See Note 3.A.) | 282,238 | 156,012 | 1,017,997 | 20,477 |
Total Liabilities | 40,709,736 | 18,246,804 | 20,913,879 | 3,819,148 |
Net Assets | $3,527,687,759 | $2,710,097,518 | $6,211,237,563 | $1,276,523,608 |
NET ASSETS: | ||||
Paid-in-Capital | $4,672,737,709 | $3,064,491,861 | $8,026,697,913 | $1,360,384,579 |
Total distributable earnings (loss) | (1,145,049,950) | (354,394,343) | (1,815,460,350) | (83,860,971) |
Total Net Assets | $3,527,687,759 | $2,710,097,518 | $6,211,237,563 | $1,276,523,608 |
Outstanding number of shares (unlimited number of shares authorized - par value $0.0001) | 80,899,596 | 60,600,000 | 148,997,548 | 18,400,000 |
Net asset value, per share | $43.61 | $44.72 | $41.69 | $69.38 |
Cost of investments in non-affiliates | $4,381,041,728 | $2,967,992,598 | $7,775,017,695 | $1,317,788,814 |
Cost of investments in affiliates | — | 12,102,999 | — | 23,220,310 |
Cost of foreign currency | 16,265,411 | 834,606 | 11,425,531 | — |
Investment securities on loan, at value (See Note 2.C.) | 36,958,615 | 16,847,367 | 18,722,079 | 2,190,898 |
Cost of investment of cash collateral (See Note 2.C.) | 40,419,170 | 17,862,441 | 19,895,882 | 3,739,695 |
October 31, 2022 | J.P. Morgan Exchange-Traded Funds | 217 |
AS OF October 31, 2022 (continued)
JPMorgan BetaBuilders U.S. Mid Cap Equity ETF | JPMorgan BetaBuilders U.S. Small Cap Equity ETF | JPMorgan Carbon Transition U.S. Equity ETF | JPMorgan Climate Change Solutions ETF | |
ASSETS: | ||||
Investments in non-affiliates, at value | $1,381,884,271 | $485,826,607 | $20,888,783 | $19,276,691 |
Investments in affiliates, at value | 7,709,091 | 8,224,756 | 31,835 | — |
Investments of cash collateral received from securities loaned, at value (See Note 2.C.) | 37,583,866 | 11,621,701 | — | — |
Cash | 23,558 | 14,072 | — | 166,641 |
Foreign currency, at value | — | — | — | 103,320 |
Deposits at broker for futures contracts | 442,000 | 538,000 | 13,000 | — |
Receivables: | ||||
Investment securities sold | — | — | — | 180 |
Dividends from non-affiliates | 515,527 | 131,736 | 17,029 | 8,095 |
Dividends from affiliates | 603 | 643 | 2 | — |
Tax reclaims | — | — | — | 13,523 |
Securities lending income (See Note 2.C.) | 69,630 | 54,249 | — | — |
Variation margin on futures contracts | — | 7,028 | — | — |
Total Assets | 1,428,228,546 | 506,418,792 | 20,950,649 | 19,568,450 |
LIABILITIES: | ||||
Payables: | ||||
Due to custodian | — | — | 90 | — |
Collateral received on securities loaned (See Note 2.C.) | 37,583,866 | 11,621,701 | — | — |
Variation margin on futures contracts | 1,920 | — | 321 | — |
Accrued liabilities: | ||||
Management fees (See Note 3.A.) | 78,414 | 34,831 | 2,557 | 7,764 |
Total Liabilities | 37,664,200 | 11,656,532 | 2,968 | 7,764 |
Net Assets | $1,390,564,346 | $494,762,260 | $20,947,681 | $19,560,686 |
NET ASSETS: | ||||
Paid-in-Capital | $1,630,072,131 | $595,592,815 | $22,379,908 | $26,388,065 |
Total distributable earnings (loss) | (239,507,785) | (100,830,555) | (1,432,227) | (6,827,379) |
Total Net Assets | $1,390,564,346 | $494,762,260 | $20,947,681 | $19,560,686 |
Outstanding number of shares (unlimited number of shares authorized - par value $0.0001) | 18,775,000 | 9,050,000 | 400,000 | 550,000 |
Net asset value, per share | $74.06 | $54.67 | $52.37 | $35.56 |
Cost of investments in non-affiliates | $1,463,806,734 | $543,796,972 | $20,936,668 | $23,170,856 |
Cost of investments in affiliates | 7,709,091 | 8,224,756 | 31,835 | — |
Cost of foreign currency | — | — | — | 103,319 |
Investment securities on loan, at value (See Note 2.C.) | 36,819,568 | 11,082,834 | — | — |
Cost of investment of cash collateral (See Note 2.C.) | 37,581,419 | 11,617,499 | — | — |
218 | J.P. Morgan Exchange-Traded Funds | October 31, 2022 |
JPMorgan Diversified Return Emerging Markets Equity ETF | JPMorgan Diversified Return International Equity ETF | JPMorgan Diversified Return U.S. Equity ETF | JPMorgan Diversified Return U.S. Mid Cap Equity ETF | |
ASSETS: | ||||
Investments in non-affiliates, at value | $163,499,769 | $666,799,101 | $506,039,431 | $266,632,252 |
Investments in affiliates, at value | — | 569,398 | 1,020,750 | 414,054 |
Investments of cash collateral received from securities loaned, at value (See Note 2.C.) | 182,157 | 4,048,549 | 391,875 | — |
Restricted Cash | 412,534 | — | — | — |
Cash | 1,365,692 | — | 1,063 | 1,246 |
Foreign currency, at value | — | 115,596 | — | — |
Deposits at broker for futures contracts | 8,721 | 181,652 | 77,300 | 134,000 |
Segregated cash balance with Authorized Participant for deposit securities | 1,776,419 | — | — | — |
Receivables: | ||||
Due from custodian | 42,938 | — | — | — |
Investment securities sold | 106,061 | 505,796 | — | — |
Fund shares sold | 11,057 | — | — | — |
Dividends from non-affiliates | 188,909 | 2,751,494 | 1,016,433 | 389,836 |
Dividends from affiliates | — | 50 | 80 | 32 |
Tax reclaims | 5,401 | 972,189 | — | — |
Securities lending income (See Note 2.C.) | 70 | 9,025 | 430 | 179 |
Variation margin on futures contracts | — | 2,894 | — | 1,065 |
Due from Authorized Participant | 1,191,497 | — | — | — |
Total Assets | 168,791,225 | 675,955,744 | 508,547,362 | 267,572,664 |
LIABILITIES: | ||||
Payables: | ||||
Due to Authorized Participant | 412,534 | — | — | — |
Due to custodian | — | 637,886 | — | — |
Foreign currency due to custodian, at value | 80,793 | — | — | — |
Investment securities purchased | 1,907,520 | — | 793,348 | — |
Collateral received on securities loaned (See Note 2.C.) | 182,157 | 4,048,549 | 391,875 | — |
Variation margin on futures contracts | 452 | — | 5,662 | — |
Collateral upon return of deposit securities | 1,776,419 | — | — | — |
Accrued liabilities: | ||||
Management fees (See Note 3.A.) | 55,635 | 207,169 | 74,024 | 52,134 |
Deferred foreign capital gains tax | 449,489 | — | — | — |
Total Liabilities | 4,864,999 | 4,893,604 | 1,264,909 | 52,134 |
Net Assets | $163,926,226 | $671,062,140 | $507,282,453 | $267,520,530 |
October 31, 2022 | J.P. Morgan Exchange-Traded Funds | 219 |
AS OF October 31, 2022 (continued)
JPMorgan Diversified Return Emerging Markets Equity ETF | JPMorgan Diversified Return International Equity ETF | JPMorgan Diversified Return U.S. Equity ETF | JPMorgan Diversified Return U.S. Mid Cap Equity ETF | |
NET ASSETS: | ||||
Paid-in-Capital | $211,647,416 | $947,961,624 | $506,324,324 | $271,219,640 |
Total distributable earnings (loss) | (47,721,190) | (276,899,484) | 958,129 | (3,699,110) |
Total Net Assets | $163,926,226 | $671,062,140 | $507,282,453 | $267,520,530 |
Outstanding number of shares (unlimited number of shares authorized - par value $0.0001) | 3,600,000 | 15,100,000 | 5,400,000 | 3,200,000 |
Net asset value, per share | $45.54 | $44.44 | $93.94 | $83.60 |
Cost of investments in non-affiliates | $175,358,922 | $806,370,835 | $470,387,088 | $257,200,919 |
Cost of investments in affiliates | — | 569,430 | 1,020,750 | 414,054 |
Cost of foreign currency | — | 116,054 | — | — |
Investment securities on loan, at value (See Note 2.C.) | 160,016 | 3,818,777 | 380,385 | — |
Cost of investment of cash collateral (See Note 2.C.) | 182,157 | 4,047,394 | 391,775 | — |
220 | J.P. Morgan Exchange-Traded Funds | October 31, 2022 |
JPMorgan Diversified Return U.S. Small Cap Equity ETF | JPMorgan International Growth ETF | JPMorgan U.S. Momentum Factor ETF | |
ASSETS: | |||
Investments in non-affiliates, at value | $286,494,163 | $52,412,025 | $228,793,910 |
Investments in affiliates, at value | 325,140 | 2,455,095 | 340,337 |
Investments of cash collateral received from securities loaned, at value (See Note 2.C.) | 22,245,259 | 749,113 | 1,131,417 |
Cash | 3,248 | 46,842 | 7,745 |
Foreign currency, at value | — | 1,207 | — |
Deposits at broker for futures contracts | 16,500 | — | 19,000 |
Receivables: | |||
Fund shares sold | — | — | 1,911,026 |
Dividends from non-affiliates | 135,493 | 24,657 | 176,083 |
Dividends from affiliates | 25 | 192 | 27 |
Tax reclaims | — | 66,912 | — |
Securities lending income (See Note 2.C.) | 21,399 | — | 3,488 |
Variation margin on futures contracts | 222 | — | — |
Total Assets | 309,241,449 | 55,756,043 | 232,383,033 |
LIABILITIES: | |||
Payables: | |||
Investment securities purchased | — | — | 1,903,954 |
Collateral received on securities loaned (See Note 2.C.) | 22,245,259 | 749,113 | 1,131,417 |
Variation margin on futures contracts | — | — | 2,658 |
Accrued liabilities: | |||
Management fees (See Note 3.A.) | 63,193 | 24,825 | 21,886 |
Total Liabilities | 22,308,452 | 773,938 | 3,059,915 |
Net Assets | $286,932,997 | $54,982,105 | $229,323,118 |
NET ASSETS: | |||
Paid-in-Capital | $311,443,842 | $73,264,362 | $266,750,790 |
Total distributable earnings (loss) | (24,510,845) | (18,282,257) | (37,427,672) |
Total Net Assets | $286,932,997 | $54,982,105 | $229,323,118 |
Outstanding number of shares (unlimited number of shares authorized - par value $0.0001) | 7,200,000 | 1,150,000 | 6,000,000 |
Net asset value, per share | $39.85 | $47.81 | $38.22 |
Cost of investments in non-affiliates | $290,344,602 | $61,114,176 | $241,340,048 |
Cost of investments in affiliates | 325,140 | 2,455,095 | 340,337 |
Cost of foreign currency | — | 1,207 | — |
Investment securities on loan, at value (See Note 2.C.) | 21,395,218 | 704,050 | 1,103,874 |
Cost of investment of cash collateral (See Note 2.C.) | 22,242,620 | 749,113 | 1,131,417 |
October 31, 2022 | J.P. Morgan Exchange-Traded Funds | 221 |
AS OF October 31, 2022 (continued)
JPMorgan U.S. Quality Factor ETF | JPMorgan U.S. Value Factor ETF | |
ASSETS: | ||
Investments in non-affiliates, at value | $578,362,907 | $443,124,575 |
Investments in affiliates, at value | 785,535 | 377,263 |
Investments of cash collateral received from securities loaned, at value (See Note 2.C.) | 20,186,790 | 920,092 |
Cash | 17,917 | 10,158 |
Deposits at broker for futures contracts | 50,000 | 20,000 |
Receivables: | ||
Investment securities sold | 3,801,101 | — |
Fund shares sold | 80 | — |
Dividends from non-affiliates | 577,630 | 600,523 |
Dividends from affiliates | 61 | 30 |
Securities lending income (See Note 2.C.) | 10,621 | 51 |
Total Assets | 603,792,642 | 445,052,692 |
LIABILITIES: | ||
Payables: | ||
Collateral received on securities loaned (See Note 2.C.) | 20,186,790 | 920,092 |
Fund shares redeemed | 3,814,001 | — |
Variation margin on futures contracts | 7,006 | 2,887 |
Accrued liabilities: | ||
Management fees (See Note 3.A.) | 56,738 | 45,993 |
Total Liabilities | 24,064,535 | 968,972 |
Net Assets | $579,728,107 | $444,083,720 |
NET ASSETS: | ||
Paid-in-Capital | $632,132,980 | $545,723,402 |
Total distributable earnings (loss) | (52,404,873) | (101,639,682) |
Total Net Assets | $579,728,107 | $444,083,720 |
Outstanding number of shares (unlimited number of shares authorized - par value $0.0001) | 15,200,000 | 13,500,000 |
Net asset value, per share | $38.14 | $32.90 |
Cost of investments in non-affiliates | $594,885,184 | $489,954,879 |
Cost of investments in affiliates | 785,535 | 377,263 |
Investment securities on loan, at value (See Note 2.C.) | 19,486,422 | 904,560 |
Cost of investment of cash collateral (See Note 2.C.) | 20,186,590 | 919,884 |
222 | J.P. Morgan Exchange-Traded Funds | October 31, 2022 |
FOR THE YEAR ENDED October 31, 2022
JPMorgan ActiveBuilders Emerging Markets Equity ETF | JPMorgan ActiveBuilders International Equity ETF | JPMorgan BetaBuilders Canada ETF | JPMorgan BetaBuilders Developed Asia Pacific ex-Japan ETF (formerly known as JPMorgan BetaBuilders Developed Asia ex-Japan ETF) | |
INVESTMENT INCOME: | ||||
Interest income from non-affiliates | $— | $168 | $27,013 | $5,403 |
Interest income from affiliates | 60,658 | 122 | 931 | 2,737 |
Dividend income from non-affiliates | 27,888,599 | 871,094 | 192,971,017 | 177,537,619 |
Dividend income from affiliates | 81,456 | 3,898 | — | — |
Income from securities lending (net) (See Note 2.C.) | 4,321 | 379 | 2,045,993 | 329,402 |
Foreign taxes withheld (net) | (3,011,928) | (98,191) | (27,021,359) | (1,416,733) |
Total investment income | 25,023,106 | 777,470 | 168,023,595 | 176,458,428 |
EXPENSES: | ||||
Management fees (See Note 3.A.) | 2,427,172 | 63,496 | 11,811,284 | 7,680,737 |
Interest expense to non-affiliates | — | — | 999 | 7,292 |
Interest expense to affiliates | 4,217 | 73 | 1,829 | 1,300 |
Other | 35,544 | — | 303,625 | 270,321 |
Total expenses | 2,466,933 | 63,569 | 12,117,737 | 7,959,650 |
Net investment income (loss) | 22,556,173 | 713,901 | 155,905,858 | 168,498,778 |
REALIZED/UNREALIZED GAINS (LOSSES): | ||||
Net realized gain (loss) on transactions from: | ||||
Investments in non-affiliates | (62,465,593)(a) | (1,852,341) | (66,786,615) | (137,713,944) |
Investments in affiliates | (373) | — | — | — |
In-kind redemptions of investments in non-affiliates (See Note 4) | — | — | 88,368,918 | 41,320,716 |
Futures contracts | — | — | (1,046,309) | (1,782,087) |
Foreign currency transactions | (727,250) | (28,604) | (3,984,590) | (3,803,433) |
Net realized gain (loss) | (63,193,216) | (1,880,945) | 16,551,404 | (101,978,748) |
Change in net unrealized appreciation/depreciation on: | ||||
Investments in non-affiliates | (276,742,521)(b) | (5,503,588) | (1,077,058,793) | (907,434,455) |
Investments in affiliates | (227) | — | — | 33 |
Futures contracts | — | — | (344,300) | 338,478 |
Foreign currency translations | (5,940) | (3,068) | (465,732) | (413,985) |
Change in net unrealized appreciation/depreciation | (276,748,688) | (5,506,656) | (1,077,868,825) | (907,509,929) |
Net realized/unrealized gains (losses) | (339,941,904) | (7,387,601) | (1,061,317,421) | (1,009,488,677) |
Change in net assets resulting from operations | $(317,385,731) | $(6,673,700) | $(905,411,563) | $(840,989,899) |
October 31, 2022 | J.P. Morgan Exchange-Traded Funds | 223 |
FOR THE YEAR ENDED October 31, 2022 (continued)
JPMorgan BetaBuilders Europe ETF | JPMorgan BetaBuilders International Equity ETF | JPMorgan BetaBuilders Japan ETF | JPMorgan BetaBuilders U.S. Equity ETF | |
INVESTMENT INCOME: | ||||
Interest income from non-affiliates | $47,925 | $— | $— | $2,449 |
Interest income from affiliates | 8,350 | 1,904 | 96 | 2 |
Dividend income from non-affiliates | 284,662,750 | 98,578,610 | 180,557,400 | 15,235,482 |
Dividend income from affiliates | — | 100,094 | — | 395,734 |
Income from securities lending (net) (See Note 2.C.) | 2,164,320 | 448,518 | 385,878 | 42,995 |
Foreign taxes withheld (net) | (31,402,169) | (8,809,161) | (18,053,827) | — |
Total investment income | 255,481,176 | 90,319,965 | 162,889,547 | 15,676,662 |
EXPENSES: | ||||
Management fees (See Note 3.A.) | 6,656,195 | 2,134,418 | 13,462,470 | 205,372 |
Interest expense to non-affiliates | 55,255 | 476 | 11,019 | 411 |
Interest expense to affiliates | 112,433 | 5,701 | 48,157 | — |
Other | 255,369 | 26,270 | 288,061 | 46,909 |
Total expenses | 7,079,252 | 2,166,865 | 13,809,707 | 252,692 |
Net investment income (loss) | 248,401,924 | 88,153,100 | 149,079,840 | 15,423,970 |
REALIZED/UNREALIZED GAINS (LOSSES): | ||||
Net realized gain (loss) on transactions from: | ||||
Investments in non-affiliates | (156,516,517) | (42,121,253) | (172,460,993) | (16,948,055) |
Investments in affiliates | — | — | — | (202,749) |
In-kind redemptions of investments in non-affiliates (See Note 4) | (116,270,725) | 61,552,036 | 112,138,563 | 22,359,482 |
In-kind redemptions of investments in affiliates (See Note 4) | — | — | — | 81,559 |
Futures contracts | 2,729,355 | (4,500,683) | (5,282,016) | (803,039) |
Foreign currency transactions | (6,001,490) | (1,759,695) | (14,486,441) | — |
Net realized gain (loss) | (276,059,377) | 13,170,405 | (80,090,887) | 4,487,198 |
Change in net unrealized appreciation/depreciation on: | ||||
Investments in non-affiliates | (1,623,647,591) | (891,549,995) | (2,110,899,231) | (201,560,235) |
Investments in affiliates | 8,328 | (98) | — | (2,675,749) |
Futures contracts | (663,360) | (746,228) | 2,783,985 | (186,674) |
Foreign currency translations | (1,856,185) | (434,633) | (691,470) | — |
Change in net unrealized appreciation/depreciation | (1,626,158,808) | (892,730,954) | (2,108,806,716) | (204,422,658) |
Net realized/unrealized gains (losses) | (1,902,218,185) | (879,560,549) | (2,188,897,603) | (199,935,460) |
Change in net assets resulting from operations | $(1,653,816,261) | $(791,407,449) | $(2,039,817,763) | $(184,511,490) |
224 | J.P. Morgan Exchange-Traded Funds | October 31, 2022 |
JPMorgan BetaBuilders U.S. Mid Cap Equity ETF | JPMorgan BetaBuilders U.S. Small Cap Equity ETF | JPMorgan Carbon Transition U.S. Equity ETF | JPMorgan Climate Change Solutions ETF (a) | |
INVESTMENT INCOME: | ||||
Interest income from non-affiliates | $9,093 | $5,423 | $80 | $1 |
Interest income from affiliates | 45 | 32 | — | 209 |
Dividend income from non-affiliates | 19,151,981 | 5,700,645 | 344,200 | 308,849 |
Dividend income from affiliates | 108,633 | 71,850 | 285 | 19 |
Non-cash dividend income from non-affiliates | — | — | — | 43,477 |
Income from securities lending (net) (See Note 2.C.) | 882,619 | 766,673 | — | — |
Foreign taxes withheld (net) | — | — | — | (25,290) |
Total investment income | 20,152,371 | 6,544,623 | 344,565 | 327,265 |
EXPENSES: | ||||
Management fees (See Note 3.A.) | 1,028,162 | 403,474 | 33,879 | 91,152 |
Interest expense to non-affiliates | 1,267 | 731 | — | — |
Interest expense to affiliates | — | — | — | 35 |
Other | — | — | 69 | — |
Total expenses | 1,029,429 | 404,205 | 33,948 | 91,187 |
Net investment income (loss) | 19,122,942 | 6,140,418 | 310,617 | 236,078 |
REALIZED/UNREALIZED GAINS (LOSSES): | ||||
Net realized gain (loss) on transactions from: | ||||
Investments in non-affiliates | (150,126,407) | (36,518,474) | (1,365,090) | (3,152,463) |
Investments in affiliates | — | — | — | (24) |
In-kind redemptions of investments in non-affiliates (See Note 4) | 152,112,852 | 23,612,174 | 1,957,290 | — |
Futures contracts | (1,640,292) | (1,267,262) | (6,573) | — |
Foreign currency transactions | (9) | — | — | (379) |
Net realized gain (loss) | 346,144 | (14,173,562) | 585,627 | (3,152,866) |
Distribution of capital gains received from investment company affiliates | 604 | — | — | — |
Change in net unrealized appreciation/depreciation on: | ||||
Investments in non-affiliates | (351,000,265) | (78,910,661) | (4,502,326) | (3,894,165) |
Investments in affiliates | 2,447 | 4,202 | — | — |
Futures contracts | 317,400 | 149,018 | 789 | — |
Foreign currency translations | — | — | — | (1,138) |
Change in net unrealized appreciation/depreciation | (350,680,418) | (78,757,441) | (4,501,537) | (3,895,303) |
Net realized/unrealized gains (losses) | (350,333,670) | (92,931,003) | (3,915,910) | (7,048,169) |
Change in net assets resulting from operations | $(331,210,728) | $(86,790,585) | $(3,605,293) | $(6,812,091) |
October 31, 2022 | J.P. Morgan Exchange-Traded Funds | 225 |
FOR THE YEAR ENDED October 31, 2022 (continued)
JPMorgan Diversified Return Emerging Markets Equity ETF | JPMorgan Diversified Return International Equity ETF | JPMorgan Diversified Return U.S. Equity ETF | JPMorgan Diversified Return U.S. Mid Cap Equity ETF | |
INVESTMENT INCOME: | ||||
Interest income from non-affiliates | $1,060 | $516,165 | $519 | $706 |
Interest income from affiliates | 404 | 453 | 2 | — |
Dividend income from non-affiliates | 8,501,696 | 31,737,433 | 13,689,899 | 5,063,665 |
Dividend income from affiliates | 254 | 14,936 | 8,370 | 4,349 |
Income from securities lending (net) (See Note 2.C.) | 3,790 | 131,625 | 14,230 | 8,520 |
Foreign taxes withheld (net) | (896,025) | (1,954,164) | — | — |
Total investment income | 7,611,179 | 30,446,448 | 13,713,020 | 5,077,240 |
EXPENSES: | ||||
Management fees (See Note 3.A.) | 722,512 | 2,840,842 | 1,045,759 | 590,788 |
Interest expense to non-affiliates | — | 488 | 206 | — |
Interest expense to affiliates | 2 | 603 | — | — |
Other | 6,686 | 22,177 | 9,052 | 8,271 |
Total expenses | 729,200 | 2,864,110 | 1,055,017 | 599,059 |
Net investment income (loss) | 6,881,979 | 27,582,338 | 12,658,003 | 4,478,181 |
REALIZED/UNREALIZED GAINS (LOSSES): | ||||
Net realized gain (loss) on transactions from: | ||||
Investments in non-affiliates | (3,093,571)(a) | (27,132,526) | (3,898,598) | (898,890) |
Investments in affiliates | — | (1,334) | — | — |
In-kind redemptions of investments in non-affiliates (See Note 4) | 644,094 | 1,329,604 | 94,669,238 | 21,537,344 |
Futures contracts | (87,698) | (1,638,676) | (95,441) | (65,144) |
Foreign currency transactions | 40,355 | (816,462) | — | — |
Net realized gain (loss) | (2,496,820) | (28,259,394) | 90,675,199 | 20,573,310 |
Distribution of capital gains received from investment company affiliates | — | 42 | — | — |
Change in net unrealized appreciation/depreciation on: | ||||
Investments in non-affiliates | (31,021,174)(b) | (198,811,980) | (128,749,913) | (45,504,507) |
Investments in affiliates | — | 1,123 | 100 | 20 |
Futures contracts | 4,805 | 30,358 | (3,974) | 36,921 |
Foreign currency translations | (47,210) | (125,756) | (1) | — |
Change in net unrealized appreciation/depreciation | (31,063,579) | (198,906,255) | (128,753,788) | (45,467,566) |
Net realized/unrealized gains (losses) | (33,560,399) | (227,165,607) | (38,078,589) | (24,894,256) |
Change in net assets resulting from operations | $(26,678,420) | $(199,583,269) | $(25,420,586) | $(20,416,075) |
226 | J.P. Morgan Exchange-Traded Funds | October 31, 2022 |
JPMorgan Diversified Return U.S. Small Cap Equity ETF | JPMorgan International Growth ETF | JPMorgan U.S. Momentum Factor ETF | |
INVESTMENT INCOME: | |||
Interest income from non-affiliates | $552 | $238 | $231 |
Interest income from affiliates | 2 | 21 | — |
Dividend income from non-affiliates | 3,682,416 | 837,258 | 3,090,293 |
Dividend income from affiliates | 6,683 | 11,767 | 3,767 |
Income from securities lending (net) (See Note 2.C.) | 176,868 | 42 | 48,771 |
Foreign taxes withheld (net) | — | (71,527) | — |
Total investment income | 3,866,521 | 777,799 | 3,143,062 |
EXPENSES: | |||
Management fees (See Note 3.A.) | 606,846 | 326,344 | 283,720 |
Interest expense to affiliates | — | 117 | — |
Other | 7,464 | 2,468 | 7,584 |
Total expenses | 614,310 | 328,929 | 291,304 |
Net investment income (loss) | 3,252,211 | 448,870 | 2,851,758 |
REALIZED/UNREALIZED GAINS (LOSSES): | |||
Net realized gain (loss) on transactions from: | |||
Investments in non-affiliates | (10,113,699) | (9,916,696) | (20,554,497) |
In-kind redemptions of investments in non-affiliates (See Note 4) | 15,327,118 | 904,212 | 26,744,128 |
Futures contracts | (252,581) | — | 27,810 |
Foreign currency transactions | — | (9,929) | — |
Net realized gain (loss) | 4,960,838 | (9,022,413) | 6,217,441 |
Change in net unrealized appreciation/depreciation on: | |||
Investments in non-affiliates | (31,229,191) | (19,652,010) | (61,409,052) |
Investments in affiliates | 2,639 | — | — |
Futures contracts | 6,465 | — | 18,123 |
Foreign currency translations | — | (7,282) | — |
Change in net unrealized appreciation/depreciation | (31,220,087) | (19,659,292) | (61,390,929) |
Net realized/unrealized gains (losses) | (26,259,249) | (28,681,705) | (55,173,488) |
Change in net assets resulting from operations | $(23,007,038) | $(28,232,835) | $(52,321,730) |
October 31, 2022 | J.P. Morgan Exchange-Traded Funds | 227 |
FOR THE YEAR ENDED October 31, 2022 (continued)
JPMorgan U.S. Quality Factor ETF | JPMorgan U.S. Value Factor ETF | |
INVESTMENT INCOME: | ||
Interest income from non-affiliates | $517 | $729 |
Interest income from affiliates | 1 | — |
Dividend income from non-affiliates | 7,923,631 | 12,268,833 |
Dividend income from affiliates | 9,184 | 11,844 |
Income from securities lending (net) (See Note 2.C.) | 73,071 | 8,551 |
Total investment income | 8,006,404 | 12,289,957 |
EXPENSES: | ||
Management fees (See Note 3.A.) | 545,487 | 614,120 |
Other | 10,244 | 6,184 |
Total expenses | 555,731 | 620,304 |
Net investment income (loss) | 7,450,673 | 11,669,653 |
REALIZED/UNREALIZED GAINS (LOSSES): | ||
Net realized gain (loss) on transactions from: | ||
Investments in non-affiliates | (28,501,135) | (33,885,570) |
In-kind redemptions of investments in non-affiliates (See Note 4) | 50,386,054 | 21,908,154 |
Futures contracts | (225,047) | (340,912) |
Net realized gain (loss) | 21,659,872 | (12,318,328) |
Distribution of capital gains received from investment company affiliates | — | 74 |
Change in net unrealized appreciation/depreciation on: | ||
Investments in non-affiliates | (80,852,731) | (55,813,717) |
Investments in affiliates | 200 | 208 |
Futures contracts | 39,537 | (4,290) |
Change in net unrealized appreciation/depreciation | (80,812,994) | (55,817,799) |
Net realized/unrealized gains (losses) | (59,153,122) | (68,136,053) |
Change in net assets resulting from operations | $(51,702,449) | $(56,466,400) |
228 | J.P. Morgan Exchange-Traded Funds | October 31, 2022 |
FOR THE PERIODS INDICATED
JPMorgan ActiveBuilders Emerging Markets Equity ETF | JPMorgan ActiveBuilders International Equity ETF | |||
Year Ended October 31, 2022 | Period Ended October 31, 2021 (a) | Year Ended October 31, 2022 | Period Ended October 31, 2021 (b) | |
CHANGE IN NET ASSETS RESULTING FROM OPERATIONS: | ||||
Net investment income (loss) | $22,556,173 | $2,679,156 | $713,901 | $203,012 |
Net realized gain (loss) | (63,193,216) | (593,949) | (1,880,945) | (69,347) |
Change in net unrealized appreciation/depreciation | (276,748,688) | (12,896,276) | (5,506,656) | 496,351 |
Change in net assets resulting from operations | (317,385,731) | (10,811,069) | (6,673,700) | 630,016 |
DISTRIBUTIONS TO SHAREHOLDERS: | ||||
Total distributions to shareholders | (5,165,856) | — | (319,380) | — |
CAPITAL TRANSACTIONS: | ||||
Change in net assets resulting from capital transactions | 903,841,753 | 336,675,029 | — | 28,789,940 |
NET ASSETS: | ||||
Change in net assets | 581,290,166 | 325,863,960 | (6,993,080) | 29,419,956 |
Beginning of period | 325,863,960 | — | 29,419,956 | — |
End of period | $907,154,126 | $325,863,960 | $22,426,876 | $29,419,956 |
CAPITAL TRANSACTIONS: | ||||
Proceeds from shares issued | $903,841,753 | $336,675,029 | $— | $28,789,940 |
Total change in net assets resulting from capital transactions | $903,841,753 | $336,675,029 | $— | $28,789,940 |
SHARE TRANSACTIONS: | ||||
Issued | 22,400,000 | 6,800,000 | — | 600,000 |
Net increase (decrease) in shares from share transactions | 22,400,000 | 6,800,000 | — | 600,000 |
October 31, 2022 | J.P. Morgan Exchange-Traded Funds | 229 |
FOR THE PERIODS INDICATED (continued)
JPMorgan BetaBuilders Canada ETF | JPMorgan BetaBuilders Developed Asia Pacific ex-Japan ETF (formerly known as JPMorgan BetaBuilders Developed Asia ex-Japan ETF) | |||
Year Ended October 31, 2022 | Year Ended October 31, 2021 | Year Ended October 31, 2022 | Year Ended October 31, 2021 | |
CHANGE IN NET ASSETS RESULTING FROM OPERATIONS: | ||||
Net investment income (loss) | $155,905,858 | $116,418,038 | $168,498,778 | $145,165,781 |
Net realized gain (loss) | 16,551,404 | 55,416,108 | (101,978,748) | (6,954,174) |
Change in net unrealized appreciation/depreciation | (1,077,868,825) | 1,736,255,618 | (907,509,929) | 397,969,872 |
Change in net assets resulting from operations | (905,411,563) | 1,908,089,764 | (840,989,899) | 536,181,479 |
DISTRIBUTIONS TO SHAREHOLDERS: | ||||
Total distributions to shareholders | (152,620,697) | (113,624,161) | (267,459,428) | (130,441,819) |
CAPITAL TRANSACTIONS: | ||||
Change in net assets resulting from capital transactions | 631,036,936 | 636,591,756 | 407,341,684 | 2,241,407,993 |
NET ASSETS: | ||||
Change in net assets | (426,995,324) | 2,431,057,359 | (701,107,643) | 2,647,147,653 |
Beginning of period | 6,071,268,619 | 3,640,211,260 | 4,113,118,547 | 1,465,970,894 |
End of period | $5,644,273,295 | $6,071,268,619 | $3,412,010,904 | $4,113,118,547 |
CAPITAL TRANSACTIONS: | ||||
Proceeds from shares issued | $890,586,159 | $758,394,817 | $581,070,458 | $2,313,974,196 |
Cost of shares redeemed | (259,549,223) | (121,803,061) | (173,728,774) | (72,566,203) |
Total change in net assets resulting from capital transactions | $631,036,936 | $636,591,756 | $407,341,684 | $2,241,407,993 |
SHARE TRANSACTIONS: | ||||
Issued | 13,350,000 | 12,300,000(a) | 11,000,000 | 41,000,000(a) |
Redeemed | (4,400,000) | (1,901,089)(a) | (3,500,000) | (1,301,359)(a) |
Net increase (decrease) in shares from share transactions | 8,950,000 | 10,398,911 | 7,500,000 | 39,698,641 |
230 | J.P. Morgan Exchange-Traded Funds | October 31, 2022 |
JPMorgan BetaBuilders Europe ETF | JPMorgan BetaBuilders International Equity ETF | |||
Year Ended October 31, 2022 | Year Ended October 31, 2021 | Year Ended October 31, 2022 | Year Ended October 31, 2021 | |
CHANGE IN NET ASSETS RESULTING FROM OPERATIONS: | ||||
Net investment income (loss) | $248,401,924 | $186,741,805 | $88,153,100 | $93,794,835 |
Net realized gain (loss) | (276,059,377) | 173,173,700 | 13,170,405 | 57,414,713 |
Change in net unrealized appreciation/depreciation | (1,626,158,808) | 1,265,712,790 | (892,730,954) | 604,876,597 |
Change in net assets resulting from operations | (1,653,816,261) | 1,625,628,295 | (791,407,449) | 756,086,145 |
DISTRIBUTIONS TO SHAREHOLDERS: | ||||
Total distributions to shareholders | (309,349,480) | (162,749,406) | (124,967,513) | (83,978,586) |
CAPITAL TRANSACTIONS: | ||||
Change in net assets resulting from capital transactions | (3,936,599,878) | 4,263,568,980 | (53,668,198) | 1,141,362,817 |
NET ASSETS: | ||||
Change in net assets | (5,899,765,619) | 5,726,447,869 | (970,043,160) | 1,813,470,376 |
Beginning of period | 9,427,453,378 | 3,701,005,509 | 3,680,140,678 | 1,866,670,302 |
End of period | $3,527,687,759 | $9,427,453,378 | $2,710,097,518 | $3,680,140,678 |
CAPITAL TRANSACTIONS: | ||||
Proceeds from shares issued | $3,919,047,179 | $5,534,506,823 | $275,139,027 | $1,372,694,023 |
Cost of shares redeemed | (7,855,647,057) | (1,270,937,843) | (328,807,225) | (231,331,206) |
Total change in net assets resulting from capital transactions | $(3,936,599,878) | $4,263,568,980 | $(53,668,198) | $1,141,362,817 |
SHARE TRANSACTIONS: | ||||
Issued | 78,900,000 | 96,500,000(a) | 5,800,000 | 24,400,000 |
Redeemed | (155,800,000) | (24,200,404)(a) | (6,000,000) | (4,000,000) |
Net increase (decrease) in shares from share transactions | (76,900,000) | 72,299,596 | (200,000) | 20,400,000 |
October 31, 2022 | J.P. Morgan Exchange-Traded Funds | 231 |
FOR THE PERIODS INDICATED (continued)
JPMorgan BetaBuilders Japan ETF | JPMorgan BetaBuilders U.S. Equity ETF | |||
Year Ended October 31, 2022 | Year Ended October 31, 2021 | Year Ended October 31, 2022 | Year Ended October 31, 2021 | |
CHANGE IN NET ASSETS RESULTING FROM OPERATIONS: | ||||
Net investment income (loss) | $149,079,840 | $147,334,454 | $15,423,970 | $6,535,651 |
Net realized gain (loss) | (80,090,887) | 467,914,152 | 4,487,198 | 15,444,975 |
Change in net unrealized appreciation/depreciation | (2,108,806,716) | 440,258,321 | (204,422,658) | 123,924,342 |
Change in net assets resulting from operations | (2,039,817,763) | 1,055,506,927 | (184,511,490) | 145,904,968 |
DISTRIBUTIONS TO SHAREHOLDERS: | ||||
Total distributions to shareholders | (220,078,396) | (70,569,312) | (14,262,272) | (5,799,680) |
CAPITAL TRANSACTIONS: | ||||
Change in net assets resulting from capital transactions | 606,595,869 | 1,556,564,791 | 692,691,398 | 404,128,109 |
NET ASSETS: | ||||
Change in net assets | (1,653,300,290) | 2,541,502,406 | 493,917,636 | 544,233,397 |
Beginning of period | 7,864,537,853 | 5,323,035,447 | 782,605,972 | 238,372,575 |
End of period | $6,211,237,563 | $7,864,537,853 | $1,276,523,608 | $782,605,972 |
CAPITAL TRANSACTIONS: | ||||
Proceeds from shares issued | $1,208,227,460 | $3,261,931,039 | $768,415,533 | $453,678,097 |
Cost of shares redeemed | (601,631,591) | (1,705,366,248) | (75,724,135) | (49,549,988) |
Total change in net assets resulting from capital transactions | $606,595,869 | $1,556,564,791 | $692,691,398 | $404,128,109 |
SHARE TRANSACTIONS: | ||||
Issued | 23,400,000 | 57,400,000(a) | 10,150,000 | 6,000,000 |
Redeemed | (12,000,000) | (29,802,452)(a) | (1,050,000) | (700,000) |
Net increase (decrease) in shares from share transactions | 11,400,000 | 27,597,548 | 9,100,000 | 5,300,000 |
232 | J.P. Morgan Exchange-Traded Funds | October 31, 2022 |
JPMorgan BetaBuilders U.S. Mid Cap Equity ETF | JPMorgan BetaBuilders U.S. Small Cap Equity ETF | |||
Year Ended October 31, 2022 | Year Ended October 31, 2021 | Year Ended October 31, 2022 | Period Ended October 31, 2021 (a) | |
CHANGE IN NET ASSETS RESULTING FROM OPERATIONS: | ||||
Net investment income (loss) | $19,122,942 | $16,342,792 | $6,140,418 | $2,804,780 |
Net realized gain (loss) | 346,144 | 191,521,497 | (14,173,562) | 10,807,502 |
Distributions of capital gains received from investment company affiliates | 604 | — | — | — |
Change in net unrealized appreciation/depreciation | (350,680,418) | 308,087,619 | (78,757,441) | 21,084,695 |
Change in net assets resulting from operations | (331,210,728) | 515,951,908 | (86,790,585) | 34,696,977 |
DISTRIBUTIONS TO SHAREHOLDERS: | ||||
Total distributions to shareholders | (18,142,752) | (13,365,064) | (6,135,146) | (2,261,493) |
CAPITAL TRANSACTIONS: | ||||
Change in net assets resulting from capital transactions | 41,293,712 | 207,905,317 | 145,626,501 | 409,626,006 |
NET ASSETS: | ||||
Change in net assets | (308,059,768) | 710,492,161 | 52,700,770 | 442,061,490 |
Beginning of period | 1,698,624,114 | 988,131,953 | 442,061,490 | — |
End of period | $1,390,564,346 | $1,698,624,114 | $494,762,260 | $442,061,490 |
CAPITAL TRANSACTIONS: | ||||
Proceeds from shares issued | $585,288,055 | $1,062,480,424 | $286,035,202 | $537,840,503 |
Cost of shares redeemed | (543,994,343) | (854,575,107) | (140,408,701) | (128,214,497) |
Total change in net assets resulting from capital transactions | $41,293,712 | $207,905,317 | $145,626,501 | $409,626,006 |
SHARE TRANSACTIONS: | ||||
Issued | 7,100,000 | 12,750,000 | 4,900,000 | 8,500,000 |
Redeemed | (6,475,000) | (10,000,000) | (2,400,000) | (1,950,000) |
Net increase (decrease) in shares from share transactions | 625,000 | 2,750,000 | 2,500,000 | 6,550,000 |
October 31, 2022 | J.P. Morgan Exchange-Traded Funds | 233 |
FOR THE PERIODS INDICATED (continued)
JPMorgan Carbon Transition U.S. Equity ETF | JPMorgan Climate Change Solutions ETF | ||
Year Ended October 31, 2022 | Period Ended October 31, 2021 (a) | Period Ended October 31, 2022 (b) | |
CHANGE IN NET ASSETS RESULTING FROM OPERATIONS: | |||
Net investment income (loss) | $310,617 | $283,722 | $236,078 |
Net realized gain (loss) | 585,627 | 1,302,566 | (3,152,866) |
Change in net unrealized appreciation/depreciation | (4,501,537) | 4,455,496 | (3,895,303) |
Change in net assets resulting from operations | (3,605,293) | 6,041,784 | (6,812,091) |
DISTRIBUTIONS TO SHAREHOLDERS: | |||
Total distributions to shareholders | (316,660) | (242,528) | (15,288) |
CAPITAL TRANSACTIONS: | |||
Change in net assets resulting from capital transactions | (63,760) | 19,134,138 | 26,388,065 |
NET ASSETS: | |||
Change in net assets | (3,985,713) | 24,933,394 | 19,560,686 |
Beginning of period | 24,933,394 | — | — |
End of period | $20,947,681 | $24,933,394 | $19,560,686 |
CAPITAL TRANSACTIONS: | |||
Proceeds from shares issued | $11,343,556 | $28,088,814 | $26,388,065 |
Cost of shares redeemed | (11,407,316) | (8,954,676) | — |
Total change in net assets resulting from capital transactions | $(63,760) | $19,134,138 | $26,388,065 |
SHARE TRANSACTIONS: | |||
Issued | 200,000 | 550,000 | 550,000 |
Redeemed | (200,000) | (150,000) | — |
Net increase (decrease) in shares from share transactions | — | 400,000 | 550,000 |
234 | J.P. Morgan Exchange-Traded Funds | October 31, 2022 |
JPMorgan Diversified Return Emerging Markets Equity ETF | JPMorgan Diversified Return International Equity ETF | |||
Year Ended October 31, 2022 | Year Ended October 31, 2021 | Year Ended October 31, 2022 | Year Ended October 31, 2021 | |
CHANGE IN NET ASSETS RESULTING FROM OPERATIONS: | ||||
Net investment income (loss) | $6,881,979 | $6,411,783 | $27,582,338 | $27,890,593 |
Net realized gain (loss) | (2,496,820) | 12,861,727 | (28,259,394) | 48,317,967 |
Distributions of capital gains received from investment company affiliates | — | — | 42 | — |
Change in net unrealized appreciation/depreciation | (31,063,579) | 35,165,878 | (198,906,255) | 134,443,885 |
Change in net assets resulting from operations | (26,678,420) | 54,439,388 | (199,583,269) | 210,652,445 |
DISTRIBUTIONS TO SHAREHOLDERS: | ||||
Total distributions to shareholders | (8,578,159) | (6,292,381) | (41,010,274) | (25,542,042) |
CAPITAL TRANSACTIONS: | ||||
Change in net assets resulting from capital transactions | 45,300,057 | (108,024,401) | 69,639,461 | (210,294,305) |
NET ASSETS: | ||||
Change in net assets | 10,043,478 | (59,877,394) | (170,954,082) | (25,183,902) |
Beginning of period | 153,882,748 | 213,760,142 | 842,016,222 | 867,200,124 |
End of period | $163,926,226 | $153,882,748 | $671,062,140 | $842,016,222 |
CAPITAL TRANSACTIONS: | ||||
Proceeds from shares issued | $59,899,317 | $— | $80,575,234 | $12,477,390 |
Cost of shares redeemed | (14,599,260) | (108,024,401) | (10,935,773) | (222,771,695) |
Total change in net assets resulting from capital transactions | $45,300,057 | $(108,024,401) | $69,639,461 | $(210,294,305) |
SHARE TRANSACTIONS: | ||||
Issued | 1,200,000 | — | 1,500,000 | 200,000 |
Redeemed | (300,000) | (1,900,000) | (200,000) | (3,800,000) |
Net increase (decrease) in shares from share transactions | 900,000 | (1,900,000) | 1,300,000 | (3,600,000) |
October 31, 2022 | J.P. Morgan Exchange-Traded Funds | 235 |
FOR THE PERIODS INDICATED (continued)
JPMorgan Diversified Return U.S. Equity ETF | JPMorgan Diversified Return U.S. Mid Cap Equity ETF | |||
Year Ended October 31, 2022 | Year Ended October 31, 2021 | Year Ended October 31, 2022 | Year Ended October 31, 2021 | |
CHANGE IN NET ASSETS RESULTING FROM OPERATIONS: | ||||
Net investment income (loss) | $12,658,003 | $12,226,454 | $4,478,181 | $3,862,473 |
Net realized gain (loss) | 90,675,199 | 54,114,412 | 20,573,310 | 40,618,595 |
Change in net unrealized appreciation/depreciation | (128,753,788) | 144,832,764 | (45,467,566) | 45,263,900 |
Change in net assets resulting from operations | (25,420,586) | 211,173,630 | (20,416,075) | 89,744,968 |
DISTRIBUTIONS TO SHAREHOLDERS: | ||||
Total distributions to shareholders | (12,386,546) | (11,091,933) | (4,185,258) | (3,596,501) |
CAPITAL TRANSACTIONS: | ||||
Change in net assets resulting from capital transactions | (164,922,989) | (26,778,764) | 52,313,151 | (66,547,601) |
NET ASSETS: | ||||
Change in net assets | (202,730,121) | 173,302,933 | 27,711,818 | 19,600,866 |
Beginning of period | 710,012,574 | 536,709,641 | 239,808,712 | 220,207,846 |
End of period | $507,282,453 | $710,012,574 | $267,520,530 | $239,808,712 |
CAPITAL TRANSACTIONS: | ||||
Proceeds from shares issued | $116,289,482 | $90,741,445 | $119,917,257 | $41,422,965 |
Cost of shares redeemed | (281,212,471) | (117,520,209) | (67,604,106) | (107,970,566) |
Total change in net assets resulting from capital transactions | $(164,922,989) | $(26,778,764) | $52,313,151 | $(66,547,601) |
SHARE TRANSACTIONS: | ||||
Issued | 1,200,000 | 1,000,000 | 1,400,000 | 500,000 |
Redeemed | (2,800,000) | (1,300,000) | (800,000) | (1,300,000) |
Net increase (decrease) in shares from share transactions | (1,600,000) | (300,000) | 600,000 | (800,000) |
236 | J.P. Morgan Exchange-Traded Funds | October 31, 2022 |
JPMorgan Diversified Return U.S. Small Cap Equity ETF | JPMorgan International Growth ETF | |||
Year Ended October 31, 2022 | Year Ended October 31, 2021 | Year Ended October 31, 2022 | Year Ended October 31, 2021 | |
CHANGE IN NET ASSETS RESULTING FROM OPERATIONS: | ||||
Net investment income (loss) | $3,252,211 | $1,963,738 | $448,870 | $140,679 |
Net realized gain (loss) | 4,960,838 | 34,553,371 | (9,022,413) | 3,165,822 |
Change in net unrealized appreciation/depreciation | (31,220,087) | 42,626,246 | (19,659,292) | 7,129,158 |
Change in net assets resulting from operations | (23,007,038) | 79,143,355 | (28,232,835) | 10,435,659 |
DISTRIBUTIONS TO SHAREHOLDERS: | ||||
Total distributions to shareholders | (2,874,215) | (2,069,847) | (823,639) | (18,324) |
CAPITAL TRANSACTIONS: | ||||
Change in net assets resulting from capital transactions | 136,552,064 | (49,484,147) | 22,746,629 | 13,086,957 |
NET ASSETS: | ||||
Change in net assets | 110,670,811 | 27,589,361 | (6,309,845) | 23,504,292 |
Beginning of period | 176,262,186 | 148,672,825 | 61,291,950 | 37,787,658 |
End of period | $286,932,997 | $176,262,186 | $54,982,105 | $61,291,950 |
CAPITAL TRANSACTIONS: | ||||
Proceeds from shares issued | $185,306,143 | $36,921,776 | $29,268,696 | $22,434,133 |
Cost of shares redeemed | (48,754,079) | (86,405,923) | (6,522,067) | (9,347,176) |
Total change in net assets resulting from capital transactions | $136,552,064 | $(49,484,147) | $22,746,629 | $13,086,957 |
SHARE TRANSACTIONS: | ||||
Issued | 4,550,000 | 850,000 | 500,000 | 300,000 |
Redeemed | (1,250,000) | (2,100,000) | (125,000) | (125,000) |
Net increase (decrease) in shares from share transactions | 3,300,000 | (1,250,000) | 375,000 | 175,000 |
October 31, 2022 | J.P. Morgan Exchange-Traded Funds | 237 |
FOR THE PERIODS INDICATED (continued)
JPMorgan U.S. Momentum Factor ETF | JPMorgan U.S. Quality Factor ETF | |||
Year Ended October 31, 2022 | Year Ended October 31, 2021 | Year Ended October 31, 2022 | Year Ended October 31, 2021 | |
CHANGE IN NET ASSETS RESULTING FROM OPERATIONS: | ||||
Net investment income (loss) | $2,851,758 | $1,432,327 | $7,450,673 | $6,171,280 |
Net realized gain (loss) | 6,217,441 | 30,365,700 | 21,659,872 | 78,968,597 |
Change in net unrealized appreciation/depreciation | (61,390,929) | 28,802,240 | (80,812,994) | 47,024,395 |
Change in net assets resulting from operations | (52,321,730) | 60,600,267 | (51,702,449) | 132,164,272 |
DISTRIBUTIONS TO SHAREHOLDERS: | ||||
Total distributions to shareholders | (2,634,717) | (1,301,587) | (6,843,698) | (6,236,190) |
CAPITAL TRANSACTIONS: | ||||
Change in net assets resulting from capital transactions | 62,421,394 | 27,816,405 | 245,070,163 | (117,395,200) |
NET ASSETS: | ||||
Change in net assets | 7,464,947 | 87,115,085 | 186,524,016 | 8,532,882 |
Beginning of period | 221,858,171 | 134,743,086 | 393,204,091 | 384,671,209 |
End of period | $229,323,118 | $221,858,171 | $579,728,107 | $393,204,091 |
CAPITAL TRANSACTIONS: | ||||
Proceeds from shares issued | $162,800,375 | $98,690,820 | $519,385,603 | $173,997,583 |
Cost of shares redeemed | (100,378,981) | (70,874,415) | (274,315,440) | (291,392,783) |
Total change in net assets resulting from capital transactions | $62,421,394 | $27,816,405 | $245,070,163 | $(117,395,200) |
SHARE TRANSACTIONS: | ||||
Issued | 3,750,000 | 2,300,000 | 13,150,000 | 4,500,000 |
Redeemed | (2,400,000) | (1,650,000) | (7,000,000) | (7,650,000) |
Net increase (decrease) in shares from share transactions | 1,350,000 | 650,000 | 6,150,000 | (3,150,000) |
238 | J.P. Morgan Exchange-Traded Funds | October 31, 2022 |
JPMorgan U.S. Value Factor ETF | ||
Year Ended October 31, 2022 | Year Ended October 31, 2021 | |
CHANGE IN NET ASSETS RESULTING FROM OPERATIONS: | ||
Net investment income (loss) | $11,669,653 | $11,282,222 |
Net realized gain (loss) | (12,318,328) | 73,664,284 |
Distributions of capital gains received from investment company affiliates | 74 | — |
Change in net unrealized appreciation/depreciation | (55,817,799) | 11,907,585 |
Change in net assets resulting from operations | (56,466,400) | 96,854,091 |
DISTRIBUTIONS TO SHAREHOLDERS: | ||
Total distributions to shareholders | (11,652,973) | (9,906,929) |
CAPITAL TRANSACTIONS: | ||
Change in net assets resulting from capital transactions | 111,623,606 | 251,164,170 |
NET ASSETS: | ||
Change in net assets | 43,504,233 | 338,111,332 |
Beginning of period | 400,579,487 | 62,468,155 |
End of period | $444,083,720 | $400,579,487 |
CAPITAL TRANSACTIONS: | ||
Proceeds from shares issued | $372,923,059 | $1,140,325,211 |
Cost of shares redeemed | (261,299,453) | (889,161,041) |
Total change in net assets resulting from capital transactions | $111,623,606 | $251,164,170 |
SHARE TRANSACTIONS: | ||
Issued | 10,450,000 | 32,750,000 |
Redeemed | (7,750,000) | (24,450,000) |
Net increase (decrease) in shares from share transactions | 2,700,000 | 8,300,000 |
October 31, 2022 | J.P. Morgan Exchange-Traded Funds | 239 |
FOR THE PERIODS INDICATED
Per share operating performance | ||||||
Investment operations | Distributions | |||||
Net asset value, beginning of period | Net investment income (loss) (b) | Net realized and unrealized gains (losses) on investments | Total from investment operations | Net investment income | Net realized gain | |
JPMorgan ActiveBuilders Emerging Markets Equity ETF | ||||||
Year Ended October 31, 2022 | $47.92 | $1.14 | $(17.27) | $(16.13) | $(0.63) | $(0.09) |
March 10, 2021 (f) through October 31, 2021 | 48.00 | 0.66 | (0.74) | (0.08) | — | — |
JPMorgan ActiveBuilders International Equity ETF | ||||||
Year Ended October 31, 2022 | 49.03 | 1.19 | (12.31) | (11.12) | (0.53) | — |
July 7, 2021 (f) through October 31, 2021 | 48.00 | 0.35 | 0.68 | 1.03 | — | — |
JPMorgan BetaBuilders Canada ETF | ||||||
Year Ended October 31, 2022 | 67.80 | 1.59 | (10.53) | (8.94) | (1.56) | — |
Year Ended October 31, 2021 (i) | 45.99 | 1.38 | 21.78 | 23.16 | (1.35) | — |
Year Ended October 31, 2020 (i) | 49.78 | 1.29 | (3.82) | (2.53) | (1.26) | — |
Year Ended October 31, 2019 (i) | 45.19 | 1.31 | 4.47 | 5.78 | (1.19) | — |
August 7, 2018 (f) through October 31, 2018 (i) | 49.31 | 0.29 | (4.31) | (4.02) | (0.10) | — |
JPMorgan BetaBuilders Developed Asia Pacific ex-Japan ETF (formerly known as JPMorgan BetaBuilders Developed Asia ex-Japan ETF) | ||||||
Year Ended October 31, 2022 | 56.89 | 2.12 | (12.86) | (10.74) | (3.39) | — |
Year Ended October 31, 2021 (i) | 44.97 | 2.44 | 11.48 | 13.92 | (2.00) | — |
Year Ended October 31, 2020 (i) | 50.63 | 1.58 | (5.65) | (4.07) | (1.59) | — |
Year Ended October 31, 2019 (i) | 45.36 | 2.10 | 5.17 | 7.27 | (2.00) | — |
August 7, 2018 (f) through October 31, 2018 (i) | 50.73 | 0.44 | (5.48) | (5.04) | (0.33) | — |
JPMorgan BetaBuilders Europe ETF | ||||||
Year Ended October 31, 2022 | 59.74 | 1.78 | (15.31) | (13.53) | (2.60) | — |
Year Ended October 31, 2021 (i) | 43.29 | 1.67 | 16.19 | 17.86 | (1.41) | — |
Year Ended October 31, 2020 (i) | 48.71 | 1.08 | (5.43) | (4.35) | (1.07) | — |
Year Ended October 31, 2019 (i) | 45.19 | 1.79 | 3.28 | 5.07 | (1.55) | — |
June 15, 2018 (f) through October 31, 2018 (i) | 49.58 | 0.26 | (4.58) | (4.32) | (0.07) | — |
(a) | Annualized for periods less than one year, unless otherwise noted. |
(b) | Calculated based upon average shares outstanding. |
(c) | Not annualized for periods less than one year. |
(d) | Includes adjustments in accordance with accounting principles generally accepted in the United States of America and as such, the net asset values for financial reporting purposes and the returns based upon those net asset values may differ from the net asset values and returns for shareholder transactions. |
(e) | Prior to December 9, 2019, market price return was calculated assuming an initial investment made at the market price at the beginning of the reporting period, reinvestment of all dividends and distributions at market price during the period, and sale at the market price on the last day of the period. The price used to calculate the market price return was the midpoint of the bid/ask spread at the close of business on the listing exchange of the fund. Effective December 9, 2019, the closing price was used to calculate the market price return; however, any prices used in the calculation for market price return prior to December 9, 2019, would have used the midpoint of the bid/ask spread at the close of business on the exchange. |
(f) | Commencement of operations. |
(g) | Since the Shares of the Fund did not trade in the secondary market until the day after the Fund’s inception, for the period from the inception to the first day of secondary market trading, the net asset value is used as a proxy for the secondary market trading price to calculate the market returns. |
(h) | Does not include expenses of unaffiliated Underlying Funds. |
(i) | Per share amounts reflects a 1:2 reverse stock split that occurred on April 12, 2021. See Note 1. |
(j) | Prior to November 1, 2019, the Fund may have waived fees if expenses exceeded the expense cap. On November 1, 2019, the Fund adopted a unitary fee structure where a management fee is accrued by the fund based on prior day net assets and other expenses are paid by the Advisor. |
(k) | Certain non-recurring expenses incurred by the Fund were not annualized for the period indicated. |
240 | J.P. Morgan Exchange-Traded Funds | October 31, 2022 |
Ratios/Supplemental data | |||||||||
Ratios to average net assets (a) | |||||||||
Total distributions | Net asset value, end of period | Market price, end of period | Total return (c)(d) | Market price total return (c)(e) | Net assets, end of period | Net expenses | Net investment income (loss) | Expenses without waivers and reimbursements | Portfolio turnover rate (c) |
$(0.72) | $31.07 | $31.15 | (34.15)% | (34.32)% | $907,154,126 | 0.33% | 3.05% | 0.33% | 28% |
— | 47.92 | 48.17 | (0.17) | 0.35(g) | 325,863,960 | 0.30(h) | 2.11 | 0.33(h) | 40 |
(0.53) | 37.38 | 37.36 | (22.91) | (23.23) | 22,426,876 | 0.25 | 2.77 | 0.25 | 28 |
— | 49.03 | 49.21 | 2.15 | 2.52(g) | 29,419,956 | 0.25 | 2.23 | 0.25 | 9 |
(1.56) | 57.30 | 57.35 | (13.34) | (13.49) | 5,644,273,295 | 0.19 | 2.51 | 0.19 | 5 |
(1.35) | 67.80 | 67.98 | 50.77 | 50.84 | 6,071,268,619 | 0.19 | 2.28 | 0.19 | 2 |
(1.26) | 45.99 | 46.10 | (4.98) | (4.81) | 3,640,211,260 | 0.19 | 2.74 | 0.19 | 4 |
(1.19) | 49.78 | 49.80 | 13.08 | 12.97 | 3,800,754,020 | 0.19 | 2.73 | 0.34(j) | 7 |
(0.10) | 45.19 | 45.24 | (8.18) | (8.05)(g) | 2,044,698,826 | 0.19(k) | 2.55 | 0.37(j)(k) | 1 |
(3.39) | 42.76 | 42.79 | (19.60) | (19.87) | 3,412,010,904 | 0.20 | 4.17 | 0.20 | 14 |
(2.00) | 56.89 | 57.12 | 31.14 | 31.26 | 4,113,118,547 | 0.19 | 4.26 | 0.19 | 6 |
(1.59) | 44.97 | 45.10 | (7.87) | (7.45) | 1,465,970,894 | 0.19 | 3.40 | 0.19 | 6 |
(2.00) | 50.63 | 50.54 | 16.18 | 15.94 | 1,442,853,830 | 0.19 | 4.22 | 0.39(j) | 7 |
(0.33) | 45.36 | 45.38 | (9.97) | (9.93)(g) | 603,313,934 | 0.19(k) | 3.94 | 0.45(j)(k) | 2 |
(2.60) | 43.61 | 43.62 | (23.01) | (23.22) | 3,527,687,759 | 0.10 | 3.36 | 0.10 | 7 |
(1.41) | 59.74 | 59.92 | 41.54 | 41.77 | 9,427,453,378 | 0.09 | 2.92 | 0.09 | 6 |
(1.07) | 43.29 | 43.34 | (8.92) | (8.90) | 3,701,005,509 | 0.09 | 2.33 | 0.09 | 5 |
(1.55) | 48.71 | 48.78 | 11.43 | 11.32 | 3,853,145,624 | 0.09 | 3.83 | 0.25(j) | 7 |
(0.07) | 45.19 | 45.28 | (8.75) | (8.55)(g) | 1,314,930,292 | 0.09(k) | 1.45 | 0.34(j)(k) | 2 |
October 31, 2022 | J.P. Morgan Exchange-Traded Funds | 241 |
FOR THE PERIODS INDICATED (continued)
Per share operating performance | |||||
Investment operations | Distributions | ||||
Net asset value, beginning of period | Net investment income (loss) (b) | Net realized and unrealized gains (losses) on investments | Total from investment operations | Net investment income | |
JPMorgan BetaBuilders International Equity ETF | |||||
Year Ended October 31, 2022 | $60.53 | $1.51 | $(15.16) | $(13.65) | $(2.16) |
Year Ended October 31, 2021 | 46.20 | 1.67 | 14.10 | 15.77 | (1.44) |
December 3, 2019 (f) through October 31, 2020 | 49.79 | 1.05 | (4.26)(g) | (3.21) | (0.38) |
JPMorgan BetaBuilders Japan ETF | |||||
Year Ended October 31, 2022 | 57.16 | 1.03 | (14.91) | (13.88) | (1.59) |
Year Ended October 31, 2021 (i) | 48.39 | 1.04 | 8.36 | 9.40 | (0.63) |
Year Ended October 31, 2020 (i) | 49.07 | 0.84 | (0.39) | 0.45 | (1.13) |
Year Ended October 31, 2019 (i) | 45.45 | 0.97 | 2.93 | 3.90 | (0.28) |
June 15, 2018 (f) through October 31, 2018 (i) | 49.58 | 0.48 | (4.61) | (4.13) | — |
JPMorgan BetaBuilders U.S. Equity ETF | |||||
Year Ended October 31, 2022 | 84.15 | 1.11 | (14.86) | (13.75) | (1.02) |
Year Ended October 31, 2021 | 59.59 | 1.02 | 24.48 | 25.50 | (0.94) |
Year Ended October 31, 2020 | 54.60 | 1.14 | 4.83 | 5.97 | (0.98) |
March 12, 2019 (f) through October 31, 2019 | 50.14 | 0.68 | 4.29 | 4.97 | (0.51) |
JPMorgan BetaBuilders U.S. Mid Cap Equity ETF | |||||
Year Ended October 31, 2022 | 93.59 | 1.03 | (19.57) | (18.54) | (0.99) |
Year Ended October 31, 2021 | 64.16 | 0.90 | 29.27 | 30.17 | (0.74) |
April 14, 2020 (f) through October 31, 2020 | 50.78 | 0.33 | 13.32(g) | 13.65 | (0.27) |
JPMorgan BetaBuilders U.S. Small Cap Equity ETF | |||||
Year Ended October 31, 2022 | 67.49 | 0.77 | (12.79) | (12.02) | (0.80) |
November 16, 2020 (f) through October 31, 2021 | 51.27 | 0.62 | 16.04 | 16.66 | (0.44) |
(a) | Annualized for periods less than one year, unless otherwise noted. |
(b) | Calculated based upon average shares outstanding. |
(c) | Not annualized for periods less than one year. |
(d) | Includes adjustments in accordance with accounting principles generally accepted in the United States of America and as such, the net asset values for financial reporting purposes and the returns based upon those net asset values may differ from the net asset values and returns for shareholder transactions. |
(e) | Prior to December 9, 2019, market price return was calculated assuming an initial investment made at the market price at the beginning of the reporting period, reinvestment of all dividends and distributions at market price during the period, and sale at the market price on the last day of the period. The price used to calculate the market price return was the midpoint of the bid/ask spread at the close of business on the listing exchange of the fund. Effective December 9, 2019, the closing price was used to calculate the market price return; however, any prices used in the calculation for market price return prior to December 9, 2019, would have used the midpoint of the bid/ask spread at the close of business on the exchange. |
(f) | Commencement of operations. |
(g) | Calculation of the net realized and unrealized gains (losses) per share do not correlate with the Fund’s net realized and unrealized gains (losses) presented in the Statement of Operations due to the timing of capital transactions in relation to the fluctuating market values of the Fund’s investments. |
(h) | Since the Shares of the Fund did not trade in the secondary market until the day after the Fund’s inception, for the period from the inception to the first day of secondary market trading, the net asset value is used as a proxy for the secondary market trading price to calculate the market returns. |
(i) | Per share amounts reflects a 1:2 reverse stock split that occurred on April 12, 2021. See Note 1. |
(j) | Prior to November 1, 2019, the Fund may have waived fees if expenses exceeded the expense cap. On November 1, 2019, the Fund adopted a unitary fee structure where a management fee is accrued by the fund based on prior day net assets and other expenses are paid by the Advisor. |
(k) | Certain non-recurring expenses incurred by the Fund were not annualized for the period indicated. |
242 | J.P. Morgan Exchange-Traded Funds | October 31, 2022 |
Ratios/Supplemental data | ||||||||
Ratios to average net assets (a) | ||||||||
Net asset value, end of period | Market price, end of period | Total return (c)(d) | Market price total return (c)(e) | Net assets, end of period | Net expenses | Net investment income (loss) | Expenses without waivers and reimbursements | Portfolio turnover rate (c) |
$44.72 | $44.75 | (23.02)% | (23.11)% | $2,710,097,518 | 0.07% | 2.88% | 0.07% | 6% |
60.53 | 60.64 | 34.26 | 34.24 | 3,680,140,678 | 0.07 | 2.85 | 0.07 | 5 |
46.20 | 46.29 | (6.45) | (6.27)(h) | 1,866,670,302 | 0.07 | 2.40 | 0.07 | 8 |
�� | ||||||||
41.69 | 41.73 | (24.96) | (24.95) | 6,211,237,563 | 0.19 | 2.10 | 0.19 | 4 |
57.16 | 57.21 | 19.47 | 18.98 | 7,864,537,853 | 0.19 | 1.83 | 0.19 | 3 |
48.39 | 48.64 | 0.87 | 1.24 | 5,323,035,447 | 0.19 | 1.77 | 0.19 | 5 |
49.07 | 49.14 | 8.74 | 9.07 | 4,318,521,919 | 0.19 | 2.14 | 0.33(j) | 4 |
45.45 | 45.36 | (8.35) | (8.51)(h) | 2,336,087,667 | 0.19(k) | 2.63 | 0.37(j)(k) | 5 |
69.38 | 69.42 | (16.42) | (16.33) | 1,276,523,608 | 0.02 | 1.47 | 0.02 | 4 |
84.15 | 84.11 | 43.02 | 42.97 | 782,605,972 | 0.02 | 1.34 | 0.02 | 4 |
59.59 | 59.58 | 11.09 | 11.05 | 238,372,575 | 0.02 | 1.99 | 0.02 | 4 |
54.60 | 54.61 | 9.95 | 9.97(h) | 46,409,125 | 0.02 | 2.01 | 0.02 | 3 |
74.06 | 73.92 | (19.87) | (20.10) | 1,390,564,346 | 0.07 | 1.29 | 0.07 | 30 |
93.59 | 93.68 | 47.15 | 47.52 | 1,698,624,114 | 0.07 | 1.05 | 0.07 | 27 |
64.16 | 64.06 | 26.91 | 26.71(h) | 988,131,953 | 0.07 | 0.91 | 0.07 | 7 |
54.67 | 54.38 | (17.87) | (18.39) | 494,762,260 | 0.09 | 1.35 | 0.09 | 30 |
67.49 | 67.56 | 32.56 | 32.70(h) | 442,061,490 | 0.09 | 0.98 | 0.09 | 27 |
October 31, 2022 | J.P. Morgan Exchange-Traded Funds | 243 |
FOR THE PERIODS INDICATED (continued)
Per share operating performance | |||||
Investment operations | Distributions | ||||
Net asset value, beginning of period | Net investment income (loss) (b) | Net realized and unrealized gains (losses) on investments | Total from investment operations | Net investment income | |
JPMorgan Carbon Transition U.S. Equity ETF | |||||
Year Ended October 31, 2022 | $62.33 | $0.77 | $(9.94) | $(9.17) | $(0.79) |
December 9, 2020 (f) through October 31, 2021 | 49.29 | 0.63 | 12.95 | 13.58 | (0.54) |
JPMorgan Climate Change Solutions ETF | |||||
December 13, 2021 (f) through October 31, 2022 | 48.00 | 0.43 | (12.84) | (12.41) | (0.03) |
JPMorgan Diversified Return Emerging Markets Equity ETF | |||||
Year Ended October 31, 2022 | 56.99 | 2.21 | (10.86) | (8.65) | (2.80) |
Year Ended October 31, 2021 | 46.47 | 1.81 | 10.70 | 12.51 | (1.99) |
Year Ended October 31, 2020 | 54.43 | 1.46 | (7.48) | (6.02) | (1.94) |
Year Ended October 31, 2019 | 50.91 | 2.07 | 2.97 | 5.04 | (1.52) |
Year Ended October 31, 2018 | 57.15 | 1.59 | (5.37) | (3.78) | (2.46) |
JPMorgan Diversified Return International Equity ETF | |||||
Year Ended October 31, 2022 | 61.02 | 1.91 | (15.62) | (13.71) | (2.87) |
Year Ended October 31, 2021 | 49.84 | 1.91 | 11.03 | 12.94 | (1.76) |
Year Ended October 31, 2020 | 55.06 | 1.35 | (5.01) | (3.66) | (1.56) |
Year Ended October 31, 2019 | 53.10 | 1.77 | 1.90 | 3.67 | (1.71) |
Year Ended October 31, 2018 | 59.18 | 1.51 | (5.29) | (3.78) | (2.30) |
JPMorgan Diversified Return U.S. Equity ETF | |||||
Year Ended October 31, 2022 | 101.43 | 2.16 | (7.56) | (5.40) | (2.09) |
Year Ended October 31, 2021 | 73.52 | 1.71 | 27.76 | 29.47 | (1.56) |
Year Ended October 31, 2020 | 76.44 | 1.65 | (2.82) | (1.17) | (1.75) |
Year Ended October 31, 2019 | 69.92 | 1.66 | 6.34 | 8.00 | (1.48) |
Year Ended October 31, 2018 | 68.52 | 1.39 | 1.88 | 3.27 | (1.87) |
(a) | Annualized for periods less than one year, unless otherwise noted. |
(b) | Calculated based upon average shares outstanding. |
(c) | Not annualized for periods less than one year. |
(d) | Includes adjustments in accordance with accounting principles generally accepted in the United States of America and as such, the net asset values for financial reporting purposes and the returns based upon those net asset values may differ from the net asset values and returns for shareholder transactions. |
(e) | Prior to December 9, 2019, market price return was calculated assuming an initial investment made at the market price at the beginning of the reporting period, reinvestment of all dividends and distributions at market price during the period, and sale at the market price on the last day of the period. The price used to calculate the market price return was the midpoint of the bid/ask spread at the close of business on the listing exchange of the fund. Effective December 9, 2019, the closing price was used to calculate the market price return; however, any prices used in the calculation for market price return prior to December 9, 2019, would have used the midpoint of the bid/ask spread at the close of business on the exchange. |
(f) | Commencement of operations. |
(g) | Since the Shares of the Fund did not trade in the secondary market until the day after the Fund’s inception, for the period from the inception to the first day of secondary market trading, the net asset value is used as a proxy for the secondary market trading price to calculate the market returns. |
(h) | Prior to November 1, 2019, the Fund may have waived fees if expenses exceeded the expense cap. On November 1, 2019, the Fund adopted a unitary fee structure where a management fee is accrued by the fund based on prior day net assets and other expenses are paid by the Advisor. |
244 | J.P. Morgan Exchange-Traded Funds | October 31, 2022 |
Ratios/Supplemental data | ||||||||
Ratios to average net assets (a) | ||||||||
Net asset value, end of period | Market price, end of period | Total return (c)(d) | Market price total return (c)(e) | Net assets, end of period | Net expenses | Net investment income (loss) | Expenses without waivers and reimbursements | Portfolio turnover rate (c) |
$52.37 | $52.38 | (14.79)% | (14.79)% | $20,947,681 | 0.15% | 1.35% | 0.15% | 16% |
62.33 | 62.34 | 27.68 | 27.70(g) | 24,933,394 | 0.15 | 1.26 | 0.15 | 27 |
35.56 | 35.71 | (25.87) | (25.56)(g) | 19,560,686 | 0.49 | 1.26 | 0.49 | 32 |
45.54 | 45.81 | (15.61) | (15.20) | 163,926,226 | 0.44 | 4.19 | 0.44 | 33 |
56.99 | 57.05 | 26.93 | 27.80 | 153,882,748 | 0.44 | 3.18 | 0.44 | 29 |
46.47 | 46.21 | (11.20) | (11.80) | 213,760,142 | 0.44 | 2.97 | 0.44 | 26 |
54.43 | 54.50 | 10.00 | 10.31 | 353,795,416 | 0.45 | 3.87 | 0.87(h) | 51 |
50.91 | 50.83 | (6.93) | (7.43) | 213,804,252 | 0.45 | 2.80 | 0.96(h) | 53 |
44.44 | 44.54 | (23.25) | (23.15) | 671,062,140 | 0.37 | 3.59 | 0.37 | 28 |
61.02 | 61.08 | 26.00 | 26.08 | 842,016,222 | 0.37 | 3.14 | 0.37 | 35 |
49.84 | 49.86 | (6.72) | (6.62) | 867,200,124 | 0.37 | 2.61 | 0.37 | 23 |
55.06 | 55.02 | 7.05 | 7.23 | 1,282,867,303 | 0.38 | 3.27 | 0.41(h) | 25 |
53.10 | 52.98 | (6.72) | (7.22) | 1,444,332,261 | 0.40 | 2.57 | 0.44(h) | 28 |
93.94 | 94.05 | (5.36) | (5.28) | 507,282,453 | 0.18 | 2.18 | 0.18 | 22 |
101.43 | 101.46 | 40.36 | 40.44 | 710,012,574 | 0.18 | 1.86 | 0.18 | 33 |
73.52 | 73.50 | (1.40) | (1.44) | 536,709,641 | 0.18 | 2.26 | 0.18 | 21 |
76.44 | 76.45 | 11.65 | 11.65 | 802,625,997 | 0.19 | 2.27 | 0.37(h) | 24 |
69.92 | 69.93 | 4.74 | 4.70 | 559,362,329 | 0.19 | 1.95 | 0.41(h) | 32 |
October 31, 2022 | J.P. Morgan Exchange-Traded Funds | 245 |
FOR THE PERIODS INDICATED (continued)
Per share operating performance | ||||||
Investment operations | Distributions | |||||
Net asset value, beginning of period | Net investment income (loss) (b) | Net realized and unrealized gains (losses) on investments | Total from investment operations | Net investment income | Net realized gain | |
JPMorgan Diversified Return U.S. Mid Cap Equity ETF | ||||||
Year Ended October 31, 2022 | $92.23 | $1.60 | $(8.73) | $(7.13) | $(1.50) | $— |
Year Ended October 31, 2021 | 64.77 | 1.30 | 27.36 | 28.66 | (1.20) | — |
Year Ended October 31, 2020 | 67.13 | 1.18 | (2.38) | (1.20) | (1.16) | — |
Year Ended October 31, 2019 | 62.24 | 1.18 | 4.78 | 5.96 | (1.07) | — |
Year Ended October 31, 2018 | 62.06 | 1.06 | 0.59 | 1.65 | (1.47) | — |
JPMorgan Diversified Return U.S. Small Cap Equity ETF | ||||||
Year Ended October 31, 2022 | 45.20 | 0.64 | (5.41) | (4.77) | (0.58) | — |
Year Ended October 31, 2021 | 28.87 | 0.46 | 16.35 | 16.81 | (0.48) | — |
Year Ended October 31, 2020 | 30.84 | 0.44 | (2.01) | (1.57) | (0.40) | — |
Year Ended October 31, 2019 | 29.58 | 0.42 | 1.22 | 1.64 | (0.38) | — |
Year Ended October 31, 2018 | 28.95 | 0.33 | 0.73 | 1.06 | (0.43) | — |
JPMorgan International Growth ETF | ||||||
Year Ended October 31, 2022 | 79.09 | 0.44 | (30.69) | (30.25) | (0.49) | (0.54) |
Year Ended October 31, 2021 | 62.98 | 0.19 | 15.95 | 16.14 | (0.03) | — |
May 20, 2020 (g) through October 31, 2020 | 51.83 | 0.05 | 11.10 | 11.15 | — | — |
(a) | Annualized for periods less than one year, unless otherwise noted. |
(b) | Calculated based upon average shares outstanding. |
(c) | Not annualized for periods less than one year. |
(d) | Includes adjustments in accordance with accounting principles generally accepted in the United States of America and as such, the net asset values for financial reporting purposes and the returns based upon those net asset values may differ from the net asset values and returns for shareholder transactions. |
(e) | Prior to December 9, 2019, market price return was calculated assuming an initial investment made at the market price at the beginning of the reporting period, reinvestment of all dividends and distributions at market price during the period, and sale at the market price on the last day of the period. The price used to calculate the market price return was the midpoint of the bid/ask spread at the close of business on the listing exchange of the fund. Effective December 9, 2019, the closing price was used to calculate the market price return; however, any prices used in the calculation for market price return prior to December 9, 2019, would have used the midpoint of the bid/ask spread at the close of business on the exchange. |
(f) | Prior to November 1, 2019, the Fund may have waived fees if expenses exceeded the expense cap. On November 1, 2019, the Fund adopted a unitary fee structure where a management fee is accrued by the fund based on prior day net assets and other expenses are paid by the Advisor. |
(g) | Commencement of operations. |
(h) | Since the Shares of the Fund did not trade in the secondary market until the day after the Fund’s inception, for the period from the inception to the first day of secondary market trading, the net asset value is used as a proxy for the secondary market trading price to calculate the market returns. |
246 | J.P. Morgan Exchange-Traded Funds | October 31, 2022 |
Ratios/Supplemental data | |||||||||
Ratios to average net assets (a) | |||||||||
Total distributions | Net asset value, end of period | Market price, end of period | Total return (c)(d) | Market price total return (c)(e) | Net assets, end of period | Net expenses | Net investment income (loss) | Expenses without waivers and reimbursements | Portfolio turnover rate (c) |
$(1.50) | $83.60 | $83.55 | (7.78)% | (7.90)% | $267,520,530 | 0.24% | 1.82% | 0.24% | 24% |
(1.20) | 92.23 | 92.30 | 44.51 | 44.73 | 239,808,712 | 0.24 | 1.57 | 0.24 | 34 |
(1.16) | 64.77 | 64.72 | (1.66) | (1.79) | 220,207,846 | 0.24 | 1.86 | 0.24 | 28 |
(1.07) | 67.13 | 67.17 | 9.73 | 9.780 | 187,973,791 | 0.24 | 1.82 | 0.43(f) | 25 |
(1.47) | 62.24 | 62.25 | 2.59 | 2.57 | 112,028,180 | 0.24 | 1.64 | 0.50(f) | 35 |
(0.58) | 39.85 | 39.93 | (10.59) | (10.49) | 286,932,997 | 0.29 | 1.55 | 0.29 | 26 |
(0.48) | 45.20 | 45.24 | 58.49 | 58.25 | 176,262,186 | 0.29 | 1.13 | 0.29 | 37 |
(0.40) | 28.87 | 28.94 | (4.99) | (4.85) | 148,672,825 | 0.29 | 1.54 | 0.29 | 30 |
(0.38) | 30.84 | 30.87 | 5.64 | 5.75 | 140,343,327 | 0.29 | 1.40 | 0.54(f) | 43 |
(0.43) | 29.58 | 29.58 | 3.61 | 3.43 | 96,135,254 | 0.29 | 1.08 | 0.61(f) | 30 |
(1.03) | 47.81 | 47.80 | (38.72) | (38.97) | 54,982,105 | 0.55 | 0.75 | 0.55 | 32 |
(0.03) | 79.09 | 79.40 | 25.63 | 25.85 | 61,291,950 | 0.55 | 0.25 | 0.55 | 37 |
— | 62.98 | 63.12 | 21.51 | 21.78(h) | 37,787,658 | 0.55 | 0.16 | 0.55 | 12 |
October 31, 2022 | J.P. Morgan Exchange-Traded Funds | 247 |
FOR THE PERIODS INDICATED (continued)
Per share operating performance | |||||
Investment operations | Distributions | ||||
Net asset value, beginning of period | Net investment income (loss) (b) | Net realized and unrealized gains (losses) on investments | Total from investment operations | Net investment income | |
JPMorgan U.S. Momentum Factor ETF | |||||
Year Ended October 31, 2022 | $47.71 | $0.50 | $(9.53) | $(9.03) | $(0.46) |
Year Ended October 31, 2021 | 33.68 | 0.34 | 14.00 | 14.34 | (0.31) |
Year Ended October 31, 2020 | 29.04 | 0.35 | 4.63 | 4.98 | (0.34) |
Year Ended October 31, 2019 | 25.98 | 0.37 | 2.99 | 3.36 | (0.30) |
November 8, 2017 (g) through October 31, 2018 | 25.00 | 0.35 | 0.95 | 1.30 | (0.32) |
JPMorgan U.S. Quality Factor ETF | |||||
Year Ended October 31, 2022 | 43.45 | 0.66 | (5.34) | (4.68) | (0.63) |
Year Ended October 31, 2021 | 31.53 | 0.60 | 11.91 | 12.51 | (0.59) |
Year Ended October 31, 2020 | 29.74 | 0.56 | 1.70 | 2.26 | (0.47) |
Year Ended October 31, 2019 | 26.56 | 0.58 | 3.11 | 3.69 | (0.51) |
November 8, 2017 (g) through October 31, 2018 | 25.00 | 0.52 | 1.52 | 2.04 | (0.48) |
JPMorgan U.S. Value Factor ETF | |||||
Year Ended October 31, 2022 | 37.09 | 0.80 | (4.19) | (3.39) | (0.80) |
Year Ended October 31, 2021 | 24.99 | 0.72 | 12.03 | 12.75 | (0.65) |
Year Ended October 31, 2020 | 27.29 | 0.77 | (2.29) | (1.52) | (0.78) |
Year Ended October 31, 2019 | 25.21 | 0.75 | 1.97 | 2.72 | (0.64) |
November 8, 2017 (g) through October 31, 2018 | 25.00 | 0.64 | 0.16 | 0.80 | (0.59) |
(a) | Annualized for periods less than one year, unless otherwise noted. |
(b) | Calculated based upon average shares outstanding. |
(c) | Not annualized for periods less than one year. |
(d) | Includes adjustments in accordance with accounting principles generally accepted in the United States of America and as such, the net asset values for financial reporting purposes and the returns based upon those net asset values may differ from the net asset values and returns for shareholder transactions. |
(e) | Prior to December 9, 2019, market price return was calculated assuming an initial investment made at the market price at the beginning of the reporting period, reinvestment of all dividends and distributions at market price during the period, and sale at the market price on the last day of the period. The price used to calculate the market price return was the midpoint of the bid/ask spread at the close of business on the listing exchange of the fund. Effective December 9, 2019, the closing price was used to calculate the market price return; however, any prices used in the calculation for market price return prior to December 9, 2019, would have used the midpoint of the bid/ask spread at the close of business on the exchange. |
(f) | Prior to November 1, 2019, the Fund may have waived fees if expenses exceeded the expense cap. On November 1, 2019, the Fund adopted a unitary fee structure where a management fee is accrued by the fund based on prior day net assets and other expenses are paid by the Advisor. |
(g) | Commencement of operations. |
(h) | Since the Shares of the Fund did not trade in the secondary market until the day after the Fund’s inception, for the period from the inception to the first day of secondary market trading, the net asset value is used as a proxy for the secondary market trading price to calculate the market returns. |
(i) | Certain non-recurring expenses incurred by the Fund were not annualized for the period indicated. |
248 | J.P. Morgan Exchange-Traded Funds | October 31, 2022 |
Ratios/Supplemental data | ||||||||
Ratios to average net assets (a) | ||||||||
Net asset value, end of period | Market price, end of period | Total return (c)(d) | Market price total return (c)(e) | Net assets, end of period | Net expenses | Net investment income (loss) | Expenses without waivers and reimbursements | Portfolio turnover rate (c) |
$38.22 | $38.25 | (18.97)% | (18.86)% | $229,323,118 | 0.12% | 1.20% | 0.12% | 43% |
47.71 | 47.68 | 42.72 | 42.38 | 221,858,171 | 0.12 | 0.80 | 0.12 | 44 |
33.68 | 33.74 | 17.33 | 17.50 | 134,743,086 | 0.12 | 1.11 | 0.12 | 39 |
29.04 | 29.05 | 13.06 | 13.06 | 56,620,589 | 0.12 | 1.35 | 0.55(f) | 52 |
25.98 | 25.99 | 5.17 | 5.21(h) | 28,575,370 | 0.12(i) | 1.32 | 0.74(f)(i) | 44 |
38.14 | 38.16 | (10.84) | (10.85) | 579,728,107 | 0.12 | 1.64 | 0.12 | 18 |
43.45 | 43.48 | 39.97 | 40.02 | 393,204,091 | 0.12 | 1.56 | 0.12 | 21 |
31.53 | 31.54 | 7.72 | 7.68 | 384,671,209 | 0.12 | 1.81 | 0.12 | 20 |
29.74 | 29.76 | 14.10 | 14.18 | 107,067,872 | 0.12 | 2.05 | 0.50(f) | 21 |
26.56 | 26.56 | 8.15 | 8.15(h) | 29,215,267 | 0.12(i) | 2.01 | 0.74(f)(i) | 22 |
32.90 | 32.88 | (9.21) | (9.24) | 444,083,720 | 0.12 | 2.28 | 0.12 | 21 |
37.09 | 37.08 | 51.38 | 51.88 | 400,579,487 | 0.12 | 2.01 | 0.12 | 34 |
24.99 | 24.90 | (5.39) | (5.76) | 62,468,155 | 0.12 | 2.99 | 0.12 | 25 |
27.29 | 27.30 | 11.01 | 11.05 | 66,849,642 | 0.12 | 2.90 | 0.52(f) | 22 |
25.21 | 25.21 | 3.12 | 3.12(h) | 28,986,509 | 0.12(i) | 2.52 | 0.75(f)(i) | 26 |
October 31, 2022 | J.P. Morgan Exchange-Traded Funds | 249 |
AS OF October 31, 2022
Diversification Classification | |
JPMorgan ActiveBuilders Emerging Markets Equity ETF | Diversified |
JPMorgan ActiveBuilders International Equity ETF | Diversified |
JPMorgan BetaBuilders Canada ETF | Diversified |
JPMorgan BetaBuilders Developed Asia Pacific ex-Japan ETF (formerly known as JPMorgan BetaBuilders Developed Asia ex-Japan ETF)(1) | Diversified |
JPMorgan BetaBuilders Europe ETF | Diversified |
JPMorgan BetaBuilders International Equity ETF | Diversified |
JPMorgan BetaBuilders Japan ETF | Diversified |
JPMorgan BetaBuilders U.S. Equity ETF | Diversified |
JPMorgan BetaBuilders U.S. Mid Cap Equity ETF | Diversified |
JPMorgan BetaBuilders U.S. Small Cap Equity ETF | Diversified |
JPMorgan Carbon Transition U.S. Equity ETF | Diversified |
JPMorgan Climate Change Solutions ETF(2) | Non-Diversified |
JPMorgan Diversified Return Emerging Markets Equity ETF | Diversified |
JPMorgan Diversified Return International Equity ETF | Diversified |
JPMorgan Diversified Return U.S. Equity ETF | Diversified |
JPMorgan Diversified Return U.S. Mid Cap Equity ETF | Diversified |
JPMorgan Diversified Return U.S. Small Cap Equity ETF | Diversified |
JPMorgan International Growth ETF | Diversified |
JPMorgan U.S. Momentum Factor ETF | Diversified |
JPMorgan U.S. Quality Factor ETF | Diversified |
JPMorgan U.S. Value Factor ETF | Diversified |
(1) | Effective March 1, 2022, JPMorgan BetaBuilders Developed Asia ex-Japan ETF changed its name to JPMorgan BetaBuilders Developed Asia Pacific ex-Japan ETF. |
(2) | Commencement of operations was December 13, 2021. |
250 | J.P. Morgan Exchange-Traded Funds | October 31, 2022 |
October 31, 2022 | J.P. Morgan Exchange-Traded Funds | 251 |
AS OF October 31, 2022 (continued)
Listing Exchange | |
ActiveBuilders Emerging Markets Equity ETF | Cboe BZX Exchange, Inc. |
ActiveBuilders International Equity ETF | NYSE Arca |
BetaBuilders Canada ETF | Cboe BZX Exchange, Inc. |
BetaBuilders Developed Asia Pacific ex-Japan ETF | Cboe BZX Exchange, Inc. |
BetaBuilders Europe ETF | Cboe BZX Exchange, Inc. |
BetaBuilders International Equity ETF | Cboe BZX Exchange, Inc. |
BetaBuilders Japan ETF | Cboe BZX Exchange, Inc. |
BetaBuilders U.S. Equity ETF | Cboe BZX Exchange, Inc. |
BetaBuilders U.S. Mid Cap Equity ETF | NYSE Arca |
BetaBuilders U.S. Small Cap Equity ETF | NYSE Arca |
Carbon Transition U.S. Equity ETF | NYSE Arca |
Climate Change Solutions ETF | NYSE Arca |
Emerging Markets Equity ETF | NYSE Arca |
International Equity ETF | NYSE Arca |
U.S. Equity ETF | NYSE Arca |
U.S. Mid Cap Equity ETF | NYSE Arca |
U.S. Small Cap Equity ETF | NYSE Arca |
International Growth ETF | NYSE Arca |
U.S. Momentum Factor ETF | NYSE Arca |
U.S. Quality Factor ETF | NYSE Arca |
U.S. Value Factor ETF | NYSE Arca |
252 | J.P. Morgan Exchange-Traded Funds | October 31, 2022 |
Shares per Creation Unit | |
ActiveBuilders Emerging Markets Equity ETF | 100,000 |
ActiveBuilders International Equity ETF | 100,000 |
BetaBuilders Canada ETF | 50,000 |
BetaBuilders Developed Asia Pacific ex-Japan ETF | 100,000 |
BetaBuilders Europe ETF | 100,000 |
BetaBuilders International Equity ETF | 200,000 |
BetaBuilders Japan ETF | 200,000 |
BetaBuilders U.S. Equity ETF | 50,000 |
BetaBuilders U.S. Mid Cap Equity ETF | 25,000 |
BetaBuilders U.S. Small Cap Equity ETF | 25,000 |
Carbon Transition U.S. Equity ETF | 50,000 |
Climate Change Solutions ETF | 25,000 |
Emerging Markets Equity ETF | 100,000 |
International Equity ETF | 100,000 |
U.S. Equity ETF | 100,000 |
U.S. Mid Cap Equity ETF | 100,000 |
U.S. Small Cap Equity ETF | 50,000 |
International Growth ETF | 25,000 |
U.S. Momentum Factor ETF | 50,000 |
U.S. Quality Factor ETF | 50,000 |
U.S. Value Factor ETF | 50,000 |
October 31, 2022 | J.P. Morgan Exchange-Traded Funds | 253 |
AS OF October 31, 2022 (continued)
ActiveBuilders Emerging Markets Equity ETF | ||||
Level 1 Quoted prices | Level 2 Other significant observable inputs | Level 3 Significant unobservable inputs | Total | |
Investments in Securities | ||||
Common Stocks | ||||
Australia | $— | $245,645 | $— | $245,645 |
Brazil | 67,597,142 | — | — | 67,597,142 |
Canada | 677,327 | — | — | 677,327 |
Chile | 3,126,846 | — | — | 3,126,846 |
China | 7,658,555 | 226,476,463 | — | 234,135,018 |
Colombia | 241,473 | — | — | 241,473 |
Czech Republic | 1,351,864 | 392,171 | — | 1,744,035 |
Ghana | 638,713 | — | — | 638,713 |
Greece | — | 1,889,710 | — | 1,889,710 |
Hong Kong | — | 13,743,619 | — | 13,743,619 |
Hungary | — | 2,316,974 | — | 2,316,974 |
India | 13,140,936 | 116,674,205 | 50,024 | 129,865,165 |
Indonesia | — | 25,189,206 | — | 25,189,206 |
254 | J.P. Morgan Exchange-Traded Funds | October 31, 2022 |
ActiveBuilders Emerging Markets Equity ETF (continued) | ||||
Level 1 Quoted prices | Level 2 Other significant observable inputs | Level 3 Significant unobservable inputs | Total | |
Kuwait | $— | $1,084,148 | $— | $1,084,148 |
Macau | — | 609,081 | — | 609,081 |
Malaysia | — | 4,663,543 | — | 4,663,543 |
Mexico | 46,348,700 | — | — | 46,348,700 |
Nigeria | — | 183,340 | — | 183,340 |
Panama | 481,923 | — | — | 481,923 |
Peru | 3,644,135 | — | — | 3,644,135 |
Philippines | — | 1,907,838 | — | 1,907,838 |
Poland | — | 5,552,145 | — | 5,552,145 |
Portugal | — | 2,120,270 | — | 2,120,270 |
Qatar | — | 8,236,821 | — | 8,236,821 |
Russia | — | — | 194,080 | 194,080 |
Saudi Arabia | — | 27,862,535 | — | 27,862,535 |
Singapore | 972,486 | — | — | 972,486 |
South Africa | 7,984,520 | 28,913,005 | — | 36,897,525 |
South Korea | 598,043 | 107,390,147 | — | 107,988,190 |
Taiwan | — | 133,090,715 | — | 133,090,715 |
Tanzania, United Republic of | — | 252,026 | — | 252,026 |
Thailand | 10,257,888 | 6,000,601 | — | 16,258,489 |
United Arab Emirates | 2,151,974 | 8,213,270 | — | 10,365,244 |
United States | 10,395,738 | 1,858,509 | — | 12,254,247 |
Zambia | 613,419 | — | — | 613,419 |
Total Common Stocks | 177,881,682 | 724,865,987 | 244,104 | 902,991,773 |
Short-Term Investments | ||||
Investment Companies | 3,448,509 | — | — | 3,448,509 |
Total Investments in Securities | $181,330,191 | $724,865,987 | $244,104 | $906,440,282 |
ActiveBuilders International Equity ETF | ||||
Level 1 Quoted prices | Level 2 Other significant observable inputs | Level 3 Significant unobservable inputs | Total | |
Investments in Securities | ||||
Common Stocks | ||||
Australia | $— | $1,372,071 | $— | $1,372,071 |
Austria | — | 76,984 | — | 76,984 |
Belgium | — | 151,344 | — | 151,344 |
Brazil | 15,328 | — | — | 15,328 |
Canada | 161,940 | — | — | 161,940 |
China | — | 140,378 | — | 140,378 |
Denmark | — | 986,297 | — | 986,297 |
Finland | — | 234,526 | — | 234,526 |
France | — | 2,682,889 | — | 2,682,889 |
Germany | — | 1,826,993 | — | 1,826,993 |
Hong Kong | — | 363,492 | — | 363,492 |
India | 116,457 | — | — | 116,457 |
Indonesia | — | 23,855 | — | 23,855 |
October 31, 2022 | J.P. Morgan Exchange-Traded Funds | 255 |
AS OF October 31, 2022 (continued)
ActiveBuilders International Equity ETF (continued) | ||||
Level 1 Quoted prices | Level 2 Other significant observable inputs | Level 3 Significant unobservable inputs | Total | |
Ireland | $— | $28,922 | $— | $28,922 |
Italy | — | 251,879 | — | 251,879 |
Japan | — | 4,240,730 | — | 4,240,730 |
Luxembourg | — | 33,888 | — | 33,888 |
Netherlands | — | 1,622,779 | — | 1,622,779 |
Norway | — | 205,092 | — | 205,092 |
Singapore | 9,091 | 317,021 | — | 326,112 |
South Africa | — | 126,287 | — | 126,287 |
South Korea | — | 107,774 | — | 107,774 |
Spain | — | 425,118 | — | 425,118 |
Sweden | — | 490,194 | — | 490,194 |
Switzerland | 1,187 | 1,151,379 | — | 1,152,566 |
Taiwan | 84,262 | — | — | 84,262 |
United Kingdom | 31,413 | 2,751,490 | — | 2,782,903 |
United States | — | 1,906,145 | — | 1,906,145 |
Total Common Stocks | 419,678 | 21,517,527 | — | 21,937,205 |
Short-Term Investments | ||||
Investment Companies | 316,955 | — | — | 316,955 |
Total Investments in Securities | $736,633 | $21,517,527 | $— | $22,254,160 |
BetaBuilders Canada ETF | ||||
Level 1 Quoted prices | Level 2 Other significant observable inputs | Level 3 Significant unobservable inputs | Total | |
Total Investments in Securities (a) | $6,060,723,523 | $— | $— | $6,060,723,523 |
Appreciation in Other Financial Instruments | ||||
Futures Contracts (a) | $530,645 | $— | $— | $530,645 |
(a) | Please refer to the SOI for specifics of portfolio holdings. |
BetaBuilders Developed Asia Pacific ex-Japan ETF | ||||
Level 1 Quoted prices | Level 2 Other significant observable inputs | Level 3 Significant unobservable inputs | Total | |
Investments in Securities | ||||
Common Stocks | ||||
Australia | $21,660,246 | $1,992,583,374 | $— | $2,014,243,620 |
China | — | 76,861,100 | — | 76,861,100 |
Hong Kong | — | 577,189,648 | — | 577,189,648 |
Macau | — | 28,642,569 | — | 28,642,569 |
New Zealand | — | 66,152,527 | — | 66,152,527 |
Singapore | 689,395 | 381,626,252 | — | 382,315,647 |
United Kingdom | — | 28,535,432 | — | 28,535,432 |
United States | — | 224,805,776 | — | 224,805,776 |
Total Common Stocks | 22,349,641 | 3,376,396,678 | — | 3,398,746,319 |
256 | J.P. Morgan Exchange-Traded Funds | October 31, 2022 |
BetaBuilders Developed Asia Pacific ex-Japan ETF (continued) | ||||
Level 1 Quoted prices | Level 2 Other significant observable inputs | Level 3 Significant unobservable inputs | Total | |
Short-Term Investments | ||||
Investment of Cash Collateral from Securities Loaned | $189,738 | $— | $— | $189,738 |
Total Investments in Securities | $22,539,379 | $3,376,396,678 | $— | $3,398,936,057 |
Appreciation in Other Financial Instruments | ||||
Futures Contracts | $363,104 | $— | $— | $363,104 |
BetaBuilders Europe ETF | ||||
Level 1 Quoted prices | Level 2 Other significant observable inputs | Level 3 Significant unobservable inputs | Total | |
Investments in Securities | ||||
Common Stocks | ||||
Australia | $— | $59,307,955 | $— | $59,307,955 |
Austria | 225,140 | 16,460,998 | — | 16,686,138 |
Belgium | — | 51,715,739 | — | 51,715,739 |
Brazil | — | 2,974,463 | — | 2,974,463 |
Chile | — | 1,901,032 | — | 1,901,032 |
China | — | 21,265,488 | — | 21,265,488 |
Denmark | — | 143,280,884 | — | 143,280,884 |
Finland | 1,608,848 | 71,686,461 | — | 73,295,309 |
France | — | 561,610,725 | — | 561,610,725 |
Germany | — | 397,143,354 | — | 397,143,354 |
Hong Kong | — | 10,443,291 | — | 10,443,291 |
Ireland | — | 23,547,640 | — | 23,547,640 |
Italy | — | 116,437,086 | — | 116,437,086 |
Jordan | — | 1,042,635 | — | 1,042,635 |
Luxembourg | — | 9,108,741 | — | 9,108,741 |
Mexico | — | 629,740 | — | 629,740 |
Netherlands | 797,991 | 288,191,258 | — | 288,989,249 |
Norway | — | 47,081,536 | — | 47,081,536 |
Poland | — | 12,804,326 | — | 12,804,326 |
Portugal | — | 9,474,601 | — | 9,474,601 |
Russia | — | — | 21,304 | 21,304 |
Singapore | — | 8,334,951 | — | 8,334,951 |
South Africa | — | 16,382,590 | — | 16,382,590 |
South Korea | — | 2,467,215 | — | 2,467,215 |
Spain | — | 134,330,710 | — | 134,330,710 |
Sweden | 395,951 | 183,396,200 | — | 183,792,151 |
Switzerland | — | 311,627,644 | — | 311,627,644 |
United Arab Emirates | — | — | — | — |
United Kingdom | 3,867,322 | 659,494,370 | — | 663,361,692 |
United States | — | 317,746,962 | — | 317,746,962 |
Total Common Stocks | 6,895,252 | 3,479,888,595 | 21,304 | 3,486,805,151 |
Short-Term Investments | ||||
Investment of Cash Collateral from Securities Loaned | 40,427,498 | — | — | 40,427,498 |
October 31, 2022 | J.P. Morgan Exchange-Traded Funds | 257 |
AS OF October 31, 2022 (continued)
BetaBuilders Europe ETF (continued) | ||||
Level 1 Quoted prices | Level 2 Other significant observable inputs | Level 3 Significant unobservable inputs | Total | |
Total Investments in Securities | $47,322,750 | $3,479,888,595 | $21,304 | $3,527,232,649 |
Appreciation in Other Financial Instruments | ||||
Futures Contracts | $1,204,811 | $— | $— | $1,204,811 |
Depreciation in Other Financial Instruments | ||||
Futures Contracts | (121,281) | — | — | (121,281) |
Total Net Appreciation/ Depreciation in Other Financial Instruments | $1,083,530 | $— | $— | $1,083,530 |
BetaBuilders International Equity ETF | ||||
Level 1 Quoted prices | Level 2 Other significant observable inputs | Level 3 Significant unobservable inputs | Total | |
Investments in Securities | ||||
Common Stocks | ||||
Australia | $2,030,111 | $215,768,513 | $— | $217,798,624 |
Austria | 111,533 | 8,066,510 | — | 8,178,043 |
Belgium | — | 25,331,019 | — | 25,331,019 |
Brazil | — | 1,456,815 | — | 1,456,815 |
Chile | — | 931,825 | — | 931,825 |
China | — | 17,636,140 | — | 17,636,140 |
Denmark | — | 70,117,777 | — | 70,117,777 |
Finland | 786,013 | 35,107,125 | — | 35,893,138 |
France | — | 274,984,154 | — | 274,984,154 |
Germany | — | 194,465,496 | — | 194,465,496 |
Hong Kong | — | 59,220,080 | — | 59,220,080 |
Ireland | — | 11,533,337 | — | 11,533,337 |
Israel | — | 15,817,668 | — | 15,817,668 |
Italy | — | 57,019,267 | — | 57,019,267 |
Japan | — | 642,565,379 | — | 642,565,379 |
Jordan | — | 510,372 | — | 510,372 |
Luxembourg | — | 4,459,110 | — | 4,459,110 |
Macau | — | 2,669,358 | — | 2,669,358 |
Mexico | — | 309,281 | — | 309,281 |
Netherlands | 336,689 | 141,149,488 | — | 141,486,177 |
New Zealand | — | 6,204,459 | — | 6,204,459 |
Norway | — | 23,062,487 | — | 23,062,487 |
Poland | — | 6,298,128 | — | 6,298,128 |
Portugal | — | 4,641,203 | — | 4,641,203 |
Russia | — | — | 4,527 | 4,527 |
Singapore | 64,362 | 39,848,476 | — | 39,912,838 |
South Africa | — | 8,021,530 | — | 8,021,530 |
South Korea | — | 1,207,790 | — | 1,207,790 |
Spain | — | 65,780,623 | — | 65,780,623 |
Sweden | 195,808 | 89,812,517 | — | 90,008,325 |
Switzerland | — | 152,480,095 | — | 152,480,095 |
United Arab Emirates | — | — | — | — |
258 | J.P. Morgan Exchange-Traded Funds | October 31, 2022 |
BetaBuilders International Equity ETF (continued) | ||||
Level 1 Quoted prices | Level 2 Other significant observable inputs | Level 3 Significant unobservable inputs | Total | |
United Kingdom | $1,895,833 | $325,642,186 | $— | $327,538,019 |
United States | — | 176,653,812 | — | 176,653,812 |
Total Common Stocks | 5,420,349 | 2,678,772,020 | 4,527 | 2,684,196,896 |
Short-Term Investments | ||||
Investment Companies | 12,102,999 | — | — | 12,102,999 |
Investment of Cash Collateral from Securities Loaned | 17,862,343 | — | — | 17,862,343 |
Total Short-Term Investments | 29,965,342 | — | — | 29,965,342 |
Total Investments in Securities | $35,385,691 | $2,678,772,020 | $4,527 | $2,714,162,238 |
Depreciation in Other Financial Instruments | ||||
Futures Contracts | $(562,111) | $— | $— | $(562,111) |
BetaBuilders Japan ETF | ||||
Level 1 Quoted prices | Level 2 Other significant observable inputs | Level 3 Significant unobservable inputs | Total | |
Investments in Securities | ||||
Common Stocks | $— | $6,138,585,841 | $— | $6,138,585,841 |
Short-Term Investments | ||||
Investment of Cash Collateral from Securities Loaned | 19,895,882 | — | — | 19,895,882 |
Total Investments in Securities | $19,895,882 | $6,138,585,841 | $— | $6,158,481,723 |
Appreciation in Other Financial Instruments | ||||
Futures Contracts | $2,052,806 | $— | $— | $2,052,806 |
BetaBuilders U.S. Equity ETF | ||||
Level 1 Quoted prices | Level 2 Other significant observable inputs | Level 3 Significant unobservable inputs | Total | |
Total Investments in Securities (a) | $1,278,937,186 | $— | $— | $1,278,937,186 |
Depreciation in Other Financial Instruments | ||||
Futures Contracts (a) | $(62,102) | $— | $— | $(62,102) |
(a) | Please refer to the SOI for specifics of portfolio holdings. |
BetaBuilders U.S. Mid Cap Equity ETF | ||||
Level 1 Quoted prices | Level 2 Other significant observable inputs | Level 3 Significant unobservable inputs | Total | |
Total Investments in Securities (a) | $1,427,177,228 | $— | $— | $1,427,177,228 |
Appreciation in Other Financial Instruments | ||||
Futures Contracts (a) | $499,942 | $— | $— | $499,942 |
(a) | Please refer to the SOI for specifics of portfolio holdings. |
October 31, 2022 | J.P. Morgan Exchange-Traded Funds | 259 |
AS OF October 31, 2022 (continued)
BetaBuilders U.S. Small Cap Equity ETF | ||||
Level 1 Quoted prices | Level 2 Other significant observable inputs | Level 3 Significant unobservable inputs | Total | |
Investments in Securities | ||||
Common Stocks | $485,817,025 | $— | $— | $485,817,025 |
Rights | — | — | 9,582 | 9,582 |
Short-Term Investments | ||||
Investment Companies | 8,224,756 | — | — | 8,224,756 |
Investment of Cash Collateral from Securities Loaned | 11,621,701 | — | — | 11,621,701 |
Total Short-Term Investments | 19,846,457 | — | — | 19,846,457 |
Total Investments in Securities | $505,663,482 | $— | $9,582 | $505,673,064 |
Appreciation in Other Financial Instruments | ||||
Futures Contracts | $293,417 | $— | $— | $293,417 |
Carbon Transition U.S. Equity ETF | ||||
Level 1 Quoted prices | Level 2 Other significant observable inputs | Level 3 Significant unobservable inputs | Total | |
Total Investments in Securities (a) | $20,920,618 | $— | $— | $20,920,618 |
Appreciation in Other Financial Instruments | ||||
Futures Contracts (a) | $1,844 | $— | $— | $1,844 |
(a) | Please refer to the SOI for specifics of portfolio holdings. |
Climate Change Solutions ETF | ||||
Level 1 Quoted prices | Level 2 Other significant observable inputs | Level 3 Significant unobservable inputs | Total | |
Investments in Securities | ||||
Common Stocks | ||||
Canada | $376,469 | $— | $— | $376,469 |
China | — | 369,808 | — | 369,808 |
Denmark | — | 177,914 | — | 177,914 |
Finland | — | 558,117 | — | 558,117 |
France | — | 1,302,609 | — | 1,302,609 |
Germany | — | 1,242,066 | — | 1,242,066 |
Ireland | — | 233,681 | — | 233,681 |
Italy | — | 392,089 | — | 392,089 |
Japan | — | 1,181,249 | — | 1,181,249 |
Netherlands | — | 495,021 | — | 495,021 |
Norway | — | 87,702 | — | 87,702 |
South Korea | — | 555,209 | — | 555,209 |
Spain | — | 1,019,354 | — | 1,019,354 |
Sweden | — | 312,487 | — | 312,487 |
Switzerland | 363,145 | 712,902 | — | 1,076,047 |
United Kingdom | 1,154,867 | 226,102 | — | 1,380,969 |
United States | 7,849,728 | 666,172 | — | 8,515,900 |
Total Common Stocks | 9,744,209 | 9,532,482 | — | 19,276,691 |
Total Investments in Securities | $9,744,209 | $9,532,482 | $— | $19,276,691 |
260 | J.P. Morgan Exchange-Traded Funds | October 31, 2022 |
Emerging Markets Equity ETF | ||||
Level 1 Quoted prices | Level 2 Other significant observable inputs | Level 3 Significant unobservable inputs | Total | |
Investments in Securities | ||||
Common Stocks | ||||
Brazil | $16,420,043 | $— | $— | $16,420,043 |
Chile | 1,905,820 | — | — | 1,905,820 |
China | 592,170 | 35,503,172 | 96,672 | 36,192,014 |
Colombia | 329,176 | — | — | 329,176 |
Czech Republic | 558,248 | 111,448 | — | 669,696 |
Egypt | — | 79,723 | — | 79,723 |
Greece | — | 1,703,506 | — | 1,703,506 |
Hong Kong | — | 147,122 | — | 147,122 |
Hungary | — | 641,393 | — | 641,393 |
India | — | 19,344,072 | 25,238 | 19,369,310 |
Indonesia | 65,668 | 5,931,621 | — | 5,997,289 |
Kuwait | — | 3,762,062 | — | 3,762,062 |
Malaysia | 627,506 | 2,820,854 | — | 3,448,360 |
Mexico | 11,703,473 | — | — | 11,703,473 |
Pakistan | 36,645 | — | — | 36,645 |
Panama | 14,054 | — | — | 14,054 |
Philippines | 197,192 | 729,016 | — | 926,208 |
Qatar | 126,296 | 3,631,722 | — | 3,758,018 |
Russia | — | — | 116,932 | 116,932 |
Saudi Arabia | — | 10,413,427 | — | 10,413,427 |
Singapore | — | 86,187 | — | 86,187 |
South Africa | 3,276,775 | 5,714,832 | — | 8,991,607 |
Taiwan | — | 16,293,097 | — | 16,293,097 |
Thailand | 3,336,237 | 468,326 | — | 3,804,563 |
Turkey | 871,614 | 10,124,367 | — | 10,995,981 |
United Arab Emirates | 543,734 | 4,599,186 | — | 5,142,920 |
United States | 551,143 | — | — | 551,143 |
Total Common Stocks | 41,155,794 | 122,105,133 | 238,842 | 163,499,769 |
Rights | ||||
Thailand | — | — | — | — |
Short-Term Investments | ||||
Investment of Cash Collateral from Securities Loaned | 182,157 | — | — | 182,157 |
Total Investments in Securities | $41,337,951 | $122,105,133 | $238,842 | $163,681,926 |
Appreciation in Other Financial Instruments | ||||
Futures Contracts | $654 | $— | $— | $654 |
International Equity ETF | ||||
Level 1 Quoted prices | Level 2 Other significant observable inputs | Level 3 Significant unobservable inputs | Total | |
Investments in Securities | ||||
Common Stocks | ||||
Australia | $1,728,831 | $69,785,312 | $— | $71,514,143 |
October 31, 2022 | J.P. Morgan Exchange-Traded Funds | 261 |
AS OF October 31, 2022 (continued)
International Equity ETF (continued) | ||||
Level 1 Quoted prices | Level 2 Other significant observable inputs | Level 3 Significant unobservable inputs | Total | |
Austria | $— | $4,311,218 | $— | $4,311,218 |
Belgium | — | 2,372,851 | — | 2,372,851 |
Brazil | — | 2,681,457 | — | 2,681,457 |
Cambodia | — | 60,758 | — | 60,758 |
Chile | — | 2,256,715 | — | 2,256,715 |
China | — | 9,167,311 | — | 9,167,311 |
Denmark | — | 4,428,164 | — | 4,428,164 |
Finland | — | 11,059,698 | — | 11,059,698 |
France | — | 28,245,824 | — | 28,245,824 |
Germany | — | 16,842,999 | — | 16,842,999 |
Hong Kong | — | 19,685,344 | — | 19,685,344 |
Indonesia | — | 1,160,460 | — | 1,160,460 |
Ireland | — | 2,578,205 | — | 2,578,205 |
Italy | — | 13,755,031 | — | 13,755,031 |
Japan | — | 201,702,525 | — | 201,702,525 |
Jordan | — | 1,825,685 | — | 1,825,685 |
Luxembourg | — | 905,814 | — | 905,814 |
Mexico | — | 911,574 | — | 911,574 |
Netherlands | — | 22,861,664 | — | 22,861,664 |
New Zealand | — | 3,832,166 | — | 3,832,166 |
Norway | — | 8,113,640 | — | 8,113,640 |
Portugal | — | 2,091,030 | — | 2,091,030 |
Russia | — | — | 18,472 | 18,472 |
Singapore | — | 19,137,071 | — | 19,137,071 |
South Africa | — | 2,049,258 | — | 2,049,258 |
South Korea | — | 45,027,943 | — | 45,027,943 |
Spain | — | 13,811,916 | — | 13,811,916 |
Sweden | — | 23,627,664 | — | 23,627,664 |
Switzerland | — | 10,887,900 | — | 10,887,900 |
United Kingdom | — | 107,489,917 | — | 107,489,917 |
United States | 23 | 12,384,661 | — | 12,384,684 |
Total Common Stocks | 1,728,854 | 665,051,775 | 18,472 | 666,799,101 |
Short-Term Investments | ||||
Investment Companies | 569,398 | — | — | 569,398 |
Investment of Cash Collateral from Securities Loaned | 4,048,549 | — | — | 4,048,549 |
Total Short-Term Investments | 4,617,947 | — | — | 4,617,947 |
Total Investments in Securities | $6,346,801 | $665,051,775 | $18,472 | $671,417,048 |
Appreciation in Other Financial Instruments | ||||
Futures Contracts | $105,847 | $— | $— | $105,847 |
U.S. Equity ETF | ||||
Level 1 Quoted prices | Level 2 Other significant observable inputs | Level 3 Significant unobservable inputs | Total | |
Total Investments in Securities (a) | $507,452,056 | $— | $— | $507,452,056 |
262 | J.P. Morgan Exchange-Traded Funds | October 31, 2022 |
U.S. Equity ETF (continued) | ||||
Level 1 Quoted prices | Level 2 Other significant observable inputs | Level 3 Significant unobservable inputs | Total | |
Appreciation in Other Financial Instruments | ||||
Futures Contracts (a) | $41,166 | $— | $— | $41,166 |
(a) | Please refer to the SOI for specifics of portfolio holdings. |
U.S. Mid Cap Equity ETF | ||||
Level 1 Quoted prices | Level 2 Other significant observable inputs | Level 3 Significant unobservable inputs | Total | |
Total Investments in Securities (a) | $267,046,306 | $— | $— | $267,046,306 |
Appreciation in Other Financial Instruments | ||||
Futures Contracts (a) | $35,424 | $— | $— | $35,424 |
(a) | Please refer to the SOI for specifics of portfolio holdings. |
U.S. Small Cap Equity ETF | ||||
Level 1 Quoted prices | Level 2 Other significant observable inputs | Level 3 Significant unobservable inputs | Total | |
Investments in Securities | ||||
Common Stocks | ||||
Aerospace & Defense | $298,255 | $— | $— | $298,255 |
Automobiles & Parts | 1,190,083 | — | — | 1,190,083 |
Banks | 16,088,503 | — | — | 16,088,503 |
Beverages | 4,493,623 | — | — | 4,493,623 |
Chemicals | 10,451,638 | — | — | 10,451,638 |
Construction & Materials | 4,884,671 | — | — | 4,884,671 |
Consumer Services | 1,493,439 | — | — | 1,493,439 |
Electricity | 5,428,722 | — | — | 5,428,722 |
Electronic & Electrical Equipment | 4,003,150 | — | — | 4,003,150 |
Finance & Credit Services | 4,627,165 | — | — | 4,627,165 |
Food Producers | 12,392,216 | — | — | 12,392,216 |
Gas, Water & Multi-utilities | 11,741,356 | — | — | 11,741,356 |
General Industrials | 4,007,529 | — | — | 4,007,529 |
Health Care Providers | 7,420,114 | — | — | 7,420,114 |
Household Goods & Home Construction | 4,409,908 | — | — | 4,409,908 |
Industrial Engineering | 3,604,825 | — | — | 3,604,825 |
Industrial Materials | 5,848,265 | — | — | 5,848,265 |
Industrial Metals & Mining | 10,481,401 | — | — | 10,481,401 |
Industrial Support Services | 6,973,303 | — | — | 6,973,303 |
Industrial Transportation | 8,183,705 | — | — | 8,183,705 |
Investment Banking & Brokerage Services | 4,116,146 | — | — | 4,116,146 |
Leisure Goods | 3,028,369 | — | — | 3,028,369 |
Life Insurance | 1,684,949 | — | — | 1,684,949 |
Media | 1,339,678 | — | — | 1,339,678 |
Medical Equipment & Services | 9,123,640 | — | — | 9,123,640 |
Mortgage Real Estate Investment Trusts | 4,935,357 | — | — | 4,935,357 |
Non-life Insurance | 2,622,421 | — | — | 2,622,421 |
October 31, 2022 | J.P. Morgan Exchange-Traded Funds | 263 |
AS OF October 31, 2022 (continued)
U.S. Small Cap Equity ETF (continued) | ||||
Level 1 Quoted prices | Level 2 Other significant observable inputs | Level 3 Significant unobservable inputs | Total | |
Non-Renewable Energy | $19,827,011 | $— | $— | $19,827,011 |
Personal Care, Drug & Grocery Stores | 9,926,671 | — | — | 9,926,671 |
Personal Goods | 2,265,081 | — | — | 2,265,081 |
Pharmaceuticals, Biotechnology & Marijuana Producers | 12,282,763 | — | 55,455 | 12,338,218 |
Precious Metals & Mining | 605,205 | — | — | 605,205 |
Real Estate Investment & Services | 2,989,636 | — | — | 2,989,636 |
Real Estate Investment Trusts | 24,206,906 | — | — | 24,206,906 |
Renewable Energy | 1,434,941 | — | — | 1,434,941 |
Retailers | 8,996,136 | — | — | 8,996,136 |
Software & Computer Services | 11,315,194 | — | — | 11,315,194 |
Technology Hardware & Equipment | 19,122,054 | — | — | 19,122,054 |
Telecommunications Equipment | 8,778,411 | — | — | 8,778,411 |
Telecommunications Service Providers | 6,858,876 | — | — | 6,858,876 |
Tobacco | 1,973,999 | — | — | 1,973,999 |
Travel & Leisure | 222,726 | — | — | 222,726 |
Waste & Disposal Services | 754,288 | — | — | 754,288 |
Total Common Stocks | 286,432,329 | — | 55,455 | 286,487,784 |
Rights | — | — | 6,379 | 6,379 |
Short-Term Investments | ||||
Investment Companies | 325,140 | — | — | 325,140 |
Investment of Cash Collateral from Securities Loaned | 22,245,259 | — | — | 22,245,259 |
Total Short-Term Investments | 22,570,399 | — | — | 22,570,399 |
Total Investments in Securities | $309,002,728 | $— | $61,834 | $309,064,562 |
Appreciation in Other Financial Instruments | ||||
Futures Contracts | $12,769 | $— | $— | $12,769 |
International Growth ETF | ||||
Level 1 Quoted prices | Level 2 Other significant observable inputs | Level 3 Significant unobservable inputs | Total | |
Investments in Securities | ||||
Common Stocks | ||||
Australia | $— | $878,707 | $— | $878,707 |
Brazil | 560,808 | — | — | 560,808 |
Canada | 3,425,905 | — | — | 3,425,905 |
China | 497,695 | 1,995,217 | — | 2,492,912 |
Denmark | — | 3,305,499 | — | 3,305,499 |
France | — | 2,967,212 | — | 2,967,212 |
Germany | — | 2,983,973 | — | 2,983,973 |
Hong Kong | — | 2,005,594 | — | 2,005,594 |
India | 733,202 | — | — | 733,202 |
Indonesia | 435,884 | 1,080,076 | — | 1,515,960 |
Japan | — | 6,395,106 | — | 6,395,106 |
Mexico | 760,981 | — | — | 760,981 |
Netherlands | — | 3,974,294 | — | 3,974,294 |
Singapore | 115,108 | 855,842 | — | 970,950 |
264 | J.P. Morgan Exchange-Traded Funds | October 31, 2022 |
International Growth ETF (continued) | ||||
Level 1 Quoted prices | Level 2 Other significant observable inputs | Level 3 Significant unobservable inputs | Total | |
South Africa | $— | $559,036 | $— | $559,036 |
South Korea | — | 295,785 | — | 295,785 |
Sweden | — | 1,924,141 | — | 1,924,141 |
Switzerland | — | 1,175,033 | — | 1,175,033 |
Taiwan | 2,143,725 | — | — | 2,143,725 |
United Kingdom | — | 7,217,951 | — | 7,217,951 |
United States | 1,153,887 | 4,971,364 | — | 6,125,251 |
Total Common Stocks | 9,827,195 | 42,584,830 | — | 52,412,025 |
Short-Term Investments | ||||
Investment Companies | 2,455,095 | — | — | 2,455,095 |
Investment of Cash Collateral from Securities Loaned | 749,113 | — | — | 749,113 |
Total Short-Term Investments | 3,204,208 | — | — | 3,204,208 |
Total Investments in Securities | $13,031,403 | $42,584,830 | $— | $55,616,233 |
U.S. Momentum Factor ETF | ||||
Level 1 Quoted prices | Level 2 Other significant observable inputs | Level 3 Significant unobservable inputs | Total | |
Total Investments in Securities (a) | $230,265,664 | $— | $— | $230,265,664 |
Appreciation in Other Financial Instruments | ||||
Futures Contracts (a) | $27,027 | $— | $— | $27,027 |
(a) | Please refer to the SOI for specifics of portfolio holdings. |
U.S. Quality Factor ETF | ||||
Level 1 Quoted prices | Level 2 Other significant observable inputs | Level 3 Significant unobservable inputs | Total | |
Total Investments in Securities (a) | $599,335,232 | $— | $— | $599,335,232 |
Appreciation in Other Financial Instruments | ||||
Futures Contracts (a) | $55,014 | $— | $— | $55,014 |
(a) | Please refer to the SOI for specifics of portfolio holdings. |
U.S. Value Factor ETF | ||||
Level 1 Quoted prices | Level 2 Other significant observable inputs | Level 3 Significant unobservable inputs | Total | |
Total Investments in Securities (a) | $444,421,930 | $— | $— | $444,421,930 |
Appreciation in Other Financial Instruments | ||||
Futures Contracts (a) | $28,231 | $— | $— | $28,231 |
(a) | Please refer to the SOI for specifics of portfolio holdings. |
October 31, 2022 | J.P. Morgan Exchange-Traded Funds | 265 |
AS OF October 31, 2022 (continued)
Investment Securities on Loan, at value, Presented on the Statements of Assets and Liabilities | Cash Collateral Posted by Borrower* | Net Amount Due to Counterparty (not less than zero) | |
BetaBuilders Canada ETF | $267,554,005 | $(267,554,005) | $— |
BetaBuilders Developed Asia Pacific ex-Japan ETF | 228,806 | (189,738)** | 39,068 |
BetaBuilders Europe ETF | 36,958,615 | (36,958,615) | — |
BetaBuilders International Equity ETF | 16,847,367 | (16,847,367) | — |
BetaBuilders Japan ETF | 18,722,079 | (18,722,079) | — |
BetaBuilders U.S. Equity ETF | 2,190,898 | (2,190,898) | — |
BetaBuilders U.S. Mid Cap Equity ETF | 36,819,568 | (36,819,568) | — |
BetaBuilders U.S. Small Cap Equity ETF | 11,082,834 | (11,082,834) | — |
Emerging Markets Equity ETF | 160,016 | (160,016) | — |
International Equity ETF | 3,818,777 | (3,818,777) | — |
U.S. Equity ETF | 380,385 | (380,385) | — |
U.S. Small Cap Equity ETF | 21,395,218 | (21,395,218) | — |
International Growth ETF | 704,050 | (704,050) | — |
U.S. Momentum Factor ETF | 1,103,874 | (1,103,874) | — |
U.S. Quality Factor ETF | 19,486,422 | (19,486,422) | — |
266 | J.P. Morgan Exchange-Traded Funds | October 31, 2022 |
Investment Securities on Loan, at value, Presented on the Statements of Assets and Liabilities | Cash Collateral Posted by Borrower* | Net Amount Due to Counterparty (not less than zero) | |
U.S. Value Factor ETF | $904,560 | $(904,560) | $— |
* | Collateral posted reflects the value of securities on loan and does not include any additional amounts received from the borrower. |
** | Subsequent to October 31, 2022, additional collateral was received. |
ActiveBuilders Emerging Markets Equity ETF | $400 |
ActiveBuilders International Equity ETF | 41 |
BetaBuilders Canada ETF | 137,053 |
BetaBuilders Developed Asia Pacific ex-Japan ETF | 10,604 |
BetaBuilders Europe ETF | 45,994 |
BetaBuilders International Equity ETF | 5,668 |
BetaBuilders Japan ETF | 12,364 |
BetaBuilders U.S. Equity ETF | 891 |
BetaBuilders U.S. Mid Cap Equity ETF | 4,290 |
BetaBuilders U.S. Small Cap Equity ETF | 3,415 |
Emerging Markets Equity ETF | 328 |
International Equity ETF | 1,908 |
U.S. Equity ETF | 1,487 |
U.S. Mid Cap Equity ETF | 1,156 |
U.S. Small Cap Equity ETF | 1,762 |
International Growth ETF | 50 |
U.S. Momentum Factor ETF | 748 |
U.S. Quality Factor ETF | 1,270 |
U.S. Value Factor ETF | 1,237 |
October 31, 2022 | J.P. Morgan Exchange-Traded Funds | 267 |
AS OF October 31, 2022 (continued)
ActiveBuilders Emerging Markets Equity ETF | |||||||||
For the year ended October 31, 2022 | |||||||||
Security Description | Value at October 31, 2021 | Purchases at Cost | Proceeds from Sales | Net Realized Gain (Loss) | Change in Unrealized Appreciation/ (Depreciation) | Value at October 31, 2022 | Shares at October 31, 2022 | Dividend Income | Capital Gain Distributions |
JPMorgan Prime Money Market Fund Class IM Shares, 3.18% (a) (b) | $3,609,948 | $203,538,498 | $203,699,337 | $(373) | $(227) | $3,448,509 | 3,448,164 | $81,456 | $— |
JPMorgan U.S. Government Money Market Fund Class IM Shares, 2.85% (a) (b) | 1,214,086 | 10,963,596 | 12,177,682 | — | — | — | — | 1,262* | — |
Total | $4,824,034 | $214,502,094 | $215,877,019 | $(373) | $(227) | $3,448,509 | $82,718 | $— | |
(a) | Investment in an affiliated fund, which is registered under the Investment Company Act of 1940, as amended, and is advised by J.P. Morgan Investment Management Inc. |
(b) | The rate shown is the current yield as of October 31, 2022. |
* | Amount is included on the Statements of Operations as Income from securities lending (net) (after payments of rebates and Citibank’s fee). |
ActiveBuilders International Equity ETF | |||||||||
For the year ended October 31, 2022 | |||||||||
Security Description | Value at October 31, 2021 | Purchases at Cost | Proceeds from Sales | Net Realized Gain (Loss) | Change in Unrealized Appreciation/ (Depreciation) | Value at October 31, 2022 | Shares at October 31, 2022 | Dividend Income | Capital Gain Distributions |
JPMorgan U.S. Government Money Market Fund Class IM Shares, 2.85% (a) (b) | $429,423 | $1,867,696 | $1,980,164 | $— | $— | $316,955 | 316,955 | $3,898 | $— |
JPMorgan U.S. Government Money Market Fund Class IM Shares, 2.85% (a) (b) | 124,086 | 1,215,015 | 1,339,101 | — | — | — | — | 649* | — |
Total | $553,509 | $3,082,711 | $3,319,265 | $— | $— | $316,955 | $4,547 | $— | |
(a) | Investment in an affiliated fund, which is registered under the Investment Company Act of 1940, as amended, and is advised by J.P. Morgan Investment Management Inc. |
(b) | The rate shown is the current yield as of October 31, 2022. |
* | Amount is included on the Statements of Operations as Income from securities lending (net) (after payments of rebates and Citibank’s fee). |
268 | J.P. Morgan Exchange-Traded Funds | October 31, 2022 |
BetaBuilders Canada ETF | |||||||||
For the year ended October 31, 2022 | |||||||||
Security Description | Value at October 31, 2021 | Purchases at Cost | Proceeds from Sales | Net Realized Gain (Loss) | Change in Unrealized Appreciation/ (Depreciation) | Value at October 31, 2022 | Shares at October 31, 2022 | Dividend Income | Capital Gain Distributions |
JPMorgan Securities Lending Money Market Fund Agency SL Class Shares, 3.23% (a) (b) | $184,490,813 | $3,564,621,000 | $3,637,800,000 | $50,390* | $— | $111,362,203 | 111,362,203 | $3,401,889* | $— |
JPMorgan U.S. Government Money Market Fund Class IM Shares, 2.85% (a) (b) | 347,161,083 | 6,929,664,529 | 6,937,596,366 | — | — | 339,229,246 | 339,229,246 | 1,668,067* | — |
Total | $531,651,896 | $10,494,285,529 | $10,575,396,366 | $50,390 | $— | $450,591,449 | $5,069,956 | $— | |
(a) | Investment in an affiliated fund, which is registered under the Investment Company Act of 1940, as amended, and is advised by J.P. Morgan Investment Management Inc. |
(b) | The rate shown is the current yield as of October 31, 2022. |
* | Amount is included on the Statements of Operations as Income from securities lending (net) (after payments of rebates and Citibank’s fee). |
BetaBuilders Developed Asia Pacific ex-Japan ETF | |||||||||
For the year ended October 31, 2022 | |||||||||
Security Description | Value at October 31, 2021 | Purchases at Cost | Proceeds from Sales | Net Realized Gain (Loss) | Change in Unrealized Appreciation/ (Depreciation) | Value at October 31, 2022 | Shares at October 31, 2022 | Dividend Income | Capital Gain Distributions |
JPMorgan Securities Lending Money Market Fund Agency SL Class Shares, 3.23% (a) (b) | $110,984,304 | $296,000,001 | $406,900,000 | $(29,882)* | $33 | $54,456 | 54,455 | $34,258* | $— |
JPMorgan U.S. Government Money Market Fund Class IM Shares, 2.85% (a) (b) | 41,285,887 | 468,811,216 | 509,961,821 | — | — | 135,282 | 135,282 | 17,434* | — |
Total | $152,270,191 | $764,811,217 | $916,861,821 | $(29,882) | $33 | $189,738 | $51,692 | $— | |
(a) | Investment in an affiliated fund, which is registered under the Investment Company Act of 1940, as amended, and is advised by J.P. Morgan Investment Management Inc. |
(b) | The rate shown is the current yield as of October 31, 2022. |
* | Amount is included on the Statements of Operations as Income from securities lending (net) (after payments of rebates and Citibank’s fee). |
October 31, 2022 | J.P. Morgan Exchange-Traded Funds | 269 |
AS OF October 31, 2022 (continued)
BetaBuilders Europe ETF | |||||||||
For the year ended October 31, 2022 | |||||||||
Security Description | Value at October 31, 2021 | Purchases at Cost | Proceeds from Sales | Net Realized Gain (Loss) | Change in Unrealized Appreciation/ (Depreciation) | Value at October 31, 2022 | Shares at October 31, 2022 | Dividend Income | Capital Gain Distributions |
JPMorgan Securities Lending Money Market Fund Agency SL Class Shares, 3.23% (a) (b) | $110,100,856 | $831,000,000 | $905,510,000 | $58,712* | $8,328 | $35,657,896 | 35,657,896 | $854,661 * | $— |
JPMorgan U.S. Government Money Market Fund Class IM Shares, 2.85% (a) (b) | 53,626,708 | 1,696,997,120 | 1,745,854,226 | — | — | 4,769,602 | 4,769,602 | 408,987* | — |
Total | $163,727,564 | $2,527,997,120 | $2,651,364,226 | $58,712 | $8,328 | $40,427,498 | $1,263,648 | $— | |
(a) | Investment in an affiliated fund, which is registered under the Investment Company Act of 1940, as amended, and is advised by J.P. Morgan Investment Management Inc. |
(b) | The rate shown is the current yield as of October 31, 2022. |
* | Amount is included on the Statements of Operations as Income from securities lending (net) (after payments of rebates and Citibank’s fee). |
BetaBuilders International Equity ETF | |||||||||
For the year ended October 31, 2022 | |||||||||
Security Description | Value at October 31, 2021 | Purchases at Cost | Proceeds from Sales | Net Realized Gain (Loss) | Change in Unrealized Appreciation/ (Depreciation) | Value at October 31, 2022 | Shares at October 31, 2022 | Dividend Income | Capital Gain Distributions |
JPMorgan Securities Lending Money Market Fund Agency SL Class Shares, 3.23% (a) (b) | $30,493,852 | $247,500,000 | $264,000,000 | $15,970* | $(98) | $14,009,724 | 14,009,724 | $223,831* | $— |
JPMorgan U.S. Government Money Market Fund Class IM Shares, 2.85% (a) (b) | 4,253,477 | 300,286,412 | 300,687,270 | — | — | 3,852,619 | 3,852,619 | 73,709* | — |
JPMorgan U.S. Government Money Market Fund Class IM Shares, 2.85% (a) (b) | 20,389,345 | 216,583,186 | 224,869,532 | — | — | 12,102,999 | 12,102,999 | 100,094 | — |
Total | $55,136,674 | $764,369,598 | $789,556,802 | $15,970 | $(98) | $29,965,342 | $397,634 | $— | |
(a) | Investment in an affiliated fund, which is registered under the Investment Company Act of 1940, as amended, and is advised by J.P. Morgan Investment Management Inc. |
(b) | The rate shown is the current yield as of October 31, 2022. |
* | Amount is included on the Statements of Operations as Income from securities lending (net) (after payments of rebates and Citibank’s fee). |
270 | J.P. Morgan Exchange-Traded Funds | October 31, 2022 |
BetaBuilders Japan ETF | |||||||||
For the year ended October 31, 2022 | |||||||||
Security Description | Value at October 31, 2021 | Purchases at Cost | Proceeds from Sales | Net Realized Gain (Loss) | Change in Unrealized Appreciation/ (Depreciation) | Value at October 31, 2022 | Shares at October 31, 2022 | Dividend Income | Capital Gain Distributions |
JPMorgan Securities Lending Money Market Fund Agency SL Class Shares, 3.23% (a) (b) | $9,087,914 | $533,999,999 | $533,000,000 | $30,919* | $— | $10,118,832 | 10,118,832 | $329,748* | $— |
JPMorgan U.S. Government Money Market Fund Class IM Shares, 2.85% (a) (b) | 10,903,860 | 706,340,622 | 707,467,432 | — | — | 9,777,050 | 9,777,050 | 220,931* | — |
Total | $19,991,774 | $1,240,340,621 | $1,240,467,432 | $30,919 | $— | $19,895,882 | $550,679 | $— | |
(a) | Investment in an affiliated fund, which is registered under the Investment Company Act of 1940, as amended, and is advised by J.P. Morgan Investment Management Inc. |
(b) | The rate shown is the current yield as of October 31, 2022. |
* | Amount is included on the Statements of Operations as Income from securities lending (net) (after payments of rebates and Citibank’s fee). |
BetaBuilders U.S. Equity ETF | |||||||||
For the year ended October 31, 2022 | |||||||||
Security Description | Value at October 31, 2021 | Purchases at Cost | Proceeds from Sales | Net Realized Gain (Loss) | Change in Unrealized Appreciation/ (Depreciation) | Value at October 31, 2022 | Shares at October 31, 2022 | Dividend Income | Capital Gain Distributions |
JPMorgan Chase & Co. (a) | $9,582,475 | $8,000,918 | $1,033,686 | $(121,190) | $(2,675,749) | $13,752,768 | 109,253 | $343,635 | $— |
JPMorgan Securities Lending Money Market Fund Agency SL Class Shares, 3.23% (b) (c) | — | 18,000,000 | 16,500,000 | 1,652* | — | 1,501,652 | 1,501,652 | 8,306* | — |
JPMorgan U.S. Government Money Market Fund Class IM Shares, 2.85% (b) (c) | 561,034 | 41,543,792 | 39,866,783 | — | — | 2,238,043 | 2,238,043 | 8,833* | — |
JPMorgan U.S. Government Money Market Fund Class IM Shares, 2.85% (b) (c) | 2,841,848 | 30,543,278 | 24,519,638 | — | — | 8,865,488 | 8,865,488 | 52,099 | — |
Total | $12,985,357 | $98,087,988 | $81,920,107 | $(119,538) | $(2,675,749) | $26,357,951 | $412,873 | $— | |
(a) | Investment in affiliate. This security is included in an index in which the Fund, as an index fund, tracks. |
(b) | Investment in an affiliated fund, which is registered under the Investment Company Act of 1940, as amended, and is advised by J.P. Morgan Investment Management Inc. |
(c) | The rate shown is the current yield as of October 31, 2022. |
* | Amount is included on the Statements of Operations as Income from securities lending (net) (after payments of rebates and Citibank’s fee). |
BetaBuilders U.S. Mid Cap Equity ETF | |||||||||
For the year ended October 31, 2022 | |||||||||
Security Description | Value at October 31, 2021 | Purchases at Cost | Proceeds from Sales | Net Realized Gain (Loss) | Change in Unrealized Appreciation/ (Depreciation) | Value at October 31, 2022 | Shares at October 31, 2022 | Dividend Income | Capital Gain Distributions |
JPMorgan Securities Lending Money Market Fund Agency SL Class Shares, 3.23% (a) (b) | $62,497,450 | $177,000,000 | $206,000,000 | $(9,049)* | $2,447 | $33,490,848 | 33,490,848 | $333,105* | $— |
October 31, 2022 | J.P. Morgan Exchange-Traded Funds | 271 |
AS OF October 31, 2022 (continued)
BetaBuilders U.S. Mid Cap Equity ETF (continued) | |||||||||
For the year ended October 31, 2022 | |||||||||
Security Description | Value at October 31, 2021 | Purchases at Cost | Proceeds from Sales | Net Realized Gain (Loss) | Change in Unrealized Appreciation/ (Depreciation) | Value at October 31, 2022 | Shares at October 31, 2022 | Dividend Income | Capital Gain Distributions |
JPMorgan U.S. Government Money Market Fund Class IM Shares, 2.85% (a) (b) | $7,753,502 | $137,173,044 | $140,833,528 | $— | $— | $4,093,018 | 4,093,018 | $45,135* | $— |
JPMorgan U.S. Government Money Market Fund Class IM Shares, 2.85% (a) (b) | 4,743,180 | 122,875,312 | 119,909,401 | — | — | 7,709,091 | 7,709,091 | 108,633 | 604 |
Total | $74,994,132 | $437,048,356 | $466,742,929 | $(9,049) | $2,447 | $45,292,957 | $486,873 | $604 | |
(a) | Investment in an affiliated fund, which is registered under the Investment Company Act of 1940, as amended, and is advised by J.P. Morgan Investment Management Inc. |
(b) | The rate shown is the current yield as of October 31, 2022. |
* | Amount is included on the Statements of Operations as Income from securities lending (net) (after payments of rebates and Citibank’s fee). |
BetaBuilders U.S. Small Cap Equity ETF | |||||||||
For the year ended October 31, 2022 | |||||||||
Security Description | Value at October 31, 2021 | Purchases at Cost | Proceeds from Sales | Net Realized Gain (Loss) | Change in Unrealized Appreciation/ (Depreciation) | Value at October 31, 2022 | Shares at October 31, 2022 | Dividend Income | Capital Gain Distributions |
JPMorgan Securities Lending Money Market Fund Agency SL Class Shares, 3.23% (a) (b) | $— | $31,000,000 | $21,000,000 | $(601)* | $4,202 | $10,003,601 | 10,003,601 | $81,923 * | $— |
JPMorgan U.S. Government Money Market Fund Class IM Shares, 2.85% (a) (b) | 11,679,894 | 71,600,406 | 81,662,200 | — | — | 1,618,100 | 1,618,100 | 20,262* | — |
JPMorgan U.S. Government Money Market Fund Class IM Shares, 2.85% (a) (b) | 5,825,244 | 41,722,141 | 39,322,629 | — | — | 8,224,756 | 8,224,756 | 71,850 | — |
Total | $17,505,138 | $144,322,547 | $141,984,829 | $(601) | $4,202 | $19,846,457 | $174,035 | $— | |
(a) | Investment in an affiliated fund, which is registered under the Investment Company Act of 1940, as amended, and is advised by J.P. Morgan Investment Management Inc. |
(b) | The rate shown is the current yield as of October 31, 2022. |
* | Amount is included on the Statements of Operations as Income from securities lending (net) (after payments of rebates and Citibank’s fee). |
Carbon Transition U.S. Equity ETF | |||||||||
For the year ended October 31, 2022 | |||||||||
Security Description | Value at October 31, 2021 | Purchases at Cost | Proceeds from Sales | Net Realized Gain (Loss) | Change in Unrealized Appreciation/ (Depreciation) | Value at October 31, 2022 | Shares at October 31, 2022 | Dividend Income | Capital Gain Distributions |
JPMorgan U.S. Government Money Market Fund Class IM Shares, 2.85% (a) (b) | $9,966 | $733,754 | $711,885 | $— | $— | $31,835 | 31,835 | $285 | $— |
(a) | Investment in an affiliated fund, which is registered under the Investment Company Act of 1940, as amended, and is advised by J.P. Morgan Investment Management Inc. |
(b) | The rate shown is the current yield as of October 31, 2022. |
272 | J.P. Morgan Exchange-Traded Funds | October 31, 2022 |
Climate Change Solutions ETF | |||||||||
For the period ended October 31, 2022 | |||||||||
Security Description | Value at December 13, 2021(a) | Purchases at Cost | Proceeds from Sales | Net Realized Gain (Loss) | Change in Unrealized Appreciation/ (Depreciation) | Value at October 31, 2022 | Shares at October 31, 2022 | Dividend Income | Capital Gain Distributions |
JPMorgan Prime Money Market Fund Class IM Shares, 3.18% (b) (c) | $— | $241,534 | $241,510 | $(24) | $— | $— | — | $19 | $— |
(a) | Commencement of operations was December 13, 2021. |
(b) | Investment in an affiliated fund, which is registered under the Investment Company Act of 1940, as amended, and is advised by J.P. Morgan Investment Management Inc. |
(c) | The rate shown is the current yield as of October 31, 2022. |
Emerging Markets Equity ETF | |||||||||
For the year ended October 31, 2022 | |||||||||
Security Description | Value at October 31, 2021 | Purchases at Cost | Proceeds from Sales | Net Realized Gain (Loss) | Change in Unrealized Appreciation/ (Depreciation) | Value at October 31, 2022 | Shares at October 31, 2022 | Dividend Income | Capital Gain Distributions |
JPMorgan Securities Lending Money Market Fund Agency SL Class Shares, 3.23% (a) (b) | $— | $200,000 | $200,000 | $— | $— | $— | — | $8* | $— |
JPMorgan U.S. Government Money Market Fund Class IM Shares, 2.85% (a) (b) | 449,126 | 1,930,332 | 2,197,301 | — | — | 182,157 | 182,157 | 1,740* | — |
JPMorgan U.S. Government Money Market Fund Class IM Shares, 2.85% (a) (b) | 703,142 | 1,411,062 | 2,114,204 | — | — | — | — | 254 | — |
Total | $1,152,268 | $3,541,394 | $4,511,505 | $— | $— | $182,157 | $2,002 | $— | |
(a) | Investment in an affiliated fund, which is registered under the Investment Company Act of 1940, as amended, and is advised by J.P. Morgan Investment Management Inc. |
(b) | The rate shown is the current yield as of October 31, 2022. |
* | Amount is included on the Statements of Operations as Income from securities lending (net) (after payments of rebates and Citibank’s fee). |
International Equity ETF | |||||||||
For the year ended October 31, 2022 | |||||||||
Security Description | Value at October 31, 2021 | Purchases at Cost | Proceeds from Sales | Net Realized Gain (Loss) | Change in Unrealized Appreciation/ (Depreciation) | Value at October 31, 2022 | Shares at October 31, 2022 | Dividend Income | Capital Gain Distributions |
JPMorgan Prime Money Market Fund Class IM Shares, 3.18% (a) (b) | $332,532 | $83,910,152 | $83,671,921 | $(1,334) | $(31) | $569,398 | 569,342 | $14,936 | $42 |
JPMorgan Securities Lending Money Market Fund Agency SL Class Shares, 3.23% (a) (b) | 6,757,673 | 42,500,001 | 47,000,000 | 97* | 1,154 | 2,258,925 | 2,258,925 | 51,178* | — |
JPMorgan U.S. Government Money Market Fund Class IM Shares, 2.85% (a) (b) | 1,350,975 | 84,651,011 | 84,212,362 | — | — | 1,789,624 | 1,789,624 | 29,767* | — |
Total | $8,441,180 | $211,061,164 | $214,884,283 | $(1,237) | $1,123 | $4,617,947 | $95,881 | $42 | |
(a) | Investment in an affiliated fund, which is registered under the Investment Company Act of 1940, as amended, and is advised by J.P. Morgan Investment Management Inc. |
(b) | The rate shown is the current yield as of October 31, 2022. |
* | Amount is included on the Statements of Operations as Income from securities lending (net) (after payments of rebates and Citibank’s fee). |
October 31, 2022 | J.P. Morgan Exchange-Traded Funds | 273 |
AS OF October 31, 2022 (continued)
U.S. Equity ETF | |||||||||
For the year ended October 31, 2022 | |||||||||
Security Description | Value at October 31, 2021 | Purchases at Cost | Proceeds from Sales | Net Realized Gain (Loss) | Change in Unrealized Appreciation/ (Depreciation) | Value at October 31, 2022 | Shares at October 31, 2022 | Dividend Income | Capital Gain Distributions |
JPMorgan Securities Lending Money Market Fund Agency SL Class Shares, 3.23% (a) (b) | $20,205,079 | $62,500,000 | $82,500,000 | $(5,152)* | $100 | $200,027 | 200,027 | $14,413* | $— |
JPMorgan U.S. Government Money Market Fund Class IM Shares, 2.85% (a) (b) | 3,486,227 | 68,028,142 | 71,322,521 | — | — | 191,848 | 191,848 | 12,188* | — |
JPMorgan U.S. Government Money Market Fund Class IM Shares, 2.85% (a) (b) | 1,191,071 | 36,056,660 | 36,226,981 | — | — | 1,020,750 | 1,020,750 | 8,370 | — |
Total | $24,882,377 | $166,584,802 | $190,049,502 | $(5,152) | $100 | $1,412,625 | $34,971 | $— | |
(a) | Investment in an affiliated fund, which is registered under the Investment Company Act of 1940, as amended, and is advised by J.P. Morgan Investment Management Inc. |
(b) | The rate shown is the current yield as of October 31, 2022. |
* | Amount is included on the Statements of Operations as Income from securities lending (net) (after payments of rebates and Citibank’s fee). |
U.S. Mid Cap Equity ETF | |||||||||
For the year ended October 31, 2022 | |||||||||
Security Description | Value at October 31, 2021 | Purchases at Cost | Proceeds from Sales | Net Realized Gain (Loss) | Change in Unrealized Appreciation/ (Depreciation) | Value at October 31, 2022 | Shares at October 31, 2022 | Dividend Income | Capital Gain Distributions |
JPMorgan Securities Lending Money Market Fund Agency SL Class Shares, 3.23% (a) (b) | $200,580 | $19,000,000 | $19,198,428 | $(2,172)* | $20 | $— | — | $11,167* | $— |
JPMorgan U.S. Government Money Market Fund Class IM Shares, 2.85% (a) (b) | 3,674,212 | 39,023,552 | 42,697,764 | — | — | — | — | 8,641* | — |
JPMorgan U.S. Government Money Market Fund Class IM Shares, 2.85% (a) (b) | 356,647 | 15,648,727 | 15,591,320 | — | — | 414,054 | 414,054 | 4,349 | — |
Total | $4,231,439 | $73,672,279 | $77,487,512 | $(2,172) | $20 | $414,054 | $24,157 | $— | |
(a) | Investment in an affiliated fund, which is registered under the Investment Company Act of 1940, as amended, and is advised by J.P. Morgan Investment Management Inc. |
(b) | The rate shown is the current yield as of October 31, 2022. |
* | Amount is included on the Statements of Operations as Income from securities lending (net) (after payments of rebates and Citibank’s fee). |
U.S. Small Cap Equity ETF | |||||||||
For the year ended October 31, 2022 | |||||||||
Security Description | Value at October 31, 2021 | Purchases at Cost | Proceeds from Sales | Net Realized Gain (Loss) | Change in Unrealized Appreciation/ (Depreciation) | Value at October 31, 2022 | Shares at October 31, 2022 | Dividend Income | Capital Gain Distributions |
JPMorgan Securities Lending Money Market Fund Agency SL Class Shares, 3.23% (a) (b) | $16,344,863 | $40,000,000 | $37,000,000 | $(4,740)* | $2,639 | $19,342,762 | 19,342,762 | $99,470 * | $— |
274 | J.P. Morgan Exchange-Traded Funds | October 31, 2022 |
U.S. Small Cap Equity ETF (continued) | |||||||||
For the year ended October 31, 2022 | |||||||||
Security Description | Value at October 31, 2021 | Purchases at Cost | Proceeds from Sales | Net Realized Gain (Loss) | Change in Unrealized Appreciation/ (Depreciation) | Value at October 31, 2022 | Shares at October 31, 2022 | Dividend Income | Capital Gain Distributions |
JPMorgan U.S. Government Money Market Fund Class IM Shares, 2.85% (a) (b) | $3,231,887 | $66,313,191 | $66,642,581 | $— | $— | $2,902,497 | 2,902,497 | $20,483* | $— |
JPMorgan U.S. Government Money Market Fund Class IM Shares, 2.85% (a) (b) | 337,403 | 16,987,573 | 16,999,836 | — | — | 325,140 | 325,140 | 6,683 | — |
Total | $19,914,153 | $123,300,764 | $120,642,417 | $(4,740) | $2,639 | $22,570,399 | $126,636 | $— | |
(a) | Investment in an affiliated fund, which is registered under the Investment Company Act of 1940, as amended, and is advised by J.P. Morgan Investment Management Inc. |
(b) | The rate shown is the current yield as of October 31, 2022. |
* | Amount is included on the Statements of Operations as Income from securities lending (net) (after payments of rebates and Citibank’s fee). |
International Growth ETF | |||||||||
For the year ended October 31, 2022 | |||||||||
Security Description | Value at October 31, 2021 | Purchases at Cost | Proceeds from Sales | Net Realized Gain (Loss) | Change in Unrealized Appreciation/ (Depreciation) | Value at October 31, 2022 | Shares at October 31, 2022 | Dividend Income | Capital Gain Distributions |
JPMorgan U.S. Government Money Market Fund Class IM Shares, 2.85% (a) (b) | $— | $1,457,003 | $707,890 | $— | $— | $749,113 | 749,113 | $3,004* | $— |
JPMorgan U.S. Government Money Market Fund Class IM Shares, 2.85% (a) (b) | 446,263 | 14,174,050 | 12,165,218 | — | — | 2,455,095 | 2,455,095 | 11,767 | — |
Total | $446,263 | $15,631,053 | $12,873,108 | $— | $— | $3,204,208 | $14,771 | $— | |
(a) | Investment in an affiliated fund, which is registered under the Investment Company Act of 1940, as amended, and is advised by J.P. Morgan Investment Management Inc. |
(b) | The rate shown is the current yield as of October 31, 2022. |
* | Amount is included on the Statements of Operations as Income from securities lending (net) (after payments of rebates and Citibank’s fee). |
U.S. Momentum Factor ETF | |||||||||
For the year ended October 31, 2022 | |||||||||
Security Description | Value at October 31, 2021 | Purchases at Cost | Proceeds from Sales | Net Realized Gain (Loss) | Change in Unrealized Appreciation/ (Depreciation) | Value at October 31, 2022 | Shares at October 31, 2022 | Dividend Income | Capital Gain Distributions |
JPMorgan U.S. Government Money Market Fund Class IM Shares, 2.85% (a) (b) | $1,686,209 | $17,772,751 | $18,327,543 | $— | $— | $1,131,417 | 1,131,417 | $9,209* | $— |
JPMorgan U.S. Government Money Market Fund Class IM Shares, 2.85% (a) (b) | 155,476 | 10,198,894 | 10,014,033 | — | — | 340,337 | 340,337 | 3,767 | — |
Total | $1,841,685 | $27,971,645 | $28,341,576 | $— | $— | $1,471,754 | $12,976 | $— | |
(a) | Investment in an affiliated fund, which is registered under the Investment Company Act of 1940, as amended, and is advised by J.P. Morgan Investment Management Inc. |
(b) | The rate shown is the current yield as of October 31, 2022. |
* | Amount is included on the Statements of Operations as Income from securities lending (net) (after payments of rebates and Citibank’s fee). |
October 31, 2022 | J.P. Morgan Exchange-Traded Funds | 275 |
AS OF October 31, 2022 (continued)
U.S. Quality Factor ETF | |||||||||
For the year ended October 31, 2022 | |||||||||
Security Description | Value at October 31, 2021 | Purchases at Cost | Proceeds from Sales | Net Realized Gain (Loss) | Change in Unrealized Appreciation/ (Depreciation) | Value at October 31, 2022 | Shares at October 31, 2022 | Dividend Income | Capital Gain Distributions |
JPMorgan Securities Lending Money Market Fund Agency SL Class Shares, 3.23% (a) (b) | $6,249,325 | $32,000,000 | $21,750,000 | $(1,600)* | $200 | $16,497,925 | 16,497,925 | $11,107* | $— |
JPMorgan U.S. Government Money Market Fund Class IM Shares, 2.85% (a) (b) | 1,942,017 | 48,920,874 | 47,174,026 | — | — | 3,688,865 | 3,688,865 | 20,005* | — |
JPMorgan U.S. Government Money Market Fund Class IM Shares, 2.85% (a) (b) | 244,069 | 21,938,281 | 21,396,815 | — | — | 785,535 | 785,535 | 9,184 | — |
Total | $8,435,411 | $102,859,155 | $90,320,841 | $(1,600) | $200 | $20,972,325 | $40,296 | $— | |
(a) | Investment in an affiliated fund, which is registered under the Investment Company Act of 1940, as amended, and is advised by J.P. Morgan Investment Management Inc. |
(b) | The rate shown is the current yield as of October 31, 2022. |
* | Amount is included on the Statements of Operations as Income from securities lending (net) (after payments of rebates and Citibank’s fee). |
U.S. Value Factor ETF | |||||||||
For the year ended October 31, 2022 | |||||||||
Security Description | Value at October 31, 2021 | Purchases at Cost | Proceeds from Sales | Net Realized Gain (Loss) | Change in Unrealized Appreciation/ (Depreciation) | Value at October 31, 2022 | Shares at October 31, 2022 | Dividend Income | Capital Gain Distributions |
JPMorgan Securities Lending Money Market Fund Agency SL Class Shares, 3.23% (a) (b) | $7,298,070 | $41,000,000 | $48,000,000 | $(1,206)* | $208 | $297,072 | 297,072 | $13,362* | $— |
JPMorgan U.S. Government Money Market Fund Class IM Shares, 2.85% (a) (b) | 1,292,238 | 62,420,086 | 63,089,304 | — | — | 623,020 | 623,020 | 11,981* | — |
JPMorgan U.S. Government Money Market Fund Class IM Shares, 2.85% (a) (b) | 682,276 | 27,808,698 | 28,113,711 | — | — | 377,263 | 377,263 | 11,844 | 74 |
Total | $9,272,584 | $131,228,784 | $139,203,015 | $(1,206) | $208 | $1,297,355 | $37,187 | $74 | |
(a) | Investment in an affiliated fund, which is registered under the Investment Company Act of 1940, as amended, and is advised by J.P. Morgan Investment Management Inc. |
(b) | The rate shown is the current yield as of October 31, 2022. |
* | Amount is included on the Statements of Operations as Income from securities lending (net) (after payments of rebates and Citibank’s fee). |
276 | J.P. Morgan Exchange-Traded Funds | October 31, 2022 |
BetaBuilders Canada ETF | BetaBuilders Developed Asia Pacific ex-Japan ETF | BetaBuilders Europe ETF | BetaBuilders International Equity ETF | BetaBuilders Japan ETF | BetaBuilders U.S. Equity ETF | |
Futures Contracts: | ||||||
Average Notional Balance Long | $31,751,231 | $24,876,461 | $54,590,710 | $25,094,282 | $61,993,883 | $5,378,893 |
Ending Notional Balance Long | 31,144,420 | 11,997,280 | 39,974,320 | 26,343,000 | 74,684,959 | 9,901,650 |
BetaBuilders U.S. Mid Cap Equity ETF | BetaBuilders U.S. Small Cap Equity ETF | Carbon Transition U.S. Equity ETF | Emerging Markets Equity ETF | International Equity ETF | U.S. Equity ETF | |
Futures Contracts: | ||||||
Average Notional Balance Long | $10,170,527 | $6,250,340 | $33,537 | $385,385 | $5,446,789 | $1,349,978 |
Ending Notional Balance Long | 7,809,280 | 8,616,915 | 38,828 | 128,115 | 3,512,400 | 776,600 |
U.S. Mid Cap Equity ETF | U.S. Small Cap Equity ETF | U.S. Momentum Factor ETF | U.S. Quality Factor ETF | U.S. Value Factor ETF | |
Futures Contracts: | |||||
Average Notional Balance Long | $509,914 | $708,292 | $474,617 | $882,430 | $1,314,117 |
Ending Notional Balance Long | 732,120 | 277,965 | 368,861 | 970,750 | 582,450 |
October 31, 2022 | J.P. Morgan Exchange-Traded Funds | 277 |
AS OF October 31, 2022 (continued)
Paid-in-Capital | Accumulated undistributed (distributions in excess of) net investment income | Accumulated net realized gains (losses) | |
ActiveBuilders Emerging Markets Equity ETF | $— | $410,128 | $(410,128) |
ActiveBuilders International Equity ETF | — | 60,218 | (60,218) |
BetaBuilders Canada ETF | 87,734,502 | (3,681,510) | (84,052,992) |
BetaBuilders Developed Asia Pacific ex-Japan ETF | 24,418,718 | 57,546,913 | (81,965,631) |
BetaBuilders Europe ETF | (146,603,773) | 24,854,990 | 121,748,783 |
BetaBuilders International Equity ETF | 57,816,611 | 8,894,159 | (66,710,770) |
BetaBuilders Japan ETF | 99,478,959 | (1,774,044) | (97,704,915) |
BetaBuilders U.S. Equity ETF | 22,447,627 | 1,009 | (22,448,636) |
BetaBuilders U.S. Mid Cap Equity ETF | 151,989,202 | (1,186,888) | (150,802,314) |
BetaBuilders U.S. Small Cap Equity ETF | 23,612,052 | 386,369 | (23,998,421) |
Carbon Transition U.S. Equity ETF | 1,958,835 | — | (1,958,835) |
Climate Change Solutions ETF | — | (14,718) | 14,718 |
Emerging Markets Equity ETF | 558,160 | 421,751 | (979,911) |
International Equity ETF | 772,631 | 3,102,024 | (3,874,655) |
U.S. Equity ETF | 94,771,000 | — | (94,771,000) |
U.S. Mid Cap Equity ETF | 21,589,548 | 501 | (21,590,049) |
U.S. Small Cap Equity ETF | 15,321,166 | 16,341 | (15,337,507) |
International Growth ETF | 755,369 | 103,578 | (858,947) |
U.S. Momentum Factor ETF | 26,671,704 | — | (26,671,704) |
U.S. Quality Factor ETF | 50,266,569 | — | (50,266,569) |
U.S. Value Factor ETF | 21,114,820 | — | (21,114,820) |
278 | J.P. Morgan Exchange-Traded Funds | October 31, 2022 |
ActiveBuilders Emerging Markets Equity ETF | 0.33% |
ActiveBuilders International Equity ETF | 0.25 |
BetaBuilders Canada ETF | 0.19 |
BetaBuilders Developed Asia Pacific ex-Japan ETF | 0.19 |
BetaBuilders Europe ETF | 0.09 |
BetaBuilders International Equity ETF | 0.07 |
BetaBuilders Japan ETF | 0.19 |
BetaBuilders U.S. Equity ETF | 0.02 |
BetaBuilders U.S. Mid Cap Equity ETF | 0.07 |
BetaBuilders U.S. Small Cap Equity ETF | 0.09 |
Carbon Transition U.S. Equity ETF | 0.15 |
Climate Change Solutions ETF | 0.49 |
Emerging Markets Equity ETF | 0.44 |
International Equity ETF | 0.37 |
U.S. Equity ETF | 0.18 |
U.S. Mid Cap Equity ETF | 0.24 |
U.S. Small Cap Equity ETF | 0.29 |
International Growth ETF | 0.55 |
U.S. Momentum Factor ETF | 0.12 |
U.S. Quality Factor ETF | 0.12 |
U.S. Value Factor ETF | 0.12 |
October 31, 2022 | J.P. Morgan Exchange-Traded Funds | 279 |
AS OF October 31, 2022 (continued)
Purchases (excluding U.S. Government) | Sales (excluding U.S. Government) | |
ActiveBuilders Emerging Markets Equity ETF | $876,523,814 | $196,419,701 |
ActiveBuilders International Equity ETF | 7,751,529 | 7,105,049 |
BetaBuilders Canada ETF | 304,068,438 | 307,672,456 |
BetaBuilders Developed Asia Pacific ex-Japan ETF | 640,910,093 | 570,942,024 |
BetaBuilders Europe ETF | 533,816,943 | 627,317,990 |
BetaBuilders International Equity ETF | 178,843,778 | 205,586,155 |
BetaBuilders Japan ETF | 273,752,351 | 356,530,610 |
BetaBuilders U.S. Equity ETF | 37,792,764 | 48,907,617 |
BetaBuilders U.S. Mid Cap Equity ETF | 443,959,019 | 501,708,237 |
BetaBuilders U.S. Small Cap Equity ETF | 134,510,043 | 139,711,229 |
Carbon Transition U.S. Equity ETF | 3,575,708 | 6,325,731 |
Climate Change Solutions ETF | 30,910,489 | 6,719,640 |
Emerging Markets Equity ETF | 87,017,900 | 53,425,238 |
International Equity ETF | 213,008,813 | 212,783,406 |
U.S. Equity ETF | 129,290,389 | 130,233,231 |
U.S. Mid Cap Equity ETF | 58,409,684 | 58,340,224 |
U.S. Small Cap Equity ETF | 54,208,638 | 56,119,665 |
International Growth ETF | 20,123,476 | 19,037,452 |
U.S. Momentum Factor ETF | 100,193,954 | 101,128,118 |
U.S. Quality Factor ETF | 83,028,246 | 113,396,428 |
U.S. Value Factor ETF | 106,388,641 | 168,004,632 |
In-Kind Purchases | In-Kind Sales | |
ActiveBuilders Emerging Markets Equity ETF | $241,083,450 | $— |
BetaBuilders Canada ETF | 886,582,863 | 257,516,556 |
BetaBuilders Developed Asia Pacific ex-Japan ETF | 462,920,792 | 171,838,304 |
BetaBuilders Europe ETF | 3,871,787,911 | 7,752,843,277 |
BetaBuilders International Equity ETF | 266,314,911 | 321,996,669 |
BetaBuilders Japan ETF | 1,196,516,714 | 597,194,984 |
280 | J.P. Morgan Exchange-Traded Funds | October 31, 2022 |
In-Kind Purchases | In-Kind Sales | |
BetaBuilders U.S. Equity ETF | $760,693,522 | $62,682,578 |
BetaBuilders U.S. Mid Cap Equity ETF | 576,320,284 | 478,569,608 |
BetaBuilders U.S. Small Cap Equity ETF | 280,269,069 | 131,916,955 |
Carbon Transition U.S. Equity ETF | 11,148,861 | 8,480,976 |
Climate Change Solutions ETF | 2,129,732 | — |
Emerging Markets Equity ETF | 15,654,424 | 5,345,668 |
International Equity ETF | 69,550,129 | 9,900,953 |
U.S. Equity ETF | 115,197,619 | 274,949,365 |
U.S. Mid Cap Equity ETF | 118,971,344 | 65,510,857 |
U.S. Small Cap Equity ETF | 182,789,928 | 43,732,671 |
International Growth ETF | 25,603,348 | 6,339,797 |
U.S. Momentum Factor ETF | 160,506,965 | 97,050,874 |
U.S. Quality Factor ETF | 515,477,365 | 240,153,950 |
U.S. Value Factor ETF | 367,326,777 | 191,521,643 |
Aggregate Cost | Gross Unrealized Appreciation | Gross Unrealized Depreciation | Net Unrealized Appreciation (Depreciation) | |
ActiveBuilders Emerging Markets Equity ETF | $1,205,508,812 | $17,329,052 | $316,397,582 | $(299,068,530) |
ActiveBuilders International Equity ETF | 27,378,949 | 496,943 | 5,621,732 | (5,124,789) |
BetaBuilders Canada ETF | 5,495,743,706 | 800,545,490 | 235,035,028 | 565,510,462 |
BetaBuilders Developed Asia Pacific ex-Japan ETF | 4,098,410,779 | 91,519,774 | 790,631,392 | (699,111,618) |
BetaBuilders Europe ETF | 4,432,895,158 | 11,861,145 | 916,440,124 | (904,578,979) |
BetaBuilders International Equity ETF | 3,015,163,613 | 148,030,737 | 449,594,223 | (301,563,486) |
BetaBuilders Japan ETF | 7,825,774,216 | 76,979,741 | 1,742,219,428 | (1,665,239,687) |
BetaBuilders U.S. Equity ETF | 1,346,962,947 | 80,315,531 | 148,403,394 | (68,087,863) |
BetaBuilders U.S. Mid Cap Equity ETF | 1,516,345,863 | 139,820,601 | 228,489,294 | (88,668,693) |
BetaBuilders U.S. Small Cap Equity ETF | 564,415,331 | 43,726,387 | 102,175,237 | (58,448,850) |
Carbon Transition U.S. Equity ETF | 20,980,431 | 1,595,225 | 1,653,194 | (57,969) |
Climate Change Solutions ETF | 23,176,297 | 416,753 | 4,316,359 | (3,899,606) |
Emerging Markets Equity ETF | 180,253,028 | 15,408,518 | 31,978,966 | (16,570,448) |
International Equity ETF | 819,337,151 | 29,264,371 | 177,078,627 | (147,814,256) |
U.S. Equity ETF | 472,085,890 | 65,924,131 | 30,516,799 | 35,407,332 |
U.S. Mid Cap Equity ETF | 257,816,164 | 25,812,151 | 16,546,585 | 9,265,566 |
U.S. Small Cap Equity ETF | 313,769,704 | 21,701,070 | 26,393,443 | (4,692,373) |
International Growth ETF | 64,913,086 | 1,894,062 | 11,190,915 | (9,296,853) |
U.S. Momentum Factor ETF | 243,278,586 | 13,347,629 | 26,333,524 | (12,985,895) |
U.S. Quality Factor ETF | 618,123,055 | 23,830,393 | 42,563,202 | (18,732,809) |
U.S. Value Factor ETF | 494,694,815 | 18,774,489 | 69,019,143 | (50,244,654) |
October 31, 2022 | J.P. Morgan Exchange-Traded Funds | 281 |
AS OF October 31, 2022 (continued)
Ordinary Income* | Net Long-Term Capital Gains | Total Distributions Paid | |
ActiveBuilders Emerging Markets Equity ETF | $5,165,856 | $— | $5,165,856 |
ActiveBuilders International Equity ETF | 319,380 | — | 319,380 |
BetaBuilders Canada ETF | 152,620,697 | — | 152,620,697 |
BetaBuilders Developed Asia Pacific ex-Japan ETF | 267,459,428 | — | 267,459,428 |
BetaBuilders Europe ETF | 309,349,480 | — | 309,349,480 |
BetaBuilders International Equity ETF | 124,967,513 | — | 124,967,513 |
BetaBuilders Japan ETF | 220,078,396 | — | 220,078,396 |
BetaBuilders U.S. Equity ETF | 14,262,272 | — | 14,262,272 |
BetaBuilders U.S. Mid Cap Equity ETF | 18,142,752 | — | 18,142,752 |
BetaBuilders U.S. Small Cap Equity ETF | 6,135,146 | — | 6,135,146 |
Carbon Transition U.S. Equity ETF | 316,660 | — | 316,660 |
Climate Change Solutions ETF | 15,288 | — | 15,288 |
Emerging Markets Equity ETF | 8,578,159 | — | 8,578,159 |
International Equity ETF | 41,010,274 | — | 41,010,274 |
U.S. Equity ETF | 12,386,546 | — | 12,386,546 |
U.S. Mid Cap Equity ETF | 4,185,258 | — | 4,185,258 |
U.S. Small Cap Equity ETF | 2,874,215 | — | 2,874,215 |
International Growth ETF | 426,147 | 397,492 | 823,639 |
U.S. Momentum Factor ETF | 2,634,717 | — | 2,634,717 |
U.S. Quality Factor ETF | 6,843,698 | — | 6,843,698 |
U.S. Value Factor ETF | 11,652,973 | — | 11,652,973 |
* | Short-term gain distributions are treated as ordinary income for income tax purposes. |
282 | J.P. Morgan Exchange-Traded Funds | October 31, 2022 |
Ordinary Income* | Total Distributions Paid | |
BetaBuilders Canada ETF | $113,624,161 | $113,624,161 |
BetaBuilders Developed Asia Pacific ex-Japan ETF | 130,441,819 | 130,441,819 |
BetaBuilders Europe ETF | 162,749,406 | 162,749,406 |
BetaBuilders International Equity ETF | 83,978,586 | 83,978,586 |
BetaBuilders Japan ETF | 70,569,312 | 70,569,312 |
BetaBuilders U.S. Equity ETF | 5,799,680 | 5,799,680 |
BetaBuilders U.S. Mid Cap Equity ETF | 13,365,064 | 13,365,064 |
BetaBuilders U.S. Small Cap Equity ETF | 2,261,493 | 2,261,493 |
Carbon Transition U.S. Equity ETF | 242,528 | 242,528 |
Emerging Markets Equity ETF | 6,292,381 | 6,292,381 |
International Equity ETF | 25,542,042 | 25,542,042 |
U.S. Equity ETF | 11,091,933 | 11,091,933 |
U.S. Mid Cap Equity ETF | 3,596,501 | 3,596,501 |
U.S. Small Cap Equity ETF | 2,069,847 | 2,069,847 |
International Growth ETF | 18,324 | 18,324 |
U.S. Momentum Factor ETF | 1,301,587 | 1,301,587 |
U.S. Quality Factor ETF | 6,236,190 | 6,236,190 |
U.S. Value Factor ETF | 9,906,929 | 9,906,929 |
* | Short-term gain distributions are treated as ordinary income for income tax purposes. |
October 31, 2022 | J.P. Morgan Exchange-Traded Funds | 283 |
AS OF October 31, 2022 (continued)
Current Distributable Ordinary Income | Current Distributable Long-Term Capital Gain (Tax Basis Capital Loss Carryover) | Unrealized Appreciation (Depreciation) | |
ActiveBuilders Emerging Markets Equity ETF | $21,433,618 | $(55,488,563) | $(299,301,088) |
ActiveBuilders International Equity ETF | 691,069 | (1,919,179) | (5,128,800) |
BetaBuilders Canada ETF | 20,455,332 | (176,305,582) | 565,619,718 |
BetaBuilders Developed Asia Pacific ex-Japan ETF | — | (174,364,068) | (698,833,270) |
BetaBuilders Europe ETF | 3,824,828 | (242,938,183) | (905,926,916) |
BetaBuilders International Equity ETF | 963,322 | (53,172,345) | (302,177,299) |
BetaBuilders Japan ETF | 92,152,354 | (240,381,239) | (1,667,220,925) |
BetaBuilders U.S. Equity ETF | 2,295,223 | (18,061,541) | (68,087,863) |
BetaBuilders U.S. Mid Cap Equity ETF | 3,025,728 | (153,857,757) | (88,668,693) |
BetaBuilders U.S. Small Cap Equity ETF | 954,217 | (43,329,496) | (58,448,850) |
Carbon Transition U.S. Equity ETF | 41,302 | (1,409,408) | (57,969) |
Climate Change Solutions ETF | 212,223 | (3,132,707) | (3,900,744) |
Emerging Markets Equity ETF | 492,234 | (31,163,663) | (17,043,519) |
International Equity ETF | — | (128,900,471) | (147,992,394) |
U.S. Equity ETF | 1,960,221 | (36,404,174) | 35,407,332 |
U.S. Mid Cap Equity ETF | 838,958 | (13,797,343) | 9,265,566 |
U.S. Small Cap Equity ETF | 683,633 | (20,495,839) | (4,692,373) |
International Growth ETF | 493,030 | (9,464,134) | (9,304,979) |
U.S. Momentum Factor ETF | 433,785 | (24,869,271) | (12,985,895) |
U.S. Quality Factor ETF | 1,317,073 | (34,982,731) | (18,732,809) |
U.S. Value Factor ETF | 1,583,828 | (52,972,391) | (50,244,654) |
284 | J.P. Morgan Exchange-Traded Funds | October 31, 2022 |
Capital Loss Carryforward Character | ||
Short-Term | Long-Term | |
ActiveBuilders Emerging Markets Equity ETF | $50,152,798 | $5,335,765 |
ActiveBuilders International Equity ETF | 1,474,903 | 444,276 |
BetaBuilders Canada ETF | 54,415,002 | 121,890,580 |
BetaBuilders Developed Asia Pacific ex-Japan ETF | 95,275,844 | 79,088,224 |
BetaBuilders Europe ETF | 111,282,137 | 131,656,046 |
BetaBuilders International Equity ETF | 25,948,932 | 27,223,413 |
BetaBuilders Japan ETF | 79,312,027 | 161,069,212 |
BetaBuilders U.S. Equity ETF | 15,995,378 | 2,066,163 |
BetaBuilders U.S. Mid Cap Equity ETF | 120,310,069 | 33,547,688 |
BetaBuilders U.S. Small Cap Equity ETF | 35,062,221 | 8,267,275 |
Carbon Transition U.S. Equity ETF | 1,099,727 | 309,681 |
Climate Change Solutions ETF | 3,132,707 | — |
Emerging Markets Equity ETF | 26,014,239 | 5,149,424 |
International Equity ETF | 50,182,642 | 78,717,829 |
U.S. Equity ETF | 27,942,518 | 8,461,656 |
U.S. Mid Cap Equity ETF | 12,737,239 | 1,060,104 |
U.S. Small Cap Equity ETF | 15,236,353 | 5,259,486 |
International Growth ETF | 6,482,137 | 2,981,997 |
U.S. Momentum Factor ETF | 22,566,377 | 2,302,894 |
U.S. Quality Factor ETF | 26,963,158 | 8,019,573 |
U.S. Value Factor ETF | 44,202,604 | 8,769,787 |
Capital Loss Utilized | ||
Short-Term | Long-Term | |
U.S. Equity ETF | $— | $3,008,424 |
U.S. Mid Cap Equity ETF | — | 3,252,019 |
October 31, 2022 | J.P. Morgan Exchange-Traded Funds | 285 |
AS OF October 31, 2022 (continued)
JPMorgan SmartRetirement Funds | JPMorgan SmartRetirement Blend Funds | |
ActiveBuilders Emerging Markets Equity ETF | 73.8% | —% |
BetaBuilders International Equity ETF | — | 81.2 |
BetaBuilders U.S. Mid Cap Equity ETF | 54.9 | 39.1 |
BetaBuilders U.S. Small Cap Equity ETF | — | 91.1 |
% of Ownership | |
ActiveBuilders International Equity ETF | 78% |
Carbon Transition U.S. Equity ETF | 75 |
Climate Change Solutions ETF | 84 |
286 | J.P. Morgan Exchange-Traded Funds | October 31, 2022 |
ActiveBuilders Emerging Markets Equity ETF | ActiveBuilders International Equity ETF | BetaBuilders Canada ETF | BetaBuilders Developed Asia Pacific ex-Japan ETF | BetaBuilders Europe ETF | BetaBuilders International Equity ETF | BetaBuilders Japan ETF | |
Australia | —% | —% | —% | 59.3% | —% | —% | —% |
Canada | — | — | 96.1 | — | — | — | — |
China | 25.8 | — | — | — | — | — | — |
France | — | 12.1 | — | — | 16.1 | 10.2 | — |
Germany | — | — | — | — | 11.4 | — | — |
Hong Kong | — | — | — | 17.0 | — | — | — |
India | 14.3 | — | — | — | — | — | — |
Japan | — | 19.1 | — | — | — | 23.8 | 100.0 |
Singapore | — | — | — | 11.2 | — | — | — |
South Korea | 11.9 | — | — | — | — | — | — |
Taiwan | 14.7 | — | — | — | — | — | — |
United Kingdom | — | 12.5 | — | — | 19.0 | 12.1 | — |
Emerging Markets Equity ETF | International Equity ETF | International Growth ETF | |
Australia | —% | 10.7% | —% |
China | 22.1 | — | — |
India | 11.8 | — | — |
Japan | — | 30.2 | 11.7 |
United Kingdom | — | 16.1 | 13.2 |
October 31, 2022 | J.P. Morgan Exchange-Traded Funds | 287 |
AS OF October 31, 2022 (continued)
288 | J.P. Morgan Exchange-Traded Funds | October 31, 2022 |
JPMorgan ActiveBuilders Emerging Markets Equity ETF(1) |
JPMorgan ActiveBuilders International Equity ETF(2) |
JPMorgan BetaBuilders Canada ETF(3) |
JPMorgan BetaBuilders Developed Asia Pacific ex-Japan ETF (formerly known as JPMorgan BetaBuilders Developed Asia ex-Japan ETF)(3) |
JPMorgan BetaBuilders Europe ETF(3) |
JPMorgan BetaBuilders International Equity ETF(3) |
JPMorgan BetaBuilders Japan ETF(3) |
JPMorgan BetaBuilders U.S. Equity ETF(3) |
JPMorgan BetaBuilders U.S. Mid Cap Equity ETF(3) |
JPMorgan BetaBuilders U.S. Small Cap Equity ETF(4) |
JPMorgan Carbon Transition U.S. Equity ETF(5) |
JPMorgan Climate Change Solutions ETF(6) |
JPMorgan Diversified Return Emerging Markets Equity ETF(3) |
JPMorgan Diversified Return International Equity ETF(3) |
JPMorgan Diversified Return U.S. Equity ETF(3) |
JPMorgan Diversified Return U.S. Mid Cap Equity ETF(3) |
JPMorgan Diversified Return U.S. Small Cap Equity ETF(3) |
JPMorgan International Growth ETF(3) |
JPMorgan U.S. Momentum Factor ETF(3) |
JPMorgan U.S. Quality Factor ETF(3) |
JPMorgan U.S. Value Factor ETF(3) |
(1) | Statement of operations for the year ended October 31, 2022, and statement of changes in net assets for the year ended October 31, 2022 and the period March 10, 2021 (commencement of operations) through October 31, 2021 |
(2) | Statement of operations for the year ended October 31, 2022, and statement of changes in net assets for the year ended October 31, 2022 and the period July 7, 2021 (commencement of operations) through October 31, 2021 |
(3) | Statement of operations for the year ended October 31, 2022 and statement of changes in net assets for the years ended October 31, 2022 and October 31, 2021 |
(4) | Statement of operations for the year ended October 31, 2022, and statement of changes in net assets for the year ended October 31, 2022 and the period November 16, 2020 (commencement of operations) through October 31, 2021 |
(5) | Statement of operations for the year ended October 31, 2022, and statement of changes in net assets for the year ended October 31, 2022 and the period December 9, 2020 (commencement of operations) through October 31, 2021 |
(6) | Statement of operations and statement of changes in net assets for the period December 13, 2021 (commencement of operations) through October 31, 2022 |
October 31, 2022 | J.P. Morgan Exchange-Traded Funds | 289 |
290 | J.P. Morgan Exchange-Traded Funds | October 31, 2022 |
(Unaudited)
Name (Year of Birth); Positions With the Funds (1) | Principal Occupation During Past 5 Years | Number of Funds in Fund Complex Overseen by Trustee (2) | Other Directorships Held During the Past 5 Years |
Independent Trustees | |||
John F. Finn (1947); Chair since 2020; Trustee since 1998. | Chairman, Gardner, Inc. (supply chain management company serving industrial and consumer markets) (serving in various roles 1974-present). | 166 | Director, Greif, Inc. (GEF) (industrial package products and services) (2007-present); Trustee, Columbus Association for the Performing Arts (1988-present). |
Stephen P. Fisher (1959); Trustee since 2018. | Retired; Chairman and Chief Executive Officer, NYLIFE Distributors LLC (registered broker-dealer) (serving in various roles 2008-2013); Chairman, NYLIM Service Company LLC (transfer agent) (2008-2017); New York Life Investment Management LLC (registered investment adviser) (serving in various roles 2005-2017); Chairman, IndexIQ Advisors LLC (registered investment adviser for ETFs) (2014-2017); President, MainStay VP Funds Trust (2007-2017), MainStay DefinedTerm Municipal Opportunities Fund (2011-2017) and MainStay Funds Trust (2007-2017) (registered investment companies). | 166 | Honors Program Advisory Board Member, The Zicklin School of Business, Baruch College, The City University of New York (2017-present). |
Gary L. French (1951); Trustee since 2014. | Real Estate Investor (2011-2020); Investment management industry Consultant and Expert Witness (2011-present); Senior Consultant for The Regulatory Fundamentals Group LLC (2011-2017). | 166 | Independent Trustee, The China Fund, Inc. (2013-2019); Exchange Traded Concepts Trust II (2012-2014); Exchange Traded Concepts Trust I (2011-2014). |
Kathleen M. Gallagher (1958); Trustee since 2018. | Retired; Chief Investment Officer — Benefit Plans, Ford Motor Company (serving in various roles 1985-2016). | 166 | Non- Executive Director, Legal & General Investment Management (Holdings) (2018-present); Non-Executive Director, Legal & General Investment Management America (U.S. Holdings) (financial services and insurance) (2017-present); Advisory Board Member, State Street Global Advisors Total Portfolio Solutions (2017-present); Member, Client Advisory Council, Financial Engines, LLC (registered investment adviser) (2011-2016); Director, Ford Pension Funds Investment Management Ltd. (2007-2016). |
Robert J. Grassi (1957); Trustee since 2014. | Sole Proprietor, Academy Hills Advisors LLC (2012-present); Pension Director, Corning Incorporated (2002-2012). | 166 | None |
October 31, 2022 | J.P. Morgan Exchange-Traded Funds | 291 |
(Unaudited) (continued)
Name (Year of Birth); Positions With the Funds (1) | Principal Occupation During Past 5 Years | Number of Funds in Fund Complex Overseen by Trustee (2) | Other Directorships Held During the Past 5 Years |
Frankie D. Hughes (1952); Trustee since 2008. | President, Ashland Hughes Properties (property management) (2014-present); President and Chief Investment Officer, Hughes Capital Management, Inc. (fixed income asset management) (1993-2014). | 166 | None |
Raymond Kanner (1953); Trustee since 2017. | Retired; Managing Director and Chief Investment Officer, IBM Retirement Funds (2007-2016). | 166 | Advisory Board Member, Penso Advisors, LLC (2020-present); Advisory Board Member, Los Angeles Capital (2018-present); Advisory Board Member, State Street Global Advisors Total Portfolio Solutions (2017- present); Acting Executive Director, Committee on Investment of Employee Benefit Assets (CIEBA) (2016-2017); Advisory Board Member, Betterment for Business (robo advisor) (2016- 2017); Advisory Board Member, BlueStar Indexes (index creator) (2013-2017); Director, Emerging Markets Growth Fund (registered investment company) (1997-2016); Member, Russell Index Client Advisory Board (2001-2015). |
Thomas P. Lemke (1954); Trustee since 2014. | Retired since 2013. | 166 | (1) Independent Trustee of Advisors’ Inner Circle III fund platform, consisting of the following: (i) the Advisors’ Inner Circle Fund III, (ii) the Gallery Trust, (iii) the Schroder Series Trust, (iv) the Delaware Wilshire Private Markets Fund (since 2020), (v) Chiron Capital Allocation Fund Ltd., and (vi) formerly the Winton Diversified Opportunities Fund (2014-2018); and (2) Independent Trustee of the Symmetry Panoramic Trust (since 2018). |
Lawrence R. Maffia (1950); Trustee since 2014 | Retired; Director and President, ICI Mutual Insurance Company (2006-2013). | 166 | Director, ICI Mutual Insurance Company (1999-2013). |
Mary E. Martinez (1960); Vice Chair since 2021; Trustee since 2013. | Associate, Special Properties, a Christie’s International Real Estate Affiliate (2010-present); Managing Director, Bank of America (asset management) (2007-2008); Chief Operating Officer, U.S. Trust Asset Management, U.S. Trust Company (asset management) (2003-2007); President, Excelsior Funds (registered investment companies) (2004-2005). | 166 | None |
Marilyn McCoy (1948); Trustee since 2005. | Vice President of Administration and Planning, Northwestern University (1985-present). | 166 | None |
292 | J.P. Morgan Exchange-Traded Funds | October 31, 2022 |
Name (Year of Birth); Positions With the Funds (1) | Principal Occupation During Past 5 Years | Number of Funds in Fund Complex Overseen by Trustee (2) | Other Directorships Held During the Past 5 Years |
Dr. Robert A. Oden, Jr. (1946); Trustee since 2005. | Retired; President, Carleton College (2002-2010); President, Kenyon College (1995-2002). | 166 | Trustee, The Coldwater Conservation Fund (2017-present); Trustee, American Museum of Fly Fishing (2013-present); Trustee and Vice Chair, Trout Unlimited (2017-2021);Trustee, Dartmouth- Hitchcock MedicalCenter (2011-2020). |
Marian U. Pardo* (1946); Trustee since 2013. | Managing Director and Founder, Virtual Capital Management LLC (investment consulting) (2007-present); Managing Director, Credit Suisse Asset Management (portfolio manager) (2003-2006). | 166 | Board Chair and Member, Board of Governors, Columbus Citizens Foundation (not-for-profit supporting philanthropic and cultural programs) (2006-present). |
Emily A. Youssouf (1951); Trustee since 2022. | Adjunct Professor (2011-present) and Clinical Professor (2009-2011), NYU Schack Institute of Real Estate; Board Member and Member of the Audit Committee (2013–present), Chair of Finance Committee (2019-present), Member of Related Parties Committee (2013-2018) and Member of the Enterprise Risk Committee (2015-2018), PennyMac Financial Services, Inc.; Board Member (2005-2018), Chair of Capital Committee (2006-2016), Chair of Audit Committee (2005-2018), Member of Finance Committee (2005-2018) and Chair of IT Committee (2016-2018), NYC Health and Hospitals Corporation. | 166 | Trustee, NYC School Construction Authority (2009-present); Board Member, NYS Job Development Authority (2008-present); Trustee and Chair of the Audit Committee of the Transit Center Foundation (2015-2019). |
Interested Trustees | |||
Robert F. Deutsch** (1957); Trustee since 2014. | Retired; Head of ETF Business for JPMorgan Asset Management (2013-2017); Head of Global Liquidity Business for JPMorgan Asset Management (2003-2013). | 166 | Treasurer and Director of the JUST Capital Foundation (2017-present). |
Nina O. Shenker** (1957); Trustee since 2022. | Vice Chair (2017-2021), General Counsel and Managing Director (2008-2016), Associate General Counsel and Managing Director (2004-2008), J.P. Morgan Asset & Wealth Management. | 166 | Director and Member of Legal and Human Resources Subcommittees, American Jewish Joint Distribution Committee (2018-present). |
(1) | The year shown is the first year in which a Trustee became a member of any of the following: the Mutual Fund Board, the ETF Board, the heritage J.P. Morgan Funds or the heritage One Group Mutual Funds. Trustees serve an indefinite term, until resignation, retirement, removal or death. The Board’s current retirement policy sets retirement at the end of the calendar year in which the Trustee attains the age of 75, provided that any Board member who was a member of the Mutual Fund Board prior to January 1, 2022 and was born prior to January 1, 1950 shall retire from the Board at the end of the calendar year in which the Trustee attains the age of 78. | ||
(2) | A Fund Complex means two or more registered investment companies that hold themselves out to investors as related companies for purposes of investment and investor services or have a common investment adviser or have an investment adviser that is an affiliated person of the investment adviser of any of the other registered investment companies. The J.P. Morgan Funds Complex for which the Board of Trustees serves currently includes nine registered investment companies (166 J.P. Morgan Funds). | ||
* | In connection with prior employment with JPMorgan Chase, Ms. Pardo was the recipient of non-qualified pension plan payments from JPMorgan Chase in the amount of approximately $2,055 per month, which she irrevocably waived effective January 1, 2013, and deferred compensation payments from JPMorgan Chase in the amount of approximately $7,294 per year, which ended in January 2013. In addition, Ms. Pardo receives payments from a fully-funded qualified plan, which is not an obligation of JPMorgan Chase. | ||
** | Designation as an “Interested Trustee” is based on prior employment by the Adviser or an affiliate of the Adviser or interests in a control person of the Adviser. | ||
October 31, 2022 | J.P. Morgan Exchange-Traded Funds | 293 |
(Unaudited) (continued)
The contact address for each of the Trustees is 277 Park Avenue, New York, NY 10172. | |||
294 | J.P. Morgan Exchange-Traded Funds | October 31, 2022 |
(Unaudited)
Name (Year of Birth), Positions Held with the Trust (Since) | Principal Occupations During Past 5 Years |
Brian S. Shlissel (1964), President and Principal Executive Officer (2021)* | Managing Director and Chief Administrative Officer for J.P. Morgan pooled vehicles, J.P. Morgan Investment Management Inc. since 2014. |
Timothy J. Clemens (1975), Treasurer and Principal Financial Officer (2020) | Executive Director, J.P. Morgan Investment Management Inc. since February 2016. Mr. Clemens has been with J.P. Morgan Investment Management Inc. since 2013. |
Gregory S. Samuels (1980), Secretary (2022) **(formerly Assistant Secretary 2014-2022) | Managing Director and Assistant General Counsel, JPMorgan Chase & Co. Mr. Samuels has been with JPMorgan Chase & Co. since 2010. |
Stephen M. Ungerman (1953), Chief Compliance Officer (2014) | Managing Director, JPMorgan Chase & Co. Mr. Ungerman has been with JPMorgan Chase & Co. since 2000. |
Kiesha Astwood-Smith (1973), Assistant Secretary (2021)** | Vice President and Assistant General Counsel, JPMorgan Chase & Co. since June 2021; Senior Director and Counsel, Equitable Financial Life Insurance Company (formerly, AXA Equitable Life Insurance Company) from September 2015 through June 2021. |
Matthew Beck (1988), Assistant Secretary (2021)*** | Vice President and Assistant General Counsel, JPMorgan Chase & Co. since May 2021; Senior Legal Counsel, Ultimus Fund Solutions from May 2018 through May 2021; General Counsel, The Nottingham Company from April 2014 through May 2018. |
Elizabeth A. Davin (1964), Assistant Secretary (2022)*** (formerly Secretary 2018-2022) | Executive Director and Assistant General Counsel, JPMorgan Chase & Co. Ms. Davin has been with JPMorgan Chase & Co. (formerly Bank One Corporation) since 2004. |
Jessica K. Ditullio (1962), Assistant Secretary (2014)*** | Executive Director and Assistant General Counsel, JPMorgan Chase & Co. Ms. Ditullio has been with JPMorgan Chase & Co. (formerly Bank One Corporation) since 1990. |
Anthony Geron (1971), Assistant Secretary (2019)** | Vice President and Assistant General Counsel, JPMorgan Chase & Co. since September 2018; Lead Director and Counsel, AXA Equitable Life Insurance Company from 2015 to 2018 and Senior Director and Counsel, AXA Equitable Life Insurance Company from 2014 to 2015. |
Carmine Lekstutis (1980), Assistant Secretary (2014)** | Executive Director and Assistant General Counsel, JPMorgan Chase & Co. Mr. Lekstutis has been with JPMorgan Chase & Co. since 2011. |
Max Vogel (1990), Assistant Secretary (2021)** | Vice President and Assistant General Counsel, JPMorgan Chase & Co. since June 2021; Associate, Proskauer Rose LLP (law firm) from March 2017 to June 2021. |
Zachary E. Vonnegut-Gabovitch (1986), Assistant Secretary (2017)** | Vice President and Assistant General Counsel, JPMorgan Chase & Co. since September 2016. |
Frederick J. Cavaliere (1978), Assistant Treasurer (2015)* | Executive Director, J.P. Morgan Investment Management Inc. Mr. Cavaliere has been with JPMorgan Chase & Co. since May 2006. |
Michael M. D’Ambrosio (1969), Assistant Treasurer (2014) | Managing Director, J.P. Morgan Investment Management Inc. Mr. D’Ambrosio has been with J.P. Morgan Investment Management Inc. since 2012. |
Shannon Gaines (1977), Assistant Treasurer (2019)*** | Vice President, J.P. Morgan Investment Management Inc. since January 2014. |
Nektarios E. Manolakakis (1972), Assistant Treasurer (2020) | Executive Director, J.P. Morgan Investment Management Inc. since February 2021, formerly Vice President, J.P. Morgan Investment Mangement Inc. since 2014; Vice President, J.P. Morgan Corporate & Investment Bank 2010-2014. |
Todd McEwen (1981), Assistant Treasurer (2020)*** | Vice President, J.P. Morgan Investment Management Inc. Mr. McEwen has been with J.P. Morgan Investment Management Inc. since 2010. |
The contact address for each of the officers, unless otherwise noted, is 277 Park Avenue, New York, NY 10172. | |
* | The contact address for the officer is 575 Washington Boulevard, Jersey City, NJ 07310. |
** | The contact address for the officer is 4 New York Plaza, New York, NY 10004. |
October 31, 2022 | J.P. Morgan Exchange-Traded Funds | 295 |
(Unaudited) (continued)
*** | The contact address for the officer is 1111 Polaris Parkway, Columbus, OH 43240. |
296 | J.P. Morgan Exchange-Traded Funds | October 31, 2022 |
(Unaudited)
Hypothetical $1,000 Investment
Beginning Account Value May 1, 2022 | Ending Account Value October 31, 2022 | Expenses Paid During the Period* | Annualized Expense Ratio | |
JPMorgan ActiveBuilders Emerging Markets Equity ETF | ||||
Actual | $1,000.00 | $815.10 | $1.56 | 0.34% |
Hypothetical | 1,000.00 | 1,023.49 | 1.73 | 0.34 |
JPMorgan ActiveBuilders International Equity ETF | ||||
Actual | 1,000.00 | 887.30 | 1.19 | 0.25 |
Hypothetical | 1,000.00 | 1,023.94 | 1.28 | 0.25 |
JPMorgan BetaBuilders Canada ETF | ||||
Actual | 1,000.00 | 898.90 | 0.96 | 0.20 |
Hypothetical | 1,000.00 | 1,024.20 | 1.02 | 0.20 |
JPMorgan BetaBuilders Developed Asia Pacific ex-Japan ETF (formerly known as JPMorgan BetaBuilders Developed Asia ex-Japan ETF) | ||||
Actual | 1,000.00 | 851.30 | 0.93 | 0.20 |
Hypothetical | 1,000.00 | 1,024.20 | 1.02 | 0.20 |
JPMorgan BetaBuilders Europe ETF | ||||
Actual | 1,000.00 | 881.70 | 0.47 | 0.10 |
Hypothetical | 1,000.00 | 1,024.70 | 0.51 | 0.10 |
JPMorgan BetaBuilders International Equity ETF | ||||
Actual | 1,000.00 | 881.10 | 0.33 | 0.07 |
Hypothetical | 1,000.00 | 1,024.85 | 0.36 | 0.07 |
JPMorgan BetaBuilders Japan ETF | ||||
Actual | 1,000.00 | 894.60 | 0.96 | 0.20 |
Hypothetical | 1,000.00 | 1,024.20 | 1.02 | 0.20 |
JPMorgan BetaBuilders U.S. Equity ETF | ||||
Actual | 1,000.00 | 940.40 | 0.15 | 0.03 |
Hypothetical | 1,000.00 | 1,025.05 | 0.15 | 0.03 |
October 31, 2022 | J.P. Morgan Exchange-Traded Funds | 297 |
(Unaudited) (continued)
Hypothetical $1,000 Investment
Beginning Account Value May 1, 2022 | Ending Account Value October 31, 2022 | Expenses Paid During the Period* | Annualized Expense Ratio | |
JPMorgan BetaBuilders U.S. Mid Cap Equity ETF | ||||
Actual | $1,000.00 | $955.70 | $0.35 | 0.07% |
Hypothetical | 1,000.00 | 1,024.85 | 0.36 | 0.07 |
JPMorgan BetaBuilders U.S. Small Cap Equity ETF | ||||
Actual | 1,000.00 | 997.20 | 0.45 | 0.09 |
Hypothetical | 1,000.00 | 1,024.75 | 0.46 | 0.09 |
JPMorgan Carbon Transition U.S. Equity ETF | ||||
Actual | 1,000.00 | 950.00 | 0.74 | 0.15 |
Hypothetical | 1,000.00 | 1,024.45 | 0.77 | 0.15 |
JPMorgan Climate Change Solutions ETF | ||||
Actual | 1,000.00 | 941.20 | 2.40 | 0.49 |
Hypothetical | 1,000.00 | 1,022.73 | 2.50 | 0.49 |
JPMorgan Diversified Return Emerging Markets Equity ETF | ||||
Actual | 1,000.00 | 886.80 | 2.14 | 0.45 |
Hypothetical | 1,000.00 | 1,022.94 | 2.29 | 0.45 |
JPMorgan Diversified Return International Equity ETF | ||||
Actual | 1,000.00 | 847.20 | 1.77 | 0.38 |
Hypothetical | 1,000.00 | 1,023.29 | 1.94 | 0.38 |
JPMorgan Diversified Return U.S. Equity ETF | ||||
Actual | 1,000.00 | 957.40 | 0.89 | 0.18 |
Hypothetical | 1,000.00 | 1,024.30 | 0.92 | 0.18 |
JPMorgan Diversified Return U.S. Mid Cap Equity ETF | ||||
Actual | 1,000.00 | 957.30 | 1.23 | 0.25 |
Hypothetical | 1,000.00 | 1,023.94 | 1.28 | 0.25 |
JPMorgan Diversified Return U.S. Small Cap Equity ETF | ||||
Actual | 1,000.00 | 990.10 | 1.50 | 0.30 |
Hypothetical | 1,000.00 | 1,023.69 | 1.53 | 0.30 |
JPMorgan International Growth ETF | ||||
Actual | 1,000.00 | 853.40 | 2.62 | 0.56 |
Hypothetical | 1,000.00 | 1,022.38 | 2.85 | 0.56 |
JPMorgan U.S. Momentum Factor ETF | ||||
Actual | 1,000.00 | 966.60 | 0.64 | 0.13 |
Hypothetical | 1,000.00 | 1,024.55 | 0.66 | 0.13 |
JPMorgan U.S. Quality Factor ETF | ||||
Actual | 1,000.00 | 963.80 | 0.59 | 0.12 |
Hypothetical | 1,000.00 | 1,024.60 | 0.61 | 0.12 |
JPMorgan U.S. Value Factor ETF | ||||
Actual | 1,000.00 | 955.70 | 0.59 | 0.12 |
Hypothetical | 1,000.00 | 1,024.60 | 0.61 | 0.12 |
* | Expenses are equal to the Fund’s annualized expense ratio, multiplied by the average account value over the period, multiplied by 184/365 (to reflect the one-half year period). |
298 | J.P. Morgan Exchange-Traded Funds | October 31, 2022 |
(Unaudited)
October 31, 2022 | J.P. Morgan Exchange-Traded Funds | 299 |
(Unaudited) (continued)
300 | J.P. Morgan Exchange-Traded Funds | October 31, 2022 |
October 31, 2022 | J.P. Morgan Exchange-Traded Funds | 301 |
(Unaudited) (continued)
302 | J.P. Morgan Exchange-Traded Funds | October 31, 2022 |
October 31, 2022 | J.P. Morgan Exchange-Traded Funds | 303 |
(Unaudited)
Dividends Received Deduction | |
JPMorgan BetaBuilders U.S. Equity ETF | 100.00% |
JPMorgan BetaBuilders U.S. Mid Cap Equity ETF | 76.69 |
JPMorgan BetaBuilders U.S. Small Cap Equity ETF | 81.44 |
JPMorgan Carbon Transition U.S. Equity ETF | 100.00 |
JPMorgan Climate Change Solutions ETF | 100.00 |
JPMorgan Diversified Return U.S. Equity ETF | 96.02 |
JPMorgan Diversified Return U.S. Mid Cap Equity ETF | 97.60 |
JPMorgan Diversified Return U.S. Small Cap Equity ETF | 83.24 |
JPMorgan U.S. Momentum Factor ETF | 100.00 |
JPMorgan U.S. Quality Factor ETF | 100.00 |
JPMorgan U.S. Value Factor ETF | 92.68 |
Long-Term Capital Gain Distribution | |
JPMorgan International Growth ETF | $397,492 |
Qualified Dividend Income | |
JPMorgan ActiveBuilders Emerging Markets Equity ETF | $8,301,765 |
JPMorgan ActiveBuilders International Equity ETF | 416,997 |
JPMorgan BetaBuilders Canada ETF | 177,352,285 |
JPMorgan BetaBuilders Developed Asia Pacific ex-Japan ETF | 171,140,032 |
JPMorgan BetaBuilders Europe ETF | 237,373,501 |
JPMorgan BetaBuilders International Equity ETF | 86,689,115 |
JPMorgan BetaBuilders Japan ETF | 148,456,869 |
JPMorgan BetaBuilders U.S. Equity ETF | 14,262,272 |
JPMorgan BetaBuilders U.S. Mid Cap Equity ETF | 14,168,125 |
JPMorgan BetaBuilders U.S. Small Cap Equity ETF | 5,040,020 |
JPMorgan Carbon Transition U.S. Equity ETF | 316,660 |
JPMorgan Climate Change Solutions ETF | 41,135 |
JPMorgan Diversified Return Emerging Markets Equity ETF | 4,103,994 |
JPMorgan Diversified Return International Equity ETF | 24,448,633 |
JPMorgan Diversified Return U.S. Equity ETF | 12,195,450 |
JPMorgan Diversified Return U.S. Mid Cap Equity ETF | 4,166,977 |
JPMorgan Diversified Return U.S. Small Cap Equity ETF | 2,440,745 |
JPMorgan International Growth ETF | 497,189 |
JPMorgan U.S. Momentum Factor ETF | 2,634,717 |
JPMorgan U.S. Quality Factor ETF | 6,843,698 |
JPMorgan U.S. Value Factor ETF | 11,148,763 |
199A Income | |
JPMorgan BetaBuilders U.S. Small Cap Equity ETF | $221,521 |
JPMorgan Diversified Return U.S. Equity ETF | 114,617 |
JPMorgan Diversified Return U.S. Mid Cap Equity ETF | 81,307 |
JPMorgan Diversified Return U.S. Small Cap Equity ETF | 245,996 |
JPMorgan U.S. Momentum Factor ETF | 38,335 |
304 | J.P. Morgan Exchange-Traded Funds | October 31, 2022 |
Total Foreign Source Income | Foreign Tax Credit | |
JPMorgan ActiveBuilders Emerging Markets Equity ETF | $28,935,718 | $3,135,909 |
JPMorgan ActiveBuilders International Equity ETF | 957,277 | 97,617 |
JPMorgan BetaBuilders Canada ETF | 195,377,694 | 26,619,434 |
JPMorgan BetaBuilders Developed Asia Pacific ex-Japan ETF | 219,960,754 | 1,402,398 |
JPMorgan BetaBuilders Europe ETF | 296,284,969 | 24,164,684 |
JPMorgan BetaBuilders International Equity ETF | 104,894,479 | 7,583,518 |
JPMorgan BetaBuilders Japan ETF | 180,498,770 | 17,053,858 |
JPMorgan Climate Change Solutions ETF | 259,565 | 25,847 |
JPMorgan Diversified Return Emerging Markets Equity ETF | 8,832,528 | 896,552 |
Total Foreign Source Income | Foreign Tax Credit | |
JPMorgan Diversified Return International Equity ETF | $34,445,430 | $1,559,258 |
JPMorgan International Growth ETF | 899,045 | 71,041 |
October 31, 2022 | J.P. Morgan Exchange-Traded Funds | 305 |


Fund | Ticker | Listing Exchange |
JPMorgan Social Advancement ETF | UPWD | Nasdaq Stock Market® LLC |
JPMorgan Sustainable Consumption ETF | CIRC | Nasdaq Stock Market® LLC |
JPMorgan Sustainable Infrastructure ETF | BLLD | Nasdaq Stock Market® LLC |

1 | |
2 | |
3 | |
6 | |
9 | |
12 | |
18 | |
22 | |
24 | |
35 | |
36 | |
39 | |
40 | |
41 |
Past performance is no guarantee of future performance. The general market views expressed in this report are opinions based on market and other conditions through the end of the reporting period and are subject to change without notice. These views are not intended to predict the future performance of a Fund or the securities markets.
Prospective investors should refer to the Funds’ prospectuses for a discussion of the Funds’ investment objectives, strategies and risks. Call J.P. Morgan Exchange-Traded Funds at (844) 457-6383 for a prospectus containing more complete information about a Fund, including management fees and other expenses. Please read it carefully before investing.
Shares are bought and sold throughout the day on an exchange at market price (not at net asset value) through a brokerage account, and are not individually subscribed and redeemed from a Fund. Shares may only be subscribed and redeemed directly from a Fund by Authorized Participants, in large creation/redemption units. Brokerage commissions will reduce returns.
December 15, 2022 (Unaudited)
 | “While investors seek to adapt to the current market environment, we believe a well-diversified portfolio and a patient outlook remain crucial components of a successful invest- ment approach.” — Brian S. Shlissel |

President, J.P. Morgan Funds
J.P. Morgan Asset Management
1-844-457-6383 or www.jpmorganfunds.com for more information
October 31, 2022 | J.P. Morgan Exchange-Traded Funds | 1 |
TWELVE MONTHS ENDED October 31, 2022 (Unaudited)
2 | J.P. Morgan Exchange-Traded Funds | October 31, 2022 |
FOR THE PERIOD September 7, 2022 (FUND INCEPTION) THROUGH October 31, 2022 (Unaudited)
REPORTING PERIOD RETURN: | |
Net Asset Value * | (1.35)% |
Market Price ** | (1.17)% |
MSCI ACWI Index (net total return) | (3.31)% |
Net Assets as of 10/31/2022 | $10,653,044 |
Fund Ticker | UPWD |
October 31, 2022 | J.P. Morgan Exchange-Traded Funds | 3 |
FOR THE PERIOD September 7, 2022 (FUND INCEPTION) THROUGH October 31, 2022 (Unaudited) (continued)
TOP TEN HOLDINGS OF THE PORTFOLIO AS OF October 31, 2022 | PERCENT OF TOTAL INVESTMENTS | |
1. | Microsoft Corp. | 6.0% |
2. | UnitedHealth Group, Inc. | 4.5 |
3. | Vinci SA (France) | 2.9 |
4. | RELX plc (United Kingdom) | 2.8 |
5. | HDFC Bank Ltd., ADR (India) | 2.7 |
6. | Alphabet, Inc., Class A | 2.6 |
7. | Boston Scientific Corp. | 2.6 |
8. | Wal-Mart de Mexico SAB de CV (Mexico) | 2.3 |
9. | Mastercard, Inc., Class A | 2.3 |
10. | Novo Nordisk A/S, Class B (Denmark) | 2.3 |
PORTFOLIO COMPOSITION BY COUNTRY AS OF October 31, 2022 | PERCENT OF TOTAL INVESTMENTS |
United States | 52.1 % |
Netherlands | 6.3 |
Japan | 5.3 |
United Kingdom | 4.8 |
France | 2.9 |
India | 2.7 |
Mexico | 2.3 |
Denmark | 2.3 |
Ireland | 1.9 |
China | 1.6 |
Italy | 1.6 |
Brazil | 1.3 |
Peru | 1.3 |
Belgium | 1.2 |
Portugal | 1.2 |
Indonesia | 1.1 |
Switzerland | 1.0 |
Hong Kong | 1.0 |
Others (each less than 1.0%) | 4.1 |
Short-Term Investments | 4.0 |
4 | J.P. Morgan Exchange-Traded Funds | October 31, 2022 |
INCEPTION DATE | CUMULATIVE SINCE INCEPTION | |
JPMorgan Social Advancement ETF | ||
Net Asset Value | September 7, 2022 | (1.35)% |
Market Price | (1.17) |
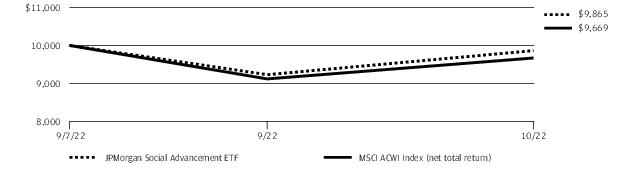
October 31, 2022 | J.P. Morgan Exchange-Traded Funds | 5 |
FOR THE PERIOD September 7, 2022 (FUND INCEPTION) THROUGH October 31, 2022 (Unaudited)
REPORTING PERIOD RETURN: | |
Net Asset Value * | (2.06)% |
Market Price ** | (1.77)% |
MSCI ACWI Index (net total return) | (3.31)% |
Net Assets as of 10/31/2022 | $10,575,739 |
Fund Ticker | CIRC |
6 | J.P. Morgan Exchange-Traded Funds | October 31, 2022 |
TOP TEN HOLDINGS OF THE PORTFOLIO AS OF October 31, 2022 | PERCENT OF TOTAL INVESTMENTS | |
1. | Deere & Co. | 4.1% |
2. | Trane Technologies plc | 3.8 |
3. | Xylem, Inc. | 3.1 |
4. | General Mills, Inc. | 2.8 |
5. | Trimble, Inc. | 2.8 |
6. | Tetra Tech, Inc. | 2.8 |
7. | Koninklijke DSM NV (Netherlands) | 2.6 |
8. | Danaher Corp. | 2.5 |
9. | Valmont Industries, Inc. | 2.5 |
10. | Brambles Ltd. (Australia) | 2.5 |
PORTFOLIO COMPOSITION BY COUNTRY AS OF October 31, 2022 | PERCENT OF TOTAL INVESTMENTS |
United States | 59.0% |
Japan | 5.9 |
Germany | 4.3 |
Netherlands | 4.2 |
United Kingdom | 3.6 |
Switzerland | 2.6 |
Finland | 2.6 |
Australia | 2.4 |
Ireland | 2.2 |
Canada | 2.2 |
China | 2.0 |
Denmark | 1.9 |
Norway | 1.8 |
Taiwan | 1.3 |
Others (each less than 1.0%) | 1.2 |
Short-Term Investments | 2.8 |
October 31, 2022 | J.P. Morgan Exchange-Traded Funds | 7 |
FOR THE PERIOD September 7, 2022 (FUND INCEPTION) THROUGH October 31, 2022 (Unaudited) (continued)
INCEPTION DATE | CUMULATIVE SINCE INCEPTION | |
JPMorgan Sustainable Consumption ETF | ||
Net Asset Value | September 7, 2022 | (2.06)% |
Market Price | (1.77) |
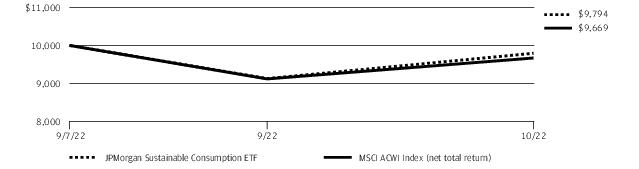
8 | J.P. Morgan Exchange-Traded Funds | October 31, 2022 |
FOR THE PERIOD September 7, 2022 (FUND INCEPTION) THROUGH October 31, 2022 (Unaudited)
REPORTING PERIOD RETURN: | |
Net Asset Value * | (10.50)% |
Market Price ** | (10.29)% |
MSCI ACWI Index (net total return) | (3.31)% |
Net Assets as of 10/31/2022 | $9,665,086 |
Fund Ticker | BLLD |
October 31, 2022 | J.P. Morgan Exchange-Traded Funds | 9 |
FOR THE PERIOD September 7, 2022 (FUND INCEPTION) THROUGH October 31, 2022 (Unaudited) (continued)
TOP TEN HOLDINGS OF THE PORTFOLIO AS OF October 31, 2022 | PERCENT OF TOTAL INVESTMENTS | |
1. | Iberdrola SA (Spain) | 3.8% |
2. | Xylem, Inc. | 3.8 |
3. | HCA Healthcare, Inc. | 3.7 |
4. | NextEra Energy, Inc. | 3.3 |
5. | Alexandria Real Estate Equities, Inc. | 2.8 |
6. | Norfolk Southern Corp. | 2.8 |
7. | Prologis, Inc. | 2.6 |
8. | Enel SpA (Italy) | 2.6 |
9. | SSE plc (United Kingdom) | 2.5 |
10. | Union Pacific Corp. | 2.5 |
PORTFOLIO COMPOSITION BY COUNTRY AS OF October 31, 2022 | PERCENT OF TOTAL INVESTMENTS |
United States | 47.2 % |
United Kingdom | 11.1 |
Spain | 9.3 |
Italy | 4.5 |
Australia | 4.3 |
Germany | 3.8 |
France | 3.7 |
China | 3.5 |
Denmark | 2.4 |
Canada | 2.3 |
South Korea | 2.2 |
Belgium | 1.6 |
Netherlands | 1.3 |
Japan | 1.0 |
Singapore | 0.7 |
Short-Term Investments | 1.1 |
10 | J.P. Morgan Exchange-Traded Funds | October 31, 2022 |
INCEPTION DATE | CUMULATIVE SINCE INCEPTION | |
JPMorgan Sustainable Infrastructure ETF | ||
Net Asset Value | September 7, 2022 | (10.50)% |
Market Price | (10.29) |
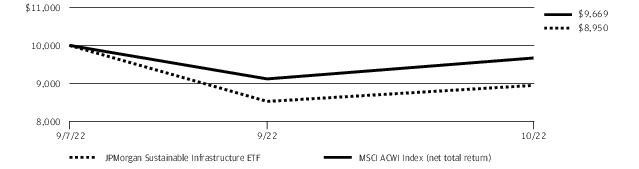
October 31, 2022 | J.P. Morgan Exchange-Traded Funds | 11 |
AS OF October 31, 2022
INVESTMENTS | SHARES | VALUE($) |
Common Stocks — 95.4% | ||
Australia — 0.9% | ||
Stockland, REIT | 39,708 | 91,491 |
Belgium — 1.2% | ||
KBC Group NV | 2,628 | 131,704 |
Brazil — 1.3% | ||
Raia Drogasil SA | 28,008 | 143,578 |
China — 1.6% | ||
NXP Semiconductors NV | 1,152 | 168,284 |
Denmark — 2.3% | ||
Novo Nordisk A/S, Class B | 2,242 | 243,775 |
France — 2.9% | ||
Vinci SA | 3,321 | 305,655 |
Hong Kong — 1.0% | ||
AIA Group Ltd. | 13,600 | 103,017 |
India — 2.6% | ||
HDFC Bank Ltd., ADR | 4,518 | 281,517 |
Indonesia — 1.1% | ||
Bank Rakyat Indonesia Persero Tbk. PT | 376,200 | 112,233 |
Ireland — 1.9% | ||
Kerry Group plc, Class A | 1,134 | 98,493 |
Kingspan Group plc | 2,041 | 102,901 |
201,394 | ||
Italy — 1.6% | ||
FinecoBank Banca Fineco SpA | 12,420 | 167,367 |
Japan — 5.3% | ||
Katitas Co. Ltd. | 5,400 | 120,839 |
Recruit Holdings Co. Ltd. | 3,800 | 116,931 |
T&D Holdings, Inc. | 9,900 | 97,913 |
Tokio Marine Holdings, Inc. | 5,400 | 97,768 |
Tokyo Electron Ltd. | 500 | 131,548 |
564,999 | ||
Mexico — 2.3% | ||
Wal-Mart de Mexico SAB de CV | 63,621 | 245,776 |
Netherlands — 6.2% | ||
ASML Holding NV | 513 | 240,642 |
Koninklijke Ahold Delhaize NV | 6,893 | 192,234 |
Koninklijke DSM NV | 1,067 | 125,511 |
NN Group NV | 2,520 | 106,703 |
665,090 | ||
Nigeria — 0.9% | ||
Airtel Africa plc (a) | 76,086 | 98,486 |
INVESTMENTS | SHARES | VALUE($) |
Norway — 0.8% | ||
Kahoot! ASA * | 38,492 | 82,073 |
Peru — 1.2% | ||
Credicorp Ltd. | 909 | 133,041 |
Portugal — 1.2% | ||
Jeronimo Martins SGPS SA | 6,282 | 129,994 |
Puerto Rico — 0.6% | ||
EVERTEC, Inc. | 1,737 | 62,202 |
South Africa — 0.9% | ||
Vodacom Group Ltd. | 14,274 | 97,227 |
Switzerland — 1.0% | ||
Sika AG (Registered) | 495 | 111,611 |
United Kingdom — 4.8% | ||
Reckitt Benckiser Group plc | 1,557 | 103,329 |
RELX plc | 11,002 | 295,519 |
Taylor Wimpey plc | 102,781 | 110,503 |
509,351 | ||
United States — 51.8% | ||
AbbVie, Inc. | 1,530 | 223,992 |
Alphabet, Inc., Class A * | 2,907 | 274,741 |
Analog Devices, Inc. | 909 | 129,642 |
Boston Scientific Corp. * | 6,336 | 273,145 |
Charles Schwab Corp. (The) | 2,043 | 162,766 |
CSX Corp. | 2,844 | 82,647 |
Deere & Co. | 612 | 242,242 |
Dollar General Corp. | 537 | 136,962 |
DR Horton, Inc. | 1,845 | 141,844 |
Eli Lilly & Co. | 471 | 170,544 |
Fiserv, Inc. * | 1,134 | 116,507 |
Intuitive Surgical, Inc. * | 954 | 235,132 |
Lam Research Corp. | 279 | 112,934 |
M&T Bank Corp. | 690 | 116,175 |
Mastercard, Inc., Class A | 747 | 245,150 |
Microsoft Corp. | 2,727 | 633,019 |
NIKE, Inc., Class B | 1,809 | 167,658 |
Pathward Financial, Inc. | 1,854 | 77,924 |
Republic Services, Inc. | 774 | 102,648 |
Roche Holding AG | 468 | 155,281 |
Skyline Champion Corp. * | 2,709 | 157,691 |
SLM Corp. | 5,463 | 90,631 |
Sun Communities, Inc., REIT | 1,233 | 166,270 |
Thermo Fisher Scientific, Inc. | 324 | 166,526 |
Union Pacific Corp. | 720 | 141,941 |
12 | J.P. Morgan Exchange-Traded Funds | October 31, 2022 |
INVESTMENTS | SHARES | VALUE($) |
Common Stocks — continued | ||
United States — continued | ||
UnitedHealth Group, Inc. | 855 | 474,653 |
Vertex Pharmaceuticals, Inc. * | 729 | 227,448 |
Visa, Inc., Class A | 765 | 158,477 |
Waste Management, Inc. | 846 | 133,981 |
5,518,571 | ||
Total Common Stocks (Cost $10,209,868) | 10,168,436 | |
Short-Term Investments — 4.0% | ||
Investment Companies — 4.0% | ||
JPMorgan Prime Money Market Fund Class IM Shares, 3.18% (b) (c)(Cost $422,009) | 421,895 | 421,937 |
Total Investments — 99.4% (Cost $10,631,877) | 10,590,373 | |
Other Assets Less Liabilities — 0.6% | 62,671 | |
NET ASSETS — 100.0% | 10,653,044 | |
Percentages indicated are based on net assets. |
Abbreviations | |
ADR | American Depositary Receipt |
PT | Limited liability company |
REIT | Real Estate Investment Trust |
SGPS | Holding company |
* | Non-income producing security. |
(a) | Security exempt from registration pursuant to Regulation S under the Securities Act of 1933, as amended. Regulation S applies to securities offerings that are made outside of the United States and do not involve direct selling efforts in the United States and as such may have restrictions on resale. |
(b) | Investment in an affiliated fund, which is registered under the Investment Company Act of 1940, as amended, and is advised by J.P. Morgan Investment Management Inc. |
(c) | The rate shown is the current yield as of October 31, 2022. |
INDUSTRY | PERCENT OF TOTAL INVESTMENTS |
Banks | 9.6% |
Semiconductors & Semiconductor Equipment | 7.4 |
Food & Staples Retailing | 6.7 |
Software | 6.0 |
IT Services | 5.5 |
Pharmaceuticals | 5.4 |
Health Care Equipment & Supplies | 4.8 |
Health Care Providers & Services | 4.5 |
Biotechnology | 4.3 |
Professional Services | 3.9 |
Household Durables | 3.9 |
Insurance | 3.8 |
Construction & Engineering | 2.9 |
Interactive Media & Services | 2.6 |
Equity Real Estate Investment Trusts (REITs) | 2.4 |
Machinery | 2.3 |
Chemicals | 2.2 |
Commercial Services & Supplies | 2.2 |
Road & Rail | 2.1 |
Wireless Telecommunication Services | 1.8 |
Textiles, Apparel & Luxury Goods | 1.6 |
Life Sciences Tools & Services | 1.6 |
Capital Markets | 1.5 |
Multiline Retail | 1.3 |
Real Estate Management & Development | 1.1 |
Household Products | 1.0 |
Building Products | 1.0 |
Others (each less than 1.0%) | 2.6 |
Short-Term Investments | 4.0 |
October 31, 2022 | J.P. Morgan Exchange-Traded Funds | 13 |
AS OF October 31, 2022
INVESTMENTS | SHARES | VALUE($) |
Common Stocks — 96.6% | ||
Australia — 2.4% | ||
Brambles Ltd. | 34,560 | 258,742 |
Canada — 2.1% | ||
Ritchie Bros Auctioneers, Inc. | 1,216 | 79,439 |
West Fraser Timber Co. Ltd. | 1,974 | 148,215 |
227,654 | ||
China — 2.0% | ||
NXP Semiconductors NV | 1,416 | 206,849 |
Denmark — 1.9% | ||
Novo Nordisk A/S, Class B | 1,819 | 197,782 |
Finland — 2.6% | ||
Neste OYJ | 3,483 | 152,655 |
UPM-Kymmene OYJ | 3,538 | 118,938 |
271,593 | ||
France — 0.8% | ||
Dassault Systemes SE | 2,413 | 80,881 |
Germany — 4.3% | ||
GEA Group AG | 2,304 | 80,535 |
Infineon Technologies AG | 1,609 | 39,043 |
Siemens AG (Registered) | 886 | 96,759 |
Symrise AG | 2,340 | 238,850 |
455,187 | ||
Ireland — 2.2% | ||
Kerry Group plc, Class A | 1,865 | 161,984 |
Origin Enterprises plc | 18,227 | 67,601 |
229,585 | ||
Japan — 5.9% | ||
FANUC Corp. | 900 | 117,766 |
Hitachi Ltd. | 2,700 | 122,509 |
Keyence Corp. | 300 | 113,120 |
Kubota Corp. | 7,300 | 101,832 |
Kurita Water Industries Ltd. | 1,800 | 65,889 |
Topcon Corp. | 9,000 | 98,445 |
619,561 | ||
Netherlands — 4.1% | ||
ASML Holding NV | 357 | 167,464 |
Koninklijke DSM NV | 2,304 | 271,021 |
438,485 | ||
INVESTMENTS | SHARES | VALUE($) |
Norway — 1.8% | ||
Orkla ASA | 19,251 | 129,851 |
TOMRA Systems ASA | 4,095 | 66,141 |
195,992 | ||
Spain — 0.4% | ||
Befesa SA (a) | 1,115 | 38,727 |
Switzerland — 2.6% | ||
SIG Group AG * | 11,564 | 222,296 |
Sika AG (Registered) | 242 | 54,565 |
276,861 | ||
Taiwan — 1.3% | ||
Taiwan Semiconductor Manufacturing Co. Ltd., ADR | 2,277 | 140,149 |
United Kingdom — 3.6% | ||
CNH Industrial NV | 13,117 | 169,734 |
Tate & Lyle plc | 26,108 | 209,783 |
379,517 | ||
United States — 58.6% | ||
AGCO Corp. | 1,033 | 128,268 |
Autodesk, Inc. * | 960 | 205,728 |
Cadence Design Systems, Inc. * | 749 | 113,391 |
Carrier Global Corp. | 4,762 | 189,337 |
Danaher Corp. | 1,033 | 259,975 |
Darling Ingredients, Inc. * | 3,044 | 238,893 |
Deere & Co. | 1,089 | 431,048 |
Dover Corp. | 1,362 | 178,000 |
Ecolab, Inc. | 1,033 | 162,253 |
Elevance Health, Inc. | 339 | 185,355 |
Eli Lilly & Co. | 585 | 211,823 |
Evoqua Water Technologies Corp. * | 3,135 | 122,829 |
General Mills, Inc. | 3,663 | 298,828 |
Gladstone Land Corp., REIT | 2,377 | 48,372 |
International Flavors & Fragrances, Inc. | 1,444 | 140,949 |
LKQ Corp. | 1,249 | 69,494 |
Nestle SA (Registered) | 2,167 | 235,897 |
NIKE, Inc., Class B | 1,968 | 182,394 |
Rayonier, Inc., REIT | 3,089 | 104,099 |
Roche Holding AG | 640 | 212,351 |
Rockwell Automation, Inc. | 804 | 205,261 |
Schneider Electric SE | 859 | 108,626 |
Sprouts Farmers Market, Inc. * | 2,002 | 59,059 |
Tetra Tech, Inc. | 2,061 | 291,178 |
Trane Technologies plc | 2,520 | 402,268 |
Trex Co., Inc. * | 1,179 | 56,698 |
14 | J.P. Morgan Exchange-Traded Funds | October 31, 2022 |
INVESTMENTS | SHARES | VALUE($) |
Common Stocks — continued | ||
United States — continued | ||
Trimble, Inc. * | 4,878 | 293,460 |
UnitedHealth Group, Inc. | 414 | 229,832 |
Valmont Industries, Inc. | 813 | 259,526 |
Weyerhaeuser Co., REIT | 3,620 | 111,967 |
Xylem, Inc. | 3,159 | 323,576 |
Zoetis, Inc. | 915 | 137,964 |
6,198,699 | ||
Total Common Stocks (Cost $10,387,736) | 10,216,264 | |
Short-Term Investments — 2.8% | ||
Investment Companies — 2.8% | ||
JPMorgan Prime Money Market Fund Class IM Shares, 3.18% (b) (c)(Cost $296,047) | 295,929 | 295,959 |
Total Investments — 99.4% (Cost $10,683,783) | 10,512,223 | |
Other Assets Less Liabilities — 0.6% | 63,516 | |
NET ASSETS — 100.0% | 10,575,739 | |
Percentages indicated are based on net assets. |
Abbreviations | |
ADR | American Depositary Receipt |
OYJ | Public Limited Company |
REIT | Real Estate Investment Trust |
* | Non-income producing security. |
(a) | Securities exempt from registration under Rule 144A or section 4(a)(2), of the Securities Act of 1933, as amended. |
(b) | Investment in an affiliated fund, which is registered under the Investment Company Act of 1940, as amended, and is advised by J.P. Morgan Investment Management Inc. |
(c) | The rate shown is the current yield as of October 31, 2022. |
INDUSTRY | PERCENT OF TOTAL INVESTMENTS |
Machinery | 16.4% |
Food Products | 12.8 |
Chemicals | 8.2 |
Pharmaceuticals | 7.2 |
Commercial Services & Supplies | 7.0 |
Building Products | 6.2 |
Semiconductors & Semiconductor Equipment | 5.3 |
Electronic Equipment, Instruments & Components | 4.8 |
Health Care Providers & Services | 3.9 |
Software | 3.8 |
Electrical Equipment | 3.0 |
Paper & Forest Products | 2.5 |
Equity Real Estate Investment Trusts (REITs) | 2.5 |
Life Sciences Tools & Services | 2.5 |
Construction & Engineering | 2.5 |
Containers & Packaging | 2.1 |
Industrial Conglomerates | 2.1 |
Textiles, Apparel & Luxury Goods | 1.7 |
Oil, Gas & Consumable Fuels | 1.4 |
Others (each less than 1.0%) | 1.3 |
Short-Term Investments | 2.8 |
October 31, 2022 | J.P. Morgan Exchange-Traded Funds | 15 |
AS OF October 31, 2022
INVESTMENTS | SHARES | VALUE($) |
Common Stocks — 98.3% | ||
Australia — 4.3% | ||
Goodman Group, REIT | 12,438 | 135,334 |
NEXTDC Ltd. * | 15,147 | 80,373 |
Transurban Group | 22,950 | 194,684 |
410,391 | ||
Belgium — 1.5% | ||
Cofinimmo SA, REIT | 1,098 | 91,063 |
Warehouses De Pauw CVA, REIT | 2,232 | 57,287 |
148,350 | ||
Canada — 2.3% | ||
Canadian National Railway Co. | 1,836 | 217,456 |
China — 3.5% | ||
China Longyuan Power Group Corp. Ltd., Class H | 63,000 | 71,988 |
Contemporary Amperex Technology Co. Ltd., Class A | 900 | 45,946 |
NARI Technology Co. Ltd., Class A | 42,300 | 141,323 |
SF Holding Co. Ltd., Class A | 11,700 | 77,093 |
336,350 | ||
Denmark — 2.4% | ||
Orsted A/S (a) | 2,826 | 233,161 |
France — 3.7% | ||
Neoen SA (a) | 1,989 | 69,377 |
Veolia Environnement SA | 9,225 | 205,865 |
Vinci SA | 891 | 82,005 |
357,247 | ||
Germany — 3.8% | ||
E.ON SE | 15,975 | 133,774 |
Encavis AG | 4,707 | 87,634 |
Vonovia SE | 6,417 | 141,884 |
363,292 | ||
Italy — 4.5% | ||
Enel SpA | 55,242 | 246,785 |
Terna - Rete Elettrica Nazionale | 28,377 | 188,187 |
434,972 | ||
Japan — 1.0% | ||
Kurita Water Industries Ltd. | 2,700 | 98,833 |
Netherlands — 1.3% | ||
Alfen Beheer BV * (a) | 1,179 | 125,067 |
Singapore — 0.7% | ||
Parkway Life REIT, REIT | 25,200 | 71,181 |
South Korea — 2.2% | ||
Samsung SDI Co. Ltd. | 405 | 208,946 |
INVESTMENTS | SHARES | VALUE($) |
Spain — 9.2% | ||
Cellnex Telecom SA (a) | 5,625 | 184,108 |
Corp. ACCIONA Energias Renovables SA | 4,689 | 184,376 |
EDP Renovaveis SA | 5,661 | 119,121 |
Iberdrola SA | 35,496 | 360,969 |
Solaria Energia y Medio Ambiente SA * | 2,628 | 41,565 |
890,139 | ||
United Kingdom — 11.0% | ||
Assura plc, REIT | 297,954 | 190,903 |
Drax Group plc | 10,026 | 59,871 |
Grainger plc | 51,480 | 134,015 |
Renewi plc * | 6,264 | 37,949 |
Segro plc, REIT | 10,521 | 94,689 |
SSE plc | 13,392 | 239,327 |
Tritax Big Box REIT plc, REIT | 38,385 | 61,721 |
UNITE Group plc (The), REIT | 12,735 | 130,088 |
United Utilities Group plc | 10,764 | 115,995 |
1,064,558 | ||
United States — 46.9% | ||
Alexandria Real Estate Equities, Inc., REIT | 1,872 | 272,002 |
Ameren Corp. | 1,728 | 140,867 |
American Tower Corp., REIT | 945 | 195,795 |
American Water Works Co., Inc. | 360 | 52,322 |
ChargePoint Holdings, Inc. * | 7,056 | 98,643 |
CMS Energy Corp. | 3,168 | 180,734 |
Enphase Energy, Inc. * | 387 | 118,809 |
Equinix, Inc., REIT | 333 | 188,625 |
Hannon Armstrong Sustainable Infrastructure Capital, Inc., REIT | 2,079 | 56,507 |
HCA Healthcare, Inc. | 1,620 | 352,301 |
Itron, Inc. * | 1,134 | 55,441 |
Medical Properties Trust, Inc., REIT | 13,239 | 151,587 |
NextEra Energy, Inc. | 4,068 | 315,270 |
Norfolk Southern Corp. | 1,170 | 266,842 |
Prologis, Inc., REIT | 2,286 | 253,174 |
SBA Communications Corp., REIT | 657 | 177,324 |
Skyline Champion Corp. * | 981 | 57,104 |
SolarEdge Technologies, Inc. * | 999 | 229,800 |
Union Pacific Corp. | 1,197 | 235,977 |
Ventas, Inc., REIT | 3,357 | 131,359 |
Welltower, Inc., REIT | 3,528 | 215,349 |
Weyerhaeuser Co., REIT | 6,345 | 196,251 |
16 | J.P. Morgan Exchange-Traded Funds | October 31, 2022 |
INVESTMENTS | SHARES | VALUE($) |
Common Stocks — continued | ||
United States — continued | ||
Xcel Energy, Inc. | 3,582 | 233,224 |
Xylem, Inc. | 3,519 | 360,451 |
4,535,758 | ||
Total Common Stocks (Cost $10,492,786) | 9,495,701 | |
Short-Term Investments — 1.1% | ||
Investment Companies — 1.1% | ||
JPMorgan Prime Money Market Fund Class IM Shares, 3.18% (b) (c)(Cost $109,226) | 109,182 | 109,193 |
Total Investments — 99.4% (Cost $10,602,012) | 9,604,894 | |
Other Assets Less Liabilities — 0.6% | 60,192 | |
NET ASSETS — 100.0% | 9,665,086 | |
Percentages indicated are based on net assets. |
Abbreviations | |
CVA | Dutch Certification |
REIT | Real Estate Investment Trust |
* | Non-income producing security. |
(a) | Security exempt from registration pursuant to Regulation S under the Securities Act of 1933, as amended. Regulation S applies to securities offerings that are made outside of the United States and do not involve direct selling efforts in the United States and as such may have restrictions on resale. |
(b) | Investment in an affiliated fund, which is registered under the Investment Company Act of 1940, as amended, and is advised by J.P. Morgan Investment Management Inc. |
(c) | The rate shown is the current yield as of October 31, 2022. |
INDUSTRY | PERCENT OF TOTAL INVESTMENTS |
Equity Real Estate Investment Trusts (REITs) | 27.2% |
Electric Utilities | 18.9 |
Road & Rail | 7.5 |
Multi-Utilities | 6.9 |
Independent Power and Renewable Electricity Producers | 6.6 |
Machinery | 4.8 |
Electrical Equipment | 4.3 |
Health Care Providers & Services | 3.7 |
Semiconductors & Semiconductor Equipment | 3.6 |
Real Estate Management & Development | 2.9 |
Electronic Equipment, Instruments & Components | 2.8 |
Transportation Infrastructure | 2.0 |
Diversified Telecommunication Services | 1.9 |
Water Utilities | 1.7 |
Others (each less than 1.0%) | 4.1 |
Short-Term Investments | 1.1 |
October 31, 2022 | J.P. Morgan Exchange-Traded Funds | 17 |
AS OF October 31, 2022
JPMorgan Social Advancement ETF | JPMorgan Sustainable Consumption ETF | JPMorgan Sustainable Infrastructure ETF | |
ASSETS: | |||
Investments in non-affiliates, at value | $10,168,436 | $10,216,264 | $9,495,701 |
Investments in affiliates, at value | 421,937 | 295,959 | 109,193 |
Cash | 52,971 | 59,059 | 59,249 |
Foreign currency, at value | — | — | 3,533 |
Segregated cash balance with Authorized Participant for deposit securities | 24,172 | — | — |
Receivables: | |||
Dividends from non-affiliates | 13,723 | 8,765 | 1,123 |
Dividends from affiliates | 37 | 26 | 10 |
Tax reclaims | 86 | 17 | — |
Total Assets | 10,681,362 | 10,580,090 | 9,668,809 |
LIABILITIES: | |||
Payables: | |||
Foreign currency due to custodian, at value | 145 | 256 | — |
Collateral upon return of deposit securities | 24,172 | — | — |
Accrued liabilities: | |||
Management fees (See Note 3.A.) | 4,001 | 4,095 | 3,723 |
Total Liabilities | 28,318 | 4,351 | 3,723 |
Net Assets | $10,653,044 | $10,575,739 | $9,665,086 |
NET ASSETS: | |||
Paid-in-Capital | $10,723,102 | $10,721,311 | $10,624,193 |
Total distributable earnings (loss) | (70,058) | (145,572) | (959,107) |
Total Net Assets | $10,653,044 | $10,575,739 | $9,665,086 |
Outstanding number of shares (unlimited number of shares authorized - par value $0.0001) | 225,000 | 225,000 | 225,000 |
Net asset value, per share | $47.35 | $47.00 | $42.96 |
Cost of investments in non-affiliates | $10,209,868 | $10,387,736 | $10,492,786 |
Cost of investments in affiliates | 422,009 | 296,047 | 109,226 |
Cost of foreign currency | — | — | 3,474 |
18 | J.P. Morgan Exchange-Traded Funds | October 31, 2022 |
FOR THE YEAR ENDED October 31, 2022
JPMorgan Social Advancement ETF (a) | JPMorgan Sustainable Consumption ETF (a) | JPMorgan Sustainable Infrastructure ETF (a) | |
INVESTMENT INCOME: | |||
Interest income from non-affiliates | $28 | $27 | $22 |
Interest income from affiliates | 146 | 143 | 140 |
Dividend income from non-affiliates | 20,773 | 16,463 | 14,981 |
Dividend income from affiliates | 1,274 | 1,280 | 455 |
Foreign taxes withheld (net) | (1,185) | (1,513) | (537) |
Total investment income | 21,036 | 16,400 | 15,061 |
EXPENSES: | |||
Management fees (See Note 3.A.) | 6,900 | 6,986 | 6,540 |
Total expenses | 6,900 | 6,986 | 6,540 |
Net investment income (loss) | 14,136 | 9,414 | 8,521 |
REALIZED/UNREALIZED GAINS (LOSSES): | |||
Net realized gain (loss) on transactions from: | |||
Investments in non-affiliates | (62,019) | (5,160) | 2,062 |
Investments in affiliates | (8) | (4) | — |
Foreign currency transactions | 19,435 | 21,851 | 27,372 |
Net realized gain (loss) | (42,592) | 16,687 | 29,434 |
Change in net unrealized appreciation/depreciation on: | |||
Investments in non-affiliates | (41,432) | (171,472) | (997,085) |
Investments in affiliates | (72) | (88) | (33) |
Foreign currency translations | (98) | (113) | 56 |
Change in net unrealized appreciation/depreciation | (41,602) | (171,673) | (997,062) |
Net realized/unrealized gains (losses) | (84,194) | (154,986) | (967,628) |
Change in net assets resulting from operations | $(70,058) | $(145,572) | $(959,107) |
October 31, 2022 | J.P. Morgan Exchange-Traded Funds | 19 |
FOR THE PERIODS INDICATED
JPMorgan Social Advancement ETF | JPMorgan Sustainable Consumption ETF | JPMorgan Sustainable Infrastructure ETF | |
Period Ended October 31, 2022 (a) | Period Ended October 31, 2022 (a) | Period Ended October 31, 2022 (a) | |
CHANGE IN NET ASSETS RESULTING FROM OPERATIONS: | |||
Net investment income (loss) | $14,136 | $9,414 | $8,521 |
Net realized gain (loss) | (42,592) | 16,687 | 29,434 |
Change in net unrealized appreciation/depreciation | (41,602) | (171,673) | (997,062) |
Change in net assets resulting from operations | (70,058) | (145,572) | (959,107) |
CAPITAL TRANSACTIONS: | |||
Change in net assets resulting from capital transactions | 10,723,102 | 10,721,311 | 10,624,193 |
NET ASSETS: | |||
Change in net assets | 10,653,044 | 10,575,739 | 9,665,086 |
Beginning of year | — | — | — |
End of period | $10,653,044 | $10,575,739 | $9,665,086 |
CAPITAL TRANSACTIONS: | |||
Proceeds from shares issued | $10,723,102 | $10,721,311 | $10,624,193 |
Total change in net assets resulting from capital transactions | $10,723,102 | $10,721,311 | $10,624,193 |
SHARE TRANSACTIONS: | |||
Issued | 225,000 | 225,000 | 225,000 |
Net increase in shares from transactions | 225,000 | 225,000 | 225,000 |
20 | J.P. Morgan Exchange-Traded Funds | October 31, 2022 |
FOR THE PERIODS INDICATED
Per share operating performance | |||||
Investment operations | |||||
Net asset value, beginning of period | Net investment income (loss) (b) | Net realized and unrealized gains (losses) on investments | Total from investment operations | Net asset value, end of period | |
JPMorgan Social Advancement ETF | |||||
September 7, 2022 (f) through October 31, 2022 | $48.00 | $0.07 | $(0.72) | $(0.65) | $47.35 |
JPMorgan Sustainable Consumption ETF | |||||
September 7, 2022 (f) through October 31, 2022 | 48.00 | 0.04 | (1.04) | (1.00) | 47.00 |
JPMorgan Sustainable Infrastructure ETF | |||||
September 7, 2022 (f) through October 31, 2022 | 48.00 | 0.04 | (5.08) | (5.04) | 42.96 |
(a) | Annualized for periods less than one year, unless otherwise noted. |
(b) | Calculated based upon average shares outstanding. |
(c) | Not annualized for periods less than one year. |
(d) | Includes adjustments in accordance with accounting principles generally accepted in the United States of America and as such, the net asset values for financial reporting purposes and the returns based upon those net asset values may differ from the net asset values and returns for shareholder transactions. |
(e) | Market price return was calculated assuming an initial investment made at the market price at the beginning of the reporting period, reinvestment of all dividends and distributions at market price during the period, and sale at the market price on the last day of the period. The closing price was used to calculate the market price return. |
(f) | Commencement of operations. |
(g) | Since the Shares of the Fund did not trade in the secondary market until the day after the Fund’s inception, for the period from the inception to the first day of secondary market trading, the net asset value is used as a proxy for the secondary market trading price to calculate the market returns. |
22 | J.P. Morgan Exchange-Traded Funds | October 31, 2022 |
Ratios/Supplemental data | ||||||
Ratios to average net assets (a) | ||||||
Market price, end of period | Total return (c)(d) | Market price total return (c)(e) | Net assets, end of period | Net expenses | Net investment income (loss) | Portfolio turnover rate (c) |
$47.44 | (1.35)% | (1.17)%(g) | $10,653,044 | 0.49% | 1.00% | 6% |
47.15 | (2.08) | (1.77)(g) | 10,575,739 | 0.49 | 0.66 | 1 |
43.06 | (10.50) | (10.29)(g) | 9,665,086 | 0.49 | 0.64 | — |
October 31, 2022 | J.P. Morgan Exchange-Traded Funds | 23 |
AS OF October 31, 2022
Diversification Classification | |
JPMorgan Social Advancement ETF(1) | Non-Diversified |
JPMorgan Sustainable Consumption ETF(1) | Non-Diversified |
JPMorgan Sustainable Infrastructure ETF(1) | Non-Diversified |
(1) | Commenced operations on September 7, 2022. |
Shares per Creation Unit | |
Social Advancement ETF | 25,000 |
Sustainable Consumption ETF | 25,000 |
Sustainable Infrastructure ETF | 25,000 |
24 | J.P. Morgan Exchange-Traded Funds | October 31, 2022 |
Social Advancement ETF | ||||
Level 1 Quoted prices | Level 2 Other significant observable inputs | Level 3 Significant unobservable inputs | Total | |
Investments in Securities | ||||
Common Stocks | ||||
Australia | $— | $91,491 | $— | $91,491 |
Belgium | — | 131,704 | — | 131,704 |
Brazil | 143,578 | — | — | 143,578 |
China | 168,284 | — | — | 168,284 |
Denmark | — | 243,775 | — | 243,775 |
France | — | 305,655 | — | 305,655 |
Hong Kong | — | 103,017 | — | 103,017 |
India | 281,517 | — | — | 281,517 |
Indonesia | — | 112,233 | — | 112,233 |
Ireland | — | 201,394 | — | 201,394 |
Italy | — | 167,367 | — | 167,367 |
Japan | — | 564,999 | — | 564,999 |
Mexico | 245,776 | — | — | 245,776 |
October 31, 2022 | J.P. Morgan Exchange-Traded Funds | 25 |
AS OF October 31, 2022 (continued)
Social Advancement ETF (continued) | ||||
Level 1 Quoted prices | Level 2 Other significant observable inputs | Level 3 Significant unobservable inputs | Total | |
Netherlands | $— | $665,090 | $— | $665,090 |
Nigeria | — | 98,486 | — | 98,486 |
Norway | — | 82,073 | — | 82,073 |
Peru | 133,041 | — | — | 133,041 |
Portugal | — | 129,994 | — | 129,994 |
Puerto Rico | 62,202 | — | — | 62,202 |
South Africa | — | 97,227 | — | 97,227 |
Switzerland | — | 111,611 | — | 111,611 |
United Kingdom | — | 509,351 | — | 509,351 |
United States | 5,363,290 | 155,281 | — | 5,518,571 |
Total Common Stocks | 6,397,688 | 3,770,748 | — | 10,168,436 |
Short-Term Investments | ||||
Investment Companies | 421,937 | — | — | 421,937 |
Total Investments in Securities | $6,819,625 | $3,770,748 | $— | $10,590,373 |
Sustainable Consumption ETF | ||||
Level 1 Quoted prices | Level 2 Other significant observable inputs | Level 3 Significant unobservable inputs | Total | |
Investments in Securities | ||||
Common Stocks | ||||
Australia | $— | $258,742 | $— | $258,742 |
Canada | 227,654 | — | — | 227,654 |
China | 206,849 | — | — | 206,849 |
Denmark | — | 197,782 | — | 197,782 |
Finland | — | 271,593 | — | 271,593 |
France | — | 80,881 | — | 80,881 |
Germany | — | 455,187 | — | 455,187 |
Ireland | — | 229,585 | — | 229,585 |
Japan | — | 619,561 | — | 619,561 |
Netherlands | — | 438,485 | — | 438,485 |
Norway | — | 195,992 | — | 195,992 |
Spain | — | 38,727 | — | 38,727 |
Switzerland | — | 276,861 | — | 276,861 |
Taiwan | 140,149 | — | — | 140,149 |
United Kingdom | 169,734 | 209,783 | — | 379,517 |
United States | 5,641,825 | 556,874 | — | 6,198,699 |
Total Common Stocks | 6,386,211 | 3,830,053 | — | 10,216,264 |
Short-Term Investments | ||||
Investment Companies | 295,959 | — | — | 295,959 |
Total Investments in Securities | $6,682,170 | $3,830,053 | $— | $10,512,223 |
26 | J.P. Morgan Exchange-Traded Funds | October 31, 2022 |
Sustainable Infrastructure ETF | ||||
Level 1 Quoted prices | Level 2 Other significant observable inputs | Level 3 Significant unobservable inputs | Total | |
Investments in Securities | ||||
Common Stocks | ||||
Australia | $— | $410,391 | $— | $410,391 |
Belgium | — | 148,350 | — | 148,350 |
Canada | 217,456 | — | — | 217,456 |
China | — | 336,350 | — | 336,350 |
Denmark | — | 233,161 | — | 233,161 |
France | — | 357,247 | — | 357,247 |
Germany | — | 363,292 | — | 363,292 |
Italy | — | 434,972 | — | 434,972 |
Japan | — | 98,833 | — | 98,833 |
Netherlands | — | 125,067 | — | 125,067 |
Singapore | — | 71,181 | — | 71,181 |
South Korea | — | 208,946 | — | 208,946 |
Spain | — | 890,139 | — | 890,139 |
United Kingdom | 134,015 | 930,543 | — | 1,064,558 |
United States | 4,535,758 | — | — | 4,535,758 |
Total Common Stocks | 4,887,229 | 4,608,472 | — | 9,495,701 |
Short-Term Investments | ||||
Investment Companies | 109,193 | — | — | 109,193 |
Total Investments in Securities | $4,996,422 | $4,608,472 | $— | $9,604,894 |
October 31, 2022 | J.P. Morgan Exchange-Traded Funds | 27 |
AS OF October 31, 2022 (continued)
Social Advancement ETF | |||||||||
For the year ended October 31, 2022 | |||||||||
Security Description | Value at September 7, 2022(a) | Purchases at Cost | Proceeds from Sales | Net Realized Gain (Loss) | Change in Unrealized Appreciation/ (Depreciation) | Value at October 31, 2022 | Shares at October 31, 2022 | Dividend Income | Capital Gain Distributions |
JPMorgan Prime Money Market Fund Class IM Shares, 3.18% (b) (c) | $— | $649,594 | $227,577 | $(8) | $(72) | $421,937 | 421,895 | $1,274 | $— |
(a) | Commencement of operations was September 7, 2022. |
(b) | Investment in an affiliated fund, which is registered under the Investment Company Act of 1940, as amended, and is advised by J.P. Morgan Investment Management Inc. |
(c) | The rate shown is the current yield as of October 31, 2022. |
Sustainable Consumption ETF | |||||||||
For the year ended October 31, 2022 | |||||||||
Security Description | Value at September 7, 2022(a) | Purchases at Cost | Proceeds from Sales | Net Realized Gain (Loss) | Change in Unrealized Appreciation/ (Depreciation) | Value at October 31, 2022 | Shares at October 31, 2022 | Dividend Income | Capital Gain Distributions |
JPMorgan Prime Money Market Fund Class IM Shares, 3.18% (b) (c) | $— | $421,336 | $125,285 | $(4) | $(88) | $295,959 | 295,929 | $1,280 | $— |
(a) | Commencement of operations was September 7, 2022. |
(b) | Investment in an affiliated fund, which is registered under the Investment Company Act of 1940, as amended, and is advised by J.P. Morgan Investment Management Inc. |
(c) | The rate shown is the current yield as of October 31, 2022. |
Sustainable Infrastructure ETF | |||||||||
For the year ended October 31, 2022 | |||||||||
Security Description | Value at September 7, 2022(a) | Purchases at Cost | Proceeds from Sales | Net Realized Gain (Loss) | Change in Unrealized Appreciation/ (Depreciation) | Value at October 31, 2022 | Shares at October 31, 2022 | Dividend Income | Capital Gain Distributions |
JPMorgan Prime Money Market Fund Class IM Shares, 3.18% (b) (c) | $— | $295,245 | $186,019 | $— | $(33) | $109,193 | 109,182 | $455 | $— |
(a) | Commencement of operations was September 7, 2022. |
(b) | Investment in an affiliated fund, which is registered under the Investment Company Act of 1940, as amended, and is advised by J.P. Morgan Investment Management Inc. |
(c) | The rate shown is the current yield as of October 31, 2022. |
28 | J.P. Morgan Exchange-Traded Funds | October 31, 2022 |
Paid-in-Capital | Accumulated undistributed (distributions in excess of) net investment income | Accumulated net realized gains (losses) | |
Social Advancement ETF | $— | $19,435 | $(19,435) |
Sustainable Consumption ETF | — | 21,851 | (21,851) |
Sustainable Infrastructure ETF | — | 27,372 | (27,372) |
October 31, 2022 | J.P. Morgan Exchange-Traded Funds | 29 |
AS OF October 31, 2022 (continued)
Social Advancement ETF | 0.49% |
Sustainable Consumption ETF | 0.49 |
Sustainable Infrastructure ETF | 0.49 |
Purchases (excluding U.S. Government) | Sales (excluding U.S. Government) | |
Social Advancement ETF | $9,601,989 | $389,481 |
Sustainable Consumption ETF | 9,368,762 | 41,297 |
Sustainable Infrastructure ETF | 9,536,972 | — |
30 | J.P. Morgan Exchange-Traded Funds | October 31, 2022 |
In-Kind Purchases | In-Kind Sales | |
Social Advancement ETF | $1,059,664 | $— |
Sustainable Consumption ETF | 1,066,420 | — |
Sustainable Infrastructure ETF | 957,038 | — |
Aggregate Cost | Gross Unrealized Appreciation | Gross Unrealized Depreciation | Net Unrealized Appreciation (Depreciation) | |
Social Advancement ETF | $10,631,877 | $352,082 | $393,586 | $(41,504) |
Sustainable Consumption ETF | 10,683,783 | 297,129 | 468,689 | (171,560) |
Sustainable Infrastructure ETF | 10,602,800 | 95,833 | 1,093,739 | (997,906) |
Current Distributable Ordinary Income | Current Distributable Long-Term Capital Gain (Tax Basis Capital Loss Carryover) | Unrealized Appreciation (Depreciation) | |
Social Advancement ETF | $34,223 | $(62,027) | $(41,602) |
Sustainable Consumption ETF | 31,917 | (5,164) | (171,673) |
Sustainable Infrastructure ETF | 37,333 | 2,062 | (997,850) |
Capital Loss Carryforward Character | ||
Short-Term | Long-Term | |
Social Advancement ETF | $62,027 | $— |
Sustainable Consumption ETF | 5,164 | — |
October 31, 2022 | J.P. Morgan Exchange-Traded Funds | 31 |
AS OF October 31, 2022 (continued)
% of Ownership | |
Social Advancement ETF | 89% |
Sustainable Consumption ETF | 89 |
Sustainable Infrastructure ETF | 89 |
32 | J.P. Morgan Exchange-Traded Funds | October 31, 2022 |
Sustainable Infrastructure ETF | |
United Kingdom | 11.1% |
October 31, 2022 | J.P. Morgan Exchange-Traded Funds | 33 |
AS OF October 31, 2022 (continued)
34 | J.P. Morgan Exchange-Traded Funds | October 31, 2022 |
October 31, 2022 | J.P. Morgan Exchange-Traded Funds | 35 |
(Unaudited)
Name (Year of Birth); Positions With the Funds (1) | Principal Occupation During Past 5 Years | Number of Funds in Fund Complex Overseen by Trustee (2) | Other Directorships Held During the Past 5 Years |
Independent Trustees | |||
John F. Finn (1947); Chair since 2020; Trustee since 1998. | Chairman, Gardner, Inc. (supply chain management company serving industrial and consumer markets) (serving in various roles 1974-present). | 166 | Director, Greif, Inc. (GEF) (industrial package products and services) (2007-present); Trustee, Columbus Association for the Performing Arts (1988-present). |
Stephen P. Fisher (1959); Trustee since 2018. | Retired; Chairman and Chief Executive Officer, NYLIFE Distributors LLC (registered broker-dealer) (serving in various roles 2008-2013); Chairman, NYLIM Service Company LLC (transfer agent) (2008-2017); New York Life Investment Management LLC (registered investment adviser) (serving in various roles 2005-2017); Chairman, IndexIQ Advisors LLC (registered investment adviser for ETFs) (2014-2017); President, MainStay VP Funds Trust (2007-2017), MainStay DefinedTerm Municipal Opportunities Fund (2011-2017) and MainStay Funds Trust (2007-2017) (registered investment companies). | 166 | Honors Program Advisory Board Member, The Zicklin School of Business, Baruch College, The City University of New York (2017-present). |
Gary L. French (1951); Trustee since 2014. | Real Estate Investor (2011-2020); Investment management industry Consultant and Expert Witness (2011-present); Senior Consultant for The Regulatory Fundamentals Group LLC (2011-2017). | 166 | Independent Trustee, The China Fund, Inc. (2013-2019); Exchange Traded Concepts Trust II (2012-2014); Exchange Traded Concepts Trust I (2011-2014). |
Kathleen M. Gallagher (1958); Trustee since 2018. | Retired; Chief Investment Officer — Benefit Plans, Ford Motor Company (serving in various roles 1985-2016). | 166 | Non- Executive Director, Legal & General Investment Management (Holdings) (2018-present); Non-Executive Director, Legal & General Investment Management America (U.S. Holdings) (financial services and insurance) (2017-present); Advisory Board Member, State Street Global Advisors Total Portfolio Solutions (2017-present); Member, Client Advisory Council, Financial Engines, LLC (registered investment adviser) (2011-2016); Director, Ford Pension Funds Investment Management Ltd. (2007-2016). |
Robert J. Grassi (1957); Trustee since 2014. | Sole Proprietor, Academy Hills Advisors LLC (2012-present); Pension Director, Corning Incorporated (2002-2012). | 166 | None |
Frankie D. Hughes (1952); Trustee since 2008. | President, Ashland Hughes Properties (property management) (2014-present); President and Chief Investment Officer, Hughes Capital Management, Inc. (fixed income asset management) (1993-2014). | 166 | None |
36 | J.P. Morgan Exchange-Traded Funds | October 31, 2022 |
Name (Year of Birth); Positions With the Funds (1) | Principal Occupation During Past 5 Years | Number of Funds in Fund Complex Overseen by Trustee (2) | Other Directorships Held During the Past 5 Years |
Raymond Kanner (1953); Trustee since 2017. | Retired; Managing Director and Chief Investment Officer, IBM Retirement Funds (2007-2016). | 166 | Advisory Board Member, Penso Advisors, LLC (2020-present); Advisory Board Member, Los Angeles Capital (2018-present); Advisory Board Member, State Street Global Advisors Total Portfolio Solutions (2017- present); Acting Executive Director, Committee on Investment of Employee Benefit Assets (CIEBA) (2016-2017); Advisory Board Member, Betterment for Business (robo advisor) (2016- 2017); Advisory Board Member, BlueStar Indexes (index creator) (2013-2017); Director, Emerging Markets Growth Fund (registered investment company) (1997-2016); Member, Russell Index Client Advisory Board (2001-2015). |
Thomas P. Lemke (1954); Trustee since 2014. | Retired since 2013. | 166 | (1) Independent Trustee of Advisors’ Inner Circle III fund platform, consisting of the following: (i) the Advisors’ Inner Circle Fund III, (ii) the Gallery Trust, (iii) the Schroder Series Trust, (iv) the Delaware Wilshire Private Markets Fund (since 2020), (v) Chiron Capital Allocation Fund Ltd., and (vi) formerly the Winton Diversified Opportunities Fund (2014-2018); and (2) Independent Trustee of the Symmetry Panoramic Trust (since 2018). |
Lawrence R. Maffia (1950); Trustee since 2014 | Retired; Director and President, ICI Mutual Insurance Company (2006-2013). | 166 | Director, ICI Mutual Insurance Company (1999-2013). |
Mary E. Martinez (1960); Vice Chair since 2021; Trustee since 2013. | Associate, Special Properties, a Christie’s International Real Estate Affiliate (2010-present); Managing Director, Bank of America (asset management) (2007-2008); Chief Operating Officer, U.S. Trust Asset Management, U.S. Trust Company (asset management) (2003-2007); President, Excelsior Funds (registered investment companies) (2004-2005). | 166 | None |
Marilyn McCoy (1948); Trustee since 2005. | Vice President of Administration and Planning, Northwestern University (1985-present). | 166 | None |
Dr. Robert A. Oden, Jr. (1946); Trustee since 2005. | Retired; President, Carleton College (2002-2010); President, Kenyon College (1995-2002). | 166 | Trustee, The Coldwater Conservation Fund (2017-present); Trustee, American Museum of Fly Fishing (2013-present); Trustee and Vice Chair, Trout Unlimited (2017-2021);Trustee, Dartmouth- Hitchcock MedicalCenter (2011-2020). |
October 31, 2022 | J.P. Morgan Exchange-Traded Funds | 37 |
(Unaudited) (continued)
Name (Year of Birth); Positions With the Funds (1) | Principal Occupation During Past 5 Years | Number of Funds in Fund Complex Overseen by Trustee (2) | Other Directorships Held During the Past 5 Years |
Marian U. Pardo* (1946); Trustee since 2013. | Managing Director and Founder, Virtual Capital Management LLC (investment consulting) (2007-present); Managing Director, Credit Suisse Asset Management (portfolio manager) (2003-2006). | 166 | Board Chair and Member, Board of Governors, Columbus Citizens Foundation (not-for-profit supporting philanthropic and cultural programs) (2006-present). |
Emily A. Youssouf (1951); Trustee since 2022. | Adjunct Professor (2011-present) and Clinical Professor (2009-2011), NYU Schack Institute of Real Estate; Board Member and Member of the Audit Committee (2013–present), Chair of Finance Committee (2019-present), Member of Related Parties Committee (2013-2018) and Member of the Enterprise Risk Committee (2015-2018), PennyMac Financial Services, Inc.; Board Member (2005-2018), Chair of Capital Committee (2006-2016), Chair of Audit Committee (2005-2018), Member of Finance Committee (2005-2018) and Chair of IT Committee (2016-2018), NYC Health and Hospitals Corporation. | 166 | Trustee, NYC School Construction Authority (2009-present); Board Member, NYS Job Development Authority (2008-present); Trustee and Chair of the Audit Committee of the Transit Center Foundation (2015-2019). |
Interested Trustees | |||
Robert F. Deutsch** (1957); Trustee since 2014. | Retired; Head of ETF Business for JPMorgan Asset Management (2013-2017); Head of Global Liquidity Business for JPMorgan Asset Management (2003-2013). | 166 | Treasurer and Director of the JUST Capital Foundation (2017-present). |
Nina O. Shenker** (1957); Trustee since 2022. | Vice Chair (2017-2021), General Counsel and Managing Director (2008-2016), Associate General Counsel and Managing Director (2004-2008), J.P. Morgan Asset & Wealth Management. | 166 | Director and Member of Legal and Human Resources Subcommittees, American Jewish Joint Distribution Committee (2018-present). |
(1) | The year shown is the first year in which a Trustee became a member of any of the following: the Mutual Fund Board, the ETF Board, the heritage J.P. Morgan Funds or the heritage One Group Mutual Funds. Trustees serve an indefinite term, until resignation, retirement, removal or death. The Board’s current retirement policy sets retirement at the end of the calendar year in which the Trustee attains the age of 75, provided that any Board member who was a member of the Mutual Fund Board prior to January 1, 2022 and was born prior to January 1, 1950 shall retire from the Board at the end of the calendar year in which the Trustee attains the age of 78. | ||
(2) | A Fund Complex means two or more registered investment companies that hold themselves out to investors as related companies for purposes of investment and investor services or have a common investment adviser or have an investment adviser that is an affiliated person of the investment adviser of any of the other registered investment companies. The J.P. Morgan Funds Complex for which the Board of Trustees serves currently includes nine registered investment companies (166 J.P. Morgan Funds). | ||
* | In connection with prior employment with JPMorgan Chase, Ms. Pardo was the recipient of non-qualified pension plan payments from JPMorgan Chase in the amount of approximately $2,055 per month, which she irrevocably waived effective January 1, 2013, and deferred compensation payments from JPMorgan Chase in the amount of approximately $7,294 per year, which ended in January 2013. In addition, Ms. Pardo receives payments from a fully-funded qualified plan, which is not an obligation of JPMorgan Chase. | ||
** | Designation as an “Interested Trustee” is based on prior employment by the Adviser or an affiliate of the Adviser or interests in a control person of the Adviser. | ||
The contact address for each of the Trustees is 277 Park Avenue, New York, NY 10172. | |||
38 | J.P. Morgan Exchange-Traded Funds | October 31, 2022 |
(Unaudited)
Name (Year of Birth), Positions Held with the Trust (Since) | Principal Occupations During Past 5 Years |
Brian S. Shlissel (1964), President and Principal Executive Officer (2021)* | Managing Director and Chief Administrative Officer for J.P. Morgan pooled vehicles, J.P. Morgan Investment Management Inc. since 2014. |
Timothy J. Clemens (1975), Treasurer and Principal Financial Officer (2020) | Executive Director, J.P. Morgan Investment Management Inc. since February 2016. Mr. Clemens has been with J.P. Morgan Investment Management Inc. since 2013. |
Gregory S. Samuels (1980), Secretary (2022) **(formerly Assistant Secretary 2014-2022) | Managing Director and Assistant General Counsel, JPMorgan Chase & Co. Mr. Samuels has been with JPMorgan Chase & Co. since 2010. |
Stephen M. Ungerman (1953), Chief Compliance Officer (2014) | Managing Director, JPMorgan Chase & Co. Mr. Ungerman has been with JPMorgan Chase & Co. since 2000. |
Kiesha Astwood-Smith (1973), Assistant Secretary (2021)** | Vice President and Assistant General Counsel, JPMorgan Chase & Co. since June 2021; Senior Director and Counsel, Equitable Financial Life Insurance Company (formerly, AXA Equitable Life Insurance Company) from September 2015 through June 2021. |
Matthew Beck (1988), Assistant Secretary (2021)*** | Vice President and Assistant General Counsel, JPMorgan Chase & Co. since May 2021; Senior Legal Counsel, Ultimus Fund Solutions from May 2018 through May 2021; General Counsel, The Nottingham Company from April 2014 through May 2018. |
Elizabeth A. Davin (1964), Assistant Secretary (2022)*** (formerly Secretary 2018-2022) | Executive Director and Assistant General Counsel, JPMorgan Chase & Co. Ms. Davin has been with JPMorgan Chase & Co. (formerly Bank One Corporation) since 2004. |
Jessica K. Ditullio (1962), Assistant Secretary (2014)*** | Executive Director and Assistant General Counsel, JPMorgan Chase & Co. Ms. Ditullio has been with JPMorgan Chase & Co. (formerly Bank One Corporation) since 1990. |
Anthony Geron (1971), Assistant Secretary (2019)** | Vice President and Assistant General Counsel, JPMorgan Chase & Co. since September 2018; Lead Director and Counsel, AXA Equitable Life Insurance Company from 2015 to 2018 and Senior Director and Counsel, AXA Equitable Life Insurance Company from 2014 to 2015. |
Carmine Lekstutis (1980), Assistant Secretary (2014)** | Executive Director and Assistant General Counsel, JPMorgan Chase & Co. Mr. Lekstutis has been with JPMorgan Chase & Co. since 2011. |
Max Vogel (1990), Assistant Secretary (2021)** | Vice President and Assistant General Counsel, JPMorgan Chase & Co. since June 2021; Associate, Proskauer Rose LLP (law firm) from March 2017 to June 2021. |
Zachary E. Vonnegut-Gabovitch (1986), Assistant Secretary (2017)** | Vice President and Assistant General Counsel, JPMorgan Chase & Co. since September 2016. |
Frederick J. Cavaliere (1978), Assistant Treasurer (2015)* | Executive Director, J.P. Morgan Investment Management Inc. Mr. Cavaliere has been with JPMorgan Chase & Co. since May 2006. |
Michael M. D’Ambrosio (1969), Assistant Treasurer (2014) | Managing Director, J.P. Morgan Investment Management Inc. Mr. D’Ambrosio has been with J.P. Morgan Investment Management Inc. since 2012. |
Shannon Gaines (1977), Assistant Treasurer (2019)*** | Vice President, J.P. Morgan Investment Management Inc. since January 2014. |
Nektarios E. Manolakakis (1972), Assistant Treasurer (2020) | Executive Director, J.P. Morgan Investment Management Inc. since February 2021, formerly Vice President, J.P. Morgan Investment Mangement Inc. since 2014; Vice President, J.P. Morgan Corporate & Investment Bank 2010-2014. |
Todd McEwen (1981), Assistant Treasurer (2020)*** | Vice President, J.P. Morgan Investment Management Inc. Mr. McEwen has been with J.P. Morgan Investment Management Inc. since 2010. |
The contact address for each of the officers, unless otherwise noted, is 277 Park Avenue, New York, NY 10172. | |
* | The contact address for the officer is 575 Washington Boulevard, Jersey City, NJ 07310. |
** | The contact address for the officer is 4 New York Plaza, New York, NY 10004. |
*** | The contact address for the officer is 1111 Polaris Parkway, Columbus, OH 43240. |
October 31, 2022 | J.P. Morgan Exchange-Traded Funds | 39 |
(Unaudited)
Hypothetical $1,000 Investment
Beginning Account Value May 1, 2022 | Ending Account Value October 31, 2022 | Expenses Paid During the Period | Annualized Expense Ratio | |
JPMorgan Social Advancement ETF | ||||
Actual * | $1,000.00 | $986.50 | $0.72 | 0.49% |
Hypothetical ** | 1,000.00 | 1,022.73 | 2.50 | 0.49 |
JPMorgan Sustainable Consumption ETF | ||||
Actual * | 1,000.00 | 979.20 | 0.72 | 0.49 |
Hypothetical ** | 1,000.00 | 1,022.73 | 2.50 | 0.49 |
JPMorgan Sustainable Infrastructure ETF | ||||
Actual * | 1,000.00 | 895.00 | 0.69 | 0.49 |
Hypothetical ** | 1,000.00 | 1,022.73 | 2.50 | 0.49 |
* | Expenses are equal to the Fund’s annualized expense ratio, multiplied by the average account value over the period, multiplied by 54/365 (to reflect the actual period). The Fund commenced operations on September 7, 2022. |
** | Expenses are equal to each Fund's respective annualized expense ratio, multiplied by the average account value over the period, multiplied by 184/365 (to reflect the one-half year period). |
40 | J.P. Morgan Exchange-Traded Funds | October 31, 2022 |
(Unaudited)
(ii) The qualifications, backgrounds and responsibilities of the portfolio management team to be primarily responsible for the day-to-day management of each of the Funds;
(iii) The investment strategy for each Fund, and the infrastructure supporting the portfolio management teams;
(iv) Information about the structure and distribution strategy of each Fund and how it fits within the Trust’s other fund offerings;
(v) The administration services to be provided by the Adviser under the Management Agreement;
(vi) Their knowledge of the nature and quality of the services provided by the Adviser and its affiliates gained from their experience as Trustees of the Trust and in the financial industry generally;
(vii) The overall reputation and capabilities of the Adviser and its affiliates;
(viii) The commitment of the Adviser to provide high quality service to the Funds;
(ix) Their overall confidence in the Adviser’s integrity;
(x) The Adviser’s responsiveness to requests for additional information, questions or concerns raised by them; and
(xi) The Adviser’s business continuity plan, steps the Adviser and its affiliates have taken to provide services to the Funds during the COVID-19 pandemic and the Adviser’s and its affiliates’ success in continuing to provide services to the other J.P. Morgan ETFs and their shareholders throughout this period.
October 31, 2022 | J.P. Morgan Exchange-Traded Funds | 41 |
(Unaudited) (continued)
42 | J.P. Morgan Exchange-Traded Funds | October 31, 2022 |
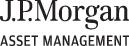

Fund | Ticker | Listing Exchange |
JPMorgan International Research Enhanced Equity ETF | JIRE | NYSE Arca |

1 | |
2 | |
5 | |
10 | |
16 | |
18 | |
29 | |
30 | |
33 | |
35 | |
36 | |
37 |
Past performance is no guarantee of future performance. The general market views expressed in this report are opinions based on market and other conditions through the end of the reporting period and are subject to change without notice. These views are not intended to predict the future performance of a Fund or the securities markets.
Prospective investors should refer to the Fund's prospectus for a discussion of the Fund's investment objectives, strategies and risks. Call J.P. Morgan Exchange-Traded Funds at (844) 457-6383 for a prospectus containing more complete information about the Fund, including management fees and other expenses. Please read it carefully before investing.
Shares are bought and sold throughout the day on an exchange at market price (not at net asset value) through a brokerage account, and are not individually subscribed and redeemed from a Fund. Shares may only be subscribed and redeemed directly from a Fund by Authorized Participants, in large creation/redemption units. Brokerage commissions will reduce returns.
December 15, 2022 (Unaudited)
 | “While investors seek to adapt to the current market environment, we believe a well-diversified portfolio and a patient outlook remain crucial components of a successful invest- ment approach.” — Brian S. Shlissel |

President, J.P. Morgan Funds
J.P. Morgan Asset Management
1-844-457-6383 or www.jpmorganfunds.com for more information
October 31, 2022 | J.P. Morgan Exchange-Traded Funds | 1 |
TWELVE MONTHS ENDED October 31, 2022 (Unaudited)
REPORTING PERIOD RETURN: | |
Net Asset Value * | (22.04)% |
Market Price ** | (22.03)% |
MSCI EAFE Index (net total return) | (23.00)% |
Net Assets as of 10/31/2022 | $5,026,188,342 |
Fund Ticker | JIRE |
2 | J.P. Morgan Exchange-Traded Funds | October 31, 2022 |
TOP TEN HOLDINGS OF THE PORTFOLIO AS OF October 31, 2022 | PERCENT OF TOTAL INVESTMENTS | |
1. | Nestle SA (Registered) | 2.8% |
2. | Roche Holding AG | 2.5 |
3. | LVMH Moet Hennessy Louis Vuitton SE (France) | 2.0 |
4. | Novo Nordisk A/S, Class B (Denmark) | 2.0 |
5. | ASML Holding NV (Netherlands) | 1.9 |
6. | Shell plc (Netherlands) | 1.7 |
7. | Novartis AG (Registered) (Switzerland) | 1.7 |
8. | BP plc (United Kingdom) | 1.7 |
9. | AstraZeneca plc (United Kingdom) | 1.6 |
10. | TotalEnergies SE (France) | 1.5 |
PORTFOLIO COMPOSITION BY COUNTRY AS OF October 31, 2022 | PERCENT OF TOTAL INVESTMENTS |
Japan | 21.7 % |
United Kingdom | 13.5 |
France | 11.4 |
Germany | 8.6 |
United States | 8.2 |
Netherlands | 6.7 |
Australia | 6.2 |
Switzerland | 5.4 |
Denmark | 3.4 |
Spain | 2.5 |
Hong Kong | 2.2 |
Sweden | 2.0 |
Singapore | 1.2 |
Others (each less than 1.0%) | 3.3 |
Short-Term Investments | 3.7 |
October 31, 2022 | J.P. Morgan Exchange-Traded Funds | 3 |
TWELVE MONTHS ENDED October 31, 2022 (Unaudited) (continued)
INCEPTION DATE | 1 YEAR | 5 YEAR | 10 YEAR | |
JPMorgan International Research Enhanced Equity ETF | ||||
Net Asset Value | October 28, 1992* | (22.04)% | (0.40)% | 4.04% |
Market Price | (22.03) | (0.40) | 4.04 |
* | Inception date for Class R6 Shares of the Predecessor Fund (as defined below). |
4 | J.P. Morgan Exchange-Traded Funds | October 31, 2022 |
AS OF October 31, 2022
INVESTMENTS | SHARES | VALUE($) |
Common Stocks — 96.9% | ||
Australia — 6.2% | ||
Aurizon Holdings Ltd. | 1,077,371 | 2,496,664 |
BHP Group Ltd. | 1,469,671 | 35,301,797 |
Commonwealth Bank of Australia | 443,760 | 29,752,685 |
Dexus, REIT | 2,444,631 | 12,181,848 |
Endeavour Group Ltd. | 1,028,449 | 4,707,526 |
Goodman Group, REIT | 1,821,380 | 19,817,908 |
GPT Group (The), REIT | 1,538,404 | 4,251,481 |
Insurance Australia Group Ltd. | 1,683,702 | 5,285,036 |
Macquarie Group Ltd. | 206,347 | 22,385,103 |
Medibank Pvt Ltd. | 4,396,494 | 7,916,632 |
Mirvac Group, REIT | 5,004,568 | 6,630,883 |
National Australia Bank Ltd. | 715,751 | 14,867,614 |
Newcrest Mining Ltd. | 298,539 | 3,306,403 |
QBE Insurance Group Ltd. | 1,287,368 | 10,086,480 |
Rio Tinto Ltd. | 661,367 | 37,532,336 |
Rio Tinto plc | 336,248 | 17,572,877 |
Santos Ltd. | 2,953,526 | 14,418,106 |
Wesfarmers Ltd. | 378,341 | 10,979,095 |
Westpac Banking Corp. | 2,024,164 | 31,255,051 |
Woodside Energy Group Ltd. | 265,566 | 6,139,479 |
Woolworths Group Ltd. | 663,662 | 14,015,079 |
310,900,083 | ||
Belgium — 0.5% | ||
KBC Group NV | 467,188 | 23,413,481 |
China — 0.6% | ||
BOC Hong Kong Holdings Ltd. | 4,039,000 | 12,550,409 |
Prosus NV * | 309,052 | 13,363,933 |
Xinyi Glass Holdings Ltd. | 4,936,300 | 6,343,915 |
32,258,257 | ||
Denmark — 3.4% | ||
Carlsberg A/S, Class B | 248,816 | 29,297,015 |
Genmab A/S * | 18,749 | 7,222,260 |
Novo Nordisk A/S, Class B | 921,210 | 100,164,325 |
Orsted A/S (a) | 349,562 | 28,840,875 |
Vestas Wind Systems A/S | 238,196 | 4,695,716 |
170,220,191 | ||
Finland — 0.9% | ||
Kone OYJ, Class B | 280,706 | 11,493,733 |
Nokia OYJ | 2,224,231 | 9,884,301 |
Nordea Bank Abp | 2,723,849 | 26,019,621 |
47,397,655 | ||
INVESTMENTS | SHARES | VALUE($) |
France — 11.5% | ||
Air Liquide SA | 428,067 | 55,997,055 |
Airbus SE | 163,540 | 17,695,646 |
Alstom SA (b) | 532,844 | 10,966,593 |
BNP Paribas SA | 914,605 | 42,889,415 |
Capgemini SE | 264,567 | 43,360,110 |
Euroapi SA * | 1 | 18 |
Kering SA | 43,871 | 20,091,221 |
L'Oreal SA | 186,896 | 58,686,165 |
LVMH Moet Hennessy Louis Vuitton SE | 159,990 | 100,952,873 |
Pernod Ricard SA | 72,012 | 12,638,919 |
Safran SA | 245,288 | 27,317,721 |
Sanofi | 196,919 | 16,946,428 |
Societe Generale SA | 628,563 | 14,417,375 |
TotalEnergies SE | 1,353,612 | 73,844,092 |
Veolia Environnement SA | 1,358,971 | 30,326,804 |
Vinci SA | 561,210 | 51,652,097 |
577,782,532 | ||
Germany — 8.7% | ||
adidas AG | 156,835 | 15,309,467 |
Allianz SE (Registered) | 329,392 | 59,259,108 |
BASF SE | 69,617 | 3,123,762 |
Bayer AG (Registered) | 278,604 | 14,649,298 |
Brenntag SE | 87,603 | 5,315,431 |
Deutsche Post AG (Registered) | 840,218 | 29,701,562 |
Deutsche Telekom AG (Registered) | 3,184,799 | 60,114,671 |
Infineon Technologies AG | 1,237,769 | 30,035,062 |
Mercedes-Benz Group AG | 79,360 | 4,593,483 |
Merck KGaA | 102,287 | 16,669,215 |
Muenchener Rueckversicherungs- Gesellschaft AG (Registered) | 153,565 | 40,537,484 |
RWE AG | 1,141,264 | 43,933,165 |
SAP SE | 389,259 | 37,467,299 |
Siemens AG (Registered) | 283,144 | 30,921,883 |
Symrise AG | 146,437 | 14,947,199 |
Volkswagen AG (Preference) | 173,377 | 22,192,504 |
Zalando SE * (a) | 253,523 | 5,843,247 |
434,613,840 | ||
Hong Kong — 2.2% | ||
AIA Group Ltd. | 4,802,200 | 36,375,676 |
CK Asset Holdings Ltd. | 1,800,348 | 9,953,352 |
CLP Holdings Ltd. | 381,000 | 2,557,198 |
Hong Kong Exchanges & Clearing Ltd. | 626,600 | 16,632,232 |
Link, REIT | 1,676,000 | 9,906,194 |
Prudential plc | 1,529,374 | 14,207,382 |
October 31, 2022 | J.P. Morgan Exchange-Traded Funds | 5 |
AS OF October 31, 2022 (continued)
INVESTMENTS | SHARES | VALUE($) |
Common Stocks — continued | ||
Hong Kong — continued | ||
Sun Hung Kai Properties Ltd. | 776,500 | 8,344,519 |
Techtronic Industries Co. Ltd. | 1,508,000 | 14,278,903 |
112,255,456 | ||
Ireland — 0.3% | ||
Kingspan Group plc | 338,862 | 17,084,307 |
Italy — 0.8% | ||
Enel SpA | 546,190 | 2,440,022 |
FinecoBank Banca Fineco SpA | 1,829,845 | 24,658,254 |
UniCredit SpA | 930,579 | 11,540,366 |
38,638,642 | ||
Japan — 21.8% | ||
AGC, Inc. | 216,200 | 6,774,619 |
Asahi Group Holdings Ltd. | 796,600 | 22,289,461 |
Asahi Kasei Corp. | 2,444,100 | 15,671,363 |
Bridgestone Corp. | 773,500 | 27,974,751 |
Capcom Co. Ltd. | 448,500 | 12,475,014 |
Central Japan Railway Co. | 212,600 | 24,614,095 |
Daiichi Sankyo Co. Ltd. | 1,213,700 | 38,851,467 |
Daikin Industries Ltd. | 192,583 | 28,846,465 |
Daito Trust Construction Co. Ltd. | 23,900 | 2,366,669 |
Daiwa House Industry Co. Ltd. | 973,900 | 19,621,490 |
Denso Corp. | 309,000 | 15,331,321 |
Dentsu Group, Inc. | 893,600 | 27,793,969 |
Fast Retailing Co. Ltd. | 11,500 | 6,407,124 |
Hitachi Ltd. | 873,200 | 39,620,426 |
Honda Motor Co. Ltd. | 1,306,572 | 29,793,076 |
Hoya Corp. | 350,600 | 32,592,263 |
ITOCHU Corp. | 1,043,500 | 26,968,792 |
Japan Airlines Co. Ltd. * | 575,200 | 10,743,662 |
Kao Corp. | 389,300 | 14,541,112 |
Keyence Corp. | 109,000 | 41,100,119 |
Konami Group Corp. | 255,900 | 11,216,440 |
Kubota Corp. | 577,600 | 8,057,284 |
Kyowa Kirin Co. Ltd. | 657,100 | 15,475,824 |
Mitsubishi Corp. | 917,800 | 24,862,178 |
Mitsubishi UFJ Financial Group, Inc. | 4,304,450 | 20,333,580 |
Mitsui Fudosan Co. Ltd. | 1,252,700 | 23,987,168 |
Murata Manufacturing Co. Ltd. | 425,200 | 20,128,732 |
Nidec Corp. | 177,600 | 9,765,161 |
Nintendo Co. Ltd. | 257,000 | 10,433,968 |
NIPPON EXPRESS HOLDINGS, Inc. | 207,200 | 10,411,370 |
Nippon Paint Holdings Co. Ltd. | 2,003,500 | 12,768,357 |
Nippon Steel Corp. | 341,400 | 4,683,504 |
INVESTMENTS | SHARES | VALUE($) |
Japan — continued | ||
Nippon Telegraph & Telephone Corp. | 1,293,400 | 35,672,887 |
Nomura Research Institute Ltd. | 617,700 | 13,669,828 |
Ono Pharmaceutical Co. Ltd. | 539,600 | 12,698,709 |
ORIX Corp. | 1,317,100 | 19,345,173 |
Otsuka Corp. | 544,500 | 17,147,481 |
Recruit Holdings Co. Ltd. | 532,700 | 16,391,802 |
Rohm Co. Ltd. | 154,500 | 10,855,883 |
Seven & i Holdings Co. Ltd. | 404,600 | 15,103,060 |
Shimadzu Corp. | 266,200 | 7,012,475 |
Shin-Etsu Chemical Co. Ltd. | 287,100 | 29,838,291 |
Shionogi & Co. Ltd. | 261,500 | 12,143,341 |
SoftBank Group Corp. | 325,000 | 13,951,022 |
Sony Group Corp. | 675,515 | 45,553,125 |
Sumitomo Electric Industries Ltd. | 1,446,400 | 15,115,350 |
Sumitomo Metal Mining Co. Ltd. | 417,000 | 11,688,865 |
Sumitomo Mitsui Financial Group, Inc. | 1,181,900 | 33,189,603 |
Suzuki Motor Corp. | 640,400 | 21,651,807 |
T&D Holdings, Inc. | 1,273,200 | 12,592,216 |
Takeda Pharmaceutical Co. Ltd. | 152,500 | 4,027,373 |
Terumo Corp. | 749,300 | 22,740,509 |
Tokio Marine Holdings, Inc. | 2,010,000 | 36,391,395 |
Tokyo Electron Ltd. | 105,900 | 27,861,932 |
Toyota Motor Corp. | 3,336,600 | 46,294,029 |
1,097,436,980 | ||
Luxembourg — 0.1% | ||
ArcelorMittal SA | 303,200 | 6,777,632 |
Malta — 0.0% ^ | ||
BGP Holdings plc ‡ * | 448,859 | 1,436 |
Netherlands — 6.7% | ||
Adyen NV * (a) | 9,216 | 13,156,757 |
Akzo Nobel NV | 430,872 | 26,600,085 |
ASML Holding NV (b) | 207,855 | 97,502,112 |
Koninklijke Ahold Delhaize NV | 647,131 | 18,047,381 |
Koninklijke DSM NV | 201,705 | 23,726,639 |
Koninklijke KPN NV | 8,685,885 | 24,295,343 |
NN Group NV | 571,256 | 24,188,394 |
Shell plc | 3,180,969 | 88,117,956 |
Wolters Kluwer NV | 197,679 | 21,005,098 |
336,639,765 | ||
Singapore — 1.2% | ||
DBS Group Holdings Ltd. | 1,443,265 | 34,892,832 |
Oversea-Chinese Banking Corp. Ltd. | 801,700 | 6,881,865 |
6 | J.P. Morgan Exchange-Traded Funds | October 31, 2022 |
INVESTMENTS | SHARES | VALUE($) |
Common Stocks — continued | ||
Singapore — continued | ||
Sea Ltd., ADR * | 49,500 | 2,459,160 |
United Overseas Bank Ltd. | 692,300 | 13,582,094 |
57,815,951 | ||
South Korea — 0.1% | ||
Delivery Hero SE * (a) | 124,540 | 4,098,477 |
Spain — 2.5% | ||
Banco Bilbao Vizcaya Argentaria SA (b) | 7,367,051 | 38,005,099 |
Banco Santander SA (b) | 2,942,904 | 7,632,356 |
Iberdrola SA | 5,936,824 | 60,373,225 |
Industria de Diseno Textil SA (b) | 851,543 | 19,328,500 |
125,339,180 | ||
Sweden — 2.0% | ||
Atlas Copco AB, Class A | 2,799,159 | 29,876,134 |
Boliden AB | 388,087 | 11,285,925 |
SKF AB, Class B | 1,296,250 | 18,764,027 |
Volvo AB, Class B | 2,518,832 | 41,225,562 |
101,151,648 | ||
Switzerland — 5.5% | ||
Cie Financiere Richemont SA (Registered) | 112,424 | 10,987,597 |
Givaudan SA (Registered) | 2,062 | 6,159,075 |
Julius Baer Group Ltd. | 94,364 | 4,527,478 |
Lonza Group AG (Registered) | 94,265 | 48,526,133 |
Novartis AG (Registered) | 1,068,445 | 86,427,334 |
SGS SA (Registered) | 10,576 | 23,314,915 |
Sika AG (Registered) | 139,577 | 31,471,240 |
UBS Group AG (Registered) | 1,204,027 | 19,088,841 |
Zurich Insurance Group AG | 104,360 | 44,475,515 |
274,978,128 | ||
United Kingdom — 13.6% | ||
3i Group plc | 3,343,102 | 44,524,703 |
AstraZeneca plc | 691,697 | 81,158,326 |
Barclays plc | 22,131,775 | 37,607,506 |
Berkeley Group Holdings plc | 527,418 | 20,984,570 |
BP plc | 15,586,030 | 86,231,398 |
British American Tobacco plc | 639,341 | 25,249,797 |
CK Hutchison Holdings Ltd. | 637,175 | 3,171,751 |
DCC plc | 155,729 | 8,643,098 |
Diageo plc | 1,653,239 | 68,034,945 |
HSBC Holdings plc | 4,863,482 | 24,959,650 |
InterContinental Hotels Group plc | 540,775 | 29,056,245 |
Intertek Group plc | 74,555 | 3,123,331 |
Lloyds Banking Group plc | 70,109,029 | 33,671,121 |
INVESTMENTS | SHARES | VALUE($) |
United Kingdom — continued | ||
London Stock Exchange Group plc | 52,683 | 4,566,670 |
Reckitt Benckiser Group plc | 614,895 | 40,806,904 |
RELX plc | 1,943,367 | 52,199,799 |
SSE plc | 1,866,205 | 33,350,736 |
Standard Chartered plc | 4,538,812 | 27,118,235 |
Taylor Wimpey plc | 5,304,467 | 5,702,990 |
Tesco plc | 8,913,517 | 22,015,358 |
Unilever plc | 672,117 | 30,676,948 |
682,854,081 | ||
United States — 8.3% | ||
CSL Ltd. | 183,212 | 32,797,781 |
Ferguson plc | 44,195 | 4,819,851 |
GSK plc | 759,106 | 12,434,990 |
Nestle SA (Registered) | 1,317,327 | 143,402,640 |
Roche Holding AG | 383,730 | 127,320,919 |
Schneider Electric SE | 430,164 | 54,396,999 |
Stellantis NV | 3,081,212 | 41,570,419 |
416,743,599 | ||
Total Common Stocks (Cost $5,006,339,694) | 4,868,401,321 | |
Short-Term Investments — 3.7% | ||
Investment Companies — 2.5% | ||
JPMorgan Prime Money Market Fund Class IM Shares, 3.18% (c) (d)(Cost $124,257,477) | 124,227,556 | 124,239,979 |
Investment of Cash Collateral from Securities Loaned — 1.2% | ||
JPMorgan Securities Lending Money Market Fund Agency SL Class Shares, 3.23% (c) (d) | 56,261,418 | 56,261,418 |
JPMorgan U.S. Government Money Market Fund Class IM Shares, 2.85% (c) (d) | 7,523,073 | 7,523,073 |
Total Investment of Cash Collateral from Securities Loaned (Cost $63,784,588) | 63,784,491 | |
Total Short-Term Investments (Cost $188,042,065) | 188,024,470 | |
Total Investments — 100.6% (Cost $5,194,381,759) | 5,056,425,791 | |
Liabilities in Excess of Other Assets — (0.6)% | (30,237,449) | |
NET ASSETS — 100.0% | 5,026,188,342 | |
Percentages indicated are based on net assets. |
October 31, 2022 | J.P. Morgan Exchange-Traded Funds | 7 |
AS OF October 31, 2022 (continued)
Abbreviations | |
ADR | American Depositary Receipt |
OYJ | Public Limited Company |
Preference | A special type of equity investment that shares in the earnings of the company, has limited voting rights, and may have a dividend preference. Preference shares may also have liquidation preference. |
REIT | Real Estate Investment Trust |
^ | Amount rounds to less than 0.1% of net assets. | |
‡ | Value determined using significant unobservable inputs. | |
* | Non-income producing security. | |
(a) | Security exempt from registration pursuant to Regulation S under the Securities Act of 1933, as amended. Regulation S applies to securities offerings that are made outside of the United States and do not involve direct selling efforts in the United States and as such may have restrictions on resale. | |
(b) | The security or a portion of this security is on loan at October 31, 2022. The total value of securities on loan at October 31, 2022 is $59,541,857. | |
(c) | Investment in an affiliated fund, which is registered under the Investment Company Act of 1940, as amended, and is advised by J.P. Morgan Investment Management Inc. | |
(d) | The rate shown is the current yield as of October 31, 2022. | |
INDUSTRY October 31, 2022 | PERCENT OF TOTAL INVESTMENTS |
Pharmaceuticals | 10.7% |
Banks | 10.1 |
Insurance | 5.8 |
Oil, Gas & Consumable Fuels | 5.3 |
Chemicals | 4.4 |
Semiconductors & Semiconductor Equipment | 3.3 |
Automobiles | 3.3 |
Textiles, Apparel & Luxury Goods | 2.9 |
Food Products | 2.8 |
Machinery | 2.7 |
Beverages | 2.6 |
Metals & Mining | 2.5 |
Electric Utilities | 2.5 |
Diversified Telecommunication Services | 2.4 |
Professional Services | 2.3 |
Capital Markets | 2.2 |
Personal Products | 2.0 |
IT Services | 1.7 |
Industrial Conglomerates | 1.6 |
Food & Staples Retailing | 1.5 |
Household Durables | 1.4 |
Electrical Equipment | 1.4 |
Electronic Equipment, Instruments & Components | 1.3 |
Real Estate Management & Development | 1.3 |
Trading Companies & Distributors | 1.2 |
Building Products | 1.2 |
Auto Components | 1.2 |
Health Care Equipment & Supplies | 1.1 |
Equity Real Estate Investment Trusts (REITs) | 1.0 |
Construction & Engineering | 1.0 |
Life Sciences Tools & Services | 1.0 |
Others (each less than 1.0%) | 10.6 |
Short-Term Investments | 3.7 |
8 | J.P. Morgan Exchange-Traded Funds | October 31, 2022 |
DESCRIPTION | NUMBER OF CONTRACTS | EXPIRATION DATE | TRADING CURRENCY | NOTIONAL AMOUNT ($) | VALUE AND UNREALIZED APPRECIATION (DEPRECIATION) ($) |
Long Contracts | |||||
SPI 200 Index | 915 | 12/15/2022 | AUD | 100,463,269 | (2,285,844) |
Abbreviations | |
AUD | Australian Dollar |
SPI | Australian Securities Exchange |
October 31, 2022 | J.P. Morgan Exchange-Traded Funds | 9 |
AS OF October 31, 2022
JPMorgan International Research Enhanced Equity ETF | |
ASSETS: | |
Investments in non-affiliates, at value | $4,868,401,321 |
Investments in affiliates, at value | 124,239,979 |
Investments of cash collateral received from securities loaned, at value (See Note 2.C.) | 63,784,491 |
Cash | 402,362 |
Foreign currency, at value | 3,505,815 |
Deposits at broker for futures contracts | 9,350,000 |
Receivables: | |
Dividends from non-affiliates | 10,889,557 |
Dividends from affiliates | 10,815 |
Tax reclaims | 10,163,956 |
Securities lending income (See Note 2.C.) | 11,292 |
Variation margin on futures contracts | 395,064 |
Total Assets | 5,091,154,652 |
LIABILITIES: | |
Payables: | |
Collateral received on securities loaned (See Note 2.C.) | 63,784,491 |
Accrued liabilities: | |
Investment advisory fees | 299,003 |
Administration fees | 312,923 |
Printing and mailing costs | 24,680 |
Custodian and accounting fees | 136,743 |
Trustees’ and Chief Compliance Officer’s fees | 474 |
Other | 407,996 |
Total Liabilities | 64,966,310 |
Net Assets | $5,026,188,342 |
NET ASSETS: | |
Paid-in-Capital | $5,474,120,772 |
Total distributable earnings (loss) | (447,932,430) |
Total Net Assets | $5,026,188,342 |
Outstanding number of shares (unlimited number of shares authorized - par value $0.0001) (a) | 108,627,892 |
Net asset value, per share | $46.27 |
Cost of investments in non-affiliates | $5,006,339,694 |
Cost of investments in affiliates | 124,257,477 |
Cost of foreign currency | 3,496,787 |
Investment securities on loan, at value (See Note 2.C.) | 59,541,857 |
Cost of investment of cash collateral (See Note 2.C.) | 63,784,588 |
10 | J.P. Morgan Exchange-Traded Funds | October 31, 2022 |
FOR THE YEAR ENDED October 31, 2022
JPMorgan International Research Enhanced Equity ETF (a) | |
INVESTMENT INCOME: | |
Interest income from non-affiliates | $9,791 |
Interest income from affiliates | 1,755 |
Dividend income from non-affiliates | 153,240,381 |
Dividend income from affiliates | 1,330,492 |
Income from securities lending (net) (See Note 2.C.) | 527,239 |
Foreign taxes withheld (net) | (6,258,050) |
Total investment income | 148,851,608 |
EXPENSES: | |
Investment advisory fees | 10,169,080 |
Administration fees | 3,813,382 |
Distribution fees (See Note 3.F.) | 63,552 |
Service fees (See Note 3.D.) | 614,648 |
Custodian and accounting fees | 677,776 |
Interest expense to non-affiliates | 37,513 |
Interest expense to affiliates | 177,446 |
Professional fees | 187,310 |
Trustees’ and Chief Compliance Officer’s fees | 41,206 |
Printing and mailing costs | 115,703 |
Registration and filing fees | 339,272 |
Transfer agency fees (See Note 2.H.) | 33,228 |
Other | 45,201 |
Total expenses | 16,315,317 |
Less fees waived | (2,058,227) |
Less expense reimbursements | (1,406,429) |
Net expenses | 12,850,661 |
Net investment income (loss) | 136,000,947 |
October 31, 2022 | J.P. Morgan Exchange-Traded Funds | 11 |
FOR THE YEAR ENDED October 31, 2022 (continued)
JPMorgan International Research Enhanced Equity ETF (a) | |
REALIZED/UNREALIZED GAINS (LOSSES): | |
Net realized gain (loss) on transactions from: | |
Investments in non-affiliates | $(35,285,993) |
Investments in affiliates | (198) |
In-kind redemptions of investments in non-affiliates (See Note 4) | 34,765,386 |
Futures contracts | 6,560,555 |
Foreign currency transactions | (4,777,927) |
Net realized gain (loss) | 1,261,823 |
Change in net unrealized appreciation/depreciation on: | |
Investments in non-affiliates | (1,397,369,531) |
Investments in affiliates | (17,611) |
Futures contracts | (2,442,081) |
Foreign currency translations | (949,733) |
Change in net unrealized appreciation/depreciation | (1,400,778,956) |
Net realized/unrealized gains (losses) | (1,399,517,133) |
Change in net assets resulting from operations | $(1,263,516,186) |
12 | J.P. Morgan Exchange-Traded Funds | October 31, 2022 |
FOR THE PERIODS INDICATED
JPMorgan International Research Enhanced Equity ETF | ||
Year Ended October 31, 2022 (a) | Year Ended October 31, 2021 (a) | |
CHANGE IN NET ASSETS RESULTING FROM OPERATIONS: | ||
Net investment income (loss) | 136,000,947 | 126,965,653 |
Net realized gain (loss) | 1,261,823 | 283,155,961 |
Change in net unrealized appreciation/depreciation | (1,400,778,956) | 1,196,412,473 |
Change in net assets resulting from operations | (1,263,516,186) | 1,606,534,087 |
Total distributions to shareholders | (199,297,281) | (106,497,601) |
CAPITAL TRANSACTIONS: | ||
Change in net assets resulting from capital transactions | 1,493,159,833 | (1,366,543,782) |
NET ASSETS: | ||
Change in net assets | 30,346,366 | 133,492,704 |
Beginning of period | 4,995,841,976 | 4,862,349,272 |
End of period | 5,026,188,342 | 4,995,841,976 |
October 31, 2022 | J.P. Morgan Exchange-Traded Funds | 13 |
FOR THE PERIODS INDICATED (continued)
JPMorgan International Research Enhanced Equity ETF | ||
Year Ended October 31, 2022(a) | Year Ended October 31, 2021(a) | |
CAPITAL TRANSACTIONS: (b) | ||
Proceeds from shares issued | $1,621,509,655 | $359,932,423 |
Distributions reinvested | 181,165,628 | 95,880,074 |
Cost of shares redeemed | (432,128,313) | (1,576,240,880) |
Change in net assets resulting from capital transactions | 1,370,546,970 | (1,120,428,383) |
Class A | ||
Proceeds from shares issued | 801,584 | 1,988,586 |
Distributions reinvested | 1,641,891 | 389,388 |
Cost of shares redeemed | (13,072,328) | (22,274,374) |
Change in net assets resulting from Class A capital transactions | (10,628,853) | (19,896,400) |
Class I | ||
Proceeds from shares issued | 239,601,698 | 105,580,831 |
Distributions reinvested | 15,288,160 | 10,211,772 |
Cost of shares redeemed | (121,648,142) | (342,011,602) |
Change in net assets resulting from Class I capital transactions | 133,241,716 | (226,218,999) |
Total change in net assets resulting from capital transactions | $1,493,159,833 | $(1,366,543,782) |
14 | J.P. Morgan Exchange-Traded Funds | October 31, 2022 |
JPMorgan International Research Enhanced Equity ETF | ||
Year Ended October 31, 2022(a) | Year Ended October 31, 2021(a) | |
SHARES TRANSACTIONS: (b) | ||
Issued | 30,420,358 | 17,748,359 |
Reinvested | 3,138,911 | 5,089,176 |
Redeemed | (8,018,891) | (80,048,903) |
Change in Shares | 25,540,378 | (57,211,368) |
Class A | ||
Issued | 14,139 | 100,334 |
Reinvested | 28,424 | 20,668 |
Redeemed | (244,325) | (1,210,975) |
Change in Class A Shares | (201,762) | (1,089,973) |
Class I | ||
Issued | 4,451,971 | 5,301,334 |
Reinvested | 264,675 | 539,735 |
Redeemed | (2,163,040) | (17,194,810) |
Change in Class I Shares | 2,553,606 | (11,353,741) |
October 31, 2022 | J.P. Morgan Exchange-Traded Funds | 15 |
FOR THE PERIODS INDICATED
Per share operating performance (a) | |||||||
Investment operations | Distributions | ||||||
Net asset value beginning of period | Net investment income loss(b) | Net realized and unrealized gains (losses) on investments | Total from investment operations | Net investment income | Net realized gain | Total Distributions | |
JPMorgan International Research Enhanced Equity ETF (e) | |||||||
Year Ended October 31, 2022 | $61.89 | $1.39 | $(14.54) | $(13.15) | $(2.47) | $— | $(2.47) |
Year Ended October 31, 2021 | 46.43 | 1.42(f) | 15.11 | 16.53 | (1.07) | — | (1.07) |
Year Ended October 31, 2020 | 52.55 | 1.13 | (5.63) | (4.50) | (1.62) | — | (1.62) |
Year Ended October 31, 2019 | 49.24 | 1.65 | 3.37 | 5.02 | (1.71) | — | (1.71) |
November 1, 2017 through (g) October 31, 2018 | 55.08 | 1.62 | (6.27) | (4.65) | (0.64) | (0.55) | (1.19) |
(a) | Per share amounts reflect the conversion of the Predecessor Fund into the Fund as of the close of business on June 10, 2022. See Note 1. |
(b) | Calculated based upon average shares outstanding. |
(c) | Includes adjustments in accordance with accounting principles generally accepted in the United States of America and as such, the net asset values for financial reporting purposes and the returns based upon those net asset values may differ from the net asset values and returns for shareholder transactions. |
(d) | JPMorgan International Research Enhanced Equity ETF acquired all of the assets and liabilities of the JPMorgan International Research Enhanced Equity Fund (“Predecessor Fund”) in a reorganization that occurred as of the close of business on June 10, 2022. Market price returns are calculated using the official closing price of the JPMorgan International Research Enhanced Equity ETF on the listing exchange as of the time that the JPMorgan International Research Enhanced Equity ETF's NAV is calculated. Prior to the JPMorgan International Research Enhanced Equity ETF's listing on June 13, 2022, the NAV performance of the Class R6 Shares of the Predecessor Fund are used as proxy market price returns. |
(e) | JPMorgan International Research Enhanced Equity ETF (the “Fund”) acquired all of the assets and liabilities of the JPMorgan International Research Enhanced Equity Fund (“Predecessor Fund”) in a reorganization that occurred as of the close of business on June 10, 2022. Performance and financial history of the Predecessor Fund’s Class R6 Shares have been adopted by the Fund and will be used going forward. As a result, the financial highlight information reflects that of the Predecessor Fund’s Class R6 Shares for the period November 1, 2017 up through the reorganization. |
(f) | Reflects income from foreign withholding tax claims, including related interest income. Had the Fund not received these proceeds, the net investment income (loss) per share would have remained the same and the net investment income (loss) ratio would have been 2.44%. |
(g) | Commencement of offering of class of shares. |
16 | J.P. Morgan Exchange-Traded Funds | October 31, 2022 |
Ratios/Supplemental data | ||||||||
Ratios to average net assets | ||||||||
Net asset value, end of period | Market price, end of period | Total Return(c) | Market price total return(d) | Net assets, end of period | Net expenses | Net investment income (loss) | Expenses without waivers and reimbursements | Portfolio turnover rate |
$46.27 | $46.28 | (22.04)% | (22.03)% | $5,026,188,342 | 0.24% | 2.66% | 0.30% | 16% |
61.89 | 61.89 | 35.93 | 35.93 | 4,562,266,369 | 0.25 | 2.46(f) | 0.31 | 20 |
46.43 | 46.43 | (8.96) | (8.96) | 4,337,775,495 | 0.24 | 2.35 | 0.30 | 52 |
52.55 | 52.55 | 10.78 | 10.78 | 4,435,538,473 | 0.25 | 3.37 | 0.31 | 22 |
49.24 | 49.24 | (8.60) | (8.60) | 4,344,571,588 | 0.25 | 3.00 | 0.32 | 42 |
October 31, 2022 | J.P. Morgan Exchange-Traded Funds | 17 |
AS OF October 31, 2022
18 | J.P. Morgan Exchange-Traded Funds | October 31, 2022 |
Level 1 Quoted prices | Level 2 Other significant observable inputs | Level 3 Significant unobservable inputs | Total | |
Investments in Securities | ||||
Common Stocks | ||||
Australia | $— | $310,900,083 | $— | $310,900,083 |
Belgium | — | 23,413,481 | — | 23,413,481 |
China | — | 32,258,257 | — | 32,258,257 |
October 31, 2022 | J.P. Morgan Exchange-Traded Funds | 19 |
AS OF October 31, 2022 (continued)
(continued) | ||||
Level 1 Quoted prices | Level 2 Other significant observable inputs | Level 3 Significant unobservable inputs | Total | |
Denmark | $— | $170,220,191 | $— | $170,220,191 |
Finland | — | 47,397,655 | — | 47,397,655 |
France | — | 577,782,532 | — | 577,782,532 |
Germany | — | 434,613,840 | — | 434,613,840 |
Hong Kong | — | 112,255,456 | — | 112,255,456 |
Ireland | — | 17,084,307 | — | 17,084,307 |
Italy | — | 38,638,642 | — | 38,638,642 |
Japan | — | 1,097,436,980 | — | 1,097,436,980 |
Luxembourg | — | 6,777,632 | — | 6,777,632 |
Malta | — | — | 1,436 | 1,436 |
Netherlands | — | 336,639,765 | — | 336,639,765 |
Singapore | 2,459,160 | 55,356,791 | — | 57,815,951 |
South Korea | — | 4,098,477 | — | 4,098,477 |
Spain | — | 125,339,180 | — | 125,339,180 |
Sweden | — | 101,151,648 | — | 101,151,648 |
Switzerland | — | 274,978,128 | — | 274,978,128 |
United Kingdom | — | 682,854,081 | — | 682,854,081 |
United States | — | 416,743,599 | — | 416,743,599 |
Total Common Stocks | 2,459,160 | 4,865,940,725 | 1,436 | 4,868,401,321 |
Short-Term Investments | ||||
Investment Companies | 124,239,979 | — | — | 124,239,979 |
Investment of Cash Collateral from Securities Loaned | 63,784,491 | — | — | 63,784,491 |
Total Short-Term Investments | 188,024,470 | — | — | 188,024,470 |
Total Investments in Securities | $190,483,630 | $4,865,940,725 | $1,436 | $5,056,425,791 |
Depreciation in Other Financial Instruments | ||||
Futures Contracts | $(2,285,844) | $— | $— | $(2,285,844) |
20 | J.P. Morgan Exchange-Traded Funds | October 31, 2022 |
Investment Securities on Loan, at value, Presented on the Statement of Assets and Liabilities | Cash Collateral Posted by Borrower* | Net Amount Due to Counterparty (not less than zero) | |
$59,541,857 | $(59,541,857) | $— |
* | Collateral posted reflects the value of securities on loan and does not include any additional amounts received from the borrower. |
$10,909 |
For the year ended October 31, 2022** | |||||||||
Security Description | Value at October 31, 2021 | Purchases at Cost | Proceeds from Sales | Net Realized Gain (Loss) | Change in Unrealized Appreciation/ (Depreciation) | Value at October 31, 2022 | Shares at October 31, 2022 | Dividend Income | Capital Gain Distributions |
JPMorgan Prime Money Market Fund Class IM Shares, 3.18% (a) (b) | $— | $200,962,258 | $76,706,220 | $1,438 | $(17,497) | $124,239,979 | 124,227,556 | $1,096,558 | $— |
JPMorgan Prime Money Market Fund Class Institutional Shares, 3.12% (a) (b) | 93,239,130 | 1,617,415,517 | 1,710,652,995 | (1,636) | (16) | — | — | 233,934 | — |
October 31, 2022 | J.P. Morgan Exchange-Traded Funds | 21 |
AS OF October 31, 2022 (continued)
For the year ended October 31, 2022** | |||||||||
Security Description | Value at October 31, 2021 | Purchases at Cost | Proceeds from Sales | Net Realized Gain (Loss) | Change in Unrealized Appreciation/ (Depreciation) | Value at October 31, 2022 | Shares at October 31, 2022 | Dividend Income | Capital Gain Distributions |
JPMorgan Securities Lending Money Market Fund Agency SL Class Shares, 3.23% (a) (b) | $82,347,090 | $627,250,000 | $653,360,999 | $25,425* | $(98) | $56,261,418 | 56,261,418 | $299,269 * | $— |
JPMorgan U.S. Government Money Market Fund Class IM Shares, 2.85% (a) (b) | 10,122,536 | 706,871,468 | 709,470,931 | — | — | 7,523,073 | 7,523,073 | 119,177* | — |
Total | $185,708,756 | $3,152,499,243 | $3,150,191,145 | $25,227 | $(17,611) | $188,024,470 | $1,748,938 | $— | |
(a) | Investment in an affiliated fund, which is registered under the Investment Company Act of 1940, as amended, and is advised by J.P. Morgan Investment Management Inc. |
(b) | The rate shown is the current yield as of October 31, 2022. |
* | Amount is included on the Statement of Operations as Income from securities lending (net) (after payments of rebates and Citibank’s fee). |
** | As of the close of business on June 10, 2022, JPMorgan International Research Enhanced Equity Fund (the "Acquired fund"), a series of JPMorgan Trust II, reorganized ("the Reorganization") into a newly created exchange-traded fund, JPMorgan International Research Enhanced Equity ETF (the "Fund"). Following the Reorganization, the Acquired Fund's performance and financial history were adopted by the Fund. The table includes transactions from the Acquired Fund for the period November 1, 2021 through June 10, 2022. |
22 | J.P. Morgan Exchange-Traded Funds | October 31, 2022 |
Futures Contracts: | |
Average Notional Balance Long | $115,025,290 |
Ending Notional Balance Long | 100,463,269 |
Class A | Class I | Class R6 | Total | |
Transfer agency fees | $10,618 | $7,750 | $14,860 | $33,228 |
October 31, 2022 | J.P. Morgan Exchange-Traded Funds | 23 |
AS OF October 31, 2022 (continued)
Paid-in-Capital | Accumulated undistributed (distributions in excess of) net investment income | Accumulated net realized gains (losses) | |
$31,012,668 | $6,547,718 | $(37,560,386) |
Class A | |
0.25 |
24 | J.P. Morgan Exchange-Traded Funds | October 31, 2022 |
Front-End Sales Charge | CDSC | |
$51 | $— |
Class A | Class I | |
0.25% | 0.25% |
Class A | Class I | Class R6 | |
0.60% | 0.35% | 0.25% |
Contractual Waivers | Voluntary Waivers | |||||
Investment Advisory Fees | Administration Fees | Service Fees | Total | Contractual Reimbursements | 12b-1 | |
$900,827 | $550,176 | $385,857 | $1,836,860 | $1,406,429 | $38,979 | |
October 31, 2022 | J.P. Morgan Exchange-Traded Funds | 25 |
AS OF October 31, 2022 (continued)
Purchases (excluding U.S. Government) | Sales (excluding U.S. Government) | |
$2,138,806,723 | $788,176,376 |
In-Kind Purchases | In-Kind Sales | |
$157,256,139 | $88,981,550 |
Aggregate Cost | Gross Unrealized Appreciation | Gross Unrealized Depreciation | Net Unrealized Appreciation (Depreciation) | |
$5,286,165,601 | $367,691,054 | $599,716,708 | $(232,025,654) |
26 | J.P. Morgan Exchange-Traded Funds | October 31, 2022 |
Ordinary Income* | Total Distributions Paid | |
$199,297,281 | $199,297,281 |
* | Short-term gain distributions are treated as ordinary income for income tax purposes. |
Ordinary Income* | Total Distributions Paid | |
$106,497,601 | $106,497,601 |
* | Short-term gain distributions are treated as ordinary income for income tax purposes. |
Current Distributable Ordinary Income | Current Distributable Long-Term Capital Gain (Tax Basis Capital Loss Carryover) | Unrealized Appreciation (Depreciation) | |
$109,999,788 | $(324,899,831) | $(232,968,325) |
Capital Loss Carryforward Character | ||
Short-Term | Long-Term | |
$41,791,174 | $283,108,657 | |
Capital Loss Utilized | ||
Short-Term | Long-Term | |
$— | $1,906,840 | |
October 31, 2022 | J.P. Morgan Exchange-Traded Funds | 27 |
AS OF October 31, 2022 (continued)
J.P. Morgan Investor Funds | JPMorgan SmartRetirement Funds | |
18.6% | 56.3% |
France | 11.6% |
Japan | 22.0 |
United Kingdom | 13.7 |
28 | J.P. Morgan Exchange-Traded Funds | October 31, 2022 |
October 31, 2022 | J.P. Morgan Exchange-Traded Funds | 29 |
(Unaudited)
Name (Year of Birth); Positions With the Funds (1) | Principal Occupation During Past 5 Years | Number of Funds in Fund Complex Overseen by Trustee (2) | Other Directorships Held During the Past 5 Years |
Independent Trustees | |||
John F. Finn (1947); Chair since 2020; Trustee since 1998. | Chairman, Gardner, Inc. (supply chain management company serving industrial and consumer markets) (serving in various roles 1974-present). | 166 | Director, Greif, Inc. (GEF) (industrial package products and services) (2007-present); Trustee, Columbus Association for the Performing Arts (1988-present). |
Stephen P. Fisher (1959); Trustee since 2018. | Retired; Chairman and Chief Executive Officer, NYLIFE Distributors LLC (registered broker-dealer) (serving in various roles 2008-2013); Chairman, NYLIM Service Company LLC (transfer agent) (2008-2017); New York Life Investment Management LLC (registered investment adviser) (serving in various roles 2005-2017); Chairman, IndexIQ Advisors LLC (registered investment adviser for ETFs) (2014-2017); President, MainStay VP Funds Trust (2007-2017), MainStay DefinedTerm Municipal Opportunities Fund (2011-2017) and MainStay Funds Trust (2007-2017) (registered investment companies). | 166 | Honors Program Advisory Board Member, The Zicklin School of Business, Baruch College, The City University of New York (2017-present). |
Gary L. French (1951); Trustee since 2014. | Real Estate Investor (2011-2020); Investment management industry Consultant and Expert Witness (2011-present); Senior Consultant for The Regulatory Fundamentals Group LLC (2011-2017). | 166 | Independent Trustee, The China Fund, Inc. (2013-2019); Exchange Traded Concepts Trust II (2012-2014); Exchange Traded Concepts Trust I (2011-2014). |
Kathleen M. Gallagher (1958); Trustee since 2018. | Retired; Chief Investment Officer — Benefit Plans, Ford Motor Company (serving in various roles 1985-2016). | 166 | Non- Executive Director, Legal & General Investment Management (Holdings) (2018-present); Non-Executive Director, Legal & General Investment Management America (U.S. Holdings) (financial services and insurance) (2017-present); Advisory Board Member, State Street Global Advisors Total Portfolio Solutions (2017-present); Member, Client Advisory Council, Financial Engines, LLC (registered investment adviser) (2011-2016); Director, Ford Pension Funds Investment Management Ltd. (2007-2016). |
Robert J. Grassi (1957); Trustee since 2014. | Sole Proprietor, Academy Hills Advisors LLC (2012-present); Pension Director, Corning Incorporated (2002-2012). | 166 | None |
Frankie D. Hughes (1952); Trustee since 2008. | President, Ashland Hughes Properties (property management) (2014-present); President and Chief Investment Officer, Hughes Capital Management, Inc. (fixed income asset management) (1993-2014). | 166 | None |
30 | J.P. Morgan Exchange-Traded Funds | October 31, 2022 |
Name (Year of Birth); Positions With the Funds (1) | Principal Occupation During Past 5 Years | Number of Funds in Fund Complex Overseen by Trustee (2) | Other Directorships Held During the Past 5 Years |
Raymond Kanner (1953); Trustee since 2017. | Retired; Managing Director and Chief Investment Officer, IBM Retirement Funds (2007-2016). | 166 | Advisory Board Member, Penso Advisors, LLC (2020-present); Advisory Board Member, Los Angeles Capital (2018-present); Advisory Board Member, State Street Global Advisors Total Portfolio Solutions (2017- present); Acting Executive Director, Committee on Investment of Employee Benefit Assets (CIEBA) (2016-2017); Advisory Board Member, Betterment for Business (robo advisor) (2016- 2017); Advisory Board Member, BlueStar Indexes (index creator) (2013-2017); Director, Emerging Markets Growth Fund (registered investment company) (1997-2016); Member, Russell Index Client Advisory Board (2001-2015). |
Thomas P. Lemke (1954); Trustee since 2014. | Retired since 2013. | 166 | (1) Independent Trustee of Advisors’ Inner Circle III fund platform, consisting of the following: (i) the Advisors’ Inner Circle Fund III, (ii) the Gallery Trust, (iii) the Schroder Series Trust, (iv) the Delaware Wilshire Private Markets Fund (since 2020), (v) Chiron Capital Allocation Fund Ltd., and (vi) formerly the Winton Diversified Opportunities Fund (2014-2018); and (2) Independent Trustee of the Symmetry Panoramic Trust (since 2018). |
Lawrence R. Maffia (1950); Trustee since 2014 | Retired; Director and President, ICI Mutual Insurance Company (2006-2013). | 166 | Director, ICI Mutual Insurance Company (1999-2013). |
Mary E. Martinez (1960); Vice Chair since 2021; Trustee since 2013. | Associate, Special Properties, a Christie’s International Real Estate Affiliate (2010-present); Managing Director, Bank of America (asset management) (2007-2008); Chief Operating Officer, U.S. Trust Asset Management, U.S. Trust Company (asset management) (2003-2007); President, Excelsior Funds (registered investment companies) (2004-2005). | 166 | None |
Marilyn McCoy (1948); Trustee since 2005. | Vice President of Administration and Planning, Northwestern University (1985-present). | 166 | None |
Dr. Robert A. Oden, Jr. (1946); Trustee since 2005. | Retired; President, Carleton College (2002-2010); President, Kenyon College (1995-2002). | 166 | Trustee, The Coldwater Conservation Fund (2017-present); Trustee, American Museum of Fly Fishing (2013-present); Trustee and Vice Chair, Trout Unlimited (2017-2021);Trustee, Dartmouth- Hitchcock MedicalCenter (2011-2020). |
October 31, 2022 | J.P. Morgan Exchange-Traded Funds | 31 |
(Unaudited) (continued)
Name (Year of Birth); Positions With the Funds (1) | Principal Occupation During Past 5 Years | Number of Funds in Fund Complex Overseen by Trustee (2) | Other Directorships Held During the Past 5 Years |
Marian U. Pardo* (1946); Trustee since 2013. | Managing Director and Founder, Virtual Capital Management LLC (investment consulting) (2007-present); Managing Director, Credit Suisse Asset Management (portfolio manager) (2003-2006). | 166 | Board Chair and Member, Board of Governors, Columbus Citizens Foundation (not-for-profit supporting philanthropic and cultural programs) (2006-present). |
Emily A. Youssouf (1951); Trustee since 2022. | Adjunct Professor (2011-present) and Clinical Professor (2009-2011), NYU Schack Institute of Real Estate; Board Member and Member of the Audit Committee (2013–present), Chair of Finance Committee (2019-present), Member of Related Parties Committee (2013-2018) and Member of the Enterprise Risk Committee (2015-2018), PennyMac Financial Services, Inc.; Board Member (2005-2018), Chair of Capital Committee (2006-2016), Chair of Audit Committee (2005-2018), Member of Finance Committee (2005-2018) and Chair of IT Committee (2016-2018), NYC Health and Hospitals Corporation. | 166 | Trustee, NYC School Construction Authority (2009-present); Board Member, NYS Job Development Authority (2008-present); Trustee and Chair of the Audit Committee of the Transit Center Foundation (2015-2019). |
Interested Trustees | |||
Robert F. Deutsch** (1957); Trustee since 2014. | Retired; Head of ETF Business for JPMorgan Asset Management (2013-2017); Head of Global Liquidity Business for JPMorgan Asset Management (2003-2013). | 166 | Treasurer and Director of the JUST Capital Foundation (2017-present). |
Nina O. Shenker** (1957); Trustee since 2022. | Vice Chair (2017-2021), General Counsel and Managing Director (2008-2016), Associate General Counsel and Managing Director (2004-2008), J.P. Morgan Asset & Wealth Management. | 166 | Director and Member of Legal and Human Resources Subcommittees, American Jewish Joint Distribution Committee (2018-present). |
(1) | The year shown is the first year in which a Trustee became a member of any of the following: the Mutual Fund Board, the ETF Board, the heritage J.P. Morgan Funds or the heritage One Group Mutual Funds. Trustees serve an indefinite term, until resignation, retirement, removal or death. The Board’s current retirement policy sets retirement at the end of the calendar year in which the Trustee attains the age of 75, provided that any Board member who was a member of the Mutual Fund Board prior to January 1, 2022 and was born prior to January 1, 1950 shall retire from the Board at the end of the calendar year in which the Trustee attains the age of 78. | ||
(2) | A Fund Complex means two or more registered investment companies that hold themselves out to investors as related companies for purposes of investment and investor services or have a common investment adviser or have an investment adviser that is an affiliated person of the investment adviser of any of the other registered investment companies. The J.P. Morgan Funds Complex for which the Board of Trustees serves currently includes nine registered investment companies (166 J.P. Morgan Funds). | ||
* | In connection with prior employment with JPMorgan Chase, Ms. Pardo was the recipient of non-qualified pension plan payments from JPMorgan Chase in the amount of approximately $2,055 per month, which she irrevocably waived effective January 1, 2013, and deferred compensation payments from JPMorgan Chase in the amount of approximately $7,294 per year, which ended in January 2013. In addition, Ms. Pardo receives payments from a fully-funded qualified plan, which is not an obligation of JPMorgan Chase. | ||
** | Designation as an “Interested Trustee” is based on prior employment by the Adviser or an affiliate of the Adviser or interests in a control person of the Adviser. | ||
The contact address for each of the Trustees is 277 Park Avenue, New York, NY 10172. | |||
32 | J.P. Morgan Exchange-Traded Funds | October 31, 2022 |
(Unaudited)
Name (Year of Birth), Positions Held with the Trust (Since) | Principal Occupations During Past 5 Years |
Brian S. Shlissel (1964), President and Principal Executive Officer (2021)* | Managing Director and Chief Administrative Officer for J.P. Morgan pooled vehicles, J.P. Morgan Investment Management Inc. since 2014. |
Timothy J. Clemens (1975), Treasurer and Principal Financial Officer (2020) | Executive Director, J.P. Morgan Investment Management Inc. since February 2016. Mr. Clemens has been with J.P. Morgan Investment Management Inc. since 2013. |
Gregory S. Samuels (1980), Secretary (2022) **(formerly Assistant Secretary 2014-2022) | Managing Director and Assistant General Counsel, JPMorgan Chase & Co. Mr. Samuels has been with JPMorgan Chase & Co. since 2010. |
Stephen M. Ungerman (1953), Chief Compliance Officer (2014) | Managing Director, JPMorgan Chase & Co. Mr. Ungerman has been with JPMorgan Chase & Co. since 2000. |
Kiesha Astwood-Smith (1973), Assistant Secretary (2021)** | Vice President and Assistant General Counsel, JPMorgan Chase & Co. since June 2021; Senior Director and Counsel, Equitable Financial Life Insurance Company (formerly, AXA Equitable Life Insurance Company) from September 2015 through June 2021. |
Matthew Beck (1988), Assistant Secretary (2021)*** | Vice President and Assistant General Counsel, JPMorgan Chase & Co. since May 2021; Senior Legal Counsel, Ultimus Fund Solutions from May 2018 through May 2021; General Counsel, The Nottingham Company from April 2014 through May 2018. |
Elizabeth A. Davin (1964), Assistant Secretary (2022)*** (formerly Secretary 2018-2022) | Executive Director and Assistant General Counsel, JPMorgan Chase & Co. Ms. Davin has been with JPMorgan Chase & Co. (formerly Bank One Corporation) since 2004. |
Jessica K. Ditullio (1962), Assistant Secretary (2014)*** | Executive Director and Assistant General Counsel, JPMorgan Chase & Co. Ms. Ditullio has been with JPMorgan Chase & Co. (formerly Bank One Corporation) since 1990. |
Anthony Geron (1971), Assistant Secretary (2019)** | Vice President and Assistant General Counsel, JPMorgan Chase & Co. since September 2018; Lead Director and Counsel, AXA Equitable Life Insurance Company from 2015 to 2018 and Senior Director and Counsel, AXA Equitable Life Insurance Company from 2014 to 2015. |
Carmine Lekstutis (1980), Assistant Secretary (2014)** | Executive Director and Assistant General Counsel, JPMorgan Chase & Co. Mr. Lekstutis has been with JPMorgan Chase & Co. since 2011. |
Max Vogel (1990), Assistant Secretary (2021)** | Vice President and Assistant General Counsel, JPMorgan Chase & Co. since June 2021; Associate, Proskauer Rose LLP (law firm) from March 2017 to June 2021. |
Zachary E. Vonnegut-Gabovitch (1986), Assistant Secretary (2017)** | Vice President and Assistant General Counsel, JPMorgan Chase & Co. since September 2016. |
Frederick J. Cavaliere (1978), Assistant Treasurer (2015)* | Executive Director, J.P. Morgan Investment Management Inc. Mr. Cavaliere has been with JPMorgan Chase & Co. since May 2006. |
Michael M. D’Ambrosio (1969), Assistant Treasurer (2014) | Managing Director, J.P. Morgan Investment Management Inc. Mr. D’Ambrosio has been with J.P. Morgan Investment Management Inc. since 2012. |
Shannon Gaines (1977), Assistant Treasurer (2019)*** | Vice President, J.P. Morgan Investment Management Inc. since January 2014. |
Nektarios E. Manolakakis (1972), Assistant Treasurer (2020) | Executive Director, J.P. Morgan Investment Management Inc. since February 2021, formerly Vice President, J.P. Morgan Investment Mangement Inc. since 2014; Vice President, J.P. Morgan Corporate & Investment Bank 2010-2014. |
Todd McEwen (1981), Assistant Treasurer (2020)*** | Vice President, J.P. Morgan Investment Management Inc. Mr. McEwen has been with J.P. Morgan Investment Management Inc. since 2010. |
The contact address for each of the officers, unless otherwise noted, is 277 Park Avenue, New York, NY 10172. | |
* | The contact address for the officer is 575 Washington Boulevard, Jersey City, NJ 07310. |
** | The contact address for the officer is 4 New York Plaza, New York, NY 10004. |
October 31, 2022 | J.P. Morgan Exchange-Traded Funds | 33 |
(Unaudited) (continued)
*** | The contact address for the officer is 1111 Polaris Parkway, Columbus, OH 43240. |
34 | J.P. Morgan Exchange-Traded Funds | October 31, 2022 |
(Unaudited)
Hypothetical $1,000 Investment
Beginning Account Value May 1, 2022 | Ending Account Value October 31, 2022 | Expenses Paid During the Period1 | Annualized Expense Ratio | |
JPMorgan International Research Enhanced Equity ETF | ||||
Actual | $1,000.00 | $887.30 | $1.14 | 0.24% |
Hypothetical | 1,000.00 | 1,024.00 | 1.22 | 0.24 |
1 | Expenses are equal to Fund’s annualized net expense ratio, multiplied by the average account value over the period, multiplied by 184/365 (to reflect the one-half year period). |
October 31, 2022 | J.P. Morgan Exchange-Traded Funds | 35 |
(Unaudited)
36 | J.P. Morgan Exchange-Traded Funds | October 31, 2022 |
(Unaudited)
Summarized below are the material factors considered and discussed by the Trustees in reaching their conclusions:
October 31, 2022 | J.P. Morgan Exchange-Traded Funds | 37 |
(Unaudited) (continued)
The Trustees considered the extent to which the Fund may benefit from potential economies of scale. The Trustees considered that there may not be a direct relationship between economies of scale realized by the Fund and those realized by the Adviser as assets increase. The Trustees considered the extent to which the Fund was priced to scale and whether it would be appropriate to add advisory fee breakpoints, but noted that the Fund has implemented a contractual expense limitation and fee waiver (“Fee Cap”) which allows the Fund’s shareholders to share potential economies of scale, and that the proposed fees are satisfactory relative to peer funds. The Trustees considered the benefits to the Fund of the use of an affiliated distributor and custodian, including the ability to rely on existing infrastructure supporting distribution, custodial and transfer agent services and the ability to negotiate competitive fees for the Fund. The Trustees further considered the Adviser’s ongoing investments in its business in support of the Fund, including the Adviser’s investments in trading systems, technology (including improvements to the J.P. Morgan Funds’ website, and cybersecurity improvements), retention of key talent, and regulatory support enhancements. The Trustees concluded that the current fee structure for the Fund, including the Fee Cap that the Adviser has in place that serves to limit the overall net expense ratio of the Fund at a competitive level, was reasonable. The Trustees concluded that the Fund’s shareholders will receive the benefits of potential economies of scale through the Fee Cap and the Adviser’s reinvestment in its operations to serve the Fund and its shareholders. The Trustees noted that the Adviser’s reinvestment ensures sufficient resources in terms of personnel and infrastructure to support the Fund.
38 | J.P. Morgan Exchange-Traded Funds | October 31, 2022 |


ITEM 2. CODE OF ETHICS.
Disclose whether, as of the end of the period covered by the report, the registrant has adopted a code of ethics that applies to the registrant’s principal executive officer, principal financial officer, principal accounting officer or controller, or persons performing similar functions, regardless of whether these individuals are employed by the registrant or a third party. If the registrant has not adopted such a code of ethics, explain why it has not done so.
The registrant must briefly describe the nature of any amendment, during the period covered by the report, to a provision of its code of ethics that applies to the registrant’s principal executive officer, principal financial officer, principal accounting officer or controller, or persons performing similar functions, regardless of whether these individuals are employed by the registrant or a third party, and that relates to any element of the code of ethics definition enumerated in paragraph (b) of this Item. The registrant must file a copy of any such amendment as an exhibit pursuant to Item 13(a)(1), unless the registrant has elected to satisfy paragraph (f) of this Item by positing its code of ethics on its website pursuant to paragraph (f)(2) of this Item, or by undertaking to provide its code of ethics to any person without charge, upon request, pursuant to paragraph (f)(3) of this Item.
If the registrant has, during the period covered by the report, granted a waiver, including an implicit waiver, from a provision of the code of ethics that applies to the registrant’s principal executive officer, principal financial officer, principal accounting officer or controller, or persons performing similar functions, regardless of whether these individuals are employed by the registrant or third party, that relates to one or more items set forth in paragraph (b) of this Item, the registrant must briefly describe the nature of the waiver, the name of the person to whom the waiver was granted, and the date of the waiver.
The Registrant has adopted a code of ethics that applies to the Registrant’s principal executive officer and principal financial officer. There were no amendments to the code of ethics or waivers granted with respect to the code of ethics in the period covered by the report.
ITEM 3. AUDIT COMMITTEE FINANCIAL EXPERT.
(a) (1) Disclose that the registrant’s board of directors has determined that the registrant either:
(i) Has at least one audit committee financial expert serving on its audit committee; or
(ii) Does not have an audit committee financial expert serving on its audit committee.
The Registrant’s Board of Trustees has determined that the Registrant has at least one audit committee financial expert serving on its audit committee. The Securities and Exchange Commission has stated that the designation or identification of a person as an audit committee financial expert pursuant to this Item 3 of Form N-CSR does not impose on such person any duties, obligations or liabilities that are greater than the duties, obligations and liabilities imposed on such person as a member of the Audit Committee and the Board of Trustees in the absence of such designation or identification.
(2) If the registrant provides the disclosure required by paragraph (a)(1)(i) of this Item, it must disclose the name of the audit committee financial expert and whether that person is “independent.” In order to be considered “independent” for purposes of this Item, a member of an audit committee may not, other than in his or her capacity as a member of the audit committee, the board of directors, or any other board committee:
| (i) | Accept directly or indirectly any consulting, advisory, or other compensatory fee from the issuer; or |
| (ii) | Be an “interested person” of the investment company as defined in Section 2(a)(19) of the Act (15 U.S.C. 80a-2(a)(19)). |
The audit committee financial expert is Gary L. French for purposes of audit committee financial expert determinations. Mr. French is not an “interested person” of the Registrant and is also “independent” as defined by the U.S. Securities and Exchange Commission for the purposes of the audit committee financial expert determination.
(3) If the registrant provides the disclosure required by paragraph (a)(1)(ii) of this Item, it must explain why it does not have an audit committee financial expert.
Not applicable.
ITEM 4. PRINCIPAL ACCOUNTANT FEES AND SERVICES.
(a) Disclose, under the caption Audit Fees, the aggregate fees billed for each of the last two fiscal years for professional services rendered by the principal accountant for the audit of the registrant’s annual financial statements or services that are normally provided by the accountant in connection with statutory and regulatory filings or engagements for those fiscal years.
AUDIT FEES
2022 – $641,349
2021 – $505,466
(b) Disclose, under the caption Audit-Related Fees, the aggregate fees billed in each of the last two fiscal years for assurance and related services by the principal accountant that are reasonably related to the performance of the audit of the registrant’s financial statements and are not reported under paragraph (a) of this Item. Registrants shall describe the nature of the services comprising the fees disclosed under this category.
AUDIT-RELATED FEES
2022 – $175,911
2021 – $147,185
Audit-related fees consist of security count procedures performed as required under Rule 17f-2 of the Investment Company Act of 1940 during the Registrant’s fiscal year.
(c) Disclose, under the caption Tax Fees, the aggregate fees billed in each of the last two fiscal years for professional services rendered by the principal accountant for tax compliance, tax advice, and tax planning. Registrants shall describe the nature of the services comprising the fees disclosed under this category.
TAX FEES
2022 – $276,692
2021 – $224,838
The tax fees consist of fees billed in connection with preparing the federal regulated investment company income tax returns for the Registrant for the tax years ended October 31, 2022 and 2021, respectively.
For the last fiscal year, no tax fees were required to be approved pursuant to paragraph (c)(7)(ii) of Rule 2-01 of Regulation S-X.
(d) Disclose, under the caption All Other Fees, the aggregate fees billed in each of the last two fiscal years for products and services provided by the principal accountant, other than the services reported in paragraphs (a) through (c) of this Item. Registrants shall describe the nature of the services comprising the fees disclosed under this category.
ALL OTHER FEES
2022 – $0
2021 – $0
(e)(1) Disclose the audit committee’s pre-approval policies and procedures described in paragraph (c)(7) of Rule 2-01 of Regulation S-X.
Pursuant to the Registrant’s Audit Committee Charter and written policies and procedures for the pre-approval of audit and non-audit services (the “Pre-approval Policy”), the Audit Committee pre-approves all audit and non-audit services performed by the Registrant’s independent public registered accounting firm for the Registrant. In addition, the Audit
Committee pre-approves the auditor’s engagement for non-audit services with the Registrant’s investment adviser (not including a sub-adviser whose role is primarily portfolio management and is sub-contracted or overseen by another investment adviser) and any Service Affiliate in accordance with paragraph (c)(7)(ii) of Rule 2-01 of Regulation S-X, if the engagement relates directly to the operations and financial reporting of the Registrant. Proposed services may be pre-approved either 1) without consideration of specific case-by- case services or 2) require the specific pre-approval of the Audit Committee. Therefore, initially the Pre-approval Policy listed a number of audit and non-audit services that have been approved by the Audit Committee, or which were not subject to pre- approval under the transition provisions of Sarbanes-Oxley Act of 2002 (the “Pre-approval List”). The Audit Committee annually reviews and pre-approves the services included on the Pre-approval List that may be provided by the independent public registered accounting firm without obtaining additional specific pre-approval of individual services from the Audit Committee. The Audit Committee adds to, or subtracts from, the list of general pre-approved services from time to time, based on subsequent determinations. All other audit and non-audit services not on the Pre-approval List must be specifically pre-approved by the Audit Committee.
One or more members of the Audit Committee may be appointed as the Committee’s delegate for the purposes of considering whether to approve such services. Any pre-approvals granted by the delegate will be reported, for informational purposes only, to the Audit Committee at its next scheduled meeting. The Audit Committee’s responsibilities to pre-approve services performed by the independent public registered accounting firm are not delegated to management.
(2) Disclose the percentage of services described in each of paragraphs (b) through (d) of this Item that were approved by the audit committee pursuant to paragraph (c)(7)(i)(C) of Rule 2-01 of Regulation S-X.
2022 – 0.0%
2021 – 0.0%
(f) If greater than 50 percent, disclose the percentage of hours expended on the principal accountant’s engagement to audit the registrant’s financial statements for the most recent fiscal year that were attributed to work performed by persons other than the principal accountant’s full-time, permanent employees.
Not applicable.
(g) Disclose the aggregate non-audit fees billed by the registrant’s accountant for services rendered to the registrant, and rendered to the registrant’s investment adviser (not including any sub-adviser whose role is primarily portfolio management and is subcontracted with or overseen by another investment adviser), and any entity controlling, controlled by, or under common control with the adviser that provides ongoing services to the registrant for each of the last two fiscal years of the registrant.
The aggregate non-audit fees billed by the independent registered public accounting firm for services rendered to the Registrant, and rendered to Service Affiliates, for the last two calendar year ends were:
2021 – $30.5 million
2020 – $30.4 million
(h) Disclose whether the registrant’s audit committee of the board of directors has considered whether the provision of non-audit services that were rendered to the registrant’s investment adviser (not including any subadviser whose role is primarily portfolio management and is subcontracted with or overseen by another investment adviser), and any entity controlling, controlled by, or under common control with the investment adviser that provides ongoing services to the registrant that were not pre-approved pursuant to paragraph (c)(7)(ii) of Rule 2-01 of Regulation S-X is compatible with maintaining the principal accountant’s independence.
The Registrant’s Audit Committee has considered whether the provision of the non-audit services that were rendered to Service Affiliates that were not pre-approved (not requiring pre-approval) is compatible with maintaining the independent public registered accounting firm’s independence. All services provided by the independent public registered accounting firm to the Registrant or to Service Affiliates that were required to be pre-approved were pre-approved as required.
(i) A registrant identified by the Commission pursuant to Section 104(i)(2)(A) of the Sarbanes-Oxley Act of 2002 (15 U.S.C. 7214(i)(2)(A)), as having retained, for the preparation of the audit report on its financial statements included in the Form NCSR, a registered public accounting firm that has a branch or office that is located in a foreign jurisdiction and that the Public Company Accounting Oversight Board has determined it is unable to inspect or investigate completely because of a position taken by an authority in the foreign jurisdiction must electronically submit to the Commission on a supplemental basis documentation that establishes that the registrant is not owned or controlled by a governmental entity in the foreign jurisdiction. The registrant must submit this documentation on or before the due date for this form. A registrant that is owned or controlled by a foreign governmental entity is not required to submit such documentation.
Not applicable.
(j) A registrant that is a foreign issuer, as defined in 17 CFR 240.3b-4, identified by the Commission pursuant to Section 104(i)(2)(A) of the Sarbanes-Oxley Act of 2002 (15 U.S.C. 7214(i)(2)(A)), as having retained, for the preparation of the audit report on its financial statements included in the Form N-CSR, a registered public accounting firm that has a branch or office that is located in a foreign jurisdiction and that the Public Company Accounting Oversight Board has determined it is unable to inspect or investigate completely because of a position taken by an authority in the foreign jurisdiction, for each year in which the registrant is so identified, must provide the below disclosures. Also, any such identified foreign issuer that uses a variable-interest entity or any similar structure that results in additional foreign entities being consolidated in the financial statements of the registrant is required to provide the below disclosures for itself and its consolidated foreign operating entity or entities. A registrant must disclose:
| (1) | That, for the immediately preceding annual financial statement period, a registered public accounting firm that the PCAOB was unable to inspect or investigate completely, because of a position taken by an authority in the foreign jurisdiction, issued an audit report for the registrant; |
| (2) | The percentage of shares of the registrant owned by governmental entities in the foreign jurisdiction in which the registrant is incorporated or otherwise organized; |
| (3) | Whether governmental entities in the applicable foreign jurisdiction with respect to that registered public accounting firm have a controlling financial interest with respect to the registrant; |
| (4) | The name of each official of the Chinese Communist Party who is a member of the board of directors of the registrant or the operating entity with respect to the registrant; and |
| (5) | Whether the articles of incorporation of the registrant (or equivalent organizing document) contains any charter of the Chinese Communist Party, including the text of any such charter. |
Not applicable.
ITEM 5. AUDIT COMMITTEE OF LISTED REGISTRANTS.
(a) If the registrant is a listed issuer as defined in Rule 10A-3 under the Exchange Act (17CFR 240.10A-3), state whether or not the registrant has a separately-designated standing audit committee established in accordance with Section 3(a)(58)(A) of the Exchange Act (15 U.S.C. 78c(a)(58)(A)). If the registrant has such a committee, however designated, identify each committee member. If the entire board of directors is acting as the registrant’s audit committee as specified in Section 3(a)(58)(B) of the Exchange Act (15
U.S.C. 78c(a)(58)(B)), so state.
The registrant has a separately designated Audit Committee established in accordance with Section 3(a)(58)(A) of the Exchange Act. The members of the Audit Committee are Gary L. French, Kathleen M. Gallagher, Raymond Kanner and Lawrence R. Maffia.
(b) If applicable, provide the disclosure required by Rule 10A-3(d) under the Exchange Act (17CFR 240.10A-3(d)) regarding an exemption from the listing standards for all audit committees.
Not applicable.
ITEM 6. SCHEDULE OF INVESTMENTS.
File Schedule I – Investments in securities of unaffiliated issuers as of the close of the reporting period as set forth in Section 210.12-12 of Regulation S-X, unless the schedule is included as part of the report to shareholders filed under Item 1 of this Form.
Included in Item 1.
ITEM 7. DISCLOSURE OF PROXY VOTING POLICIES AND PROCEDURES FOR CLOSED-END MANAGEMENT INVESTMENT COMPANIES.
A closed-end management investment company that is filing an annual report on this Form N-CSR must, unless it invests exclusively in non-voting securities, describe the policies and procedures that it uses to determine how to vote proxies relating to portfolio securities, including the procedures that the company uses when a vote presents a conflict between the interests of its shareholders, on the one hand, and those of the company’s investment adviser; principal underwriter; or any affiliated person (as defined in Section 2(a)(3) of the Investment Company Act of 1940 (15 U.S.C. 80a-2(a)(3)) and the rules thereunder) of the company, its investment adviser, or its principal underwriter, on the other. Include any policies and procedures of the company’s investment adviser, or any other third party, that the company uses, or that are used on the company’s behalf, to determine how to vote proxies relating to portfolio securities.
Not applicable.
ITEM 8. PORTFOLIO MANAGERS OF CLOSED-END MANAGEMENT INVESTMENT COMPANIES.
Not applicable.
ITEM 9. PURCHASE OF EQUITY SECURITIES BY CLOSED-END MANAGEMENT INVESTMENT COMPANY AND AFFILIATED PURCHASERS.
(a) If the registrant is a closed-end management investment company, provide the information specified in paragraph (b) of this Item with respect to any purchase made by or on behalf of the registrant or any “affiliated purchaser,” as defined in Rule 10b-18(a)(3) under the Exchange Act (17 CFR 240.10b-18(a)(3)), of shares or other units of any class of the registrant’s equity securities that is registered by the registrant pursuant to Section 12 of the Exchange Act (15 U.S.C. 781).
Not applicable.
ITEM 10. SUBMISSION OF MATTERS TO A VOTE OF SECURITY HOLDERS.
Describe any material changes to the procedures by which shareholders may recommend nominees to the registrant’s board of directors, where those changes were implemented after the registrant last provided disclosure in response to the requirements of Item 7(d)(2)(ii)(G) of Schedule 14A (17 CFR 240.14a-101), or this Item.
No material changes to report.
ITEM 11. CONTROLS AND PROCEDURES.
(a) Disclose the conclusions of the registrant’s principal executive and principal financial officers, or persons performing similar functions, regarding the effectiveness of the registrant’s disclosure controls and procedures (as defined in Rule 30a-3(c) under the Act (17 CFR 270.30a-3(c))) as of a date within 90 days of the filing date of the report that includes the disclosure required by this paragraph, based on the evaluation of these controls and procedures required by Rule 30a-3(b) under the Act (17 CFR 270.30a-3(b)) and Rules 13a-15(b) or 15d-15(b) under the Exchange Act (17 CFR 240.13a-15(b) or 240.15d-15(b)).
The Registrant’s principal executive and principal financial officers have concluded, based on their evaluation of the Registrant’s disclosure controls and procedures as of a date within 90 days of the filing date of this report, that the Registrant’s disclosure controls and procedures are reasonably designed to ensure that information required to be disclosed by the Registrant on Form N-CSR is recorded, processed, summarized and reported within the required time
periods and that information required to be disclosed by the Registrant in the reports that it files or submits on Form N-CSR is accumulated and communicated to the Registrant’s management, including its principal executive and principal financial officers, as appropriate to allow timely decisions regarding required disclosure.
(b) Disclose any change in the registrant’s internal control over financial reporting (as defined in Rule 30a-3(d) under the Act (17 CFR 270.30a-3(d)) that occurred during the period covered by this report that has materially affected, or is reasonably likely to materially affect, the registrant’s internal control over financial reporting.
There were no changes in the Registrant’s internal control over financial reporting that occurred during the reporting period covered by this report that have materially affected, or are reasonably likely to materially affect, the Registrant’s internal control over financial reporting.
ITEM 12. DISCLOSURE OF SECURITIES LENDING ACTIVITIES FOR CLOSED-END MANAGEMENT INVESTMENT COMPANIES.
Not applicable.
ITEM 13. EXHIBITS.
| (a) | File the exhibits listed below as part of this Form. Letter or number the exhibits in the sequence indicated. |
(1) Any code of ethics, or amendment thereto, that is the subject of the disclosure required by Item 2, to the extent that the registrant intends to satisfy the Item 2 requirements through filing of an exhibit.
(2) A separate certification for each principal executive officer and principal financial officer of the registrant as required by Rule 30a-2(a) under the Act (17 CFR 270.30a-2), exactly as set forth below:
(1) Any written solicitation to purchase securities under Rule 23c-1 under the Act (17 CFR 270.23c-1) sent or given during the period covered by the report by or on behalf of the registrant to 10 or more persons.
Not applicable.
(2) Change in the registrant’s independent public accountant. Provide the information called for by Item 4 of Form 8-K under the Exchange Act (17 CFR 249.308). Unless otherwise specified by Item 4, or related to and necessary for a complete understanding of information not previously disclosed, the information should relate to events occurring during the reporting period.
Not applicable.
| (b) | A separate or combined certification for each principal executive officer and principal officer of the registrant as required by Rule 30a-2(b) under the Act of 1940. |
SIGNATURES
Pursuant to the requirements of the Securities Exchange Act of 1934 and the Investment Company Act of 1940, the registrant has duly caused this report to be signed on its behalf by the undersigned, thereunto duly authorized.
J.P. Morgan Exchange-Traded Fund Trust
| By: | /s/ Brian S. Shlissel | |
| Brian S. Shlissel | ||
| President and Principal Executive Officer | ||
| December 29, 2022 |
Pursuant to the requirements of the Securities Exchange Act of 1934 and the Investment Company Act of 1940, this report has been signed below by the following persons on behalf of the registrant and in the capacities and on the dates indicated.
| By: | /s/ Brian S. Shlissel | |
| Brian S. Shlissel | ||
| President and Principal Executive Officer | ||
| December 29, 2022 | ||
| By: | /s/ Timothy J. Clemens | |
| Timothy J. Clemens | ||
| Treasurer and Principal Financial Officer | ||
| December 29, 2022 | ||