UNITED STATES
SECURITIES AND EXCHANGE COMMISSION
Washington, D.C. 20549
FORM N-CSR
CERTIFIED SHAREHOLDER REPORT OF REGISTERED
MANAGEMENT INVESTMENT COMPANIES
Investment Company Act file number: 811-22903
J.P. Morgan Exchange-Traded Fund Trust
(Exact name of registrant as specified in charter)
277 Park Avenue
New York, NY 10172
(Address of principal executive offices) (Zip code)
Gregory S. Samuels
J.P. Morgan Investment Management Inc.
277 Park Avenue
New York, NY 10172
(Name and Address of Agent for Service)
With copies to:
| Elizabeth A. Davin, Esq. | Jon S. Rand, Esq. | |
| JPMorgan Chase & Co. | Dechert LLP | |
| 1111 Polaris Parkway | 1095 Avenue of the Americas | |
| Columbus, OH 43240 | New York, NY 10036 |
Registrant’s telephone number, including area code: 1-844-457-6383
Date of fiscal year end: June 30
Date of reporting period: July 1, 2022 through June 30, 2023
Form N-CSR is to be used by management investment companies to file reports with the Commission not later than 10 days after the transmission to stockholders of any report that is required to be transmitted to stockholders under Rule 30e-1 under the Investment Company Act of 1940 (17 CFR 270.30e-1). The Commission may use the information provided on Form N-CSR in its regulatory, disclosure review, inspection, and policymaking roles.
A registrant is required to disclose the information specified by Form N-CSR, and the Commission will make this information public. A registrant is not required to respond to the collection of information contained in Form N-CSR unless the Form displays a currently valid Office of Management and Budget (“OMB”) control number. Please direct comments concerning the accuracy of the information collection burden estimate and any suggestions for reducing the burden to Secretary, Securities and Exchange Commission, 450 Fifth Street, NW, Washington, DC 20549-0609. The OMB has reviewed this collection of information under the clearance requirements of 44 U.S.C. Section 3507.
ITEM 1. REPORTS TO STOCKHOLDERS.
a.) The following is a copy of the report transmitted to shareholders pursuant to Rule 30e-1 under the Investment Company Act of 1940 (17 CFR 270.30e-1).
b.) A copy of the notice transmitted to shareholders in reliance on Rule 30e-3 under the 1940 Act that contains disclosures specified by paragraph (c)(3) of that rule is included in the Annual Reports. Not Applicable. Notices do not incorporate disclosures from the shareholder reports.
Fund | Ticker | Listing Exchange |
JPMorgan ActiveBuilders U.S. Large Cap Equity ETF | JUSA | NYSE Arca |
JPMorgan Active Growth ETF | JGRO | NYSE Arca |
JPMorgan Active Small Cap Value ETF | JPSV | NYSE Arca |
JPMorgan Active Value ETF | JAVA | NYSE Arca |
JPMorgan Equity Premium Income ETF | JEPI | NYSE Arca |
JPMorgan Nasdaq Equity Premium Income ETF | JEPQ | The NASDAQ Stock Market LLC |

1 | |
2 | |
3 | |
3 | |
6 | |
9 | |
12 | |
15 | |
18 | |
21 | |
43 | |
50 | |
52 | |
65 | |
66 | |
70 | |
72 | |
73 | |
74 | |
75 |
August 11, 2023 (Unaudited)
 | “Equity markets delivered strong returns during the first half of 2023, with investors who remained fully invested likely benefitting. Going forward, we believe investors may be best served by maintaining a long-term view and holding a well-diversified portfolio.” — Brian S. Shlissel |

President, J.P. Morgan Exchange-Traded Funds
J.P. Morgan Asset Management
1-844-4JPM-ETF or jpmorgan.com/etfs for more information
June 30, 2023 | J.P. Morgan Exchange-Traded Funds | 1 |
TWELVE MONTHS ENDED June 30, 2023 (Unaudited)
2 | J.P. Morgan Exchange-Traded Funds | June 30, 2023 |
TWELVE MONTHS ENDED June 30, 2023 (Unaudited)
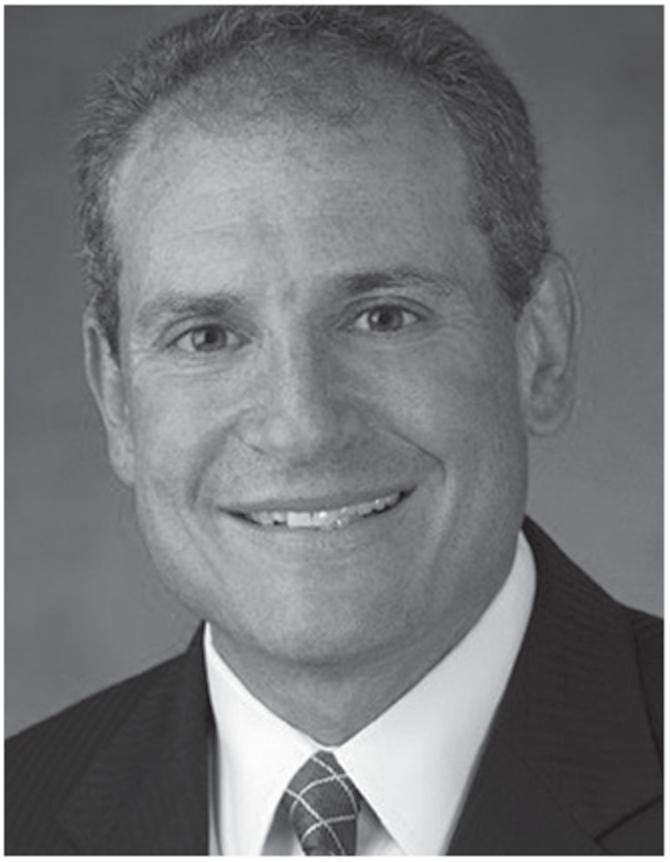
REPORTING PERIOD RETURN: | |
Net Asset Value * | 19.37% |
Market Price ** | 19.74% |
S&P 500 Index | 19.59% |
Net Assets as of 6/30/2023 | $27,827,186 |
Fund Ticker | JUSA |
June 30, 2023 | J.P. Morgan Exchange-Traded Funds | 3 |
TWELVE MONTHS ENDED June 30, 2023 (Unaudited) (continued)
TOP TEN HOLDINGS OF THE PORTFOLIO AS OF June 30, 2023 | PERCENT OF TOTAL INVESTMENTS | |
1. | Microsoft Corp. | 7.1 % |
2. | Apple, Inc. | 6.1 |
3. | Amazon.com, Inc. | 2.9 |
4. | NVIDIA Corp. | 2.8 |
5. | Meta Platforms, Inc., Class A | 2.4 |
6. | UnitedHealth Group, Inc. | 1.7 |
7. | Alphabet, Inc., Class C | 1.7 |
8. | AbbVie, Inc. | 1.6 |
9. | Alphabet, Inc., Class A | 1.6 |
10. | Lowe's Cos., Inc. | 1.6 |
PORTFOLIO COMPOSITION BY SECTOR AS OF June 30, 2023 | PERCENT OF TOTAL INVESTMENTS |
Information Technology | 25.8% |
Health Care | 14.3 |
Financials | 13.7 |
Consumer Discretionary | 11.3 |
Industrials | 9.6 |
Communication Services | 7.9 |
Energy | 4.9 |
Consumer Staples | 4.5 |
Materials | 3.1 |
Utilities | 3.0 |
Real Estate | 1.6 |
Short-Term Investments | 0.3 |
4 | J.P. Morgan Exchange-Traded Funds | June 30, 2023 |
INCEPTION DATE | 1 YEAR | SINCE INCEPTION | |
JPMorgan ActiveBuilders U.S. Large Cap Equity ETF | |||
Net Asset Value | July 7, 2021 | 19.37 % | 2.71 % |
Market Price | 19.74 | 2.76 |
June 30, 2023 | J.P. Morgan Exchange-Traded Funds | 5 |
FOR THE PERIOD August 8, 2022 (FUND INCEPTION) THROUGH June 30, 2023 (Unaudited)
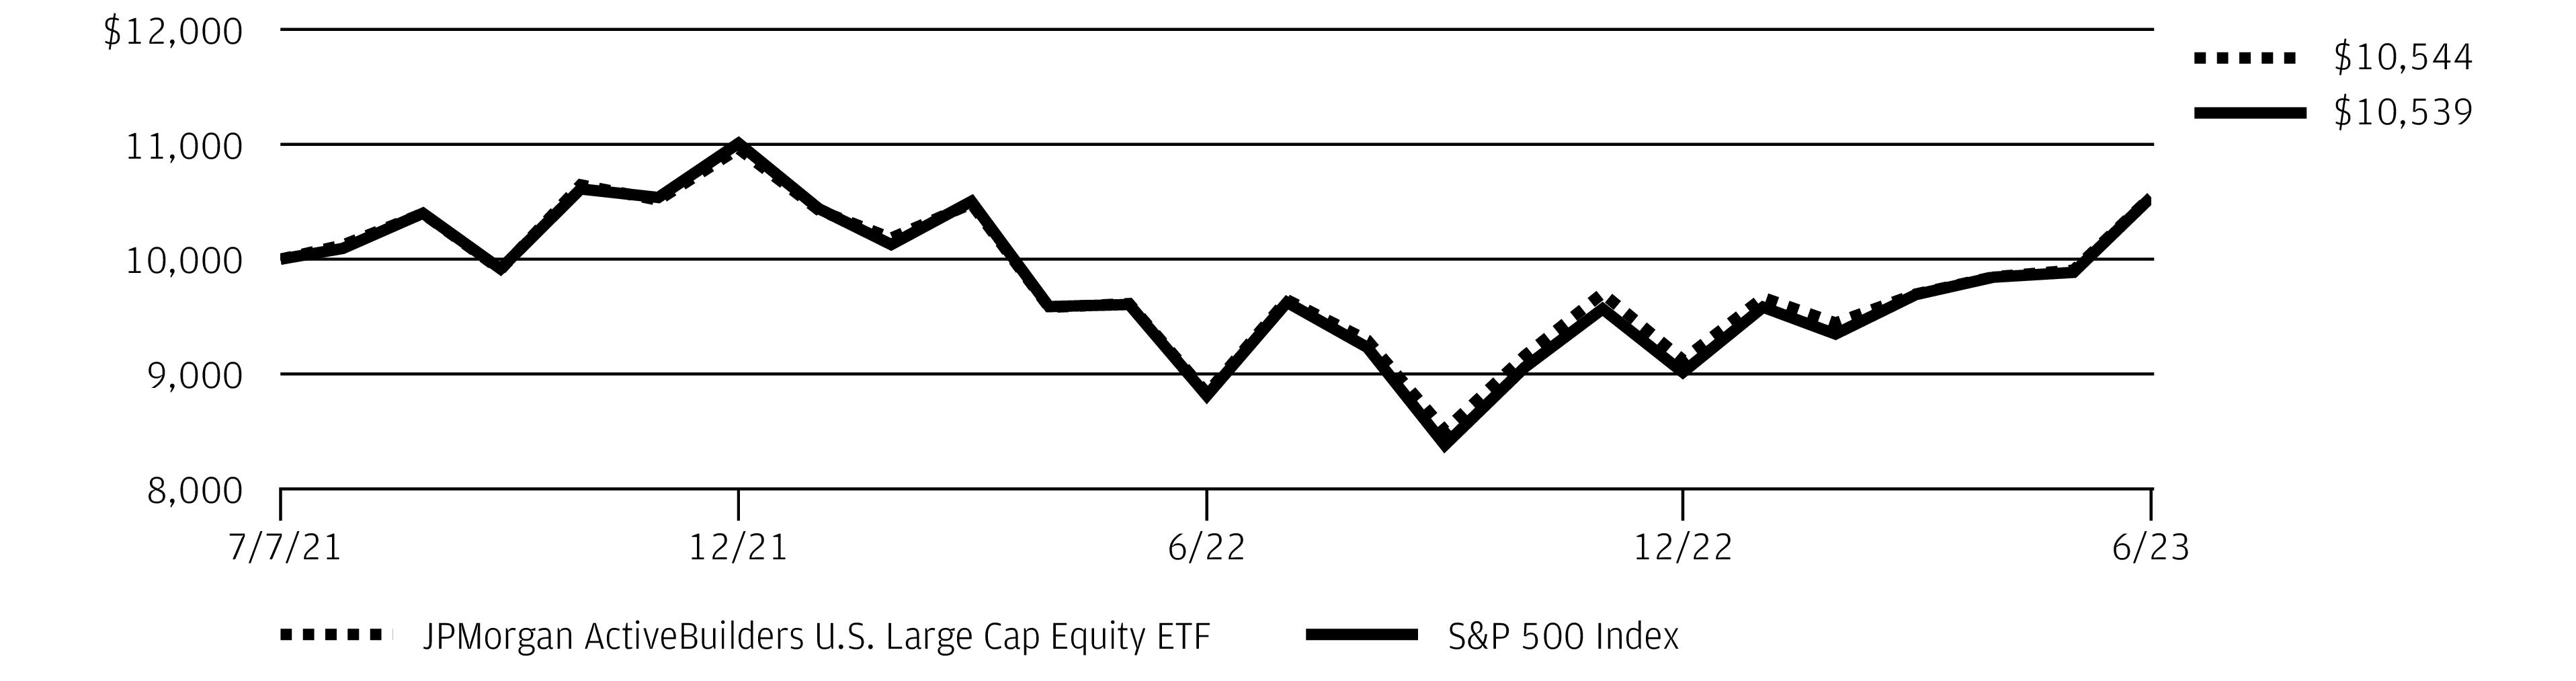
REPORTING PERIOD RETURN: | |
Net Asset Value * | 11.73% |
Market Price ** | 11.77% |
Russell 1000 Growth Index | 12.07% |
Net Assets as of 6/30/2023 | $358,030,378 |
Fund Ticker | JGRO |
6 | J.P. Morgan Exchange-Traded Funds | June 30, 2023 |
TOP TEN HOLDINGS OF THE PORTFOLIO AS OF June 30, 2023 | PERCENT OF TOTAL INVESTMENTS | |
1. | Microsoft Corp. | 10.8 % |
2. | Apple, Inc. | 9.9 |
3. | NVIDIA Corp. | 5.4 |
4. | Amazon.com, Inc. | 5.0 |
5. | Alphabet, Inc., Class C | 4.7 |
6. | Meta Platforms, Inc., Class A | 4.0 |
7. | Tesla, Inc. | 2.8 |
8. | Mastercard, Inc., Class A | 2.4 |
9. | Netflix, Inc. | 1.9 |
10. | Regeneron Pharmaceuticals, Inc. | 1.6 |
PORTFOLIO COMPOSITION BY SECTOR AS OF June 30, 2023 | PERCENT OF TOTAL INVESTMENTS |
Information Technology | 42.5% |
Consumer Discretionary | 14.9 |
Health Care | 11.8 |
Communication Services | 11.7 |
Industrials | 7.9 |
Financials | 5.5 |
Energy | 1.6 |
Consumer Staples | 1.4 |
Materials | 0.8 |
Short-Term Investments | 1.9 |
June 30, 2023 | J.P. Morgan Exchange-Traded Funds | 7 |
FOR THE PERIOD August 8, 2022 (FUND INCEPTION) THROUGH June 30, 2023 (Unaudited) (continued)
INCEPTION DATE | CUMULATIVE SINCE INCEPTION | |
JPMorgan Active Growth ETF | ||
Net Asset Value | August 8, 2022 | 11.73 % |
Market Price | 11.77 |
8 | J.P. Morgan Exchange-Traded Funds | June 30, 2023 |
FOR THE PERIOD March 7, 2023 (FUND INCEPTION) THROUGH June 30, 2023 (Unaudited)
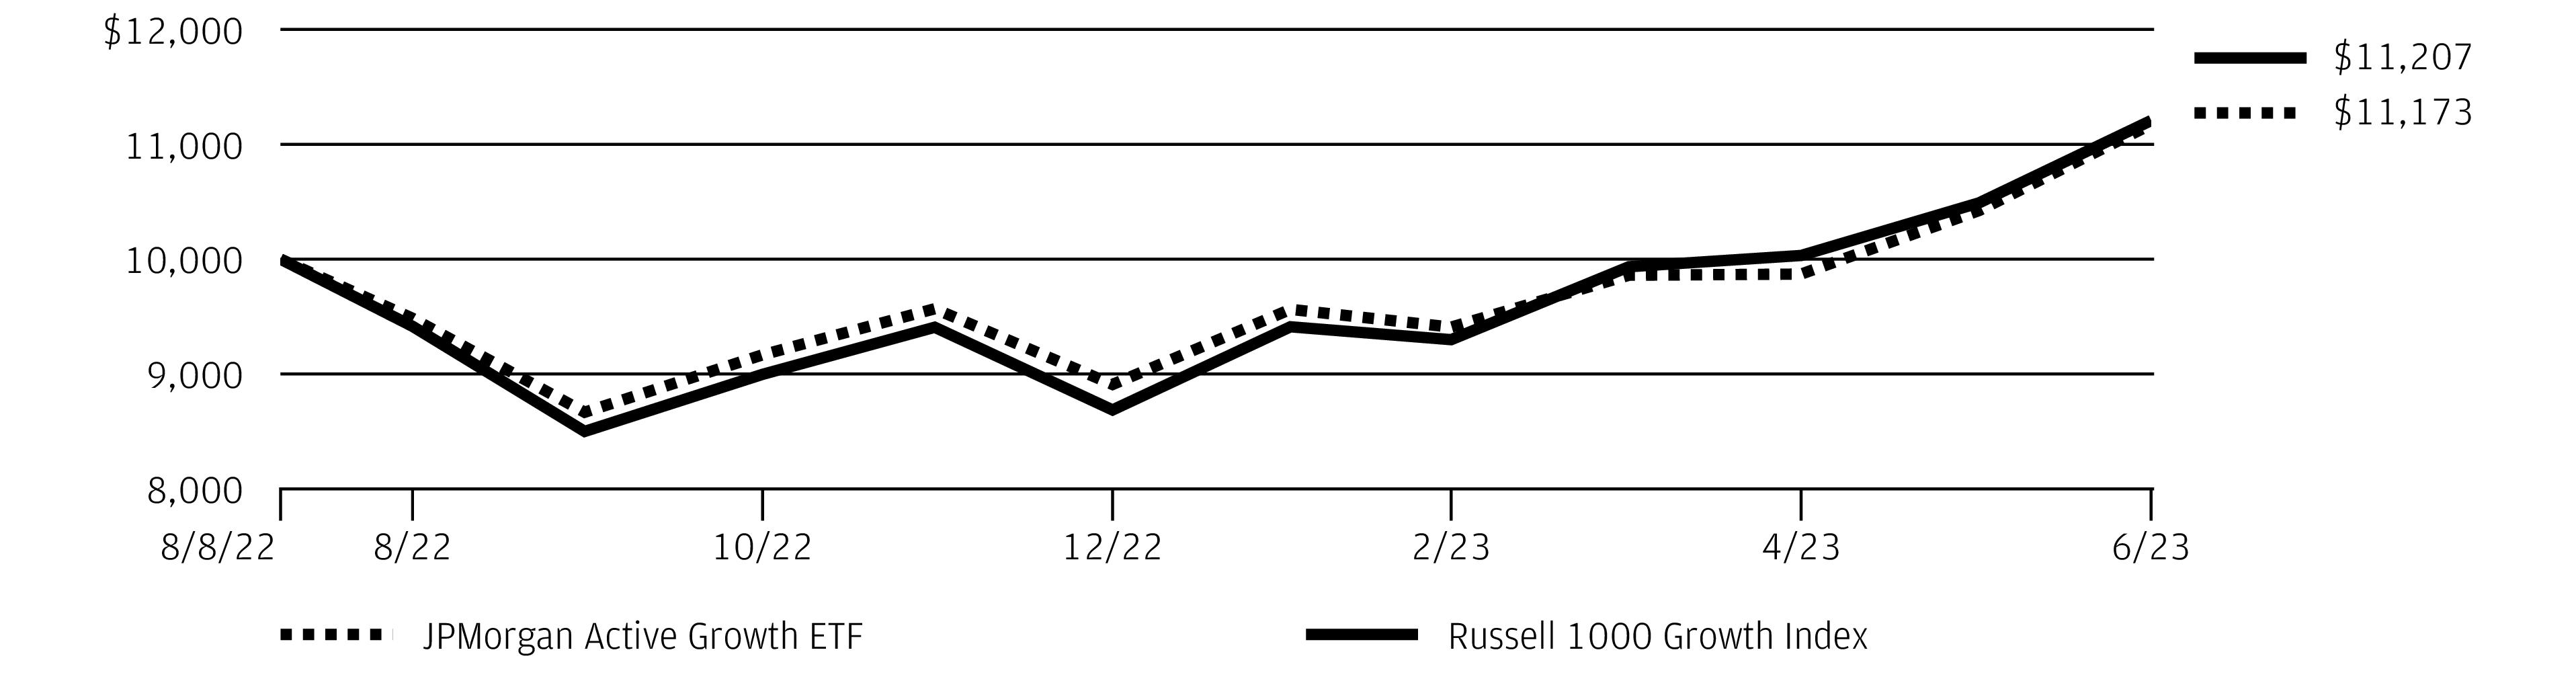
REPORTING PERIOD RETURN: | |
Net Asset Value * | (1.48)% |
Market Price ** | (1.40)% |
Russell 2000 Value Index | (2.63)% |
Net Assets as of 6/30/2023 | $10,836,656 |
Fund Ticker | JPSV |
June 30, 2023 | J.P. Morgan Exchange-Traded Funds | 9 |
FOR THE PERIOD March 7, 2023 (FUND INCEPTION) THROUGH June 30, 2023 (Unaudited) (continued)
TOP TEN HOLDINGS OF THE PORTFOLIO AS OF June 30, 2023 | PERCENT OF TOTAL INVESTMENTS | |
1. | Selective Insurance Group, Inc. | 2.3 % |
2. | Patterson Cos., Inc. | 1.8 |
3. | Encompass Health Corp. | 1.7 |
4. | Comfort Systems USA, Inc. | 1.5 |
5. | Alamo Group, Inc. | 1.5 |
6. | Watts Water Technologies, Inc., Class A | 1.4 |
7. | Agree Realty Corp. | 1.4 |
8. | Safety Insurance Group, Inc. | 1.3 |
9. | SouthState Corp. | 1.3 |
10. | Radian Group, Inc. | 1.3 |
PORTFOLIO COMPOSITION BY SECTOR AS OF June 30, 2023 | PERCENT OF TOTAL INVESTMENTS |
Financials | 22.9% |
Industrials | 19.5 |
Real Estate | 9.5 |
Consumer Discretionary | 9.5 |
Information Technology | 6.9 |
Materials | 6.2 |
Health Care | 6.2 |
Utilities | 5.0 |
Consumer Staples | 4.5 |
Energy | 3.9 |
Communication Services | 3.3 |
Short-Term Investments | 2.6 |
10 | J.P. Morgan Exchange-Traded Funds | June 30, 2023 |
INCEPTION DATE | CUMULATIVE SINCE INCEPTION | |
JPMorgan Active Small Cap Value ETF | ||
Net Asset Value | March 7, 2023 | (1.48 )% |
Market Price | (1.40 ) |
June 30, 2023 | J.P. Morgan Exchange-Traded Funds | 11 |
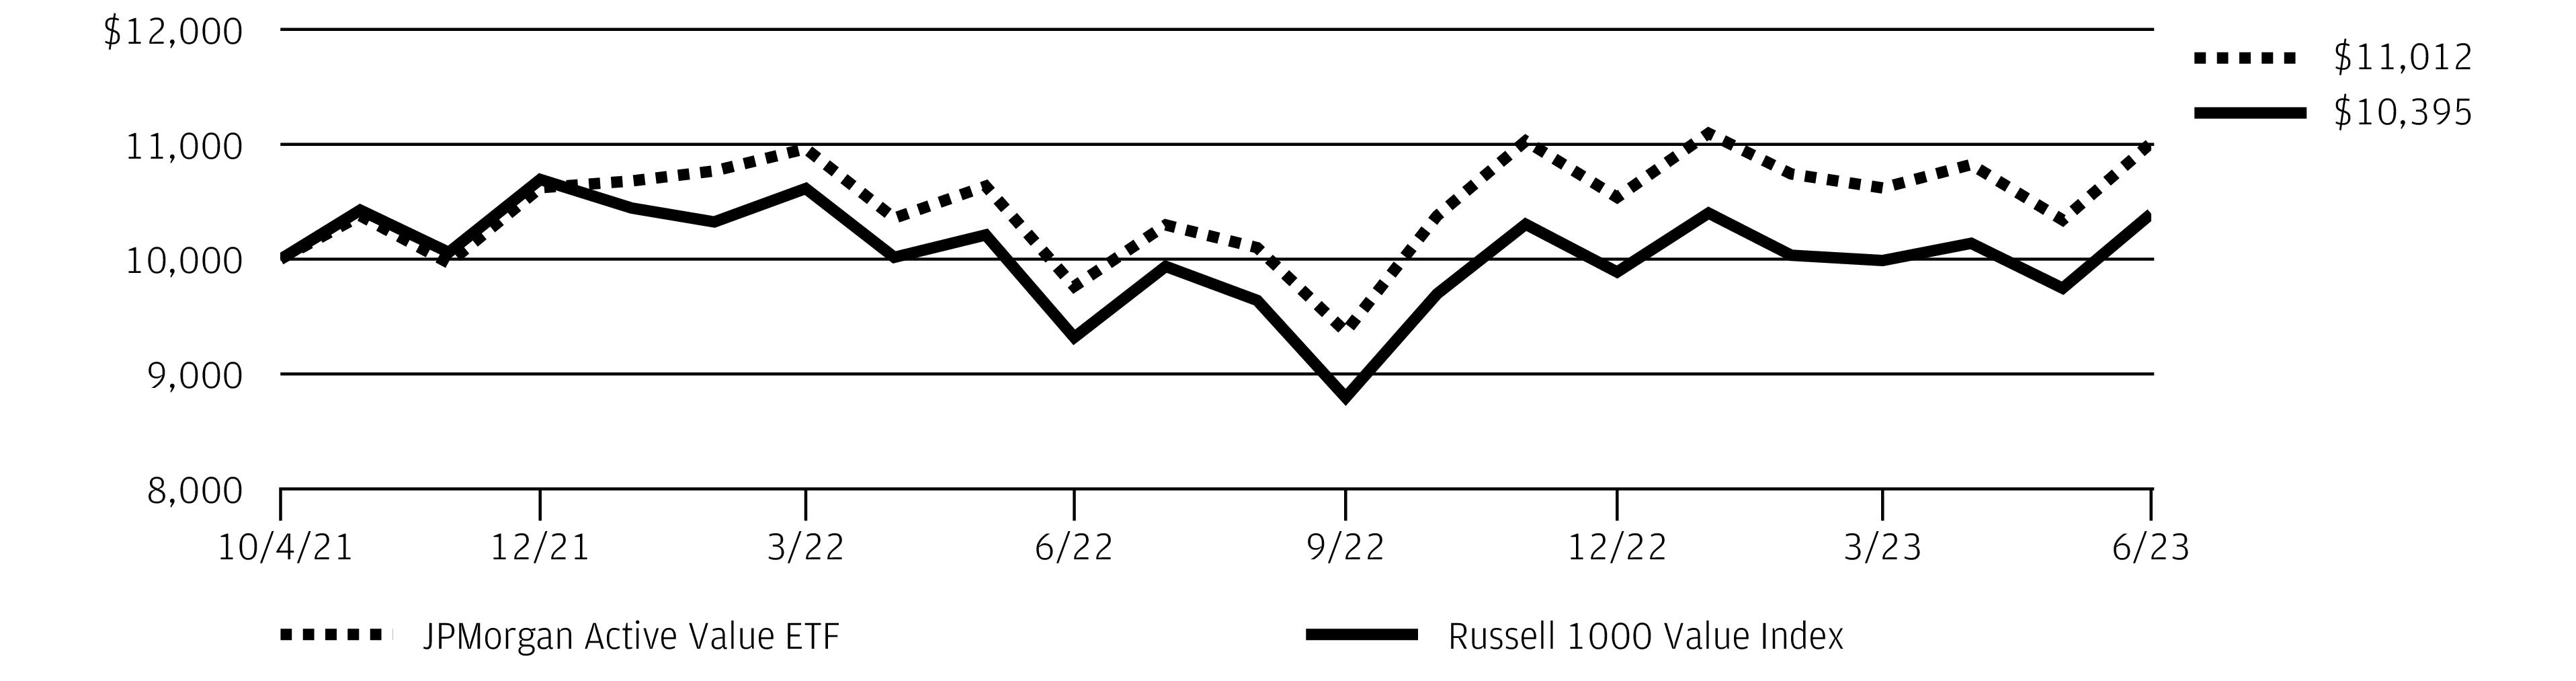
TWELVE MONTHS ENDED June 30, 2023 (Unaudited)
REPORTING PERIOD RETURN: | |
Net Asset Value * | 12.79% |
Market Price ** | 13.04% |
Russell 1000 Value Index | 11.54% |
Net Assets as of 6/30/2023 | $418,442,628 |
Fund Ticker | JAVA |
12 | J.P. Morgan Exchange-Traded Funds | June 30, 2023 |
TOP TEN HOLDINGS OF THE PORTFOLIO AS OF June 30, 2023 | PERCENT OF TOTAL INVESTMENTS | |
1. | Bank of America Corp. | 2.7 % |
2. | Wells Fargo & Co. | 2.7 |
3. | Bristol-Myers Squibb Co. | 2.6 |
4. | Berkshire Hathaway, Inc., Class B | 2.3 |
5. | Exxon Mobil Corp. | 2.2 |
6. | Chevron Corp. | 2.0 |
7. | Raytheon Technologies Corp. | 2.0 |
8. | NextEra Energy, Inc. | 1.8 |
9. | Philip Morris International, Inc. | 1.7 |
10. | Comcast Corp., Class A | 1.7 |
PORTFOLIO COMPOSITION BY SECTOR AS OF June 30, 2023 | PERCENT OF TOTAL INVESTMENTS |
Financials | 22.3% |
Health Care | 16.9 |
Industrials | 12.0 |
Energy | 8.0 |
Information Technology | 6.5 |
Consumer Staples | 6.5 |
Consumer Discretionary | 6.2 |
Utilities | 5.6 |
Communication Services | 5.2 |
Materials | 4.9 |
Real Estate | 2.9 |
Short-Term Investments | 3.0 |
June 30, 2023 | J.P. Morgan Exchange-Traded Funds | 13 |
TWELVE MONTHS ENDED June 30, 2023 (Unaudited) (continued)
INCEPTION DATE | 1 YEAR | SINCE INCEPTION | |
JPMorgan Active Value ETF | |||
Net Asset Value | October 4, 2021 | 12.79 % | 5.70 % |
Market Price | 13.04 | 5.72 |
14 | J.P. Morgan Exchange-Traded Funds | June 30, 2023 |
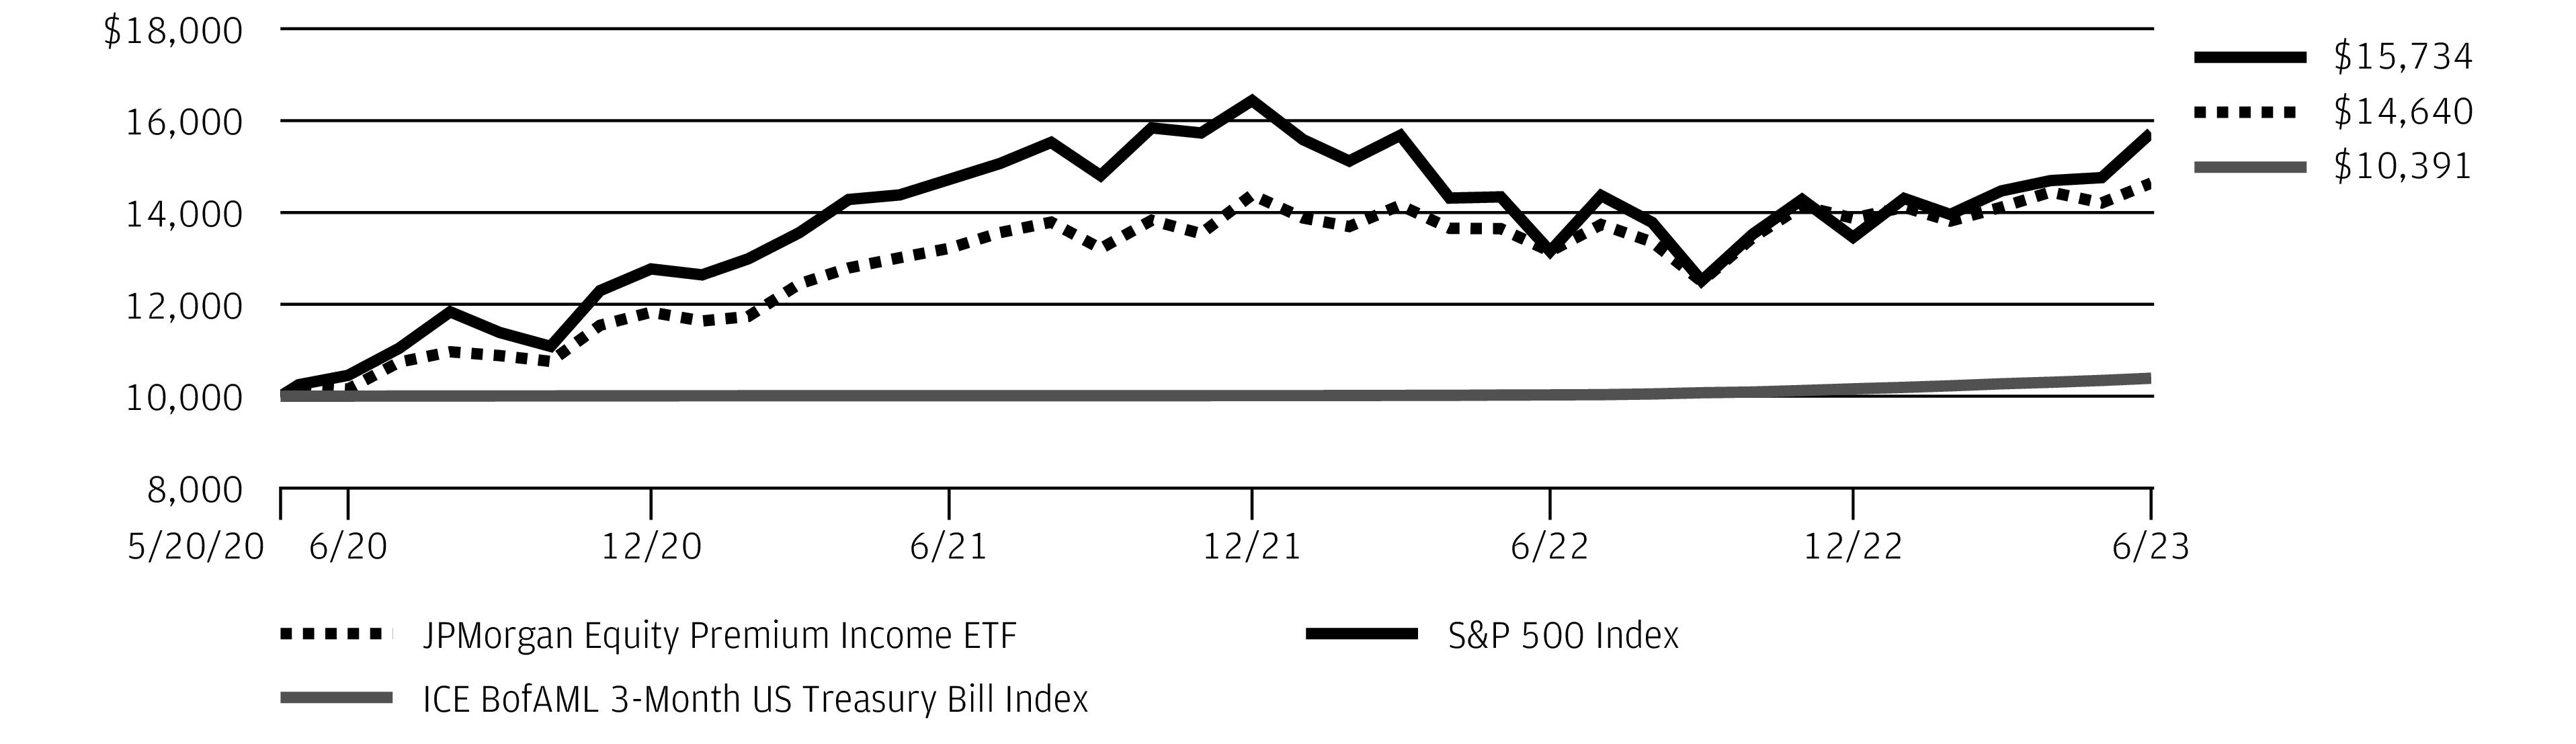
TWELVE MONTHS ENDED June 30, 2023 (Unaudited)
REPORTING PERIOD RETURN: | |
Net Asset Value * | 11.30% |
Market Price ** | 11.37% |
S&P 500 Index | 19.59% |
ICE BofAML 3-Month US Treasury Bill Index | 3.62% |
Net Assets as of 6/30/2023 | $28,046,696,328 |
Fund Ticker | JEPI |
June 30, 2023 | J.P. Morgan Exchange-Traded Funds | 15 |
TWELVE MONTHS ENDED June 30, 2023 (Unaudited) (continued)
TOP TEN HOLDINGS OF THE PORTFOLIO AS OF June 30, 2023 | PERCENT OF TOTAL INVESTMENTS | |
1. | Adobe, Inc. | 1.7 % |
2. | Amazon.com, Inc. | 1.7 |
3. | Microsoft Corp. | 1.6 |
4. | Mastercard, Inc., Class A | 1.5 |
5. | Comcast Corp., Class A | 1.5 |
6. | Hershey Co. (The) | 1.4 |
7. | Accenture plc, Class A | 1.4 |
8. | Visa, Inc., Class A | 1.4 |
9. | Progressive Corp. (The) | 1.4 |
10. | PepsiCo, Inc. | 1.4 |
PORTFOLIO COMPOSITION BY SECTOR AS OF June 30, 2023 | PERCENT OF TOTAL INVESTMENTS |
Information Technology | 13.4% |
Financials | 11.8 |
Industrials | 11.5 |
Health Care | 11.4 |
Consumer Staples | 11.0 |
Consumer Discretionary | 7.8 |
Utilities | 4.7 |
Communication Services | 4.3 |
Materials | 3.4 |
Real Estate | 3.1 |
Energy | 2.4 |
Other **** | 13.1 |
Short-Term Investments | 2.1 |
16 | J.P. Morgan Exchange-Traded Funds | June 30, 2023 |
INCEPTION DATE | 1 YEAR | SINCE INCEPTION | |
JPMorgan Equity Premium Income ETF | |||
Net Asset Value | May 20, 2020 | 11.30 % | 13.03 % |
Market Price | 11.37 | 13.05 |
June 30, 2023 | J.P. Morgan Exchange-Traded Funds | 17 |
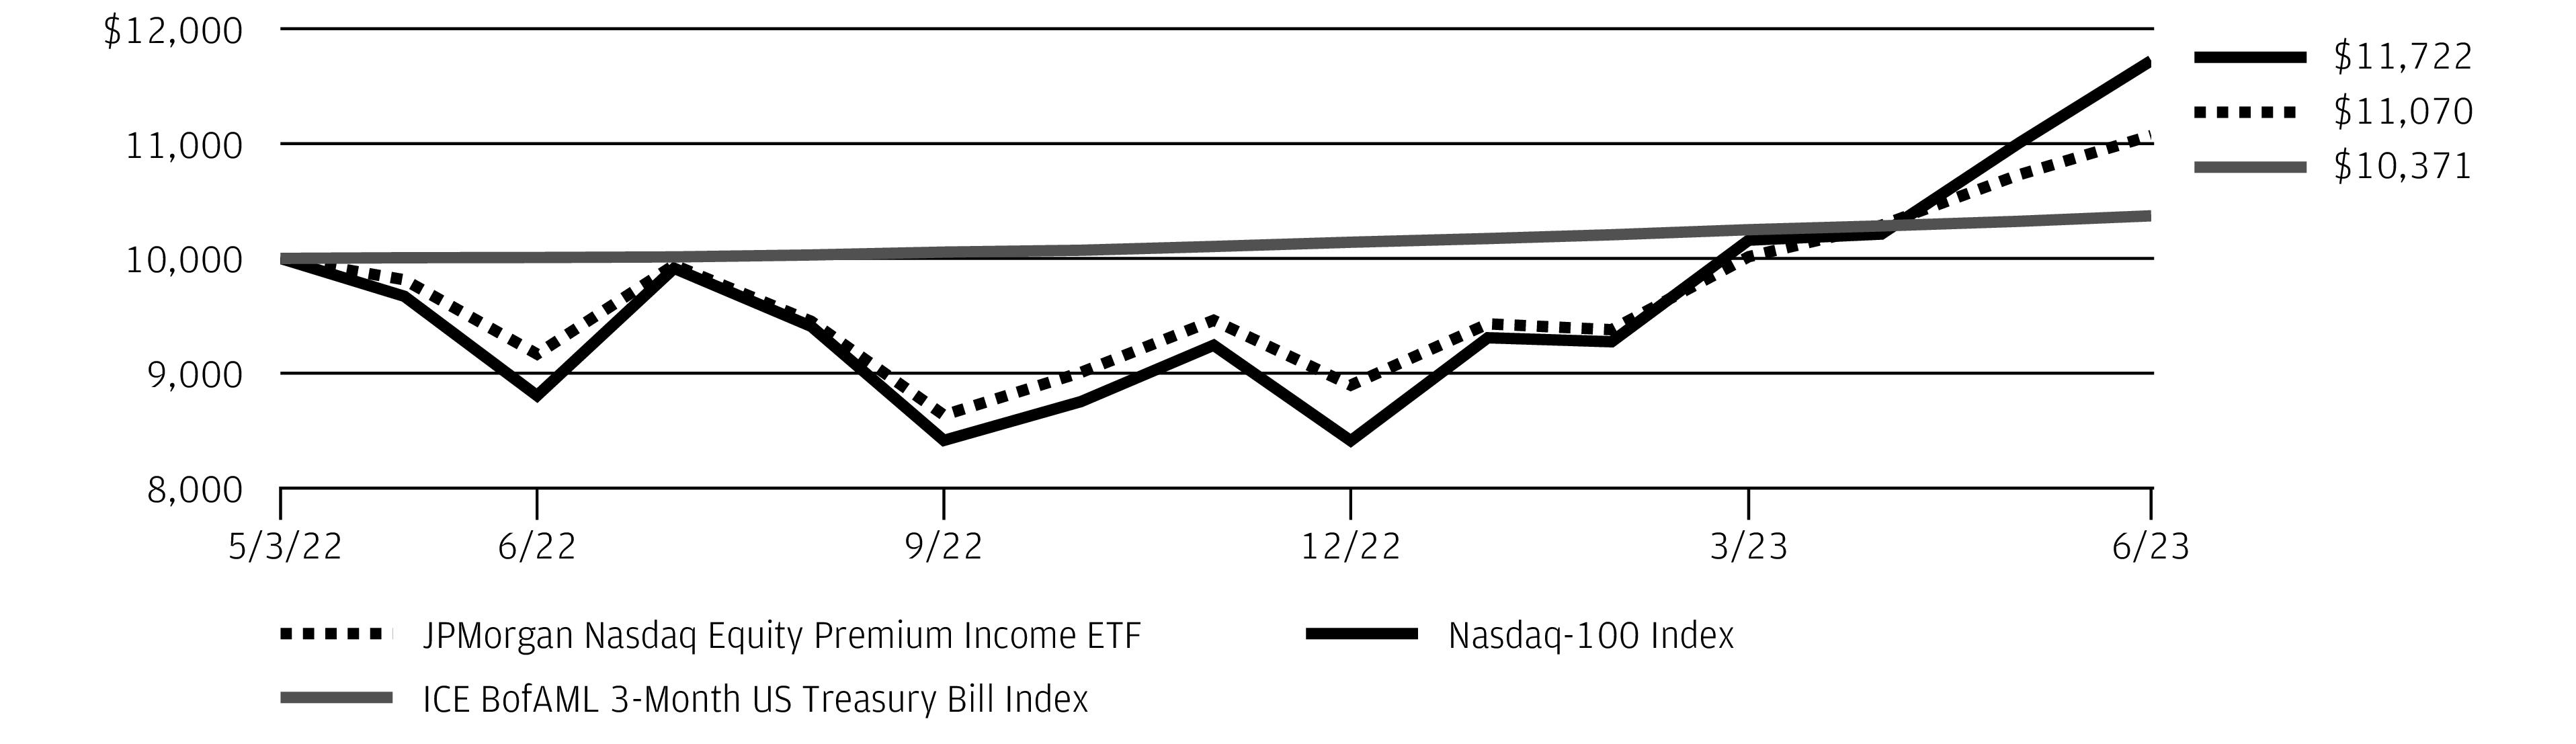
TWELVE MONTHS ENDED June 30, 2023 (Unaudited)
REPORTING PERIOD RETURN: | |
Net Asset Value * | 20.76% |
Market Price ** | 20.11% |
Nasdaq-100 Index® | 33.13% |
ICE BofAML 3-Month US Treasury Bill Index | 3.62% |
Net Assets as of 6/30/2023 | $3,956,996,062 |
Fund Ticker | JEPQ |
18 | J.P. Morgan Exchange-Traded Funds | June 30, 2023 |
TOP TEN HOLDINGS OF THE PORTFOLIO AS OF June 30, 2023 | PERCENT OF TOTAL INVESTMENTS | |
1. | Microsoft Corp. | 10.9 % |
2. | Apple, Inc. | 9.7 |
3. | Alphabet, Inc., Class C | 6.2 |
4. | Amazon.com, Inc. | 5.8 |
5. | NVIDIA Corp. | 5.8 |
6. | Meta Platforms, Inc., Class A | 3.6 |
7. | Barclays Bank plc, ELN, 69.30%, 8/8/2023, (linked to Nasdaq-100 Index) | 3.4 |
8. | Morgan Stanley Finance LLC, ELN, 62.59%, 7/11/2023, (linked to Nasdaq-100 Index) | 3.3 |
9. | BNP Paribas, ELN, 63.79%, 8/1/2023, (linked to Nasdaq-100 Index) | 3.3 |
10. | Tesla, Inc. | 3.3 |
PORTFOLIO COMPOSITION BY SECTOR AS OF June 30, 2023 | PERCENT OF TOTAL INVESTMENTS |
Information Technology | 41.8% |
Communication Services | 13.3 |
Consumer Discretionary | 12.8 |
Health Care | 4.8 |
Consumer Staples | 4.3 |
Industrials | 3.1 |
Utilities | 1.1 |
Financials | 0.8 |
Real Estate | 0.3 |
Energy | 0.2 |
Other **** | 16.2 |
Short-Term Investments | 1.3 |
June 30, 2023 | J.P. Morgan Exchange-Traded Funds | 19 |
TWELVE MONTHS ENDED June 30, 2023 (Unaudited) (continued)
INCEPTION DATE | 1 YEAR | SINCE INCEPTION | |
JPMorgan Nasdaq Equity Premium Income ETF | |||
Net Asset Value | May 3, 2022 | 20.76 % | 9.16 % |
Market Price | 20.11 | 9.23 |
the ICE BofAML 3-Month US Treasury Bill Index is rebalanced and the issue selected is the outstanding Treasury Bill that matures closest to, but not beyond, 3 months from the rebalancing date. Investors cannot invest directly in an index.
20 | J.P. Morgan Exchange-Traded Funds | June 30, 2023 |
AS OF June 30, 2023
INVESTMENTS | SHARES | VALUE($) |
Common Stocks — 99.6% | ||
Aerospace & Defense — 2.0% | ||
Boeing Co. (The) * | 20 | 4,223 |
General Dynamics Corp. | 361 | 77,669 |
Howmet Aerospace, Inc. | 171 | 8,475 |
Northrop Grumman Corp. | 428 | 195,082 |
Raytheon Technologies Corp. | 2,058 | 201,602 |
Textron, Inc. | 442 | 29,893 |
TransDigm Group, Inc. | 43 | 38,449 |
555,393 | ||
Air Freight & Logistics — 0.8% | ||
FedEx Corp. | 98 | 24,294 |
United Parcel Service, Inc., Class B | 1,098 | 196,817 |
221,111 | ||
Automobile Components — 0.1% | ||
Aptiv plc * | 180 | 18,376 |
Automobiles — 1.2% | ||
Tesla, Inc. * | 1,313 | 343,704 |
Banks — 3.6% | ||
Bank of America Corp. | 6,779 | 194,490 |
Citigroup, Inc. | 1,179 | 54,281 |
Citizens Financial Group, Inc. | 876 | 22,846 |
Fifth Third Bancorp | 700 | 18,347 |
KeyCorp | 462 | 4,269 |
M&T Bank Corp. | 303 | 37,499 |
PNC Financial Services Group, Inc. (The) | 523 | 65,872 |
Truist Financial Corp. | 2,733 | 82,947 |
US Bancorp | 3,681 | 121,620 |
Wells Fargo & Co. | 9,477 | 404,478 |
1,006,649 | ||
Beverages — 1.8% | ||
Coca-Cola Co. (The) | 4,102 | 247,023 |
Constellation Brands, Inc., Class A | 111 | 27,320 |
Monster Beverage Corp. * | 1,656 | 95,121 |
PepsiCo, Inc. | 728 | 134,840 |
504,304 | ||
Biotechnology — 4.5% | ||
AbbVie, Inc. | 3,384 | 455,926 |
Alnylam Pharmaceuticals, Inc. * | 65 | 12,346 |
Amgen, Inc. | 158 | 35,079 |
Biogen, Inc. * | 441 | 125,619 |
BioMarin Pharmaceutical, Inc. * | 128 | 11,095 |
Exact Sciences Corp. * | 599 | 56,246 |
Moderna, Inc. * | 80 | 9,720 |
INVESTMENTS | SHARES | VALUE($) |
Biotechnology — continued | ||
Neurocrine Biosciences, Inc. * | 48 | 4,527 |
Regeneron Pharmaceuticals, Inc. * | 387 | 278,075 |
Sarepta Therapeutics, Inc. * | 201 | 23,019 |
Seagen, Inc. * | 130 | 25,020 |
Vertex Pharmaceuticals, Inc. * | 629 | 221,351 |
1,258,023 | ||
Broadline Retail — 3.2% | ||
Amazon.com, Inc. * | 6,238 | 813,186 |
Etsy, Inc. * | 71 | 6,007 |
MercadoLibre, Inc. (Brazil) * | 66 | 78,184 |
897,377 | ||
Building Products — 0.9% | ||
Carrier Global Corp. | 705 | 35,045 |
Masco Corp. | 526 | 30,182 |
Trane Technologies plc | 891 | 170,413 |
235,640 | ||
Capital Markets — 4.1% | ||
Ameriprise Financial, Inc. | 285 | 94,666 |
BlackRock, Inc. | 177 | 122,332 |
Blackstone, Inc. | 395 | 36,723 |
Charles Schwab Corp. (The) | 1,251 | 70,907 |
CME Group, Inc. | 306 | 56,699 |
Goldman Sachs Group, Inc. (The) | 222 | 71,604 |
Intercontinental Exchange, Inc. | 318 | 35,959 |
Morgan Stanley | 3,945 | 336,903 |
MSCI, Inc. | 19 | 8,916 |
Raymond James Financial, Inc. | 287 | 29,782 |
S&P Global, Inc. | 591 | 236,926 |
State Street Corp. | 172 | 12,587 |
T. Rowe Price Group, Inc. | 328 | 36,742 |
1,150,746 | ||
Chemicals — 2.2% | ||
Air Products and Chemicals, Inc. | 504 | 150,963 |
Axalta Coating Systems Ltd. * | 3,537 | 116,049 |
Chemours Co. (The) | 302 | 11,141 |
Dow, Inc. | 575 | 30,625 |
Eastman Chemical Co. | 928 | 77,692 |
Linde plc | 153 | 58,305 |
LyondellBasell Industries NV, Class A | 170 | 15,611 |
PPG Industries, Inc. | 971 | 143,999 |
Sherwin-Williams Co. (The) | 69 | 18,321 |
622,706 | ||
June 30, 2023 | J.P. Morgan Exchange-Traded Funds | 21 |
AS OF June 30, 2023 (continued)
INVESTMENTS | SHARES | VALUE($) |
Common Stocks — continued | ||
Commercial Services & Supplies — 0.3% | ||
Cintas Corp. | 36 | 17,895 |
Republic Services, Inc. | 453 | 69,386 |
87,281 | ||
Communications Equipment — 0.1% | ||
Motorola Solutions, Inc. | 64 | 18,770 |
Construction Materials — 0.5% | ||
Vulcan Materials Co. | 634 | 142,929 |
Consumer Finance — 1.0% | ||
American Express Co. | 1,281 | 223,150 |
Capital One Financial Corp. | 430 | 47,029 |
270,179 | ||
Consumer Staples Distribution & Retail — 1.1% | ||
BJ's Wholesale Club Holdings, Inc. * | 74 | 4,663 |
Costco Wholesale Corp. | 158 | 85,064 |
Dollar General Corp. | 642 | 108,999 |
Performance Food Group Co. * | 145 | 8,735 |
Target Corp. | 103 | 13,585 |
US Foods Holding Corp. * | 130 | 5,720 |
Walmart, Inc. | 505 | 79,376 |
306,142 | ||
Containers & Packaging — 0.1% | ||
Ball Corp. | 622 | 36,207 |
Distributors — 0.0% ^ | ||
LKQ Corp. | 138 | 8,041 |
Diversified Telecommunication Services — 0.2% | ||
AT&T, Inc. | 413 | 6,587 |
Verizon Communications, Inc. | 1,516 | 56,380 |
62,967 | ||
Electric Utilities — 2.0% | ||
Entergy Corp. | 216 | 21,032 |
NextEra Energy, Inc. | 4,768 | 353,785 |
PG&E Corp. * | 7,478 | 129,220 |
Xcel Energy, Inc. | 893 | 55,518 |
559,555 | ||
Electrical Equipment — 1.2% | ||
Eaton Corp. plc | 1,537 | 309,091 |
Rockwell Automation, Inc. | 100 | 32,945 |
342,036 | ||
Electronic Equipment, Instruments & Components — 0.3% | ||
Amphenol Corp., Class A | 579 | 49,186 |
INVESTMENTS | SHARES | VALUE($) |
Electronic Equipment, Instruments & Components — continued | ||
Corning, Inc. | 284 | 9,951 |
Keysight Technologies, Inc. * | 55 | 9,210 |
68,347 | ||
Energy Equipment & Services — 0.6% | ||
Baker Hughes Co. | 5,130 | 162,159 |
Entertainment — 0.8% | ||
Netflix, Inc. * | 471 | 207,471 |
Walt Disney Co. (The) * | 223 | 19,909 |
227,380 | ||
Financial Services — 3.0% | ||
Berkshire Hathaway, Inc., Class B * | 809 | 275,869 |
Block, Inc. * | 252 | 16,776 |
Fidelity National Information Services, Inc. | 157 | 8,588 |
Fiserv, Inc. * | 111 | 14,003 |
FleetCor Technologies, Inc. * | 120 | 30,129 |
Mastercard, Inc., Class A | 969 | 381,108 |
PayPal Holdings, Inc. * | 121 | 8,074 |
Visa, Inc., Class A | 397 | 94,279 |
828,826 | ||
Food Products — 0.3% | ||
Mondelez International, Inc., Class A | 1,224 | 89,279 |
Ground Transportation — 1.7% | ||
CSX Corp. | 3,064 | 104,482 |
Norfolk Southern Corp. | 573 | 129,934 |
Uber Technologies, Inc. * | 4,640 | 200,309 |
Union Pacific Corp. | 126 | 25,782 |
460,507 | ||
Health Care Equipment & Supplies — 2.3% | ||
Abbott Laboratories | 434 | 47,315 |
Align Technology, Inc. * | 161 | 56,936 |
Baxter International, Inc. | 679 | 30,935 |
Becton Dickinson & Co. | 212 | 55,970 |
Boston Scientific Corp. * | 2,089 | 112,994 |
Dexcom, Inc. * | 348 | 44,721 |
Intuitive Surgical, Inc. * | 310 | 106,001 |
Medtronic plc | 1,111 | 97,879 |
ResMed, Inc. | 31 | 6,774 |
Stryker Corp. | 55 | 16,780 |
Zimmer Biomet Holdings, Inc. | 401 | 58,386 |
634,691 | ||
22 | J.P. Morgan Exchange-Traded Funds | June 30, 2023 |
INVESTMENTS | SHARES | VALUE($) |
Common Stocks — continued | ||
Health Care Providers & Services — 3.4% | ||
AmerisourceBergen Corp. | 83 | 15,972 |
Centene Corp. * | 629 | 42,426 |
Cigna Group (The) | 232 | 65,099 |
CVS Health Corp. | 219 | 15,139 |
Elevance Health, Inc. | 212 | 94,190 |
HCA Healthcare, Inc. | 219 | 66,462 |
Humana, Inc. | 155 | 69,305 |
McKesson Corp. | 201 | 85,889 |
UnitedHealth Group, Inc. | 989 | 475,353 |
Universal Health Services, Inc., Class B | 145 | 22,877 |
952,712 | ||
Health Care REITs — 0.3% | ||
Ventas, Inc. | 1,443 | 68,211 |
Hotel & Resort REITs — 0.1% | ||
Host Hotels & Resorts, Inc. | 1,965 | 33,071 |
Hotels, Restaurants & Leisure — 2.6% | ||
Airbnb, Inc., Class A * | 172 | 22,043 |
Booking Holdings, Inc. * | 37 | 99,912 |
Carnival Corp. * | 265 | 4,990 |
Chipotle Mexican Grill, Inc. * | 55 | 117,645 |
Domino's Pizza, Inc. | 49 | 16,512 |
Expedia Group, Inc. * | 230 | 25,160 |
Marriott International, Inc., Class A | 489 | 89,824 |
McDonald's Corp. | 882 | 263,198 |
Royal Caribbean Cruises Ltd. * | 47 | 4,876 |
Starbucks Corp. | 399 | 39,525 |
Yum! Brands, Inc. | 272 | 37,686 |
721,371 | ||
Household Durables — 0.1% | ||
Lennar Corp., Class A | 63 | 7,895 |
Toll Brothers, Inc. | 189 | 14,944 |
Whirlpool Corp. | 33 | 4,910 |
27,749 | ||
Household Products — 0.7% | ||
Church & Dwight Co., Inc. | 58 | 5,813 |
Colgate-Palmolive Co. | 598 | 46,070 |
Kimberly-Clark Corp. | 65 | 8,974 |
Procter & Gamble Co. (The) | 933 | 141,574 |
202,431 | ||
Industrial Conglomerates — 0.4% | ||
Honeywell International, Inc. | 506 | 104,995 |
INVESTMENTS | SHARES | VALUE($) |
Industrial REITs — 0.7% | ||
Prologis, Inc. | 1,546 | 189,586 |
Insurance — 2.0% | ||
Aflac, Inc. | 178 | 12,424 |
Chubb Ltd. | 354 | 68,166 |
Globe Life, Inc. | 220 | 24,117 |
Hartford Financial Services Group, Inc. (The) | 863 | 62,153 |
Loews Corp. | 529 | 31,412 |
Marsh & McLennan Cos., Inc. | 196 | 36,864 |
MetLife, Inc. | 987 | 55,795 |
Progressive Corp. (The) | 1,320 | 174,729 |
Prudential Financial, Inc. | 305 | 26,907 |
Travelers Cos., Inc. (The) | 332 | 57,655 |
550,222 | ||
Interactive Media & Services — 5.7% | ||
Alphabet, Inc., Class A * | 3,723 | 445,643 |
Alphabet, Inc., Class C * | 3,922 | 474,444 |
Meta Platforms, Inc., Class A * | 2,268 | 650,871 |
1,570,958 | ||
IT Services — 1.1% | ||
Accenture plc, Class A | 478 | 147,501 |
Cognizant Technology Solutions Corp., Class A | 809 | 52,811 |
International Business Machines Corp. | 316 | 42,284 |
MongoDB, Inc. * | 36 | 14,796 |
Shopify, Inc., Class A (Canada) * | 830 | 53,618 |
311,010 | ||
Life Sciences Tools & Services — 0.7% | ||
Danaher Corp. | 392 | 94,080 |
Thermo Fisher Scientific, Inc. | 176 | 91,828 |
185,908 | ||
Machinery — 1.9% | ||
Deere & Co. | 679 | 275,124 |
Dover Corp. | 806 | 119,006 |
Otis Worldwide Corp. | 374 | 33,290 |
Parker-Hannifin Corp. | 271 | 105,701 |
533,121 | ||
Media — 1.0% | ||
Charter Communications, Inc., Class A * | 154 | 56,575 |
Comcast Corp., Class A | 4,255 | 176,795 |
Trade Desk, Inc. (The), Class A * | 573 | 44,247 |
277,617 | ||
June 30, 2023 | J.P. Morgan Exchange-Traded Funds | 23 |
AS OF June 30, 2023 (continued)
INVESTMENTS | SHARES | VALUE($) |
Common Stocks — continued | ||
Metals & Mining — 0.3% | ||
Alcoa Corp. | 126 | 4,275 |
Freeport-McMoRan, Inc. | 1,299 | 51,960 |
Nucor Corp. | 82 | 13,447 |
69,682 | ||
Multi-Utilities — 1.0% | ||
Ameren Corp. | 254 | 20,744 |
CenterPoint Energy, Inc. | 716 | 20,871 |
CMS Energy Corp. | 1,301 | 76,434 |
Dominion Energy, Inc. | 564 | 29,210 |
Public Service Enterprise Group, Inc. | 1,859 | 116,392 |
263,651 | ||
Oil, Gas & Consumable Fuels — 4.3% | ||
Cheniere Energy, Inc. | 197 | 30,015 |
Chevron Corp. | 1,019 | 160,340 |
ConocoPhillips | 3,364 | 348,544 |
Diamondback Energy, Inc. | 361 | 47,421 |
EOG Resources, Inc. | 1,380 | 157,927 |
EQT Corp. | 125 | 5,141 |
Exxon Mobil Corp. | 2,845 | 305,126 |
Marathon Oil Corp. | 654 | 15,055 |
Pioneer Natural Resources Co. | 595 | 123,272 |
1,192,841 | ||
Passenger Airlines — 0.3% | ||
Delta Air Lines, Inc. * | 319 | 15,165 |
Southwest Airlines Co. | 1,995 | 72,239 |
87,404 | ||
Personal Care Products — 0.1% | ||
Estee Lauder Cos., Inc. (The), Class A | 64 | 12,568 |
Pharmaceuticals — 3.4% | ||
Bristol-Myers Squibb Co. | 5,861 | 374,811 |
Eli Lilly & Co. | 486 | 227,924 |
Johnson & Johnson | 1,326 | 219,480 |
Merck & Co., Inc. | 682 | 78,696 |
Pfizer, Inc. | 1,136 | 41,668 |
942,579 | ||
Professional Services — 0.1% | ||
Booz Allen Hamilton Holding Corp. | 66 | 7,366 |
Equifax, Inc. | 65 | 15,294 |
Leidos Holdings, Inc. | 193 | 17,077 |
39,737 | ||
INVESTMENTS | SHARES | VALUE($) |
Residential REITs — 0.3% | ||
AvalonBay Communities, Inc. | 121 | 22,902 |
Equity LifeStyle Properties, Inc. | 225 | 15,050 |
Mid-America Apartment Communities, Inc. | 49 | 7,441 |
Sun Communities, Inc. | 169 | 22,048 |
UDR, Inc. | 446 | 19,160 |
86,601 | ||
Semiconductors & Semiconductor Equipment — 7.9% | ||
Advanced Micro Devices, Inc. * | 1,867 | 212,670 |
Analog Devices, Inc. | 953 | 185,654 |
ASML Holding NV (Registered), NYRS (Netherlands) | 91 | 65,952 |
Broadcom, Inc. | 99 | 85,876 |
First Solar, Inc. * | 368 | 69,953 |
Intel Corp. | 135 | 4,514 |
Lam Research Corp. | 165 | 106,072 |
NVIDIA Corp. | 1,812 | 766,512 |
NXP Semiconductors NV (China) | 2,024 | 414,272 |
Qorvo, Inc. * | 215 | 21,937 |
Teradyne, Inc. | 773 | 86,058 |
Texas Instruments, Inc. | 941 | 169,399 |
2,188,869 | ||
Software — 10.2% | ||
Adobe, Inc. * | 321 | 156,966 |
Cadence Design Systems, Inc. * | 69 | 16,182 |
HubSpot, Inc. * | 72 | 38,310 |
Intuit, Inc. | 382 | 175,029 |
Microsoft Corp. | 5,806 | 1,977,175 |
Oracle Corp. | 2,245 | 267,357 |
Salesforce, Inc. * | 616 | 130,136 |
Synopsys, Inc. * | 128 | 55,733 |
Workday, Inc., Class A * | 129 | 29,140 |
2,846,028 | ||
Specialized REITs — 0.2% | ||
Digital Realty Trust, Inc. | 99 | 11,273 |
Equinix, Inc. | 30 | 23,518 |
SBA Communications Corp. | 125 | 28,970 |
63,761 | ||
Specialty Retail — 3.6% | ||
AutoNation, Inc. * | 96 | 15,803 |
AutoZone, Inc. * | 69 | 172,042 |
Best Buy Co., Inc. | 371 | 30,403 |
Burlington Stores, Inc. * | 67 | 10,545 |
Home Depot, Inc. (The) | 282 | 87,600 |
24 | J.P. Morgan Exchange-Traded Funds | June 30, 2023 |
INVESTMENTS | SHARES | VALUE($) |
Common Stocks — continued | ||
Specialty Retail — continued | ||
Lowe's Cos., Inc. | 1,961 | 442,598 |
O'Reilly Automotive, Inc. * | 58 | 55,407 |
TJX Cos., Inc. (The) | 2,210 | 187,386 |
1,001,784 | ||
Technology Hardware, Storage & Peripherals — 6.2% | ||
Apple, Inc. | 8,692 | 1,685,987 |
Seagate Technology Holdings plc | 689 | 42,629 |
1,728,616 | ||
Textiles, Apparel & Luxury Goods — 0.4% | ||
NIKE, Inc., Class B | 846 | 93,373 |
Tapestry, Inc. | 634 | 27,135 |
120,508 | ||
Tobacco — 0.5% | ||
Altria Group, Inc. | 276 | 12,503 |
Philip Morris International, Inc. | 1,338 | 130,615 |
143,118 | ||
Trading Companies & Distributors — 0.0% ^ | ||
WESCO International, Inc. | 51 | 9,132 |
Wireless Telecommunication Services — 0.2% | ||
T-Mobile US, Inc. * | 383 | 53,199 |
Total Common Stocks (Cost $25,040,053) | 27,698,365 | |
INVESTMENTS | SHARES | VALUE($) |
Short-Term Investments — 0.3% | ||
Investment Companies — 0.3% | ||
JPMorgan U.S. Government Money Market Fund Class IM Shares, 5.05% (a) (b) (Cost $90,192) | 90,192 | 90,192 |
Total Investments — 99.9% (Cost $25,130,245) | 27,788,557 | |
Other Assets Less Liabilities — 0.1% | 38,629 | |
NET ASSETS — 100.0% | 27,827,186 | |
Percentages indicated are based on net assets. |
Abbreviations | |
NYRS | New York Registry Shares |
REIT | Real Estate Investment Trust |
^ | Amount rounds to less than 0.1% of net assets. | |
* | Non-income producing security. | |
(a) | Investment in an affiliated fund, which is registered under the Investment Company Act of 1940, as amended, and is advised by J.P. Morgan Investment Management Inc. | |
(b) | The rate shown is the current yield as of June 30, 2023. | |
DESCRIPTION | NUMBER OF CONTRACTS | EXPIRATION DATE | TRADING CURRENCY | NOTIONAL AMOUNT ($) | VALUE AND UNREALIZED APPRECIATION (DEPRECIATION) ($) |
Long Contracts | |||||
S&P 500 Micro E-Mini Future Equity Index | 4 | 09/15/2023 | USD | 89,735 | 2,883 |
Abbreviations | |
USD | United States Dollar |
June 30, 2023 | J.P. Morgan Exchange-Traded Funds | 25 |
AS OF June 30, 2023
INVESTMENTS | SHARES | VALUE($) |
Common Stocks — 98.1% | ||
Aerospace & Defense — 0.4% | ||
TransDigm Group, Inc. | 1,451 | 1,297,441 |
Automobiles — 2.8% | ||
Tesla, Inc. * | 38,829 | 10,164,267 |
Beverages — 0.9% | ||
Constellation Brands, Inc., Class A | 4,133 | 1,017,255 |
Monster Beverage Corp. * | 39,965 | 2,295,590 |
3,312,845 | ||
Biotechnology — 4.1% | ||
AbbVie, Inc. | 12,744 | 1,716,999 |
Alnylam Pharmaceuticals, Inc. * | 8,204 | 1,558,268 |
Exact Sciences Corp. * | 38,366 | 3,602,567 |
Moderna, Inc. * | 2,625 | 318,937 |
Natera, Inc. * | 11,783 | 573,361 |
Regeneron Pharmaceuticals, Inc. * | 8,061 | 5,792,151 |
Sarepta Therapeutics, Inc. * | 4,302 | 492,665 |
Seagen, Inc. * | 3,223 | 620,299 |
14,675,247 | ||
Broadline Retail — 5.8% | ||
Amazon.com, Inc. * | 137,064 | 17,867,663 |
Etsy, Inc. * | 1,609 | 136,138 |
MercadoLibre, Inc. (Brazil) * | 2,179 | 2,581,243 |
20,585,044 | ||
Building Products — 0.9% | ||
Trane Technologies plc | 17,195 | 3,288,716 |
Capital Markets — 2.4% | ||
Blackstone, Inc. | 32,376 | 3,009,996 |
Charles Schwab Corp. (The) | 5,100 | 289,068 |
Morgan Stanley | 30,852 | 2,634,761 |
MSCI, Inc. | 682 | 320,056 |
S&P Global, Inc. | 5,582 | 2,237,768 |
8,491,649 | ||
Chemicals — 0.2% | ||
Sherwin-Williams Co. (The) | 2,331 | 618,927 |
Commercial Services & Supplies — 0.7% | ||
Copart, Inc. * | 28,484 | 2,598,026 |
Communications Equipment — 0.2% | ||
Arista Networks, Inc. * | 4,508 | 730,566 |
INVESTMENTS | SHARES | VALUE($) |
Construction & Engineering — 1.0% | ||
AECOM | 10,268 | 869,597 |
Quanta Services, Inc. | 13,742 | 2,699,616 |
3,569,213 | ||
Consumer Staples Distribution & Retail — 0.1% | ||
Target Corp. | 3,452 | 455,319 |
Electrical Equipment — 1.3% | ||
AMETEK, Inc. | 11,250 | 1,821,150 |
Hubbell, Inc. | 5,554 | 1,841,484 |
Rockwell Automation, Inc. | 3,381 | 1,113,871 |
4,776,505 | ||
Electronic Equipment, Instruments & Components — 1.0% | ||
Amphenol Corp., Class A | 19,261 | 1,636,222 |
Jabil, Inc. | 12,246 | 1,321,711 |
Keysight Technologies, Inc. * | 4,548 | 761,562 |
3,719,495 | ||
Energy Equipment & Services — 0.3% | ||
TechnipFMC plc (United Kingdom) * | 62,107 | 1,032,218 |
Entertainment — 2.1% | ||
Netflix, Inc. * | 15,528 | 6,839,929 |
Take-Two Interactive Software, Inc. * | 4,571 | 672,668 |
7,512,597 | ||
Financial Services — 2.7% | ||
Block, Inc. * | 8,259 | 549,802 |
Mastercard, Inc., Class A | 22,219 | 8,738,733 |
PayPal Holdings, Inc. * | 4,250 | 283,602 |
9,572,137 | ||
Ground Transportation — 1.6% | ||
Old Dominion Freight Line, Inc. | 2,351 | 869,282 |
Uber Technologies, Inc. * | 115,650 | 4,992,611 |
5,861,893 | ||
Health Care Equipment & Supplies — 3.3% | ||
Align Technology, Inc. * | 5,373 | 1,900,108 |
Cooper Cos., Inc. (The) | 3,999 | 1,533,336 |
Dexcom, Inc. * | 21,376 | 2,747,030 |
Insulet Corp. * | 3,712 | 1,070,318 |
Intuitive Surgical, Inc. * | 13,547 | 4,632,261 |
11,883,053 | ||
Health Care Providers & Services — 1.9% | ||
HCA Healthcare, Inc. | 7,215 | 2,189,608 |
26 | J.P. Morgan Exchange-Traded Funds | June 30, 2023 |
INVESTMENTS | SHARES | VALUE($) |
Common Stocks — continued | ||
Health Care Providers & Services — continued | ||
McKesson Corp. | 5,261 | 2,248,078 |
UnitedHealth Group, Inc. | 5,179 | 2,489,235 |
6,926,921 | ||
Hotels, Restaurants & Leisure — 2.7% | ||
Airbnb, Inc., Class A * | 5,779 | 740,637 |
Booking Holdings, Inc. * | 650 | 1,755,214 |
Chipotle Mexican Grill, Inc. * | 921 | 1,970,019 |
Hilton Worldwide Holdings, Inc. | 11,457 | 1,667,566 |
Marriott International, Inc., Class A | 11,316 | 2,078,636 |
Starbucks Corp. | 13,192 | 1,306,800 |
9,518,872 | ||
Household Durables — 0.2% | ||
Garmin Ltd. | 8,502 | 886,674 |
Insurance — 0.5% | ||
Progressive Corp. (The) | 13,535 | 1,791,628 |
Interactive Media & Services — 8.7% | ||
Alphabet, Inc., Class C * | 139,312 | 16,852,573 |
Meta Platforms, Inc., Class A * | 49,298 | 14,147,540 |
31,000,113 | ||
IT Services — 1.9% | ||
Cognizant Technology Solutions Corp., Class A | 11,151 | 727,937 |
MongoDB, Inc. * | 7,161 | 2,943,099 |
Shopify, Inc., Class A (Canada) * | 31,999 | 2,067,136 |
Snowflake, Inc., Class A * | 6,164 | 1,084,741 |
6,822,913 | ||
Life Sciences Tools & Services — 0.6% | ||
Mettler-Toledo International, Inc. * | 580 | 760,751 |
Thermo Fisher Scientific, Inc. | 2,971 | 1,550,119 |
2,310,870 | ||
Machinery — 1.3% | ||
Deere & Co. | 7,909 | 3,204,648 |
Ingersoll Rand, Inc. | 23,676 | 1,547,463 |
4,752,111 | ||
Media — 0.9% | ||
Trade Desk, Inc. (The), Class A * | 42,184 | 3,257,448 |
Metals & Mining — 0.6% | ||
Freeport-McMoRan, Inc. | 54,007 | 2,160,280 |
Oil, Gas & Consumable Fuels — 1.3% | ||
Cheniere Energy, Inc. | 14,372 | 2,189,718 |
INVESTMENTS | SHARES | VALUE($) |
Oil, Gas & Consumable Fuels — continued | ||
ConocoPhillips | 10,826 | 1,121,682 |
EOG Resources, Inc. | 10,983 | 1,256,894 |
4,568,294 | ||
Personal Care Products — 0.4% | ||
Estee Lauder Cos., Inc. (The), Class A | 6,630 | 1,301,999 |
Pharmaceuticals — 1.8% | ||
Eli Lilly & Co. | 11,975 | 5,616,036 |
Royalty Pharma plc, Class A | 29,492 | 906,584 |
6,522,620 | ||
Professional Services — 0.5% | ||
Equifax, Inc. | 6,925 | 1,629,453 |
Semiconductors & Semiconductor Equipment — 10.1% | ||
Advanced Micro Devices, Inc. * | 30,612 | 3,487,013 |
ASML Holding NV (Registered), NYRS (Netherlands) | 1,943 | 1,408,189 |
Broadcom, Inc. | 3,361 | 2,915,432 |
Entegris, Inc. | 11,294 | 1,251,601 |
First Solar, Inc. * | 12,136 | 2,306,932 |
Lam Research Corp. | 4,773 | 3,068,371 |
Marvell Technology, Inc. | 18,590 | 1,111,310 |
NVIDIA Corp. | 45,476 | 19,237,258 |
SolarEdge Technologies, Inc. * | 4,552 | 1,224,716 |
36,010,822 | ||
Software — 19.4% | ||
Adobe, Inc. * | 4,676 | 2,286,517 |
Cadence Design Systems, Inc. * | 4,461 | 1,046,194 |
Confluent, Inc., Class A * | 39,656 | 1,400,253 |
Crowdstrike Holdings, Inc., Class A * | 6,100 | 895,907 |
HashiCorp, Inc., Class A * | 20,553 | 538,077 |
HubSpot, Inc. * | 5,254 | 2,795,601 |
Intuit, Inc. | 10,352 | 4,743,183 |
Microsoft Corp. | 113,418 | 38,623,366 |
Oracle Corp. | 40,625 | 4,838,031 |
Palo Alto Networks, Inc. * | 11,053 | 2,824,152 |
Salesforce, Inc. * | 14,496 | 3,062,425 |
ServiceNow, Inc. * | 2,478 | 1,392,562 |
Synopsys, Inc. * | 6,515 | 2,836,696 |
Workday, Inc., Class A * | 9,576 | 2,163,123 |
69,446,087 | ||
Specialty Retail — 2.9% | ||
AutoZone, Inc. * | 822 | 2,049,542 |
Lowe's Cos., Inc. | 20,626 | 4,655,288 |
June 30, 2023 | J.P. Morgan Exchange-Traded Funds | 27 |
AS OF June 30, 2023 (continued)
INVESTMENTS | SHARES | VALUE($) |
Common Stocks — continued | ||
Specialty Retail — continued | ||
Ross Stores, Inc. | 12,282 | 1,377,181 |
TJX Cos., Inc. (The) | 11,053 | 937,184 |
Tractor Supply Co. | 5,364 | 1,185,980 |
10,205,175 | ||
Technology Hardware, Storage & Peripherals — 9.9% | ||
Apple, Inc. | 181,938 | 35,290,514 |
Textiles, Apparel & Luxury Goods — 0.5% | ||
Lululemon Athletica, Inc. * | 2,727 | 1,032,169 |
Tapestry, Inc. | 18,656 | 798,477 |
1,830,646 | ||
Trading Companies & Distributors — 0.2% | ||
Air Lease Corp. | 16,132 | 675,124 |
Total Common Stocks (Cost $293,993,896) | 351,053,722 | |
Short-Term Investments — 1.9% | ||
Investment Companies — 1.9% | ||
JPMorgan U.S. Government Money Market Fund Class IM Shares, 5.05% (a) (b) (Cost $6,933,264) | 6,933,264 | 6,933,264 |
Total Investments — 100.0% (Cost $300,927,160) | 357,986,986 | |
Other Assets Less Liabilities — 0.0% ^ | 43,392 | |
NET ASSETS — 100.0% | 358,030,378 | |
Percentages indicated are based on net assets. |
Abbreviations | |
NYRS | New York Registry Shares |
^ | Amount rounds to less than 0.1% of net assets. | |
* | Non-income producing security. | |
(a) | Investment in an affiliated fund, which is registered under the Investment Company Act of 1940, as amended, and is advised by J.P. Morgan Investment Management Inc. | |
(b) | The rate shown is the current yield as of June 30, 2023. | |
28 | J.P. Morgan Exchange-Traded Funds | June 30, 2023 |
AS OF June 30, 2023
INVESTMENTS | SHARES | VALUE($) |
Common Stocks — 97.5% | ||
Aerospace & Defense — 1.2% | ||
AerSale Corp. * | 6,025 | 88,568 |
Moog, Inc., Class A | 343 | 37,191 |
125,759 | ||
Automobile Components — 0.9% | ||
Atmus Filtration Technologies, Inc. * | 1,700 | 37,332 |
Patrick Industries, Inc. | 685 | 54,800 |
92,132 | ||
Banks — 14.4% | ||
BancFirst Corp. | 425 | 39,100 |
Camden National Corp. | 1,849 | 57,264 |
City Holding Co. | 927 | 83,421 |
Columbia Banking System, Inc. | 6,437 | 130,542 |
First Busey Corp. | 5,922 | 119,032 |
First Commonwealth Financial Corp. | 6,675 | 84,439 |
First Merchants Corp. | 3,080 | 86,948 |
Heritage Commerce Corp. | 9,414 | 77,948 |
Independent Bank Corp. | 1,540 | 68,545 |
Independent Bank Corp. | 7,127 | 120,874 |
Lakeland Bancorp, Inc. | 5,135 | 68,758 |
Old National Bancorp | 9,386 | 130,841 |
Premier Financial Corp. | 4,022 | 64,432 |
Simmons First National Corp., Class A | 3,779 | 65,188 |
SouthState Corp. | 2,153 | 141,667 |
TriCo Bancshares | 2,635 | 87,482 |
WSFS Financial Corp. | 3,548 | 133,831 |
1,560,312 | ||
Beverages — 1.0% | ||
Primo Water Corp. | 8,299 | 104,069 |
Building Products — 4.4% | ||
AZZ, Inc. | 2,708 | 117,690 |
CSW Industrials, Inc. | 666 | 110,683 |
Hayward Holdings, Inc. * | 9,413 | 120,957 |
UFP Industries, Inc. | 1,284 | 124,612 |
473,942 | ||
Capital Markets — 2.2% | ||
Donnelley Financial Solutions, Inc. * | 1,100 | 50,083 |
LPL Financial Holdings, Inc. | 428 | 93,060 |
Virtus Investment Partners, Inc. | 462 | 91,231 |
234,374 | ||
Chemicals — 6.2% | ||
Chase Corp. | 1,002 | 121,462 |
Diversey Holdings Ltd. * | 12,667 | 106,276 |
INVESTMENTS | SHARES | VALUE($) |
Chemicals — continued | ||
Hawkins, Inc. | 2,139 | 102,009 |
HB Fuller Co. | 1,711 | 122,354 |
Innospec, Inc. | 1,112 | 111,689 |
Stepan Co. | 1,112 | 106,263 |
670,053 | ||
Commercial Services & Supplies — 0.9% | ||
Brady Corp., Class A | 1,981 | 94,236 |
Communications Equipment — 0.7% | ||
Viavi Solutions, Inc. * | 6,676 | 75,639 |
Construction & Engineering — 1.5% | ||
Comfort Systems USA, Inc. | 964 | 158,289 |
Diversified Telecommunication Services — 0.4% | ||
Iridium Communications, Inc. | 674 | 41,869 |
Electric Utilities — 0.9% | ||
Portland General Electric Co. | 2,088 | 97,781 |
Electronic Equipment, Instruments & Components — 4.6% | ||
Fabrinet (Thailand) * | 444 | 57,667 |
Insight Enterprises, Inc. * | 482 | 70,536 |
Knowles Corp. * | 5,477 | 98,915 |
Plexus Corp. * | 798 | 78,395 |
TTM Technologies, Inc. * | 7,701 | 107,044 |
Vishay Intertechnology, Inc. | 3,001 | 88,229 |
500,786 | ||
Energy Equipment & Services — 1.4% | ||
ChampionX Corp. | 3,923 | 121,770 |
RPC, Inc. | 4,600 | 32,890 |
154,660 | ||
Financial Services — 2.3% | ||
PennyMac Financial Services, Inc. | 1,607 | 112,988 |
Radian Group, Inc. | 5,471 | 138,307 |
251,295 | ||
Food Products — 1.7% | ||
Flowers Foods, Inc. | 3,081 | 76,655 |
Hostess Brands, Inc. * | 4,267 | 108,041 |
184,696 | ||
Gas Utilities — 2.4% | ||
Chesapeake Utilities Corp. | 685 | 81,515 |
ONE Gas, Inc. | 1,762 | 135,339 |
Southwest Gas Holdings, Inc. | 685 | 43,601 |
260,455 | ||
June 30, 2023 | J.P. Morgan Exchange-Traded Funds | 29 |
AS OF June 30, 2023 (continued)
INVESTMENTS | SHARES | VALUE($) |
Common Stocks — continued | ||
Ground Transportation — 1.2% | ||
Marten Transport Ltd. | 5,904 | 126,936 |
Health Care Equipment & Supplies — 0.8% | ||
Utah Medical Products, Inc. | 941 | 87,701 |
Health Care Providers & Services — 4.8% | ||
Encompass Health Corp. | 2,652 | 179,567 |
Ensign Group, Inc. (The) | 1,027 | 98,037 |
ModivCare, Inc. * | 1,027 | 46,431 |
Patterson Cos., Inc. | 5,916 | 196,766 |
520,801 | ||
Hotel & Resort REITs — 1.0% | ||
RLJ Lodging Trust | 5,235 | 53,763 |
Sunstone Hotel Investors, Inc. | 5,566 | 56,328 |
110,091 | ||
Hotels, Restaurants & Leisure — 2.0% | ||
Bloomin' Brands, Inc. | 2,312 | 62,170 |
Everi Holdings, Inc. * | 6,790 | 98,183 |
Jack in the Box, Inc. | 585 | 57,055 |
217,408 | ||
Household Durables — 1.7% | ||
La-Z-Boy, Inc. | 1,884 | 53,958 |
M/I Homes, Inc. * | 856 | 74,635 |
MDC Holdings, Inc. | 1,199 | 56,077 |
184,670 | ||
Industrial REITs — 2.5% | ||
Plymouth Industrial REIT, Inc. | 3,424 | 78,820 |
Rexford Industrial Realty, Inc. | 1,740 | 90,863 |
Terreno Realty Corp. | 1,711 | 102,831 |
272,514 | ||
Insurance — 3.6% | ||
Safety Insurance Group, Inc. | 2,027 | 145,377 |
Selective Insurance Group, Inc. | 2,534 | 243,137 |
388,514 | ||
Interactive Media & Services — 1.7% | ||
IAC, Inc. * | 1,797 | 112,852 |
TripAdvisor, Inc. * | 4,258 | 70,214 |
183,066 | ||
Machinery — 6.3% | ||
Alamo Group, Inc. | 856 | 157,427 |
EnPro Industries, Inc. | 320 | 42,730 |
Kadant, Inc. | 549 | 121,933 |
INVESTMENTS | SHARES | VALUE($) |
Machinery — continued | ||
Lincoln Electric Holdings, Inc. | 513 | 101,897 |
Mueller Industries, Inc. | 1,198 | 104,561 |
Watts Water Technologies, Inc., Class A | 856 | 157,273 |
685,821 | ||
Media — 1.2% | ||
Cable One, Inc. | 144 | 94,620 |
John Wiley & Sons, Inc., Class A | 1,148 | 39,066 |
133,686 | ||
Mortgage Real Estate Investment Trusts (REITs) — 0.4% | ||
Ladder Capital Corp. | 4,457 | 48,358 |
Multi-Utilities — 0.8% | ||
Unitil Corp. | 1,780 | 90,264 |
Office REITs — 1.6% | ||
Equity Commonwealth | 5,496 | 111,349 |
Highwoods Properties, Inc. | 2,654 | 63,457 |
174,806 | ||
Oil, Gas & Consumable Fuels — 2.5% | ||
Chord Energy Corp. | 430 | 66,134 |
CNX Resources Corp. * | 2,142 | 37,956 |
Matador Resources Co. | 2,112 | 110,500 |
PDC Energy, Inc. | 856 | 60,896 |
275,486 | ||
Personal Care Products — 1.8% | ||
Edgewell Personal Care Co. | 2,824 | 116,659 |
Inter Parfums, Inc. | 585 | 79,110 |
195,769 | ||
Pharmaceuticals — 0.6% | ||
Prestige Consumer Healthcare, Inc. * | 1,030 | 61,213 |
Professional Services — 0.7% | ||
ASGN, Inc. * | 941 | 71,168 |
Residential REITs — 1.1% | ||
American Homes 4 Rent, Class A | 2,055 | 72,850 |
Centerspace | 827 | 50,744 |
123,594 | ||
Retail REITs — 2.5% | ||
Agree Realty Corp. | 2,395 | 156,609 |
Kite Realty Group Trust | 5,134 | 114,694 |
271,303 | ||
Semiconductors & Semiconductor Equipment — 1.6% | ||
Amkor Technology, Inc. | 2,921 | 86,900 |
30 | J.P. Morgan Exchange-Traded Funds | June 30, 2023 |
INVESTMENTS | SHARES | VALUE($) |
Common Stocks — continued | ||
Semiconductors & Semiconductor Equipment — continued | ||
Cohu, Inc. * | 1,114 | 46,298 |
Synaptics, Inc. * | 525 | 44,824 |
178,022 | ||
Specialized REITs — 0.8% | ||
Rayonier, Inc. | 2,738 | 85,973 |
Specialty Retail — 2.3% | ||
Group 1 Automotive, Inc. | 513 | 132,405 |
Urban Outfitters, Inc. * | 3,365 | 111,483 |
243,888 | ||
Textiles, Apparel & Luxury Goods — 2.7% | ||
Kontoor Brands, Inc. | 2,052 | 86,389 |
Movado Group, Inc. | 1,627 | 43,653 |
Oxford Industries, Inc. | 599 | 58,954 |
Steven Madden Ltd. | 3,115 | 101,829 |
290,825 | ||
Trading Companies & Distributors — 3.3% | ||
Applied Industrial Technologies, Inc. | 837 | 121,223 |
Beacon Roofing Supply, Inc. * | 1,382 | 114,678 |
McGrath RentCorp | 1,369 | 126,605 |
362,506 | ||
Water Utilities — 0.9% | ||
American States Water Co. | 1,178 | 102,486 |
Total Common Stocks (Cost $10,713,824) | 10,567,216 | |
INVESTMENTS | SHARES | VALUE($) |
Short-Term Investments — 2.6% | ||
Investment Companies — 2.6% | ||
JPMorgan U.S. Government Money Market Fund Class IM Shares, 5.05% (a) (b) (Cost $278,027) | 278,027 | 278,027 |
Total Investments — 100.1% (Cost $10,991,851) | 10,845,243 | |
Liabilities in Excess of Other Assets — (0.1)% | (8,587 ) | |
NET ASSETS — 100.0% | 10,836,656 | |
Percentages indicated are based on net assets. |
Abbreviations | |
REIT | Real Estate Investment Trust |
* | Non-income producing security. |
(a) | Investment in an affiliated fund, which is registered under the Investment Company Act of 1940, as amended, and is advised by J.P. Morgan Investment Management Inc. |
(b) | The rate shown is the current yield as of June 30, 2023. |
June 30, 2023 | J.P. Morgan Exchange-Traded Funds | 31 |
AS OF June 30, 2023
INVESTMENTS | SHARES | VALUE($) |
Common Stocks — 96.9% | ||
Aerospace & Defense — 3.4% | ||
Boeing Co. (The) * | 7,562 | 1,596,792 |
General Dynamics Corp. | 11,121 | 2,392,683 |
Northrop Grumman Corp. | 4,194 | 1,911,625 |
Raytheon Technologies Corp. | 86,365 | 8,460,316 |
14,361,416 | ||
Air Freight & Logistics — 0.8% | ||
United Parcel Service, Inc., Class B | 18,625 | 3,338,531 |
Banks — 9.9% | ||
Bank of America Corp. | 391,686 | 11,237,470 |
Citigroup, Inc. | 74,239 | 3,417,963 |
Citizens Financial Group, Inc. | 70,140 | 1,829,251 |
First Horizon Corp. | 40,870 | 460,605 |
KeyCorp | 135,865 | 1,255,393 |
M&T Bank Corp. | 8,191 | 1,013,718 |
PNC Financial Services Group, Inc. (The) | 47,321 | 5,960,080 |
Truist Financial Corp. | 59,557 | 1,807,555 |
US Bancorp | 100,201 | 3,310,641 |
Wells Fargo & Co. | 263,098 | 11,229,023 |
41,521,699 | ||
Beverages — 0.8% | ||
Keurig Dr Pepper, Inc. | 31,816 | 994,886 |
Monster Beverage Corp. * | 14,253 | 818,692 |
PepsiCo, Inc. | 9,198 | 1,703,654 |
3,517,232 | ||
Biotechnology — 4.1% | ||
AbbVie, Inc. | 48,790 | 6,573,477 |
Amgen, Inc. | 4,865 | 1,080,127 |
Biogen, Inc. * | 9,952 | 2,834,827 |
BioMarin Pharmaceutical, Inc. * | 17,179 | 1,489,076 |
Regeneron Pharmaceuticals, Inc. * | 3,547 | 2,548,661 |
Vertex Pharmaceuticals, Inc. * | 7,340 | 2,583,020 |
17,109,188 | ||
Building Products — 1.3% | ||
Carrier Global Corp. | 47,026 | 2,337,663 |
Masco Corp. | 52,224 | 2,996,613 |
5,334,276 | ||
Capital Markets — 3.6% | ||
BlackRock, Inc. | 5,457 | 3,771,551 |
Charles Schwab Corp. (The) | 24,641 | 1,396,652 |
CME Group, Inc. | 7,806 | 1,446,374 |
Goldman Sachs Group, Inc. (The) | 6,841 | 2,206,496 |
Morgan Stanley | 41,202 | 3,518,651 |
INVESTMENTS | SHARES | VALUE($) |
Capital Markets — continued | ||
S&P Global, Inc. | 3,824 | 1,533,003 |
T. Rowe Price Group, Inc. | 10,097 | 1,131,066 |
15,003,793 | ||
Chemicals — 3.5% | ||
Air Products and Chemicals, Inc. | 12,801 | 3,834,284 |
Axalta Coating Systems Ltd. * | 112,163 | 3,680,068 |
Chemours Co. (The) | 102,451 | 3,779,417 |
FMC Corp. | 13,425 | 1,400,764 |
PPG Industries, Inc. | 14,520 | 2,153,316 |
14,847,849 | ||
Commercial Services & Supplies — 0.5% | ||
Republic Services, Inc. | 13,964 | 2,138,866 |
Construction Materials — 0.7% | ||
Vulcan Materials Co. | 13,141 | 2,962,507 |
Consumer Finance — 1.0% | ||
American Express Co. | 14,590 | 2,541,578 |
Capital One Financial Corp. | 13,232 | 1,447,184 |
3,988,762 | ||
Consumer Staples Distribution & Retail — 2.3% | ||
BJ's Wholesale Club Holdings, Inc. * | 21,848 | 1,376,643 |
Dollar General Corp. | 8,453 | 1,435,150 |
Performance Food Group Co. * | 42,593 | 2,565,802 |
US Foods Holding Corp. * | 38,336 | 1,686,784 |
Walmart, Inc. | 15,551 | 2,444,306 |
9,508,685 | ||
Containers & Packaging — 0.3% | ||
Ball Corp. | 19,170 | 1,115,886 |
Electric Utilities — 2.3% | ||
Entergy Corp. | 6,648 | 647,316 |
NextEra Energy, Inc. | 99,512 | 7,383,790 |
Xcel Energy, Inc. | 27,510 | 1,710,297 |
9,741,403 | ||
Electrical Equipment — 0.8% | ||
Eaton Corp. plc | 12,575 | 2,528,833 |
Emerson Electric Co. | 11,336 | 1,024,661 |
3,553,494 | ||
Entertainment — 0.3% | ||
Endeavor Group Holdings, Inc., Class A * | 22,532 | 538,965 |
Walt Disney Co. (The) * | 6,863 | 612,729 |
1,151,694 | ||
32 | J.P. Morgan Exchange-Traded Funds | June 30, 2023 |
INVESTMENTS | SHARES | VALUE($) |
Common Stocks — continued | ||
Financial Services — 4.0% | ||
Berkshire Hathaway, Inc., Class B * | 28,110 | 9,585,510 |
Fidelity National Information Services, Inc. | 46,275 | 2,531,242 |
Fiserv, Inc. * | 32,565 | 4,108,075 |
WEX, Inc. * | 3,466 | 631,055 |
16,855,882 | ||
Food Products — 1.0% | ||
Mondelez International, Inc., Class A | 57,046 | 4,160,935 |
Gas Utilities — 0.2% | ||
National Fuel Gas Co. | 18,115 | 930,386 |
Ground Transportation — 0.9% | ||
CSX Corp. | 77,924 | 2,657,208 |
Knight-Swift Transportation Holdings, Inc. | 7,771 | 431,757 |
Uber Technologies, Inc. * | 13,864 | 598,509 |
3,687,474 | ||
Health Care Equipment & Supplies — 2.5% | ||
Baxter International, Inc. | 47,524 | 2,165,193 |
Becton Dickinson & Co. | 6,547 | 1,728,474 |
Boston Scientific Corp. * | 40,711 | 2,202,058 |
Medtronic plc | 30,121 | 2,653,660 |
Zimmer Biomet Holdings, Inc. | 12,363 | 1,800,053 |
10,549,438 | ||
Health Care Providers & Services — 5.3% | ||
AmerisourceBergen Corp. | 24,387 | 4,692,790 |
Centene Corp. * | 82,104 | 5,537,915 |
Cigna Group (The) | 7,925 | 2,223,755 |
CVS Health Corp. | 15,149 | 1,047,250 |
Elevance Health, Inc. | 3,961 | 1,759,833 |
Humana, Inc. | 2,076 | 928,242 |
UnitedHealth Group, Inc. | 11,001 | 5,287,521 |
Universal Health Services, Inc., Class B | 4,452 | 702,392 |
22,179,698 | ||
Health Care REITs — 1.0% | ||
Ventas, Inc. | 85,488 | 4,041,018 |
Hotel & Resort REITs — 0.2% | ||
Host Hotels & Resorts, Inc. | 60,544 | 1,018,956 |
Hotels, Restaurants & Leisure — 1.9% | ||
Booking Holdings, Inc. * | 537 | 1,450,077 |
Carnival Corp. * | 77,843 | 1,465,784 |
Domino's Pizza, Inc. | 6,040 | 2,035,420 |
INVESTMENTS | SHARES | VALUE($) |
Hotels, Restaurants & Leisure — continued | ||
McDonald's Corp. | 7,635 | 2,278,360 |
Wynn Resorts Ltd. | 7,252 | 765,884 |
7,995,525 | ||
Household Durables — 0.3% | ||
Toll Brothers, Inc. | 16,221 | 1,282,594 |
Household Products — 0.6% | ||
Procter & Gamble Co. (The) | 16,635 | 2,524,195 |
Industrial Conglomerates — 0.7% | ||
Honeywell International, Inc. | 13,835 | 2,870,763 |
Insurance — 3.8% | ||
Chubb Ltd. | 10,076 | 1,940,235 |
Hartford Financial Services Group, Inc. (The) | 26,578 | 1,914,148 |
Loews Corp. | 16,311 | 968,547 |
Marsh & McLennan Cos., Inc. | 6,029 | 1,133,934 |
MetLife, Inc. | 38,092 | 2,153,341 |
Progressive Corp. (The) | 24,716 | 3,271,657 |
Prudential Financial, Inc. | 9,391 | 828,474 |
Travelers Cos., Inc. (The) | 16,549 | 2,873,899 |
Willis Towers Watson plc | 2,683 | 631,846 |
15,716,081 | ||
Interactive Media & Services — 1.9% | ||
Alphabet, Inc., Class C * | 22,447 | 2,715,414 |
Meta Platforms, Inc., Class A * | 17,728 | 5,087,581 |
7,802,995 | ||
IT Services — 0.3% | ||
International Business Machines Corp. | 9,743 | 1,303,711 |
Machinery — 1.9% | ||
AGCO Corp. | 8,278 | 1,087,895 |
Dover Corp. | 20,602 | 3,041,885 |
Parker-Hannifin Corp. | 10,165 | 3,964,757 |
8,094,537 | ||
Media — 2.8% | ||
Charter Communications, Inc., Class A * | 12,894 | 4,736,869 |
Comcast Corp., Class A | 165,222 | 6,864,974 |
11,601,843 | ||
Metals & Mining — 0.3% | ||
Alcoa Corp. | 37,117 | 1,259,380 |
Multi-Utilities — 3.1% | ||
Ameren Corp. | 9,574 | 781,909 |
CenterPoint Energy, Inc. | 14,627 | 426,377 |
June 30, 2023 | J.P. Morgan Exchange-Traded Funds | 33 |
AS OF June 30, 2023 (continued)
INVESTMENTS | SHARES | VALUE($) |
Common Stocks — continued | ||
Multi-Utilities — continued | ||
CMS Energy Corp. | 35,170 | 2,066,237 |
Dominion Energy, Inc. | 84,197 | 4,360,563 |
Public Service Enterprise Group, Inc. | 84,044 | 5,261,995 |
12,897,081 | ||
Oil, Gas & Consumable Fuels — 8.0% | ||
Cheniere Energy, Inc. | 6,596 | 1,004,966 |
Chevron Corp. | 53,928 | 8,485,571 |
ConocoPhillips | 48,878 | 5,064,250 |
Diamondback Energy, Inc. | 11,525 | 1,513,924 |
EOG Resources, Inc. | 38,532 | 4,409,602 |
EQT Corp. | 36,700 | 1,509,471 |
Exxon Mobil Corp. | 86,012 | 9,224,787 |
Pioneer Natural Resources Co. | 10,763 | 2,229,878 |
33,442,449 | ||
Passenger Airlines — 1.1% | ||
Delta Air Lines, Inc. * | 30,270 | 1,439,036 |
Southwest Airlines Co. | 86,208 | 3,121,591 |
4,560,627 | ||
Personal Care Products — 0.1% | ||
Kenvue, Inc. * (a) | 13,293 | 351,201 |
Pharmaceuticals — 5.0% | ||
Bristol-Myers Squibb Co. | 168,535 | 10,777,813 |
Eli Lilly & Co. | 3,531 | 1,655,968 |
Johnson & Johnson | 37,962 | 6,283,470 |
Merck & Co., Inc. | 7,081 | 817,077 |
Pfizer, Inc. | 34,997 | 1,283,690 |
20,818,018 | ||
Residential REITs — 0.9% | ||
AvalonBay Communities, Inc. | 3,739 | 707,681 |
Mid-America Apartment Communities, Inc. | 14,515 | 2,204,248 |
Sun Communities, Inc. | 7,616 | 993,583 |
3,905,512 | ||
Semiconductors & Semiconductor Equipment — 4.4% | ||
Advanced Micro Devices, Inc. * | 12,176 | 1,386,968 |
Analog Devices, Inc. | 17,585 | 3,425,734 |
Intel Corp. | 39,823 | 1,331,681 |
NXP Semiconductors NV (China) | 22,810 | 4,668,751 |
ON Semiconductor Corp. * | 9,104 | 861,056 |
Qorvo, Inc. * | 17,817 | 1,817,869 |
Skyworks Solutions, Inc. | 9,460 | 1,047,127 |
INVESTMENTS | SHARES | VALUE($) |
Semiconductors & Semiconductor Equipment — continued | ||
Teradyne, Inc. | 12,227 | 1,361,232 |
Texas Instruments, Inc. | 14,651 | 2,637,473 |
18,537,891 | ||
Software — 1.6% | ||
Microsoft Corp. | 8,717 | 2,968,487 |
Oracle Corp. | 10,046 | 1,196,378 |
Salesforce, Inc. * | 10,977 | 2,319,001 |
6,483,866 | ||
Specialized REITs — 0.8% | ||
Digital Realty Trust, Inc. | 28,977 | 3,299,611 |
Specialty Retail — 3.4% | ||
AutoZone, Inc. * | 843 | 2,101,903 |
Best Buy Co., Inc. | 13,177 | 1,079,855 |
Home Depot, Inc. (The) | 7,152 | 2,221,697 |
Lowe's Cos., Inc. | 19,061 | 4,302,068 |
O'Reilly Automotive, Inc. * | 1,350 | 1,289,655 |
TJX Cos., Inc. (The) | 37,165 | 3,151,220 |
14,146,398 | ||
Technology Hardware, Storage & Peripherals — 0.2% | ||
Apple, Inc. | 4,679 | 907,586 |
Textiles, Apparel & Luxury Goods — 0.6% | ||
Kontoor Brands, Inc. | 21,857 | 920,179 |
NIKE, Inc., Class B | 15,075 | 1,663,828 |
2,584,007 | ||
Tobacco — 1.7% | ||
Philip Morris International, Inc. | 71,991 | 7,027,761 |
Trading Companies & Distributors — 0.6% | ||
WESCO International, Inc. | 14,989 | 2,683,930 |
Wireless Telecommunication Services — 0.2% | ||
T-Mobile US, Inc. * | 7,133 | 990,774 |
Total Common Stocks (Cost $386,187,099) | 405,707,404 | |
Short-Term Investments — 3.0% | ||
Investment Companies — 2.9% | ||
JPMorgan U.S. Government Money Market Fund Class IM Shares, 5.05% (b) (c) (Cost $12,221,401) | 12,221,401 | 12,221,401 |
34 | J.P. Morgan Exchange-Traded Funds | June 30, 2023 |
INVESTMENTS | SHARES | VALUE($) |
Short-Term Investments — continued | ||
Investment of Cash Collateral from Securities Loaned — 0.1% | ||
JPMorgan U.S. Government Money Market Fund Class IM Shares, 5.05% (b) (c) (Cost $252,180) | 252,180 | 252,180 |
Total Short-Term Investments (Cost $12,473,581) | 12,473,581 | |
Total Investments — 99.9% (Cost $398,660,680) | 418,180,985 | |
Other Assets Less Liabilities — 0.1% | 261,643 | |
NET ASSETS — 100.0% | 418,442,628 | |
Percentages indicated are based on net assets. |
Abbreviations | |
REIT | Real Estate Investment Trust |
* | Non-income producing security. |
(a) | The security or a portion of this security is on loan at June 30, 2023. The total value of securities on loan at June 30, 2023 is $246,763. |
(b) | Investment in an affiliated fund, which is registered under the Investment Company Act of 1940, as amended, and is advised by J.P. Morgan Investment Management Inc. |
(c) | The rate shown is the current yield as of June 30, 2023. |
June 30, 2023 | J.P. Morgan Exchange-Traded Funds | 35 |
AS OF June 30, 2023
INVESTMENTS | SHARES | VALUE($) |
Common Stocks — 85.0% | ||
Aerospace & Defense — 1.6% | ||
General Dynamics Corp. | 447,447 | 96,268,222 |
Raytheon Technologies Corp. | 2,258,420 | 221,234,823 |
Textron, Inc. | 1,806,875 | 122,198,956 |
439,702,001 | ||
Air Freight & Logistics — 1.6% | ||
FedEx Corp. | 267,021 | 66,194,506 |
United Parcel Service, Inc., Class B | 2,067,301 | 370,563,704 |
436,758,210 | ||
Banks — 0.7% | ||
US Bancorp | 6,104,114 | 201,679,927 |
Beverages — 3.3% | ||
Coca-Cola Co. (The) | 6,282,096 | 378,307,821 |
Constellation Brands, Inc., Class A | 458,045 | 112,738,616 |
Monster Beverage Corp. * | 621,776 | 35,714,814 |
PepsiCo, Inc. | 2,150,751 | 398,362,100 |
925,123,351 | ||
Biotechnology — 3.4% | ||
AbbVie, Inc. | 2,722,780 | 366,840,150 |
Biogen, Inc. * | 122,838 | 34,990,404 |
Regeneron Pharmaceuticals, Inc. * | 329,917 | 237,058,561 |
Vertex Pharmaceuticals, Inc. * | 899,113 | 316,406,856 |
955,295,971 | ||
Broadline Retail — 1.7% | ||
Amazon.com, Inc. * | 3,561,718 | 464,305,558 |
Building Products — 1.3% | ||
Trane Technologies plc | 1,956,574 | 374,214,343 |
Capital Markets — 2.6% | ||
CME Group, Inc. | 1,830,941 | 339,255,058 |
Intercontinental Exchange, Inc. | 1,169,115 | 132,203,524 |
Raymond James Financial, Inc. | 643,700 | 66,796,749 |
S&P Global, Inc. | 510,112 | 204,498,800 |
742,754,131 | ||
Chemicals — 3.2% | ||
Air Products and Chemicals, Inc. | 1,081,717 | 324,006,693 |
Dow, Inc. | 1,780,420 | 94,825,169 |
Linde plc | 889,418 | 338,939,411 |
LyondellBasell Industries NV, Class A | 917,767 | 84,278,544 |
PPG Industries, Inc. | 407,746 | 60,468,732 |
902,518,549 | ||
INVESTMENTS | SHARES | VALUE($) |
Communications Equipment — 0.2% | ||
Motorola Solutions, Inc. | 176,336 | 51,715,822 |
Consumer Finance — 0.8% | ||
American Express Co. | 1,279,709 | 222,925,308 |
Consumer Staples Distribution & Retail — 1.9% | ||
Costco Wholesale Corp. | 706,149 | 380,176,499 |
Walmart, Inc. | 1,032,172 | 162,236,795 |
542,413,294 | ||
Containers & Packaging — 0.2% | ||
Avery Dennison Corp. | 278,751 | 47,889,422 |
Electric Utilities — 2.1% | ||
NextEra Energy, Inc. | 3,437,119 | 255,034,230 |
PG&E Corp. * | 4,729,723 | 81,729,613 |
Xcel Energy, Inc. | 3,989,981 | 248,057,119 |
584,820,962 | ||
Electrical Equipment — 1.3% | ||
Eaton Corp. plc | 1,806,674 | 363,322,141 |
Electronic Equipment, Instruments & Components — 0.6% | ||
Keysight Technologies, Inc. * | 1,066,867 | 178,646,879 |
Entertainment — 0.1% | ||
Netflix, Inc. * | 35,986 | 15,851,473 |
Financial Services — 5.1% | ||
Berkshire Hathaway, Inc., Class B * | 559,800 | 190,891,800 |
FleetCor Technologies, Inc. * | 619,946 | 155,656,042 |
Jack Henry & Associates, Inc. | 1,498,940 | 250,817,630 |
Mastercard, Inc., Class A | 1,075,211 | 422,880,486 |
Visa, Inc., Class A (a) | 1,681,371 | 399,291,985 |
1,419,537,943 | ||
Food Products — 2.0% | ||
Hershey Co. (The) | 1,605,625 | 400,924,562 |
Mondelez International, Inc., Class A | 2,347,424 | 171,221,107 |
572,145,669 | ||
Ground Transportation — 2.6% | ||
CSX Corp. | 4,322,778 | 147,406,730 |
Norfolk Southern Corp. | 882,855 | 200,196,200 |
Old Dominion Freight Line, Inc. | 701,421 | 259,350,415 |
Union Pacific Corp. | 646,949 | 132,378,704 |
739,332,049 | ||
Health Care Equipment & Supplies — 0.3% | ||
Boston Scientific Corp. * | 1,725,586 | 93,336,947 |
36 | J.P. Morgan Exchange-Traded Funds | June 30, 2023 |
INVESTMENTS | SHARES | VALUE($) |
Common Stocks — continued | ||
Health Care Providers & Services — 2.5% | ||
Centene Corp. * | 889,808 | 60,017,550 |
Elevance Health, Inc. | 303,735 | 134,946,423 |
Humana, Inc. | 301,762 | 134,926,843 |
UnitedHealth Group, Inc. | 765,849 | 368,097,663 |
697,988,479 | ||
Hotels, Restaurants & Leisure — 3.3% | ||
Booking Holdings, Inc. * | 64,232 | 173,447,597 |
Chipotle Mexican Grill, Inc. * | 173,648 | 371,433,072 |
McDonald's Corp. | 171,704 | 51,238,191 |
Yum! Brands, Inc. | 2,370,919 | 328,490,827 |
924,609,687 | ||
Household Products — 3.3% | ||
Colgate-Palmolive Co. | 4,701,423 | 362,197,628 |
Kimberly-Clark Corp. | 1,528,458 | 211,018,911 |
Procter & Gamble Co. (The) | 2,394,086 | 363,278,610 |
936,495,149 | ||
Industrial Conglomerates — 1.3% | ||
Honeywell International, Inc. | 1,802,357 | 373,989,077 |
Industrial REITs — 0.7% | ||
Prologis, Inc. | 1,549,964 | 190,072,085 |
Insurance — 2.7% | ||
Globe Life, Inc. | 217,290 | 23,819,330 |
Progressive Corp. (The) | 3,014,709 | 399,057,030 |
Travelers Cos., Inc. (The) | 1,995,381 | 346,517,865 |
769,394,225 | ||
Interactive Media & Services — 2.2% | ||
Alphabet, Inc., Class A * | 2,982,566 | 357,013,150 |
Meta Platforms, Inc., Class A * | 910,362 | 261,255,687 |
618,268,837 | ||
IT Services — 2.4% | ||
Accenture plc, Class A | 1,294,367 | 399,415,769 |
Cognizant Technology Solutions Corp., Class A | 3,189,163 | 208,188,561 |
VeriSign, Inc. * | 250,984 | 56,714,854 |
664,319,184 | ||
Life Sciences Tools & Services — 1.4% | ||
Danaher Corp. | 269,012 | 64,562,880 |
Thermo Fisher Scientific, Inc. | 614,666 | 320,701,985 |
385,264,865 | ||
INVESTMENTS | SHARES | VALUE($) |
Machinery — 1.6% | ||
Deere & Co. | 334,443 | 135,512,959 |
Dover Corp. | 1,505,914 | 222,348,202 |
Otis Worldwide Corp. | 1,143,958 | 101,823,702 |
459,684,863 | ||
Media — 1.8% | ||
Charter Communications, Inc., Class A * (a) | 241,821 | 88,837,781 |
Comcast Corp., Class A | 9,744,911 | 404,901,052 |
493,738,833 | ||
Multi-Utilities — 2.6% | ||
Ameren Corp. | 2,022,120 | 165,146,540 |
CMS Energy Corp. | 2,036,801 | 119,662,059 |
Dominion Energy, Inc. | 1,361,227 | 70,497,946 |
Public Service Enterprise Group, Inc. | 5,642,927 | 353,303,660 |
Sempra Energy | 168,662 | 24,555,501 |
733,165,706 | ||
Oil, Gas & Consumable Fuels — 2.4% | ||
Chevron Corp. | 722,063 | 113,616,613 |
ConocoPhillips | 2,332,420 | 241,662,036 |
EOG Resources, Inc. | 1,541,985 | 176,464,763 |
Exxon Mobil Corp. | 1,252,314 | 134,310,677 |
666,054,089 | ||
Personal Care Products — 0.1% | ||
Kenvue, Inc. * (a) | 548,459 | 14,490,287 |
Pharmaceuticals — 3.8% | ||
Bristol-Myers Squibb Co. | 5,346,933 | 341,936,365 |
Eli Lilly & Co. | 748,171 | 350,877,236 |
Johnson & Johnson | 1,036,556 | 171,570,749 |
Merck & Co., Inc. | 1,821,025 | 210,128,075 |
1,074,512,425 | ||
Professional Services — 0.2% | ||
Automatic Data Processing, Inc. | 96,177 | 21,138,743 |
Booz Allen Hamilton Holding Corp. | 376,979 | 42,070,856 |
63,209,599 | ||
Residential REITs — 0.7% | ||
Sun Communities, Inc. | 792,078 | 103,334,496 |
UDR, Inc. | 1,829,811 | 78,608,680 |
181,943,176 | ||
Semiconductors & Semiconductor Equipment — 4.3% | ||
Analog Devices, Inc. | 1,584,574 | 308,690,861 |
June 30, 2023 | J.P. Morgan Exchange-Traded Funds | 37 |
AS OF June 30, 2023 (continued)
INVESTMENTS | SHARES | VALUE($) |
Common Stocks — continued | ||
Semiconductors & Semiconductor Equipment — continued | ||
ASML Holding NV (Registered), NYRS (Netherlands) | 254,578 | 184,505,405 |
NXP Semiconductors NV (China) | 1,610,760 | 329,690,357 |
Texas Instruments, Inc. | 2,074,592 | 373,468,052 |
1,196,354,675 | ||
Software — 5.7% | ||
Adobe, Inc. * | 964,355 | 471,559,951 |
Cadence Design Systems, Inc. * | 537,277 | 126,002,202 |
Intuit, Inc. | 816,821 | 374,259,214 |
Microsoft Corp. | 1,352,427 | 460,555,491 |
ServiceNow, Inc. * | 114,349 | 64,260,708 |
Synopsys, Inc. * | 256,315 | 111,602,114 |
1,608,239,680 | ||
Specialized REITs — 1.8% | ||
American Tower Corp. | 116,681 | 22,629,113 |
Equinix, Inc. | 318,294 | 249,523,398 |
SBA Communications Corp. | 1,017,134 | 235,730,976 |
507,883,487 | ||
Specialty Retail — 2.6% | ||
AutoZone, Inc. * | 77,886 | 194,197,837 |
Best Buy Co., Inc. | 316,369 | 25,926,440 |
Lowe's Cos., Inc. | 1,687,123 | 380,783,661 |
O'Reilly Automotive, Inc. * | 78,030 | 74,542,059 |
TJX Cos., Inc. (The) | 437,857 | 37,125,895 |
Ulta Beauty, Inc. * | 16,814 | 7,912,584 |
720,488,476 | ||
Technology Hardware, Storage & Peripherals — 0.2% | ||
Apple, Inc. | 282,142 | 54,727,084 |
Textiles, Apparel & Luxury Goods — 0.2% | ||
NIKE, Inc., Class B | 526,318 | 58,089,718 |
Tobacco — 0.4% | ||
Altria Group, Inc. | 949,784 | 43,025,215 |
Philip Morris International, Inc. | 771,326 | 75,296,844 |
118,322,059 | ||
Wireless Telecommunication Services — 0.2% | ||
T-Mobile US, Inc. * | 411,142 | 57,107,624 |
Total Common Stocks (Cost $22,117,076,502) | 23,842,703,319 | |
INVESTMENTS | PRINCIPAL AMOUNT($) | VALUE($) |
Equity-Linked Notes — 13.1% | ||
Barclays Bank plc, ELN, 44.00%, 7/12/2023, (linked to S&P 500 Index) (United Kingdom) (b) | 58,753 | 212,538,977 |
BNP Paribas, ELN, 39.10%, 7/17/2023, (linked to S&P 500 Index) (b) | 58,113 | 225,494,712 |
BNP Paribas, ELN, 40.39%, 8/4/2023, (linked to S&P 500 Index) (b) | 56,642 | 242,646,965 |
BNP Paribas, ELN, 42.16%, 8/7/2023, (linked to S&P 500 Index) (b) | 56,662 | 241,479,845 |
BNP Paribas, ELN, 43.03%, 7/31/2023, (linked to S&P 500 Index) (b) | 64,595 | 276,287,026 |
BofA Finance LLC, ELN, 38.80%, 7/18/2023, (linked to S&P 500 Index) (b) | 57,756 | 230,575,813 |
BofA Finance LLC, ELN, 40.10%, 7/14/2023, (linked to S&P 500 Index) (b) | 57,892 | 230,076,123 |
BofA Finance LLC, ELN, 40.90%, 7/28/2023, (linked to S&P 500 Index) (b) | 64,256 | 281,059,599 |
GS Finance Corp., ELN, 44.60%, 7/10/2023, (linked to S&P 500 Index) (b) | 57,544 | 205,994,285 |
GS Finance Corp., ELN, 45.85%, 7/11/2023, (linked to S&P 500 Index) (b) | 59,333 | 202,894,533 |
National Bank of Canada, ELN, 41.60%, 7/24/2023, (linked to S&P 500 Index) (b) | 60,376 | 261,991,992 |
Royal Bank of Canada, ELN, 41.27%, 8/1/2023, (linked to S&P 500 Index) (Canada) (b) | 64,356 | 277,810,694 |
Royal Bank of Canada, ELN, 42.13%, 8/8/2023, (linked to S&P 500 Index) (Canada) (b) | 56,410 | 244,073,660 |
Royal Bank of Canada, ELN, 42.31%, 7/21/2023, (linked to S&P 500 Index) (Canada) (b) | 60,425 | 261,454,745 |
Royal Bank of Canada, ELN, 45.51%, 7/25/2023, (linked to S&P 500 Index) (Canada) (b) | 63,716 | 285,419,008 |
Total Equity-Linked Notes (Cost $3,882,005,213) | 3,679,797,977 | |
SHARES | ||
Short-Term Investments — 2.2% | ||
Investment Companies — 0.8% | ||
JPMorgan U.S. Government Money Market Fund Class IM Shares, 5.05% (c) (d) (Cost $224,743,189) | 224,743,189 | 224,743,189 |
38 | J.P. Morgan Exchange-Traded Funds | June 30, 2023 |
INVESTMENTS | SHARES | VALUE($) |
Short-Term Investments — continued | ||
Investment of Cash Collateral from Securities Loaned — 1.4% | ||
JPMorgan Securities Lending Money Market Fund Agency SL Class Shares, 5.29% (c) (d) | 334,933,313 | 334,966,807 |
JPMorgan U.S. Government Money Market Fund Class IM Shares, 5.05% (c) (d) | 47,208,090 | 47,208,090 |
Total Investment of Cash Collateral from Securities Loaned (Cost $382,192,492) | 382,174,897 | |
Total Short-Term Investments (Cost $606,935,681) | 606,918,086 | |
Total Investments — 100.3% (Cost $26,606,017,396) | 28,129,419,382 | |
Liabilities in Excess of Other Assets — (0.3)% | (82,723,054 ) | |
NET ASSETS — 100.0% | 28,046,696,328 | |
Percentages indicated are based on net assets. |
Abbreviations | |
ELN | Equity-Linked Note |
NYRS | New York Registry Shares |
REIT | Real Estate Investment Trust |
* | Non-income producing security. |
(a) | The security or a portion of this security is on loan at June 30, 2023. The total value of securities on loan at June 30, 2023 is $379,594,014. |
(b) | Securities exempt from registration under Rule 144A or section 4(a)(2), of the Securities Act of 1933, as amended. |
(c) | Investment in an affiliated fund, which is registered under the Investment Company Act of 1940, as amended, and is advised by J.P. Morgan Investment Management Inc. |
(d) | The rate shown is the current yield as of June 30, 2023. |
June 30, 2023 | J.P. Morgan Exchange-Traded Funds | 39 |
AS OF June 30, 2023
INVESTMENTS | SHARES | VALUE($) |
Common Stocks — 81.8% | ||
Air Freight & Logistics — 0.2% | ||
United Parcel Service, Inc., Class B | 46,521 | 8,338,889 |
Automobiles — 3.3% | ||
Tesla, Inc. * | 499,902 | 130,859,346 |
Beverages — 2.0% | ||
Coca-Cola Co. (The) | 265,156 | 15,967,694 |
Constellation Brands, Inc., Class A | 56,664 | 13,946,710 |
Monster Beverage Corp. * | 388,272 | 22,302,344 |
PepsiCo, Inc. | 139,202 | 25,782,995 |
77,999,743 | ||
Biotechnology — 2.4% | ||
AbbVie, Inc. | 107,512 | 14,485,092 |
Amgen, Inc. | 38,645 | 8,579,963 |
Biogen, Inc. * | 59,705 | 17,006,969 |
Regeneron Pharmaceuticals, Inc. * | 40,202 | 28,886,745 |
Seagen, Inc. * | 22,255 | 4,283,197 |
Vertex Pharmaceuticals, Inc. * | 62,093 | 21,851,148 |
95,093,114 | ||
Broadline Retail — 6.1% | ||
Amazon.com, Inc. * | 1,743,044 | 227,223,216 |
MercadoLibre, Inc. (Brazil) * | 13,275 | 15,725,565 |
242,948,781 | ||
Commercial Services & Supplies — 0.5% | ||
Copart, Inc. * | 228,374 | 20,829,992 |
Communications Equipment — 1.2% | ||
Cisco Systems, Inc. | 874,594 | 45,251,494 |
Consumer Staples Distribution & Retail — 1.2% | ||
Costco Wholesale Corp. | 65,298 | 35,155,137 |
Dollar Tree, Inc. * | 69,849 | 10,023,332 |
45,178,469 | ||
Electric Utilities — 1.0% | ||
NextEra Energy, Inc. | 227,028 | 16,845,478 |
Xcel Energy, Inc. | 391,296 | 24,326,872 |
41,172,350 | ||
Electrical Equipment — 0.5% | ||
Eaton Corp. plc | 88,009 | 17,698,610 |
Entertainment — 1.4% | ||
Netflix, Inc. * | 113,378 | 49,941,875 |
Take-Two Interactive Software, Inc. * | 46,339 | 6,819,247 |
56,761,122 | ||
INVESTMENTS | SHARES | VALUE($) |
Financial Services — 0.8% | ||
FleetCor Technologies, Inc. * | 26,642 | 6,689,273 |
Mastercard, Inc., Class A | 30,403 | 11,957,500 |
PayPal Holdings, Inc. * | 197,442 | 13,175,305 |
31,822,078 | ||
Food Products — 1.1% | ||
Kraft Heinz Co. (The) | 368,131 | 13,068,651 |
Mondelez International, Inc., Class A | 435,897 | 31,794,327 |
44,862,978 | ||
Ground Transportation — 0.4% | ||
CSX Corp. | 339,375 | 11,572,688 |
Uber Technologies, Inc. * | 129,132 | 5,574,628 |
17,147,316 | ||
Health Care Equipment & Supplies — 1.6% | ||
Dexcom, Inc. * | 199,708 | 25,664,475 |
Intuitive Surgical, Inc. * | 114,104 | 39,016,722 |
64,681,197 | ||
Health Care Providers & Services — 0.3% | ||
UnitedHealth Group, Inc. | 22,438 | 10,784,600 |
Hotels, Restaurants & Leisure — 2.0% | ||
Airbnb, Inc., Class A * | 14,936 | 1,914,198 |
Booking Holdings, Inc. * | 14,288 | 38,582,315 |
Chipotle Mexican Grill, Inc. * | 9,253 | 19,792,167 |
Marriott International, Inc., Class A | 91,305 | 16,771,815 |
Starbucks Corp. | 25,095 | 2,485,911 |
79,546,406 | ||
Industrial Conglomerates — 0.7% | ||
Honeywell International, Inc. | 126,017 | 26,148,527 |
Industrial REITs — 0.3% | ||
Prologis, Inc. | 94,964 | 11,645,435 |
Interactive Media & Services — 9.7% | ||
Alphabet, Inc., Class C * | 2,014,038 | 243,638,177 |
Meta Platforms, Inc., Class A * | 490,115 | 140,653,203 |
384,291,380 | ||
IT Services — 0.1% | ||
Cognizant Technology Solutions Corp., Class A | 83,515 | 5,451,859 |
Life Sciences Tools & Services — 0.2% | ||
Thermo Fisher Scientific, Inc. | 18,142 | 9,465,588 |
Machinery — 0.4% | ||
Deere & Co. | 42,305 | 17,141,563 |
40 | J.P. Morgan Exchange-Traded Funds | June 30, 2023 |
INVESTMENTS | SHARES | VALUE($) |
Common Stocks — continued | ||
Media — 1.4% | ||
Charter Communications, Inc., Class A * | 29,121 | 10,698,182 |
Comcast Corp., Class A | 1,065,771 | 44,282,785 |
54,980,967 | ||
Oil, Gas & Consumable Fuels — 0.3% | ||
Diamondback Energy, Inc. | 72,963 | 9,584,420 |
Pharmaceuticals — 0.3% | ||
Bristol-Myers Squibb Co. | 148,909 | 9,522,731 |
Professional Services — 0.4% | ||
Verisk Analytics, Inc. | 67,765 | 15,316,923 |
Semiconductors & Semiconductor Equipment — 14.3% | ||
Advanced Micro Devices, Inc. * | 467,495 | 53,252,355 |
Analog Devices, Inc. | 204,522 | 39,842,931 |
Applied Materials, Inc. | 100,648 | 14,547,662 |
ASML Holding NV (Registered), NYRS (Netherlands) | 29,665 | 21,499,709 |
Broadcom, Inc. | 55,954 | 48,536,178 |
Intel Corp. | 382,966 | 12,806,383 |
Lam Research Corp. | 44,692 | 28,730,699 |
Marvell Technology, Inc. | 260,336 | 15,562,886 |
Micron Technology, Inc. | 65,207 | 4,115,214 |
NVIDIA Corp. | 532,511 | 225,262,803 |
NXP Semiconductors NV (China) | 124,084 | 25,397,513 |
QUALCOMM, Inc. | 269,606 | 32,093,898 |
Teradyne, Inc. | 147,878 | 16,463,258 |
Texas Instruments, Inc. | 160,589 | 28,909,232 |
567,020,721 | ||
Software — 15.9% | ||
Adobe, Inc. * | 85,330 | 41,725,517 |
Crowdstrike Holdings, Inc., Class A * | 35,429 | 5,203,457 |
HubSpot, Inc. * | 23,528 | 12,519,014 |
Intuit, Inc. | 87,735 | 40,199,300 |
Microsoft Corp. | 1,254,771 | 427,299,715 |
Oracle Corp. | 97,352 | 11,593,650 |
Palo Alto Networks, Inc. * | 108,404 | 27,698,306 |
ServiceNow, Inc. * | 20,322 | 11,420,354 |
Synopsys, Inc. * | 89,850 | 39,121,588 |
Workday, Inc., Class A * | 51,921 | 11,728,435 |
628,509,336 | ||
Specialty Retail — 1.0% | ||
Lowe's Cos., Inc. | 71,062 | 16,038,693 |
O'Reilly Automotive, Inc. * | 25,915 | 24,756,600 |
40,795,293 | ||
INVESTMENTS | SHARES | VALUE($) |
Technology Hardware, Storage & Peripherals — 9.9% | ||
Apple, Inc. | 1,964,456 | 381,045,530 |
Seagate Technology Holdings plc | 189,911 | 11,749,794 |
392,795,324 | ||
Textiles, Apparel & Luxury Goods — 0.3% | ||
NIKE, Inc., Class B | 103,216 | 11,391,950 |
Wireless Telecommunication Services — 0.6% | ||
T-Mobile US, Inc. * | 162,922 | 22,629,866 |
Total Common Stocks (Cost $2,686,643,493) | 3,237,668,368 | |
PRINCIPAL AMOUNT($) | ||
Equity-Linked Notes — 16.1% | ||
Barclays Bank plc, ELN, 69.30%, 8/8/2023, (linked to Nasdaq-100 Index) (a) | 9,036 | 132,830,194 |
BNP Paribas, ELN, 63.79%, 8/1/2023, (linked to Nasdaq-100 Index) (a) | 8,642 | 130,900,979 |
Morgan Stanley Finance LLC, ELN, 62.59%, 7/11/2023, (linked to Nasdaq-100 Index) (a) | 9,694 | 131,282,740 |
Royal Bank of Canada, ELN, 59.85%, 7/18/2023, (linked to Nasdaq-100 Index) (Canada) (a) | 8,975 | 120,692,300 |
Societe Generale, ELN, 67.45%, 7/25/2023, (linked to Nasdaq-100 Index) (a) | 7,902 | 122,418,969 |
Total Equity-Linked Notes (Cost $654,983,525) | 638,125,182 | |
SHARES | ||
Short-Term Investments — 1.3% | ||
Investment Companies — 1.3% | ||
JPMorgan U.S. Government Money Market Fund Class IM Shares, 5.05% (b) (c) (Cost $49,625,385) | 49,625,385 | 49,625,385 |
Total Investments — 99.2% (Cost $3,391,252,403) | 3,925,418,935 | |
Other Assets Less Liabilities — 0.8% | 31,577,127 | |
NET ASSETS — 100.0% | 3,956,996,062 | |
Percentages indicated are based on net assets. |
Abbreviations | |
ELN | Equity-Linked Note |
June 30, 2023 | J.P. Morgan Exchange-Traded Funds | 41 |
AS OF June 30, 2023 (continued)
NYRS | New York Registry Shares |
REIT | Real Estate Investment Trust |
* | Non-income producing security. |
(a) | Securities exempt from registration under Rule 144A or section 4(a)(2), of the Securities Act of 1933, as amended. |
(b) | Investment in an affiliated fund, which is registered under the Investment Company Act of 1940, as amended, and is advised by J.P. Morgan Investment Management Inc. |
(c) | The rate shown is the current yield as of June 30, 2023. |
42 | J.P. Morgan Exchange-Traded Funds | June 30, 2023 |
AS OF June 30, 2023
JPMorgan ActiveBuilders U.S. Large Cap Equity ETF | JPMorgan Active Growth ETF | JPMorgan Active Small Cap Value ETF | |
ASSETS: | |||
Investments in non-affiliates, at value | $27,698,365 | $351,053,722 | $10,567,216 |
Investments in affiliates, at value | 90,192 | 6,933,264 | 278,027 |
Cash | 443 | 33,495 | 1,707 |
Deposits at broker for futures contracts | 19,000 | — | — |
Receivables: | |||
Investment securities sold | 29,534 | — | 35,179 |
Fund shares sold | — | 115,544 | — |
Dividends from non-affiliates | 19,939 | 40,863 | 9,649 |
Dividends from affiliates | 13 | 960 | 39 |
Variation margin on futures contracts | 978 | — | — |
Total Assets | 27,858,464 | 358,177,848 | 10,891,817 |
LIABILITIES: | |||
Payables: | |||
Investment securities purchased | 27,492 | — | 48,701 |
Fund shares redeemed | — | 28,878 | — |
Accrued liabilities: | |||
Management fees (See Note 3.A.) | 3,786 | 118,592 | 6,460 |
Total Liabilities | 31,278 | 147,470 | 55,161 |
Net Assets | $27,827,186 | $358,030,378 | $10,836,656 |
NET ASSETS: | |||
Paid-in-Capital | $26,962,153 | $312,339,762 | $10,957,300 |
Total distributable earnings (loss) | 865,033 | 45,690,616 | (120,644 ) |
Total Net Assets | $27,827,186 | $358,030,378 | $10,836,656 |
Outstanding number of shares (unlimited number of shares authorized - par value $0.0001) | 550,000 | 6,425,000 | 220,000 |
Net asset value, per share | $50.59 | $55.72 | $49.26 |
Cost of investments in non-affiliates | $25,040,053 | $293,993,896 | $10,713,824 |
Cost of investments in affiliates | 90,192 | 6,933,264 | 278,027 |
June 30, 2023 | J.P. Morgan Exchange-Traded Funds | 43 |
AS OF June 30, 2023 (continued)
JPMorgan Active Value ETF | JPMorgan Equity Premium Income ETF | JPMorgan Nasdaq Equity Premium Income ETF | |
ASSETS: | |||
Investments in non-affiliates, at value | $405,707,404 | $27,522,501,296 | $3,875,793,550 |
Investments in affiliates, at value | 12,221,401 | 224,743,189 | 49,625,385 |
Investments of cash collateral received from securities loaned, at value (See Note 2.C.) | 252,180 | 382,174,897 | — |
Cash | 42,869 | 988,824 | 183,271 |
Foreign currency, at value | 9,529 | — | — |
Receivables: | |||
Investment securities sold | — | 771,617,437 | 125,194,150 |
Fund shares sold | 174,445 | 44,612,973 | 21,755,719 |
Interest from non-affiliates | — | 80,293,880 | 19,572,500 |
Dividends from non-affiliates | 426,522 | 21,702,132 | 863,935 |
Dividends from affiliates | 1,693 | 31,125 | 6,873 |
Securities lending income (See Note 2.C.) | 82 | 60,937 | — |
Total Assets | 418,836,125 | 29,048,726,690 | 4,092,995,383 |
LIABILITIES: | |||
Payables: | |||
Investment securities purchased | — | 612,167,640 | 134,997,389 |
Collateral received on securities loaned (See Note 2.C.) | 252,180 | 382,174,897 | — |
Accrued liabilities: | |||
Management fees (See Note 3.A.) | 141,317 | 7,687,825 | 1,001,932 |
Total Liabilities | 393,497 | 1,002,030,362 | 135,999,321 |
Net Assets | $418,442,628 | $28,046,696,328 | $3,956,996,062 |
NET ASSETS: | |||
Paid-in-Capital | $403,548,843 | $28,927,568,836 | $3,721,962,044 |
Total distributable earnings (loss) | 14,893,785 | (880,872,508 ) | 235,034,018 |
Total Net Assets | $418,442,628 | $28,046,696,328 | $3,956,996,062 |
Outstanding number of shares (unlimited number of shares authorized - par value $0.0001) | 7,875,000 | 507,225,000 | 81,875,000 |
Net asset value, per share | $53.14 | $55.29 | $48.33 |
Cost of investments in non-affiliates | $386,187,099 | $25,999,081,715 | $3,341,627,018 |
Cost of investments in affiliates | 12,221,401 | 224,743,189 | 49,625,385 |
Cost of foreign currency | 9,525 | — | — |
Investment securities on loan, at value (See Note 2.C.) | 246,763 | 379,594,014 | — |
Cost of investment of cash collateral (See Note 2.C.) | 252,180 | 382,192,492 | — |
44 | J.P. Morgan Exchange-Traded Funds | June 30, 2023 |
FOR THE YEAR ENDED June 30, 2023
JPMorgan ActiveBuilders U.S. Large Cap Equity ETF | JPMorgan Active Growth ETF (a) | JPMorgan Active Small Cap Value ETF (b) | |
INVESTMENT INCOME: | |||
Interest income from non-affiliates | $799 | $— | $— |
Interest income from affiliates | — | 39 | — |
Dividend income from non-affiliates | 416,908 | 1,154,049 | 68,074 |
Dividend income from affiliates | 3,613 | 160,587 | 6,225 |
Total investment income | 421,320 | 1,314,675 | 74,299 |
EXPENSES: | |||
Management fees (See Note 3.A.) | 42,698 | 651,622 | 23,690 |
Total expenses | 42,698 | 651,622 | 23,690 |
Net investment income (loss) | 378,622 | 663,053 | 50,609 |
REALIZED/UNREALIZED GAINS (LOSSES): | |||
Net realized gain (loss) on transactions from: | |||
Investments in non-affiliates | (1,125,780 ) | (11,977,966 ) | (24,645 ) |
In-kind redemptions of investments in non-affiliates (See Note 4) | — | 4,973,326 | — |
Futures contracts | 10,834 | — | — |
Net realized gain (loss) | (1,114,946 ) | (7,004,640 ) | (24,645 ) |
Change in net unrealized appreciation/depreciation on: | |||
Investments in non-affiliates | 5,260,190 | 57,059,826 | (146,608 ) |
Futures contracts | 2,893 | — | — |
Change in net unrealized appreciation/depreciation | 5,263,083 | 57,059,826 | (146,608 ) |
Net realized/unrealized gains (losses) | 4,148,137 | 50,055,186 | (171,253 ) |
Change in net assets resulting from operations | $4,526,759 | $50,718,239 | $(120,644 ) |
June 30, 2023 | J.P. Morgan Exchange-Traded Funds | 45 |
FOR THE YEAR ENDED June 30, 2023 (continued)
JPMorgan Active Value ETF | JPMorgan Equity Premium Income ETF | JPMorgan Nasdaq Equity Premium Income ETF | |
INVESTMENT INCOME: | |||
Interest income from non-affiliates | $— | $1,704,013,033 | $174,146,637 |
Interest income from affiliates | — | 261,549 | 2,642 |
Dividend income from non-affiliates | 5,509,318 | 295,918,292 | 9,343,001 |
Dividend income from affiliates | 296,277 | 9,157,803 | 818,573 |
Income from securities lending (net) (See Note 2.C.) | 119 | 162,790 | 74 |
Total investment income | 5,805,714 | 2,009,513,467 | 184,310,927 |
EXPENSES: | |||
Management fees (See Note 3.A.) | 1,078,937 | 63,365,783 | 4,635,375 |
Interest expense to non-affiliates | — | 530 | 16 |
Other | — | 35,463 | — |
Total expenses | 1,078,937 | 63,401,776 | 4,635,391 |
Net investment income (loss) | 4,726,777 | 1,946,111,691 | 179,675,536 |
REALIZED/UNREALIZED GAINS (LOSSES): | |||
Net realized gain (loss) on transactions from: | |||
Investments in non-affiliates | (4,441,125 ) | (1,986,544,408 ) | (331,397,937 ) |
In-kind redemptions of investments in non-affiliates (See Note 4) | 2,203,966 | 188,660,157 | 45,899,313 |
Futures contracts | — | (4,000,766 ) | 83,798 |
Foreign currency transactions | 116 | — | — |
Net realized gain (loss) | (2,237,043 ) | (1,801,885,017 ) | (285,414,826 ) |
Change in net unrealized appreciation/depreciation on: | |||
Investments in non-affiliates | 21,464,205 | 1,882,951,860 | 538,790,194 |
Investments in affiliates | — | (17,595 ) | — |
Futures contracts | — | — | 15,350 |
Foreign currency translations | 4 | — | — |
Change in net unrealized appreciation/depreciation | 21,464,209 | 1,882,934,265 | 538,805,544 |
Net realized/unrealized gains (losses) | 19,227,166 | 81,049,248 | 253,390,718 |
Change in net assets resulting from operations | $23,953,943 | $2,027,160,939 | $433,066,254 |
46 | J.P. Morgan Exchange-Traded Funds | June 30, 2023 |
FOR THE PERIODS INDICATED
JPMorgan ActiveBuilders U.S. Large Cap Equity ETF | JPMorgan Active Growth ETF | ||
Year Ended June 30, 2023 | Period Ended June 30, 2022 (a) | Period Ended June 30, 2023 (b) | |
CHANGE IN NET ASSETS RESULTING FROM OPERATIONS: | |||
Net investment income (loss) | $378,622 | $334,991 | $663,053 |
Net realized gain (loss) | (1,114,946 ) | (861,236 ) | (7,004,640 ) |
Change in net unrealized appreciation/depreciation | 5,263,083 | (2,601,888 ) | 57,059,826 |
Change in net assets resulting from operations | 4,526,759 | (3,128,133 ) | 50,718,239 |
DISTRIBUTIONS TO SHAREHOLDERS: | |||
Total distributions to shareholders | (378,735 ) | (154,858 ) | (206,646 ) |
CAPITAL TRANSACTIONS: | |||
Change in net assets resulting from capital transactions | — | 26,962,153 | 307,518,785 |
NET ASSETS: | |||
Change in net assets | 4,148,024 | 23,679,162 | 358,030,378 |
Beginning of period | 23,679,162 | — | — |
End of period | $27,827,186 | $23,679,162 | $358,030,378 |
CAPITAL TRANSACTIONS: | |||
Proceeds from shares issued | $— | $26,962,153 | $329,978,902 |
Cost of shares redeemed | — | — | (22,460,117 ) |
Total change in net assets resulting from capital transactions | $— | $26,962,153 | $307,518,785 |
SHARE TRANSACTIONS: | |||
Issued | — | 550,000 | 6,875,000 |
Redeemed | — | — | (450,000 ) |
Net increase (decrease) in shares from share transactions | — | 550,000 | 6,425,000 |
June 30, 2023 | J.P. Morgan Exchange-Traded Funds | 47 |
FOR THE PERIODS INDICATED (continued)
JPMorgan Active Small Cap Value ETF | JPMorgan Active Value ETF | ||
Period Ended June 30, 2023 (a) | Year Ended June 30, 2023 | Period Ended June 30, 2022 (b) | |
CHANGE IN NET ASSETS RESULTING FROM OPERATIONS: | |||
Net investment income (loss) | $50,609 | $4,726,777 | $410,429 |
Net realized gain (loss) | (24,645 ) | (2,237,043 ) | (635,535 ) |
Change in net unrealized appreciation/depreciation | (146,608 ) | 21,464,209 | (1,943,900 ) |
Change in net assets resulting from operations | (120,644 ) | 23,953,943 | (2,169,006 ) |
DISTRIBUTIONS TO SHAREHOLDERS: | |||
Total distributions to shareholders | — | (4,338,724 ) | (377,424 ) |
CAPITAL TRANSACTIONS: | |||
Change in net assets resulting from capital transactions | 10,957,300 | 354,602,282 | 46,771,557 |
NET ASSETS: | |||
Change in net assets | 10,836,656 | 374,217,501 | 44,225,127 |
Beginning of period | — | 44,225,127 | — |
End of period | $10,836,656 | $418,442,628 | $44,225,127 |
CAPITAL TRANSACTIONS: | |||
Proceeds from shares issued | $10,957,300 | $370,777,128 | $46,771,557 |
Cost of shares redeemed | — | (16,174,846 ) | — |
Total change in net assets resulting from capital transactions | $10,957,300 | $354,602,282 | $46,771,557 |
SHARE TRANSACTIONS: | |||
Issued | 220,000 | 7,275,000 | 925,000 |
Redeemed | — | (325,000 ) | — |
Net increase (decrease) in shares from share transactions | 220,000 | 6,950,000 | 925,000 |
48 | J.P. Morgan Exchange-Traded Funds | June 30, 2023 |
JPMorgan Equity Premium Income ETF | JPMorgan Nasdaq Equity Premium Income ETF | |||
Year Ended June 30, 2023 | Year Ended June 30, 2022 | Year Ended June 30, 2023 | Period Ended June 30, 2022 (a) | |
CHANGE IN NET ASSETS RESULTING FROM OPERATIONS: | ||||
Net investment income (loss) | $1,946,111,691 | $600,120,493 | $179,675,536 | $1,172,963 |
Net realized gain (loss) | (1,801,885,017 ) | (538,883,868 ) | (285,414,826 ) | (478,926 ) |
Change in net unrealized appreciation/depreciation | 1,882,934,265 | (450,224,219 ) | 538,805,544 | (4,639,012 ) |
Change in net assets resulting from operations | 2,027,160,939 | (388,987,594 ) | 433,066,254 | (3,944,975 ) |
DISTRIBUTIONS TO SHAREHOLDERS: | ||||
Total distributions to shareholders | (1,873,734,871 ) | (493,807,029 ) | (149,409,334 ) | (338,751 ) |
CAPITAL TRANSACTIONS: | ||||
Change in net assets resulting from capital transactions | 17,686,859,307 | 9,172,786,489 | 3,572,183,413 | 105,439,455 |
NET ASSETS: | ||||
Change in net assets | 17,840,285,375 | 8,289,991,866 | 3,855,840,333 | 101,155,729 |
Beginning of period | 10,206,410,953 | 1,916,419,087 | 101,155,729 | — |
End of period | $28,046,696,328 | $10,206,410,953 | $3,956,996,062 | $101,155,729 |
CAPITAL TRANSACTIONS: | ||||
Proceeds from shares issued | $19,072,623,769 | $9,663,664,928 | $3,840,224,854 | $105,439,455 |
Cost of shares redeemed | (1,385,764,462 ) | (490,878,439 ) | (268,041,441 ) | — |
Total change in net assets resulting from capital transactions | $17,686,859,307 | $9,172,786,489 | $3,572,183,413 | $105,439,455 |
SHARE TRANSACTIONS: | ||||
Issued | 348,400,000 | 160,575,000 | 85,625,000 | 2,225,000 |
Redeemed | (25,250,000 ) | (8,175,000 ) | (5,975,000 ) | — |
Net increase (decrease) in shares from share transactions | 323,150,000 | 152,400,000 | 79,650,000 | 2,225,000 |
June 30, 2023 | J.P. Morgan Exchange-Traded Funds | 49 |
FOR THE PERIODS INDICATED
Per share operating performance | |||||||
Investment operations | Distributions | ||||||
Net asset value, beginning of period | Net investment income (loss) (b) | Net realized and unrealized gains (losses) on investments | Total from investment operations | Net investment income | Net realized gain | Total distributions | |
JPMorgan ActiveBuilders U.S. Large Cap Equity ETF | |||||||
Year Ended June 30, 2023 | $43.05 | $0.69 | $7.54 | $8.23 | $(0.69 ) | $— | $(0.69 ) |
July 7, 2021 (f) through June 30, 2022 | 49.00 | 0.61 | (6.28 ) | (5.67 ) | (0.28 ) | — | (0.28 ) |
JPMorgan Active Growth ETF | |||||||
August 8, 2022 (f) through June 30, 2023 | 49.95 | 0.19 | 5.65 | 5.84 | (0.07 ) | — | (0.07 ) |
JPMorgan Active Small Cap Value ETF | |||||||
March 7, 2023 (f) through June 30, 2023 | 50.00 | 0.23 | (0.97 ) | (0.74 ) | — | — | — |
JPMorgan Active Value ETF | |||||||
Year Ended June 30, 2023 | 47.81 | 0.98 | 5.09 | 6.07 | (0.74 ) | — | (0.74 ) |
October 4, 2021 (f) through June 30, 2022 | 49.50 | 0.63 | (1.78 ) | (1.15 ) | (0.47 ) | (0.07 ) | (0.54 ) |
JPMorgan Equity Premium Income ETF | |||||||
Year Ended June 30, 2023 | 55.45 | 5.84 | 0.04 | 5.88 | (6.04 ) | — | (6.04 ) |
Year Ended June 30, 2022 | 60.50 | 6.11 | (6.20 ) | (0.09 ) | (4.96 ) | — | (4.96 ) |
Year Ended June 30, 2021 | 50.76 | 5.17 | 9.42 | 14.59 | (4.85 ) | — | (4.85 ) |
May 20, 2020 (f) through June 30, 2020 | 50.00 | 0.63 | 0.13 (i) | 0.76 | — | — | — |
JPMorgan Nasdaq Equity Premium Income ETF | |||||||
Year Ended June 30, 2023 | 45.46 | 6.04 | 2.47 | 8.51 | (5.64 ) | — | (5.64 ) |
May 3, 2022 (f) through June 30, 2022 | 50.00 | 1.11 | (5.27 ) | (4.16 ) | (0.38 ) | — | (0.38 ) |
(a) | Annualized for periods less than one year, unless otherwise noted. |
(b) | Calculated based upon average shares outstanding. |
(c) | Not annualized for periods less than one year. |
(d) | Includes adjustments in accordance with accounting principles generally accepted in the United States of America and as such, the net asset values for financial reporting purposes and the returns based upon those net asset values may differ from the net asset values and returns for shareholder transactions. |
(e) | Market price return was calculated assuming an initial investment made at the market price at the beginning of the reporting period, reinvestment of all dividends and distributions at market price during the period, and sale at the market price on the last day of the period. The closing price was used to calculate the market price return. |
(f) | Commencement of operations. |
(g) | Since the Shares of the Fund did not trade in the secondary market until the day after the Fund’s inception, for the period from the inception to the first day of secondary market trading, the net asset value is used as a proxy for the secondary market trading price to calculate the market returns. |
(h) | Certain non-recurring expenses incurred by the Fund were not annualized for the period indicated. |
(i) | Calculation of the net realized and unrealized gains (losses) per share do not correlate with the Fund’s net realized and unrealized gains (losses) presented in the Statement of Operations due to the timing of capital transactions in relation to the fluctuating market values of the Fund’s investments. |
50 | J.P. Morgan Exchange-Traded Funds | June 30, 2023 |
Ratios/Supplemental data | |||||||
Ratios to average net assets (a) | |||||||
Net asset value, end of period | Market price, end of period | Total return (c)(d) | Market price total return (c)(e) | Net assets, end of period | Net expenses | Net investment income (loss) | Portfolio turnover rate (c) |
$50.59 | $50.64 | 19.37 % | 19.74 % | $27,827,186 | 0.17 % | 1.50 % | 38 % |
43.05 | 42.96 | (11.67 ) | (11.85 )(g) | 23,679,162 | 0.17 (h) | 1.25 (h) | 40 |
55.72 | 55.74 | 11.73 | 11.77 (g) | 358,030,378 | 0.44 | 0.45 | 60 |
49.26 | 49.30 | (1.48 ) | (1.40 )(g) | 10,836,656 | 0.74 | 1.57 | 13 |
53.14 | 53.15 | 12.79 | 13.04 | 418,442,628 | 0.44 | 1.91 | 80 |
47.81 | 47.71 | (2.37 ) | (2.57 )(g) | 44,225,127 | 0.44 | 1.64 | 56 |
55.29 | 55.33 | 11.30 | 11.37 | 28,046,696,328 | 0.35 | 10.69 | 190 |
55.45 | 55.45 | (0.49 ) | (0.62 ) | 10,206,410,953 | 0.35 | 10.23 | 195 |
60.50 | 60.57 | 30.22 | 29.90 | 1,916,419,087 | 0.35 | 8.89 | 195 |
50.76 | 50.94 | 1.52 | 1.88 (g) | 27,916,586 | 0.35 | 11.11 | 13 |
48.33 | 48.37 | 20.81 | 20.11 | 3,956,996,062 | 0.35 | 13.49 | 162 |
45.46 | 45.76 | (8.37 ) | (7.77 )(g) | 101,155,729 | 0.35 | 14.59 | 12 |
June 30, 2023 | J.P. Morgan Exchange-Traded Funds | 51 |
AS OF June 30, 2023
Diversification Classification | |
JPMorgan ActiveBuilders U.S. Large Cap Equity ETF | Diversified |
JPMorgan Active Growth ETF(1) | Non-diversified |
JPMorgan Active Small Cap Value ETF(2) | Diversified |
JPMorgan Active Value ETF | Diversified |
JPMorgan Equity Premium Income ETF | Diversified |
JPMorgan Nasdaq Equity Premium Income ETF | Non-Diversified |
(1) | Commencement of operations was August 8, 2022. |
(2) | Commencement of operations was March 7, 2023. |
Listing Exchange | |
ActiveBuilders U.S. Large Cap Equity ETF | NYSE Arca |
Active Growth ETF | NYSE Arca |
Active Small Cap Value ETF | NYSE Arca |
Active Value ETF | NYSE Arca |
Equity Premium Income ETF | NYSE Arca |
Nasdaq Equity Premium Income ETF | The NASDAQ Stock Market LLC |
52 | J.P. Morgan Exchange-Traded Funds | June 30, 2023 |
ActiveBuilders U.S. Large Cap Equity ETF | ||||
Level 1 Quoted prices | Level 2 Other significant observable inputs | Level 3 Significant unobservable inputs | Total | |
Total Investments in Securities (a) | $27,788,557 | $— | $— | $27,788,557 |
Appreciation in Other Financial Instruments | ||||
Futures Contracts (a) | $2,883 | $— | $— | $2,883 |
(a) | Please refer to the SOI for specifics of portfolio holdings. |
June 30, 2023 | J.P. Morgan Exchange-Traded Funds | 53 |
AS OF June 30, 2023 (continued)
Active Growth ETF | ||||
Level 1 Quoted prices | Level 2 Other significant observable inputs | Level 3 Significant unobservable inputs | Total | |
Total Investments in Securities (a) | $357,986,986 | $— | $— | $357,986,986 |
(a) | Please refer to the SOI for specifics of portfolio holdings. |
Active Small Cap Value ETF | ||||
Level 1 Quoted prices | Level 2 Other significant observable inputs | Level 3 Significant unobservable inputs | Total | |
Total Investments in Securities (a) | $10,845,243 | $— | $— | $10,845,243 |
(a) | Please refer to the SOI for specifics of portfolio holdings. |
Active Value ETF | ||||
Level 1 Quoted prices | Level 2 Other significant observable inputs | Level 3 Significant unobservable inputs | Total | |
Total Investments in Securities (a) | $418,180,985 | $— | $— | $418,180,985 |
(a) | Please refer to the SOI for specifics of portfolio holdings. |
Equity Premium Income ETF | ||||
Level 1 Quoted prices | Level 2 Other significant observable inputs | Level 3 Significant unobservable inputs | Total | |
Investments in Securities | ||||
Common Stocks | $23,842,703,319 | $— | $— | $23,842,703,319 |
Equity Linked Notes | — | 3,679,797,977 | — | 3,679,797,977 |
Short-Term Investments | ||||
Investment Companies | 224,743,189 | — | — | 224,743,189 |
Investment of Cash Collateral from Securities Loaned | 382,174,897 | — | — | 382,174,897 |
Total Short-Term Investments | 606,918,086 | — | — | 606,918,086 |
Total Investments in Securities | $24,449,621,405 | $3,679,797,977 | $— | $28,129,419,382 |
Nasdaq Equity Premium Income ETF | ||||
Level 1 Quoted prices | Level 2 Other significant observable inputs | Level 3 Significant unobservable inputs | Total | |
Investments in Securities | ||||
Common Stocks | $3,237,668,368 | $— | $— | $3,237,668,368 |
Equity Linked Notes | — | 638,125,182 | — | 638,125,182 |
Short-Term Investments | ||||
Investment Companies | 49,625,385 | — | — | 49,625,385 |
Total Investments in Securities | $3,287,293,753 | $638,125,182 | $— | $3,925,418,935 |
54 | J.P. Morgan Exchange-Traded Funds | June 30, 2023 |
Investment Securities on Loan, at value, Presented on the Statements of Assets and Liabilities | Cash Collateral Posted by Borrower* | Net Amount Due to Counterparty (not less than zero) | |
Active Value ETF | $246,763 | $(246,763 ) | $— |
Equity Premium Income ETF | 379,594,014 | (379,594,014 ) | — |
* | Collateral posted reflects the value of securities on loan and does not include any additional amounts received from the borrower. |
Active Value ETF | $16 |
Equity Premium Income ETF | 3,921 |
Nasdaq Equity Premium Income ETF | 2 |
June 30, 2023 | J.P. Morgan Exchange-Traded Funds | 55 |
AS OF June 30, 2023 (continued)
ActiveBuilders U.S. Large Cap Equity ETF | |||||||||
For the year ended June 30, 2023 | |||||||||
Security Description | Value at June 30, 2022 | Purchases at Cost | Proceeds from Sales | Net Realized Gain (Loss) | Change in Unrealized Appreciation/ (Depreciation) | Value at June 30, 2023 | Shares at June 30, 2023 | Dividend Income | Capital Gain Distributions |
JPMorgan U.S. Government Money Market Fund Class IM Shares, 5.05% (a) (b) | $108,091 | $1,103,194 | $1,121,093 | $— | $— | $90,192 | 90,192 | $3,613 | $— |
(a) | Investment in an affiliated fund, which is registered under the Investment Company Act of 1940, as amended, and is advised by J.P. Morgan Investment Management Inc. |
(b) | The rate shown is the current yield as of June 30, 2023. |
Active Growth ETF | |||||||||
For the year ended June 30, 2023 | |||||||||
Security Description | Value at August 8, 2022(a) | Purchases at Cost | Proceeds from Sales | Net Realized Gain (Loss) | Change in Unrealized Appreciation/ (Depreciation) | Value at June 30, 2023 | Shares at June 30, 2023 | Dividend Income | Capital Gain Distributions |
JPMorgan U.S. Government Money Market Fund Class IM Shares, 5.05% (b) (c) | $— | $21,921,382 | $14,988,118 | $— | $— | $6,933,264 | 6,933,264 | $160,587 | $— |
(a) | Commencement of operations was August 8, 2022. |
(b) | Investment in an affiliated fund, which is registered under the Investment Company Act of 1940, as amended, and is advised by J.P. Morgan Investment Management Inc. |
(c) | The rate shown is the current yield as of June 30, 2023. |
Active Small Cap Value ETF | |||||||||
For the year ended June 30, 2023 | |||||||||
Security Description | Value at March 7, 2023(a) | Purchases at Cost | Proceeds from Sales | Net Realized Gain (Loss) | Change in Unrealized Appreciation/ (Depreciation) | Value at June 30, 2023 | Shares at June 30, 2023 | Dividend Income | Capital Gain Distributions |
JPMorgan U.S. Government Money Market Fund Class IM Shares, 5.05% (b) (c) | $— | $1,125,077 | $847,050 | $— | $— | $278,027 | 278,027 | $6,225 | $— |
(a) | Commencement of operations was March 7, 2023. |
(b) | Investment in an affiliated fund, which is registered under the Investment Company Act of 1940, as amended, and is advised by J.P. Morgan Investment Management Inc. |
(c) | The rate shown is the current yield as of June 30, 2023. |
56 | J.P. Morgan Exchange-Traded Funds | June 30, 2023 |
Active Value ETF | |||||||||
For the year ended June 30, 2023 | |||||||||
Security Description | Value at June 30, 2022 | Purchases at Cost | Proceeds from Sales | Net Realized Gain (Loss) | Change in Unrealized Appreciation/ (Depreciation) | Value at June 30, 2023 | Shares at June 30, 2023 | Dividend Income | Capital Gain Distributions |
JPMorgan U.S. Government Money Market Fund Class IM Shares, 5.05% (a) (b) | $— | $2,083,561 | $1,831,381 | $— | $— | $252,180 | 252,180 | $2,549 * | $— |
JPMorgan U.S. Government Money Market Fund Class IM Shares, 5.05% (a) (b) | 1,396,966 | 24,383,997 | 13,559,562 | — | — | 12,221,401 | 12,221,401 | 296,277 | — |
Total | $1,396,966 | $26,467,558 | $15,390,943 | $— | $— | $12,473,581 | $298,826 | $— | |
(a) | Investment in an affiliated fund, which is registered under the Investment Company Act of 1940, as amended, and is advised by J.P. Morgan Investment Management Inc. |
(b) | The rate shown is the current yield as of June 30, 2023. |
* | Amount is included on the Statements of Operations as Income from securities lending (net) (after payments of rebates and Citibank’s fee). |
Equity Premium Income ETF | |||||||||
For the year ended June 30, 2023 | |||||||||
Security Description | Value at June 30, 2022 | Purchases at Cost | Proceeds from Sales | Net Realized Gain (Loss) | Change in Unrealized Appreciation/ (Depreciation) | Value at June 30, 2023 | Shares at June 30, 2023 | Dividend Income | Capital Gain Distributions |
JPMorgan Securities Lending Money Market Fund Agency SL Class Shares, 5.29% (a) (b) | $— | $577,000,000 | $242,000,000 | $(15,598 )* | $(17,595 ) | $334,966,807 | 334,933,313 | $3,658,024 * | $— |
JPMorgan U.S. Government Money Market Fund Class IM Shares, 5.05% (a) (b) | — | 271,752,731 | 224,544,641 | — | — | 47,208,090 | 47,208,090 | 497,912 * | — |
JPMorgan U.S. Government Money Market Fund Class IM Shares, 5.05% (a) (b) | 121,300,698 | 7,436,174,011 | 7,332,731,520 | — | — | 224,743,189 | 224,743,189 | 9,157,803 | — |
Total | $121,300,698 | $8,284,926,742 | $7,799,276,161 | $(15,598 ) | $(17,595 ) | $606,918,086 | $13,313,739 | $— | |
(a) | Investment in an affiliated fund, which is registered under the Investment Company Act of 1940, as amended, and is advised by J.P. Morgan Investment Management Inc. |
(b) | The rate shown is the current yield as of June 30, 2023. |
* | Amount is included on the Statements of Operations as Income from securities lending (net) (after payments of rebates and Citibank’s fee). |
June 30, 2023 | J.P. Morgan Exchange-Traded Funds | 57 |
AS OF June 30, 2023 (continued)
Nasdaq Equity Premium Income ETF | |||||||||
For the year ended June 30, 2023 | |||||||||
Security Description | Value at June 30, 2022 | Purchases at Cost | Proceeds from Sales | Net Realized Gain (Loss) | Change in Unrealized Appreciation/ (Depreciation) | Value at June 30, 2023 | Shares at June 30, 2023 | Dividend Income | Capital Gain Distributions |
JPMorgan U.S. Government Money Market Fund Class IM Shares, 5.05% (a) (b) | $1,754,620 | $996,070,262 | $948,199,497 | $— | $— | $49,625,385 | 49,625,385 | $818,573 | $— |
(a) | Investment in an affiliated fund, which is registered under the Investment Company Act of 1940, as amended, and is advised by J.P. Morgan Investment Management Inc. |
(b) | The rate shown is the current yield as of June 30, 2023. |
ActiveBuilders U.S. Large Cap Equity ETF | Equity Premium Income ETF | Nasdaq Equity Premium Income ETF | |
Futures Contracts: | |||
Average Notional Balance Long | $92,830 | $12,978,788 | $108,456 |
Average Notional Balance Short | — | (66,973,163 ) | — |
Ending Notional Balance Long | 89,735 | — | — |
58 | J.P. Morgan Exchange-Traded Funds | June 30, 2023 |
Paid-in-Capital | Accumulated undistributed (distributions in excess of) net investment income | Accumulated net realized gains (losses) | |
ActiveBuilders U.S. Large Cap Equity ETF | $— | $167 | $(167 ) |
Active Growth ETF | 4,820,977 | 4 | (4,820,981 ) |
Active Value ETF | 2,175,004 | 268 | (2,175,272 ) |
Equity Premium Income ETF | 171,713,196 | 39,999 | (171,753,195 ) |
Nasdaq Equity Premium Income ETF | 44,339,176 | — | (44,339,176 ) |
ActiveBuilders U.S. Large Cap Equity ETF | 0.17 % |
Active Growth ETF | 0.44 |
Active Small Cap Value ETF | 0.74 |
Active Value ETF | 0.44 |
Equity Premium Income ETF | 0.35 |
Nasdaq Equity Premium Income ETF | 0.35 |
June 30, 2023 | J.P. Morgan Exchange-Traded Funds | 59 |
AS OF June 30, 2023 (continued)
Purchases (excluding U.S. Government) | Sales (excluding U.S. Government) | |
ActiveBuilders U.S. Large Cap Equity ETF | $9,543,350 | $9,503,772 |
Active Growth ETF | 126,447,730 | 97,740,009 |
Active Small Cap Value ETF | 11,101,383 | 1,261,541 |
Active Value ETF | 199,104,709 | 192,164,923 |
Equity Premium Income ETF | 37,719,791,712 | 34,236,282,707 |
Nasdaq Equity Premium Income ETF | 2,909,061,218 | 2,252,984,672 |
In-Kind Purchases | In-Kind Sales | |
Active Growth ETF | $294,237,599 | $21,941,969 |
Active Small Cap Value ETF | 905,166 | — |
Active Value ETF | 352,080,076 | 15,276,197 |
Equity Premium Income ETF | 15,128,233,463 | 1,154,717,872 |
60 | J.P. Morgan Exchange-Traded Funds | June 30, 2023 |
In-Kind Purchases | In-Kind Sales | |
Nasdaq Equity Premium Income ETF | $3,089,190,297 | $221,373,735 |
Aggregate Cost | Gross Unrealized Appreciation | Gross Unrealized Depreciation | Net Unrealized Appreciation (Depreciation) | |
ActiveBuilders U.S. Large Cap Equity ETF | $25,369,263 | $3,362,810 | $940,633 | $2,422,177 |
Active Growth ETF | 302,118,298 | 57,546,978 | 1,678,290 | 55,868,688 |
Active Small Cap Value ETF | 10,993,651 | 573,459 | 721,867 | (148,408 ) |
Active Value ETF | 401,519,486 | 27,520,733 | 10,859,234 | 16,661,499 |
Equity Premium Income ETF | 26,800,581,029 | 1,927,081,146 | 598,242,793 | 1,328,838,353 |
Nasdaq Equity Premium Income ETF | 3,405,417,536 | 550,357,313 | 30,355,914 | 520,001,399 |
Ordinary Income* | Total Distributions Paid | |
ActiveBuilders U.S. Large Cap Equity ETF | $378,735 | $378,735 |
Active Growth ETF | 206,646 | 206,646 |
Active Value ETF | 4,338,724 | 4,338,724 |
Equity Premium Income ETF | 1,873,734,871 | 1,873,734,871 |
Nasdaq Equity Premium Income ETF | 149,409,334 | 149,409,334 |
* | Short-term gain distributions are treated as ordinary income for income tax purposes. |
Ordinary Income* | Total Distributions Paid | |
ActiveBuilders U.S. Large Cap Equity ETF | $154,858 | $154,858 |
Active Value ETF | 377,424 | 377,424 |
Equity Premium Income ETF | 493,807,029 | 493,807,029 |
Nasdaq Equity Premium Income ETF | 338,751 | 338,751 |
* | Short-term gain distributions are treated as ordinary income for income tax purposes. |
June 30, 2023 | J.P. Morgan Exchange-Traded Funds | 61 |
AS OF June 30, 2023 (continued)
Current Distributable Ordinary Income | Current Distributable Long-Term Capital Gain (Tax Basis Capital Loss Carryover) | Unrealized Appreciation (Depreciation) | |
ActiveBuilders U.S. Large Cap Equity ETF | $190,939 | $(1,036,680 ) | $2,422,177 |
Active Growth ETF | 466,578 | (259,031 ) | 55,868,688 |
Active Small Cap Value ETF | 52,525 | (22,846 ) | (148,408 ) |
Active Value ETF | 471,377 | (2,075,538 ) | 16,661,503 |
Equity Premium Income ETF | 191,696,972 | (1,174,878,278 ) | 1,328,114,121 |
Nasdaq Equity Premium Income ETF | 31,109,342 | (19,918,405 ) | 520,001,399 |
Capital Loss Carryforward Character | ||
Short-Term | Long-Term | |
ActiveBuilders U.S. Large Cap Equity ETF | $973,345 | $63,335 |
Active Growth ETF | 259,031 | — |
Active Small Cap Value ETF | 22,846 | — |
Active Value ETF | 2,033,118 | 42,420 |
Equity Premium Income ETF | 1,010,524,741 | 164,353,537 |
Nasdaq Equity Premium Income ETF | 19,918,405 | — |
Net Capital Losses (Gains) | Specified Ordinary Losses | ||
Short-Term | Long-Term | ||
ActiveBuilders U.S. Large Cap Equity ETF | $271,246 | $429,239 | $— |
Active Growth ETF | 10,376,110 | — | 3,149 |
Active Value ETF | (72,597 ) | 225,065 | — |
Equity Premium Income ETF | 1,068,373,987 | 157,403,926 | — |
Nasdaq Equity Premium Income ETF | 295,998,408 | 150,981 | — |
62 | J.P. Morgan Exchange-Traded Funds | June 30, 2023 |
% of Ownership | |
ActiveBuilders U.S. Large Cap Equity ETF | 91 % |
Active Small Cap Value ETF | 91 |
June 30, 2023 | J.P. Morgan Exchange-Traded Funds | 63 |
AS OF June 30, 2023 (continued)
64 | J.P. Morgan Exchange-Traded Funds | June 30, 2023 |
JPMorgan ActiveBuilders U.S. Large Cap Equity ETF * | JPMorgan Active Value ETF **** |
JPMorgan Active Growth ETF ** | JPMorgan Equity Premium Income ETF ***** |
JPMorgan Active Small Cap Value ETF *** | JPMorgan Nasdaq Equity Premium Income ETF ****** |
* Statement of operations for the year ended June 30, 2023, and statement of changes in net assets for the year ended June 30, 2023 and the period July 7, 2021 (commencement of operations) through June 30, 2022 |
** Statement of operations and statement of changes in net assets for the period August 8, 2022 (commencement of operations) through June 30, 2023 |
*** Statement of operations and statement of changes in net assets for the period March 7, 2023 (commencement of operations) through June 30, 2023 |
**** Statement of operations for the year ended June 30, 2023, and statement of changes in net assets for the year ended June 30, 2023 and the period October 4, 2021 (commencement of operations) through June 30, 2022 |
***** Statement of operations for the year ended June 30, 2023 and statement of changes in net assets for the years ended June 30, 2023 and 2022 |
****** Statement of operations for the year ended June 30, 2023, and statement of changes in net assets for the year ended June 30, 2023 and the period May 3, 2022 (commencement of operations) through June 30, 2022 |
June 30, 2023 | J.P. Morgan Exchange-Traded Funds | 65 |
(Unaudited)
Name (Year of Birth); Positions With the Funds (1) | Principal Occupation During Past 5 Years | Number of Funds in Fund Complex Overseen by Trustee (2) | Other Directorships Held During the Past 5 Years |
Independent Trustees | |||
John F. Finn (1947); Chair since 2020; Trustee since 1998. | Chairman, Gardner, Inc. (supply chain management company serving industrial and consumer markets) (serving in various roles 1974-present). | 176 | Director, Greif, Inc. (GEF) (industrial package products and services) (2007-present); Trustee, Columbus Association for the Performing Arts (1988-present). |
Stephen P. Fisher (1959); Trustee since 2018. | Retired; Chairman and Chief Executive Officer, NYLIFE Distributors LLC (registered broker-dealer) (serving in various roles 2008-2013); Chairman, NYLIM Service Company LLC (transfer agent) (2008-2017); New York Life Investment Management LLC (registered investment adviser) (serving in various roles 2005-2017); Chairman, IndexIQ Advisors LLC (registered investment adviser for ETFs) (2014-2017); President, MainStay VP Funds Trust (2007-2017), MainStay DefinedTerm Municipal Opportunities Fund (2011-2017) and MainStay Funds Trust (2007-2017) (registered investment companies). | 176 | Honors Program Advisory Board Member, The Zicklin School of Business, Baruch College, The City University of New York (2017-present). |
Gary L. French (1951); Trustee since 2014. | Real Estate Investor (2011-2020); Investment management industry Consultant and Expert Witness (2011-present); Senior Consultant for The Regulatory Fundamentals Group LLC (2011-2017). | 176 | Independent Trustee, The China Fund, Inc. (2013-2019); Exchange Traded Concepts Trust II (2012-2014); Exchange Traded Concepts Trust I (2011-2014). |
Kathleen M. Gallagher (1958); Trustee since 2018. | Retired; Chief Investment Officer — Benefit Plans, Ford Motor Company (serving in various roles 1985-2016). | 176 | Non- Executive Director, Legal & General Investment Management (Holdings) (2018-present); Non-Executive Director, Legal & General Investment Management America (U.S. Holdings) (financial services and insurance) (2017-present); Advisory Board Member, State Street Global Advisors Total Portfolio Solutions (2017-present); Member, Client Advisory Council, Financial Engines, LLC (registered investment adviser) (2011-2016); Director, Ford Pension Funds Investment Management Ltd. (2007-2016). |
Robert J. Grassi (1957); Trustee since 2014. | Sole Proprietor, Academy Hills Advisors LLC (2012-present); Pension Director, Corning Incorporated (2002-2012). | 176 | None |
66 | J.P. Morgan Exchange-Traded Funds | June 30, 2023 |
Name (Year of Birth); Positions With the Funds (1) | Principal Occupation During Past 5 Years | Number of Funds in Fund Complex Overseen by Trustee (2) | Other Directorships Held During the Past 5 Years |
Independent Trustees (continued) | |||
Frankie D. Hughes (1952); Trustee since 2008. | President, Ashland Hughes Properties (property management) (2014-present); President and Chief Investment Officer, Hughes Capital Management, Inc. (fixed income asset management) (1993-2014). | 176 | None |
Raymond Kanner (1953); Trustee since 2017. | Retired; Managing Director and Chief Investment Officer, IBM Retirement Funds (2007-2016). | 176 | Advisory Board Member, Penso Advisors, LLC (2020-present); Advisory Board Member, Los Angeles Capital (2018-present); Advisory Board Member, State Street Global Advisors Total Portfolio Solutions (2017- present); Acting Executive Director, Committee on Investment of Employee Benefit Assets (CIEBA) (2016-2017); Advisory Board Member, Betterment for Business (robo advisor) (2016- 2017); Advisory Board Member, BlueStar Indexes (index creator) (2013-2017); Director, Emerging Markets Growth Fund (registered investment company) (1997-2016); Member, Russell Index Client Advisory Board (2001-2015). |
Thomas P. Lemke (1954); Trustee since 2014. | Retired since 2013. | 176 | (1) Independent Trustee of Advisors’ Inner Circle III fund platform, consisting of the following: (i) the Advisors’ Inner Circle Fund III, (ii) the Gallery Trust, (iii) the Schroder Series Trust, (iv) the Delaware Wilshire Private Markets Fund (since 2020), (v) Chiron Capital Allocation Fund Ltd., and (vi) formerly the Winton Diversified Opportunities Fund (2014-2018); and (2) Independent Trustee of the Symmetry Panoramic Trust (since 2018). |
Lawrence R. Maffia (1950); Trustee since 2014. | Retired; Director and President, ICI Mutual Insurance Company (2006-2013). | 176 | Director, ICI Mutual Insurance Company (1999-2013). |
Mary E. Martinez (1960); Vice Chair since 2021; Trustee since 2013. | Associate, Special Properties, a Christie’s International Real Estate Affiliate (2010-present); Managing Director, Bank of America (asset management) (2007-2008); Chief Operating Officer, U.S. Trust Asset Management, U.S. Trust Company (asset management) (2003-2007); President, Excelsior Funds (registered investment companies) (2004-2005). | 176 | None |
Marilyn McCoy (1948); Trustee since 1999. | Retired; Vice President of Administration and Planning, Northwestern University (1985-2023). | 176 | None |
June 30, 2023 | J.P. Morgan Exchange-Traded Funds | 67 |
(Unaudited) (continued)
Name (Year of Birth); Positions With the Funds (1) | Principal Occupation During Past 5 Years | Number of Funds in Fund Complex Overseen by Trustee (2) | Other Directorships Held During the Past 5 Years |
Independent Trustees (continued) | |||
Dr. Robert A. Oden, Jr. (1946); Trustee since 1997. | Retired; President, Carleton College (2002-2010); President, Kenyon College (1995-2002). | 176 | Trustee, The Coldwater Conservation Fund (2017-present); Trustee, American Museum of Fly Fishing (2013-present); Trustee and Vice Chair, Trout Unlimited (2017-2021); Trustee, Dartmouth- Hitchcock Medical Center (2011-2020). |
Marian U. Pardo* (1946); Trustee since 2013. | Managing Director and Founder, Virtual Capital Management LLC (investment consulting) (2007-present); Managing Director, Credit Suisse Asset Management (portfolio manager) (2003-2006). | 176 | Board Chair and Member, Board of Governors, Columbus Citizens Foundation (not-for-profit supporting philanthropic and cultural programs) (2006-present). |
Emily A. Youssouf (1951); Trustee since 2014. | Adjunct Professor (2011-present) and Clinical Professor (2009-2011), NYU Schack Institute of Real Estate; Board Member and Member of the Audit Committee (2013–present), Chair of Finance Committee (2019-present), Member of Related Parties Committee (2013-2018) and Member of the Enterprise Risk Committee (2015-2018), PennyMac Financial Services, Inc.; Board Member (2005-2018), Chair of Capital Committee (2006-2016), Chair of Audit Committee (2005-2018), Member of Finance Committee (2005-2018) and Chair of IT Committee (2016-2018), NYC Health and Hospitals Corporation. | 176 | Trustee, NYC School Construction Authority (2009-present); Board Member, NYS Job Development Authority (2008-present); Trustee and Chair of the Audit Committee of the Transit Center Foundation (2015-2019). |
Interested Trustees | |||
Robert F. Deutsch** (1957); Trustee since 2014. | Retired; Head of ETF Business for JPMorgan Asset Management (2013-2017); Head of Global Liquidity Business for JPMorgan Asset Management (2003-2013). | 176 | Treasurer and Director of the JUST Capital Foundation (2017-present). |
Nina O. Shenker** (1957); Trustee since 2022. | Vice Chair (2017-2021), General Counsel and Managing Director (2008-2016), Associate General Counsel and Managing Director (2004-2008), J.P. Morgan Asset & Wealth Management. | 176 | Director and Member of Legal and Human Resources Subcommittees, American Jewish Joint Distribution Committee (2018-present). |
(1) | The year shown is the first year in which a Trustee became a member of any of the following: the JPMorgan Mutual Fund Board, the JPMorgan ETF Board, the heritage J.P. Morgan Funds or the heritage One Group Mutual Funds. Trustees serve an indefinite term, until resignation, retirement, removal or death. The Board's current retirement policy sets retirement at the end of the calendar year in which the Trustee attains the age of 75, provided that any Board member who was a member of the JPMorgan Mutual Fund Board prior to January 1, 2022 and was born prior to January 1, 1950 shall retire from the Board at the end of the calendar year in which the Trustee attains the age of 78. | ||
(2) | A Fund Complex means two or more registered investment companies that hold themselves out to investors as related companies for purposes of investment and investor services or have a common investment adviser or have an investment adviser that is an affiliated person of the investment adviser of any of the other registered investment companies. The J.P. Morgan Funds Complex for which the Board of Trustees serves currently includes nine registered investment companies (176 J.P. Morgan Funds). | ||
* | In connection with prior employment with JPMorgan Chase, Ms. Pardo was the recipient of non-qualified pension plan payments from JPMorgan Chase in the amount of approximately $2,055 per month, which she irrevocably waived effective January 1, 2013, and deferred compensation payments from JPMorgan Chase in the amount of approximately $7,294 per year, which ended in January 2013. In addition, Ms. Pardo receives payments from a fully-funded qualified plan, which is not an obligation of JPMorgan Chase. | ||
68 | J.P. Morgan Exchange-Traded Funds | June 30, 2023 |
** | Designation as an “Interested Trustee” is based on prior employment by the Adviser or an affiliate of the Adviser or interests in a control person of the Adviser. | ||
The contact address for each of the Trustees is 277 Park Avenue, New York, NY 10172. | |||
June 30, 2023 | J.P. Morgan Exchange-Traded Funds | 69 |
(Unaudited)
Name (Year of Birth), Positions Held with the Trust (Since) | Principal Occupations During Past 5 Years |
Brian S. Shlissel (1964), President and Principal Executive Officer (2021) | Managing Director and Chief Administrative Officer for J.P. Morgan pooled vehicles, J.P. Morgan Investment Management Inc. since 2014. |
Timothy J. Clemens (1975), Treasurer and Principal Financial Officer (2020) | Managing Director, J.P. Morgan Investment Management Inc. Mr. Clemens has been with J.P. Morgan Investment Management Inc. since 2013. |
Gregory S. Samuels (1980), Secretary (2022) (formerly Assistant Secretary 2014-2022) | Managing Director and Assistant General Counsel, JPMorgan Chase & Co. Mr. Samuels has been with JPMorgan Chase & Co. since 2010. |
Stephen M. Ungerman (1953), Chief Compliance Officer (2014) | Managing Director, JPMorgan Chase & Co. Mr. Ungerman has been with JPMorgan Chase & Co. since 2000. |
Kiesha Astwood-Smith (1973), Assistant Secretary (2021) | Vice President and Assistant General Counsel, JPMorgan Chase & Co. since June 2021; Senior Director and Counsel, Equitable Financial Life Insurance Company (formerly, AXA Equitable Life Insurance Company) from September 2015 through June 2021. |
Matthew Beck (1988), Assistant Secretary (2021)* | Vice President and Assistant General Counsel, JPMorgan Chase & Co. since May 2021; Senior Legal Counsel, Ultimus Fund Solutions from May 2018 through May 2021; General Counsel, The Nottingham Company from April 2014 through May 2018. |
Elizabeth A. Davin (1964), Assistant Secretary (2022) (formerly Secretary 2018-2022)* | Executive Director and Assistant General Counsel, JPMorgan Chase & Co. Ms. Davin has been with JPMorgan Chase & Co. (formerly Bank One Corporation) since 2004. |
Jessica K. Ditullio (1962), Assistant Secretary (2014)* | Executive Director and Assistant General Counsel, JPMorgan Chase & Co. Ms. Ditullio has been with JPMorgan Chase & Co. (formerly Bank One Corporation) since 1990. |
Anthony Geron (1971), Assistant Secretary (2019) | Vice President and Assistant General Counsel, JPMorgan Chase & Co. since September 2018; Lead Director and Counsel, AXA Equitable Life Insurance Company from 2015 to 2018 and Senior Director and Counsel, AXA Equitable Life Insurance Company from 2014 to 2015. |
Carmine Lekstutis (1980), Assistant Secretary (2014) | Executive Director and Assistant General Counsel, JPMorgan Chase & Co. Mr. Lekstutis has been with JPMorgan Chase & Co. since 2011. |
Max Vogel (1990), Assistant Secretary (2021) | Vice President and Assistant General Counsel, JPMorgan Chase & Co. since June 2021; Associate, Proskauer Rose LLP (law firm) from March 2017 to June 2021. |
Zachary E. Vonnegut-Gabovitch (1986), Assistant Secretary (2017) | Executive Director and Assistant General Counsel, JPMorgan Chase & Co. Mr. Vonnegut-Gabovitch has been with JPMorgan Chase & Co. since September 2016. |
Frederick J. Cavaliere (1978), Assistant Treasurer (2015)** | Executive Director, J.P. Morgan Investment Management Inc. Mr. Cavaliere has been with JPMorgan Chase & Co. since May 2006. |
Michael M. D’Ambrosio (1969), Assistant Treasurer (2014) | Managing Director, J.P. Morgan Investment Management Inc. Mr. D’Ambrosio has been with J.P. Morgan Investment Management Inc. since 2012. |
Aleksandr Fleytekh (1972), Assistant Treasurer (2023) | Executive Director, J.P. Morgan Investment Management Inc. Mr. Fleytekh has been with J.P. Morgan Investment Management Inc. since February 2012. |
Shannon Gaines (1977), Assistant Treasurer (2019)* | Executive Director, J.P. Morgan Investment Management Inc. Mr. Gaines has been with J.P. Morgan Investment Management Inc. since January 2014. |
Jeffrey D. House (1972), Assistant Treasurer (2023)* | Vice President, J.P. Morgan Investment Management Inc. since July 2006. |
Michael Mannarino (1985), Assistant Treasurer (2023) | Vice President, J.P. Morgan Investment Management Inc. since 2014. |
70 | J.P. Morgan Exchange-Traded Funds | June 30, 2023 |
Nektarios E. Manolakakis (1972), Assistant Treasurer (2020) | Executive Director, J.P. Morgan Investment Management Inc. since February 2021, formerly Vice President, J.P. Morgan Investment Management Inc. since 2014; Vice President, J.P. Morgan Corporate & Investment Bank 2010-2014. |
Todd McEwen (1981), Assistant Treasurer (2020)* | Vice President, J.P. Morgan Investment Management Inc. Mr. McEwen has been with J.P. Morgan Investment Management Inc. since 2010. |
Joseph Parascondola (1963), Assistant Treasurer (2023)** | Executive Director, J.P. Morgan Investment Management Inc. Mr. Parascondola has been with J.P. Morgan Investment Management Inc. since 2006. |
Gillian I. Sands (1969), Assistant Treasurer (2023) | Executive Director, J.P. Morgan Investment Management Inc. Ms. Sands has been with J.P. Morgan Investment Management Inc. since 2012. |
The contact address for each of the officers, unless otherwise noted, is 277 Park Avenue, New York, NY 10172. | |
* | The contact address for the officer is 1111 Polaris Parkway, Columbus, OH 43240. |
** | The contact address for the officer is 575 Washington Boulevard, Jersey City, NJ 07310. |
June 30, 2023 | J.P. Morgan Exchange-Traded Funds | 71 |
(Unaudited)
Hypothetical $1,000 Investment
Beginning Account Value January 1, 2023 | Ending Account Value June 30, 2023 | Expenses Paid During the Period | Annualized Expense Ratio | |
JPMorgan ActiveBuilders U.S. Large Cap Equity ETF | ||||
Actual * | $1,000.00 | $1,155.80 | $0.91 | 0.17 % |
Hypothetical * | 1,000.00 | 1,023.95 | 0.85 | 0.17 |
JPMorgan Active Growth ETF | ||||
Actual * | 1,000.00 | 1,254.40 | 2.46 | 0.44 |
Hypothetical * | 1,000.00 | 1,022.61 | 2.21 | 0.44 |
JPMorgan Active Small Cap Value ETF | ||||
Actual ** | 1,000.00 | 985.20 | 2.31 | 0.74 |
Hypothetical * | 1,000.00 | 1,021.13 | 3.71 | 0.74 |
JPMorgan Active Value ETF | ||||
Actual * | 1,000.00 | 1,044.90 | 2.23 | 0.44 |
Hypothetical * | 1,000.00 | 1,022.61 | 2.21 | 0.44 |
JPMorgan Equity Premium Income ETF | ||||
Actual * | 1,000.00 | 1,055.10 | 1.78 | 0.35 |
Hypothetical * | 1,000.00 | 1,023.06 | 1.76 | 0.35 |
JPMorgan Nasdaq Equity Premium Income ETF | ||||
Actual * | 1,000.00 | 1,244.40 | 1.95 | 0.35 |
Hypothetical * | 1,000.00 | 1,023.06 | 1.76 | 0.35 |
* | Expenses are equal to each Fund's annualized net expense ratio, multiplied by the average account value over the period, multiplied by 181/365 (to reflect the one-half year period). |
** | Expenses are equal to the Fund’s annualized net expense ratio, multiplied by the average account value over the period, multiplied by 115/365 (to reflect the actual period). The Fund commenced operations on March 7, 2023. |
72 | J.P. Morgan Exchange-Traded Funds | June 30, 2023 |
(Unaudited)
June 30, 2023 | J.P. Morgan Exchange-Traded Funds | 73 |
(Unaudited)
Dividends Received Deduction | |
JPMorgan ActiveBuilders U.S. Large Cap Equity ETF | 100.00 % |
JPMorgan Active Growth ETF | 100.00 |
JPMorgan Active Value ETF | 100.00 |
JPMorgan Equity Premium Income ETF | 14.03 |
JPMorgan Nasdaq Equity Premium Income ETF | 5.48 |
Qualified Dividend Income | |
JPMorgan ActiveBuilders U.S. Large Cap Equity ETF | $378,735 |
JPMorgan Active Growth ETF | 206,646 |
JPMorgan Active Value ETF | 4,338,724 |
JPMorgan Equity Premium Income ETF | 275,499,494 |
JPMorgan Nasdaq Equity Premium Income ETF | 8,463,321 |
74 | J.P. Morgan Exchange-Traded Funds | June 30, 2023 |
(Unaudited)
(i) The background and experience of the Adviser’s senior
(ii) The qualifications, backgrounds and responsibilities of the portfolio management team to be primarily responsible for the day-to-day management of the Fund;
(iii) The investment strategy for the Fund, and the infrastructure supporting the portfolio management team;
(iv) Information about the structure and distribution strategy of the Fund and how it fits within the Trust’s other fund offerings;
(v) The administration services to be provided by the Adviser under the Management Agreement;
(vi) Their knowledge of the nature and quality of the services provided by the Adviser and its affiliates gained from their experience as Trustees of the Trust and in the financial industry generally;
(vii) The overall reputation and capabilities of the Adviser and its affiliates;
(viii) The commitment of the Adviser to provide high quality service to the Fund;
(ix) Their overall confidence in the Adviser’s integrity;
(x) The Adviser’s responsiveness to requests for additional information, questions or concerns raised by them; and
(xi) The Adviser’s business continuity plan, steps the Adviser and its affiliates have taken to provide services to the Fund during the COVID-19 pandemic and the Adviser’s and its affiliates’ success in continuing to provide services to the other J.P. Morgan ETFs and their shareholders throughout this period.
June 30, 2023 | J.P. Morgan Exchange-Traded Funds | 75 |
(Unaudited) (continued)
76 | J.P. Morgan Exchange-Traded Funds | June 30, 2023 |


Fund | Ticker | Listing Exchange |
JPMorgan Market Expansion Enhanced Equity ETF | JMEE | NYSE Arca |

1 | |
2 | |
5 | |
15 | |
20 | |
22 | |
31 | |
32 | |
36 | |
38 | |
39 |
August 11, 2023 (Unaudited)
 | “Equity markets delivered strong returns during the first half of 2023, with investors who remained fully invested likely benefitting. Going forward, we believe investors may be best served by maintaining a long-term view and holding a well-diversified portfolio.” — Brian S. Shlissel |

President, J.P. Morgan Exchange-Traded Funds
J.P. Morgan Asset Management
1-844-4JPM-ETF or jpmorgan.com/etfs for more information
June 30, 2023 | J.P. Morgan Exchange-Traded Funds | 1 |
TWELVE MONTHS ENDED June 30, 2023 (Unaudited)
REPORTING PERIOD RETURN: | |
Net Asset Value * | 16.61% |
Market Price ** | 16.73% |
S&P 1000 Index | 15.20% |
Net Assets as of 6/30/2023 | $854,560,372 |
Fund Ticker | JMEE |
2 | J.P. Morgan Exchange-Traded Funds | June 30, 2023 |
TOP TEN HOLDINGS OF THE PORTFOLIO AS OF June 30, 2023 | PERCENT OF TOTAL INVESTMENTS | |
1. | Builders FirstSource, Inc. | 1.1 % |
2. | Jabil, Inc. | 0.9 |
3. | Reliance Steel & Aluminum Co. | 0.7 |
4. | Toll Brothers, Inc. | 0.7 |
5. | United Therapeutics Corp. | 0.7 |
6. | EMCOR Group, Inc. | 0.6 |
7. | Clean Harbors, Inc. | 0.6 |
8. | Life Storage, Inc. | 0.6 |
9. | nVent Electric plc | 0.6 |
10. | Tri Pointe Homes, Inc. | 0.5 |
PORTFOLIO COMPOSITION BY SECTOR AS OF June 30, 2023 | PERCENT OF TOTAL INVESTMENTS |
Industrials | 21.6% |
Financials | 13.3 |
Consumer Discretionary | 13.3 |
Information Technology | 11.7 |
Health Care | 9.9 |
Real Estate | 7.2 |
Materials | 5.8 |
Consumer Staples | 4.6 |
Energy | 4.1 |
Utilities | 2.5 |
Communication Services | 1.1 |
Short-Term Investments | 4.9 |
June 30, 2023 | J.P. Morgan Exchange-Traded Funds | 3 |
TWELVE MONTHS ENDED June 30, 2023 (Unaudited) (continued)
INCEPTION DATE | 1 YEAR | 5 YEAR | 10 YEAR | |
JPMorgan Market Expansion Enhanced Equity ETF | ||||
Net Asset Value | July 31, 1998* | 16.61 % | 6.85 % | 9.91 % |
Market Price | 16.73 | 6.87 | 9.91 |
* | Inception date for Class I Shares of the predecessor Fund (as defined below). |
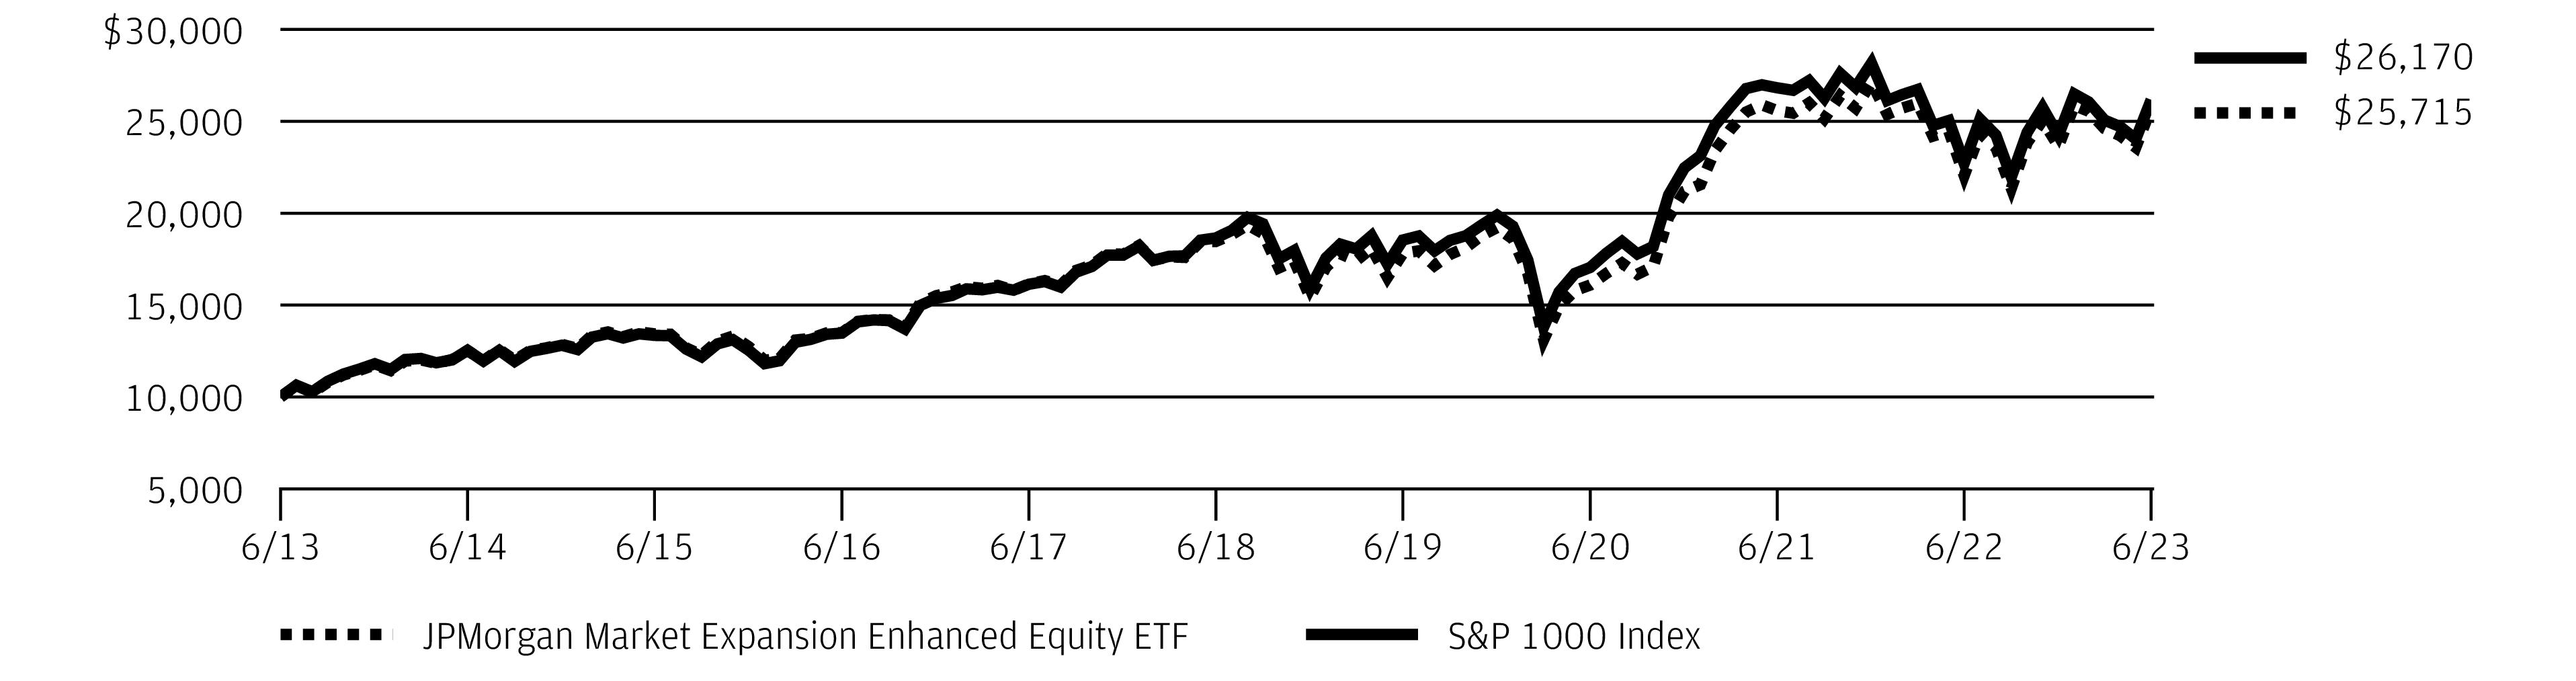
4 | J.P. Morgan Exchange-Traded Funds | June 30, 2023 |
AS OF June 30, 2023
INVESTMENTS | SHARES | VALUE($) |
Common Stocks — 97.5% | ||
Aerospace & Defense — 0.2% | ||
AeroVironment, Inc. * | 5,796 | 592,815 |
Curtiss-Wright Corp. | 1,607 | 295,142 |
Woodward, Inc. | 4,509 | 536,165 |
1,424,122 | ||
Air Freight & Logistics — 0.5% | ||
Forward Air Corp. | 8,319 | 882,729 |
GXO Logistics, Inc. * | 20,609 | 1,294,657 |
Hub Group, Inc., Class A * | 22,212 | 1,784,068 |
3,961,454 | ||
Automobile Components — 1.2% | ||
Adient plc * | 24,124 | 924,432 |
American Axle & Manufacturing Holdings, Inc. * | 37,017 | 306,131 |
Dana, Inc. | 86,446 | 1,469,582 |
Fox Factory Holding Corp. * | 5,651 | 613,190 |
Gentherm, Inc. * | 8,581 | 484,912 |
Goodyear Tire & Rubber Co. (The) * | 182,577 | 2,497,653 |
LCI Industries | 6,377 | 805,798 |
Lear Corp. | 14,969 | 2,148,800 |
Patrick Industries, Inc. | 7,124 | 569,920 |
9,820,418 | ||
Automobiles — 0.4% | ||
Harley-Davidson, Inc. | 40,087 | 1,411,463 |
Thor Industries, Inc. (a) | 14,997 | 1,552,190 |
Winnebago Industries, Inc. | 10,260 | 684,239 |
3,647,892 | ||
Banks — 5.9% | ||
Ameris Bancorp | 51,930 | 1,776,525 |
Associated Banc-Corp. | 40,787 | 661,973 |
Axos Financial, Inc. * | 46,004 | 1,814,398 |
Banc of California, Inc. | 38,569 | 446,629 |
Bancorp, Inc. (The) * | 14,455 | 471,956 |
Banner Corp. | 39,125 | 1,708,589 |
Brookline Bancorp, Inc. | 18,841 | 164,670 |
Cadence Bank | 18,801 | 369,252 |
Columbia Banking System, Inc. | 54,697 | 1,109,255 |
Commerce Bancshares, Inc. | 29,794 | 1,450,968 |
Cullen/Frost Bankers, Inc. (a) | 17,226 | 1,852,312 |
Customers Bancorp, Inc. * | 52,253 | 1,581,176 |
CVB Financial Corp. | 71,587 | 950,675 |
Dime Community Bancshares, Inc. | 12,518 | 220,692 |
East West Bancorp, Inc. | 61,457 | 3,244,315 |
FB Financial Corp. | 8,353 | 234,302 |
INVESTMENTS | SHARES | VALUE($) |
Banks — continued | ||
First Bancorp (a) | 9,335 | 277,716 |
First BanCorp (Puerto Rico) | 183,806 | 2,246,109 |
First Commonwealth Financial Corp. | 88,650 | 1,121,422 |
First Financial Bancorp | 11,658 | 238,290 |
First Financial Bankshares, Inc. | 16,696 | 475,669 |
First Horizon Corp. | 138,377 | 1,559,509 |
FNB Corp. | 151,664 | 1,735,036 |
Glacier Bancorp, Inc. | 2,723 | 84,876 |
Hancock Whitney Corp. | 35,236 | 1,352,358 |
Hanmi Financial Corp. | 8,801 | 131,399 |
National Bank Holdings Corp., Class A | 47,435 | 1,377,512 |
NBT Bancorp, Inc. | 8,895 | 283,306 |
New York Community Bancorp, Inc. | 134,834 | 1,515,534 |
OFG Bancorp (Puerto Rico) | 71,518 | 1,865,189 |
Old National Bancorp | 164,798 | 2,297,284 |
Pathward Financial, Inc. | 7,158 | 331,845 |
Pinnacle Financial Partners, Inc. | 50,005 | 2,832,783 |
Preferred Bank | 3,586 | 197,194 |
Prosperity Bancshares, Inc. (a) | 35,815 | 2,022,831 |
Renasant Corp. | 14,269 | 372,849 |
Seacoast Banking Corp. of Florida | 20,530 | 453,713 |
Southside Bancshares, Inc. | 31,430 | 822,209 |
SouthState Corp. | 9,005 | 592,529 |
Synovus Financial Corp. | 38,240 | 1,156,760 |
Triumph Financial, Inc. * | 5,903 | 358,430 |
UMB Financial Corp. | 11,321 | 689,449 |
United Community Banks, Inc. | 26,888 | 671,931 |
Veritex Holdings, Inc. | 36,524 | 654,875 |
Washington Federal, Inc. | 30,467 | 807,985 |
Webster Financial Corp. | 30,797 | 1,162,587 |
Wintrust Financial Corp. | 37,338 | 2,711,486 |
WSFS Financial Corp. | 6,900 | 260,268 |
50,718,620 | ||
Beverages — 0.3% | ||
Boston Beer Co., Inc. (The), Class A * | 2,399 | 739,947 |
Celsius Holdings, Inc. * | 7,589 | 1,132,203 |
Coca-Cola Consolidated, Inc. | 1,394 | 886,612 |
2,758,762 | ||
Biotechnology — 1.9% | ||
Arrowhead Pharmaceuticals, Inc. * | 41,381 | 1,475,646 |
Eagle Pharmaceuticals, Inc. * | 28,743 | 558,764 |
Emergent BioSolutions, Inc. * | 3,872 | 28,459 |
Exelixis, Inc. * | 228,216 | 4,361,208 |
June 30, 2023 | J.P. Morgan Exchange-Traded Funds | 5 |
AS OF June 30, 2023 (continued)
INVESTMENTS | SHARES | VALUE($) |
Common Stocks — continued | ||
Biotechnology — continued | ||
Neurocrine Biosciences, Inc. * | 27,249 | 2,569,581 |
REGENXBIO, Inc. * | 61,493 | 1,229,245 |
United Therapeutics Corp. * | 26,167 | 5,776,365 |
15,999,268 | ||
Broadline Retail — 0.6% | ||
Kohl's Corp. (a) | 63,916 | 1,473,264 |
Macy's, Inc. | 144,817 | 2,324,313 |
Nordstrom, Inc. | 28,255 | 578,380 |
Ollie's Bargain Outlet Holdings, Inc. * | 9,219 | 534,056 |
4,910,013 | ||
Building Products — 3.3% | ||
AAON, Inc. | 8,030 | 761,324 |
Apogee Enterprises, Inc. | 5,500 | 261,085 |
AZZ, Inc. | 6,477 | 281,490 |
Builders FirstSource, Inc. * | 70,605 | 9,602,280 |
Carlisle Cos., Inc. | 13,613 | 3,492,143 |
Gibraltar Industries, Inc. * | 24,098 | 1,516,246 |
Griffon Corp. | 13,217 | 532,645 |
Lennox International, Inc. | 6,498 | 2,118,803 |
Owens Corning | 26,950 | 3,516,975 |
Resideo Technologies, Inc. * | 41,092 | 725,685 |
Simpson Manufacturing Co., Inc. | 11,421 | 1,581,808 |
Trex Co., Inc. * | 4,267 | 279,745 |
UFP Industries, Inc. | 36,016 | 3,495,353 |
28,165,582 | ||
Capital Markets — 1.7% | ||
Affiliated Managers Group, Inc. | 10,657 | 1,597,378 |
Avantax, Inc. * | 94,557 | 2,116,186 |
Donnelley Financial Solutions, Inc. * | 12,728 | 579,506 |
Evercore, Inc., Class A | 6,146 | 759,584 |
Federated Hermes, Inc. | 12,264 | 439,664 |
Interactive Brokers Group, Inc., Class A | 37,673 | 3,129,496 |
Jefferies Financial Group, Inc. | 47,304 | 1,569,074 |
Piper Sandler Cos. | 3,395 | 438,838 |
SEI Investments Co. | 11,124 | 663,213 |
Stifel Financial Corp. | 34,394 | 2,052,290 |
StoneX Group, Inc. * | 8,613 | 715,568 |
Virtus Investment Partners, Inc. | 1,931 | 381,314 |
14,442,111 | ||
Chemicals — 2.3% | ||
AdvanSix, Inc. | 29,340 | 1,026,313 |
Ashland, Inc. | 11,044 | 959,834 |
INVESTMENTS | SHARES | VALUE($) |
Chemicals — continued | ||
Avient Corp. | 41,272 | 1,688,025 |
Axalta Coating Systems Ltd. * | 22,657 | 743,376 |
Cabot Corp. | 27,395 | 1,832,452 |
Chemours Co. (The) (a) | 62,522 | 2,306,437 |
Hawkins, Inc. | 5,004 | 238,641 |
HB Fuller Co. | 26,979 | 1,929,268 |
Ingevity Corp. * | 24,188 | 1,406,774 |
Livent Corp. * (a) | 19,322 | 530,003 |
Minerals Technologies, Inc. | 14,462 | 834,313 |
RPM International, Inc. | 24,765 | 2,222,163 |
Scotts Miracle-Gro Co. (The) | 10,993 | 689,151 |
Sensient Technologies Corp. | 15,471 | 1,100,452 |
Stepan Co. | 20,247 | 1,934,803 |
Trinseo plc | 10,170 | 128,854 |
19,570,859 | ||
Commercial Services & Supplies — 1.7% | ||
ABM Industries, Inc. | 16,783 | 715,795 |
Brady Corp., Class A | 47,381 | 2,253,914 |
Brink's Co. (The) | 13,764 | 933,612 |
Clean Harbors, Inc. * | 30,057 | 4,942,272 |
CoreCivic, Inc. * | 115,800 | 1,089,678 |
Deluxe Corp. | 11,996 | 209,690 |
Enviri Corp. * | 17,334 | 171,087 |
Interface, Inc. | 16,900 | 148,551 |
Matthews International Corp., Class A | 8,671 | 369,558 |
MillerKnoll, Inc. | 22,120 | 326,934 |
OPENLANE, Inc. * | 33,537 | 510,433 |
Pitney Bowes, Inc. | 39,977 | 141,519 |
Stericycle, Inc. * | 6,377 | 296,148 |
Tetra Tech, Inc. | 14,200 | 2,325,108 |
Viad Corp. * | 5,256 | 141,281 |
14,575,580 | ||
Communications Equipment — 1.2% | ||
ADTRAN Holdings, Inc. | 14,611 | 153,854 |
Calix, Inc. * | 14,625 | 729,934 |
Ciena Corp. * | 88,208 | 3,747,958 |
Digi International, Inc. * | 8,866 | 349,232 |
Extreme Networks, Inc. * | 31,311 | 815,651 |
Lumentum Holdings, Inc. * (a) | 14,611 | 828,882 |
NETGEAR, Inc. * | 98,932 | 1,400,877 |
Viasat, Inc. * (a) | 44,567 | 1,838,834 |
Viavi Solutions, Inc. * | 58,739 | 665,513 |
10,530,735 | ||
6 | J.P. Morgan Exchange-Traded Funds | June 30, 2023 |
INVESTMENTS | SHARES | VALUE($) |
Common Stocks — continued | ||
Construction & Engineering — 2.2% | ||
AECOM | 34,504 | 2,922,144 |
Arcosa, Inc. | 14,122 | 1,070,024 |
Comfort Systems USA, Inc. | 26,172 | 4,297,442 |
EMCOR Group, Inc. | 27,044 | 4,997,190 |
MasTec, Inc. * | 15,095 | 1,780,757 |
MDU Resources Group, Inc. | 55,506 | 1,162,296 |
MYR Group, Inc. * | 17,182 | 2,376,958 |
18,606,811 | ||
Construction Materials — 0.2% | ||
Eagle Materials, Inc. | 7,188 | 1,339,987 |
Consumer Finance — 0.7% | ||
Encore Capital Group, Inc. * | 8,581 | 417,208 |
Enova International, Inc. * | 33,713 | 1,790,835 |
EZCORP, Inc., Class A * (a) | 23,387 | 195,983 |
FirstCash Holdings, Inc. | 13,580 | 1,267,421 |
Navient Corp. | 27,728 | 515,186 |
PROG Holdings, Inc. * | 17,963 | 576,972 |
SLM Corp. | 96,070 | 1,567,862 |
6,331,467 | ||
Consumer Staples Distribution & Retail — 1.8% | ||
Andersons, Inc. (The) | 32,306 | 1,490,922 |
BJ's Wholesale Club Holdings, Inc. * | 55,135 | 3,474,056 |
Casey's General Stores, Inc. | 17,375 | 4,237,415 |
SpartanNash Co. | 51,787 | 1,165,725 |
Sprouts Farmers Market, Inc. * | 98,995 | 3,636,086 |
United Natural Foods, Inc. * | 67,090 | 1,311,610 |
15,315,814 | ||
Containers & Packaging — 1.1% | ||
AptarGroup, Inc. | 13,834 | 1,602,807 |
Berry Global Group, Inc. | 19,132 | 1,230,953 |
Greif, Inc., Class A | 12,770 | 879,726 |
Myers Industries, Inc. | 10,175 | 197,700 |
O-I Glass, Inc. * | 19,122 | 407,872 |
Silgan Holdings, Inc. | 41,660 | 1,953,438 |
Sonoco Products Co. | 52,810 | 3,116,846 |
9,389,342 | ||
Diversified Consumer Services — 0.7% | ||
Adtalem Global Education, Inc. * | 13,575 | 466,165 |
Graham Holdings Co., Class B | 1,679 | 959,515 |
Grand Canyon Education, Inc. * | 5,093 | 525,649 |
INVESTMENTS | SHARES | VALUE($) |
Diversified Consumer Services — continued | ||
H&R Block, Inc. | 44,428 | 1,415,920 |
Service Corp. International | 43,691 | 2,822,002 |
6,189,251 | ||
Diversified REITs — 0.3% | ||
American Assets Trust, Inc. | 12,580 | 241,536 |
Armada Hoffler Properties, Inc. | 47,681 | 556,914 |
Essential Properties Realty Trust, Inc. | 72,044 | 1,695,916 |
2,494,366 | ||
Diversified Telecommunication Services — 0.3% | ||
Cogent Communications Holdings, Inc. | 10,797 | 726,530 |
Iridium Communications, Inc. | 35,468 | 2,203,272 |
2,929,802 | ||
Electric Utilities — 0.9% | ||
Hawaiian Electric Industries, Inc. | 47,461 | 1,718,088 |
IDACORP, Inc. | 32,816 | 3,366,922 |
OGE Energy Corp. | 73,969 | 2,656,227 |
7,741,237 | ||
Electrical Equipment — 1.7% | ||
Acuity Brands, Inc. | 8,849 | 1,443,095 |
Encore Wire Corp. | 15,109 | 2,809,216 |
EnerSys | 2,850 | 309,282 |
Hubbell, Inc. | 6,193 | 2,053,351 |
nVent Electric plc | 94,555 | 4,885,657 |
Regal Rexnord Corp. | 18,154 | 2,793,901 |
14,294,502 | ||
Electronic Equipment, Instruments & Components — 3.5% | ||
Advanced Energy Industries, Inc. | 11,091 | 1,236,092 |
Arrow Electronics, Inc. * | 25,093 | 3,594,070 |
Belden, Inc. | 11,565 | 1,106,192 |
Benchmark Electronics, Inc. | 9,965 | 257,396 |
Cognex Corp. | 36,567 | 2,048,483 |
Coherent Corp. * | 19,225 | 980,091 |
Fabrinet (Thailand) * | 26,866 | 3,489,356 |
Itron, Inc. * | 3,125 | 225,313 |
Jabil, Inc. | 70,940 | 7,656,554 |
Littelfuse, Inc. | 5,549 | 1,616,479 |
OSI Systems, Inc. * | 4,709 | 554,862 |
Rogers Corp. * | 3,965 | 642,053 |
TD SYNNEX Corp. | 23,113 | 2,172,622 |
Vontier Corp. | 123,578 | 3,980,447 |
29,560,010 | ||
June 30, 2023 | J.P. Morgan Exchange-Traded Funds | 7 |
AS OF June 30, 2023 (continued)
INVESTMENTS | SHARES | VALUE($) |
Common Stocks — continued | ||
Energy Equipment & Services — 0.9% | ||
Bristow Group, Inc. * | 7,615 | 218,779 |
ChampionX Corp. | 90,899 | 2,821,505 |
Helmerich & Payne, Inc. | 18,184 | 644,623 |
NOV, Inc. | 104,789 | 1,680,815 |
Oceaneering International, Inc. * | 50,276 | 940,161 |
Patterson-UTI Energy, Inc. | 89,914 | 1,076,271 |
ProPetro Holding Corp. * | 19,862 | 163,663 |
7,545,817 | ||
Entertainment — 0.0% ^ | ||
Marcus Corp. (The) (a) | 8,110 | 120,271 |
Financial Services — 1.8% | ||
Essent Group Ltd. | 46,686 | 2,184,905 |
Euronet Worldwide, Inc. * | 4,062 | 476,757 |
EVERTEC, Inc. (Puerto Rico) | 40,616 | 1,495,887 |
MGIC Investment Corp. | 132,635 | 2,094,307 |
Mr. Cooper Group, Inc. * | 28,445 | 1,440,455 |
NMI Holdings, Inc., Class A * | 55,194 | 1,425,109 |
Radian Group, Inc. | 23,815 | 602,043 |
Voya Financial, Inc. | 20,330 | 1,457,864 |
Walker & Dunlop, Inc. | 12,412 | 981,665 |
WEX, Inc. * | 17,643 | 3,212,261 |
15,371,253 | ||
Food Products — 1.5% | ||
Darling Ingredients, Inc. * | 44,039 | 2,809,248 |
Flowers Foods, Inc. | 50,146 | 1,247,633 |
Fresh Del Monte Produce, Inc. | 8,150 | 209,537 |
Hostess Brands, Inc. * | 35,388 | 896,024 |
Ingredion, Inc. | 31,376 | 3,324,287 |
John B Sanfilippo & Son, Inc. | 2,678 | 314,049 |
Pilgrim's Pride Corp. * | 50,164 | 1,078,024 |
Post Holdings, Inc. * | 15,158 | 1,313,441 |
Simply Good Foods Co. (The) * | 22,093 | 808,383 |
TreeHouse Foods, Inc. * | 13,167 | 663,353 |
12,663,979 | ||
Gas Utilities — 0.7% | ||
Chesapeake Utilities Corp. | 18,026 | 2,145,094 |
ONE Gas, Inc. | 17,609 | 1,352,547 |
Southwest Gas Holdings, Inc. | 4,139 | 263,447 |
Spire, Inc. | 7,124 | 451,947 |
UGI Corp. | 76,381 | 2,059,996 |
6,273,031 | ||
INVESTMENTS | SHARES | VALUE($) |
Ground Transportation — 1.9% | ||
ArcBest Corp. | 13,677 | 1,351,288 |
Avis Budget Group, Inc. * | 12,580 | 2,876,668 |
Knight-Swift Transportation Holdings, Inc. | 42,855 | 2,381,024 |
Landstar System, Inc. | 19,379 | 3,731,233 |
Ryder System, Inc. | 12,995 | 1,101,846 |
Saia, Inc. * | 6,740 | 2,307,843 |
Werner Enterprises, Inc. | 25,348 | 1,119,875 |
XPO, Inc. * | 28,893 | 1,704,687 |
16,574,464 | ||
Health Care Equipment & Supplies — 3.6% | ||
Avanos Medical, Inc. * | 11,916 | 304,573 |
CONMED Corp. (a) | 6,550 | 890,080 |
Envista Holdings Corp. * | 94,291 | 3,190,807 |
Glaukos Corp. * | 20,773 | 1,479,245 |
Globus Medical, Inc., Class A * | 20,304 | 1,208,900 |
Haemonetics Corp. * | 30,017 | 2,555,647 |
Inari Medical, Inc. * | 15,318 | 890,589 |
Integer Holdings Corp. * | 8,518 | 754,780 |
Integra LifeSciences Holdings Corp. * | 18,732 | 770,447 |
Lantheus Holdings, Inc. * | 47,777 | 4,009,446 |
LivaNova plc * | 11,544 | 593,708 |
Masimo Corp. * | 25,140 | 4,136,787 |
Merit Medical Systems, Inc. * | 13,291 | 1,111,659 |
Neogen Corp. * | 117,614 | 2,558,105 |
NuVasive, Inc. * | 45,981 | 1,912,350 |
Omnicell, Inc. * | 10,993 | 809,854 |
Orthofix Medical, Inc. * | 12,828 | 231,674 |
Shockwave Medical, Inc. * | 9,710 | 2,771,331 |
Varex Imaging Corp. * | 10,612 | 250,125 |
30,430,107 | ||
Health Care Providers & Services — 3.0% | ||
Acadia Healthcare Co., Inc. * | 23,287 | 1,854,577 |
Addus HomeCare Corp. * | 3,972 | 368,205 |
Amedisys, Inc. * | 21,919 | 2,004,273 |
AMN Healthcare Services, Inc. * | 5,531 | 603,543 |
Chemed Corp. | 4,356 | 2,359,515 |
Encompass Health Corp. | 57,021 | 3,860,892 |
Enhabit, Inc. * (a) | 12,526 | 144,049 |
Ensign Group, Inc. (The) | 13,385 | 1,277,732 |
Fulgent Genetics, Inc. * (a) | 40,111 | 1,485,310 |
HealthEquity, Inc. * | 39,464 | 2,491,757 |
ModivCare, Inc. * | 11,996 | 542,339 |
Option Care Health, Inc. * | 68,443 | 2,223,713 |
8 | J.P. Morgan Exchange-Traded Funds | June 30, 2023 |
INVESTMENTS | SHARES | VALUE($) |
Common Stocks — continued | ||
Health Care Providers & Services — continued | ||
Progyny, Inc. * | 57,685 | 2,269,328 |
R1 RCM, Inc. * (a) | 30,674 | 565,935 |
RadNet, Inc. * | 11,349 | 370,204 |
Tenet Healthcare Corp. * | 41,439 | 3,372,306 |
25,793,678 | ||
Health Care REITs — 0.4% | ||
CareTrust REIT, Inc. | 24,205 | 480,711 |
Community Healthcare Trust, Inc. | 38,624 | 1,275,365 |
Physicians Realty Trust | 121,281 | 1,696,721 |
Sabra Health Care REIT, Inc. | 25,077 | 295,156 |
3,747,953 | ||
Health Care Technology — 0.1% | ||
HealthStream, Inc. | 7,837 | 192,477 |
NextGen Healthcare, Inc. * | 16,463 | 267,030 |
Veradigm, Inc. * | 51,437 | 648,106 |
1,107,613 | ||
Hotel & Resort REITs — 0.2% | ||
DiamondRock Hospitality Co. | 51,275 | 410,713 |
Park Hotels & Resorts, Inc. (a) | 65,387 | 838,261 |
Xenia Hotels & Resorts, Inc. | 29,995 | 369,239 |
1,618,213 | ||
Hotels, Restaurants & Leisure — 2.3% | ||
BJ's Restaurants, Inc. * | 6,198 | 197,096 |
Bloomin' Brands, Inc. | 20,060 | 539,413 |
Boyd Gaming Corp. | 22,157 | 1,537,031 |
Brinker International, Inc. * | 35,920 | 1,314,672 |
Cheesecake Factory, Inc. (The) | 14,517 | 501,998 |
Churchill Downs, Inc. | 13,298 | 1,850,683 |
Cracker Barrel Old Country Store, Inc. (a) | 4,371 | 407,290 |
Dave & Buster's Entertainment, Inc. * | 13,485 | 600,892 |
Golden Entertainment, Inc. * | 9,055 | 378,499 |
Jack in the Box, Inc. | 6,650 | 648,574 |
Light & Wonder, Inc. * | 16,442 | 1,130,552 |
Marriott Vacations Worldwide Corp. | 10,797 | 1,325,008 |
Papa John's International, Inc. | 6,477 | 478,197 |
Planet Fitness, Inc., Class A * | 24,963 | 1,683,505 |
Texas Roadhouse, Inc. | 15,755 | 1,768,971 |
Travel + Leisure Co. | 30,923 | 1,247,434 |
Wendy's Co. (The) | 34,184 | 743,502 |
Wyndham Hotels & Resorts, Inc. | 50,326 | 3,450,854 |
19,804,171 | ||
INVESTMENTS | SHARES | VALUE($) |
Household Durables — 2.2% | ||
Cavco Industries, Inc. * | 2,131 | 628,645 |
KB Home | 24,024 | 1,242,281 |
La-Z-Boy, Inc. | 12,181 | 348,864 |
Meritage Homes Corp. | 15,853 | 2,255,406 |
Taylor Morrison Home Corp. * | 34,204 | 1,668,129 |
Tempur Sealy International, Inc. | 51,273 | 2,054,509 |
Toll Brothers, Inc. | 78,596 | 6,214,586 |
Tri Pointe Homes, Inc. * | 136,583 | 4,488,117 |
18,900,537 | ||
Household Products — 0.4% | ||
Central Garden & Pet Co. * | 27,349 | 1,060,321 |
Central Garden & Pet Co., Class A * | 55,045 | 2,006,941 |
Energizer Holdings, Inc. | 17,547 | 589,228 |
3,656,490 | ||
Industrial REITs — 1.3% | ||
EastGroup Properties, Inc. | 16,446 | 2,855,026 |
First Industrial Realty Trust, Inc. | 65,459 | 3,445,762 |
Innovative Industrial Properties, Inc. | 10,746 | 784,565 |
LXP Industrial Trust | 69,914 | 681,662 |
Rexford Industrial Realty, Inc. | 66,356 | 3,465,110 |
11,232,125 | ||
Insurance — 3.0% | ||
American Financial Group, Inc. | 23,890 | 2,836,937 |
Assured Guaranty Ltd. | 16,008 | 893,246 |
CNO Financial Group, Inc. | 32,943 | 779,761 |
Employers Holdings, Inc. | 17,232 | 644,649 |
First American Financial Corp. | 27,127 | 1,546,781 |
Hanover Insurance Group, Inc. (The) | 3,128 | 353,558 |
Horace Mann Educators Corp. | 10,610 | 314,693 |
James River Group Holdings Ltd. | 43,065 | 786,367 |
Kinsale Capital Group, Inc. | 3,425 | 1,281,635 |
Mercury General Corp. | 7,010 | 212,193 |
Old Republic International Corp. | 75,719 | 1,905,847 |
Palomar Holdings, Inc. * | 6,198 | 359,732 |
Primerica, Inc. | 7,080 | 1,400,141 |
Reinsurance Group of America, Inc. | 19,782 | 2,743,566 |
RenaissanceRe Holdings Ltd. (Bermuda) | 15,782 | 2,943,659 |
RLI Corp. | 16,565 | 2,260,625 |
Selective Insurance Group, Inc. | 4,488 | 430,624 |
Unum Group | 87,669 | 4,181,811 |
25,875,825 | ||
June 30, 2023 | J.P. Morgan Exchange-Traded Funds | 9 |
AS OF June 30, 2023 (continued)
INVESTMENTS | SHARES | VALUE($) |
Common Stocks — continued | ||
Interactive Media & Services — 0.3% | ||
QuinStreet, Inc. * | 35,373 | 312,343 |
TripAdvisor, Inc. * | 25,408 | 418,978 |
Yelp, Inc. * | 17,826 | 649,045 |
Ziff Davis, Inc. * | 12,938 | 906,436 |
2,286,802 | ||
IT Services — 0.1% | ||
Perficient, Inc. * | 9,219 | 768,219 |
Leisure Products — 0.7% | ||
Brunswick Corp. | 23,734 | 2,056,314 |
Mattel, Inc. * | 89,393 | 1,746,739 |
Polaris, Inc. (a) | 15,245 | 1,843,578 |
YETI Holdings, Inc. * | 18,284 | 710,150 |
6,356,781 | ||
Life Sciences Tools & Services — 0.7% | ||
Azenta, Inc. * | 20,679 | 965,295 |
Bruker Corp. | 26,375 | 1,949,640 |
Medpace Holdings, Inc. * | 7,034 | 1,689,356 |
Repligen Corp. * (a) | 4,904 | 693,720 |
Syneos Health, Inc. * | 23,734 | 1,000,151 |
6,298,162 | ||
Machinery — 5.5% | ||
AGCO Corp. | 30,576 | 4,018,298 |
Alamo Group, Inc. | 6,657 | 1,224,289 |
Chart Industries, Inc. * | 9,219 | 1,473,104 |
Crane Co. | 31,876 | 2,840,789 |
Crane NXT Co. | 31,876 | 1,799,081 |
Esab Corp. | 11,410 | 759,221 |
Federal Signal Corp. | 15,329 | 981,516 |
Flowserve Corp. | 34,910 | 1,296,907 |
Franklin Electric Co., Inc. | 31,849 | 3,277,262 |
Graco, Inc. | 45,904 | 3,963,810 |
Hillenbrand, Inc. | 27,996 | 1,435,635 |
ITT, Inc. | 44,720 | 4,168,351 |
John Bean Technologies Corp. | 7,934 | 962,394 |
Kennametal, Inc. | 22,103 | 627,504 |
Lincoln Electric Holdings, Inc. | 11,278 | 2,240,149 |
Lindsay Corp. | 2,788 | 332,720 |
Middleby Corp. (The) * | 14,969 | 2,212,867 |
Mueller Industries, Inc. | 15,416 | 1,345,508 |
Oshkosh Corp. | 32,406 | 2,806,036 |
SPX Technologies, Inc. * | 13,111 | 1,114,042 |
Standex International Corp. | 19,963 | 2,824,166 |
Terex Corp. | 18,926 | 1,132,343 |
INVESTMENTS | SHARES | VALUE($) |
Machinery — continued | ||
Timken Co. (The) | 25,464 | 2,330,720 |
Titan International, Inc. * | 15,158 | 174,014 |
Toro Co. (The) | 7,665 | 779,147 |
Watts Water Technologies, Inc., Class A | 5,875 | 1,079,414 |
47,199,287 | ||
Marine Transportation — 0.3% | ||
Kirby Corp. * | 16,103 | 1,239,126 |
Matson, Inc. | 11,916 | 926,231 |
2,165,357 | ||
Media — 0.4% | ||
Cable One, Inc. | 2,602 | 1,709,722 |
John Wiley & Sons, Inc., Class A | 11,250 | 382,838 |
New York Times Co. (The), Class A | 43,874 | 1,727,758 |
3,820,318 | ||
Metals & Mining — 2.3% | ||
Alcoa Corp. | 41,146 | 1,396,084 |
Arconic Corp. * | 41,301 | 1,221,683 |
ATI, Inc. * (a) | 49,242 | 2,177,974 |
Cleveland-Cliffs, Inc. * | 129,229 | 2,165,878 |
Commercial Metals Co. | 54,894 | 2,890,718 |
Haynes International, Inc. | 10,084 | 512,469 |
Materion Corp. | 10,168 | 1,161,185 |
Reliance Steel & Aluminum Co. | 23,479 | 6,376,662 |
Royal Gold, Inc. | 4,509 | 517,543 |
SunCoke Energy, Inc. | 72,583 | 571,228 |
United States Steel Corp. | 15,283 | 382,228 |
19,373,652 | ||
Mortgage Real Estate Investment Trusts (REITs) — 0.5% | ||
Annaly Capital Management, Inc. (a) | 144,488 | 2,891,205 |
Ellington Financial, Inc. (a) | 12,789 | 176,488 |
KKR Real Estate Finance Trust, Inc. | 16,997 | 206,854 |
PennyMac Mortgage Investment Trust | 26,355 | 355,265 |
Ready Capital Corp. (a) | 27,428 | 309,388 |
3,939,200 | ||
Multi-Utilities — 0.3% | ||
NorthWestern Corp. | 21,372 | 1,213,075 |
Unitil Corp. | 25,164 | 1,276,066 |
2,489,141 | ||
Office REITs — 0.7% | ||
Brandywine Realty Trust | 126,732 | 589,304 |
Corporate Office Properties Trust | 59,455 | 1,412,056 |
10 | J.P. Morgan Exchange-Traded Funds | June 30, 2023 |
INVESTMENTS | SHARES | VALUE($) |
Common Stocks — continued | ||
Office REITs — continued | ||
Cousins Properties, Inc. | 41,025 | 935,370 |
Highwoods Properties, Inc. | 44,975 | 1,075,352 |
Hudson Pacific Properties, Inc. | 37,072 | 156,444 |
Kilroy Realty Corp. | 52,025 | 1,565,432 |
5,733,958 | ||
Oil, Gas & Consumable Fuels — 3.4% | ||
Antero Midstream Corp. | 74,514 | 864,362 |
Antero Resources Corp. * | 30,627 | 705,340 |
California Resources Corp. | 18,723 | 847,965 |
Callon Petroleum Co. * | 11,111 | 389,663 |
Chord Energy Corp. | 16,218 | 2,494,328 |
Civitas Resources, Inc. | 18,841 | 1,307,000 |
CNX Resources Corp. * | 23,735 | 420,584 |
CONSOL Energy, Inc. | 12,791 | 867,358 |
Dorian LPG Ltd. | 7,487 | 192,042 |
DT Midstream, Inc. | 14,511 | 719,310 |
Equitrans Midstream Corp. | 103,341 | 987,940 |
Green Plains, Inc. * | 29,205 | 941,569 |
HF Sinclair Corp. | 48,395 | 2,158,901 |
Matador Resources Co. | 42,496 | 2,223,391 |
Murphy Oil Corp. | 38,039 | 1,456,894 |
Ovintiv, Inc. | 11,363 | 432,589 |
PBF Energy, Inc., Class A | 22,157 | 907,108 |
PDC Energy, Inc. | 43,886 | 3,122,050 |
Range Resources Corp. | 77,546 | 2,279,852 |
REX American Resources Corp. * | 13,005 | 452,704 |
SM Energy Co. | 57,116 | 1,806,579 |
Southwestern Energy Co. * | 456,402 | 2,742,976 |
Talos Energy, Inc. * | 9,328 | 129,379 |
World Kinect Corp. | 16,413 | 339,421 |
28,789,305 | ||
Paper & Forest Products — 0.2% | ||
Louisiana-Pacific Corp. | 25,790 | 1,933,734 |
Passenger Airlines — 0.0% ^ | ||
Hawaiian Holdings, Inc. * | 22,440 | 241,679 |
Personal Care Products — 0.8% | ||
BellRing Brands, Inc. * | 36,639 | 1,340,987 |
Coty, Inc., Class A * (a) | 77,102 | 947,584 |
Edgewell Personal Care Co. | 15,258 | 630,308 |
elf Beauty, Inc. * | 13,305 | 1,519,830 |
Inter Parfums, Inc. | 4,947 | 668,983 |
INVESTMENTS | SHARES | VALUE($) |
Personal Care Products — continued | ||
Medifast, Inc. | 12,481 | 1,150,249 |
USANA Health Sciences, Inc. * | 2,983 | 188,048 |
6,445,989 | ||
Pharmaceuticals — 0.7% | ||
Innoviva, Inc. * | 162,064 | 2,063,075 |
Jazz Pharmaceuticals plc * | 22,246 | 2,757,836 |
Prestige Consumer Healthcare, Inc. * | 15,258 | 906,783 |
Supernus Pharmaceuticals, Inc. * | 12,828 | 385,610 |
6,113,304 | ||
Professional Services — 3.2% | ||
ASGN, Inc. * | 15,158 | 1,146,400 |
CACI International, Inc., Class A * | 12,303 | 4,193,354 |
Concentrix Corp. | 13,764 | 1,111,443 |
ExlService Holdings, Inc. * | 9,290 | 1,403,347 |
FTI Consulting, Inc. * (a) | 9,299 | 1,768,670 |
Genpact Ltd. | 94,091 | 3,534,999 |
Heidrick & Struggles International, Inc. | 33,142 | 877,269 |
Insperity, Inc. | 8,771 | 1,043,398 |
KBR, Inc. | 35,215 | 2,291,088 |
Kelly Services, Inc., Class A | 10,612 | 186,877 |
Korn Ferry | 36,567 | 1,811,529 |
ManpowerGroup, Inc. | 31,755 | 2,521,347 |
Maximus, Inc. | 17,284 | 1,460,671 |
Paylocity Holding Corp. * | 9,513 | 1,755,434 |
Resources Connection, Inc. | 31,051 | 487,811 |
Science Applications International Corp. | 13,281 | 1,493,847 |
27,087,484 | ||
Real Estate Management & Development — 0.4% | ||
Anywhere Real Estate, Inc. * | 81,000 | 541,080 |
Jones Lang LaSalle, Inc. * | 15,105 | 2,353,359 |
RE/MAX Holdings, Inc., Class A | 5,804 | 111,785 |
3,006,224 | ||
Residential REITs — 0.3% | ||
Apartment Income REIT Corp. | 39,091 | 1,410,794 |
Centerspace | 12,490 | 766,387 |
NexPoint Residential Trust, Inc. | 6,611 | 300,668 |
2,477,849 | ||
Retail REITs — 1.9% | ||
Agree Realty Corp. | 47,803 | 3,125,838 |
Brixmor Property Group, Inc. | 151,223 | 3,326,906 |
Kite Realty Group Trust | 59,116 | 1,320,651 |
Macerich Co. (The) | 15,281 | 172,217 |
June 30, 2023 | J.P. Morgan Exchange-Traded Funds | 11 |
AS OF June 30, 2023 (continued)
INVESTMENTS | SHARES | VALUE($) |
Common Stocks — continued | ||
Retail REITs — continued | ||
NNN REIT, Inc. | 75,307 | 3,222,387 |
Retail Opportunity Investments Corp. | 121,801 | 1,645,532 |
RPT Realty | 24,126 | 252,117 |
Saul Centers, Inc. | 2,967 | 109,275 |
SITE Centers Corp. | 49,842 | 658,911 |
Spirit Realty Capital, Inc. | 42,108 | 1,658,213 |
Tanger Factory Outlet Centers, Inc. (a) | 8,034 | 177,310 |
Urstadt Biddle Properties, Inc., Class A | 31,680 | 673,517 |
Whitestone | 8,655 | 83,953 |
16,426,827 | ||
Semiconductors & Semiconductor Equipment — 3.8% | ||
Axcelis Technologies, Inc. * | 9,513 | 1,744,018 |
Cirrus Logic, Inc. * | 42,885 | 3,474,114 |
Cohu, Inc. * | 10,993 | 456,869 |
Diodes, Inc. * | 10,712 | 990,753 |
FormFactor, Inc. * | 23,077 | 789,695 |
Ichor Holdings Ltd. * | 35,468 | 1,330,050 |
Kulicke & Soffa Industries, Inc. (Singapore) | 61,616 | 3,663,071 |
Lattice Semiconductor Corp. * | 37,766 | 3,628,180 |
MaxLinear, Inc. * | 18,793 | 593,107 |
MKS Instruments, Inc. | 14,385 | 1,555,018 |
Photronics, Inc. * | 15,626 | 402,995 |
Power Integrations, Inc. | 15,416 | 1,459,433 |
Rambus, Inc. * | 30,212 | 1,938,704 |
Semtech Corp. * | 18,184 | 462,965 |
Silicon Laboratories, Inc. * | 21,235 | 3,349,609 |
SiTime Corp. * | 4,116 | 485,564 |
SMART Global Holdings, Inc. * | 57,514 | 1,668,481 |
Synaptics, Inc. * | 9,155 | 781,654 |
Ultra Clean Holdings, Inc. * | 21,182 | 814,660 |
Universal Display Corp. | 11,186 | 1,612,238 |
Veeco Instruments, Inc. * | 1,822 | 46,789 |
Wolfspeed, Inc. * (a) | 17,643 | 980,774 |
32,228,741 | ||
Software — 2.9% | ||
ACI Worldwide, Inc. * | 28,843 | 668,292 |
Adeia, Inc. | 98,998 | 1,089,968 |
Alarm.com Holdings, Inc. * | 5,651 | 292,044 |
Aspen Technology, Inc. * | 7,742 | 1,297,637 |
Blackbaud, Inc. * | 12,644 | 900,000 |
DoubleVerify Holdings, Inc. * | 36,331 | 1,414,002 |
Dynatrace, Inc. * | 55,329 | 2,847,784 |
Envestnet, Inc. * | 29,109 | 1,727,619 |
INVESTMENTS | SHARES | VALUE($) |
Software — continued | ||
InterDigital, Inc. | 8,581 | 828,496 |
LiveRamp Holdings, Inc. * | 80,415 | 2,296,652 |
Manhattan Associates, Inc. * | 17,447 | 3,487,306 |
NCR Corp. * | 54,676 | 1,377,835 |
Progress Software Corp. | 8,306 | 482,579 |
Qualys, Inc. * | 8,671 | 1,120,033 |
SPS Commerce, Inc. * | 10,614 | 2,038,525 |
Teradata Corp. * | 27,796 | 1,484,584 |
Xperi, Inc. * | 102,124 | 1,342,931 |
24,696,287 | ||
Specialized REITs — 1.9% | ||
CubeSmart | 92,846 | 4,146,502 |
EPR Properties | 9,613 | 449,888 |
Four Corners Property Trust, Inc. | 7,249 | 184,125 |
Lamar Advertising Co., Class A | 23,629 | 2,345,178 |
Life Storage, Inc. | 36,762 | 4,887,876 |
National Storage Affiliates Trust | 66,229 | 2,306,756 |
PotlatchDeltic Corp. | 13,365 | 706,340 |
Rayonier, Inc. | 50,262 | 1,578,227 |
16,604,892 | ||
Specialty Retail — 3.6% | ||
Aaron's Co., Inc. (The) | 8,947 | 126,510 |
Abercrombie & Fitch Co., Class A * | 15,805 | 595,532 |
American Eagle Outfitters, Inc. | 56,141 | 662,464 |
Asbury Automotive Group, Inc. * | 8,761 | 2,106,320 |
AutoNation, Inc. * | 20,513 | 3,376,645 |
Boot Barn Holdings, Inc. * | 7,771 | 658,126 |
Caleres, Inc. | 12,644 | 302,571 |
Chico's FAS, Inc. * | 28,343 | 151,635 |
Designer Brands, Inc., Class A | 18,373 | 185,567 |
Dick's Sporting Goods, Inc. | 17,851 | 2,359,724 |
Five Below, Inc. * | 11,444 | 2,249,204 |
Foot Locker, Inc. (a) | 30,574 | 828,861 |
Group 1 Automotive, Inc. | 10,171 | 2,625,135 |
Guess?, Inc. (a) | 12,828 | 249,505 |
Haverty Furniture Cos., Inc. | 4,447 | 134,388 |
Hibbett, Inc. | 4,356 | 158,079 |
Lithia Motors, Inc., Class A | 6,935 | 2,109,003 |
Murphy USA, Inc. | 5,993 | 1,864,482 |
ODP Corp. (The) * | 14,746 | 690,408 |
RH * (a) | 4,062 | 1,338,794 |
Sally Beauty Holdings, Inc. * | 57,376 | 708,594 |
Shoe Carnival, Inc. | 5,158 | 121,110 |
12 | J.P. Morgan Exchange-Traded Funds | June 30, 2023 |
INVESTMENTS | SHARES | VALUE($) |
Common Stocks — continued | ||
Specialty Retail — continued | ||
Signet Jewelers Ltd. | 15,416 | 1,006,048 |
Sleep Number Corp. * | 6,103 | 166,490 |
Upbound Group, Inc. | 31,659 | 985,545 |
Urban Outfitters, Inc. * | 18,668 | 618,471 |
Valvoline, Inc. | 51,173 | 1,919,499 |
Williams-Sonoma, Inc. | 22,335 | 2,795,002 |
31,093,712 | ||
Technology Hardware, Storage & Peripherals — 0.6% | ||
Avid Technology, Inc. * | 75,320 | 1,920,660 |
Super Micro Computer, Inc. * | 12,376 | 3,084,718 |
5,005,378 | ||
Textiles, Apparel & Luxury Goods — 1.7% | ||
Capri Holdings Ltd. * | 41,834 | 1,501,422 |
Carter's, Inc. | 8,771 | 636,775 |
Columbia Sportswear Co. | 2,231 | 172,322 |
Crocs, Inc. * | 17,089 | 1,921,487 |
Deckers Outdoor Corp. * | 7,665 | 4,044,514 |
G-III Apparel Group Ltd. * | 11,444 | 220,526 |
Kontoor Brands, Inc. | 15,048 | 633,521 |
Oxford Industries, Inc. | 4,062 | 399,782 |
PVH Corp. | 17,584 | 1,494,113 |
Skechers U.S.A., Inc., Class A * | 47,598 | 2,506,511 |
Steven Madden Ltd. | 21,848 | 714,211 |
Wolverine World Wide, Inc. | 21,883 | 321,461 |
14,566,645 | ||
Tobacco — 0.0% ^ | ||
Vector Group Ltd. | 32,143 | 411,752 |
Trading Companies & Distributors — 1.7% | ||
Boise Cascade Co. | 17,447 | 1,576,336 |
DXP Enterprises, Inc. * | 3,425 | 124,704 |
GATX Corp. | 5,997 | 772,054 |
GMS, Inc. * | 47,256 | 3,270,115 |
MSC Industrial Direct Co., Inc., Class A | 12,375 | 1,179,090 |
NOW, Inc. * | 179,660 | 1,861,278 |
Univar Solutions, Inc. * | 42,619 | 1,527,465 |
Veritiv Corp. | 3,852 | 483,850 |
Watsco, Inc. (a) | 8,805 | 3,358,843 |
14,153,735 | ||
Water Utilities — 0.6% | ||
American States Water Co. | 9,557 | 831,459 |
INVESTMENTS | SHARES | VALUE($) |
Water Utilities — continued | ||
California Water Service Group | 12,644 | 652,810 |
Essential Utilities, Inc. (a) | 87,908 | 3,508,408 |
4,992,677 | ||
Wireless Telecommunication Services — 0.1% | ||
Gogo, Inc. * | 60,396 | 1,027,336 |
Total Common Stocks (Cost $602,937,871) | 833,167,959 | |
Short-Term Investments — 5.1% | ||
Investment Companies — 2.3% | ||
JPMorgan U.S. Government Money Market Fund Class IM Shares, 5.05% (b) (c) (Cost $19,564,496) | 19,564,496 | 19,564,496 |
Investment of Cash Collateral from Securities Loaned — 2.8% | ||
JPMorgan Securities Lending Money Market Fund Agency SL Class Shares, 5.29% (b) (c) | 17,996,401 | 17,998,200 |
JPMorgan U.S. Government Money Market Fund Class IM Shares, 5.05% (b) (c) | 5,817,078 | 5,817,078 |
Total Investment of Cash Collateral from Securities Loaned (Cost $23,815,278) | 23,815,278 | |
Total Short-Term Investments (Cost $43,379,774) | 43,379,774 | |
Total Investments — 102.6% (Cost $646,317,645) | 876,547,733 | |
Liabilities in Excess of Other Assets — (2.6)% | (21,987,361 ) | |
NET ASSETS — 100.0% | 854,560,372 | |
Percentages indicated are based on net assets. |
Abbreviations | |
REIT | Real Estate Investment Trust |
^ | Amount rounds to less than 0.1% of net assets. | |
* | Non-income producing security. | |
(a) | The security or a portion of this security is on loan at June 30, 2023. The total value of securities on loan at June 30, 2023 is $23,326,174. | |
(b) | Investment in an affiliated fund, which is registered under the Investment Company Act of 1940, as amended, and is advised by J.P. Morgan Investment Management Inc. | |
(c) | The rate shown is the current yield as of June 30, 2023. | |
June 30, 2023 | J.P. Morgan Exchange-Traded Funds | 13 |
AS OF June 30, 2023 (continued)
DESCRIPTION | NUMBER OF CONTRACTS | EXPIRATION DATE | TRADING CURRENCY | NOTIONAL AMOUNT ($) | VALUE AND UNREALIZED APPRECIATION (DEPRECIATION) ($) |
Long Contracts | |||||
Russell 2000 E-Mini Index | 49 | 09/15/2023 | USD | 4,662,840 | 35,260 |
S&P MidCap 400 E-Mini Index | 54 | 09/15/2023 | USD | 14,277,060 | 369,440 |
404,700 |
Abbreviations | |
USD | United States Dollar |
14 | J.P. Morgan Exchange-Traded Funds | June 30, 2023 |
AS OF June 30, 2023
JPMorgan Market Expansion Enhanced Equity ETF | |
ASSETS: | |
Investments in non-affiliates, at value | $833,167,959 |
Investments in affiliates, at value | 19,564,496 |
Investments of cash collateral received from securities loaned, at value (See Note 2.B.) | 23,815,278 |
Cash | 82,717 |
Deposits at broker for futures contracts | 1,281,000 |
Receivables: | |
Investment securities sold | 59,254 |
Dividends from non-affiliates | 830,241 |
Dividends from affiliates | 2,709 |
Securities lending income (See Note 2.B.) | 11,589 |
Variation margin on futures contracts | 100,529 |
Total Assets | 878,915,772 |
LIABILITIES: | |
Payables: | |
Investment securities purchased | 318,994 |
Collateral received on securities loaned (See Note 2.B.) | 23,815,278 |
Accrued liabilities: | |
Investment advisory fees | 90,346 |
Administration fees | 50,967 |
Printing and mailing costs | 21,747 |
Custodian and accounting fees | 16,662 |
Other | 41,406 |
Total Liabilities | 24,355,400 |
Net Assets | $854,560,372 |
NET ASSETS: | |
Paid-in-Capital | $627,894,304 |
Total distributable earnings (loss) | 226,666,068 |
Total Net Assets | $854,560,372 |
Outstanding number of shares (unlimited number of shares authorized - par value $0.0001) | 17,048,634 |
Net asset value, per share | $50.12 |
Cost of investments in non-affiliates | $602,937,871 |
Cost of investments in affiliates | 19,564,496 |
Investment securities on loan, at value (See Note 2.B.) | 23,326,174 |
Cost of investment of cash collateral (See Note 2.B.) | 23,815,278 |
June 30, 2023 | J.P. Morgan Exchange-Traded Funds | 15 |
FOR THE YEAR ENDED June 30, 2023
JPMorgan Market Expansion Enhanced Equity ETF | |
INVESTMENT INCOME: | |
Interest income from non-affiliates | $112,533 |
Interest income from affiliates | 179 |
Dividend income from non-affiliates | 12,331,789 |
Dividend income from affiliates | 797,866 |
Income from securities lending (net) (See Note 2.B.) | 213,434 |
Total investment income | 13,455,801 |
EXPENSES: | |
Investment advisory fees | 2,082,505 |
Administration fees | 624,755 |
Custodian and accounting fees | 56,908 |
Professional fees | 48,257 |
Trustees’ and Chief Compliance Officer’s fees | 26,474 |
Printing and mailing costs | 84,893 |
Registration and filing fees | 61,797 |
Other | 27,482 |
Total expenses | 3,013,071 |
Less fees waived | (62,621 ) |
Less expense reimbursements | (976,495 ) |
Net expenses | 1,973,955 |
Net investment income (loss) | 11,481,846 |
REALIZED/UNREALIZED GAINS (LOSSES): | |
Net realized gain (loss) on transactions from: | |
Investments in non-affiliates | 13,885,892 |
In-kind redemptions of investments in non-affiliates (See Note 4) | 34,709,226 |
Futures contracts | 1,625,751 |
Net realized gain (loss) | 50,220,869 |
Change in net unrealized appreciation/depreciation on: | |
Investments in non-affiliates | 68,259,447 |
Futures contracts | 1,661,387 |
Change in net unrealized appreciation/depreciation | 69,920,834 |
Net realized/unrealized gains (losses) | 120,141,703 |
Change in net assets resulting from operations | $131,623,549 |
16 | J.P. Morgan Exchange-Traded Funds | June 30, 2023 |
FOR THE PERIODS INDICATED
JPMorgan Market Expansion Enhanced Equity ETF | ||
Year Ended June 30, 2023 | Year Ended June 30, 2022 (a) | |
CHANGE IN NET ASSETS RESULTING FROM OPERATIONS: | ||
Net investment income (loss) | $11,481,846 | $12,427,409 |
Net realized gain (loss) | 50,220,869 | 99,215,056 |
Change in net unrealized appreciation/depreciation | 69,920,834 | (248,681,340 ) |
Change in net assets resulting from operations | 131,623,549 | (137,038,875 ) |
DISTRIBUTIONS TO SHAREHOLDERS: | ||
Total distributions to shareholders | (52,218,514 ) | (176,087,906 ) |
CAPITAL TRANSACTIONS: | ||
Change in net assets resulting from capital transactions | (58,838,049 ) | 26,187,530 |
NET ASSETS: | ||
Change in net assets | 20,566,986 | (286,939,251 ) |
Beginning of period | 833,993,386 | 1,120,932,637 |
End of period | $854,560,372 | $833,993,386 |
June 30, 2023 | J.P. Morgan Exchange-Traded Funds | 17 |
FOR THE PERIODS INDICATED (continued)
JPMorgan Market Expansion Enhanced Equity ETF | ||
Year Ended June 30, 2023 | Year Ended June 30, 2022(a) | |
CAPITAL TRANSACTIONS: (b) | ||
Proceeds from shares issued | $20,677,423 | $16,072,047 |
Distributions reinvested | — | 123,329,499 |
Cost of shares redeemed | (79,515,472 ) | (53,645,989 ) |
Change in net assets resulting from capital transactions | (58,838,049 ) | 85,755,557 |
Class A | ||
Proceeds from shares issued | — | 7,213,239 |
Distributions reinvested | — | 17,945,255 |
Cost of shares redeemed | — | (41,770,683 ) |
Change in net assets resulting from Class A capital transactions | — | (16,612,189 ) |
Class C | ||
Proceeds from shares issued | — | 1,510,970 |
Distributions reinvested | — | 3,548,357 |
Cost of shares redeemed | — | (11,945,898 ) |
Change in net assets resulting from Class C capital transactions | — | (6,886,571 ) |
Class I | ||
Proceeds from shares issued | — | 32,169,494 |
Distributions reinvested | — | 23,772,565 |
Cost of shares redeemed | — | (83,394,480 ) |
Change in net assets resulting from Class I capital transactions | — | (27,452,421 ) |
Class R2 | ||
Proceeds from shares issued | — | 2,031,211 |
Distributions reinvested | — | 1,950,085 |
Cost of shares redeemed | — | (12,598,142 ) |
Change in net assets resulting from Class R2 capital transactions | — | (8,616,846 ) |
Total change in net assets resulting from capital transactions | $(58,838,049 ) | $26,187,530 |
18 | J.P. Morgan Exchange-Traded Funds | June 30, 2023 |
JPMorgan Market Expansion Enhanced Equity ETF | ||
Year Ended June 30, 2023 | Year Ended June 30, 2022(a) | |
SHARES TRANSACTIONS: (b) | ||
Issued | 425,000 | 267,214 |
Reinvested | — | 2,224,181 |
Redeemed | (1,575,000 ) | (1,008,937 ) |
Change in Shares | (1,150,000 ) | 1,482,458 |
Class A | ||
Issued | — | 120,263 |
Reinvested | — | 322,868 |
Redeemed | — | (750,550 ) |
Change in Class A Shares | — | (307,419 ) |
Class C | ||
Issued | — | 23,706 |
Reinvested | — | 63,214 |
Redeemed | — | (204,223 ) |
Change in Class C Shares | — | (117,303 ) |
Class I | ||
Issued | — | 541,296 |
Reinvested | — | 427,319 |
Redeemed | — | (1,480,505 ) |
Change in Class I Shares | — | (511,890 ) |
Class R2 | ||
Issued | — | 32,990 |
Reinvested | — | 34,939 |
Redeemed | — | (230,081 ) |
Change in Class R2 Shares | — | (162,152 ) |
June 30, 2023 | J.P. Morgan Exchange-Traded Funds | 19 |
FOR THE PERIODS INDICATED
Per share operating performance (a) | |||||||
Investment operations | Distributions | ||||||
Net asset value beginning of period | Net investment income loss(c) | Net realized and unrealized gains (losses) on investments | Total from investment operations | Net investment income | Net realized gain | Total Distributions | |
JPMorgan Market Expansion Enhanced Equity ETF (g) | |||||||
Year Ended June 30, 2023 | $45.83 | $0.67 | $6.67 | $7.34 | $(0.66 ) | $(2.39 ) | $(3.05 ) |
Year Ended June 30, 2022 | 62.87 | 0.70 | (8.03 ) | (7.33 ) | (0.66 ) | (9.05 ) | (9.71 ) |
Year Ended June 30, 2021 | 41.41 | 0.63 | 23.22 | 23.85 | (0.63 ) | (1.76 ) | (2.39 ) |
Year Ended June 30, 2020 | 48.77 | 0.63 | (4.82 ) | (4.19 ) | (0.68 ) | (2.49 ) | (3.17 ) |
October 1, 2018 through June 30, 2019 | 58.92 | 0.54 | (4.01 ) | (3.47 ) | (0.68 ) | (6.00 ) | (6.68 ) |
Year Ended June 30, 2019 | 57.67 | 0.63 | (3.24 ) | (2.61 ) | (0.44 ) | (5.95 ) | (6.39 ) |
(a) | Per Share amounts reflect the conversion of the Predecessor Fund into the Fund as of the close of business on May 6, 2022. See Note 1. |
(b) | Annualized for periods less than one year, unless otherwise noted. |
(c) | Calculated based upon average shares outstanding. |
(d) | Not annualized for periods less than one year. |
(e) | Includes adjustments in accordance with accounting principles generally accepted in the United States of America and as such, the net asset values for financial reporting purposes and the returns based upon those net asset values may differ from the net asset values and returns for shareholder transactions. |
(f) | JPMorgan Market Expansion Enhanced Equity ETF acquired all of the assets and liabilities of the JPMorgan Market Expansion Enhanced Index Fund (“Predecessor Fund”) in a reorganization on May 6, 2022. Market price returns are calculated using the official closing price of the JPMorgan Market Expansion Enhanced Equity ETF on the listing exchange as of the time that the JPMorgan Market Expansion Enhanced Equity ETF's NAV is calculated. Prior to the JPMorgan Market Expansion Enhanced Equity ETF's listing on May 9, 2022, the NAV performance of the Class R6 and the Class I Shares of the Predecessor Fund are used as proxy market price returns. |
(g) | JPMorgan Market Expansion Enhanced Equity ETF (the “Fund”) acquired all of the assets and liabilities of the JPMorgan Market Expansion Enhanced Index Fund (“Predecessor Fund”) in a reorganization that occurred as of the close of business on May 6, 2022. Performance and financial history of the Predecessor Fund’s Class R6 Shares have been adopted by the Fund and will be used going forward. As a result, the financial highlight information reflects that of the Predecessor Fund’s Class R6 Shares for the period October 1, 2018 (“Predecessor Fund's Class R6 Shares inception date”) up through the reorganization and the Predecessor Fund's Class I Shares for the period July 1, 2018 through June 30, 2019. |
20 | J.P. Morgan Exchange-Traded Funds | June 30, 2023 |
Ratios/Supplemental data | ||||||||
Ratios to average net assets (b) | ||||||||
Net asset value, end of period | Market price, end of period | Total Return(d)(e) | Market price total return(d)(f) | Net assets, end of period | Net expenses | Net investment income (loss) | Expenses without waivers and reimbursements | Portfolio turnover rate(d) |
$50.12 | $50.16 | 16.61 % | 16.73 % | $854,560,372 | 0.24 % | 1.38 % | 0.36 % | 29 % |
45.83 | 45.82 | (13.80 ) | (13.81 ) | 833,993,386 | 0.25 | 1.21 | 0.36 | 27 |
62.87 | 62.87 | 58.97 | 58.97 | 766,008,977 | 0.25 | 1.18 | 0.35 | 35 |
41.41 | 41.41 | (9.65 ) | (9.65 ) | 500,129,035 | 0.25 | 1.45 | 0.36 | 49 |
48.77 | 48.77 | (4.81 ) | (4.81 ) | 512,511,625 | 0.25 | 1.51 | 0.37 | 36 |
48.67 | 48.67 | (3.56 ) | (3.56 ) | 264,414,719 | 0.34 | 1.14 | 0.61 | 36 |
June 30, 2023 | J.P. Morgan Exchange-Traded Funds | 21 |
AS OF June 30, 2023
22 | J.P. Morgan Exchange-Traded Funds | June 30, 2023 |
Level 1 Quoted prices | Level 2 Other significant observable inputs | Level 3 Significant unobservable inputs | Total | |
Total Investments in Securities (a) | $876,547,733 | $— | $— | $876,547,733 |
Appreciation in Other Financial Instruments | ||||
Futures Contracts (a) | $404,700 | $— | $— | $404,700 |
(a) | Please refer to the SOI for specifics of portfolio holdings. |
June 30, 2023 | J.P. Morgan Exchange-Traded Funds | 23 |
AS OF June 30, 2023 (continued)
Investment Securities on Loan, at value, Presented on the Statement of Assets and Liabilities | Cash Collateral Posted by Borrower* | Net Amount Due to Counterparty (not less than zero) | |
$23,326,174 | $(23,326,174 ) | $— |
* | Collateral posted reflects the value of securities on loan and does not include any additional amounts received from the borrower. |
$2,935 |
24 | J.P. Morgan Exchange-Traded Funds | June 30, 2023 |
For the year ended June 30, 2023 | |||||||||
Security Description | Value at June 30, 2022 | Purchases at Cost | Proceeds from Sales | Net Realized Gain (Loss) | Change in Unrealized Appreciation/ (Depreciation) | Value at June 30, 2023 | Shares at June 30, 2023 | Dividend Income | Capital Gain Distributions |
JPMorgan Securities Lending Money Market Fund Agency SL Class Shares, 5.29% (a) (b) | $— | $83,000,000 | $65,000,001 | $(1,799 )* | $— | $17,998,200 | 17,996,401 | $303,250 * | $— |
JPMorgan U.S. Government Money Market Fund Class IM Shares, 5.05% (a) (b) | 4,706,771 | 84,397,428 | 83,287,121 | — | — | 5,817,078 | 5,817,078 | 108,333 * | — |
JPMorgan U.S. Government Money Market Fund Class IM Shares, 5.05% (a) (b) | 29,389,113 | 156,432,490 | 166,257,107 | — | — | 19,564,496 | 19,564,496 | 797,866 | — |
Total | $34,095,884 | $323,829,918 | $314,544,229 | $(1,799 ) | $— | $43,379,774 | $1,209,449 | $— | |
(a) | Investment in an affiliated fund, which is registered under the Investment Company Act of 1940, as amended, and is advised by J.P. Morgan Investment Management Inc. |
(b) | The rate shown is the current yield as of June 30, 2023. |
* | Amount is included on the Statement of Operations as Income from securities lending (net) (after payments of rebates and Citibank’s fee). |
Futures Contracts: | |
Average Notional Balance Long | $22,564,980 |
Ending Notional Balance Long | 18,939,900 |
June 30, 2023 | J.P. Morgan Exchange-Traded Funds | 25 |
AS OF June 30, 2023 (continued)
Paid-in-Capital | Accumulated undistributed (distributions in excess of) net investment income | Accumulated net realized gains (losses) | |
$32,800,816 | $113,491 | $(32,914,307 ) |
26 | J.P. Morgan Exchange-Traded Funds | June 30, 2023 |
Contractual Waivers | ||
Investment Advisory Fees | Contractual Reimbursements | |
$32,497 | $974,799 |
June 30, 2023 | J.P. Morgan Exchange-Traded Funds | 27 |
AS OF June 30, 2023 (continued)
Purchases (excluding U.S. Government) | Sales (excluding U.S. Government) | |
$233,976,218 | $267,600,184 |
In-Kind Purchases | In-Kind Sales | |
$20,015,830 | $76,195,071 |
Aggregate Cost | Gross Unrealized Appreciation | Gross Unrealized Depreciation | Net Unrealized Appreciation (Depreciation) | |
$651,196,819 | $268,251,498 | $42,495,884 | $225,755,614 |
Ordinary Income* | Net Long-Term Capital Gains | Total Distributions Paid | |
$11,287,892 | $40,930,622 | $52,218,514 |
* | Short-term gain distributions are treated as ordinary income for income tax purposes. |
Ordinary Income* | Net Long-Term Capital Gains | Total Distributions Paid | |
$43,345,176 | $132,742,730 | $176,087,906 |
* | Short-term gain distributions are treated as ordinary income for income tax purposes. |
Current Distributable Ordinary Income | Unrealized Appreciation (Depreciation) | |
$5,667,356 | $225,755,614 |
28 | J.P. Morgan Exchange-Traded Funds | June 30, 2023 |
Net Capital Losses (Gains) | ||
Short-Term | Long-Term | |
$7,063,101 | $(2,363,848 ) | |
J.P. Morgan Investor Funds | |
71.7 % |
June 30, 2023 | J.P. Morgan Exchange-Traded Funds | 29 |
AS OF June 30, 2023 (continued)
30 | J.P. Morgan Exchange-Traded Funds | June 30, 2023 |
June 30, 2023 | J.P. Morgan Exchange-Traded Funds | 31 |
(Unaudited)
Name (Year of Birth); Positions With the Funds (1) | Principal Occupation During Past 5 Years | Number of Funds in Fund Complex Overseen by Trustee (2) | Other Directorships Held During the Past 5 Years |
Independent Trustees | |||
John F. Finn (1947); Chair since 2020; Trustee since 1998. | Chairman, Gardner, Inc. (supply chain management company serving industrial and consumer markets) (serving in various roles 1974-present). | 176 | Director, Greif, Inc. (GEF) (industrial package products and services) (2007-present); Trustee, Columbus Association for the Performing Arts (1988-present). |
Stephen P. Fisher (1959); Trustee since 2018. | Retired; Chairman and Chief Executive Officer, NYLIFE Distributors LLC (registered broker-dealer) (serving in various roles 2008-2013); Chairman, NYLIM Service Company LLC (transfer agent) (2008-2017); New York Life Investment Management LLC (registered investment adviser) (serving in various roles 2005-2017); Chairman, IndexIQ Advisors LLC (registered investment adviser for ETFs) (2014-2017); President, MainStay VP Funds Trust (2007-2017), MainStay DefinedTerm Municipal Opportunities Fund (2011-2017) and MainStay Funds Trust (2007-2017) (registered investment companies). | 176 | Honors Program Advisory Board Member, The Zicklin School of Business, Baruch College, The City University of New York (2017-present). |
Gary L. French (1951); Trustee since 2014. | Real Estate Investor (2011-2020); Investment management industry Consultant and Expert Witness (2011-present); Senior Consultant for The Regulatory Fundamentals Group LLC (2011-2017). | 176 | Independent Trustee, The China Fund, Inc. (2013-2019); Exchange Traded Concepts Trust II (2012-2014); Exchange Traded Concepts Trust I (2011-2014). |
Kathleen M. Gallagher (1958); Trustee since 2018. | Retired; Chief Investment Officer — Benefit Plans, Ford Motor Company (serving in various roles 1985-2016). | 176 | Non- Executive Director, Legal & General Investment Management (Holdings) (2018-present); Non-Executive Director, Legal & General Investment Management America (U.S. Holdings) (financial services and insurance) (2017-present); Advisory Board Member, State Street Global Advisors Total Portfolio Solutions (2017-present); Member, Client Advisory Council, Financial Engines, LLC (registered investment adviser) (2011-2016); Director, Ford Pension Funds Investment Management Ltd. (2007-2016). |
Robert J. Grassi (1957); Trustee since 2014. | Sole Proprietor, Academy Hills Advisors LLC (2012-present); Pension Director, Corning Incorporated (2002-2012). | 176 | None |
32 | J.P. Morgan Exchange-Traded Funds | June 30, 2023 |
Name (Year of Birth); Positions With the Funds (1) | Principal Occupation During Past 5 Years | Number of Funds in Fund Complex Overseen by Trustee (2) | Other Directorships Held During the Past 5 Years |
Independent Trustees (continued) | |||
Frankie D. Hughes (1952); Trustee since 2008. | President, Ashland Hughes Properties (property management) (2014-present); President and Chief Investment Officer, Hughes Capital Management, Inc. (fixed income asset management) (1993-2014). | 176 | None |
Raymond Kanner (1953); Trustee since 2017. | Retired; Managing Director and Chief Investment Officer, IBM Retirement Funds (2007-2016). | 176 | Advisory Board Member, Penso Advisors, LLC (2020-present); Advisory Board Member, Los Angeles Capital (2018-present); Advisory Board Member, State Street Global Advisors Total Portfolio Solutions (2017- present); Acting Executive Director, Committee on Investment of Employee Benefit Assets (CIEBA) (2016-2017); Advisory Board Member, Betterment for Business (robo advisor) (2016- 2017); Advisory Board Member, BlueStar Indexes (index creator) (2013-2017); Director, Emerging Markets Growth Fund (registered investment company) (1997-2016); Member, Russell Index Client Advisory Board (2001-2015). |
Thomas P. Lemke (1954); Trustee since 2014. | Retired since 2013. | 176 | (1) Independent Trustee of Advisors’ Inner Circle III fund platform, consisting of the following: (i) the Advisors’ Inner Circle Fund III, (ii) the Gallery Trust, (iii) the Schroder Series Trust, (iv) the Delaware Wilshire Private Markets Fund (since 2020), (v) Chiron Capital Allocation Fund Ltd., and (vi) formerly the Winton Diversified Opportunities Fund (2014-2018); and (2) Independent Trustee of the Symmetry Panoramic Trust (since 2018). |
Lawrence R. Maffia (1950); Trustee since 2014. | Retired; Director and President, ICI Mutual Insurance Company (2006-2013). | 176 | Director, ICI Mutual Insurance Company (1999-2013). |
Mary E. Martinez (1960); Vice Chair since 2021; Trustee since 2013. | Associate, Special Properties, a Christie’s International Real Estate Affiliate (2010-present); Managing Director, Bank of America (asset management) (2007-2008); Chief Operating Officer, U.S. Trust Asset Management, U.S. Trust Company (asset management) (2003-2007); President, Excelsior Funds (registered investment companies) (2004-2005). | 176 | None |
Marilyn McCoy (1948); Trustee since 1999. | Retired; Vice President of Administration and Planning, Northwestern University (1985-2023). | 176 | None |
June 30, 2023 | J.P. Morgan Exchange-Traded Funds | 33 |
(Unaudited) (continued)
Name (Year of Birth); Positions With the Funds (1) | Principal Occupation During Past 5 Years | Number of Funds in Fund Complex Overseen by Trustee (2) | Other Directorships Held During the Past 5 Years |
Independent Trustees (continued) | |||
Dr. Robert A. Oden, Jr. (1946); Trustee since 1997. | Retired; President, Carleton College (2002-2010); President, Kenyon College (1995-2002). | 176 | Trustee, The Coldwater Conservation Fund (2017-present); Trustee, American Museum of Fly Fishing (2013-present); Trustee and Vice Chair, Trout Unlimited (2017-2021); Trustee, Dartmouth- Hitchcock Medical Center (2011-2020). |
Marian U. Pardo* (1946); Trustee since 2013. | Managing Director and Founder, Virtual Capital Management LLC (investment consulting) (2007-present); Managing Director, Credit Suisse Asset Management (portfolio manager) (2003-2006). | 176 | Board Chair and Member, Board of Governors, Columbus Citizens Foundation (not-for-profit supporting philanthropic and cultural programs) (2006-present). |
Emily A. Youssouf (1951); Trustee since 2014. | Adjunct Professor (2011-present) and Clinical Professor (2009-2011), NYU Schack Institute of Real Estate; Board Member and Member of the Audit Committee (2013–present), Chair of Finance Committee (2019-present), Member of Related Parties Committee (2013-2018) and Member of the Enterprise Risk Committee (2015-2018), PennyMac Financial Services, Inc.; Board Member (2005-2018), Chair of Capital Committee (2006-2016), Chair of Audit Committee (2005-2018), Member of Finance Committee (2005-2018) and Chair of IT Committee (2016-2018), NYC Health and Hospitals Corporation. | 176 | Trustee, NYC School Construction Authority (2009-present); Board Member, NYS Job Development Authority (2008-present); Trustee and Chair of the Audit Committee of the Transit Center Foundation (2015-2019). |
Interested Trustees | |||
Robert F. Deutsch** (1957); Trustee since 2014. | Retired; Head of ETF Business for JPMorgan Asset Management (2013-2017); Head of Global Liquidity Business for JPMorgan Asset Management (2003-2013). | 176 | Treasurer and Director of the JUST Capital Foundation (2017-present). |
Nina O. Shenker** (1957); Trustee since 2022. | Vice Chair (2017-2021), General Counsel and Managing Director (2008-2016), Associate General Counsel and Managing Director (2004-2008), J.P. Morgan Asset & Wealth Management. | 176 | Director and Member of Legal and Human Resources Subcommittees, American Jewish Joint Distribution Committee (2018-present). |
(1) | The year shown is the first year in which a Trustee became a member of any of the following: the JPMorgan Mutual Fund Board, the JPMorgan ETF Board, the heritage J.P. Morgan Funds or the heritage One Group Mutual Funds. Trustees serve an indefinite term, until resignation, retirement, removal or death. The Board's current retirement policy sets retirement at the end of the calendar year in which the Trustee attains the age of 75, provided that any Board member who was a member of the JPMorgan Mutual Fund Board prior to January 1, 2022 and was born prior to January 1, 1950 shall retire from the Board at the end of the calendar year in which the Trustee attains the age of 78. | ||
(2) | A Fund Complex means two or more registered investment companies that hold themselves out to investors as related companies for purposes of investment and investor services or have a common investment adviser or have an investment adviser that is an affiliated person of the investment adviser of any of the other registered investment companies. The J.P. Morgan Funds Complex for which the Board of Trustees serves currently includes nine registered investment companies (176 J.P. Morgan Funds). | ||
* | In connection with prior employment with JPMorgan Chase, Ms. Pardo was the recipient of non-qualified pension plan payments from JPMorgan Chase in the amount of approximately $2,055 per month, which she irrevocably waived effective January 1, 2013, and deferred compensation payments from JPMorgan Chase in the amount of approximately $7,294 per year, which ended in January 2013. In addition, Ms. Pardo receives payments from a fully-funded qualified plan, which is not an obligation of JPMorgan Chase. | ||
34 | J.P. Morgan Exchange-Traded Funds | June 30, 2023 |
** | Designation as an “Interested Trustee” is based on prior employment by the Adviser or an affiliate of the Adviser or interests in a control person of the Adviser. | ||
The contact address for each of the Trustees is 277 Park Avenue, New York, NY 10172. | |||
June 30, 2023 | J.P. Morgan Exchange-Traded Funds | 35 |
(Unaudited)
Name (Year of Birth), Positions Held with the Trust (Since) | Principal Occupations During Past 5 Years |
Brian S. Shlissel (1964), President and Principal Executive Officer (2021) | Managing Director and Chief Administrative Officer for J.P. Morgan pooled vehicles, J.P. Morgan Investment Management Inc. since 2014. |
Timothy J. Clemens (1975), Treasurer and Principal Financial Officer (2020) | Managing Director, J.P. Morgan Investment Management Inc. Mr. Clemens has been with J.P. Morgan Investment Management Inc. since 2013. |
Gregory S. Samuels (1980), Secretary (2022) (formerly Assistant Secretary 2014-2022) | Managing Director and Assistant General Counsel, JPMorgan Chase & Co. Mr. Samuels has been with JPMorgan Chase & Co. since 2010. |
Stephen M. Ungerman (1953), Chief Compliance Officer (2014) | Managing Director, JPMorgan Chase & Co. Mr. Ungerman has been with JPMorgan Chase & Co. since 2000. |
Kiesha Astwood-Smith (1973), Assistant Secretary (2021) | Vice President and Assistant General Counsel, JPMorgan Chase & Co. since June 2021; Senior Director and Counsel, Equitable Financial Life Insurance Company (formerly, AXA Equitable Life Insurance Company) from September 2015 through June 2021. |
Matthew Beck (1988), Assistant Secretary (2021)* | Vice President and Assistant General Counsel, JPMorgan Chase & Co. since May 2021; Senior Legal Counsel, Ultimus Fund Solutions from May 2018 through May 2021; General Counsel, The Nottingham Company from April 2014 through May 2018. |
Elizabeth A. Davin (1964), Assistant Secretary (2022) (formerly Secretary 2018-2022)* | Executive Director and Assistant General Counsel, JPMorgan Chase & Co. Ms. Davin has been with JPMorgan Chase & Co. (formerly Bank One Corporation) since 2004. |
Jessica K. Ditullio (1962), Assistant Secretary (2014)* | Executive Director and Assistant General Counsel, JPMorgan Chase & Co. Ms. Ditullio has been with JPMorgan Chase & Co. (formerly Bank One Corporation) since 1990. |
Anthony Geron (1971), Assistant Secretary (2019) | Vice President and Assistant General Counsel, JPMorgan Chase & Co. since September 2018; Lead Director and Counsel, AXA Equitable Life Insurance Company from 2015 to 2018 and Senior Director and Counsel, AXA Equitable Life Insurance Company from 2014 to 2015. |
Carmine Lekstutis (1980), Assistant Secretary (2014) | Executive Director and Assistant General Counsel, JPMorgan Chase & Co. Mr. Lekstutis has been with JPMorgan Chase & Co. since 2011. |
Max Vogel (1990), Assistant Secretary (2021) | Vice President and Assistant General Counsel, JPMorgan Chase & Co. since June 2021; Associate, Proskauer Rose LLP (law firm) from March 2017 to June 2021. |
Zachary E. Vonnegut-Gabovitch (1986), Assistant Secretary (2017) | Executive Director and Assistant General Counsel, JPMorgan Chase & Co. Mr. Vonnegut-Gabovitch has been with JPMorgan Chase & Co. since September 2016. |
Frederick J. Cavaliere (1978), Assistant Treasurer (2015)** | Executive Director, J.P. Morgan Investment Management Inc. Mr. Cavaliere has been with JPMorgan Chase & Co. since May 2006. |
Michael M. D’Ambrosio (1969), Assistant Treasurer (2014) | Managing Director, J.P. Morgan Investment Management Inc. Mr. D’Ambrosio has been with J.P. Morgan Investment Management Inc. since 2012. |
Aleksandr Fleytekh (1972), Assistant Treasurer (2023) | Executive Director, J.P. Morgan Investment Management Inc. Mr. Fleytekh has been with J.P. Morgan Investment Management Inc. since February 2012. |
Shannon Gaines (1977), Assistant Treasurer (2019)* | Executive Director, J.P. Morgan Investment Management Inc. Mr. Gaines has been with J.P. Morgan Investment Management Inc. since January 2014. |
Jeffrey D. House (1972), Assistant Treasurer (2023)* | Vice President, J.P. Morgan Investment Management Inc. since July 2006. |
Michael Mannarino (1985), Assistant Treasurer (2023) | Vice President, J.P. Morgan Investment Management Inc. since 2014. |
36 | J.P. Morgan Exchange-Traded Funds | June 30, 2023 |
Nektarios E. Manolakakis (1972), Assistant Treasurer (2020) | Executive Director, J.P. Morgan Investment Management Inc. since February 2021, formerly Vice President, J.P. Morgan Investment Management Inc. since 2014; Vice President, J.P. Morgan Corporate & Investment Bank 2010-2014. |
Todd McEwen (1981), Assistant Treasurer (2020)* | Vice President, J.P. Morgan Investment Management Inc. Mr. McEwen has been with J.P. Morgan Investment Management Inc. since 2010. |
Joseph Parascondola (1963), Assistant Treasurer (2023)** | Executive Director, J.P. Morgan Investment Management Inc. Mr. Parascondola has been with J.P. Morgan Investment Management Inc. since 2006. |
Gillian I. Sands (1969), Assistant Treasurer (2023) | Executive Director, J.P. Morgan Investment Management Inc. Ms. Sands has been with J.P. Morgan Investment Management Inc. since 2012. |
The contact address for each of the officers, unless otherwise noted, is 277 Park Avenue, New York, NY 10172. | |
* | The contact address for the officer is 1111 Polaris Parkway, Columbus, OH 43240. |
** | The contact address for the officer is 575 Washington Boulevard, Jersey City, NJ 07310. |
June 30, 2023 | J.P. Morgan Exchange-Traded Funds | 37 |
(Unaudited)
Hypothetical $1,000 Investment
Beginning Account Value January 1, 2023 | Ending Account Value June 30, 2023 | Expenses Paid During the Period* | Annualized Expense Ratio | |
JPMorgan Market Expansion Enhanced Equity ETF | ||||
Actual | $1,000.00 | $1,087.90 | $1.24 | 0.24 % |
Hypothetical | 1,000.00 | 1,023.60 | 1.20 | 0.24 |
* | Expenses are equal to the Fund’s annualized net expense ratio, multiplied by the average account value over the period, multiplied by 181/365 (to reflect the one-half year period). |
38 | J.P. Morgan Exchange-Traded Funds | June 30, 2023 |
(Unaudited)
June 30, 2023 | J.P. Morgan Exchange-Traded Funds | 39 |


ITEM 2. CODE OF ETHICS.
Disclose whether, as of the end of the period covered by the report, the registrant has adopted a code of ethics that applies to the registrant’s principal executive officer, principal financial officer, principal accounting officer or controller, or persons performing similar functions, regardless of whether these individuals are employed by the registrant or a third party. If the registrant has not adopted such a code of ethics, explain why it has not done so.
The registrant must briefly describe the nature of any amendment, during the period covered by the report, to a provision of its code of ethics that applies to the registrant’s principal executive officer, principal financial officer, principal accounting officer or controller, or persons performing similar functions, regardless of whether these individuals are employed by the registrant or a third party, and that relates to any element of the code of ethics definition enumerated in paragraph (b) of this Item. The registrant must file a copy of any such amendment as an exhibit pursuant to Item 13(a)(1), unless the registrant has elected to satisfy paragraph (f) of this Item by positing its code of ethics on its website pursuant to paragraph (f)(2) of this Item, or by undertaking to provide its code of ethics to any person without charge, upon request, pursuant to paragraph (f)(3) of this Item.
If the registrant has, during the period covered by the report, granted a waiver, including an implicit waiver, from a provision of the code of ethics that applies to the registrant’s principal executive officer, principal financial officer, principal accounting officer or controller, or persons performing similar functions, regardless of whether these individuals are employed by the registrant or third party, that relates to one or more items set forth in paragraph (b) of this Item, the registrant must briefly describe the nature of the waiver, the name of the person to whom the waiver was granted, and the date of the waiver.
The Registrant has adopted a code of ethics that applies to the Registrant’s principal executive officer and principal financial officer. There were no amendments to the code of ethics or waivers granted with respect to the code of ethics in the period covered by the report.
ITEM 3. AUDIT COMMITTEE FINANCIAL EXPERT.
(a) (1) Disclose that the registrant’s board of directors has determined that the registrant either:
| (i) | Has at least one audit committee financial expert serving on its audit committee; or |
| (ii) | Does not have an audit committee financial expert serving on its audit committee. |
The Registrant’s Board of Trustees has determined that the Registrant has at least one audit committee financial expert serving on its audit committee. The Securities and Exchange Commission has stated that the designation or identification of a person as an audit committee financial expert pursuant to this Item 3 of Form N-CSR does not impose on such person any duties, obligations or liabilities that are greater than the duties, obligations and liabilities imposed on such person as a member of the Audit Committee and the Board of Trustees in the absence of such designation or identification.
(2) If the registrant provides the disclosure required by paragraph (a)(1)(i) of this Item, it must disclose the name of the audit committee financial expert and whether that person is “independent.” In order to be considered “independent” for purposes of this Item, a member of an audit committee may not, other than in his or her capacity as a member of the audit committee, the board of directors, or any other board committee:
| (i) | Accept directly or indirectly any consulting, advisory, or other compensatory fee from the issuer; or |
| (ii) | Be an “interested person” of the investment company as defined in Section 2(a)(19) of the Act (15 U.S.C. 80a-2(a)(19)). |
The Audit committee financial experts are Gary L. French, Kathleen M. Gallagher, Raymond Kanner and Lawrence R. Maffia, each of whom is not an “interested person” of the Registrant and is also “independent” as defined by the U.S. Securities and Exchange Commission for the purposes of the audit committee financial expert determination.
(3) If the registrant provides the disclosure required by paragraph (a)(1)(ii) of this Item, it must explain why it does not have an audit committee financial expert.
Not applicable.
ITEM 4. PRINCIPAL ACCOUNTANT FEES AND SERVICES.
(a) Disclose, under the caption Audit Fees, the aggregate fees billed for each of the last two fiscal years for professional services rendered by the principal accountant for the audit of the registrant’s annual financial statements or services that are normally provided by the accountant in connection with statutory and regulatory filings or engagements for those fiscal years.
AUDIT FEES
2023 – $233,444
2022 – $182,288
(b) Disclose, under the caption Audit-Related Fees, the aggregate fees billed in each of the last two fiscal years for assurance and related services by the principal accountant that are reasonably related to the performance of the audit of the registrant’s financial statements and are not reported under paragraph (a) of this Item. Registrants shall describe the nature of the services comprising the fees disclosed under this category.
AUDIT-RELATED FEES
2023 – $32,527
2022 – $33,384
Audit-related fees consist of security count procedures performed as required under Rule 17f-2 of the Investment Company Act of 1940 during the Registrant’s fiscal year.
(c) Disclose, under the caption Tax Fees, the aggregate fees billed in each of the last two fiscal years for professional services rendered by the principal accountant for tax compliance, tax advice, and tax planning. Registrants shall describe the nature of the services comprising the fees disclosed under this category.
TAX FEES
2023 – $68,721
2022 – $43,103
The tax fees consist of fees billed in connection with preparing the federal regulated investment company income tax returns for the Registrant for the tax years ended June 30, 2023 and 2022, respectively.
For the last fiscal year, no tax fees were required to be approved pursuant to paragraph (c)(7)(ii) of Rule 2-01 of Regulation S-X.
(d) Disclose, under the caption All Other Fees, the aggregate fees billed in each of the last two fiscal years for products and services provided by the principal accountant, other than the services reported in paragraphs (a) through (c) of this Item. Registrants shall describe the nature of the services comprising the fees disclosed under this category.
ALL OTHER FEES
2023 – $0
2022 – $0
(e)(1) Disclose the audit committee’s pre-approval policies and procedures described in paragraph (c)(7) of Rule 2-01 of Regulation S-X.
Pursuant to the Registrant’s Audit Committee Charter and written policies and procedures for the pre-approval of audit and non-audit services (the “Pre-approval Policy”), the Audit Committee pre-approves all audit and non-audit services performed by the Registrant’s independent public registered accounting firm for the Registrant. In addition, the Audit Committee pre-approves the auditor’s engagement for non-audit services with the Registrant’s investment adviser (not including a sub-adviser whose role is primarily portfolio management and is sub-contracted or overseen by another investment adviser) and any Service Affiliate in accordance with paragraph (c)(7)(ii) of Rule 2-01 of Regulation S-X, if the engagement relates directly to the operations and financial reporting of the Registrant. Proposed services may be pre-approved either 1) without consideration of specific case-by- case services or 2) require the specific pre-approval of the Audit Committee. Therefore, initially the Pre-approval Policy listed a number of audit and non-audit services that have been approved by the Audit Committee, or which were not subject to pre- approval under the transition provisions of Sarbanes-Oxley Act of 2002 (the “Pre-approval List”). The Audit Committee annually reviews and pre-approves the services included on the Pre-approval List that may be provided by the independent public registered accounting firm without obtaining additional specific pre-approval of individual services from the Audit Committee. The Audit Committee adds to, or subtracts from, the list of general pre-approved services from time to time, based on subsequent determinations. All other audit and non-audit services not on the Pre-approval List must be specifically pre-approved by the Audit Committee.
One or more members of the Audit Committee may be appointed as the Committee’s delegate for the purposes of considering whether to approve such services. Any pre-approvals granted by the delegate will be reported, for informational purposes only, to the Audit Committee at its next scheduled meeting. The Audit Committee’s responsibilities to pre-approve services performed by the independent public registered accounting firm are not delegated to management.
(2) Disclose the percentage of services described in each of paragraphs (b) through (d) of this Item that were approved by the audit committee pursuant to paragraph (c)(7)(i)(C) of Rule 2-01 of Regulation S-X.
2023 – 0.0%
2022 – 0.0%
(f) If greater than 50 percent, disclose the percentage of hours expended on the principal accountant’s engagement to audit the registrant’s financial statements for the most recent fiscal year that were attributed to work performed by persons other than the principal accountant’s full-time, permanent employees.
Not applicable.
(g) Disclose the aggregate non-audit fees billed by the registrant’s accountant for services rendered to the registrant, and rendered to the registrant’s investment adviser (not including any sub-adviser whose role is primarily portfolio management and is subcontracted with or overseen by another investment adviser), and any entity controlling, controlled by, or under common control with the adviser that provides ongoing services to the registrant for each of the last two fiscal years of the registrant.
The aggregate non-audit fees billed by the independent registered public accounting firm for services rendered to the Registrant, and rendered to Service Affiliates, for the last two calendar year ends were:
2022 – $31.6 million
2021 – $30.7 million
(h) Disclose whether the registrant’s audit committee of the board of directors has considered whether the provision of non-audit services that were rendered to the registrant’s investment adviser (not including any subadviser whose role is primarily portfolio management and is subcontracted with or overseen by another investment adviser), and any entity controlling, controlled by, or under common control with the investment adviser that provides ongoing services to the registrant that were not pre-approved pursuant to paragraph (c)(7)(ii) of Rule 2-01 of Regulation S-X is compatible with maintaining the principal accountant’s independence.
The Registrant’s Audit Committee has considered whether the provision of the non-audit services that were rendered to Service Affiliates that were not pre-approved (not requiring pre-approval) is compatible with maintaining the independent public registered accounting firm’s independence. All services provided by the independent public registered accounting firm to the Registrant or to Service Affiliates that were required to be pre-approved were pre-approved as required.
(i) A registrant identified by the Commission pursuant to Section 104(i)(2)(A) of the Sarbanes-Oxley Act of 2002 (15 U.S.C. 7214(i)(2)(A)), as having retained, for the preparation of the audit report on its financial statements included in the Form NCSR, a registered public accounting firm that has a branch or office that is located in a foreign jurisdiction and that the Public Company Accounting Oversight Board has determined it is unable to inspect or investigate completely because of a position taken by an authority in the foreign jurisdiction must electronically submit to the Commission on a supplemental basis documentation that establishes that the registrant is not owned or controlled by a governmental entity in the foreign jurisdiction. The registrant must submit this documentation on or before the due date for this form. A registrant that is owned or controlled by a foreign governmental entity is not required to submit such documentation.
Not applicable.
(j) A registrant that is a foreign issuer, as defined in 17 CFR 240.3b-4, identified by the Commission pursuant to Section 104(i)(2)(A) of the Sarbanes-Oxley Act of 2002 (15 U.S.C. 7214(i)(2)(A)), as having retained, for the preparation of the audit report on its financial statements included in the Form N-CSR, a registered public accounting firm that has a branch or office that is located in a foreign jurisdiction and that the Public Company Accounting Oversight Board has determined it is unable to inspect or investigate completely because of a position taken by an authority in the foreign jurisdiction, for each year in which the registrant is so identified, must provide the below disclosures. Also, any such identified foreign issuer that uses a variable-interest entity or any similar structure that results in additional foreign entities being consolidated in the financial statements of the registrant is required to provide the below disclosures for itself and its consolidated foreign operating entity or entities. A registrant must disclose:
| (1) | That, for the immediately preceding annual financial statement period, a registered public accounting firm that the PCAOB was unable to inspect or investigate completely, because of a position taken by an authority in the foreign jurisdiction, issued an audit report for the registrant; |
| (2) | The percentage of shares of the registrant owned by governmental entities in the foreign jurisdiction in which the registrant is incorporated or otherwise organized; |
| (3) | Whether governmental entities in the applicable foreign jurisdiction with respect to that registered public accounting firm have a controlling financial interest with respect to the registrant; |
| (4) | The name of each official of the Chinese Communist Party who is a member of the board of directors of the registrant or the operating entity with respect to the registrant; and |
| (5) | Whether the articles of incorporation of the registrant (or equivalent organizing document) contains any charter of the Chinese Communist Party, including the text of any such charter. |
Not applicable.
ITEM 5. AUDIT COMMITTEE OF LISTED REGISTRANTS.
(a) If the registrant is a listed issuer as defined in Rule 10A-3 under the Exchange Act (17CFR 240.10A-3), state whether or not the registrant has a separately-designated standing audit committee established in accordance with Section 3(a)(58)(A) of the Exchange Act (15 U.S.C. 78c(a)(58)(A)). If the registrant has such a committee, however designated, identify each committee member. If the entire board of directors is acting as the registrant’s audit committee as specified in Section 3(a)(58)(B) of the Exchange Act (15
U.S.C. 78c(a)(58)(B)), so state.
The registrant has a separately designated Audit Committee established in accordance with Section 3(a)(58)(A) of the Exchange Act. The members of the Audit Committee are Gary L. French, Kathleen M. Gallagher, Raymond Kanner and Lawrence R. Maffia.
(b) If applicable, provide the disclosure required by Rule 10A-3(d) under the Exchange Act (17CFR 240.10A-3(d)) regarding an exemption from the listing standards for all audit committees.
Not applicable.
ITEM 6. SCHEDULE OF INVESTMENTS.
File Schedule I – Investments in securities of unaffiliated issuers as of the close of the reporting period as set forth in Section 210.12-12 of Regulation S-X, unless the schedule is included as part of the report to shareholders filed under Item 1 of this Form.
Included in Item 1.
ITEM 7. DISCLOSURE OF PROXY VOTING POLICIES AND PROCEDURES FOR CLOSED-END MANAGEMENT INVESTMENT COMPANIES.
A closed-end management investment company that is filing an annual report on this Form N-CSR must, unless it invests exclusively in non-voting securities, describe the policies and procedures that it uses to determine how to vote proxies relating to portfolio securities, including the procedures that the company uses when a vote presents a conflict between the interests of its shareholders, on the one hand, and those of the company’s investment adviser; principal underwriter; or any affiliated person (as defined in Section 2(a)(3) of the Investment Company Act of 1940 (15 U.S.C. 80a-2(a)(3)) and the rules thereunder) of the company, its investment adviser, or its principal underwriter, on the other. Include any policies and procedures of the company’s investment adviser, or any other third party, that the company uses, or that are used on the company’s behalf, to determine how to vote proxies relating to portfolio securities.
Not applicable.
ITEM 8. PORTFOLIO MANAGERS OF CLOSED-END MANAGEMENT INVESTMENT COMPANIES.
Not applicable.
ITEM 9. PURCHASE OF EQUITY SECURITIES BY CLOSED-END MANAGEMENT INVESTMENT COMPANY AND AFFILIATED PURCHASERS.
(a) If the registrant is a closed-end management investment company, provide the information specified in paragraph (b) of this Item with respect to any purchase made by or on behalf of the registrant or any “affiliated purchaser,” as defined in Rule 10b-18(a)(3) under the Exchange Act (17 CFR 240.10b-18(a)(3)), of shares or other units of any class of the registrant’s equity securities that is registered by the registrant pursuant to Section 12 of the Exchange Act (15 U.S.C. 781).
Not applicable.
ITEM 10. SUBMISSION OF MATTERS TO A VOTE OF SECURITY HOLDERS.
Describe any material changes to the procedures by which shareholders may recommend nominees to the registrant’s board of directors, where those changes were implemented after the registrant last provided disclosure in response to the requirements of Item 7(d)(2)(ii)(G) of Schedule 14A (17 CFR 240.14a-101), or this Item.
No material changes to report.
ITEM 11. CONTROLS AND PROCEDURES.
(a) Disclose the conclusions of the registrant’s principal executive and principal financial officers, or persons performing similar functions, regarding the effectiveness of the registrant’s disclosure controls and procedures (as defined in Rule 30a-3(c) under the Act (17 CFR 270.30a-3(c))) as of a date within 90 days of the filing date of the report that includes the disclosure required by this paragraph, based on the evaluation of these controls and procedures required by Rule 30a-3(b) under the Act (17 CFR 270.30a-3(b)) and Rules 13a-15(b) or 15d-15(b) under the Exchange Act (17 CFR 240.13a-15(b) or 240.15d-15(b)).
The Registrant’s principal executive and principal financial officers have concluded, based on their evaluation of the Registrant’s disclosure controls and procedures as of a date within 90 days of the filing date of this report, that the Registrant’s disclosure controls and procedures are reasonably designed to ensure that information required to be disclosed by the Registrant on Form N-CSR is recorded, processed, summarized and reported within the required time periods and that information required to be disclosed by the Registrant in the reports that it files or submits on Form N-CSR is accumulated and communicated to the Registrant’s management, including its principal executive and principal financial officers, as appropriate to allow timely decisions regarding required disclosure.
(b) Disclose any change in the registrant’s internal control over financial reporting (as defined in Rule 30a-3(d) under the Act (17 CFR 270.30a-3(d)) that occurred during the period covered by this report that has materially affected, or is reasonably likely to materially affect, the registrant’s internal control over financial reporting.
There were no changes in the Registrant’s internal control over financial reporting that occurred during the reporting period covered by this report that have materially affected, or are reasonably likely to materially affect, the Registrant’s internal control over financial reporting.
ITEM 12. DISCLOSURE OF SECURITIES LENDING ACTIVITIES FOR CLOSED-END MANAGEMENT INVESTMENT COMPANIES.
Not applicable.
ITEM 13. EXHIBITS.
| (a) | File the exhibits listed below as part of this Form. Letter or number the exhibits in the sequence indicated. |
(1) Any code of ethics, or amendment thereto, that is the subject of the disclosure required by Item 2, to the extent that the registrant intends to satisfy the Item 2 requirements through filing of an exhibit.
(2) A separate certification for each principal executive officer and principal financial officer of the registrant as required by Rule 30a-2(a) under the Act (17 CFR 270.30a-2), exactly as set forth below:
(1) Any written solicitation to purchase securities under Rule 23c-1 under the Act (17 CFR 270.23c-1) sent or given during the period covered by the report by or on behalf of the registrant to 10 or more persons.
Not applicable.
(2) Change in the registrant’s independent public accountant. Provide the information called for by Item 4 of Form 8-K under the Exchange Act (17 CFR 249.308). Unless otherwise specified by Item 4, or related to and necessary for a complete understanding of information not previously disclosed, the information should relate to events occurring during the reporting period.
Not applicable.
| (b) | A separate or combined certification for each principal executive officer and principal officer of the registrant as required by Rule 30a-2(b) under the Act of 1940. |
SIGNATURES
Pursuant to the requirements of the Securities Exchange Act of 1934 and the Investment Company Act of 1940, the registrant has duly caused this report to be signed on its behalf by the undersigned, thereunto duly authorized.
| J.P. Morgan Exchange-Traded Fund Trust | ||
| By: | /s/ Brian S. Shlissel | |
| Brian S. Shlissel | ||
| President and Principal Executive Officer. | ||
| September 1, 2023 | ||
Pursuant to the requirements of the Securities Exchange Act of 1934 and the Investment Company Act of 1940, this report has been signed below by the following persons on behalf of the registrant and in the capacities and on the dates indicated.
| By: | /s/ Brian S. Shlissel | |
| Brian S. Shlissel | ||
| President and Principal Executive Officer | ||
| September 1, 2023 | ||
| By: | /s/ Timothy J. Clemens | |
| Timothy J. Clemens | ||
| Treasurer and Principal Financial Officer | ||
| September 1, 2023 | ||